Angular Highcharts Quick Guide
User Manual:
Open the PDF directly: View PDF ![]() .
.
Page Count: 16
Previous Page Next Page
Angular Highcharts - Quick GuideAngular Highcharts - Quick Guide
Angular Highcharts - Quick Guide
Advertisements
Angular Highcharts - OverviewAngular Highcharts - Overview
Angular Highcharts - Overview
HighChart Angular Wrapper is a open source angular based component to provides an
elegant and feature rich Highcharts visualizations within an Angular application and can be
used along with Angular components seamlessly. There are chapters discussing all the
basic components of Highcharts with suitable examples within a Angular application.
Compatible − All modern browsers are supported along with iPhone/iPad
browsers and Internet Explorer 6 onwards. Modern browsers use SVG for the
graphics rendering and in legacy Internet Explorer graphics are drawn using VML.
Pure TypeScript − No JavaScript is required as complete Highcharts API is
available in TypeScript.
No Flash − No requirement of client side plug-ins like Flash player or Java as
Highcharts is uses native browser technologies and charts can run without
modification on modern mobile devices.
Clean Syntax − Most of the methods are chain-able thus configuration options of
the chart can be managed using syntax as tight as JSON.
Dynamic − Series and points can be added dynamically any time after chart
creation. Event hooks supported. Server interactions are supported.
Documented − Highcharts APIs are thoroughly documented with numerous code
and syntax examples.
Angular Highcharts - Environment SetupAngular Highcharts - Environment Setup
Angular Highcharts - Environment Setup
FeaturesFeatures
Features
This tutorial will guide you on how to prepare a development environment to start your
work with Highcharts and Angular Framework. In this chapter, we will discuss the
Environment Setup required for Angular 6. To install Angular 6, we require the following −
Nodejs
Npm
Angular CLI
IDE for writing your code
Nodejs has to be greater than 8.11 and npm has to be greater than 5.6.
To check if nodejs is installed on your system, type node -v in the terminal. This will help
you see the version of nodejs currently installed on your system.
C:\>node -v
v8.11.3
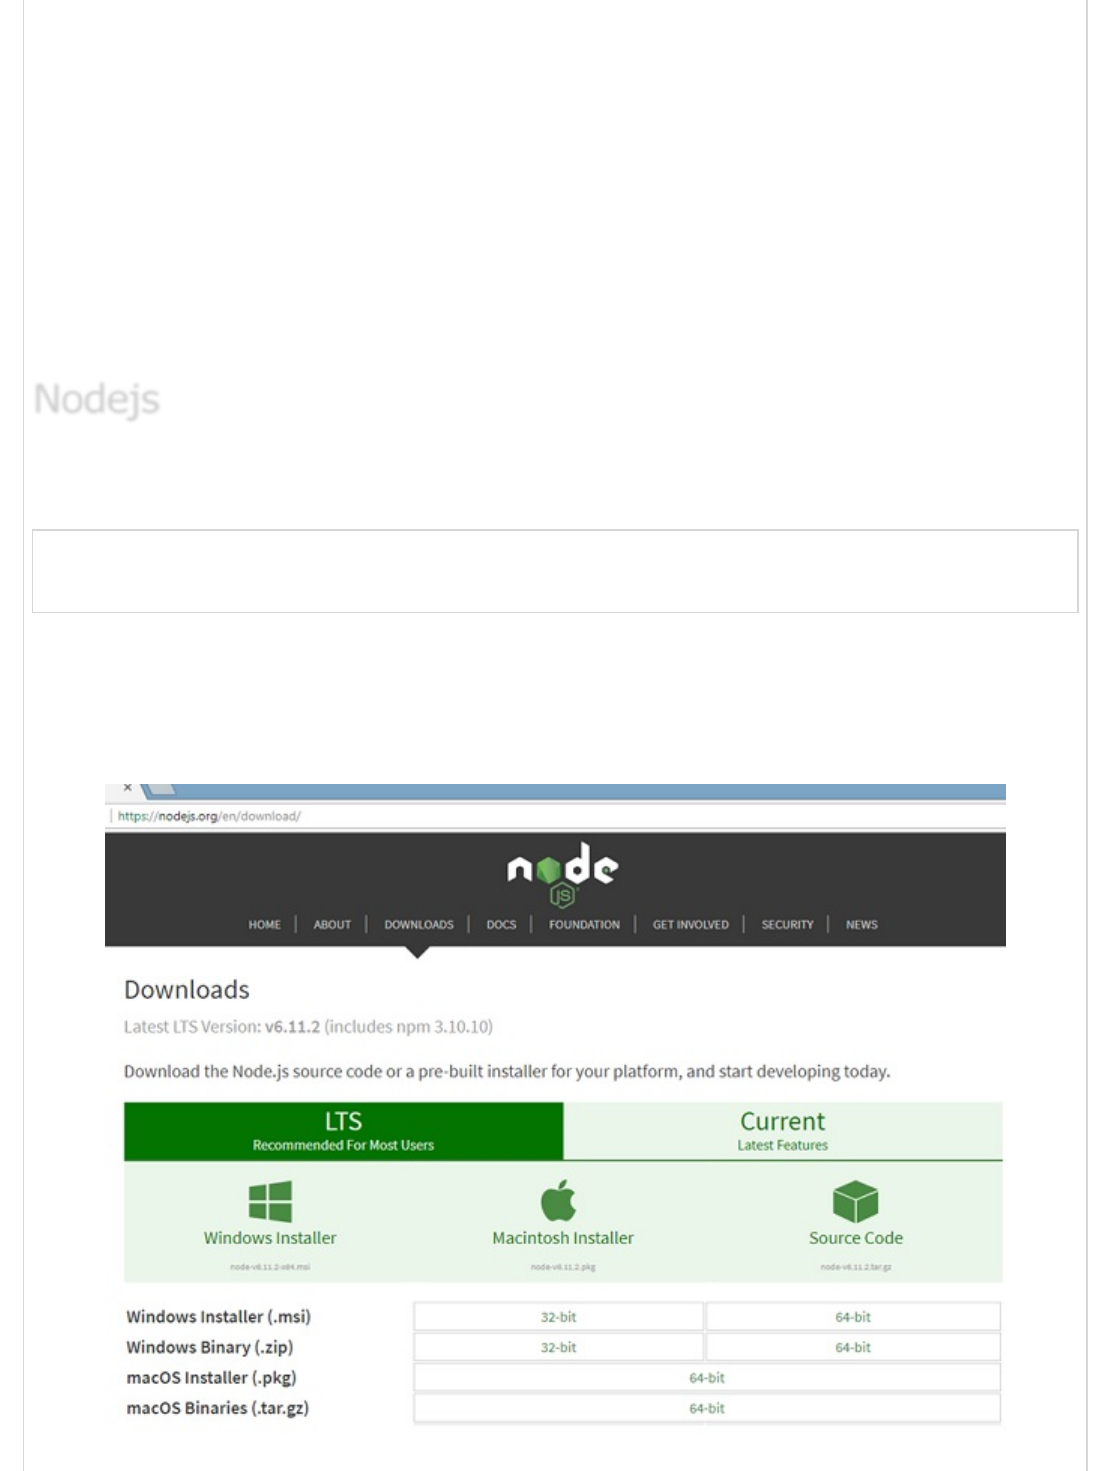
If it does not print anything, install nodejs on your system. To install nodejs, go the
homepage https://nodejs.org/en/download/ of nodejs and install the package based on
your OS.
The homepage of nodejs will look like the following −
NodejsNodejs
Nodejs
Based on your OS, install the required package. Once nodejs is installed, npm will also get
installed along with it. To check if npm is installed or not, type npm -v in the terminal. It
should display the version of the npm.
C:\>npm -v
5.6.0
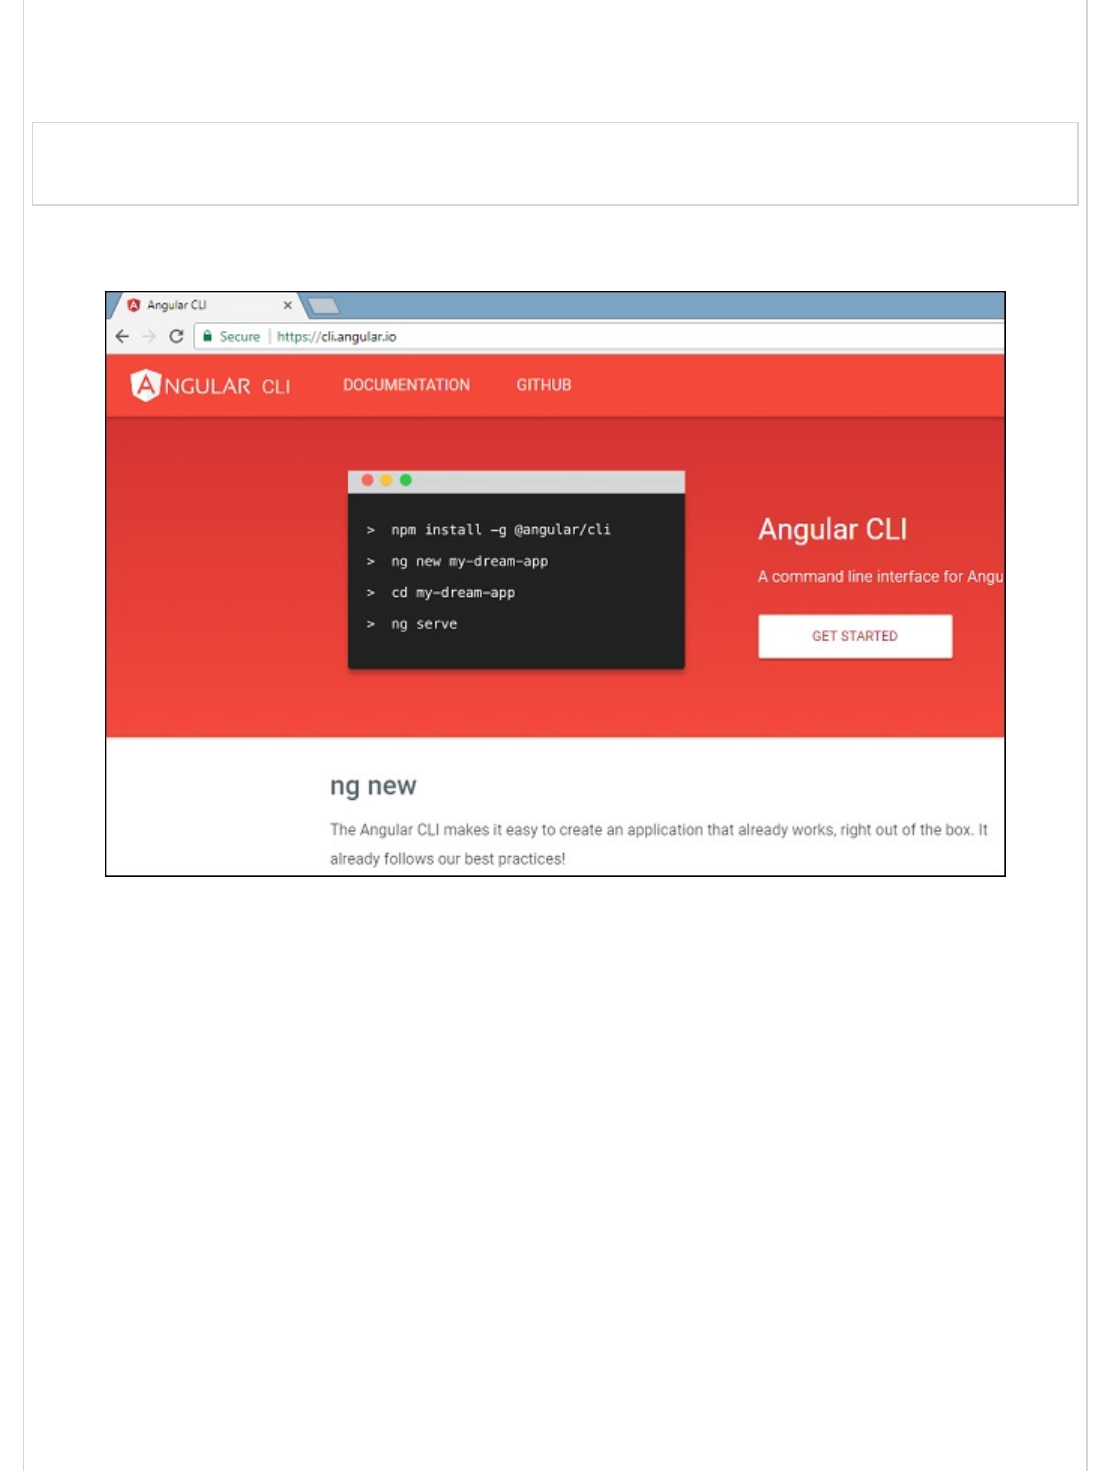
Angular 6 installations are very simple with the help of angular CLI. Visit the homepage
https://cli.angular.io/ of angular to get the reference of the command.
Type npm install -g @angular/cli, to install angular cli on your system.
You will get the above installation in your terminal, once Angular CLI is installed. You can
use any IDE of your choice, i.e., WebStorm, Atom, Visual Studio Code, etc.
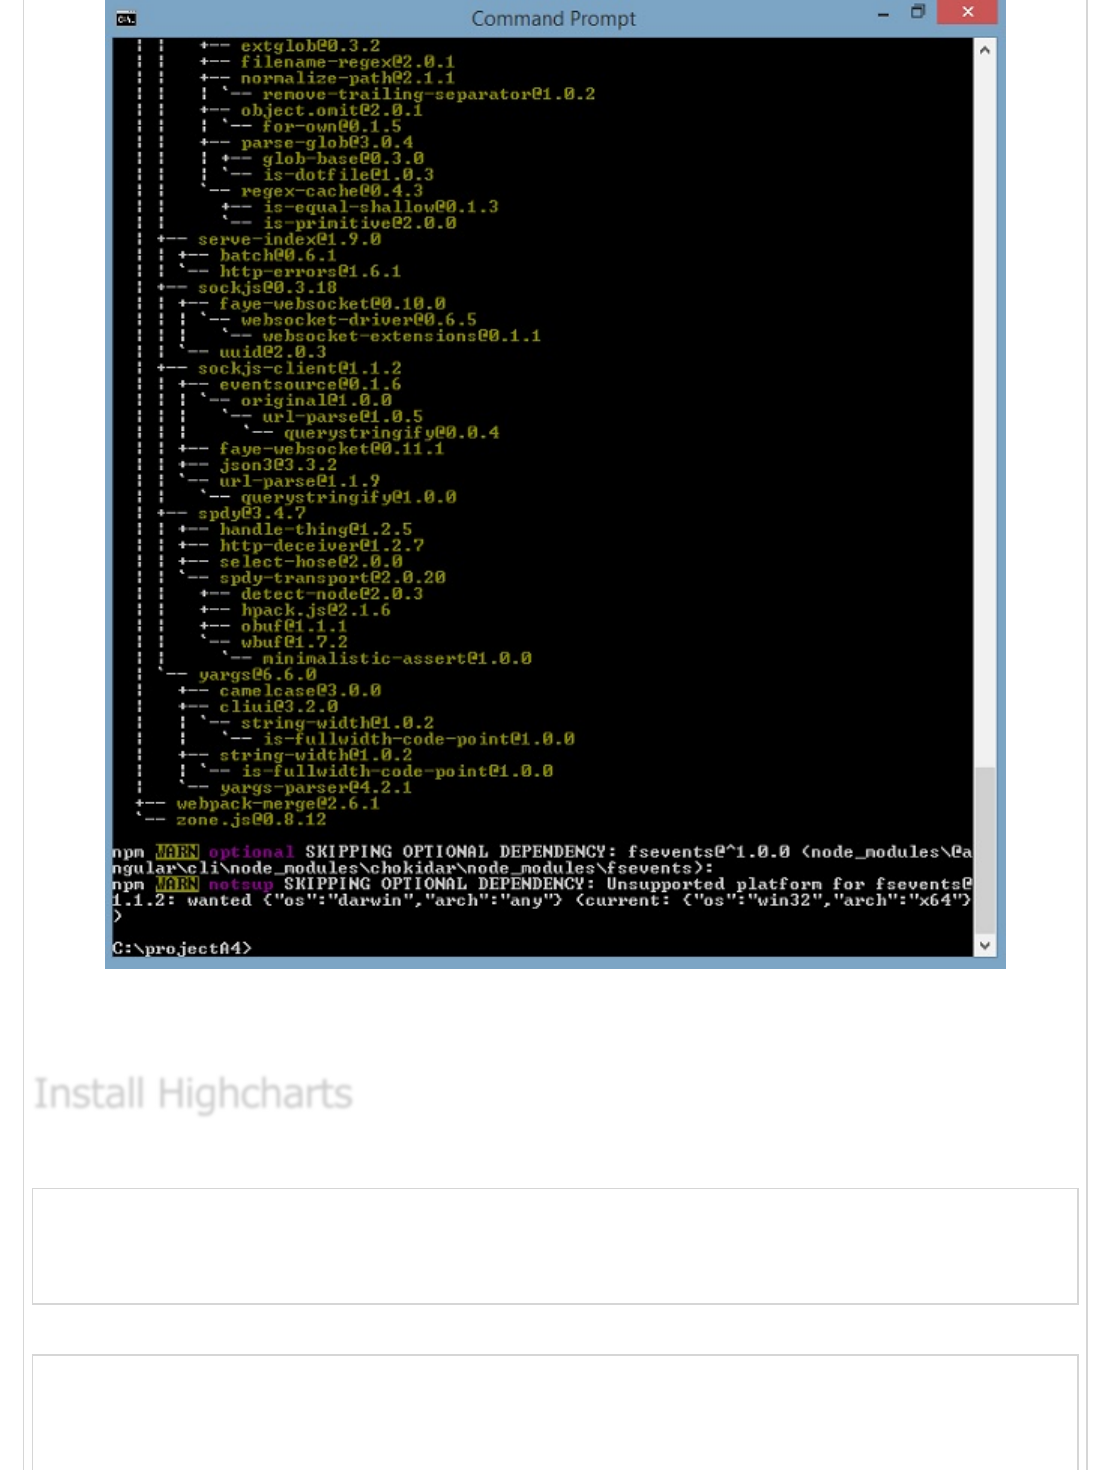
Run the following command to install highchart module in the project created.
highchartsApp>npm install highcharts --save
+ highcharts@6.2.0
added 1 package in 137.534s
Run the following command to install highchart wrapper module in the project created.
highchartsApp>npm install highcharts-angular --save
+ highcharts-angular@2.3.1
added 1 package in 20.93s
Install HighchartsInstall Highcharts
Install Highcharts
Add the following entry in highchartsApp.module.ts file
import { HighchartsChartComponent } from 'highcharts-angular';
declarations: [
...
HighchartsChartComponent
],
Angular Highcharts - Configuration SyntaxAngular Highcharts - Configuration Syntax
Angular Highcharts - Configuration Syntax
In this chapter, we will showcase the configuration required to draw a chart using the
Highcharts API in Angular.
Follow the following steps to update the Angular application we created in Angular 6 -
Project Setup chapter −
Step Description
1Create a project with a name highchartsApp as explained in the Angular 6 - Project
Setup chapter.
2Modify app.module.ts, app.component.ts and app.component.html as explained below.
Keep rest of the files unchanged.
3 Compile and run the application to verify the result of the implemented logic.
Following is the content of the modified module descriptor app.module.ts.
import { BrowserModule } from '@angular/platform-browser';
import { NgModule } from '@angular/core';
import { AppComponent } from './app.component';
import { HighchartsChartComponent } from 'highcharts-angular';
@NgModule({
declarations: [
AppComponent,
HighchartsChartComponent
],
imports: [
BrowserModule,
],
providers: [],
bootstrap: [AppComponent]
})
export class AppModule { }
Following is the content of the modified HTML host file app.component.html.
<highcharts-chart>
[Highcharts] = "highcharts"
[options] = "chartOptions"
Step 1 - Create Angular ApplicationStep 1 - Create Angular Application
Step 1 - Create Angular Application
style = "width: 100%; height: 400px; display: block;"
</highcharts-chart>
We'll see the updated app.component.ts in the end after understanding configurations.
Create Highcharts and create chartOptions
highcharts = Highcharts;
chartOptions = {
}
Configure the type, title and sub-title of the chart using chartOptions.
chart: {
type: "spline"
},
Configure the ticker to be displayed on the X-Axis using chartOptions.
Configure the title to be displayed on the Y-Axis using chartOptions.
yAxis: {
title:{
text:"Temperature °C"
}
},
Configure the tooltip. Put suffix to be added after value (y-axis) using chartOptions.
tooltip: {
valueSuffix:" °C"
},
xAxis:{
categories:["Jan", "Feb", "Mar", "Apr", "May", "Jun", "Jul", "Aug", "Sep", "Oct", "Nov", "Dec"
},
Step 2 − Use ConfigurationsStep 2 − Use Configurations
Step 2 − Use Configurations
Create ChartCreate Chart
Create Chart
xAxisxAxis
xAxis
yAxisyAxis
yAxis
tooltiptooltip
tooltip
seriesseries
series
Configure the data to be displayed on the chart using chartOptions. Series is an array
where each element of this array represents a single line on the chart.
series: [
{
name: 'Tokyo',
data: [7.0, 6.9, 9.5, 14.5, 18.2, 21.5, 25.2,26.5, 23.3, 18.3, 13.9, 9.6]
},
{
name: 'New York',
data: [-0.2, 0.8, 5.7, 11.3, 17.0, 22.0, 24.8,24.1, 20.1, 14.1, 8.6, 2.5]
},
{
name: 'Berlin',
data: [-0.9, 0.6, 3.5, 8.4, 13.5, 17.0, 18.6, 17.9, 14.3, 9.0, 3.9, 1.0]
},
{
name: 'London',
data: [3.9, 4.2, 5.7, 8.5, 11.9, 15.2, 17.0, 16.6, 14.2, 10.3, 6.6, 4.8]
}
]
Consider the following example to further understand the Configuration Syntax −
app.component.ts
import { Component } from '@angular/core';
import * as Highcharts from 'highcharts';
@Component({
selector: 'app-root',
templateUrl: './app.component.html',
styleUrls: ['./app.component.css']
})
export class AppComponent {
highcharts = Highcharts;
chartOptions = {
chart: {
type: "spline"
},
title: {
text: "Monthly Average Temperature"
},
subtitle: {
text: "Source: WorldClimate.com"
},
xAxis:{
categories:["Jan", "Feb", "Mar", "Apr", "May", "Jun",
"Jul", "Aug", "Sep", "Oct", "Nov", "Dec"]
},
yAxis: {
title:{
text:"Temperature °C"
}
},
tooltip: {
valueSuffix:" °C"
ExampleExample
Example
},
series: [
{
name: 'Tokyo',
data: [7.0, 6.9, 9.5, 14.5, 18.2, 21.5, 25.2,26.5, 23.3, 18.3, 13.9, 9.6]
},
{
name: 'New York',
data: [-0.2, 0.8, 5.7, 11.3, 17.0, 22.0, 24.8,24.1, 20.1, 14.1, 8.6, 2.5]
},
{
name: 'Berlin',
data: [-0.9, 0.6, 3.5, 8.4, 13.5, 17.0, 18.6, 17.9, 14.3, 9.0, 3.9, 1.0]
},
{
name: 'London',
data: [3.9, 4.2, 5.7, 8.5, 11.9, 15.2, 17.0, 16.6, 14.2, 10.3, 6.6, 4.8]
}
]
};
}
Verify the result.
ResultResult
Result
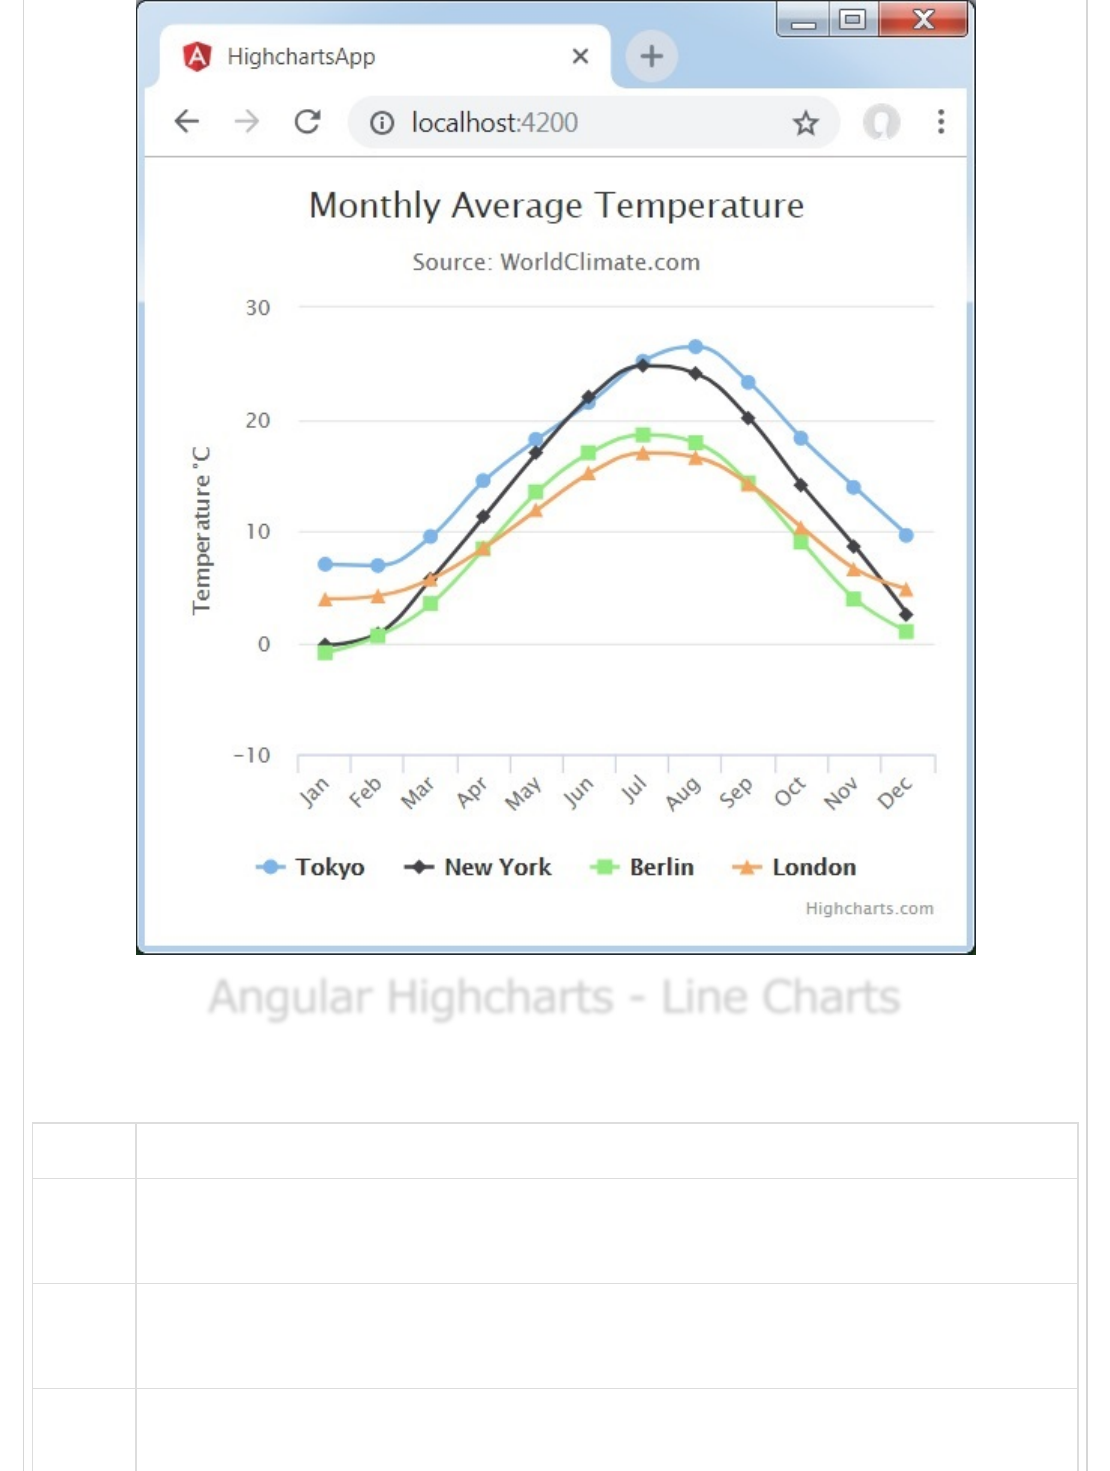
Angular Highcharts - Line ChartsAngular Highcharts - Line Charts
Angular Highcharts - Line Charts
Line charts are used to draw line/spline based charts. In this section, we will discuss the
different types of line and spline based charts.
Sr.No Chart Type & Description
1
Basic line
Basic line chart.
2
With data labels
Chart with data labels.
3Time series, zoomable
Chart with time series.
4
Spline with inverted axes
Spline chart having inverted axes.
5
Spline with symbols
Spline chart using symbols for heat/rain.
6
Spline with plot bands
Spline chart with plot bands.
Angular Highcharts - Area ChartsAngular Highcharts - Area Charts
Angular Highcharts - Area Charts
Area charts are used to draw area based charts. In this section, we will discuss the
different types of area based charts.
Sr.No. Chart Type & Description
1
Basic Area
Basic area chart.
2
Area with negative values
Area chart having negative values.
3
Stacked area
Chart having areas stacked over one another.
4
Percentage area
Chart with data in percentage terms.
5
Area with missing points
Chart with missing points in the data.
6
Inverted axes
Area using inverted axes.
7
Area-spline
Area chart using spline.
Angular Highcharts - Bar ChartsAngular Highcharts - Bar Charts
Angular Highcharts - Bar Charts
Bar charts are used to draw bar based charts. In this section, we will discuss the different
types of bar based charts.
Sr.No. Chart Type & Description
1
Basic Bar
Basic bar chart.
2
Stacked Bar
Bar chart having bar stacked over one another.
3
Bar Chart with negative values
Bar Chart with negative values.
Angular Highcharts - Column ChartsAngular Highcharts - Column Charts
Angular Highcharts - Column Charts
Column charts are used to draw column based charts. In this section, we will discuss the
different types of column based charts.
Sr.No. Chart Type & Description
1
Basic Column
Basic column chart.
2
Column with negative values
Column chart having negative values.
3
Stacked column
Chart having column stacked over one another.
4
Stacked and Grouped column
Chart with column in stacked and grouped form.
5
Column with stacked percentage
Chart with stacked percentage.
6
Column with rotated labels
Column Chart with rotated labels in columns.
7
Column Range
Column Chart using ranges.
Angular Highcharts - Pie ChartsAngular Highcharts - Pie Charts
Angular Highcharts - Pie Charts
Pie charts are used to draw pie based charts. In this section, we will discuss the different
types of pie based charts.
Sr.No. Chart Type & Description
1
Basic Pie
Basic pie chart.
2
Pie with Legends
Pie chart with Legends.
3
Donut Chart
Donut Chart.
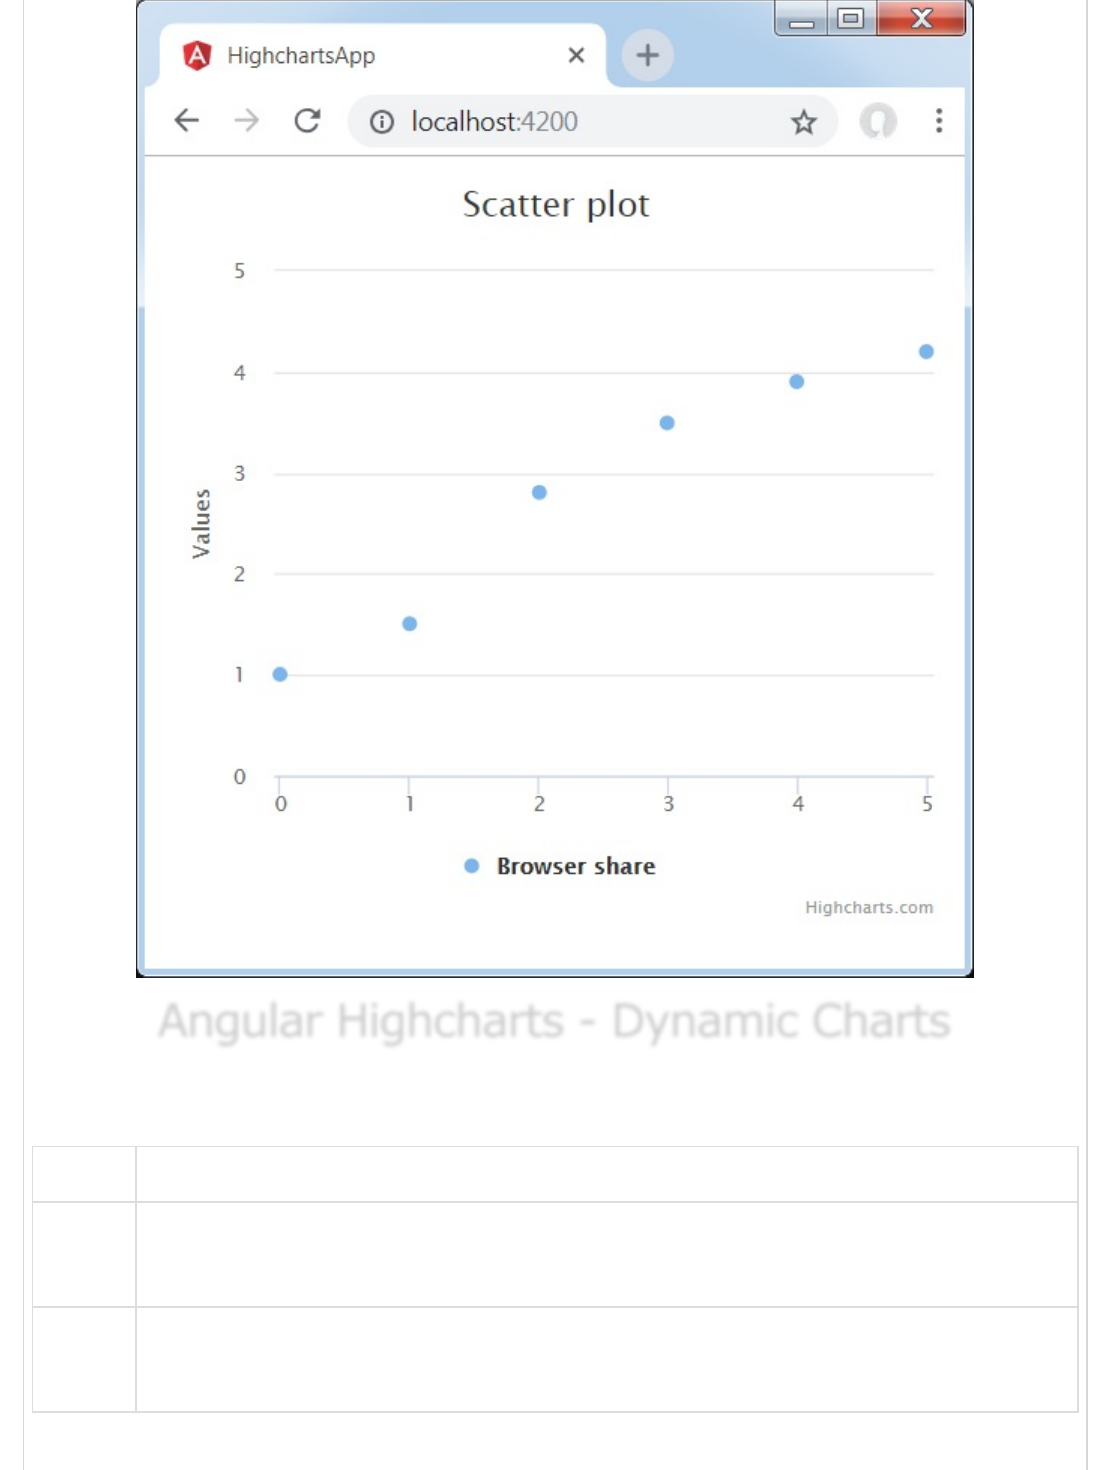
Angular Highcharts - Scatter ChartsAngular Highcharts - Scatter Charts
Angular Highcharts - Scatter Charts
Following is an example of a basic scatter chart.
We have already seen the configuration used to draw a chart in Highcharts Configuration
Syntax chapter.
An example of a basic scatter chart is given below.
Let us now see the additional configurations/steps taken.
Configure the chart type to be scatter based. series.type decides the series type for the
chart. Here, the default value is "line".
var chart = {
type: 'scatter',
zoomType: 'xy'
};
app.component.ts
GWP Highcharts - Pie ChartsGWP Highcharts - Pie Charts
GWP Highcharts - Pie Charts
ConfigurationsConfigurations
Configurations
seriesseries
series
ExampleExample
Example
import { Component } from '@angular/core';
import * as Highcharts from 'highcharts';
@Component({
selector: 'app-root',
templateUrl: './app.component.html',
styleUrls: ['./app.component.css']
})
export class AppComponent {
highcharts = Highcharts;
chartOptions = {
title : {
text: 'Scatter plot'
},
series : [{
type: 'scatter',
zoomType:'xy',
name: 'Browser share',
data: [ 1, 1.5, 2.8, 3.5, 3.9, 4.2 ]
}]
};
}
Verify the result.
ResultResult
Result
Angular Highcharts - Dynamic ChartsAngular Highcharts - Dynamic Charts
Angular Highcharts - Dynamic Charts
Dynamic charts are used to draw data based charts where data can change after rendering
of chart. In this section, we will discuss the different types of dynamic chart.
Sr.No. Chart Type & Description
1
Spline updating each second
Spline Chart updating each second.
2
Click to add a point
Chart with point addition capability.
Angular Highcharts - CombinationsAngular Highcharts - Combinations
Angular Highcharts - Combinations
Combination charts are used to draw mixed charts; for example, bar chart with pie chart.
In this section, we will discuss the different types of combinations charts.
Sr.No. Chart Type & Description
1
Column, Line and Pie
Chart with Column, Line and Pie.
2
Dual Axes, Line and Column
Chart with Dual Axes, Line and Column.
3
Multiple Axes
Chart having Multiple Axes.
4
Scatter with regression line
Scatter chart with regression line.
Angular Highcharts - 3D ChartsAngular Highcharts - 3D Charts
Angular Highcharts - 3D Charts
3D charts are used to draw 3-dimensional charts. In this section, we will discuss the
different types of 3D charts.
Sr.No. Chart Type & Description
1
3D Column
3D Column Chart.
2
3D Scatter
3D Scatter Chart.
3
3D Pie
3D Pie Chart.
Angular Highcharts - Map ChartsAngular Highcharts - Map Charts
Angular Highcharts - Map Charts
Map charts are used to draw heat map or Tree map charts. In this section, we will discuss
the different types of Map charts.
Sr.No. Chart Type & Description
1Heat Map