File 2 Part II Apollo 1070
User Manual: Apollo 1070
Open the PDF directly: View PDF ![]() .
.
Page Count: 22

271
Apollo Group. Inc. ________________________________________
Introduction
As the largest for-profit education company, and the company that pioneered the modern for-
profit education model, Apollo Group, Inc. has the potential to be the industry leader in student success.
Instead the investigation demonstrates that, at least during the period examined, the company invested
relatively little in students and struggled to retain Associate degree students. While the company has
started to take positive steps in the right direction, more remains to be done.
Company Profile
Apollo Group, Incorporated (“Apollo”) is a publicly traded for-profit educational institution
headquartered in Phoenix, AZ. Apollo operates two for-profit college brands, the University of Phoenix
and Western International University. In 1994, Apollo became the second for-profit college to become
publicly traded. The University of Phoenix accounts for the overwhelming majority of the company’s
students and is the Nation’s largest for-profit college. It offers Associate, Bachelor’s, Master’s, and
Doctoral programs in over 100 different fields.1078 Thirty-six percent of Apollo’s students are enrolled in
the Associate degree programs, 48 percent in Bachelor’s degree programs, and 16 percent in Graduate
level programs.1079 The company’s Associate degree program is exclusively online.1080
Apollo operates over 280 locations, and of these locations, approximately 76 are campuses that
provide classes in person. The remaining installations are “learning centers” that provide local resources
for students that learn online.
Like more than half of the regionally accredited brands the committee examined, both the
University of Phoenix and Western International University are regionally accredited by the Higher
Learning Commission. The University of Phoenix was first accredited by the HLC in 1978.
The University of Phoenix was founded by John Sperling in 1976 to assist working adults who
had some college credit complete college degrees. He founded the company after San Jose State
University, where he was a tenured professor, refused to expand a successful grant program Sperling
had run that helped police and firefighters complete degrees at the college.1081 At its founding, the
University of Phoenix required all entering students be at least 23 years old, have at least 2 years of
work experience, and have already completed significant credit towards a college degree.1082 The
company offered exclusively Bachelor’s degrees. The University of Phoenix offered convenient
locations designed to make it easy for working adults to attend classes on existing commuter routes. It
offered a “one class at a time” structure, with frequent starts on a rolling basis. A small group of
learners would move through the curriculum together, with little or no class selection choice. This
1078 For full list of campuses see: http://www.phoenix.edu/campus-locations.html and http://www.west.edu/why-
west/campus-locations (accessed May 10, 2012).
1079 Apollo Group, 2011 Form 10-K.
1080 Apollo’s Associate program was at one time primarily run through Axia College. In June 2011, Axia College was
merged with the University of Phoenix Online.
1081 Christopher R. Beha, “Leaving the Field: What I Learned from For-Profit Education,” Harper’s Magazine, October
2011.
1082 Id.

272
innovative model proved to work extremely well for non-traditional students, and is the foundation of
most for-profit education offerings today.
Sperling served as CEO of the company until August 2001, and continues to play an active role
as chairman of the board. In 2001, Todd Nelson was selected as CEO after serving in a number of other
roles at Apollo, and served as CEO until 2006.1083 Under Nelson’s leadership, enrollment increased from
124,800 students to 282,300 students, but the company came under repeated scrutiny.
News reports of a 2006 deposition of John Sperling reported that Sperling testified that Nelson
was asked to leave Apollo because, “he was mainly concerned with anything that would cause the stock
to drop. ... [H]e was preoccupied primarily with the stock price and not with the functioning of the
company.” 1084 Interviewed by a reporter in 2009 about Nelson’s tenure as CEO, the former president of
the University of Phoenix Jorge Klor de Alva replied, “There was a breakdown in the culture that John
had built up.” 1085
In 2003, the company was sued by two former employees under the False Claims Act for
violating the incentive compensation rules then in place. This case was settled in 2009 for $78.5
million. In 2004, the Department of Education alleged that Apollo had violated the same rules regarding
how much of a role the number of students enrolled could play in setting recruiter pay. The suit was
settled for $9.8 million.
In 2008, Charles Edelstein became CEO, and in 2009, he was joined as co-CEO by Gregory
Capelli. Capelli had joined the company in 2007, as executive vice president of Global Strategy and
assistant to the executive chairman. The two remain co-CEOs, but Edelstein will step down in August
2012.
According to news reports, at John Sperling’s 80th birthday party in 2001, Mr. Sperling set the
goal of increasing Apollo’s enrollment from an already impressive 124,800 students to 470,800.1086 This
aspiration was reinforced by a 2002 corporate goal known as “5-5-5”: “Five Years, Five Million
Students and Five Billion Dollars.” 1087 During this period, Apollo also eliminated the requirement that
students have previous college credit, added a shorter term Associate degree program, and moved to
expand online enrollment.1088
1083 Nelson’s combined compensation and severance pay from Apollo amounted to $41.3 million. In 2007, Nelson became
CEO of EDMC and continues in that role today.
1084 Charlie Deitch, “There’s big money in studying art … if you own the school,” Pittsburgh City Paper, March 13, 2008,
http://www.pittsburghcitypaper.ws/pittsburgh/art-of-the-deal/Content?oid=1339907 (accessed June 12, 2012).
1085 Thomas Bartlett, “Phoenix Risen” The Chronicle of Higher Education, July 6, 2009.
1086 Daniel Golden, “Plunge of For-Profit College Shares Make Patriarch Sperling Rail at Obama” Bloomberg, December 29,
2010.
1087 2004 Department of Education University of Phoenix Program Review Report.
1088 Daniel Golden, “Plunge of For-Profit College Shares Make Patriarch Sperling Rail at Obama” Bloomberg, December 29,
2010.
273
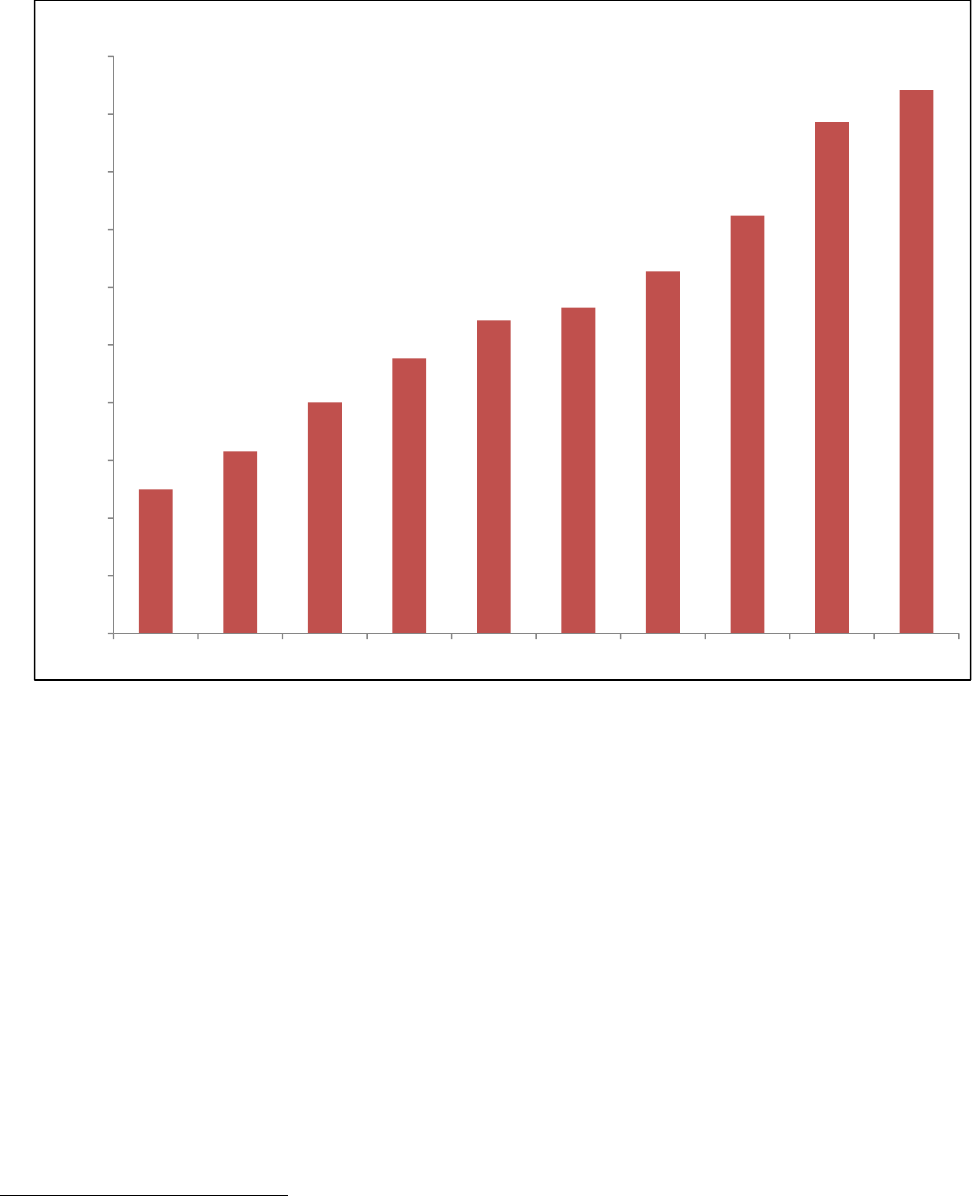
While Apollo ultimately fell short of Sperling’s goal, the company experienced rapid enrollment
growth, from 124,800 students in 2001 to 470,800 students in 2010, a larger number of students than the
entire Big Ten
Conference.1089 However, this growth came at a cost. In the words of former University of Phoenix
senior vice president, Robert W. Tucker, “At critical junctures, John chose growth over academic
integrity, which ultimately diminished a powerful educational model.” 1090
Much of this growth was driven by growth in Associate degree students at the University of
Phoenix.
1089 Enrollment is calculated using the Securities and Exchange Commission quarterly or annual filing for the August-October
period each year. See Appendix 7. The Big Ten Conference enrolled 458,310 students in Fall 2010. IPEDs Enrollment
Figures for Indiana University, Michigan State University, Northwestern University, Ohio State University, Penn State
University, Purdue University, University of Iowa, University of Illinois, University of Michigan, University of Minnesota,
University of Nebraska, and University of Wisconsin. By March 2012, Apollo’s enrollment had dropped to 355,800.
1090 “Plunge of For-Profit College Shares Make Patriarch Sperling Rail at Obama” Daniel Golden. Bloomberg. Dec 29,
2010.
124,800
157,800
200,100
238,400
271,400 282,300
313,700
362,100
443,000
470,800
0
50,000
100,000
150,000
200,000
250,000
300,000
350,000
400,000
450,000
500,000
Fall2001 Fall2002 Fall2003 Fall2004 Fall2005 Fall2006 Fall2007 Fall2008 Fall2009 Fall2010
EnrollmentatApolloGroup,Inc.,2001‐10
274
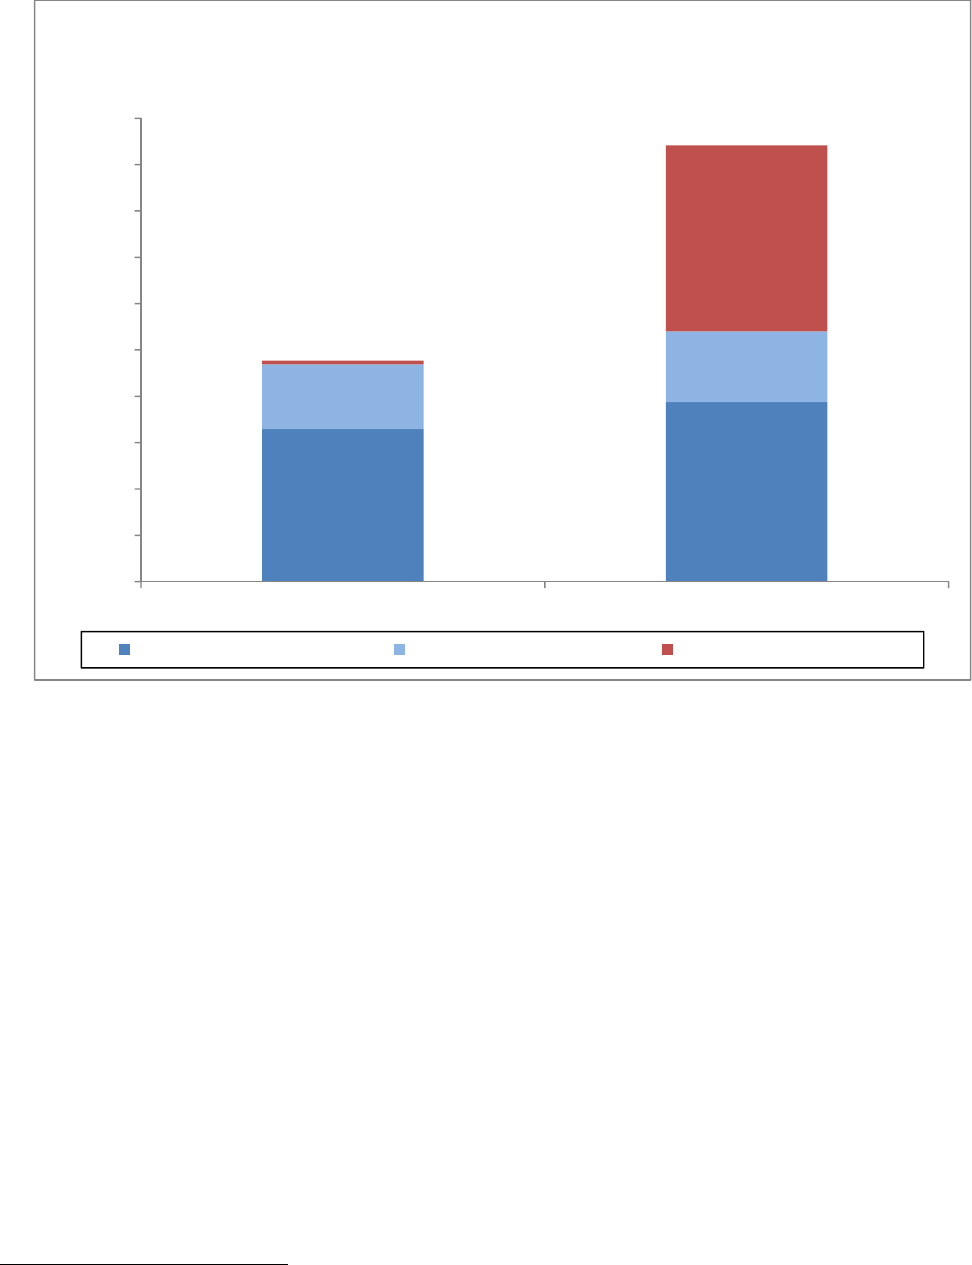
In 2004, Apollo enrolled 4,000 Associate degree students, which represented 2 percent of the
company’s total enrollment. By 2008, the company enrolled 146,500 Associate degree students who
made up 41 percent of the student body.1091
In late 2010, Apollo leadership initiated the University Orientation Program that required all
students with less than 24 credits to successfully complete a 3-week orientation course before actually
beginning classes. Any student who withdraws before the conclusion of the program incurs no financial
obligation to Apollo. While not as robust as the Kaplan Commitment program initiated around the same
time, which allows students to actually attend classes for 5 weeks and withdraw at no cost, the program
is a promising step and appers to have had a significant impact on the number and type of students who
enroll. While 80 percent of those who start the orientation ultimately enroll at Apollo, the program
appears to be at least partially responsible for the drop in enrollment to 355,800 students as of March
2012.1092 This drop in enrollment, led to a drop in both revenue and profit in 2011.
The company has also recently focused its marketing efforts towards shifting the mix of its
enrollments towards Bachelor’s level students.1093 Both the drop in enrollments and the changing mix of
students has been helpful to Apollo’s 90/10 ratio.1094 The company at least partly attributes the lower
1091 Apollo Group, Inc. 10-K period ending 8/31/2008.
1092 November 2011, Wunderlich Securities Conference; Apollo Group, Inc. 2012, Q2 Form 10-Q.
1093 Apollo Group Investors Call, Q2 2011.
1094 December 2011 William Blair Conference.
164,500193,600
69,900
76,400
4,000
200,800
‐
50,000
100,000
150,000
200,000
250,000
300,000
350,000
400,000
450,000
500,000
Aug.2004 Aug.2010
EnrollmentatUniversityofPhoenixbyDegreeLevel,
2004and2010
Bachelor'sDegreeStudents GraduateDegreeStudents AssociateDegreeStudents

275
mix of Associate degree students as the reason it was able to remain in compliance with the 90/10 rule
for fiscal year 2011.1095
Prior to 2011, growth in enrollment led to growth in revenue. Revenue almost doubled—from
$2.7 billion in 2007 to $4.9 billion in 2010. 1096
Federal Revenue
Nearly all for-profit education companies derive the majority of revenues from Federal financial
aid programs. Between 2001 and 2010, the share of title IV Federal financial aid funds flowing to for-
profit colleges increased from 12.2 to 24.8 percent and from $5.4 to $32.2 billion.1097 Together, the 30
companies the committee examined derived 79 percent of revenues from title IV Federal financial aid
programs in 2010, up from 69 percent in 2006.1098
In 2010, Apollo reported 85.3 percent of revenue from title IV Federal financial aid
programs.1099 However, this amount does not include revenue received from Departments of Defense
and Veterans Affairs education programs. Department of Defense Tuition Assistance and post-9/11 GI
bill funds accounted for approximately 3.4 percent of Apollo’s revenue, or $144 million.1100 With these
funds included, 88.7 percent of Apollo’s total revenue was comprised of Federal education funds.1101
1095 Apollo Group Investors Call, Q2 2011. Apollo elected not to take advantage of the temporary ECASLA provision
allowing for the exclusion of up to $2,000 in loans per student from their 90/10 calculation. This means that unlike a number
of other for-profit education companies, their 90/10 is more reflective of the actual amount of Federal revenue the company
receives.
1096 Revenue figures for publicly traded companies are from Securities and Exchange Commission annual 10-K filings.
Revenue figures for privately held companies are taken from the company financial statements produced to the committee.
See Appendix 18. Matching the drop in enrollment, revenue fell to $4.7 billion in 2011.
1097 “Federal financial aid funds” as used in this report means funds made available through title IV of the Higher Education
Act, including subsidized and unsubsidized Stafford loans, Pell grants, PLUS loans and multiple other small loan and grant
programs. See 20 U.S.C. §1070 et seq. Senate HELP Committee staff analysis of U.S. Department of Education, Federal
Student Aid Data Center, Title IV Program Volume Reports by School,
http://federalstudentaid.ed.gov/datacenter/programmatic.html, 2000-1 and 2009-10. Figures for 2000-1 calculated using data
provided to the committee by the U.S. Department of Education.
1098 Senate HELP Committee staff analysis of Proprietary School 90/10 numerator and denominator figures for each OPEID
provided to the U.S. Department of Education pursuant to section 487(d)(4) of the Higher Education Act of 1965. Data for
fiscal year 2006 provided to the committee by each company; data for fiscal year 2010 provided by the Department of
Education on October 14, 2011. See Appendix 9.
1099 Senate HELP Committee staff analysis of fiscal 2010 Proprietary School 90/10 numerator and denominator figures for
each OPEID provided to the U.S. Department of Education pursuant to section 487(d)(4) of the Higher Education Act of
1965. Data provided by the Department of Education on October 14, 2011. See Appendix 9.
1100 Post-9/11 GI bill disbursements for August 1, 2009-July 31, 2010 provided to the committee from the Department of
Veterans Affairs on November 5, 2010; post-9/11 GI bill disbursements for August 1, 2009-June 15, 2011 provided to the
committee from the Senate Committee on Veterans’ Affairs via the Department of Veterans Affairs on July 18, 2011;
Department of Defense Tuition Assistance Disbursements and MyCAA disbursements for fiscal years 2009-11 provided (by
branch) by the Department of Defense on December 19, 2011. Committee staff calculated the average monthly amount of
benefits collected from VA and DOD for each company, and estimated the amount of benefits received during the company’s
2010 fiscal year. See Appendix 11 and 12.
1101 “Federal education funds” as used in this report means Federal financial aid funds combined with estimated Federal funds
received from Department of Defense and Department of Veterans Affairs military education benefit programs. See
Appendix 10.

276
Over the past 10 years, the amount of Pell grant funds collected by for-profit colleges as a whole
increased from $1.4 billion to $8.8 billion; the share of total Pell disbursements that for-profit colleges
collected increased from 14 to 25 percent.1102 Part of the reason for this increase is that Congress has
repeatedly increased the amount of Pell grant dollars available to a student over the past 4 years, and, for
the 2009-10 and 2010-11 academic years, allowed students attending year-round to receive two Pell
awards in 1 year. Poor economic conditions have also played a role in increasing the number of Pell
eligible students enrolling in for-profit colleges.
1102 Senate HELP Committee staff analysis of U.S. Department of Education, Federal Student Aid Data Center, Title IV Pell
Grant Program Volume Reports by School, 2001-2 and 2010-11,
http://federalstudentaid.ed.gov/datacenter/programmatic.html.
88.7%
11.3%
ApolloGroup,Inc.FederalMoneyShare,2010
FederalEducationFunds Non‐FederalFunds
FederalEducation
Funds:$3.8Billion

277
The result of these increases is that Apollo collects more Pell Grant dollars than any other
college in the country, passing $1 billion in 2010. Apollo more than quadrupled the amount of Pell
grants it collected, from $257 million in 2007 to $1.15 billion in 2010.1103
Spending
While the Federal student aid programs are intended to support educational opportunities for
students, for-profit education companies direct much of the revenue derived from these programs to
marketing and recruiting new students, and to profit. On average, among the 15 publicly traded
education companies, 86 percent of revenues came from Federal taxpayers in fiscal year
2009.1104 During the same period the companies spent 23 percent of revenues on marketing and
1103 Pell disbursements are reported according to the Department of Education’s student aid “award year,” which runs from
July 1 through June 30 each year. Senate HELP Committee staff analysis of U.S. Department of Education, Federal Student
Aid Data Center, Title IV Pell Grant Program Volume Reports by School, 2006-7 through 2009-10,
http://federalstudentaid.ed.gov/datacenter/programmatic.html. See Appendix 13.
1104 Senate HELP Committee staff analysis of fiscal year 2009 Proprietary School 90/10 numerator and denominator figures
plus all additional Federal revenues received in fiscal year 2009 provided to the committee by each company pursuant to the
committee document request of August 5, 2010.
$257
$401
$657
$1,155
0
200
400
600
800
1,000
1,200
1,400
2007 2008 2009 2010
DollarsinMillions
PellGrantFundsCollectedbyApolloGroup,Inc.,
AwardYears2007‐10

278
recruiting ($3.7 billion), and 19.7 percent on profit ($3.2 billion).1105 These 15 companies spent a total
of $6.9 billion on marketing, recruiting and profit in fiscal year 2009.
In 2009, Apollo allocated 27 percent of its revenue, or $1.1 billion, to profit and 23.7 percent, or
$935 million, to marketing and recruiting.1106
Apollo devoted a total of $2.04 billion to marketing, recruiting, and profit in fiscal year 2009.1107
The amount of profit Apollo generated also increased rapidly, growing from $632 million in 2006 to
over $1 billion in 2010. Matching the drop in enrollment, profit fell in 2011 to $961 million.
1105 Senate HELP Committee staff analysis of fiscal year 2009 Securities and Exchange Commission annual 10-K filings.
Marketing and recruiting includes all spending on marketing, advertising, admissions and enrollment personnel. Profit is
based on operating income. See Appendix 19.
1106 Id. On average, the 30 for-profit schools examined spent 23 percent of revenue on marketing and 19.4 percent on profit.
“Other” category includes administration, instruction, executive compensation, student services, physical plant, maintenance
and other expenditures.
1107 Id.
Marketing,23.7%
Profit,27.0%
Other,49.4%
SpendingatApolloGroup,Inc.,2009
Marketing:
$935 Million
Profit:
$1.1Billion

279
Executive Compensation
Executives at Apollo, like most for-profit executives, are more generously compensated than
leaders of public and non-profit colleges and universities. Executive compensation across the for-profit
sector drastically outpaces both compensation at public and non-profit colleges and universities, despite
poor student outcomes at many for-profit institutions.1108 In 2009, Apollo Founder and Chairman John
Sperling received $8.6 million in compensation, more than 13 times as much as the president of the
University of Arizona, who received $633,206 in total compensation for 2009-10. Co-CEOs Charles
Edelstein and Gregory Capelli together received $3.4 million. The chief executive officers of the large
publicly traded for-profit education companies took home, on average, $7.3 million in fiscal year
2009.1109
1108 Senate HELP Committee staff analysis of fiscal year 2009 Securities and Exchange Commission annual proxy filings and
chief executive salary surveys published by the Chronicle of Higher Education for the 2008-9 school year. See Appendix 17a
and Appendix 17b.
1109 Includes compensation information for 13 of 15 publicly traded for-profit education companies. Kaplan, owned by the
Washington Post Company, does not disclose executive compensation for its executives. And National American University
was not listed on a major stock exchange in 2009.
$632
$767
$1,066
$1,011
0
200
400
600
800
1,000
1,200
2007 2008 2009 2010
DollarsinMillions
ApolloGroup,Inc.Profit(OperatingIncome),2007‐10

280
Executive Title 2009
Compensation 2010
Compensation
John G. Sperling Founder and Chairman $8,617,597.00 $6,963,239.00
Joseph L. D'Amico President and COO $5,115,263.00 $5,500,246.00
Brian L. Schwartz Senior VP and CFO $2,345,379.00 $2,369,601.00
William J. Pepicello President, University of Phoenix $2,035,470.00 $2,035,470.00
Charles B. Edelstein Co-CEO $1,800,000.00 $1,636,950.00
Gregory W. Cappelli Co-CEO $1,659,712.00 $1,659,712.00
Total 1110 $21,573,421.00 $20,165,218.00
Co-CEO’s Gregory Capelli’s 2011 compensation was $25.1 million.1111
Tuition and Other Academic Charges
Compared to public colleges offering the same programs, the price of tuition is higher at Apollo.
Tuition for an Associate of Arts in Business at the University of Phoenix Online costs $24,500.1112 The
same degree costs $4,087 at Phoenix College in the Maricopa Community College system.1113
1110 Senate HELP Committee staff analysis of fiscal year 2009 and 2010 Securities and Exchange Commission annual proxy
filings. Information analyzed includes figures for named executive officers. See Appendix 17b.
1111 Apollo Group 2011 DEF 14C.
1112 See Appendix 14; see also, University of Phoenix, School of Business, http://cdn-
static.phoenix.edu/content/dam/altcloud/programs/Sealsheets/AAFB-013B.pdf?cm_sp=Program+Page-_-SealSheet+PDF-_-
AAFB (accessed April 19, 2012).
1113 See Appendix 14; see also, Phoenix College, Phoenix College, http://www.pc.maricopa.edu/ (accessed April 19, 2012).

281
Tuition for a Bachelor’s of Science in Business at the University of Phoenix in Hohokam, AZ,
costs $74,575.1114 The same degree at the University of Arizona costs $44,200.1115 However, the cost of
tuition for a Bachelor’s degree at the University of Phoenix is considerably less than a Bachelor’s degree
at a comparable non-profit college. It costs $142,716 to obtain a Bachelor’s degree at the non-profit
Prescott College.1116
1114 See Appendix 14; see also, University of Phoenix, School of Business, http://cdn-
static.phoenix.edu/content/dam/altcloud/programs/Sealsheets/AAFB-013B.pdf?cm_sp=Program+Page-_-SealSheet+PDF-_-
AAFBhttp://cdn-static.phoenix.edu/content/dam/altcloud/programs/Sealsheets/BSB-M-025B.pdf?cm_sp=Program+Page-_-
SealSheet+PDF-_-BSB-M (accessed April 19, 2012).
1115 See Appendix 14; see also, University of Arizona, The University of Arizona, http://www.arizona.edu/ (accessed April
19,2012).
1116 See Appendix 14; see also, Prescott College, Prescott College, http://www.prescott.edu/ (accessed April 19, 2012).
$24,500
$4,087
$0
$5,000
$10,000
$15,000
$20,000
$25,000
$30,000
UniversityofPhoenix PhoenixCollege
CostofanAssociateDegreeinBusinessatUniversityofPhoenixand
PhoenixCollege

282
The higher tuition that Apollo charges is reflected in the amount of money that Apollo collects
for each veteran that it enrolls. From 2009-11, Apollo trained 29,336 veterans and received $210 million
in post-9/11 GI bill benefits, averaging $7,158 per veteran. In contrast, public colleges collected an
average of $4,642 per veteran trained in the same period.1117
According to Apollo executives, the company has increased tuition, “3 percent, 4 percent, 5
percent really in most areas of the country the last couple of years.” 1118 To the company’s credit, while
executives have indicated in calls with investors that they have considered raising tuition as a means of
addressing 90/10 concerns, unlike some other for-profit colleges, Apollo has elected not to do so.1119
Internal Apollo emails indicate that the company is aware tuition costs and increases are a
concern for many students. According to one internal email, “they are starting to hear an increase in the
reason that the student is not returning to school is because they are advising that the price increase/high
tuition is preventing them from returning.” 1120
Internal documents from the period examined indicate that, when presented with questions
regarding cost from prospective students, recruiters are trained not to provide direct answers. According
1117 See Appendix 11. Post-9/11 GI bill disbursements for August 1, 2009-June 15, 2011 provided to the committee from the
Senate Committee on Veterans’ Affairs via the Department of Veterans Affairs on July 18, 2011.
1118 William Blair Conference, December 2011.
1119 Apollo Group Investors Call, Q2 2011. See also Apollo Group Investors Call, Q4 2010.While Apollo is uncomfortably
close to the 90/10 threshold, calls with investors suggest the company is focused on more appropriate ways to deal with the
problem, including increasing debt counseling and the number of employer funded students. See Apollo Group, 2010,
Q4Earnings Call with Investors; Apollo Group, 2011, Q3 Earnings Call with Investors.
1120 Apollo Group, Internal Email, RE: GP, October 2, 2008 (AGI0045757, at AGI0045758).
$74,575
$44,200
$142,716
$0
$20,000
$40,000
$60,000
$80,000
$100,000
$120,000
$140,000
$160,000
UniversityofPhoenix UniversityofArizona PrescottCollege
CostofaBachelor'sDegreeatUniversityofPhoenix,theUniversityof
ArizonaandatPrescottCollege

283
to a 2007 training manual, if the prospect says “you’re too expensive,” the recruiter could respond, “Can
you afford not to go?” or “If student loans will match your payment to your income when you are in
repayment, why do loans scare you?” or “If you are going to be making more money, wouldn’t these
loans be easier to pay back?” or finally “Why would you not want to invest in yourself?” 1121 If a student
complains that the University of Phoenix is expensive compared to other schools, the recruiters were
given proposed responses including, “When your degree hangs on the wall in a few years . . . will you
tell your friends and family you bought the cheapest degree you could find?” 1122
Recruiting
Enrollment growth is critical to the business success of for-profit education companies,
particularly publicly traded companies that are closely watched by Wall Street analysts. In order to meet
revenue and profit expectations for-profit colleges must demonstrate consistent enrollment growth each
quarter.
Internal documents from the period examined by the committee demonstrate an aggressive
approach to enrolling prospective students.1123 Recruiters were trained to push prospective students to
commit to attending the school by creating a sense of urgency. A 2007 manual instructed “after gaining
voice-to-voice contact with your students, uncovering and developing needs, matching our benefits to
their needs, and helping them to work through their concerns, you now have to challenge them to act
NOW.” 1124 The document goes on to state, “this chapter will help you create urgency in your students
so they resist the urge to wait and get excited to begin NOW.” 1125
In order to create this sense of urgency, a 2007 training document states: “Do not tell the student
we have classes running every week unless you can agree on a start date, or rolling start dates is a selling
point.” 1126 Another suggested response to generate a sense of urgency is, “it looks like I might be able
to squeeze you into” the next start date.1127 Apollo’s training manuals instructed recruiters to avoid
telling prospective students “you have plenty of time to get everything in order,” because “if the student
thinks he/she has plenty of time, he/she might wait and apply later.” 1128
The committee reviewed a small sampling of complaints from students who felt they were
misled or deceived by recruiters.1129 While student complaints may not be representative of the
experience of the majority of students, they do provide an important window into practices that appear
to be occurring. As one servicemember said in his complaint:
1121 Apollo Group, University of Phoenix Enrollment Counselor Guide, 2007 (AGI0015231, at 15339). The company states
that this document is no longer in use.
1122 Apollo Group, University of Phoenix Enrollment Counselor Guide Online Campus, 2007 (AGI0014312, at
AGI0014465). The company states that this document is no longer in use.
1123 According to Apollo the training manuals cited in the report are no longer in use.
1124 Apollo Group, University of Phoenix Enrollment Counselor Guide, 2007 (AGI0015231, at AGI0015329).
1125 Id.
1126 Id., at 15333; See Also, Apollo Group, University of Phoenix Enrollment Counselor Guide Online Campus, 2007
(AGI0014312).
1127 Apollo Group, University of Phoenix Enrollment Counselor Guide, 2007 (AGI0015231, at AGI0015334).
1128 Apollo, 2007, Enrollment Counselor Guide: School of Advanced Studies (AGI00014312, at AGI0014504) (University of
Phoenix).
1129 After extensive negotiation, Apollo provided the committee with a small sample of student complaints but failed to
provide the vast majority of the 5,152 complaints students lodged with the company.

284
I believe that the University of Phoenix is using deceptive practices in order to lure
students into the school, the enrollment counselors tell students that they should be
complete with their course of studies in a short period of time fully knowing how long it
is going to take. . . . I have talked with other students at the University of Phoenix and
this appears to be a common tactic used by University of Phoenix enrollment counselors
[sic]. 1130
Another military student who was billed for a class that he never took wrote:
As a marine of 19 years, I’ve served in Desert Storm, Somalia, and Operation Iraqi
Freedom x2. You cannot imagine the emotional battle this has taken on me after dealing
with this for nearly TWO years!! An education institution such as yours earns millions of
dollars each year, and yet you punish those who are willing to risk their lives and fight for
your freedoms, you should be ashamed! I am very disappointed as an American that an
institution such as your calls itself a place of ‘higher’ learning.’ It was because of the
selfless sacrifice of our WWII Veterans and the implementation of the GI Bill that paved
the way for hundreds Colleges to open across our country. I am going to retire from the
Marines after 20 years of service, I hope you will take a good look at how you treat
Veteran’s in the future [sic]. 1131
The son of one Apollo student, disputing a bill, wrote, “My father did not make any loans [sic].
The school Phoenix University never told him upfront that he was applying for a loan he thought he was
applying for some type of Pell Grant from the government which he would not have to repay. They told
him they he was approved for a loan with your institution after the period that classes would start … My
father does not speak English and is not computer savvy [sic].” 1132
Another former student was told by an Apollo admissions counselor that her felony conviction
would not hinder a career as a pharmacy technician.1133 The student graduated with a 3.61 GPA, and
$27,000 in debt, only to discover that the required licensing board placed a lifetime bar on individuals
with certain felony convictions sitting for the exam.1134
Government Accountability Office Undercover Recordings1135
Undercover recordings made during GAO visits to University of Phoenix campuses in Hohokam,
AZ, and Philadelphia, PA showed multiple instances of deceptive and misleading recruitment.
Recordings of the encounters at the Hohokam campus document misleading tactics with regard
to the cost of attending. Asked about a Bachelor’s program in elementary education that required 120
credits, the recruiter said, “This is a Bachelor’s so it’s four years, you would finish in exactly four years,
that’s the worst scenario. . . . There are ways to speed it up.”1136 Yet, when the undercover prospective
student asks about cost, the recruiter quoted a price based on attending three terms a year, “With tuition
1130 Letter from Office of the Attorney General State of Arizona Consumer Information & Complaints to University of
Phoenix, May 4, 2009 (AGI0051856).
1131 Apollo Group, Internal Correspondence, July 7, 2009 (AGI0053273).
1132 Letter from [REDACTED] to Apollo Group, July 27, 2009 (AGI0052827).
1133 Letter from Aubrie Roupe, former University of Phoenix student, to Senator Tom Harkin, April 2, 2011.
1134 Id.
1135 Apollo was also visited by GAO for their report “Experiences of Undercover Students Enrolled in Online Classes at
Selected Colleges.” The GAO agent was unable to enroll at the school as they did not meet requirements for acceptance
based on insufficient evidence of high school graduation.
1136 Audio Recording: Undercover Recording of Visits by GAO Agents to For-Profit Schools, School 1 Scenario 2 at minute
11:16, available at http://harkin.senate.gov/help/gao.cfm (accessed June 14, 2012).

285
and books it’s approximately . . . its right about $9,500 a year.” 1137 In reality, if the prospective student
were to take full-time classes year round to finish in less than 4 years, the cost would be greater than
$9,500. In another instance, when asked about the job placement rate, the admissions representative
states, “we don’t have that statistic, because a lot of them move out of state. And a lot of them did.” 1138
Outcomes
While aggressive recruiting and high cost programs might be less problematic if students were
receiving promised educational outcomes, committee staff analysis showed that tremendous numbers of
students are leaving for-profit colleges without a degree. Because 98 percent of students who enroll in a
2-year degree program at a for-profit college, and 96 percent who enroll in a 4-year degree program,
take out loans, hundreds of thousands of students are leaving for-profit colleges with debt but no
diploma or degree each year.1139
Two metrics are key to assessing student outcomes: (1) retention rates based on information
provided to the committee and (2) student loan “cohort default rates.” These metrics indicate that many
students who enroll at Apollo are not achieving their educational and career goals.
Retention Rates
Information Apollo provided to the committee indicates that, of the 279,576 students who
enrolled at Apollo in 2008-9, 60.5 percent, or 169,138 students, withdrew by mid-2010. Amongst all 30
companies analyzed, 599,575 students withdrew, and because of its size, Apollo accounted for 28
percent of those students. These withdrawn students were enrolled a median of 4 months.1140 Apollo’s
overall withdrawal rate is significantly higher than the sector-wide withdrawal rate of 54 percent. While
the withdrawal rate for Bachelor’s degree students is slightly below the average of the companies
examined, the withdrawal rate for Associate students is 16 percent higher than the Bachelor’s
withdrawal rate. The withdrawal rate for Apollo’s Associate program is 66.4 percent, meaning that
more than two-thirds of the students who enrolled in 2008-9, 117,738 people, withdrew by mid-2010.
This is the fifth highest Associate withdrawal rate of any company examined by the committee.1141
Status of Students Enrolled in Apollo Group, Inc. in 2008-9, as of 2010
1137 Audio Recording: Undercover Recording of Visits by GAO Agents to For-Profit Schools, School 1, Scenario 2 at minute
14:27 , available at http://harkin.senate.gov/help/gao.cfm (accessed June 14, 2012).
1138 Audio Recording: Undercover Recording of Visits by GAO Agents to For-Profit Schools, School 1 Scenario 1, at 26:14,
available at http://harkin.senate.gov/help/gao.cfm (accessed June 14, 2012).
1139 Patricia Steele and Sandy Baum, “How Much Are College Students Borrowing?,” College Board Policy Brief, August
2009 http://advocacy.collegeboard.org/sites/default/files/09b_552_PolicyBrief_WEB_090730.pdf (accessed June 12, 2012).
1140 Senate HELP Committee staff analysis. See Appendix 15. Rates track students who enrolled between July 1, 2008 and
June 30, 2009. For-profit education companies use different internal definitions of whether students are “active” or
“withdrawn.” The date a student is considered “withdrawn” varies from 10 to 90 days from date of last attendance. Two
companies provided amended data to properly account for students that had transferred within programs. Committee staff
note that the data request instructed companies to provide a unique student identifier for each student, thus allowing accurate
accounting of students who re-entered or transferred programs within the school. The dataset is current as of mid-2010,
students who withdrew within the cohort period and re-entered afterward are not counted. Some students counted as
withdrawals may have transferred to other institutions.
1141 It is not possible to compare student retention or withdrawal rates at public or non-profit institutions because this data
was provided to the committee directly by the companies. While the Department of Education tracks student retention and
outcomes for all colleges, because students who have previously attended college are excluded from the data set, it fails to
provide an accurate picture of student outcomes or an accurate means of comparing for-profit and non-profit and public
colleges.

286
Degree Level Enrollment Percent
Completed Percent
Still
Enrolled
Percent
Withdrawn Number
Withdrawn Median
Days
Associate
Degree 177,368 4.7% 28.9% 66.4% 117,738 126
Bachelor’s
Degree 102,208 1.8% 47.9% 50.3% 51,400 115
All Students 279,576 3.6% 35.9% 60.5% 169,138 123
The dataset does not capture some students who withdraw and subsequently return, which is one
of the advantages of the for-profit education model. The analysis also does not account for students who
withdraw after mid-2010 when the data were produced.
Online vs. Brick and Mortar Outcomes
An analysis of withdrawal rates among the 11 companies that provided disaggregated data
indicates that students enrolled in online programs had higher withdrawal rates than students enrolled in
campus based programs. Overall brick and mortar Apollo students are faring significantly better than
online Apollo students. However, all Associate students attended online, and when only the Bachelor’s
degree students are analyzed, withdrawal rates are much more evenly distributed between online and
brick and mortar students. Apollo estimates that approximately 75 percent of the company’s
undergraduate students who default are online students.1142
StatusofOnlineStudentsEnrolledatApolloin2008‐9,asofmid‐2010
Degree
Type
EnrollmentStudents
Completed
Completed Students
Still
Enrolled
Still
Enrolled
Students
Withdrawn
Withdrawn
Associate177,2468,3804.7% 51,191 28.9% 117,67566.4%
Bachelor’s58,7131,3682.3% 28,319 48.2% 29,02649.4%
All235,9599,7484.1% 79,510 33.7% 146,70162.2%
StatusofBrick&MortarStudentsEnrolledatApolloin2008‐9,asofmid‐2010
Degree
Type
EnrollmentStudents
Completed
CompletedStudents
Still
Enrolled
Still
Enrolled
Students
Withdrawn
Withdrawn
Associate200% 150% 150%
Bachelor’s42,0103770.9% 19,973 47.5% 21,66051.6%
All42,0123770.9% 19,974 47.5% 21,66151.6%
Student Loan Defaults
The number of students leaving Apollo with no degree correlates with the high rates of student
loan defaults by students who attended Apollo. The Department of Education tracks and reports the
number of students who default on student loans (meaning that the student does not make payments for
1142 Apollo, Default Management Plan, September, 2010 (AGI0032838).

287
at least 360 days) within 3 years of entering repayment, which usually begins 6 months after leaving
college.1143
Slightly more than 1 in 5 students who attended a for-profit college (22 percent) defaulted on a
student loan, according to the most recent data.1144 In contrast, 1 student in 11 at public and non-profit
schools defaulted within the same period.1145 On the whole, students who attended for-profit schools
default at nearly three times the rate of students who attended other types of institutions.1146 The
consequence of this higher rate is that almost half of all student loans defaults nationwide are held by
students who attended for-profit colleges.1147
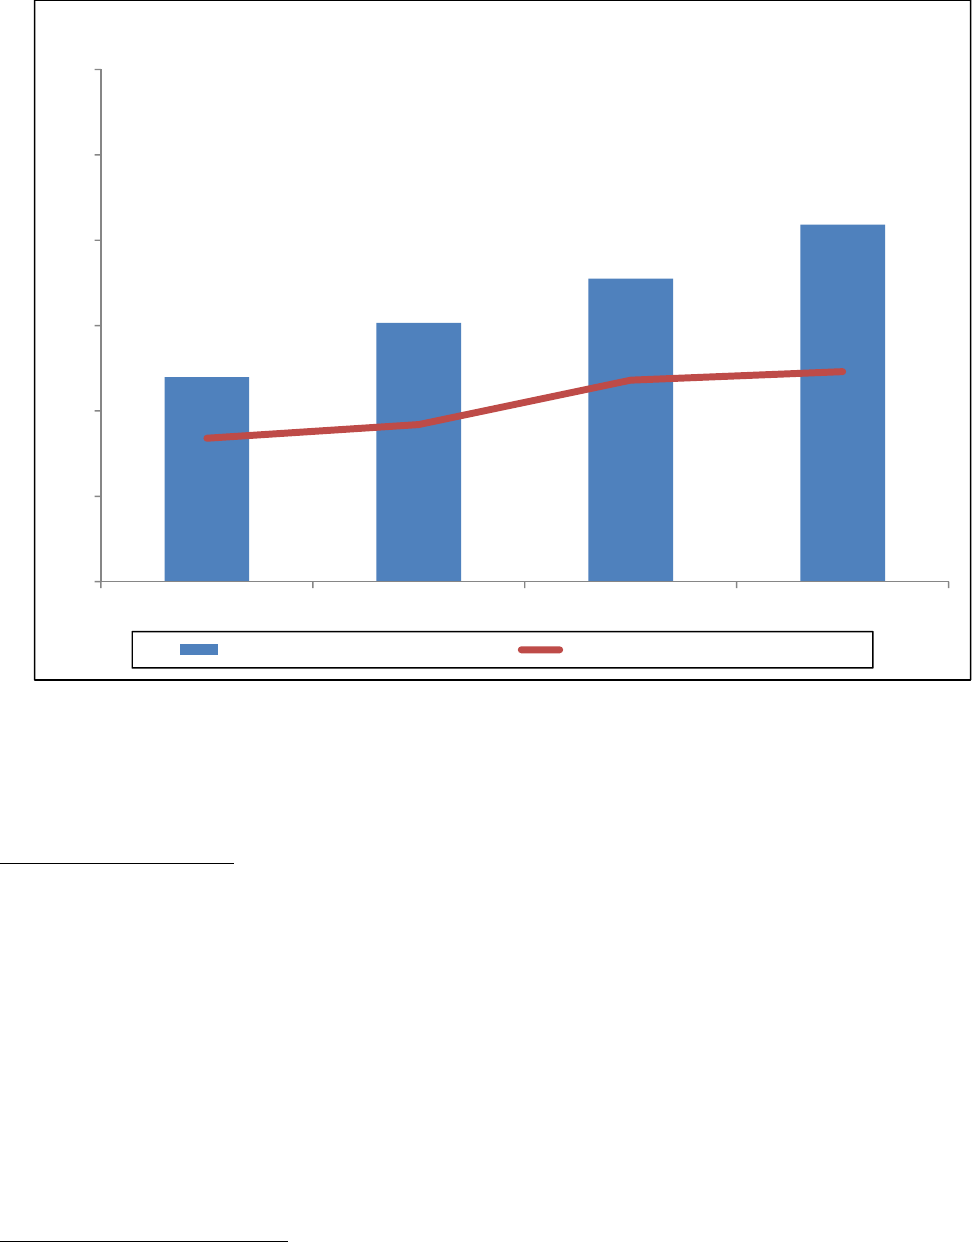
The 3 year default rate across all 30 companies examined increased each fiscal year between
2005 and 2008, from 17.1 percent to 22.6 percent.1148 This change represents a 32.6 percent increase
over 4 years.1149 Apollo’s default rate has similarly increased, growing from 12 percent for students
entering repayment in 2005 to 20.9 percent for students entering repayment in 2008.1150 The company
expects the rate for 2009 to be 26.7 percent.1151 Company officials have also told investors that they do
not expect the 2010 rate to exceed 30 percent.1152 This is important because, as of 2014, a 3-year default
rate of greater than 30 percent will result in a loss of access to title IV funding.
1143 Direct Loan Default Rates, 34 CFR 668.183(c).
1144 Senate HELP Committee staff analysis of U.S. Department of Education Trial Cohort Default Rates fiscal year 2005-08,
http://federalstudentaid.ed.gov/datacenter/cohort.html. Default rates calculated by cumulating number of students entered
into repayment and default by sector.
1145 Id.
1146 Id.
1147 Id.
1148 Senate HELP Committee staff analysis of U.S. Department of Education Trial Cohort Default Rates fiscal year 2005-08,
http://federalstudentaid.ed.gov/datacenter/cohort.html. Default rates calculated by cumulating number of students entered
into repayment and default for all OPEID numbers controlled by the company in each fiscal year. See Appendix 16.
1149 Id.
1150 Id.
1151 Apollo Investors Call, Q2 2012.
1152 Id.
288
An internal email from an associate vice president at Apollo makes clear that the long-term
prognosis for students is even worse. The email documents that the company expects the lifetime
default rates for Associate degree students entering repayment in 2006 to be 77.7 percent and to be 55.8
percent for students entering repayment in 2007.1153
Default management
It is likely that the reported default rates significantly undercount the number of students who
ultimately face default, because of companies’ efforts to place students in deferments and forbearances.
Helping get delinquent students into repayment, deferment, or forbearance prior to default is encouraged
by the Department of Education. However, for many students forbearance and deferment serve only to
delay default beyond the 3-year measurement period the Department of Education uses to track defaults.
Default management is sometimes accomplished by putting students who have not made
payments on their student loans into temporary deferments or forbearances. While the use of deferment
and forbearance is fairly widespread throughout the sector, documents produced indicate that a number
of companies also pursue default management strategies that include loan counseling, education, and
alternative repayment options. Default management contractors are paid to counsel students into
1153 Apollo Internal Email, RE: Default Information…, May 11, 2010 (AGI0049553).(At the time all 2 year students (the
Axia program) were enrolled and tracked through WIU). See Also Apollo Internal Email, RE: HELP – PLEASE HURRY,
July 16, 2009 (AGI0049229); Apollo Internal Email, FW: Cohort Default Rates, September 10, 2008 (AGI0048359); Apollo
Internal Email, FW: Axia and WIU 2005 Cohort Default Rate Notification, September 19, 2007 (AGI0048483); Apollo
Internal Email, Re: CDR for graduates…., April 29, 2010 (AGI0048299).
12.0%
15.2%
17.8%
20.9%
0%
5%
10%
15%
20%
25%
30%
2005 2006 2007 2008
ApolloGroup,Inc.Trial3‐YearDefaultRates,2005‐8
ApolloGroup,Inc.DefaultRate AverageDefaultRate,AllSchools

289
repayment options that ensure that students default outside the 2-year, soon to be 3-year, statutory
window, in which the Department of Education monitors defaults.
Apollo, like many other for-profit colleges, contracted with the General Revenue Corporation
(GRC), a subsidiary of Sallie Mae, to “cure” students who are approaching default.1154 The company
also contracts with the i3 group for additional default management services.1155 According to executives,
i3’s role is to “perform our ‘swat’ effort on the WIU F[iscal] Y[ear] 09 late stage delinquent student
borrower population.” 1156 In practice, documents indicate that nearly all “cures” are accomplished by
deferment or forbearance, not by students actually repaying their loans. Some companies pay different
amounts for different types of cures, but it is unclear from the documents produced if this is Apollo’s
practice.
This practice is troubling for taxpayers. The cohort default rate is designed not just as a sanction
but also as a key indicator of a school’s ability to serve its students and help them secure jobs. If schools
actively work to place students in forbearance and deferment, that means taxpayers and policymakers
fail to get an accurate assessment of repayment and default rates. A school that has large numbers of its
students defaulting on their loans indicates problems with program quality, retention, student services,
career services, and reputation in the employer community. Aggressive default management
undermines the validity of the default rate indicator by masking the true number of students who end up
defaulting on their loans. Critically, schools that would otherwise face penalties—including loss of
access to further taxpayer funds—continue to operate because they are able to manipulate their default
statistics.
Moreover, forbearances may not always be in the best interest of the student. This is because
during forbearance of Federal loans, as well as during deferment of unsubsidized loans, interest still
accrues. The additional interest accrued during the period of forbearance is added to the principal loan
balance at the end of the forbearance, with the result that interest then accrues on an even larger balance.
Thus, some students will end up paying much more over the life of their loan after a forbearance or
deferment.
Instruction and Academics
The quality of any college’s academics is difficult to quantify. However the amount that a
school spends on instruction per student compared to other spending and what students say about their
experience are two useful measures.
Apollo spent $892 per student on instruction in 2009, compared to $2,225 per student on
marketing, and $2,535 per student on profit. 1157 This is one of the lowest amounts spent on instruction
per student of any company analyzed. On average, the 30 for-profit education companies examined
spent $2,050 on instruction per student, and the 15 publicly traded education companies spend $1,909 on
1154 Apollo, Cohort Default Management Solutions Agreement, June 22, 2010. (AGI0034246). Company redacted all
information regarding fees paid to GRC.
1155 Apollo Internal Email, Re:i3 Contract – Ready for your execution, August 18, 2010 (AGI0034261).
1156 Id.
1157 Senate HELP Committee staff analysis. See Appendix 20, Appendix 21, and Appendix 22. Marketing and profit figures
provided by company or Securities and Exchange filings, instruction figure from IPEDS. IPEDs data for instruction
spending based on instructional cost provided by the company to the Department of Education. According to IPEDS,
instruction cost is composed of “general academic instruction, occupational and vocational instruction, special session
instruction, community education, preparatory and adult basic education, and remedial and tutorial instruction conducted by
the teaching faculty for the institution’s students.” Denominator is IPEDS “full-time equivalent” enrollment.

290
instruction per student. In contrast, public and non-profit 4-year colleges and universities, generally
spend a higher amount per student on instruction while community colleges spend a more comparable
amount but charge far less tuition than for-profit colleges. On a per student basis, University of Arizona
spent $11,128 per student on instruction, while Midwestern University spent $10,219 per student, and
Phoenix College spent $3,344 per student.1158
A large portion of the faculty at many for-profit colleges is composed of part-time and adjunct
faculty. While a large number of part-time and adjunct faculty is an important factor in a low-cost
education delivery model, it also raises questions regarding the academic independence they are able to
exercise to balance the colleges’ business interests. Among the 30 schools the committee examined, 80
percent of the faculty is part-time.1159 In 2010, Apollo employed 1,140 full-time and 31,671 part-time
faculty.1160 Thus, fully 96 percent of Apollo’s faculty was employed on a part-time basis.1161
In 2010, the HLC expressed concern regarding the high percentage of University of Phoenix
students in directed studies and had questions about its rigor and quality.1162 Directed studies is the
practice by which students pursue independent study with more minimal instruction supervision. At
least one campus (Oklahoma City) had over 40 percent of students in directed studies.1163 The company
uses directed studies as a tool for keeping students in the program and has the concern that decreasing its
usage could hurt retention.1164
1158 Senate HELP Committee staff analysis. See Appendix 23. Many for-profit colleges enroll a significant number of
students in online programs. In some cases, the lower delivery costs of online classes – which do not include construction,
leasing and maintenance of physical buildings – are not passed on to students, who pay the same or higher tuition for online
courses.
1159 Senate HELP Committee staff analysis of information provided to the committee by the company pursuant to the
committee document request of August 5, 2010. See Appendix 24.
1160 Id.
1161 Id.
1162 Apollo, Internal Email, FW: DS study guidelines, March 1, 2010 (AGI0047203).
1163 Apollo, Directed Studies graph, March 1, 2010 (AGI0047205).
1164 Apollo, Internal Email, FW: DS discussion, March 18, 2010 (AGI0047230).
291
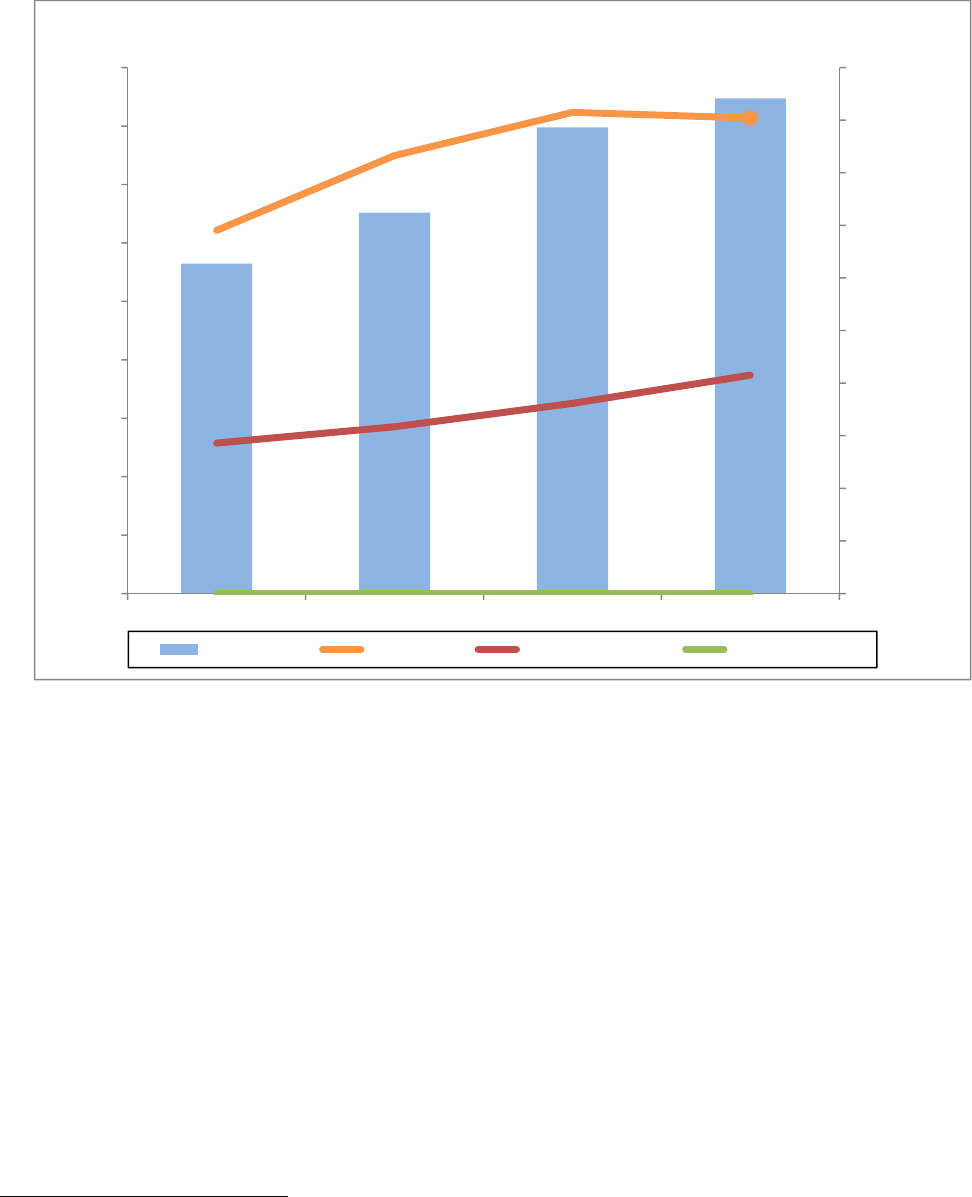
Staffing
While for-profit education companies employ large numbers of recruiters to enroll new students,
the same companies frequently employ far less staff to provide tutoring, remedial services or career
counseling and placement. In 2010, with 470,800 students, Apollo employed 8,137 recruiters, 0 career
services employees, and 3,737 student services employees.1165 That means each student services staffer
was responsible for 126 students, but the company employed one recruiter for every 58 students. Apollo
has long taken the position, that given that their students are working adults, they are not in need of
career counseling or job placement services.1166 Additionally, because the company holds regional
accreditation, their accreditor does not require tracking of how many students are employed. Apollo did
not alter this position even after it began enrolling over 100,000 Associate degree seekers, or after it
eliminated its age, work experience, and credit requirements.
Enforcement Actions
In November 2010, the University of Phoenix received a subpoena from the Florida Attorney
General’s office regarding “misrepresentations regarding financial aid” and “unfair or deceptive
1165 Senate HELP Committee staff analysis of information provided to the committee by the company pursuant to the
committee document request of August 5, 2010. See Appendix 7 and Appendix 24.
1166 In the company’s response, found in Appendix 6, Apollo, for the first time, stated to the committee that it utilizes a third-
party provider to “accelerate the delivery of career services to University of Phoenix students.”
313,700
362,100
443,000
470,800
8,137Recruiters
0
50,000
100,000
150,000
200,000
250,000
300,000
350,000
400,000
450,000
500,000
0
1000
2000
3000
4000
5000
6000
7000
8000
9000
2007 2008 2009 2010
NumberofStudents
NumberofEmployees
ApolloGroup,Inc.Staffing,2006‐7
Enrollment Recruiting StudentServices CareerServices

292
practices regarding recruiting, enrollment, placement, etc.” 1167 The Delaware attorney general also
issued a subpoena to the University of Phoenix regarding the company’s business practices in
Delaware.1168 The Massachusetts attorney general is investigating whether the University of Phoenix
used unfair or deceptive tactics to recruit students or in connection with student financial aid.1169
In October 2010, Apollo announced that the Securities and Exchange Commission (SEC) had
requested information from Apollo about the company’s insider trading policies relating to stock sales
made by John Sperling and Peter Sperling in 2009, although no additional information has been made
public by the SEC. The sales in question occurred around the time the Department of Education was
investigating University of Phoenix policies regarding title IV financial aid programs.1170 In April 2012,
the SEC announced an insider trading investigation based on trades prior to the February 2012
announcement of lower than expected earnings.1171
Conclusion
When the University of Phoenix was started in 1976, it pioneered an entirely new model of
learning. That model revolutionized thinking about how to provide opportunities for higher education to
underserved and non-traditional students. Yet in the 2000s, Apollo appears to have made critical
decisions that prioritized financial success over student success. While Apollo has recently put in place
some important reforms, both by instituting the University Orientation Program and by appearing to
address some issues with recruiting and marketing practices, and career services, serious concerns
remain. The company makes one of the lowest investments in per student spending on instruction and
does not employ career counseling staff though the company has recently partnered with a company that
provides career services. Student retention data provided by the company demonstrates that 66 percent
of students seeking Associate degrees withdrew, 16 percent higher than the withdrawal rate for students
in the Bachelor’s programs. Because the company received $3.8 billion in Federal financial aid,
including over a billion in Pell grant dollars, these poor outcomes are particularly troubling. Apollo is a
mature for-profit education provider and has a demonstrated ability to provide high quality programs
that lead to student success. However, at least during the period analyzed, the company did not appear
to be fully meeting that goal.
1167 Florida Office of the Attorney General, Public Consumer-Related Investigation,
http://myfloridalegal.com/__85256309005085AB.nsf/0/9682560BAF290B1F852577C000722E75 (accessed June 19, 2012).
1168 Apollo 10-K August 31, 2011.
1169 Jahna Berry, “Massachusetts’ AG probing University of Phoenix for alleged deceptive tactic,” The Arizona Republic
http://www.azcentral.com/business/articles/2011/05/16/20110516apollo-group-arizona-university-of-phoenix-investigated-
deceptive-unfair-tactics.html (accessed June 14, 2012).
1170Apollo 8-K October 26, 2010.
1171 Apollo 8-K April 18, 2012.
