App2.6C Report Card Rating Policy Tech Manual
User Manual:
Open the PDF directly: View PDF ![]() .
.
Page Count: 41

Appendix 2.6C

Report Card Rating
Policy and Technical Manual
For Report Cards Issued on October 9, 2014
Oregon Department of Education
Office of Learning
Instruction, Standards, Assessment, and Accountability Unit
Salem, Oregon
October 2014
App2.6C_ReportCardRating_PolicyTechManual
Oregon Extended Assessment Technical Report
ii
It is the policy of the State Board of Education and a priority of the Oregon Department of
Education that there will be no discrimination or harassment on the grounds of race, color, sex,
marital status, religion, national origin, age or handicap in any educational programs, activities
or employment. Persons having questions about equal opportunity and nondiscrimination
should contact the State Superintendent of Public Instruction at the Oregon Department of
Education.
This document was produced by the
Oregon Department of Education
Office of Learning
Instruction, Standards, Assessment, and Accountability Unit
255 Capitol Street NE
Salem, OR 97310-0203
All or any part of this document may be photocopied for educational purposes
without permission from the Oregon Department of Education.
App2.6C_ReportCardRating_PolicyTechManual
Oregon Extended Assessment Technical Report

iii
Table of Contents
I. Introduction .......................................................................................................................................... 1
Report Card Scope, Purpose, and Guiding Principles ...................................................................... 1
Guidelines for Reproducing and Distributing the Report Cards ...................................................... 1
Objective of the Report Card Rating Policy and Technical Manual ................................................. 2
II. Field Test School Accountability ........................................................................................................... 3
When to Include Double-Test OAKS Scores in School Accountability ............................................. 3
When to Retain the Overall School Rating from the Previous Year ................................................ 3
III. Report Card Rating Overview................................................................................................................ 4
Ratings Detail Report ....................................................................................................................... 4
IV. Calculating the Achievement Rating ..................................................................................................... 6
Business Rules .................................................................................................................................. 6
Calculation of Combined Percent Met ............................................................................................. 7
Assignment of Achievement Points ................................................................................................. 8
Determination of Achievement Rating ............................................................................................ 9
V. The Oregon Growth Model ................................................................................................................. 10
Overview of the Growth Model ..................................................................................................... 10
Calculation of Student Achievement Growth ................................................................................ 10
Achievement Growth Aggregations ............................................................................................... 10
VI. Calculating the Growth Rating ............................................................................................................ 11
Business Rules ................................................................................................................................ 11
Median Growth Percentile ............................................................................................................. 12
Median Growth Targets ................................................................................................................. 13
Determination of On-Track Growth ............................................................................................... 14
Assignment of Growth Points ........................................................................................................ 14
Determination of Growth Rating ................................................................................................... 15
VII. Calculating the Subgroup Growth Rating............................................................................................ 16
Business Rules ................................................................................................................................ 16
Median Growth Percentile ............................................................................................................. 17
Median Growth Target .................................................................................................................. 18
Determination of On-Track Growth ............................................................................................... 18
Assignment of Growth Points ........................................................................................................ 19
Determination of Growth Rating ................................................................................................... 19
VIII. Calculating the Graduation Rating ...................................................................................................... 21
App2.6C_ReportCardRating_PolicyTechManual
Oregon Extended Assessment Technical Report
iv
Business Rules ................................................................................................................................ 21
Calculation of Cohort Adjusted Graduation Rate .......................................................................... 21
Calculation of Combined Graduation Rate .................................................................................... 21
Assignment of Graduation Points .................................................................................................. 22
Determination of Graduation Rating ............................................................................................. 22
IX. Calculating the Subgroup Graduation Rating ..................................................................................... 24
Business Rules ................................................................................................................................ 24
Calculation of Cohort Adjusted Graduation Rate .......................................................................... 25
Calculation of Combined Graduation Rate .................................................................................... 25
Assignment of Graduation Points .................................................................................................. 26
Determination of Graduation Rating ............................................................................................. 26
X. Calculating the Overall School Rating ................................................................................................. 27
Business Rules ................................................................................................................................ 27
Calculation of Weighted Percent of Points .................................................................................... 27
Determination of Overall School Rating ........................................................................................ 28
XI. Subgroup Determinations ................................................................................................................... 30
All Students .................................................................................................................................... 30
Economically Disadvantaged ......................................................................................................... 30
English Learners ............................................................................................................................. 30
Student with Disabilities ................................................................................................................ 31
Race/Ethnicity ................................................................................................................................ 31
Underserved Races/Ethnicities ...................................................................................................... 31
Subgroup Membership for Graduation Rates ............................................................................... 31
XII. Small and New School Rules ............................................................................................................... 32
XIII. Comparison School Rating .................................................................................................................. 33
Comparison School Index .............................................................................................................. 33
Comparison Group ......................................................................................................................... 33
Comparison School Rating ............................................................................................................. 34
App2.6C_ReportCardRating_PolicyTechManual
Oregon Extended Assessment Technical Report

v
List of Tables/Figures
Tables
Table 1.
2013-14 Achievement Point Cutoffs by School Type and Subject…………………………….
9
Table 2.
Achievement Rating Levels and Cutoffs………………………………………………………………………
9
Table 3.
Example of Median Growth Percentiles by Subject……………………………………………………..
13
Table 4.
Example of Median Growth Targets by Subject……………….………………………………………….
14
Table 5.
Example of On-Track Growth by Subject………………………………………………………………..……
14
Table 6.
Growth Point Cutoffs by On-Track Growth and School Type…………………………………….…
15
Table 7.
Growth Rating Levels and Cutoffs……………………………………………………………………………….
15
Table 8.
Example of Median Growth Percentiles for Specific Subgroups…………………………………..
17
Table 9.
Example of Median Growth Targets for Specific Subgroups………...................................
18
Table 10.
Example of On-Track Growth by Subgroup…………………………………………………………….……
18
Table 11.
Subgroup Growth Point Cutoffs by On-Track Growth and School Type…………………….…
19
Table 12.
Subgroup Growth Rating Points Calculation by Subject………………………………………………
19
Table 13.
Subgroup Growth Rating Levels and Cutoffs……………………………………………………………….
20
Table 14.
Example of Cohort Adjusted Graduation Rates……………………………………………………………
22
Table 15.
2013-14 Graduation Point Cutoffs…………………………………………………………………………..
22
Table 16.
2013-14 Graduation Rating Levels and Cutoffs……………………………………………............
23
Table 17.
Example of Subgroup Cohort Adjusted Graduation Rates……………………………………………
25
Table 18.
2013-14 Subgroup Graduation Point Cutoffs…………………………………………………………..
26
Table 19.
2013-14 Subgroup Graduation Rating Levels and Cutoffs………………………………………..
26
Table 20.
Rating Indicators and Weights by School Type…………………………………………………………….
28
Table 21.
Overall School Rating Example for a Fictitious High School………………………………...........
28
Table 22.
2013-14 Overall School Rating Levels and Cutoffs……………………………………………………….
29
Table 23.
Example Comparison Group……………………………………………………………………………………….
34
Table 24.
Example Comparison Group and Weighted Percent of Points…………………………………….
35
Figures
Figure 1.
Calculation of Combined Percent Met ………………………………………………………………………..
8
App2.6C_ReportCardRating_PolicyTechManual
Oregon Extended Assessment Technical Report

1
I. Introduction
The Oregon Legislature created the school and district report cards in 1999. This legislation required the
Oregon Department of Education (ODE) to produce and issue a report card to all public schools and
districts in the state of Oregon on or before December 15 of each year. Per Oregon Revised Statutes
(ORS) 329.105 and 329.115, report cards must contain data from the most recent school year (if
available) and meet the requirements of state and federal laws. The aim of report cards is to provide
clear, meaningful, and relevant information to parents, educators, and communities concerning public
school and district performance, improvement, and accountability.
In 2012, as part of Oregon’s approved ESEA flexibility waiver, the ODE redesigned the school and district
report cards to better convey how schools are doing at ensuring students achieve college and career
readiness. The purpose of the report card redesign was to (a) more accurately reflect student learning
and growth, (b) incorporate key measures of college and career readiness, (c) align the report card with
district achievement compacts, and (d) make the Report Cards more user friendly and accessible.
The report card redesign included a stakeholder and public engagement process to make design,
content, and methodology recommendations. This included public outreach efforts (i.e., focus groups
and several online surveys) and the creation of a Report Card (RC) Steering Committee consisting of 17
members representing a diverse assortment of stakeholders throughout Oregon. The RC Steering
Committee met twice per month from September 2012 to March 2013. Staff from the ODE attended
each committee meeting in an advisory capacity. In addition to school and district data as required by
Oregon’s ESEA flexibility waiver and other federal/state laws, the redesigned school and district report
cards include the recommendations from the RC Steering Committee (e.g., school principal/district
superintendent letter, school/district demographic profile, comparison school rating, school
performance data, student outcome data, and curriculum and learning environment data).
Report Card Scope, Purpose, and Guiding Principles
The report cards are an annual snapshot of school and district performance, improvement, and
accountability. They display valid, stable, and reliable data that are also comparable across schools and
districts within the state of Oregon. The report cards contain a large amount of data pertaining to a wide
variety of education indicators (e.g., demographics, school performance on statewide assessments,
graduation, curriculum and learning environment, etc.). The purpose of the school and district report
cards is to communicate information to parents, educators, and communities about how schools are
doing at ensuring students achieve college and career readiness while meeting the legislative
expectation for school and district accountability. As such, the report cards should:
Be clear, concise, well-defined, and understandable.
Use information that is valid, stable, and reliable.
Include all students.
Report current levels of performance and improvement over time.
Rate school performance.
Be part of a larger accountability system.
Meet federal and state requirements.
Guidelines for Reproducing and Distributing the Report Cards
Districts are responsible for ensuring that the school and district report cards reach the parents of
children enrolled in Oregon public schools. As prescribed in Oregon Administrative Rule (OAR) 581-022-
1060, each parent must receive a copy of the report cards by January 15, 2015. While many districts
App2.6C_ReportCardRating_PolicyTechManual
Oregon Extended Assessment Technical Report

2
choose to mail report cards to parents, it is important to note that this is not a requirement. Districts
have discretion concerning the method they use to distribute report cards to parents and communities.
Alternative distribution methods, according to OAR 581-022-1060, include mailing a copy, electronically
sending a copy, and providing a link to a state or district web site containing the reports and also making
copies available in local schools, libraries, parents centers, community centers, or other public locations
easily accessible to parents and others.
The 2013-14 school and district report cards as well as supporting documents are available for download
from the ODE website (see http://www.ode.state.or.us/search/page/?id=1786). For further information
concerning the report cards, please contact Dr. Jonathan Wiens at jon.wiens@state.or.us or Dr. W.
Joshua Rew at josh.rew@state.or.us.
Objective of the Report Card Rating Policy and Technical Manual
This manual is a compilation of policies and technical details pertaining to the report card ratings. The
overall school rating is a requirement of Oregon’s ESEA flexibility waiver as well as ORS 329.105 and OAR
581-022-1060. Please see Report Card Rating Overview and Calculating the Overall School Rating for
specific details concerning the overall school rating and its calculation. Furthermore, the manual also
includes a description of the calculations for each indicator and the comparison school rating as well as
policies pertaining to subgroup determinations and small and new school rules.
App2.6C_ReportCardRating_PolicyTechManual
Oregon Extended Assessment Technical Report

3
II. Field Test School Accountability
During the Spring of 2014, 195 public schools in Oregon administered the Smarter Balanced (SB) field
test in either English/language arts, mathematics, or both to students in certain tested grades. To lessen
the burden on students and schools participating in the SB field test, the ODE applied for and received a
Field Test Flexibility Waiver from the U. S. Department of Education. This waiver gives field test schools
the flexibility to administer only one English/language arts and one mathematics assessment (e.g., either
the OAKS reading assessment or the SB English/language arts field test) to students in field test grades
during the 2013-14 school year. Administering more than one assessment to students in the same
subject (i.e., OAKS and the SB field test) is not a requirement; however, field test schools may choose to
“double-test” their students. The administration of the field test and whether a school double-tests
students may impact the 2013-14 overall school ratings.
Field test schools that had a sufficient number of OAKS tests (as described below) will receive an overall
school rating in 2013-14. Field test schools that did not have a sufficient number of OAKS tests will retain
their overall school rating from 2012-13. The intention of the following rules was to ensure that field
test schools received valid ratings in 2013-14 by determining when to (a) include double-test OAKS
scores in the school accountability system and (b) retain the overall school rating from the previous year
for field test schools.
When to Include Double-Test OAKS Scores in School Accountability
The school accountability system will include double-test OAKS scores for a specific field test grade and
subject within a school if OAKS participation is ≥ 94.5% of all students in that specific field test grade and
subject. Furthermore, the school accountability system will include double-test OAKS scores for small
field test schools under the following rules:
Two or fewer non-participants when the total participation denominator is between 20 to 39
students for a specific field test grade and subject.
One non-participant when the total participation denominator is less than 20 students for a
specific field test grade and subject.
When to retain the Overall School Rating from the Previous Year
Field test schools that double-test all students in all field test grades and subjects will be eligible to
receive a new overall school rating on the 2013-14 school report card (provided they meet the standard
minimum n-size requirements). However, a field test school will not receive achievement and growth
ratings in 2013-14 if there is a greater than or equal to 40% decrease in the number of included OAKS
tests (across both subjects and all tested grades) from 2012-13 to 2013-14. In this case, these field test
schools will retain their overall school rating from 2012-13 on the 2013-14 school report card.
Please visit the following link (http://www.ode.state.or.us/search/page/?id=4136) to view additional
information concerning field test school accountability, such as the list of field test schools, the Field
Test Flexibility approval letter, and guidance from the U. S. Department of Education.
App2.6C_ReportCardRating_PolicyTechManual
Oregon Extended Assessment Technical Report

4
III. Report Card Rating Overview
The elementary, middle, and high school report cards display two ratings: the overall school rating and
the comparison school rating. The overall school rating is normative and consists of five levels where
level 1 is the lowest and level 5 is the highest rating. Each level corresponds to how schools perform on
all applicable rating indicators (i.e., achievement, growth, subgroup growth, graduation, and subgroup
graduation) as compared to all schools statewide. The comparison school rating consists of three rating
categories (i.e., below average, about average, and above average) and represents a school’s overall
rating as compared to schools from the same school type (i.e., elementary, middle, high and combined1
schools) with similar student demographics. The majority of this manual discusses the calculation of the
overall school rating and the rating indicators; however, see Comparison School Rating for details
concerning the comparison school rating and its calculation.
Ratings Detail Report
The ratings detail report describes the overall school rating, the rating methodology, and the rating for
each indicator (i.e., academic achievement, academic growth, subgroup growth, graduation, and
subgroup graduation). It consists of the following sections:
Overall School Rating (page 1): Summary of indicator ratings (i.e., levels, percent of points
earned, weights, and weighted points), weighted percent of points, overall rating cutoffs,
number of missed participation targets, and federal reporting designations (see Calculating the
Overall School Rating).
Indicator Ratings (page 2): Summary of subgroup indicator ratings (i.e., levels, points earned,
and points eligible), summary of indicator ratings (i.e., level and percent of points earned), and
indicator rating cutoffs. The indicator ratings are the ratings for academic achievement,
academic growth, subgroup growth, graduation, and subgroup graduation.
Academic Achievement Rating (page 3): Summary of reading and mathematics achievement by
subgroup (i.e., level, number of tests, percent met, and combined percent met) and the
achievement rating cutoffs. The definition of the academic achievement rating is the points a
school earns according to the percent of students who meet the state achievement standards
on reading and mathematics assessments in grades 3 through 8 and 11 (see Calculating the
Achievement Rating).
Academic Growth Rating (page 4): Summary of reading and mathematics growth for all students
in the school (i.e., level, number of students, median growth percentile, combined median
growth percentile, combined target growth percentile [for elementary and middle schools only],
and on track growth [for elementary and middle schools only]) and the growth rating cutoffs.
The definition of the academic growth rating is the points a school earns according to the value
of the median growth percentile (see Calculating the Growth Rating).
Subgroup Growth Rating (page 5): Summary of reading and mathematics growth by subgroup
(i.e., level, number of students, median growth percentile, combined median growth percentile,
combined target growth percentile [for elementary and middle schools only], and on track
growth [for elementary and middle schools only]) and the growth rating cutoffs. The definition
of the subgroup growth rating is the points a school earns according to the value of the median
growth percentile for four specific subgroups: Economically Disadvantaged, English Learners,
Students with Disabilities, and Underserved Races/Ethnicities (see Calculating the Subgroup
Growth Rating).
1 Combined schools are schools that are a combination of high school grades and any grades 7 and lower.
App2.6C_ReportCardRating_PolicyTechManual
Oregon Extended Assessment Technical Report
5
Graduation Rating (page 6 for high schools): Summary of the four-year and five-year cohort
graduation rates for all students in the school (i.e., level, adjusted cohort, graduation rates, and
combined graduation rate) and the graduation rating cutoffs. The definition of the graduation
rating is the points a school earns according to the value of the highest four-year or five-year
cohort adjusted graduation rate (see Calculating the Graduation Rating).
Subgroup Graduation Rating (page 7 for high schools): Summary of the four-year and five-year
cohort graduation rates by subgroup (i.e., level, adjusted cohort, graduation rates, and
combined graduation rate) and the graduation rating cutoffs. The definition of the subgroup
graduation rates is the points a school earns according to the value of the highest four-year or
five-year cohort adjusted graduation rate for four specific subgroups: Economically
Disadvantaged, English Learners, Students with Disabilities, and Underserved Races/Ethnicities
(see Calculating the Subgroup Graduation Rating).
The last two sections of the ratings detail report describe participation in statewide assessments. The
overall school rating does not include participation in statewide assessments as a rating indicator.
However, while schools do not receive points for participation, a school’s overall rating will lower by one
level for each consecutive year that at least one subgroup misses the participation target of 94.5 percent
(starting with the 2012-13 school year). The first participation section is a summary of reading and
mathematics assessment participation by subgroup (i.e., status, number of participants and non-
participants, and prior, current, and combined participation rates). Note that the combined participation
rate for field test schools includes both OAKS and SB test participants.
The second participation section is a summary of reading and mathematics assessment participation by
grade and assessment type (i.e., OAKS or the SB field test). This section is only applicable to field test
schools, and indicates by grade and subject whether (a) the school administered the SB field test in the
tested grade, and (b) the school accountability system will include double-test OAKS scores in the
Academic Achievement, Academic Growth, and Subgroup Growth indicators. Additionally, this section
displays the total number of students enrolled on the first school day in May (i.e., the denominator), the
number of SB field test participants and SB field test participation rate, and the number of OAKS
participants and the OAKS participation rate. The rationale for this section is twofold: (1) to provide field
test schools with OAKS participation data which is the basis for including or excluding double-test OAKS
scores in the school accountability system and (2) to meet the requirements of the Field test Flexibility
Waiver (see Field Test School Accountability).
App2.6C_ReportCardRating_PolicyTechManual
Oregon Extended Assessment Technical Report

6
IV. Calculating the Achievement Rating
The achievement rating is the first of five rating indicators that constitute the overall school rating. The
focal determinant of the achievement rating for each school is the percent of students who meet the
state achievement standards on reading and mathematics assessments in grades 3 through 8 and 11.
The achievement rating section consists of the following parts: business rules, calculation of combined
percent met, assignment of achievement points, and the determination of achievement rating.
Business Rules
The business rules for the achievement rating pertain to (a) the inclusion of students in the rating, (b)
minimum n-size requirement to receive a rating, (c) reporting of subgroup achievement, and (d) the
suppression of achievement results to protect student confidentiality.
The student inclusion rules are identical to those from the previous report card as well as the AYP
reports. Please see the Assessment Inclusion Rules for Accountability Reporting at
http://www.ode.state.or.us/search/page/?id=1302 to view a full description of the inclusion rules.
The achievement rating for each school includes students who
are a resident at the school on the first school day in May (as submitted in the 3rd period
Cumulative ADM collection),
are enrolled in grades 3 to 8 or 11,
are full academic year2 at their “May 1” school,
have a valid test, and
are not a first-year Limited English Proficient student.
Additional student inclusion rules are the following:
Given that students may have multiple scores because they take the reading and mathematics
assessments multiple times during the school year, the achievement rating only uses the highest
score by subject for the given school year.
The achievement rating credits the student’s highest score to the school where he or she was
enrolled on the first school day in May (even if the student earned the score in another school
and district prior to May 1).
Students in high school may take the mathematics and reading assessment prior to the 11th
grade. The achievement rating will only use the scores from earlier grades as long as the score
met the high school achievement standard.
Extended assessments are subject to a one percent cap3. This signifies that the number of
extended assessments meeting the alternate achievement standards can represent no more
than one percent of the total number of tests within a given district.
The achievement rating will exclude Double-test OAKS scores if the OAKS participation rate is
less than 94.5% of all students in that specific field test grade and subject. On the other hand,
the achievement rating will include double-test OAKS scores for small field test schools under
the following rules:
2 Full academic year refers to a student with enrollment in a school or district for more than one-half of the instructional days prior to the first
school day in May. This definition does not require the enrollment to be continuous or consecutive, and it may be part time or full time. The
ODE calculates the full academic year (FAY) flag as part of the 3rd Period Cumulative ADM collection and inserts it in the assessment data. The
FAY flag identifies students as enrolled for a full academic year when their ADM within a resident school is greater than 0.5.
3 Please visit http://www.ode.state.or.us/news/announcements/announcement.aspx?ID=9994&TypeID=6 for further information concerning
the one percent cap for extended assessments.
App2.6C_ReportCardRating_PolicyTechManual
Oregon Extended Assessment Technical Report

7
o Two or fewer non-participants when the total participation denominator is between 20 to
39 for a specific field test grade and subject.
o One non-participant when the total participation denominator is less than 20 for a specific
field test grade and subject.
Schools receive an achievement rating if they meet the minimum n-size requirements4. These
requirements are the following for mathematics and reading:
All schools will receive an achievement rating if they have at least 40 tests for the two most
recent school years in either reading or mathematics.
Small schools will receive an achievement rating using four years of assessment data if they have
fewer than 40 tests for the two most recent school years in either reading or mathematics.
Schools will not receive an achievement rating if they have fewer than 40 tests for the four most
recent school years.
Subgroup achievement results are not part of the achievement rating. However, the ratings detail report
displays subgroup achievement and compares it to the Annual Measurable Objectives5 as long as they
have at least 40 tests across two or four years. The ratings detail report presents the achievement of
following subgroups6:
All Students
Economically Disadvantaged
English Learners
Student with Disabilities
American Indian/Alaska Native
Asian
Black/African American
Hispanic/Latino
Native Hawaiian/Pacific Islander
White
Multi-Racial
Underserved Races/Ethnicities
The ratings detail report suppresses the achievement results (i.e., counts and percentages) for all
schools and subgroups that meet suppression criteria in order to protect student confidentiality. The
suppression criteria include the following:
All counts of tests less than six and corresponding percentages receive an “*”.
All percentages greater than 95% receive “> 95%” and corresponding counts receive an “*”.
All percentages less than 5% receive “< 5%” and corresponding counts receive an “*”.
Calculation of Combined Percent Met
The ratings detail displays the counts of tests and the percent of students meeting the state
achievement standards in reading and mathematics for the 2012-13 and 2013-14 school years.
Additionally, the ratings detail report displays the combined percent met that represents the percent of
all students meeting in the 2012-13 and 2013-14 school year. Note that the ratings detail report rounds
all percentages to the nearest tenth of a percent. The calculation of the combined percent met includes
the following:
4 Please see Small and New School Rules for further information concerning how the school rating treats small schools.
5 Please see http://www.ode.state.or.us/search/page/?id=24 for Annual Measurable Objectives for 2012-13 to 2017-18.
6 Please see Subgroup Determinations for further information concerning the rules to determine subgroup membership.
App2.6C_ReportCardRating_PolicyTechManual
Oregon Extended Assessment Technical Report

8
Numerator = total number of students who are enrolled in the school for a full academic year
with a valid test score meeting achievement standard.
Denominator = total number of students who are enrolled in the school for a full academic year
with a valid test7.
Figure 1. Calculation of Combined Percent Met8
Assignment of Achievement Points
The achievement rating uses a five point scale with cutoffs to assign points to schools for their
mathematics and reading achievement. Schools receive one to five points according to whether their
combined percent met for mathematics or reading is above or below a specific cutoff. The total possible
points a school can earn is ten (i.e., five points for mathematics and five for reading).
The following criteria determine the cutoffs for each of the five points:
5 points: Schools who receive five points are in the top 10 percent of all schools in the state for
the combined percent met in reading or mathematics. Note that these schools meet the Annual
Measurable Objective.
4 points: Schools who receive four points meet the Annual Measurable Objective but are not in
the top 10 percent of all schools.
3 points: Schools who receive three points do not meet the AMO but are not in the lowest 15
percent of schools.
2 points: Schools who receive two points are in the lowest 15 percent of schools in terms of
combined percent met but not in the lowest 5 percent.
1 point: Schools who receive one point are in the lowest 5 percent of all schools in the state for
combined percent met in reading or mathematics.
7 Full academic year refers to a student with enrollment in a school or district for more than one-half of the instructional days prior to the first
school day in May. This definition does not require the enrollment to be continuous or consecutive, and it may be part time or full time. The
ODE calculates the full academic year (FAY) flag as part of the 3rd Period Cumulative ADM collection and inserts it in the assessment data. The
FAY flag identifies students as enrolled for a full academic year when their ADM within a resident school is greater than 0.5.
8 The calculation of combined percent met for four year schools is similar except the numerator and denominator consist of two additional
years. For instance, the numerator will consist of the number of students meeting the achievement standard in 2010-11, 2011-12, 2012-13, and
2013-14. The denominator will consist of the number of students with valid tests in 2010-11, 2011-12, 2012-13, and 2013-14.
App2.6C_ReportCardRating_PolicyTechManual
Oregon Extended Assessment Technical Report
9
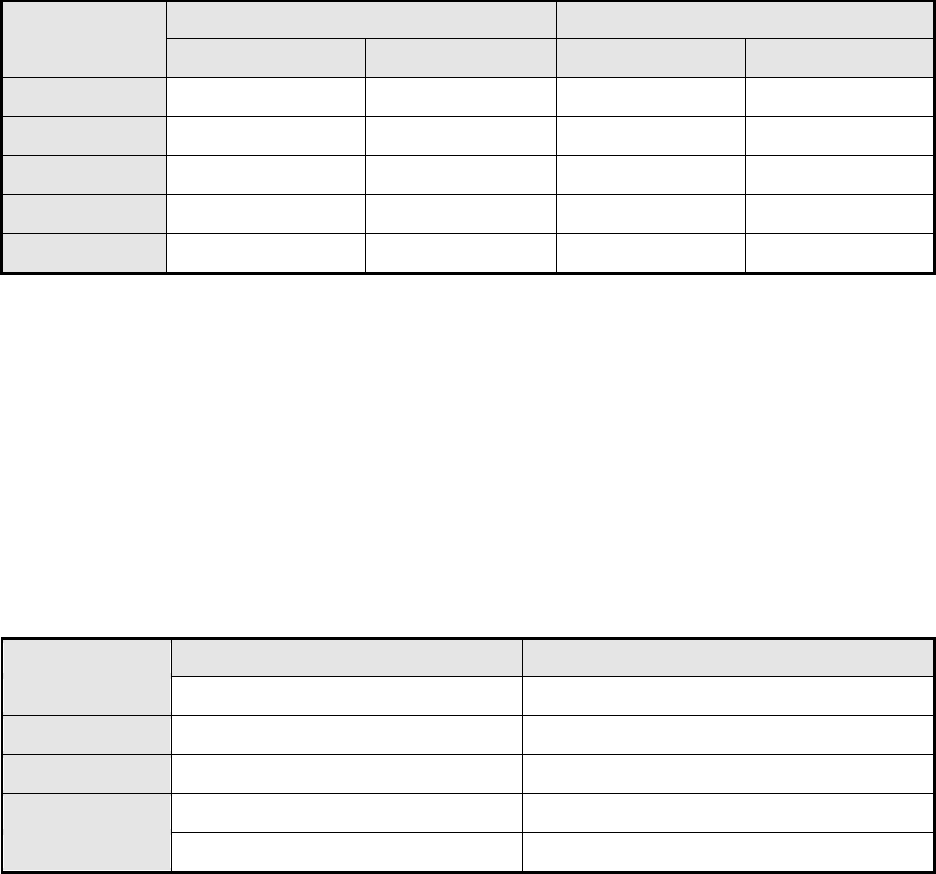
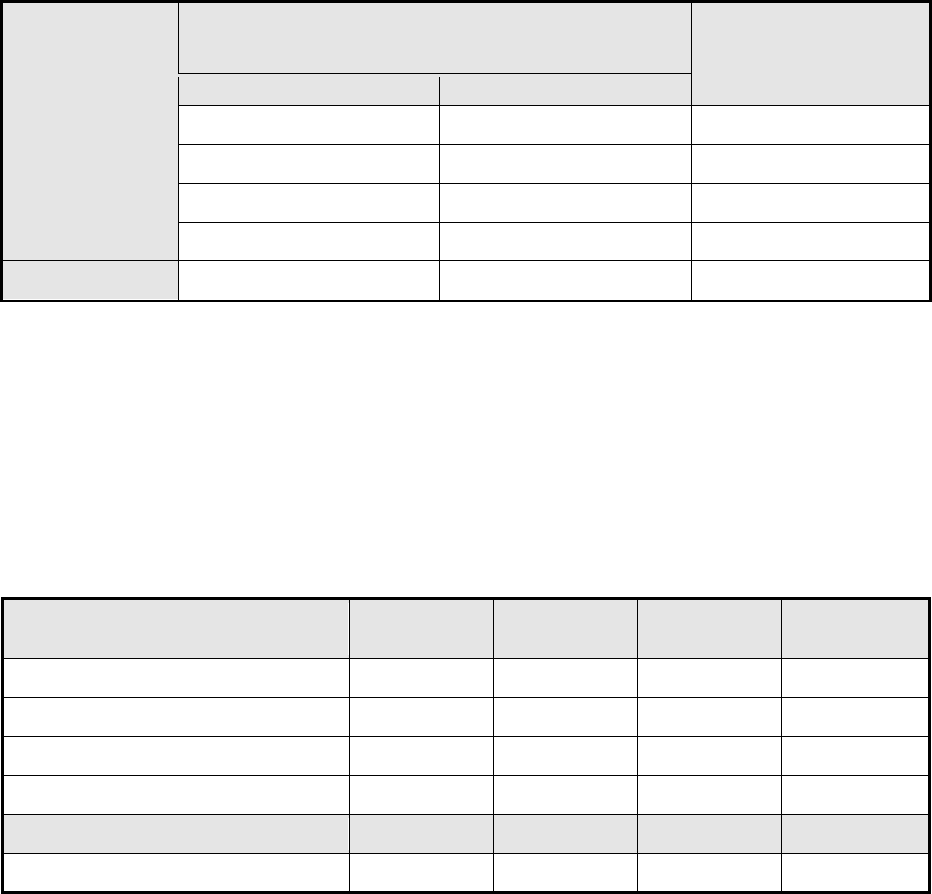
The following table describes the point scale and cutoffs for the 2013-14 school year.
Table 1. 2013-14 Achievement Point Cutoffs by School Type and Subject
Points
Elementary/Middle
High
Reading
Math
Reading
Math
5
87.2
82.3
93.2
81.5
4
72.0
69.0
85.0
70.0
3
58.8
49.2
66.6
42.1
2
49.6
39.3
56.2
25.3
1
< 49.6
< 39.3
< 56.2
< 25.3
Note that the cutoffs are different for each subject and school type (i.e., elementary, middle, or high
school). For the purposes of accountability, high schools are those schools with grade 10 or higher
regardless of whether they also have elementary or middle school grades.
Determination of Achievement Rating
The achievement rating consists of five levels. Each level corresponds to the percent of total points (i.e.,
) a schools earns above a cutoff. The
following table lists the achievement rating levels and cutoffs.
Table 2. Achievement Rating Levels and Cutoffs
Rating
Points
Percent of Points Earned
Level 5
9 or 10
90% or 100%
Level 4
7 or 8
70% or 80%
Level 3
5 or 6
50% or 60%
Level 2
3 or 4
30% or 40%
Level 1
2
20%
For instance, a Level 5 rating refers to a school that earns at least 90 percent of possible points. This also
signifies that the school is in the top ten percent of all schools in at least one subject (i.e., five points). It
is important to note that the percent of points a school earns is not equivalent to the percent of
students who meet the state achievement standards on reading and mathematics assessments.
Lastly, while the achievement rating uses points to determine the level a school earns, the ratings detail
report incorporates the percent of points from the achievement rating and the other rating indicators
(i.e., growth, subgroup growth, etc.) to calculate and determine the overall school rating.
App2.6C_ReportCardRating_PolicyTechManual
Oregon Extended Assessment Technical Report

10
V. The Oregon Growth Model
An important feature of the school accountability system and the overall school rating is student
achievement growth (by school and subgroup). Student achievement growth refers to a student’s
progress on mathematics and reading assessments from year to year. This section summarizes the
Oregon Growth Model, the calculation of student achievement growth, and school aggregations of
achievement growth.
Overview of the Growth Model
The Oregon Growth Model is a statistical model that provides a description of each student’s
achievement growth on mathematics and reading assessments from year to year. Oregon adopted this
growth model to obtain a waiver from specific provisions of the NCLB Act. Moreover, it is an adaptation
of the Colorado Growth Model and specifically takes into account Oregon’s assessment and
accountability system.
Calculation of Student Achievement Growth
The Oregon Growth Model calculates an estimate of achievement growth using current and past
achievement scores. The Oregon Growth Model expresses a student’s achievement growth as a
percentile. This percentile is known as a student growth percentile, and it is a normative measure of
achievement growth. It specifically reflects a student’s achievement growth relative to his or her
academic peers (i.e., students in the same grade who have similar past achievement scores for the same
subject). For instance, a student growth percentile of 50 indicates that a student’s achievement grew
equal to or more than 50 percent of academic peers with similar achievement histories. This growth
percentile also represents the achievement growth of the average or typical student. The Oregon
Growth Model also calculates a target growth percentile for 3rd through 8th grade students. The target
growth percentile shows the amount of growth a student needs to either meet or maintain the
achievement standard in the next three years.
The Oregon Growth Model uses the scores from mathematics and reading assessments for students in
the 3rd through 8th and 11th grades. Moreover, the Oregon Growth Model only includes students with at
least two consecutive achievement scores (i.e., a current score and at least one but as many as three
prior achievement scores). Note that the Oregon Growth Model does not calculate student growth
percentiles for 3rd grade students because they lack prior achievement scores. It will not calculate
student growth percentiles for students who take extended assessments, are missing the current
achievement score, or have irregular grade sequences due to retention or acceleration.
Achievement Growth Aggregations
The Oregon Growth Model calculates school level measures of student achievement growth and growth
targets from mathematics and reading assessments. These are median growth and target growth
percentiles (i.e., aggregates of student growth percentiles and target growth percentiles). They
represent the typical achievement growth and typical target growth in mathematics and reading for
schools and their respective subgroups. The growth rating uses the medians to determine whether a
school and respective subgroups are on course to meet achievement standards in mathematics and
reading (see Calculating the Growth Rating).
App2.6C_ReportCardRating_PolicyTechManual
Oregon Extended Assessment Technical Report

11
VI. Calculating the Growth Rating
The growth rating is the second of five rating indicators that comprise the overall school rating. The focal
determinant of the growth rating for each school is the median growth percentile. As noted in The
Oregon Growth Model, the median growth percentile is an aggregate measure of student achievement
growth on OAKS mathematics and reading assessments. The growth rating section consists of the
following parts: business rules, median growth percentile, median growth targets, determination of on-
track growth, assignment of growth points, and determination of growth rating.
Business Rules
The business rules for the growth rating pertain to (a) the inclusion of students in the rating, (b)
minimum n-size requirement to receive a rating, and (c) the suppression of growth results to protect
student confidentiality.
The bulk of student inclusion rules are identical to those from the previous report card as well as the
AYP reports. Please see the Assessment Inclusion Rules for Accountability Reporting at
http://www.ode.state.or.us/search/page/?id=1302 to view a full description of the inclusion rules. The
student inclusion rules that deviate from the previous report card and AYP reports pertain to the
requirement that students must have two or more years of assessment data for inclusion in the Oregon
Growth Model.
The growth rating for each school will include students who
are part of the achievement rating (see Calculating the Achievement Rating),
are a resident at the school on the first school day in May (as submitted in the 3rd period
Cumulative ADM collection),
are enrolled in grades 4 through 8 or 11,
are full academic year9 at their “May 1” school,
have a valid test, and
are not a first-year Limited English Proficient student.
Additional student inclusion rules are the following:
The growth rating excludes students who take extended assessments, are missing the current
achievement score, or have irregular grade sequences due to retention or acceleration.
Students in grades four through eight must (a) have valid achievement scores from prior school
years, (b) not be a first-year Limited English Proficient student in prior school years, and (c) be a
resident in a Oregon school on the first school day in May for prior school years.
Students in the eleventh grade must (a) have a valid eighth grade achievement score from a
prior school year, (b) not be a first-year Limited English Proficient student for the year of their
eighth grade achievement score, and (c) be a resident in an Oregon school on the first school
day in May for the year of their eighth grade achievement score.
Given that students may have multiple scores because they take the reading and mathematics
assessments multiple times during the school year, the growth rating only uses the highest score
by subject for the given school year.
9 Full academic year refers to a student with enrollment in a school or district for more than one-half of the instructional days prior to the first
school day in May. This definition does not require the enrollment to be continuous or consecutive, and it may be part time or full time. The
ODE calculates the full academic year (FAY) flag as part of the 3rd Period Cumulative ADM collection and inserts it in the assessment data. The
FAY flag identifies students as enrolled for a full academic year when their ADM within a resident school is greater than 0.5.
App2.6C_ReportCardRating_PolicyTechManual
Oregon Extended Assessment Technical Report

12
The growth rating credits the student’s highest score to the school where he or she was enrolled
on the first school day in May (even if the student earned the score in another school and
district prior to May 1).
Students in high school may take the mathematics and reading assessment in 9th through 11th
grades. The growth rating only uses the highest score from earlier grades as long as the score
meets the high school achievement standard.
The growth rating will exclude Double-test OAKS scores if the OAKS participation rate is less
than 94.5% of all students in that specific field test grade and subject. On the other hand, the
growth rating will include double-test OAKS scores for small field test schools under the
following rules:
o Two or fewer non-participants when the total participation denominator is between 20 to
39 for a specific field test grade and subject.
o One non-participant when the total participation denominator is less than 20 for a specific
field test grade and subject.
Schools receive a growth rating if they meet the minimum n-size requirements10. Schools that use four
years of data for the achievement rating will also use four years of data for the growth rating. The
minimum size requirements are the following:
Schools will receive a growth rating if they have (a) at least 40 tests in the achievement rating
and (b) at least 30 students with growth percentiles.
The rationale for the minimum n-size of 30 student growth percentiles is twofold. First, a large number
of elementary schools in Oregon serve kindergarten through fifth grade. While students in these schools
take assessments in the third through fifth grades, only fourth and fifth grade students will have growth
percentiles (approximately two-thirds of students taking assessments in these respective schools). Thus,
a suitable minimum n-size for the growth rating is two-thirds of 40 (i.e., the minimum n-size for the
achievement rating) or approximately 30 students with growth percentiles. Second, the ODE conducted
a simulation11 to determine the influence of n-size on the stability of the standard errors of median
growth percentiles. Findings from the simulation suggested that the standard error of the median
reaches a reasonable level of stability at an n-size of 30.
The report card will suppress the growth results (i.e., counts and medians) for all schools that meet
suppression criteria in order to protect student confidentiality. The suppression criteria include the
following:
Student counts less than six will receive an “*”.
Median growth percentiles will receive an “*” if the student count is less than six.
Median target growth percentiles will receive an “*” if the student count is less than six.
Median Growth Percentile
The aggregate measure of student achievement growth is the median growth percentile. It represents
the typical achievement growth at the respective school. A median is a measure that describes the
middle value within a set of values. Thus, the median growth percentile indicates that 50 percent of
students in the school exhibit achievement growth above and below the median.
10 Please see Small and New School Rules for further information concerning how the school rating treats small schools.
11 The simulation consisted of (a) a random uniform distribution consisting of 300,000 cases with values ranging from zero to one, (b) 10,000
random samples of size five through seventy-five, (c) calculation of sample median, and (d) calculation of the standard error of the median for
each set of 10,000 random samples.
App2.6C_ReportCardRating_PolicyTechManual
Oregon Extended Assessment Technical Report

13
For instance, let’s suppose a school has seven students with the following growth percentiles: 37, 58, 39,
65, 46, 51, and 57. To determine the median growth percentile, it is necessary to rank order the growth
percentiles (i.e., 37, 39, 46, 51, 57, 58, and 65) and select the middle growth percentile. The middle
value or median growth percentile for this school is 51.
Note that, if the number of student growth percentiles is even, the median growth percentile is the
average of the two middle values. This can produce a median growth percentile that is not a whole
number (e.g., 51.5).
The ratings detail report displays the median growth percentiles for each school year (e.g., 2012-13 and
2013-14). Also, it displays a median growth percentile representing the two most recent school years.
This is not the average of the two medians. Rather, the median growth percentile is the combination of
two years of student growth percentiles, the rank order of the growth percentiles, and the selection of
the middle value. Note that the “combined” median growth percentile for small schools will include four
years of student growth percentiles. Finally, the ratings detail report shows median growth percentiles
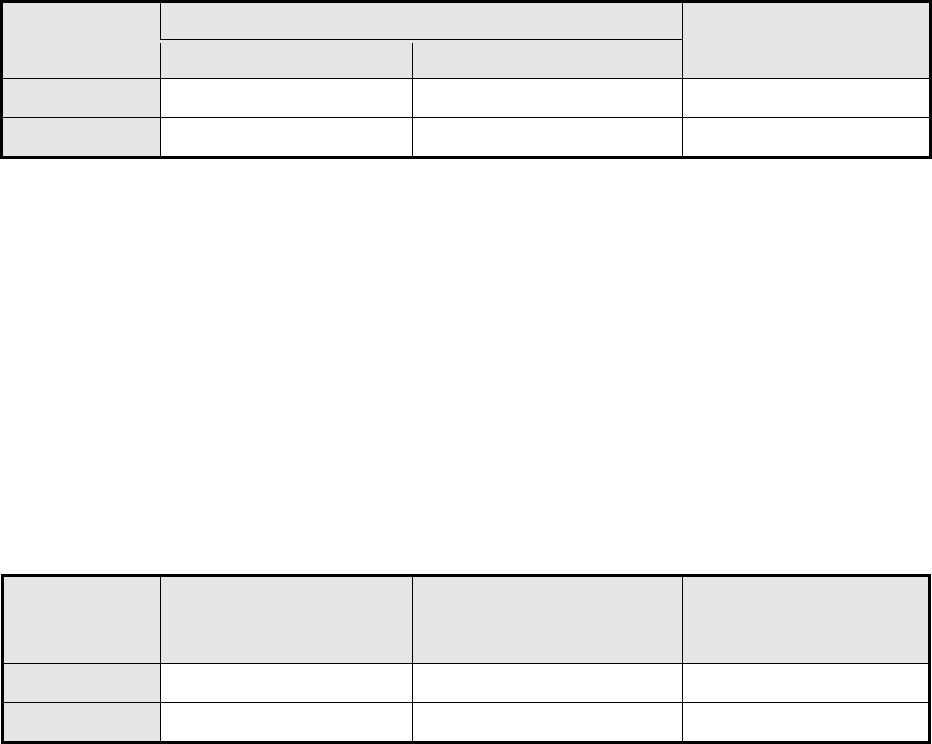
at the nearest tenth. The following table is an example of mathematics and reading median growth
percentiles for a fictitious school.
Table 3. Example of Median Growth Percentiles by Subject
Subject
Median Growth
Combined Median
2012-13
2013-14
Reading
39.0
51.5
45.0
Math
53.0
56.0
54.5
Median Growth Targets
A critical part of the growth rating is to measure whether the typical student in each school is “on-track”
to meet achievement standards over a particular time. To address this, the Oregon Growth Model
calculates a growth target representing the amount of growth a student needs to either meet or
maintain the mathematics or reading achievement standard in the next three years (only for 3rd through
8th grade students; see The Oregon Growth Model).
The median growth target is the school level measure of the amount of growth a typical student needs
to meet the mathematics or reading achievement standard in the next three years. The ratings detail
report displays the median growth target for each school year (e.g., 2012-13 and 2013-14). Also, the
ratings detail report displays a median growth target representing the two most recent school years.
This is not the average of the two medians. Rather, the median growth target is the combination of two
years of growth targets, the rank order of the growth targets, and the selection of the middle value.
Note that the “combined” median growth target for small schools will include four years of growth
targets. Similar to median growth percentiles, the ratings detail report shows median growth targets at
the nearest tenth. The following table is an example of mathematics and reading median growth targets
for a fictitious school.
App2.6C_ReportCardRating_PolicyTechManual
Oregon Extended Assessment Technical Report
14
Table 4. Example of Median Growth Target by Subject
Subject
Median Growth Target
Combined Median
Growth Target
2012-13
2013-14
Reading
68.0
63.0
66.5
Math
51.0
48.0
50.0
Determination of On-Track Growth
The growth rating provides a determination of whether the typical student in each school is “on-track”
to meet mathematics or reading achievement standards in the next three years. This determination
depends on the comparison between the median growth percentile and the median growth target. A
school will exhibit “on-track growth” when the median growth percentile is equal to or greater than the
median growth target. Conversely, a school will not exhibit “on-track growth” when the median growth
percentile is less than the median growth target. Note that the Oregon Growth Model does not calculate
growth targets for 11th grade students; thus, the determination of on-track growth is only applicable to
elementary, middle, and combined (e.g., K-12) schools. The following table is an example of the on-track
growth determination for a fictitious school.
Table 5. Example of On-Track Growth by Subject
Subject
Combined
Median Growth
Percentile
P
Percentile
Combined
Median Growth
Target
On-Track Growth
Growth?
Reading
45.0
66.5
No
Math
54.5
50.0
Yes
Assignment of Growth Points
The growth rating uses a five point scale with cutoffs to assign schools points for their mathematics and
reading achievement growth. Elementary and middle schools receive one to five points according to a
combination of whether (a) they exhibit on-track growth and (b) their median growth percentile for
mathematics or reading is above or below a specific cutoff. High schools receive one to five points
according to whether their median growth percentile for mathematics or reading is above or below a
specific cutoff. The total possible points a school can earn is ten (i.e., five points for mathematics and
five for reading). The following table describes the point scale and cutoffs.
App2.6C_ReportCardRating_PolicyTechManual
Oregon Extended Assessment Technical Report
15
Table 6. Growth Point Cutoffs by On-Track Growth and School Type
Points
On-Track Growth
(Applies to Elementary, Middle and Combined Schools)
High
Schools
Yes
No
5
60
70
65
4
45
55
50
3
35
45
40
2
30
40
35
1
< 30
< 40
< 35
Determination of Growth Rating
The growth rating consists of five levels. Each level corresponds to the percent of total points (i.e.,
) a schools earns above a cutoff. The
following table lists the growth rating levels and cutoffs.
Table 7. Growth Rating Levels and Cutoffs
Rating
Points
Percent of Points Earned
Level 5
9 or 10
90% or 100%
Level 4
7 or 8
70% or 80%
Level 3
5 or 6
50% or 60%
Level 2
3 or 4
30% or 40%
Level 1
2
20%
For instance, a Level 5 rating refers to a school that earns 90 percent of possible points. This also
signifies that the school is in the top ten percent of all schools in at least one subject (i.e., five points).
Lastly, while the growth rating uses points to determine the level a school earns, the ratings detail
report incorporates the percent of points from the growth rating and the other rating indicators (i.e.,
achievement, subgroup growth, etc.) to calculate and determine the overall school rating.
App2.6C_ReportCardRating_PolicyTechManual
Oregon Extended Assessment Technical Report

16
VII. Calculating the Subgroup Growth Rating
The subgroup growth rating is the third of five rating indicators that constitute the overall school rating.
The focal determinant of the growth rating for each subgroup within each school is the median growth
percentile. As noted in The Oregon Growth Model, the median growth percentile is an aggregate
measure of student achievement growth on mathematics and reading assessments. The subgroup
growth rating section consists of the following parts: business rules, median growth percentile, median
growth target, determination of on-track growth, assignment of growth points, and determination of
growth rating.
Business Rules
The business rules for the subgroup growth rating pertain to (a) the inclusion of students in the rating,
(b) minimum n-size requirement to receive a rating, (c) reporting of subgroup rating, and (d) the
suppression of growth results to protect student confidentiality.
The student inclusion rules for the subgroup growth rating are identical to those for the growth rating.
The subgroup growth rating for each school will include students who are part of the achievement rating
(see Calculating the Achievement Rating) and the growth rating (see Calculating the Growth Rating).
Subgroups within a school receive a growth rating if they meet the minimum n-size requirements12.
These requirements are the following:
All subgroups within schools will receive a growth rating if they have (a) at least 40 tests in the
achievement rating and (b) at least 30 students with growth percentiles.
Subgroups within schools will not receive a growth rating if they have less than 30 students with
growth percentiles or if they have fewer than 40 tests in the subgroup achievement calculation.
The growth rating for most subgroups will use two years of data; however, the subgroup growth
rating at small schools will use four years of data. Please see the Small and New School Rules for
further information concerning how the school rating treats small schools.
The rationale for the minimum n-size of 30 student growth percentiles for each subgroup is identical to
that for the growth rating (see Calculating the Growth Rating). The ratings detail report displays the
growth rating for the following subgroups13:
Economically Disadvantaged
English Learners
Student with Disabilities
American Indian/Alaska Native
Asian
Black/African American
Hispanic/Latino
Native Hawaiian/Pacific Islander
White
Multi-Racial
Underserved Races/Ethnicities
12 Please see Small and New School Rules for further information concerning how the school rating treats small schools.
13 Please see Subgroup Determinations for further information concerning the rules to determine subgroup membership.
App2.6C_ReportCardRating_PolicyTechManual
Oregon Extended Assessment Technical Report

17
The subgroup growth rating only includes the above subgroups in bold. Specifically, the growth for
students who are Economically Disadvantaged, English Learners, Students with Disabilities, and
Underserved Races/Ethnicities will determine the subgroup growth rating. Note that Underserved
Races/Ethnicities includes students who are American Indian/Alaska Native, Black/African American,
Hispanic/Latino, and Native Hawaiian/Pacific Islander.
The ratings detail report suppresses the growth results (i.e., counts and medians) for all subgroups that
meet suppression criteria in order to protect student confidentiality. The suppression criteria include the
following:
Student counts less than six will receive an “*”.
Median growth percentiles will receive an “*” if the student count is less than six.
Median target growth percentiles will receive an “*” if the student count is less than six.
Median Growth Percentile
The aggregate measure of student achievement growth is the median growth percentile. It represents
the typical achievement growth for a specific subgroup at the respective school. A median is a measure
that describes the middle value within a set of values. Thus, the median growth percentile indicates that
50 percent of students of a specific subgroup within the school exhibit achievement growth above and
below the median.
For instance, let’s suppose a subgroup has seven students with the following growth percentiles: 37, 58,
39, 65, 46, 51, and 57. To determine the median growth percentile, it is necessary to rank order the
growth percentiles (i.e., 37, 39, 46, 51, 57, 58, and 65) and select the middle growth percentile. The
middle value or median growth percentile for this subgroup is 51.
Note that, if the number of student growth percentiles is even, the median growth percentile is the
average of the two middle values. This can produce a median growth percentile that is not a whole
number (e.g., 51.5).
The ratings detail report displays the median growth percentiles for each school year (e.g., 2012-13 and
2013-14). It also displays a median growth percentile representing the two most recent school years.
This is not the average of the two medians. Rather, it is the combination of two years of student growth
percentiles, the rank order the growth percentiles, and the selection of the middle value. Note that the
“combined” median growth percentile for small subgroups will include four years of student growth
percentiles. Finally, the ratings detail report shows median growth percentiles at the nearest tenth. The
following table is an example of mathematics and reading median growth percentiles for two subgroups.
Table 8. Example of Median Growth Percentiles for Specific Subgroups
Subgroup
Median Growth Percentile
Combined
Median Growth
Percentile
2012-13
2013-14
Economically Disadvantaged
39.0
51.5
45.0
English Learners
53.0
56.0
54.5
App2.6C_ReportCardRating_PolicyTechManual
Oregon Extended Assessment Technical Report
18
Median Growth Target
As mentioned in the Calculating the Growth Rating, a critical part of the growth rating is to measure
whether the typical student from a specific subgroup is “on-track” to meet achievement standards over
a particular time. The Oregon Growth Model also calculates a growth target for each subgroup
representing the amount of growth a student from a specific subgroup needs to either meet or maintain
the mathematics or reading achievement standard in the next three years (only for 3rd through 8th grade
students; see The Oregon Growth Model).
The median growth target is the aggregate measure of the amount of growth a typical student from a
specific subgroup needs to meet the mathematics or reading achievement standard in the next three
years. The ratings detail report displays the median growth targets for each school year (e.g., 2012-13
and 2013-14). Also, it displays a median growth target representing the two most recent school years.
This is not the average of the two medians. Rather, the median growth target is the combination of two
years of growth targets, the rank order of the growth targets, and the selection of the middle value.
Note that the “combined” median growth target for small subgroups will include four years of growth
targets. Similar to median growth percentiles, the ratings detail report shows median growth targets at
the nearest tenth. The following table is an example of mathematics and reading median growth targets
for two subgroups.
Table 9. Example of Median Growth Targets for Specific Subgroups
Subgroup
Median Growth Target
Combined
Median Growth
Target
2012-13
2013-14
Economically Disadvantaged
68.0
63.0
66.5
English Learners
51.0
48.0
50.0
Determination of On-Track Growth
The growth rating provides a determination of whether the typical student from a specific subgroup is
“on-track” to meet mathematics or reading achievement standards in the next three years. This
determination depends on the comparison between the combined median growth percentile and the
combined median growth target. A subgroup within a school will exhibit “on-track growth” when the
combined median growth percentile is equal to or greater than the combined median growth target.
Conversely, a subgroup within a school will not exhibit “on-track growth” when the combined median
growth percentile is less than the combined median growth target. Note that the Oregon Growth Model
does not calculate a combined median growth target for 11th grade students; thus, the determination of
on-track growth is only applicable to subgroups within elementary and middle schools. The following
table is an example of the on-track growth determination for a fictitious school.
Table 10. Example of On-Track Growth by Subgroup
Subgroup
Combined
Median Growth
Percentile
Combined
Median Growth
Target
On-Track
Growth?
Economically Disadvantaged
45.0
66.5
No
English Learners
54.5
50.0
Yes
App2.6C_ReportCardRating_PolicyTechManual
Oregon Extended Assessment Technical Report
19
Assignment of Growth Points
The subgroup growth rating uses a five point scale with cutoffs to assign points to subgroups within
schools for their mathematics and reading achievement growth. Note that the subgroup growth rating
only assigns points to the following subgroups (assuming these subgroups meet the minimum n-size
requirements): Economically Disadvantaged, English Learners, Students with Disabilities, and
Underserved Races/Ethnicities. Subgroups within elementary and middle schools receive one to five
points according to a combination of whether (a) they exhibit on-track growth and (b) their median
growth percentile for mathematics or reading is above or below a specific cutoff. Subgroups within high
schools receive one to five points according to whether their median growth percentile for mathematics
or reading is above or below a specific cutoff. The total possible points a subgroup can earn is ten (i.e.,
five points for mathematics and five for reading). The following table describes the point scale and
cutoffs.
Table 11. Subgroup Growth Point Cutoffs by On-Track Growth and School Type
Points
On-Track Growth
(Applies to Elementary, Middle and Combined Schools)
High
Schools
Yes
No
5
60
70
65
4
45
55
50
3
35
45
40
2
30
40
35
1
< 30
< 40
< 35
Determination of Growth Rating
The subgroup growth rating consists of five levels. Each level corresponds to the percent of points (i.e.,
) a school earns above a cutoff. Note that
the total number of points a school earns is the sum of points from the four subgroups for mathematics
and reading. The following table provides an example of the subgroup growth rating determination by
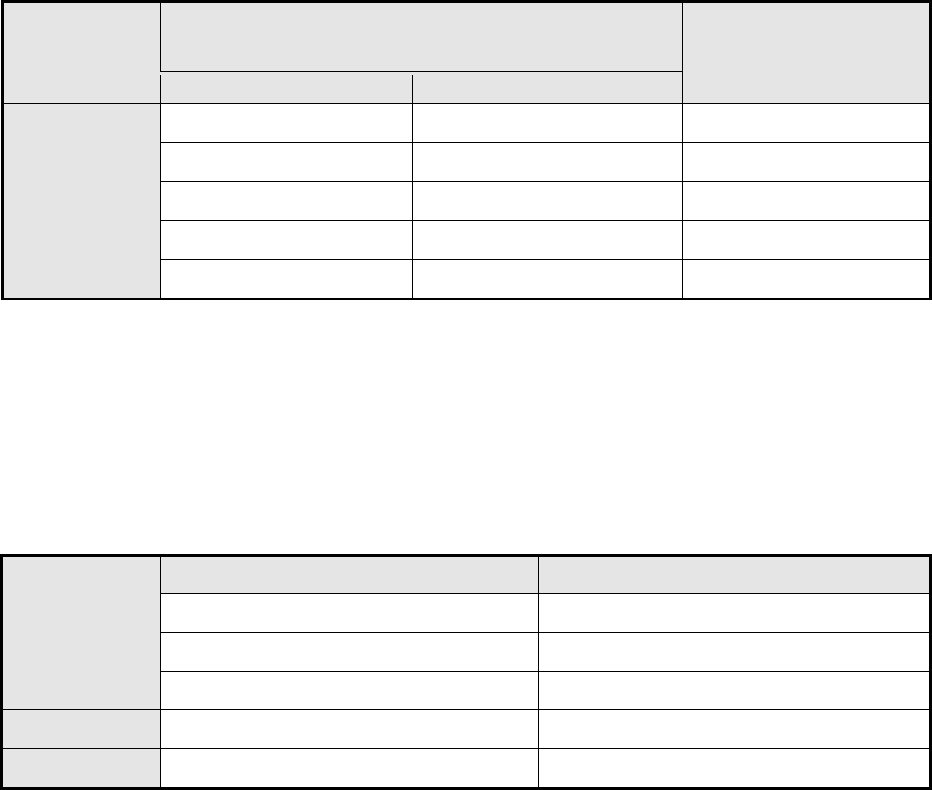
subgroup.
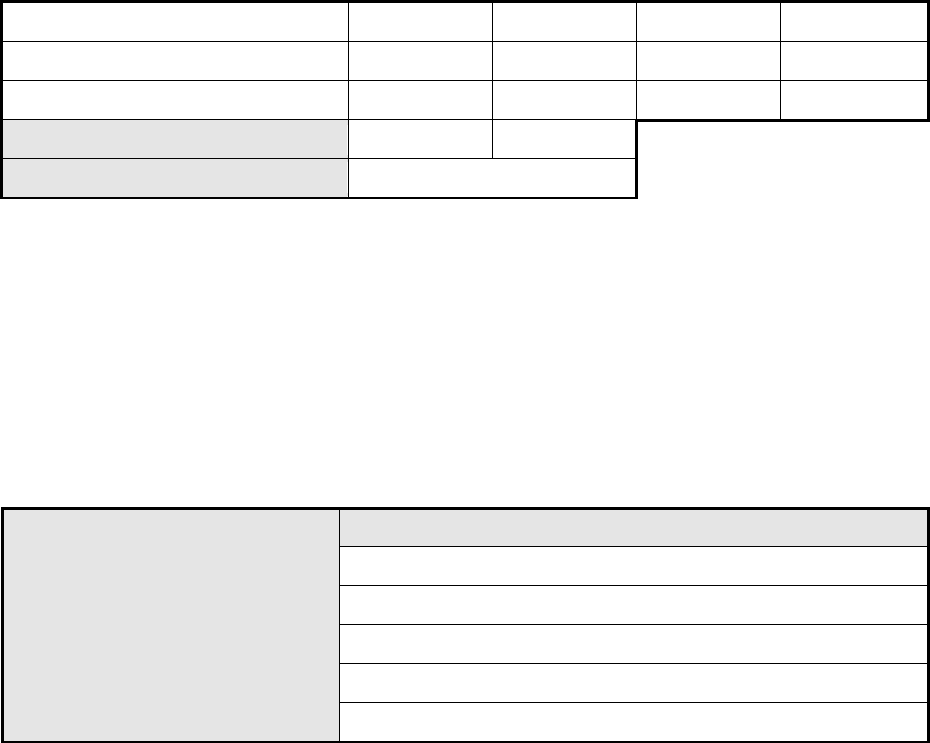
Table 12. Subgroup Growth Rating Points Calculation by Subject
Reading
Points Earned
Points
Possible
Median
Growth
On-Track
Growth
Economically Disadvantaged
3
5
45.0
No
English Learners
4
5
54.5
Yes
Students with Disabilities
*
*
*
*
Underserved Race/Ethnicity
3
5
44
Yes
Math
Economically Disadvantaged
3
5
46
No
App2.6C_ReportCardRating_PolicyTechManual
Oregon Extended Assessment Technical Report
20
English Learners
5
5
61
Yes
Students with Disabilities
*
*
*
*
Underserved Race/Ethnicity
2
5
34
Yes
Totals
20
30
Percent of Points Earned
66.7%
The example in the table indicates that the students with disabilities subgroup did not meet the
minimum n-size requirements or the suppression criteria; thus, they did not receive a rating and the
ratings detail report suppressed their growth data. The subgroup growth rating for the school now
depends on the sum of points from six subgroups (i.e., three subgroups in two subjects).
The sum of points the school earned is 20, the total possible points is 30, and the percent of points
earned is 66.7 (i.e., 20 ÷ 30). The following table lists the subgroup growth rating levels and cutoffs.
Table 13. Subgroup Growth Rating Levels and Cutoffs
Rating
Percent of Points Earned
Level 5
90% or above
Level 4
70% to 89.9%
Level 3
50% or 69.9%
Level 2
30% or 49.9%
Level 1
Less than 30%
Note that the levels, cutoffs, and interpretations for the subgroup growth rating are identical to those
for the achievement rating (see Calculating the Achievement Rating) and the growth rating (see
Calculating the Growth Rating). Lastly, while the subgroup growth rating uses points to determine the
level a school earns, the ratings detail report incorporates the percent of points from the subgroup
growth rating and the other rating indicators (i.e., achievement, growth, etc.) to calculate and determine
the overall school rating.
App2.6C_ReportCardRating_PolicyTechManual
Oregon Extended Assessment Technical Report

21
VIII. Calculating the Graduation Rating
The graduation rating is the fourth of five rating indicators that comprise the overall school rating, and is
only applicable to high schools and combined schools (e.g., K-12 schools). The focal determinant of the
graduation rating for each school is the higher of the four-year or five-year cohort adjusted graduation
rates. The cohort graduation rates represent the percent of students in the adjusted cohort who
graduate with a regular high school diploma within a certain amount of years of entering high school
(e.g., four and five years). The adjusted cohort refers to a group of students who began high school in a
specific year (e.g., 2008-09 or 2009-10) after the inclusion of students who transfer into the school and
the exclusion of students who emigrate, decease, or transfer out of the school.
The graduation rating section consists of the following parts: business rules, calculation of cohort
adjusted graduation rate, calculation of combined graduation rate, assignment of graduation points, and
the determination of graduation rating.
Business Rules
The business rules for the graduation rating pertain to (a) the inclusion of students in the rating and (b)
the minimum n-size requirement to receive a rating.
The Oregon Cohort Graduation Rate Policy and Technical Manual contains the student inclusion rules.
Please visit http://www.ode.state.or.us/search/page/?id=2644 and click on the Cohort Graduation Rate
Policy and Technical Manual 2012-13 link under 2012-2013 Cohort Graduation Rates to view a complete
description of the student inclusion rules.
Schools receive a graduation rating if they meet the minimum n-size requirements14. These
requirements are the following:
All schools will receive a graduation rating if they have at least 40 students in their adjusted
cohort for the two most recent school years.
Small schools will receive a graduation rating using four years of graduation data if they have at
least 40 students in their adjusted cohort for the four most recent school years.
Schools will not receive a graduation rating if they have fewer than 40 students in their adjusted
cohort for the four most recent school years.
Note that the ratings detail report does not suppress the graduation results for schools with small n-
sizes (i.e., adjusted cohort counts less than six students).
Calculation of Cohort Adjusted Graduation Rate
The Oregon Cohort Graduation Rate Policy and Technical Manual contains the calculation of the four-
year and five-year cohort adjusted graduation rates. To view a complete description of the calculation,
please visit http://www.ode.state.or.us/search/page/?id=2644 and click on the Cohort Graduation Rate
Policy and Technical Manual 2012-13 link under 2012-2013 Cohort Graduation Rates.
Calculation of Combined Graduation Rate
The ratings detail report displays the four-year and five-year cohort adjusted graduation rates for the
two most recent school years. Additionally, it displays combined four-year and five-year cohort adjusted
graduation rates representing the two most recent school years. Note that this is not the average of
14 Please see Small and New School Rules for further information concerning how the school rating treats small schools.
App2.6C_ReportCardRating_PolicyTechManual
Oregon Extended Assessment Technical Report
22
graduation rates. Rather, it is the combination of two years of student graduation data and the
calculation of a combined rate (i.e., the sum of numerators ÷ the sum of denominators). Note that the
“combined” graduation rate for small schools will include four years of graduation data. Finally, the
ratings detail report shows the cohort adjusted graduation rates at the nearest tenth. The following
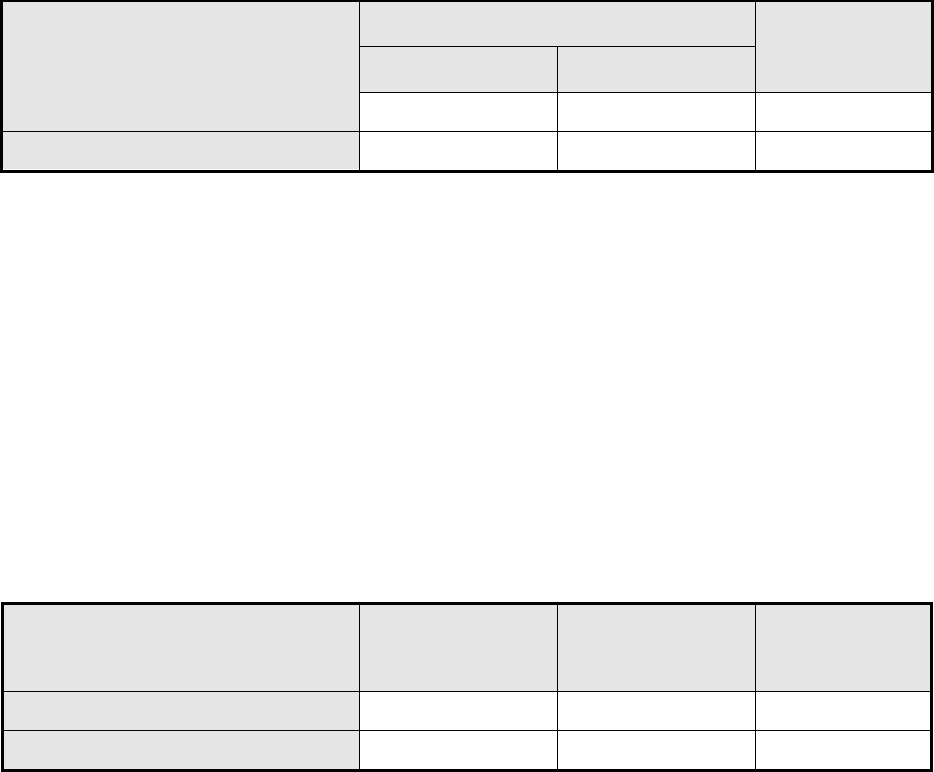
table is an example of the cohort adjusted graduation rates for a fictitious school.
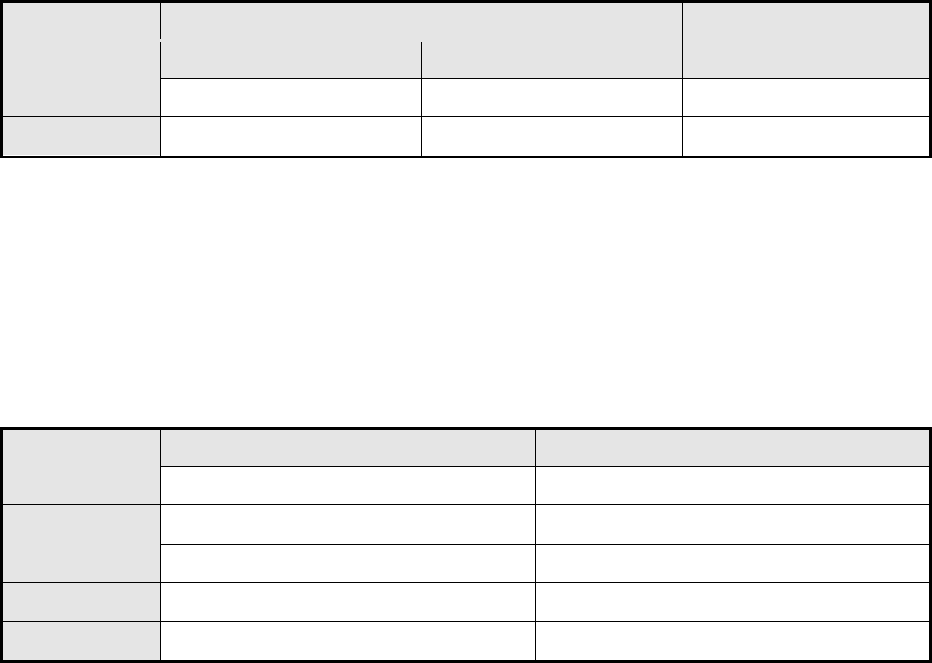
Table 14. Example of Cohort Adjusted Graduation Rates
Cohort
Cohort Adjusted Graduation Rate
Combined
Graduation Rate
2011-12
2012-13
Four-Year
76.7
79.5
78.1
Five-Year
82.2
85.6
83.9
Assignment of Graduation Points
The graduation rating uses a five point scale with cutoffs to assign schools points for their four-year and
five-year cohort adjusted graduation rates. Schools receive one to five points according to whether their
rates are above or below a specific cutoff. The total possible points a school can earn is five. The
following table describes the point scale and cutoffs for the 2013-14 school year.
Table 15. 2013-14 Graduation Point Cutoffs
Points
Four-Year Rate
Five-Year Rate
5
87.5
90.1
4
74.0
78.1
3
69.0
74.0
2
60.0
60.0
1
<60.0
<60.0
Determination of Graduation Rating
The graduation rating consists of five levels. Each level corresponds to the percent of points a school
earns above a cutoff. As mentioned previously, the ratings detail report displays a four-year and five-
year cohort adjusted graduation rate for the current year and a combination of the two most recent
years (or four years in the case of small schools). The highest four-year or five-year cohort adjusted
graduation rate (among the current year and combined year rates) will be the applied rate which
determines a school’s graduation rating. The following table lists the graduation rating levels and cutoffs
for the 2013-14 school year.
App2.6C_ReportCardRating_PolicyTechManual
Oregon Extended Assessment Technical Report

23
Table 16. 2013-14 Graduation Rating Levels and Cutoffs
Rating
Percent of Points Earned
Four-Year Rate
Five-Year Rate
Level 5
87.5% or above
90.1% or above
Level 4
74.0% to 87.4%
78.1% to 90.0%
Level 3
69.0% to 73.9%
74.0% to 78.0%
Level 2
60.0% to 68.9%
60.0% to 73.9%
Level 1
Less than 60.0%
Less than 60.0%
While the graduation rating uses points to determine the level a school earns, the ratings detail report
incorporates the percent of points from the graduation rating and the other rating indicators (i.e.,
achievement, growth, etc.) to calculate and determine the overall school rating.
App2.6C_ReportCardRating_PolicyTechManual
Oregon Extended Assessment Technical Report

24
IX. Calculating the Subgroup Graduation Rating
The subgroup graduation rating is the fifth rating indicator. Similar to the graduation rating (see
Calculating the Graduation Rating), it is only applicable to high schools. The focal determinant of the
subgroup graduation rating is the higher of the four-year or five-year cohort adjusted graduation rates.
The subgroup cohort graduation rates represent the percent of students from a specific subgroup in the
adjusted cohort who graduate with a regular high school diploma within a certain amount of years of
entering high school (e.g., four and five years). The adjusted cohort refers to a group of students from a
specific subgroup that began high school in a specific year (e.g., 2008-09 or 2009-10) after the inclusion
of students who transfer into the school and the exclusion of students who emigrate, decease, or
transfer out of the school.
The subgroup graduation rating section consists of the following parts: business rules, calculation of
cohort adjusted graduation rate, calculation of combined graduation rate, assignment of graduation
points, and the determination of graduation rating.
Business Rules
The business rules for the subgroup graduation rating pertain to (a) the inclusion of students in the
rating and (b) the minimum n-size requirement to receive a rating.
The Oregon Cohort Graduation Rate Policy and Technical Manual contains the student inclusion rules.
These rules are applicable to the subgroup cohort adjusted graduation rates. Please visit
http://www.ode.state.or.us/search/page/?id=2644 and click on the Cohort Graduation Rate Policy and
Technical Manual 2012-13 link under 2012-2013 Cohort Graduation Rates to view a complete
description of the student inclusion rules.
Subgroups within schools receive a subgroup graduation rating if they meet the minimum n-size
requirements15. These requirements are the following:
All subgroups within schools will receive a graduation rating if they have at least 40 students in
their adjusted cohort for the two most recent school years.
Subgroups within small schools will receive a graduation rating using four years of graduation
data if they have fewer than 40 students in their adjusted cohort for the two most recent school
years.
Subgroups within schools will not receive a graduation rating if they have fewer than 40
students in their adjusted cohort for the four most recent school years.
The ratings detail report displays the subgroup graduation rating for the following subgroups16:
Economically Disadvantaged
English Learners
Student with Disabilities
American Indian/Alaska Native
Asian
Black/African American
Hispanic/Latino
Native Hawaiian/Pacific Islander
White
15 Please see Small and New School Rules for further information concerning how the school rating treats small schools.
16 Please see Subgroup Determinations for further information concerning the rules to determine subgroup membership.
App2.6C_ReportCardRating_PolicyTechManual
Oregon Extended Assessment Technical Report
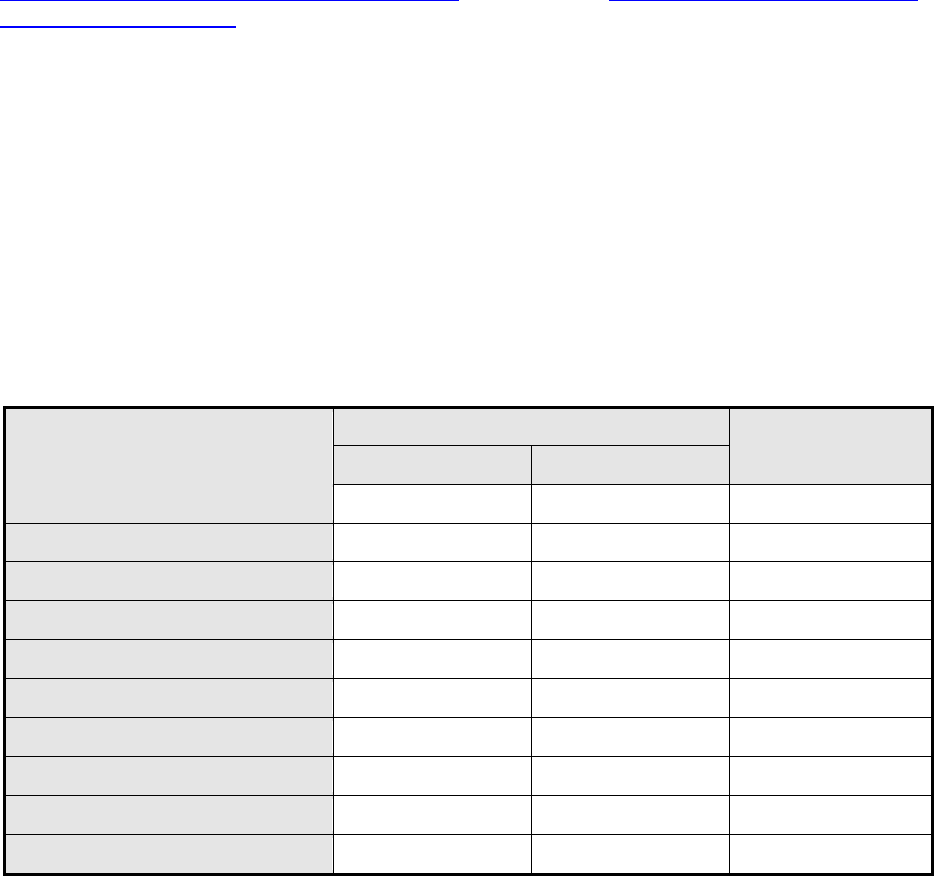
25
Multi-Racial
Underserved Races/Ethnicities
The subgroup graduation rating only includes the above subgroups in bold. Specifically, the graduation
data for students who are Economically Disadvantaged, English Learners, Students with Disabilities,
and Underserved Races/Ethnicities will determine the subgroup graduation rating. Note that
Underserved Races/Ethnicities includes students who are American Indian/Alaska Native, Black/African
American, Hispanic/Latino, and Native Hawaiian/Pacific Islander.
Note that the ratings detail report does not suppress the graduation results for subgroups with small n-
sizes (i.e., adjusted cohort counts less than six students).
Calculation of Cohort Adjusted Graduation Rate
The Oregon Cohort Graduation Rate Policy and Technical Manual contains the calculation of the four-
year and five-year cohort adjusted graduation rates. These calculations are applicable to the subgroup
cohort adjusted graduation rates. To view a complete description of the calculation, please visit
http://www.ode.state.or.us/search/page/?id=2644 and click on the Cohort Graduation Rate Policy and
Technical Manual 2012-13 link under 2012-2013 Cohort Graduation Rates.
Calculation of Combined Graduation Rate
The ratings detail report displays the four-year and five-year cohort adjusted graduation rates for the
two most recent school years. Additionally, it displays a combined four-year and five-year cohort
adjusted graduation rates representing the two most recent school years. Note that this is not the
average of graduation rates. Rather, it is the combination of two years of subgroup graduation data and
the calculation of a combined rate (i.e., the sum of numerators ÷ the sum of denominators). Note that
the “combined” graduation rate for small schools will include four years of subgroup graduation data.
Finally, the ratings detail report shows the cohort adjusted graduation rates at the nearest tenth. The
following table is an example of the cohort adjusted graduation rates by subgroup.
Table 17. Example of Subgroup Cohort Adjusted Graduation Rates
Cohort
Cohort Adjusted Graduation Rate
Combined
Graduation Rate
2011-12
2012-13
Four-Year
Economically Disadvantaged
72.1
74.8
73.5
English Learners
51.6
54.7
53.2
Students with Disabilities
57.2
60.5
58.9
Underserved Races/Ethnicities
61.6
65.1
63.4
Five-Year
Economically Disadvantaged
78.3
81.1
79.7
English Learners
58.4
60.5
59.5
Students with Disabilities
64.9
67.2
66.1
Underserved Races/Ethnicities
68.3
72.6
70.5
App2.6C_ReportCardRating_PolicyTechManual
Oregon Extended Assessment Technical Report
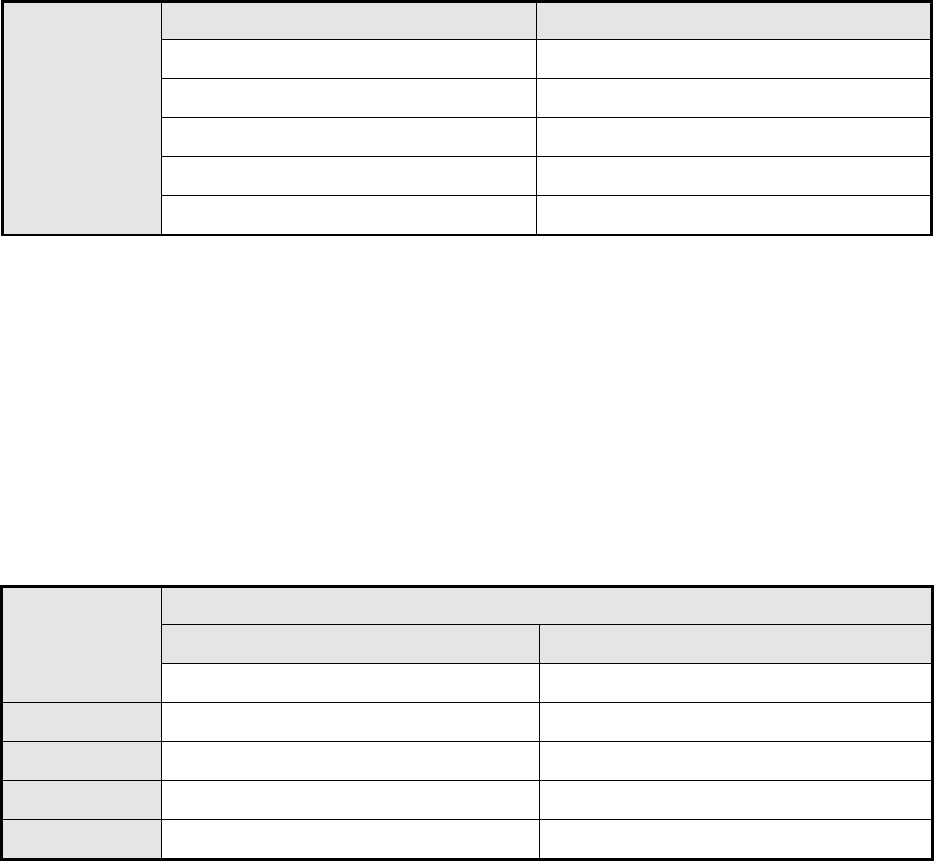
26
Assignment of Graduation Points
The graduation rating uses a five point scale with cutoffs to assign subgroups within schools points for
their four-year and five-year cohort adjusted graduation rates. Subgroups within schools receive one to
five points according to whether their rates are above or below a specific cutoff. The total possible
points a subgroup can earn is five. The following table describes the point scale and cutoffs for the 2013-
14 school year.
Table 18. 2013-14 Subgroup Graduation Point Cutoffs
Points
Four-Year Rate
Five-Year Rate
5
87.5
90.1
4
74.0
78.1
3
69.0
74.0
2
60.0
60.0
1
< 60.0
< 60.0
Determination of Graduation Rating
The subgroup graduation rating consists of five levels. Each level corresponds to the percent of points a
subgroup within a school earns above a cutoff. As mentioned previously, the ratings detail report
displays a four-year and five-year cohort adjusted graduation rate for the current year and a
combination of the two most recent years (or four years in the case of small schools). The highest four-
year or five-year cohort adjusted graduation rate (among the current year and combined year rates) will
be the applied rate which determines the subgroup graduation ratings. The following table lists the
graduation rating levels and cutoffs for the 2013-14 school year.
Table 19. 2013-14 Subgroup Graduation Rating Levels and Cutoffs
Rating
Percent of Points Earned
Four-Year Rate
Five-Year Rate
Level 5
87.5% or above
90.1% or above
Level 4
74.0% to 87.4%
78.1% to 90.0%
Level 3
69.0% to 73.9%
74.0% to 78.0%
Level 2
60.0% to 68.9%
60.0% to 73.9%
Level 1
Less than 60.0%
Less than 60.0%
While the subgroup graduation rating uses points to determine the level a school earns, the ratings
detail report incorporates the percent of points from the subgroup graduation rating and the other
rating components (i.e., achievement, growth, etc.) to calculate and determine the overall school rating.
App2.6C_ReportCardRating_PolicyTechManual
Oregon Extended Assessment Technical Report

27
X. Calculating the Overall School Rating
The overall school rating includes the school’s performance on each of the rating indicators (see
Calculating the Achievement Rating, Calculating the Growth Rating, Calculating the Subgroup Growth
Rating, Calculating the Graduation Rating, and Calculating the Subgroup Graduation Rating). Note that
only high schools receive a rating for graduation and subgroup graduation. The focal determinant of the
overall school rating is the weighted percent of points. This is the sum of weighted points (i.e., the
percent of points earned × weight) a school earns across all applicable rating components. The overall
school rating section consists of the following: business rules, calculation of weighted percent of points,
and determination of overall school rating.
Business Rules
The business rules for the overall school rating are the following:
The overall school rating does not include participation in statewide assessments as a rating
indicator. However, while schools do not receive points for participation, a school’s overall
rating will lower by one level for each consecutive year that at least one subgroup misses the
participation target of 94.5 percent (starting with the 2012-13 school year).
o For example, if a school has at least one subgroup missing the participation target in 2013-
14 (but not in 2012-13), the overall school rating will lower by one level (e.g., level 4 to level
3). On the other hand, if that same school also had a subgroup missing the participation
target in 2012-13, the overall school rating will lower by two levels (e.g., level 4 to level 2).
Schools will not receive a rating for a specific rating indicator if they do not meet the respective
minimum n-size requirement for that indicator. Schools will still receive an overall rating as long
as they have a rating for at least one indicator.
Field test schools that did not have a sufficient number of OAKS tests will retain their overall
school rating from 2012-13 (see Field Test School Accountability for more information).
Only high schools receive a rating for graduation and subgroup graduation.
High schools that receive a level 1 for their graduation rating cannot have an overall school
rating which exceeds level 2.
Calculation of Weighted Percent of Points
Each school type (e.g., elementary/middle, combined, and high school) has a specific set of weights for
each rating indicator. The determination of school types are the following:
Elementary/middle: schools with a high grade of 9 or less (e.g., K-5, 6-8, and K-8 schools).
Combined: schools with a high grade of 10 to 12 and a low grade of 7 or lower (e.g., K-12 and 7-
12 schools).
High: schools with a high grade of 10 or higher and a low grade of 8 or higher.
All school types have weights for the achievement, growth, and subgroup growth rating; however, only
combined and high schools have weights for the graduation and subgroup graduation ratings (due to the
fact that graduation is not applicable to elementary and middle schools). The following table lists the
rating indicators and their respective weight for each school type.
App2.6C_ReportCardRating_PolicyTechManual
Oregon Extended Assessment Technical Report
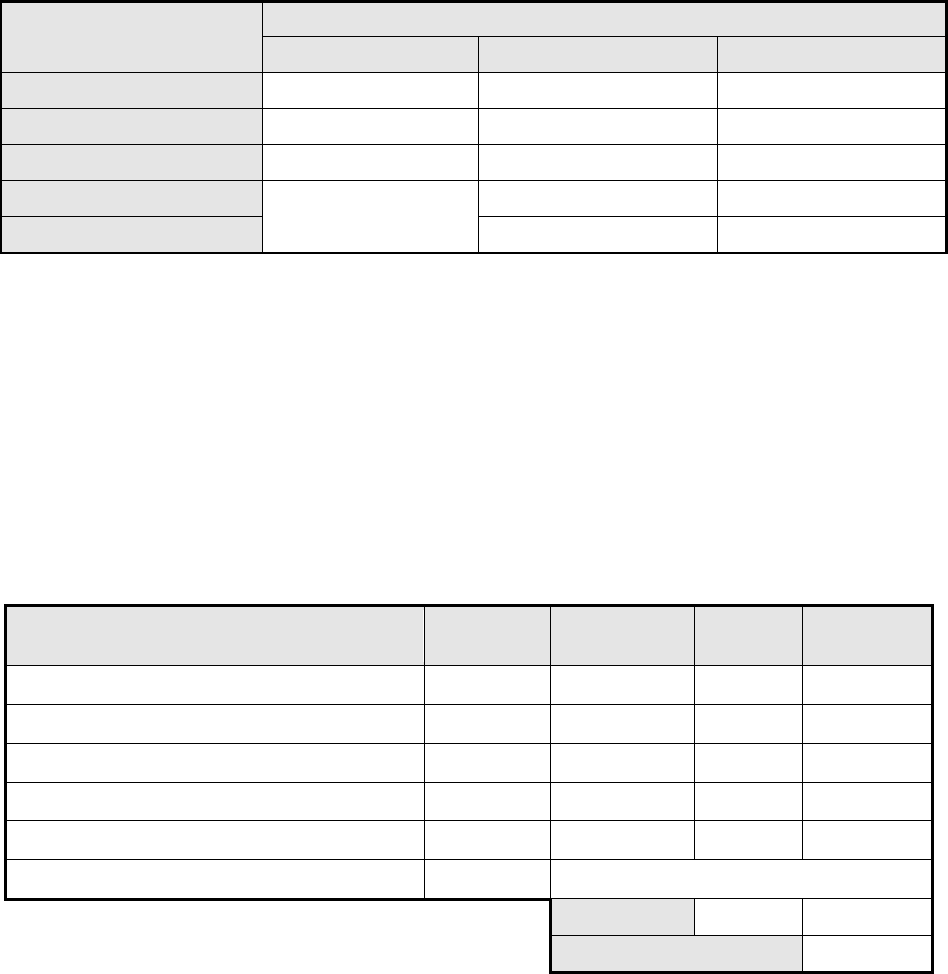
28
Table 20. Rating Indicators and Weights by School Type
Rating Indicator
Weights by School Type
Elementary/Middle
Combined
High
Achievement
25
20
20
Growth
50
30
20
Subgroup Growth
25
15
10
Graduation
Not Applicable
25
35
Subgroup Graduation
10
15
Determination of Overall School Rating
The overall school rating consists of five levels. Each level corresponds to the weighted percent of points
a school earns above a cutoff. The weighted percent of points is the sum of weighted points a school
earns across all eligible rating indicators. The weighted points refer to the product of the percent of
points a schools earns for a specific rating indicator and the corresponding weight (i.e., the percent of
points earned × weight). The total possible weighted points a school can earn is 100 and the highest
weighted percent of points is 100 percent. The following table provides an example of the overall school
rating determination for a fictitious high school.
Table 21. Overall School Rating Example for a Fictitious High School
Rating Indicator
Level
% of Points
Earned
Weight
Weighted
Points
Achievement
Level 4
80.0
20
16.0
Growth
Level 3
60.0
20
12.0
Subgroup Growth
Level 3
55.0
10
5.5
Graduation
Level 4
80.0
35
28.0
Subgroup Graduation
Level 2
45.0
15
6.8
Number of Missed Participation Targets
0
Not Applicable
Totals
100
68.3
Weighted Percent
68.3%
App2.6C_ReportCardRating_PolicyTechManual
Oregon Extended Assessment Technical Report

29
The example in the table illustrates the percent of points the high school earned for each rating
component, the corresponding weight, the weighted points for each rating component, and the percent
of weighted points of 68.3. The following table lists the overall school rating levels and cutoffs for the
2013-14 school year.
Table 22. 2013-14 Overall School Rating Levels and Cutoffs
Rating
Percent of Points Earned
Level 5
87.0% or above
Level 4
70.0% to 86.9%
Level 3
47.0% to 69.9%
Level 2
26.5% to 46.9%
Level 1
Less than 26.5%
The fictitious high school earned 68.3 percent of weighted points which corresponds to an overall school
rating of level 3. Note that the overall school rating is normative and indicates how well schools perform
on all applicable rating components (i.e., achievement, growth, subgroup growth, graduation, and
subgroup graduation) as compared to all schools statewide.
App2.6C_ReportCardRating_PolicyTechManual
Oregon Extended Assessment Technical Report

30
XI. Subgroup Determinations
The subgroup determinations refer to the rules pertaining to the assignment of students to specific
subgroups. As noted previously, the ratings detail report displays achievement, growth, and graduation
data by subgroup. These subgroups include All Students, Economically Disadvantaged, English Learners,
Student with Disabilities, American Indian/Alaska Native, Asian, Black/African American,
Hispanic/Latino, Native Hawaiian/Pacific Islander, White, Multi-Racial, and Underserved
Races/Ethnicities. Moreover, the ratings detail report also provides a subgroup growth and graduation
rating for specific subgroups (i.e., All Students, Economically Disadvantaged, Limited English Proficient,
Students with Disabilities, and Underserved Races/Ethnicities). Lastly, the subgroup graduation rates
have additional rules to determine subgroup membership.
All Students
The All Students subgroup includes all students who are a resident at the school on the first school day
in May (as submitted in the 3rd Period Cumulative ADM collection). Exceptions to this are the following:
Foreign exchange students, home schooling students, and students who pay tuition
Students enrolled in private alternative programs and do not receive instruction in core
academic subjects assessed by statewide assessments
Students identified by the school or district as transferring in without a test score after the
testing window closed
Students enrolled in district special education programs
Economically Disadvantaged
The ratings detail report uses the eligibility application for free and reduced price meal programs to
determine membership in the economically disadvantaged subgroup. School districts identify students
as eligible for free and reduced price lunch in the 3rd Period Cumulative ADM collection. Schools and
districts that do not administer school lunch programs may identify economically disadvantaged
students by other means. Please see the Cumulative ADM Manual for more information about free and
reduced price lunch data (see www.ode.state.or.us/go/cumADMManual).
English Learners
Information concerning the English Learners subgroup comes from the No Child Left Behind (NCLB) Act
Limited English Proficient (LEP) collection. School districts identify students as either Limited English
Proficient or formerly Limited English Proficient. Formerly Limited English Proficient refers to a student
who exited a Limited English Proficient program in either of the two previous school years (see Executive
Numbered Memorandum No. 010-2006-07). English Learners represents a student who:
is age 3 through 21;
attends or is preparing to enroll in an elementary school or secondary school;
was not born in the United States or whose native language is a language other than English;
is a Native American or Alaska Native or a native resident of the outlying areas;
comes from an environment where a language other than English has had a significant impact
on the individual’s level of English language proficiency;
is migratory, whose native language is a language other than English, and
comes from an environment where a language other than English is dominant; and whose
difficulties in speaking, reading, writing, or understanding the English language may be sufficient
to deny the individual:
o the ability to meet the State’s proficient level of achievement on statewide assessments
(described in section 1111(b)(3) of the No Child Left Behind Act);
App2.6C_ReportCardRating_PolicyTechManual
Oregon Extended Assessment Technical Report
31
o the ability to successfully achieve in classrooms where the language of instruction is English;
or the opportunity to participate fully in society.
Student with Disabilities
The Students with Disabilities subgroup includes all students receiving special education services at any
time during the school year as part of an Individualized Education Programs (IEP). The data source for
the Student with Disabilities subgroup is the 3rd Period Cumulative ADM collection.
Race/Ethnicity
Information concerning a student’s race/ethnicity comes from the 3rd Period Cumulative ADM collection.
A student may self-identify as one of the following:
American Indian/Alaska Native: A student having origins in any of the original peoples of North
America and who is not Hispanic.
Asian: A student having origins in any of the original peoples of the Far East, Southeast Asia, or
the Indian subcontinent, and who is not Hispanic.
Native Hawaiian/Pacific Islander: A student having origins in any of the original peoples of
Hawaii, Guam, Samoa, or other Pacific Islands and who is not Hispanic.
Black/African American: A student having origins in any of the black racial groups of Africa and
who is not Hispanic.
Hispanic/Latino: A student of Mexican, Puerto Rican, Cuban, Central or South American, or other
Spanish culture or origin, regardless of race.
White: A student having origins in any of the original peoples of Europe, North Africa, or the
Middle East and who is not Hispanic.
Multi-Racial: A student having origins in more than one race and who is not Hispanic.
Underserved Races/Ethnicities
The ratings detail report uses the Underserved Races/Ethnicities subgroup as part of the subgroup
growth, subgroup graduation, and overall school ratings. This subgroup consists of students from
specific racial/ethnic subgroups (i.e., American Indian/Alaska Native, Native Hawaiian/Pacific Islander,
Black/African American, and Hispanic/Latino) that have an historical achievement gap in Oregon. The
data source for the Underserved Races/Ethnicities subgroup is the race/ethnicity information from the
3rd Period Cumulative ADM collection.
Subgroup Membership for Graduation Rates
The cohort adjusted graduation rates represent the percent of students in the adjusted cohort who
graduate with a regular high school diploma within a certain amount of years of entering high school
(e.g., four and five years). Because these rates use multiple years of data, it is necessary to use multiple
years of data to determine subgroup membership. Thus, the determination of subgroup membership
requires the following rules:
Economically Disadvantaged: If any 3rd Period Cumulative ADM collection or Spring Membership
collection identifies the student as Economically Disadvantaged during any school year in which
the student was enrolled in a high school grade.
English Learners: If any LEP collection record identified the student as an English Learner during
any school year in which the student was enrolled in a high school grade.
Students with Disabilities: If any Special Education Child Count (SECC) record indicates a student
received special education services during any school year in which the student was enrolled in
a high school grade.
Race/Ethnicity: The student collection record that determines the final outcome of the student,
or in the student’s last enrollment record, whichever is later.
App2.6C_ReportCardRating_PolicyTechManual
Oregon Extended Assessment Technical Report

32
XII. Small and New School Rules
All public schools receive a report card and ratings detail report; however, schools receive an overall
school rating as long as they (a) are open on the first school day in May, (b) have a sufficient number of
resident students, and (c) have operated for two or more years. This includes all charter schools,
alternative schools, state operated schools, and correctional facilities in the state of Oregon.
However, certain schools (i.e., small and new schools) will not receive a school rating. The rules for small
and new schools are the following:
“Small schools” are those schools that have insufficient data across the two most recent school
years as indicated by having an insufficient number (fewer than 40) of either mathematics or
reading achievement tests. The ratings for these small schools will use four years of data for all
indicators (when available).
Small schools will not receive a rating for any rating indicators (including the overall school
rating) if they have insufficient tests or students across the four most recent school years. Please
see the minimum n-size requirements for the Calculating the Achievement Rating, Calculating
the Growth Rating, Calculating the Subgroup Growth Rating, Calculating the Graduation Rating,
and Calculating the Subgroup Graduation Rating for specific details.
Schools will not receive an overall rating unless they have a rating for at least one indicator.
Note that schools without indicator ratings will not receive an overall school rating.
New schools are schools where the first year of operation is the current year. These schools will
receive a report card and ratings detail report but not an overall school rating. This also includes
schools that experience a significant boundary change and receive new school status from ODE.
It is important to note that district-administered programs and other public and private programs (e.g.,
magnet/special programs, special education, and career technical education programs) do not receive a
report card, ratings detail report, or overall school rating according to the students enrolled in their
programs. The ratings detail report will credit data pertaining to students from these programs to the
resident school and/or district report cards and ratings detail reports if the resident school or district
initiated the placement of students in the programs. Please visit
http://www.ode.state.or.us/pubs/instID/institutions-definitions-081506.pdf for further information
about school and program definitions as well as how to distinguish between programs and schools.
Finally, the school report card, ratings detail reports, and overall school ratings do not include
achievement, growth, or graduation data for the following students:
Students enrolled in private schools
Foreign exchange students and home schooling students
Students enrolled in private alternative programs and do not receive instruction in core
academic subjects assessed Oregon statewide assessments
Students identified by the school or district as transferring in without a test score after the
testing window closed
Please see the Calculating the Achievement Rating, Calculating the Growth Rating, Calculating the
Subgroup Growth Rating, Calculating the Graduation Rating, and Calculating the Subgroup Graduation
Rating for specific details concerning student inclusion rules.
App2.6C_ReportCardRating_PolicyTechManual
Oregon Extended Assessment Technical Report

33
XIII. Comparison School Rating
The comparison school rating represents a school’s overall rating as compared to schools from the same
school type (i.e., elementary, middle, high and combined17 schools) with similar student demographics.
The comparison school rating is a complex measure that requires the calculation of the comparison
school index and the determination of comparison groups. The following three sections provide a basic
discussion concerning how the ODE calculates the comparison school index, determines the comparison
group, and calculates the comparison school rating for the school report card.
Comparison School Index
Each school with sufficient student enrollment18 has a comparison school index. The comparison school
index is the critical determinant of a school’s comparison group and an important contributor to the
comparison school rating as well as the like-school averages on the school report card. The ODE derived
the comparison school index from four demographic variables using principal components analysis
(PCA). The four demographic variables are (1) the percent of students identified as economically
disadvantaged, (2) the percent of students identified as ever English learners19, (3) the percent of
students identified as belonging to an underserved racial/ethnic group20, and (4) the percent of students
identified as mobile within the school year21.
PCA is a multivariate statistical technique that applies a linear transformation to a number of similar
variables (e.g., demographic variables) in order to produce a smaller set of uncorrelated and
independent components (e.g., comparison school index). The aim of PCA is to retain the component(s)
that explain the most variation in the original variables. ODE employs a PCA model that produces two
components, and ODE uses the first component as the comparison school index. Thus, the comparison
school index is simply the weighted linear combination of the four demographic variables that explains
the largest amount of variability in those variables.
Comparison Group
The procedure that ODE uses to determine a school’s comparison group is the following: (1) separate
schools by type (i.e., elementary, middle, high and combined schools), (2) sort the comparison school
index from lowest to highest, and (3) select the 10 schools immediately above and 10 schools
immediately below a school’s respective comparison school index. The comparison group will typically
contain 20 schools; however, schools at the extreme ends of the comparison school index will have less
than 20 schools because there are fewer schools above or below their comparison school index. Table
23 shows the comparison group for a fictitious elementary school: Jackie Robinson Elementary School.
Note that (1) all the schools in the table are from the same school type (i.e., elementary) and (2) the
values within the comparison school index are in order from lowest to highest. The comparison group
for Jackie Robinson Elementary School includes 20 schools and ranges from George Washington
Elementary School to Eleanor Roosevelt Elementary School (i.e., the 10 schools above the comparison
17 Combined schools are schools that are a combination of high school grades and any grades 7 and lower.
18 Schools with a student enrollment ≥ 40 students according to Spring Membership 2012-13.
19 These are students who were ever eligible for or participating in a program to acquire academic English.
20 These are students who are either American Indian/Alaska Native, Black/African American, Hispanic/Latino, or Native Hawaiian/Pacific
Islander.
21 These are students who experienced one or more of the following: (a) attended more than one Oregon public school during the school year,
(b) entered the Oregon public education system late (i.e., after October 1), (c) exited the Oregon public education system early (i.e., before May
2 without earning a diploma, certificate, etc.), and (d) had significant gaps in enrollment during the school year totaling ten or more consecutive
school days.
App2.6C_ReportCardRating_PolicyTechManual
Oregon Extended Assessment Technical Report
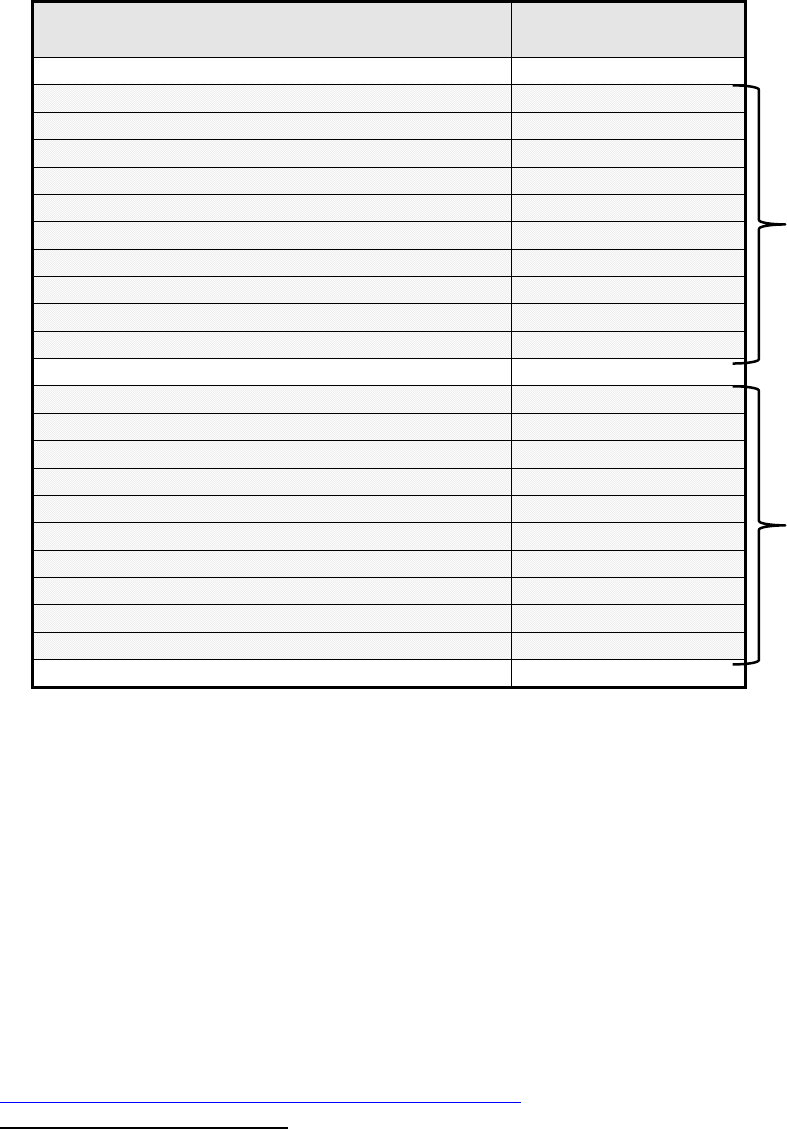
34
school index) and Jason Lee Elementary School to William Clark Elementary School (i.e., the 10 schools
below the comparison school index).
Table 23. Example Comparison Group
Comparison School Rating
Each school will receive a comparison school rating unless it (a) does not receive an overall rating or (b)
does not have sufficient students to calculate a comparison school index. The comparison school rating
represents a school’s overall rating as compared to schools from the same school type with similar
student demographics (i.e., similar comparison school indices). However, in lieu of a direct comparison
between rating levels, the comparison school rating uses the weighted percent of points which
determines the level for the overall school rating. The weighted percent of points denotes the weighted
points a school earns across all applicable rating indicators (i.e., achievement, growth, subgroup growth,
graduation, and subgroup graduation). Thus, the comparison school rating is the comparison between a
school’s weighted percent of points22 and the points for the schools in its respective comparison group.
Note that the percent of points by rating indicator, weighted percent of points, and the overall rating
are found on the first page of the school’s rating detail report (see
http://www.ode.state.or.us/data/reportcard/reports.aspx).
22 Some schools receive a rating penalty if they (1) fail to meet the participation target of 94.5% for one or more subgroups or (2) have a
graduation rating of Level 1. ODE will lower a school’s overall rating by one category if the school misses the participation target (e.g., Level 4 to
a Level 3). Also, a school can have an overall rating of no higher than Level 2 if its graduation rating is Level 1. When either or both occur, ODE
translates the new overall rating to the maximum weighted percent of points available for that respective rating level.
School Name
Comparison
School Index
Sacagawea Elementary School
-1.404
Eleanor Roosevelt Elementary School
-1.400
Babe Didrikson Elementary School
-1.387
Margaret Mead Elementary School
-1.352
Roberto Clemente Elementary School
-1.341
Martin Luther King Jr. Elementary School
-1.340
Marie Curie Elementary School
-1.329
Rosa Parks Elementary School
-1.300
Marcus Whitman Elementary School
-1.294
Susan B. Anthony Elementary School
-1.292
George Washington Elementary School
-1.282
Jackie Robinson Elementary School
-1.282
Jason Lee Elementary School
-1.281
Ronald Reagan Elementary School
-1.280
Meriwether Lewis Elementary School
-1.275
Harriet Tubman Elementary School
-1.271
Abraham Lincoln Elementary School
-1.266
Clara Barton Elementary School
-1.241
John Adams Elementary School
-1.240
Hank Aaron Elementary School
-1.231
Helen Keller Elementary School
-1.226
William Clark Elementary School
-1.216
Louisa May Alcott Elementary School
-1.214
10 Schools
Above
10 Schools
Below
App2.6C_ReportCardRating_PolicyTechManual
Oregon Extended Assessment Technical Report

35
The procedure that ODE uses to produce the comparison school rating is the following: (1) separate
schools by type, (2) sort the comparison school index from lowest to highest, (3) compute the mean and
standard deviation for the weighted percent of points of all schools in the comparison group including
the school of interest, (4) compute the z-score23 for the school, and (5) transform the z-score into a
percentile. Schools can receive one of three comparison school ratings: below average, about average,
and above average. Below average refers to schools that fall into the bottom third of comparison
schools (i.e., a percentile ≤ 33.33), about average represents schools that fall into the middle third of
comparison schools (i.e., a percentile > 33.33 and ≤ 66.66), and above average denotes schools that fall
into the top third of comparison schools (i.e., a percentile ≥ 66.66). Table 24 shows the comparison
school rating for a fictitious elementary school: Jackie Robinson Elementary School.
Table 24. Example Comparison Group and Weighted Percent of Points
The mean and standard deviation of the weighted percent of points for Jackie Robinson Elementary
School and its comparison group are 76.75 and 12.73. Jackie Robinson Elementary School’s z-score and
percentile are -0.73 and 23.38 which results in a comparison school rating of below average.
23 The z-score represents the number of standard deviations a value is above or below the mean.
School Name
Comparison
School Index
Weighted
Percent of Points
Sacagawea Elementary School
-1.404
72.5
Eleanor Roosevelt Elementary School
-1.400
93.3
Babe Didrikson Elementary School
-1.387
56.7
Margaret Mead Elementary School
-1.352
80.0
Roberto Clemente Elementary School
-1.341
45.0
Martin Luther King Jr. Elementary School
-1.340
70.0
Marie Curie Elementary School
-1.329
57.5
Rosa Parks Elementary School
-1.300
85.0
Marcus Whitman Elementary School
-1.294
80.0
Susan B. Anthony Elementary School
-1.292
75.0
George Washington Elementary School
-1.282
75.0
Jackie Robinson Elementary School
-1.282
67.5
Jason Lee Elementary School
-1.281
69.9
Ronald Reagan Elementary School
-1.280
90.0
Meriwether Lewis Elementary School
-1.275
99.2
Harriet Tubman Elementary School
-1.271
87.5
Abraham Lincoln Elementary School
-1.266
80.0
Clara Barton Elementary School
-1.241
75.0
John Adams Elementary School
-1.240
80.0
Hank Aaron Elementary School
-1.231
78.8
Helen Keller Elementary School
-1.226
81.3
William Clark Elementary School
-1.216
85.0
Louisa May Alcott Elementary School
-1.214
100.0
App2.6C_ReportCardRating_PolicyTechManual
Oregon Extended Assessment Technical Report
