Artisan Trend Usage Guide
User Manual:
Open the PDF directly: View PDF ![]() .
.
Page Count: 8

Artisan Engineering
4085 2nd Avenue
Burnaby, BC V5C 3X1
(778) 251-4290
Artisan Trend
Usage Guide
Written by: Riley Stewart, 2018.
Not to be copied, used, or revised without explicit written permission from the author and Artisan Engineering,
Ltd.
OVERVIEW
This is a usage guide for the trending application developed by Artisan Engineering by Riley
Stewart. Artisan Trend is intended to be used to view plots of data contained within chemical test
reports produced by Artisan Engineering.
PREPARING REPORTS
As a general note, files sent to clients should be in the form of a password-locked excel
worksheet; data contained within PDF reports cannot be accessed by Artisan Trend, and thus
cannot be used.
File Name
When producing reports, file names should adhere to the following conventions (any of these
works):
Note: Here “_____” indicates anything may be put there.
●‘YEAR-MONTH-DAY_______ .xlsx’ where each is numeric.
○Ex: ‘2017-08-16 _ AC Report.xlsx’
●‘________MonthDAYYEAR.xlsx’ where day and year are numeric.
○Month may be in short form or long form
■Short form: first three letters of month (ex.: Jan, Feb, Mar, Apr, etc.)
■Long form: full month name (ex. January, February, March, April, etc.)
○Ex. ‘BentallReportJul172017.xlsx’
This serves to provide dates for each data point.
Chemical Test Labels
Chemical tests labels, located in the header of each data table in an excel file, for example:
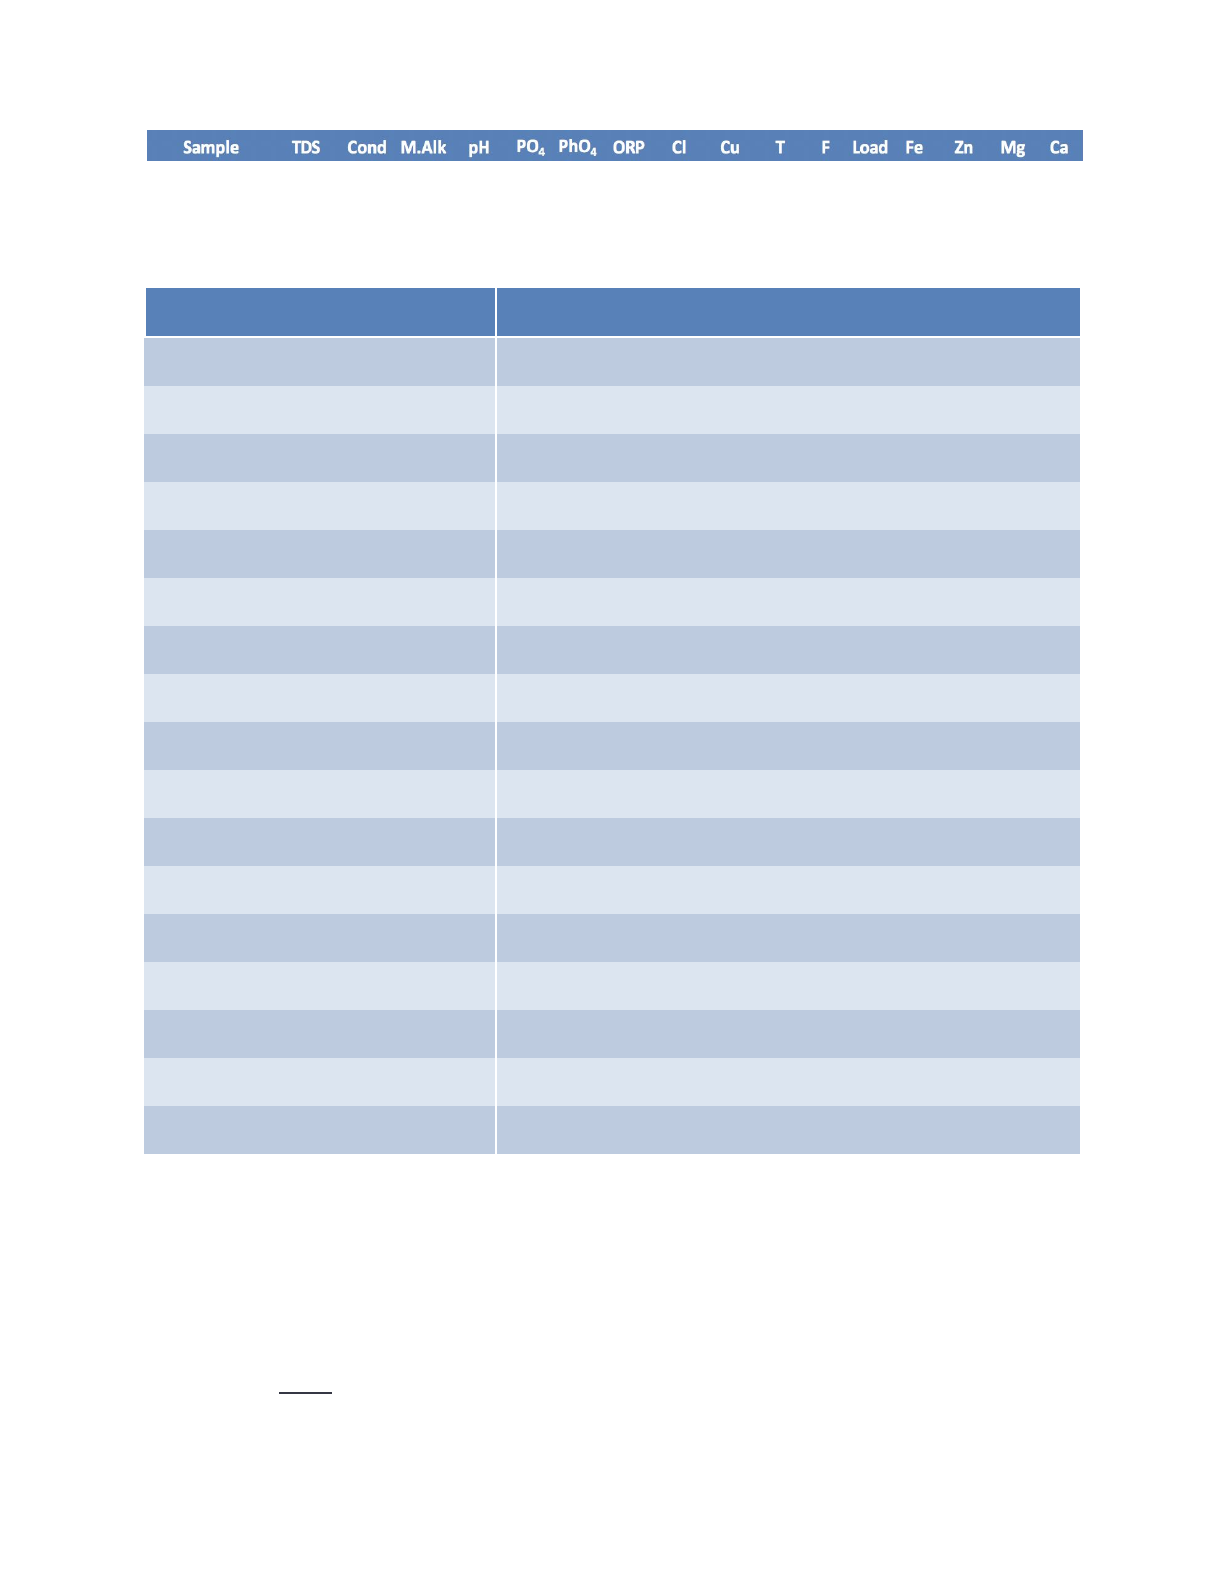
These vary from file to file; here is a table of all the chemical test labels that will work (case
insensitive):
Chemical Test Label
Allowed Test Labels
TDS
TDS
Cond
Cond, Cond., Conductivity
M. Alk
M. Alk, Alkalinity, M.Alk, Alk., M Alk
pH
pH
PO4
PO4
PhO4
PhO4
ORP
ORP
Cl
Free Cl, Cl, FCl
Copper/Cu
Cu
Iron/Fe
Fe, Iron
FATP
FATP, F, Free ATP, F.ATP
TATP
TATP, T, Total ATP, T.ATP
Zinc/Zn
Zn
Mg Hardness
Mg, Mg Hardness
Ca Hardness
Ca, Ca Hardness
Nitrite
Nitrite, Nit, Nit.
Molybdenum
Mo, Molybdenum
CONFIGURATION
Excel File Location
Upon launching the application, a pop-up menu will appear, requesting the user to select the
folder that contains the excel reports produced by Artisan Engineering. This location must only
contain these excel files; other files in the folder cause no issues. If issues are detected caused
by an incorrect directory selected (no files present, difficulties loading files, etc.), the user will be
informed and asked to select the directory again. The directory selected may be changed at any
time by selecting ‘File’, and then ‘Change file directory’:
Sample Labels
When labelling samples in reports, consistency is key. For a particular sample, variations on
sample names (ex. TASC 1 CT vs. TASC CT 1) is accounted for based upon matching labels
according to similarity, and thus is fine. Larger variations in sample names (ex. Main HW vs. Hot
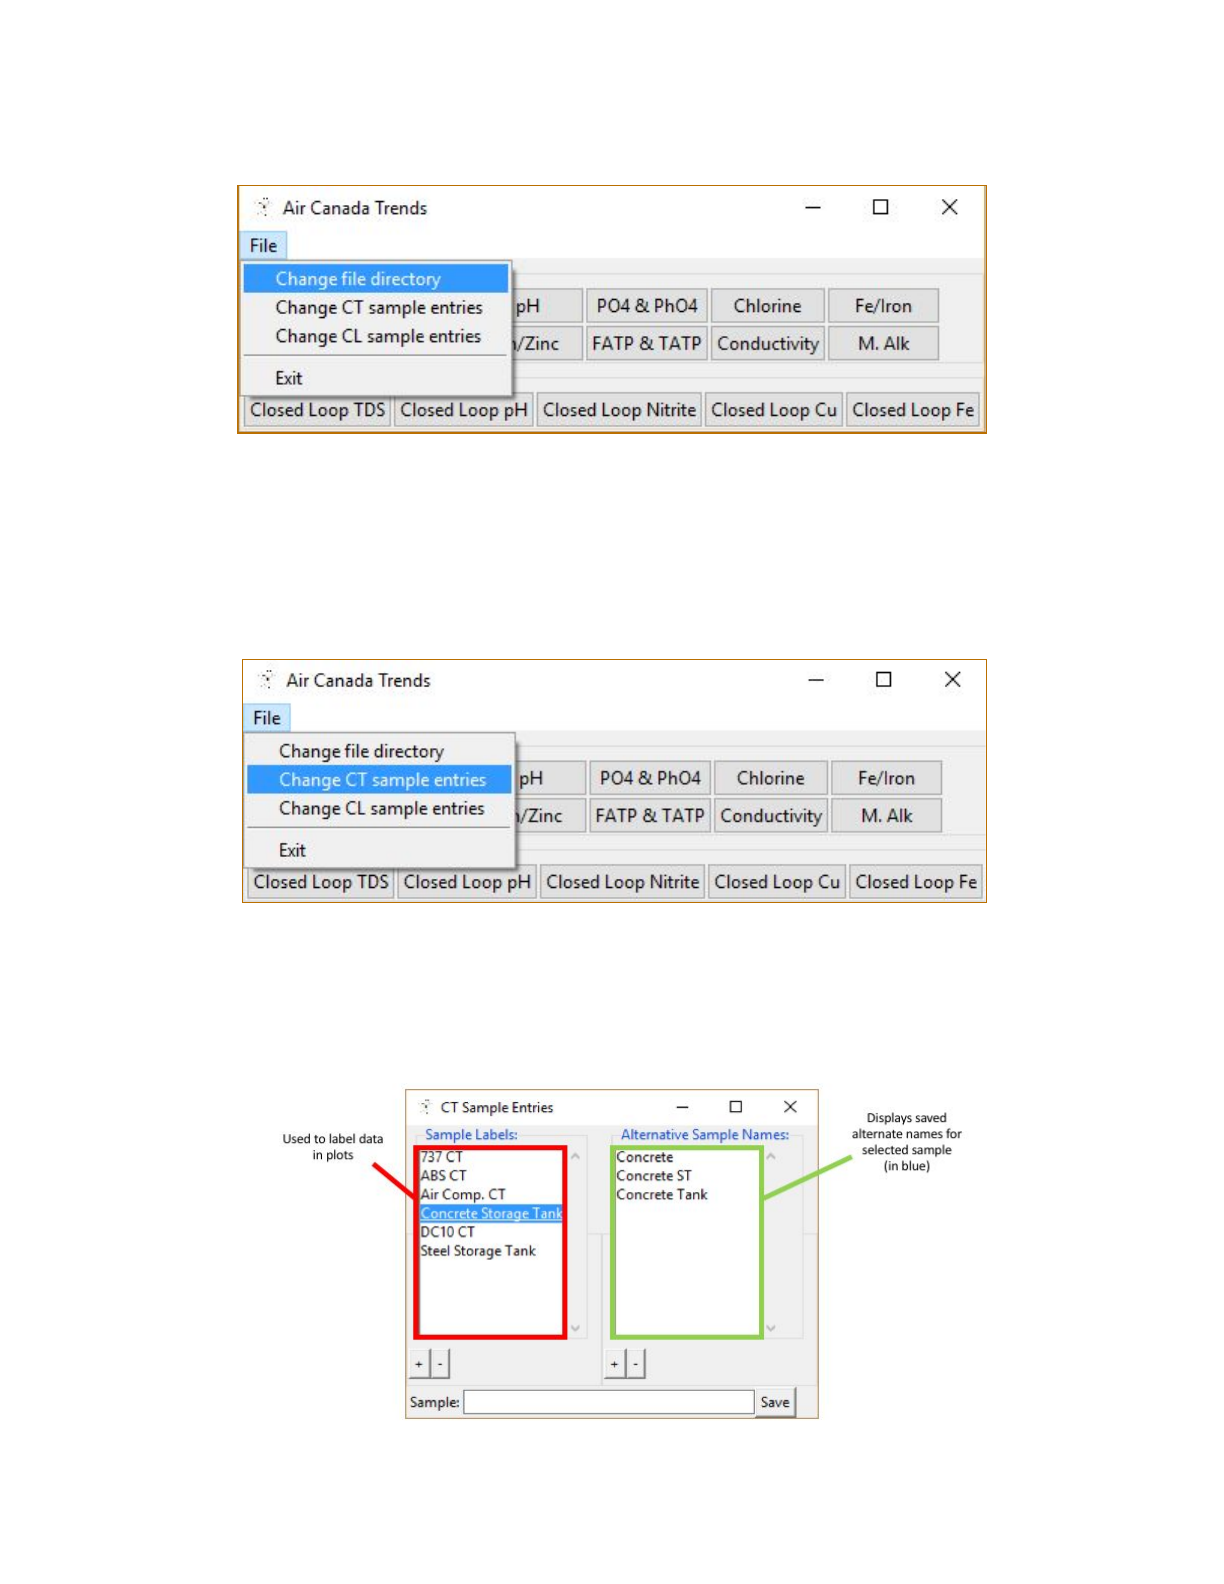
Heating Water) must be accounted for using Artisan Trend’s alternate sample name system:
By selecting ‘File’, and then ‘Change CT sample entries’ or ‘Change CL (Closed Loop) sample
entries’, the label system can be viewed:
As you can see above, each sample has alternate names associated with it, which allows Artisan
Trend to compile data for each sample correctly, even with larger variations in sample labels
used in the excel worksheets. Only the sample listed in ‘Sample Labels’ are plotted by the
program.
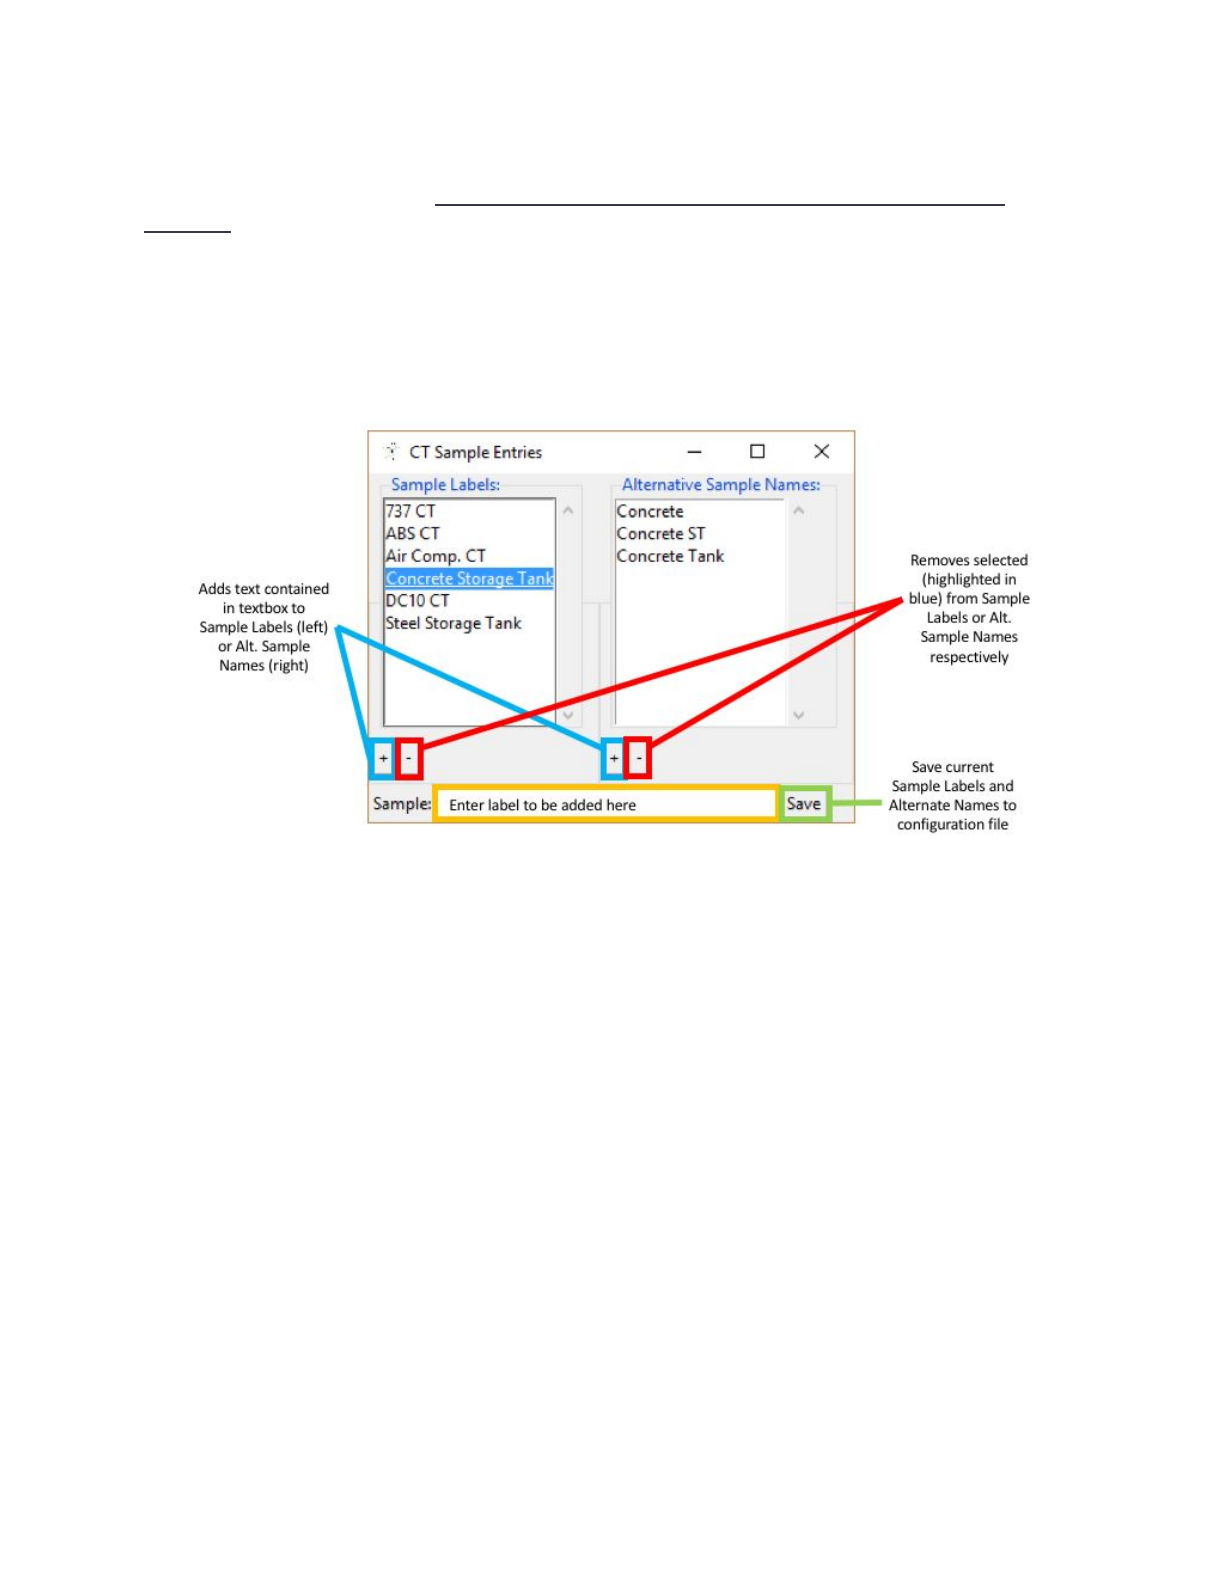
To add an item to one of the lists, first enter the sample/sample alternate name in the text box
located near the bottom of the window. Then press the ‘+’ button for the particular list wanted. To
remove an item from one of the lists, first select the item (will highlight blue) and then press the ‘-’
button for the respective list you are removing the item from:
To save the current configuration of sample labels/alternate names, press the ‘Save’ button.
USAGE
To utilize Artisan Trend, simply click the .exe file contained with the folder. This folder may be
placed anywhere, and a shortcut can be easily created and placed on the desktop for ease of
use.
To generate a plot for a particular chemical test, simply press the respective button; if trending
CT samples, select the test under the ‘CT Tests’ header. If CL samples are wanted, select the test
under the ‘Cl Tests’ header.
This will produce an interactive .html file containing the plot. This plot automatically opens using
the default web browser for the user. This plot is saved to the folder containing the .exe with the
name ‘Trend (START DATE - END DATE)’, where START DATE is the earliest dated excel file, and
END DATE is the latest.
Being interactive, the plot has a number of features:
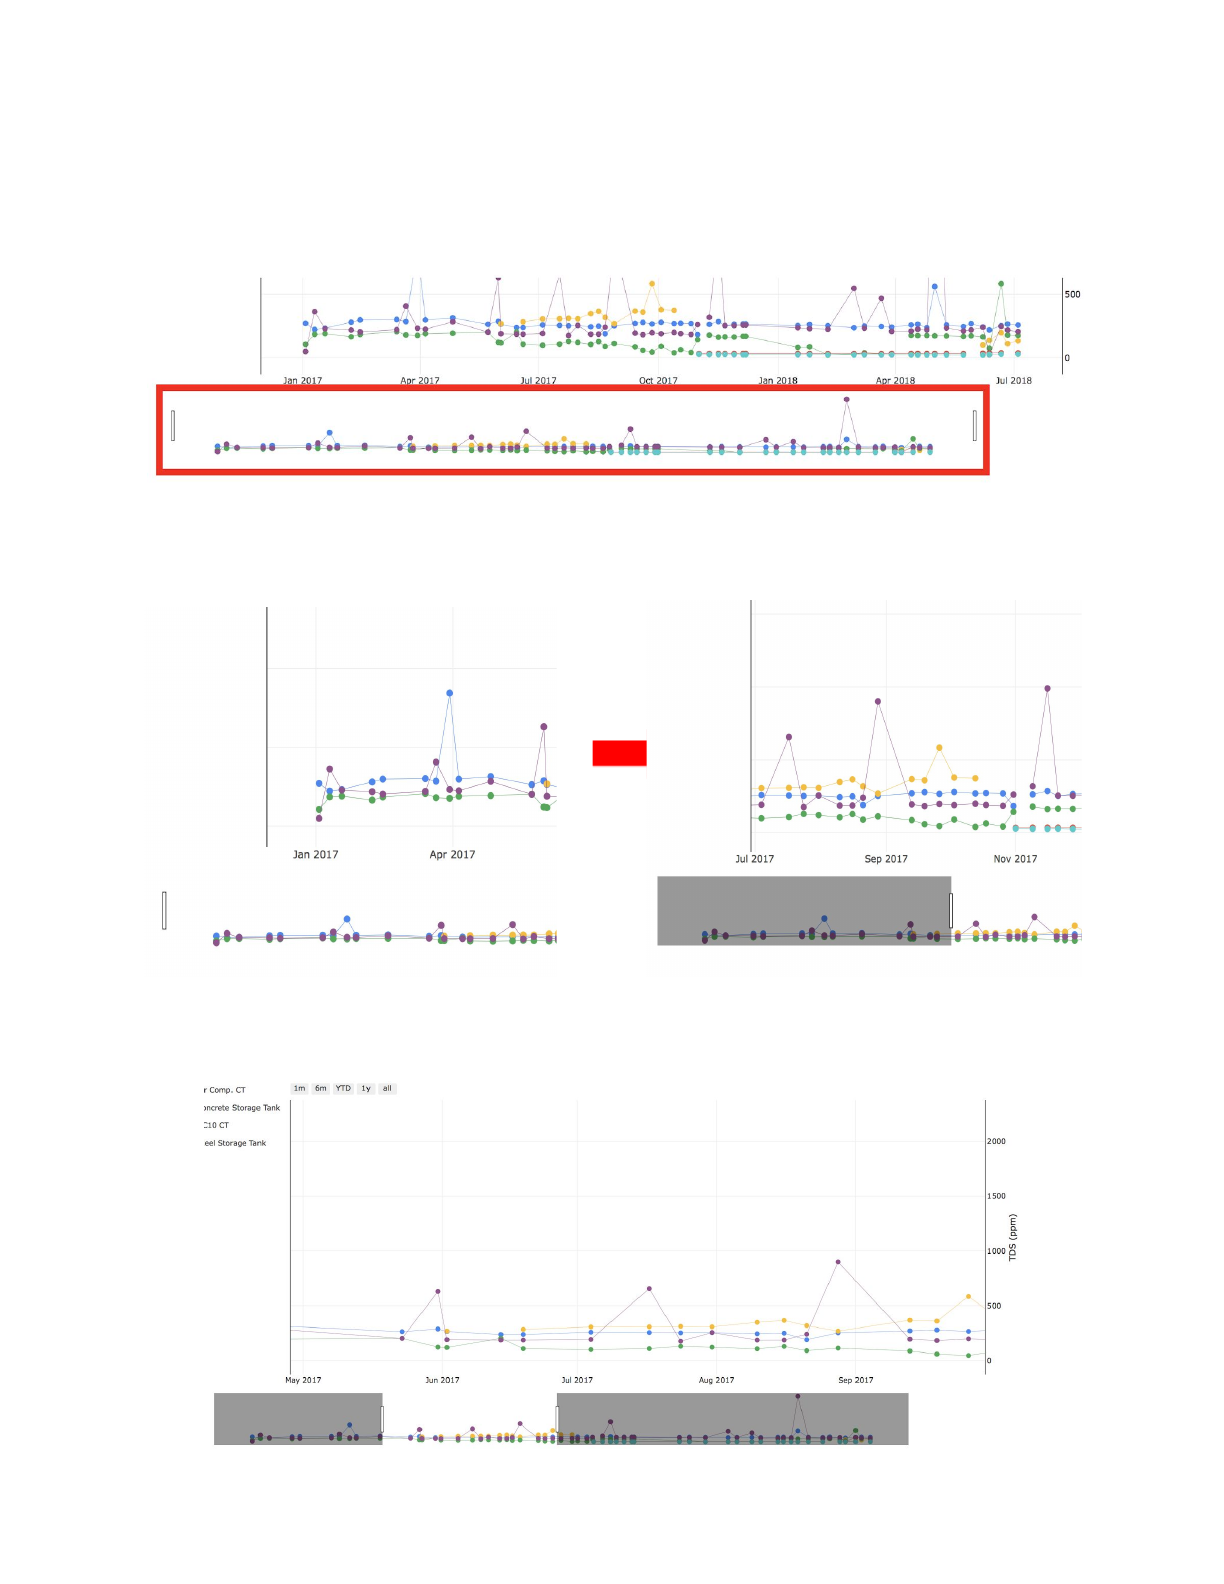
Time Slider
From the plot page, the time range of the plot may be adjusted by dragging either sides of the
time slider, located below the plot.
By dragging either the left or right bar on either side of the time slider, the start date and end
date of the data plotted above is altered:
As seen above, the start date of the data plotted is adjusted using the left slider bar. The end
date may be adjusted similarly using the right slider bar. This allows for a specific date range to
be displayed. For example, the summer months of 2017:
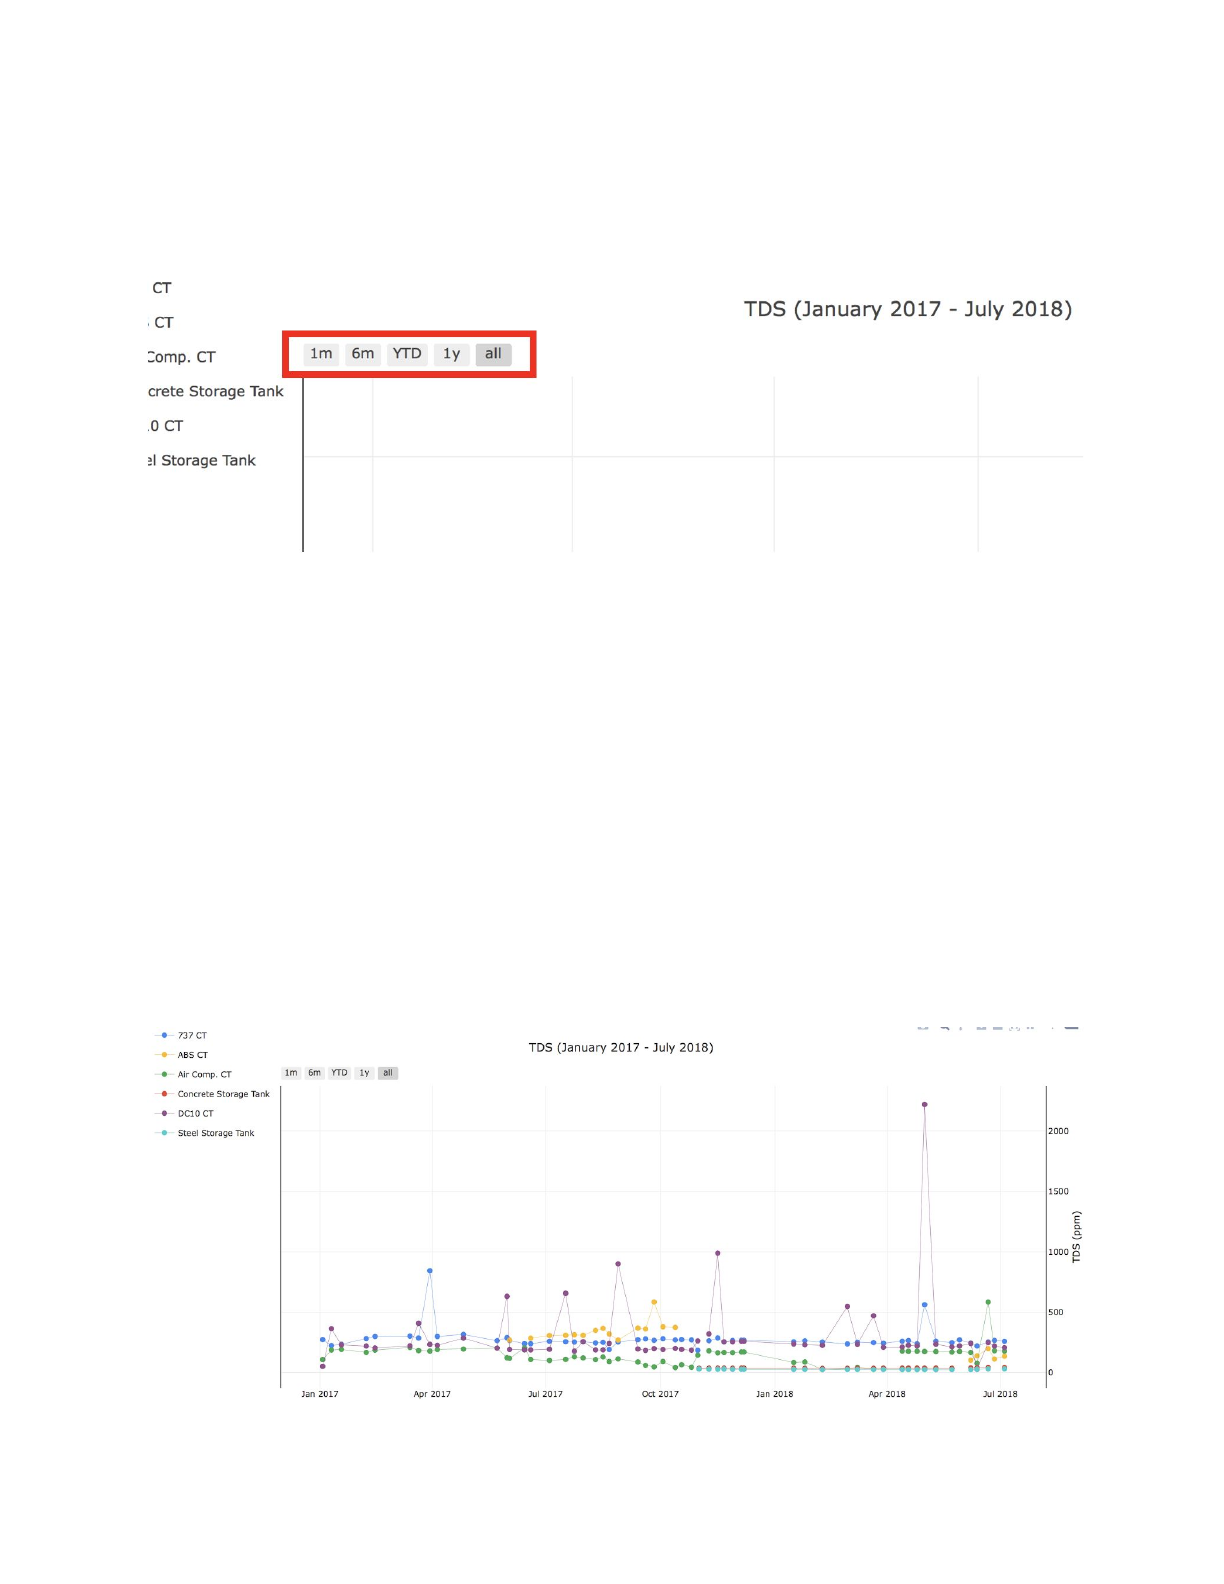
Time Selector
For ease of use, time selector buttons can be used to quickly view preset time ranges, based
upon the end date of the data. These buttons are located on the top right corner off the plot:
There are 5 buttons:
1. 1m - displays last month of data
2. 6m - displays last 6 months of data
3. YTD (Year to date) - displays the last year to the current date
4. 1y - displays last year of data
5. All - displays total date range of data
Legend
The legend, located at the top right corner of the plot page, can be interacted with to select and
deselect samples to be displayed. Initially, all samples are displayed. To hide a particular sample,
simply click on the sample name in the legend. This will grey out the sample name in the legend,
and hide the sample in the plot:
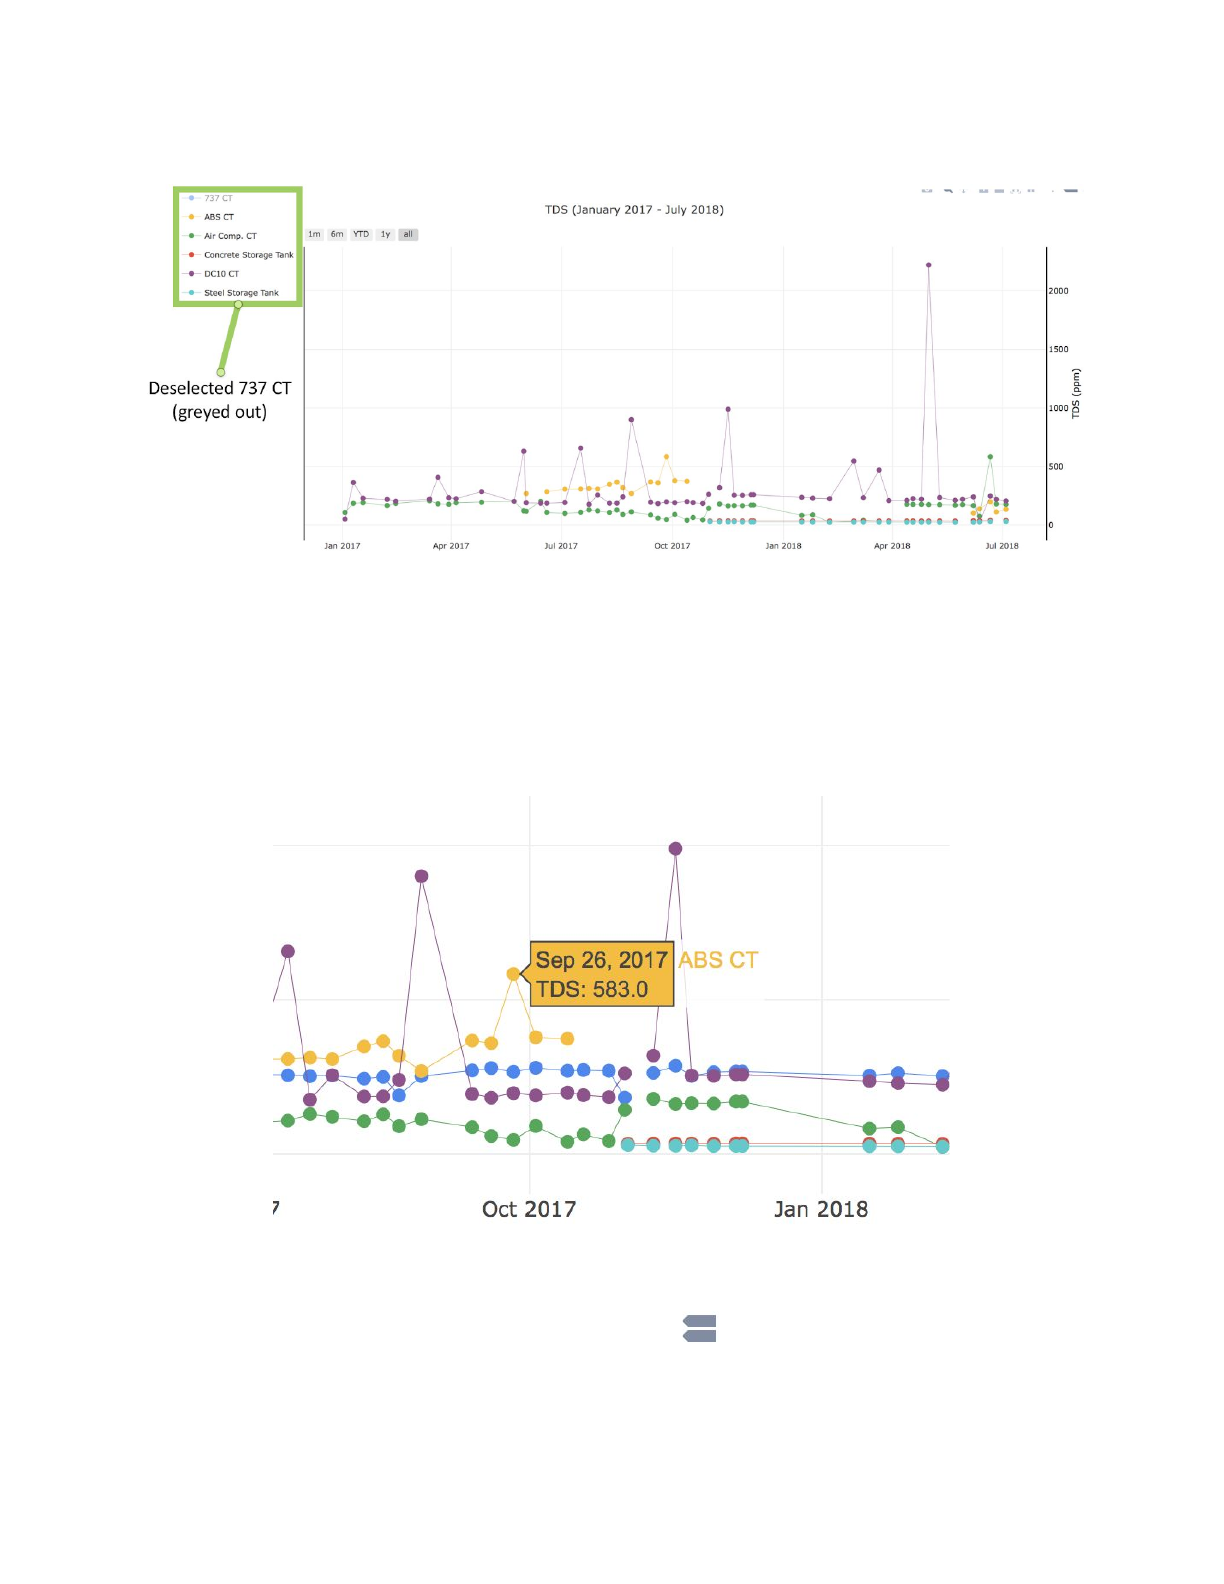
In this example, 737 CT is deselected:
Additionally, to quickly isolate and display a single sample, simply double-click on the sample
name in the legend.
Point-by-point Information
To see additional information about a data point, such as the exact date and value, simply hover
over the point, upon which a small box will appear:
To visualize and compare between samples for data taken on a particular day, first switch the
hover mode to compare data on hover by pressing the button located in the top right
corner.
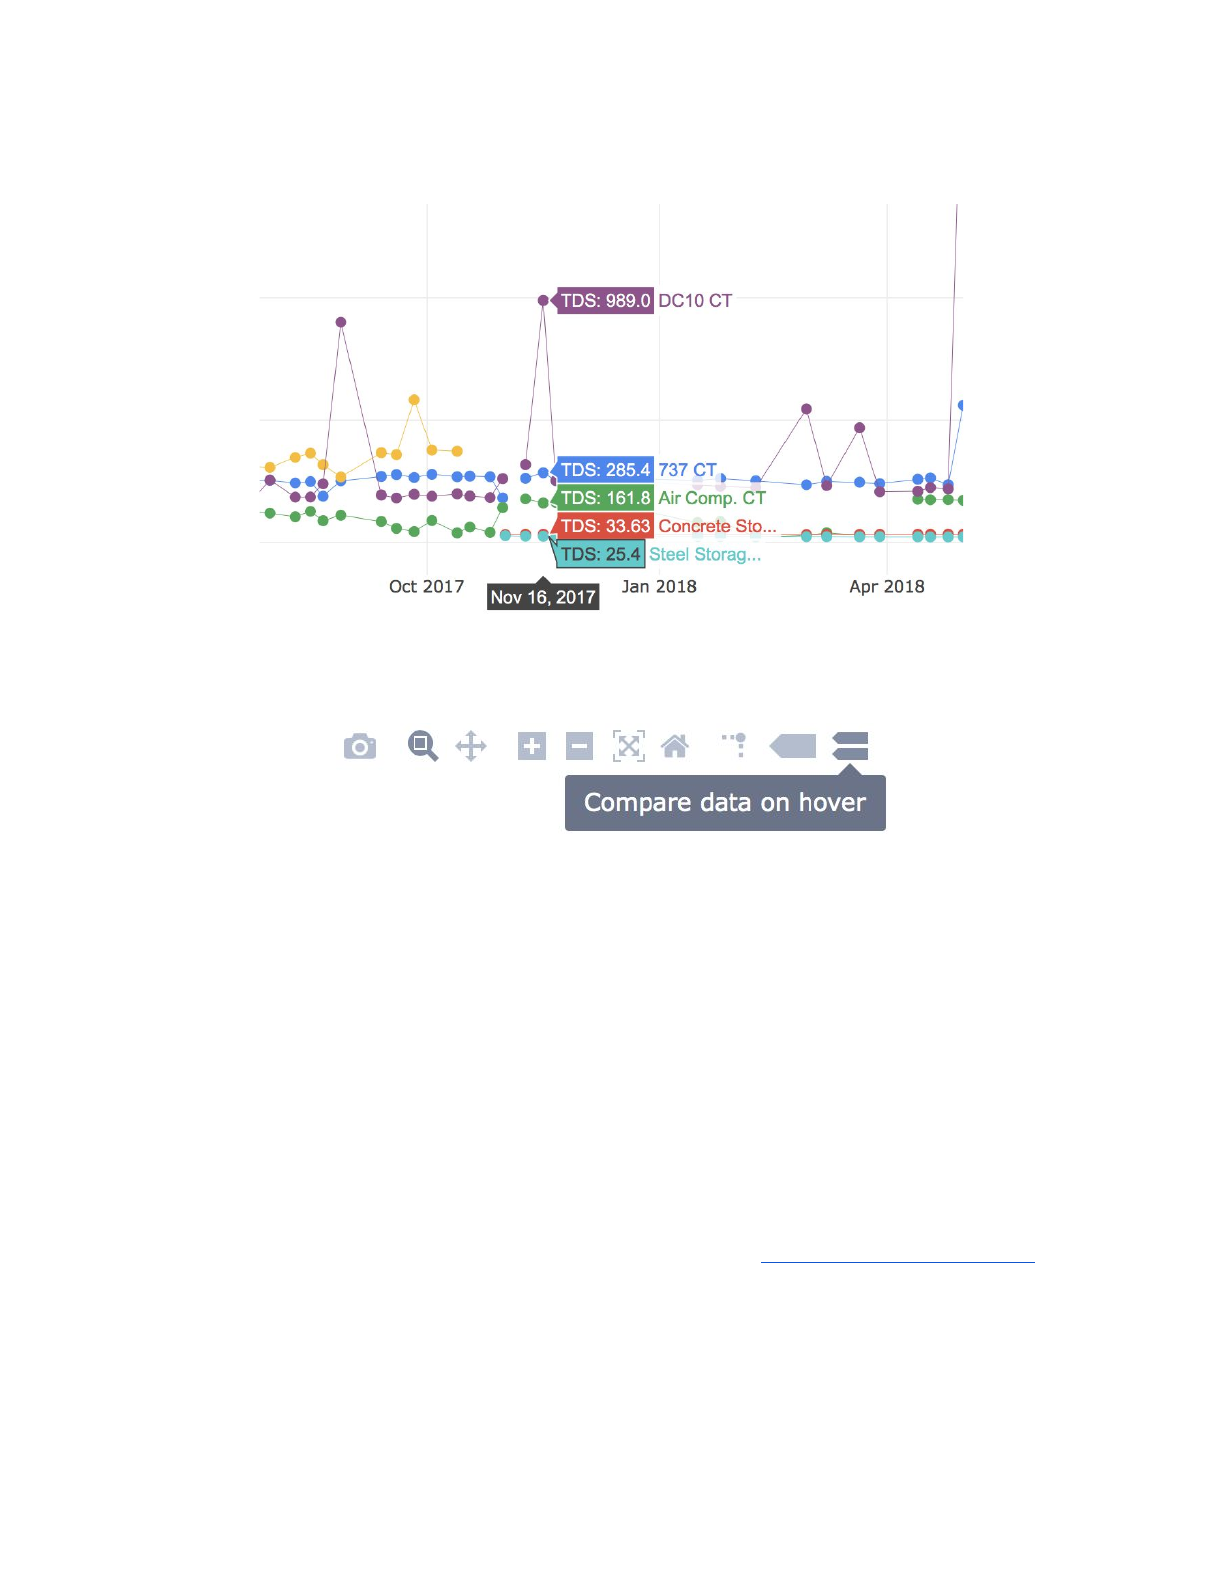
With this mode enabled, hovering over a data point shows information on all data points taken on
the same date:
Additional options are also contained at the top right corner. Information about the use of each
can be found by hovering over a button:
Deployment
For ease of use, Artisan Trend exists within a single folder. When deploying to clients, this folder
may be copied to a usb drive or directly downloaded to client computers via Google Drive. While
each client has its own folder, they vary by only by an .ini file, which holds configuration settings
such as file directory, client sample names, etc.
The folder may be placed anywhere on client computer. For practical use, a shortcut may be
created by navigating inside the folder, and then right-clicking the folder and selecting ‘Create
Shortcut’. This shortcut may be dragged to the desktop, which then may be used to easily access
the application.
Troubleshooting
For troubleshooting problems with the application, please email riley.stewart1775@gmail.com. I’d
be happy to fix anything that comes up!
The source files (python scripts, pyinstaller .spec files, etc.) are also on Google Drive.
