User Guide Atollic True STUDIO For STM32
User Manual:
Open the PDF directly: View PDF ![]() .
.
Page Count: 421 [warning: Documents this large are best viewed by clicking the View PDF Link!]
- About this Document
- Section 1. Getting Started
- Introduction
- Preparing for Start
- Starting the Program
- Creating a New Project
- Importing EWARM Projects
- Importing AC6 Projects
- Configuring the Project’s Build Settings
- Building the Project
- Linking the Project
- Managing Existing Workspaces
- Managing Existing Projects
- Disassemble/List Object and Elf Files
- I/O Redirection
- Position Independent Code
- Using CMSIS-Pack in TrueSTUDIO
- Create CMSIS-Pack Based Projects
- Installing 3rd Party Plugins
- Using ST-Link Utility Inside Atollic TrueSTUDIO
- Miscellaneous Tools
- Section 2. Debugging
- Introduction to Debugging with TrueSTUDIO
- Starting the Debugger
- The Startup Script
- Managing the Debug Configurations
- Customize the Debug Perspective
- Debugging
- Attach to Running Target Using SEGGER Probe
- Stopping the Debugger
- Upgrading the GDB Server
- Configure Segger’s GDB Server
- Debugging Code in RAM
- Debugging Two Targets at the Same Time
- Section 3. Build Analyzer
- Section 4. Static Stack Analyzer
- Section 5. Serial Wire Viewer Tracing
- Section 6. MTB Tracing (Cortex-M0+)
- Section 7. Instruction Tracing
- Section 8. RTOS-Aware Debugging
- RTOS Kernel Awareness Debugging
- Segger embOS
- HCC Embedded eTaskSync
- FreeRTOS and OpenRTOS
- Quadros RTXC
- Express Logic ThreadX
- TOPPERS/ASP
- Micrium µC/OS-III
- Section 9. Source Code Review
- Section 10. Revision History

Atollic TrueSTUDIO® for ARM®
Quick Start Guide
User Guide

Document Data
ii | P a g e
COPYRIGHT
© Copyright 2009-2018 STMicroelectronics. All rights reserved. No part of this document may be
reproduced or distributed without prior written consent of STMicroelectronics. The software
product described in this document is furnished under a license and may only be used, or copied,
according to the license terms.
TRADEMARKS
Atollic, Atollic TrueSTUDIO, Atollic TrueSTORE and the Atollic logotype are trademarks, or registered
trademarks, owned by STMicroelectronics. ARM, ARM7, ARM9 and Cortex are trademarks, or
registered trademarks, of ARM Limited. ECLIPSE is a registered trademark of the Eclipse foundation.
Microsoft, Windows, Word, Excel and PowerPoint are registered trademarks of Microsoft
Corporation. Adobe and Acrobat are registered trademarks of Adobe Systems Incorporated. All other
product names are trademarks, or registered trademarks, of their respective owners.
DISCLAIMER
The information in this document is subject to change without notice and does not represent a
commitment of STMicroelectronics. The information contained in this document is assumed to be
accurate, but STMicroelectronics assumes no responsibility for any errors or omissions. In no event
shall STMicroelectronics, its employees, its contractors, or the authors of this document be liable for
any type of damage, losses, costs, charges, claims, demands, claim for lost profits, fees, or expenses
of any nature or kind.
DOCUMENT IDENTIFICATION
TS-UG November 2012
REVISION HISTORY
20th January 2018 – Applies to Atollic TrueSTUDIO® for STM32 v9.0.0
21th August 2018 – Applies to Atollic TrueSTUDIO® for STM32 v9.1.0
STMicroelectronics Software AB
Science Park
Gjuterigatan 7
SE- 553 18 Jönköping
Sweden
Email: sales@atollic.com
Web: www.atollic.com
STMicroelectronics
Web: www.st.com
Table of Contents
iii | P a g e
Contents
About this Document ............................................................. 29
Intended Readers ..................................................................................... 29
Document Conventions ........................................................................... 30
Getting Started .................................................... 31
Introduction .............................................................................................. 32
Preparing for Start .................................................................................... 33
Workspaces & Projects ................................................................................... 33
Perspectives & Views ...................................................................................... 34
Views ................................................................................................ 36
Starting the Program ................................................................................ 39
Starting With Different Language ................................................................... 41
Change What is Started ................................................................................... 42
Creating a New Project ............................................................................. 43
One-Click Example Project Installation ........................................................... 54
Using an Existing Project ................................................................................. 55
Prevent “GCC not found in PATH” Error ......................................................... 56
Creating a Static Library .................................................................................. 56
Hide Information in a Static Library ................................................................ 57
Creating a Makefile Project From Existing Code ............................................. 58
Importing EWARM Projects ...................................................................... 61
Using the Project Import Converter ................................................................ 61
Import Projects from Folder or Archive .......................................................... 61
Before Building Imported Project ................................................................... 67
Step-by-step checklist ..................................................................................... 68
Common Build Errors ...................................................................................... 72
Configuring the Debugger ............................................................................... 72
Importing AC6 Projects ............................................................................. 75

Table of Contents
iv | P a g e
Using the Project Import Converter ................................................................ 75
Import Projects from Folder or Archive .......................................................... 76
Import Projects using Double-Click ................................................................. 80
Using Imported Projects .................................................................................. 81
Restoring Converted Projects ......................................................................... 82
Configuring the Project’s Build Settings ................................................... 84
Build Configurations ........................................................................................ 88
Create a New Build Configuration for Release ................................ 89
Changing Active Build Configuration ............................................... 90
Source Folders ................................................................................................. 90
Include Libraries .............................................................................................. 93
Compiler settings ............................................................................................ 95
Set the Compiler to Use The C99-Standard ..................................... 96
Compiler Optimization ..................................................................... 97
Link Time Optimization (LTO) .......................................................................... 98
Changing Toolchain Version .......................................................................... 100
Create a New Build Configuration For an Old Toolchain Version .. 101
Convert .elf-File to Another Output Format ................................................. 103
Temporary Assembly File .............................................................................. 105
Building the Project ................................................................................ 106
Enable Parallel Build ...................................................................................... 107
Enable Build on Save ..................................................................................... 107
Rebuild Project .............................................................................................. 108
Build All Projects ........................................................................................... 109
Build All Build Configurations ........................................................................ 109
Headless Build ............................................................................................... 110
Logging .......................................................................................................... 112
The Build Size ................................................................................................ 112
Command Line Patterns ................................................................................ 115
Create .list-Files .............................................................................. 115

Table of Contents
v | P a g e
Building One File ........................................................................................... 116
Linking the Project .................................................................................. 119
Referring Project ........................................................................................... 119
Dead Code Removal ...................................................................................... 121
Adding Code to be Executed Before Main() .................................................. 122
Page Size Allocation for Malloc ..................................................................... 123
Include Additional Object Files ..................................................................... 124
Treat Linker Warnings as Errors .................................................................... 126
Linker Script ................................................................................................... 127
Generate a New Linker Script ....................................................................... 131
Automatically ................................................................................. 131
Manually ........................................................................................ 132
Modify Existing Linker Script ......................................................................... 133
Place Code in a New Memory Region ............................................ 133
Place Code in External Ram ........................................................... 135
Place Variables at Specific Addresses ............................................ 136
Linking in a Block of Binary Data .................................................... 137
Locate Uninitialized Data in Memory ............................................ 138
Managing Existing Workspaces .............................................................. 140
Backup of Preferences for a Workspace ....................................................... 140
Copy Preferences Between Workspaces ...................................................... 140
Keeping Track on Java Heap Space ............................................................... 141
Unlocking Locked Workspaces ...................................................................... 141
Managing Existing Projects ..................................................................... 143
Edit ................................................................................................................ 143
Editor Zoom In / Zoom Out ............................................................ 143
Quickly Find and Open a File.......................................................... 144
Branch Folding ............................................................................... 144
Block selection mode ..................................................................... 145

Table of Contents
vi | P a g e
Find all Keyboard Shortcuts ........................................................... 147
The Index ....................................................................................................... 148
Finding Include Paths, Macros etc. ............................................................... 151
Add or Remove Folder to Include Path ......................................................... 153
Locate Where a File is Included .................................................................... 153
Creating Links to External Files ..................................................................... 154
Update CMSIS Math library ........................................................................... 155
Converting a C-Project to a C++-Project ....................................................... 156
Disassemble/List Object and Elf Files ..................................................... 158
I/O Redirection ....................................................................................... 160
Position Independent Code .................................................................... 163
Using CMSIS-Pack in TrueSTUDIO .......................................................... 166
Configuration ................................................................................................ 166
CMSIS Pack Manager Perspective ................................................................. 167
Open Installed CMSIS Packs View ................................................................. 173
Install CMSIS Packages .................................................................................. 174
Create CMSIS-Pack Based Projects ......................................................... 177
Create CMSIS C/C++ Project .......................................................................... 177
Configure the CMSIS C/C++ Project .............................................................. 180
Updating Linker Script for CMSIS C/C++ Project ........................................... 184
Disable CMSIS Startup File ............................................................................ 185
Debugging the CMSIS C/C++ Project ............................................................. 185
Adding more CMSIS-Pack Features Into Project ........................................... 187
Installing 3rd Party Plugins ...................................................................... 188
Install From Eclipse Marketplace .................................................................. 188
Install Using “Install New Software” ............................................................. 189
Uninstalling 3rd Party Plugins ........................................................................ 192
Solving Upgrade Problem .............................................................................. 193
Using ST-Link Utility Inside Atollic TrueSTUDIO ..................................... 194
Requirements ................................................................................................ 194
Table of Contents
vii | P a g e
Steps That Needs to be Performed ............................................................... 195
Setup ST-Link Utility as an External Tool ....................................................... 195
Convert the Build Output to Intel Hex .......................................................... 196
Modify the Debug Configuration .................................................................. 197
Create a Launch Group.................................................................................. 198
Finished ......................................................................................................... 200
Miscellaneous Tools ............................................................................... 201
Quick Access Search Bar ................................................................................ 201
Version control .............................................................................................. 202
Subversion - SVN ............................................................................ 202
Locks in SVN ................................................................................... 204
Include SVN Revision-Number in a String ...................................... 205
Ignore a File .................................................................................... 206
Local SVN Repository ..................................................................... 206
Using SVN on External Resources .................................................. 209
Multi Monitor Support .................................................................................. 210
Open Additional Instance of TrueSTUDIO ..................................................... 211
Shell Access ................................................................................................... 212
Debugging ..........................................................215
Introduction to Debugging with TrueSTUDIO ........................................ 216
Starting the Debugger ............................................................................ 218
External GDB Server ...................................................................................... 224
JTAG Scan Chain ............................................................................................ 225
The Startup Script ................................................................................... 227
Start Debugging at the Very Beginning .......................................... 227
Load the Program Without Debugging .......................................... 227
Hardware Initialization Code ......................................................... 227
Managing the Debug Configurations ..................................................... 228
Generic Binary Path ....................................................................................... 229

Table of Contents
viii | P a g e
Debug Launch Configuration Settings File .................................................... 230
Customize the Debug Perspective .......................................................... 232
Debugging ............................................................................................... 233
Terminate, Rebuild and Re-launch ................................................................ 234
Disassembly View .......................................................................................... 234
Breakpoints ................................................................................................... 235
Conditional Breakpoint .................................................................. 236
Expressions .................................................................................................... 237
Live Expressions ............................................................................................ 238
Local Variables .............................................................................................. 239
Fill Memory with a Byte Pattern ................................................................... 241
SFRs ............................................................................................................... 241
Fault Analyzer ................................................................................................ 245
Fault Analyzer View........................................................................ 246
Terminal View ............................................................................................... 247
Segger Real Time Terminal ............................................................ 249
Attach to Running Target Using SEGGER Probe ..................................... 251
Stopping the Debugger ........................................................................... 254
Upgrading the GDB Server ..................................................................... 256
Configure Segger’s GDB Server .............................................................. 257
Change Flash Caching .................................................................................... 258
Enable Log File ............................................................................................... 258
Settings Command Line Option .................................................................... 259
Debugging Code in RAM ......................................................................... 260
Debugging Two Targets at the Same Time ............................................. 261
First Alternative - Local GDB-server Using GUI Options................................ 261
Second Alternative - Remote GDB-server Using Command-line
Options ......................................................................................................... 262
Build Analyzer ....................................................263
Introduction to Build Analyzer ............................................................... 264
Table of Contents
ix | P a g e
Using Build Analyzer ............................................................................... 265
Memory Regions ........................................................................................... 265
Memory Details ............................................................................................. 266
Size Information ............................................................................. 267
Sorting ............................................................................................ 269
Search and Filter ............................................................................ 270
Calculate Sum of Size ..................................................................... 271
Display Size Information in Byte Format ....................................... 271
Copy and Paste ............................................................................... 273
Static Stack Analyzer...........................................274
Introduction to Static Stack Analyzer ..................................................... 275
Using Static Stack Analyzer ..................................................................... 276
Enable Stack Usage Information ................................................................... 276
Basic Column Information ............................................................................. 277
Function column ............................................................................ 277
Depth Column ................................................................................ 278
Max Cost Column ........................................................................... 278
Local Cost Column .......................................................................... 278
Type Column .................................................................................. 278
Info Column .................................................................................... 278
List Tab .......................................................................................................... 279
Call Graph Tab ............................................................................................... 280
Using Search Field ......................................................................................... 281
Copy and Paste .............................................................................................. 282
Serial Wire Viewer Tracing ..................................284
Using Serial Wire Viewer Tracing ........................................................... 285
Serial Wire Debug (SWD) .............................................................................. 285
Serial Wire Output (SWO) ............................................................................. 285
Serial Wire Viewer (SWV) .............................................................................. 285
Table of Contents
x | P a g e
Instrumentation Trace Macrocell (ITM) ........................................................ 286
Starting SWV Tracing .............................................................................. 287
The SWV Views ....................................................................................... 294
The Timeline Graphs ..................................................................................... 296
Statistical Profiling ......................................................................................... 296
Exception Tracing .......................................................................................... 298
Exception Data ............................................................................... 298
Exception Statistics ........................................................................ 299
Printf() Redirection over ITM ................................................................. 302
Change the Trace Buffer Size ................................................................. 303
Common SWV Problems ........................................................................ 304
MTB Tracing (Cortex-M0+) ..................................305
Introduction to MTB ............................................................................... 306
Configure MTB ........................................................................................ 307
Using MTB ............................................................................................... 309
Analyzing MTB Information .................................................................... 310
Copy the MTB Log ......................................................................................... 312
Instruction Tracing ..............................................313
Instruction Tracing .................................................................................. 314
Cortex-M7 and ETMv4 .................................................................................. 314
Enable Trace .................................................................................................. 315
Writing a Trace Port Configuration File ......................................... 316
Configuring the Tracing Session .................................................................... 318
ETM Trace Port Configuration File Reference ............................................... 319
Add Trace Trigger .......................................................................................... 319
Add Trace Trigger in the Editor ...................................................... 321
Managing Trace Triggers ............................................................................... 321
Start Trace Recording .................................................................................... 322
Analyzing the Trace ....................................................................................... 322

Table of Contents
xi | P a g e
Display Options .............................................................................. 324
Search the Trace Log ..................................................................... 324
Exporting a Trace Log .................................................................................... 325
RTOS-Aware Debugging ......................................326
RTOS Kernel Awareness Debugging ....................................................... 327
Segger embOS ........................................................................................ 328
Requirements ................................................................................................ 328
Finding the Views .......................................................................................... 328
System Information ....................................................................................... 329
Task List ......................................................................................................... 330
Timers ............................................................................................................ 331
Resource Semaphores ................................................................................... 332
Mailboxes ...................................................................................................... 333
HCC Embedded eTaskSync ..................................................................... 335
Requirements ................................................................................................ 335
Finding the View ............................................................................................ 335
Task List ......................................................................................................... 336
FreeRTOS and OpenRTOS ....................................................................... 337
Requirements ................................................................................................ 337
Finding the Views .......................................................................................... 337
Task List ......................................................................................................... 338
Queues .......................................................................................................... 340
Semaphores .................................................................................................. 341
Timers ............................................................................................................ 342
Quadros RTXC ......................................................................................... 344
Requirements ................................................................................................ 344
Finding the Views .......................................................................................... 344
Kernel Information ........................................................................................ 345
Tasks (Task List and Stack Info) ..................................................................... 345
Task List tab .................................................................................... 346

Table of Contents
xii | P a g e
Stack Info tab ................................................................................. 347
Alarms ........................................................................................................... 348
Counters ........................................................................................................ 349
Event Sources ................................................................................................ 349
Exception Backtrace ...................................................................................... 350
Exceptions ..................................................................................................... 351
Mailboxes ...................................................................................................... 352
Mutexes......................................................................................................... 353
Partitions ....................................................................................................... 354
Pipes .............................................................................................................. 355
Queues .......................................................................................................... 356
Semaphores .................................................................................................. 357
Express Logic ThreadX ............................................................................ 359
Requirements ................................................................................................ 359
Finding the Views .......................................................................................... 359
Thread List ..................................................................................................... 360
Semaphores .................................................................................................. 361
Mutexes......................................................................................................... 362
Message Queues ........................................................................................... 363
Event Flags .................................................................................................... 364
Timers ............................................................................................................ 365
Memory Block Pools...................................................................................... 365
Memory Byte Pools ....................................................................................... 366
TOPPERS/ASP .......................................................................................... 368
Requirements ................................................................................................ 368
Finding the Views .......................................................................................... 368
Tasks .............................................................................................................. 369
Static Information Tab ................................................................... 369
Current Status Tab ......................................................................... 370
Dataqueues ................................................................................................... 371

Table of Contents
xiii | P a g e
Static Information Tab ................................................................... 371
Current Status Tab ......................................................................... 372
Event Flags .................................................................................................... 373
Static Information Tab ................................................................... 373
Current Status Tab ......................................................................... 374
Mailboxes ...................................................................................................... 374
Static Information Tab ................................................................... 375
Current Status Tab ......................................................................... 375
Memory Pools ............................................................................................... 376
Static Information Tab ................................................................... 376
Current Status Tab ......................................................................... 377
Cyclic Handlers .............................................................................................. 378
Static Information Tab ................................................................... 378
Current Status Tab ......................................................................... 379
Alarm Handlers .............................................................................................. 379
Static Information Tab ................................................................... 380
Current Status Tab ......................................................................... 380
Prioritized Dataqueues .................................................................................. 381
Static Information Tab ................................................................... 381
Current Status Tab ......................................................................... 382
System Status ................................................................................................ 383
Interrupt Line Configuration ......................................................................... 383
Interrupt Handler Static Information ............................................................ 384
CPU Exception Handler Static Information ................................................... 385
Micrium µC/OS-III ................................................................................... 387
Requirements ................................................................................................ 387
Finding the Views .......................................................................................... 387
System Information ....................................................................................... 388
Task List ......................................................................................................... 390
Table of Contents
xiv | P a g e
Semaphores .................................................................................................. 391
Mutexes......................................................................................................... 392
Message Queues ........................................................................................... 393
Event Flags .................................................................................................... 394
Timers ............................................................................................................ 395
Memory Partitions ........................................................................................ 396
Source Code Review ...........................................398
Introduction to Code Reviews ................................................................ 399
Planning a Review – Review ID Creation ................................................ 401
Creating a Review ID ..................................................................................... 402
Tailoring a Review ID Template ..................................................................... 407
Conducting a Source Code Review ......................................................... 409
Individual Phase ............................................................................................ 412
Team Phase ................................................................................................... 414
Rework Phase ................................................................................................ 416
Additional Settings ........................................................................................ 417
Revision History ................................................419
Revision History ...................................................................................... 420

List of Figures
xv | P a g e
Figures
Figure 1 - Workspaces and Projects ............................................................. 34
Figure 2 – Editing Perspective ...................................................................... 35
Figure 3 - Switch Perspective ....................................................................... 36
Figure 4 - Switch Perspective ....................................................................... 36
Figure 5 – Toolbar Buttons for Perspectives and Views .............................. 36
Figure 6 - View Menu toolbar button .......................................................... 37
Figure 7 - Show View Dialog Box .................................................................. 38
Figure 8 – Toolbar Buttons for Perspectives and Views .............................. 38
Figure 9 - Workspace Launcher .................................................................... 39
Figure 10 - Information Center .................................................................... 40
Figure 11 – Information Center Menu Command ....................................... 41
Figure 12 – Information Center Toolbar Button (A) ..................................... 41
Figure 13 – Startup Preferences ................................................................... 42
Figure 14 – Project Creation Buttons ........................................................... 43
Figure 15 - Starting the Project Wizard ........................................................ 43
Figure 16 - C Project Configuration .............................................................. 44
Figure 17 - C Project Configuration .............................................................. 45
Figure 18 - TrueSTUDIO Hardware Configuration ........................................ 46
Figure 19 - TrueSTUDIO Project Wizard Using Search Field......................... 47
Figure 20 – TrueSTUDIO Filter Board/Microcontroller ................................ 48
Figure 21 - TrueSTUDIO Hardware Configuration ........................................ 49
Figure 22 - TrueSTUDIO Software Configuration ......................................... 50
Figure 23 - TrueSTUDIO Debugger Configuration ........................................ 51
Figure 24 - Select Configurations ................................................................. 52
Figure 25 - Project Explorer View ................................................................. 53
Figure 26 – Editor View ................................................................................ 53
Figure 27 – Project Creation Buttons ........................................................... 54
igure 28 – Atollic TrueSTORE ........................................................................ 54
Figure 29 – Selection of Existing Project File ............................................... 55
Figure 30 – Selection of Static Library Project ............................................. 56
Figure 31 – Examples of options to be used with objcopy ...................... 58
Figure 32 – Create a Makefile Project from existing code ........................... 58
Figure 33 – Locate the code and select <none> .......................................... 59
Figure 34 – Edit the PATH variable ............................................................... 59

List of Figures
xvi | P a g e
Figure 35 - Import Projects (EWARM) .......................................................... 62
Figure 36 - Import Projects from Folder or Archive (EWARM) .................... 63
Figure 37 - Import Projects from File System (EWARM) .............................. 64
Figure 38 - Display Installed Project Configurators (EWARM) ..................... 64
Figure 39 - Import Several Projects from File System (EWARM) ................. 65
Figure 40 - EWARM CMSIS option................................................................ 69
Figure 41 - TrueSTUDIO compiler include paths .......................................... 69
Figure 42 - TrueSTUDIO linker script file option .......................................... 70
Figure 43 - Edit Debug Configuration ........................................................... 73
Figure 44 - Selecting Debug Probe ............................................................... 73
Figure 45 – Import Projects .......................................................................... 76
Figure 46 – Import Projects from Folder or Archive .................................... 77
Figure 47 – Import Projects from File System .............................................. 78
Figure 48 – Display Installed Project Configurators ..................................... 78
Figure 49 – Project Converter Conversion Information ............................... 79
Figure 50 – Project Imported Information ................................................... 79
Figure 51 – Import Several Projects from File System ................................. 80
Figure 52 – Project Converter Information .................................................. 80
Figure 53 – Project Imported Information ................................................... 81
Figure 54 – Edit Debugger Configuration ..................................................... 82
Figure 55 – Build Settings Toolbar Button ................................................... 84
Figure 56 – Build Settings Menu Selection................................................... 84
Figure 57 - Project Properties Dialog Box .................................................... 85
Figure 58 – Tool Settings, Miscellaneous Options ....................................... 86
Figure 59 – Target Settings Dialog Box......................................................... 87
Figure 60 – Select Affected Build Configuration .......................................... 88
Figure 61 – Change active Build Configuration ............................................ 90
Figure 62 – Source Folders ........................................................................... 91
Figure 63 – Source Location Tab .................................................................. 91
Figure 64 – Folder Selection Tab .................................................................. 92
Figure 65 – New Source Folder .................................................................... 92
Figure 66 – Include a Library ........................................................................ 93
Figure 67 – Add the Library to the Include Paths ......................................... 94
Figure 68 – Compiler Settings ...................................................................... 95
Figure 69 – Finding the C/C++ Manual in Information Center ..................... 96
Figure 70 – Compiler Optimization Settings for a Project ........................... 97
Figure 71 – Compiler Optimization Settings for a File ................................. 98

List of Figures
xvii | P a g e
Figure 72 – Linker LTO Settings for a Project ............................................... 99
Figure 73 – Linker LTO Settings for a Project ............................................. 100
Figure 74 – Build Settings Toolbar Button ................................................. 100
Figure 75 – Tool Chain Version tab ............................................................ 101
Figure 76 – Manage the Build Configurations............................................ 102
Figure 77 – Create New Configuration ....................................................... 103
Figure 78 – Old Tool Chain Version for the New Build Configuration ....... 103
Figure 79 – Output Format Selection ......................................................... 104
Figure 80 - Build Toolbar Button ................................................................ 106
Figure 81 – Parallel Build ............................................................................ 107
Figure 82 – Build on Save ........................................................................... 108
Figure 83 – Rebuild Toolbar Button ........................................................... 108
Figure 84 – Rebuild Active Configuration Menu Selection ........................ 109
Figure 85 – Build All Projects ...................................................................... 109
Figure 86 – Build All Build Configurations .................................................. 110
Figure 87 – Open the Properties view ....................................................... 113
Figure 88 – Open the Properties view ....................................................... 114
Figure 89 – Build Settings Toolbar Button ................................................. 115
Figure 90 – Generate –list Files .................................................................. 116
Figure 91 – Enable the Build Automatically Menu Item ............................ 117
Figure 92 – Build Selected File(s) ............................................................... 118
Figure 93 – GNU Linker manual link ........................................................... 119
Figure 94 – Set Project References ............................................................ 120
Figure 95 – Set Project References ............................................................ 121
Figure 96 – Enable Dead Code Removal .................................................... 122
Figure 97 – Do Not Use Standard Start Files .............................................. 123
Figure 98 – Linker Page Size Allocation for malloc() .................................. 124
Figure 99 – Add Additional Object Files ..................................................... 125
Figure 100 – Add File With a List of Object Files ........................................ 126
Figure 101 – Automatically Generate a New Linker Script ........................ 131
Figure 102 – Select New, Other… ............................................................... 132
Figure 103 – Select New, Other… ............................................................... 132
Figure 104 – Enter the name of the script ................................................. 133
Figure 105 – Manage Workspaces ............................................................. 140
Figure 106 – Display Java Heap Space Status............................................. 141
Figure 107 – Workspace Unavailable ......................................................... 142
Figure 108 – Editor with text zoomed in .................................................... 144

List of Figures
xviii | P a g e
Figure 109 – Folding Markers ..................................................................... 145
Figure 110 – Mark a column....................................................................... 146
Figure 111 – Add text to all rows ............................................................... 146
Figure 112 – Select a block of text ............................................................. 147
Figure 113 – Find all Shortcuts ................................................................... 147
Figure 114 – The Indexer Picks up the Documentation for a Function ..... 148
Figure 115 – Workspace Indexer Settings .................................................. 149
Figure 116 – Project Indexer Settings ........................................................ 150
Figure 117 – Scanner Discovery Settings ................................................... 151
Figure 118 – Preprocessor Include Paths, Macros etc. .............................. 152
Figure 119 – Add or remove include path ................................................. 153
Figure 120 – Include Browser ..................................................................... 154
Figure 121 – Create Linked File .................................................................. 155
Figure 122 – Create Linked File .................................................................. 156
Figure 123 – Build Tools ............................................................................. 158
Figure 124 – Disassemble file(s) without data ........................................... 159
Figure 125 – List symbols with size ............................................................ 159
Figure 126 – New, Other… ......................................................................... 160
Figure 127 – Select Minimal System Calls Implementation ....................... 161
Figure 128 – Select Location and Heap Implementation ........................... 161
Figure 129 – Add –fPIE for Assembler and C Compiler .............................. 163
Figure 130 – Use –fPIE for Linker ............................................................... 164
Figure 131 – Remove the monitor reset command ................................... 165
Figure 132 – CMSIS Packs Preferences ...................................................... 167
Figure 133 – Open CMSIS Pack Manager Perspective ............................... 168
Figure 134 – Packs View Empty .................................................................. 168
Figure 135 – Packs View Toolbar................................................................ 169
Figure 136 – Refresh all Packs .................................................................... 169
Figure 137 – Read error during refreshing packs ....................................... 169
Figure 138 – Packs View Updated .............................................................. 170
Figure 139 – Devices Software Pack .......................................................... 171
Figure 140 – Search STM32 Devices Software Pack................................... 172
Figure 141 – Boards Software Pack ............................................................ 173
Figure 142 – Open Installed CMSIS Packs View ......................................... 174
Figure 143 – Install Packs ........................................................................... 175
Figure 144 – Installing Pack ........................................................................ 175
Figure 145 – Installed Pack ......................................................................... 176

List of Figures
xix | P a g e
Figure 146 – Installed CMSIS-Packs ............................................................ 176
Figure 147 – Create CMSIS C/C++ Project .................................................. 177
Figure 148 – Create CMSIS C/C++ Project (main) ...................................... 178
Figure 149 – Create CMSIS C/C++ Project (device) .................................... 179
Figure 150 – Create CMSIS C/C++ Project (configurations) ....................... 179
Figure 151 – Configure CMSIS C/C++ Project ............................................. 180
Figure 152 – Configure CMSIS C/C++ Project with Startup file .................. 181
Figure 153 – Configure CMSIS C/C++ Project with CMSIS CORE files ........ 182
Figure 154 – Build CMSIS C/C++ Project .................................................... 183
Figure 155 – Setup CMSIS C/C++ Project Linker Script File ........................ 184
Figure 156 – Disable Startup File from CMSIS C/C++ Project .................... 185
Figure 157 – Debug CMSIS C/C++ Project Configurations ......................... 186
Figure 158 – Debug CMSIS RTE C/C++ Project ........................................... 187
Figure 159 – Select Eclipse Marketplace .................................................... 188
Figure 160 – Install Using Eclipse Marketplace .......................................... 189
Figure 161 – Select Install New Software................................................... 189
Figure 162 – Enter Download Site and Select Plugins ............................... 190
Figure 163 – Accept License Agreements .................................................. 191
Figure 164 – The Plugins are Installed ....................................................... 192
Figure 165 – Uninstalling Plugins ............................................................... 192
Figure 166 – ST-LINK_CLI.exe ..................................................................... 194
Figure 167 – ST-LINK_CLI.exe ..................................................................... 195
Figure 168 – Convert the Build Output to Intel Hex .................................. 196
Figure 169 – Modify the Debug Configuration .......................................... 197
Figure 170 – Create a Launch Group .......................................................... 198
Figure 171 – Edit a Launch Group .............................................................. 198
Figure 172 – Select Launch Mode: debug .................................................. 199
Figure 173 – Select Launch Mode: debug .................................................. 200
Figure 174 – Debug History ........................................................................ 200
Figure 175 – Quick Access Search Bar ........................................................ 201
Figure 176 – Enable SVN Command Group................................................ 203
Figure 177 – SVN Views .............................................................................. 204
Figure 178 – Add SVN Property .................................................................. 205
Figure 179 – Open SVN Repositories ......................................................... 207
Figure 180 – New Repository Button ......................................................... 207
Figure 181 – Create Repository Dialog ....................................................... 208
Figure 182 –Repository Created................................................................. 208

List of Figures
xx | P a g e
Figure 183 –Share Project Dialog ............................................................... 208
Figure 184 –Projects Version Controlled ................................................... 208
Figure 185 – Multiple Editors, Views and Windows used at the same time
.................................................................................................................... 211
Figure 186 – New Window ......................................................................... 211
Figure 187 – New Window ......................................................................... 212
Figure 188 – Terminal................................................................................. 213
Figure 189 –Terminal View ........................................................................ 213
Figure 190 –Launch Terminal ..................................................................... 214
Figure 191 –Terminal Opened .................................................................... 214
Figure 192 –Local Debugging ..................................................................... 216
Figure 193 –Remote Debugging ................................................................. 217
Figure 194 – Start Debug Session Toolbar Button ..................................... 218
Figure 195 - Debug Configuration Dialog Box ............................................ 218
Figure 196 – The Configure Debug Toolbar Button ................................... 219
Figure 197 - Debug Configuration, Debugger Panel for the SEGGER J-Link220
Figure 198 - Debug Configuration, Debugger Panel for the ST-Link .......... 220
Figure 199 - Debug Configuration, Startup Scripts Panel .......................... 222
Figure 200 – Debug Perspective ................................................................. 224
Figure 201 – JTAG Scan Chain Selected...................................................... 225
Figure 202 – The Configure Debug Toolbar Button ................................... 228
Figure 203 – The target ELF-file in Debug Session Configuration .............. 229
Figure 204 – Using variables in the path .................................................... 230
Figure 205 – Debug configuration as shared file ....................................... 231
Figure 206 – Customize Perspective Dialog Box ........................................ 232
Figure 207 - Run Menu ............................................................................... 233
Figure 208 - Run Control Command Toolbar ............................................. 233
Figure 209 – Terminate, Rebuild and Re-launch Toolbar Button .............. 234
Figure 210 – Instruction Stepping Button .................................................. 234
Figure 211 – Disassembly View .................................................................. 235
Figure 212 - Toggle Breakpoint Context Menu .......................................... 235
Figure 213 – Breakpoints View .................................................................. 235
Figure 214 – Breakpoints Properties .......................................................... 236
Figure 215 – Conditional Breakpoint ......................................................... 237
Figure 216 – Expressions View ................................................................... 237
Figure 217 – Drag and Drop of Variable to the Expressions View ............. 238
Figure 218 – Complex Expressions ............................................................. 238

List of Figures
xxi | P a g e
Figure 219 – Live Expressions View ............................................................ 239
Figure 220 – Live Expressions View Number Format ................................. 239
Figure 221 – Variables View ....................................................................... 240
Figure 222 – Variables View – change Number format ............................. 240
Figure 223 - The Memory Fill Toolbar Button ............................................ 241
Figure 224 - The Memory Fill dialog ........................................................... 241
Figure 225 - SFRs Menu Command ............................................................ 242
Figure 226 - SFRs View ............................................................................... 243
Figure 227 - SFRs Filter Clear ...................................................................... 243
Figure 228 – SFR View Buttons .................................................................. 244
Figure 229 – CMSIS-SVD Settings Properties Panel ................................... 244
Figure 230 – Fault Analyzer View with STKERR .......................................... 247
Figure 231 – Terminal View ........................................................................ 248
Figure 232 – Terminal Toolbars.................................................................. 248
Figure 233 – Terminal Settings ................................................................... 248
Figure 234 – Terminal Settings ................................................................... 250
Figure 235 – Modify Startup Script ............................................................ 252
Figure 236 - The Terminate Menu Command ............................................ 254
Figure 237 - C/C++ Editing Perspective ...................................................... 255
Figure 238 – Changing the Path to the GDB Server ................................... 256
Figure 239 –GDB Server Control Panel – General Tab ............................... 257
Figure 240 –GDB Server Control Panel – Settings tab ............................... 258
Figure 241 – Debug Configuration – Connect to Remote GDB Server....... 259
Figure 242 – Build Analyzer ........................................................................ 265
Figure 243 – Memory Regions Tab ............................................................ 266
Figure 244 – Memory Details Tab .............................................................. 267
Figure 245 – Memory Details Sorted ......................................................... 269
Figure 246 – Memory Details Search/Filter ............................................... 270
Figure 247 – Calculate Sum of Size ............................................................ 271
Figure 248 – Show Byte Count ................................................................... 271
Figure 249 – Size Information in Byte Format ........................................... 272
Figure 250 – Copy and Paste ...................................................................... 273
Figure 251 – Static Stack Analyzer List Tab ................................................ 275
Figure 252 – Static Stack Analyzer Call Graph Tab ..................................... 275
Figure 253 – Enable Generate per Function Stack Usage Information ...... 276
Figure 254 –Function Symbols in Static Stack Analyzer ............................. 277
Figure 255 –List tab .................................................................................... 279

List of Figures
xxii | P a g e
Figure 256 –Call Graph tab ......................................................................... 281
Figure 257 –List tab using filter .................................................................. 282
Figure 258 –Call Graph tab using search .................................................... 282
Figure 259 – Copy and Paste ...................................................................... 283
Figure 260 –Different Types of Tracing ...................................................... 286
Figure 261 – Open Debug Configurations Toolbar Button ........................ 287
Figure 262 – Change ST-Link Debug Configuration for SWV ...................... 287
Figure 263 – Change SEGGER J-Link Debug Configuration for SWV .......... 288
Figure 264 – SWV Data Trace Menu Command ......................................... 289
Figure 265 – Configure Serial Wire Viewer Button .................................... 289
Figure 266 – The Serial Wire Viewer Settings Dialog ................................. 290
Figure 267 – The Start/Stop Trace Button ................................................. 293
Figure 268 – Resume Debug Button .......................................................... 293
Figure 269 – Empty SWV Data Button ....................................................... 293
Figure 270 – Several SWV Views Displayed Simultaneously...................... 295
Figure 271 –Statistical Profiling Configuration .......................................... 297
Figure 272 – Statistical Profiling View ........................................................ 297
Figure 273 – Exception Tracing Configuration ........................................... 298
Figure 274 – Exception View, Data Tab ...................................................... 298
Figure 275 – Exception View, Statistics Tab ............................................... 299
Figure 276 – Serial Wire Viewer Preferences............................................. 303
Figure 277 –MTB Trace Log View ............................................................... 306
Figure 278 – Configure MTB Trace Setting Button .................................... 307
Figure 279 – Configure MTB Trace View .................................................... 307
Figure 280 – Configure MTB with Error Setting ......................................... 308
Figure 281 – The Start/Stop MTB Button ................................................... 309
Figure 282 – Clear Buffer Button ............................................................... 309
Figure 283 – Scroll Trace View on Update Button ..................................... 309
Figure 284 –MTB Trace Log Information ................................................... 311
Figure 285 –MTB Trace Buffer Wrapped ................................................... 311
Figure 286 – Enable Tracing in the Debug Configuration .......................... 315
Figure 287 – Configuration Toolbar Button ............................................... 318
Figure 288 - Trace Configuration ................................................................ 318
Figure 289 - Trace Configuration ................................................................ 320
Figure 290 – Add Trace Trigger in the Editor ............................................. 321
Figure 291 –Trace Trigger in the Editor ...................................................... 321
Figure 292 –Trace Trigger in the Editor ...................................................... 322

List of Figures
xxiii | P a g e
Figure 293 – Record Toolbar Button .......................................................... 322
Figure 294 - The Trace Log View ................................................................ 323
Figure 295 - Trace Restarted ...................................................................... 323
Figure 296 – Display Options Toolbar Button ............................................ 324
Figure 297 – Search Toolbar Button .......................................................... 324
Figure 298 – Export Toolbar Button ........................................................... 325
Figure 299 - Exporting the Trace Log ......................................................... 325
Figure 300 - View Top Level Menu ............................................................. 328
Figure 301 - embOS Show View Toolbar Button ........................................ 329
Figure 302 - embOS System Information View .......................................... 329
Figure 303 - embOS System Information View (Fault Condition) .............. 329
Figure 304 - embOS Task List View ............................................................ 330
Figure 305 - embOS Timers View ............................................................... 332
Figure 306 - embOS Resource Semaphores View ...................................... 333
Figure 307 - embOS Mailboxes View ......................................................... 333
Figure 308 – eTaskSync Show View Toolbar Button .................................. 335
Figure 309 - eTaskSync Task List View ....................................................... 336
Figure 310 – FreeRTOS View Top Level Menu ........................................... 338
Figure 311 – FreeRTOS Show View Toolbar Button ................................... 338
Figure 312 - FreeRTOS Task List View ........................................................ 339
Figure 313 - FreeRTOS Queues View .......................................................... 340
Figure 314 - FreeRTOS Semaphores View .................................................. 342
Figure 315 - FreeRTOS Timers View ........................................................... 343
Figure 316 – RTXC Show View Toolbar Button .......................................... 344
Figure 317 – RTXC Kernel Information View .............................................. 345
Figure 318 - RTXC Task List tab in Task view .............................................. 346
Figure 319 – RTXC Task Stack Info .............................................................. 347
Figure 320 - RTXC Alarms View .................................................................. 348
Figure 321 - RTXC Counters View ............................................................... 349
Figure 322 - RTXC Event Sources View ....................................................... 350
Figure 323 - RTXC Exception Backtrace View ............................................. 351
Figure 324 - RTXC Exceptions View ............................................................ 351
Figure 325 - RTXC Mailboxes View ............................................................. 352
Figure 326 - RTXC Mutexes View ............................................................... 353
Figure 327 - RTXC Partitions View .............................................................. 354
Figure 328 - RTXC Pipes View ..................................................................... 355
Figure 329 - RTXC Queues View ................................................................. 356

List of Figures
xxiv | P a g e
Figure 330 - RTXC Semaphores View ......................................................... 357
Figure 331 – ThreadX View Top Level Menu .............................................. 359
Figure 332 - ThreadX Show View Toolbar Button ...................................... 360
Figure 333 - ThreadX Thread List View ...................................................... 360
Figure 334 - ThreadX Semaphores View .................................................... 362
Figure 335 - ThreadX Mutexes View .......................................................... 362
Figure 336 - ThreadX Message Queues View ............................................. 363
Figure 337 - ThreadX Event Flags View ...................................................... 364
Figure 338 - ThreadX Timers View ............................................................. 365
Figure 339 - ThreadX Memory Block Pools View ....................................... 366
Figure 340 - ThreadX Memory Byte Pools View ........................................ 367
Figure 341 – TOPPERS Show View Toolbar Button .................................... 368
Figure 342 – TOPPERS Tasks Static Information Tab ................................. 369
Figure 343 – TOPPERS Tasks Current Status Tab ....................................... 370
Figure 344 – TOPPERS Dataqueues Static Information Tab ....................... 371
Figure 345 – TOPPERS Dataqueues Current Status Tab ............................. 372
Figure 346 – TOPPERS Event Flags Static Information Tab ........................ 373
Figure 347 – TOPPERS Event Flags Current Status Tab .............................. 374
Figure 348 – TOPPERS Mailboxes Static Information Tab ......................... 375
Figure 349 – TOPPERS Mailboxes Current Status Tab ............................... 375
Figure 350 – TOPPERS Memory Pools Static Information Tab ................... 376
Figure 351 – TOPPERS Memory Pools Current Status Tab ........................ 377
Figure 352 – TOPPERS Cyclic Handlers Static Information Tab .................. 378
Figure 353 – TOPPERS Cyclic Handlers Current Status Tab........................ 379
Figure 354 – TOPPERS Alarm Handlers Static Information Tab ................. 380
Figure 355 – TOPPERS Alarm Handlers Current Status Tab ....................... 380
Figure 356 – TOPPERS Prioritized Dataqueues Static Information Tab ..... 381
Figure 357 – TOPPERS Prioritized Dataqueues Current Status Tab ........... 382
Figure 358 – TOPPERS System Status View ................................................ 383
Figure 359 – TOPPERS Interrupt Line Config View ..................................... 384
Figure 360 – TOPPERS Interrupt Handler Static Info View ........................ 385
Figure 361 – TOPPERS Exception Handler Static Info View ....................... 385
Figure 362 - View Top Level Menu ............................................................. 388
Figure 363 - Show View Toolbar Button .................................................... 388
Figure 364 - µC/OS-III System Information View ....................................... 389
Figure 365 - µC/OS-III Task List View .......................................................... 390
Figure 366 - µC/OS-III Semaphores View ................................................... 392

List of Figures
xxv | P a g e
Figure 367 - µC/OS-III Mutexes View ......................................................... 393
Figure 368 - µC/OS-III Message Queues View............................................ 394
Figure 369 - µC/OS-III Event Flags View ..................................................... 395
Figure 370 - µC/OS-III Timers View ............................................................ 395
Figure 371 - µC/OS-III Memory Partitions View ......................................... 396
Figure 372 – Atollic TrueSTUDIO Support for the Code Review Workflow 399
Figure 373 – Project Properties Menu Selection ....................................... 402
Figure 374 - GUI for Creating and Managing Code Reviews ...................... 402
Figure 375 - Dialog for Creating a New Review ID ..................................... 403
Figure 376 - Dialog for Managing the Work Product of a Review ............. 403
Figure 377 - Add Reviewers to the Review ................................................ 404
Figure 378 - Choose Author for the Review Session .................................. 404
Figure 379 - Review Comment Parameter Options ................................... 405
Figure 380 - Setting Default Options for Review Parameters .................... 405
Figure 381 - Naming the Review Issue Data Folder ................................... 406
Figure 382 - Filter Settings for the Different Phases .................................. 406
Figure 383 - Editing the DEFAULT Review Template ................................. 408
Figure 384 - Code Review Selected via Open Perspective Command ....... 409
Figure 385 - The Code Review Perspective ................................................ 409
Figure 386 – The Code Review Table View ................................................ 410
Figure 387 – The Code Review Editor View ............................................... 411
Figure 388 - Individual Phase Selected in the Code Review Toolbar ......... 412
Figure 389 - Reviewer ID Selection Dialog ................................................. 412
Figure 390 - The Source Code Button & Drop-Down Menu ...................... 413
Figure 391 - Add Code Review Issue... ....................................................... 413
Figure 392 – A Code Review Issue in the Review Editor View ................... 414
Figure 393 - Review Marker Displayed on Editor Line 101 ........................ 414
Figure 394 - Team Phase Toolbar Button ................................................... 415
Figure 395 - Code Review Editor View Content in Team Phase ................. 415
Figure 396 - Review Markers and Tooltip Information in the Editor ......... 416
Figure 397 - Team Phase Toolbar Button ................................................... 416
Figure 398 - Code Review Editor View Content in the Rework Phase ....... 417
Figure 399 - Accessing Code Review Preference Settings ......................... 417
Figure 400 - Customize Filters Applied for All Phases ................................ 418
Figure 401 - Customize Visible Code Review Table Columns .................... 418

List of Tables
xxvi | Page
Tables
Table 1 – Typographic Conventions ............................................................. 30
Table 2 - EWARM vs TrueSTUDIO build options .......................................... 68
Table 3 – Memory Regions Usage Color .................................................... 266
Table 4 – Memory Details .......................................................................... 267
Table 5 – Static Stack Analyzer List tab ...................................................... 279
Table 6 – Static Stack Analyzer Call Graph tab ........................................... 280
Table 7 – Exception Data Columns ............................................................. 299
Table 8 – Exception Statistics Columns ...................................................... 301
Table 9 – MTB Trace Log View Columns .................................................... 310
Table 10 – embOS System Variables .......................................................... 330
Table 11 – embOS Task Parameters ........................................................... 331
Table 12 – embOS Timer Parameters ........................................................ 332
Table 13 – embOS Resource Semaphore Parameters ............................... 333
Table 14 – embOS Mailbox Parameters ..................................................... 334
Table 15 – eTaskSync Task Parameters ...................................................... 336
Table 16 – FreeRTOS Task Parameters....................................................... 340
Table 17 – FreeRTOS Queue Parameters ................................................... 341
Table 18 – FreeRTOS Semaphore Parameters ........................................... 342
Table 19 – FreeRTOS Timer Parameters .................................................... 343
Table 20 – RTXC Kernel Information .......................................................... 345
Table 21 – RTXC Task List Parameters ........................................................ 347
Table 22 – RTXC Stack Info ......................................................................... 347
Table 23 – RTXC Alarm Parameters ........................................................... 348
Table 24 – RTXC Counter Parameters ........................................................ 349
Table 25 – RTXC Event Source Parameters ................................................ 350
Table 26 – RTXC Exception Backtrace Parameters .................................... 351
Table 27 – RTXC Exception Parameters ..................................................... 352
Table 28 – RTXC Mailbox Parameters ........................................................ 352
Table 29 – RTXC Mutex Parameters ........................................................... 354
Table 30 – RTXC Partition Parameters ....................................................... 355
Table 31 – RTXC Pipe Parameters .............................................................. 356
Table 32 – RTXC Queue Parameters .......................................................... 357
Table 33 – RTXC Semaphore Parameters ................................................... 358
Table 34 – ThreadX Thread Parameters ..................................................... 361

Overview
xxvii | P a g e
Table 35 – ThreadX Semaphore Parameters ............................................. 362
Table 36 – ThreadX Mutex Parameters ..................................................... 363
Table 37 – ThreadX Message Queue Parameters ...................................... 364
Table 38 – ThreadX Event Flag Parameters ............................................... 364
Table 39 – ThreadX Timer Parameters ....................................................... 365
Table 40 – ThreadX Memory Block Pool Parameters ................................ 366
Table 41 – ThreadX Memory Byte Pool Parameters .................................. 367
Table 42 – TOPPERS Tasks Static Information ........................................... 370
Table 43 – TOPPERS Tasks Current Status ................................................. 371
Table 44 – TOPPERS Dataqueue Static Information .................................. 372
Table 45 – TOPPERS Dataqueues Current Status ....................................... 372
Table 46 – TOPPERS Event Flags Static Information .................................. 373
Table 47 – TOPPERS Event Flags Current Status ........................................ 374
Table 48 – TOPPERS Mailboxes Static Information .................................... 375
Table 49 – TOPPERS Mailboxes Current Status.......................................... 376
Table 50 – TOPPERS Memory Pools Static Information ............................. 377
Table 51 – TOPPERS Memory Pools Current Status ................................... 377
Table 52 – TOPPERS Cyclic Handlers Static Information ............................ 379
Table 53 – TOPPERS Cyclic Handlers Current Status .................................. 379
Table 54 – TOPPERS Alarm Handlers Static Information ........................... 380
Table 55 – TOPPERS Alarm Handlers Current Status Information ............. 381
Table 56 – TOPPERS Prioritized Dataqueue Static Information ................. 382
Table 57 – TOPPERS Prioritized Dataqueues Current Status Information . 382
Table 58 – TOPPERS System Status Information ....................................... 383
Table 59 – TOPPERS Interrupt Line Config Information ............................. 384
Table 60 – TOPPERS Interrupt Handlers Static Information ...................... 385
Table 61 – TOPPERS Interrupt Handlers Static Information ...................... 386
Table 62 – µC/OS-III System Variables ....................................................... 390
Table 63 – µC/OS-III Task Parameters ........................................................ 391
Table 64 – µC/OS-III Semaphore Parameters ............................................ 392
Table 65 – µC/OS-III Mutexes Parameters ................................................. 393
Table 66 – µC/OS-III Message Queue Parameters ..................................... 394
Table 67 – µC/OS-III Event Flag Parameters .............................................. 395
Table 68 – µC/OS-III Timer Parameters ...................................................... 396
Table 69 – µC/OS-III Memory Partitions Parameters ................................ 397
Table 70 – Atollic TrueSTUDIO Support for the Code Review Workflow... 400
Table 71 - Code Review Toolbar Buttons ................................................... 410

Introduction
29 | P a g e
ABOUT THIS DOCUMENT
Welcome to the Atollic TrueSTUDIO® for STM32 User Guide. The purpose of this
document is to provide information on how to use Atollic TrueSTUDIO®.
INTENDED READERS
This document is primarily intended for users of Atollic TrueSTUDIO®.
Please note that this manual applies to users of STM32 target devices only.
Introduction
30 | P a g e
DOCUMENT CONVENTIONS
The text in this document is formatted to ease understanding and provide clear and
structured information on the topics covered. The following typographic conventions
apply:
Table 1 – Typographic Conventions
Style
Use
Command
Keyboard Command or Source Code Section.
Object Name
Name of a User Interface Object (Menu, Menu Command,
Button, Dialog Box, etc.) that appears on the computer
screen.
Cross Reference
Cross reference within the document, or to an external
document.
Product Name
Name of Atollic product.
Identifies instructions specific to the Graphical User
Interface (GUI).
Identifies instructions specific to the Command Line
Interface (CLI).
Identifies Help Tips and Hints.
Identifies a Caution.

Introduction
31 | P a g e
GETTING STARTED
This section provides information on how to begin using Atollic TrueSTUDIO® for STM32.
The following topics are covered:
Introduction
Preparing for Start
Starting the Program
Creating a New Project
Configuring the Project
Building the Project
Debugging

Getting Started
32 | P a g e
INTRODUCTION
Welcome to Atollic® TrueSTUDIO® for STM32. The product is available for free. Advanced
functionality which earlier required a license is now fully enabled directly after installation.
TrueSTUDIO has the following key features:
Built on Open Standards (Eclipse, CDT, GCC, and GDB)
Edit, Compile & Build (No code size limitation)
Project Management
o STM32 MCUs and Board support
o CMSIS-Pack project support
o Build/Memory Analyzer
o Stack Analyzer
o Bug Tracking
o Version Control
Debug
o Hard Fault Analyzer
o Live Variable Watch
o Trace (SWV, ETM, ETB, MTB)
o Statistical Profiling
o RTOS-aware Debug
o Multi Project Debug

Getting Started
33 | P a g e
PREPARING FOR START
Atollic TrueSTUDIO is built using the ECLIPSE™ framework, and thus inherits some
characteristics that may be unfamiliar to new users. The following sections outline
important information to users without previous experience of ECLIPSE™.
WORKSPACES & PROJECTS
As Atollic TrueSTUDIO is built using the ECLIPSE™ framework, the ECLIPSE™ project and
workspace model applies. The basic concept is outlined below:
A workspace contains projects. Technically, a workspace is a directory containing
project directories or references to them.
A project contains files. Technically, a project is a directory containing files that
may be organized in sub-directories.
A single computer may hold several workspaces at various locations in the file
system. Each workspace may contain many projects.
The user may switch between workspaces, but only one workspace can be active
at any one time.
The user may access any project within the active workspace. Projects located in
another workspace cannot be accessed, unless the user switches to that
workspace.
Switching workspace is a quick way of shifting from one set of projects to another
set of projects. It will trigger a quick restart of the product.
In practice, the project and workspace model facilitates a well-structured hierarchy of
workspaces, containing projects, containing files.
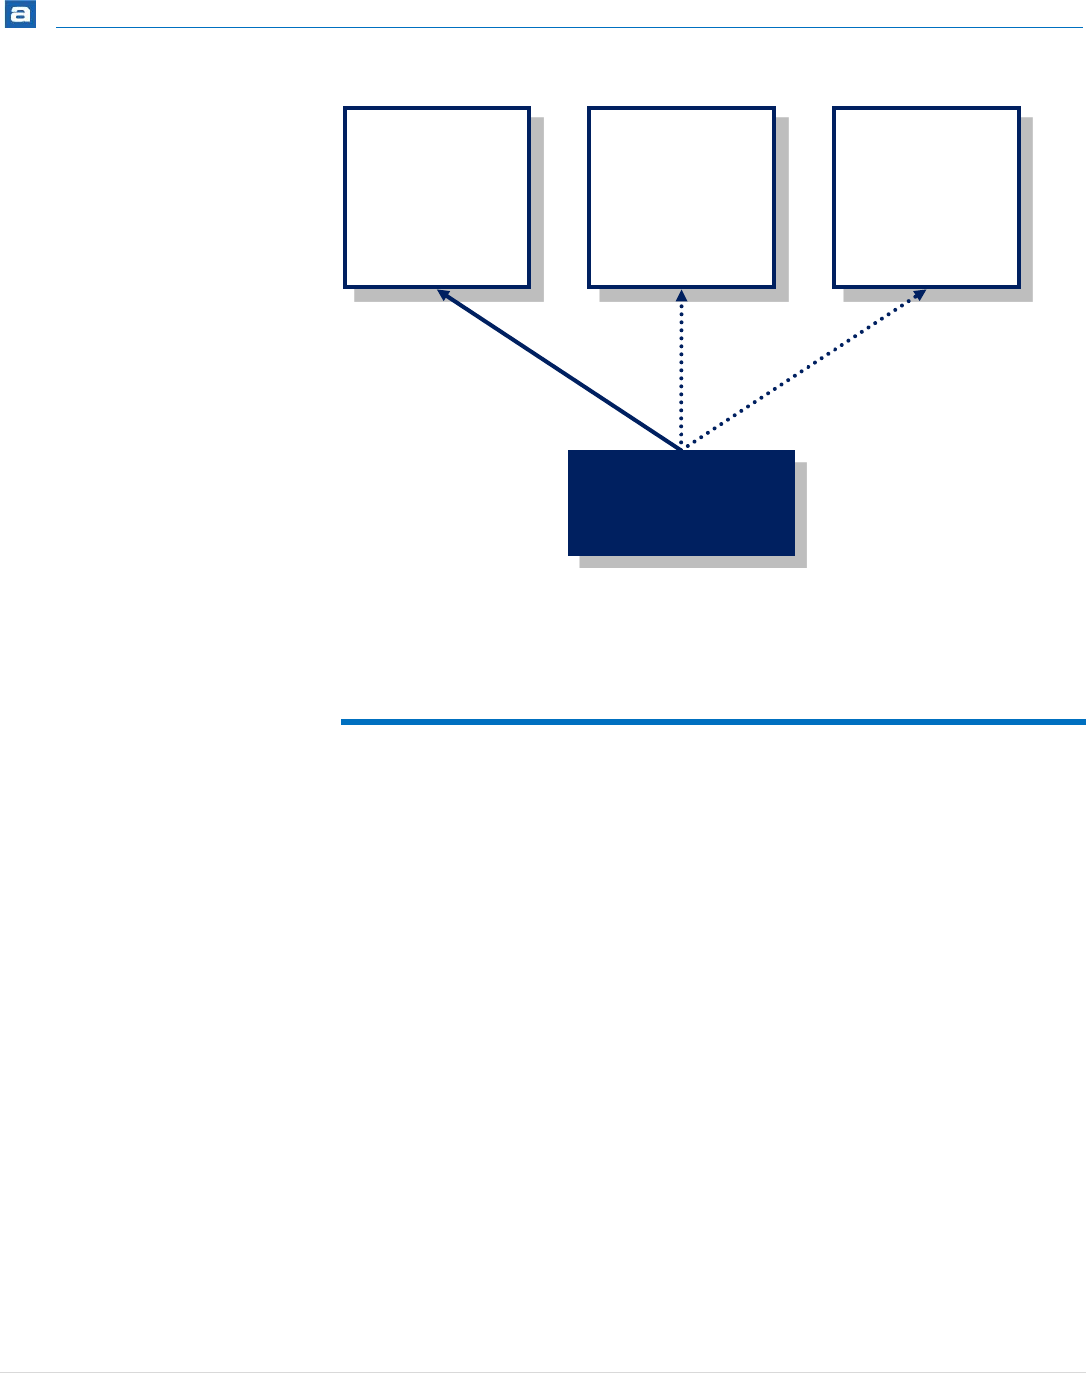
Getting Started
34 | P a g e
PERSPECTIVES & VIEWS
Atollic TrueSTUDIO is a very powerful product with a great many views, loaded with
various features. Displaying all views simultaneously would overload the user with
information that may not be relevant to the task at hand.
To overcome this problem, views can be organized in perspectives, where a perspective
contains a number of predefined views. A perspective typically handles one development
task, such as:
C/C++ Code Editing
Debugging
Bug Database Access
Version Control
Code Review
As an example, the C/C++ Editing perspective displays views that relate to code editing,
such as Editor Outline and Class Browser. The Debug perspective displays views that relate
to Debugging, such as Breakpoints and CPU Registers.
Atollic TrueSTUDIO®
Workspace 1
(C:\Joe\Workspace)
Project A
Project B
. . .
Workspace 2
(C:\Customer1)
Project C
Project D
. . .
Workspace 3
(X:\NewProjects)
Project E
Project F
. . .
Workspace
currently inactive
Workspace
currently active
Workspace
currently inactive
Figure 1 - Workspaces and Projects
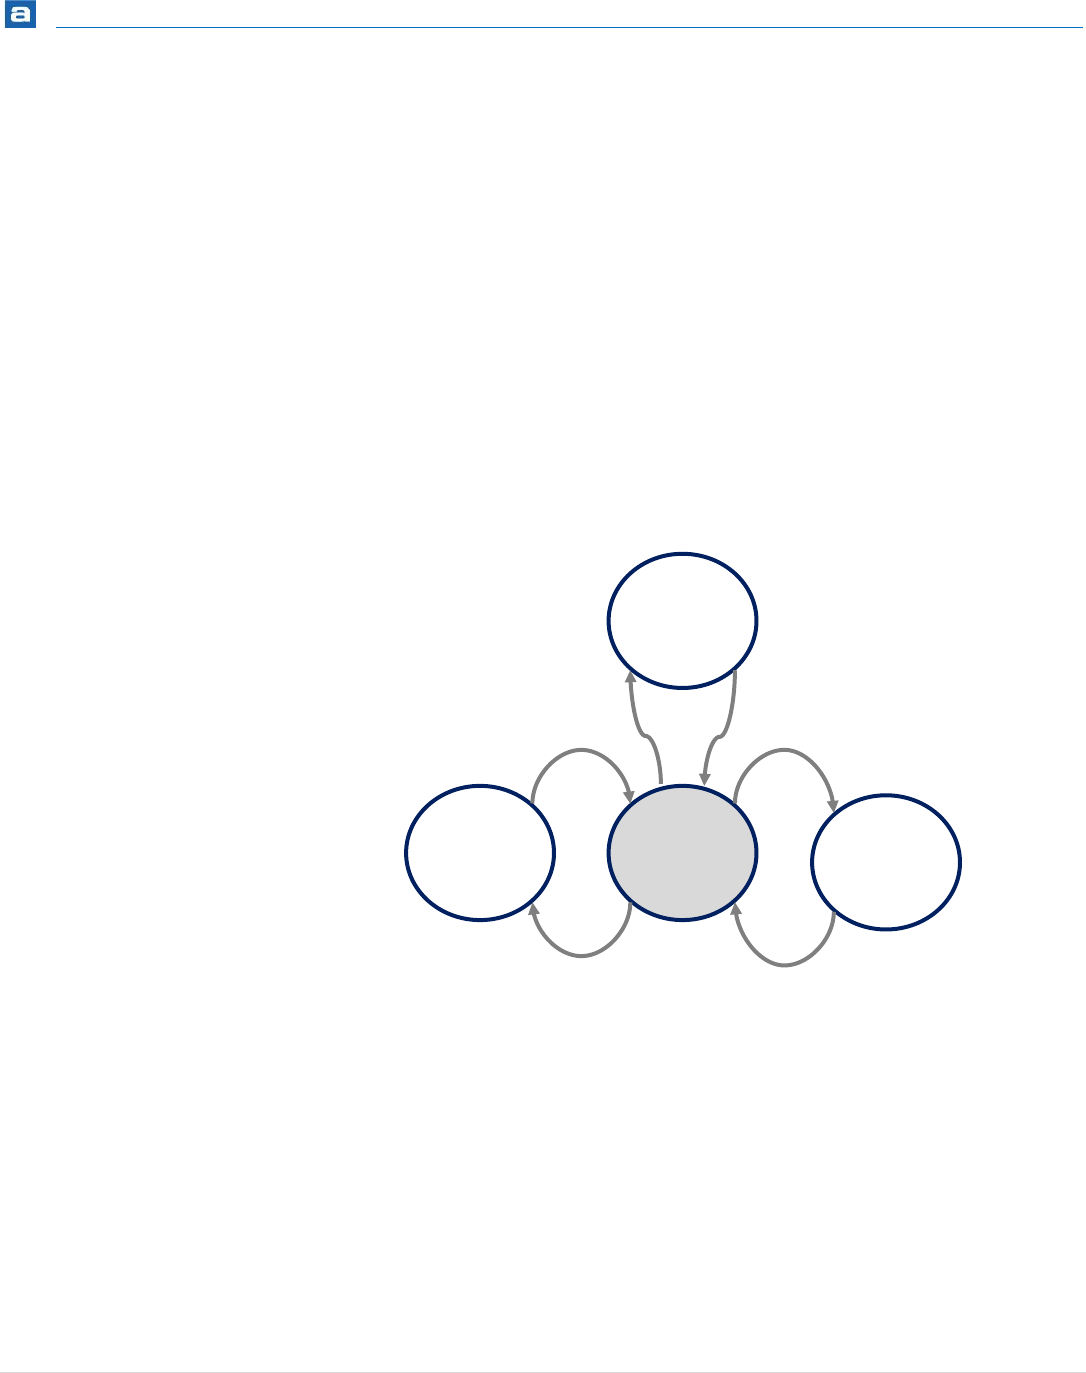
Getting Started
35 | P a g e
Switching from one perspective to another is a quick way to hide some views and display
others.
Atollic TrueSTUDIO comes with a number of pre-configured perspectives. Developers may
modify these, or create entirely new, at will. Atollic TrueSTUDIO is designed around a
philosophy that one perspective shall be used for one task, and that a perspective should
not contain a lot of GUI objects from other perspectives.
As the figure below outlines, the idea is that one perspective shall be used for each work
task. It is however clear that one perspective, the C/C++ editing perspective is the
“master” perspective where developers spend most time. Therefor that perspective is the
center-point of Atollic TrueSTUDIO, and developers temporarily jump to other
perspectives to do other tasks, and when completed, jump back to the editing and building
perspective again.
The C/C++ Editing perspective is also the perspective that is opened when Atollic
TrueSTUDIO is started the first time.
Figure 2 – Editing Perspective
We think it is valuable to use the editing and building perspective as the master
perspective, and all other perspectives used temporarily for other work tasks.
To switch perspective, select the Open Perspective toolbar button or use the menu
command View, Open Perspective:
Editing
Building
Debug
Version
control
. . .
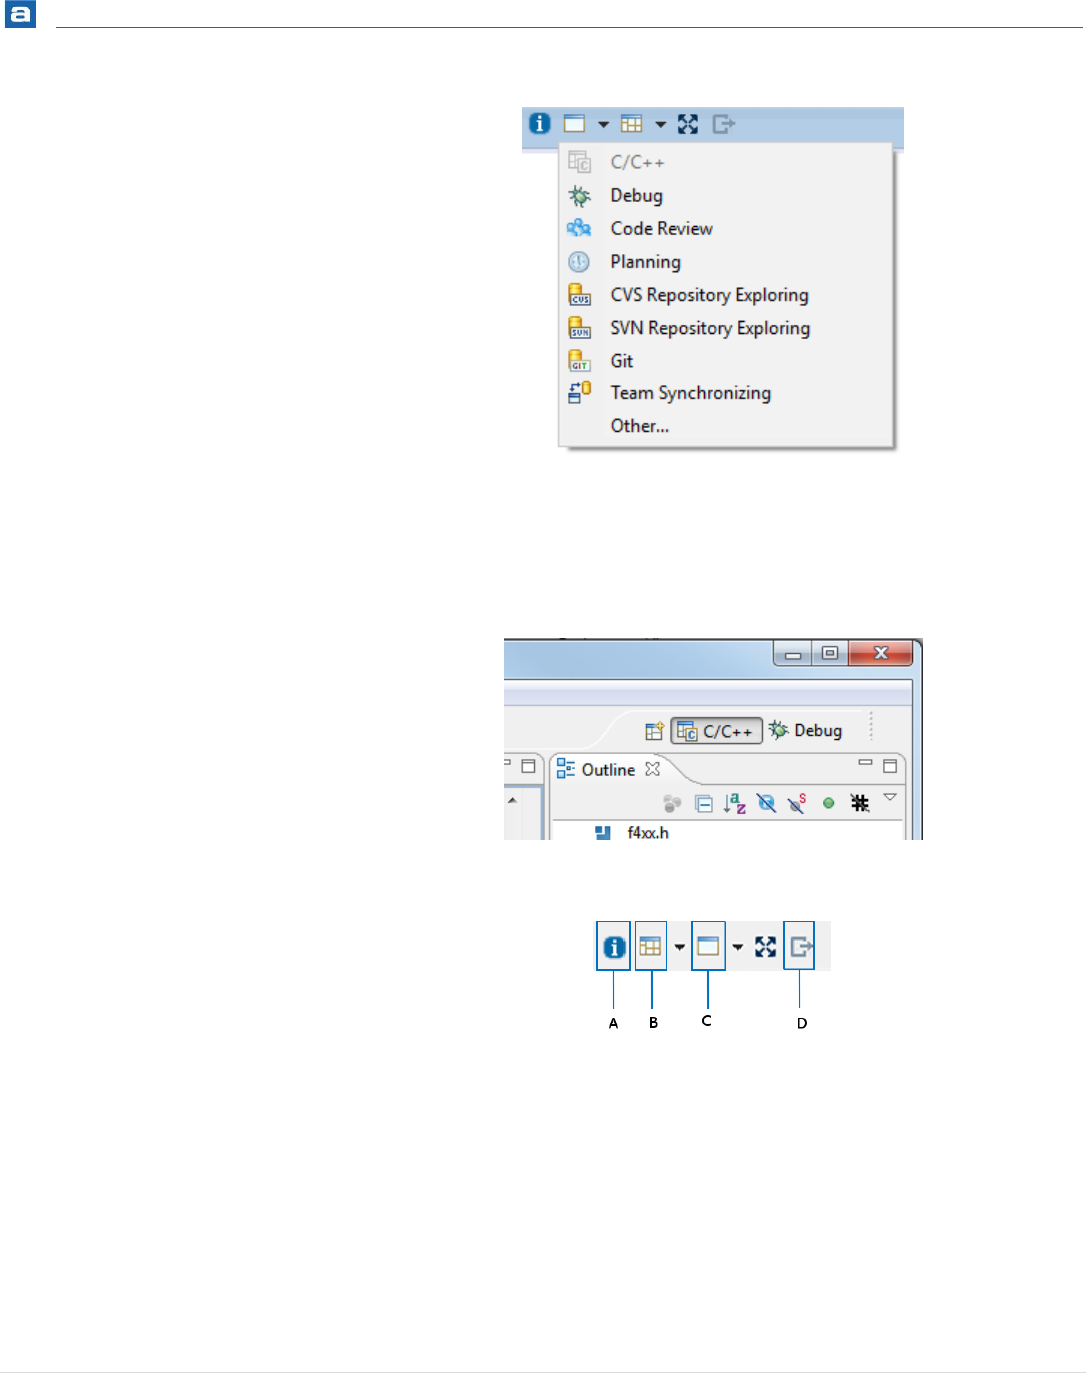
Getting Started
36 | P a g e
Figure 3 - Switch Perspective
Alternatively, click any of the perspective buttons in the top right corner of the main
window (only the last few ones active are displayed here):
Figure 4 - Switch Perspective
Figure 5 – Toolbar Buttons for Perspectives and Views
One can always return to the default C/C++ Editing and Building perspective by clicking the
Return to editor and building perspective toolbar button (D). Editing and Building is the
main activity for most C/C++ developers, hence the dedicated button.
VIEWS
When Atollic TrueSTUDIO is started for the first time, the C/C++ Editing Perspective is
activated by default. This perspective does not show all available views by default, to
reduce information overload. The same principle applies to all perspectives.
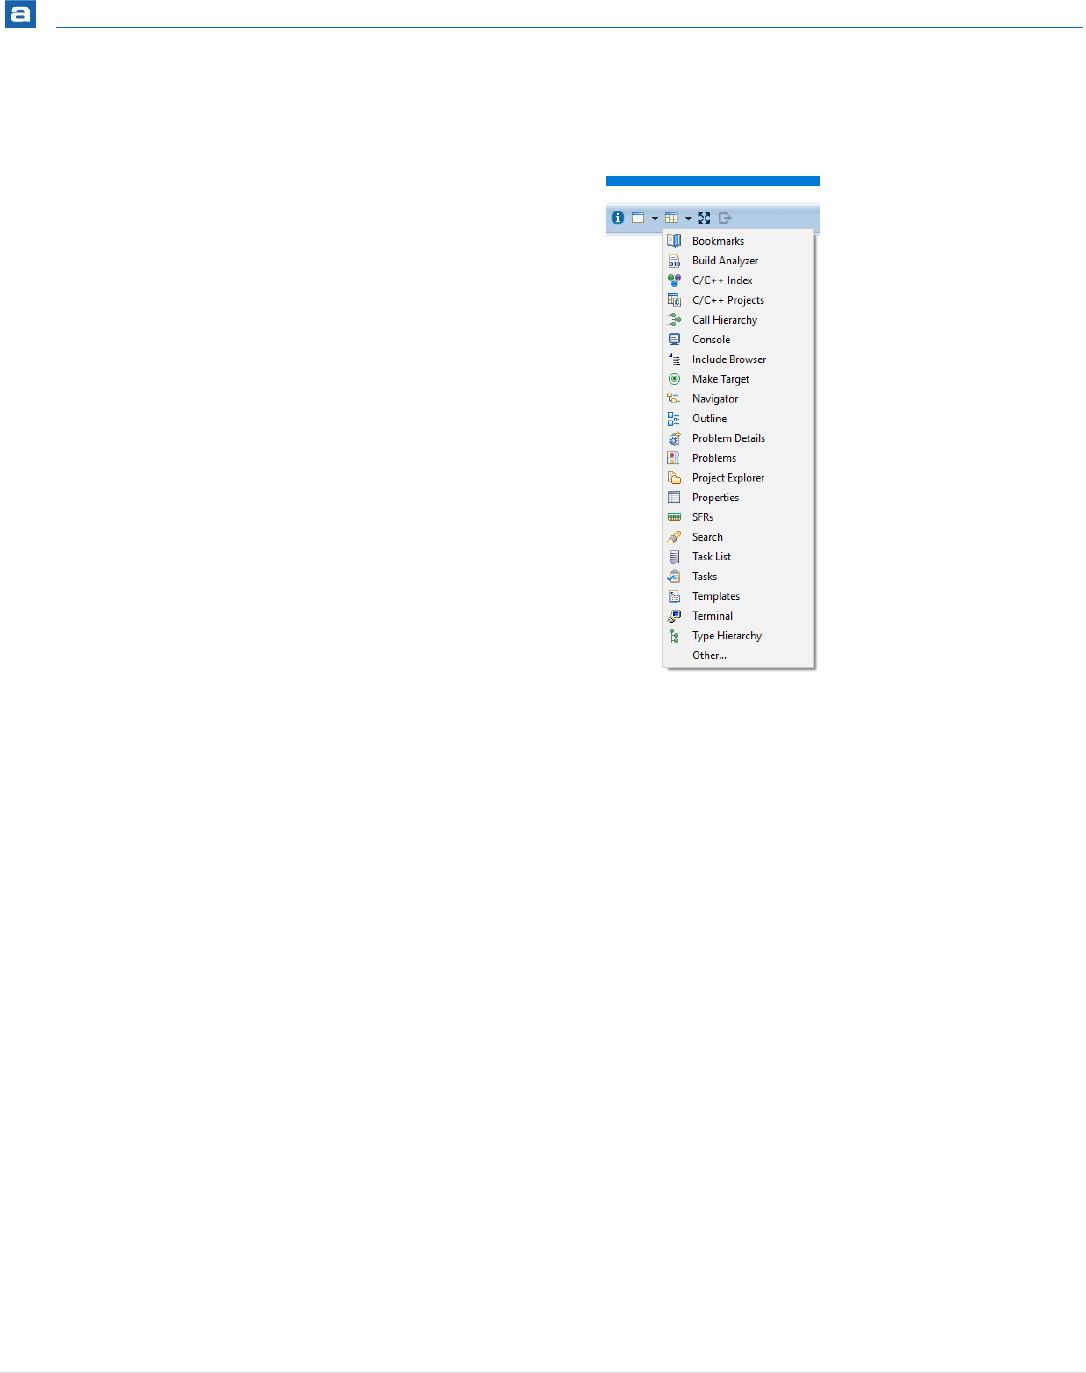
Getting Started
37 | P a g e
To access additional features built into the product, open additional views. To do this,
select the View toolbar button (C) or use the menu command View:
Figure 6 - View Menu toolbar button
The above list of views, while comprehensive, is still not complete. This list only contains
the most common views for the work task related to the currently selected Perspective. To
access even more views, select Other… from the list. This opens the Show View dialog box.
Double click on any view to open it and access the additional features:
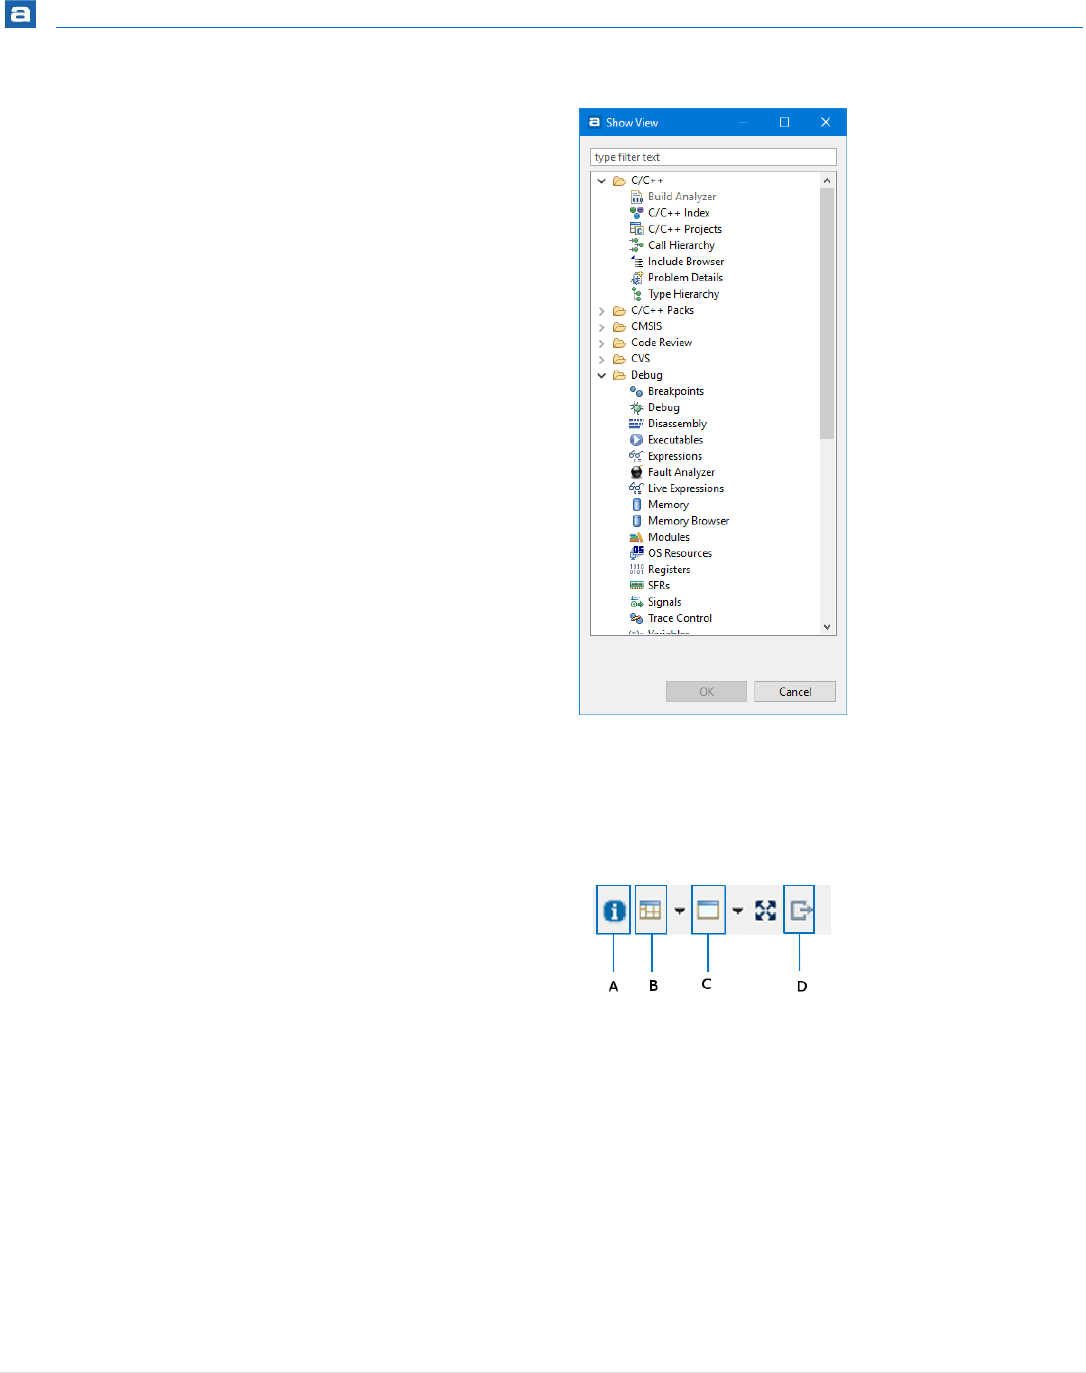
Getting Started
38 | P a g e
Figure 7 - Show View Dialog Box
The remaining toolbar buttons related to perspectives and views are:
Figure 8 – Toolbar Buttons for Perspectives and Views
Information Center (A) – Displays the initial welcome screen from the first time the
product was started, after being installed. More details will follow in “Starting the
Program” below.
Perspective (B) – A shortcut that opens a perspective of the user’s choice.
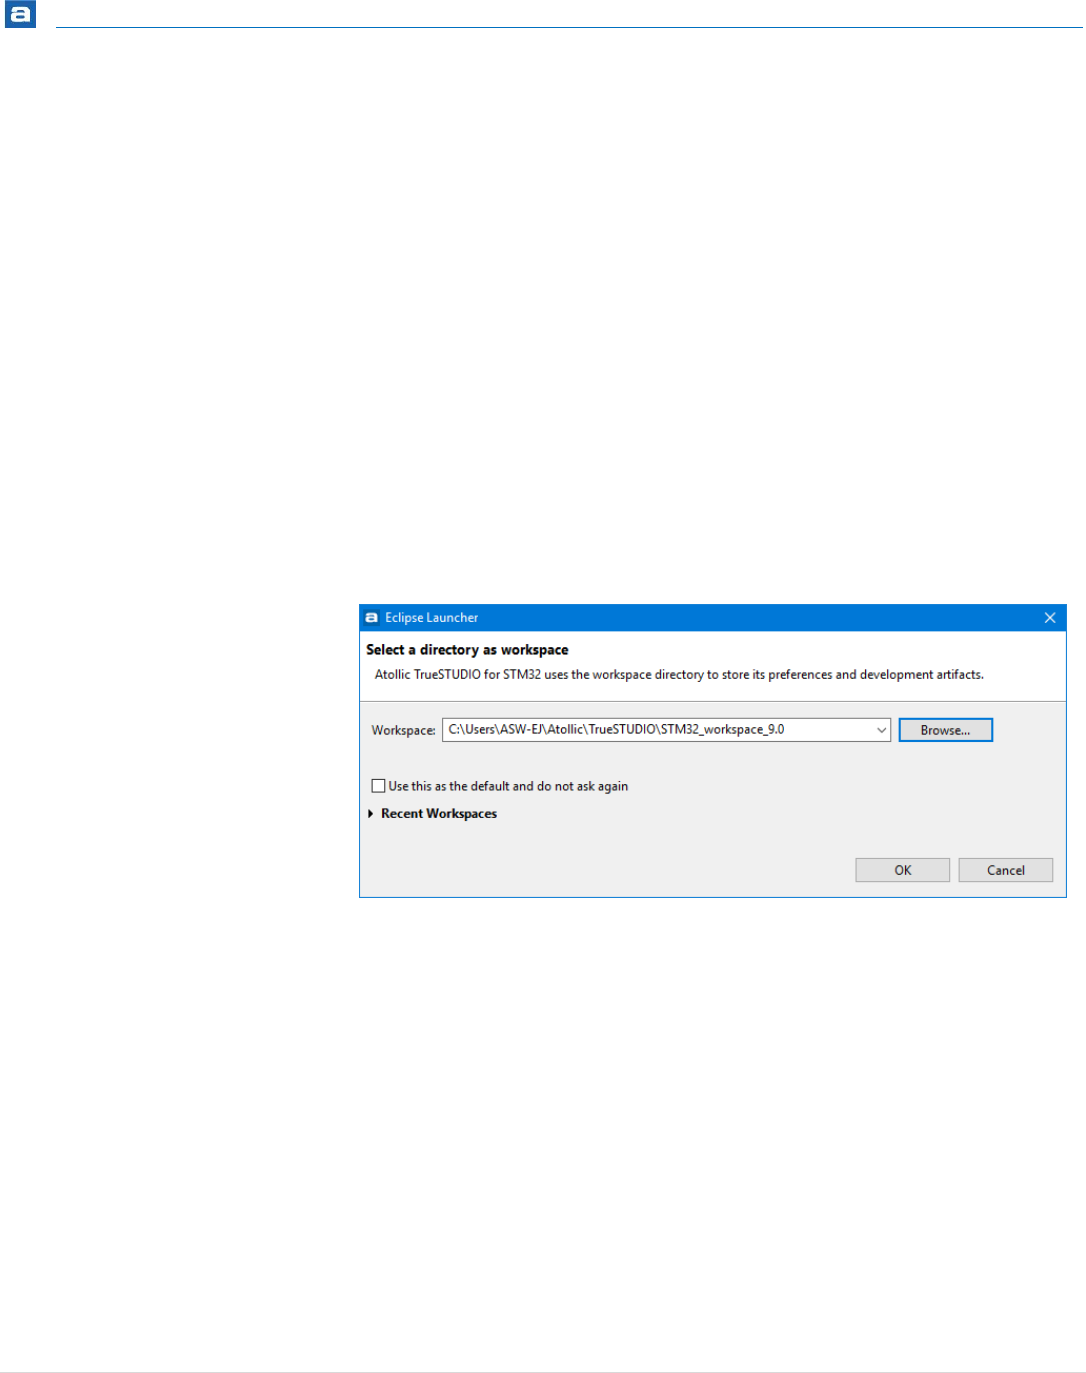
Getting Started
39 | P a g e
STARTING THE PROGRAM
After installing Atollic TrueSTUDIO according to Atollic TrueSTUDIO Installation Guide, start
the program by performing the following steps (applies to Microsoft® Windows® Vista®
and Windows 7®):
1. Open the Microsoft® Windows® Start Menu
2. Click on All Programs
3. Open the Atollic folder
4. Open the TrueSTUDIO for STM32 folder
5. Click on the Atollic TrueSTUDIO item in this folder
6. Wait for the program to start, and the Workspace Launcher dialog to be
displayed.
Figure 9 - Workspace Launcher
This dialog enables the user to select the name and location of the Active
Workspace. The Active Workspace is a folder that will hold all projects
currently accessible by the user. The user may open any existing project in the
workspace. Any newly created projects will be stored in the workspace.
7. Enter the full name (with path) of the workspace folder to be used for the
current session. Alternatively, browse to an existing workspace folder, or use
the default workspace folder. This is located within the home directory of the
current user, e.g. C:\Users\User\Atollic\TrueSTUDIO
If the appointed workspace folder does not yet exist, it will be created.
8. Click on the OK button
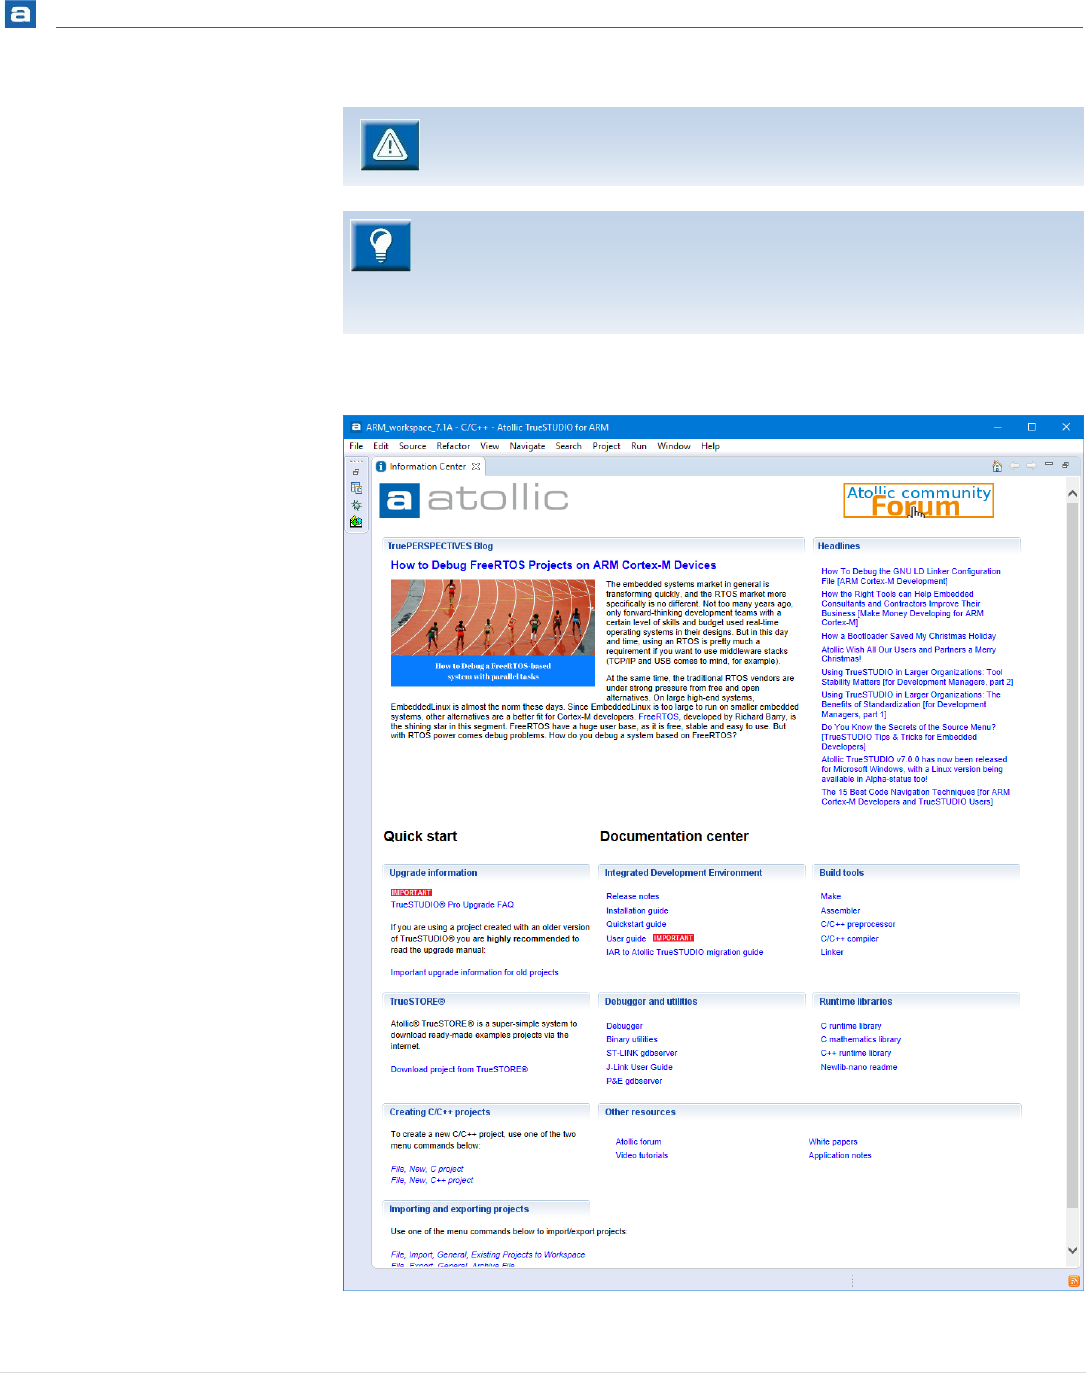
Getting Started
40 | P a g e
1. Wait for the Information Center window to be displayed.
Figure 10 - Information Center
The user must have write-access to the home directory to be able to start
Atollic TrueSTUDIO.
Atollic recommends that the Active Workspace folder is located not too
many levels below the file system root. This is to avoid exceeding the
Windows® path length character limitations. This can cause build errors if the
file paths become longer than Windows can handle.
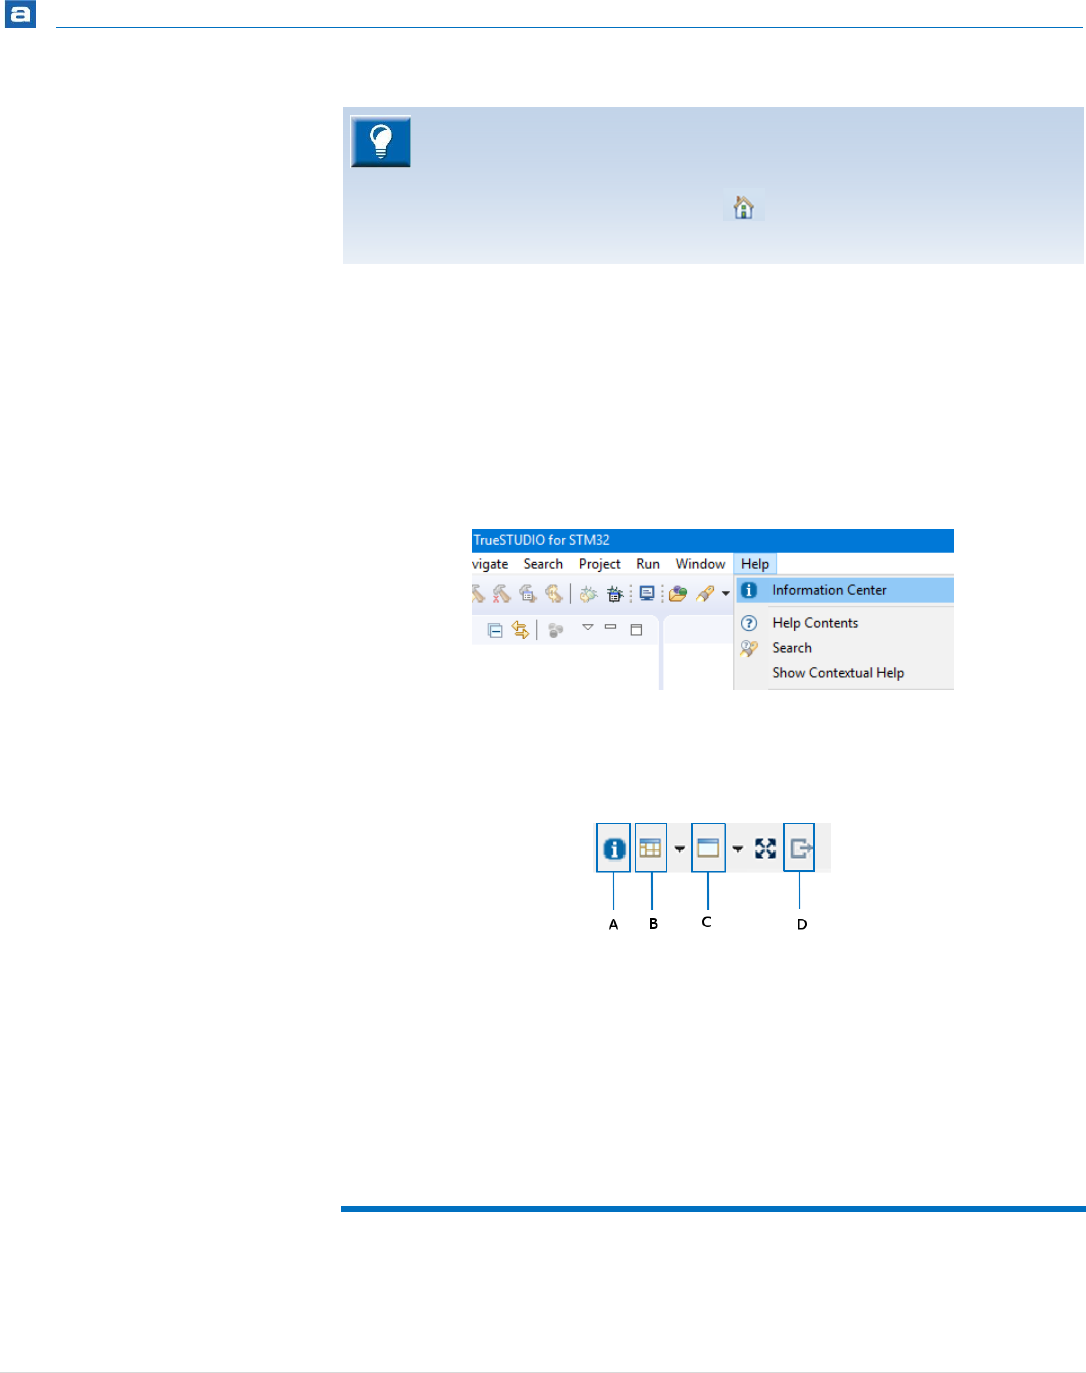
Getting Started
41 | P a g e
This window enables the user to quickly reach information regarding the product, and how
to use it, by clicking on the corresponding hypertext links. It is not required to read all
material before using the product for the first time. Rather, it is recommended to consider
the Information Center as a collection of reference information to return to, whenever
required during development. When connected to internet also Atollic TruePERSPECTIVES
Blog articles can be reached.
The Information Center window may be reached at any time via the Help, Information
Center menu command or via the Information Center toolbar button.
Figure 11 – Information Center Menu Command
Figure 12 – Information Center Toolbar Button (A)
9. Start using Atollic TrueSTUDIO by closing the Information Center page (click
the “X” in the Information Center page tab above its main window area). The
Information Center window is closed, but may be restored at any time, as
described above.
STARTING WITH DIFFERENT LANGUAGE
Start Atollic TrueSTUDIO from command line using following options:
Sometimes when opening an old workspace the Information Center does not
display valid information, e.g. “This page can’t be displayed” is shown or old
manuals are opened when accessing documents. In such case reload the
page by clicking the Home button, , at the top right corner of the
Information Center window.
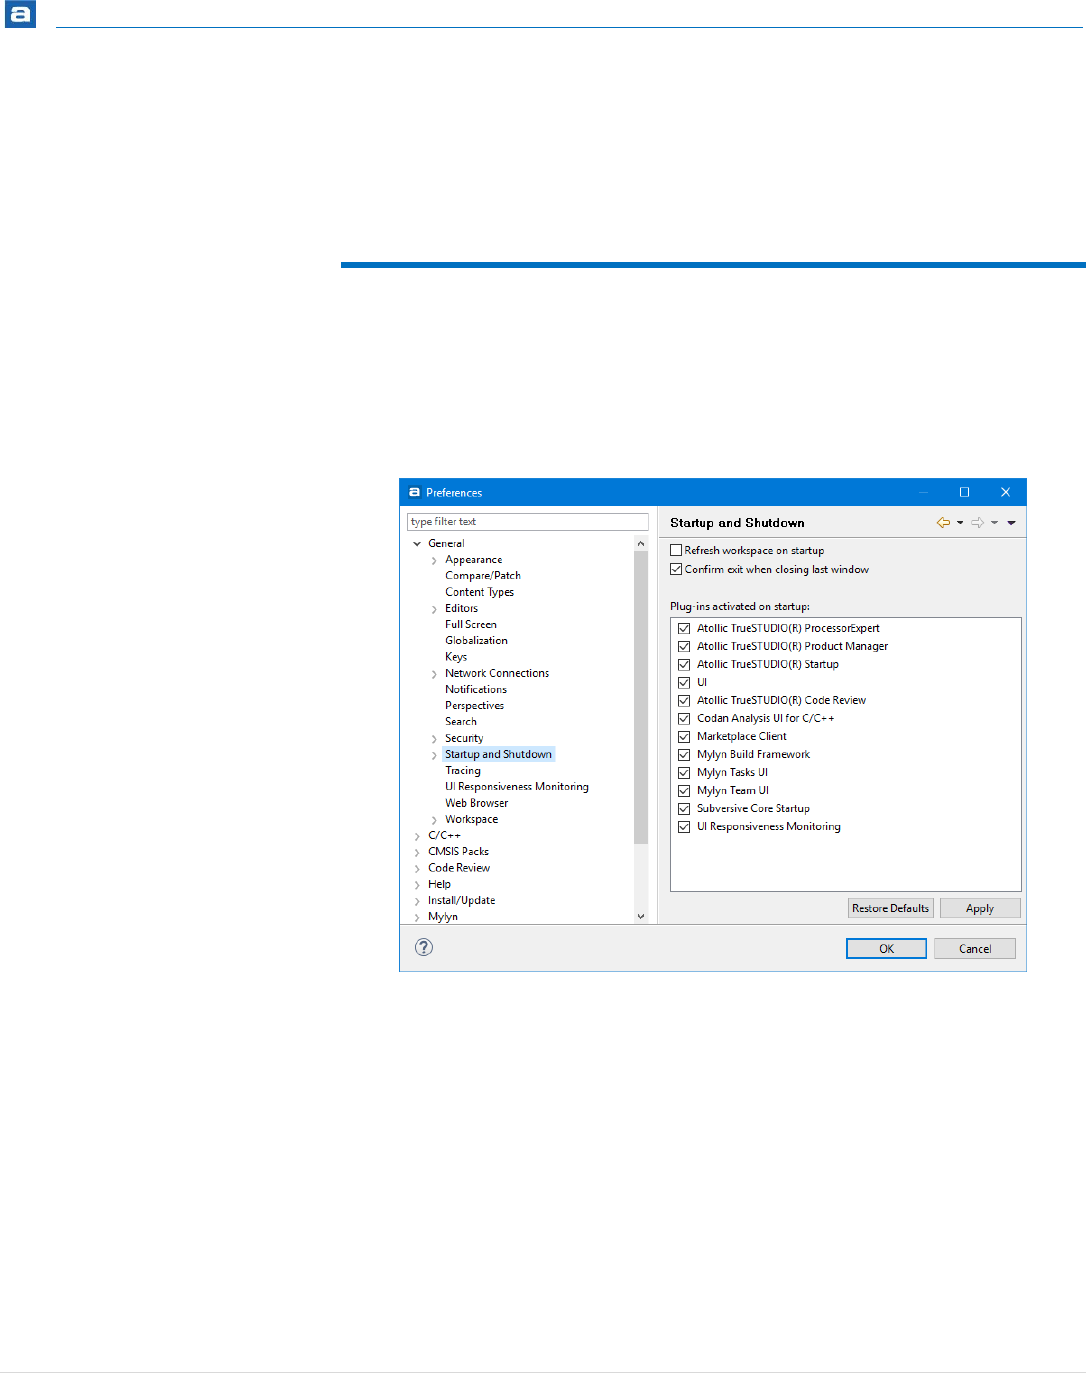
Getting Started
42 | P a g e
English TrueSTUDIO.exe -nl en
Japanese TrueSTUDIO.exe -nl ja
Korean TrueSTUDIO.exe -nl ko
Simplified Chinese TrueSTUDIO.exe -nl zh
CHANGE WHAT IS STARTED
If some parts of Atollic TrueSTUDIO is never used, it is a good idea to not start them at all.
That reduces the memory used and speeds things up a bit.
In the menu select Window, Preferences and in the Preference Dialog select General,
Startup and Shutdown.
Figure 13 – Startup Preferences
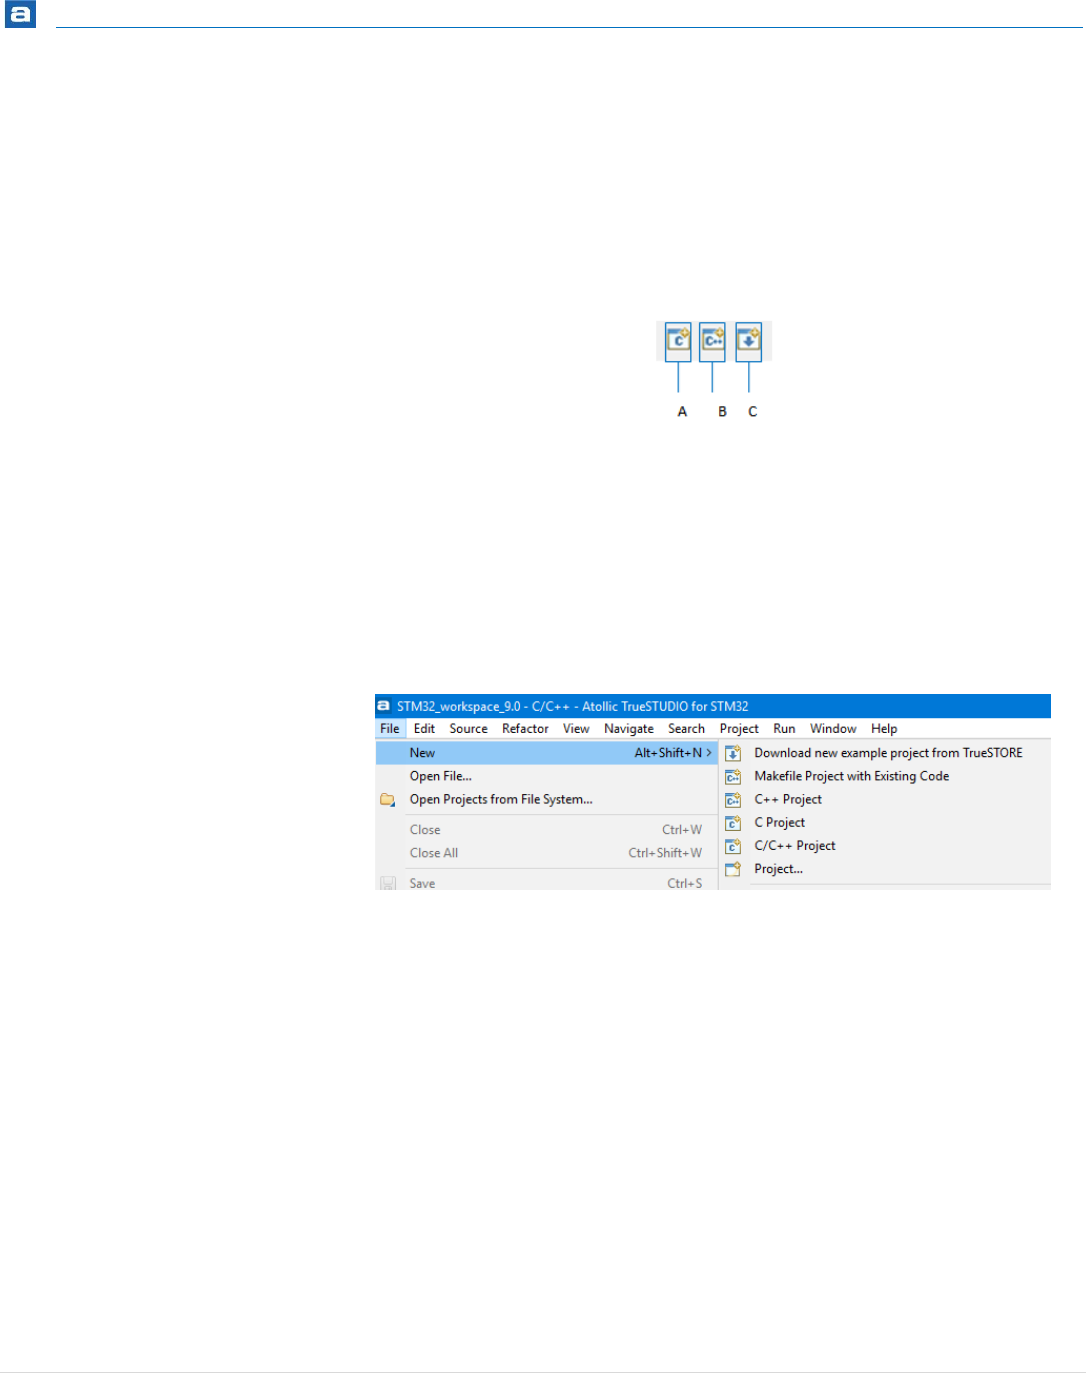
Getting Started
43 | P a g e
CREATING A NEW PROJECT
Atollic TrueSTUDIO supports both Managed and Unmanaged projects. Managed projects
are handled entirely by the IDE and may be configured via GUI settings. Unmanaged
projects require the existence of a makefile, which needs to be maintained manually.
The toolbar has three buttons for quick creation of new projects.
Figure 14 – Project Creation Buttons
To create a new Managed Mode C project, perform the following steps:
1. Click the button A to create a C Project (A).
As an alternative, select the File, New…, C Project menu command to start
the Atollic TrueSTUDIO project wizard.
Figure 15 - Starting the Project Wizard
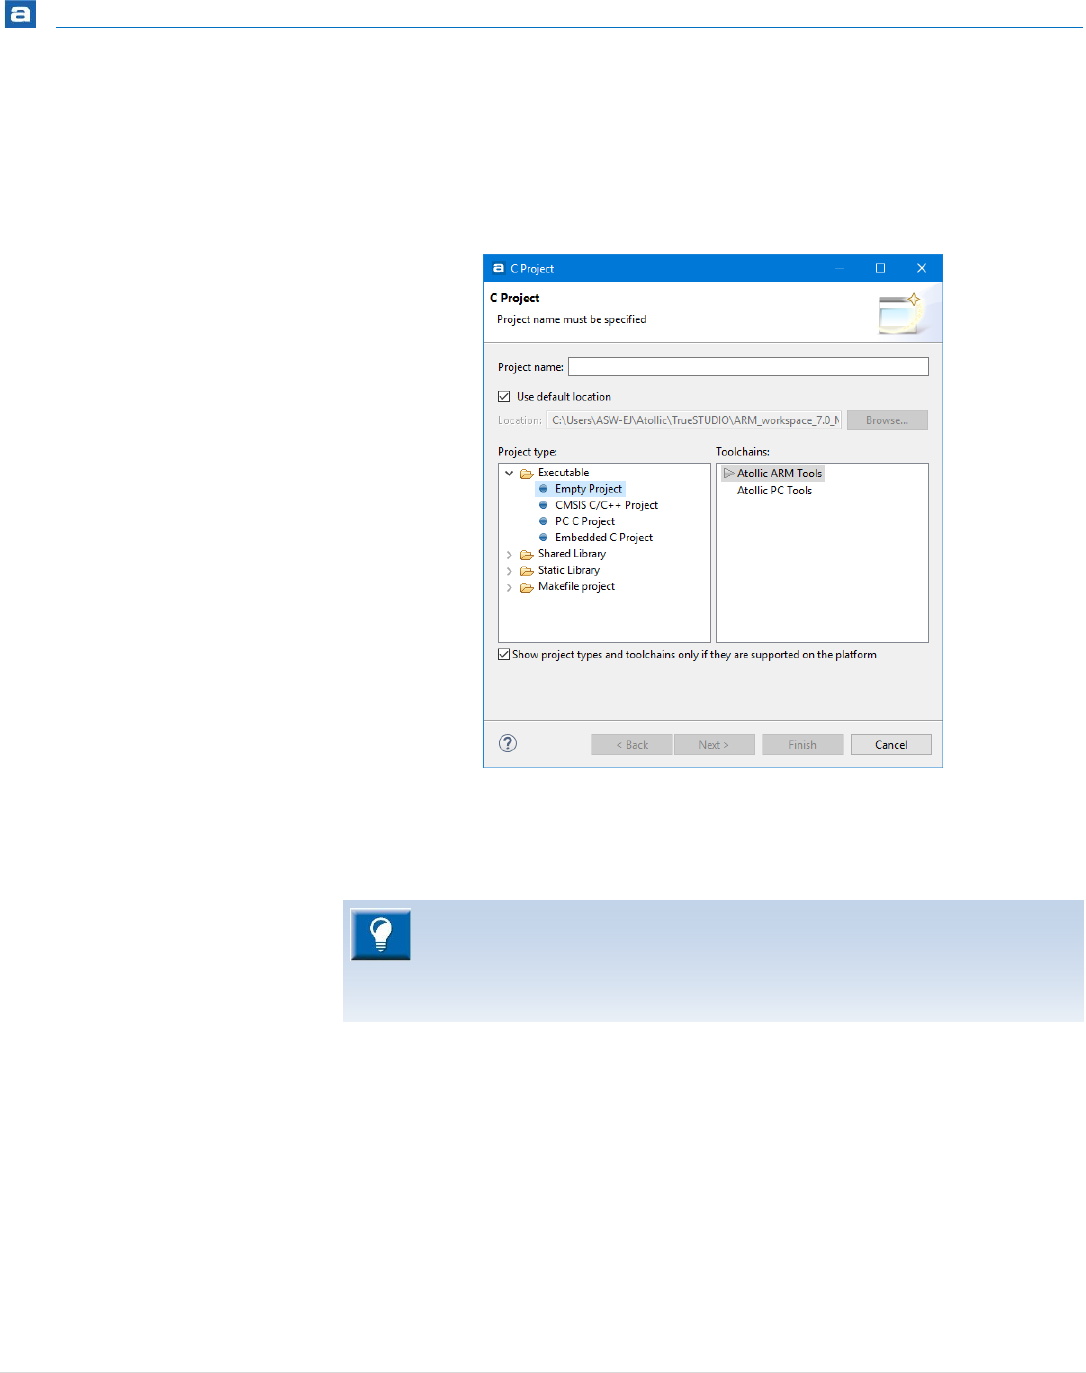
Getting Started
44 | P a g e
Wait for the C Project configuration page to be displayed where different kind of
projects can be created. The Atollic TrueSTUDIO product contains two kind of
toolchains, an Atollic ARM Tools and a Atollic PC Tools. The Atollic ARM Tools
toolchain shall be used when building embedded projects. The Atollic PC Tools
toolchain is usable for testing code on the PC.
Figure 16 - C Project Configuration
Enter a Project name (such as “MyProject”), select Embedded C Project as
Project type. Click the Next button.
The project type CMSIS C/C++ Project requires some preparations before it
can be used. Please read the Using CMSIS-Pack in TrueSTUDIO section at
page 166 and Create CMSIS-Pack Based Projects at page 177.
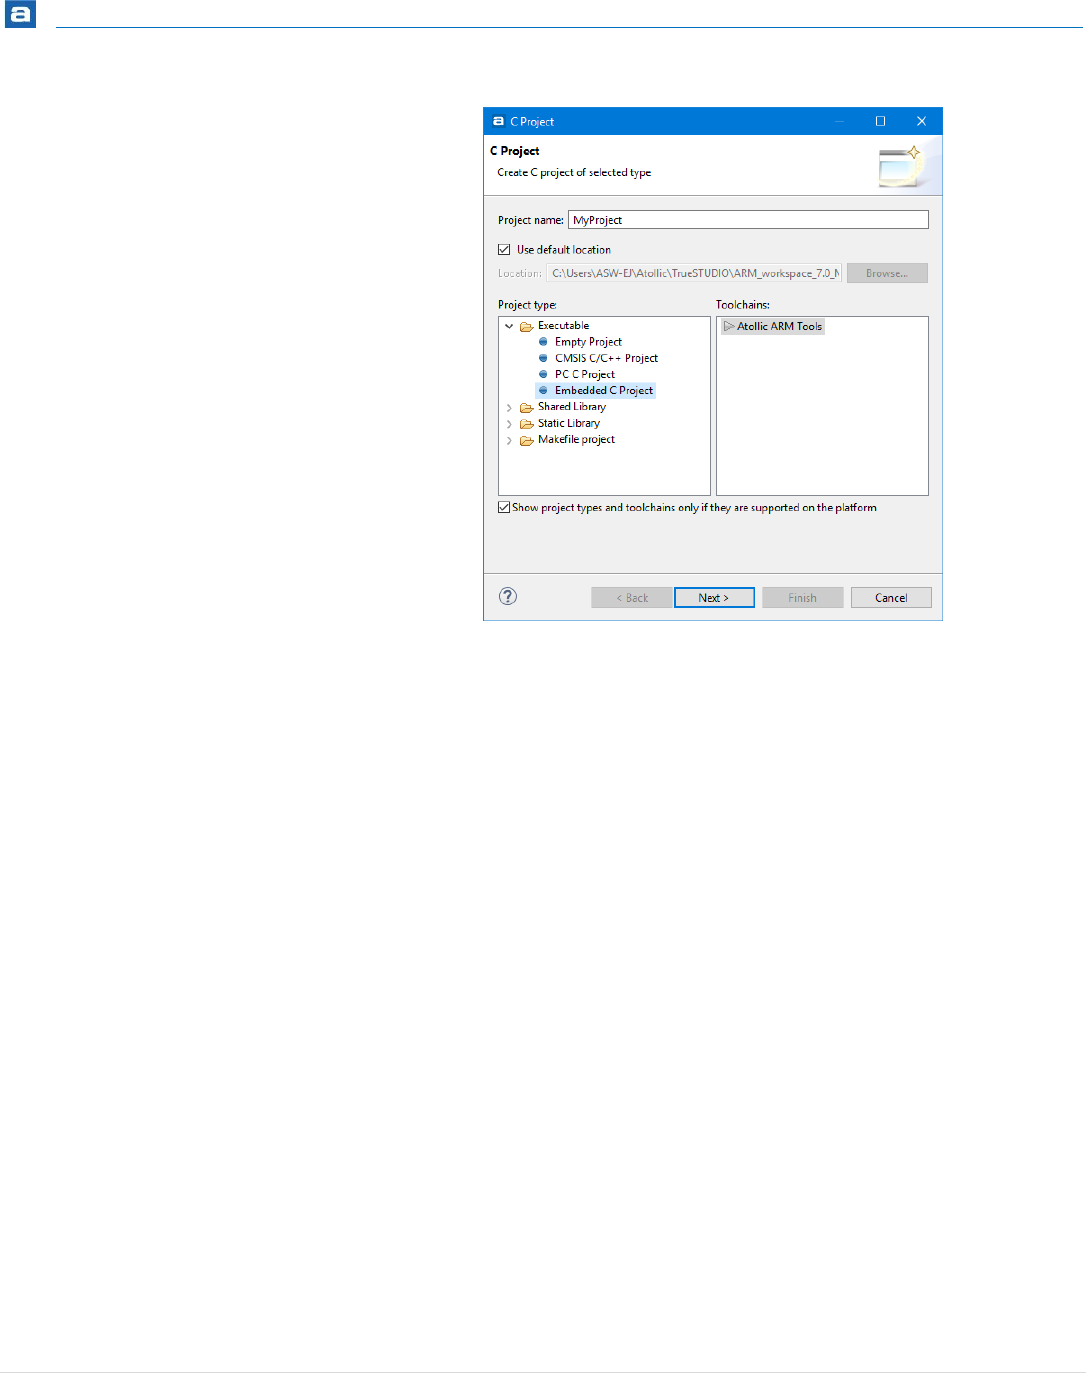
Getting Started
45 | P a g e
Figure 17 - C Project Configuration
2. Wait for the TrueSTUDIO Hardware configuration page to be displayed.
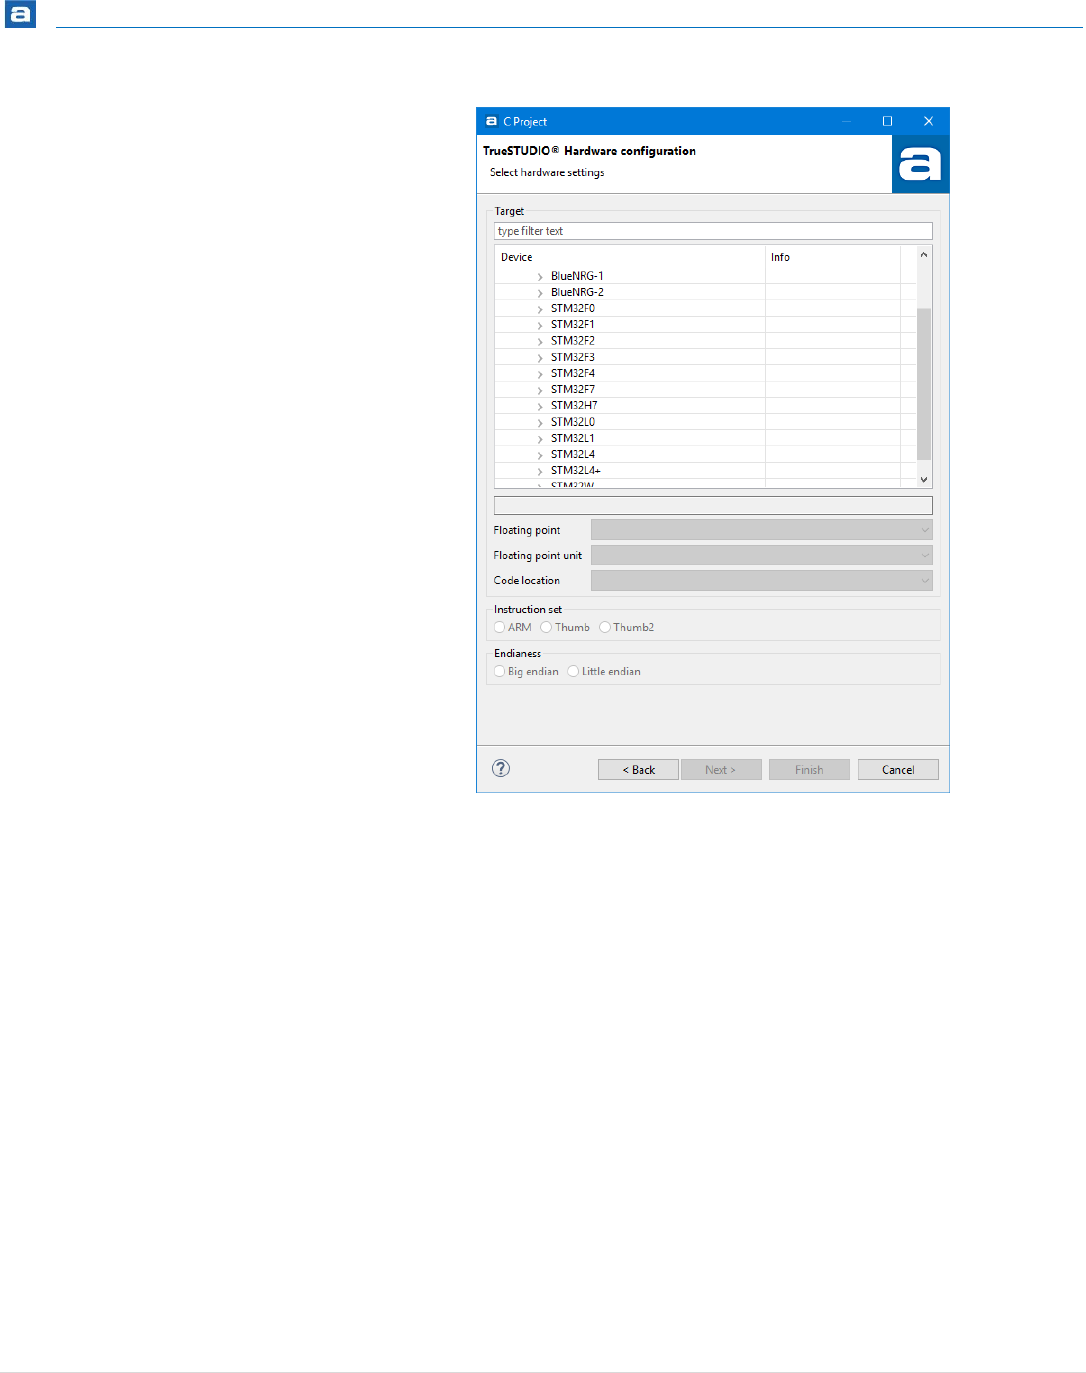
Getting Started
46 | P a g e
Figure 18 - TrueSTUDIO Hardware Configuration
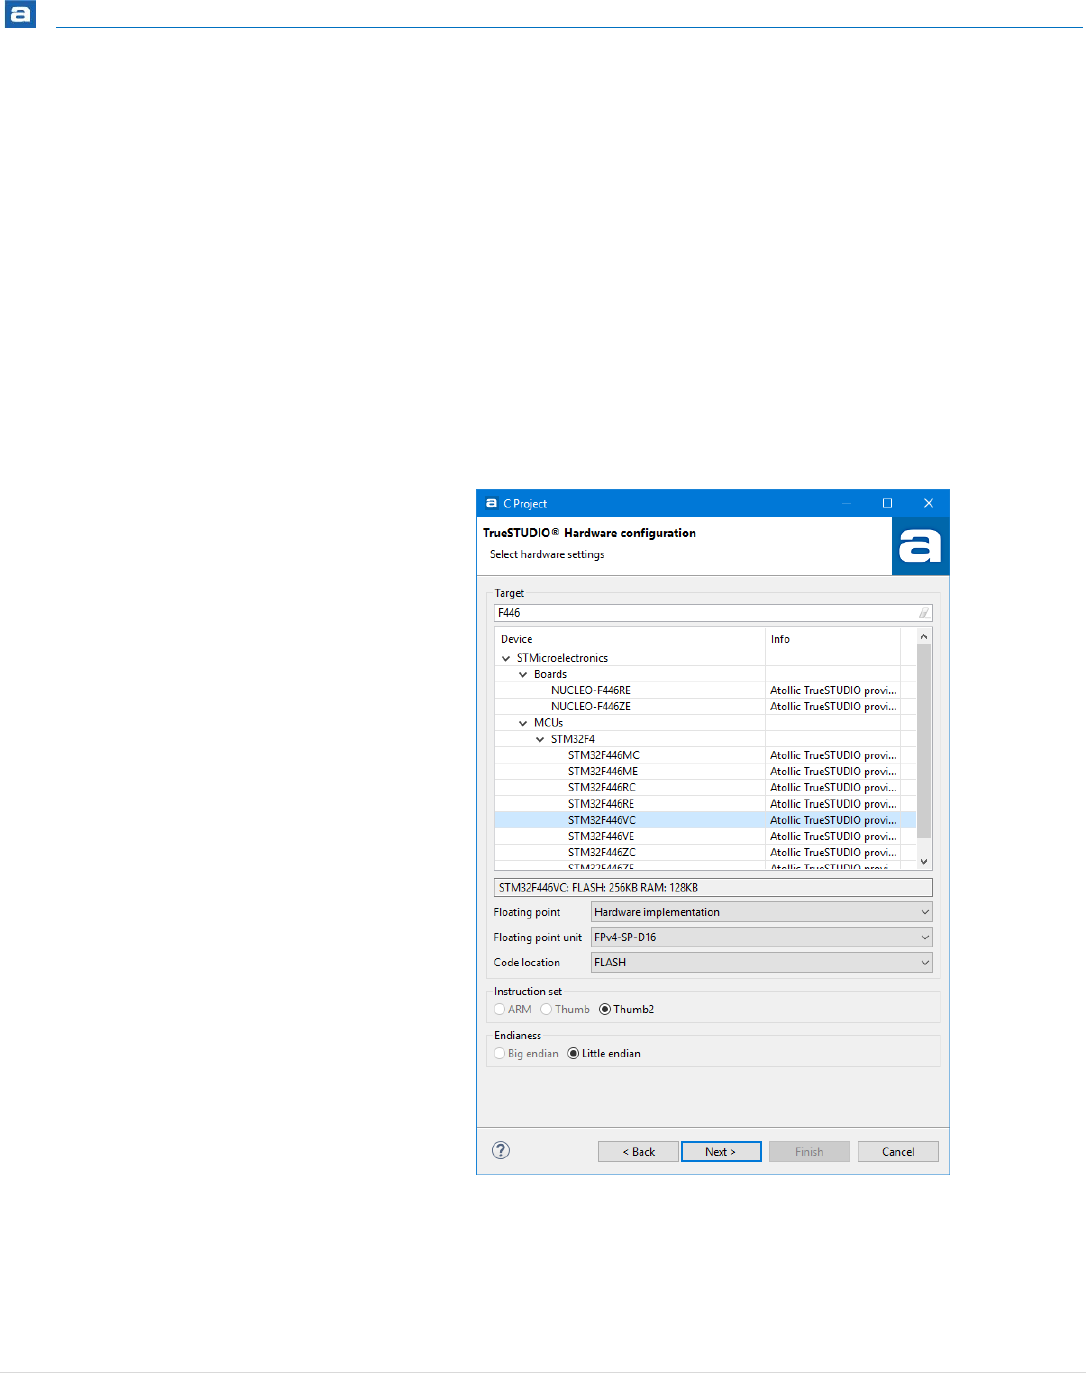
Getting Started
47 | P a g e
Configure the hardware settings according to your evaluation board or custom
board design. The Atollic TrueSTUDIO product contains support for STM32 and
BlueNRG microcontrollers and boards.
To make the selection easier to find a specific board or microcontroller the Select
Hardware Settings dialog includes a Target Filter search field. When this field
contains some characters only Board/Microcontroller matching the text in the
filter field is selectable in the Board/Microcontroller fields. Enter some
characters in the Filter field to reduce the number of selectable
boards/microcontrollers.
For instance if you know the name of your Board/MCU contains “F446” then
enter F446 into the search field. This will limit the number of items which can be
selected and makes it much more easy to find the Board/MCU.
Figure 19 - TrueSTUDIO Project Wizard Using Search Field
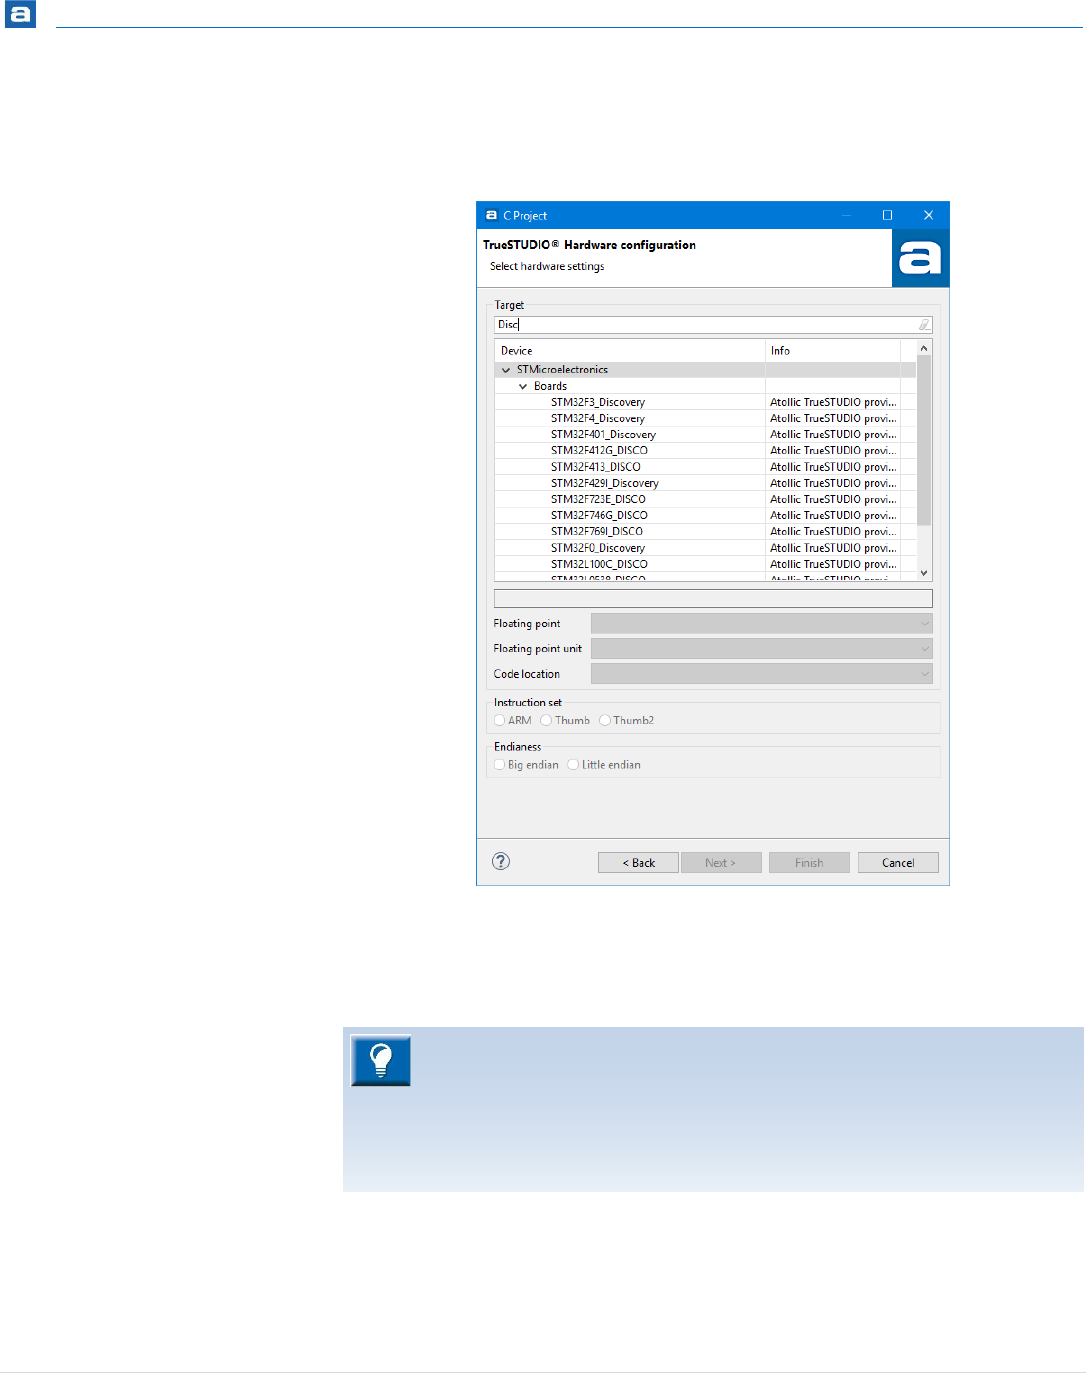
Getting Started
48 | P a g e
If the name of your board starts with “Disc” then just enter Disc into the search
field and only boards and devices containing Disc in the name will be listed.
Figure 20 – TrueSTUDIO Filter Board/Microcontroller
Select the board or microcontroller to create a project for.
The Info table in the Project Wizard displays Atollic TrueSTUDIO provided this
device. or CMSIS-Pack provided this device. The information depends on if the
project will be created based upon Atollic TrueSTUDIO Target Supported
Device information or if it will be based on installed CMSIS Pack files. See the
section Using CMSIS-Pack in TrueSTUDIO on page 166 for more information
about CMSIS-Pack.
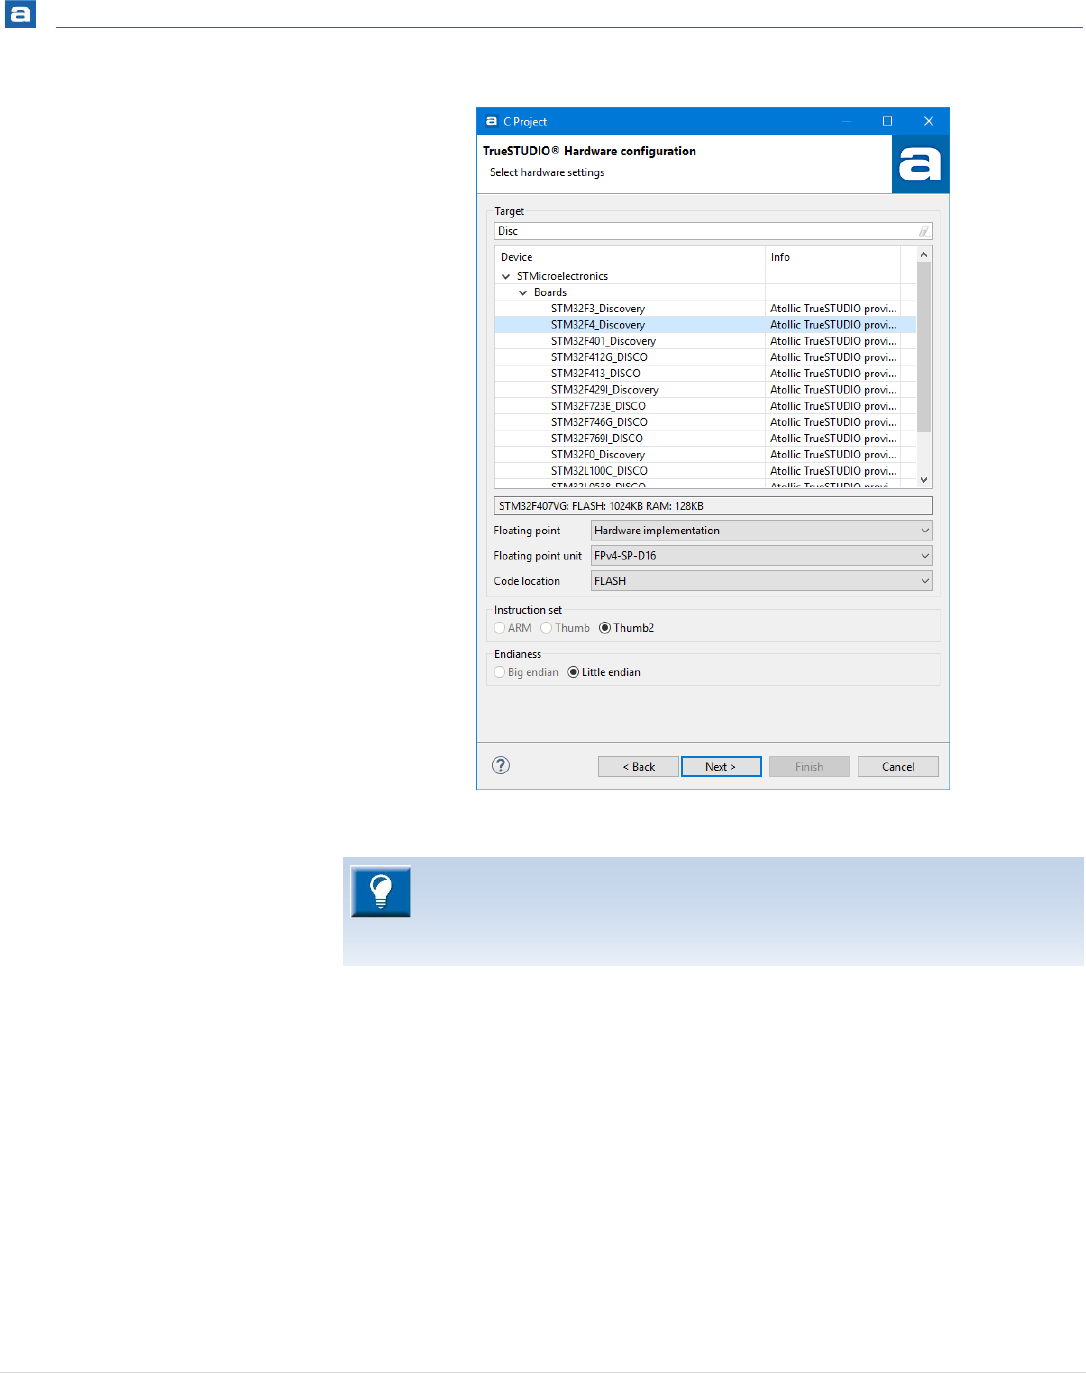
Getting Started
49 | P a g e
Figure 21 - TrueSTUDIO Hardware Configuration
The default selection for floating point operations is either Software
implementation, Mix HW/SW implementation or Hardware
implementation, depending on the selected microcontroller.
Some microcontrollers have floating point support implemented in hardware.
For such microcontrollers, the selection Hardware implementation is more
efficient, and will thus be default.
However, this setting will not work properly on devices that do not have
floating point support in hardware. In such a case, Software implementation
will be default.
Please note that evaluation boards may have hardware switches for
configuration of Code location in RAM or FLASH. The setting selected in the
project wizard must correspond to the settings on the board.
The text field below the tree displays information about the used device when
a Board or MCU is selected in the tree.
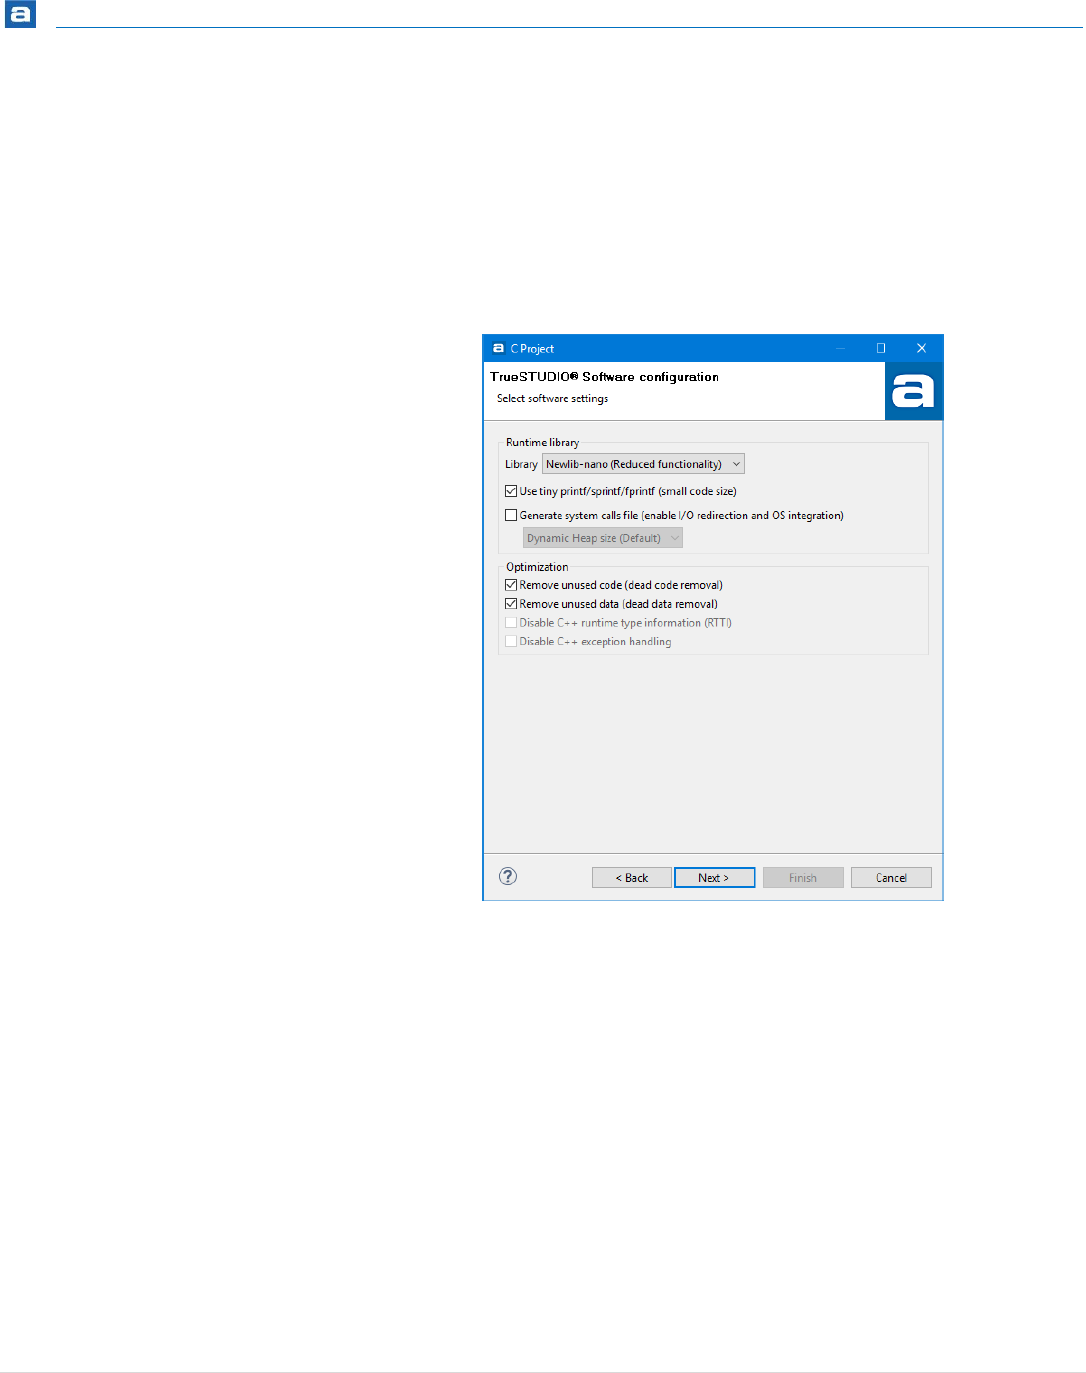
Getting Started
50 | P a g e
The Mix HW/SW implementation is for those projects that have libraries that
aren’t compiled for hardware floating point. In this implementation the
function calls are not using the FPU-registers as in a pure Hardware
implementation. The FPU will however still be used inside the project
functions.
When finished, click the Next button.
3. Wait for the TrueSTUDIO Software configuration page to be displayed.
Figure 22 - TrueSTUDIO Software Configuration
Select the desired Runtime library to be used. For information about the
differences between Newlib–nano and the regular Newlib, please refer to
the Newlib-nano readme file, accessible from the Information Center (Figure
10).
If the target board has a limited amount of memory, the Use tiny
printf/sprinf/fprintf (small code size) setting is recommended.
When finished, click the Next button.
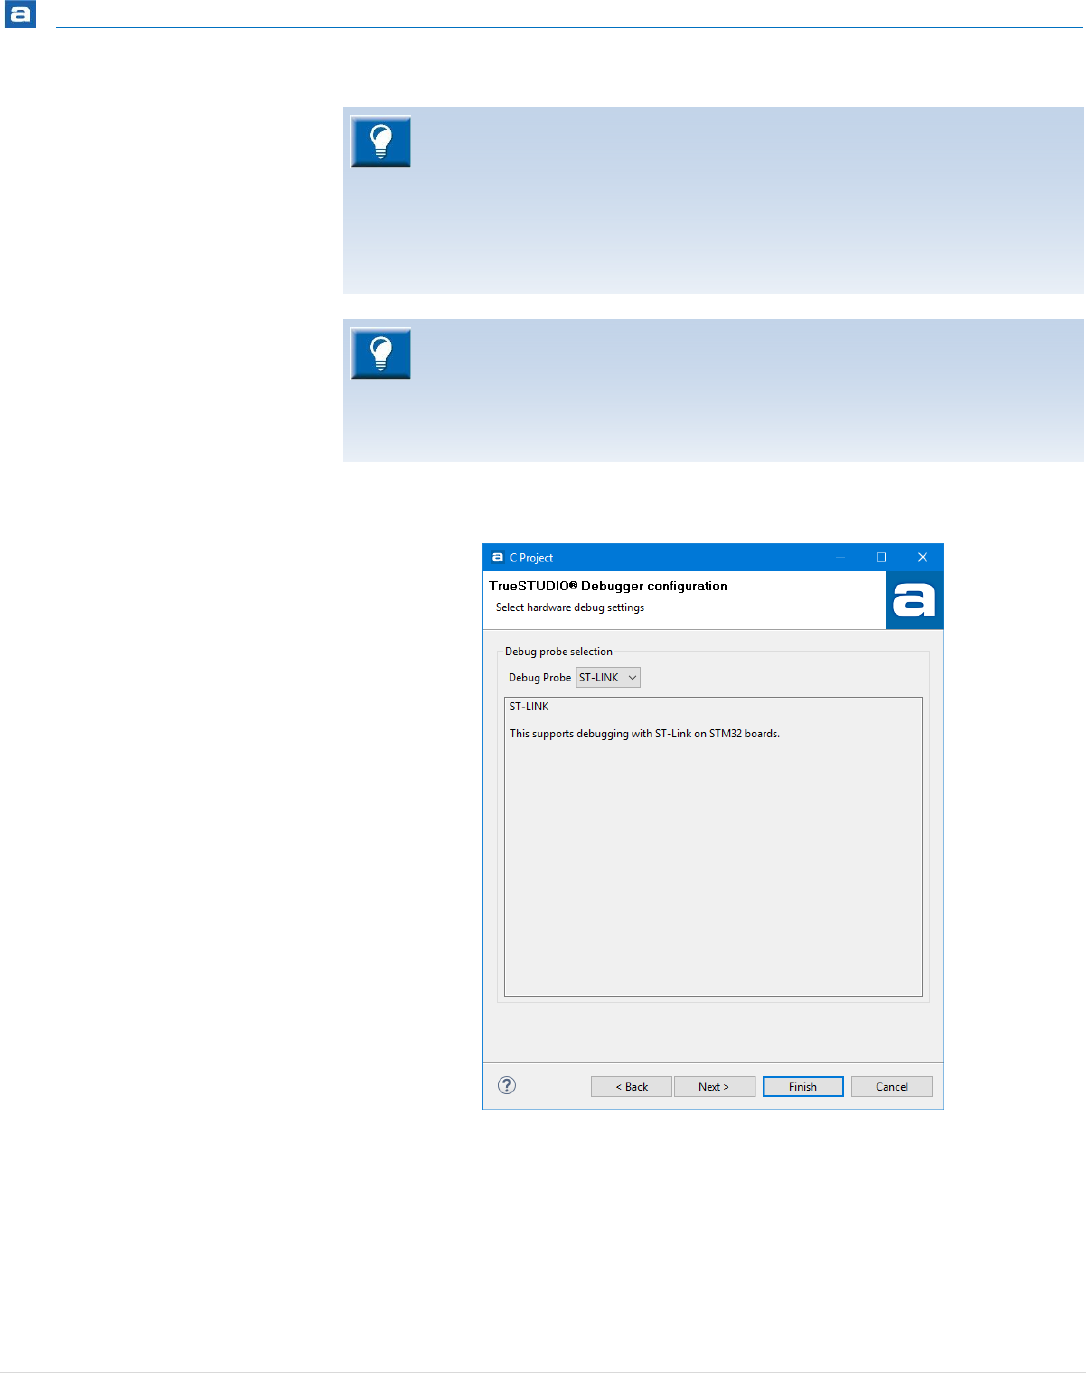
Getting Started
51 | P a g e
4. Wait for the TrueSTUDIO Debugger configuration page to be displayed.
Figure 23 - TrueSTUDIO Debugger Configuration
Atollic TrueSTUDIO supports several different types of JTAG probes. Select the
probe to be used during debugging.
When finished, click the Next button.
If Newlib-nano is used and float shall be used by scanf/printf add these options
to the “C Linker” options field
-u _scanf_float -u _printf_float
E.g. The option field line may now look like
-Wl,-cref,-u,Reset_Handler -u scanf_float -u_printf_float
If using an RTOS, it is recommended to generate a system calls file, and select
the Fixed Heap size option. This option requires that the _Min_Heap_Size
symbol is defined in the linker script .ld file. The .ld file is stored in the root
directory of the currently selected project. The heap size defined by
_Min_Heap_Size must meet the heap size required by the application.
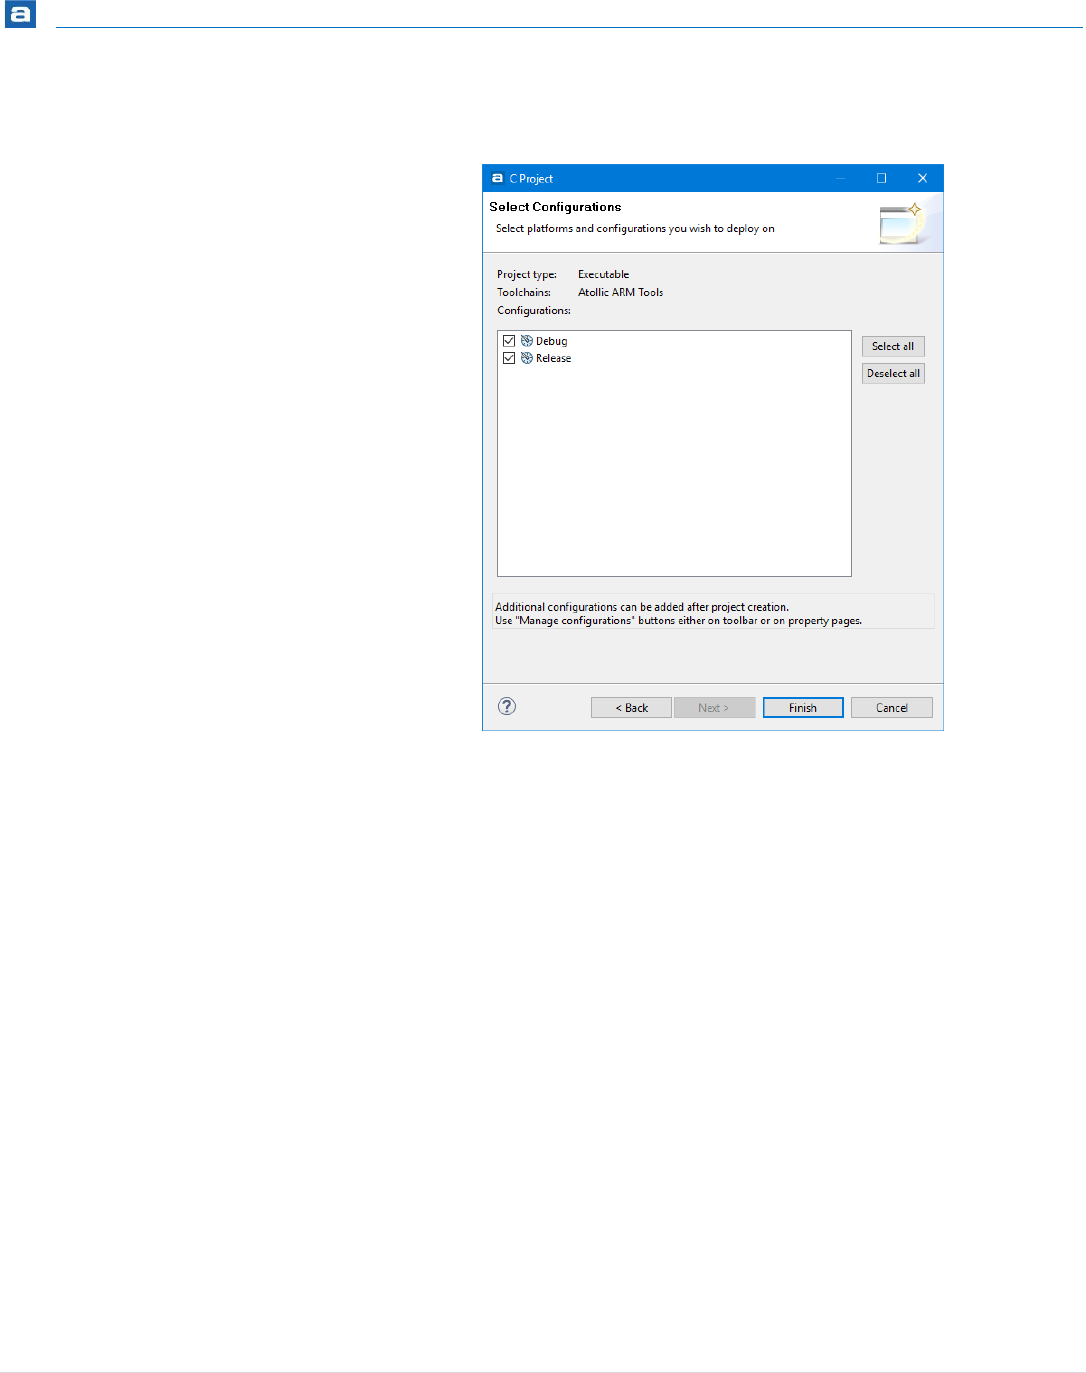
Getting Started
52 | P a g e
5. Wait for the TrueSTUDIO Select Configurations page to be displayed.
Figure 24 - Select Configurations
Keep the default selections. Click on the Finish button.
A new Managed Mode C-project is now created. Atollic TrueSTUDIO
generates target specific sample files in the project folder to simplify
development.
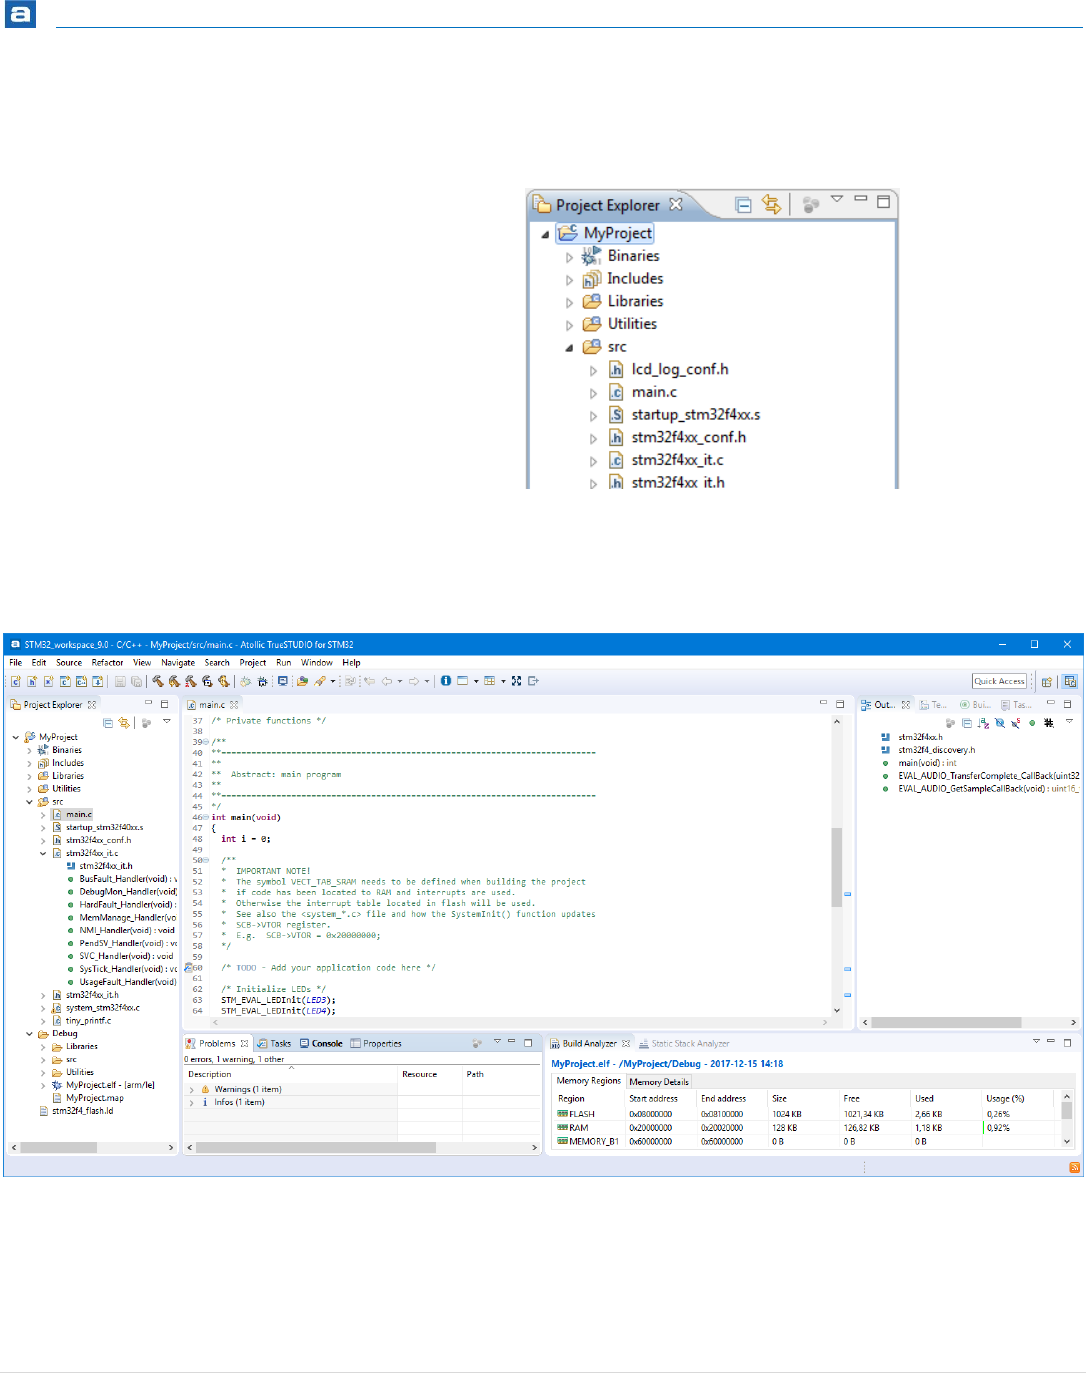
Getting Started
53 | P a g e
6. Expand the project folder (“MyProject” in this example) and the src
subfolder in the Project Explorer view.
Figure 25 - Project Explorer View
7. Double click on the main.c file in the Project Explorer tree to open the file
in the editor.
Figure 26 – Editor View
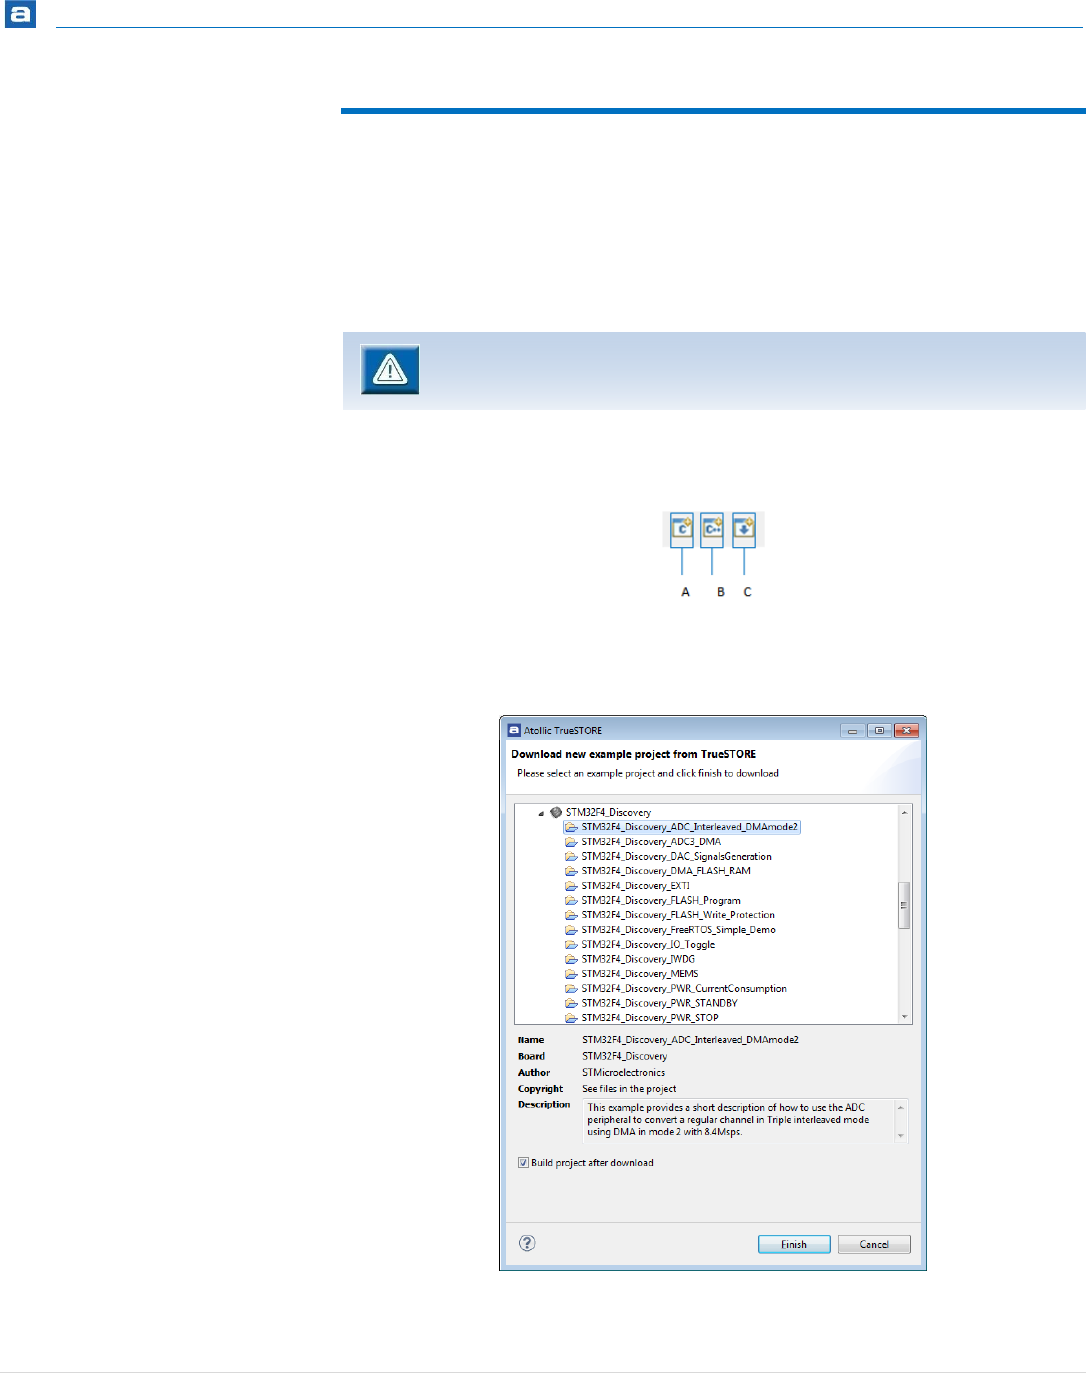
Getting Started
54 | P a g e
ONE-CLICK EXAMPLE PROJECT INSTALLATION
The Atollic TrueSTORE system is a repository with hundreds of free example projects for
various evaluation boards. Atollic TrueSTUDIO users can easily find the latest available set
of example projects on our server, as well as download and install them into the Atollic
TrueSTUDIO Active Workspace, with a single mouse-click! Any example application of
interest is up and running on the target hardware in less than a minute.
To find the examples relevant to a specific target board, select the Download button in the
toolbar (C in the image below).
Figure 27 – Project Creation Buttons
Wait for the Atollic TrueSTORE Dialog box to open.
igure 28 – Atollic TrueSTORE
The Atollic TrueSTORE® requires an internet connection to work, as all
example projects are stored on our internet server.
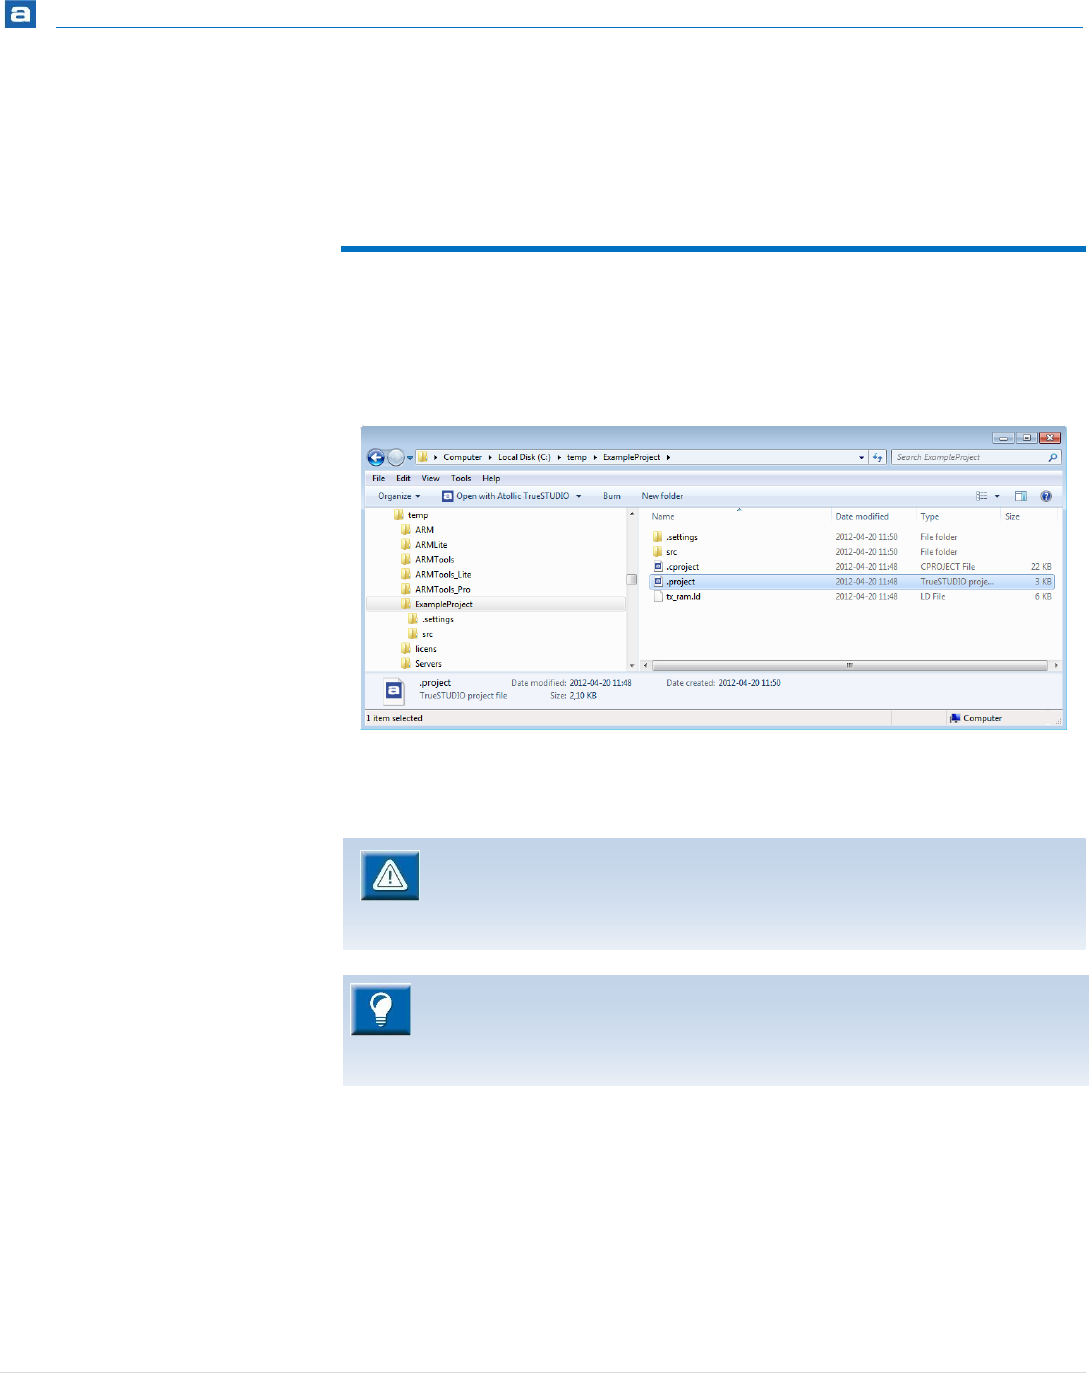
Getting Started
55 | P a g e
Select the project(s) of interest and click Finish. The project is imported into the Active
Workspace and is immediately ready to be built and executed on the target board.
The whole process typically takes less than a minute.
USING AN EXISTING PROJECT
To use an existing project in Atollic TrueSTUDIO, double-click the .project file located
within the project folder to open it. This requires that Atollic TrueSTUDIO is associated to
be used for .project files.
Figure 29 – Selection of Existing Project File
Wait for Atollic TrueSTUDIO to start, as a result of double-clicking the .project file.
When clicking on the.project file the Project Import Converter will investigate the project
and if it is made for Atollic TrueSTUDIO it is directly imported. But if the project is made
from some other tool the Project Import Converter tries to identify if it is a known project
format and in such case will convert the project to an Atollic TrueSTUDIO project. There
are two sections which covers conversion of projects in this manual:
Importing AC6 Projects - conversion of STM32CubeMX (AC6) projects
Importing EWARM Projects – importing IAR EWARM projects
Please note that if the File Browser is configured not to display file extensions,
two nameless icons will appear in the file list, representing the .project and
the .cproject files. The use of files without a filename is an unfortunate
heritage from the ECLIPSE™ framework.
Atollic recommends that example projects downloaded from outside Atollic
TrueSTUDIO®, e.g. from STMicroelectronics, be located not too many levels
below the file system root. This is to avoid exceeding the Windows® path
length character limitations.
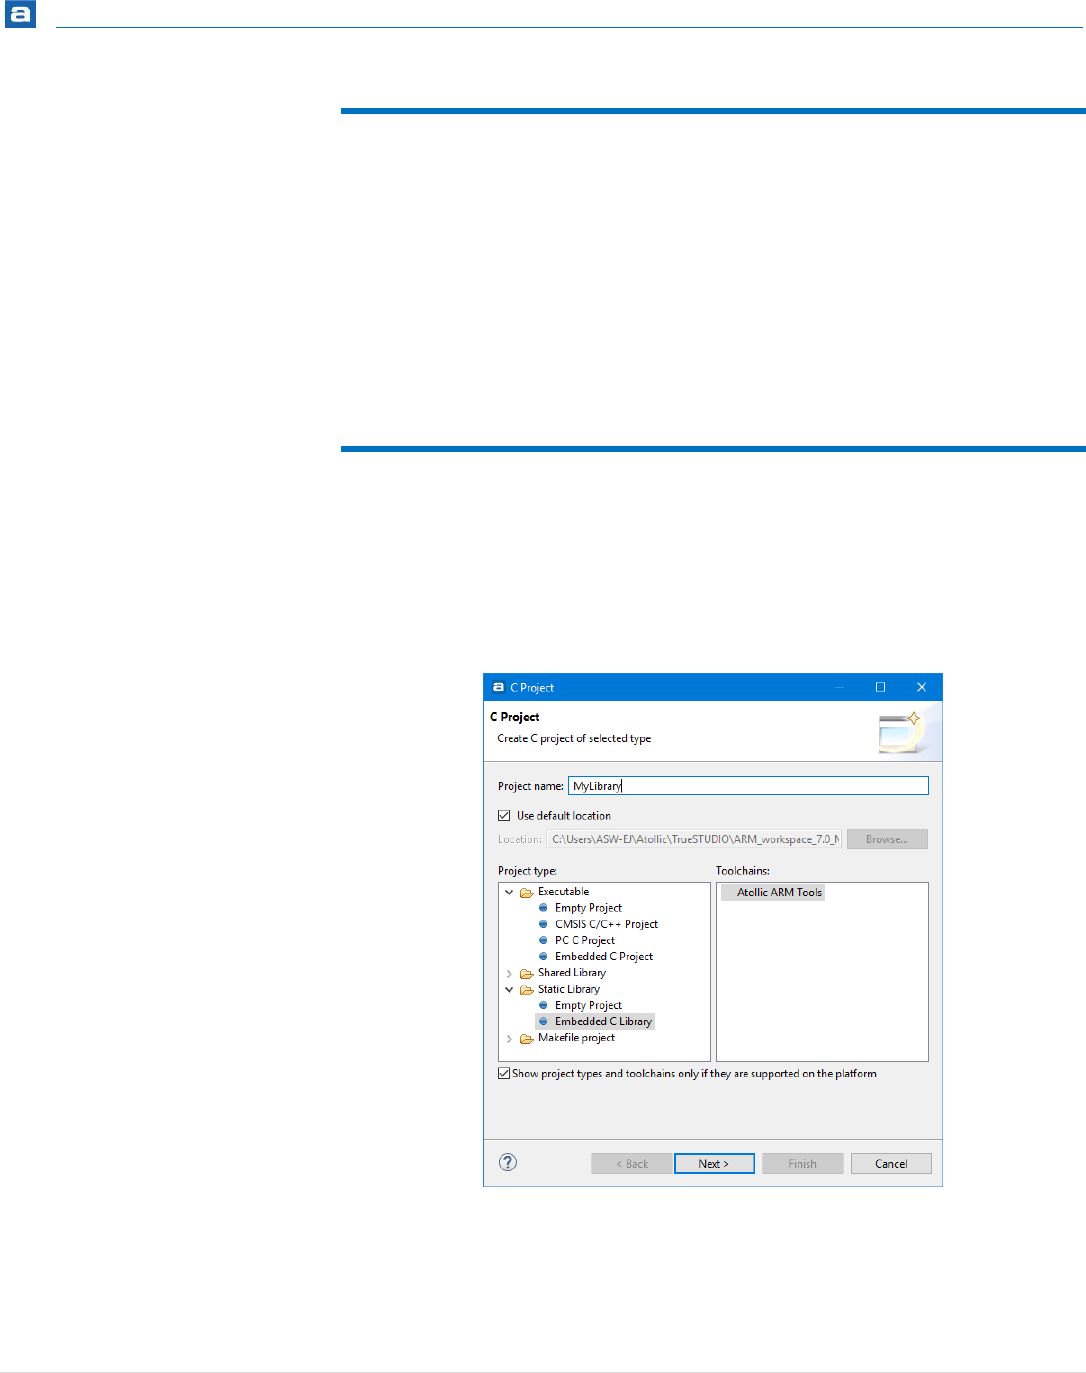
Getting Started
56 | P a g e
PREVENT “GCC NOT FOUND IN PATH” ERROR
Some old projects will issue an error in the Problems view saying Program “gcc” not found
in PATH. The error is caused when the project uses a deprecated discovery method
setting. The error can be removed by updating Window Preferences and Project
Properties settings.
1. Open Window, Preferences. In Preferences dialog select C/C++, Property Pages
Settings and enable checkbox: Display “Discovery Options” page.
2. Open Project , Properties, C/C++ Build, Discovery Options and disable checkbox:
Automate discovery of paths and symbols.
CREATING A STATIC LIBRARY
To create a Static Library-project select in the top menu File, New, C Project and in the
wizard-dialog that pops up select Static Library, Embedded C Library and Atollic ARM
Tools.
Figure 30 – Selection of Static Library Project
Press Next and select the device to be used. This will make the project build settings
correct. The project will then be built as an archive file with the name lib{project-
name}.a, as for an instance libMyLibrary.a
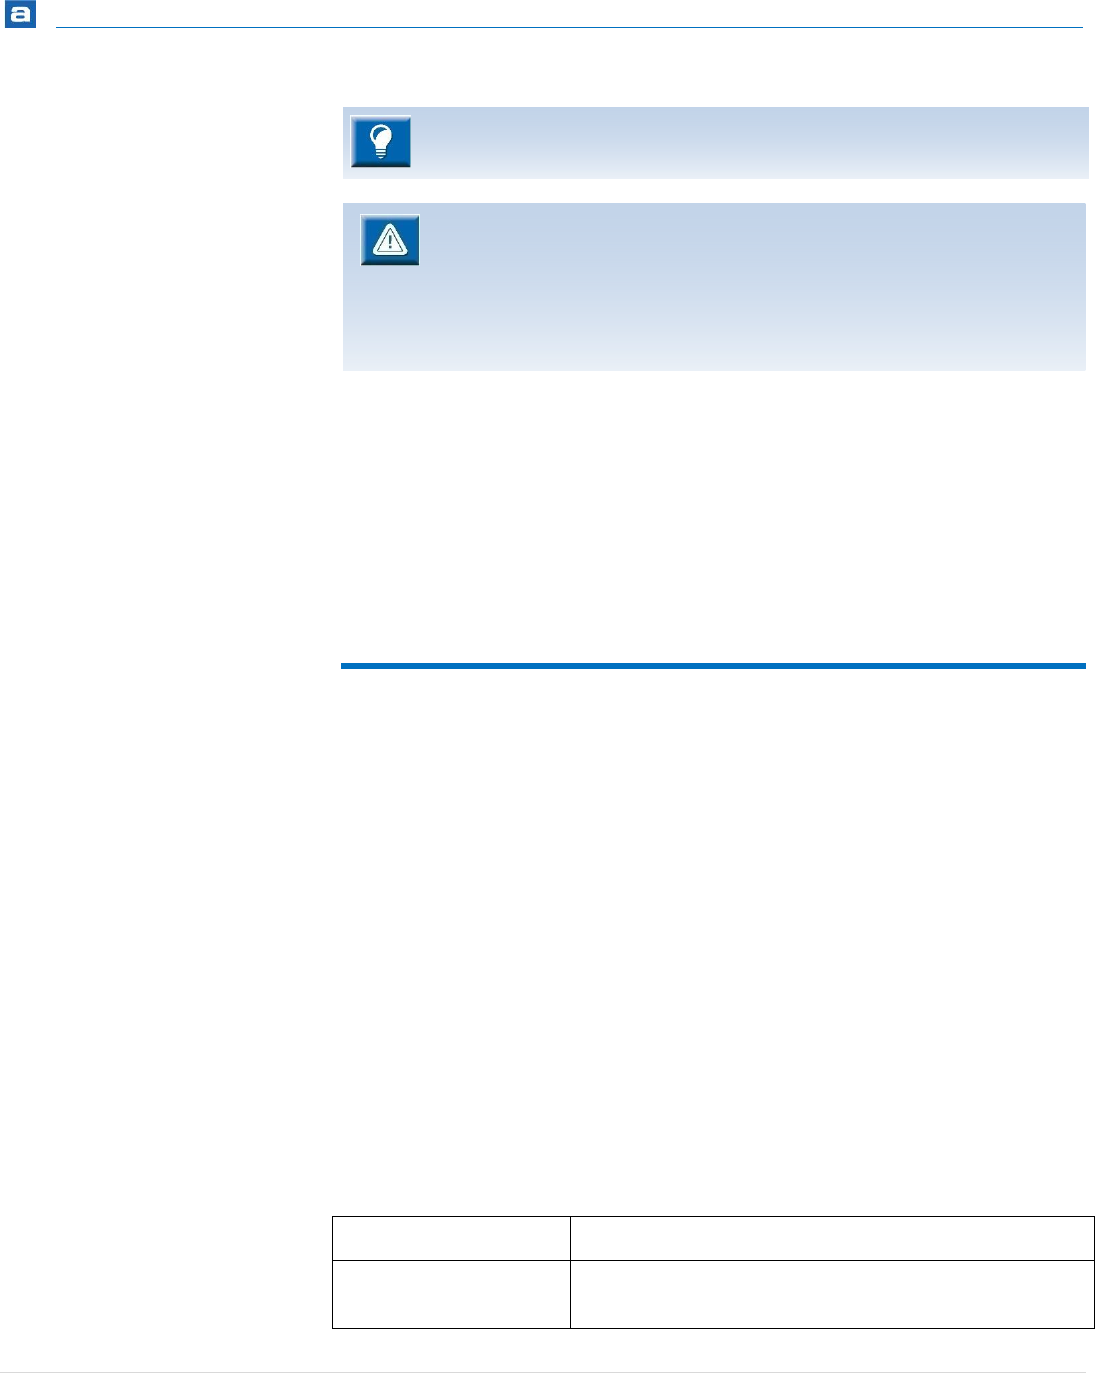
Getting Started
57 | P a g e
The GNU Binary Utilities command line tools are needed to create an archive file from an
object file without first creating a library project.
1. Open a Windows command prompter – cmd.exe
2. Move to the ARMTOOLS\bin folder in TrueSTUDIO installation folder
cd C:\%installdir%\ARMTools\bin
3. Run the archive command
arm-atollic-eabi-ar -r libStaticLibrary.a src\syscalls.o
HIDE INFORMATION IN A STATIC LIBRARY
The GNU Binary Utilities is included in the Atollic Toolchain and contains several programs.
The programs strip and objcopy takes parameters which removes information or
change information from the archive file.
For instance objcopy can be used if a library shall be exported and used by other people
and there is a need to hide information in the library such as function names or variables.
Below is an example on how to remove symbols and redefine some names in a library.
1. Open a Windows command prompter – cmd.exe
2. Move to the ARMTOOLS\bin folder in TrueSTUDIO installation folder
cd C:\%installdir%\ARMTools\bin
3. Run the objcopy command to change some information.
arm-atollic-eabi-objcopy --strip-unneeded --redefine-sym
myfunc=aaaa libTest.a libRenamed.a
This will open library libTest, remove all symbols that are not needed for relocation
processing and will also redefine myfunc to aaaa, and create a new library libRenamed.
Option
Information
-g
--strip-debug
Do not copy debugging symbols or sections from the source
file.
It is recommended to always place a library and the library code in a separate
project and never include them in the main-project.
If the library project should be recompiled at the same time as the project
that have included it, the library project should be added as a reference to
the other project. Select Project, Properties, C/C++ General, Paths and
Symbols and in References-tab select the library project.
For more information about Project referring, see Referring Project on page
119
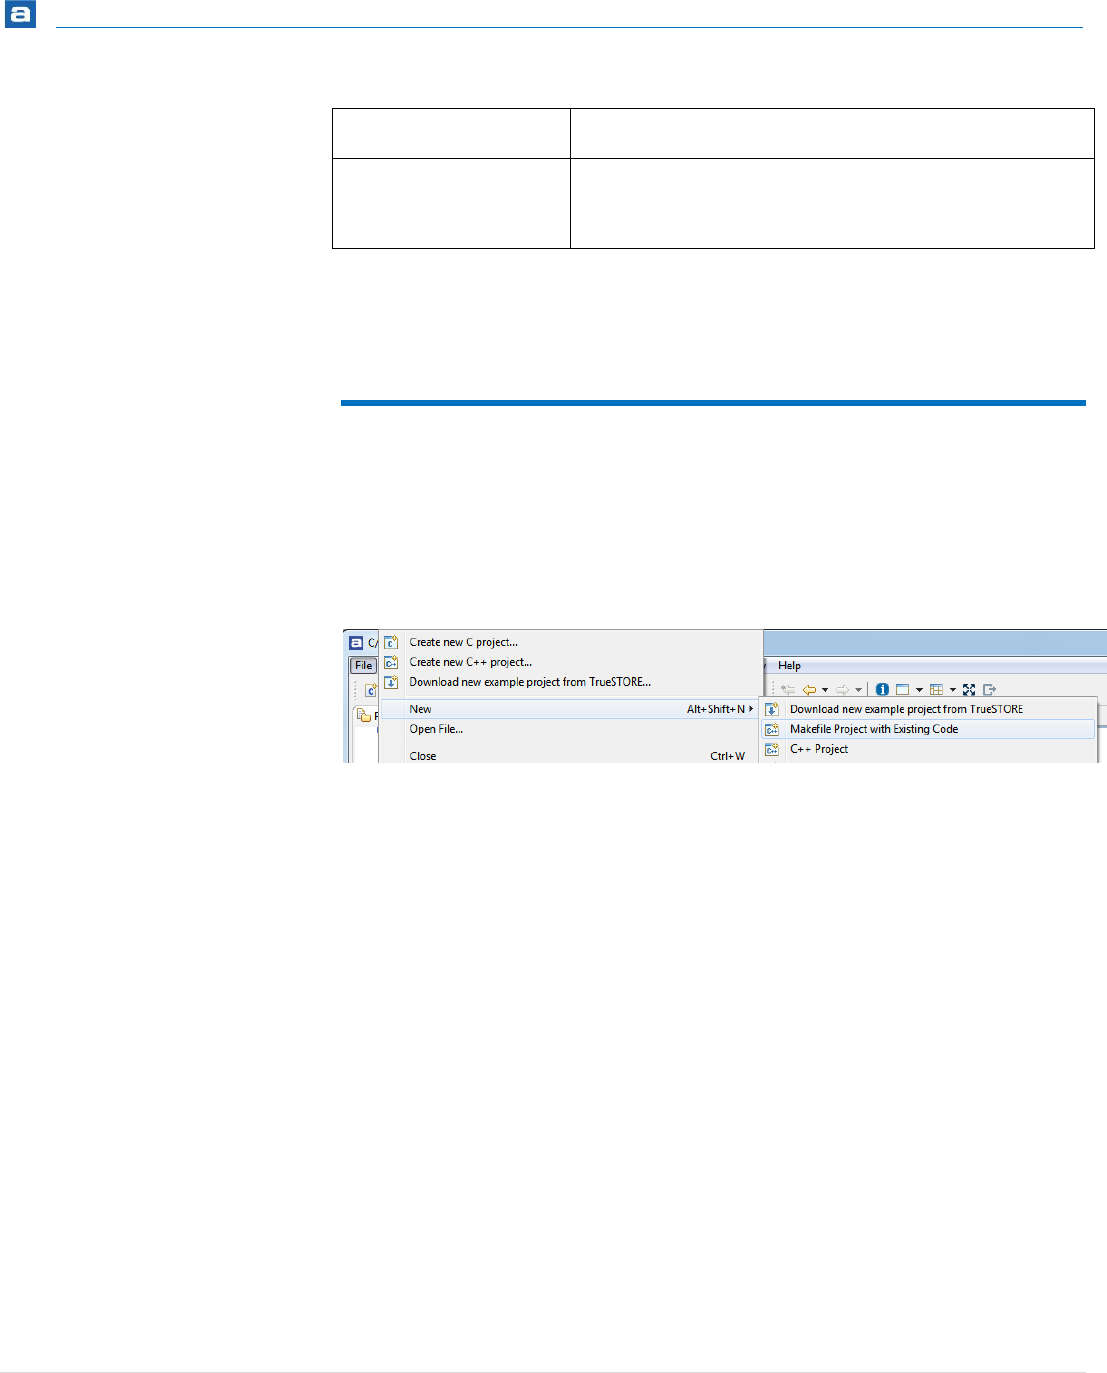
Getting Started
58 | P a g e
--strip-unneeded
Strip all symbols that are not needed for relocation processing.
--redefine-sym old=new
Change the name of a symbol old, to new. This can be useful
when one is trying link two things together for which you
have no source, and there are name collisions.
Figure 31 – Examples of options to be used with objcopy
The GNU Binary Utilities Manual contains complete information on how to use the
included Binary Utilities software.
CREATING A MAKEFILE PROJECT FROM EXISTING
CODE
To import an existing makefile project select File, New and Makefile Project with Existing
Code.
Figure 32 – Create a Makefile Project from existing code
Enter the name of the new project and the location of the existing code.
Make sure to select <none> as the Toolchain for the Indexer Settings.
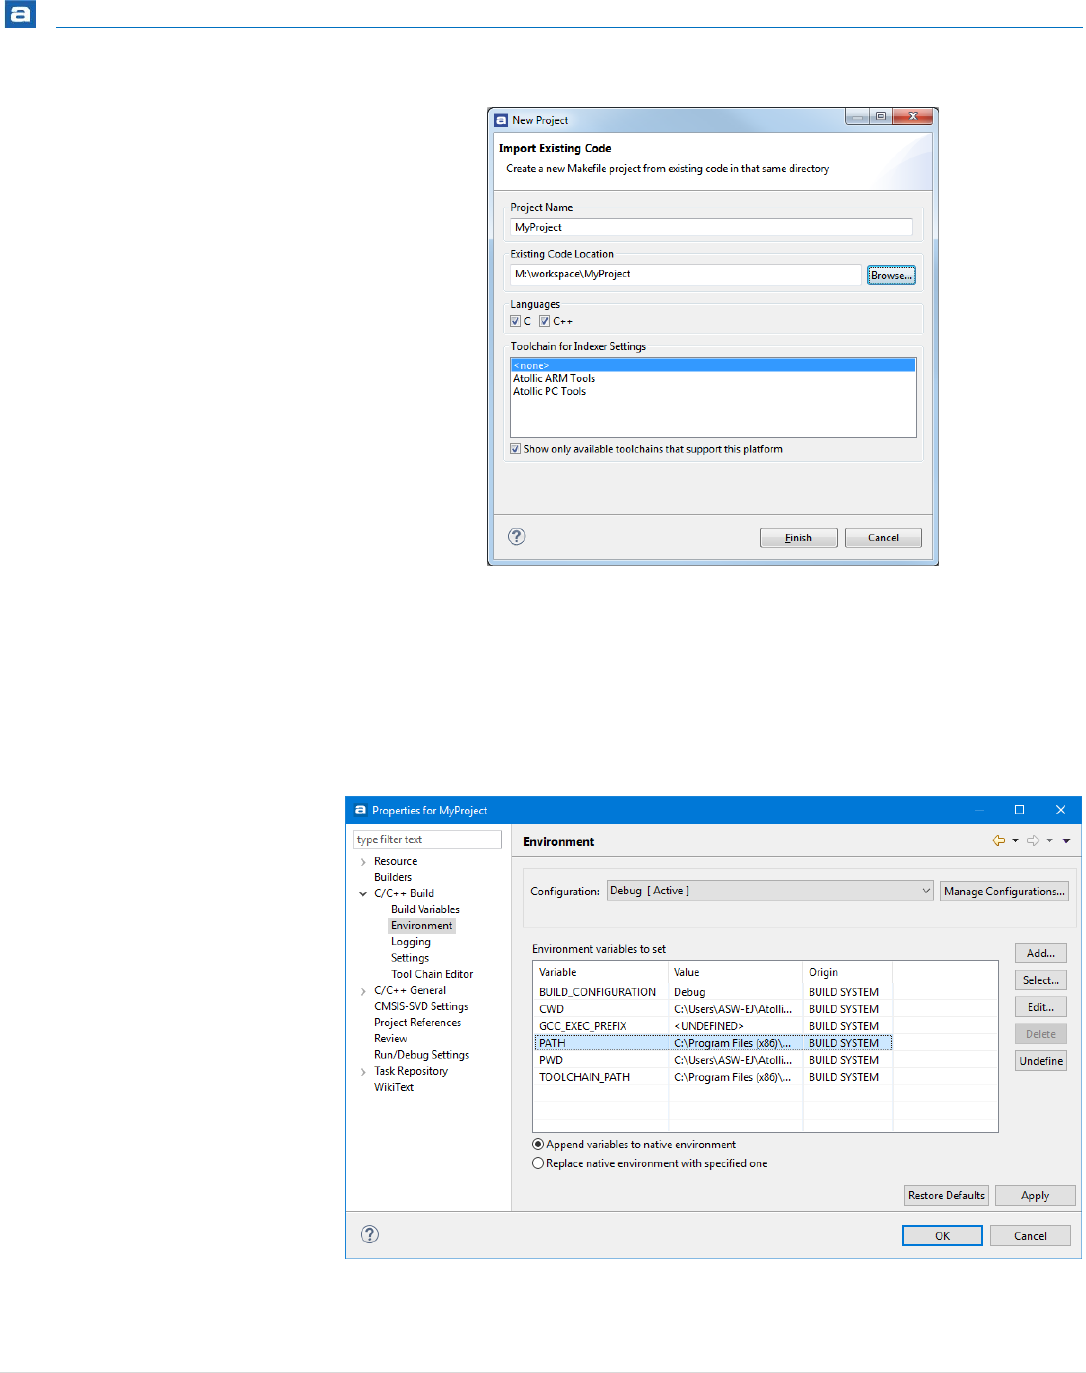
Getting Started
59 | P a g e
Figure 33 – Locate the code and select <none>
Then add the path to the existing toolchain to the system PATH environment variable.
That can be done from within Atollic TrueSTUDIO by select Project, Properties and then
C/C++ Build, Environment.
Locate the PATH variable in the list, select it and click Edit. If PATH can’t be located, click
Add and write PATH in the Name textbox.
Figure 34 – Edit the PATH variable

Getting Started
60 | P a g e
In the Value textbox, add the full path to the location of the toolchain, and also any other
location from where any executables in the makefile are located. Separate the paths with
a “;”.
Getting Started
61 | P a g e
IMPORTING EWARM PROJECTS
Atollic TrueSTUDIO v8.0 has a new Project Import Converter supporting IAR Embedded
Workbench® for ARM® (EWARM) projects. The new Project Import Converter
automatically updates EWARM projects to Atollic TrueSTUDIO format during import. After
an import the project will need manual updates in order to build correctly.
The Project Import Converter will not modify any source or project files for your original
EWARM project. It is however recommended that you backup or make a copy of the
original EWARM project since you most likely need to modify some of the source code
after the project has been imported to Atollic TrueSTUDIO.
A log file is created in the project folder during import. The name of this log file is
ProjectName_converter.log. This log file is placed into the same folder as the
.project file and can be investigated to find information about the conversion. The
ProjectName_converter.log. can for instance contain the following info.
Project: STM32F4-Discovery
Converter: IARProjectParser
Date: 20170421
Project needs GCC compatible startup code and linker script
USING THE PROJECT IMPORT CONVERTER
You must use Import Projects from Folder or Archive in Atollic TrueSTUDIO in order to
import EWARM projects into Atollic TrueSTUDIO.
IMPORT PROJECTS FROM FOLDER OR ARCHIVE
Use the following method to import one or many projects.
To open the Import wizard, select File, Import…
It is always recommended to make backups of the project files and source code
before converting projects.
Please note! The imported project will not be copied to the workspace. All
files in the project will be located at the original place and will be overwritten
when manual changes are made.
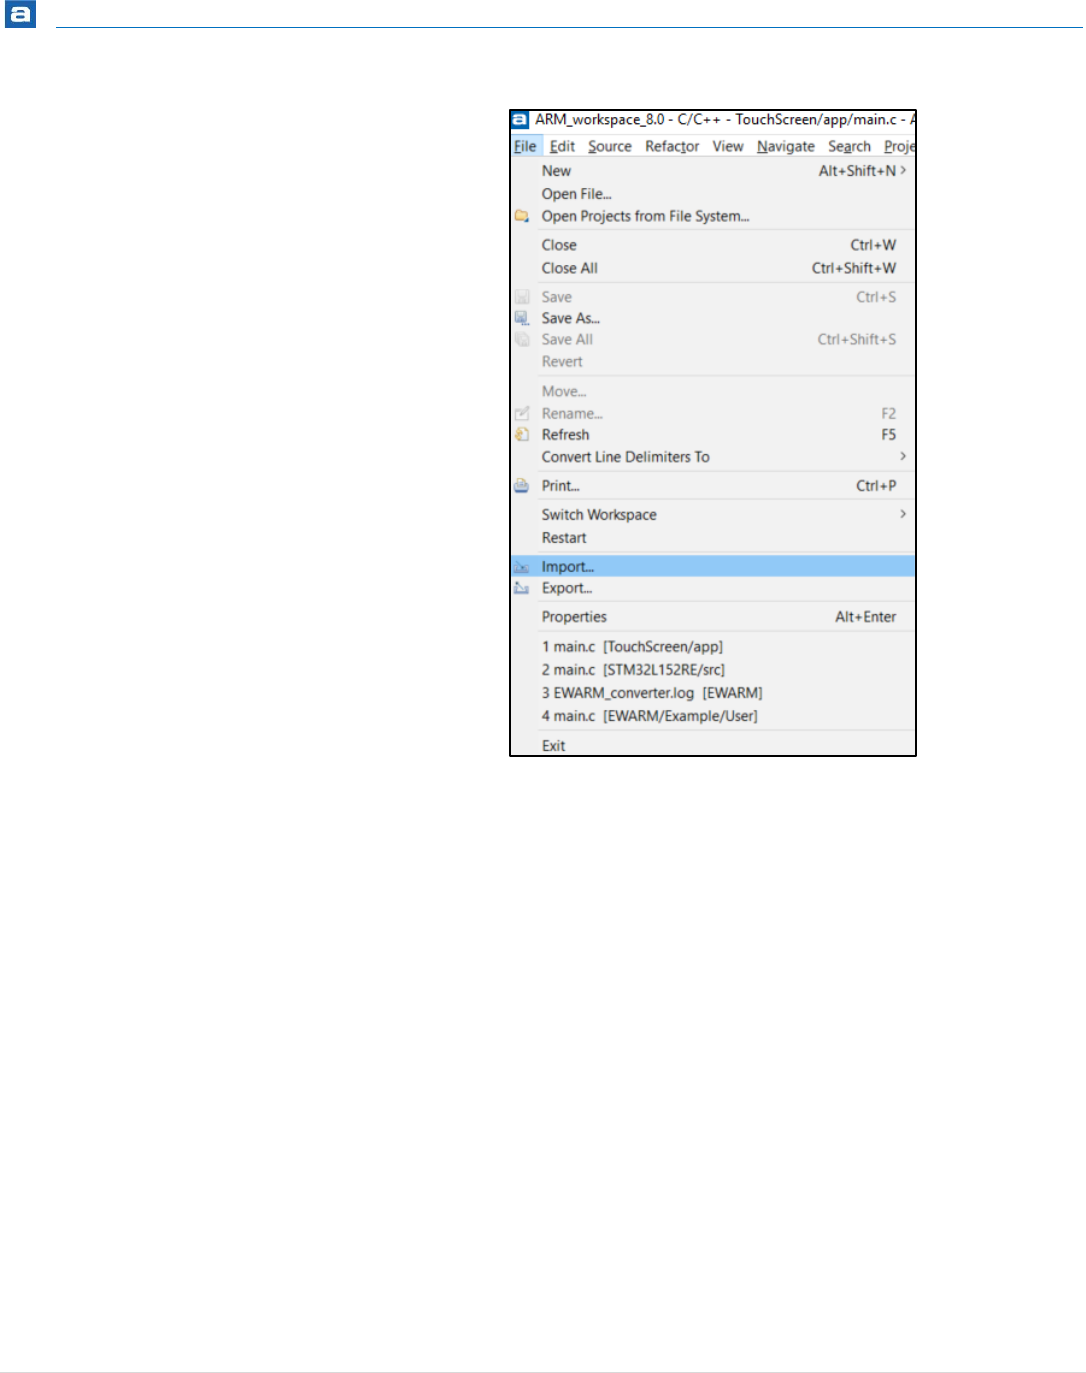
Getting Started
62 | P a g e
Figure 35 - Import Projects (EWARM)
In the Import wizard select Projects from Folder or Archive and press Next.
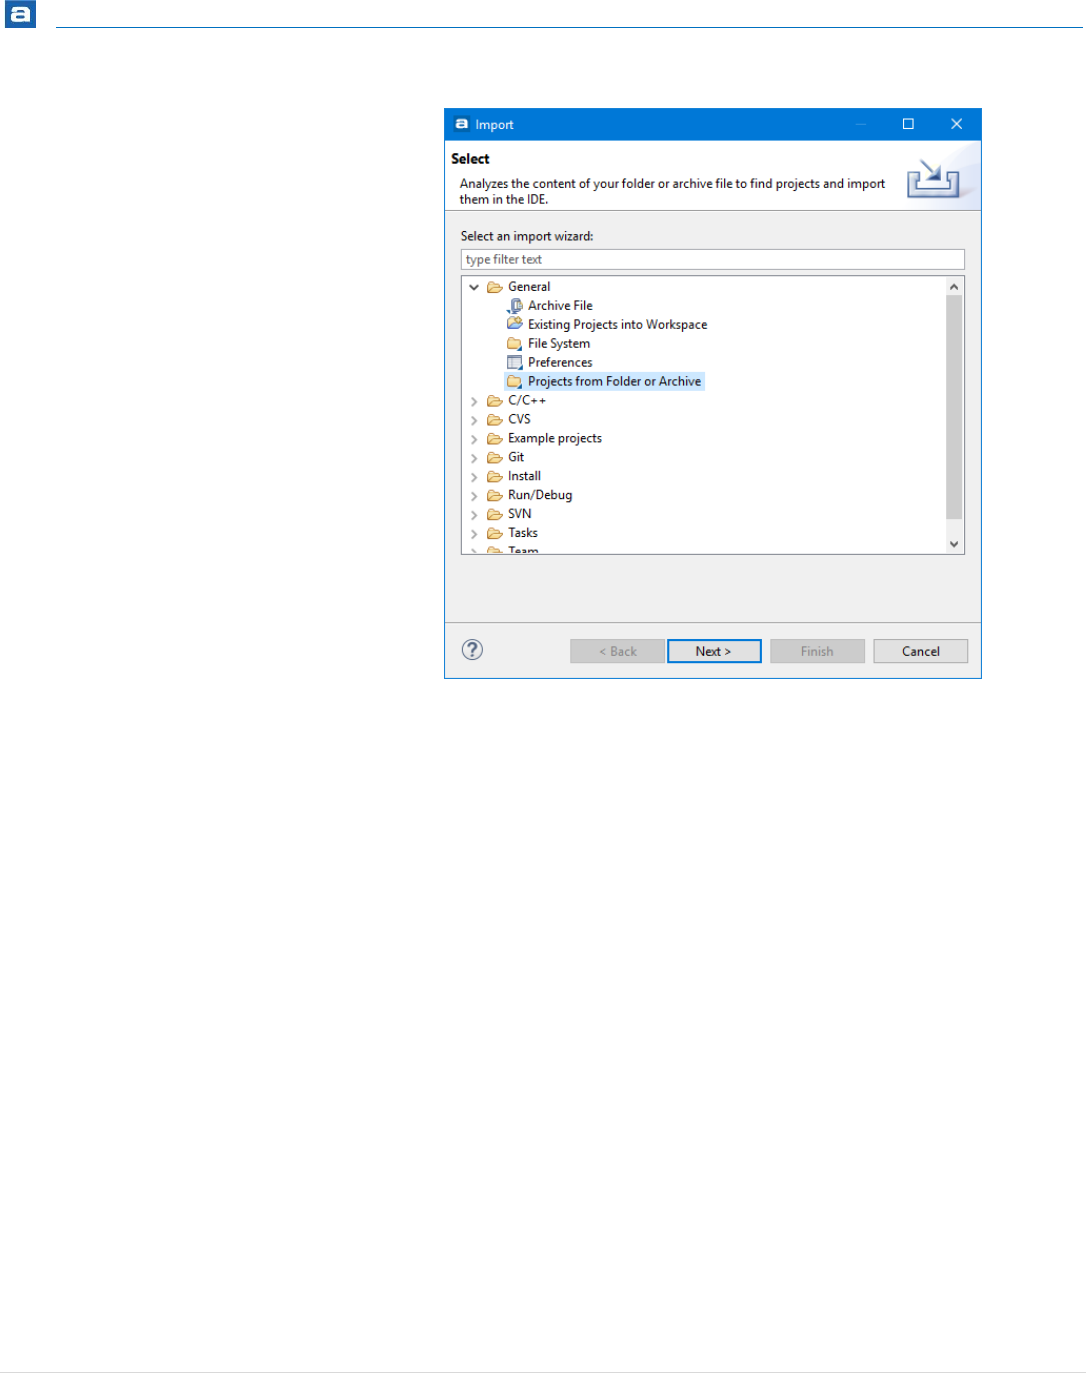
Getting Started
63 | P a g e
Figure 36 - Import Projects from Folder or Archive (EWARM)
The Import Projects from File System or Archive dialog is opened.
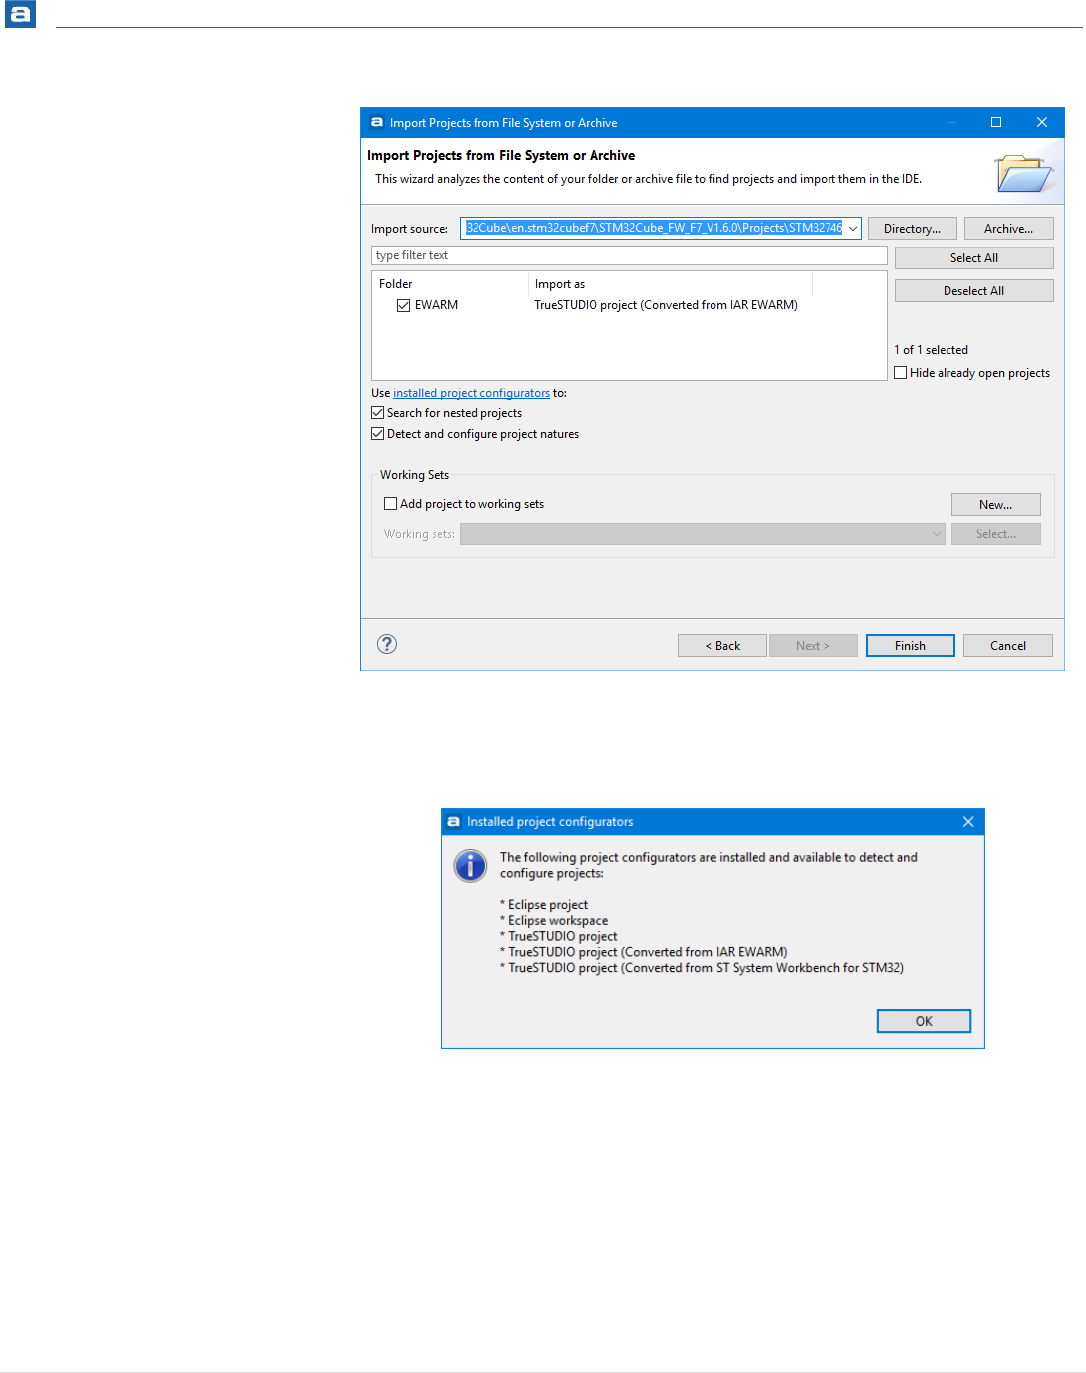
Getting Started
64 | P a g e
Figure 37 - Import Projects from File System (EWARM)
To see the Installed project configurators in the product, press the installed project
configurators link in the Import Projects from File System or Archive dialog.
Figure 38 - Display Installed Project Configurators (EWARM)
In the Import Projects from File System or Archive dialog browse to the folder containing
the project to be imported.
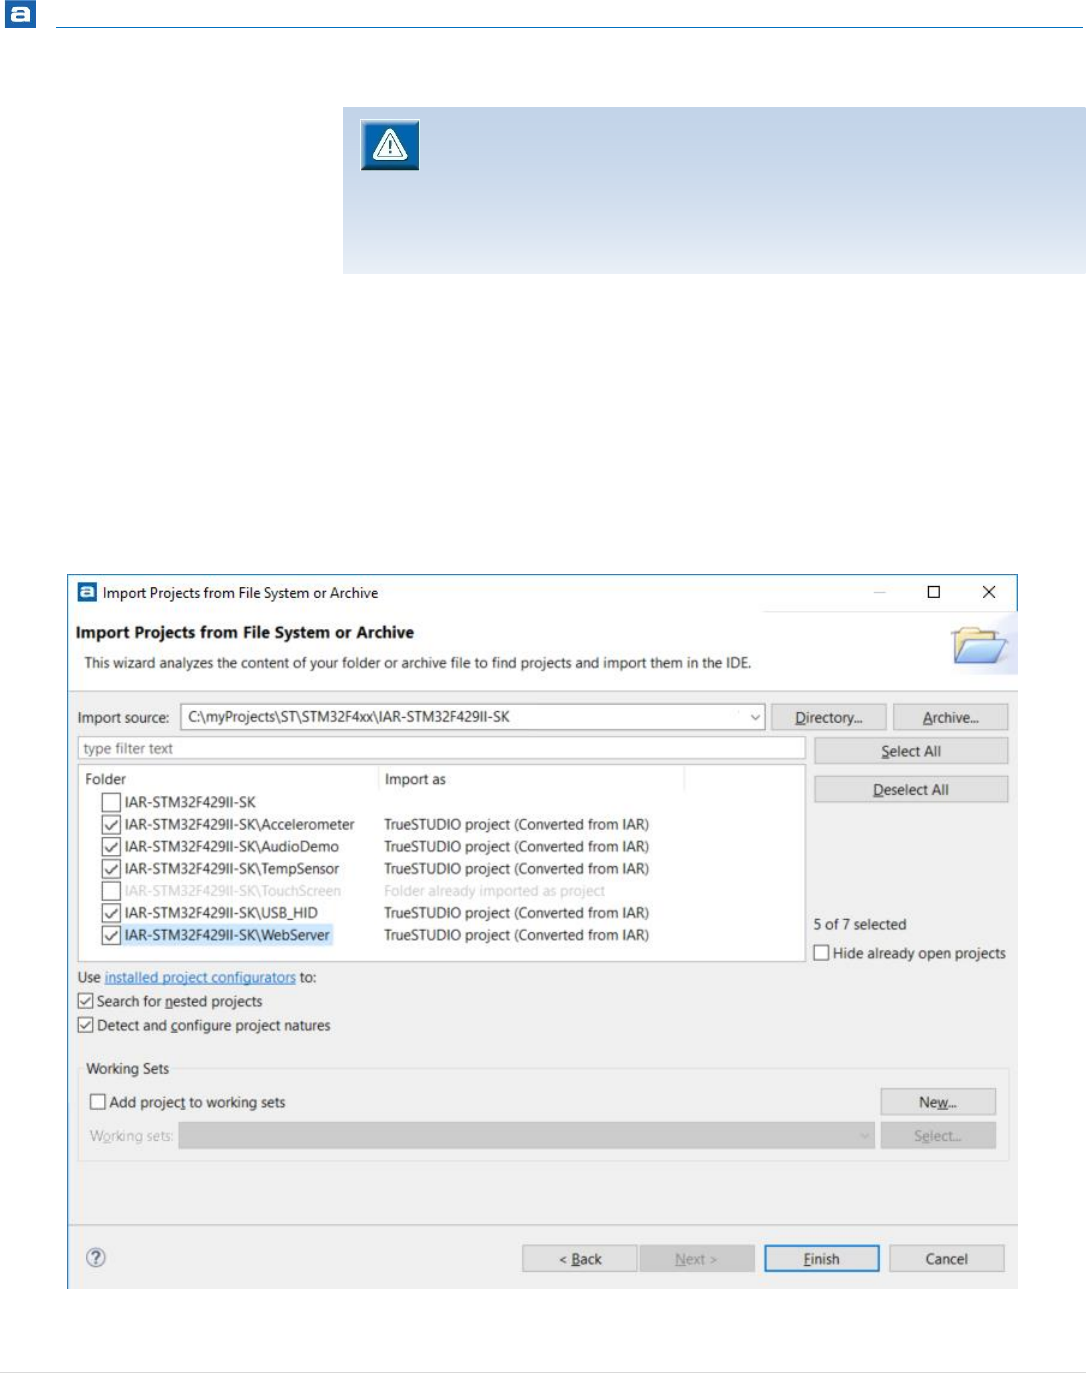
Getting Started
65 | P a g e
Select the project and make sure the checkbox Detect and configure project natures is
enabled otherwise the Project Import Converter will not be used. Press Finish to import
the project.
The project is now imported into the workspace. Please note that files included in the
project are not copied to the workspace, instead all files are linked to the workspace. This
means that the actual files will be updated in the original EWARM project. Press OK to use
the imported project.
If a folder which contains several projects are selected and Search for nested projects are
selected several projects will be seen in the dialog.
Figure 39 - Import Several Projects from File System (EWARM)
Eclipse cannot handle two projects with the same name in a workspace.
Therefore it may only be possible to import one project for a board into the
workspace. If an attempt is made to import a second project with the same
name, the import will be cancelled silently without any specific message.
Remove the first project from the workspace or create a new workspace if
another project shall be tested.

Getting Started
66 | P a g e
Many projects can then be imported in one step using this method. However, as
mentioned earlier, Eclipse requires different names to be used for each selected project. If
you run into this problem you can either rename the original EWARM project(s), or import
them into different Atollic TrueSTUDIO Workspaces.
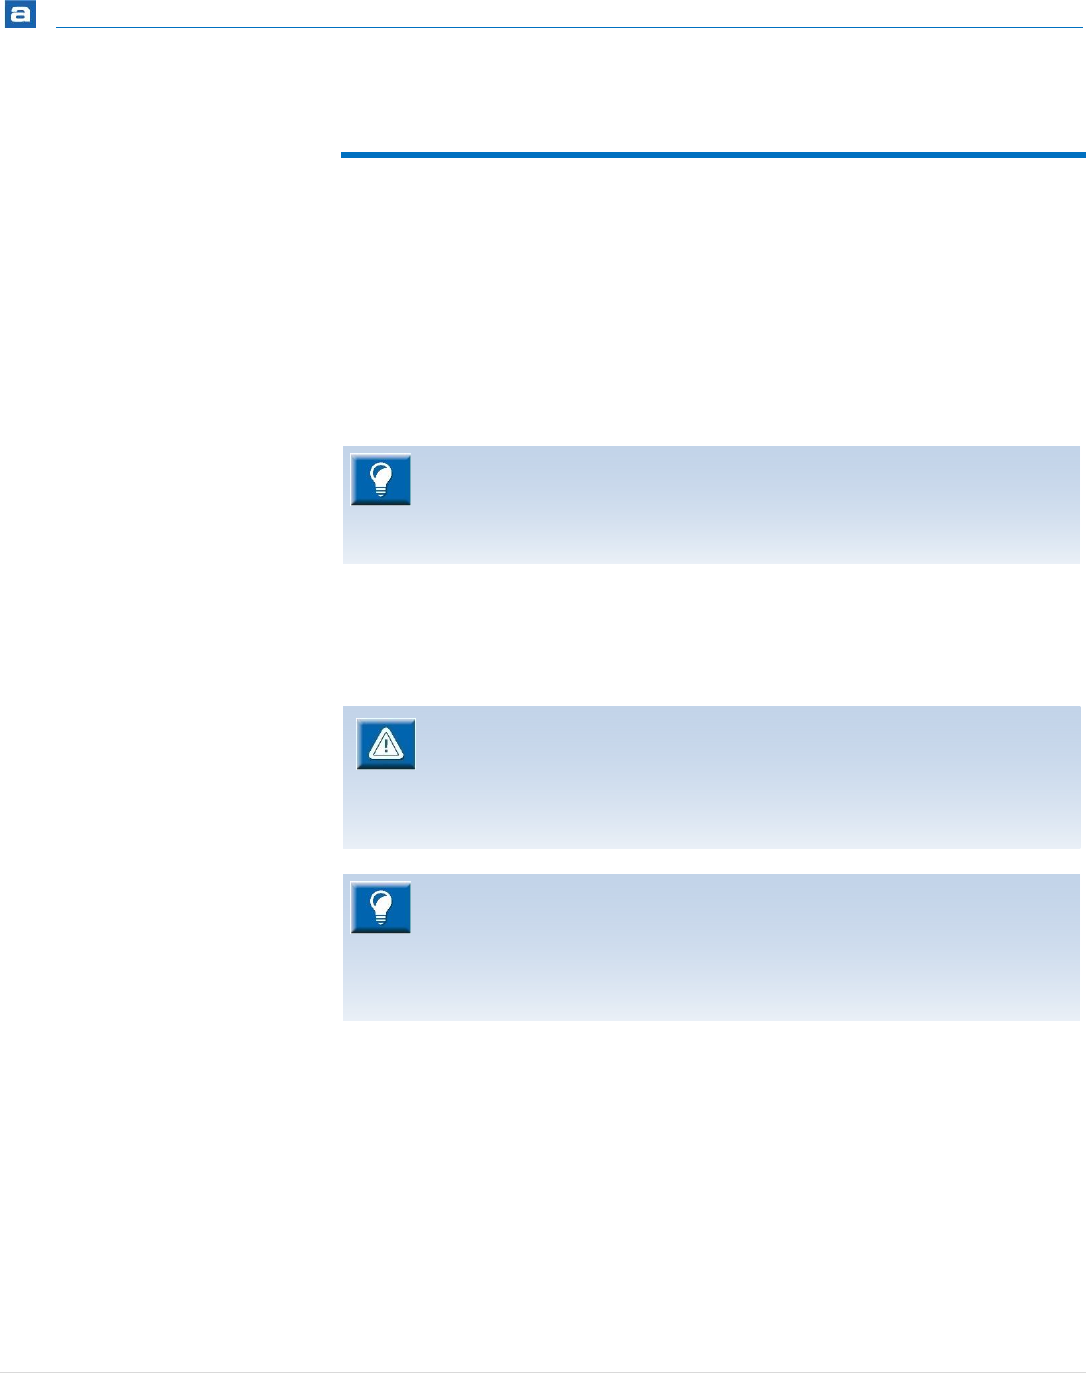
Getting Started
67 | P a g e
BEFORE BUILDING IMPORTED PROJECT
Start by having a look in the generated log file that is included in your imported project.
This log file contains valuable information about the imported project, for example if there
were problems importing certain parts for EWARM.
Before we build we need to make some manual modifications to the source code and
make sure that the build options are set correctly. Below is a step-by-step list and we will
walk through this list and give examples on what typically needs to be done to get to a
project that builds in Atollic TrueSTUDIO.
There are essentially four parts of the migration process that you need to manually
update. Review and modify build options, modify assembler source code, add a linker
script file and watch out for tool specific code. These steps are described below and will in
most cases lead to a project that builds and functions correctly.
For more detailed information on how to migrate EWARM code and build
options, please see the IAR to Atollic Migration Guide, sections 3 and 4.
You can access the IAR to Atollic Migration Guide from Atollic TrueSTUDIO
Information Center.
Linker scripts, startup code and standard C/C++ libraries are tightly releated so
we must make sure to use either Atollic TrueSTUDIO or EWARM versions of
this code and scripts. It is strongly recommended to use Atollic TrueSTUDIO
versions since migrating all this from EWARM to Atollic TrueSTUDIO would be
very time consuming and prone to errors.
In the process of manullay updating our new Atollic TrueSTUDIO project we
will need startup code and a linker script file. We can easily get this if we
create a dummy project in our Atollic TrueSTUDIO Workspace. The only thing
you have to remember is to make sure that our dummy project is based on
the same ARM device as our original project.

Getting Started
68 | P a g e
STEP-BY-STEP CHECKLIST
The following steps are necessary to double-check in order to obtain a successful build.
1. Update Atollic TrueSTUDIO build options.
We should make sure that pre-defined symbols, include paths, FPU selection and
C/C++ language settings match the original project.
With one exception, all pre-defined symbols and search paths have already been
updated but you should make sure that options like FPU and C/C++ language
matches the original project. See table below for information on where to find
different build options.
Option
EWARM
TrueSTUDIO
FPU
General Options -> Target -> Floating point
settings
[Build tool] -> Taget -> Floating point / FPU
Note: [Build tool] is either Assembler, C Compiler,
C++ Compiler or C++ Linker. If you change the FPU
option then you should make the same change in
all four build tools.
C/C++ language
C/C++ Compiler -> Language 1
C Compiler -> General
C++ Compiler -> General
Note: The Atollic TrueSTUDIO project will by
default use the C compiler for C files and C++
compiler for C++ files.
Compiler defines
C/C++ Compiler -> Preprocessor -> Defined
Symbols
C Compiler -> Symbols -> Defined symbols
Compiler paths
Assembler -> Preprocessor -> Additional
include directories
C Compiler -> Directories -> Include path
Assembler defines
Assembler-> Preprocessor -> Defined
Symbols
Assembler -> Symbols -> Defined symbols
Assembler paths
C/C++ Compiler -> Preprocessor ->
Additional include directories
Assembler -> Directories -> Include path
Table 2 - EWARM vs TrueSTUDIO build options
The exception mentioned in the paragraph above is the CMSIS include path. In
EWARM you can specify to use CMSIS with the Use CMSIS option.
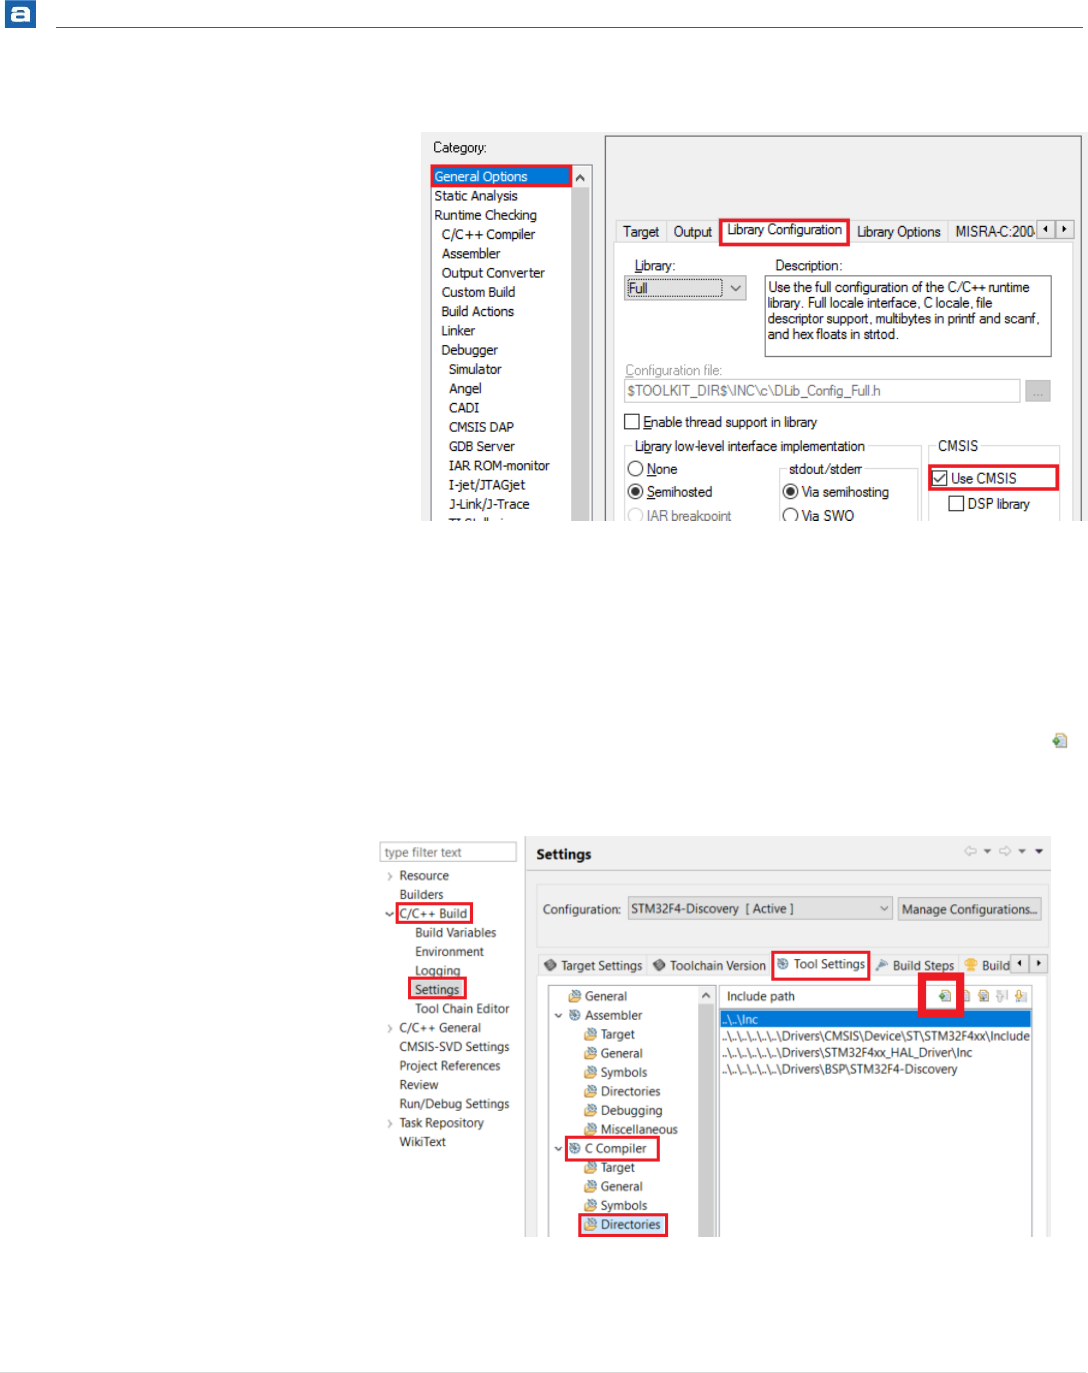
Getting Started
69 | P a g e
Figure 40 - EWARM CMSIS option
If Use CMSIS is checked then you will need to add a path to the CMSIS library to use in
your application. You can do this in the Directory part of the C Compiler settings. The path
to add is the absolute path the CMSIS/Include located in your EWARM installation,
typically something like this:
C:\Program Files (x86)\IAR Systems\Embedded Workbench x.x\arm\CMSIS\Include
In the Directory part of the C Compiler setting (see picture below), click the Add… icon ( )
to add your path.
Figure 41 - TrueSTUDIO compiler include paths
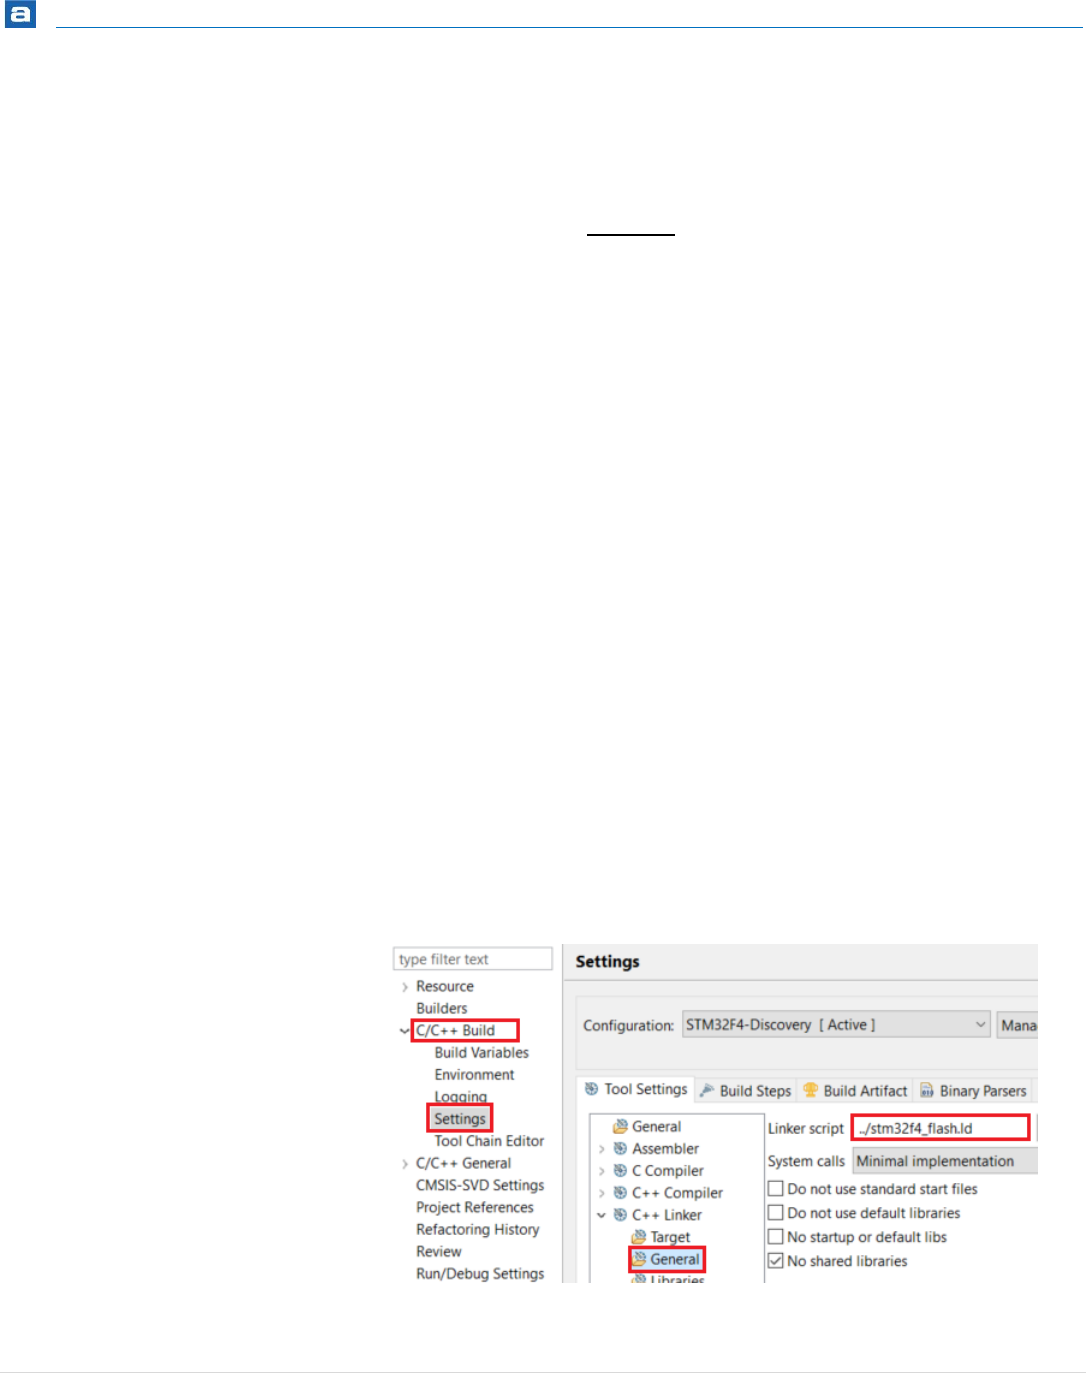
Getting Started
70 | P a g e
2. Modify or replace assembler source files.
The IAR assembler code syntax differs from what is used by Atollic TrueSTUDIO
so we will need to rewrite all assembler source code.
A special case is the startup file that comes with most projects and usually are
written in assembler code. Atollic TrueSTUDIO can generate this startup file for
you so that you do not have to write this code yourself. A recommended way is
to add an. iar extension to the startup file that was added to your imported
EWARM project. After this you can add a Atollic TrueSTUDIO startup file based
on the same ARM device to your imported project. If you created a dummy
project as described in the tip above, then you can simply drag-and-drop the
startup file from your dummy project to your imported project.
Once we have our new startup file we can compare it against the original startup
file. We can ignore the C/C++ initialization code since we will be using Atollic
TrueSTUDIO standard libraries and we are using an Atollic TrueSTUDIO
generated startup file now. What we should pay attention to is for example the
content of vector table and exception/interrupt handlers. For example, interrupt
handlers that was implemented and used in the original project must also be
implemented in our new startup file.
3. Add an Atollic TrueSTUDIO linker script file.
No linker script file is included so we need to add one that matches what we had
in our original EWARM project. A starting point is to have Atollic TrueSTUDIO
generate a linker script file that is based on the same ARM device as the original
project and add that linker script file to your imported project.
If you have your dummy project as described above, then you can simply, in
Atollic TrueSTUDIO Project Explorer, drag-and-drop that linker script file into the
root of your imported project.
We need to let the linker know which linker script file to use and this is done in
the General Settings of the C++ Linker.
Figure 42 - TrueSTUDIO linker script file option

Getting Started
71 | P a g e
You can either Browse to the linker script file, or if it is located in the root of your
imported project, type in the path.
In our example, we use STM32F4 so that path would be then “../stm32f4_flash.ld”.
With the linker script file in place we need to make sure that the memory
configuration in the linker script matches the configuration in the IAR .icf-file. Usually
most memory segments do not have to be located at a specific address, as long as it is
in the correct memory region. There are however applications that require that some
memory regions and entry labels are located at an absolute address. In this case you
should make sure your new application locate these regions/labels at the same
memory location. See the IAR to Atollic Migration Guide for more details on how this
can be done in Atollic TrueSTUDIO.
4. The last step before we try our build is to see if there are tool specific code in our
project, other than the startup file mentioned above.
Applications and libraries that comes from silicon vendors or 3’rd party
companies can contain source code, or libraries, that are created just for a
specific development toolchain. If this is the case in your project, then you
should see if you can find that corresponding code for TrueSTUDIO or GCC and
replace source code, libraries and include paths with the versions created for
TrueSTUDIO or possible GCC.
As an example, FreeRTOS have in their Source folder a sub-folder called
portable. Here you have source code ported to various development tool
vendors. An imported EWARM project using FreeRTOS would normally contain
files in the Source/portable/IAR folder. We should replace that code with
the code in Source/portable/GCC.
Once we have replaced this code we must also update our build tools include
paths so that any reference to Source/portable/IAR is changed to
Source/portable/GCC.
Intrinsic functions are also part of code that can differ from tool vendor to tool
vendor. Luckily CMSIS defines a set of intrinsic functions used for Cortex-M and
both EWARM and Atollic TrueSTUDIO follow CMSIS. In order to make sure that
we include declarations of CMSIS we should include CMSIS cmsis_gcc.h
instead of EWARM intrinsics.h in our source code.
For information about none CMSIS intrinsic functions and other ARM language
extensions used by, see ARM® C Language Extensions and CMSIS Core
documentation.
Getting Started
72 | P a g e
You are now ready to build the newly imported project and correct any remaining error
and check warnings. Depending on your project there might be more things that you
manually would need to modify in order to get to a Atollic TrueSTUDIO project that
matches the original EWARM project. For this reason, and for those who would not use
the EWARM import wizard, there is an IAR to Atollic Migration Guide available from Atollic
TrueSTUDIO Information Center with detailed information on how migrate a project from
EWARM to Atollic TrueSTUDIO.
COMMON BUILD ERRORS
This section will list and suggest solutions for the most common errors you would see after
building a project imported from EWARM to Atollic TrueSTUDIO.
fatal error: intrinsics.h: No such file or directory
EWARM intrinsics.h mostly contains declarations of various intrinsic functions. Most
the once used in a Cortex-M project are available in the CMSIS core_cmFunc.h and
cmsis_gcc.h header files. So, what we can do is to replace all occurrences of
intrinsics.h with for example cmsis_gcc.h.
undefined reference to ‘xyz'
Here ‘xyz’ can be a variable or a function that used in your application but not defined.
One way to find where this missing variable/function should be defined is to find the
definition in the original EWARM project.
There is a chance that the missing function could be defined as an intrinsic function that is
not included in our core_cmFunc.h or cmsis_gcc.h header files.
CONFIGURING THE DEBUGGER
After the imported project builds without errors we can test and debug the application
using any of the Atollic TrueSTUDIO supported debuggers. Before we download and debug
our application we need to configure the debugger and we do this in the Debug
Configuration dialog that we can access from the Run menu or the toolbar icon. (The
Unresolved issues? If still not successful after reading the IAR to Atollic
Migration Guide, please contact your local distributor or Atollic support for
assistance.
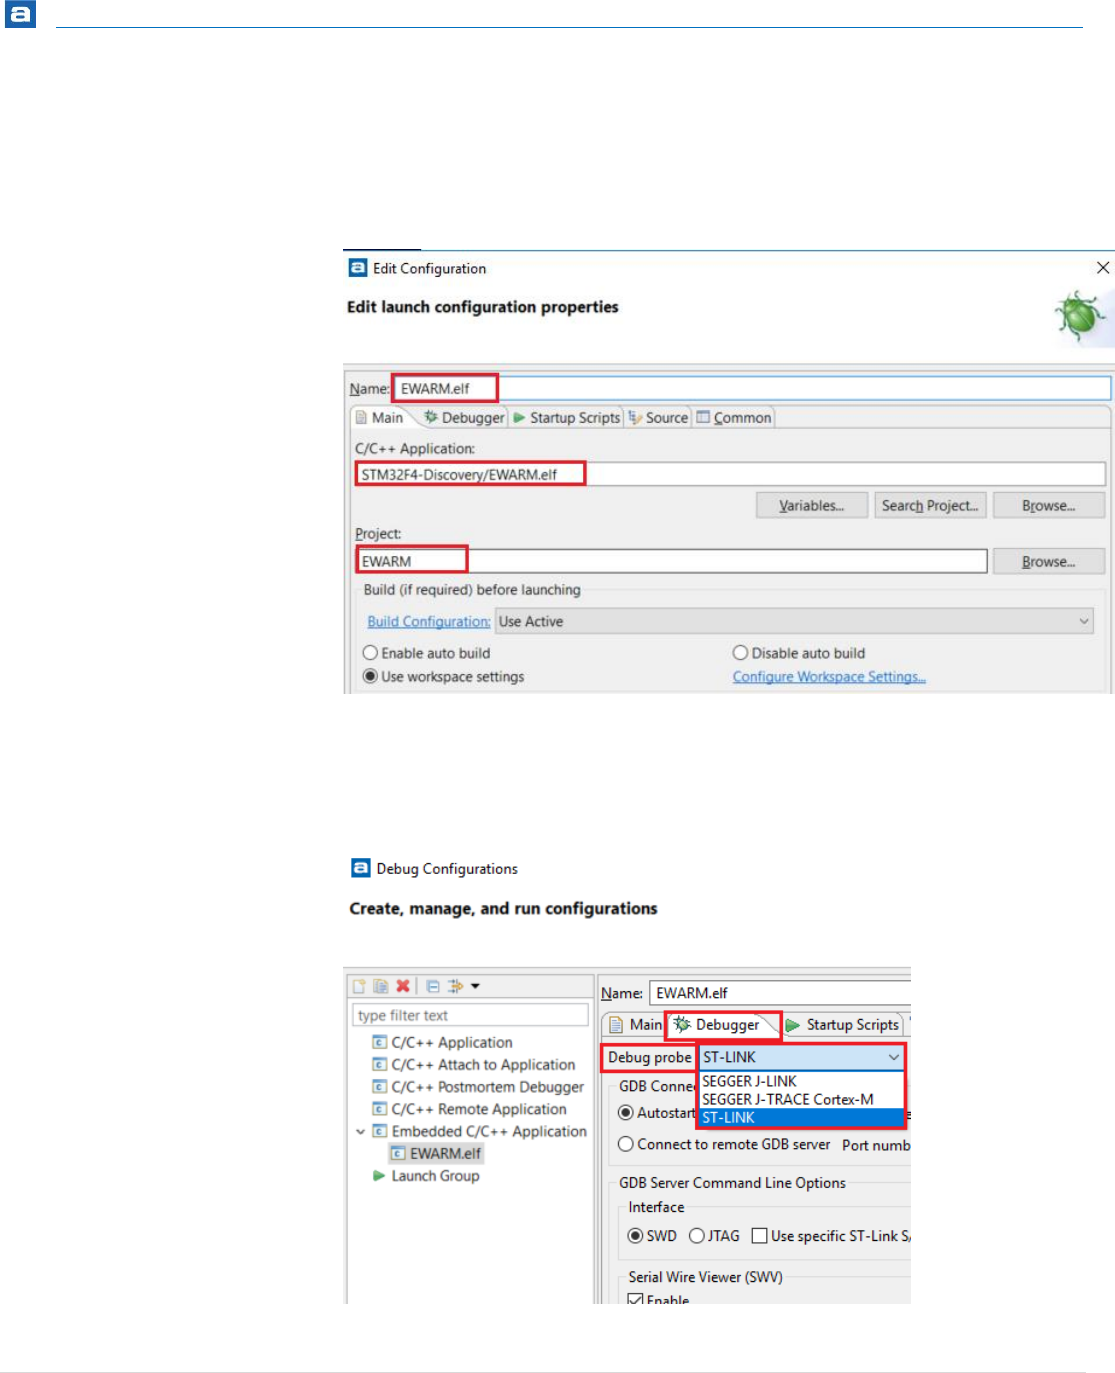
Getting Started
73 | P a g e
same dialog will open if we attempt to start a debug session before we have created our
debug configuration.)
In the Main tab, we need to make sure that the Name of the ElfDwarf file is correct as well
as the Application and the Project selected.
Figure 43 - Edit Debug Configuration
After this is done we select the Debugger tab. Here we first of all select which Debug
probe we will be using. Once we have selected our debug probe we can modify our GDB
Connection, select debug interface, add trace (if we have that available) and more.
Figure 44 - Selecting Debug Probe
Getting Started
74 | P a g e
If you like to get more control over the download and debug session, then you can do this
in the Startup Scripts tab. Here you can add commands to for example load additional files
or debug information, chose to download without starting a debug session, stop at the
application entry point or run to main (or any global label in your application) and much
more. For more information see The Startup Script chapter at page 227.
Now we are ready to download and test our application and we can do this by clicking on
OK or Debug (depending on how you started the Debug Configuration dialog).
For more detailed information on migrating EWARM projects, see the IAR to Atollic
TrueSTUDIO migration guide.
If you are uncertain on how to configure your debugger after selecting the
debug probe, then try the default vaules.
After you select a debug probe, Atollic TrueSTUDIO will default to a debug
configuration that works for most projects that use that particular debug
probe.
In case the default values does not work, check your debug settings in EWARM
and apply the same values to your debug configuration in Atollic TrueSTUDIO.

Getting Started
75 | P a g e
IMPORTING AC6 PROJECTS
As of Atollic TrueSTUDIO v7.1, there is a new Project Import Converter supporting System
Workbench for STM32 (AC6, SW4STM32) projects. Such projects can be found in
STMicroelectronics software such as STM32Cube Firmware Package projects.
The new Project Import Converter automatically updates System Workbench for STM32
(AC6, SW4STM32) projects to Atollic TrueSTUDIO format during import. After an import
the project shall build and it shall be possible to debug the project in Atollic TrueSTUDIO.
In some cases it may be needed to do some manual target or build setting changes.
The Project Import Converter makes it easy to import, build and debug ready-made
projects located in the STMicrolectronics STM32Cube Firmware Package projects even if
STMicrolelectronics only have prepared SW4STM32 projects in the examples package.
Example from STM32CubeF7:
G:ST\STM32Cube\en.stm32cubef7\STM32Cube_FW_F7_V1.5.0\Projects\STM32F
769I-
Discovery\Examples\DMA\DMA_FLASHToRAM\SW4STM32\STM32769I_DISCOVERY
The Project Import Converter will update the imported project but it will make backup
copies of the .project and .cproject files before these are changed. See the section
Restoring Converted Projects at page 82 for information on how to restore the project if it
shall be used with AC6 later.
During import a log file is created in the project folder. The name of this log file is
ProjectName_converter.log. This log file is placed into the same folder as the
.project file and can be investigated to find information about the conversion. The
ProjectName_converter.log. can for instance contain the following info. This is
normal behavior.
Project: STM32F4-Discovery
Converter: AC6 project converter
Date: 20170127
USING THE PROJECT IMPORT CONVERTER
The Project Import Converter can be started in two ways:
It is always recommended to take manual backups of the project files and
source code before converting projects. When using STM32Cube Firmware
Package projects it could be possible to reinstall the complete package.
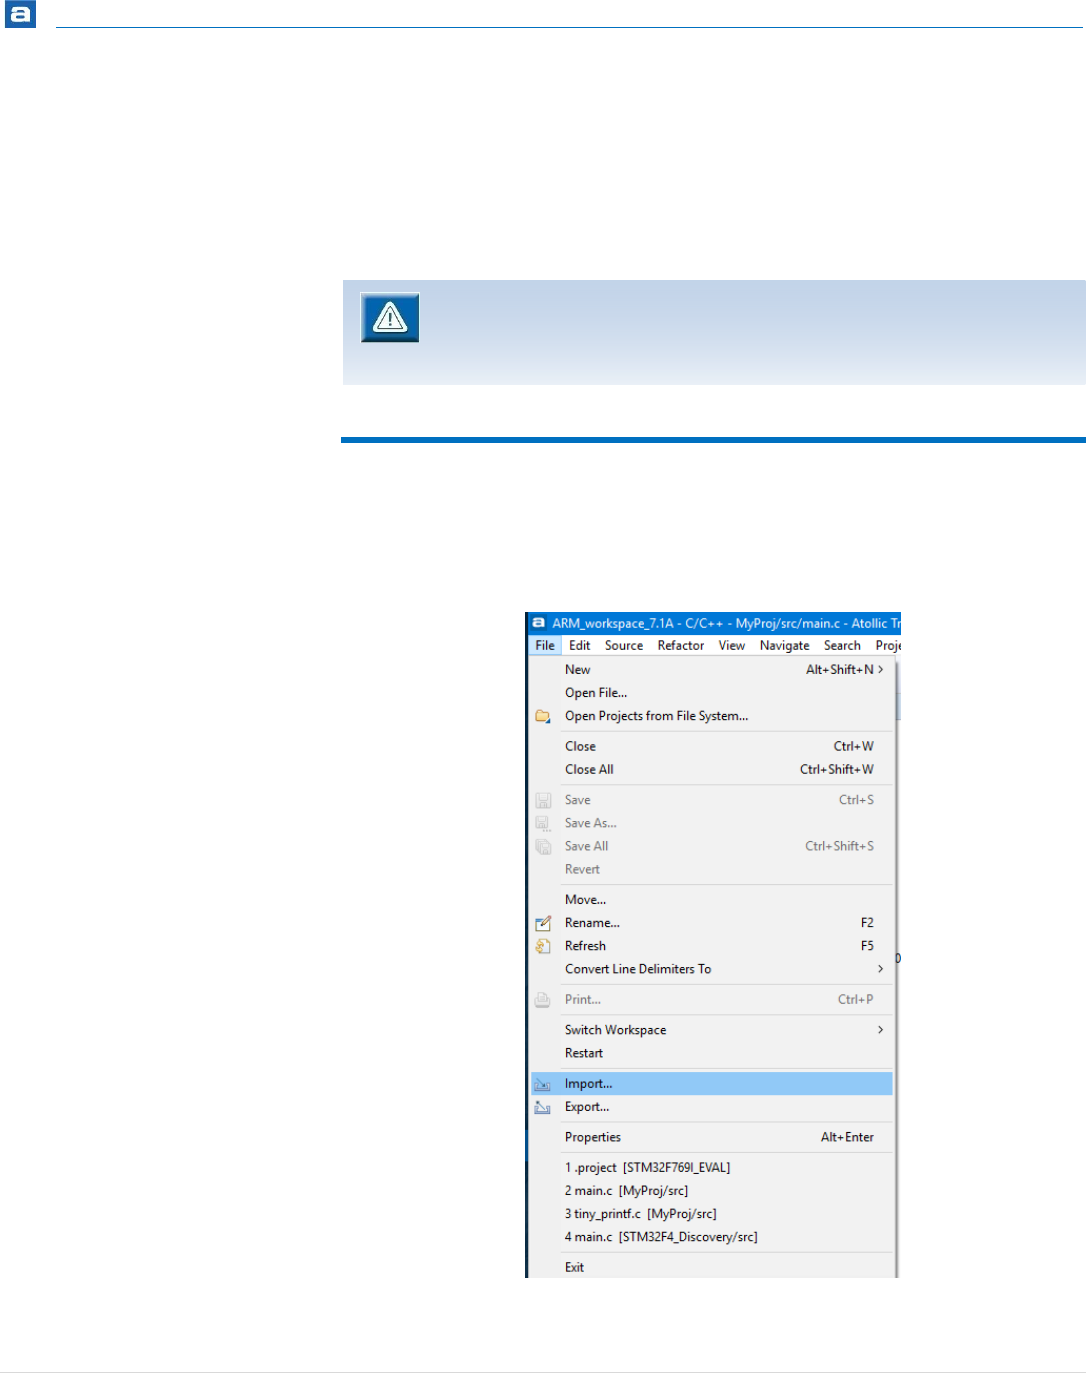
Getting Started
76 | P a g e
1. Use Import Projects from Folder or Archive in Atollic TrueSTUDIO.
2. Double-click the .project file in Windows File Explorer.
These two different ways of using the Project Import Converter is described in next
sections.
IMPORT PROJECTS FROM FOLDER OR ARCHIVE
Use the following method to import one or many projects.
To open the Import wizard select File, Import…
Figure 45 – Import Projects
Please note! The imported project will not be copied to the workspace. All
files in the project will be located at the original place and will be overwritten
when changes are made.
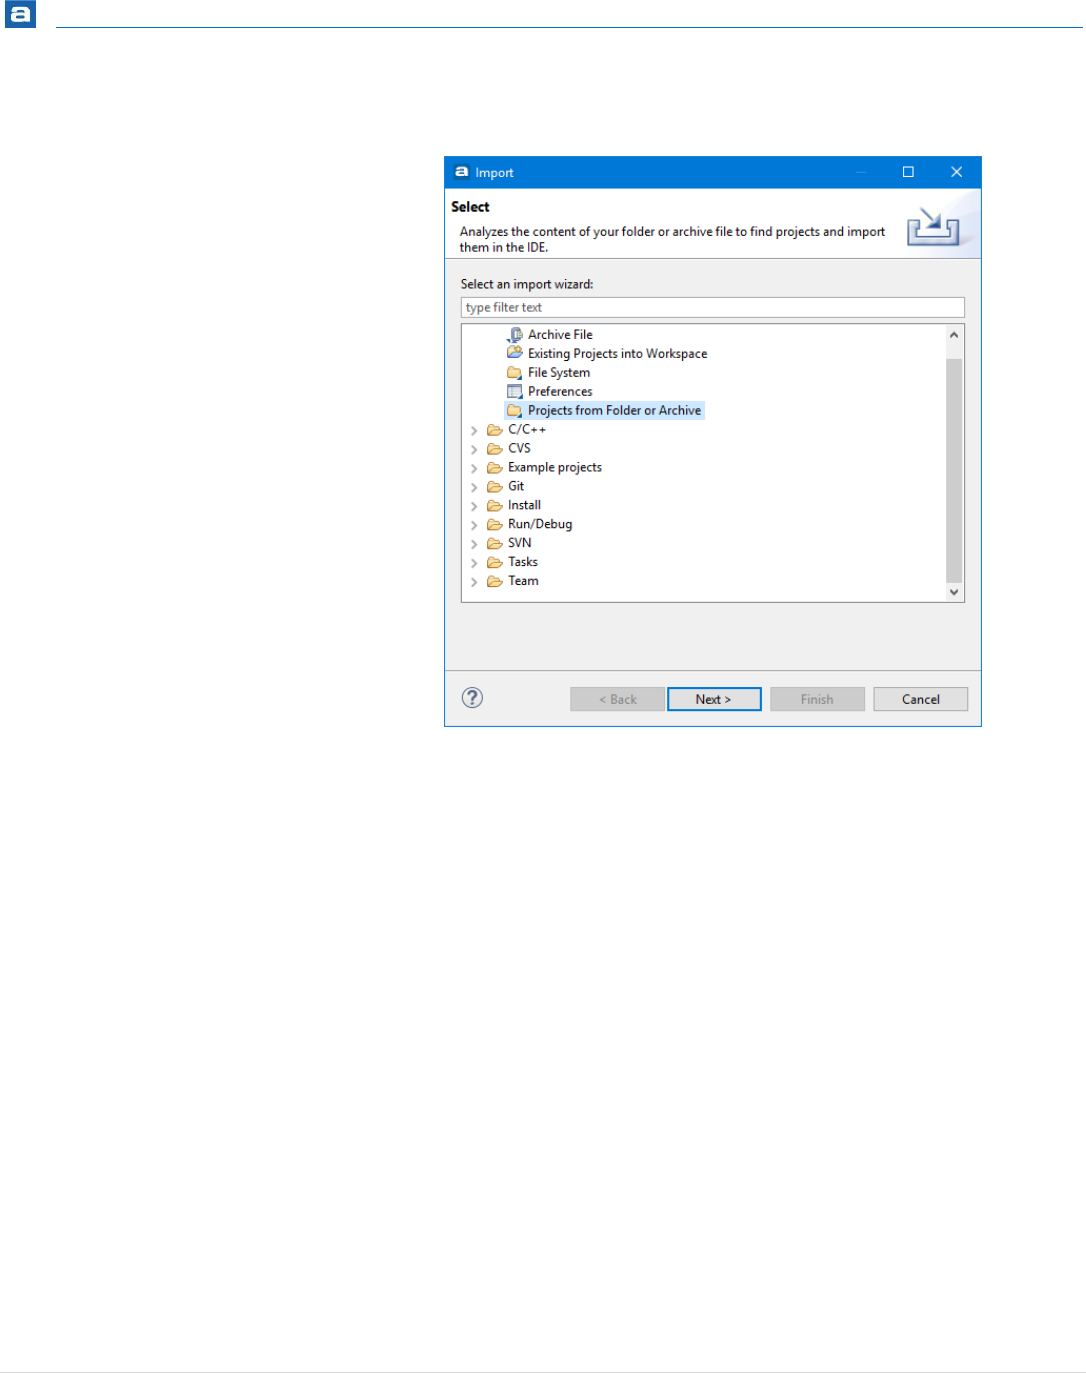
Getting Started
77 | P a g e
In the Import wizard select Projects from Folder or Archive and press Next.
Figure 46 – Import Projects from Folder or Archive
The Import Projects from File System or Archive dialog is opened.
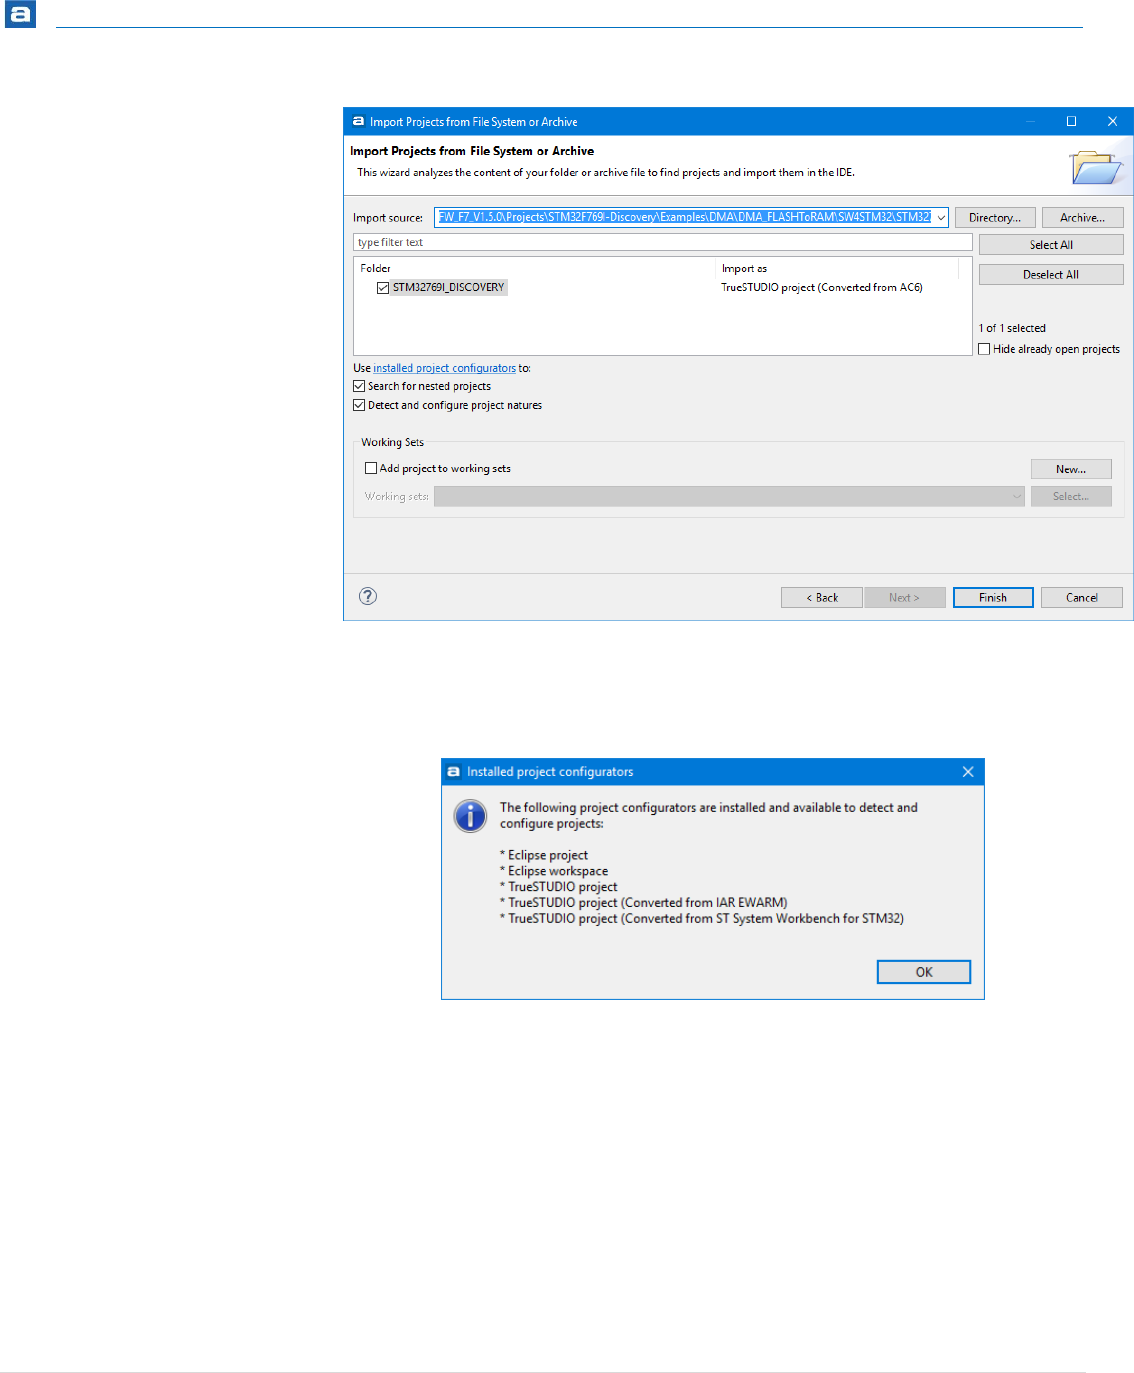
Getting Started
78 | P a g e
Figure 47 – Import Projects from File System
To see the Installed project configurators in the product press the installed project
configurators link in the Import Projects from File System or Archive dialog.
Figure 48 – Display Installed Project Configurators
In the Import Projects from File System or Archive dialog browse to the folder containing
the project to be imported.
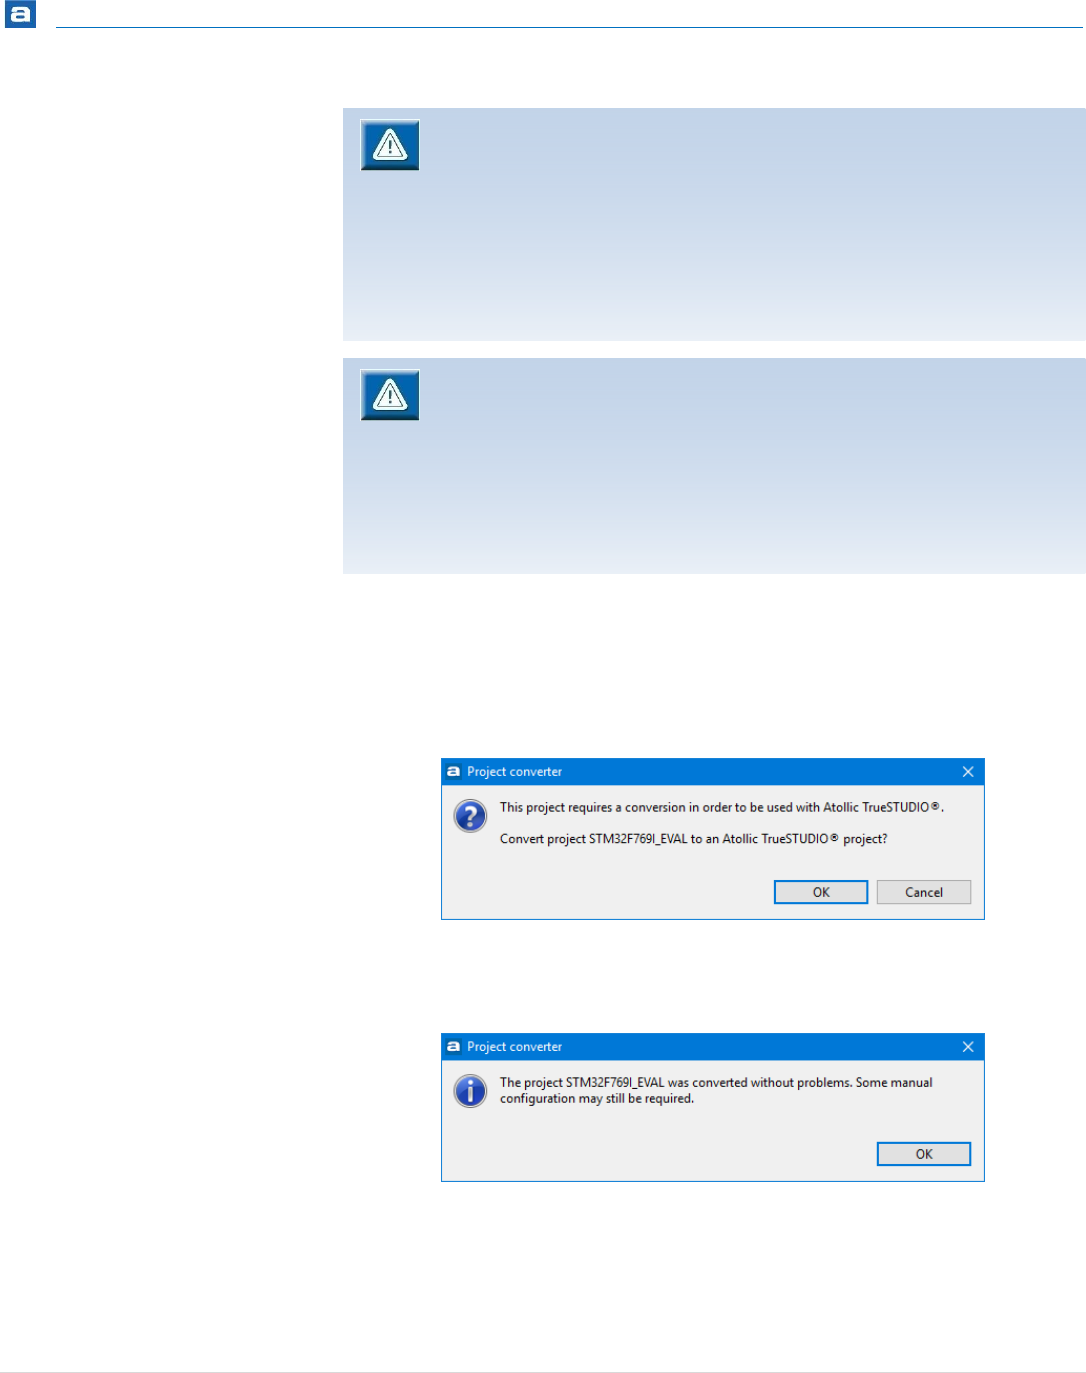
Getting Started
79 | P a g e
Select the project and make sure the checkbox Detect and configure project natures is
enabled otherwise the Project Import Converter will not be used. Press Finish to import
the project.
The following dialog can be displayed if the Project Import Converter prepares to convert
the project.
Figure 49 – Project Converter Conversion Information
Press OK to import the project with conversion.
Figure 50 – Project Imported Information
The project is now imported into the workspace. Please note that files included in the
project are not copied to the workspace, instead all files are linked to the workspace. This
means that the actual files will be updated in the STM32Cube package in this case. Press
OK to use the imported project.
In the Import as column in the Import Projects from File System or Archive
dialog it displays TrueSTUDIO project or TrueSTUDIO project (Converted
from AC6) which informs how the project will be imported.
Do not try to import lines where no information is available in the Import as
column.
The Import as column may also display Folder already imported as project
and in such cases it will not be possible to import it again into current
workspace.
Some examples may use identical project names for projects aimed at
different boards. Eclipse cannot handle two ormore projects with the same
name in a workspace. Therefor, it may only be possible to import one project
for a board into the workspace. If an attempt to import a second project with
the same name is made, the import will be cancelled silently without any
specific message. To import a second project, remove the first project from
the workspace or create a new workspace.
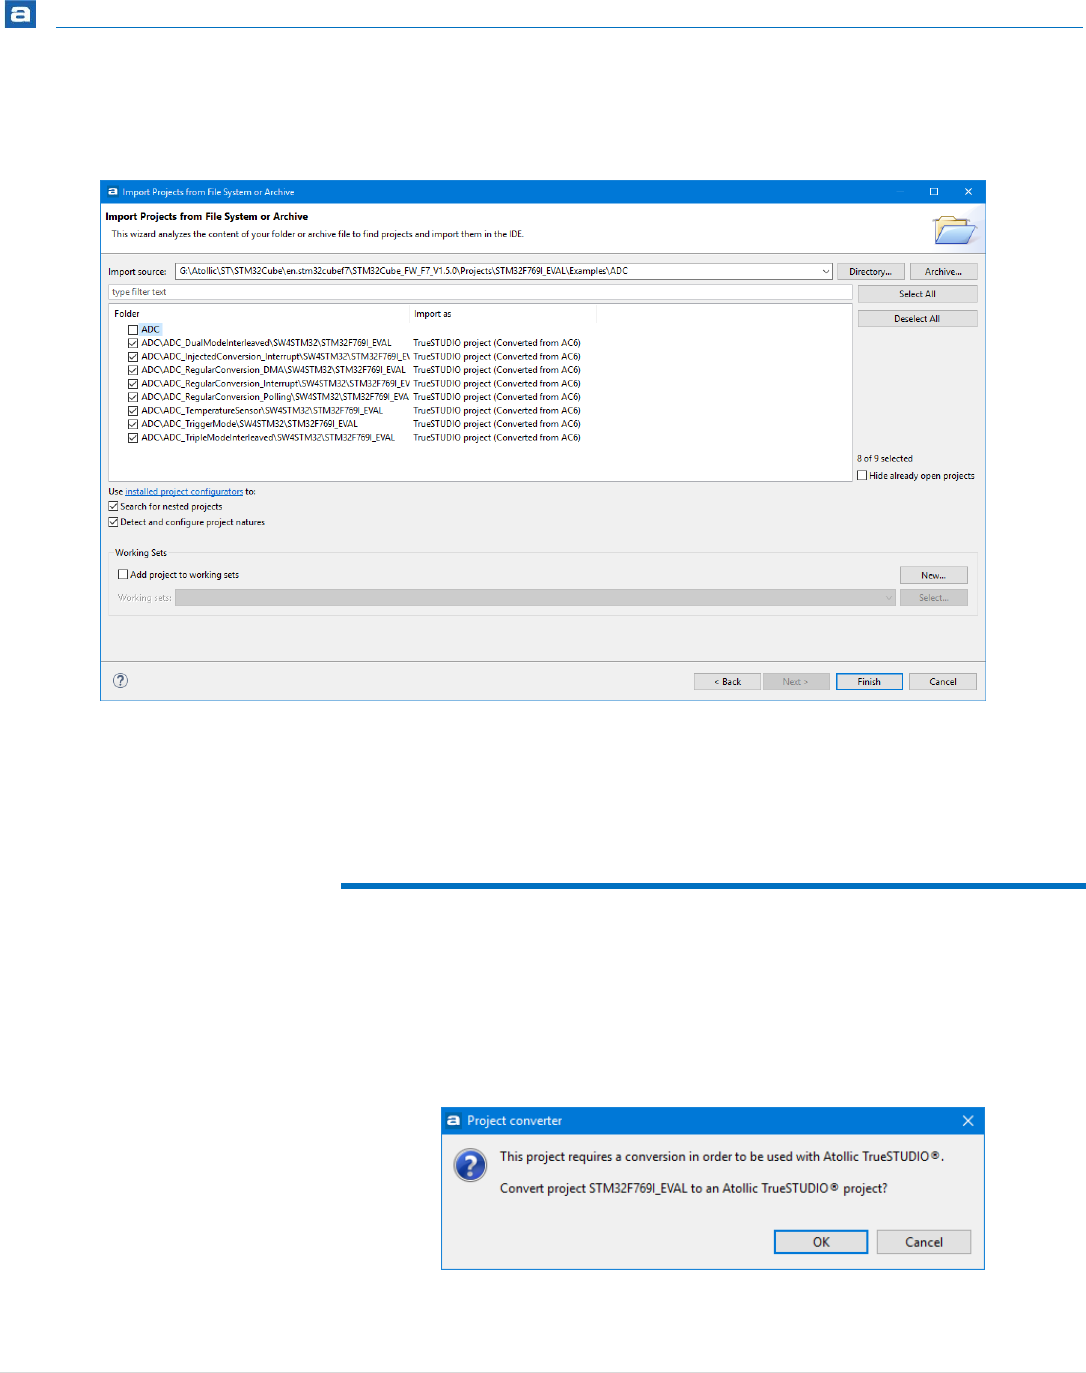
Getting Started
80 | P a g e
If a folder which contains several projects are selected and Search for nested projects are
selected several projects will be seen in the dialog.
Figure 51 – Import Several Projects from File System
Many projects can then be imported in one step using this method. However, as
mentioned earlier the STM32Cube examples uses the same project name for each board
and as Eclipse requires different names to be used only one of the selected project in such
case will be imported.
IMPORT PROJECTS USING DOUBLE-CLICK
When using double-click on the .project file in Windows File Explorer to import an
STM32CubeMX (AC6, SW4STM32) project follow this guide.
After double-click on .project file, Atollic TrueSTUDIO will be opened if it is not already
started, and the following dialog is displayed.
Figure 52 – Project Converter Information

Getting Started
81 | P a g e
Press OK to convert the project and import it into the workspace and a new dialog is
opened after a successful conversion.
Figure 53 – Project Imported Information
The project is now imported into the workspace. Press OK to use the imported project.
Please note that files included in the project are not copied to the workspace, instead all
files are linked to the workspace. This means that the actual files will be updated in the
STM32Cube package in this case.
USING IMPORTED PROJECTS
When a STM32CubeMX (AC6, SW4STM32) project has been imported and is converted to
Atollic TrueSTUDIO project there could be some updates needed. But in most cases it
should work to build and debug the project directly.
The first step to use the project in Atollic TrueSTUDIO could be to make a build and verify
that it builds without errors. After the project has been built a debug session can be
started.
First time a debug session is started the Debug Configurations dialog will be opened. Make
sure to configure to use correct Debug probe, e.g. ST-LINK or SEGGER J-LINK, and Interface
SWD or JTAG according to hardware requirements. If SWV shall be used then make sure to
set the Core Clock to the speed of the clock that will used by the target when debugging
the project.
Some examples may use identical project names for projects aimed at
different boards. Eclipse cannot handle two ormore projects with the same
name in a workspace. Therefor, it may only be possible to import one project
for a board into the workspace. If an attempt to import a second project with
the same name is made, the import will be cancelled silently without any
specific message. To import a second project, remove the first project from
the workspace or create a new workspace.
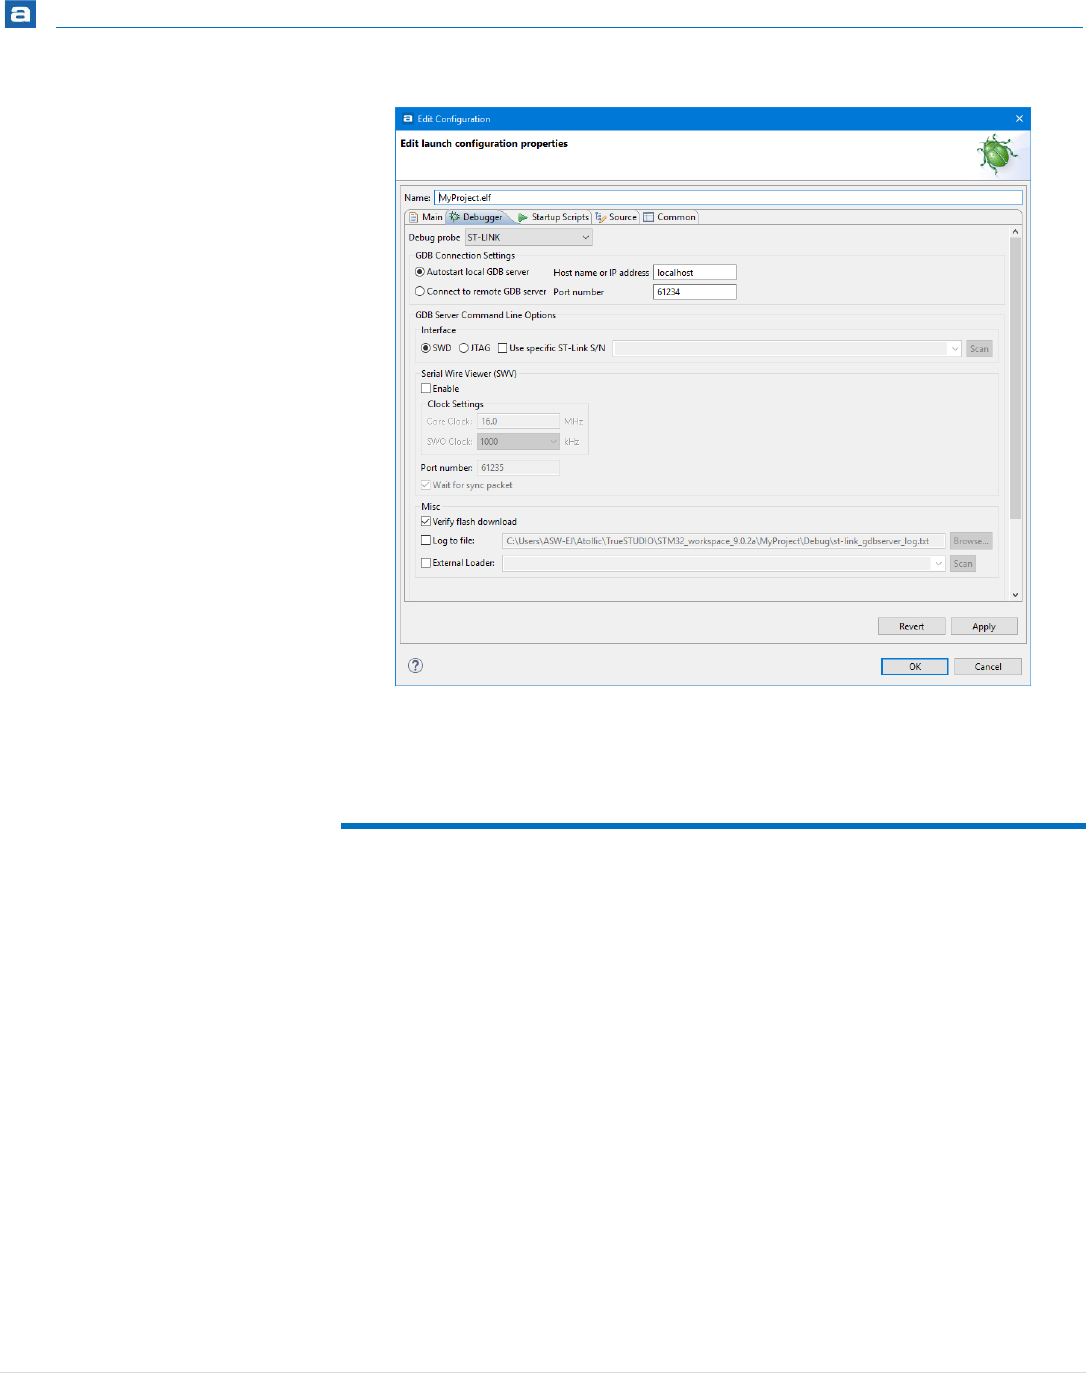
Getting Started
82 | P a g e
Figure 54 – Edit Debugger Configuration
When correct setting for debugging is set make sure the debugger probe and board is
connected and start a debug session by pressing the OK button.
RESTORING CONVERTED PROJECTS
As mentioned earlier the Project Import Converter made copy of the .project and
.cproject files when the project was coverted. The original .project file was copied
to .project_org file. The original .cproject file was copied to .cproject_org
file.
One way to restore the project and use it with AC6 again is to replace these project files
with the original files. Open a command prompt and rename the files. (Note! The filename
can not be renamed using Windows File Explorer as this program does not allow to
rename a file to start with “.” .)
E.g. In a Command Prompt window use the move command to rename the files
1. Rename the converted projet files if you these files shall be kept.
move .project .project_ts
move.cproject .cproject_ts
2. Replace and use the original files
move .project_org .project
move.cproject_org .cproject

Getting Started
83 | P a g e
The project should now be ready to be opened with System Workbench for STM32 (AC6,
SW4STM32) again.
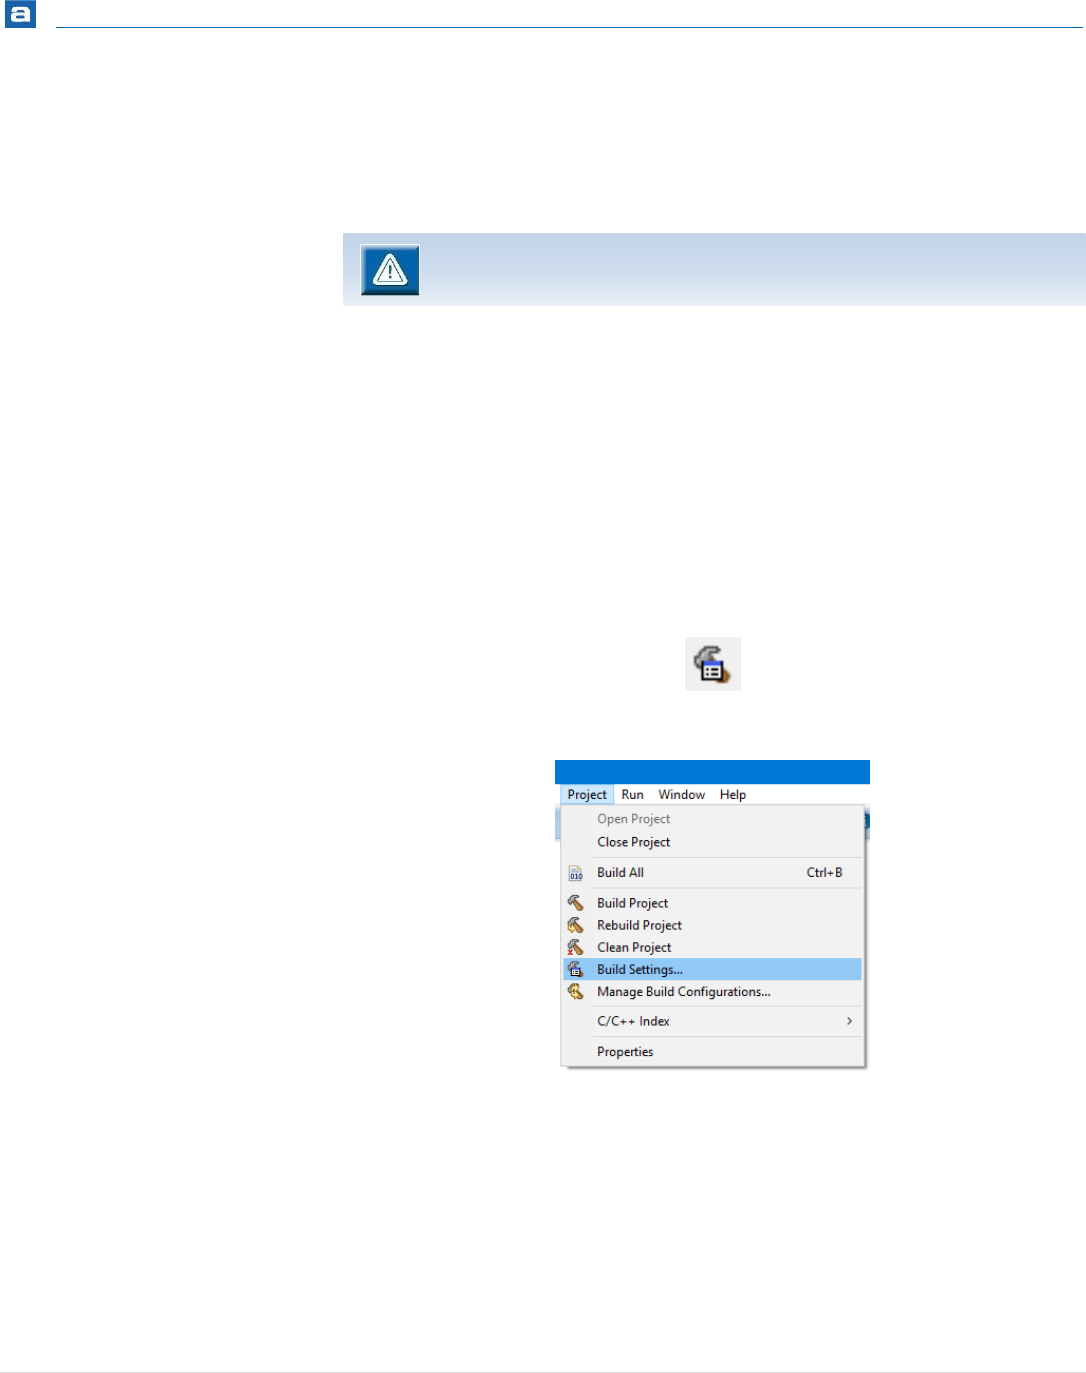
Getting Started
84 | P a g e
CONFIGURING THE PROJECT’S BUILD
SETTINGS
Managed Mode projects can be configured using dialog boxes. Unmanaged Mode projects
require a manually maintained makefile.
Atollic TrueSTUDIO provides extensive GUI controls for configuration of command line tool
options using a simple point-and-click mechanism.
To configure a Managed Mode project, perform the following steps:
1. Select a project in Project Explorer view.
2. Click on the Build settings toolbar button or select Project, Build
Settings….
Figure 55 – Build Settings Toolbar Button
Figure 56 – Build Settings Menu Selection
3. The project Properties dialog box is displayed.
4. Expand the C/C++ Build item in the tree in the left column. Then select the
Settings item to display the build Settings panel for the active Build
Configuration.
How a project is built is saved in a Build Configuration. Each configuration has
many Build settings.
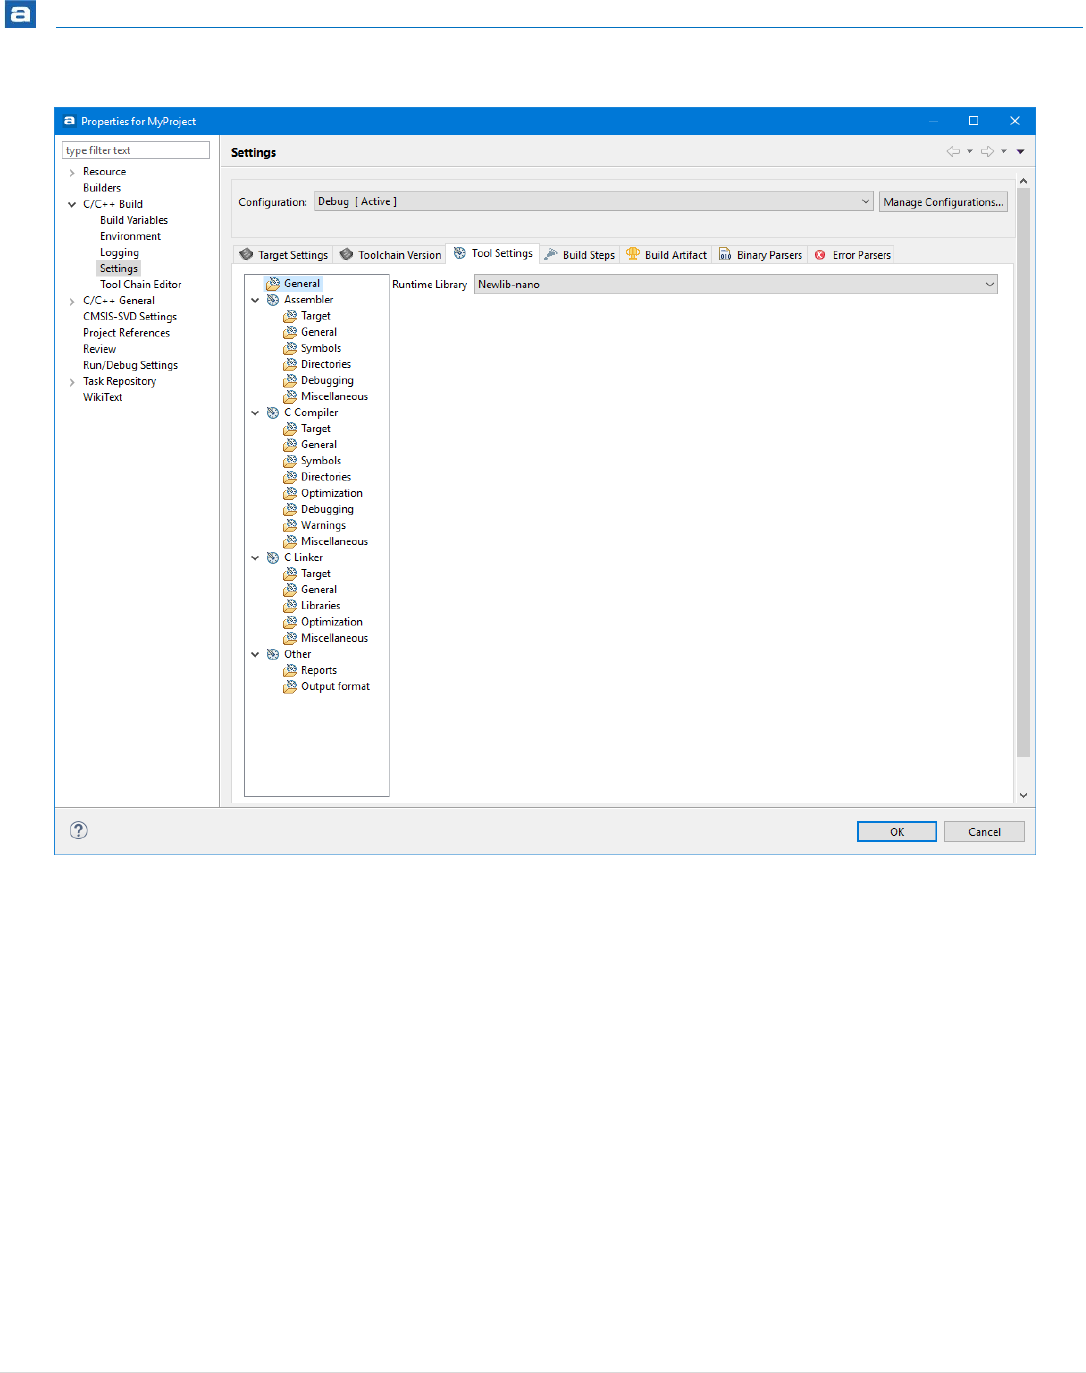
Getting Started
85 | P a g e
Figure 57 - Project Properties Dialog Box
5. Select panels as desired and configure the command line tool options using
the GUI controls.
Advanced users may wish to enter command line options manually. This can be
done in the Miscellaneous panel for any tool.
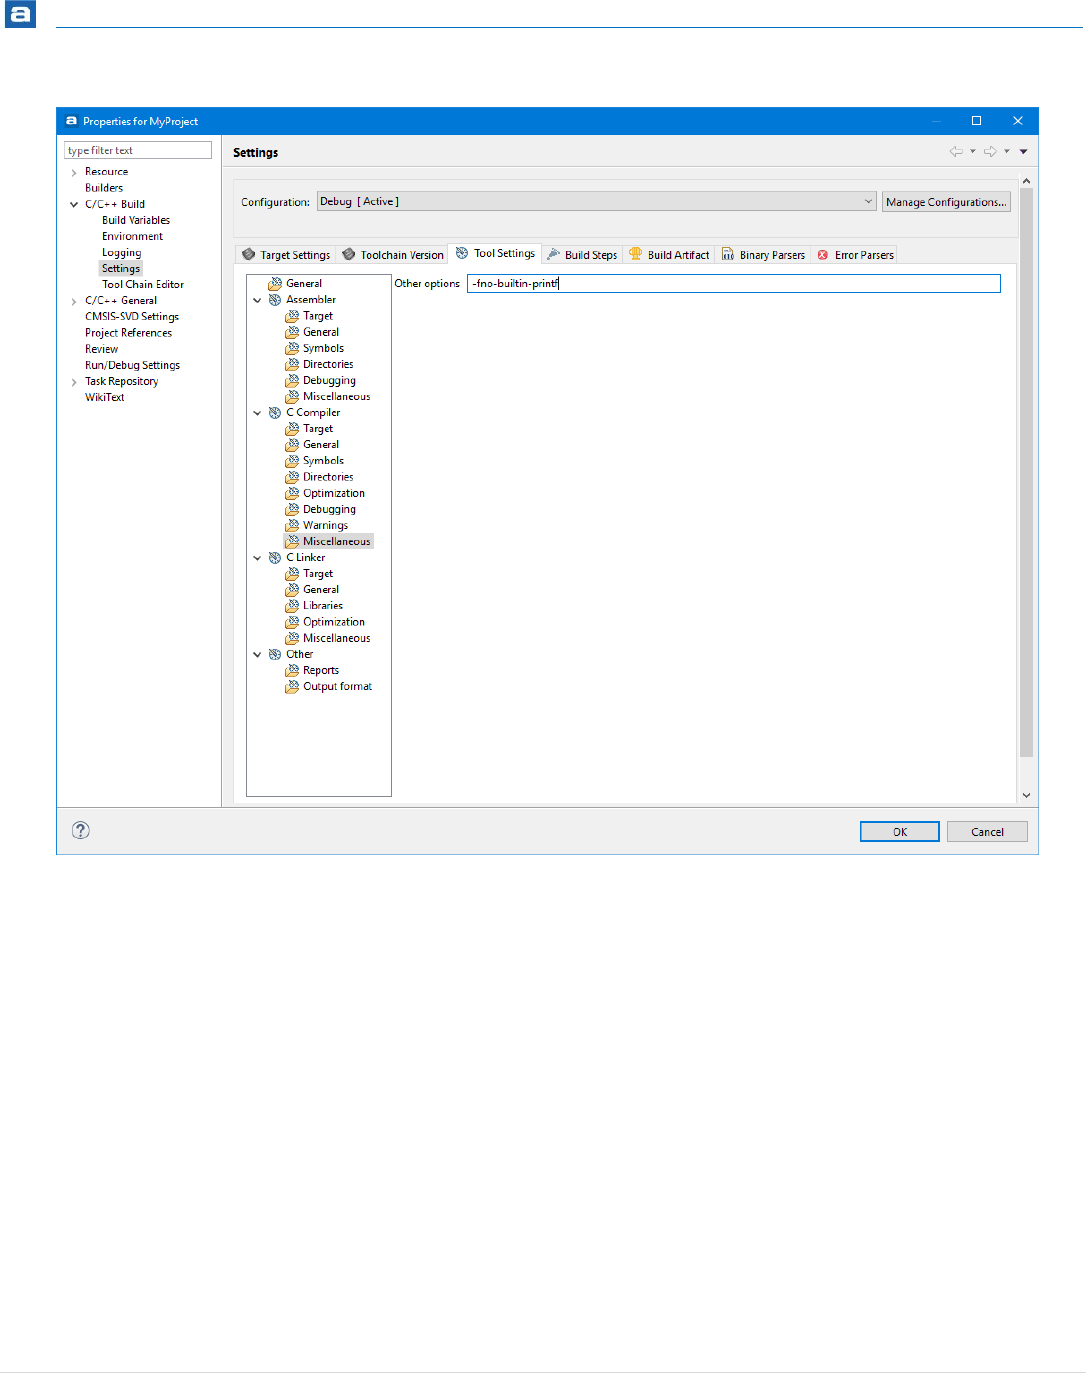
Getting Started
86 | P a g e
Figure 58 – Tool Settings, Miscellaneous Options
6. Some project build settings are relevant for both Managed Mode projects
and Unmanaged Mode projects. For instance the selected microcontroller
or evaluation board may affect both the options to the compiler during a
Managed Mode build, and also how additional components in Atollic
TrueSTUDIO, for instance the SFR view, and debugger, will behave.
Project build settings relevant for both Managed Mode projects and
Unmanaged Mode projects are collected in the Target Settings panel.
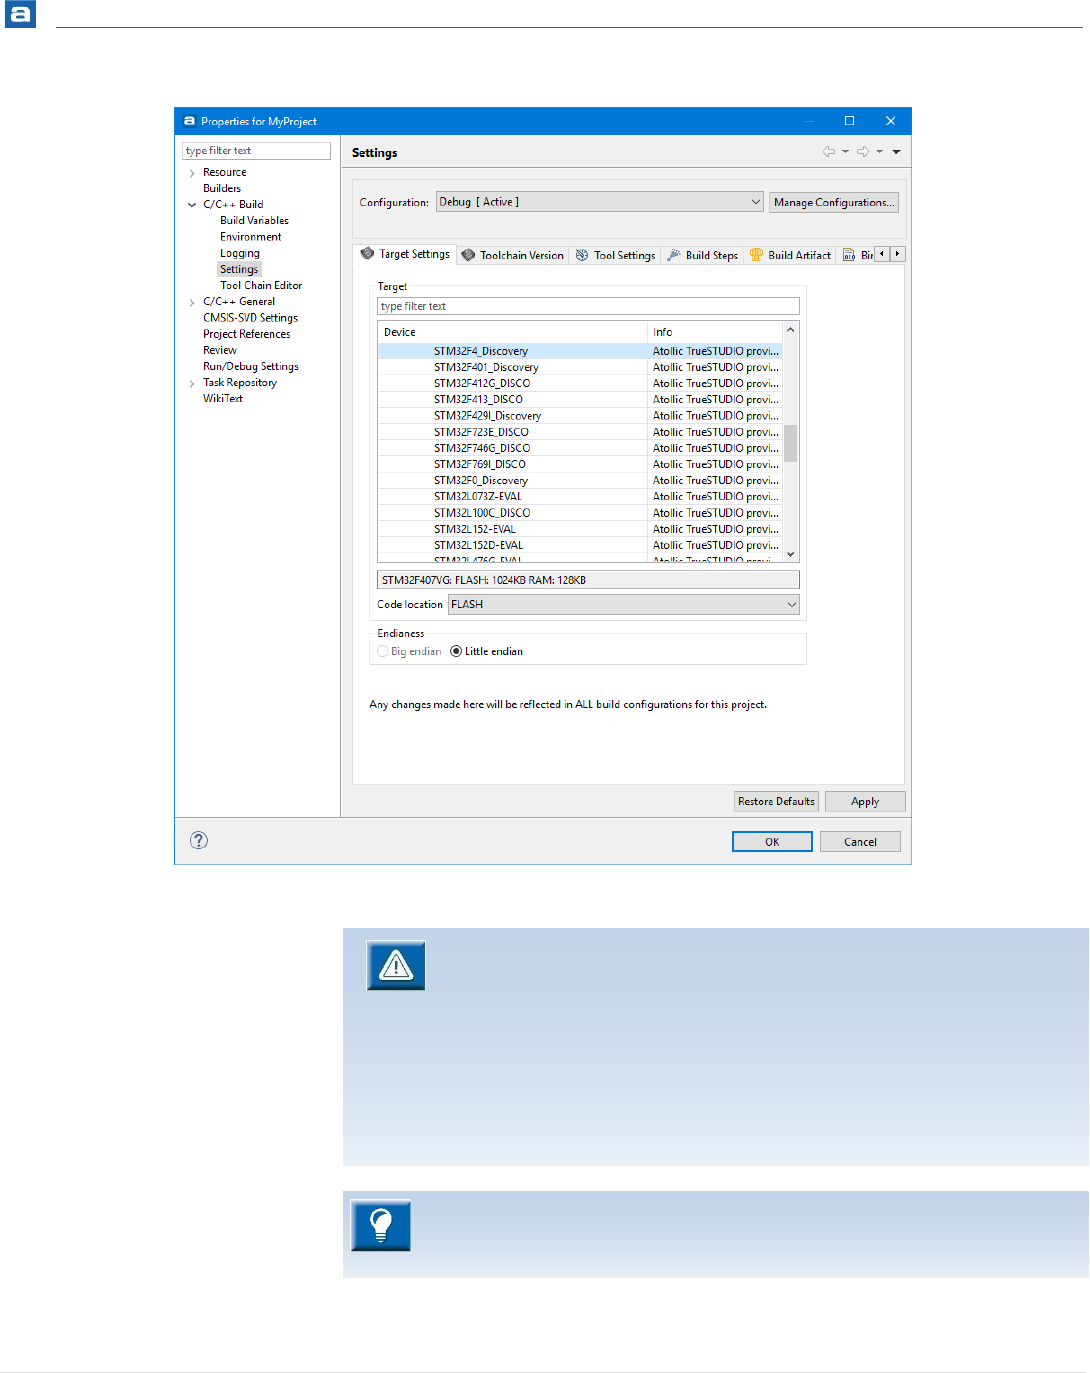
Getting Started
87 | P a g e
Figure 59 – Target Settings Dialog Box
Any changes made here will be reflected in ALL build configurations for this
project.
Changing to a different hardware target, will cause a new linker script file
(.ld) to be generated, with FLASH and RAM settings adjusted to the
memory size of the new target device. See Generate a New Linker Script,
page 131 for more information.
However, libraries, header files, etc. will not be generated automatically for
the new target! These must be added manually to the project.
If the target device needs to be changed, Atollic recommends generating a
new project for that target. Copy the source code from the current project to
the new project.
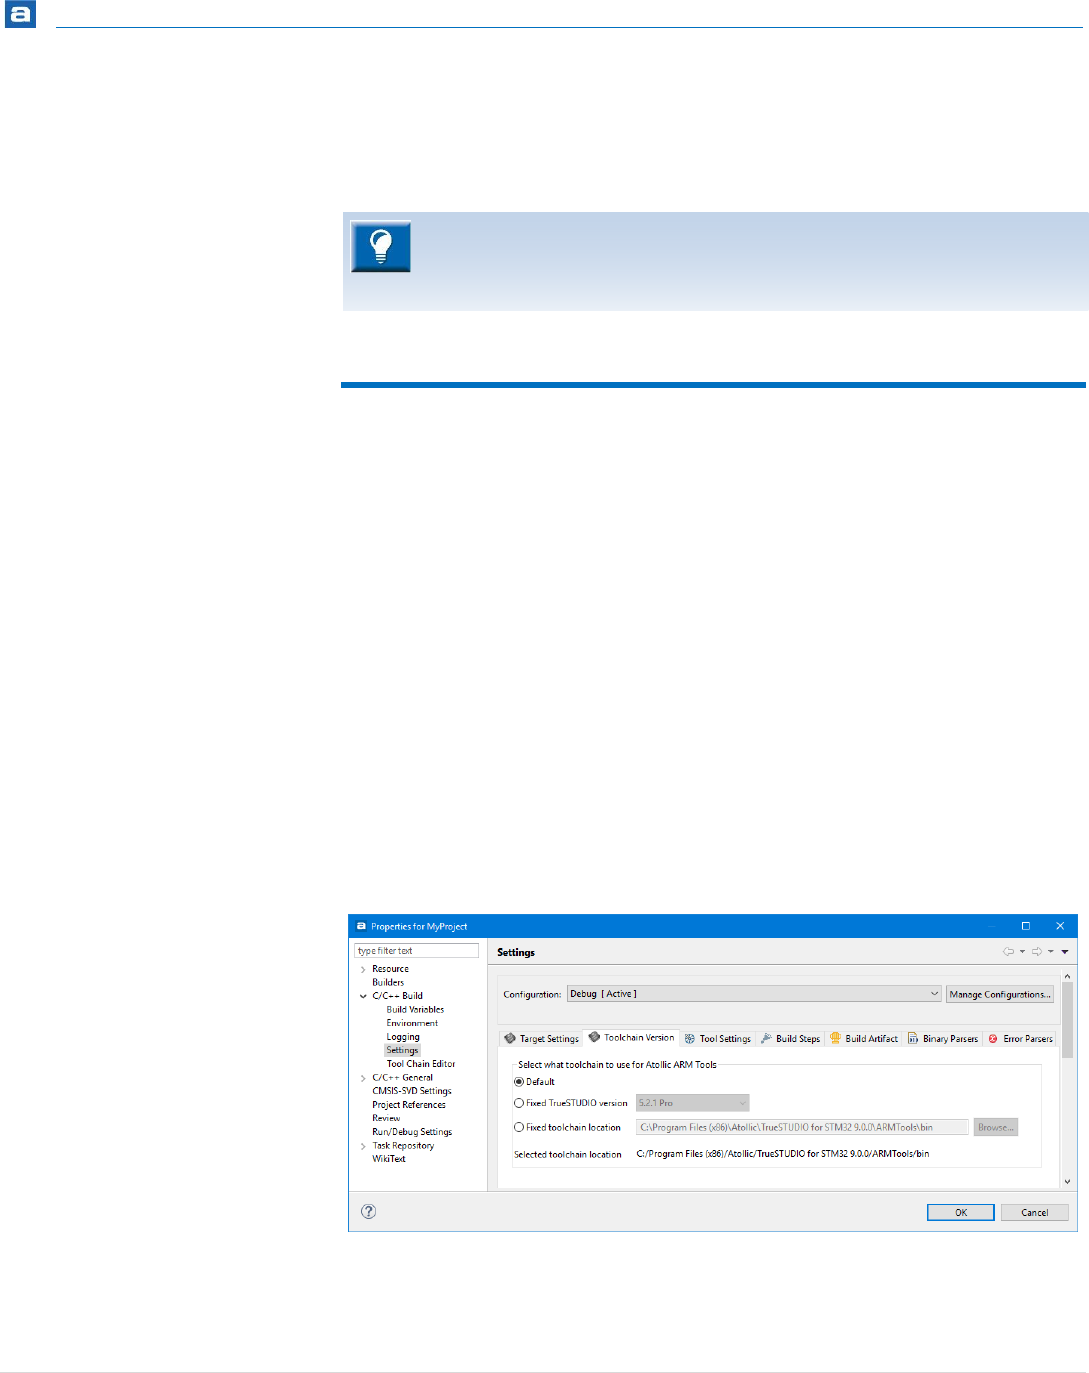
Getting Started
88 | P a g e
7. Click the OK button to accept the new settings. This will change the
settings for the selected Build Configuration.
BUILD CONFIGURATIONS
A Build Configuration stores how a project is built. Each Build configuration has several
Build Settings. Each Build Setting can be individually set for each Build Configuration.
A Project can have an unlimited number of Build Configurations. This is a very powerful
tool to be able to quickly build a project in different ways, such as with different
optimization levels, tool chain versions and even different build behavior can be set. It is
even possible to have a project be built as both a library and an executable with two
different Build Configurations.
A project created in Atollic TrueSTUDIO contains by default two Build configurations, the
Debug and the Release configuration. In these configurations there are two build settings
that differentiate them. The Debug configuration is built with debugging information and
no optimization level. The Release configuration is optimized for small code size and with
no debugging information.
Settings done in the project will usually only affect the current configuration. However
what Build Configuration that is affected can be selected in the dropdown list located at
the top of the panel.
Figure 60 – Select Affected Build Configuration
The Build Analyzer view can be used to analyse the size and location of a
program in detail. Please read more about the Build Analyzer at page 264

Getting Started
89 | P a g e
This does not change what Build Configuration is used when building. To change that the
Active Configuration needs to be changed, see Changing Active Build Configuration on
page 90.
When building is done, the build-result such as an .elf-file, is stored in a folder with the
same name as the Build Configuration. This makes it easy to locate. For this reason it is
also a good idea to not use white space in the name of a Build Configuration.
CREATE A NEW BUILD CONFIGURATION FOR RELEASE
When most of the development is done and it is time to switching to the Release
configuration, there might be a lot of settings done under the development process that is
missing in the Release configuration.
To make sure that the Release configuration contains all necessary settings, it may be
easiest to create a new Release configuration, copy the settings from the Debug
configuration, and then just change the debug information level and optimization level.
1. Select the project in the Project Explorer and right click Project, Manage Build
Configurations…
2. Optional - Delete the old Release configuration or the configuration that does not have
all the used settings
3. Click New…
4. Name the new configuration. E.g. NewRelease. It is recommended not to use any
whitespaces in the name of the Build Configuration.
5. Select to copy settings from the existing Debug configuration.
6. Click OK.
7. Select the new NewRelease configuration and click Set Active. This determines what
Build Configuration is to be used when building the project.
8. Close the dialog by clicking the OK button.
Next, open up Project, Properties, and navigate to C/C++ Build, Settings, Tool Settings. In
the Debugging node, for the Assembler and C/C++ Compiler, set the debug level to none.
Then select an optimization level in the Optimization node for the C/C++ Compiler.
The build output folder will be named as the active build configuration. So when the
project is built, the .elf file will be located in the NewRelease folder for the new Release
configuration.
Building all Build Configurations
It is easy to build all Build Configurations at the same time.
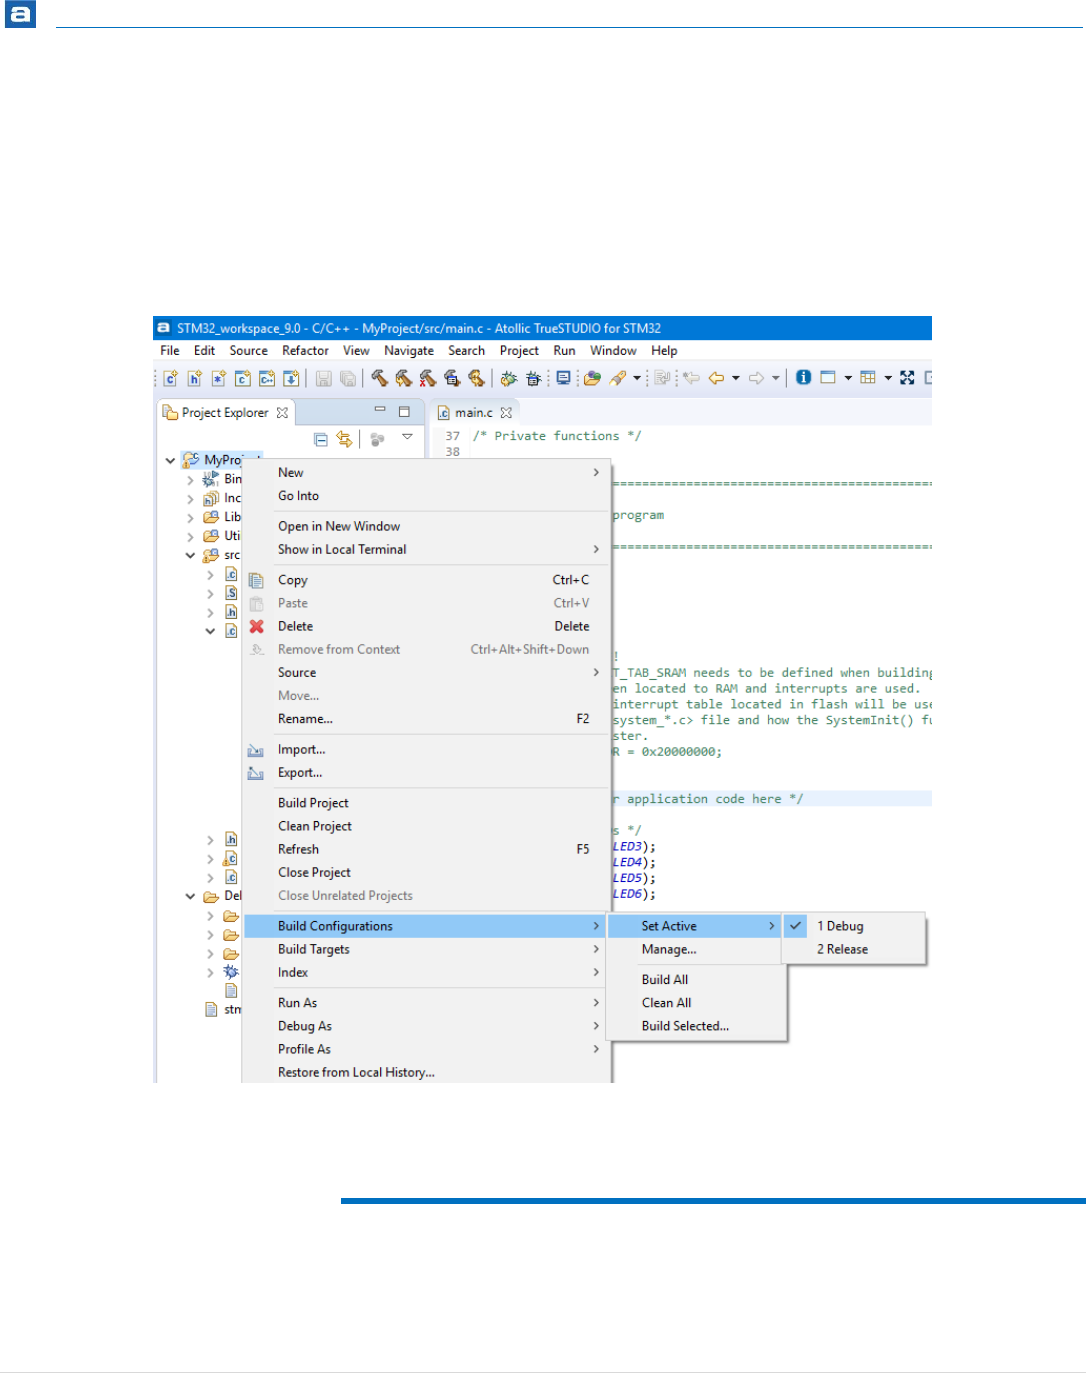
Getting Started
90 | P a g e
For another example see Create a New Build Configuration For an Old Toolchain Version on
page 101.
CHANGING ACTIVE BUILD CONFIGURATION
To change what Build Configuration is used to build, right click the project and select Build
Configuration, Set Active and select the preferred Build Configuration
Figure 61 – Change active Build Configuration
SOURCE FOLDERS
A folder within a project can be recognized as a source folder if it is annotated with a small
C-icon in the Project Explorer.
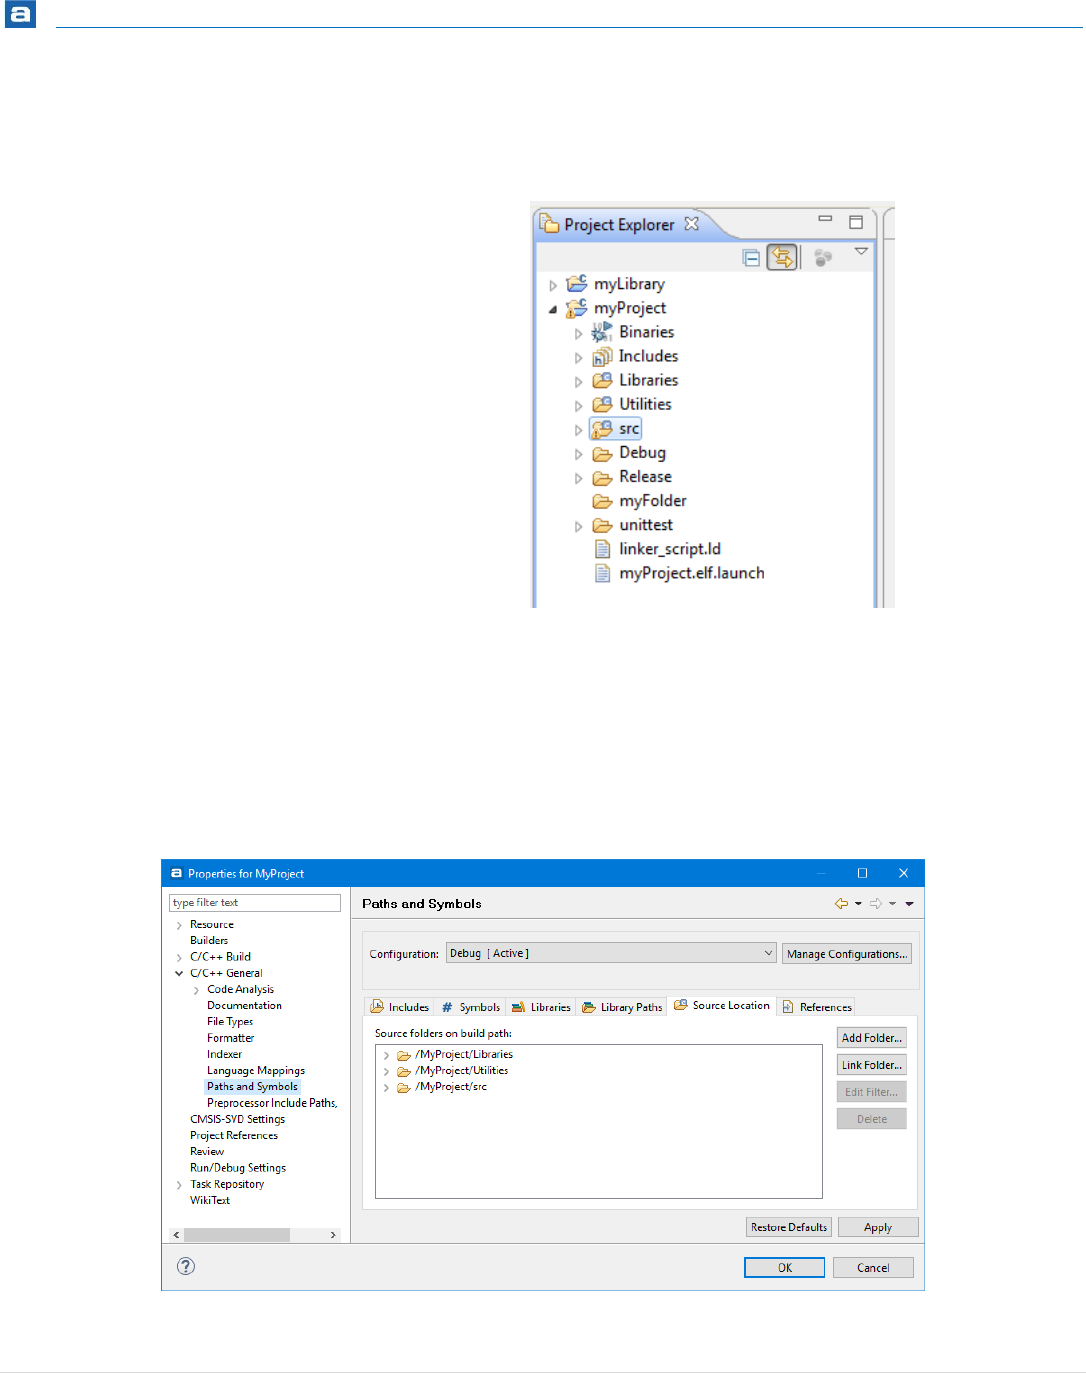
Getting Started
91 | P a g e
For Atollic TrueSTUDIO to be able to recognize changes in a source file, it needs to be
located in a source folder. Either as a resource located within the project or linked from
some other location.
Figure 62 – Source Folders
To make Atollic TrueSTUDIO handle an existing folder as a new source folder do the
following steps:
1. Select the project and in the top menu select Project, Properties.
2. In the Properties panel open C/C++ General, Paths and Symbols and then the Source
Location tab.
Figure 63 – Source Location Tab
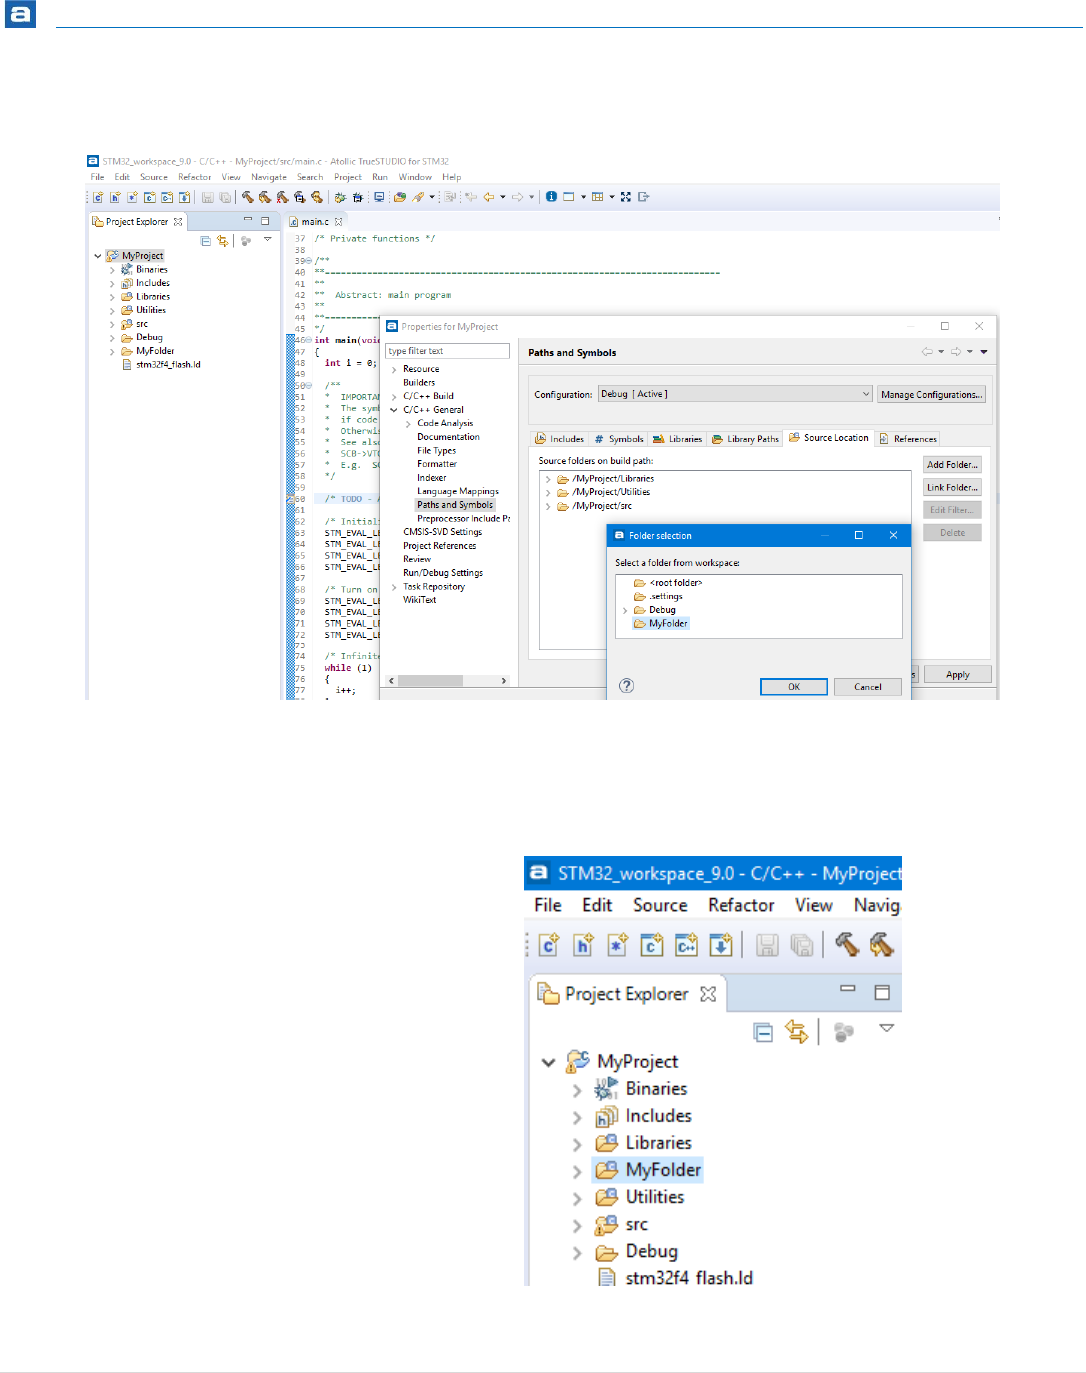
Getting Started
92 | P a g e
3. Click Add Folders… and select the new source location.
Figure 64 – Folder Selection Tab
There should then be a new Source folder in the project.
Figure 65 – New Source Folder
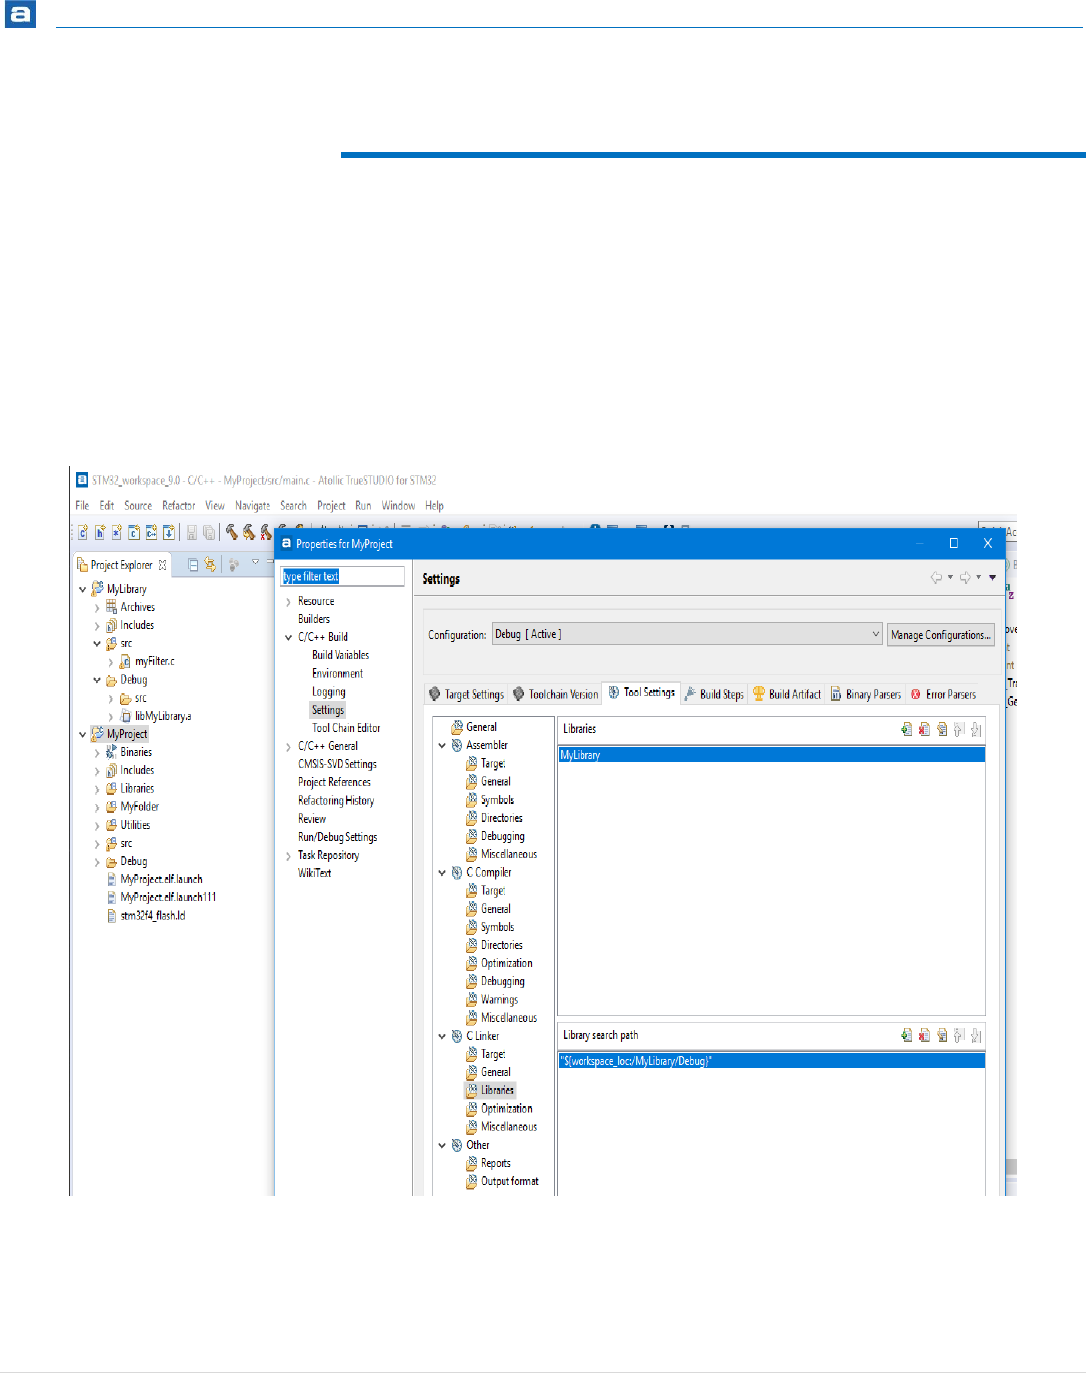
Getting Started
93 | P a g e
INCLUDE LIBRARIES
This guide is for including libraries into Atollic TrueSTUDIO projects. For information how
to refer to a library created in an existing project, see Referring Project on page 119. On
page 155 there is a guide for how to Update CMSIS Math library.
In order to include a library into a project right-click on the project where the library will
be included; select Properties, C/C++ Build and Settings. Then select the Tool Settings-tab,
select C Linker, Libraries.
Figure 66 – Include a Library
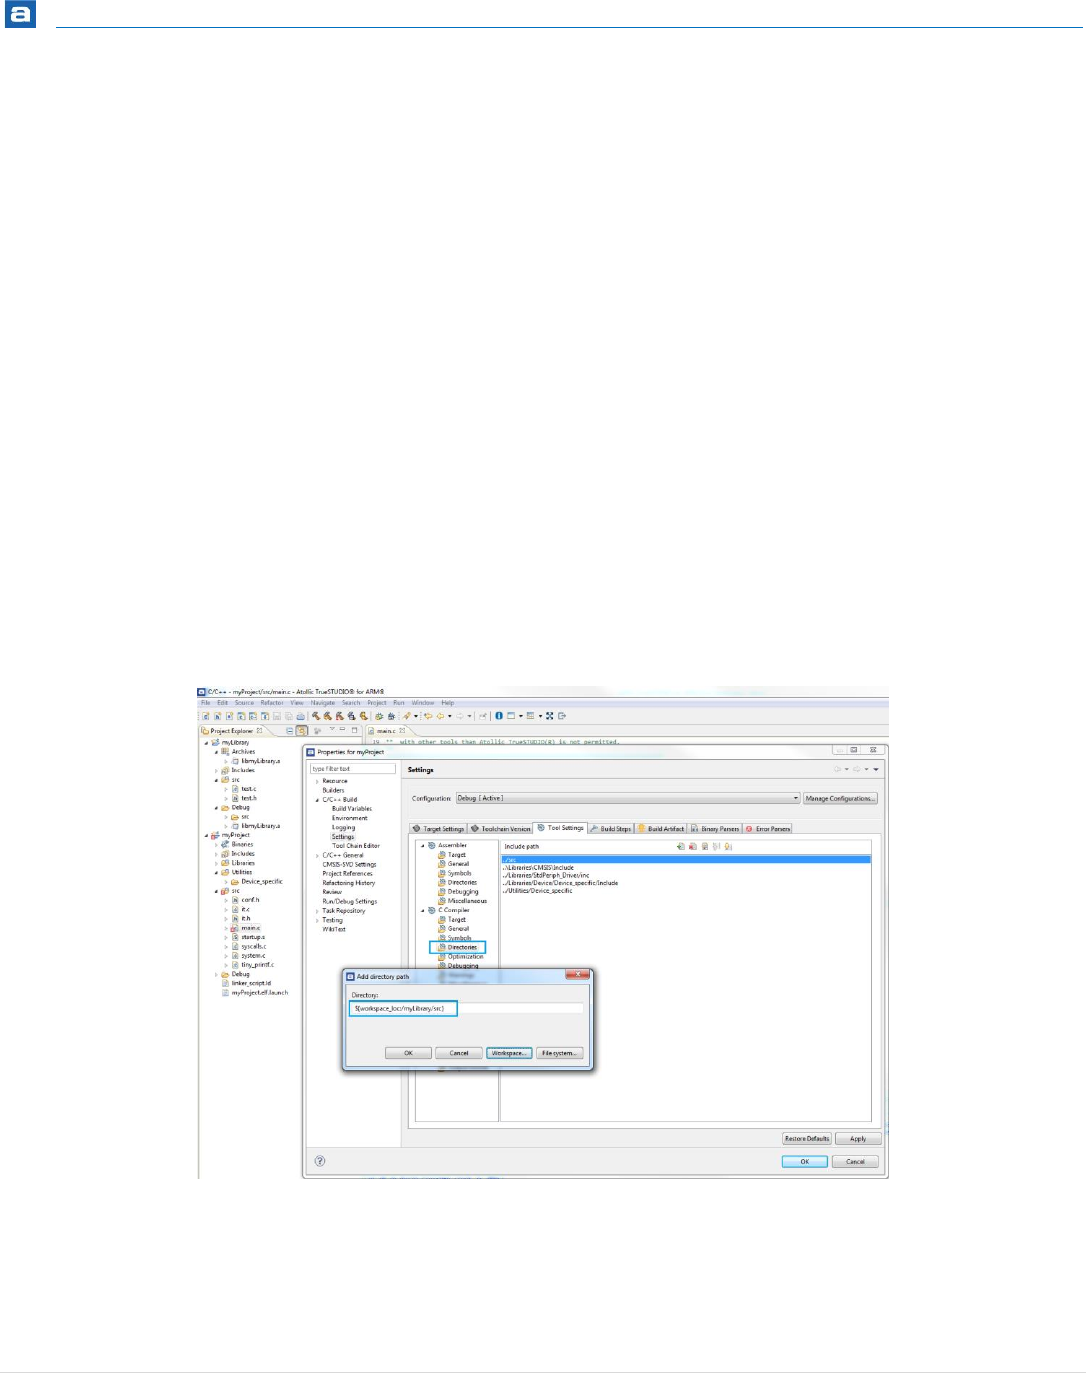
Getting Started
94 | P a g e
3. In the Libraries list add the name of the library - not the path! The name is the
filename without “lib” prefix and without the file extension (.a). It is important
not to include those parts of the name. This is a GCC convention.
Example: For a library-file named libMyLibrary.a add the name MyLibrary.
If by any chance the library’s name don’t confirm to the GCC convention, the full
name to the library can be entered, preceded by a colon “:”.
Example: For a library-file name STemWin524b_CM4_GCC.a add the name
:STemWin524b_CM4_GCC.a
4. In the Library Paths list, set the path to where the library is located. Do not
include the name of the library in the path.
Example: ../../MyLibrary/Debug, this is the path to the archive file of the
library project myLibrary residing in the same workspace as the application
project.
5. The source folder for the header files should also be added to the Include paths.
Do that by selecting Project, Properties, Tool Settings, C Compiler, Directories
and press the Add… button. Then add the path to the source folder for the
header files in the library.
Figure 67 – Add the Library to the Include Paths
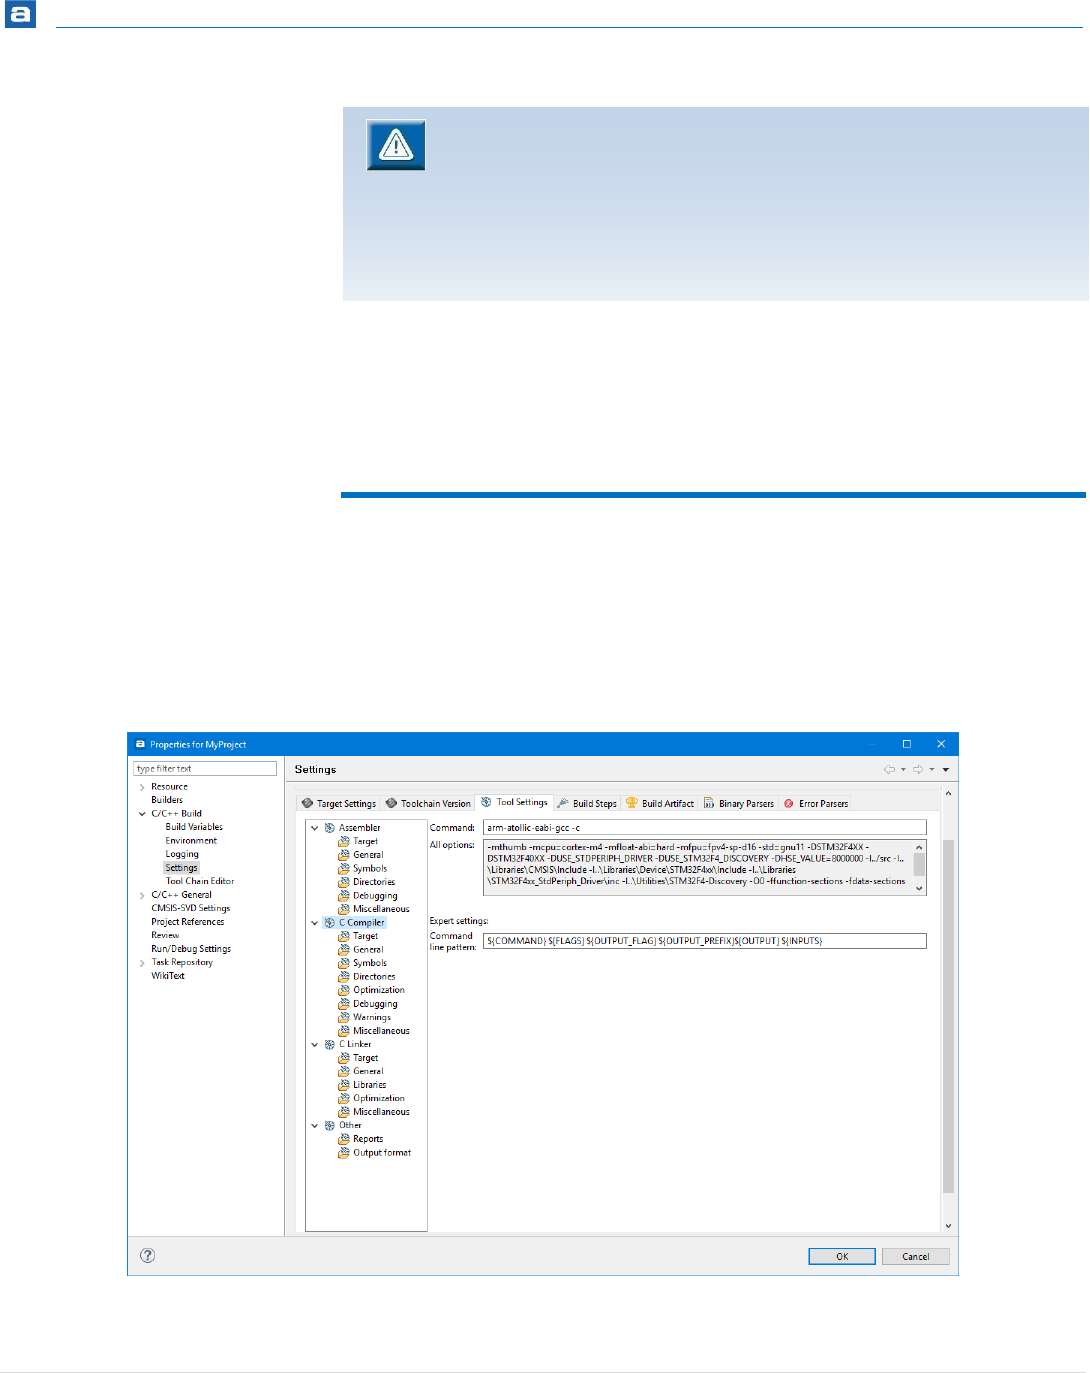
Getting Started
95 | P a g e
The included libraries can also be found by right-clicking the project and select C/C++
General and open the Libraries-tab and the Libraries Path-tab.
See Referring Project on page 119 for more information if a project is referring to another
project, a library or a normal project.
COMPILER SETTINGS
All the settings for the compiler can be found by open the Build Configuration with the
Build Settings Toolbar button.
Then select the Build Configuration that should be changed and the Tool Setting tab.
Select the C Compiler tool node.
The compilers command line command and options are then displayed.
Figure 68 – Compiler Settings
Libraries added by include paths are considered static in that way that they
are provided by external parties. The .h files are not rescanned as the content
should not have changed for external header files.
If external libraries is to be treated as normal source folder, the folders must
also be added as source-folders to the project.
This is particularly important when using tools that generates external code,
such as STM32CubeMX
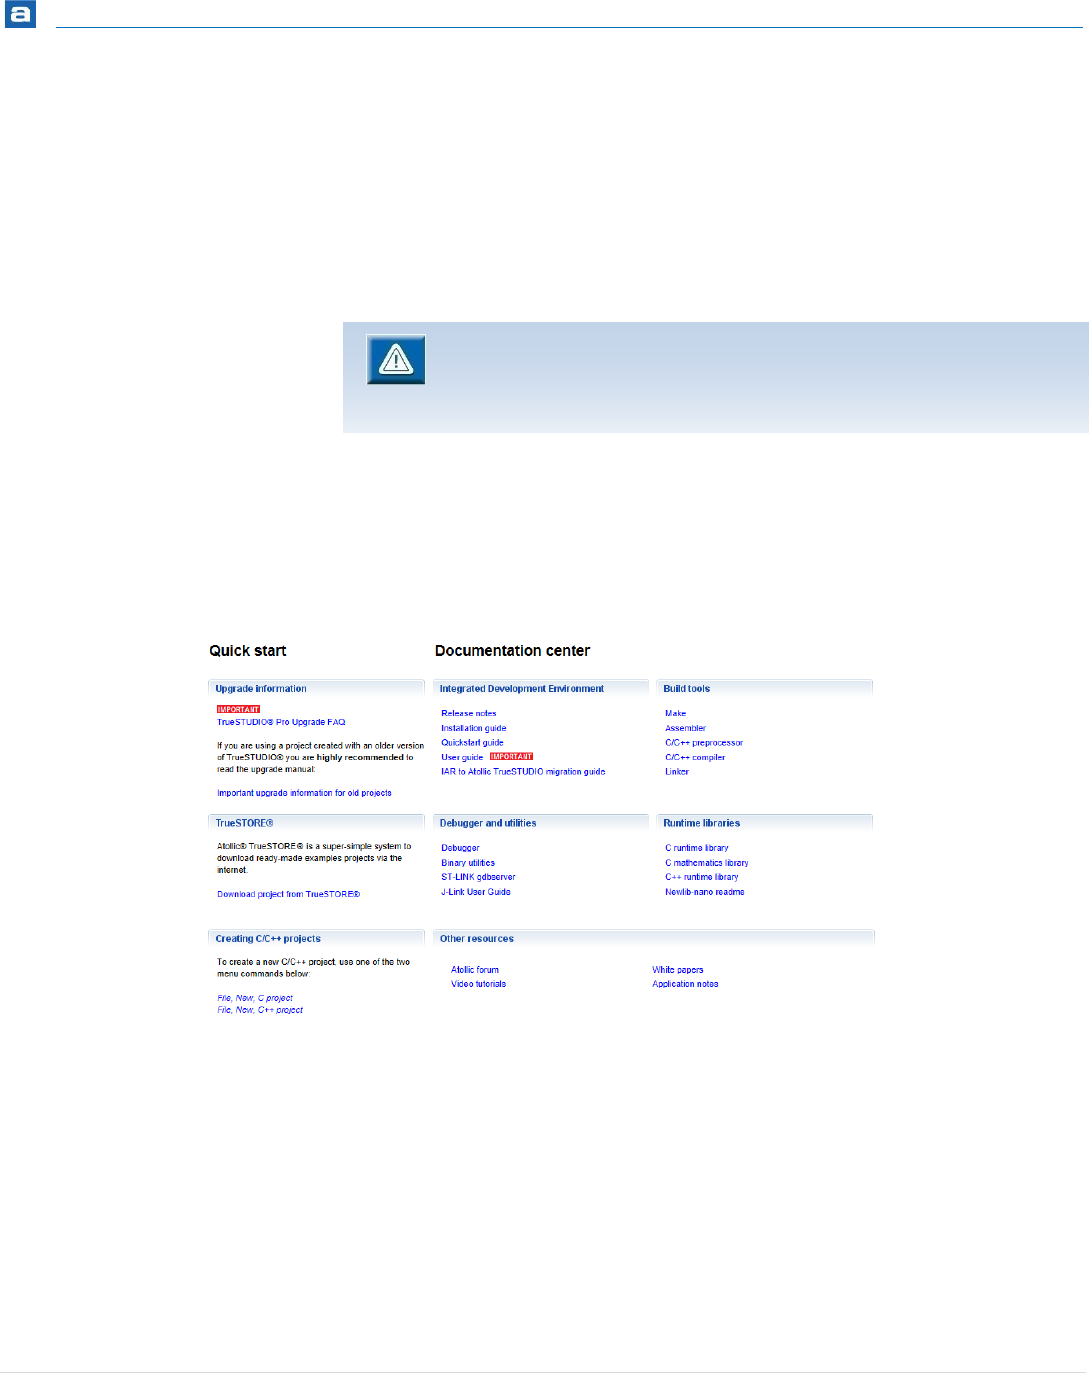
Getting Started
96 | P a g e
The different nodes below the C Compiler can then be selected to configure how the
compiling is done. More about these options are found in the following pages in this
chapter.
The options can also be manually changed by editing the All options field.
More about all options are found in the Compiler manual found in the Information Center
as the C/C++ Compiler link.
More information about compiler settings can be found in the Compiler manual. The
manual can be found from the Information Center view.
Figure 69 – Finding the C/C++ Manual in Information Center
SET THE COMPILER TO USE THE C99-STANDARD
User can set the compiler to use the C99 standard by adding the '-std=c99' switch to the c
compiler tool.
Do this by selecting the General node.
From the dropdown menu select C99.
See also section Add or Remove Folder to Include Path on page 153 for
information on an easy way to update the include path.

Getting Started
97 | P a g e
This change will also be reflected in the editor’s behavior.
Read more about the status of the C99 implementation here http://gcc.gnu.org/gcc-
4.5/c99status.html.
Other C standards can also be set with the same drop down menu.
COMPILER OPTIMIZATION
The GNU C/C++ compiler (and hence Atollic TrueSTUDIO) have 6 levels of compiler
optimization; -O0 for no optimization up to -O3 for full optimization. There is one level for
size optimization (-Os) which is commonly required in embedded projects and another
level for speed optimization (-Ofast).
Also available is a level for turning on optimizations that won’t interfere with the debug
experience (-Og).
To enable compiler optimization in the commercial versions of Atollic TrueSTUDIO, select
optimization option from the dropdown list in the C/C++ Build, Settings, Tool Settings, C
compiler, Optimization panel in the Project Properties dialog box. The optimization
options can also be set per file in the File Properties dialog box, found by right-clicking an
individual file.
Figure 70 – Compiler Optimization Settings for a Project
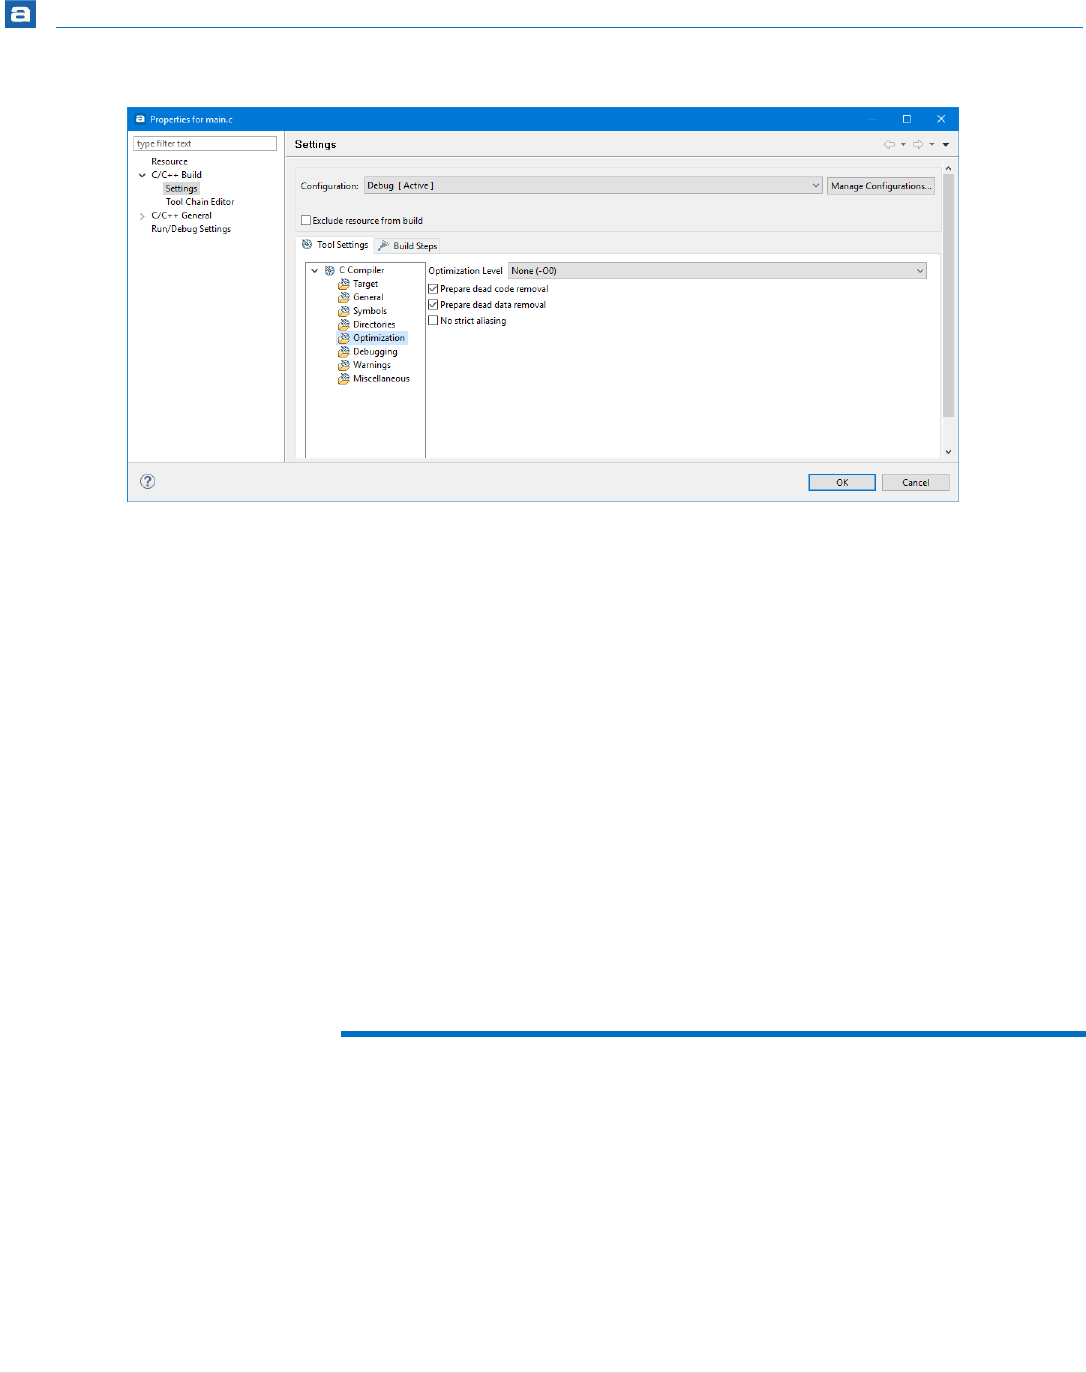
Getting Started
98 | P a g e
Figure 71 – Compiler Optimization Settings for a File
The optimization setting is per Build Configuration. Per default the Debug configuration is
optimized with –O0 and the Release configuration has -Os.
In addition to the simplified optimization settings mentioned above, about 100
optimization settings can be set individually using various command line options and
#pragmas. Consult the Compiler manual for details. It can be found from the Information
Center view.
To define a specific optimization level on a block of code, use the optimize attribute on the
block:
void __attribute__((optimize("O1"))) myFunc(unsigned char
data) {
// The code the needs to have the –O1 optimizing
}
LINK TIME OPTIMIZATION (LTO)
Using LTO means that when compiling individual files the output is not object code, but
instead an intermediate internal format between the original source code and assembly
code. This means that when the linker is doing the final link it has access to more
optimizable information about each file and a globally optimized program is generated.
However, because of the way this works also means that in order to use this feature fully it
is necessary to provide the linker tool with some extra information that usually has only
been supplied to the compiler tool. This extra information can be any optional extra flag
that you might have added to the compiler process.
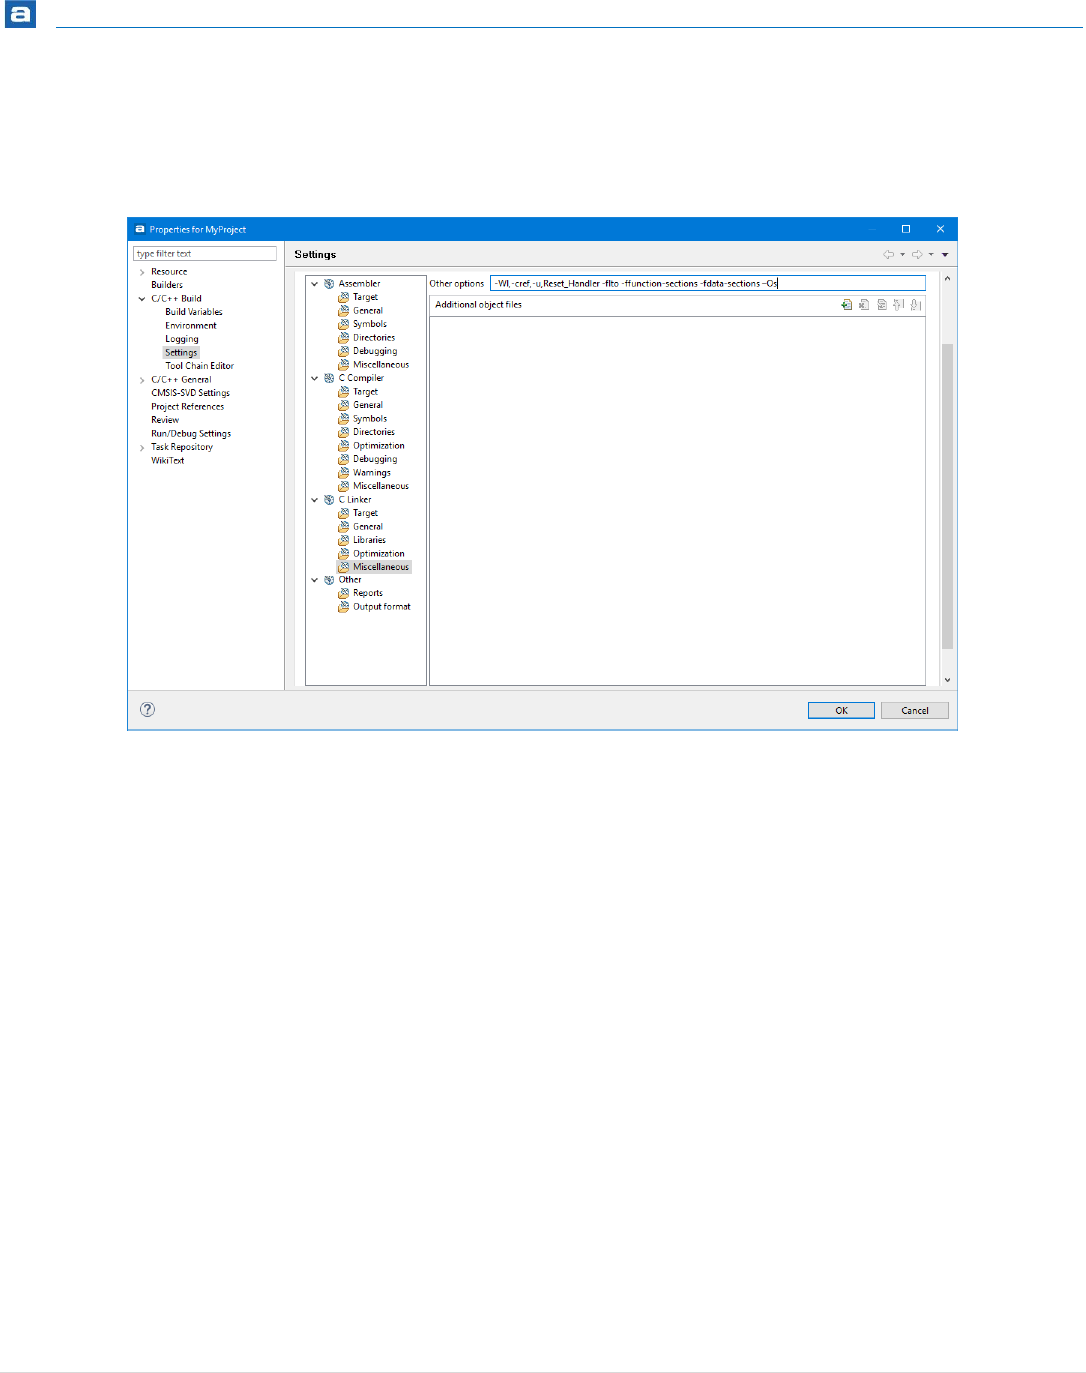
Getting Started
99 | P a g e
In most cases however it will only be required to add the following flags to the Linker tool
Miscellaneous field
-flto -ffunction-sections -fdata-sections -Os -g
Figure 72 – Linker LTO Settings for a Project
The optimization flag (-Os) should have the same value as the optimization flag for the
compiler, see page 93 for more information.
Please note! -g shall be used to get extra debug information needed when debugging the
program.
It is also required to change the Compiler tool settings and there add the –flto flag to the
miscellaneous field.
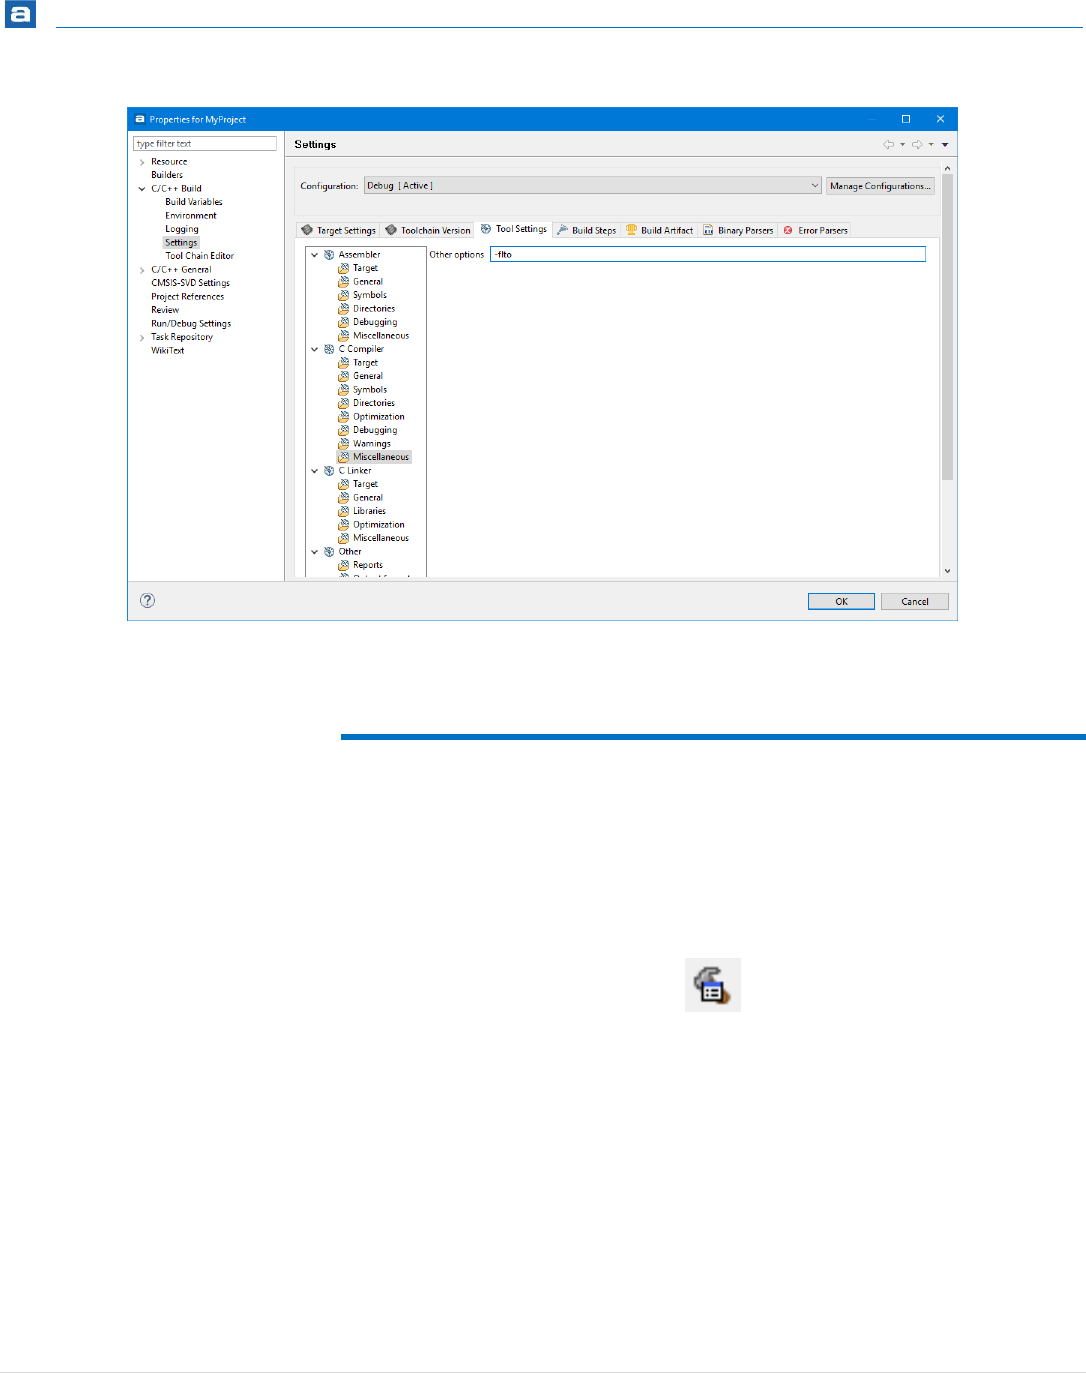
Getting Started
100 | P a g e
Figure 73 – Linker LTO Settings for a Project
CHANGING TOOLCHAIN VERSION
When upgrading to a new version of Atollic TrueSTUDIO it is a good idea to not
immediately also switch the tool chain.
To change to an older version of the Atollic ARM Tools toolchain or the PC toolchain click
on the Build Settings toolbar button.
Figure 74 – Build Settings Toolbar Button
Select the Toolchain Version tab.
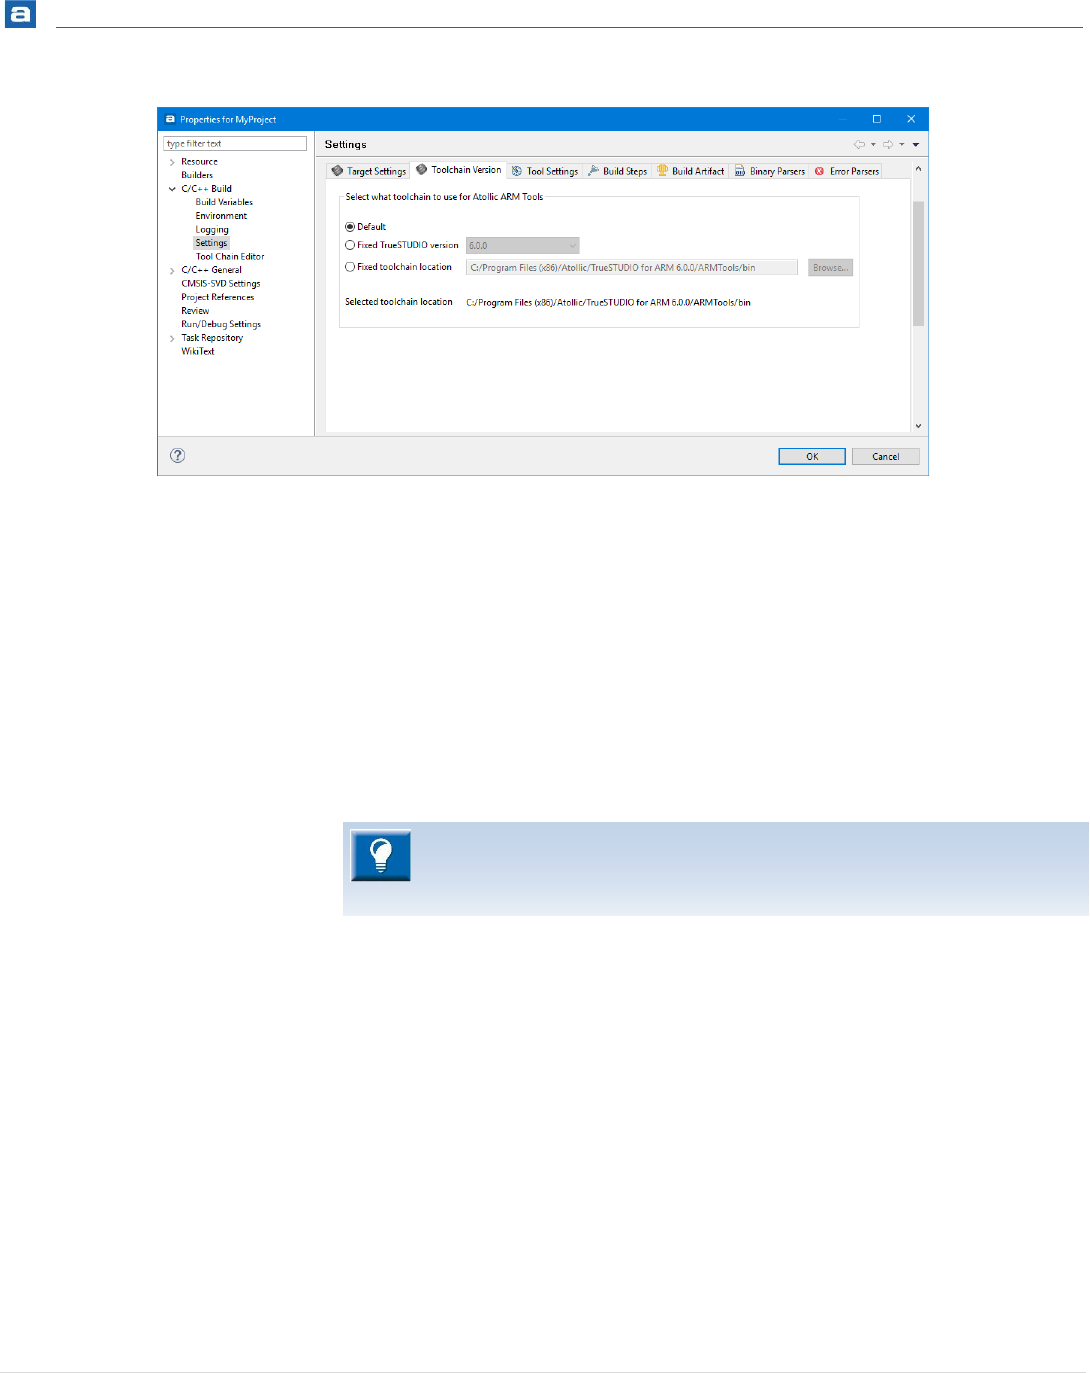
Getting Started
101 | P a g e
Figure 75 – Tool Chain Version tab
There are three options available here:
Default – This option will use the tool chain in the currently running installation of
TrueSTUDIO.
Fixed TrueSTUDIO version – if there are other versions of Atollic TrueSTUDIO
installed on the computer, this option allows the user to select from what version
the tool chain will be selected. It will then select that version even if the
installation folder for the selected version is changed.
Fixed toolchain location – Used to point to a specific folder.
These setting are saved individually for each Project’s Build Configuration. That way it is
possible to have different Build Configurations using different toolchain versions. This way
a quick regression test can be created.
CREATE A NEW BUILD CONFIGURATION FOR AN OLD
TOOLCHAIN VERSION
To create a new Build Configuration for an older version of the toolchain, do the following:
1. Right click the project and select Build Configurations, Manage…
When working with a version control system in a team, the second option is
strongly recommended for a project. That way all developers will use the same
toolchain even if using different versions of Atollic TrueSTUDIO.
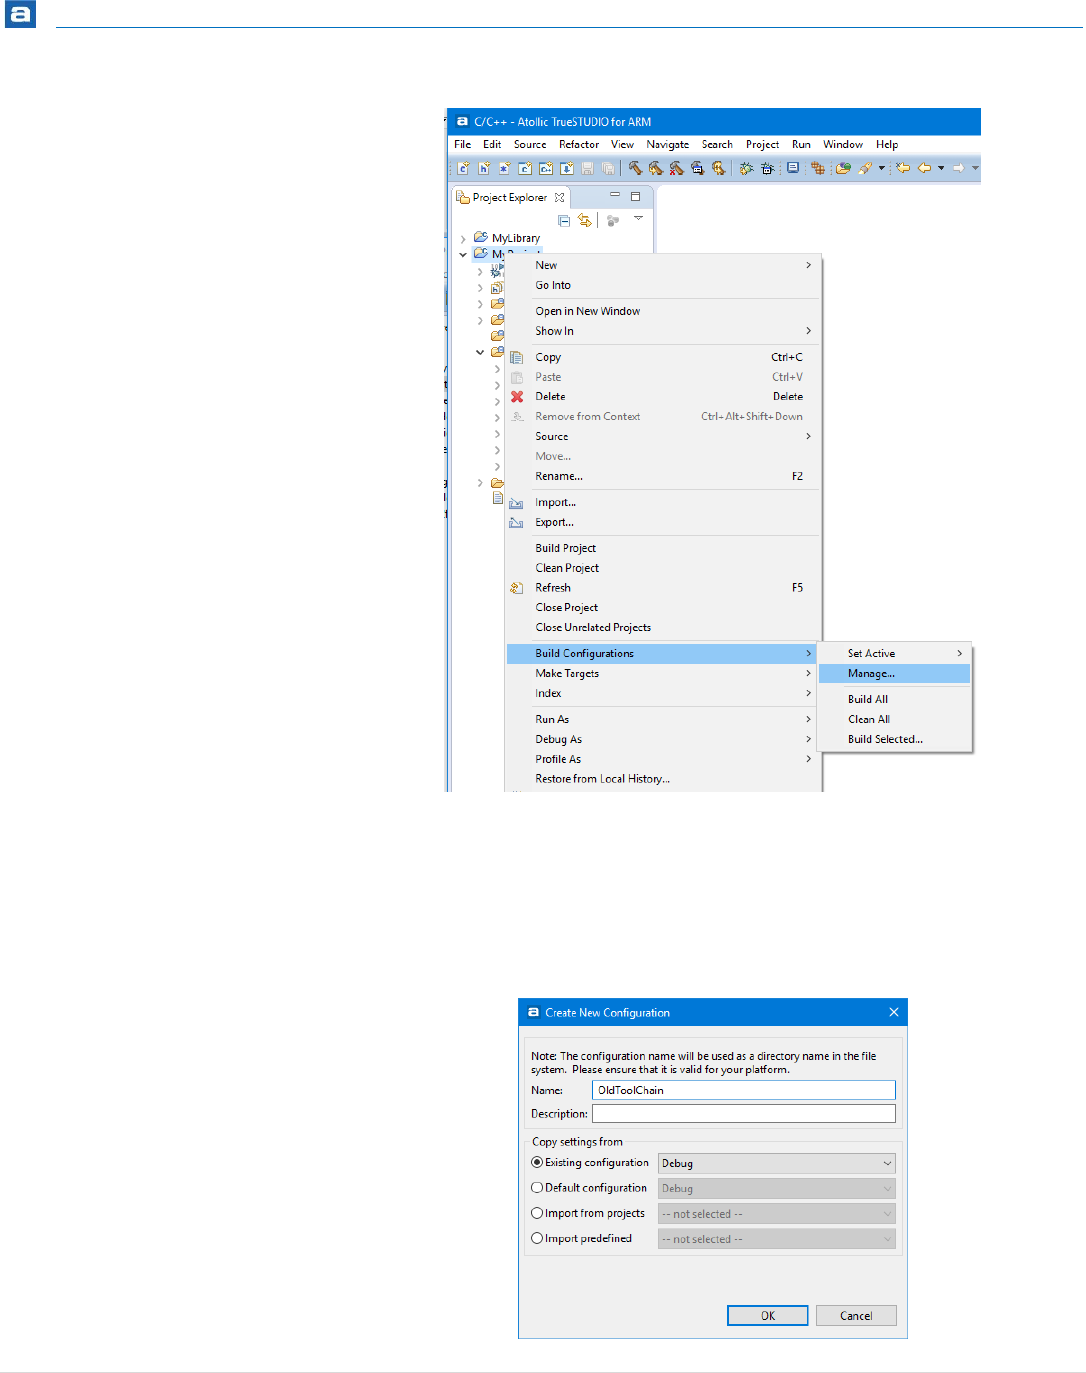
Getting Started
102 | P a g e
Figure 76 – Manage the Build Configurations
2. In the panel select New… to create a new Build Configuration.
3. Enter a good name for the new Build Configuration. Use one word, such as
OldToolChain, without white space and press OK and OK again in the Manage
Configuration panel.
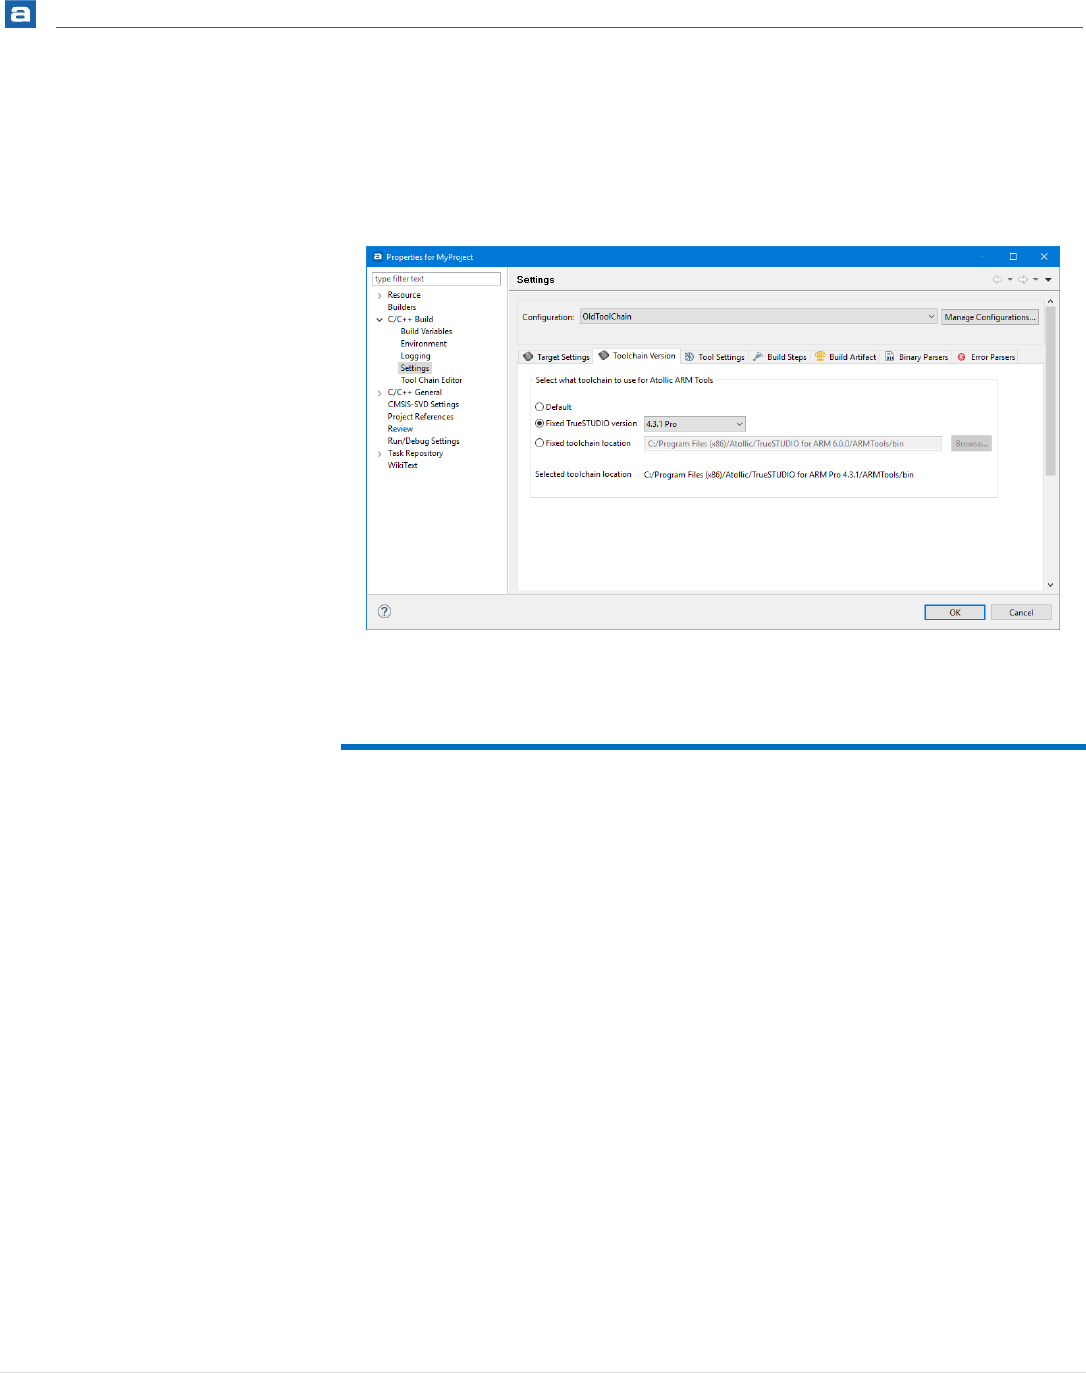
Getting Started
103 | P a g e
Figure 77 – Create New Configuration
4. In the Toolchain Version tab it is now possible to set the Default version of the tool
chain for the normal Debug Build Configuration and a Fixed TrueSTUDIO version for
the OldToolChain Build Configuration.
Figure 78 – Old Tool Chain Version for the New Build Configuration
CONVERT .ELF-FILE TO ANOTHER OUTPUT FORMAT
To convert your program to another output format, do the following:
1. Open up Project, Properties, C/C++ Build, Settings, Tool Settings, Other, Output
format
2. Check the box Convert build output and choose a format in the dropdown menu.
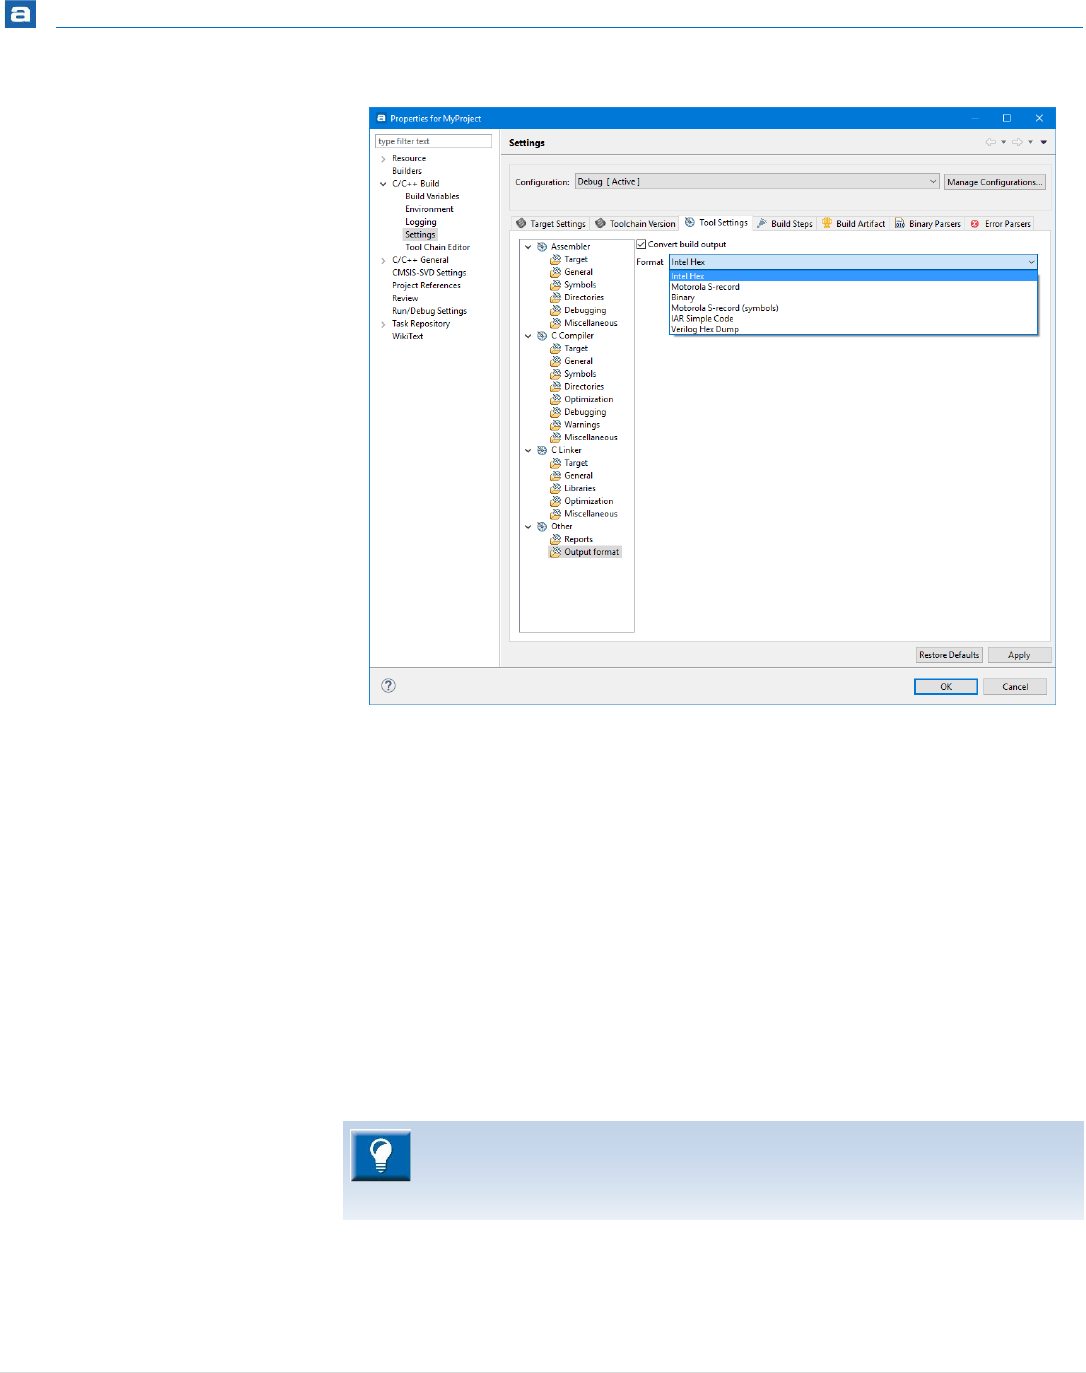
Getting Started
104 | P a g e
Figure 79 – Output Format Selection
3. Build the project
The converted output will be located in the output directory associated with the currently
active Build Configuration, typically Debug/Release directory.
Other supported file formats are: Binary, Motorola S-record, Motorola S-record with
symbols, IAR Simple Code and Verilog Hex Dump.
To manually create .hex, .srec and .bin-files, add Post-build steps in the Build Step tab:
arm-atollic-eabi-objcopy -O binary myfile.elf myfile.bin
arm-atollic-eabi-objcopy -O ihex myfile.elf myfile.hex
arm-atollic-eabi-objcopy -O srec myfile.elf myfile.srec
Conversion to the IAR Simple Code File Format can only be made using the
dropdown menu in Atollic TrueSTUDIO. The IAR Simple Code File Format can
not be generated with
objcopy
.

Getting Started
105 | P a g e
TEMPORARY ASSEMBLY FILE
Save the temporary assembly file by adding the -save-temps flag to the compiler.
In the menu select Project, Properties, C/C++ build, Settings.
Open the Tool Settings tab.
Then C Compiler, Miscellaneous. Add –save-temps and rebuild the project.
The assembler file will be located in the build output directory and will be called:
FILENAME.s
There will also be a FILENAME.i that is the preprocessed c-code. That is the code as it will
look after the preprocessor but before the code is compiled. If there might be a problem
with some #define then looking into this file is a good idea.
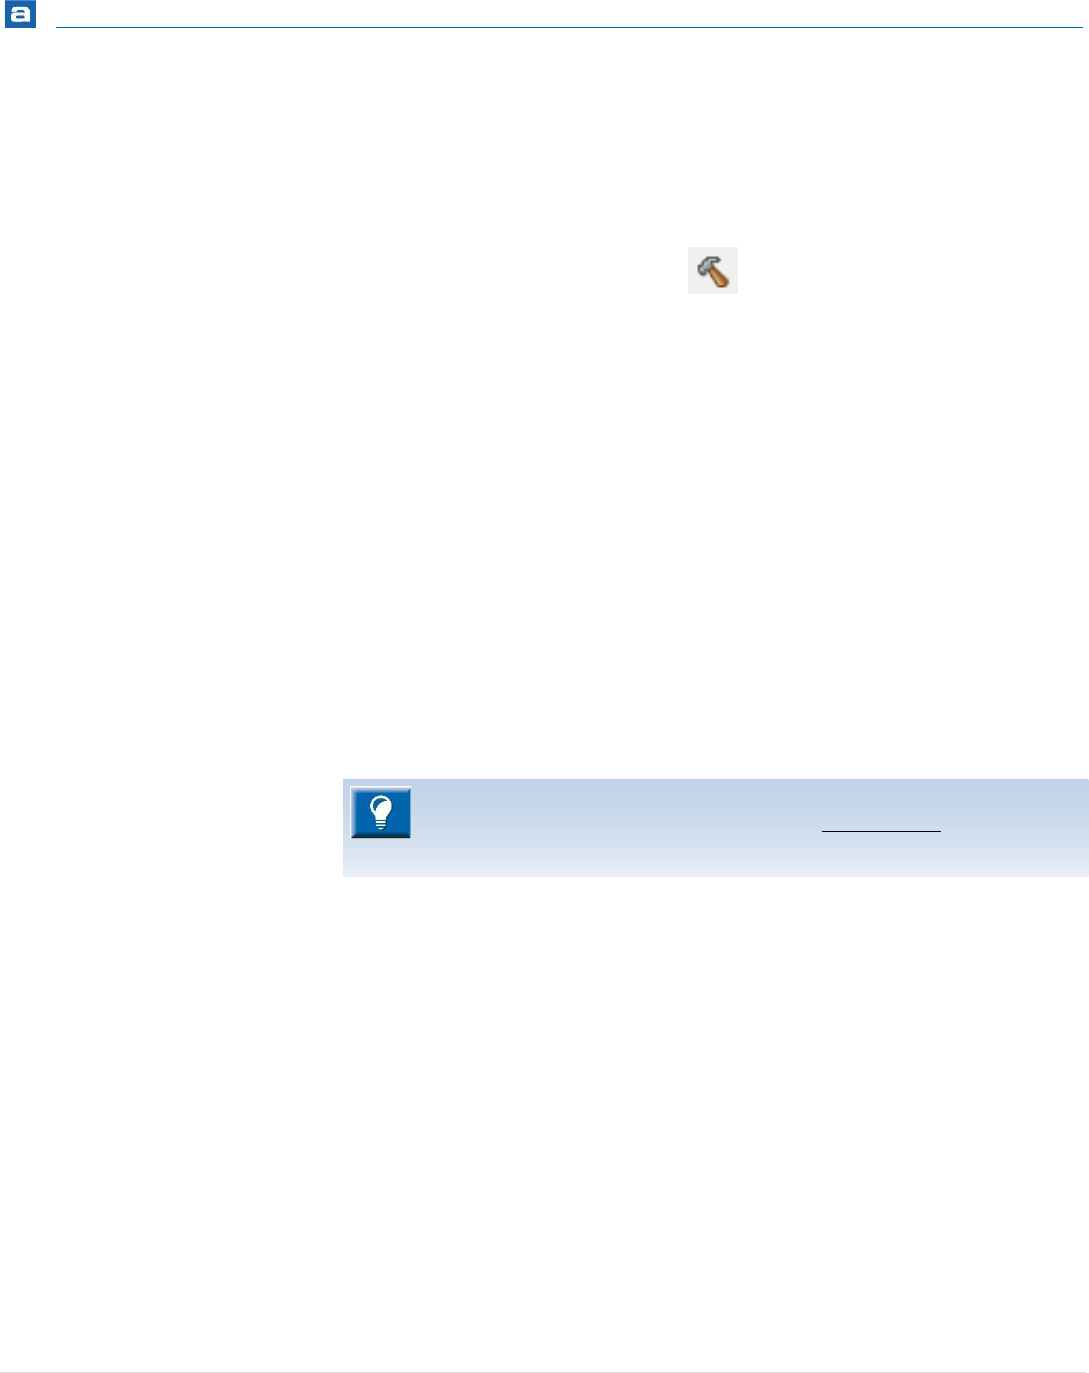
Getting Started
106 | P a g e
BUILDING THE PROJECT
To start a Build, click on the Build toolbar button. Only files that are changed since the last
build, or that depends on changed files or settings, will be built.
Figure 80 - Build Toolbar Button
The Build result is displayed in the Console window. At the end are the code size figures.
For example:
Print size information
text data bss dec hex filename
66232 2808 4004 73044 11d54 GSM lib cb1.elf
Print size information done
The values are organized according to memory sections and areas. Per default, the linker
arranges the memory into the sections text, data, bss. More information is found
in the linker script file (.ld).
The dec and hex figures express the size of the .elf file. Below the filename header
is the name of the .elf file.
The Build Analyzer view can be used to analyse the size and location of a
program in detail. Please read more about the Build Analyzer at page 264

Getting Started
107 | P a g e
ENABLE PARALLEL BUILD
Parallel Build is when more than one thread is used at the same time to compile and build
the code. Most of the times it will reduce the build time significantly. The optimal
number of threads to use is usually equal to the number of CPU cores on the computer.
To enable Parallel Build select Project, Properties and in the Properties panel select C/C++
Build. Open the Behavior tab and Enable Parallel Build.
Figure 81 – Parallel Build
ENABLE BUILD ON SAVE
To enable Atollic TrueSTUDIO to automatically build a file when it is saved, the Build
Behavior setting needs to be changed.
In the top menu select Project, Properties and in the Properties panel select C/C++ Build.
Open the Behavior tab and enable Build on resource save.
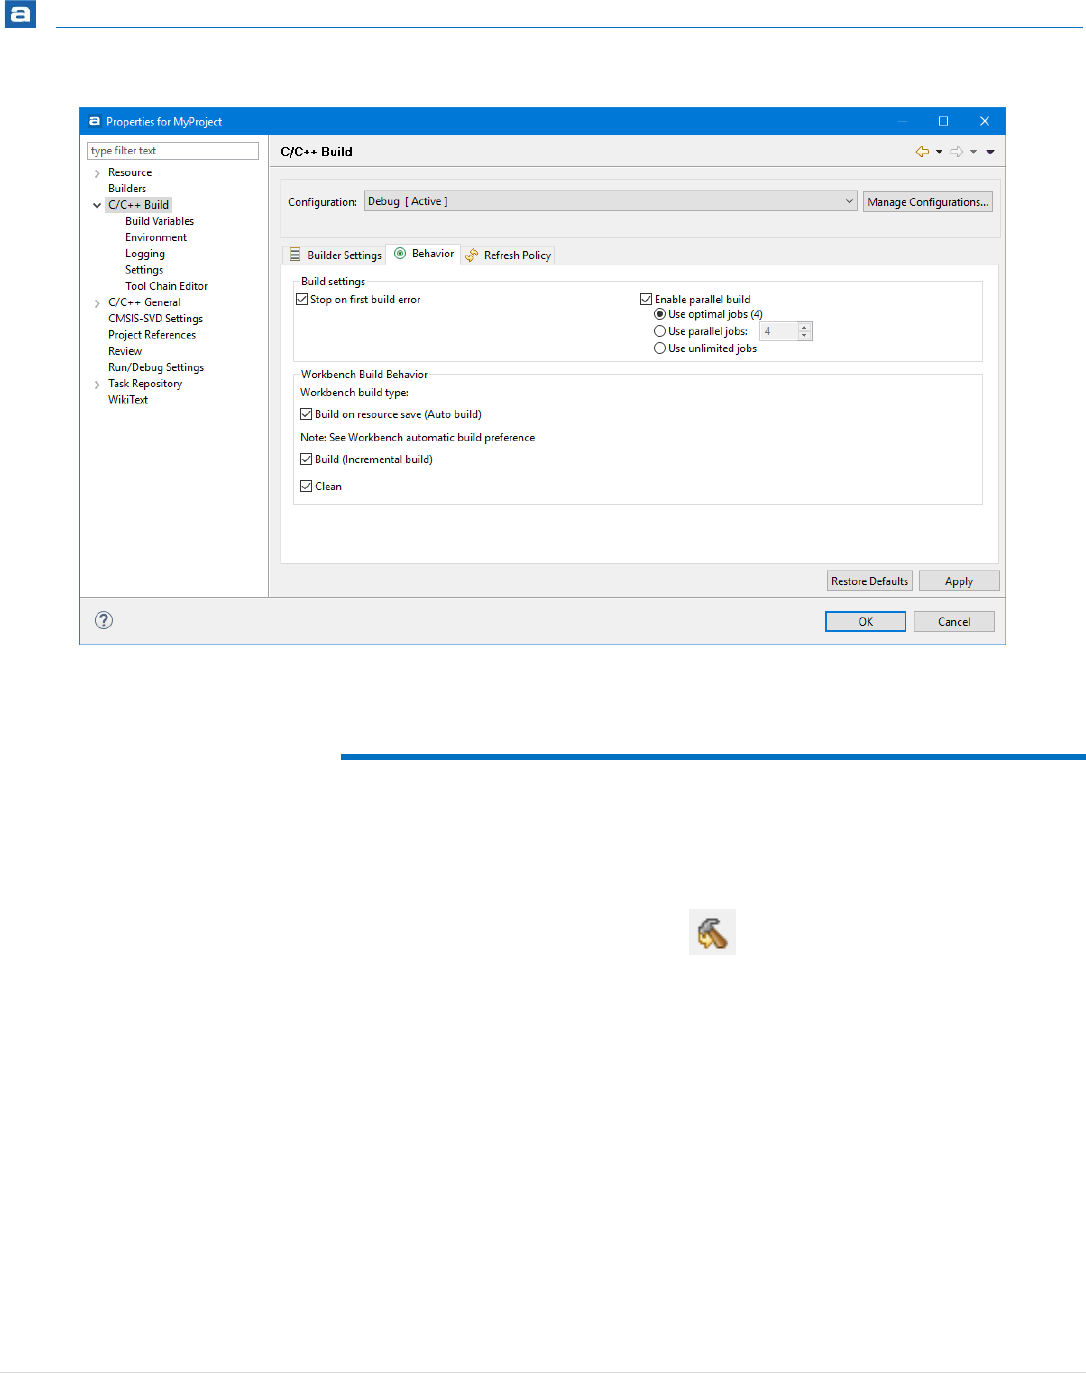
Getting Started
108 | P a g e
Figure 82 – Build on Save
REBUILD PROJECT
To force a Rebuild of all files included in the project, click on the Rebuild toolbar button or
select the menu command Project, Rebuild Project.
Figure 83 – Rebuild Toolbar Button
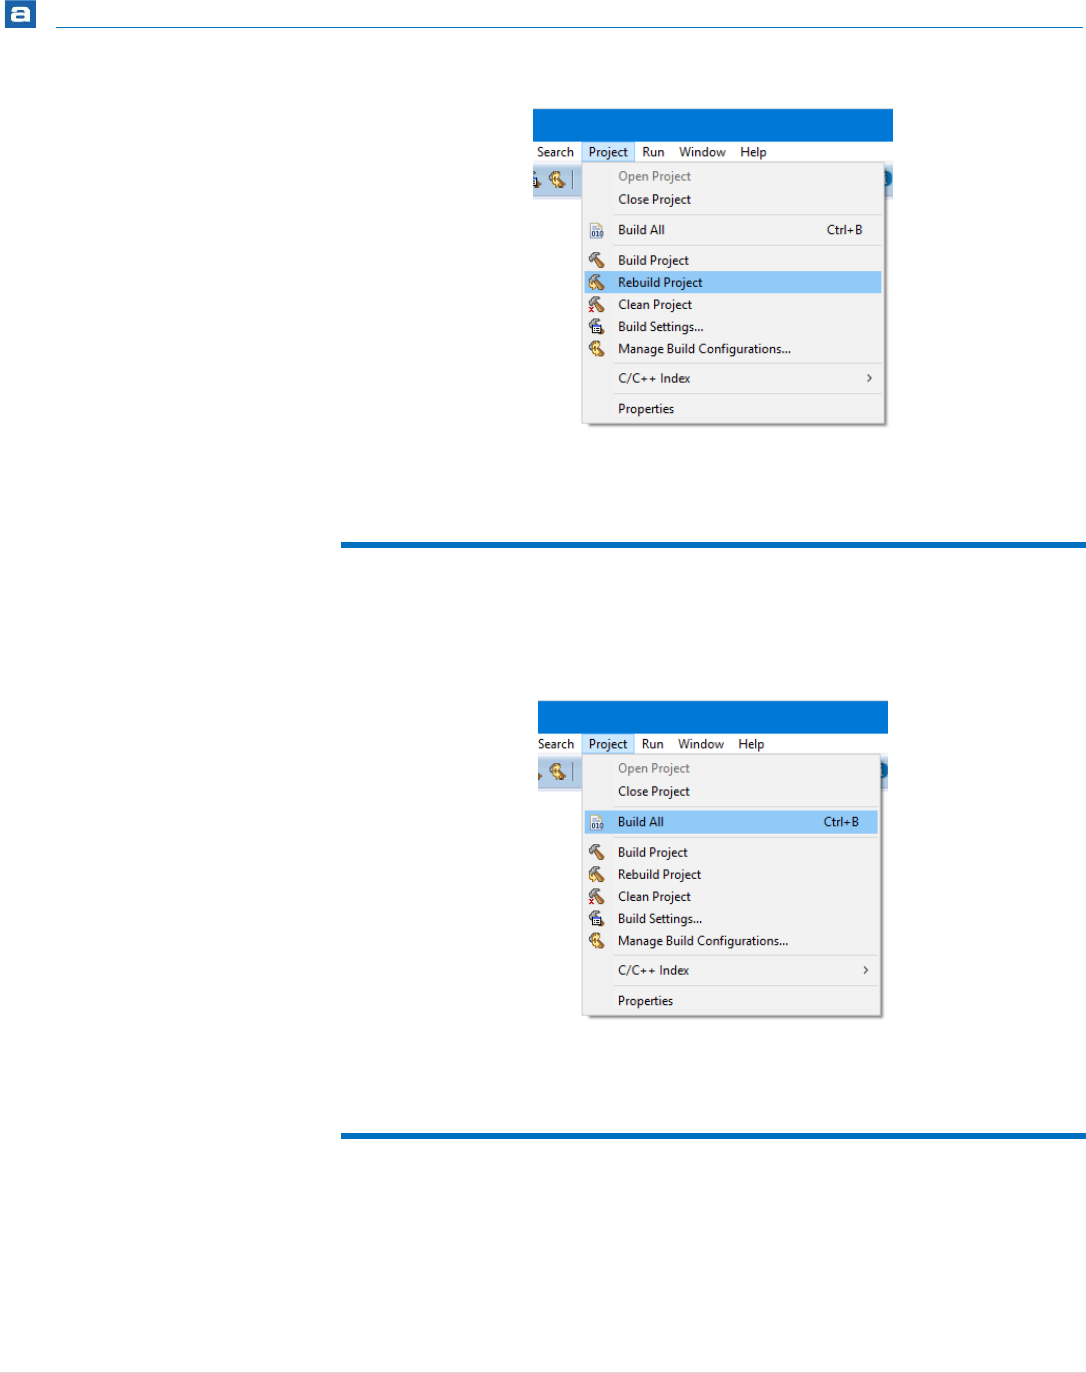
Getting Started
109 | P a g e
Figure 84 – Rebuild Active Configuration Menu Selection
BUILD ALL PROJECTS
To build all open projects in a workspace, select Project in the top menu and then Build All or
press Ctrl+B. This will build the active Build Configuration for each project.
Figure 85 – Build All Projects
BUILD ALL BUILD CONFIGURATIONS
To build all Build Configurations for a project, right-click the project and in the context menu select
Build Configurations and Build All.
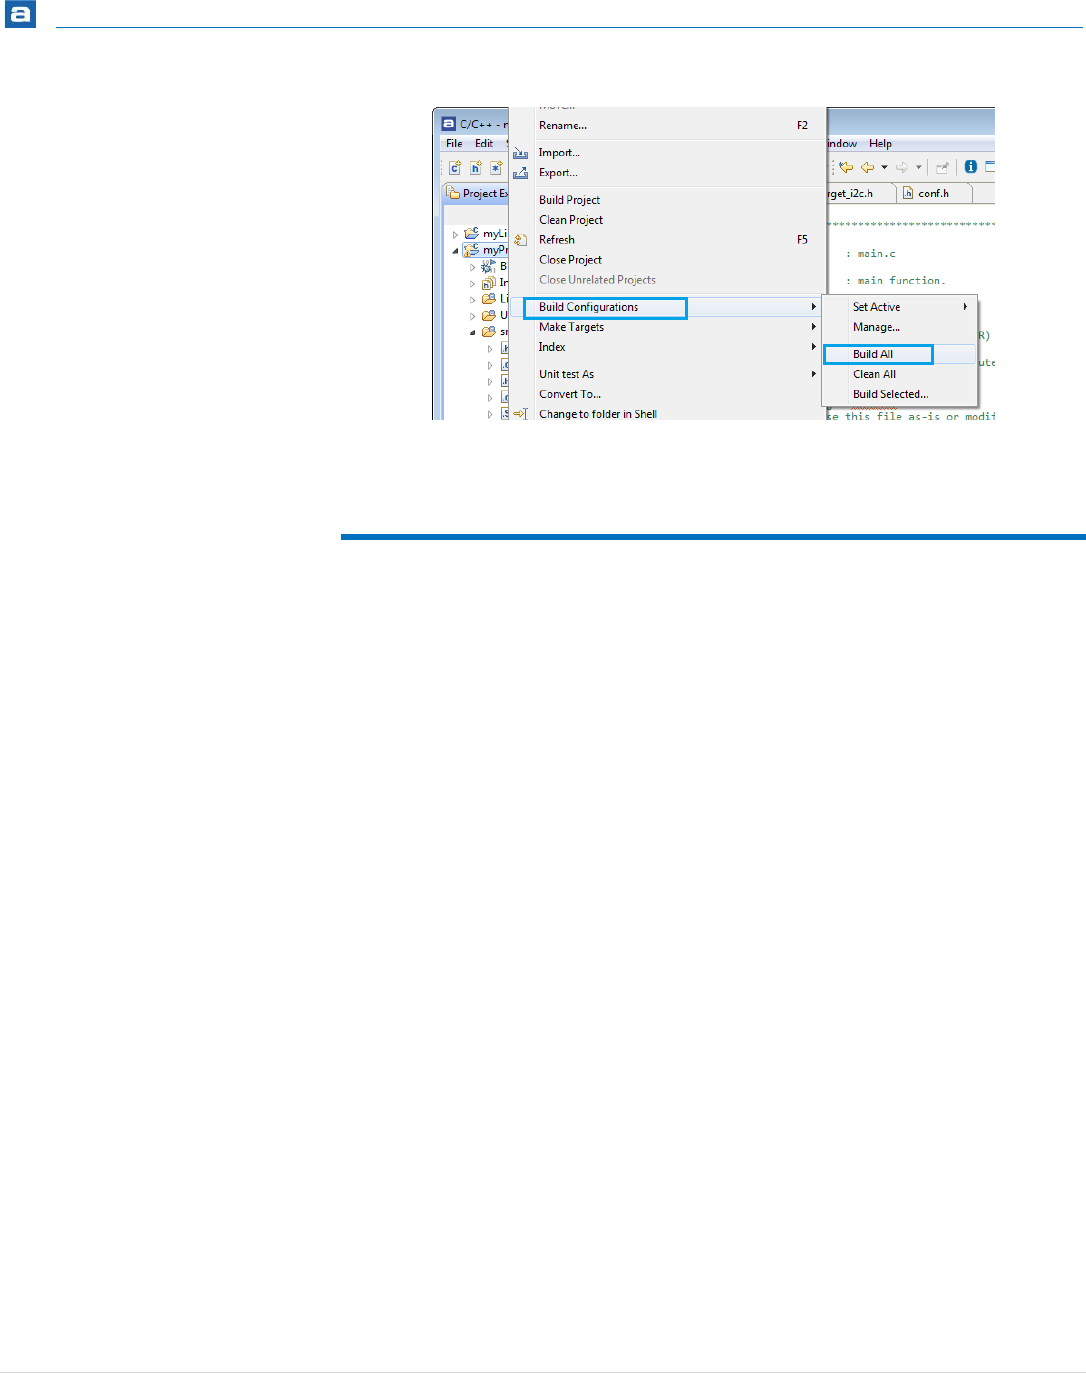
Getting Started
110 | P a g e
Figure 86 – Build All Build Configurations
HEADLESS BUILD
This is intended for Managed Mode projects that are to be integrated into script-
controlled builds, such as nightly builds on build servers for continuous integration process
methods, etc. It is possible to start a build process from the operating system command
line also for Managed Mode projects. The IDE GUI is never displayed in this case, and the
user does not have to interact manually with the IDE at all.
The IDE installation folder, e.g. C:\Program Files (x86)\Atollic\TrueSTUDIO for
STM32 9.0.0\ide, contains the file headless.bat, which is used for running
headless builds.

Getting Started
111 | P a g e
Option
Description
-data {[uri:/]/path/to/workspace}
This option is always required and selects which workspace to
use for the headless build. If the selected workspace folder
does not exist, it will be created automatically.
-import {[uri:/]/path/to/project}
Optionally import a project into the workspace before the
headless build starts. Please note that importing into a
workspace is not the same as copying the files to the
workspace. It tells Atollic TrueSTUDIO that there exists new
files in a workspace.
-importAll {[uri:/]/path/to/projectTreeURI}
Optionally import several projects into the workspace before
the headless build starts.
-build {projname_reg_exp}
Build all build configurations (see page 88 for more
information) of the selected project. If the project name
contains wildcards (? and *), all matching projects will be
built.
-build {projname_reg_exp/configname}
Build the selected project using only the selected build
configuration. If the project name contains wildcards (? and
*), all matching projects will be built.
This option can be used several times. That way libraries can
be built before the project depending on them.
-build all
Build all configurations of all projects in the selected
workspace.
-cleanBuild {projname_reg_exp}
Rebuild all build configurations of the selected project. If the
project name contains wildcards (? and *), all matching
projects will be rebuilt.
-cleanBuild
{projname_reg_exp/configname}
Rebuild the selected build configuration of the selected
project. If the project name contains wildcards (? and *), all
matching projects will be rebuilt.
-cleanBuild all
Rebuild all build configurations of all projects in the selected
workspace.
-I {include_path}
Additional include path to add to tools.
-include {include_file}
Additional include file to pass to tools.
-D {prepoc_define}
Additional preprocessor defines to pass to the tools.
-E {var=value}
Replace/add value to environment variable when running all
tools.
-Ea {var=value}
Append value to environment variable when running all tools.
-Ep {var=value}
Append value to environment variable when running all tools.

Getting Started
112 | P a g e
Option
Description
-Er {var}
Remove/unset the given environment variable.
An option argument is parsed as a string, a comma separated list of strings, or a boolean,
depending on the type of option.
Example:
headless.bat -data "C:\Users\User\headless\buildWS" -
importAll "C:\Users\User\headless\checkOutDir" -cleanBuild
all > "C:\Users\User\headless\build.log"
This command will create a temporary workspace folder buildWS for this build. It will
import all projects from the folder checkOutDir (not copy, just import to the temporary
workspace) and build all build configurations defined in each project. The result will be
stored in the folder checkOutDir. A log file will be created in the folder headless.
Doing an import is vital if ether a temporary workspace is used or a batch-script is used
and the project to build is checked out from a repository before the build. This is because
Atollic TrueSTUDIO needs to know about the files before using them to build.
LOGGING
To enable project build logging, right-click on the project and select Properties. Then
select C/C++ Build, Loggings.
The logs can then by default be found in
WORKSPACE_PATH\.metadata\.plugins\org.eclipse.cdt.ui\MyProjec
t.build.log
A global build log for all projects in a workspace can be enabled by selecting Window,
Preferences and in the dialog open C/C++, Build, Logging and Enable global build logging.
THE BUILD SIZE
After building a project, object files and an application binary file (typically in ELF format)
exist under the Debug or Release folder in the Project Explorer view file tree.

Getting Started
113 | P a g e
To study the properties (such as code or data size) of an object file, open the Properties
view.
To open the Properties view, press the Show View toolbar button and select the
Properties view.
Figure 87 – Open the Properties view
Then select the object file in the Project Explorer view. The Property view will display a
large number of properties, including code and data sizes of the object module.
To study the properties (such as code or data size) of a linked application binary file, open
the Properties view and select the ELF file in the Project Explorer view.

Getting Started
114 | P a g e
Figure 88 – Open the Properties view
The Property view will display a large number of properties, including code and data sizes
of the complete application.
Data is normally stored in the “data" segment and code is normally stored in the "text"
segment.
The Build Analyzer view can be used to analyse the size and location of a
program in detail. Please read more about the Build Analyzer at page 264

Getting Started
115 | P a g e
COMMAND LINE PATTERNS
The Command Line Pattern is used to assemble parts the builds up the command line that is
used to build the project.
To find it, press the Build Settings toolbar button.
Figure 89 – Build Settings Toolbar Button
In the C/C++ Build, Settings select the Tool Settings tab. Each one of the different tools in
the toolchain (Assembler, Compiler, Linker and Other) has its own patter that can be
modified.
The pattern consists of the replaceable variables COMMAND, FLAGS, OUTPUT_FLAG,
OUTPUT_PREFIX, OUTPUT and INPUTS.
The default command line pattern is ${COMMAND} ${FLAGS} ${OUTPUT_FLAG}
${OUTPUT_PREFIX} ${OUTPUT} ${INPUTS}
White space and other characters are significant and are copied to the created command.
The environment variables can also be used. They are defined in Project, Properties,
C/C++ Build, and then Environment.
CREATE .LIST-FILES
To get list files with assembler information when the files in the projects are compiled the
build conigurations for the C/C++ compiler needs to be updated.
In the C/C++ Build, Settings select the Tool Settings tab and then C Compiler. In the Expert
settings for Command Line Pattern add -Wa,-aln=${OUTPUT}.list as shown below.
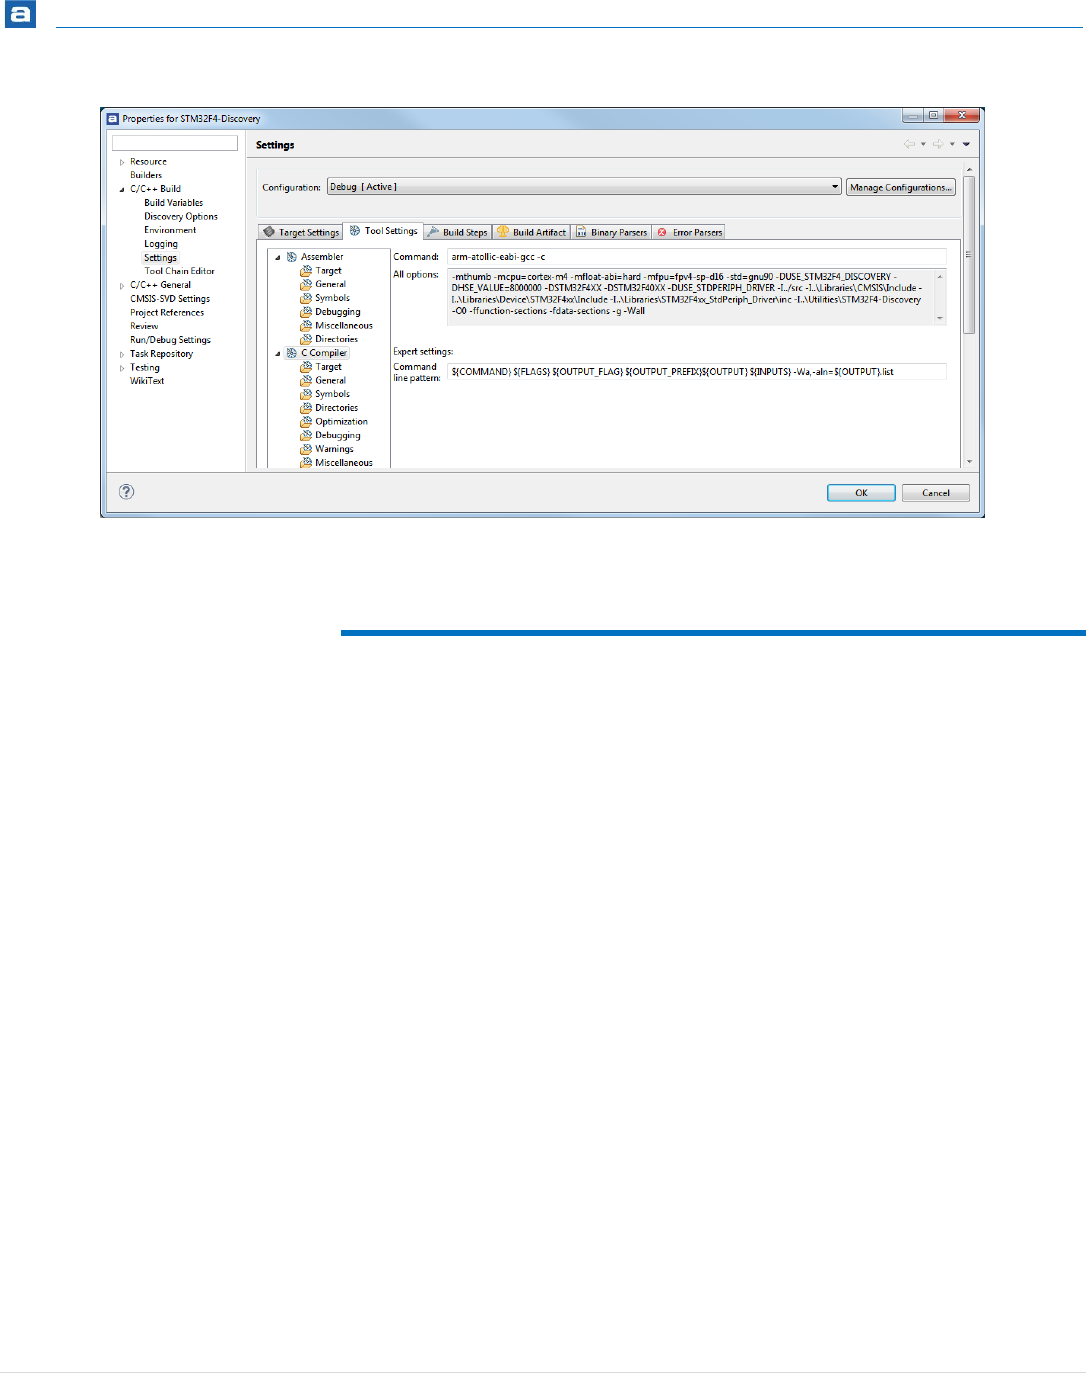
Getting Started
116 | P a g e
Figure 90 – Generate –list Files
BUILDING ONE FILE
It is a bit complicated to enable the build option to build only one file in a project. It cannot
be done while the default setting Build Automatically is enabled. This will also disable the
Build on resource save behavior.
In the top menu select Window, Customize Perspective and in the dialog window open
the Menu Visibility tab.
Expand the Project node and enable the Build Automatically option.

Getting Started
117 | P a g e
Figure 91 – Enable the Build Automatically Menu Item
Press OK, then go to the Project menu and make sure Build automatically is unchecked for
the project.
The popup menu option Build Selected File(s) is now enabled.
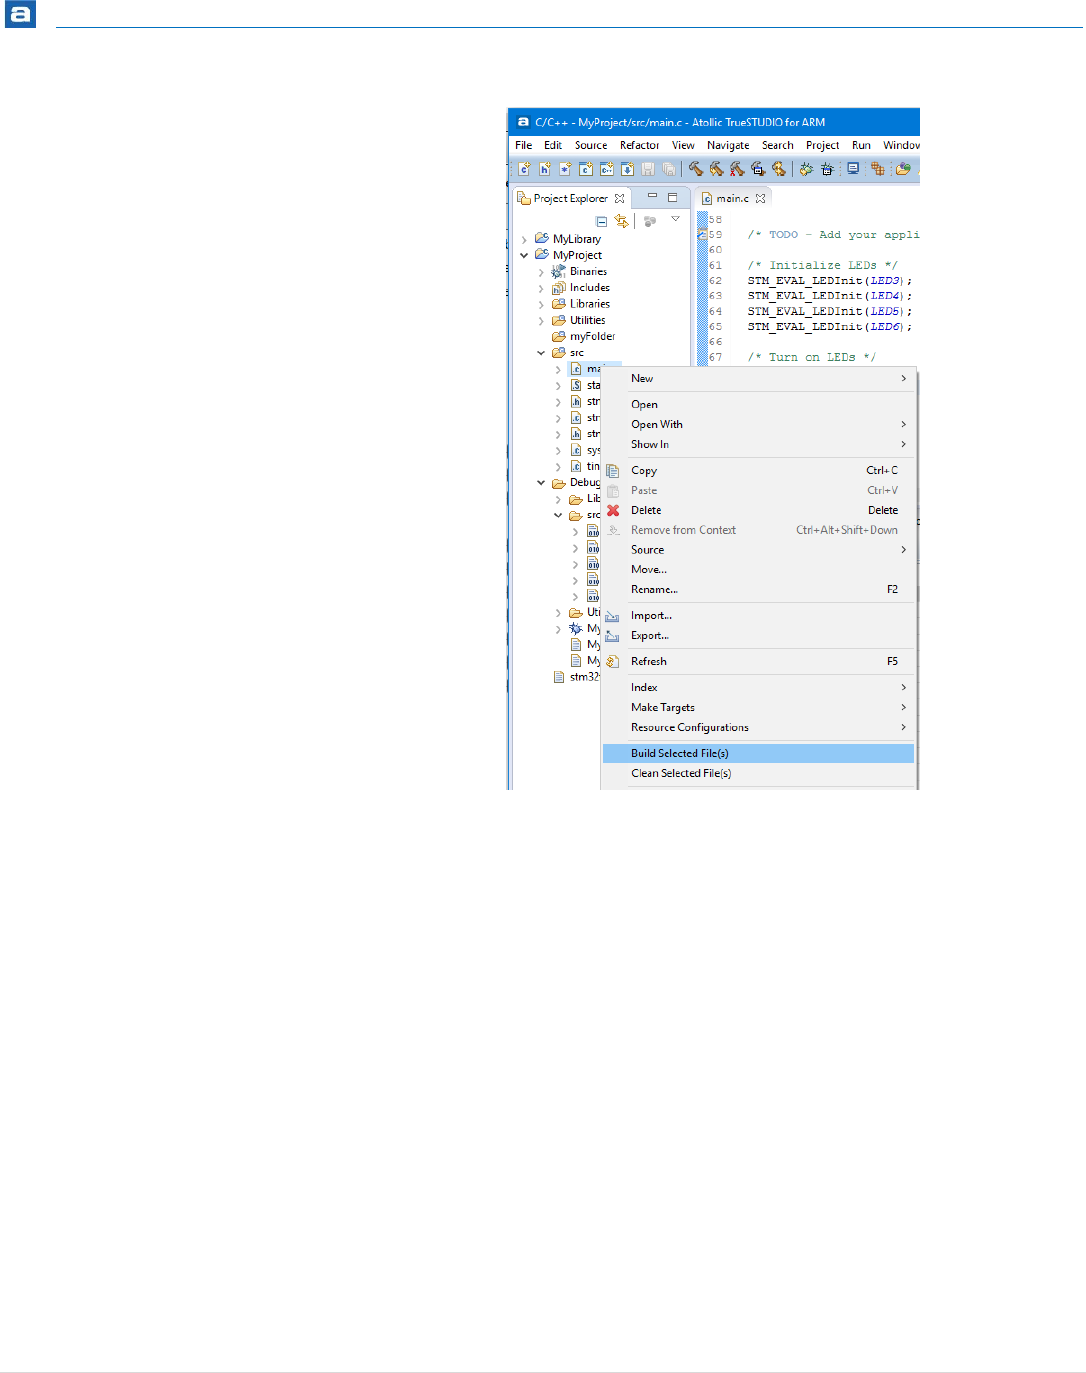
Getting Started
118 | P a g e
Figure 92 – Build Selected File(s)
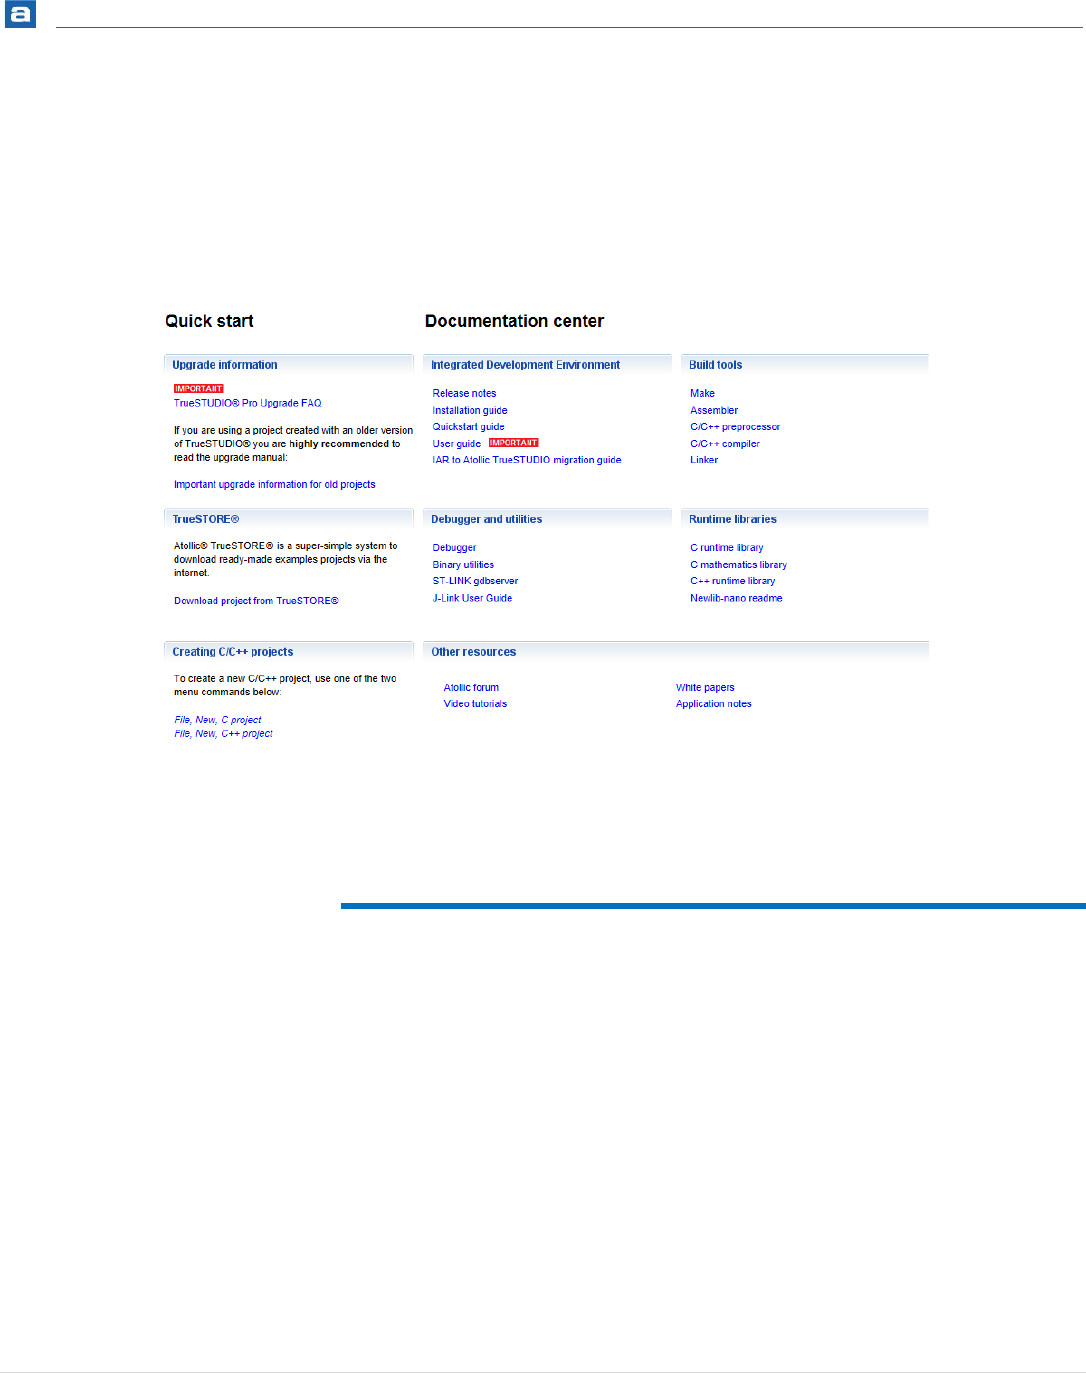
Getting Started
119 | P a g e
LINKING THE PROJECT
For detailed information about the linker, please read The GNU Linker manual. It can be
found by selecting the Information Center toolbar button and open the Information
Center view. Locate Document center, Debugger utilities in the Information Center and
press the Linker link.
Figure 93 – GNU Linker manual link
This chapter will explain some of the more common problems encountered during linking.
REFERRING PROJECT
Whenever one project is using code from another project, these should be referring to
each other.
If a project needs to refer to a specific build of another project, select instead Project,
Properties and then C/C++ General, Paths and Symbols and open the References tab and
select the Build Configuration that the current project is referring to.
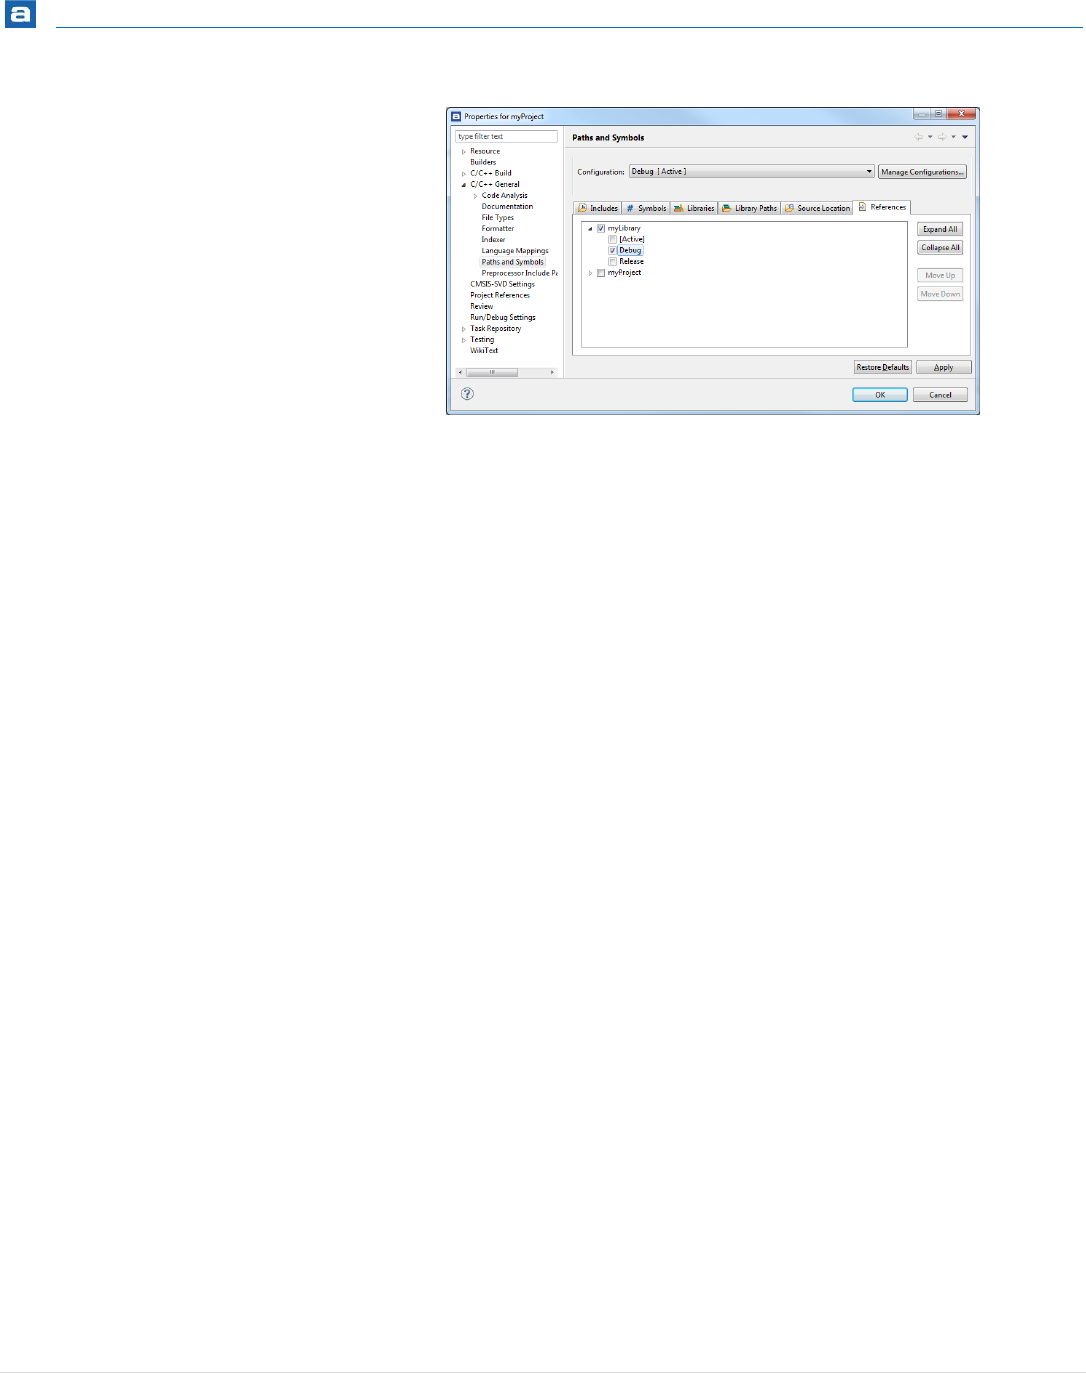
Getting Started
120 | P a g e
Figure 94 – Set Project References
With this way of referring between different Build Configurations. Note that the
references also can have priority among each other.
There are many advantages to having project references correctly set:
The involved projects will not be rebuilt more than necessary.
The Indexer will also be able to find functions from the library and open them. To
do that press the Ctrl key and in the editor, click the library-function where it is
used. The source file in the library will then be opened in an editor. For more
information about the Indexer, see page 148.
It is possible to create the Call hierarchy for the functions in the library. To find
the Call Hierarchy, mark the function name and press Ctrl+Alt+H. The Call
Hierarchy will then be displayed in the Call Hierarchy view.
If a library project is added as a reference, all the correct setting in Paths and Symbols
property page for the library will be entered. The tool settings that depends on this
Property page will also be adjusted.
This is the recommended method of adding libraries that is developed locally. For more
information about adding libraries see page 93.
There is another way to have projects referring to each other. In the top menu select
Project, Properties and select Project References. Then select and mark the referred
project.
However it is not possible to refer to different Build Configurations from this preference
and it will not automatically set up libraries.
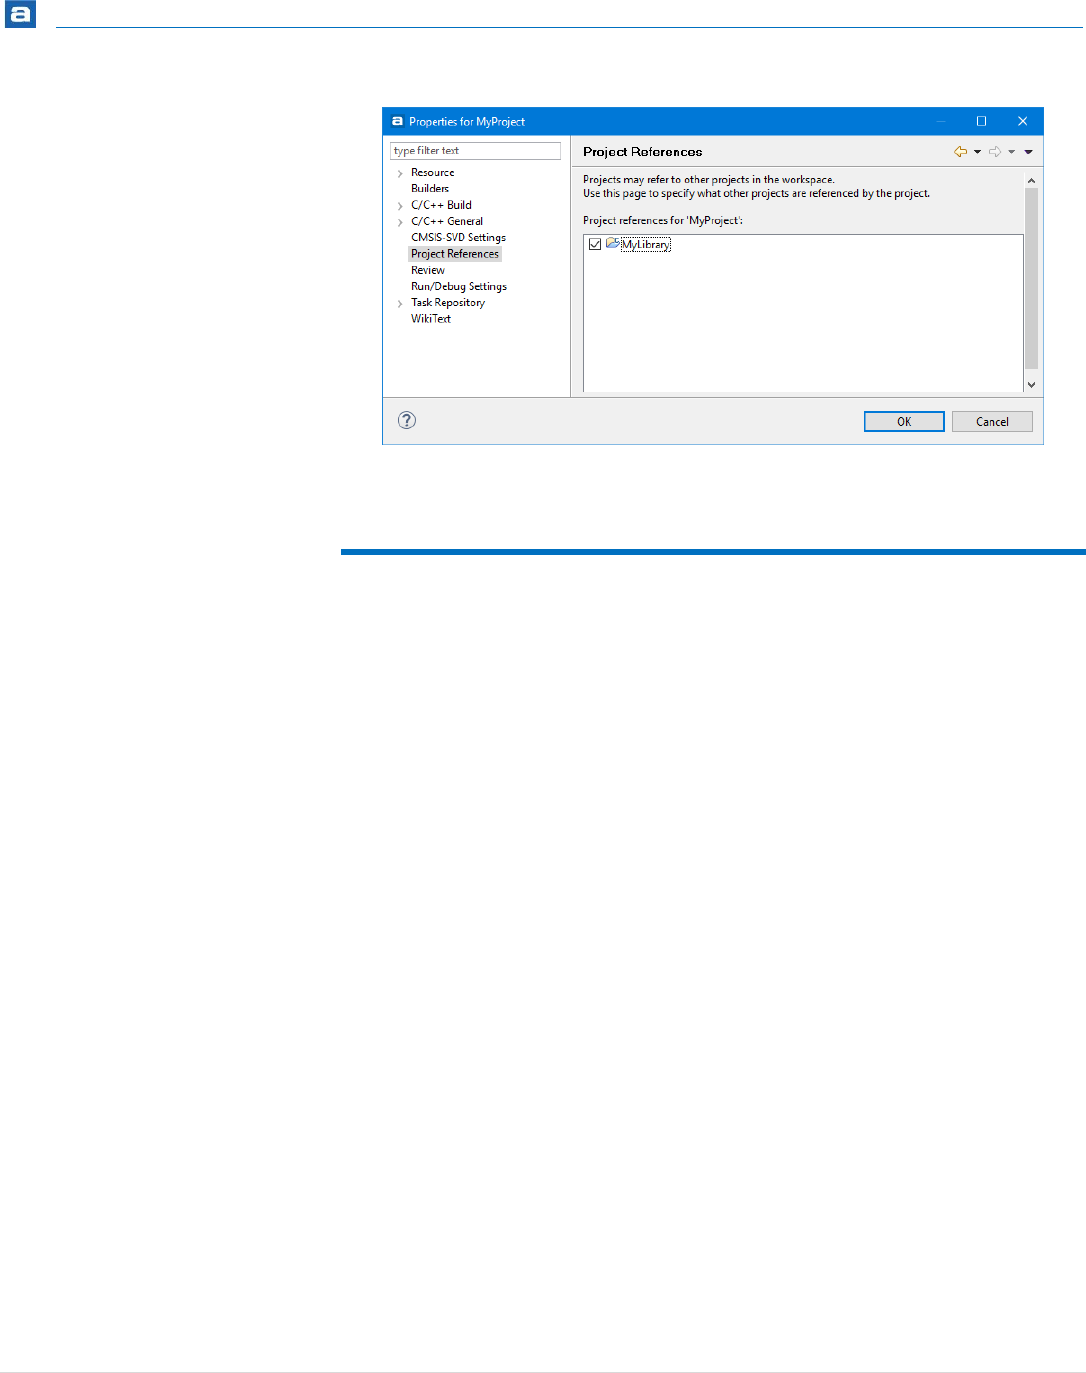
Getting Started
121 | P a g e
Figure 95 – Set Project References
DEAD CODE REMOVAL
Linker optimization is the process where the linker removes unused code and data
sections from the output binary. Runtime- and middleware libraries typically include many
functions that are not used by all applications, thus wasting valuable memory unless
removed from the output binary.
To enable linker optimization, select the Remove unused code and/or the Remove unused
data checkboxes in the Project wizard as appropriate (at project creation time).
Dead code removal can be selected at any time by opening the Build Configuration in the
properties for the project. Right-click the project and select Properties and in the dialog
select C/C++ Build, Settings. In the panel select the Tool Settings-tab, C Linker, General.
Enable Dead code removal and rebuild the project.

Getting Started
122 | P a g e
Figure 96 – Enable Dead Code Removal
ADDING CODE TO BE EXECUTED BEFORE MAIN()
The check-box Do not use standard start files gives two options to execute user-defined
code before entering main, instead of modifying the Reset-handler. Both are triggered by
the libc_init_array call in the startup code.

Getting Started
123 | P a g e
Figure 97 – Do Not Use Standard Start Files
Option1: Constructors for objects or constructor functions are placed in a list called
.init_array. These functions are then executed one by one by the libc_init_array.
Option2: Add code to an .init section. libc_init_array will run the _init function
which will execute all instructions added to the .init section. The crti and crtn contains
the start and end of the _init function.
PAGE SIZE ALLOCATION FOR MALLOC
The page size setting for malloc can be changed from 128 bytes to 4096 bytes. The
setting for a new project uses 128 as the default value (malloc-getpagesize_P=0x80 is used
when building the project). This means that the heap increases in chunks of 128 bytes.
When the page size is set to 4096 the heap will increase in chunks of 4096 bytes. Update
the setting if a page size of 4096 is preferred.
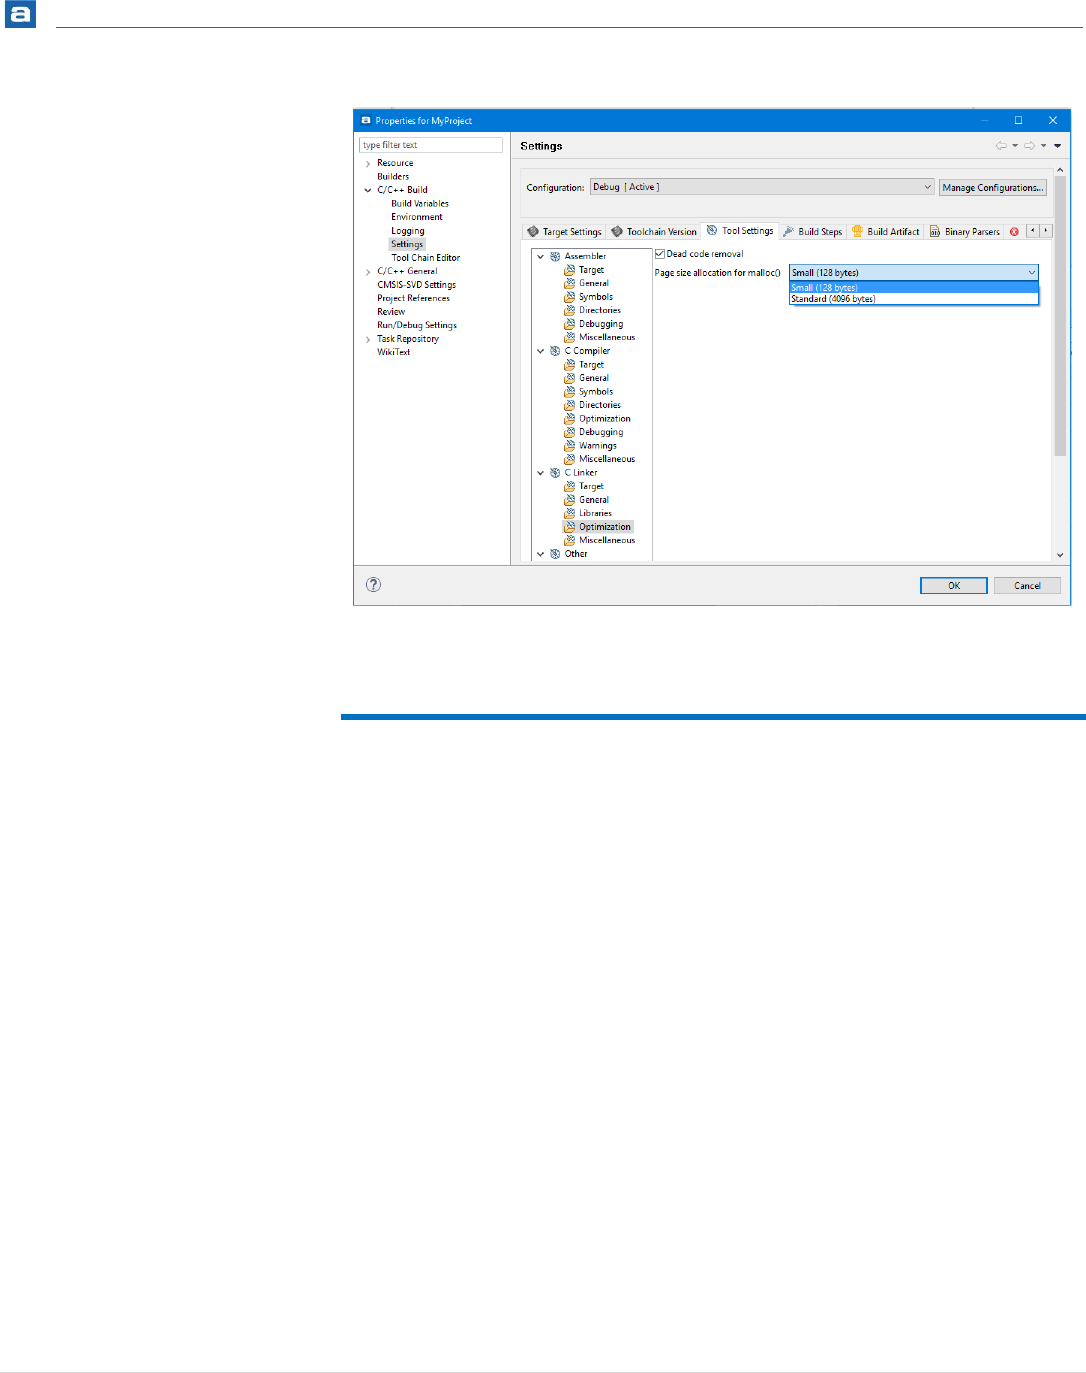
Getting Started
124 | P a g e
Figure 98 – Linker Page Size Allocation for malloc()
INCLUDE ADDITIONAL OBJECT FILES
In Atollic TrueSTUDIO it is easy to include additional object files. It can be files from other
projects, precompiled libraries where no source code is available or object files created
with other compilers.
To do that, open the Build Settings panel by pressing the Build Settings button.
Then navigate to the Tool Settings tab and select the C Linker, Miscellaneous node.
Additional object files can either be entered with the Add file path dialog or simply cut and
pasted into the panel.
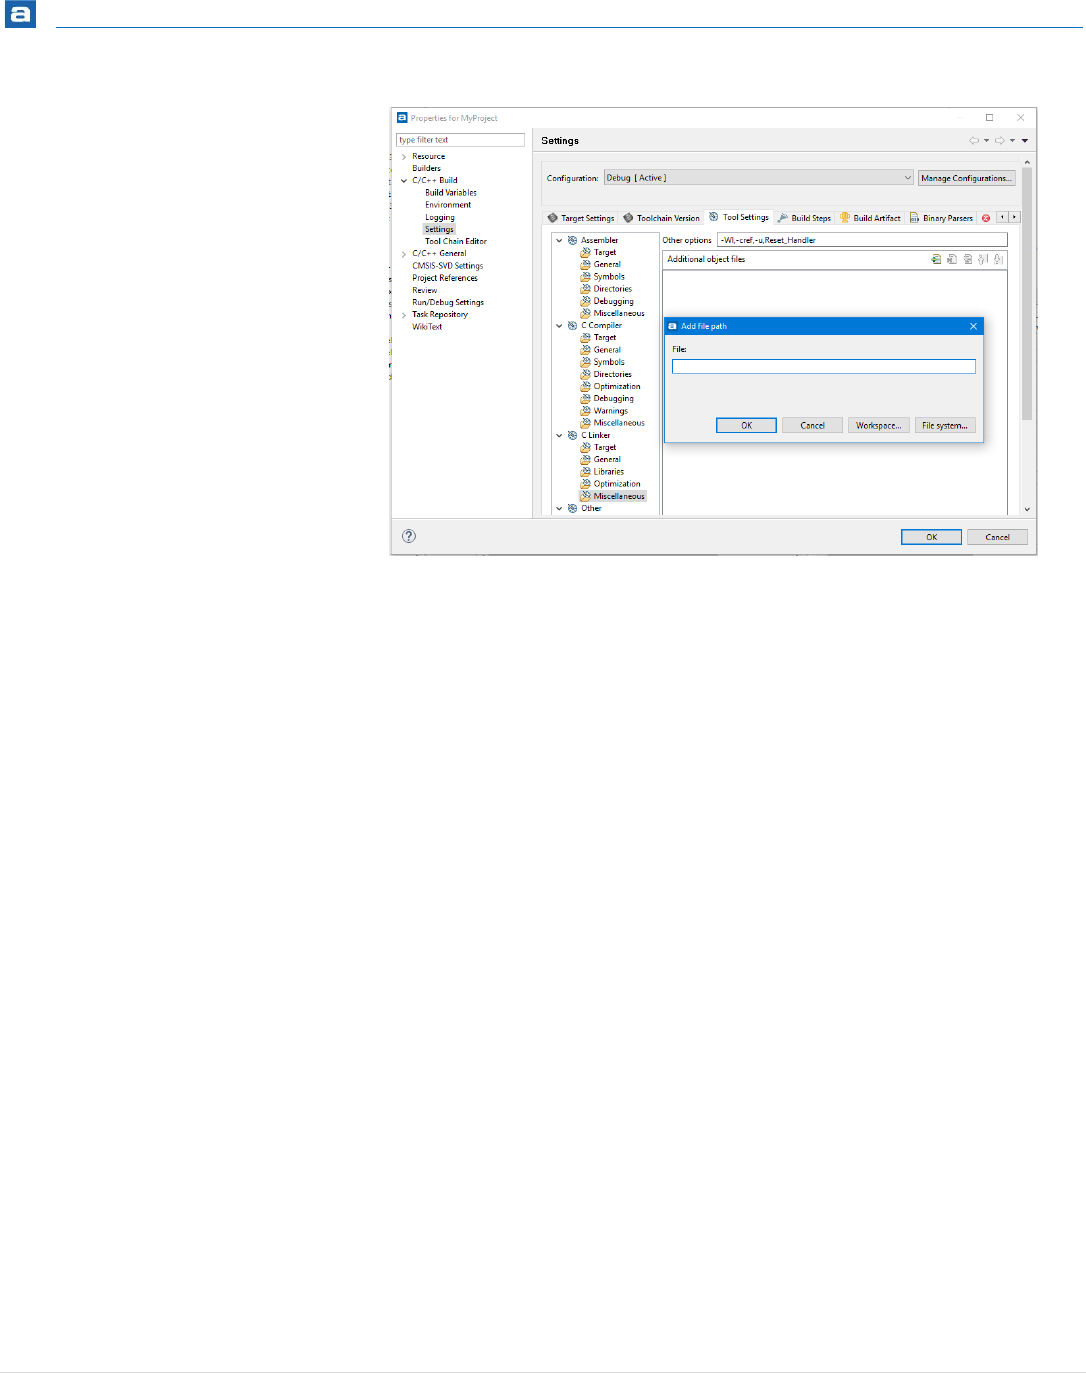
Getting Started
125 | P a g e
Figure 99 – Add Additional Object Files
If a project has many object files, either created during compilation or added as additional
object files, this method is no longer possible. Instead an external list of object files needs
to be referred to during linking.
In the Other Options field add -Wl,@FILENAME where FILENAME is a file containing a list
of object files to be included during linking.
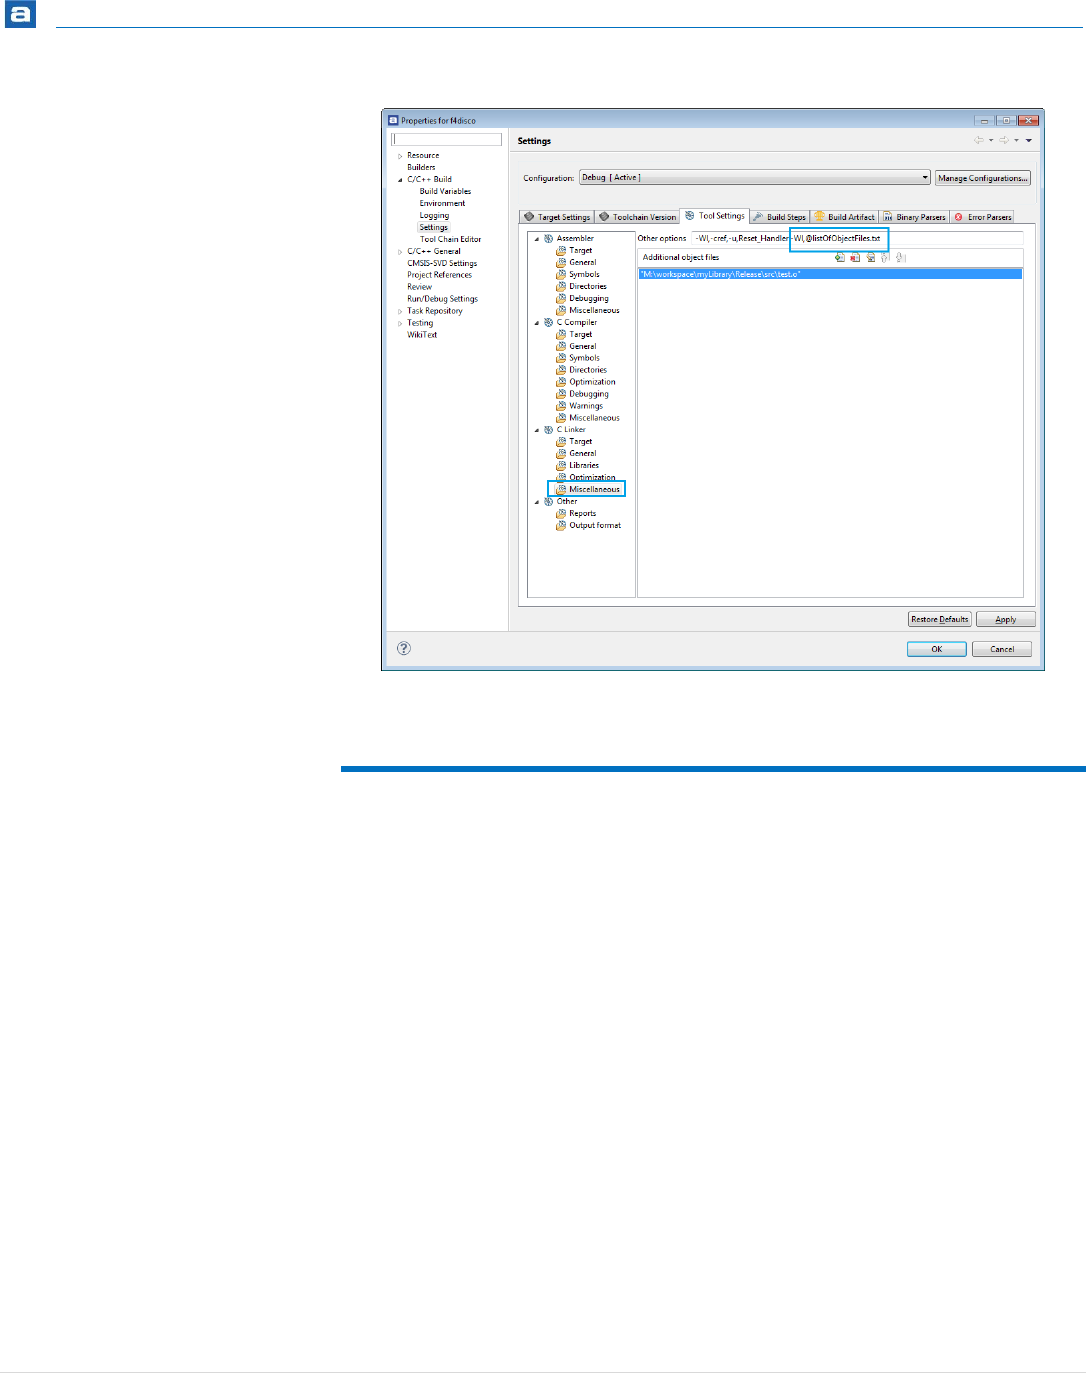
Getting Started
126 | P a g e
Figure 100 – Add File With a List of Object Files
TREAT LINKER WARNINGS AS ERRORS
The GNU Linker is normally silent for warnings. However, the linker can treat warnings as
errors by adding the option --fatal-warnings.
One example on how the silent warnings appears is if the startup code containing the
normal Reset_Handler function is missing in the project. Then the GNU Linker will in
normal silent mode create an elf file and only report a warning output in the Console
window about the missing Reset_Handler. Example of warning message:
c:/program files (x86)/atollic/truestudio for arm
7.1.0/armtools/bin/../lib/gcc/arm-atollic-
eabi/5.3.1/../../../../arm-atollic-eabi/bin/ld.exe: warning: cannot
find entry symbol Reset_Handler; defaulting to 08000000
When the --fatal-warnings option is used the linker will not generate the .elf file but
display an error in the console log. Example of error message:
arm-atollic-eabi-gcc: error: Wl,--fatal-warnings,-cref,-
u,Reset_Handler: No such file or directory
The easiest way to add the --fatal-warnings option is to:

Getting Started
127 | P a g e
1. Open the Build Settings panel by pressing the Build Settings button.
2. Navigate to the Tool Settings tab and select the C Linker, Miscellaneous node.
3. Add the --fatal-warnings option to the Other options field, e.g.
Update the field from
Wl,-cref,-u,Reset_Handler
to
Wl,--fatal-warnings,-cref,-u,Reset_Handler
LINKER SCRIPT
The linker (.ld) script file defines where things end up in memory. Some important parts
of the linker script file is described below.
1. The ENTRY defines the start of the program.
The first instruction to execute in a program is called is defined with the ENTRY command.
Example:
/* Entry Point */
ENTRY(Reset_Handler)
2. The location of stack.
Example:
/* Highest address of the user mode stack */
_estack = 0x20020000; /* end of 128K RAM */
The ENTRY information is used by GDB so the program counter (PC) is set to
the value of the ENTRY address when a program has been loaded. In the
described example the program will start to execute from Reset_Handler
when a step or continue command is given to GDB.
Note! The start of the program can be overridden if the GDB script contains a
monitor reset command after the load command. Then the code will
start to run from reset.

Getting Started
128 | P a g e
3. Define the minimum size of Heap and Stack
It is common to define in the linker script the minimum size of Heap and Stack to be used
by the system. Example:
/* Generate a link error if heap and stack don't fit into RAM
*/
_Min_Heap_Size = 0; /* required amount of heap */
_Min_Stack_Size = 0x400; /* required amount of stack */
The values defined here are normally used later in the linker script to make it possible for
the linker to test if the Heap and Stack will fit into memory. The linker can then issue an
error if there is not enough memory available.
4. Specify memory regions
The memory regions are specified with name, ORIGIN and LENGTH. It is common also to
have an attribute list specifying the usage of a particular memory region, e.g. (rx) , ‘r’ (Read
Only section) and ‘x’ (Executable section), but there is no need to specify any attribute.
Example:
/* Specify the memory areas */
MEMORY
{
FLASH (rx) : ORIGIN = 0x08000000, LENGTH = 1024K
RAM (xrw) : ORIGIN = 0x20000000, LENGTH = 128K
MEMORY_B1 (rx) : ORIGIN = 0x60000000, LENGTH = 0K
}
5. Specify output sections (.text and .rodata)
The output sections defines where in memory the sections such as ‘.text’, ‘.data’ etc. shall
be located. The following example tells the linker to put all .text, .rodata etc. sections in
the FLASH region. There are alos some glue sections mentioned here and these are used
by GCC if there are some mixed code in the program. The glue code is used if there are
some arm code which makes a call to thumb code or vice versa. Example:
/* The program code and other data goes into FLASH */
The location of stack is normally used by the startup file. The startup code
normally initialize the stack pointer with the address given in the linker script.
For Cortex-M based devices the stack address is also set at the first address in
the interrupt vector table.

Getting Started
129 | P a g e
.text :
{
. = ALIGN(4);
*(.text) /* .text sections (code) */
*(.text*) /* .text* sections (code) */
*(.rodata) /* .rodata sections (constants, etc.) */
*(.rodata*) /* .rodata* sections (constants, etc.) */
*(.glue_7) /* glue arm to thumb code */
*(.glue_7t) /* glue thumb to arm code */
*(.eh_frame)
KEEP (*(.init))
KEEP (*(.fini))
. = ALIGN(4);
_etext = .; /* define a global symbols at end of code */
} >FLASH
6. Specify initialized data (.data)
Initialized data values needs some extra handling as the initialization values needs to be
placed in flash and the startup code must be able to initialize the RAM variables with
correct values. The following example creates symbols _sidata, _sdata and _edata. The
startup code can then use these symbols to copy the values from FLASH to RAM during
program start. Example:
/* used by the startup to initialize data */
_sidata = LOADADDR(.data);
/* Initialized data sections into RAM, load LMA copy after code */
.data :
{
. = ALIGN(4);
_sdata = .; /* create a global symbol at data start */
*(.data) /* .data sections */
*(.data*) /* .data* sections */
. = ALIGN(4);
_edata = .; /* define a global symbol at data end */
} >RAM AT> FLASH

Getting Started
130 | P a g e
7. Specify uninitialized data (.bss)
Uninitialized data values shall be reset to 0 by the startup code so the linker script file
needs to identify the location of these variables. The following example creates symbols
_sbss and _ebss. The startup code can then use these symbols to set the values of the
variables to 0.
/* Uninitialized data section */
. = ALIGN(4);
.bss :
{
/* This is used by the startup to initialize the .bss secion */
_sbss = .; /* define a global symbol at bss start */
__bss_start__ = _sbss;
*(.bss)
*(.bss*)
*(COMMON)
. = ALIGN(4);
_ebss = .; /* define a global symbol at bss end */
__bss_end__ = _ebss;
} >RAM
When building an Atollic TrueSTUDIO Project Wizard generated project, a .map and a
.list file is created in the build output folder (Debug/Release). These files contains
detailed information on final location of code/data in the program.
The Build Analyzer view can be used to analyse the size and location of a
program in detail. Please read more about the Build Analyzer at page 264
Please read the Linker manual, accessible from the Atollic TrueSTUDIO
Information Center, for details about how the linker works. Especially section
3.6 and 3.7 could be of interest.
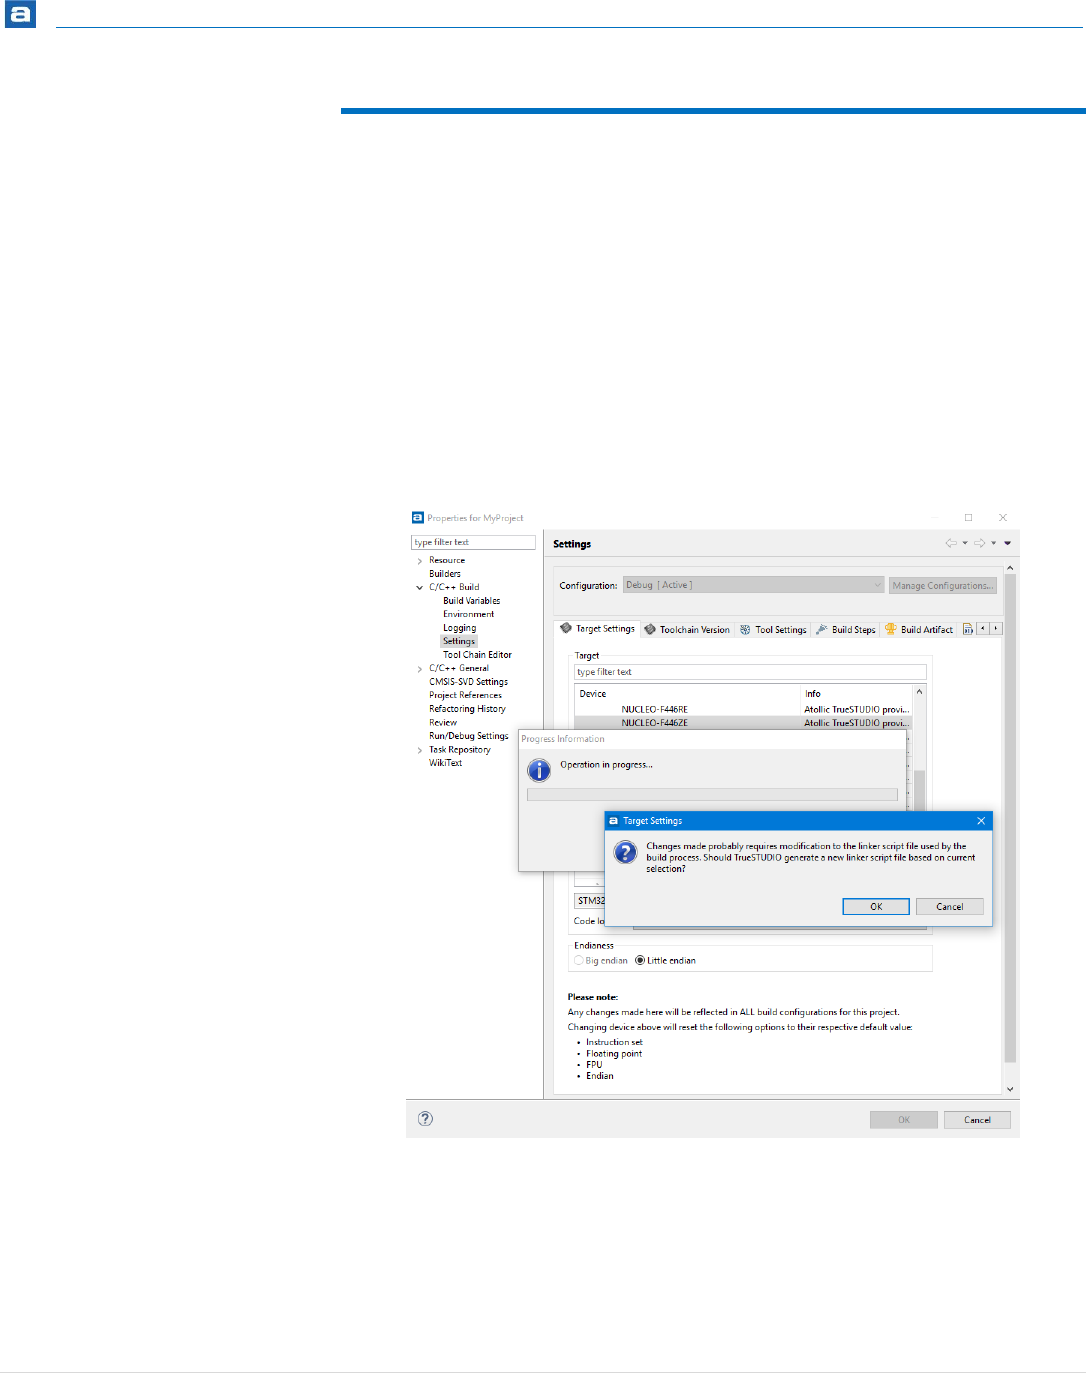
Getting Started
131 | P a g e
GENERATE A NEW LINKER SCRIPT
From time to time there is the need for a new Linker script, as for instance when changing
the target platform for an existing project.
AUTOMATICALLY
This is the recommended method to generate a new Linker script.
Whenever anything in the Target Setting tab is changed a new Linker script can be selected
to be generated.
If the script is generated it can also be automatically used in the selected Build
Configuration. If possible the path to the script will be set to be relative to the project.
Figure 101 – Automatically Generate a New Linker Script
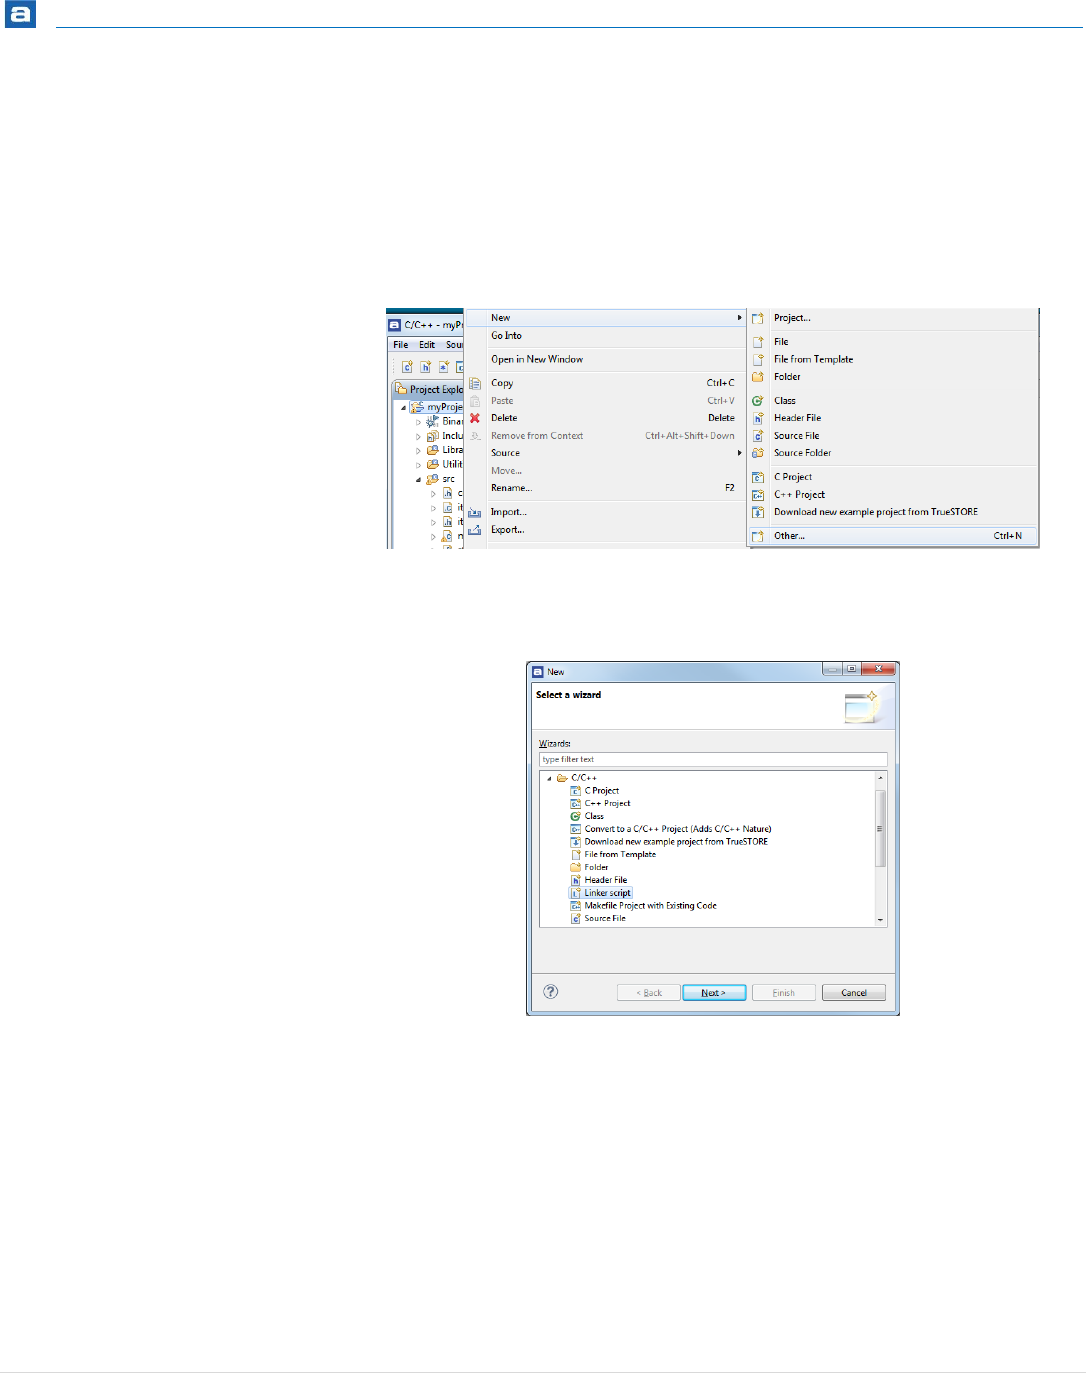
Getting Started
132 | P a g e
MANUALLY
The linker scripts can also be manually created. These scripts will not be automatically
added to any Build Configuration.
To manually create a new linker script, start by selecting the project to add the script into.
Right click the project and select New, Other…
Figure 102 – Select New, Other…
1. In the dialog that then pops up select C/C++ and then Linker script.
Figure 103 – Select New, Other…
2. Click Next.
3. The target must now be select properly. Here is the chance to select a new target.
The current settings can be found by right-clicking the project and selecting
Properties, C/C++ Build, Settings.
4. Click Finish.
The script is now generated.
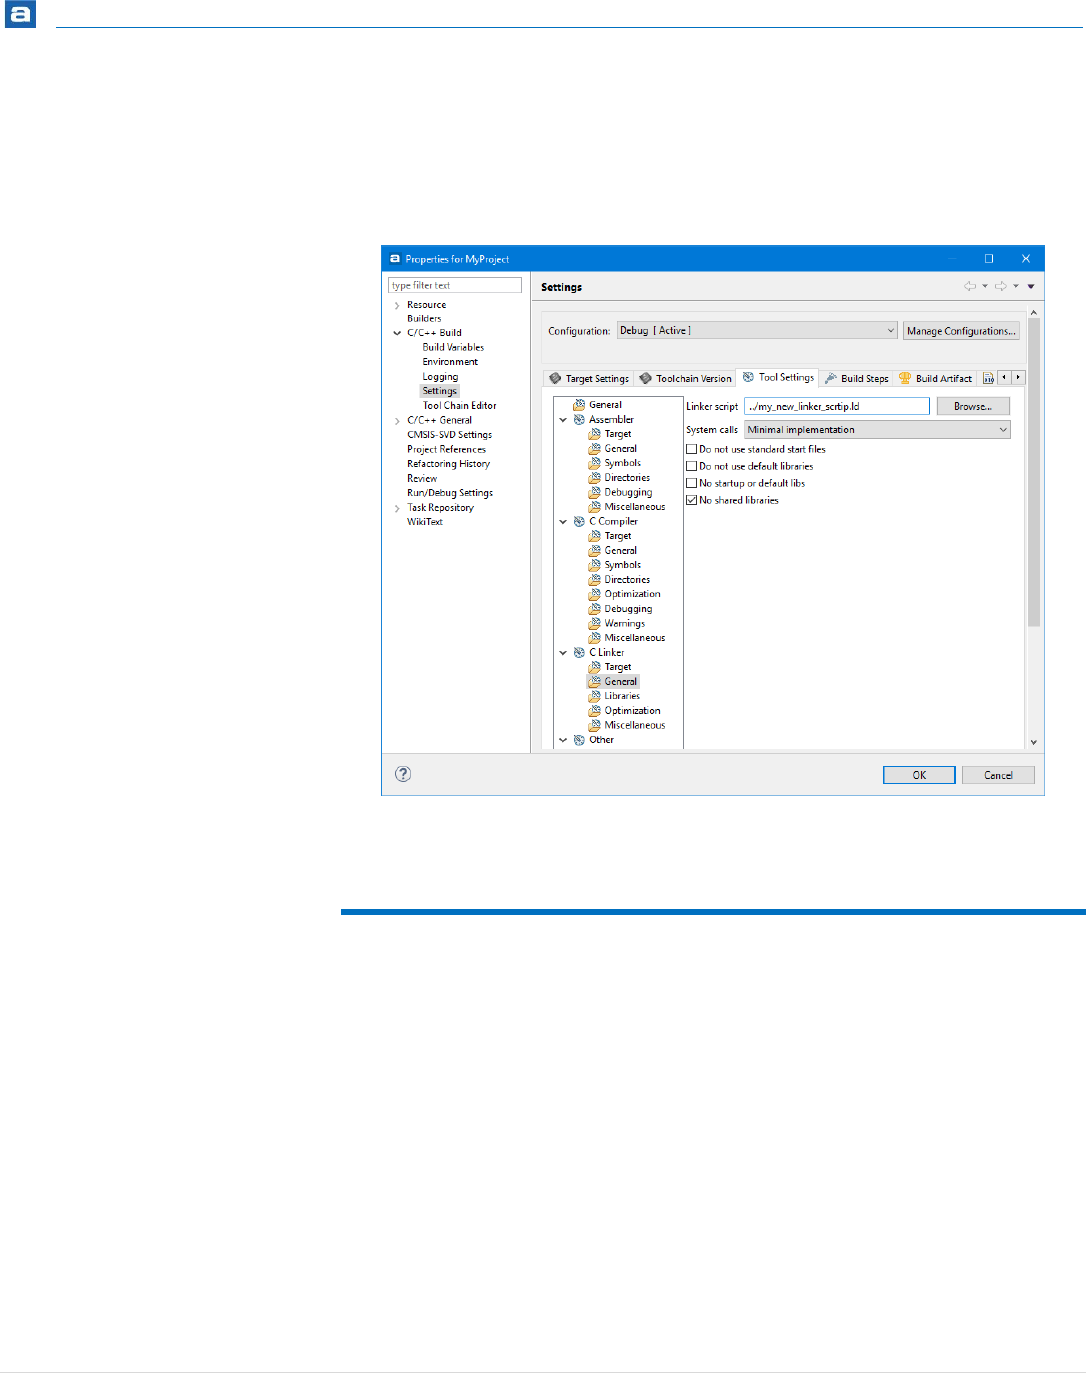
Getting Started
133 | P a g e
In order to use the new script it needs to be selected in a Build Configuration. Right-click
the project and select Properties and in the dialog select C/C++ Build, Settings and in the
panel select the Tool Settings-tab, C Linker, General.
Enter the name of the new linker script.
Figure 104 – Enter the name of the script
MODIFY EXISTING LINKER SCRIPT
This chapter includes some common use cases for how to edit the linker script. Editing and
managing the script allows for more exact placement of the code and data.
PLACE CODE IN A NEW MEMORY REGION
Many modern devices has more than one memory region. It is possible to use the linker
script in Atollic TrueSTUDIO to specifically place code in different areas.
Modify the .ld-linker script’s memory regions. This is an example of a linker script file
containing the following memory regions:
MEMORY
Getting Started
134 | P a g e
{
FLASH (rx) : ORIGIN = 0x08000000, LENGTH = 128K
RAM (xrw) : ORIGIN = 0x20000000, LENGTH = 16K
MEMORY_B1 (rx) : ORIGIN = 0x60000000, LENGTH = 0K
}
Add a new area by editing the file. In this example the IP-Code region is added.
MEMORY
{
FLASH (rx) : ORIGIN = 0x08000000, LENGTH = 64K
IP_CODE (x) : ORIGIN = 0x08010000, LENGTH = 64K
RAM (xrw) : ORIGIN = 0x20000000, LENGTH = 8K
MEMORY_B1 (rx) : ORIGIN = 0x60000000, LENGTH = 0K
}
Place the following code a bit further down in the script, between the .data { ... } and the
.bss { ... } section:
.ip_code :
{
*(.IP_Code*);
} > IP_CODE
This tells the linker to place all sections named .IP_Code* into the IP_CODE memory region
which is specified to start at target memory address: 0x8010000.
In the C-code, tell the compiler which functions should go to this section by adding
__attribute__((section(".IP_Code"))) before the function declaration.
Example:
__attribute__((section(".IP_Code"))) int placed_logic()
{
/* TODO - Add your application code here */
return 1;
}
The placed_logic()-function will now be placed in the IP_CODE memory region by the
linker.
Variables and functions may not be placed in the same memory region.

Getting Started
135 | P a g e
PLACE CODE IN EXTERNAL RAM
To place code in external ram some modifications of the linker script is needed. In short
this is what to do.
Define a new memory region in the MEMORY {} region in the Linker script:
MEMORY {
...
EXT_RAM (xrw) : ORIGIN = 0x64000000, LENGTH = 8K
...
}
Then also define an output section for the code/data. This should be placed with a Load
Memory Address in EXT_RAM, and a Virtual Memory Address in FLASH:
/* used by the startup to initialize the external ram */
_siextram = LOADADDR(.EXTRAM);
.EXTRAM :
{
. = ALIGN(4);
_sextram = .; /* create a global symbol at ext_ram start */
*(.EXTRAM) /* .EXTRAM sections */
*(.EXTRAM*) /* .EXTRAM* sections */
. = ALIGN(4);
_eextram = .; /* define a global symbol at ext_ram end */
} >EXT_RAM AT> FLASH
Startup Code:
Then the external ram needs to be initialized and the code/data copied from flash to
external ram. The startup code can access the location information symbols _siextram,
_sextram and _eextram by doing something like:
extern int _siextram;
extern int _sextram;
extern int _eextram;
void copy_fn() {
const int *origin = &_siextram;
int *dest = &_sextram;
const int * const dest_end = &_eextram;
.... copy loop ....
}

Getting Started
136 | P a g e
How to use this in the code:
Mark variables or functions with the correct attribute, for example:
__attribute__((section(".EXTRAM"))) int placed_logic()
{
return 1;
}
PLACE VARIABLES AT SPECIFIC ADDRESSES
The first step in order to place variables at a specified address in memory is to create a
new memory region in the linker script (the .ld-file). Take a look at an example of a linker
script file containing the following memory regions:
MEMORY
{
FLASH (rx) : ORIGIN = 0x08000000, LENGTH = 128K
RAM (xrw) : ORIGIN = 0x20000000, LENGTH = 16K
MEMORY_B1 (rx) : ORIGIN = 0x60000000, LENGTH = 0K
}
A new memory region should be added by editing the file. In this example add the MYVARS
region.
MEMORY
{
FLASH (rx) : ORIGIN = 0x08000000, LENGTH = 64K
MYVARS (x) : ORIGIN = 0x08010000, LENGTH = 64K
RAM (xrw) : ORIGIN = 0x20000000, LENGTH = 8K
MEMORY_B1 (rx) : ORIGIN = 0x60000000, LENGTH = 0K
}
Now the memory section should be added. Place the following a bit further down in the
script, between the .data { ... } and the .bss { ... } section:
.myvars :
{
*(.myvars*);
} > MYVARS
Variables and functions may not be placed in the same memory region.

Getting Started
137 | P a g e
This tells the linker to place all sections named .myvars* from input into the .myvars
output section in the MYVARS memory region, which is specified to start at target memory
address: 0x8010000.
A section can be called almost anything except some predefined names such as data.
Now the variables need to be put in that region.
To be absolutely certain that the order will stay the same even if they are spread in
multiple files, add each variable to its own section. Then map the order of the variables in
the linker script.
So for example, the c code could be:
__attribute__((section(".myvars.VERSION_NUMBER"))) uint32_tVERSION_N
UMBER;
__attribute__((section(".myvars.CRC"))) uint32_t CRC;
__attribute__((section(".myvars.BUILD_ID"))) uint16_t BUILD_ID;
__attribute__((section(".myvars.OTHER_VAR"))) uint8_t OTHER_VAR;
And then decide the order in the linker script by adding the specially named sections like:
.myvars :
{
*(.myvars.VERSION_NUMBER)
*(.myvars.CRC)
*(.myvars.BUILD_ID)
*(.myvars*);
} > MYVARS
LINKING IN A BLOCK OF BINARY DATA
The scenario is that there is a file with binary data needs to be put in the memory. It is
named ../readme.txt.
Then the reference in the C file might look like this using the incbin directive and the
allocatable (“a”) option on the section.
asm(".section .binary_data,\"a\";"
".incbin \"../readme.txt\";"
);
That section is then added in the linker script with instructions that the section should be
put in flash.

Getting Started
138 | P a g e
.binary_data :
{
_binary_data_start = .;
KEEP(*(.binary_data));
_binary_data_end = .;
} > FLASH
This block can then be accessed from the C code with code similar to the following:
extern int _binary_data_start;
int main(void)
{
int *bin_area = &_binary_data_start;
…
}
LOCATE UNINITIALIZED DATA IN MEMORY
Sometimes there is a need to have variables located into flash, or some other non-volatile
memory, which do not shall be initialized at startup. In such cases it is possible to create a
specific MEMORY AREA in the linker script and use the NOLOAD directive.
Example
1. Update the linker script with a MY_DATA area.
MEMORY
{
FLASH (rx) : ORIGIN = 0x08000000, LENGTH = 64K
MY_DATA (rx) : ORIGIN = 0x08010000, LENGTH = 64K
RAM (xrw) : ORIGIN = 0x20000000, LENGTH = 128K
}
2. Add a section for MY_DATA using the NOLOAD directive. This can be done using the
following code a bit further down in the linker script.
.my_data (NOLOAD) :
/* .my_data : */
{
*(.MY_Data*);
} > MY_DATA
Finally data can be used somewhere in the program by adding a section attribute when
declaring variables which shall be located in MY_DATA memory.

Getting Started
139 | P a g e
__attribute__((section(".MY_Data.a"))) int Distance;
__attribute__((section(".MY_Data.a"))) int Seconds;
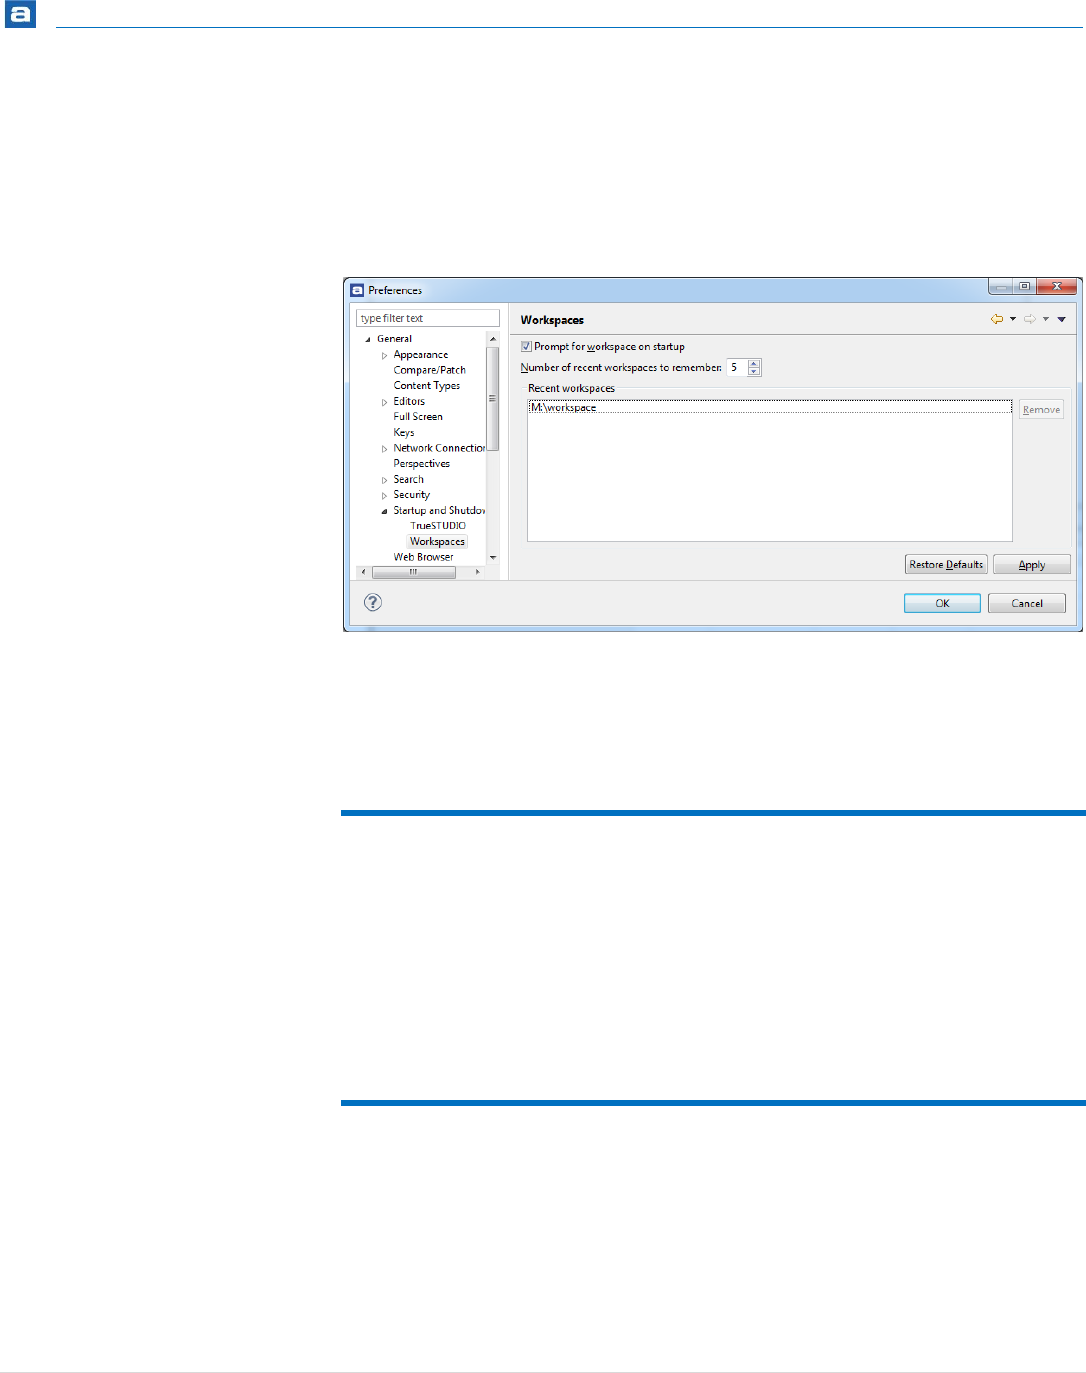
Getting Started
140 | P a g e
MANAGING EXISTING WORKSPACES
The workspaces known to Atollic TrueSTUDIO can be managed by selecting Window,
Preferences and in the Preferences Dialog select General, Startup and Shutdown,
Workspaces.
Figure 105 – Manage Workspaces
However, removing a Workspace from that list will not remove the files. Neither will
removing the files from the file system remove the workspace from this list.
BACKUP OF PREFERENCES FOR A WORKSPACE
It is generally a very good idea to take a copy of the existing preferences for a workspace.
If the workspace crashes and needs to be recreated, they will otherwise needs to be set
again by hand. A both time-consuming and complicated process.
In the menu select File, Export. Then in the panel select General, Preferences. Press the
Next button and in the next page enable Export All and a good filename of your choice.
COPY PREFERENCES BETWEEN WORKSPACES
To copy Workspace preferences from one workspace to another, an existing export of
preferences should first be created, see above.
Then select File, Switch Workspace and your new workspace. Atollic TrueSTUDIO will then
restart and open with the new workspace.

Getting Started
141 | P a g e
In the menu select File, Import and in the panel select General, Preferences. Press the
Next button and on the next page enable Import All and enter your file name. The
preferences will now be the same in the two workspaces.
KEEPING TRACK ON JAVA HEAP SPACE
Too keep track on how much Java heap space is used, select Window in the menu and
then Preferences.
Figure 106 – Display Java Heap Space Status
Select the General node and then enable Show heap status. The currently used and
available Java Heap Space will then be displayed in the lower right corner of the
Workspace. The garbage collector can also be manually triggered there.
UNLOCKING LOCKED WORKSPACES
Only one instance of Atollic TrueSTUDIO can access one workspace at a time. This is to
prevent conflicting changes in the workspace.
If Atollic TrueSTUDIO is started with a workspace that already is used by another instance
of the program, the following error message is displayed:
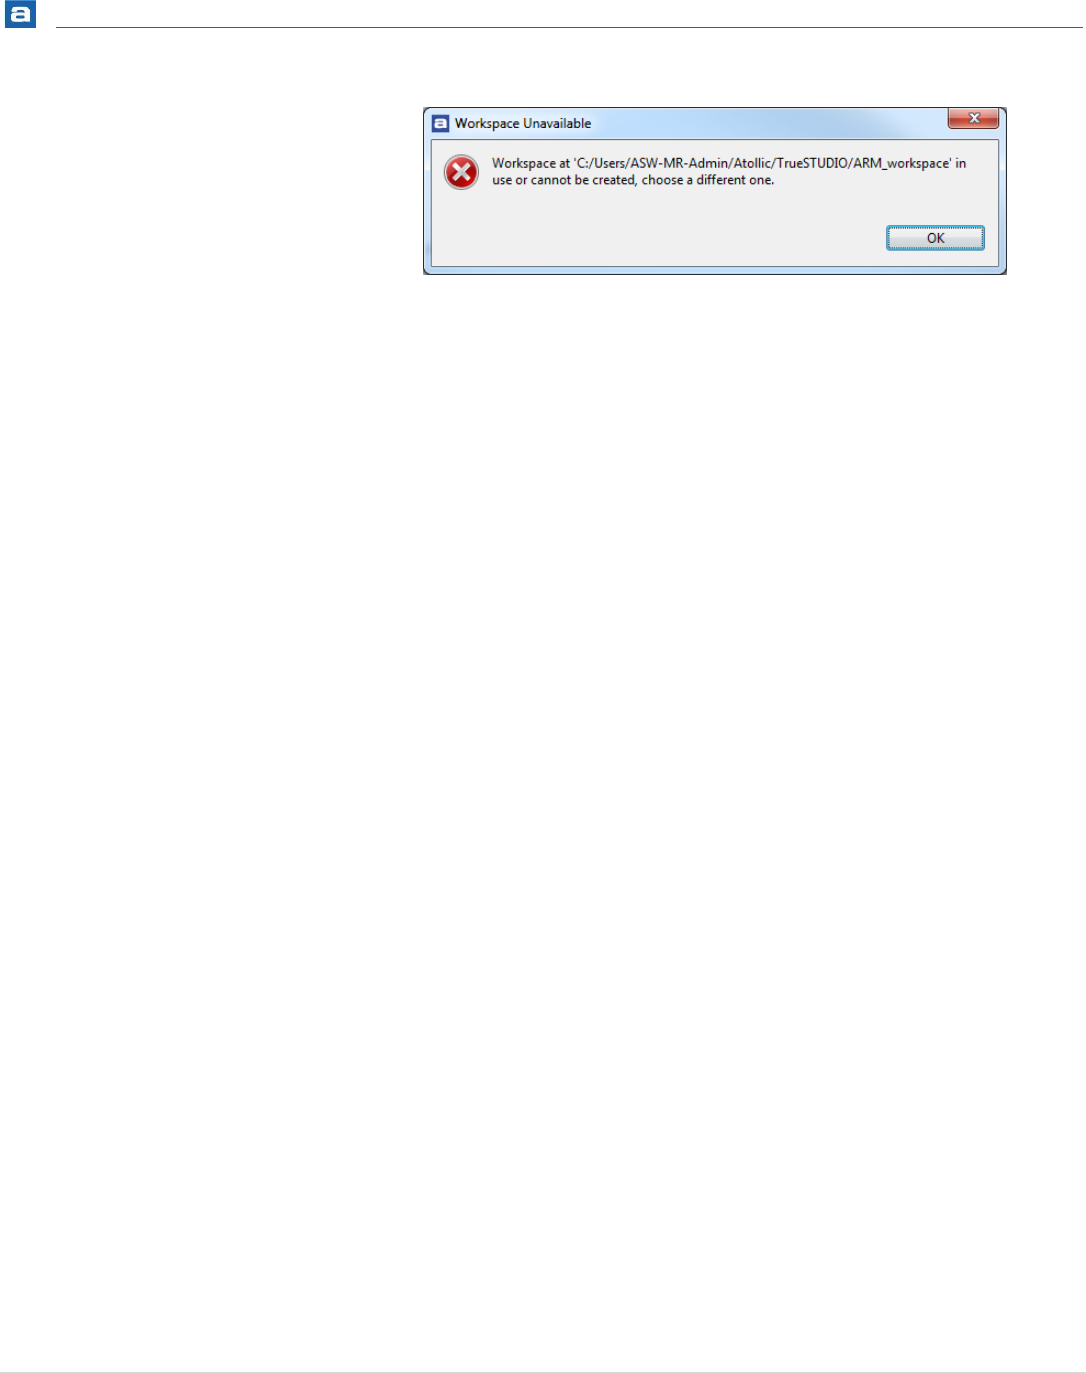
Getting Started
142 | P a g e
Figure 107 – Workspace Unavailable
Getting Started
143 | P a g e
MANAGING EXISTING PROJECTS
If no other instance of Atollic TrueSTUDIO is accessing the workspace, delete
the .lock file in the .metadata folder in the workspace directory.
EDIT
Atollic TrueSTUDIO contains a state-of-the-art editor with almost any feature one can
imagine! Noteworthy features are spell checking of C/C++ comments, word- and code
completion, content assist, parameter hints and code templates. The editor also includes
an include-file dependency browser, code navigation using hypertext-links, bookmark &
to-do lists, and powerful search mechanisms.
There are so many features that it is easy to miss some really useful capabilities. While we
have simplified the user experience in Atollic TrueSTUDIO, there are probably still many
features that could be put to good use by more developers.
Below are some of the useful tools that are easily missed.
EDITOR ZOOM IN / ZOOM OUT
It is possible to increase/decrease default font size for text editors by pressing Ctrl++ and
Ctrl+-.
Ctrl++ Zoom in text
Ctrl+- Zoom out text
If a keyboard with numeric keypad is used and the + or – keys are pressed on the numeric
keypad then also use Shift key to make zoom work (Ctrl+Shift+ or Ctrl+Shift-).
It is a good idea to only have the currently active projects opened. Close the
rest of the opened projects in the workspace. This will make the indexer work
faster and reduce the memory used by TrueSTUDIO. It also makes it easier
finding errors and bug in the code.
A project is closed by right-clicking it and select Close Project.

Getting Started
144 | P a g e
Figure 108 – Editor with text zoomed in
QUICKLY FIND AND OPEN A FILE
Pressing Ctrl+Shift+R to find and open a file quickly is one of these featured easily missed.
Type a couple of characters that is part of the file name to open. It is possible to add * and
? symbols as appropriate for wildcard search as well. The editor then lists the matching.
Select the correct file in the matching items search result list, and open the file in any of
these 3 ways:
Show In: Sends this file to one of the views chosen in the dropdown list (such as the
#include file dependency browser view)
Open With: Opens this file in any of the editors listed in the drop down list.
Open: This is probably the most commonly used option; it just opens the file in the
standard C/C++ editor.
BRANCH FOLDING
If a block is enclosed within #if/#endif, it can be folded. To activate the functionality, go to
Window, Preferences, C/C++, Editor, Folding and check the checkbox Enable folding of
preprocessor branches (#if/#endif). After the checkbox has been checked, the editor has
to be restarted. Just close the file and open it again and there should be a small icon in the
left margin of the editor.
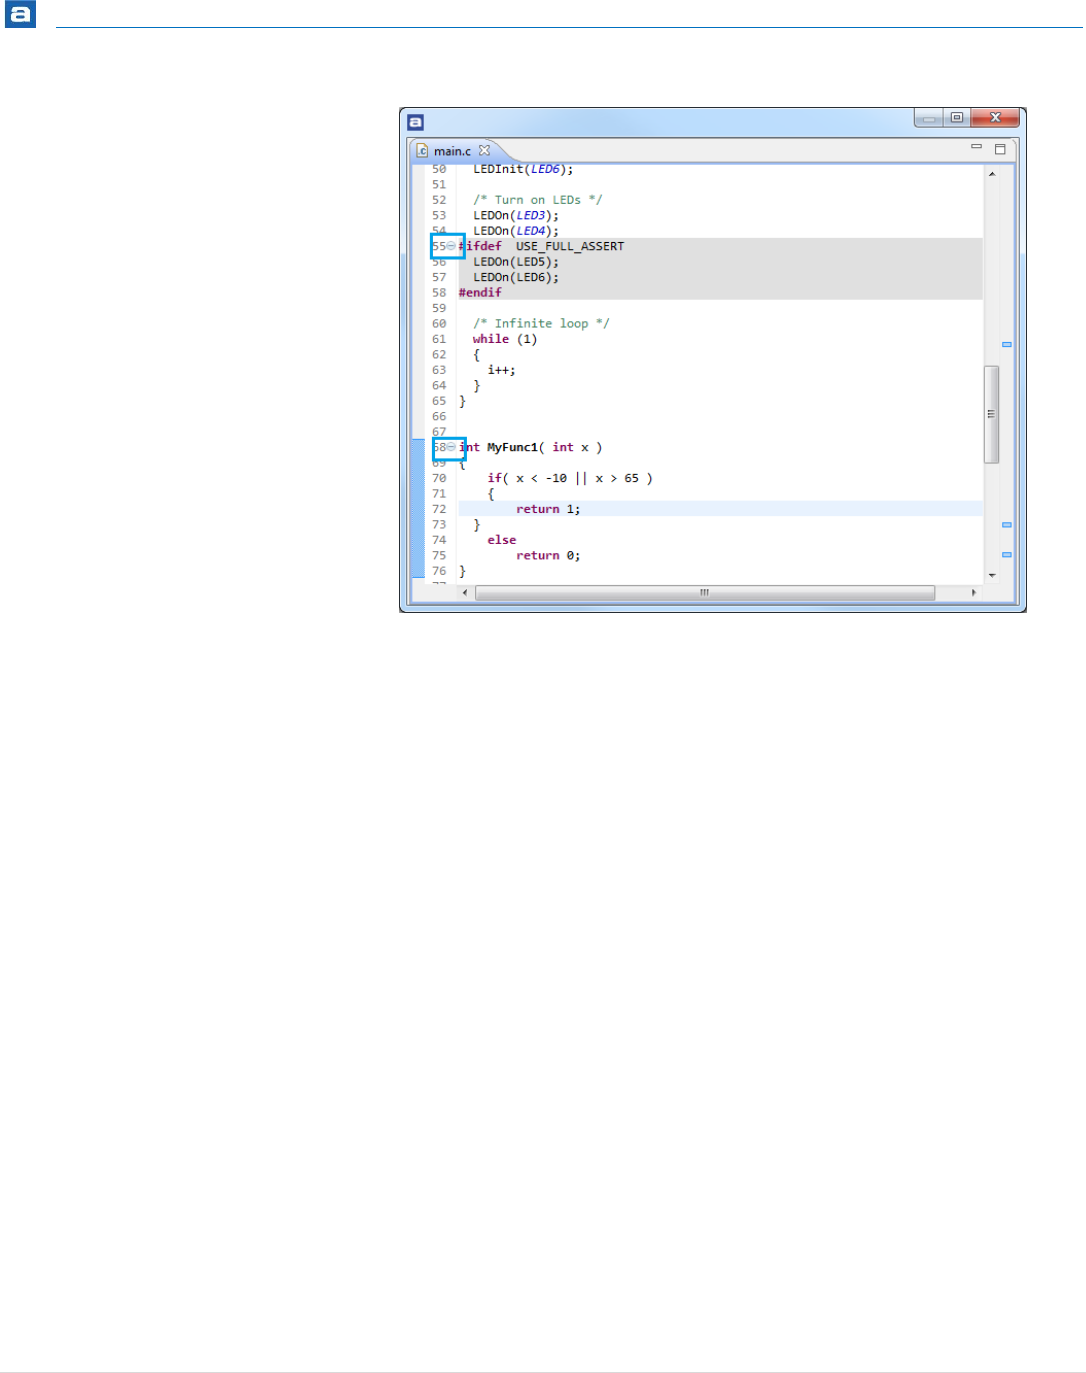
Getting Started
145 | P a g e
Figure 109 – Folding Markers
BLOCK SELECTION MODE
An often missed feature in Atollic TrueSTUDIO is the Block selection mode.
Alt+Shift+A toggles selection mode between normal and block. When block mode is
enabled a block of text can be selected by either the mouse or the keyboard using SHIFT
and ARROW buttons.
How to use Block selection mode:
Press Alt+Shift+A
Press the cursor somewhere in the text and drag it down. A column will now be marked.

Getting Started
146 | P a g e
Figure 110 – Mark a column
Add some text there. It will be entered in all marked rows.
Figure 111 – Add text to all rows
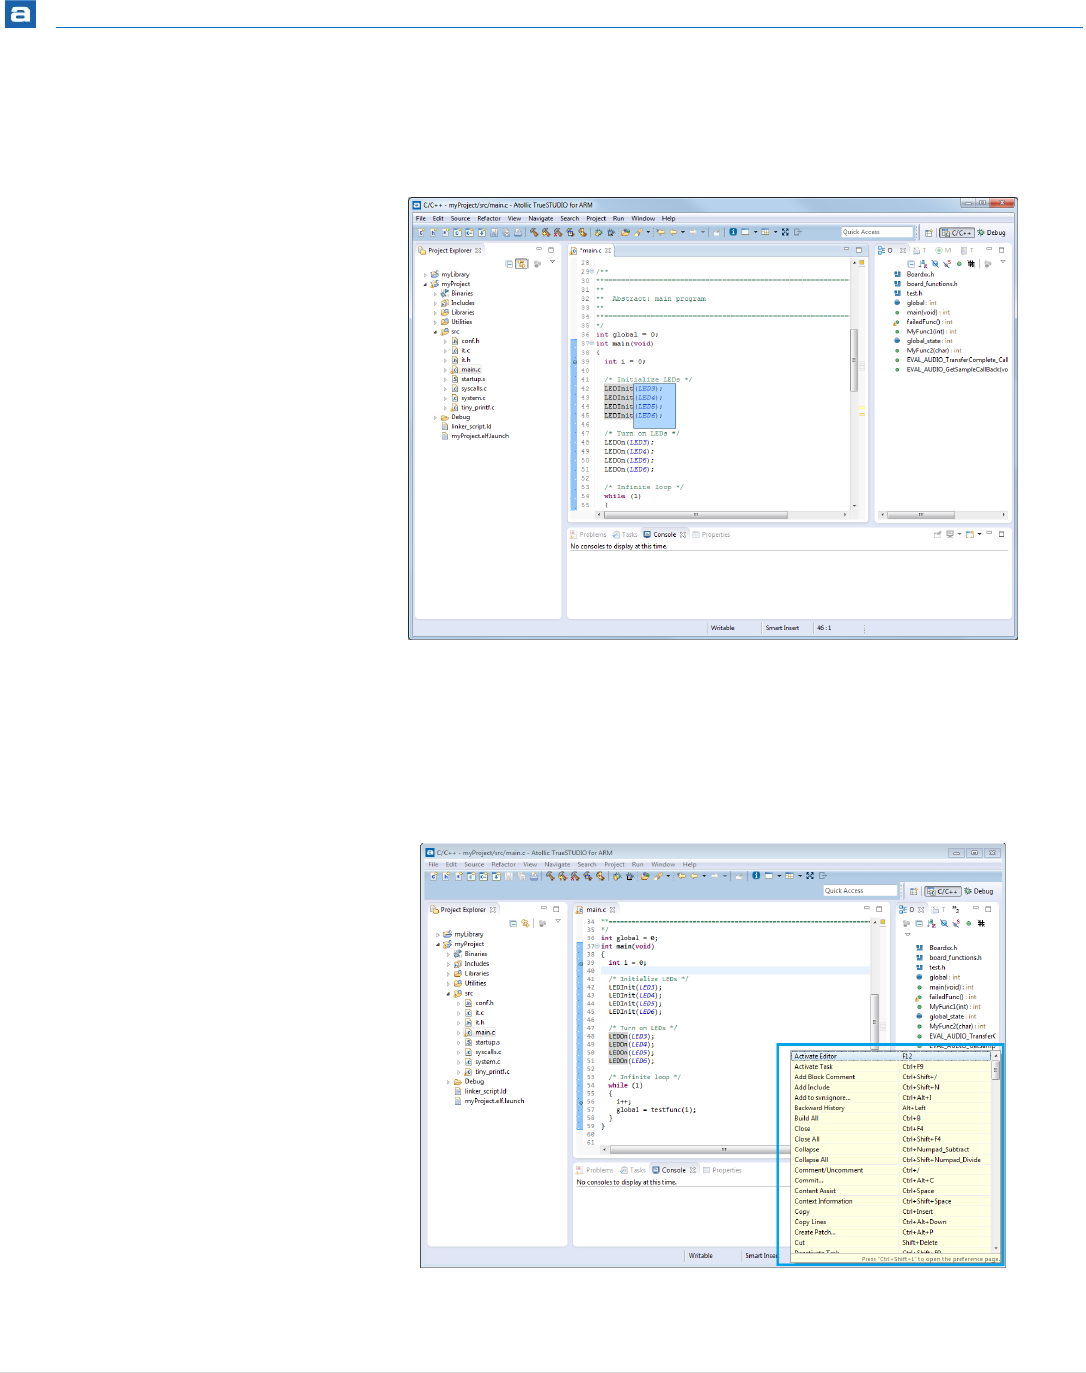
Getting Started
147 | P a g e
Whole areas can also be selected and edited in group.
Figure 112 – Select a block of text
FIND ALL KEYBOARD SHORTCUTS
To find all current Keyboard Shortcuts press Ctrl+Shift+L. This will open up information
about the other shortcuts.
Figure 113 – Find all Shortcuts
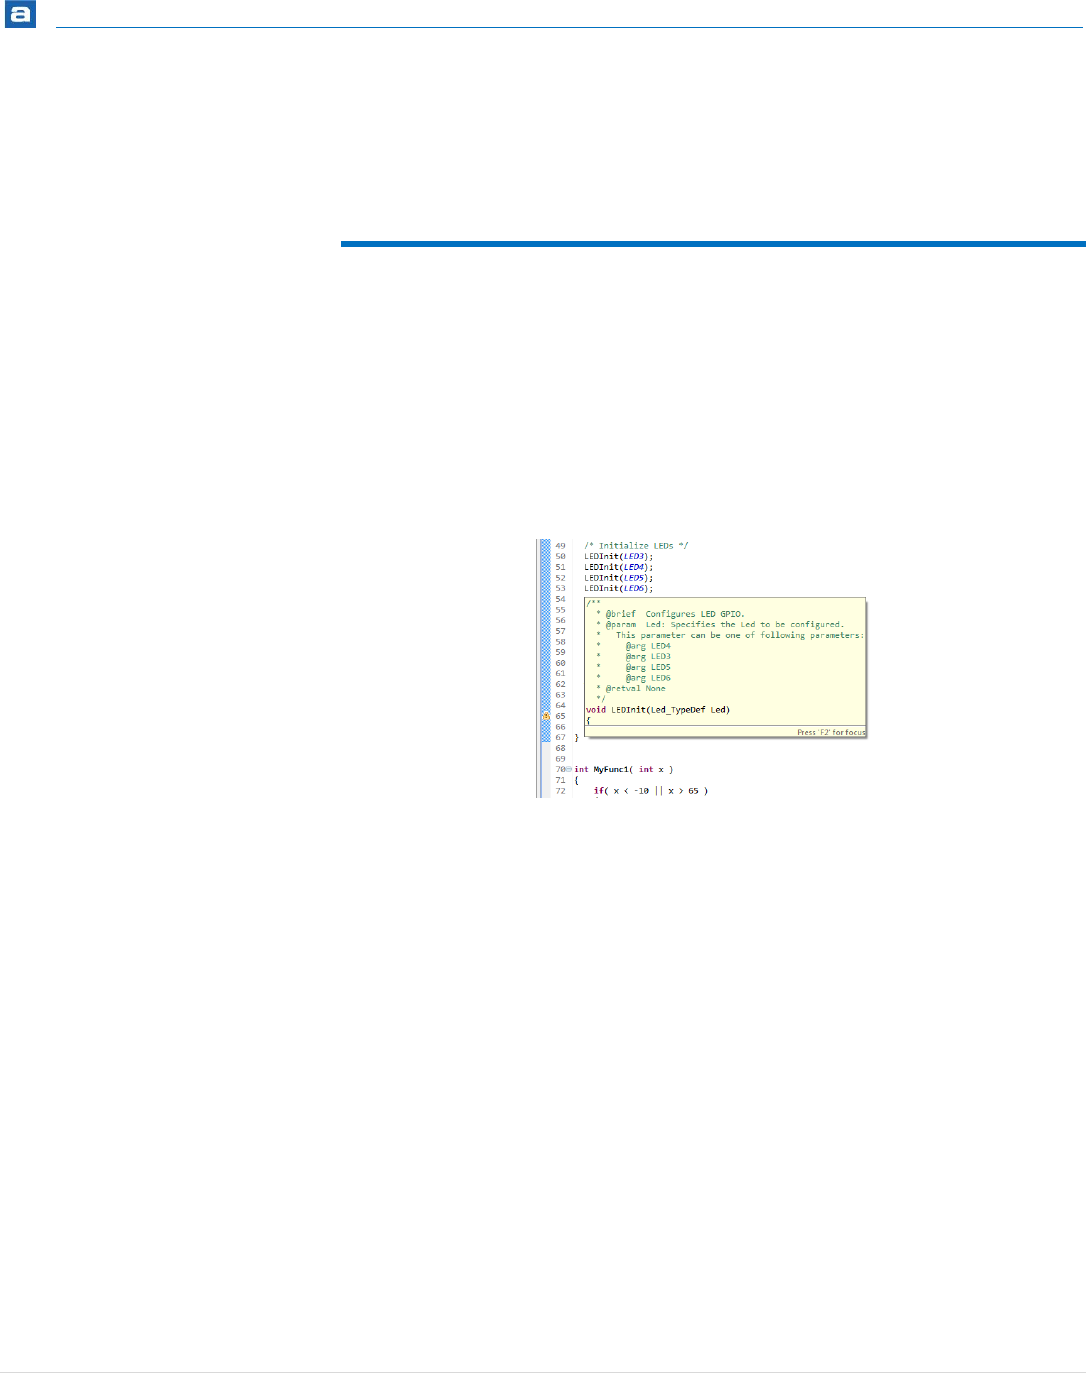
Getting Started
148 | P a g e
Press Ctrl+Shift+L again to open up the preferences to change the shortcuts.
THE INDEX
In Atollic TrueSTUDIO there is an important mechanism called Indexer that creates a
database of the source and header files. That database is called the Index and is used to
provide information for all navigation and content assist in Atollic TrueSTUDIO. It includes
the information about where to find information such as where a function is located and
used, where a preprocessor symbol is located and where global variables are defined.
Try pressing Ctrl and clicking on a function that is used somewhere in the code. The editor
will jump to its definition. Also hovering over it will display its comments and
documentation.
Figure 114 – The Indexer Picks up the Documentation for a Function
The Indexer is running in the background and keeps track on all changes in the project.
The Indexer is normally customized per Workspace, but can also be set on a per project
basis. To customize the Indexer per Workspace in the menu select Window, Preferences
and in the Preferences dialog select C/C++, Indexer.
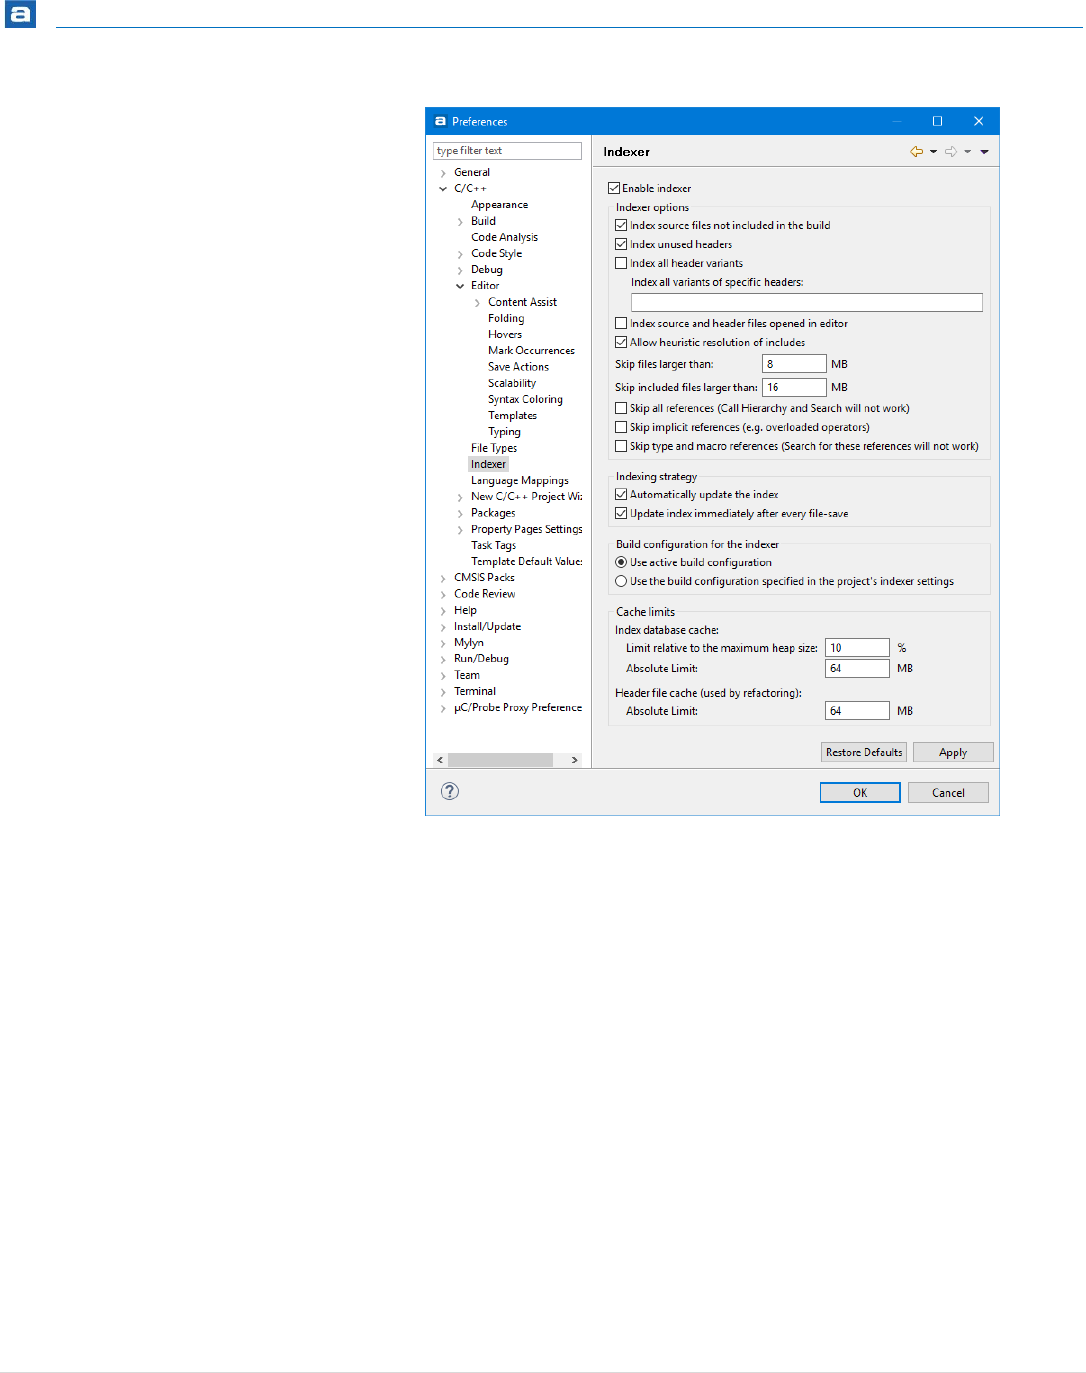
Getting Started
149 | P a g e
Figure 115 – Workspace Indexer Settings
To customize the Indexer setting per project right-click the project and select Properties.
In the Properties dialog select C/C++ General and then Indexer.

Getting Started
150 | P a g e
Figure 116 – Project Indexer Settings
Select Enable project specific settings. It is a good idea to skip large files and files with
many hundreds of includes. This will prevent the Java heap from running out of space. If
the project is version controlled, it is also a good idea to store the settings within the
project.
From time to time the Index fails to keep track on the changes in the project. Most likely
this is due to some includes being changed or missed. Then the Index database needs to
be rebuilt. To do that right-click the project and select Index, Rebuild.
If this doesn’t solve the problem or the indexer’s database file (the .pdom-file) is corrupted,
open the workspace folder and locate the hidden directory:
.metadata\.plugins\org.eclipse.cdt.core
Delete the file: YOUR_PROJECT_NAME.pdom and restart Atollic TrueSTUDIO. The Index is
now rebuilt from scratch.
The most likely reason for a corrupted .pdom-file is that TrueSTUDIO somehow crashed
during indexing. That can happen if Atollic TrueSTUDIO runs out of Java heap space, see
Keeping Track on Java Heap Space on page 141 for more information about the Java Heap.
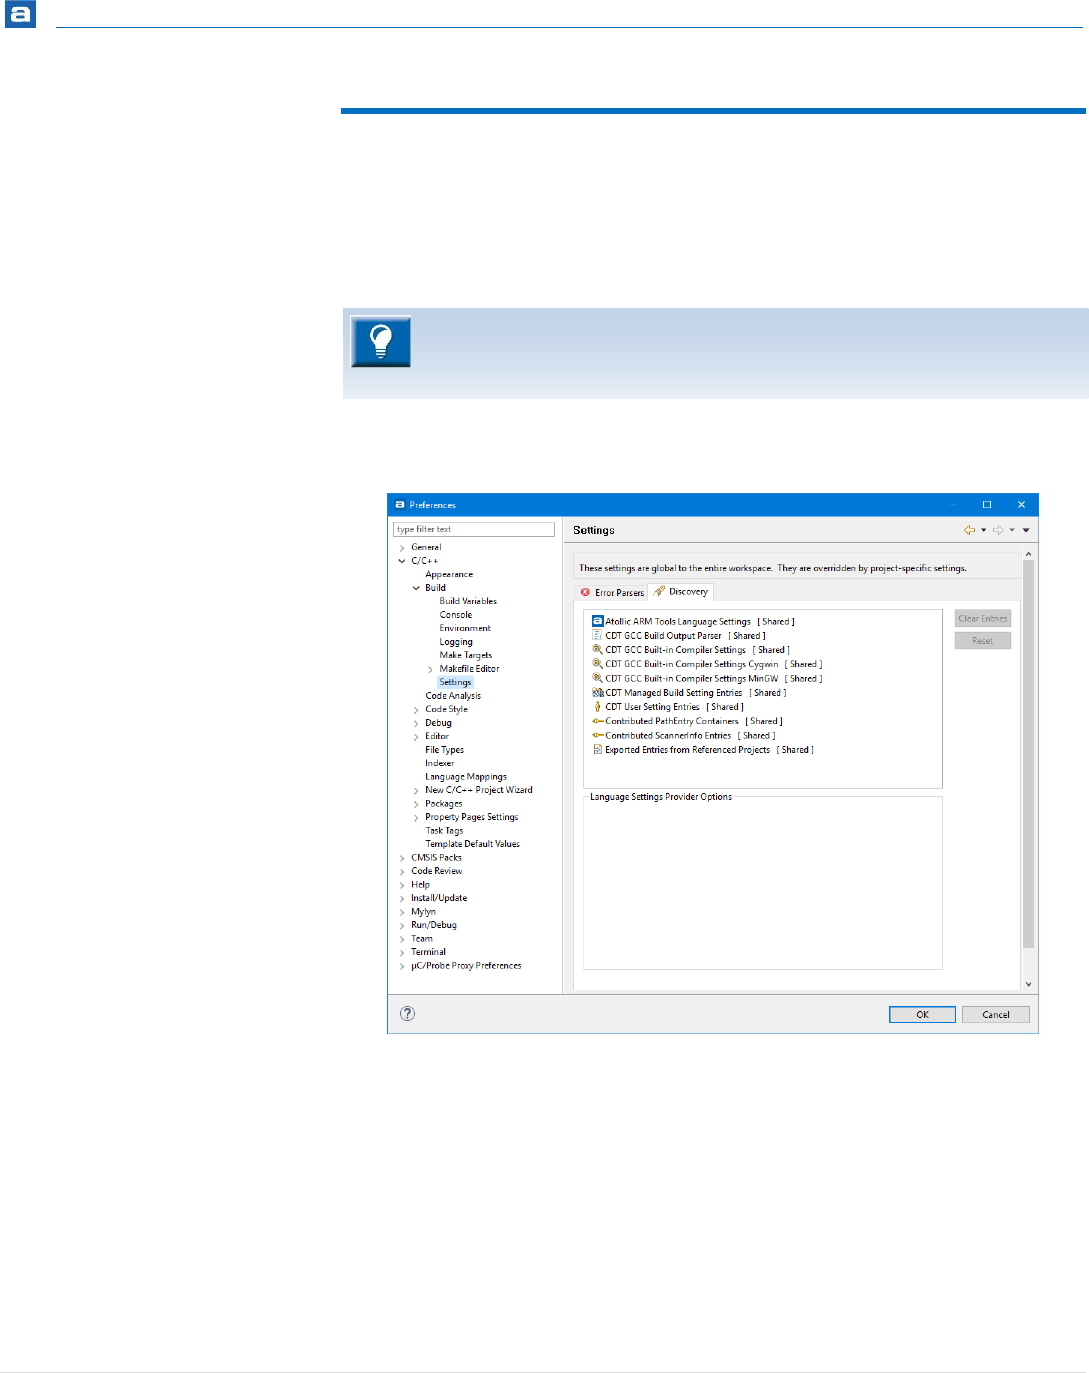
Getting Started
151 | P a g e
FINDING INCLUDE PATHS, MACROS ETC.
For the Indexer to work correctly it needs to be fed with information about all the symbols
and included files. The process providing that information is called the Scanner Discovery
mechanism. It uses Language Setting Providers to try to automatically provide that
information.
The preferences for the Scanner Discovery mechanism can be found by selecting Window
in the menu and then Preferences.
Figure 117 – Scanner Discovery Settings
In the Preferences panel select C/C++, Build, Settings and then to the right the Discovery-
tab.
A list of the available Language Setting Providers are then displayed. A Language Setting
Provider is a specialized mechanism to discover settings. Some providers calls the tool
chain for built in compiler symbol and includes. Others scan the build output for that
information. The found entries are then stored in the workspace (shared) or for each
project.
The Atollic ARM Tools Language Settings is by default not shared between projects.
The Scanner Discovery mechanism is rewritten and the old property
Discovery Options for projects is deprecated and replaced with the new
Preprocessor Include Paths, Macros etc. property.

Getting Started
152 | P a g e
By selecting one provider that individual provider can be configured. If that provider have
found and are sharing some entries in the workspace, those entries can be removed by
pressing Clear Entries. That can be a good idea to do if the path to included files are
wrong.
Enable Allocate console in the Console View will send output to the console each time the
providers runs.
The project and Build Configuration specific settings and entries can be found by selecting
the project and then in the menu select Project, Properties and in the Properties panel for
the project select C/C++ General, Preprocessor Include Paths, Macros etc. and select the
Providers tab first.
Figure 118 – Preprocessor Include Paths, Macros etc.
When using a version control system it is best to enable Store entries in project setting
folder.
Do not enable the Use global provider shared between projects option! The Atollic ARM
Tools Language Settings is by default not shared between projects. Since each project has
different arguments to the tools based on the Target Settings, sharing between projects
will not give a totally accurate result.
The Entries tab displays the found entries for the different providers. At the top is the CDT
User Setting Entries. By selecting that user defined entries can be added.
By pressing Restore Default all locally stored entries will be removed.
It is recommended to always Restore Default when changing tool chain version
or upgrading Atollic TrueSTUDIO. This replaces the old method for clearing of
discovered entries found in the deprecated Discovery Options properties.
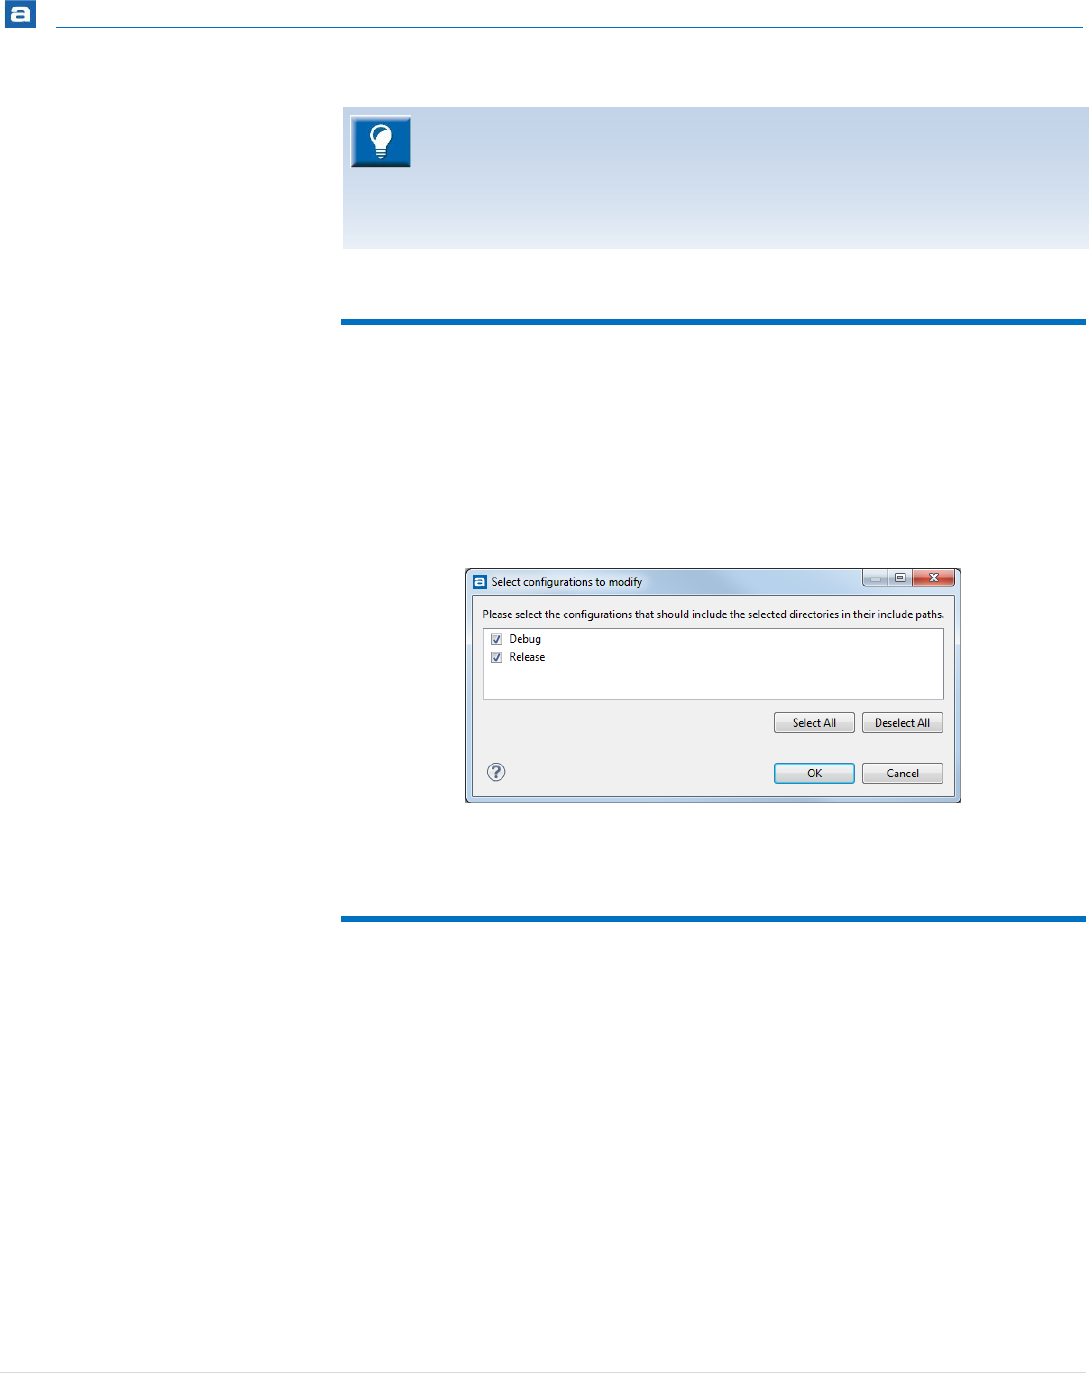
Getting Started
153 | P a g e
ADD OR REMOVE FOLDER TO INCLUDE PATH
To add or remove folder(s) from the include path, right-click on a folder in the Project
Explorer view and select Add/remove include path… A dialog is opened and here it is
possible to select the configurations that should include the selected directories in their
include paths. Select the configurations which shall contain the folder in the include path.
Then press OK to update the path. This is an easy way to update the include path for a
project.
Figure 119 – Add or remove include path
LOCATE WHERE A FILE IS INCLUDED
To locate where in the code a specific file is included, open the Include Browser view. From
the Project Explorer view, click and drag the file you want to know inclusions for to the
Include Browser view. All the places it is included will be displayed and the inclusion tree
for those files also.
The view is also able to display all the files included in the selected file and the name of the
folder where the files are located.
When sharing a project in a version control system, it is a good idea to set the
SVN property svn:ignore on the file
%PROJECT_LOCATION%/.settings/language.settings.xml since it
includes a hash specific to each individual environment. See more in the
chapter about SVN on page 206.
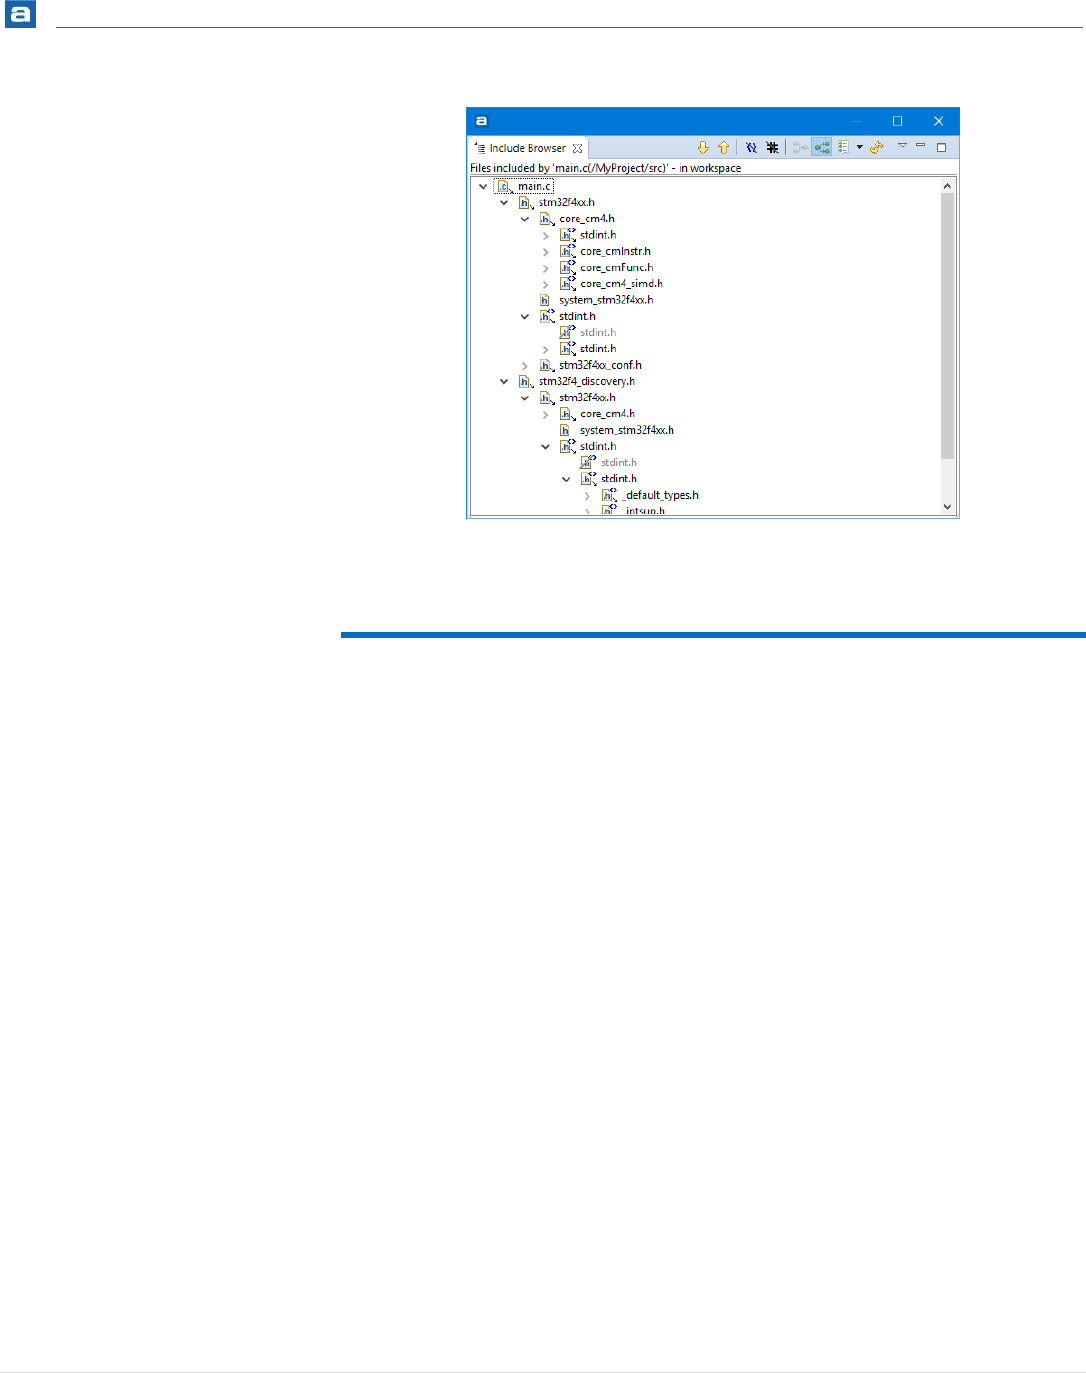
Getting Started
154 | P a g e
Figure 120 – Include Browser
CREATING LINKS TO EXTERNAL FILES
Even if the Indexer will find external source files and libraries included in other source files,
Atollic TrueSTUDIO will not keep track on changes in these files.
To be able to keep track on these changes and properly edit external source files in Atollic
TrueSTUDIO, a link to the folders or to the files needs to be added to the project. To add a
link to a file, right-click on a source folder and select New, File.
In the dialog click on the Advanced button and select Link to file in the file system.
Enter the file name and Browse to the file you want to create a link to.

Getting Started
155 | P a g e
Figure 121 – Create Linked File
When this is done, Atollic TrueSTUDIO will keep track of all changes in the file and rebuild
when the file is changed.
The process to create a link to a folder is similar.
UPDATE CMSIS MATH LIBRARY
Follow these steps to use the latest version of the CMSIS library provided by ARM. Other
libraries from ARM or other source can be added with a similar method.
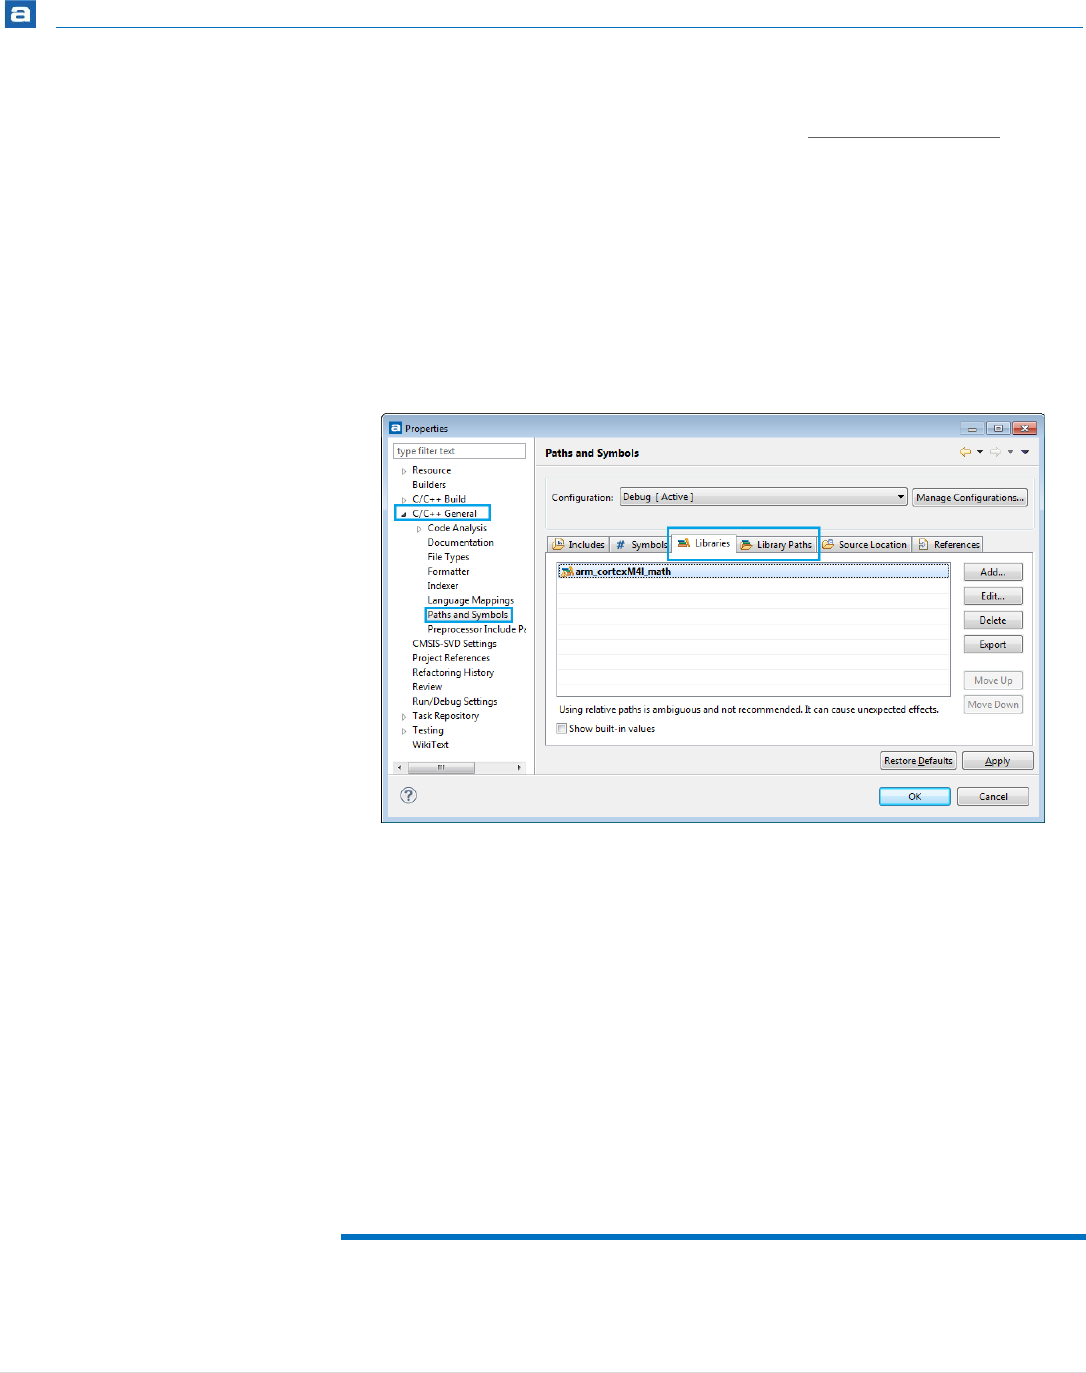
Getting Started
156 | P a g e
1. Download the latest version of the library from https://silver.arm.com/
(registration is needed).
2. Unpack the zip-file.
3. Create a folder in the project in Libraries\CMSIS named lib.
4. Add the path to the library and the library name by selecting Project, Properties,
C/C++ General, Paths and Symbols and then use the Path tab. (On page 93
another method is explained in Include Libraries). Remember not to include the
“lib”-prefix and the file extension (.a).
Figure 122 – Create Linked File
5. Add the symbol ARM_MATH_CM4 or ARM_MATH_CM3 in the Symbol tab.
6. Copy the library files from the extracted folder CMSIS\lib\GCC to the folder
created in step 3. Very with the FPU settings in the Target Settings that the
correct library is used.
7. To be able to debug the library, the source to it must also be added to the known
sources, see page 90 for more information about how to do that.
It might also be a good idea to also update the header files with the ones provided in the
download.
CONVERTING A C-PROJECT TO A C++-PROJECT
To convert a C-project to a C++-project do the following steps:

Getting Started
157 | P a g e
1. Open the Navigator view.
2. Select the project and open it.
3. Double click the file .project to open it in the editor
4. Locate the row <nature>org.eclipse.cdt.core.cnature</nature>
5. Insert a row after it that looks almost the same, but with an extra “c”:
6. <nature>org.eclipse.cdt.core.ccnature</nature>
7. Do not remove the cnature-row!
8. Save the file and the project will now also compile with the C++ tools.
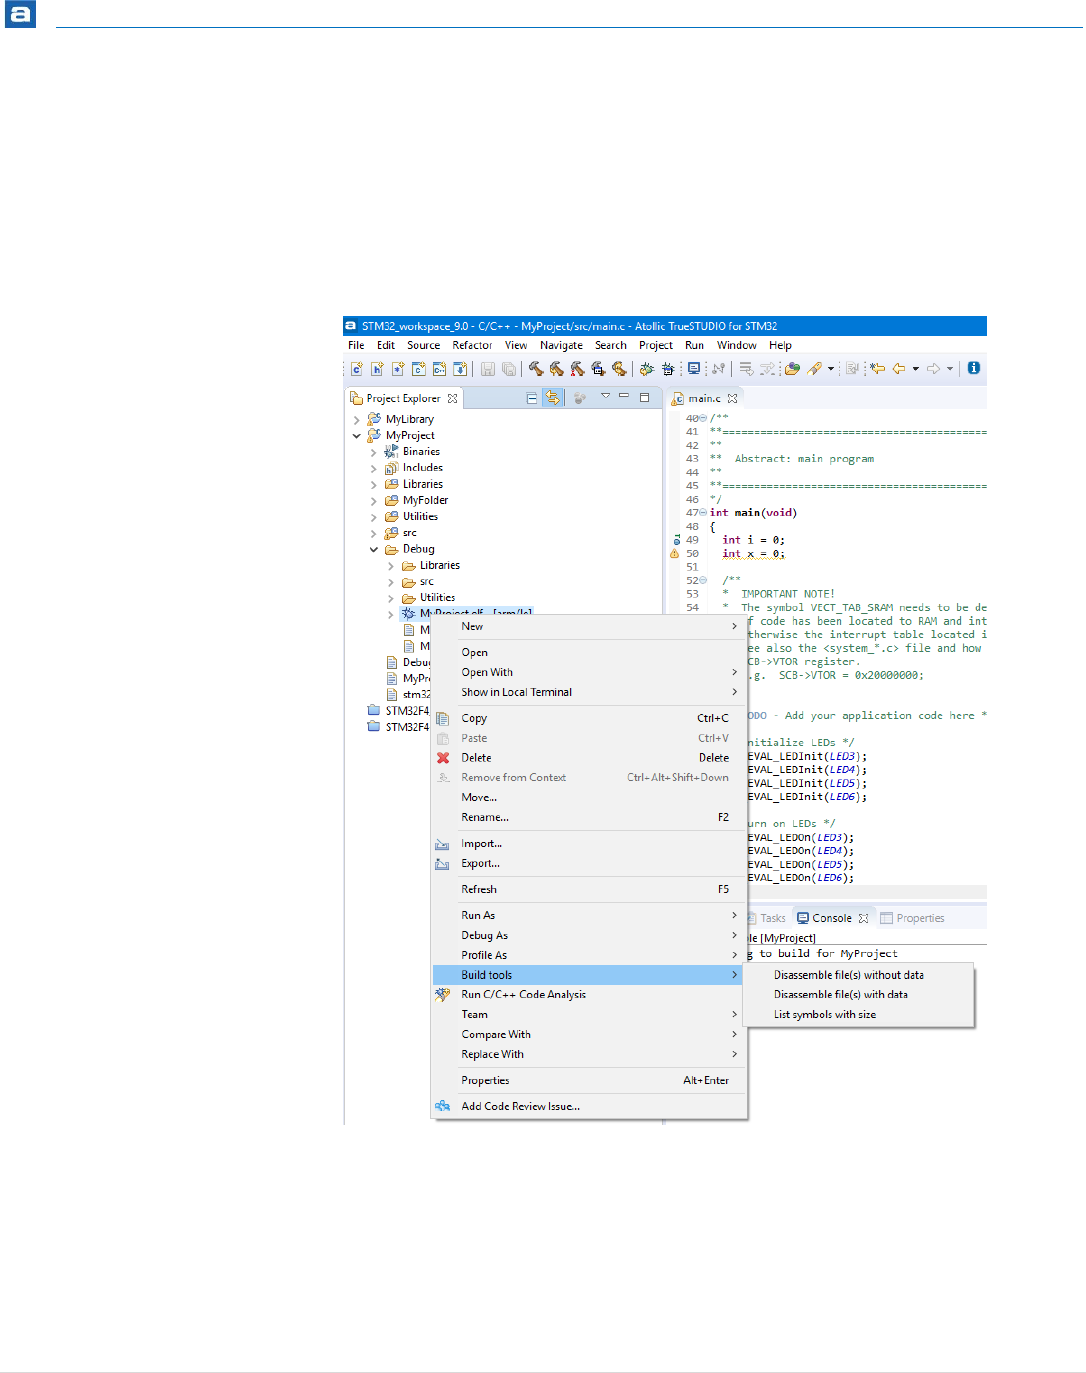
Getting Started
158 | P a g e
DISASSEMBLE/LIST OBJECT AND ELF FILES
Sometimes it can be interesting to get detailed information about the content of an object
or elf file. This can be done using the build tools included in the Toolchain. To make it even
easier to get access to the such information a Build tools selection has been added. To use
this feature just make a right-click on the object or elf file in the Project Explorer view and
select Build tools.
Figure 123 – Build Tools
The Build tools selection has three options. Select option depending on your needs and
the file will be opened in the editor. The options are:
Disassemble file(s) without data
Disassemble file(s) with data
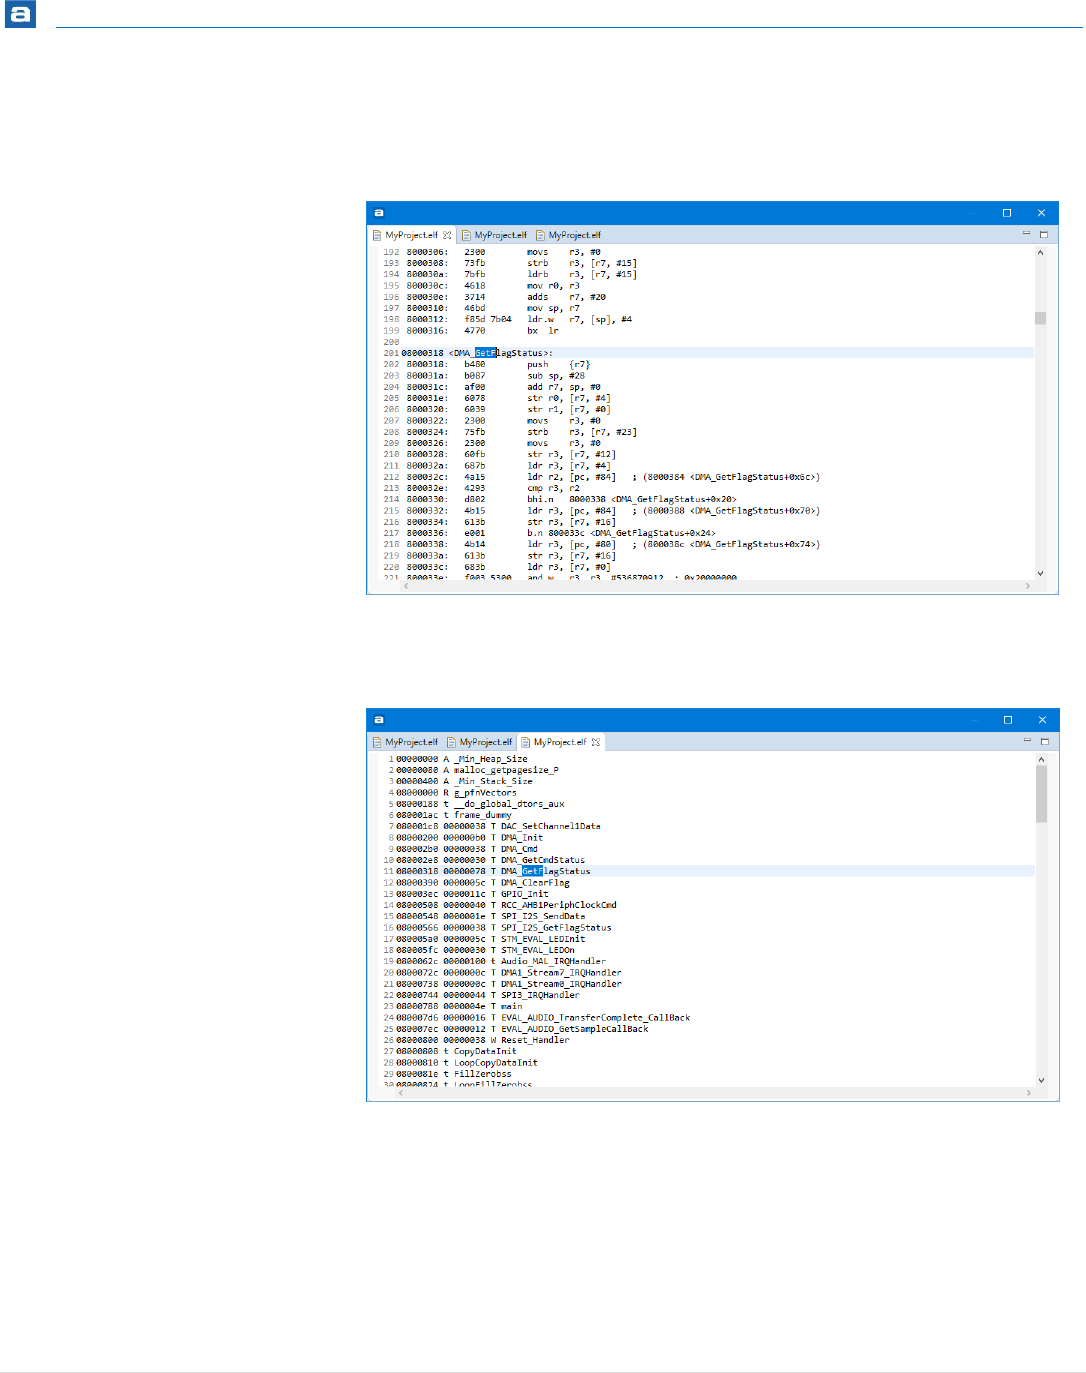
Getting Started
159 | P a g e
List symbols with size
Example of a file opened with Disassemble file(s) without data.
Figure 124 – Disassemble file(s) without data
Example of a file opened with List symbols with size.
Figure 125 – List symbols with size
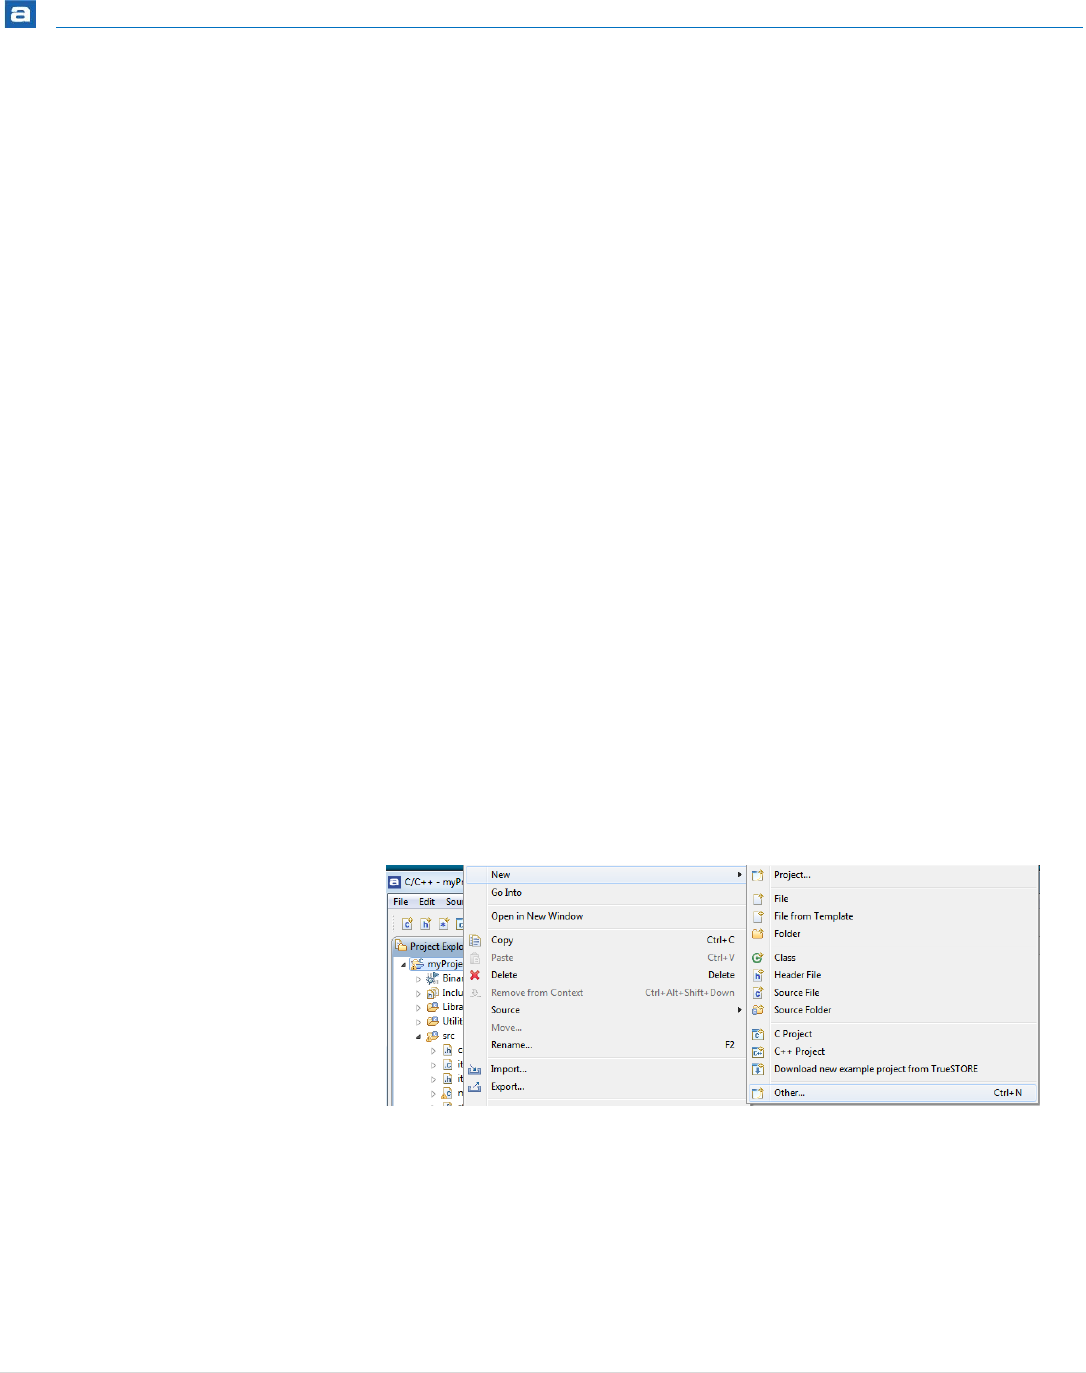
Getting Started
160 | P a g e
I/O REDIRECTION
The C runtime library includes many functions, including some that typically handle I/O.
The I/O related runtime functions include printf(), fopen(), fclose(), and many
others.
It is common practice to redirect the I/O from these functions to the actual embedded
platform, such as redirecting printf() output to an LCD display or a serial cable, or to
redirect file operations like fopen() and fclose() to some Flash file system
middleware. Atollic TrueSTUDIO also comes with an integrated Terminal that can be used
to display redirected I/O, see page 247 for more information.
In Atollic TrueSTUDIO three different techniques are generally most used. It is the old
UART output, Segger’s Real Time Terminal (RTT) that is explained on page 249 and on
targets that has support for SWV, the ITM output that is explained on page 302.
A fair comparison between the three techniques to generate debug output:
SWV Low or none CPU overhead but very limited bandwidth. Only supported by some
targets.
UART Some CPU overhead and medium bandwidth.
RTT A bit smaller CPU overhead than UART and higher bandwidth. Needs a Segger Probe.
Atollic TrueSTUDIO do support I/O redirection. To enable I/O redirection the file
syscalls.c should be included and built into the project:
1. In the Project explorer view, Right click on the project and select New, Other...
Figure 126 – New, Other…
2. Expand System calls.
3. Select Minimal System Calls Implementation and click next.
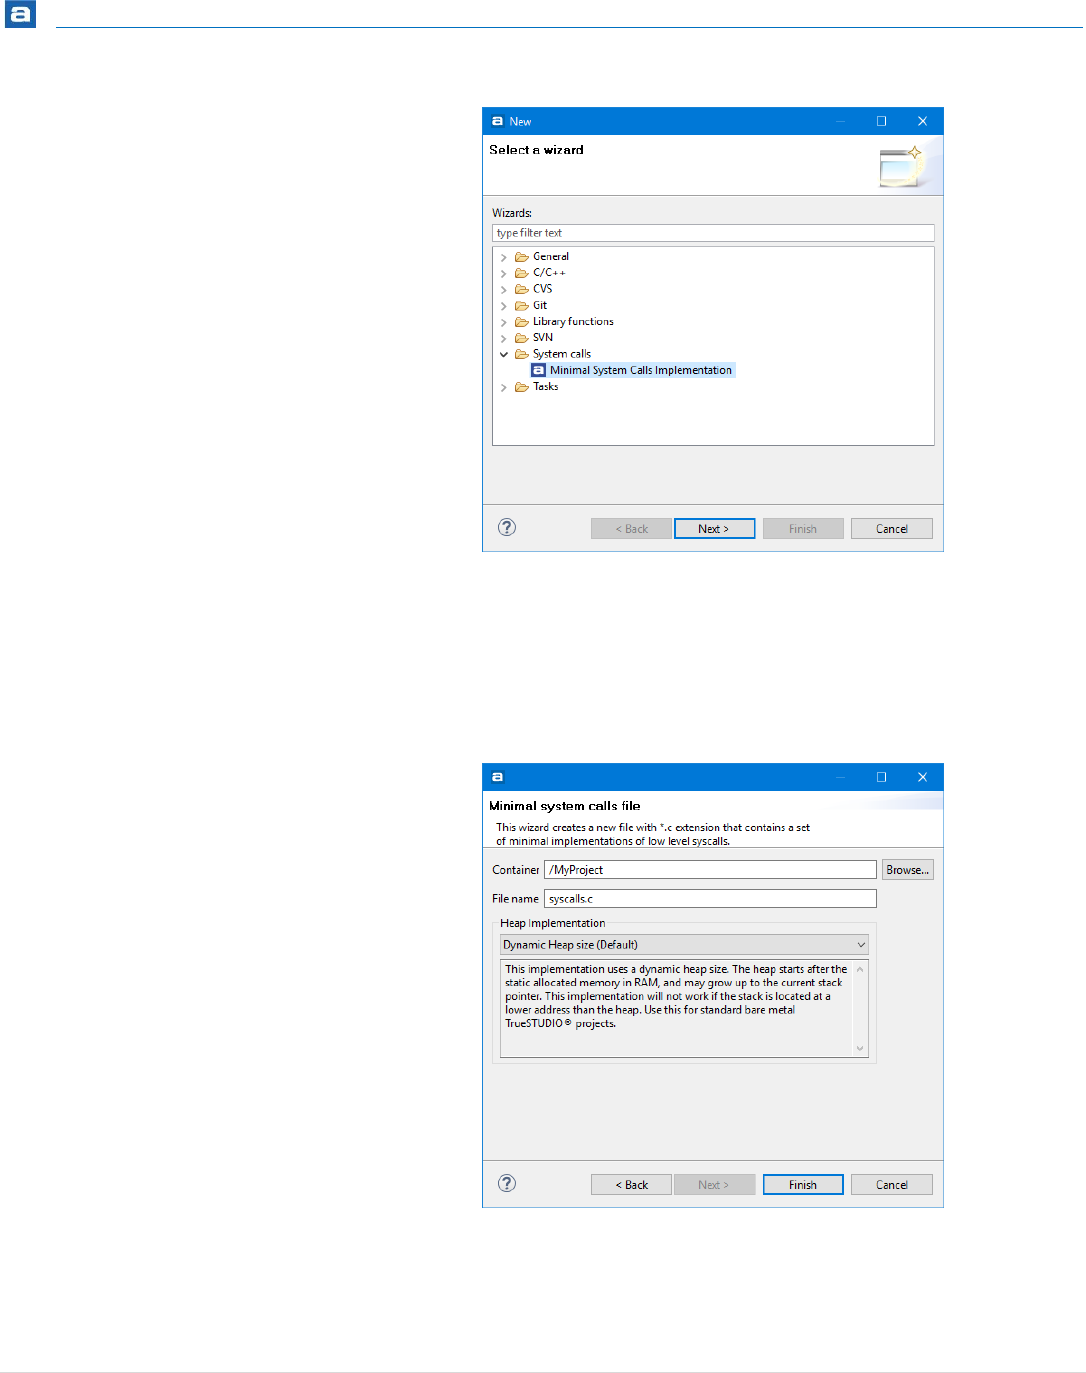
Getting Started
161 | P a g e
Figure 127 – Select Minimal System Calls Implementation
4. Click Browse... and select the src folder as new file container. Also select the
Heap Implementation. There is one dynamic heap implementation that is default
and a fixed one intended for RTOS use. If the latter is selected a modification of
the script linker_script.ld in accordance with the instructions is also
needed.
Figure 128 – Select Location and Heap Implementation
5. Click OK.

Getting Started
162 | P a g e
6. Click on Finish and verify that syscalls.c is added to the project.
To redirect the printf() to the target output, the _write() function needs to be
modified. Exactly how this is done depends on the hardware and library implementation.
Here is an example:
int _write(int file, char *ptr, int len)
{
int index;
for(index=0 ; index<len ; index++){
__io_putchar(*ptr++) /* Your target output function */
}
}
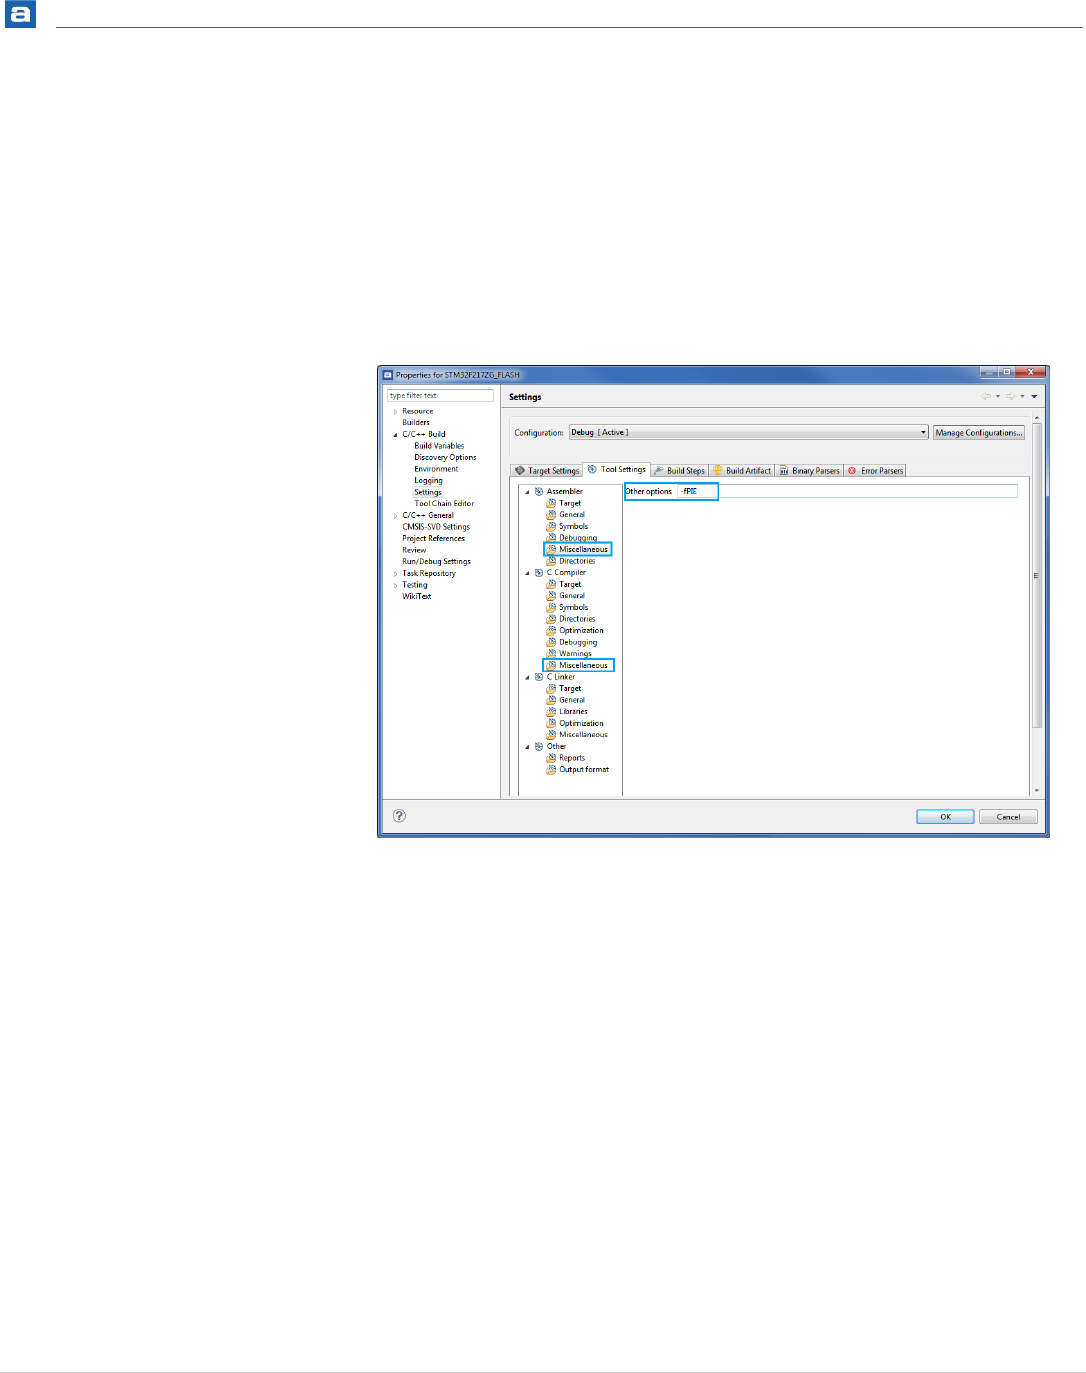
Getting Started
163 | P a g e
POSITION INDEPENDENT CODE
When for instance working on a bootloader, position independency is a great help. PIC
(Position Independent Code) is relative to the program counter. If it is compiled for
address 0 but placed at 0x81000 it still runs properly.
The compiler has an option -fPIE that enables the compiler to generate position
independent code for executable. Add this option into the tool settings for the Assembler
and C Compiler in the Miscellaneous settings.
Figure 129 – Add –fPIE for Assembler and C Compiler
Also use this -fPIE option for the linker. E.g. in the Miscellaneous settings the Other
options field for the C linker, the command may look like
-Wl,-cref,-u,Reset_Handler -fPIE
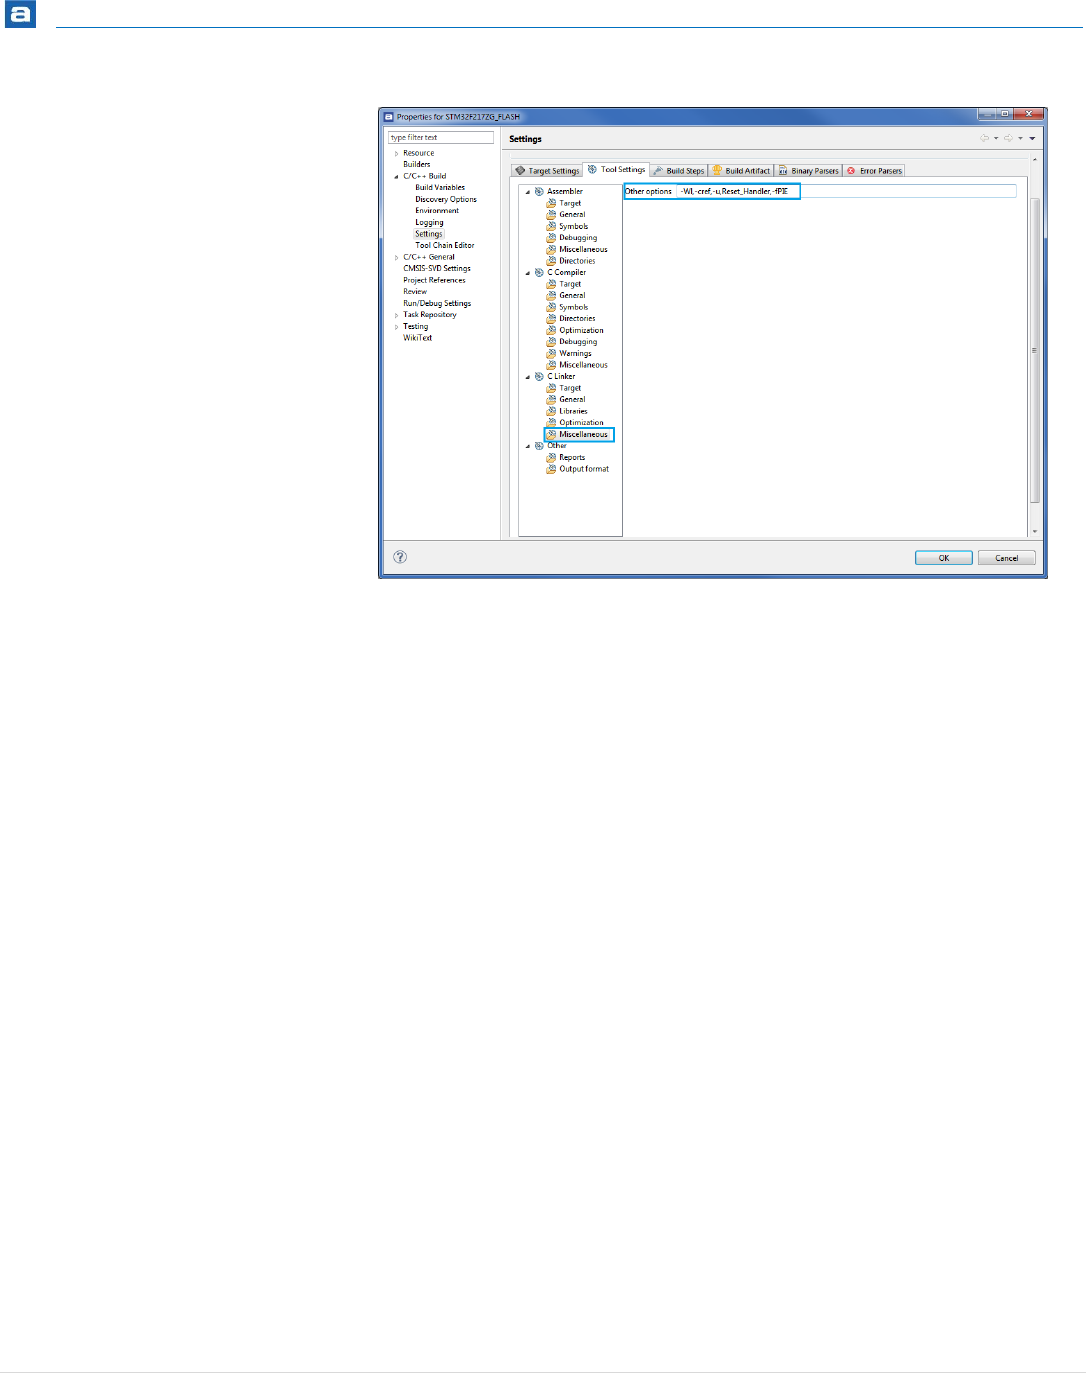
Getting Started
164 | P a g e
Figure 130 – Use –fPIE for Linker
Make sure that the stack pointer is set up correctly. Normally this is done by issuing a
monitor reset command as part of the Startup-script for the debug session.
However now the start code needs to set the stack pointer instead; do this by adding the
following assembly line at the top of the Reset_Handler()-function located in the
startup file:
ldr sp, =_estack
This will make sure that the stack pointer is initialized when the Reset_Handler()-
function runs.
Since the monitor reset command is not used any more, it needs to be removed from
the Debug Startup Script.
Do this by opening your debug configuration, by pressing the Debug Configuration button,
switch to the Startup Scripts tab.
This contains all commands that are used to launch a debug session. Try commenting
the monitor reset line out by adding a # sign in front.
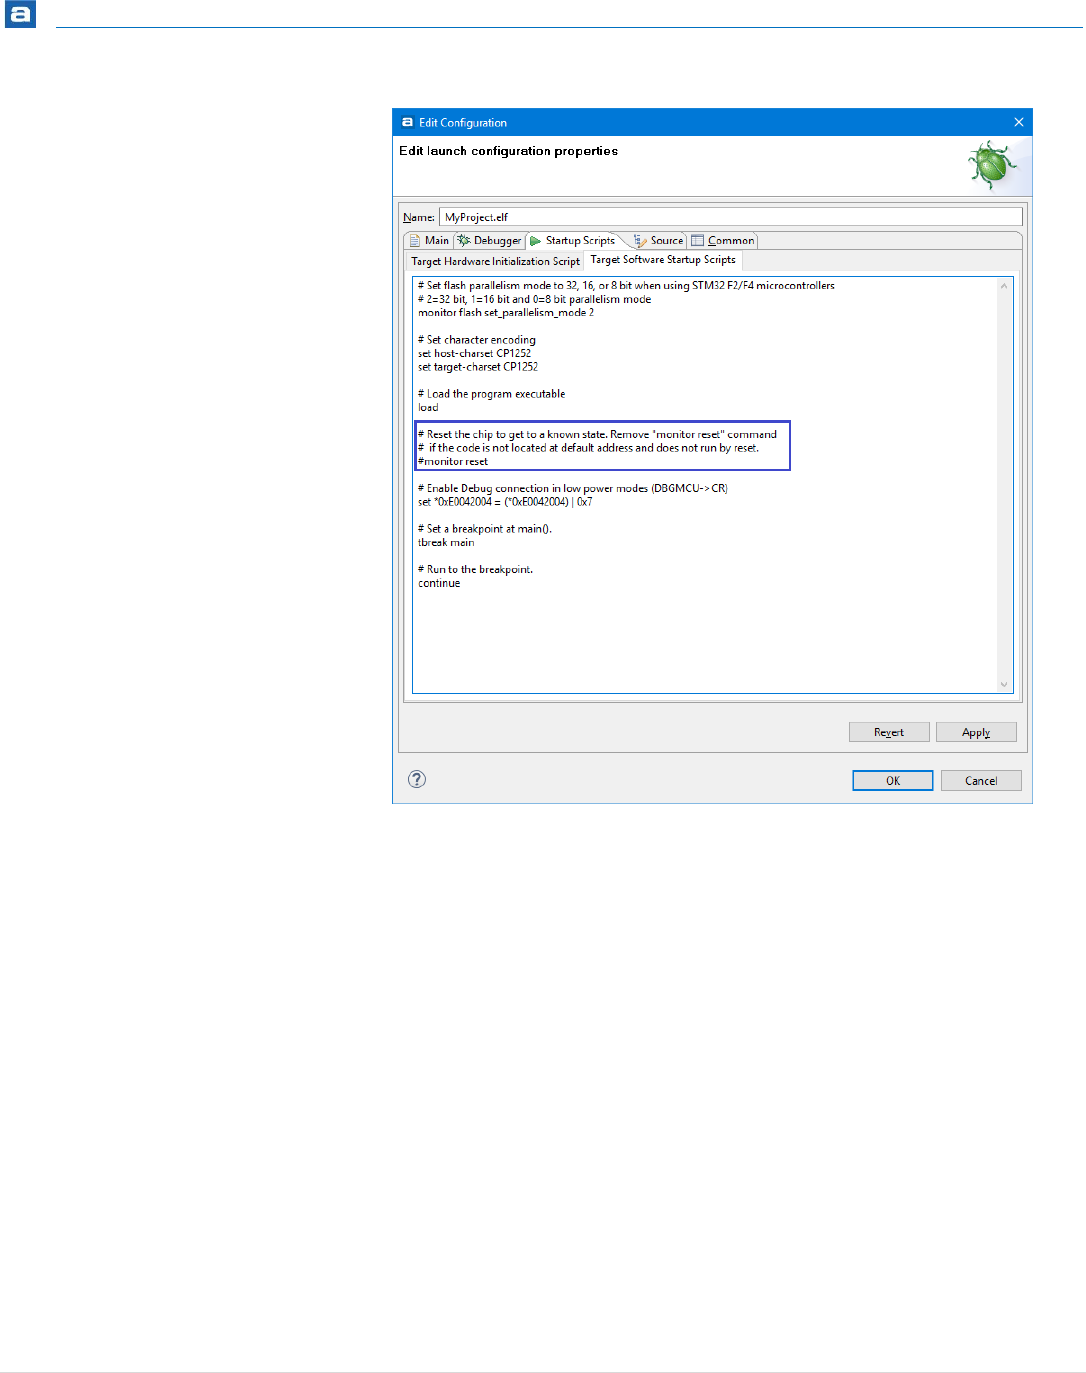
Getting Started
165 | P a g e
Figure 131 – Remove the monitor reset command
Also in some examples the SystemInit()-function for the vector table relocation needs
to be changed.
SCB->VTOR = FLASH_BASE | 0x20000; /* Vector Table Relocation in
Internal FLASH */
If not, this SystemInit()-function will relocate interrupts to flash beginning.
To test that the code is started where it should be, also comment out the continue
command from the Debug Startup script. This will suspend execution on the first
instruction in the Reset_Handler(), making it possible to debug the start-up code.
Getting Started
166 | P a g e
USING CMSIS-PACK IN TRUESTUDIO
The Cortex Microcontroller Software Interface Standard (CMSIS) is a vendor-independent
hardware abstraction layer for the Cortex-M processor series and defines generic tool
interfaces. The CMSIS enables consistent device support and simple software interfaces to
the processor and the peripherals, simplifying software re-use, reducing the learning curve
for microcontroller developers, and reducing the time to market for new devices.
CMSIS-Pack is one of these components and from version 6.0 Atollic TrueSTUDIO supports
the CMSIS-Pack standard.
The CMSIS-Pack Management for Eclipse v2.0 software created by ARM is integrated into
Atollic TrueSTUDIO v7.0. and used to:
Install, remove, delete Packs as well as to import examples
create and manage CDT-based C/C++ projects
The CMSIS-Pack software also includes:
an editor for configuration files supporting configuration wizard annotations
version tracking of configuration files with merge functionality
integrated help based on Eclipse help framework
CONFIGURATION
Before using CMSIS-Pack the CMSIS Pack root folder needs to be configured. In the menu
select Window, Preferences and in the Preferences dialog configure the CMSIS-Pack root
folder to point to some location on the disk where downloaded Packs shall be stored. For
instance in this case the Packs are stored into F:\CMSIS_Pack.
ARM has made the following definition of CMSIS-Pack.
“CMSIS-Pack: describes with a XML based package description (PDSC) file the
user and device relevant parts of a file collection (called software pack) that
includes source, header, and library files, documentation, Flash programming
algorithms, source code templates, and example projects. Development tools
and web infrastructures use the PDSC file to extract device
parameters, software components, and evaluation board configurations.”
More information about CMSIS can be found on the ARM website:
http://www.arm.com/products/processors/cortex-m/cortex-microcontroller-
software-interface-standard.php
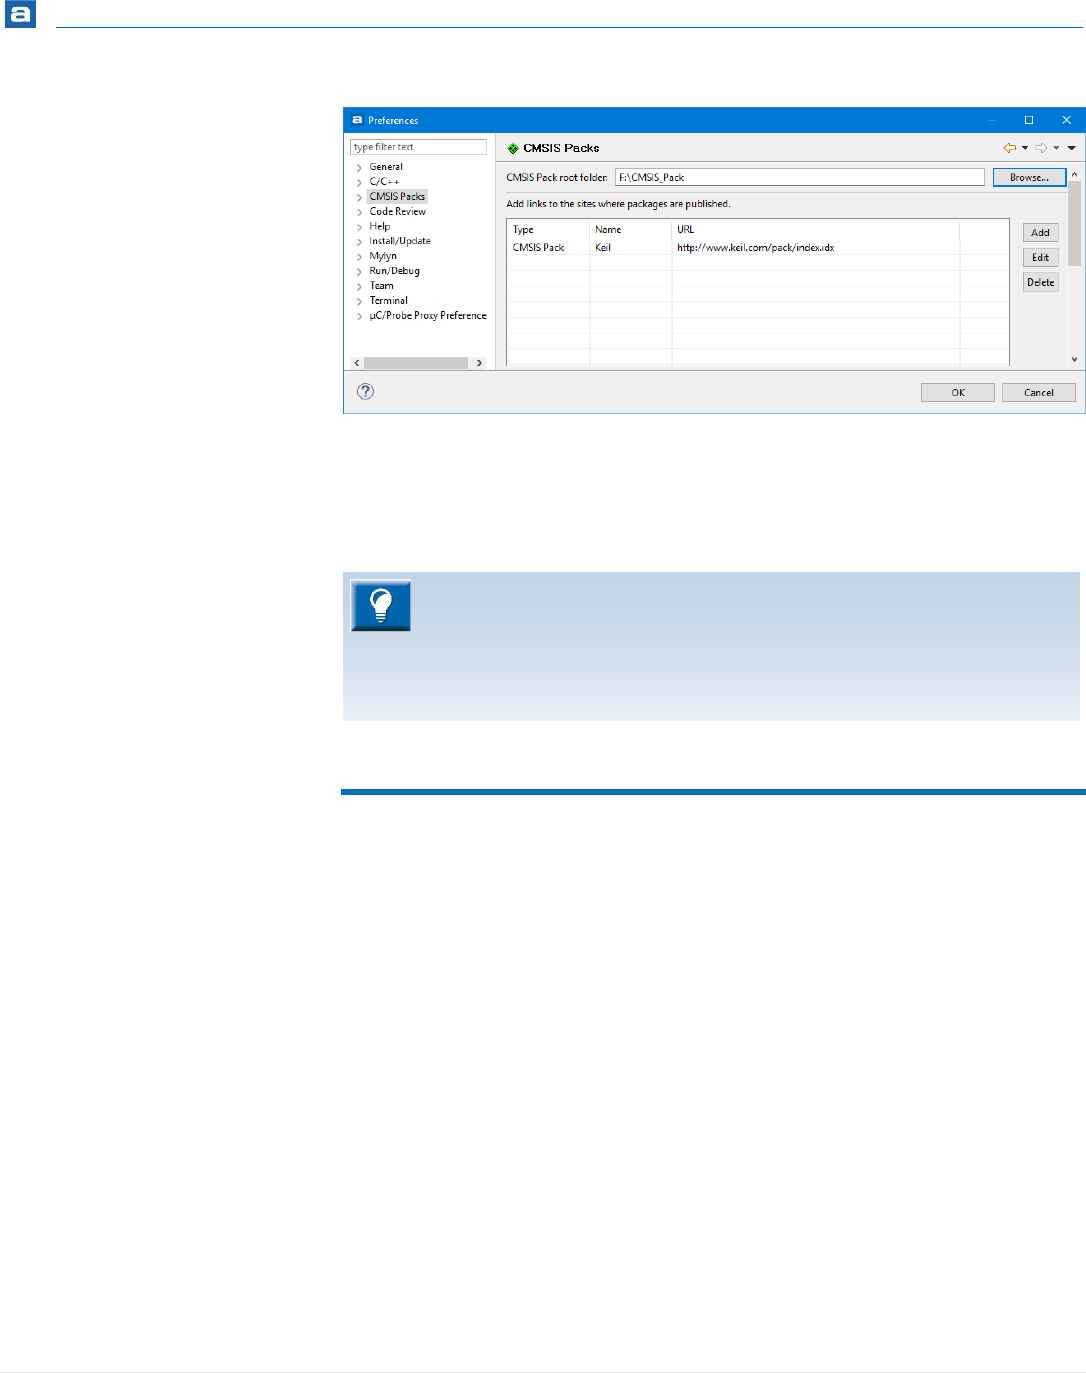
Getting Started
167 | P a g e
Figure 132 – CMSIS Packs Preferences
The CMSIS Packs configuration also contains links to the sites where packages are
published. Use Add, Edit and Delete to change the sites which will be searched by the
CMSIS Pack plugin.
CMSIS PACK MANAGER PERSPECTIVE
There is a specific CMSIS Pack Manager perspective which is used when downloading and
using a new CMSIS-Pack.
Open the CMSIS Pack Manager perspective, e.g. this can be done by writing Pack in the
Quick Access field and select CMSIS Pack Manager.
The configuration of the location of CMSIS-Pack files needs to be done in the
preferences each time a new Workspace is used.
Atollic TrueSTUDIO version 6.0 was using the older CMSIS-Pack v1.1 software.
Please use a new location as CMSIS Pack root folder when using this new
CMSIS-Pack v2.0.
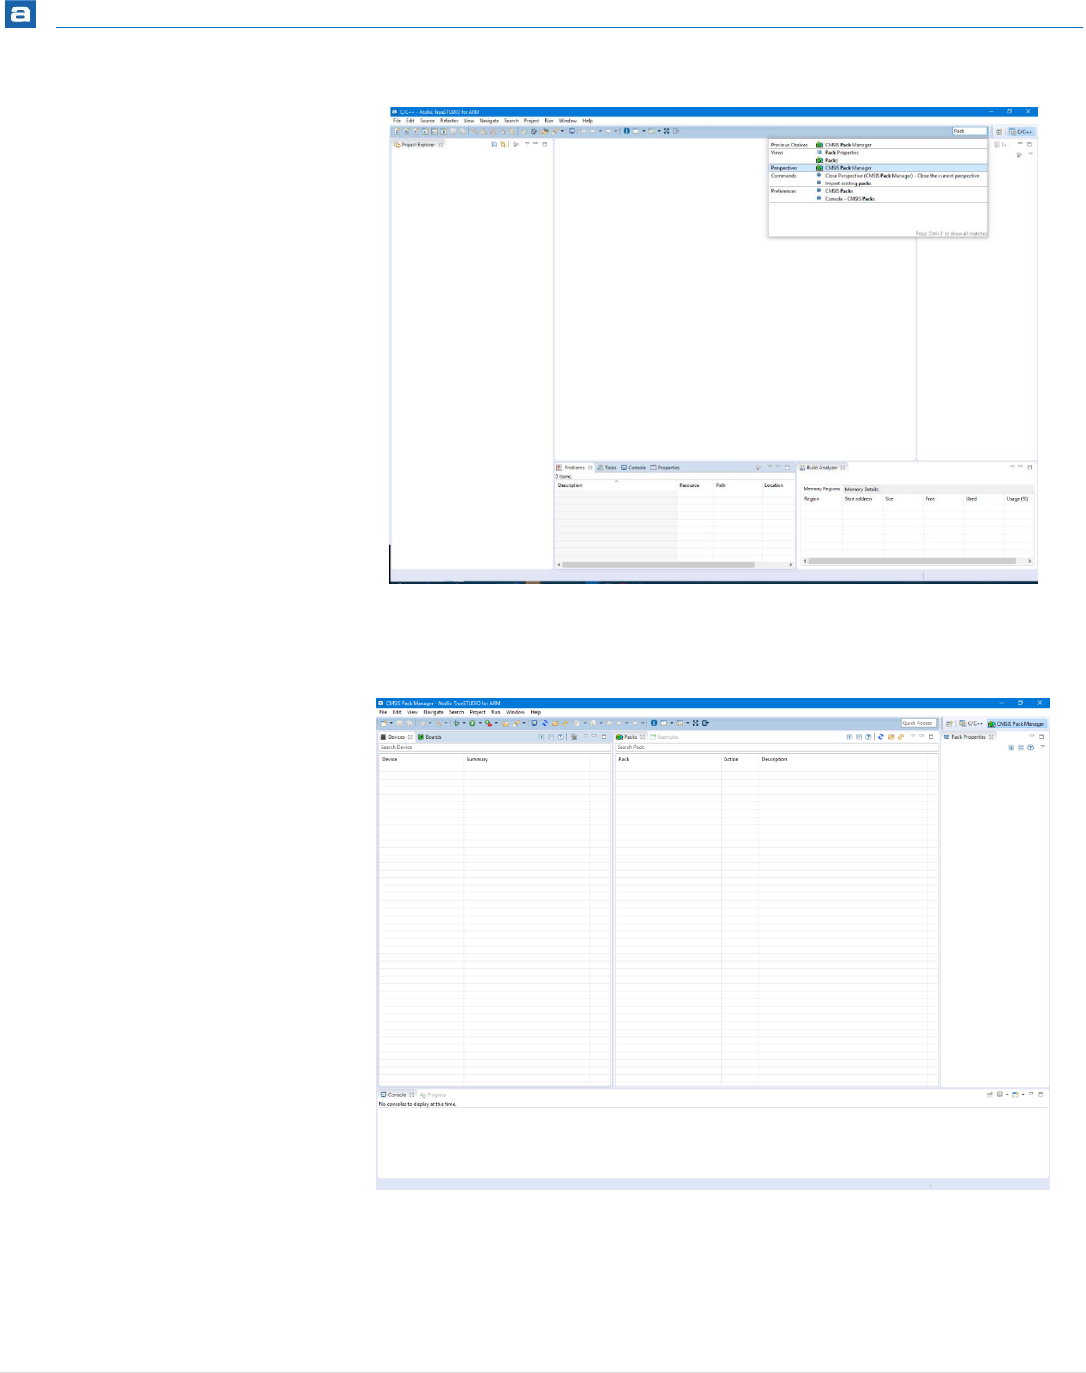
Getting Started
168 | P a g e
Figure 133 – Open CMSIS Pack Manager Perspective
The Packs perspective is now opened and when using it first time the Packs view is empty.
Figure 134 – Packs View Empty
See the figure below and the information about what the Packs view toolbar buttons does.
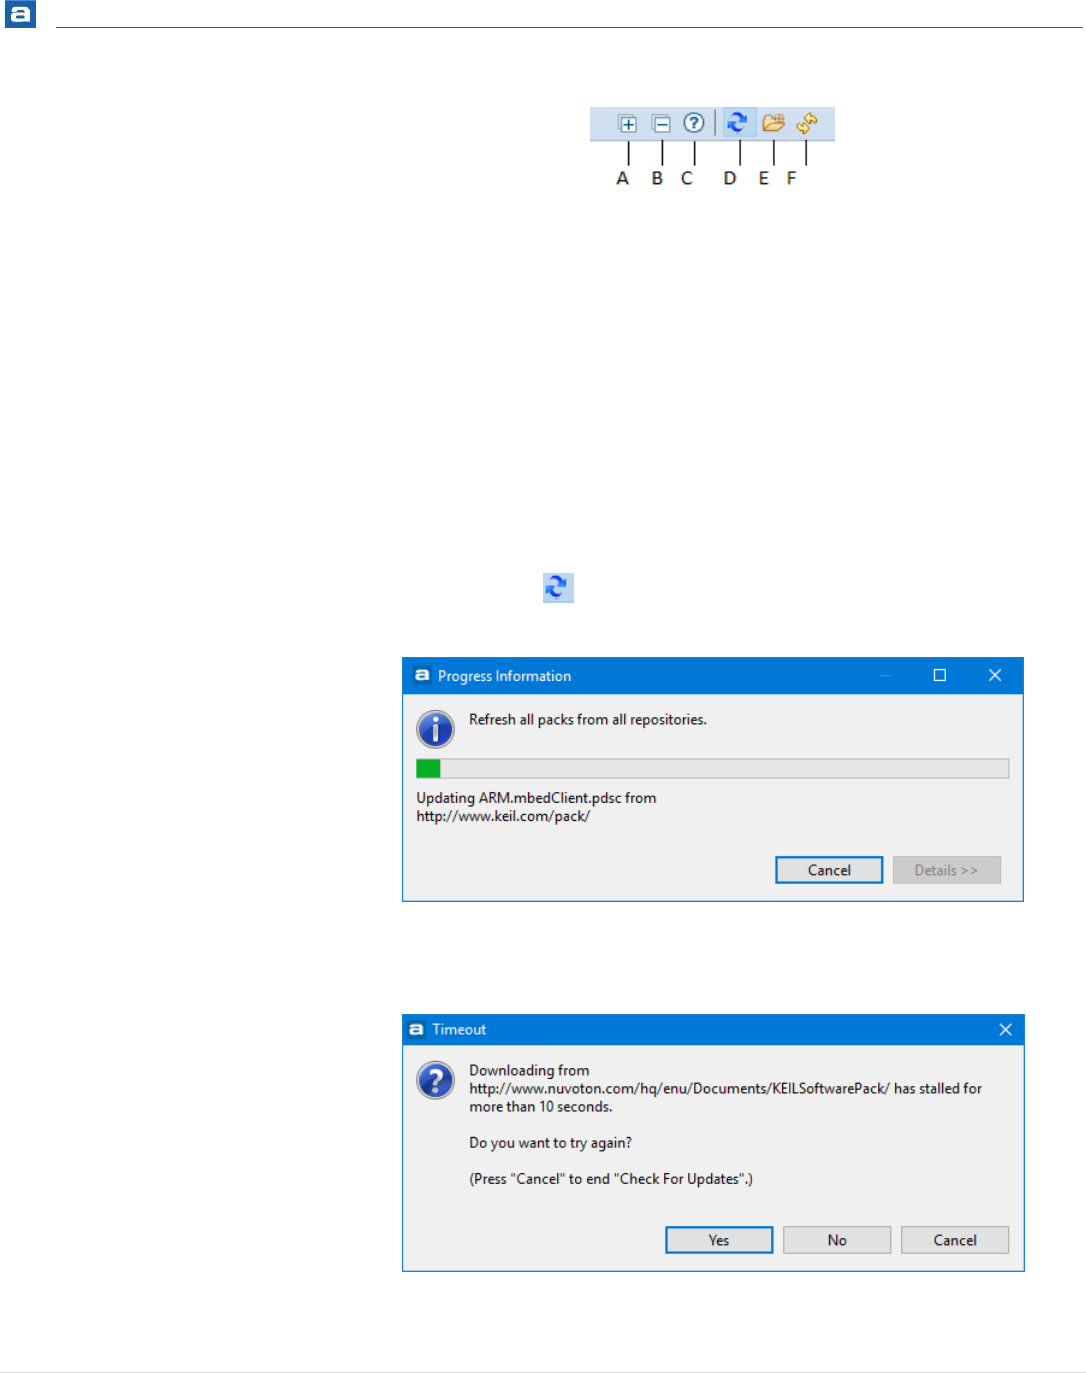
Getting Started
169 | P a g e
Figure 135 – Packs View Toolbar
(A) Expands all nodes
(B) Collapse all expanded nodes
(C) Help for Packs view
(D) Check for updates on the web
(E) Import existing Packs
(F) Reload Packs in the CMSIS Pack root folder
Use the Blue Arrow icon to check for updates of the packages definitions from all
repositories. All packs are now read from the repositories. This may take some minutes
Figure 136 – Refresh all Packs
If any errors occurs press Yes, if this does not help then press No or Cancel.
Figure 137 – Read error during refreshing packs
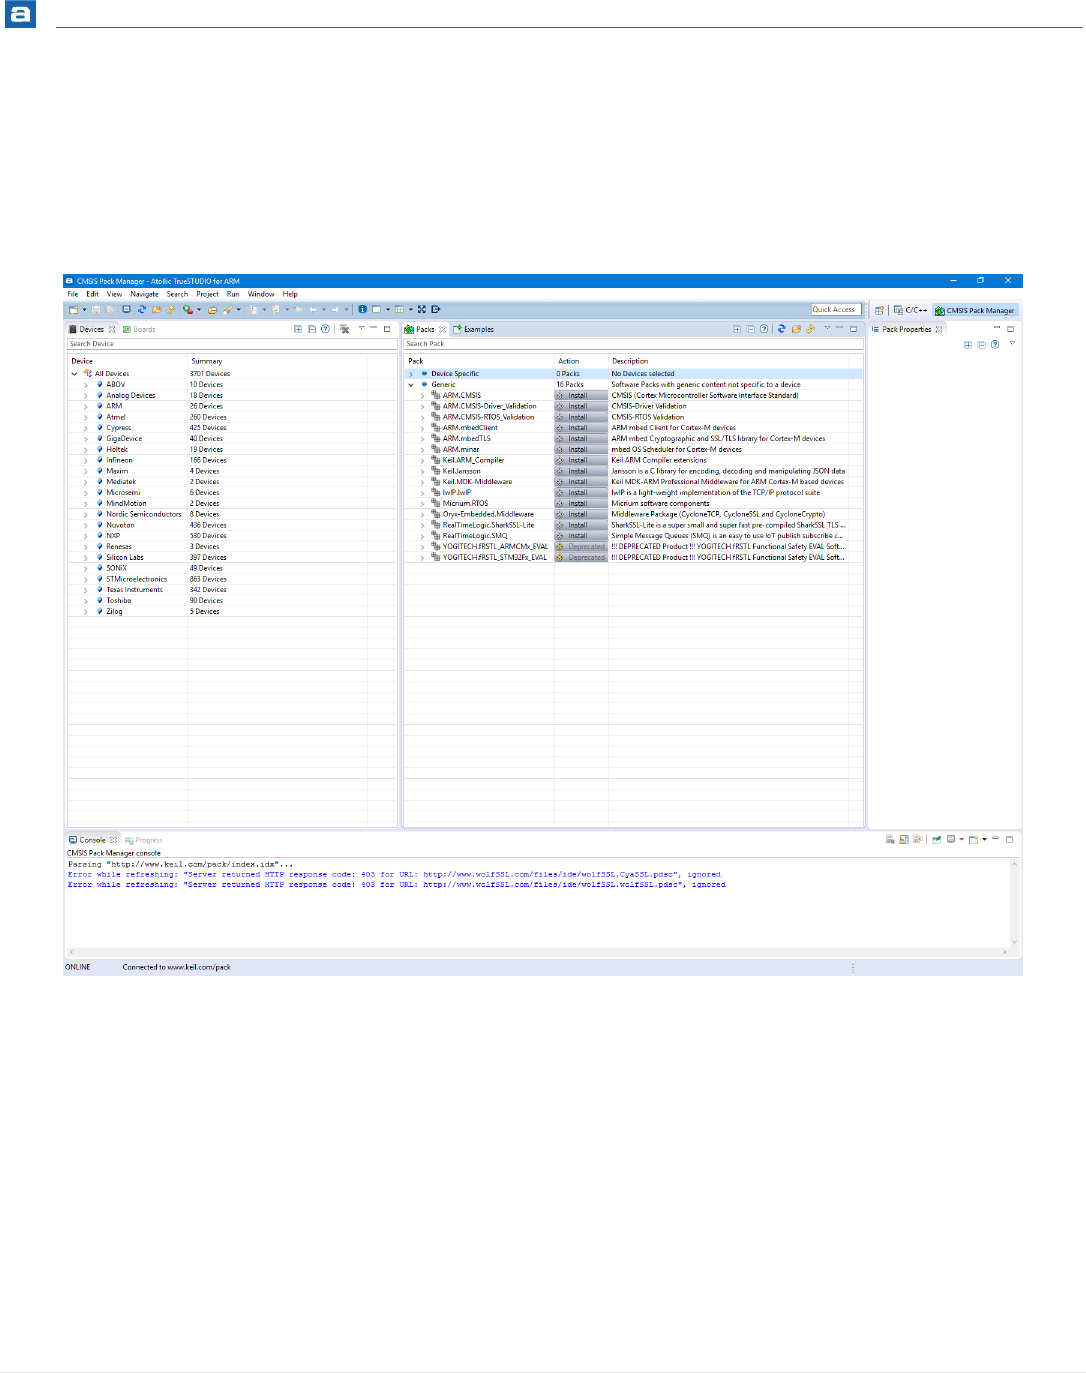
Getting Started
170 | P a g e
When updating is finished the Packs view is populated with new Device Specific and
Generic information. The Devices and Board tabs are populated with device and board
information from different vendors.
The Packs view shows the Software Packs available for the selected device or board. Enter
a pack name using wildcards into the field Search Pack to narrow the list.
Figure 138 – Packs View Updated
The Devices and Boards tabs contains information on devices and boards from different
vendors.
The Devices view lists devices that are supported in available Software Packs. Select a
device to narrow the list in the Packs and Examples view.
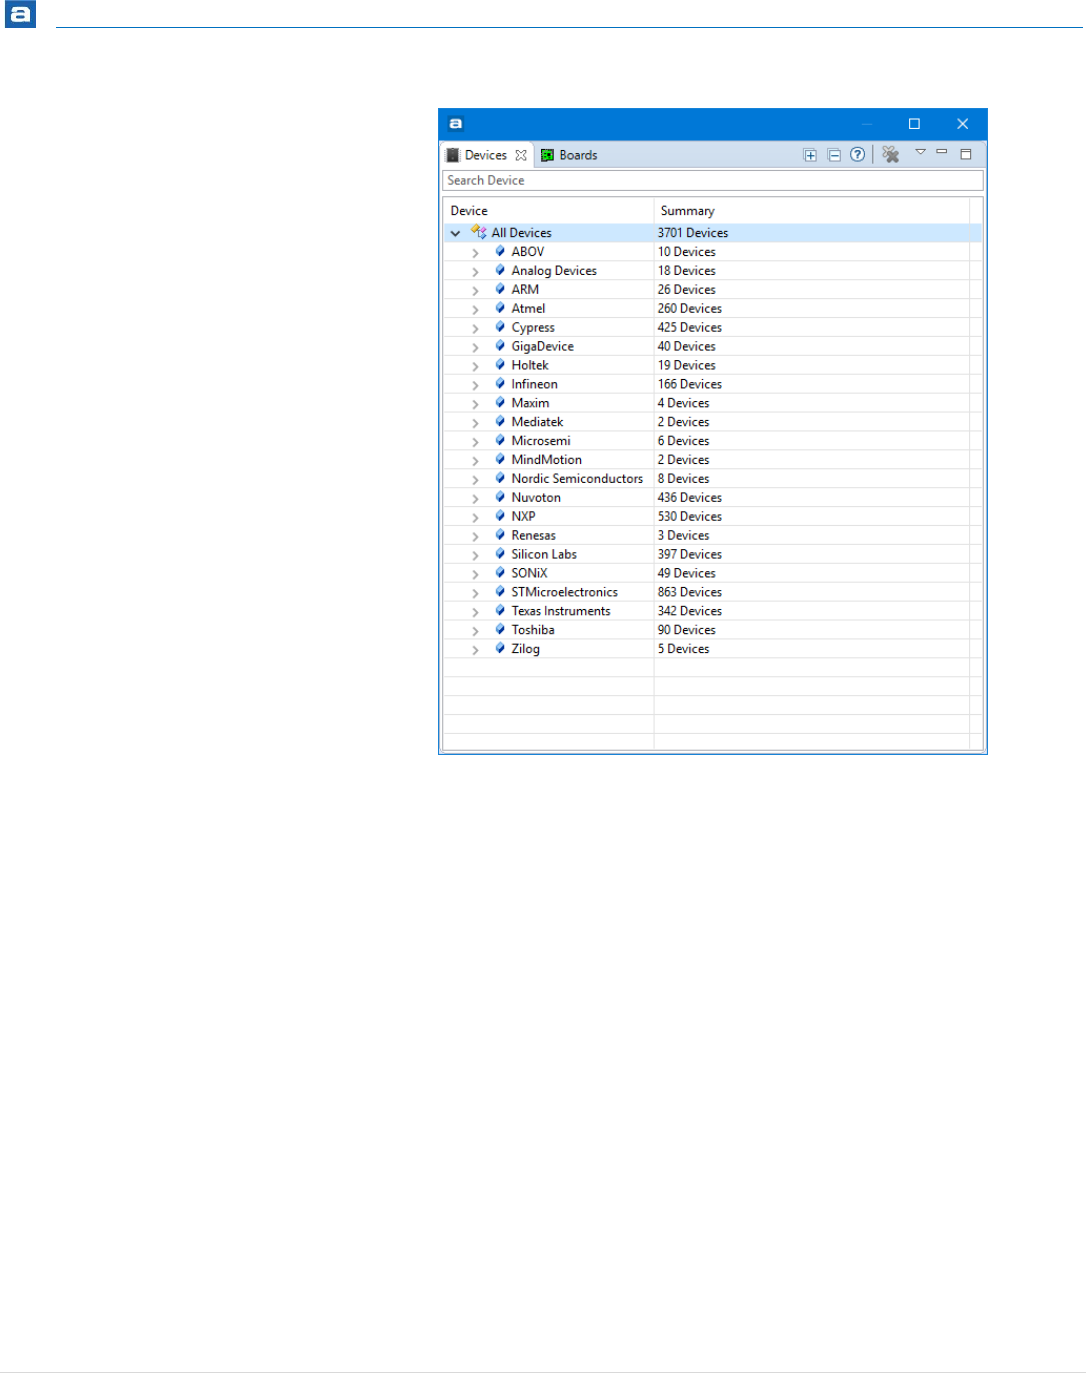
Getting Started
171 | P a g e
Figure 139 – Devices Software Pack
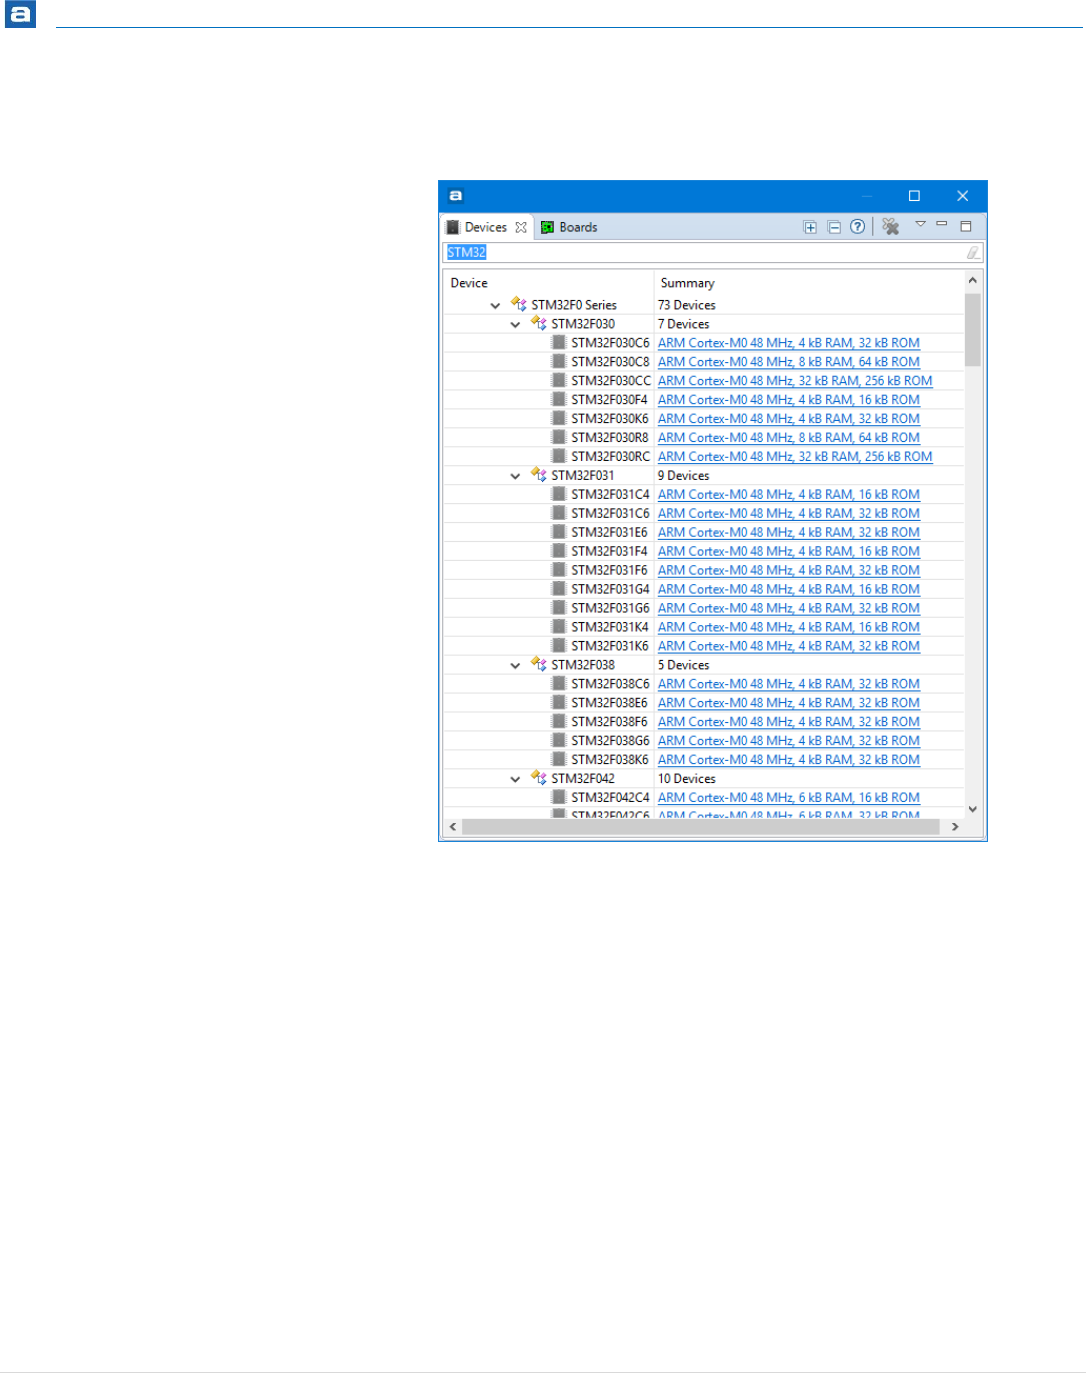
Getting Started
172 | P a g e
Enter a device name in the Devices tab using wildcards into the field Search Device to
reduce the list.
Figure 140 – Search STM32 Devices Software Pack
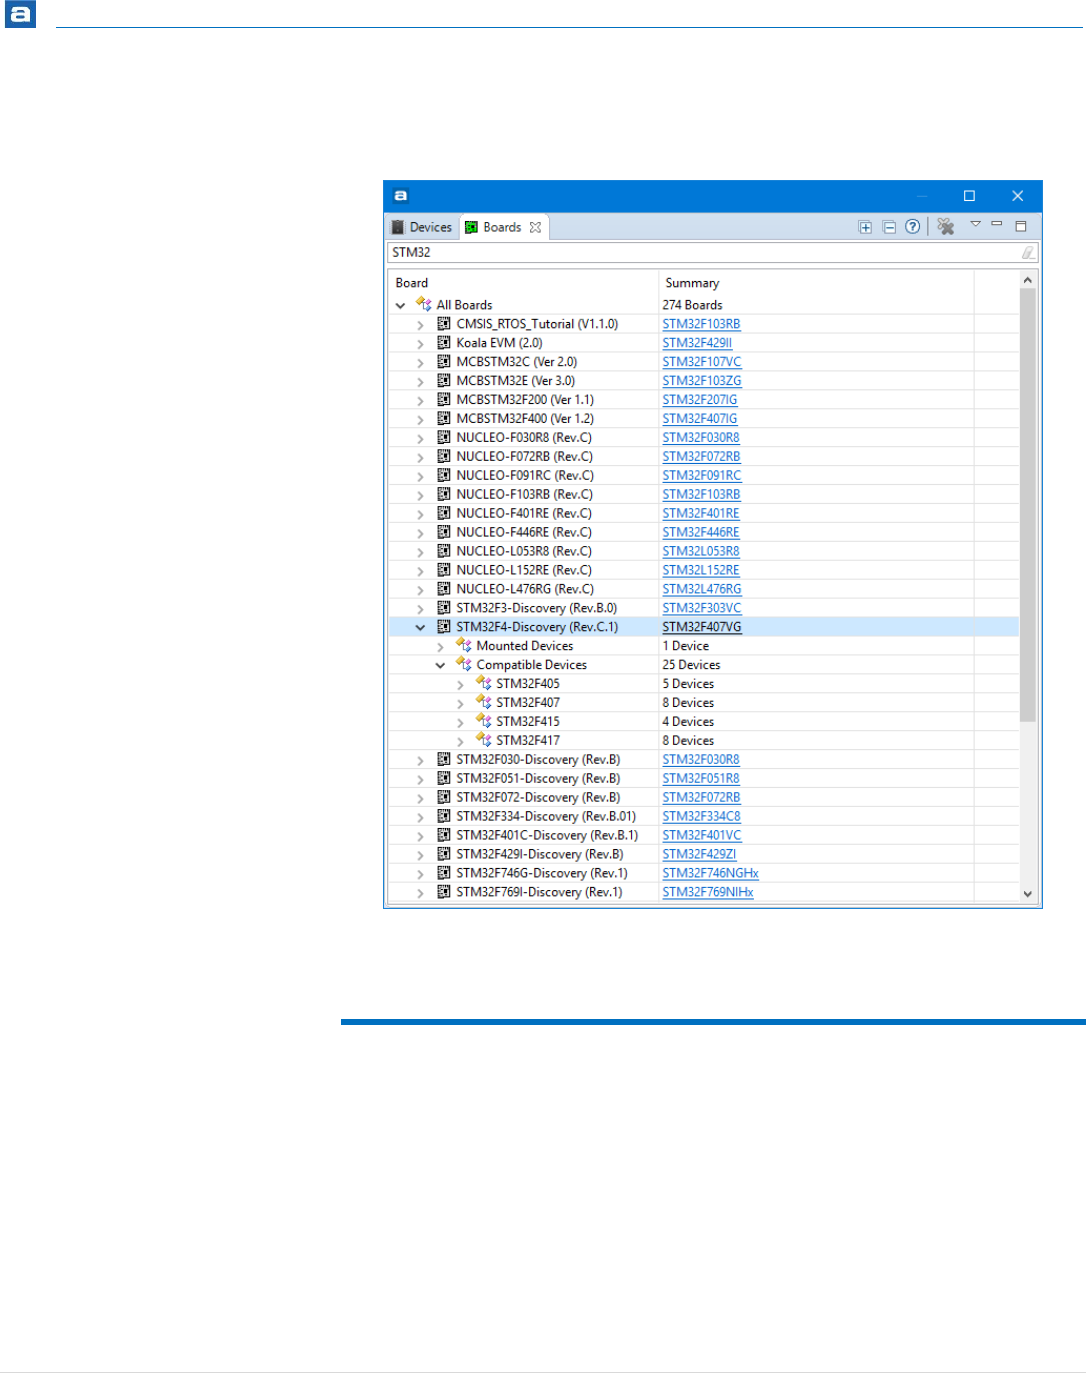
Getting Started
173 | P a g e
The Boards view lists the boards that are supported in available Software Packs. Select a
board to narrow the list in the Packs and Examples view. E.g. STM32
Figure 141 – Boards Software Pack
OPEN INSTALLED CMSIS PACKS VIEW
Open the Installed CMSIS Packs view by writing Installed in the Quick Access field and
select Views Installed CMSIS Packs.
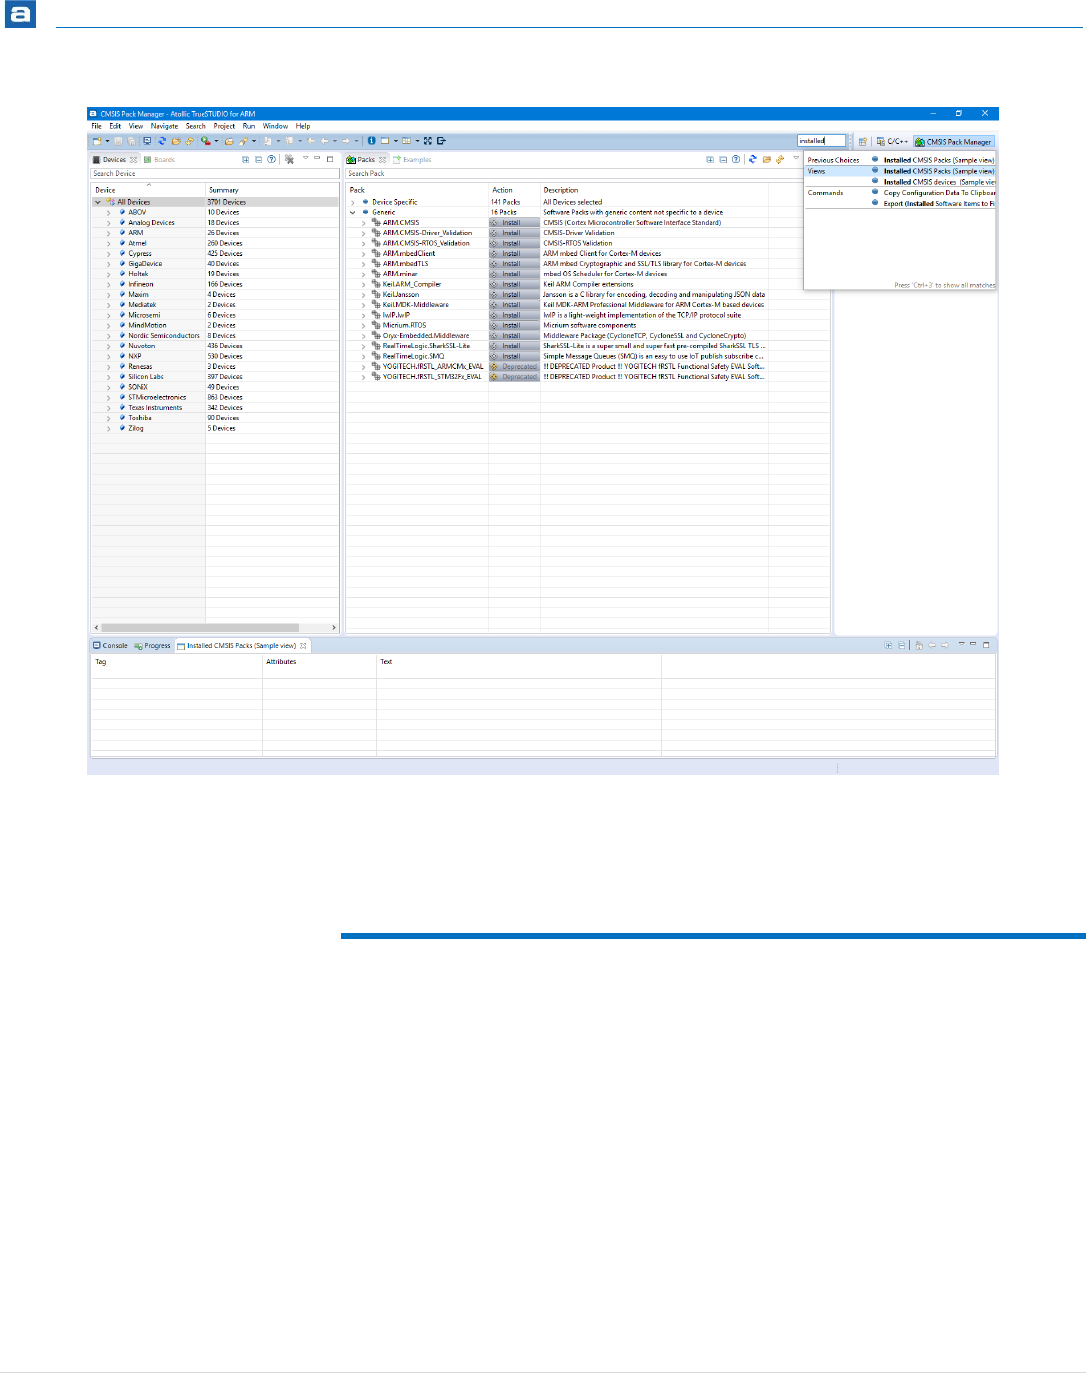
Getting Started
174 | P a g e
Figure 142 – Open Installed CMSIS Packs View
The Installed CMSIS Packs (Sample view) displays the installed packages. Currently no
packages has been installed so at this time the view is empty. There is also a similar
Installed CMSIS devices (Sample view) which displays installed devices.
INSTALL CMSIS PACKAGES
The Packs view is used to install new CMSIS Packs. Select a Pack in the view and click on
the right mouse button and select Install.
It is recommended to install the ARM.CMSIS Pack as this contains basic CMSIS software
and is used by most other CMSIS Packs.
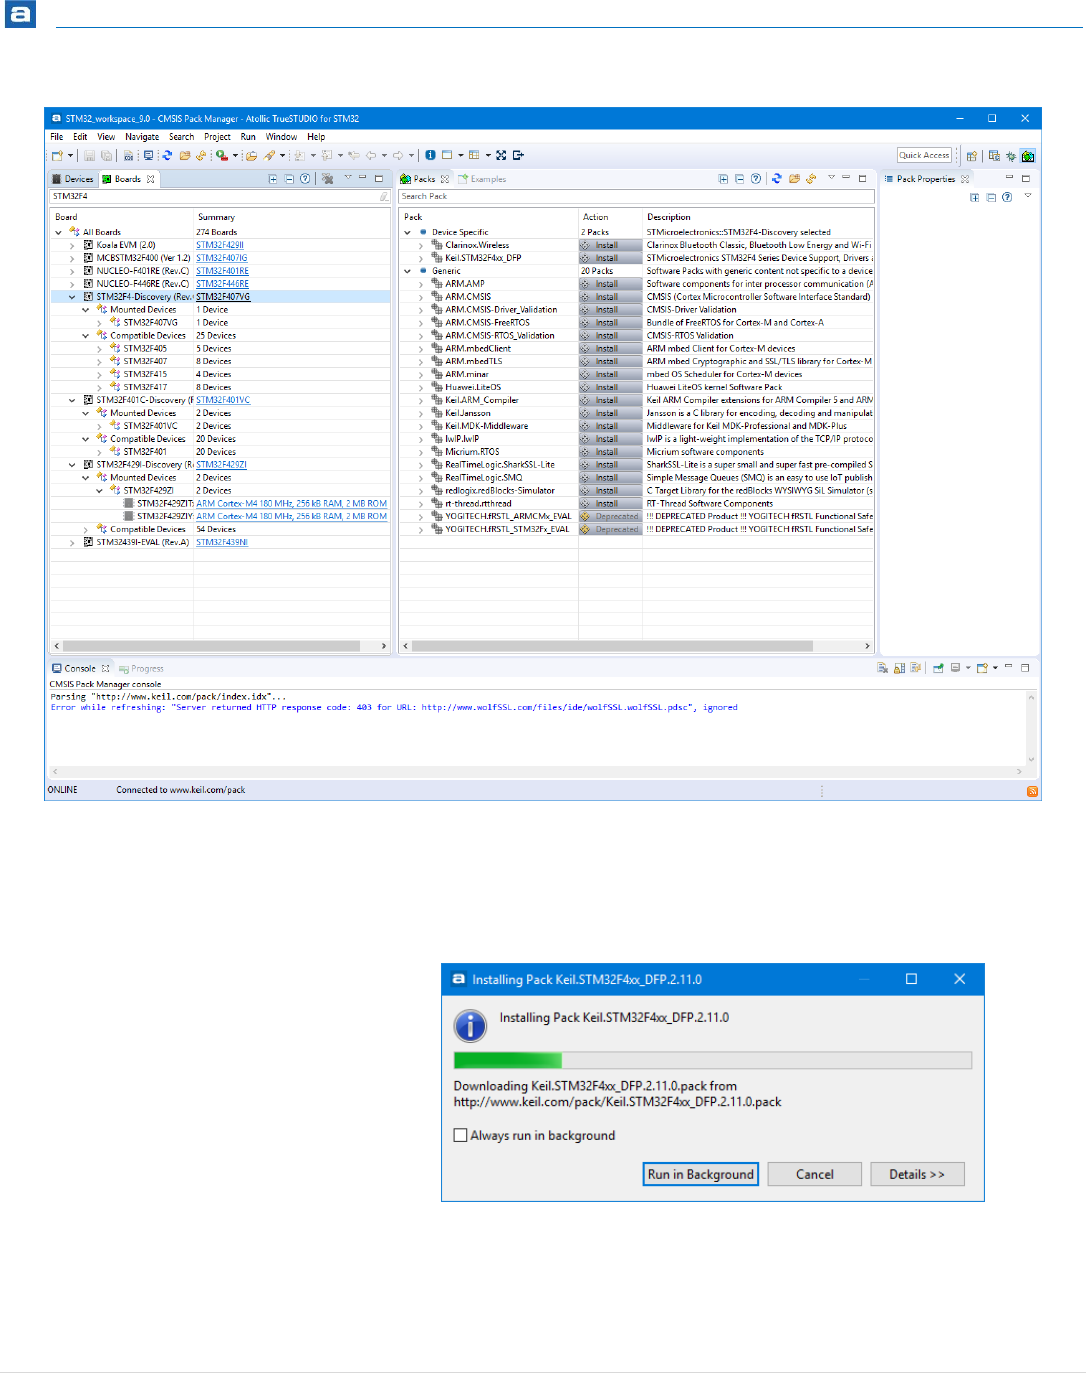
Getting Started
175 | P a g e
Figure 143 – Install Packs
Select the version of the Pack that shall be installed and press the Install button in the
action column. The installation will then start. We will now install the Keil.STM32F4xx_DFP
and the generic ARM.CMSIS packages.
Figure 144 – Installing Pack
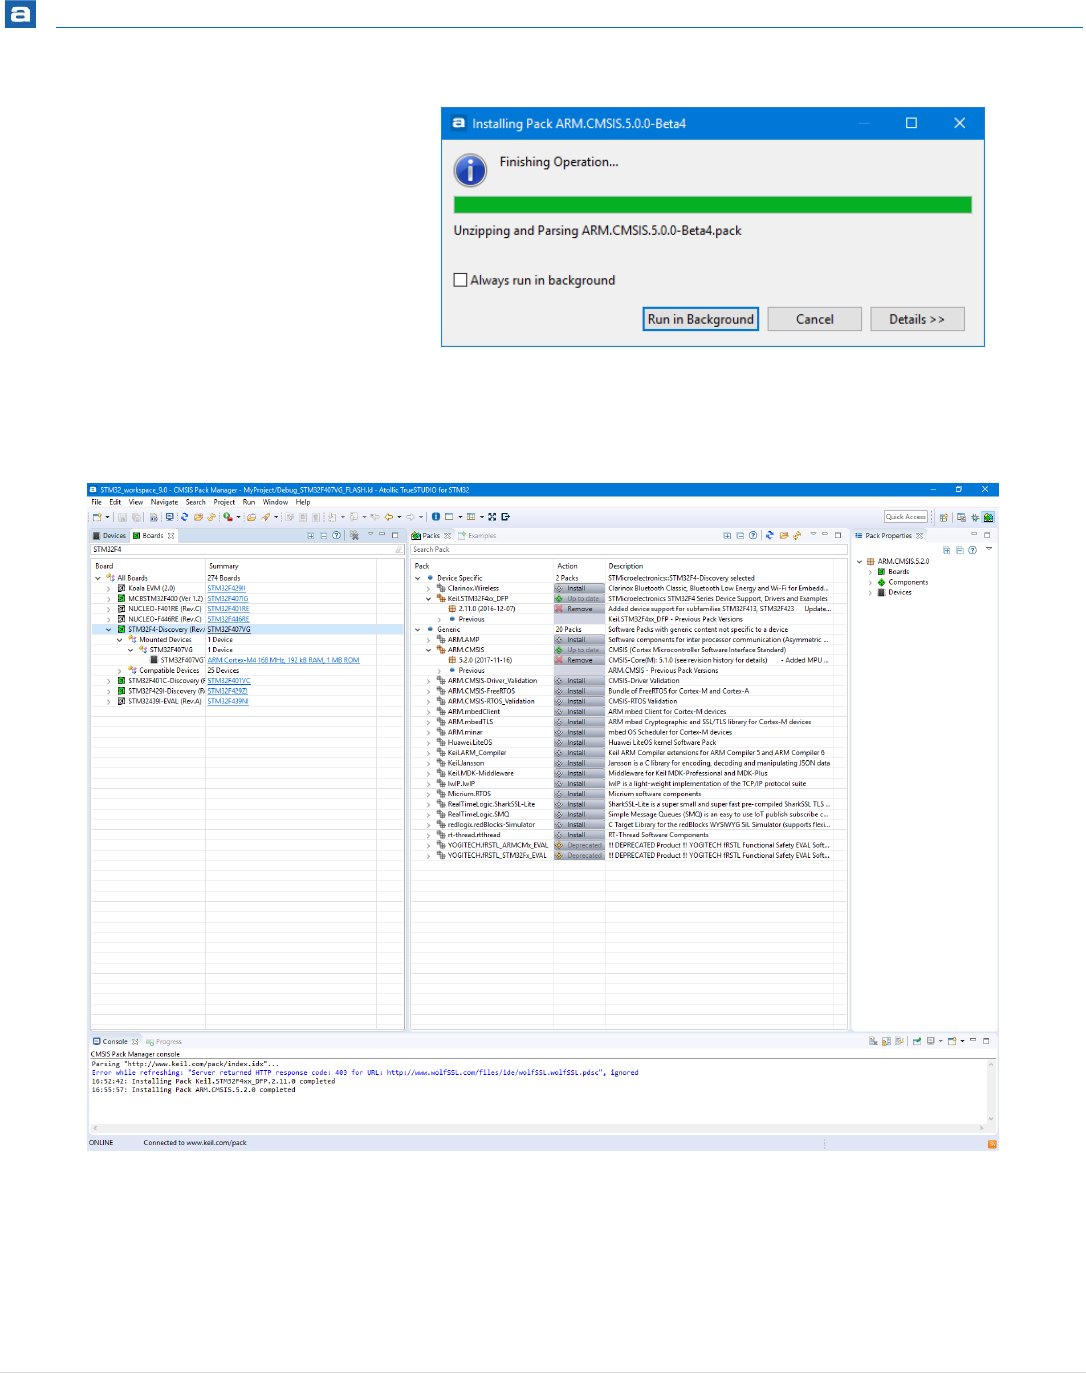
Getting Started
176 | P a g e
Figure 145 – Installed Pack
When a Pack is installed the color of the icon for the Pack is changed to yellow in the Packs
view.
Figure 146 – Installed CMSIS-Packs

Getting Started
177 | P a g e
CREATE CMSIS-PACK BASED PROJECTS
It is possible to create a new project in Atollic TrueSTUDIO based on installed CMSIS-Packs.
There are several ways to create projects based on CMSIS-Pack. One way is to create a
CMSIS C/C++ Project and another way is to use the Embedded C Project which will be
populated with devices/boards defined also in installed CMSIS-Pack files.
CREATE CMSIS C/C++ PROJECT
Open the C/C++ perspective Atollic TrueSTUDIO and create a new project. Enter a project
name and select CMSIS C/C++ Project.
Figure 147 – Create CMSIS C/C++ Project
Press Next.
The CMSIS C/C++ Project dialog is displayed.
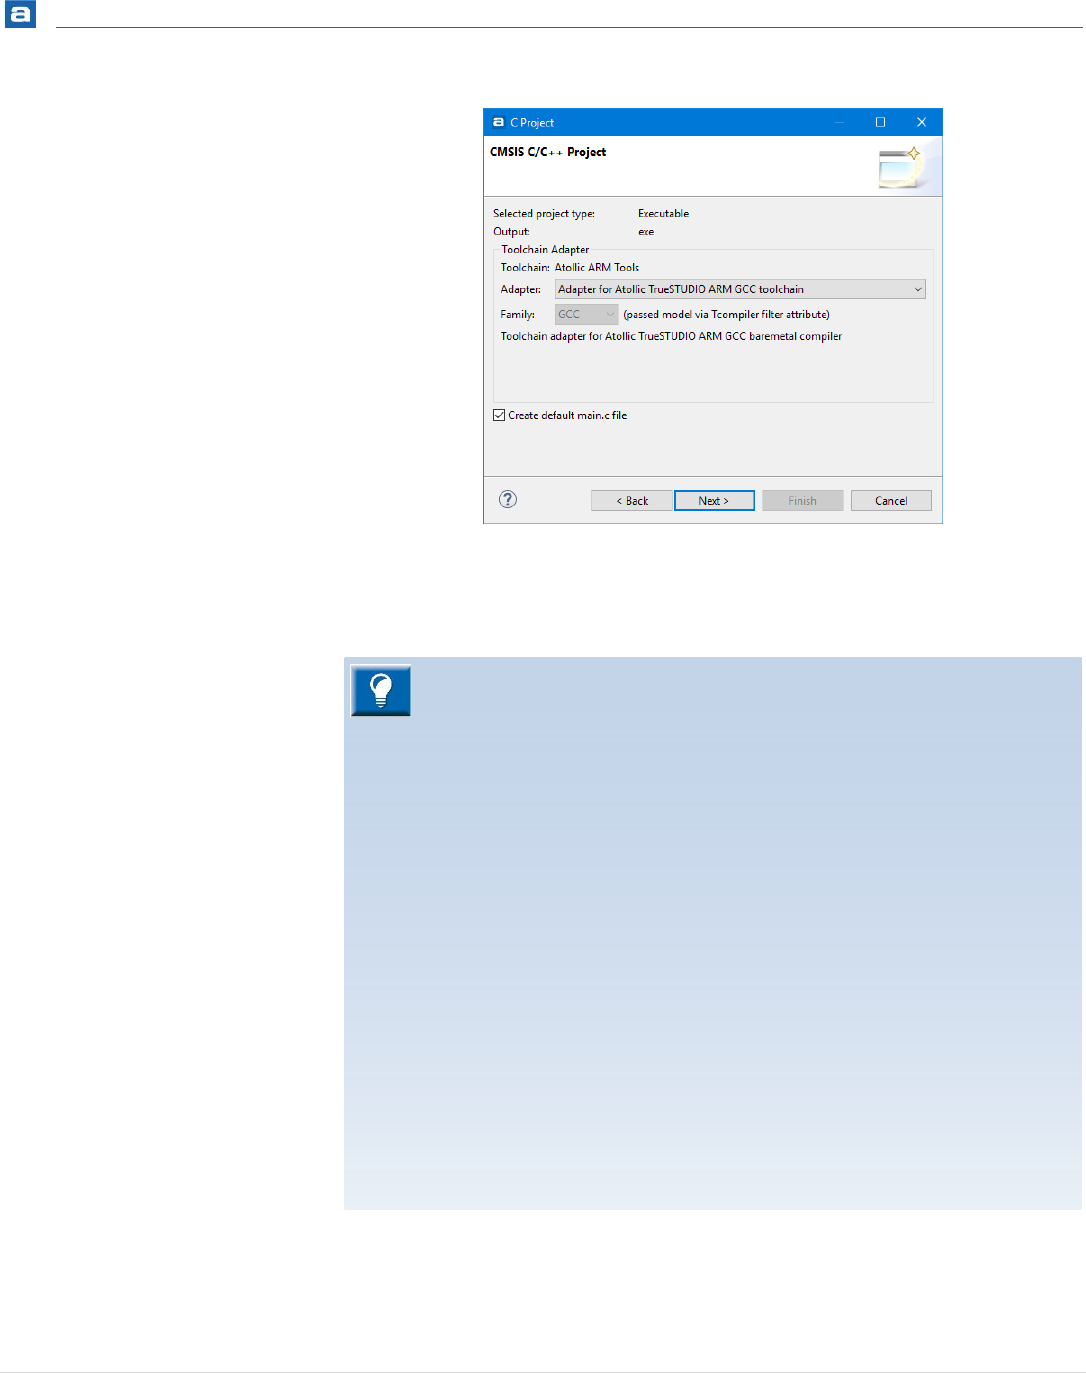
Getting Started
178 | P a g e
Figure 148 – Create CMSIS C/C++ Project (main)
Select Create default main.c file, the Atollic ARM GCC Toolchain will be used and GCC and
software will be taken from the CMSIS-Pack files.
Press Next.
Select the device from a package to generate the project for. In this case we use the
STMicroelectronics STM32F407VGTx device
Note! Unfortunately many CMSIS-Pack files are not yet complete with GCC
startup and linker files included in the CMSIS-Pack so some manual
adaptations may be required after a project is created, to make it build
correctly.
If the startup and/or linker script file is missing when the project is generated
then investigate if these files are included in the Pack by using a file browser.
If the files are found then copy them into the project and rebuild the project.
If the startup and/or linker script file is missing in the Pack then create a
TrueSTUDIO project for the device if it is supported by Atollic TrueSTUDIO and
copy those files to the project. Alternatively create a basic ARM project for a
similar ARM core and base the startup and linker script for the CMSIS project
on these files. Make sure to update the startup file to include the interrupt
vectors and linker script file with the device memory mapping etc.
If the CMSIS-Pack project provides a linker script and you would like to change
some information in it there is a need to create a linker script outside the
normal folder, see information about this in the Updating Linker Script for
CMSIS C/C++ Project chapter at page 184.
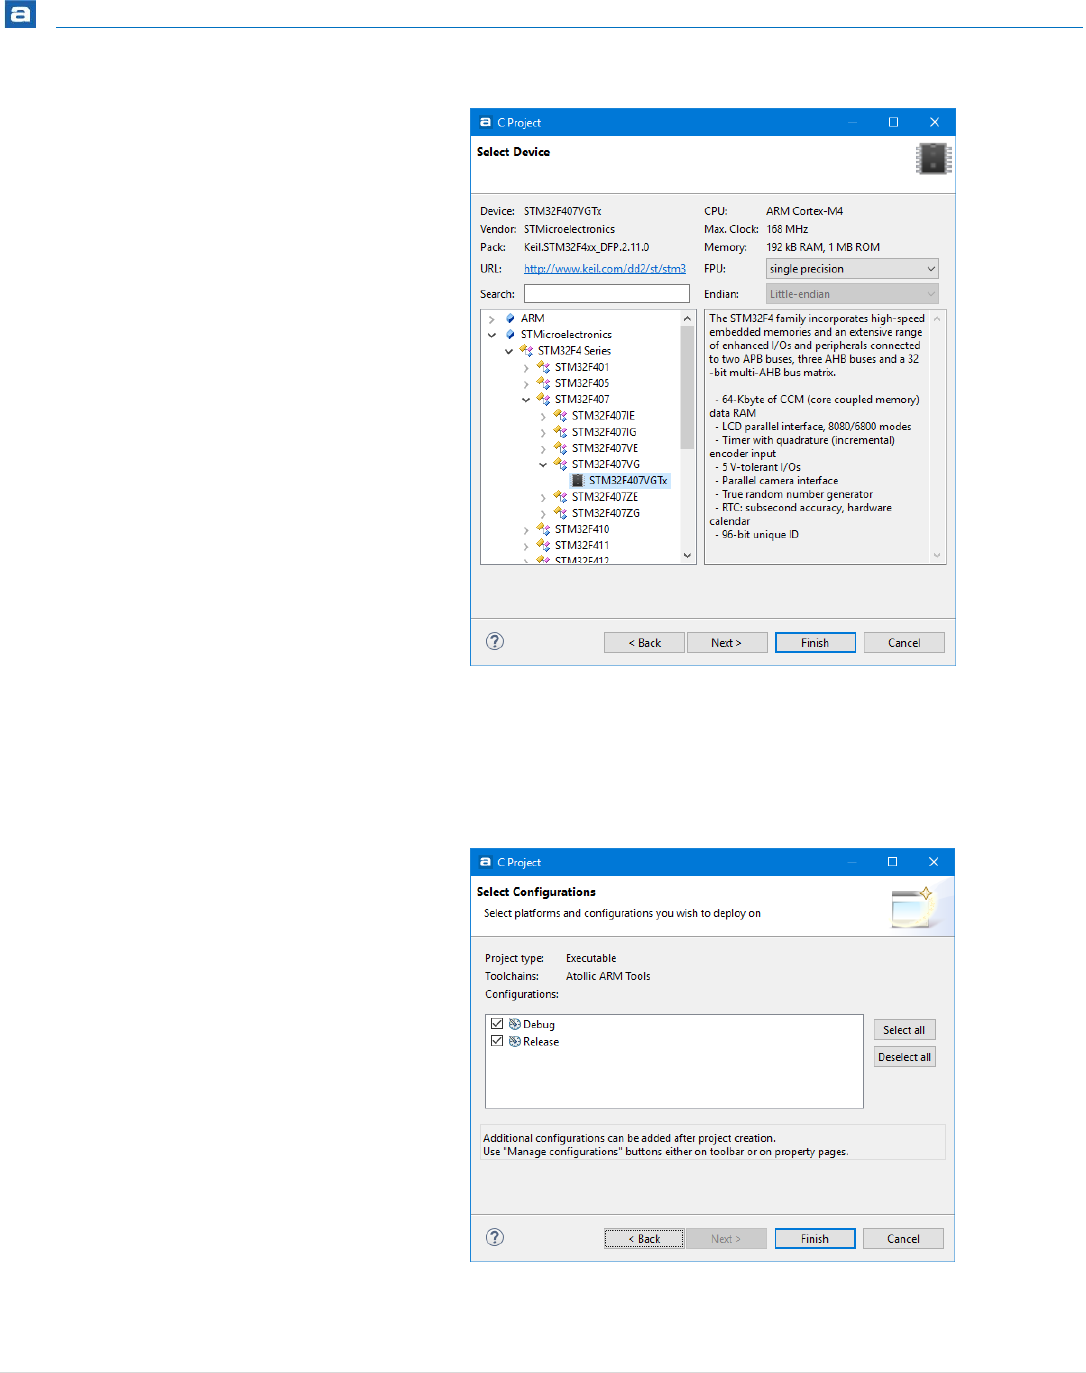
Getting Started
179 | P a g e
Figure 149 – Create CMSIS C/C++ Project (device)
Press Next.
The Select Configurations dialog is displayed. By default a Debug and a Release
configurations are prepared.
Figure 150 – Create CMSIS C/C++ Project (configurations)

Getting Started
180 | P a g e
Press Finish and the project will be created.
CONFIGURE THE CMSIS C/C++ PROJECT
When a CMSIS C/C++ project has been created it needs to be configured to use the
software from the CMSIS-Pack. The configuration of a project is made by selecting needed
software using the *.rteconfig file.
Figure 151 – Configure CMSIS C/C++ Project
For instance we would like use the Startup file from the STM32F407VGTx device.
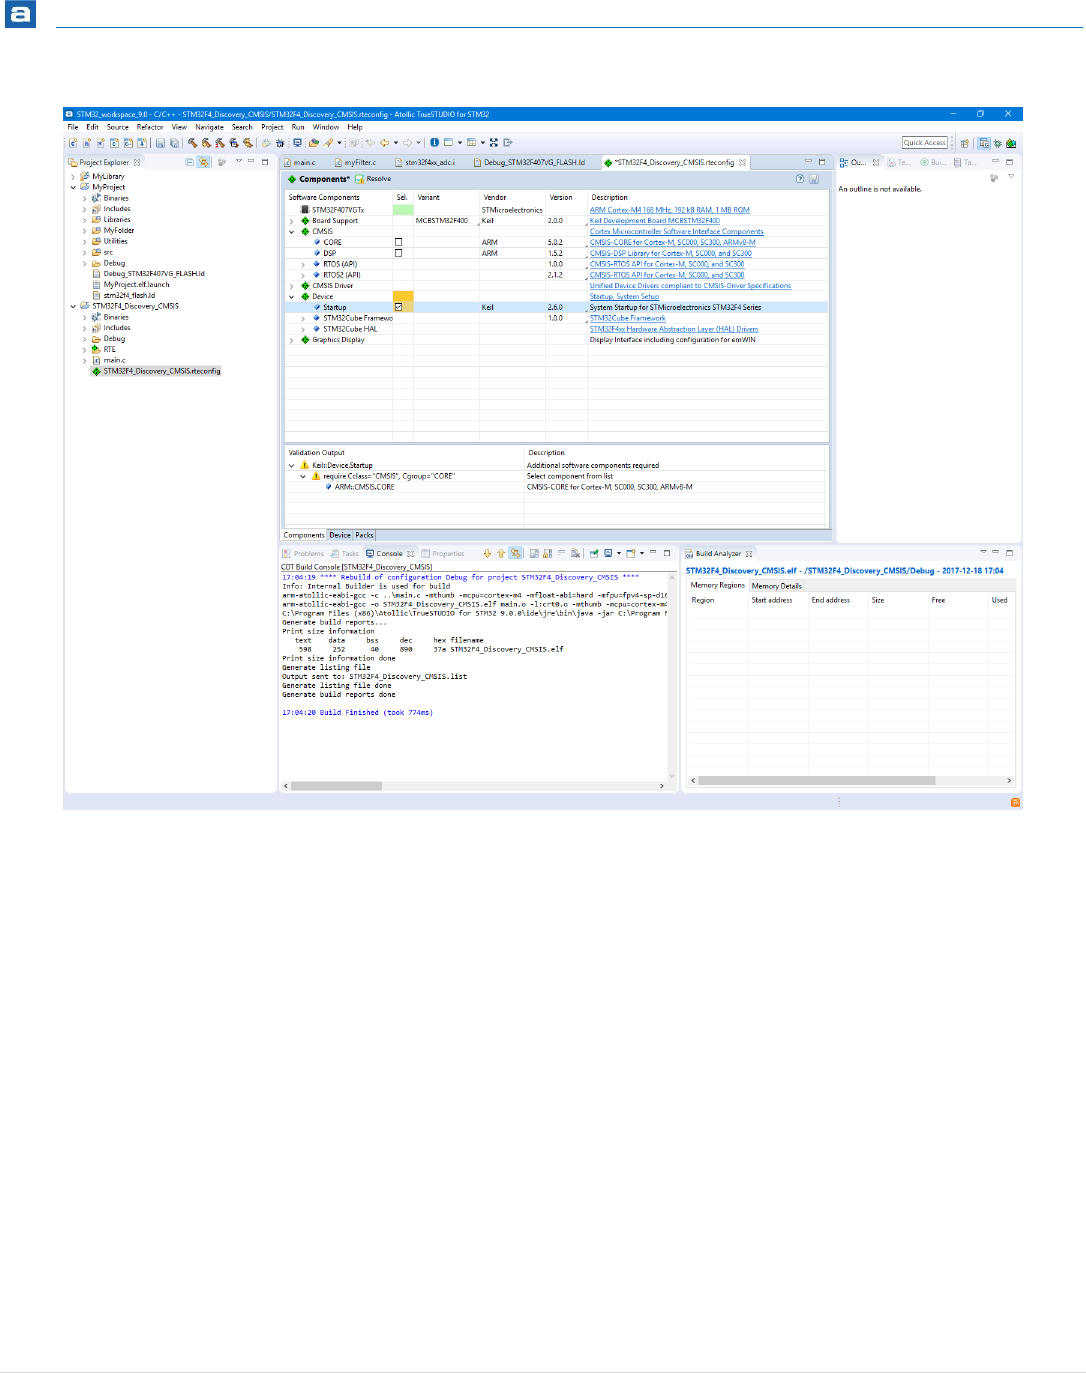
Getting Started
181 | P a g e
Figure 152 – Configure CMSIS C/C++ Project with Startup file
As seen in the figure above the Startup file depends on files in the CMSIS CORE group so
we need to include also the CMSIS CORE files to this project.

Getting Started
182 | P a g e
Figure 153 – Configure CMSIS C/C++ Project with CMSIS CORE files
Save the setting by pressing on the Disk icon on the toolbar. If we build the project we get
the following build result.
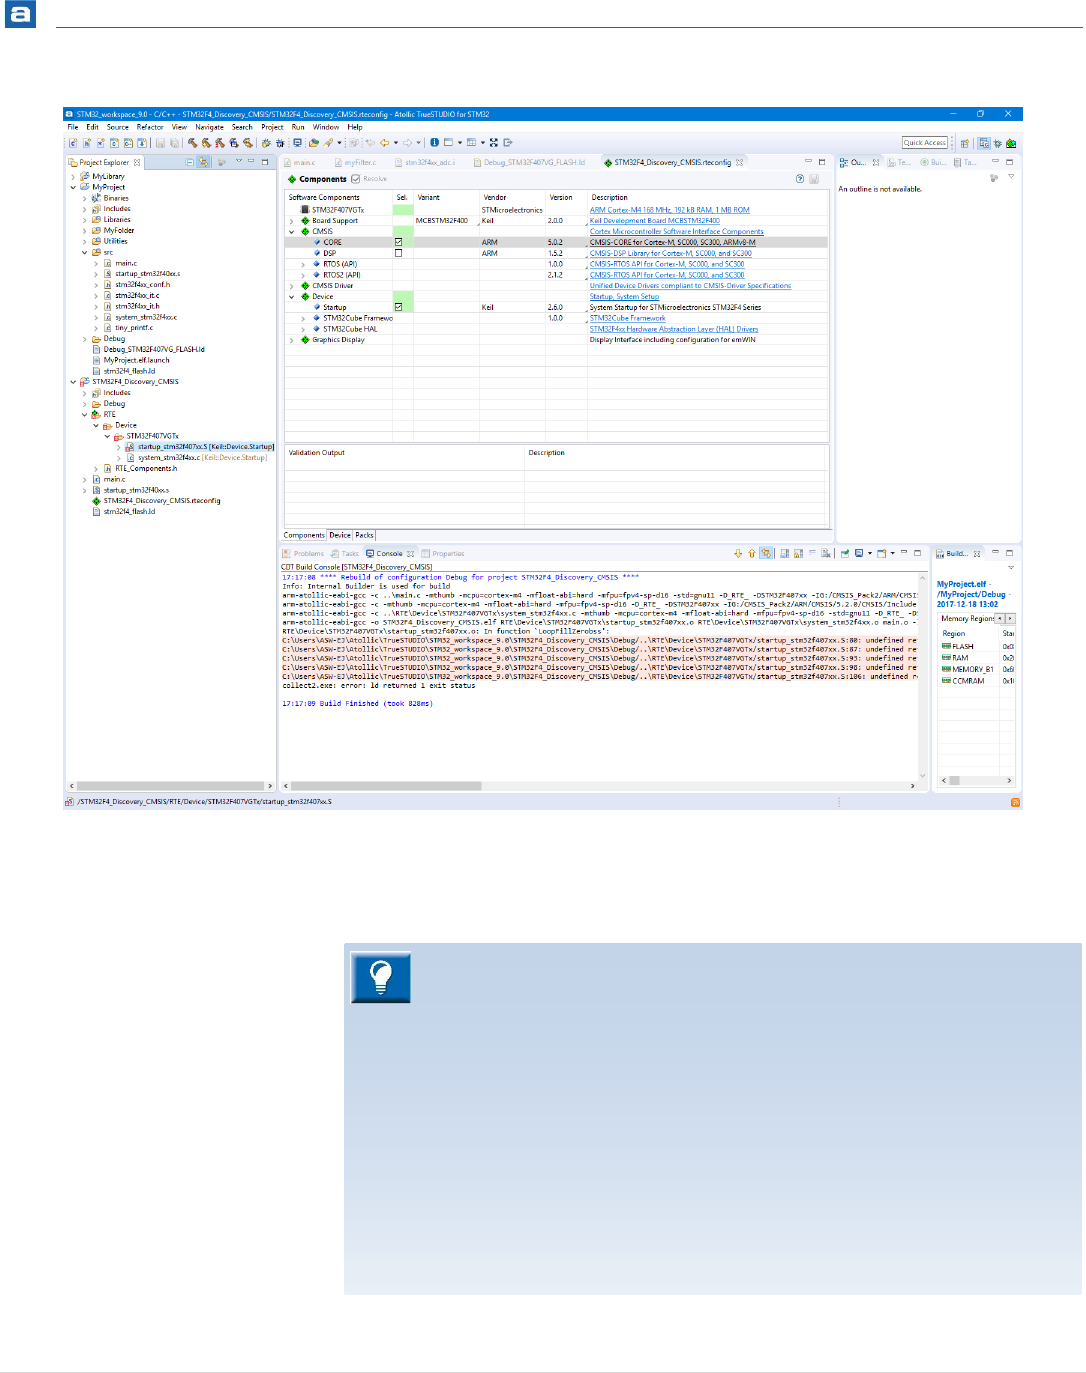
Getting Started
183 | P a g e
Figure 154 – Build CMSIS C/C++ Project
As seen this project does not build correctly. The reason is that the CMSIS Pack file does
not contain correct information to build with gcc.
Note! If there are any build errors please check if the project contains a
startup file and a linker script file.
When using GCC the startup file and linker script file is tightly connected as for
instance the startup file needs to get information from the linker script where
memory and stack should be located.
If the Pack does not contain any startup or linker script file the Atollic
TrueSTUDIO wizard will generate and add generic startup and linker script
files to the project. In such cases there is a need to manually update the linker
script with stack location and memory location and size information. Also the
startup script only contains the first 16 generic Cortex-M interrupts so there is
a need to add the device specific interrupts into the startup file if such
interrupts are used.
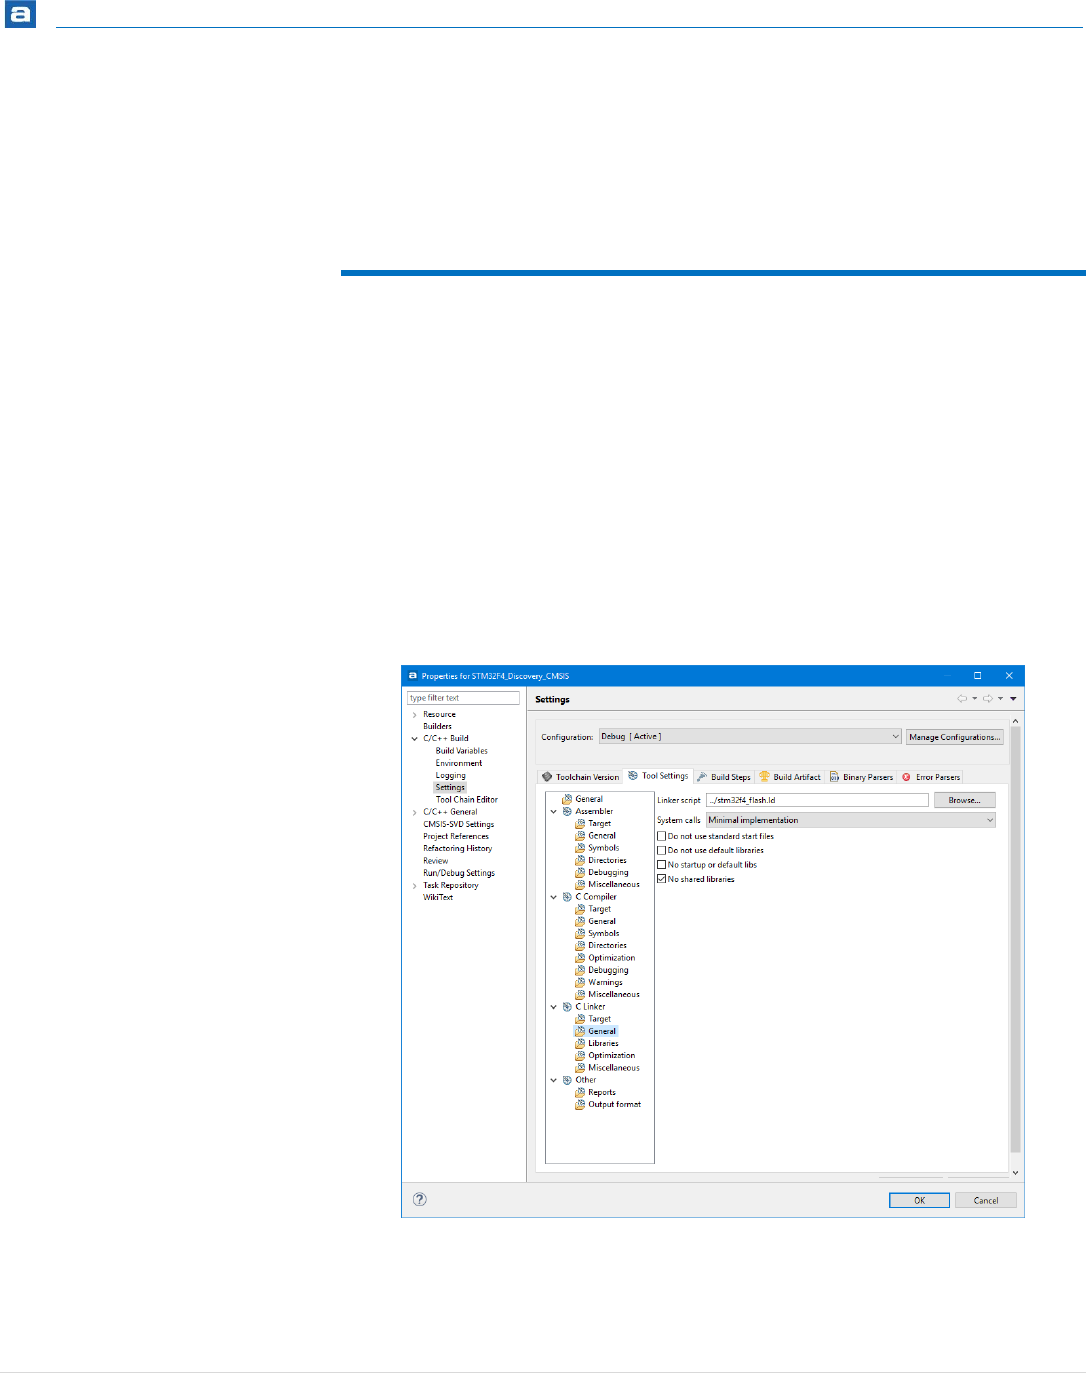
Getting Started
184 | P a g e
To solve the problem in this case copy the startup file from the
RTE/Device/STM32F407VGTx folder (Note! This folder was not created as a source
folder) to the project root folder were the main.c file is located. Also copy the
system_stm32f4xx.c file to the project root directory.
UPDATING LINKER SCRIPT FOR CMSIS C/C++
PROJECT
CMSIS-Pack components that provides linker scripts will automatically set the linker script
used to the one provided from the Pack. To still allow the user to modify and create their
own linker scripts, the toolchain linker script option is only updated by CMSIS-Packs if the
location of the linker script is not changed.
If the linker script file is missing in the pack it can be copied from some other project for
STM32. The best way could be to create a standard Atollic TrueSTUDIO project for the
board and copy the linker script files from that project into the created CMSIS Pack
project. When the linker script file has been copied update the properties for the project
so that the linker file is used.
Figure 155 – Setup CMSIS C/C++ Project Linker Script File
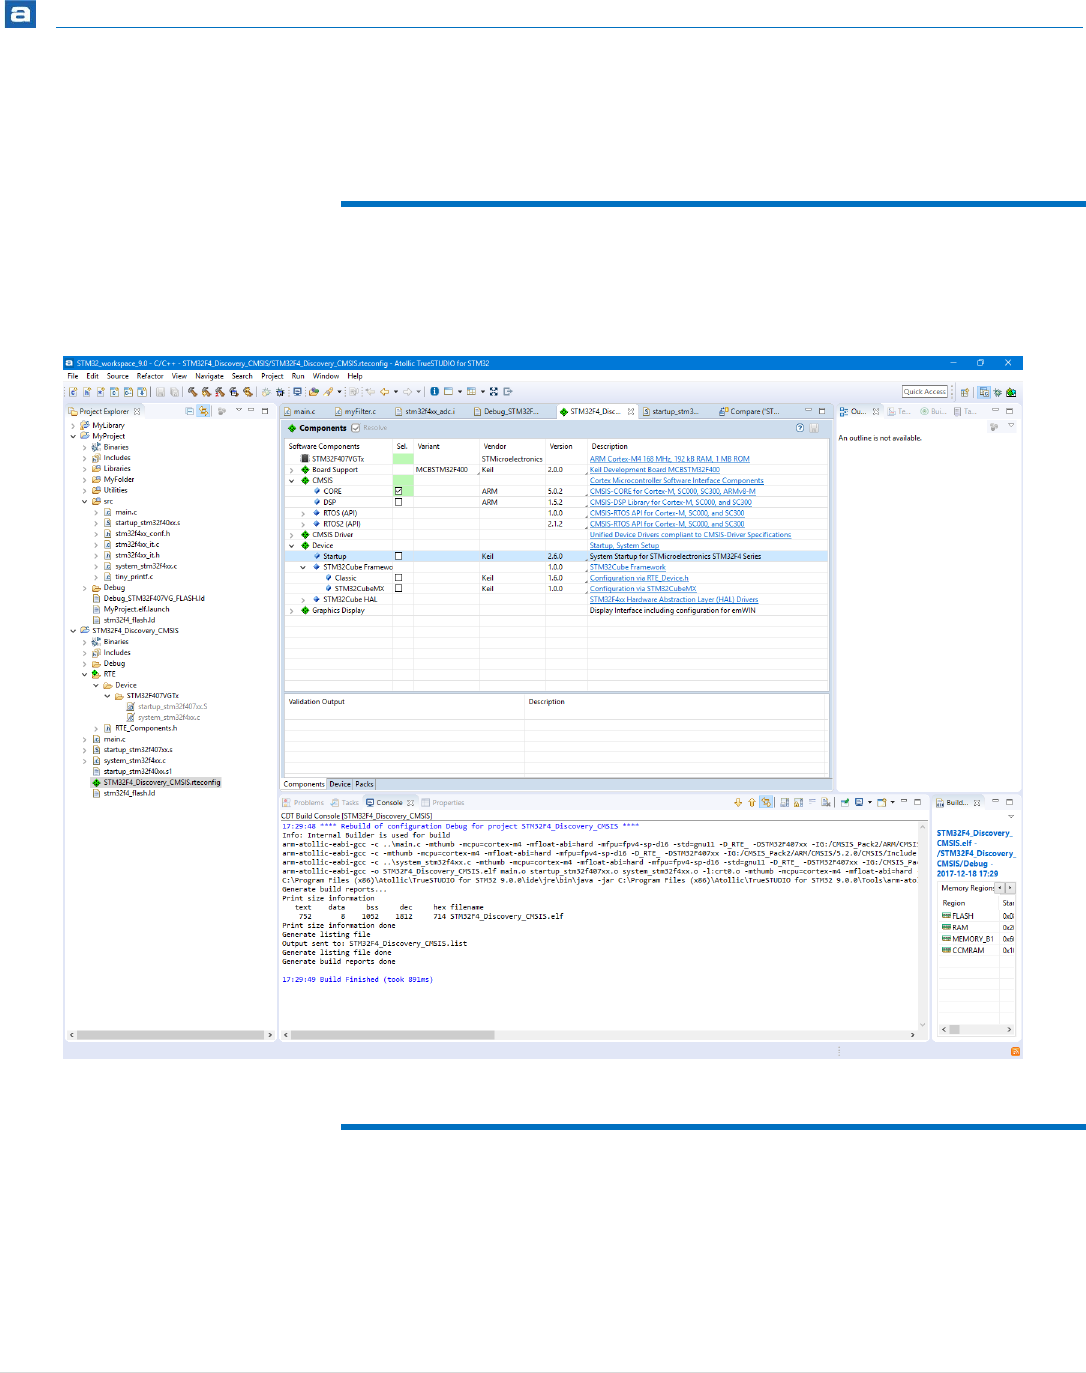
Getting Started
185 | P a g e
If the linker script for this project needs to be updated manually then please take a copy of
the linker script and make the updates in this new file. Then update the Linker script
setting in the Tool Settings tab in Properties for the project to point to the new script.
DISABLE CMSIS STARTUP FILE
Disable the Startup file from the CMSIS Component configuration if the Startup file has
been copied to the project.
Figure 156 – Disable Startup File from CMSIS C/C++ Project
DEBUGGING THE CMSIS C/C++ PROJECT
Finally when the project builds OK it is ready for testing.
Start a debug session for the project. First time a project is debugged a new Debug
Configuration needs to be created. Select ST-LINK as debug probe and make sure that SWD
is enabled if the board to be debugged is using ST-LINK and SWD.
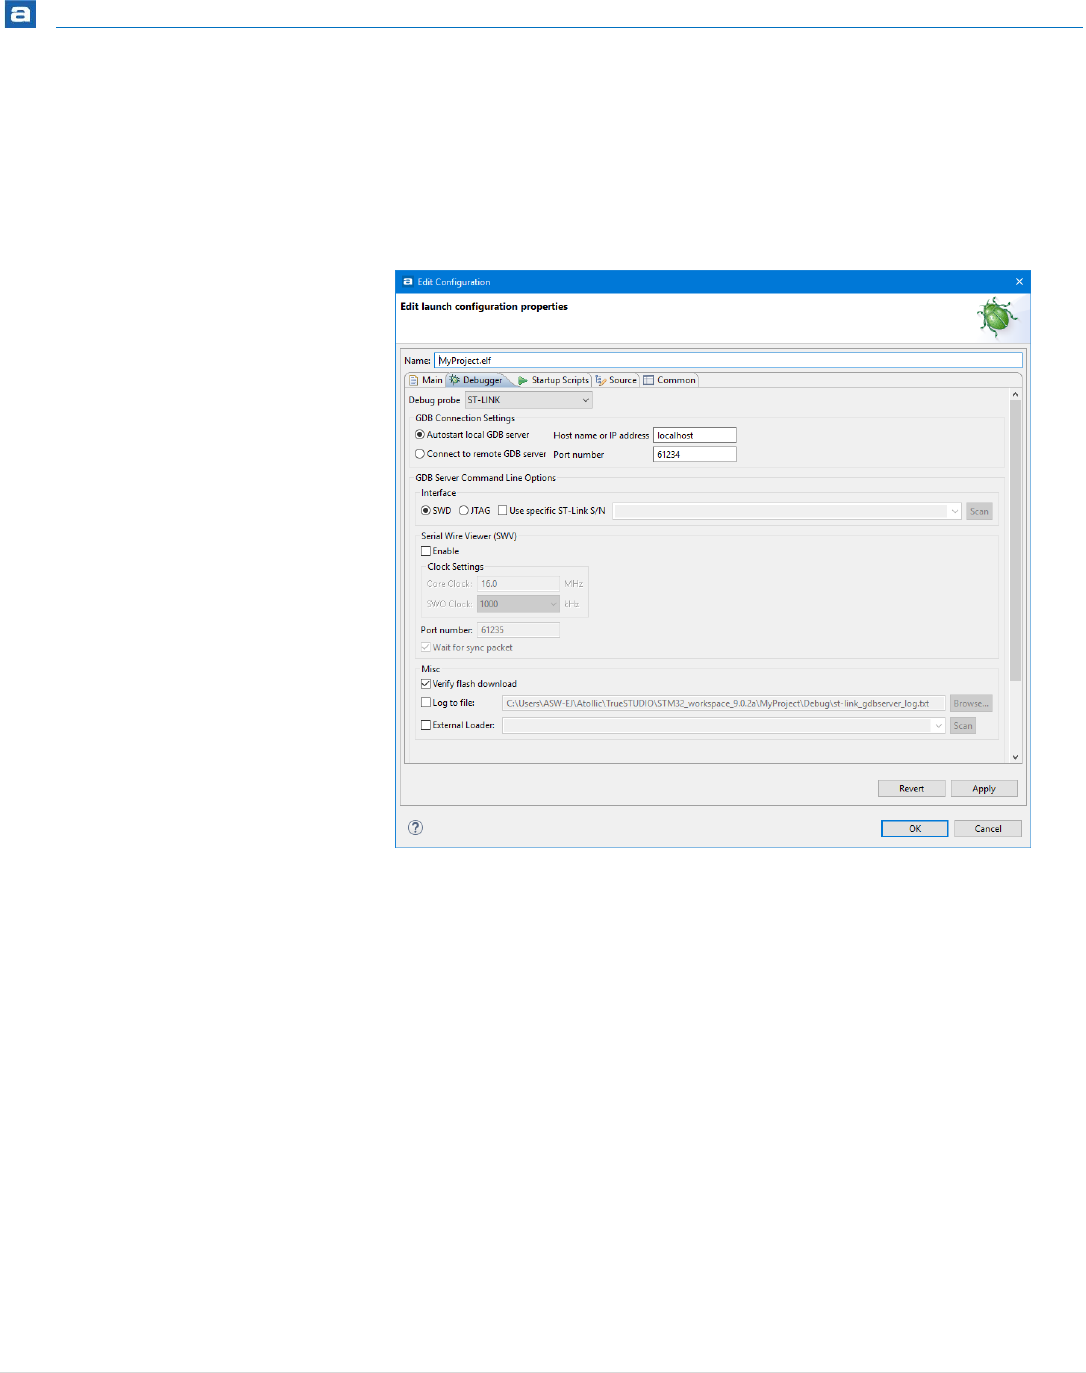
Getting Started
186 | P a g e
The RTE project can be debugged using a debug probe and a board. In this case we will
debug the created STM32project using the STM32F4-Discovery board which includes a ST-
LINK onboard.
Press F11 and the Edit Configuration dialog appears. In the Debugger tab select Interface
SWD.
Figure 157 – Debug CMSIS C/C++ Project Configurations
Make sure the board is connected to the PC using the Debug connector on the board and
then Press OK.
The program is now loaded to the board and the debug session is started.
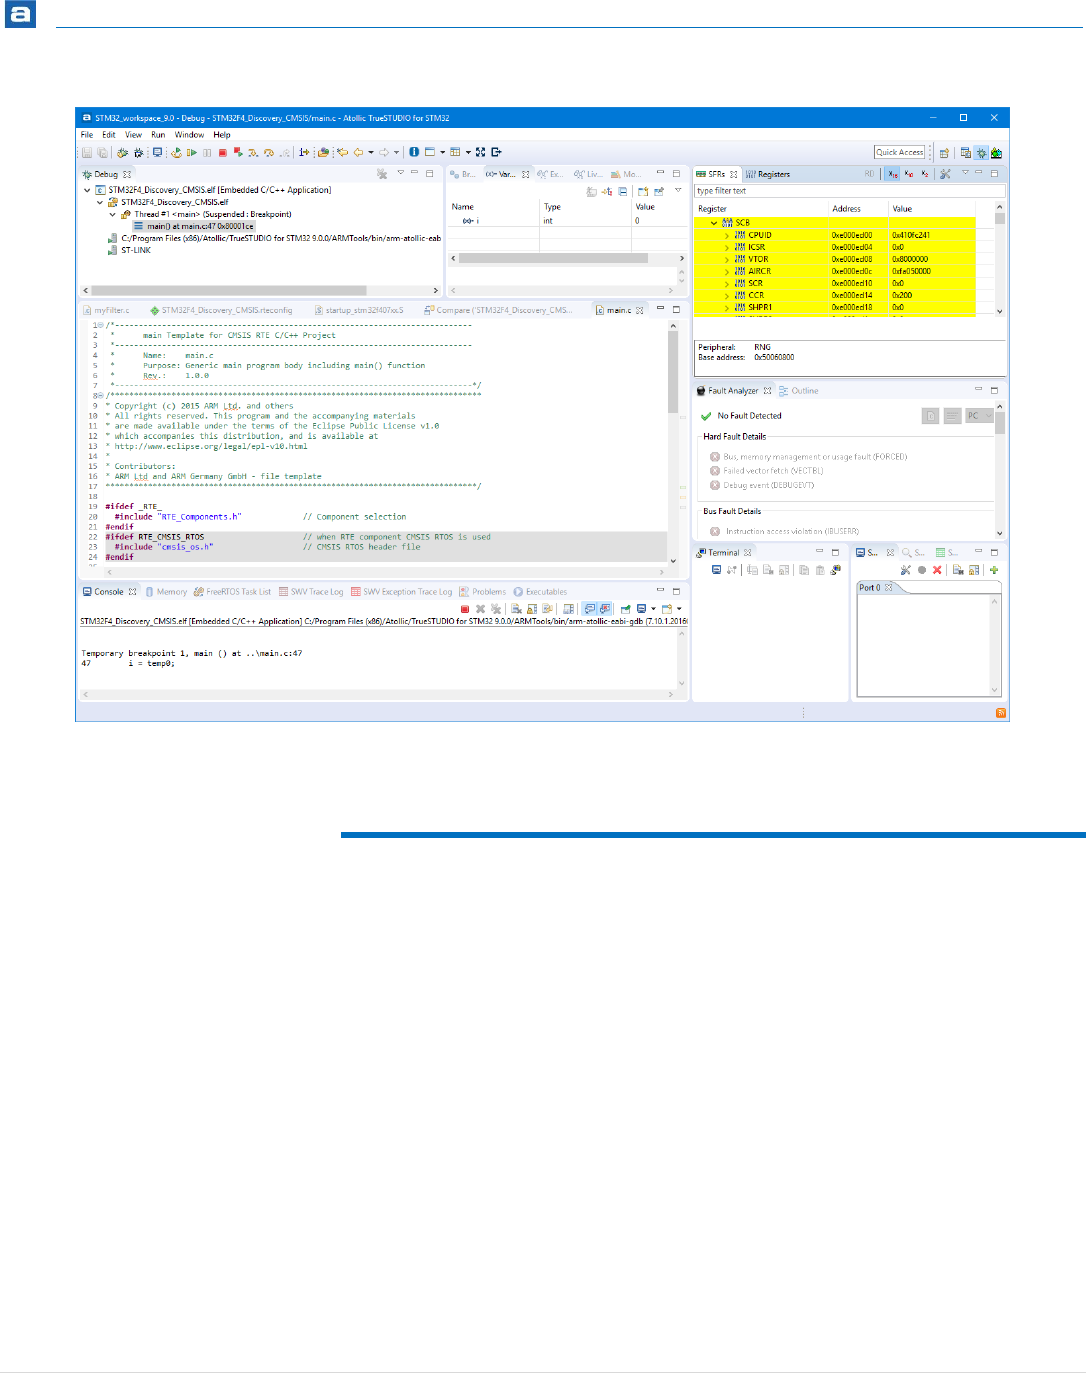
Getting Started
187 | P a g e
Figure 158 – Debug CMSIS RTE C/C++ Project
ADDING MORE CMSIS-PACK FEATURES INTO
PROJECT
The project can be updated according your application needs.
The Keil CMSIS_Pack for STM32 contains many examples for different board. One way to
easy test examples is to open the Pack in file explorer and double-click on a .project file in
an example. The project will then be imported into TrueSTUDIO. E.g. Open the following
folder in the Pack to discover how to use STM32 drivers.
F:\CMSIS_Pack\Keil\STM32F4xx_DFP\2.11.0\Projects\STM32F4-
Discovery\Examples\GPIO\GPIO_EXTI\TrueSTUDIO\STM32F4-Discovery
Build and test the program in the Debugger to discover the usage of GPIO drivers on the
board.

Getting Started
188 | P a g e
INSTALLING 3RD PARTY PLUGINS
It is possible to install hundreds of additional third party ECLIPSE™ plugins in Atollic
TrueSTUDIO for users that want even more functionality in their TrueSTUDIO IDE.
ECLIPSE™ plugins are easily found by searching at Eclipse marketplace
(http://marketplace.eclipse.org/). However, please bear in mind that not all plugins for
ECLIPSE™ are compatible with Atollic TrueSTUDIO.
INSTALL FROM ECLIPSE MARKETPLACE
To install from Eclipse Marketplace select Help, Eclipse Marketplace…
Figure 159 – Select Eclipse Marketplace
Search for the plugin and make the installation.
Atollic does not provide support for any third party plugins.
Support for third party plugins are always provided by their respective
manufacturer.
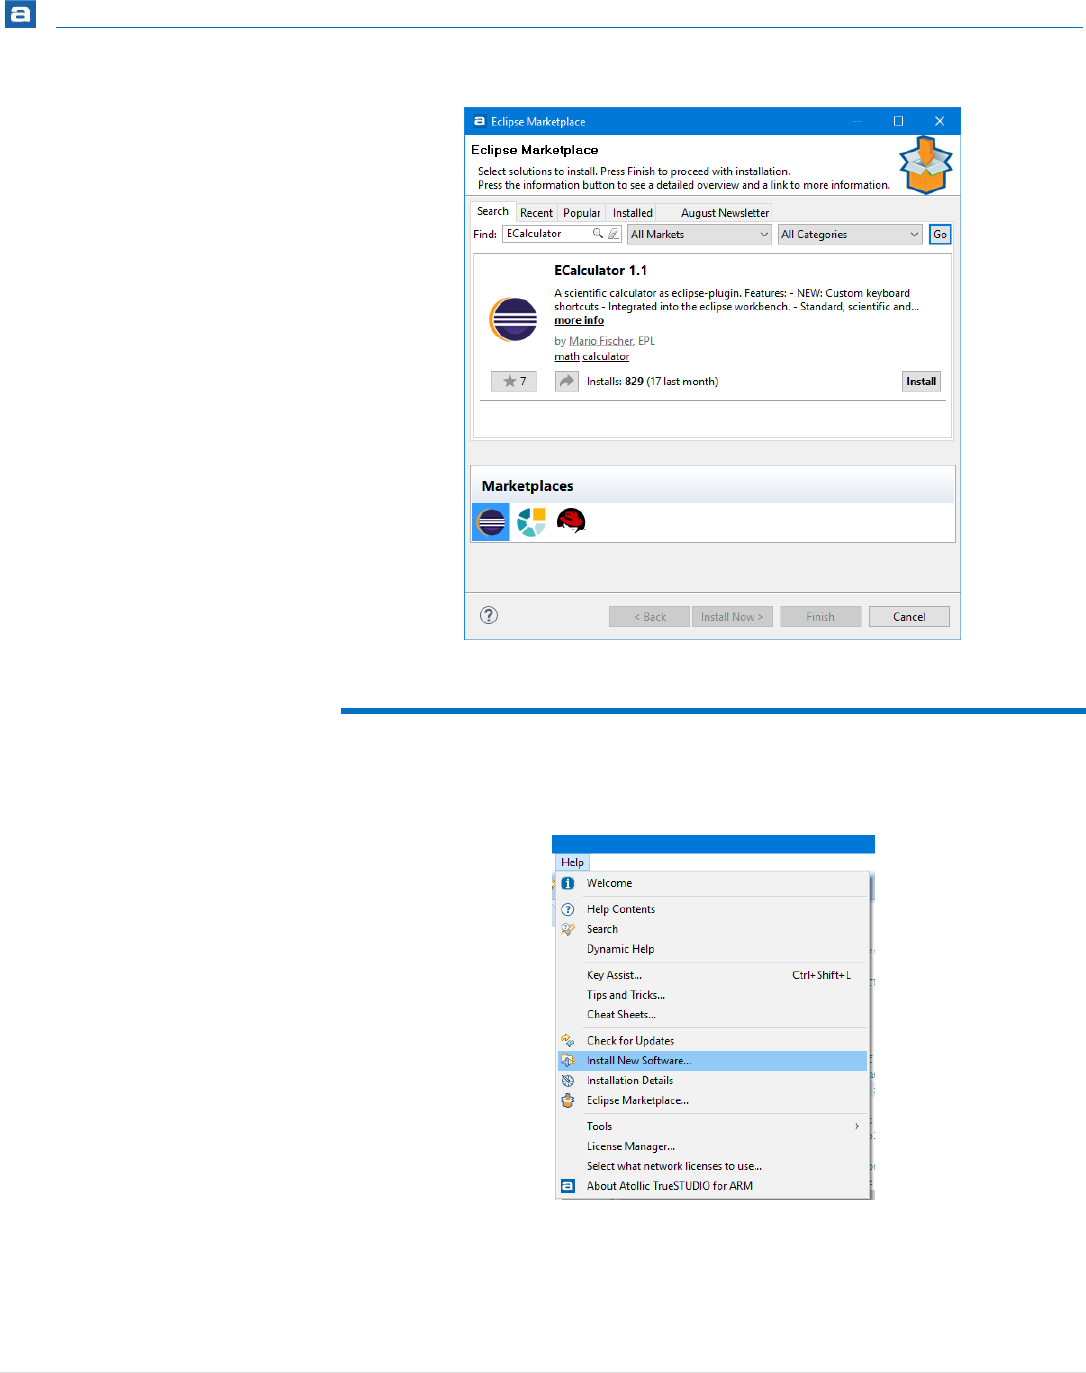
Getting Started
189 | P a g e
Figure 160 – Install Using Eclipse Marketplace
INSTALL USING “INSTALL NEW SOFTWARE”
2. To install a plugin select Help, Install New Software…
Figure 161 – Select Install New Software
3. Then enter the URL to the update site for the plugin. If the URL is not known,
All Available Sites can be selected.
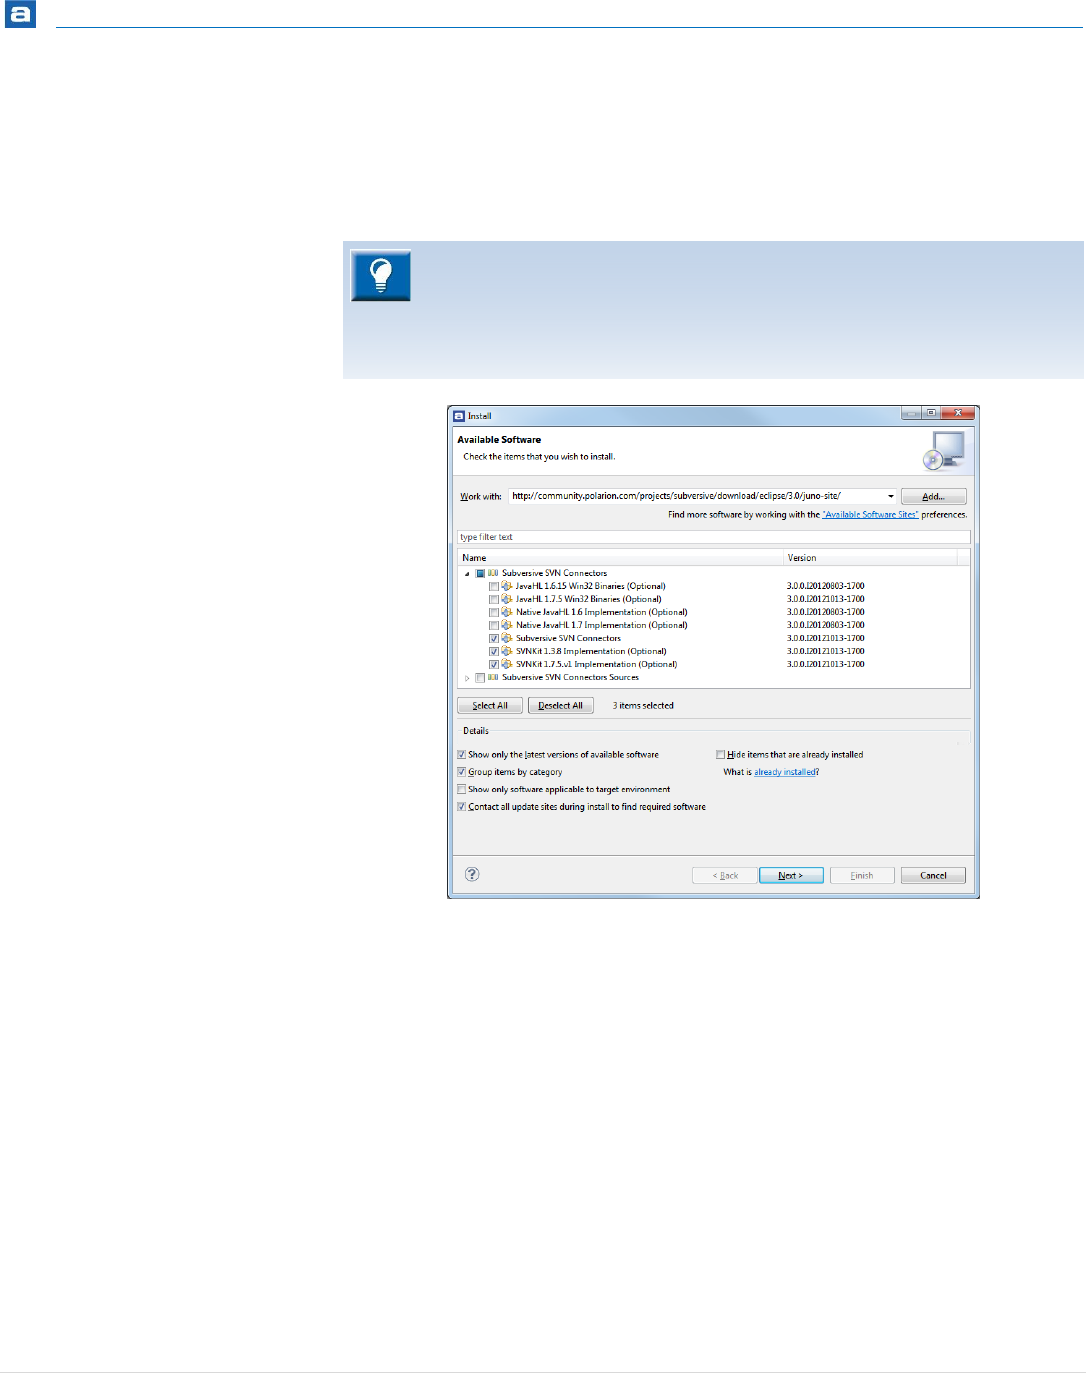
Getting Started
190 | P a g e
Select the appropriate plugins. Please remember that not all ECLIPSE™
plugins are compatible with Atollic TrueSTUDIO.
Click the Next button.
Figure 162 – Enter Download Site and Select Plugins
4. Review the items to be installed and click the Next button.
5. Read all the licenses agreements and click accept if the terms are found
acceptable. Then click the Finish button.
If no direct internet connection is available, the plugin can be downloaded in
archive form from a computer with internet connection, and then manually
moved to the computer with a TrueSTUDIO installation. Add the archived file
by clicking the Add button and then select Archive and select the
downloaded file.
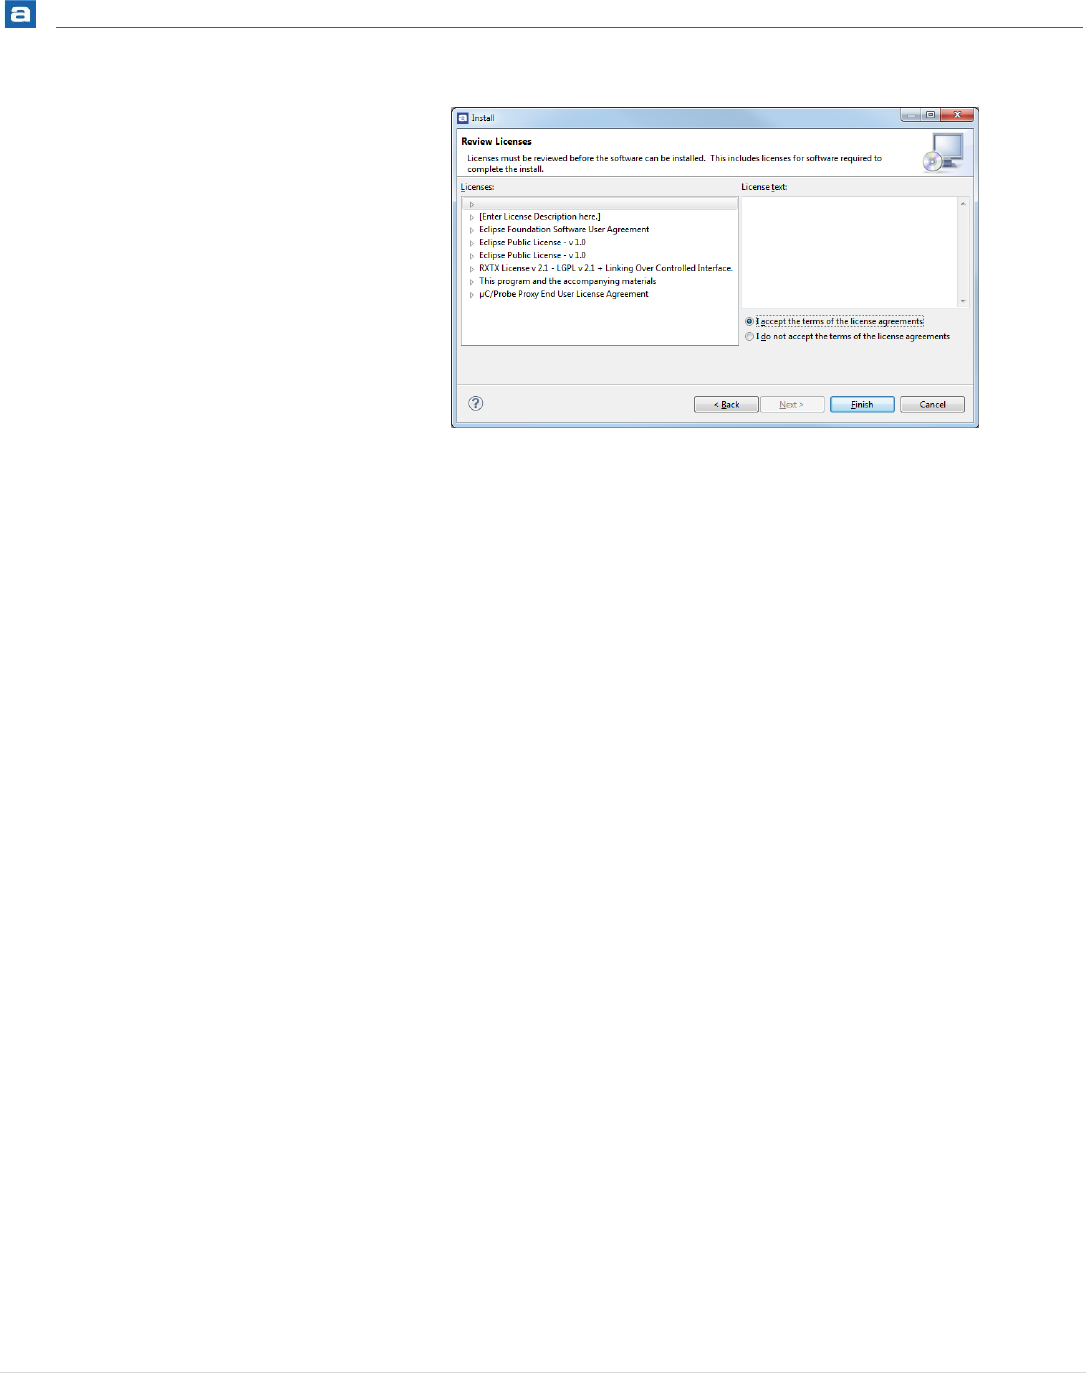
Getting Started
191 | P a g e
Figure 163 – Accept License Agreements
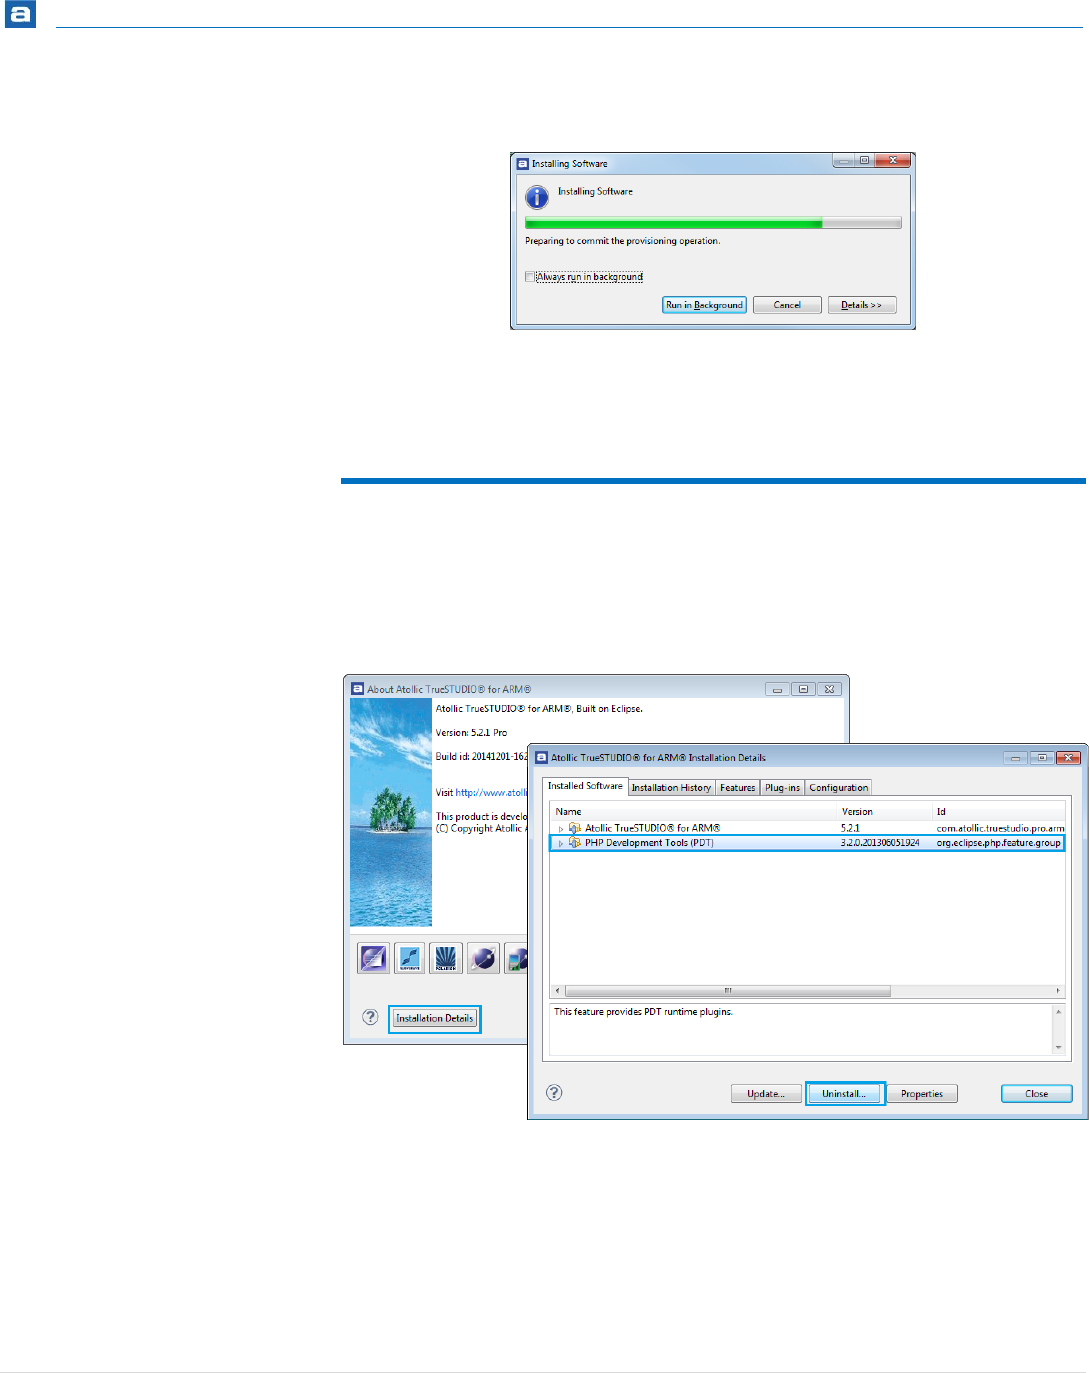
Getting Started
192 | P a g e
6. The plugins are now automatically downloaded and installed.
Figure 164 – The Plugins are Installed
7. Restart Atollic TrueSTUDIO and the plugins are ready to be used.
UNINSTALLING 3RD PARTY PLUGINS
To uninstall a 3rd Party Plugin that is no longer preferred, in the top menu select Help,
About Atollic TrueSTUDIO, Installation Details.
In the new panel select the plugin to uninstall and press Uninstall…
Figure 165 – Uninstalling Plugins

Getting Started
193 | P a g e
SOLVING UPGRADE PROBLEM
If some problem occurs when upgrading or installing new software into Atollic
TrueSTUDIO then please try to uninstall the software again and restart the product. If
there are problems to run Atollic TrueSTUDIO after restarting then try this:
1. Go to the .eclipse directory in your home directory in Windows, Eg.
C:\Users\your_name\.eclipse
2. Identify the folder which corresponds to the Atollic TrueSTUDIO version you are
using.
3. Rename this folder and restart Atollic TrueSTUDIO. The product should now start
as it was first installed without any updates.
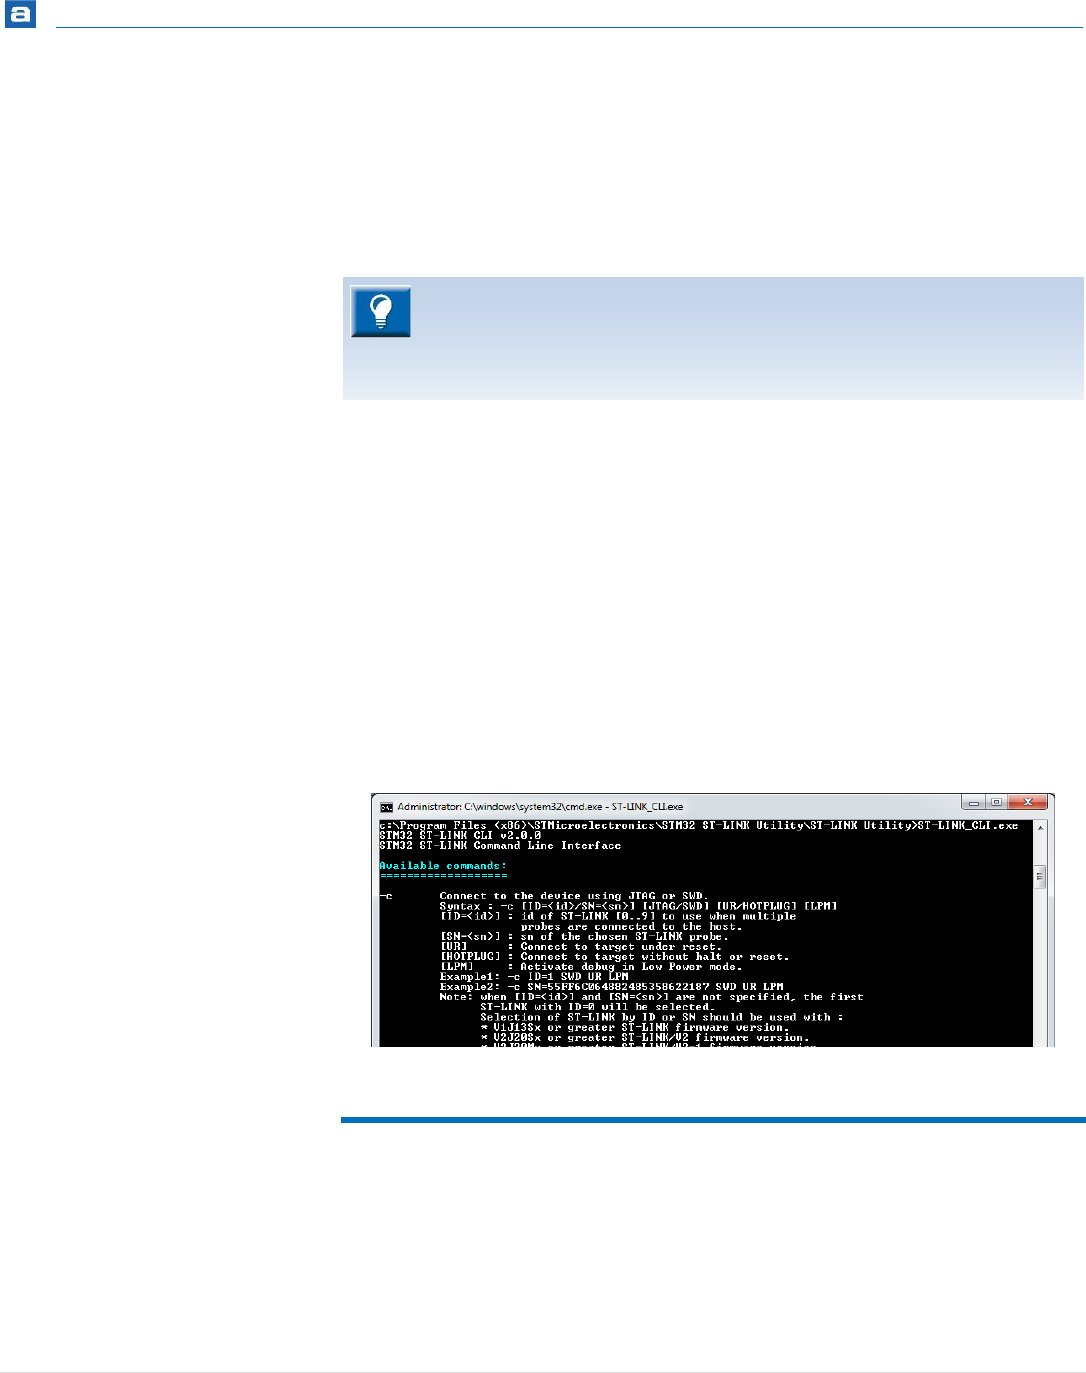
Getting Started
194 | P a g e
USING ST-LINK UTILITY INSIDE ATOLLIC
TRUESTUDIO
The ST-Link GDB-server used for debugging STM32 devices does not implement all
functionality available in the ST-Link utility. It is however possible to call ST-Link Utility
from inside the IDE, this can save a lot of time when performing various debugging related
tasks.
Typical use cases when this is beneficial:
When certain parts of the flash need to be erased before loading binary
When you want to compare the binary file in target with the one just built with
Atollic TrueSTUDIO.
For setting option bytes such as read out protection.
For faster loading into flash than is offered by the ST-Link GDB-server
Figure 166 – ST-LINK_CLI.exe
REQUIREMENTS
St-Link Utility (Download it from http://www.st.com)
A working ST-Link
The ST-Link utility does not support elf-files. Use Intel Hex.
This chapter shows and explains many useful techniques in Atollic
TrueSTUDIO. External tools and Launch groups are features that can be used
to solve many other problems.
We recommend all users of Atollic TrueSTUDIO to read this chapter.
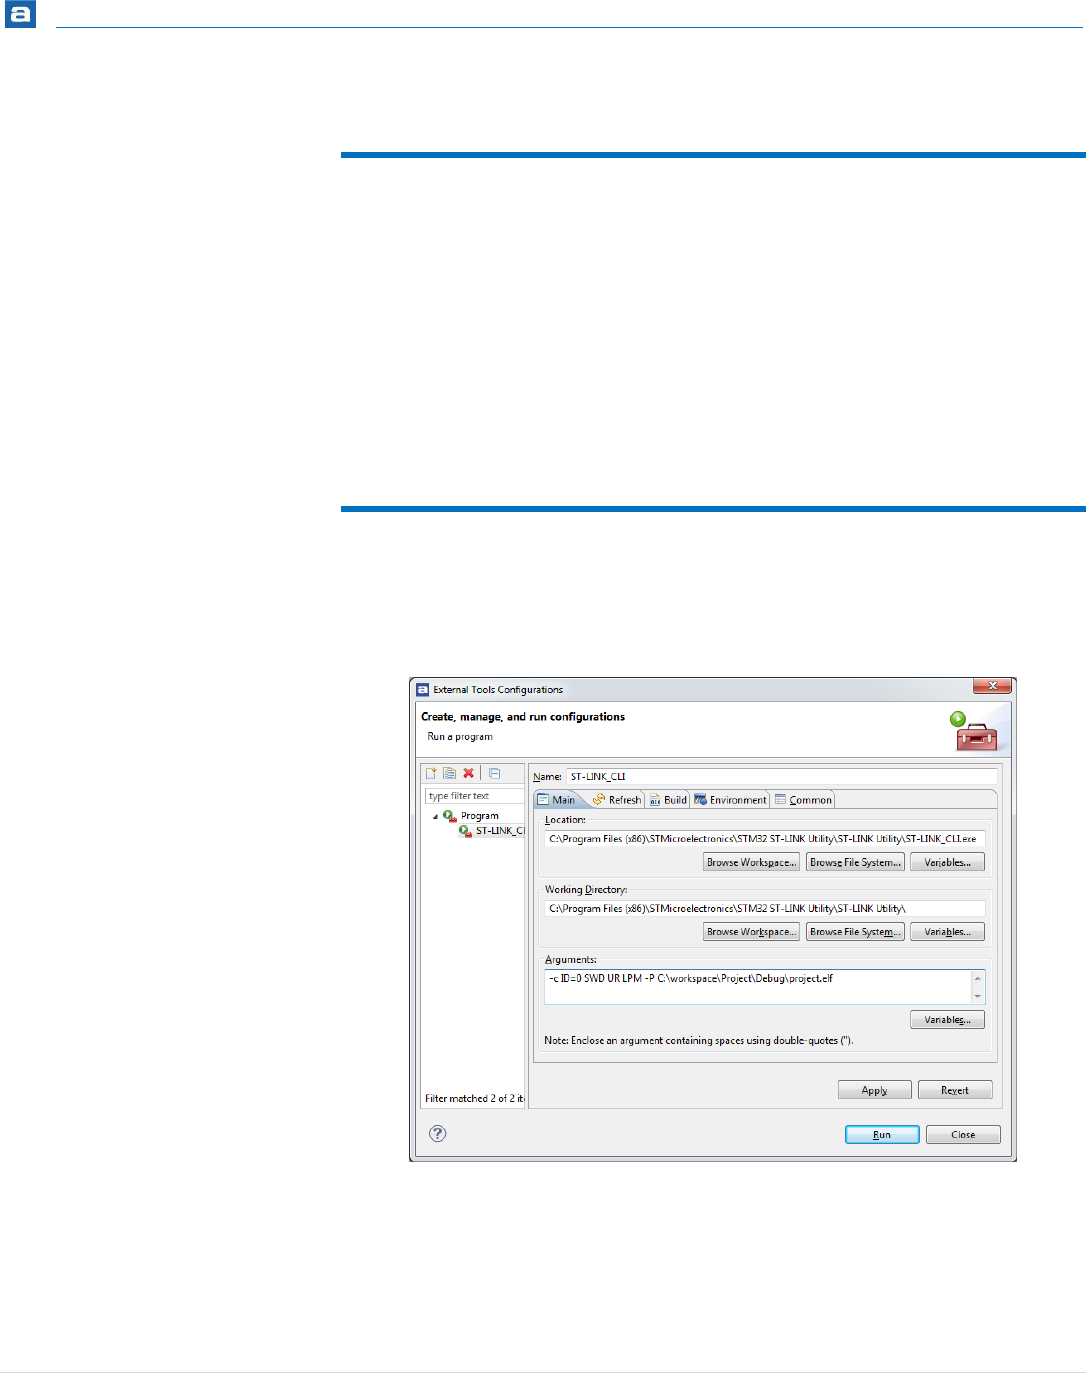
Getting Started
195 | P a g e
STEPS THAT NEEDS TO BE PERFORMED
1. Setup ST-Link Utility with suitable input parameters as an external tool
2. Convert your build output to Intel Hex
3. Create / modify a debug configuration so that the flash operation is only
performed by ST-Link Utility
4. Create a Launch Group to perform the ST-Link Utility operations before the Atollic
TrueSTUDIO debugger starts
SETUP ST-LINK UTILITY AS AN EXTERNAL TOOL
In the main menu select Run, External Tools…, External Tools Configurations…
Create a new Launch configuration as shown below.
Figure 167 – ST-LINK_CLI.exe
Name i.e. “ST-LINK_CLI”
Location i.e. C:\Program Files (x86)\STMicroelectronics\STM32 ST-LINK Utility\ST-
LINK Utility\ST-LINK_CLI.exe
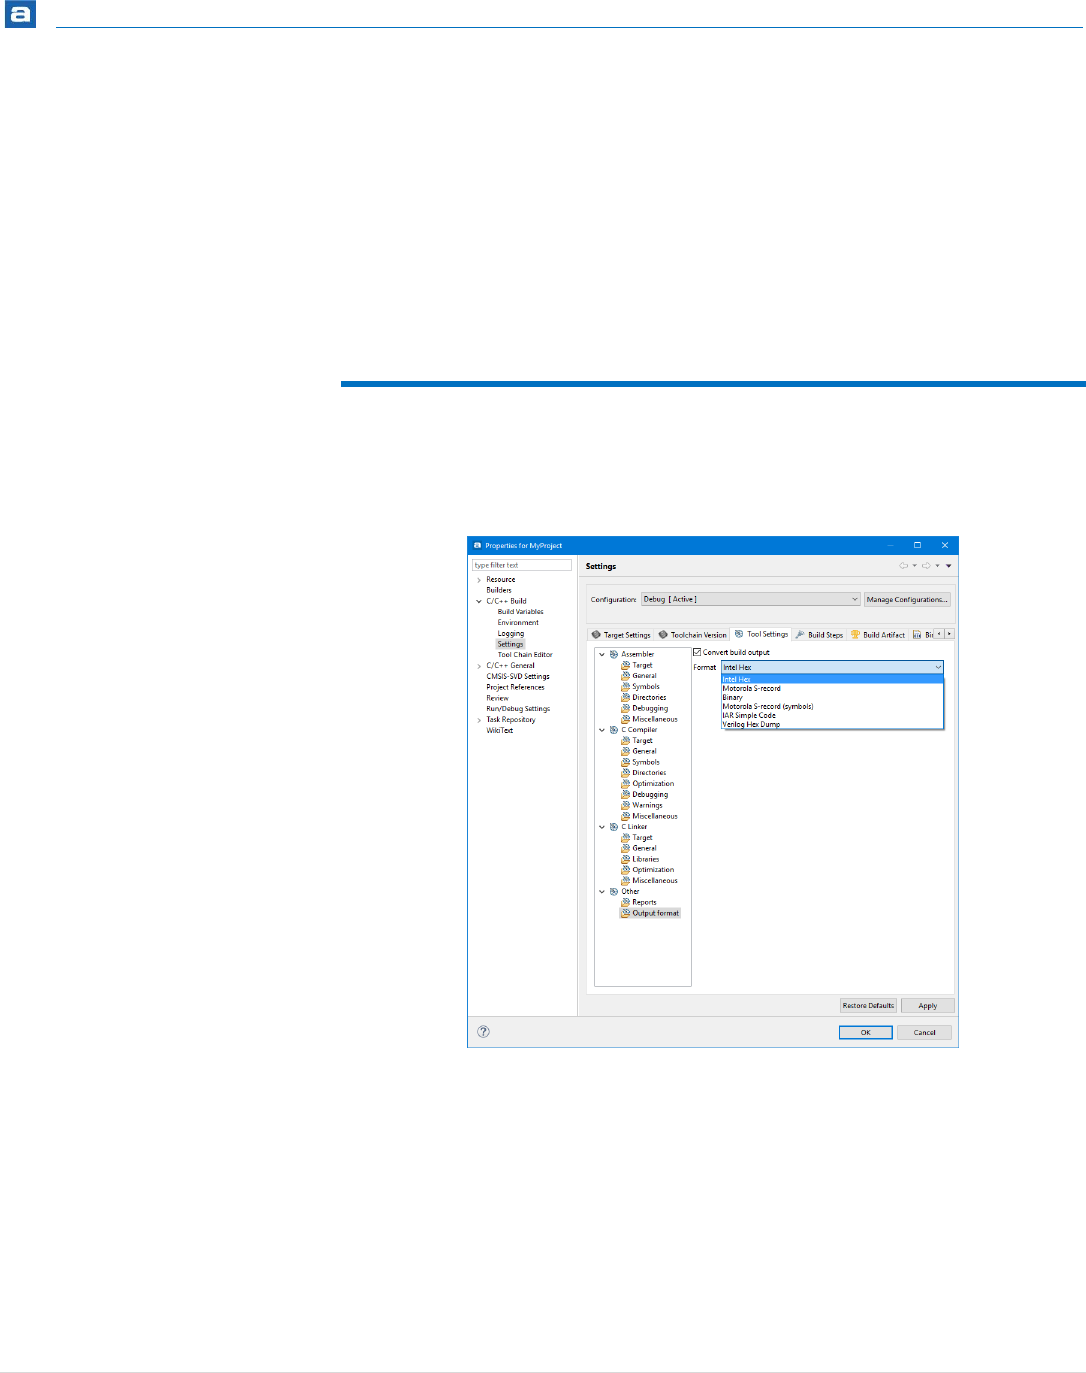
Getting Started
196 | P a g e
Working Directory i.e. C:\Program Files (x86)\STMicroelectronics\STM32 ST-LINK
Utility\ST-LINK Utility\
Arguments i.e. -c ID=0 SWD UR LPM -P C:\workspace\Project\Debug\Project.hex
Press Apply
Test that the external tool just setup is working by clicking Run or Run, External Tools…,
ST-LINK_CLI
CONVERT THE BUILD OUTPUT TO INTEL HEX
In the top menu select Project, Build settings…, C/C++ Settings, Tool Settings, other,
Output format.
Figure 168 – Convert the Build Output to Intel Hex
Be cautious about which Configuration that is selected! In the screenshot Debug was
selected so the conversion will not take place when building a Release configuration.
Check the Convert build output checkbox
Select Intel Hex
Click OK
Build your project!
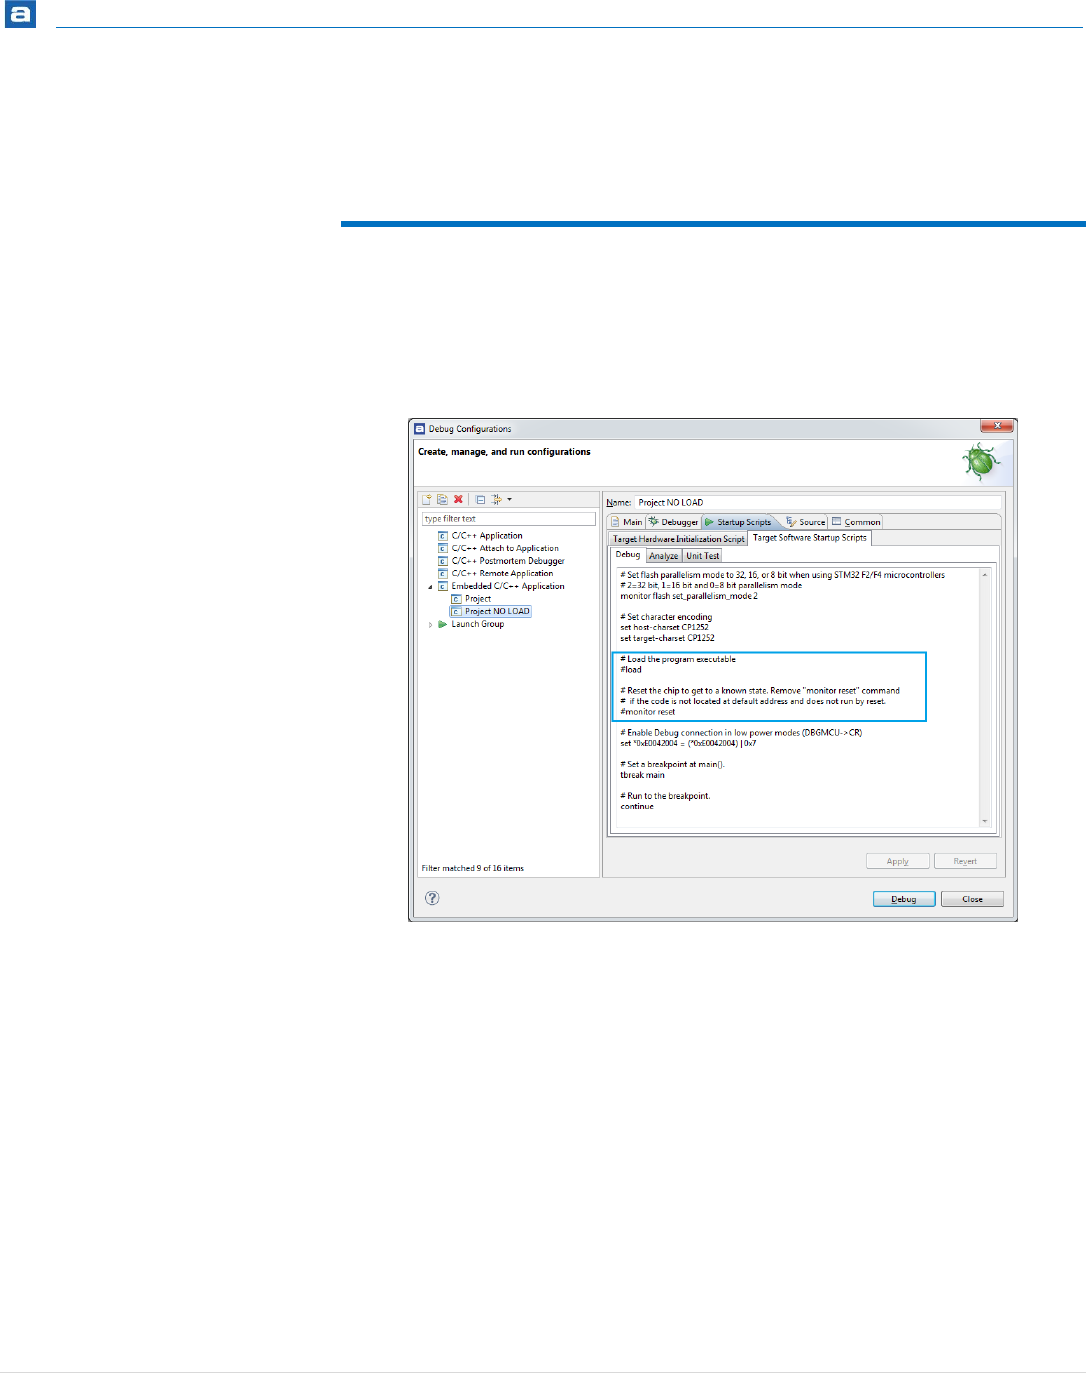
Getting Started
197 | P a g e
The output name will be %PROJECT%.hex. Make sure that this binary is selected when
creating the debug configuration. This will not work with an .elf-file.
MODIFY THE DEBUG CONFIGURATION
It is recommended that you make a copy of your current debug configuration as we will
need to modify the debug script slightly.
In the top menu select Run, Debug Configurations…
Figure 169 – Modify the Debug Configuration
Right-click on your debug configuration and select duplicate.
Change the name of this configuration to “… NO LOAD”, this is since GDB will not
be used to load the hex.
Open the Startup Scripts tab, comment out the “load” command load, #load. It
might also be a good idea to comment out the “monitor reset” command.
Click Apply.
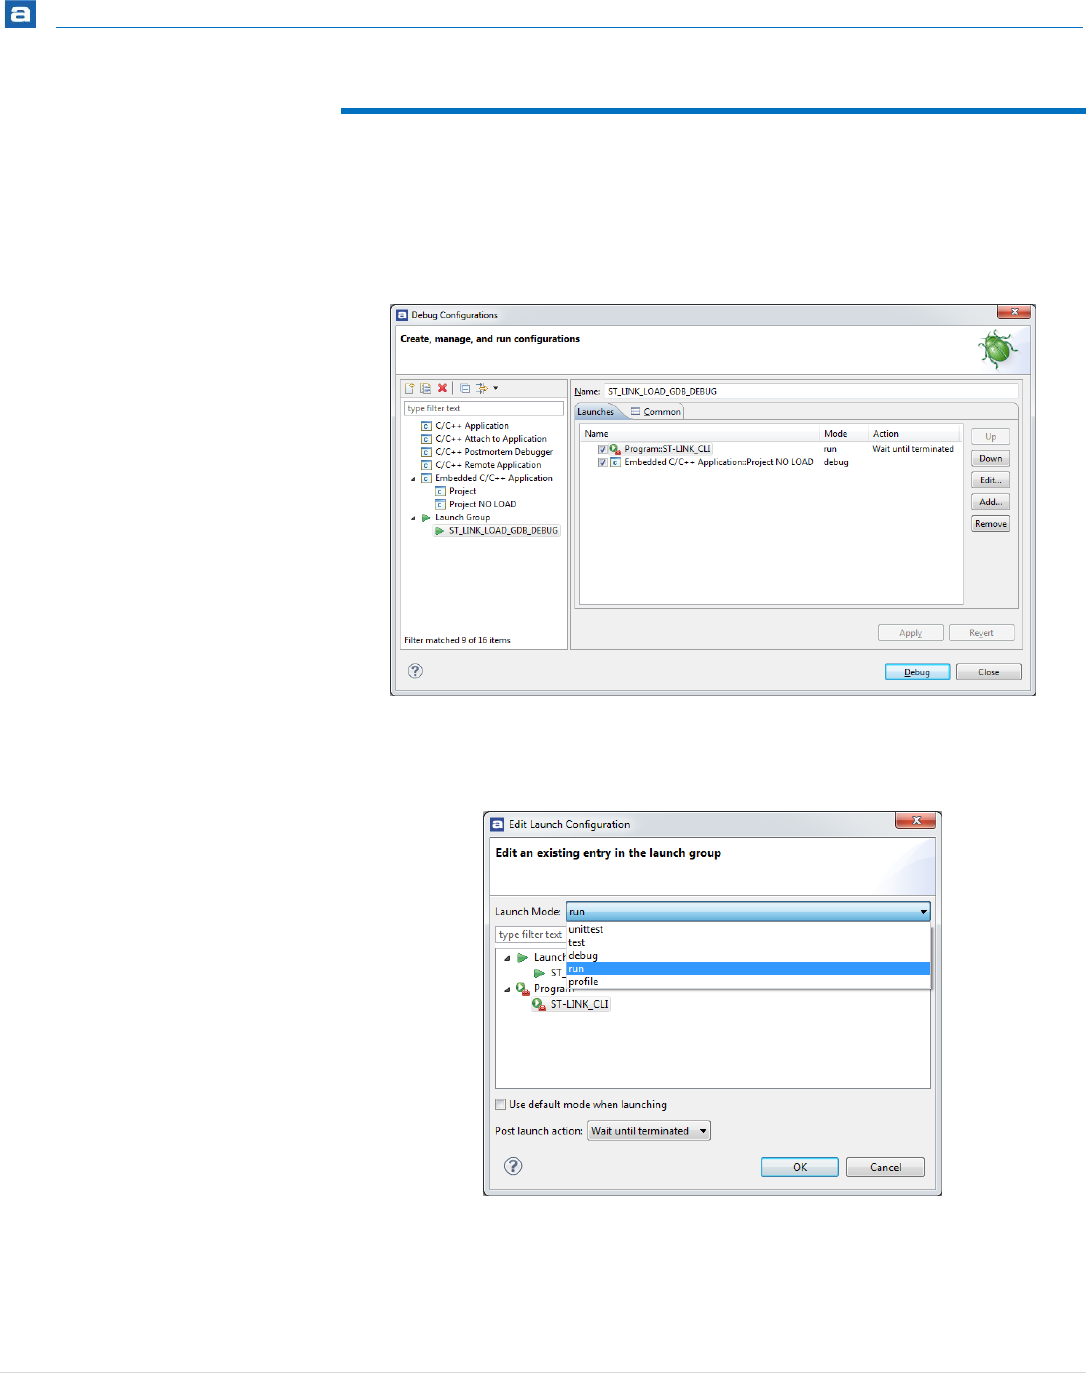
Getting Started
198 | P a g e
CREATE A LAUNCH GROUP
The Launch Group is used to launch several applications (configurations) by just clicking
one button.
Double-click on the Launch Group node to create a Launch group and give it a name.
Figure 170 – Create a Launch Group
Click Add…
Figure 171 – Edit a Launch Group
Select Launch Mode: run
Expand Programs and select your external tool configuration, i.e. ST-LINK_CLI.
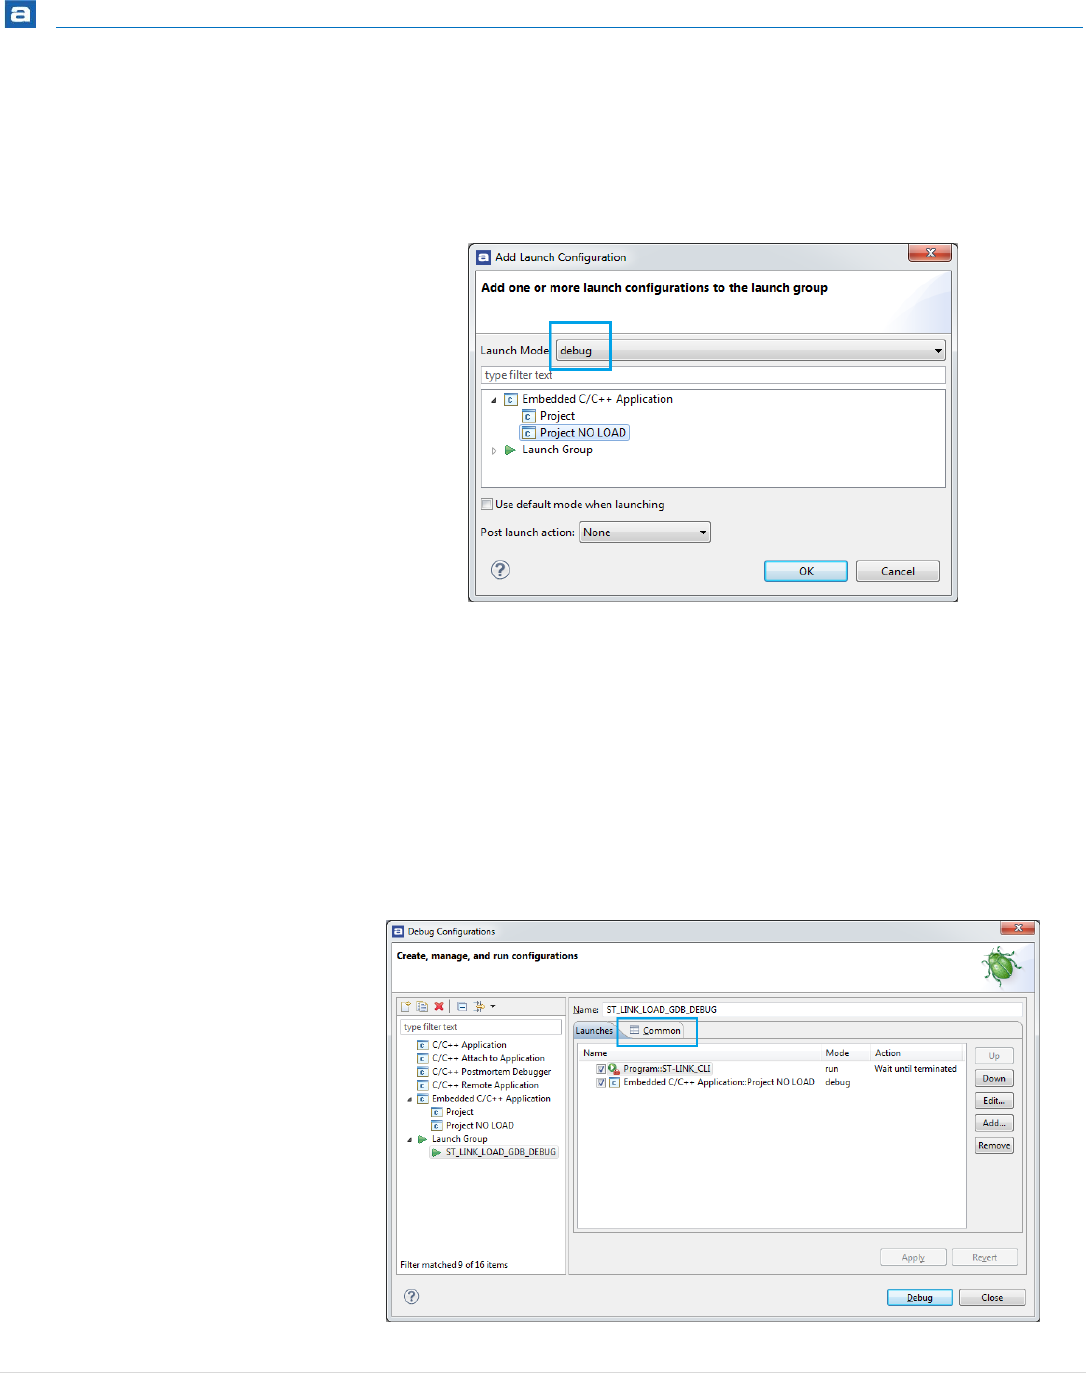
Getting Started
199 | P a g e
Set Post launch action to Wait until terminated.
Click OK to return to the previous panel.
In that panel click Add…
Figure 172 – Select Launch Mode: debug
Select Launch Mode: debug
Expand Embedded C/C++ Applications and select your debug configuration, i.e.
Project NO LOAD.
Set Post launch action to None.
Click OK to return to the previous panel.

Getting Started
200 | P a g e
Figure 173 – Select Launch Mode: debug
Open the Common-tab
Enable Display in favorites menu = Run
Enable Display in favorites menu = Debug
Click Apply
This will make the launch group available in Atollic TrueSTUDIO from the Run, Run-menu
and later the Run, Debug History…
FINISHED
ST-Link Utility is now flashing the binary into the target memory and the debugger is
started as soon as the ST-Link Utility has finished.
Figure 174 – Debug History
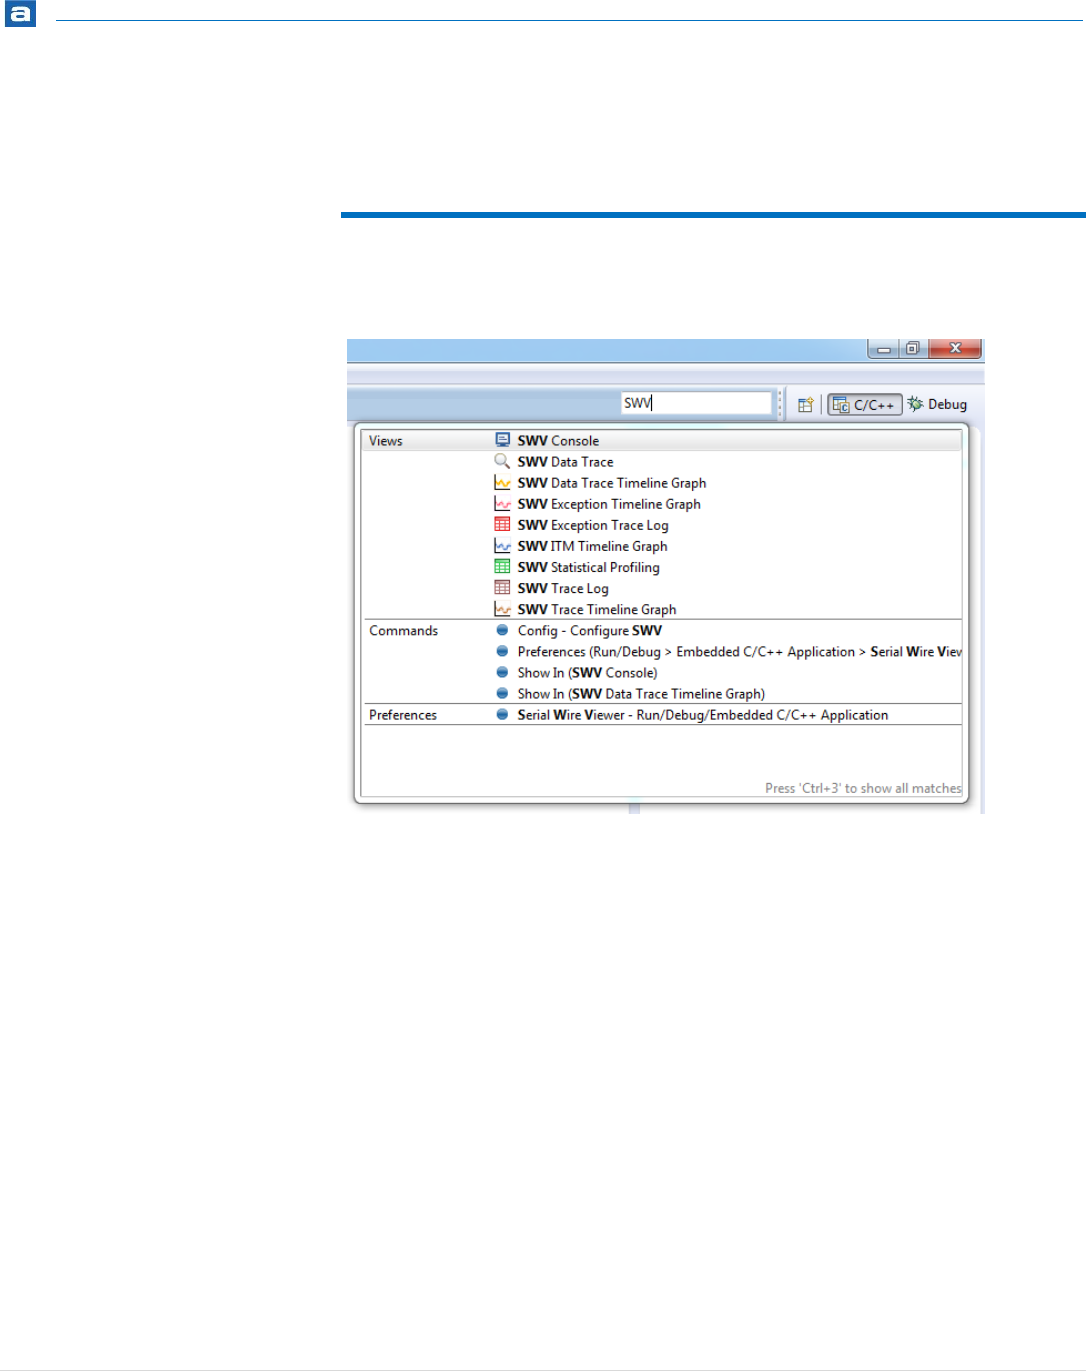
Introduction
201 | P a g e
MISCELLANEOUS TOOLS
QUICK ACCESS SEARCH BAR
Quick Access search bar that is a massive time saver.
Figure 175 – Quick Access Search Bar
The Quick Access search bar is an edit field in the toolbar, where any search phrase or
keyword can be entered. GUI objects like menu commands, toolbar buttons, preference
settings or views ca be found with it.
As any search string is typed, the Quick Access search bar shows all the GUI objects that
match the criteria, in “real-time”. Type a couple of more characters and the search results
list is refined correspondingly “on-the-fly”.
The Quick Access search bar is an enormous time saver when looking for a specific GUI
object that can’t be found quickly, such as finding a preference setting deeply buried in the
configuration dialogs. Or to just issue a menu command or toolbar button hidden in the
currently active perspective.
For example, in the screenshot above the search string “SWV” has been entered and the
Quick Access search bar immediately provides the list of matching views, GUI commands
and preference settings. To open the view or preference setting just click on the GUI
object in the search result list

Getting Started
202 | P a g e
VERSION CONTROL
Atollic TrueSTUDIO includes a basic version-system for projects that works well for a
project with just one developer on one computer. It allows users to keep tracks on local
file history.
For more information about a local repository see Local SVN Repository below.
However if users need to collaborate, keep better track of changes and perhaps work on
many workstations, a better version control-system is needed.
Atollic TrueSTUDIO supports three such systems GIT, Concurrent Versions System (CVS)
and Subversion (SVN). The CVS is an older system that Atollic TrueSTUDIO supports for
those that already have CVS-repositories.
Atollic TrueSTUDIO includes:
Fully integrated GUI client for SVN & CVS
Check-in/out and Branch/merge (including a merge-conflict editor)
Repository & history browser
File revision annotations, file difference viewer and revision graph viewer
Full traceability of all lines, in all files, throughout complete project history
Who did what, when and why?
What did the code look like at time or version X?
Who added code line X, when and why?
SUBVERSION - SVN
Subversion (SVN) is an open source version control system that was design to replace the
older CVS. It is more or less a de facto standard in the computer industry.
A free and very good online book about SVN can be found here
http://svnbook.red-bean.com/
SVN manages files, directories and the changes made to them. That way it is possible to go
back to previous version of the code or inspect what changes has been made over time. It
also operates over a network and allows the same code to be changed simultaneously on
many computers, even over the internet. Thus development can be done faster and with
fewer errors. If some incorrect code is entered it can just revert to the previous version.
There are several other clients to use with SVN.
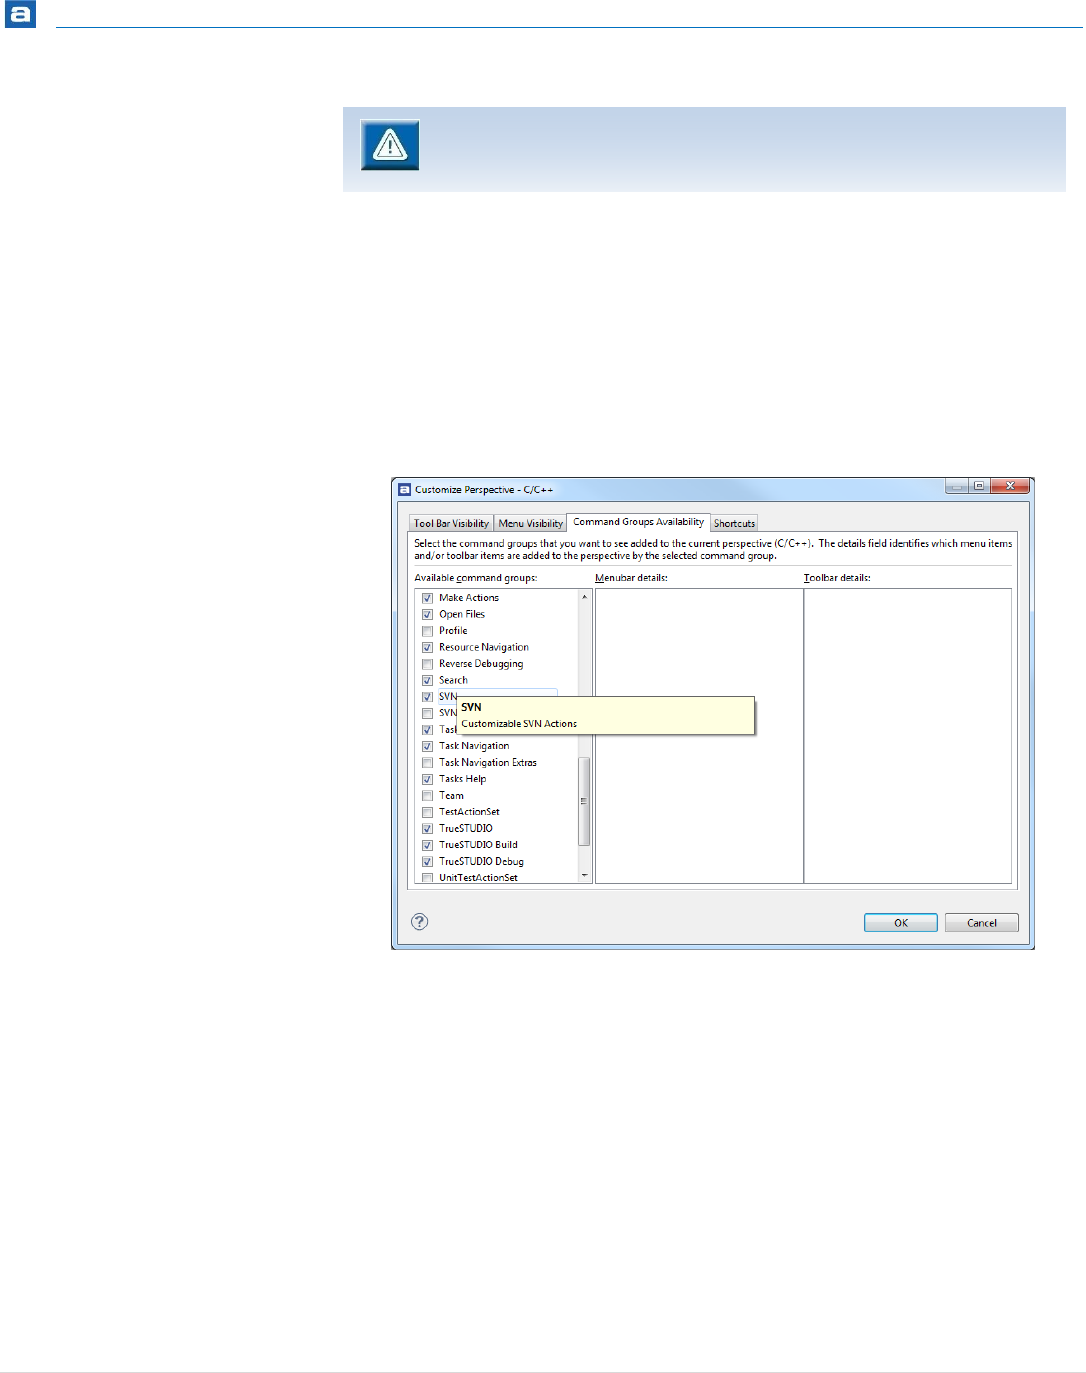
Getting Started
203 | P a g e
To be able to use SVN a Subversion repository is needed. How to set up and maintain a
network repository is out of the scope of this manual. On page 206 set up off a local
repository is explained. There are also several websites such as Freepository, Google Code
and SourceForge provides free source code hosting that can be accessed with Atollic
TrueSTUDIO’s SVN-integration. A good introduction to how to set up a repository can also
be found in chapter 5 in the SVN-book and in several good tutorials on the net.
After making sure a repository exists, the next thing to do to be able to use SVN in a
project, is to enable SVN in Atollic TrueSTUDIO. In the top menu select Window,
Customize Perspective.
Figure 176 – Enable SVN Command Group
In the dialog that opens up select the Command Groups Availability-tab. Find SVN in the
Available command groups-column and make sure it is selected. Click OK.
Some extra items are now available in the toolbar. However they should be greyed out.
There will also be a new top-menu called SVN.
There are several views in Atollic TrueSTUDIO for managing SVN. They can be found by in
the top-menu select Window, Show View, Other.
Atollic do not recommend to use different clients within a project, since
version-conflicts can occur and will probably cause more problems than it’s
worth.
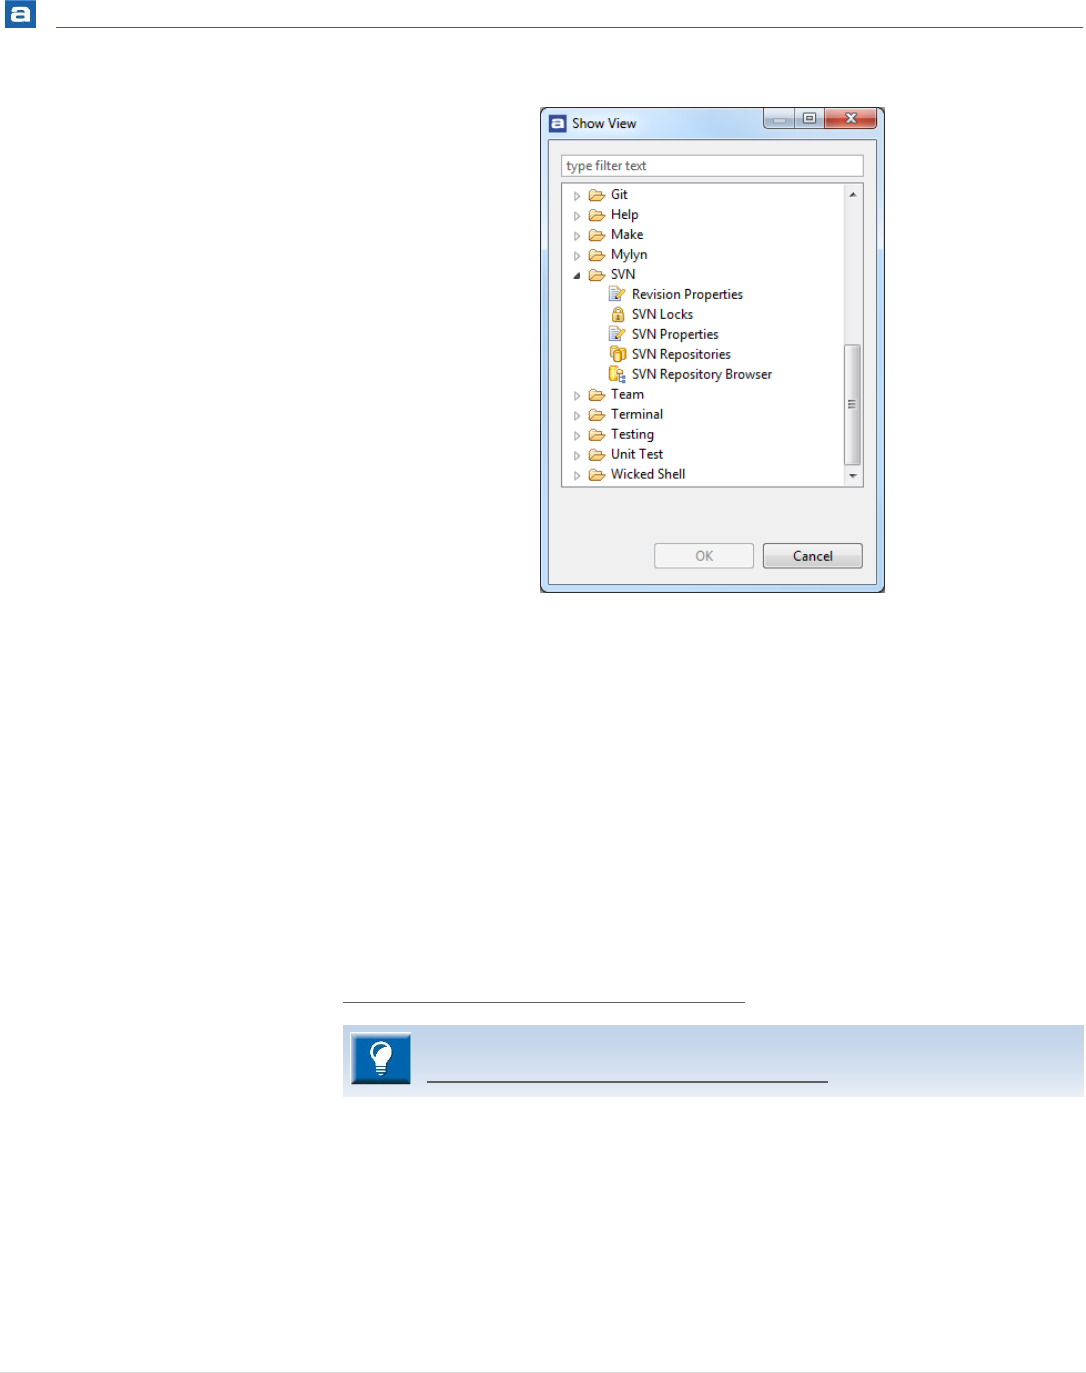
Getting Started
204 | P a g e
Figure 177 – SVN Views
The first view needed is the SVN Repositories since that where repositories are connected.
Connect to an existing repository (in the organization or on the web) by right-clicking in
the view and select New, Repository location. A new dialog will be displayed. In that
dialog enter the URL and other communication-options for the repository.
Next step is to share the project in the repository. Right-click on the project and select
Team, Share Project. In the dialog that then pops up, select SVN and click on Next. Select
the repository and then Finish.
Do the initial commit into the repository.
For more information about how to use SVN, see the tutorials at
http://www.atollic.com/index.php/videotutorials
LOCKS IN SVN
In normal cases locks is never used in SVN. SVN is very good in merging different versions
and branches of the same file. That way more than one developer can edit the same
source-file without fearing to interfere in other developers work.
However in very special cases, such as editing images and other complex file-types, SVN
can’t merge. In that case we recommend to lock the file before editing it.
For more information about how to use SVN, see the tutorials at
http://www.atollic.com/index.php/videotutorials
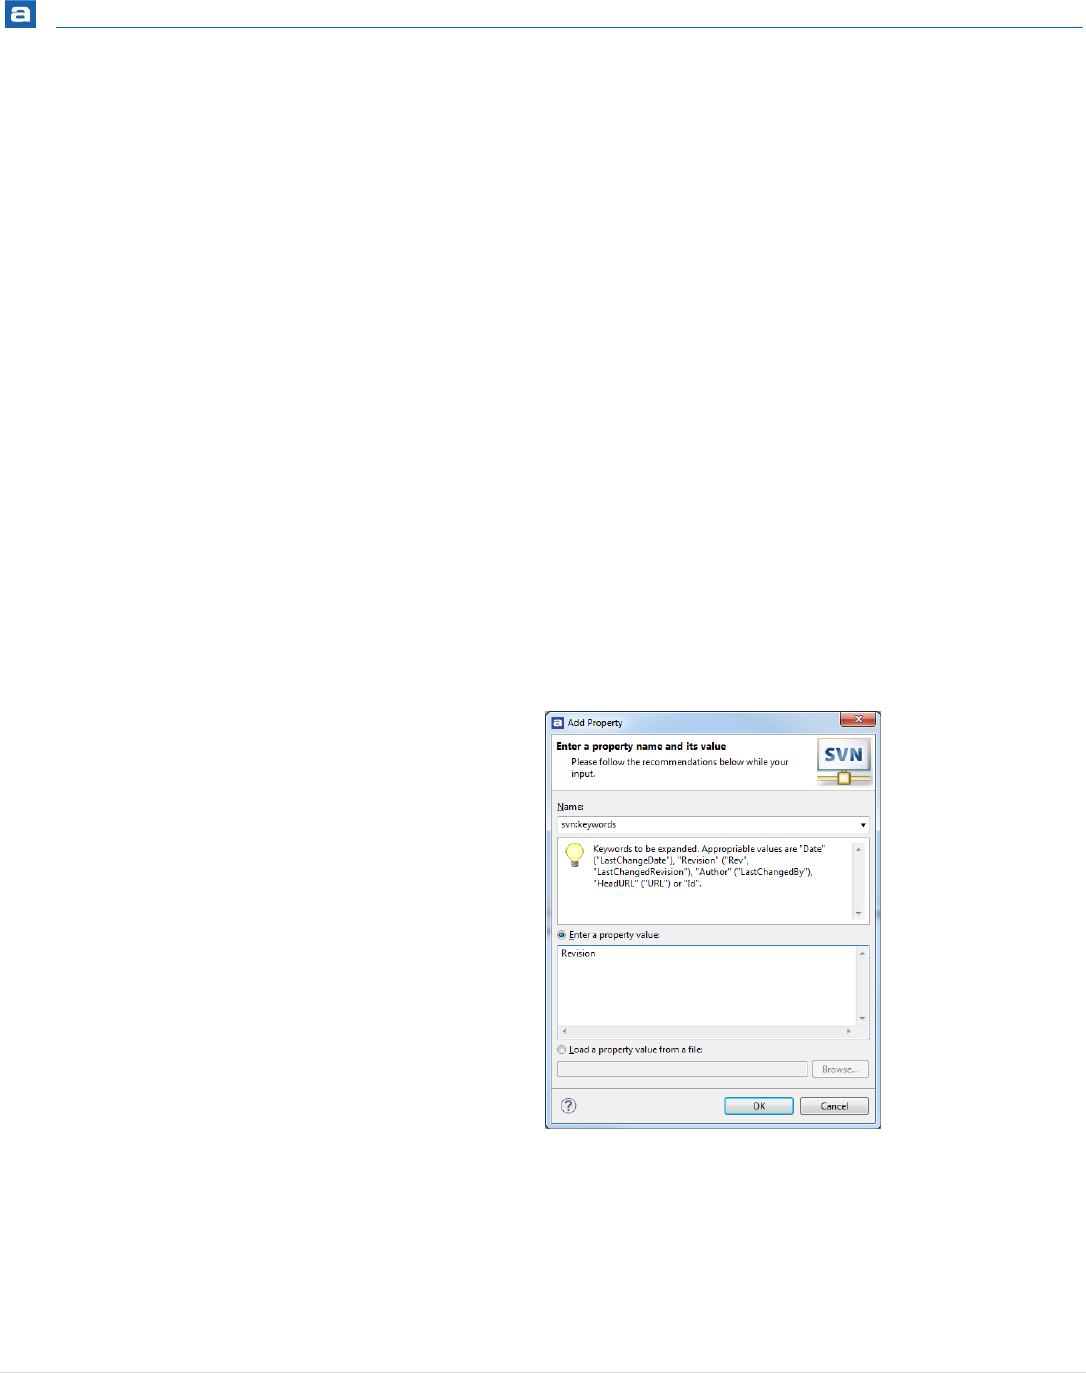
Getting Started
205 | P a g e
Locking is easy. Just right-click on the file, select Team, Lock and enter a brief comment on
why the file is locked.
If others now want to edit the same file, they will only have a read-only version of the file
and can’t save or check it in.
Remember to unlock the file after editing it.
To make sure a file is always locked before anyone can edit it, do the following:
Right-click on it and select Team, Set Property
Add a property with the name svn:needs-lock, no value is needed
Check in the file.
INCLUDE SVN REVISION-NUMBER IN A STRING
A file can have a string in the source code that is the SVN revision number for the latest
time when the file was checked in to the repository.
1. Right-click on the file and select Team, Set Property
2. Add the property svn:keywords with the value Revision
Figure 178 – Add SVN Property
3. Check with Team, Show Properties that the property is correctly added
4. Add $Revision$ anywhere in the code
That string will be replaced with a text showing the revision number of that file.
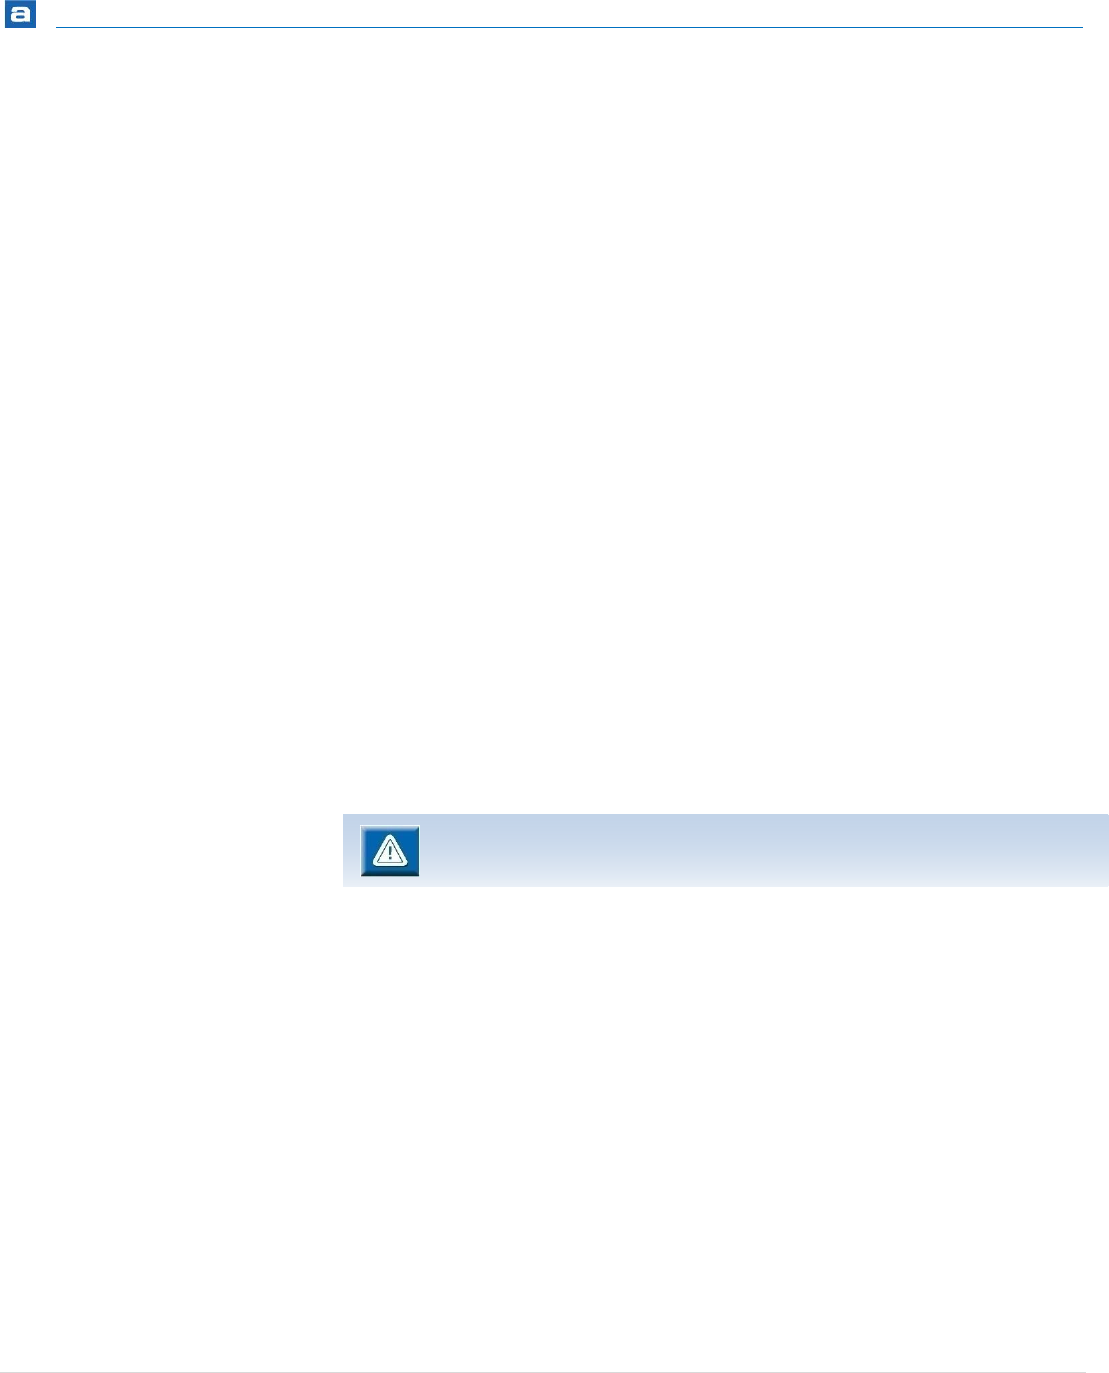
Getting Started
206 | P a g e
It can be something like this:
define MESSAGE5 "SVN $Revision$"
Remember to edit the file and commit it to the repository to update the value to the
current revision.
Other possible values to the svn:keywords is Date, Author, HeadURL and Id.
To have a fixed length of the $Revision$-string, it can be written like
"$Revision:: $".
IGNORE A FILE
To ignore sharing a specific file in a repository, the property svn:ignore needs to be set
instead. It is done in the same manner as the other properties above.
When sharing a project in a version control system, it is a good idea to set the SVN
property svn:ignore on the file
%PROJECT_LOCATION%/.settings/language.settings.xml since it includes a hash
specific to each individual environment.
LOCAL SVN REPOSITORY
A local Subversion repository is easy to set up and is an excellent tool even for developers
who don’t work in a team. It provides a simple way to go back to older versions of the
code and try out ideas. Some sort of version control is strongly recommended for all
developers.
To set up a local repository, do the following:
Local repositories is not possible if the SNVKit SVN connector is selected.

Getting Started
207 | P a g e
1. Open the SVN Repositories by selecting Window, Show View, Other… and in the
panel select SVN, SVN Repositories and press OK.
Figure 179 – Open SVN Repositories
2. In the view click the New Repository button.
Figure 180 – New Repository Button
3. In the Create Repository dialog enter the name and location for the new local
repository and make sure File System is selected.

Getting Started
208 | P a g e
Figure 181 – Create Repository Dialog
When creating a repository in this way, using Berkley DB as repository-type is
not recommended and can cause problem.
4. The new local repository is now created.
Figure 182 –Repository Created
5. To start version controlling a project in the repository, right click the project and
select Team, Share Project…
6. In the Share Project dialog select SVN and press Next.
Figure 183 –Share Project Dialog
7. Now select the new repository and Finish.
8. Enter an initial comment and the project is version controlled.
Figure 184 –Projects Version Controlled

Getting Started
209 | P a g e
USING SVN ON EXTERNAL RESOURCES
Since SVN doesn't commit files that reside physically outside of the project it is necessary
to show the files within an Atollic TrueSTUDIO project.
This is particularly important to remember when using tools such as STM32CubeMX that
crates project with code that are linked into the project and for different downloadable
example projects that lets the actual code reside outside the project.
There is however at least two different method to solve this. Since SVN doesn't commit
files that reside physically outside of the project it is necessary to show the files within a
Atollic TrueSTUDIO project. These examples are for STM32CubeMX but can easily be
adapted to fit other external resources.
Alternative 1 - Live with linked files/folders
Create a project for version control in the CubeMX-project-root (the folder that contains
the TrueSTUDIO, Inc, Src etc) and use it together with the normal development project.
This will set up the workspace with a versioning-project, and a development-project.
Versioning project
In the top menu select File, New, Project
In the New Project wizard that is opened, select General, Project
Input a name for this project, for example MyVersionedCubeMXProject
Uncheck the Use default location, then browse to the CubeMX-project’s-root folder
Commit MyVersionedCubeMXProject to SVN
Development project
In the top menu select File, Import, General, Existing Projects into Workspace
Select root directory and browse to the MyVersionedCubeMXProject\TrueSTUDIO
folder
Make sure Copy projects into workspace is Unchecked!
Workflow of this setup is to develop/debug using the development project and version
control the project using the MyVersionedCubeMXProject
Alternative 2 - Resolve the project so that all code reside physically within the project
Export the CubeMX project as an archive, this will resolve all .c source code.
Remove the CubeMX project from the TrueSTUDIO workspace. Do not delete them, but
keep the CubeMX files on the disk a while longer.
Import the project that was exported in step one. This project will now contain all .c files
and settings. Lets call this project CubeMX-resolved from now on.

Getting Started
210 | P a g e
However since CubeMX doesn't make references to header files in the generated project
these will be missing. Included directories also needs to be manually inspected that they
still are intact.
Manually copy the needed header files from the original CubeMX project to the CubeMX-
resolved project
Open the Build Configuration for the CubeMX-resolved project and correct the include
paths in the C-Compiler, Directories node.
If the same structure for the header files is kept as they were in the original CubeMX
project then only ..\..\ needs to be removed from the include paths.
For example..\..\..\Drivers\STM32F4xx_HAL_Driver\Inc\Legacy
becomes..\Drivers\STM32F4xx_HAL_Driver\Inc\Legacy.
Commit the CubeMX-resolved to SVN
MULTI MONITOR SUPPORT
The Atollic TrueSTUDIO IDE can be dragged between monitors and even extended to cover
several monitors.
Individual views can also be de-attached from the IDE by clicking the tab with the view
name located in the upper left corner of the view and dragged to a new place on any
monitor. This can also be done with open editors, so that individual files can be opened
and edited in individual windows.
By in the top menu selecting Windows, New Editor the same file can also be edited
simultaneously in different editor windows. Changes will be displayed immediately in both
windows. One editor-window be dragged to another monitor. This is very practical when
editing large files.
If instead in the top menu Window, New Window is selected a cloned copy of the current
Atollic TrueSTUDIO IDE will be opened. It will however always work with the same
workspace and all editing done in the projects will be displayed in both opened IDEs. They
are after all clones and not individual instantiations Atollic TrueSTUDIO.
The individual clones of Atollic TrueSTUDIO can however be opened in different
perspectives. It is thus possible to open one window for editing and one for debugging.
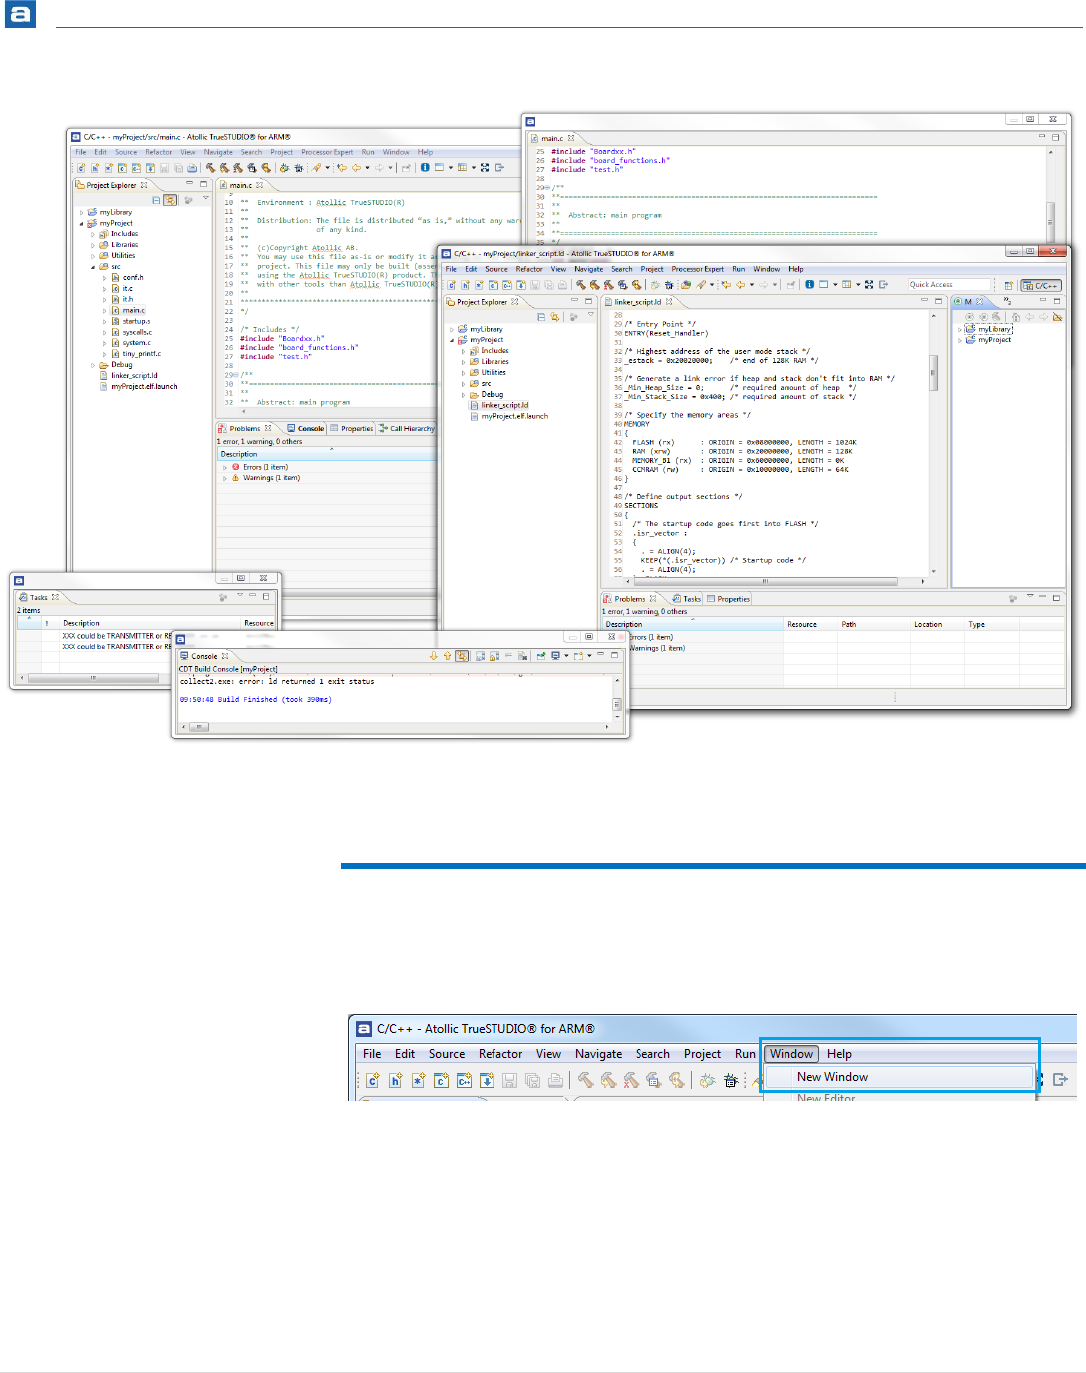
Getting Started
211 | P a g e
Figure 185 – Multiple Editors, Views and Windows used at the same time
OPEN ADDITIONAL INSTANCE OF TRUESTUDIO
It is possible to open two instances of Atollic TrueSTUDIO for the same workspace at the
same time. To do that select in the top menu Window, New Window.
Figure 186 – New Window
Atollic TrueSTUDIO will now be opened in an additional window. This is useful when the
workplace is equipped with two screens. It is then possible to edit and debug at the same
time. One instance of Atollic TrueSTUDIO can then be used for editing and the other for
debugging.

Getting Started
212 | P a g e
Figure 187 – New Window
SHELL ACCESS
To access Windows Shell (cmd.exe) open the shell by selecting Window, Show View and
select Terminal view.

Getting Started
213 | P a g e
Figure 188 – Terminal
In the Terminal view a Terminal is launched by clicking the Open a Terminal icon.
Figure 189 –Terminal View
The Launch Terminal dialog is now opened. Select Local Terminal and the Encoding to use.
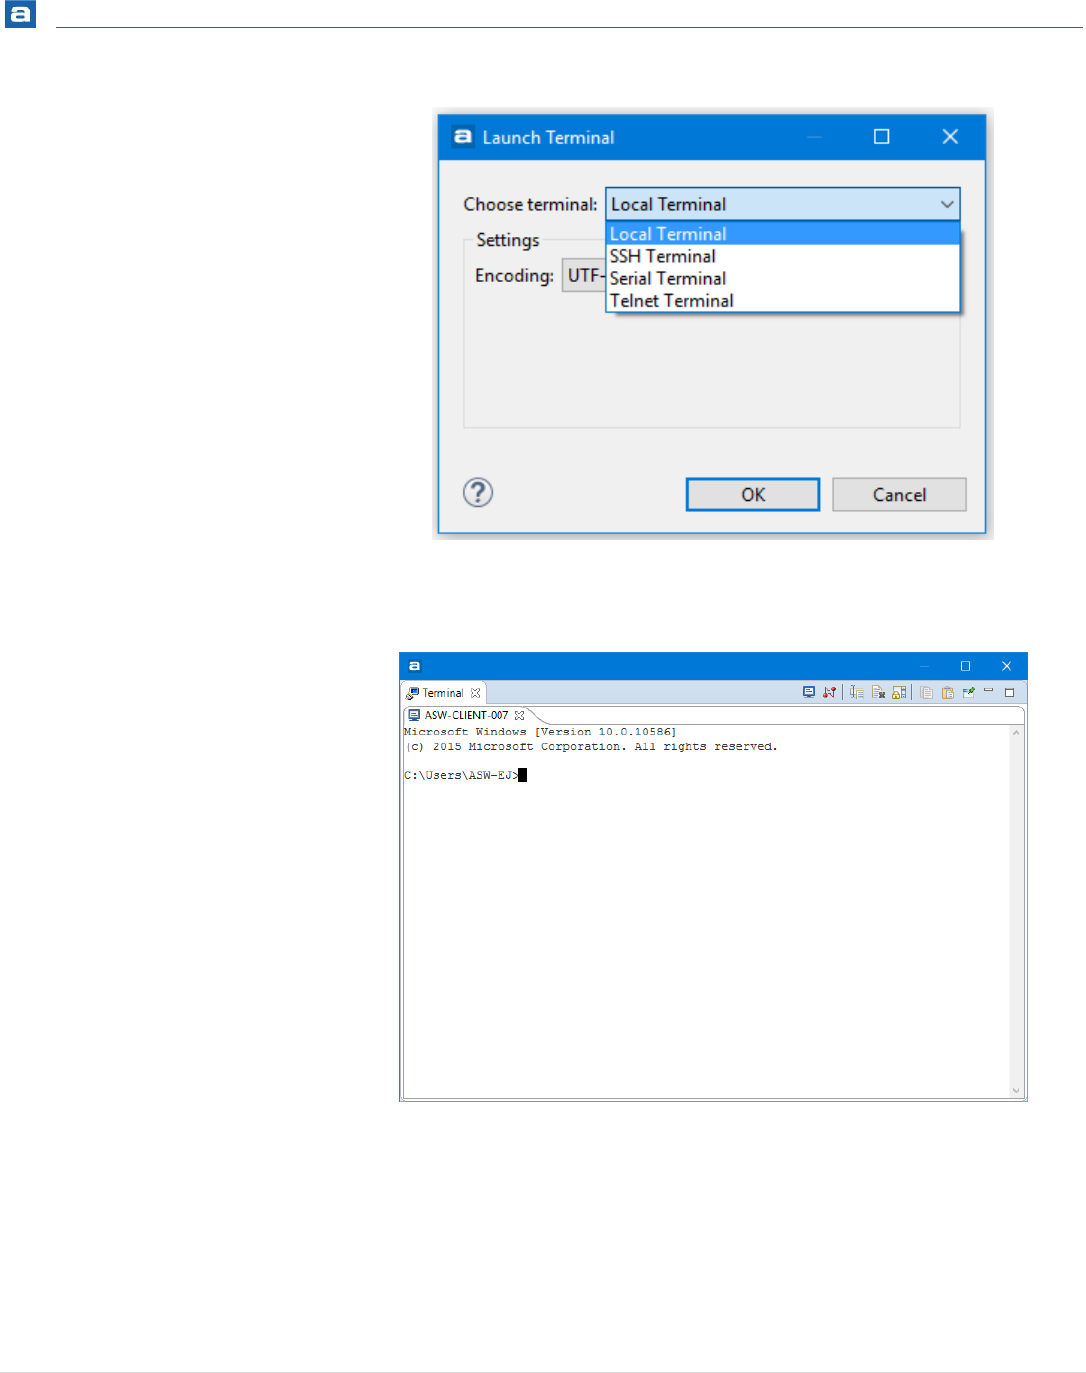
Getting Started
214 | P a g e
Figure 190 –Launch Terminal
The Terminal is now opened and is ready to use.
Figure 191 –Terminal Opened

Introduction
215 | P a g e
DEBUGGING
This section provides information on how to begin using Atollic TrueSTUDIO for STM32.
The following topics are covered:
Introduction to Debugging with TrueSTUDIO
Starting the Debugger
Debug Configuration
Debug Perspective
Debugging
Stopping the Debugger
Upgrading the GDB Server
Configure the GDB Server
Advanced Debugging
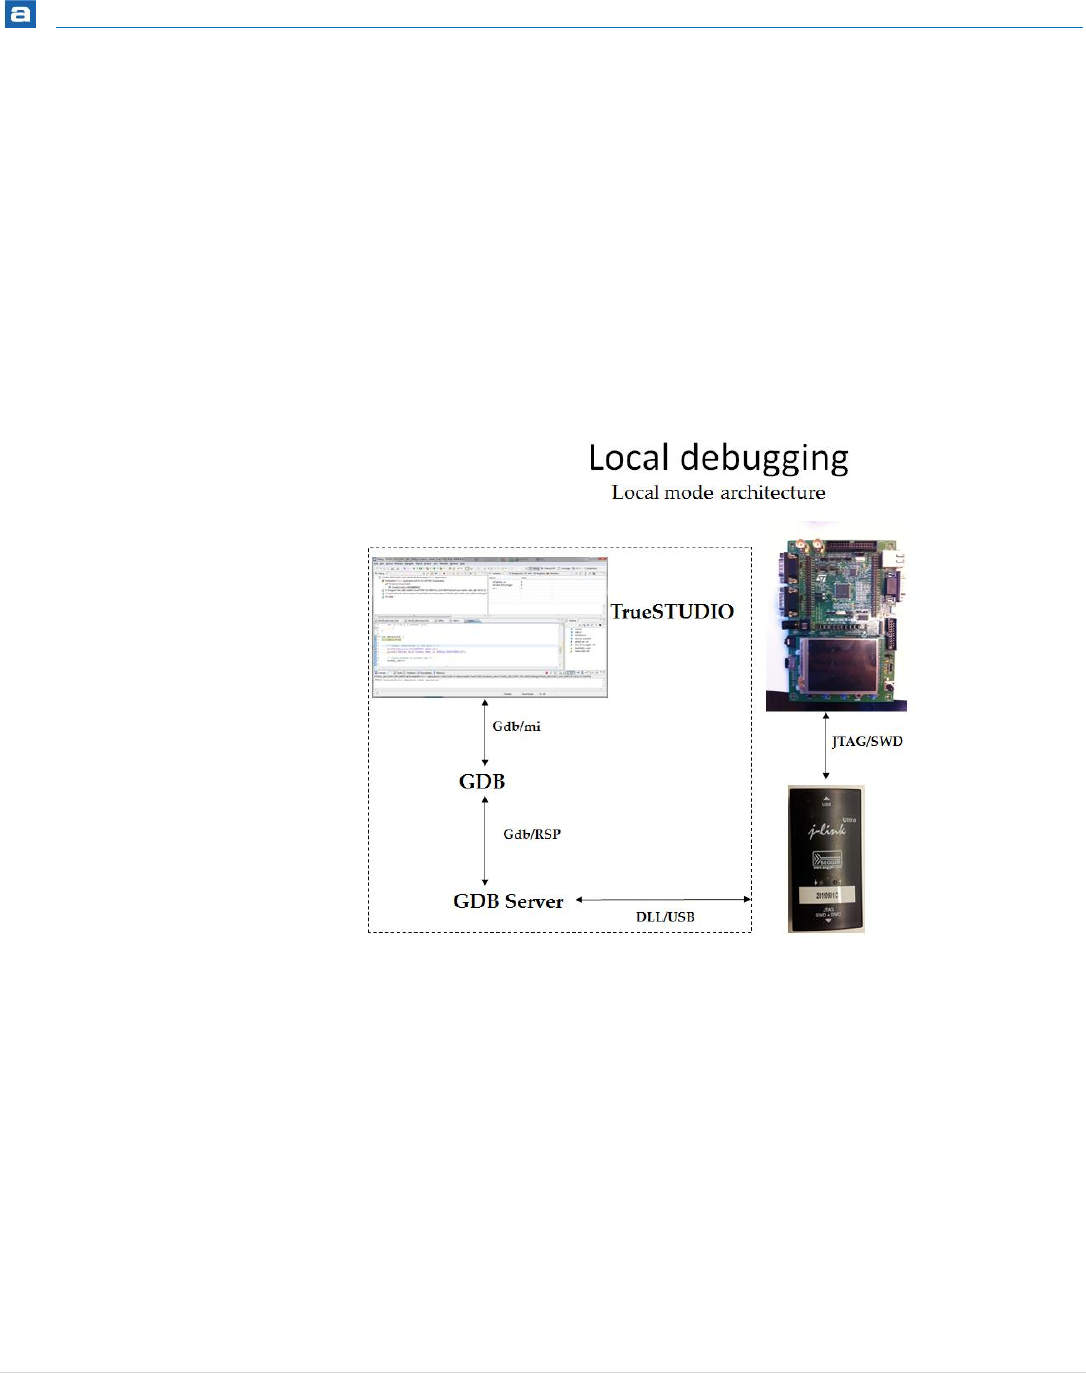
Debugging
216 | P a g e
INTRODUCTION TO DEBUGGING WITH
TRUESTUDIO
Atollic TrueSTUDIO includes a very powerful graphical debugger based on the GDB
command line debugger. Atollic TrueSTUDIO also bundles GDB servers for the ST-LINK and
SEGGER J-Link JTAG probes.
Debugging with Atollic TrueSTUDIO is done with a GDB Server. The GDB Server is a
program that connects GDB (GNU Debugger) on the PC to a target system. It can be
started locally or remotely as shown in the two conceptual pictures below:
Figure 192 –Local Debugging
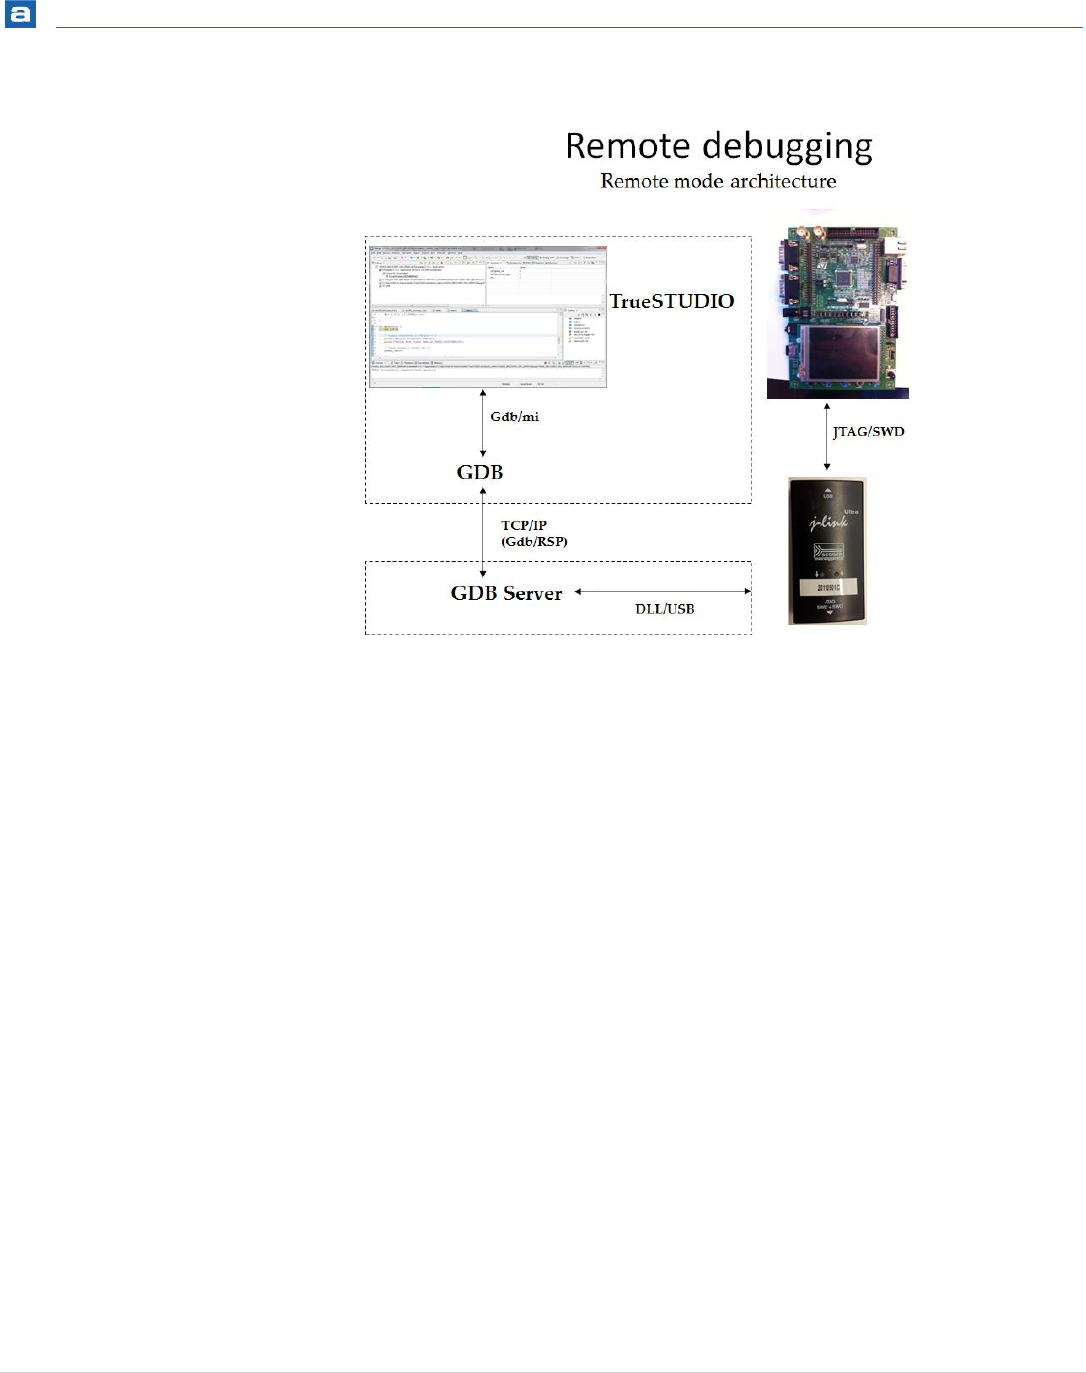
Debugging
217 | P a g e
Figure 193 –Remote Debugging
If Local debugging is selected Atollic TrueSTUDIO automatically starts and stops the GDB
server as required during debugging, thus creating a seamless integration of the GDB
server.
To prepare for debugging with an ST-LINK JTAG probe connected to your electronic board,
perform the following steps:
1. Verify that the RAM and FLASH configuration switches on the target board
is set to match the Atollic TrueSTUDIO project configuration, regarding
memory. Note: Not all boards have such configuration abilities.
2. Determine whether the board supports JTAG-mode or SWD-mode
debugging, or both, and if Serial Wire Viewer (SWV) operation is
supported. Note that the physical connector for the JTAG probe may be
identical, regardless of the modes supported. Consult the hardware Circuit
Diagram or a Hardware Designer within your organization to determine the
actual debug modes supported.
3. Connect the JTAG cable between the JTAG probe and the target board.
4. Connect the USB cable between the PC and the JTAG probe.
5. Make sure the target board has a proper power supply attached.
Once the steps above are performed, a debug session in Atollic TrueSTUDIO can be
started.
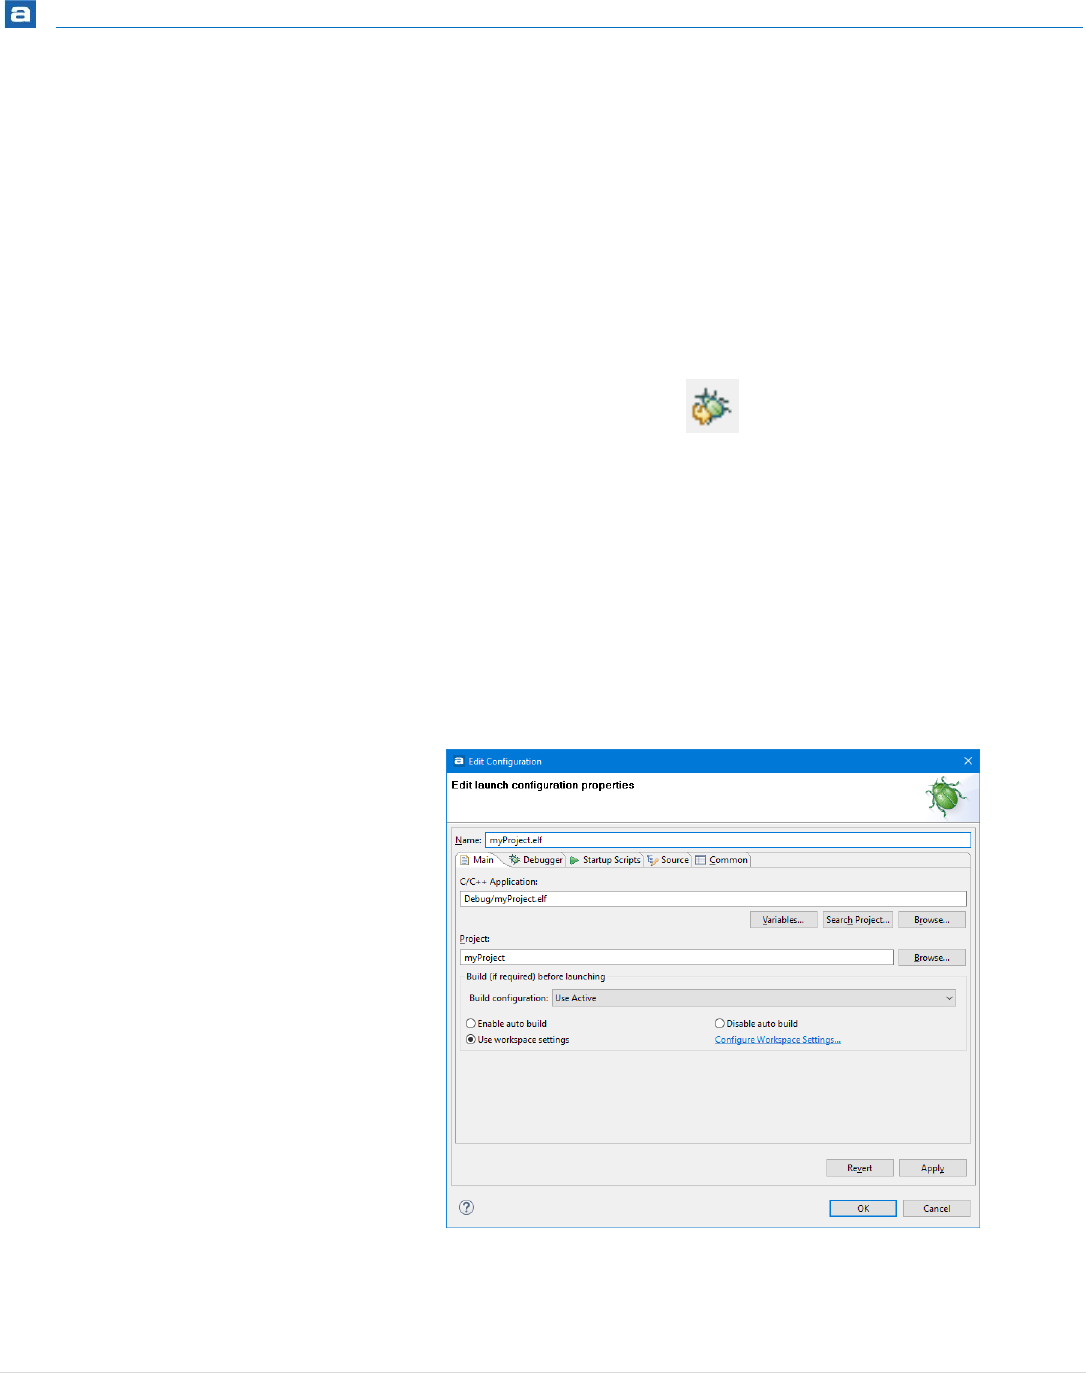
Debugging
218 | P a g e
STARTING THE DEBUGGER
Perform the following steps to start the debugger locally:
1. Select your project in Project Explorer view to the left.
2. Click on the Debug toolbar button (the insect icon) or press the F11 key to
start the debug session.
Figure 194 – Start Debug Session Toolbar Button
Alternatively, start the debug session by right-clicking on the project name
in the Project Explorer view. Then select Debug As, Embedded C/C++
Debugging from the context menu.
3. The first time debugging is started for a project; Atollic TrueSTUDIO
displays a dialog box that enables the user to confirm the debug
configuration, before launching the debug session. After the first debug
session is started, this dialog box will not be displayed any more.
Figure 195 - Debug Configuration Dialog Box
The debug configurations can also be reached by clicking the Configure
Debug toolbar button.
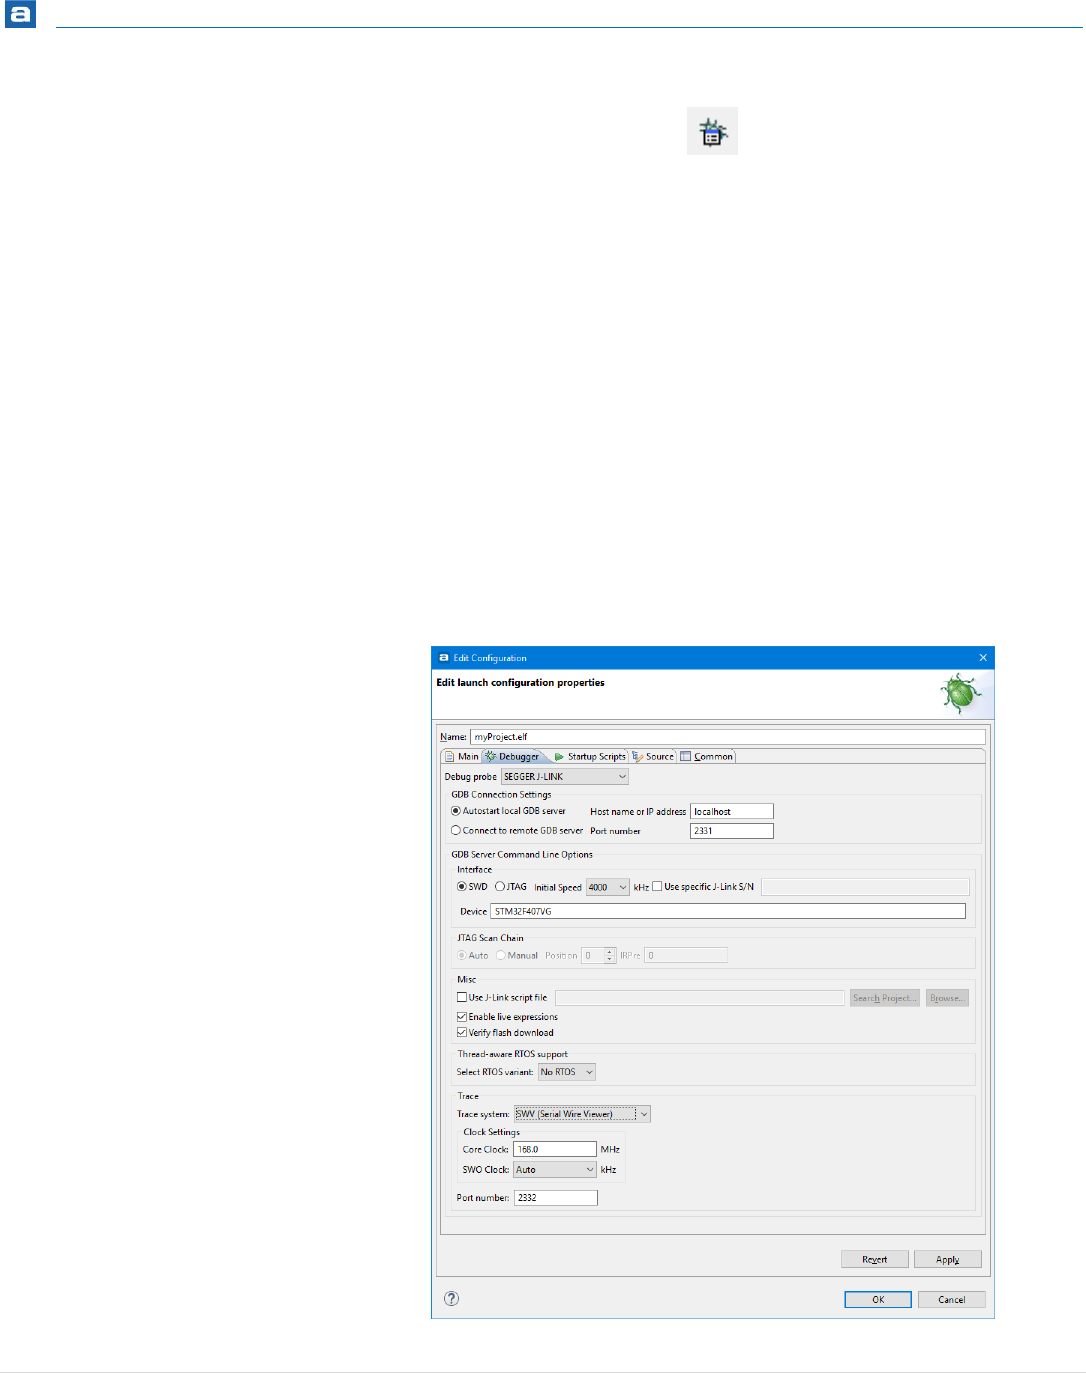
Debugging
219 | P a g e
Figure 196 – The Configure Debug Toolbar Button
4. The Main panel contains information on the project and executable to
debug. The settings in the Main panel do not normally have to be changed.
Make sure the path and name to the binary to debug is correct. See also
page 229.
5. Click on the Debugger panel to display it. The panel contains information
on the JTAG probe to use, its configuration, and how to start it. Some
settings are probe-specific.
6. Open the Debug probe drop down list. Select the JTAG probe to be used
during the debug session.

Debugging
220 | P a g e
Figure 197 - Debug Configuration, Debugger Panel for the SEGGER J-Link
Figure 198 - Debug Configuration, Debugger Panel for the ST-Link
The Debugger Panel for SEGGER J-Link probe contains a checkbox Use specific
J-Link S/N. Enable this checkbox If several SEGGER debug probes are
connected to the PC and enter the serial number of the SEGGER J-Link probe to
be used.
Update the Device name if there is a problem to use Segger J-Link gdbserver
with default device name. The name to use can be found if
JLinkGDBServer.exe is started and Target device is selected in the Config GUI.
Select RTOS variant listbox can be used if Thread-aware RTOS support is used
with FreeRTOS and embOS.
It has been noticed that when Thread-aware RTOS support is used there may
be a need to updated the gdb Target Software Startup Scripts. The script is
available in the Startup Scripts tab. Please add “thread 2” command line
before the last “continue” command in the script. This will force a thread
context switch before the “continue” command is sent.
Debugging
221 | P a g e
7. GDB Connection Settings. Normally these don’t have to be changed. For
remote debugging change the Autostart radio-button to Connect to
Remote, see page 224 for more information.
The port number can always be changed. When the debug session is
started, the GDB server will prompt Atollic TrueSTUDIO for what port to
use in the communication.
8. Select debug probe Interface: SWD or JTAG, depending on the capabilities
of the target board and the selected JTAG probe.
9. If SWD interface was selected in step above, please proceed as follows;
otherwise skip to step 10.
For the ST-Link JTAG probe:
The SWV settings include the option Wait for sync packet.
Enabling this option will ensure that a larger part of the received
data packages are correct (complete), but may also lead to an
increased number of packages being lost. This is especially true if
the data load (number of packages) is high.
For the SEGGER J-Link JTAG probe:
The initial speed of the debug connection can be configured.
Atollic recommends starting at an initial speed of 4000 KHz. If the
communication turns out not to work as expected at that speed,
please try another value. Proceeding stepwise in this manner, will
lead to a quicker launch of the debug session.
The JTAG Scan Chain settings are specific to the JTAG interface
and are thus disabled, see page 225 for more information about
JTAG Scan Chains.
To be able to use some sort of tracings, select the appropriate
Trace system such as the Serial Wire Viewer (SWV) feature or the
Embedded Trace Buffer (ETB).
The Debugger Panel for ST-Link probe contains a checkbox Use specific ST-Link
S/N. Enable this checkbox if several ST-Link debug probes are connected to the
PC. The Scan button can be used to get the serial numbers of connected ST-
Link’s. After a scan the serial numbers are presented in the list-box. Use the
list-box to select the ST-LINK to be used for debugging.
When using two GDB servers at the same time, they must both use different
port numbers, e.g. 61234 and port 61244.
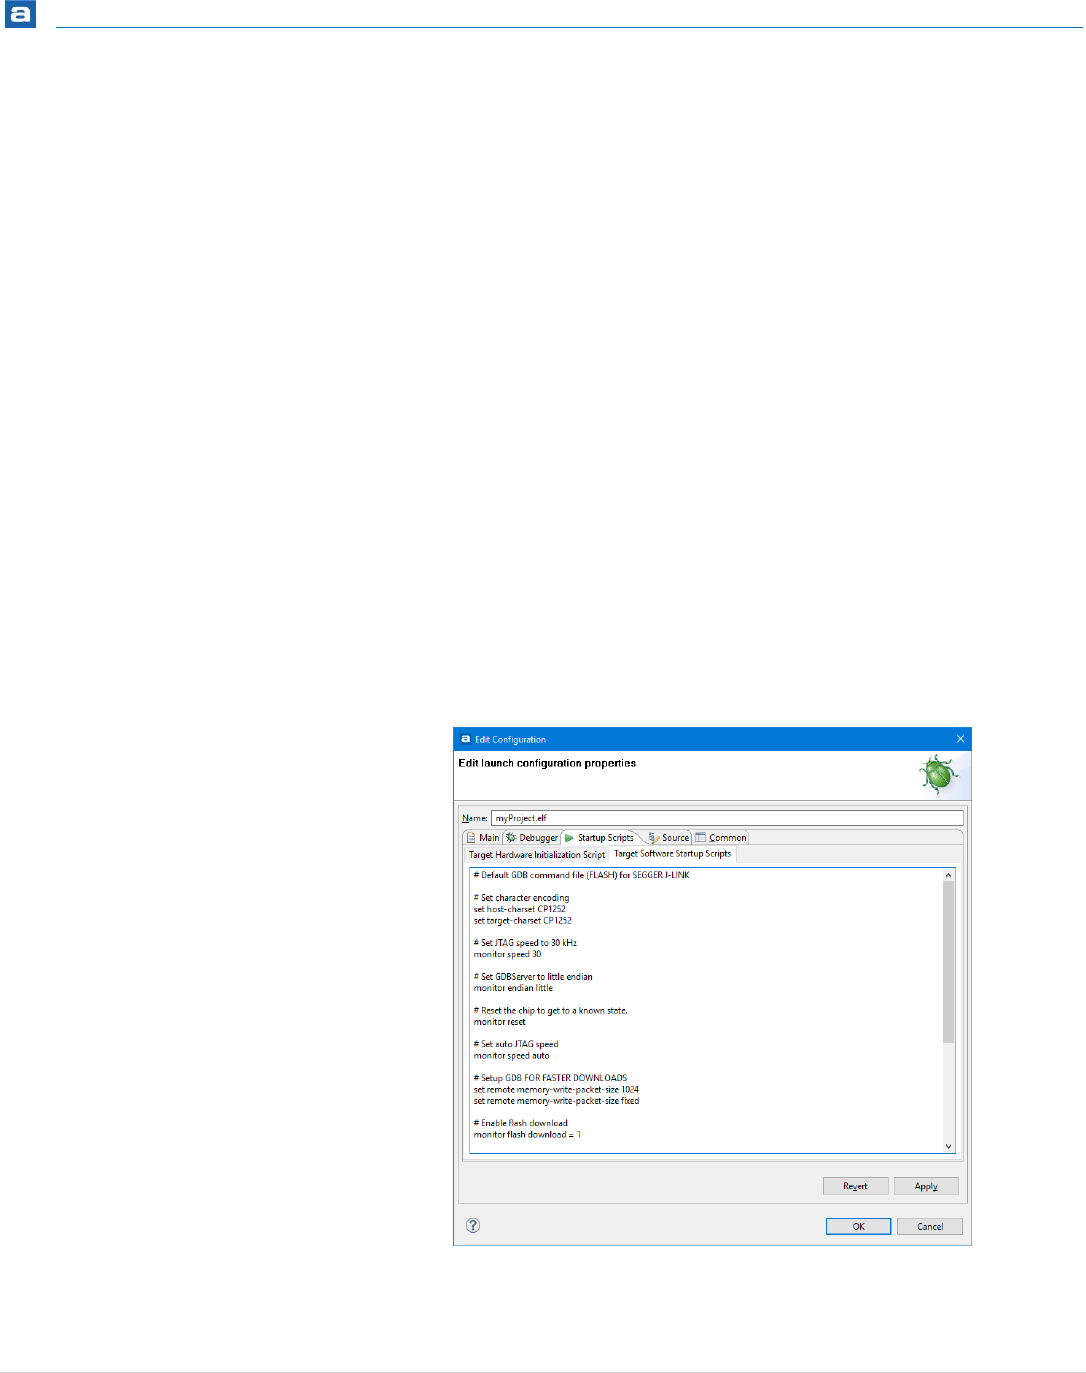
Debugging
222 | P a g e
10. If the ST-Link JTAG probe was selected in step 6, the Misc settings
contains a checkbox External Loader. Enable this checkbox if the program
shall be programmed into an external flash on the board. The Scan button
can be used to get a list of external flash loader files, “.stldr”, included
with STM32 CubeProgrammer. Use the list-box to select the “.stldr” file
to be used for programming the external flash. It is also possible to
manually enter a path and filename to a “.stldr” filename directly into
the list-box.
11. If any other debug probe than ST-Link JTAG probe was selected in step 6,
the following Misc settings are relevant:
Atollic TrueSTUDIO is able to automatically recognize and launch J-Link
scripts at the start of a debug session. If a script is needed to debug a
wizard-created project, the wizard will also automatically create one.
To manually select the J-Link script to be launched, please enable the Use
J-Link script file option and browse to the desired script file.
To be able to use the Live Expressions view during debugging the Live
Expression mechanism has to be enabled during startup. It is enabled by
default.
12. Click on the Startup Scripts panel to display it.
Figure 199 - Debug Configuration, Startup Scripts Panel
Debugging
223 | P a g e
13. The Startup Script panel contains the initialization scripts that are sent to
the GDB debugger upon debugger start. The scripts can contain any GDB or
GDB server commands that are compatible with the application, JTAG
probe and target board. The Startup Script tab is also where GDB script
programs are defined.
For more information see The Startup Script chapter at page 227.
The Target Hardware Initialization tab is for the script used to initialize the
hardware and the Target Software Startup Scripts tab is for the scripts
used to initialize the software.
14. Click on the OK button to start the debug session.
15. Atollic TrueSTUDIO launches the debugger, and switches to the Debug
perspective, which provides a number of views and windows suitable for
debugging.
If there is a problem for Atollic TrueSTUDIO to connect to the GDB Server.
Then please check the connection to the hardware.
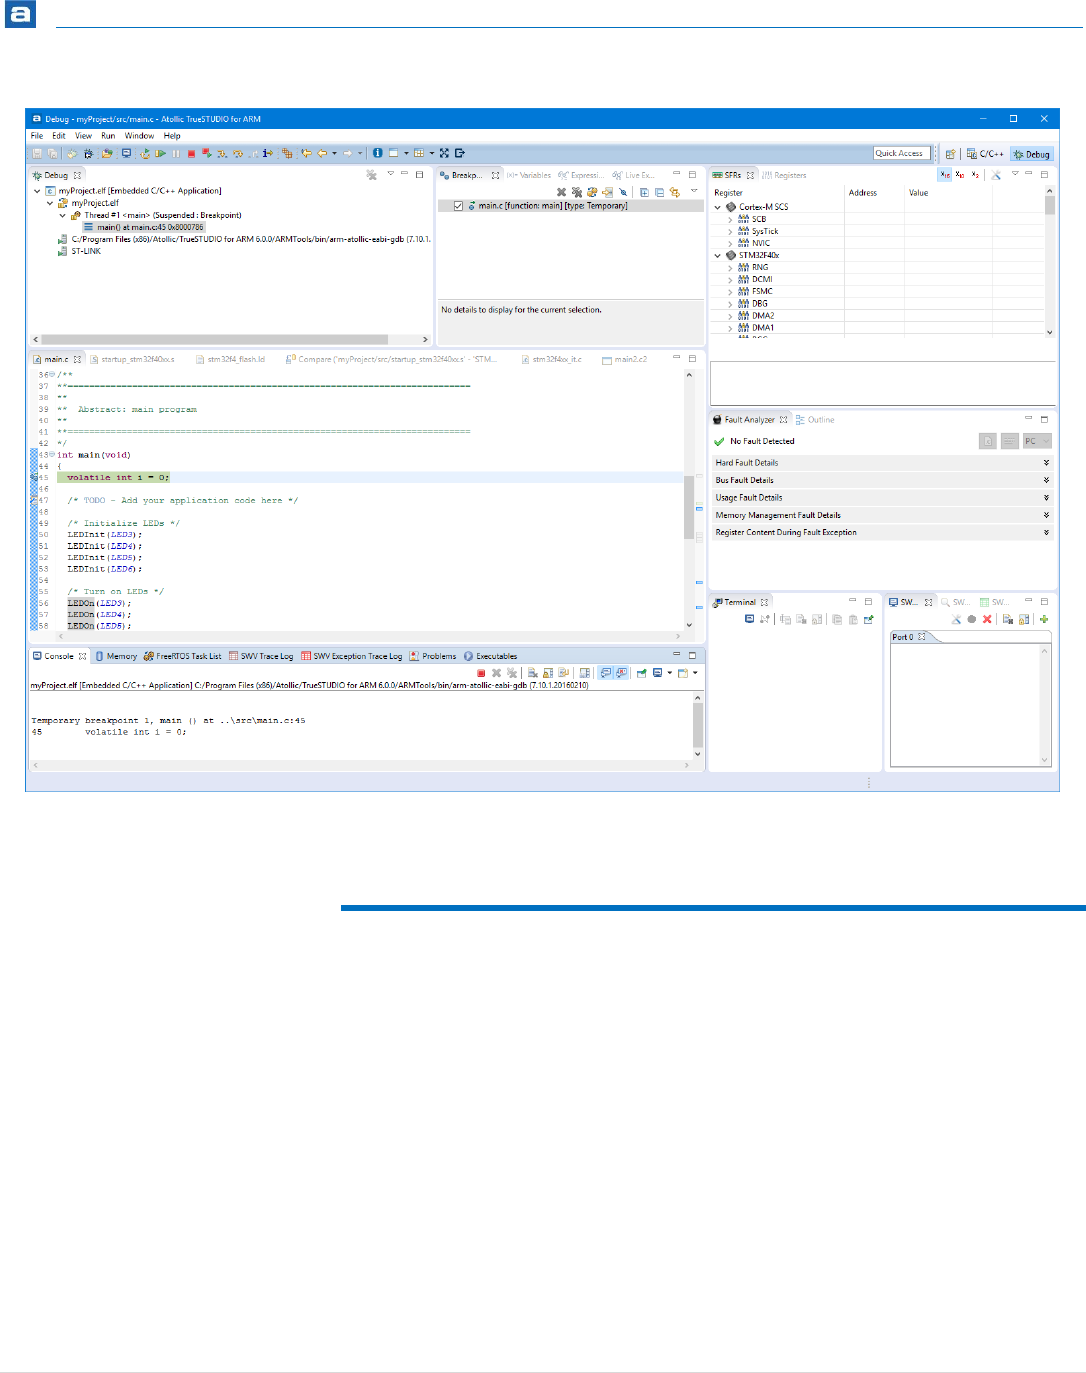
Debugging
224 | P a g e
Figure 200 – Debug Perspective
EXTERNAL GDB SERVER
The GDB Server can also be manually started as an external program as seen on page 216.
To do that, open a command console window and change folder to the folder where the
GDB server is located (%INSTALLATION_DIR%\Servers\Selected Server).
Manually enter the command to start the GDB server.
For ST-Link - ST-LINK_gdbserver.exe -v -d –e
For Segger J-Link - JLinkGDBServer.exe
The GDB Server will now start.
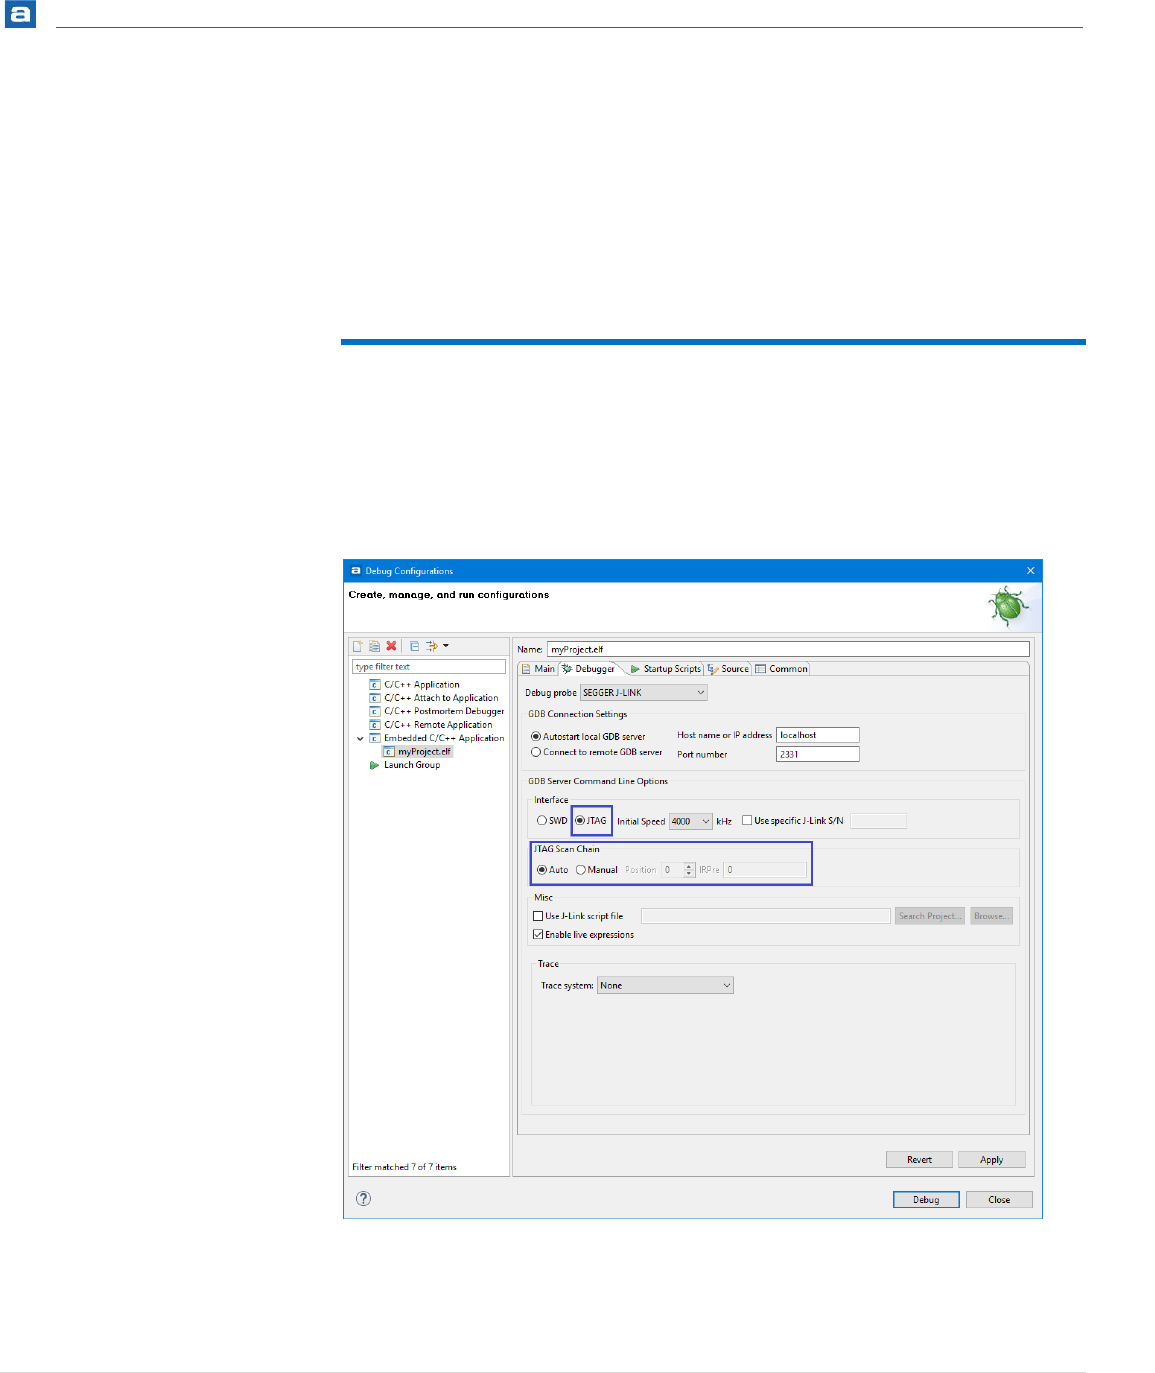
Debugging
225 | P a g e
Open the debug configuration for the project and in the Debugger tab change the GDB
connection setting to be Connect to remote GDB server.
If the setting is made correctly when starting a debug session, some logging will be seen in
the command console window.
JTAG SCAN CHAIN
Some JTAG probes can be used for multi target and multi core debugging in a JTAG Scan
Chain. This requires the configuration of JTAG Scan Chain settings.
Please note that the JTAG Interface must be selected in the Debug Configuration for JTAG
Scan Chain to work.
Figure 201 – JTAG Scan Chain Selected
In most cases, Atollic TrueSTUDIO is able to automatically detect these settings, in which
case the Auto option has been selected.

Debugging
226 | P a g e
If manual configuration is required, please select the Manual option. Then select Position
and IRPre for each core.
If a Segger JTAG Probe is used, more information can be found in the J-Link User Guide,
section 5.3.1 and 5.3.3, included with the Atollic TrueSTUDIO installation. It can be found
by selecting the Information Center toolbar button and open the Information Center
view. Locate Document center, Debugger utilities in the Information Center and press the
J-Link User Guide link.
For more information, please refer to the documentation from the debugger probe
manufacturer, microcontroller manufacturer and/or the manufacturer of the target board.

Debugging
227 | P a g e
THE STARTUP SCRIPT
The Startup Script panel contains the initialization scripts that are sent to the GDB
debugger upon debugger start. The scripts can contain any GDB commands or GDB server
commands that are compatible with the application, JTAG probe and target board. The
Startup Script tab is also where GDB script programs are defined.
More about the GDB script commands can be found in the Debugger manual bundled with
Atollic TrueSTUDIO and found in the Information Center.
It is possible to edit the script with the GDB commands needed to start the Debugging in a
proper way.
START DEBUGGING AT THE VERY BEGINNING
One common thing to edit is to change the continue statement at the end of the GDB
script to a comment. When the continue statement is removed/commented the program
will stop at the Reset_Handler where it is possible to step forward in the code.
LOAD THE PROGRAM WITHOUT DEBUGGING
Another possibility is to remove all code after the load command and replace it with a
quit command. Atollic TrueSTUDIO will then load the program to the target, but then
immediately quit debugging and return to the C/C++ perspective.
HARDWARE INITIALIZATION CODE
It is also possible to add the initialization code for external memories, such as SDRAM,
here. It is usually done in the Target Hardware Initialization script.
In most cases the Target Hardware Initialization script can be empty but if some hardware
needs to be configured before software can be loaded to target commands can be added
here. For example in some systems the external data/address bus and DRAM refresh
control needs to be initialized before software can be loaded.

Debugging
228 | P a g e
MANAGING THE DEBUG CONFIGURATIONS
A majority of Atollic TrueSTUDIO users will focus on the Build Configuration for Debug.
This is to be able to build, download and investigate the behavior of the software during
execution. The build configuration named Debug, has two important properties:
Complete symbolic information is emitted by the tool chain to help the user
navigate the information in the source code, during the debug process.
The lowest level of optimization is normally used, to maintain a direct relationship
between source code and machine code. If too high optimization levels are used,
large portions of the generated machine code may be removed during
optimization. This limits the abilities to map source code to machine code.
Consequently it makes it harder to follow the execution at source code level in a
debugger.
When the software is considered to behave as required, a Release build configuration,
with no symbolic debug information, and a high level of optimization, is usually built. See
Build Configurations on page 88 for more information.
After switching from the Debug to the Release build configuration, the target board can be
programmed by launching a debug session. During this process, caution must be executed
to prevent unexpected results from occurring.
The Atollic TrueSTUDIO philosophy of determining which executable image will be loaded
into the target, with the current project settings, must be considered carefully.
It is possible to create multiple debug launch configurations. To do this, click on the
Configure Debug toolbar button.
Figure 202 – The Configure Debug Toolbar Button
This brings up the list of existing debug launch configurations. By right clicking on an
existing configuration, the options to create a new configuration, duplicate the existing, or
delete it, appears.
The easiest way to create a new configuration is to duplicate an existing one, edit the
configuration settings in the dialog box, and then rename it. In this way multiple debug
launch configurations are easily created. The user may toggle among the debug launch
configurations in the list, and launch the most suitable session for the task at hand.
If the user does not explicitly choose a debug launch configuration from the existing list,
Atollic TrueSTUDIO launches the most recently used debug launch configuration.
Assume that a user has created a build configuration named Debug, and a debug launch
configuration that loads the ELF-file, created by the Debug build, to the target. Assume
further that the user launches a debug session to debug this ELF-file.

Debugging
229 | P a g e
Following this, the user switches to the build configuration named Release, and launches a
new debug session by clicking on the debugging icon. Atollic TrueSTUDIO will fetch the
most recent debug launch configuration, which specifies that the ELF-file from the Debug
build configuration, and not the Release ELF-file, is to be programmed into the target.
Atollic TrueSTUDIO has no means of automatically selecting the ELF-file associated with
the currently active build configuration (Debug or Release), when a debug session is
started. The build image used will always be the one specified in the debug launch
configuration, regardless of the active build configuration.
This behavior is different from some other development environments that automatically
reconfigure the debug launch mechanism, to use the ELF-file from the currently active
build configuration.
In Atollic TrueSTUDIO, the user must create a debug launch configuration that explicitly
refers to the particular ELF-file that is to be loaded, when a debug session is started.
Example: The user generates a project from the Project Wizard and builds an ELF-file using
the build configuration named Debug. The debug session configuration dialog box shows
the location of the ELF-file:
Figure 203 – The target ELF-file in Debug Session Configuration
To create a debug launch configuration that refers to the Release ELF-file, instead of the
Debug ELF-file, simply change Debug in the above path to Release. It is recommended to
rename the debug launch configuration to clearly mark it as a Release configuration.
To load the Release ELF-file into the target, start a debug session based on this debug
launch configuration.
If desired, other properties of the new debug launch configuration can be edited as well.
For example, setting the temporary breakpoint at the first line of main(), may be
omitted by inserting a comment on the corresponding line in the GDB initialization script.
This is done via the Debug dialog box, in the Startup Scripts, Target Software Startup
Scripts panel.
GENERIC BINARY PATH
By default the path to the binary used when debugging includes the name to a selected
Build Configuration. However generic binary paths is also possible.
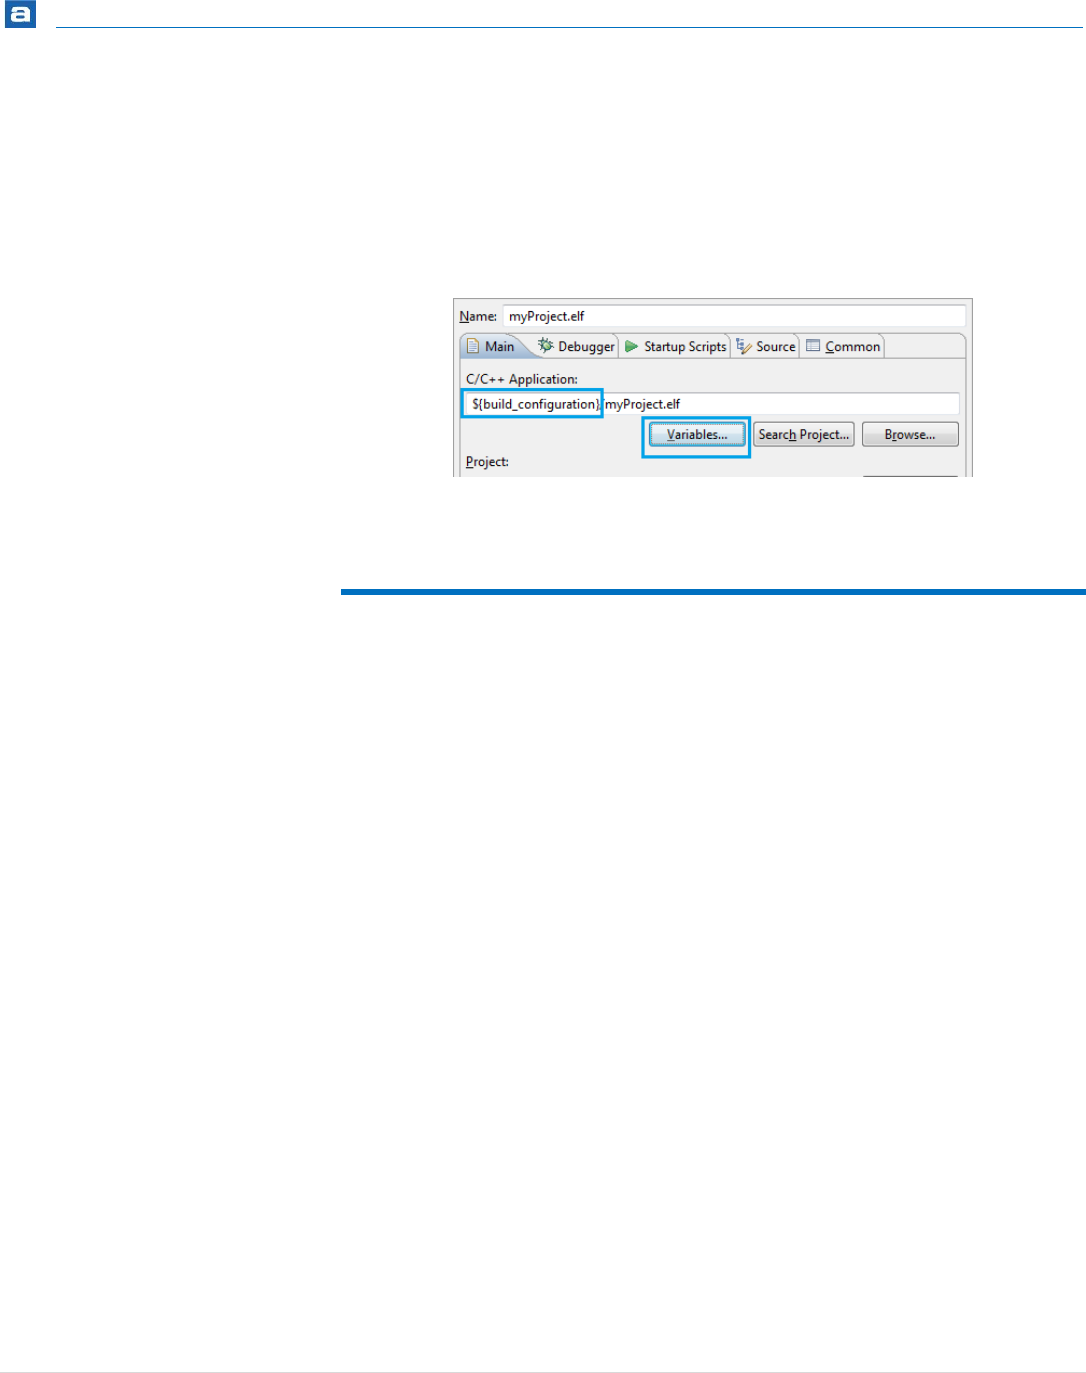
Debugging
230 | P a g e
It is possible to use different variables in the path to the binary. They can be accessed by
pressing the Variables… button.
One such variable is ${build_configuration}. When using it in the path Atollic
TrueSTUDIO will attempt to determine the name of the active Build Configuration
(normally Debug or Release) and replace the variable with that string. This can be used to
create a generic Debug Configuration that can be used in all debugging for all Build
Configurations.
Figure 204 – Using variables in the path
DEBUG LAUNCH CONFIGURATION SETTINGS FILE
The debug launch configuration settings are stored in the
DebugConfigFile.elf.launch file. Normally in TrueSTUDIO project this file is
stored in the project folder but <*.elf.launch> files can also be stored in the workspace
metadata folder.
In the Debug Configurations dialog there is a Common tab. In this tab the Save as
selection is used to select to save the debug launch configuration as Local file or as Shared
file. Normally in projects created with TrueSTUDIO project wizard the selection is set to
save as Shared file. The file will then be located by default in the Project folder in the
workspace. This makes it easier to export or store the debug configuration setting into a
version control system.

Debugging
231 | P a g e
Figure 205 – Debug configuration as shared file
In this way it is possible to have x number of debug launch configurations saved in the
project. Each file will be named according to the debug configuration name you specify
plus extension. E.g. File name: STM32F3_Discovery.elf.launch
When save as Local file is configured the debug configuration will be saved in the
workspace instead. E.g. File name:
C:\TrueSTUDIO\ARM_workspace_5.3\.metadata\.plugins\org.eclips
e.debug.core\.launches
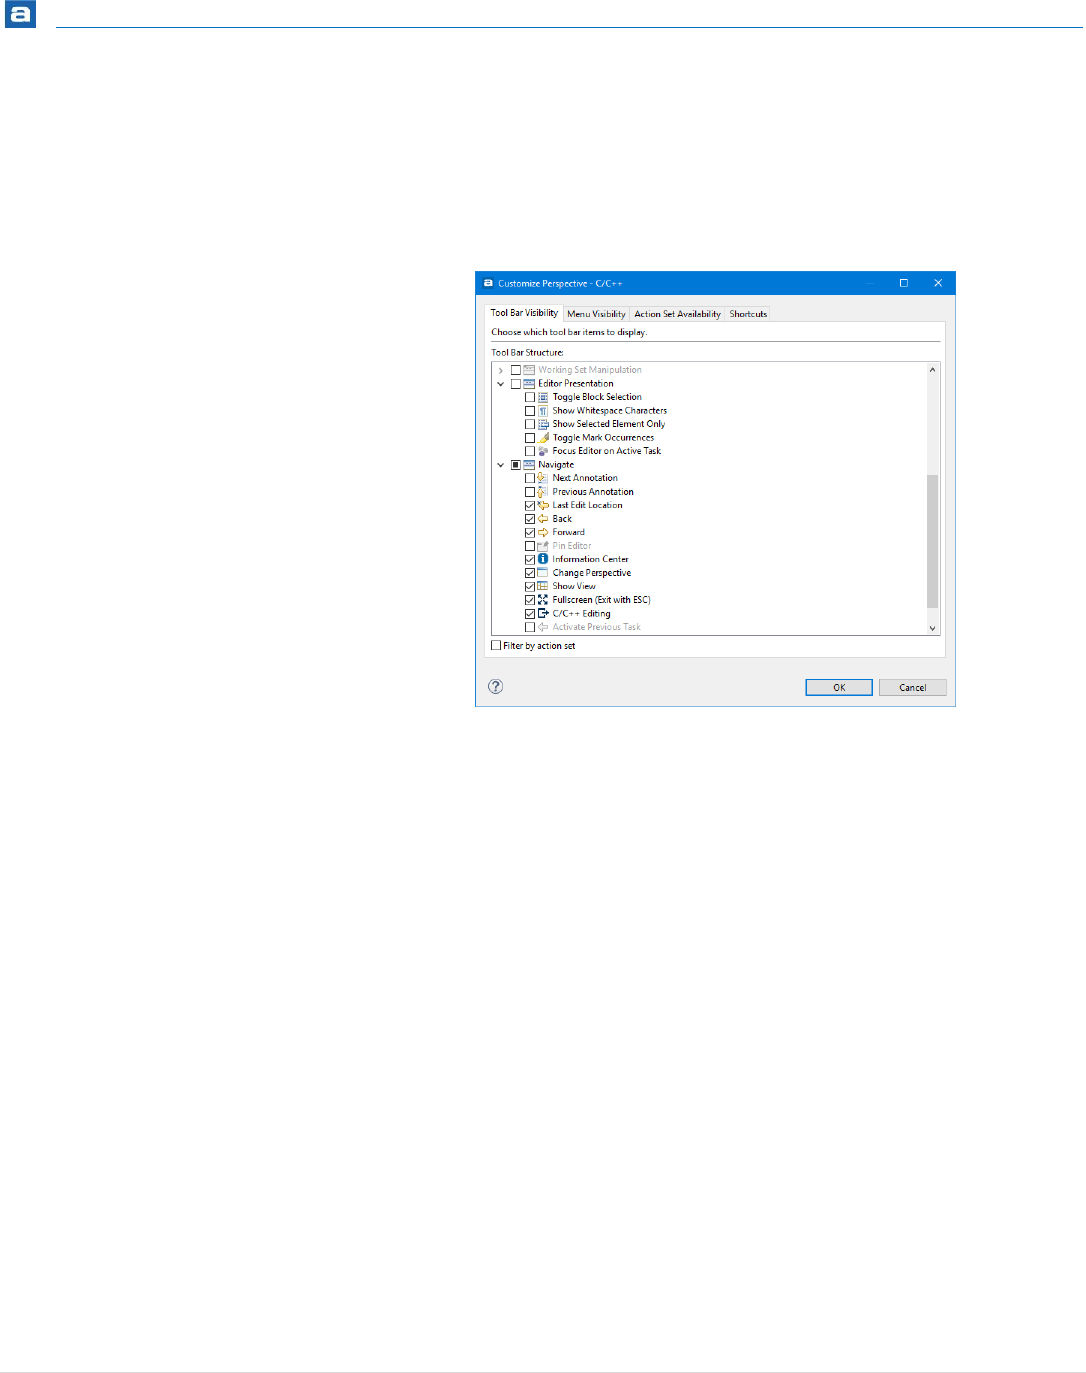
Debugging
232 | P a g e
CUSTOMIZE THE DEBUG PERSPECTIVE
The Debug perspective and other perspectives in Atollic TrueSTUDIO can be
enhanced with several toolbar buttons and menus by selecting the Window,
Customize Perspective menu command.
Figure 206 – Customize Perspective Dialog Box
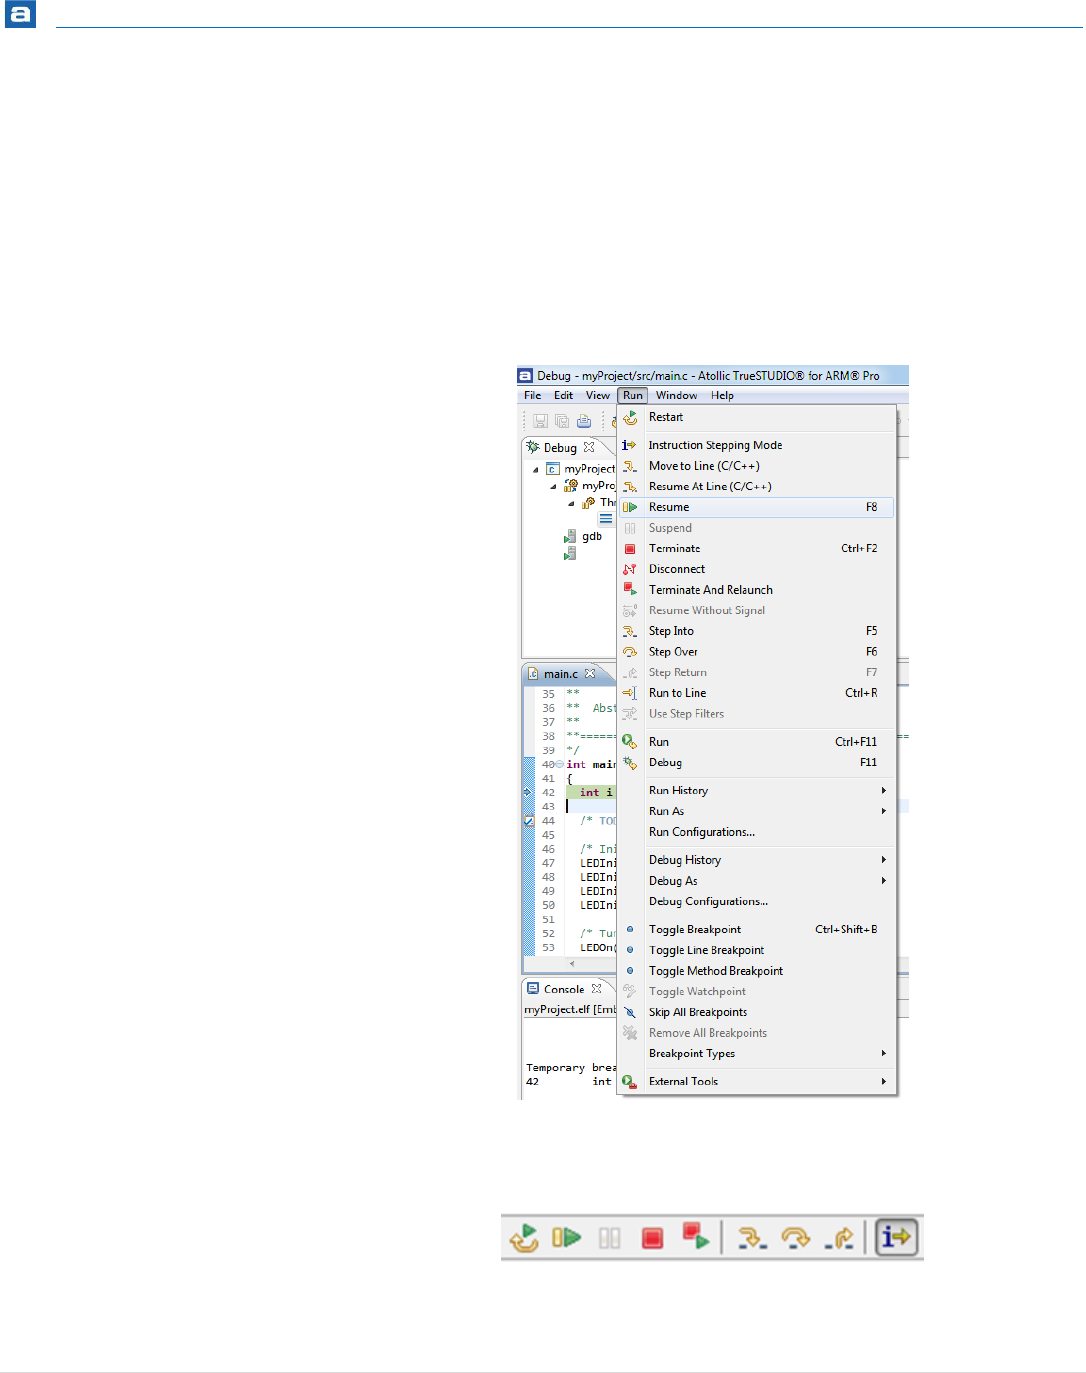
Debugging
233 | P a g e
DEBUGGING
Once the debug session has been started, Atollic TrueSTUDIO switches automatically to
the Debug perspective, sets a breakpoint at main(), resets the processor, and executes the
startup code until execution stops at the first executable program line inside main().
The Debug perspective is now active. The next program line to be executed is highlighted
in the source code window. A number of execution control functions are available from
the Run menu:
Figure 207 - Run Menu
Alternatively, the execution control commands are available in the Debug view toolbar.
Figure 208 - Run Control Command Toolbar
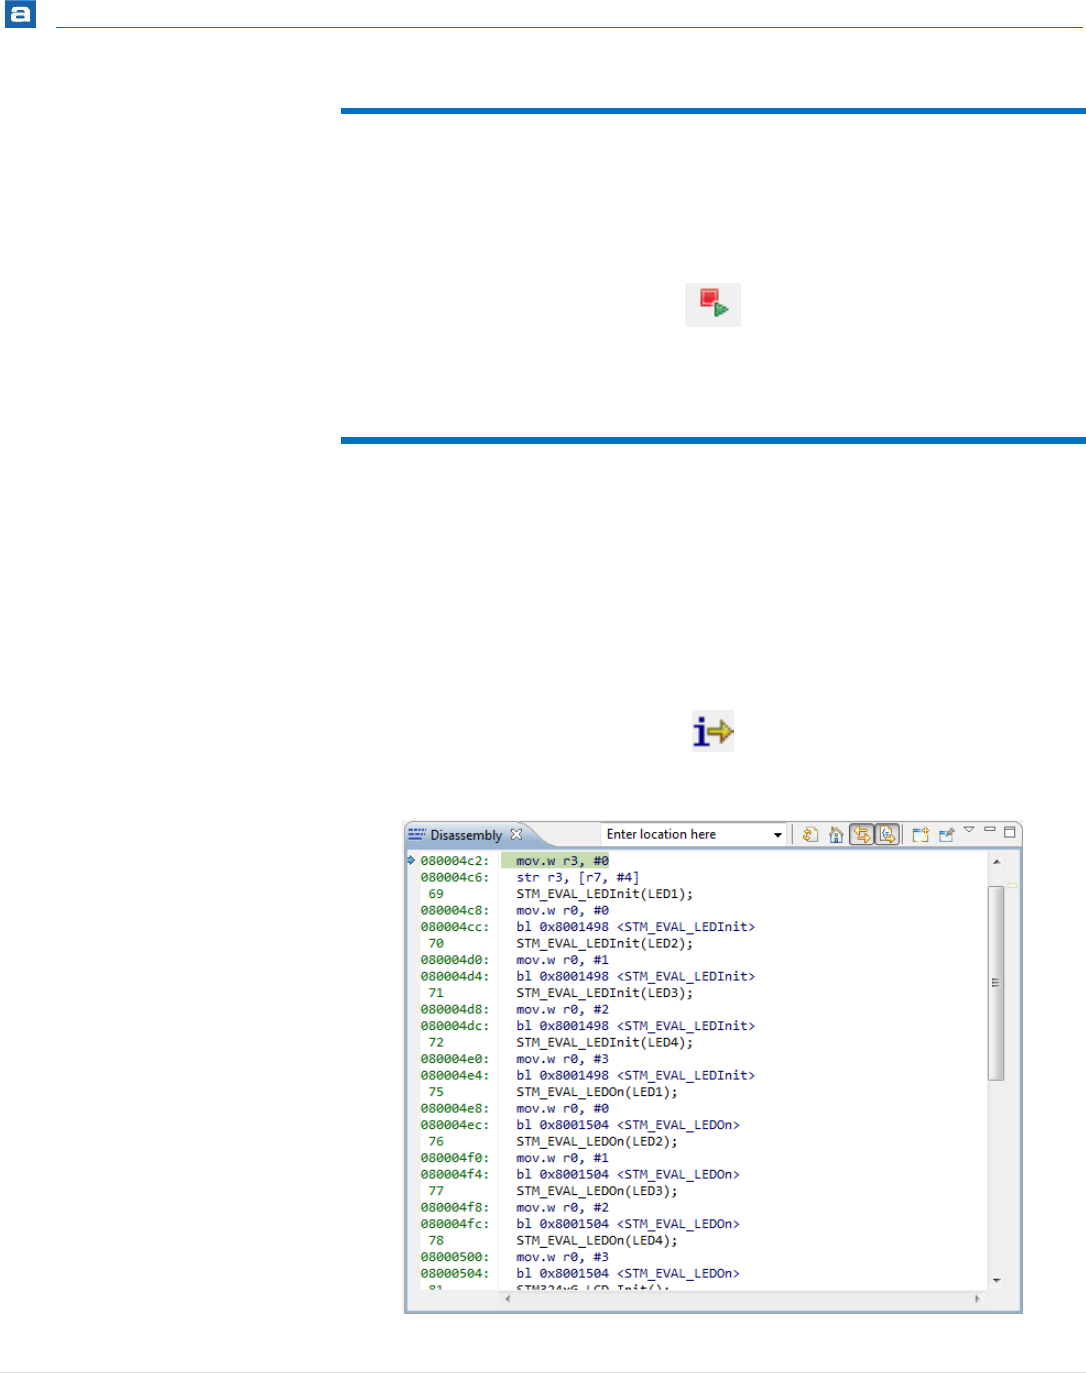
Debugging
234 | P a g e
TERMINATE, REBUILD AND RE-LAUNCH
By pressing this toolbar button, the current debug session is terminated, the source code is
built (modified source code only), a new build image generated and the debug session is
re-launched – all with just one mouse-click.
Figure 209 – Terminate, Rebuild and Re-launch Toolbar Button
DISASSEMBLY VIEW
A common user action, not available from the Run menu, is to switch between C/C++ level
stepping in the C/C++ source code window, and assembler level instruction stepping in the
Disassembly view.
Click on the instruction stepping button to activate assembler level instruction stepping in
the Disassembly view. Click it once more to return to C/C++ level stepping in the C/C++
source code window.
Figure 210 – Instruction Stepping Button
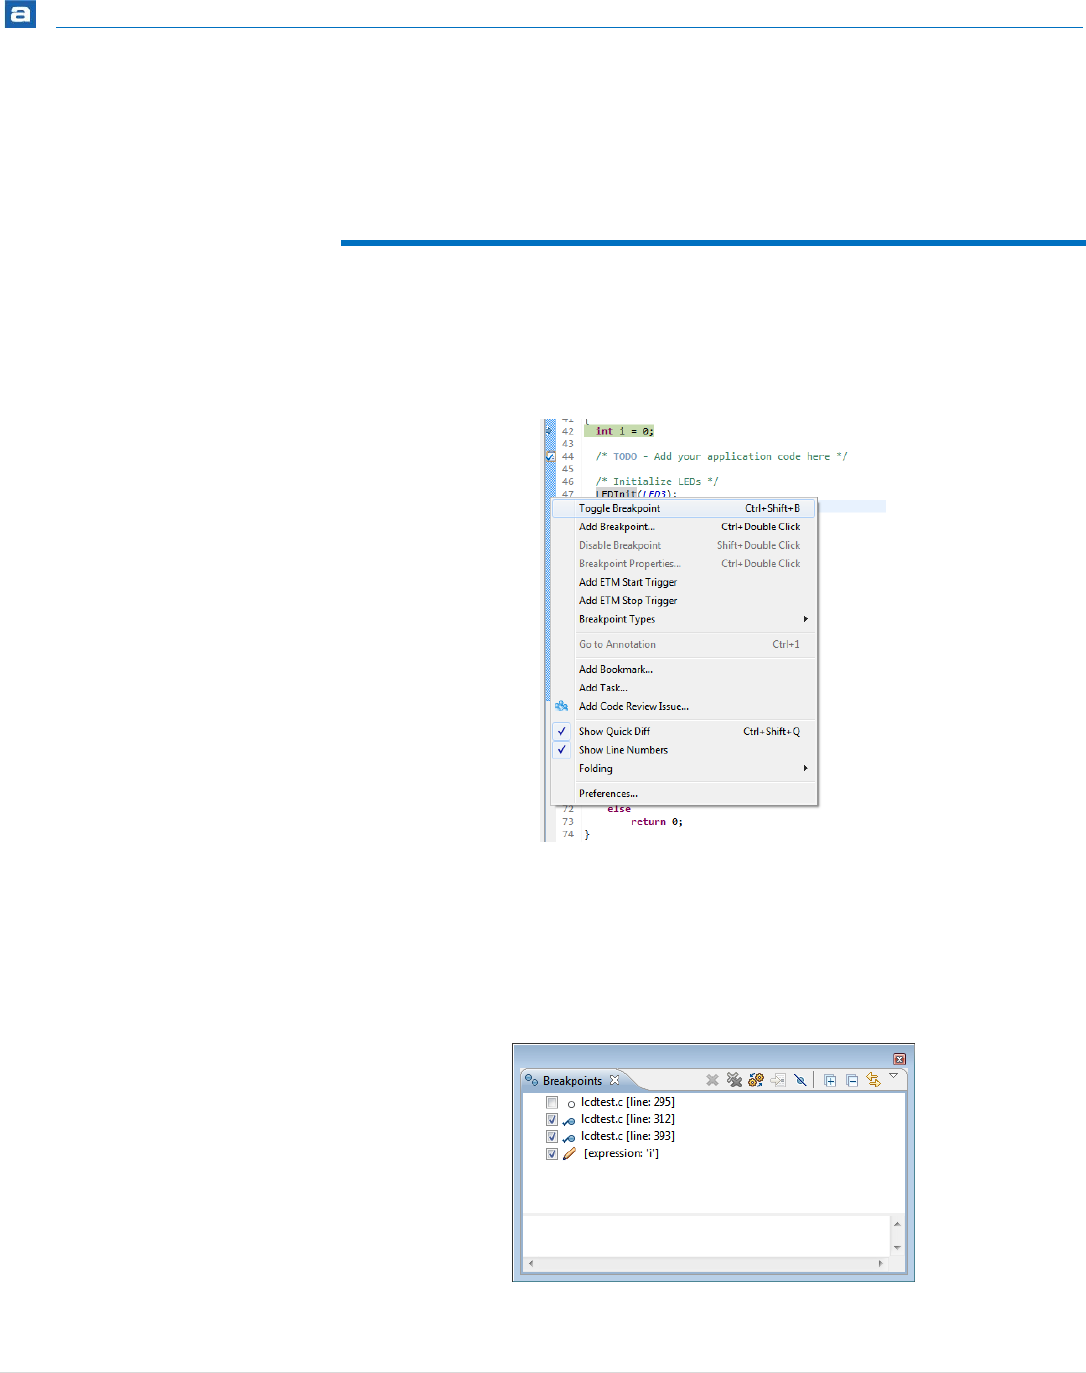
Debugging
235 | P a g e
Figure 211 – Disassembly View
By right-clicking in the left part of the view, the Function Offset can also be displayed.
BREAKPOINTS
A standard code breakpoint at a source code line can easily be inserted by double-clicking
in the left editor margin, or by right-clicking the mouse in the left margin of the C/C++
source code editor. A context menu will appear in the latter case.
Figure 212 - Toggle Breakpoint Context Menu
Select the Toggle Breakpoint menu command to set or remove a breakpoint at the
corresponding source code line.
More complicated types of breakpoints, such as Watch Points and Event Breakpoints (for
PC projects) are configured in the Breakpoints view.
Figure 213 – Breakpoints View
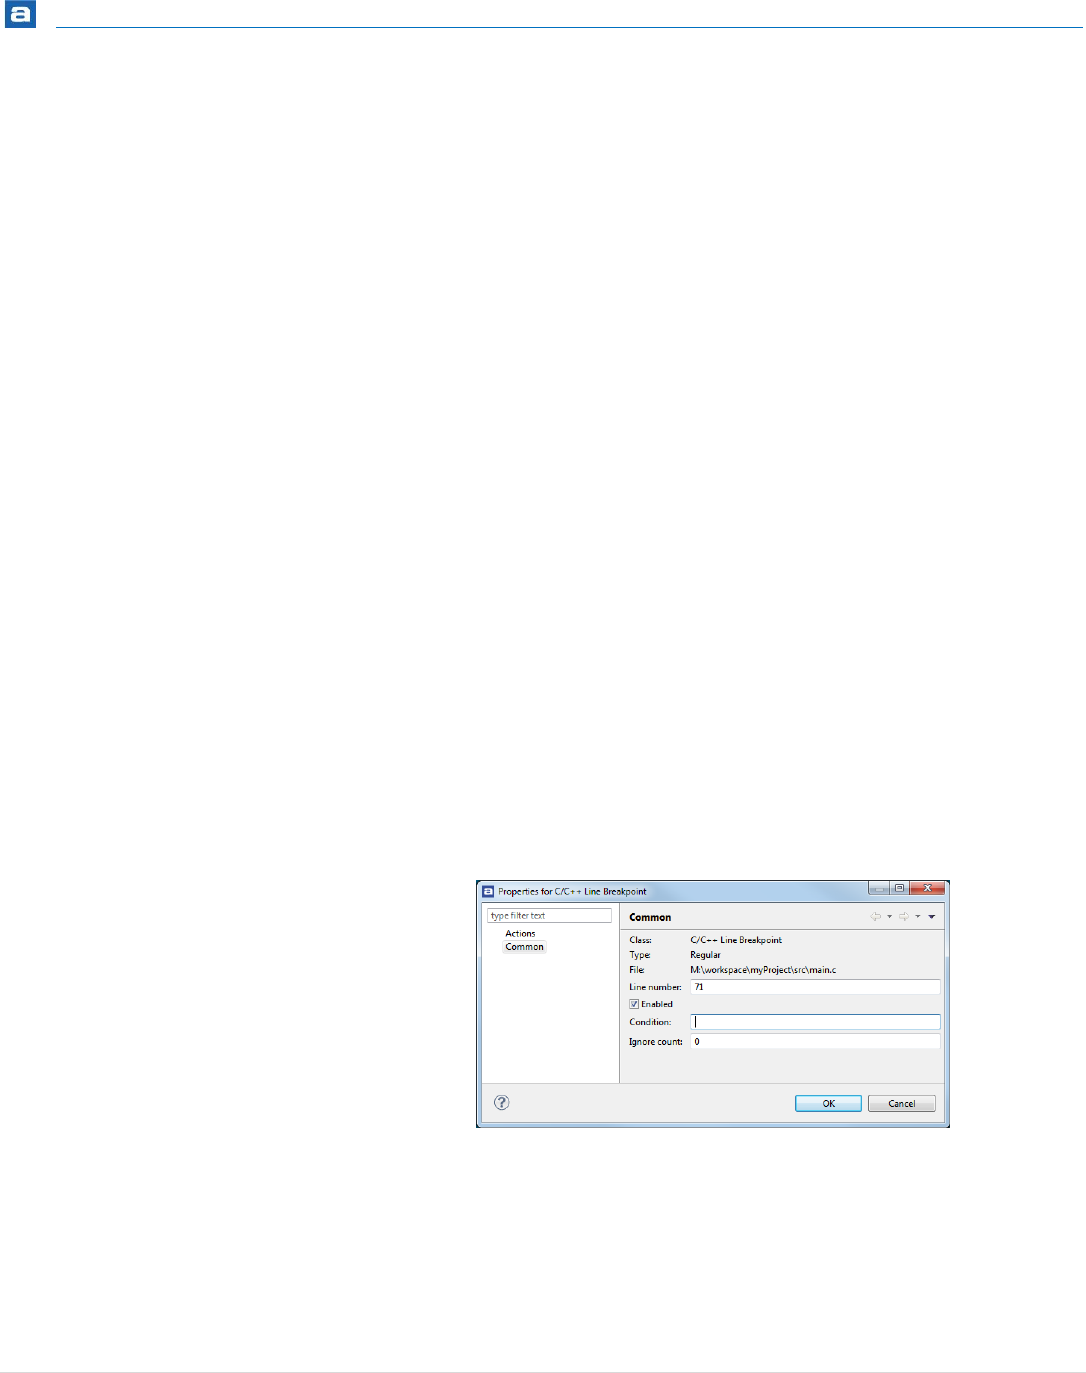
Debugging
236 | P a g e
Technically the breakpoints are either a hardware breakpoint or a software breakpoint.
The hardware breakpoints are handled by the Debug Unit of the CPU. The number of
hardware breakpoints depends on the target implementation, but normally an ARM 7/9
has two breakpoints and Cortex-M has four to six breakpoints (up to eight is possible).
A Software breakpoint is an instruction (BKPT) inserted into the code
Atollic TrueSTUDIO does not decide if a breakpoint should be a hardware breakpoint of a
software breakpoint. This is handled seamlessly by the GDB server.
Since this is handled by the GDB server, it is handled slightly different depending on what
GDB server is used.
For example: the ST-Link GDB server only uses hardware breakpoints, and is therefore
limited to 6 breakpoints.
The SEGGER J-Link GDB server uses both hardware and software breakpoints depending
on the number of breakpoints that the user want to set.
The SEGGER J-Link GDB server should therefore be able to support virtually unlimited
number of breakpoints using software breakpoints. But even here there is no manual
control whether the breakpoint should be set as software or hardware breakpoint.
CONDITIONAL BREAKPOINT
When setting a normal breakpoint the program will break each time reaching that line. If
that is not the desired behavior a condition can be set on the breakpoint that regulates if
the program should actually break or not on that breakpoint.
Set a breakpoint at a line. Right-click it and open the Breakpoint Properties... The
Breakpoint Properties can also be opened from the Breakpoints view.
The following view is opened.
Figure 214 – Breakpoints Properties
Enter a condition. In the example below “g1==100” is a global variable, but the variable
can also be a local stack variable.
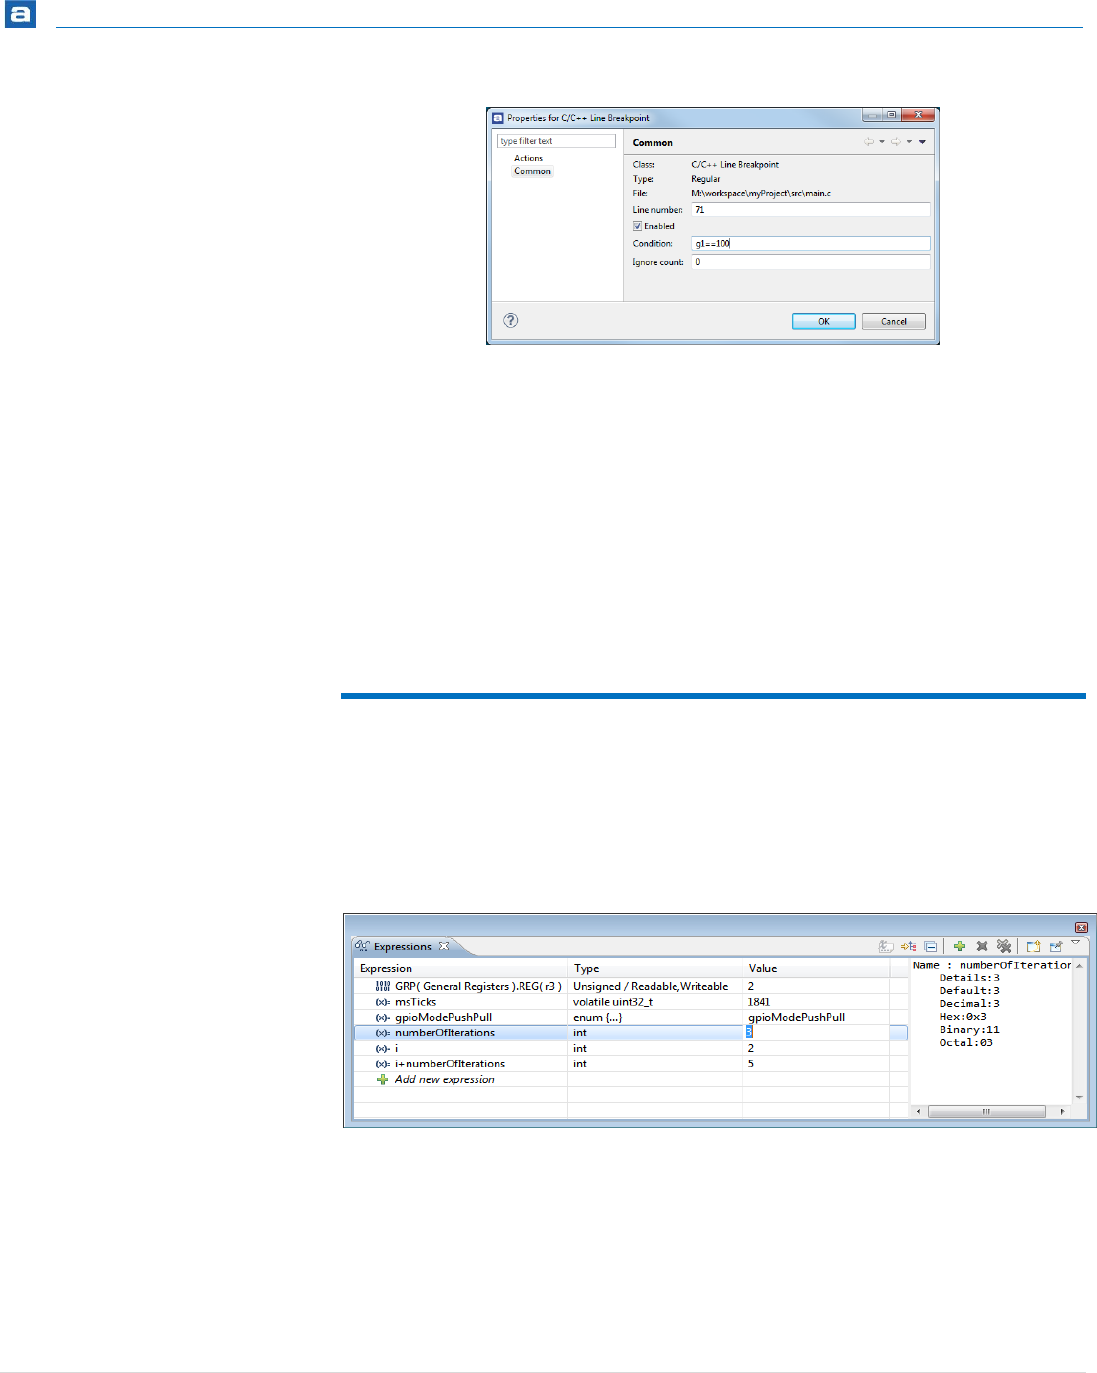
Debugging
237 | P a g e
Figure 215 – Conditional Breakpoint
What happens when running now is that the gdbserver will break each time the line is
executed but gdb will test the condition and restart running if the variable g1 not is equal
to 100. This method could be used when debugging an RTOS with several tasks if the RTOS
kernel has a variable that the Breakpoint condition could be tested on to see which task is
running. The only problem with this method is that it takes some time for GDB to evaluate
the condition.
The conditions are written in C-style so it is possible to write expressions such as
“g1%2==0” to get more complex conditions.
EXPRESSIONS
The Expressions view displays many different types of data, including global variables,
local variables and CPU core registers. The Expressions view also allows users to create
mathematical expressions that are evaluated automatically, such as (Index * 4 + Offset).
The information is updated whenever the debug execution is halted.
Figure 216 – Expressions View
An expression is displayed in many formats simultaneously, and the view can parse
complicated data types and display complex data types like a C-language struct.
Furthermore, CPU core registers may be added to the view, in addition to local and global
variables. Open the Register view and select Watch to add the register to the Expressions
view.
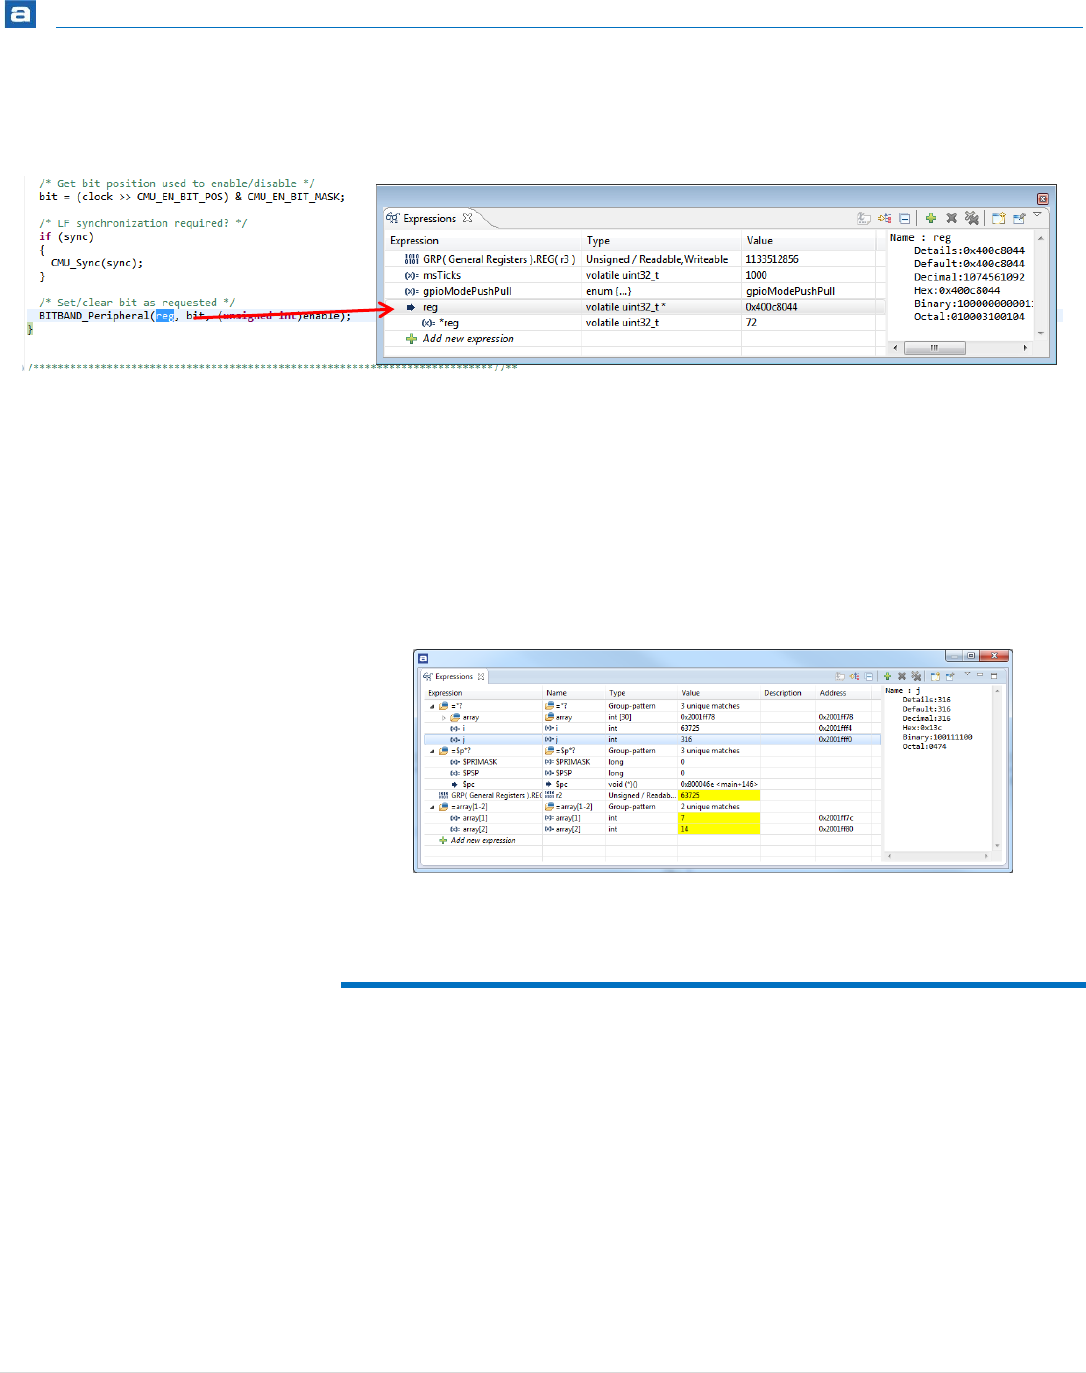
Debugging
238 | P a g e
The users may drag and drop variables from the editor into the Expressions view. This
applies to complex data types as well.
Figure 217 – Drag and Drop of Variable to the Expressions View
The value of variables and writeable registers may also be changed via the Expressions
view.
By starting an expression with “=” regular expressions can be used to display collapsible
groups of local variables and arrays.
By starting an expression with “=$” pattern matched groups of registers can also be
created.
Figure 218 – Complex Expressions
LIVE EXPRESSIONS
The Live Expressions view works a lot like the Expression view with the exceptions that all
the expressions are sampled live during the debug execution.
The view displays many different types of global variables. The Expressions view also
allows users to create mathematical expressions that are evaluated automatically, such as
(Index * 4 + Offset).
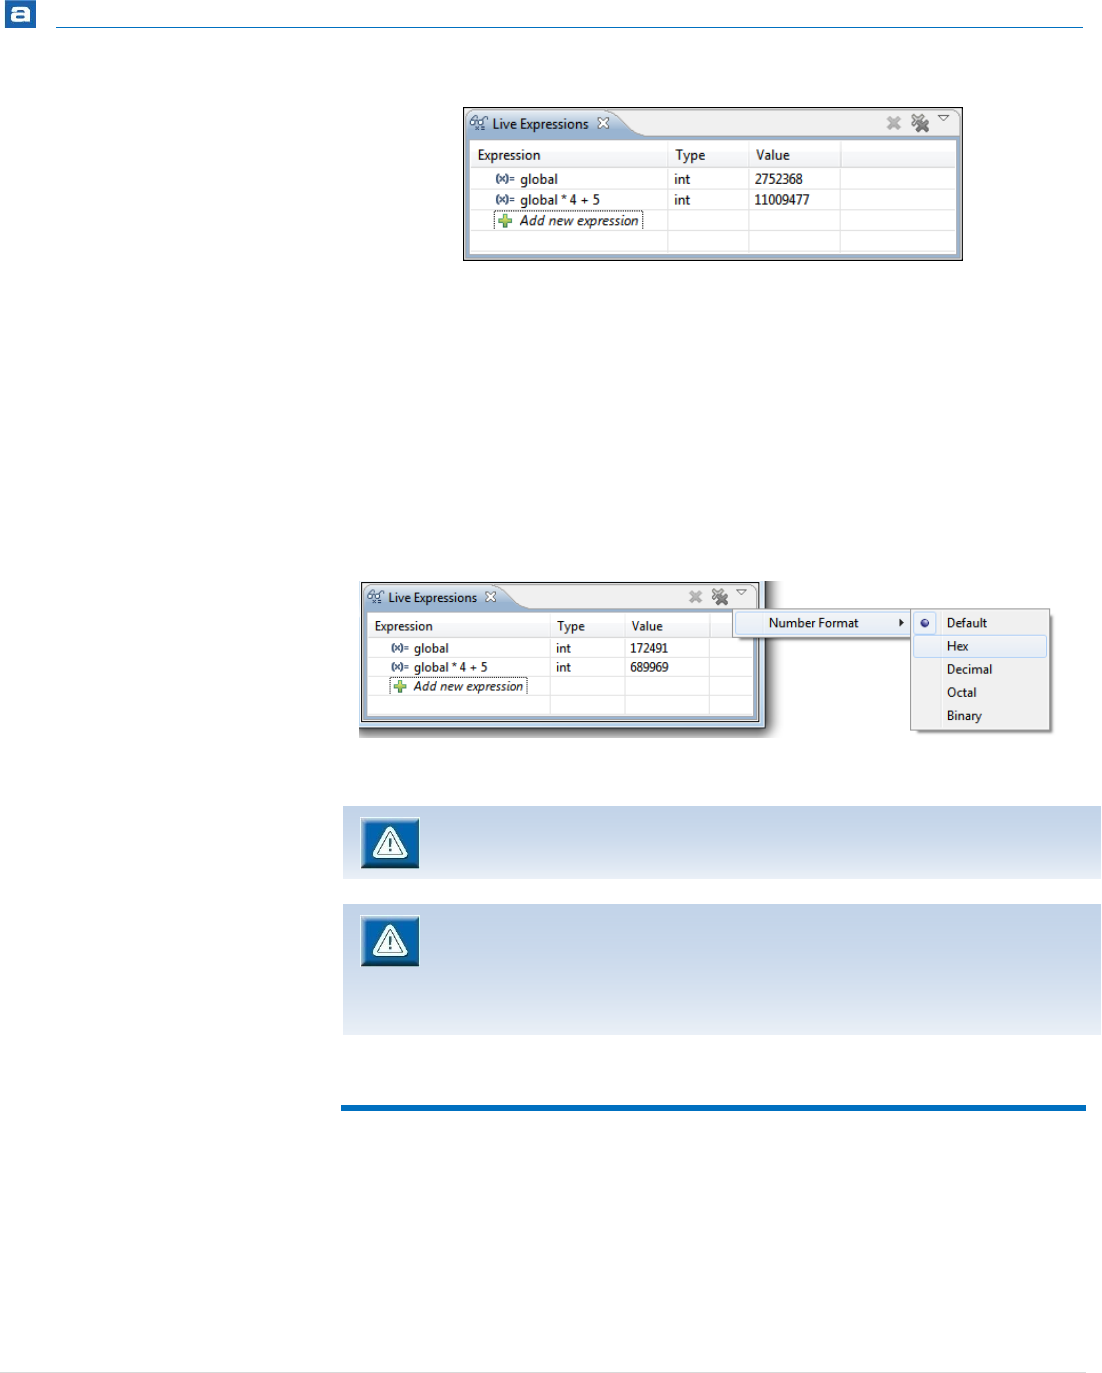
Debugging
239 | P a g e
Figure 219 – Live Expressions View
An expression is displayed in many formats simultaneously, and the view can parse
complicated data types and display complex data types like a C-language struct.
The sample speed is determined by the number of Expressions being sampled. An
increased number of Expressions being sampled will result in a slower sample rate.
Only one format of numbers is used at the same time to speed up the sampling. To change
the format, use the dropdown arrow.
Figure 220 – Live Expressions View Number Format
LOCAL VARIABLES
The Variables view auto-detects and display the value of local variables. It provides
extensive information about each variable, such as value in hex/dec/bin format. The
content of complex variable types is also displayed.
The Live Expressions view requires a Segger J-Link probe and a Segger J-Link
GDBServer v4.78h or later.
To be able to use the Live Expressions view during debugging the Live
Expression mechanism has to be enabled during startup. This is by default
enabled when Segger J-Link probe is selected in the debug configuration.
Please read the Starting the Debugger section for more information.
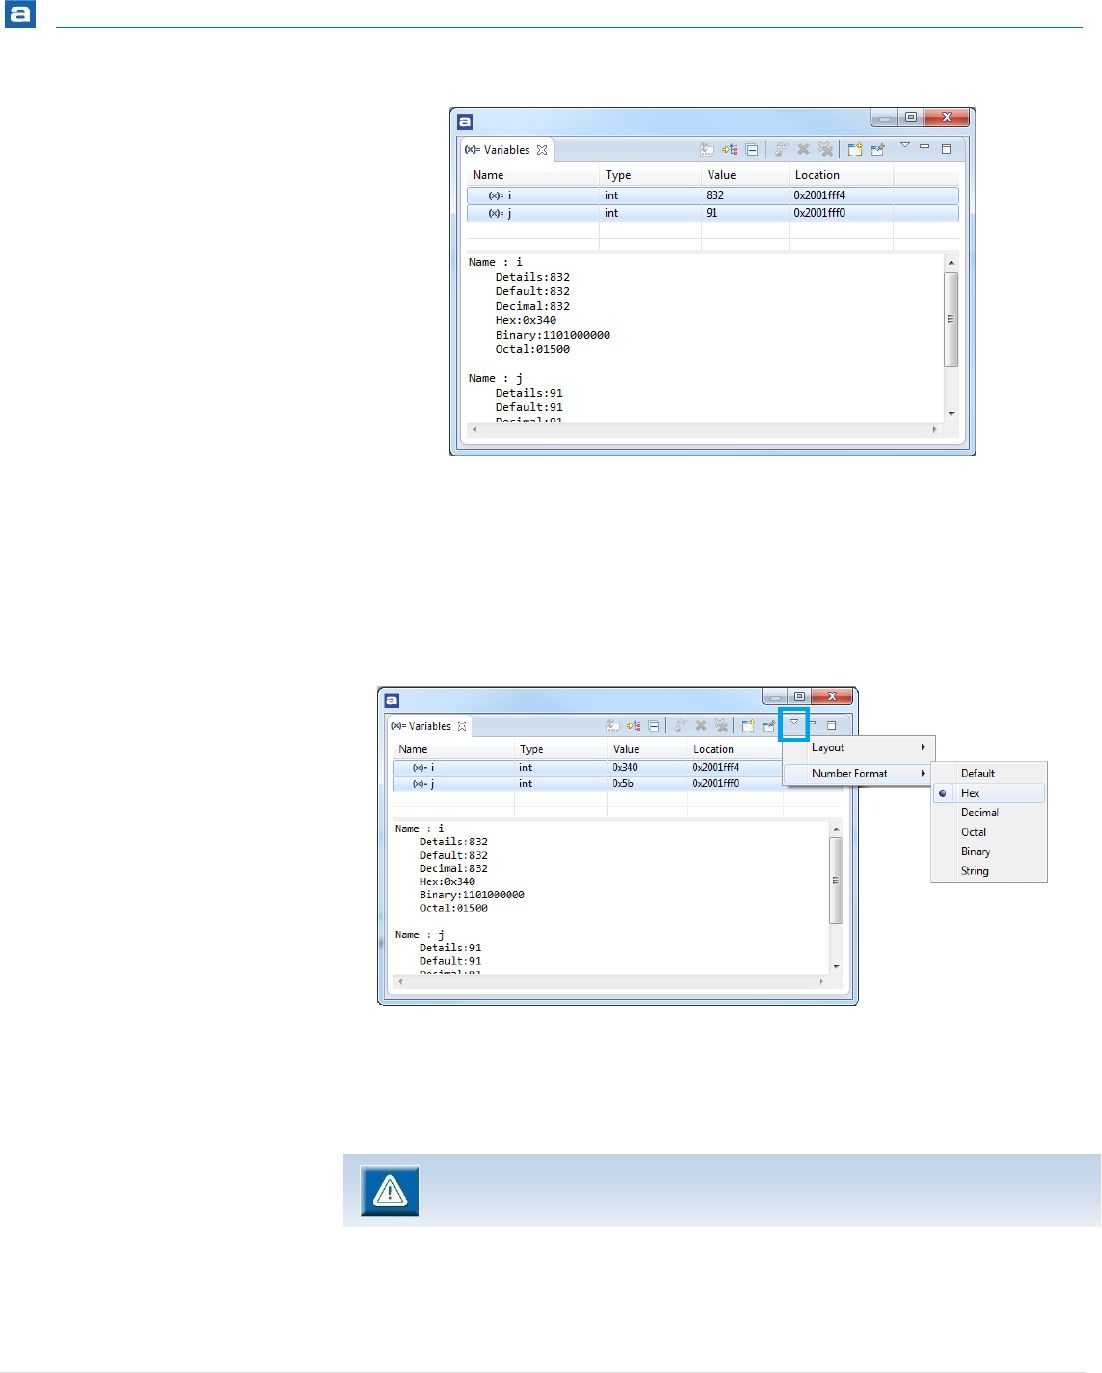
Debugging
240 | P a g e
Figure 221 – Variables View
The location column can be displayed by selecting the small arrow in the upper right
corner and then layout, Select Columns… A dialog with the selectable columns will then
open up.
From the same small arrow, the Number Format can also be changed for the Value
column.
Figure 222 – Variables View – change Number format
Bi right clicking a variable, it can also be opened in the Memory view and also by selecting
Watch to the Expression View.
Global Variables cannot be displayed in the Variables view. Use the Expression
view instead. See page 237 - Expressions for more information.
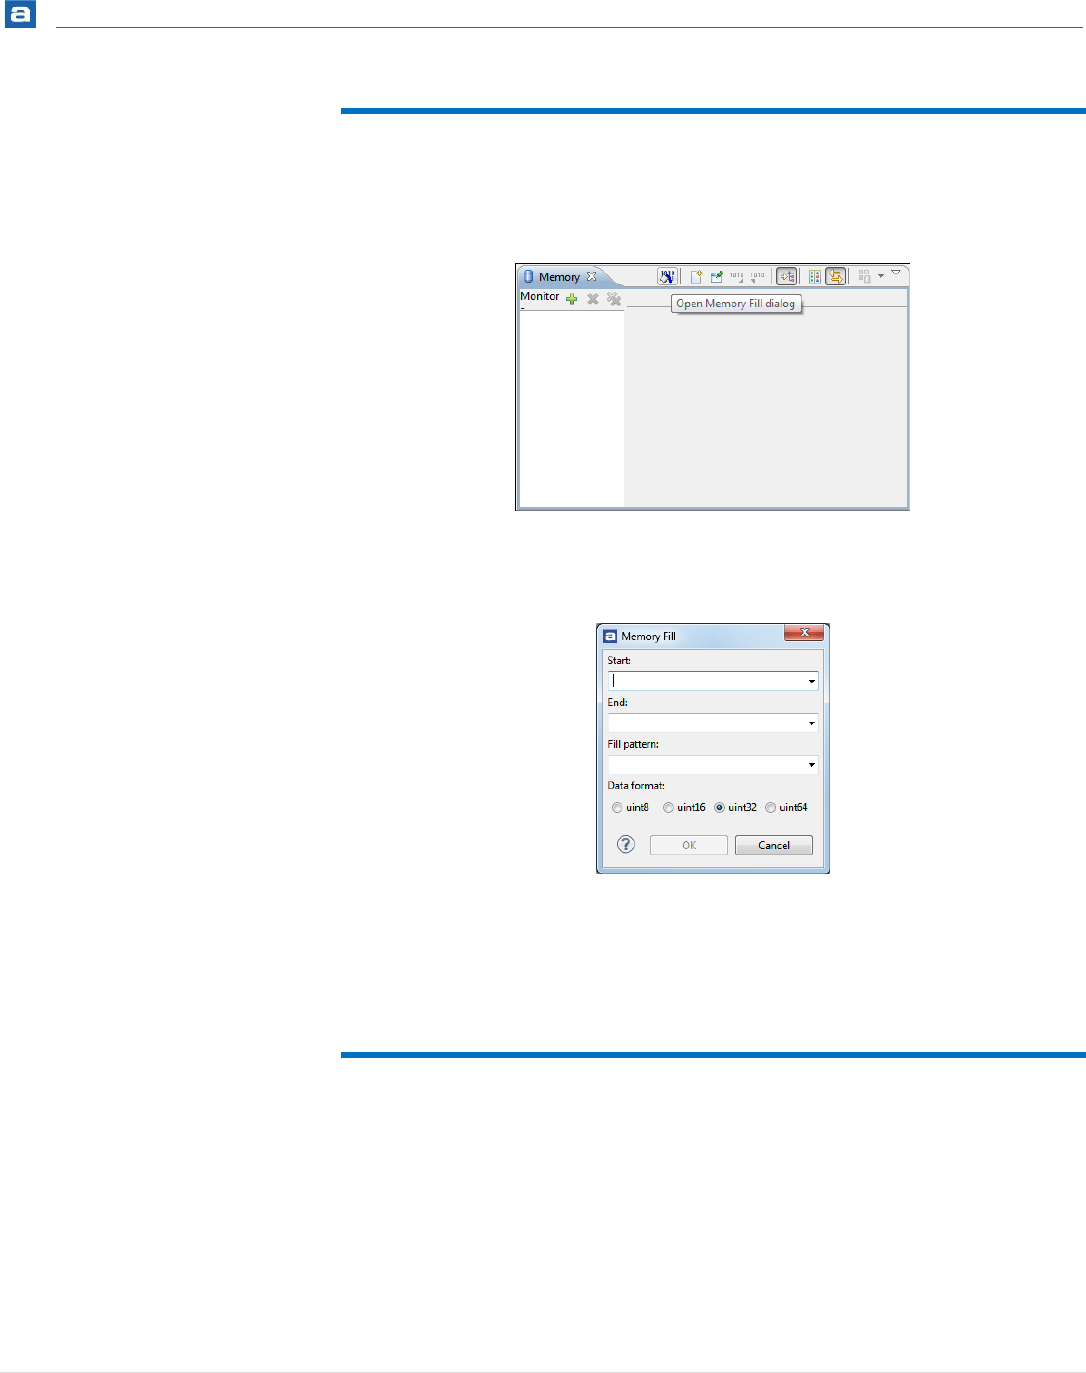
Debugging
241 | P a g e
FILL MEMORY WITH A BYTE PATTERN
In the Memory view and the Memory Browser view there is an added toolbar button
called Open Memory Fill dialog
Figure 223 - The Memory Fill Toolbar Button
The Memory Fill dialog is opened when the toolbar button is pressed.
Figure 224 - The Memory Fill dialog
The filled area is up to, but not including, the end address.
SFRS
Special Function Registers (SFRs) can be viewed, accessed and edited via the SFRs view.
The view displays the information for the current project. It will change its content if
another project is selected. To open the view, select the View, SFRs menu command.
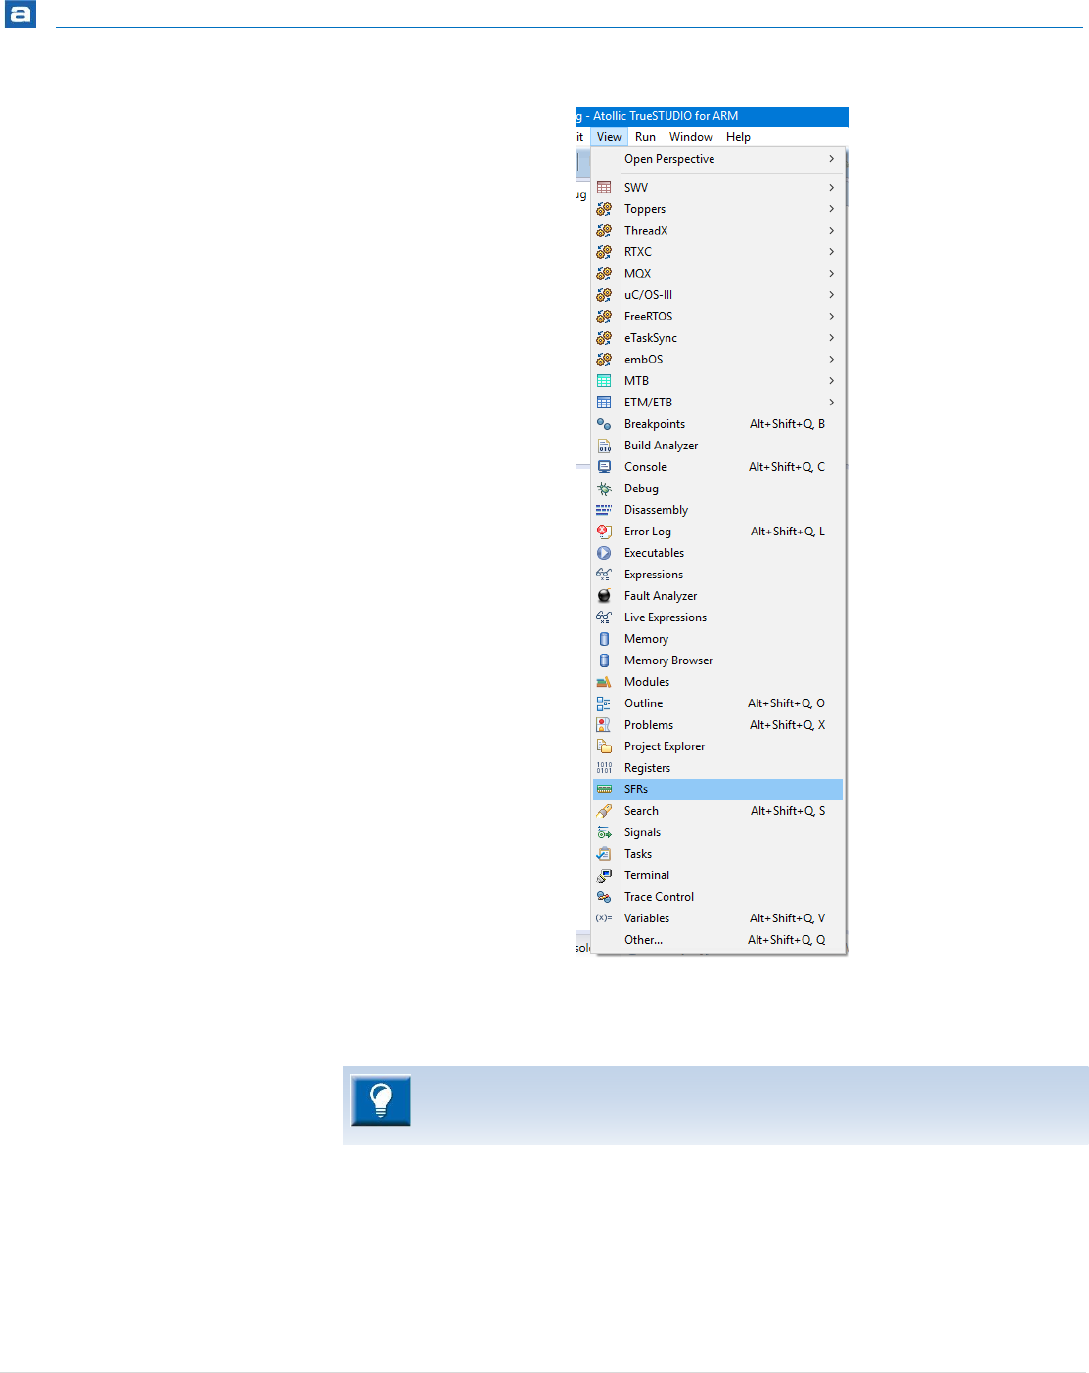
Debugging
242 | P a g e
Figure 225 - SFRs Menu Command
The SFRs view can also be useful in the C/C++ Editing Perspective, however
then only the names and addresses of the registers will be displayed.
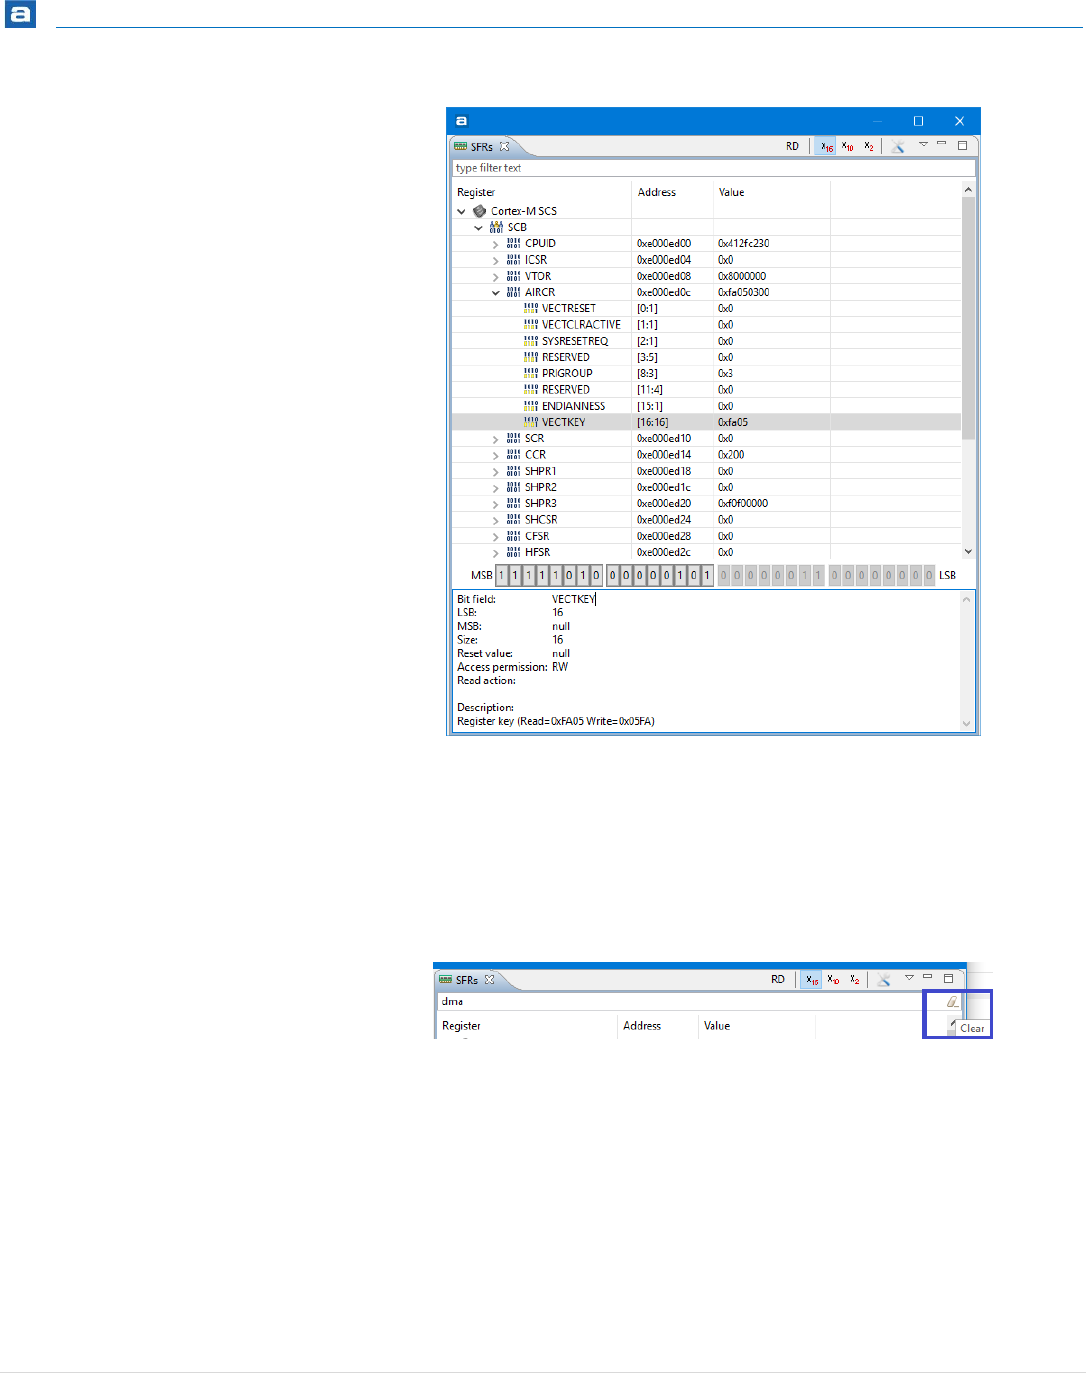
Debugging
243 | P a g e
Figure 226 - SFRs View
The top of the SFRs view contains a search field to filter visible nodes, e.g peripherals,
registers, bit fields. When some text is entered in the search field only the nodes
containing this text will be visible. When the node to view is found, select the node, then
press the Clear button to the right of the search field if all elements shall be seen.
Figure 227 - SFRs Filter Clear
The information at the end of the SFRs view displays detailed information of the selected
line. For registers and bit fields this include information of Access permission and Read
action.
The Access permissions contains the following information:
RO (read-only)
WO (write-only)
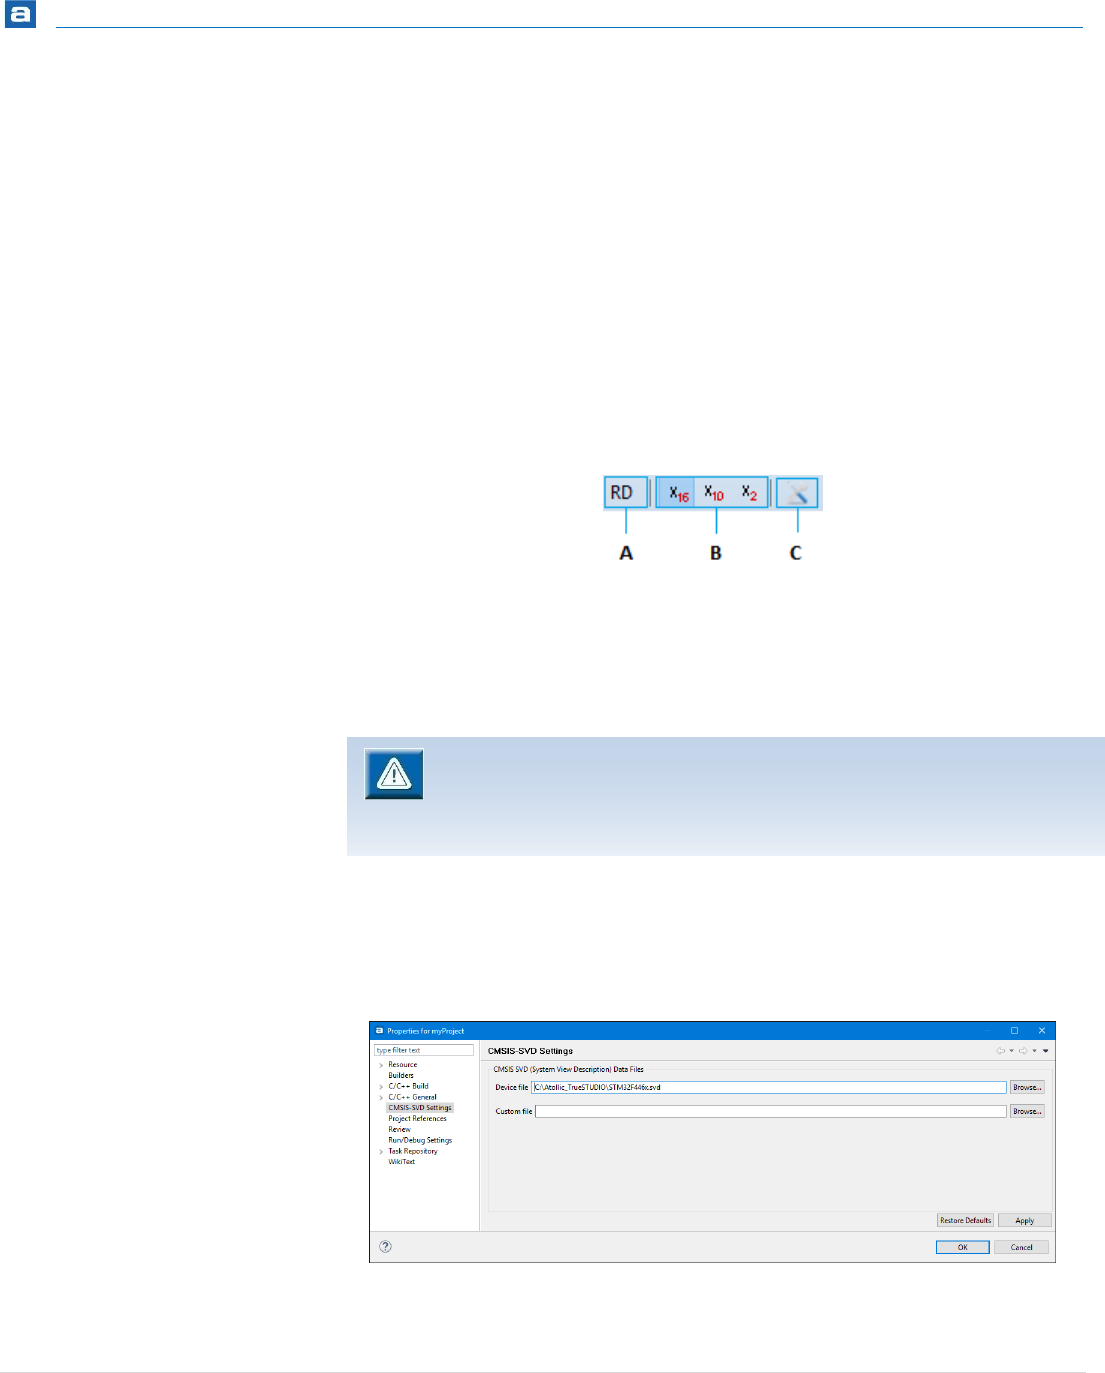
Debugging
244 | P a g e
RW (read-write)
W1 (writeOnce),
RW1 (read-writeOnce)
The Read action contains information only if there is some kind of read action when
reading the register/bit field:
clear
set
modify
modifyExternal
The toolbar buttons are found at the top right corner of the SFRs view.
Figure 228 – SFR View Buttons
The RD button (A) is used to force a read of the selected register. This will cause a
read of the register even if the register, or some of the bit fields in the register,
contains a ReadAction attribute set in the SVD file.
Base format buttons (B) are used to change what base the registers values are
displayed in.
The Configure SVD settings button (C) opens up the CMSIS-SVD Settings
Properties Panel for the current project.
Figure 229 – CMSIS-SVD Settings Properties Panel
When the register has been read by pressing the RD button all other registers
visible in the view will also be read again to reflect any other register updates.
The program needs to be stopped to perform a read of the registers.

Debugging
245 | P a g e
Two CMSIS-SVD (System View Description) data files can be pointed out for the project. All
SVD-files must comply with the syntax as outlined in the CMSIS-SVD specification found on
ARM® website. If this requirement is not met, the SFR-view is likely not to show any
register information.
The Device file field is typically used to for the System View Description (SVD) file. This file
should include the information for the whole device. Other views may fetch information
from the SVD file pointed out by this field, therefore Atollic recommends only using this
field for SVD-files containing full system description. Updated SVD files can be obtained
from STMicroelectronics, see the HW Model, CAD Libraries and SVD in the device
description section on the ST web-site.
The Custom file field can be used to define special function registers related to custom
hardware, in order to simplify the viewing of different register states. Another possible use
case is to create a SFR favorites’ file, containing a subset of the content in the Device file.
This subset may be frequently checked or registers. If a Custom file is pointed out a new
top-node in the SFR-view will be created containing the Custom file related register
information.
Both fields may be changed by the user and both fields may be used at the same time.
FAULT ANALYZER
The Fault Analyzer view helps developers to identify and resolve hard-to-find system faults
that occur when the CPU has been driven into a fault condition by the application
software. The fault analyzer feature interprets information extracted from the Cortex-M
nested vector interrupt controller (NVIC) in order to identify the reasons that caused the
fault.
Some conditions that trigger faults are:
accessing invalid memory locations
accessing memory locations on misaligned boundaries
executing undefined instruction
include division by zero errors
Within the debugger, after a fault has occurred, the code line where the fault occurred will
be displayed. The user can view the reasons for the error condition. Faults are broadly
categorized into bus, usage and memory faults.
Bus faults occur when an invalid access attempt is made across the bus, either of a
peripheral register or a memory location.
Usage faults are the result of illegal instructions or other program errors.
Memory faults include attempts of access an illegal location or violations of rules
maintained by the memory protection unit (MPU).

Debugging
246 | P a g e
To further aid fault analysis, an exception stack frame visualization option provides a
snapshot of the MCU register values at the time of the crash. Isolating the fault to an
individual instruction allows the developer to reconstruct the MCU condition at the time
the faulty instruction was executed.
In the Debugger perspective the Fault Analyzer view is opened from the menu. Select the
menu command View, Fault Analyzer or use the toolbar icon Show View to open a drop
down list; then select Fault Analyzer.
FAULT ANALYZER VIEW
The Fault Analyzer view has five main sections which can be expanded and collapsed. The
sections contain different kind of information to help understand the reason why a
particular fault has occurred. The sections are Hard Fault Details, Bus Fault Details, Usage
Fault Details, Memory Management Fault Details and Register Content During Fault
Exception. It is possible to Open editor on fault location and to Open disassembly on fault
location by pressing the buttons in the view.
Below is an example of the Fault Analyzer view when an error has been detected. In this
case the error was caused by a project which configured the stack to be placed outside the
RAM of the Cortex-M4 device. This causes a Hard Fault Detetected and the Bus Fault
Details present the Stacking error (STKERR). The Register Content During Fault Exception
presents the sp value 0x2003ffd8 and this device only had RAM available from 0x20000000
to 0x2001ffff.
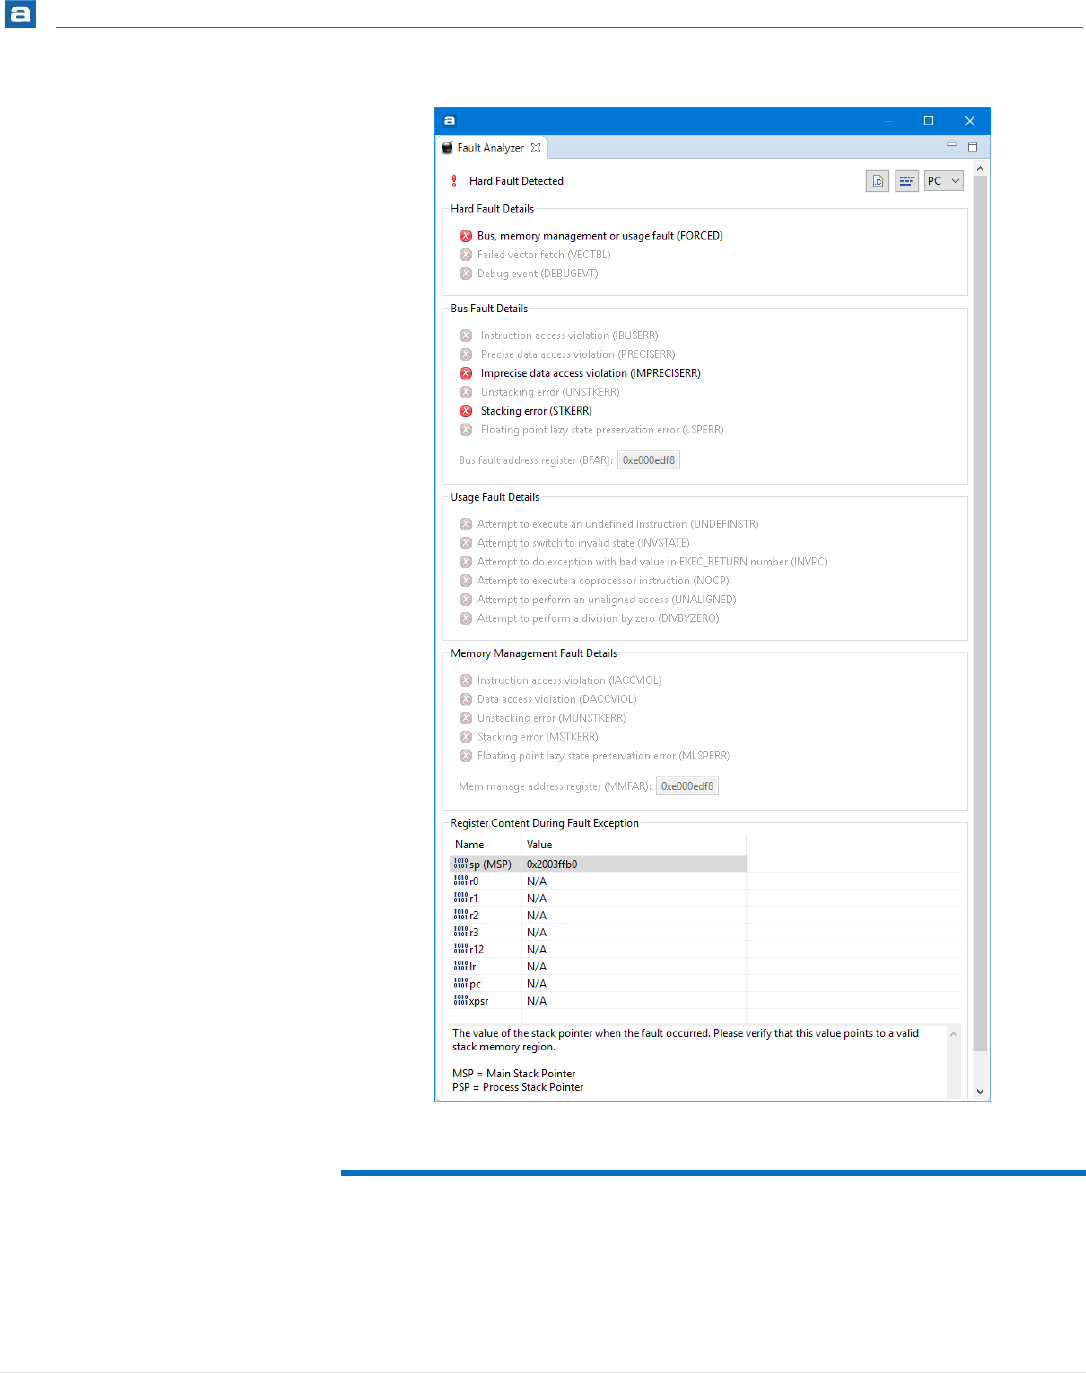
Debugging
247 | P a g e
Figure 230 – Fault Analyzer View with STKERR
TERMINAL VIEW
A terminal is included to allow I/O communication with target using Local, SSH, Serial, and
Telnet Terminal communication.
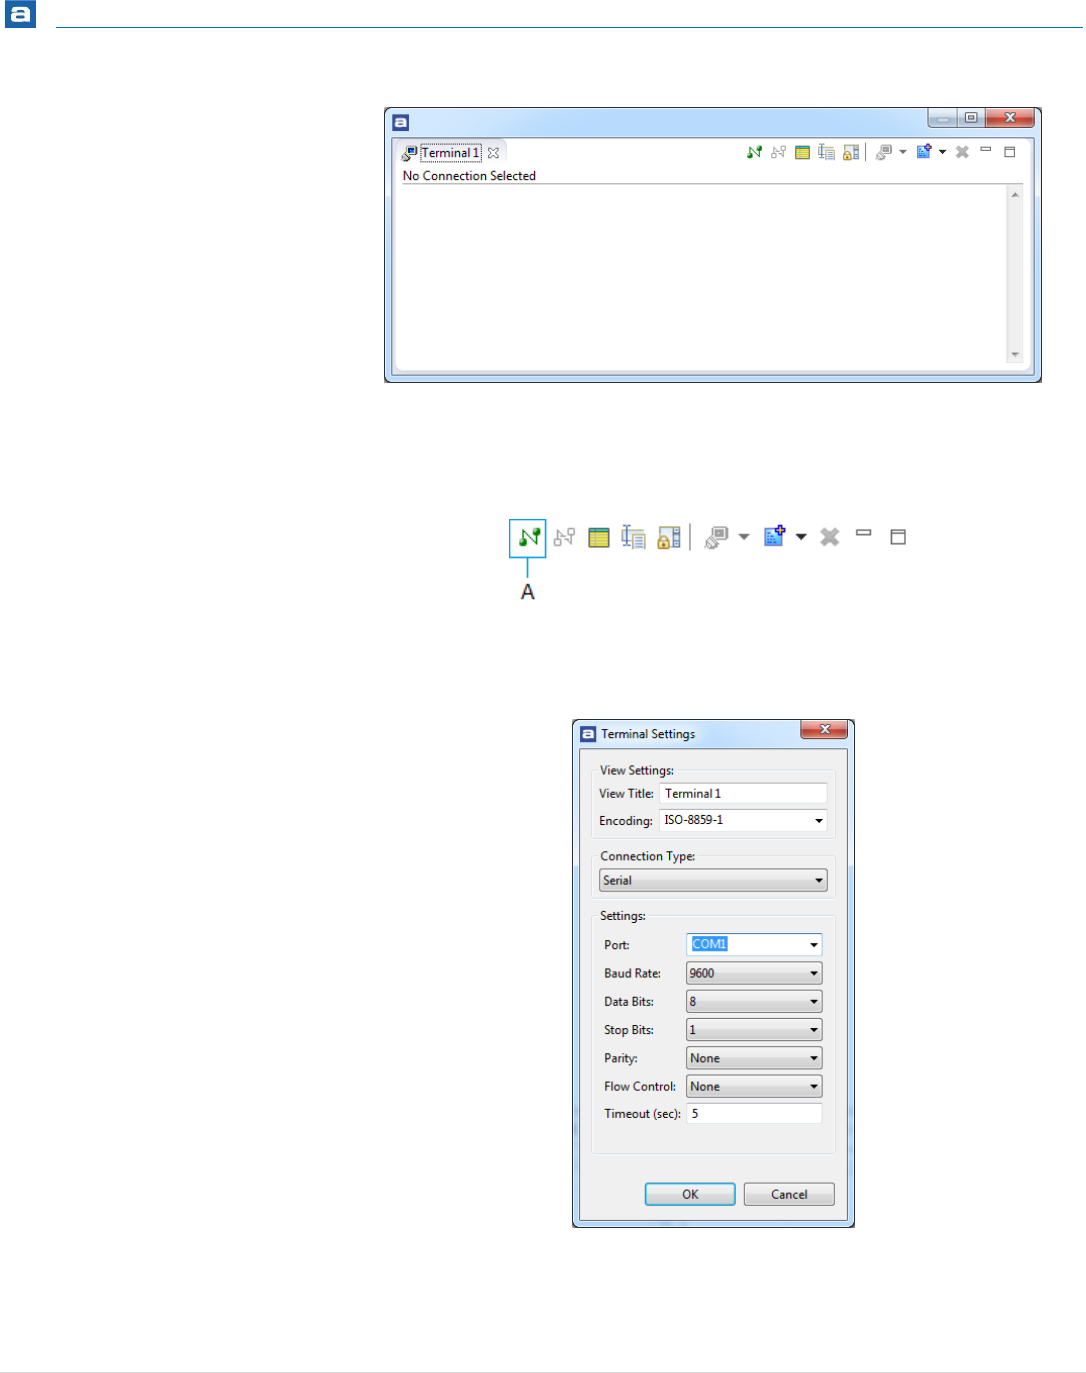
Debugging
248 | P a g e
Figure 231 – Terminal View
It can be located by selecting the Open View toolbar button and then select Serial
Terminal in the dropdown list.
Figure 232 – Terminal Toolbars
To start using the terminal, press button A. This will open up the Terminal Settings Dialog.
Figure 233 – Terminal Settings
Select what type of connection is preferred. That will most likely be Serial communication.

Debugging
249 | P a g e
For more information for how to redirect the I/O to the Terminal, see the chapter about
I/O Redirection on page 160.
SEGGER REAL TIME TERMINAL
To use Segger Real Time Terminal (RTT) with a Segger J-Link, do the following steps:
1. Download the RTT-library from http://segger.com/pr-j-link-real-
time.html
2. Add the source-files from the RTT-pack to the project.
3. Make sure that these folders are treated as source code folders by right-clicking on
the c-file or the folder then select Resource configuration, Exclude from build… and
Deselect all.
4. Setup include paths by select in the menu Project, Build Settings, Tool Settings, C
Compiler, Directories and add all headers
5. Exclude the main.c supplied in the TrueSTUDIO example project. Also exclude the
tiny_printf.c and the syscalls.c (if available). This since RTT will override some
of these implementations.
6. The RTT-pack comes with three different demonstration examples. This means 3
different main() implementation. Make sure only one is built. Again for these (2 of
these 3) source files use: right-click on the c-files, Resource configuration, Exclude
from build… and Select all.
7. Please note that for some versions of the example package the SEGGER_RTT_printf()
contains a bug. The va_start() call must always be followed by a va_end call. The
function might then look like this:
int SEGGER_RTT_printf(unsigned BufferIndex, const char *
sFormat, ...) {
int ret;
va_list ParamList;
va_start(ParamList, sFormat);
ret = SEGGER_RTT_vprintf(BufferIndex, sFormat,
&ParamList);
va_end(ParamList);
return ret;
}
8. Build and start a debug session. Open the “Terminal”-view. Setup a connection:
Encoding: ISO-8859-1
Connection type: Telnet
Host: localhost
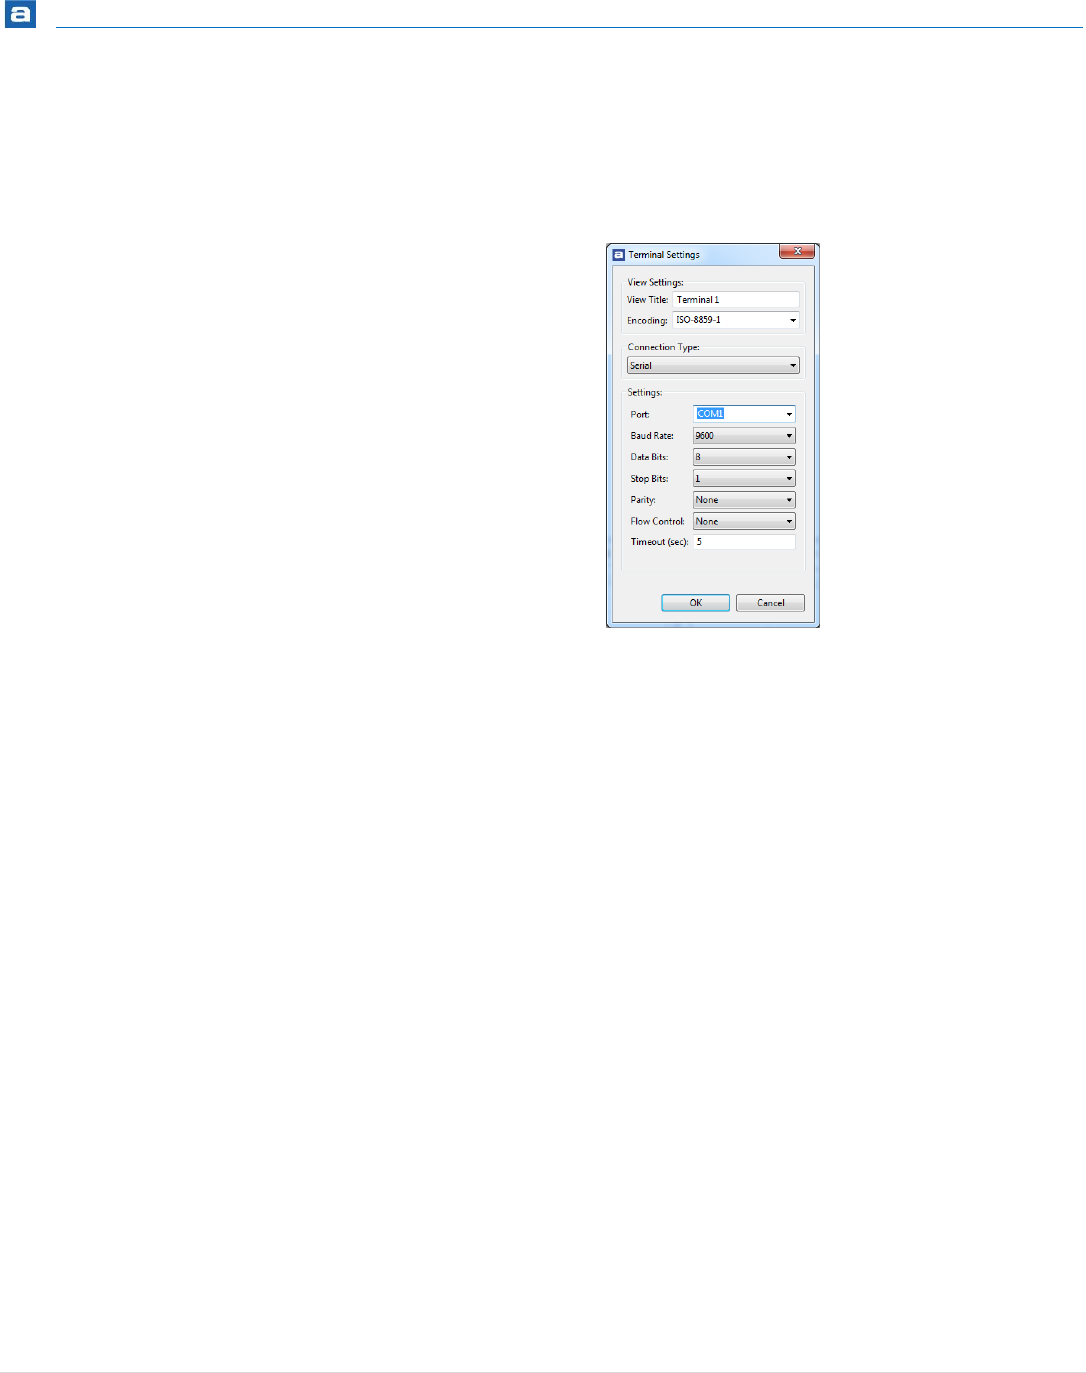
Debugging
250 | P a g e
Port: 19021
Ok
9. Connect and run the application
Figure 234 – Terminal Settings

Debugging
251 | P a g e
ATTACH TO RUNNING TARGET USING
SEGGER PROBE
This approach is useful when trying to resolve problems which occur at rare occasions,
often after several days of running your embedded application, by connecting Atollic
TrueSTUDIO debugger via JTAG/SWD the embedded target using a SEGGER J-Link.
Finding the root cause of the problem in case of a CPU crash is further simplified by
learning how to use the Fault Analyzer view, see page 245.
This method is applicable to any Atollic TrueSTUDIO user who has a SEGGER J-Link/Trace
debugger. Before trying this approach consider whether halting the application in the
wrong state could potentially harm the hardware (i.e. in the case of a motor controller
application). Why? When GDB connects to the SEGGER J-Link GDB-server the target CPU
will be halted. This behavior is currently not possible to change and applies even if the
GDB-server is started with the -nohalt option.
It is quite simple to make Atollic TrueSTUDIO connect using a SEGGER J-Link. Essentially
the following three or four steps are needed:
1. Modify the debug configuration
2. Connect the J-Link to the embedded target
3. Start a debug session using the modified debug configuration
4. Optionally analyze the CPU fault condition with the Fault Analyzer tool
Step 1 Modify the debug configuration
The default generated debug configurations in Atollic TrueSTUDIO contains the GDB
commands needed to setup target communication speed, to flash and reset the device
and to set some breakpoints. This is not of any use to us when we want to connect to a
running system which may, or may not, have crashed. Therefore the first step is to make
sure that we have a debug script that will not accidentally flash or reset your CPU, which
could be very annoying when you finally have managed to trigger a crash behavior which
has been difficult to track down.
In order to create a modified debug configuration perform the steps below:
1. Press the Debug Configurations button
2. In the left frame of the Debug Configurations GUI, select the debug configuration
associated to the project/application that you want to debug and make a copy of
this by right-clicking it and click Duplicate
3. Give the duplicate Debug Configuration a name
4. Go to the tab called Startup Script, Target Software Startup Script, Debug
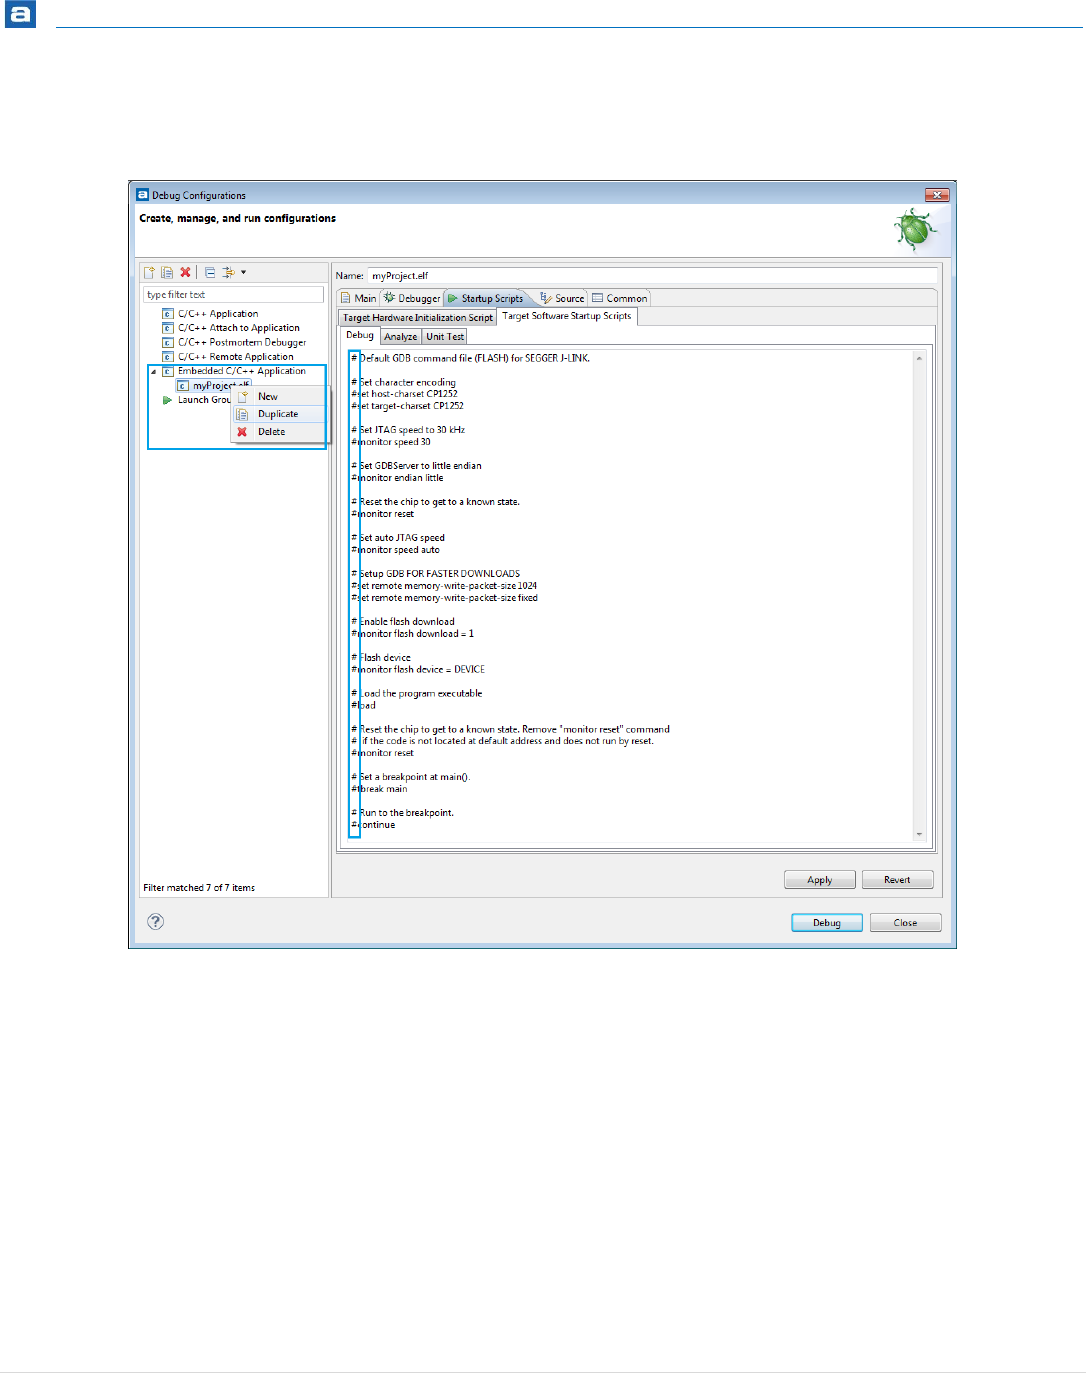
Debugging
252 | P a g e
5. Use the # (hash-key) to comment out all GDB-commands or simply delete all
commands. See picture below.
Figure 235 – Modify Startup Script
Step 2: Connect the J-Link to the embedded target
Connect the J-link to the computer. Then connect it to the embedded target. No reset
should be issued.
Step 3: Start a debug session using the modified debug configuration
Important! Do not make the mistake of launching the debug session using the wrong
debug configuration, that will probably flash and reset the target.
Instead the safest way to launch a debug session with full control of which debug
configuration is applied (and thereby preventing a potential reset) is by using the menu
selection Run, Debug Configurations... Then select the modified debug configuration in
the left frame and click Debug.

Debugging
253 | P a g e
Voilà - the debugger should now be connected to the embedded target which is
automatically halted. At this point different status registers and variables can be
investigated in the application. If the CPU has crashed, then also use the Fault Analyzer to
better understand what went wrong, why and where.
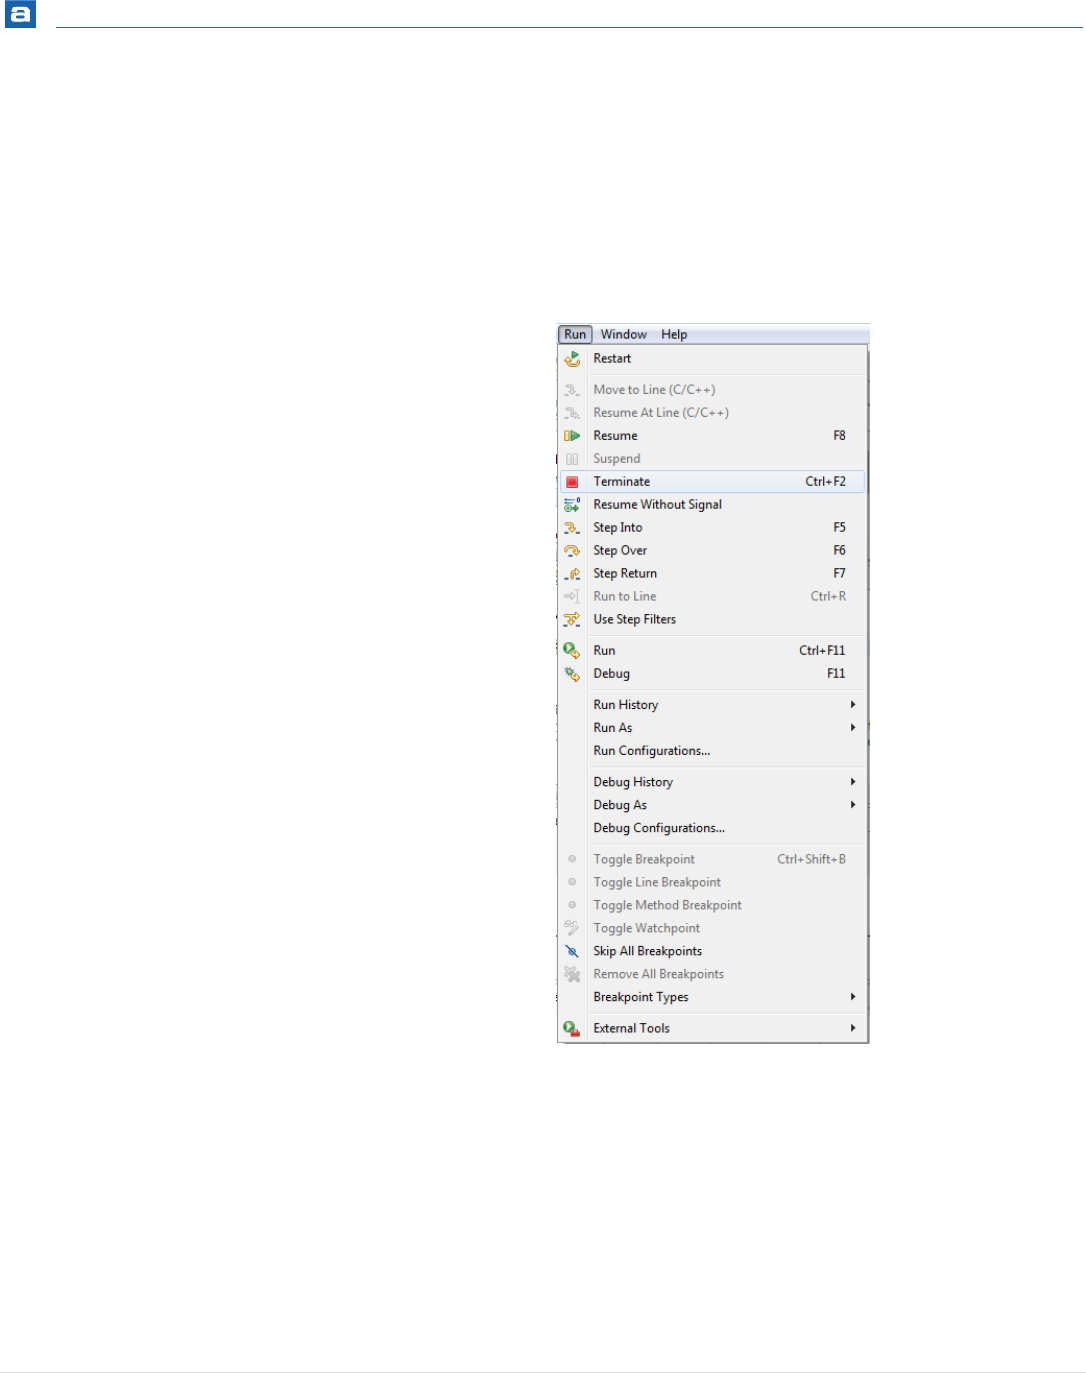
Debugging
254 | P a g e
STOPPING THE DEBUGGER
When the debug session is completed, the running application must be stopped.
1. Stop the target application by selecting the Run, Terminate menu
command, or by clicking on the Terminate toolbar button in the Debug
view.
Figure 236 - The Terminate Menu Command
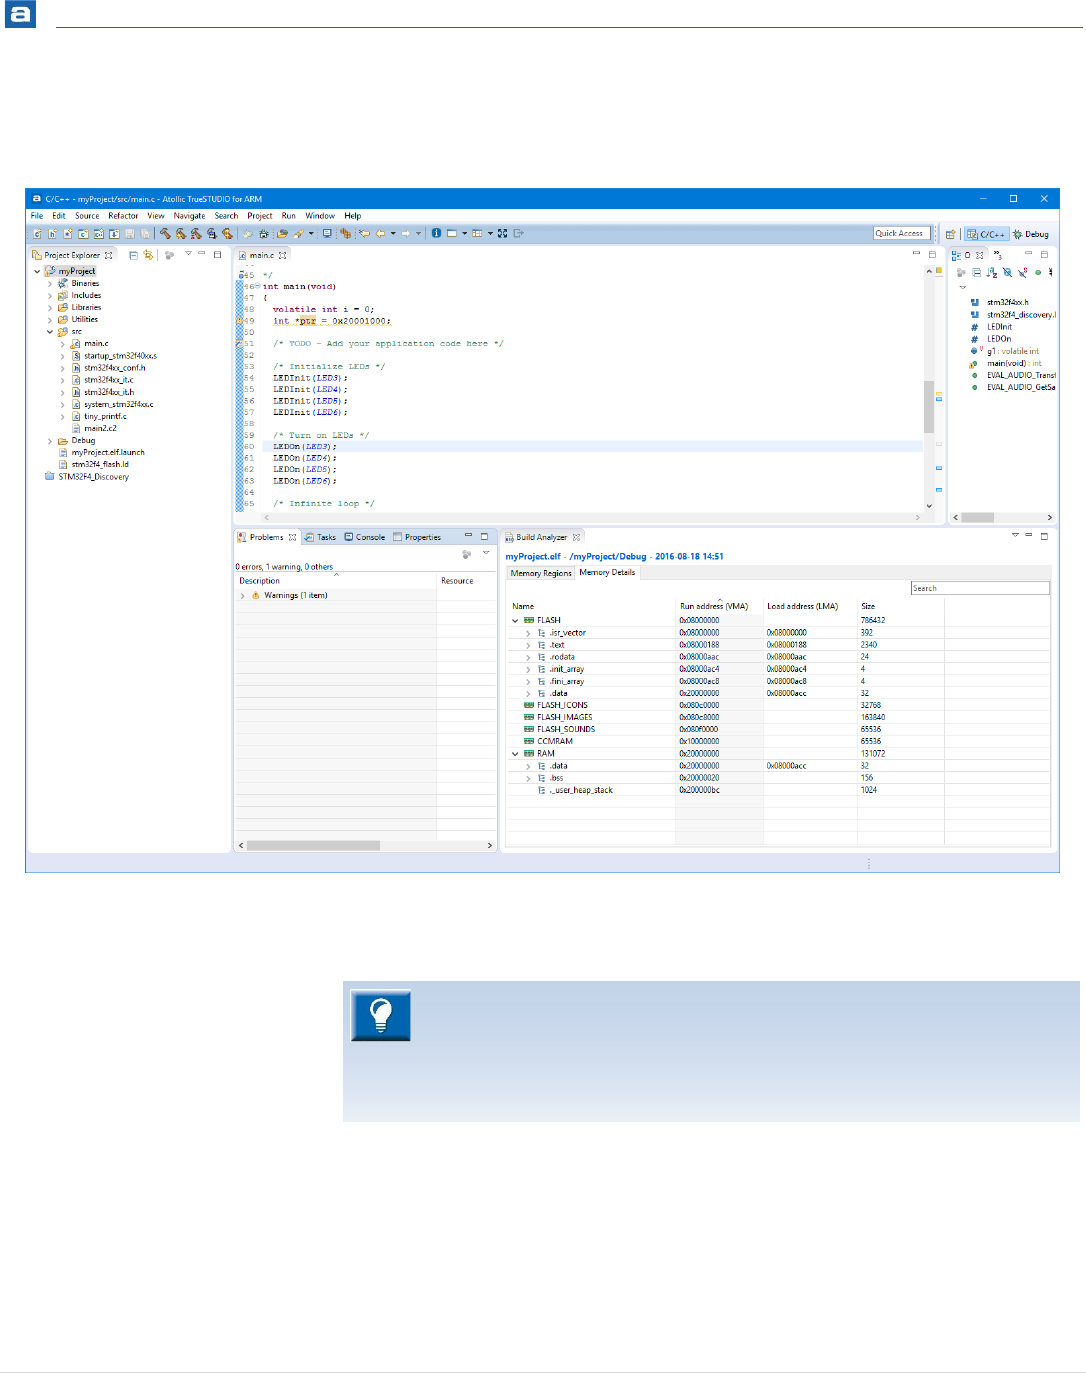
Debugging
255 | P a g e
2. Atollic TrueSTUDIO now automatically switches to the C/C++ editing
perspective
Figure 237 - C/C++ Editing Perspective
Note! If the debugging is stopped in a sudden way, the actual GDB Server
process might still be running without doing anything but eating up CPU
power and hanging the TCP/IP port. Please make sure that no process name
“arm-atollic-eabi-gdb.exe” is running when encountering this problem. It will
also eat up the memory and eventually nothing will work on the computer.

Debugging
256 | P a g e
UPGRADING THE GDB SERVER
Some GDB probe manufacturer, such as Segger, upgrades their GDB server more
frequently than new versions of Atollic TrueSTUDIO are released. To use the latest version,
download it from the manufacturer website and install it in the preferred folder.
Then change the setting that points out where the server is stored. Select the top-menu
Window, Preferences and then open Run/Debug, Embedded C/C++ Application, Debug
Hardware, and the name of the GDB probe used. The path to the newly installed GDB
server can be entered there.
Figure 238 – Changing the Path to the GDB Server
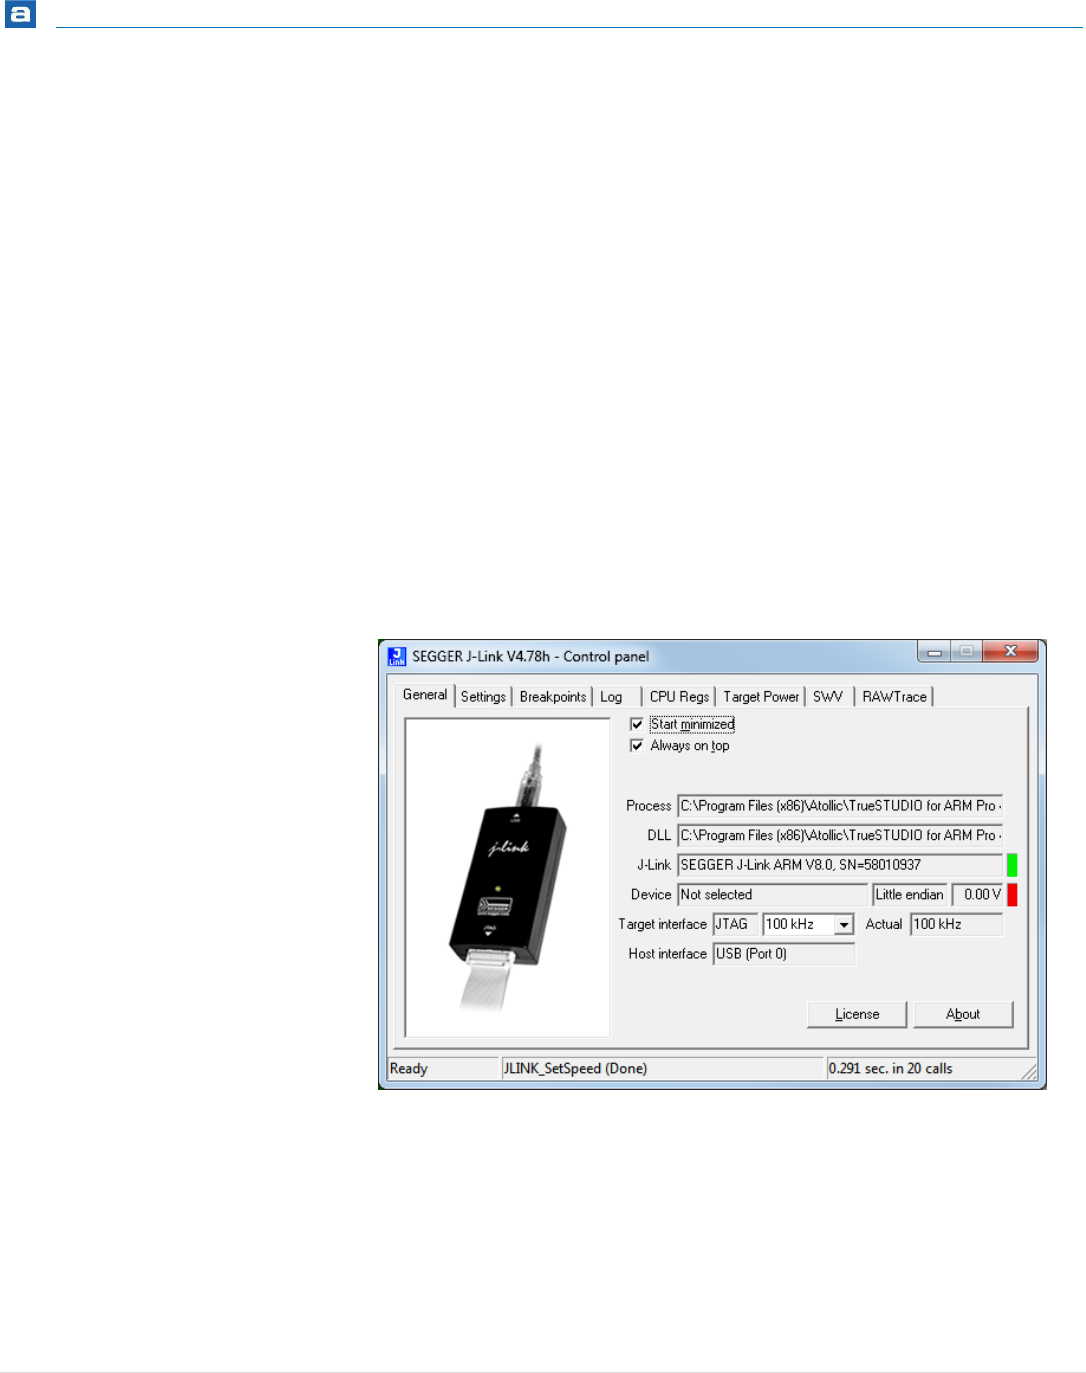
Debugging
257 | P a g e
CONFIGURE SEGGER’S GDB SERVER
Segger’s GDB Server can be configured for such as logging and flashing.
Do the following steps to configure Seggers’s GDB server.
Connect the JTAG probe to the computer.
Open a command window (cmd) in Windows and move to the folder for the installed GDB
server:
cd %TrueSTUDIO installation folder%\Servers\J-Link_gdbserver
(or where the GDB server is installed).
Start the GDB server with
JLINK.exe
Now there should have a new icon in Windows Notification Area (by default in the lower
right corner in Windows) for Segger J-Link GDB server. Right click to open it. The Control
panel for the GDB server will then be opened.
Figure 239 –GDB Server Control Panel – General Tab
A good idea is now to in the General tab deselect Start minimized and Always on top.

Debugging
258 | P a g e
CHANGE FLASH CACHING
The Memory View does not always reflect exactly what’s flashed on the target.
What does not happen is if the program alters the flash contents, the Memory panel does
not reflect that.
To fix this go to the Settings tab and deselect the Allow caching of flash contents.
ENABLE LOG FILE
Do the following steps to enable logging to a log file in Seggers’s GDB server
1. Open the Control Panel as described above.
2. Then open the Settings tab and enter a name of a log file.
3. Close, stop the running GDB server and restart debugging.
4. The GDB server should now save information in the new log file.
Figure 240 –GDB Server Control Panel – Settings tab
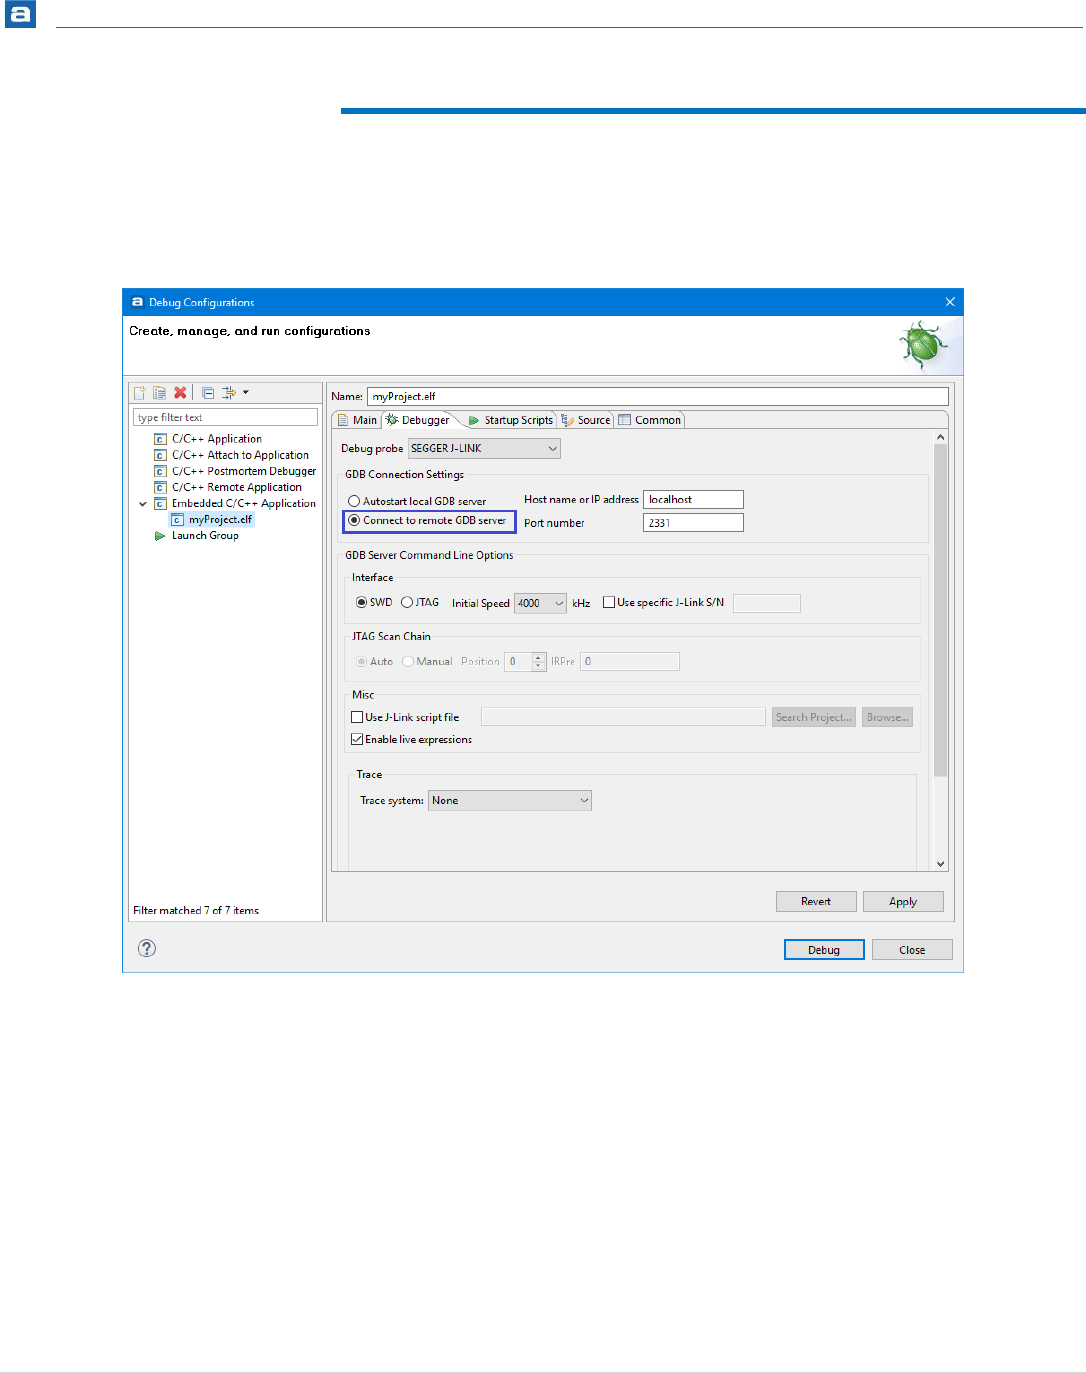
Debugging
259 | P a g e
SETTINGS COMMAND LINE OPTION
There is a Command Line option to the Segger GDB server to include a settings file when
debugging. In order to make this useful in Atollic TrueSTUDIO set the Debug Configuration
to Connect to remote GDB server.
Figure 241 – Debug Configuration – Connect to Remote GDB Server
Then start the GDB server manually from the command line.
A typical command line for a STM32F10C eval board is the following:
JLinkGDBServerCL.exe -port 2331 -CPU Cortex-M -device STM32F107VC -
endian little -speed 4000 -if swd
Now add the -SettingsFile C:\tmp\ExampleSettingsFile.txt to the command.

Debugging
260 | P a g e
DEBUGGING CODE IN RAM
It is possible to debug program in RAM instead of FLASH and debugging in RAM can be
done with any kind of debug probe but there are some requirements to do this.
1. First the program needs to be located into the RAM so the program needs to fit
into the RAM. In most cases microcontrollers have a smaller RAM compared to
the size of the FLASH so unfortunately in many cases it will not be possible to
have the complete program, data and stack stored into RAM.
2. Normally for Cortex-M based devices there is a need to set the Vector Base
Register (VBR) to the location in RAM where the interrupt vector is located. The
Cortex-M0 core does not have any VBR so when a microcontroller which is based
on Cortex-M0 is used it will not be possible to use any interrupts when code is
located to RAM.
3. When debugging in RAM the gdb script which loads the code must not have a
monitor reset command after the load command. Remove the monitor reset
command after the load command and gdb will set the Program Counter to the
entry of the program which has been loaded.
If there is a monitor reset command after load a reset will be issued and the
code will then execute from FLASH.
Some STM32-EVAL boards have special Mode switches which shall be set in
RAM mode if debugging in RAM. This is a solution in STM32 to configure the
device so that it uses address 0x20000000 as the base of interrupt vector. In
that case there is no need to setup the vector base register to the RAM start
address offset when the Mode switches are in RAM mode.

Debugging
261 | P a g e
DEBUGGING TWO TARGETS AT THE SAME
TIME
Multiprocessor debugging is possible using two ST-Link or Segger’s J-Links at the same time
connected to two different microcontrollers, these probes are both connected to one PC
on different USB-ports. For clarity let us say that the developer have two different
microcontrollers: HW_A and HW_B.
In Atollic TrueSTUDIO this will typically require only running one instance of Atollic
TrueSTUDIO containing one project for each microcontroller.
The default port to be used for Segger J-Link is 2331 and for ST-Link 61234. This is
presented in the Debugger tab in the Debug Configurations dialog. The developer needs to
change the port for one of the projects to use another port, e.g. port 2341.
FIRST ALTERNATIVE - LOCAL GDB-SERVER USING
GUI OPTIONS
The debug configuration for the project can use GDB connection selection Autostart local
GDBServer.
However, please note that as two J-Links are connected to the PC the Segger J-Link
software will display a GUI where it must be selected which J-Link that is to be associated
with which hardware board and the ST-Link a panel with similar functionality where the
ST-Link with the correct serial number should be selected.
The developer needs to be quite fast to make the selection here and start the GDB server.
When the selection is made, the GDB server will start and connect to the board using the
selected probe and GDB will connect to the GDB server.
If this selection is not made fast enough the debug session in Atollic TrueSTUDIO will
timeout because there was no server to connect to.
When the Debug Configuration has been configured for both projects so that each board is
associated to a specific probe, the user may try to debug each board individually first.
When it is confirmed that this is working it is time to debug both targets at the same time.
Proceed as follow:
1. First start to debug HW_A.
2. The developer will automatically be switched to the Debug Perspective in Atollic
TrueSTUDIO when a debug session is started. Switch to C/C++ Perspective.
3. Select the project for HW_B and start debugging this. The Debug perspective will now
open again.
4. There will be two application stacks/nodes in the debug view: One for each project
(hardware). When changing selected node in the Debug view the depending editor,
variable view etc. will be updated to present information valid to the selected
project/board.

Debugging
262 | P a g e
Second Alternative - Remote GDB-server
Using Command-line Options
It may be easier to start the GDB server manually and change the Debug Configurations to
Connect to remote GDB server. This setting is made in the Debugger tab in the Debug
Configurations dialog.
If Connect to remote GDB server is selected, the developer must start the GDB server
manually before starting the debug session.
To start Segger J-Link GDB server manually please follow this procedure:
1. Open a Windows Console (Command Prompt, cmd.exe)
2. Change directory to the location where the GDB server is located, normally to:
C:\Program Files (x86)\Atollic\TrueSTUDIO for STM32 9.0.0\Servers\J-
Link_gdbserver
3. Start the GDB server: E.g start using port 2341 with SWD interface mode:
JLinkGDBServerCL.exe -port 2341 -if SWD -select usb=123456789
(The 123456789 is serial number of dongle.)
Start another GDB server in a second command prompt, using another port number in a
similar way and let this connect to the second probe.
Now when both GDB servers are running the developer can debug the two projects
individually or multi-target. Please note that the Debug Configurations needs to use the
same port as the GDB server is listening on and Connect to remote GDB server shall be
used.

Introduction
263 | P a g e
BUILD ANALYZER
This section provides information on how to use the Atollic TrueSTUDIO Build Analyzer view.
The following topics are covered:
Introduction to Build Analyzer
Using Build Analyzer

Build Analyzer
264 | P a g e
INTRODUCTION TO BUILD ANALYZER
The Build Analyzer view is used to get a visual view on built programs. It analyzes an .elf
file in detail and presents the information in the view. If a .map file, with similar name, is
found in the same folder as the .elf file also information from the .map file is used and
even more information can be presented. The view can also analyze and display
information about an object file.
The view contains two tabs. The Memory Regions tab and the Memory Details tab.
The Memory Regions tab is populated with data if the .elf file contains a corresponding
.map file. When the .map file is available this tab can be seen as a brief summary of the
memory regions with information about region name, start address and size. The size
information also comprises total size, free and used part of the region, and a usage
number in percentage.
The Memory Details tab contains detailed program information based on the .elf file.
The different section names are presented with address and size information and each
section can be expanded and collapsed. When a section is expanded functions/data in this
section is listed (green icons are used to show function names and blue icons are used for
data variables). Each presented function/data contains address and size information. The
memory details tab also contain information for object files, .o files, when such files are
selected.
When there is a need to optimize or simplify a program the Build Analyzer view is good to
use when there is a need to optimize or simplify a program.

Build Analyzer
265 | P a g e
USING BUILD ANALYZER
The Build Analyzer view is by default open in the C/C++ perspective. If the view is closed it
can be opened from the menu. Select the menu command View, Build Analyzer or use the
toolbar icon Show View to open a drop down list; then select Other and in the Show View
dialog C/C++ -> Build Analyzer. Another way to open the Build Analyzer view is to type
Build Analyzer into the Quick Access search bar and select it from the views.
When the Build Analyzer view is open select an .elf or an .o file in the Project Explorer
view. The Build Analyzer view will then be updated with the information it founds in the
file. When an .elf file is selected and a .map file, with similar name, is found in the same
folder also information from the .map file is used by the view.
The Build Analyzer view will also be updated if a project node in the Project Explorer view
is selected. In this case the Build Analyzer uses the .elf file which corresponds to the
current active build configuration for the project. The view only provides information for
embedded projects so it will be empty for PC projects.
Figure 242 – Build Analyzer
MEMORY REGIONS
The Memory Regions tab of the Build Analyzer view displays information based on the
corresponding .map file. If no information is displayed there is no corresponding .map file
found. When a .map file is found the Region names, Start address, End address, Total size
of region, Free size, Used size and Usage (%) information is presented.
These regions are normally defined in the linker script .ld file used when building the
program. If any changes of the location or size of a memory region needs to be done then
please update the linker script file.
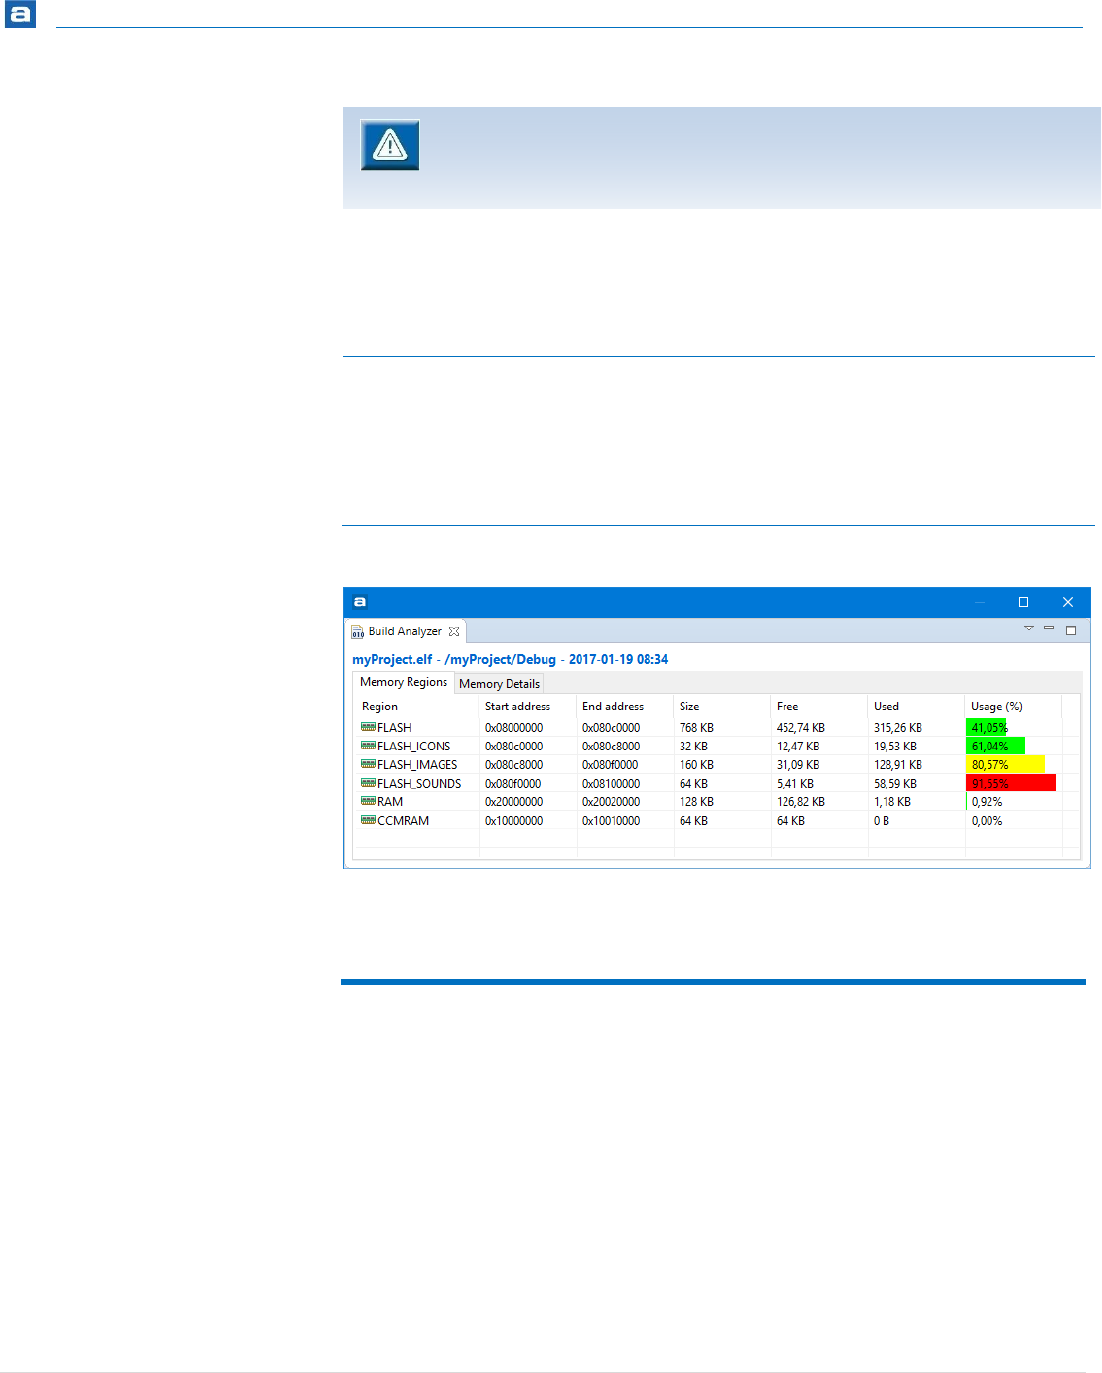
Build Analyzer
266 | P a g e
The Usage (%) column contains a bar icon corresponding to the percentage value. The bar
has different color depending of the percentage of used memory:
Usage Color
Description
Green
Less than 75% of memory used
Yellow
75-90% of memory used
Red
More than 90% of memory used
Table 3 – Memory Regions Usage Color
Figure 243 – Memory Regions Tab
MEMORY DETAILS
The Memory Details tab of the Build Analyzer view contains information for the .elf file.
The view can also display information about an object file, so if an object file is selected
the size information for the object file is updated.
Each section in the Memory Details tab can be expanded so that individual functions and
data can be seen. The table contains columns with Name, Run Address (VMA), Load
Address (LMA) and Size information.
The column information are described in the table below:
The Memory Regions tab is empty if the
.elf
file does not have a
corresponding .map file. Memory Regions tab is also empty when a .o file is
selected.
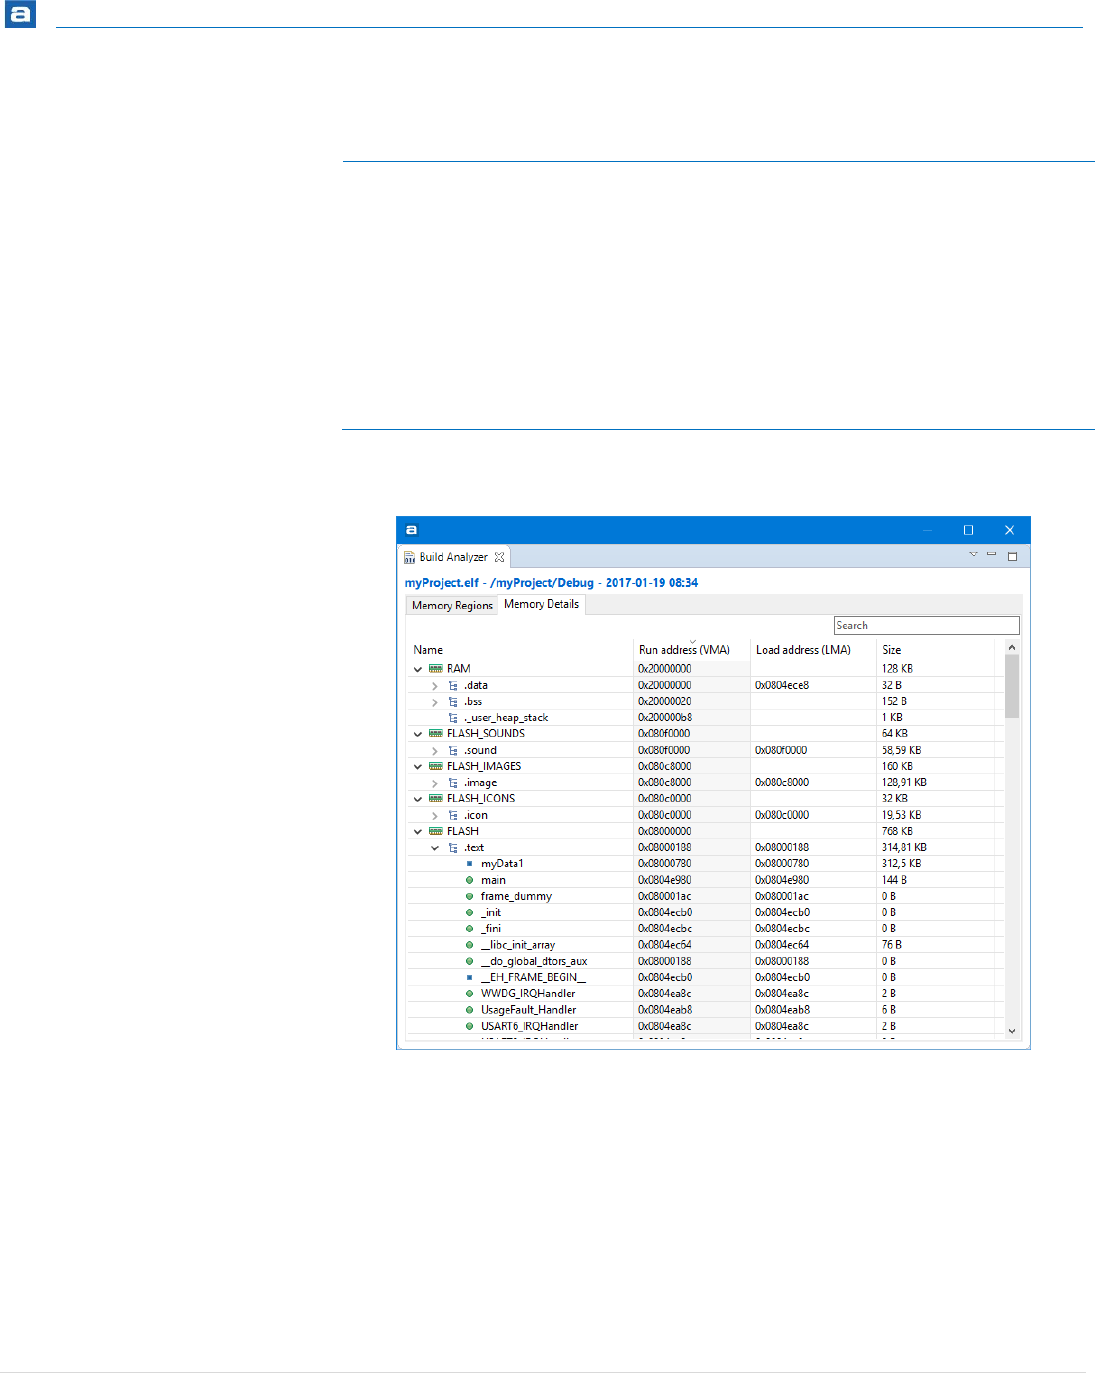
Build Analyzer
267 | P a g e
Name
Description
Name
Name of Memory Regions (if a corresponding .map file is
found), Sections, Symbols, Functions, Variables, …
Run Address (VMA)
The Virtual Memory Address contains the address used
when program is running.
Load Address (LMA)
The Load Memory Address is the address used for load,
e.g. Initialization values for global variables.
Size
The used size (total size for Memory Regions)
Table 4 – Memory Details
Figure 244 – Memory Details Tab
SIZE INFORMATION
The size information in the Memory Details tab is calculated from the symbol size in the
.elf file. If a corresponding .map file is investigated this may contain a different size
value. Normally the size is correct for c-files but the value presented for assembler files
depends on how the size information is written in the assembler files. The constants used

Build Analyzer
268 | P a g e
by the function shall be defined within the .section definition. At the end of the section the
.size directive is used by the linker to calculate the size of the function.
Example: Reset_Handler in startup.s file
This is an example on how to write the Reset_Handler in an assembler startup file to
include the constants _sidata, _sdata, _edata, _sbss, _ebss in the size information for the
Reset_Handler in the .elf file. If these constants are defined outside the Reset_Handler
section definition the size of these constants will not be included in the calculated size of
the Reset_Handler. To include them in the size of the Reset_Handler these definitions
should be placed inside the Reset_Handler section in the following way.
.section .text.Reset_Handler
.weak Reset_Handler
.type Reset_Handler, %function
Reset_Handler:
ldr sp, =_estack /* set stack pointer */
/* Copy the data segment initializers from flash to SRAM */
movs r1, #0
b LoopCopyDataInit
CopyDataInit:
ldr r3, =_sidata
/* initialization code data, bss, ... */
...
/* Call the application's entry point.*/
bl main
bx lr
/* start address for the initialization values defined in
linker script */
.word _sidata
.word _sdata
.word _edata
.word _sbss
.word _ebss
.size Reset_Handler, .-Reset_Handler
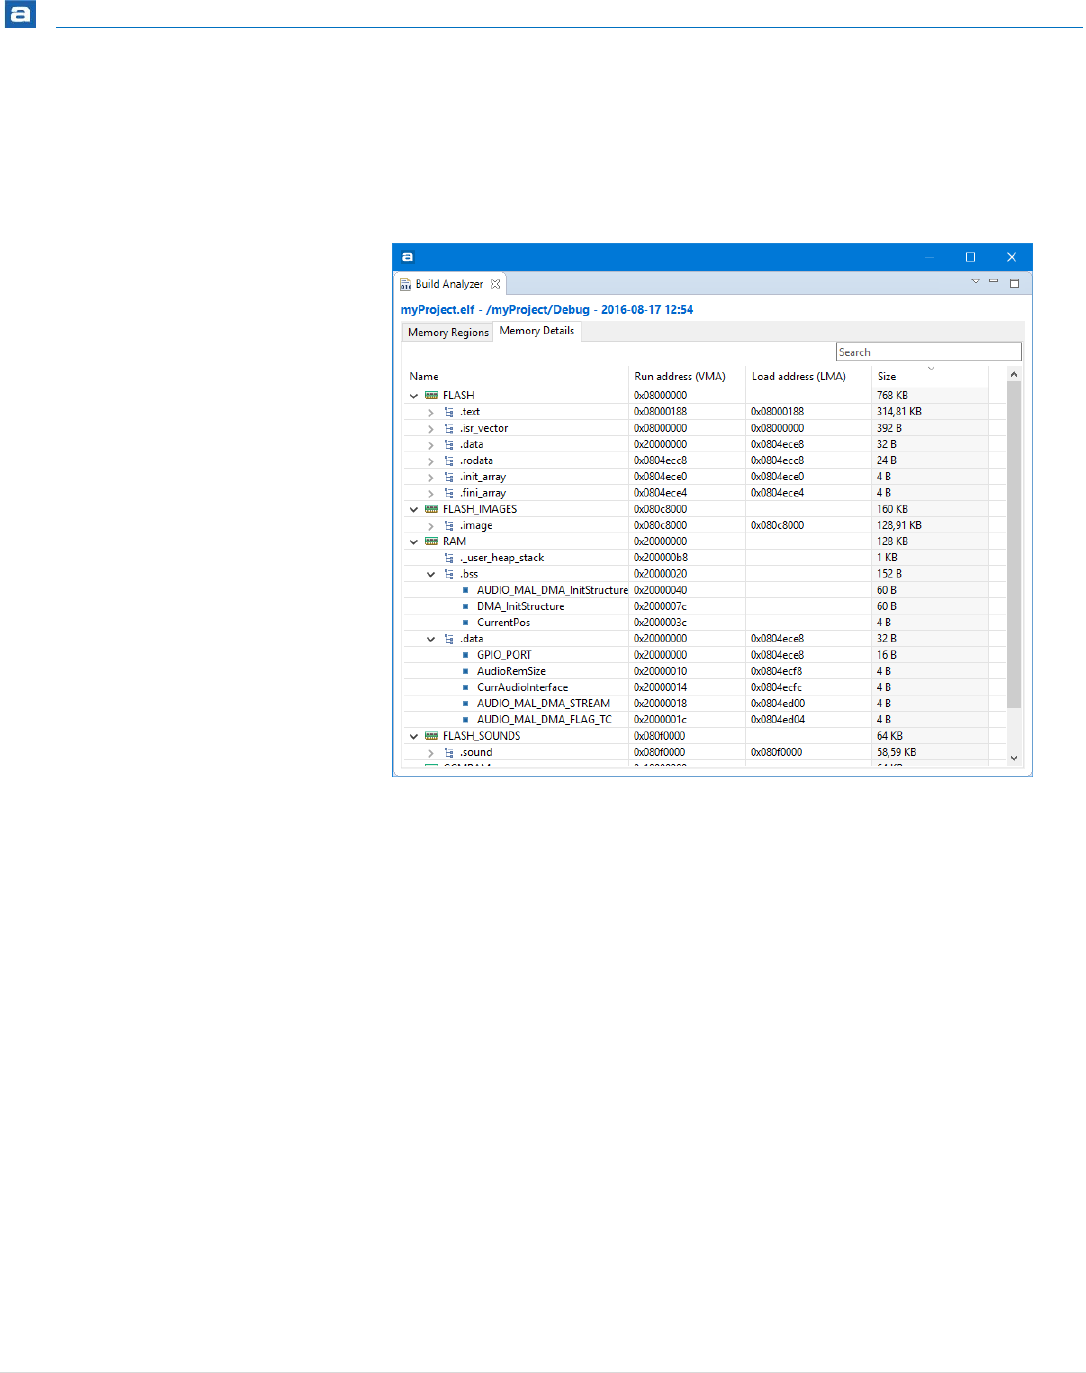
Build Analyzer
269 | P a g e
SORTING
The sort order of Memory Details tab can be changed by clicking on a column name.
E.g. Sort information by size:
Figure 245 – Memory Details Sorted

Build Analyzer
270 | P a g e
SEARCH AND FILTER
The information in the Memory Details tab can be filtered by entering a string in the
search field.
E.g. Search for names including the string “dma”.
Figure 246 – Memory Details Search/Filter
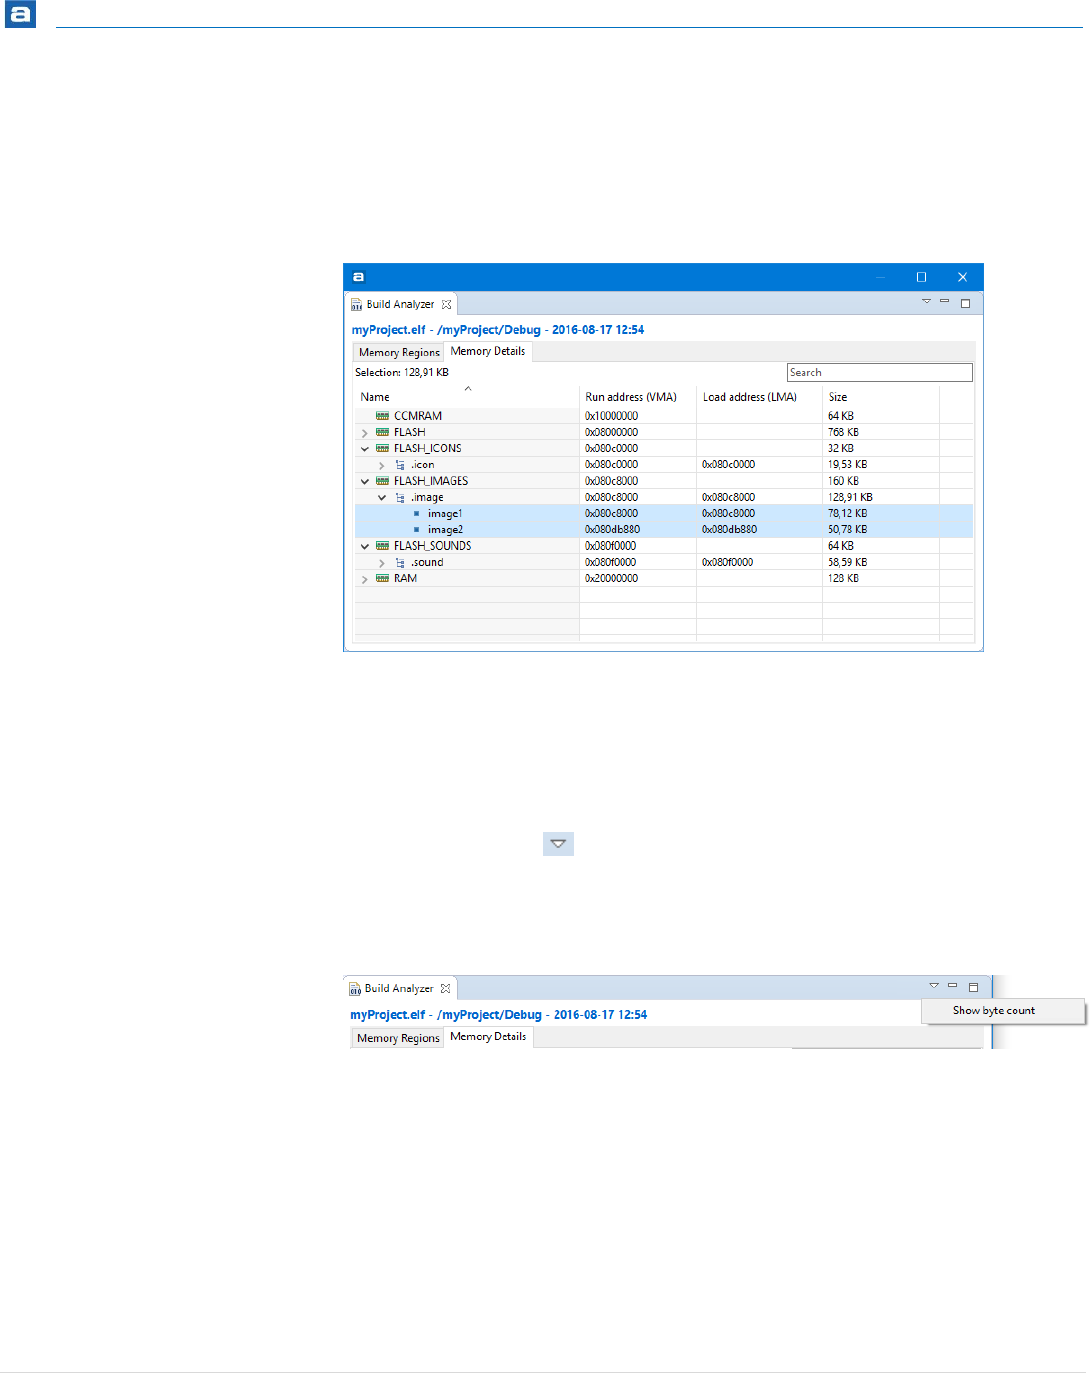
Build Analyzer
271 | P a g e
CALCULATE SUM OF SIZE
The sum of the size of several lines in the Memory Details tab can be calculated by
selecting several lines in the view. The sum of the selection is presented above the Name
column in the view.
Figure 247 – Calculate Sum of Size
DISPLAY SIZE INFORMATION IN BYTE FORMAT
The Build Analyzer can display size information in “Byte/Kbyte” format or in “Show Byte
Count” format. The icon in the Build Analyzer toolbar is used to switch between these
two formats. The Show byte count format can be an better option to use when making
Copy and Paste of data into an Excel document for later calculations.
Figure 248 – Show Byte Count
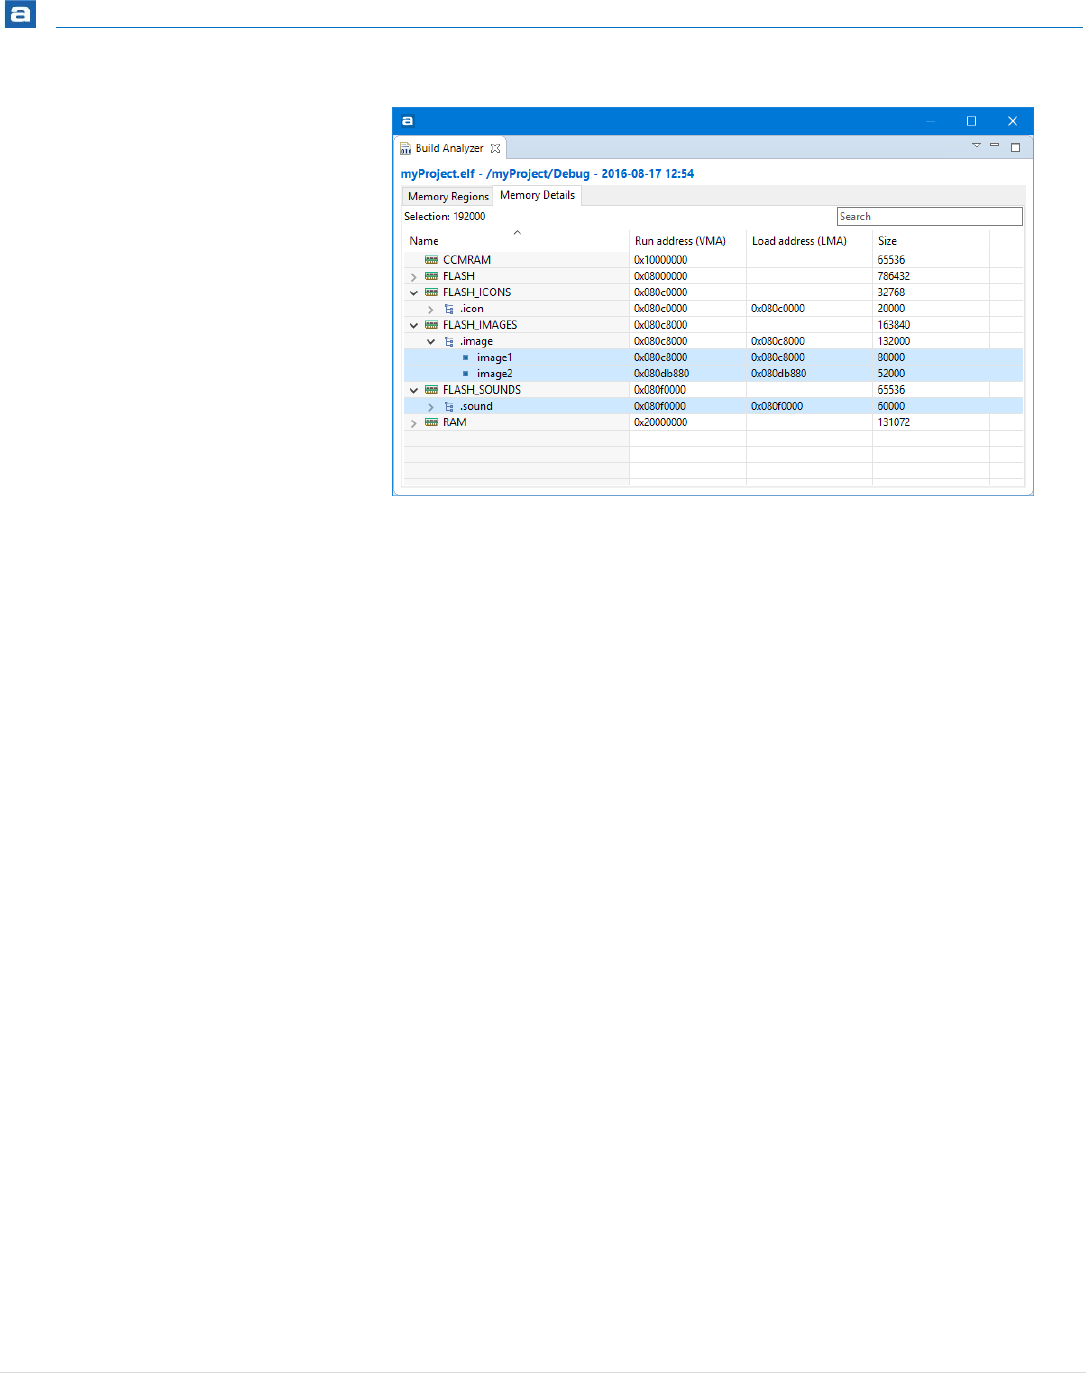
Build Analyzer
272 | P a g e
Figure 249 – Size Information in Byte Format
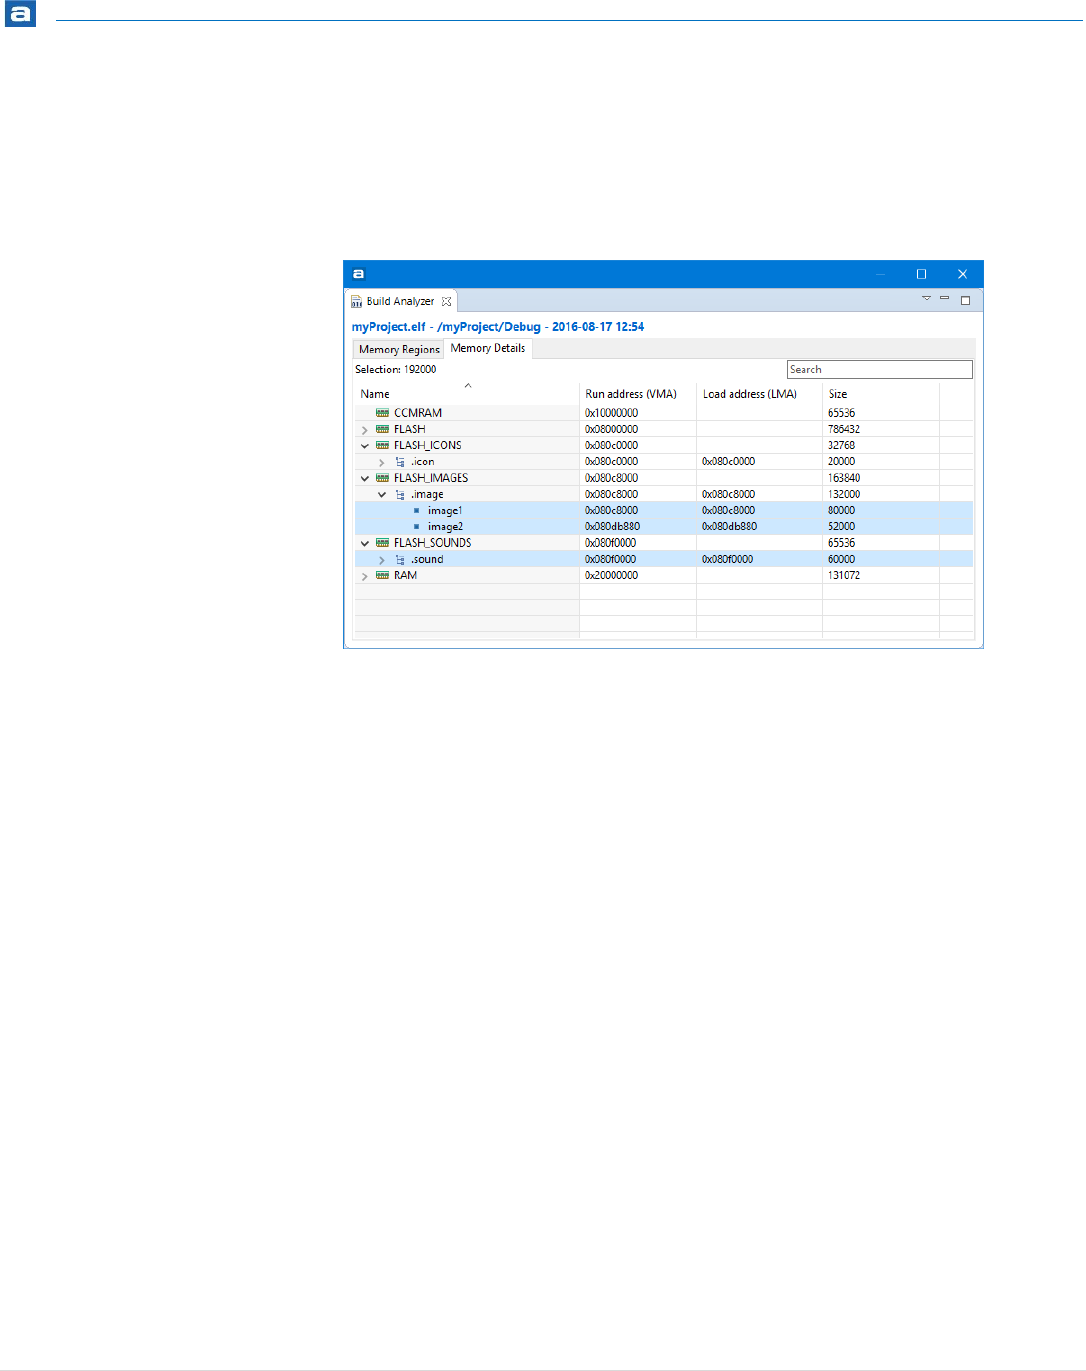
Introduction
273 | P a g e
COPY AND PASTE
The data in the Memory Details tab can be copied to other applications in CSV-format by
selecting the rows to copy and type Ctrl+C. The copied data can be pasted into another
application with the Ctrl+V command.
Figure 250 – Copy and Paste
For example when making a copy of the selected lines in previous figure the copied
information will be:
"image1";"0x080c8000";"0x080c8000";"80000"
"image2";"0x080db880";"0x080db880";"52000"
".sound";"0x080f0000";"0x080f0000";"60000"

Introduction
274 | P a g e
STATIC STACK ANALYZER
This section provides information on how to use the Atollic TrueSTUDIO Static Stack Analyzer
view.
The following topics are covered:
Introduction to Static Stack Analyzer
Using Static Stack Analyzer

Static Stack Analyzer
275 | P a g e
INTRODUCTION TO STATIC STACK ANALYZER
The Static Stack Analyzer view calculates the stack usage based on the built program. It
analyzes the .su files, generated by gcc, and the .elf file in detail and presents the
information in the view.
The view contains two tabs. The List tab and the Call Graph tab.
The List tab is populated with the stack usage for each function included in the program.
There is one line per function and each line consist of Function, Local cost, Type, Location
and Info columns.
Figure 251 – Static Stack Analyzer List Tab
The Call Graph tab contains an expandable list with functions included in the program.
Lines which are representing functions which are calling other functions can be expanded
to see the call hierarchy.
Figure 252 – Static Stack Analyzer Call Graph Tab
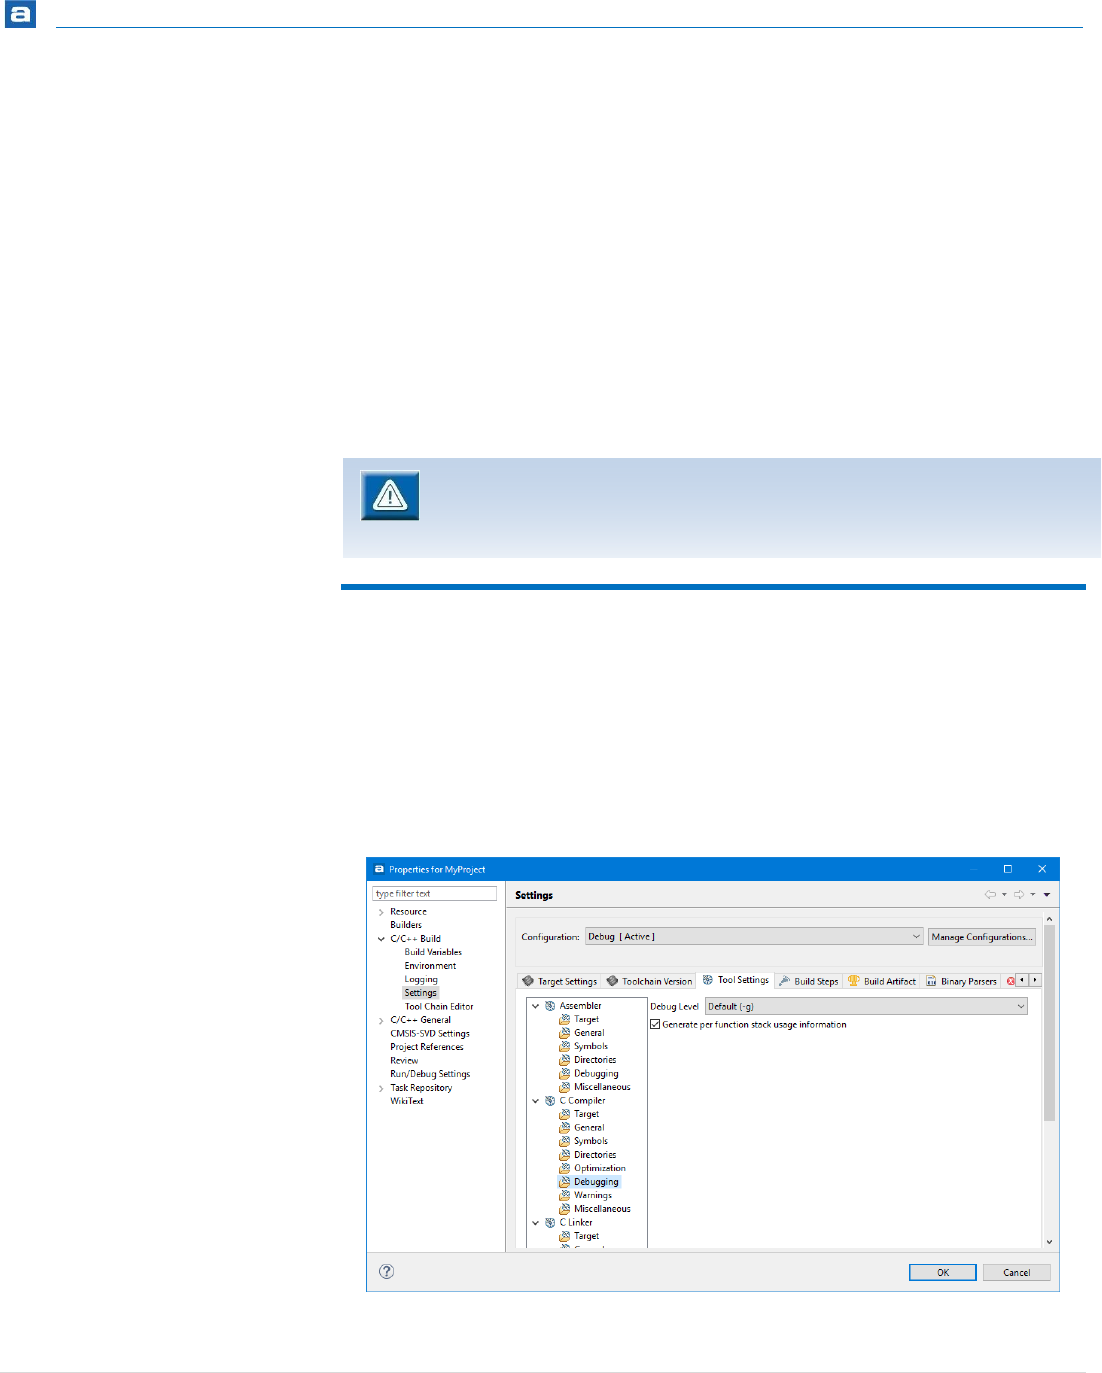
Static Stack Analyzer
276 | P a g e
USING STATIC STACK ANALYZER
The Static Stack Analyzer view is by default open in the C/C++ perspective. If the view is
closed it can be opened from the menu. Select the menu command View, Static Stack
Analyzer or use the toolbar icon Show View to open a drop down list; then select Other
and in the Show View dialog C/C++ -> Static Stack Analyzer. Another way to open the
Static Stack Analyzer view is to type Static Stack Analyzer into the Quick Access search
bar and select it from the views.
The Static Stack Analyzer view will be populated when a project has been built and is
selected in the Project Explorer. The program needs to be built with option Generate per
function stack usage information enabled. Otherwise the view will not be able to present
any stack information.
ENABLE STACK USAGE INFORMATION
If the top of the view displays the message No stack usage information found, please
enable in the compiler settings then there is a need to update the build configuration for
the linker to generate stack information. Open the properties for the project, for instance
with a right-click on the project in the Project Explorer view. Select Properties and in the
dialog and select C/C++ Build, Settings. Select the Tool Settings-tab, C Compiler,
Debugging and enable Generate per function stack usage information, see figure below.
Then save the setting and rebuild the program.
Figure 253 – Enable Generate per Function Stack Usage Information
How to setup the compiler to generate stack usage information is explained in
next chapter.
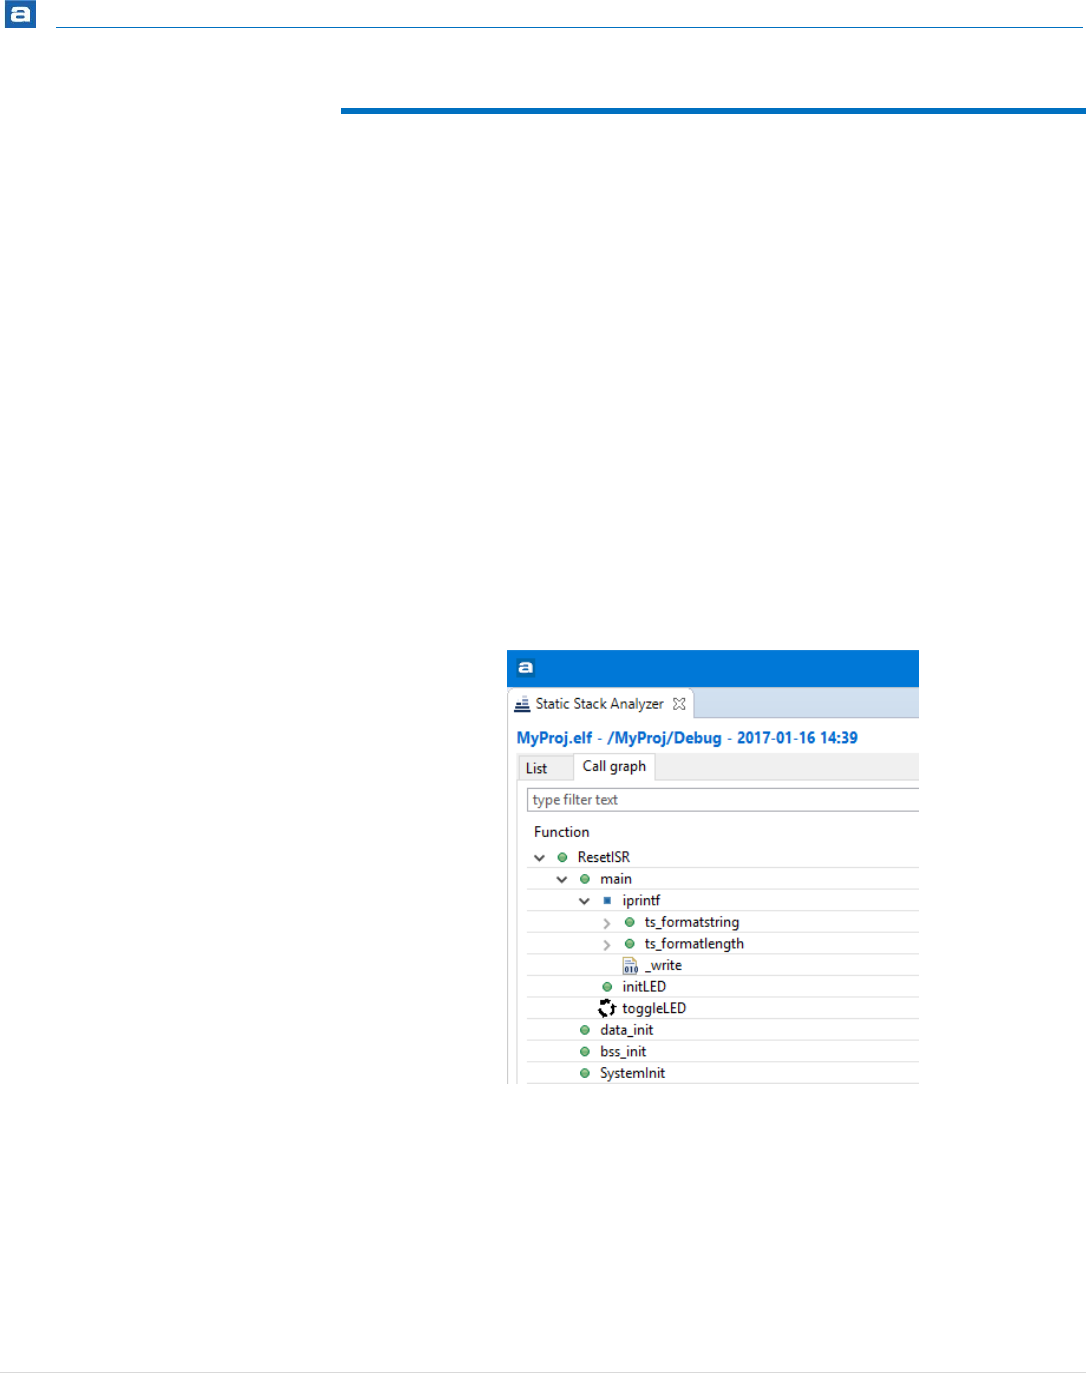
Static Stack Analyzer
277 | P a g e
BASIC COLUMN INFORMATION
The information in the Static Stack Analyzer tabs contains the following symbols and
definitions in the columns.
FUNCTION COLUMN
Normally there is a small icon to the left of the function name in the Function column. The
icon is:
green dot when the function uses STATIC stack allocation (fixed stack)
blue square when the function uses DYNAMIC stack allocation (run-time
dependent)
010 icon is used if the stack information is not known. This can be the case for
library functions or assembler functions.
Three arrows in a circle are used in the Call Graph view when the function makes
recursive calls
Figure 254 –Function Symbols in Static Stack Analyzer

Static Stack Analyzer
278 | P a g e
DEPTH COLUMN
The Depth column specifies the call stack depth this function uses
0 when function does not call any other functions
Number >=1 when function calls other functions
? when function makes recursive calls or the depth could not be calculated
MAX COST COLUMN
The Max cost column specifies how many bytes of stack the function will use including
stack needed for called functions.
LOCAL COST COLUMN
The Local cost column specifies how many bytes of stack the function will use. This column
does not take into account any stack which may be needed by functions it may call.
TYPE COLUMN
The Type column specifies
STATIC (the function uses a fixed stack)
DYNAMIC (the function uses a run-time dependent stack)
Empty field (no stack usage information available for the function)
INFO COLUMN
The Info column contains specific information about the stack usage calculation. For
instance it can hold a combination of the following messages.
Max cost uncertain (the reason can be that the function makes a call to some
sub function where the stack information is not known or the function makes
recursive calls etc.)
Recursive (the function makes recursive calls)
No stack usage information available for this function (no stack usage
information available for this function)
Local cost uncertain due to dynamic size, verify at run-time (the function
allocates stack dynamically, e.g. depending on in parameter)
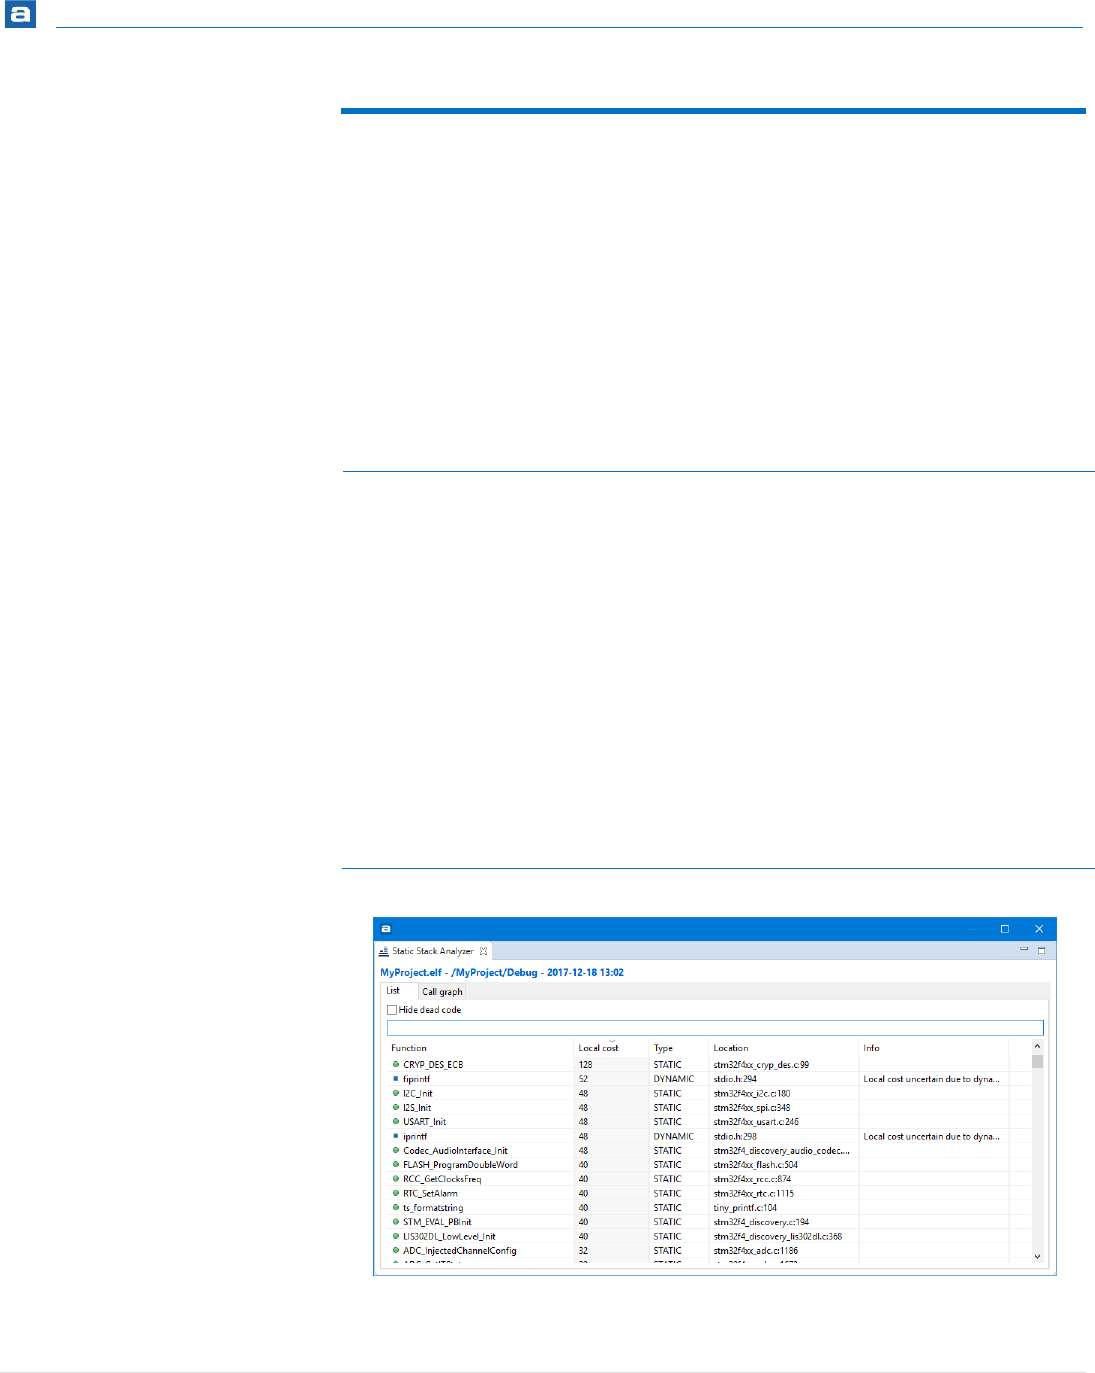
Static Stack Analyzer
279 | P a g e
LIST TAB
The List tab contains a list of all functions included in the selected program with options to
Hide dead code functions and to Filter visible functions.
The Hide dead code selection is used to enable or disable listing dead code functions.
The Filter field works in the way that when some characters are entered into the field only
functions matching the characters are displayed.
The column information in the List tab is described in the table below:
Name
Description
Function
Function name
Local cost
The number displays how many bytes of stack the function
will use.
Type
Tells if the function uses a STATIC or DYNAMIC stack
allocation. When DYNAMIC allocation is used the actual
stack size is run-time dependent and the the Local cost
value is uncertain due to the dynamic size of stack.
Location
Info
Indicates where the function is declared. It is possible to
double click on a line and open the file with the defined
function in the editor.
Additional information about the calculation.
Table 5 – Static Stack Analyzer List tab
Figure 255 –List tab

Static Stack Analyzer
280 | P a g e
CALL GRAPH TAB
The Call Graph tab contains detailed program information in a tree view. Each function
included in the program but not called by any other function is presented on top level. It is
possible to expand the tree to see called functions. Only functions available in the .elf file
can be visible in the tab.
The Filter field works in the way that when some characters are entered into the field only
functions matching the characters are displayed.
The column information in the Call Graph tab is described in the table below:
Name
Description
Function
Function name.
Depth
Max cost
Local cost
Displays how many nested function levels that will be
called by the function. The value is 0 if no functions are
called and ? mark is displayed if the number of called
functions could not be calculated for instance the source
code could not be found or the function makes recursive
calls.
The number displays how many bytes of stack the function
will use including stack needed for called functions.
The number displays how many bytes of stack the function
will use.
Type
Tells if the function uses a STATIC or DYNAMIC stack
allocation. When DYNAMIC allocation is used the actual
stack size depends on run-time and then the Local cost
value is uncertain due to the dynamic size of stack.
Location
Info
Indicates where the function is declared. It is possible to
double click on a line and open the file with the defined
function in the editor.
Additional information about the calculation.
Table 6 – Static Stack Analyzer Call Graph tab
By double-clicking on a line which displays the file location and line number in
the List tab, the function will be opened in the Editor view.

Static Stack Analyzer
281 | P a g e
The main function is normally called by the Reset_Handler and can in those cases be
seen when expanding the Reset_Handler node. In this figure below the reset function
name is called ResetISR. By expanding the node it can be seen that the ResetISR calls
the main function which calls initLED and toggleLED functions. The local cost of stack
for the main function is in this case 16 and the max cost is 32 as the main function call
initLED and toggleLED functions which also consumes 16 bytes of stack.
Figure 256 –Call Graph tab
By double-clicking on a line which displays the file location and line number in the tab, the
function will be opened in the Editor view.
USING SEARCH FIELD
The List tab and the Call Graph tab contains a filter/search field which can be used to
search a specific function or functions matching the characters entered into the field.
The next figure displays the List view using Filter field to see functions containing the
characters LED in the name.
The main function is normally called by the Reset_Handler and can in those
cases be seen when expanding the Reset_Handler node.
If unused functions are listed in the tab then please check if the linker option
dead code removal should be enabled to remove unused code from the
program. Read more on this in the Dead Code Removal chapter, page 121.
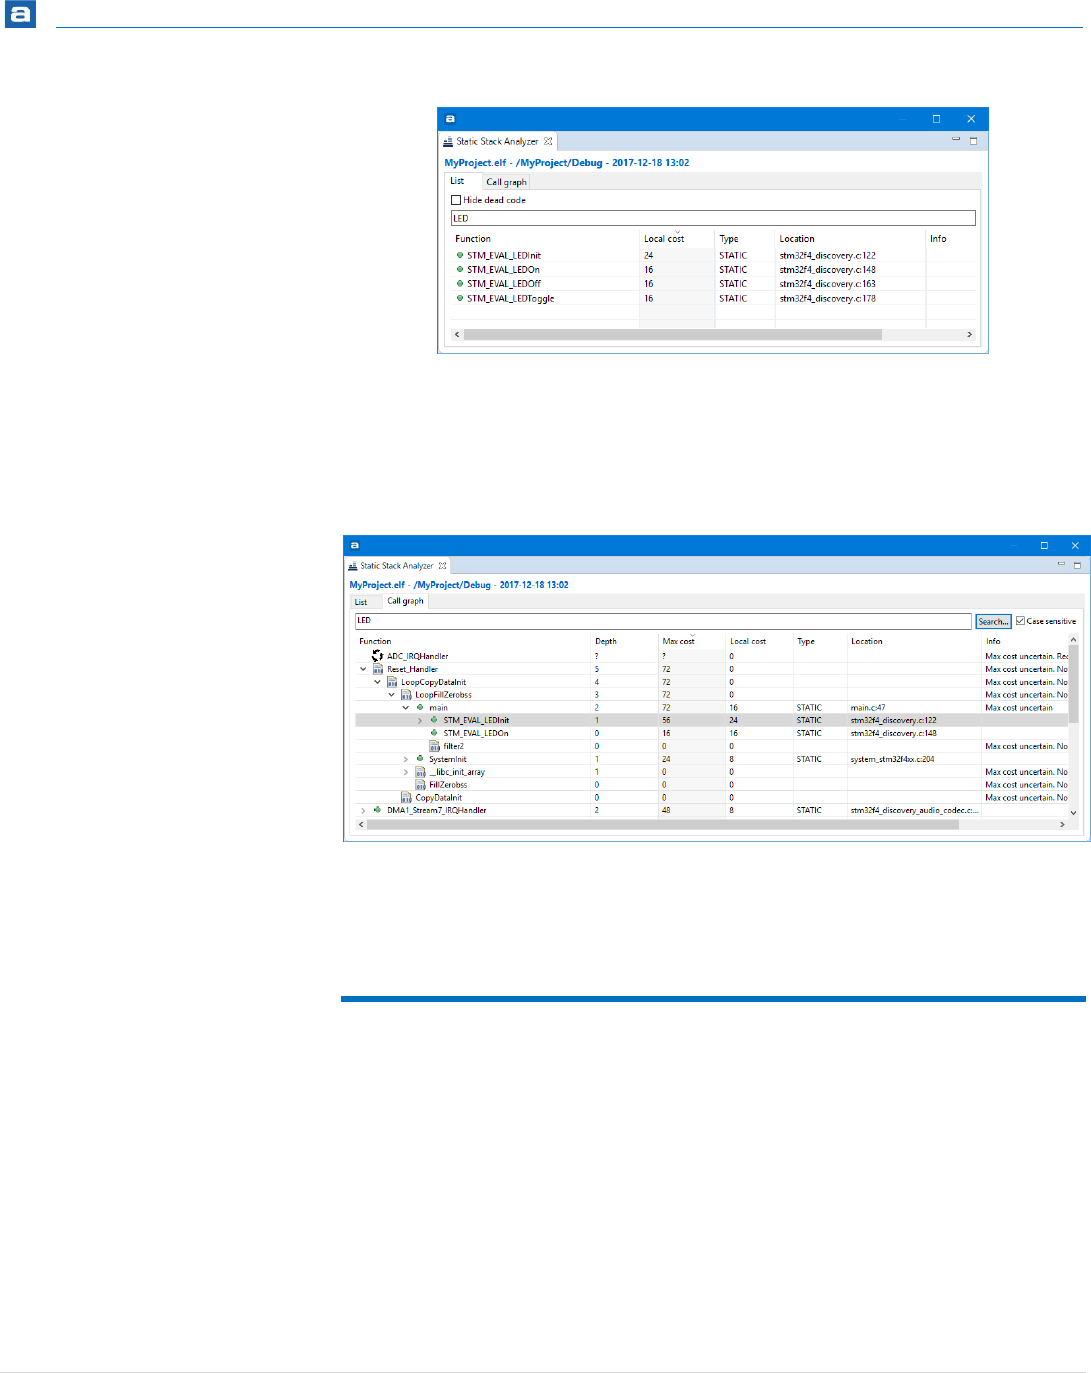
Static Stack Analyzer
282 | P a g e
Figure 257 –List tab using filter
Another example is to use the Search field in the Call Graph tab. The function(s) matching
the search field is find, press Serch to find next function(s).
Figure 258 –Call Graph tab using search
COPY AND PASTE
The data in the List tab can be copied to other applications in CSV-format by selecting the
rows to copy and type Ctrl+C. The copied data can be pasted into another application with
the Ctrl+V command.

Static Stack Analyzer
283 | P a g e
Figure 259 – Copy and Paste
For example when making a copy of the selected lines in previous figure the copied
information will be:
"STM_EVAL_LEDInit";"24";"STATIC";"stm32f4_discovery.c:122";""
"STM_EVAL_LEDOn";"16";"STATIC";"stm32f4_discovery.c:148";""
"SetSysClock";"16";"STATIC";"system_stm32f4xx.c:338";""
"SystemInit";"8";"STATIC";"system_stm32f4xx.c:204";""
"main";"16";"STATIC";"main.c:47";""

Getting Started
284 | P a g e
SERIAL WIRE VIEWER
TRACING
This section provides information on how to use Serial Wire Viewer Tracing (SWV) in
Atollic TrueSTUDIO for STM32.
The following topics are covered:
Using Serial Wire Viewer Tracing
Start SWV Tracing
The Timeline graphs
Statistical profiling
Printf() redirection over ITM
Change the Trace Buffer Size
Common SWV problems

Serial Wire Viewer
285 | P a g e
USING SERIAL WIRE VIEWER TRACING
To use system analysis and real-time tracing in compatible ARM® processors, a number of
different technologies interact; Serial Wire Viewer (SWV), Serial Wire Debug (SWD) and
Serial Wire Output (SWO). These technologies are part of the ARM® Coresight™ debugger
technology and will be explained below.
SERIAL WIRE DEBUG (SWD)
Serial Wire Debug (SWD) is a debug port similar to JTAG, and provides the same debug
capabilities (run, stop on breakpoints, single-step) but with fewer pins. It replaces the JTAG
connector with a 2-pin interface (one clock pin and one bi-directional data pin). The SWD
port itself does not provide for real-time tracing.
SERIAL WIRE OUTPUT (SWO)
The Serial Wire Output (SWO) pin can be used in combination with SWD and is used by the
processor to emit real-time trace data, thus extending the two SWD pins with a third pin.
The combination of the two SWD pins and the SWO pin enables Serial Wire Viewer (SWV)
real-time tracing in compatible ARM® processors.
Please note that the SWO is just one pin and it is easy to set a configuration that produces
more data than the SWO is able to send.
SERIAL WIRE VIEWER (SWV)
Serial Wire Viewer is a real-time trace technology that uses the Serial Wire Debugger
(SWD) port and the Serial Wire Output (SWO) pin. Serial Wire Viewer provides advanced
system analysis and real-time tracing without the need to halt the processor to extract the
debug information.
Serial Wire Viewer (SWV) provides the following types of target information:
Event notification on data reading and writing
Event notification on exception entry and exit
Event counters
Timestamp and CPU cycle information
Based on this trace data, modern debuggers can provide developers with advanced
debugger capabilities.
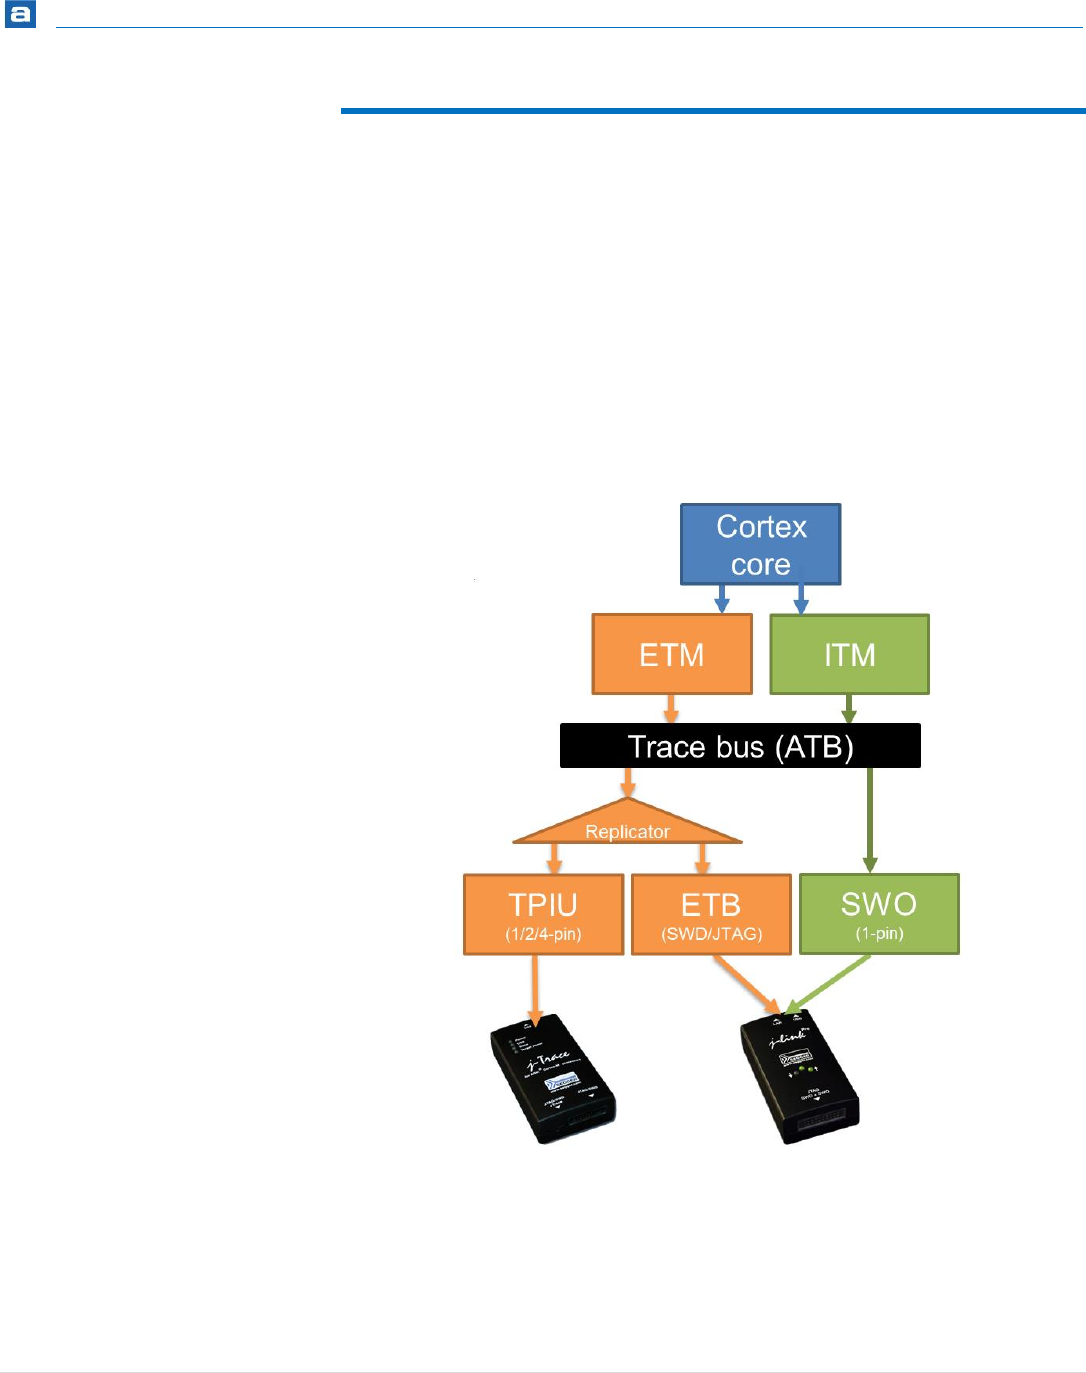
Serial Wire Viewer
286 | P a g e
INSTRUMENTATION TRACE MACROCELL (ITM)
The Instrumentation Trace Macrocell (ITM) enables applications to write arbitrary data to
the SWO pin, which can then be interpreted and visualized in the debugger in various
ways. For example, ITM can be used to redirect printf() output to a console view in
the debugger. The standard is to use port 0 for this purpose.
The ITM port has 32 channels, and by writing different types of data to different ITM
channels, the debugger can interpret or visualize the data on various channels differently.
Writing a byte to the ITM port only takes one write cycle, thus taking almost no execution
time from the application logic.
Figure 260 –Different Types of Tracing
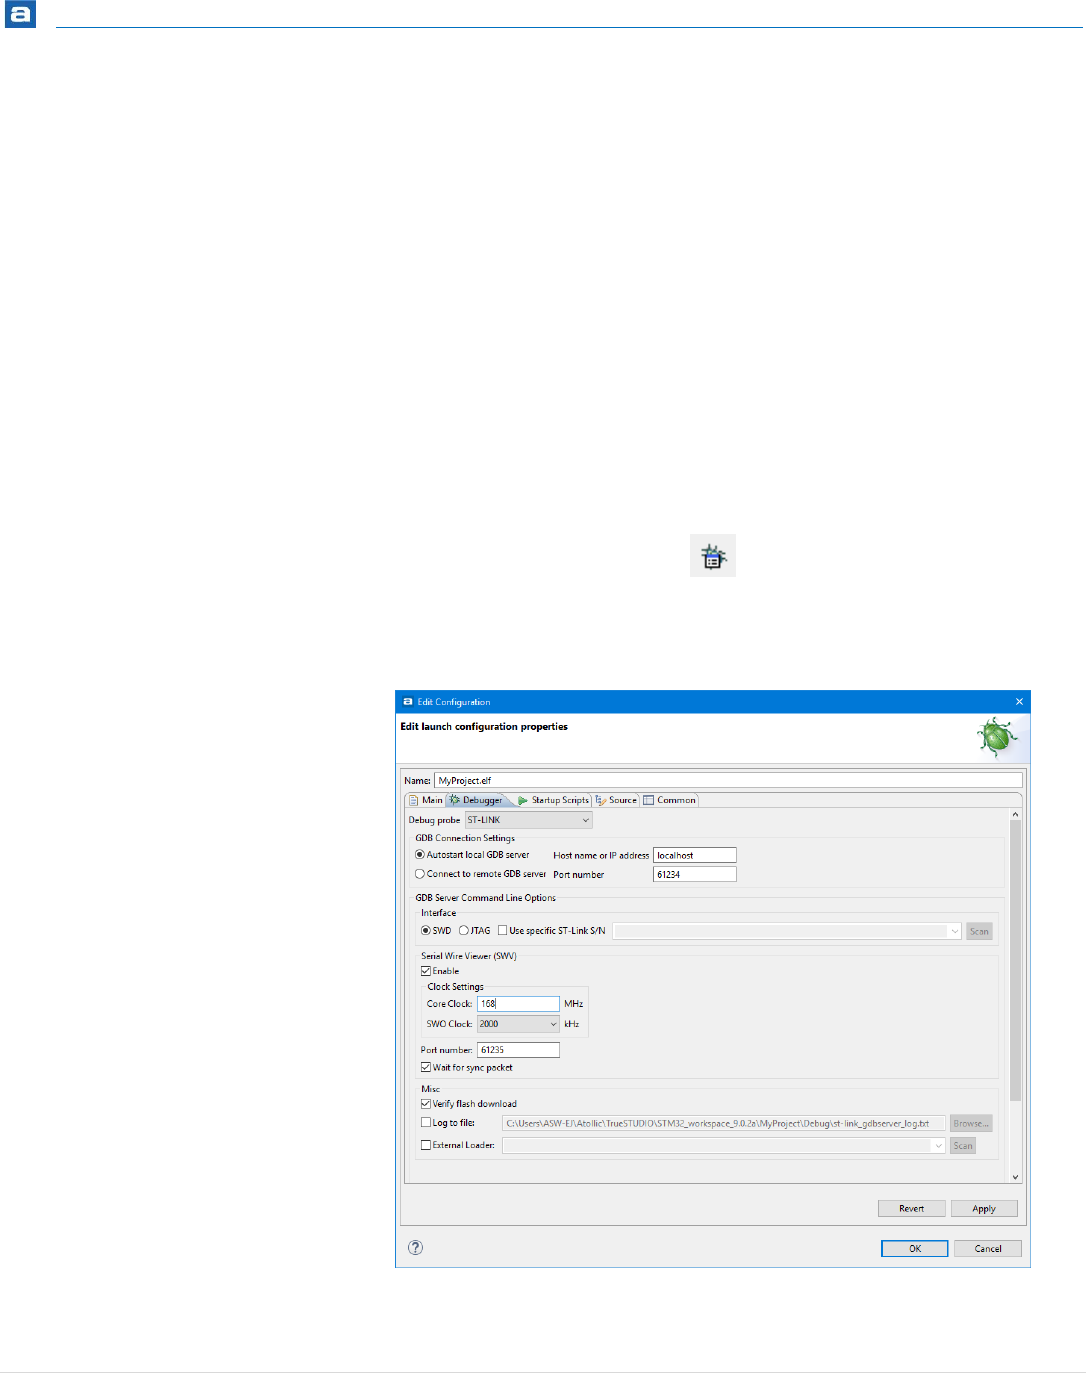
Serial Wire Viewer
287 | P a g e
STARTING SWV TRACING
To use the Serial Wire Viewer (SWV) in Atollic TrueSTUDIO, the JTAG Probe must support
SWV. Older JTAG Probes, such as ST-LINK V1, don’t.
The GDB server must also support SWV. The ST-LINK gdbserver must be of version 1.4.0 or
later, and the SEGGER J-LINK gdbserver must be of version 4.32.A or later. Older GDB
server versions that may be installed must be upgraded to the versions included in the
Atollic TrueSTUDIO product package in order to use SWV tracing.
To use SWV the board must support SWD. Please note that devices based on ARM Cortex-
M0 and Cortex-M0+ cores do not support SWV tracing.
1. Open the Atollic TrueSTUDIO debug configuration dialog by selecting the
current project in the Project Explorer, and clicking the Configure Debug
toolbar button.
Figure 261 – Open Debug Configurations Toolbar Button
The Debug configuration panel is then opened.
Figure 262 – Change ST-Link Debug Configuration for SWV

Serial Wire Viewer
288 | P a g e
Figure 263 – Change SEGGER J-Link Debug Configuration for SWV
2. Enable SWV by selecting the SWD interface.
3. For the ST-Link JTAG probe:
Check the SWV Enable checkbox.
For the SEGGER J-Link JTAG probe:
Select SWV (Serial Wire Viewer) as the Trace system.
4. Enter the Core Clock frequency. This must correspond to the value set by
the application program to be executed.
5. Enter the desired SWO Clock frequency. The latter depends on the JTAG
Probe and must be a multiple of the Core Clock value. For Segger J-Link-
based probes, it is also possible to select Auto, which will automatically use
the highest available frequency by taking into account the capacity of the
JTAG Probe and the Core Clock.
6. Switch to the Debug perspective by starting a debug session as described
earlier in this document. A debug session must be running to enable

Serial Wire Viewer
289 | P a g e
configuration and start of the Serial Wire Viewer tracing capabilities.
Please note that switching to the Debug perspective alone is not sufficient
for SWV to work. A debug session must also be running.
7. Pause the target execution by clicking the yellow Pause button.
8. Open one of the SWV views. For first-time users, Atollic recommends the
SWV Trace log view because it will give a good view of the incoming SWV
packages and how well the tracing is working.
Thus, select the View, SWV, SWV Trace log menu command.
Figure 264 – SWV Data Trace Menu Command
9. Open the Serial Wire Viewer settings panel by clicking on the Configure
Serial Wire Viewer button in the SWV Trace log view toolbar.
Figure 265 – Configure Serial Wire Viewer Button
10. Configure the data to be traced, and the trace method.

Serial Wire Viewer
290 | P a g e
Figure 266 – The Serial Wire Viewer Settings Dialog
A. Information about the current clock settings for this session.
B. Events that can be traced:
CPI – Cycle per instruction. For each cycle beyond the first one that
an instruction uses, an internal counter is increased with one. The
counter (DWT CPI count) can count up to 256 and is then set to 0.
Each time that happens one of these packages are sent. This is one
aspect of the processors performance and used to calculate
instructions per seconds. The lower the value, the better the
performance.
SLEEP – Sleep cycles. The number of cycles the CPU is in sleep
mode. Counted in DWT Sleep Count Register. Each time the CPU has
been in sleep mode for 256 cycles, one of these packages is sent.
This is used when debugging for power consumption or waiting for
external devises.
FOLD – Folded instruction. A counter for how many instructions are
folded (removed). Every 256 instruction folded (taken zero cycles)
you will receive one of these events. Counted in DWT Fold count
register.
Branch folding is a technique where, on the prediction of most
branches, the branch instruction is completely removed from the
instruction stream presented to the execution pipeline. Branch

Serial Wire Viewer
291 | P a g e
folding can significantly improve the performance of branches,
taking the CPI for branches below 1.
EXC – Exception overhead. The DWT Exception Count register keeps
track on the number of cycles the CPU spends in exception
overhead. This includes stack operations and returns but not the
time spent processing the exception code. When the timer
overflows one of these events is sent. Used to calculate what the
exception-handling actually costs the program.
LSU – Load Store Unit Cycles. DWT LSU Count Register counts the
total number of cycles the processor is processing an LSU operation
beyond the first cycle. When the timer overflows one of these
events is sent.
With this measurement how much time is spent with memory-
operations can be tracked.
EXETRC – Trace exceptions. Whenever an exception occur one of
these events is sent. These events can be monitored in the SWV
Exception Trace view and the SWV Exception Timeline view. From
these views you can also jump to the exception handler code for
that exception.
C. PC Sampling. Enabling this starts sampling the Program Counter
with some cycle interval. Since the SWO-pin has a limited
bandwidth it is not a good idea to sample to fast. Experiment with
this to be able to sample often, but not too often. The results from
the sample are used, among other things, for the Statistical
Profiling view.
D. Timestamps – Must be enabled to know when an event occurred.
The Prescaler should only be changed as a last effort to reduce
overflow packages.
E. Data Trace - Up to four different symbols or areas of the memory
can be traced, as for an example the value for a global variable. To
do that, enable one comparator and enter the name of the variable
or the memory-address to trace. The value of the traced variables
can be displayed both in the Data trace view and the Data Trace
Timeline graph.
F. ITM stimulus ports – Enable one or more of the 32 ITM ports. The
most common way to use this is to send information
Serial Wire Viewer
292 | P a g e
programmatically and almost none intrusive. As for an instance the
CMSIS function ITM_SendChar is used to send characters to port
0, see below.
The packages from the ITM ports is display in the SWV console view
and the ITM Timeline Graph.
Overflow while running SWV is an indication that SVW is configured to
trace more data than the SWO-pin is able to process. In such a case,
decrease the amount of data traced.
To use any of the timeline views in Atollic TrueSTUDIO, enable
Timestamps. The default Prescaler value is 1. Keep this value, unless
problems occur related to SWV package overflow.
It is possible to trace up to four different C variable symbols, or fixed
numeric areas of the memory.
Below are three examples for the SWV-trace configuration:
Example 1: To trace the value of a global variable, enable a Comparator
and enter the name of the variable or the memory address to be traced.
The value of the traced variables is displayed both in the Data Trace view
and the Data Trace Timeline graph.
Example 2: To profile the program execution, enable the PC-sampling. In
the beginning a high value for the Cycles/sample is recommended.
The result from the PC-sampling is then displayed in the SWV Statistical
Profiling view.
Example 3: To trace the exceptions occurring during program execution,
enable the Trace Event EXETRC: Trace Exceptions.
Information about the exceptions is then displayed in the SWV Exception
Trace Log view and the SWV Exception Timeline Graph.
11. Save the SWV configuration in Atollic TrueSTUDIO by clicking the OK
button. The configuration is saved together with other debug
configurations and will remain effective until changed.
12. Press the Start/Stop Trace button to send the SWV configuration to the
target board and start SWV trace recoding. The board will not send any
Atollic recommends limiting the amount of data traced. Most ARM® -based
microcontrollers reads and writes data faster than the maximum SWO-pin
throughput. Too much trace data result in data overflow, lost packages and
possibly corrupt data. For optimum performance, trace only data vital to the
task at hand.

Serial Wire Viewer
293 | P a g e
SWV packages until it is properly configured. The SWV Configuration must
be resent, if the configuration registers on the target board are reset.
Actual tracing will not start until the target starts to execute.
Figure 267 – The Start/Stop Trace Button
Please note the tracing cannot be configured while it is running. Pause
debugging before attempting to send a new configuration to the board.
Each new, or changed, configuration must be sent to the board to take
effect.
The configuration is sent to the board when the Start/Stop Trace-button is
pressed.
13. Start the target execution again by pressing the green Resume Debug
button.
Figure 268 – Resume Debug Button
14. Packages should now be arriving in the SWV Trace Log view (and possibly
other views too, dependent on trace configuration).
Collected data can be cleared by pressing the Empty SWV-Data button. All
the timers are also restarted when this button is pressed.
Figure 269 – Empty SWV Data Button
Serial Wire Viewer
294 | P a g e
THE SWV VIEWS
The views that displays SWV trace data are:
SWV Trace Log - Lists all incoming SWV packages in a spreadsheet. Useful as
a first diagnostic for the trace quality. The data in this view can be copied to other
applications in CSV-format by selecting the rows to copy and type Ctrl+C. The
copied data can be pasted into another application with the Ctrl+V command.
SWV Trace Timeline Graph – A graph displaying all SWV-packages received
as a function of time.
SWV Exception Trace Log – The view has two tabs. The first is similar to the
SWV Trace Log, but is restricted to Exception events and also has additional
information about the type of event. The data can be copied and pasted into
other applications. Each row is linked to the code for the corresponding exception
handler. Double click on the event and the corresponding interrupt hander source
code is opened in the editor view.
The second tab displays statistical information about the Exception events. This
information may be of great value when optimizing the code. Hypertext links to
exception handler source code in the editor is included.
SWV Exception Timeline Graph – A graph displaying the distribution of
exceptions over time. Remember that each exception sends up to three SWV-
packages. Double click on the event in the tool tip and the code for the exception
handler is opened up in the editor view.
SWV Console - Prints readable text output from the target application.
Typically this is done via printf() with output redirected to ITM channel 0. Other
ITM channels can get their own console view too.
SWV ITM Timeline Graph – A graph displaying the distribution of ITM-
packages over time. This can be used for code block execution time visualization.
SWV Data Trace – Tracks up to four different symbols or areas in the memory.
For example, global variables can be referenced by name.
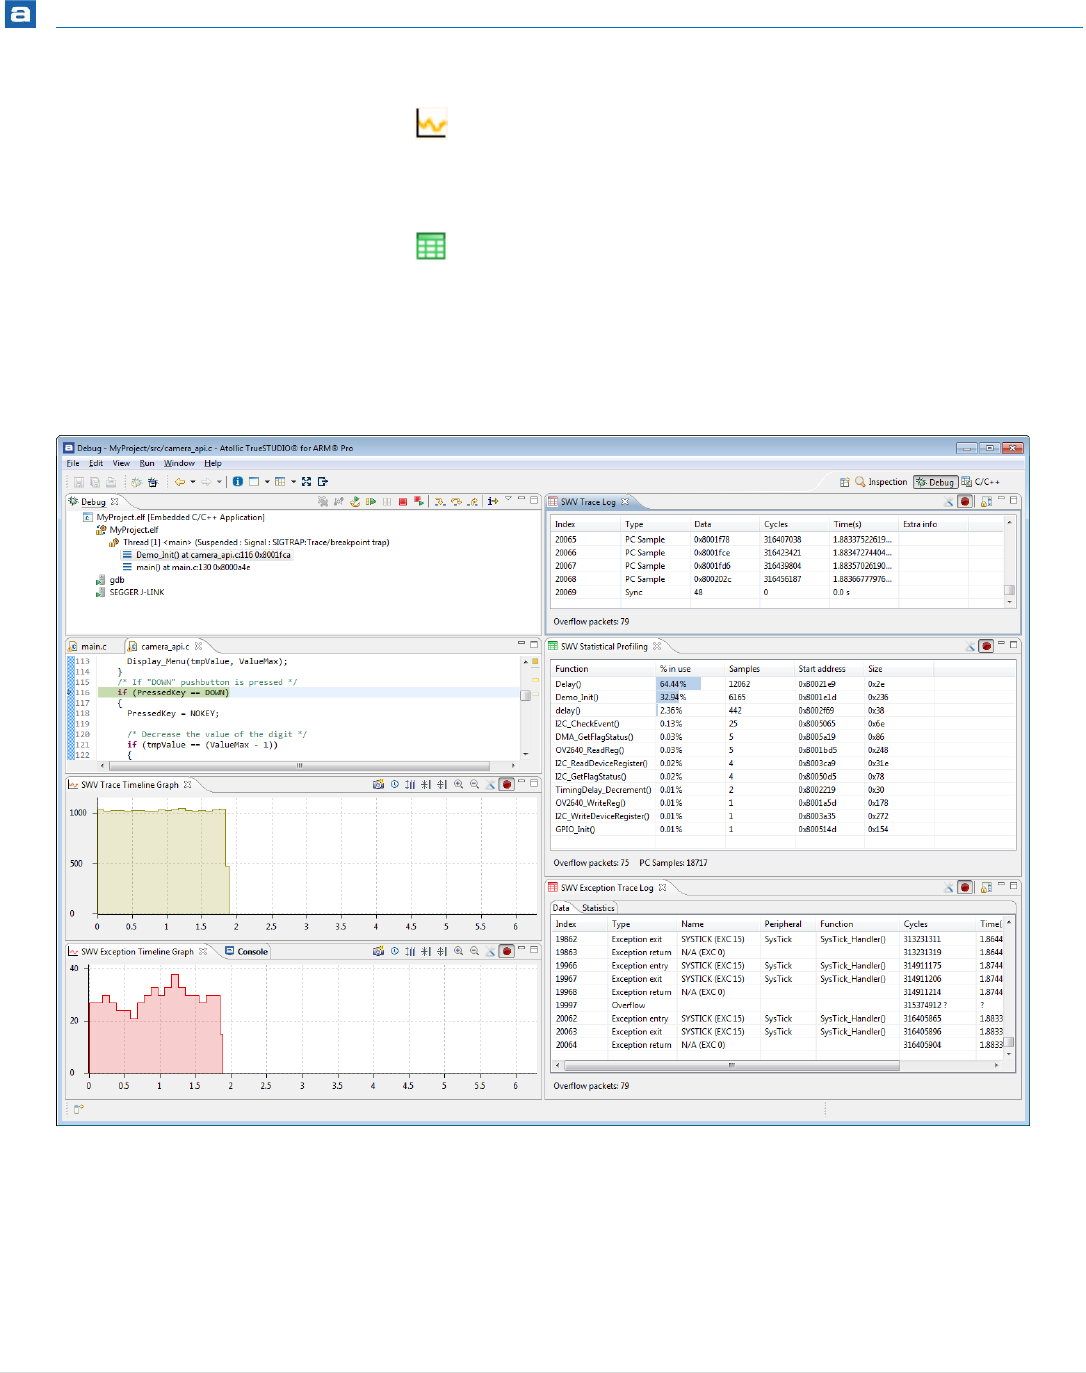
Serial Wire Viewer
295 | P a g e
SWV Data Trace Timeline Graph – A graphical display that shows the
distribution of variable values over time. Applies to the variables or memory areas
in the SWV Data Trace.
SWV Statistical Profiling – Statistics based on Program Counter (PC) sampling.
Shows the amount of execution time spent within various functions. This is useful
when optimizing code. The data can be copied and pasted into other applications.
The view is updated when debugging is suspended.
More than one SWV view may be open at the same time, for simultaneous tracking of
various events.
Figure 270 – Several SWV Views Displayed Simultaneously

Serial Wire Viewer
296 | P a g e
THE TIMELINE GRAPHS
All the timeline graphs, except the Data Trace Timeline, have some common features:
Any graph can be saved as an image file by clicking the camera icon.
The graphs show the time in seconds by default.
The zoom range is limited while debugging is running. More details are available
when debugging is paused.
Zoom in: Double-click on the left mouse button. Zoom out: Double-click on the
right button or use the corresponding toolbar buttons in the view.
The tooltip shows the number of packages in each bar. Except for the Trace
Timeline Graph, the content of bars with less than 50 packages is showed in a
detailed view.
The Data Trace Timeline displays distinct values for variables during execution and
has different features than the above graphs.
STATISTICAL PROFILING
This is a way to obtain information about the amount of execution time spent within
various functions. It is not based on code analysis but on statistical information regarding
the part of the code executed. This is a technical limitation of the SWV protocol.
1. Configure SWV to send Program Counter samples, as described below.
Enable the PC Sampling (A) and Timestamps.
With the given Core clock cycle intervals, SWV will report the Program
Counter values to Atollic TrueSTUDIO. Atollic recommends beginning with
the PC-sampling set to a high Cycle/sample value. This will ensure that the
interface will not overflow.
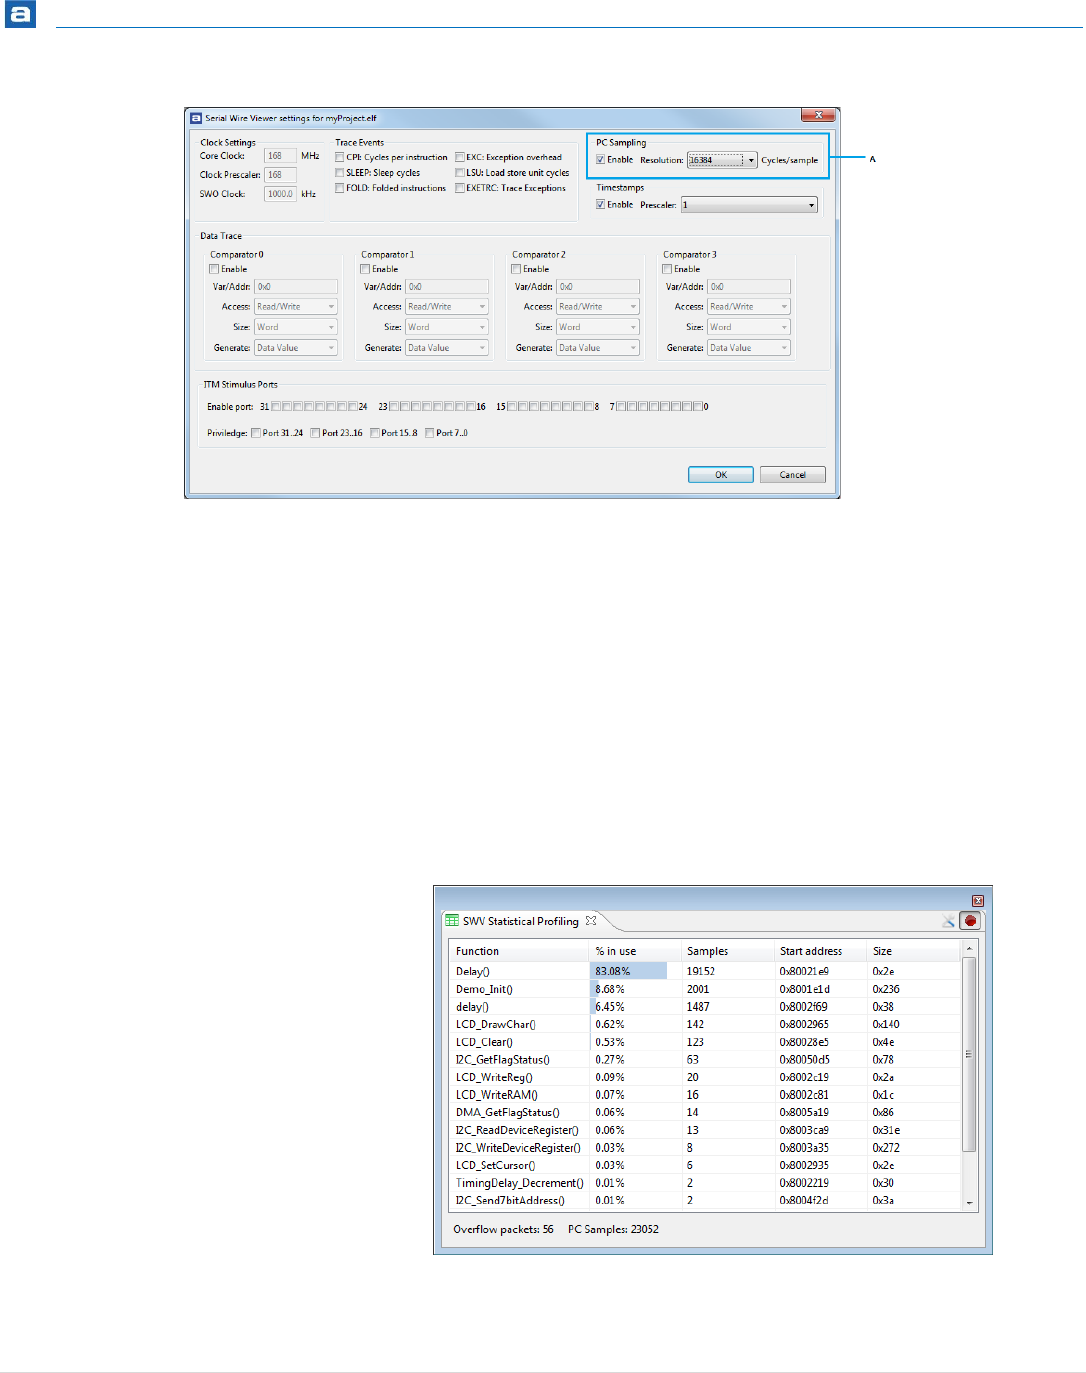
Serial Wire Viewer
297 | P a g e
Figure 271 –Statistical Profiling Configuration
2. Open the Statistical Profiling view by selecting View, SWV Statistical
Profiling. It will be empty, since no data has been collected.
3. Push the red Start/Stop Trace button to send the configuration to the
board.
4. When you start executing code in the target system, Atollic TrueSTUDIO
starts collecting statistics about function usage via SWV.
5. Suspend (Pause) the debugging. The collected data is displayed in the view.
The longer the debugging session, the more statistics will be collected.
Figure 272 – Statistical Profiling View
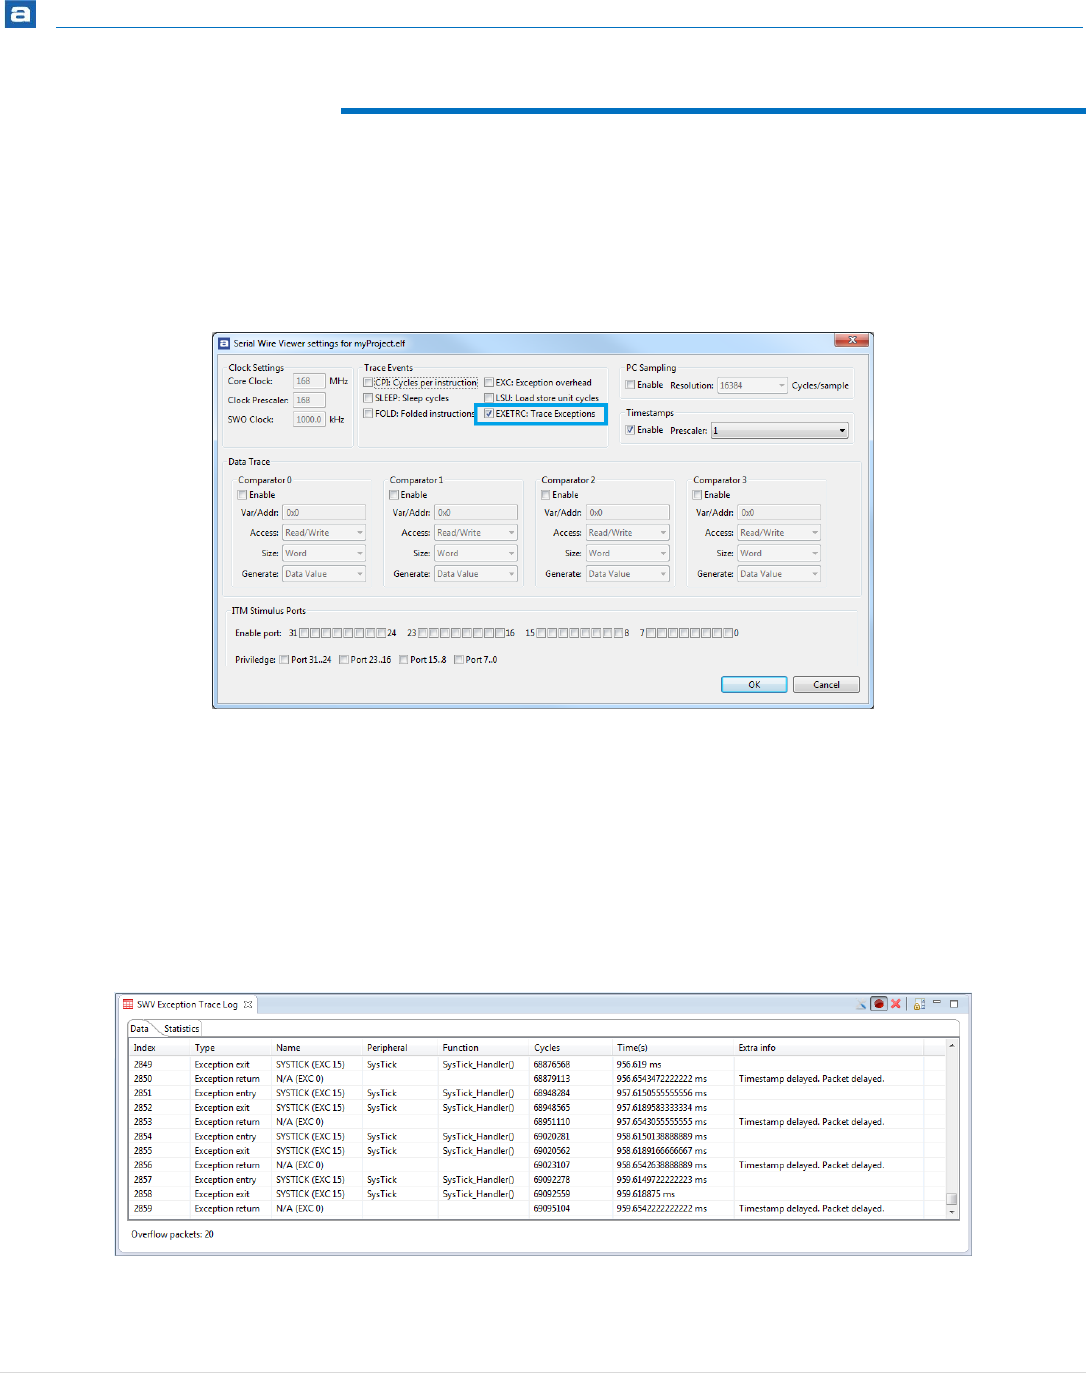
Serial Wire Viewer
298 | P a g e
EXCEPTION TRACING
To make it possible to trace the exceptions encountered during execution, the exception
packages needs to be enabled. Open SWV Configuration as described above.
Enable EXETRC: Trace Exception. This will generate Trace Exception packages. Disable all
other packages not needed at the moment.
Figure 273 – Exception Tracing Configuration
EXCEPTION DATA
The exception packages are displayed in the SWV Exception Trace Log view. The view has
two tabs, the Data tab and the Statistics tab.
By double-clicking on an entry in the tab, the function will be opened in the Editor if it is
available in the source code.
Figure 274 – Exception View, Data Tab
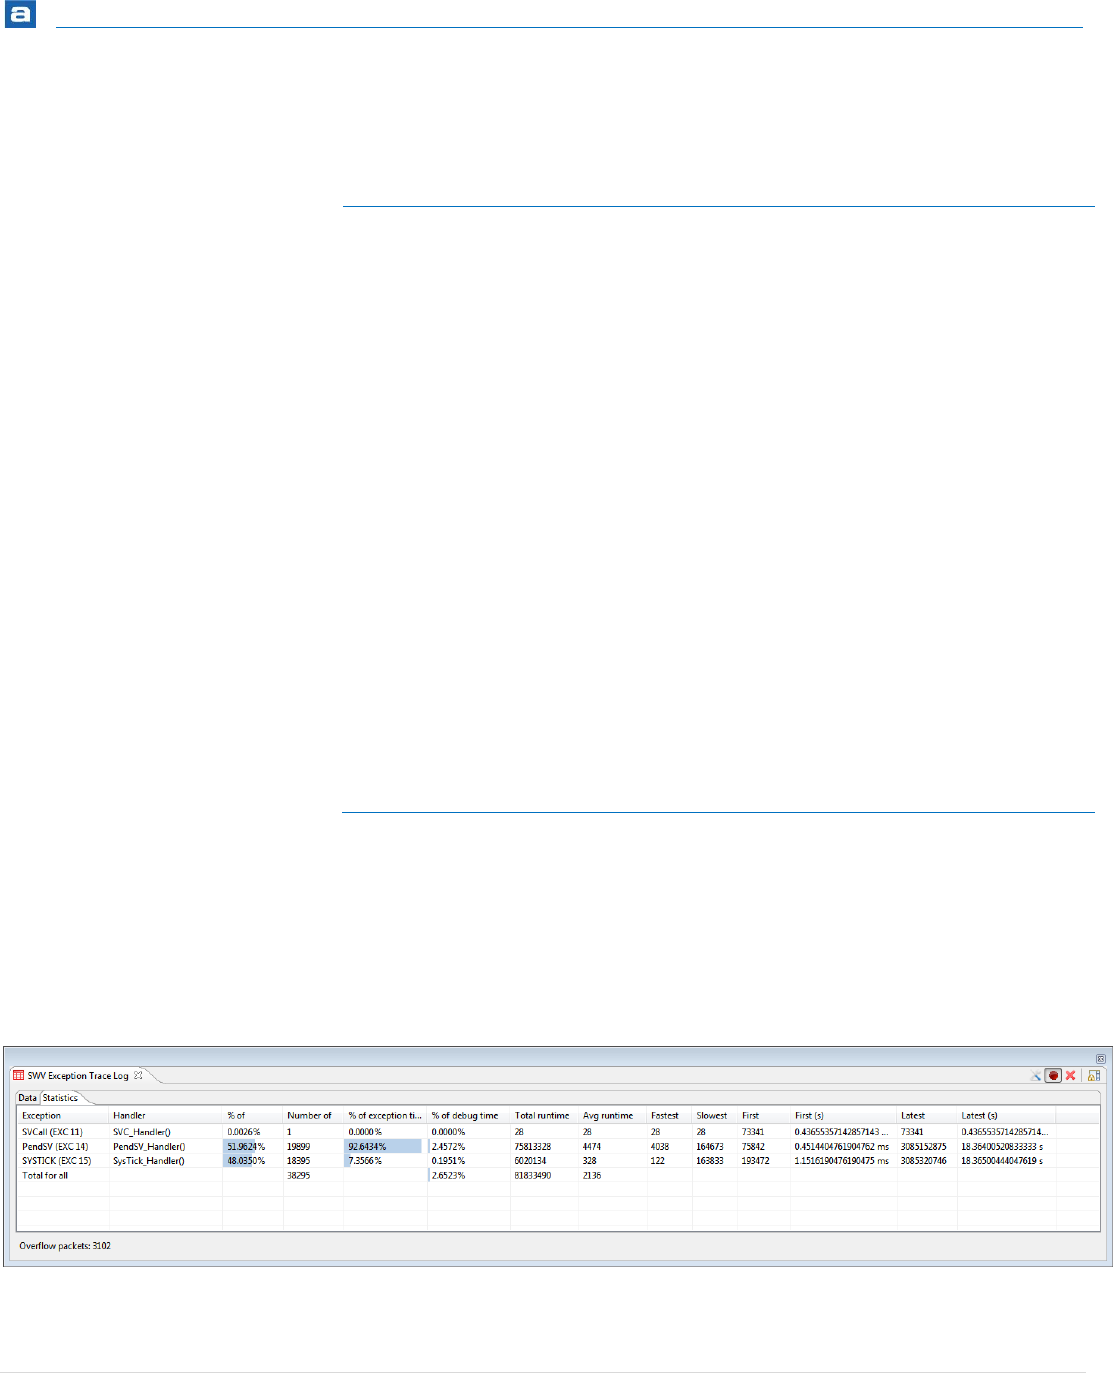
Serial Wire Viewer
299 | P a g e
The columns in the Data tab are:
Name
Description
Index
The Id for the exception package. Are shared with the
other SWV packages.
Type
Normally each exception will generate three packages
each; Exception entry, Exception exit and then an
Exception return package. TrueSTUDIO displays all three.
Name
The name of the exception provided by the manufacturer.
Also the exception or interrupt number.
Peripheral
The peripheral for the exception.
Function
The name of the interrupt handler function for this
interrupt. Updated when debug is paused. Is cached
during the whole debug session.
By double clicking the function, the editor will open that
function in the source code.
Cycles
The timestamp for the exception in cycles.
Time(s)
The timestamp for the exception in seconds
Extra info
Optional extra information about that package.
Table 7 – Exception Data Columns
EXCEPTION STATISTICS
The exception statistics is collected whenever Exception packages are received by SWV. It
can be found in the SWV Exception Trace Log view, in the Statistics tab.
Figure 275 – Exception View, Statistics Tab

Serial Wire Viewer
300 | P a g e
The statistics can be access by selecting the Statistics tab in the view.
By double-clicking on an entry in the tab, the function will be opened in the Editor if it is
available in the source code.
The available columns are described in the table below:
Name
Description
Exception
The name of the exception provided by the manufacturer.
Also the exception or interrupt number.
Handler
The name of the interrupt handler for this interrupt.
Updated when debug is paused. Is cached during the
whole debug session.
By double clicking the handler, the editor will open that
function in the source code.
% of
This exception type’s share, in percentage, of all
exceptions.
Number of
The total number of entry packets received by SWV of this
exception type.
% of exception time
How big part of the execution time for all exceptions that
this exception type have.
% of debug time
How big part of the total execution time for this debug
session that this exception type have. All the timers are
restarted when the Empty SWV-Data button is pressed.
Total runtime
The total execution time in cycles for this exception type.
Avg runtime
The average execution time in cycles for this exception
type.
Fastest
The execution time in cycles for the fastest exception of
this exception type.
Slowest
The execution time in cycles for the slowest exception of
this exception type.
First
The first encounter of an entry event for this exception
type in cycles.
First(s)
The first encounter of an entry event for this exception
type in seconds.
Latest
The latest encounter of an entry event for this exception

Serial Wire Viewer
301 | P a g e
Name
Description
type in cycles.
Latest(s)
The latest encounter of an entry event for this exception
type in seconds.
Table 8 – Exception Statistics Columns

Serial Wire Viewer
302 | P a g e
PRINTF() REDIRECTION OVER ITM
Since SWV enables target software to send data back to the debugger using any of the 32
ITM channels, this feature can be used to redirect printf() output back to the ITM console
view in the debugger (ITM channel 0 is typically used for printf-redirection).
1. To make printf()send ITM-packages, the file syscalls.c must be
configured. If no syscalls.c file was generated when the project
where generated, the following steps can be performed to generate it:
In the Project explorer, right click on the project and select New, Other...
Expand System calls.
Select "Minimal System Calls Implementation" and click next.
Click Browse... and select the src folder as new file container and click OK.
Click on Finish and verify that syscalls.c is added to the project.
2. Inside the syscalls.c file, replace the _write()function with the
following code:
int _write(int file, char *ptr, int len)
{
/* Implement your write code here, this is used
by puts and printf for example */
int i=0;
for(i=0 ; i<len ; i++)
ITM_SendChar((*ptr++));
return len;
}
3. Next step is to locate the core_cmX.h file which contains the function
ITM_SendChar(). The core_cmX.h file is included by the Device
Peripheral Access Layer Header File (i.e. stm32f4xx.h). That file in turn
needs to be included in the syscalls.c file.
If uncertain about where to find the Device Peripheral Access Layer Header
File, use the Include Browser. Drop the core file in the Include Browser
view, and check that which files are including the core_cmX.h file.
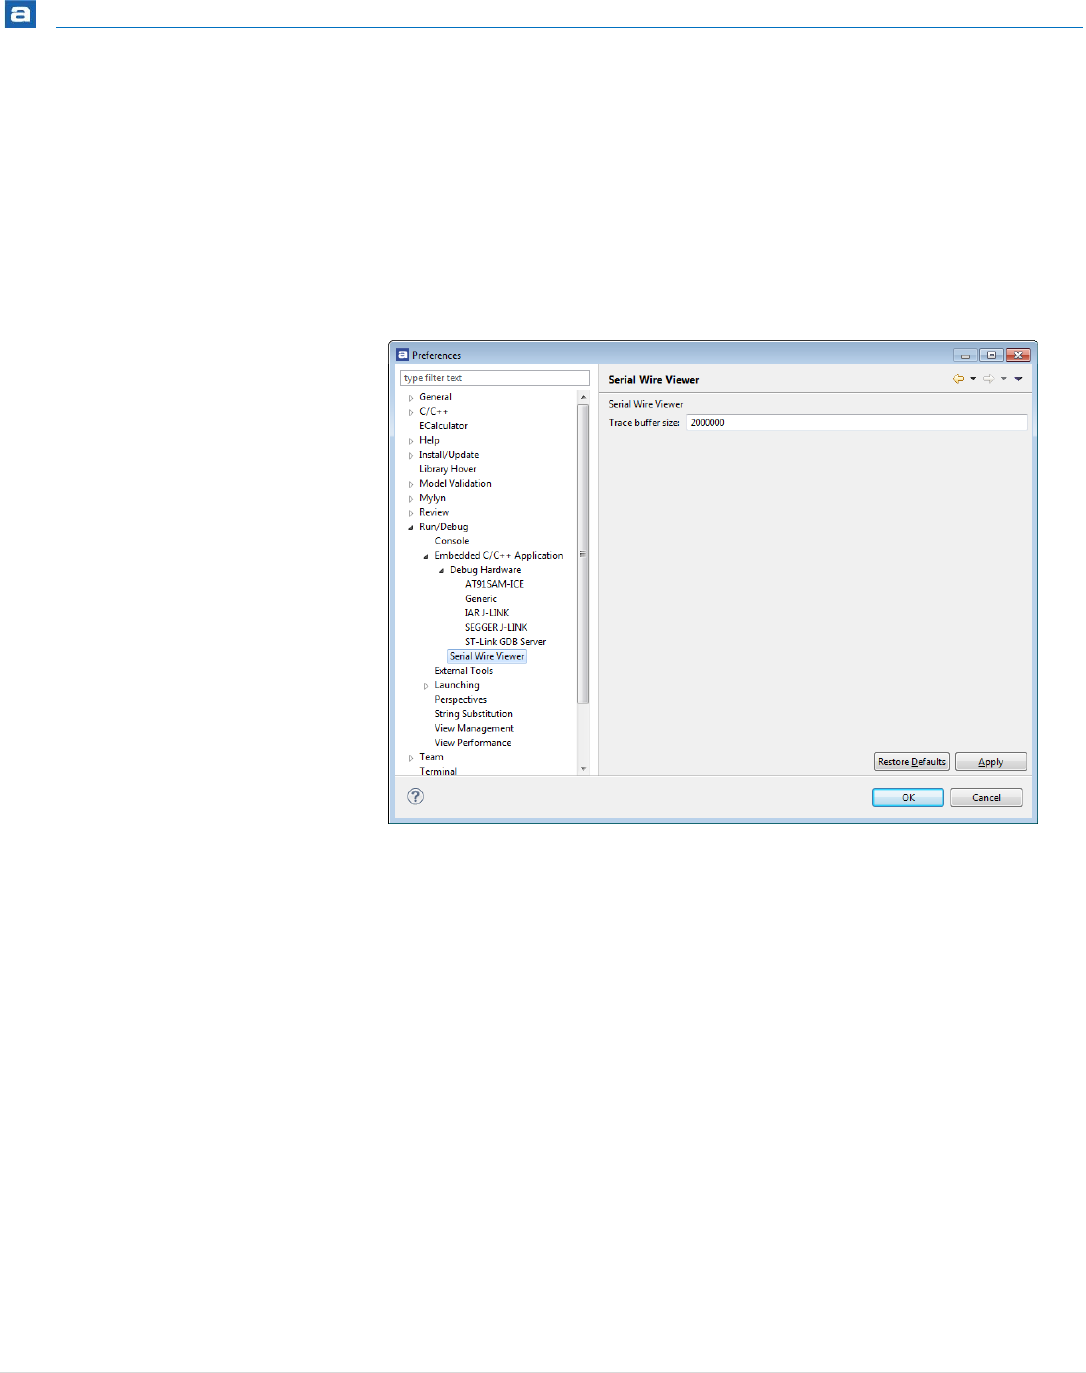
Serial Wire Viewer
303 | P a g e
CHANGE THE TRACE BUFFER SIZE
The incoming SWV-packages are saved in the Serial Wire Viewer Trace buffer. It has a
default maximum size of 2 000 000 packages. To trace more packages, this figure must be
increased.
Select the menu command Widows, Preferences. In the dialog select Run/Debug,
Embedded C/C++ Application and then Serial Wire Viewer.
Figure 276 – Serial Wire Viewer Preferences
The buffer is stored in the heap. The allocated heap is displayed by first selecting Window,
Preferences and General; then enabling “Show heap status”. The current heap and
allocated memory will be displayed in the lower, right corner.
There is an upper limit to the amount of memory Atollic TrueSTUDIO can allocate. This
limit can be increased to store more information during a debug-session.
Proceed as follows:
Navigate to the Atollic TrueSTUDIO installation directory. Open the
folder in which the IDE is stored.
Edit the TrueSTUDIO.ini file and change the –Xmx1024m
parameter to the desired size in megabytes.
Save the file and try launching Atollic TrueSTUDIO again.

Serial Wire Viewer
304 | P a g e
COMMON SWV PROBLEMS
Common reasons for SWV not tracing are:
The Core Clock of the target is incorrectly set. It is very important to select the
right Core Clock. If the frequency of the target Core Clock is unknown, it can
sometimes be found by setting a breakpoint in a program loop and open the
Expressions View, when the breakpoint is hit.
Click on Add new expression, type SystemCoreClock and press Enter. This
is a global variable that according to the CMSIS-standard must be set to the
correct speed of the Core Clock.
In CMSIS standard libraries there should be a function called
SystemCoreClockUpdate(). This can be included in main()to set the
SystemCoreClock-variable. Then use the Variable view to track it.
For most devices that do not have libraries that follow the CMSIS-standard, the
Core Clock can be found in the startup code. It is often named SYSCLK, or a
similar abbreviation. Also note that if software dynamically change the CPU clock
speed during runtime, then SWV might stop as the clocking suddenly becomes
wrong during execution.
SWV is not enabled in the currently used debug configuration.
The SWV configuration has not been sent to the target board.
Some manufacturers, such as Energy Micro, disable SWO pin by default. In this
case, enable SWO with a function-call, such as DBG_SWOEnable().
The SWO receives too much data. Reduce the amount of data enabled for tracing.
The JTAG Probe, the GDB server, the target board, or possibly some other part,
does not support SWV.
To make sure that any data is received, do the following steps:
Open the SWV configuration. Disable all tracing except PS Sampling and
Timestamps. Set the Resolution to the highest possible value.
Save and open the SWV Trace Log.
Start tracing.
Make sure that incoming packages can be seen in the SWV Trace Log.

Getting Started
305 | P a g e
MTB TRACING
(CORTEX-M0+)
This section provides information on how to use the CoreSight Micro Trace Buffer (MTB)
which is a simple execution trace block available on some Cortex-M0+ devices.
The following topics are covered:
Introduction to MTB
Configure MTB
Using MTB
Analyzing and Copy MTB Information

MTB Tracing
306 | P a g e
INTRODUCTION TO MTB
The CoreSight Micro Trace Buffer (MTB) is an optional hardware included on some Cortex-
M0+ processor based devices. MTB contains a simple execution trace block which can log
trace information in a memory buffer in the processor RAM. The buffer location and size
are configurable. Currently STM32 microcontrollers does not include MTB support.
The MTB Tace Log view in Atollic TrueSTUDIO is used to configure MTB and view
instruction trace data from the device. As the trace data is stored in the processor RAM
the MTB Trace Log view does not need any special debug probe. A normal debug
connection works fine and it works both in Serial Wire Debug mode and in JTAG Debug
mode.
To use MTB when debugging a Cortex-M0+ device it needs to be configured. When
configuration is made and MTB enabled the MTB module in the processor will capture
branches made by the processor into the RAM buffer.
The MTB execution trace packet consists of a pair of 32-bit words generated by the MTB
when it detects a branch instruction or an exception entry. The trace packet consist of a
source address (current PC location) and a destination address (next PC address). The MTB
module stores all such branches into the processor RAM.
Open the MTB Trace Log view, for instance by writing MTB in the Quick Access field in the
toolbar and select views MTB Trace Log. The MTB Tace Log view reads the trace packets
from the processor when the program is stopped and then visualize the executed
instructions using program information from the .elf file.
Figure 277 –MTB Trace Log View
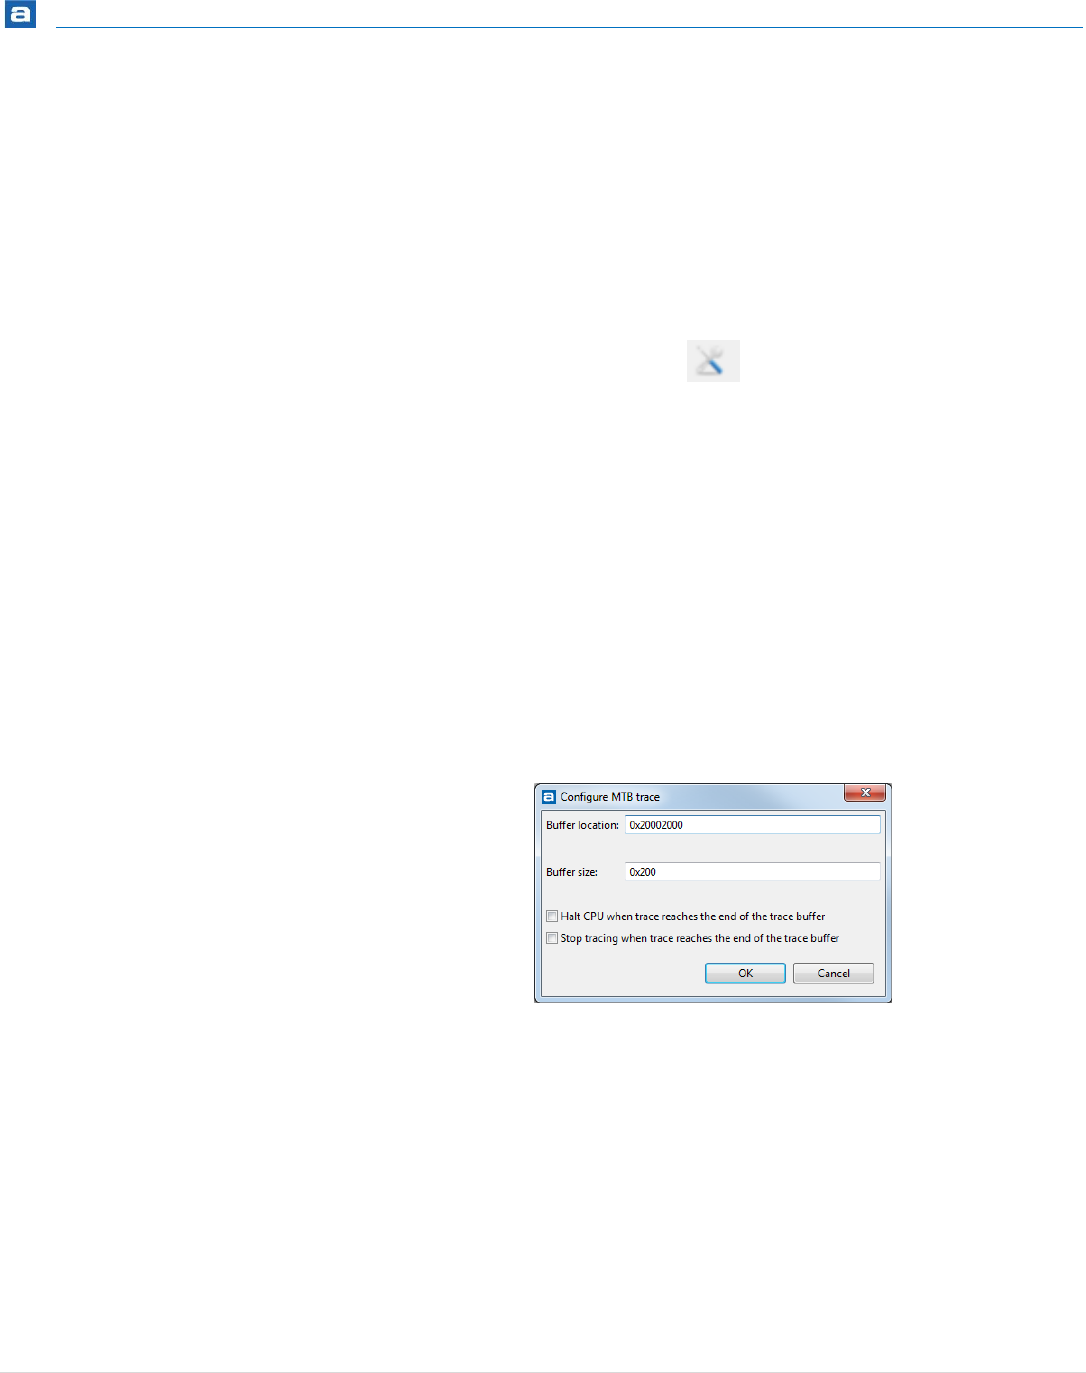
MTB Tracing
307 | P a g e
CONFIGURE MTB
The MTB must be configured before it can be used. Buffer locations and buffer size needs
to be set and it is also possible to configure specific behavior on MTB when buffer is full.
Configuration of MTB is done after a debug session is started.
Open the Configure MTB Trace dialog box by clicking on the Configure MTB Trace Setting
button in the MTB Trace Log view toolbar.
Figure 278 – Configure MTB Trace Setting Button
In the Configure MTB Trace dialog configure the Buffer location and Buffer size and the
trace operation to be used when/if trace buffer is full. The addresses where to store the
configured data is read from the device CMSIS-SVD file. The CMSIS-SVD file needs to have
a MTB node including information about the POSTION, FLOW, MASTER, and BASE
registers. The reason to read the CMSIS-SVD file to get this information is because the
location of MTB registers on the Cortex-M0+ device is defined by the chip manufacturer
when designing the chip. The MTB Trace Log view updates these registers to control the
behavior of the trace features.
If a Cortex-M0+ device is used which includes MTB but does not have these registers
specified in the CMSIS-SVD files the registers can be added into a custom CMSIS-SVD file.
Make sure to add an MTB node in this custom file containing information about the
POSTION, FLOW, MASTER, and BASE registers.
Figure 279 – Configure MTB Trace View
Please note, the buffer must be located to a memory area which is not used by the
debugged application. There are also some restriction on the buffer location and the
buffer size. For instance the size needs to be a power of 2. (e,g. 32, 64, 128, …) The
configuration dialog will signal if any errors in the settings is made. See example below
where wrong configuration is entered.
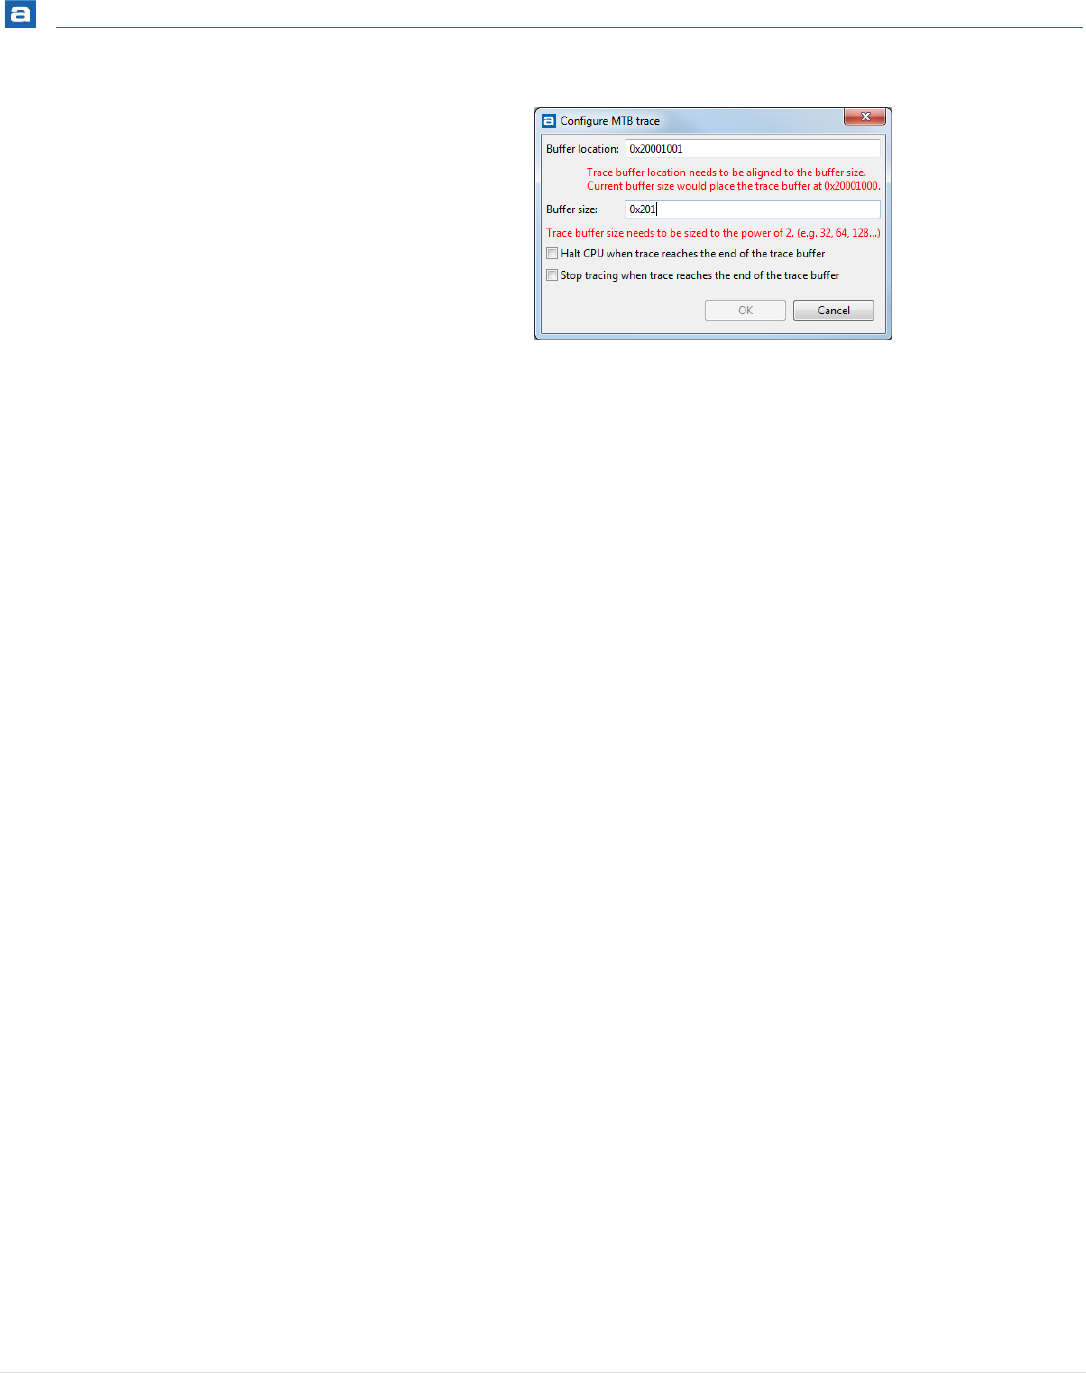
MTB Tracing
308 | P a g e
Figure 280 – Configure MTB with Error Setting
The MTB configuration is saved in the debug information for the project and reloaded when a new
debug session is started for the project.

MTB Tracing
309 | P a g e
USING MTB
Press the Start/Stop Tracing button to start/stop MTB trace. Actual tracing will not start
until the target starts to execute.
Figure 281 – The Start/Stop MTB Button
When trace is started the trace buffer in the processor will be automatically read by the
MTB Tace Log view each time the program is stopped, after a step, breakpoint executed or
processor stopped by some reason. Each time the buffer has been read by the the MTB
Tace Log view it will configure the CoreSight MTB unit to store next trace instruction data
at the start of the target trace buffer.
Start the target execution by pressing the green Resume Debug button or by issuing step
commands.
The MTB Trace Log view will be updated when new trace data is found in the target trace
buffer.
Collected data can be cleared by pressing the Clear the Buffer button.
Figure 282 – Clear Buffer Button
The Scroll Trace on Update button is used to toggle if the view shall scroll when updated
with new data.
Figure 283 – Scroll Trace View on Update Button
Note! If the Start/Stop MTB button is disabled, color grey, then the MTB
Trace Log view has not been able to detect that MTB is available for the
device when reading the CMSIS-SVD file. Please verify that the Cortex-M0+
contains MTB.
Please also investigate the CMSIS-SVD file which can be seen in the SFRs view.
If the MTB node is missing or if the necessary registers in the MTB view are
missing then create a custom CMSIS-SVD file containing these registers. If the
MTB node with registers are available in the file then please try to restart the
debug session again.

MTB Tracing
310 | P a g e
ANALYZING MTB INFORMATION
The MTB Trace Log view contains the following columns:
Name
Description
Index
An incremental number for each line in the view.
Address
The address of the executed instruction.
Function
The Function name which holds the address of the
instruction. The function name is calculated by the MTB
Trace Log view using information from the elf-file.
Instruction
Executed instruction.
“ ”
Branch information. “Arrows” displays if a branch is made
by this instruction, “X” indicates that a conditional branch
instruction is executed without doing a branch.
Additional
Raw packet
Contains information about the instruction, e.g. data is
displayed in hex format. The last line when the view is
populated says “End of Trace…”. This makes it easier to
find what happened since last execution.
Packet information. E.g. If the Raw packet displays 0x752-
0x760 and then 0x744-0x74e. First time 0x752-0x760 is
displayed the MTB instruction log signals that an
instruction on 0x752 is executed. The MTB then signals at
0x760 that a branch is made to 0x744. The MTB Trace Log
view calculates the lines in between.
Table 9 – MTB Trace Log View Columns
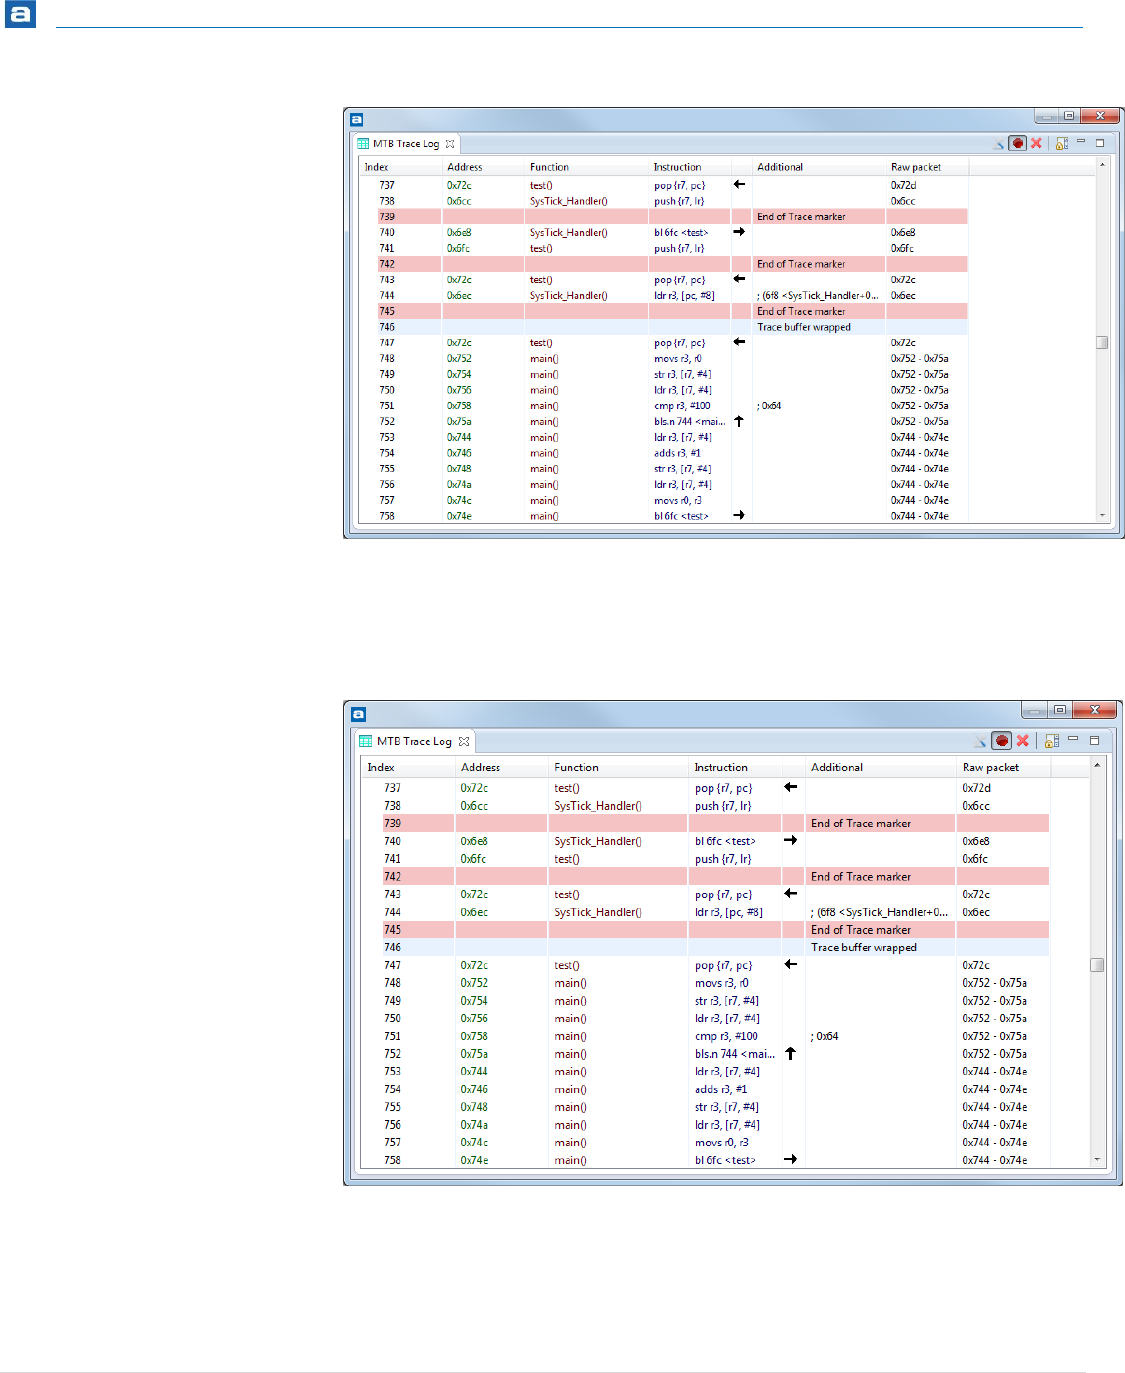
MTB Tracing
311 | P a g e
Figure 284 –MTB Trace Log Information
The Additional column can also indicate “Trace buffer wrapped” which means that the
instruction trace buffer has been wrapped over. When this happens some trace data has
been lost since last run.
Figure 285 –MTB Trace Buffer Wrapped

MTB Tracing
312 | P a g e
COPY THE MTB LOG
For further analyses of the MTB Log the lines in the view can be copied. This is done using
normal windows selection and copy. The log information is copied in csv-format.
Select the lines to be copied (using Shift) and scroll down or mark all lines in the view
(using Ctrl+A). The marked lines are then copied in a comma separated list and placed in a
clipboard using Ctrl+C. The clipboard can be pasted into another file using an editor.

313 | P a g e
INSTRUCTION TRACING
This section provides information on how to do Instruction Tracing with Atollic TrueSTUDIO
for STM32.
The following topics are covered:
Enable Trace
Configuring Start and Stop Triggers
Start Trace Recording
Analyzing the Trace
Exporting the Trace
Instruction Tracing
314 | P a g e
INSTRUCTION TRACING
Atollic TrueSTUDIO supports instruction tracing, provided that trace-enabled hardware is
being used. Instruction tracing records the execution flow of the processor in real-time.
The recorded trace buffer can then be analyzed to locate the cause of software errors.
Instruction tracing is particularly useful when debugging problems that only occur
sporadically.
Atollic TrueSTUDIO supports instructing tracing using both the ETM and the ETB methods:
ETM tracing works with many Cortex-M devices but requires using an ETM-trace
enabled JTAG probe. Atollic TrueSTUDIO supports ETM tracing using the Segger J-
Trace JTAG probe. The J-Link and ST-LINK probes cannot be used for ETM tracing
as they have no trace buffer. The trace buffer in ETM-compatible trace probes are
typically many megabytes in size.
ETB tracing can only be used with Cortex devices that have this feature enabled in
the silicon. ETB tracing can be done using any of the supported JTAG probes,
including Segger J-Link, as the trace buffer is not located in the JTAG probe but
instead inside the target device. This adds to the chip cost and therefore is not
supported by all chip vendors. The on-chip ETB trace buffer is tiny; typically 2KB
or 4KB only.
Both ETM and ETB tracing records all executed machine code instructions, until the
hardware limits are reached. A trace buffer is filled very quickly even though it is highly
compressed. The compressed trace buffer in a JTAG probe with a 16MB of trace buffer
typically expands into 200MB of uncompressed machine readable data, and to 2-3GB of
human readable data. Instruction tracing thus quickly generates a huge amount of data.
CORTEX-M7 AND ETMV4
Instruction tracing support for Cortex-M7 based cores, using the ARM Embedded Trace
Macrocell ETMv4, are supported by Atollic TrueSTUDIO from v7.0. Earlier versions of
Atollic TrueSTUDIO only supported ETMv3.
ETM/ETB Trace may not work on max CPU clock speed. Please check the User
manual from the board/microcontroller manufacturer if there are any trace
clock limitations.
There is also a limitation of the clock speed for Segger J-Trace for Cortex-M
debug probe. This version of debug probe is specified up to 100 MHz trace
clock. This means that, as the trace clock usually is ½ of the speed of the CPU
clock, the max CPU clock speed is 200 MHz when using Segger J-Trace for
Cortex-M. For higher CPU frequencies, the Segger J-Trace PRO Cortex-M
should be used.

Instruction Tracing
315 | P a g e
The ETMv4 uses a much more complex and packed protocol than the ETMv3 and currently
Atollic TrueSTUDIO only supports basic instruction tracing for ETMv4 based devices.
Support for speculated execution and data tracing is not implemented yet and only RAW
and Assembly filtering levels in the Trace Log view can be used for Cortex-M7.
ENABLE TRACE
Instruction tracing (using ETM or ETB) must be enabled in the debug configuration. To
enable instruction tracing, first open the debug configuration dialog box:
Figure 286 – Enable Tracing in the Debug Configuration
Perform the following steps to configure a project for instruction tracing:
As mentioned earlier, the Segger J-Trace for Cortex-M debug probe is specified
up to 100 MHz trace clock which normally means that the speed of the CPU
clock can be up to 200 MHz. For higher CPU frequencies, the Segger J-Trace
PRO Cortex-M should be used.

Instruction Tracing
316 | P a g e
1. In the Debug probe dropdown list, select Segger J-Trace (for ETM and ETB
tracing) or Segger J-Link (ETB tracing only).
2. In the Trace systems dropdown list, select the ETM or ETB trace system.
3. Ensure the Probe buffer size setting corresponds to the JTAG probe in use (ETM
tracing only).
4. For ETM tracing, make sure the Trace Port config selection points to a file that
setup the ETM trace pins of the device in a way that works for the target board in
use. The commands in the file are sent to the target when trace recording is
started first time in a debug session. See the section below for information on
how to write a new trace port configuration file for custom designed or
unsupported boards.
For ETM tracing it is also possible to Save raw ETM trace data to file. Such file
contains the raw trace data received from the Cortex-M device and the file can
be used for deeper investigation of trace data.
5. Click OK to save the settings.
The project is now configured to use ETM or ETB tracing.
WRITING A TRACE PORT CONFIGURATION FILE
To be able to use ETM tracing the trace port pins must be configured. A specific trace port
configuration file can be used for this purpose, if the application software does not
configure these pins for tracing a device or board. The configuration file is implemented in
gdb script syntax, and configures the special function registers (SFR’s) related to the ETM
trace port pins.
Atollic TrueSTUDIO comes with a readymade trace port configuration file for most of the
supported boards, but it is possible to edit them, or create new ones, to enable ETM
tracing on new boards. It is recommended to copy such readymade file to the Project or
some other folder on the files system if any changes are needed. Make the change in the
copied file and make sure to point to the correct file in the Trace Port Config selection in
the debug configuration.
See the example below forSTM32F4xx:
#RCC_AHB1ENR: IO port E clock enable
set *((unsigned long*) 0x40023830) |= 0x00000010
if ($tracePortWidth == 1)
#Trace Port 1-bit configuration
#Enable trace in 1-pin mode
set *((unsigned long*) 0xE0042004) &= ~0x000000E0
set *((unsigned long*) 0xE0042004) |= 0x00000060

Instruction Tracing
317 | P a g e
#GPIOE_MODER: PE2..PE3 = Alternate function mode
set *((unsigned long*) 0x40021000) &= ~0x000000F0
set *((unsigned long*) 0x40021000) |= 0x000000A0
#GPIOE_OTYPER: PE2..PE3 = Output push-pull
set *((unsigned long*) 0x40021004) &= ~0x0000000C
#GPIOE_OSPEEDR: PE2..PE3 = 50 MHz Fast speed
set *((unsigned long*) 0x40021008) &= ~0x000000F0
set *((unsigned long*) 0x40021008) |= 0x000000F0
#GPIOE_PUPDR: PE2..PE3 = No pull-up, pull-down
set *((unsigned long*) 0x4002100C) &= ~0x000000F0
#GPIOE_AFRL: PE2..PE3 = AF0
set *((unsigned long*) 0x40021020) &= ~0x0000FF00
end
if ($tracePortWidth == 2)
#Trace Port 2-bit configuration
#Enable trace in 2-pin mode
set *((unsigned long*) 0xE0042004) &= ~0x000000E0
set *((unsigned long*) 0xE0042004) |= 0x000000A0
#GPIOE_MODER: PE2..PE4 = Alternate function mode
set *((unsigned long*) 0x40021000) &= ~0x000003F0
set *((unsigned long*) 0x40021000) |= 0x000002A0
#GPIOE_OTYPER: PE2..PE4 = Output push-pull
set *((unsigned long*) 0x40021004) &= ~0x0000001C
#GPIOE_OSPEEDR: PE2..PE4 = 50 MHz Fast speed
set *((unsigned long*) 0x40021008) &= ~0x000003F0
set *((unsigned long*) 0x40021008) |= 0x000003F0
#GPIOE_PUPDR: PE2..PE4 = No pull-up, pull-down
set *((unsigned long*) 0x4002100C) &= ~0x000003F0
#GPIOE_AFRL: PE2..PE4 = AF0
set *((unsigned long*) 0x40021020) &= ~0x000FFF00
end
if ($tracePortWidth == 4)
#Trace Port 4-bit configuration
#Enable trace in 4-pin mode
set *((unsigned long*) 0xE0042004) &= ~0x000000E0
set *((unsigned long*) 0xE0042004) |= 0x000000E0
#GPIOE_MODER: PE2..PE6 = Alternate function mode
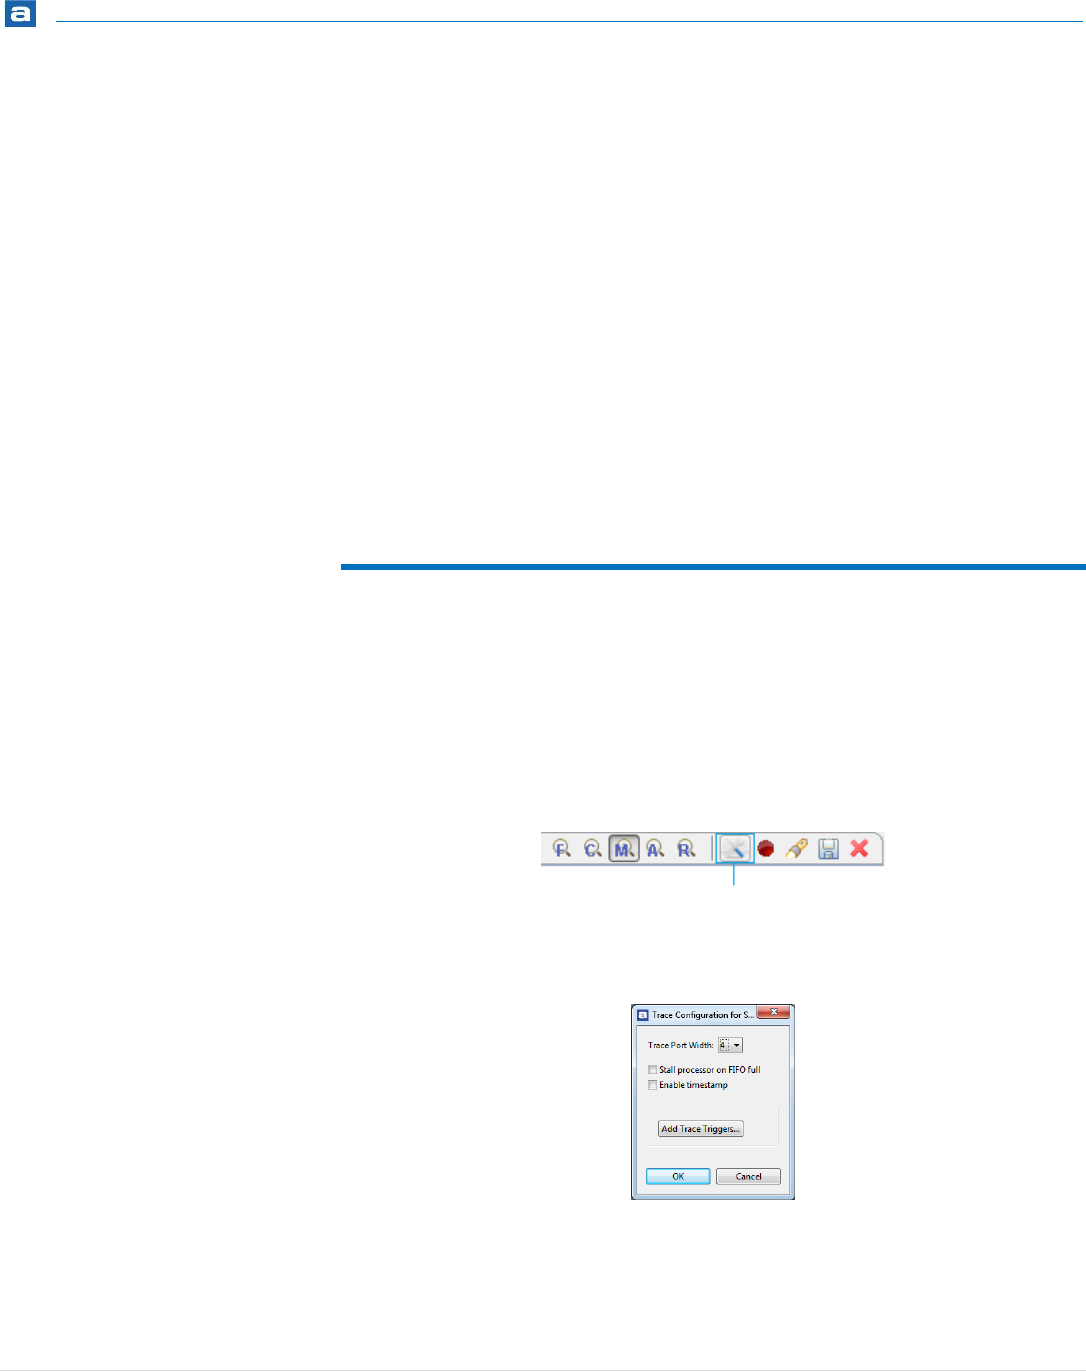
Instruction Tracing
318 | P a g e
set *((unsigned long*) 0x40021000) &= ~0x00003FF0
set *((unsigned long*) 0x40021000) |= 0x00002AA0
#GPIOE_OTYPER: PE2..PE6 = Output push-pull
set *((unsigned long*) 0x40021004) &= ~0x0000007C
#GPIOE_OSPEEDR: PE2..PE6 = 50 MHz Fast speed
set *((unsigned long*) 0x40021008) &= ~0x00003FF0
set *((unsigned long*) 0x40021008) |= 0x00002AA0
#GPIOE_PUPDR: PE2..PE6 = No pull-up, pull-down
set *((unsigned long*) 0x4002100C) &= ~0x00003FF0
#GPIOE_AFRL: PE2..PE6 = AF0
set *((unsigned long*) 0x40021020) &= ~0x0FFFFF00
end
CONFIGURING THE TRACING SESSION
Once the JTAG probe and trace system have been configured, and a debug session has
been started, the tracing can be configured.
To configure trace, suspend the debug session and open the Trace Log view (Select View in
the top menu and then ETM/ETB, Trace Log).
In the Trace Log view toolbar, click on the Configuration toolbar button.
Figure 287 – Configuration Toolbar Button
The Trace Configuration dialog box will be displayed:
Figure 288 - Trace Configuration
Configure the Trace Port Width dropdown list to match the number of pins used for ETM
tracing on the hardware board.
Instruction Tracing
319 | P a g e
Using the Stall processor on FIFO full checkbox, select one of these two options:
Stall the processor when the ETM trace FIFO buffer becomes full. With this
setting, no trace data is lost but the timing behavior of the application can be
changed.
Do not stall the processor when the ETM trace FIFO buffer becomes full. With this
setting, the processor will always continue to run at full speed but trace data may
be lost.
Some devices support timestamps. Enabling the timestamps can be useful if timing
information is needed. It will however reduce the amount of other information available.
ETM TRACE PORT CONFIGURATION FILE
REFERENCE
When Segger J-TRACE probe is used and ETM tracing selected the Debugger tab in the
Debug Configurations dialog contains a file reference to a trace port configuration file. This
file is by default located in the installation of Atollic TrueSTUDIO. This means that if such
project made with an older Atollic TrueSTUDIO version is imported and used in a new
Atollic TrueSTUDIO version, the reference requires that the earlier version also is installed.
Please update the reference to point to the ETM trace port configuration file available in
the new installation.
Example of location of ETM Trace Port configuration file for STM32F1xx:
C:\Program Files (x86)\Atollic\TrueSTUDIO for STM32
9.0.0\ide\plugins\com.atollic.truestudio.tsp.stm32_1.0.0.
201712151711\tsp\etm\stm32f4xx.init
ADD TRACE TRIGGER
The trick with Instruction tracing is to trace only where tracing is needed. Otherwise the
important information can be impossible to locate in the huge amount of data that will be
collected or lost since it occurred to long time before debugging was suspended and the
trace information uploaded.
There are four hardware triggers that can be set to starting and stopping the tracing on
different conditions.
To access them, open the Trace Configuration as above and select Add Trace Triggers…
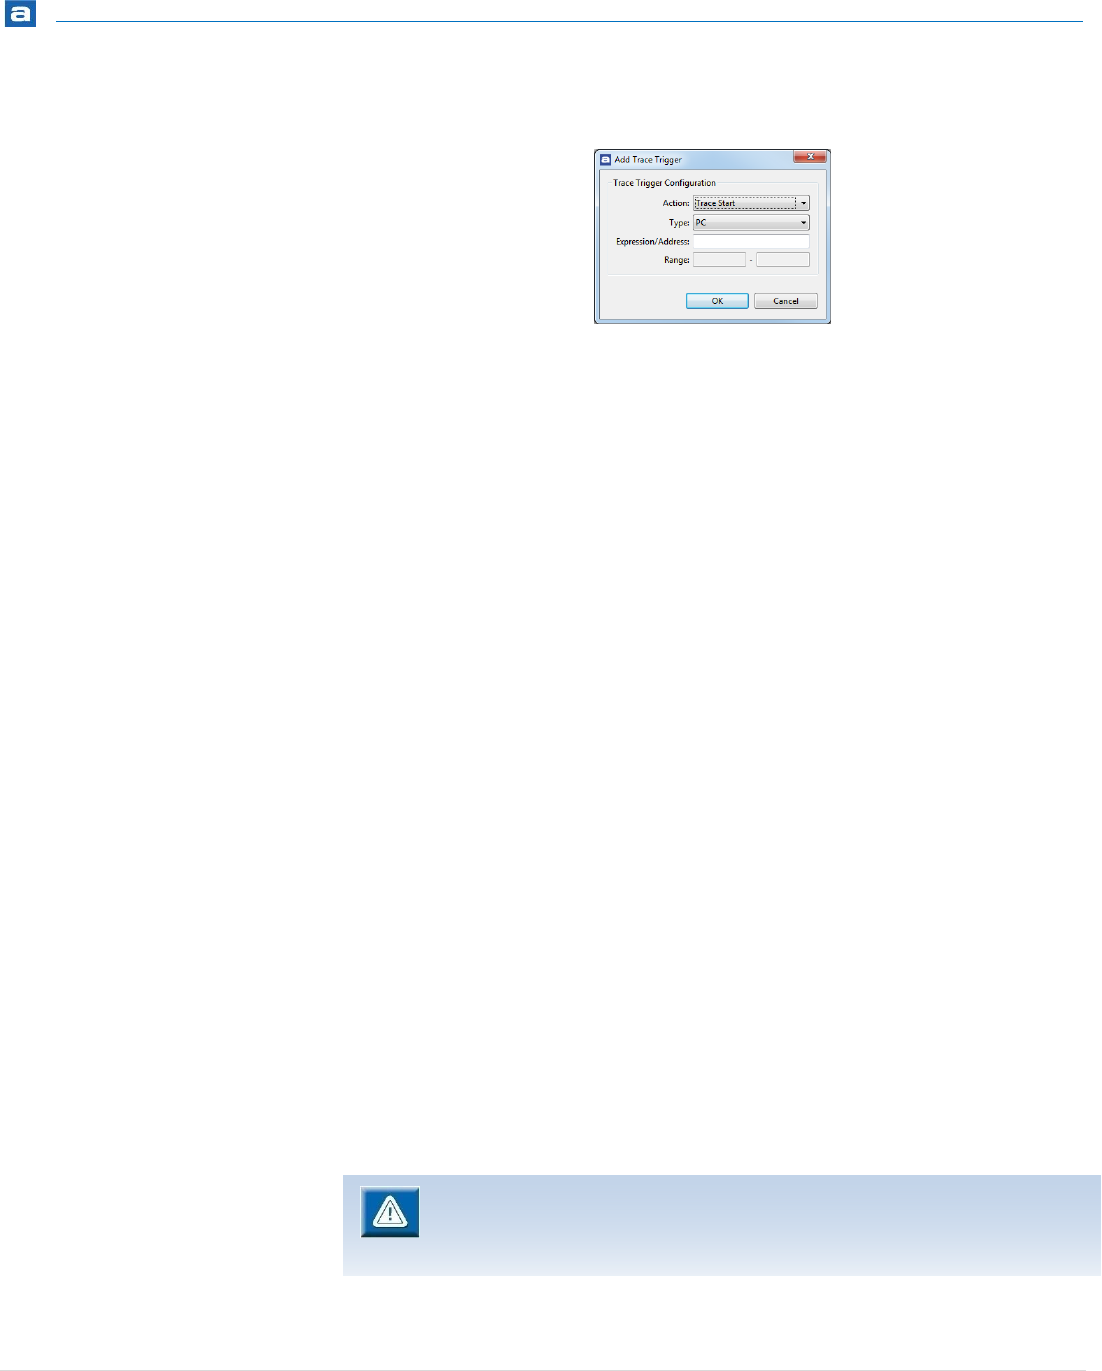
Instruction Tracing
320 | P a g e
The triggers can also be added from the Breakpoints view.
Figure 289 - Trace Configuration
For each of the triggers 0-3, it is possible to define that the trigger shall start or stop
tracing, if its configured conditions are met. Each trigger has the following options:
The Action to perform when the condition is triggered:
o Trace Start: Starts collecting trace data
o Trace Stop: Stops collecting trace data
The Type of memory access that triggers the action:
o PC: Triggered when execution reaches an address
o Data Read: Triggered when data is read from an address
o Data Write: Triggered when data is written to an address
o Data Read/Write: Triggered when data is read or written to an address
Enter the address to trigger on in the Expression/Address field. This field accepts:
o Numeric address constants such as 0xffff0010
o Numeric address ranges such as 0xffff0010 to 0xffff001f
o Function symbols such as “main”
o Variable symbols such as “MyGlobalCounter”
o It is also possible to define mathematical expressions like “main + 7”
Typically, at least one trigger is configured to start tracing, and another trigger is
configured to stop tracing. Once the trace start and stop conditions have been configured,
click OK to save the trace trigger settings.
When using ETMv4 based devices, Cortex-M7, only PC triggered type of events
are supported. Data Read, Data Write, or Data Read/Write triggered events
are not supported.

Instruction Tracing
321 | P a g e
ADD TRACE TRIGGER IN THE EDITOR
Start and Stop Trace Triggers can also be added directly in the C/C++ Editor Ruler and the
Disassembly view. These triggers work in line with the Breakpoints, except that they will
not suspend the execution. Instead they will start or stop collecting of trace data when
execution reaches that line.
Right click on the ruler to the left in the editor window and select Add Trace Trigger.
Figure 290 – Add Trace Trigger in the Editor
A new trigger will be created and tracing starts to be collected when execution reaches
that line of code.
Figure 291 –Trace Trigger in the Editor
MANAGING TRACE TRIGGERS
All the Trace Triggers are visible from the Breakpoints view.
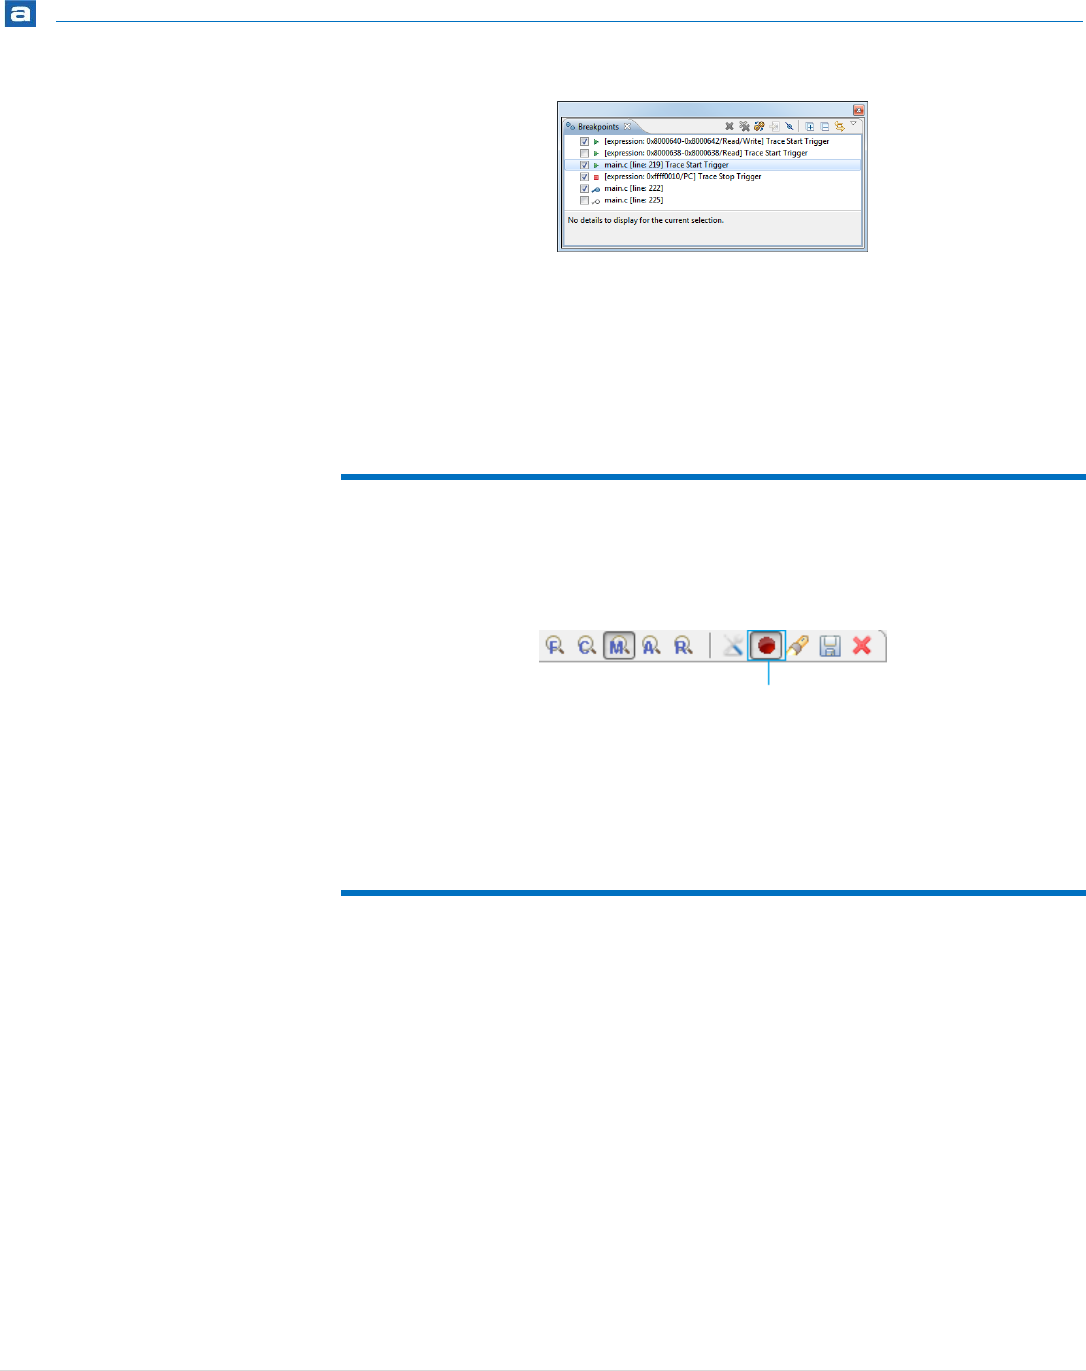
Instruction Tracing
322 | P a g e
Figure 292 –Trace Trigger in the Editor
From this view the triggers can easily be inactivated, activated, removed and even added.
Bear in mind that the hardware supports up to a maximum of four simultaneous Trace
Triggers.
START TRACE RECORDING
Once tracing has been enabled, click the Record toolbar button in the Trace Log view to
enable recording of trace data.
Figure 293 – Record Toolbar Button
With trace recording enabled, start target execution. When execution is suspended, the
Trace Log view is filled with the recorded instruction trace (provided the trace start trigger
condition was fulfilled).
ANALYZING THE TRACE
When suspending execution, the trace buffer is uploaded to the Trace Log view. It is filled
with the recorded instruction stream, along with other data that is provided by analyzing
the trace recording.
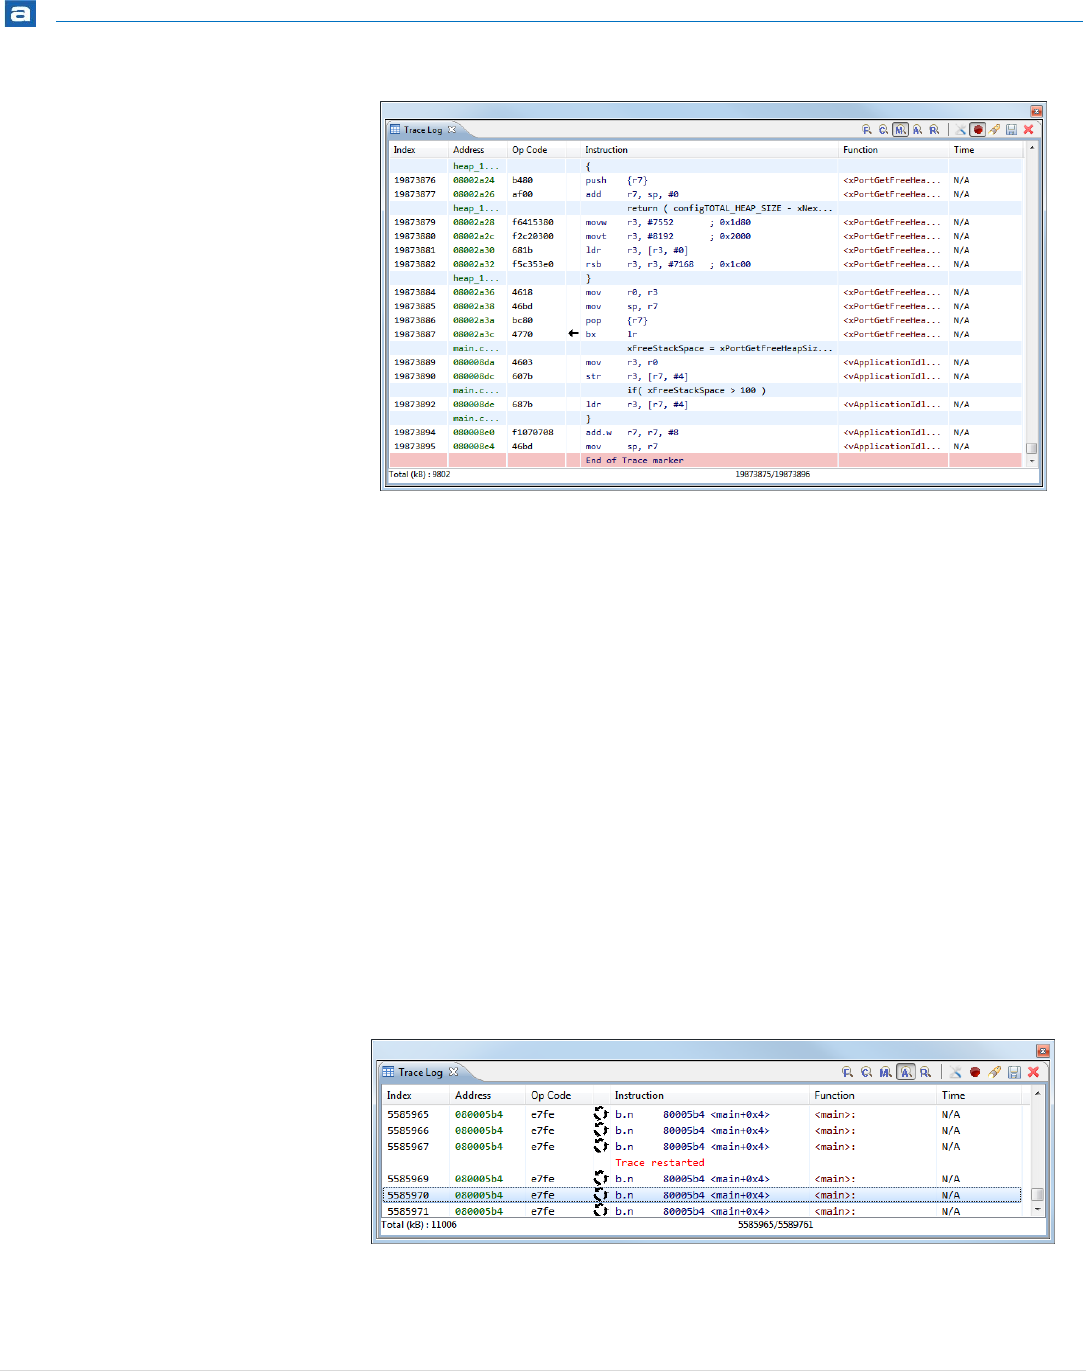
Instruction Tracing
323 | P a g e
Figure 294 - The Trace Log View
The Trace Log view shows detailed information on what the processor was doing up to the
point of suspending execution.
Please note the column with graphical icons that annotate the Trace Log view with
information about execution flow branches:
Call a new function
Return from a function
Jump up in the code
Jump down in the code
Iterate on the same instruction
A conditional branch was not taken
At the end of the view is the End of Trace marker displayed. This is added to the Trace Log
each time the buffer is overflowed and it indicates that some trace data most likely is lost.
Figure 295 - Trace Restarted

Instruction Tracing
324 | P a g e
The other important marker is the Trace restarted marker. It indicates that the target
wasn’t able to generate all the trace information without affecting the performance of the
running application. Some data is lost.
To overcome this issue, enable Stall processor on FIFO full in the Trace Configuration.
DISPLAY OPTIONS
The Log Trace view supports several different display options:
Function call tracing
C tracing
C/Assembler mixed mode tracing
Assembler tracing
Raw trace packet log
Use the different Display Options Toolbar Buttons to switch between the different view-
modes.
The Function call tracing displays what function the execution is in and from where it is
called or returned from.
Figure 296 – Display Options Toolbar Button
SEARCH THE TRACE LOG
The recorded trace buffer can become very large. Atollic TrueSTUDIO supports appended
trace buffers of a total of 100 million lines. For this reason, a search function is available,
to enable users to find important information in the potentially huge dataset.
Figure 297 – Search Toolbar Button
Enabling Stall processor on FIFO full will slow down the processor in some
situation and hence affect the timing of the execution. For some real time
applications this is unacceptable.
When using ETMv4 based devices, Cortex-M7, only Assembler tracing and Raw
trace packet log are supported.
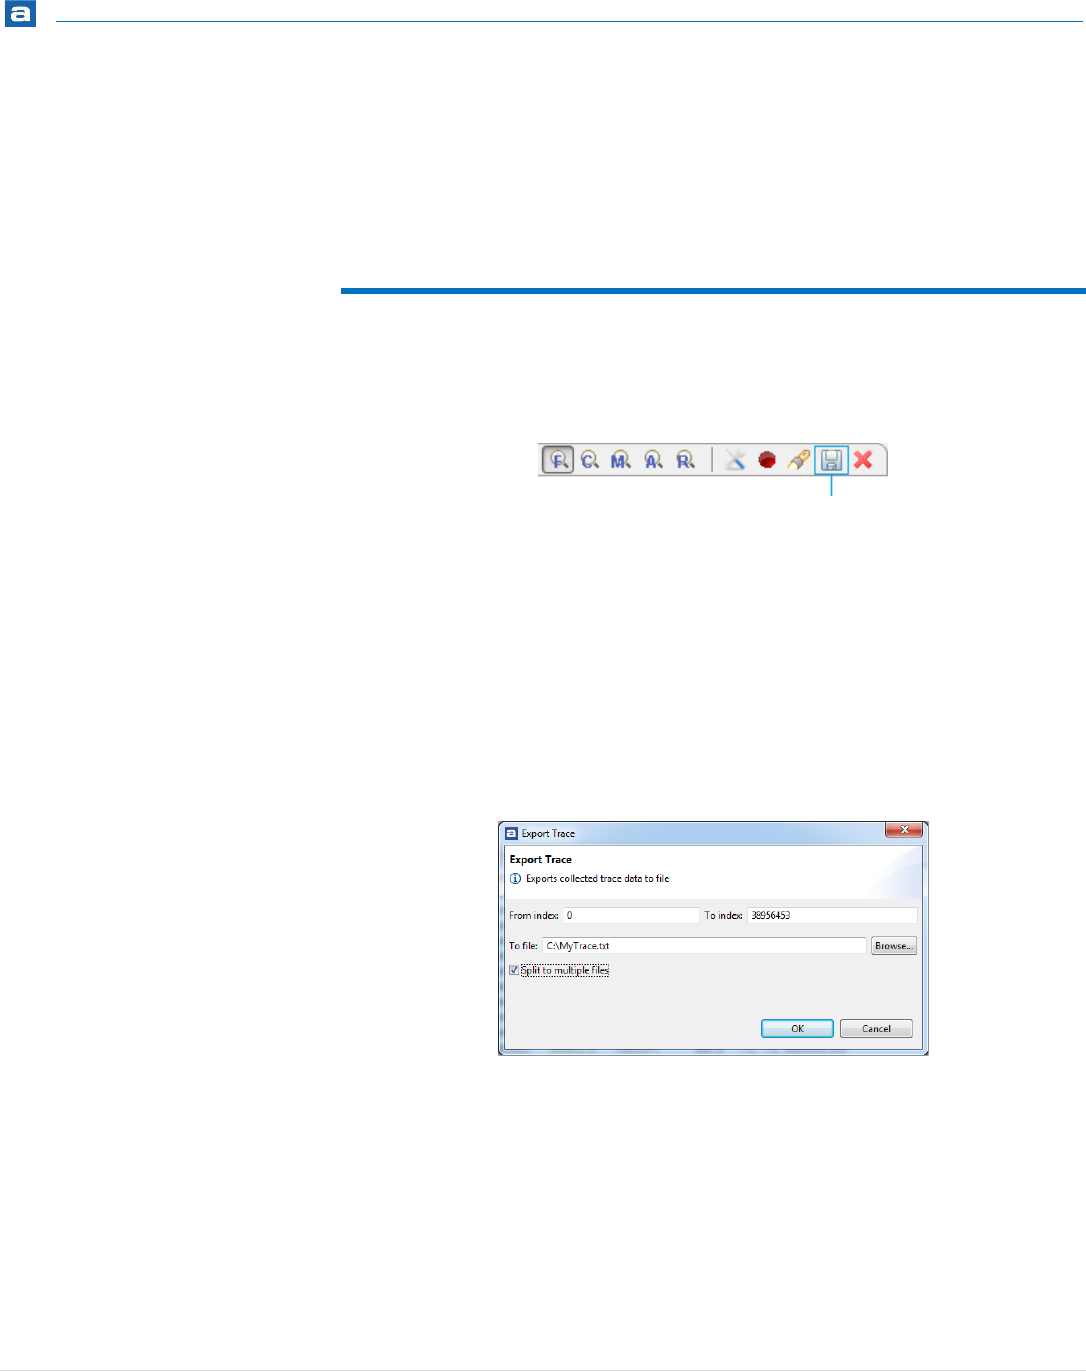
Instruction Tracing
325 | P a g e
Using the search feature it is possible to search for certain data of particular interest. For
example, assume a system crash sometimes happens because a variable has an illegal
value. By searching the instruction trace for the address of the variable, it is possible to
understand what code modifies the value and gives it the illegal value causing a system
crash.
EXPORTING A TRACE LOG
It is possible to save the trace log by clicking on the Export Trace toolbar button in the
Trace Log view.
Figure 298 – Export Toolbar Button
The trace log can be saved to either comma separated value files (*.csv) that can be
imported into Microsoft® Excel®, or to human readable ASCII text files (*.txt).
Configure the trace record range to export using the From Index and To Index fields.
As the saved trace log becomes approximately 200 times larger than its compressed size in
the JTAG probe trace buffer, the saved trace log can optionally be split to many files in
order to avoid exported trace logs which are several gigabytes in size (for example, the
16MB compressed trace buffer in Segger J-Trace expands to 2-3GB when saved to a
human readable trace log file in *.CSV or *.TXT formats).
Figure 299 - Exporting the Trace Log
Select the file filename and folder to use for the export using the Browse button. In the
Save As dialog box, select the desired filename and folder, select *.CSV or *.TXT file
format, and click Save to return to the Export Trace dialog box. Click OK to start exporting
the trace log.

RTOS-Aware Debugging
326 | P a g e
RTOS-AWARE
DEBUGGING
This section provides information on how to debug Real Time Operating Systems (RTOS) with
Atollic TrueSTUDIO for STM32.
The following topics are covered:
RTOS Kernel Awareness Debugging
Segger embOS
FreeRTOS and OpenRTOS
Express Logic ThreadX
Micrium uC/OS-III
HCC Embedded eTaskSync
Quadros RTXC
TOPPERS/ASP

RTOS-Aware Debugging
327 | P a g e
RTOS KERNEL AWARENESS DEBUGGING
This chapter provides information regarding the Atollic TrueSTUDIO Real Time Operating
Systems kernel awareness debug features.
Several different Real Time Operating Systems are supported and the current state of the
RTOS kernel and the various RTOS kernel objects can easily be inspected in a set of
dedicated views, in the Atollic TrueSTUDIO Debug perspective.
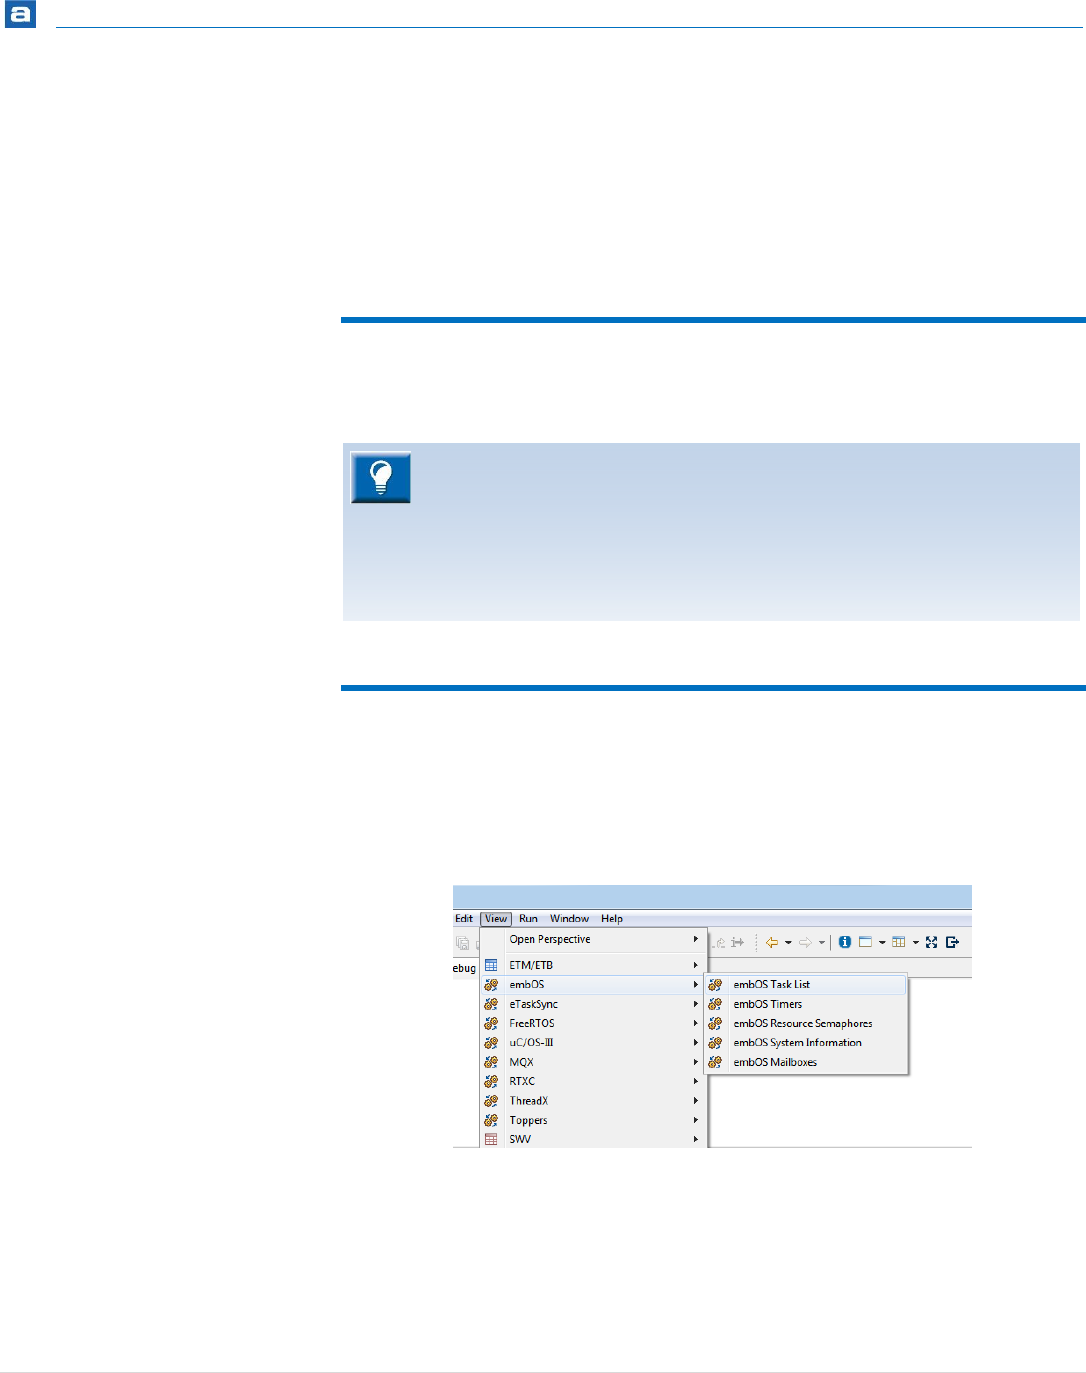
RTOS-Aware Debugging
328 | P a g e
SEGGER EMBOS
The kernel awareness features for Segger embOS in Atollic TrueSTUDIO provide the
developer with a detailed insight into the internal data structures of the embOS kernel.
During a debug session, the current state of the embOS kernel and the various embOS
kernel objects such as tasks, mailboxes, semaphores and software timers, can easily be
inspected in a set of dedicated views, in the Atollic TrueSTUDIO Debug perspective.
REQUIREMENTS
The kernel awareness features require Segger embOS version 3.80 or later.
FINDING THE VIEWS
A number of debugger views are available in the Atollic TrueSTUDIO Debug perspective
when debugging an application containing the embOS real-time operating system.
These views can be opened from the Show View toolbar dropdown list button.
Figure 300 - View Top Level Menu
Please note that the level of information available in the different views in
Atollic TrueSTUDIO depends on the options used when the embOS kernel was
built. This manual refers to an embOS kernel built with the debug and
profiling (DP) build options. Please note that microcontrollers based on the
ARM-cores Cortex-M0 and Cortex-M0+ do not support Serial Wire Viewer
tracing.
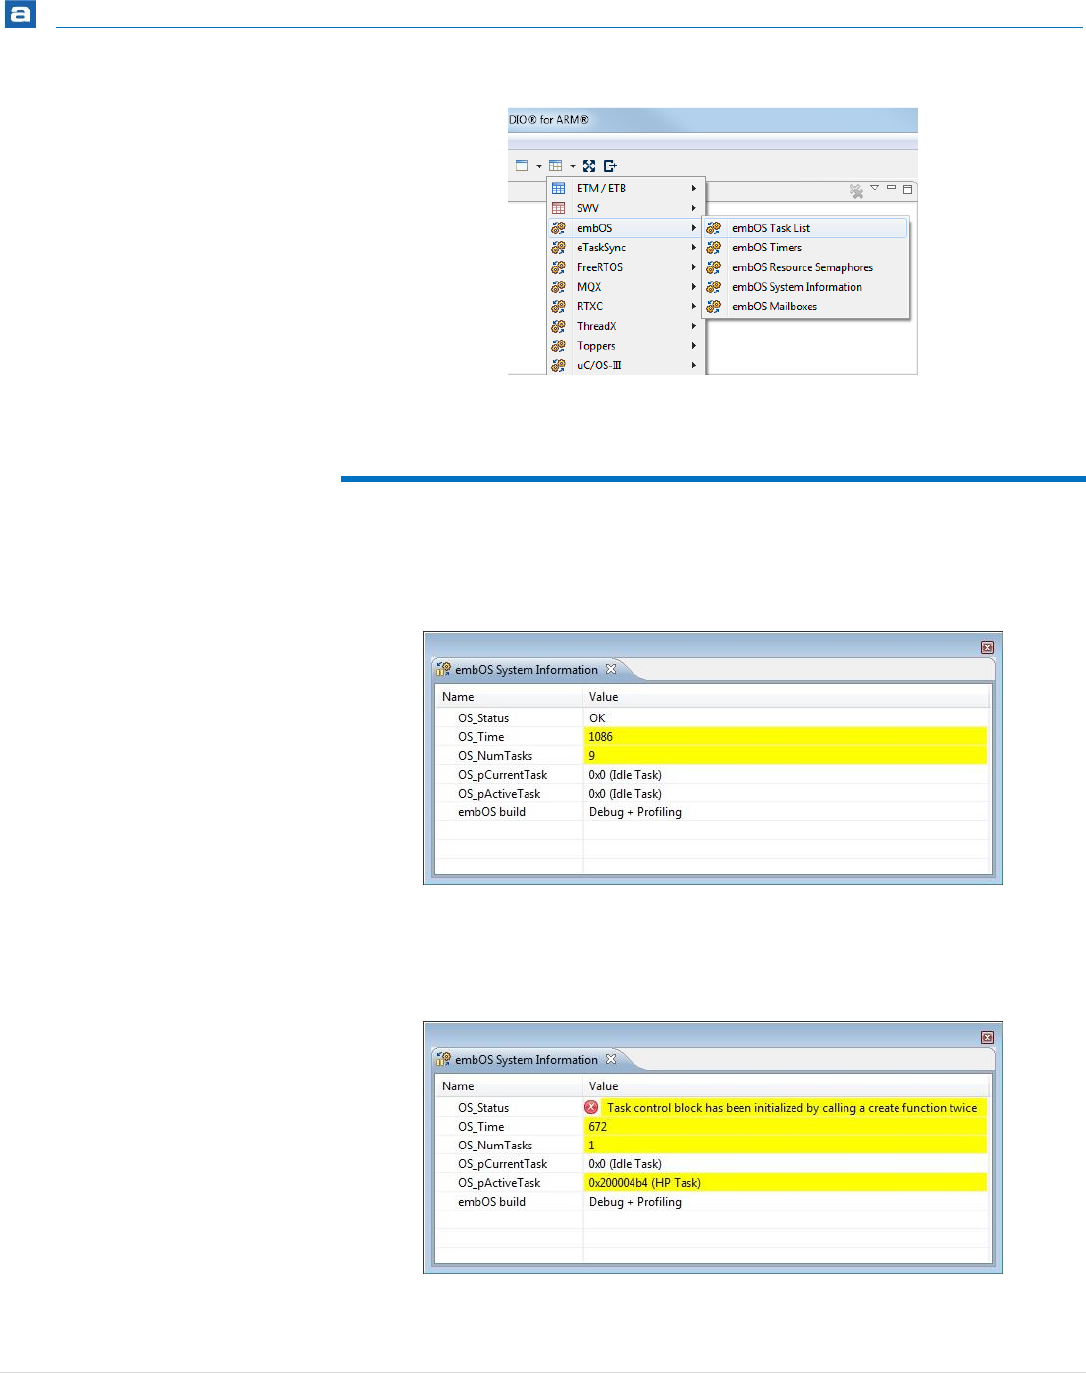
RTOS-Aware Debugging
329 | P a g e
Figure 301 - embOS Show View Toolbar Button
SYSTEM INFORMATION
The embOS System Information view displays a number of system variables available in
the embOS kernel, such as status, number of tasks, etc.
Figure 302 - embOS System Information View
This view also provides descriptive fault information messages for any fault conditions
detected by the OS kernel.
Figure 303 - embOS System Information View (Fault Condition)
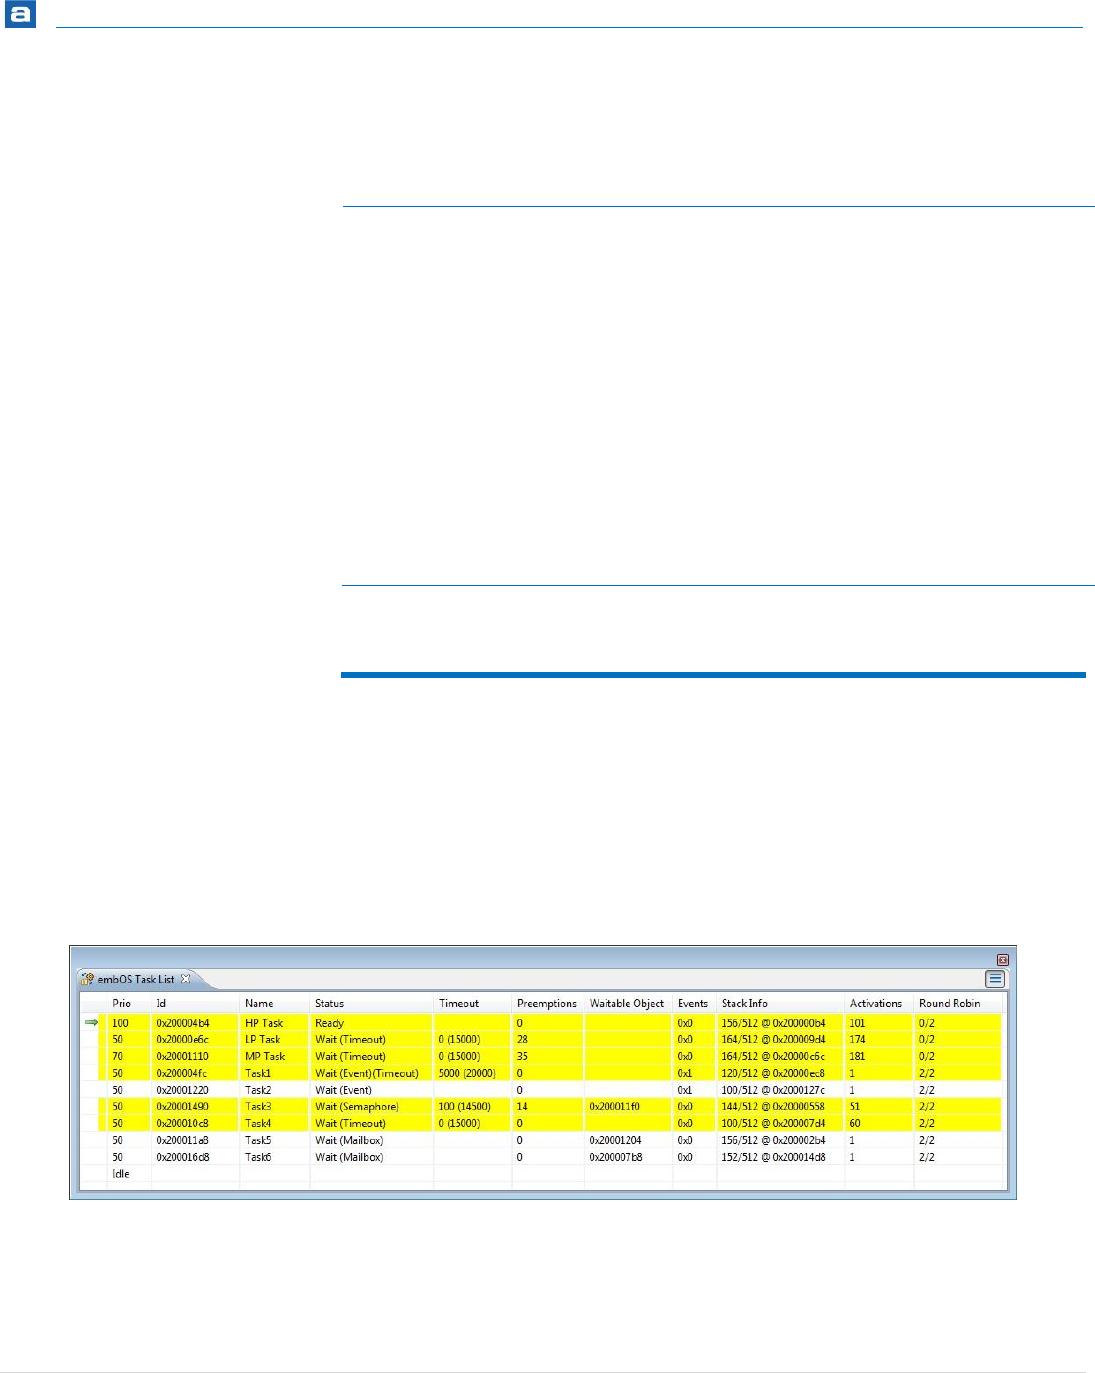
RTOS-Aware Debugging
330 | P a g e
The available system variables are described in the table below:
Name
Description
OS_Status
The current status of embOS.
OS_Time
The number of system ticks since program start.
OS_NumTasks
The number of created tasks.
OS_pCurrentTask
The address (TCB) and name of the currently running task.
OS_pActiveTask
The address (TCB) and name of the next running task.
embOS build
The build options of the currently running embOS kernel.
In the example, debugging and profiling information (DP)
is available.
Table 10 – embOS System Variables
TASK LIST
The embOS Task List view displays detailed information regarding all available tasks in the
target system. The task list is updated automatically each time the target execution is
suspended.
There is one column for each type of task parameter, and one row for each task. If the
value of any parameter for a particular task has changed since the last time the debugger
was suspended, the corresponding row will be highlighted in yellow.
Figure 304 - embOS Task List View
Please note that due to performance reasons, stack analysis (the Stack Info column) is
disabled by default. To enable stack analysis, use the Stack analysis toggle toolbar button
in the View toolbar:

RTOS-Aware Debugging
331 | P a g e
The available parameters are described in the table below:
Name
Description
N/A
Indicates the currently running task. The currently running
task is indicated by a green arrow symbol.
Prio
The task priority.
Id
The task identifier (TCB address).
Name
The task name.
Status
The current status of the task. The type of object that
currently blocks a task is presented in parenthesis.
Timeout
The timeout value (OS_Delay) and in parenthesis the point
in time when the timeout will occur.
Preemptions
The number of times the task has been preempted by a
higher priority task.
Waitable Object
The address of the object the task is waiting for.
Events
The event mask of the task. A value of 0x0 means that the
task is not waiting on any events.
Stack Info
The amount of used stack space, the available stack space
and the stack start address. [Used/Total@Address].
Note! This feature must be enabled in the View toolbar.
Activations
The number of times the task has been activated.
Round Robin
The number of remaining time slices (ticks) and the time
slice reload value, during round robin scheduling.
Table 11 – embOS Task Parameters
TIMERS
The embOS Timers view displays detailed information regarding all available software
timers in the target system. The timers view is updated automatically each time the target
execution is suspended.
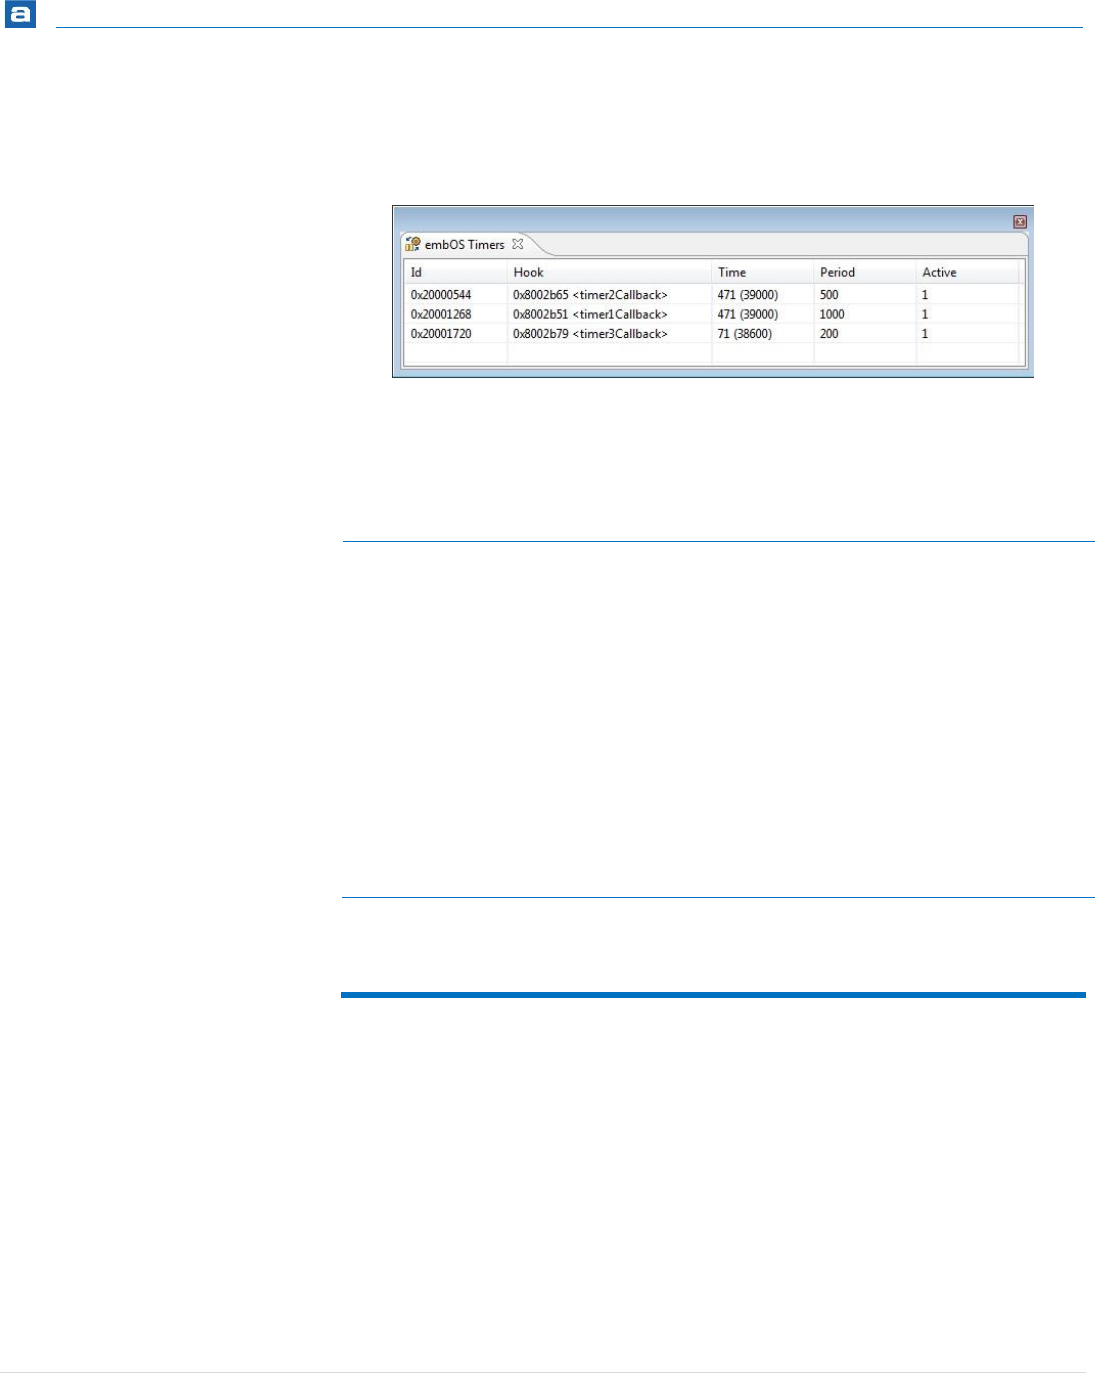
RTOS-Aware Debugging
332 | P a g e
There is one column for each type of timer parameter, and one row for each timer. If the
value of any parameter for a particular timer has changed since the last time the debugger
was suspended, the corresponding row will be highlighted in yellow.
Figure 305 - embOS Timers View
The available parameters are described in the table below:
Name
Description
Id
The timer identifier (address).
Hook
The address and name of the function that is called when
the timer expires.
Time
The current timer value (ticks) and in parenthesis the
point in time when the timer expires.
Period
The timer time period (ticks).
Active
Shows whether the timer is active or not.
1 = Active
0 = Not active
Table 12 – embOS Timer Parameters
RESOURCE SEMAPHORES
The embOS Resource Semaphores view displays detailed information regarding all
available resource semaphores in the target system. The view is updated automatically
each time the target execution is suspended.
There is one column for each type of semaphore parameter, and one row for each
semaphore. If the value of any parameter for a particular semaphore has changed since
the last time the debugger was suspended, the corresponding row will be highlighted in
yellow.

RTOS-Aware Debugging
333 | P a g e
Figure 306 - embOS Resource Semaphores View
The available parameters are described in the table below:
Column
Description
Id
The resource semaphore identifier (address).
Owner
The address (TCB) and name of the task currently owning
the semaphore.
Use counter
The semaphore use counter. Keeps track of how many
times the semaphore has been claimed by a task.
Waiting tasks
The address (TCB) and name of all tasks waiting on the
semaphore.
Table 13 – embOS Resource Semaphore Parameters
MAILBOXES
The embOS Mailboxes view displays detailed information regarding all available mailboxes
in the target system. The view is updated automatically each time the target execution is
suspended.
There is one column for each type of mailbox parameter, and one row for each mailbox. If
the value of any parameter for a particular mailbox has changed since the last time the
debugger was suspended, the corresponding row will be highlighted in yellow.
Figure 307 - embOS Mailboxes View

RTOS-Aware Debugging
334 | P a g e
The available parameters are described in the table below:
Column
Description
Id
The mailbox identifier (address).
Messages
The current number of messages and the maximum
number of messages the mailbox can hold.
Message size
The size (in bytes) of a message item.
pBuffer
The address of the message buffer.
Waiting tasks
The address (TCB) and name of all tasks waiting on the
mailbox.
Table 14 – embOS Mailbox Parameters
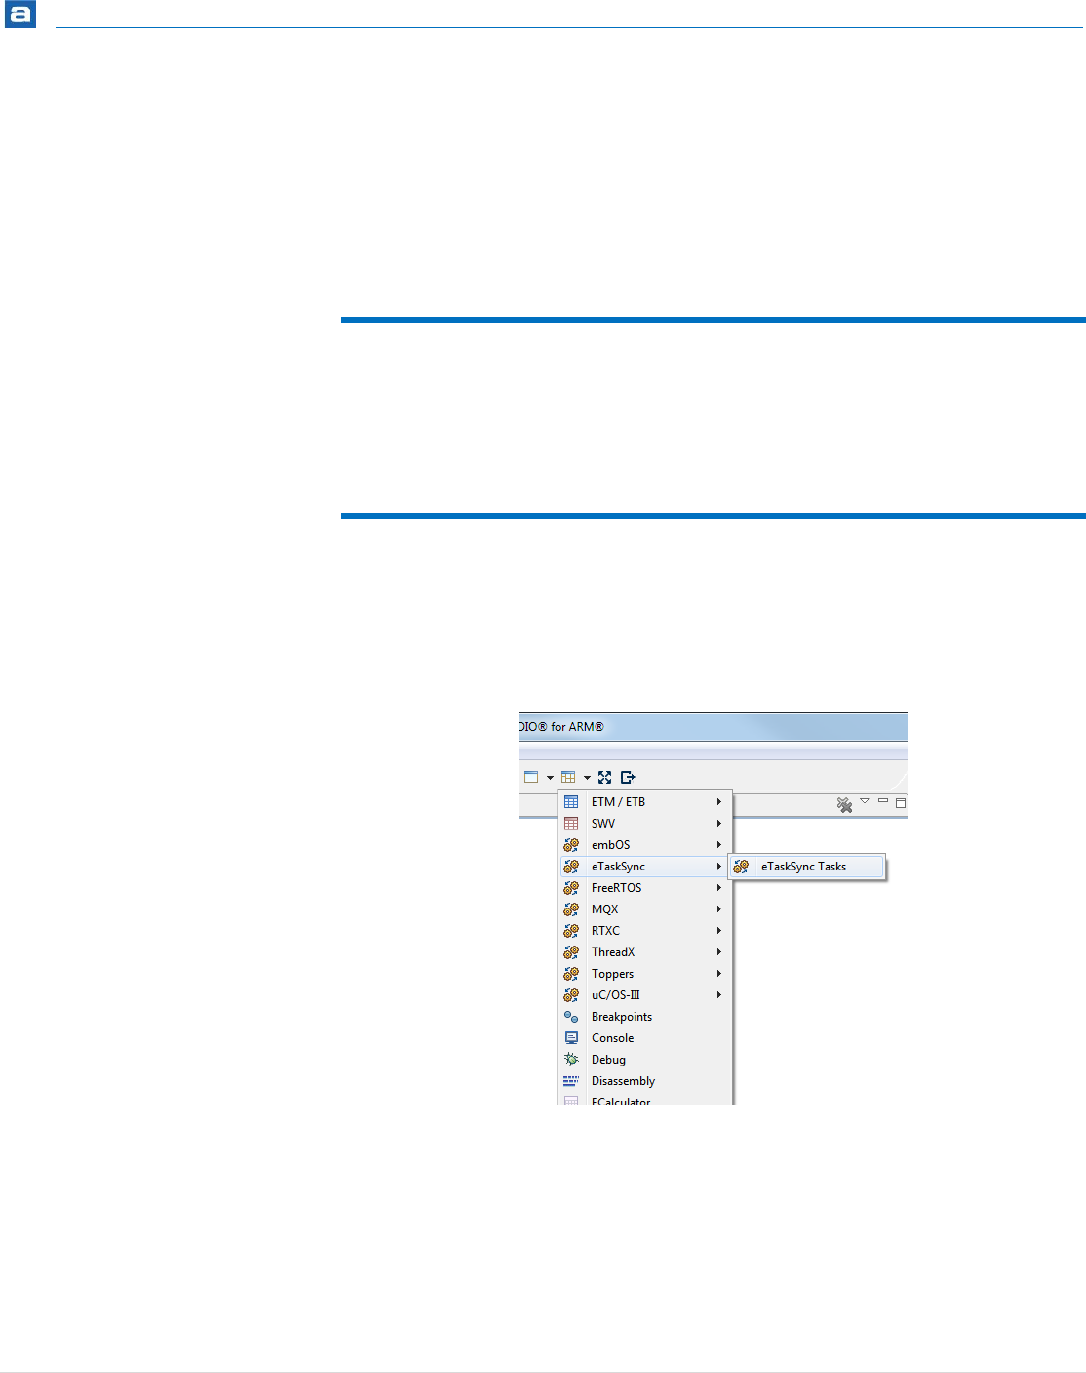
RTOS-Aware Debugging
335 | P a g e
HCC EMBEDDED ETASKSYNC
The kernel awareness features for eTaskSync in Atollic TrueSTUDIO provide the developer
with a detailed insight into the task structures of the eTaskSync kernel. During a debug
session, the current state of the tasks can be easily inspected in a dedicated view, in the
Atollic TrueSTUDIO Debug perspective.
REQUIREMENTS
The kernel awareness features described in this document is based on eTaskSync Versions
3.01.
FINDING THE VIEW
One view is available in the Atollic TrueSTUDIO Debug perspective when debugging an
application containing the eTaskSync real-time operating system.
It is available from the Show View toolbar dropdown list button.
Figure 308 – eTaskSync Show View Toolbar Button
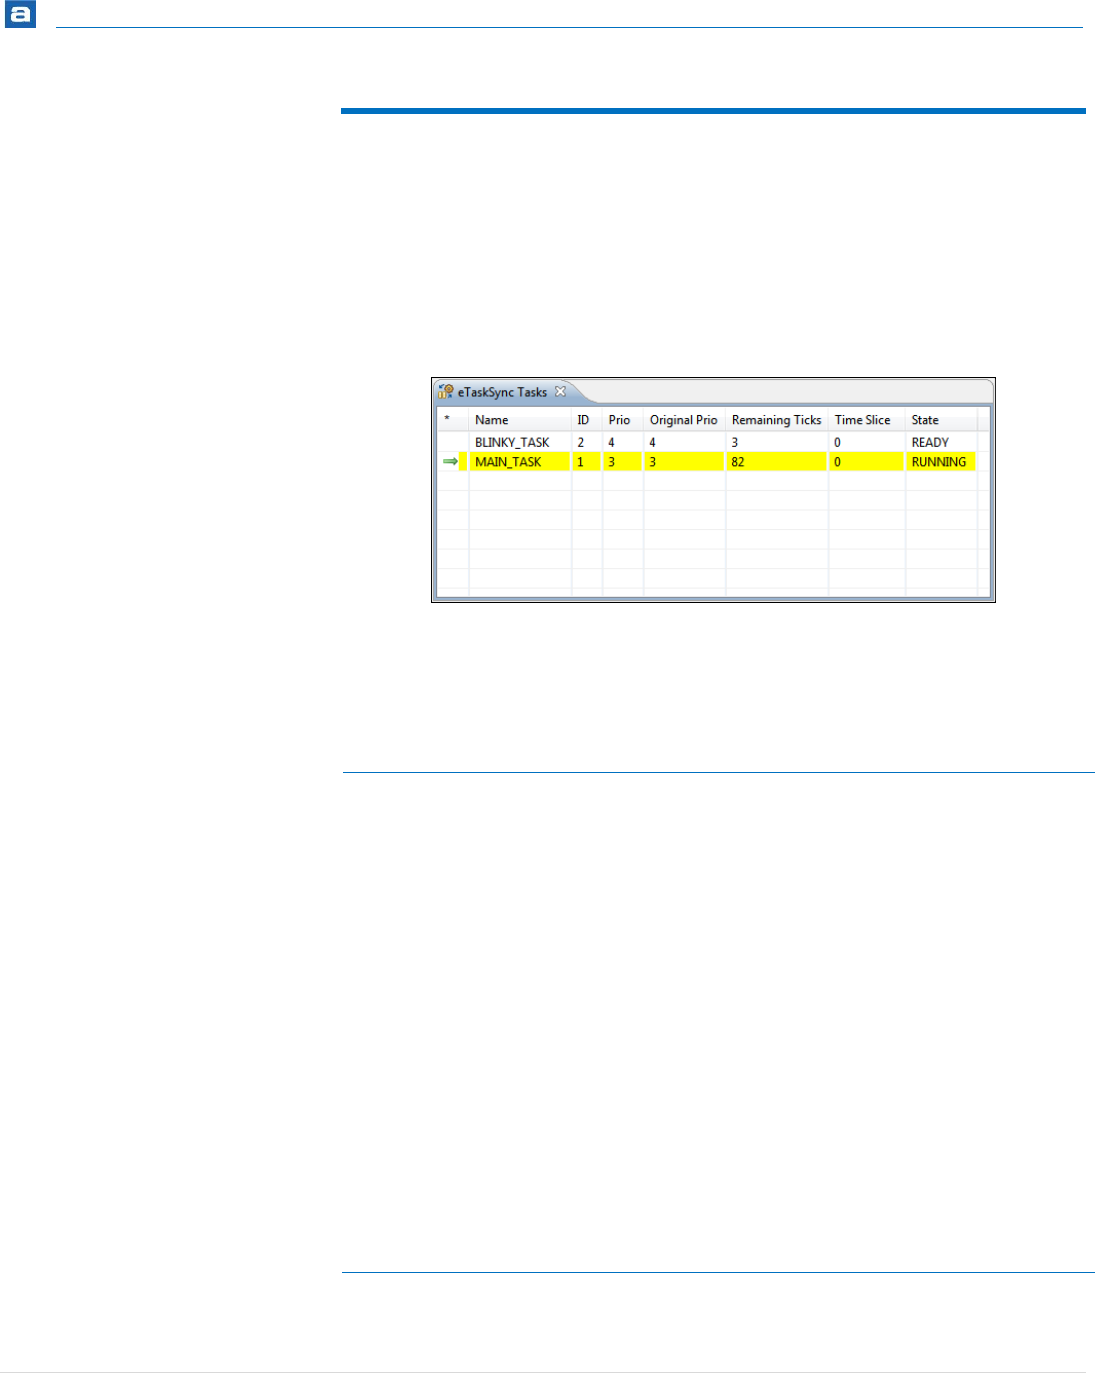
RTOS-Aware Debugging
336 | P a g e
TASK LIST
The eTaskSync Task List view displays detailed information regarding all available tasks in
the target system. The task list is updated automatically each time the target execution is
suspended.
There is one column for each type of task parameter, and one row for each task. If the
value of any parameter for a particular task has changed since the last time the debugger
was suspended, the corresponding row will be highlighted in yellow.
Figure 309 - eTaskSync Task List View
The available parameters are described in the table below:
Name
Description
N/A
Indicates the currently running task. The currently running
task is indicated by a green arrow symbol.
Name
The name assigned to the task.
ID
The task base ID
Prio
The task actual priority
Original Prio
The original (base) priority of the task
Remaining ticks
Number of remaining ticks
Time Slice
The time slice. This is not always present. Only if
SYNC_TIME_SLICE_ENABLE option is set at compile time in
hcc/src/config/config_sync.h.
State
The state of the task.
Table 15 – eTaskSync Task Parameters
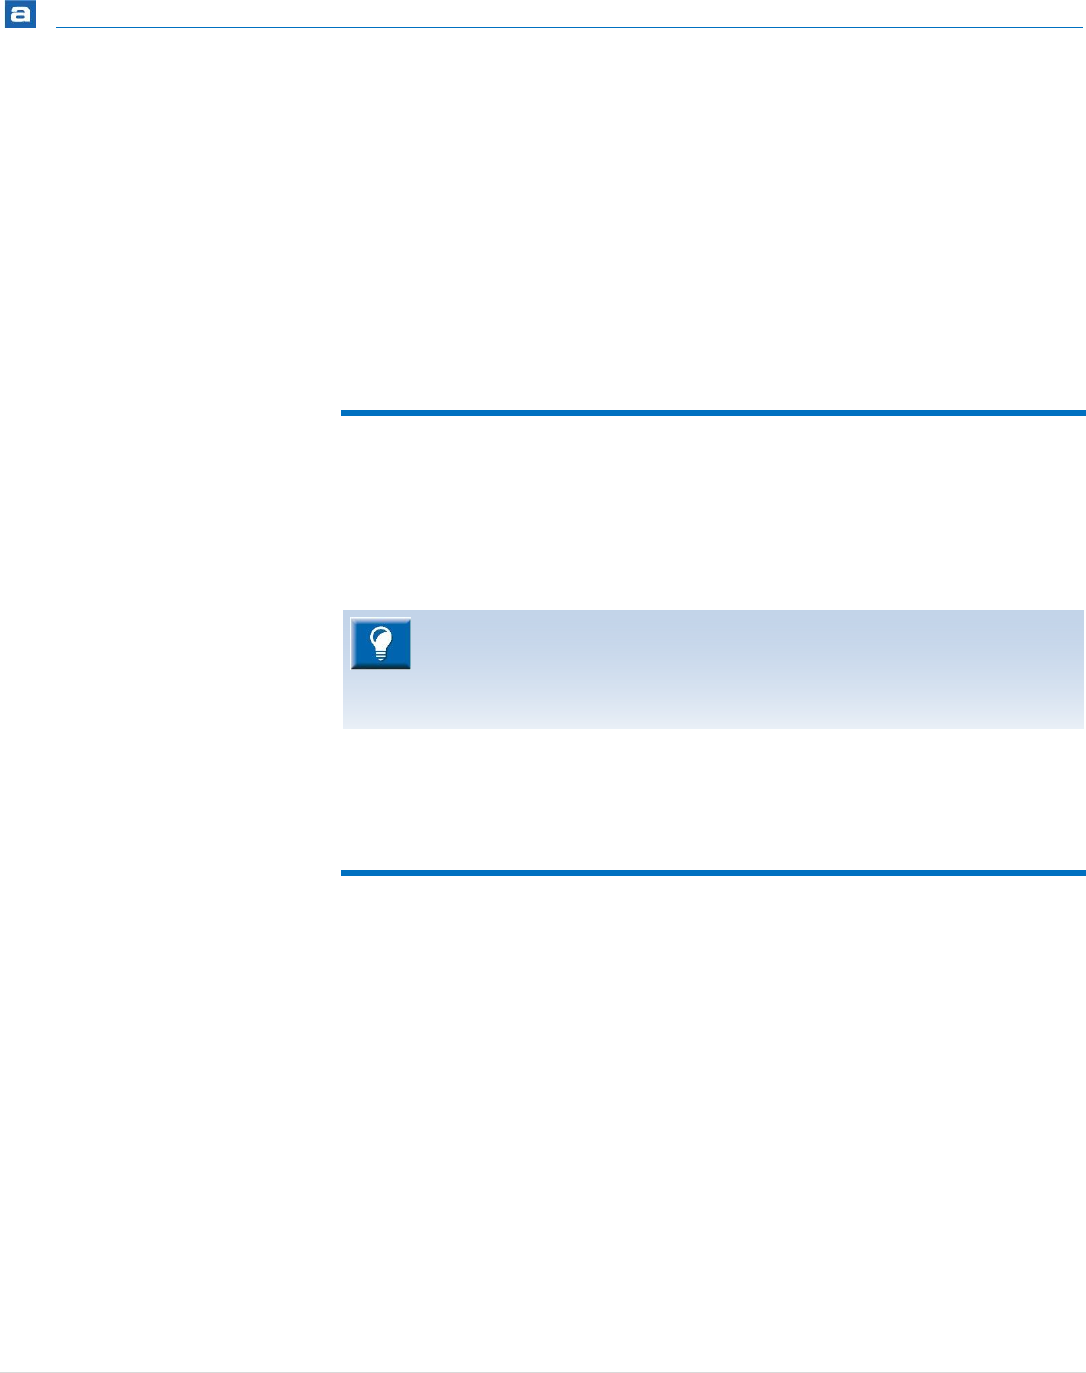
RTOS-Aware Debugging
337 | P a g e
FREERTOS AND OPENRTOS
As FreeRTOS and OpenRTOS are technically identical, we will only refer to FreeRTOS here,
but the information applies equally to both.
The kernel awareness features for FreeRTOS in Atollic TrueSTUDIO provide the developer
with a detailed insight into the internal data structures of the FreeRTOS kernel. During a
debug session, the current state of the FreeRTOS kernel and the various FreeRTOS kernel
objects such as tasks, mailboxes, semaphores and software timers, can be easily inspected
in a set of dedicated views, in the Atollic TrueSTUDIO Debug perspective.
REQUIREMENTS
In order for the FreeRTOS Queues and the FreeRTOS Semaphores views to be able to
locate the appropriate RTOS kernel data structures, the associated kernel objects need to
be added to the FreeRTOS queue registry. Please consult the FreeRTOS reference manual
for details.
Also set the define configUSE_TRACE_FACILITY in FreeRTOSconfig.h to list the type
of the semaphore in the semaphore view or it will say "N/A"
FINDING THE VIEWS
A number of debugger views are available in the Atollic TrueSTUDIO Debug perspective
when debugging an application containing the FreeRTOS real-time operating system.
These views are available from the Show View toolbar dropdown list button.
The following define fixes so GDB doesn't fail when going through the stack of
a task in FreeRTOS 7.6. The same problem might also affect earlier releases.
#define configTASK_RETURN_ADDRESS 0x00
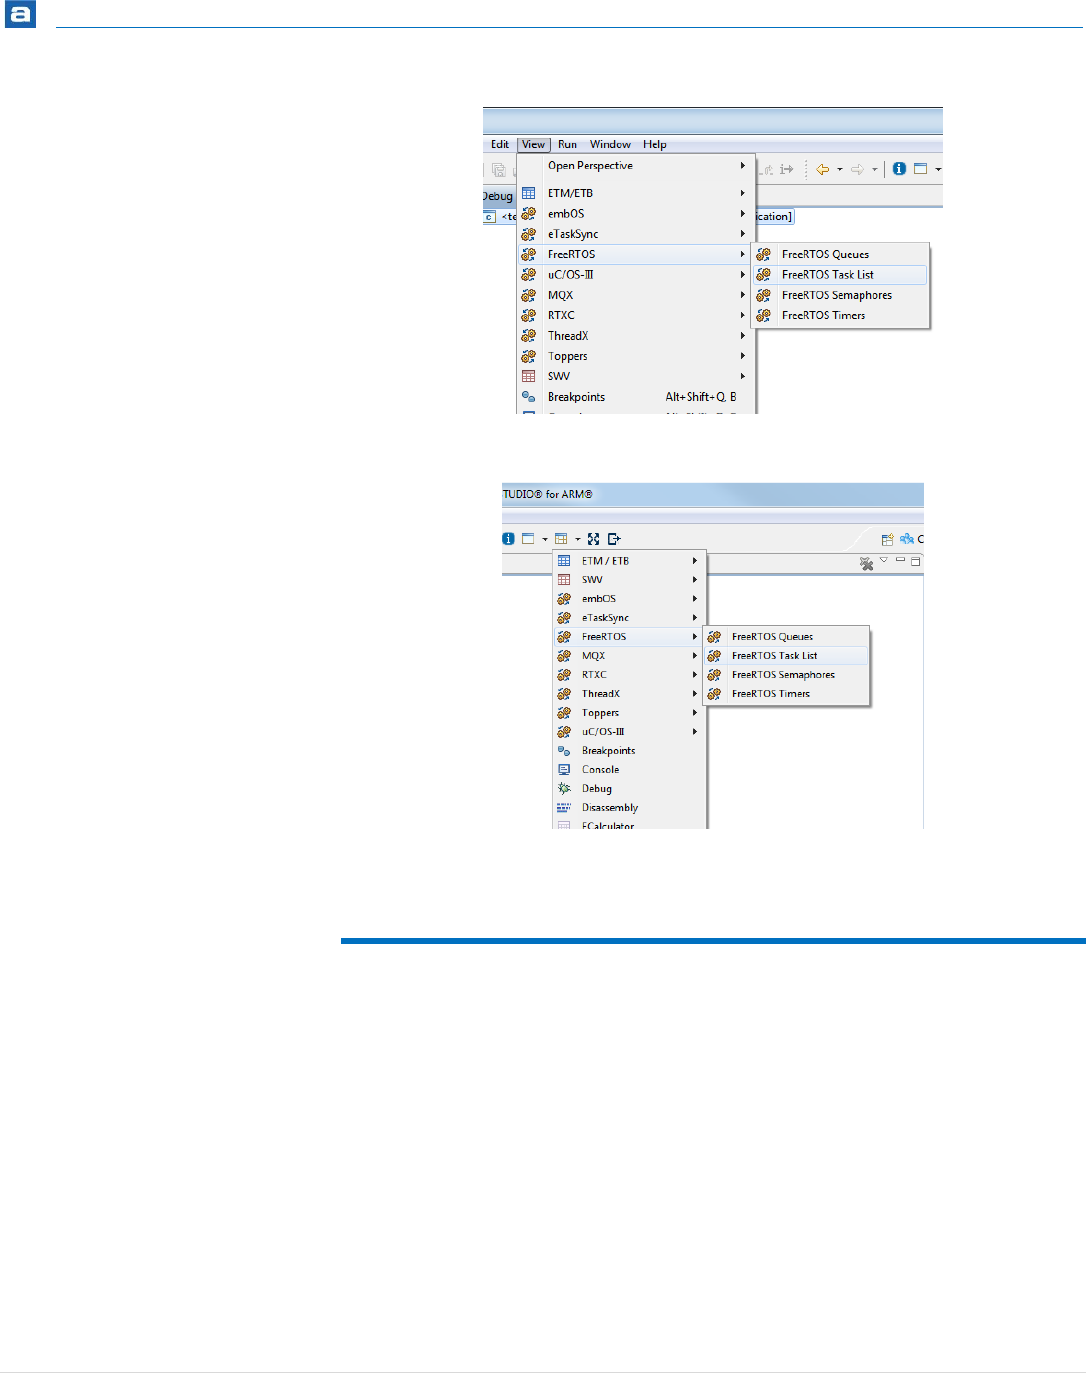
RTOS-Aware Debugging
338 | P a g e
Figure 310 – FreeRTOS View Top Level Menu
Figure 311 – FreeRTOS Show View Toolbar Button
TASK LIST
The FreeRTOS Task List view displays detailed information regarding all available tasks in
the target system. The task list is updated automatically each time the target execution is
suspended.
There is one column for each type of task parameter, and one row for each task. If the
value of any parameter for a particular task has changed since the last time the debugger
was suspended, the corresponding row will be highlighted in yellow.

RTOS-Aware Debugging
339 | P a g e
Figure 312 - FreeRTOS Task List View
Please note that due to performance reasons, stack analysis (the Min Free Stack column)
is disabled by default. To enable stack analysis, use the Stack analysis toggle toolbar
button in the View toolbar:
The available parameters are described in the table below:
Name
Description
N/A
Indicates the currently running task. The currently running
task is indicated by a green arrow symbol.
Name
The name assigned to the task.
Priority (Base/Actual)
The task base priority and actual priority. The base priority
is the priority assigned to the task. The actual priority is a
temporary priority assigned to the task due to the priority
inheritance mechanism.
Start of Stack
The address of the stack region assigned to the task.
Top of Stack
The address of the saved task stack pointer.
State
The current state of the task.
Event Object
The name of the resource that has caused the task to be
blocked.
Min Free Stack
Run Time (%)
The stack “high watermark”. Displays the minimum
number of bytes left on the stack for a task. A value of 0
(most likely) indicates that a stack overflow has occurred.
Note! This feature must be enabled in the View toolbar.
The run-time statistics provide information on the
percentage of time the task has been used. This can be
used for profiling the system during development.
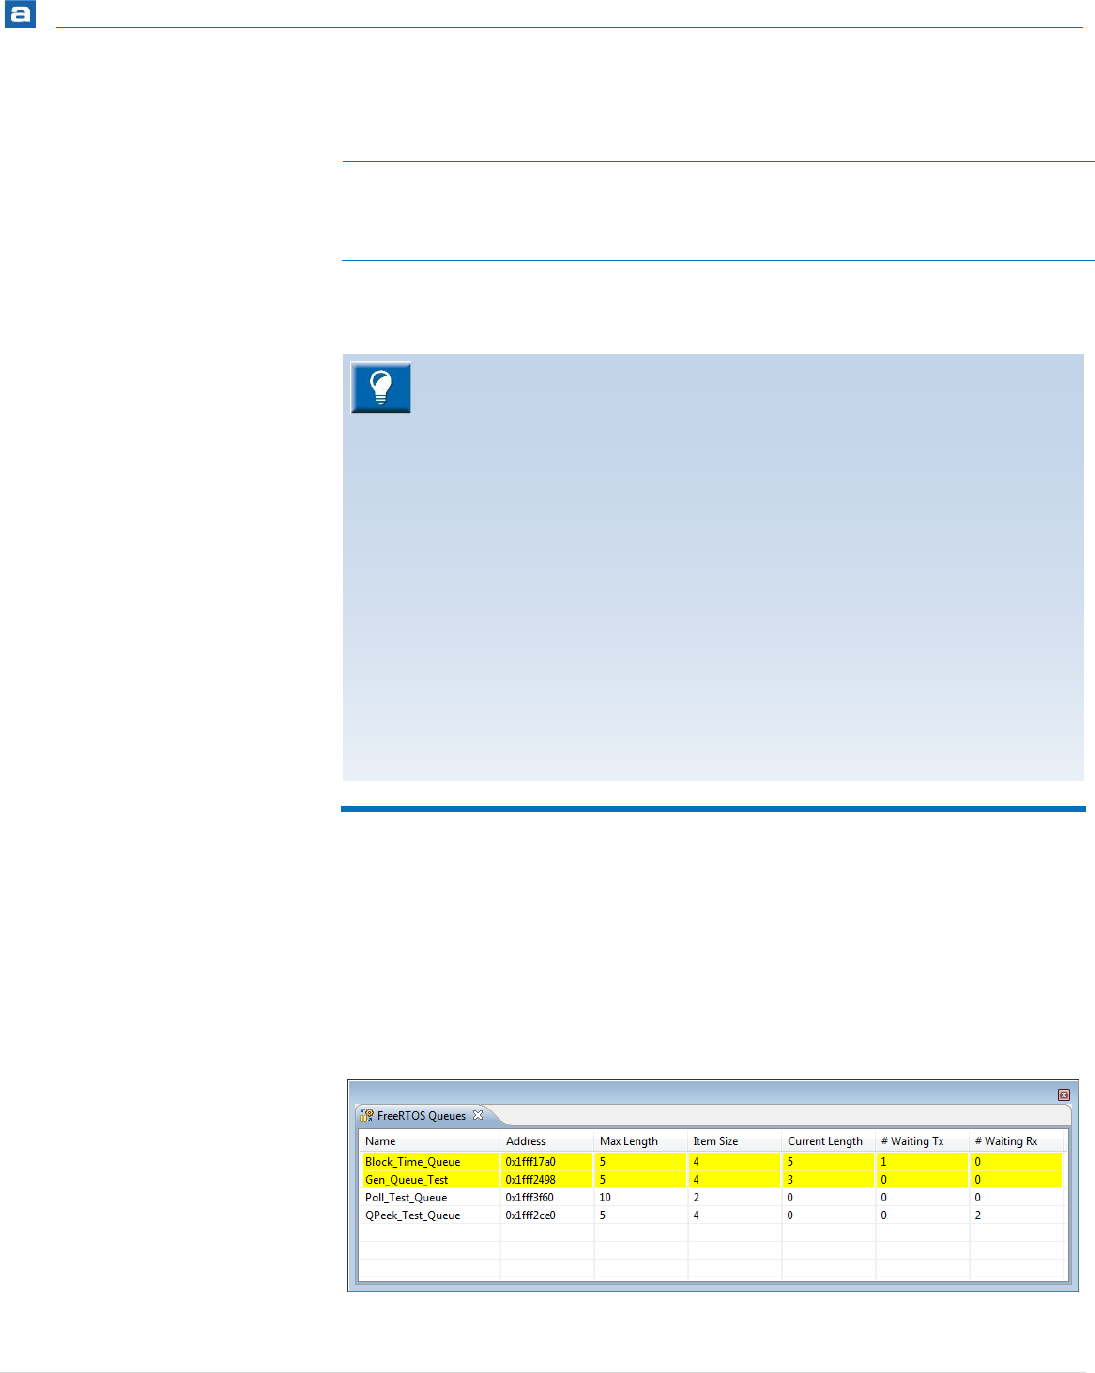
RTOS-Aware Debugging
340 | P a g e
Name
Description
Note! A clock is used to generate timer interrupts and
macros needs to be defined in <FreeRTOSConfig.h> to get
the profiling information. See info below.
Table 16 – FreeRTOS Task Parameters
QUEUES
The FreeRTOS Queues view displays detailed information regarding all available queues in
the target system. The queues view is updated automatically each time the target
execution is suspended.
There is one column for each type of queue parameter, and one row for each queue. If the
value of any parameter for a particular queue has changed since the last time the
debugger was suspended, the corresponding row will be highlighted in yellow.
Figure 313 - FreeRTOS Queues View
To get valid profiling information the run-time statistics profiling clock is
recommended to run 10-100 times faster than the frequency of the clock used
to handle the tick interrupt.
The <FreeRTOS_Config.h> files can be updated in the following way:
1. Enable collection of run-time statistics by setting the following macro to 1.
#define configGENERATE_RUN_TIME_STATS 1
2. Define portCONFIGURE_TIMER_FOR_RUN_TIME_STATS() to call
the function that configures a timer to be used for profiling.
3. Define portGET_RUN_TIME_COUNTER_VALUE() to call the
function witch reads current value from the profiling timer.
More information on how to configure FreeRTOS for run-time statistics is
available in the FreeRTOS documentation.

RTOS-Aware Debugging
341 | P a g e
The available parameters are described in the table below:
Name
Description
Name
The name assigned to the queue in the queue registry.
Address
The address of the queue.
Max Length
The maximum number of items that the queue can hold.
Item Size
The size in bytes of each queue item.
Current Length
The number of items currently in the queue.
#Waiting Tx
The number of tasks currently blocked waiting to send to
the queue.
#Waiting Rx
The number of tasks currently blocked waiting to receive
from the queue.
Table 17 – FreeRTOS Queue Parameters
SEMAPHORES
The FreeRTOS Semaphores view displays detailed information regarding all available
synchronization objects in the target system, including:
Mutexes
Counting semaphores
Binary semaphores
Recursive semaphores
The view is updated automatically each time the target execution is suspended.
There is one column for each type of semaphore parameter, and one row for each
semaphore. If the value of any parameter for a particular semaphore has changed since
the last time the debugger was suspended, the corresponding row will be highlighted in
yellow.

RTOS-Aware Debugging
342 | P a g e
Figure 314 - FreeRTOS Semaphores View
The available parameters are described in the table below:
Column
Description
Name
The name assigned to the object in the queue registry.
Address
The address of the object.
Type
The type of the object.
Size
The maximum number of owning tasks.
Free
The number of free slots currently available.
#Blocked tasks
The number of tasks currently blocked waiting for the
object.
Table 18 – FreeRTOS Semaphore Parameters
TIMERS
The FreeRTOS Timers view displays detailed information regarding all available software
timers in the target system. The timers view is updated automatically each time the target
execution is suspended.
There is one column for each type of timer parameter, and one row for each timer. If the
value of any parameter for a particular timer has changed since the last time the debugger
was suspended, the corresponding row will be highlighted in yellow.
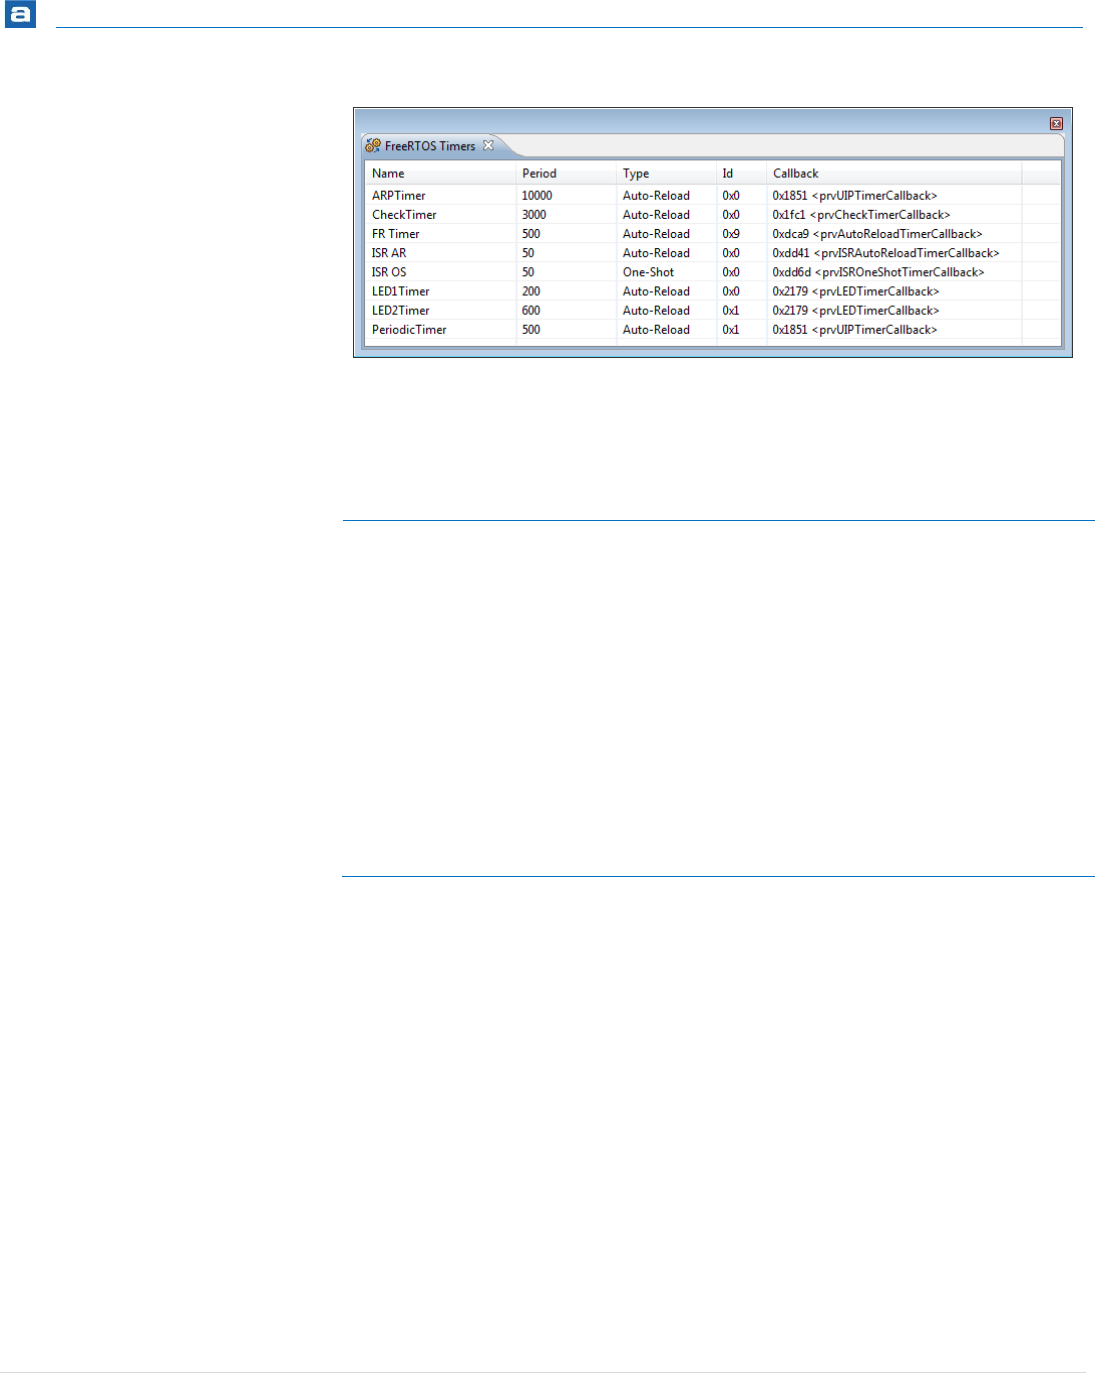
RTOS-Aware Debugging
343 | P a g e
Figure 315 - FreeRTOS Timers View
The available parameters are described in the table below:
Name
Description
Name
The name assigned to the timer.
Period
The time (in ticks) between timer start and the execution
of the callback function.
Type
The type of timer. Auto-Reload timers are automatically
reactivated after expiration. One-Shot timers expire only
once.
Id
The timer identifier.
Callback
The address and name of the callback function executed
when the timer expires.
Table 19 – FreeRTOS Timer Parameters
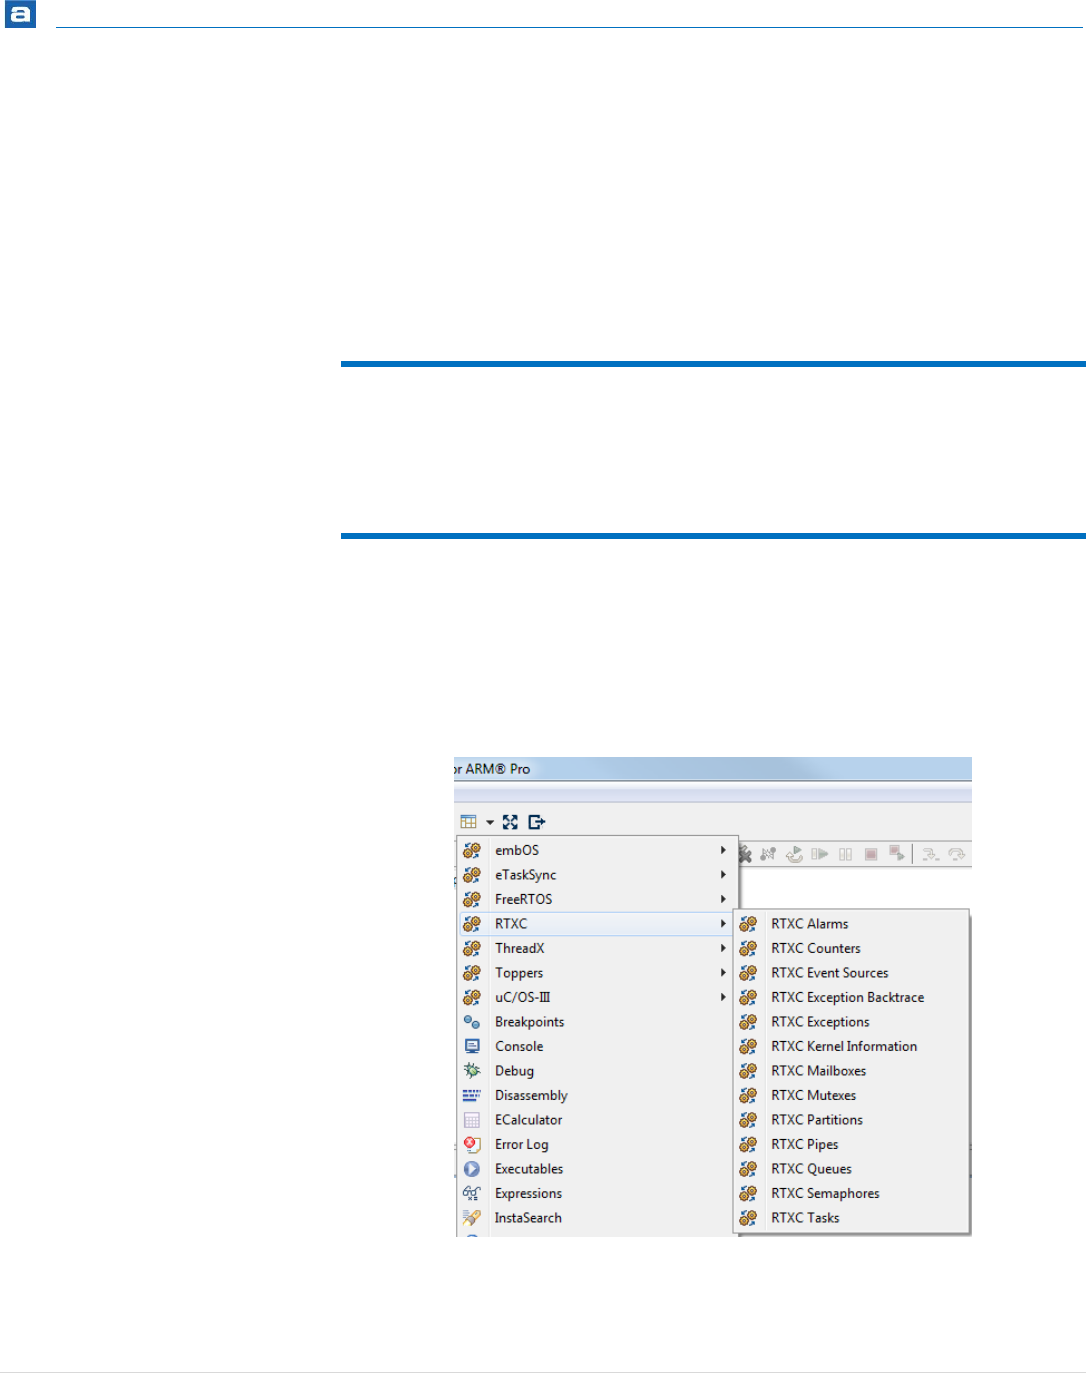
RTOS-Aware Debugging
344 | P a g e
QUADROS RTXC
The kernel awareness features for Quadros RTXC RTOS in Atollic TrueSTUDIO provide the
developer with a detailed insight into the internal data structures of the RTXC kernel.
During a debug session, the current state of the RTXC kernel and the various RTXC kernel
objects such as tasks, semaphores, mailboxes, etc, can be easily inspected in a set of
dedicated views, in the Atollic TrueSTUDIO Debug perspective.
REQUIREMENTS
The kernel awareness features described in this document is based on RTXC Version 2.1.2.
FINDING THE VIEWS
The Quadros RTXC Kernel Awareness views, is available in the Atollic TrueSTUDIO Debug
perspective when debugging an application containing the RTXC real-time operating
system.
The views can be accessed from the Show View toolbar dropdown list button.
Figure 316 – RTXC Show View Toolbar Button
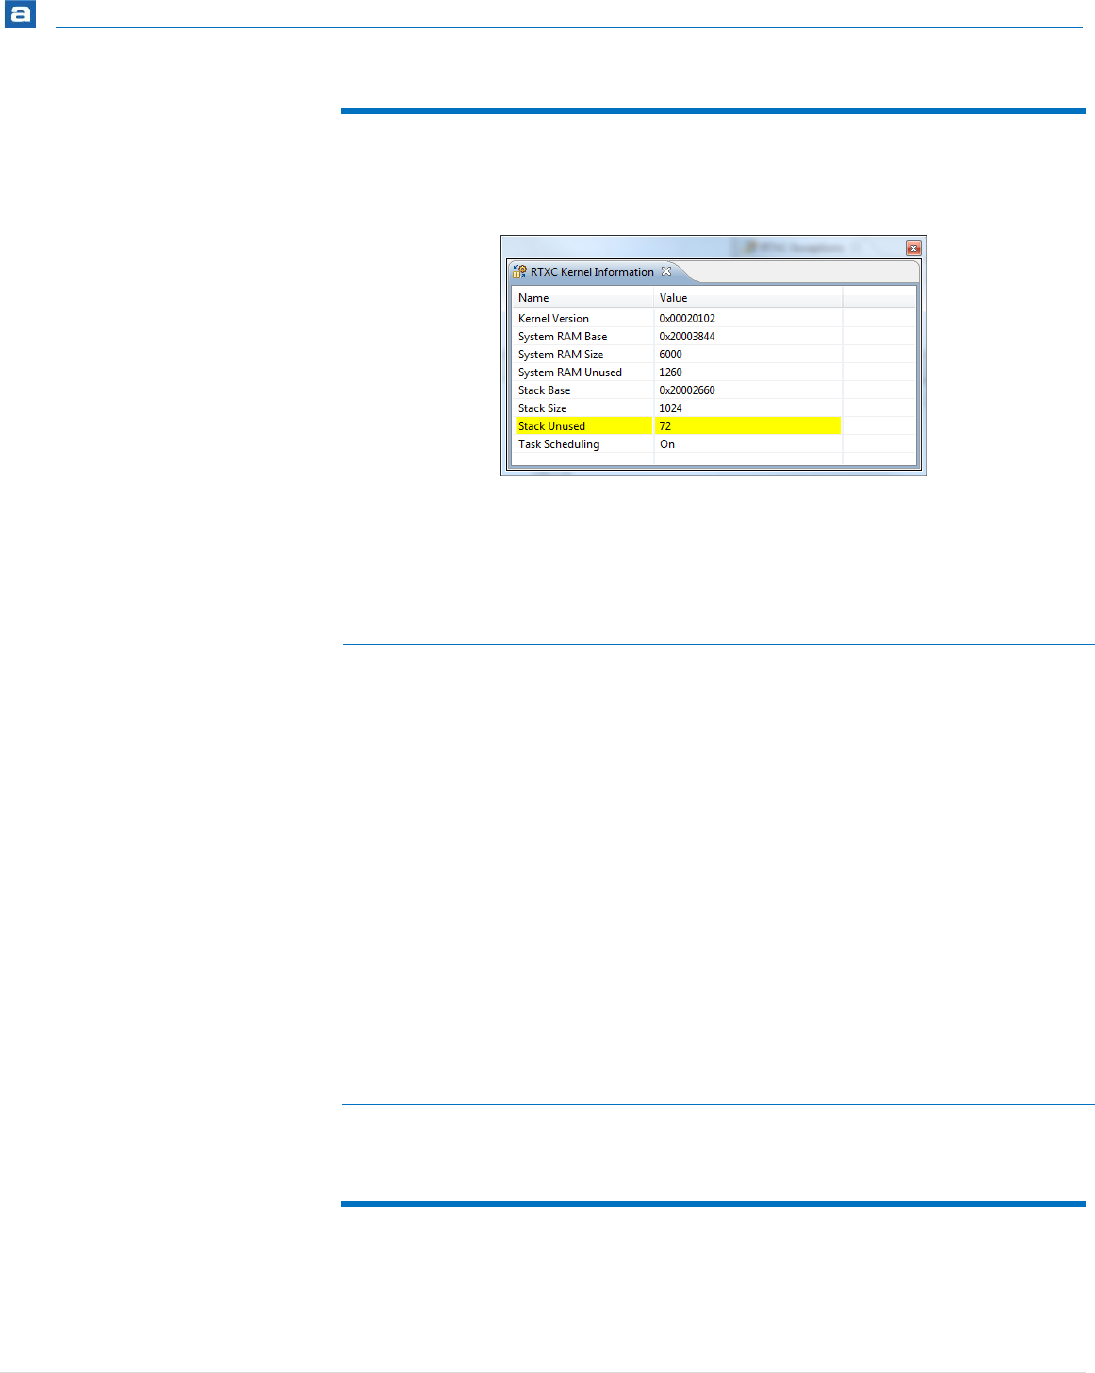
RTOS-Aware Debugging
345 | P a g e
KERNEL INFORMATION
The RTXC Kernel Information view displays general information about the kernel.
Figure 317 – RTXC Kernel Information View
The available system variables are described in the table below:
Name
Description
Kernel Version
A sixteen-bit quantity defining the version number of the
RTXC Quadros kernel.
System RAM Base
The base address of the system RAM.
System RAM Size
The size of the system RAM.
System RAM Unused
The amount of unused system RAM.
Stack Base
The base address of the kernel stack.
Stack Size
Displays the size of the kernel stack.
Stack Unused
The number of bytes unused, high watermark.
Task Scheduling
The task scheduler information (on /off).
Table 20 – RTXC Kernel Information
TASKS (TASK LIST AND STACK INFO)
The RTXC Tasks view contains one Task List tab and one Stack Info tab. Each tab displays
detailed information regarding all available tasks in the target system.

RTOS-Aware Debugging
346 | P a g e
TASK LIST TAB
The RTXC Task List tab displays detailed information regarding all available tasks in the
target system. The task list is updated automatically each time the target execution is
suspended.
There is one column for each type of task parameter, and one row for each task. If the
value of any parameter for a particular task has changed since the last time the debugger
was suspended, the corresponding row will be highlighted in yellow.
Figure 318 - RTXC Task List tab in Task view
The available parameters are described in the table below:
Name
Description
N/A
Indicates the currently running task. The currently running
task is indicated by a green arrow symbol.
#
The task id.
Name
The name assigned to the task.
Priority
The priority for the task.
Entry
The task’s entry point address (in hexadecimal).
Arguments
The task’s environment arguments address.
Tick Slice
Ticks remaining / total ticks.
State
The tasks current state.

RTOS-Aware Debugging
347 | P a g e
Table 21 – RTXC Task List Parameters
STACK INFO TAB
The RTXC Stack info tab displays detailed stack information for each task. The stack
information list is updated automatically each time the target execution is suspended.
There is one column for each type of stack information, and one row for each task. If the
value of any parameter for a particular task has changed since the last time the debugger
was suspended, the corresponding row will be highlighted in yellow.
Figure 319 – RTXC Task Stack Info
The available parameters are described in the table below:
Name
Description
#
The task id.
Name
The name assigned to the task.
Address
The base address of the task’s stack.
Size
The amount of memory allocated for the stack.
Used
The number of bytes unused, high watermark.
Spare
The amount of stack space left over.
Table 22 – RTXC Stack Info
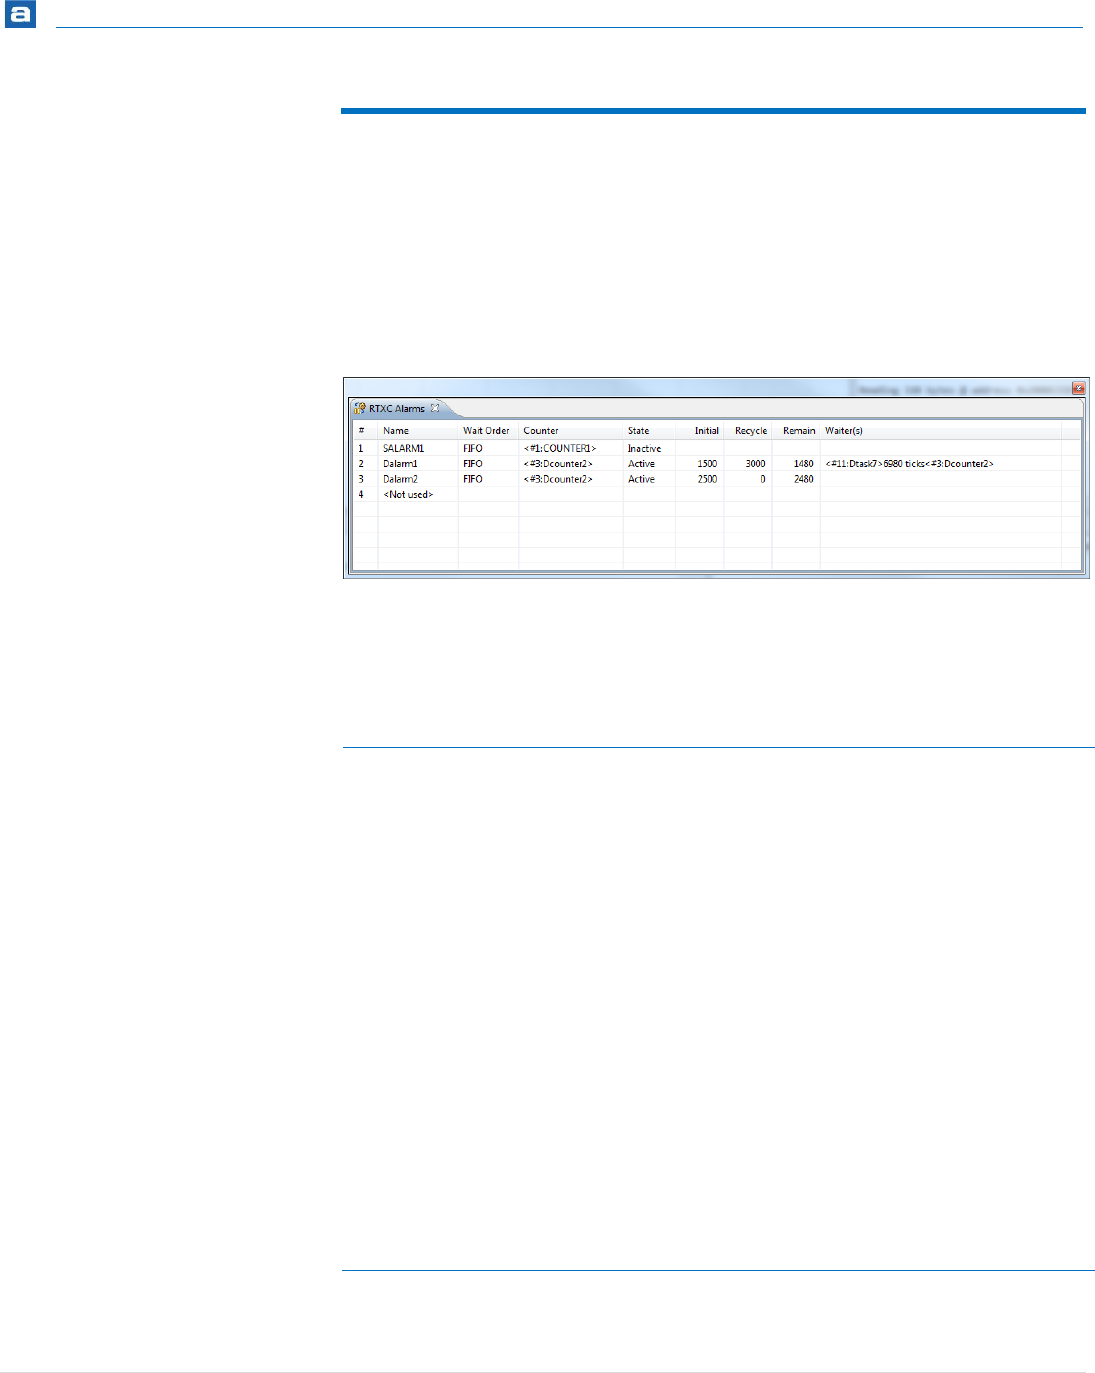
RTOS-Aware Debugging
348 | P a g e
ALARMS
The RTXC Alarms view displays detailed information regarding all available alarms in the
target system. The view is updated automatically each time the target execution is
suspended.
There is one column for each type of alarm parameter, and one row for each alarm. If the
value of any parameter for a particular alarm has changed since the last time the debugger
was suspended, the corresponding row will be highlighted in yellow.
Figure 320 - RTXC Alarms View
The available parameters are described in the table below:
Name
Description
#
The object id.
Name
The name assigned to the alarm.
Wait order
The alarm’s wait order that can be either Priority or FIFO.
Counter
The alarm’s parent counter.
State
The alarm’s current state.
Initial
The alarm’s initial period in ticks.
Recycle
The alarm’s recycle value.
Remain
The number of remaining ticks.
Waiter(s)
The task(s) that is waiting on the alarm, if any. Only the
first 5 tasks are shown.
Table 23 – RTXC Alarm Parameters

RTOS-Aware Debugging
349 | P a g e
COUNTERS
The RTXC Counters view displays detailed information regarding all available counters in
the target system. The counter information is updated automatically each time the target
execution is suspended.
There is one column for each type of parameter, and one row for each counter. If the
value of any parameter for a particular task has changed since the last time the debugger
was suspended, the corresponding row will be highlighted in yellow.
Figure 321 - RTXC Counters View
The available parameters are described in the table below:
Name
Description
#
The object id.
Name
The name assigned to the counter.
Parent
The parent event source.
Accumulator
The counter’s accumulator.
Count
The counter’s count value.
Modulus
The counter’s modulus.
Table 24 – RTXC Counter Parameters
EVENT SOURCES
The RTXC Event Sources view displays detailed information regarding all available event
sources in the target system. The event source information is updated automatically each
time the target execution is suspended.

RTOS-Aware Debugging
350 | P a g e
There is one column for each type of parameter, and one row for each event source. If the
value of any parameter for a particular event source has changed since the last time the
debugger was suspended, the corresponding row will be highlighted in yellow.
Figure 322 - RTXC Event Sources View
The available parameters are described in the table below:
Name
Description
#
The object id.
Name
The name assigned to the event source.
Counter(s)
The counter(s) associated with this event source.
Accumulator
The event source’s accumulator.
Table 25 – RTXC Event Source Parameters
EXCEPTION BACKTRACE
The RTXC Exception Backtrace view displays detailed backtrace information during an
exception.
Each line represents an exception that is either executing, or was preempted by the item
above it. The topmost line shows the active component, which preempted the component
listed on the second line, which in turn preempted the third, and so on.
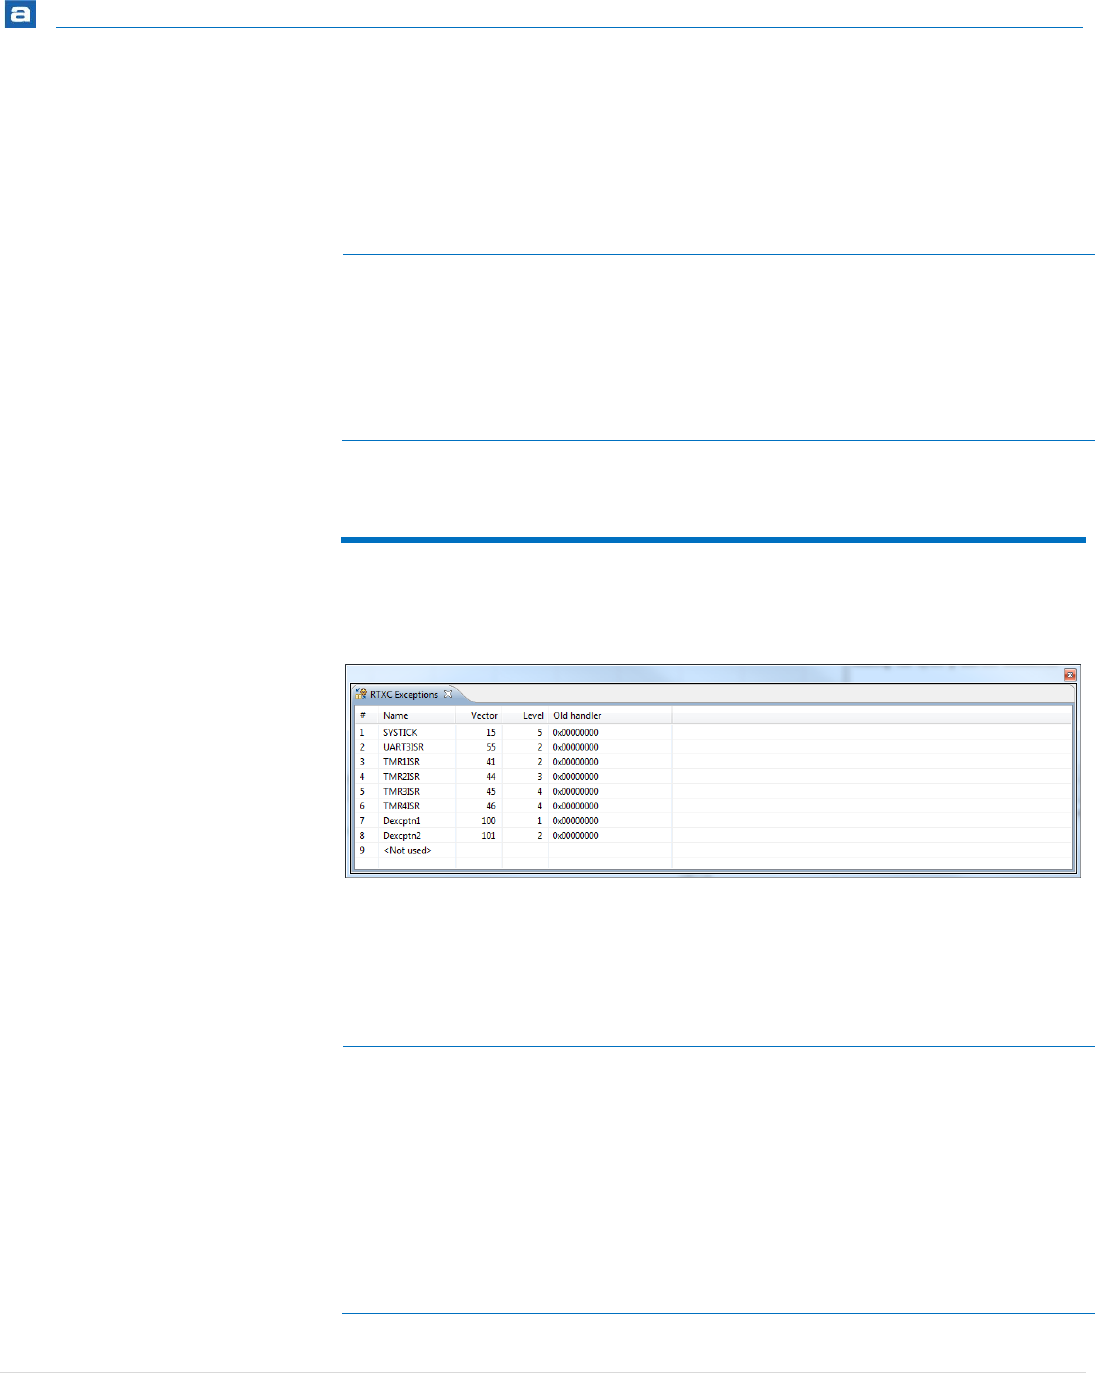
RTOS-Aware Debugging
351 | P a g e
Figure 323 - RTXC Exception Backtrace View
The available parameters are described in the table below:
Name
Description
#
The exception id. A zero represents the Kernel.
Name
The name of the exception.
Registers
The saved register context for the exception (in
hexadecimal).
Table 26 – RTXC Exception Backtrace Parameters
EXCEPTIONS
The RTXC Exceptions view displays one line entry for each exception in the application.
Figure 324 - RTXC Exceptions View
The available parameters are described in the table below:
Name
Description
#
The object id.
Name
The name assigned to the exception.
Vector
The vector number.
Level
The interrupt level.
Old Handler
Previous handler address.
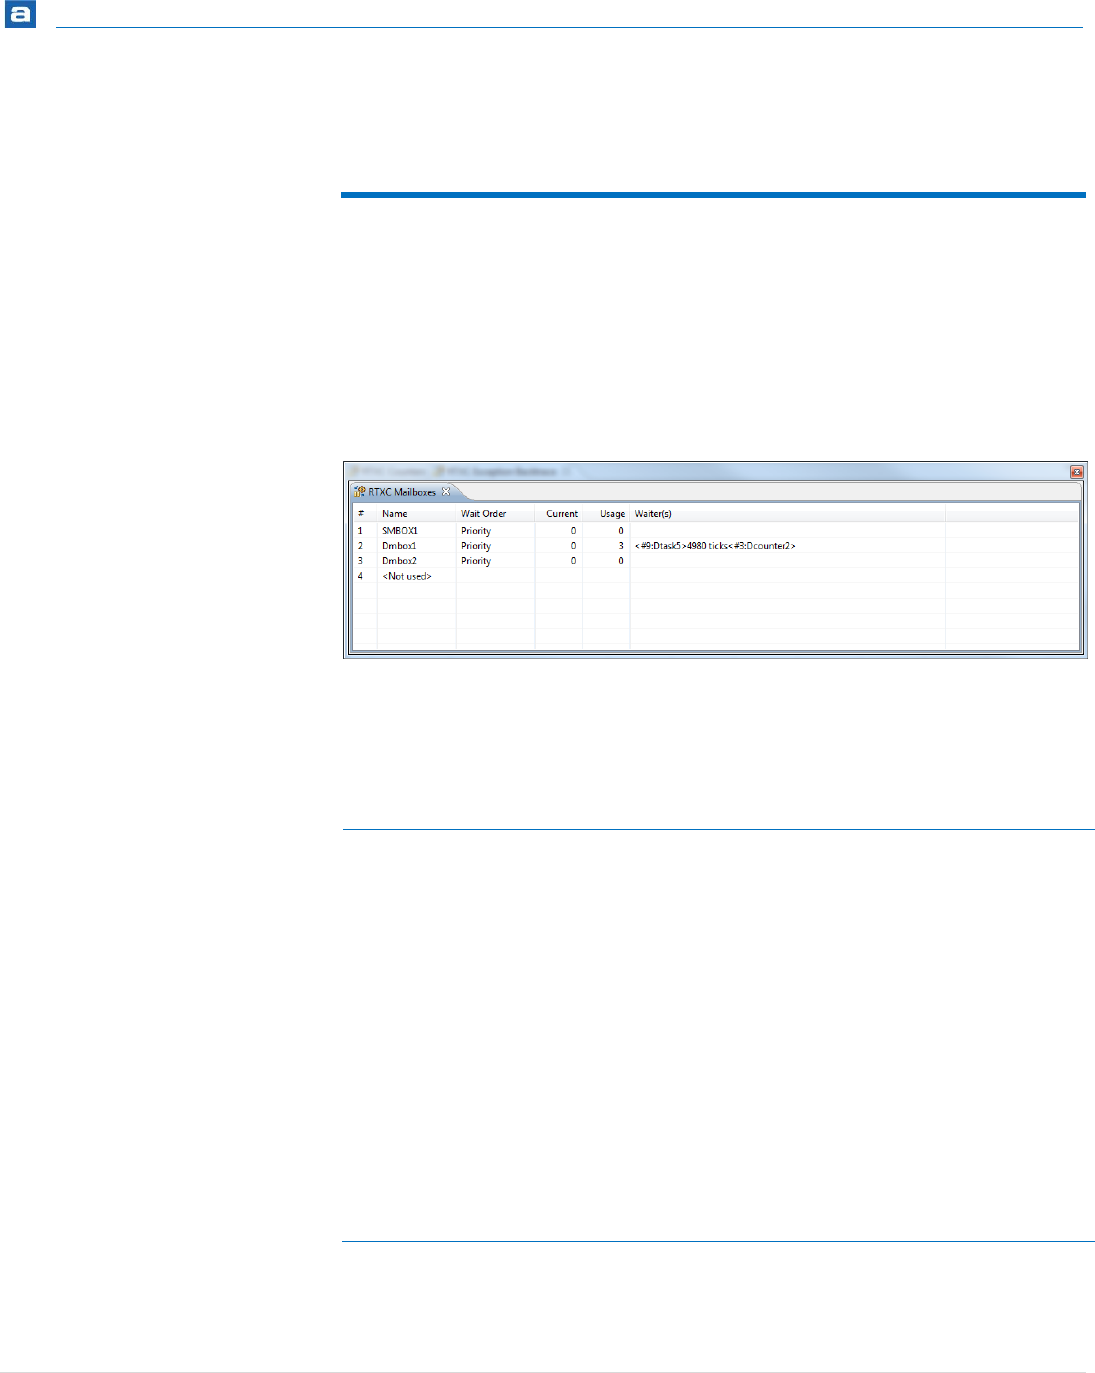
RTOS-Aware Debugging
352 | P a g e
Table 27 – RTXC Exception Parameters
MAILBOXES
The RTXC Mailboxes view displays detailed information regarding all available mailboxes
in the target system. The view is updated automatically each time the target execution is
suspended.
There is one column for each type of mailbox parameter, and one row for each mailbox. If
the value of any parameter for a particular mailbox has changed since the last time the
debugger was suspended, the corresponding row will be highlighted in yellow.
Figure 325 - RTXC Mailboxes View
The available parameters are described in the table below:
Name
Description
#
The object id.
Name
The name assigned to the mailbox.
Wait order
The mailbox’s wait order that can be either Priority or
FIFO.
Current
The current number of messages in the mailbox.
Usage
The total number of messages that have been placed in
the mailbox. Mailbox statistics must be enabled for
displaying this information.
Waiter(s)
The task that is waiting on the mailbox, if any. Only the
first 5 tasks are shown.
Table 28 – RTXC Mailbox Parameters
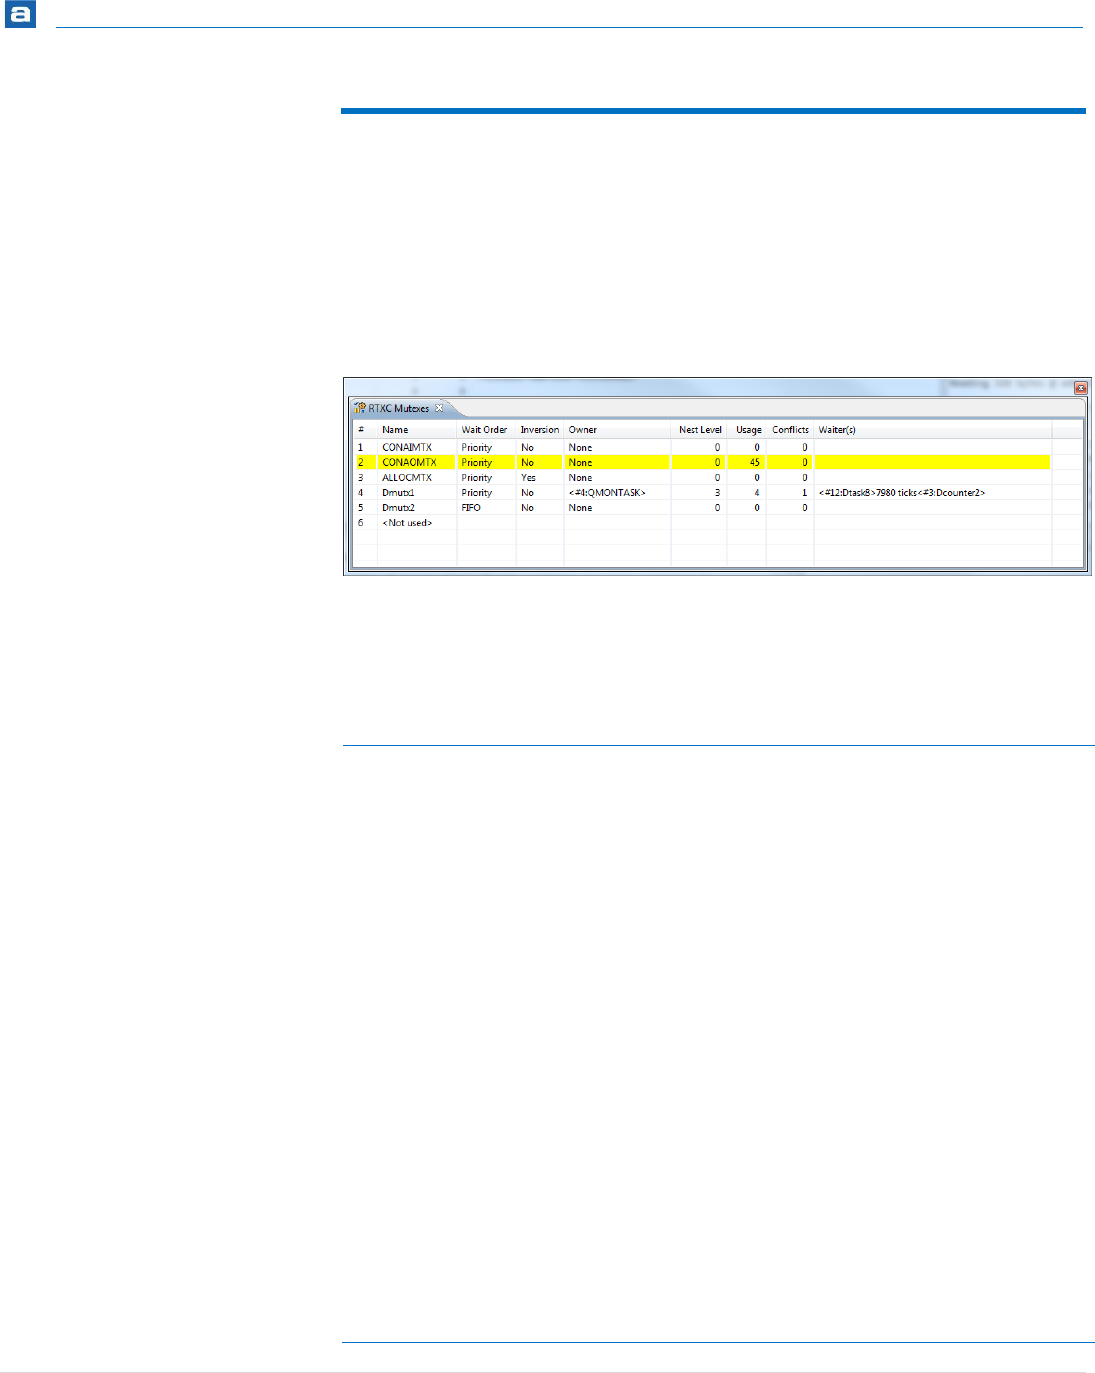
RTOS-Aware Debugging
353 | P a g e
MUTEXES
The RTXC Mutexes view displays detailed information regarding all available mutexes in
the target system. The view is updated automatically each time the target execution is
suspended.
There is one column for each type of mutex parameter, and one row for each mutex. If the
value of any parameter for a particular mutex has changed since the last time the
debugger was suspended, the corresponding row will be highlighted in yellow.
Figure 326 - RTXC Mutexes View
The available parameters are described in the table below:
Name
Description
#
The object id.
Name
The name assigned to the mutex.
Wait order
The mutex’s wait order that can be either Priority or FIFO.
Inversion
Shows whether or not priority inversion is enabled for the
mutex.
Owner
The task currently owning the mutex.
Nest level
The nest level.
Usage
The total number of releases performed on the mutex.
Mutex statistics must be enabled for displaying this
information.
Conflicts
The number of contentions that have occurred. Mutex
statistics must be enabled for displaying this information.
Waiter(s)
The task(s) that is waiting on the mutex, if any. Only the
first 5 tasks are shown.

RTOS-Aware Debugging
354 | P a g e
Table 29 – RTXC Mutex Parameters
PARTITIONS
The RTXC Partitions view displays detailed information regarding all available partitions in
the target system. The view is updated automatically each time the target execution is
suspended.
There is one column for each type of parameter, and one row for each partition. If the
value of any parameter for a particular partition has changed since the last time the
debugger was suspended, the corresponding row will be highlighted in yellow.
Figure 327 - RTXC Partitions View
The available parameters are described in the table below:
Name
Description
#
The object id.
Name
The name assigned to the partition.
Wait order
The partition’s wait order that can be either Priority or
FIFO.
Available
The current number of available blocks in the partition.
Total
The total number of blocks in the partition.
BSize
The size of each block in the partition.
Usage
The usage count for the partition. Partition statistics must
be enabled for displaying this information.
Worst
The low watermark for the available blocks in the
partition. Partition statistics must be enabled for
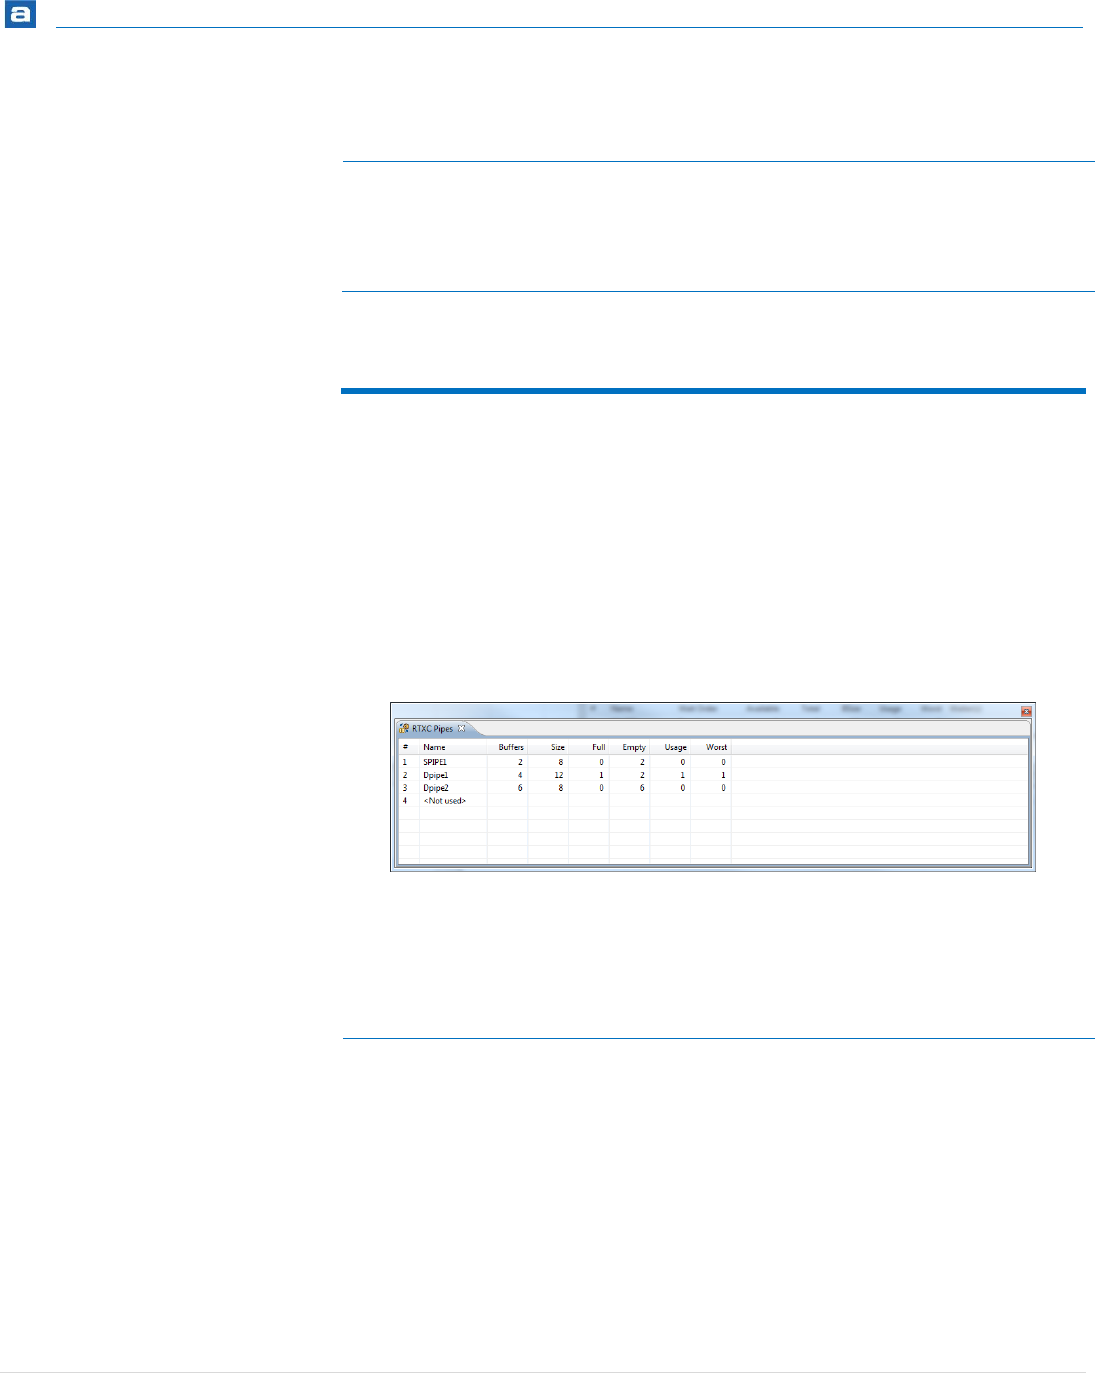
RTOS-Aware Debugging
355 | P a g e
Name
Description
displaying this information.
Waiter(s)
The task(s) currently waiting on the partition, if any. Only
the first 5 tasks are shown.
Table 30 – RTXC Partition Parameters
PIPES
The RTXC Pipes view displays detailed information regarding all available pipes in the
target system. The view is updated automatically each time the target execution is
suspended.
There is one column for each type of pipe parameter, and one row for each pipe. If the
value of any parameter for a particular pipe has changed since the last time the debugger
was suspended, the corresponding row will be highlighted in yellow.
Figure 328 - RTXC Pipes View
The available parameters are described in the table below:
Name
Description
#
The object id.
Name
The name assigned to the pipe.
Buffers
The maximum number of buffers.
Size
The size of each buffer.
Full
The current number of full buffers.
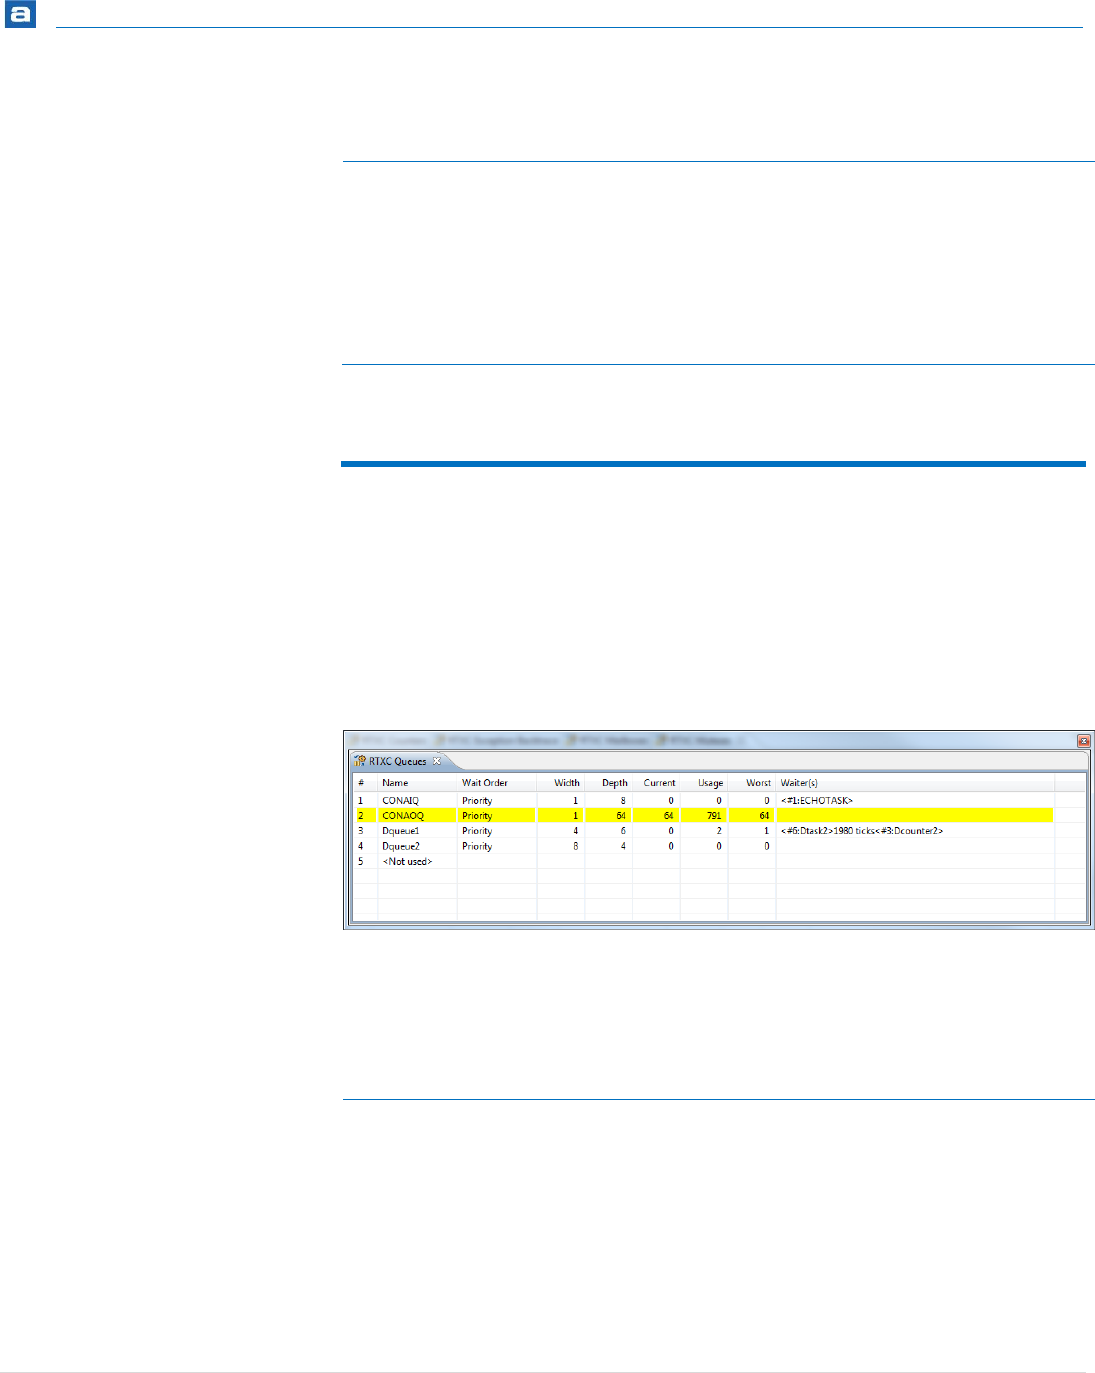
RTOS-Aware Debugging
356 | P a g e
Name
Description
Empty
The current number of empty buffers.
Usage
The usage count for the pipe. Pipe statistics must be
enabled for displaying this information.
Worst
The maximum full buffer count. Pipe statistics must be
enabled for displaying this information.
Table 31 – RTXC Pipe Parameters
QUEUES
The RTXC Queus view displays detailed information regarding all available queues in the
target system. The view is updated automatically each time the target execution is
suspended.
There is one column for each type of queue parameter, and one row for each queue. If the
value of any parameter for a particular queue has changed since the last time the
debugger was suspended, the corresponding row will be highlighted in yellow.
Figure 329 - RTXC Queues View
The available parameters are described in the table below:
Name
Description
#
The object id.
Name
The name assigned to the queue.
Wait Order
The queue’s wait order that can be either Priority or FIFO.
Width
The size of each entry in the queue.

RTOS-Aware Debugging
357 | P a g e
Name
Description
Depth
The maximum number of entries in the queue.
Current
The current number of entries in the queue.
Usage
The total number of accesses to the queue. Queue
statistics must be enabled for displaying this information.
Worst
The maximum numbers of entries that has been in the
queue. Queue statistics must be enabled for displaying
this information.
Waiter(s)
The task(s) currently waiting on the partition, if any. Only
the first 5 tasks are shown.
Table 32 – RTXC Queue Parameters
SEMAPHORES
The RTXC Semaphores view displays detailed information regarding all available
semaphores in the target system. The view is updated automatically each time the target
execution is suspended.
There is one column for each type of semaphore parameter, and one row for each
semaphore. If the value of any parameter for a particular semaphore has changed since
the last time the debugger was suspended, the corresponding row will be highlighted in
yellow.
Figure 330 - RTXC Semaphores View

RTOS-Aware Debugging
358 | P a g e
The available parameters are described in the table below:
Name
Description
#
The object id.
Name
The name assigned to the semaphore.
Wait Order
The semaphore’s wait order that can be either Priority or
FIFO.
Signal Type
The semaphore’s signal type. Can be either Single or
Multiple.
Count
The semaphore’s current count.
Usage
The semaphore’s usage count. Semaphore statistics must
be enabled for displaying this information.
Waiter(s)
The task(s) currently waiting on the semaphore, if any.
Only the first 5 tasks are shown.
Table 33 – RTXC Semaphore Parameters
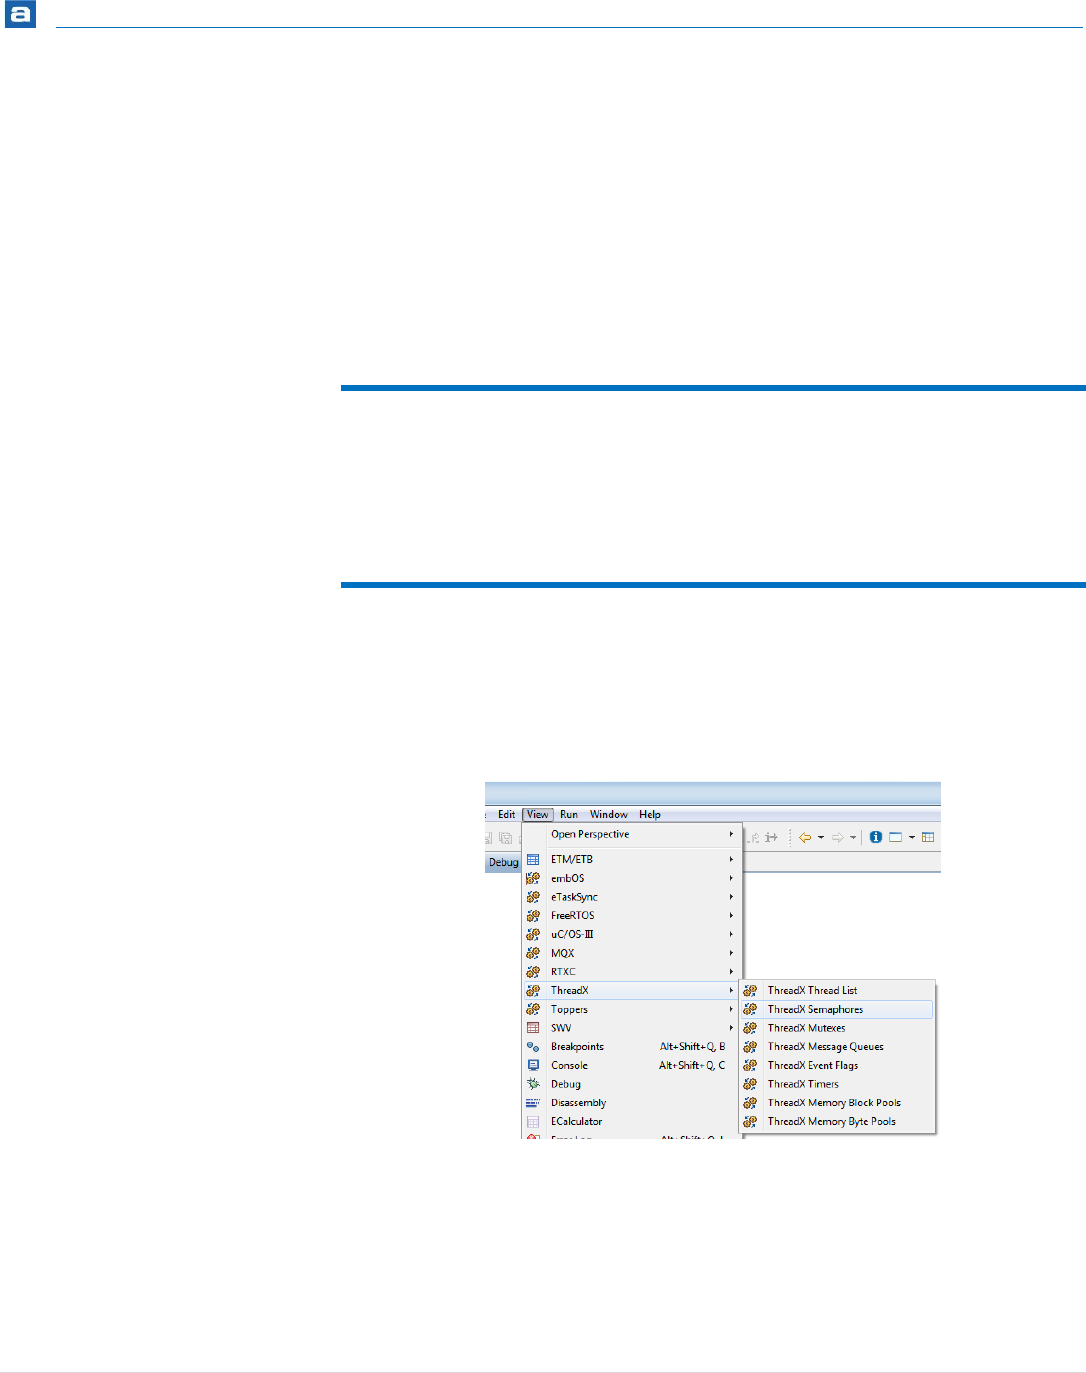
RTOS-Aware Debugging
359 | P a g e
EXPRESS LOGIC THREADX
The kernel awareness features for Express Logic ThreadX® real-time operating system in
Atollic TrueSTUDIO provide the developer with a detailed insight into the internal data
structures of the ThreadX kernel. During a debug session, the current state of the ThreadX
kernel and the various ThreadX kernel objects such as tasks, mailboxes, semaphores and
software timers, can be easily inspected in a set of dedicated views, in the Atollic
TrueSTUDIO Debug perspective.
REQUIREMENTS
The kernel awareness features described in this document is based on ThreadX Cortex-
M4/GNU Version G5.5.5.0.
FINDING THE VIEWS
A number of debugger views are available in the Atollic TrueSTUDIO Debug perspective
when debugging an application containing the ThreadX real-time operating system.
These views are available from the Show View toolbar dropdown list button.
Figure 331 – ThreadX View Top Level Menu

RTOS-Aware Debugging
360 | P a g e
Figure 332 - ThreadX Show View Toolbar Button
THREAD LIST
The ThreadX Thread List view displays detailed information regarding all available threads
in the target system. The thread list is updated automatically each time the target
execution is suspended
There is one column for each type of thread parameter, and one row for each thread. If
the value of any parameter for a particular thread has changed since the last time the
debugger was suspended, the corresponding row will be highlighted in yellow.
Figure 333 - ThreadX Thread List View
Please note that due to performance reasons, stack analysis (the Stack Usage column) is
disabled by default. To enable stack analysis, use the Stack analysis toggle toolbar button
in the View toolbar:
The available parameters are described in the table below:

RTOS-Aware Debugging
361 | P a g e
Name
Description
N/A
Indicates the currently running thread. The currently
running thread is indicated by a green arrow symbol.
Name
The thread name.
Priority
The thread priority.
State
The state of the current thread. The name of the object
that currently suspends a thread is presented in
parenthesis. For sleeping threads, the remaining sleep
time (ticks) is presented.
Run Count
The threads run counter.
Stack Start
The start address of the stack area.
Stack End
The end address of the stack area.
Stack Size
The size of the stack area (bytes).
Stack Ptr
The address of the thread stack pointer.
Stack Usage
The maximum stack usage (bytes).
Table 34 – ThreadX Thread Parameters
SEMAPHORES
The ThreadX Semaphores view displays detailed information regarding all available
resource semaphores in the target system. The view is updated automatically each time
the target execution is suspended.
There is one column for each type of semaphore parameter, and one row for each
semaphore. If the value of any parameter for a particular semaphore has changed since
the last time the debugger was suspended, the corresponding row will be highlighted in
yellow.
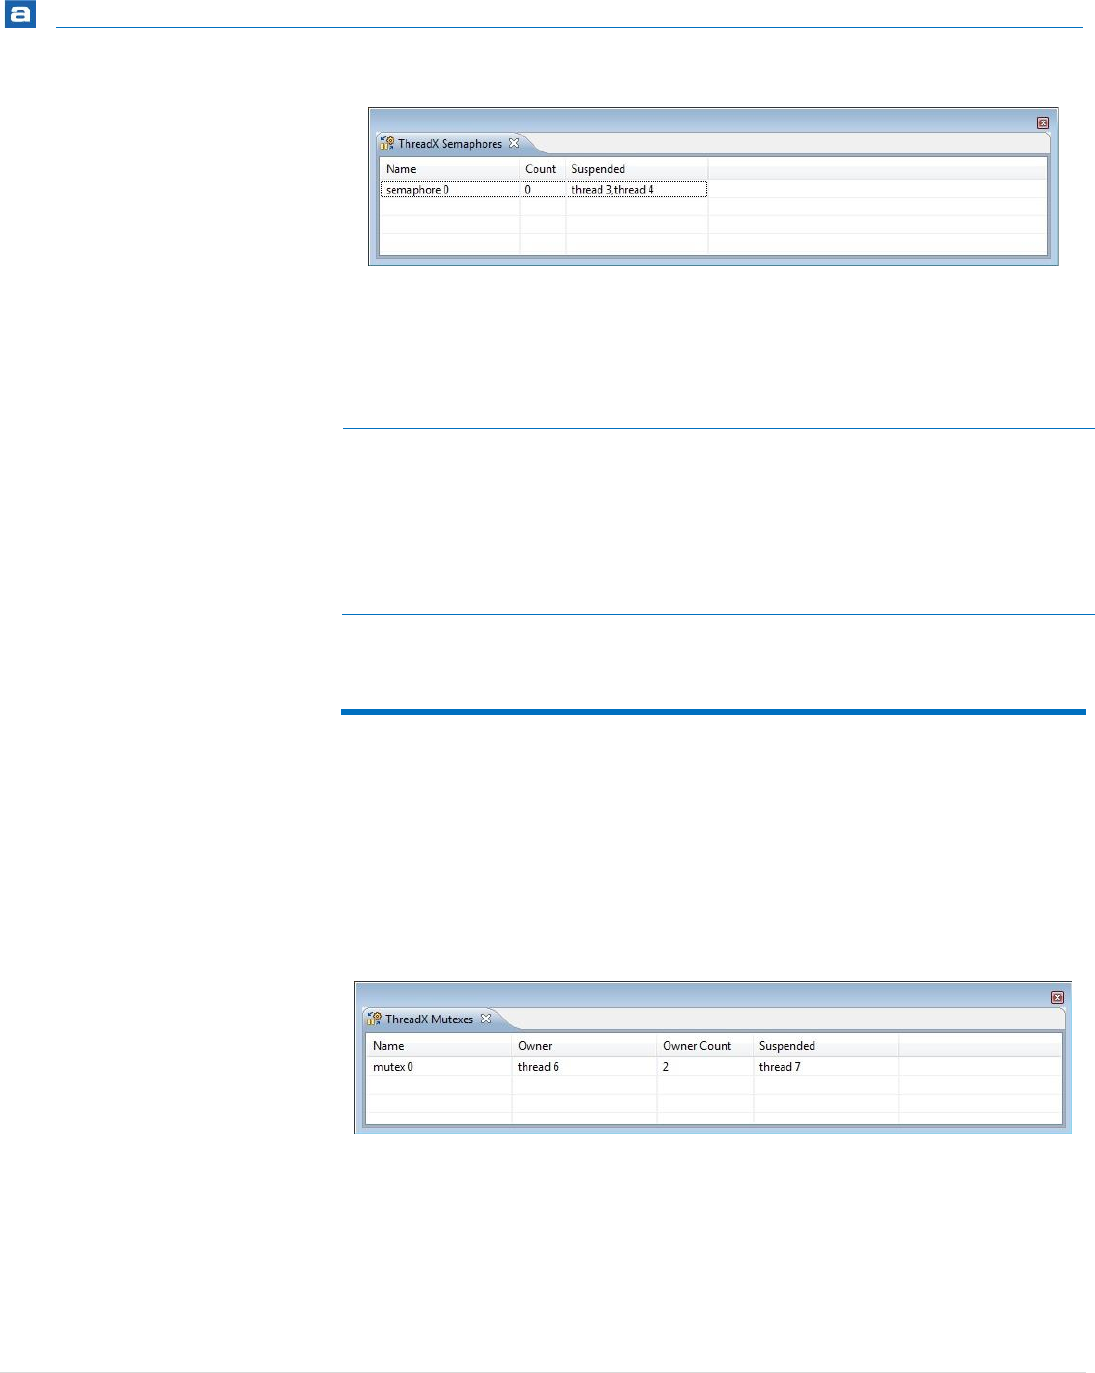
RTOS-Aware Debugging
362 | P a g e
Figure 334 - ThreadX Semaphores View
The available parameters are described in the table below:
Column
Description
Name
The name of the semaphore.
Count
The current semaphore count.
Suspended
The threads currently suspended because of the
semaphore state.
Table 35 – ThreadX Semaphore Parameters
MUTEXES
The ThreadX Mutexes view displays detailed information regarding all available mutexes
in the target system. The view is updated automatically each time the target execution is
suspended.
There is one column for each type of mutex parameter, and one row for each mutex. If the
value of any parameter for a particular mutex has changed since the last time the
debugger was suspended, the corresponding row will be highlighted in yellow.
Figure 335 - ThreadX Mutexes View
The available parameters are described in the table below:
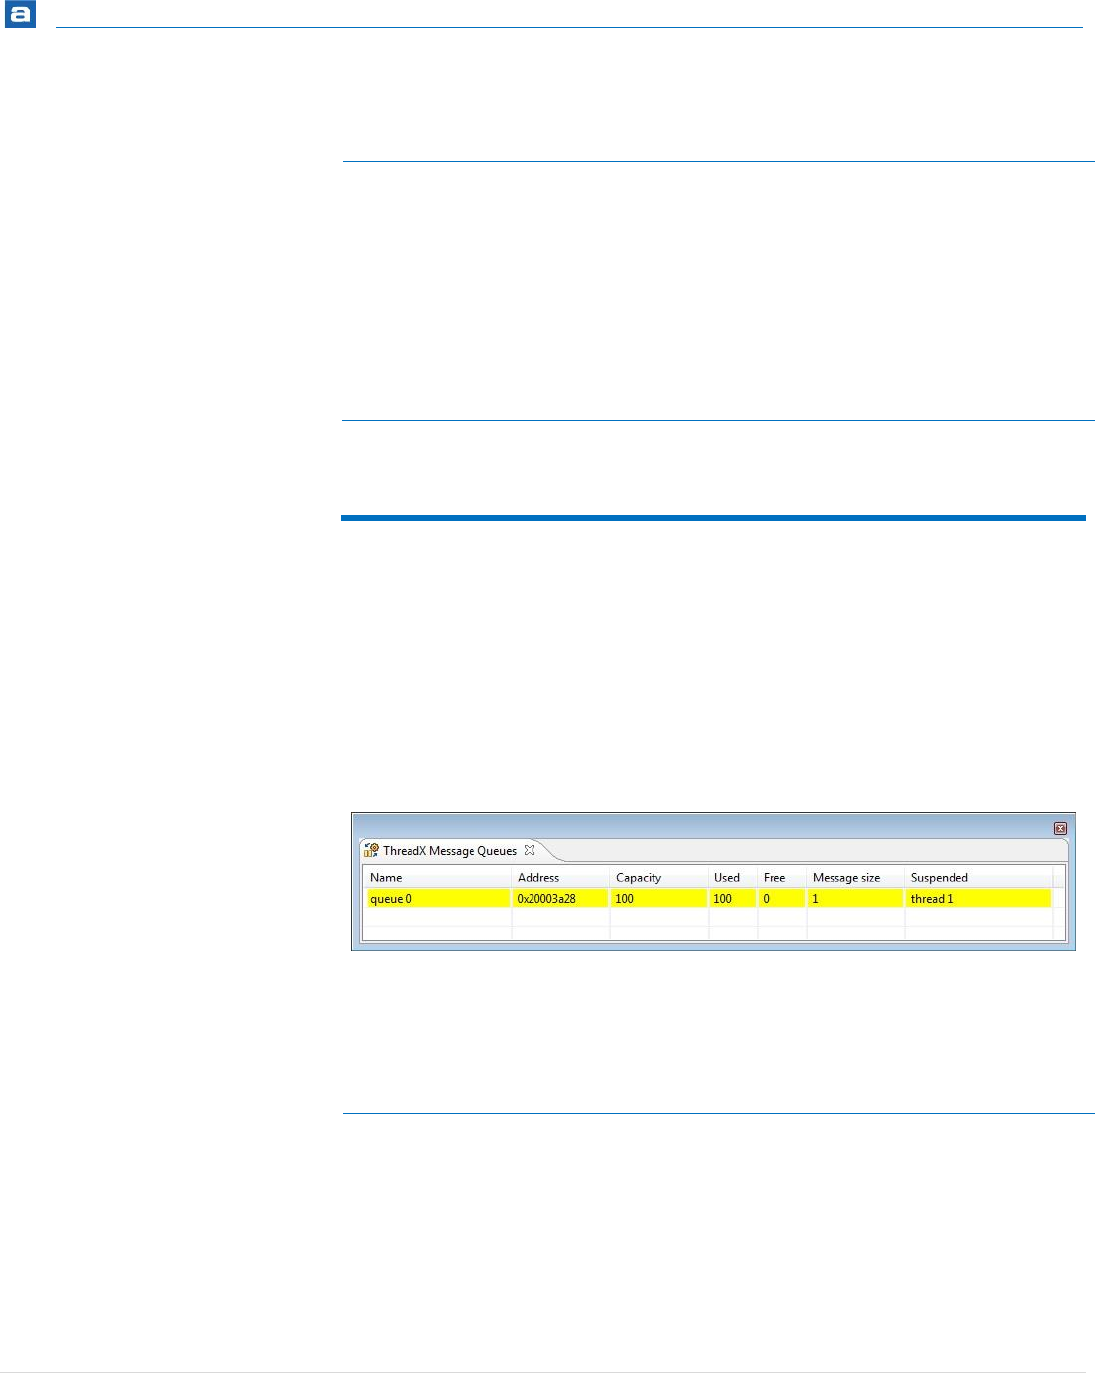
RTOS-Aware Debugging
363 | P a g e
Column
Description
Name
The name of the mutex.
Owner
The thread that currently owns the mutex.
Owner Count
The mutex owner count (number of get operations
performed by the owner thread).
Suspended
The threads currently suspended because of the mutex
state.
Table 36 – ThreadX Mutex Parameters
MESSAGE QUEUES
The ThreadX Message Queues view displays detailed information regarding all available
message queues in the target system. The view is updated automatically each time the
target execution is suspended.
There is one column for each type of message queue parameter, and one row for each
message queue. If the value of any parameter for a particular message queue has changed
since the last time the debugger was suspended, the corresponding row will be highlighted
in yellow.
Figure 336 - ThreadX Message Queues View
The available parameters are described in the table below:
Column
Description
Name
The name of the message queue.
Address
The address of the message queue.
Capacity
The maximum number of entries allowed in the queue.
Used
The current number of used entries in the queue.
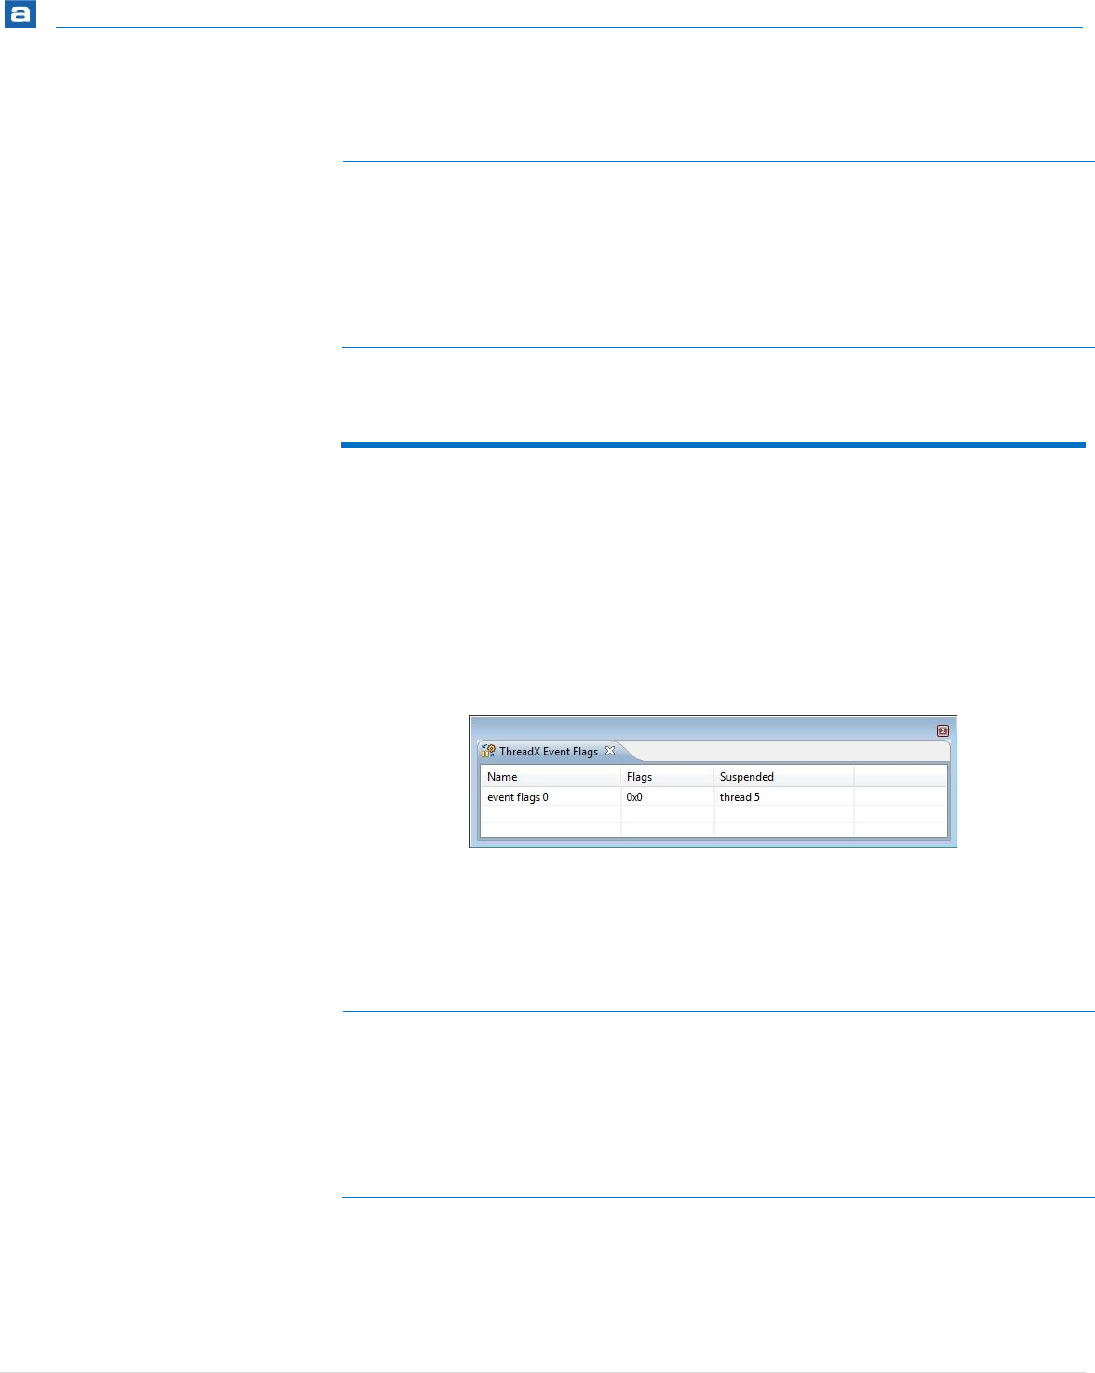
RTOS-Aware Debugging
364 | P a g e
Column
Description
Free
The current number of free entries in the queue.
Message size
The size (in 32-bit words) of each message entry.
Suspended
The threads currently suspended because of the message
queue state.
Table 37 – ThreadX Message Queue Parameters
EVENT FLAGS
The ThreadX Event Flags view displays detailed information regarding all available event
flag groups in the target system. The view is updated automatically each time the target
execution is suspended.
There is one column for each type of parameter, and one row for each event flag group. If
the value of any parameter for a particular event flag group has changed since the last
time the debugger was suspended, the corresponding row will be highlighted in yellow.
Figure 337 - ThreadX Event Flags View
The available parameters are described in the table below:
Column
Description
Name
The name of the event flag group.
Flags
The current value of the event flag group.
Suspended
The threads currently suspended because of the state of
the event flag group.
Table 38 – ThreadX Event Flag Parameters
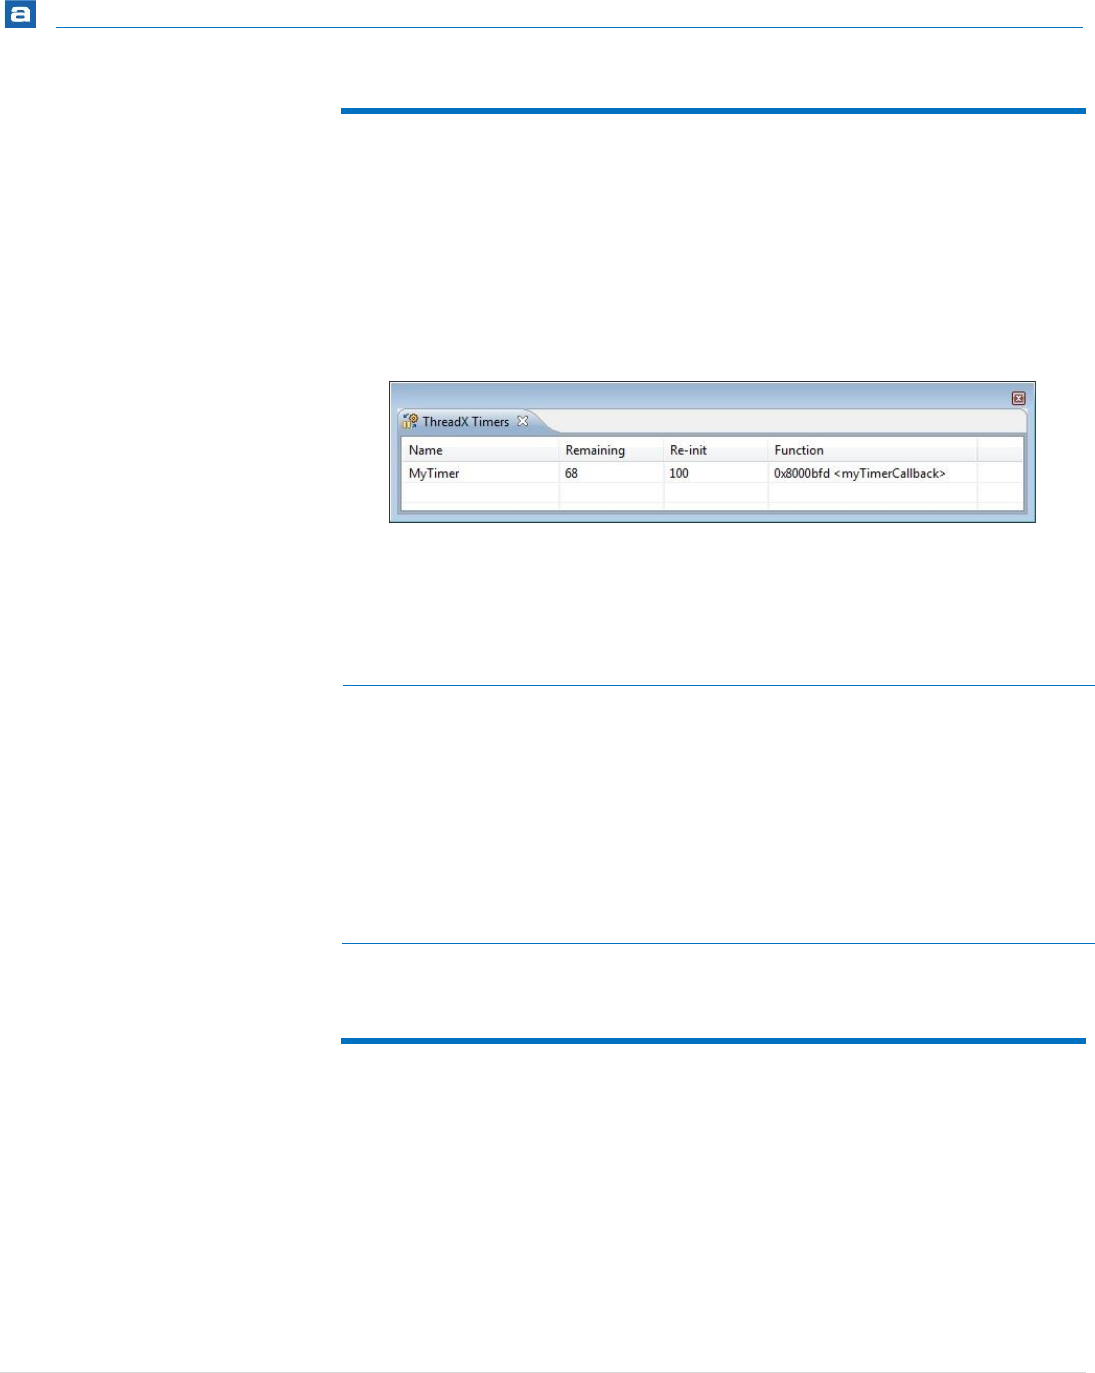
RTOS-Aware Debugging
365 | P a g e
TIMERS
The ThreadX Timers view displays detailed information regarding all available software
timers in the target system. The timers view is updated automatically each time the target
execution is suspended.
There is one column for each type of timer parameter, and one row for each timer. If the
value of any parameter for a particular timer has changed since the last time the debugger
was suspended, the corresponding row will be highlighted in yellow.
Figure 338 - ThreadX Timers View
The available parameters are described in the table below:
Name
Description
Name
The name of the software timer.
Remaining
The remaining number of ticks before the timer expires.
Re-init
The timer re-initialization value (ticks) after expiration.
Contains value 0 for One-Shot timers.
Functions
The address and name of the function that will be called
when the timer expires.
Table 39 – ThreadX Timer Parameters
MEMORY BLOCK POOLS
The ThreadX Memory Block Pools view displays detailed information regarding all
available memory block pools in the target system. The view is updated automatically each
time the target execution is suspended.
There is one column for each type of parameter, and one row for each memory block pool.
If the value of any parameter for a particular memory block pool has changed since the
last time the debugger was suspended, the corresponding row will be highlighted in
yellow.

RTOS-Aware Debugging
366 | P a g e
Figure 339 - ThreadX Memory Block Pools View
The available parameters are described in the table below:
Column
Description
Name
The name of the block pool.
Address
The block pool starting address.
Used
The current number of allocated blocks.
Free
The current number of free blocks.
Size
The total number of blocks available.
Block size
The size (bytes) of each block.
Pool size
The total pool size (bytes).
Suspended
The threads currently suspended because of the state of
the memory block pool.
Table 40 – ThreadX Memory Block Pool Parameters
MEMORY BYTE POOLS
The ThreadX Memory Byte Pools view displays detailed information regarding all available
memory byte pools in the target system. The view is updated automatically each time the
target execution is suspended.
There is one column for each type of parameter, and one row for each memory byte pool.
If the value of any parameter for a particular memory byte pool has changed since the last
time the debugger was suspended, the corresponding row will be highlighted in yellow.
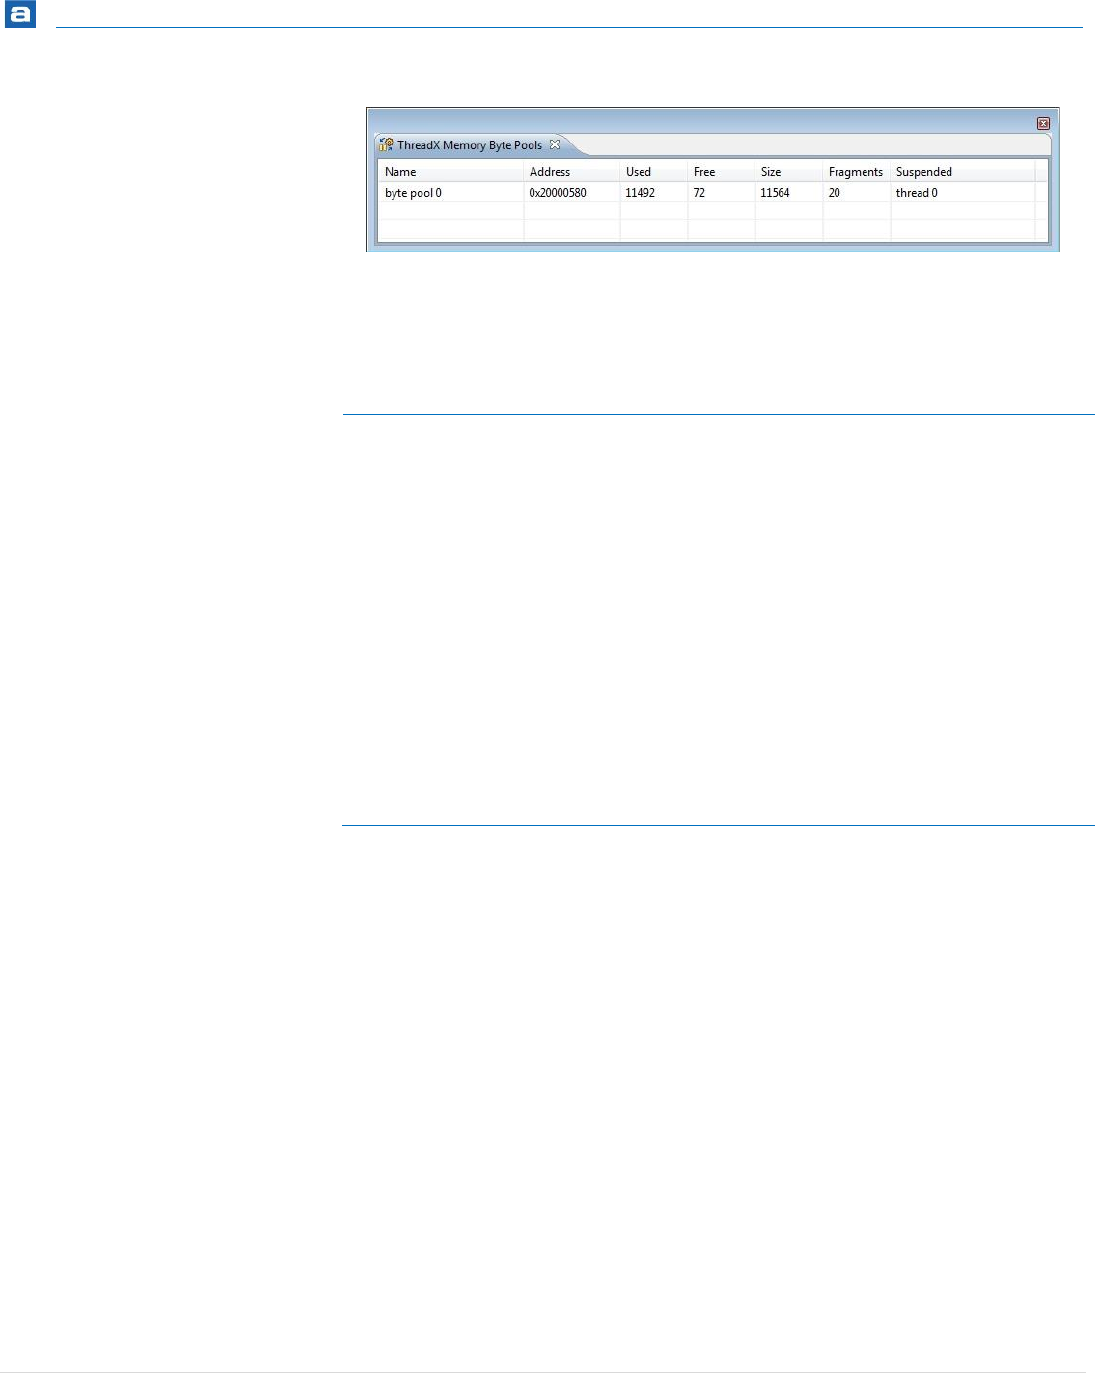
RTOS-Aware Debugging
367 | P a g e
Figure 340 - ThreadX Memory Byte Pools View
The available parameters are described in the table below:
Column
Description
Name
The name of the byte pool.
Address
The byte pool starting address.
Used
The current number of allocated bytes.
Free
The current number of free bytes.
Size
The total number of bytes available.
Fragments
The number of fragments.
Suspended
The threads currently suspended because of the state of
the memory byte pool.
Table 41 – ThreadX Memory Byte Pool Parameters

RTOS-Aware Debugging
368 | P a g e
TOPPERS/ASP
The kernel awareness features for TOPPERS RTOS in Atollic TrueSTUDIO provide the
developer with a detailed insight into the internal data structures of the TOPPERS kernel.
During a debug session, the current state of the TOPPERS kernel and the various TOPPERS
kernel objects such as tasks, semaphores, mailboxes, etc, can be easily inspected in a set of
dedicated views, in the Atollic TrueSTUDIO Debug perspective.
Each view for the TOPPERS RTOS contains two tabs - one tab for the hardcoded Static
Information and one tab for the Current dynamic status.
REQUIREMENTS
The kernel awareness features described in this document is based on TOPPERS/ASP
Release 1.7.0.
FINDING THE VIEWS
The views are available in the Atollic TrueSTUDIO Debug perspective when debugging an
application containing the TOPPERS real-time operating system.
They are available from the Show View toolbar dropdown list button.
Figure 341 – TOPPERS Show View Toolbar Button
All displayed functions can be double-clicked and opened in the editor if the source file can
be found in a source folder located within the Toppers project.

RTOS-Aware Debugging
369 | P a g e
TASKS
The TOPPERS Tasks view displays detailed information regarding all available tasks in the
target system. The task list is updated automatically each time the target execution is
suspended.
There is one column for each type of task parameter, and one row for each task. If the
value of any parameter for a particular task has changed since the last time the debugger
was suspended, the corresponding row will be highlighted in yellow.
By double-clicking on a task entry, the source code for the entry will be opened in the
editor if it can be found in a source folder located within the project.
By double-clicking on a Tex routine, the source code for it will be opened in the editor if it
can be found in a source folder located within the project.
STATIC INFORMATION TAB
Figure 342 – TOPPERS Tasks Static Information Tab
The available system variables are described in the table below:
Name
Description
ID
The Task base ID
Auto start
If the Task is to auto start or not. Displays yes or No.
Initial Prio
The Initial Prio for the task.
Entry
Task Entry function name or address.
Tex routine
Task exception function name or address.
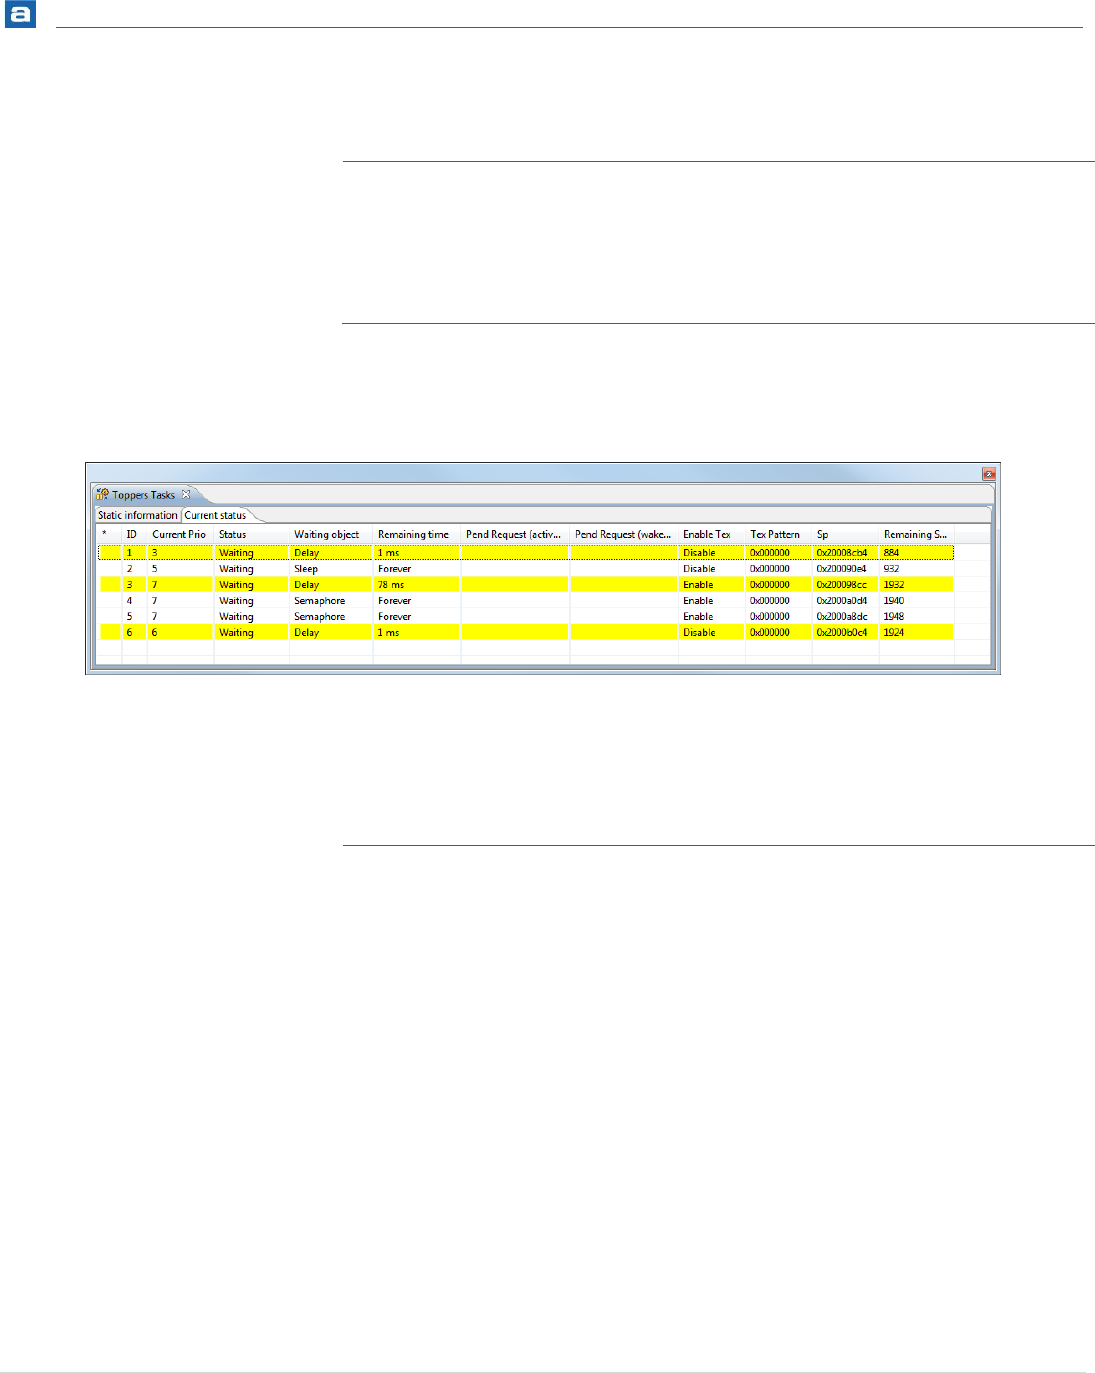
RTOS-Aware Debugging
370 | P a g e
Name
Description
Entry Arg
Display exinf value as Hex form.
Stack Area
Task Stack bottom address in Hex form.
Stack Size
The tasks stack size in decimal form.
Table 42 – TOPPERS Tasks Static Information
CURRENT STATUS TAB
Figure 343 – TOPPERS Tasks Current Status Tab
The available system variables are described in the table below:
Name
Description
ID
The Task base ID
Current Prio
The current Prio for the Task.
Status
Displays Running, Dormant, Ready, Waiting, Suspended,
Waiting-Suspended or Unknown
Waiting object
When Status is Waiting, this column displays Delay, Sleep,
Recv DTQ, Recv PDTQ, Semaphore, EventFlag, Send DTQ,
Send PDTQ, Mailbox or Mempool
Remaining time
When Status is Waiting, this column displays the
remaining time waiting or Forever.
Pending Request (active)
Pend or blank.
Pending Request (wake-up)
Pend or blank.

RTOS-Aware Debugging
371 | P a g e
Name
Description
Enable Tex
Enable, Disable or blank.
Tex Pattern
Displays texptn as Hex form or blank.
Sp
The Stack Pointer in hex.
Remaining Stack
The calculated remaining stack as an integer.
Table 43 – TOPPERS Tasks Current Status
DATAQUEUES
The TOPPERS Dataqueues view displays detailed information regarding all available data
queues in the target system. The list is updated automatically each time the target
execution is suspended.
There is one column for each type of data queue parameter, and one row for each data
queue. If the value of any parameter for a particular data queue has changed since the last
time the debugger was suspended, the corresponding row will be highlighted in yellow.
STATIC INFORMATION TAB
Figure 344 – TOPPERS Dataqueues Static Information Tab
The available system variables are described in the table below:
Name
Description
ID
The Data Queue base ID.
Send Task Queueing Order
Displays Priority or FIFO.
Capacity
The data queue quantity as a decimal value.
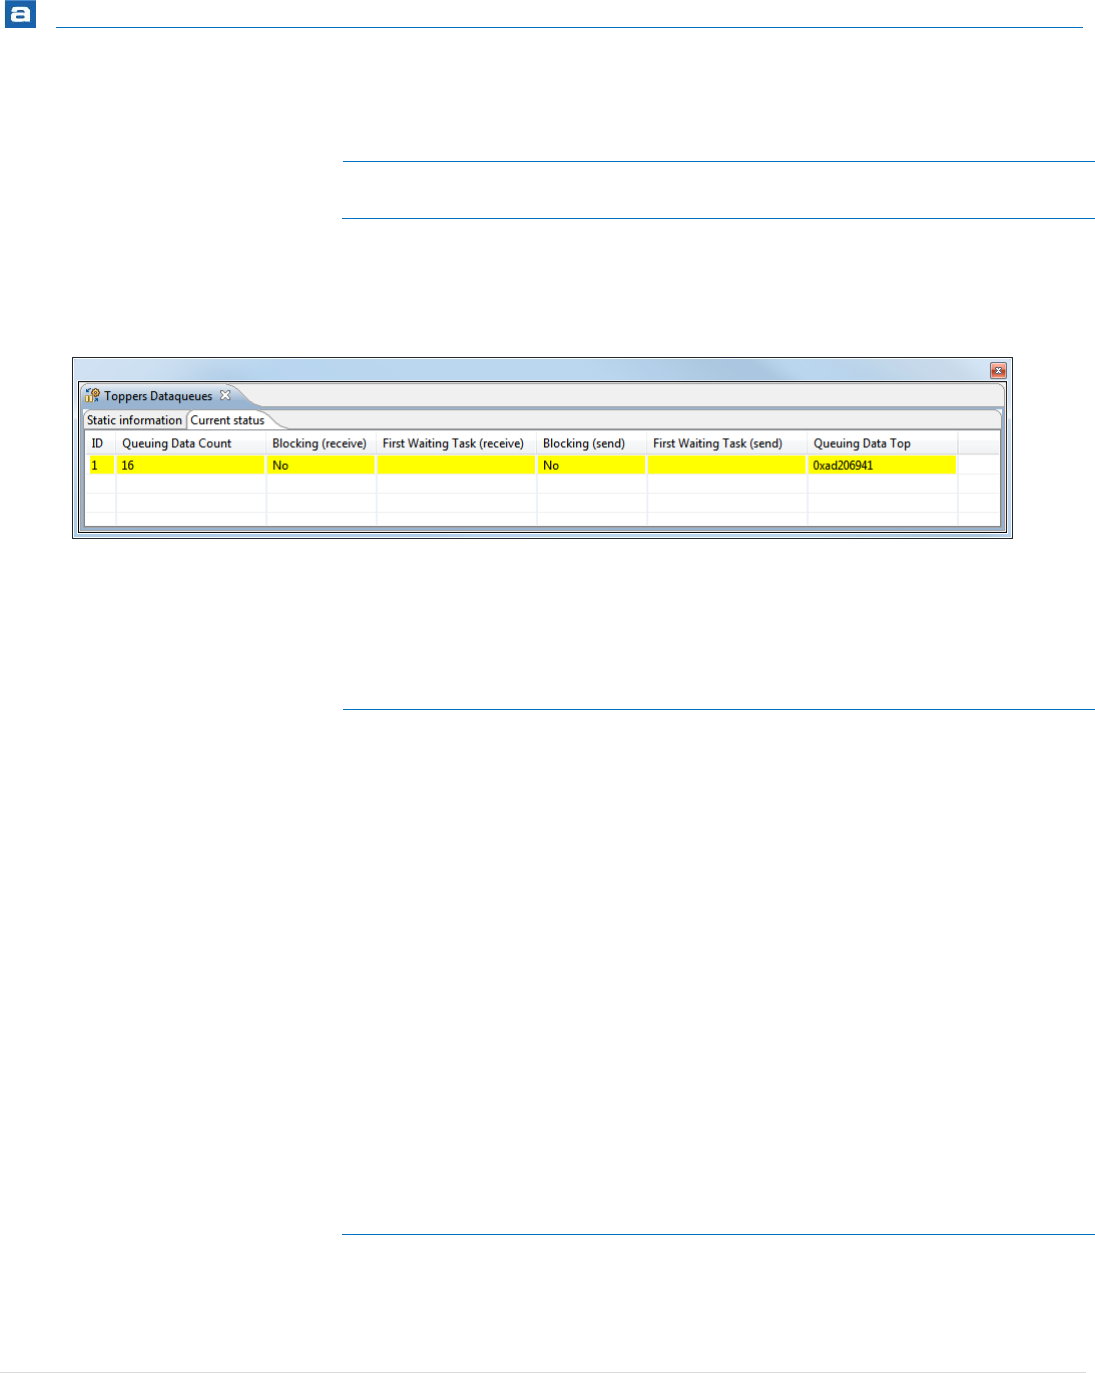
RTOS-Aware Debugging
372 | P a g e
Name
Description
Dataqueue Area
The address in Hex form.
Table 44 – TOPPERS Dataqueue Static Information
CURRENT STATUS TAB
Figure 345 – TOPPERS Dataqueues Current Status Tab
The available system variables are described in the table below:
Name
Description
ID
The Data Queue base ID
Queuing Data Count
Displays count value in decimal form.
Blocking (receive)
If there is a waiting task of this object displays Yes,
otherwise displays No.
First Waiting Task (receive)
When there is a waiting task of this object, displays 1st
waiting task ID. When there is no waiting task of this
object, displays blank space.
Blocking (send)
If there is a waiting task of this object displays Yes,
otherwise displays No.
First Waiting Task (send)
When there is a waiting task of this object, displays 1st
waiting task ID. When there is no waiting task of this
object, displays blank space.
Queuing Data Top
When there is queuing data, display 1st queuing data
address as Hex.
Table 45 – TOPPERS Dataqueues Current Status
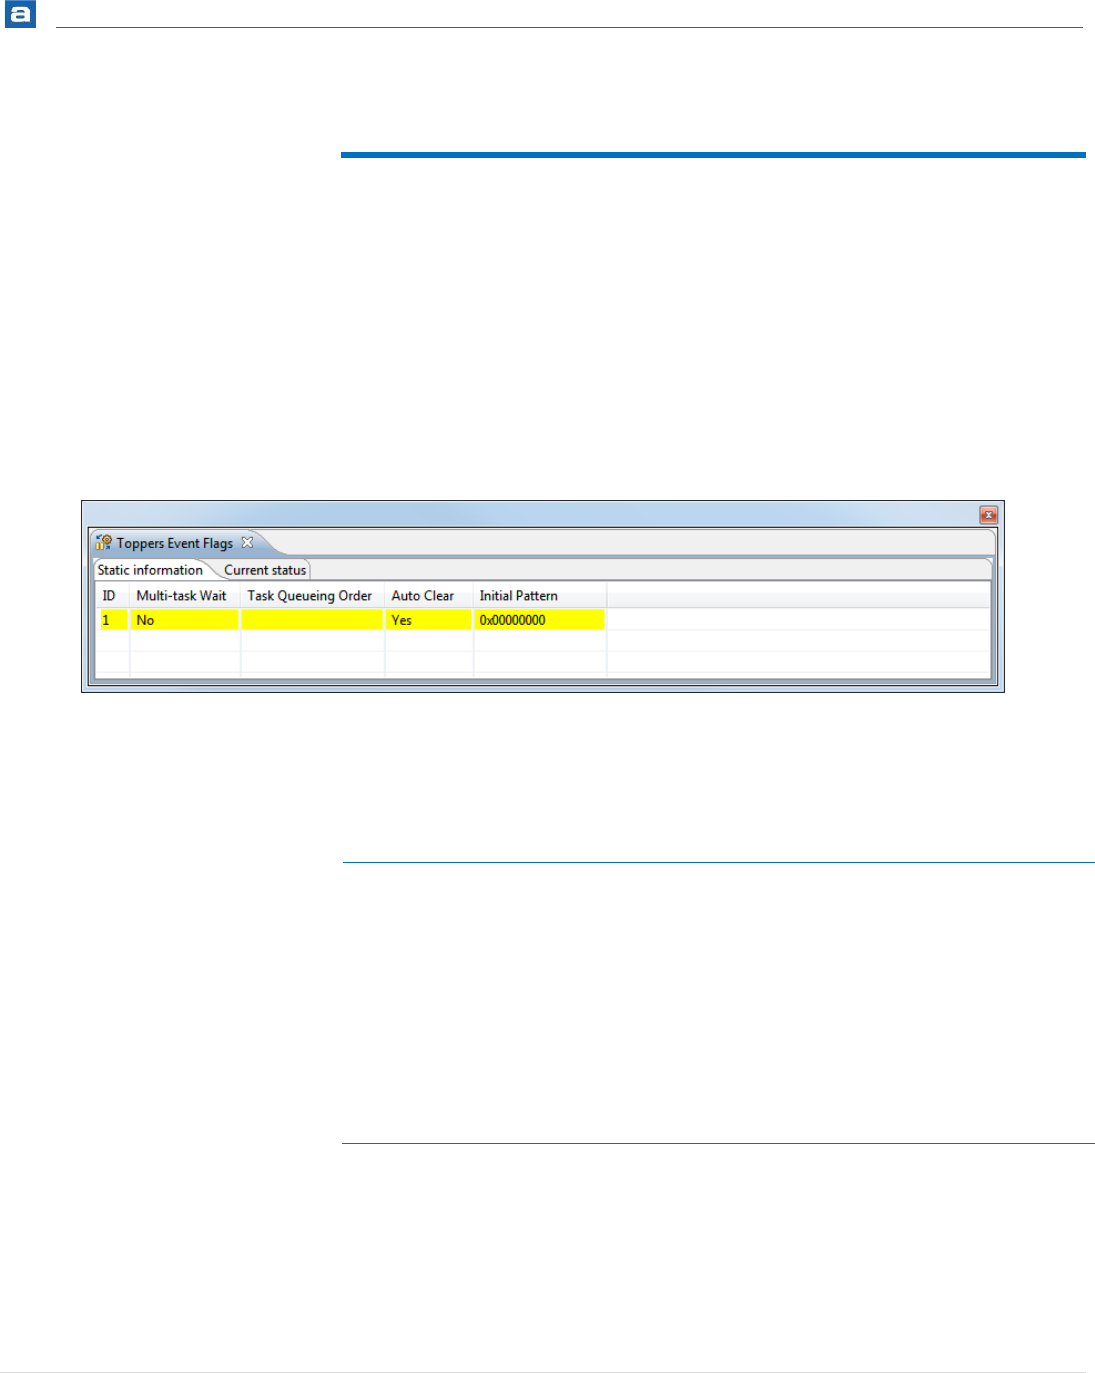
RTOS-Aware Debugging
373 | P a g e
EVENT FLAGS
The TOPPERS Event Flags view displays detailed information regarding all available event
flags in the target system. The list is updated automatically each time the target execution
is suspended.
There is one column for each type of event flag parameter, and one row for each event
flag. If the value of any parameter for a particular event flag has changed since the last
time the debugger was suspended, the corresponding row will be highlighted in yellow.
STATIC INFORMATION TAB
Figure 346 – TOPPERS Event Flags Static Information Tab
The available system variables are described in the table below:
Name
Description
ID
The Event Flag ID.
Multi-task Wait
If true displays Yes, otherwise displays No.
Task Queueing Order
Displays Priority or FIFO.
Auto Clear
If true displays Yes, otherwise displays No.
Initial Pattern
Display the iflgptn value as Hex form.
Table 46 – TOPPERS Event Flags Static Information
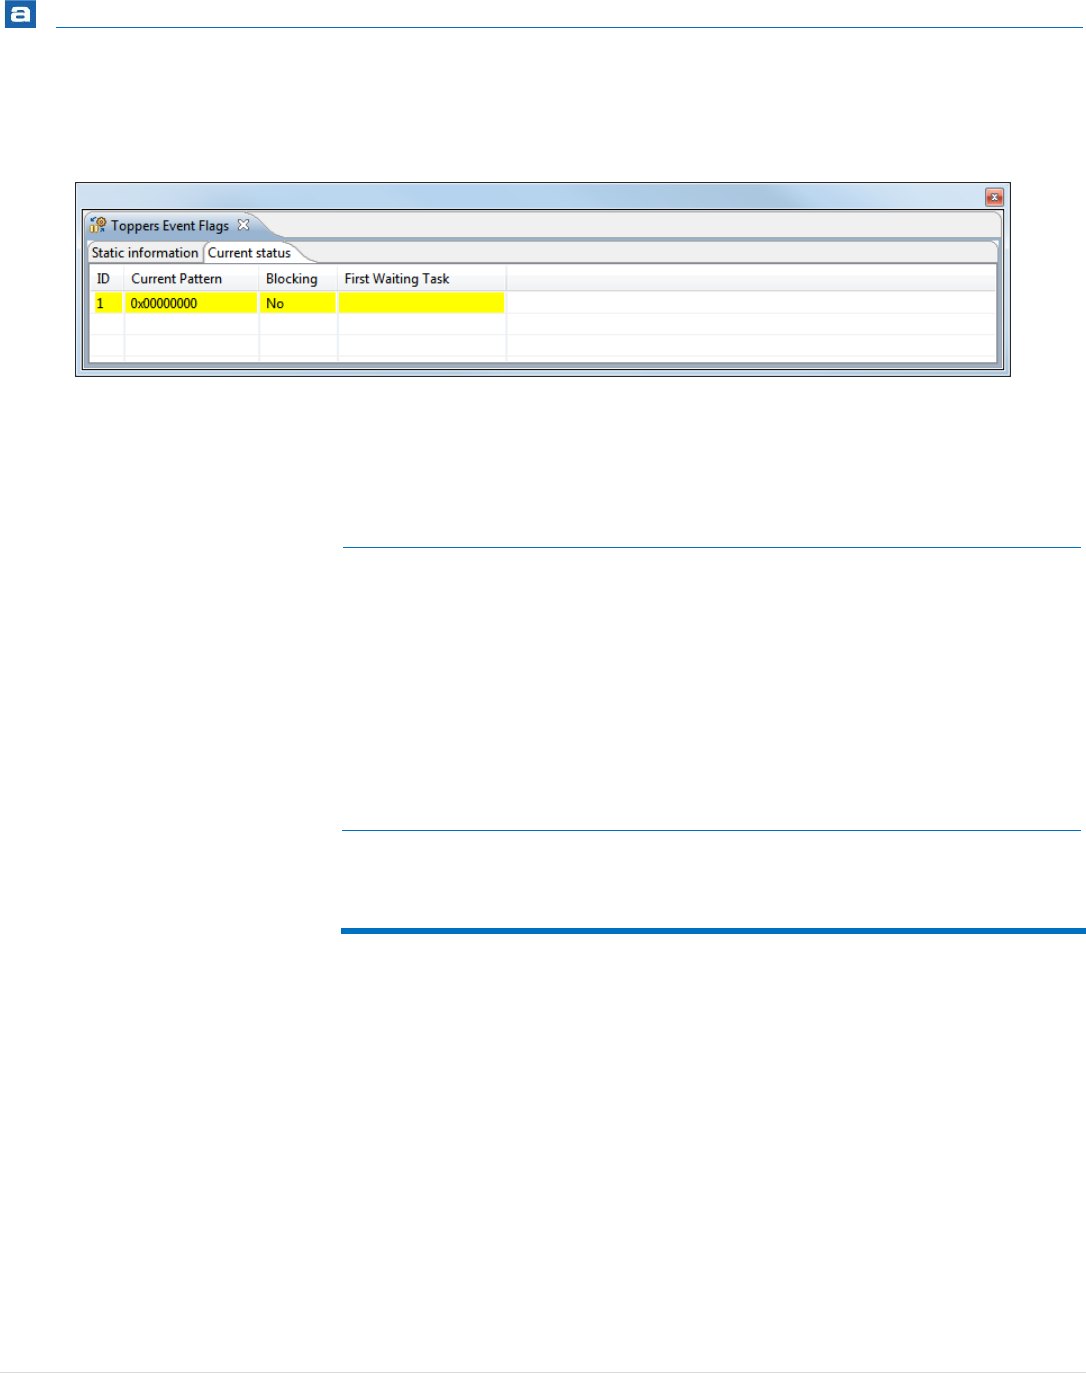
RTOS-Aware Debugging
374 | P a g e
CURRENT STATUS TAB
Figure 347 – TOPPERS Event Flags Current Status Tab
The available system variables are described in the table below:
Name
Description
ID
The Event Flag ID
Current Pattern
Display flgptn value as Hex form.
Blocking
If there is a waiting task of this object displays Yes,
otherwise displays No.
First Waiting Task
When there is a waiting task of this object, displays 1st
waiting task ID. When there is no waiting task of this
object, displays blank space.
Table 47 – TOPPERS Event Flags Current Status
MAILBOXES
The TOPPERS Mailboxes view displays detailed information regarding all available
mailboxes in the target system. The list is updated automatically each time the target
execution is suspended.
There is one column for each type of mailbox parameter, and one row for each mailbox. If
the value of any parameter for a particular mailbox has changed since the last time the
debugger was suspended, the corresponding row will be highlighted in yellow.
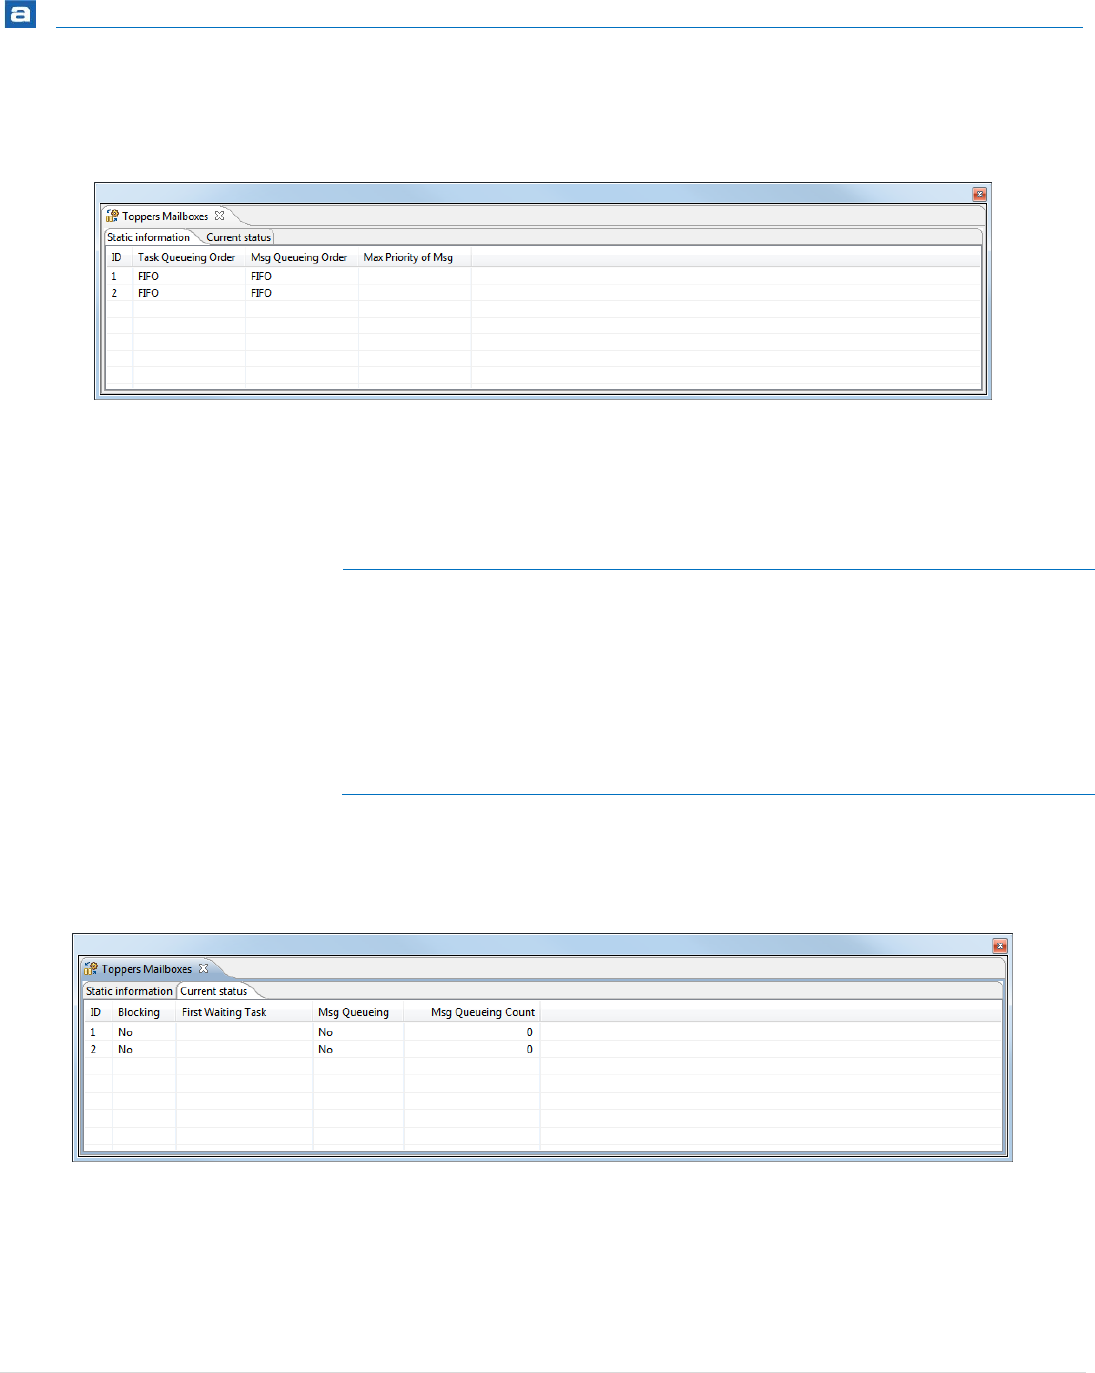
RTOS-Aware Debugging
375 | P a g e
STATIC INFORMATION TAB
Figure 348 – TOPPERS Mailboxes Static Information Tab
The available system variables are described in the table below:
Name
Description
ID
The Mailbox ID.
Task Queueing Order
Displays Priority or FIFO.
Message Queueing Order
Displays Priority or FIFO.
Max Priority of Message
The maximum prio value in decimal form.
Table 48 – TOPPERS Mailboxes Static Information
CURRENT STATUS TAB
Figure 349 – TOPPERS Mailboxes Current Status Tab
The available system variables are described in the table below:
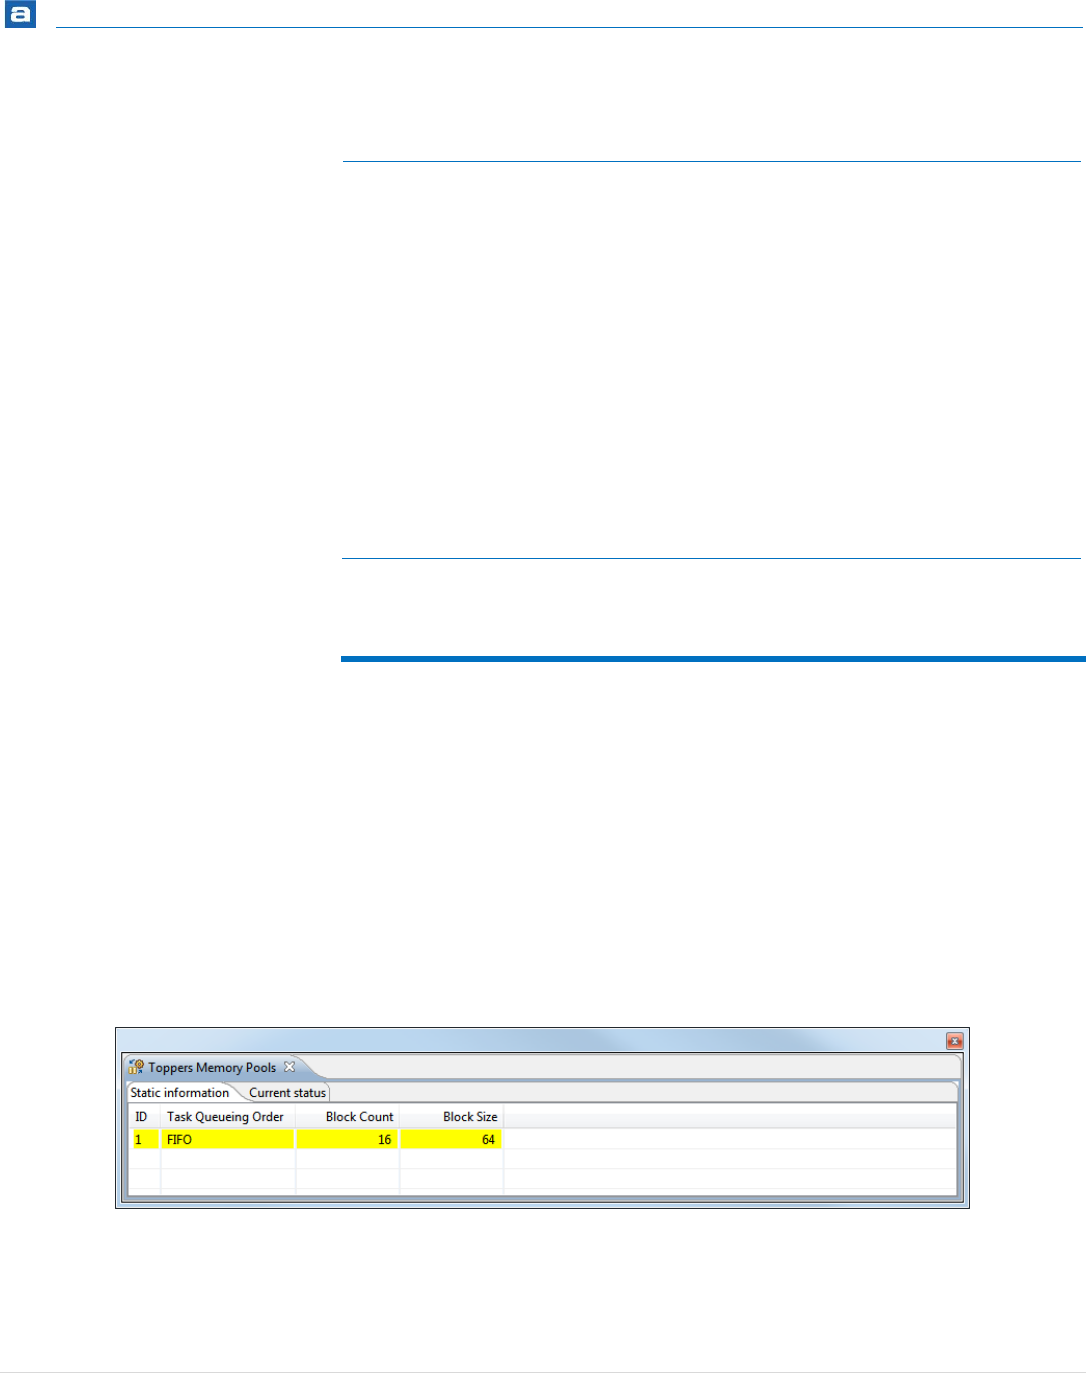
RTOS-Aware Debugging
376 | P a g e
Name
Description
ID
The Mailbox ID
Blocking
If there is a waiting task of this object displays Yes,
otherwise displays No.
First Waiting Task
When there is a waiting task of this object, displays 1st
waiting task ID. When there is no waiting task of this
object, displays blank space.
Msg Queueing
Displays No if there are no messages in this Mailbox,
otherwise displays Yes.
Msg Queueing Count
When there is no message in this Mailbox display 0.
Count posted message when there are messages in this
Mailbox.
Table 49 – TOPPERS Mailboxes Current Status
MEMORY POOLS
The TOPPERS Memory Pools view displays detailed information regarding all available
memory pools in the target system. The list is updated automatically each time the target
execution is suspended.
There is one column for each type of memory pool parameter, and one row for each
memory pool. If the value of any parameter for a particular memory pool has changed
since the last time the debugger was suspended, the corresponding row will be highlighted
in yellow.
STATIC INFORMATION TAB
Figure 350 – TOPPERS Memory Pools Static Information Tab
The available system variables are described in the table below:
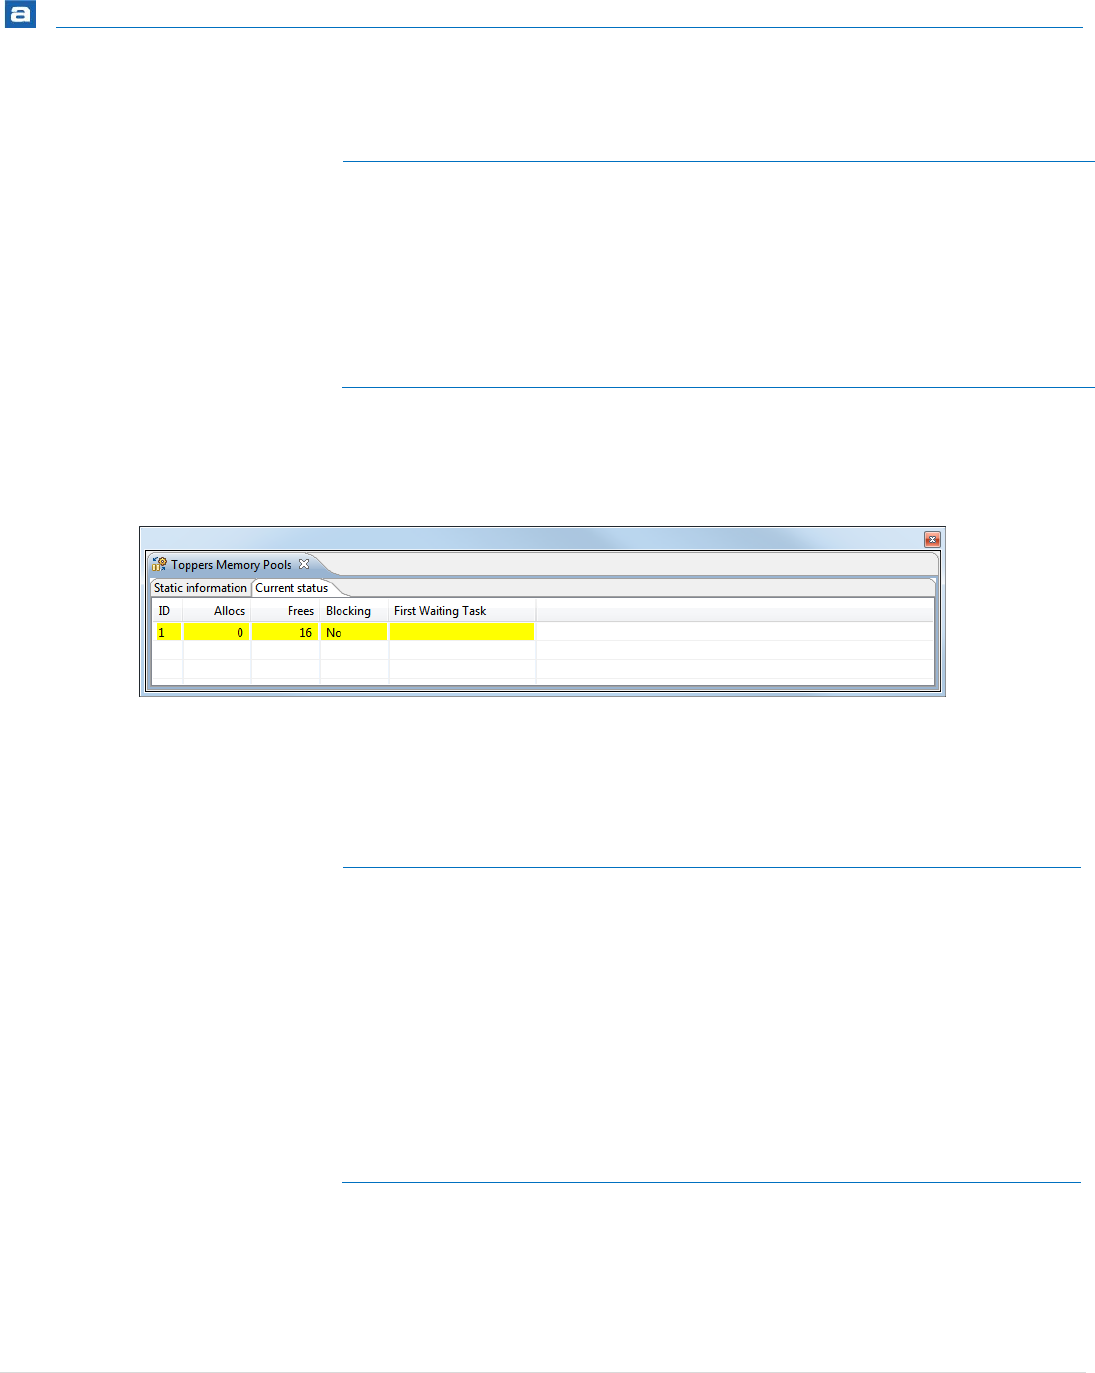
RTOS-Aware Debugging
377 | P a g e
Name
Description
ID
The Memory Pool ID.
Task Queueing Order
Displays Priority or FIFO.
Block Count
Number of Blocks in this Memory Pool.
Block Size
Byte size of 1-block in decimal form.
Table 50 – TOPPERS Memory Pools Static Information
CURRENT STATUS TAB
Figure 351 – TOPPERS Memory Pools Current Status Tab
The available system variables are described in the table below:
Name
Description
ID
The Memory Pool ID
Allocs
Number of allocated blocks in decimal form.
Frees
Number of free blocks in decimal form.
Blocking
Display Yes if there is a waiting task of this object,
otherwise displays No.
First Waiting Task
Display 1st waiting task ID when there is a waiting task
of this object.
Table 51 – TOPPERS Memory Pools Current Status
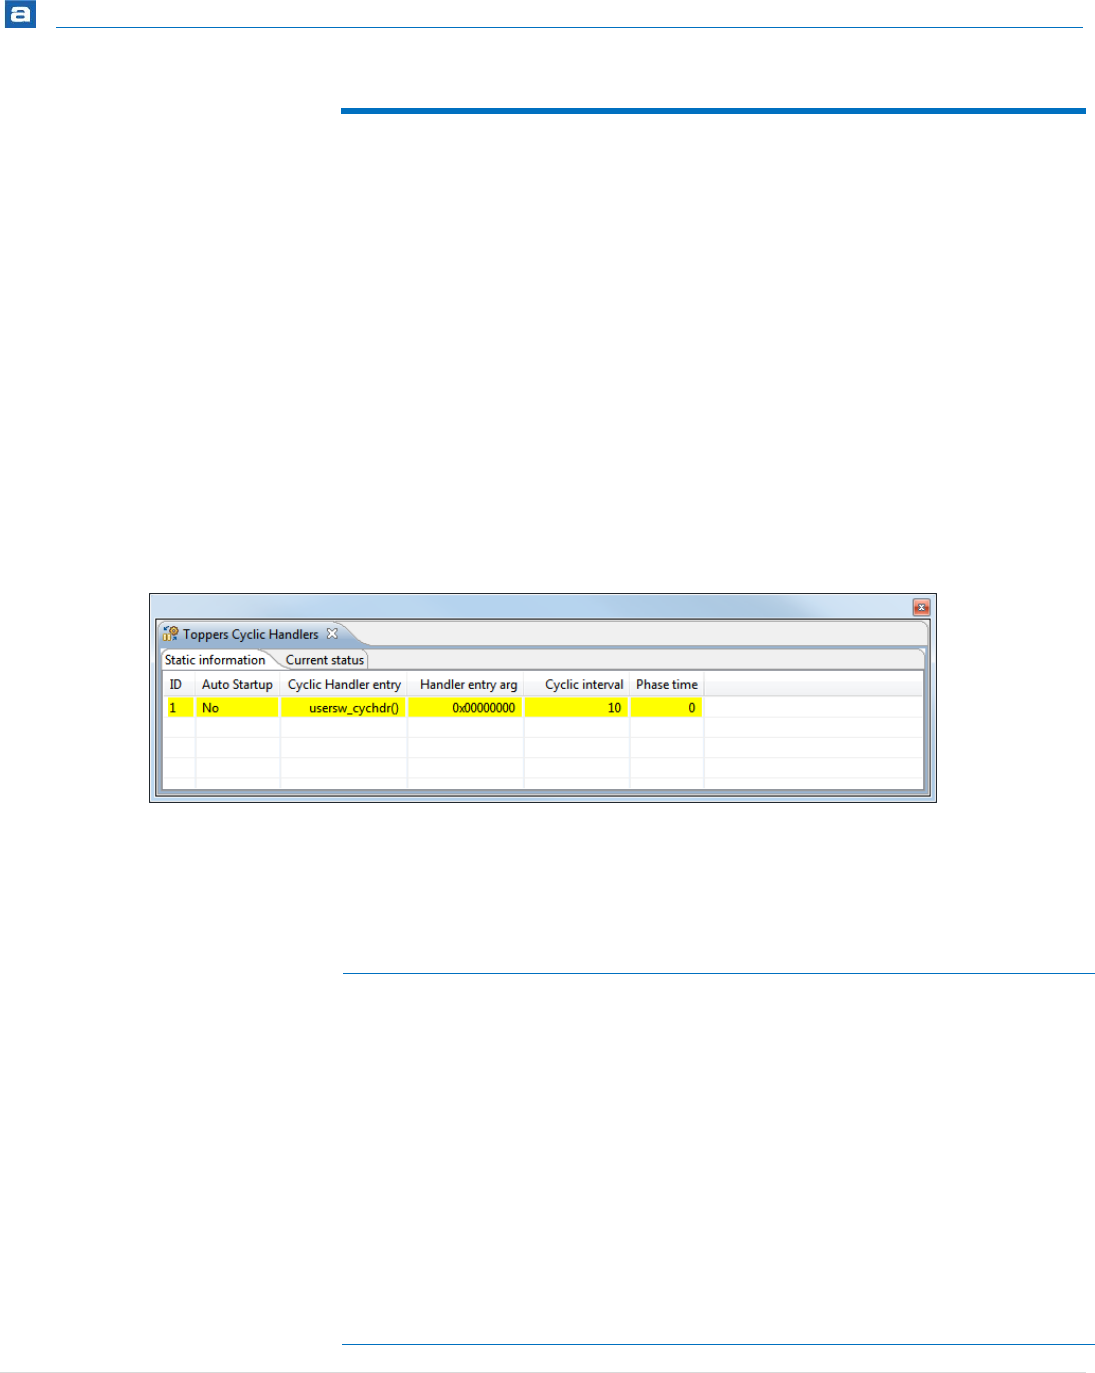
RTOS-Aware Debugging
378 | P a g e
CYCLIC HANDLERS
The TOPPERS Cyclic Handlers view displays detailed information regarding all available
cyclic handlers in the target system. The list is updated automatically each time the target
execution is suspended.
There is one column for each type of cyclic handler parameter, and one row for each cyclic
handler. If the value of any parameter for a particular cyclic handler has changed since the
last time the debugger was suspended, the corresponding row will be highlighted in
yellow.
By double-clicking on a handler, the source code for the handler will be opened in the
editor if it can be found in a source folder located within the project.
STATIC INFORMATION TAB
Figure 352 – TOPPERS Cyclic Handlers Static Information Tab
The available system variables are described in the table below:
Name
Description
ID
The Cyclic Handler ID.
Auto Startup
Displays Yes if the Cyclic Handler is set to staring
automatically, otherwise No.
Cyclic Handler Entry
Cyclic Handler Entry function name or address in
hexadecimal form.
Handler Entry Argument
The handler argument value in hex form.
Cyclic Interval
The Cyclic interval in ms.
Phase Time
The Phase interval in ms.

RTOS-Aware Debugging
379 | P a g e
Table 52 – TOPPERS Cyclic Handlers Static Information
CURRENT STATUS TAB
Figure 353 – TOPPERS Cyclic Handlers Current Status Tab
The available system variables are described in the table below:
Name
Description
ID
The Cyclic Handler ID
Starting
If the Cyclic Handler is starting Yes is displayed,
otherwise No.
Rest time until cyclic event
Display Remaining time as ms in decimal form when
Cyclic event is started.
Table 53 – TOPPERS Cyclic Handlers Current Status
ALARM HANDLERS
The TOPPERS Alarm Handlers view displays detailed information regarding all available
alarm handlers in the target system. The list is updated automatically each time the target
execution is suspended.
There is one column for each type of alarm handler parameter, and one row for each
alarm handler. If the value of any parameter for a particular alarm handler has changed
since the last time the debugger was suspended, the corresponding row will be highlighted
in yellow.
By double-clicking on a handler, the source code for the handler will be opened in the
editor if it can be found in a source folder located within the project.
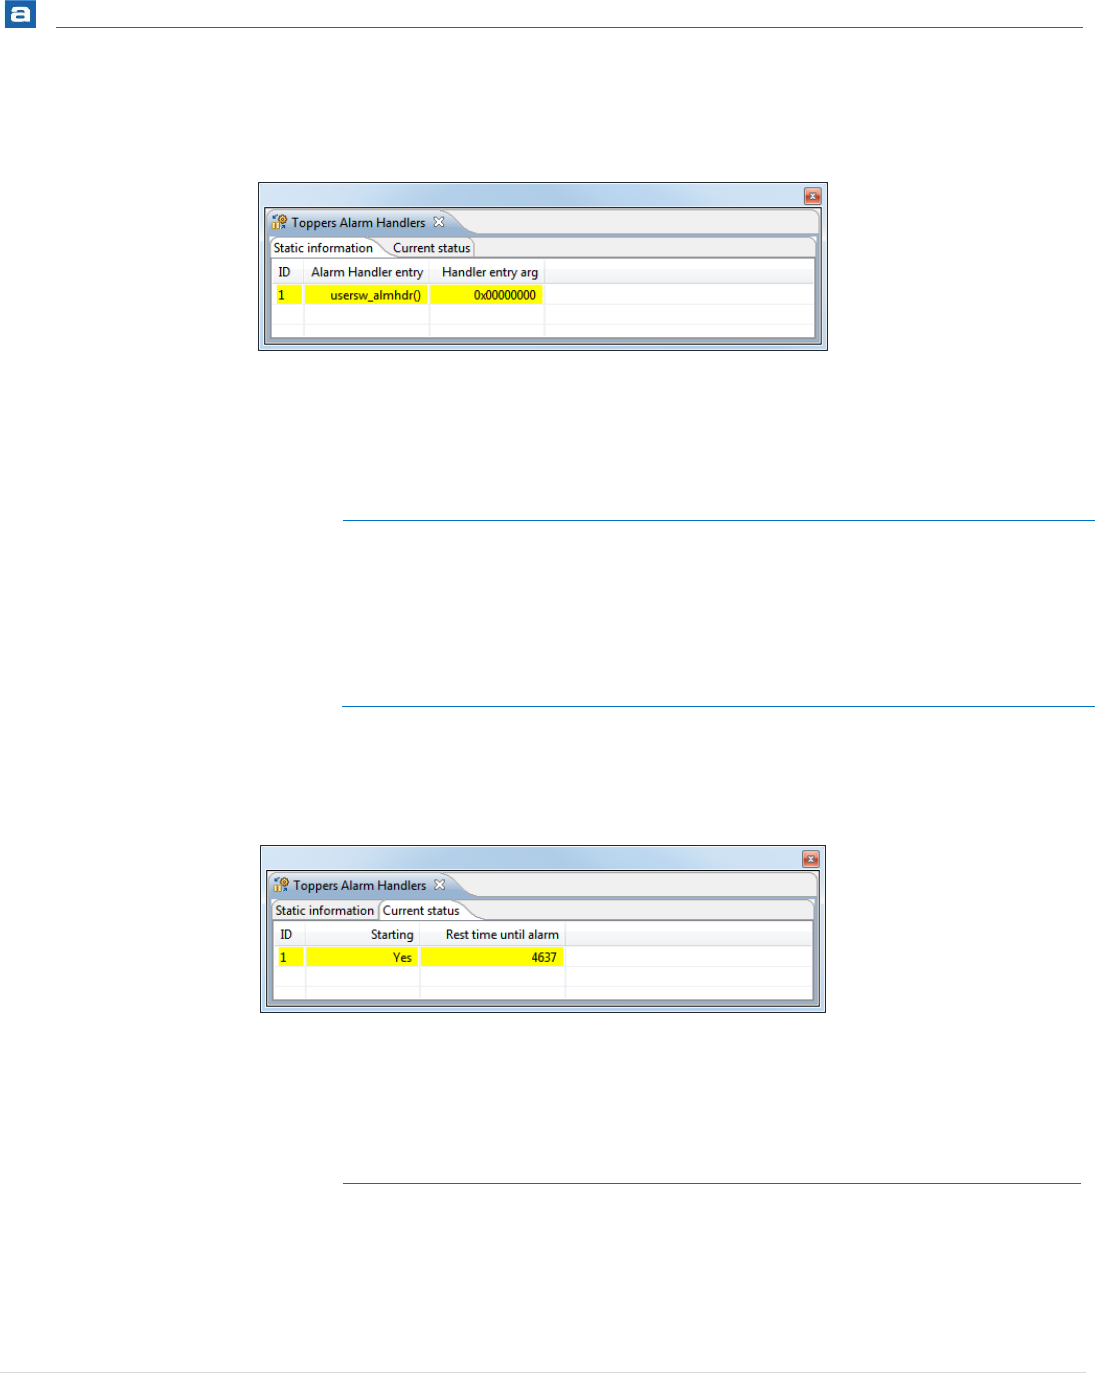
RTOS-Aware Debugging
380 | P a g e
STATIC INFORMATION TAB
Figure 354 – TOPPERS Alarm Handlers Static Information Tab
The available system variables are described in the table below:
Name
Description
ID
The Alarm Handler ID.
Alarm Handler Entry
Alarm Handler Entry function name or address in
hexadecimal form.
Handler Entry Argument
The handler argument value in hex form.
Table 54 – TOPPERS Alarm Handlers Static Information
CURRENT STATUS TAB
Figure 355 – TOPPERS Alarm Handlers Current Status Tab
The available system variables are described in the table below:
Name
Description
ID
The Alarm Handler ID
Starting
If the Alarm Handler is starting Yes is displayed,
otherwise No.
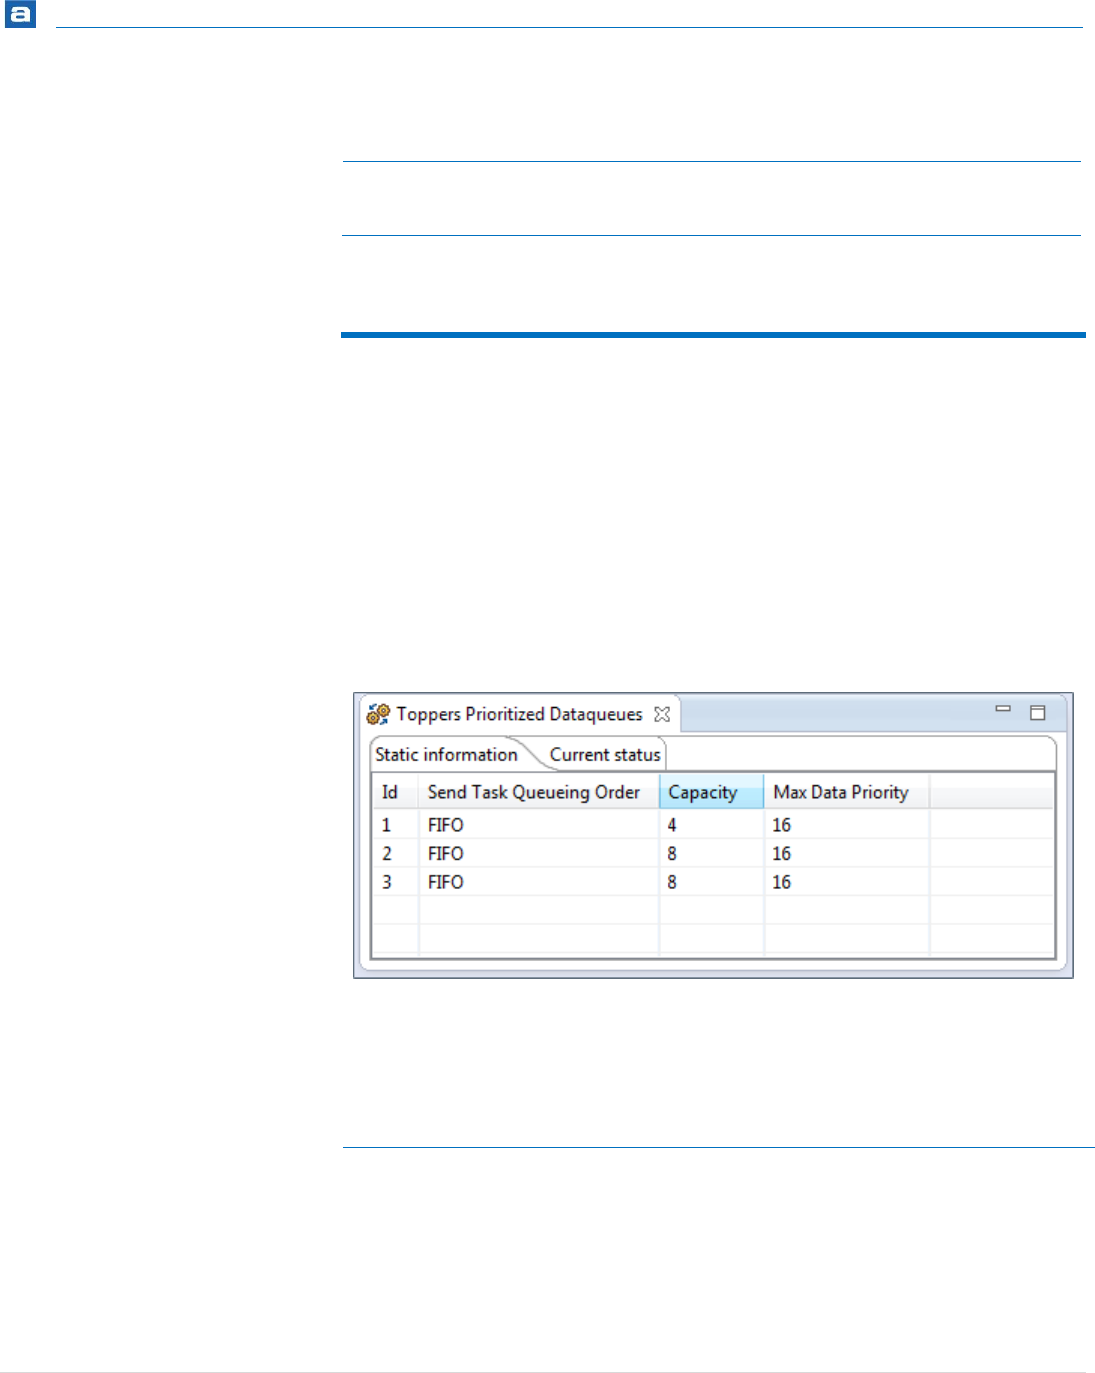
RTOS-Aware Debugging
381 | P a g e
Name
Description
Rest time until alarm
Display Remaining time as ms in decimal form when
Alarm is started.
Table 55 – TOPPERS Alarm Handlers Current Status Information
PRIORITIZED DATAQUEUES
The TOPPERS Prioritized Dataqueues view displays detailed information regarding all
available prioritized data queues in the target system. The list is updated automatically
each time the target execution is suspended.
There is one column for each type of prioritized data queue parameter, and one row for
each prioritized data queue. If the value of any parameter for a particular prioritized data
queue has changed since the last time the debugger was suspended, the corresponding
row will be highlighted in yellow.
STATIC INFORMATION TAB
Figure 356 – TOPPERS Prioritized Dataqueues Static Information Tab
The available system variables are described in the table below:
Name
Description
ID
The prioritized data queue base ID.
Send Task Queueing Order
Displays Priority or FIFO.
Capacity
The prioritized data queue quantity as a decimal value.

RTOS-Aware Debugging
382 | P a g e
Name
Description
Max Data Priority
Max priority of prioritized-Data.
Table 56 – TOPPERS Prioritized Dataqueue Static Information
CURRENT STATUS TAB
Figure 357 – TOPPERS Prioritized Dataqueues Current Status Tab
The available system variables are described in the table below:
Name
Description
ID
The Data Queue base ID
Queuing Data Count
Displays count value in decimal form.
Blocking (receive)
If there is a waiting task of this object displays Yes,
otherwise displays No.
First Waiting Task (receive)
When there is a waiting task of this object, displays 1st
waiting task ID. When there is no waiting task of this
object, displays blank space.
Blocking (send)
If there is a waiting task of this object displays Yes,
otherwise displays No.
First Waiting Task (send)
When there is a waiting task of this object, displays 1st
waiting task ID. When there is no waiting task of this
object, displays blank space.
Queuing Data Top
When there is queuing data, display 1st queuing data
address as Hex.
Table 57 – TOPPERS Prioritized Dataqueues Current Status Information
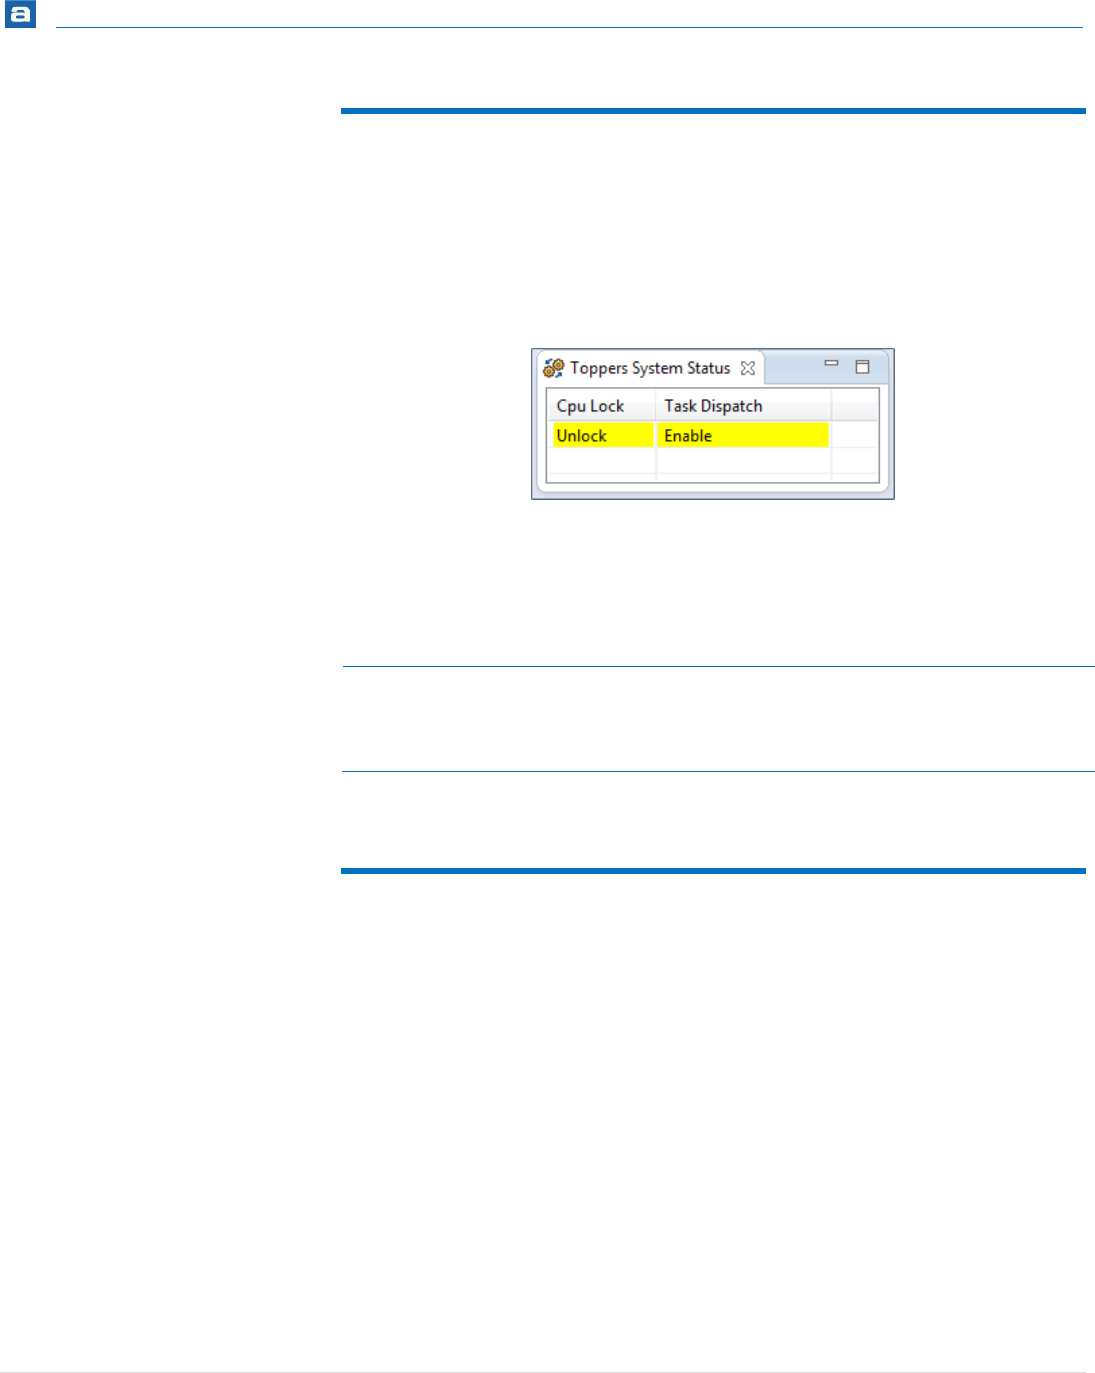
RTOS-Aware Debugging
383 | P a g e
SYSTEM STATUS
The TOPPERS System Status view displays detailed information regarding the system.
There is two columns with status values. If one value has changed since the last time the
debugger was suspended, the corresponding row will be highlighted in yellow.
Figure 358 – TOPPERS System Status View
The available system values are described in the table below:
Name
Description
Cpu Lock
CPU lock flag
Task Dispatch
Enable flag of dispatching task
Table 58 – TOPPERS System Status Information
INTERRUPT LINE CONFIGURATION
The TOPPERS Interrupt Line Config view displays detailed information regarding all
available Interrupts in the target system.
There is one column for each type of interrupt parameter, and one row for each interrupt.
The SWV Exception view is recommended for more information about each interrupt. See
Page 298 - Exception Tracing.
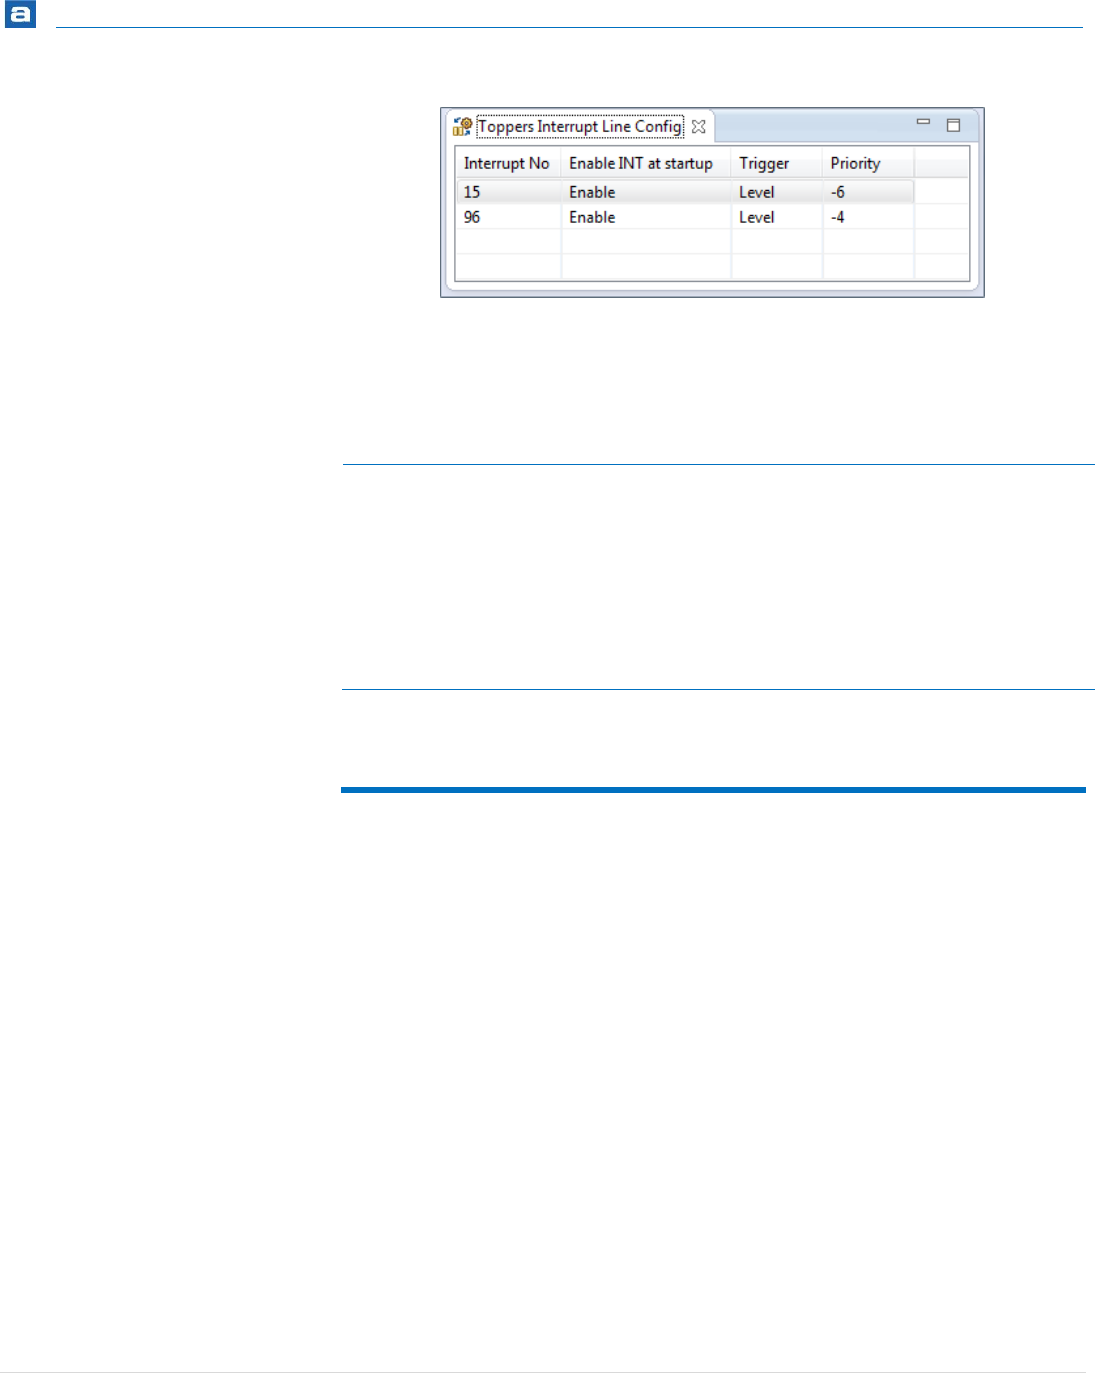
RTOS-Aware Debugging
384 | P a g e
Figure 359 – TOPPERS Interrupt Line Config View
The available system variables are described in the table below:
Name
Description
Interrupt No
The Interrupt Line number
Enable INT at startup
Displays Enable or Disable
Trigger
Displays Edge or Level
Priority
Priority of Interrupt
Table 59 – TOPPERS Interrupt Line Config Information
INTERRUPT HANDLER STATIC INFORMATION
The TOPPERS Interrupt Handler Static Info view displays detailed information regarding all
available Interrupts in the target system
There is one column for each type of interrupt parameter, and one row for each interrupt.
The SWV Exception view is recommended for more information about each interrupt. See
Page 298 - Exception Tracing.
By double-clicking on an interrupt handler, the source code for it will be opened in the
editor if it can be found in a source folder located within the project.
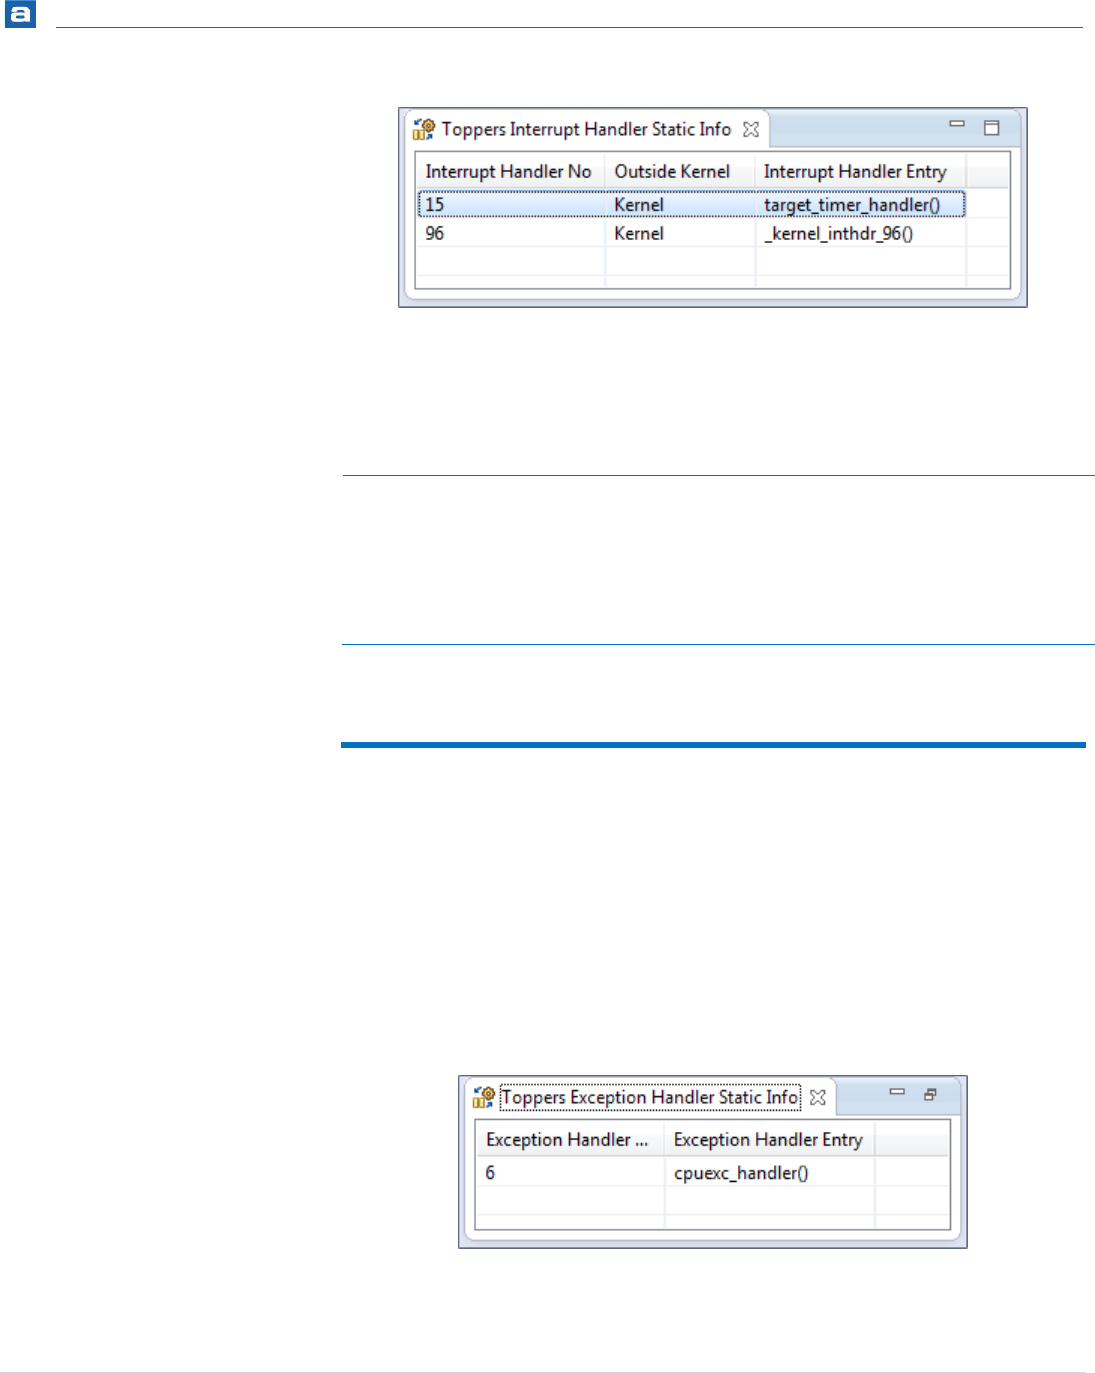
RTOS-Aware Debugging
385 | P a g e
Figure 360 – TOPPERS Interrupt Handler Static Info View
The available system variables are described in the table below:
Name
Description
Interrupt Handler No
The Interrupt Line number
Outside Kernel
Displays Outside or Kernel
Priority
Handler entry address
Table 60 – TOPPERS Interrupt Handlers Static Information
CPU EXCEPTION HANDLER STATIC INFORMATION
The TOPPERS Exception Handler Static Info view displays detailed information regarding
all available CPU exception in the target system
There is one column for each type of exception parameter, and one row for each
exception.
By double-clicking on an Exception handler, the source code for it will be opened in the
editor if it can be found in a source folder located within the project.
Figure 361 – TOPPERS Exception Handler Static Info View
The available system variables are described in the table below:

RTOS-Aware Debugging
386 | P a g e
Name
Description
Exception Handler No
CPU Exception Handler No.
Execption Handler Entry
Handler entry address
Table 61 – TOPPERS Interrupt Handlers Static Information

RTOS-Aware Debugging
387 | P a g e
MICRIUM µC/OS-III
The kernel awareness features for Micriµm µC/OS-IIITM in Atollic TrueSTUDIO provide the
developer with a detailed insight into the internal data structures of the µC/OS-III kernel.
During a debug session, the current state of the µC/OS-III kernel and the various µC/OS-III
kernel objects such as tasks, memory partitions, message queues, semaphores and
software timers, can be easily inspected in a set of dedicated views, in the Atollic
TrueSTUDIO Debug perspective.
REQUIREMENTS
The kernel awareness features described in this document is based on µC/OS-III V3.02.00.
FINDING THE VIEWS
A number of debugger views are available in the Atollic TrueSTUDIO Debug perspective
when debugging an application containing the µC/OS-III real-time operating system.
These views are available from the Show View toolbar dropdown list button.
Please note that the level of information available in the different views in
Atollic TrueSTUDIO depends on the configuration of the µC/OS-III RTOS. If
some feature is not enabled, the views presented in this document may
contain columns presenting information such as “N/A” (Not Applicable) or “0”
instead of expected values when debugging the target system. The Micriµm
µC/OS-III Users Guide contains information on how different features can be
enabled in the operating system.
E.g. Enable statistics task in os_cfg.h:
#define OS_CFG_STAT_TASK_EN 1u

RTOS-Aware Debugging
388 | P a g e
Figure 362 - View Top Level Menu
Figure 363 - Show View Toolbar Button
SYSTEM INFORMATION
The µC/OS-III System Information view displays a number of system variables available in
the µC/OS-III kernel, such as state, version, CPU usage, different counter information, etc.

RTOS-Aware Debugging
389 | P a g e
Figure 364 - µC/OS-III System Information View
The available system variables are described in the table below:
Name
Description
µC/OS-III State
The current status of µC/OS-III.
µC/OS-III Version
The version of the RTOS.
CPU Usage
The actual CPU usage of all tasks.
Idle Task Counter
The idle task counter.
Statistic Task Counter
The statistic task counter.
Tick Task Counter
The tick task counter.
Timer Task Counter
The timer task counter.
Context Switches
The total number of context switches.
Interrupt Nesting Counter
The interrupt nesting level counter.
Max Interrupt Disable Time
The maximum interrupt disabled time (µs).
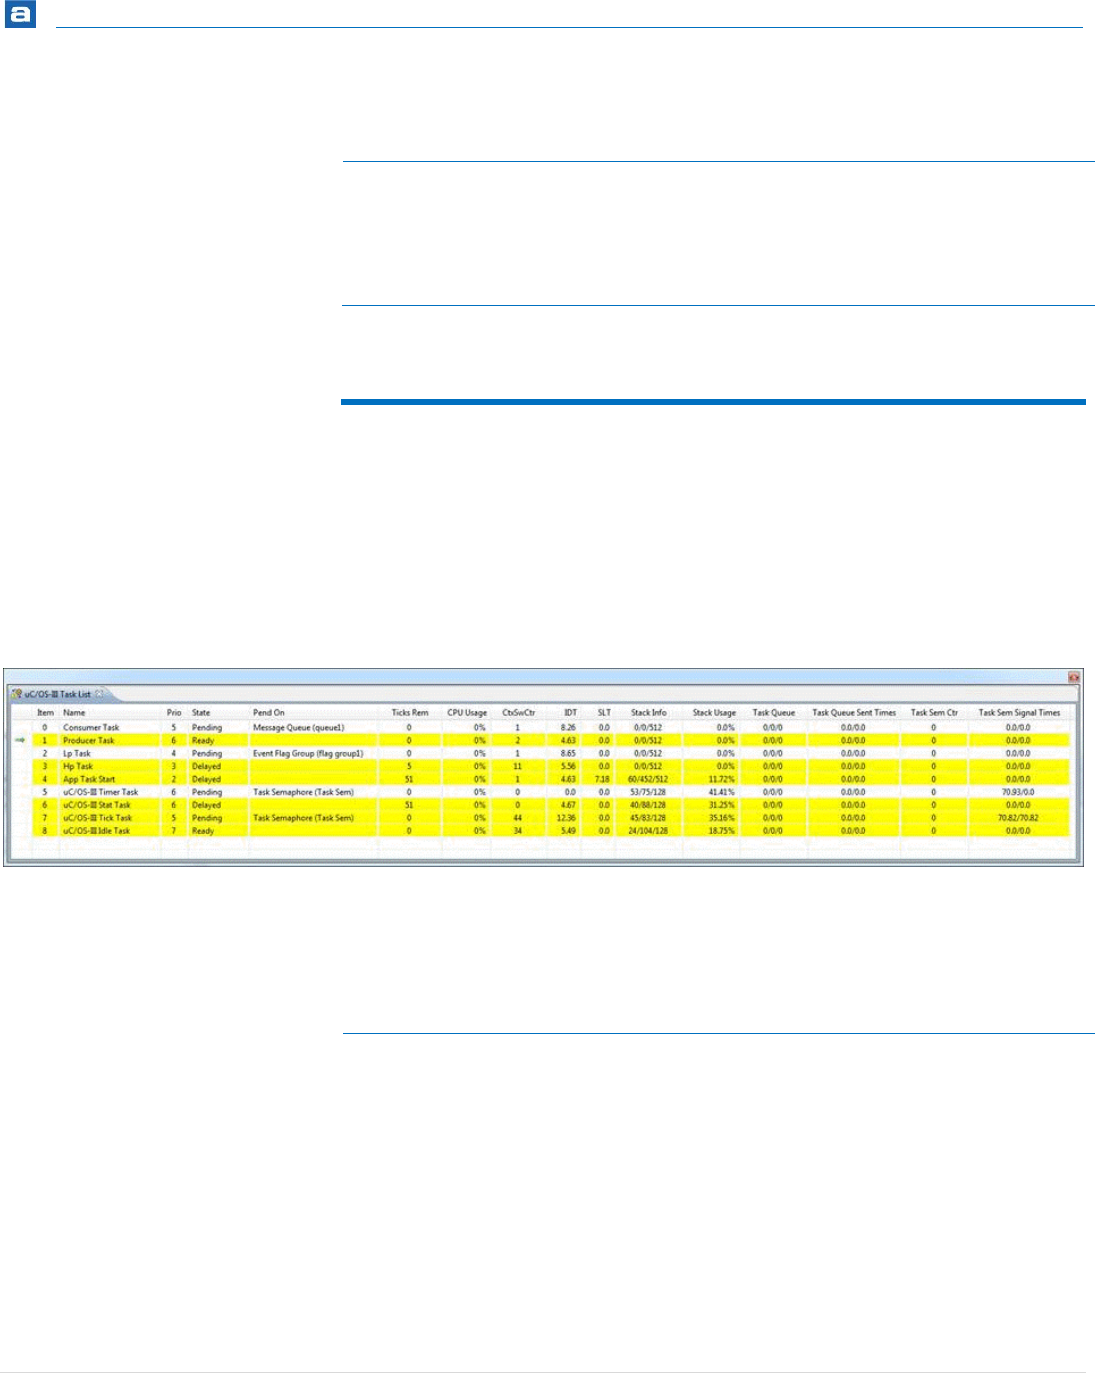
RTOS-Aware Debugging
390 | P a g e
Name
Description
Scheduler Lock Nesting Counter
The counter for the nesting level of the scheduler
lock.
Max Scheduler Lock Time
The maximum amount of time the scheduler was
locked irrespective of which task did the locking
Table 62 – µC/OS-III System Variables
TASK LIST
The µC/OS-III Task List view displays detailed information regarding all available tasks in
the target system. The task list is updated automatically each time the target execution is
suspended.
There is one column for each type of task parameter, and one row for each task. If the
value of any parameter for a particular task has changed since the last time the debugger
was suspended, the corresponding row will be highlighted in yellow.
Figure 365 - µC/OS-III Task List View
The available parameters are described in the table below:
Name
Description
N/A
Indicates the currently running task. The currently running
task is indicated by a green arrow symbol.
Name
The task name.
Prio
The task priority. Low number indicates high priority.
State
The current state of the task.
Pend On
The type of the object the task is waiting on and in

RTOS-Aware Debugging
391 | P a g e
Name
Description
parenthesis the name of the actual object.
Ticks Rem
The amount of time (ticks) remaining for a delayed task to
become ready-to-run or for a pending task to timeout
CPU Usage
The task CPU usage.
CtxSwCtr
The number of times the task has executed (switched in).
IDT
(Interrupt Disable Time)
The maximum amount of time (µs) interrupts has been
disabled by the task.
SLT
(Scheduler Lock Time)
The maximum amount of time (µs) the scheduler has been
locked by the task.
Stack Info
The stack information: Used/Free/Size, expressed in
number of stack entries.
Stack Usage
The stack usage.
Task Queue
Task queue information: Current/Maximum/Size.
Task Queue Sent Times
Task queue sent times: Latest/Maximum.
The amount of time (µs) it took for a message to be sent
and actually read by the task.
Task Sem Ctr
The number of times the task has been signaled while the
task was not able to run.
Task Sem Signal Times
Task semaphore signal times: Latest/Maximum.
The amount of time (µs) it took for the task to execute
after the semaphore was signaled.
Table 63 – µC/OS-III Task Parameters
SEMAPHORES
The µC/OS-III Semaphores view displays detailed information regarding all available
resource semaphores in the target system. The view is updated automatically each time
the target execution is suspended.
There is one column for each type of semaphore parameter, and one row for each
semaphore. If the value of any parameter for a particular semaphore has changed since
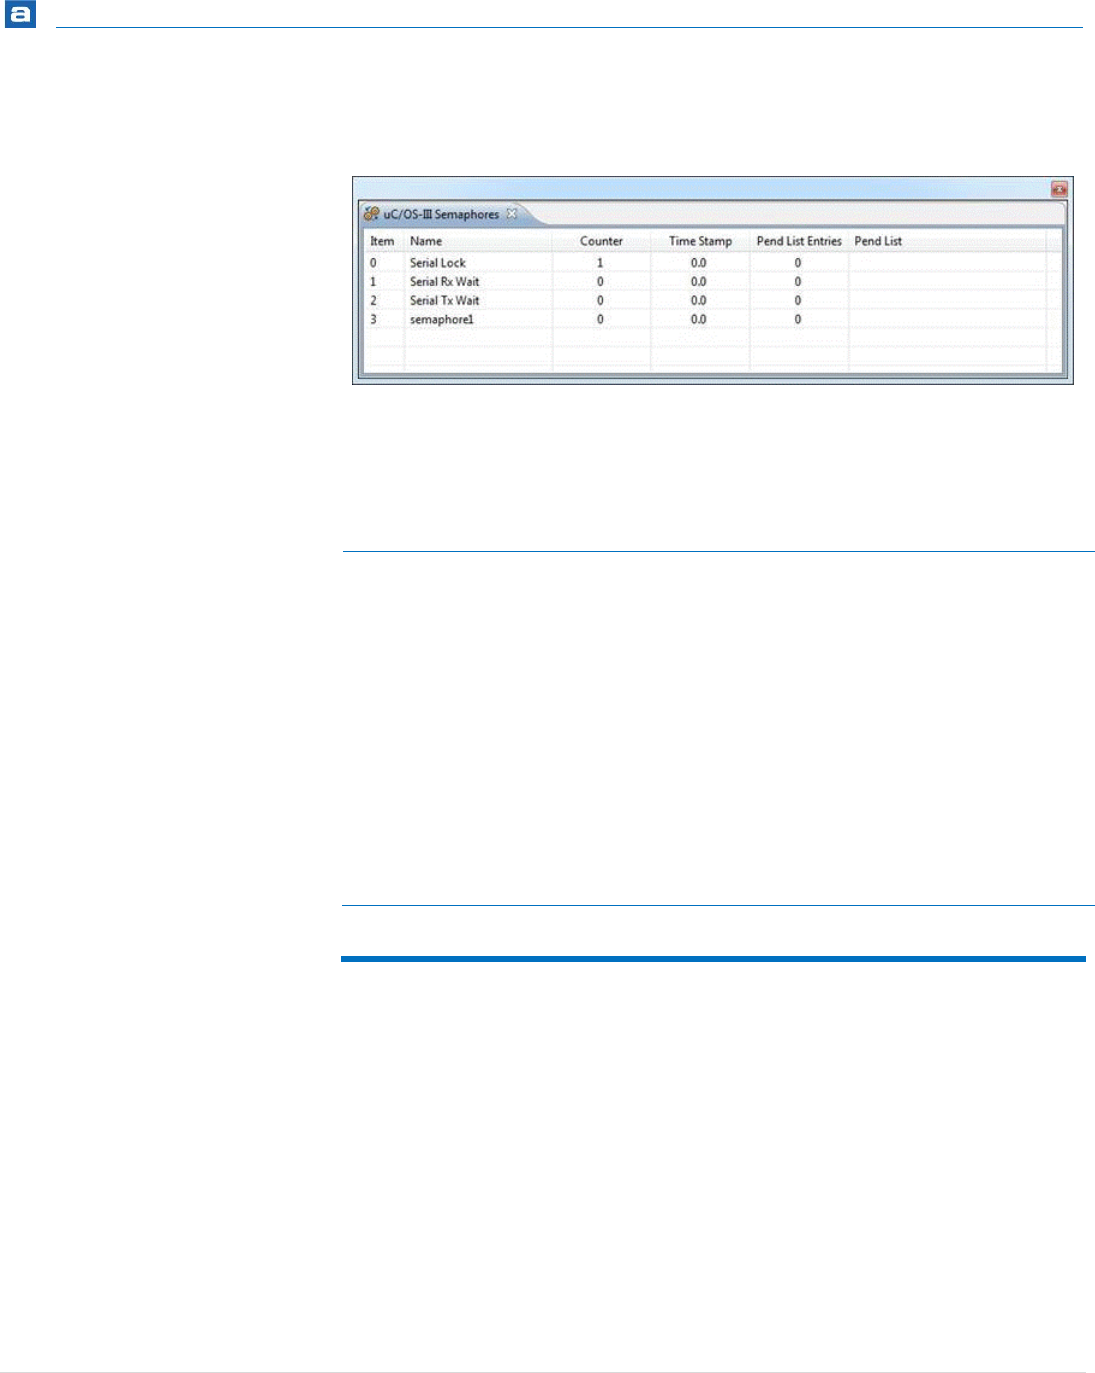
RTOS-Aware Debugging
392 | P a g e
the last time the debugger was suspended, the corresponding row will be highlighted in
yellow.
Figure 366 - µC/OS-III Semaphores View
The available parameters are described in the table below:
Column
Description
Item
The semaphore item counter.
Name
The name of the semaphore.
Counter
The current semaphore count.
Time Stamp
The semaphore last signal time (µs).
Pend List Entries
The number of tasks pending on the semaphore.
Pend List
List of tasks pending on the semaphore. Highest priority
tasks are sorted first in the list.
Table 64 – µC/OS-III Semaphore Parameters
MUTEXES
The µC/OS-III Mutexes view displays detailed information regarding all available mutexes
in the target system. The view is updated automatically each time the target execution is
suspended.
There is one column for each type of mutex parameter, and one row for each mutex. If the
value of any parameter for a particular mutex has changed since the last time the
debugger was suspended, the corresponding row will be highlighted in yellow.

RTOS-Aware Debugging
393 | P a g e
Figure 367 - µC/OS-III Mutexes View
The available parameters are described in the table below:
Column
Description
Item
The mutex item counter.
Name
The name of the mutex.
Owner
The name of the task that currently owns the mutex.
Owner Org Prio
The owning task original priority (task priority may have
been raised due to priority inheritance).
Owner Nest Ctr
The owning task nesting counter. Number of times the
owning task acquired the mutex.
Time Stamp
Latest release time (µs).
Pend List Entries
Number of tasks pending on the mutex.
Pend List
List of tasks pending on the semaphore. Highest priority
tasks are sorted first in list.
Table 65 – µC/OS-III Mutexes Parameters
MESSAGE QUEUES
The µC/OS-III Message Queues view displays detailed information regarding all available
message queues in the target system. The view is updated automatically each time the
target execution is suspended.
There is one column for each type of message queue parameter, and one row for each
message queue. If the value of any parameter for a particular message queue has changed
since the last time the debugger was suspended, the corresponding row will be highlighted
in yellow.

RTOS-Aware Debugging
394 | P a g e
Figure 368 - µC/OS-III Message Queues View
The available parameters are described in the table below:
Column
Description
Item
The message queue item counter.
Name
The name of the message queue.
Size
The maximum number of entries allowed in the queue.
Entries
The current number of entries in the queue.
Max entries
The peak number of entries in the queue.
Pend List Entries
The number of tasks pending on the queue.
Pend List
List of tasks pending on the queue. Highest priority tasks
are sorted first in list.
Table 66 – µC/OS-III Message Queue Parameters
EVENT FLAGS
The µC/OS-III Event Flags view displays detailed information regarding all available event
flag groups in the target system. The view is updated automatically each time the target
execution is suspended.
There is one column for each type of parameter, and one row for each event flag group. If
the value of any parameter for a particular event flag group has changed since the last
time the debugger was suspended, the corresponding row will be highlighted in yellow.

RTOS-Aware Debugging
395 | P a g e
Figure 369 - µC/OS-III Event Flags View
The available parameters are described in the table below:
Column
Description
Item
The event flag group item counter.
Name
The name of the event flag group.
Flags
The current value of the event flag group.
Time Stamp
The last time the group was posted to.
Pend List Entries
The number of tasks pending on the event flag group.
Pend List
List of tasks pending on the event flag group. Highest
priority tasks are sorted first in list.
Table 67 – µC/OS-III Event Flag Parameters
TIMERS
The µC/OS-III Timers view displays detailed information regarding all available software
timers in the target system. The timers view is updated automatically each time the target
execution is suspended.
There is one column for each type of timer parameter, and one row for each timer. If the
value of any parameter for a particular timer has changed since the last time the debugger
was suspended, the corresponding row will be highlighted in yellow.
Figure 370 - µC/OS-III Timers View
The available parameters are described in the table below:
Name
Description
Item
The timer item counter.
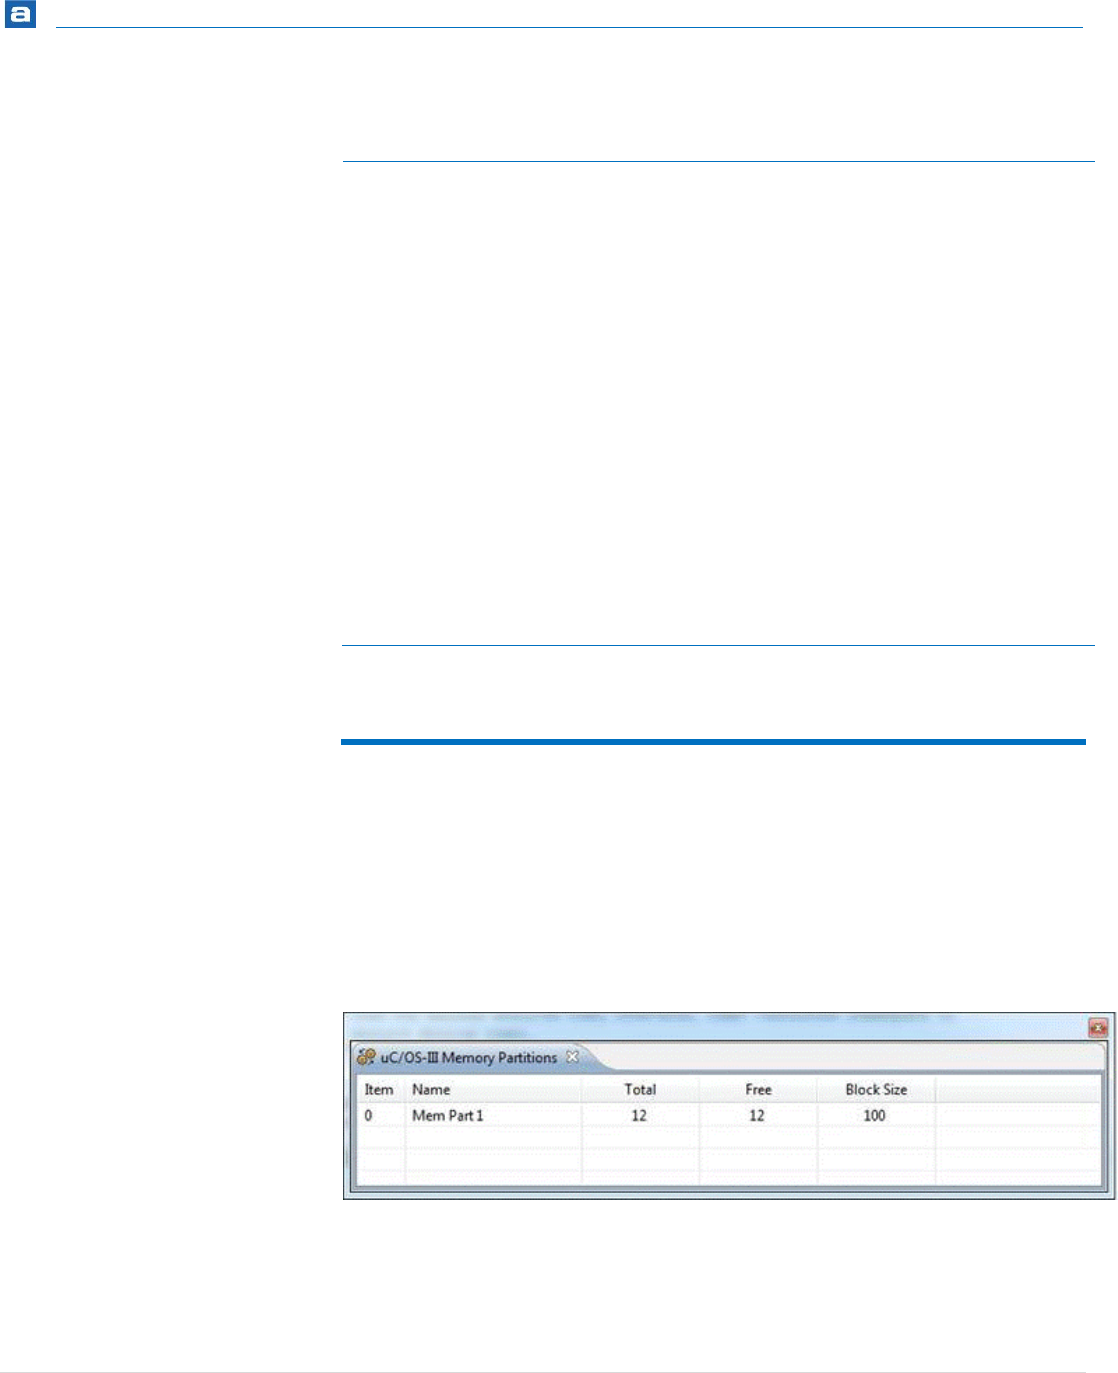
RTOS-Aware Debugging
396 | P a g e
Name
Description
Name
The name of the software timer.
Type
The type of the timer.
State
The state of the timer.
Match
The time when the timer expires.
Remain
The time remaining before the timer expires.
Delay
The expiration time for one-shot timers and initial delay
for periodic timers.
Period
The timer period (for periodic timers).
Callback
The address and name of function to call when the timer
expires.
Table 68 – µC/OS-III Timer Parameters
MEMORY PARTITIONS
The µC/OS-III Memory Partitions view displays detailed information regarding all available
memory partitions in the target system. The view is updated automatically each time the
target execution is suspended.
There is one column for each type of parameter, and one row for each memory partition.
If the value of any parameter for a particular memory partition has changed since the last
time the debugger was suspended, the corresponding row will be highlighted in yellow.
Figure 371 - µC/OS-III Memory Partitions View

RTOS-Aware Debugging
397 | P a g e
The available parameters are described in the table below:
Column
Description
Item
The memory partition item counter.
Name
The name of the memory partition.
Total
The number of memory blocks available from the
partition.
Free
The number of free memory blocks available from the
partition.
Block size
The size of each memory blocks in the partition.
Table 69 – µC/OS-III Memory Partitions Parameters

Introduction
398 | P a g e
SOURCE CODE REVIEW
This section provides information on how to perform source code reviews and hold code
review meetings with Atollic TrueSTUDIO for STM32.
This section covers information on the following topics:
Introduction to source code reviews and code review meetings
The Review perspective and related views
Creating and configuring reviews sessions
Performing a 3-step source code review
Additional reading and available templates and appendices

Revision History
399 | P a g e
INTRODUCTION TO CODE REVIEWS
Atollic TrueSTUDIO for STM32 has integrated tool support for performing source code
reviews and code review meetings. Code review is one of the most cost-effective ways of
improving software quality. In order to learn more about code reviews, please visit the
white paper section on the Atollic website and read our white paper on source code
review. The tool support can be deployed in any project size, ranging from one to several
developers. In this chapter, the project is assumed to contain more than one team
member.
In order to put the concepts and terminology used in Atollic TrueSTUDIO into context, the
two flow charts below are provided.
The first flow chart shows a commonly deployed software review workflow. The second
flowchart shows the individual source code review steps available in Atollic TrueSTUDIO.
The dashed lines between the two flow charts, map the steps of one flow chart to the
corresponding steps in the other.
Figure 372 – Atollic TrueSTUDIO Support for the Code Review Workflow
Planning
Overview
Preparation
Meeting
Rework
Follow-up
Create review
Individual
phase
Group
phase
Rework
phase
Follow-up

Revision History
400 | P a g e
Process step
Traditional content
Tool support in Atollic TrueSTUDIO
Planning /
Create review
The review is planned by the
moderator. A review topic is
determined and the work product
is outlined.
Create the review, choose authors, work
product and configure problem types,
resolution types, severity levels, etc.
Overview /
Individual or
Group phase
The author describes the
background of the work product
and the reviewers are educated
regarding the work product at
hand.
Once a review is created, a start-up meeting
may be held where the author and the
reviewers go through the work product in
order to get an overview.
Preparation /
Individual
phase
Each reviewer examines the work
product to identify possible
defects.
Each reviewer examines the work product
to identify possible defects.
Review
meeting /
Group phase
During this meeting the chairman
goes through the work product,
part by part, and the reviewers
point out the defects found for
each part.
The accumulated defects found by the
group of reviewers are discussed.
Rework
The author makes changes to the
work product according to the
action plans from the inspection
meeting.
The author makes changes to the work
product according to the action plans from
the review meeting.
Follow-up
The changes made by the author
are checked to make sure
everything is correct.
Table 70 – Atollic TrueSTUDIO Support for the Code Review Workflow

Revision History
401 | P a g e
PLANNING A REVIEW – REVIEW ID
CREATION
A pre-requisite that is necessary in order to efficiently deploy code reviews within your
project team is the access to a shared Atollic TrueSTUDIO project, either using a version
control system, which is recommended, or using a network drive. All review comments are
saved as XML formatted files in a selectable folder within the Atollic TrueSTUDIO project.
The comments may thus be shared between reviewers using a commonly accessed version
control system. This is a big advantage, as no server-side database needs to be installed,
configured and administered to perform code reviews. The normal version control system,
such as GIT or Subversion, is used for team collaboration.
In order to perform a code review the first step is to create a review ID for this specific
code review session. Creating a review ID is typically done by a moderator, which may be a
team leader or an employee from the quality assurance department. This is a simple
operation where the user is prompted to configure the following options:
Review ID (= name) and description
Review comment classification types
Review comment severities
Review comment resolution decisions
Review comment statuses
Work product content
Authors/Reviewers for the review
The steps to create a specific code review session can be severely simplified by taking the
time to create a project, or company standard, review template. All future reviews that are
created later can then be based on this review template. The moderator will thus only be
required to configure most of the above options once for each TrueSTUDIO workspace.
This is described in next chapter.
Review comments are stored as XML formatted files in a selectable folder within the
TrueSTUDIO project; one file for each reviewer. The overall review settings are saved as a
hidden XML formatted file in the project root folder in the workspace.
A review ID is tightly connected to inspection of resources (files) for one TrueSTUDIO
project. A review ID should preferably not contain any whitespaces as it will be part of the
review storage file name.
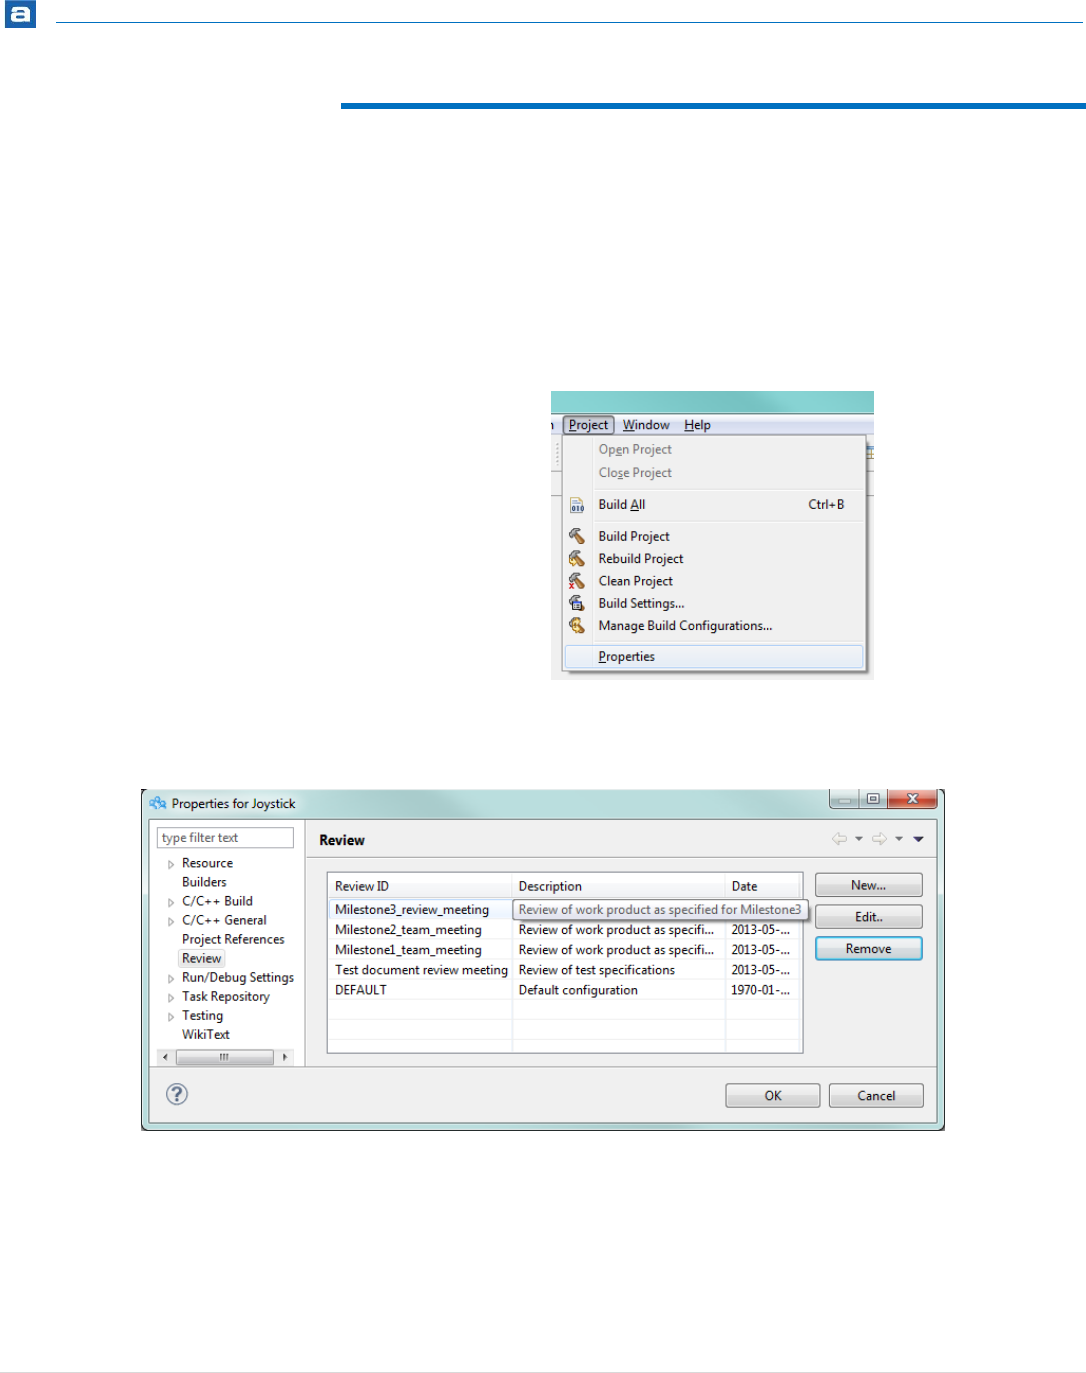
Revision History
402 | P a g e
CREATING A REVIEW ID
In order to create a review ID the user must access the properties for the Atollic
TrueSTUDIO project that is containing the desired work product. This is done by
performing the following steps:
1. Select the project in Project Explorer view.
2. Click on the Build Settings toolbar button or right-click on the project in
the Project Explorer view and click Properties.
Figure 373 – Project Properties Menu Selection
3. Select the Review node
Figure 374 - GUI for Creating and Managing Code Reviews
4. The user may choose to add a New, or Edit or Remove an existing, review
in the dialog box.
5. Click New to add a new Review ID.
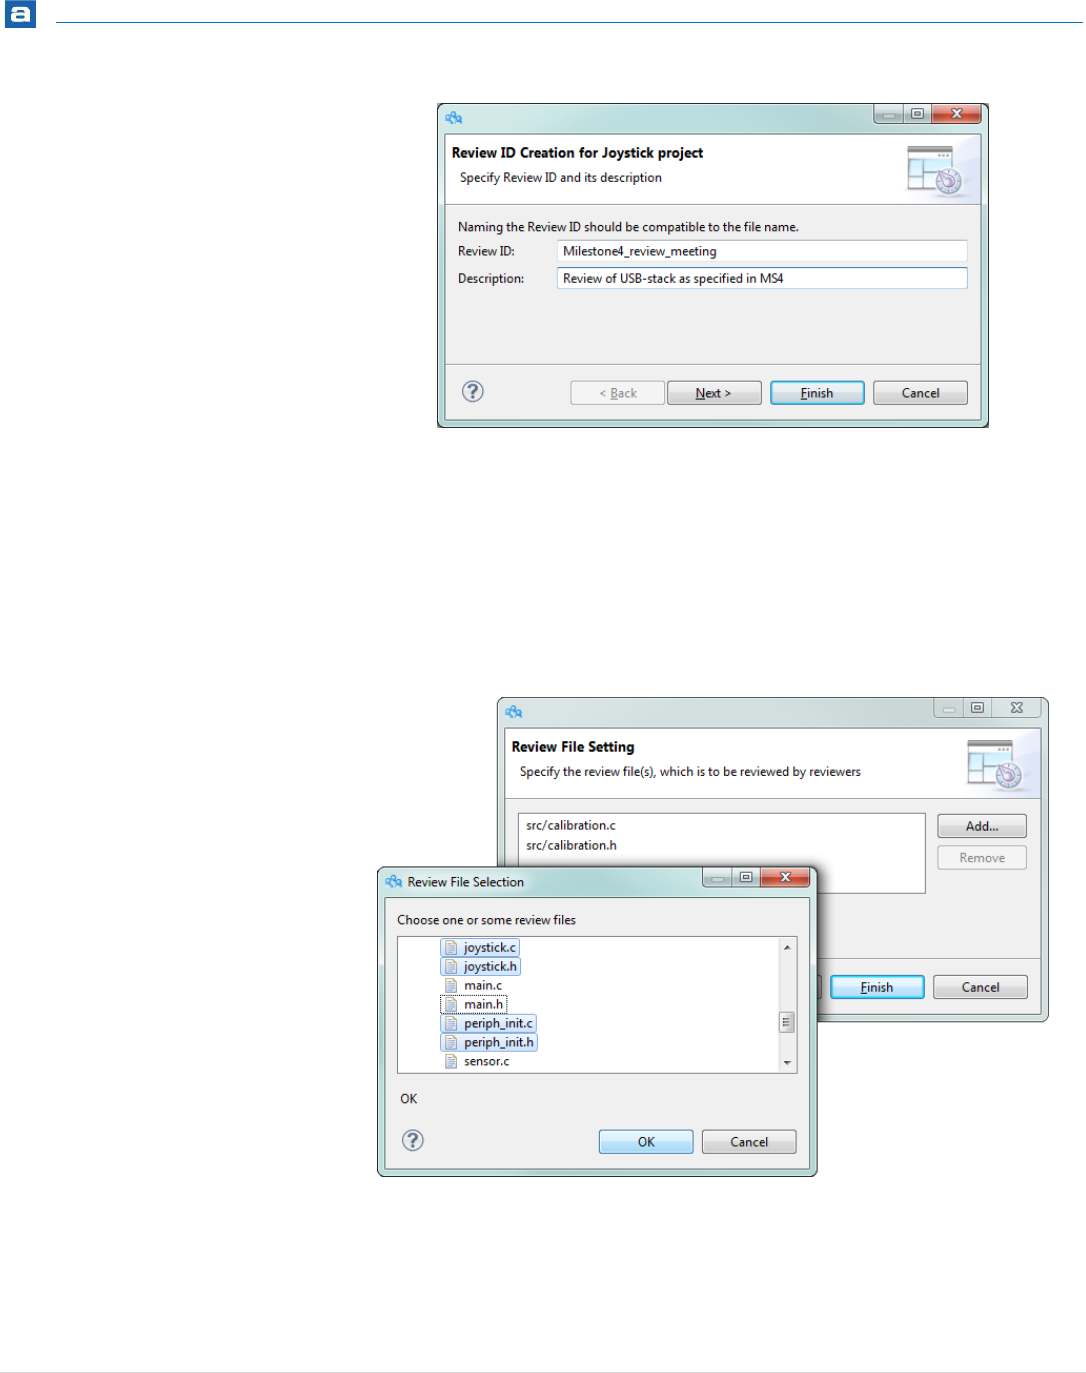
Revision History
403 | P a g e
Figure 375 - Dialog for Creating a New Review ID
6. Give the review a Review ID, i.e. a name. It is recommended not to use
whitespaces as this will be part of the file name. Also provide a short
description for the meeting. Click Next.
7. The next step determines the work product for the meeting. Choose which
files that will be subject to this review. Use the buttons to Add and
Remove files.
Figure 376 - Dialog for Managing the Work Product of a Review
8. Create a Reviewer ID by clicking Add and entering a reviewer name.
Repeat for each reviewer that will attend the meeting. The review issues
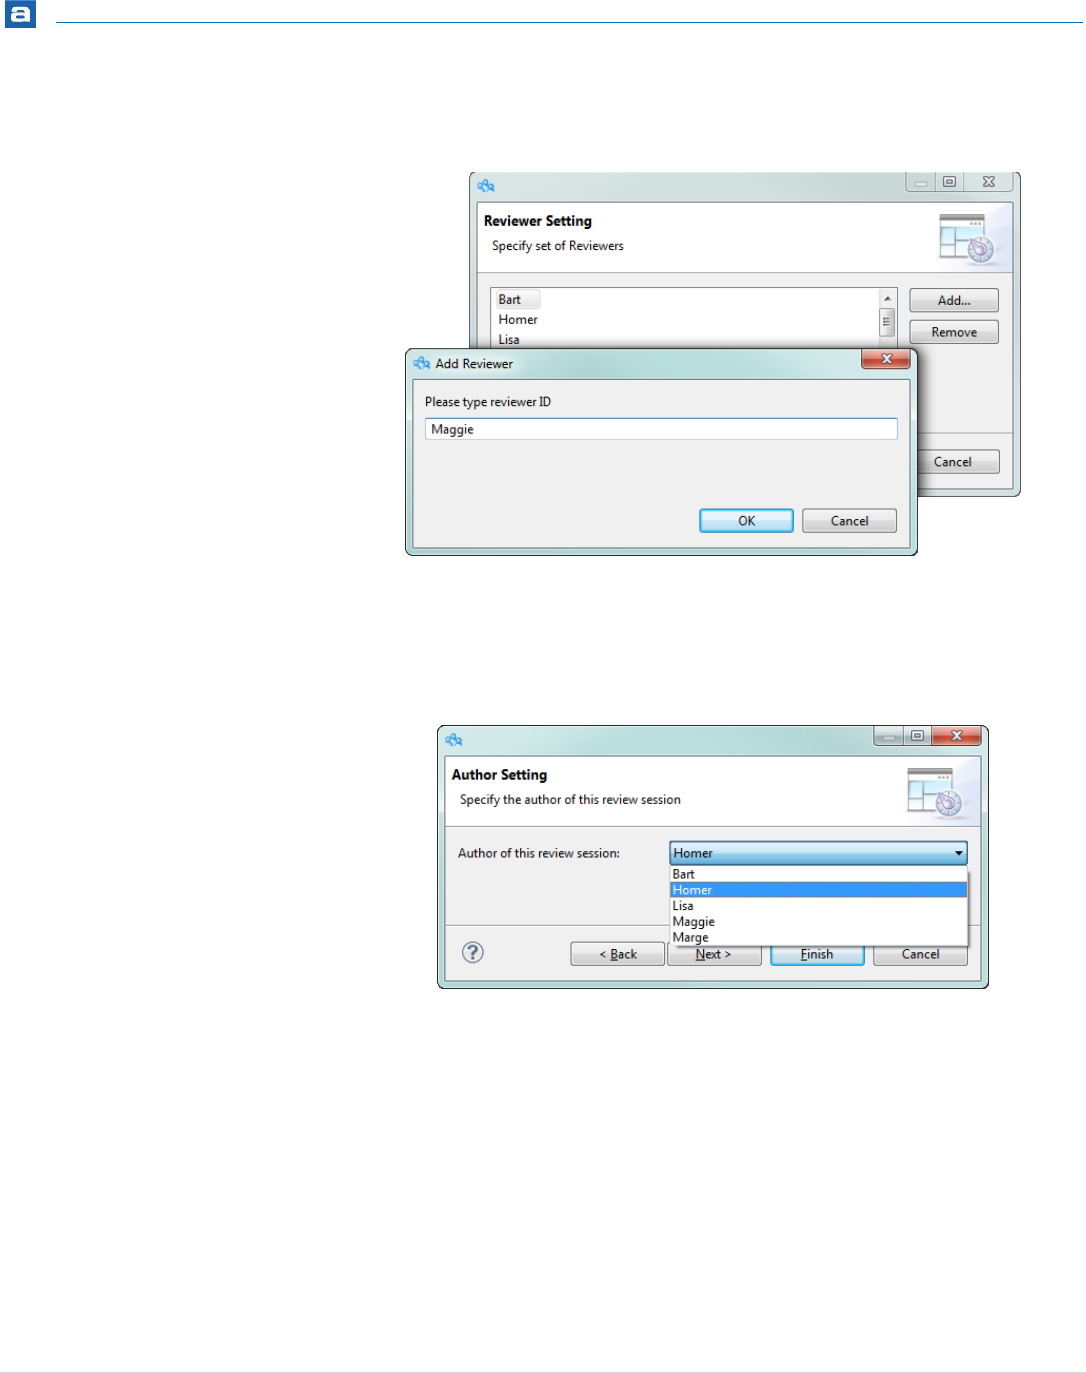
Revision History
404 | P a g e
collected by each reviewer will be stored in corresponding XML-formatted
files. It is recommended not to use whitespaces in the reviewer IDs.
Figure 377 - Add Reviewers to the Review
9. Select an author among the reviewers. The review issues identified in the
Team Phase will be assigned to the author as default. Naturally, an explicit
assignment overrides the default.
Figure 378 - Choose Author for the Review Session
10. In this step, it is possible to configure available parameter options for the
review comments. The parameter options are:
Review comment classification types
Review comment severities
Review comment resolution decisions
Review comment statuses
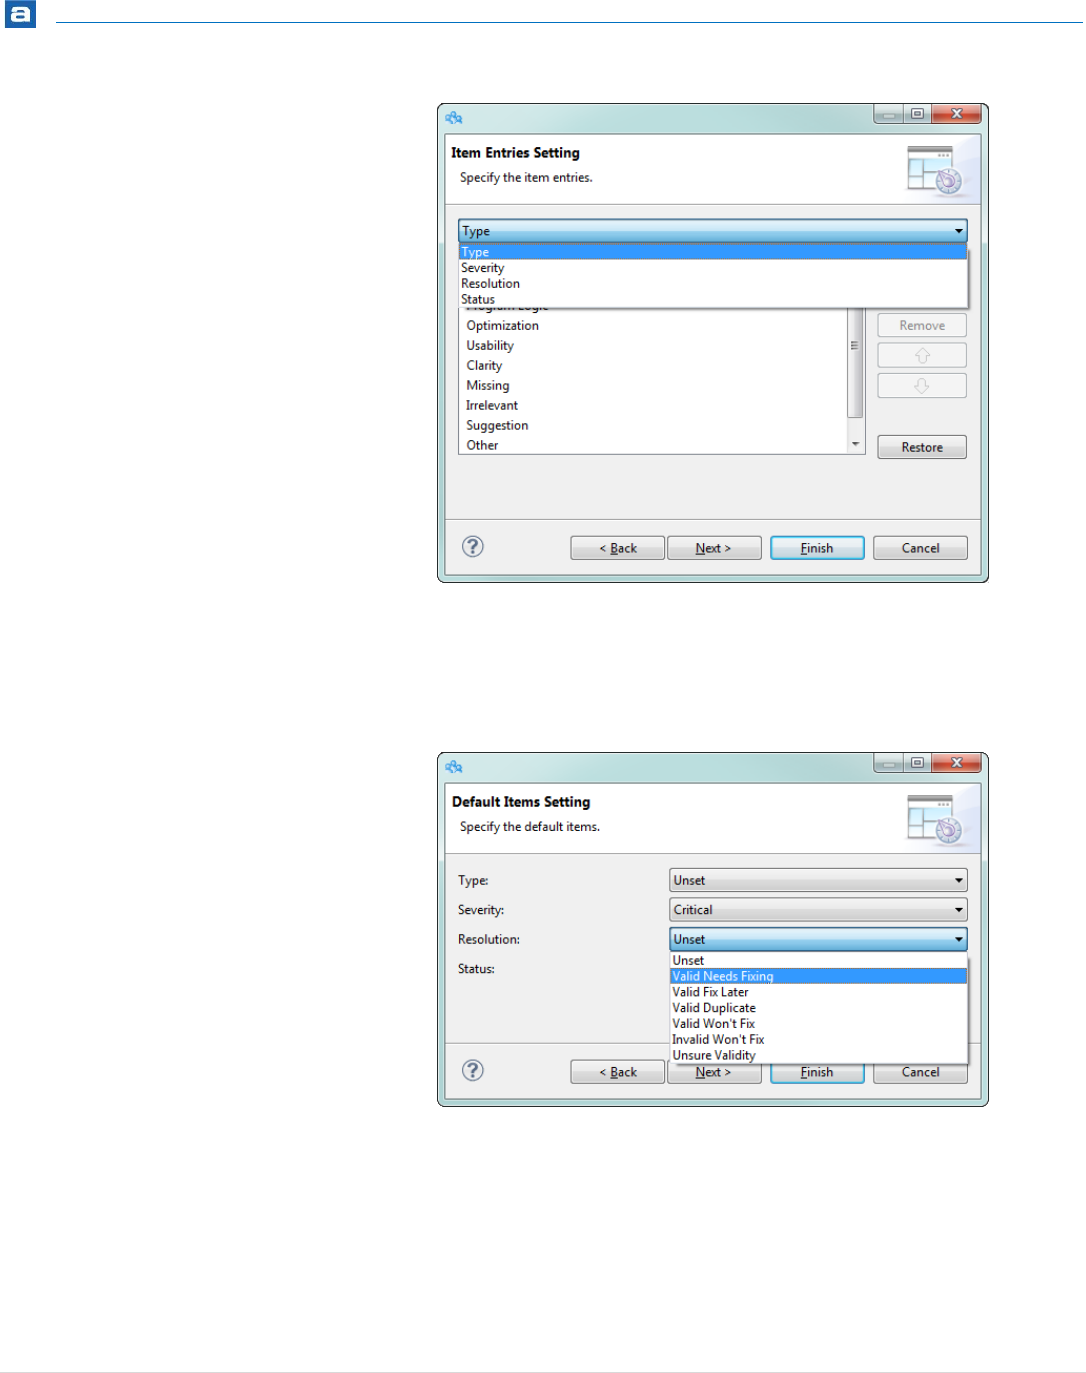
Revision History
405 | P a g e
Figure 379 - Review Comment Parameter Options
11. It is possible to set a default option for each of the above review
parameters. This will be used unless an option is chosen explicitly when a
review comment is created or modified.
Figure 380 - Setting Default Options for Review Parameters
12. Choose the folder name where review issue data will be saved within the
project. This folder will be stored in the root level of the corresponding
project. It is possible to put the review issue data in a subfolder, i.e.
“ProjectName/reviews/MileStone1_2013-01-02/” by using “/”
(forward slash). The previous example would be specified as:
“reviews/MileStone1_2013-01-02”

Revision History
406 | P a g e
Figure 381 - Naming the Review Issue Data Folder
13. In the final step the user can customize which information shall be shown
in the Review Table view during the three different phases; Individual,
Team, Rework. This is done by setting up filters. These filter can be toggled
on and off in the Code Review Table view during the inspection.
Figure 382 - Filter Settings for the Different Phases
Individual Phase – The default filter allows the reviewers to view their
own comments only. It is recommended is to keep this filter, so that
reviewers are not biased by each other’s review comments.
Team Phase – The default filter allows the moderator and the
reviewers to view only comments which have “Resolution: Unset”.
This means that only review comments that still require a decision are
shown.

Revision History
407 | P a g e
Rework Phase – This phase is relevant to reviewers that have had
review issues assigned to them (typically: the author), during the Team
Phase. The default filter allows such a reviewer to view only the issues
assigned to him, or her, and in addition have “Status: Open”.
Click Finish to save all settings for the specific Review ID.
14. As a final, and very important, step, make sure to commit the review
settings file which resides in the project root folder and is called
.code_review_properties to the version control system. Configuration
files are typically hidden from the rest of the project resources by using a
leading “.” (dot-character) in the filename. A file with a leading “.” in the
filename will not be shown by the Project Explorer view. In order to
commit this file the user must open the Navigator view which also shows
hidden configuration files.
TAILORING A REVIEW ID TEMPLATE
The DEFAULT review ID contains the template settings which all future reviews will be
based on. A company conducting regular code reviews can save a lot of time by making
sure that the DEFAULT Review ID correlates well to the outlined terminology used in
company process for code reviews and issue tracking. The following information is
transferred from the template to any freshly created review ID:
Review comment classification types
Review comment severities
Review comment resolution decisions
Review comment statuses
Default selections
Authors for the review
Phase filter selections
The DEFAULT review ID template can be edited from the Review panel in the Project
Properties by selecting DEFAULT and clicking Edit…

Revision History
408 | P a g e
Figure 383 - Editing the DEFAULT Review Template
The user may also choose to remove a Review ID by clicking Remove… in the Review panel
in the Project Properties. This will remove the corresponding sections from the review
settings file and all individual reviewer files containing the individual review issue data.
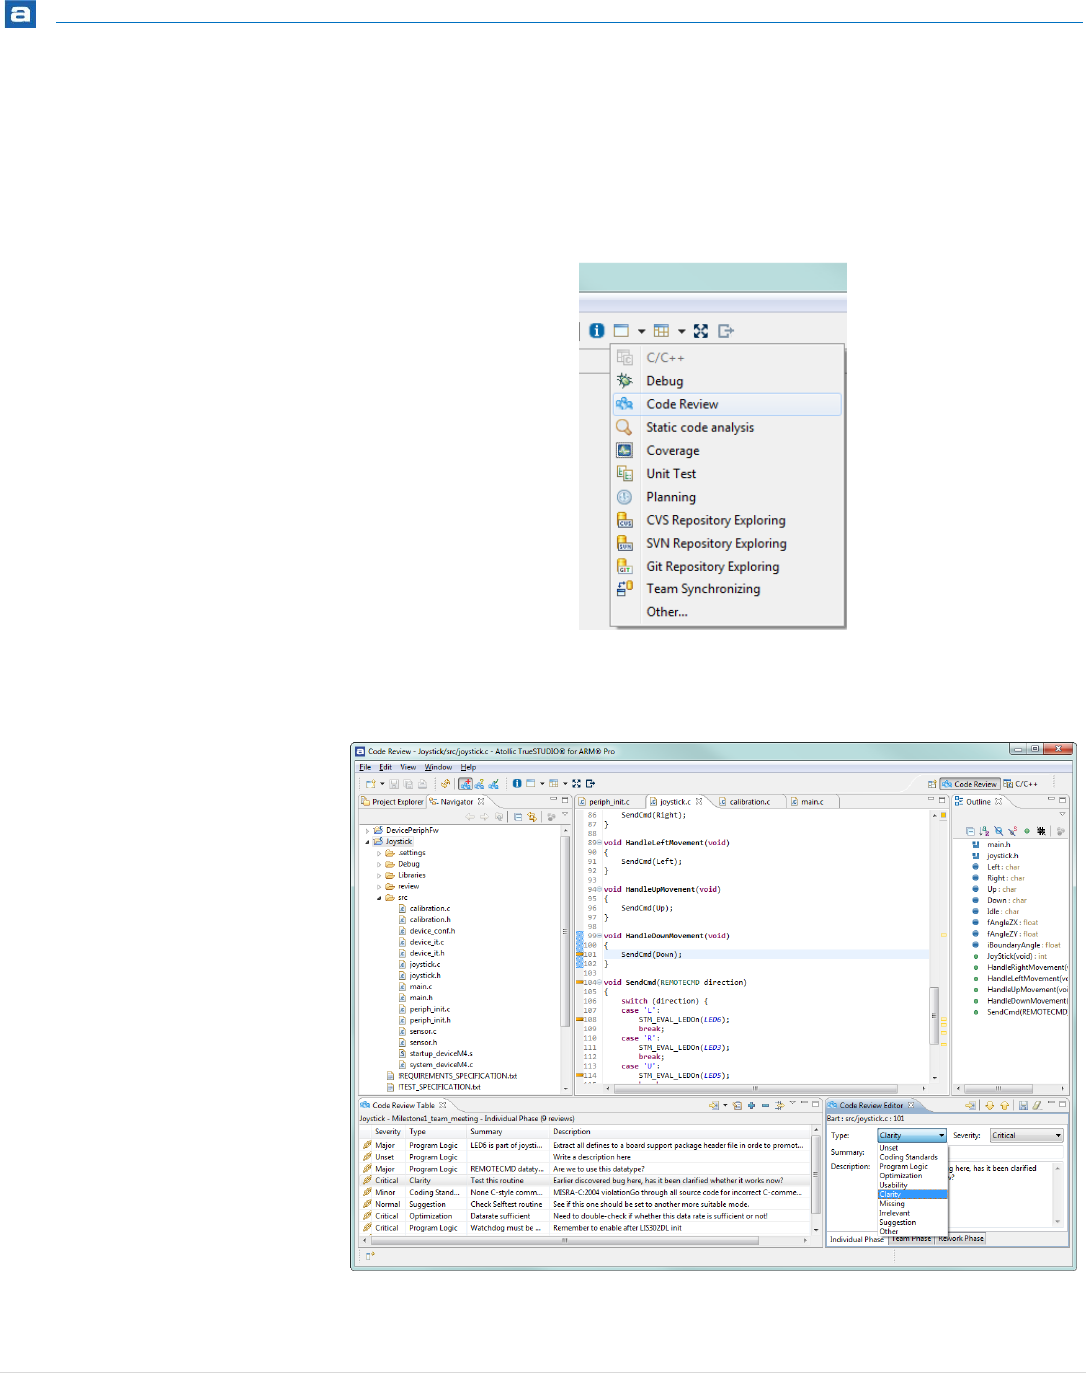
Revision History
409 | P a g e
CONDUCTING A SOURCE CODE REVIEW
The source code review is conducted in a separate perspective called the Code Review
perspective. This is accessed from the Open perspective toolbar button; or from the menu
command View > Open perspective > Code Review
Figure 384 - Code Review Selected via Open Perspective Command
The Code Review perspective contains a number of unique views and toolbar buttons.
Figure 385 - The Code Review Perspective

Revision History
410 | P a g e
The Code Review perspective has a toolbar adapted for navigation of review issues. The
toolbar has the following buttons and functionality:
Button
Name
Description
Refresh
Opens/refreshes the code review session
Individual Phase
Log into the individual phase and add code
review comments
Team Phase
Log into the Team Phase, and perform a code
review meeting
Rework Phase
Log into the Rework Phase, and correct the
problems assigned to you at the code review
meeting
Table 71 - Code Review Toolbar Buttons
The following views are primarily associated to the code review perspective:
The main editor area – The editor area of the perspective is needed to review the
source code files.
The Code Review Table view – This is the list of review issues. Different set of
issues will be listed depending on selected Phase and Reviewer.
The Code Review Editor view – An editor showing the current issue being created
or modified. The editor view provides different toolbar buttons depending on the
current phase of the review.
Figure 386 – The Code Review Table View
Button
Name
Description
Go to the source code
Select a file from the work product to
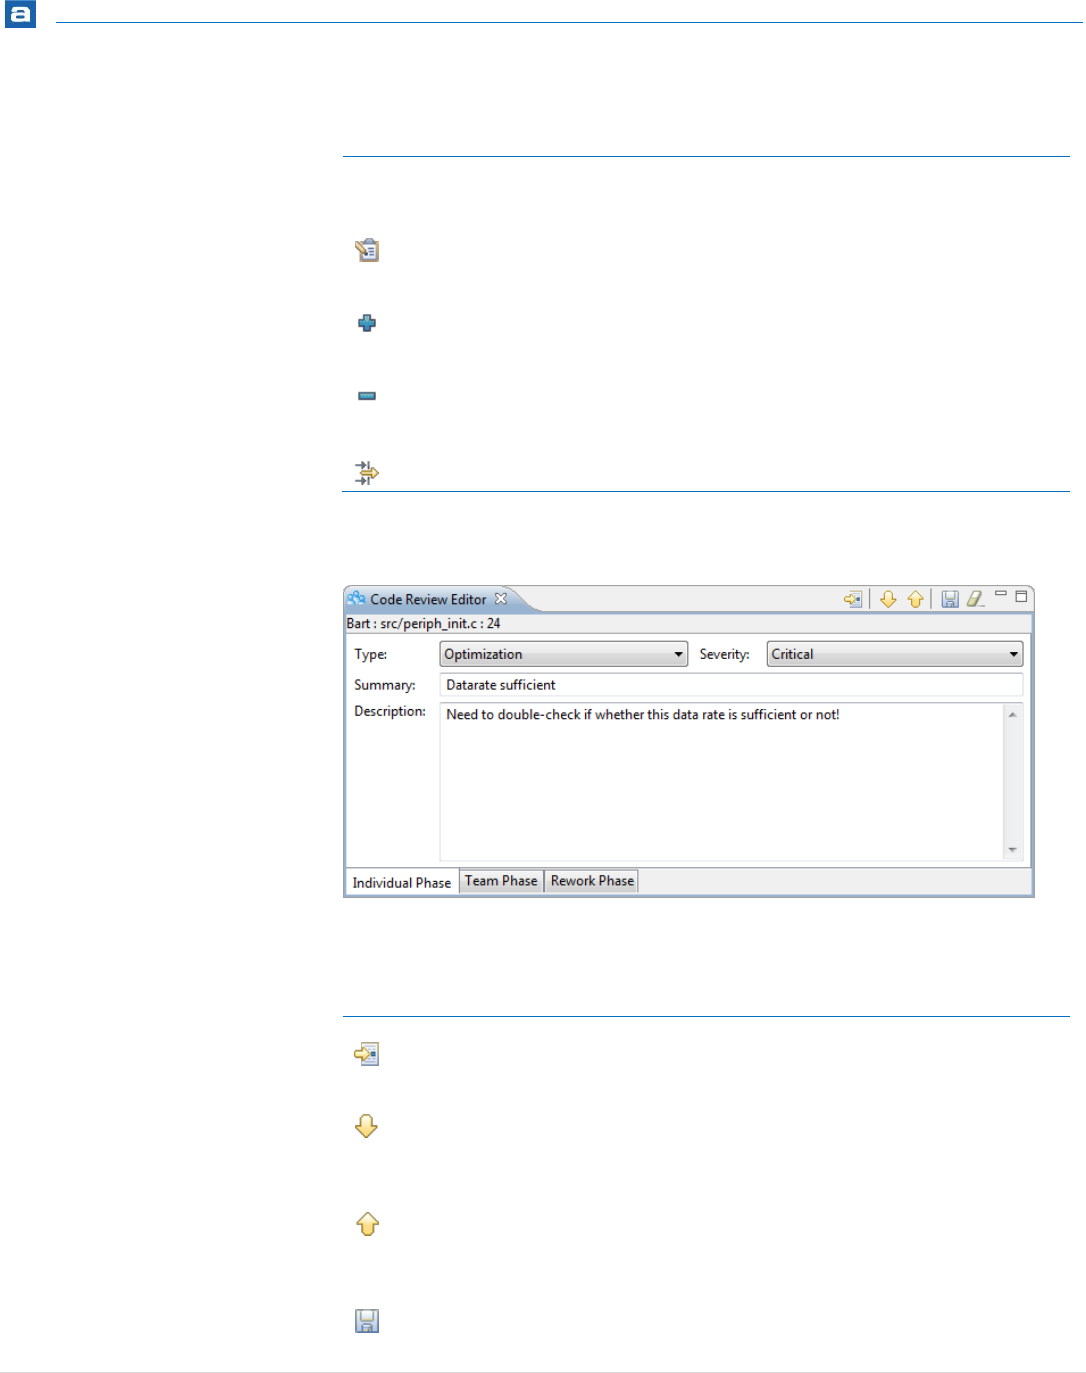
Revision History
411 | P a g e
Button
Name
Description
review
Edit the code review
Edit the settings for this specific code
review
Add code review issue
Adds a code review issue associated to the
code line the marker currently is on
Delete code review
issue
Delete the currently selected code review
issue
Filters…
Apply the filter setup for this code review
Table 72 - Code Review Table View Toolbar Button Description
Figure 387 – The Code Review Editor View
Button
Name
Description
Go to the source code
Select a file from the work product to
review
Next
Next review issue in the review table. Also
saves any changes made to the current
review issue.
Previous
Previous review issue in the review table.
Also saves any changes made to the current
review issue.
Save
Save changes to current review issue
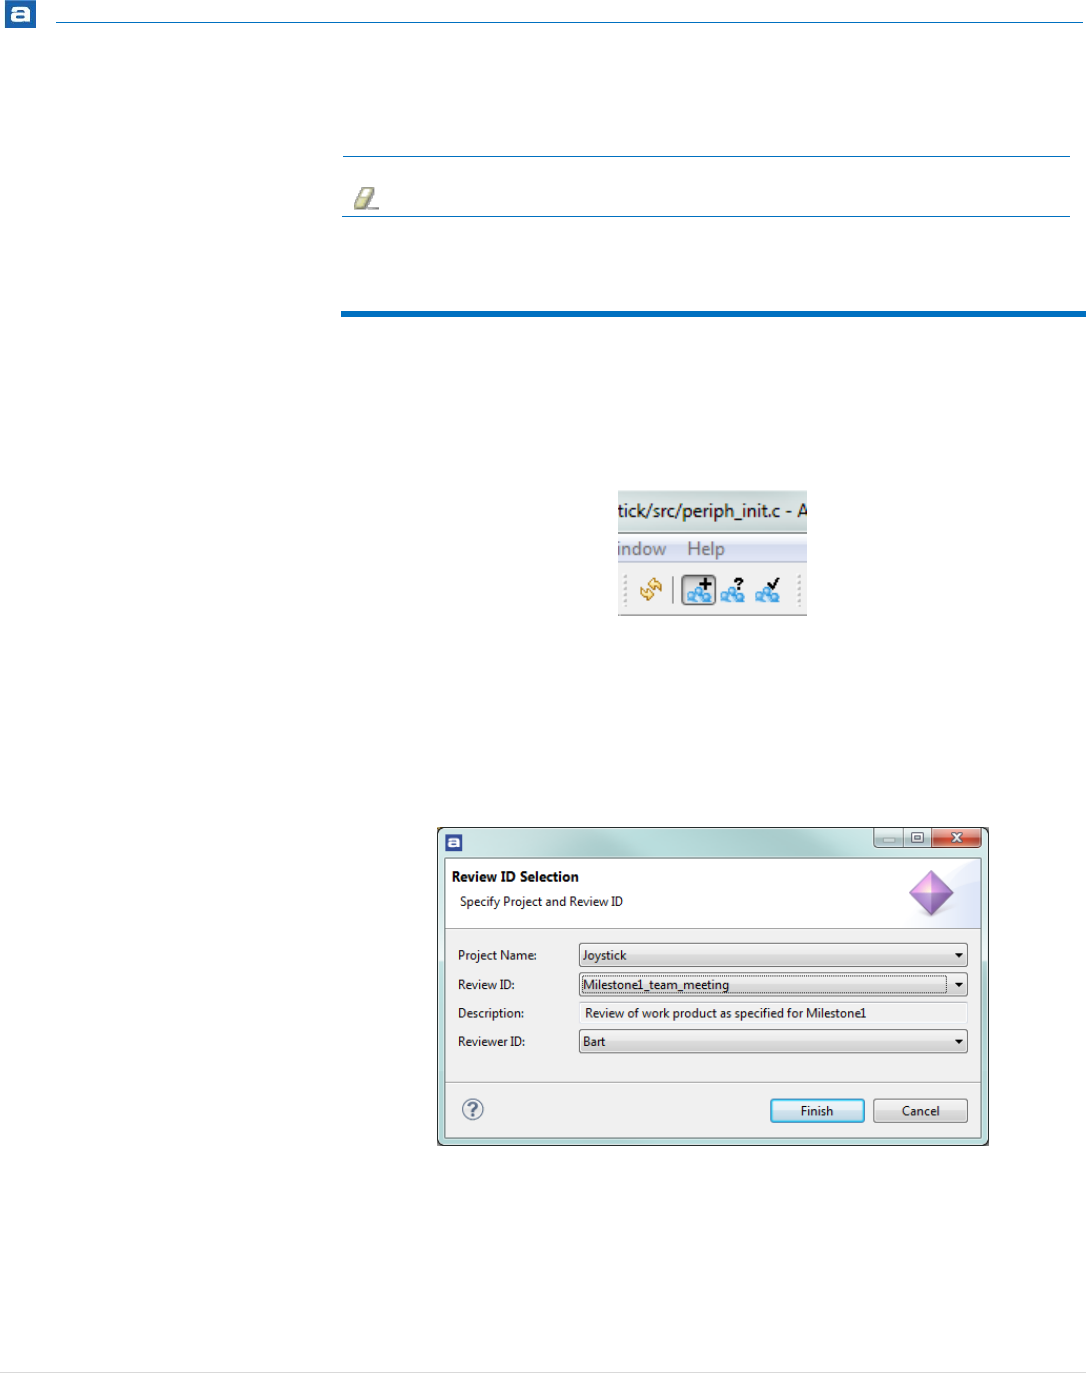
Revision History
412 | P a g e
Button
Name
Description
Clear
Clears the content of the editor
Table 73 – The Code Review Editor View Toolbar Button Description
INDIVIDUAL PHASE
In order to start working in the individual phase and add review comments, the reviewer
must use their own associated reviewer ID to log into a review session. The user does this
by clicking on the toolbar button Individual Phase in the Code Review perspective.
Figure 388 - Individual Phase Selected in the Code Review Toolbar
The Review ID selection dialog will appear when the user clicks on either of the three code
review phase related toolbar buttons. Review ID must be chosen so that the associated
work product is shown to the reviewer. The user must also choose his or her name from
the Reviewer ID drop-down menu. This will make sure that all review issues found are
associated with the specified Reviewer ID.
Figure 389 - Reviewer ID Selection Dialog
When a user has logged into the individual phase of a certain Review ID, it is possible for
him or her to start adding review comments. This is done by reviewing the work product.
The work product can be browsed by using the Go to the source code button in the Code
Review Table.
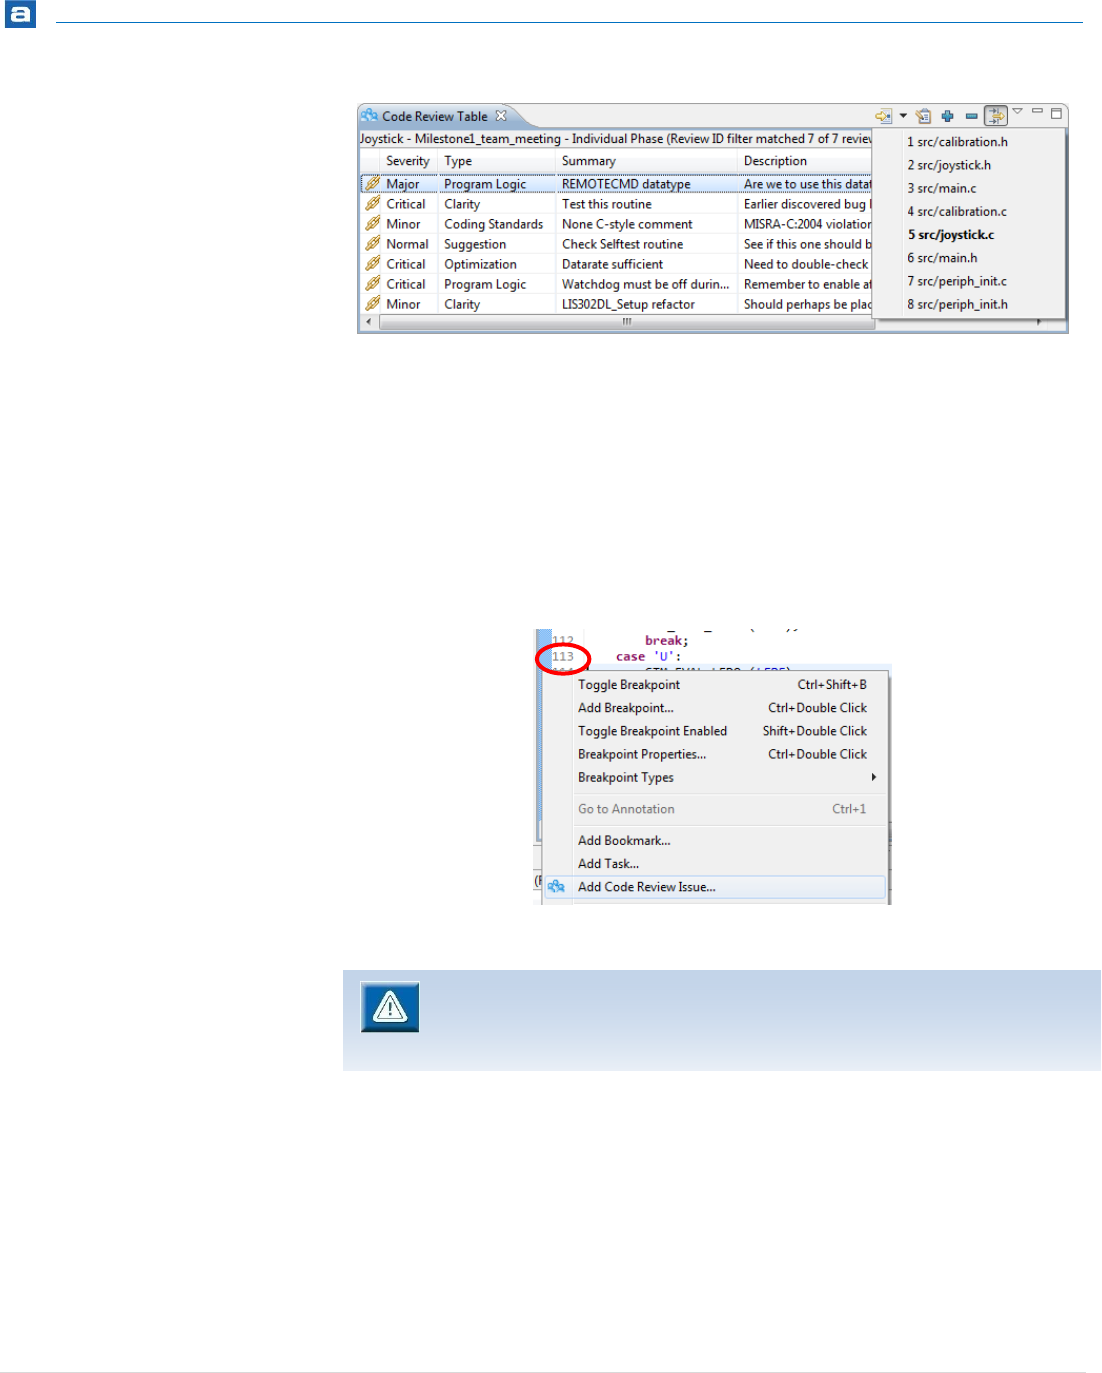
Revision History
413 | P a g e
Figure 390 - The Source Code Button & Drop-Down Menu
By selecting a file from the drop-down menu it will be opened in the Editor window of the
IDE.
To add a code review issue perform these two steps:
1. In the editor select a code-line with the mouse cursor, doing so the selected text will
be copied into the “description” field of the review issue.
2. Right-click on the line number and choose “Add code Review Issue…”
Figure 391 - Add Code Review Issue...
When clicking Add Code Review Issue… the reviewer will be hyper-linked into the Code
Review Editor view where a new review issue is being created.
If the user right-clicks in the editor instead of the line number, the review issue
may not be associated to the correct line number.
If no text is selected, the review issue description field will be empty.
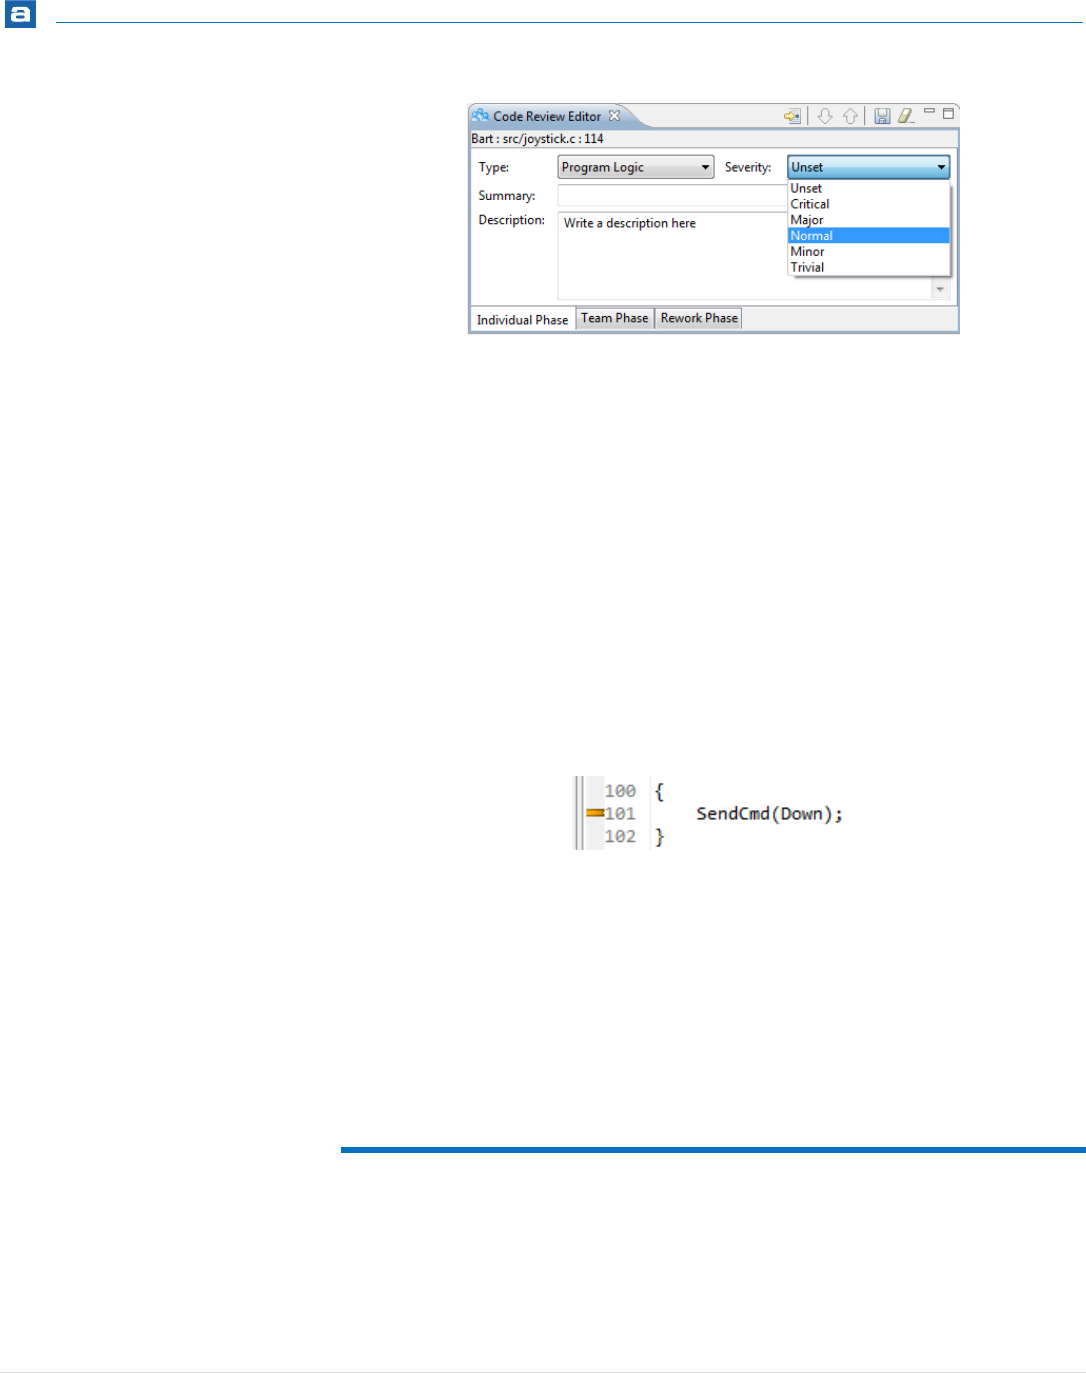
Revision History
414 | P a g e
Figure 392 – A Code Review Issue in the Review Editor View
The top of the Code Review Editor view shows information about who found the review
issue, in which file and at which code line. The user may also choose to select a code block,
right-click and then click Add Cod Review Issue… In this case the content of the code block
will be copied into the description field of the Review issue. The type and severity fields
are mandatory information for each review issue.
The type field identifies the type of review issue and the severity field defines the severity
level for the current issue.
After entering all information into the review issue being added, click the Save button in
the Code Review Editor view. Upon saving, the review issue will become visible in the
Code Review Table view. A review marker will also be added to the left margin of the main
editor window.
Figure 393 - Review Marker Displayed on Editor Line 101
Go through the different files included in the work product and add review comments.
When an individual user has finished reviewing the work product, he/she must remember
to commit the .review file to the version control system. This enables other reviewers to
access the review issues by retrieving the files them from the version control system.
This path to the .review file was specified during the review configuration phase. By
default the file is saved in the review subfolder within the project folder.
TEAM PHASE
In this phase the team members gather in a code review meeting to discuss all the review
issues that were found by the individual reviewers. Before starting this phase it is
important that the review moderator assures that all reviewers have committed their
.review file, and subsequently updates his or her own local copy of each .review file
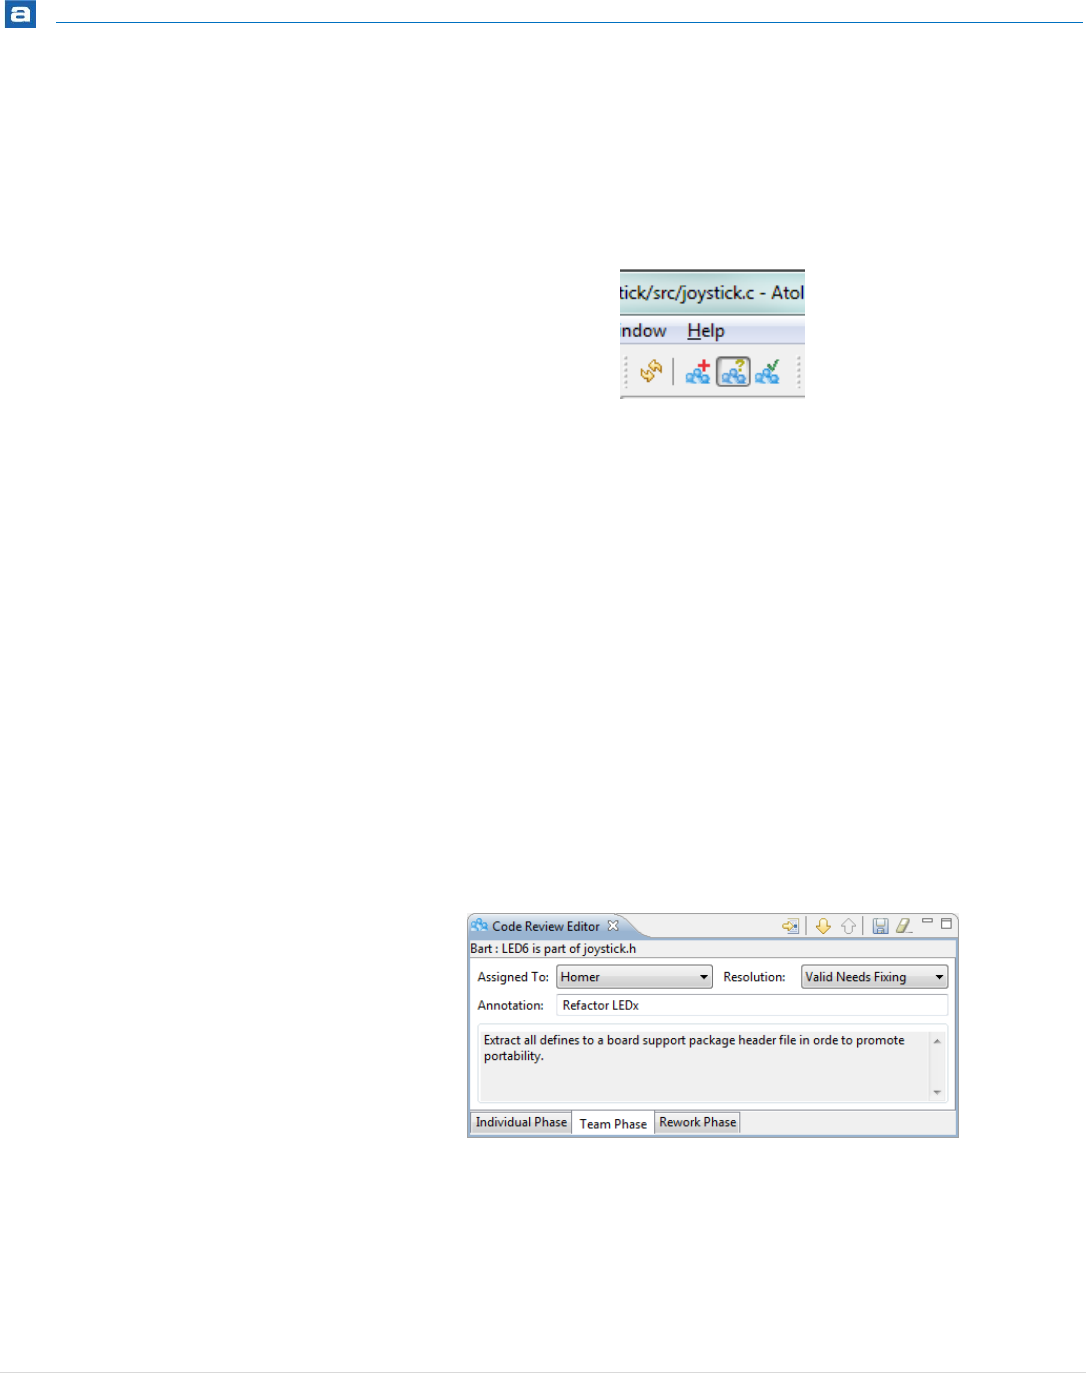
Revision History
415 | P a g e
from the version control system. If this is not done properly, the issues from one, or more,
reviewers are not taken into account, and will not show up in the collaborative Code
Review Table view.
To start the team phase (code review meeting), click on the Team Phase toolbar button in
the Code Review perspective.
Figure 394 - Team Phase Toolbar Button
The Review ID Selection dialog will appear where the user is prompted to select a Project,
a Review ID and a Reviewer ID. The Reviewer ID in this phase is typically the author of the
work product under review or the moderator hosting the meeting.
All review issues collected by all reviewers are now displayed in the Code Review Table
view (provided that the review comment files have been committed to the version control
system, and have subsequently been updated to the computer being used for the code
review meeting).
Click on any review issue in the Code Review Table view and its content will be shown in
the Code Review Editor view. If an already existing review issue is modified in this phase,
make sure to click Save, Next, or Previous button to automatically save any changes. By
double-clicking on any review issue in the Code Review Table view, the associated source
code lines are also shown in the editor area of the IDE.
Review issues can also be navigated from the Code Review Editor view by using the Next
and Previous buttons. The Go to the source code button allows jumping from the Code
Review Editor view into the source code.
Figure 395 - Code Review Editor View Content in Team Phase
The Assigned To field contains the author’s Review ID by default, but can be changed to
the Reviewer ID of any other team reviewer. When the group has reached a decision on
how to handle the review issue at hand, the Resolution field must be changed to reflect
this decision. The Annotation field allows additional information to be added.
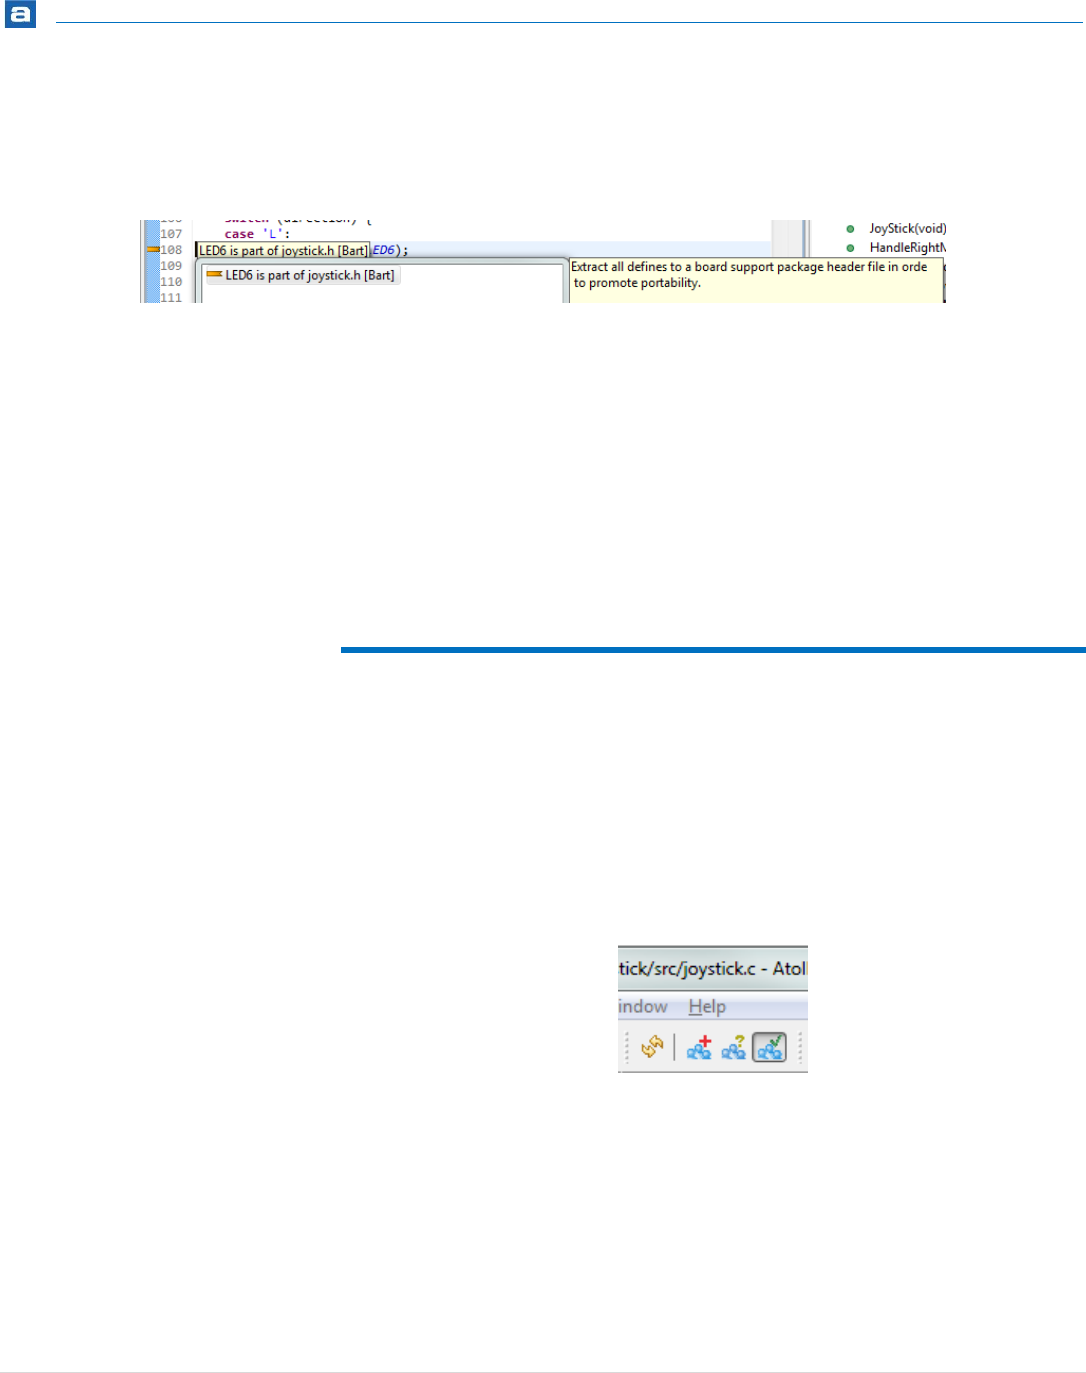
Revision History
416 | P a g e
By single-clicking on a review marker in the source code, the summary and description of
the review issues for the specific code line will be shown in a tooltip.
Figure 396 - Review Markers and Tooltip Information in the Editor
Review markers are also subject to the filter that is configured for the current phase of the
code review. For example, if the filter is set to show Resolution: Unset issues only, then
only review markers associated with such review issues will be shown.
When all review issues have been handled in the code review meeting; a reviewer has
been assigned and a resolution has been chosen for all review comments, it is important to
remember to commit the .review files to the version control system. When this is done
all reviewers are able to access the decision outcome information from the Team Phase,
and the code review can enter the Rework Phase.
REWORK PHASE
In this phase each reviewer will work on the review issues that were assigned to him/her
at the code review meeting, in order to implement the agreed resolution. Before starting
this phase it is important that the each reviewer updates the folder containing the
.review files from the version control system. If this is not done, the reviewer will not be
able to access any assigned-to or resolution information from the code review meeting.
To start this phase click on the Rework Phase toolbar button in the Code Review
perspective.
Figure 397 - Team Phase Toolbar Button
The Review ID Selection dialog will appear where the user is prompted to select a Project
a Review ID and a Reviewer ID.
In the Code Review Table view, the user will only see the review issues that were assigned
to the reviewer that was selected in the Review ID Selection dialog when entering this
phase. The purpose of this phase is that each reviewer addresses the review issues that
were assigned to him/her respectively.
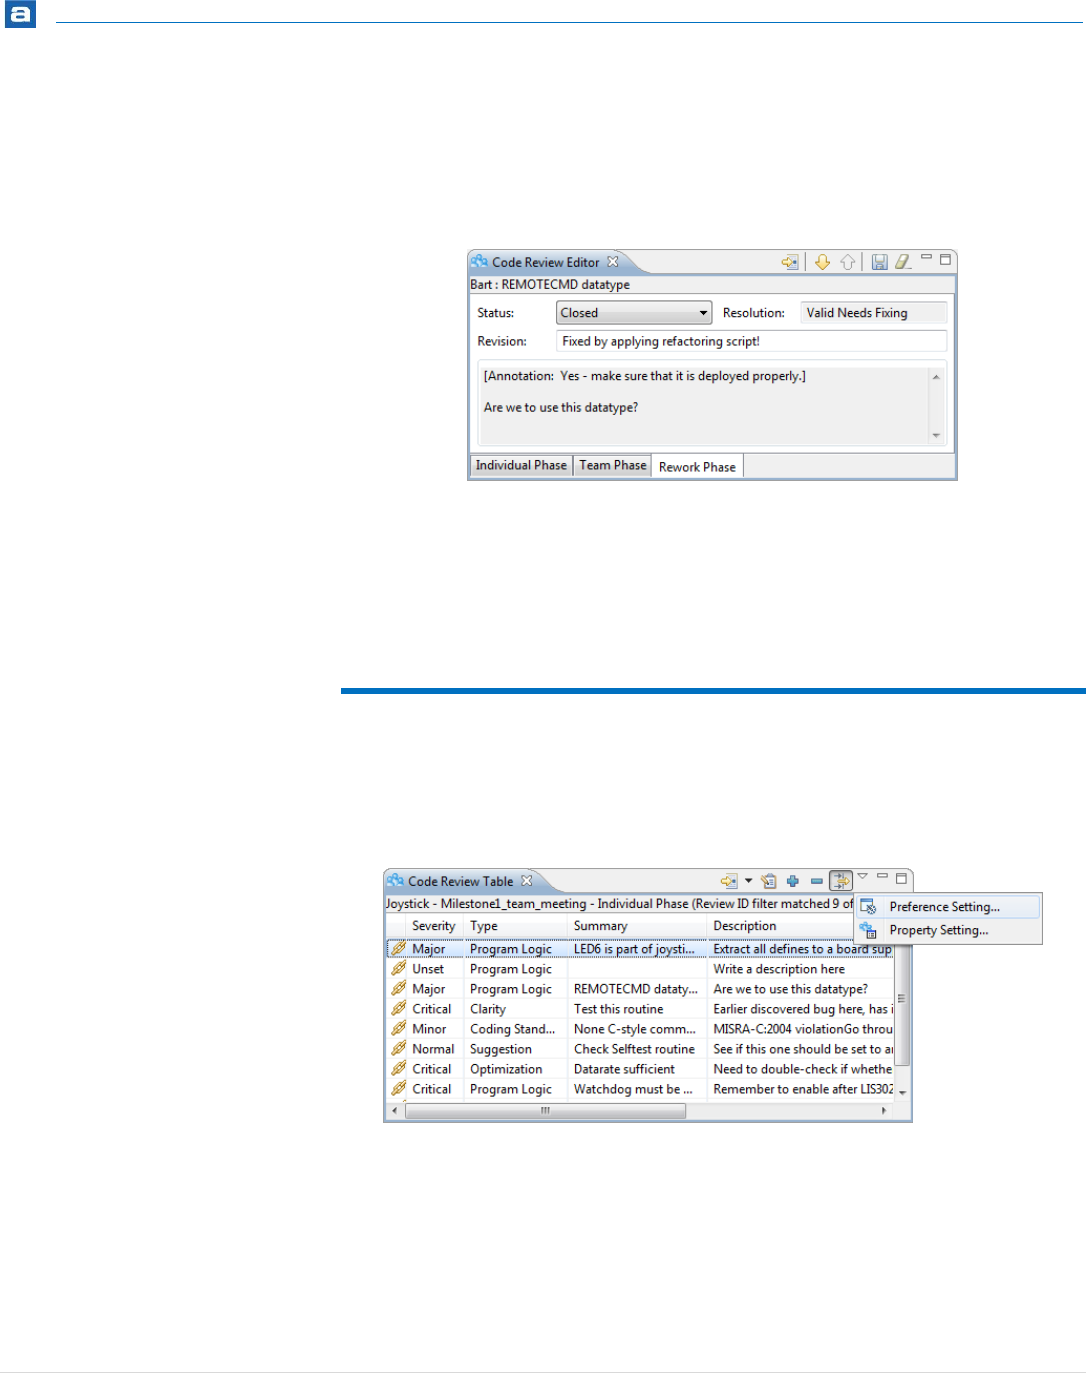
Revision History
417 | P a g e
The Code Review Editor view will now contain the fields Status, Resolution and Revision.
The Status field allows the status of each review issue to be changed. The resolution fields
simply states the agreed resolution decided at the code review meeting. It can and should
not be changed in this phase. The Revision field provides the possibility to write a
comment related to the implemented resolution.
Figure 398 - Code Review Editor View Content in the Rework Phase
When all fields are filled in for the Review issue at hand, the reviewer must click Save,
before the buttons Next and Previous can be used to view the next review issue to fix.
When updated statuses for all review issues have been saved, the Code Review Table view
will be empty. The reviewer must then remember to commit the .review file to the
version control system so that the moderator can verify that everything has been fixed.
ADDITIONAL SETTINGS
The Code Review Table view can also be customized temporarily without overwriting the
.code_review_properties file. This is done from the Preference settings found in the
Code Review Table view toolbar.
Figure 399 - Accessing Code Review Preference Settings
In this customization dialog the user may change filters that are applied on the Code
Review Table view in order to show only review issues that have a certain parameter
combination. It is also possible to tailor which columns, and thereby which parameters, are
visible in each phase.
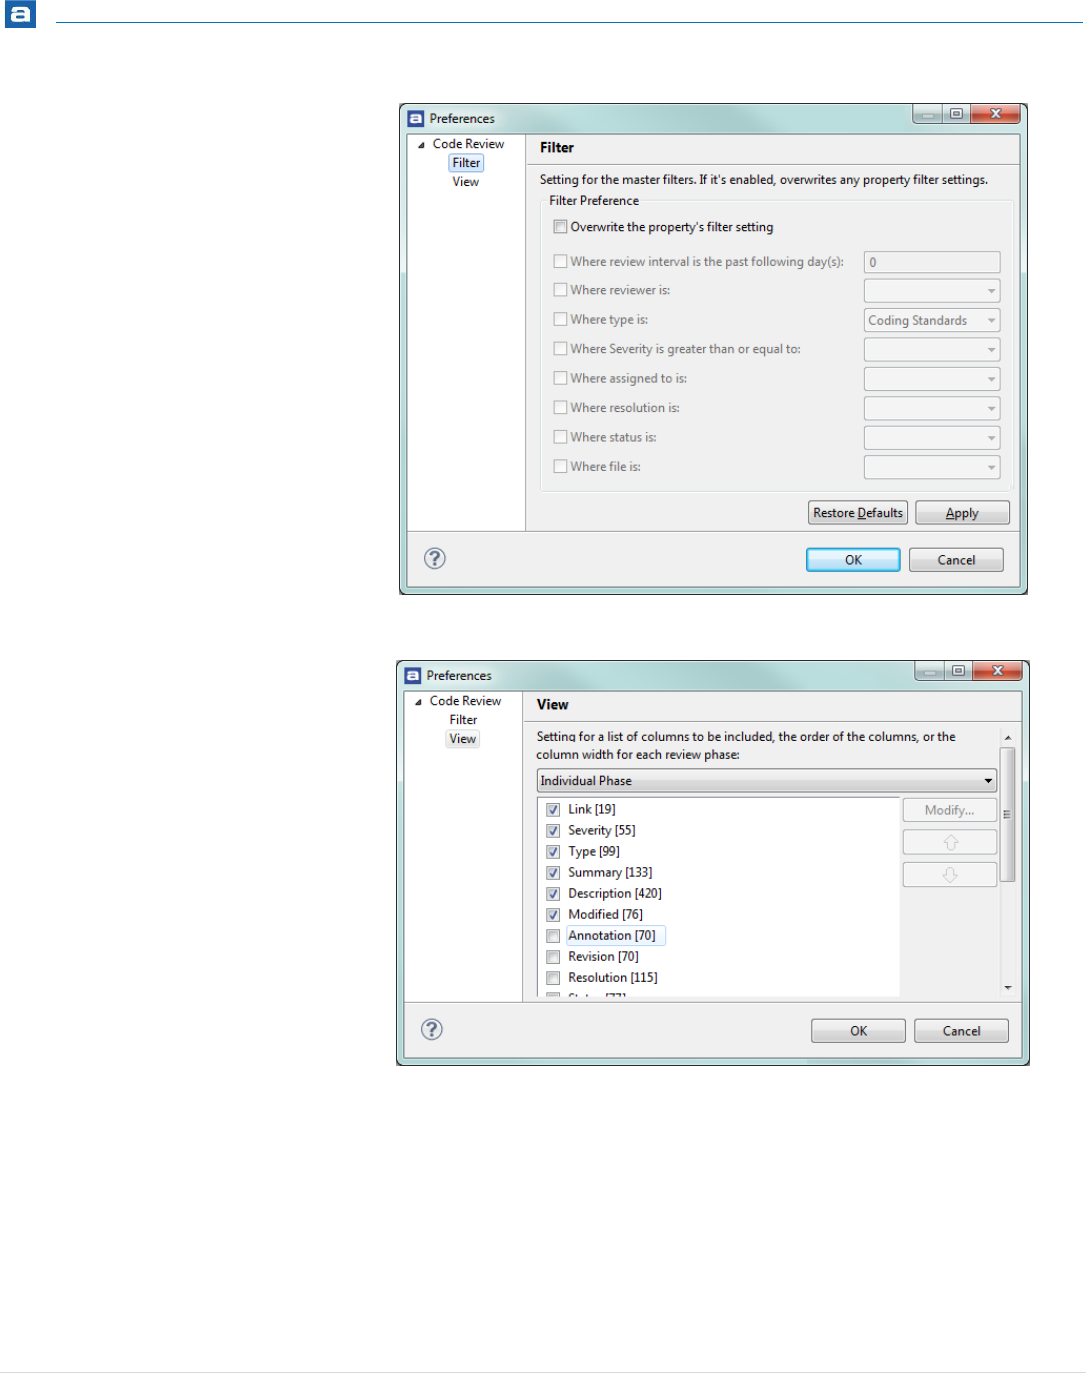
Revision History
418 | P a g e
Figure 400 - Customize Filters Applied for All Phases
Figure 401 - Customize Visible Code Review Table Columns

Revision History
419 | P a g e
REVISION HISTORY
This section provides information what’s changed in this document in each revision.

Revision History
420 | P a g e
REVISION HISTORY
The revision history of this document is briefly described below.
Revision
Change
Page
20
Atollic TrueSTUDIO for STM32 v9.0 updates
Updated Static Stack Analyzer Using Search Field
Updated text and screen shots to use STM32 examples
Removed irrelevant information such as Licensing and
Lite/Pro descriptionwhich no longer exist in the product.
Added chapter Disassemble/List Object and Elf Files
Updated product name to TrueSTUDIO for STM32
Updated Introduction
Updated SVD file information (get from ST instead of from
ARM)
Removed sections regarding license system
Removed sections regarding non-ST target devices
Removed sections regarding integration of non-ST tools and
software
Removed sections regarding P&E GDB server
Removed sections regarding OpenOCD debug server
Updated figure 44 and 238 regarding avialble debug probes
Removed sections regarding connection to web shop
Updated sections regarding difference beween Lite and Pro
mode. All features are now available from start without
licensning.