Bai 13 Xlstat Getting Started Manual
Bai%2013%20-%20xlstat%20Getting%20started%20manual
User Manual:
Open the PDF directly: View PDF ![]() .
.
Page Count: 104 [warning: Documents this large are best viewed by clicking the View PDF Link!]
XLSTAT Getting started manual © Addinsoft 1
Getting started manual
XLSTAT Getting started manual © Addinsoft 2
Table of Contents
Install XLSTAT and register a license key ....................................................................................................... 4
Install XLSTAT on Windows ....................................................................................................................... 4
Verify that your Microsoft Excel is up-to-date ...................................................................................... 4
Enable the Microsoft Excel macros ....................................................................................................... 6
Install XLSTAT in administrator mode ................................................................................................... 8
Run XLSTAT for the first time .............................................................................................................. 10
Install XLSTAT on Mac ............................................................................................................................. 13
Install XLSTAT from the downloaded file ............................................................................................ 13
Run XLSTAT for the first time .............................................................................................................. 17
Register a license key .............................................................................................................................. 20
Use XLSTAT .................................................................................................................................................. 23
Overview of XLSTAT interface ................................................................................................................. 23
Select data in XLSTAT .............................................................................................................................. 28
Set up your first analysis ......................................................................................................................... 32
Principal Component Analysis ............................................................................................................. 32
Linear regression ................................................................................................................................. 38
t-test .................................................................................................................................................... 45
Set up you first chart ............................................................................................................................... 51
Univariate plots ................................................................................................................................... 52
Histograms ........................................................................................................................................... 56
Scatter plots......................................................................................................................................... 61
Parallel coordinate plots...................................................................................................................... 64
Error bars ............................................................................................................................................. 67
Plot a function ..................................................................................................................................... 69
Customize a graphic ................................................................................................................................ 73
Tools of XLSTAT ....................................................................................................................................... 83
Tools used to make automatic searches and changes in a dataset .................................................... 83
Manage sheets .................................................................................................................................... 85
Export results into image files ............................................................................................................. 86
Tools to manage menu bars ................................................................................................................ 87
Advanced tools to save time in XLSTAT ....................................................................................................... 88
XLSTAT Getting started manual © Addinsoft 3
Enable the advanced buttons .................................................................................................................. 88
Reuse the settings of a dialog box ........................................................................................................... 90
Launch an analysis using the Visual Basic editor ..................................................................................... 93
Customize an analysis using Visual Basic .............................................................................................. 100
XLSTAT Getting started manual © Addinsoft 4
Install XLSTAT and register a license key
Install XLSTAT on Windows
Verify that your Microsoft Excel is up-to-date
Before installing XLSTAT, it is very important to verify that you have an up-to-date version of Microsoft
Excel. This way, you will ensure that XLSTAT works properly.
There are two ways for updating Microsoft Excel. You can either use the “Windows Update” function
available from the “Start” menu or use the Microsoft Excel website to find the “Service Pack” that
corresponds with your version of Office.
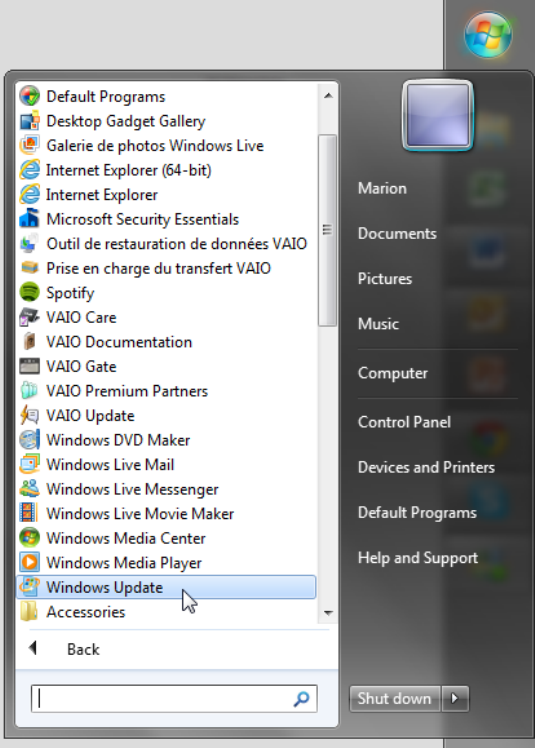
The simplest option, and the one we recommend, is to use the “Start” menu.
Go to the “Start” menu and click on “All Programs”. Then, press the option “Windows Update”.
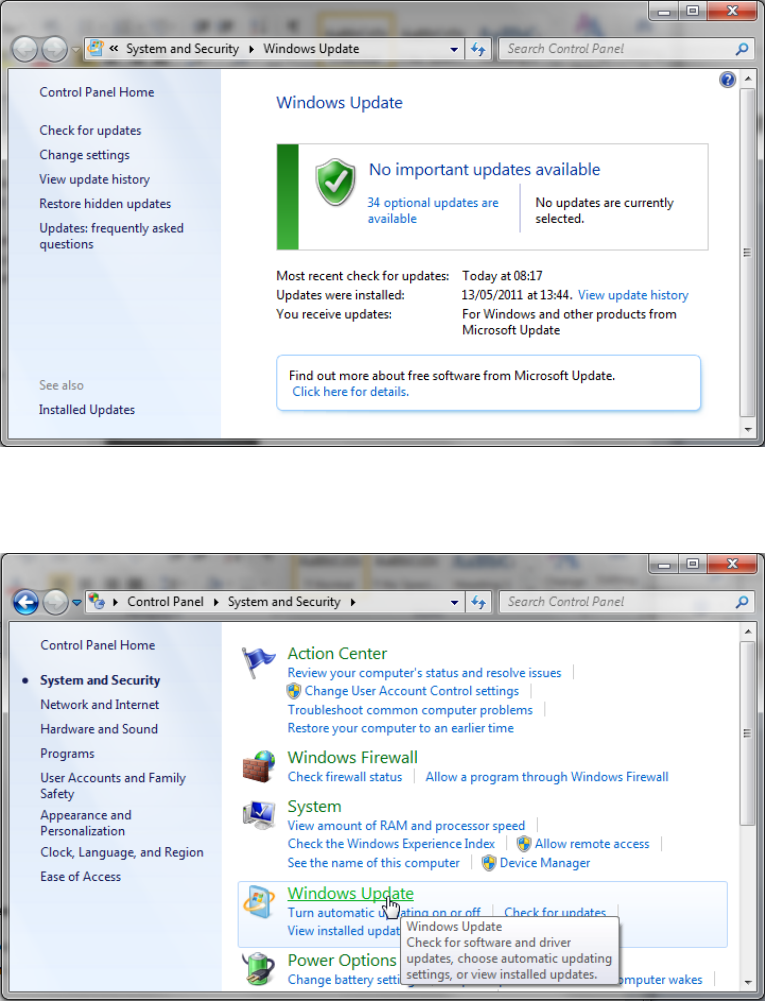
You are directed to the “Windows update” folder.
XLSTAT Getting started manual © Addinsoft 5
There, you will get notified if you do need to make updates. Proceed to the updates, if necessary.
Also, note that the “Windows Update” menu can also be found in the “Control Panel”, for Windows 7 it
is under the menu “System and Security”.
Once you have completed the updates, you may need to restart your computer for them to be taken into
account.
In the next chapter, you will find information on how to enable the Microsoft Excel macros so that
XLSTAT runs smoothly.
XLSTAT Getting started manual © Addinsoft 6
Enable the Microsoft Excel macros
The last step before installing XLSTAT is to make sure that the macros’ settings are properly set.
Independent of your versions of Excel and XLSTAT, it is necessary that the macros are enabled and that
their security level is set to “Medium” so that XLSTAT can run.
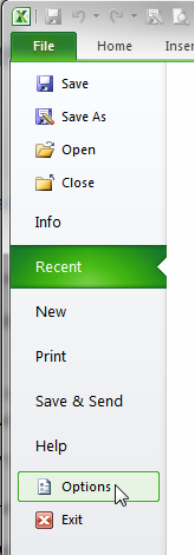
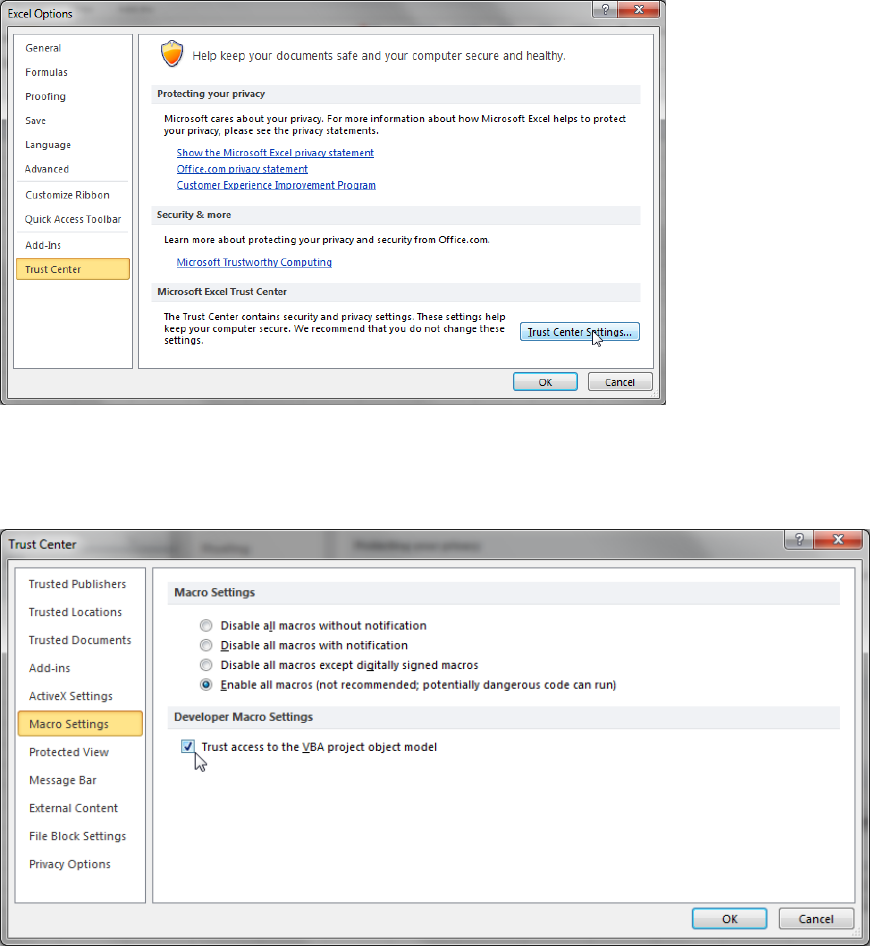
To set the “Macro security level” you need to open the Excel “Options” menu. It is located in the “File”
tab in Excel 2010 and in the “Office menu window” in Excel 2007.
Select the option “Trust Center” and then “Trust Center Settings...”.
XLSTAT Getting started manual © Addinsoft 7
Click on “Macro Settings” and select the 2nd option.
Activate the option “Trust access to the VBA project object model”.
Exit both the “Trust center” window and the “Excel options” window by pressing “OK” on both windows.
When this is done, you can carry on installing XLSTAT, you can get more information about this in the
next chapter.
XLSTAT Getting started manual © Addinsoft 8
Install XLSTAT in administrator mode
Once you have made sure that your version of Microsoft Excel is up-to-date, and the macro security level
is set to medium, you can proceed to the installation of XLSTAT. In this chapter, you will learn how to
install XLSTAT from the file downloaded from our website.
It is necessary that you have the administrator rights on your machine. If there are several accounts on
the machine, the administrator needs to install and run XLSTAT once to enter the license key.
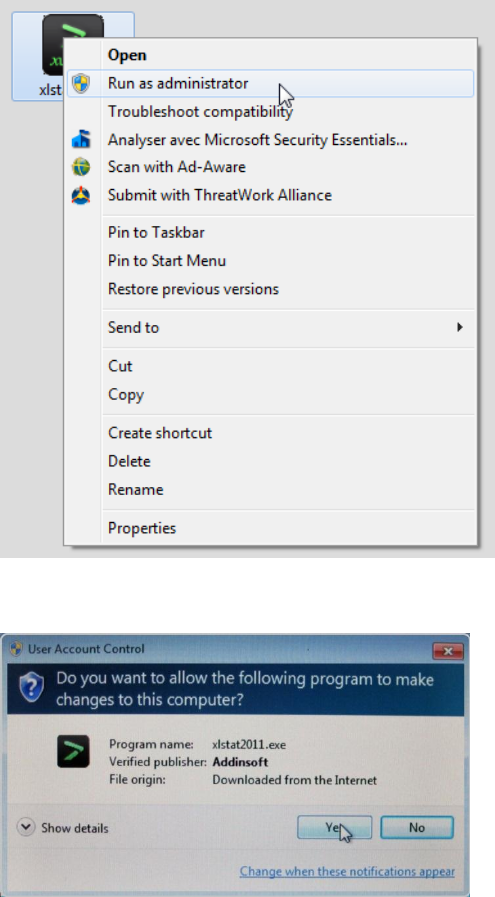
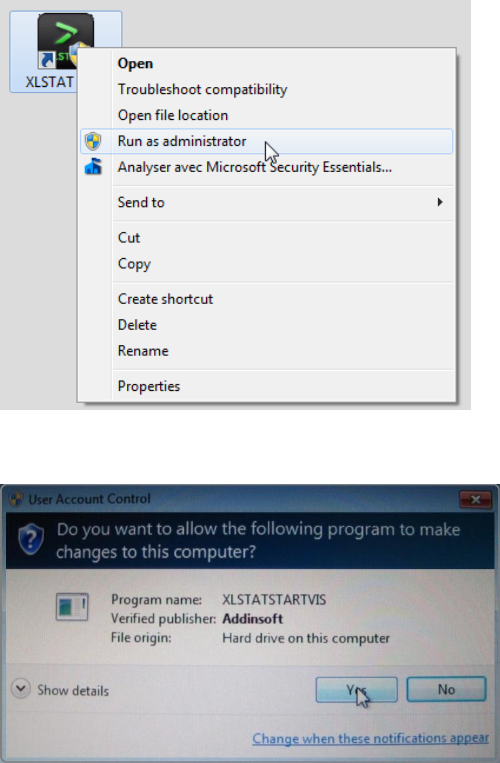
To proceed to the installation you should execute the XLSTAT file that you previously downloaded on the
XLSTAT website. To be sure that you have the administrator rights you can right click and select the
option “Run as administrator”.
Allow XLSTAT to modify the settings on your computer.
XLSTAT Getting started manual © Addinsoft 9
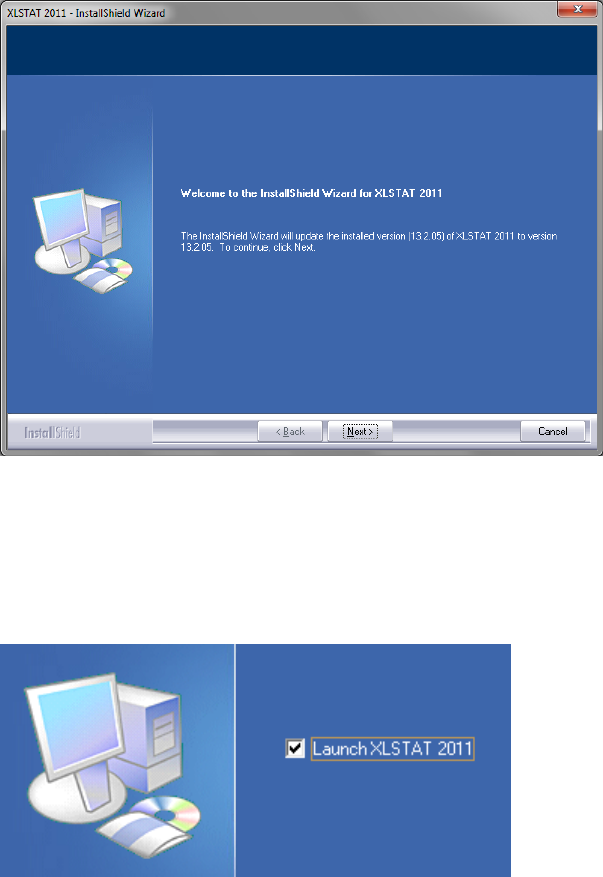
Once this is done, the “InstallShield Wizard” will start.
Follow the instructions until the installation is completed. First, you select the installation language.
Then, you accept the license agreement. After that you decide on the installation type, and finally you
choose a folder for the program files.
You can decide to launch XLSTAT right away by ticking the option “Launch XLSTAT”.
You have now installed XLSTAT successfully and are ready to run XLSTAT for the first time. This is the
topic of the next chapter in this getting started series.
XLSTAT Getting started manual © Addinsoft 10
Run XLSTAT for the first time
Now that you have installed XLSTAT you are ready to run it for the first time. In this chapter, you will see
how to run XLSTAT for the first time.
There are many ways to run XLSTAT for the first time. First, you can choose the option to start XLSTAT
automatically after the installation procedure. You simply need to select that option when you exit the
“InstallShield wizard”.
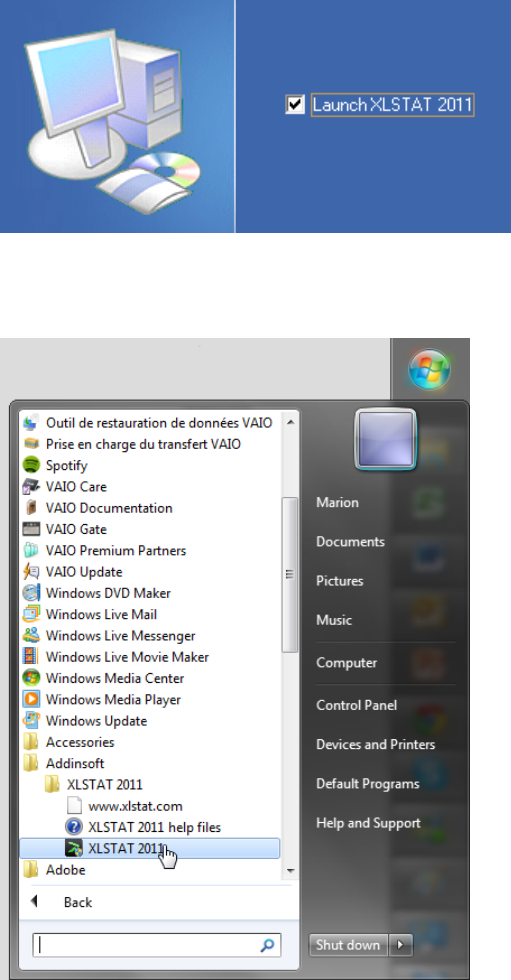
Secondly, you can use the XLSTAT command, which is found in the “Windows Start” menu under “All
Programs / Addinsoft / XLSTAT”.
XLSTAT Getting started manual © Addinsoft 11
Alternatively, it is also possible to double-click on the XLSTAT shortcut on your desktop.
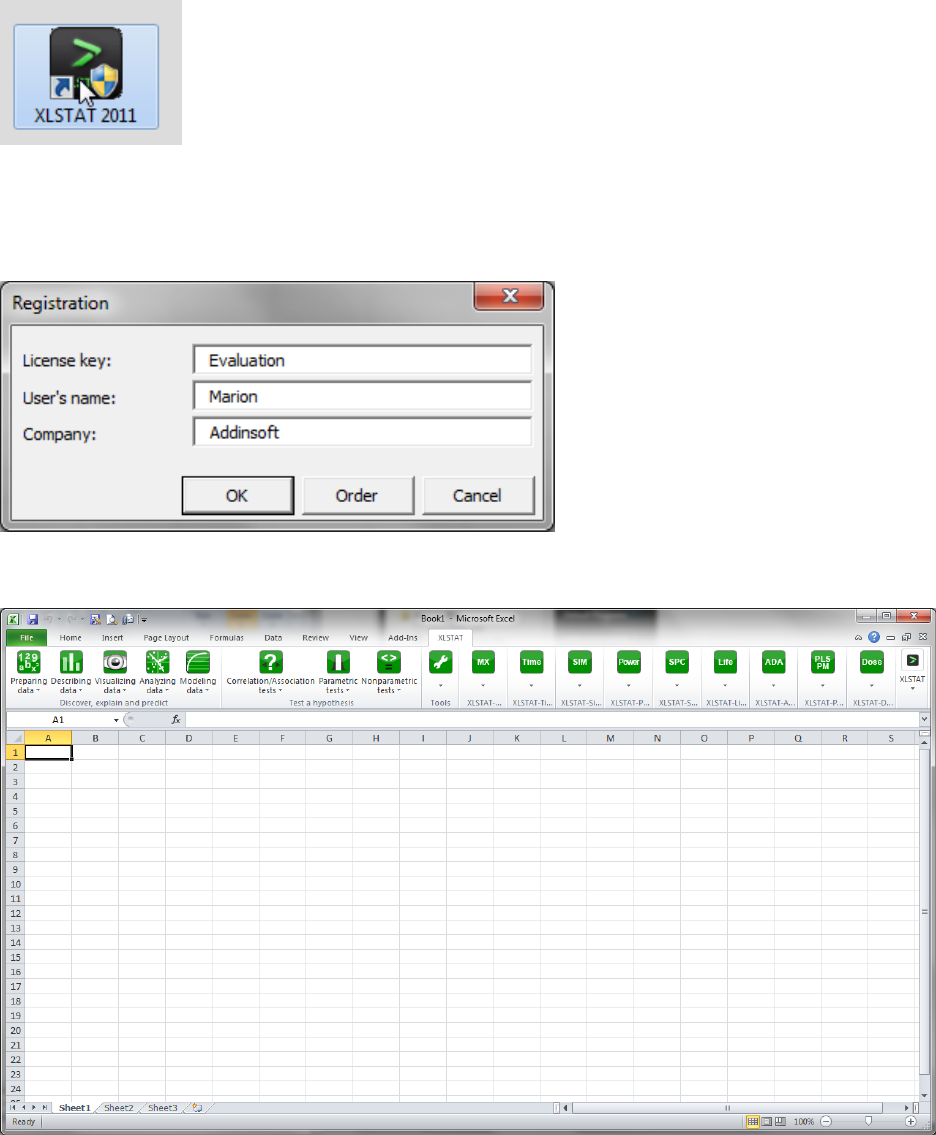
XLSTAT will then prompt you for a license number. If you have one, copy and paste it in the license key
field. If you are trying out the software, leave the "Evaluation" license key as it is. Enter your name and
your company name and click “OK”.
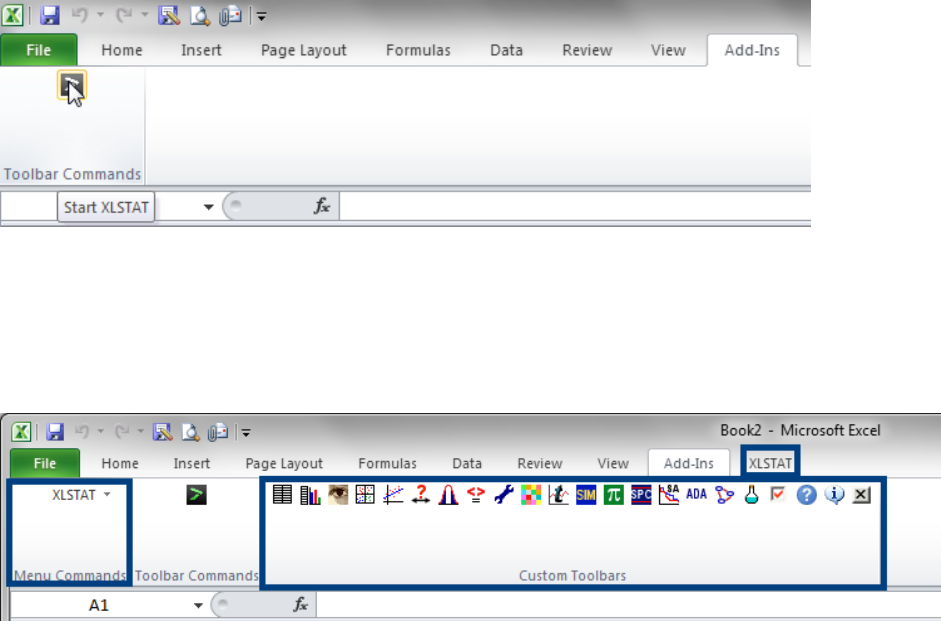
You are now viewing the new Microsoft Excel tab called XLSTAT.
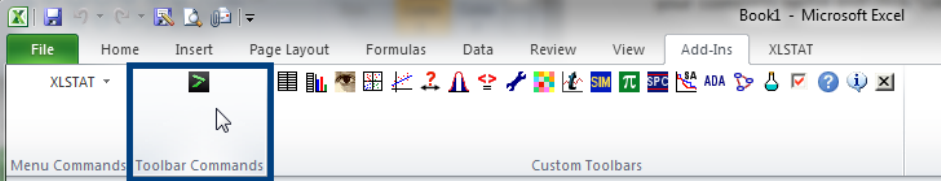
We can also see some changes in the “Add-ins” tab. You should especially pay attention to the button
XLSTAT in the “toolbar command” as it can later be used to open or close XLSTAT from Excel.
XLSTAT Getting started manual © Addinsoft 12
You have now run XLSTAT for the first time and if you had a license key you had the opportunity to set it
right away. In the next chapter, you will learn how you can enter a license key at the end of your
evaluation period. If you already have set your license you can skip the next chapter and read the one
after where we will have a look at the XLSTAT interface.
XLSTAT Getting started manual © Addinsoft 13
Install XLSTAT on Mac
Install XLSTAT from the downloaded file
To install XLSTAT on a Mac you should have the password for installing new program on this Mac.
We recommend you to have an updated version of Microsoft Excel for Mac. Also remember that you
need a version MS Excel compatible with XLSTAT. Check the requirements of XLSTAT before installing.
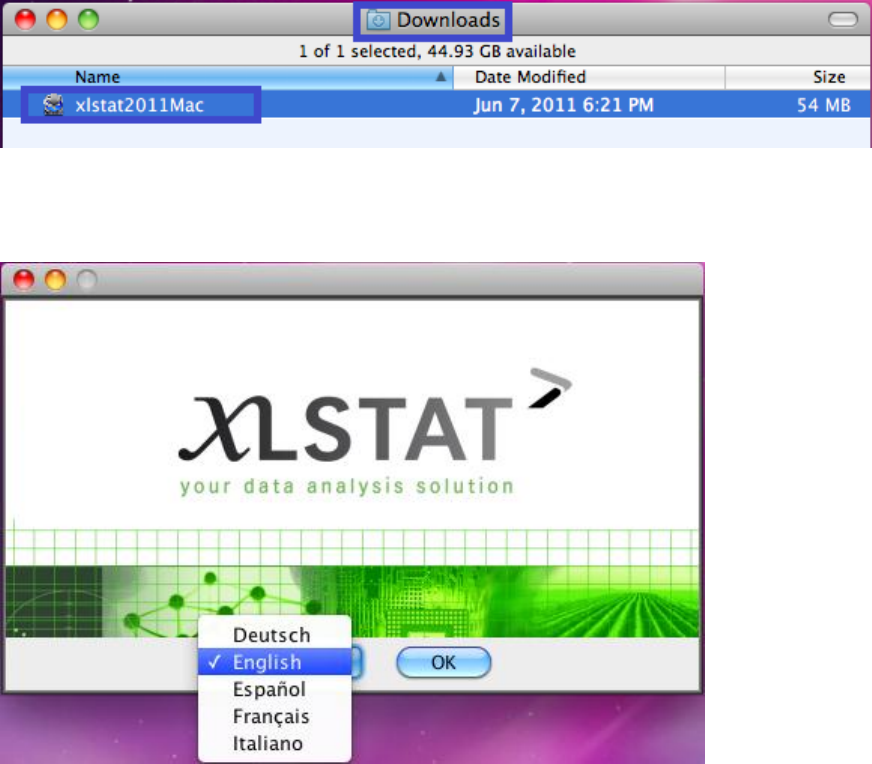
To start the installation of XLSTAT, you simply need to double-click on the downloaded file from the
XLSTAT website.
The next thing to do is to select the language you wish to use for XLSTAT installation. We keep “English”
as the language to use for the installation.
The “InstallAnywhere” window will start and you should follow the 9 steps of the installation.
1. Introduction
2. License Agreement
XLSTAT Getting started manual © Addinsoft 14
3. Choose Install Set
4. Choose Install Folder
5. Choose User Preferences
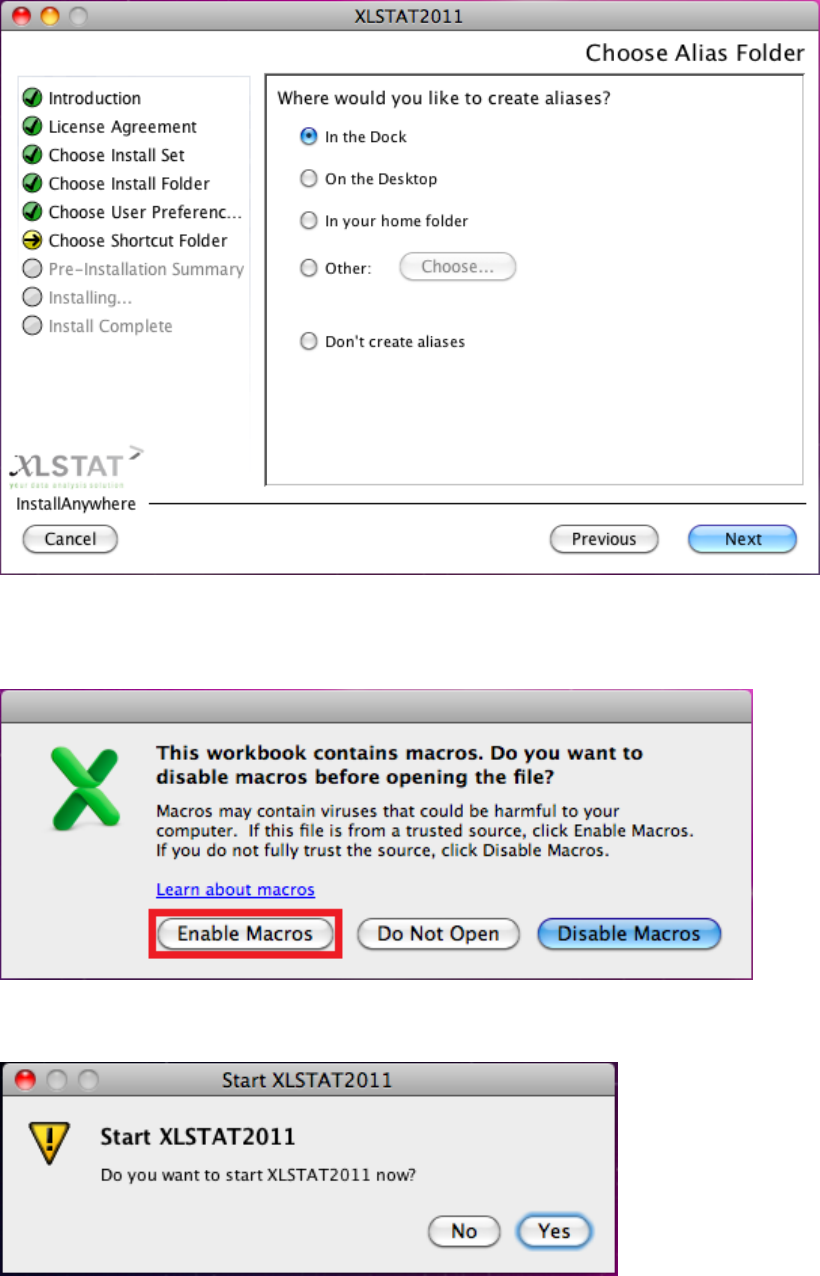
6. Choose Shortcut Folder
7. Pre-Installation Summary
8. Installing
9. Install Complete
Press “Next” every time you are ready to go to the next step.
You should agree to the “License Agreement” to be able to install XLSTAT.
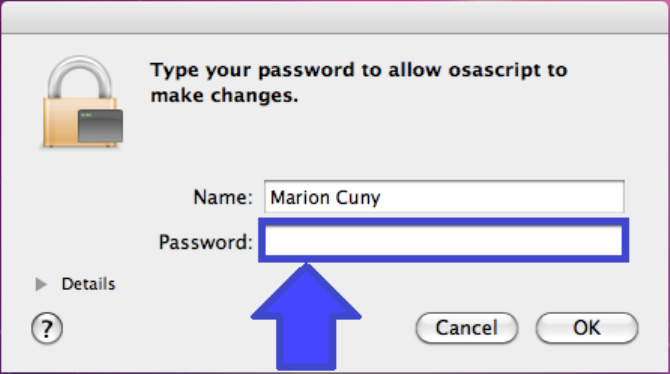
You will be prompted to enter your password to continue the installation of XLSTAT on a Mac.
We recommend you to choose the “Typical” install set and to use the default installation folder.
The step “Choose User Preferences” is only available if you selected the option “Personalized
installation”.
You can then select one or several aliases of XLSTAT. Placing on in the “Dock” is useful.
XLSTAT Getting started manual © Addinsoft 15
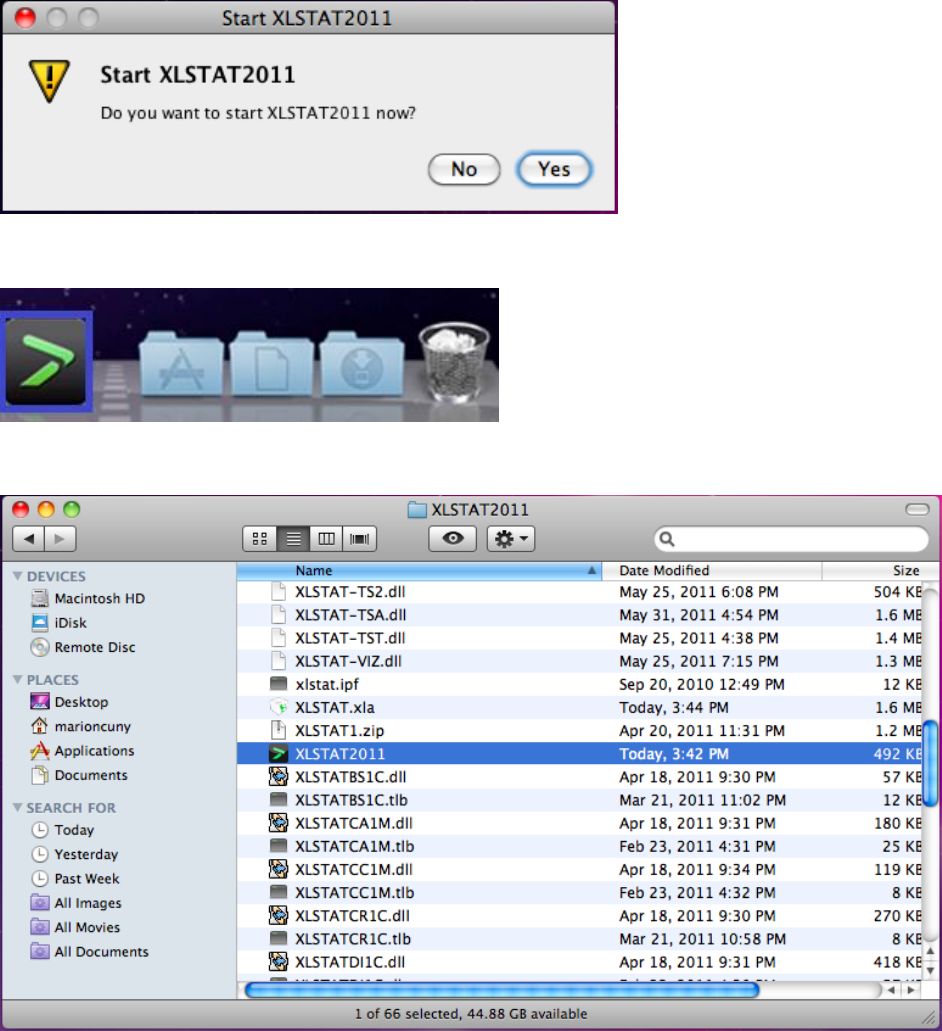
For XLSTAT to run the macros should be enabled. Every time you are asked if you want to enable the
macros, select to do so.
At the end of the installation process you can decide to launch XLSTAT right away.
XLSTAT Getting started manual © Addinsoft 16
You have now successfully installed XLSTAT on your Mac and can start analyzing your data.
XLSTAT Getting started manual © Addinsoft 17
Run XLSTAT for the first time
Now that you have installed XLSTAT on your Mac, you are ready to run it for the first time. In this
chapter, you will see how to run XLSTAT for the first time.
There are many ways to run XLSTAT for the first time. First, you can choose the option to start XLSTAT
automatically after the installation procedure.
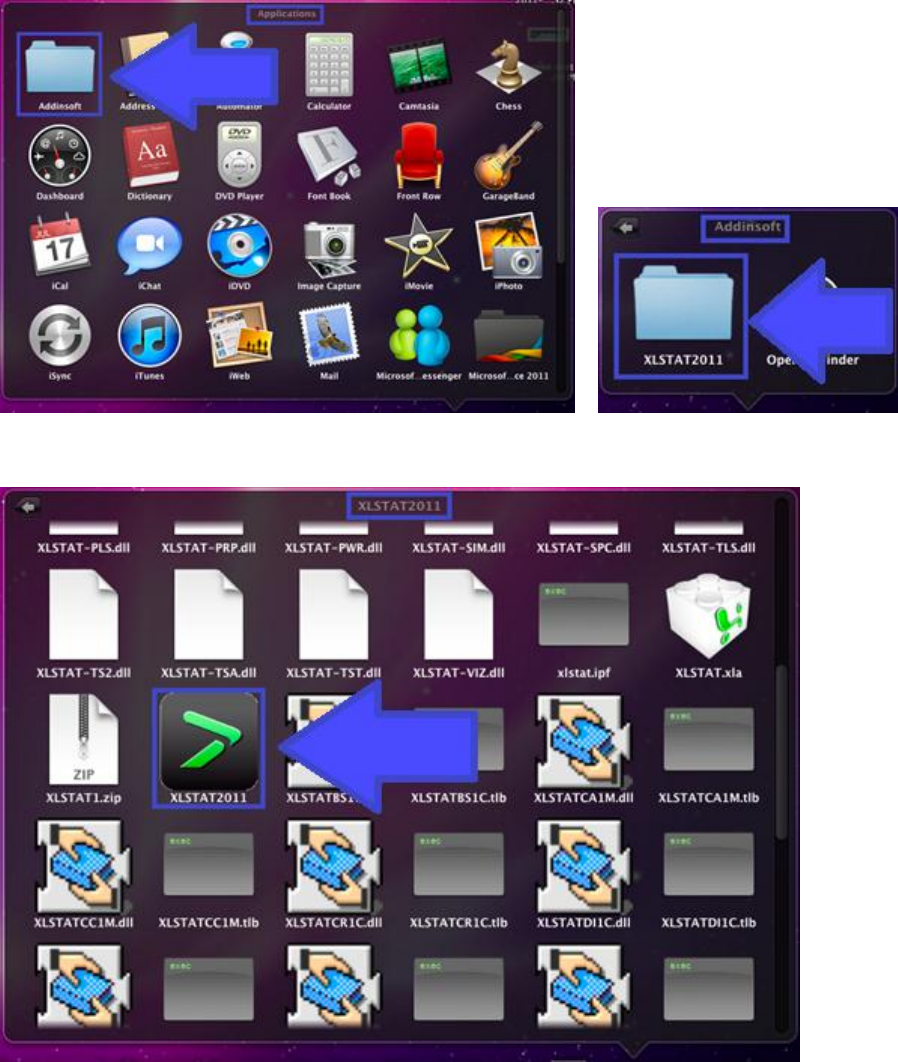
Alternatively you can use the shortcuts you created to start XLSTAT. Here is the shortcut from the dock.
It is also possible to launch XLSTAT from the “Applications” menu either from the “Finder” or the “Dock”.
XLSTAT Getting started manual © Addinsoft 18
In the “Applications” folder select the folder “Addinsoft” then “XLSTAT 2011”
Look for the “XLSTAT 2011” icon.
Once you have clicked on it XLSTAT will start.
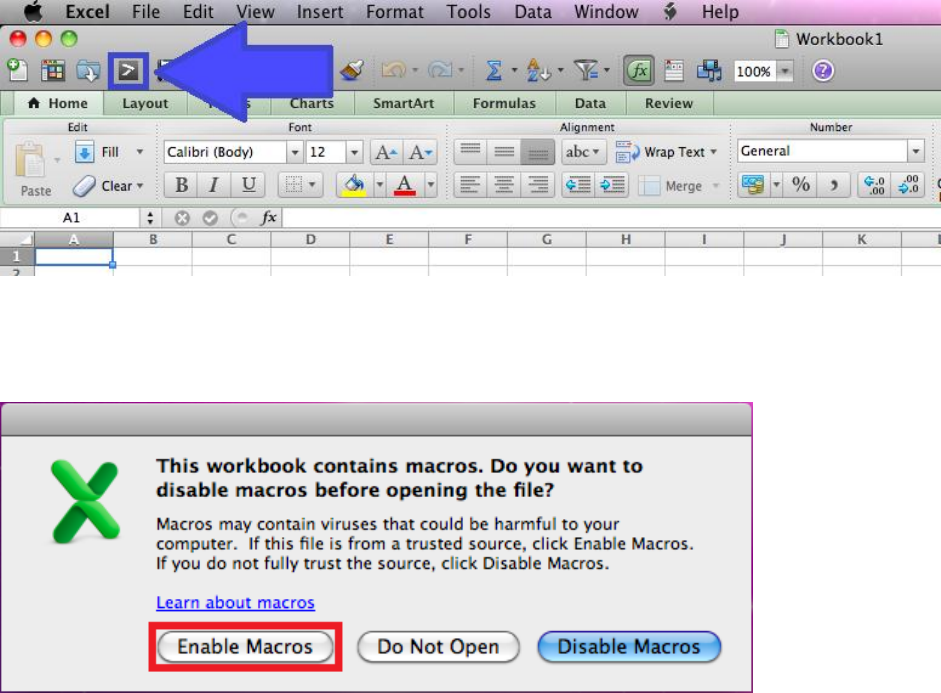
The last way of opening XLSTAT is to first launch Excel. Once Excel is opened you can press the XLSTAT
icon to start the program.
XLSTAT Getting started manual © Addinsoft 19
This icon is also used to close the program.
In all cases you may have to enable the macros.
You have now run XLSTAT for the first time. In the next chapter you can learn about how to register a
license key.
XLSTAT Getting started manual © Addinsoft 20
Register a license key
In this chapter, you will see how to enter a license key to extend your use of the XLSTAT software.
You may have received an email with a license key after your order. You will need to have the key
available when you want to enter your license key.
If you are using XLSTAT on Windows, you need to run XLSTAT in administrator mode to register your
license. You simply should right click on the desktop shortcut of XLSTAT and select the option “Run as
administrator”. If you have installed XLSTAT on Mac OS X, you can directly go to the “About XLSTAT”
menu.
You are prompted to allow the “XLSTATSTARTVIS” file will modify the settings of your computer.
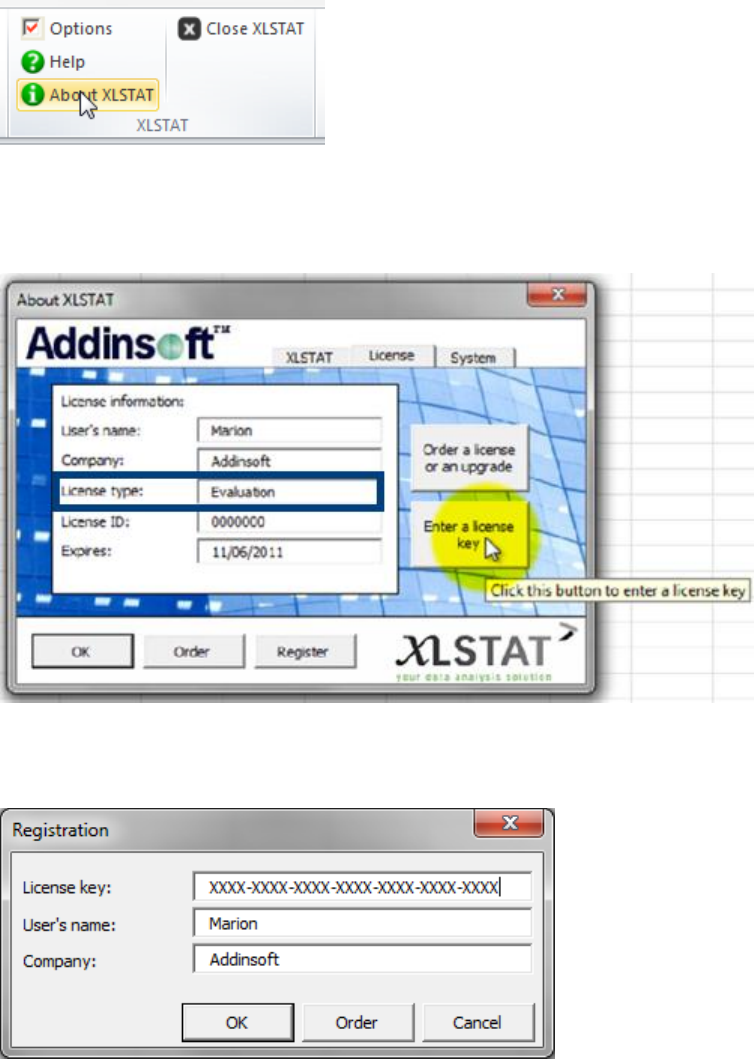
XLSTAT opens. Press the icon “About XLSTAT”.
XLSTAT Getting started manual © Addinsoft 21
Go to the tab “License” in the dialog box that opens. Note that the license type says “Evaluation”.
Click on “Enter a license key”.
Copy and Paste your license code in the field license key and fill in the information about your name and
organization’s name. Press “OK”.
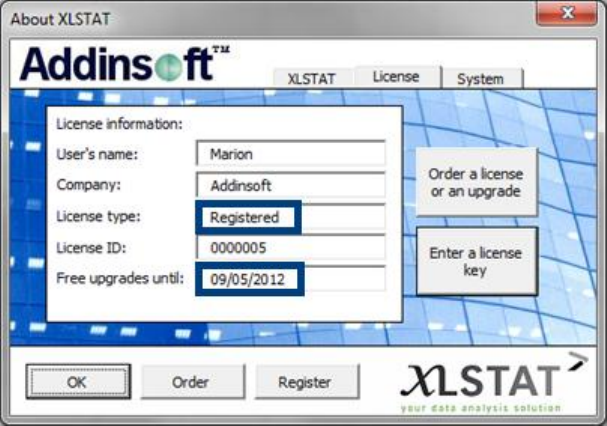
Exit the “About XLSTAT” dialog box.
To check that your license code has been correctly registered, we can open again the “About XLSTAT”.
Now you can see that the license type has been changed as well as the expiration date of the license or
of the free upgrades.
XLSTAT Getting started manual © Addinsoft 22
We have now seen how to register a license key in XLSTAT. Before starting using XLSTAT you may be
interested in having a look at the XLSTAT interface. If so, you will find all the information you need in the
next chapter.
XLSTAT Getting started manual © Addinsoft 23
Use XLSTAT
Overview of XLSTAT interface
Before starting to use the software, it should be useful to have a quick look at the interface of XLSTAT.
We have seen, in a previous chapter, that we can open XLSTAT from the “Add-ins” tab of Microsoft Excel.
Once XLSTAT is opened you have several new items on the Microsoft Excel interface.
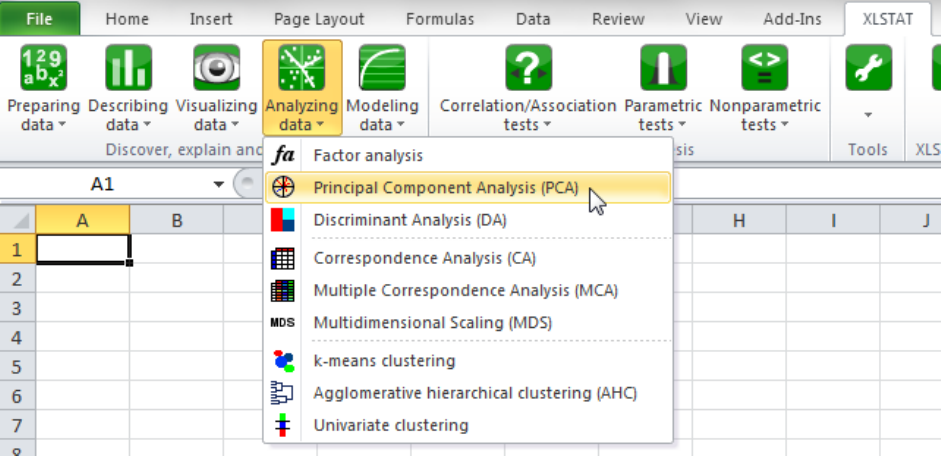
First, in the “Add-ins” tab in the “Menu Commands” section, you now have a new item - XLSTAT. Then,
there are several new icons in the “Custom toolbars” section. Finally, you now have a new tab dedicated
to XLSTAT. All three options enable you to launch XLSTAT’s functions.
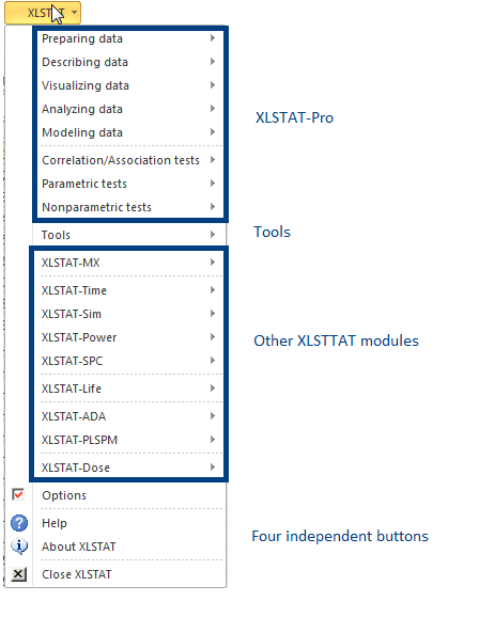
Let’s have a look at the menu command. When you press XLSTAT, you get a command menu. The items
are organized with first the XLSTAT-Pro functionalities to prepare, describe, visualize, analyze and model
data, as well as the functions to test a hypothesis.
XLSTAT Getting started manual © Addinsoft 24
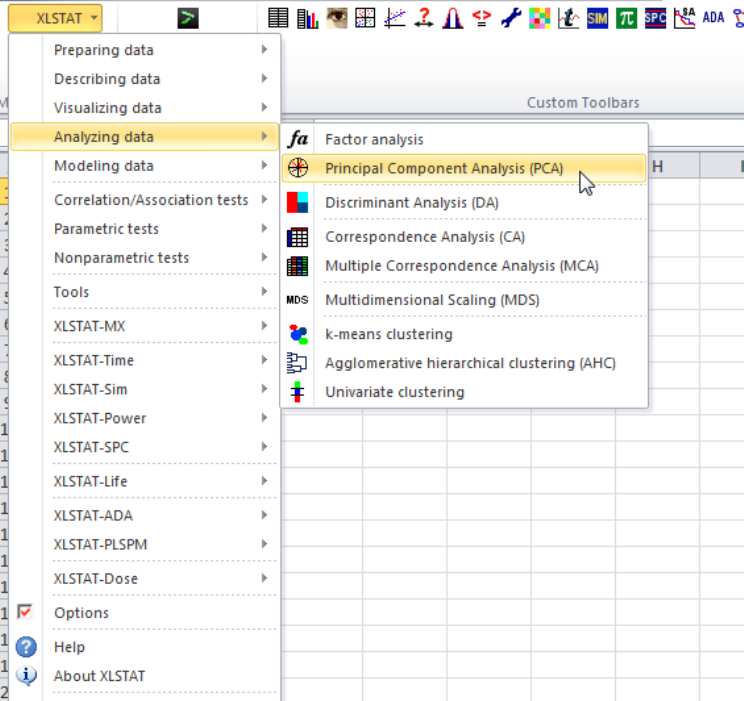
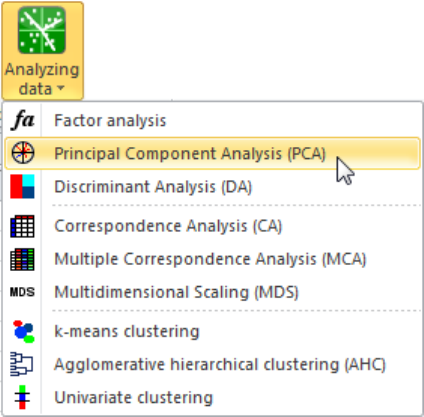
Let’s launch a Principal Component Analysis. This function is found in the menu “Analyzing data”. You
can easily launch a PCA by passing the cursor over the “Analyzing data” menu and clicking on the
XLSTAT Getting started manual © Addinsoft 25
Principal Component Analysis option.
After the XLSTAT-Pro functionalities, you will find the “Tools” and the other XLSTAT modules.
Finally, you have four independent buttons, namely “Options”, “Help”, “About XLSTAT” and “close
XLSTAT”. The “help” icon gives you access to the help documentation which contains information about
the methods, dialog boxes and results found in XLSTAT as well as tutorials. The “About XLSTAT” button
provides you with details on your XLSTAT version, license and system. The last icon is used to close
XLSTAT.
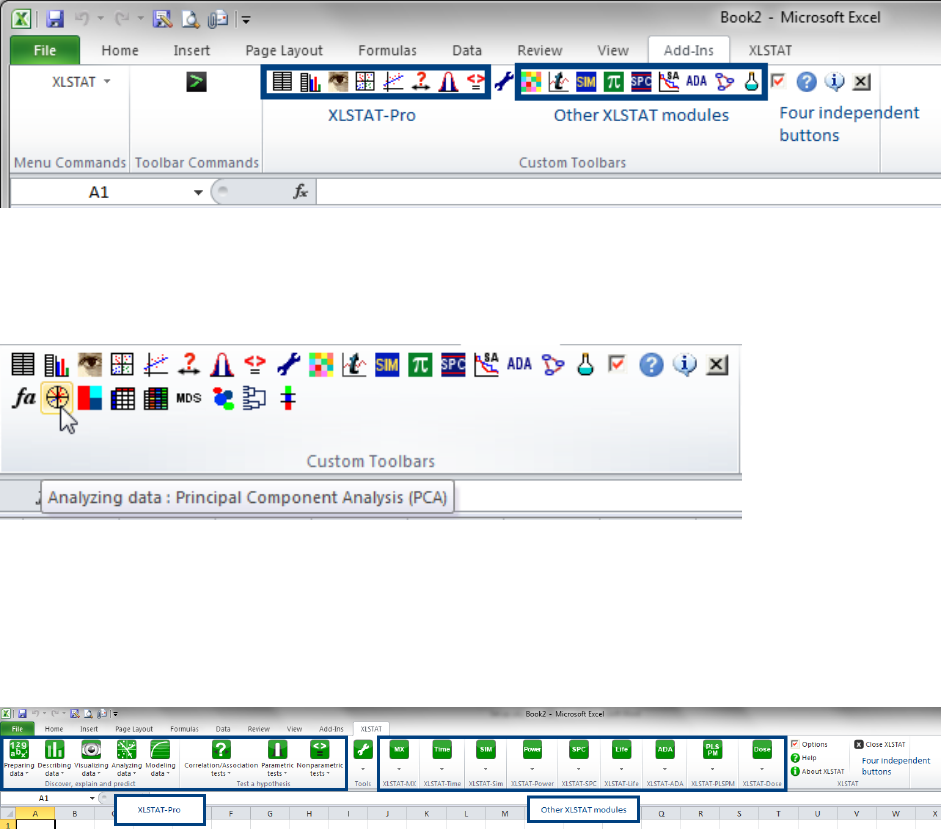
The XLSTAT toolbar is organized in the same way as the command menu. XLSTAT-Pro functionalities are
placed first, then the tools, next the other XLSTAT modules and at the end the four buttons. Each item is
represented by an icon. By passing the cursor over an icon you will get the name of the corresponding
menu.
XLSTAT Getting started manual © Addinsoft 26
Here, to launch a Principal Component Analysis you should first open the tool bar “Analyzing data” by
pressing the 4th icon. Then you need to find the PCA icon and click on it. This way of launching a function
is most efficient for people who are already accustomed to the XLSTAT software and icons.
Let’s now move on to the dedicated XLSTAT tab.
Here the menu bar is a mix between the icon tool bar and the command menu. The display follows the
same layout as seen previously with first the XLSTAT-Pro functions, next the tools menu, then the other
XLSTAT’s products and the four independent buttons.
Let’s launch a principal component analysis from this menu. We first click on the “Analyzing data” menu
icon to make the list of functions appear. We then press the PCA option.
XLSTAT Getting started manual © Addinsoft 27
In general, in our tutorials and videos we use this dedicated tab to launch the functions.
We have now had a look at the XLSTAT’s interface. To help you manipulate the data in XLSTAT we
recommend you to read the next chapter that shows you how to select data in XLSTAT.
XLSTAT Getting started manual © Addinsoft 28
Select data in XLSTAT
Now that you can find your marks in XLSTAT thanks to the previous chapter on XLSTAT interface you can
start learning to use the software. In this chapter you will see how to select data in XLSTAT.
There are three ways to select data in XLSTAT, the column selection, the range selection and the
keyboard selection. Let’s study each of them one by one.
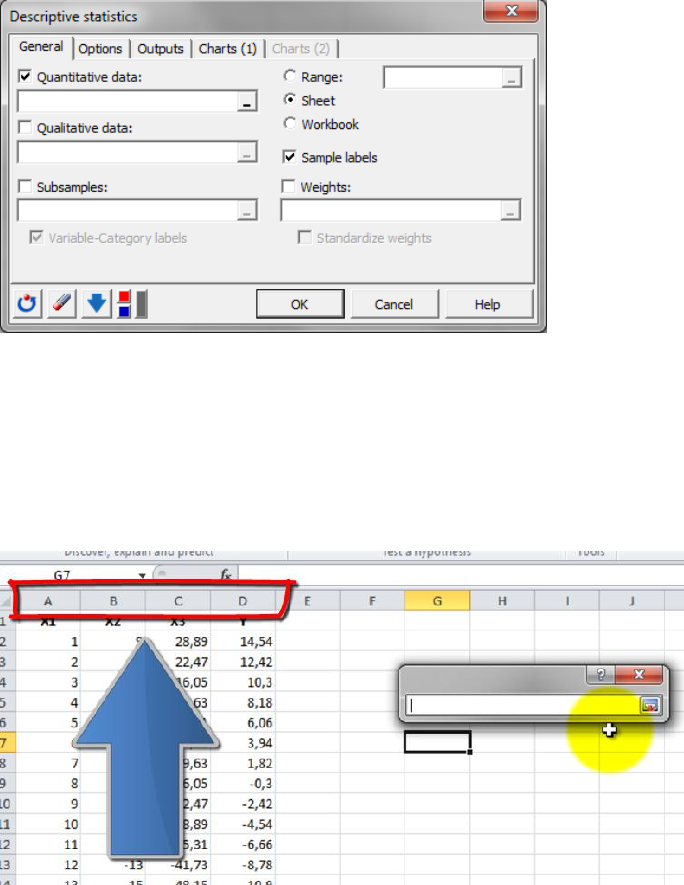
Let’s open a dialog box, for example “Descriptive statistics”. You will always have to select data in the
“General” tab of the dialog box. There could be one or several fields to fill in.
In this case, we have several fields where we could enter data; we only use the “quantitative data” field.
To select data you need to click on the range selector. Once this is done, you can use the cursor to mark
the data to use.
The first way to select data is called column selection. Column selection is very easy. To select a column
you simply need to click on its header.
Here we select the column A. Then you need to press “Enter” to confirm the selection.
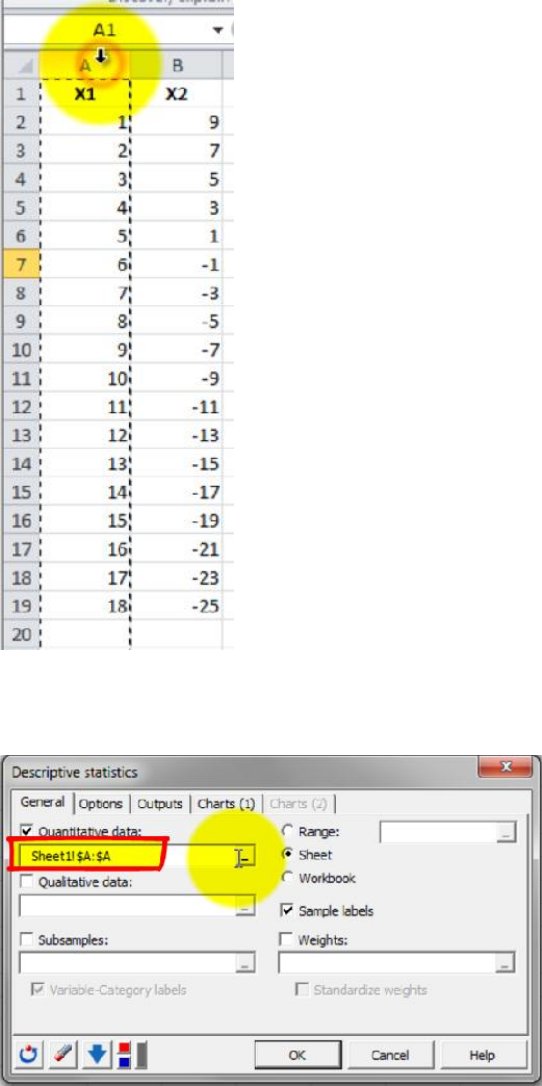
XLSTAT Getting started manual © Addinsoft 29
Note that the reference to the column in the range selector is the name of the sheet and the column
with the notation “$A:$A”. This means that save all the data contained in the column A is selected.
We will now select the same content but this time we will select it using a range selection. To perform a
range selection on column A, you need to select the data from the first cell of column A to the last value
in column A. You should click again “Enter” to validate the selection.
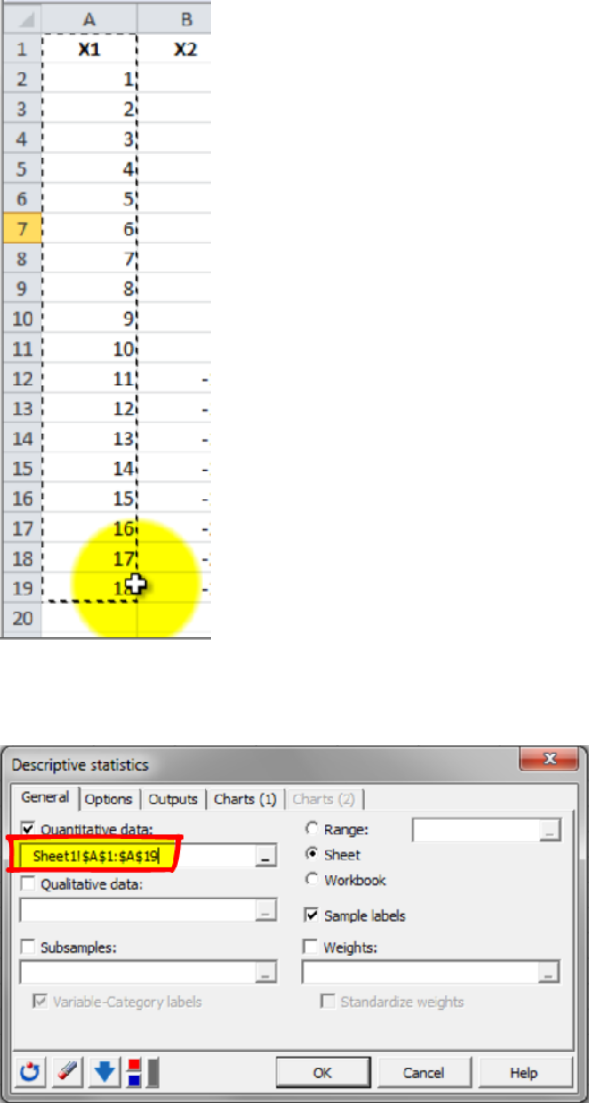
XLSTAT Getting started manual © Addinsoft 30
This time the reference to the data in column A is noted “$A$1:$A$19”. This defines the exact position of
the data.
It is also possible to do a multiple selection. To do that you simply need to select the first column and
move on to the last column of the selection. Once they are all activated, press “Enter”.
XLSTAT Getting started manual © Addinsoft 31
Finally the selection can be non-adjacent. This time we select column A, B and D by pressing on them
while also holding down the “Control” or “Shift” key.
When the selection is marked, click “OK”.
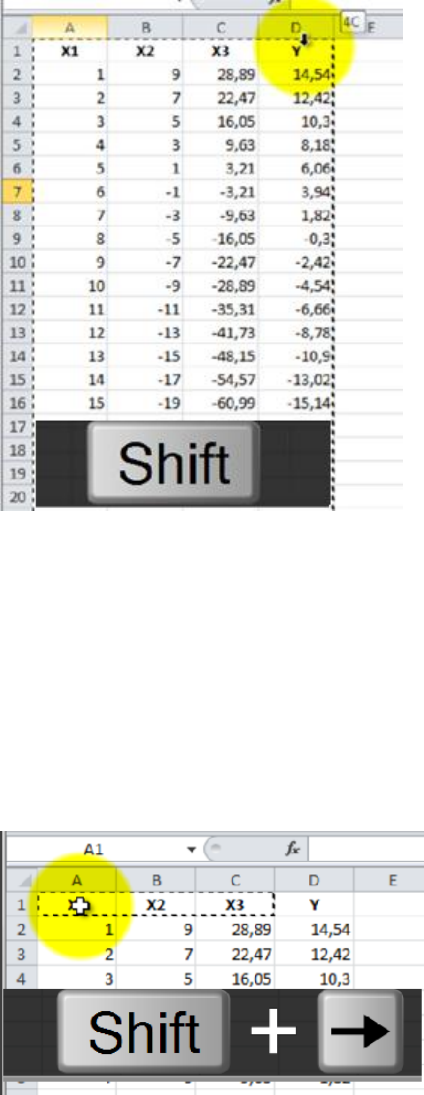
The last type of selection uses the keyboard instead of the cursor.
For example to select all the dataset you can place the cursor in the first cell and hold down the key
“Shift”. You can now use the right arrow to select the columns one by one and the down arrow to select
the rows in the same way.
You can also hold down the keys “Shift” and “Control” to select all the columns or rows at once using
respectively the right and down arrows.
We have now seen many ways to efficiently select data in XLSTAT. If you would like to learn how to set
up an analysis, go to the next chapter.
XLSTAT Getting started manual © Addinsoft 32
Set up your first analysis
Now that we have seen the details of the data selection in XLSTAT, let’s start the set-up of an analysis.
XLSTAT analyses can be found in the different menus of the menu bar. They are simply selected by
clicking on one of the available options.
Remember that if you have any doubts while setting up an analysis you can always press the help button
which is present on all dialog boxes. In the help documentation, you will find information about all the
different options.
In this chapter, you can choose which analysis you would like to set-up from the three options on offer: a
Principal Component Analysis, a linear regression, and a t-test.
Principal Component Analysis
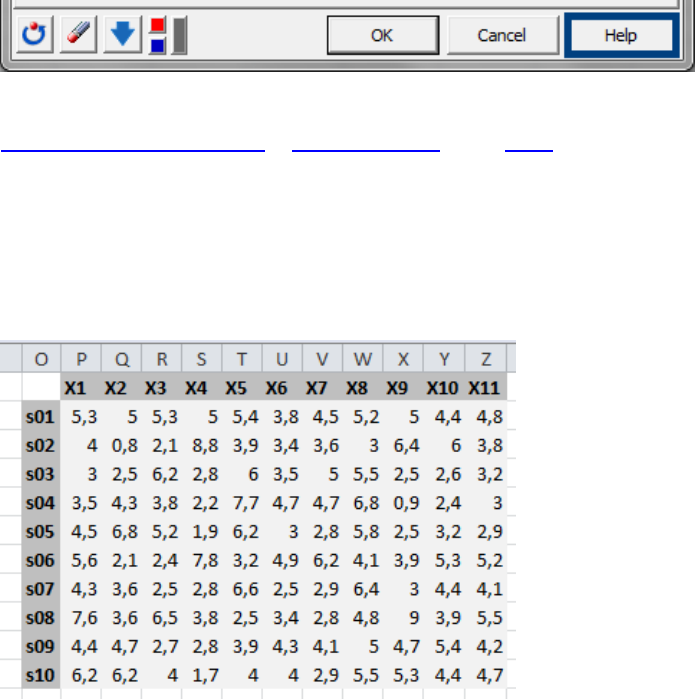
We are now going to run a Principal Component Analysis on a dataset containing 10 samples and 11
variables.
Note that, the observations are in rows, and variables in columns.
To start the setup of a PCA, we go to the menu “Analyzing data” and select the option “Principal
Component Analysis”.
XLSTAT Getting started manual © Addinsoft 33
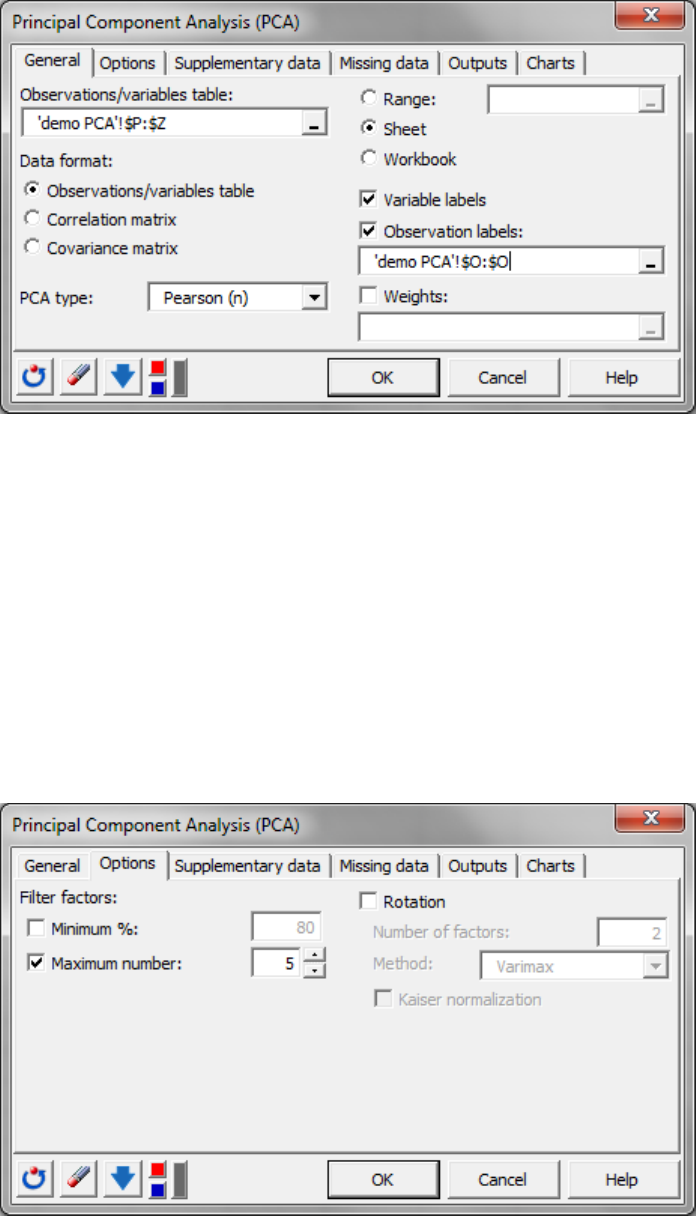
A dialog box opens.
In the “General” tab, we first need to select the data. This is a step which is common to all analyses. Click
on the range selector and select the columns P to Z which contain all the descriptive variables.
We are here dealing with a dataset whose format is a table of observations by variables. So we can use
the default option for the data format.
There are different types of PCA depending on the pre-treatment to be applied before performing the
PCA. The most common one is “Pearson (n)” that will apply standardization to the variables.
We should specify that the data contains variable labels by leaving the option “Variable labels” ticked.
Also, we can determine the “Observation labels” by selecting the column O where the names of the
samples are stored.
The last thing to be done in the “General” tab is to decide where to get the outputs. This is also a step
common to all analyses.
With the “Range” option, the results are placed anywhere in the workbook from a specific cell that you
should determine.
Using the “Sheet” option the outputs are displayed on a new sheet.
The “Workbook” option is used to dispose the results in a new workbook.
XLSTAT Getting started manual © Addinsoft 34
When the “General” tab options are filled out, we can move on to the other tabs. You should pay special
attention to the tabs “Outputs” and “Charts” as they are responsible for the numerical and graphical
results that are computed.
Since you are learning how to set up one of your first analyses, we are going to go through all the tabs.
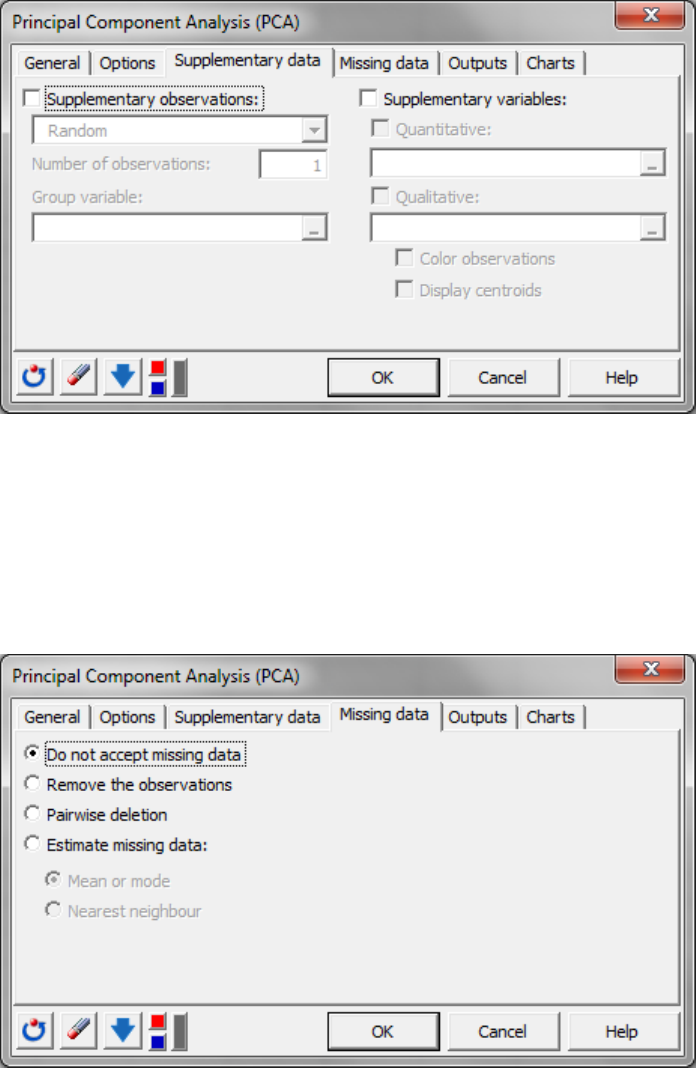
First we go to the “Options” tab. In general, this tab enables you to add options to your analysis. In this
case study, we have two types of options. We can choose to put some conditions for the number of
factors to be computed, either by defining a minimum level of variance which should be explained by the
factors, or by setting a set value for the number of factors. Here, we can set the number of factors to 5.
The other type of option is a rotation of the Principal Components. We will not use it in this example.
XLSTAT Getting started manual © Addinsoft 35
We move on to the next tab, “supplementary data”. This section of the dialog box offers the possibility
to include new data in the results but not in the model. They can be new samples or new variables to be
projected into the PCA space. However we don’t need to use this option in this case study.
Next, we have the tab “Missing data” which is a very common tab in the XLSTAT dialog boxes.
It is used to deal with missing values in the dataset. There are often different options. Here, we have a
small dataset and we know that it does not contain missing data so we keep the selected option “Do not
accept missing data”. In case of missing data, we will then get a warning message when we launch the
computations.
Now, we arrive at one of the important tabs for the results, the tab “outputs”. There are many numerical
results that can be displayed for a PCA. In general, you can add to or remove from the preselected list of
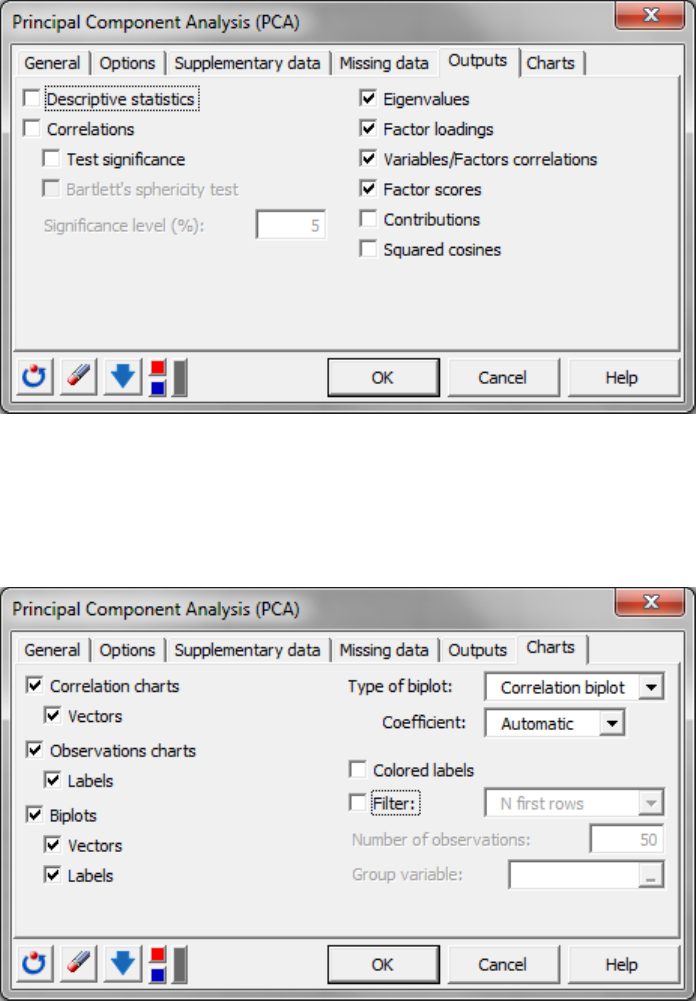
XLSTAT Getting started manual © Addinsoft 36
options. The most important results are probably the eigenvalues, the factor loadings, the
variables/factors correlations and the factor scores.
Finally, in the last tab “Charts” you can set up the graphical results to be displayed.
The option “filter” is used to show the labels of determined observations in the score plot if there are
too many samples. In our case this will not be a problem as we have only 10 samples.
We have now completed the setup of this dialog box. Therefore we can now click the “OK” button.
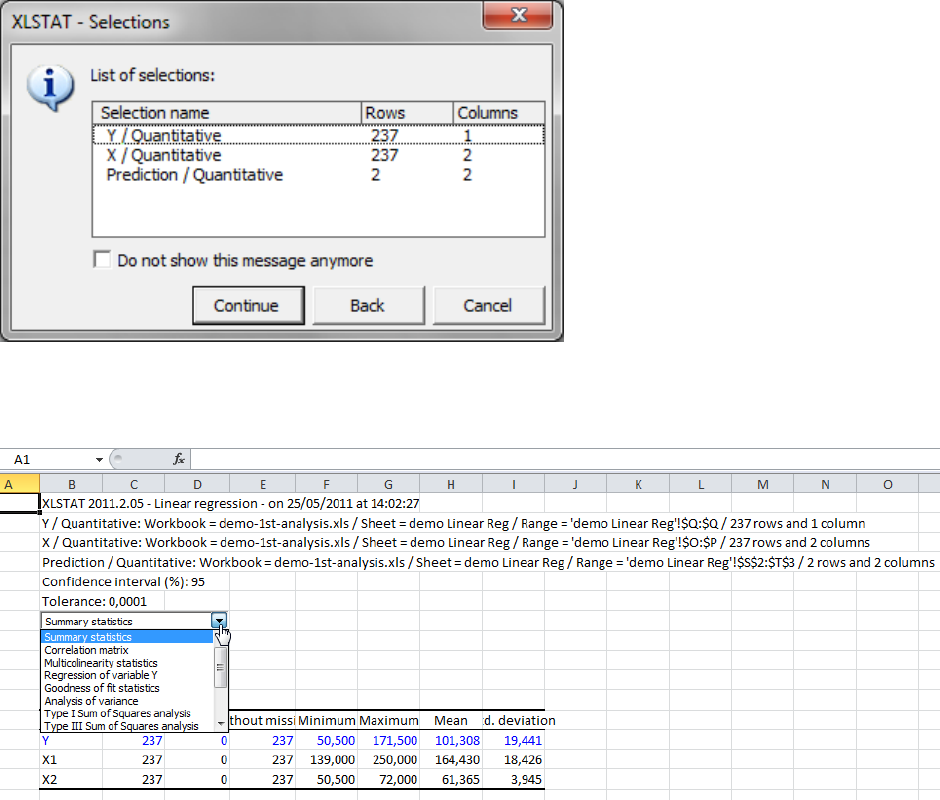
We are prompted by a summary message. At this step, you can decide to make changes and click on the
“Back” button to return to the dialog box of the analysis. Or you can decide to go on with the
computations and press “Continue”.
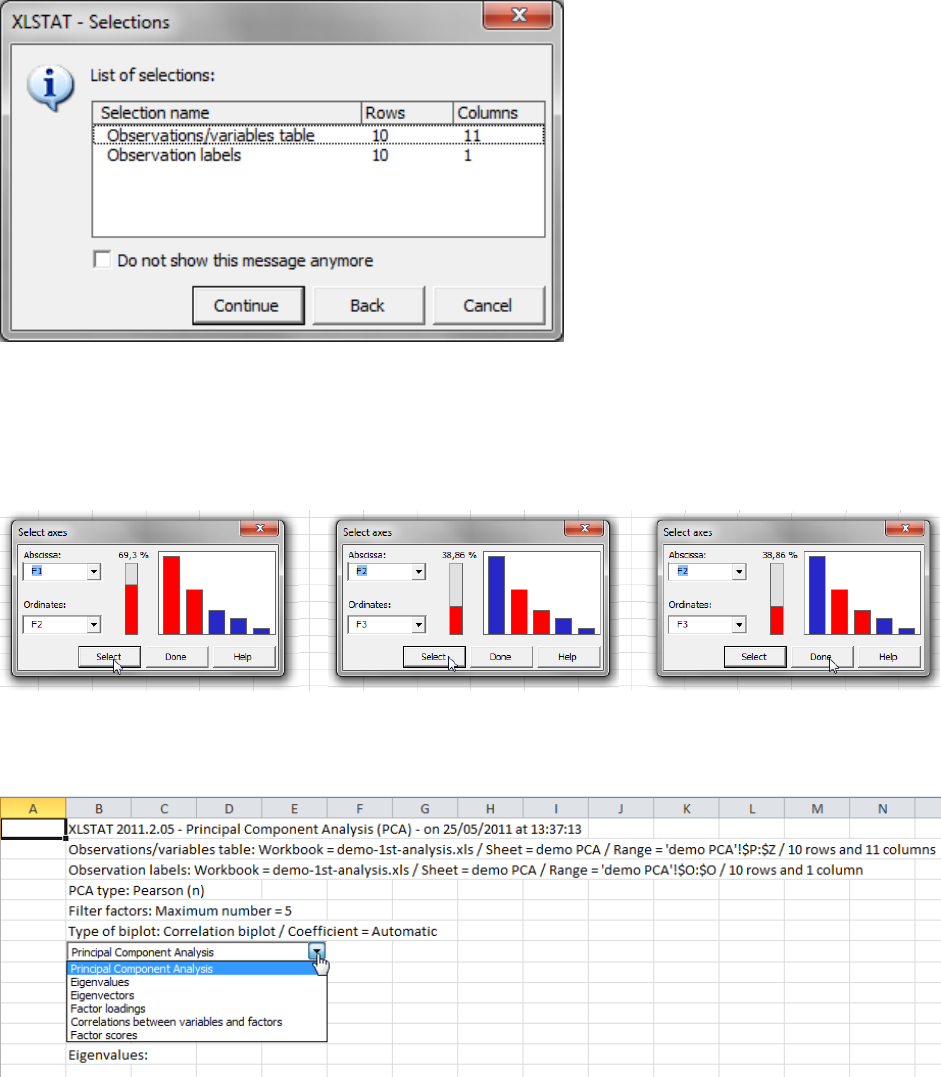
XLSTAT Getting started manual © Addinsoft 37
A pop-up window asks you to select the axes of the plots to be displayed. You should decide this, by
looking at the amount of explained variance by each factor. Here, we can click on “select” to confirm the
selection of “Factors 1 and 2”. Then we change the selection to “Factors 2 and 3” to use them as well and
press “select” again. Finally we click “done” to proceed.
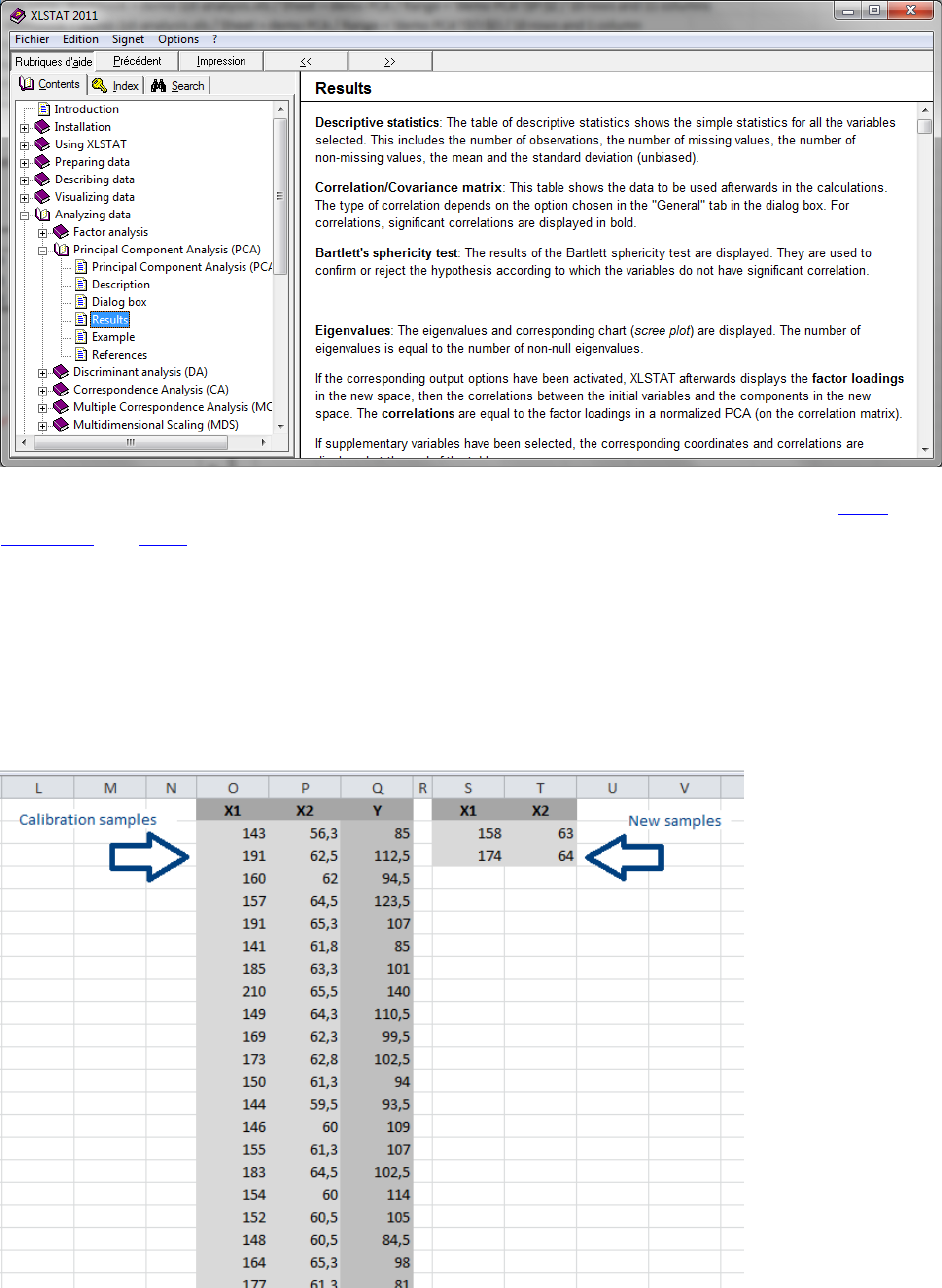
You are now looking at the results of the analysis. You can navigate them easily by using the drop-down
menu.
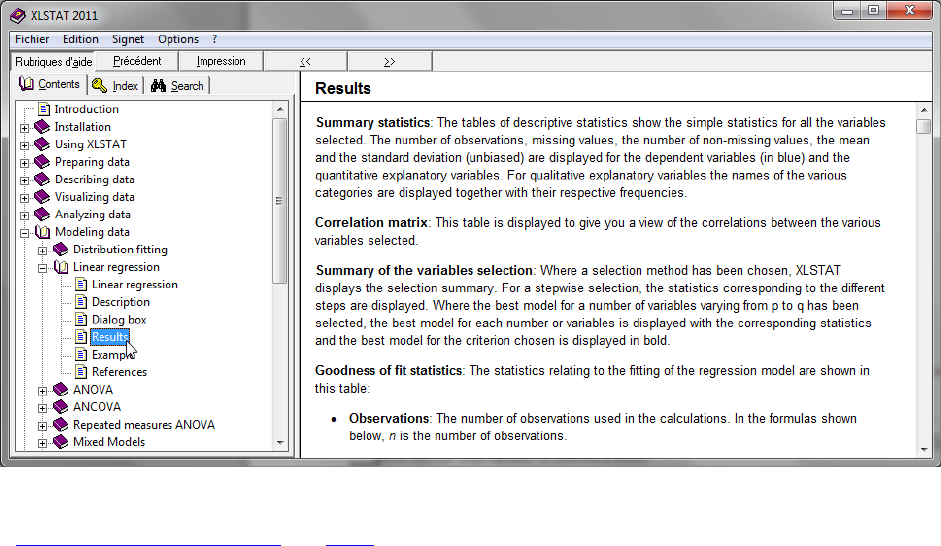
To help you interpret the results you can go into the help documentation and look at the section
“Results” in the PCA chapter.
XLSTAT Getting started manual © Addinsoft 38
We have now seen how to set up a PCA in XLSTAT. If you want to learn about how to set up a linear
regression or a t-test, click on one of the corresponding links. If you want to learn about how to set up
your first plot, read the next chapter.
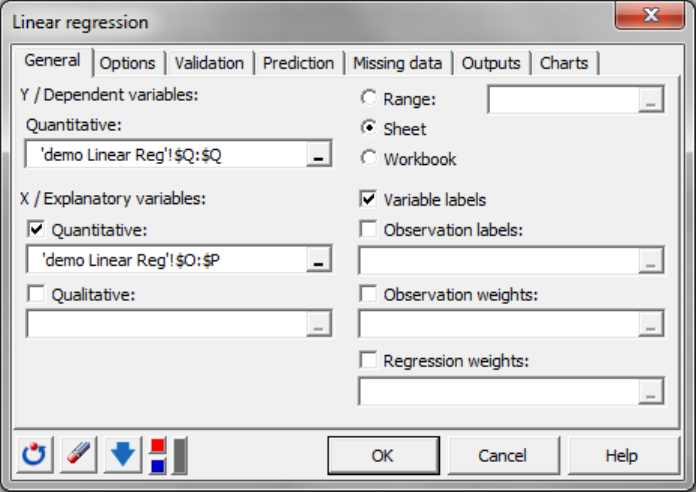
Linear regression
We are going to set up a linear regression between the variable to explain Y and the explicative variables
X1 and X2. We will also predict the values of two new observations.
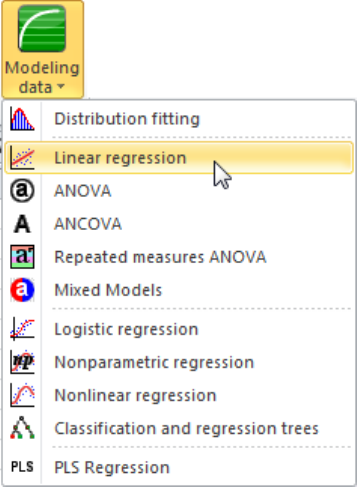
XLSTAT Getting started manual © Addinsoft 39
In this chapter, we will go through the different parts of the linear regression dialog box.
The linear regression function can be found under the menu “Modeling data”.
In any analysis, the first thing to do is to select the data. This will always be done in the “General” tab.
Here, we will set the quantitative dependent variable as “Y”. To do so, we select the whole column E by
clicking on its header. You should press “Enter” to confirm the selection. Then, we set the two
quantitative explanatory variables, to “X1” and “X2” by selecting the content of the columns C and D.
Again click “Enter” to validate the selection.
Sometimes there is more information to be filled out in the “General” tab, such as the presence or
absence of variable and observation labels.
In this example, the variable labels are included in the selection of the columns so the corresponding
option must be ticked. However there are no “Observation labels” so we leave the box unchecked.
Another thing that will always be done in the “General” tab is to decide where to get the outputs.
With the “Range option” they will be placed from a specific cell that you have to determine.
Using the “Sheet” option the results are displayed on a new sheet, and when using the “Workbook”
option the results appear in a new workbook.
XLSTAT Getting started manual © Addinsoft 40
When the “General” tab options are filled out you can move on to the other tabs. You should pay special
attention to the tabs “Outputs” and “Charts” as they are responsible for the numerical and graphical
results that are computed.
Before going to these tabs you often have other tabs to fill out. As this is one of your first analyses, we
will go through each tab.
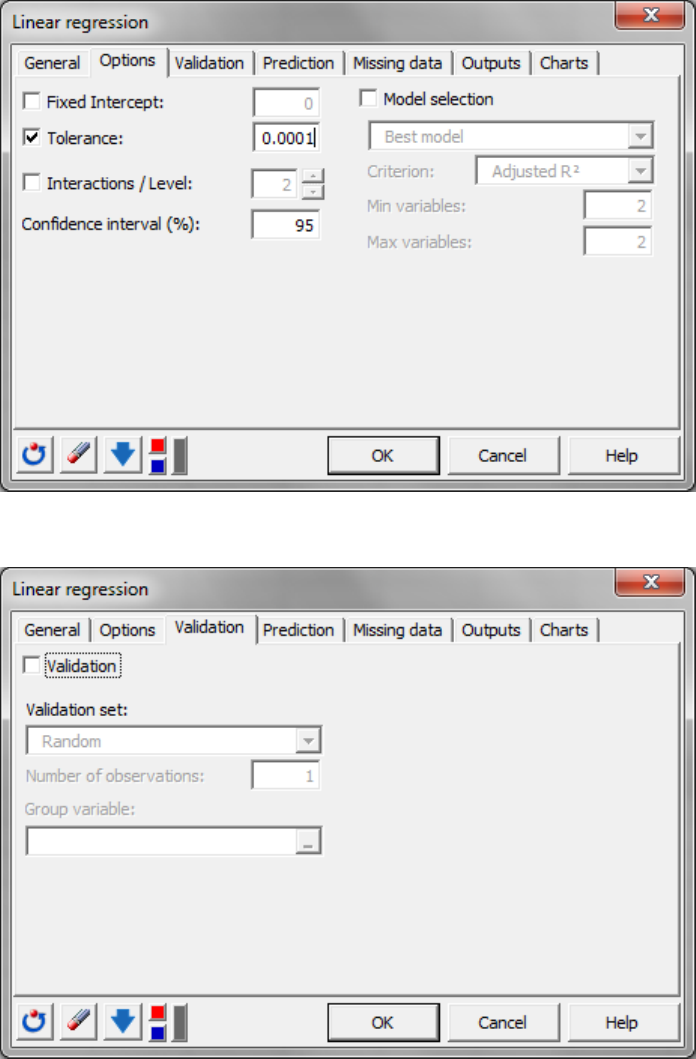
The “Options” tab will often offer various options for the analysis you are setting up. For linear
regressions you can fix the intercept, add interactions and do a model selection. We will not set any
special option in this example.
XLSTAT Getting started manual © Addinsoft 41
The next tab “Validation” is to be used when you want to use a validation set.
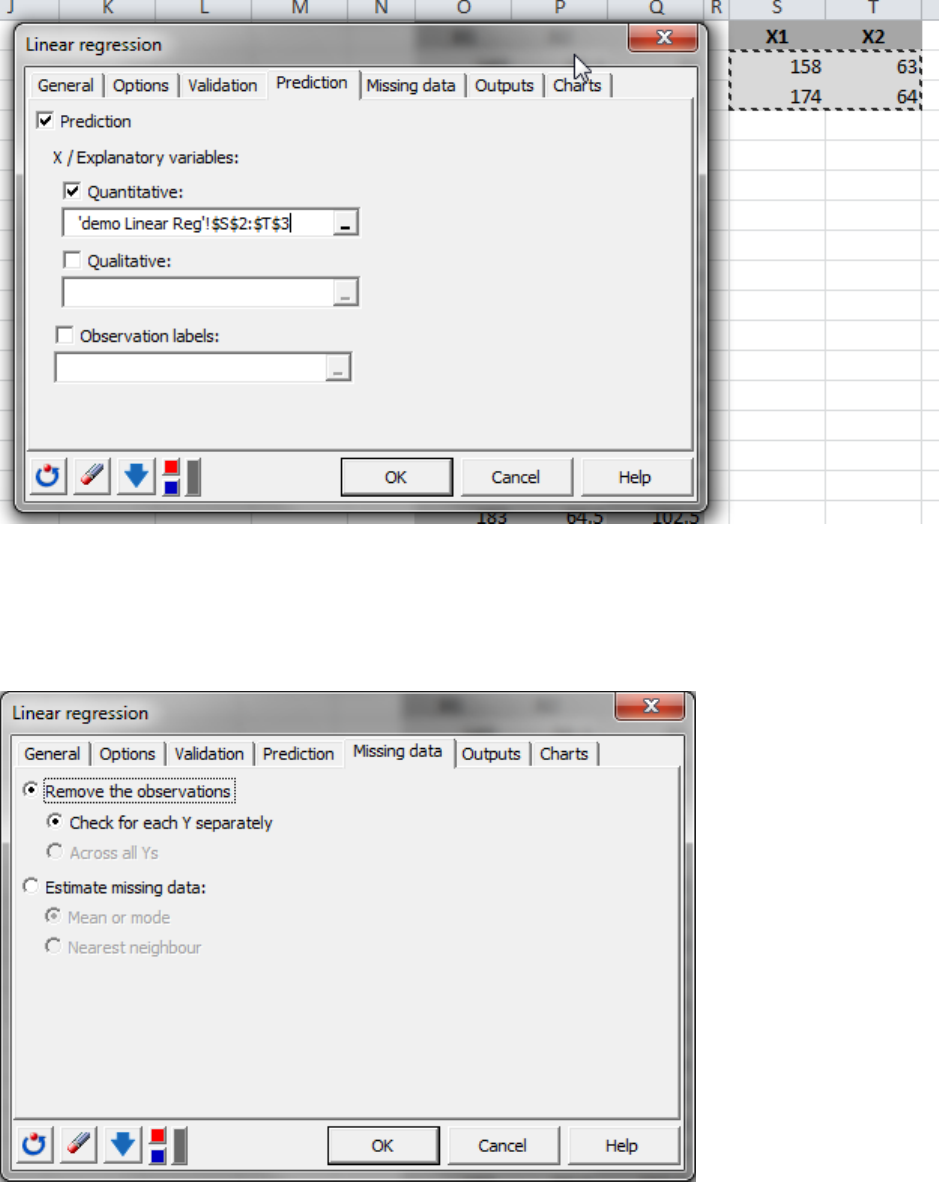
We will not use this option, so we move on to the next tab “Prediction”.
This tab is to be used when you want to predict the new values of the variable to explain from the values
of the observations on the explicative variables. We have here two new samples to predict we will add
them in the field, “Quantitative variables”. Here we should pay attention to not selecting the label of the
variables.
XLSTAT Getting started manual © Addinsoft 42
Once this is done we can move on to another very usual tab in the software, “Missing data”. This tab is
used to set how to handle missing data. In this case, you can remove the observations or estimate the
missing data. There are other cases where you can get a warning message when there are missing
values. We keep the option pre-selected.
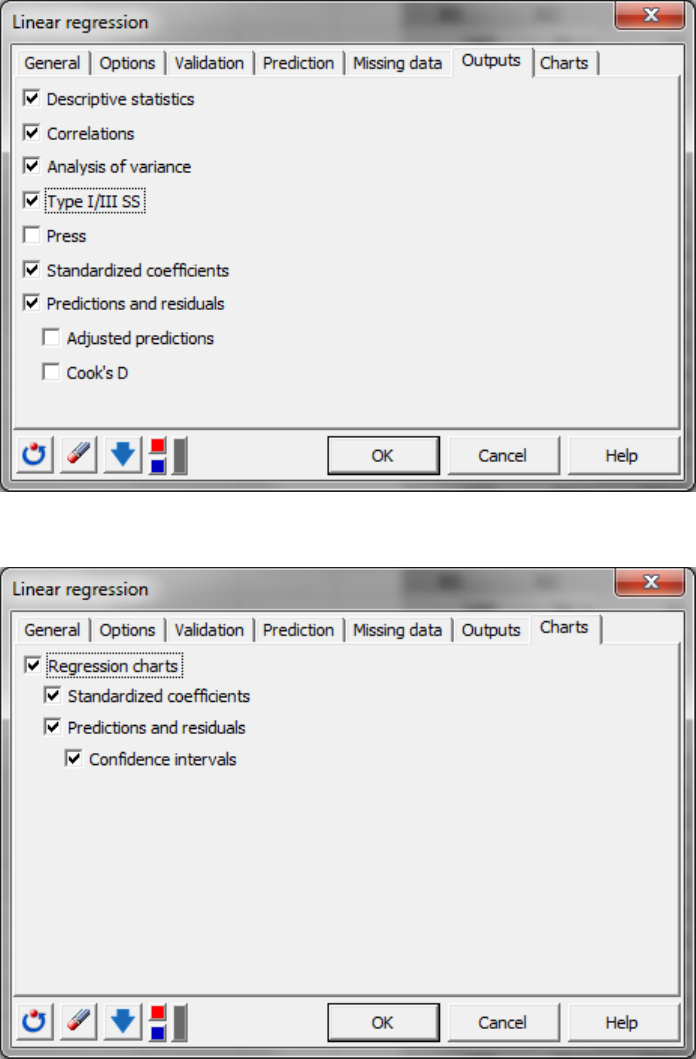
The “Outputs” tab is where you can set up the numerical results to be generated. You can simply add or
remove a result by ticking the corresponding box.
XLSTAT Getting started manual © Addinsoft 43
The last tab, “Charts”, is used to select or unselect the display of graphical results.
Once everything is set, you can click on the “OK” button.
You are prompted by a summary message. At this step you can decide to make changes and click on the
“Back” button to return to the dialog box of the analysis. Or you can decide to go on with the
computations and press “Continue”.
XLSTAT Getting started manual © Addinsoft 44
You are now looking at the results of the linear regression. You can navigate them easily by using the
drop-down menu.
If you need help to interpret the results you can look into the help documentation under the chapter
linear regression in the page “Results”.
XLSTAT Getting started manual © Addinsoft 45
We have now seen how to set up a linear regression in XLSTAT. If you want to learn about how to set up
a Principal Component Analysis or a t-test, check out the corresponding section of this chapter. If you
want to learn about how to set up your first plot, read the next chapter.
t-test
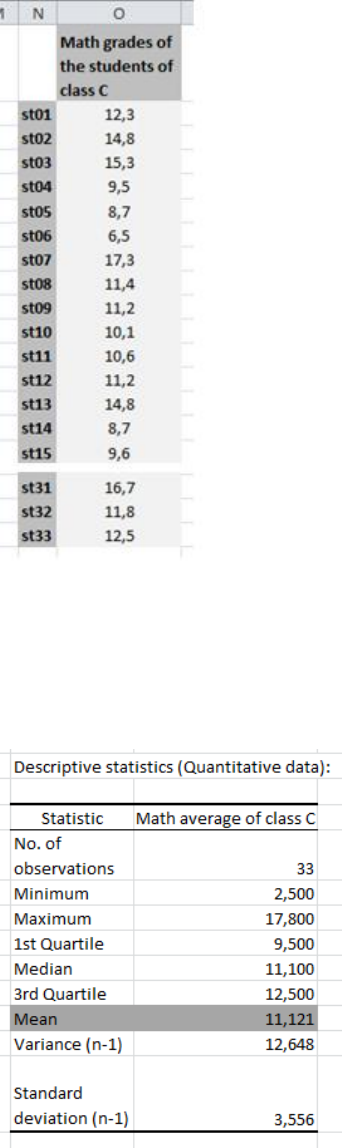
For presenting the t-test, we are going to compare the average grade in math of 33 students of the class
C to the average of the class B which is 11.5.
XLSTAT Getting started manual © Addinsoft 46
We don’t have the information about the variance of the grades in the class B so we cannot run a z-test
and have to run a t-test.
We can have a look at some descriptive statistics on the performance of the class C. As you can see the
average is 11.121 which is inferior to 11.5.
We can use a t-test to determine if the class C is performing significantly worse than the class B at a risk
alpha 5%. To start the test, we go over to the menu “Parametric tests” and select the first option “One-
sample t-test and z-test”.

XLSTAT Getting started manual © Addinsoft 47
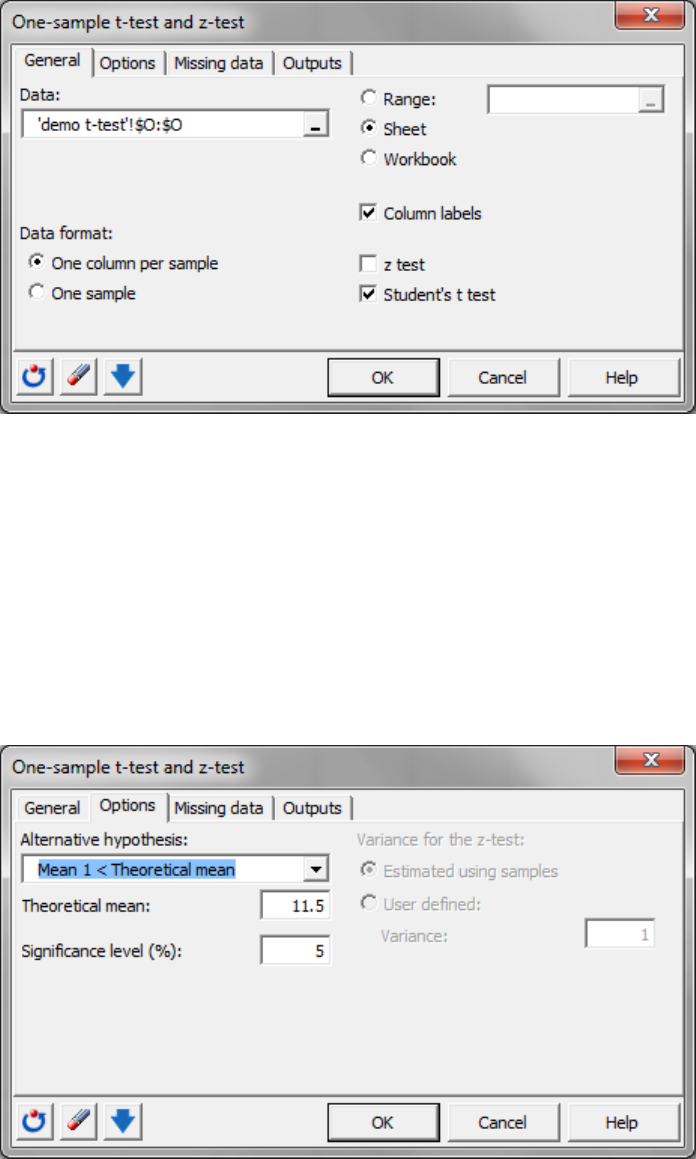
In the first dialog box section “General”, we need to select the data. This is a common step to all
analyses.
Press the “Range selector” and select the column O that contains the “Math average of the students of
class C”.
The data format is “One sample per column” as we have only one column corresponding to one sample
to test. If the data were spanned over several columns for the same sample we could use the other
option.
The name of the column was included in our data selection so we tick the option “Column labels”.
Next, we have to decide if we want to run a t-test or a z-test. As explained before we don’t have the
information about the standard deviation of the results of class B so we have to run a “Student’s t-test”.
Finally, we have to set-up another thing which is common to all analyses. It is the selection of the
location of the computed results.
With the default option “Sheet”, the results will be displayed in a new sheet. The option “Range” enables
you to specify where in the workbook you would like to display the results. The last option, “Workbook”,
has the outputs appear in a new workbook. We keep the default option for this analysis.
When the “General” tab is filled out you can move on to the other tabs. You should pay special attention
to the tabs “Outputs” and “Charts” when they are accessible as they are responsible for the computation
of the numerical and graphical results. In this case we only have the tab “outputs”.
XLSTAT Getting started manual © Addinsoft 48
We can move on to the tab “Options” to specify our analysis.
The “options” tab will often offer various options for the analysis you are running. Here, the first thing to
select is the alternative hypothesis. We know that the average of the class C is inferior to the average of
the class B so we can select the option “Mean 1 < Theoretical mean” to run a one-sided test which is
more accurate than a two-sided test.
Then we enter 11.5 in the “Theoretical mean” field.
We will keep the default significance level at 5%.
The options in grey are to be used when setting up a z-test.
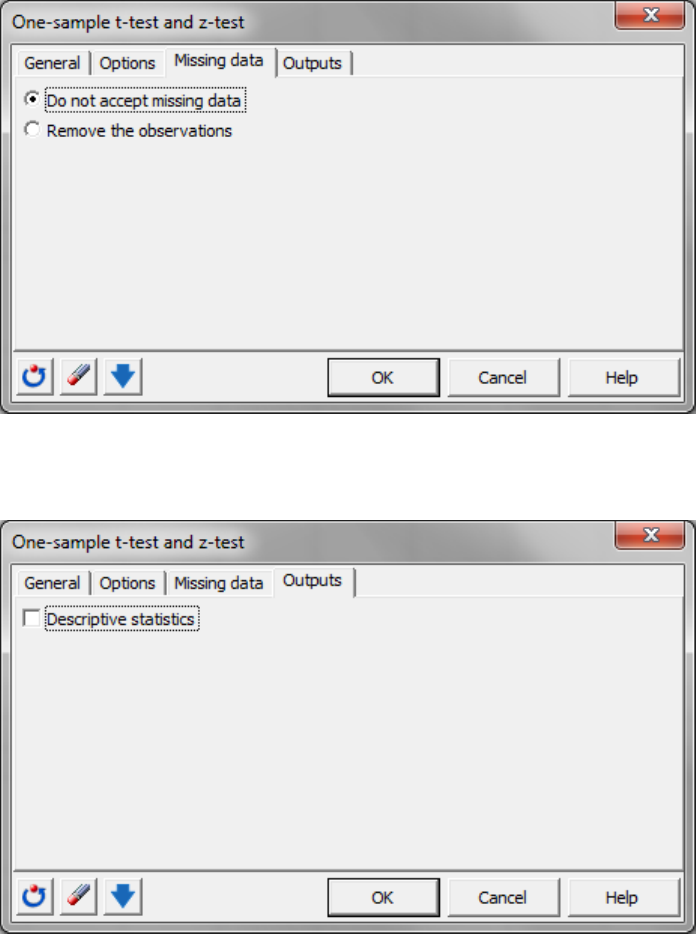
We can now move on to another very usual tab in the software, “Missing data”. This tab is used to set
how to handle missing data. In this case, you can remove the observations or get a warning message
when there are missing data. We select the latter by selecting “Do not accept missing data”.
XLSTAT Getting started manual © Addinsoft 49
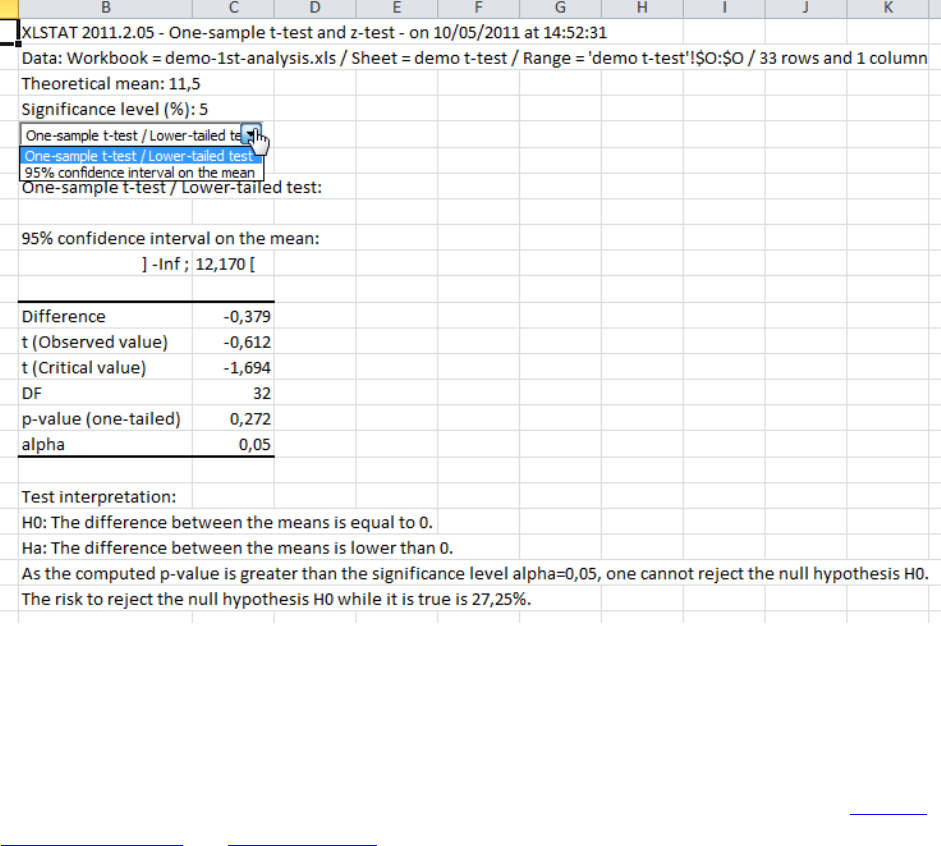
In the last section “Outputs” we keep selected the only available option “Descriptive statistics”. Other
results will also be computed but they are not optional.
When everything is set, we press “OK”.
The results of the t-test appear in a new sheet as determined. You can navigate them easily by using the
drop-down menu. We can go directly to the result of the test.
XLSTAT Getting started manual © Addinsoft 50
The p-value obtained with this test is 0.272 which is greater than 0.05. We should then reject the null
hypothesis and conclude that the class C preforms significantly less well than the class B. For more
information on how to interpret the results of a t-test you can look into the help documentation under
the chapter t-test.
We have now seen how to set up a t-test in XLSTAT. If you want to learn about how to set up a Principal
Component Analysis or a linear regression, check put the corresponding section in this chapter. If you
want to learn about how to set up your first plot, read the next chapter.
XLSTAT Getting started manual © Addinsoft 51
Set up you first chart
Now that we have seen how to set-up an analysis, let’s learn how to set-up of a graphic in XLSTAT.
There are two types of plots – the one which is generated while doing an analysis and the one which is
set up from independent dialog boxes. We will have a look at the latter.
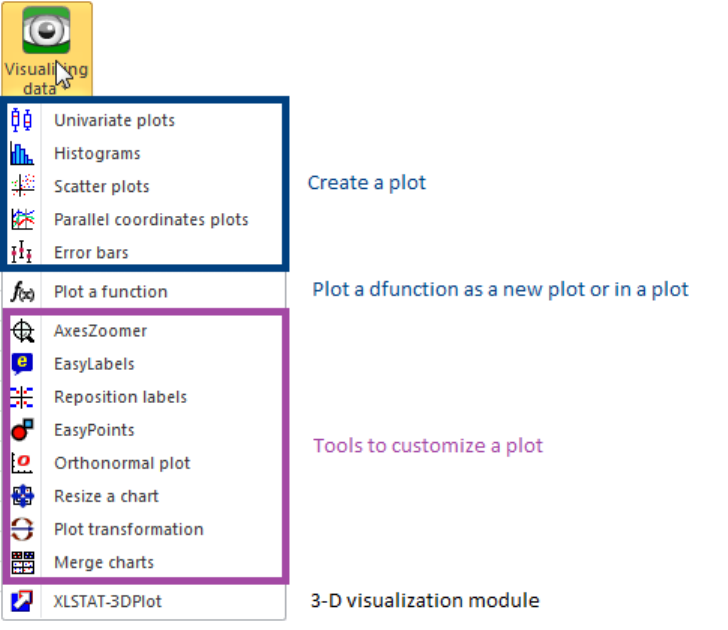
All the plots are grouped under the Visualizing data menu.
The first five options are used to create a plot.
The option “Plot a function” can be used both to create a plot and to add a function to a plot.
The rest of the options are utilized to customize a plot.
In this chapter we are only going to look at the set-up of plots and the different options for each plot.
Remember that if you have any doubts while creating a plot you can always look into the help
documentation where all the options of the dialog boxes are described.
Select one of the plots in the menu to get more information on how to set up each that specific plot.
XLSTAT Getting started manual © Addinsoft 52
1) Univariate plot
2) Histograms
3) Scatter plots
4) Parallel coordinates plots
5) Error bars
6) Plot a function
Univariate plots
There are two types of charts for the univariate plots depending on the nature of the variables.
When you select continuous variables you can get a wide range of Univariate plots such as box plots,
scattergrams, strip plots, stem-and-leaf plots as well as Normal P-P and Q-Q plots. Some of these plots
can be aggregated if you have several variables.
For qualitative variables you can plot bar charts, pie charts, and depending on the fact that you have a
group variable, you can also get stacked bars and clustered bars and if you compare the different groups
to the total sample, you can get doughnut plots.

XLSTAT Getting started manual © Addinsoft 53
Let’s plot a box plot for each of the two continuous variables of the following dataset. We will aggregate
the box plots into one graphic.
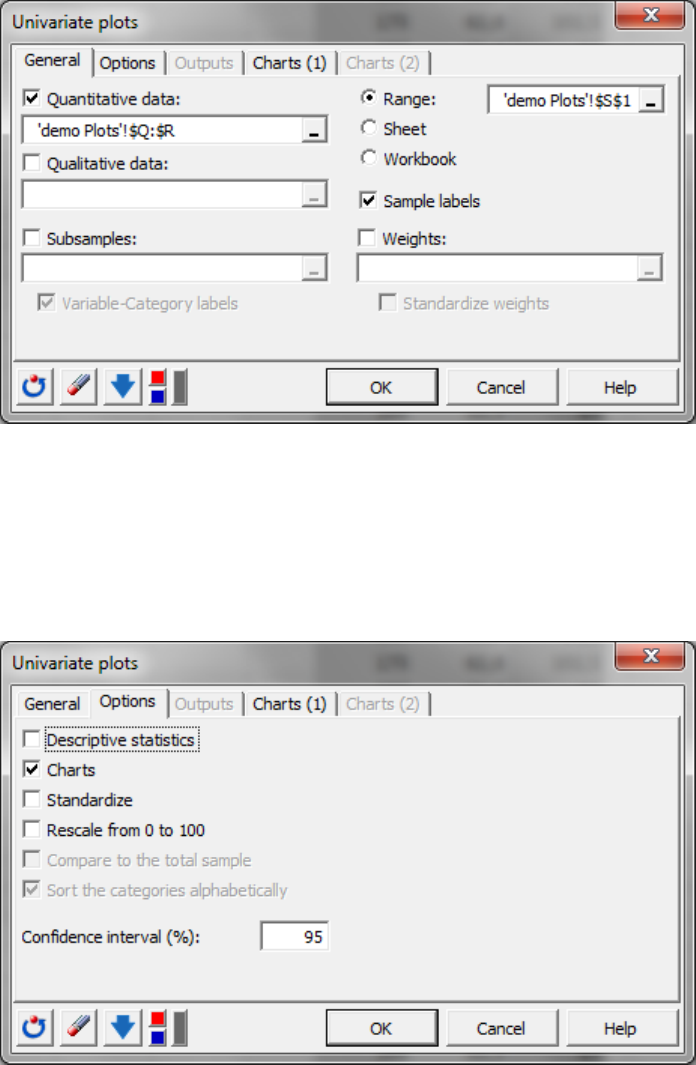
The first thing we should do is to select the data. Click on the range selector of the “Quantitative data”
and select the columns Q and R. We leave the fields “Qualitative data” and “Subsamples” empty as we
don’t have any data for these.
We have to specify that the selection contains the names of the variables so we leave the box “Sample
labels” ticked. There are no weights so we leave this section blank.
XLSTAT Getting started manual © Addinsoft 54
We can finally decide where to place the graphic. We are going to use the “Range” option to display the
plot next to the data. Select the cell where the results should start to be displayed. The “Sheet” option is
used to get the chart in a new sheet and the option “Workbook” in a new workbook.
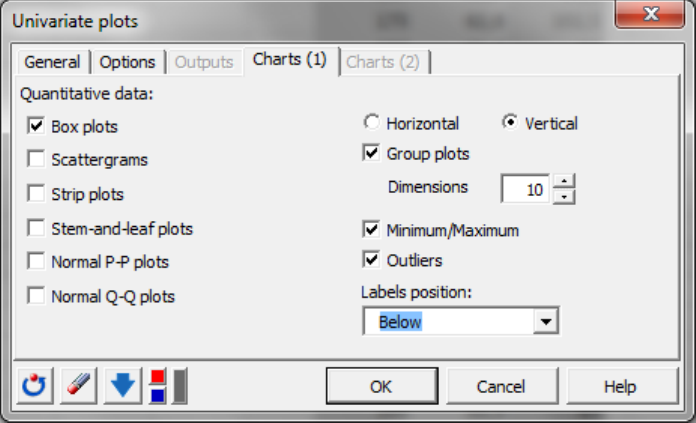
We move on to the next tab “Options”.
In this tab you can decide if you want to get, in addition to the box plots, descriptive statistics. We don’t
need this option to create a box plot so we can simply deselect it. Then we can opt to normalize or
rescale the data. This is especially useful if the data do not have the same scale. The grey options only
apply when the data are divided into groups.
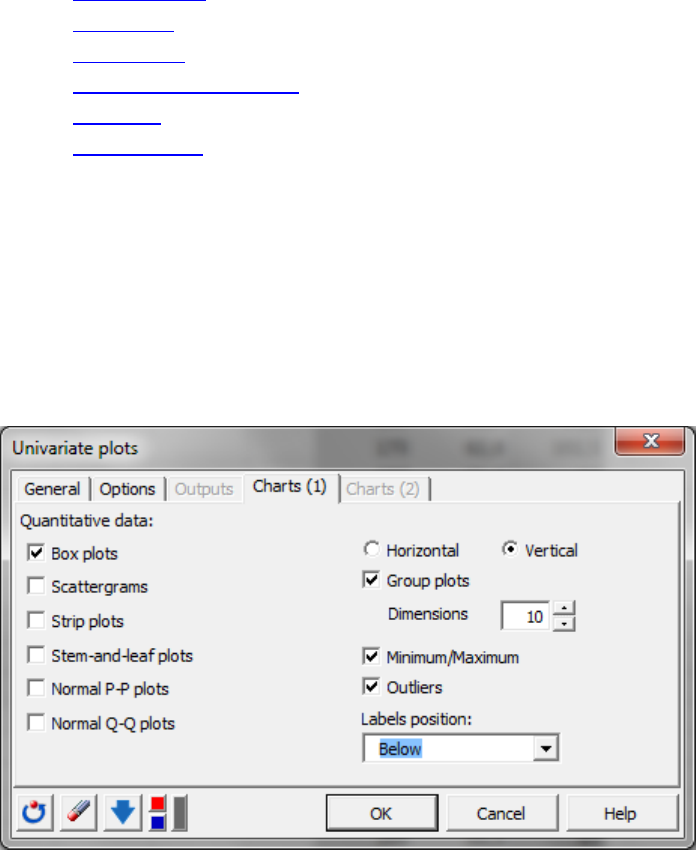
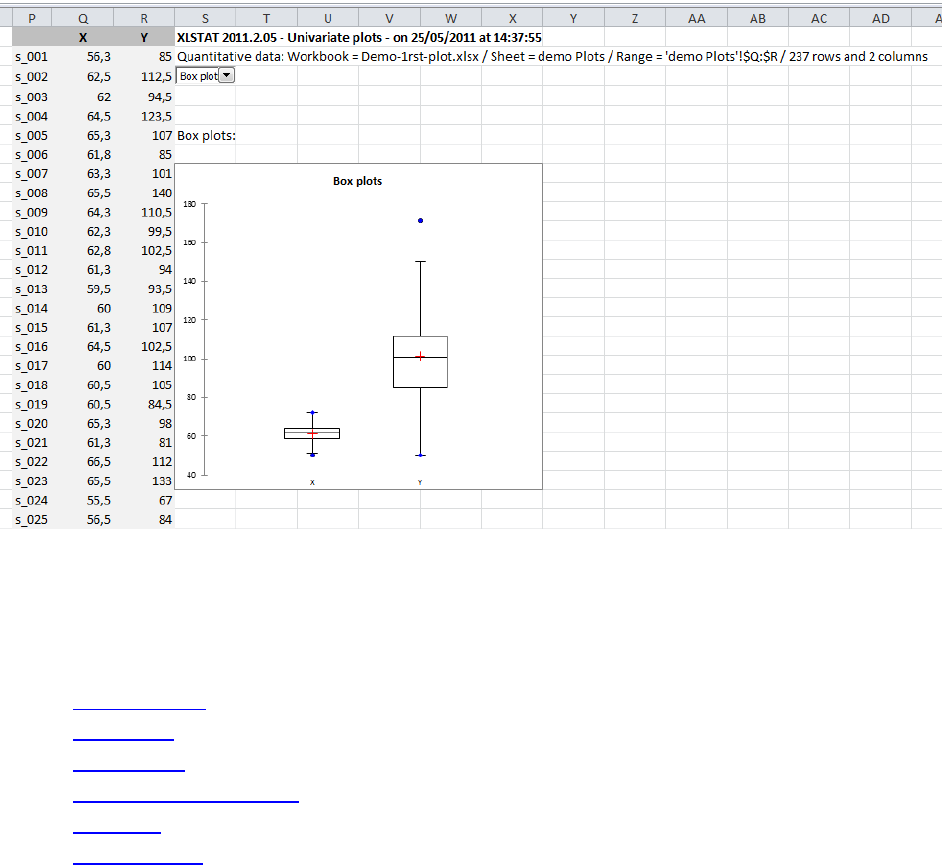
We can now move on to the tab Charts (1) containing the plot options for quantitative data.
XLSTAT Getting started manual © Addinsoft 55
We only want to plot a box plot so we leave the other options unselected. Then we can decide if we
want to have the box plot horizontal or vertical. Vertical is the most common, we will keep this option.
We want to get the plot aggregated so we enable the option “Group plots”.
The option “Minimum/Maximum” is used to show on the chart the extreme values as dots. The option
“Outliers” shows the outlier samples as crosses.
And finally the option “Label position” enables you to customize the placement of the labels. We will
take the option “Bellow”.
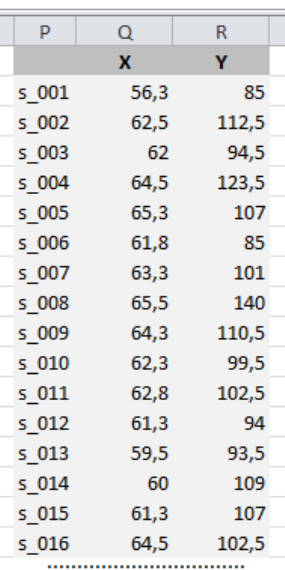
Now that everything is set we can click on “OK” and proceed with the computations.
The generated box plot is placed alongside the dataset, as requested.
XLSTAT Getting started manual © Addinsoft 56
We have now seen how to create a box plot. Creating other univariate plots is pretty similar; if you need
more information have a look at the help documentation.
If you want to learn more about another type of chart, read the corresponding section of this document.
1) Univariate plot
2) Histograms
3) Scatter plots
4) Parallel coordinates plots
5) Error bars
6) Plot a function
If you want to learn about how to customize a plot go to the next chapter.
Histograms
The second plotting option is “Histograms”. The histograms can be drawn for continuous or discrete
variables.
Here we have two continuous variables. We will plot two histograms at the same time, one for each
variable.
XLSTAT Getting started manual © Addinsoft 57
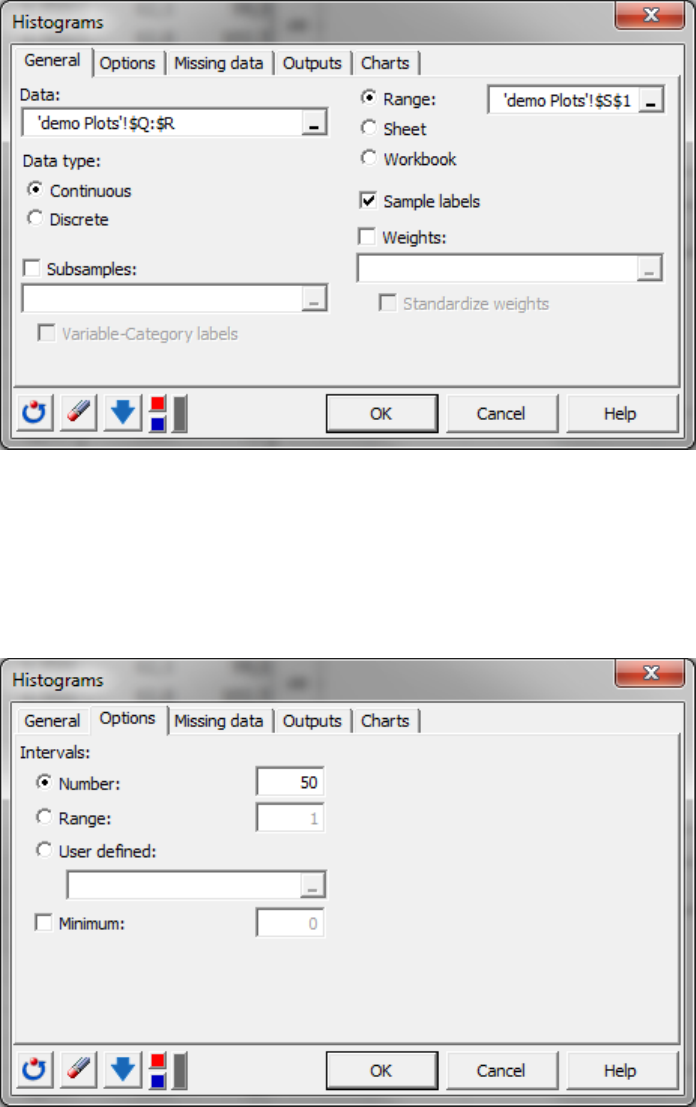
We need to select the data to plot. In this case, we select the data in column Q and R. The data are
continuous so the data type must be set as “Continuous”. We don’t have subgroups in our dataset so we
leave the option “Subsamples” blank.
We have included the names of the variables in our column selection; this is why we tick the box
“Sample labels”. No weights are applied to the observations.
Finally, we would like to display this plots next to the data so we check the “Range” option and select a
cell next to the data table. The option “Sheet” would have placed the graphic in a new sheet and the
option “Workbook” in a new workbook.
XLSTAT Getting started manual © Addinsoft 58
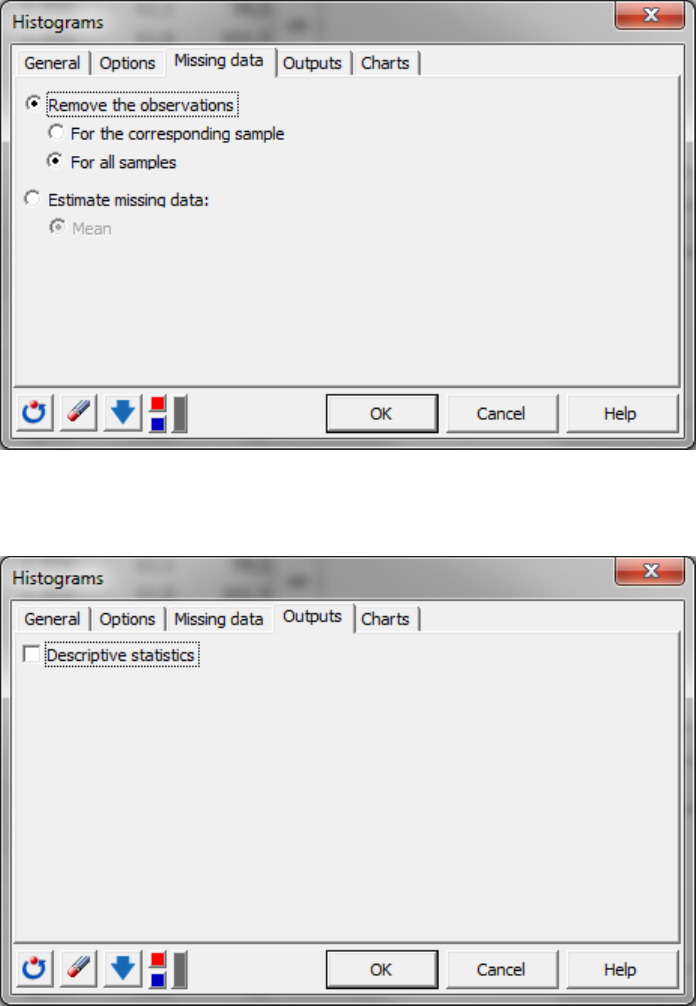
We can now move on to the next tab “Options”. Here, the number and size of the intervals can be
customized. We increase the number of intervals to 50.
The “User defined” option can be very useful if you want to customize the size of the intervals.
More options are available if a column of sub-samples has been selected.
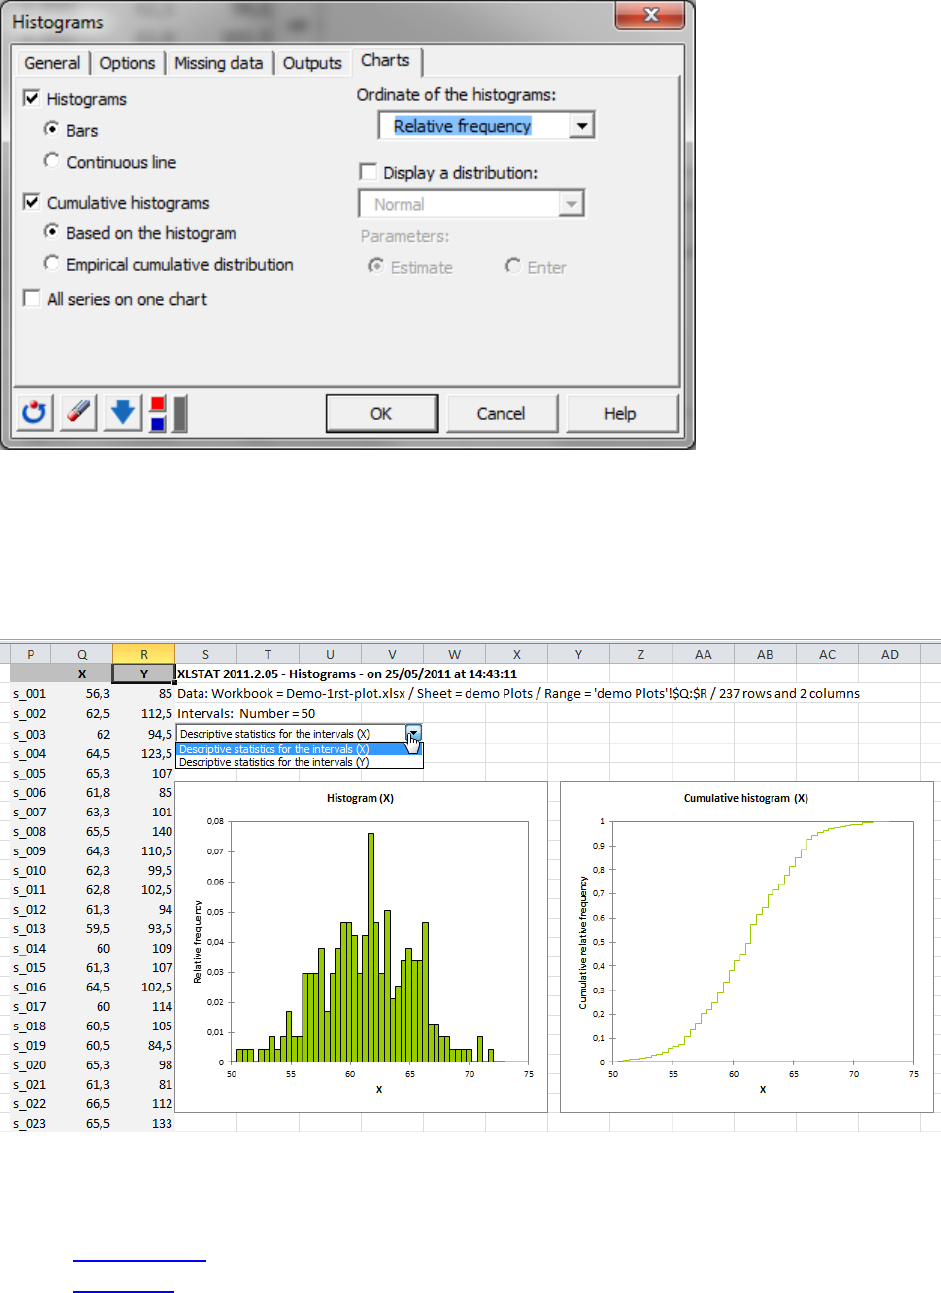
The next tab deals with handling missing data.
Here we select to ”Remove the observations” “for all samples”.
XLSTAT Getting started manual © Addinsoft 59
In the “Outputs” tab we can unselect the option “Descriptive statistics” as we only want to generate
histograms.
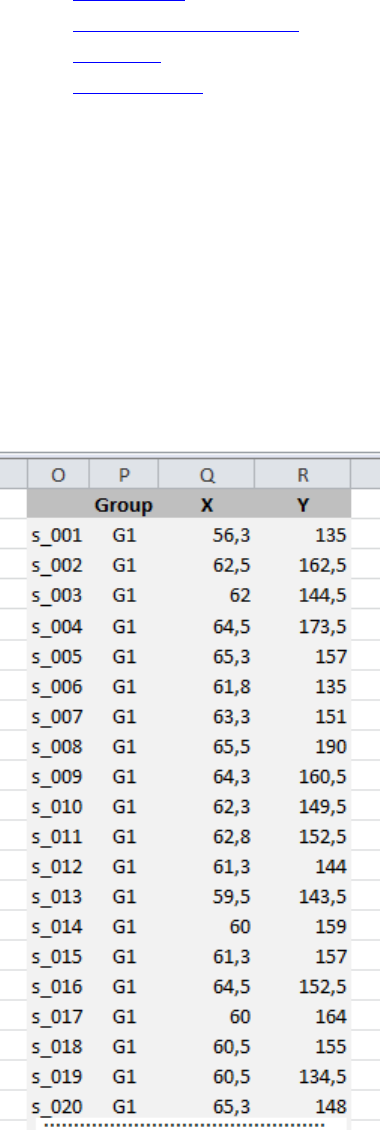
Finaly, we can customize the appearance of the histograms.
Fisrt, we can choose between histograms with bars or a continuous line. The first option is more classic.
We can also want to add the cumulative histograms based on the histogram or an empiracal distribution.
Then the ordinate of the histograms can be selected, usually we use “Relative frequency”.
Finaly we can display a distribution on the histograms. We select the Normal distribution for the two
variables we have and we let XLSTAT estimate the parameters of the distributions.
XLSTAT Getting started manual © Addinsoft 60
Now that the dialog box is set, we can launch the computations.
As requested the plots are displayed next to the data table. You have first the results for the first variable
and then the next one. You can use the drop-box menu to go directly to the results for the second
variable.
We have now seen how to create histograms. If you want to learn more about another type of chart,
read the corresponding section of this document.
1) Univariate plot
2) Histograms
XLSTAT Getting started manual © Addinsoft 61
3) Scatter plots
4) Parallel coordinates plots
5) Error bars
6) Plot a function
If you want to learn about how to customize a plot go to the next chapter.
Scatter plots
Scatter plots are a very popular type of plot. A basic scatter plot displays two continuous variables. You
can also add a third continuous variable that will be used for the size of the dots, as well as a discrete or
category variable to group the samples by color on the plot.
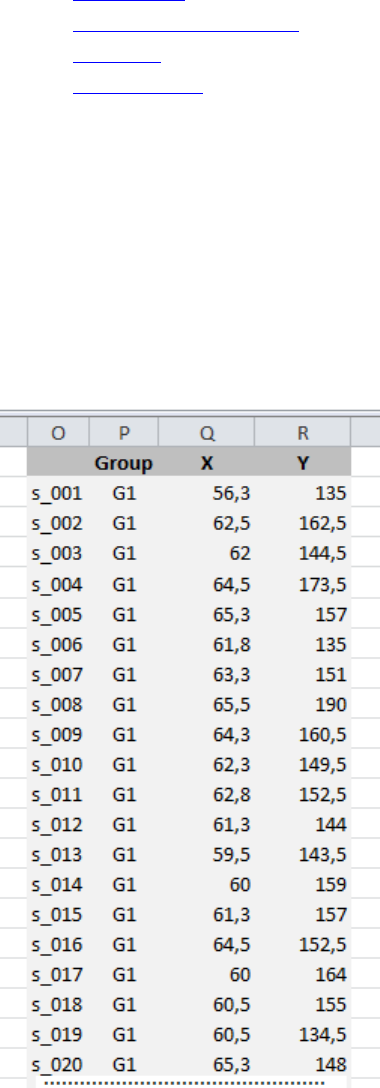
We are going to create a scatter plot with two continuous variables and one category variable to group
the samples.
Let’s start with entering the data.
In the “X” field, we should select the variable that will be displayed in abscissa; here we select the
column Q containing the X variable.

XLSTAT Getting started manual © Addinsoft 62
In the field “Y”, we select the column R. we don’t have a third variable to use for determining the size of
the dots on the plot so we leave the field Z empty.
We can select the option “Group” and use the column P.
The selection includes the variable labels so this option must be ticked. Finally we determine the
“Observation labels” by selecting the column O.
No weights are applied to the observations so we can leave this option unselected.
We finally decide to have the plot placed next to the data table. So among the options for displaying the
results we pick the option “Range” and select the cell where the results should start being displayed.
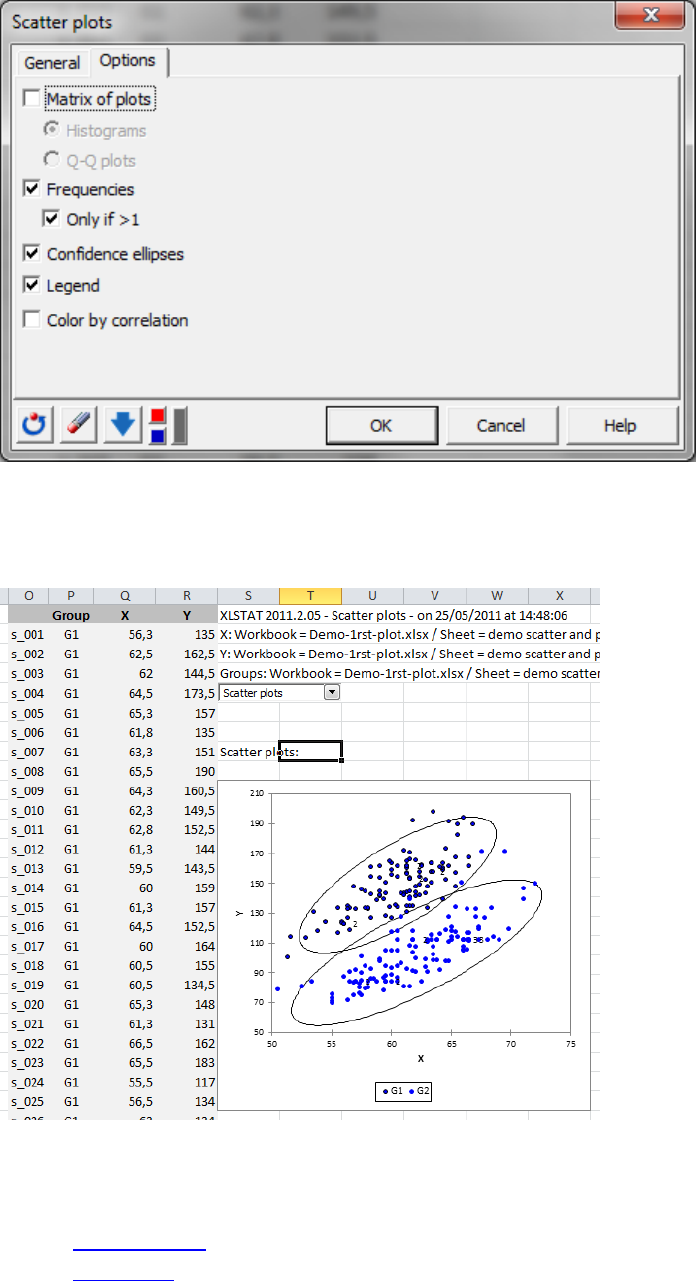
We move on to the tab “Options”.
We can also get a two-entry table with Y-variables in rows and Y-variables in columns displaying all
possible combinations of variables in pairs, by selecting the option “Matrix of plots”. We will not add this
option in this example.
The frequency option is used to display the number of superimposing points on the graphic. We will
enable this option as well as the condition “Only if >1” so that the graphic does not become over
crowded.
We can add confidence ellipses for the two groups and a legend.
We will not use the option “Color by correlation” as we already have the color by group.
XLSTAT Getting started manual © Addinsoft 63
Now that the dialog box is set, we can launch the plotting.
The plot is displayed next to the data table as requested.
We have now seen how to create scatter plots. If you want to learn more about another type of chart,
read the corresponding section of this document.
1) Univariate plot
2) Histograms
XLSTAT Getting started manual © Addinsoft 64
3) Scatter plots
4) Parallel coordinates plots
5) Error bars
6) Plot a function
If you want to learn about how to customize a plot go to the next chapter.
Parallel coordinate plots
The parallel coordinates plot is a chart used to discover or validate groups.
This type of plot can draw both quantitative and qualitative data.
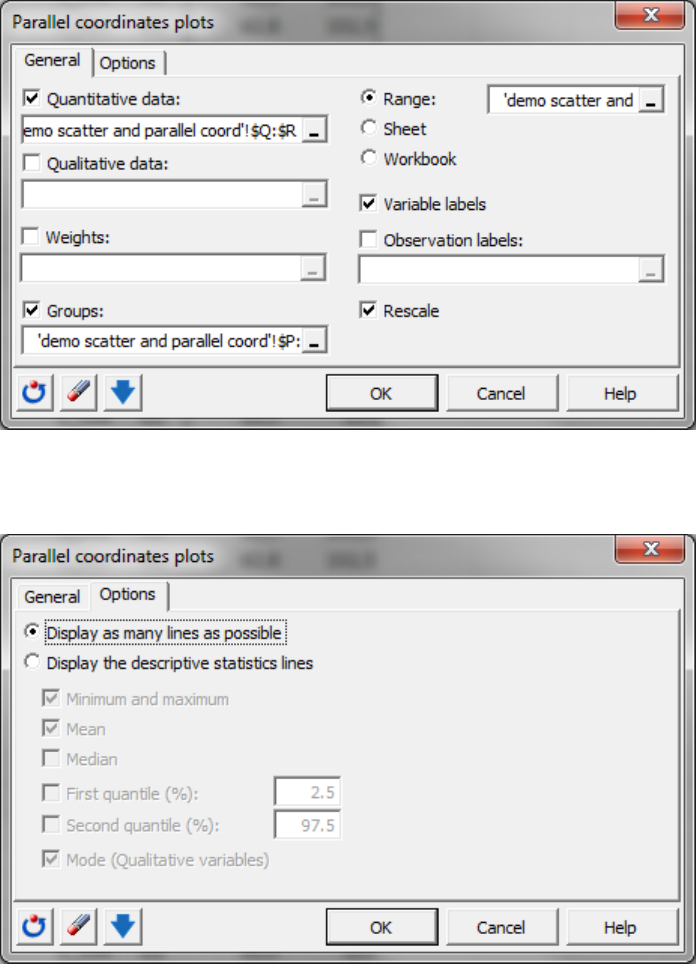
We have an example with two quantitative variables and a group variable that we would like to validate.
Once the dialog box is opened, we determine the data to plot by selecting the two quantitative variables
X and Y in the columns Q and R.
We set the group variable as the column P. We then check that the “variable labels” option is selected as
the names of the variables were included in our selection.
XLSTAT Getting started manual © Addinsoft 65
We don’t need to specify the observation labels else there will be too many labels for the plot to be
clear.
We use the option “Rescale” so that both variable variations will be between 0 and 1.
Before moving on to the next tab, we specify the location of the results. We will place the plot alongside
the data table. This is why we use the option “range” and select a cell next to the table.
We can move on to the next tab “Options”. Usually we get more striking charts when we use the option
“Display as many lines as possible” rather than descriptive statistics.
When this is done we can press “OK” and then “continue” on the summary window.
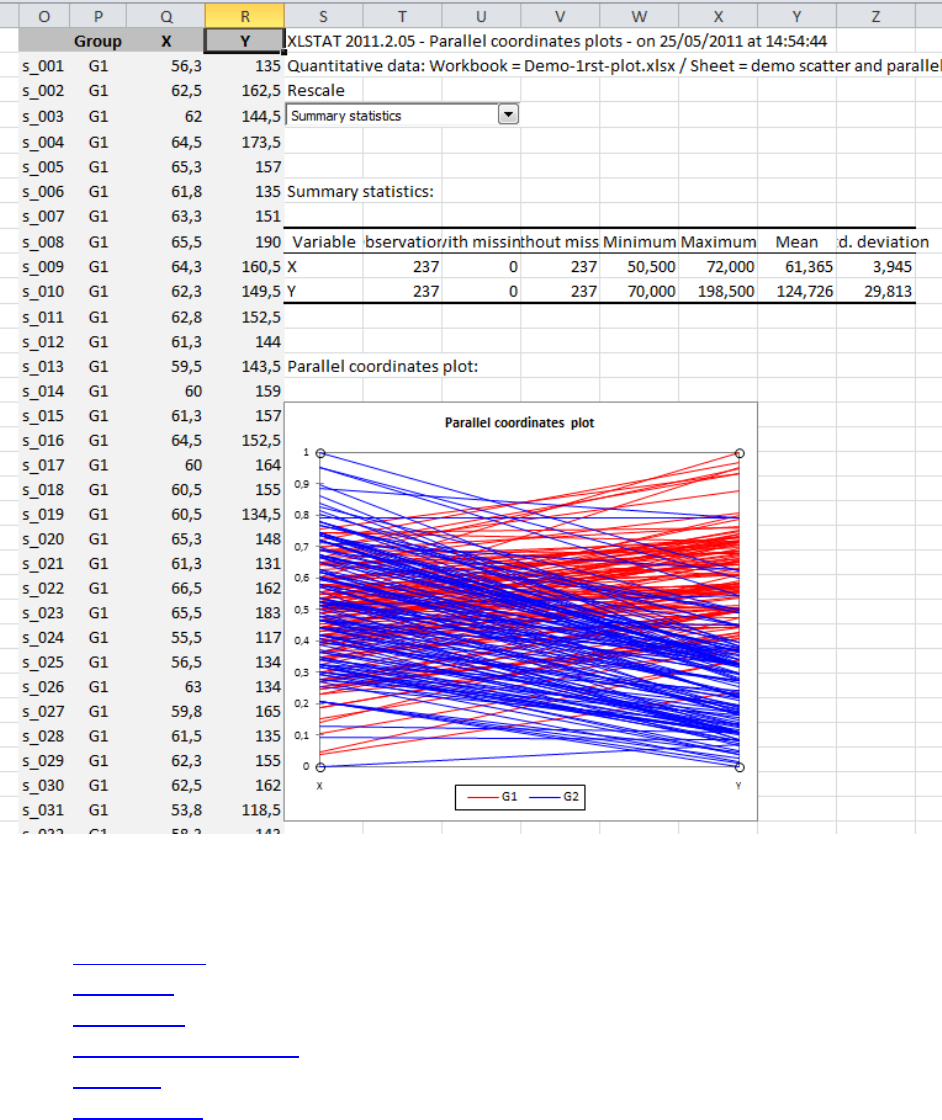
XLSTAT Getting started manual © Addinsoft 66
The results are placed as requested next to the data table and it can be seen that the two groups behave
differently on the variable Y.
We have now seen how to create parallel coordinates plots. If you want to learn more about another
type of chart, read the corresponding section of this document.
1) Univariate plot
2) Histograms
3) Scatter plots
4) Parallel coordinates plots
5) Error bars
6) Plot a function
If you want to learn about how to customize a plot go to the next chapter.
XLSTAT Getting started manual © Addinsoft 67
Error bars
A plot containing different error bars is difficult to achieve under Microsoft Excel. This “Error bar” tool
simplifies this action. The data may contain values for the minimum and/or maximum of each series you
wish to draw.
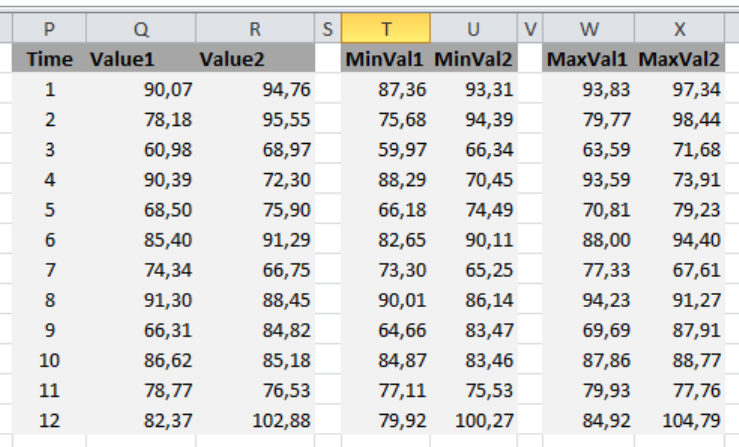
In this example, we have two series of values with their respective minimum and maximum.
Once we have opened the dialog box, we need first to set up the X and Y variables. In abscissa, we are
going to use the “time” variable in the column P. For the Y variables we can select the two series of
values in columns Q and R.
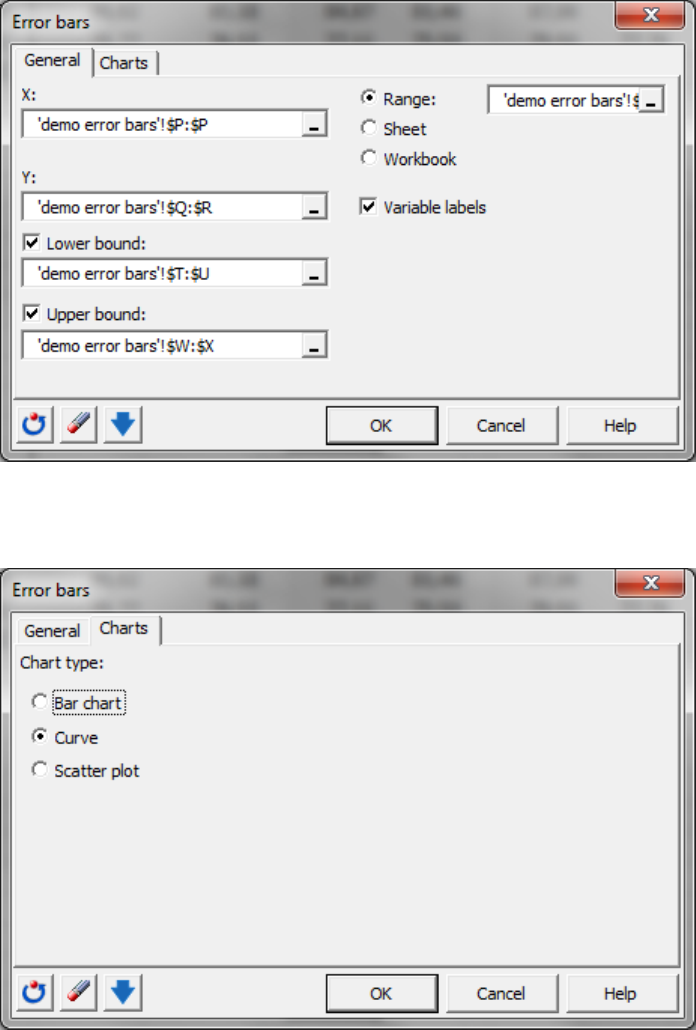
We now have to tick the “lower bound” box and specify it with the two columns T and U which contain
the minimal values for the two series. We do the same for the “upper bound” with the columns W and X.
We don’t forget to check the box “variable labels” as the name of the variables are included in the
selection. Finally we decide to place the plot next to the data table by ticking the option “range” and
selecting the Z1 cell. The two other options, “sheet” and “workbook”, place the results in a new
corresponding item.
XLSTAT Getting started manual © Addinsoft 68
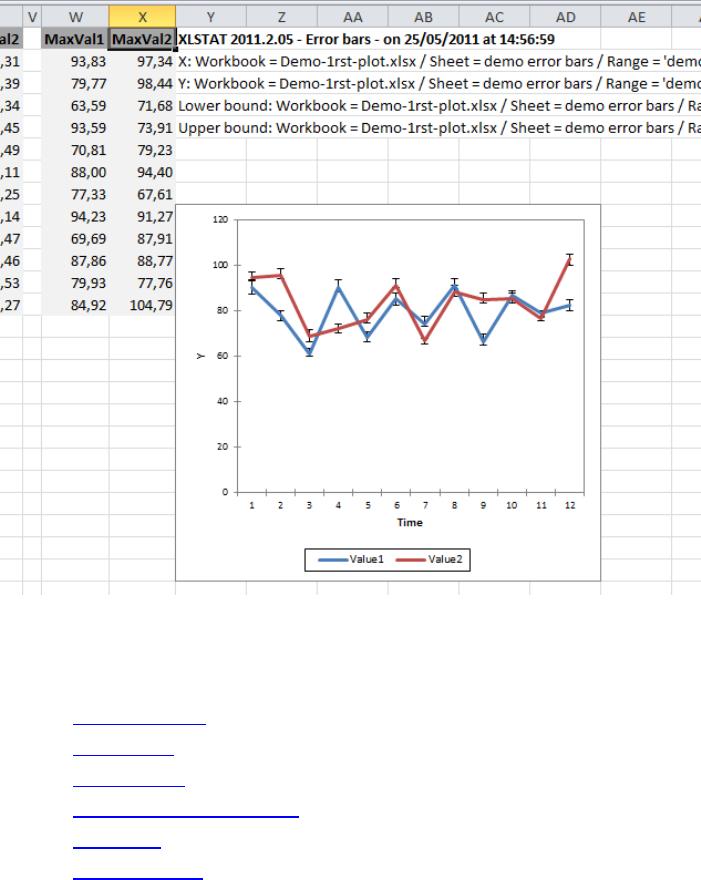
In the “Charts” tab we can decide the type of plot to be displayed. We will select the option “curve” as
we are dealing here with a series.
Once the dialog box is set we can launch the computations. The plot is displayed as requested next to
the data table.
XLSTAT Getting started manual © Addinsoft 69
We have now seen how to create plots displaying error bars. If you want to learn more about another
type of chart, read the corresponding section of this document.
1) Univariate plot
2) Histograms
3) Scatter plots
4) Parallel coordinates plots
5) Error bars
6) Plot a function
If you want to learn about how to customize a plot go to the next chapter.
Plot a function
The option “plot a function” is used for two things either to create a plot or to add a function to a plot.
We are going to do both.
The two methods are pretty similar. The only step that differs is the selection of an existing plot or not.
If you want to add a function to a plot you need to select the plot first.
XLSTAT Getting started manual © Addinsoft 70
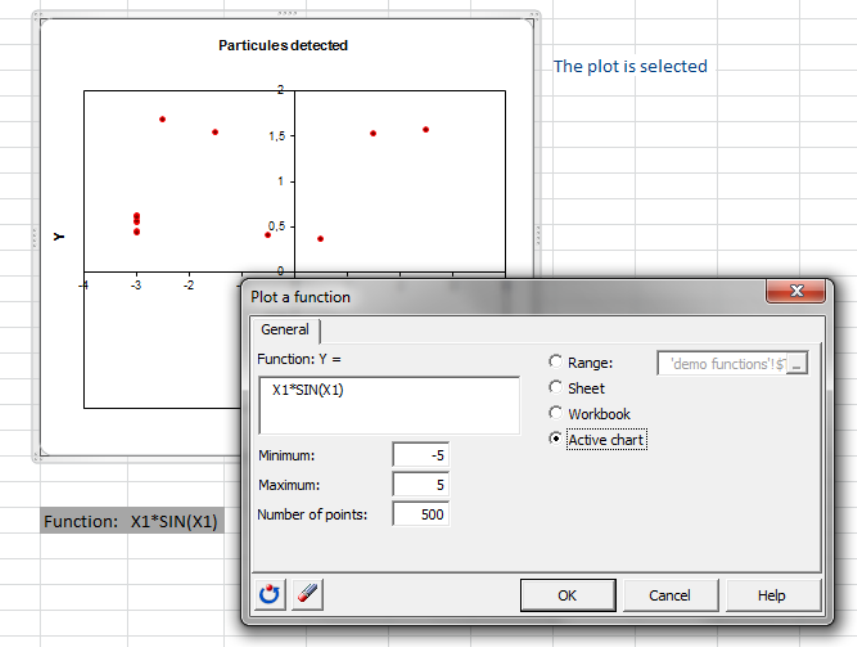
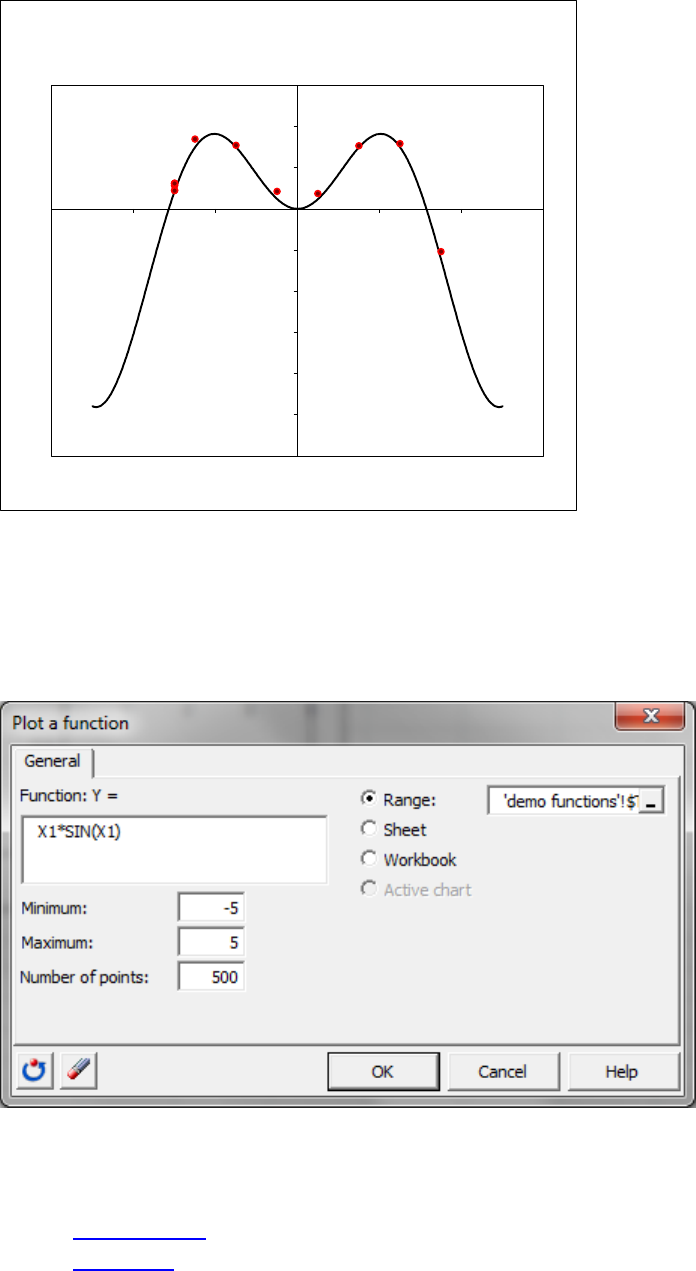
Once this is done, you can go to the menu “Visualizing data – Plot a function”. You need to enter the
function using the Microsoft Excel convention. For example, here, we are going to use the function
Y=x*sin(x).
We need to enter X1*SIN(X1) all in capital letters.
We then add the domain of variation for X1. We leave the pre-selection -5 to 5. Next we can adjust the
number of points to be computed to draw the function. 500 points are enough on our interval.
Finally, the result will be displayed on the “Active chart”.
We now click “OK”.
The function has been added to the plot.
XLSTAT Getting started manual © Addinsoft 71
We can now repeat the same thing without selecting a chart.
As you can see now the option “Active chart” is unavailable. We can then decide to place the results next
to the other chart by clicking the option “Range” and selecting a cell next to the chart. The other options
“Sheet” and “Workbook” can be used to place the results in a new sheet or new workbook respectively.
We have now seen how to plot a function. If you want to learn more about another type of chart, read
the corresponding section of this document.
1) Univariate plot
2) Histograms
-6
-5
-4
-3
-2
-1
0
1
2
3
-6 -4 -2 0 2 4 6
Y
X
Particules detected

XLSTAT Getting started manual © Addinsoft 73
Customize a graphic
In the previous chapter we have seen how to generate a graphic with XLSTAT. In this chapter, we are
going to see how we can customize graphics in Microsoft Excel with the XLSTAT tools. Plots can either be
generated in XLSTAT directly from the data - as we have seen in the previous chapter - or during an
analysis; or they can be generated with Microsoft Excel. Both types of graphics can be customized with
the XLSTAT tools.
Any graphic from XLSTAT can also be customized with the customization options from Microsoft Excel
available on right click. We are not going to look into these options but rather introduce you to the
possibilities offered by XLSTAT.
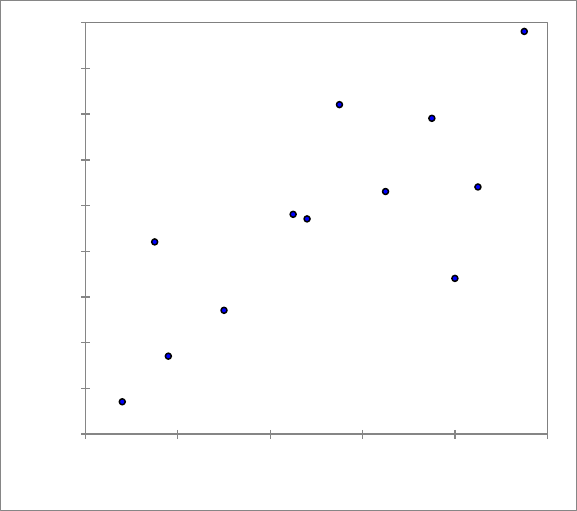
In this chapter, we will use a scatter plot that shows the size and weight of 12 children.
There are more information we could use on the plot such as the age and the identity of each child. We
are going to add this using the XLSTAT customization tools.
60
65
70
75
80
85
90
95
100
105
52 54 56 58 60 62
Weight
Size
XLSTAT Getting started manual © Addinsoft 74
The options for tailoring a plot are grouped under the menu visualizing data in the bottom part of the
menu.
Let’s have a look at each of these tools.
XLSTAT Getting started manual © Addinsoft 75
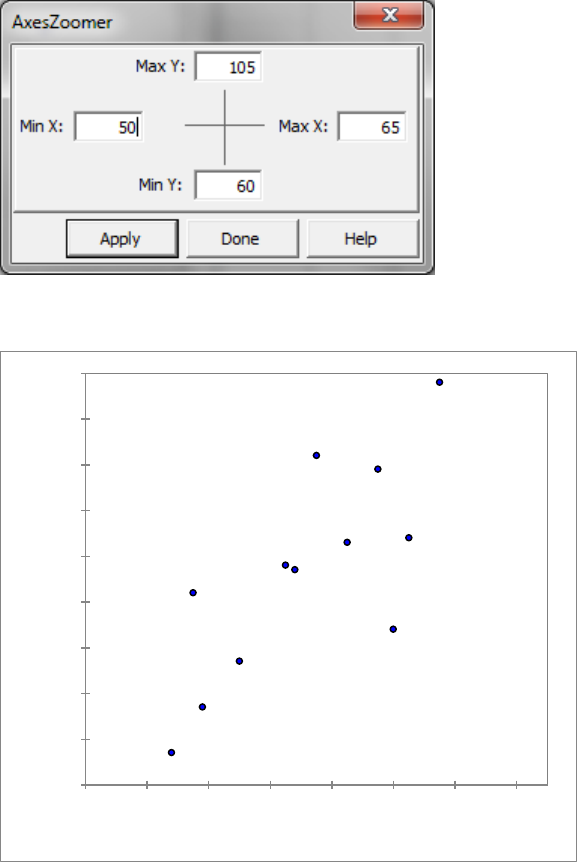
The first tool, “AxesZoomer”, enables you to set the exact dimension of the axes of your plot.
Here we change the upper and lower bounds of the X axis to 50 and 65 respectively.
Once the new axes boundaries have been set up, we click “OK” and the graphic changes.
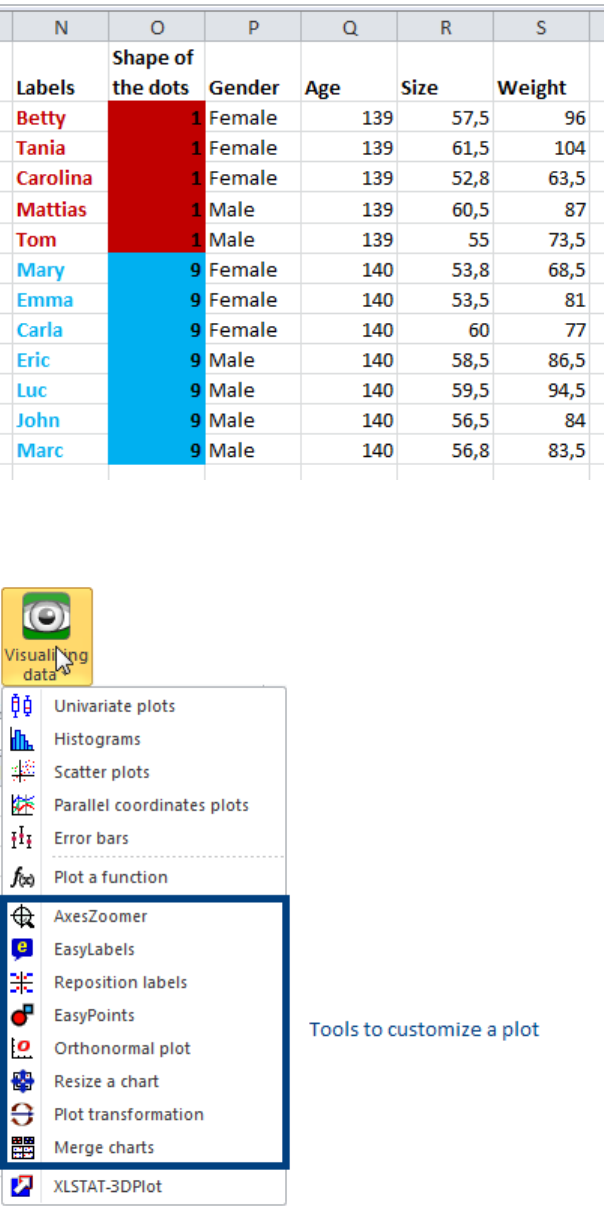
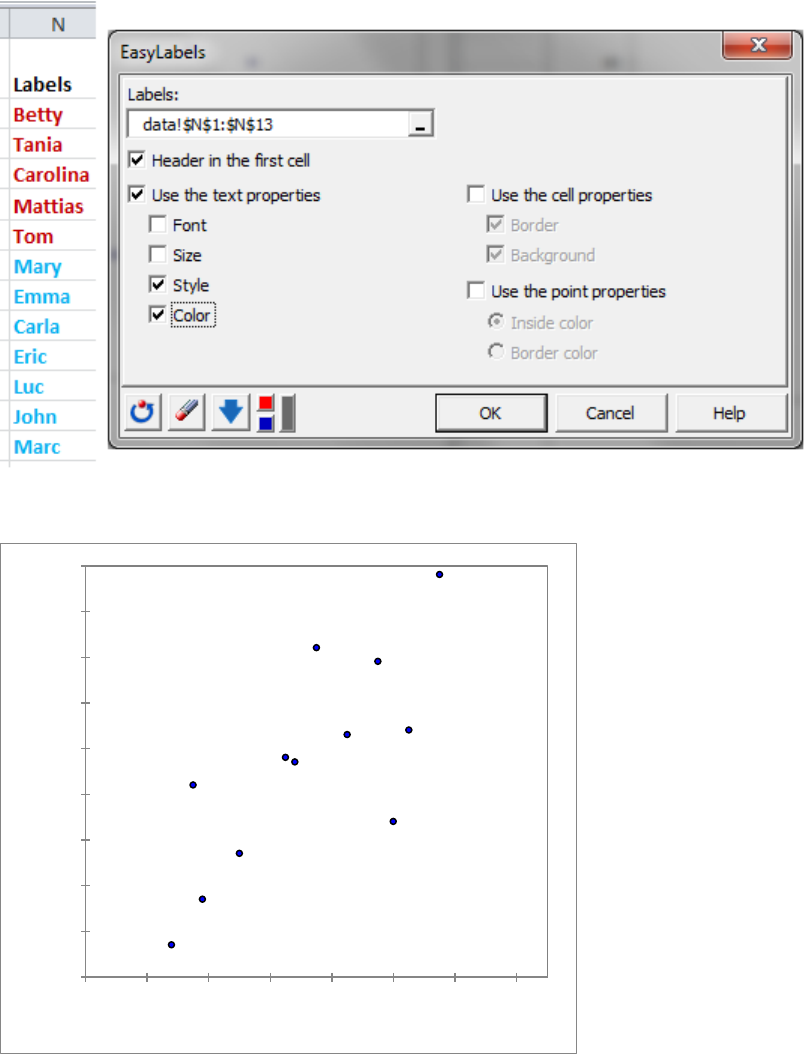
The second tool “EasyLabels” allows you to add or change labels and their characteristics in a plot.
In this example we simply select new labels in the “Labels” field using the column N and then decide to
use the text properties “style” and “color” for their appearance. It is also possible to use either the cell
or the dots’ properties to define the look of the labels. This is not necessary in our case.
60
65
70
75
80
85
90
95
100
105
50 52 54 56 58 60 62 64
Weight
Size
XLSTAT Getting started manual © Addinsoft 76
Once you click “OK” the labels appear on the plot.
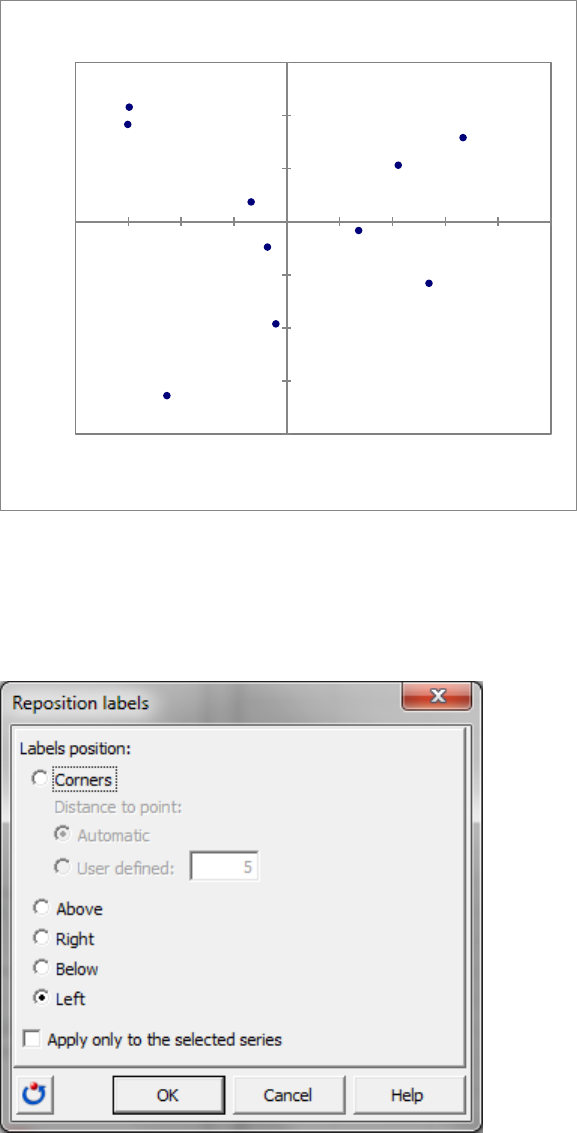
The next option for customizing a plot is “Reposition labels”. It helps defining the labels’ position.
The option “corners” is most useful when the plot is divided in quadrants such as in a score plot. The
position of the labels will vary depending on the quadrant.
Betty
Tania
Carolina
Mattias
Tom
Mary
Emma
Carla
Eric
Luc
John
Marc
60
65
70
75
80
85
90
95
100
105
50 52 54 56 58 60 62 64
Weight
Size
XLSTAT Getting started manual © Addinsoft 77
The other available options place all selected labels in a single type of position. We select the option
“Left”. It is also possible to only apply the change of position to the selected series. In this example we
only have one series so this is not applicable. When we press “OK” we can see the labels shifting
position.
When you click “OK” the plot is changed.
s01
s02
s03
s04
s05
s06
s07
s08
s09
s10
-4
-3
-2
-1
0
1
2
3
-4 -3 -2 -1 0 1 2 3 4 5
F2 (25,31 %)
F1 (43,99 %)
Observations (axes F1 and F2: 69,30 %)

XLSTAT Getting started manual © Addinsoft 78
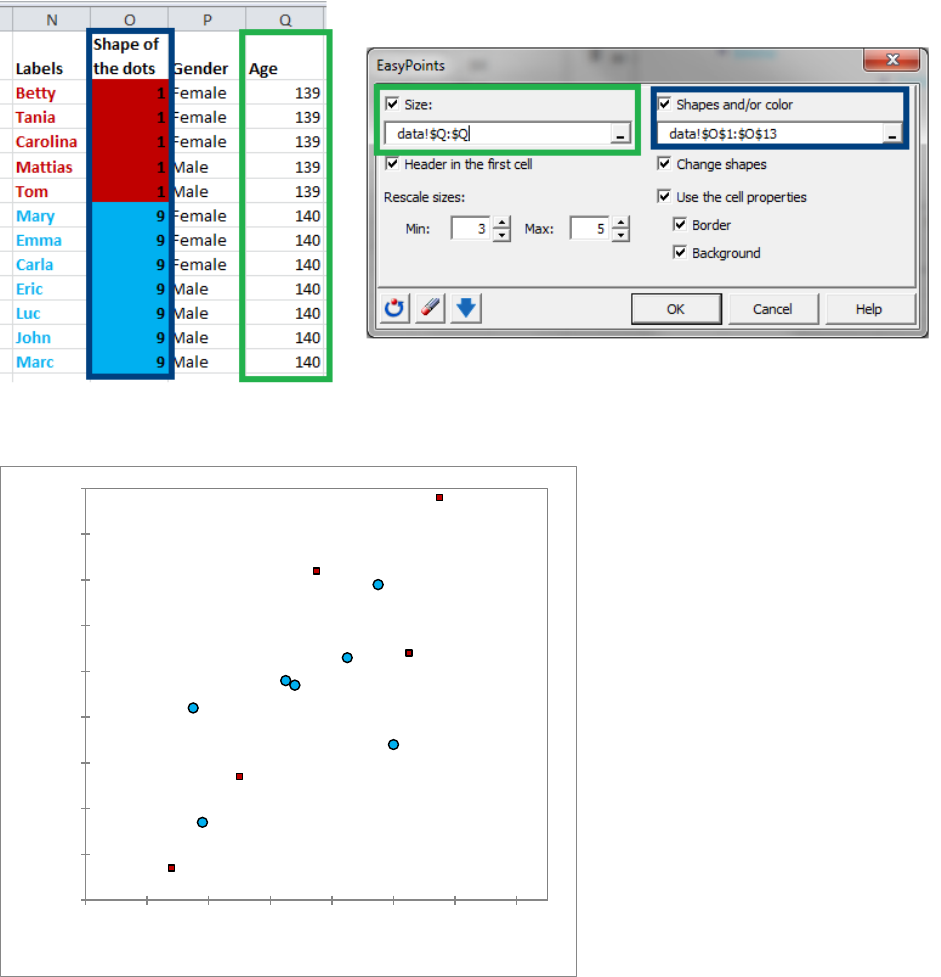
After modifying the position of the labels, you can modify the size, shape and color of the dots in a
graphic using the option “EasyPoints”.
First we select to use the variable “Age” as the variable to define the points’ size. We need to indicate
that the first cell contains the label of the variable. Then we can select the variation range of the size of
the points. As we only have two values for the age it is not necessary to have a large variation this is why
we select 3 and 5 for the size of the points.
Next we define the shape and/or color of the dots. We select a column containing cells of 1s and 9s with
red or blue background. This code also corresponds to the “age”, we could use another type of
information if needed.
There is a numerical code to define the shape of the dots. Here we are using 1 for square and 9 for circle.
Numerical code
Shape
1
□
2
◊
3
∆
4
x
5
*
6
.
7
-
8
+
9
○
Betty
Tania
Carolina
Mattias
Tom
Mary
Emma
Carla
Eric
Luc
John
Marc
60
65
70
75
80
85
90
95
100
105
50 52 54 56 58 60 62 64
Weight
Size
XLSTAT Getting started manual © Addinsoft 79
We activate the box “change shapes” as we have used the code for this purpose and we will use the cell
properties.
Once this is ready we press “OK” and you can now see the new size, shape and color of the points.
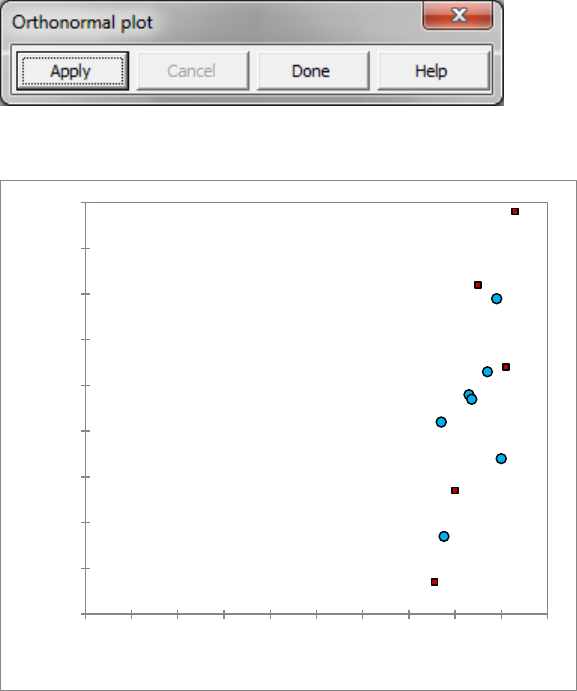
The following option “Orthonormal plot” resizes the axes of a plot to make the plot orthonormal; this
means that a unit on the X-axis appears the same size as a unit on the Y-axis. This option is especially
useful when you have resized a plot and still want to keep it orthonormal.
The dialog box for this option is very simple. Once you have selected the graphic to modify, you simply
need to press “Apply”. Once the plot is modified you can exit the dialog box by clicking the “Done”
button.
Betty
Tania
Carolina
Mattias
Tom
Mary
Emma
Carla
Eric
Luc
John
Marc
60
65
70
75
80
85
90
95
100
105
50 52 54 56 58 60 62 64
Weight
Size
XLSTAT Getting started manual © Addinsoft 80
The result is as follow.
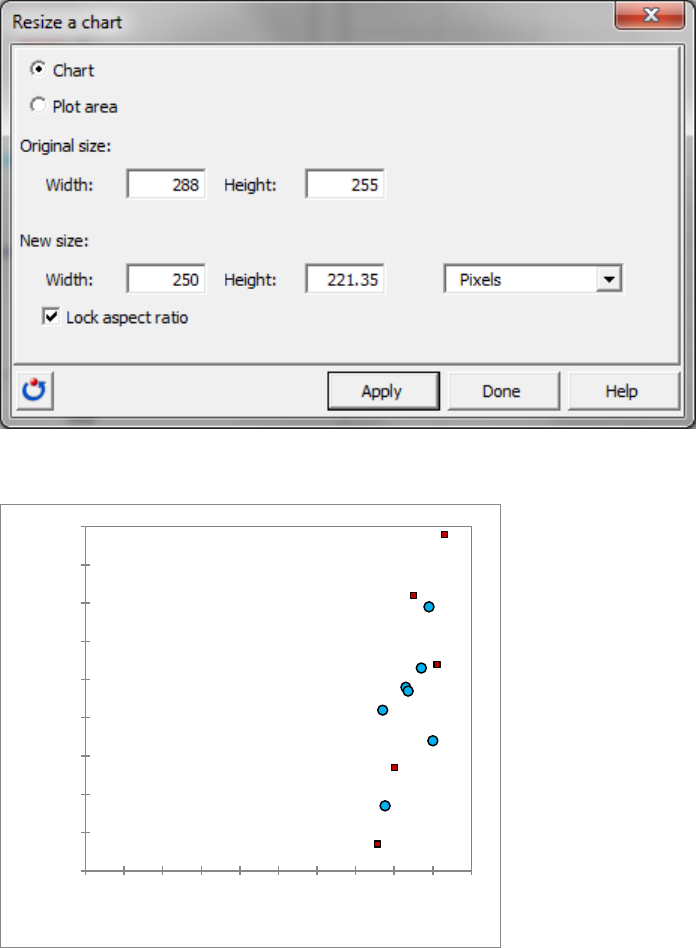
We now move on to the next option “Resize a chart”.
The option “resize a chart” enables you, as its name indicates, to customize the dimensions of a graphic
and in particular the full chart and the plot area. This is especially useful to create plots to include in a
presentation or article.
You can lock the aspect ratio if you want to keep some properties such as the orthonormality, we will
then activate this option.
We will decrease the size of the plot to have a specific width of 250 pixels. Note that you can also use
percent.
Betty
Tania
Carolina
Mattias
Tom
Mary
Emma
Carla
Eric
Luc
John
Marc
60
65
70
75
80
85
90
95
100
105
15 20 25 30 35 40 45 50 55 60 65
Weight
Size
XLSTAT Getting started manual © Addinsoft 81
When you click “Apply” the plot is modified as follow.
A chart can also easily be transformed thanks to the “Plot transformation” option. The transformations
include symmetry, translation, rotation and rescaling.
Betty
Tania
Carolina
Mattias
Tom
Mary
Emma
Carla
Eric
Luc
John
Marc
60
65
70
75
80
85
90
95
100
105
15 20 25 30 35 40 45 50 55 60 65
Weight
Size

XLSTAT Getting started manual © Addinsoft 82
Finally, you can merge similar charts and choose which title to use.
All these customization options render the task of creating informative visuals easier. In the next chapter
you will discover the XLSTAT tools. Among them is one tool that will be very useful for you to export
graphics or tables to image file types.
XLSTAT Getting started manual © Addinsoft 83
Tools of XLSTAT
In this chapter you will be introduced to the various tools of XLSTAT. The XLSTAT tools are placed in a
dedicated menu.
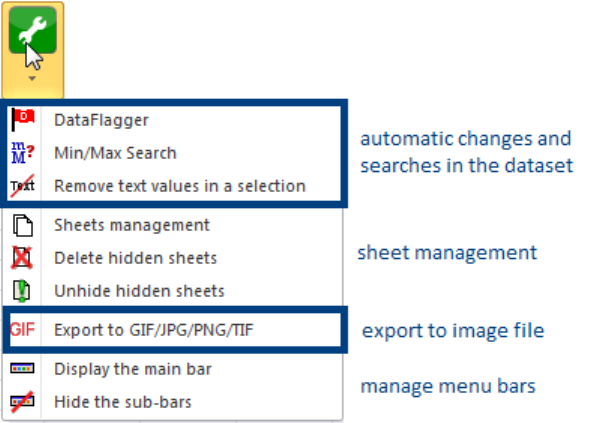
They can be divided into four categories. First, you have the tools used to make automatic searches and
changes in a dataset, secondly the tools managing sheets, then a tool to export results into image files
and finally two tools to manage menu bars.
Tools used to make automatic searches and changes in a dataset
Let’s now have a look at the first three tools.
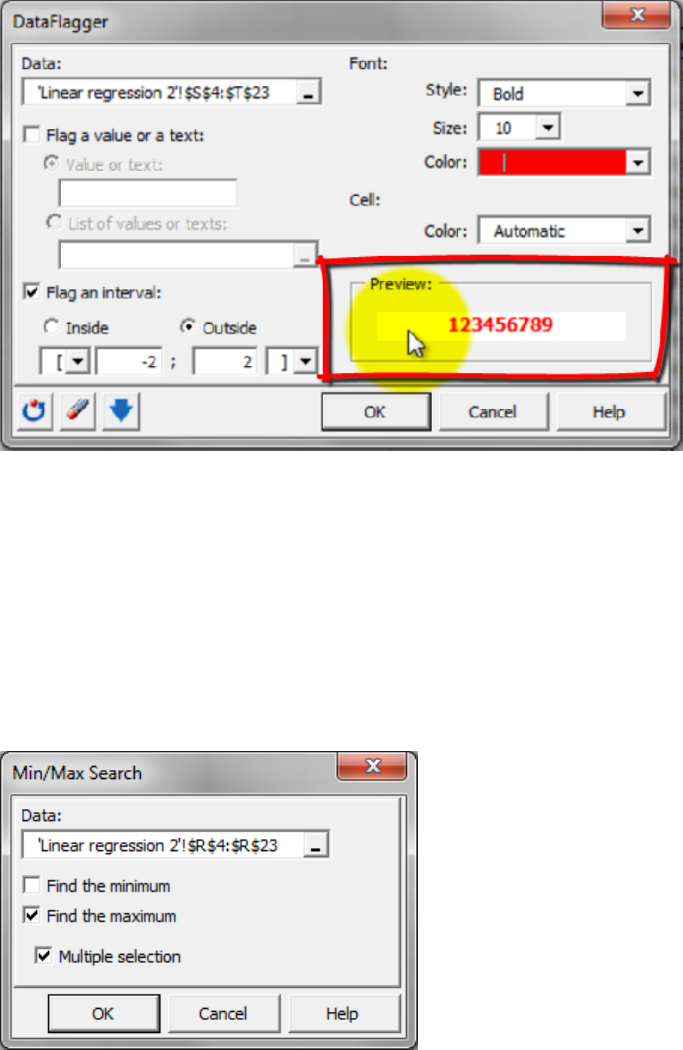
The “Dataflagger” tool is a great tool to easily flag numerical or textual data that correspond to
something you are looking for. For this demo, we select to flag values in the standardized residuals
coming from a linear regression. It is possible to enlighten data that are either equal to some values that
can be specified or data that are inside or outside a specified interval. We decide to use the second
option and we want to highlight the data that are outside the interval. We define the interval as ranging
from -2 to 2. Then we can determine the way the data should be marked. You can play on the style, size,
color of the font, and also modify the color of the cell. Here we set the color to red and the style to bold.
The preview field helps you to refine the visualization options.
XLSTAT Getting started manual © Addinsoft 84
When ready we press “OK”. As you can see a value is now in bold and red in the dataset.
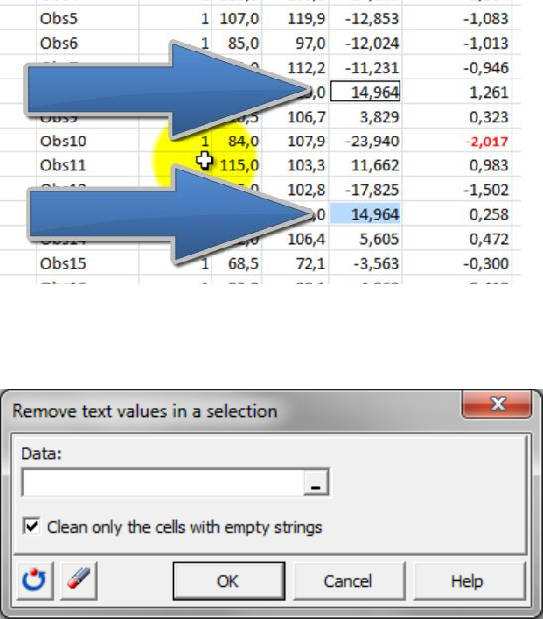
The “Min/Max search” option is used, as its name indicates, to pinpoint minimum and/or maximum in
datasets. For this demo, we select the data corresponding to the column R containing the residuals of a
linear regression. We only want to have the maximum values so we only activate the corresponding box.
In addition, it is possible to navigate between the extreme values thanks to the option “multiple
selection” so we keep that option selected.
As you can see two values are highlighted. You can navigate between the two by pressing “Enter”.
XLSTAT Getting started manual © Addinsoft 85
The last option “remove text values in a selection” is useful to clean up a dataset of unwanted text
values.
Manage sheets
The second type of tool contains three options that manage the sheets of a workbook. XLSTAT often
generates hidden sheets to create graphical results while running an analysis. You may want to see the
numerical results behind a plot and to do so you will need to access the related hidden sheet.
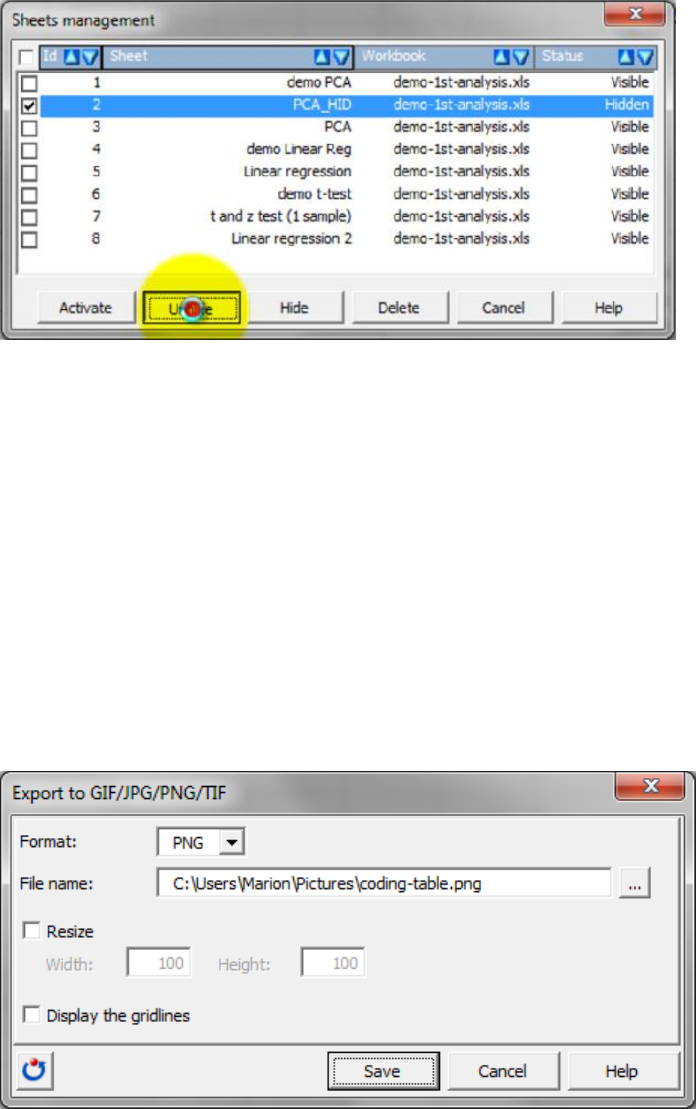
The first option “Sheets management” includes all the possible actions to be done on sheets: activate,
delete and hide a sheet as well as unhide hidden sheets. The next two options are shortcuts for either
deleting or unhiding hidden sheets.
When you open the first option you get the list of all the sheets present in the current worksheet. We
are going to select a hidden sheet in this dataset. The hidden sheets generated by XLSTAT have a name
that starts with HID and ends with the abbreviation of the related method so that they are easy to
identify. Here, we select “HID_PCA”. Then we simply press “Unhide”. The sheet is now accessible from
the bottom tabs of the Excel workbook.
XLSTAT Getting started manual © Addinsoft 86
Export results into image files
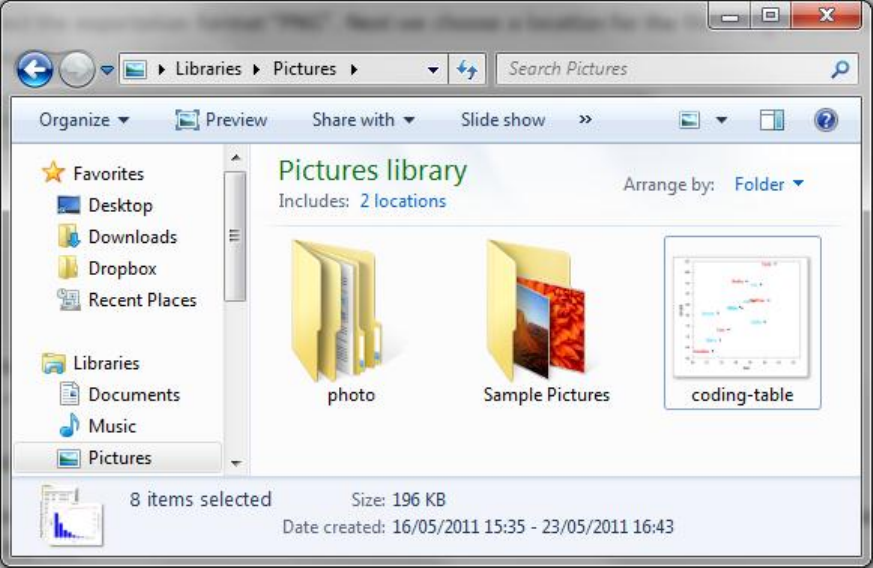
The “Export to GIF/JPG/PNG/TIF” option is very useful to transform your data and results into an image.
The advantage of using this tool is that if you have customized what you want to export the layout will
be kept.
First you need to select a plot or a table and then you can simply click that option to export it.
In this demo, we select a scree plot obtained for a Principal Component Analysis. Once it is selected we
press the option “Export to GIF/JPG/PNG/TIF”.
Then we select the exportation format “PNG”. Next we choose a location for the file and give a name to
the future image.
It is also possible to resize the future image but we will not use this option in this example. Press “Save”
to generate the file.
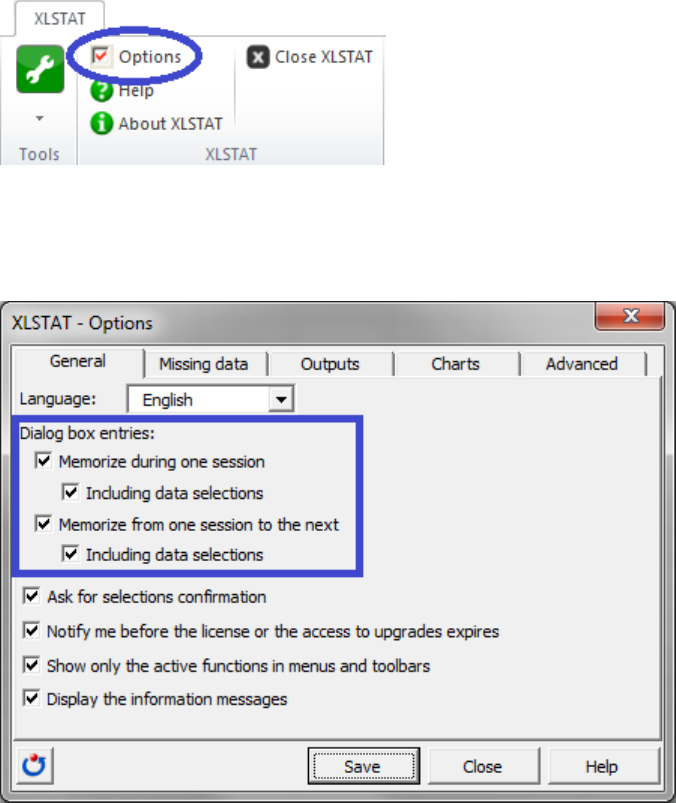
The file is now available in the selected folder.
XLSTAT Getting started manual © Addinsoft 87
Tools to manage menu bars
The last type of tool is used to manage the menu bars in the “Add-ins” tab. So let’s first move into the
“Add-ins” tab.
The tool “display the main bar” is to be used if the main bar is not available.
If you use the icons of this tab to launch functions it can get a bit crowded with a lot of icons in the menu
bar. It is then very easy to close all the sub-bars by using the tool “hide the sub-bars”.
XLSTAT Getting started manual © Addinsoft 88
Advanced tools to save time in XLSTAT
Enable the advanced buttons
XLSTAT comes with advanced options that will help you save on the time you spend analyzing data.
However these options should be enabled so that you can use them. In this chapter, we will see how you
can easily activate the advanced buttons.
All XLSTAT options are managed from the menu “Options” available in the tool bar.
In the first tab, “General”, there are two options for the “dialog box entries” that are enabled by default
and already help you saving time: “memorize during one session” and “memorize from one session to
the next”.
These two options will remember the settings of the dialog boxes including the data selections. This way
if you perform the same type of analysis during the same session or from a session to the other, the
dialog boxes will already be preset.
To enable the advanced buttons we need to go in the “Advanced” tab.
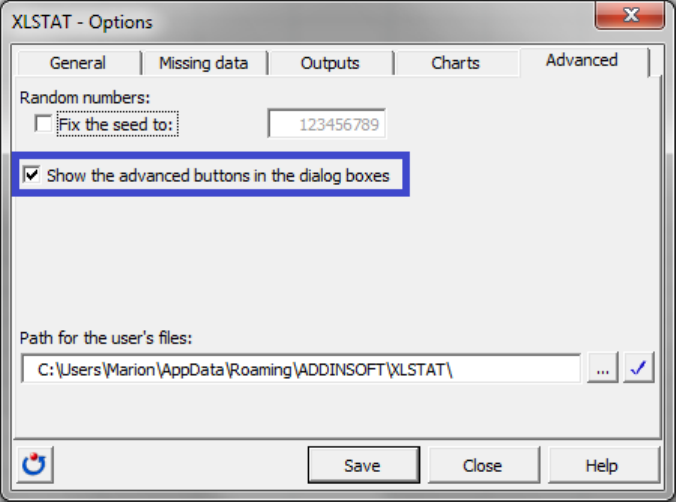
XLSTAT Getting started manual © Addinsoft 89
Select the option: “Show the advanced buttons in the dialog boxes” and save this change.
Exit the “Options” dialog box by pressing “Close”.
Now when you open a dialog box you should see three new buttons appearing at the bottom left of the
box.
The red button is used to save the settings of an analysis dialog box, while the blue button will enable
you to load saved settings for a dialog box.
The grey button generates Visual Basic for Application code which can be used to launch an analysis from
the VBA editor.
In the next chapters, you will learn how to use the advanced buttons.
XLSTAT Getting started manual © Addinsoft 90
Reuse the settings of a dialog box
In this chapter, you will learn how to reduce the time spent working on your data by saving and reusing
the settings of a dialog box. This is especially useful when you are doing repetitive analysis or if you want
someone to repeat the same analysis as you.
Most of the dialog boxes in XLSTAT have a red and a blue button at the bottom of the dialog box.
The red button is used to save the settings of an analysis and the blue one to load those settings.
To demonstrate these features to you we need to set up an analysis. We will use Principal Component
Analysis; however we will not enter into too many details about the settings of this method.
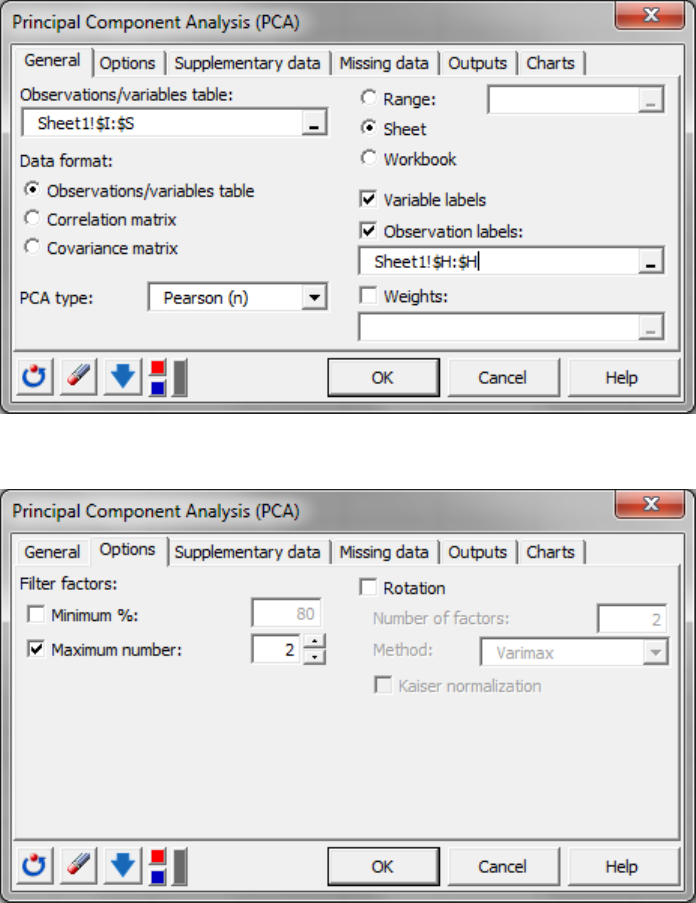
We first select the data and set the observation labels.
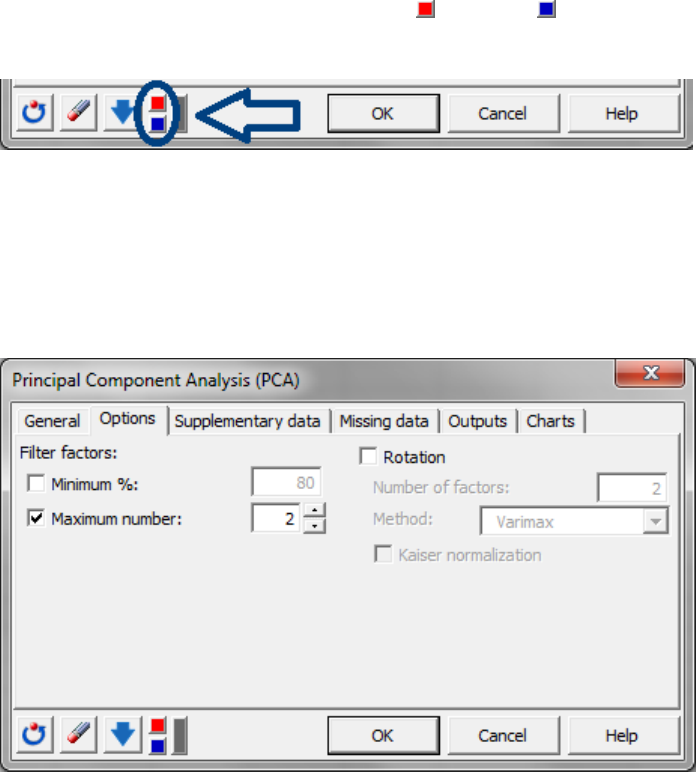
In the “Options” tab we select to only compute results for the first two components.
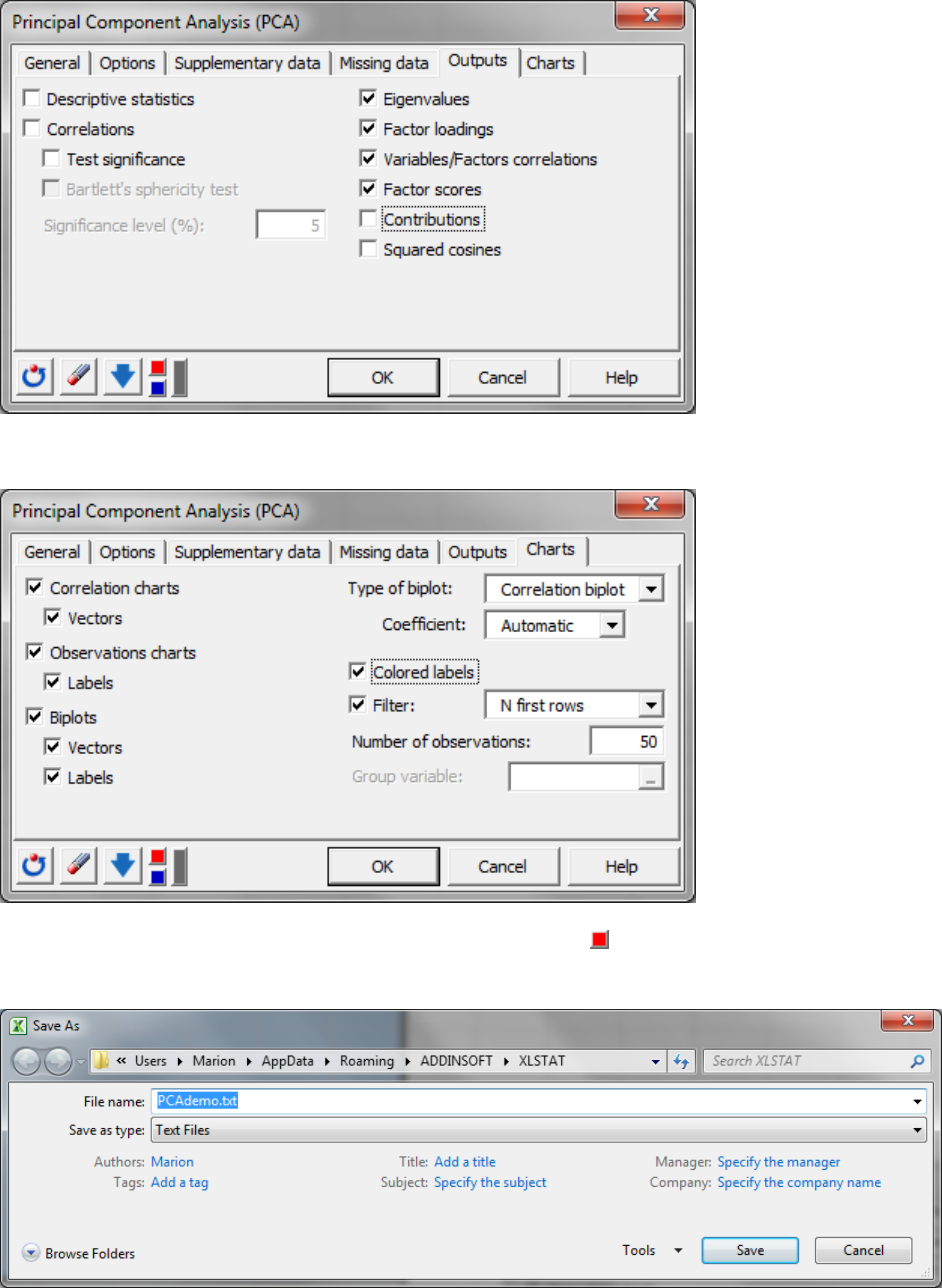
In the “Outputs” we reduce the number of outputs to the most important results.
XLSTAT Getting started manual © Addinsoft 91
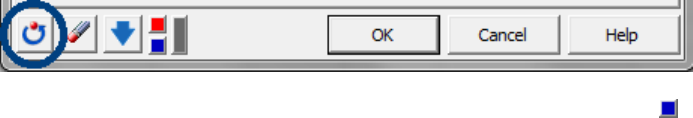
Finally in the “Charts” tab, we activate the option “Colored labels”.
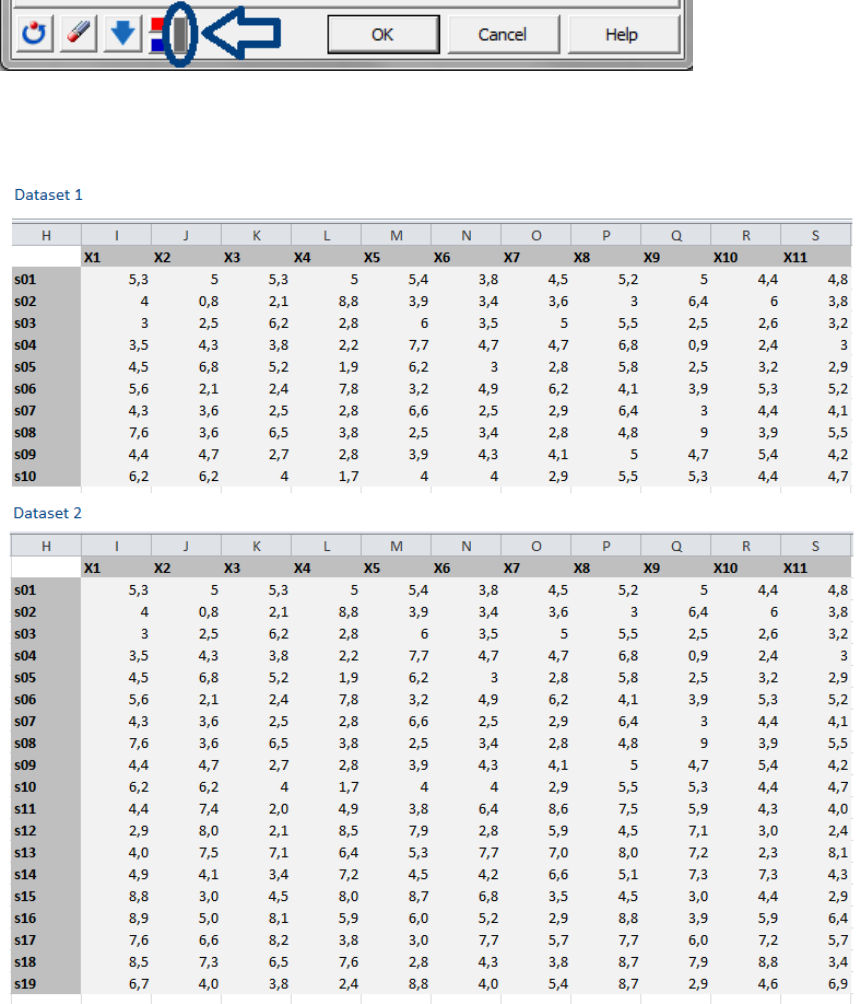
We can now save these parameters, by clicking on the red button . We give the set of parameters a
name such as “PCAdemo”.
XLSTAT Getting started manual © Addinsoft 92
We can then click on the button with a turning arrow to reset the dialog box to the default parameters.
We can now simply load the saved settings by clicking on the blue button . Everything is back to the
former settings.
In practice you will do that on datasets that are similar to the dataset which you used to create the
settings and to perform the exact same analysis. You should also use the same name of sheet for the
new dataset so that you can launch the analysis directly. If not you will simply have to select the data
manually, the rest being set automatically.
We have now seen how to create and reuse a set of settings for an analysis. If you want to learn more
about how to use the Visual Basic Editor menu to launch an analysis we invite you to read the next
chapter.
XLSTAT Getting started manual © Addinsoft 93
Launch an analysis using the Visual Basic editor
In the previous chapter we have seen how the settings of an analysis could be saved and reused to gain
time. In this chapter you will see how to work on your data from the Visual Basic Editor.
First we need to create the VBA code that we will use later to launch the analysis. On most of the XLSTAT
dialog boxes you will find a grey button located at the bottom left of the dialog box. It is used to
generate VBA code.
First we need to set up an analysis. For this demonstration we take the example of a Principal
Component Analysis that we will apply on two similar datasets.
XLSTAT Getting started manual © Addinsoft 94
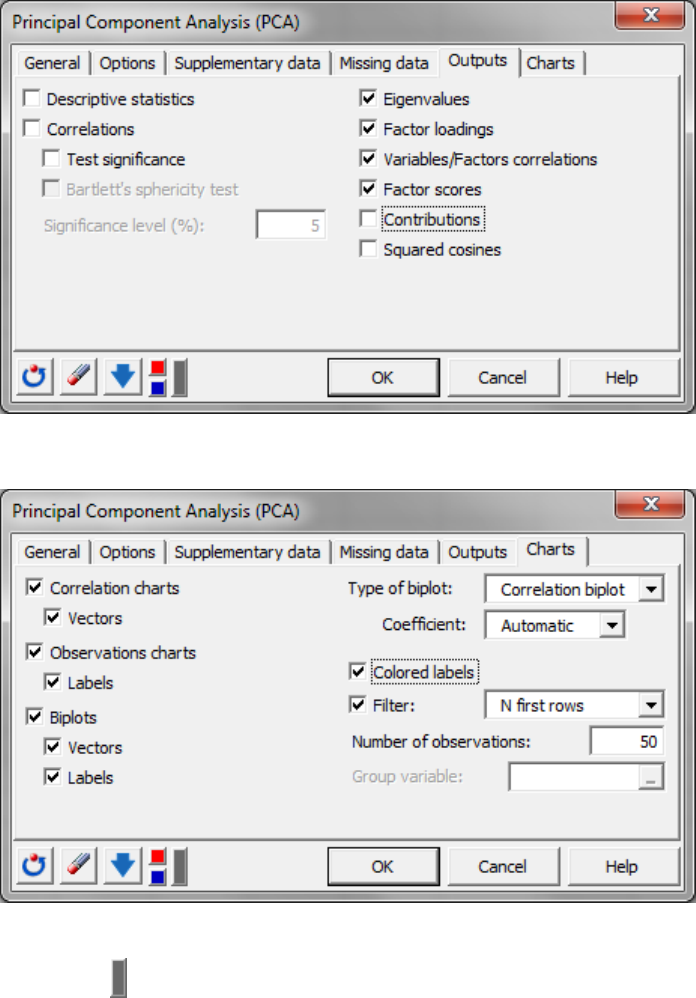
We set the data selection in the “General” tab.
In the “Options” tab we select to only compute results for the first two components.
In the “Outputs” we reduce the number of outputs to the most important results.
XLSTAT Getting started manual © Addinsoft 95
Finally in the “Charts” tab, we activate the option “Colored labels”.
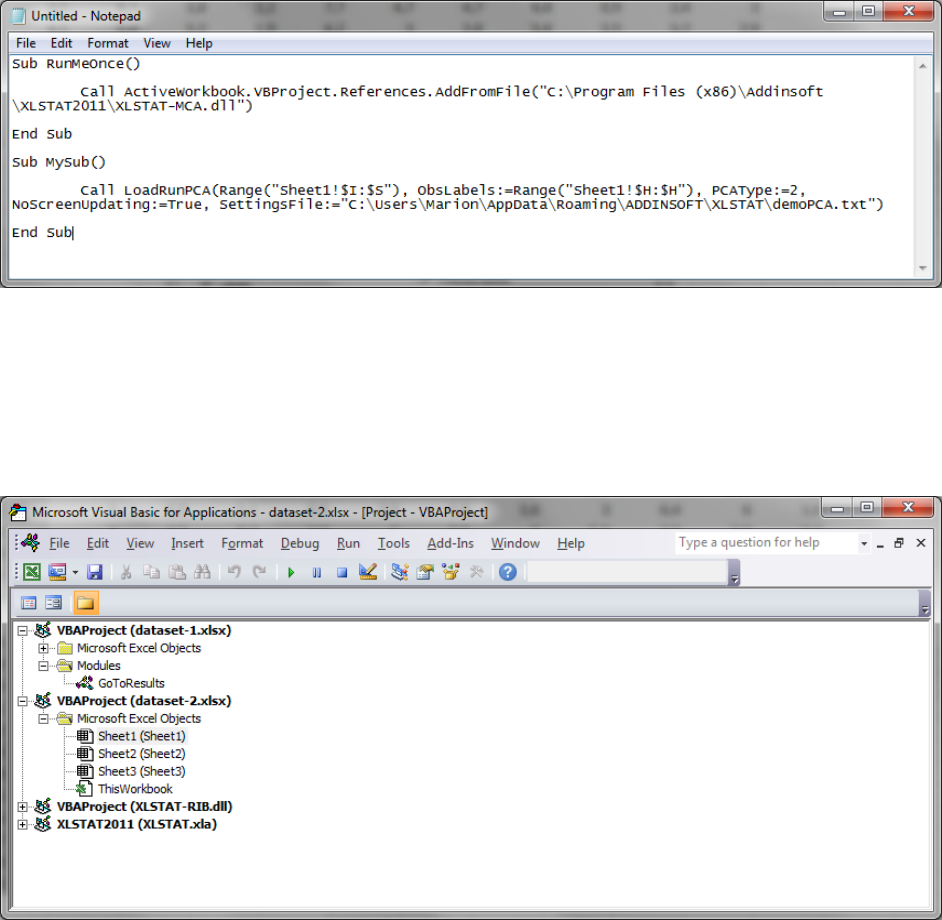
Now that everything is set we should generate the VBA code to reproduce this analysis. We click on the
grey button .
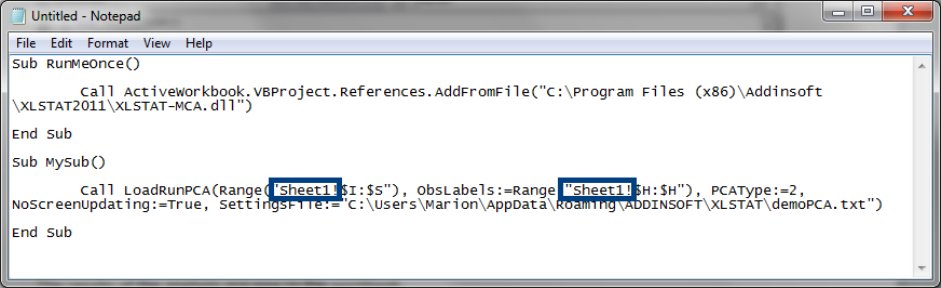
The code appears in a notepad document.
XLSTAT Getting started manual © Addinsoft 96
You can now launch the analysis on “dataset 1”.
Next you open a new workbook where there is a similar dataset “dataset 2”. We will now run a PCA on
this dataset from the Visual Basic editor.
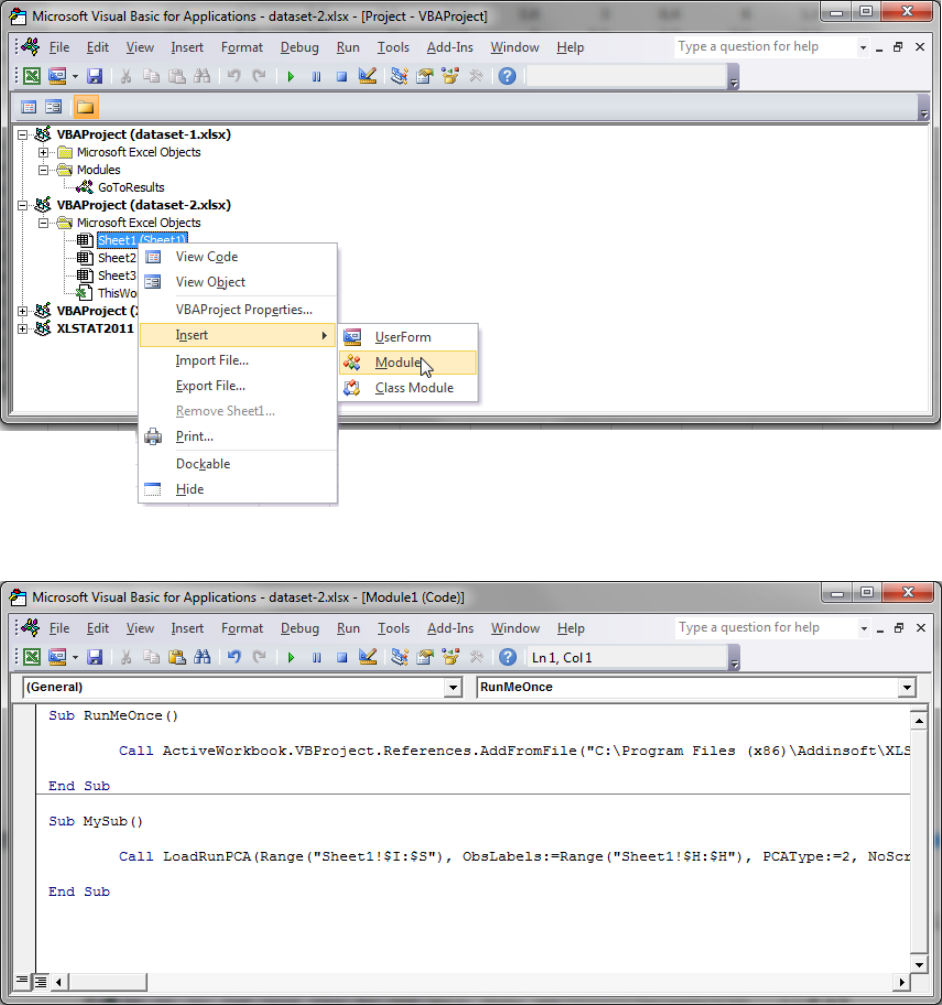
To access the Visual Basic editor you need to press “Alt” and “F11” simultaneously.
Now, we simply need to select the appropriate sheet, in our case “Sheet1”. Then, we right click and
select the option “Insert – Module”.
XLSTAT Getting started manual © Addinsoft 97
We copy the VBA code that we generated earlier in the module.
As you can see there are two “subs”.
We need to run them in order of appearance. To run a sub you place the cursor in front of the sub and
click “Run – Run Sub/Userform”.
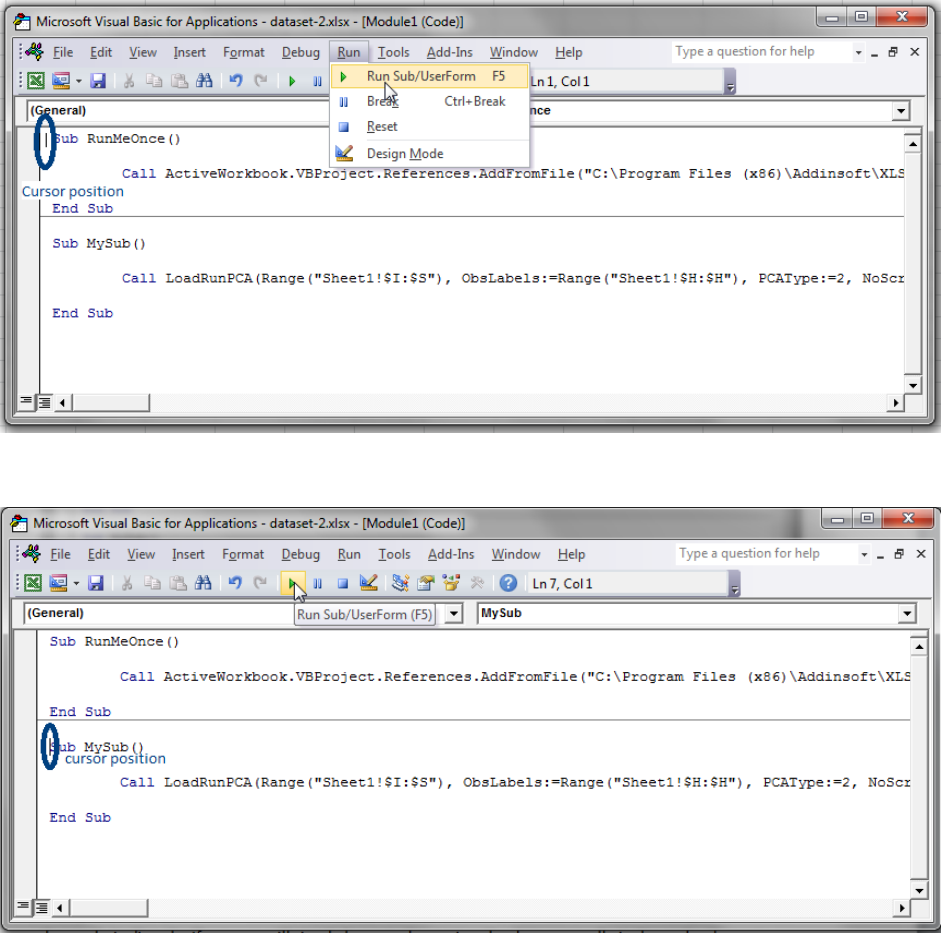
XLSTAT Getting started manual © Addinsoft 98
Once this is done with the first one you can do the same on the second one.
The results of the analysis are now in the workbook.
We can go through them and see that the new dataset has been analyzed in the same way as the first
one.
Finally, note that you should also use the same name of sheet for the new dataset so that you can launch
the analysis directly as this is specified in the code. If not you will simply have to determine the data
manually in the code, the rest being set automatically.
XLSTAT Getting started manual © Addinsoft 99
We have now seen how to generate VBA code from XLSTAT analysis dialog boxes, how to launch the
visual basic application and how to use the XLSTAT VBA code in the VBA editor.
If you want to learn more about how you can customize an analysis using Visual Basic, read the next
chapter.
XLSTAT Getting started manual © Addinsoft 100
Customize an analysis using Visual Basic
In the previous chapter we have seen how to launch an analysis with the Visual Basic Editor. In this
chapter you will see how to automatically combine some analyses using the Visual Basic Editor.
First we need to create the VBA code that we will use later to launch the analysis. On most of the XLSTAT
dialog boxes you will find a grey button located at the bottom left of the dialog box. It is used to
generate VBA code. This code will then be adapted to our special case.
For this demonstration we want to combine a k-means clustering in order to obtain classes and then we
would like to apply a discriminant analysis in order to understand the meaning of the classes.
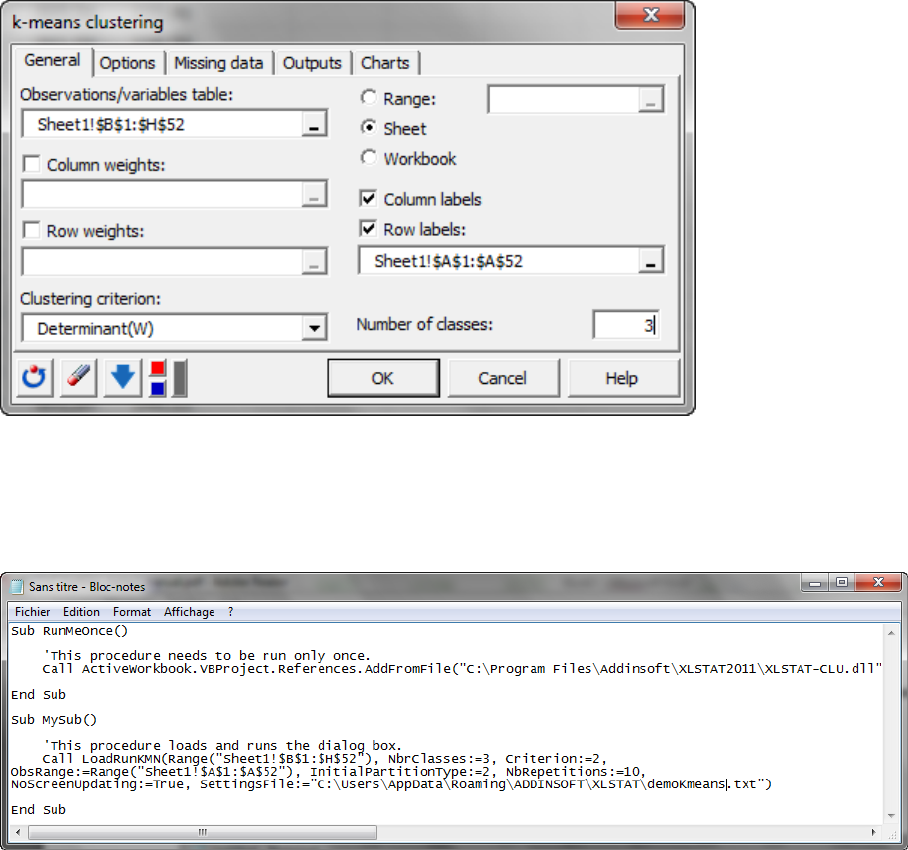
We start by setting up the k-means. Once the dialog box is opened, we set the data selection in the
“General” tab as well as the observation labels. We also decide to group the samples into three classes.
We don’t specify any other option, the default options will be taken into account. Now that everything is
set we should generate the VBA code to reproduce this analysis. We click on the grey button.
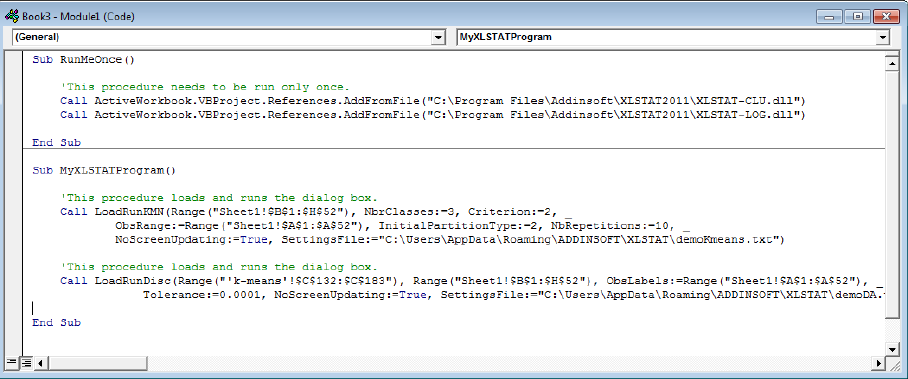
The code appears in a notepad document.
XLSTAT Getting started manual © Addinsoft 101
We launch the analysis.
We are now going to apply the same procedure to generate the code for the discriminant analysis based
on the results of the k-means and the original data.
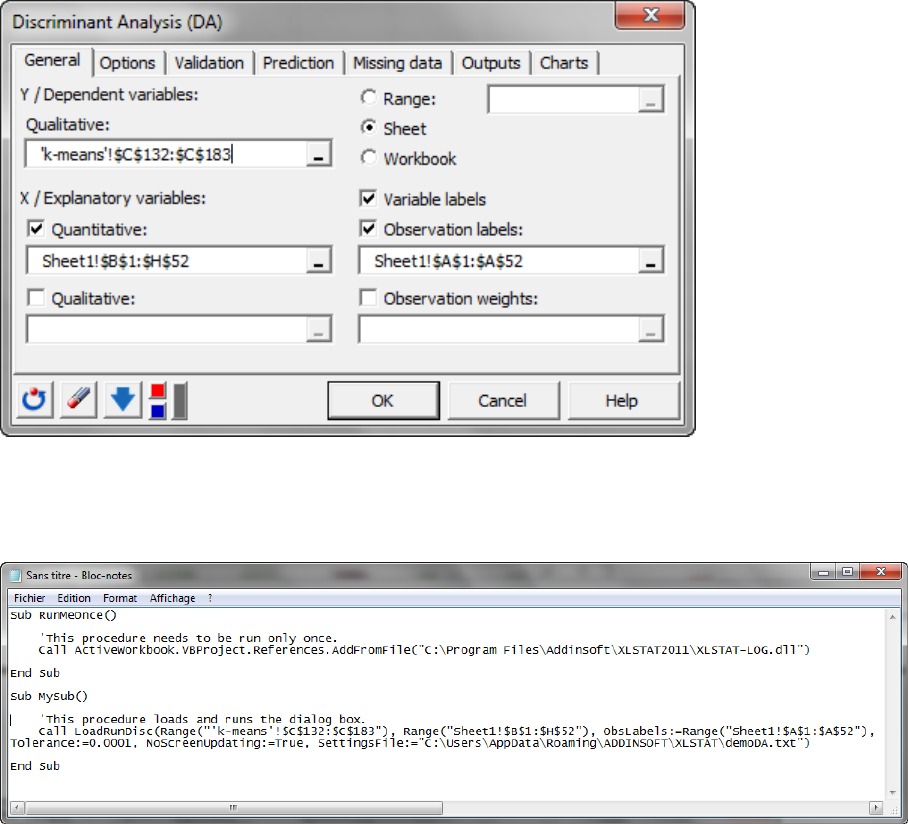
We open the “Discriminant Analysis” dialog box that is found under the menu “Analyzing data”. We now
select the results of the classification in the “Dependent variables” field. For the “Explanatory variables”
we select the original dataset. We also specify the “Observation labels”.
We can now generate the VBA code to reproduce this second analysis and click on the grey button.
The code appears in another notepad document.
To access the Visual Basic editor you need to press “Alt” and “F11” simultaneously.
Now, we simply need to select the appropriate sheet, in our case “Sheet1”. Then, we right click and
select the option “Insert – Module”.
We copy the two VBA codes one after the other in the module.
XLSTAT Getting started manual © Addinsoft 102
As you can see there are two “subs” called “RunMeOnce” we will merge them into one. Then we are
going to merge the two subs corresponding to the two analyses into one as well.
If you launch these subs, the two methods will be applied and the results for both the methods will be
displayed.
However, to run the analysis on a different dataset will be tedious and you will have to generate new
codes.
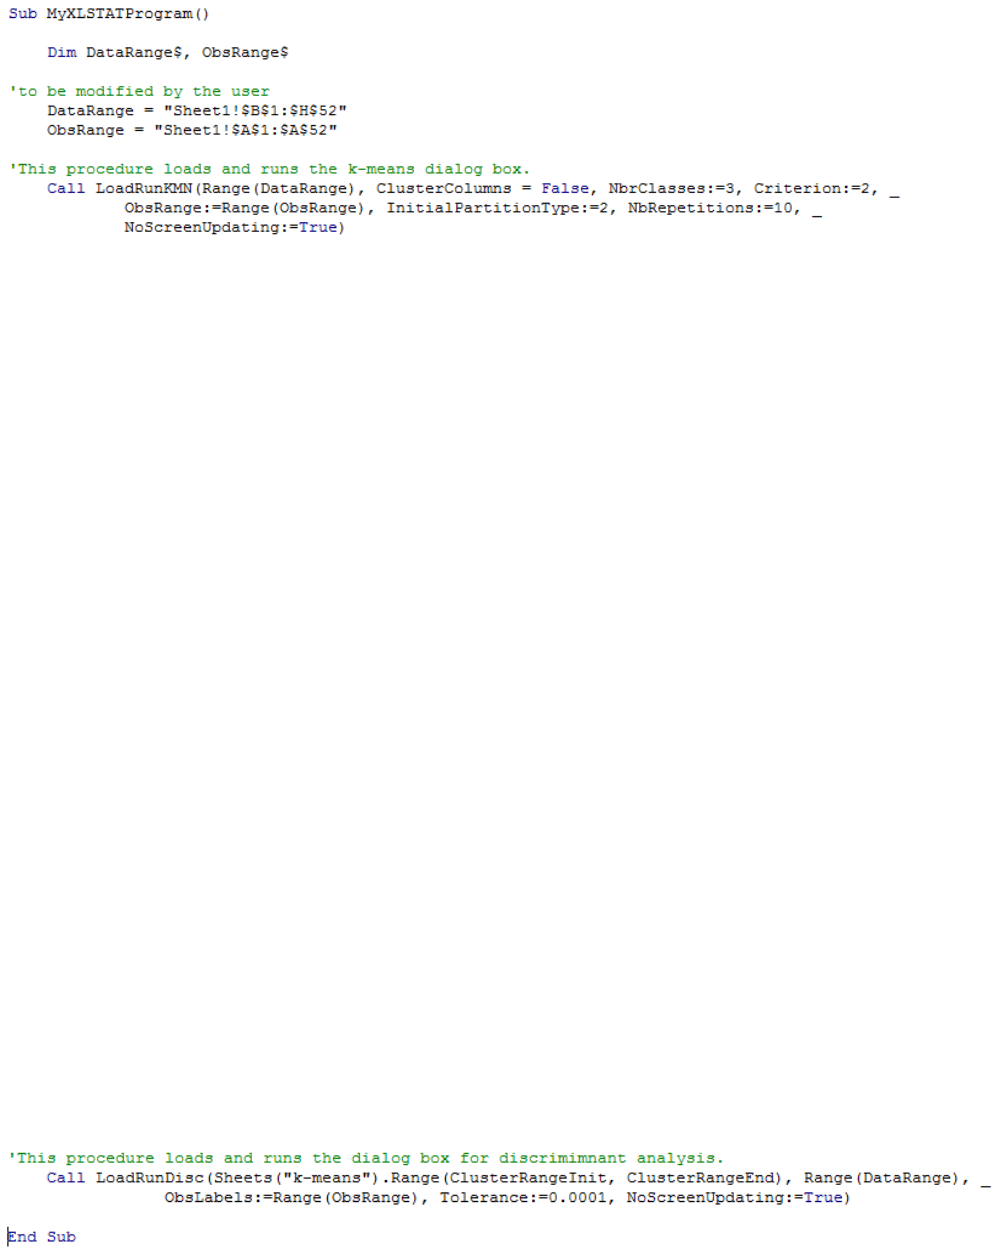
We will modify the VBA code in order to better fit the desired analyses.
We are going to declare and define two new string variables: “DataRange” for the dataset location and
“ObsRange” for the observation labels.
To declare string variables in VBA code we use the notation “Dim” and add a $ at the end of the name of
the variable. When this is done for both variables, we can give the variables their values.
In our case we can just copy and paste the previous positions, but, later on, when you want to run this
on another dataset you need to change this part of the code.
Now we replace in the code all the references to the dataset location and the observation labels by the
two variables we just created.
XLSTAT Getting started manual © Addinsoft 103
There is still one part of the code that we cannot run automatically as we don’t have a generic position
for the classes obtained after the k-means. To be able to use our code we need to locate these results.
We will use a function called “find”.
In XLSTAT the results of a k-means analysis are always placed in a sheet called “k-means” and the results
we want are located after the name of the results “Results by object” in the second column. Also we can
deduct the size of the results using the size of the original dataset. We are going to use this information
to obtain the location of the samples’ classes.
Here is the code we create. We first find the first cell as being two cells bellow the title of the results.
Then we compute the size of the results using the size of the labels. Finally we find the last cell as being
(1 + size of the results) below the name of the results.
‘search for the position of the classes in the outputs of the k-means analysis
‘define the initial cell within the results
Dim ClusterRangeInit$
ClusterRangeInit = Sheets(“k-means”).Columns(2).Cells.Find(what:=“Results by
objects”).Offset(2, 1).Address
‘compute the size of the range
Dim temp&
Temp = Application.CountA(Range(ObsRange))
‘define the last cell within the results
ClusterRangeEnd = Sheets(“k-means).Columns(2).Cells.Find(what:=“Results by objects”).Offset(1
+ temp, 1).Address
We insert this code in the module between the two functions.
We can then modify the code to launch the discriminant analysis.
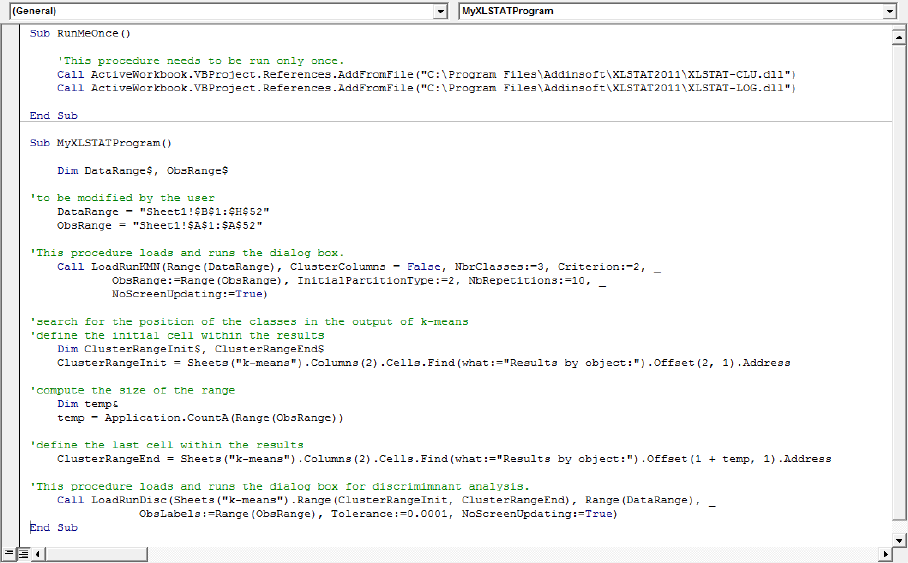
XLSTAT Getting started manual © Addinsoft 104
You can now run the sub by placing the cursor in front of the sub and click “Run – Run Sub/Userform” as
we have seen in a previous chapter.
The results of the analysis will be placed in the workbook.
We have now seen how to modify codes from XLSTAT to generate routine analysis combining two
analyses. More advanced uses of the XLSTAT VBA codes are possible like designing your own dialog box
and select the results you want to display.
Here is the entire program:
