Beginners Guide To WinDBG Part 1 Win DBG
User Manual:
Open the PDF directly: View PDF ![]() .
.
Page Count: 6

Introduction
WinDBG is a debugging tool from Microsoft for user and kernel mode debugging. WinDBG is a GUI interface
built on CDB, NTSD and KD along with debugging extensions. We will mainly be using WinDBG along with SOS
extension for managed code debugging.
WinDBG is a very powerful tool for debugging and it allows you to set a breakpoint, view source code using
symbol files, view stack trace, parameters to a method, memory and registers. Please refer to the below link to
download WinDBG
http://www.microsoft.com/whdc/DevTools/Debugging/default.mspx
Once you have installed Debugging Tools for Windows, you can instantiate WinDBG from Start->Programs-
>Debugging Tools for Windows(x86)->WinDbg
We recommend you to read and read and read WinDBG Help that will be your only source on documentation.
Accessing WinDbg Help
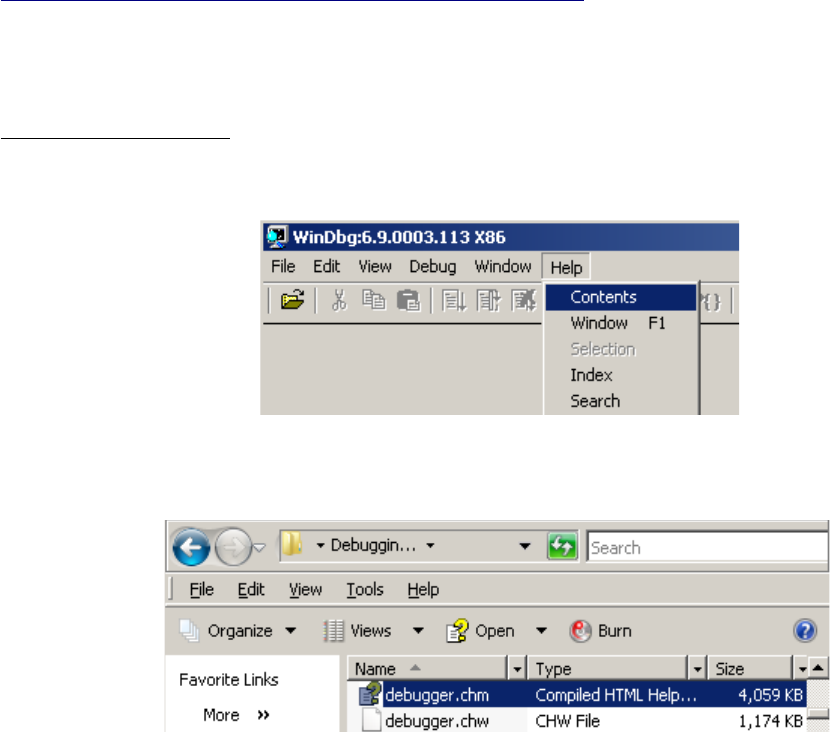
1) Start->Programs->Debugging Tools for Windows(x86)->Debugging Help (on x86)
2) WinDbg Help Menu
3) Go to WinDBG Installed Folder(Default location on x86 is “c:\program files\Debugging Tools for
Windows (x86)) “
Please note that when you see a command starting with kd> on help, these commands are for kernel debugging.
Those KD commands will not run in user mode debugging. They can't be used to debug a win32 user mode
process.
Memory Dumps
Memory dump is a snapshot of the memory and register at the time of crash. You can also collect a memory of a
process to get the snapshot of a process's memory at a particular instance.
User Mode Dump

User Mode Dump includes the virtual memory information, process environment block, process and thread
structures to assist in debugging.
1) Full Dump - includes all the information about a process(exe) including committed virtual memory page,
thread and process data structures, handle data, loaded and unloaded modules and their addresses.
2) Mini Dump - includes only specific memory snapshot of a process. Although, the name is minidump but
it can be larger than full dump depending on the dump option you choose. Below paragraph from
WinDBG help
The name "minidump" is misleading, because the largest minidump files actually contain more information than
the "full" user-mode dump. For example, .dump /mf or .dump /ma will create a larger and more complete file
than .dump /f. For this reason, .dump /m[MiniOptions] recommended over .dump /f for all user-mode dump file
creation.
If you are creating a minidump file with the debugger, you can choose exactly what information to
include. A simple .dump /m command will include basic information about the loaded modules that
make up the target process, thread information, and stack information.
What dump to collect for a Win32 User Mode Process?
As described in ADPlus.vbs
ADPlus has 3 modes of operation: 'Hang', 'Quick' and 'Crash' mode.
Hang Mode
In 'Hang' mode, ADPlus assumes that a process is hung and it will attach a debugger to the process(s) specified on
the command line. After the debugger is attached to the process(s) ADPlus will dump the memory of each process to
a .dmp file for later analysis with a debugger (such as WinDBG). In this mode, processes are paused briefly while their
memory is being dumped to a file and then resumed.
Quick Mode
In '-quick' mode ADPlus assumes that a process is hung and it will attach a debugger to the process(s) specified on
the command line with either the '-p' or '-pn' or '-iis' switches. After the debugger is attached to the process(s)
ADPlus will create mini dumps for each process, containing commonly requested debug information, rather than
dumping the entire memory for each process.'Quick' mode is generally faster than 'Hang' mode, but requires symbols
to be installed on the server where ADPlus is running.
Crash Mode
In 'Crash' mode, ADPlus assumes that a process will crash and it will attach a debugger to the process(s) specified on
the command line with either the '-p' or '-pn' or '-iis' switches. After the debugger is attached to the process(s)
ADPlus will configure the debugger to log 'first chance' access violations (AV's) to a text file. When a 'second chance'
access violation occurs, the processes memory is dumped to a .dmp file for analysis with a debugger such as
WinDBG. In this mode, a debugger remains attached to the process(s) until the process exits or the debugger is
exited by pressing CTRL-C in the minimized debugger window. When the process crashes, or CTRL-C is pressed, it
will need to be re-started.
Hang Dump Check List
1) Memory Leak?
2) High CPU Usage, Performance?
3) Process Hang/Deadlock?
4) Analyze the state of an application at a particular instance?
Crash Dump Check List
1) Application crashing due to unhandled exception?
2) Unexpected behavior due to a handled exception or a first chance exception?
How to Collect Memory Dump using ADPlus(visual basic script)

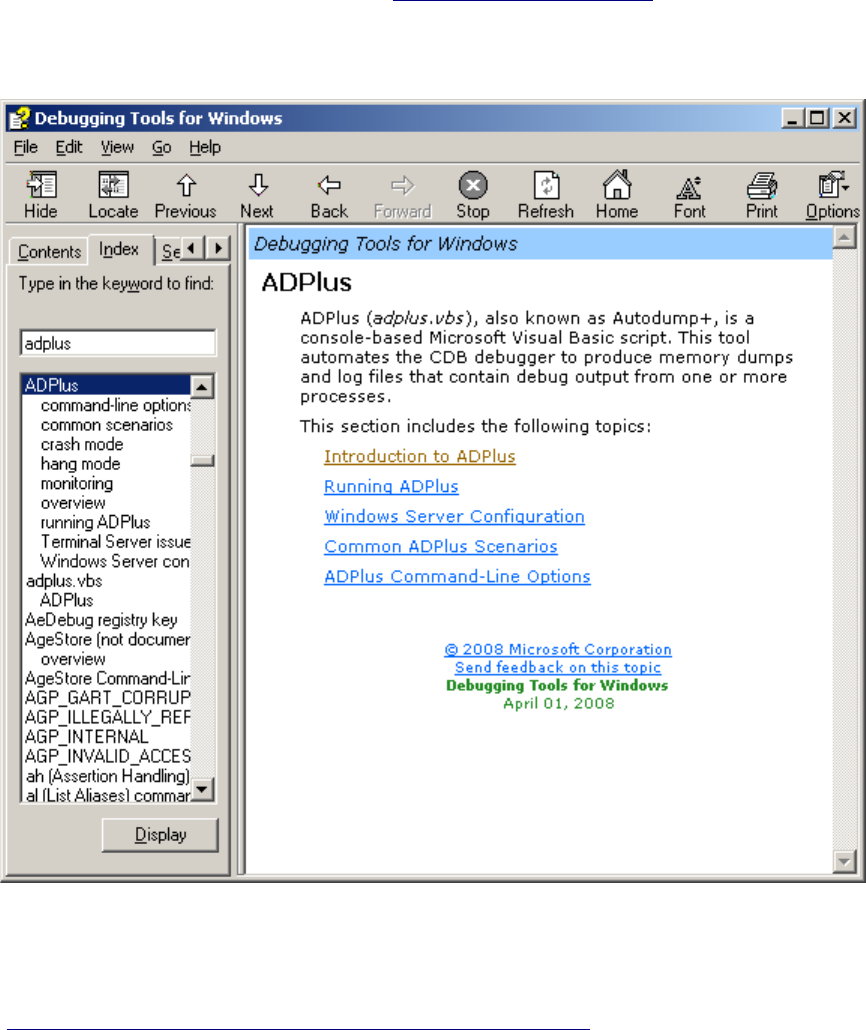
ADPlus.vbs file is installed in a default location with Debugging tools for Windows
The best source for ADPlus documentation is winDBG help as shown in below snapshot. You can also open the
ADPlus.vbs file to explore all the options because it seems to be well documented.
Steps to collect hang memory dump using ADPlus
1. If WinDBG is not installed on a system, follow
http://www.microsoft.com/whdc/DevTools/Debugging/default.mspx to download WinDbg for 32bit OS or
64 bit OS depending on the version of windows OS .
2. Please note that WinDBG supports XCOPY so you can either install it directly on a system or you can
choose to install it on a test system and copy the installed folder on a production machine. Sometime
XCOPY is desirable for security reasons and if you don't want to get a permission to install a software.
By Default, Debugging Tools for Windows get installed under “\Program Files\Debugging Tools for
Winodws\”
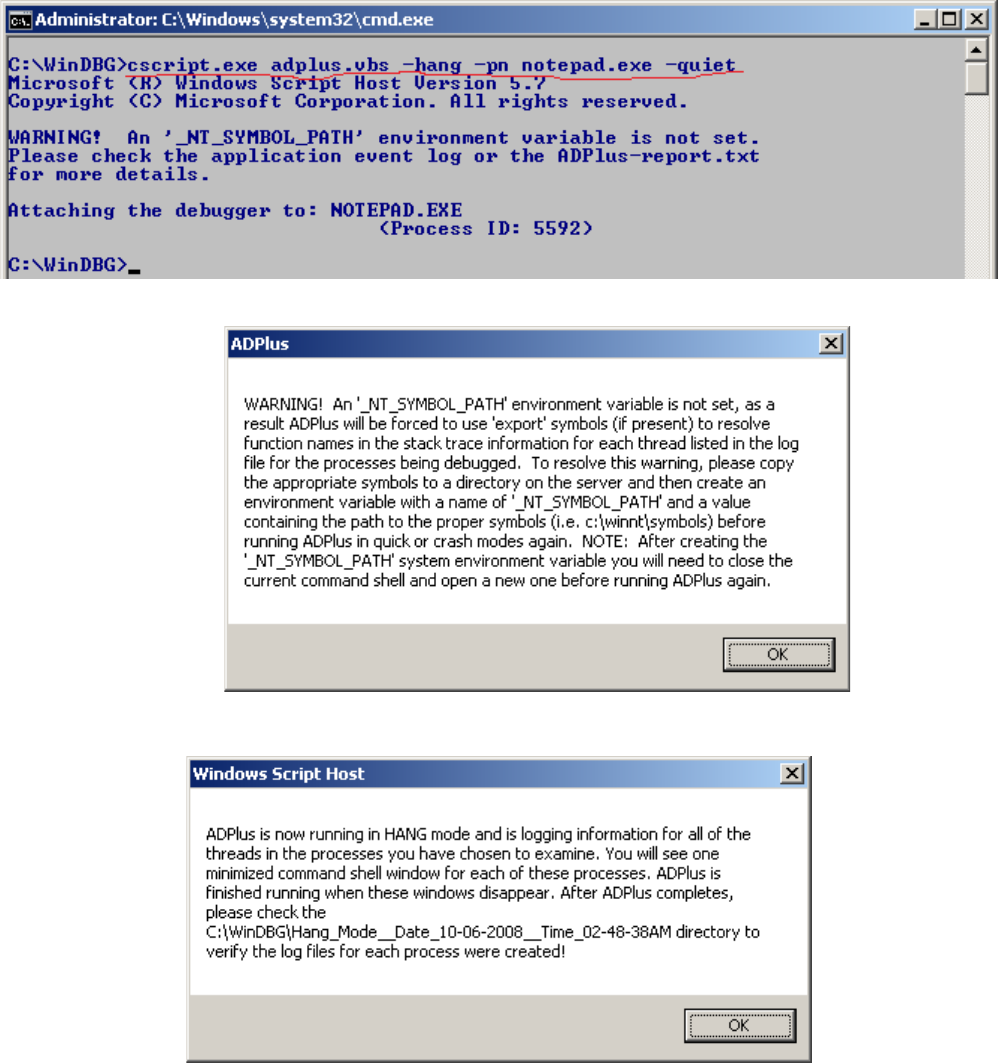
3. Open command prompt window and go to the installed folder. Run the command as shown below(Figure
1)
cscript.exe – to specify cscript.exe script interpreter to run vbscript.exe otherwise it will try to set cscript.exe
as default script interpreter
adplus.vbs – vbscript file to generate memory dump
-hang – As described in adplus.vbs file(copy and paste), ADPlus has 3 modes of operation: 'Hang', 'Quick'

and 'Crash' mode. In 'Hang' mode, ADPlus assumes that a process is hung and it will attach a debugger to
the process(s) specified on the command line with either the '-p' or '-pn' or '-iis' switches. After the debugger
is attached to the process(s) ADPlus will dump the memory of each process to a .dmp file for later analysis
with a debugger (such as WinDBG). In this mode, processes are paused briefly while their memory is being
dumped to a file and then resumed.
-pn – Adplus supports -pn and -p switch to specify the name or process id of an application
notepad.exe – process to be debugged to generate memory dump
-quiet – ADPlus support quiet mode to suppress the dialog boxes as shown below in Figure 2 and
Figure 3
Figure - 1
Figure 2
Figure 3

4. The name of executable specified in -pn switch must not contain drive or folder path. Process name
should be specified as shown in the Task Manager.
5. By default, the Adplus script will create subfolder similar to the following Hang_Mode__Date_mm-
ddyyyy__Time_hh-mm-ssAM/PM. This subfolder will be created under C:\WinDBG\, folder will contain
debugger logs and a memory dump.
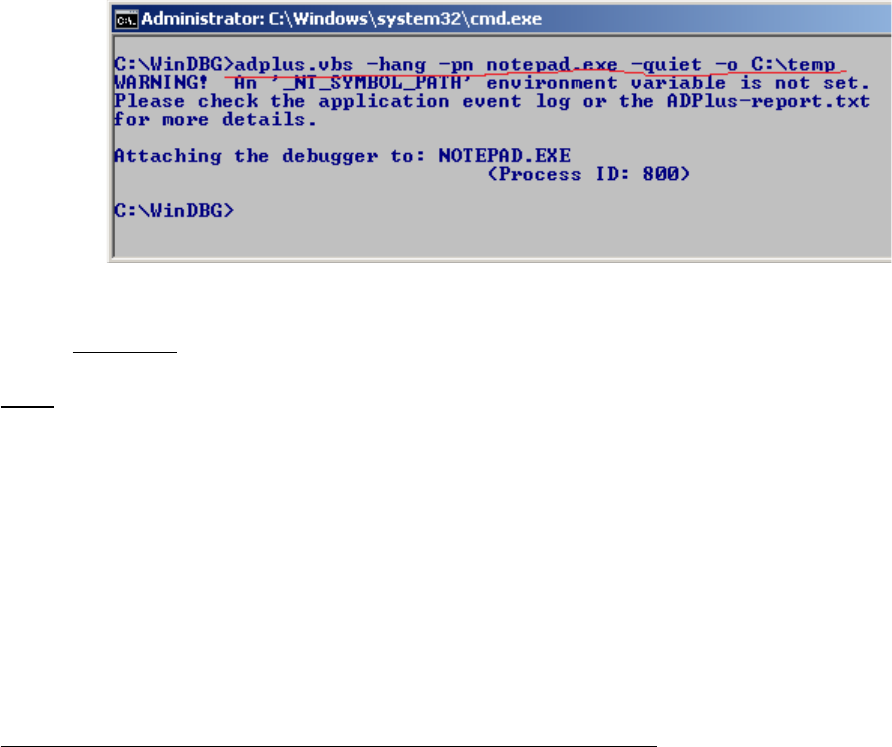
6. Default destination for memory dumps can be changed with –o switch as show below
7. You can also use -p switch and get the process ID from task manager, -p switch comes handy when a
process name is not complete in task manager or if you have the multiple instances of a process running
for example - asp.net worker process(w3wp.exe)
Note
1) You should collect more than one memory dump at different intervals to analyze the application state
and to find out what objects have survived garbage collection or to analyze deadlock/hang
2) You may want to collect memory dump right after garbage collection to analyze managed memory issue.
You could probably make it configurable which will ensure that GC.Collect() is called along with
GC.WaitForPendingFinalizers()
3) -r Repeats IntervalInSeconds , ADPlus supports -r switch to enable repeated hang attachments.
However, this switch is supported only in hang mode and this is ignored in crash mode.
IntervalInSeconds specifies the interval, in seconds, between each run
Steps to collect crash memory dump using ADPlus
same as above just replace the -hang switch to -crash.
Followings are the additional switches you should know to collect crash dump
-FullOnFirst
This will create a full dump on first chance exception. Remember, you can't do managed heap analysis
unless you have a full dump. Sometime, you do want to get a full dump in case you are noticing
unexpected behavior after a first chance exception has occurred. You may want to analyze application
state, handles, objects on heap or data structures. Since there could be several first chance exceptions
this may really slow down your application since it has to dump the memory on every single first chance
exception. The default behavior is to have minidumps created on first chance.
You are better off using a configuration file if you already know the exception type.
(below descriptions as documented in WinDbg)
-MiniOnSecond
Creates minidumps on second chance for all defined exceptions. The default behavior is to have full
dumps created on second chance.
-NoDumpOnFirst
Creates no dumps on first chance for all defined exceptions. The default behavior is to have minidumps
created on first chance.

-NoDumpOnSecond
Creates no dumps on second chance for all defined exceptions. The default behavior is to have full dumps
created on second chance.
Continue – WinDBG commands and Dump Analysis in Beginner's Guide to WinDBG – Part 2