(Bloomberg Financial Series Bloomberg Visual Guide Series) David Wilson To Marke
User Manual:
Open the PDF directly: View PDF ![]() .
.
Page Count: 196 [warning: Documents this large are best viewed by clicking the View PDF Link!]
Visual Guide to
Financial Markets

e Bloomberg Financial Series is meant to serve as the
all-encompassing, yet easy-to-follow, guide on today’s
most relevant nance and trading topics. e content
lives up to the title by being visual; all charts are in
color and presented in a large format for ease of use
and readability. Other visual attributes include con-
sistent elements that function as additional learning
aids for the reader:
■ Key Point sections: Primary ideas and takeaways,
designed to help the reader skim through de ni-
tions and text.
■ De nitions: Terminology and technical concepts
that arise in the discussion.
■ Step-by-Step instructions: Tutorials designed to
ensure that readers understand and can execute
each section of a multi-phase process.
■ Do It Yourself: Worksheets, formulas, and calcula-
tions.
■ Bloomberg Functionality Cheat Sheet: For Bloom-
berg terminal users, a back-of-the-book summary
of relevant functions for the topics and tools
discussed.
For e-reader users, e Bloomberg Financial Series
is available as an enhanced e-book and o ers spe-
cial features, like an interactive Test Yourself section
where readers can test their newly honed knowledge
and skills. e enhanced e-book version includes
video tutorials and special pop-up features. It can be
purchased wherever e-books are sold.
How to Use This Book

Visual Guide to
Financial Markets
David Wilson
BLOOMBERG PRESS
An Imprint of

Copyright © 2012 by David Wilson. All rights reserved.
Published by John Wiley & Sons, Inc., Hoboken, New Jersey.
Published simultaneously in Canada.
Charts reprinted with permission from Bloomberg. Copyright 2011 Bloomberg L.P. All rights reserved.
No part of this publication may be reproduced, stored in a retrieval system, or transmitted in any form or by any means,
electronic, mechanical, photocopying, recording, scanning, or otherwise, except as permitted under Section 107 or 108
of the 1976 United States Copyright Act, without either the prior written permission of the Publisher, or authorization
through payment of the appropriate per-copy fee to the Copyright Clearance Center, Inc., 222 Rosewood Drive, Danvers,
MA 01923, (978) 750-8400, fax (978) 646-8600, or on the Web at www.copyright.com. Requests to the Publisher for permis-
sion should be addressed to the Permissions Department, John Wiley & Sons, Inc., 111 River Street, Hoboken, NJ 07030,
(201) 748-6011, fax (201) 748-6008, or online at http://www.wiley.com/go/permissions.
Limit of Liability/Disclaimer of Warranty: While the publisher and author have used their best eorts in preparing this
book, they make no representations or warranties with respect to the accuracy or completeness of the contents of this
book and specically disclaim any implied warranties of merchantability or tness for a particular purpose. No warranty
may be created or extended by sales representatives or written sales materials. e advice and strategies contained herein
may not be suitable for your situation. You should consult with a professional where appropriate. Neither the publisher
nor author shall be liable for any loss of prot or any other commercial damages, including but not limited to special,
incidental, consequential, or other damages.
For general information on our other products and services or for technical support, please contact our Customer Care
Department within the United States at (800) 762-2974, outside the United States at (317) 572-3993 or fax (317) 572-4002.
Wiley also publishes its books in a variety of electronic formats. Some content that appears in print may not be available
in electronic books. For more information about Wiley products, visit our web site at www.wiley.com.
Library of Congress Cataloging-in-Publication Data
Wilson, David, 1958 Mar. 28-
Bloomberg visual guide to nancial markets / David Wilson.
p. cm. – (Bloomberg visual guide series)
Includes bibliographical references and index.
ISBN 978-1-118-20423-8 (pbk.); ISBN 978-1-118-22846-3 (ebk); ISBN 978-1-118-23325-2 (ebk); ISBN 978-1-118-26559-8 (ebk);
ISBN 978-1-118-37348-4 (ebk); ISBN 978-1-118-37349-1 (ebk); ISBN 978-1-118-37350-7 (ebk)
1. Finance. 2. Capital market. 3. Investments. I. Title.
HG173.W495 2012
332′.0415 -dc23 2012001524
Printed in the United States of America
10 9 8 7 6 5 4 3 2 1
To Sandy,
who has taught me far more about life and love
than I ever taught her about business and nance.

vii
Contents
Acknowledgments ix
Introduction xi
■ Part I: Direct Investing 1
■ Chapter 1: Overview 3
Quotations 4
Three Rs 6
■ Chapter 2: Government 11
Currencies 12
Quotations 13
Three Rs 15
Bills 18
Quotations 20
Three Rs 21
Notes and Bonds 24
Quotations 26
Three Rs 27
■ Chapter 3: Companies 35
Money Markets 35
Quotations 38
Three Rs 39
Notes and Bonds 42
Quotations 45
Three Rs 46
Stocks 50
Quotations 53
Three Rs 55
■ Chapter 4: Hard Assets 63
Gold 63
Quotations 66
Three Rs 66
Commodities 68
Quotations 70
Three Rs 71
Real Estate 73
Quotations 75
Three Rs 75
■ Chapter 5: Indexes 79
Currency 79
Debt 81
Equity 83
Hard Assets 85
■ Chapter 6: Government Revisited 87
Municipal Bonds 88
Quotations 90

viii ■Contents
Three Rs 91
Mortgage-Backed Securities 93
Quotations 95
Three Rs 95
■ Chapter 7: Companies Revisited 99
Preferred Stock 99
Quotations 100
Three Rs 101
Convertible Securities 103
Quotations 104
Three Rs 105
Bank Loans 106
Quotations 109
Three Rs 109
■ Chapter 8: Hard Assets Revisited 113
Master Limited Partnerships 114
Quotations 115
Three Rs 116
Real Estate Investment Trusts 118
Quotations 120
Three Rs 120
■ Part II: Indirect Investing 123
■ Chapter 9: Overview 125
Quotations 126
Three Rs 127
■ Chapter 10: Derivatives 129
Futures and Forwards 129
Quotations 131
Three Rs 134
Options and Warrants 137
Quotations 140
Three Rs 142
Swaps 145
Interest-Rate Swaps 147
Quotations 149
Three Rs 149
Credit Default Swaps 152
Quotations 153
Three Rs 154
■ Chapter 11: Mutual Funds and Exchange-Traded Funds 159
Quotations 161
Three Rs 162
Alternative Funds 165
Quotations 168
Three Rs 168
■ Chapter 12: Indexes Revisited 173
Futures 173
Options 175
Swaps 176
Funds 177
Appendix: Bloomberg Functionality Cheat Sheet 179
About the Author 181
Index 183

ix
is book is the product of more than two decades
spent learning about and teaching nancial markets
at Bloomberg News even though it was put together
in far less time.
Bloomberg’s editor-in-chief, Matt Winkler,
brought me on board in October 1990. Less than a
year later, he and I started training 25 newly hired
reporters for our Princeton, New Jersey, bureau. We
spent eight weeks in a room with folding tables,
bare floors, and air-conditioning ducts hanging
from the ceiling.
Matt sent me to London the next year to run our
rst European training class, which meant getting my
rst passport. It was a thrill to teach currencies on
the same day that George Soros became the man who
broke the Bank of England, thanks to his hedge fund’s
billion-dollar bet against the British pound.
After serving as the bureau chief in Princeton and
then in New York, I became Bloomberg News’s rst
global training editor in 1994. For the next ve years, I
traveled the world to teach new reporters and editors
about nancial markets, journalism, and the Bloom-
berg terminal. e position was an invaluable learning
experience.
Some of the materials I put together during the
period provided a foundation for this book. Handouts
broke down quotes on securities and commodities
in detail, and you’ll nd similar dissections in most
of the chapters. Another handout highlighted what
you’ll come to know as the three Rs of nancial mar-
kets: returns, risks, and relative value.
e training instinct came ooding back when my
wife and I saw an o -o -Broadway play written by Ken
Jaworowski, a former colleague, in October 2010. e
characters included an economics professor who lec-
tured his students about how the yield curve a ected
the outlook for growth. Afterward, I met the actor
who played the professor and gave him an impromptu
session on the topic, with curves drawn on the back of
a paper placemat. anks, K.J., for the moment.
Matt suggested me as the author of this book, and
I thank him and his chief of sta , Reto Gregori, for
giving me the opportunity. I’m thankful to Stephen
Isaacs, an editor-at-large at Bloomberg Press, and to
Acknowledgments

x■Acknowledgments
Evan Burton, Judy Howarth, and Chris Gage, my edi-
tors at John Wiley & Sons.
Chris Nagi and Nick Baker, who oversee my Chart
of the Day stories for Bloomberg News, let me take
time o as necessary to put the book together. I’m
grateful to them, along with Al Mayers and Anthony
Mancini at Bloomberg Radio, where I serve as stocks
editor, for their support.
Brendan Moynihan and Shin Pei, editors-at-large
for Bloomberg News, read this book in draft form and
provided feedback that helped me improve the n-
ished product. I appreciate their assistance.
I have worked with and trained many other people
at Bloomberg News who deserve thanks. It would take
pages to identify them all, so I hope they will accept
my heartfelt gratitude as a group.
My goal as a nancial journalist has been to tell sto-
ries in a way that my father, William, and my mother,
Evelyn, could understand. ough neither of them
worked in nance, they followed the subject as it
related to our family. ey both have passed away, and
I carry their memory with me always.
e comments of a couple of friends, Runi Sriwar-
dena and Robin Vitale, reinforced the need to keep
things as simple as possible. I’m grateful to them for
the reminder, and I did the best I could to meet that
goal.
Finally, I’d like to thank my wife, Sandy, for her love
and friendship over the years. Little did she know
when we rst met in the mid-1990s at Bloomberg
News that she would end up married to an author.
en again, I didn’t know anyone who shared my at-
titude toward life until she came along.
While I was working on the book, Sandy’s eorts
allowed me to come home and focus on my “night job”
after putting in a full day at the oce. I’m grateful for
her willingness to let me pursue this, and I hope the
results are worth the sacrice.
David Wilson, February 2012

xi
Financial markets are supposed to be complicated.
If they were easier to understand, there wouldn’t
be as much money to go around. Individual investors
wouldn’t need to pay brokers and nancial advisers as
much to manage their nest eggs. ey might be less
inclined to buy high and sell low, ensuring pro ts for
those who do the opposite.
is book is designed to make things simpler. It’s
built around the choices that you have about where to
put your money, an approach that’s more in keeping
with the investment decisions that people make in the
real world.
Look at it this way: If a family member asked you
for some money to start a business, your rst thought
probably wouldn’t be about the kind of securities you
would receive in return. More than likely, it would be
about the person, his or her relationship to you, suc-
cess in life and work, background in business, and
any past requests made for nancial help.
You’ ll nd three basic equivalents of the family
member in nancial markets:
1. Governments, which rely on money from investors
to bridge gaps between spending and taxes. e
bigger the budget de cit, the more borrowing they
need to do.
2. Companies, which raise funds to run and expand
their business and enable owners to buy and sell
their investments.
3. Hard assets, which have a presence that goes be-
yond entries in computer databases or on scraps
of paper. Gold is one example that many investors
favor. Commodities and real estate are others.
After deciding what to invest in, you have to gure
out how to put your money to work. You can invest di-
rectly in governments, companies, and hard assets, and
there’s more than one choice for each. You can make in-
vestments that indirectly re ect their value as well.
Chapter 1 provides an overview of direct investing
and introduces a format used throughout the book.
We’ll begin with the basics, especially the assets and
the markets where they are bought and sold. After
Introduction

that, we’ll dissect a market quotation as it might ap-
pear on a Bloomberg terminal.
We’ll conclude with a review of the three Rs of
financial markets: returns, risks, and relative value.
We’ll go through the components of returns, includ-
ing interest on bonds and dividends on stocks. We’ll
examine the risks that can reduce those returns.
Finally, we’ll look at ways that investors deter-
mine whether an asset is cheap, expensive, or fairly
valued.
Government markets are our next stop in Chap-
ter 2. We’ll start by determining why you’re eectively
making an investment in the government when keep-
ing cash in a bank account or maybe under a mattress.
e answer lies in currencies.
We’ll look at lending money to the government.
You have a choice between buying bills, IOUs that pay
o in no more than a year; notes, which last for as long
as 10 years; and bonds, which raise funds for longer
periods. We’ll tackle bills before moving into notes
and bonds.
Companies compete with the government to raise
money in nancial markets, and Chapter 3 spells out
how. ey can raise funds for a year or less by selling
securities that are similar to government bills. To line
up nancing for longer periods, they can turn to notes
and bonds instead.
Another choice for companies isn’t available to
governments: selling partial ownership, otherwise
known as equity. is chapter explains how investors
can distinguish one company’s shares from another’s.
xii ■Introduction
Hard assets are an alternative to stocks, bonds, and
cash, and Chapters 4 is all about them. Gold comes
rst because many investors consider the precious
metal to be separate from other assets. en we’ll look
at commodities and real estate.
Indexes enable investors to track how well or poor-
ly nancial markets are performing. ese indicators
provide a way for them to assess their own perfor-
mance, or those of the managers working for them.
ey provide a way to invest as well because many
index-based funds are available. Chapter 5 presents
indexes that are based on direct investments.
Chapters 6 through 8 revisit government, compa-
nies, and hard assets to introduce additional markets.
Government debt includes state and local borrowing,
along with many bonds backed by home mortgages.
Companies sell securities that are a cross between
bonds and stocks, and take out bank loans. Inves-
tors can prot from hard assets without having to
own them, and we’ll look at commodity and real es-
tate businesses that provide an added bonus of tax
benets.
e remainder of the book explores indirect invest-
ing, or markets that are one step removed from own-
ership of government IOUs, corporate securities, and
hard assets. Chapter 9 provides an overview of the two
main categories for this type of investing, derivatives
and funds.
Derivatives are covered in more detail in Chapter
10. e value of these contracts is tied to some oth-
er investment, such as a stock, a bond, an interest

Visual Guide to Financial Markets ■xiii
rate, a currency, or an index. We’ll review three basic
types—futures, options, and swaps—and touch on a
few variations as well.
Chapter 11 is all about funds. eir value is based
on investments made by someone else, namely the
manager. We’ll go through mutual funds and ex-
change-traded funds, or ETFs, along with alternative
funds for wealthier investors that are more complex
and costly.
e nal chapter revisits the subject of indexes.
We’ll look at indicators based on derivatives and
funds, and we’ll learn what investors do with them.
at’s a lot to go through, and each chapter could
be developed as its own book. Even so, you’ll be able
to gain a basic knowledge of nancial markets by the
time you’re done. Charts and visual aids show what
each chapter is telling.
With all that in mind, let’s get started.
DIRECT INVESTING
Visual Guide to Financial Markets
by David Wilson
Copyright © 2012 by David Wilson.

3
Overview
Financial markets o er you two basic investment
choices: debt or equity. You can lend money to a
government or company for some amount of time, or
you can buy at least a share of companies and hard
assets.
Debt represents a promise to pay. A borrower is re-
quired to make interest payments, if any, according
to a schedule that’s set when the loan is made. e
borrower eventually has to repay the full amount
and possibly a little extra.
Equity means full or partial ownership. Entire com-
panies are bought and sold in the stock market along
with their shares. Gold, other commodities, and real
estate change hands through markets as well.
Debt payments and equity investments vary from
one market to the next, as you’ll nd out later.
What’s constant is that governments, companies, and
producers of hard assets play a role in these markets
directly. ey are more than names that are attached
to contracts.
Financial markets enable borrowers to nd lenders
and equity owners to locate investors. is rst takes
place in what’s known as the primary market, where
new securities and assets are sold.
Borrowers usually rely on competitive auctions for
fundraising, though some sales are negotiated. Com-
panies can sell stock publicly for the rst time in ini-
tial public o erings (IPOs). ey can sell additional
shares as needed.
Commodity markets that focus on the buying and
selling of raw materials, rather than derivative con-
tracts, can be labeled primary markets. In real estate,
marketplaces for new buildings can be described the
same way.
In secondary markets, investors trade with each
other rather than governments, companies, and own-
ers of hard assets. Most buying and selling happens in
KEY POINT:
Governments and companies
raise money from investors in
primary markets. Investors buy
from and sell to each other in
secondary markets.
4■CHAPTER 1 Overview
conditions. Bottom-up analysis begins by con-
sidering the outlook for a speci c government,
company, or asset.
2. Technical analysis is the study of prices and other
data to determine trading patterns. If a chart shows
that a stock fell to $20 and rebounded twice in six
months, then a technical analyst may conclude
that the next retreat to $20 will attract enough buy-
ers to lead to a rebound. Sales, earnings, and other
fundamental data aren’t part of the picture.
3. Quantitative analysis relies on number crunching.
Financial and trading statistics and other data are
collected and run through mathematical formu-
las programmed into computers. e results are
used to guide investment decisions. e people do-
ing the analysis are known as rocket scientists or
quants, because their work is relatively complex.
Quotations
Whether you’re looking at governments, companies,
or hard assets, you’ll need to know something about
prices and trading to understand what’s happening to
their value.
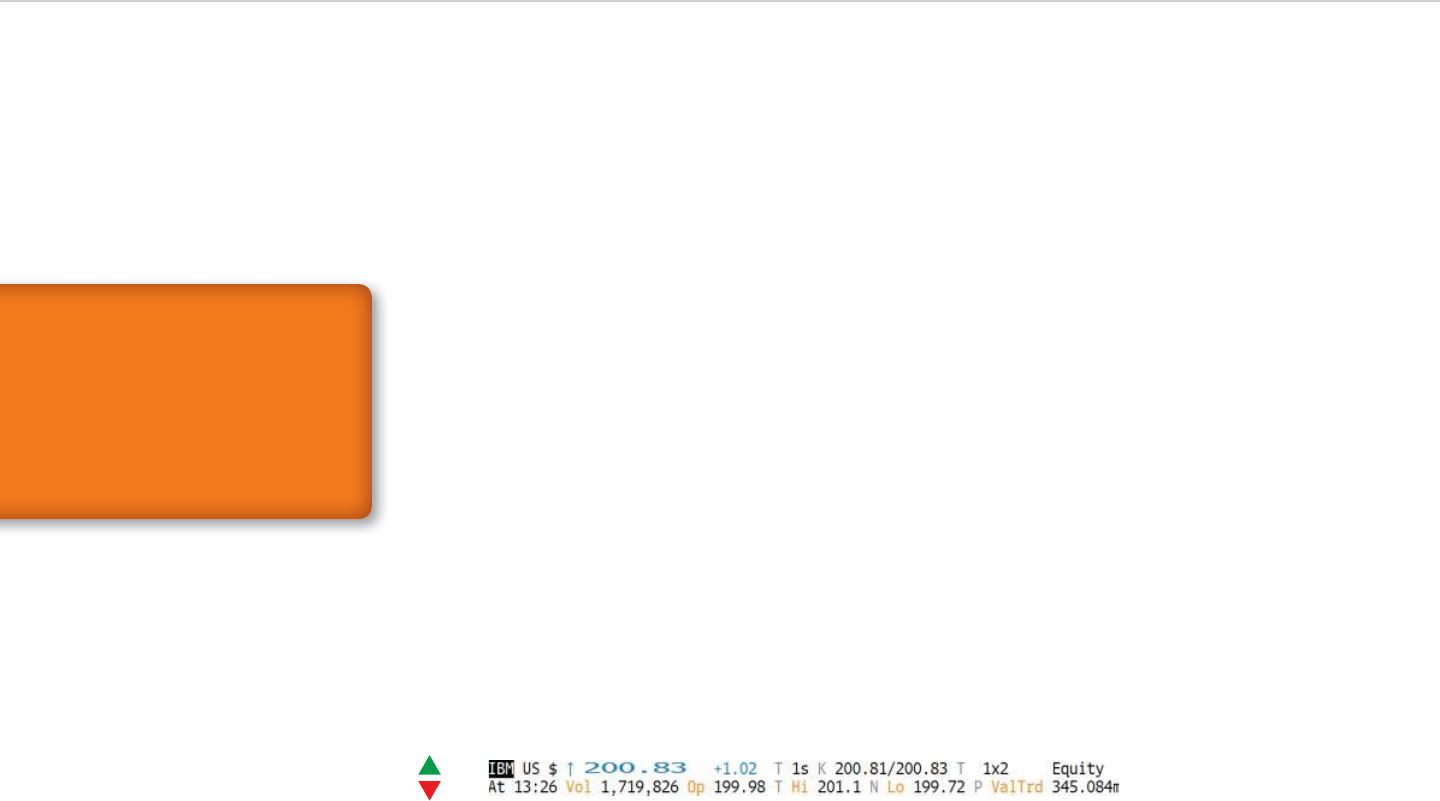
e key details vary by market as we’ll learn later.
e data presented in Exhibit 1.1, a stock quotation
these markets if only because they tend to be far big-
ger than primary markets.
e longer the life of a security or asset, the greater
the role of secondary trading. Debt maturing in a few
months is less likely to change hands than a security
with years left until it comes due. Equity has no matu-
rity date by de nition. Gold and other commodities
can be stored inde nitely. Buildings typically last for
decades, and land is eternal.
Investors who own a security or hard asset are said
to have a long position. e holding becomes more
valuable as the price increases. e opposite is a short
position, established by selling a security or asset bor-
rowed from another investor. Anyone with a short po-
sition stands to gain when the price drops, and vice
versa.
ree basic types of analysis help investors decide
whether to go long or short. Some investors rely on
one type, and others combine them in search of in-
vestments most likely to rise or fall.
1. Fundamental analysis focuses on the prospects
for governments, companies, or hard assets. e
analysis can take what’s known as a top-down or
a bottom-up approach. Top-down analysis begins
by looking at overall economic and business
KEY POINT:
There are three main
approaches to market analysis.
Fundamentals provide insight
into a government, company
or hard asset. Technicals
refl ect a security’s price moves.
Quantitative analysis relies on
data.
Exhibit 1.1: An IBM Stock Quote

Visual Guide to Financial Markets ■5
rather get as much money as possible, all other
things being equal.
Ask price: is is the lowest price at which anyone is
willing to sell. It’s known as the oer price. By either
name, it’s the ip side of the bid price, as a buyer
would rather pay as little as possible. e dierence
between the bid and ask prices is known as the bid-
ask spread. e narrower the spread, the easier it
is for investors to buy and sell without moving the
price, and vice versa.
Time: is shows whether the latest price is a rea-
sonable indication of market value. If it’s a minute
or two old, then the answer is probably yes. If it’s an
hour or two old, then maybe not. Times are present-
ed in 24-hour format. is means that a stock price
posted at the close of U.S. stock exchanges, 4 p.m.
Eastern time, would appear as 16:00.
Price range: Opening, high, and low prices for the
day’s trading put the current price in context. How
much have prices moved during the day? Is the cur-
rent price closer to the high or the low? It’s easier
to answer these questions when the data are readily
available. For the same reason, many quotes include
the previous day’s closing price.
for International Business Machines Corp., diers
from what you see in Exhibit 1.2, a quote for one of
IBM’s bonds.
Yet some facts and gures are usually included, no
matter what the security, and they are worth knowing
now. Let’s take a closer look at them.
Security symbol: is code, known as a ticker, is
the rst thing you’ll see in any quote. Some symbols
identify only the original seller or the issuer. Others
include details about the security itself.
Uptick/downtick arrow: e direction of the ar-
row shows the last change, usually in the price. It’s
known as an uptick/downtick arrow because each
price move in a security is called a tick.
Latest price: is is the most basic piece of data
in any quote. It’s usually taken from trades. Some
investments aren’t quoted at a price as we’ll see
later.
Change on the day: By comparing this gure with
the latest price, you’ll know how much the market
value has moved during the day.
Bid price: is is the highest price that anyone is
willing to pay. It’s shown because a seller would
Exhibit 1.2: An IBM Bond Quote

6■CHAPTER 1 Overview
ties in a single market, between market segments, and
among markets as we’ll see again later.
Returns
Price changes usually make the biggest contribution
to returns on an investment. eir e ect depends on
the direction of the move and on whether an investor
owns the security or asset or is betting on a decline.
e rst point is obvious enough. Investors in a
government, company, or hard asset want to make
money. e same goes for anyone who’s betting
against them. e second point refers to whether
someone has a long or short position.
Investors can go long through the primary or sec-
ondary market. Either way, the price they pay for a
security or asset becomes the starting point for deter-
mining their returns.
To go short, investors borrow securities or assets and
sell them as mentioned earlier. e borrowing is usually
conducted in a securities-lending market, where inves-
tors are paid for making their holdings available.
e price of the second transaction, or short sale, is
the basis for calculating returns. If the price declines,
then short sellers can make money by buying back
whatever was sold and by repaying the lender. eir
pro t comes from the gap between the short sale and
market prices. If the security or asset rises, then the
short seller loses.
When we study returns later, we’ll focus on what
investors in governments, companies, and hard assets
will earn. Remember, though, that rising prices don’t
You may have noticed that volume, or the amount
of trading, isn’t part of this list. at’s no accident. Vol-
ume is available mainly for stocks and other securities
that trade on exchanges. For currencies, bonds, and
hard assets, they often are hard to nd or undisclosed.
Three Rs
Now that you have gone this far, it’s time to address a
basic question: What’s in it for me? Put another way,
how would markets for investing in governments,
companies, and hard assets a ect me? To nd the
answer, you have to focus on the three Rs of returns,
risks, and relative value.
e rst two Rs, returns and risks, go together. If
one investment produces higher returns than anoth-
er, then it’s usually riskier as well. Investors who pay
too much attention to the returns can end up su er-
ing unexpected losses when a change in market direc-
tion highlights the risks.
Relative value, the third R, begins with understand-
ing the relationship between the rst two. If the price
of a security or hard asset falls, it’s possible the move
might be temporary and the potential returns may
rise accordingly. It’s also possible the investment has
become more speculative. Returns in the future may
be the same or lower after adjusting for the added risk.
ese kinds of judgments are essential in deter-
mining whether an investment is cheap, expensive, or
fairly priced, the goal of relative-value analysis. ey
can be made for a speci c security, between securi-
STEP-BY-STEP:
REAL RETURN MATH
1. The Standard & Poor’s 500 In-
dex fell 0.003 percent in 2011.
2. Dividends paid during the
year equaled 2.089 percent of
the index’s value.
3. Add price changes and divi-
dends to calculate the nomi-
nal return of 2.086 percent, or
2.1 percent after rounding.
4. Infl ation was 3.4 percent,
based on the change in the
Consumer Price Index (CPI)
for the 12 months ended in
November.
5. Subtract infl ation from the
nominal return to calculate
the real return of minus
1.3 percent.
KEY POINT:
Returns, risks, and relative
value are the three Rs of
investing. Returns are based
on price changes and any
payments that investors
receive. Risks can be general,
specifi c to an investment,
or somewhere in between.
Relative value refers to what’s
cheap, expensive, or fairly
valued.

Visual Guide to Financial Markets ■7
rather than rise. Yet that’s a risk they inevitably
take when they buy securities, commodities, or real
estate.
e short sellers we encountered earlier have the
opposite risk. When their asset’s price increases, the
value of their short position declines, and vice versa.
eir losses can be in nite. Buyers can only lose what
they paid for their holdings plus investment fees and
expenses.
Either way, prices may go in the wrong direction.
is is called market risk. It’s a concern for anyone
who’s invested in a security or market, whether the
holding is direct or indirect.
Another universal risk is the threat that investors
won’t be able to sell an asset at the current market
price because there aren’t enough potential buyers
around. This is known as liquidity risk. The phrase
refers to the ability to raise cash, known as a liquid
asset. Some investments are more liquid than oth-
ers because there’s more trading in them. It’s prob-
ably much easier to sell a 10-year Treasury note,
for example, than a 10-year corporate note. That’s
the case because the government security changes
hands all day, and the company debt might trade
occasionally.
Demand for actively traded securities sometimes
evaporates. Shares of some of the biggest U.S. com-
panies changed hands for as little as one cent a share
on May 6, 2010, when the Standard & Poor’s 500 Index
plunged as much as 10 percent before rebounding.
at’s liquidity risk in the extreme.
lead to gains for everyone invested in a market. Lower
prices don’t hurt everyone either.
We’ll consider what else a ects returns besides
changes in price. Anyone who lends money to govern-
ments and companies typically earns interest. Stocks
often pay dividends. Gold and other commodities
don’t provide either type of payment, which means re-
turns are more closely tied to price moves. Real estate
owners receive lease payments or rental income.
In ation reduces returns by making these pay-
ments less valuable before they are received. Investors
take this e ect into account by tracking real returns,
which are adjusted for in ation. Figures that don’t
have any adjustment are known as nominal returns.
Costs and expenses hurt returns. Buying and sell-
ing securities and hard assets requires the payment of
trading fees. Having someone hold them in an account
adds to the cost. You incur storage and transportation
expense for commodities and maintenance expenses
for real estate. Taxes are imposed on interest and divi-
dend payments and investment gains as a rule.
Because the costs can vary considerably from one
investor to the next, we’ll keep the discussion of them
to a minimum in later chapters. Even so, you should
learn about the tax bene ts that go with investing in
some markets.
Risks
Investors probably wouldn’t bother putting money
into governments, companies, and hard assets if
they knew the prices of their holdings would fall
KEY POINT:
For owners of a security or
hard asset, market risk is the
possibility of a drop in value.
For short sellers, it’s the
opposite.
DEFINITION:
Liquidity
Liquidity is the ease of buying
and selling without causing
price changes.

8■CHAPTER 1 Overview
economy from day to day and by setting benchmark
rates.
Additional moves are made when necessary, as
they were during the 2008 nancial crisis and its af-
termath. e Fed added hundreds of billions of dollars
to the economy through bond purchases, a practice
known as quantitative easing, and started paying in-
terest on funds that banks kept on deposit.
Fiscal policy shapes the way a government takes
in and spends money, which in turn a ects the econ-
omy’s performance. e types of taxes that house-
holds and businesses must pay and the rates they are
charged a ect the revenue side. Outlays are linked to
decisions about national defense, social programs,
and other areas that the government manages.
Policy decisions can explain why the U.S. federal
budget was balanced for part of the 1990s, for instance.
ey can account for the de cits that reached more
than $1 trillion annually during the next decade.
Investors have to concern themselves with cur-
rency risk. Because U.S. stocks and bonds are priced
in dollars, their value is a ected by the dollar’s value
against other currencies. If the dollar is dropping, then
demand from non-U.S. investors may decline, causing
prices to fall.
Currency risk can cut the opposite way as well. A
rising dollar makes U.S. exports more costly to over-
seas buyers, which tends to reduce international trade
and curtail economic growth. Gains in the dollar re-
duce the value of sales and pro ts that U.S. companies
make outside the country.
Risks found outside the markets can trip up inves-
tors in governments, companies, and hard assets as
well. Four of them are worth a closer look.
We’ll start with economic risk, or the possibility
that slower growth or contraction—in the worst case,
a recession or depression—will cut government tax
revenue along with corporate sales and earnings. Risk
exists when growth accelerates, as companies must
pay more for workers or raw materials. Companies
most vulnerable to this risk are known as cyclicals
because their fortunes are closely linked to the econo-
my’s up-and-down cycles.
Political risk is the potential for legislative actions
to deter or prevent governments and companies from
reaching their goals. is risk was especially pro-
nounced for the United States in July and August 2011
when President Barack Obama and Congress were
unable to agree on raising the country’s debt ceiling
until the limit was almost reached.
Policy risk is a speci c type of political risk, which
isn’t limited to the executive and legislative branches.
It’s focused on monetary policy, controlled by the Fed-
eral Reserve (Fed) and other central banks, and s-
cal policy, de ned by taxing and spending decisions
made by the president and Congress.
Monetary policy a ects the amount of funds avail-
able to the economy as well as their cost, otherwise
known as interest rates. e Fed’s version is designed
to meet two goals: containing in ation and maxi-
mizing employment. e central bank pursues these
objectives by adjusting the amount of money in the
KEY POINT:
Currency-market moves
can affect the value of any
investment. When the
dollar is rising, demand for
investments priced in the U.S.
currency tends to increase.
When the dollar is falling,
assets denominated in other
currencies become more
valuable.

Visual Guide to Financial Markets ■9
key detail. Relative-value analysis would help them
decide whether the di erence matters, based on the
potential returns.
e same issue arises when looking at similar se-
curities from di erent entities. Suppose investors
can choose between a three-month government bill
and a corporate security maturing at about the same
time. e company probably will be a riskier bet than
the government. If the corporate security provides
enough additional income to compensate for the
greater risk, it may be worth buying. If not, it’s the
other way around.
Di erent securities from the same entity can be
studied this way. Consider the example of a company
that has publicly traded bonds and shares. It’s possible
to decide which is cheaper by comparing interest pay-
ments on the debt with dividends on the stock even
though the payments aren’t identical.
Relative-value comparisons like these can be ex-
tended to entire markets. ey help investors decide
whether to focus on stocks or bonds, how much cash
to keep on hand, and whether to put money into hard
assets, among other things.
The criteria used to determine what’s cheap, ex-
pensive, and fairly priced vary by market. For bills,
notes, bonds, and other types of debt, interest rates
are important. Though the rates differ, as we’ll
learn later, there’s a common thread to how they are
interpreted. Investors want to know how much they
stand to earn for lending out money, and rates are
the guidepost.
We’ll examine more speci c risks in later chapters.
Credit risk, or the ability of a government or company
to keep up payments on its debt, is one of them. An-
other is business risk, or the threat that a company’s
operations or nances may falter.
Relative Value
U.S. government bills, maturing in one year or less, paid
next to nothing after the Fed began targeting near-zero
interest rates at the end of 2008. Earlier in the 2000s, the
securities rewarded investors with rates of 6 percent or
more. During the 1980s, rates exceeded 10 percent.
e historical comparisons show Treasury debt
is far less lucrative than it used to be. ey provide a
starting point for determining whether the securities
are cheap, expensive, or fairly priced in relative terms.
Similar analysis is done on all the other types of secu-
rities we’ll cover.
History only tells part of the story. Investors have
to determine how much risk there is today for a gov-
ernment, company, or hard asset. en they have to
decide whether the potential returns are high enough
to justify taking that risk.
e opinions of credit-rating services, especially
Standard & Poor’s, Moody’s Investors Service, and
Fitch Ratings, are often part of that process. ese
companies assess the risks that go with debt securi-
ties. eir judgments help shape the views of inves-
tors, for better or worse.
Investors may study two securities that are essen-
tially the same except for the maturity date or another
KEY POINT:
Rating services are private
companies though they are
often called agencies, and
some of them have offi cial
recognition from U.S. and
international regulators.
STEP-BY-STEP:
RISK AND RETURN
1. Suppose a three-month Trea-
sury bill has a 0.1 percent
rate.
2. Suppose a three-month
corporate security has a
0.5 percent rate.
3. Subtract the Treasury bill
rate from the corporate rate,
and what’s left is 0.4 percent.
4. The 0.4 percent is what an
investor gets paid for lend-
ing money to the company,
rather than the government.
5. The investor has to deter-
mine whether the additional
amount is worth the risk.
6. Relative-value analysis
guides the decision-making.

10 ■CHAPTER 1 Overview
Investors in debt securities are concerned with a
borrower’s ability to pay interest on time and repay
the money when it’s due. is leads them to focus on
cash: where it’s coming from, where it’s going, how
much exists, and how fast it’s growing. e less a bor-
rower needs the money, the more secure someone will
be with owning its debt.
Stock investors also concentrate on cash. For one
thing, they’re interested in a company’s ability to pay
dividends. For another, companies with cash can buy
back shares, which can increase returns on the re-
maining stock. ese payouts help determine relative
value as do revenue and earnings, which indicate how
well the business is doing.
Relative-value comparisons are more basic for
hard assets, if only because less data are available. For
commodities, history and supply-demand analysis
play larger roles than they would in securities. ere
aren’t any interest, dividends, and earnings to use in
deciding what’s cheap and expensive.
In real estate, it’s possible to assess value through
comparisons between a property and similar ones
that have been sold recently. That said, the analysis
isn’t as straightforward as finding rates on bonds
or financial ratios for stocks. Real estate doesn’t
change hands that often, so the right numbers can
be elusive.

11
Government
Can you imagine an investment that carries no
risk? No worries about markets, liquidity, or
anything else? What kind of an interest rate would
you expect this investment to provide? Put another
way, what kind of a return would you need to be a
buyer?
For many investors, the answer to the rst two
questions is “yes.” at’s because a risk-free rate is of-
ten used in evaluating returns and in making relative-
value judgments. e rate is theoretical because every
investment carries some risk.
e third and fourth questions can be answered by
looking at the interest rate on three-month Treasury
bills. It’s reasonably close to a risk-free U.S. rate for a
couple of reasons. First, the government can require
many of the more than 300 million Americans to pay
taxes, and the revenue is a source of funds for making
payments on the securities. Second, the government
has the ability to pay with new money.
Other borrowers don’t have the two advantages
working for them. is means government securi-
ties markets are a relatively sure bet for investors. e
three-month period provides an additional margin of
safety as there isn’t much time for risks to surface. e
promise to pay goes with bills, a form of debt. e gov-
ernment can’t sell equity, a riskier type of investment.
Some safety exists in cash, as suggested by the im-
age of people stu ng their money under a mattress
during times of economic turmoil. Government is
responsible for sustaining the value of that cash as it
makes decisions on a country’s borrowing.
Remember, though, that risk-free remains a relative
term. Government debt can lose value as interest rates
rise and in ation accelerates, as do other securities.
Investors who turn over their money for longer peri-
ods can su er bigger losses when rates or in ation go
against them. We’ll explore the risks later in this chap-
ter. For now, let’s take a closer look at currencies.
KEY POINT:
Rates on government securities
are sometimes called risk-free
rates because the debt carries
little risk for investors.
Visual Guide to Financial Markets
by David Wilson
Copyright © 2012 by David Wilson.

12 ■CHAPTER 2 Government
Currencies
We often measure the value of money by how far
it goes at the supermarket, the shopping mall, the
online store, and other retail locations. Another
barometer serves as the foundation for a
multitrillion-dollar market: the amount of a foreign
currency we can purchase.
Money comes in pairs in the foreign exchange mar-
kets. Pairs that include the dollar tend to be watched
most closely. e dollar is a reserve currency, held by
central banks and used internationally to set the price
of goods and services. Because the United States is
the world’s largest economy, there are plenty of dol-
lars crossing borders each day.
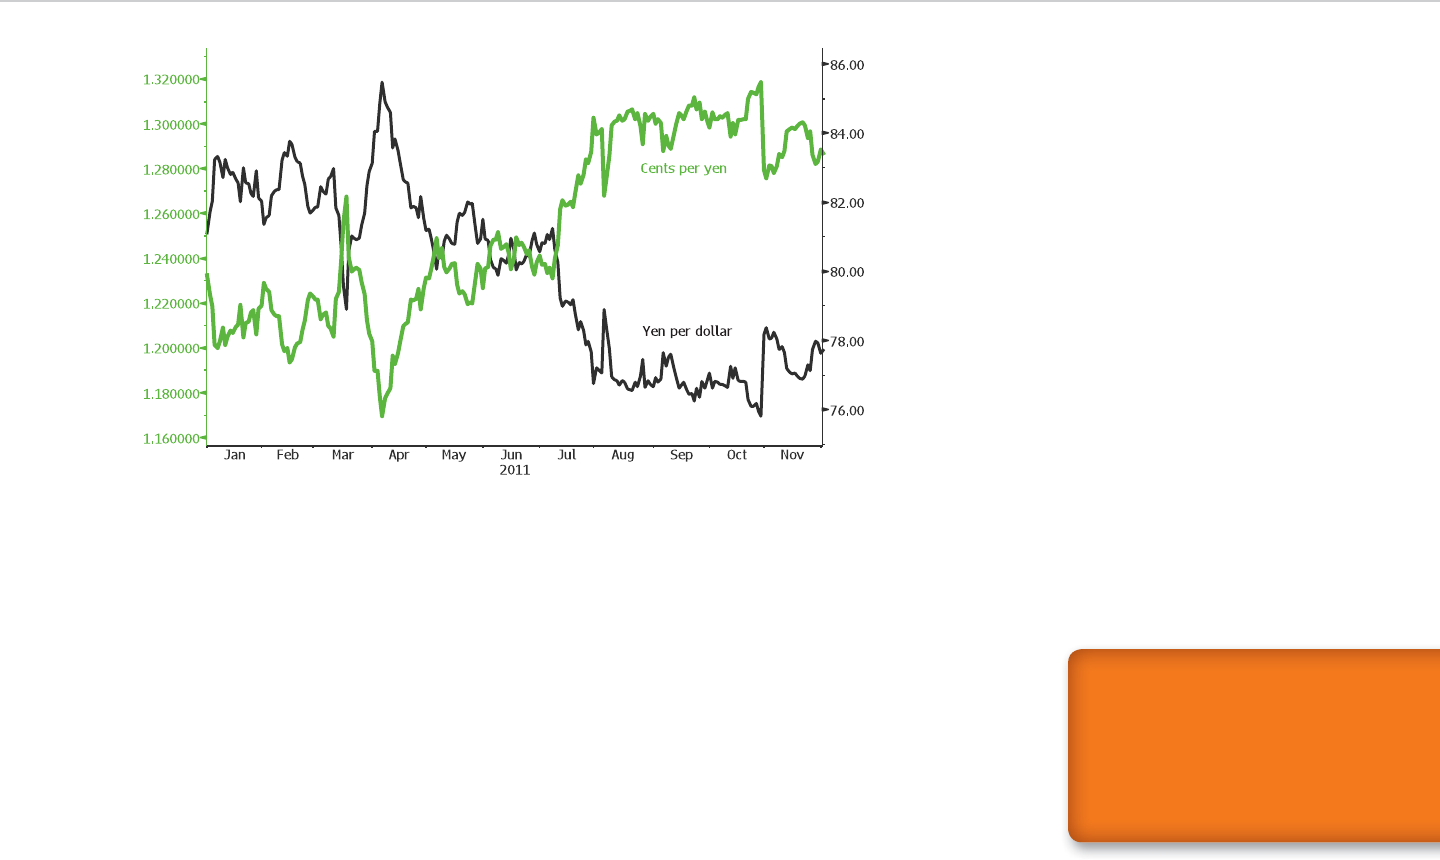
Each pair has two values, based on buying or sell-
ing one unit of the currency. ere’s a value, for in-
stance, that shows Japanese tourists en route to the
United States how many dollars they can buy with
their yen. Another exists for the U.S. businessman
going to Tokyo, who has the opposite concern. e
values are mirror images of each other, as shown in
Exhibit 2.1.
Only one of the values in any currency pair is front
and center on traders’ computer screens. Usually, it’s
the amount of another currency you can buy for a dol-
lar. at’s the case with the yen.
There are prominent exceptions. The euro, Eu-
rope’s common currency, is among them. Traders
focus on the number of dollars and cents required
to buy one euro and not the reverse. Others include
British Commonwealth currencies, especially the
British pound and the Australian and New Zealand
dollars.
Currency pairs that exclude the dollar get some
attention. eir exchange rates are called cross rates
because they re ect each currency’s value against
the dollar. is assumes someone will go across the
dollar—buying dollars with one currency and selling
those dollars for the other currency—to complete a
trade. If the dollar trades at 80 yen and the pound is
at $1.60, the pound-yen cross rate is 80 times 1.60, or
128 yen to the pound.
Regardless of the pairing, currency moves can af-
fect economies and nancial markets. A declining
currency makes a country’s goods and services cheap-
er in international markets, and vice versa. is may
encourage more people to visit, like those Japanese
tourists, and to invest in government securities, com-
panies, and hard assets.
Foreign exchange swings can be a double bene t or
a double whammy for investment returns. If a stock or
bond rises, a strengthening of the currency in which
it’s denominated will enhance the gain. If the price
drops, a weaker currency will magnify the loss.
Trillions of dollars changes hands daily in the
global currency markets. e latest available gure
is $4 trillion, taken from an April 2010 survey by the
Bank for International Settlements (BIS). e BIS,
which assists central banks and monetary authorities
worldwide, canvasses them every three years on trad-
ing in currencies and related contracts.
STEP-BY-STEP: FROM
DOLLARS TO YEN
1. Assume the dollar is trading
at 80 yen.
2. The yen’s value is the
inverse, so divide 80 by 100.
3. One yen is equal to 80/100 of
a dollar, or 0.8 cent.
STEP-BY-STEP: FROM
POUNDS TO DOLLARS
1. Assume the pound is trading
at $1.60.
2. The dollar’s value is the in-
verse, so divide 100 by 1.60.
3. One dollar is equal to
100/1.60, or 62.5 pence.
Visual Guide to Financial Markets ■13
currency. You could go to an automated teller ma-
chine (ATM) and withdraw the number of yen you
wanted. You may stop at a bank branch, a foreign-
exchange kiosk at the airport, or a hotel’s front
desk.
If you choose one of these other locations, you’ll
run across a table with three columns. e rst has
the names of currencies, including the dollar. e
second shows how much you would receive in return
for each currency, and the third shows how much you
would have to pay to buy them. e line for the dollar
might look like this: JPY 76.25 78.75.
Practically all this buying and selling takes place
over the counter, or away from exchanges. Banks,
brokers, and other nancial companies connect over
electronic networks to carry out their trading. is
approach means the amount of information available
about foreign exchange trading from day to day is rel-
atively sparse, as we’ll see shortly.
Quotations
Suppose you were that businessman who traveled
to Tokyo from New York and needed to exchange
KEY POINT:
Foreign-exchange quotes
always show the value of one
currency against another.
Moves in the two currencies
over time are mirror images of
each other.
Exhibit 2.1: Dollar’s Value in Yen and Yen’s Value in Dollars
14 ■CHAPTER 2 Government
–.13: Change from the previous day’s last price, re-
corded at 5 p.m. New York time in this case. Curren-
cy markets don’t open and close during the week, as
trading happens worldwide 24 hours a day. e last
price might be based on trading in London, home to
the world’s biggest foreign exchange market, or in
Tokyo, another currency trading hub, for some mar-
ket participants.
BGN 76.32/76.33 BGN: Highest bid and lowest ask
prices, along with the source of each. BGN stands for
Bloomberg generic pricing, which combines quotes
from a number of banks. In other cases, a code for a
speci c bank may appear.
e spread between them is 0.01 yen, far narrower
than the 2.5-yen di erential in our earlier example.
at’s the case because there’s far more currency
bought and sold in the market than at bank branches,
currency kiosks, and hotels.
At 14:32: e second line begins with the time at
which the mid price was recorded. is is as com-
mon as the uptick/downtick arrow in quotes, as
you’ll see later. It’s essential because currency val-
ues, like security prices, are constantly changing.
Op 76.46: Opening price, recorded shortly after
5 p.m. New York time the day before.
e rst number is the bid price, and the second
is the ask, or o er, price. e gap between them,
2.5 yen, is the bid-ask spread. e wider the spread,
the greater the pro ts for a bank, money changer, or
hotel from currency exchange.
Bid and ask prices are all that are disclosed in the
global foreign exchange market. Prices at which cur-
rencies trade aren’t made public, which means there’s
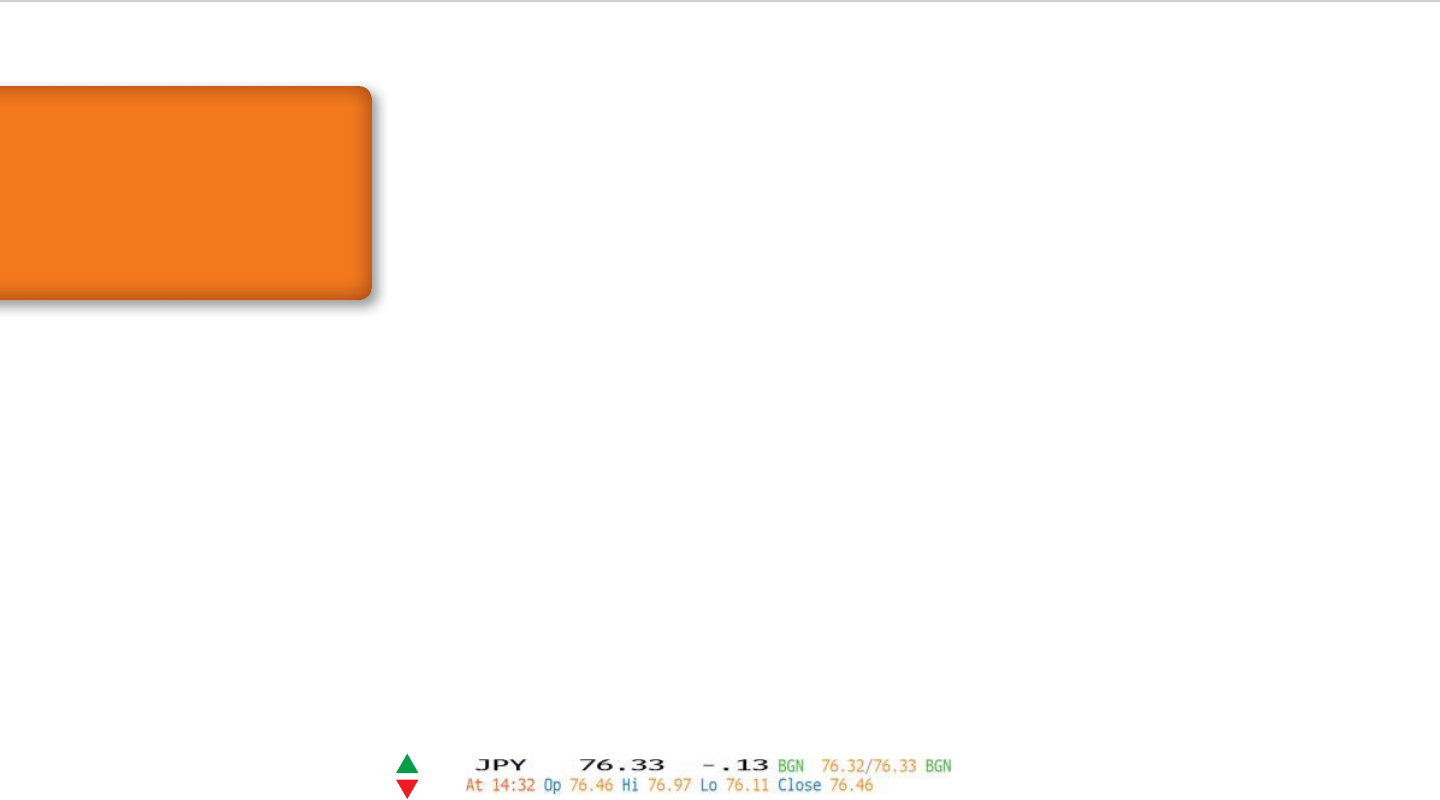
little detail available to show in quotes. Take the Japa-
nese yen as an example (see Exhibit 2.2).
ere’s no way to tell how many yen changed hands
during the day, or the exact price at which dollars were
sold for yen. Let’s nd out what is available.
JPY: e quote’s rst line begins with a three-letter
code for the yen. Each currency has a code. Some of
the more popular ones are EUR for the euro, GBP for
the British pound, CAD for the Canadian dollar, and
CHF for the Swiss franc. When only three letters are
included, the other currency is the dollar. Six-letter
codes are used for cross rates, where the dollar isn’t
involved in the trade. EURJPY, for example, shows
the value of one euro in yen.
76.33: is is the number of yen one dollar will buy.
It’s known as the mid price because it’s halfway be-
tween the bid and ask prices.
KEY POINT:
USD is the three-letter code for
the U.S. dollar. Others include
AUD (Australian dollar), CAD
(Canadian dollar), CHF (Swiss
franc), EUR (euro), and GBP
(British pound), along with JPY
for the yen.
Exhibit 2.2: Yen Quote

Visual Guide to Financial Markets ■15
potential for swings re ects the willingness of gov-
ernments to allow markets to set the value of their
currencies.
Some rates are xed, which means they don’t move.
Argentina, for example, set the value of its peso at $1
between 1991 and 2002. e xing of the exchange
rate helped the country bounce back from years of
economic contraction.
Fixed exchange rates are an example of pegging,
known as linking, in which governments determine
the value of currencies. In other cases, monetary au-
thorities set the range in which the value can uctu-
ate and buy and sell currency to maintain the range.
In 2005, Hong Kong pegged its dollar at HK$7.75 to
HK$7.85 to the U.S. dollar and China let its currency—
the renminbi, denominated in yuan— oat within a
band tied to a basket of currencies.
en there are the freely oating currencies, where
the value is almost entirely determined in markets.
e “almost” is included because central banks occa-
sionally stage what’s known as an intervention. ey
buy and sell currencies when values get too far out of
line for their liking.
Central banks can set lower exchange rates through
currency devaluations. e dollar was last devalued in
1934, when the amount of gold that the U.S. currency
could buy was cut by 41 percent. e pound’s value
tumbled 4 percent on Sept. 16, 1992, when the United
Kingdom withdrew from an agreement that xed its
exchange rate. Several emerging market currencies
have been devalued more recently.
Hi 76.97: High price for the current trading day.
Lo 76.11: Low price for the current trading day.
Close 76.46: Closing price for the previous day. It’s
the basis for the day’s change of –.13, shown in the
rst line.
Three Rs
e Japanese tourists and the U.S. businessman in-
troduced earlier are exchanging currency to cover ex-
penses rather than to turn a pro t. e same might be
said about companies doing business internationally.
ey may need to buy another currency to complete a
purchase or to make an exchange for their local cur-
rency to bring revenue home.
Many investors make foreign exchange trades for
similar reasons. Funds that invest outside their home
country need the local currency to purchase stocks,
bonds, and other assets. Some of these funds trade to
reduce the risk that currency moves will a ect their
pro ts.
Currency speculators have another goal in mind.
They want to make money as one currency rises or
falls in value against another. We’ll look at the three
Rs of returns, risks, and relative value from their
perspective.
Returns
Speculators buy and sell currencies in anticipation
of changes in exchange rates over time. Returns from
making these bets depend on how rates move. e
DEFINITION:
Speculators
Speculators buy and sell to
profi t from changes in market
value.

16 ■CHAPTER 2 Government
Eurodollar rates. Although the name originally referred
to European bank deposits of dollars, the Euro-pre x
has come to mean foreign. ere are Eurodollar rates in
Tokyo and Euroyen rates outside of Japan.
Risks
We’ve seen how market and liquidity risks a ect the
currency market. Anyone buying stocks, bonds, or
hard assets with their money, rather than depositing
the funds in a bank, is more likely to sustain losses.
ey may be large enough to wipe out any gains from
exchange-rate moves.
Political, economic, and policy risks are part of the
territory as well. After all, U.S. paper money says “ e
United States of America” and “Federal Reserve Note.”
is means the president, Congress, and the Fed each
has a role to play in determining its value.
Market-speci c issues also exist, beginning with
interest rate risk. Because money obtained through
the currency market goes into bank deposits, the rate
is set for a certain period. If the central bank raises
rates during that time, the deposit won’t earn as much
money as it might have otherwise. Currency moves
tied to the rate increase may not make up for this lost
opportunity.
In ation risk is another concern. When prices are
rising, the money on a deposit will buy less than it might
have otherwise. If the in ation rate exceeds the deposit
rate, the funds will buy less. Put another way, in ation
reduces the purchasing power of money, whether it’s in
your wallet, your pocketbook, or a bank.
Generally, the daily movements in oating curren-
cies—the dollar, euro, yen, British pound and Swiss
franc, to name a few—re ect what tourists, business-
men, companies, speculators, and others are buying
and selling. is means they provide the greatest po-
tential for returns.
Exchange rate changes aren’t entirely tied to returns
though. Speculators don’t buy currencies and hide
them under a mattress or in a corner o ce. Instead,
they deposit the funds in a bank and earn interest.
Banks dominate currency trading worldwide, so it
makes sense that they would end up with the money.
Deposits are the investment of choice because their
market and liquidity risk is low. is reduces the odds
of investment losses that would cut into returns if the
currency moves the right way.
Put this all together, and it’s understandable that de-
posit rates would a ect the ow of funds into and out of
currencies, as well as their returns. Money tends to ow
into a country as rates increase and ow out as rates fall.
Banks take their lead on what to pay for deposits
from a central bank, such as the Fed. ey’re guided
by a rate that the central bank sets directly. e United
States has a target rate for overnight loans between
banks that’s known as the federal funds rate. e Fed’s
policy makers set the target, and the central bank ad-
justs the amount of money in the banking system each
business day to control the market rate.
Speculators can deposit funds in the country that
printed the money or elsewhere. Interest rates for
deposits made outside the country are known as
KEY POINT:
Governments can directly
affect the value of their
currencies in three ways.
They can establish a fi xed rate
or peg, intervene in foreign-
exchange markets by buying or
selling, or offi cially devalue the
currency.
Visual Guide to Financial Markets ■17
Relative Value
What does the same item cost in di erent locations? e
answer provides a way to determine the value of one cur-
rency against another. McDonald’s Big Mac sandwiches
and Starbucks lattes have been used in these kinds of
comparisons because they’re so widely available.
e analysis is based on the principle that people
should be able to buy goods and services for the same
price anywhere. Economists refer to this as purchas-
ing power parity. Ideally, exchange rates would main-
tain parity, though it doesn’t quite work out that way
in currency markets.
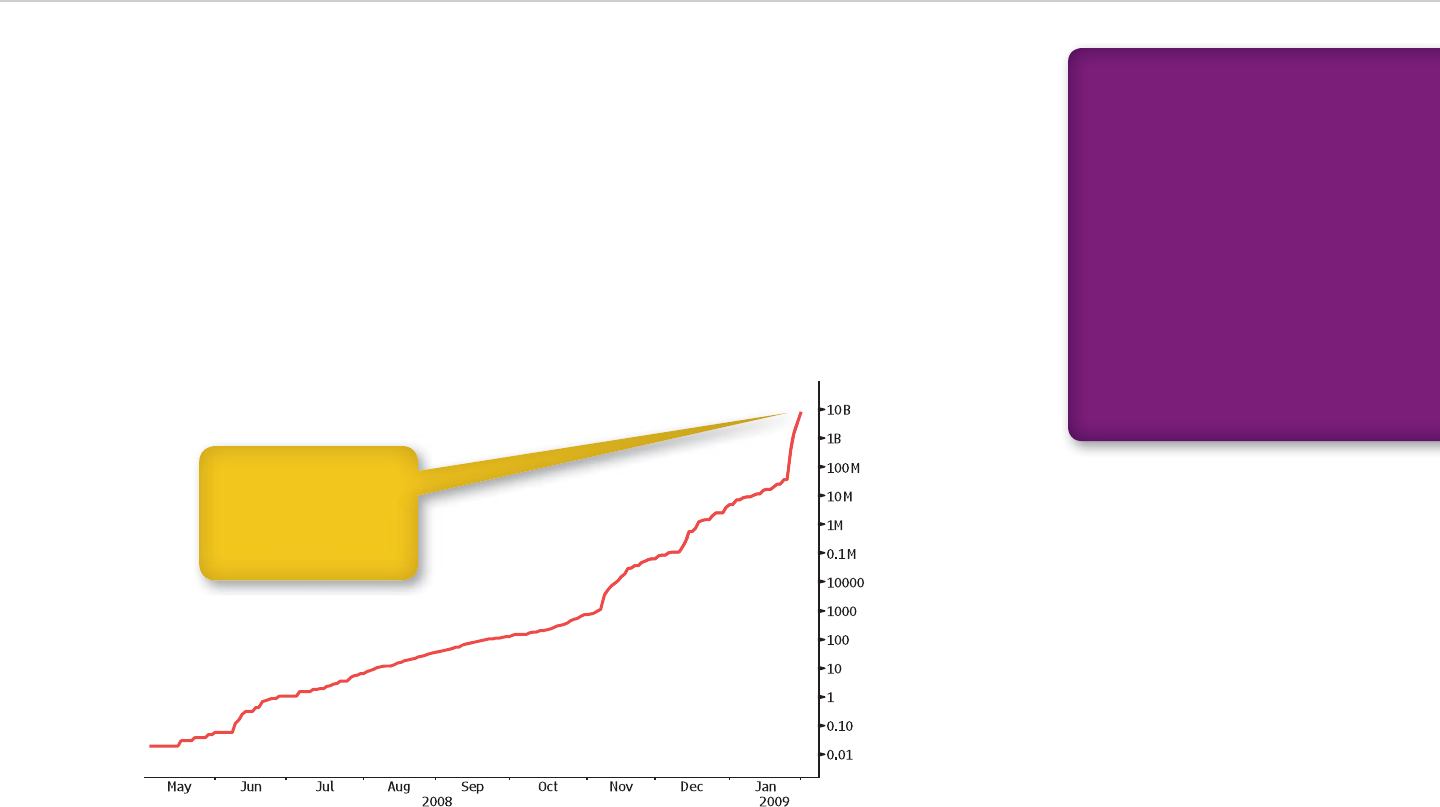
In extreme cases, in ation turns into hyperin a-
tion. Prices rise so far and fast that the increases es-
sentially wipe out a currency’s value. is took place
in Germany after World War I and in several emerging
markets more recently.
e African country of Zimbabwe provided a worst-
case scenario during the 2000s, as shown in Exhibit 2.3.
Soaring prices prompted Zimbabwe’s central bank to
redenominate its currency, the dollar, multiple times.
e central bank resorted to printing bills with face
values as high as Z$100 trillion before doing away with
the local currency in 2009.
Exhibit 2.3: Number of Zimbabwe Dollars per U.S. Dollar During Hyperinfl ation
The African country’s
central bank issued bills
in denominations as high
as 100 trillion dollars
before the local currency
was abandoned.
1. Assume Big Macs cost $3 at
McDonald’s restaurants in
the United States and
12.5 yuan in China.
2. Divide the Chinese Big Mac
price by the exchange rate to
translate into dollars. If the
yuan is at 6.25 to the dollar,
then the price is 12.5/6.25 = $2.
3. At $2, the Big Mac is
33 percent cheaper in China.
This suggests the yuan is
33 percent undervalued
relative to the dollar.
STEP-BY-STEP:
PURCHASING POWER

18 ■CHAPTER 2 Government
securities we’ll run across later. Companies refer to them
as cash equivalents in nancial statements.
Treasury bills are as safe an investment as you’ll nd
in nancial markets, for a couple of reasons. First, con-
sider the government’s power to impose taxes on tens of
millions of people and millions of companies to pay its
debts. No other borrower is in that position. Second, the
government can create money through the central bank.
If worse came to worst, it would be possible to obtain the
money by cranking up the Fed’s printing presses. at’s
an option no one else has.
e relative safety of government bills is tied to
their maturity date. ere’s less potential for things to
go wrong in a year than there is in ve, 10, or 30 years.
What might happen? We’ll nd out when we examine
the three Rs.
Investors can buy bills in the primary or second-
ary market. e primary market consists of auctions
conducted by the Federal Reserve Bank of New York
(New York Fed) on the Treasury’s behalf. e second-
ary market is run by the largest banks and securities
rms, along with the brokers that connect them.
e Treasury currently sells one-month, three-
month, and six-month bills each week, along with
one-year bills each month. Some banks and securities
rms are required to bid at every auction, ensuring
the government will have buyers for whatever bills are
sold. ese bidders are known as primary dealers, a
title that ts their position within the primary market.
Primary dealers compete at auctions by submitting
bids, based on the interest rate they’re willing to accept.
ere’s another relative-value gauge that was men-
tioned earlier: deposit rates. e gap in rates between
two countries in uences the movement of money be-
tween them, which in turn a ects exchange rates. For
currency speculators, the rate di erential counts for
more than Big Macs and lattes.
Bills
Trillion-dollar budget gaps have to be closed some-
how. e U.S. government has learned this lesson the
hard way in the past few years. Increased spending to
help sustain the country’s economy and uctuations
in tax revenue swelled the federal de cit to more than
$1 trillion annually.
Investors made up the shortfall. e government
stepped up fundraising in the money market, where
money is made available for as long as a year. It leaned
more heavily on the bond market to borrow for two to
30 years.
We’ll visit the government bond market shortly,
so let’s focus on the money market. e U.S. Treasury
sells debt securities maturing in one, three, six, or
12 months on a regular schedule, and for other peri-
ods as needed. ey are known as Treasury bills.
e word “bills” may make you think about the $1, $5,
$10, and $20 bills in your wallet or pocketbook. at’s an
idea worth keeping in mind. Treasury bills play much the
same role as paper money even though the government
doesn’t print and distribute them. Accountants con-
sider them the same as cash, like other money market
DEFINITION:
Treasury bills
Treasury bills are securities
that the U.S. government
sells to borrow funds for a
year or less. Investors and
companies classify them as
cash equivalents.
Visual Guide to Financial Markets ■19
e securities don’t pay interest before they mature,
so the size of the discount has much to do with their
returns, the rst of the three Rs. ey are stated as an-
nual rates for consistency’s sake even for bills matur-
ing in less than a year, as most of them do.
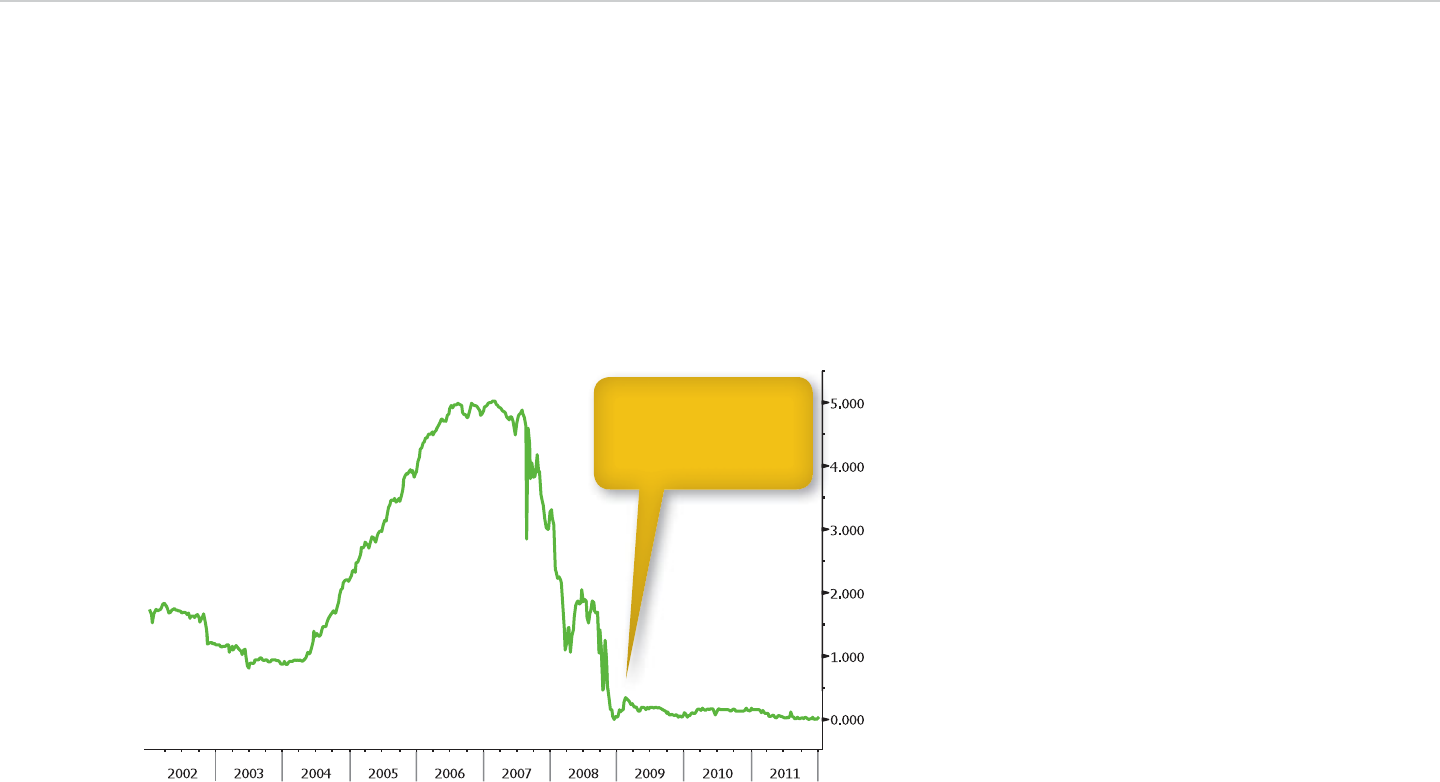
As 2008 ended, discount rates at bill auctions
dropped to almost zero. e decline resulted from
the Fed’s e orts to prop up the U.S. economy through
monetary policy. Put another way, the government
could pay almost nothing to borrow money. Exhibit 2.4
places the borrowing costs in perspective.
e New York Fed then sells the bills at the lowest pos-
sible rate, which translates into the highest price. is
enables the Treasury to borrow as cheaply as possible.
Investors can buy new bills through primary deal-
ers or straight from the Treasury. If they go through
a dealer, the rm’s auction bid will largely determine
what they have to pay. ey can go through Treasury
Direct, a program that lets smaller investors buy secu-
rities at the average rates set in auctions.
ese rates are known as discount rates because
Treasury bills are bought for less than their face value.
Exhibit 2.4: Three-Month Treasury Bill’s High Discount Rate at Auction
Sources: U.S. Treasury, Bloomberg.
The Treasury’s borrow-
ing cost fell to almost
nothing after the Federal
Reserve adopted a target
interest rate near zero.

20 ■CHAPTER 2 Government
Now that we know what isn’t in Treasury bill
quotes, let’s look at what is (see Exhibit 2.5).
B: Symbol for Treasury bills.
9/20/12: Maturity date, when the holder receives
face value from the Treasury. It’s shown in month/
day/year format.
Up arrow: Direction of the most recent change in
the discount rate. Because the rate moved up, this is
known as an uptick. A down arrow would signify a
decline in the rate, or a downtick. You’ll see arrows
like this in many other quotes.
is uptick/downtick arrow tracks the discount
rate rather than the price. Higher rates mean lower
prices, and vice versa. Keep that in mind, as it’s true
for other types of debt securities.
.090: Discount rate in percentage points. Investors
buying this bill would earn 0.09 point on their in-
vestment by keeping it until the maturity date. at
amounts to nine cents for every $1,000 invested.
Percentages like this are so small that traders and
investors move the decimal point two places to the
right and talk about basis points. Each basis point
amounts to 0.01 percentage point, so the bill’s dis-
count rate is 9 basis points.
Discount rates are the focus in the secondary
market, where the primary dealers and others trade
bills sold at past auctions. ere isn’t an exchange
where the securities are bought and sold. Instead,
trades are made between rms electronically in the
over-the-counter (OTC) market.
Securities rms operate their own electronic trad-
ing networks. Similar systems are provided by inde-
pendent rms, including Bloomberg, which has one
called Bloomberg BondTrader for Treasury bills and
other debt securities.
Dealers may use brokers to carry out trades. Can-
tor Fitzgerald LP, ICAP Plc, and Tullett Prebon Plc
operate three of the biggest brokerages for bills and
other government securities, including the notes and
bonds we’ll study later in this chapter.
Quotations
Prices are nowhere to be found in quotes on Treasury
bills. Instead, they are quoted at discount rates, in
keeping with how they’re sold at auctions. is rate
determines the price that a buyer will pay.
e number or dollar amount of bills traded during
the day won’t be found in quotes either. ey’re omit-
ted because the OTC markets where they trade don’t
make the data widely available.
DEFINITION:
Basis points
Basis points are hundredths of a
percentage point
Exhibit 2.5: A Treasury Bill Quote

Visual Guide to Financial Markets ■21
Returns
Because government bills don’t pay interest before
maturity, their returns depend mainly on the di er-
ence between the purchase price and face value. e
price, in turn, results from the quoted discount rate.
As an example, let’s assume you bought Treasury
bills maturing in one year at a 0.1 percent rate. Based
on how the math works out, you would pay about $999
for every $1,000 face amount of the securities.
ese bills are bound to rise in value as the number
of days to maturity, or the amount of time until that
nal $1,000 payment is due, gets smaller. Changes in
market rates will a ect how and when the increase oc-
curs. In the end, the price will equal $1,000 as long as
the Treasury is paying its debts on time.
Risks
Bills are a type of xed-income security, as the tim-
ing and amount of the payment are preset. Investors
in the securities are taking the same kinds of risks as
they do with government bonds, corporate debt, and
related securities as we’ll see later.
e most basic concern is whether a borrower, in this
instance the government, will be able to pay on time.
is is known as credit risk. e discount rate is a gauge
of the amount of risk that investors see. e higher the
rate, the greater the concern, and vice versa. Bond yields,
which we’ll learn about shortly, play a similar role.
Judging credit risk is the business of credit-rating
services, often called agencies even though they are
.005: Today’s rate change in percentage points. For
the bill, it’s 0.005 point. We might as well move the
decimal point again and refer to the drop as half a
basis point.
.095/.090: Bid and ask rates. e bid rate is higher
because the resulting price will be lower. For the ask
rate, it’s the other way around.
At 14:33: Time of the quote, using the 24-hour clock.
Op .095, Hi .100, Lo .080, Prev .095: Opening, high,
and low rates for the current day and closing rate for
the previous day.
CBBT: Source of the current rate. is is a compos-
ite quote from Bloomberg BondTrader.
Three Rs
Safety comes with a price in the government bill mar-
ket. It’s measured by the potential return, which usually
won’t come close to matching what’s available on other
investments. On the other hand, the risks are relatively
low as well. e United States has paid its debts on time
for decades and isn’t poised to follow companies and
some local governments into bankruptcy court.
e relative safety explains why the rate the United
States pays to borrow has historically been known as a
risk-free rate. e phrase isn’t quite accurate, as noted
earlier, because investors face risks even when the
government’s nances are sound. We’ll explore them
as we go through the three Rs, and learn how investors
nd relative value.
KEY POINT:
The price of a Treasury bill is
less than the face value as long
as the discount rate exceeds
zero. How much less depends
on the rate and the time to
maturity.
1. Start with a value in percent-
age points, such as the .090 in
Exhibit 2.5.
2. Multiply by 100, which is the
same as shifting the decimal
point two places to the right.
3. In this case, .090 × 100 = 9.0,
or 9 basis points. Each basis
point equals 0.01 percentage
point.
STEP-BY-STEP:
BASIS POINTS

22 ■CHAPTER 2 Government
Price Index (CPI), the most widely followed gauge of
in ation, increases at a faster rate. If the pace acceler-
ates, then the risk will rise as well.
Government bills have relatively little risk by com-
parison with other xed-income securities. First, the
government can raise taxes or print more money if
needed to pay its debts. Other borrowers don’t have
those options. at’s why bill rates are often called
risk-free even if that isn’t exactly the case.
Second, the bills mature in no more than a year.
is means there isn’t much time for interest rates or
in ation to cut into the value of the nal payment or
the potential return from reinvesting the money.
Relative Value
Is that 0.1 percent bill in our example, or some other
security like it, worth buying or something to avoid?
We can make relative-value comparisons to help us
answer the question.
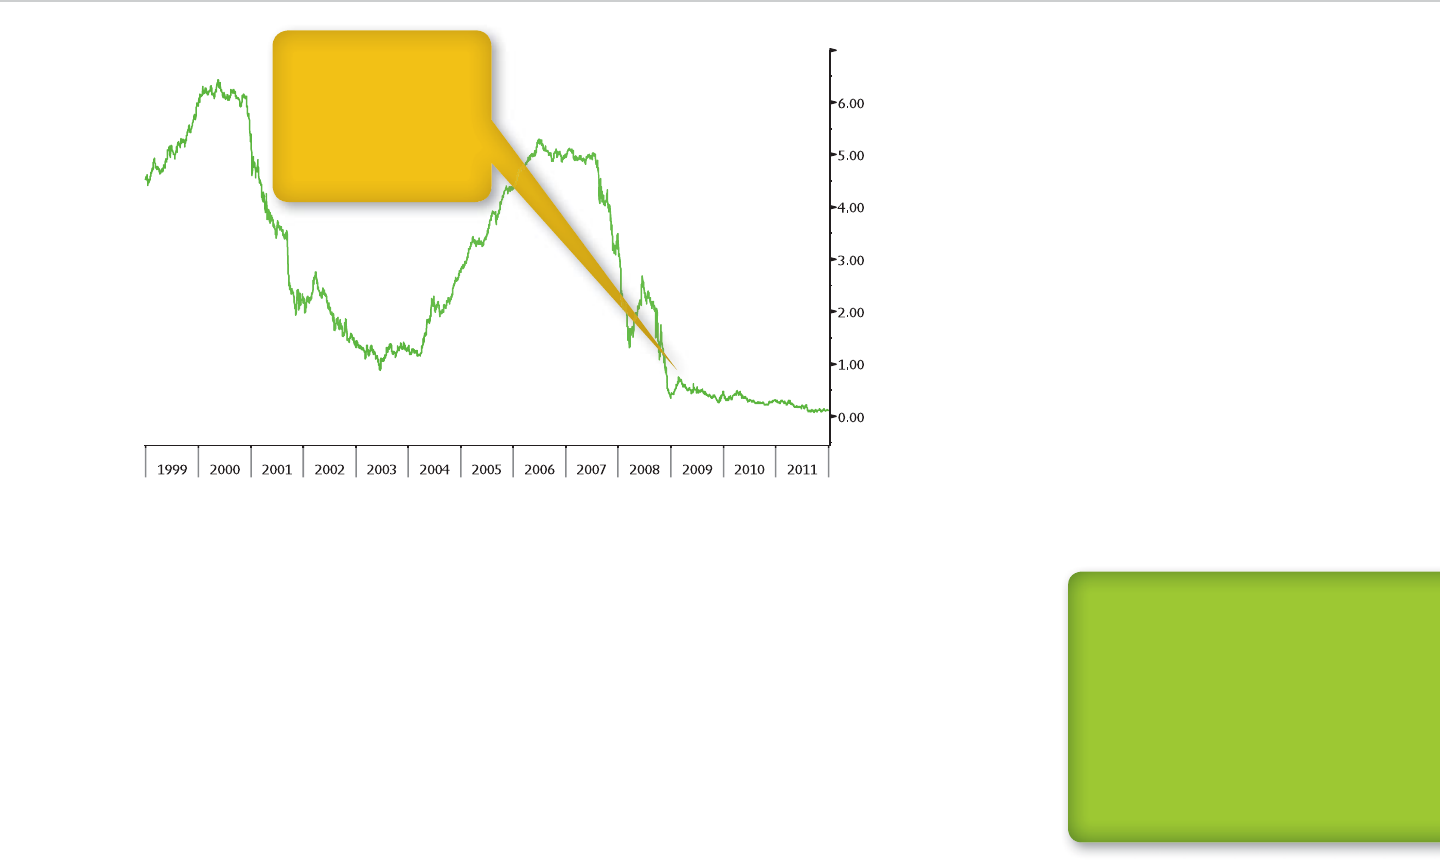
Let’s consider how the 0.1 percent rate stacks up
against one-year Treasury bill rates over time. For the
10-year period that ended in 2008, the rate was about
4.5 percent on average. By that standard, the bills earn
next to nothing. en again, the bill rate fell below 1
percent from 2009 onward, which means the gap with
0.1 percent isn’t so wide. Exhibit 2.6 shows the histori-
cal rates.
en you can look at how the discount rate com-
pares with similar rates for three- and six-month bills.
Let’s assume the three-month rate is 0.005 percent,
and the six-month rate is 0.05 percent. is means
companies. Standard & Poor’s, Moody’s Investors
Service, and Fitch Ratings are the three largest services.
ey analyze governments, or sovereigns, and compa-
nies, and they assign ratings to their debt. Although
the borrower usually pays for the ratings, there are
exceptions for sovereign debt. When a government
doesn’t pay, the rating is said to be unsolicited.
Bill ratings start at A-1+ for S&P, P-1 for Moody’s,
and F1+ for Fitch. e companies use fewer tiers, or
levels, than they do for notes and bonds, which we’ll
see later. Only borrowers with high ratings typically
can raise funds in the money market.
Interest rate risk is another concern, as higher rates
translate into lower prices for bills and other debt se-
curities. If the one-year Treasury bill rate in the earlier
example climbed to 0.2 percent the next day from 0.1
percent, the price would fall by about $10 for every
$1,000 face amount. Investors who sell the security or
have to re ect its value in their nancial statements
would su er losses.
Lower rates, on the other hand, pose reinvestment
risk. is refers to the inability to earn as much on a
similar investment when payments are received. e
risk is minimal in our example, because the one-year
bill rate can’t fall too far from 0.1 percent. If the rate
was 1 percent, or perhaps 10 percent, then the risk
would be far greater.
In ation risk, or the threat that price increases will
reduce the buying power of whatever money you re-
ceive, is present as well. is would turn into a reality
in our 0.1 percent example as long as the Consumer
KEY POINT:
MONEY-MARKET RATINGS
Each of the three main credit-
rating services has its own
scale.
S&P uses A-1+, A-1/2/3, B,
B-1/2/3, C, D, Not Rated.
Moody’s uses Prime-1/2/3, Not
Prime.
Fitch uses F1+, F1/2/3, B, C, D,
Not Rated.
Visual Guide to Financial Markets ■23
government, or a company. e borrower might well
be a bigger credit risk than the U.S. government. If that
turns out to be the case, you ought to earn more for
turning over your money.
How much more? e answer provides another
way to judge relative value. Let’s assume the other in-
vestment has a 0.5 percent discount rate. Subtract the
0.1 percent bill rate to calculate the gap between them:
0.4 percentage point. e gure is known as a rate
spread and is expressed in basis points. So, you’ll be
able to earn another 40 basis points for your trouble.
the one-year bill will return 20 times as much if you
tie up your money for four times longer or twice the
amount for investing twice as long. e comparisons
may make the 0.1 percent rate look better.
Investors can plot each rate on a graph and con-
nect the dots between them. e result is a rate curve,
used to compare government bills with other types of
securities. We’ll revisit this topic when we run across
another type of curve for notes and bonds.
Suppose you shunned the one-year Treasury bills
and bought one-year securities sold by some other
DEFINITION:
Rate curve
Rate curves show borrowing
costs over time by displaying
discount rates as dots on a
graph and then connecting
the dots. Rate spreads are
differences in rates between
two securities, or two points on
a curve.
Exhibit 2.6: One-Year Treasury Bill Rates
Source: U.S. Federal Reserve.
The bill rate peaked at
0.75 percent in Febru-
ary 2009, two months
after the Federal Reserve
adopted a near-zero rate
policy. In 2011, the rate
dropped as low as 0.08
percent.

24 ■CHAPTER 2 Government
bonds and the rate at which they pay interest. Lower
yields translate into higher prices, and vice versa.
We’ll take a closer look at yield shortly. For now,
it’s enough to know that Treasury yields are a bench-
mark, or point of reference, for the cost of borrowing.
Yields for notes and bonds sold by U.S. agencies, other
countries, and companies are tied to the yield on Trea-
suries that mature at about the same time. e gap in
yields largely determines which securities investors
want to buy, sell, or hold.
To understand why Treasury notes and bonds are
benchmarks—and Treasury bills, too—let’s review the
reasons why the bills can be a safe investment. e
federal government has the power to impose taxes,
which other governments don’t have to the same ex-
tent and companies don’t have at all. e central bank
has the ability to create money, which sets apart the
government from every other borrower.
Auctions are the primary market for Treasury notes
and bonds. It’s been this way since the 1970s, when the
government dropped an earlier practice of selling se-
curities at xed prices. e New York Fed handles auc-
tions on behalf of the Treasury as it does for bill sales.
Yields at these auctions are like discount rates for
bills since they represent the Treasury’s cost of bor-
rowing. e government has generally been able to
raise funds more cheaply since the 1980s. Yields are
still well above zero as the 10-year note shown in
Exhibit 2.7 illustrates.
Treasury notes are sold monthly. Each auction of
two-year, three-year, ve-year, and seven-year notes
To determine if 40 basis points is a little or a lot,
you can look at whether the spread has widened or
narrowed over time. You can determine how much
more credit risk you would be taking with the other
borrower, rather than the government.
Notes and Bonds
Considering how much money the United States bor-
rows these days, could you possibly imagine that the
country didn’t sell bonds regularly during its rst two
centuries? Well, it’s true if only technically.
ere’s a distinction made in the Treasury market
and elsewhere between notes, which mature in two to
10 years, and bonds, which last for longer periods. e
only U.S. securities that t into the latter category are
30-year bonds.
Regular sales of 30-year Treasuries started in Feb-
ruary 1977, more than two centuries after the Dec-
laration of Independence was adopted. ey were
suspended in October 2001 because the country had
budget surpluses and resumed in February 2006.
Along the way, the government raised money from
bond investors through sales of notes as well as bills.
ese days, notes maturing in two, three, ve, seven,
and 10 years are sold on a set schedule.
e price the government pays to borrow in note
and bond sales is called the yield. e yield is set by
nancial companies who buy the securities when
they’re rst sold and by the investors who trade them
afterward. It’s based on the price of the notes and
DEFINITION:
Yield
Yield is the projected annual
return on a bond, based on the
current price and future interest
payments
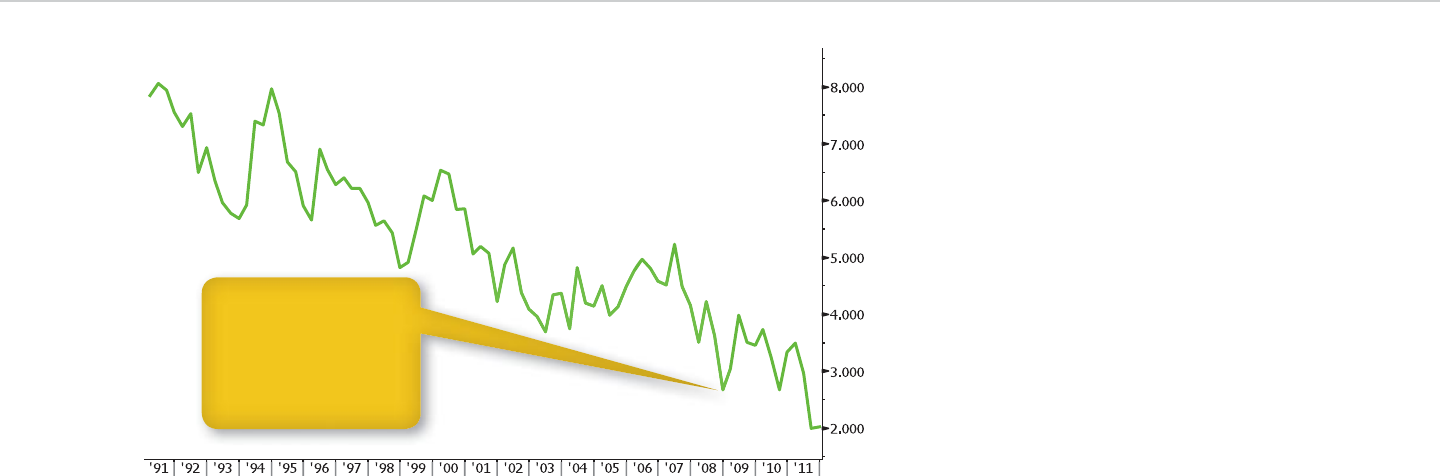
Visual Guide to Financial Markets ■25
dollar amount and a yield, rather than the discount
rate used for bills. e New York Fed accepts the low-
est bids at which the sale can be completed.
Investors can buy notes and bonds from dealers
or through the Treasury Direct program, as they can
with bills. Other similarities exist between the auc-
tions, based on details left out of the earlier discussion
of bill sales.
Bids are competitive or noncompetitive, depend-
ing on whether there’s a yield speci ed. Primary deal-
ers may submit competitive bids on their own behalf
consists of new securities with their own maturity
date. For 10-year notes, that’s only true in February,
May, August, and November. In other months, ad-
ditional amounts of the most recent 10-year security
are sold. ese sales are called reopenings because
they reopen an opportunity for investors to buy the
notes. irty-year bond auctions work the same way
as 10-year sales.
Regardless of the schedule or the maturity that’s
being sold, the government can count on o ers from
primary dealers. ese rms make bids that specify a
Exhibit 2.7: Ten-Year Treasury Note’s High Yield at Auction
Sources: U.S. Treasury, Bloomberg.
The Treasury’s borrow-
ing cost initially fell after
the Fed adopted a target
interest rate near zero,
and then rose on concern
that the policy would fuel
infl ation.
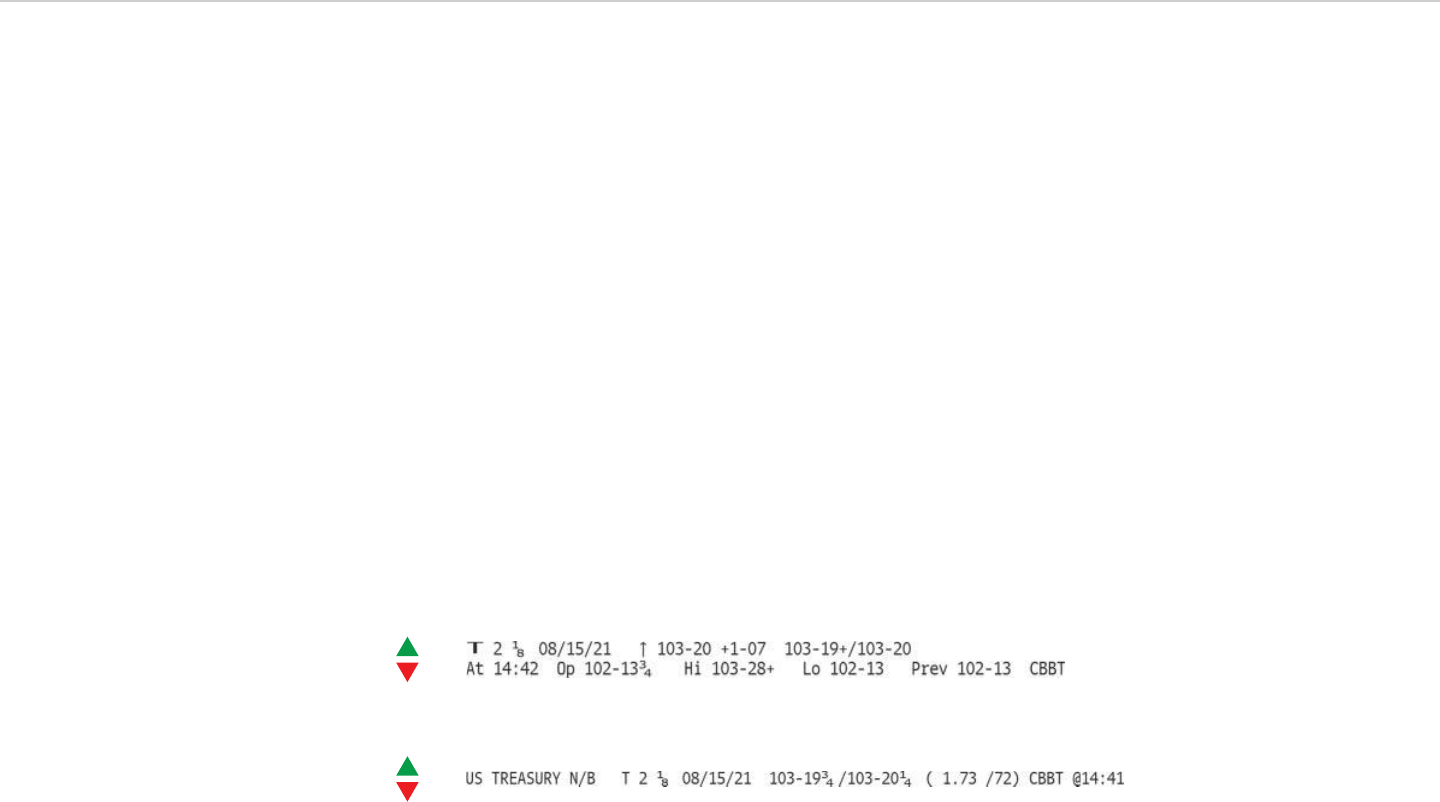
26 ■CHAPTER 2 Government
that handle the buying and selling of bills. Exchanges
aren’t part of the Treasury market though they play a
role in other countries’ debt markets.
Quotations
There’s more than one type of quotation for Trea-
sury notes and bonds, and it’s worth looking at
a couple of formats to find out what we’ll see (see
Exhibits 2.8 and 2.9).
The prices in the two quotes are about the same
as they show the same Treasury note. The first one
resembles the bill quote in Exhibit 2.5 except that
the numbers differ. To find out why, let’s go through
the details.
T: Symbol for Treasury notes and bonds.
2 1/8: Annual interest rate, or coupon rate, in per-
centage points. e note’s owner will receive 2 1/8
percent of face value, or $2.125 for every $1,000
invested, each year until maturity.
and noncompetitive oers for clients. Treasury Direct
bids are noncompetitive as successful bidders have to
accept the average yield.
Bidders are direct or indirect. Primary dealers
and Treasury Direct participants make their bids
directly. Indirect bidders must go through primary
dealers, and foreign central banks are in this cat-
egory. Auction results show the percentage of bids
made indirectly and the percentage of bonds sold to
indirect bidders.
e bid-to-cover ratio, an indicator of demand, is
made available for each auction. It’s calculated by di-
viding the dollar value of bids by the dollar value of se-
curities sold. If the ratio for a $10 billion note sale was
3.25, the ratio would mean investors sought to buy
$32.5 billion of the securities. By comparing the 3.25
with previous ratios for similar note sales, you can as-
sess how motivated the bidders were.
Once the notes and bonds are sold, they begin trad-
ing in the secondary market. Trades are made over
the counter through the same electronic networks
Exhibit 2.8: A Treasury Note Quote, Part 1
Exhibit 2.9: A Treasury Note Quote, Part 2

Visual Guide to Financial Markets ■27
CBBT: Source of the price information. is is a
composite quote from Bloomberg BondTrader, as
the Treasury bill quote was earlier.
A pair of gures appears only in the second quote:
1.73/1.72. is shows the bond’s yield at the bid and
ask prices. Yield is based on the note’s annual interest
rate—in this case, 2 1/8 percent—and the di erence
between the market price and face value.
Why would the note yield less than 2 1/8 percent, as it
does here? Go back and look at the 103–20 price. Any in-
vestor who pays that much will lose 3 5/8 percent of the
security’s face value at maturity. If the price was less than
100 instead, then the yield would exceed 2 1/8 percent.
Three Rs
Returns, the rst of the three Rs, and yields are much
the same for government notes and bonds. If investors
buy a security and put it away until maturity, it’s a safe
bet the interest will be paid on time and the princi-
pal amount, or face value, will be paid o . Changes in
yield won’t a ect returns unless they sell the security
before the maturity date.
Even so, the risks confronting buy-and-hold inves-
tors rise over time. In ation has more of an opportu-
nity to cut into the value of note and bond payments.
Interest rates have more room to fall, reducing the
income from reinvesting those funds when they’re
received. ere’s more time for the government’s
nances to worsen, hurting its ability to borrow.
08/15/21: Maturity date in month/day/year format.
Up arrow: e uptick/downtick arrow tracks prices
this time around. When it’s up, the last price change
was an increase, and vice versa.
103-20: Price of the note as a percentage of face
value. Here, it’s 103 percent and then some. e
20 means 20/32 of a percentage point, as Treasury
notes and bonds are quoted in fractions, and the
standard denominator is 32. e price is 103 20/32
percent, which is the same as 103 5/8 percent.
+1-07: Change on the day in fractions of a point. e
note rose 1 7/32, or about $1.22 for every $1,000 in-
vested.
103-19+/103-20: Bid and ask prices for the note,
in percentages of face value. The + sign that ends
the bid price indicates that it’s halfway between
103 19/32 and 103 20/32. (The second quote’s
bid price ends with 19 3/4 divided by 32, which
means the full number is 103 79/128. The ask
price ends with 20 1/4, making the number 103
81/128. Bond-market fractions get even smaller
sometimes.)
At 14:42: Time of the quote, using the 24-hour clock.
Op 102-13 3/4, Hi 103-28+, Lo 102-13, Prev 102-13:
Opening, high, and low prices for the current day,
and the close from the previous day. e opening
price is 102 55/128, as the fraction equals 13 3/4
divided by 32. e high is between 103 28/32 and
103 29/32, as the + indicates.
KEY POINT:
When a bond’s price is greater
than 100, the yield is lower than
the coupon rate, and vice versa.
The yield accounts for the gap
between the purchase price and
face value.

28 ■CHAPTER 2 Government
year to send the real return below zero. e higher the
in ation rate, the more a bond investor su ers.
In ation-indexed notes and bonds are designed to
adjust for shifts in in ation rates. Treasury Infl ation-
Protected Securities, called TIPS, are the U.S. govern-
ment’s version. e principal amount changes along
with the CPI, and the government pays the adjusted
principal at maturity as long as the CPI has risen.
Quotes on TIPS show the real yield rather than the
nominal yield. If 10-year TIPS have a 0.48 percent yield,
for instance, anyone buying and holding them can ex-
pect to earn 0.48 percent after in ation each year for
the next decade, based on current market rates.
To gauge the outlook for in ation, subtract TIPS
yields from those on xed-rate Treasuries maturing
about the same time. e 10-year note yield of 1.73 per-
cent minus our 10-year TIPS yield, 0.48 percent, equals
1.25 percentage points. at’s how much consumer
prices may increase each year, on average, in the next
decade. Exhibit 2.10 shows how the gap between xed-
rate yields and TIPS, an implied in ation rate, com-
pares with changes in consumer prices over time.
TIPS are a variation on oating-rate bonds, where
the interest payments vary or oat along with a speci-
ed market interest rate. We’ll have more on these
later, as the Treasury doesn’t sell oating-rate debt.
Zero-coupon securities aren’t sold directly by the
U.S. government either. Securities rms create them
from xed-rate and in ation-indexed notes and
bonds. Each interest payment is transformed into
a separate security as is the principal payment. e
Relative-value comparisons are built around yields
in the same way that the analysis of bills started with
discount rates. It’s possible to include bills in the
analysis by calculating bond-equivalent yields, based
on the assumption that they paid interest.
Returns
Our discussion of yield touched on the two main com-
ponents of bond returns. e rst is interest, which
is paid according to a set schedule. e second is the
purchase price relative to the face amount, or princi-
pal, repaid at the maturity date.
Not all government notes and bonds pay interest
and principal the same way. Some account for in a-
tion, which otherwise reduces the value of bond pay-
ment. Others have a single payment at maturity, like
government bills. Let’s nd out how these di erences
a ect returns.
Fixed-rate debt accounts for most of the Trea-
sury’s borrowing. e 10-year note is a perfect ex-
ample. e annual interest rate and the face amount
stay the same until maturity. In other words, they’re
xed. Anyone who bought the note at the quoted
price and kept the security until August 15, 2021,
would be assured of a 1.73 percent annual yield at
current market rates.
e 1.73 percent gure represents a nominal re-
turn, as it doesn’t take in ation into account. e real
return can only be estimated because it’s ultimately
based on price changes for the next 10 years. Consum-
er prices would have to increase about 1.75 percent a
DEFINITION:
Treasury Infl ation-
Protected Securities
Treasury Infl ation-Protected
Securities, or TIPS, are bonds
whose principal is adjusted as
consumer prices increase. TIPS
are a form of infl ation-indexed
debt.
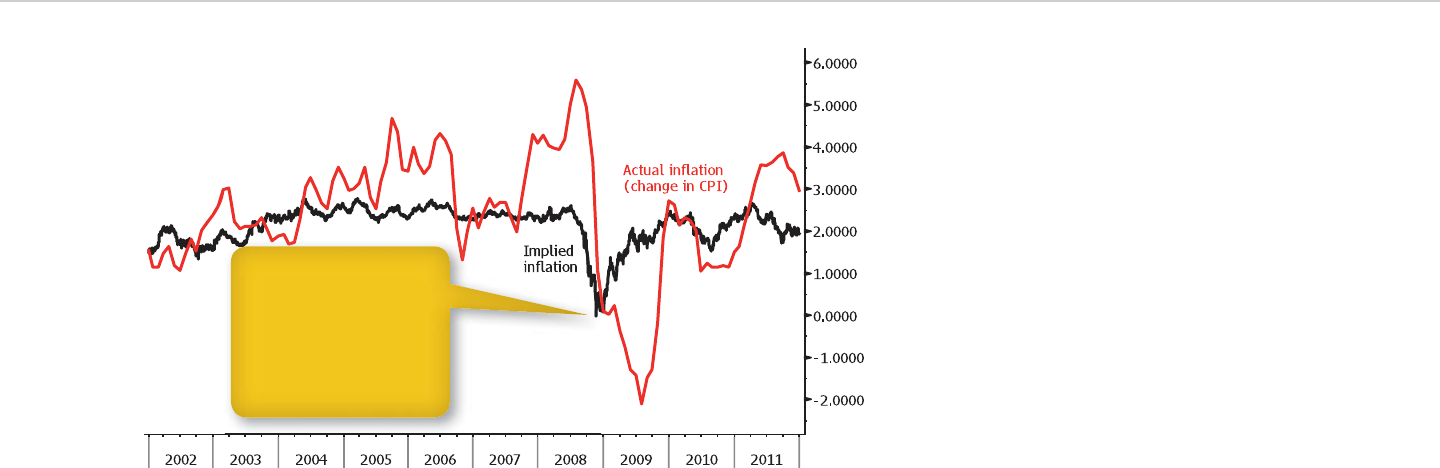
Visual Guide to Financial Markets ■29
Risks
e risks of owning government notes and bonds in-
crease over time. ey depend on the amount of mon-
ey you receive as an investor and the amount of time
that passes until each payment arrives.
To illustrate, let’s compare a 10-year Treasury note
and a 10-year STRIP as investments. Assume that both
securities have a face value of $1,000 and a coupon of
2 percent.
Owners of the note receive $10 every six months,
as it pays interest twice a year, plus $1,000 at maturity.
is means they get a total of $1,200. If they buy the
result is Separate Trading of Registered Interest and
Principal Securities (STRIP or STRIPS).
STRIPS are similar to government bills, except that
most of them take longer than a year to mature. e buy-
er pays less than face value and receives the full amount
at maturity in a single payment. e gap between market
price and face value closes over time, which means an in-
vestor has to pay income taxes on STRIPS each year even
though income isn’t paid out.
Companies raise money by selling xed-rate debt,
along with other types of notes and bonds. We’ll look
at the possibilities in more detail later.
Exhibit 2.10: Ten-Year Implied Inflation Rate and 12-Month Change in Consumer Price Index
The yield gap between
fi xed-rate and infl ation-
indexed Treasuries ap-
proached zero during the
2008 fi nancial crisis as
many investors sought
the safety of government
debt.

30 ■CHAPTER 2 Government
has a different top rating, Aaa. Fitch uses AAA.
Treasuries had these ratings across the board be-
fore 2011, when S&P cut the United States for the
first time.
All three companies use the letters A, B, and C in
their bond-rating systems. S&P’s scale includes plus
and minus signs as well. Moody’s uses the small “a”
along with the number 1, 2, or 3 for several ratings
below Aaa. Fitch uses pluses and minuses in much the
same way as S&P does, and both include a fourth let-
ter in their scales, D, meaning default.
We’ll revisit the credit ratings later when we look
at corporate notes and bonds. For the moment, it’s
enough to know there’s more time for them to worsen
while notes and bonds are outstanding than there is
with bills. e same holds true for investors’ outlook,
which may or may not be in line with the assessments
made by rating companies.
Risk and time are linked for interest rates, in a-
tion, and reinvestment as well. Let’s take in ation as
an example. If consumer prices increase 2 percent a
year, the value of a $1,000 payment on a note or bond
will be about $780 after 10 years. at’s far below the
$980 value after one year, the longest maturity date for
a Treasury bill.
Relative Value
When investors consider whether a note or bond is
cheap, expensive, or fairly priced, they inevitably look
at yield. It’s a common denominator for debt securi-
ties regardless of who sold them, which currency they
security at an auction, they will only have to wait six
months before the money starts rolling in.
e interest payments make the note less risky than
the STRIP even though they mature at the same time.
ey amount to $200, or one-sixth of the $1,200 total,
and all but the last one arrives before the 10 years are
up. Investors in the STRIP receive $1,000, and all the
money comes at maturity.
An indicator called duration shows the note is a
safer bet. Duration is the time period investors will
have to wait for the amount they initially invested to
be returned. It’s based on what all the payments are
worth today, or their present value.
e note’s duration is about nine years, thanks to
the 2 percent annual interest rate. e STRIP has a 10-
year duration, matching its maturity date.
Modi ed duration, a similar gure, shows how
much the note’s price would rise or decline if the
yield changed by one percentage point. is g-
ure is a percentage rather than a number of years.
e modi cation has to do with how interest is
calculated.
Now that you’ve seen how bond investors gauge
risk, let’s remind ourselves where it comes from.
Credit risk, interest rate risk, in ation risk, and
reinvestment risk a ects government notes, and
bonds, as well as bills.
S&P, Moody ’s, and Fitch, the largest rating services,
are among those assessing credit risk. AAA ratings
have become synonymous with the least risky bor-
rowers, and we have S&P to thank for that. Moody’s
KEY POINT:
Note and bond ratings differ
from money-market ratings.
S&P and Fitch use AAA, AA,
A, BBB, BB, B, CCC, CC, C, D.
S&P’s ratings can add + or –
from AA to CCC, and Fitch’s
can do so from AAA to B.
Moody’s uses Aaa, Aa, A, Baa,
Ba, B, Caa, Ca, C.
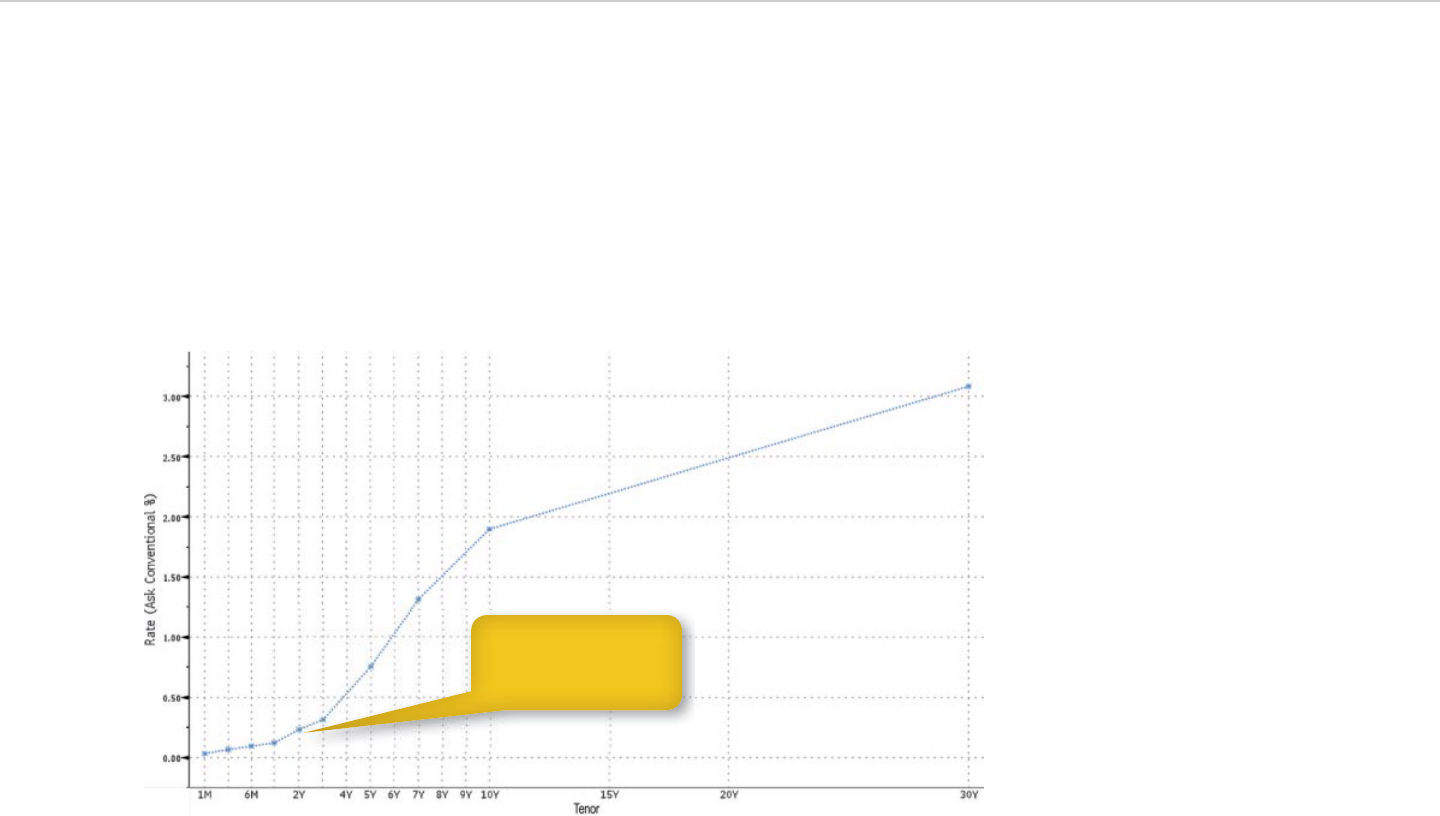
Visual Guide to Financial Markets ■31
to maturity. e dots are joined into a yield curve,
which shows how much it might cost to borrow for
other periods (see Exhibit 2.11).
The line in this graph rises along with the time
to maturity. This means the yield curve is upward
sloping, which is usually the case. Investors get
paid more for lending money to the government for
longer.
Curves don’t always look this way. When the cen-
tral bank is raising interest rates to restrain in ation,
yields may fall over time rather than rise. at can
are denominated in, when and how they pay interest,
or any other detail.
ere are yields at two, three, ve, seven, and
10 years to consider for Treasury notes, along with
yields on 30-year bonds. We can add one-month,
three-month, six-month, and one-year bills to the mix
by assuming they paid interest and by adjusting their
discount rates accordingly.
Graphs come in handy to see how they compare as
they did for bills. ere’s a dot for each security, whose
position depends on the yield and the amount of time
Exhibit 2.11: Treasury Yield Curve
Yields of one year or less
are bond equivalents for
Treasury bills.
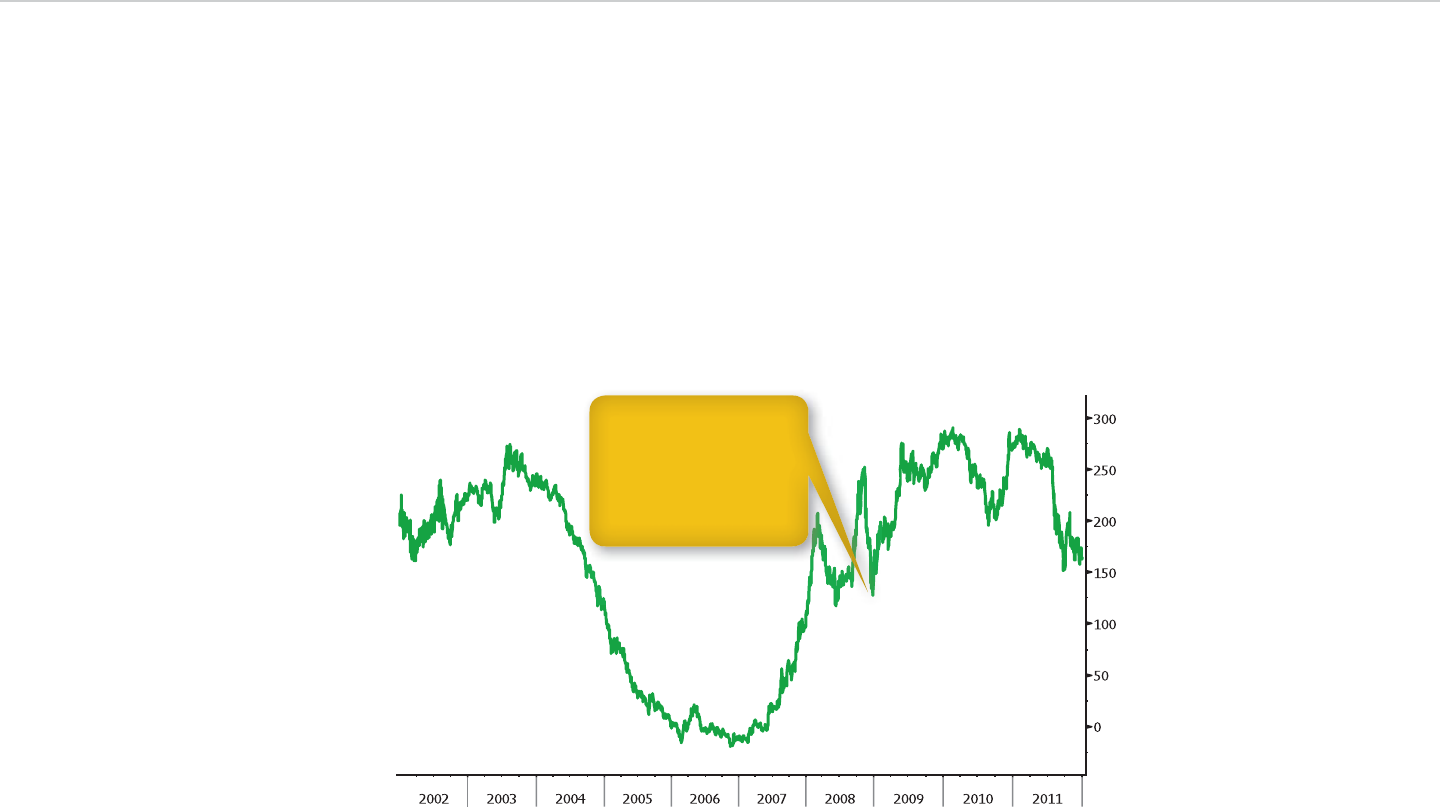
32 ■CHAPTER 2 Government
Regardless of how the curve appears, di erences in
yield will occur among the depicted bills, notes, and
bonds. is leads to another way of judging relative
value: looking at those gaps, or yield spreads, the bond
market’s equivalent of rate spreads.
We can do this with securities on the curve. Ten-
year Treasury notes yielded about 2 percent, while
two-year notes yielded about 0.25 percent. In other
words, bond investors stood to earn about 175 basis
points by lending money to the government for eight
more years. e di erential was in line with historical
standards as shown in Exhibit 2.12.
happen because bill yields are more closely linked to
Fed policy than note and bond yields, which are more
in uenced by the in ation outlook.
When curves slope downward, they are said to be
inverted. is kind of shape has historically pointed to-
ward slower economic growth at best, and a recession
at worst, because it signals the central bank wants to
discourage borrowing.
At other times, there’s little di erence in bill, note,
and bond yields. e curve looks like a straight line,
and it’s said to be at. Curves can atten as they shift
from being upward sloping to inverted, and vice versa.
Exhibit 2.12: Two-Year/Ten-Year Treasury Note Yield Spread
The spread initially nar-
rowed after the Fed
adopted a target interest
rate near zero, and then
widened on concern that
the policy would fuel
infl ation.

Visual Guide to Financial Markets ■33
ere’s more to relative-value comparisons than
yield curves and yield spreads as you might imagine.
We’ll see the e ect of credit ratings, for example, when
we look at corporate notes and bonds. For the mo-
ment, it’s enough to know the central role that curves
and spreads have to play.
e spread narrowed to about zero in February
2006 and turned negative for much of the following
year, as the chart depicts. When two-year and 10-year
yields are about the same, the yield curve attens.
When their spread is less than zero, the result is an
inverted curve.
Similar comparisons can be made among Trea-
suries and other types of U.S. government debt, and
between the United States and other countries. Inves-
tors do so regularly as they search for what’s cheap,
expensive, and fairly priced.
DEFINITION:
Yield curve
Yield curves show borrowing
costs over time by display-
ing yields as dots on a graph
and then connecting the dots.
Yield spreads are differences in
yields between two securities,
or two points on a curve.

34 ■CHAPTER 2 Government
Answer the following multiple-choice questions:
1. Currencies quoted in dollars per unit, rather than
units per dollar, include:
a. Euro.
b. British pound.
c. Australian dollar.
d. All of the above.
e. a and b only.
2. Governments a ect the value of currencies
through:
a. Pegging.
b. Intervention.
c. Devaluation.
d. All of the above.
e. b and c only.
3. Treasury-bill returns come from:
a. Price changes.
b. Interest payments.
c. Dividend payments.
d. All of the above.
e. a and b only.
4. Treasury note and bond returns come from:
a. Price changes.
b. Interest payments.
c. Dividend payments.
d. All of the above.
e. a and b only.
5. e Treasury yield curve is usually:
a. Flat.
b. Inverted.
c. Upward sloping.
d. Humped.
e. All of the above.
Answers: 1. d; 2. d; 3. a; 4. e; 5. c

35
Companies have more ways to raise money than
the government does. ey can borrow by selling
the equivalent of Treasury bills and by making other
arrangements to borrow funds for a year or less. ey
can sell notes and bonds, occasionally or regularly.
ey can sell shares, which enables them to bring in
new owners and allows current investors to increase
their stakes.
Each of these investments can be riskier than
handing over money to a government. Companies
can’t compel anyone to buy their products or ser-
vices, as the government can. ere isn’t any print-
ing press that can come to their aid during business
slumps.
ese investments have degrees of risk as well.
Equity holders can’t count on receiving payments
from the company, as the owners of corporate notes
and bonds usually can. Companies aren’t required to
pay dividends on their shares, and some of the most
successful ones don’t. Owners of the stock can only
hope the value of their holdings will rise over time.
e ultimate risk is that a company will be unable
to meet its nancial obligations and go bankrupt. In-
vestors in U.S. government debt don’t have to worry
about that prospect. Let’s look at how one bankruptcy
shut down the money market, where the shorter-term
borrowing is done.
Money Markets
Companies turn to the money market to borrow mon-
ey for days, weeks, or months, typically to nance day-
to-day operations. Lehman Brothers Holdings Inc.,
which led for bankruptcy in September 2008, was
among the nancial companies that tapped the mar-
ket by selling securities.
Lehman’s collapse caused the value of investments in
the rm to plunge. e losses hurt many investors who
Companies
KEY POINT:
Companies compete with
government to borrow money
from investors. They can raise
additional funds by selling
stock, which government
can’t do.
Visual Guide to Financial Markets
by David Wilson
Copyright © 2012 by David Wilson.

36 ■CHAPTER 3 Companies
meet this goal, the central bank adds and removes
money from the banking system as needed through
open market operations.
International banks borrow from and lend to
each other in several financial centers, especial-
ly London, where rates are set for one-month to
12-month loans of dollars and other currencies.
The British Bankers’ Association surveys these
rates each day and compiles averages. Each aver-
age is known as a London Interbank Offered Rate
(Libor). The cost of borrowing for financial and
non-financial companies alike is often tied to Libor,
as we’ll see later. Libor is available for several cur-
rencies and maturities, and Exhibit 3.1 illustrates
rates in dollars.
Certificates of deposit (CDs) are another way
for banks to raise money-market funds. These
aren’t the kind of CDs you’ll see advertised at your
local bank branch. They have denominations of
$100,000 or more, which explains why they’re often
described as jumbo CDs. Larger investors and com-
panies buy them to earn some money on their ex-
cess cash.
Bankers’ acceptances (BAs) are part of the money
market mix as well. ey are used in international
trade to help ensure a future payment will be made
on time. Banks create them when an importer with
enough money in its accounts asks the institution
to take responsibility for the payment. e importer
sends the acceptance to its supplier, which has the
KEY POINT:
Companies compete with
government to borrow money
from investors. They can raise
additional funds by selling
stock, which government
can’t do.
DEFINITION:
Libor
Libor is the London Interbank
Offered Rate, which banks in
London charge each other to
borrow. Libor varies by matu-
rity, 1 to 12 months, and by cur-
rency. It’s a benchmark for com-
mercial and consumer loans.
had seen the money market securities as a safe bet. e
casualties included the Reserve Primary Fund, which
was the country’s oldest money market mutual fund.
Many investors responded by refusing to buy simi-
lar securities, regardless of the company selling them.
eir retreat left the money market unable to function
and forced a number of companies that raised mon-
ey there to turn to bank borrowings and bond sales,
which are more costly and time consuming. e U.S.
government had to provide hundreds of billions of
dollars in nancial support to money funds, among
the biggest buyers of the debt.
Fortunately, instances like this are rare. Compa-
nies can use the money market to borrow from in-
vestors as well as each other. They can gain access
to financing in many ways, and they’re all worth a
look.
Banks can borrow directly from other banks in
the United States through the federal funds market.
e money comes from funds that have to be held
in reserve under federal regulations. When a bank’s
reserves are too low, it’s able to borrow to meet the
minimum standard. When a bank has excess reserves,
it can earn money by lending them.
e rate on overnight loans of federal funds, or fed
funds for short, is signi cant. e Federal Reserve
(Fed) sets a target for this rate through monetary pol-
icy, designed to contain in ation and maximize em-
ployment. ough the market rate will uctuate from
day to day, the Fed ensures it stays near the target. To
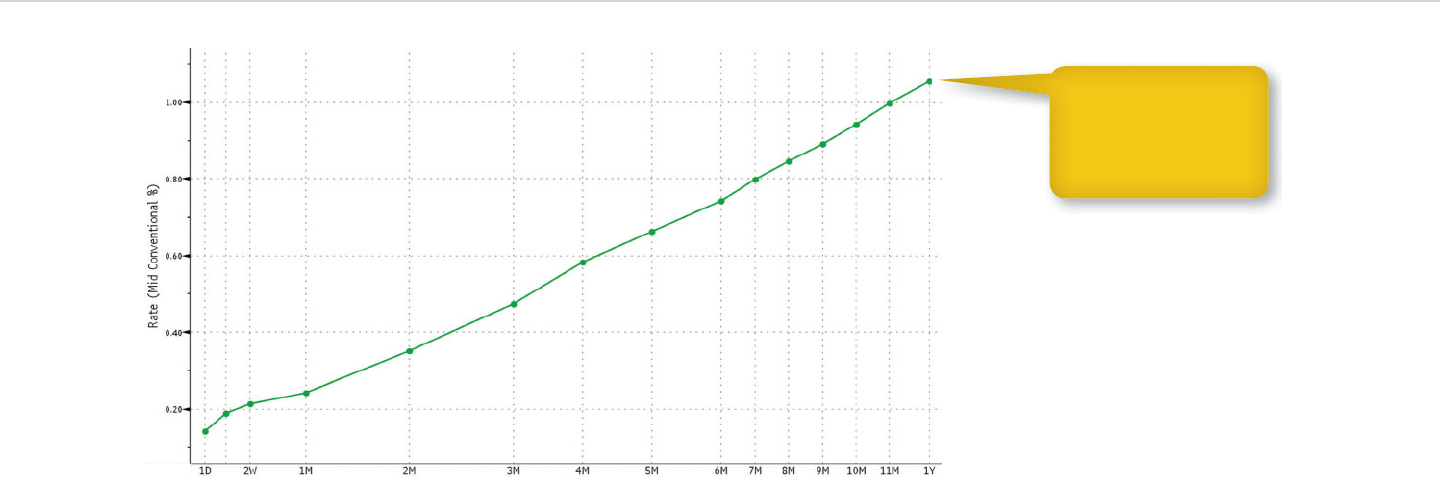
Visual Guide to Financial Markets ■37
sides live up to their obligations. ese are known as
tri-party repos because there are three participants
rather than two.
Repos are a type of secured nancing, in which the
securities serve as collateral. Many companies rely
on unsecured nancing, or borrowing that’s based on
a promise to pay. Investors lose if a company fails to
keep the promise, as Lehman’s lenders found out the
hard way.
Even so, demand exists for securities that enable
companies to borrow for as long as nine months
without having to put up collateral. is type of debt
ability to raise cash right away by selling the agree-
ment for less than face value.
Repurchase agreements (repos or RPs) enable se-
curities rms as well as banks to nance investments.
ese agreements have two components, a sale of se-
curities and a contract that requires the seller to buy
them back later. e gap between the sale and repur-
chase prices provides a return to the buyer, who is ef-
fectively a lender. e buyer may seek higher returns
by selling the borrowed security in a short sale.
Many of these agreements go through another
bank or a clearinghouse, which ensures that both
Exhibit 3.1: A Dollar Libor Curve
The British Bankers
Association fi xes Libor
for periods ranging from
overnight to one year.
The rates tend to rise
over time.

38 ■CHAPTER 3 Companies
Combine fed funds, Libor, BAs, CDs, RPs, and CP,
and you end up with a bowl of money market alpha-
bet soup. You won’t nd this on a menu of investments
for individuals. It’s made for brokerage rms, banks,
pension and endowment funds, money managers, and
other institutional investors.
ere’s an emphasis on the primary market be-
cause it’s easier to track than the secondary market
for the securities. Companies that sell CP, for instance,
regularly post discount rates for di erent maturities.
After the securities are sold, nding their market rates
may be di cult to do, if not impossible.
CP sellers can choose to adopt a do-it-yourself
(DIY) approach or to have a securities rm do the
work on their behalf. Securities that are sold without
a middleman are labeled as direct issue, and those
going through brokerages are dealer placed.
Quotations
Less detail is in quotes on companies’ money market
securities than there was earlier on Treasury bills. As
an example, take a look at Exhibit 3.2, a quote on CP
sold by General Electric’s nance unit, GE Capital.
Rather than complain about what’s missing, be thank-
ful for what you have: a quote on an individual company
is called commercial paper (CP), and it represents the
corporate equivalent of Treasury bills.
Financial companies run CP programs to provide
cash for daily operations. Automakers’ nance units
raise money this way as well because CP is a exible
way for these companies to borrow money.
Companies can le for U.S. regulatory approval to
sell CP up to a speci ed dollar limit. Once they have
clearance, they are free to choose which maturities to
sell and when to sell them. Some companies sell secu-
rities daily, and others do so less often.
Not all CP is unsecured. Some banks and nancial
companies sell asset-backed paper through specially
created units known as conduits. ese units, also
called special investment vehicles (SIVs), are set up
to own assets that the company wants to get o its
books. Many of them collapsed in the 2008 nancial
crisis because they owned mortgage-related securi-
ties. When the SIVs failed, the companies that started
them had to take back the assets and su ered as a
result.
e crisis took a toll on the CP market, especially
because of Lehman’s failure. Many investors shunned
the market to avoid a similar disaster in the future.
Many companies that sold the securities turned to
bond sales so they wouldn’t lose access to nancing.
KEY POINT:
Companies sometimes provide
security to lenders by putting
up collateral. Other times
they don’t. Investors must
depend on what’s known as the
company’s full faith and credit,
or promise to pay.
Exhibit 3.2: A GE Capital Commercial-Paper Quote

Visual Guide to Financial Markets ■39
the additional risk anyway because of the potential for
higher returns. ey make relative-value comparisons
similar to those we saw earlier for government securi-
ties. With that in mind, let’s go through the three Rs.
Returns
Companies follow the government’s example by
avoiding interest payments on money market debt.
Investors buy these securities at a discount to the face
value, which they get at maturity. is means the dif-
ference between the purchase price and face amount
counts the most in returns.
e discount is larger than it would be for a gov-
ernment security with the same terms. Otherwise,
investors would lack a nancial incentive for buying
the corporate debt. CP sold directly by top-rated com-
panies for three months might have a 0.2 percent dis-
count rate, for example, when the comparable Trea-
sury bill rate is near zero. at way, the securities will
provide some income, unlike the government’s debt.
e 0.2 percent gure may vary over time even if
the government keeps paying next to nothing to bor-
row because the rate re ects supply and demand.
Speci cally, it’s based on the value of securities being
sold and the amount that investors are willing to put
into them.
Risks
Now that we have moved to companies from govern-
ments, it’s worth reviewing the risks that investors
that provides something more than the current discount
rate. With that in mind, let’s see what’s here.
DIGE090D: DI stands for direct issue. GE Capital is
among the companies that go directly to investors
for funds, rather than having dealer-placed paper.
GE designates the seller, General Electric Capital,
GE’s nance unit. e three numbers followed by a
D stand for 90 days, the period from the initial sale
to the maturity date. CP is sold for as long as 270
days, so the 0 before the 90 would be 1 or 2 in some
cases.
Up arrow: e uptick/downtick arrow refers to the
rate, as it did with Treasury bills, rather than price.
.14: Current rate of 0.14 percent, or 14 basis points.
unch: Rate change on the day. ere wasn’t one in
this case.
At 10:20: Time of the quote, using the 24-hour clock.
Companies usually make CP sales early in the day, as
this quote suggests.
Op .14, Hi .14, Lo .14: Opening, high, and low rates
for the current day. Here they show the rate was un-
changed throughout the day.
Three Rs
Lehman’s collapse showed that corporate money mar-
ket investments can be riskier than government bills.
At worst, investors may end up with unexpected losses
on their holdings. Many investors are willing to take
KEY POINT:
The higher the discount rate, the
riskier the investment. Rates
on CP and other money market
investments generally exceed
those on government bills.

40 ■CHAPTER 3 Companies
o a business may mean less cash is available to meet
obligations.
Industry risk can aect the value of companies and
their securities as well. is is the threat that a com-
pany may suer because of what’s happening in its
industry rather than its own actions. Consider what
happened to photography, for example, when digital
cameras replaced lm cameras as the industry stan-
dard. e shift hurt Eastman Kodak Co. so badly that
the company, once the world’s largest maker of lm,
led for bankruptcy. Fujilm Holdings Inc. and other
competitors also were aected.
Business risk, event risk, and industry risk are lower
for corporate money market securities than for notes
and bonds because of their shorter time to maturity.
at said, the risks must be examined, as the Lehman
example shows. ey do much to explain the return
gap between companies and governments.
Relative Value
Let’s turn our attention to that 0.2 percent rate on
CP. Considering that Treasury bill rates are close to
zero, the two-tenths of a percentage point may be
enough to draw some investors to the company’s
securities. Others might look at that additional re-
turn and conclude it isn’t enough to compensate for
the risk.
is is the kind of relative-value judgment that
money market investors make daily. Others are simi-
lar to those cited with government bills, so let’s run
through the comparisons in summary form.
take in markets. e clearest is market risk, or the po-
tential for prices to fall rather than rise. ere’s also li-
quidity risk, which is the inability to sell at the market
price when raising cash.
CP and other money market investments are af-
fected by these risks, along with those tied to the
economy, politics, policy, and currency swings. Inter-
est rate risk, ination risk, and reinvestment risk are a
concern though they’re less of an issue than for notes
and bonds because these securities mature in a short
time.
Credit risk, on the other hand, takes on greater
meaning. ere’s plenty of room for dierences among
companies as the rating scales from S&P, Moody’s,
and Fitch indicate. Investors have to take them into
account in determining which securities are worth
owning. e analysis is more complex than it is for
Treasury bills, where they can focus on the U.S. gov-
ernment’s ability to pay its debts.
Investors must deal with concerns that specically
aect corporate securities, starting with business risk,
or the possibility that a company’s performance will
worsen. As the risk increases, so does the potential
for a drop in cash ow, or the amount of money the
company can use to cover debt payments and other
expenses.
Event risk is a specic type of business risk, tied to
an occurrence that may aect the company’s ability
to operate or to pay debts. Mergers and acquisitions
can add to a company’s debt burden and hinder its
ability to compete. Splitting up a company or spinning

Visual Guide to Financial Markets ■41
a curve might look for the highest-rated, directly
placed CP.
Rate spreads may provide insight into what’s
cheap, expensive, or fairly valued as yield spreads
did in the previous chapter. It’s possible to com-
pare spreads for any two maturities included on the
curve.
Di erent credit ratings: CP is classi ed by rating.
Borrowers rated A1+ by S&P and P1 by Moody’s get the
best deal. e rates they pay can be shown on a curve
and compared with those of lower-rated companies.
History: e 0.2 percent rate is tiny by historical
standards. Top-rated U.S. companies paid three times
as much to borrow in the CP market in mid-2010, ac-
cording to data compiled by Bloomberg. In 2006 and
2007, the rate was more than 5 percent, or 25 times as
high.
Different maturities: Companies sell CP for one
to 270 days, so many other rates and time periods
are available. Rate curves are more useful for this
analysis than they are for Treasury debt, with four
maturities sold regularly. Exhibit 3.3 shows how
KEY POINT:
Rate curves are available for
asset-backed commercial paper,
fed funds, and repurchase
agreements, as well as
unsecured commercial paper
and Treasury bills. All of them
can be used in relative-value
analysis.
Exhibit 3.3: Commercial Paper A1+/P1 Direct Issue Rates
Companies paid less to
borrow, rather than more,
through 30 days.

42 ■CHAPTER 3 Companies
the funds were used to buy back stock, a way to re-
ward shareholders. Some went to pay for an expan-
sion of the company’s business.
Companies without Microsoft’s financial stabil-
ity can raise money from bond investors for simi-
lar purposes. They may sell debt securities to help
pay for takeovers, to refinance more costly borrow-
ing, and to pay off earlier obligations, among other
reasons.
Investors buy them, secured or unsecured, be-
cause they can provide higher returns than lending
money to the government. To calculate how much
higher, they compare yields on the securities with
those on government notes or bonds that mature at
about the same time. e di erence between them is
a yield spread, or premium, and shows what inves-
tors will earn for taking the added risk of lending to
a company.
is risk can be small when a borrower’s credit ex-
ceeds minimum ratings, de ned as BBB– by S&P and
Fitch and Baa3 by Moody’s. Companies in the catego-
ry are described as investment-grade borrowers, and
the notes and bonds they sell are called investment-
grade securities.
Ratings below the thresholds put companies into
the high-yield category. ey have to borrow in the
non-investment-grade, or junk bond, market, which
Michael Milken popularized at Drexel Burnham
Lambert in the 1970s and 1980s.
Some investors avoid buying junk-rated debt on
principle. Others are willing to invest as long as the
Direct issue vs. dealer placed: Companies that
run their own CP sales pay lower rates on their bor-
rowing than those who work with dealers. By track-
ing them separately, it’s possible to compare their
curves.
Di erent security types: Money market investors
can buy asset-backed CP, rather than securities that
carry only a promise to pay. ey can dig into the al-
phabet soup we made earlier and come up with CDs
or repos. ese investments have rate curves, so it’s
possible to compare them with others or to look at
speci c rate spreads.
Notes and Bonds
Microsoft Corp. doesn’t need to borrow money. e
world’s largest software maker once paid out $32.6 bil-
lion to investors because too much money was sitting
around. Microsoft piled up billions of dollars more
cash each year, thanks to the dominance of its Win-
dows operating system and O ce collection of word
processing, spreadsheet, and presentation software
for personal computers.
None of this stopped Microsoft from raising funds
in the bond market. e rst sale of debt, totaling
$3.75 billion, was completed in May 2009. e com-
pany later borrowed billions of dollars more through
additional sales.
Why would Microsoft go this route? Borrow-
ing money didn’t cost that much since the company
received the highest possible credit ratings. Some of
DEFINITION:
Investment-grade
Investment-grade bonds exceed
rating thresholds set by S&P,
Moody’s, and Fitch. High-yield,
or junk, bonds are below them.
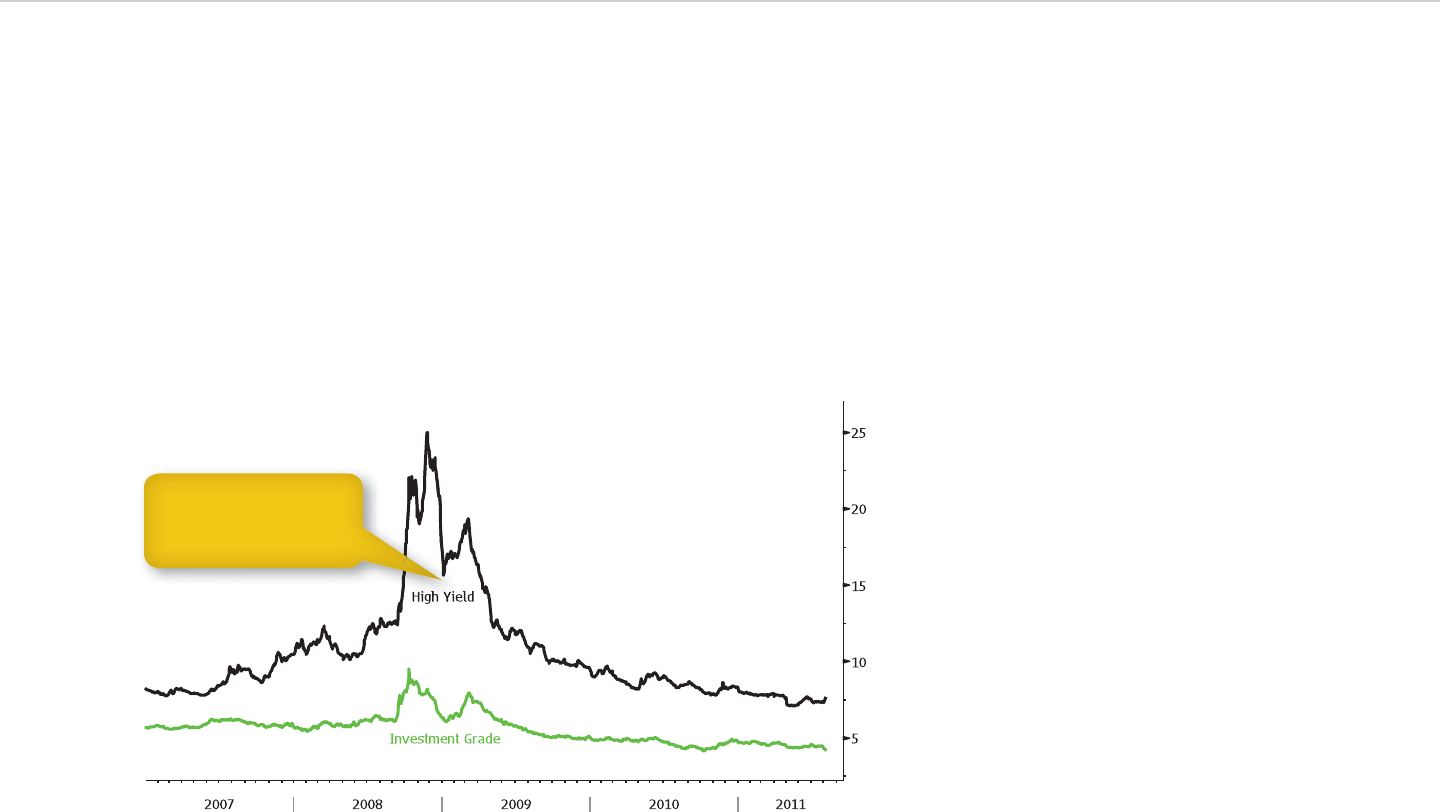
Visual Guide to Financial Markets ■43
investments, and they pro t by earning more than
enough to cover their nancing costs. Industrial, me-
dia and telephone companies and utilities also turn
to bond investors regularly. ey spend relatively large
amounts of money on plants and equipment, and
their businesses produce the kind of cash needed to
make debt payments.
Some companies that borrow regularly to
finance daily operations sell medium-term notes
(MTNs). These securities are created and sold in
much the same way as CP even though MTNs usu-
ally mature in one to 10 years and can last as long as
30 years.
potential returns are high enough. Either way, high-
yield notes and bonds are prone to bigger gains and
losses than investment-grade issues. Exhibit 3.4, a
chart of yield indexes compiled by the Financial In-
dustry Regulatory Authority (FINRA), an independent
regulator, and Bloomberg, shows the volatility.
As you can see, high-yield securities can be more
lucrative than their investment-grade counterparts as
long as the borrower makes payments on time. at’s
a bigger if, as we’ll nd out later.
Financial companies are among the biggest sell-
ers of notes and bonds because their business is all
about money. ey raise funds to make loans and
Exhibit 3.4: FINRA-Bloomberg Corporate Bond Yield Indexes
Yields fell far more on
high-yield bonds after
the Fed adopted a target
interest rate near zero.

44 ■CHAPTER 3 Companies
ey can then sell securities on a daily basis, as they
would with CP, to provide funds as needed. ey can
also sell notes and bonds more quickly later on, which
allows them to take advantage of favorable market
moves.
Either way, yields and yield spreads provide a basis
for setting prices and interest payments. Let’s assume
that XYZ Co. wants to sell 10-year notes and investors
demand a yield spread of 205 basis points to buy them.
One basis point equals 0.01 percentage point. So, if
the 10-year Treasury note’s yield is 2 percent, the XYZ
yield will have to be 4.05 percent.
e bond’s annual interest rate, or coupon, and
price would be adjusted to produce the required yield.
e coupon might be set at 4 percent a year for the
sake of rounding. To lift the yield to 4.05 percent, the
buyer would pay a bit less than face value.
Once corporate notes and bonds are sold, they
trade in a secondary market that’s primarily over the
counter. ough it’s possible to buy and sell some se-
curities on the New York Stock Exchange (NYSE) or
the Nasdaq Stock Market (NASDAQ), the amount of
debt changing hands there is small.
Price information is easier to obtain for corporate
debt than for government bonds because of the Trade
Reporting and Compliance Engine (TRACE). TRACE
was introduced in 2002 to collect secondary market
trading data from securities rms, compile the g-
ures, and send out the results. ese days, it’s run by
FINRA, which oversees the rms and ensures they
provide the required information.
Most corporate notes and bonds are debentures,
or unsecured loans. is means investors only have a
company’s promise to pay interest and repay the prin-
cipal, or borrowed money, on time. If the promise isn’t
kept, they can’t come and repossess any of its assets,
as a bank can when people fail to keep up with mort-
gage and car payments.
Owners of secured corporate debt, on the other
hand, are in the same position as the bank. e notes
and bonds are backed by buildings, equipment, prop-
erty, and other collateral. As an example, transporta-
tion companies sell securities backed by airplanes
and railcars.
Many corporate notes and bonds are bought when
they rst go on sale and rarely, if ever, are traded later.
is means bond investors pay considerable attention
to what they can buy in the primary market.
Some companies raising money in the United
States register each bond sale individually with regu-
lators. Registrations can cover more than one type of
security. For example, a company looking to sell ve-
year and 10-year notes and 30-year bonds at the same
time can le one statement for all of them.
Once the documents are approved, one or more
securities rms conduct the sale on the company’s
behalf. ese rms, called underwriters, line up inves-
tors to buy the bonds and arrange for other banks and
brokers to do the same.
Others use a di erent approach, especially for
MTNs. ese companies lay the groundwork for future
sales by ling a document called a shelf registration.
STEP-BY-STEP:
BORROWING RATES
1. ABC Inc. wants to sell bonds
maturing in 30 years.
2. The 30-year Treasury bond
yields 3 percent.
3. Investors demand a premium
of 255 basis points to buy
ABC’s bonds. That’s 2.55 per-
centage points.
4. Add the yield to the spread to
determine ABC’s borrowing
cost, 5.55 percent.
5. The coupon will be set at 5.5
percent and the bonds will be
sold at less than face value
to provide the 5.55 percent
yield.
DEFINITION:
Debentures
Debentures are notes and
bonds without any collateral
backing them other than a
company’s full faith and credit.
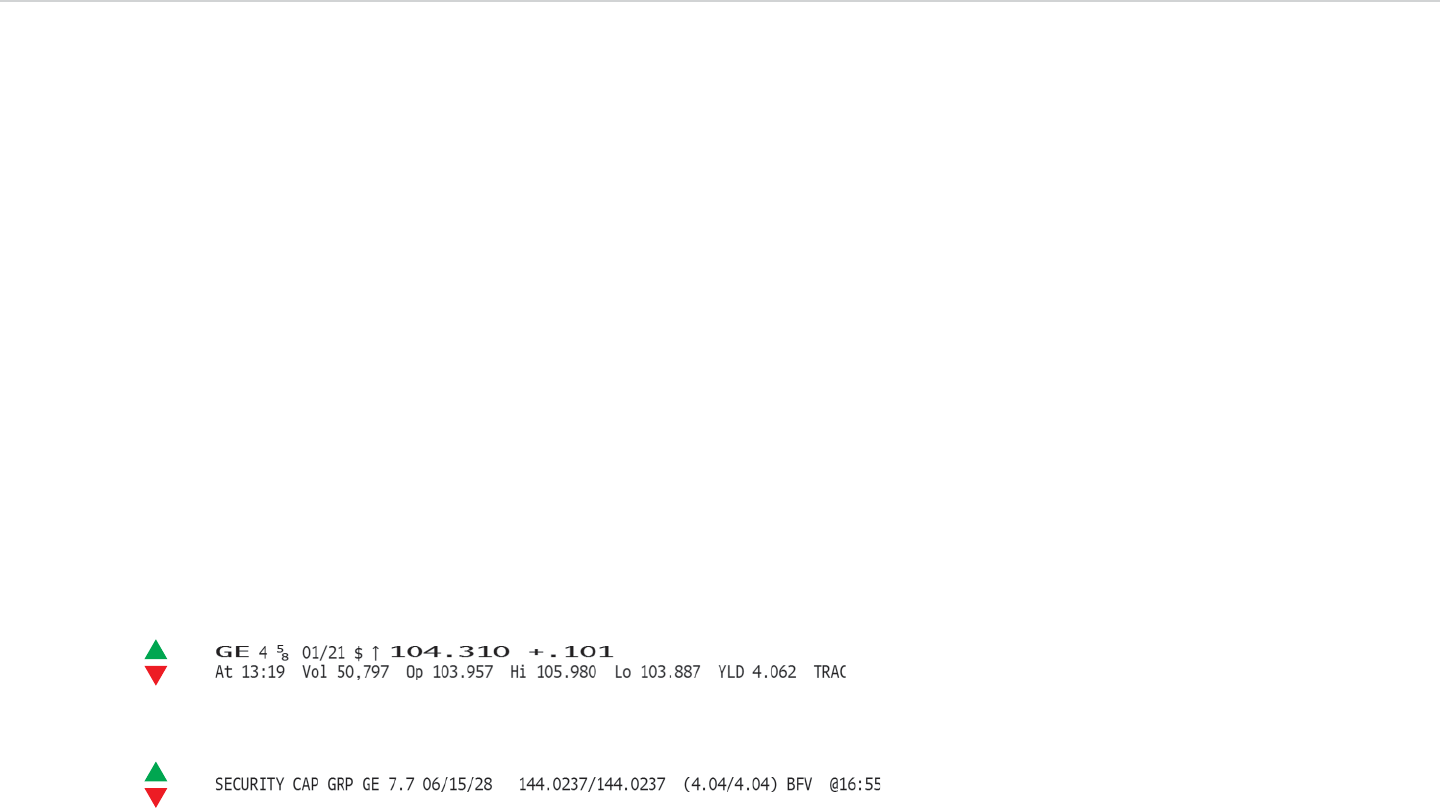
Visual Guide to Financial Markets ■45
e second is for a bond sold by a GE unit, Security
Capital Group, which originally matured in 30 years.
e price is an estimate made by Bloomberg, using the
yield on comparable securities as a guide.
Let’s go through these quotes and nd out what
they have to oer. We’ll focus on the rst and mention
the second along the way.
GE: Symbol for General Electric, which begins the
rst quote and follows Security Capital’s name in
the second.
4 5/8: Annual interest rate of 4 5/8 percent, or 4.625
percent. e comparable rate for the bond is 7.7 per-
cent. Rates can be stated as fractions or decimals, as
these two examples suggest.
01/21: Month and year of maturity for the GE Capi-
tal note. e Security Capital quote has an exact
date, 06/15/28, in the month/day/year format.
$: Dollar-denominated security. GE sells bonds in
several currencies, so the dollar sign is more than
a formality.
Many corporate debt securities aren’t displayed on
TRACE. Finding prices for the notes and bonds can be
dicult at best because they rarely trade. Bloomberg
provides price estimates based on yields for similar se-
curities, and we’ll see one further on.
Quotations
ere’s quite a disparity in the amount of detail that
bond quotes provide, as you may have guessed by
now. e two-for-one display in Exhibits 3.5 and 3.6
provides an illustration.
For starters, these quotes are for two separate
bonds. Their main similarity is they were sold by
units of General Electric. The first quote is for a note
from GE’s finance unit, GE Capital, which started
out as a 10-year security. The statistics include
the first figure we have seen so far for volume, or
the amount of trading. It’s here because of TRACE,
which provides real-time prices for a fee and de-
layed prices free.
Exhibit 3.5: A GE Capital Bond Quote
Exhibit 3.6: A GE Unit’s Bond Quote

46 ■CHAPTER 3 Companies
ere’s another piece of data that might have ap-
peared in the quote for GE’s note: 233 bp vs T2.625
11/15/20. It’s the dierence in yield between the se-
curity and a 10-year Treasury maturing at about the
same time.
e bp stands for basis points, which means the GE
yield is 233 basis points higher than the Treasury note
yield. e spread is the additional amount you’re paid
as an investor to take the risk of lending money to the
company, which can’t impose taxes or print money as
the government can.
e gap is equivalent to 2.33 percentage points.
Subtract that amount from the 4.06 percent yield on
GE’s security after rounding, and you’ll be left with the
Treasury note’s yield at the time: 1.73 percent, in line
with what we saw earlier. e yield dierential usually
uctuates over time, as Exhibit 3.7 illustrates.
Three Rs
When we looked at government notes and bonds, we
started with the idea that yields and returns are simi-
lar. is may not be true for corporate debt, as these
securities are designed to give companies more ex-
ibility in managing their nances.
Interest payments on many corporate securities
are linked to a market interest rate. is means they
will uctuate from one period to the next rather than
staying the same. Investors can’t be sure how much
interest they will receive while owning the debt.
Up arrow: e uptick/downtick arrow, tied to price
changes this time.
104.310: Price of the note as a percentage of face
value. It’s in decimals rather than the fractions
used for Treasuries. A buyer would have to pay
$1,043.10 for every $1,000 face amount. The price
for the Security Capital bond would be $1,440.237,
as it’s valued at 144.0237 percent of the face
amount.
+.101: Change from the previous day’s close in
percent.
At 13:19: Time of the quote, using the 24-hour clock.
Vol 50,797: Number of notes traded today. Each
note has a face value of $1,000, which means about
$50.8 million of the securities were traded. Other
quotes show a dollar amount in place of this kind
of number.
Op 103.957, Hi 105.980, Lo 103.887: Opening, high,
and low prices for the current day.
Yld 4.062: Yield, rounded to three decimal places, at
the current price.
TRAC: TRACE, the source of the GE note’s price. e
Security Capital bond was priced using Bloomberg
Fair Value (BFV), which compares the bond with
similar securities and estimates the yield, then the
price. is kind of estimate often has to be made be-
cause many securities are bought and held, rather
than traded.
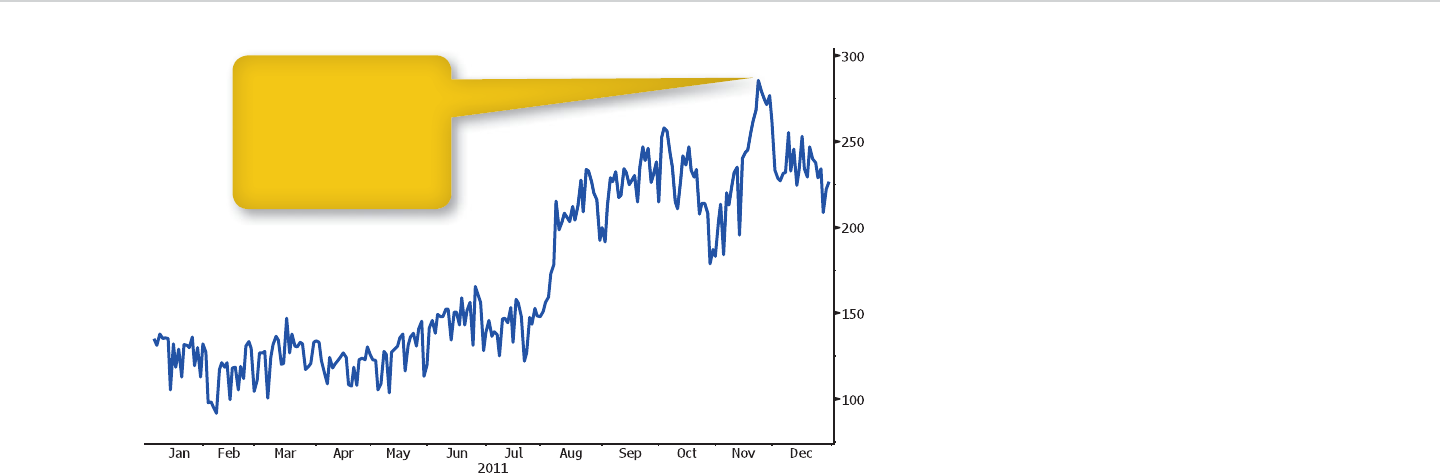
Visual Guide to Financial Markets ■47
Returns
Investors make money on corporate notes and bonds
in two ways as they do with government debt. ey
are assured of receiving interest payments, based on
a schedule that’s set when the securities are rst sold.
ey stand to bene t from any market-price increases
though the debt will be repaid at face value when the
maturity date rolls around.
Fixed-rate corporate debt pays the same amount
of interest every time. e market price of the note or
bond uctuates to keep the yield in line with current
interest rates. When rates rise, companies bene t
In some cases, investors don’t know how long they
will be able to own the debt either. e issue arises be-
cause companies sell notes and bonds they can buy
back before the maturity date at a set price. is fea-
ture allows them to take advantage of future declines
in interest rates by re nancing at a lower cost.
ese kinds of bells and whistles have to be built
into return calculations and relative-value compari-
sons, which makes them more di cult. ey heighten
some risks we have seen before and introduce others
we haven’t. Let’s look at the three Rs with those points
in mind.
Exhibit 3.7: Yield Gap Between GE Capital Bond and Treasuries (in basis points)
The yield gap peaked at
286 basis points, more
than triple its low. The
widening made GE
Capital’s bonds cheaper
by comparison with
Treasuries.

48 ■CHAPTER 3 Companies
Callable securities have what’s called a yield to
worst, which assumes they are bought back at the
rst possible opportunity. is yield can be calculated
because call prices are set when the notes and bonds
are rst sold.
Corporate debt can be putable. Investors owning
these securities would be able to sell them back to
the company at predetermined prices before they
mature. This feature sets a floor under the price of
the notes and bonds, which aids returns. Call pro-
visions have the opposite effect, as they give com-
panies the right to buy their debt at what may be
below-market prices.
Companies can sell convertible notes and bonds,
which can be exchanged for common stock at a set
price for each share. e ability to convert may belong
to the investor, the company, or both, depending on
the terms of the security. We’ll revisit convertibles lat-
er, when we look more closely at variations on invest-
ing in companies.
Risks
We have seen three levels of risk that investors take
in buying corporate notes and bonds. e rst is the
broadest, consisting of market risk, liquidity risk, eco-
nomic risk, political risk, policy risk, and currency
risk. e second combines credit risk, interest rate
risk, in ation risk, and reinvestment risk, which are
concerns for anyone owning debt securities. Real re-
turns, adjusted for in ation, take this level of risk into
account.
from having lower-cost nancing. When they decline,
investors pro t because the future interest payments
become more valuable.
Companies also sell fl oating-rate notes and bonds,
where only the timing of interest payments is preset.
e amount that’s paid each time depends on a mar-
ket rate such as Libor, which we discussed earlier.
Payments are usually based on a spread to Libor for
a speci ed currency and maturity date, often three
months.
Floating-rate debt makes sense for companies
whose income rises and falls along with interest rates.
Banks are among them because they provide credit
cards, make commercial loans, and buy securities
whose interest payments oat. Companies looking for
rates to fall may favor oating-rate notes and bonds,
which assure them of lower interest expense as long as
their outlook is accurate.
Some companies sell in ation-indexed securities,
similar to the U.S. government’s Treasury In ation-
Protected Securities (TIPS). Changes in an in ation
gauge such as the Consumer Price Index (CPI) replace
Libor, or some other market rate, in the formula for
calculating interest.
Returns on corporate notes and bonds depend
on whether they remain outstanding until maturity.
Some of these securities are callable, which means
companies are allowed to buy them back in advance.
A 30-year bond that can be called after ve years
would e ectively turn into a ve-year note if the com-
pany repurchases the debt.
STEP-BY-STEP:
FLOATING-RATE
INTEREST
1. ABC Inc. sells 10-year
fl oating-rate notes. They pay
interest twice a year at three-
month dollar Libor plus
75 basis points.
2. Six months after the sale,
Libor is 0.5 percent. Add the
spread, and the note’s annual
interest rate is 1.25 percent.
3. ABC’s fi rst payment is half
the annual rate. That’s 0.625
percent, or 62.5 cents for
every $1,000 borrowed.
4. One year after the sale, Libor
is 0.75 percent. The annual
rate rises to 1.5 percent.
5. ABC’s second payment is
0.75 percent, or 75 cents per
$1,000.
DEFINITION:
Floating-rate
Floating-rate debt pays interest
that varies along with Libor or
another market rate.

Visual Guide to Financial Markets ■49
Relative Value
Yield, especially in the form of curves and spreads, is
a guidepost for determining whether corporate notes
and bonds are cheap, expensive, or fairly valued. e
same kinds of analysis we learned about earlier for
government debt can be done with company securi-
ties. Let’s run through them in summary form.
History: e easiest way to judge whether a yield is
low, high, or somewhere in between is to look at where
it’s been. is usually has to be done on a security- speci c
basis because most companies don’t sell securities with
the consistency of the U.S. government. is means
benchmark maturities are unavailable for comparisons.
Similar companies: Yield curves are available for
categories of corporate notes and bonds that provide
a benchmark for speci c securities. If a bank note
yields 4 percent and matures in ve years, for exam-
ple, the ve-year yield on a curve of bank debt would
shed light on the note’s relative value.
Corporate curves are created di erently than the
Treasury curve. e connect-the-dots approach cited
earlier won’t work because there are too many maturi-
ties and yields to consider, including some for cheap
or expensive securities.
Instead, the rst step in creating a corporate curve
is de ning a debt category. Industry groups and credit
ratings are among the criteria. Financial, industrial,
media and telephone companies, and utilities can
have their own curves. ere may be one curve for
companies with top ratings from S&P and Moody’s,
another for ratings one level lower, and so on.
Business risk, event risk, and industry risk amount
to a third level, focused on companies. A more spe-
ci c business risk for note and bond investors is
worth adding: bankruptcy risk, which Lehman’s in-
vestors learned about the hard way. If a company’s
performance su ers enough, it may be unable to stay
in business without seeking court protection from
creditors. e reorganization that follows often re-
sults in losses for note and bond investors, among
others.
While we’re at it, we might add a bankruptcy-
related threat to the second level: default risk. It’s the
most extreme form of credit risk. Companies default
when they don’t pay interest or repay principal on
their debt as required. is can take place because
they don’t have the money or because they decide to
keep their cash instead. Bankruptcy risk and default
risk increase with the amount of time until corporate
debt matures. at’s why they’re especially relevant
here. We could have mentioned them in the discus-
sion of money market securities, based on the Lehman
example.
Call risk deserves a mention because of the earlier
reference to callable notes and bonds. When interest
rates fall, companies have more of an incentive to re-
nance or repay the debt to reduce interest expense.
is would cause bond investors to lose years of in-
terest payments at above-market rates. ey would
get back their original investment sooner than they
wanted and would have to settle for lower returns if
the funds were reinvested in similar securities.
KEY POINT:
Corporate yield curves aren’t
created through a connect-the-
dots approach. Instead, a group
of similar bonds is identifi ed
and a curve is calculated that
comes closest to fi tting them all.
KEY POINT:
Corporate bonds can have
options built into them. Callable
bonds give companies the
option to buy them back before
maturity. Putable bonds give
investors the option to sell them
back early. Convertible bonds
provide investors with the
option to swap debt for equity.

50 ■CHAPTER 3 Companies
ere’s a comparison between top-rated industrial
debt and Treasuries in the following chart. As you
might expect, yields on the corporate securities are
higher (see Exhibit 3.8).
Similar comparisons are possible between compa-
nies and other government-related borrowers that we
have yet to cover. We’ll touch on those later. Now it’s
time to shift our focus toward equity, as in stock, and
away from debt.
Stocks
“How’s the market doing?” e question could refer
to any of the nancial markets we have examined or
any of the ones we’ll consider in later chapters, but it
doesn’t. You could insert “stock” before “market” by
default.
This is true because individuals and institutional
investors have bought and sold shares in the United
States for more than two centuries. Stocks tend to
account for a bigger percentage of their holdings
than any other asset. Share prices tend to fluctu-
ate more than bond prices and money market rates
each day.
All the interest in stocks works to the benet of
companies looking to raise money. ey can sell
shares and obtain funds they don’t have to repay. It’s
good for corporate executives, nancial backers, and
others with stakes in a company because it gives them
the opportunity to turn their holdings into cash.
Once the category is created, a group of corporate
notes and bonds is compiled. eir yields and matu-
rity dates are run through a mathematical formula
to calculate the curve, which comes closest to tting
them all.
Dierent industries: Financial companies can be
broken down into banks, broker-dealers, insurance
companies, and real estate owners. Relative-value
comparisons among these segments are made pos-
sible through industry-specic yield curves. It’s possi-
ble, for instance, to track the spread between ve-year
notes on banks and insurers and decide which oers
more value.
Different credit ratings: This kind of analysis
can focus on yields for investment-grade and high-
yield securities as a group. Spreads between the
two categories enable investors to determine how
much more they would earn by putting money into
companies rated below BBB- at S&P and Baa3 at
Moody’s.
Investors can compare yields for similar corpo-
rate borrowers at dierent rating levels. S&P and
Moody’s ratings provide a basis to create rating-
specic curves for banks, industrial companies, and
others.
Dierent borrowers: Corporate yield curves are
directly comparable to those on government debt
even though they are compiled dierently. e Trea-
sury curve is a benchmark for gauging the relative
value of companies’ notes and bonds.
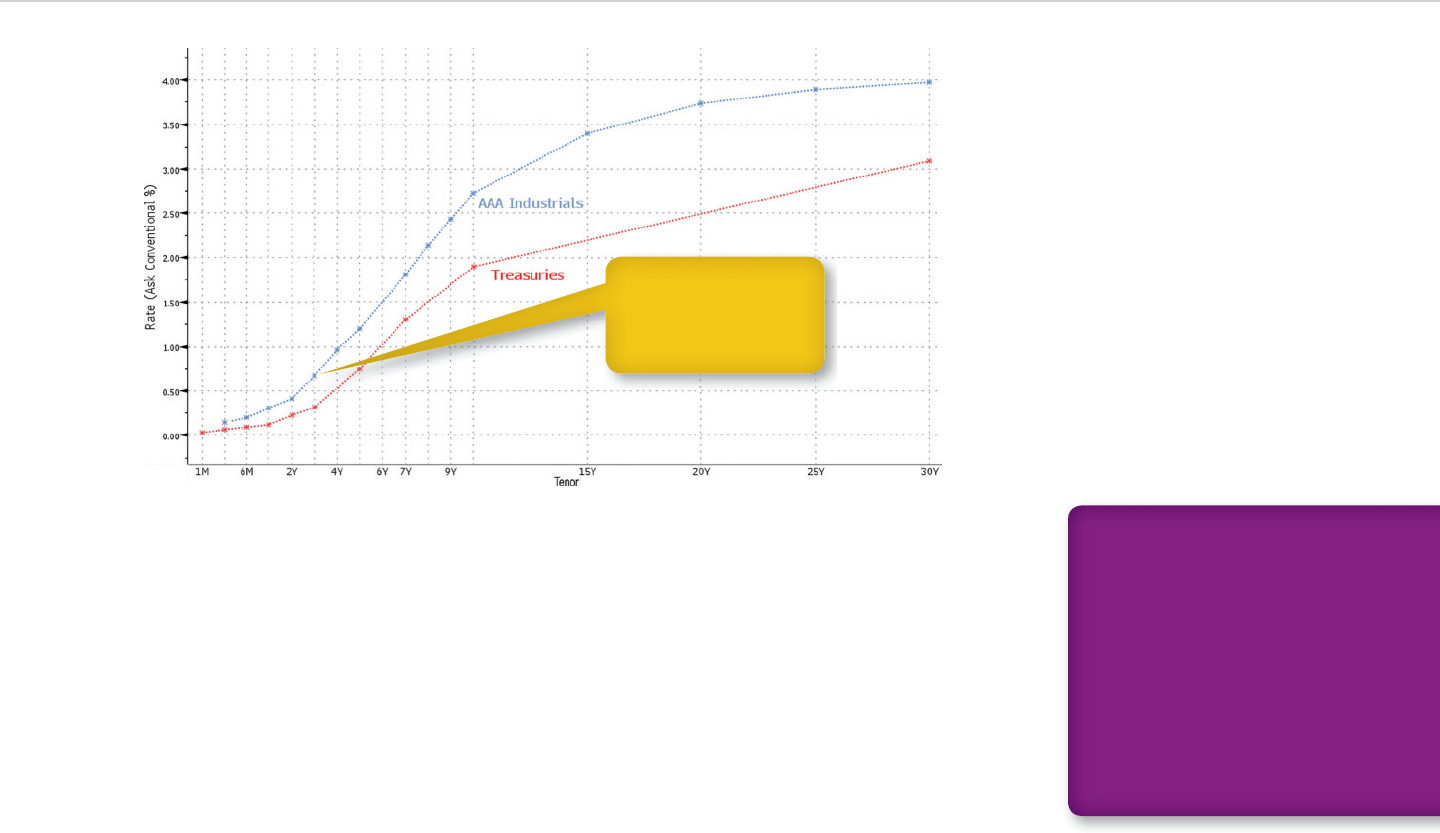
Visual Guide to Financial Markets ■51
firm that audits its financial statements, accept or
reject takeover bids, and decide other issues. Some
companies ensure a smaller number of holders
make these decisions by creating non-voting and
voting shares. Others accomplish the same goal by
having a separate class of stock with extra votes for
each share.
Dividends are taken out of a company’s pro ts, and
the payments are usually made quarterly. Companies
can go without them if they need the funds to nance
expansion or sustain their business. ose that make
e fewer shares there are, the greater the per-
centage of ownership that each share provides, and
vice versa. If a company had 1,000 shares outstand-
ing, for instance, then each share would amount to a
0.1 percent stake. If there are a million instead, then
a share is only 0.0001 percent of the total.
Any other bene ts of owning shares are up to the
company that sells them. Voting rights and dividend
payments are two of the most widely available perks.
Stockholders select the members of a company’s
board of directors, approve the outside accounting
STEP-BY-STEP:
OWNERSHIP STAKES
1. Apple Inc. had 929.4 million
shares outstanding in Octo-
ber 2011 when co-founder
Steve Jobs died.
2. Jobs owned about 5.6 mil-
lion shares at the time of his
death.
3. Divide 5.6 into 929.4. The
result shows Jobs left behind
a 0.6 percent stake.
Exhibit 3.8: AAA Industrial and Treasury Yield Curves
While the industrial
curve has more dots,
each one is an estimate
rather than a yield on an
actual security.

52 ■CHAPTER 3 Companies
number of shares to be sold, and the price to charge
for them. Underwriters line up other rms to take part
in the share sale and investors to buy the stock.
Investors and executives can sell shares when a
company goes public. is portion of the sale is a sec-
ondary o ering even though it’s occurring in the pri-
mary market. e di erence is that the proceeds will
go to whoever sells the shares, rather than the com-
pany. In some cases, secondary o erings account for
an entire IPO.
Going public lays the foundation for companies to
sell additional shares and raise more money. While
these sales are sometimes called secondary o erings,
the phrase doesn’t apply when they involve new stock.
Newly public companies can be more rewarding
than older ones. is was the case during the 2000s,
when a Bloomberg index of U.S. companies in their
rst year of trading rose as the Standard & Poor’s
500 Index fell. Exhibit 3.9 compares the indexes.
IPOs bring companies into the secondary market,
where their stock trades daily. U.S. companies usu-
ally list their shares on the NYSE or the NASDAQ. e
NYSE’s roots go back to 1792 when brokers gathered
under a buttonwood tree in New York to set rules
for stock and bond trading. NASDAQ, an electronic
market, followed in 1971.
e NYSE and NASDAQ compete for stock trad-
ing with BATS Global Markets Inc. and Direct Edge
Holdings LLC, which own exchanges. All four com-
panies operate multiple markets, which are linked
electronically to help investors make the best possible
the distributions set a payout ratio, or a percentage of
earnings, they want to maintain each year.
Companies can return cash to holders by buying
back stock as well as paying dividends. e repur-
chases increase earnings per share by reducing the
amount of outstanding stock. Let’s suppose the com-
pany with 1 million shares posted a $1 million pro t.
e earnings would amount to $1 a share. If the com-
pany bought back 100,000 shares and reported the
earnings, the $1 million would be divided among only
900,000 shares. at works out to $1.11 a share.
ere’s no obligation for companies to repurchase
stock. ey can do the opposite. Sales of stock and
related securities, takeovers of other companies, and
grants to executives are among the moves that in-
crease the number of outstanding shares.
ese kinds of actions can dilute earnings, or spread
them over a greater number of shares. at $1 million
pro t would be 91 cents a share, for instance, if the
company had 1.1 million shares outstanding. Increase
the share count to 2 million, and the pro t drops to
50 cents a share.
e number of shares outstanding often rises be-
cause a company sells new stock as mentioned earlier.
ese sales are done in the primary market, where
companies make initial public o erings (IPOs) and
sell additional shares.
IPOs result from a company’s decision to become
publicly traded. e company selects one or more se-
curities rms to be underwriters. ese rms work
with the company to determine the sale’s timing, the
KEY POINT:
Secondary offerings are sales of
existing stock even though the
phrase is often used to describe
sales of new shares after an IPO.
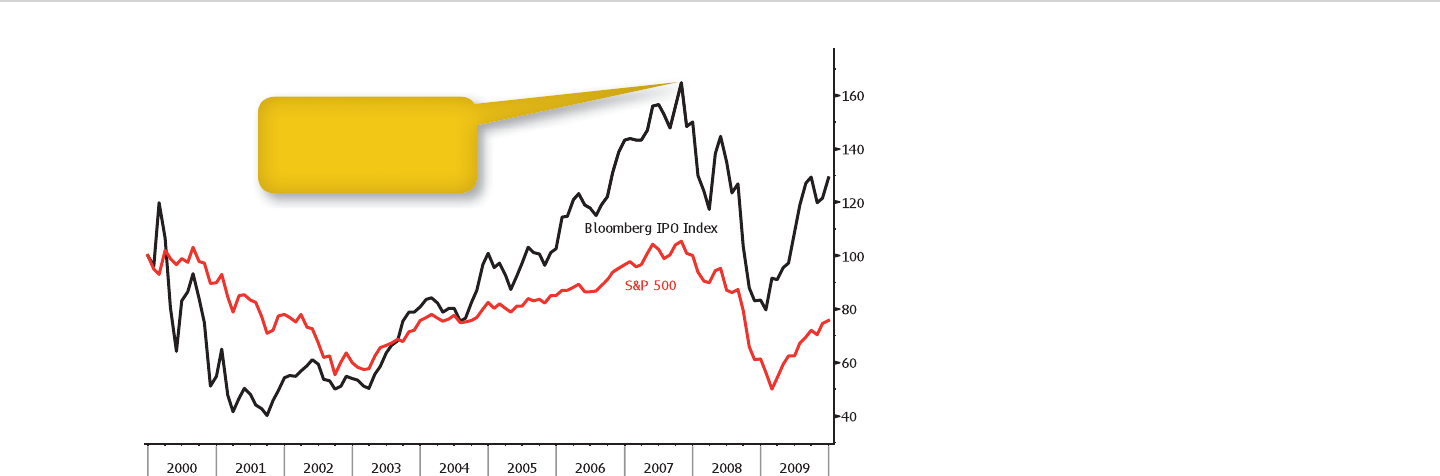
Visual Guide to Financial Markets ■53
pools get their name because participants and public
investors are kept in the dark about who’s buying and
selling and how many shares they have to trade.
Quotations
Stock quotes provide a level of detail we haven’t
run across before. Exchanges collect, consolidate,
and distribute all kinds of trading data, including
details about purchases and sales taking place on
other markets. Let’s check a quote for Apple Inc.,
which became the world’s biggest company by
deal on their trades. e NYSE is the only one with
oor trading, where brokers buy and sell on an ex-
change oor.
e development of all-electronic markets has
led to high-frequency trading, in which rms use
computer-based buying and selling to pro t from
instantaneous market moves. e rms may own
stock for a few seconds. Estimates of their share of
trading in U.S. markets have been as high as 70 per-
cent. Institutional investors can bypass exchanges and
trade through dark pools, run by securities rms and
others, where large blocks of stock change hands. e
Exhibit 3.9: Initial Public Offerings versus Standard & Poor’s 500 Index (December 31, 1999 = 100)
IPOs are more volatile
than stocks overall, as
shown by the Bloomberg
index’s swings.
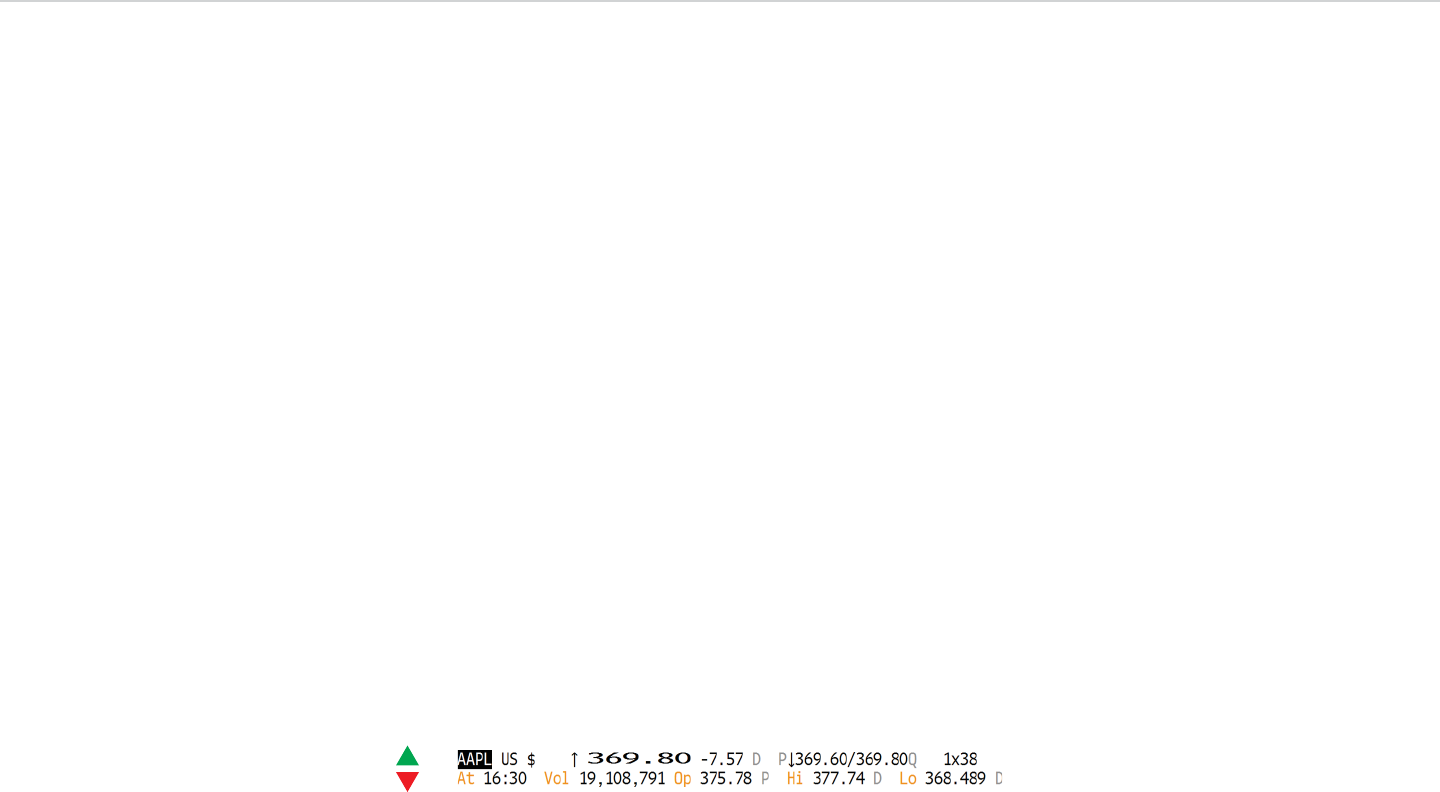
54 ■CHAPTER 3 Companies
–7.57: Change from the previous close. At the time
of the quote, Apple was $7.57 lower on the day.
D: Second letter of the code for the Alternative
Display Facility, where the latest price was posted.
FINRA runs the facility to report on stock trades
made outside NASDAQ.
P: Second letter of the exchange code for NYSE Arca,
an electronic market owned by NYSE Euronext,
where the bid price was posted. e letter original-
ly stood for the Pacic Stock Exchange, a regional
market with historical ties to NYSE Arca.
Down arrow: Uptick/downtick arrow, referring this
time to the latest change in Apple’s bid price.
369.60: Highest price that any potential buyer is
willing to pay for Apple’s shares.
/: Separator for the bid and ask price.
369.80: Lowest price that any potential seller will
accept for Apple’s shares.
Q: Second letter of UQ, the two-letter code for
NASDAQ.
1 u 38: Number of round lots associated with the
bid and ask prices. When combined with the earlier
details, here’s what the quote says: Someone wants
market value in 2011, to see this for ourselves (see
Exhibit 3.10).
AAPL: Apple’s ticker, or stock symbol. U.S. tickers
are no more than ve letters. Use of one- to three-
letter tickers was restricted to companies listed on
the NYSE or the American Stock Exchange (AMEX)
and four-letter tickers were reserved for listings on
NASDAQ until 2007.
Companies can use one to four letters regardless of
where they’re listed, including the AMEX, now NYSE
Amex. NASDAQ stocks with traditional tickers can
have a fth letter, which designates the type of secu-
rity, a company in bankruptcy, or other conditions.
US: U.S. composite trading. Individual markets each
have their own two-letter code on the Bloomberg
terminal. e rst letter is always U, designating a
U.S. market. e second can appear alone in quotes.
$: Dollar-denominated security.
Up arrow: Uptick/downtick arrow, displaying the
latest change in the stock price.
369.80: Price of the latest trade. U.S. share prices
have been quoted in dollars and cents since 2001.
Before then, they were quoted in fractions, just like
Treasury notes and bonds.
Exhibit 3.10: An Apple Inc. Stock Quote

Visual Guide to Financial Markets ■55
Three Rs
Stocks are similar to corporate notes and bonds
when it comes to returns and risks, the rst two
Rs that we’ll consider. Dividends, like interest pay-
ments, are included in return calculations. Most of
the risks that go with owning a company’s shares
a ect its debt’s value.
Relative value is where they part company. ough
yields can show whether shares are cheap, expensive,
and fairly priced, they aren’t as encompassing a gauge
as they are for bonds. For instance, yields based on
dividends aren’t meaningful for companies that don’t
pay them.
Earnings carry more weight with stock investors
than bond investors, who are more concerned with a
company’s ability to pay debts. One of the most widely
used relative-value gauges for stocks is the price-
earnings ratio (P/E). It’s calculated by dividing the
stock’s price by earnings per share, which can be his-
torical or estimated.
Before we go any further, let’s go through the three
Rs in sequence to ensure we don’t miss anything.
Returns
Dividends contribute to returns on stocks in the
same way that interest affects bond returns, as
mentioned earlier. The biggest difference is that
there isn’t any time limit on how long investors can
to buy 100 shares of Apple at $369.60 each on NYSE
Arca. Someone else is looking to sell 3,800 shares
at $369.80 apiece on NASDAQ. is is known as
the inside market, because the bid and ask prices
are inside the range set by prices available in other
markets.
At 16:30: Time of the latest price. In this case, it’s the
o cial close for the stock. Prices between 09:30 and
16:00, or 9:30 a.m. and 4 p.m. Eastern, are from the
trading day.
Vol 19,108.791: Volume, or the number of shares
changing hands during the current day. The to-
tal consists of round lots, or trades in multiples of
100 shares, and odd lots, or trades of fewer than
100 shares. Round lots are the standard for U.S.
stocks.
Op 375.78 P, Hi 377.74 D, Lo 368.489 D: Open-
ing, high, and low prices for the current day, along
with the markets on which they were recorded.
On this day, Apple opened at $375.78 on NYSE
Arca. The high of $377.74 and the low of $368.489
both appeared on FINRA’s facility. Note that the
low price goes out to three decimal places, rather
than two.
Quotes posted during the trading day would end
the second line with a number like this: ValTrd
4780.216m. It’s the dollar value of shares trad-
ed. e m is for $1 million, so the gure shows
$4.78 billion of Apple shares changed hands.
DEFINITION:
Price-earnings ratio
The price-earnings ratio (P/E)
is the share price divided
by earnings per share. The
calculation is based on past or
projected profi ts.

56 ■CHAPTER 3 Companies
of market risk, liquidity risk, economic risk, political
risk, policy risk, and currency risk. e third touches
on business risk, event risk, and industry risk along
with the threat of bankruptcy.
Currency risk can be linked to a company’s busi-
ness rather than its shares. Many companies based
outside the U.S. have American Depositary Receipts
(ADRs), representing some number of shares.
ADRs trade on the NYSE, NASDAQ, and other mar-
kets. They are also known as American Depositary
Shares (ADSs).
ough ADRs are dollar-denominated, their own-
ers still have to deal with currency risk. If the company
is based in a country whose currency is losing value,
then its shares are likely to fall as many international
investors move their money elsewhere. e U.S.-listed
securities will decline as well.
Currency risk can cut the other way because of its
eect on a company’s business. If the local currency
rises in value, international sales and earnings may
count for less when they’re translated into that cur-
rency. e increase might lead to slower growth in
revenue and prot, or even declines, as the company’s
products become more costly.
Bankruptcy risk is worth highlighting because it’s
more acute for shareholders than for any other in-
vestors in a company. When a company reorganizes,
the holders have to settle for what remains after pay-
ments to banks, bondholders, and suppliers. In many
cases, the shares are canceled, leaving the holders
with nothing to show for their investment.
receive payouts because stocks don’t have a matu-
rity date.
e role that dividends play in returns increases
with the amount of time an investor owns shares. Pay-
outs accounted for 90 percent of U.S. stock returns
between 1871 and 2009, according to a study done by
Grantham, Mayo, Van Otterloo & Co. (GMO), a money
management rm. e gure reected dividend yields
as well as ination-adjusted growth in payouts, which
James Montier, a member of GMO’s asset allocation
team, noted in an August 2010 report.
Investors don’t make a habit of studying stock re-
turns for 138-year intervals. ey’re more likely to
focus on the latest quarter, the latest year, and some
other relatively short period. Price changes aect re-
turns far more than dividends for these periods.
When stocks don’t pay dividends, investors can
only make money if the price rises. Dividend-paying
stocks, by contrast, can have positive returns even
when the price drops. at’s possible as long as the
loss is smaller than the payout.
Dividends provide a nancial cushion against
losses. ey enable investors to earn additional
income by reinvesting the payouts. Shareholders in
companies that keep their cash have to go without
those benets.
Risks
Shareholders can be perched at either end of the
three levels of risk cited earlier. e rst level consists

Visual Guide to Financial Markets ■57
e P/E ratio is one way to value stocks. Inves-
tors may use historical or projected earnings in their
analysis, and each approach has merit. Historical
earnings have the advantage of being more de nite
than estimates, which may not prove to be accurate.
en again, anyone buying a stock has to rely on fu-
ture pro ts to push the share price higher. e past is
useful as a guide to the future.
For the fastest-growing companies, historical P/Es
will be higher than those based on projected earnings.
For those growing more slowly, there may be little dif-
ference between the ratios.
Finding cheap, expensive, and fairly priced stocks
may involve price-to-sales and price-to-cash ow ra-
tios, calculated by dividing share prices by sales or
cash ow per share rather than earnings. Another
yardstick is book value, or the value of what a business
owns minus what it owes. More precisely, book value
shows what the company’s assets are worth after sub-
tracting liabilities.
We need to give yields their due as well, starting
with dividend yields. ey can be historical or esti-
mated, like the earnings gures in P/E ratios. If the
company with the $30 stock paid $1 a share in the past
12 months, then the shares have a dividend yield of
3.3 percent, or 1 divided by 30. If the company raised
its payout rate to $1.20 a share, the projected dividend
yield would be 4 percent.
ere’s a yield for earnings as well as dividends,
which is useful for studying stocks without pay-
outs. e earnings yield is the inverse of the P/E, or
e second level of risk hasn’t been mentioned be-
cause it’s less of an issue for equity investors. Credit
risk and default risk don’t a ect the value of securi-
ties directly. In ation may be more of an opportunity
than a risk as price increases can lead to higher sales,
earnings, and share values. Interest rate risk and rein-
vestment risk are less of a concern because an inves-
tor can put dividend payments back into the stock, as
opposed to settling for a lower-yielding investment.
Relative Value
Price has taken a back seat in our searches for rela-
tive value. at’s no accident. Prices of government
bills and other money market securities are an after-
thought, designed to produce a speci ed discount
rate. Note and bond prices are tied to the securities’
face value, which the borrowers are obligated to pay at
maturity. Little room exists for them to move without
a substantial change in market interest rates.
Stock prices don’t have these kinds of constraints.
ough shares can have a face amount, known as a
par value, they don’t have to. When they do, it’s often a
fraction of a cent. at’s ne for accounting purposes
because par value isn’t a sum of money that investors
will receive in a few months or years.
Instead, the company’s share price is driven by
what’s happening to sales, earnings, and dividend
payments over time. Faster growth usually brings
bigger gains for the stock, and declines can send the
price lower.
STEP-BY-STEP:
PRICE-EARNINGS RATIO
1. ABC Inc.’s shares trade at $30.
2. ABC’s earnings in the previ-
ous four quarters equaled $3
a share.
3. Divide the profi t into the
stock price for the P/E ratio,
which is 10.
STEP-BY-STEP:
ESTIMATED P/E RATIO
1. ABC Inc.’s shares trade at $30.
2. Analysts expect next year’s
earnings to be $3.33 a share
on average.
3. Divide the projection into the
stock price for the estimated
P/E ratio, which is nine.

58 ■CHAPTER 3 Companies
Dierent companies: Comparisons based on -
nancial ratios provide the most insight when they
involve shares of a company and its competitors. Divi-
dend yields are an example. Utilities and telephone
companies have the highest payouts because their
businesses are stable, leaving them with plenty of
money to distribute. ere’s little to be gained by com-
paring yields on a utility stock and shares of a technol-
ogy company, which may be growing much faster and
need cash for expansion.
Dierent industries: Money managers make judg-
ments about the companies in which they invest and
about the industries represented in their holdings.
ey may have a preference for some industry groups
over others that aects their weightings, or percent-
age of assets. In coming to these conclusions, they
look at ratios, yields, and other indicators for industry
groups. ey’re the same as the gauges used for indi-
vidual stocks except that they’re based on averages.
Dierent categories: Industry groups are one of
many ways to categorize stocks. Others include mar-
ket value, growth rates, economic ties, and location.
Relative-value comparisons make it possible to sort
through them and determine what’s worth buying,
selling, or holding.
Market value is known as market capitalization
(cap). Stocks can be large-cap, mid-cap, or small-cap,
depending on the company’s value. Some investors de-
scribe the largest companies as mega-caps and refer to
the smallest as micro-caps. e dollar values used for
each category depend on who’s doing the categorizing
100 divided by the ratio. Our $30 stock yields 10 percent,
based on the $3 in prot during the past 12 months.
Similar ratios and yields for industry groups and
market indexes are available. Investors use these indi-
cators as benchmarks when looking at specic stocks.
is approach is worthwhile because moves in these
gauges over time can be substantial. e P/E for the
Standard & Poor’s 500 Index, displayed in Exhibit 3.11,
provides an example.
Now that we have an idea how to determine relative
value, it’s time to look at some comparisons that help
investors decide what stocks to buy, sell, or hold. is
analysis can be done for individual shares or broader
categories, as we saw earlier for money-market securi-
ties, notes, and bonds. Here’s a summary.
History: Maybe the shares of a company are trad-
ing at record prices. Maybe they lost half their value
during the past three months. Maybe they haven’t
changed all that much in the past three years. e only
way to know is to look at historical prices, a starting
point for relative-value judgments.
Historical data is available for the P/E, price-to-
sales ratio, price-to-cash-flow ratio, price-to-book-
value (or book) ratio and more gauges, along with
dividend and earnings yields. These can shed light
on the significance of price moves. If a stock has ris-
en to a record and the P/E ratio has changed little
during the past year, the price move may mean the
business is doing well. If the P/E has climbed, the
gain may have more to do with speculation than
the company’s results.
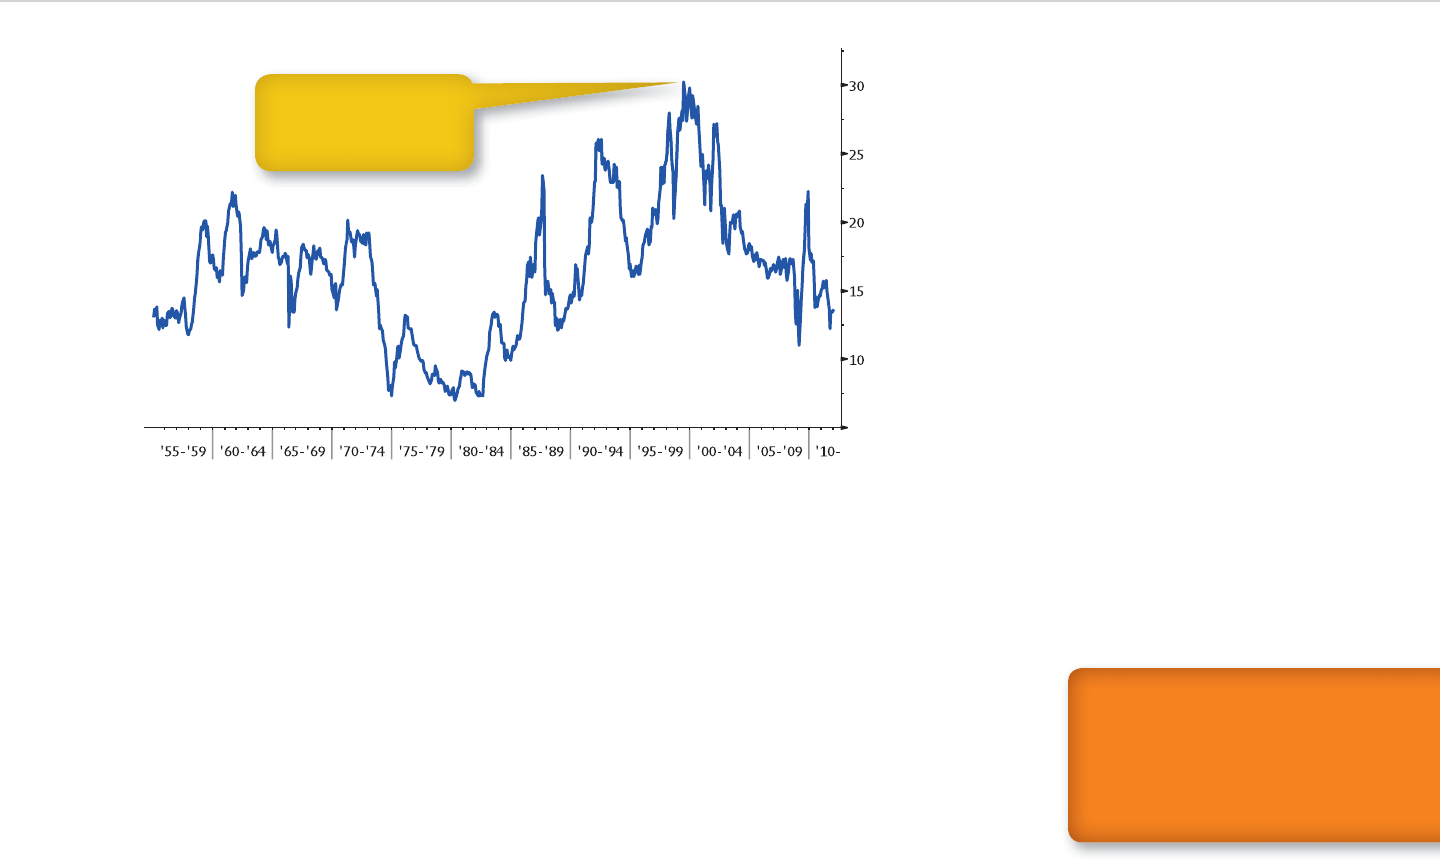
Visual Guide to Financial Markets ■59
growth and recession. Commodity, energy, industrial,
and technology stocks are cyclical. Health-care, tele-
phone, and utility shares are defensive. Consumer
companies are in both categories. Cyclicals include
media companies, retailers, automakers, and home-
builders, which depend on consumers’ discretionary
income. e makers of food, beverages, and other
consumer staples are defensive stocks. By combining
economic and relative-value analysis, investors can
decide how heavily to bet on either category.
Location refers to countries, regions, or economic
areas. e broadest distinction made globally is
and how stocks are performing. It’s enough to know
that these breakdowns exist and can serve as a start-
ing point for determining relative value.
Sales, earnings, assets, and other nancial barome-
ters can de ne companies as growth or value. Growth
stocks are tied to the biggest increases in revenue and
pro t. Value stocks have some of the lowest price-to-
book ratios. Beyond that, the criteria are as variable as
the market cap thresholds. at doesn’t stop investors
from looking for value in one or the other.
Industries can be classi ed as cyclical or defensive,
based on how vulnerable they are to slower economic
KEY POINT:
Stocks are categorized by
industry group and companies’
market cap, short for
capitalization. They can also be
classifi ed as growth or value.
Exhibit 3.11: Standard & Poor’s 500 Index Price-Earnings Ratio
The ratio peaked at the
end of the so-called Inter-
net bubble, when online
companies soared.

60 ■CHAPTER 3 Companies
between developed markets and emerging markets,
as dened by the pace of economic growth and other
criteria. Investors may favor one geographic region
over another or concentrate on countries or markets
where the outlook is most promising. ese kinds of
investment decisions rely on the ability to assess value
worldwide, and that’s made possible by the kind of
analysis we have just explored.

Visual Guide to Financial Markets ■61
4. Returns on stocks always re ect:
a. Price changes.
b. Dividend payments.
c. Share repurchases.
d. All of the above.
e. a and b only.
5. Underwriters sell:
a. Stocks.
b. Corporate bonds.
c. Treasury securities.
d. All of the above.
e. a and b only.
Answer the following multiple-choice questions:
1. e federal funds rate is set by:
a. Banks.
b. e Federal Reserve.
c. e U.S. Treasury.
d. All of the above.
e. a and b only.
2. Companies can borrow for one year by selling:
a. Corporate bonds.
b. Medium-term notes.
c. Commercial paper.
d. All of the above.
e. a and b only.
3. Bonds of companies with relatively low credit rat-
ings are labeled as:
a. Non-investment grade.
b. High yield.
c. Junk.
d. All of the above.
e. a and b only.
Answers: 1. e; 2. b; 3. d; 4. a; 5. e

63
Hard Assets
All the investments we have examined so far t
into one of three categories: stocks, bonds, and
cash. Investors also can pick from a number of al-
ternative investments, or strategies and assets other
than buying stocks and bonds or holding onto cash.
Alternative can refer to hedge funds, or private
partnerships that rely on investment strategies be-
sides buying and holding securities. Private-equity
funds, which acquire entire companies mainly with
borrowed money, are another alternative.
We’ll take a closer look at these funds and others
later. For the moment, we’ll focus on alternative as-
sets. Commodities and real estate are two of the most
popular types. Because of their physical presence,
they’re described as real assets, tangible assets, and
hard assets. ey are more than pieces of paper or en-
tries on computer screens. ey can protect investors
against in ation risk, as their value tends to increase
during periods when prices are rising more broadly.
Let’s start by considering gold, a precious metal
that’s sometimes seen as its own asset class. is dis-
tinction exists because gold’s value depends on the
amount of con dence that investors have in nancial
assets, not just the industrial demand that matters for
most raw materials.
Gold
“Do you think gold is money?”
Representative Ron Paul, a Republican from Texas,
asked that question to Federal Reserve (Fed) Chair-
man Ben Bernanke at a congressional hearing in July
2011.
Bernanke’s answer was no. “It’s a precious metal,”
he said.
e reply prompted Paul to note that gold has been
seen as money for 6,000 years. He asked, “Has some-
body reversed that, eliminated that economic law?”
Visual Guide to Financial Markets
by David Wilson
Copyright © 2012 by David Wilson.

64 ■CHAPTER 4 Hard Assets
He then questioned why central banks owned gold
and concluded, “Some people still think it’s money.”
is exchange shows why gold di ers from other
commodities. Few would argue a barrel of crude oil, a
pound of copper, or a bushel of corn is money as Paul
did with gold at the hearing. Yet many investors share
his view of the metal’s role.
Gold is often described as a store of value or a way
to preserve wealth. Historically, the Fed and other
central banks followed the gold standard. eir cur-
rencies were backed by the metal, resulting in what’s
known as hard money.
is standard has been replaced by a system of
at money, in which currencies have value primarily
because of their legal status. Fiat money has been the
standard since August 1971, when the United States
ended trading of gold at a xed price of $35 an ounce.
Exhibit 4.1 shows what has happened to the price.
Gold prices re ect the dollar’s value because the
commodity is bought and sold in dollars worldwide.
ey indicate the level of concern among investors
about the future of the global nancial system. Many
investors consider gold to be a better investment than
stocks, bonds, and cash during times of nancial tur-
moil because its value extends beyond national bor-
ders. Some own gold bullion, in the form of bars or
coins, to hedge against this kind of upheaval.
Bullion is called physical gold, a phrase used to dis-
tinguish the metal from the securities and derivatives
linked to its value. Physical gold is a hard asset, which
explains its popularity among many investors.
Individuals can own gold directly, which isn’t pos-
sible for many other commodities because of the
quantities and costs involved. ey have the option
of buying allocated gold, which banks store on behalf
of the owners. ere’s also unallocated gold, which
banks and investment funds own. Gold certi cates
and other securities can be backed by allocated or un-
allocated metal.
Central banks own gold, as Paul’s questioning of
Bernanke suggested. European central banks have
limited gold sales under a series of ve-year agree-
ments since 1999. e International Monetary Fund
(IMF), which promotes global nancial stability and
economic development, owns the metal as part of its
o cial reserves for international payments.
All this means investment demand plays a larger
role in setting the price of gold than it does with other
commodities. Industrial demand is tied to the pro-
duction of gold jewelry as well as dental llings and
electronic components.
e primary market for gold consists of sales by
mining companies to their customers. Investors aren’t
active in that market because there aren’t any initial
public o erings (IPOs) for newly produced metal. In-
stead, they do business in secondary markets, which
are split between spot and futures trading.
In spot markets, gold changes hands for immedi-
ate delivery. Buying and selling takes place over the
counter. While you won’t nd data about the price and
quantity of gold traded on a given day, market quotes
are available from brokerage rms and precious-metal
DEFINITION:
Spot markets
In spot markets, gold and
other commodities are sold for
immediate delivery. Futures
markets set prices for later
deliveries.
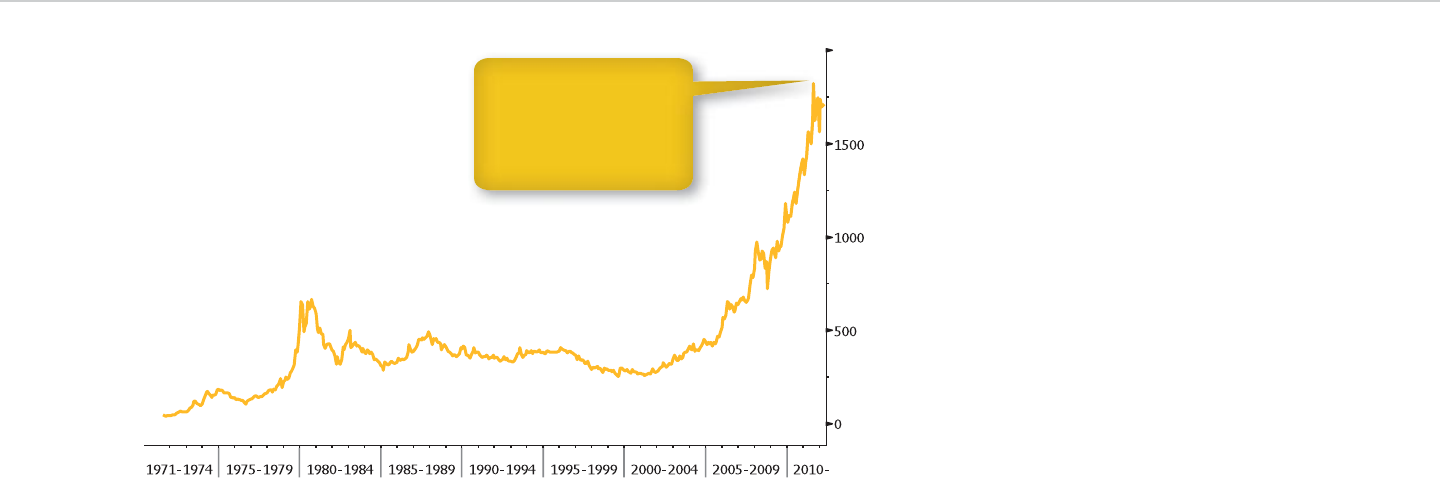
Visual Guide to Financial Markets ■65
trade on exchanges, which specify the amount and
quality of gold as well as other contract terms. Ex-
changes provide data on trades as they take place.
is makes the futures market easier to follow than
the spot market.
As the delivery date draws closer, any price gap
between gold futures and spot markets will usu-
ally shrink. There’s less of a difference over time
between estimates of the metal’s future price,
which affect the market value of the contract, and
its current price.
dealers. Spot prices are a benchmark for gold’s market
value.
Another benchmark is the London gold xing, a
price provided by a group of ve dealers. e price
comes from a spot market, dating back to 1919, which
operates each weekday morning and afternoon. e
group consists of the Barclays Capital unit of Barclays
Plc, Deutsche Bank AG, HSBC Holdings Plc, Bank of
Nova Scotia’s ScotiaMonetta unit and Societé Generale.
Gold futures prices are followed as well. Futures
contracts lock in the price for a later delivery. ey
Exhibit 4.1: Gold Prices Since the United States Ended Trading at $35/Ounce
Gold rose every year from
2001 through 2011, when
the metal soared more
than fi vefold after falling
54 percent in the previ-
ous two decades.
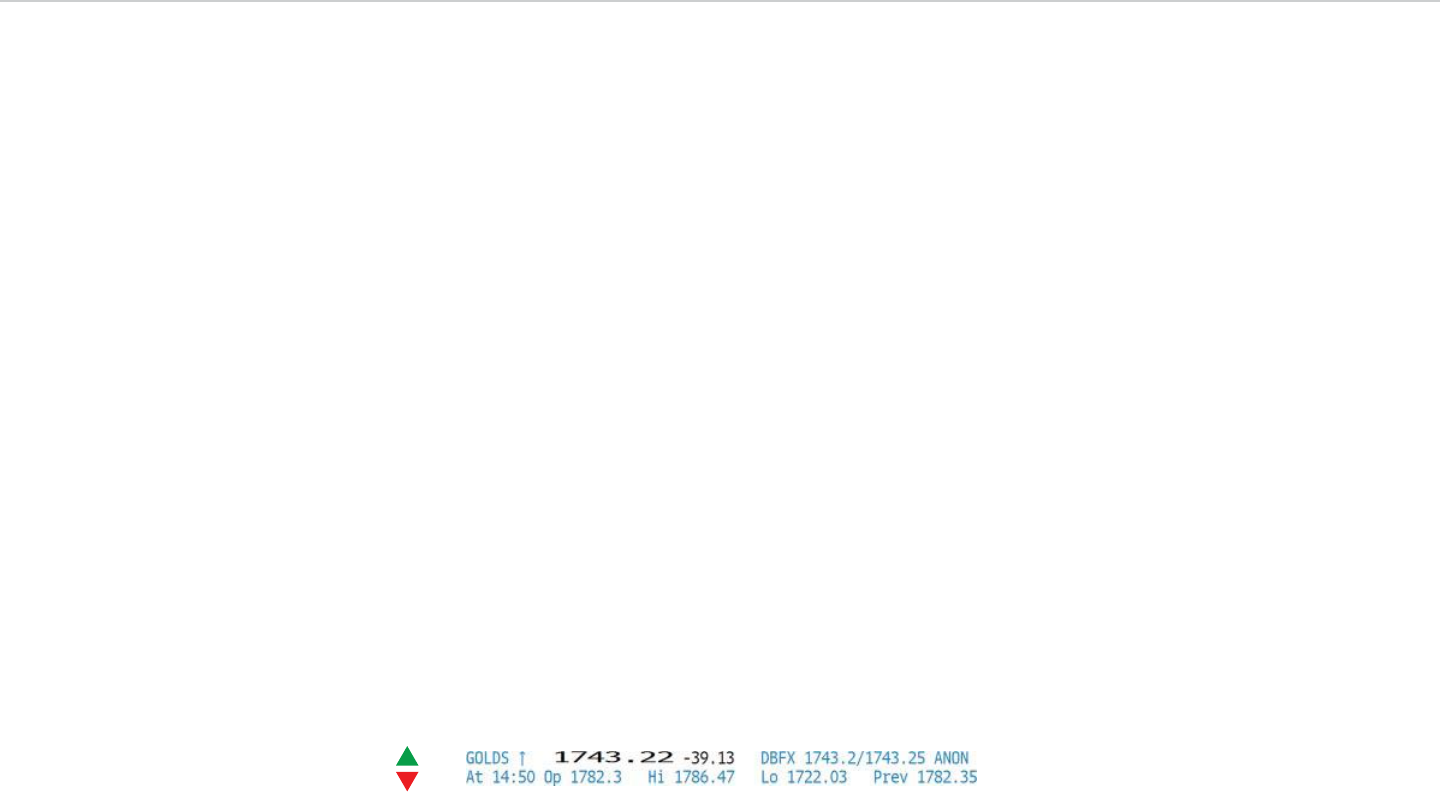
66 ■CHAPTER 4 Hard Assets
1743.2/1743.25: Highest bid price, $1,743.20 an
ounce, and lowest ask price, $1,743.25 an ounce.
ANON: Symbol showing the dealer with the lowest
ask price has chosen to remain anonymous.
At 14:50: Time of the latest update.
Op 1782.3, Hi 1786.47, Lo 1722.03: Opening, high,
and low prices for the current day.
Prev 1782.35: Closing price for the previous day,
based on the specied time and place.
Three Rs
Returns are easier to gure out for gold than for
stocks, bonds, and cash. Gold has no discount rate,
and you can avoid any payments in the calculations.
is means gold investors can’t count on income
they would otherwise receive. ey’re at the mercy of
swings in spot and futures markets.
Gold’s risks dier from those of nancial assets.
Owning the metal provides investors with insurance
against extreme outcomes, according to the late Peter
Bernstein, a market historian. e price of gold is the
premium charged for that insurance. When investors
We’ll take a closer look at futures later, when we
delve into derivatives. Let’s focus on spot trading.
Quotations
When you look for a quote on spot gold, Exhibit 4.2
shows what you might nd. Prices are quoted in dol-
lars worldwide, which explains why the dollar sign we
have seen in other quotes is missing.
GOLDS: Symbol for spot gold.
Up arrow: Uptick/downtick arrow, pointing in the
direction of the latest price change.
1743.22: Price of latest trade in dollars and cents.
-39.13: Change from previous day’s close. As with
currencies, the market never formally closes dur-
ing the week. e last trade at a specied time and
place, such as 6 p.m. Eastern time in New York, rep-
resents the closing price.
DBFX: Symbol for the gold dealer with the highest
bid price. In this case, it’s Deutsche Bank. e FX in
the symbol isn’t an accident, as some of the largest
securities rms have xed income, currency, and
commodity (FICC) trading desks.
Exhibit 4.2: A Spot Gold Quote

Visual Guide to Financial Markets ■67
Risks
ere’s a saying that every problem is an opportunity
in disguise. If that’s true, it might be said that gold in-
vestors see through the costume.
Risks to nancial, economic, and political stability
represent opportunities to make money in gold. Many
investors turn to the metal as a haven from these
kinds of threats. e phrase “safe haven” is often used
even though a haven would be safe by de nition.
Because of this tendency, growing investor con -
dence represents the biggest risk in owning gold. In-
vestment demand may decline as countries and regions
resolve issues that might lead to extreme outcomes.
Currency risk takes on a di erent meaning with
gold. A stronger dollar makes the metal more costly
for international investors, who must exchange their
local currencies for dollars before they can make
purchases. is may reduce investment demand and
bring down the price.
Relative Value
Gold traded for less than $300 an ounce when the
2000s began. e market price was about $1,100 when
the decade ended and approached $2,000 within the
next two years. Did that surge make the precious met-
al too costly?
is kind of relative-value question isn’t easily
answered. Gold lacks a yield that can be compared
with the yields on bonds or dividend paying stocks.
e metal doesn’t produce any revenue or earnings by
become more concerned that the outcomes might oc-
cur, the price or the premium tends to rise even as the
value of stocks, bonds, and cash falls.
Relative value is less obvious with gold as well. De-
ciding how much an ounce of the metal should cost is
more di cult than comparing prices in di erent mar-
kets. e kind of supply-and-demand analysis done
with other commodities is less useful because of the
larger role played by investment demand, which can
be volatile.
Returns
Gold bullion doesn’t pay interest. Gold bars don’t pay
dividends. Gold coins don’t generate any reinvest-
ment income. is means returns from owning bul-
lion, bars, and coins depend on price changes.
Storage and insurance costs reduce the returns.
Owners of allocated gold have to pay annual fees for
keeping the metal in bank vaults and insuring against
theft. ese costs, along with management fees, are
also borne by investors who have claims on unallo-
cated gold.
Gold futures add more variables to the return
equation as we’ll touch on later. Contracts end on a
regular schedule, and investors who want to main-
tain their bets must sell expiring contracts and buy
new ones. Price di erences between futures can
increase or cut into returns. Investors have to keep
money on deposit to own futures, and those funds
earn interest.
KEY POINT:
Investors in gold and other
commodities give up the
interest they would receive
from bonds and the dividends
that go along with stocks.

68 ■CHAPTER 4 Hard Assets
calculated for gold versus platinum and palladium,
two other precious metals.
Commodities
China’s emergence as one of the world’s largest econo-
mies has bolstered demand for raw materials. Im-
ports of steel, iron ore, coal, copper, aluminum, and
other industrial products have risen as the country
has gone through a building boom. Oil imports have
increased as China’s energy needs have grown faster
than production. Corn, wheat, soybeans, and other
agricultural items have been shipped in growing num-
bers as the Chinese standard of living increases, giving
consumers more money to spend on food.
Price increases spurred by the Chinese buying have
fueled growth in investment demand for commodities.
Greater interest in owning assets that perform di er-
ently than stocks and bonds and protect against in a-
tion has contributed as well. Another catalyst has been
the development of new ways to invest in them, such as
exchange-traded funds (ETFs), which we’ll cover later.
Commodities can be split into ve categories: pre-
cious metals, base or industrial metals, energy, agricul-
ture, and livestock. Growing demand for them has led
to higher prices in each category, as Exhibit 4.3 shows.
Gold ts into the precious-metal category along
with silver, platinum, and palladium. e latter two
metals are largely limited to industrial use. ey go
into catalytic converters, which reduce auto pollution,
and other products.
sitting in a vault, so there are no price ratios to work
with either.
Supply and demand gures can provide some in-
sight. e World Gold Council, an industry trade group,
presents them in quarterly reports. Gold buying is split
into three categories: investment, jewelry, and technol-
ogy. Even though jewelry makers are the biggest pur-
chasers, investors have been gaining on them.
In the end, anyone trying to nd out whether the
metal is cheap, expensive, or fairly valued has to focus
on the price of gold itself. Here are some comparisons
that are worth making in the analysis.
History: e price comparisons and the chart in this
chapter show that gold costs far more these days than
it did when the 1990s began. e chart illustrates that
a surge in the late 1970s gave way to two decades of
declines. at’s perspective worth having.
Other markets: Gold trades in several markets
worldwide beyond the ones already mentioned. In-
vestors with the ability to buy and sell in multiple
markets can look at prices to determine where they
can get the best deals. Similar opportunities may be
available by comparing spot and futures prices.
Other precious metals: Silver attracts some buying
from investors seeking a haven, and a ratio of gold
and silver prices can serve as a guide to their deci-
sion making. e ratio show how many ounces of sil-
ver would cost as much as one ounce of gold. When
gold trades at $1,800 an ounce and silver changes
hands at $30, the number would be 60. Ratios can be
KEY POINT:
The price of gold depends
on demand from jewelry
makers, electronic equipment
producers, and investors.
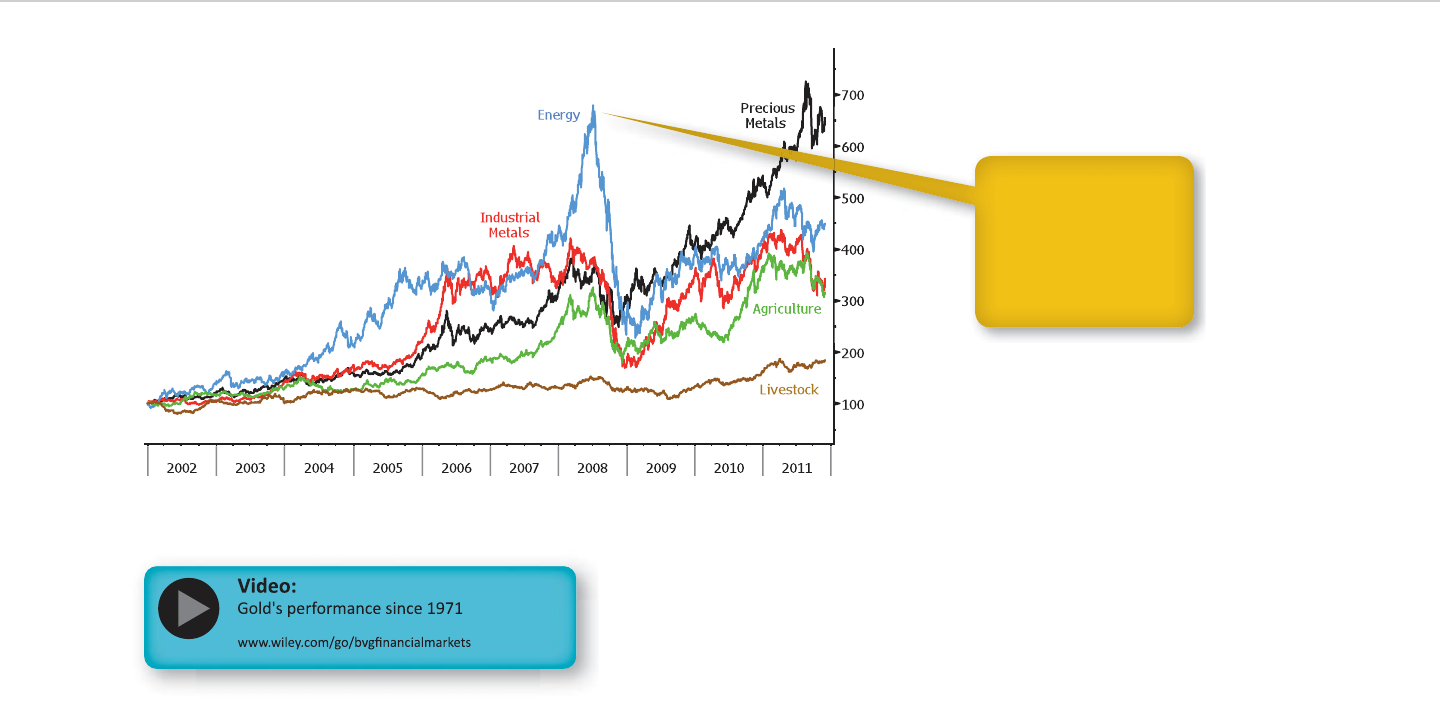
Visual Guide to Financial Markets ■69
Crude oil dominates energy trading even though
it’s only part of a bigger picture. Heating oil and gas-
oline, two commodities made from crude, change
hands actively. So do natural gas, coal, and electricity.
Grains such as corn, wheat, and soybeans are
mainstays of agricultural commodity markets, as
are foodstuffs, or food and beverages in raw form.
Cocoa, coffee, sugar, and orange juice are all food-
stuffs. The category can be stretched to include
cotton, which comes from plants, and lumber,
which begins with trees.
Copper is an example of a base metal. It’s some-
times described as Dr. Copper, the metal with a
Ph.D. in economics, because its gains and losses are
a barometer of the economy’s prospects. Aluminum,
lead, nickel, tin, and zinc are part of this group as well.
Exhibit 4.3: Commodity Market Performance (December 31, 2001 = 100)
Energy prices followed
the lead of crude oil,
which peaked at a record
$147.27 a barrel in New
York during July 2008
and plunged as much as
78 percent in the next six
months.
70 ■CHAPTER 4 Hard Assets
that are closely followed. Futures can serve as price
references for other commodities.
We’ll concentrate on spot markets because we
haven’t looked at futures. When we do, we will feature
commodities prominently.
Quotations
Even though spot prices for commodities aren’t al-
ways benchmarks, it’s worth taking a look at one that’s
closely tracked (see Exhibit 4.4).
e quote is for a grade of crude oil called West
Texas Intermediate (WTI). It’s a benchmark for oil
contracts because it’s plentiful, ows more easily than
other grades, and is low in sulfur, which costs extra to
remove.
WTI spot trading takes place over the counter,
which means there’s little data available. e quote is
based on the price of the WTI futures contract closest
to expiring, and anyone seeking a more detailed look
at the market would have to focus on futures. Here are
the components of the spot quote:
USCRWTIC: Symbol for WTI on the Bloomberg ter-
minal. USCR stands for U.S. crude, as there’s more
than one grade. e C at the end refers to Cushing,
Oklahoma, where deliveries are made.
Cattle and hogs are examples of the livestock that
change hands in commodity trading. Pork bellies,
used to make bacon and featured in the 1983 movie
“Trading Places,” were in this group. Contracts on fro-
zen bellies stopped trading in 2011 after restaurants
shifted toward bacon made from fresh bellies.
All these products can be identi ed as commodities
because they are widely available, essentially the same
regardless of where they’re produced, and raw materials
rather than nished goods. Even gasoline is processed
before it’s sold at the pump.
Gold, oil wells, corn elds, or cattle herds are iden-
tical in terms of trading. e key di erence in trading
is between spot and futures markets, as opposed to
primary and secondary markets.
Spot markets on many commodities are small
and hard to follow. Base metals are one excep-
tion because there’s a spot market operated by the
London Metal Exchange, which reports trading
data. Precious metals are another, as spot trading
occurs in gold, silver, platinum, and palladium. Fu-
tures markets are more active and widely followed
than spot markets as a rule. When people discuss
oil prices, they’re more likely to refer to New York
or London futures trading than spot prices in West
Texas or the North Sea, two oil-producing regions
DEFINITION:
Commodities
Commodities are raw materials.
There are fi ve main categories:
precious metals, base or
industrial metals, energy,
agriculture, and livestock.
KEY POINT:
West Texas Intermediate, or
WTI, is one of many grades of
U.S. crude oil. Others include
Bakken UHC (U.S. High Sweet
Crude) and Louisiana Light
Sweet. Crude is classifi ed as
light or heavy by its density,
and as sweet or sour based on
its sulfur content.
Exhibit 4.4: A West Texas Intermediate Crude-Oil Quote

Visual Guide to Financial Markets ■71
Additionally, you can assess relative value in com-
modities in ways that are less relevant for gold. Inves-
tors can look at whether to sell them now or to store
them for sale later. ey can compare the cost of raw
materials, such as crude oil, with the price of products
to gauge processing pro ts.
Returns
Chances are that no one will o er a chance to buy
1,000 barrels of crude oil unless you’re an institutional
investor, a brokerage, or an energy company. Let’s sus-
pend disbelief for a moment and pretend the oppor-
tunity arose.
Assuming you made the deal, changes in the
price of crude would determine if you turned a
profit. Any gain would have to exceed storage and
transportation costs for the oil, along with trading
fees and expenses.
Returns for commodity futures work the same
way as those for gold futures, so price changes aren’t
the whole story. Many investors sell contracts as
the expiration date approaches and buy contracts
that mature at a later date. This process is called
a futures roll, and we’ll learn more about it when
we focus on futures. For now, it’s enough to know
that the price gap between contracts has an effect
on returns.
Interest on deposits has to be accounted for. e
funds, known as margins, vary from one contract to
the next. We’ll revisit them in our look at futures.
Down arrow: Uptick/downtick arrow, showing the
direction of the latest price change.
80.00: Latest price. ere’s no dollar sign included
before the amount because oil, like gold, is priced in
dollars worldwide.
–5.75: Change from the previous day, $5.75.
80.00/80.00: Bid and ask prices, which are the same
here.
At 13:52: Time of the quote, using the 24-hour clock.
Op 80.39, Hi 80.98, Lo 80.00: Opening, high, and low
prices for the current day.
Three Rs
Metals, energy, agriculture, and livestock are the same
as gold from an investor’s perspective. e interest
payments made on notes and bonds and the divi-
dends available from stocks are nowhere to be found.
Unless the price moves the right way, the commodity
investment doesn’t make any money.
e risks di er because demand for commodities
is tied to economic growth rather than instability.
ere’s a greater need for metals used in buildings,
machinery, cars, appliances, electronics, and other
products as the economy accelerates. Oil, natural gas,
and other forms of energy provide the power to keep
them running. Grains, meats, and other foods gain
popularity as household income increases, especially
in emerging markets.
DEFINITION:
Futures roll
In a futures roll, traders sell
contracts about to come due
and buy contracts with a later
expiration date.

72 ■CHAPTER 4 Hard Assets
was for gold. Prices and price moves can be more tell-
ing, as you’ll see from these possible comparisons.
History: Energy soared far more than other com-
modities during the 2000s and tumbled before
the end of the decade, as the chart in this chapter
shows. Precious metals ended up in a similar posi-
tion more recently. Anyone making the comparison
might conclude that history would repeat itself, a
signal that gold and other precious metals were too
expensive. at’s the kind of insight available from
studying past pricing.
Other markets: Oil, like gold, is traded around the
world. ough crude varies more than gold in its
makeup, investors can make judgments about rela-
tive value that account for those di erences. As a
price gap between two grades of crude widens or
narrows, one or the other may become cheap. at
happened in 2011 with WTI, a benchmark for U.S.
trading, as Exhibit 4.5 illustrates. WTI changed hands
for about $28 a barrel less than its European coun-
terpart, North Sea Brent (Brent), during the year as
shipments failed to keep pace with production.
Similar commodities: Five categories were de ned in
the chart. It’s possible to split grains from food and -
ber, namely cotton, in the agricultural products group.
Prices for the commodities within each group provide
a basis for making buying and selling decisions.
Raw material versus products: Oil markets have
crack spreads. Crack refers to a catalytic cracker, a
Risks
Economic risk stands out as a concern for commod-
ity investors as noted earlier. ese days, the big-
gest risk is related to the Chinese economy. China is
the world’s largest buyer of many commodities, and
slower growth in the country could send shock waves
through markets for raw materials.
Market and liquidity risks are present, especially
for investors owning commodities rather than fu-
tures. ere may be less demand for 1,000 barrels of
oil than for a contract on the same amount of crude.
e oil buyer would have to take delivery, unlike the
futures buyer, who can sell the contract later without
owning the crude.
Commodity investors have to be mindful of event
risk. Floods, droughts, and other natural disasters
can cause price swings, tied to changes in supply.
Shipping lane closures, pipeline breakdowns, and re-
nery shutdowns can have the same e ect.
Relative Value
Commodities o er more opportunity to analyze
what’s cheap, expensive, or fairly priced than gold if
only because more than one product is available to
consider. Each has its own balance of supply and de-
mand, which can be tracked through industry data.
For instance, U.S. government statistics in uence
prices for energy, farm products, and livestock.
ough equivalents for bond yields and stock price
ratios are unavailable, that’s less of an issue than it
KEY POINT:
Like gold, oil is priced in dollars
worldwide. This means WTI
and Brent can be compared
directly even though Brent is
produced in a region where the
dollar isn’t the local currency.
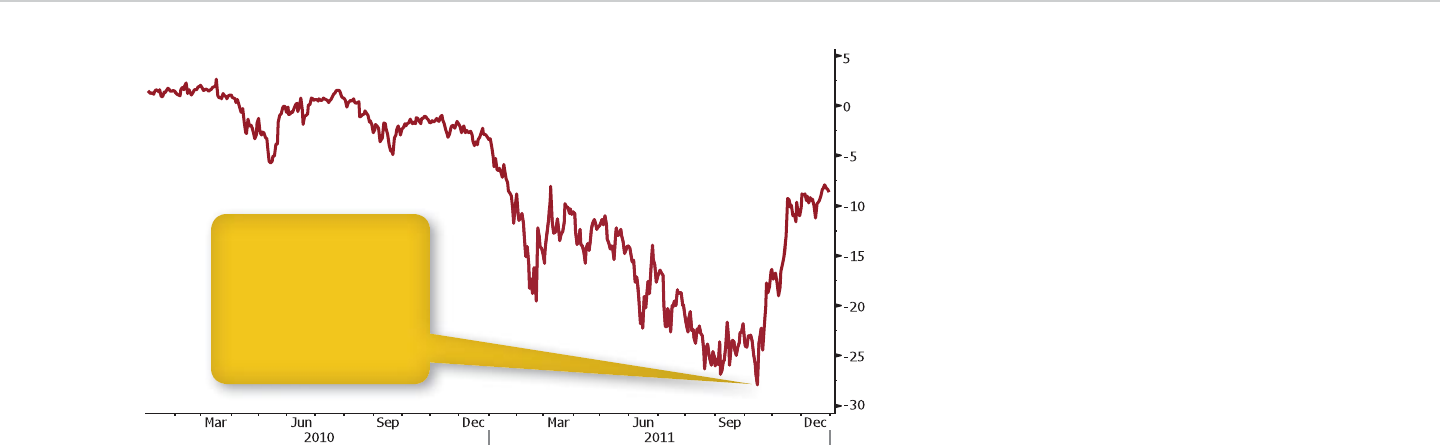
Visual Guide to Financial Markets ■73
bonds, and money market securities. Under David
Swensen, who was named chief investment o cer in
1985, the endowment posted an average annual return
of 13.1 percent for the 20 years ending in June 2010.
Near the end of the period, the fund had the big-
gest chunk of its money in “real assets,” as de ned
in nancial reports. Oil and gas elds and farmland,
which bene ted from commodity price increases,
were among them. ere was also real estate.
When Yale’s endowment and other institutional
investors put money into real estate, they have two
choices at their disposal. First, they can buy proper-
ties themselves, hire managers to run them, and earn
piece of re ning equipment that turns crude into gaso-
line, heating oil, and other products. Spreads track the
di erence between the cost of crude and the market
price of the products, a gauge of relative value. Re ners
make more money when these spreads widen and less
when they narrow. Similarly, crush spreads compare
the cost of soybeans with the price of soybean oil and
soybean meal, produced by crushing the beans.
Real Estate
Yale University’s endowment fund became a model for
its peers by making investments well beyond stocks,
Exhibit 4.5: Price Gap between WTI and Brent (in $/barrel)
The WTI discount wid-
ened to a record $27.88
a barrel in October 2011
because of a bottleneck
in Cushing, Oklahoma,
where oil buyers take
delivery under futures
contracts.

74 ■CHAPTER 4 Hard Assets
employees on business trips, bene ting the hotel and
motel industry.
U.S. commercial real estate values went through a
bigger boom and bust than home prices in the 2000s
and beyond, as the chart below shows. e swings
in commercial prices are re ected in an index from
Moody’s Investors Service and another company, Real
Estate Analytics LLC. e housing index comes from
S&P, working with economists Robert Shiller and Karl
Case (see Exhibit 4.6).
ough economic growth in uences residential
real estate values, the two don’t move in tandem.
Demand for rental housing may rise when the econ-
omy falters because fewer people can a ord to buy
homes. is was the case during the 2007–2009 reces-
sion and its aftermath, a period in which apartment
demand rose as falling house prices deterred many
potential buyers.
Land values mirror the economy more closely be-
cause the pace of growth in uences the value of the
commodities produced there. e housing bubble
that ended in 2007 meant higher prices for lum-
ber and the timberland where the wood came from.
China’s increasing demand for crop imports has had a
similar e ect on farmland. Higher energy and metals
prices have meant rising values for oil and gas leases
and mining rights.
e primary market for real estate is composed
of sales, leases, and rentals that property developers
make. When a building or piece of land gets bought,
the purchase takes place in the secondary market.
the income they produce. Second, they can invest in
real estate funds and leave all the work to the fund
manager.
Most individual investors don’t have the same
kinds of opportunities because the price tag for real
estate is too high. ey might be able to buy a home
or two and rent them, but that’s about it. Real estate
funds are a less costly investment along with real es-
tate investment trusts (REITs), which are speci cally
created to own property and are governed by di erent
rules than the average company.
We’ll look at REITs more closely later, when we re-
visit the investments covered so far. For now, let’s fo-
cus directly on the real estate.
ere are three main types of investment proper-
ties: commercial, residential, and land. Shopping
malls and stores, o ce buildings, warehouses, self-
storage facilities, hotels and motels, and hospitals are
examples of commercial real estate. Apartment build-
ings are in the residential category along with mobile
home parks. e oil and gas elds and farms that
Yale’s endowment fund owns take their place along-
side timberland, mine sites, and undeveloped land as
investment choices.
e value of commercial property has much to
do with the economy’s performance. When consum-
ers are spending more, the value of the places where
they make purchases is likely to rise. When corpo-
rate pro ts are increasing, companies are more likely
to expand, which means they may have to add o ce
and warehouse space. ey are more likely to send
KEY POINT:
The Moody’s/REAL index is
based on commercial real estate
sales valued at more than
$2.5 million. The S&P/Case-
Shiller indexes refl ect home
sales across the U.S. and in 20
metropolitan areas.
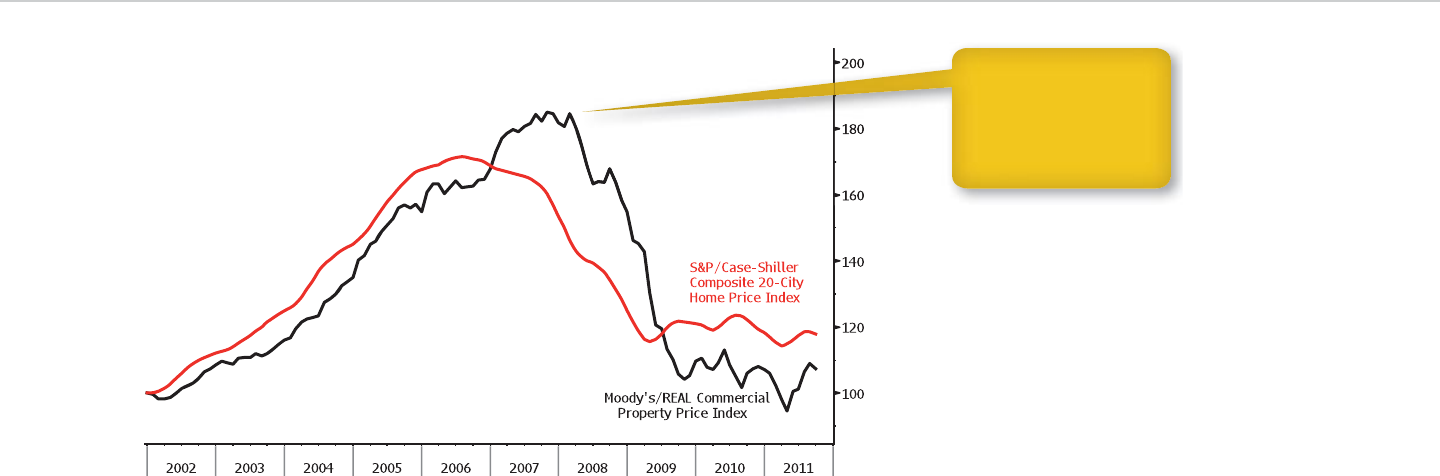
Visual Guide to Financial Markets ■75
ere are no symbols, market prices, volume g-
ures, or any other details we have become used to see-
ing for securities. Properties don’t change hands often
enough to generate those kinds of data.
Three Rs
When we looked at notes and bonds earlier, we
saw yield was a common denominator for deciding
what was cheap, expensive, and fairly valued. Real
estate has a similar gauge, known as capitalization
(cap) rates.
Speci c properties seldom change hands, and
there isn’t an exchange where they are bought and
sold. Instead, real estate brokers line up property list-
ings and work with potential purchasers to arrange
sales. Investment banks take the place of brokers for
more costly deals.
Quotations
Price quotes on real estate are about as simple as it
gets. ey consist of an o er price, which is the dollar
amount that a seller wants for the property.
Exhibit 4.6: U.S. Commercial Real Estate, Home Prices (December 2001 = 100)
Commercial real estate
peaked after a U.S. reces-
sion began in December
2007 and fell further than
home prices during the
slump.

76 ■CHAPTER 4 Hard Assets
As part of that process, they would want to know how
much they stand to make on the deal.
Cap rates indicate what’s possible. e rate for
our example is 8 percent, or $120,000 divided by
$1.5 million. If a buyer pays less for the shopping cen-
ter, the rate will increase accordingly. If multiple bid-
ders are competing and the price rises, the rate will
drop. e relationship is the same as the link we saw
earlier between note and bond prices and yields.
Di erences between cap rates and yields exist that
are worth noting. Net operating income isn’t guar-
anteed. Next year’s earnings may decline as retailers
close and stores go unoccupied, or as maintenance
costs pile up. Either of these events would reduce the
cap rate. On the other hand, income may increase as
store leases expire and the owner raises rates. e cap
rate would rise accordingly.
The 8 percent figure may not be comparable to
cap rates for other shopping centers. Data used to
calculate the rates often aren’t publicly available,
and accounting differences among property owners
may affect the results. Less room for discrepancies
is available with 10-year note yields, for instance,
as security prices and payment amounts can be
verified.
Financing costs are another variable to consider
though they weren’t included in our example. e
8 percent gure assumed the buyer paid cash for
the property, which is seldom done. Any interest
expense on debt would have to be subtracted from
net operating income to calculate returns.
Cap rates indicate how much an investor stands
to earn on a property. ey’re based on income, op-
erating expenses, and purchase prices. Only purchase
prices are xed, which means the rates may be more
volatile than bond yields. We’ll see how they’re put to-
gether shortly.
Real estate owners face the same kind of business-
related risks as holders of a company’s debt and equi-
ty. ey must make relative-value judgments, compli-
cated by a lack of publicly available data. Let’s spend
some time looking at how the three Rs apply to them.
Returns
As yields are a starting point for note and bond re-
turns, cap rates show the potential gains from real es-
tate. ey provide a way to evaluate properties and to
determine if deals are worth doing or avoiding.
Cap rate calculations begin with rent or lease pay-
ments, depending on the type of building. For example,
let’s consider a shopping center that receives $12,000
a month from the retail stores located there. Multiply
the amount by 12 and you end up with $144,000 a year
in income.
We have to subtract the costs of maintenance, re-
pairs, and other expenses of running the building. Let’s
assume they totaled $24,000 for the latest year. Subtract
that amount and we’re left with $120,000, which real es-
tate investors would de ne as net operating income.
ere’s one more detail to add to this scenario: the
property is up for sale with a $1.5 million asking price.
Prospective buyers would have to evaluate its worth.
DEFINITION:
Cap rates
Capitalization (cap) rates in-
dicate the annual return from
owning a property. They can be
calculated for specifi c buildings
and land and for real estate
companies.

Visual Guide to Financial Markets ■77
Cap rates provide a way to compare returns on
real estate and other types of investments. Blackstone
Group LP carried out a $39 billion buyout of Equity
O ce Properties at a 5.3 percent cap rate, as noted in
a February 2007 story from Bloomberg News. at was
a record low, according to Green Street Advisors Inc.,
a research rm that came up with the gure. Ten-year
Treasury notes yielded about 4.7 percent, which indi-
cated the additional return on the deal was only about
0.6 percentage point.
Even so, this analysis has limits. Cap rates aren’t
turned into the equivalent of yield curves as the
time element isn’t the same. Instead of maturity
dates, the timing of deals matters. More recent sales
are usually a better gauge of value than those com-
pleted months earlier, when the real estate market
may have differed.
To address the issue, brokers and investment
banks obtain data on comparable properties (comps)
that have changed hands. Looking at the comps helps
the rms set selling prices along with aiding potential
buyers.
Replacement value and income potential provide a
basis for judging if real estate is worth buying. e rst
gauge is based on the projected cost of a new building
that’s similar to the one being sold. e second focus-
es on how much money the property could generate,
as opposed to the current income.
Risks
When we revisit the rst level of risks, we can see two
signi cant ones for investors in real estate. Liquid-
ity risk is relatively high because o ces, apartments,
and other buildings often carry price tags in the mil-
lions of dollars and can take months or years to sell.
Economic risk is an issue for owners of commercial
properties, as their success in nding tenants and
producing income depends on how well businesses
are performing.
Business risk, event risk, and industry risk apply.
Real estate investors may end up with properties that
are less lucrative or are in less desirable locations, as
the market changes over time. Disputes may occur
with leaseholders or tenants that result in lost pay-
ments and legal costs.
Fires, oods, and other disasters can destroy and
damage buildings, which reduces income and increas-
es expenses at the same time. And when the industry
takes a turn for the worse, there’s plenty of su ering to
go around, as Exhibit 4.6 makes clear.
Relative Value
e similarity between cap rates and note and bond
yields carries over to their use in evaluating what’s cheap,
expensive, or fairly priced. Comparing rates is similar to
studying yield spreads. e higher the rate, the more val-
ue there may be in a property, and vice versa.
1. Suppose an offi ce building is
up for sale at $3 million.
2. Income from rents and leases
is $25,000 a month. Multiply
the monthly amount by 12 for
the annual income: $300,000.
3. Maintenance and repair costs
are $120,000 a year. Subtract
the expenses from annual
income for the net operating
income: $180,000.
4. Divide $180,000 into $3 mil-
lion to calculate the cap rate,
expressed as a percentage: 6
percent.
STEP-BY-STEP:
CAP RATE MATH
KEY POINT:
Cap rates can vary more than
note and bond yields over time
because a property’s cash fl ow
and maintenance costs have
more room to fl uctuate than
interest payments.

78 ■CHAPTER 4 Hard Assets
4. Commodity-related properties that investors can
buy include:
a. Farms.
b. Timberland.
c. Oil and gas elds.
d. All of the above.
e. a and b only.
5. Cap-rate calculations for real estate exclude:
a. Rental income.
b. Maintenance costs.
c. Interest payments.
d. All of the above.
e. a and b only.
Answer the following multiple-choice questions:
1. Investors seeking to own gold can buy:
a. Jewelry.
b. Bullion.
c. Futures.
d. All of the above.
e. a and b only.
2. ese organizations own gold:
a. e Federal Reserve.
b. e World Bank.
c. e United Nations.
d. All of the above.
e. a and b only.
3. e benchmark grade of U.S. crude oil is commonly
called:
a. USCR.
b. WTI.
c. Brent.
d. All of the above.
e. a and b only.
Answers: 1. d; 2. e; 3. b; 4. d; 5. c

79
Indexes
The 2000s have been called a lost decade for U.S.
stock investors because they lost money even
after taking dividends into account. Exhibit 5.1 shows
how stocks fared relative to the dollar, bonds, com-
modities, and real estate in the 10-year period.
This kind of comparison is made possible by
market indexes, which track performance over
time. Indexes provide a way to gauge the daily per-
formance of currency, debt, equity, and hard asset
markets and a way to assess their moves during
the day.
Each market has indicators that provide more spe-
ci c data. Stock indexes, for example, can be used to
compare larger companies with those that are mid-
sized and smaller. ey track industry groups and
other market segments.
Money managers use indexes to show whether
they’re beating the market. Funds specializing in the
largest U.S. companies may focus on how their re-
turns compare with those of the Standard & Poor’s
500 Index, a gauge of similar stocks. Bond funds may
use debt indexes for the same purpose.
Indexes provide a basis for the derivatives and
funds that we’ll come across in looking at indirect
investing. Various contracts are tied to an index’s
value, and hundreds of funds are designed to mirror a
benchmark’s moves.
Put another way, indexes let you follow markets
and provide a way for you to invest in them. is dual
purpose is more than enough reason to take a closer
look at these indicators.
Currency
When people talk about a weaker or stronger dollar,
they might be referring to another speci c currency,
like the yen. In many cases, they’re talking about a
gain or loss of value against a number of currencies.
Indexes are the easiest way to track the broader
moves. Exhibit 5.2 compares the performance of three
indicators during the 2000s.
KEY POINT:
Indexes are gauges of market
performance. They serve as
the underlying assets for some
derivatives and as benchmarks
for funds.
Visual Guide to Financial Markets
by David Wilson
Copyright © 2012 by David Wilson.
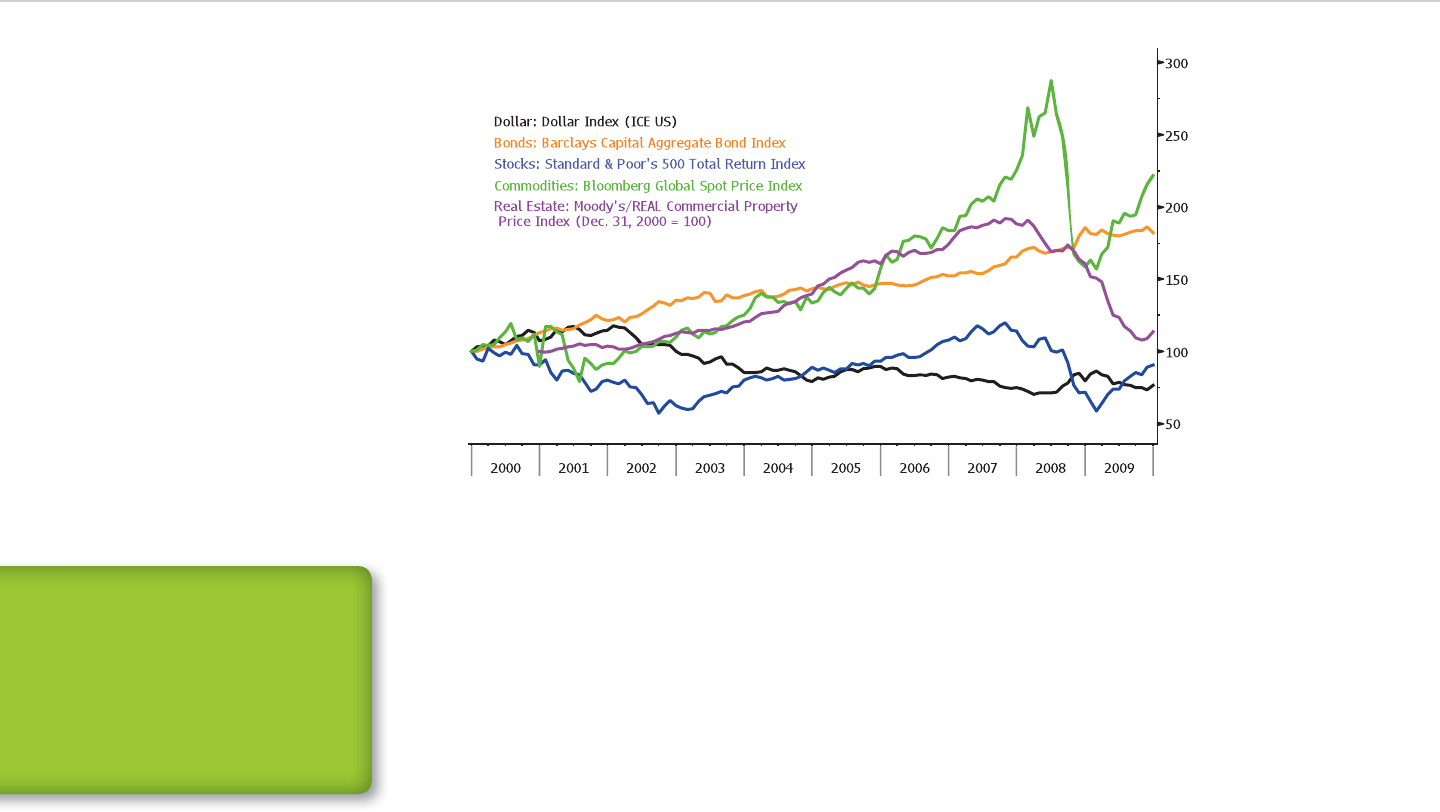
80 ■CHAPTER 5 Indexes
e Dollar Index is among them. e indicator,
calculated by the IntercontinentalExchange (ICE),
is based on the value of the U.S. currency against the
euro, Japanese yen, British pound, Canadian dollar,
Swedish krona, and Swiss franc.
Trade is taken into account in determining each
currency’s share of the index. The euro accounts
for more than half of its value. That’s based on the
amount of imports and exports moving between
the United States and countries using the European
currency.
Two trade-weighted indexes are compiled by the
Federal Reserve (Fed). One of them shows the dollar’s
value against major currencies, de ned by the Fed as
the Australian dollar and the components of the Dollar
Index. e other is broader, including the Chinese yuan,
Mexican peso. and other emerging market currencies.
ese indexes, and others compiled by rms such
as Barclays Capital and Goldman Sachs, are based on
the dollar’s swings against other currencies. Deposit
rates, mentioned earlier as an in uence on invest-
ment returns, aren’t part of the calculations.
DEFINITION:
Trade-weighted indexes
A trade-weighted index is
based on the value of a coun-
try’s currency against several
others. Each currency’s weight-
ing in the index is tied to the
share of trade with the country.
Exhibit 5.1: Market Performance during the 2000s (December 31, 1999 = 100)
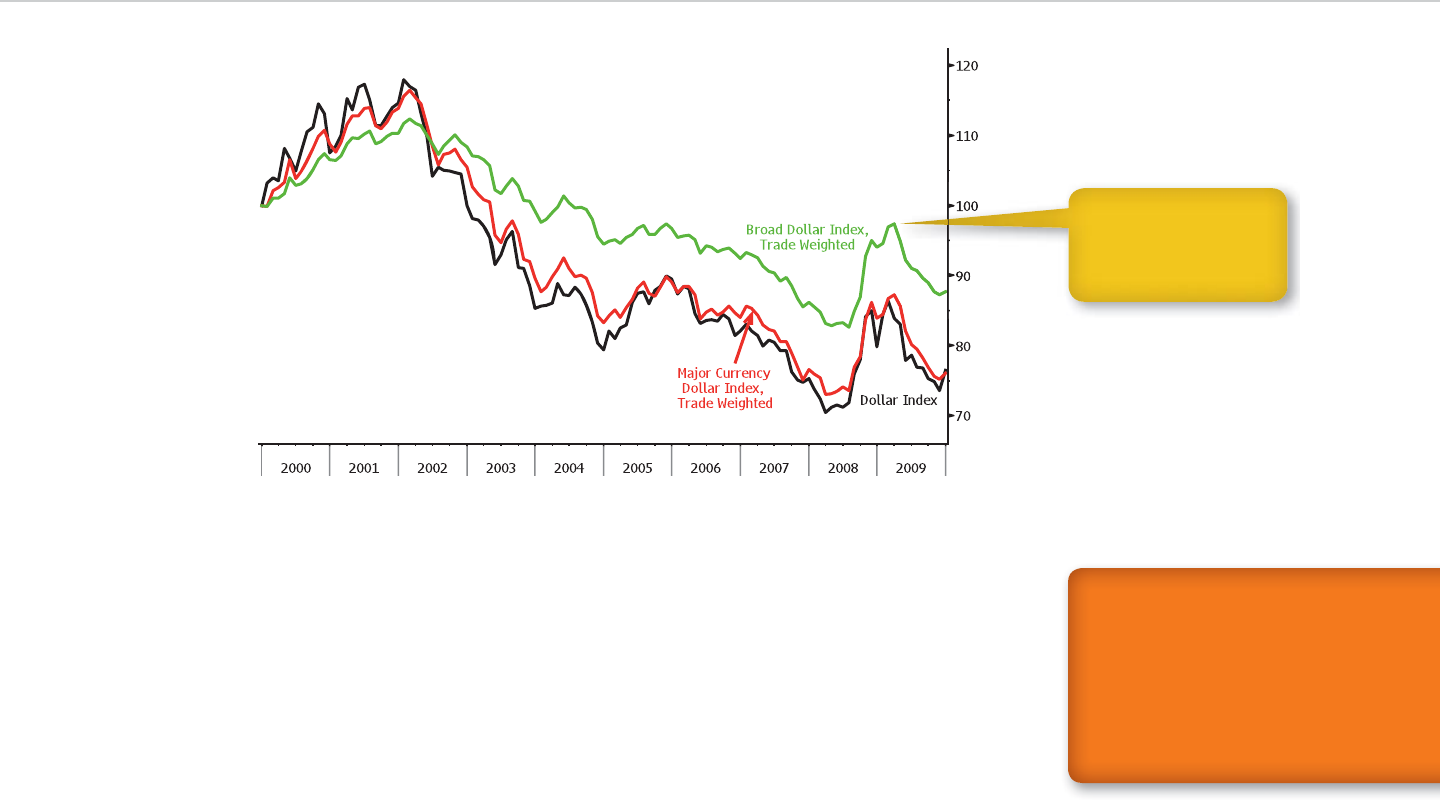
Visual Guide to Financial Markets ■81
Debt
Lending money to governments and companies pro-
duced the kinds of returns in the 2000s that were asso-
ciated with stocks in past decades. Exhibit 5.3 shows
the relative performance of government debt, corpo-
rate debt, mortgage-backed debt, and municipal debt,
as well as Treasury bills, during the 10-year period.
In Exhibit 5.3, the four bond indexes were relatively
close to each other when a crisis began to sweep
through the nancial system in 2007. At that point,
many investors bought Treasury securities for their
relative safety and sold riskier types of debt, especially
corporate securities.
It’s worth noting that these indexes weren’t provided
by exchanges, which play a minor role in bond trading.
e government bond indicator is compiled by Bloom-
berg, along with the European Federation of Financial
Analysts Societies (EFFAS), a regional trade group.
e corporate, mortgage, and municipal indexes
come from Barclays Capital, a unit of Barclays Plc
that’s among the biggest dealers in U.S. bonds.
KEY POINT:
Indexes can track price
changes or total returns, which
include interest or dividend
income. Bond benchmarks
refl ect returns, while the most
widely followed stock-market
indicators are price-based.
Exhibit 5.2: Currency Index Performance (December 31, 1999 = 100)
Sources: ICE US, Federal Reserve, Bloomberg.
The dollar held onto more
value in the currency
market against smaller
countries than the U.S.’s
main trading partners.
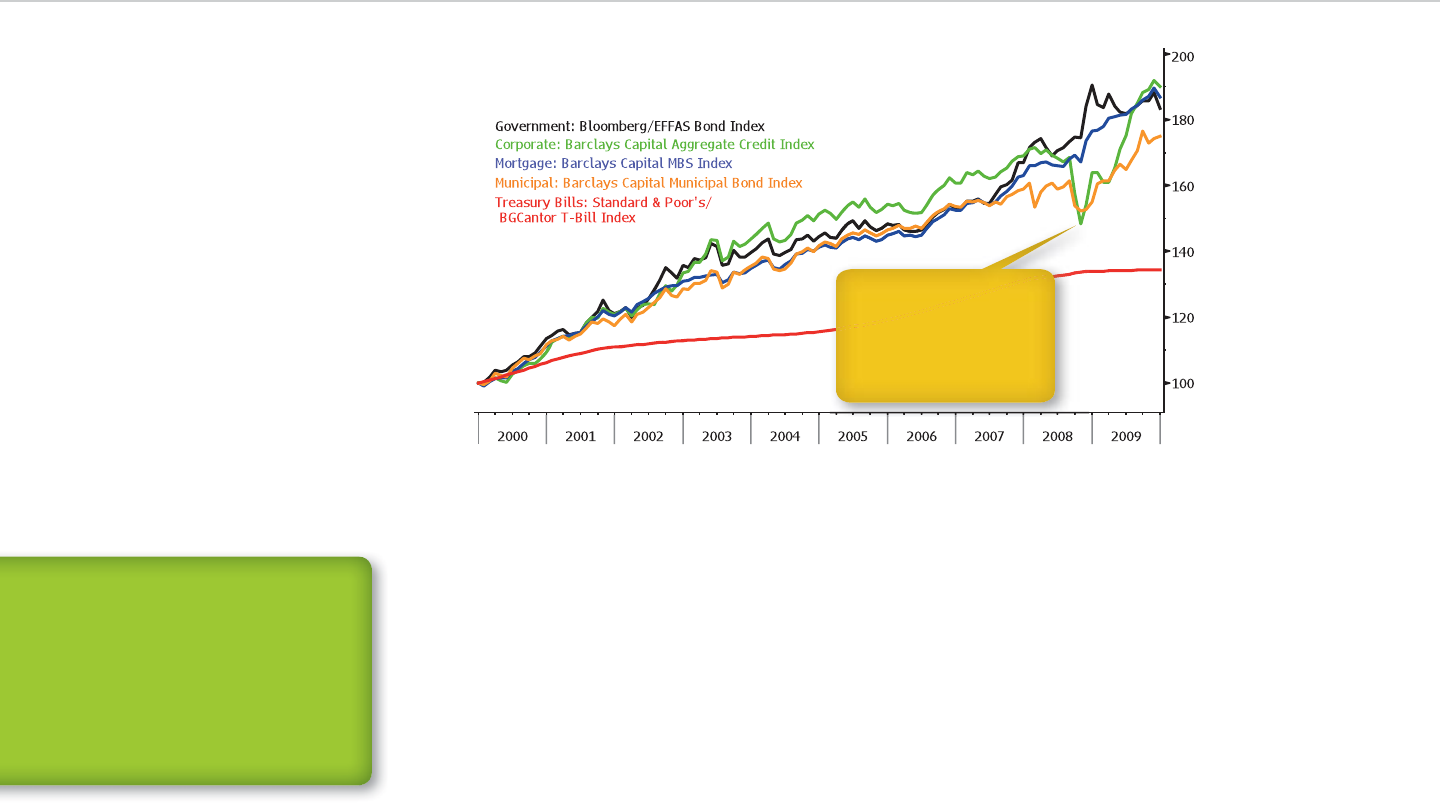
82 ■CHAPTER 5 Indexes
e Treasury-bill index is from Standard & Poor’s and
a market data unit of BGC Partners Inc., a bond broker.
BGC is a recent entrant into the world of bond
data, as the bill index made its debut in March 2010.
e Barclays Capital indicators have been around for
longer, as they were produced by Lehman Brothers
Holdings Inc. before that rm went into bankruptcy
in September 2008.
Bond indexes from securities rms have tradition-
ally served as market benchmarks. Bank of America
Corp.’s Merrill Lynch unit and JPMorgan Chase & Co.
are among the providers of index series similar to
Barclays Capital’s.
S&P and other independent providers compile
bond indexes as well. Bloomberg produces gauges for
Treasuries and government bonds in 25 other coun-
tries through an agreement with EFFAS.
Regardless of who puts them together and calcu-
lates their value, bond indexes are based on total re-
turns, which account for interest payments and price
changes. is feature sets them apart from the most
widely followed stock indexes.
Other indexes track the average yield spread be-
tween a speci c category of bonds and U.S. Treasuries.
ese are called option-adjusted spreads (OAS) be-
cause they account for the value of any options built
DEFINITION:
Option-adjusted spreads
Option-adjusted spreads (OAS)
exclude the estimated value of
options to call, put, or convert
individual securities. They are
used to calculate some bond
indexes.
Exhibit 5.3: Bond Index Performance (December 31, 1999 = 100)
Corporate bonds became
the U.S. bond market’s
top performers of the
2000s by rebounding from
a plunge during the 2008
fi nancial crisis.

Visual Guide to Financial Markets ■83
into the bonds. A borrower might be able to buy back
the debt before maturity at a set price, or an owner
may be able to sell it back the same way. Taking them
out of the equation ensures the bonds are comparable
to each other.
Indexes may focus on bond-market segments, espe-
cially for government debt. e Bloomberg and EFFAS
indexes, for instance, break down Treasury bills, notes,
and bonds into six categories based on the amount of
time to maturity. ere are indexes for securities ma-
turing in less than a year, 1 to 3 years, 3 to 5 years, 5 to
7 years, 7 to 10 years, and more than 10 years.
Equity
U.S. stock-market reports in newspapers, online, and
on radio and television cite three indexes as a matter
of course. ey are the Dow Jones Industrial Average
(DJIA or Dow), the Standard & Poor’s 500 Index, and
the NASDAQ Composite Index.
e Dow average is the oldest of these indicators.
It has been calculated since 1896 and has been
composed of 30 stocks since 1928. e average’s mem-
bers are among the biggest U.S. companies. Not all of
them are industrials these days as nancial stocks
are included.
Standard & Poor’s introduced the S&P 500 in 1957,
and data for the index go back to 1928. e S&P 500
tracks more of the largest U.S. companies than the
Dow industrials and is more widely used as a gauge of
money managers’ performance. Funds with trillions
of dollars in assets use the S&P 500 as a benchmark.
Some are created specically to mirror the index, and
we’ll learn more about them later.
e NASDAQ Composite tracks all of the shares
listed on the NASDAQ Stock Market. Technology com-
panies account for the bulk of its value. Two of the big-
gest ones are Microsoft Corp. and Intel Corp., which
became the rst NASDAQ companies to join the Dow
industrials in 1999.
Exhibit 5.4 shows how the lost decade of the 2000s
looked for each of the three indicators.
Stock indexes can be dened by three criteria,
starting with their coverage. e Dow industrials
and the S&P 500 cover the entire U.S. market, but the
NASDAQ Composite is tied to a specic exchange.
Other indexes focus on market segments. e
Russell 2000 Index, compiled by Russell Investments, is
a good example. e Russell 2000 is a popular indicator
for small-cap companies, which have less market value
than those in the Dow average or the S&P 500.
S&P has four levels of indexes that track industry
groups. e broadest consists of 10 categories, in-
cluding two for consumer-related companies. Energy,
nancial, health care, industrial, raw material, tech-
nology, and telephone and utility companies round
out the lineup. e narrowest has about 130 indus-
tries, including some that consist of only one or two
companies.
e second criteria is the method of weighting or
determining each stock’s eect on the value of an in-
dex. Share prices are used for the Dow industrials. e
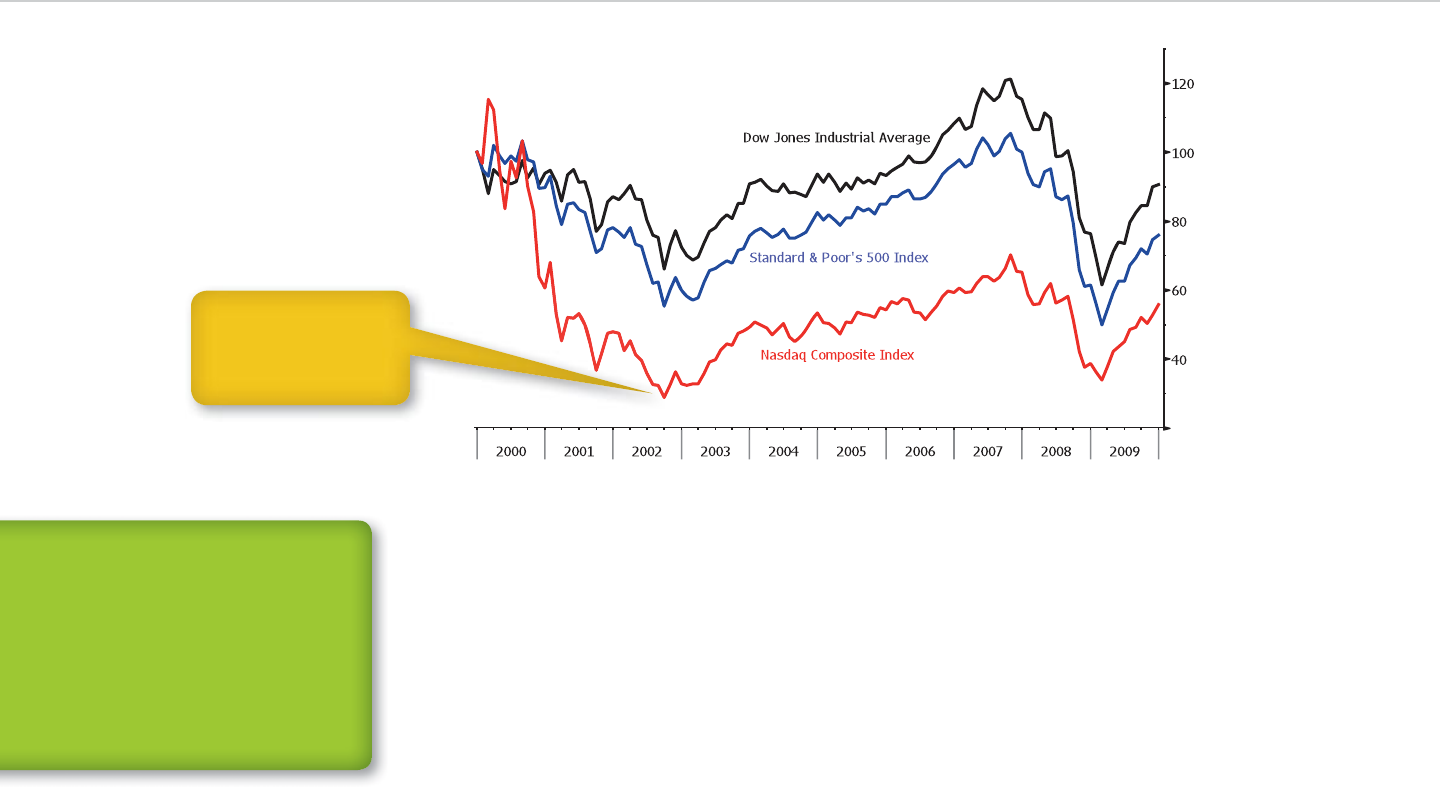
84 ■CHAPTER 5 Indexes
company whose stock costs the most to buy counts
the most in the average, and vice versa. Company size
doesn’t matter, so the smallest member of the average
could have the biggest e ect on its performance.
Weighting stocks by market capitalization (mar-
ket cap) addresses the size issue. e S&P 500 was
calculated this way, and the NASDAQ Composite still
is. A drawback emerged as funds made greater use of
indexes to gauge their performance and guide their
trading. eir decision making was in uenced by
shares they couldn’t buy because insiders and major
investors owned them. ose shares counted toward
market value even though they were o the market.
Index providers resolved this concern by using fl oat,
or the number of shares available for trading, in place of
market cap to weight each company. e S&P 500 be-
came a oat-adjusted index, and others followed.
ese changes weren’t enough to please everyone.
Another method was developed that took market value
out of the equation entirely. Robert Arnott, the founder
of the Research A liates LLC investment rm, created
indexes that weighed companies by sales, earnings,
dividends, and other company-speci c gauges. Arnott’s
approach, fundamental indexing, re ects his view that
a company’s market value is often out of line with the
performance of its business.
DEFINITION:
Float
A fl oat is the number of shares
available for trading. Shares
owned by founders and their
families, offi cers, directors,
other insiders, and related
companies are excluded because
they generally don’t trade.
Exhibit 5.4: Stock Index Performance (December 31, 1999 = 100)
The Nasdaq rose the
most during the Internet
bubble, which burst in
2000, and suffered the
biggest loss afterward.
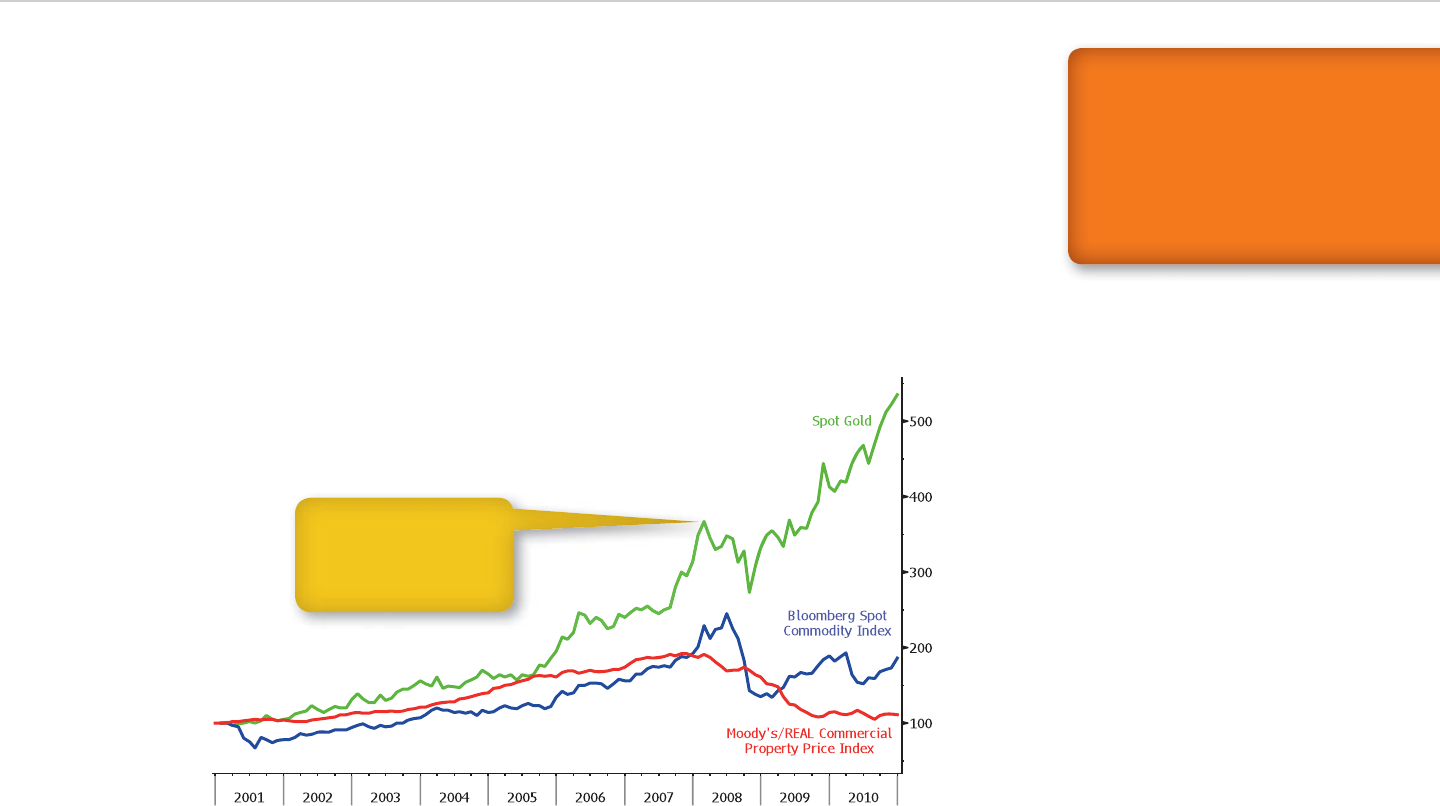
Visual Guide to Financial Markets ■85
Exhibit 5.5: Hard Asset Performance (December 31, 2000 = 100)
Gold rose every year from
2001 through 2010, while
commodities and real
estate tumbled during
the 2008 fi nancial crisis.
Finally, there’s the role of dividends. e most pop-
ular stock indexes are based only on price changes
as a rule. is means they can’t be compared directly
with bond indexes, which include interest payments.
To overcome this hurdle, stock index providers com-
pile total return versions of their indicators.
Hard Assets
Although gold, commodities, and real estate are
similar because of their hard-asset status, their
markets di er. Indexes that track them all aren’t
readily available. Exhibit 5.5 shows each one sepa-
rately by comparing gold with commodity and real
estate indexes.
Gold’s spot price plays the role of an index in the
chart. at’s the case in the precious metals market,
where it’s a widely followed benchmark.
Commodities are represented by the Bloomberg
Spot Commodity Index, based on price quotes on 24
raw materials for immediate delivery. ey are divided
into six categories, including energy, precious metals,
KEY POINT:
The three main benchmarks for
U.S. stocks are each calculated
differently. The Dow average is
price weighted, the S&P 500 is
fl oat weighted, and the Nasdaq
Composite is market-cap
weighted.

86 ■CHAPTER 5 Indexes
and base metals. Corn, soybeans, and wheat comprise
the crops category. Sugar, coee, cocoa, and cotton
are classied as food and ber. A livestock group con-
sists of steers and hogs.
Other commodity gauges that are called spot in-
dexes are based on futures prices. For those indica-
tors, “spot” refers to market performance, the main
component of total returns. Other sources of returns
are included in some commodity futures indexes
as we’ll learn when we examine indexes based on
derivatives.
e Moody’s/REAL index represents commercial
real estate. Moody’s and Real Estate Analytics work
with two other organizations on the index. e data
are compiled by Real Capital Analytics Inc., and the
methodology comes from the Massachusetts Institute
of Technology’s Center for Real Estate.
Moody’s publishes the index, based on sale prices,
every month. Indicators for apartments, oces, in-
dustrial buildings, and retail stores are available every
quarter. ere are gauges for metropolitan areas
as well.
Quarterly indexes are also available from the Na-
tional Council of Real Estate Investment Fiduciaries
(NCREIF), a trade group that serves institutional in-
vestors. e council tracks farmland and timberland
prices and the performance of private equity funds
specializing in real estate.

87
Government Revisited
U.S. Treasuries are a mainstay of the government
bond market for a few reasons. Trillions of dol-
lars’ worth of bills, notes, and bonds are outstanding,
which makes an abundance of securities available
for trading. e newest ones are bought and sold
more often than other types of bonds. ey change
hands minute by minute, let alone day by day. Finally,
Treasuries are sold in dollars, the world’s reserve cur-
rency. is increases their appeal for central banks
and others who want the safest places to invest their
money.
Yet the market extends far beyond Treasuries.
Supranational borrowers play a role in public -
nance by raising funds on behalf of global and re-
gional organizations. Countries around the world
rely on bond investors to help pay their bills. U.S.
government agencies sell bills, notes, and bonds,
and they are an alternative to Treasury securities.
U.S. state and local governments borrow in the bond
market as well.
e World Bank, which provides nancing and
technical support for development projects in
emerging markets worldwide, sells bonds through
the International Bank for Reconstruction and De-
velopment and the International Finance Corp., a
private lending unit. e European Investment Bank
and the Asian Development Bank play similar roles
in their regions with funding obtained from bond in-
vestors.
The European sovereign debt crisis that surfaced
in 2011 drove home the reliance of governments
across the region on bond financing. In Japan,
yields on 10-year government debt dropped below
2 percent years before 10-year Treasuries made a
similar move. Australia, Canada, other developed
countries, and a number of emerging markets sell
government bonds as well.
e two largest providers of U.S. mortgage -
nancing, the Federal National Mortgage Association
(FNMA or Fannie Mae) and the Federal Home Loan
DEFINITION:
Supranational
Supranational borrowers are
global organizations, such as the
World Bank, or regional groups,
such as the European Investment
Bank, that are backed by a num-
ber of governments.
Visual Guide to Financial Markets
by David Wilson
Copyright © 2012 by David Wilson.

88 ■CHAPTER 6 Government Revisited
Mortgage Corp. (FHLMC or Freddie Mac), regularly
sell bills, notes, and bonds to raise funds for home
loan purchases from banks and other lenders.
Fannie Mae taps the money market through Bench-
mark Bills, coming due in three, six, and 12 months.
Freddie Mac follows suit through sales of Reference
Bills. Both sell Discount Notes, with maturities
ranging from overnight to 360 days.
Fannie Mae sells notes and bonds under the
Benchmark name as well. Freddie Mac does the
same with the Reference name and raises addi-
tional funds by selling medium-term notes (MTNs).
As if this wasn’t enough, they sell securities backed
by home loans, which we’ll examine in more detail
later in this chapter.
Government bond investors can choose from se-
curities sold by the Federal Home Loan Bank System,
which helps nance local banks and credit unions; the
Federal Farm Credit Banks, which support lenders in
agricultural and rural areas; and the Tennessee Valley
Authority (TVA), which provides electricity in seven
Southern states.
Why lend money to U.S. agencies, other countries,
or the World Bank rather than buying Treasuries?
Yield is part of the equation. Many of these securities
have higher potential returns than U.S. government
debt, as a yield curve comparison between agency
bills, notes, and bonds and Treasuries shows (see
Exhibit 6.1).
Buying non-U.S. government debt can re-
duce currency risk. Though many countries sell
dollar-denominated bonds, they raise funds in lo-
cal currencies as well. When those currencies rise
in value against the dollar, the interest and prin-
cipal payments on the debt are worth more to U.S.
investors.
Otherwise, the risks of investing in these variations
on government debt are similar to those we examined
earlier with Treasuries. e biggest di erence is that
global and regional organizations, other countries,
and government agencies may lack the kind of taxing
power and money printing capability that the United
States has at its disposal. is means the nancial
backing for their securities may not be as solid.
Now that we have surveyed these securities, let’s
take a closer look at two categories. We’ll begin with
municipal bonds, which U.S. state and local gov-
ernments sell to ll budget gaps and pay for public
projects. en we’ll examine mortgage-backed secu-
rities (MBS), which enable Fannie Mae, Freddie Mac,
and banks to repackage home loans and sell them to
investors.
Municipal Bonds
e nances of U.S. state and local government bor-
rowers emerged as a national issue in December 2010
after Meredith Whitney, an analyst at her own secu-
rities rm, sounded an alarm on the CBS television
show 60 Minutes. Her views had an impact because
she had forecasted three years earlier, before a crisis
shook the U.S. nancial system, that Citigroup Inc.
KEY POINT:
National governments compete
with global and regional
organizations, government
agencies, and state and local
authorities to raise funds from
bond investors.
DEFINITION:
Agency bills, notes,
and bonds
Agency debt is sold by U.S.
government agencies. Fannie
Mae and Freddie Mac, two
mortgage fi nance companies
that were privately owned
before a federal takeover in
2008, are among them.

Visual Guide to Financial Markets ■89
a similar petition earlier in the year. Harrisburg, Penn-
sylvania, sought bankruptcy as well, though its initial
ling was rejected because the city didn’t have state
authorization. Even so, the number of defaults during
the rst nine months of 2011 fell by about half from
the same period a year earlier, according to gures
compiled by the Distressed Debt Securities Newslet-
ter. In dollar terms, the decline was steeper at about
two-thirds.
Statistics for the three decades leading up to
Je erson County’s ling o ered a starker contrast.
Fewer than 40 local governments asked for bankruptcy
would have to cut its dividend or sell assets to raise
capital.
“ ere’s not a doubt in my mind that you will
see a spate of municipal-bond defaults,” Whitney
said during the interview. She described a spate as
“50 to 100 sizeable defaults, more. is will amount to
hundreds of billions of dollars.”
Less than a year after her appearance, the largest
municipal bankruptcy in U.S. history took place in
Je erson County, Alabama, where the city of Birming-
ham is located. e county led for court protection
in November 2011. Central Falls, Rhode Island, made
Exhibit 6.1: U.S. Government Agency and Treasury Yield Curve
While the agency curve
has more dots, each one
is an estimate, as seen
earlier with the corporate
curve.
90 ■CHAPTER 6 Government Revisited
on these securities are made only from the revenue
these facilities generate.
e primary market for state and local government
debt can be divided in two. In competitive sales, which
are similar to Treasury auctions, brokerages compete
to purchase the securities for resale to investors. e
rm that delivers the best deal for the borrower wins.
In negotiated sales, the borrower selects the secu-
rities rm and works out the terms in advance. Some
governments have standing relationships with an indi-
vidual rm, which arranges sales as they arise and pro-
motes the bonds to customers. ese ties are governed
by pay-to-play rules, designed to prevent rms from
winning bond business by making political donations.
Many municipal bond issues never reach the sec-
ondary market because they’re bought and held until
maturity. ose that are traded change hands over the
counter, in an electronic market with millions of list-
ings. Only a relative handful of bonds trade actively.
Quotations
Let’s look at a bond from California, one of those
high-income-tax states, as an example. e state sold
$1.2 billion of the bonds in 2009 as part of the biggest
tax-exempt borrowing in ve years. Yet a market price
isn’t available for the securities (see Exhibit 6.2).
protection, according to court records compiled by
Bloomberg News. e number of lings made by com-
panies was more than 20,000.
The relative safety of municipal bonds, which
help states, counties, cities, and their agencies meet
daily financing needs and pay for public projects,
explains their appeal to many investors. Some bor-
rowers enhance the safety of their debt through
arrangements with bond-insurance companies,
which make interest and principal payments if the
borrowers can’t.
Municipal debt can provide income that’s ex-
empt from federal, state, and local taxes. e value
of these tax-free earnings varies with an investor’s
tax bracket. Residents of states with high income tax
rates, such as California and New York, have more of
an incentive to buy these bonds than people living
in Florida, Texas, and other states that don’t impose
income taxes.
Regardless of the tax bene ts, municipal bonds t
into one of two categories. General obligation bonds
(GOs) are similar to Treasuries because they are
backed by the power to impose and raise taxes. e
municipality or municipal agency that sells them is
responsible for making the payments. Revenue bonds
are used to nance the construction of sewer treat-
ment plants, toll roads, and other projects. Payments
DEFINITION:
Municipal bonds
Municipal bonds are sold by
U.S. states, counties, and cities.
Income from the securities is
usually exempt from federal
taxes and can be exempt from
state and local taxes.
Exhibit 6.2: A California Municipal-Bond Quote

Visual Guide to Financial Markets ■91
Returns
State and local governments are able to raise funds
more cheaply because of the tax exemptions available
on their bonds. e California bonds quoted earlier
are an example because interest isn’t subject to state
and federal taxes.
e tax-free yield of 4.05 percent on the debt
amounts to a taxable-equivalent yield of about
6.25 percent, based on the U.S. exemption and the
country’s top income tax rate of 35 percent.
California is among 41 states that impose an in-
come tax on its residents. e state’s top bracket is
9.3 percent, and anyone who has a million-dollar in-
come has to pay another 1 percent. at adds up to
10.3 percent. For anyone paying the state’s top rate,
the bonds have a taxable-equivalent yield of about
7.4 percent.
Two other states, New Hampshire and Tennessee,
tax only interest and dividend income. is means
residents are eligible for bene ts similar to those
available in California by buying municipal debt. Alas-
ka, Florida, Nevada, South Dakota, Texas, Washing-
ton, and Wyoming have no income tax at all.
Not all municipal bonds are tax-free. Taxable se-
curities are sold to pay for sports arenas and other
projects that are ineligible for tax-exempt nanc-
ing under federal regulations. Governments sold
subsidized taxable debt in the Build America Bonds
program, which lasted from April 2009 to December
2010. Federal subsidies covered 35 percent of the
interest expense.
CA ST: Abbreviation for the state of California.
CA: Two-letter state code.
6: Annual interest rate of 6 percent.
4/1/2038: Maturity date.
112.4: Current price as a percentage of face value.
4.054: Tax-free yield, in percent, at the current price.
BFV: Bloomberg Fair Value, the source of the price
and yield. As we saw previously with the Secu-
rity Capital bond, BFV is an estimate based on the
bond’s terms, the maturity date, the borrower’s
credit rating, and other criteria.
Three Rs
Most municipal bonds have two yields. A tax-free yield
is based on the purchase price and interest rate, like
yields on other debt securities. A taxable-equivalent
yield adjusts for tax savings that go along with owning
the bonds.
Taxable-equivalent yields can be as much as
46 percent higher, based on the current federal and
state income-tax brackets. e exact percentage
depends on the location of the bond seller and inves-
tor and the security’s tax status.
Tax bene ts in uence all of the three Rs. ey
have to be accounted for when calculating returns
and making relative-value comparisons. ey pose a
risk because lawmakers can reduce or eliminate them
through tax law changes.
STEP-BY-STEP: TAXABLE
EQUIVALENT YIELD
1. Assume a municipal bond has
a tax-free yield of 3 percent.
2. Determine the investor’s
federal tax bracket. We’ll use
35 percent.
3. Determine the investor’s
state tax bracket, assum-
ing the bond was sold by a
state or local government or
agency. We’ll use 10 percent.
4. Add the federal and state
brackets for the overall tax
rate. Here, it’s 45 percent.
5. Divide the tax-free yield by
1 minus the tax rate for a
taxable-equivalent yield, as
in 3/(1 – 0.45) = 5.45 percent
KEY POINT:
Tax benefi ts available to
municipal-bond investors are
based on state income-tax
brackets and other laws, and
vary from state to state.

92 ■CHAPTER 6 Government Revisited
investors. e risk turned into reality for Florida resi-
dents in 2007 when the state repealed a tax on intan-
gible personal property, including municipal bonds.
e state doesn’t have an income tax, so the repeal
eliminated the tax benet from owning bonds sold by
state and local governments.
Relative Value
Yield curves and spreads are available for municipal
debt as they are with government and corporate bills,
notes, and bonds. ey provide a way to determine
which securities are cheap, expensive, or fairly valued,
To create curves, GOs are grouped nationally by
credit rating and the availability of bond insurance.
State-specic curves are available. Revenue bonds
are classied by the type of project, including roads,
bridges, schools, hospitals, and power plants.
is type of relative-value analysis only goes so far
because it’s based on tax-free yields. Tax rates dier
from state to state and from investor to investor, so
creating taxable-equivalent yield curves comparable
to those for governments and corporate debt be-
comes impossible.
Because of this limitation, investors track yields
on municipal securities as a percentage of Treasury
yields, as shown in Exhibit 6.3. When they surpass
100 percent, investors are better o owning state and
local debt regardless of tax benets. ey are usually
lower than the 100 percent threshold, which means
municipals would be more rewarding only because of
their tax-exempt status.
Yields on taxable notes and bonds are comparable
to those on Treasuries and corporate securities. ey
are based on the debt’s price relative to face value, the
interest rate, and the payment schedule. Taxable debt
is aimed at investors who can’t benet from owning
tax-free securities. Mutual funds, insurers, and non-
U.S. investors are among them.
Risks
e risks that go along with owning government and
corporate bills, notes, and bonds depend on who’s do-
ing the borrowing and where the money’s going. Even
though this is true for municipal bonds as well, both
questions have to be answered to dene these risks.
States, counties, cities, and other municipalities
sell GOs. All the tax revenue they don’t collect for a
specic reason is available to pay interest and repay
principal on the GOs. e pace of economic growth
and the inuence of politics and policy can cause rev-
enue to decline, hampering the government’s ability
to make payments.
Governments sell revenue bonds through agencies
and other entities that are created for specic proj-
ects. ese entities, rather than the government, are
responsible for making payments on the debt. Inves-
tors face greater risk than they do with GOs because
the project’s revenue has to cover the expense. If it
doesn’t, they won’t be able to legally ask the govern-
ment to pay.
GOs and revenue bonds can be tax-exempt, which
means tax policy is a more general risk for municipal
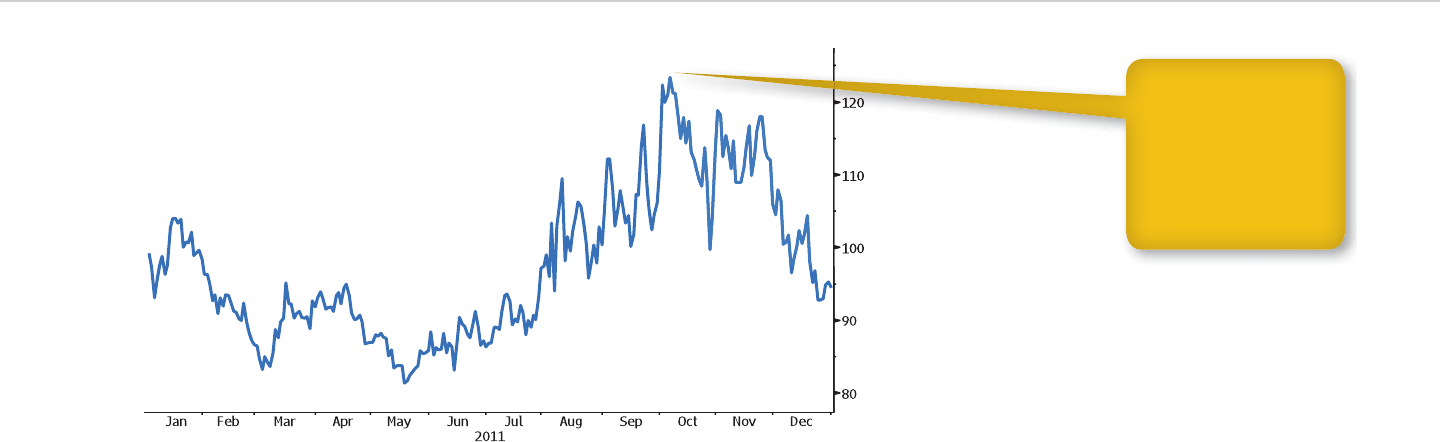
Visual Guide to Financial Markets ■93
When the bubble ended, many homeowners were
unable to keep up with those payments. Others de-
cided not to make them because they owed more
than their houses were worth. Either way, many of the
mortgage-backed securities became worthless, and
others lost much of their value. Investors were hurt by
the ripple e ect.
e market where these losses occurred was largely
a creation of the government even before the housing
boom ended. After the collapse, its role became even
bigger. It’s possible to view MBS as another method of
lending money to the government.
Mortgage-Backed Securities
Many home buyers across the United States suf-
fered for years from the aftereffects of a housing
market bubble that burst in 2007. The same can be
said for the investors who ended up owning their
mortgages.
e investors didn’t purchase the home loans. In-
stead, they bought securities that were backed by
groups of mortgages, known as pools. ese bonds
entitled the holders to receive a portion of the principal
and interest payments on the loans as they were made.
Exhibit 6.3: AAA Municipal Bond Yield as Percentage of 10-Year Treasury Yield
Yields on top-rated
municipal debt were as
much as 123 percent
of Treasury yields dur-
ing 2011. This means
the state and local gov-
ernment bonds were
cheaper even without tax
benefi ts.

94 ■CHAPTER 6 Government Revisited
insured loans. Financial companies buy the loans and
create the trusts because Ginnie Mae doesn’t pur-
chase mortgages as Fannie Mae and Freddie Mac do.
e trusts are known as real estate mortgage in-
vestment conduits (REMICs). ey can sell bonds
known as passthrough securities, which entitle inves-
tors to some of the interest and principal from the
pooled mortgages. ey can sell collateralized mort-
gage obligations (CMOs), which represent the right to
payments on a speci ed portion of the pool.
CMO sales consist of multiple classes, or tranches,
of securities. By design, some tranches su er losses
on mortgages and reach maturity sooner than others.
is means the bonds are supposed to have varying
degrees of risk even though it didn’t work out that way
when the housing market collapsed.
Loans that don’t qualify for government guaran-
tees can serve as collateral for private-label securities,
another type of mortgage-backed bond. ey include
jumbo loans, which exceed buying limits set by Fannie
Mae and Freddie Mac. Mortgage strips are created by
splitting up interest and principal payments on home
loans into separate securities.
For each of these types of securities, the primary
market begins with the making and buying of home
loans and the creation of pools. Prices are posted as a
benchmark for possible sales in the next three months.
ese to be announced (TBA) prices are based on
three criteria: the inclusion of 30-year or 15-year mort-
gages in the pool, the annual interest rate built into the
bonds, and the agency standing behind them.
Why would investors do that now, especially after
the losses that many of them su ered? ey’re in a
position to earn higher returns from these securities
than from Treasuries, as they did when home buying
was booming. e housing market’s collapse reduced
the risks associated with the bonds.
at’s getting ahead of ourselves. Before we go
to the three Rs, we need to understand more about
the basics. MBS are part of a category that’s called
structured fi nance or securitized products. Struc-
tured investments are created by setting up pools of
assets and selling securities that are tied to di erent
portions of the pool.
Asset-backed securities (ABS) are in this category.
ese bonds are backed by loans other than mortgag-
es, including credit card balances, home equity, auto
loans, and manufactured housing loans. e debt is
repackaged and sold the same way as MBS. e big-
gest di erence is that the government doesn’t play
a direct role in this market. Private companies do all
the work.
In the mortgage market, Fannie Mae and Fred-
die Mac buy loans from banks and other lenders and
move them into trusts, which create the pools. e
agencies started out as government-sponsored enter-
prises (GSEs), or private companies created by Con-
gress, to expand the mortgage market and were taken
over in 2008 after home prices plunged.
e Government National Mortgage Association
(GNMA or Ginnie Mae) guarantees payments on se-
curities sold by trusts that consist of government-
DEFINITION:
To be announced
To be announced, or TBA,
mortgage-backed securities
represent partial ownership
of a pool of home loans that’s
going to be created later.
DEFINITION:
Structured fi nance
Structured fi nance is a method
of transforming mortgages and
other types of loans into securi-
ties. The loans are bundled into
pools, and bonds backed by the
pools are sold to investors.

Visual Guide to Financial Markets ■95
Secondary trading in mortgage-backed debt takes
place over the counter, using electronic networks.
Bloomberg BondTrader and Tradeweb are among the
online marketplaces. Mortgage-backed securities can
be packaged along with commercial real-estate bonds
and/or corporate loans into collateralized debt obliga-
tions (CDOs), asset-backed securities that are similar to
CMOs. e CDO market collapsed in the 2008 nancial
crisis as the securities lost much of their value.
Quotations
Mortgage-backed bond quotes resemble those for
other types of debt even though the securities di er.
See Exhibit 6.4 for a quote for a TBA security guaran-
teed by Ginnie Mae.
GNSF: Symbol for Ginnie Mae I, a guarantee pro-
gram run by the government agency. Securities sold
through Fannie Mae and Freddie Mac have their
own symbols as well.
CBBT: Pricing source. is quote is based on prices
from rms using Bloomberg BondTrader.
Up arrow: Uptick/downtick arrow, showing the di-
rection of the most recent price change.
103-17+: Latest price as a percentage of face value.
MBS quotes are in fractions, like Treasury notes and
bonds. e 17+ shows the price is between 103 17/32
percent and 103 18/32 percent of face value.
+10+: Change on the day. e + following the 10
means the change is between 10/32 and 11/32.
103-16+/103-17: Bid and ask prices, presented as per-
centages. ere are no volume totals to go along with
the prices because trading takes place over the counter.
At 10:09: Time of the latest price.
Op 103-13, Hi 103-20+, Lo 103-08+: Opening, high,
and low prices for the current day’s trading.
Prev 103-07: Closing price on the previous trading day.
Two pieces of data excluded from the quote are im-
portant: the delivery month, October, and the security’s
interest rate, 3.5 percent. Each month and rate has a price.
Three Rs
e value of mortgage-backed debt is de ned by the
securities in the pool of mortgages backing them and
the loans included in the pool. Some of the loans are
paid o early. Others have to be written o because
the borrower can’t keep up the payments.
All this detail complicates the process of determin-
ing which bonds are cheap, expensive, or fairly valued.
We’ll run across some unique data used in calculat-
ing returns, and we’ll encounter some risks that are
equally distinctive. We’ll learn how all this a ects rela-
tive-value comparisons.
Returns
e Ginnie Mae security in our quote had a 3.5 percent
interest rate. e percentage is set below the rates
on mortgages that make up the pool, as the gap
KEY POINT:
Returns on MBS refl ect the
performance of the pooled
loans. Although CMOs are
designed to safeguard some
investors at the expense of
others, everyone can be hurt if
enough mortgages go bad.

96 ■CHAPTER 6 Government Revisited
A statistic called the constant prepayment rate
tracks the early payo s. e rate is a percentage of
the balance for all the loans in the pools, and it’s
calculated on an annual basis. If 1 percent of the
balance was repaid ahead of time last month, for ex-
ample, the constant rate would be 12 percent. Loan
defaults have a similar piece of data known as the
constant default rate (CDR).
Estimating returns on MBS would require study of
two other statistics, linked to the mortgage pool. e
weighted average coupon (WAC) is based on rates
and balances for all the loans. e weighted average
maturity (WAM) is a period of years that re ects the
balances and the maturity dates.
Risks
Constant prepayment rates are constant because they
are shown as annual percentages. Mortgage holders
may repay loans more quickly or more slowly in the
future than they have in the past. e pace of a pool’s
projected payo s is known as the prepayment speed.
Changes in speed present risks either way. Pre-
payment risk covers the possibility of a pickup. If
the speed increases, then the investor loses a greater
amount of interest and gets back a higher percentage
of principal.
covers expenses. A schedule is available for paying
out interest and principal from the loans to bond
investors.
Beyond that, not much about the return on the
security is certain. The same can be said about
any other mortgage-backed bond, whether it’s a
straightforward passthrough security or a more
complex CMO.
Complications occur because the mortgages un-
derlying the bonds can be repaid in advance. Some
families sell their homes to move into another local
house or to relocate. Others repay the debt as part of
a re nancing, which allows them to take advantage of
lower interest rates.
Once the deals are complete, these mortgages ef-
fectively come out of the pool. ey’re joined by loans
on property that goes through foreclosure because the
owner falls too far behind in making interest and prin-
cipal payments.
Either way, the returns on MBS suffer. When
loans are paid off, investors have to go without the
interest they would have received. They may receive
the principal amount sooner than they wanted,
depending on how interest rates have moved. When
loans go bad, investors lose the principal and the
interest.
Exhibit 6.4: A Ginnie Mae TBA Mortgage-Bond Quote
DEFINITION:
Prepayment
Prepayment is the payoff of
home loans before maturity,
which reduces the size of a
mortgage pool.

Visual Guide to Financial Markets ■97
Relative Value
The to be announced pools where we found our
Ginnie Mae quote break down MBS by loan types,
interest payments, and issue dates. Some pools are
for 30-year fixed-rate mortgages, the traditional
type of loan for U.S. home buyers. Others are limited
to 15-year loans. Still others are designed for dif-
ferent types of adjustable-rate mortgages (ARMs),
whose interest payments are tied to a benchmark
market rate.
ese breakdowns provide a starting point for de-
termining which MBS are cheap, expensive, or fairly
priced. ere’s plenty more where that came from
when you add in REMICs, passthroughs, CMO tranch-
es, private-label securities, and other variations on
mortgage-backed debt.
Comparing the yields on MBS and Treasuries may
provide insight into relative value. e spreads signal
how much more investors are likely to earn for as-
suming those risks cited earlier. We’ll go beyond the
scope of this book if we proceed much further. MBS
are harder to analyze than government and corporate
debt, even for professional investors.
Lower interest rates can cause acceleration by en-
couraging homeowners to re nance. When that’s the
case, prepayment risk is tied to reinvestment risk.
Investors would not only receive money earlier than
they probably wanted, but also be unable to earn as
much as they did previously unless they purchased
riskier securities.
ere’s also extension risk, the opposite of pre-
payment risk. When rates rise, mortgages in the pool
stay outstanding for longer periods because re -
nancing doesn’t make sense for most homeowners.
MBS owners are stuck with relatively low rates and
have to wait for an extended period to receive their
money.
More general risks come into play as the past few
years have illustrated. Mortgage-backed investors
bear market risk related to housing as well as the se-
curities. ey take on liquidity risk that’s linked to the
number and variety of available securities. ey also
face the risk that a faltering economy may cost home-
owners their jobs, leaving them unable to make mort-
gage payments. Interest rate risk and in ation risk are
present as well.
KEY POINT:
Lower interest rates cause
mortgages to be paid off faster
as homeowners refi nance.
The increase in prepayment
speed limits potential gains for
mortgage-bond investors as
rates decline.

99
Companies Revisited
When companies report on the state of their -
nances, they make a clear distinction between
equity and debt. is isn’t as easy to do when looking
at variations on their stock and bonds. e three types
of securities we’ll consider in this chapter, preferred
stock, convertible securities, and bank loans, don’t t
neatly into either category.
ough companies can count preferred stock as
equity, the dividends they pay on the securities are
more in line with bond interest than common-stock
payouts. Convertible securities start out as bonds or
preferred and end up as common equity, assuming the
company’s shares perform according to plan. Lever-
aged loans, or bank loans made to companies with
high debt loads, can turn into equity if the borrower
goes bust.
For bond investors, preferred stock can be appeal-
ing because of its dividends. Convertible securities o er
the opportunity for returns that go beyond interest and
principal payments or preferred dividends. Bank loans
have oating rates as a rule, so investors aren’t locked
into xed payments as they are with most bonds.
Stock investors can reduce market risk by own-
ing preferred or convertible securities thanks to their
payouts. ey would have a higher standing in a bank-
ruptcy, which matters because companies often have
nothing left for common shareholders by the time
they reorganize. Investing in leveraged loans would
put them further up the legal ladder.
To gain a better understanding of all this, let’s con-
sider each of their securities individually, beginning
with preferred stock.
Preferred Stock
U.S. banks raised hundreds of billions of dollars in 2008
and 2009 to recover from nancial damage caused by
bad loans and investments. e funding had to be in
the form of equity, rather than debt, to meet capital
requirements set by the industry’s regulators.
KEY POINT:
While preferred stock can be
convertible into common stock,
not all convertible securities
are preferred. Bonds can also
provide holders with the right
to swap their securities for
common.
Visual Guide to Financial Markets
by David Wilson
Copyright © 2012 by David Wilson.

100 ■CHAPTER 7 Companies Revisited
Some banks sold common stock to increase their
capital. Citigroup Inc., the owner of Citibank, was
among them. Bank of America Corp., JPMorgan
Chase & Co., Wells Fargo & Co., and other banks
took a di erent route. ey sold preferred stock, an-
other form of equity that counted toward their capital
requirements.
Investors might have preferred these kinds of secu-
rities because they paid higher dividends than com-
mon stock as a rule. Bank of America, for example,
sold preferred stock in January 2008 with an 8.2 per-
cent annual dividend rate. e payout was about two
percentage points higher than the common stock’s
dividend yield at the time.
e stock’s preferred status re ects the safety of the
dividend. Companies often can’t stop payouts as they
can with common stock. ough they may be able to
defer one or more preferred dividends, they have to
catch up before handing out any money to common
stockholders.
ere’s another reason for investors to prefer this
stock: ey have a higher legal standing than holders
of common stock when a company goes into bank-
ruptcy. Owners of preferred stock may end up with
something in a reorganization even if common-stock
investors get nothing.
Many companies have a reason to prefer bonds
and bank loans to raise money. ey can deduct in-
terest payments on income tax returns as a business
expense. Preferred dividends normally aren’t entitled
to this deduction because they have to be paid from
after-tax pro ts. As a result, they cost more than inter-
est paid at the same rate or lower rates.
To get around the limitation on deductions, com-
panies can create trusts that sell preferred stock and
lend them the money raised from the sale. Interest
payments on the loan cover dividend payments on
the shares, known as trust preferred. e company
can then take the interest deduction.
Financial companies, especially banks, and utilities
dominate the preferred stock market. Companies in
these industries need to raise large amounts of money
to operate and to keep regulators happy. e require-
ments in other industries aren’t as severe.
Preferred stock is initially sold through underwrit-
ers like common shares. e price setting process dif-
fers because preferred has a par value that’s similar to
the face value for bonds. e securities rms handling
the sale work with the seller to set the dividend rate,
meaning the price paid annually for the use of the
money.
Once the sale is completed, preferred stock can
trade on exchanges or over the counter. Companies
that are listed on the NYSE and NASDAQ will typically
arrange to have their preferreds listed there as well.
Quotations
Preferred stock quotes are basically the same as cor-
porate bond quotes. Exhibit 7.1 shows a JPMorgan
Chase preferred issue, originally sold in August 2008,
as an example.
KEY POINT:
Preferred stock pays higher
dividends than common stock
and gives investors more of a
claim on a company’s assets in
a bankruptcy.
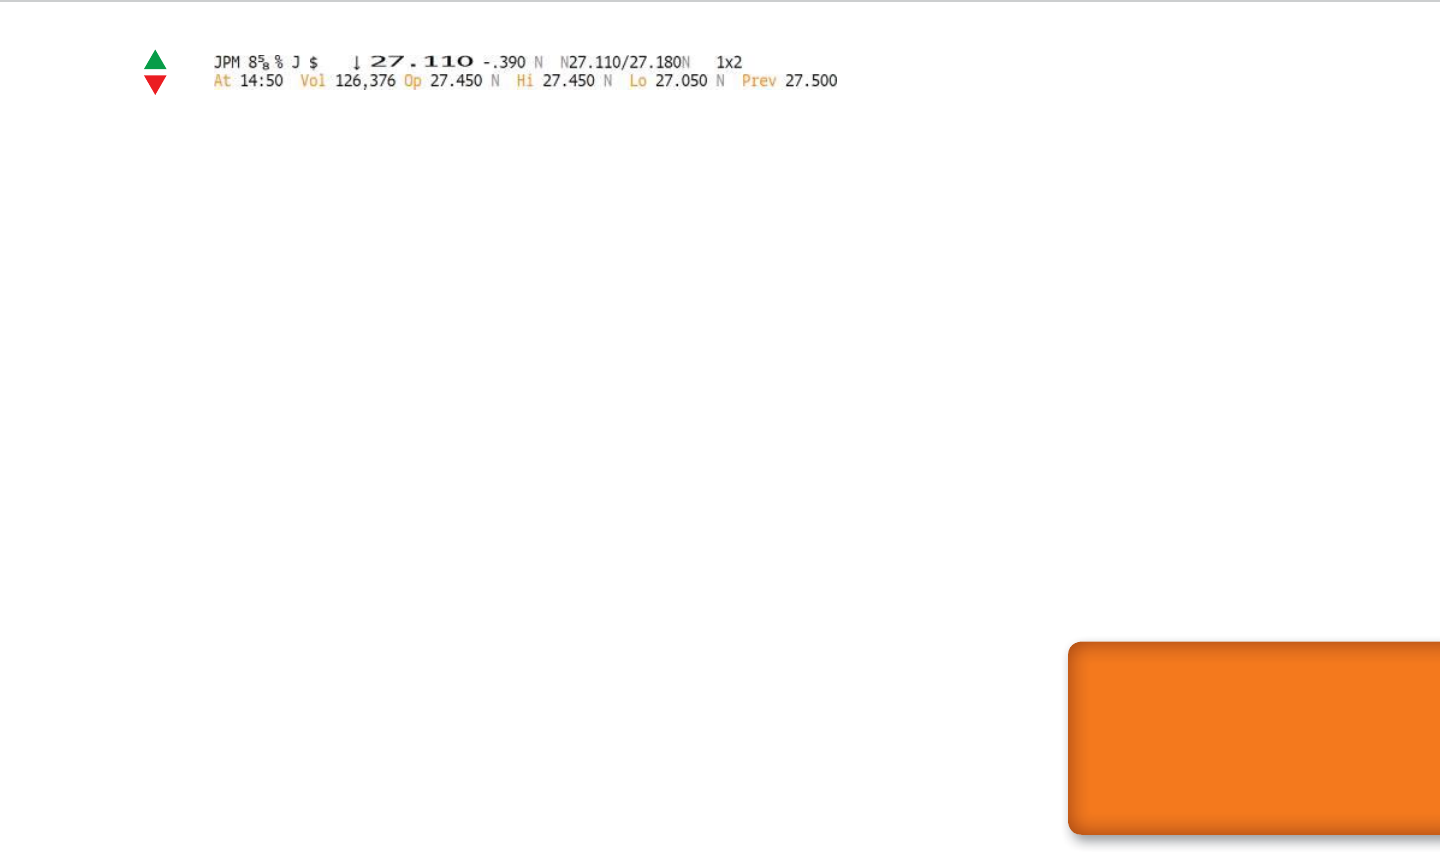
Visual Guide to Financial Markets ■101
e dividend payments and tax savings provide a
basis for judging which preferred shares are cheap, ex-
pensive, or fairly priced and for comparing them with
other assets. eir risks are similar to those for other
corporate securities.
Returns
Price changes and dividend payments largely account
for returns on preferred stock as they do with common
shares. e similarity only goes so far as prices have less
room to move and dividends play a bigger role.
Preferred stock has a par value that’s more than a
nominal amount. It’s similar to the face value of notes
and bonds. e JPMorgan Chase stock is valued at $25
each, a price tag within the reach of individual inves-
tors. e stock represents partial ownership—1/400th
of a share, to be precise—of preferred with a $10,000
par value.
The stock’s price reflects the par value and the
dividend yield that investors demand to own the
stock. The $27.11 price in our quote amounts to a
dividend yield of about 7.95 percent, based on the
$25 value.
Dividends on preferred stock are usually higher than
those on common stock, which means they account for
Rather than reviewing all the data in detail, let’s
look at a few key points:
8 5/8%: Annual dividend rate for the preferred,
which is similar to the coupon rate on a bond. Own-
ers of JPMorgan’s preferred will receive payouts
amounting to 8 5/8 percent of the face value of their
securities.
J: Series of the preferred, as designated by JPMorgan.
A single letter is usually enough to distinguish these
securities from other JPMorgan preferred. If not,
then companies are free to use two letters.
27.110: Market price in dollars, comparable to the
$25 par amount. e shares are trading at a pre-
mium, which means their dividend yield will be less
than the 8 5/8 percent rate.
Three Rs
Companies that buy preferred stock receive tax ben-
e ts, as individual investors do when they purchase
municipal bonds. ey have to be taken into account
when calculating returns on the securities. ey in-
crease demand for the shares, which helps explain
why companies sell them even though they can be a
costly way to raise funds.
Exhibit 7.1: A JPMorgan Chase Preferred-Stock Quote
KEY POINT:
Preferred stock is quoted
in dollars and cents, not as
a percentage of par value.
Even so, the face amount is a
reference point for the price, as
100 is for bonds.
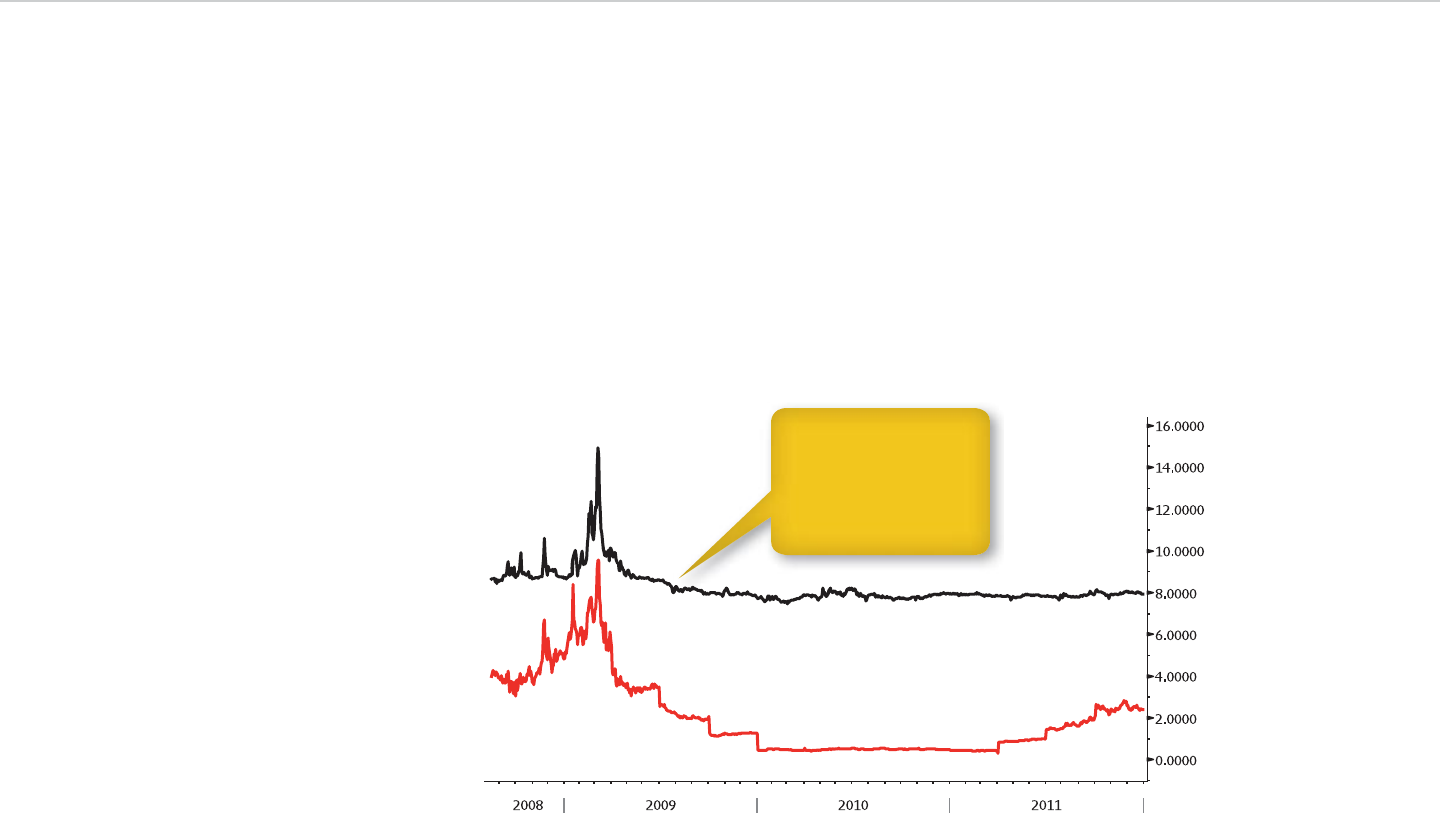
102 ■CHAPTER 7 Companies Revisited
We need to revisit one more element of returns:
the tax break available to companies that purchase
them. is provision, called the dividends received
deduction, exempts U.S. companies from paying
taxes on 70 percent of the dividend payments they
receive.
e deduction, also available on common stock,
minimizes the risk of triple taxation on the payouts.
Unless a company sells trust preferred, only after-tax
funds can be used for dividends. e company receiv-
ing the funds and its shareholders would also have to
pay income taxes if not for the regulation.
more of the return. e yield on JPMorgan Chase’s se-
curity was more than triple the dividend yield on the
bank’s common at the time of the quote. Exhibit 7.2
tracks the yield gap between the two securities.
On the other hand, preferred dividends are less
of a sure thing than interest on bonds. As noted ear-
lier, companies can delay payouts on some securities.
ey are called cumulative preferred because payouts
accumulate and must be made in full before the com-
pany pays common stock dividends. Preferred can be
non-cumulative, and the JPMorgan Chase security is
an example.
Exhibit 7.2: Dividend Yields on JPMorgan Chase Preferred and Common Stock
JPMorgan Chase left the
preferred-stock dividend
unchanged in 2009, when
the common-stock pay-
out was reduced by 87
percent.

Visual Guide to Financial Markets ■103
issues, or between its preferred and common stock,
show how much more investors will earn by choosing
one security over another. Comparing the yields on
stock sold by dierent companies does the same.
Earnings, cash ow, debt levels, and other indica-
tors can add meaning to these comparisons. If a com-
pany is in a better nancial position to pay preferred
dividends, then the stock price ought to rise, causing
the dividend yield to drop. e opposite can happen.
Convertible Securities
Bank of America made more than one preferred-
stock sale in response to the nancial crisis. So did
Citigroup, which didn’t stop with selling common
stock. Both banks sold preferred shares that the
owner could convert into common shares.
By providing this option, the banks were able to
raise money at a lower cost than they might have oth-
erwise. Bank of America’s convertible preferred carried
a 7.25 percent dividend, and Citigroup’s was 6.5 per-
cent. Payouts on other preferred issues that couldn’t
be swapped for common were at least 8 percent.
Convertible bonds provide similar savings in inter-
est expense by comparison with plain vanilla debt,
which can’t be exchanged. e lower cost reects
the value that investors put on the option to convert,
which rises along with the company’s common-stock
price.
A price is built into this option when the securities
are rst sold. It’s called the conversion price, and it’s
Risks
Preferred stock carries the same business risk, event
risk, and industry risk as other corporate securi-
ties. e degree of risk that investors have to assume
falls somewhere between those associated with bills,
notes, and bonds and common stock.
Companies that run into nancial setbacks can
put o dividends on cumulative preferred and skip
payouts entirely on non-cumulative stock. is isn’t
an option with debt payments, which must be made
according to schedule for companies to avoid bank-
ruptcy lings or reorganizations.
Ination risk, interest rate risk, and reinvestment
risk are present as they are with companies’ debt. e
pace of price increases and rate changes aect the
value of preferred dividends. If rates fall, investors
may have to settle for less income when they reinvest
payouts.
Call risk is another concern for preferred stock in-
vestors because the stock can be callable, like bonds.
Falling interest rates or a pickup in business may lead
companies to exercise the option and renance at a
lower cost.
Relative Value
Dividend yields are as fundamental a gauge of relative
value for preferred stock as yields are for notes and
bonds. Historical yields on a specic security provide
perspective on whether it’s worth buying, selling, or
holding. Yield gaps between a company’s preferred

104 ■CHAPTER 7 Companies Revisited
may be exchanged for common stock, enabling the
company to increase its equity nancing.
Sales are made in the primary market through un-
derwriters as they are for other types of securities.
Convertible debt is likely to trade over the counter af-
ter the initial sale, and convertible preferred may be
listed on an exchange along with the seller’s common
shares.
Quotations
Convertible bonds and preferred stock are quoted
like their peers that aren’t convertible. Some di er-
ences are apparent when taking a closer look. Exhibit
7.3 shows an Intel Corp. convertible bond quote as an
example.
3 1/4: Annual interest rate. For convertible pre-
ferred, this would be the dividend rate. Either way,
the rate is lower than it would be for a security that
isn’t convertible. e gap represents what investors
are giving up for the right to receive common stock
in the future.
117.900: Price as a percentage of face value or
par value for convertible preferred. Because the
price is more than 100, the yield will be less than
3 1/4 percent.
YLD 2.367: Yield at the current market price. e
quote might have noted the yield spread between
the Intel bond and a comparable Treasury security:
–117bp vs T4 3/8 05/41. It’s negative because Intel
based on the stock’s market price. If a company’s stock
trades at $40, the conversion might be set at a 25 per-
cent premium, or $50 a share.
e price results in a conversion ratio, or the num-
ber of shares that an investor would receive in an
exchange. In our example, assume the security has
a $1,000 face value. Divide the $50 price into that
amount, and the result shows an investor would re-
ceive 20 shares of common stock for each convertible
security.
Convertible bonds have a maturity date, which
means any exchange has to be completed before then.
Companies can establish similar limits on preferred
securities by giving themselves the right to buy back
the stock or requiring their conversion after a speci-
ed period.
If the stock rises above the conversion price, then
the security’s value will be tied to the number of shares
that a holder would receive rather than the security’s
interest or dividend payments.
If the stock doesn’t surpass the conversion price,
the interest or dividend rate would largely deter-
mine the value of the security. e option to convert
is worth something as well. e value depends on the
gap between the conversion price and the stock price
and the amount of time left for the di erential to close.
Convertible securities are sold by a broader range
of companies than preferred stock. Any company
whose common stock has been a top performer might
raise money this way because the funds may not have
to be repaid. Instead, the convertible debt or preferred
KEY POINT:
Companies pay less in interest
or dividends on securities that
are convertible than those that
aren’t. The difference refl ects
the value of the option to
convert.
STEP-BY-STEP: VALUING
CONVERTIBLES
1. Assume the security has a
face value of $1,000 and is
convertible at $50 a common
share, leading to a conver-
sion ratio of 20.
2. When the common exceeds
$50, multiply the market
price by the ratio to deter-
mine the convertible’s value.
At a $60 stock price, the secu-
rity is worth about $1,200.
3. When the common is less
than $50, the interest or
dividend rate would dictate
value. At $40, the convertible
would trade for more than
the $800 price implied by the
conversion ratio.
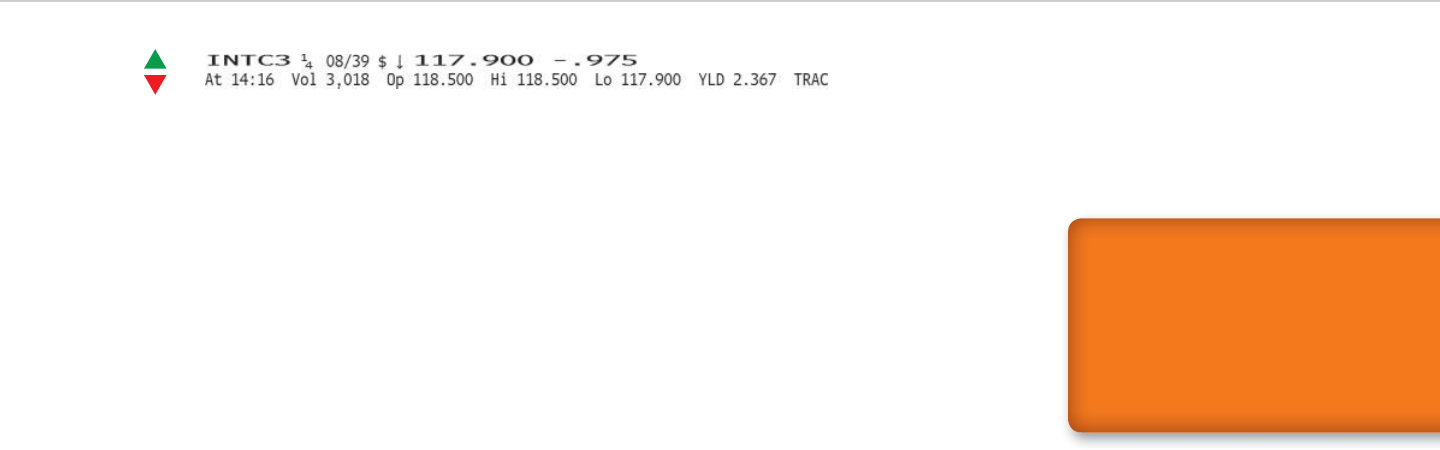
Visual Guide to Financial Markets ■105
the change in price may re ect the performance of the
common stock rather than the convertible.
Let’s take the Intel convertibles as an example. e
bonds have a face value of $1,000 and can be swapped
for common stock at $22.448 a share, which means 44.55
is the conversion ratio. If the stock trades at $30, then
multiplying by 44.55 will result in a price of $1,336.50
for each bond. A quote at that price would read 133.65
because it’s equivalent to 133.65 percent of par.
When the common stock price is lower than the
conversion price, the di erential won’t dictate the
returns on convertible securities as noted earlier. For
bonds, the face value and interest payments are what
count the most. For preferred stock, the par value and
dividends play the same role.
e option to convert the bonds or preferred is
worth something as well even if it doesn’t make sense
to exercise right away. e value of this feature de-
clines as the time to conversion gets closer, which
works against investors if the common stock doesn’t
rise enough to justify a conversion.
Risks
Business risk, event risk, and industry risk are as sig-
ni cant for investors in convertible securities as they
are for owners of other debt and preferred stock.
can borrow more cheaply than the U.S. government.
at’s only possible because the notes, unlike Trea-
suries, can be exchanged for common stock.
Three Rs
Price changes on convertible securities can occur as
interest rates rise or fall, a ecting the value of their
payouts. e market price of the company’s common
stock may uctuate, causing the gap between the
market price and the conversion price to change.
If the common stock price rises high enough, the
returns on the convertible debt or preferred may de-
pend largely on changes in the stock price. Otherwise,
they are more closely linked to the interest or divi-
dends that are paid.
Investors in convertibles bear the same risks as com-
mon stockholders though they usually receive higher
payouts from the company in return for assuming them.
Returns
Convertible securities produce returns through price
changes and payouts, either as bond interest or preferred
stock dividends. ough we have seen these combina-
tions before, they have a di erent look this time because
Exhibit 7.3: An Intel Convertible-Bond Quote
KEY POINT:
The right to convert bonds
and preferred stock always
has some value. The amount
of value determines whether
investors are better off owning
convertibles or securities that
don’t have this feature.

106 ■CHAPTER 7 Companies Revisited
Price is more revealing than yield when the com-
mon stock exceeds the conversion price. Relative
value for convertibles hinges on price dierences be-
tween the securities and the underlying stock.
e Intel convertible should trade at 133.65 when
the stock is at $30 as noted earlier. If the bond is quot-
ed at 130, then it will be a cheaper way to buy a stake
in the company. If the quote is 135, then the common
stock will be a better value.
It’s possible to bet on changes in the relative price
of convertibles and common shares by purchasing
one security and selling the other short at the same
time. is strategy, known as convertible arbitrage, is
designed to prot from any price gaps between mar-
kets. Some hedge funds focus on this kind of trading
as we’ll nd out later.
Bank Loans
ink about the reference to leveraged loans at the be-
ginning of this chapter. is phrase seems redundant
somehow. Companies that borrow money are said to
have nancial leverage. ey become leveraged by
taking out loans. is suggests every bank loan might
be leveraged by denition.
In practice, it doesn’t work that way. Companies that
have borrowed relatively large amounts of money are
said to be leveraged. ey have to pay a high price, in
the form of an interest rate, to obtain any more funds.
If they’re able to persuade lenders to make the money
available, the result will be a leveraged loan.
e conversion feature intensies the eect of
these risks. If they prevent the common stock from
rising above the conversion price, the investor will
get nothing for accepting the low interest or dividend
payments on the convertible.
Risks that go along with owning debt securities are
present. Interest rate risk, ination risk, and reinvest-
ment risk arise with bond interest and preferred-stock
dividends. Call risk is another concern for investors,
as convertible securities can also be callable.
Relative Value
Two basic approaches are used to decide whether
a convertible security is cheap, expensive, or fairly
priced. e rst is to compare the yield on the bond
or preferred stock to yields on similar securities. e
second is to compare the value of the common stock
that’s available in a conversion and the option to con-
vert with the stock’s market value.
Starting with the yield is more appropriate for
relative-value analysis when the security’s conversion
price is higher than the common stock price. at’s
because there’s less of a price dierential between
convertibles and other bonds or preferred shares that
can’t be turned into common. Exhibit 7.4 tracks the
dierence in yield between our Intel convertible and
Treasuries.
e option to convert still has a value, which we’ll
see when we examine options. Comparisons with oth-
er securities have to account for the value. Otherwise,
the results may be misleading.
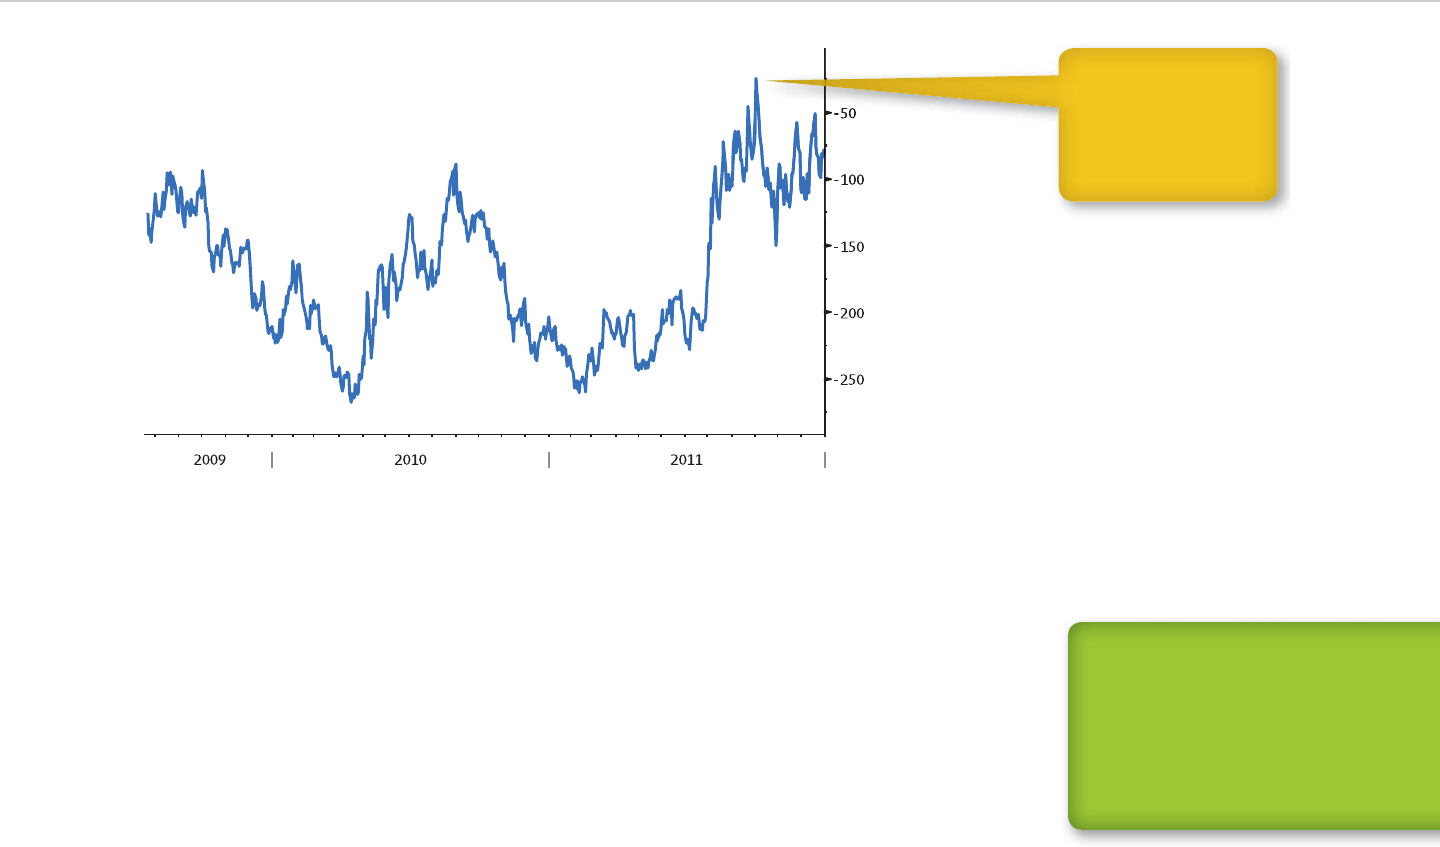
Visual Guide to Financial Markets ■107
Leveraged loans dominate the bank-loan market.
ey are a banking equivalent of high-yield bonds, and
their performance has been comparable to non-invest-
ment grade debt. Exhibit 7.5 shows the relationship.
Leveraged loans are syndicated, which means re-
sponsibility for providing the money is shared by a
group of banks. Lending to investment-grade compa-
nies can be done the same way. Each syndicate has an
arranger, who plays much the same role as an under-
writer in a sale of securities. e biggest di erence is
that arrangers don’t always guarantee the loan will be
made, as underwriters would.
is type of loan dates back to the 1980s, when lev-
eraged buyouts (LBOs) emerged as a way to nance
takeovers of multibillion-dollar companies. Buyouts
allow nanciers to acquire companies mainly with
borrowed money, which they obtain by pledging their
targets’ assets as collateral.
ese days, the loans are made to heavily indebted
companies, not just because of buyouts. ey typically
carry oating rates that are based on the London In-
terbank O ered Rate (Libor). Loans with rates set at
least 150 basis points, or 1.5 percentage points, more
than Libor t into the category.
Exhibit 7.4: Intel Convertible-Bond Yield Gap versus Treasuries
DEFINITION:
Syndicated
Syndicated loans are made
through a group of banks,
rather than a single lender. One
member of the group arranges
the loan.
The yield gap narrowed
to 24 basis points as
Treasury-bond yields fell
below the 3.25 percent
annual interest rate on
Intel’s convertible bond.

108 ■CHAPTER 7 Companies Revisited
First-lien loans are a secured form of debt whose
holders have rst priority on a borrower’s assets in
bankruptcy. ese loans are similar to rst mortgages
on commercial buildings or homes. Second-lien loans
resemble second mortgages because the lenders have
a lower standing than the rst-lien lenders if the com-
pany goes bust.
Once a leveraged loan has been signed, sealed, and
delivered, members of the syndicate can sell their por-
tion in a secondary market. ese sales take place over
e most popular forms of syndicated lending
include term loans, which are made for a speci ed
number of years and must be repaid when they ma-
ture. Credit facilities provide companies with more
exible ways to borrow money, such as revolving
loans, a corporate equivalent of a credit card. Com-
panies can borrow when funds are needed, and re-
pay them when they aren’t, for as long as the revolv-
ing credit stays available. Syndicates often provide
multiple types of nancing in a single agreement.
Exhibit 7.5: Leveraged Loan and High-Yield Bond Performance
KEY POINT:
Leveraged loans and high-yield
bonds are made available to
companies with higher-than-
normal debt loads. They are
examples of what’s known as
leveraged fi nance.
The swings in leveraged
loans and high-yield debt
stemmed from the 2008
fi nancial crisis and its
aftermath.

Visual Guide to Financial Markets ■109
3/11/18: Maturity date, March 11, 2018. e term
loan and the letter of credit mature in seven years.
$: Dollars, the currency that Hertz borrowed.
Up arrow: Uptick/downtick arrow, showing the di-
rection of the most recent price change.
99.125: Price, stated as a percentage of par value.
+.125: Change on the day.
98.625/99.625: Bid and ask prices.
At 11:00: Time of the latest price quote.
Op 99.000, Hi 99.125, Lo 99.000: Opening, high, and
low prices for the current day’s trading.
Prev 99.000: Previous day’s closing price.
BVAL: Bloomberg Valuation, the pricing source.
Other prices are available from the Loan Syndica-
tion and Trading Association, a trade group whose
market index appeared in Exhibit 7.5, and from
banks and brokers.
Three Rs
Leveraged loans can be described as high-yield,
oating-rate debt. High yield means the interest pay-
ments account for a larger part of returns than they do
the counter in a marketplace dominated by banks, fund
managers, and other institutional investors.
Leveraged loans can be repackaged into collateral-
ized loan obligations (CLOs), just as home loans can
be transformed into collateralized mortgage obliga-
tions (CMOs). CLO sales are done in much the same
way as CMOs, with multiple tranches of securities.
e owners of these bonds share in payments on the
loans and have rights to the collateral backing them.
Quotations
Hertz Global Holdings Inc. (Hertz), a car rental com-
pany, borrowed $1.6 billion in March 2011 to renance
debt. Lenders provided most of the funds through a
$1.4 billion term loan. Exhibit 7.6 shows a quote for
that loan.
HTZ: Symbol for Hertz’s debt. e symbol for this
loan on the Bloomberg terminal is HTZ TL 1L, with
TL signifying a term loan and 1L designating a rst-
lien loan.
0: Placeholder for the interest rate. Hertz pays 275
basis points more than three-month Libor. e
period corresponds to the schedule for interest
payments on the loan.
Exhibit 7.6: A Hertz Leveraged-Loan Quote

110 ■CHAPTER 7 Companies Revisited
Risks
e relationship between interest rates and loan de-
mand isn’t constant. If Libor and other benchmark
rates surge, then the value of leveraged loans will like-
ly drop. Higher rates may increase the risk that bor-
rowers will fail to keep up the payments and hurt their
business.
Credit risk is the issue in the rst scenario. As the
risk grows, loan prices fall because the interest pay-
ment formula may no longer provide enough com-
pensation to satisfy lenders. A cut to Hertz’s credit
ratings may justify an interest rate of Libor plus 325
basis points for its loan, rather than Libor plus 275,
for example. Because the formula won’t change, the
price does.
Default risk follows from credit risk, and it’s anoth-
er concern for leveraged loan investors. Interest rate
risk, in ation risk, and reinvestment risk must be ex-
amined even though the oating rate minimizes them
to a degree.
Higher interest rates may weigh on Hertz be-
cause of their effect on economic growth. Fewer
people may be able or willing to travel, hurting de-
mand for rental cars. This is an economic risk and a
business risk as Hertz is the kind of company whose
results are especially sensitive to the economy’s
performance.
Industry risk and event risk are part of the mix as
well. Too much competition among rental car com-
panies may hamper Hertz’s ability to draw customers.
for investment-grade loans, as is the case for bonds.
e oating rate ensures the payments will uctuate
along with the level of interest rates, and the returns
will swing along with them.
Lenders take on the risks associated with compa-
nies and debt, and they are magni ed because the
borrower’s nancial position is comparatively weak.
Yields on the loans provide a basis for relative-value
analysis.
Returns
e familiar combination of price changes and inter-
est payments accounts for the returns on leveraged
loans. Prices tend to increase as a borrower’s business
and nancial performance improves, and vice versa.
Interest rises and falls along with Libor, based on the
spread associated with the loan.
When Hertz had to make the rst payment on its
loan in June 2011, the three-month dollar Libor was
about 0.25 percent, or 25 basis points. Add the 275 ba-
sis point spread, and Hertz paid interest at a 3 percent
annual rate. When the second payment was due, Li-
bor was near 0.35 percent. is raised the oating rate
to an annualized 3.1 percent.
Rising interest rates can increase demand for
leveraged loans because of their floating payments.
Fixed rate securities and loans tend to lose value
when rates move higher, as the only way to keep
their yields in line with market rates is to reduce
the price.
KEY POINT:
Floating rates on leveraged
loans are designed to adjust
for swings in market interest
rates, rather than changes in a
company’s performance.

Visual Guide to Financial Markets ■111
To overcome this hurdle, investors can calculate
a xed-rate equivalent yield for the loans. Data com-
piled by Bloomberg shows, for example, that a 3.75
percent yield on Hertz’s loan equals about 4.5 percent
at a xed rate. High-yield debt maturing at about the
same time might yield 6.75 percent.
e lower yield reects the loan’s safety, another
consideration in relative-value analysis. e leveraged
loan is secured. If Hertz doesn’t pay the interest and
repay the principal when it’s due, lenders have a legal
right to seize the collateral. e high-yield bonds, by
contrast, are unsecured.
Interest formulas and credit ratings, taken to-
gether, can show whether the yield is appropriate.
Comparing the formulas will show who’s paying less
or more to borrow. Ratings from S&P, Moody’s, and
other services, along with investors’ own credit analy-
sis, shed light on whether the loans’ interest payments
and yields are reasonable.
Competitors may be reducing rental rates to win more
business, hurting the company’s prots and cash ow.
Changes in tax laws, management, agreements with
car companies, and other events may lead to business
setbacks.
Relative Value
Yields provide a way to determine whether leveraged
loans are cheap, expensive, or fairly priced, as they
do for bonds. Formulas for interest payments, credit
ratings, and other criteria add depth to relative-value
analysis.
Comparisons between loan yields are easy enough
because oating rates are the norm. e process gets
more complicated when comparing the loans with
high-yield bonds, another mainstay of nancing for
less creditworthy companies. e bonds typically have
xed rates, so their yields are more certain as long as
the company can make the payments.
113
Hard Assets Revisited
David Einhorn, the founder of Greenlight Capital,
is a hedge-fund manager who’s better known
for his pans than his picks. He sold Lehman Brothers
Holdings Inc.’s stock short before the securities rm
went bankrupt in 2008. He prevailed in a six-year ght
against Allied Capital Inc., a small business lender,
that he wrote about in the book Fooling Some of the
People All of the Time. He bet against St. Joe Co., a
real estate developer whose biggest shareholder was
Bruce Berkowitz’s Fairholme Fund, among the best-
performing U.S. mutual funds of the 2000s.
Yet Einhorn’s track record creates interest in what
he’s buying, not just what he’s selling short. In the
third quarter of 2011, he bet gold mining stocks would
do better than gold bullion, which he had previously
bought on behalf of a publicly traded company he
chairs.
On a conference call, Einhorn disclosed he sold
some of the metal and put the money into a gold
mining stock fund. e fund tracks the performance
of the NYSE Arca Gold Miners Index, which had
climbed with the price of gold for more than two
years before falling o the pace in the rst half of
2011. Exhibit 8.1 illustrates the index’s relative per-
formance.
is kind of variation on the theme of hard assets
isn’t unique to Einhorn. Some investors own mining
stocks as well as gold and other metals, or as a substi-
tute for them. Others make similar choices with ener-
gy companies and the commodities that they provide
or with agricultural stocks and farm products.
Bond markets o er investment opportunities with
a hard asset twist. Notes and bonds sold by commodi-
ty producers are among them, along with government
securities sold by Australia, Canada, South Africa, and
other countries whose economies are most closely
tied to commodities.
is approach can apply to real estate investing.
Higher property prices can have a spillover e ect on
shares of developers and construction companies.
KEY POINT:
Investing in commodity
producers and real estate
companies is one alternative to
buying hard assets. Another is
investing in locations dependent
on commodities or real estate.
Visual Guide to Financial Markets
by David Wilson
Copyright © 2012 by David Wilson.
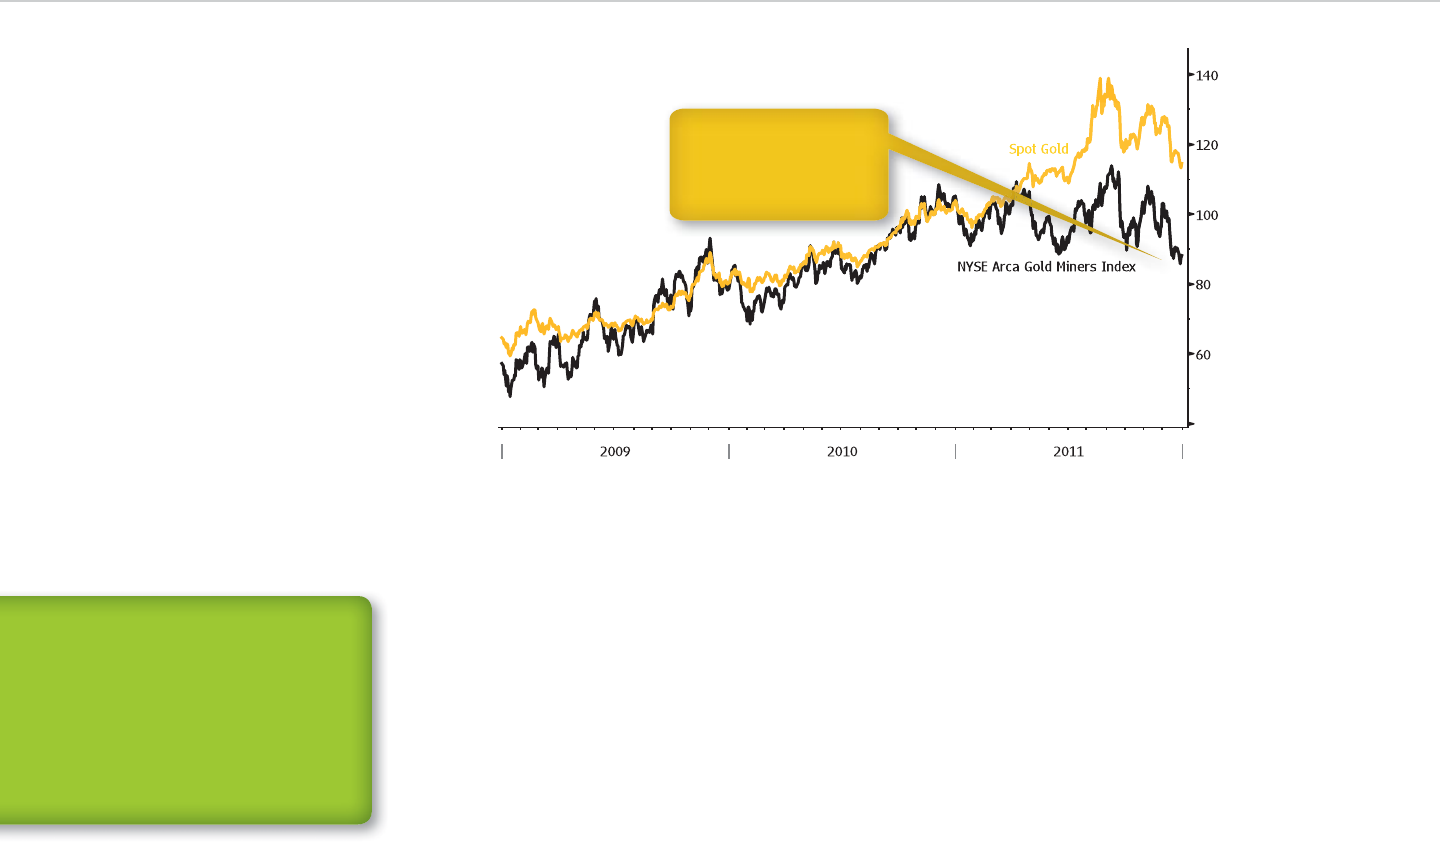
114 ■CHAPTER 8 Hard Assets Revisited
Increased demand for land can lift the shares of com-
panies that own thousands of acres or more. e
same can be said for their bonds, whose value may
increase as the companies’ prosperity reduces their
credit risk.
Companies known as passthrough entities are
another type of investment linked to hard assets.
ey pass through earnings to investors, just as
mortgage passthroughs entitle holders to a piece of
principal and interest payments on the mortgages
that back them.
ese entities are master limited partnerships,
which focus on commodity-related businesses, and
real estate investment trusts, which own property.
Both are exempted from corporate income taxes as
long as they meet criteria set by the U.S. government.
Let’s take a closer look at each.
Master Limited Partnerships
Kinder Morgan Inc. put itself in position to control
the largest network of U.S. energy pipelines in October
Exhibit 8.1: Gold-Mining Stocks versus Gold Price
DEFINITION:
Passthrough entities
These entities pass through
earnings to investors, rather
than paying income taxes on
the profi ts. The tax exemption
lets them pay higher dividends
than corporations.
Einhorn tells investors
he bought gold-mining
stocks and sold some
gold.

Visual Guide to Financial Markets ■115
the other 2 percent and is paid based on the MLP’s
performance. Kinder Morgan is a general partner, and
El Paso played that role.
Payouts on the units are known as distributions
and are made quarterly. ey are based on cash ows,
rather than net income, and are usually larger than
dividends paid on common shares. e checks are
bigger because MLPs can pass along earnings without
paying corporate income taxes rst.
is exemption explains why energy and commod-
ity producers create MLPs in the rst place. To keep
their status, MLPs have to generate at least 90 percent
of taxable income every year from sources speci ed as
qualifying by the Internal Revenue Service (IRS). ey
can include dividends and interest payments, as well
as income from their business.
Some investors stay away from MLPs because of
the tax complications. For others, the additional in-
come they provide is more than enough to justify hav-
ing to do some extra recordkeeping.
MLP units are available through the same primary
market as stocks. e partnerships make initial public
o erings (IPOs) with the help of underwriters. Once
the IPOs are complete, the units are listed on exchang-
es or are traded in the over-the-counter (OTC) market.
Quotations
MLP units are quoted the same way as common
shares, as exchanges provide the same data for
them. Enterprise Products Partners LP (Products),
2011, when the company agreed to buy El Paso Corp.
for $21.1 billion. e deal brought together the two
companies along with two publicly traded units that
managed the bulk of their assets.
Kinder Morgan Energy Partners LP owned or oper-
ated about 28,000 miles of pipelines, as well as 180 ter-
minals for storing oil products and chemicals. El Paso
Pipeline Partners LP had a more extensive pipeline
network, covering 43,000 miles, along with a lique ed
natural gas terminal.
Both units had Partners in their names, followed
by the LP identi er, for a reason. ey were master
limited partnerships (MLPs), which combine the tax
bene ts of partnerships with the ease of buying and
selling that goes along with exchange-listed securities.
MLPs got their start with the federal Tax Reform Act of
1986, which de ned the kinds of companies that were
eligible and the requirements to qualify.
Most MLPs are in energy-related and commodity-
related businesses as Kinder Morgan’s and El Paso’s
partnerships are. Leveraged buyout (LBO) rms,
which use funds raised from investors and borrowed
money to acquire companies, are among the excep-
tions. Blackstone Group LP, KKR & Co. LP, and other
rms reorganized as MLPs to go public. We’ll nd out
more about their business later.
MLPs have partnership units, rather than common
stock. Owners of the securities are de ned as unit-
holders, not shareholders. ey are also limited part-
ners, who typically own a 98 percent stake as a group.
Management is left to the general partner, which has
KEY POINT:
Most master limited partnerships
focus on energy or commodities.
Leveraged-buyout fi rms, which
buy companies mainly with
borrowed money, are exceptions.
DEFINITION:
Distributions
Distributions by master limited
partnerships are comparable
to dividend payments by other
companies. They are usually
larger because MLPs are exempt
from corporate income taxes.

116 ■CHAPTER 8 Hard Assets Revisited
partnership units with each other, and with dierent
types of securities, in relative-value analysis.
Returns
Price changes and payouts add up to returns on MLP
units as they do for other forms of equity as well
as debt. Even so, these two components have char-
acteristics that are unlike what we saw with their
counterparts.
MLP units don’t necessarily track energy and com-
modity prices even when the shares of producers do.
Enterprise Products, the MLP from our quote, shows
the performance gaps that can occur. In 2005, the units
fell 7 percent even though natural gas rose 83 percent in
New York trading. e reverse was true ve years later,
as Enterprise Products gained 32 percent in the face of
a 21 percent drop in gas prices.
Investors in the units have more of a sure thing
in distributions, known legally as quarterly required
distributions (QRDs). e amounts are specied in
a contract between the general and limited partners
that governs the MLP.
ey also have more tax issues, which aect after-
tax returns on the units. Distributions are taxed dif-
ferently from dividends or interest payments. Any
which transports and processes natural gas, is a
good example (see Exhibit 8.2).
All the details that we saw for Apple Inc.’s stock are
here. e rst line has the ticker symbol, exchange
code, dollar sign, uptick/downtick arrow, latest price,
change on the day, and bid and ask quotes. e second
line shows the 24-hour time of the latest trade, the
current day volume, the open, high, and low prices,
and the stock value traded in thousands of dollars.
Both lines have one-letter exchange IDs next to all
their prices.
Three Rs
MLPs tend to focus on pipelines, terminals, and other
stable segments of energy and commodity production.
Surging prices for oil, natural gas, and other products
may have little eect on the market value of their
units. e tradeo for investors is that the units gen-
erate more income than most common stock thanks
to their tax status. eir distributions are largely re-
sponsible for returns.
e risks of MLP investing are largely tied to the
potential for distributions to decline, rather than rise.
Distribution rates represent a basis for comparing
Exhibit 8.2: Quote for the Enterprise Products MLP

Visual Guide to Financial Markets ■117
about as certain as interest payments on bonds. For
another, MLPs’ exemption from income taxes means
unitholders will receive more money than owners of
common stock get from dividends.
There’s one more reason why MLPs are attrac-
tive. The yields largely explain why investors buy
the securities in the first place even with all their
tax complications. The Alerian MLP Index, a bench-
mark consisting of 50 partnerships, yielded about
6 percent near the end of 2011. That was almost
triple the yield on the Standard & Poor’s 500 Index
and the 10-year Treasury note. Exhibit 8.3 illustrates
the comparison.
is kind of comparison provides insight into
whether MLPs are cheap, expensive, or fairly val-
ued. Historical yield spreads between their units and
stocks, Treasury securities, or other investments pro-
vide more perspective.
en again, the analysis can only go so far because
MLPs have tax advantages. Yields are most directly
comparable between partnerships, where there isn’t a
di erence in tax treatment to take into account. If En-
terprise Products has a 5.4 percent yield and Kinder
Morgan Energy Partners yields 5.9 percent, as they did
in December 2011, the half-percentage-point gap is
meaningful on its own.
Distribution growth is another consideration in
relative-value analysis for MLPs. e faster that pay-
outs are rising, the more likely it is that the units’
yield will be maintained or increase. Payouts at En-
terprise Products, for instance, rose at an annual rate
portion that exceeds taxable income is subtracted
from the price you paid for the units. is reduces
what’s known as their cost basis. If you sell the secu-
rities, the lower cost basis may mean a larger gain, and
a bigger tax bill to match.
Unit owners have to pay their share of the MLP’s
annual income tax bill because the exemption only
applies to the partnership. MLPs hand out forms, des-
ignated as Schedule K-1s by the IRS, which show how
much each investor owes.
Risks
e ultimate risk for MLP investors is that a partner-
ship won’t make a quarterly required distribution on
schedule. is is a form of default risk, as it’s similar to
a company missing an interest payment or failing to
repay principal when it’s due on notes or bonds.
Anything that puts the partnership closer to a de-
fault constitutes a risk. e business may fail to retain
customers, causing revenue to decline. Price cutting
by competitors may require the partnership to follow
suit, another potential blow to revenue. Takeovers,
asset purchases and sales, and natural disasters are
among the events that may hurt MLPs and their in-
vestors.
Relative Value
Yields tied to payouts are a more useful relative-value
indicator for MLP units than for common stock. For
one thing, the distributions that determine them are
DEFINITION:
Cost basis
The cost basis of a security is
the price used to calculate gains
and losses for tax purposes,
which can differ from the origi-
nal purchase price.
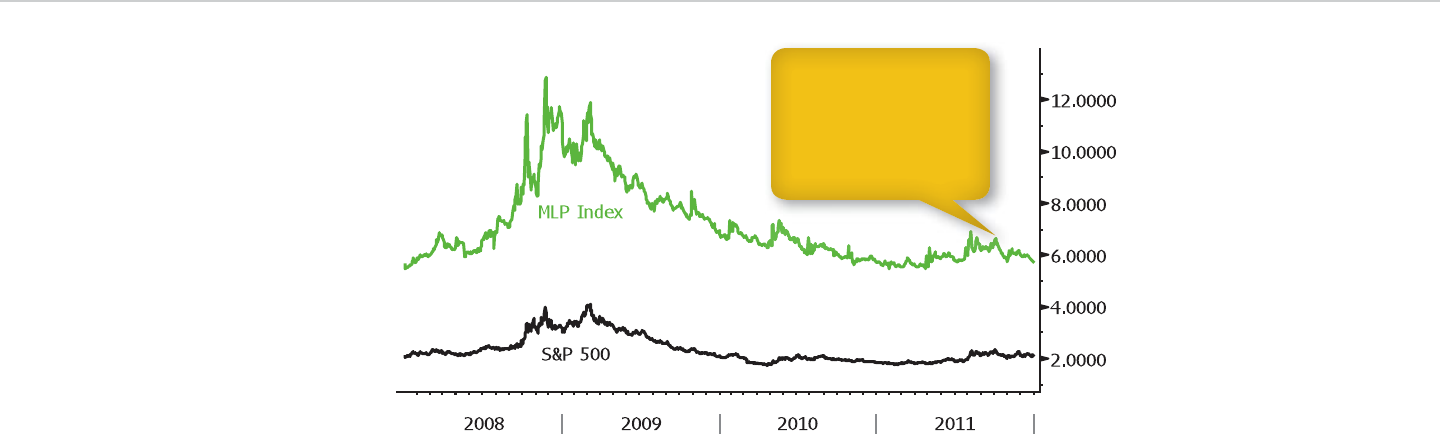
118 ■CHAPTER 8 Hard Assets Revisited
Real Estate Investment Trusts
Weyerhaeuser Co. can trace its corporate history
back to 1900, when a German immigrant named
Frederick Weyerhaeuser and 15 partners joined
forces to buy 900,000 acres of timberland in the
Paci c Northwest.
For the next 110 years, Weyerhaeuser was orga-
nized as a corporation. en the company decided
of 6 percent for the ve years ended in 2011. e pace
of growth at Kinder Morgan’s partnership was even
faster, 7.2 percent, in the period. Both gures were
higher than the distribution yield, a favorable sign for
future payouts.
e nancial ratios used to evaluate common
stocks apply to MLPs. Unit prices relative to earnings,
cash ow, and book value are among the indicators
used to carry out relative-value analysis.
Exhibit 8.3: Alerian MLP Index Dividend Yield versus Standard & Poor’s
500 Index Yield
The MLP index con-
sistently yields more
because MLPs are
passthrough entities,
exempted from corporate
income taxes.

Visual Guide to Financial Markets ■119
and hybrid REITs own property as well as debt
securities.
REITs di er from other types of companies because
they have their own way of tracking performance. It’s
a gauge known as funds from operations (FFO) that’s
calculated by making some adjustments to net in-
come.
FFO adds back depreciation, a charge taken to
reflect wear and tear on buildings and equipment,
as well as amortization, a similar adjustment for
other types of assets. The charges are accounting
entries rather than cash payments, and they’re at
odds with the tendency of real estate values to rise
over time.
Any gains or losses from sales of property or
investments are subtracted in calculating FFO.
Though REITs may sell assets regularly, each deal
can only be made once. The proceeds from these
sales are unrelated to their daily business, or
operations.
REITs make IPOs like other types of companies.
Afterward, their units trade on the NYSE, NASDAQ,
and competing stock exchanges or in the OTC
market.
Since 2001, REITs have been included in Stan-
dard & Poor’s U.S. stock indexes, such as the S&P
500. S&P made them eligible in recognition of
the industry’s shift toward running their proper-
ties as well as owning them. REITs were omitted
before then because they were more like funds than
companies.
to transform itself into a real estate investment trust
(REIT). Once the change was made, Weyerhaeuser no
longer had to pay income taxes on its earnings. at
made more money available for dividends.
Weyerhaeuser is an exception among REITs be-
cause of its status as a forest products company.
Most trusts own and manage commercial proper-
ties: offices, hotels, apartment buildings, warehous-
es, and storage facilities. They enable investors to
put money into real estate without making the kind
of commitment that goes along with buying and
running buildings.
REITs as we know them now date back to 1960,
when a U.S. law created them. For years, the trusts
were largely content to own properties and hire out-
side managers to run them. ey evolved into op-
erators and owners as Weyerhaeuser’s conversion to
REIT status would suggest.
By law, REITs have to earn at least 95 percent of
their income from property and related investments
and pay out at least 90 percent of their taxable income
to investors. As long as they meet these criteria and
others, the pro t isn’t taxed before being distributed.
Only the REIT’s investors have to pay income taxes, so
there’s more money available to hand out to them. e
trust’s investors are called unitholders, like the limited
partners in MLPs.
Dividend and interest income can count toward
the 95 percent threshold, and there are REITs that
own mortgages and mortgage-backed securities
(MBSs). Mortgage REITs invest only in the bonds,
STEP-BY-STEP: FUNDS
FROM OPERATIONS
1. Start with a REIT’s net income
2. Add back depreciation and
amortization.
3. Subtract net gains or add back
net losses from property sales.
4. The result is the REIT’s funds
from operations.
120 ■CHAPTER 8 Hard Assets Revisited
basis for comparing individual REITs and for assessing
trusts as a group relative to other investments.
Returns
REITs are passthrough entities, which is why they’re
bound by the 90 percent minimum distribution from
income each year. ey meet this requirement through
dividends rather than the distributions that partner-
ships make. at said, the payouts have the same eect.
When the 90 percent standard is combined with
the income tax exemption for REITs, the result is high-
er dividends than those paid on common stock. e
Bloomberg Industries North America REIT Index, for
instance, had a dividend yield of about 3.75 percent in
December 2011. e yield for this index, composed of
about 130 REITs, was about double the corresponding
yield for the S&P 500. Exhibit 8.5 shows the dierential.
As the comparison suggests, dividends account for
a large proportion of REIT returns. Demand for higher
yielding investments comes into play because of its ef-
fect on prices. As noted earlier, the 10-year Treasury
note’s yield was about the same as the S&P 500’s divi-
dend yield in late 2011. Investors looking for income
had an incentive to favor REITs because their payouts
were higher.
Quotations
e similarity between REITs and common stock ex-
tends to their quotes. Exhibit 8.4 shows a quote for
units of Prologis, the world’s largest REIT.
There’s no difference between this quote and
the ones that we saw for Enterprise Products and
Apple, aside from the symbol and numbers. The
price of the latest trade is shown along with bid,
ask, open, high, and low prices, and the exchange
code for each. The number of round lots for the bid
and ask prices and the numbers of units changing
hands are included.
Three Rs
REITs provide the higher dividend yields associated
with MLPs without creating the kinds of tax compli-
cations presented by the partnerships. ese payouts
account for much of the return available from REIT
units. e rest comes from price changes, as with oth-
er types of securities.
Some distinctive risks go with REITs. Market risk
goes beyond unit-price changes to include shifts in real
estate values, for example. As for relative value, dividend
yields are as useful as they are for MLPs. ey provide a
Exhibit 8.4: A Quote for the Prologis REIT
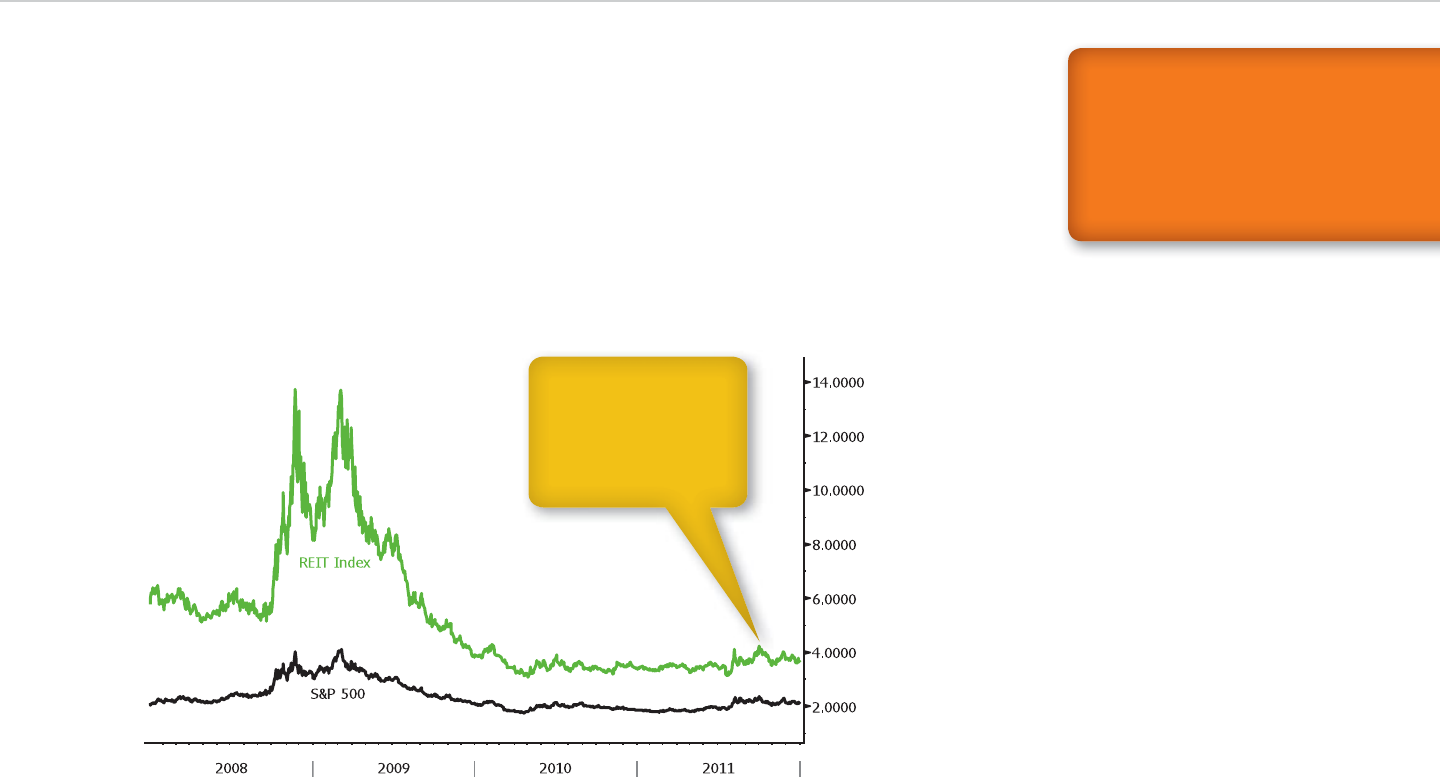
Visual Guide to Financial Markets ■121
for o ces, stores, and other property held by a REIT
worsens, then the value of a trust’s assets probably
will decline. Any potential gains from selling build-
ings may be more elusive. e REIT may have a more
di cult time nding buyers and making sales, and
any properties sold may fetch lower prices than they
would command otherwise.
Interest rate risk has another meaning as well.
Higher rates may hurt a REIT’s sales e orts by increas-
ing the cost of mortgages and may also lead to higher
REIT prices rise and fall with the trusts’ perfor-
mance. When occupancy rates are increasing and lease
or rental rates are climbing, stock prices usually follow
suit. When their business isn’t faring as well, prices
tend to fall. Let’s look into the risks more closely.
Risks
Market risk takes on another dimension for REIT in-
vestors. e trusts may be hurt by lower real estate
values as well as falling stock prices. If the market
Exhibit 8.5: Bloomberg Industries North American REIT Index Dividend Yield versus Standard
& Poor’s 500 Index Yield
The REIT index con-
sistently yields more
because REITs are
passthrough entities,
exempted from corporate
income taxes.
KEY POINT:
REIT investors are affected
by the performance of the real
estate market and the stock
market. This can increase or
depress returns, depending on
their performance.

122 ■CHAPTER 8 Hard Assets Revisited
interest expense on the trust’s borrowings. ey are
less of an issue for investors as payouts are in the form
of dividends rather than interest.
Economic risk is much the same for REITs as for
other companies. When the economy is expanding,
demand increases for oces, stores, hotel rooms,
warehouse space, and other business-related property.
During recessions, the demand dries up. Apartment
buildings are an exception, as shown in the real estate
boom and bust during the 2000s. Families are more in-
clined to buy homes in times of economic growth and
stay in rental housing during periods of weakness.
Business risk, industry risk, and event risk are a
consideration for REIT investors. When trusts are un-
able to nd or retain tenants, these setbacks may de-
press the value of their shares. When rivals are luring
tenants with more lucrative deals, the holders may be
hurt. Takeovers, disasters, and other events may have
the same eect.
Relative Value
Investors can determine whether REIT units are
cheap, expensive, or fairly priced by analyzing their
dividends, which are as useful an indicator as they are
for MLPs.
Payouts provide a way to distinguish among
REITs that own specic types of property, such as
oces or stores. ey are a benchmark for compar-
ing REIT categories. Mortgage REITs, which buy
securities with borrowed money as well as funds from
unitholders, have produced higher dividend yields
than trusts that own property.
Dividend yields are a starting point for comparing
REIT units with other securities as the earlier refer-
ences to the S&P 500 and the 10-year Treasury note
suggested. e higher the relative payout, the more
investors have to gain by taking the risks associated
with REITs, and vice versa.
Financial ratios tied to the price of REIT units
are helpful. Funds from operations take the place of
earnings in the analysis, resulting in price-FFO ratios.
e FFO gure may be adjusted for capital spending
on property maintenance. Prices relative to cash ow
and book value can be used as well.
Debt ratios are one more common denominator
for relative-value analysis. Mortgage REITs aren’t the
only ones who rely on borrowed funds. Trusts turn
to banks and bond investors to nance property pur-
chases, and debt loads aect their ability to maintain
payouts in the face of business setbacks.
INDIRECT INVESTING
Visual Guide to Financial Markets
by David Wilson
Copyright © 2012 by David Wilson.

125
Overview
Derivatives and funds aren’t ordinarily grouped
together, yet they both represent indirect owner-
ship of money market securities, notes, bonds, stocks,
commodities, real estate, and other assets. Owning
a derivative contract di ers from having an asset in
your possession. Buying shares of a fund isn’t the same
as having direct control of its holdings.
e connections run deeper. Funds can own deriva-
tives, government and corporate securities, or hard as-
sets. Derivatives are available on shares of funds, especi-
ally those that track the Standard & Poor’s 500 Index, the
Dow Jones Industrial Average, and other benchmarks.
Risk is another common denominator. Derivatives
are a way to transfer the risk associated with securi-
ties and hard assets. Energy and commodity produc-
ers can minimize the risk that price swings will cut
into revenue, and investors can protect against losses
on their holdings. Investing in funds reduces the risks
that go with putting money into individual countries,
companies, or hard assets.
At the same time, substantial di erences exist.
Derivatives last for a speci c length of time, as short
as a few weeks. Fund shares have no expiration date.
Some of the oldest U.S. funds started in the 1920s, and
shares sold then may still be around today.
Leverage represents a second point of departure.
Buyers of derivatives have to pay a small percentage
of a contract’s value even though their daily gains and
losses are based on the entire amount. Fund investors
have to pay full price for shares even though they can
borrow part of the money in some cases. Leverage
largely depends on the investment strategy followed
by the fund and its manager.
Derivatives provide more control of what you
own than funds allow. Contracts de ne the terms
and conditions for anyone taking delivery, and they
don’t usually change over time. Fund assets can dif-
fer daily as the manager makes trades. e longer
you own the shares, the more extensive the changes
are likely to be.
DEFINITION:
Leverage
Financial leverage is the abil-
ity to multiply potential gains
or losses on an investment.
Derivatives provide leverage
because the value of contracts
is greater than the cost of buy-
ing them. Funds have leverage
only if the manager borrows
money to make investments.

126 ■CHAPTER 9 Overview
e role of the primary market in derivatives and
funds di ers as well. Derivative contracts are created
and canceled every trading day, and not many are
used to raise money as stocks and bonds are. Some
funds, by contrast, go public as companies, master
limited partnerships (MLPs), and real estate invest-
ment trusts (REITs) do.
en again, the mix of markets is comparable. De-
rivative exchanges handle trading in standardized
contracts though the over-the-counter (OTC) mar-
kets have some as well. Customized derivatives are
available through OTC markets. Some funds are listed
on exchanges, and others change hands through the
fund’s manager in OTC trading.
Quotations
To understand the price of a derivative, you have to
know the contract’s terms. Quotes provide some of
these key details. Exhibit 9.1 is an example of a futures
contract, and Exhibit 9.2 illustrates an option. Both
derivatives are based on Eurodollar deposits, and
track money market rates.
Expiration: Futures lapse on a set schedule, often
monthly or quarterly. Other contracts known as
forwards expire after a preset period, such as three
months. Time references are in quotes that de ne
the contract’s duration.
Total contracts: e number changes daily as new
contracts are bought and existing ones are canceled,
and the daily swings are usually bigger than you would
see with bills, bonds, or stocks. For these reasons,
quotes on exchange-traded contracts show what’s
called open interest, or the number outstanding.
Buy or sell: Options contracts give you the right
to do one or the other. Call options represent the
right to buy, and put options convey the right to sell.
Quotes on any contract de ne whether it’s for buy-
ing or selling.
At what price: For many derivatives, the answer is
simple: the price paid for the contract. Options add
a wrinkle because they lock in the price of a later
purchase or sale. at price is inevitably included in
option quotes as well.
More details than these are provided in derivative
quotes. We’ll go through them as we examine each
type of contract individually.
Fund quotations depend on who’s responsible
for the market. In many cases, investors buy and sell
shares directly with the fund company after each
trading day ends. Exchange codes, trading ranges, or
Exhibit 9.1: A Eurodollar Futures Quote
KEY POINT:
Derivatives enable investors to
transfer risk, especially market
risk, to others more willing to
bear them. The contract terms
defi ne the risk and the length of
time it’s being shifted.
Visual Guide to Financial Markets ■127
gap between the price of a derivative and the price of
a related security, commodity, or index can indicate
whether the contract is cheap, expensive, or fairly
priced. Financial ratios used to compare funds are
based on averages for their investments.
Returns
Derivatives don’t pay interest or dividends as a rule,
which means price changes are the sole source of re-
turns. e moves are inevitably tied to the price of the
underlying asset, and the link grows stronger as the
time until contracts expire gets shorter.
Changes in the time to expiration a ect returns as
the gap between a contract’s price and the asset’s mar-
ket price closes on a daily basis. If the derivative price
is higher, then the value will decline over time. If it’s
lower, then the value will increase.
Fund returns are tied to income from their in-
vestments, as well as management fees and other
expenses. Bond funds receive interest on the se-
curities they own. Stock funds get dividends. Bal-
anced funds, which own debt and equity, receive
both. The income helps to cover the fund’s costs.
Lower expenses mean higher returns. This helps to
explain the appeal of index funds, which are gener-
ally cheaper.
volume aren’t included in their quotes. Other funds
are listed on stock exchanges, and their quotes are as
detailed as you would see for stocks, MLPs, or REITs.
Three Rs
Returns on derivatives and fund shares depend on the
performance of other investments. Most derivative
contracts rise and fall along with the value of the se-
curity, commodity, or index they represent. e moves
may not be identical as timing a ects the contracts’
price as well.
Fund returns stem from price changes in their
investments, along with any interest and dividend
payments. Moves may be more limited for funds that
track indexes passively than for those whose manag-
ers actively make buying and selling decisions, which
can enable them to beat the market.
Risks associated with these indirect investments are
tied to their underlying assets. For derivatives, the risks
are magni ed because the amount of money required
to buy contracts or sell them short is a small percentage
of their value. Funds, on the other hand, tend to be less
risky because they own a number of investments.
e underlying assets for derivatives and funds are
an essential element in analyzing relative value. e
Exhibit 9.2: A Eurodollar Options Quote
DEFINITION:
Fund returns
Passive funds are designed to
mirror the returns of an index,
and hold some or all of its secu-
rities. Active funds aim to beat
their benchmark’s return and
own investments picked by the
manager.
KEY POINT:
Derivatives don’t pay interest
or dividends even if the
underlying asset does. Funds
distribute payments on their
holdings to shareholders after
deducting expenses.

128 ■CHAPTER 9 Overview
Relative Value
ere’s nothing as straightforward as yields or price-
earnings ratios (P/Es) that indicate whether deriva-
tives are cheap, expensive, or fairly priced. For funds,
yields and P/Es can be useful with a couple of caveats:
ey’re averages, and the holdings used to calculate
them can change at any time.
Relative-value analysis varies for derivatives, based
on the type of contract. Futures and options can be
compared from one period to another, based on ex-
piration dates. ey can be compared with the price
of the underlying asset. Option contracts, for example,
have a value that goes beyond the asset price. ey’re
worth something even when an investor wouldn’t
exercise the option as we learned from convertible
bonds and preferred stock.
Swaps are exchanges of payments that di er by in-
terest rate, currency, or other criteria. ere are two
sides to each contract, and it’s possible to look at their
value from either side. What’s cheap for one partici-
pant in a swap may be expensive for the other.
Payments in xed interest rates are a standard fea-
ture in some swaps. e rates can be compared with
note and bond yields on Treasury securities, as with
other forms of debt, as a gauge of value.
Relative-value analysis doesn’t stop there. To learn
more, let’s take a closer look at the three main types of
derivatives: futures, options, and swaps. We’ll consider
forwards in our examination of futures, and learn
about warrants as part of our study of options.
Risks
Before we look at risks that are speci c to derivatives
and funds, let’s review the broader concerns that go
with investing. Market risk and liquidity risk are uni-
versal as are political risk, economic risk, policy risk,
and currency risk. e owners of contracts and fund
shares can’t escape them.
Interest rate risk and inflation risk affect the val-
ue of derivatives and funds tied to bills, notes, and
bonds. Funds and their investors bear credit risk,
default risk, reinvestment risk, and call risk in con-
nection with debt securities. Business risk, indus-
try risk, and event risk go with contracts and fund
shares linked to companies, including stocks and
bonds.
With derivatives, we can add two more risks to this
lineup. Leverage is a risk because the value of con-
tracts is much higher than the amount of money re-
quired to buy them or sell them short would suggest.
Counterparty risk is the prospect that the buyer or
seller may fail to live up to the contract’s obligations.
is arises with OTC derivatives as exchanges are the
counterparty for their contracts.
Fund shares have risks all their own. Managers
can stray from the investment strategy that’s laid out
for the fund or can make decisions that don’t pay o .
Even though this isn’t a concern for investors in in-
dex funds, they face the risk that daily moves in stock
prices will fail to mirror the fund’s benchmark. is is
known as tracking error.
DEFINITION:
Counterparty
Counterparties are the par-
ticipants in a contract. Buyers
and sellers of derivatives are
counterparties, and both sides
have obligations to meet under
the agreements.
129
Derivatives
Commodities and real estate can be described as
real assets, as mentioned earlier. Money market
securities, stocks, and bonds are one step removed
from reality as their owners have a nancial asset
rather than something tangible. Even investors in se-
cured bonds don’t have a real asset unless a borrower
defaults.
Take another step back, and you’ll encounter de-
rivatives. ese contracts derive their value from a
real or nancial asset. Derivatives are traded on gold,
other commodities, real estate, currencies, interest
rates, notes, bonds, stocks, and indexes that track one
or more of these assets.
We ran into futures contracts, a type of derivative,
when we looked at commodities. e spot price quote
that we saw for West Texas Intermediate (WTI) crude
oil was based on futures prices, not the other way
around. at’s because oil futures are among the most
actively traded contracts and are far easier to follow
than WTI cargoes. Futures prices are benchmarks for
other commodity markets.
It’s time to take a closer look at futures as well as
forwards, a similar type of contract that’s more easily
customized. To help illustrate these derivatives and
others, we’ll bring back a classic comic strip and car-
toon character known for his love of hamburgers.
Futures and Forwards
Would you gladly pay someone Tuesday for a ham-
burger today? If so, you can identify with J. Wellington
Wimpy, a friend of Popeye the sailor man. Wimpy hat-
ed to spend money, and hamburgers were his favorite
meal. He would make this o er at his local diner in an
attempt to eat without paying.
Let’s turn this around. Would you gladly pay some-
one today for a hamburger on Tuesday? If you expect-
ed the burger to cost more by Tuesday, the answer
KEY POINT:
Derivatives are available for
government and corporate
securities and for hard assets.
Some are tied to specifi c
investments, and others are
linked to indexes.
Visual Guide to Financial Markets
by David Wilson
Copyright © 2012 by David Wilson.

130 ■CHAPTER 10 Derivatives
might be yes. If you could sell the future burger to
someone else at the higher price, you might agree.
For those who aren’t convinced, let’s sweeten the
deal. You could lock in today’s burger price by paying
much less than the full amount. Assuming the diner
charged $4, you might only have to set aside a 10-cent
deposit. You would save money and earn a pro t as
long as Tuesday’s price was higher than $4. is kind
of opportunity is available in futures, because they
establish the price of a later purchase or sale. ere
are futures on the cattle used to make ground beef and
the wheat for hamburger rolls, among other commod-
ities. Futures markets began with commodity trading,
though contracts to buy and sell stocks, bonds, and
money market investments have become far more
active.
e hamburger contract in our example wouldn’t
qualify as a future because there’s no exchange that
handles the trading and sets the terms. Instead, it re-
sembles a forward contract, or an agreement that’s
traded over the counter and can be customized. For-
ward rates are posted in the currency and money
markets, and this type of contract can cover other
securities and commodities.
Either way, the burger is the underlying asset for
the contract. e initial 10-cent cost is called a mar-
gin. Futures exchanges determine the amount and re-
quire buyers and short sellers to set aside the money
in an account. ey might have to add funds later,
based on daily changes in market value, to maintain
the margin. With forwards, there’s one payment made
at the time of signing. is means the contracts are
riskier than futures as markets move in one direction
or the other.
If you paid the 10 cents to avoid the risk of a higher
burger price on Tuesday, then you would be hedging. If
you did this for a potential pro t, you would be specu-
lating. Futures and forward markets exist for hedgers
to transfer the risk of price changes to speculators.
e contract would specify the burger you could
buy, the time of day you could buy it, and the number
you could have at one sitting, among other conditions.
Futures exchanges set the terms of their contracts.
ey often require agreements to be settled through
cash payments rather than deliveries of commodities
or securities. With forwards, the terms are up to the
buyer and seller. is means they can reach an agree-
ment that more closely meets their needs than a fu-
tures contract, assuming there’s one available for what
they’re trading.
Futures contracts are easier to trade because
they’re standardized. Rather than having to take de-
livery of a commodity or security, the futures buyer
can turn around and sell. e reverse is true for sell-
ers, and it’s typical for futures to be settled in this way.
In other words, futures are more liquid than forwards,
which may be an advantage when market prices are
moving.
Chicago is a hub for U.S. futures trading as the
home of the Chicago Mercantile Exchange (CME
or Merc), and the Chicago Board of Trade (CBOT).
e two markets competed from the end of the 1800s
KEY POINT:
Futures markets began with
agricultural contracts, which
have been around since the
1800s. Financial futures,
introduced in the 1970s,
account for most of today’s
trading.

Visual Guide to Financial Markets ■131
to lock in interest rates for loans they will receive later.
FRAs resemble interest rate swaps, a type of derivative
we’ll encounter later.
Separate primary and secondary markets for fu-
tures don’t exist. e main distinction between new
and existing contracts is in the margin payment re-
quired to trade them.
Quotations
Futures quotes resemble the stock quotes we saw ear-
lier, except for two main di erences. First, you won’t
nd exchange codes because futures contracts trade
on one exchange. Second, there’s a piece of data you
haven’t seen before, open interest.
With that in mind, let’s look at a crude-oil futures
quote from the NYMEX (see Exhibit 10.1). When
people refer to the price of oil, they’re often citing the
value of the most active NYMEX contract. It’s worth
knowing what they mean.
CLX1: Futures symbol with three components: a
contract code, a letter signifying the delivery month,
and the last digit of the delivery year.
Contract codes usually are no more than two let-
ters. CL means WTI, the benchmark grade of U.S.
until 2007, when the CME Group Inc., the Merc’s own-
er, acquired the CBOT.
CME Group owns the New York Mercantile Ex-
change (NYMEX), home to WTI futures and other en-
ergy contracts, and the exchange’s Comex division, a
trading hub for contracts on gold and other precious
metals. ey were acquired in 2008.
IntercontinentalExchange Inc., known as ICE, of-
fers trading in energy, agricultural, and index futures,
along with marketplaces for over-the-counter (OTC)
commodity contracts.
Additional futures markets are run by NYSE Euronext,
the owner of the New York Stock Exchange, as well as the
Nasdaq Stock Market, the Chicago Board Options Ex-
change (CBOE), and other nancial companies.
e London Metal Exchange (LME) o ers contracts
that are more like forwards than futures. Traders can
buy and sell aluminum, copper, lead, nickel, tin, and
zinc contracts for delivery in three, 15, or 27 months.
e three-month prices are a global benchmark for
base, or industrial, metals. Derivatives lasting for days
and weeks are available, along with spot trading.
Financial forwards generally trade in an OTC mar-
ket through banks and other nancial companies.
ey arrange contracts for currencies as well as for-
ward rate agreements (FRAs), which allow borrowers
DEFINITION:
Open interest
Open interest is the number of
futures contracts outstanding
for a specifi c expiration month
or for all months. The total
changes daily as contracts are
bought and sold.
Exhibit 10.1 A West Texas Intermediate Crude-Oil Futures Quote
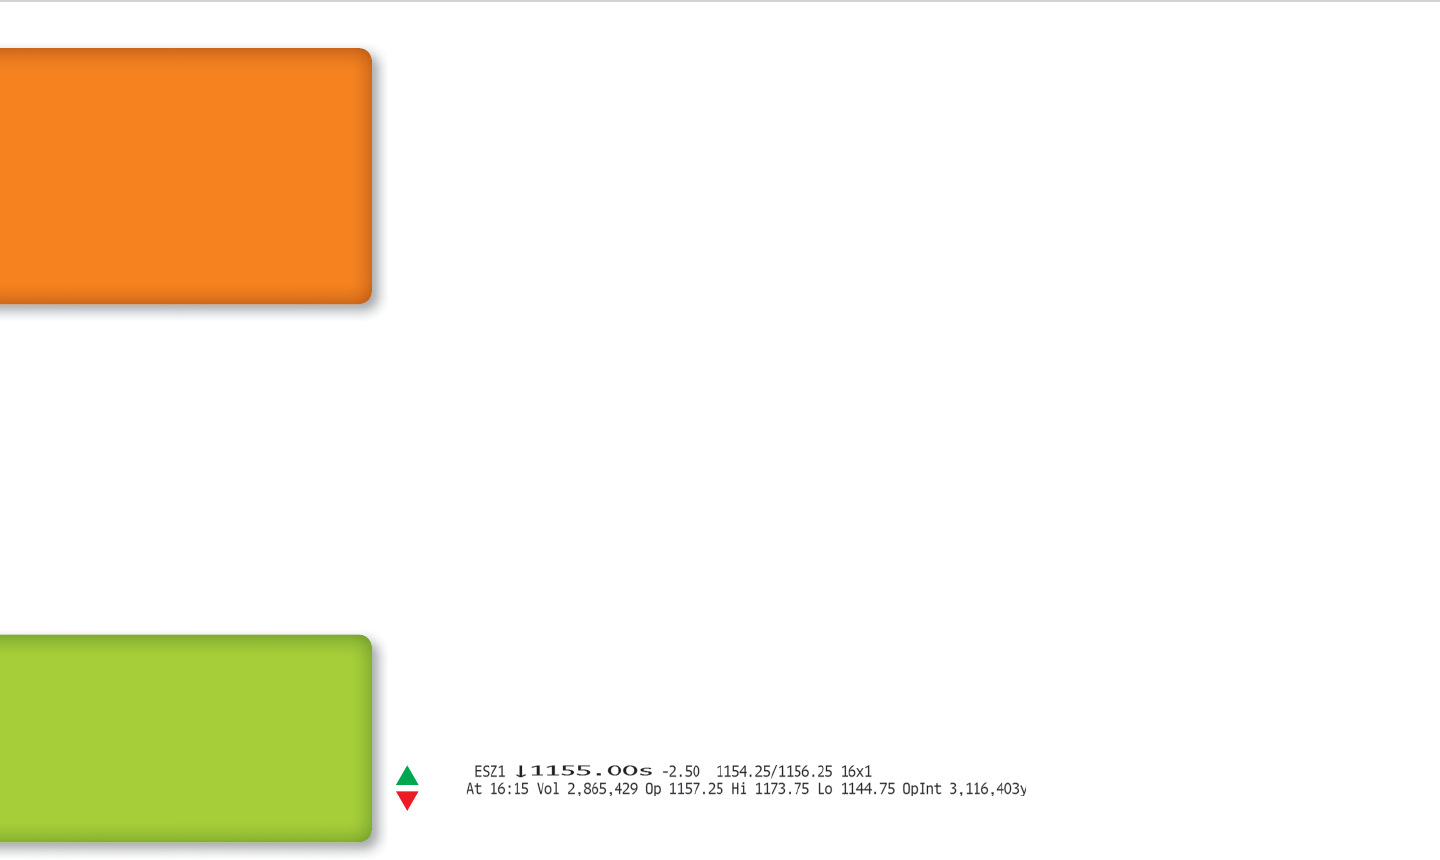
132 ■CHAPTER 10 Derivatives
OpInt 270,703: Open interest as of the previous
day. It’s less than the volume in this case because
contracts can change hands multiple times during
a trading day.
Financial futures are quoted in the same way as
commodity contracts. For example, let’s look at e-mini
futures on the Standard & Poor’s 500 Index, traded on
the CME (see Exhibit 10.2). ese contracts have the
e-mini designation because they trade electronically,
rather than on an exchange oor, and are one- fth the
value of other S&P 500 futures on the CME.
ough the numbers are bigger than the ones we
saw for oil, the format is similar. e rst line begins
with the four-character symbol, including the expira-
tion month and year. e current price and change on
the day follow, along with the bid and ask prices and
the number of contracts for each. e second line has
the time of the quote, volume, opening price, high and
low prices, and open interest.
e di erence is the letter “s” that follows the cur-
rent price. is designates a settlement price, used to
calculate the day’s gains and losses. All futures have
one, including oil contracts.
LME quotes di er from what we have seen, es-
pecially because of the symbols used for contracts.
crude. ere’s a space added after one-letter codes,
such as C for corn. e X means November deliv-
ery, as each month has a corresponding letter and
number. e 1 stands for 2011, as 2 would desig-
nate 2012, 3 would mean 2013, and so on through
9 for 2019.
Down arrow: Uptick/downtick arrow, which shows
the latest price change.
82.71: Latest price, stated here in dollars per
barrel.
+.12: Change on the day, a gain of 12 cents a barrel.
82.70/82.72: Bid and ask prices.
1 u3: Number of contracts associated with the bid
and ask prices. Each contrast represents 1,000 bar-
rels of oil, based on terms the NYMEX sets.
At 16:59: Time of the latest trade. NYMEX oil futures
are traded 24 hours a day during the week, so the
24-hour format is more than a convention.
Vol 343,350: Volume, or the number of contracts
traded. e total is equivalent to 343.35 million bar-
rels of crude.
Op 82.57, Hi 84.00, Lo 81.36: Opening, high, and low
prices for the current day’s trading.
KEY POINT:
Letters used to designate
expiration months are F
(January), G (February), H
(March), J (April), K (May), M
(June), N (July), Q (August),
U (September), V (October), X
(November), and Z (December).
The last digit of the year
follows the letter.
Exhibit 10.2 A Standard & Poor’s 500 Index E-mini Futures Quote
DEFINITION:
Settlement price
The settlement price of a
futures contract determines
the daily change in its value.
Exchanges sets the time of day
and procedure for settlement.
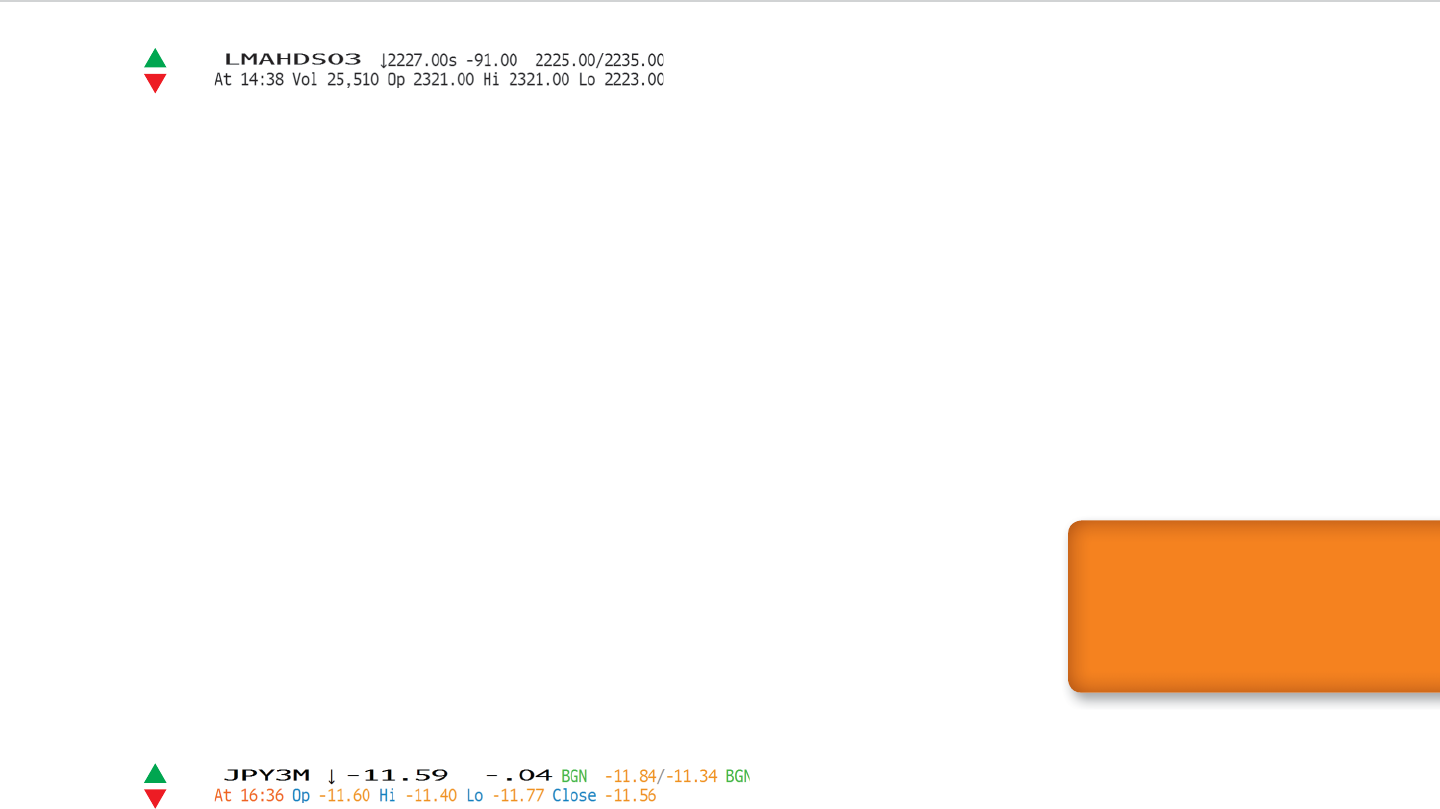
Visual Guide to Financial Markets ■133
JPY3M: Symbol for the forward contract. JPY is the
code for the dollar’s value in yen, as we saw in Chap-
ter 2, and 3M stands for three months. e number
can be anywhere from 1 to 30, and the M can be sub-
stituted with a W for weeks or a Y for years. Forward
symbols can end in ON for overnight trades, TN for
two nights, or SN for three nights.
Down arrow: Uptick/downtick arrow, showing the
most recent change in the forward rate.
–11.59: Spread between the three-month forward
rate and the spot rate, or the dollar’s value against
the yen for immediate delivery. e size of the gap
re ects interest rates in the United States and Japan
and the time until delivery. Longer periods mean
wider spreads, and vice versa.
Because these gures are small, the decimal point
is two places to the right of where it goes in currency
quotes. Here the spread amounts to 0.1159 yen.
Some similarities exist as well. Let’s look at an alumi-
num quote and touch on a couple of key points (see
Exhibit 10.3).
LMAHDS03: Symbol, consisting of ve components.
LM designates the LME. AH stands for aluminum,
and the exchange has a two-letter code for each
metal traded there. D means the price is in dollars.
S shows the price is based on reports made to the
exchange by members. e 03 means the contract is
for delivery in three months.
Vol 25,510: Number of contracts traded. ere’s no
gure for open interest, as the three-month expi-
ration period sets each day’s aluminum contracts
apart from those traded a day earlier or later.
Let’s turn our attention to currency forwards.
Quotes for these derivatives di er, as the three-month
forward rate for the dollar versus the yen shows in
Exhibit 10.4.
Exhibit 10.3: An Aluminum Three-Month Forward Quote
Exhibit 10.4 A Yen Three-Month Forward Quote
KEY POINT:
Currency forward rates are
expressed as spreads. To
determine the actual rate, add
or subtract the spread from the
spot rate.

134 ■CHAPTER 10 Derivatives
they would receive from the securities. Stock-index
futures are ineligible for payments on the shares used
to compile them.
is means the returns depend on price changes,
which can be steep because margins are a few per-
centage points of the contract’s value. e exact per-
centage gure varies from one future to the next and
is set by an exchange, which can adjust margins in
response to changes in the pace of price moves and
trading. Investors can lose all their money more eas-
ily by owning futures rather than the underlying asset.
is risk results from leverage. e value of a contract
might be 20 times the amount of margin required. If
that’s the case, then a 5 percent decline wipes out the
initial payment.
There’s another risk that affects forwards and
other OTC derivatives: counterparty risk, or the
possibility the other party may not meet its end of
the bargain. Buyers may fail to take deliveries, or
sellers may fail to make them. Some OTC contracts
are administered by exchanges, which minimizes
the risk.
Relative-value analysis can focus on time. Inves-
tors can compare contracts that expire in di erent
months to determine which ones may be cheap,
expensive, or fairly valued. e prices of a contract
and the underlying asset provide another basis for
comparisons. It’s possible to make a pro t by buying
whichever looks cheaper and short selling the more
costly asset.
e minus sign before the spread means you have
to subtract it from the spot rate to calculate the for-
ward rate. We can use the rate of 76.33 yen per dollar
from Chapter 2 as an illustration. After subtracting
the 0.1159, we’re left with a three-month forward
rate of 76.2141 yen.
–.04: Change on the day. e minus sign means the
spread narrowed. e .04 translates into 0.0004 yen.
BGN: Source of the rate spread. BGN stands for
Bloomberg generic pricing, which is compiled
from data provided by banks and currency-trading
rms.
–11.84/–11.34: Bid and ask spreads. e bid spread
is wider because this means the forward rate will be
lower.
BGN: Source of the bid and ask spreads.
At 16:36: Time of the most recent quote.
Op –11.60, Hi –11.40, Lo –11.77, Close –11.56:
Opening, high, and low for the current day’s trad-
ing, along with the previous day’s close. e high is
the narrowest spread between the spot and forward
rates, and the low is the widest spread.
Three Rs
Futures contracts don’t pay interest or dividends even
if the underlying asset does. Investors in Treasury note
and bond futures, for instance, forgo the payments
KEY POINT:
Futures exchanges eliminate
counterparty risk by taking the
other side of each trade. They
sell contracts to buyers and
purchase them from sellers, and
their clearinghouses ensure
that both groups meet their
obligations. Clearinghouses
play a similar role in many OTC
derivatives.

Visual Guide to Financial Markets ■135
Let’s assume the S&P 500 declines 1 percent on a given
trading day, and the contract follows suit. If the index
future started the day at 1,200, the loss would be 12
points. Multiply by $50, and you have a $600 loss.
If the margin account ends the day with less than
$3,200, the investor will have to return the balance to
$4,000 to maintain the contract. Otherwise, the ex-
change automatically sells or buys back the contract,
which forces the investor to take a loss. Any added
margin payments increase the cost of the contract
and reduce the potential returns.
Returns for trades that are made for months or
years have another component. Contracts expire at
least quarterly, and investors have to exit them before
they lapse and buy later ones to keep up their posi-
tions. is process is known as a futures roll, as stated
earlier, and the di erence in price between contracts
can add to or subtract from returns.
Futures prices can be transformed into curves,
similar to rate curves for bills and yield curves for
notes and bonds. When a futures curve slopes up-
ward, prices increase as the time until expiration gets
longer. e contract is said to be in contango.
e opposite of contango is backwardation, which
exists when prices drop for later contract months
rather than rising. Curves for futures in backward-
ation have a downward slope, like an inverted yield
curve. Exhibit 10.5 shows how the shape of the curve
for oil shifted in 2008 when crude surged to a record
value and then plunged.
Returns
e leverage that’s built into futures provides inves-
tors with opportunities and risks. To see this, let’s
examine the S&P 500 e-mini futures we saw earlier.
e contract is valued at $50 times the S&P 500 gure
linked to the future. If it’s 1,200, for example, then the
total is $60,000.
e margin required to buy the futures or to sell
them short is as low as $4,000, or 6.7 percent of the to-
tal value, based on December 2011 gures. is initial
margin is tied to two criteria. e rst is whether the
investor is designated as a speculator or hedger. e
second is whether the contract is new or has changed
hands before.
Margin payments are made into an account at the
exchange’s clearinghouse, which processes trades. e
clearinghouse ensures that the investor keeps a main-
tenance margin, or a minimum amount on deposit. e
e-mini has a maintenance margin of $3,200. If losses
cause the account balance to fall below that amount,
the investor has to provide enough additional money to
restore the account to the initial margin amount.
Returns would be based on the entire $60,000. If
the S&P 500’s value rises by about 7 percent, own-
ers of e-mini contracts can double their money. is
works both ways, as a drop of about 7 percent would
cost investors an amount that’s equal to the initial
margin.
Margins have to be maintained daily, so any losses
may lead to additional payments that a ect returns.
STEP-BY-STEP:
MARGIN ACCOUNTING
1. An investor buys an S&P 500
e-mini future and pays the
$4,000 initial margin. The
contract has an index value
of 1,250 at the time of the
purchase.
2. For the rest of the trading
day, the future falls to 1,230.
The drop amounts to 20
points. The contract’s value
falls by $50 times the point
decline, or $1,000.
3. The loss reduces the mar-
gin to $3,000, less than the
maintenance margin, so the
exchange clearinghouse re-
quires the investor to put up
another $1,000.
4. In the next day’s trading, the
future rises to 1,240. The gain
amounts to 10 points, or $500.
5. The margin rises to $4,500.
The investor can withdraw
the day’s profi t from the
account.
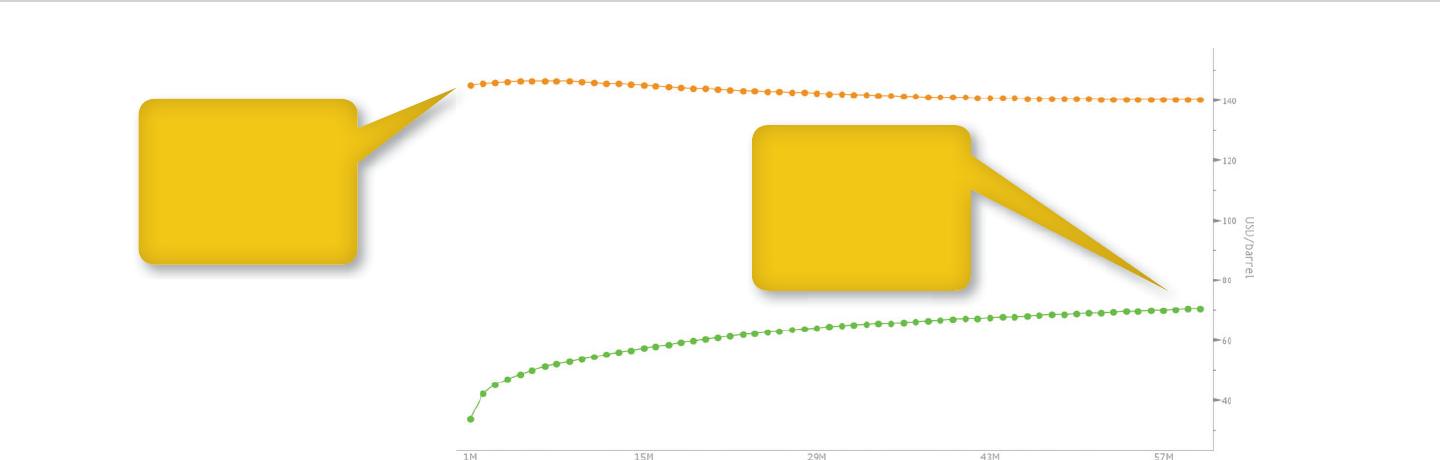
136 ■CHAPTER 10 Derivatives
futures, by contrast, would lose the full amount of the
initial margin payment.
e 100 percent plunge wouldn’t occur all at once
because exchanges settle contract gains and losses dai-
ly through their clearinghouses. Buyers can limit their
losses by selling the contracts themselves or choosing
not to make additional margin payments, which would
cause the exchange to do the selling for them.
Even so, the potential for losing one’s entire in-
vestment is far greater with futures than with the
underlying asset. The same can be said for forwards,
which have a comparable amount of leverage built
into them.
July 2008’s curve indicated that futures traders
saw oil prices falling over time. Five months later,
the curve pointed to higher prices. e latter signal
was accurate as crude more than doubled in the next
12 months in New York trading.
Risks
Futures magnify the market risk that goes along with
any kind of investing. Seven percent swings in the
Standard & Poor’s 500’s value, for instance, can hap-
pen in a week or a few days. When they take place,
shares of S&P 500 funds are worth 93 percent of their
value before the loss. Investors in S&P 500 e-mini
Exhibit 10.5: Oil Futures Contango and Backwardation
When WTI peaked at
$147.27 a barrel on July
11, 2008, futures prices
fell as delivery time got
longer. The backward-
ation signaled lower
prices were coming.
When WTI fell to a low
of $32.40 a barrel on Dec.
19, 2008, futures rose
along with the time to
delivery. The contango
pointed toward higher
prices.

Visual Guide to Financial Markets ■137
Another is to compare the price of a contract and
the underlying asset. is can be done with S&P 500
e-mini futures, for example, to see how their values
compare with the benchmark stock index. e time
until expiration needs to be accounted for along with
the dividends paid on S&P 500 stocks.
When the e-mini futures are cheap, it’s possible
to lock in a pro t by buying them and short sell-
ing some or all of the index’s stocks. When they’re
comparatively costly, short selling the futures and
purchasing the stocks can have the same e ect. is
trading strategy is known as stock index arbitrage,
and it’s been around since the 1980s. Knowing where
relative value exists is essential to making this
strategy work.
Both approaches are similar to those used with
notes and bonds. Spreads between contracts that ex-
pire in di erent months or quarters appear on futures
curves, as yield spreads are shown on yield curves. e
price gap between futures and an underlying asset is
another example of a spread.
Relative-value analysis for forwards follows the lead
of futures. In the currency market, hedgers and specu-
lators can consider forward curves, forward spreads,
and spot-forward spreads in their decision making.
Similar data can be located for other contracts.
Options and Warrants
Wimpy still has his hamburger cravings, so let’s look
at them from another angle. Suppose he wants to
Otherwise, the risks of owning the contracts are
similar to those for the type of investment they rep-
resent. Interest rate risk and inflation risk affect
note and bond futures though their influence is tied
to prices rather than to the value of payments. Busi-
ness risk, event risk, and industry risk come into
play in single-stock contracts, a minor part of the
futures market.
With commodity contracts, weather is a concern.
Higher-than-normal winter temperatures reduce de-
mand for natural gas and heating oil, fuels used to
warm up o ces and homes. Droughts, ooding, and
other natural disasters harm grains and other agricul-
tural products.
Relative Value
Futures exchanges routinely list multiple contracts,
each with a di erent expiration date. S&P 500 e-mini
futures expire quarterly as do the full-sized versions.
Crude oil futures in New York expire monthly and are
available for each month in the next six years at any
given time.
Whatever the schedule might be, there are price
gaps between contracts to consider. e numbers will
be positive if the futures are in contango and negative
if they instead are in backwardation.
Either way, it’s possible to analyze price di eren-
tials and determine whether they’re justi ed, based
on the supply-demand balance and other indicators.
is analysis is one way to uncover relative value in
the futures market.
DEFINITION:
Stock index arbitrage
Stock index arbitrage is buying
index futures while simulta-
neously selling shares in the
benchmark, or vice versa, to
profi t from price gaps between
them.

138 ■CHAPTER 10 Derivatives
call owner will pay or the put owner will receive by ex-
ercising the option.
To lock in the price, Wimpy or the diner would
have to pay a premium, as they would for other
types of insurance. If the strike price represents a
better deal than the market price, then part of the
option’s premium will reflect the gap between the
two. If the burgers sell on Tuesday for $4, the same
price we saw earlier, then a call option with a $3.75
strike price will be worth something. That some-
thing is 25 cents a burger, known as the option’s in-
trinsic value.
Option prices have a second component: time
value, which shows how much investors pay to lock in
the purchase or sale price until the contract expires.
e longer the time until expiration and the more
that a security’s or commodity’s prices uctuate, the
higher the time value will be for its options.
Let’s assume that Wimpy’s $3.75 call options are
good for two burgers each. They might be quoted
at 35 cents, a premium that consists of 25 cents of
intrinsic value and 10 cents of time value for each
burger. If the diner owned put options with the
same $3.75 strike price, they might trade at 5 cents.
The puts would have less time value because ham-
burger prices are more likely to rise than fall, based
on history.
e value of the contract would be $7.50, based on
the two-burger limit. is is known as the option’s no-
tional amount, as the money may or may not change
hands when the contract expires.
lock in the price today for burgers on Tuesday, but
he’s unsure how many he’s going to eat. Perhaps he’ll
only want two, or maybe he’ll be hungrier and have
half a dozen.
Futures and forwards won’t help Wimpy in that
case. Both contracts set the amount that will change
hands at the delivery date. He’ll have to take all the
burgers whether he wants to eat them or not. Instead,
he would rather be able to buy six burgers at today’s
price even if he only wants two on Tuesday.
Let’s look at all this from the diner’s perspective.
Burger sales may be slow on Tuesdays, so the manage-
ment might be interested in lining up potential buy-
ers. is would ensure the burgers are sold at today’s
price even if they’re cheaper by Tuesday.
is kind of exibility is available through options,
because the contracts set the terms for potential pur-
chases and sales. e key word is potential because
the contracts only represent the right to make a deal.
ere’s no obligation to buy or sell, as there is with fu-
tures and forwards. Even so, these contracts provide
similar opportunities to hedge against or speculate on
price moves.
Option buyers can lock in the purchase or sale
price, depending on the contract they own. Wimpy
would want call options, setting the price to buy burg-
ers on Tuesday. e diner would prefer put options,
covering possible sales.
e price of the later purchases or sales is called
the strike price because it’s where the deal was struck.
It’s also called the exercise price because it’s what the
KEY POINT:
Option premiums differ from
insurance premiums because
some contracts provide a
guaranteed benefi t: the ability
to buy an asset at a below-
market price or to sell at an
above-market price.
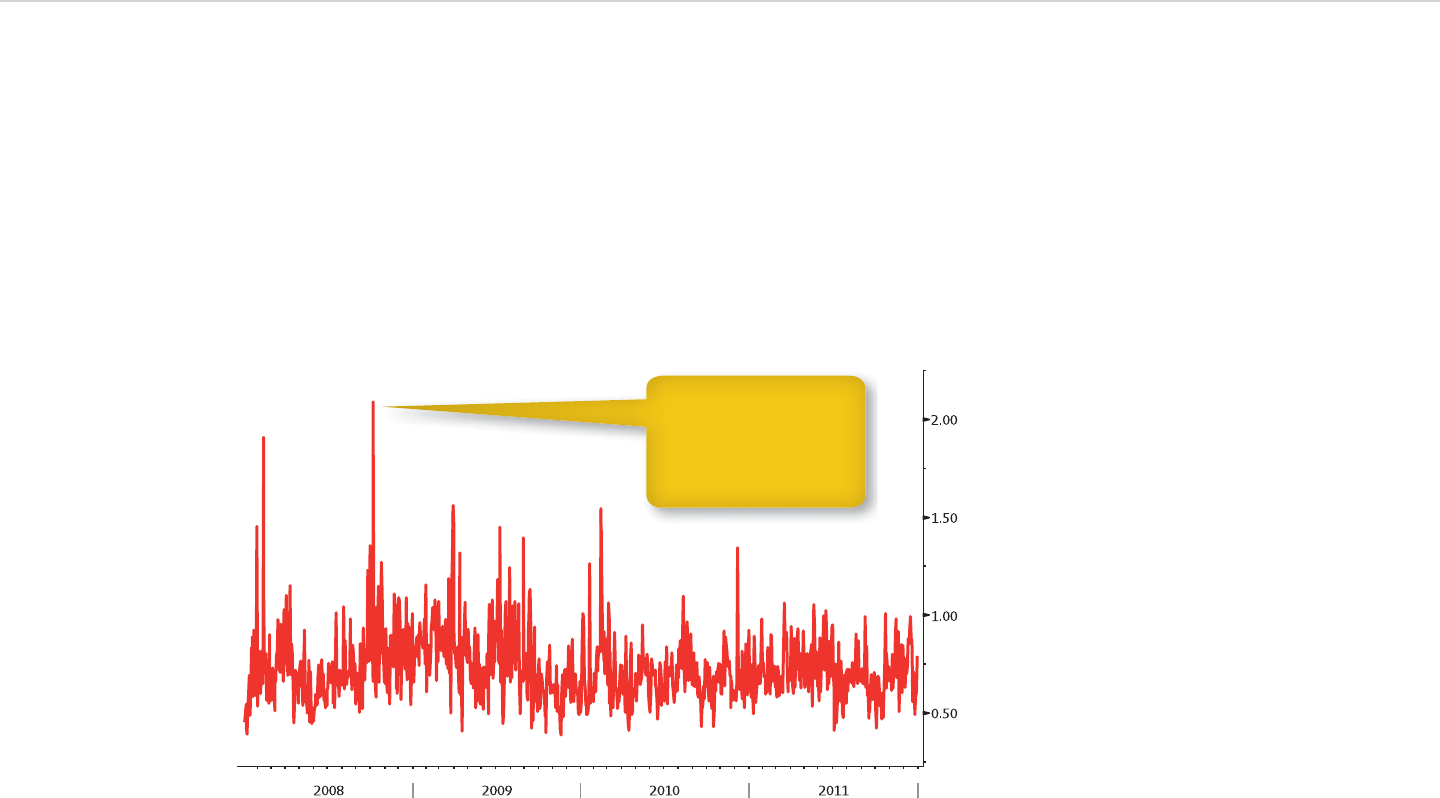
Visual Guide to Financial Markets ■139
may be used before the expiration dates. The names
reflect historical differences in contract terms be-
tween the regions.
Comparing the amount of trading in put and call
options would provide insight into the diner’s pros-
pects. If puts were more active, then it’s likely that in-
vestors are locking in the current price because they
expect a decline. If calls were more active, the outlook
for gains would be brighter.
Here’s a real example, using options on the Apple
stock we saw earlier. Exhibit 10.6 shows the put-call
Wimpy would have to buy three contracts to lock
in the price on half a dozen burgers. If he only wants
two on Tuesday, he can exercise one of them and let
the other two expire. If he decides before Tuesday that
he won’t eat six burgers, he can sell one or two of the
contracts instead of letting them lapse.
If the burgers are only available on Tuesday,
Wimpy would have European-style options. They
may only be exercised on the expiration date.
American-style options are more like offers made
by Groupon and other daily-deal websites, as they
Exhibit 10.6: Apple Put-Call Ratio
Apple’s ratio peaked at
more than 2-to-1 in
October 2008, when a
fi nancial crisis sent
stocks plunging.

140 ■CHAPTER 10 Derivatives
Some companies distribute securities known as
rights to current shareholders when they need to raise
money. Rights are similar to warrants and entitle their
holders to buy shares at a preset price. ey are issued
primarily by non-U.S. companies and can trade on
stock exchanges.
Options are more standardized than forwards, war-
rants, and rights, which means derivatives exchanges
play a bigger role in trading. e biggest U.S. options
market is run by the CBOE, which the CBOT began in
1973. e exchange went public as CBOE Holdings Inc.
in 2010. Options trade alongside futures on the deriva-
tives markets of CME Group and ICE, among other rms.
Customized OTC options are available from secu-
rities rms. eir underlying assets, time to maturity,
and notional amounts, along with other terms, can dif-
fer from those available for exchange-traded contracts.
Quotations
Option quotations vary from one market to the next, as
they do for the underlying assets. For that reason, we’ll
look at two quotes this time around. e rst (Exhibit
10.7) is for an option on S&P 500 e-mini futures.
ESV1C: is option ticker symbol has three ele-
ments. e rst is the contract, identi ed by the rst
two letters. ES stands for S&P 500 e-mini options.
e letter and number that follow designate the
expiration month and year, using the same conven-
tion as futures. Here the letter V stands for October,
ratio, calculated by dividing the number of puts trad-
ed each day by the number of calls.
Analysts use put-call ratios to track investor sen-
timent about markets as well as speci c securities.
at’s possible because there are options on indexes
and related investments, such as the Standard &
Poor’s 500 e-mini futures.
Options are similar to futures in that contracts
have standardized terms and trade on exchanges,
which set the range of available strike prices, the no-
tional amount, and other criteria. For the kind of cus-
tomization that goes along with forwards, investors
can turn to warrants, another type of agreement that
covers the right to buy or sell.
e similarity between warrants and forwards has
limits. Companies can create and sell equity warrants
and list them on stock exchanges. ey can’t do the
same with forwards, which trade exclusively over the
counter.
Warrants can be packaged with bonds or pre-
ferred stock to create the equivalent of convertibles
with separate securities. In September 2008, billion-
aire Warren Bu ett’s company, Berkshire Hathaway
Inc., received preferred shares and ve-year warrants
in Goldman Sachs Group Inc. in return for a $5 bil-
lion investment. In 2011, Goldman bought back the
preferred. Berkshire kept the warrants, which still
had about two and a half years remaining at the time.
is wouldn’t have been possible if Berkshire re-
ceived convertible preferred shares in the rst place.
Having the warrants gave Bu ett more exibility.
KEY POINT:
Warrants enable companies to
lay the groundwork for future
equity fi nancing. They receive
the funds when investors
exercise the warrants to buy
shares.

Visual Guide to Financial Markets ■141
open interest, or the number outstanding. e “y”
next to the open-interest gure means the number
is from yesterday, or the previous trading day.
During the trading day, we would see figures
like these in the quote: 36.25/36.75, 33u83. They
are bid and ask premiums in points, along with the
number of contracts for each. In this case, some-
one offered to buy 33 e-mini S&P 500 options at a
strike price of 1,200. The proposed price is 36.25
index points, or $1,812.50, for each contract.
Someone else put 83 options up for sale at 36.75
points each, or $1,837.50.
Now let’s look at the second option (see Exhibit
10.8), allowing its owner to purchase shares of Apple
stock at $400 each. Some key di erences are worth
keeping in mind between this quote and the one for
the S&P 500 e-mini option.
AAPL US: Ticker and Bloomberg country code for
Apple’s stock. US refers to U.S. composite trading,
covering all the exchanges and electronic markets
where shares change hands.
12/17/11: Month, day, and year when the contract
expires. Every option has one as every future does.
Exchanges set the schedule.
and 1 means 2011 because it’s the last digit of the
year.
e symbol’s fth character will always be C, for
call option, or P, for put option.
1155: Strike price of the option. Combine this num-
ber with the C, and you have an option to buy S&P
500 futures at an index value of 1,155.
Down arrow: Uptick/downtick arrow, showing the
direction of the last price change.
29.50s: Option premium in index points. e “s” des-
ignates a settlement price, as it did with futures. To
nd the contract’s value, multiply the premium by a
preset dollar amount, as you would with futures. We
learned earlier that e-minis are worth $50 for each
index point. Our 1,155 call option is valued at 29.50
times that amount or $1,450.
–3.75: Change on the day, in points. Multiply this val-
ue by $50 to determine the day’s loss, totaling $187.50.
At 16:15: Time of the quote.
Op 31.75, Hi 36.25, Lo 26.75: Opening, high, and low
prices for the current day.
Vol 1,571, OpInt 6,618y: Volume, or the number of
contracts traded during the current day, followed by
Exhibit 10.7 A Standard & Poor’s 500 E-mini Call Option Quote
KEY POINT:
Every option has a month
and year of expiration and is
designated as a call or put.
Investors would refer to the
contract in Exhibit 10.7 as an
October 1155 call.
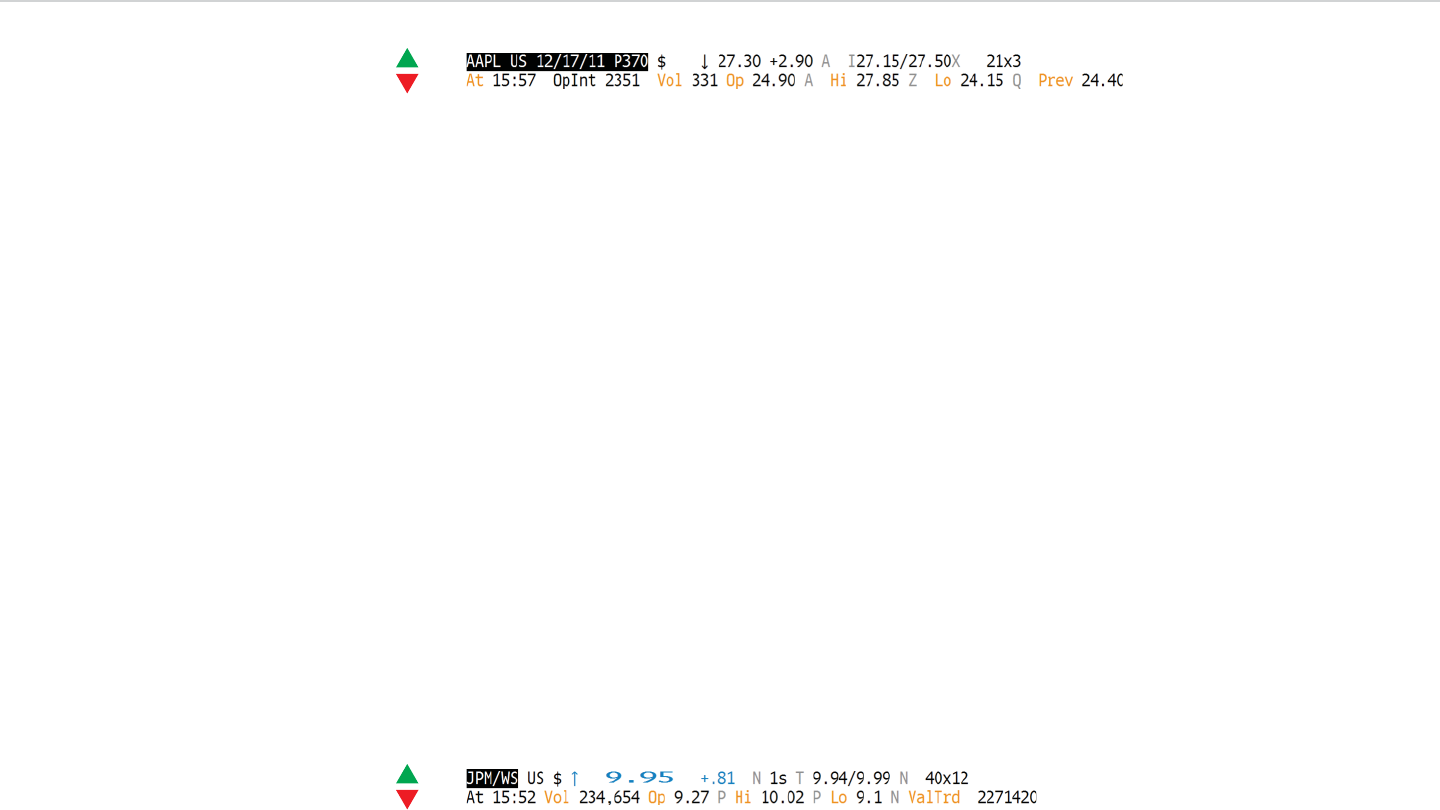
142 ■CHAPTER 10 Derivatives
Warrants that trade publicly are quoted in basi-
cally the same way as stock. Take a look at this quote
(Exhibit 10.9) on JPMorgan Chase warrants, originally
awarded to the U.S. government as part of a nancial
industry bailout.
e /WS designates the security as a warrant, at
least on the Bloomberg terminal. For rights, /RT is the
comparable code.
What follows the /WS is similar to what we saw
with Apple’s shares. e 40u12, for example, shows
someone wants to buy 4,000 warrants at $9.94 apiece
and someone else has 1,200 of them available for sale
at $9.99 each.
Three Rs
Price changes are the key to returns on options as
they are on futures. Premiums on calls and puts will
change as the underlying asset’s value rises or falls.
P370: P as in put option, with a strike price of 370.
27.30: Premium per share of the latest trade. Each
option represents the right to buy 100 shares, or
a round lot. So, the contract cost the buyer $27.30
times 100, or $2,730.
+2.90: Change on the day.
A: Second letter of the two-letter code for the ex-
change where the trade was completed. Equity
options trade on more than one exchange unlike
S&P 500 e-mini options, which belong to the CME.
e codes are the same as those for stock, so the A
stands for NYSE Amex.
Beyond that, the details are similar to those in oth-
er quotes. e rst line ends with the bid and ask pre-
miums, the corresponding number of contracts, and
the exchange ID. e second line has the time of the
quote, open interest, volume, and opening, high, low,
and previous closing premiums.
Exhibit 10.8 An Apple Put-Option Quote
Exhibit 10.9 A JPMorgan Chase Warrant Quote

Visual Guide to Financial Markets ■143
Returns
Price changes—in this case, premium changes—are
responsible for returns on options. ese contracts,
like futures, have no interest and dividend payments.
is means we need to look more closely at intrin-
sic value and time value, the components of option
premiums.
Intrinsic value can rise or fall over time, depending
on what happens to the price of the underlying asset.
If the S&P 500 or Apple’s stock price rises, their call
options will follow suit. If the index or the shares fall
instead, the holders of put options will bene t.
Time value re ects the number of days, weeks, or
months until the option expires. is falls to zero on
the expiration date, when the contract is exercised or
becomes worthless. Even so, time value may rise or
decline daily as intrinsic value does. e moves de-
pend on how much investors are willing to pay to lock
in a strike price.
To see how all this works, let’s delve into Apple op-
tions. When we looked at Apple’s shares, they were
quoted at $369.80 each. It wouldn’t make sense nan-
cially for buyers to pay more than this price or for sell-
ers to take anything less.
is means call options with a strike price of less than
$369.80 are worth something because they’re a better
deal. In other words, they have intrinsic value. e same
goes for put options whose strike price exceeds $369.80.
ere are $5 gaps between strike prices on Apple
options because the stock price is so high. Calls at
$365 or lower and puts at $370 or higher, including the
e demand from investors to lock in the asset’s price
and the amount of time left until the contract expires
a ect returns as well.
e risks associated with options are similar to
those for futures, starting with leverage. Premiums,
like margins, are a small percentage of the underlying
asset’s market value. It doesn’t take much of a price
swing in the asset for puts and calls to become worth-
less. e biggest di erence is that option owners can’t
lose more than the original premium. e contracts
don’t require additional payments.
Counterparty risk exists for OTC options, avail-
able from securities firms. OTC and exchange-trad-
ed contracts are subject to any risks that go along
with the underlying assets. Economic risk can drag
down S&P 500 e-mini options along with the index,
for instance.
Relative-value comparisons among options are
trickier than we have seen. Investors can’t just look
at call and put premiums to make comparisons.
ey have to use an indicator of the potential price
swings built into time values. We’ll see how that works
shortly.
e three Rs for warrants and for rights are simi-
lar to those for options. ese derivatives can produce
higher returns than the underlying assets because
of leverage, which adds to their risks. Investors may
have less chance to pro t from declines as companies’
warrants and rights are calls by de nition. ough
brokerages can create call and put warrants, these
securities are sold outside the United States.
KEY POINT:
Leverage on options varies
along with their premiums,
which depend on the terms
of each contract. The higher
the premium, the lower the
leverage, and vice versa.

144 ■CHAPTER 10 Derivatives
exiting the contracts in advance. When that happens,
returns are tied to the price of the underlying asset
and the premium paid.
In the best-case scenario, locking in the purchase
price in advance would be a money-making strategy
even after taking the additional expense into account.
In the worst-case scenario, savings from the stock
purchase would partially o set the 100 percent loss
from the option.
Risks
e Apple call option we used for the discussion of
returns shows the risks of leverage. e contract’s $8
premium is only 2.2 percent of the stock price. Buyers
of the company’s stock would have to put up far more
money, as the Fed limits borrowing for stock purchas-
es to 50 percent of the price paid.
If Apple’s shares trade at the $369.80 price on the
date of expiration, the stock investor won’t have any
loss. e owner of the call will lose at least 40 percent,
as the premium will shrink to the intrinsic value of
$4.80. e loss may reach 100 percent if the investor
decides against buying the stock.
is shows the risks posed by leverage, which af-
fects warrants and rights in the same way as options.
Contracts traded over the counter have counterparty
risk, assuming there isn’t an exchange to ensure buy-
ers and sellers meet their obligations.
ough these risks are identical for puts and calls,
the same can’t be said for market risk. When the un-
derlying asset’s price declines, put buyers will bene t
one cited earlier, are in the money. is means they
have intrinsic value. Options are out of the money
when they lack intrinsic value. When the strike price
is about the same at the market price, the option is at
the money.
Let’s assume the $365 call is trading at an $8-a-
share premium. e contract is in the money by $4.80
a share, based on the di erence between the strike
price and the $369.80 market price. You would then
subtract the intrinsic value from the premium to cal-
culate the time value, which is $3.20 a share.
A $365 put, by comparison, would have nothing but
time value. Investors would rather sell their stock for
the market price, $369.80, than for the strike price. e
option may trade for only $1 a share, a signal that inves-
tors see Apple’s stock as more likely to rise than fall.
Changes in intrinsic and time value largely deter-
mine returns for option investors. Even though this
is the case for short sellers, they can’t earn any more
than the premiums they collect from selling options.
e potential losses can be much greater, depending
on what happens to the premiums and asset prices
over the life of the contracts.
Suppose an investor sold the $365 call option short
at the $8 price. If Apple’s shares traded for $390 at expi-
ration, the contract would be valued at $25, more than
three times the premium. at would cause a loss on
the short sale. Falling prices for the stock would have
a similar e ect on investors shorting puts.
ere’s one more return scenario left to consider.
Some investors exercise their options rather than
STEP-BY-STEP:
EXERCISING OPTIONS
1. The cost of buying Apple’s
stock by exercising the op-
tion is the $365 strike price
plus an $8 premium, or $373.
2. If Apple trades for more
than $373, the exercise will
produce a profi t as long as the
investor can cover fees and
expenses.
3. If Apple is valued between
$365 and $373, then the ex-
ercise will result in a smaller
loss than allowing the option
to expire worthless.
4. If Apple changes hands for
less than $365, it will be
cheaper to buy the stock and
allow the option to expire
than to exercise.

Visual Guide to Financial Markets ■145
realized volatility, a historical reading that’s based on
a speci ed number of trading days. Someone looking
at trends may use a 90-day reading, and someone else
focused on more recent swings may go with 10 days
instead. Either way, they will see an annual rate that’s
comparable to implied volatility.
Put-call ratios, such as the one we saw for Apple
options, provide insight as well. e ratios are used to
analyze markets as well as speci c securities and hard
assets. A ratio based on S&P 500 puts and calls is used
to track sentiment toward U.S. stocks.
Swaps
Wimpy has guided us through the world of deriva-
tives, so let’s turn to him once more. Suppose our
comic strip character won the right to eat one free hot
dog a week for a year through a local contest.
We know Wimpy likes hamburgers more than
anything else, so he wouldn’t have much use for hot
dogs. Even though he could give up the prize, he’s too
cheap to do that. e cost of one hot dog a week adds
up, after all.
Instead, the burger lover makes a deal at the din-
er. Wimpy nds another customer who’s entitled to
eat a free burger every week for the next year. He ar-
ranges to exchange his hot-dog prize for the other
customer’s burgers. e dog-for-burger deal is an
example of a swap or an exchange between two par-
ties. Financial swaps aren’t as simple as Wimpy’s
agreement because they usually involve exchanges of
and call buyers will su er. When the asset rises in
price, the opposite will be true.
Beyond that, option risks are tied to the asset that
the contracts represent. Apple’s options are subject to
business risk, event risk, and industry risk, like the com-
pany’s stock and other securities. For owners of bond
options, in ation rates and in ation are concerns.
Relative Value
Before we can determine whether options are cheap,
expensive, or fairly valued, we need some basis for
comparison. Contracts vary by underlying asset,
strike price, and month of expiration, among other
criteria. ere has to be a way to make relative-value
judgments regardless of the di erences.
at’s where implied volatility (vol) comes in han-
dy. e gure is an annual percentage rate that’s based
on an option’s strike price, the asset’s market price,
the time to expiration, and the interest rate on three-
month Treasury bills or comparable debt.
Apple’s $365 call option, for example, may have a
30 percent implied volatility. is gure is compara-
ble to percentages for other calls and for puts, as well
as the swings in the company’s stock price over time.
Exhibit 10.10 provides an illustration of how much this
can uctuate.
Comparing the implied volatility of calls can show
which strike prices or maturity dates are worth buy-
ing or selling. Analyzing calls relative to puts can in-
dicate what investors see ahead for the underlying
asset. Relative-value analysis can involve the asset’s
DEFINITION:
Implied volatility
Implied volatility is an estimate
of future price swings in an
option’s underlying asset until
the contract expires. Realized
volatility shows the actual fl uc-
tuation in the asset over time.
Both are expressed as annual
percentage rates.
DEFINITION:
Swap
Swaps are contracts to ex-
change a series of payments
that differ from each other in
some way.
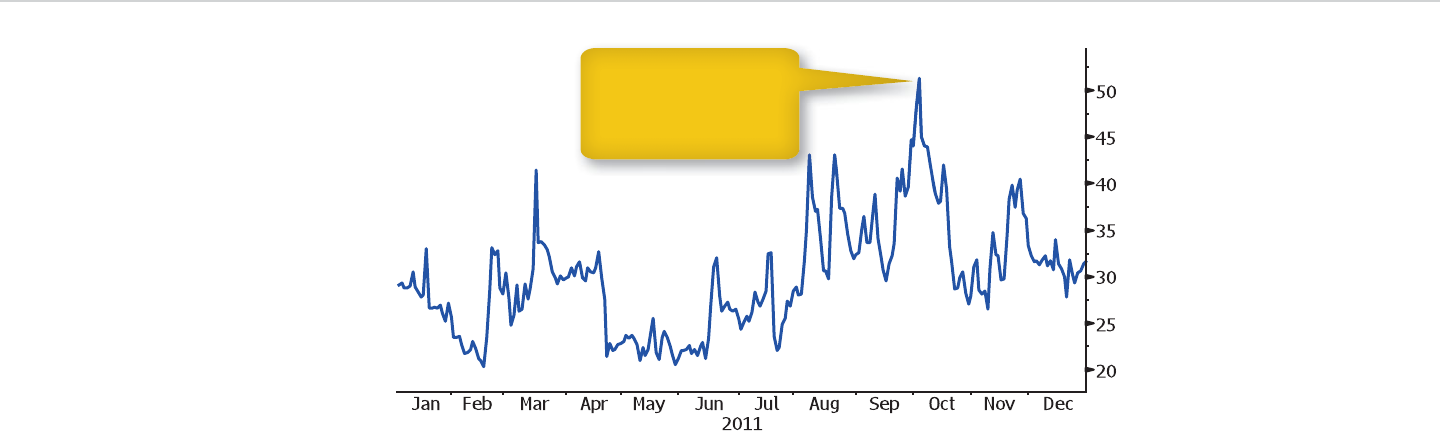
146 ■CHAPTER 10 Derivatives
up with marks and francs. e agreement was known
as a currency swap because the payments were in
di erent currencies.
ough we’ll touch on currency swaps later, we’ll
focus on two other contracts that are more popular
these days. e rst is an interest rate swap, or an
exchange of payments made at di erent rates in the
same currency. e second is a credit default swap
(CDS), or a contract that protects against the risk that
a borrower might be unable to pay its debts.
Both swaps are based on notional amounts,
which are used to calculate payments. In interest
payments rather than food. Yet they can accomplish
a similar goal: giving at least one of the parties some-
thing they would rather have, like cheaper money.
Swaps have been around since 1981, when In-
ternational Business Machines Corp. (IBM) and the
World Bank signed the rst contract. IBM wanted
to pay o debt denominated in deutschemarks, Ger-
many’s currency at the time, and Swiss francs. e
World Bank wanted to borrow in both currencies.
e brokerage rm of Salomon Brothers, which lat-
er became part of Citigroup, put together the swap.
is enabled the bank to borrow in dollars and end
Exhibit 10.10: Apple Implied Volatility
Higher implied volatility
during the second half of
the year refl ected bigger
stock-market swings.

Visual Guide to Financial Markets ■147
figure is an example of a notional amount, used to
calculate the amount of money changing hands un-
der the contract.
Now suppose the bank loan has a oating rate of
Libor plus 2 percentage points, or 200 basis points.
e interest rate swap can ensure that the diner re-
ceives payments tied to Libor, which would help cover
interest on the loan. e payments made would be
based on the the xed rate, set at the time of the swap
agreement.
e amount of money changing hands each time is
based solely on the gap between the swap rates. If the
oating rate is 0.25 of a percentage point lower than
the agreed-upon xed rate, for example, the diner
pays the other party 0.25 percent of the $5 million no-
tional amount, or $12,500. If the oating rate is higher,
the diner gets paid instead.
Swaps are usually designed to ensure that both
sets of payments have the same value when the
agreement begins. The gap between the floating
and fixed rates determines whether the diner pays
or receives money along the way and how much.
Because the diner’s swap is tied to the loan, they
both ought to mature at about the same time. The
five-year swap would be ideal for the five-year loan.
In some cases, the bank that makes a loan ensures
that the timing matches by serving as the swap’s
other party.
Put this all together, and the diner has what might
be called a plain vanilla swap, with conventional
terms and conditions. e standards are set by the
rate swaps, the amounts dictate the size of fixed
or floating payments that each party makes to the
other periodically. In CDS contracts, they represent
the money that would change hands in case of a
default.
Interest Rate Swaps
To understand how interest rate swaps work, let’s as-
sume the diner wants to borrow money for ve years
to nance an expansion. e management wants to
borrow at a xed interest rate, so the borrowing cost
won’t change from year to year. Unfortunately, lenders
are so worried that rates may rise that a oating-rate
loan is a better deal.
is leaves the diner with three choices. e rst is
to skip the expansion because the nancing is too ex-
pensive. e second is to take out the xed-rate loan
and hope for the best. e third is to borrow at the
oating rate and make a separate arrangement to ob-
tain the xed rate.
To carry out the third choice, the diner would
have to arrange a five-year interest rate swap. This
would mean making payments to another party,
usually a bank or securities firm, at a fixed rate. In
return, the diner would get payments based on the
floating rate.
Let’s assume the diner borrowed $5 million for
the expansion. The swap contract’s value can be set
at $5 million even though it’s a number pulled out
of the air as opposed to a future cash payment. The
DEFINITION:
Interest rate swaps
Interest rate swaps are ex-
changes of payments made at a
fi xed interest rate for payments
made at a fl oating rate, usually
Libor or some other benchmark.
STEP-BY-STEP
1. Suppose the diner’s fi xed-rate
payments on the swap are
$200,000.
2. Suppose the diner’s counter-
party owes $250,000 when
one of the payments is due.
3. The payments are netted out
to determine the gap be-
tween them. In this case, the
counterparty owes $50,000
more than the diner.
4. Only the net amount changes
hands each time. In our exam-
ple, the diner receives $50,000
from the counterparty.
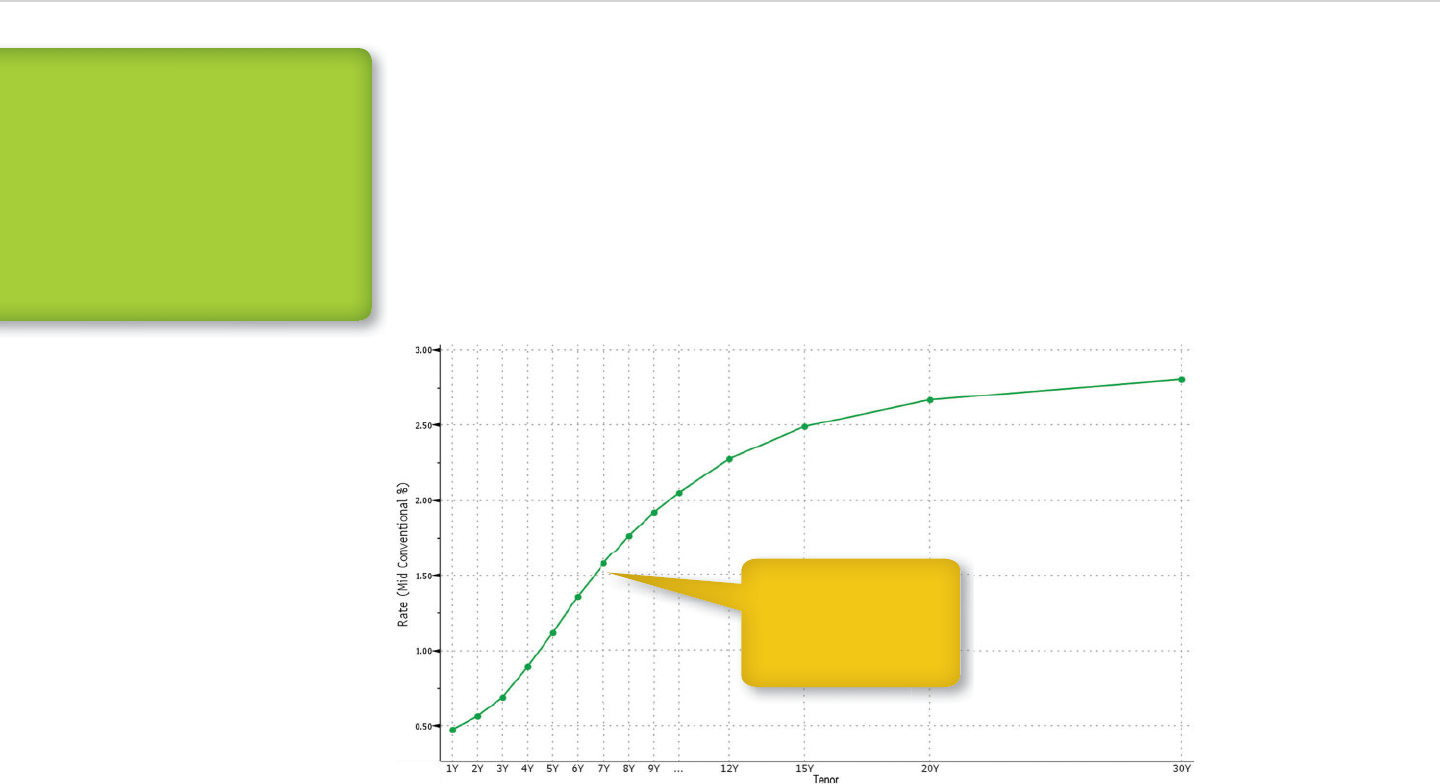
148 ■CHAPTER 10 Derivatives
While the ve-year swap in our example is typi-
cal, other time periods are available, as Exhibit 10.11
shows. We’ll take a closer look at the possibilities later
in considering relative value.
Forward rate agreements (FRAs), mentioned
in the futures and forwards discussion, are single-
payment versions of swaps. FRAs specify the number
of months until they go into e ect and the number of
months until they are settled. e gap between the
two determines the interest rate that’s used to calcu-
late the payments.
International Swaps and Derivatives Association
(ISDA), an industry trade group that has a set of forms
for documenting deals.
e ISDA does its work in the OTC market, where
interest rate swaps and similar contracts are arranged
and traded. Some trading may move to specialized
markets, called swap execution facilities, under terms
of the Dodd-Frank Wall Street Reform and Consumer
Protection Act signed in 2010. e law requires swaps
that are processed by a clearinghouse to be traded on
exchanges or the new facilities.
DEFINITION:
Forward rate agreements
Forward rate agreements
(FRAs) are contracts to ex-
change fi xed-rate and fl oating-
rate payments once rather than
several times. The agreements
become effective in a specifi ed
number of months after they
are signed.
Exhibit 10.11: U.S. Dollar Swap Curve
Swap rates tend to rise
over time, as note and
bond yields do. This
means rate curves are
typically upward sloping.
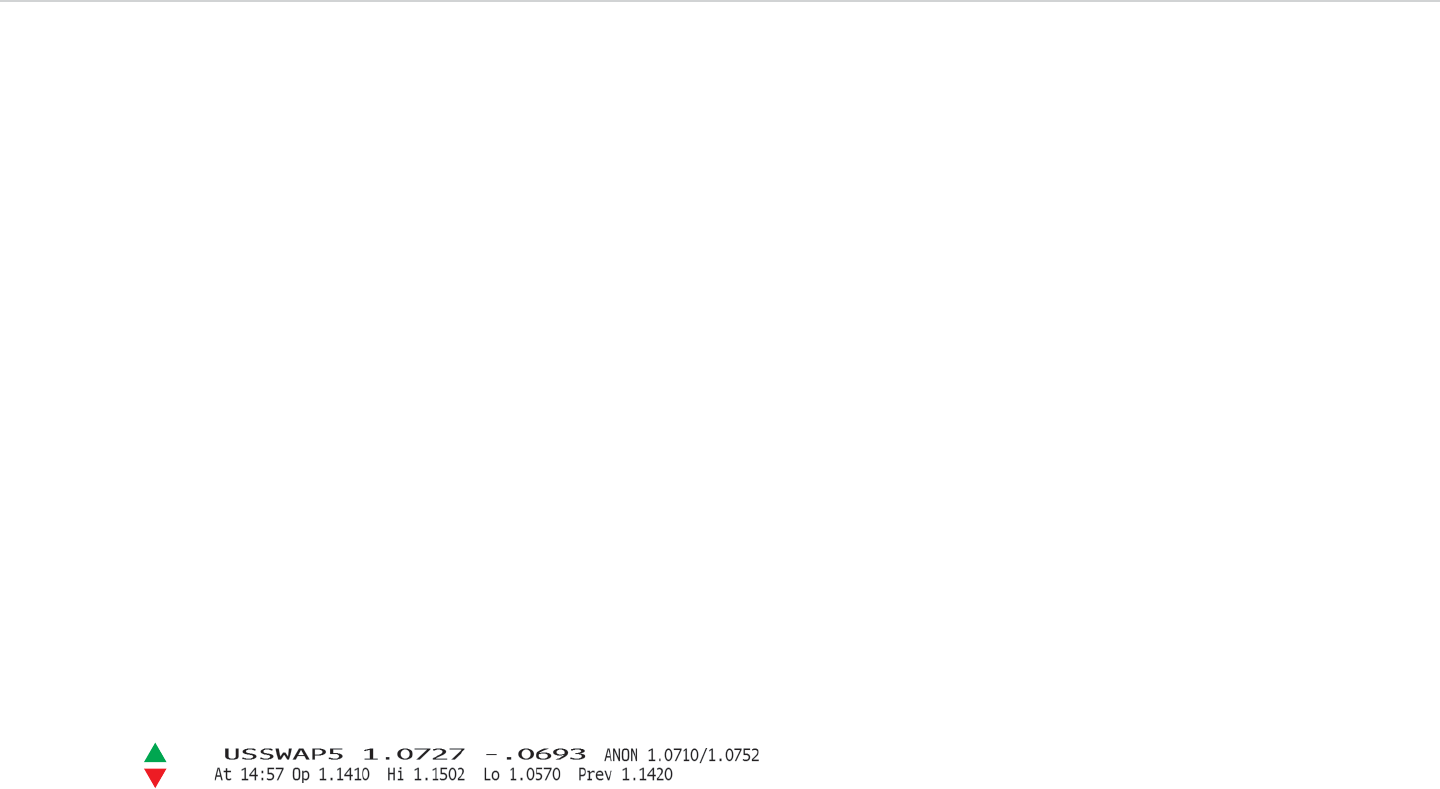
Visual Guide to Financial Markets ■149
Exhibit 10.12: A Quote for a Five-Year Interest Rate Swap in Dollars
For example, consider what’s described as a 3u6
FRA. The contract begins in three months and ends
in six. Six minus three leaves three, so the contract
is based on three-month fixed and floating rates.
The floating rate for this type of agreement is usu-
ally Libor.
Quotations
Interest-rate swap quotes may give you a sense of déjà
vu. ey resemble what we saw for government bills
earlier. Exhibit 10.12 is a sample for a ve-year swap
contract.
e quote shows a rate rather than a price as bill
quotes do. Because swaps change hands in the OTC
market, the day’s trading, exchange identiers, and
other data—including the uptick/downtick arrow, a
xture with other quotations—are unavailable.
Yet the comparison is too simplistic. e swap
quote only tells one side of the story: the xed rate.
You have to know the oating rate, which would be
three-month Libor for a plain vanilla swap. With that
in mind, let’s look at what the quotation provides.
USSWAP5: Swap symbol. US stands for U.S. dollars,
and 5 is the number of years until expiration. e
number may be as long as 30, depending on the
agreement.
1.0727: Fixed rate for the swap.
–.0693: Change on the day in percentage points. e
decline amounts to 6.93 basis points.
ANON 1.0710/1.0752: Bid and ask rates, obtained
from anonymous sources. e bid is what a seller
would have to pay under the contract, and the ask
is what a buyer would receive. at’s why the bid is
lower, unlike the yields in a bond quote.
At 14:57: Time of the latest quote.
Op 1.1410, Hi 1.1502, Lo 1.0570: Opening, high, and
low rates for the current day.
Prev 1.1420: Closing rate for the previous day.
Three Rs
Returns on interest rate swaps will almost inevitably be
positive for one party and negative for the other. Rate
changes determine which side comes out ahead. When
rates rise, the party that’s paying the xed rate is the
winner. e amount of money received from the swap in-
creases along with the oating rate. When rates fall, the
contract’s value tilts in favor of the oating-rate payer.

150 ■CHAPTER 10 Derivatives
Within a single currency, there are swaps in which
the oating payments are tied to a published rate that
can change overnight. e rate at which U.S. banks
borrow from each other through the federal funds
market is an example. ese contracts are known as
overnight indexed swaps.
e gap between Libor and the xed rates on these
swaps, or the Libor-OIS spread, is a gauge of the per-
ceived risk in the nancial system. e wider the
spread, the more reluctant banks are to lend to each
other. e gap soared at the height of the 2008 nan-
cial crisis as Exhibit 10.13 shows.
Some swaps have no xed rate. e parties agree to
exchange payments based on di erent oating rates,
such as the three-month Treasury bill rate and three-
month Libor. ese agreements are known as basis
swaps.
Returns on cross currency swaps, overnight in-
dexed swaps, and basis swaps will di er from those
on plain-vanilla interest rate swaps because of the way
they are put together.
Risks
Interest rate swaps have a total notional amount that
is far larger than the global economy, based on data
compiled by the Bank for International Settlements
(BIS) and the World Bank. e combined value of
contracts outstanding at the end of 2010 was $364 tril-
lion, according to the BIS, an organization that helps
central banks. Economic output was about $63 trillion
worldwide for the year, according to the World Bank.
Interest rate risk is the most basic concern for swap
investors because it’s essentially the same as market
risk. Leverage is another risk, as gains and losses on the
contracts are based on notional amounts that are far
higher than the sums that change hands. ere’s coun-
terparty risk, as swaps last for years and both parties
must survive to meet their contractual obligations.
Relative-value comparisons focus on xed rates for
swaps. e rates are similar to note and bond yields
because they vary by time to maturity. ey can be
tracked historically, compared with each other, or
measured against Treasuries and other debt securities
with similar maturity dates.
Returns
Swap returns, like those on notes and bonds, are tied to
changes in the value of future payments with. ere are
a couple of key di erences. e rst is that no princi-
pal repayment is required when the contract matures.
e notional amount is a number used in calculating
payment amounts. e second is that the gap between
what the parties owe each other is what counts.
e di erential varies in accordance with the
terms of the contract and rate changes. Many types of
swaps exist besides the one arranged by the diner, and
it’s worth spending some time on them to understand
how they work.
We encountered a currency swap in IBM’s deal with
the World Bank. Returns on these contracts, known as
cross currency swaps, are tied to moves in the foreign
exchange market as well as interest rate swings.
KEY POINT:
Interest rate swaps are netted
out, which means only the
difference between the fi xed-
rate and fl oating-rate payments
changes hands between the two
parties.
KEY POINT:
Notional amounts of swaps
never change hands. They
are only used to calculate
payments. This means the risk
associated with these contracts
is less than the size of the swap
market would indicate.
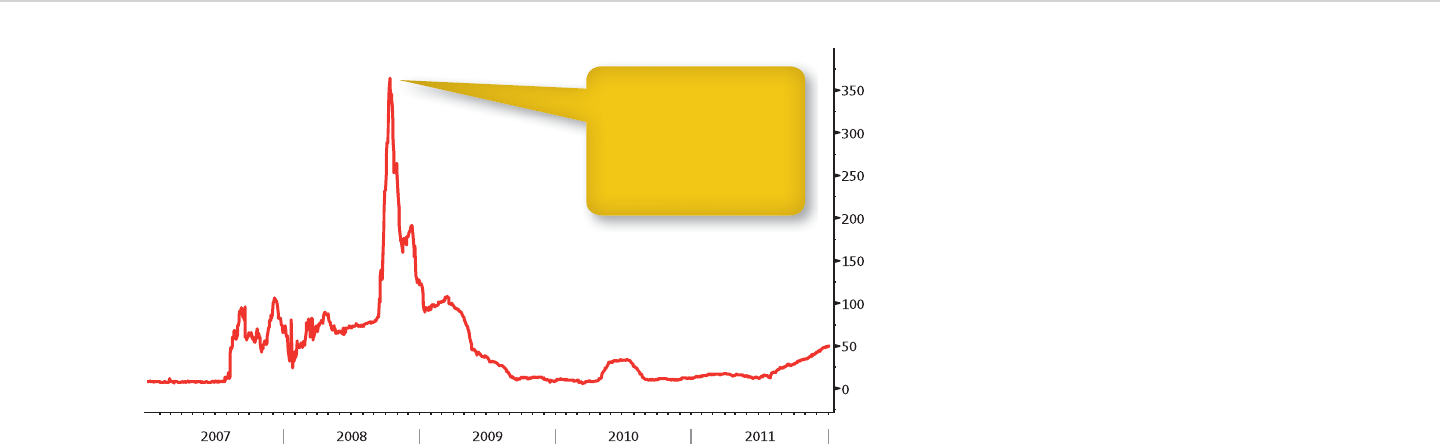
Visual Guide to Financial Markets ■151
Interest rate risk stems from the rate, or rates, used
to calculate swap payments. Because oating pay-
ments are based on a market rate, interest rate risk is
interchangeable with market risk. Basis swaps have a
variation, known as basis risk, that re ects the poten-
tial for changes in the spread between the contract’s
market rates.
Relative Value
Interest rate swaps are available for one to 30 years,
and there’s a xed rate associated for each maturity.
It’s possible to depict each rate as a dot on a graph
e comparison shows how much leverage is built
into the interest rate swap market. e combined
notional amount isn’t a real number like the World
Bank’s gure for gross domestic product, though it’s
useful as a gauge of the e ect that rate swings can
have on contracts over time.
Notional amounts highlight the extent of counter
party risk in the market. When Lehman Brothers led for
bankruptcy in 2008, the rm defaulted on 66,000 interest
rate swaps, which had a total notional amount of $9 tril-
lion. ese gures came from LCH.Clearnet, a rm that
clears rate swap trades and managed Lehman’s default.
Exhibit 10.13: Libor-Overnight Index Swap Spread (in basis points)
The spread peaked at
364 basis points during
the 2008 fi nancial crisis,
which essentially shut
down the world’s bank-
ing system.

152 ■CHAPTER 10 Derivatives
bonds instead. If its nances later took a turn for the
worse, investors in the securities would have reason
for concern.
Some investors might sell the bonds and reinvest
the money elsewhere. Others might buy a contract
that’s designed to protect them against the risk that
the diner will default, le for bankruptcy, or restruc-
ture its nances out of court. is agreement is a
credit default swap (CDS), and the possible reasons
for a payo are known as credit events.
Swaps are available on governments and compa-
nies, known as reference entities because they aren’t
directly involved in the contracts. Each swap has a
reference obligation, or a note or bond that provides
a basis for determining credit events as they occur.
Five-year agreements are a benchmark for the market
though the time period can range from six months to
10 years. ey are denominated in dollars as well as
other currencies.
Having “swap” in the name is somewhat of a mis-
nomer. A periodic exchange of payments doesn’t oc-
cur as with interest rate swaps, cross currency swaps,
and other contracts. e protection buyer pays a per-
centage of the contract’s value to the protection seller
each year. If the nancial position of a government or
company is especially weak, the protection buyer may
be required to pay an additional amount at the time
of the contract. is is known as an upfront payment.
CDSs change hands over the counter through swap
dealers, as interest rate swaps do, though many con-
tracts are processed by clearing rms. e ISDA sets
and connect them as Exhibit 10.11 did earlier. e re-
sult is a swap curve, a tool that investors can use to
judge whether contracts are cheap, expensive, or fairly
priced.
Current rates can be compared with historical
rates to see how they have changed. Considering
what’s happened to yields on Treasuries over time,
you won’t be surprised to know that swap rates have
tended to drop. e ve-year swap rate was about 1.25
percent at the end of 2011, down from about 5 percent
a decade earlier.
Rates at di erent points on the curve can be trans-
lated into swap spreads, another guide to relative val-
ue. We can look at the spread between two-year and
10-year interest rate swaps, for example, as we would
compare two-year and 10-year Treasury yields.
Treasuries are a third point of comparison. Spe-
ci cally, the spread between swap rates and yields on
Treasury notes or bonds with a similar maturity indi-
cate whether there’s more value in the contracts or the
securities.
Swap rates provide a way to determine the relative
value of individual bonds. Yields and prices on many
debt securities are set relative to a benchmark swap
rate rather than the rate on a government security. e
rate represents a point of comparison in the future.
Credit Default Swaps
Wimpy’s diner borrowed from a bank in the interest
rate swap example. Let’s suppose that the diner sold
KEY POINT:
Analysis of relative value
varies according to the terms
of interest-rate swaps, which
are standardized only in plain-
vanilla contracts.
DEFINITION:
Credit default swap
Credit default swaps (CDSs) are
contracts that enable investors
to guard against or speculate on
bond defaults by governments
and companies.

Visual Guide to Financial Markets ■153
a CDS quote for GE debt, which would look much
the same as what we saw for the interest rate swap.
Exhibit 10.14 shows how it might appear.
GECC: Symbol for General Electric Capital, GE’s
nance unit. ough GE Capital is the reference en-
tity, its status may change because of takeovers and
other corporate actions. If the swap covered govern-
ment debt rather than corporate debt, a country
would be the reference entity.
CDS: Identier for a CDS.
USD: ree-letter code for the dollar, a standard
currency for swaps. Contracts can be denominated
in euros, yen or other currencies, which makes the
USD reference necessary.
SR: Senior debt, specied in most swaps. “Senior” re-
fers to the ranking of bondholders if a company goes
into bankruptcy. Contracts can be linked to subordi-
nated debt, which has a lower standing.
5Y: Five years, the most widely used maturity for
swaps. Contracts can run from six months to 30
years. e time to maturity for new swaps is the
same each trading day as it is with forwards.
242.5Y: Mid price in basis points. is is the per-
centage of face value that the buyer of a swap has
CDS guidelines, and buyers and sellers can customize
the agreements.
Rates in the CDS market are quoted in basis points.
If a ve-year swap is priced at 250, then the buyer must
pay 2.5 percent a year. at’s $250,000 a year for a stan-
dard contract, providing $10 million of protection. In
this case, the protection buyer will pay a total of $1.25
million over the life of the swap. Payments are usually
made quarterly.
Even though the swaps are a form of insurance or
hedging, they can be used to speculate like other types
of derivatives. If traders gured Wimpy’s diner would
go into bankruptcy, they could make a prot by buying
a contract without owning any bonds. at’s impos-
sible with other types of insurance.
Swap rates tend to rise and fall along with bond
yields, so they can signal the perceived safety of a bor-
rower. If swaps on a highly rated country or company
are more expensive than those on its peers, the gap
suggests the entity has eectively been downgraded
by investors even if its credit ratings are unchanged.
Quotations
Let’s suppose we wanted to insure the General Elec-
tric (GE) bonds cited in Chapter 3. We might look at
Exhibit 10.14 A GE Capital Five-Year Credit Default Swap Quote

154 ■CHAPTER 10 Derivatives
versa. Returns for protection buyers are based on
price changes. Sellers depend on the swap’s payments,
made over time or upfront, for their returns. ey
stand to make money as long as the reference entity,
either a government or a company, meets its debt ob-
ligations.
Leverage and counterparty risk come into play
with these contracts as they did with interest rate
swaps. e $10 million in our earlier example can be
de ned as a notional amount even though it’s pay-
able in the case of credit event. e buyer and seller
of protection must stay in business to meet their obli-
gations. at’s especially true for swaps traded with-
out the bene t of clearinghouses, which tally daily
gains and losses on the contracts and require margin
payments similar to those made on exchange-traded
futures and options.
Because contracts are available for periods other
than ve years, it’s possible to create CDS curves
and track CDS spreads, which help investors de-
cide what’s cheap, expensive, or fairly valued. ese
curves and spreads are similar to the ones for gov-
ernment bonds, corporate bonds, and interest rate
swaps, and provide a basis for comparing these in-
vestments. Exhibit 10.15 displays a curve for con-
tracts on GE Capital’s debt.
Returns
There are two sides to returns on CDSs, as we saw
with other derivatives. Let’s start with the pro-
tection buyer and then turn our attention to the
to pay yearly to keep the contract in place. In this
example, 242.5 basis points would amount to 2.425
percent.
To gure out the dollar amount of the payment,
we have to know the contract’s size. A typical CDS
may cover $10 million of debt. Assuming that’s the
case here, we can calculate what 2.425 percent of
$10 million would be. at works out to $242,500 a
year. When a borrower’s ability to pay its debt is in
doubt, swap buyers may have to make an upfront
payment.
As of close 10/12: Time of the latest quote. e
spread is from the previous day, as quotes dur-
ing the day are available only through specialized
services.
CMAN: Price source. CMAN stands for the New York
o ce of CMA Datavision, a provider of over-the-
counter trading data for the credit markets.
Bid 234.1 Ask 251.0: Bid and ask prices in basis
points.
ere’s one more detail omitted from the quote
that’s worth highlighting: the projected recovery rate,
or percentage of face value that bondholders would
receive if the borrower went bust. A 40 percent rate is
typically used.
Three Rs
CDSs resemble put options because they increase in
value as the underlying asset’s price falls, and vice
KEY POINT:
CDS buyers profi t when a
company’s fi nancial position
worsens. This makes the
contracts similar to put options
on stocks, which rise in value
when the share price declines.
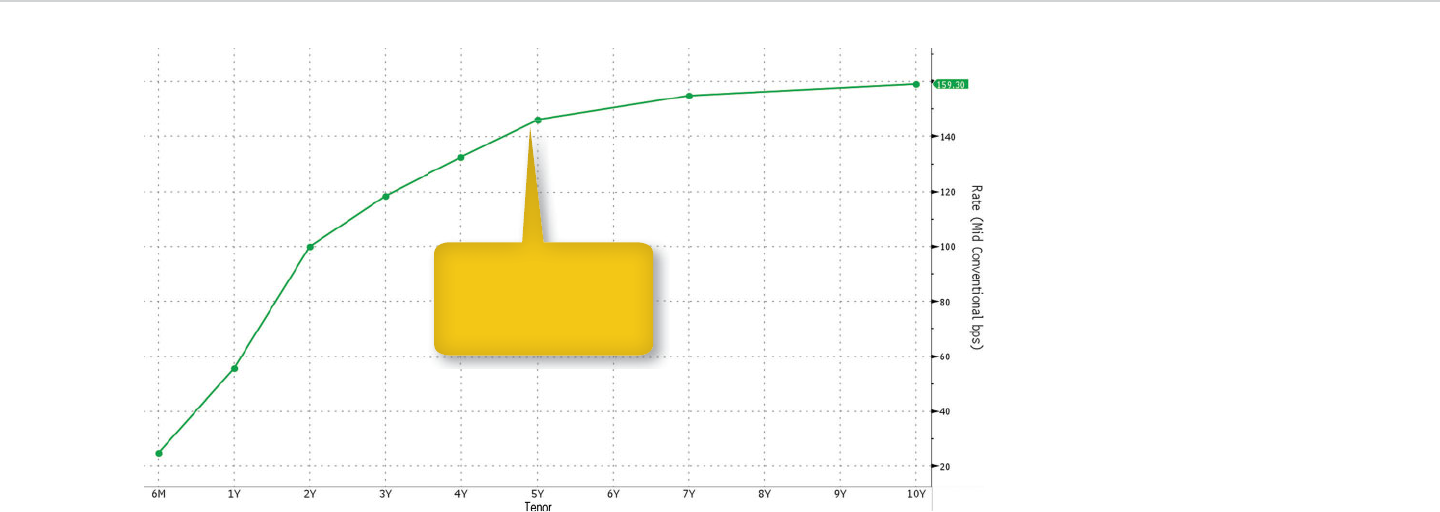
Visual Guide to Financial Markets ■155
avoid default, bankruptcy, or restructuring. More lee-
way exists than for a put option, where small changes
in an asset’s value can lead to losses that exceed the
initial premium. en again, any increase in the swap
rate would hurt the seller’s returns while the contract
is in e ect.
Either way, the key point to understanding returns
is that CDSs are a bet against the country or company
that serves as the reference entity. e wager pays o
in extreme cases. Otherwise, changes in CDS rates in-
uence the contract’s value.
protection seller. The buyer is anticipating the enti-
ty’s business or financial position will worsen, mak-
ing a credit event more likely. This puts the buyer in
a similar position to the owner of put options. The
biggest difference between the derivatives is that
swaps have no intrinsic value. Because they are a
form of insurance, the buyer may end up with noth-
ing but years of protection if the contract isn’t sold
before expiration.
e seller will make money on the swap payments
as long as the government or company manages to
Exhibit 10.15: GE Capital Credit Default Swap Curve
CDS curves can display
upfront payments, rather
than the spreads depict-
ed in this chart.

156 ■CHAPTER 10 Derivatives
In addition to the ve-year benchmark, contracts last-
ing one year, two years, three years, four years, and
seven years are available. at adds up to eight matu-
rity dates, more than enough to take the connect-the-
dots approach one more time and come up with swap
curves. ey are available for individual reference en-
tities, be they governments or companies.
Tracking the history of any swap rate plotted on the
curve is a way to nd relative value. Another is to cal-
culate the spread between two CDS rates and to study
where it’s been over time.
Comparisons between swaps and corporate notes
are worthwhile. It’s possible to use the swap curve to
calculate the rate for a contract that matches the ma-
turity of a speci c note. From there, an investor can
decide if the swap is worth buying or avoiding.
Much of this should have a familiar ring. e analy-
sis is similar to what’s performed for government and
corporate notes and bonds and their variations. It re-
sembles the relative-value approach for interest rate
swaps. Even as the investments change, the process
of deciding which ones are cheap, expensive, or fairly
priced stays much the same.
Risks
Financial markets sometimes force us to think di er-
ently about risk than we normally do. Faster econom-
ic growth is a risk for investors in notes and bonds.
Higher asset prices are a risk for short sellers, as well
as owners of put options.
We’ll have to get into the same mind-set to under-
stand the risks of CDSs. eir value is likely to fall as the
pace of economic growth accelerates, lifting govern-
ment tax revenue and corporate pro ts. Increases in
the price of bonds and other assets are a risk, assuming
they occur because a reference entity is moving toward
a stronger nancial position.
We have to look at credit risk and default risk dif-
ferently than we did with money market debt, notes,
bonds, and bank loans. ese risks are more like op-
portunities. e greater the credit risk, the more value
there is in the contracts’ insurance. Defaults lead to
swap payo s, which compensate for losses on the en-
tity’s bonds at a minimum.
Business risk, event risk, and industry risk a ect
swaps tied to corporate debt though they’re the oppo-
site of what they are for the underlying securities. Any-
thing that would cause the price of notes and bonds to
fall would increase the value of the contracts because
they protect against a worst-case scenario.
Relative Value
e shortest standard CDS agreements last six
months and the longest run 10 years as noted earlier.
KEY POINT:
CDS curves are similar to
Treasury yield curves, and the
two types of curves can be
compared directly to determine
relative value.

Visual Guide to Financial Markets ■157
c. Put-call value.
d. All of the above.
e. a and b only.
4. Categories of interest-rate swaps include:
a. Cross currency swaps.
b. Overnight indexed swaps.
c. Basis swaps.
d. All of the above.
e. a and b only.
5. Credit-default swaps guard against the risk of de-
fault on a:
a. Reference entity.
b. Reference bond maturity.
c. Reference security only.
d. All of the above.
e. a and b only.
Answer the following multiple-choice questions:
1. e counterparty for a futures trade is:
a. Another investor.
b. A securities rm.
c. An exchange.
d. All of the above.
e. a and b only.
2. For futures, the equivalent of an inverted yield
curve is:
a. Contango.
b. Backwardation.
c. A futures roll.
d. All of the above.
e. a and b only.
3. ese are the components of an option’s price:
a. Time value.
b. Intrinsic value.
Answers: 1. c; 2. b; 3. d; 4. e; 5. a
159
Mutual Funds
and Exchange-Traded Funds
Peter Lynch, Bill Miller, and Bill Gross are among
the investors who made names for themselves
in the fund industry. Lynch headed the Fidelity Ma-
gellan mutual fund for 13 years and posted an aver-
age annual return of 29 percent. Miller’s returns at
his agship fund, Legg Mason Capital Management
Value Trust, beat the Standard & Poor’s 500 Index
for 15 straight years. Under Gross’s leadership, the
Pimco Total Return bond fund grew into the world’s
largest mutual fund, a distinction that Fidelity Ma-
gellan once held.
Yet the fund industry may owe a bigger debt to the
work of a university professor, Harry Markowitz, than
to any of these fund managers. Markowitz’s research
showed that owning the right mix of assets would al-
low investors to increase returns without taking on
more risk.
Markowitz published his results during the 1950s,
when he taught at the University of Chicago. e stud-
ies became the basis for what’s known as modern
portfolio theory, and they earned him a Nobel Prize
in economics.
By de ning the relationship between risk and re-
turns, Markowitz helped make a case for diversifi ca-
tion. Rather than owning one stock, own 20, 50, or
maybe 100. is may earn you more money and cush-
ion the blow if one holding does poorly.
By investing in a fund, you can have stakes in 20,
50, or 100 companies and spare yourself the time and
expense of buying them one by one. Funds o er simi-
lar opportunities to diversify in money market securi-
ties, government bonds, corporate bonds, municipal
bonds, mortgage-backed debt, preferred stock, con-
vertible securities, bank loans, hard assets, master
DEFINITION:
Diversifi cation
Diversifi cation means putting
your investment eggs in many
baskets rather than a few. This
reduces the risk that losses on
any one holding will cause the
value of your assets to plunge.
Visual Guide to Financial Markets
by David Wilson
Copyright © 2012 by David Wilson.

160 ■CHAPTER 11 Mutual Funds and Exchange-Traded Funds
limited partnerships (MLPs), and real estate invest-
ment trusts (REITs).
Some funds routinely invest in more than one
type of asset. Balanced funds are an example. ey
own stocks, bonds, and cash equivalents in percent-
ages that are set by the fund company. A balanced
fund may keep 60 percent of assets in stocks and the
other 40 percent in bonds and cash.
Whatever the assets may be, they are owned by
all of the investors as a group, or mutually. It isn’t
like a manager buys a stock or bond and then as-
signs some percentage of the holding to each own-
er. at’s why this type of investment is commonly
called a mutual fund.
Many funds have one or more managers who
decide what to buy, hold, and sell at any given time.
ey are called actively managed, or active, funds
because someone at the fund is doing the deci-
sion making. Active funds have been around in the
U.S. since 1924, when the Massachusetts Investors
Trust began.
Other funds are built to track the performance
of stock, bond, and commodity indexes. ey’re
known as passively managed, or passive, because
the fund company must follow the lead of the in-
dex provider. e manager’s main responsibility is
to keep the fund holdings in line with the index’s
makeup.
e Vanguard 500 Index Fund, introduced in
1975, was the rst passive fund. e fund owns
shares of each company in the Standard & Poor’s
500 Index, and its investment in each one depends
on its standing in the index. If a company represents
1 percent of the S&P 500’s value, for example, then the
fund will invest 1 percent of its money in the stock.
Passive funds are described as index funds be-
cause of their ties to a speci c index, or benchmark.
ey don’t have to own every security in the index to
t the category, either. When it would be too costly or
impractical to buy them all, a fund can own some of
them instead.
Where you buy and sell shares of a fund, and when
you’re able to do so, depends on how it’s organized.
ere are three basic categories: open-end funds,
closed-end funds, and exchange-traded funds (ETFs).
Open-end funds are the biggest part of the industry.
e term refers to the number of shares outstanding,
which changes daily. e fund’s manager sells shares
and buys them back each business day after the close
of trading. e trades are made with fund companies
or through so-called supermarkets run by Charles
Schwab, Fidelity, Vanguard, and other rms.
All buying and selling is done at net asset value
(NAV), or the total value of a fund’s assets, divided by
the number of shares outstanding. If a fund has $1 bil-
lion of assets and 100 million shares, for example, the
net asset value is $10 a share. “Net” means the value
accounts for any borrowing done by the fund.
Closed-end funds trade on exchanges rather than
through fund companies. ere’s a primary market,
where shares of newly created funds are rst sold, and
a secondary market, where they trade afterward. is
KEY POINT:
Some index funds own a cross
section of securities in their
benchmarks rather than all the
components. This approach
can reduce trading costs and
liquidity risk. The sampling is
designed to track the index as
closely as possible.

Visual Guide to Financial Markets ■161
ETFs and ETNs are examples of exchange-traded
products, or ETPs. Another example is exchange-
traded commodities (ETCs), a category that’s some-
times used for ETFs and ETNs tied to gold, oil, and
other raw materials.
is the smallest fund category in the United States, and
the oldest. e rst closed-end fund, the Boston Per-
sonal Property Trust, was formed in 1893.
Market prices usually di er from NAV. If the $1 bil-
lion fund mentioned previously is a closed-end fund,
its shares may trade at $9 or $10.50 rather than the $10
NAV. e lower price is $1 less than the NAV, giving buy-
ers a 10 percent discount. e higher price is 50 cents
more than the NAV, amounting to a 5 percent premium.
Exchange-traded funds (ETFs) are a cross between
the other two types. ey are similar to closed-end
funds because shares are bought and sold on ex-
changes as their name implies. Even so, the number of
shares can vary as it does for open-end funds. Institu-
tions can swap assets for shares, and vice versa, which
keeps the stock price in line with the NAV.
ETFs arrived in the United States a century af-
ter closed-end funds. e rst was the trust behind
the Standard & Poor’s Depositary Receipt (SPDR or
Spider), which tracks the S&P 500 and is among the
most actively traded ETFs today. While most ETFs
own stocks as the SPDR Trust does, some focus on
bonds or commodities instead.
e popularity of ETFs led to the development of
exchange-traded notes (ETNs), whose returns re ect
the performance of a market index. ETNs are linked
to commodities, currencies, and other assets. ey
are debt obligations of nancial companies, so buyers
take counterparty risk along with the risks of invest-
ing in the market that ETNs track. ey don’t pay in-
terest, either.
Passive funds, like SPDRs, are the rule for ETFs and
other ETPs because managers have to disclose their
holdings so institutions can trade with them. Closed-
end funds, on the other hand, are actively managed.
Open-end funds can be active or passive.
Active funds use indexes as a benchmark, or way to
gauge their performance. Managers seek to gain more
than the benchmark when prices are rising, or lose
less when they’re dropping. Few are able to do this
consistently because funds have a handicap: fees and
expenses. e managers have to beat the benchmark
by a wide enough margin to cover the costs and still
come out ahead.
Quotations
Open-end fund quotes lack many details that we’re
used to seeing. Exhibit 11.1, an example for the Van-
guard 500 Index Fund, makes that clear.
KEY POINT:
Exchange-traded products
(ETPs) consist of fund shares,
notes, and commodity-related
investments. Most ETPs are
exchange-traded funds, or ETFs.
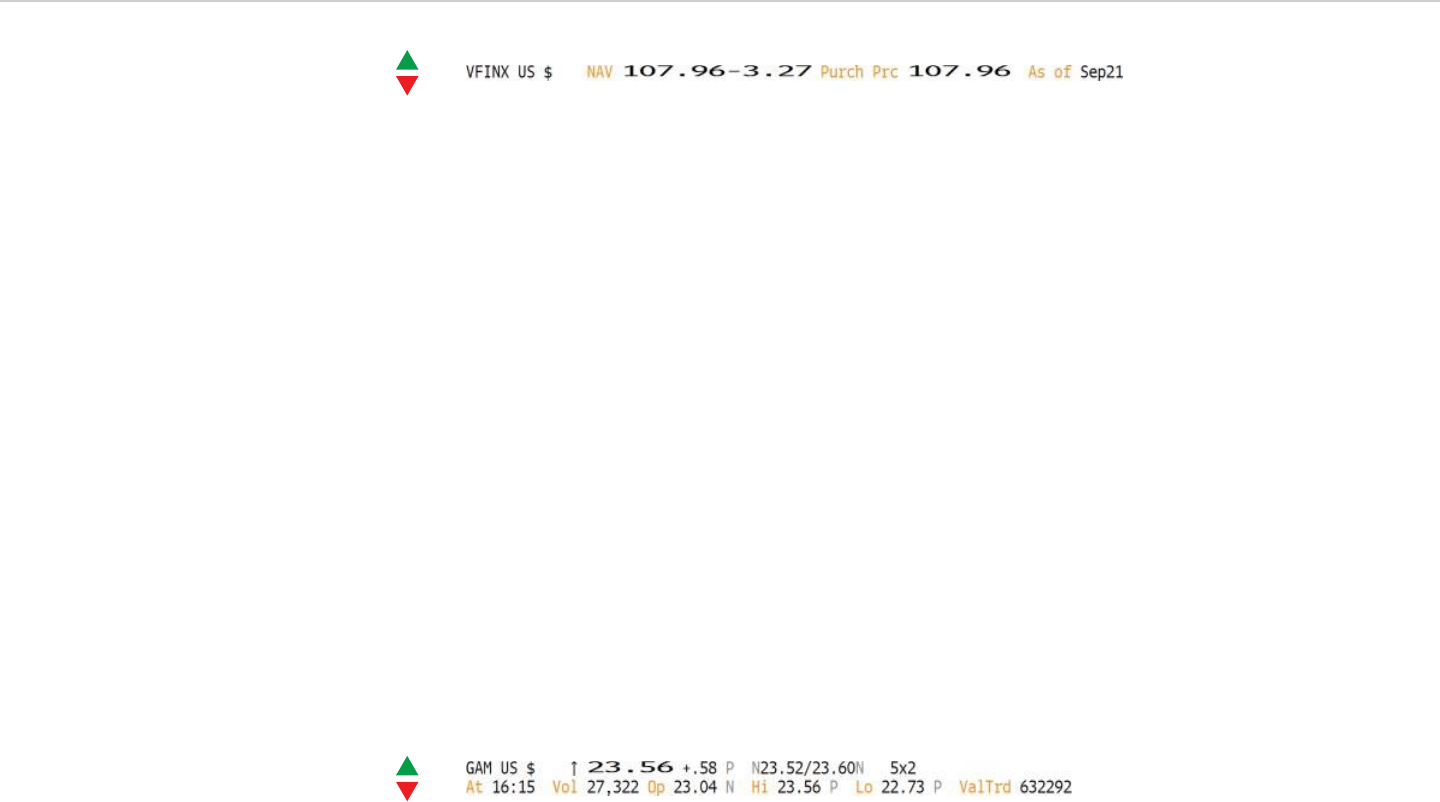
162 ■CHAPTER 11 Mutual Funds and Exchange-Traded Funds
markets as common stock. General American Inves-
tors Inc., a closed-end fund that has been investing
since 1927, is a good example (see Exhibit 11.2).
e stock symbol, exchange codes, dollar sign,
uptick-downtick arrow, share price, change on the
day, bid and ask, time, volume, open, high, and low are
all here.
at’s the case for the S&P 500 SPDR as well.
Exhibit 11.3 shows what you’ll see when looking at
shares of this fund.
Except for the size of the numbers, the SPDR quote
looks the same as the General American quote or a
quote on Apple.
Three Rs
Fund investors don’t have to write checks to cover
fees and expenses, including the manager’s salary. In-
stead, those costs come out of returns, which otherwise
VFINX: Symbol for the fund. Open-end funds traded
in the United States have ve-letter symbols, and
the fth letter is always X to show their status.
US: Two-letter country code.
$: Dollar-denominated security.
NAV 107.96: NAV of each fund share as of the previ-
ous day.
–3.27: Latest change in net asset value.
Purch Prc 107.96: Purchase price of the fund’s
shares as of the previous day. Vanguard sells every
share of the Vanguard 500 that investors want to
buy, and vice versa, after the close of trading each
day. e trades are made at each day’s closing NAV.
As of Sep21: Date of the most recent price.
Quotations on closed-end funds and ETFs, by con-
trast, have all the details provided in stock quotes.
is makes sense, as their shares trade in the same
Exhibit 11.1: A Quote for the Vanguard 500 Index Mutual Fund
Exhibit 11.2: Quote for the General American Investors Closed-End Fund
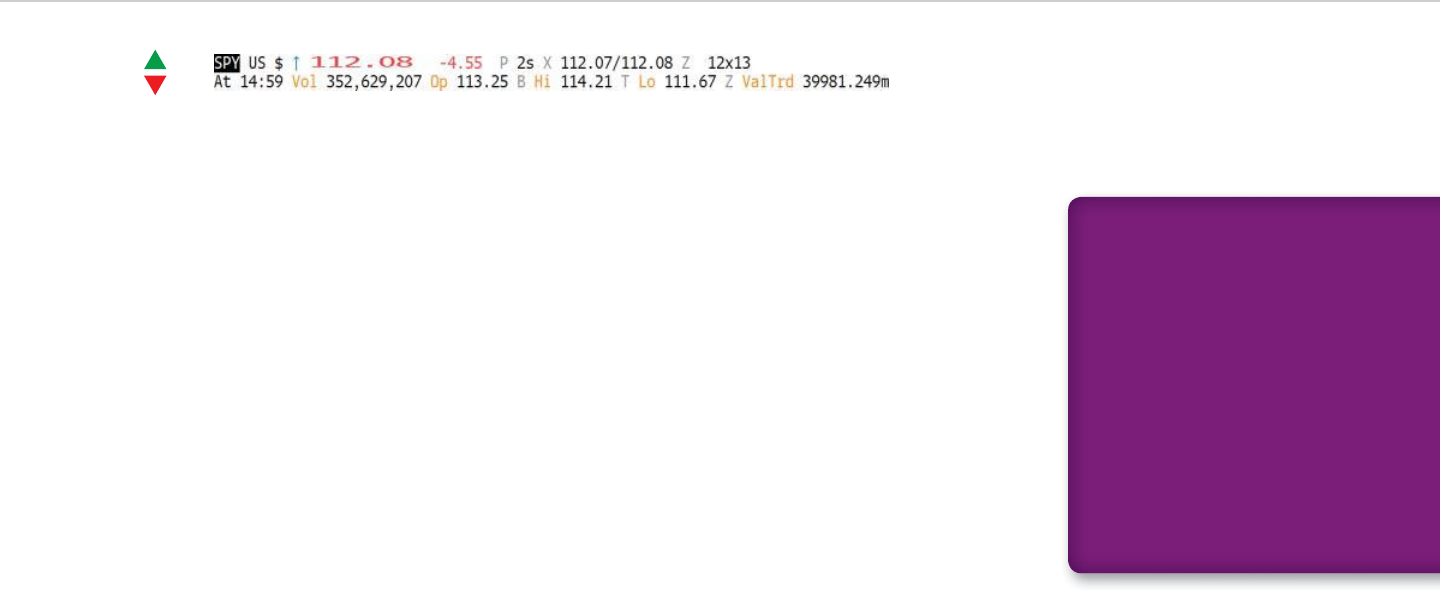
Visual Guide to Financial Markets ■163
from a 10 percent discount, for instance, that would
add to returns. A swing in the other direction would
do the opposite.
at’s the plus side of returns. e minus side con-
sists of fund fees and expenses. Some funds require
the payment of an upfront fee, known as a load, when
investors buy shares. e load is a set percentage of
the amount invested. Others are no-load funds, which
means they don’t impose this charge.
Even if investors avoid loads, they can’t get away
from paying the fund’s operating costs. Managers
and their sta don’t work for free. ere are expenses
related to buying and selling the fund’s stock and its
holdings. Back-o ce charges must be paid. Marketing
and distribution costs are part of the mix, and many
funds cover them by imposing a 12b-1 fee, named for
a U.S. rule that authorized the charge.
Active funds are more costly than passive funds as
a group. An active fund’s annual expenses may equal
1.5 percent of assets, for example. For the cheapest in-
dex funds, the expense ratio is less than 0.1 percent.
In other words, paying someone to decide which
stocks, bonds, or other assets are worth owning can
cost far more than turning over the decision making
to an index provider as passive funds do. e higher
are tied to price changes and income from the fund’s
investments. e costs may lead to negative returns for
investors even in periods where the fund made money.
e risks of fund investing are linked mainly to its
holdings. Additional risks go along with having some-
one else manage your money. e manager may pick
poorly performing investments or change strategies
through daily buying and selling.
Relative-value analysis is made more di cult be-
cause a fund’s assets tend to shift over time. A stock
that may be among its biggest and cheapest holdings
in one period, for example, may be gone the next be-
cause it’s become too expensive for the manager to
hold. is can a ect the yields or nancial ratios used
to compare a fund with itself or its peers.
Returns
Fund returns primarily depend on the performance
of the securities or hard assets they own. If the hold-
ings rise in value, the returns will be positive, and vice
versa. Interest payments are part of the equation for
bond funds as dividends are for stock funds.
ere’s another component of returns that mainly
a ects closed-end funds: price changes relative to
NAV. If a fund’s stock moved to a 5 percent premium
Exhibit 11.3: Quote for the SPDR Standard & Poor’s 500 Exchange-Traded Fund
STEP-BY-STEP: PRICE
AND NAV
1. Shares of a closed-end fund
rise to $22 from $20 during a
year. The increase amounts
to $2, or 10 percent.
2. The NAV climbs to $19 a
share from $18 in the same
period. The gain is $1, or half
of the stock’s advance.
3. The fund’s premium to NAV
widens to $3, or 16 percent,
from $2, or 11 percent. The
larger premium accounts for
the other half of the increase.

164 ■CHAPTER 11 Mutual Funds and Exchange-Traded Funds
Passive funds have a di erent risk, called track-
ing error, in which they fail to keep pace with their
benchmark indexes. e error can happen because of
the fund’s investments, expenses, and timing of cash
ows, among other reasons.
Relative Value
What makes a fund’s shares look cheap? What makes
them expensive? e answer lies with its holdings,
which allow you to classify the fund and determine its
relative value. is process involves analysis similar to
what we looked at earlier for individual securities.
Let’s start with stock funds. ey can be large-cap,
mid-cap, or small-cap, like companies. e appropri-
ate category depends on the average market value of
the companies in which they’re invested. e same
approach can determine whether the fund’s holdings
are domestic or international, whether the manager
favors growth stocks or value stocks, and whether its
industry stakes di er from those of its benchmark.
ese distinctions make it possible to compare
a fund against itself and its peers. Average price-
earnings ratios (P/Es), dividend yields, and other
gauges are a basis for these kinds of comparisons.
Money market funds and bond funds are catego-
rized by the securities they hold: government, cor-
porate, municipal, mortgage-backed, and so on. e
average maturity of their holdings is used to classify
them as short-term, intermediate-term, or long-term.
e distinction between domestic and international
funds applies.
the fees and expenses, the more di cult it is for a
fund’s manager to beat its benchmark.
Risks
e risks of investing in a fund depend primarily on its
holdings as the returns do. Bond funds take on interest
rate risk and credit risk with their investments. Stock
funds deal with business risk and industry risk.
Actively managed funds pose another threat,
known as manager risk. It’s the possibility that a man-
ager will steer the fund away from its strategy, as de-
ned by the fund company, or will fail to deliver ac-
ceptable returns.
Legg Mason’s Value Trust illustrates this kind of
risk. e fund’s returns under Miller beat those of the
S&P 500 each year from 1991 through 2005. During
the next three years, Value Trust trailed its benchmark
by such a wide margin that the fund was among the
worst performers in its category.
By November 2011, when Miller said he would re-
tire as manager, most of the fund’s advantage over the
index had been lost. Exhibit 11.4 shows Value Trust’s
rise and fall, starting in 1991.
Miller’s approach to value led him to invest in com-
panies such as Amazon.com Inc., eBay Inc, and Google
Inc. that many of his peers viewed as growth stocks. is
kind of shift is described as style drift. He also bought
stakes in Citigroup Inc., Eastman Kodak Co., and other
companies that later plunged in value. Anyone invest-
ed in an S&P 500 index fund, rather than Value Trust,
would have avoided being hurt by his decisions.
KEY POINT:
Actively managed funds can
fail to follow their stated
investment strategy because of
a manager’s decision making.
Passively managed funds can
fail to track their benchmarks.
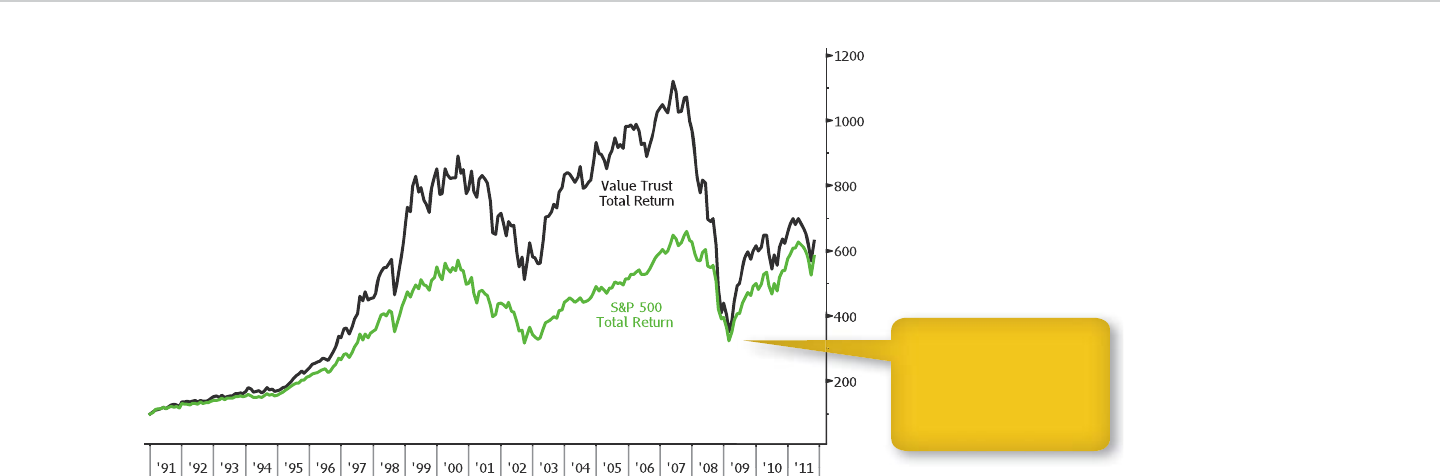
Visual Guide to Financial Markets ■165
Hedge funds are private investment partnerships
that are free to sell short and to use derivatives in
pursuing their strategies. Private equity funds buy
stakes in companies and often take them over with
borrowed money. Venture capital funds provide
money and expertise to newer companies that have
not become public. ere’s also angel investing, done
by individuals rather than funds.
ese days, hedge funds are far di erent than
they were when Alfred W. Jones started the rst one
in 1949. Back then, the funds focused on hedging by
Average yields provide a basis to determine wheth-
er these funds are cheap or expensive. Indicators of
the fund’s credit risk and interest rate risk, such as av-
erage maturity, are used in the analysis as well.
Alternative Funds
Commodities and real estate are alternative assets
because they aren’t stocks, bonds, or cash. Alternative
investing involves funds whose strategies go beyond
buying and holding publicly traded securities.
Exhibit 11.4: Legg Mason Value Trust versus Standard & Poor’s 500 Index
Value Trust suffered
bigger losses than most
of its peers during the
worst bear market since
the Great Depression.

166 ■CHAPTER 11 Mutual Funds and Exchange-Traded Funds
their pro ts as dividends each year to maintain that
status. Some BDCs are publicly traded.
Venture capital funds make investments in
newer companies that aren’t in a position to raise
money through the equity or debt markets. These
funds provide financing to help the companies grow
and business expertise needed to manage their
development.
Technology companies often depend on venture
capital nancing in their early stages. Apple Inc.,
Amazon.com Inc., Genentech Inc., and Google Inc.
are among companies that raised money from funds
before going public. Kleiner Perkins Cau eld & Byers
and Sequoia Capital, based in California’s Silicon Val-
ley, are among the funds that specialize in technology
investing.
Angel investments are a fallback for companies too
small for venture capital. Wealthy individuals are the
angels, providing companies with funding and man-
agement advice. Angels can act on their own or as part
of a larger group.
Hedge funds are the most diverse category be-
cause they can pursue any one of several strategies.
Some involve high degrees of risk, and others are
much safer bets. Some range across stocks, bonds,
commodities, and currencies, and others are more
market specific.
Global macro strategies are the biggest-picture
approach to investing. Managers of macro funds
determine the potential for changes in the global
economy and markets. ey invest in stocks, bonds,
buying the shares of some companies and betting
against others at the same time.
Many of today’s hedge funds follow a similar
strategy to Jones’s fund. Others don’t hedge at all.
Their investments aren’t limited to stocks either.
What these funds have in common is that they
can take money from a limited number of institu-
tions and wealthy individuals, have few restrictions
on their decision making, and disclose little about
themselves.
Private equity funds invest in privately held
companies, mainly by buying stock. Their strate-
gies include leveraged buyouts (LBOs), in which
they take over public companies with borrowed
money. The target’s assets are used as collateral for
the loans, and funds put up some money as equity.
Companies are often overhauled and taken pub-
lic again, enabling funds to reap profits from their
investments.
Most funds are set up as limited partnerships, a
form of organization that’s similar to the MLPs we
encountered in the energy industry. A private equi-
ty firm serves as the general partner, raising money
and making investments. Firms set up new funds
every few years, and each one usually lasts about
a decade.
Business development companies (BDCs), au-
thorized by Congress in 1980, are similar to private-
equity funds. BDCs focus on nancing for smaller
companies. ey are passthrough entities, like MLPs
and REITs, and must pay out at least 90 percent of
KEY POINT:
Hedge funds got their name
by going long and short at the
same time. Not all funds are
hedged today. Some are long-
only or short-only.
DEFINITION:
Macro funds
Macro funds make investment
decisions based on the pros-
pects for economic growth, in-
fl ation, interest rates, and fi scal
and monetary policy. These are
known as macro issues because
they affect economies, indus-
tries, and companies.

Visual Guide to Financial Markets ■167
Another strategy that has a similar goal is arbi-
trage, or buying a security that’s cheap and selling
short a similar security that’s more expensive. Some
arbitrageurs buy shares of takeover targets and bet
against the acquirer. Others buy convertibles and sell
short the underlying shares, or vice versa.
Convertible arbitrage is among the strategies pur-
sued by funds that own debt, as opposed to equity.
Others specialize in dierent versions of arbitrage or
in mortgage-backed or asset-backed debt.
Managed-futures funds bet on or against commod-
ities, currencies, bonds, and stocks through the use
of futures contracts. e managers who run them are
called commodity trading advisers, and their strate-
gies are largely designed to identify and prot from
market trends.
ese categories aren’t all-inclusive. Equity funds
can be distinguished by their preference for growth
or value stocks or by the regions in which they invest.
Emerging market equity and debt funds can be con-
sidered separately. ere are funds that seek to prot
from market volatility or price swings. Funds can pur-
sue two or more strategies at the same time.
Investors can put money into more than one strate-
gy through funds of funds, which invest in a number of
hedge funds. e fund-of-funds approach is especially
expensive, as investors must pay fees to the fund’s
manager and to the rms running the hedge funds in
which it has stakes.
Hedge fund managers aren’t the only investors us-
ing these strategies. Mutual funds and ETFs follow the
commodities, or currencies to prot from those views,
and use leverage to magnify their bets.
George Soros, who co-founded and managed the
Quantum Fund, became a billionaire by succeeding
with this strategy. He earned $1 billion for his inves-
tors when the United Kingdom eectively devalued
the pound in September 1992. Soros’s funds bet the
currency would decline, and he became known as the
man who broke the Bank of England.
Equity hedge funds can have a long bias or short
bias, which means they can focus on owning stocks
or betting against them. Long-biased funds more
closely resemble mutual funds and ETFs in their strat-
egy. Short-biased funds rely on bets against securities,
made through short sales.
Long-short equity funds are among those whose
investing resembles Jones’s original strategy. ese
funds buy some stocks and bet against others. ey
include 130/30 funds, which use leverage to invest 130
percent of assets in long positions and to make short
sales totaling 30 percent of assets. Other funds range
from 120/20 to 150/50, depending on the percentage
of assets they buy and sell short. e 150/50 reects a
short-sale limit under U.S. rules.
ere are market neutral funds, a type of long-short
fund that buys securities and sells them short in equal
amounts. e manager might pursue this strategy by
buying shares of one company in a given industry and
betting against another. e funds are designed to
minimize market risk, enabling them to make money
whether prices are rising or falling.
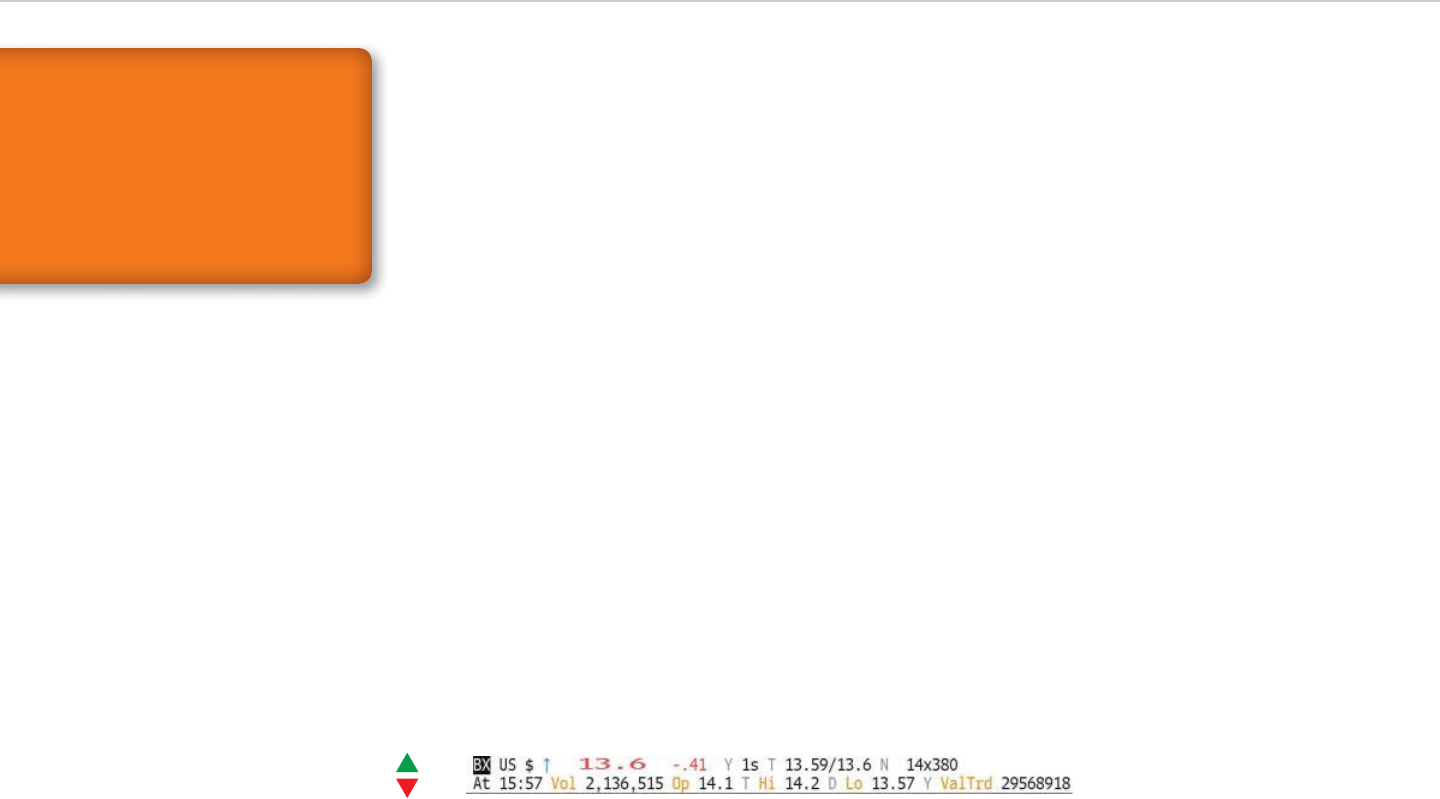
168 ■CHAPTER 11 Mutual Funds and Exchange-Traded Funds
Three Rs
Alternative funds have varying goals for returns. Some
of them are designed to pursue higher returns than an
investor can obtain from stocks and bonds. Others
look for absolute returns, or gains regardless of how
markets are faring. Either way, the funds charge high-
er fees than mutual funds and ETFs, which reduce the
amount of money that goes to investors.
Liquidity risk is especially prominent with these
funds because managers routinely set limits on in-
vestors’ ability to sell stock. Leverage is another note-
worthy risk, especially for private equity funds, which
depend on borrowed money in LBOs. Investors bear
risks tied to the funds’ holdings, and they vary in ac-
cordance with the assets bought or sold short.
Relative-value analysis can be more challenging for
funds than for other investments because the data used
in comparisons aren’t publicly available. Only accred-
ited investors are legally permitted to obtain access.
Returns
Changes in the NAV of an alternative fund’s shares
determine returns. Fund shares don’t pay dividends
though payouts on the funds’ investments a ect
long-short, market neutral, arbitrage, and managed-
futures approaches, among others.
Quotations
Alternative-fund quotations can amount to noth-
ing more than a ticker symbol, a net asset value
per share and a date when the NAV was disclosed.
Anyone seeking additional details must go to more
specialized databases, available on the Bloomberg
terminal and from other providers. Only accredited
investors, defined as institutions and wealthy indi-
viduals in the U.S. and elsewhere, are permitted to
view them.
Managers of these funds are a di erent story be-
cause some are publicly traded. Apollo Global Man-
agement LLC, Blackstone Group LP, and KKR & Co. LP
are among them. Blackstone and KKR are organized
as MLPs as the LP at the end of their names indicates.
Exhibit 11.5 shows a quote on Blackstone. There’s
no difference, aside from the numbers, between
this quote and the ones we saw before for Enter-
prise Products, Prologis, and Apple. Prices, volume,
exchange codes, and other details in the first and
second lines are identical.
Exhibit 11.5: A Blackstone Group LP Unit Quote
KEY POINT:
Hedge funds seek absolute
returns, or profi ts regardless
of whether the markets where
they trade are rising or falling.
Mutual funds focus on relative
returns, or performance by
comparison with their peers
and/or market benchmarks.
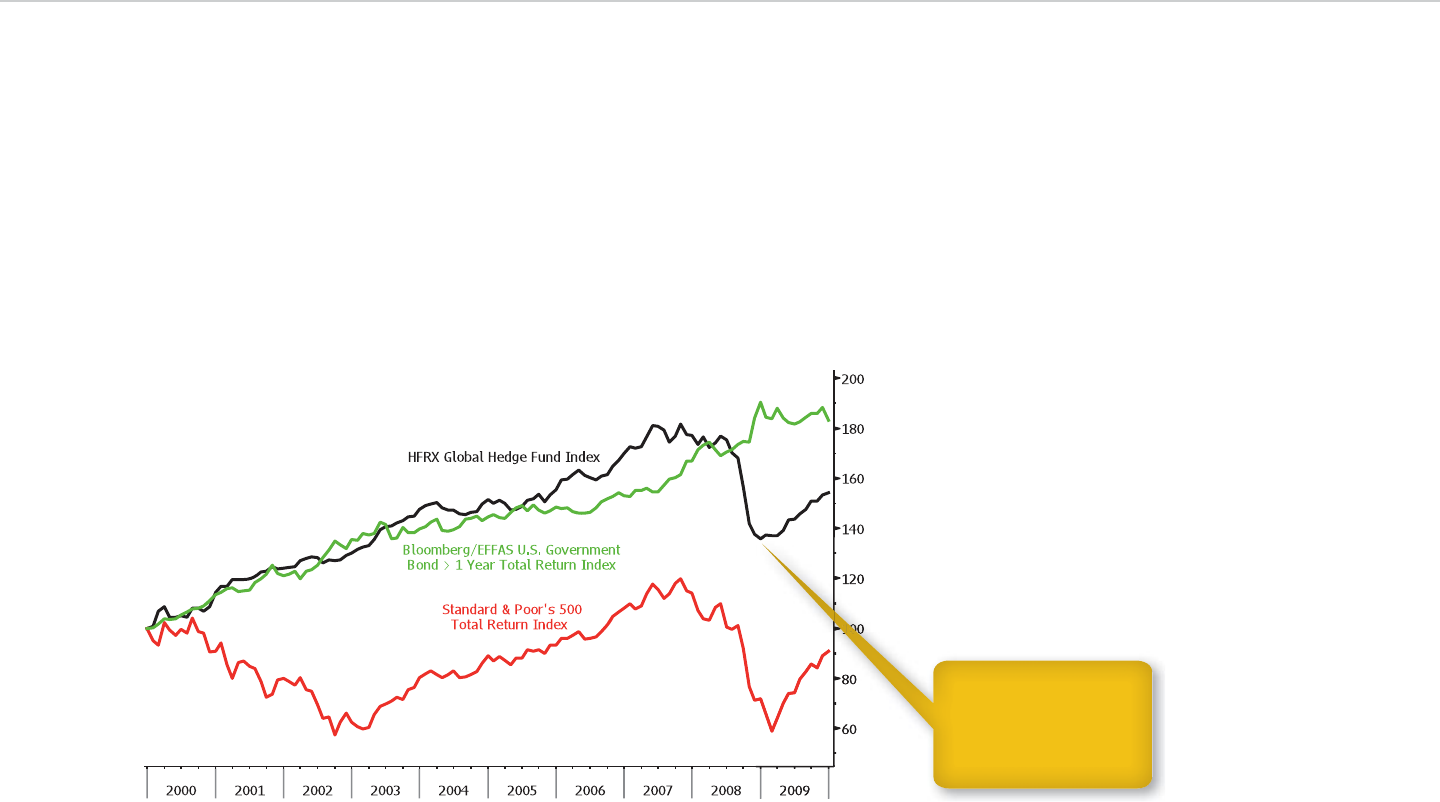
Visual Guide to Financial Markets ■169
2-and-20 arrangement. ough some funds have lower
fees, the most popular and successful ones cost more.
Private equity fund fees are similar to those for
hedge funds except that the manager has to exceed a
minimum rate of return before receiving a percentage
of pro ts. e threshold is the fund’s hurdle rate, and
the earnings payout is known as carried interest.
Alternative funds’ ability to charge so much for
their services is based on their performance. During
the 2000s, hedge fund returns tracked gains in Treasur-
ies even though many of them were invested in stocks
and not bonds. Exhibit 11.6 makes the comparison.
returns by increasing NAVs. Interest payments have
the same e ect for funds investing in debt.
e use of leverage, a common practice for hedge
funds in addition to private equity funds, can help in-
vestors make money. Hedge funds borrow money to
make their investments and trade derivatives, which
have leverage built into them.
Returns on funds re ect their higher fees. Hedge
funds collect management fees and a percentage of
investment earnings as a rule. Investors may be required
to pay 2 percent of assets under management along with
20 percent of pro ts every year, which is known as a
Exhibit 11.6: Hedge Funds versus U.S. Stocks and Bonds
Hedge funds behaved
like bonds until the 2008
fi nancial crisis, when
they started acting more
like stocks.

170 ■CHAPTER 11 Mutual Funds and Exchange-Traded Funds
credit risk, and default risk for investors. e last two
risks are most notable for hedge funds specializing
in distressed securities, which are the bonds and
shares of companies that face business or financial
difficulty.
One more risk that goes along with alternative
funds can be described as a lack of transparency.
Investors in stocks, bonds, currencies, and com-
modities usually can nd the market value of their
holdings in real time. Fund investors don’t have that
opportunity, as NAVs and other data are provided
only periodically.
Relative Value
Alternative fund investing has more to do with getting
behind a manager and a strategy, and being willing to
pay the fees required to pro t from them, than looking
for shares that are cheap, expensive, or fairly valued.
e data needed to make relative-value judgments
can be elusive, especially for those who don’t qualify
as accredited investors.
Historical returns are more widely available, which
makes relative performance easier to judge than rela-
tive value. ere are indexes available for fund catego-
ries and strategies, which make it possible to determine
how a speci c fund is faring compared with its peers.
We’ll look at some of these indexes in the next section.
Funds don’t always deliver on the promise of
absolute returns. In 2008, the hedge fund index shown
in the chart dropped 23 percent. e decline ended a
decade-long string of annual gains. e indicator fell
again in 2011 and did worse than stocks and bonds.
Risks
Alternative investments carry a high degree of liquidi-
ty risk. Hedge funds limit investors’ ability to withdraw
money, especially through initial lock-up periods that
may last a year or two. Funds sometimes cut o with-
drawals after steep losses, a tactic designed to give
themselves time to rebound.
Borrowing by hedge funds and private equity funds
increases the potential for investment losses as well as
pro ts. Fund managers face the risk that a holding’s
interest or dividends, or a company’s earnings and
cash ow, may fail to cover the payments required on
the borrowed funds.
Business risk, industry risk, event risk, and bank-
ruptcy risk a ect alternative funds that invest in com-
panies. e risks are high for venture capital funds, as
well as angel investors. e companies they support
are not as established as those that are publicly trad-
ed. Many of them are likely to fail over time.
Funds that invest in debt securities pose in-
terest rate risk, inflation risk, reinvestment risk,
KEY POINT:
Alternative funds can use two
forms of leverage, borrowed
money and derivatives, to
increase their potential profi ts.
This magnifi es the risk of
losses if the funds’ strategies or
investments perform poorly.
KEY POINT:
Alternative funds provide
less data about themselves
than mutual funds, closed-end
funds, and ETFs. This lack of
transparency can complicate
relative-value analysis.

Visual Guide to Financial Markets ■171
b. Keeping a portion of their pro ts.
c. Earning income on their investments.
d. All of the above.
e. a and b only.
4. Alternative funds cover their expenses by:
a. Imposing annual fees on investors.
b. Keeping a portion of their pro ts.
c. Earning income on their investments.
d. All of the above.
e. a and b only.
5. Alternative funds in this category buy entire com-
panies:
a. Hedge funds.
b. Private equity.
c. Venture capital.
d. All of the above.
e. a and b only.
Answer the following multiple-choice questions:
1. ese types of mutual funds can trade at prices
that di er from asset value per share:
a. Exchange-traded fund
b. Closed-end fund
c. Open-end fund
d. All of the above.
e. a and b only.
2. Mutual funds may deviate from their strategy be-
cause of:
a. Manager risk.
b. Style drift.
c. Tracking error.
d. All of the above.
e. a and b only.
3. Mutual funds cover their expenses by:
a. Imposing annual fees on investors.
Answers:1. e; 2. e; 3. c; 4. d; 5. b

173
Indexes Revisited
When you hear about how commodity markets
are doing, chances are that you won’t nd out
the actual prices at which raw materials trade. Instead,
you’ll be told all about commodity futures. at’s be-
cause the contracts change hands more actively and
price data are more readily available in real time.
It’s the same for indexes that track commodities as
a group. ough you may recall the spot index cited
earlier, the most widely followed indicators are based
on the prices of futures. Bloomberg has a series of these
indexes as do Standard & Poor’s and other providers.
is is one example of how derivatives-based in-
dexes shed light on what’s happening in nancial
markets. Barometers linked to options provide insight
into the kind of price swings that investors expect for
stocks and other investments. Credit default swap
(CDS) indexes show the amount of risk they see in
lending money to countries and companies.
Indexes based on fund performance are helpful.
ey make it possible to see how managers compare
with their peers rather than the market in which they
invest. ese indicators classify funds by type, in-
vestment style, geography, and other criteria, which
makes for fair comparisons.
We’ll look at fund indexes later. For now, let’s focus
on those tied to derivatives.
Futures
Commodity futures indexes have existed for longer
than some types of derivatives. In 1956, the Com-
modity Research Bureau (CRB) began producing an
index. Dow Jones got started even earlier. Goldman
Sachs brought out a commodity gauge in 1991 that’s
now produced by S&P.
Bloomberg came out more recently with the
UBS Bloomberg Constant Maturity Commodity In-
dexes (UBS Bloomberg CMCI), compiled for UBS
AG. These indicators, unlike the others, adjust for
changes in the time until contracts expire. Even
KEY POINT:
Indexes based on derivatives
can be the underlying asset for
other contracts.
Visual Guide to Financial Markets
by David Wilson
Copyright © 2012 by David Wilson.
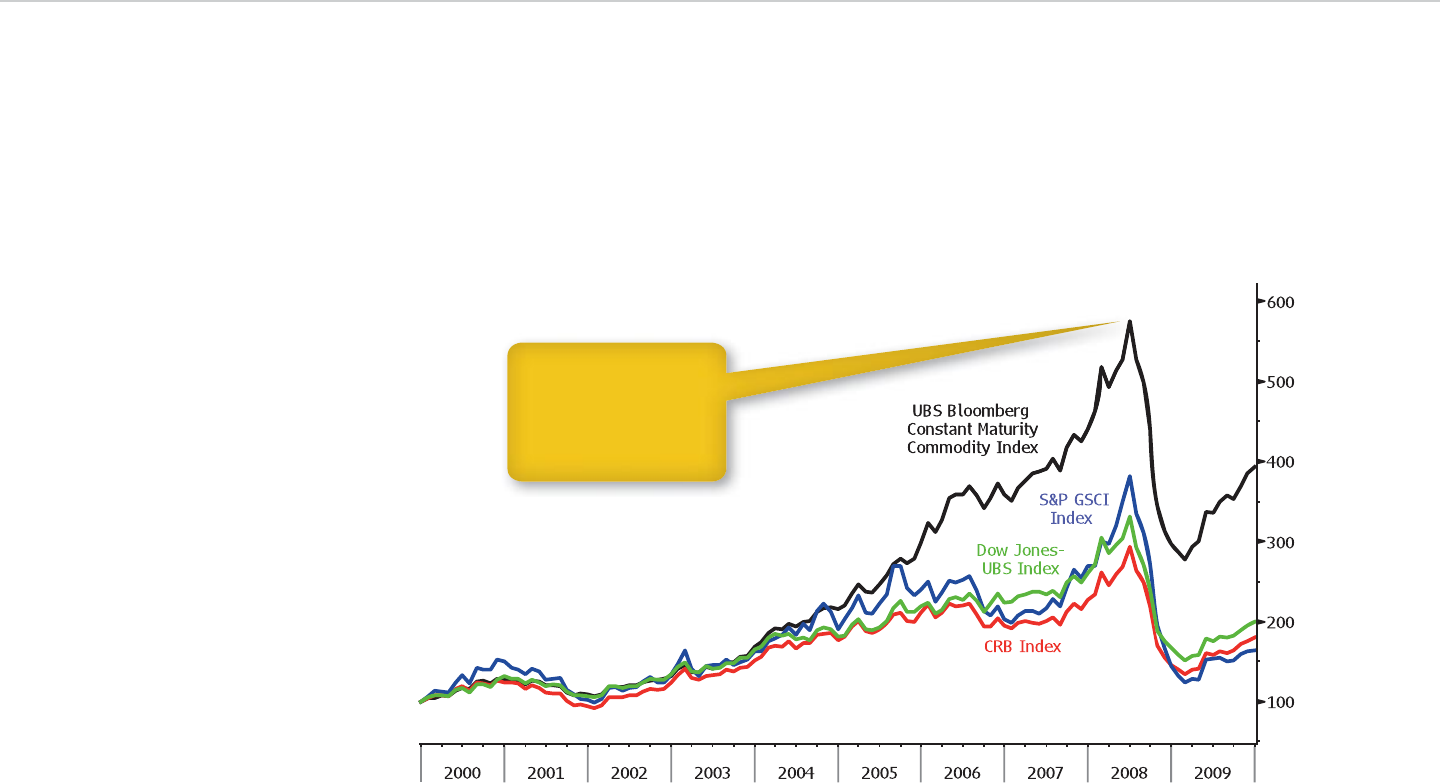
174 ■CHAPTER 12 Indexes Revisited
so, they are similar in how they’re organized and
calculated.
Exhibit 12.1 tracks the performance of bench-
mark commodity indexes in the 2000s, when prices
surged along with demand from China and elsewhere.
Compared with the other gauges, the UBS Bloomberg
index fared the best because it didn’t have any losses
from selling futures as they expired and buying new ones.
The UBS Bloomberg indexes track 24 commodi-
ties, split into five categories: energy, precious
Exhibit 12.1: Commodity Index Total Returns (December 31, 1999 = 100)
The constant-maturity
index avoided the futures
roll losses and trad-
ing costs that affected
other commodity market
gauges.

Visual Guide to Financial Markets ■175
volatility indexes, which are tied to the value of several
contracts.
e Chicago Board Options Exchange’s Volatility
Index (VIX) is the most widely followed of these indi-
cators. is index is calculated from the prices of S&P
500 options, and it’s designed to signal how much the
index might swing within the next month. Futures,
options, and exchange-traded securities are tied to
its value.
ere’s a tendency for the VIX to rise when share
prices are falling, and vice versa. Investors are more
inclined to buy options to guard against further losses,
or perhaps to speculate on rebounds, than they are to
lock in gains as stocks climb. Because of this, the index
is considered a gauge of investor fear.
e VIX was introduced in 1993, and the current
version dates back to 2003. e CBOE switched to S&P
500 options from contracts on another index, the S&P
100, which had been more popular among derivatives
traders. Exhibit 12.2 shows how the VIX fared during
the “lost decade” of the 2000s.
e VIX peaked at 80.86 in November 2008, at the
height of the U.S. nancial crisis. Its low for the decade
was 9.89, set in January 2007 as a ve-year bull market
in stocks neared its conclusion.
Bond, currency, and commodity indexes use op-
tions to gauge future volatility. Bank of America
Corp.’s Merrill Lynch securities unit has the Merrill
Option Volatility Estimate (MOVE) index. It’s based
on the value of contracts for two-year, ve-year, and
10-year Treasury notes and 30-year bonds having one
metals, industrial metals, agriculture, and livestock.
Each category has a separate series of gauges. Eco-
nomic and trading indicators are used to determine
a commodity’s weight in the overall and category
indexes.
ree types of constant maturity indicators are
calculated. ey start with price return indexes, which
are based on changes in the value of commodity
futures.
Excess return indexes add gains or losses from sell-
ing futures as they expire and buying contracts that
mature later. is futures roll can add to returns when
prices are lower in later months and reduce them
when prices are higher.
Total return indexes add interest paid on the con-
tract’s margin, or money that the owner must keep on
deposit. Treasury bill rates are used to calculate this
component.
Other index providers use di erent commodities
and categories, weighting criteria, and index names.
Spot indexes are basically the same as the UBS
Bloomberg price return indexes. ey are calculated
from futures prices rather than prices for immediate
delivery.
Options
e prices paid for options show how much traders
expect the value of the underlying asset to uctuate,
as mentioned earlier. With this in mind, derivatives
exchanges and nancial companies have created
DEFINITION:
Constant maturity
indicators
Constant maturity indexes
exclude the price effects of
changes in the amount of time
until debt securities mature or
contracts expire. The Federal
Reserve (Fed) calculates
constant maturity yields for
benchmark Treasury bills,
notes, and bonds.
KEY POINT:
The VIX tends to rise when share
prices fall because investors are
increasingly willing to hedge
against or speculate on further
losses in stocks. The demand
increases the option premiums
used to calculate the index.
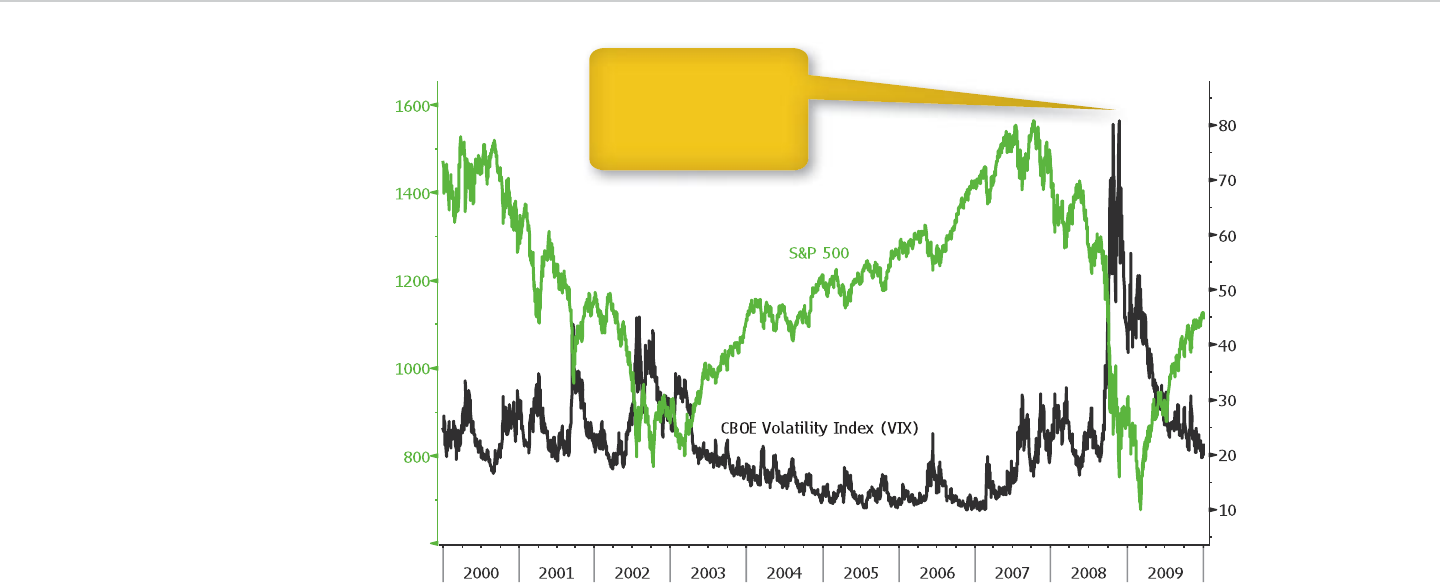
176 ■CHAPTER 12 Indexes Revisited
Swaps
e CDS market is the place to look for swap-based
indexes. Markit Group Ltd. calculates indexes for
government and corporate CDS contracts that track
the market and serve as the underlying asset for
month to maturity. JPMorgan Chase & Co. produces
foreign-exchange volatility indexes for global mar-
kets, the Group of Seven industrial countries, and
emerging markets. e CBOE provides crude oil and
gold indexes, using options on funds that own the
commodities.
Exhibit 12.2: VIX Index versus Standard & Poor’s 500 Index
The VIX surged to a
record during the 2008
fi nancial crisis from its
low for the 2000s, set the
previous year.

Visual Guide to Financial Markets ■177
content to mirror them. Institutions have a similar
bounty of choices in hedge funds as well as funds of
funds.
How does anyone decide which funds to buy, sell,
or hold? e answer often lies with performance.
Funds that consistently produce larger gains or small-
er losses than others in the same category are keepers.
Funds that don’t are sale candidates.
To determine how a fund and its manager are do-
ing, it’s possible to use market indexes. e S&P 500
would work for funds invested in the largest U.S.
companies. Beating the S&P 500 may not be much of
an accomplishment, though, if most funds in the
category are doing the same.
at’s where fund indexes come in handy. ey
provide a yardstick for measuring how well or poorly
a fund and its manager are doing relative to their
peers.
e Bloomberg Indexes for Active Funds are
among the indicators, and they’re worth a closer
look. Peer groups are de ned by three criteria: fund
type, country of domicile, and Bloomberg objective.
ey’re used to compile about 475 indexes for open-
end funds, closed-end funds, exchange-traded funds
(ETFs), hedge funds, and funds of funds.
Country of domicile refers to the location where
the funds are registered. Many of them are based in
the Cayman Islands and other places that provide tax
advantages for investors. ey are known as o shore
funds and tracked separately from those based in the
United States and elsewhere.
derivatives. Investors can buy index-based contracts
to protect against or speculate on changes in govern-
ment and corporate credit quality.
CDS indexes di er from other market gauges be-
cause time elements are built into them. Each index
consists of contracts lasting for a speci ed period.
Markit tracks swaps that last three years, seven years,
and 10 years as well as ve years, the industry bench-
mark. ere’s a maturity date as well. Corporate CDS
indexes expire in June and December, in accordance
with the terms of the contracts they track. ey roll
over in March and September.
Markit’s SovX indexes follow the performance
of sovereign CDS globally and regionally. Indica-
tors are available for the world’s investment-grade
countries, Group of Seven countries, and emerging
markets.
Another series of Markit indexes, known as CDX,
are based on U.S. and Canadian corporate CDS. Ba-
rometers for investment-grade and high-yield debt
protection are available. e CDX indexes cover
emerging markets as well, and a separate series called
iTraxx shows the performance of CDS for non-U.S.
companies.
Funds
Individual investors can choose from thousands
of open-end funds, closed-end funds, and exchange-
traded mutual funds. Some of them are designed
to surpass benchmark indexes, and others are
KEY POINT:
CDS indexes differ from bond
indexes because they are linked
to maturity dates. Bond market
indicators drop securities as
they mature and add new ones
to take their place.
KEY POINT:
Indexes are a benchmark to
judge how managers of active
funds perform over time, and
they are the basis for passive
funds. Investors who beat their
benchmark are said to generate
alpha, or excess returns.

178 ■CHAPTER 12 Indexes Revisited
Bloomberg objectives are dened by funds’ invest-
ments and strategy. Bond funds may focus on govern-
ment debt, agency debt, corporate debt, municipal
debt, or mortgage debt, or they may target high-yield
securities. Stock funds may favor larger companies,
smaller companies, or those in between. ey may
prefer to own the fastest growing companies, or the
ones likely to oer the best value.
All these criteria are used to set objectives. With
hedge funds, strategies come into play as well. ere
are macro indexes, long-biased and short-biased in-
dexes, long-short indexes, market neutral indexes, ar-
bitrage indexes, and managed futures indexes.
Lipper uses a similar approach for mutual fund in-
dexes. Dow Jones and Credit Suisse AG jointly track
the performance of hedge funds, and the indexes
compete against gauges from Eurekahedge Pte, Hedge
Fund Research Inc. and Hennessee Group. Cambridge
Associates LLC and State Street Corp. are among the
rms that produce indexes for private equity funds.

179
Bloomberg Functionality
Cheat Sheet
Currencies
FXIP FX information portal
FXTF FX ticker nder
FXC Currency rates matrix
WCR World currency rates
WCRS World currency ranker
Money Markets
PGM Program lookup
MMR Money rate monitors
BBAL BBA Libor xings
CPHS Direct issuer CP rates
MMCV Money-market curves
Government Bonds
BTMM Treasury and money-market monitor
SOVM Sovereign debt monitor
WB World bond markets
GGR Generic government rates
CRVF Curve nder
Corporate Bonds
SECF Security nder
NIM New issue monitor for bonds
TRAC TRACE home page
FICM Fixed income credit monitor
YCRV Yield curve analysis
Visual Guide to Financial Markets
by David Wilson
Copyright © 2012 by David Wilson.

180 ■APPENDIX Bloomberg Functionality Cheat Sheet
Stocks
ECDR Equity oerings
WEI World equity indexes
MOST Most active stocks
MOV Index movers*
EQS Equity screening
Commodities
SECF Security nder
GLCO Global commodity prices and data
NRG Bloomberg Energy Service menu
MINE Metals, minerals, and mining menu
AGRS Agricultural markets menu
Real Estate
RE Real estate menu
CRE Commercial real estate data
RMEN Global indexes
REUS U.S. real estate
HSST U.S. housing data
Futures
SECF Security nder
CTM Contract table menu
WEIF World equity index futures
WBF World bond futures
FRD Currency spot and forward rates
Options
MOSO Most active options
OMON Option monitor*
CALL Call option monitor*
PUT Put option monitor*
OMST Most active contracts*
Swaps
IRSB Interest rate swap rates
WS World swap matrix
USSW U.S. swap market
CDS Credit default swap overview
GCDS Global CDS monitor
Funds
FUND Funds and portfolio holdings
MHD Mutual fund holdings*
EXTF Exchange-traded products
HFND Hedge fund home page
PE Private equity home page
*Security-specic function

181
About the Author
David Wilson produces “Chart of the Day” stories
for Bloomberg News that provide insight into U.S.
markets, business, and the economy. He serves as
stocks editor for Bloomberg Radio, where he reports,
writes, and delivers hourly updates on market devel-
opments and analyst research. He is based in New
York City.
Wilson joined Bloomberg News in 1990, when he
became the second U.S. stock market reporter ever
hired by the news service. He later ran the Princeton
and New York bureaus, began a global training pro-
gram for reporters and editors, wrote columns, and
ran global stock market coverage. He co-wrote an
edition of e Bloomberg Way, a guide to business and
nancial journalism, which was used worldwide for
more than a decade.
Before coming to Bloomberg, Wilson worked for
Dow Jones, where he rose from news assistant to stock
reporter. His rst market stories chronicled the after-
math of the market’s Black Monday crash in 1987. He
wrote for the Dow Jones News Service, and many of
his stories appeared in the Wall Street Journal.
Wilson started his journalism career at the As-
bury Park Press, where he was an editorial assistant
and pop-music writer. He holds a bachelor’s degree
in English, with a concentration in media studies,
from Monmouth University and an MBA degree from
Rider University.
Visual Guide to Financial Markets
by David Wilson
Copyright © 2012 by David Wilson.

183
Index
A
Adjustable-rate mortgages (ARMs), 97
Agency securities. See Bonds
Alaska, 91
Alerian MLP Index, 117–118
Allied Capital, 113
Alternative assets. See Commodities, Real estate
Alternative Display Facility, 54, 55
Alternative funds
angel investing, 165–166, 170
funds of funds, 167
global macro, 166–167
hedge funds, 63, 106, 113, 127, 165–169, 177
long-biased, 167
long-short, 167
managed futures, 167
market neutral, 167
private equity, 63, 165–166, 169, 170
short-biased, 167
venture capital, 165–166, 170
Amazon.com, 164, 166
American Depositary
Receipts (ADRs), 56
Shares (ADSs), 56
Angel investing. See Alternative funds
Apollo Global Management, 168
Apple, 51, 53–55, 116, 120, 139–140, 141–146,
162, 166, 168
Arbitrage, 167
convertible, 106
stock-index, 137
Arnott, Robert, 84
Asian Development Bank, 87
Ask
premium, 141–142
price, 5, 14, 27, 54–55, 66, 71, 94, 109, 116, 120,
132, 134, 142, 154, 162
rate, 21, 149
Auctions, debt, 3, 18–20, 24–26, 30, 90
Australia, 113
Auto loans, 93
B
Backwardation, 135–136, 137
Bank for International Settlements (BIS),
12, 150
Bank of America, 100, 103
Merrill Lynch, 82, 175
Bank reserves, 36
Bankers’ acceptances (BAs), 36
Bankruptcy. See also Eastman Kodak, Lehman
Brothers, Risk
corporate, 21, 40, 54, 99–100, 103, 108,
152–153, 155
municipal, 21, 88–90
Barclays Capital, 65, 81–82
Aggregate Bond Index, 80
Aggregate Credit Index, 82
MBS Index, 82
Municipal Bond Index, 82
BATS Global Markets, 52–53
Basis points, 20–21, 23–24, 32, 39, 44, 46–47, 48, 107,
109–110, 147, 149, 151, 153–154
benchmark
base metals prices, 131
CDS rate, 156
commodities, 129
fund performance, 79, 128, 160–161, 164,
168, 177
futures, 129
index, bonds, 81–83
index, commodities, 174–175
index, hard assets, 85
index, MLPs, 117
index, stocks, 83, 125, 137
index, real estate,
index, REITs, 120–121
interest rate, 8, 24, 32, 36, 97, 110, 147
maturities, 49,
mortgage-backed bonds, 95
gold price, 65, 85
oil price, 70, 72, 131
ratio, 58
REITs, 122
swap rate, 152
yield curve, 50
yields, 58
Visual Guide to Financial Markets
by David Wilson
Copyright © 2012 by David Wilson.

184 ■Index
Benchmark
Bills, 87–88
Bonds, 88
Notes, 88
Berkowitz, Bruce, 113
Berkshire Hathaway, 140
Bernanke, Ben, 63–64
BGCantor, 82
Bid
premium, 141
price, 5, 14, 27, 54, 66, 71, 94, 109, 120, 132, 134,
142, 154, 162
rate, 21, 149
Bid-ask spread, 4, 5, 14
Bid-to-cover ratio, 26
Bidders
direct, 26
indirect, 26
Bids, auction
competitive, 3, 25
noncompetitive, 25–26
Big Mac, McDonald’s, 17
Bills, 9, 11, 18–24, 25–26, 27–32, 35, 38–41, 57, 81–82,
83, 87, 88, 92, 103, 126, 128, 135, 145, 149,
150, 175
Agency, 88
Treasury, 9, 11, 18–24, 27, 30, 31, 35, 38–41,
81–82, 83, 145, 150, 175
Blackstone Group, 77, 115, 168
Bloomberg
bond indexes, 43
BondTrader, 20–21, 27, 94
Constant Maturity Commodity Indexes,
173–175
country code, 141
data, 41, 111
EFFAS government bond indexes, 81–83
exchange codes, 54
Fair Value pricing, 45–46, 91
functionality cheat sheet, 179–180
generic pricing, 14, 134
IPO Index, 52–53
Indexes for Active Funds, 177–178
News, 77, 90
North America REIT Index, 120–121
Spot Commodity Index, 85
terminal, 70, 142, 168
Valuation, 109
Bond indexes, 81–83, 85
Bond insurance, 90, 92
Bonds, 6, 8, 10, 12, 15, 16, 52, 55, 57, 63, 64, 66, 67, 68,
71, 72, 73, 75, 76, 77, 79, 81, 87–97, 100–103,
109–111, 117, 119, 125–126, 129–130, 135,
137, 140, 148, 149–150, 152, 156, 160–161,
163, 166–170. See also Funds, Futures,
Options
agency, 23, 87–89, 95, 178
asset backed (ABS), 93
callable, 48
convertible, 48, 49, 99, 103–107, 128, 140,
159, 167
corporate, 5, 9, 35–36, 38, 40, 42–50, 55, 99–100,
113–114, 156, 159, 170
general obligation (GO), 90, 92
government (Treasury), 18, 20–23, 24–33, 54,
87, 156, 159, 169
high yield (junk or non-investment-grade),
42–43, 50, 107–108, 110, 111, 177, 178
ination indexed, 28, 48
investment grade, 42–43, 50, 110, 177
mortgage backed (MBS), 87–88, 93–97,
119, 159
municipal, 87–92, 101, 159
private label, 94
putable, 48, 49
revenue, 90
secured, 42, 44, 129
supranational, 87
unsecured, 42, 44, 111
Bondholders, 153–154
Book value, 57–58, 118, 122
Boston Personal Property Trust, 161
Bottom-up analysis, 4
Brent, North Sea, 72–73
British Bankers’ Association, 36–37
British Commonwealth, 12
Buett, Warren, 140
Build America Bonds, 91
Business development companies (BDCs), 166
C
California, 90–91
Cambridge Associates, 178
Canada, 113
Cantor Fitzgerald, 20
Capital, 88, 100
requirements, 99–100
spending, 122
Capitalization (cap) rates, 75–77
Carried interest, 169
Case, Karl, 74–75
Cash, 7, 9, 10, 11, 18, 36, 38, 42, 43, 49, 50, 52, 56, 58,
63, 64, 66–67, 76, 119, 130, 147, 160, 165
Cash ow, 40, 77, 103, 111, 115, 118, 122, 164, 170
CBOE Holdings, 140
Central Falls, Rhode Island, 89
Certicates of deposit (CDs), 36
Chicago Board of Trade (CBOT), 130–131

Index ■185
Chicago Board Options Exchange (CBOE), 131,
140, 175
Chicago Mercantile Exchange (CME), 130–131,
132, 142
Citigroup, 88, 100, 103, 146, 164
Clearinghouse, 37, 134–136, 148, 154
CMA Datavision, 154
CME Group, 131, 140
Collateralized
debt obligations (CDOs), 94
loan obligations (CLOs), 109
mortgage obligations (CMOs), 94, 95, 96, 97, 109
Companies, 3
Commercial paper (CP), 38–42
asset-backed, 42
dealer placed, 38, 39, 42
direct issue, 38, 39, 41, 42
Commodities, 3, 4, 7, 10, 63, 64, 67, 68–73, 74, 79,
85–86, 113, 116, 125, 129, 130, 161, 165, 166,
167, 170, 173–176. See also Gold
agriculture, 68–70, 71, 72, 85–86, 113, 130, 131,
137, 174–175
aluminum, 68, 69, 131, 132–133
base (industrial) metals, 68–70, 71, 86, 131,
174–175
cattle, 70, 130
coal, 68, 69
copper, 68, 69, 70, 131
corn, 64, 68, 69, 132
cotton, 69, 72, 86
electricity, 69
energy, 68–70, 71, 72, 74, 85, 113, 116, 131,
174–175
exchange-traded (ETCs), 161
ber, 72, 86
food, 68, 69, 71, 72, 86
gasoline, 69, 70, 73
iron ore, 68
lead, 69, 131
livestock, 68–70. 71, 72, 86, 174–175
heating oil, 69, 73, 137
hogs, 70, 86
natural gas, 69, 71, 115, 116, 137
nickel, 69, 131
oil, 64, 68, 69, 70–73, 74, 116, 129, 131–132,
135–136, 137, 161, 176
palladium, 68, 70
platinum, 68, 70
pork bellies, 70
precious metals, 68–70, 71, 174–175
silver, 68, 70
soybeans, 68, 69, 86
steel, 68
steers, 86
tin, 69, 131
wheat, 68, 69, 86, 130
zinc, 69, 131
Commodity Research Bureau (CRB), 173–174
Commodity trading advisers, 167
Conduits, 38
Constant
default rate (CDR), 96
maturity, 173–175
prepayment rate, 96
Consumer price index (CPI), 6, 22, 28, 48
Contango, 135–136, 137
Conversion
premium, 103–104
price, 103–106
ratio, 104–105
Cost basis, 117
Counterparty, 128, 147. See also Risk
Country of domicile, 177
Coupon. See also Interest rate
rate, 26–27, 29, 44, 101
weighted average, 96
Crack spread, 72–73
Credit card balances, 93
Credit event, 152, 154
Credit rating, 33, 40, 41–42, 49, 50, 91, 92, 110,
111, 153
high yield, 42–43, 50,
investment grade, 42–43, 50
services, 9, 21–22
scales, 22, 30
Credit Suisse, 178
Crush spread, 73
Currency, 6, 8, 12–18, 80, 153. See also Indexes, Risk
Australian dollar, 12
British pound, 12, 80
Canadian dollar, 12, 80
Chinese renminbi, 15
codes, 14
cross rates, 12, 14
deutschemark, 146
devaluation, 15–16, 167
dollar, 8, 12–18, 36–37, 45, 54, 56, 64, 66, 67, 71,
72, 79, 80, 87, 88, 101, 109, 116, 133, 146, 148,
149, 152, 153, 154, 162. See also Dollar Index
euro, 12, 14, 80, 153
exchange rates, 15
xed rate, 15
oating rate, 15
Hong Kong dollar, 15
intervention, 15
New Zealand dollar, 12
pegging, 15, 16
reserve, 12, 87

186 ■Index
Currency (cont’d )
Swedish krona, 80
Swiss franc, 12, 80, 146
yen, 12, 80, 153
Curve. See Benchmark, Rate, Yield
D
Dark pools, 53
Debentures, 44. See also Bonds
Debt, 3, 4, 7–11, 18, 20–22, 26, 28–30, 33, 35–50, 55,
76, 79, 81–83, 87–97, 99, 103–111, 116, 119,
122, 127, 128, 145–146, 150, 152–154, 159,
161, 166, 167, 169, 170, 175, 177, 178. See also
Bonds, Loans, Money Market, Notes
senior, 153
subordinated, 153
Deposit, bank, 16, 17, 126
rates, 18, 80
Developed markets, 60
Derivatives, 3, 64, 66, 79, 86, 125–157, 165, 169, 170,
173–178
Direct Edge Holdings, 52–53
Discount rate, 19–25, 28, 31, 38, 39, 57, 66
Distressed Debt Securities Newsletter, 89
Distressed securities, 170
Distributions, 52, 115–118, 120
quarterly required (QRD), 116, 117
Diversication, 159–160
Dividend yield. See Yield
Dividends, 6, 7, 9, 10, 35, 51–52, 55–58, 67, 71, 79,
81, 84–85, 88, 91, 99–106, 114–122, 127, 134,
137, 143, 163, 164, 166, 168, 170
Dividends received deduction, 102
Dodd-Frank Wall Street Reform and Consumer
Protection Act, 148
Dollar. See Currencies
Dollar Index, 81
Dow Jones, 173, 178
Dow Jones Industrial Average, 83, 85, 125
Drexel Burnham Lambert, 42
Duration, 30
modied, 30
E
Earnings yield. See Yield
Eastman Kodak, 40, 164
eBay, 164
Einhorn, David, 113
Electronic trading, 13, 20, 26, 52–53, 54, 90, 95,
132, 141
El Paso, 115
Products Partners, 115
Emerging markets, 15, 17, 60, 71, 80, 87, 167, 176, 177
Enterprise Products Partners LP, 115–117, 120, 168
ETFs. See Funds.
ETNs. See Notes.
Equity, 3, 4, 11, 35, 49, 50, 57, 76, 79, 99–100, 104, 116,
127, 140, 142, 166, 167. See also Stock
home, 93
Equity Oce Properties, 77
Eurekahedge, 178
Euro. See Currencies
Eurodollar
deposits, 16, 126
futures, 126–127
options, 126–127
rates, 16
European Federation of Financial Analysts Societies
(EFFAS), 81
European Investment Bank, 87
Euroyen rates, 16
Exchange rates. See Currency.
Exchange-traded products (ETPs), 161. See also
Commodities, Funds, Notes
Expiration. See Futures, Options, Swaps
F
Face value, 17, 19, 20, 21, 26, 27, 29, 36, 39, 44, 46, 47,
57, 91, 92, 95, 100, 101, 104, 105, 153, 154,
Fairholme Fund, 113
Fannie Mae (FNMA), 87–88, 93–94,
Federal Farm Credit Banks, 88
Federal (fed) funds, 36, 38, 41, 150
rate, 16, 36
Federal Home Loan Bank System, 88
Federal Home Loan Mortgage Corporation.
See Freddie Mac
Federal National Mortgage Association.
See Fannie Mae
Federal Reserve (Fed), 8, 9, 16, 18–19, 23, 25, 32, 36,
43, 63–64, 80–81, 144, 175
Federal Reserve Bank of New York (New York Fed),
18–19, 24–25
Fidelity, 160
Magellan, 159
FINRA (Financial Industry Regulatory Authority),
43, 44
Bloomberg yield indexes, 43
Fiscal policy, 8. See also Risk
Fitch Ratings, 9, 22, 30, 40, 42. See also Credit ratings
Fixed rate, 28, 47–48, 97, 110–111, 147, 149
Float, 84
Floating rate, 48, 109–111, 149
Floor trading, 53
Florida, 91, 92
Fooling Some of the People All of the Time, 113
Foreign exchange, 12–16, 150, 175. See also
Currency

Index ■187
Forward, 126, 128, 129–137, 138, 140, 148, 153
contract codes, LME, 133
curves, 137
rate agreements (FRAs), 131, 148–149
spreads, 137
Forward contracts
commodity, 132–133
currency, 133–134
Freddie Mac (FHLMC), 87–88, 93, 94
Fujilm Holdings, 40
Fundamental analysis, 4
Fund of hedge funds, 167
Funds, 159–170. See also Alternative funds
12b–1 fee, 163
actively managed, 127, 160, 161, 163, 164, 177
balanced, 160
bond, 79, 127–128, 159–161, 163–164, 178
closed-end, 160–161
commodity, 160–161, 162, 163, 166, 170, 177
exchange-traded (ETF), 68, 159–165, 167, 168,
170, 177
expense ratio, 163–164
load, 163
money market, 164
mutual, 160, 168
no-load, 163
open-end, 160, 161–162, 177
passively managed, 127, 160, 161, 163,
164, 177
stock, 160–161, 163, 178
Funds from operations (FFO), 119
Futures, 64–66, 70, 126–128, 129–137, 138, 140, 141,
142, 143, 148, 167, 173–175
contract codes, 131–132
curve, 135, 137
expiration, 71, 126, 127, 128, 131
month codes, 132
roll, 71, 135
settlement price, 132
Futures contracts
bond, 134, 137
commodity, 70–73, 86, 173
Eurodollar, 126–127
gold, 65, 67, 68, 71
oil, 70, 73, 129, 131–132, 135–136, 137
S&P 500 and e-mini, 131–132, 134–135, 137
VIX (CBOE Volatility Index), 175
G
Genentech, 166
General American Investors, 162
General Electric Capital (GE Capital), 38–39,
45–47, 153–155
Ginnie Mae (GNMA), 93–97
Gold, 3, 4, 7, 15, 63–68, 70, 71, 72, 85, 113–114, 129,
131, 161, 176
allocated, 64
bullion, 64, 67, 113
London xing, 65
physical, 64
unallocated, 64
Goldman Sachs, 80, 140, 173
Google, 164, 166
Government National Mortgage Association. See
Ginnie Mae
Government-sponsored enterprises (GSEs), 94
Grantham, Mayo, Van Otterloo (GMO), 56
Green Street Advisors, 77
Greenlight Capital, 113
Gross, Bill, 159
Groupon, 139
Growth stocks, 59
H
Hard assets, 3, 4, 6–10, 12, 16, 63–77, 79, 85–86,
113–122, 125, 129, 145, 159, 163. See also
Commodities, Gold, Real Estate
Harrisburg, Pennsylvania, 89
Hedge Fund Research, 178
Hedge funds. See Alternative funds
Hedgers, 64, 130, 135, 137–138
Hennessee Group, 178
Hertz Global Holdings, 109–111
High-frequency trading, 53
High-yield bonds. See Bonds
Hurdle rate, 169
Hyperination, 17
I
IBM (International Business Machines), 146, 150
ICAP, 20
Indexes, 79–86, 173–178
bond, 81–83
commodity, 85–86
credit default swap, 173, 176–177
currency, 79–80
real estate, 85–86
stock, 83–85
Industrial demand
Industry
auto, 38, 59
banking, 50
beverage, 59
commodity, 59, 115, 125
construction, 113
consumer discretionary, 59, 83
consumer staples, 59, 83
cyclical, 8, 59
defensive, 59

188 ■Index
Industry (cont’d )
energy, 59, 83, 113, 115, 125, 166
nancial, 38, 43, 49, 50, 83, 93, 100
food, 59
health-care, 59, 83
industrial, 49, 50–51, 59, 83
media, 43, 49, 59
raw materials, 83
retail, 12, 59, 76, 86
technology, 58, 59, 83
telephone, 43, 49, 58, 59, 83
utility, 43, 49, 59, 58, 83, 100
Ination, 7, 16. See also Risk
Initial public oerings (IPOs), 3, 52–53, 64, 115, 119
Inside market, 55
Intel, 83
IntercontinentalExchange (ICE), 80, 131, 140
Internal Revenue Service (IRS), 115, 117
Interest. See also Risk
payments, 3, 9, 24, 28, 30, 39, 44, 46, 47–48, 49,
55, 71, 77, 82, 85, 93, 97, 100, 105, 109, 110,
111, 114, 115, 116, 117, 163, 169
rate, 8, 9, 11, 16, 18, 19, 22, 25, 26, 27, 28, 30,
31, 32, 43, 44, 45, 46, 47, 48, 49, 57, 91, 92,
94, 95, 96, 97, 101, 103, 104, 105, 106–107,
109, 110, 128, 129, 131, 133, 145, 147, 148,
150, 166
International Bank for Reconstruction and
Development, 87
International Finance Corp., 87
International Monetary Fund (IMF), 64
International Swaps and Derivatives Association
(ISDA), 147–148, 152–153
Intrinsic value, 143
Inverted yield curve. See Yield curve
Investment-grade bonds. See Bonds
J
Jeerson County, Alabama, 89–90
JPMorgan Chase, 82, 100–102, 142, 175
Junk bonds. See Bonds, high-yield
K
K-1, Schedule, 117
Kinder Morgan, 114–115
Energy Partners, 114–115, 117–118
KKR, 168
Kleiner Perkins Caueld & Byers, 166
L
LCH. Clearnet, 151
Legg Mason Capital Management Value Trust,
159, 164
Lehman Brothers Holdings, 35–40, 49, 82, 113,
127, 151
Leverage, 106, 125, 136, 143, 167, 169, 170. See also
Loan, Risk
Leveraged buyout (LBO), 115
Libor (London interbank oered rate), 36–37, 38, 48,
107, 109, 110, 147, 149, 150–151
Libor-OIS spread, 150–151
Lipper, 178
Liquidity, 7, 11, 130. See also Risk
Loan Syndication and Trading Association, 109
index, 108
Loans, 106–111
rst-lien, 108
investment-grade, 110
leveraged, 99, 106–111
revolving, 108
second-lien, 108
syndicated, 107
term, 108
London Metal Exchange (LME), 70, 131
Long
bias, 167
position, 4
Lynch, Peter, 159
M
Manufactured housing loans, 93
Margin, 71, 130, 131, 134–136, 143, 154, 175
initial, 135–136
maintenance, 135
Market analysis, 4
Market capitalization (cap), 58–59, 84–85, 164
Markit, 176–177
CDX, 177
iTraxx, 177
SovX, 177
Markowitz, Harry, 159
Massachusetts Institute of Technology Center for
Real Estate, 86
Massachusetts Investment Trust, 160
Master limited partnership (MLPs), 114–118, 119,
120, 122, 126, 127, 160, 166, 168
Maturity, 21, 26–31, 36, 39–40, 45, 48–49, 57, 83, 90,
94, 96, 140, 150–153, 156, 175
average, 164–165
constant, 173, 175
date, 4, 9, 18, 20–21, 27–28, 30, 39, 45,
47–48, 50, 56, 77, 91, 96, 104, 109, 145,
150, 156, 177
weighted average, 96
Medium-term notes (MTNs), 43, 44, 88
Mergers and acquisitions (M&A), 40
Merrill Option Volatility Estimate (MOVE), 175
Microsoft, 42, 83
Mid price, 14

Index ■189
Milken, Michael, 42
Miller, Bill, 159, 164
Montier, James, 56
Money market, 18–24, 30, 35–42, 49, 50, 57, 58, 73,
101–102, 125, 126, 129, 130, 156, 159. See
also Bankers’ acceptances (BAs), Bills,
Certicates of deposit (CDs), Commercial
paper (CP), Federal funds, Repurchase
agreements (repos or RPs)
Funds, 164
Ratings, 30
Monetary policy, 8, 19, 36, 166. See also Risk
Moody’s
Investors Service, 9, 22, 30, 40, 41, 42, 49, 50, 74,
85–86, 111. See also Credit ratings
REAL Commercial Property Price Index,
74–75, 86
Mortgage-backed securities (MBS). See Bonds
MOVE index, 175
Municipal bonds. See Bonds
competitive sale, 90
negotiated sale, 90
N
NASDAQ
Composite Index, 83–85
Stock Market, 44, 52, 56, 100, 119, 131
National Council of Real Estate Fiduciaries
(NCREIF), 86
Net asset value (NAV), 160, 161, 162, 163, 168,
169, 170
Net operating income, 76–77
Nevada, 91
New Hampshire, 91
New York Mercantile Exchange (NYMEX),
131–132
New York Stock Exchange (NYSE), 44, 52–53, 56,
100, 119
Notes. See Bonds
exchange-traded (ETNs), 161
Notional amount. See Options, Swaps
NYSE Amex, 54
NYSE Arca, 54–55
Gold Miners Index, 113
NYSE Euronext, 54, 131
O
Odd lot, 55
Oer price. See Ask price
Open market operations, 36
Open interest, 126, 131–132, 133, 141, 142
Option-adjusted spread (OAS), 82–83
Options, 49, 82, 103–106, 126, 128, 137–145,
173, 175–176
American-style, 139
call, 126, 138, 139, 140–145
European-style, 139
expiration date, 143, 144, 145
implied volatility, 145–146
intrinsic value, 138, 143, 144, 154
notional amount, 138, 140
premium, 138, 141–142, 143, 144, 155, 175
put, 126, 141–142, 154, 155, 156
put-call ratio, 139–140
strike price, 138, 140, 141, 142, 143–144, 145
time value, 138, 143, 144
Option contracts
bond, 145
Eurodollar, 126–127
S&P 500, 175
stock, 145
VIX (CBOE Volatility Index), 175
Over the counter (OTC), 13, 20, 26, 44, 64, 70, 90, 95,
100, 104, 108–109, 115, 126, 130, 131, 140,
144, 152, 154
P
Par value, 57, 100, 101, 104, 105, 109
Partners
general, 115, 166
limited, 115, 116, 119
Partnership units, 115, 116
Partnerships, limited, 166
Passthrough
entities, 114, 118, 120, 121, 166
securities, 94, 96, 97, 114
Paul, Rep. Ron, 63–64
Payout ratio, 52
Pimco Total Return, 159
Policy
scal, 8
monetary, 8
Preferred stock. See Stock
Prepayment, 96. See also Risk
speed, 96
Price-earnings ratio (P/E), 55, 57–58,
128, 164
Price ratios
book value, 58, 59, 122
cash ow, 57, 58, 122
sales, 57, 58
Primary dealer, 18–20, 25–26
Primary market, 3–4, 18, 24, 38, 44, 52, 64, 74, 90, 94,
104, 115, 126, 131, 160
Principal, 27, 28, 44, 49, 88, 90, 92, 93, 94, 96, 99, 111,
114, 117, 150
Private equity. See Alternative funds
Prologis, 120, 168

190 ■Index
Protection
buyer, 152, 154–155
seller, 152, 154–155
Purchasing power parity, 17
Q
Quantitative analysis, 4
Quantitative easing, 8
Quantum Fund, 167
R
Rate
curve, 23, 41–42, 135, 148
spread, 23, 32, 41–42, 134
Ratings
money market, 22
note and bond, 30
Raw materials. See Commodities
Real Capital Analytics, 86
Real estate, 3, 7, 73–77, 121–122
apartment buildings, 74
commercial, 74–75, 77, 85–86, 108, 119
developers, 113
farms, 73–74, 86
hotels and motels, 74
land, 4, 73, 74, 76, 86, 114
mobile home parks, 74
oil and gas elds, 73–74
oce buildings, 74
residential, 74, 76
self-storage facilities, 74
shopping centers, 76
shopping malls, 74
stores, 74
timberland, 74, 86, 118
warehouses, 74
Real Estate Analytics, 74, 86
Real estate investment trust (REIT), 74, 118–122,
126, 127, 160, 166
hybrid, 119
mortgage, 119, 122
Real estate mortgage investment conduit (REMIC),
93–94, 97
Recovery rate, 154
Reference Bills, Notes, Bonds, 88
Reference
entity, 152–156
obligation, 152
Relative value, 6, 9–10, 15, 17–18, 21, 22–24, 28,
30–33, 39, 40–42, 47, 49–50, 55, 57–60,
67–68, 71–73, 76–77, 91–92, 95, 97, 103, 106,
110–111, 116–118, 120, 122, 127–128, 134,
137, 143, 145, 148, 150–152, 156, 163–165,
168, 170
Repurchase agreements (repos or RPs), 36–37,
41, 42
tri-party, 37
Repurchases, stock, 52
Research Aliates, 84
Reserve currency, 12
Reserve Primary Fund, 35
Return, 6–7, 9, 10, 11, 12, 15–16, 19, 21–22, 23, 24, 27,
28–29, 36–37, 39, 40, 42, 43, 46, 47–48, 49,
55–56, 66–67, 71, 73, 76, 77, 79, 80, 86, 88,
91–92, 93, 95–96, 99, 101–102, 105, 109–110,
116–117, 120–121, 127, 134–135, 142–144,
149–150, 154–155, 159, 161, 162–164,
168–170
absolute, 168, 170
excess, 175, 177
fund, 127
nominal, 7, 28
price, 175
real, 7, 28, 48
total, 81, 82, 85, 86, 165, 174–175
Rights, 140, 142–145
Risk
basis, 151
bankruptcy, 35, 49, 56, 170
business, 9, 40, 49, 56, 77, 103, 105, 110, 122, 128,
137, 145, 156, 164, 170
call, 49, 103, 106, 128
counterparty, 128, 134, 143, 144, 150, 151,
154, 161
credit, 9, 21, 23–24, 30, 40, 48–49, 57, 110, 114,
128, 156, 164–165, 170
currency, 8, 48, 56, 67, 88, 128
default, 49, 57, 110, 117, 128, 156, 170
economic, 8, 48, 56, 72, 77, 110, 122, 128, 143
event, 40, 49, 46, 72, 77, 103, 105, 110, 122, 128,
137, 145, 156, 170
extension, 97
industry, 40, 49, 56, 77, 103, 105, 110, 122, 128,
137, 145, 156, 164, 170
ination, 16, 40, 103, 106, 128, 137, 170
interest rate, 16, 22, 30, 40, 48, 57, 97, 103,
106, 110, 121, 128, 137, 150, 151, 164,
165, 170
leverage, 128, 134, 136, 143, 144, 150, 151, 154,
168, 170
liquidity, 7, 11, 16, 40, 48, 56, 72, 77, 97, 128, 160,
168, 170
manager, 164
market, 7, 11, 16, 40, 48, 56, 72, 97, 99, 120, 121,
126, 128, 135, 144, 150, 151, 167
policy, 8, 16, 48, 56, 128
political, 8, 48, 56, 128
prepayment, 96–97

Index ■191
reinvestment, 22, 30, 40, 48, 57, 96, 103, 106, 110,
128, 170
Risk-free rate, 11, 21, 22
Round lot, 54, 55
Russell
2000 Index, 83
Investments, 83
S
Salomon Brothers, 146
Schwab, Charles, 160
Secondary market, 3, 6, 18, 20, 26, 38, 44, 52, 64, 70,
74, 90, 108, 131, 160
Secondary oering, 52
Secured nancing, 37, 42, 44, 108, 111, 129
Securities lending, 6
Securitized products, 94
Security Capital Group, 45–46, 91
Sequoia Capital, 166
Settlement price, 132, 141
Shelf registration, 44
Shiller, Robert, 74–75
Short
bias, 167
position, 4
sale, 6, 106, 113, 127, 128, 134, 135, 137, 167
sellers, 130, 144, 156, 165
Soros, George, 167
South Africa, 113
South Dakota, 91
Special investment vehicles (SIVs), 38
Speculators, 15
Spot
index, 173, 175
market, 64–71, 85–86, 129
rate, 133–134
Spot-forward spread, 133, 137
Spread. See Bid-ask spread, Crack spread, Credit-
default swap, Crush spread, Option-
adjusted spread, Rate, Spot-forward
spread, Yield
St. Joe, 113
Standard & Poor’s (S&P), 9, 22, 30, 40, 41, 42, 49,
50, 74, 82, 83, 111, 119, 173. See also Credit
ratings
100 Index, 175
500 Index (S&P 500), 6, 7, 52–53, 58–59, 79,
83, 117–118, 119, 120–121, 125, 132, 136,
140–141, 145, 159, 160, 161, 162–163, 165,
175–176, 177
BGCantor Treasury-Bill Index, 82
Case-Shiller Composite 20-City Home Price
Index, 74–75
Depositary Receipt (SPDR), 161
Starbucks latte, 17
State Street, 178
Stock
common, 48, 50–60, 99–106, 115–118, 120, 162
convertible preferred, 99, 103–108, 140, 159, 167
cumulative preferred, 102, 103
non-cumulative preferred, 102, 103
preferred, 99–103, 140, 159
trust preferred, 100, 102
Stock-index weight, 83–84
Float adjusted, 84
Fundamental, 84
Market cap, 84
Price, 83–84
STRIPS (Separate Trading of Registered Interest and
Principal Securities), 28–29
Structured nance, 94
Style drift, 164
Supranational bonds. See Bonds
Swap, 145–156
curve, 148, 152, 154–155, 156
expiration, 149, 155
notional amount, 146–147, 150, 151, 154
spread, 152
Swap contract
basis, 150, 151. See also Risk
credit default (CDS), 152–156
cross currency, 146, 150, 152
interest-rate (IRS), 146, 147–152, 154
overnight indexed (OIS), 150
Swensen, David, 73
Symbol. See Ticker symbol
T
Tax Reform Act of 1986, 115
Taxes, 7
Technical analysis, 4
Tennessee, 91
Tennessee Valley Authority, 88
Texas, 91
Ticker symbol, 5, 20, 26, 45, 54, 66, 70, 75, 94, 109,
116, 120, 131, 132–133, 140–141, 141, 149,
153, 162, 168
To be announced (TBA), 94
Top-down analysis, 4
TRACE (Trade Reporting and Compliance Engine),
44–46
Tracking error, 164
Trade-weighted indexes, 80
Tradeweb, 94
Trading costs, 7
Tranche, CMO, 94
Transparency, 170
Treasury Direct, 19, 25–26

192 ■Index
Treasury securities. See Bills, Bonds, Notes
Treasury Inflation Protected Securities (TIPs),
28, 48
Tullett Prebon, 20
U
UBS Bloomberg Constant Maturity Commodity
Indexes, 173–175
underwriter, 44, 52, 100, 104, 107, 115,
Unsecured nancing, 37, 38, 41, 42, 44, 111
Upfront payment, 152, 154, 155
Uptick/downtick arrow, 5, 14, 20, 27, 39, 46, 54, 66,
71, 95, 109, 116, 132, 133, 141, 149, 162
V
Value stocks, 59
Vanguard, 160, 162
500 Index Fund, 160, 161–162
Venture capital. See Alternative funds
VIX index, 175
Volatility, 43, 145, 167, 175
implied, See Options
indexes, 175–176
realized, 145
Volume, 6, 45, 55, 75, 94, 116, 127, 132, 141, 142, 162, 168
Voting rights, 51
W
Warrants, 128, 137, 140–145
call, 143
put, 143
Washington, 91
Weighted average
coupon (WAC), 96
maturity (WAM), 96
Wells Fargo, 100
West Texas Intermediate (WTI), 70–73, 129,
131–132, 135–136
Weyerhaeuser, 118–119
Whitney, Meredith, 88–89
Wimpy, J. Wellington, 129, 137–139, 145–146,
152–153
World Bank, 87, 88, 146, 150–151
Wyoming, 91
Y
Yale University, 73
Ye n . See Currencies
Yield, 24–33, 44–47, 49–50, 57–58, 67, 72, 75, 76, 77,
87–88, 92, 103, 104, 106–107, 110, 117, 120,
128, 148, 149, 150, 152, 153, 156, 163, 165
bond-equivalent, 28
constant maturity, 175
curve, 31–33, 49, 50–51, 77, 88–89, 92, 135,
137, 156
distribution, 118
dividend, 55–58, 67, 100–102, 103, 120–121,
122, 164–165
earnings, 57–58
xed-rate equivalent, 111
index, 43
municipal as percentage of Treasury, 93
spread (premium), 24, 32–33, 41, 42, 44,
46–47, 77, 82–83, 92, 97, 104–105, 106–107,
117–118, 137
tax-free, 91–92
taxable equivalent, 91–92
to worst, 48
Z
Zero coupon, 28–29
Zimbabwe, 17
