Bloombergdescr Bloomberg Guide
User Manual:
Open the PDF directly: View PDF  .
.
Page Count: 41
1
Using the Bloomberg terminal for data
Contents of Package
1.Getting information on your company Pages 2-31
2.Getting information on comparable companies Pages 32-39
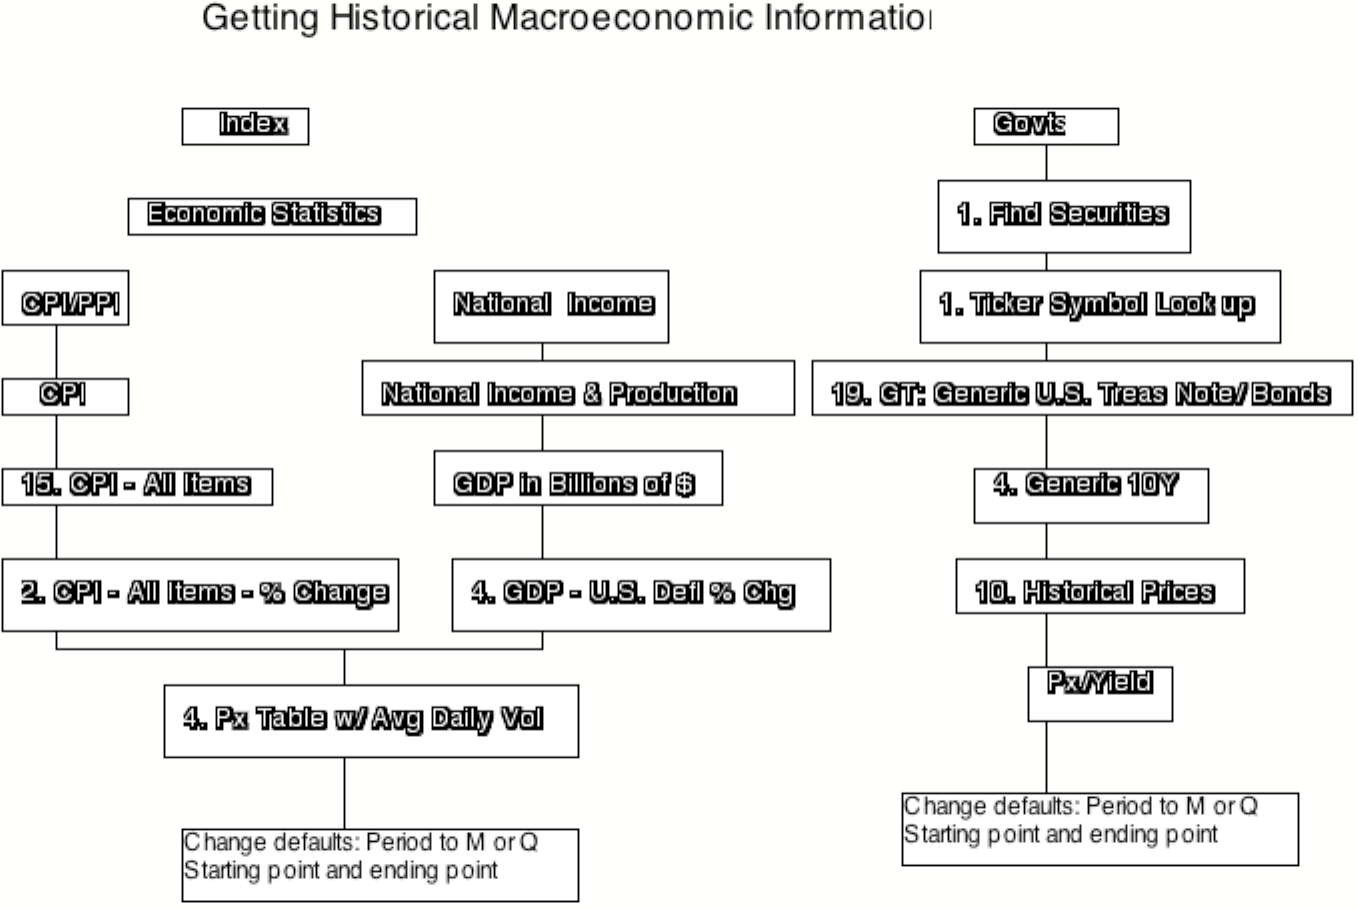
3.Getting macro economic information Pages 40

2
Instructions for Getting Bloomberg Data
• Pick Equity
• Under Finding Securities, choose Ticker Symbol Look up (TK)
• Enter the name of your company. You will get all of the equity listings that the company has. Choose the one that you are interested in. For
instance, if you look up Nestle, you will get Nestle’s local listings in Switzerland (Registered and Bearer Stock) as well as all of Nestle’s
ADR listings around the world. You might have to work through the listings by trial and error until you get the listing that has all of the
financial information that you want. (One quick test that seems to work is to try the DES page below. The right listing will have 10-11
pages. All the other listings will have only 2-4 pages)
• Once you are in equity screen for your company,
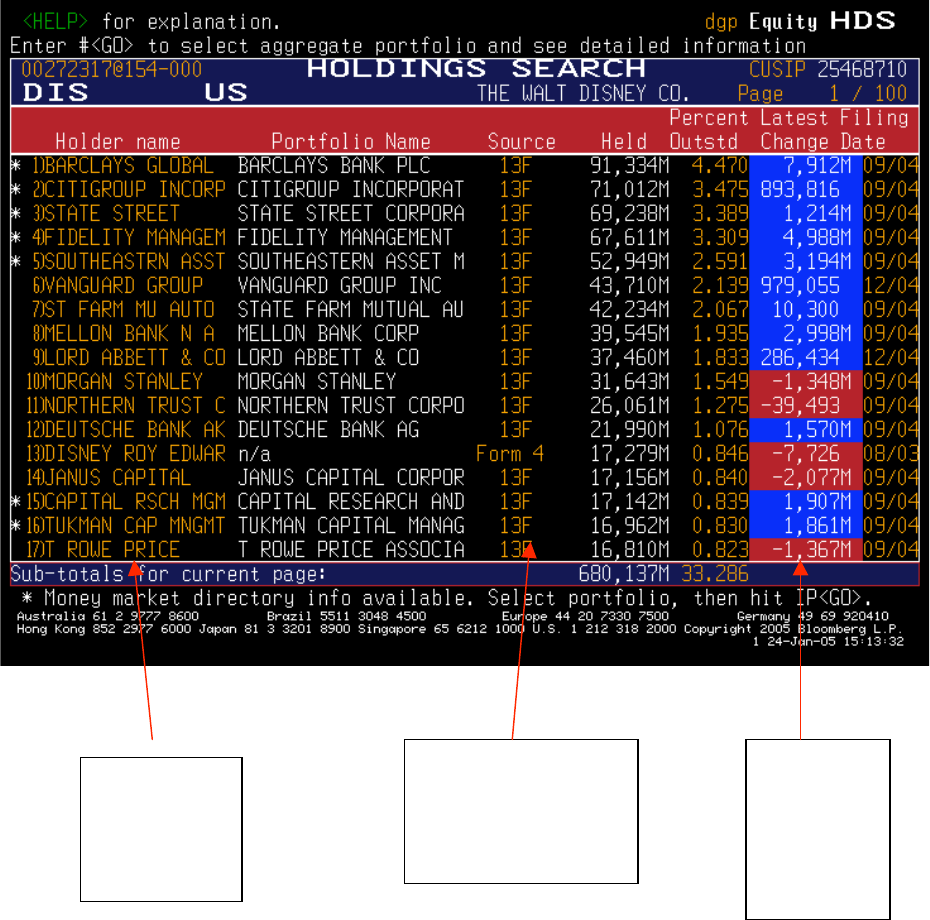
• Type HDS: Print page 1 off
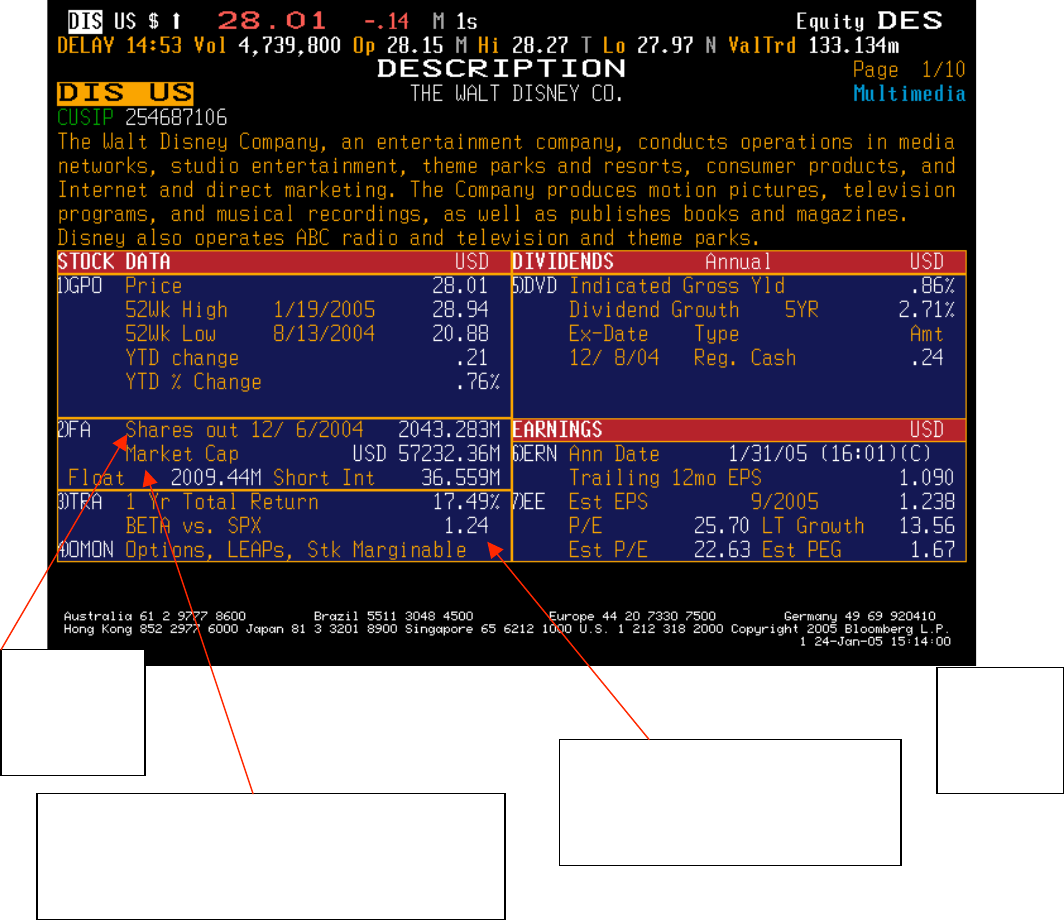
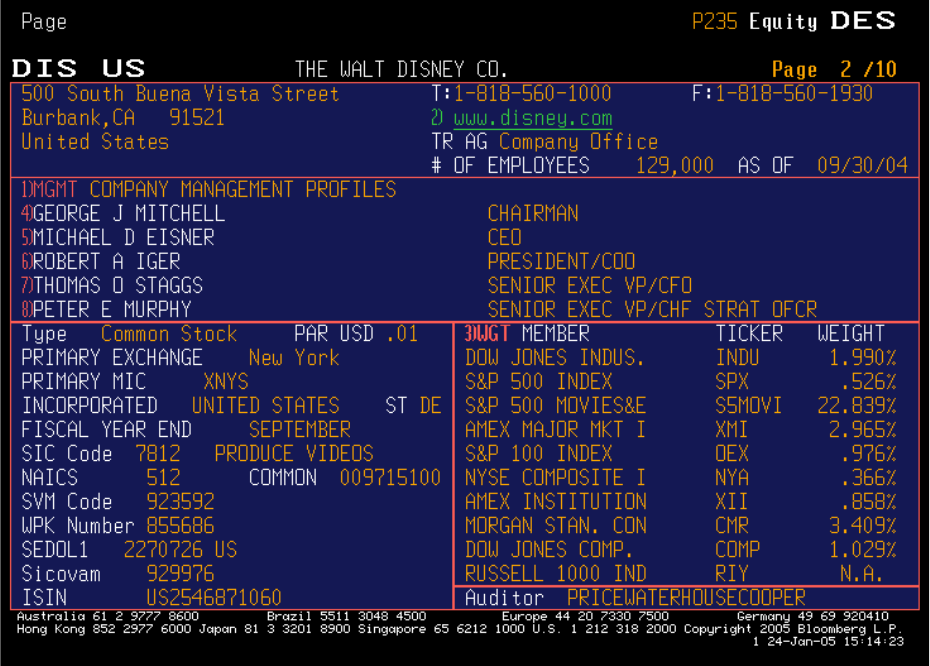
• Choose Description (DES): Print first 10 pages off; Ignore beta on first page.
• Chose Debt Distibution (DDIS): Print off just first page
• Choose Financial Analysis (FA):
• The full report option that was available until last year is more difficult to get to now. Instead, print off the following sub-
reports
• Enterprise Value (Will give you market value of equity, total book debt and cash for the last 10 years)
• Income Statement Summary
• Assets
• Liabilities
• Cashflow
• If you want quarterly data, you can change your preferences in FA and print quarterly data.
• Choose Earnings Estimates (EE)
• Choose Zacks
• Print off first page
• If you do not have a beta, pick Beta Calculations (BETA)
• Using the tab button, you can change the period to M
• Using the tab button, you can change the range to a 5-year range
• Using the tab button, you can also change the market index.
• Go back to the main menu (out of equity). Pick Corp Bond.
• Enter the name of your company
• You will get a list of corporate bonds issued by your company, if any.
• Choose a long-term bond (preferable without special features like convertibility) from the list.
• Choose Description
3
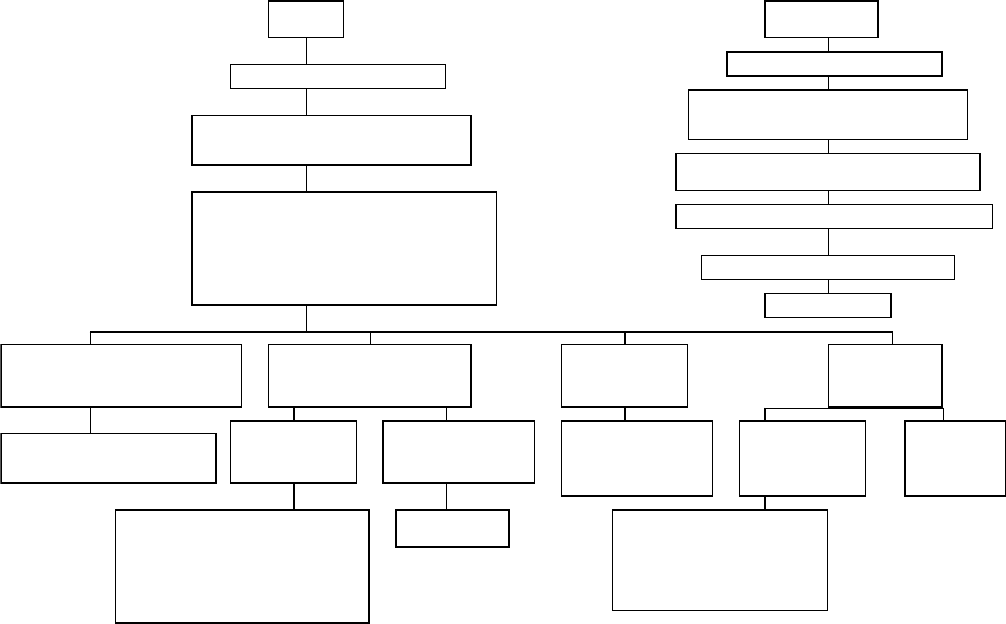
Using Bloomberg to get information on your company
Equity
Equity
Finding Securities
Finding Securities
Ticker Symbol Look Up (TK)
Ticker Symbol Look Up (TK)
Enter the name of your company
Choose the listing for your company
that you are interested in. If you have
a company with multiple listings, this
may take some work. Try the DES
page (see below). If you get only 2
pages, you have the wrong listing.
2. Company Information
2. Company Information
/Description
/Description
1. Description (DES)
1. Description (DES)
2. Debt Detail (DDIS)
2. Debt Detail (DDIS)
Fundamentals and
Fundamentals and
Earnings Analysis
Earnings Analysis
Stockholder
Stockholder
Information
Information
Risk and
Risk and
Volatilitiy
Volatilitiy
1. Financial
1. Financial
Analysis (FA)
Analysis (FA)
Corp
Corp
13. Earnings
13. Earnings
Estimates (EE)
Estimates (EE)
3) Zacks
3) Zacks
HDS
HDS
(Just
(Just
Pg 1)
Pg 1)
Beta
Beta
Calculation
Calculation
(BETA)
(BETA)
Change defaults:
Period to M
Starting point: 5 yrs ago
Leave ending point as is
1. Finding Securities
1. Finding Securities
Ticker Symbol Look Up
Ticker Symbol Look Up
Enter the name of your company
Choose the listing for your company
that you are interested in
Pick a long term bond for the company
Description
Description
Shadow
Shadow: Indicates menu choices on Bloomberg
Regular font: Indicates input that you have to provide or change
To get ratings information
To get all other information
Issue/Issuer Information
Issue/Issuer Information
Historical
Historical
Volatility
Volatility
(HVT)
(HVT)
1. Enterprise Value
1. Enterprise Value
2. Income Statement
2. Income Statement
3. Assets
3. Assets
4. Liabilities
4. Liabilities
5. Cashflows
5. Cashflows

4
WHERE TO FIND THE DATA
This is a listing of all of the financial data that you will need to analyze your company and where exactly on the Bloomberg output you will find the
data. Once you have identified what you would like to look up, use the item number and go to the specified page number on Bloomberg to look it up.
Item Input In Bloomberg Page Number Used in this spreadsheet
1 Beta Equity: Beta Calculation 29 Capstr, Dividend, Valuation
2 Current EPS Equity: Description 8 Valuation
3 Payout Ratio Equity: Description 10 Valuation
4 Total Debt Equity: Description 16 Capstr, Dividend, Valuation
5 Book Value of Equity Equity: Description 16 CapStr, Valuation
6 Number of Shares Outstanding Equity: Description 8 CapStr, Valuation
7 Effective Tax Rate Equity: Description 10 CapStr, Valuation
8 Chg in Non-Cash Working Capital Equity: Description 17 Valuation
9 Capital Expenditures Equity: Description 17 CapStr, Valuation
10 Depreciation Equity: Description 17 CapStr, Valuation
11 EPS - 5 years ago Equity: FA (Income) 12 Valuation
12 Analyst Projection for Growth Equity: Earnings Estimates 27 Valuation
5
13 Interest Expenses Equity: Description 15 CapStr, Valuation
14 Net Sales/ Revenues Equity: Description 15 Valuation
15 Market Capitalization Equity: Description 8 Risk, CapStr, Valuation
16 EBIT (/Operating Income) Equity: Description 15 CapStr
17 Bond Rating Corp Bond: Description 31 CapStr
18 Past 10 years Net Income Equity: FA (Income) 25 Dividends
19 Past 10 years Depreciation Equity: FA (Cashflow) 25 Dividends
20 Past 10 years Chg in non-cash Work. Cap. Equity: FA (Cashflow) 26 Dividends
21 Past 10 years Dividends Equity: FA (Cashflow) 26 Dividends
22 Past 10 years Equity Buybacks Equity FA (Cashflow) 25 Dividends
23 Past 10 years Cap Ex Equity: FA (Cashflow) 26 Dividends
24 Average Debt Ratio 10 years Equity FA (Leverage) 21 Dividends
25 Past 10 years BV of Equity Equity FA (Liabilities) 24 Dividends
26 Total Return on Stock Equity: FA (Price Ratio) 18 Dividends
27 Operating Income past 10 years Equity: FA (Income) 22 DebtDesign
28 Stock Price Volatility Equity: HVT 28 Risk, Option pricing
29 Value of Firm: Last 10 years Equity: FA (Enterprise Value) 21 Dividends

6
30 EBITDA for last 10 years Equity: FA (Income) 21 Capital Structure
31 Alpha (Intercept) Beta Calculation 29 Risk
32 R squared Beta Calculation 29 Risk
33 Standard Error of Beta Beta Calculation 29 Risk
34a Stockholders of record Equity: HDS 8 Corporate Governance
34b Percent of institutional holding Equity: DES 11 Corporate Governance
35 Debt Distribution/ Maturity Equity: DDIS 30 Debt value, WACC
36 Business Breakdown Equity: DES 13 Risk
37 Geographic Breakdown Equity: DES 14 Risk, Financing Choices
38 Non-cash Working Capital Equity: DES 16 Valuation, Dividend policy
39 Net Debt Issued Equity: DES 16 Valuation, Dividend policy
As a general rule, stay away from the computational data provided by Bloomberg, where they try to estimate numbers based upon raw data. For
instance, the WACC and Dividend discount model valuations that they provide are not very useful.
7
Mutual fund
holdings are shown
as 13F in the US.
Change in
holding
since last
filing date.
Item 34a:
Largest
stockholders
in company
8
Item 15: Market cap in millions. If your
stock has multiple classes (voting and non-
voting), this will be the market cap of all
outstanding shares.
This is the Bloomberg default
beta . It is a two-year weekly
return adjusted beta.
Item 6: No
of shares
outstanding
Item 2:
EPS
estimates
9
10
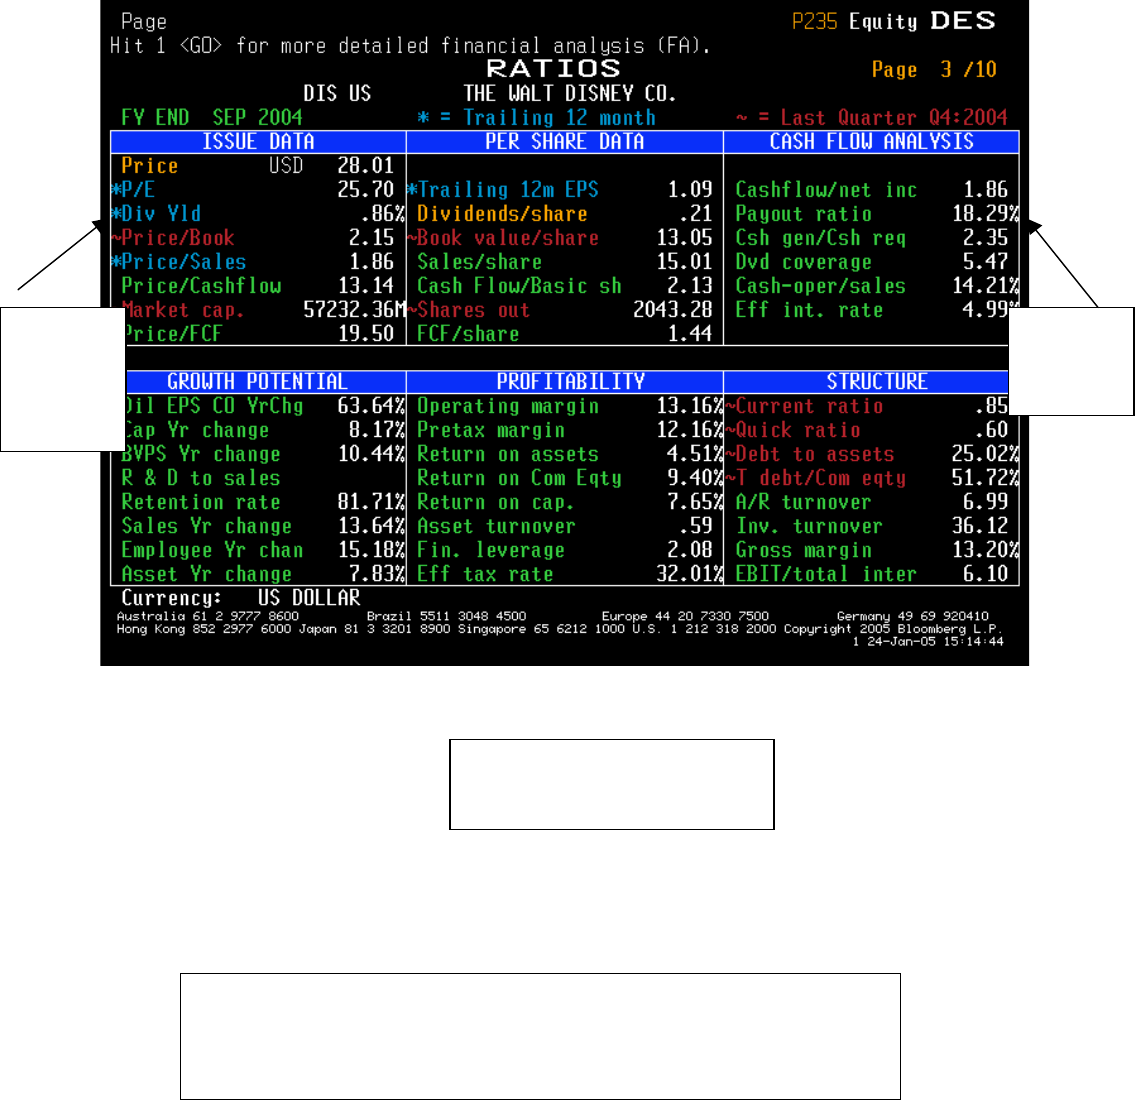
Item 7: Effective tax rate for
most recent year.
Item 3:
Payout
Ratio
Dividend
yield
Note: Do not trust the return on equity and capital numbers that you see
on this page. They are often incorrectly estimated. The same can be
said for the multiples and interest coverage ratios. Do your own
computations.
11
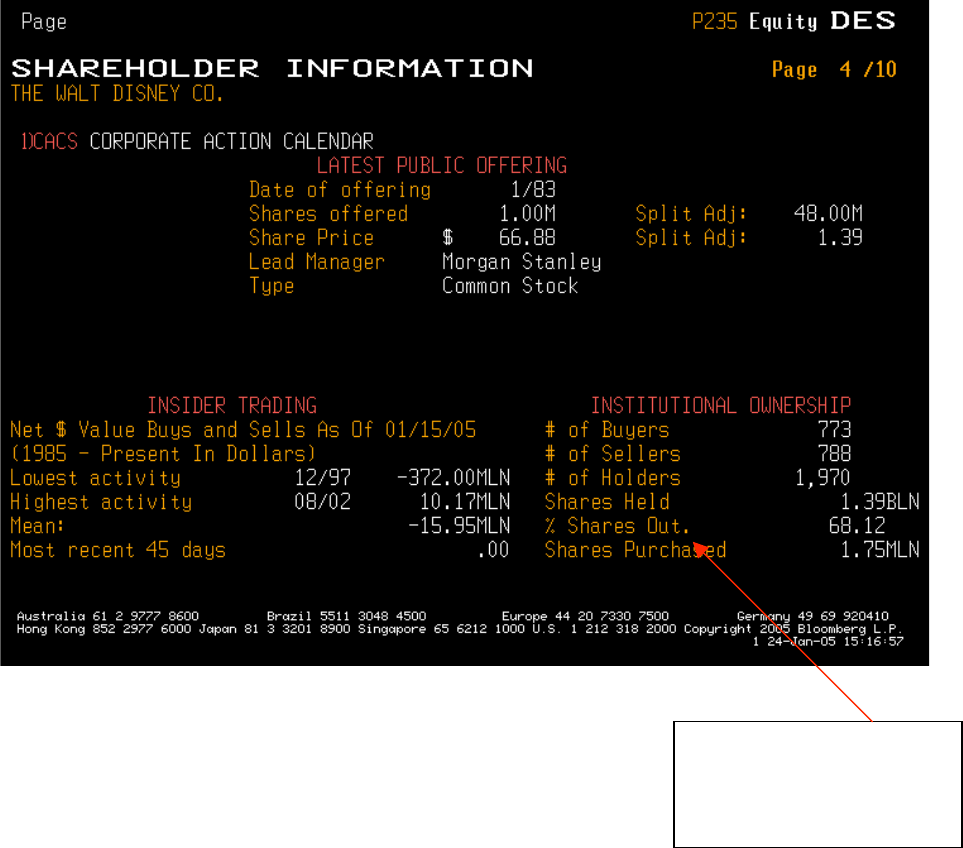
Item 34b: Percent of stock
held by institutions and
number of institutional
investors.
12
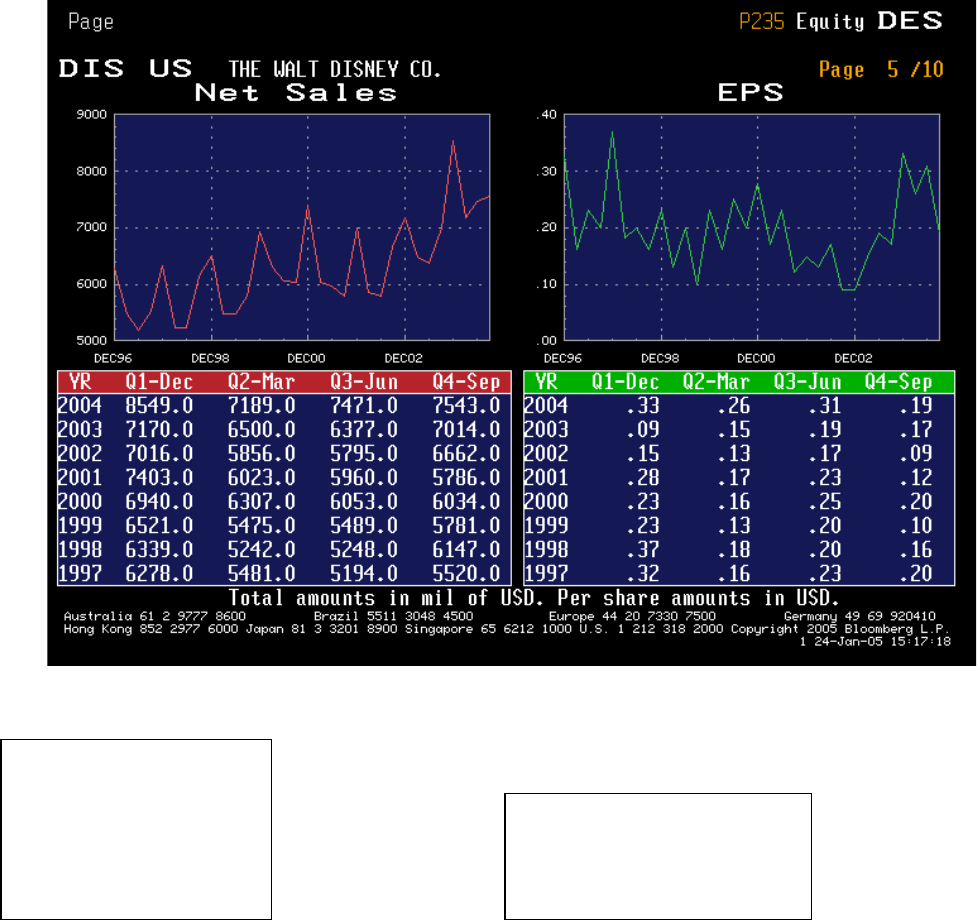
Quarterly revenue and EPS
numbers for past few years.
Item 11: EPS from 5
years ago can be
obtained by adding up
four quarters of EPS.
13
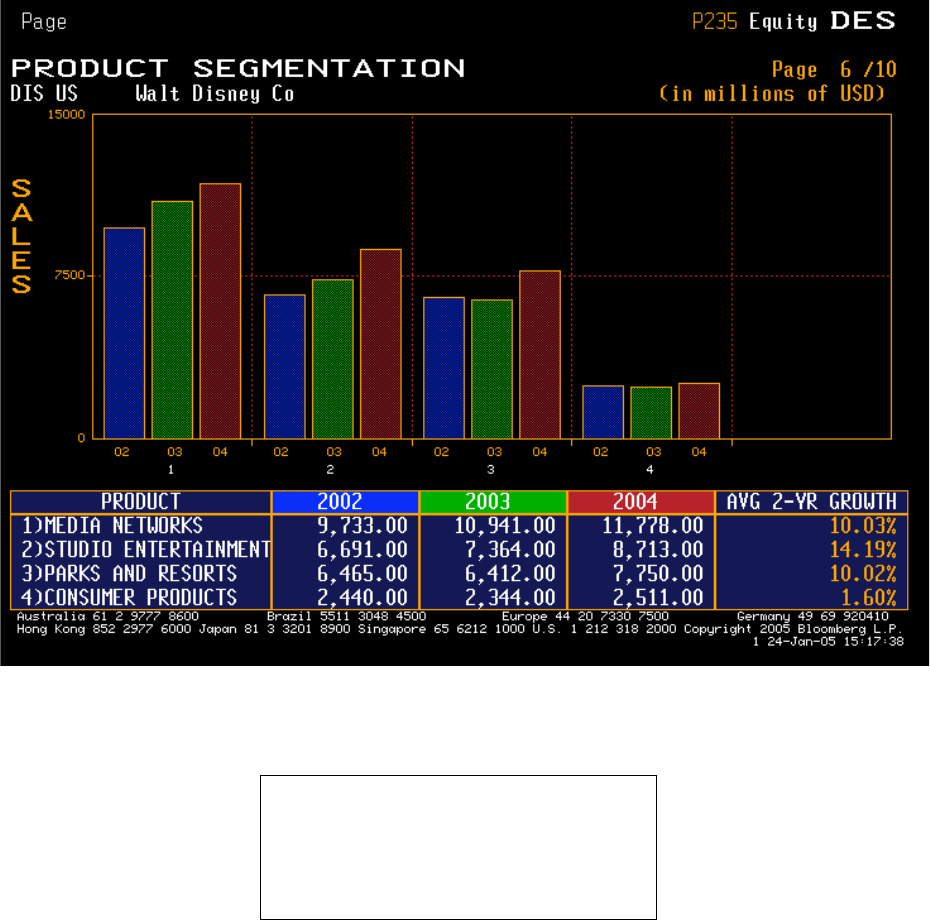
Item 37: Breakdown of revenues by
business and growth in each. For
more detail, look at the annual report
and the 10K for the company.
14
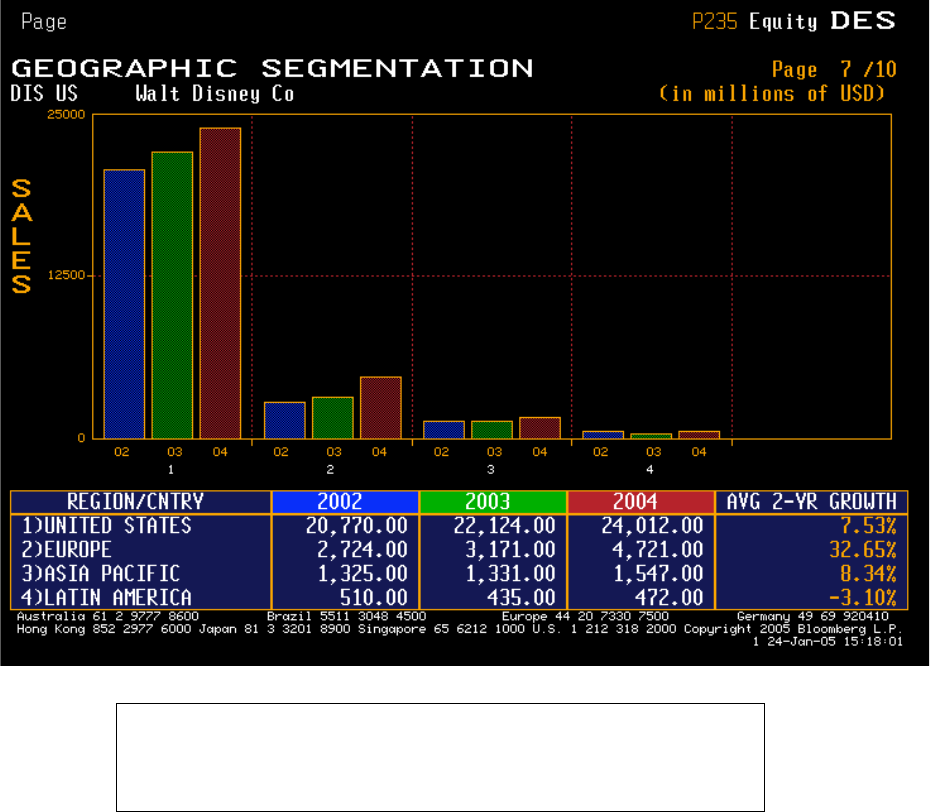
Item 38: Breakdown of revenues by geographic area. Again,
there should be more detail in the annual report or 10K.
15
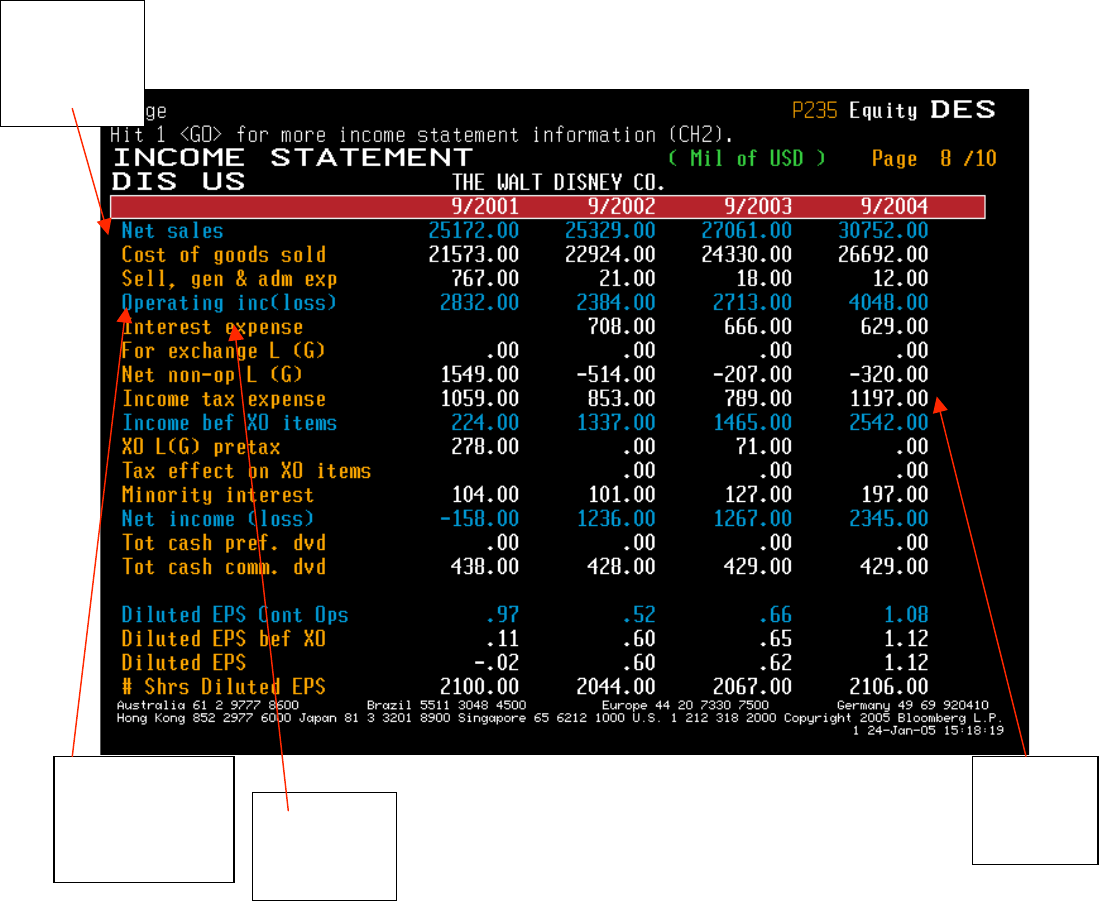
Item 14:
Revenues:
Last 4
years
Item 16:
Operating
Income/EBIT
Item 13:
Interest
Expenses
Taxes on
taxable
income
16
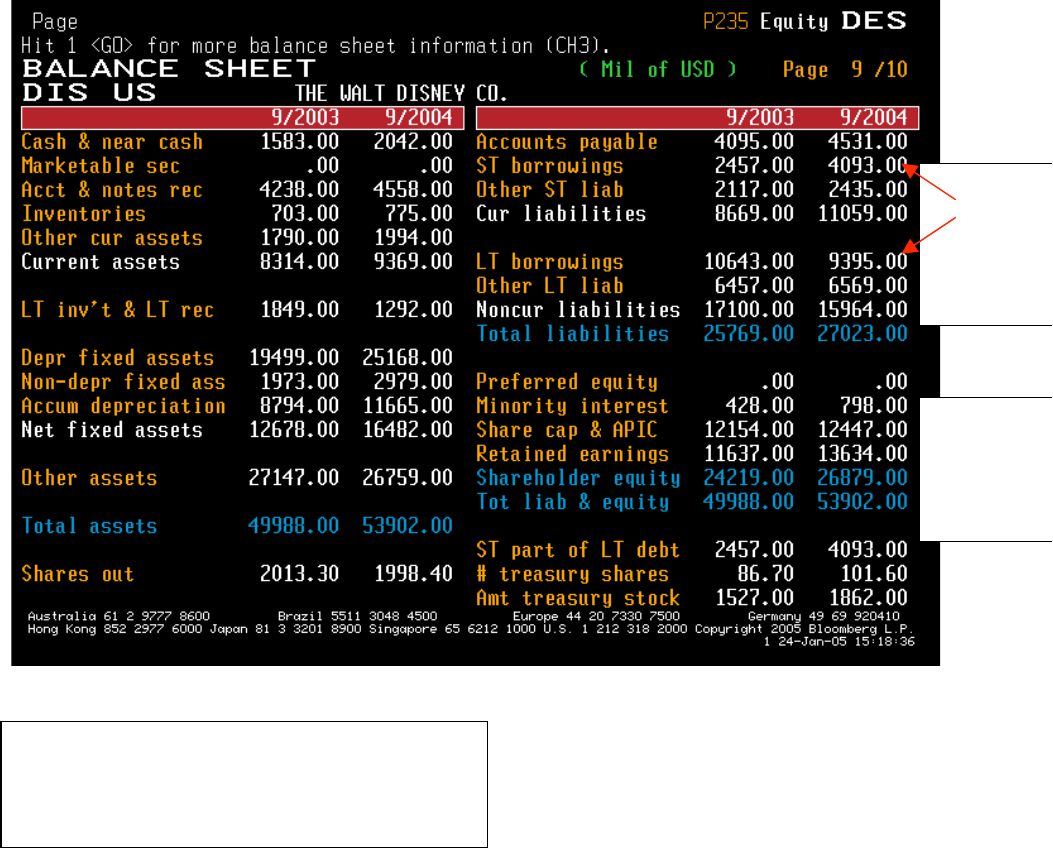
Item 4:
Total Debt
= ST
Borrowing
+ LT
Borrowings
Item 5:
Book
Value of
Equity
Item 38: Non-cash Working capital = Acct &
Notes rec + Inventories + Other Current Assets
– Accounts Payable – Other ST Liab
17
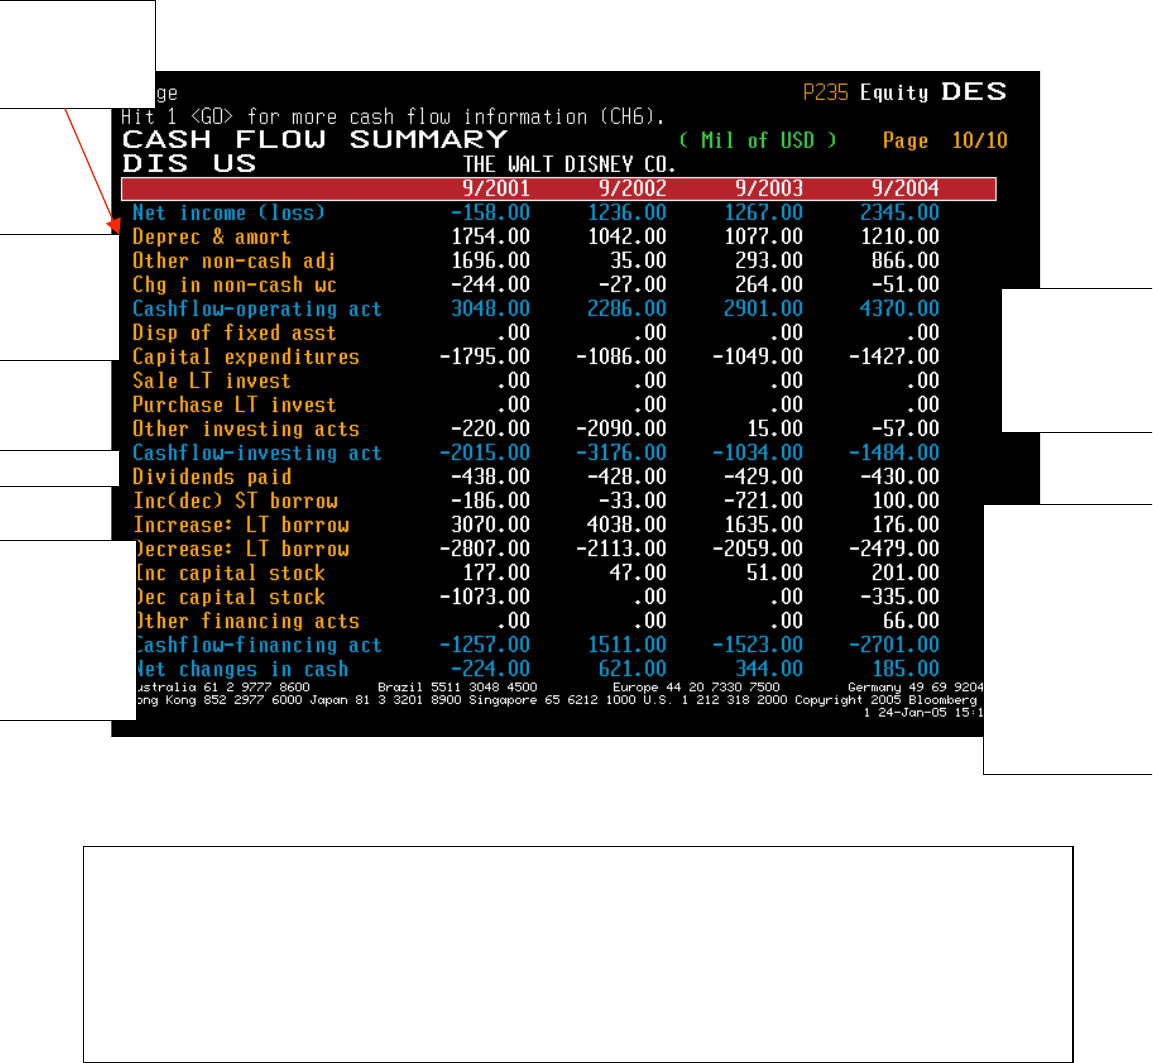
Item 10:
Deprecn &
Amortization
Item 8:
Change in
non-cash
WC
Item 11:
Capital
expenditures
Dividend
s
Stock
buybacks =
Dec
Capital
Stock
Item 39: Net
debt issued =
Inc(dec) ST
borrow +
Increase LT
borrow –
Decrease LT
borrow
Note:
1. The change in non-cash working capital computed by Bloomberg is an approximation since
it includes short term interest bearing debt in ST liabilities.
2. Capital expenditures do not include acquisitions. If the acquisitions are funded with cash it
may be shown as LT investments. If funded with stock, it will not show up here.
3. If disposal of fixed assets is a consistent number, you can net out against cap ex to reflect
replacement of existing assets.
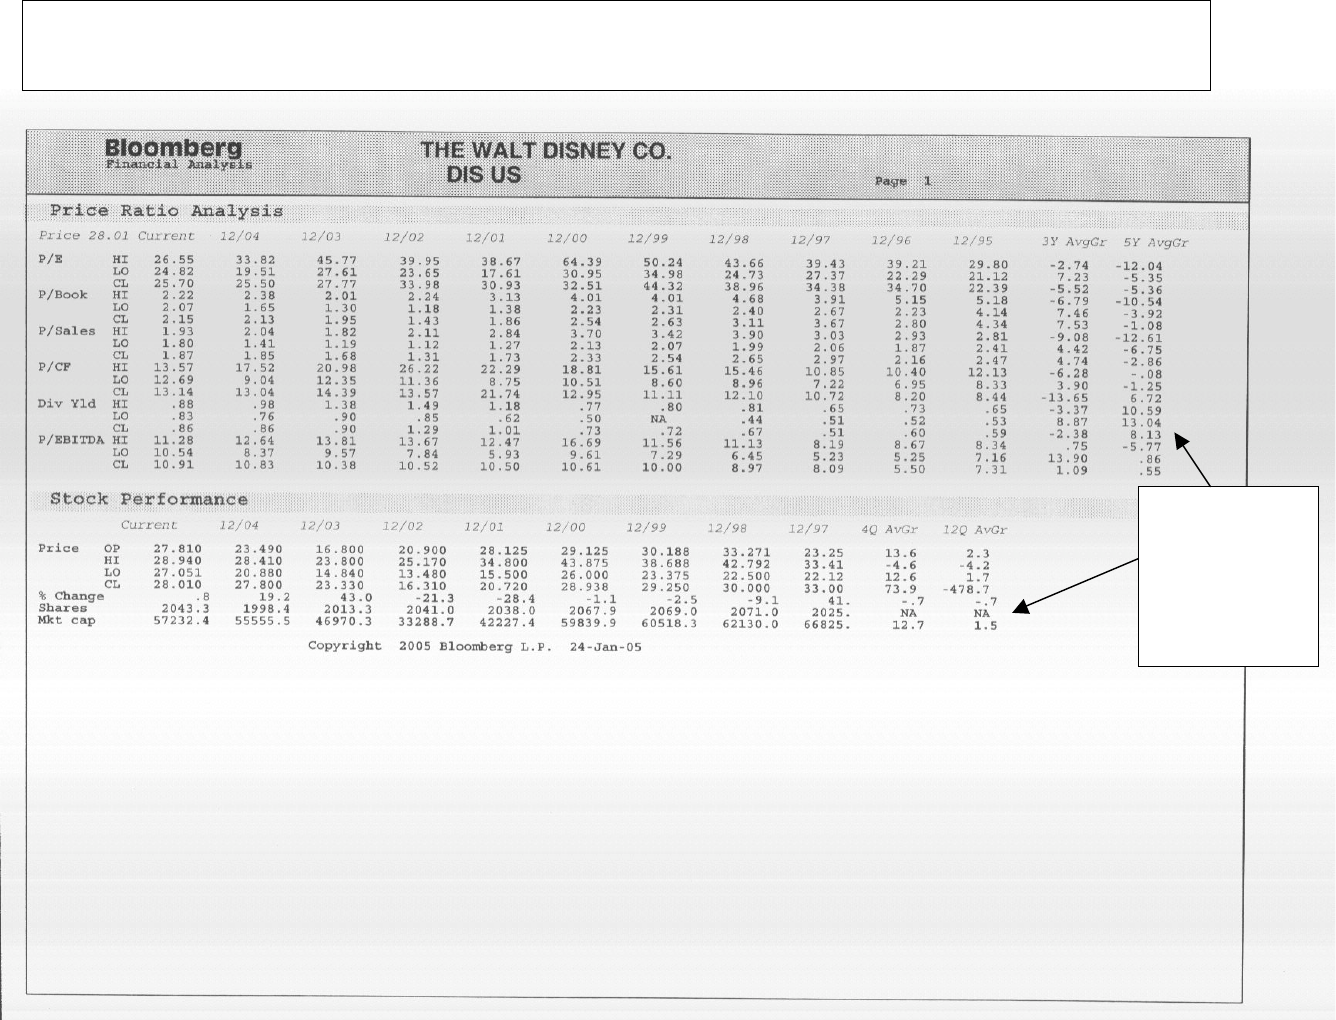
18
Item 26
Total Return =
% Change +
Div Yld
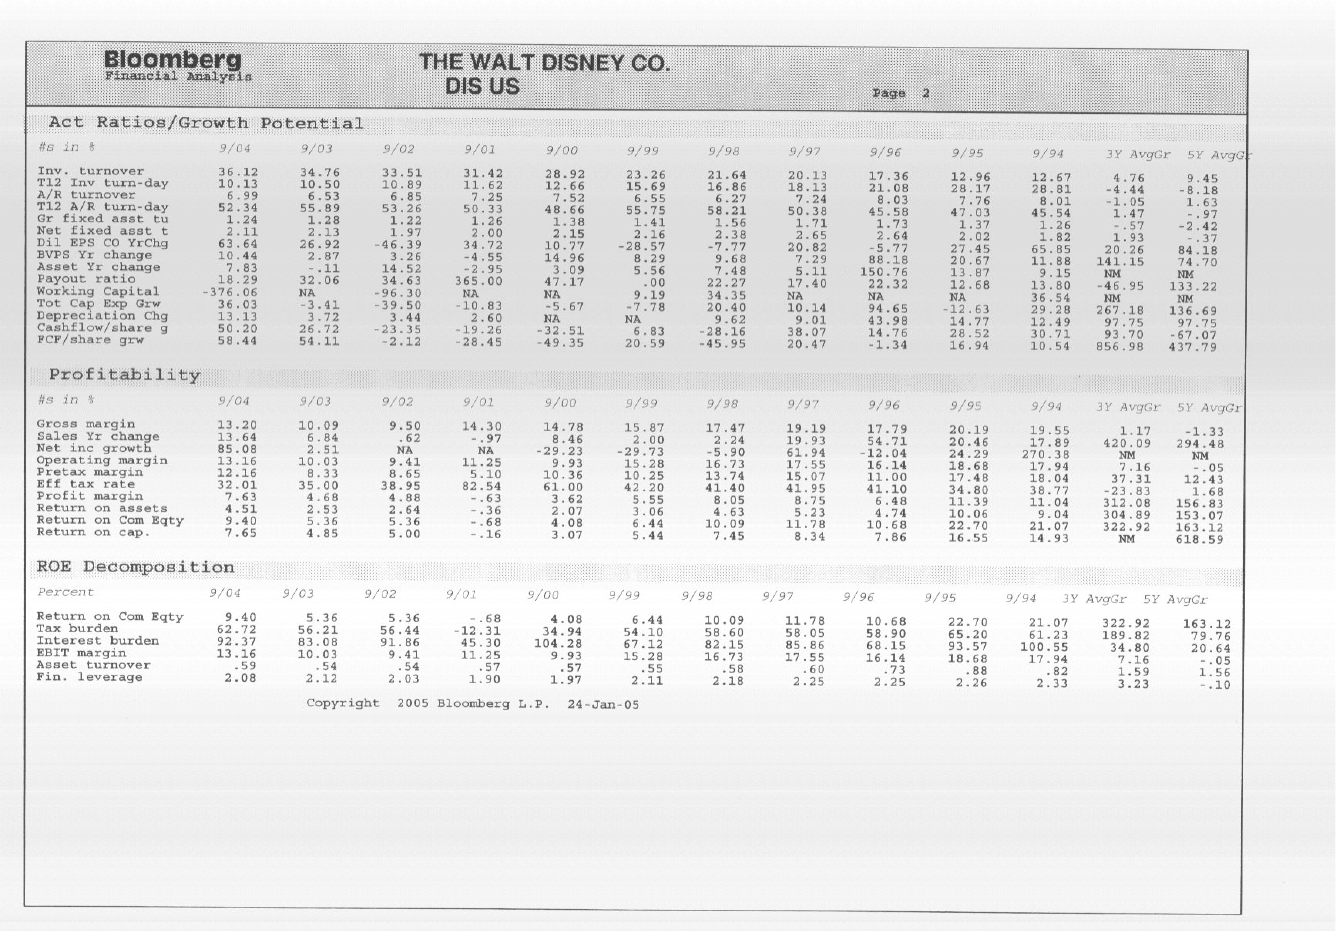
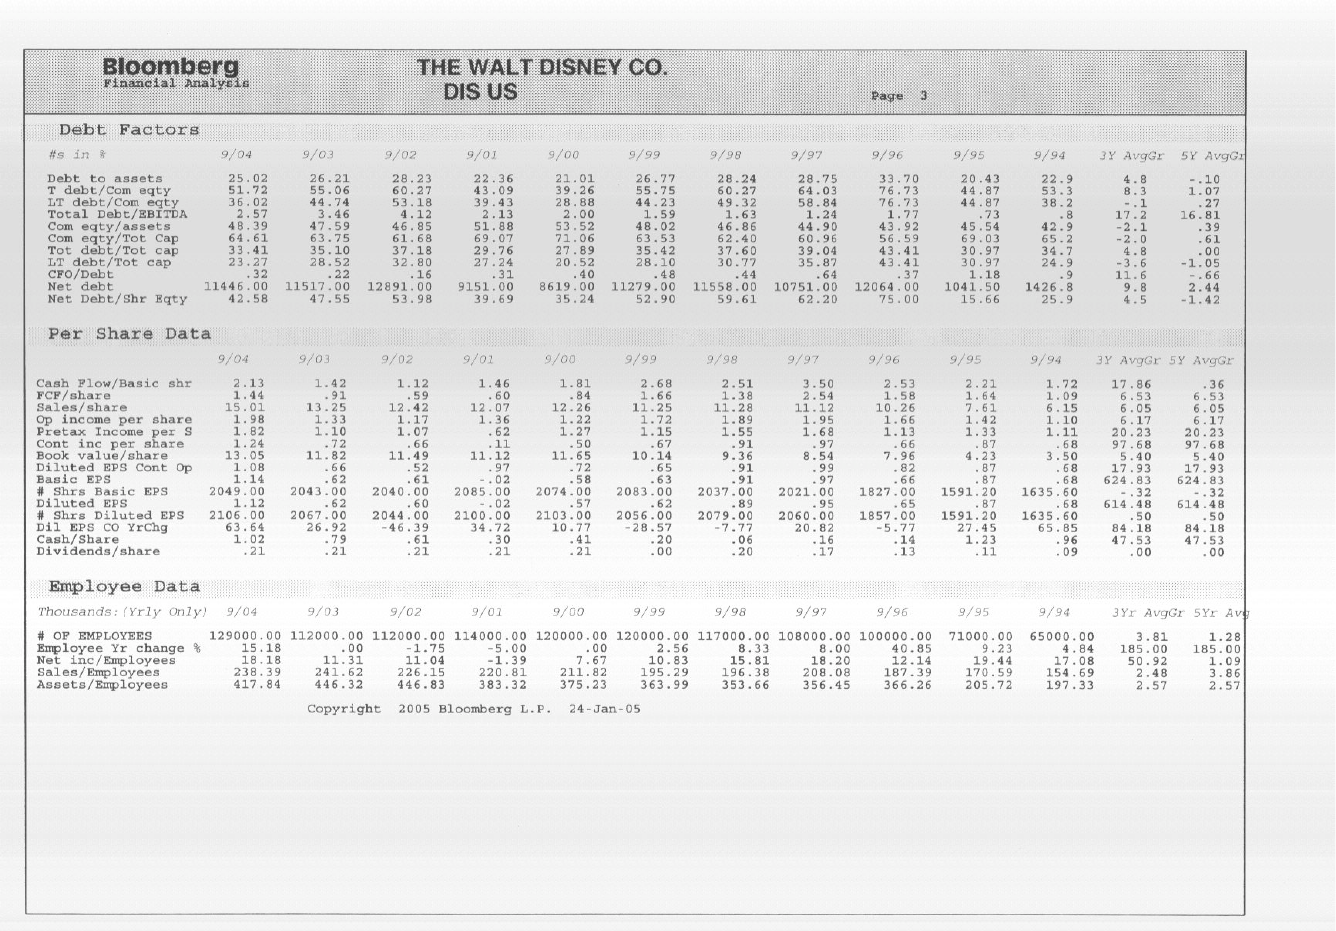
Note that I have used the old FA format. The new data is in roughly the same place but you have to print the section off
separately. (There are separate print outs for price ratio analysis and stock performance, for example.
19
20
21
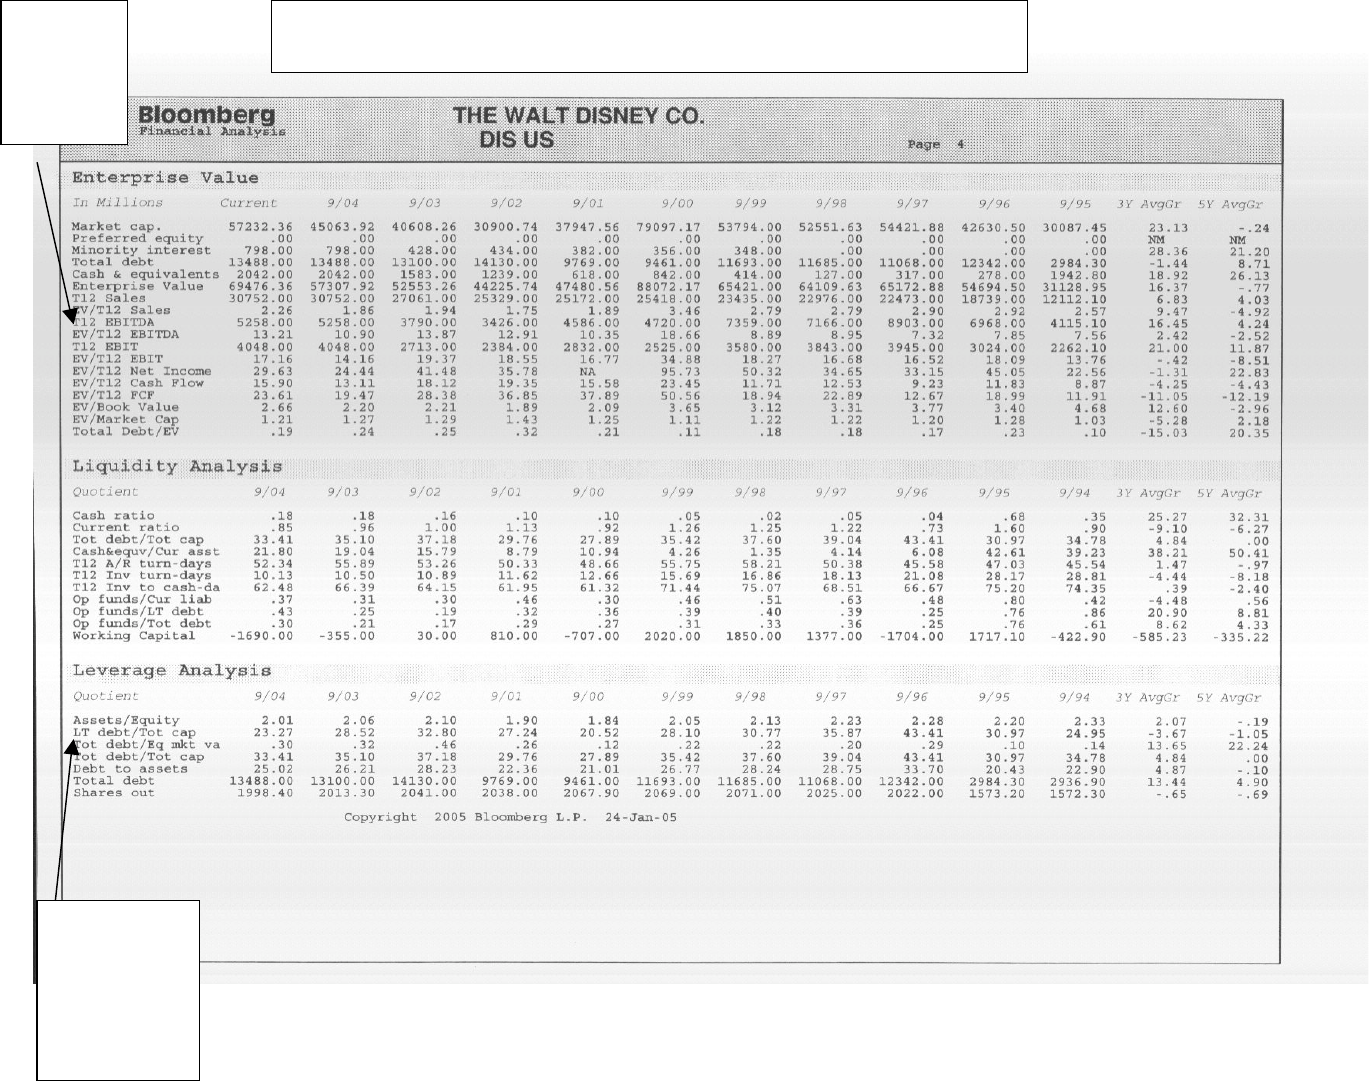
Item 24:
Average
market debt
to equity
ratio for last
10 years
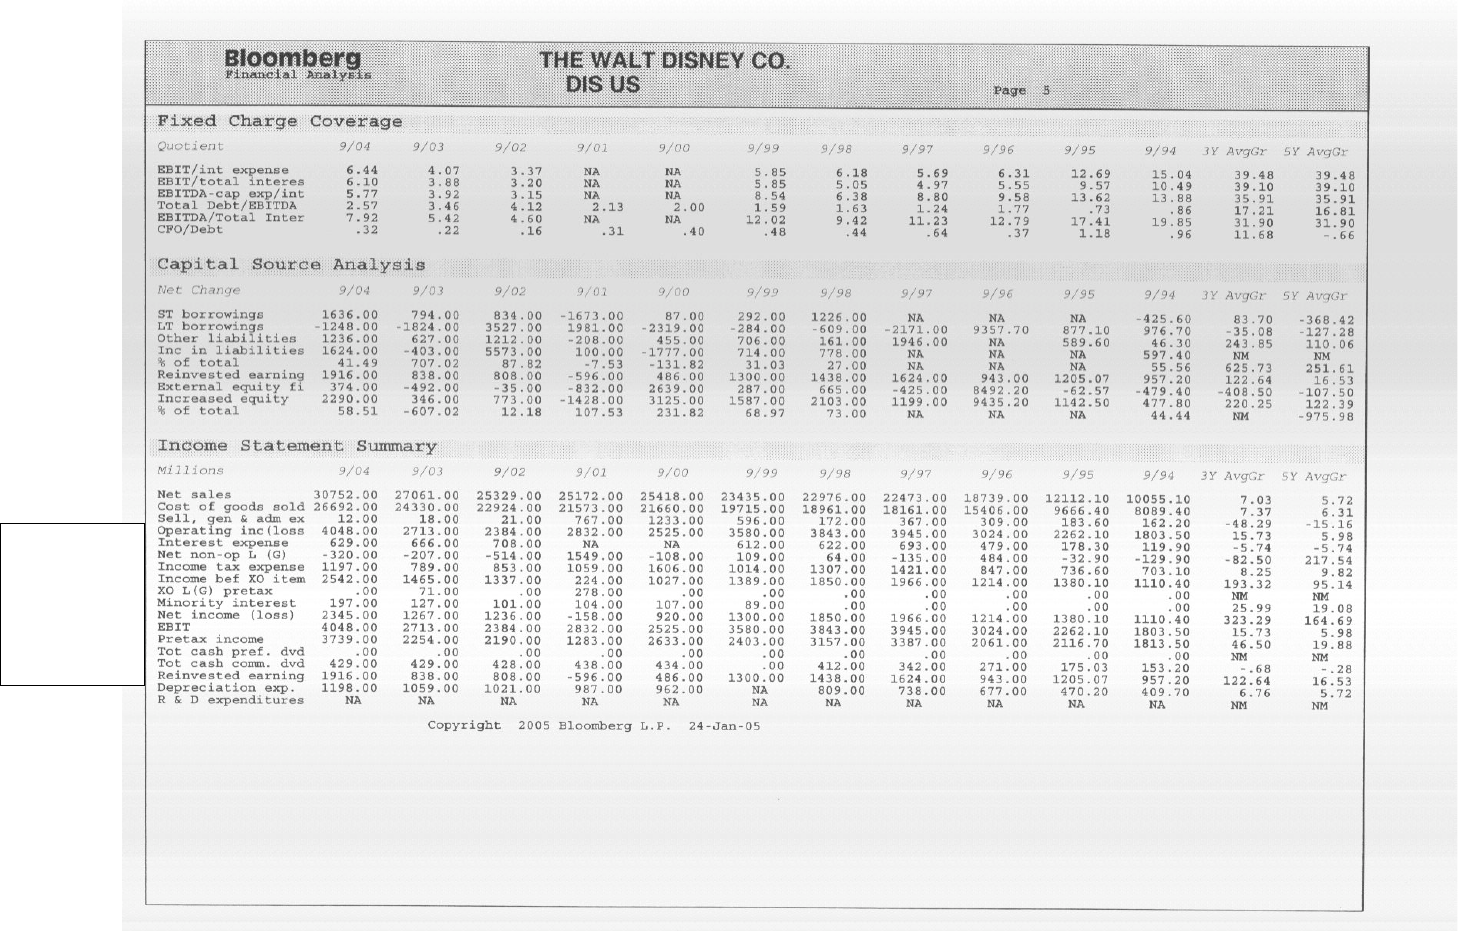
Item 30:
EBITDA
for last
10 years
Item 29: Value of firm = Market cap + Total debt + Preferred Equity. If
you want enterprise value, subtract out cash.
22
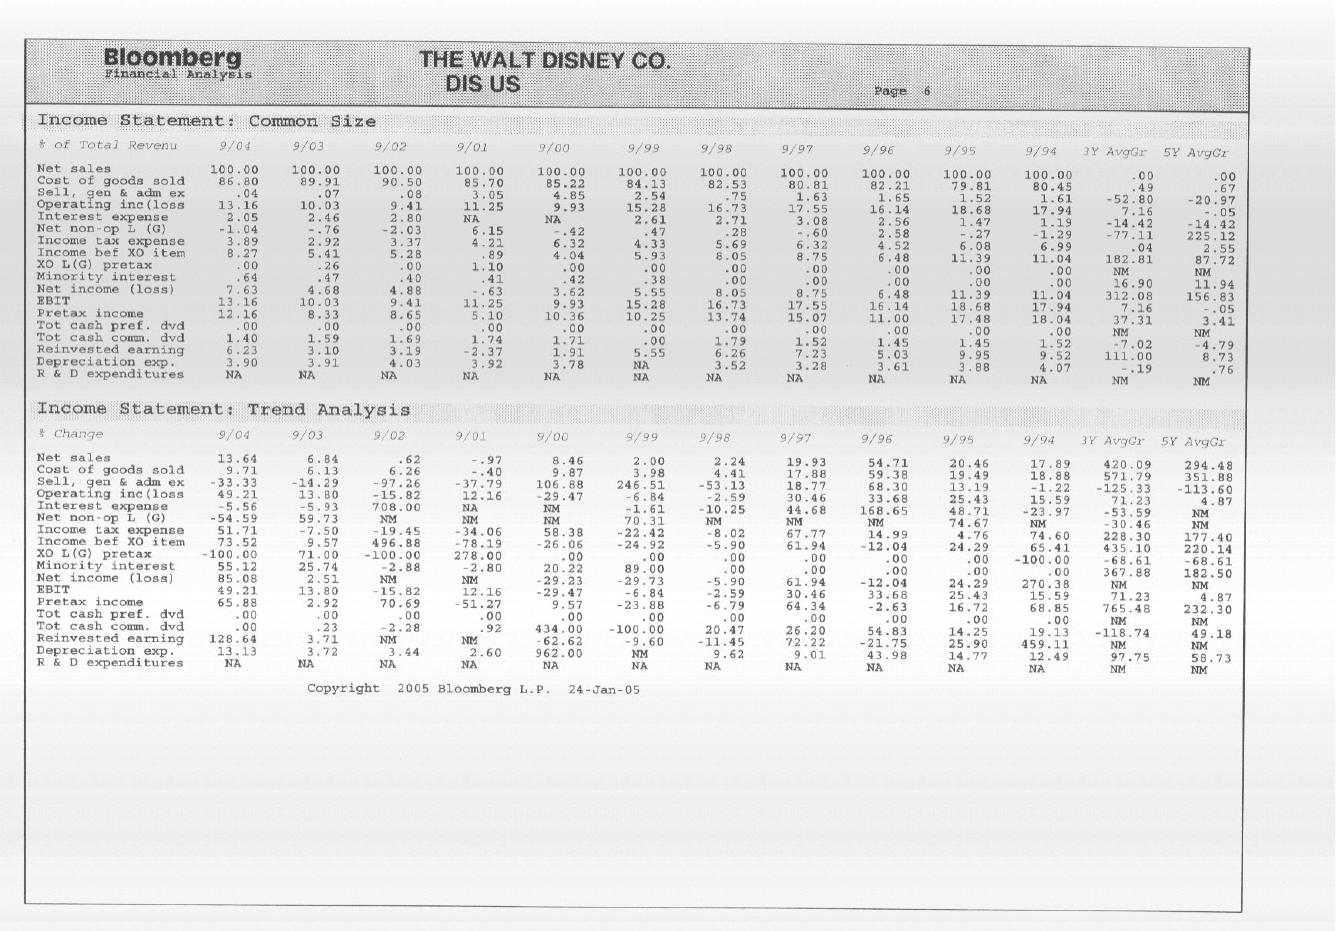
Item 27:
Operating
income
each year
for last 10
years
23
24
25
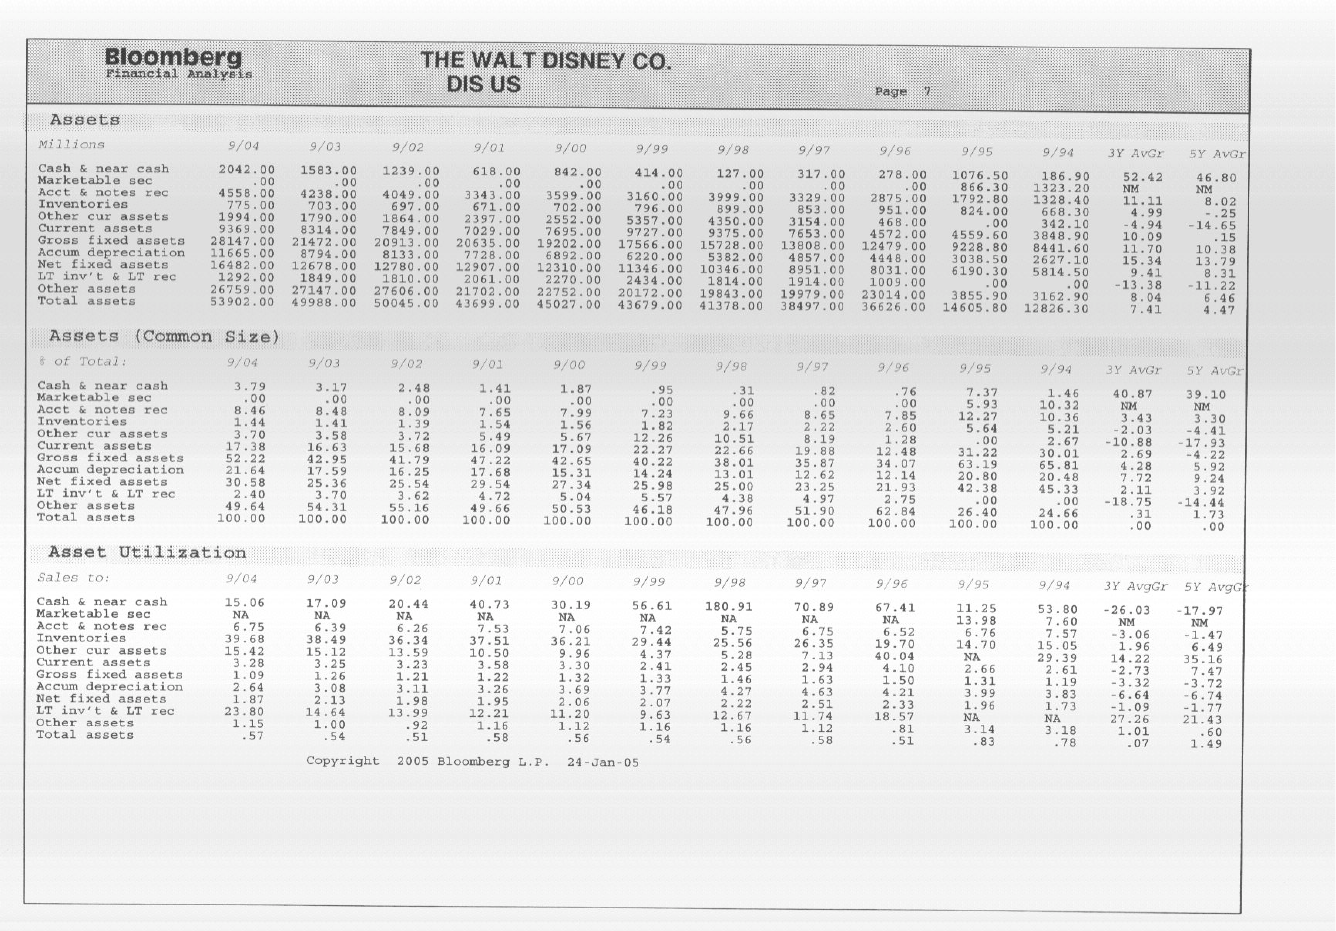
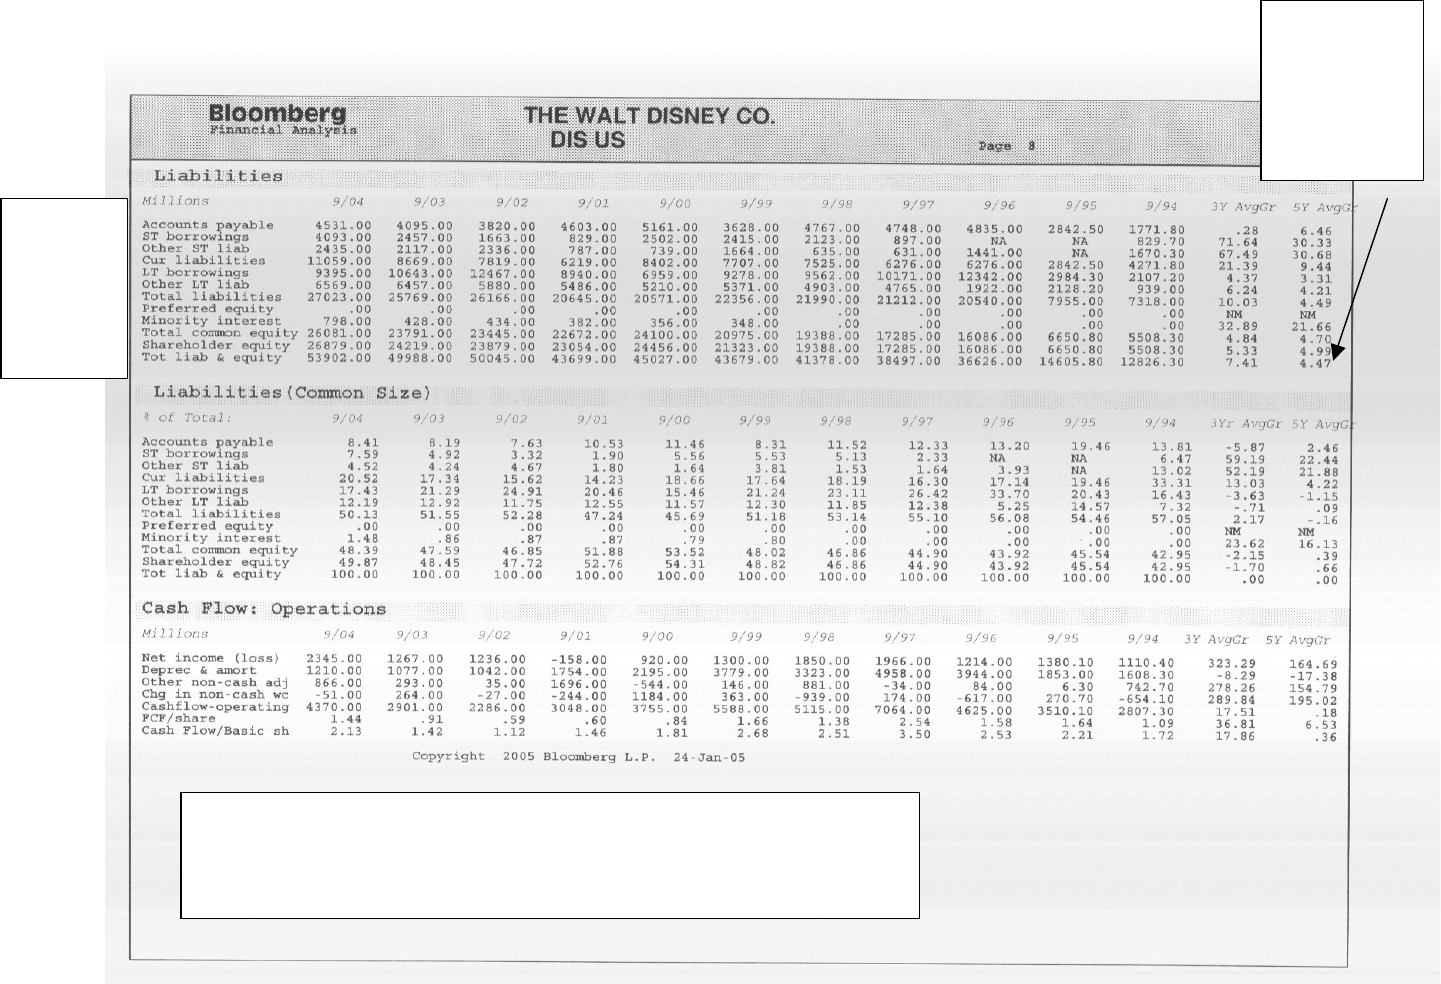
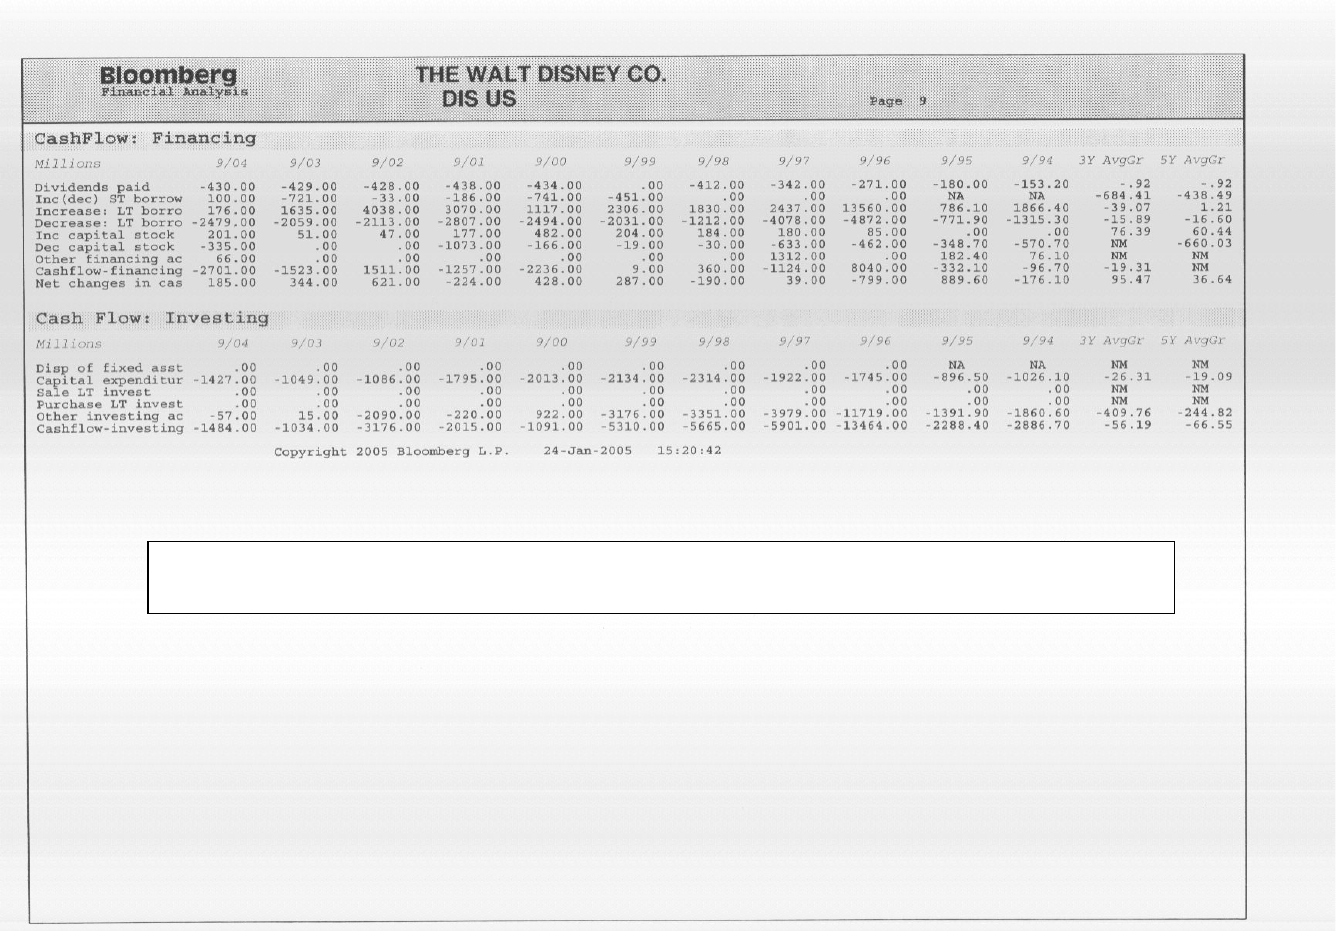
Items 18-20: Last 10 years of net income, depresciation and changes in
non-cash working capital.
Item 25:
Book value
of equity
each year for
last 10 years
Total
Debt =
ST Borr
+ LT
Borr
26
Items 21-23: Last 10 years of dividends paid, stock buybacks (dec in capital stock), stock issues (inc in
capital stock) and capital expenditures
27
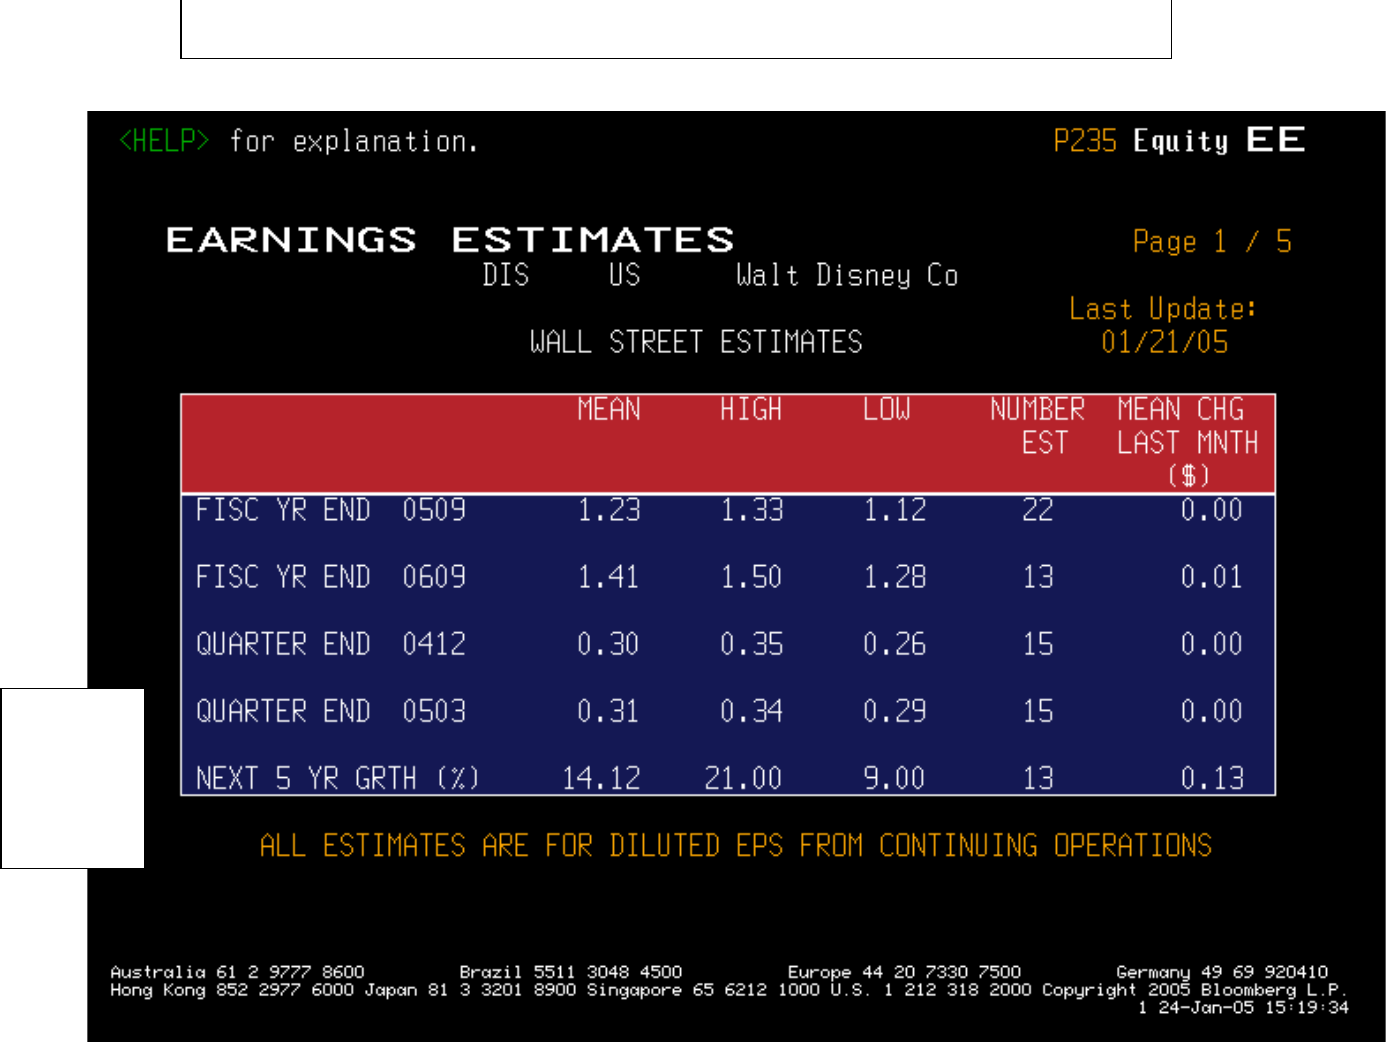
These are from Zacks. You can also try I/B/E/S from the EE menu. The number est is the number
of analysts making estimates and the average is a %. (14.12% annually for next 5 years)
Item 12:
Expected
growth in
EPS: Next
5 years
28
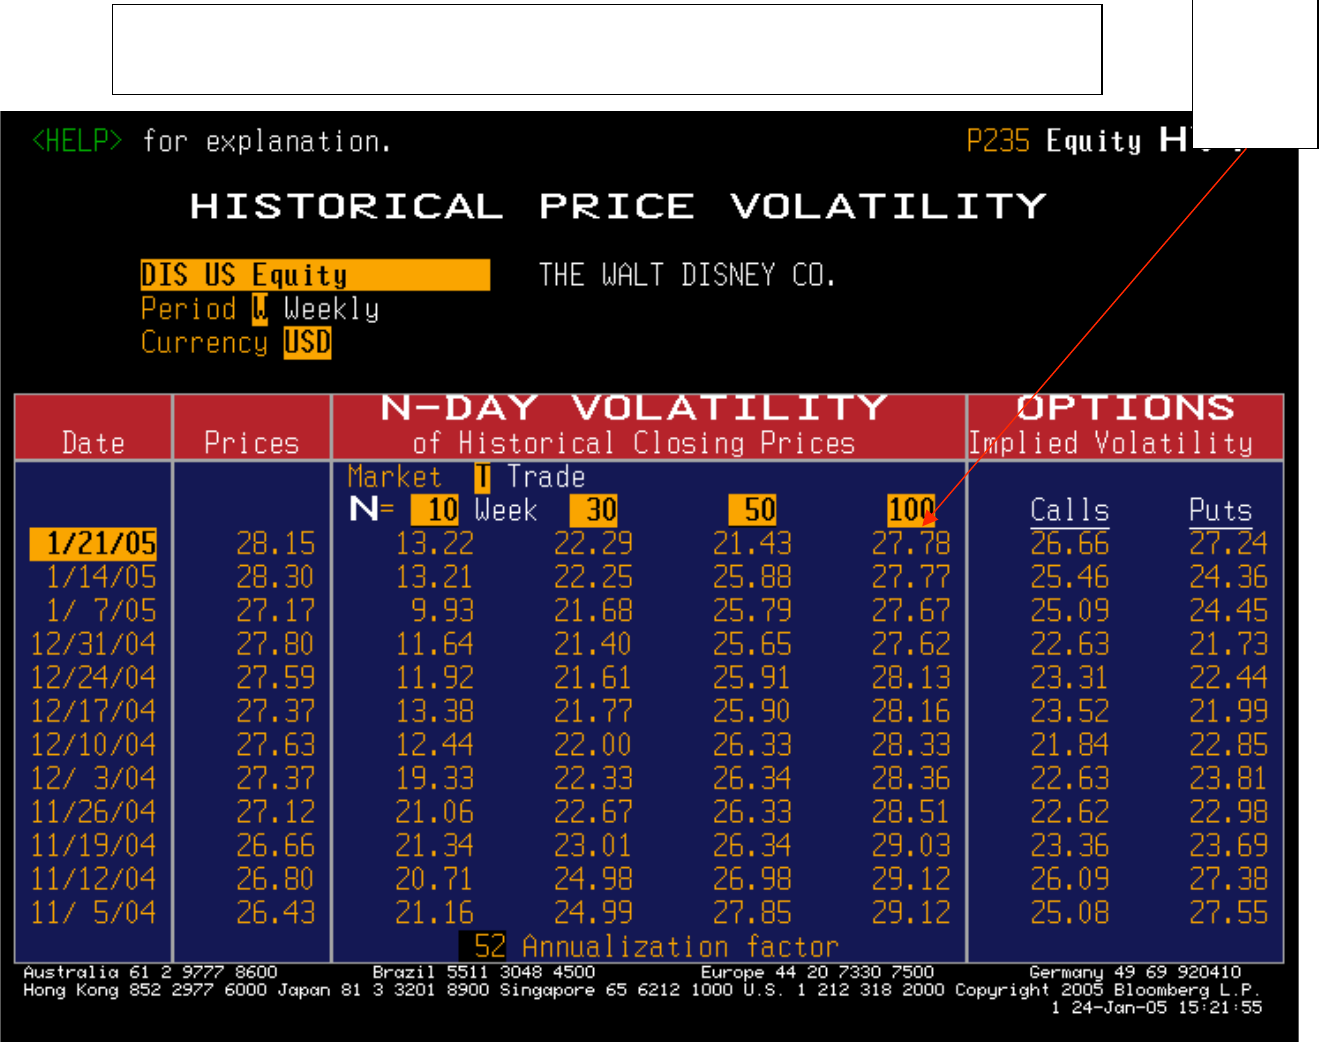
The default in Bloomberg is daily data. It is better to use weekly data and the 100 week estimate of
standard deviation.
Item 28:
Std
deviation
in stock
price
29
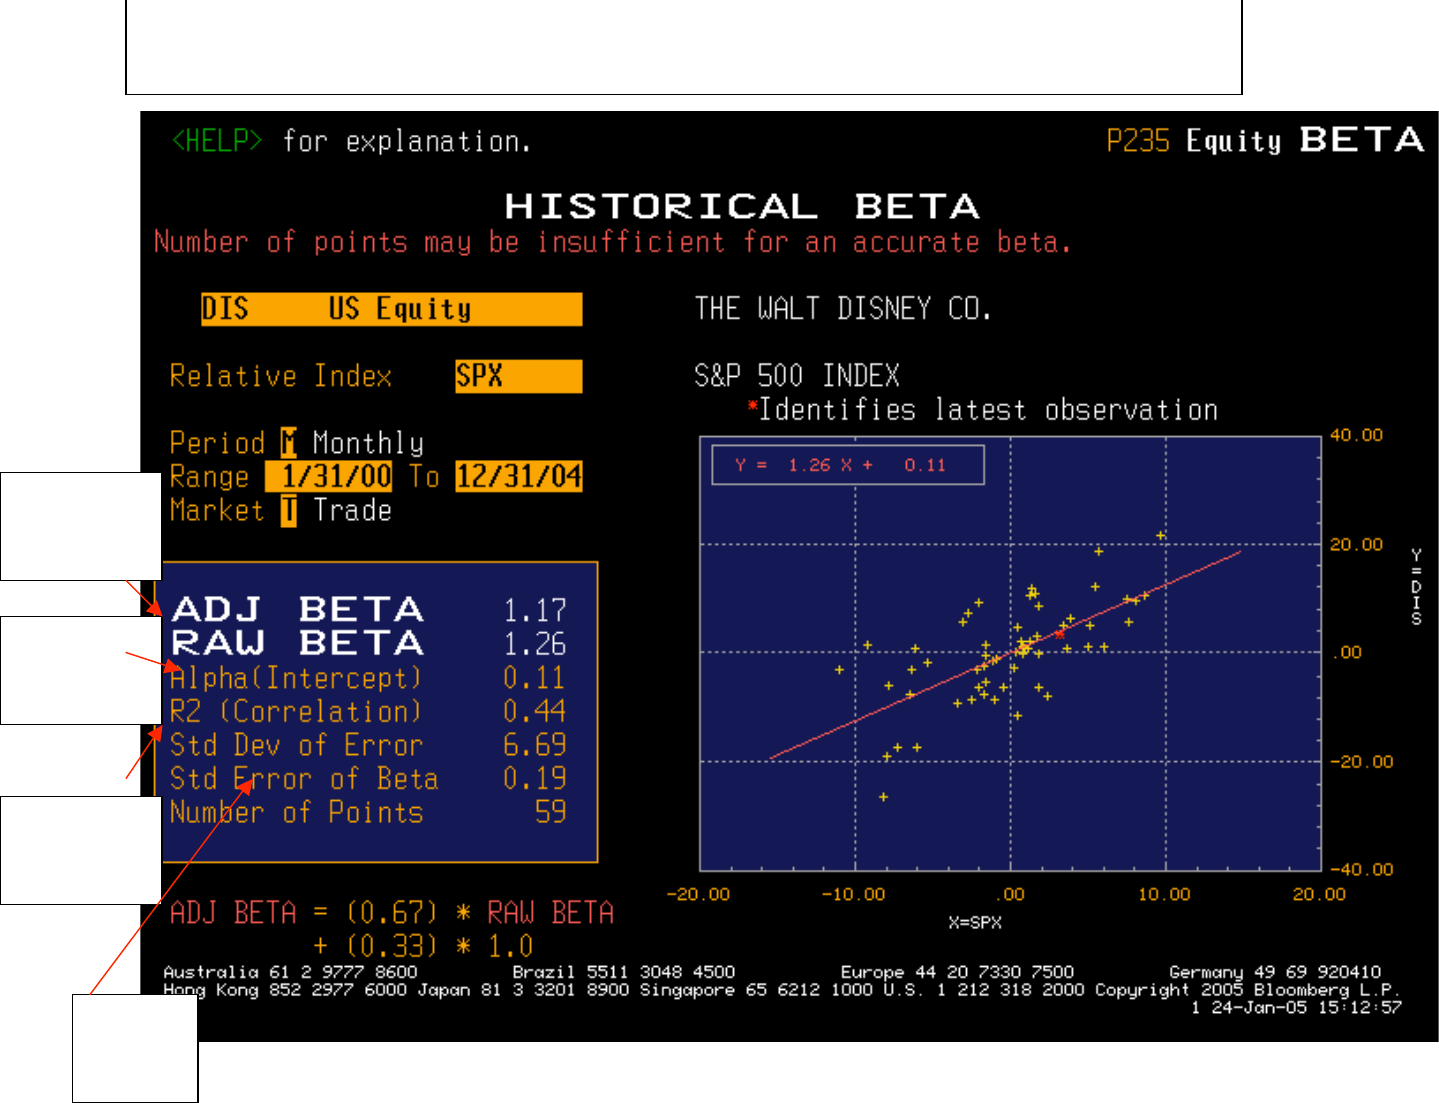
Item 1:
Regression
beta
Item 32 : R
squared of
regression
Item 33:
Std Error
of Beta
Note: Bloomberg’s default beta calculation always uses two years of weekly returns and the local market index.
You can (and probably should) change both. I would change weekly to monthly, two years to five years.and
narrow indices to broader ones.
Item 31:
Regression
Intercept
30
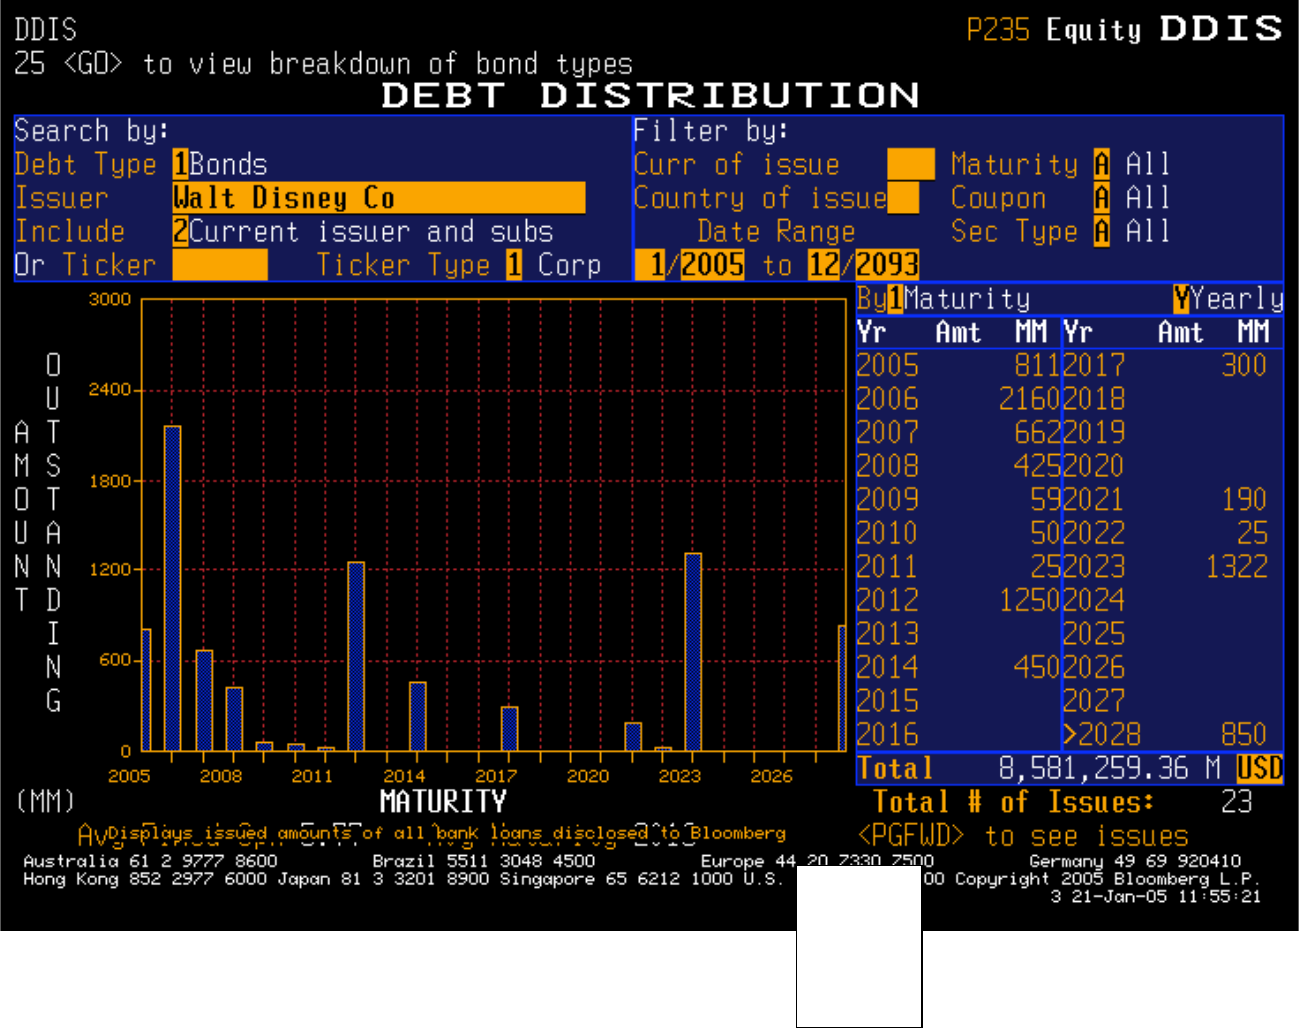
Item 35:
Maturity
distributi
on for
debt.
31
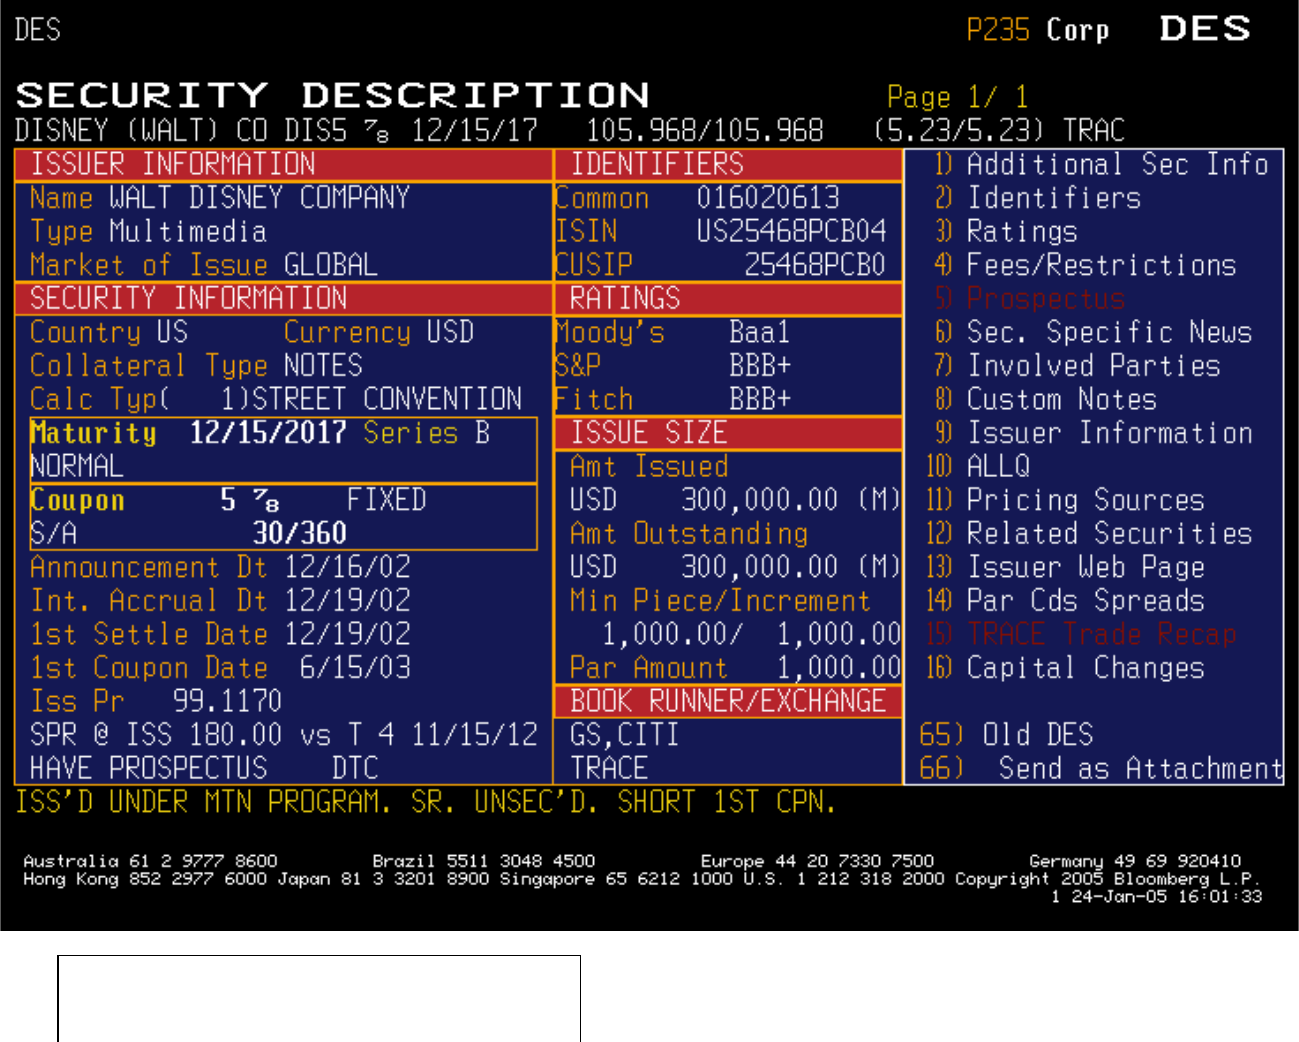
Item 17: Bond Ratings from S&P, Moody’s and
Fitch for corporate bonds issued by firm.
32
DATA ON COMPARABLE COMPANIES
I. Getting data on related companies
• Pick Equity
• Choose 1. Finding Securities
• Choose Ticker Symbol Look up (TK)
• Enter the name of your company
• Once you are in equity screen for your company, enter
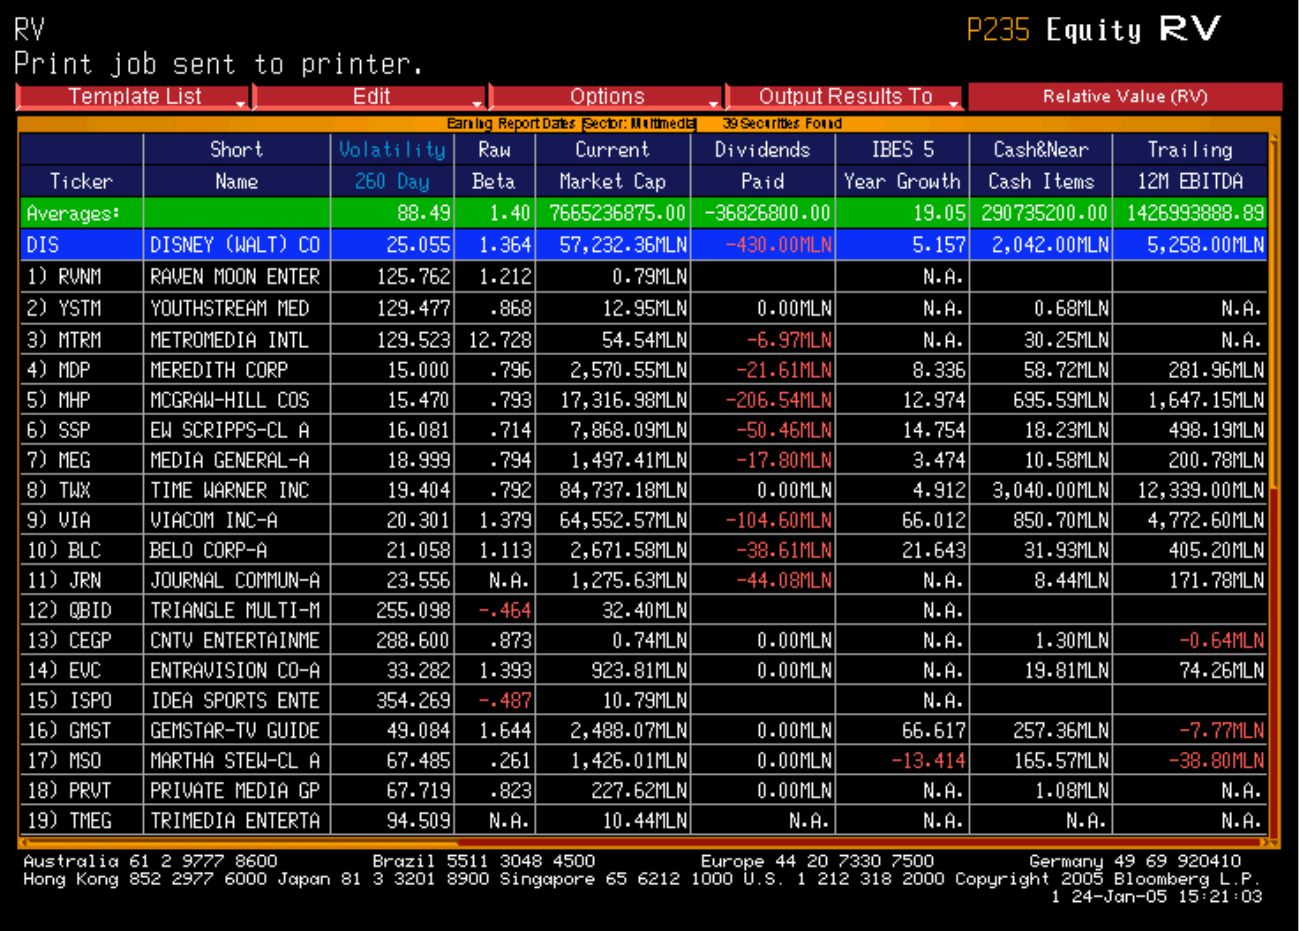
• Relative Value (RV): You can modify the data that is printed out. In particular, you can change the display to include only those items that
you want for all of your comparable firms by going into the “Edit” function and changing the display.
• Peer Value (PV): Your company’s numbers will be printed out next to the average for the sector and the entire market.
Bloomberg will pick the comparable companies and you will have little flexibility. If you prefer to pick your own comparables, try the
alternate approach (QSRC, two pages forward).
33
34
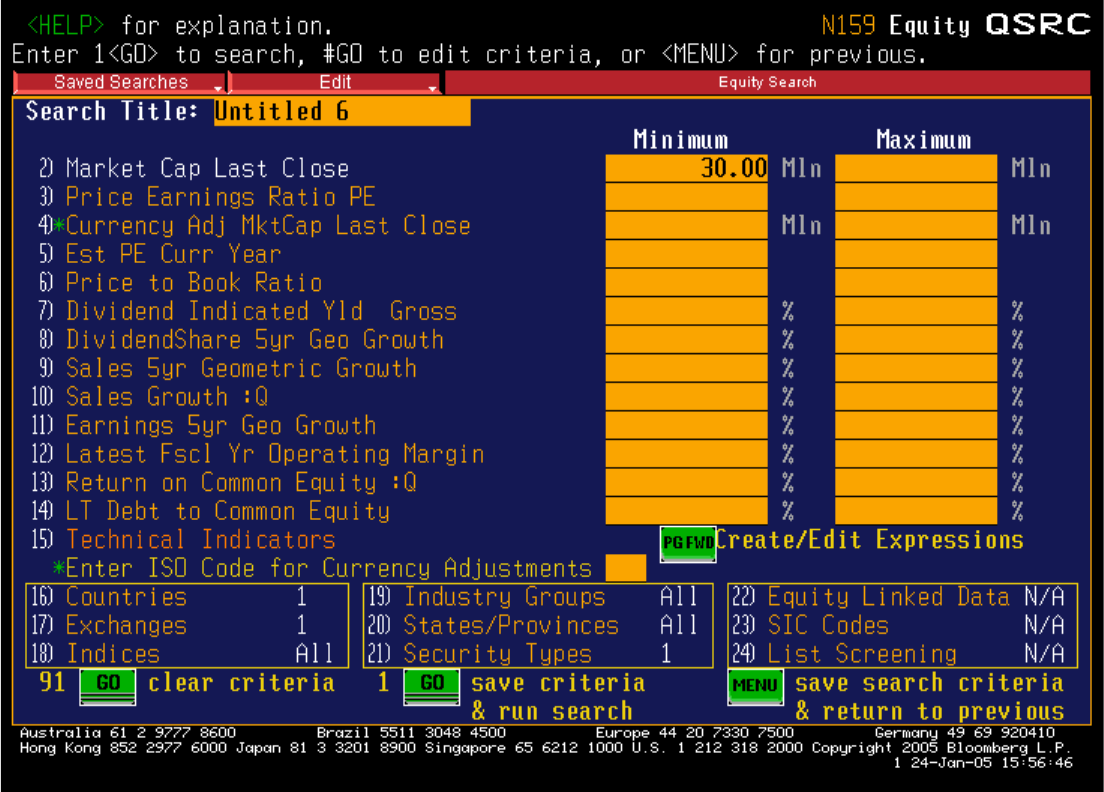
II. Using Bloomberg to get Sector Data or to Screen Stocks
• Start with this screen by typing “ESRC”. You will begin with this screen. If you want to screen based on market cap, PE or growth, you
can do it here. (For example, I have screened for stocks with market cap> 30 million)
•
35
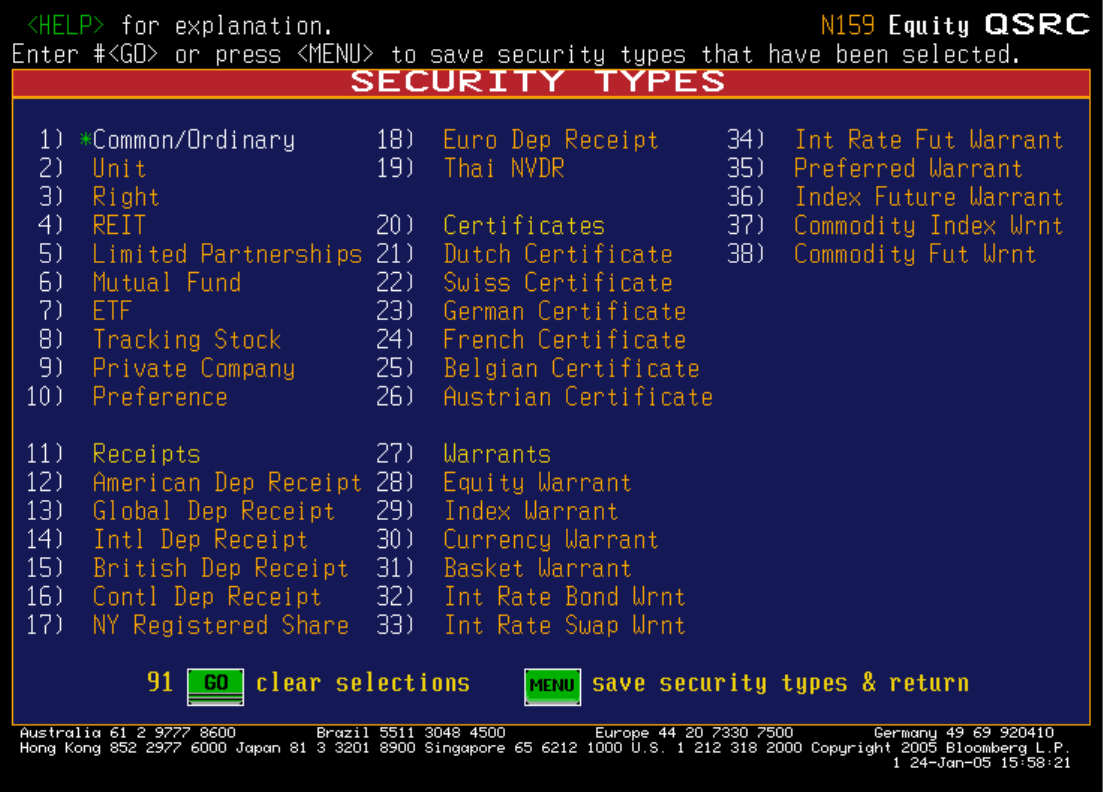
• Restrict your search to just common stocks to avoid multiple listings for the same company:
36
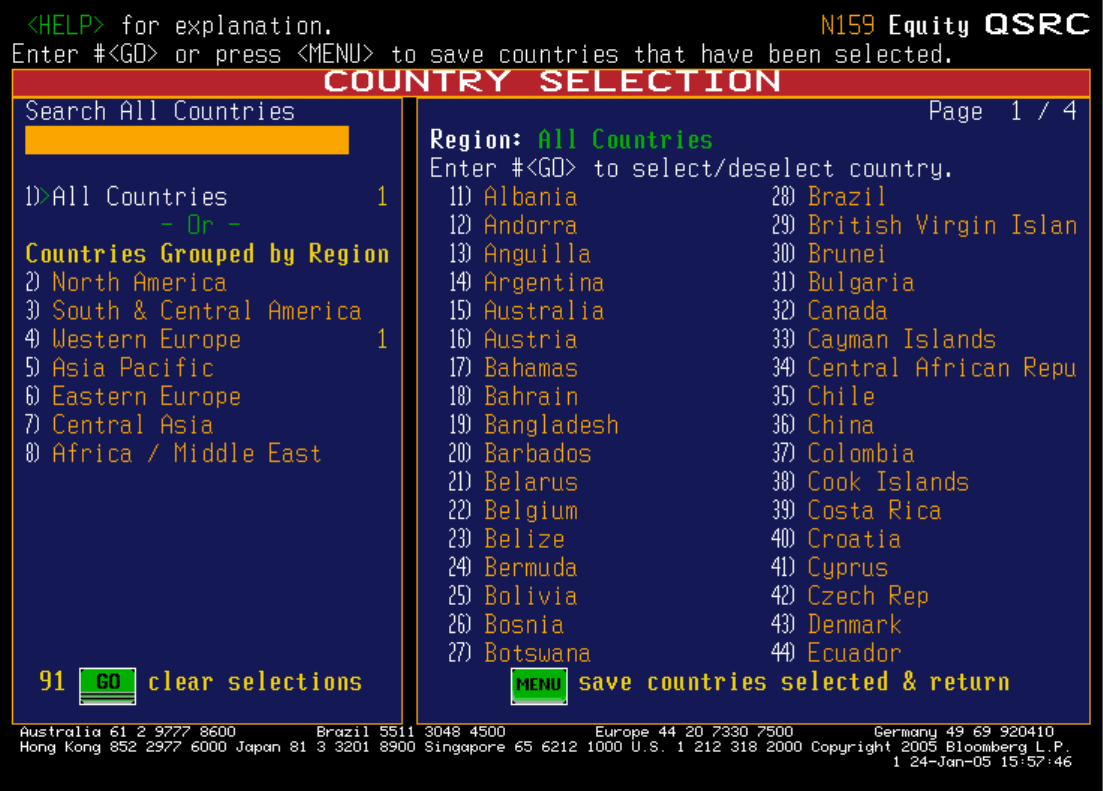
• Pick the country or countries you want to screen for
37
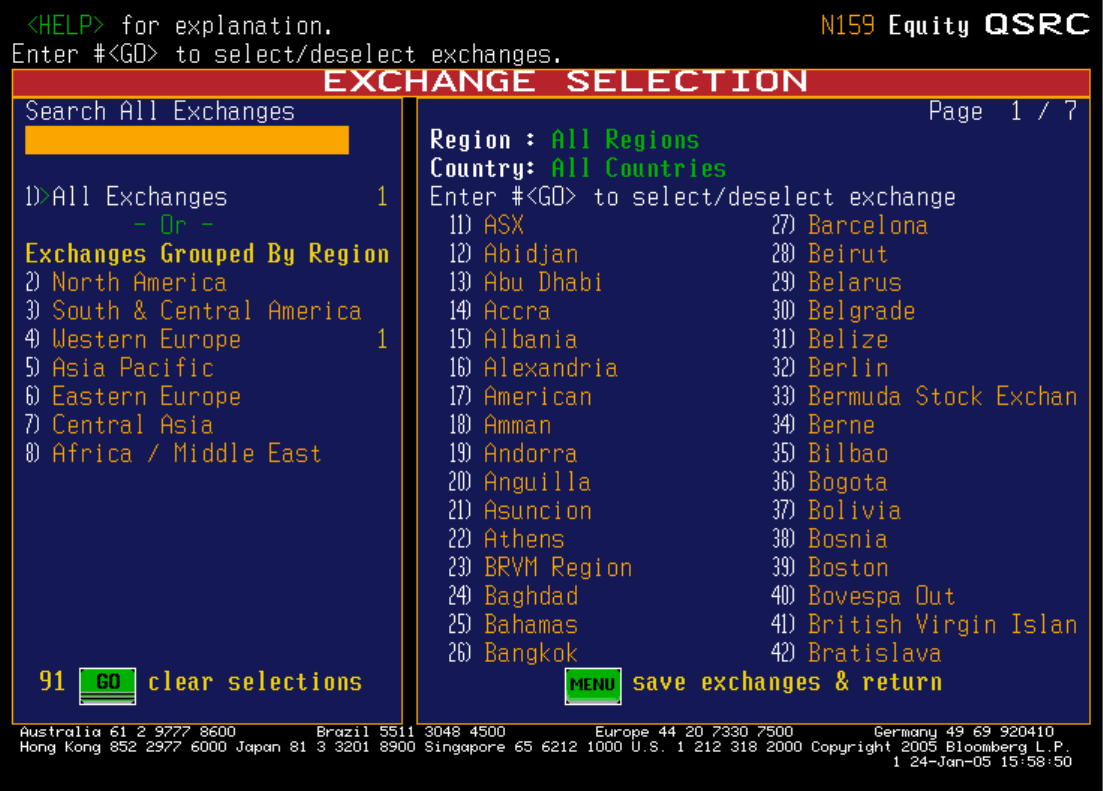
• And make sure that you pick the exchanges to go with those countries. Looking for French stocks on the Indonesian exchange will give you
no listings…..
38
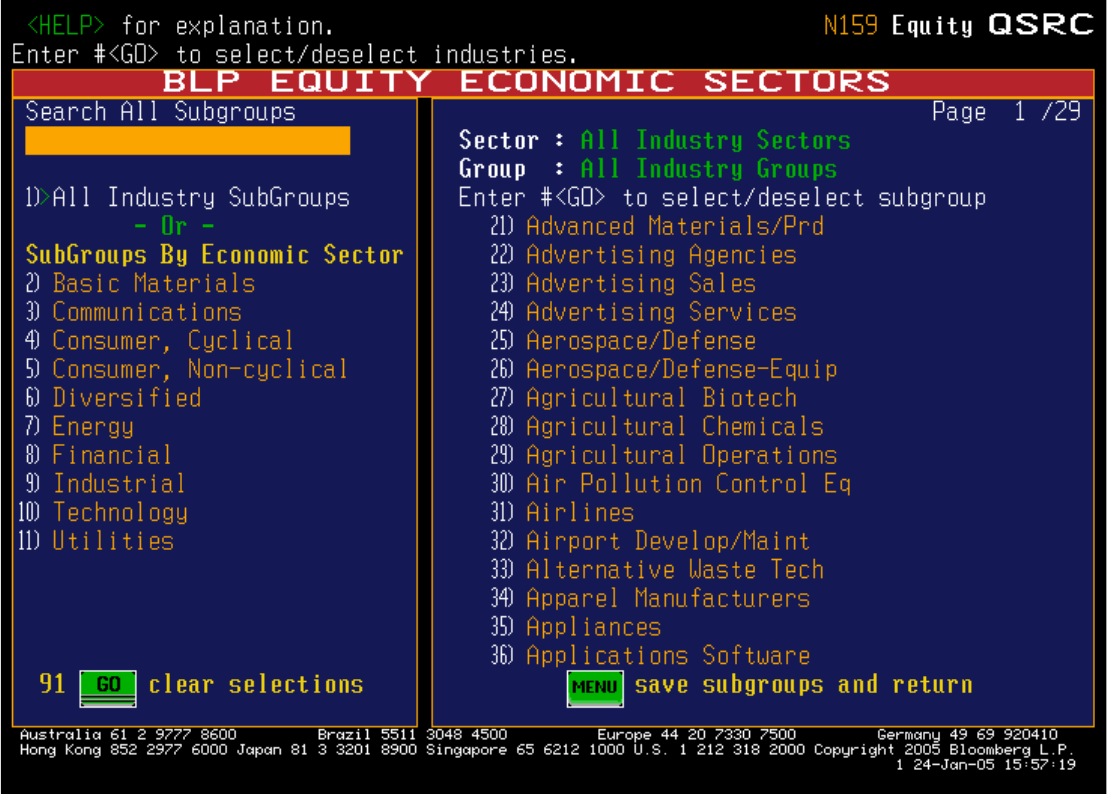
• Pick the industry group you want to analyze or collect data from
• Go into the Edit function and choose the items you want displayed in your output.

39
Warning: This is not the friendliest interface in the world. You will often find yourself building elaborate criteria for 20 minutes and then
losing them all because you hit the menu button twice instead of once. I would suggest saving the criteria under Save Set as you go along and
assigning the criteria set a name. I would also suggest adding the company name to your data set - the default is only the ticker symbols, which
are tough to expand, and keeping your data sets manageable.
40
41
