CAT L2.3 MANAGEMENT ACCOUNTING Revision Guide
User Manual:
Open the PDF directly: View PDF ![]() .
.
Page Count: 91
- CONTENTS
- REVISION QUESTIONS
- COST BEHAVIOUR PATTERNS
- ANSWER TO REVISION QUESTIONS
- REVISION QUESTION
- Costs of holding large stocks
- LABOUR
- REVISION QUESTION
- 3 marks
- LABOUR
- ANSWER TO REVISION QUESTION
- REVISION QUESTIONS
- ANSWERS TO REVISION QUESTIONS
- 1. CB LIMITED
- REVISION QUESTIONS
- ANSWERS TO REVISION QUESTIONS
- REVISION QUESTIONS
- ANSWERS TO REVISION QUESTIONS
- REVISION QUESTIONS
- ANSWERS TO REVISION QUESTIONS
- [Total: 20 Marks]
- ANSWERS TO REVISION QUESTIONS
- ANSWERS TO REVISION QUESTIONS
- REVISION QUESTION
- ANSWER TO REVISION QUESTION
- REVISION QUESTIONS
- ANSWERS TO REVISION QUESTIONS
- 2. WTT Limited

CAT
Certified Accounting Technicians Examination
Stage: Level 2 L2.3
Subject Title: Management Accounting
Revision Guide
INSIDE COVER - BLANK
Page 1
CONTENTS
Title
Page
Study Techniques
3
Examination Techniques
4
Assessment Strategy
9
Learning Resources
10
Revision Questions and Solutions
10
Page 2
BLANK

Page 3
STUDY TECHNIQUE
What is the best way to manage my time?
• Identify all available free time between now and the examinations.
• Prepare a revision timetable with a list of “must do” activities.
• Remember to take a break (approx 10 minutes) after periods of
intense study.
What areas should I revise?
• Rank your competence from Low to Medium to High for each topic.
• Allocate the least amount of time to topics ranked as high.
• Allocate between 25% - 50% of time for medium competence.
• Allocate up to 50% of time for low competence.
How do I prevent myself veering off-track?
• Introduce variety to your revision schedule.
• Change from one subject to another during the course of the day.
• Stick to your revision timetable to avoid spending too much time on one topic.
Are study groups a good idea?
• Yes, great learning happens in groups.
• Organise a study group with 4 – 6 people.
• Invite classmates of different strengths so that you can learn from one another.
• Share your notes to identify any gaps.
Page 4
EXAMINATION TECHNIQUES
INTRODUCTION
Solving and dealing with problems is an essential part of learning, thinking and intelligence.
A career in accounting will require you to deal with many problems.
In order to prepare you for this important task, professional accounting bodies are placing
greater emphasis on problem solving as part of their examination process.
In exams, some problems we face are relatively straightforward, and you will be able to deal
with them directly and quickly. However, some issues are more complex and you will need to
work around the problem before you can either solve it or deal with it in some other way.
The purpose of this article is to help students to deal with problems in an exam setting. To
achieve this, the remaining parts of the article contain the following sections:
• Preliminary issues
• An approach to dealing with and solving problems
• Conclusion.
Preliminaries
The first problem that you must deal with is your reaction to exam questions.
When presented with an exam paper, most students will quickly read through the questions
and then many will … PANIC!
Assuming that you have done a reasonable amount of work beforehand, you shouldn’t be
overly concerned about this reaction. It is both natural and essential. It is natural to panic in
stressful situations because that is how the brain is programmed.
Archaeologists have estimated that humans have inhabited earth for over 200,000 years. For
most of this time, we have been hunters, gatherers and protectors.
In order to survive on this planet we had to be good at spotting unusual items, because any
strange occurrence in our immediate vicinity probably meant the presence of danger. The
brain’s natural reaction to sensing any extraordinary item is to prepare the body for ‘fight or
flight’. Unfortunately, neither reaction is appropriate in an exam setting.
The good news is that if you have spotted something unusual in the exam question, you have
completed the first step in dealing with the problem: its identification. Students may wish to
Page 5
use various relaxation techniques in order to control the effects of the brain’s extreme
reaction to the unforeseen items that will occur in all examination questions.
However, you should also be reassured that once you have identified the unusual item, you
can now prepare yourself for dealing with this, and other problems, contained in the exam
paper.
A Suggested Approach for Solving and Dealing with Problems in Exams.
The main stages in the suggested approach are:
1. Identify the Problem
2. Define the Problem
3. Find and Implement a Solution
4. Review
1. Identify the Problem
As discussed in the previous section, there is a natural tendency to panic when faced with
unusual items. We suggest the following approach for the preliminary stage of solving and
dealing with problems in exams:
Scan through the exam question
You should expect to find problem areas and that your body will react to these items.
PANIC!!
Remember that this is both natural and essential.
Pause
Take deep breaths or whatever it takes to help your mind and body to calm down.
Try not to exhale too loudly – you will only distract other students!
Do something practical
Look at the question requirements.
Note the items that are essential and are worth the most marks.
Start your solution by neatly putting in the question number and labelling each part of your
answer in accordance with the stated requirements.
Actively reread the question
Page 6
Underline (or highlight) important items that refer to the question requirements. Tick or
otherwise indicate the issues that you are familiar with. Put a circle around unusual items that
will require further consideration.
2. Define the Problem
Having dealt with the preliminary issues outlined above, you have already made a good start
by identifying the problem areas. Before you attempt to solve the problem, you should make
sure that the problem is properly defined. This may take only a few seconds, but will be time
well spent. In order to make sure that the problem is properly defined you should refer back
to the question requirements. This is worth repeating: Every year, Examiner Reports note that
students fail to pass exams because they do not answer the question asked. Examiners have a
marking scheme and they can only award marks for solutions that deal with the issues as
stipulated in the question requirements. Anything else is a waste of time. After you have re-
read the question requirements ask yourself these questions in relation to the problem areas
that you have identified:
Is this item essential in order to answer the question?
Remember that occasionally, examiners will put ‘red herrings’ (irrelevant issues) into the
question in order to test your knowledge of a topic.
What’s it worth?
Figure out approximately how many marks the problem item is worth. This will help you to
allocate the appropriate amount of time to this issue.
Can I break it down into smaller parts?
In many cases, significant problems can be broken down into its component parts. Some parts
of the problem might be easy to solve.
Can I ignore this item (at least temporarily)?
Obviously, you don’t want to do this very often, but it can be a useful strategy for problems
that cannot be solved immediately.
Note that if you leave something out, you should leave space in the solution to put in the
answer at a later stage. There are a number of possible advantages to be gained from this
approach:
1) It will allow you to make progress and complete other parts of the question that you are
familiar with. This means that you will gain marks rather than fretting over something
that your mind is not ready to deal with yet.
Page 7
2) As you are working on the tasks that you are familiar with, your mind will relax and you
may remember how to deal with the problem area.
3) When you complete parts of the answer, it may become apparent how to fill in the
missing pieces of information. Many accounting questions are like jigsaw puzzles: when
you put in some of the parts that fit together, it is easier to see where the missing pieces
should go and what they look like.
3. Find and Implement a Solution
In many cases, after identifying and defining the problem, it will be easy to deal with the
issue and to move on to the next part of the question. However, for complex problems that
are worth significant marks, you will have to spend more time working on the issue in order
to deal with the problem. When this happens, you should follow these steps:
Map out the problem
Depending on your preferred learning style, you can do this in a variety of ways including
diagrams, tables, pictures, sentences, bullet points or any combination of methods. It is best
to do this in a working on a separate page (not on the exam paper) because some of this work
will earn marks. Neat and clearly referenced workings will illustrate to the examiner that you
have a systematic approach to answering the question.
Summarise what you know about the problem
Make sure that this is brief and that it relates to the question requirements. Put this
information into the working where you have mapped out the problem. Be succinct and
relevant. The information can be based on data contained in the question and your own
knowledge and experience. Don’t spend too long at this stage, but complete your workings as
neatly as possible because this will maximise the marks you will be awarded.
Consider alternative solutions
Review your workings and compare this information to the question requirements. Complete
as much of the solution as you can. Make sure it is in the format as stipulated in the question
requirements. Consider different ways of solving the problem and try to eliminate at least one
alternative.
Implement a solution
Go with your instinct and write in your solution. Leave extra space on the page for a change
of mind and/or supplementary information. Make sure the solution refers to your workings
that have been numbered.
Page 8
4. Review
After dealing with each problem and question, you should spend a short while reviewing your
solution. The temptation is to rush onto the next question, but a few moments spent in
reviewing your solution can help you to gain many marks. There are three questions to ask
yourself here:
Have I met the question requirements?
Yes, we have mentioned this already. Examiner Reports over the years advise that failure to
follow the instructions provided in the question requirements is a significant factor in causing
students to lose marks. For instance, easy marks can be gained by putting your answer in the
correct format. This could be in the form of a report or memo or whatever is asked in the
question. Likewise, look carefully at the time period requested. The standard accounting
period is 12 months, but occasionally examiners will specify a different accounting period.
Is my solution reasonable?
Look at the figures in your solution. How do they compare relative to the size of the figures
provided in the question?
For example, if Revenue were 750,000 and your Net Profit figure was more than 1 million,
then clearly this is worth checking.
If there were some extraordinary events it is possible for this to be correct, but more than
likely, you have misread a figure from your calculator. Likewise, the depreciation expense
should be a fraction of the value of the fixed assets.
What have I learned?
Very often in exams, different parts of the solution are interlinked. An answer from one of
your workings can frequently be used in another part of the solution. The method used to
figure out an answer may also be applicable to other parts of your solution.
Conclusion
In order to pass your exams you will have to solve many problems. The first problem to
overcome is your reaction to unusual items. You must expect problems to arise in exams and
be prepared to deal with them in a systematic manner. John Foster Dulles, a former US
Secretary of State noted that: The measure of success is not whether you have a tough
problem to deal with, but whether it is the same problem you had last year. We hope that, by
applying the principles outlined in this article, you will be successful in your examinations
and that you can move on to solve and deal with new problems.

Page 9
ASSESSMENT STRATEGY
Examination Approach
Questions in this examination are structured to ensure that students may demonstrate their
knowledge and understanding of the principles and techniques of cost and management
accounting at an introductory level.
Where appropriate, students are expected to apply and integrate relevant learning from other
syllabi with their learning from the Management Accounting syllabus. This is achieved
through a blend of theoretical and numeric questions, often set in the context of a scenario.
Examination Format
Examination Duration: 3 Hours
The examination is unseen, closed book.
The paper has 6 questions. Questions 1 and 2 are compulsory. Students are required to
answer 3 of the remaining 4 questions. Generally the examination consists of 1
essay/memorandum-type question and 5 computational-type questions. A multiple choice
question may be included as one of the computational questions. Some of the computational
questions may require brief commentary on salient points related to the computations carried
out.
Marks Allocation
Question Marks
1 25
2 (students have a choice part A or B) 15
Choice of 3 questions out of 4 60 (20 marks each)
Total 100

Page 10
LEARNING RESOURCES
Core Texts
Drury, C., Cost and Management Accounting – An Introduction, 7th ed. / Cengage 2011 /
ISBN: 97814032138
Manuals
Institute of Certified Public Accountants of Rwanda – L2.3 Management Accounting
Supplementary Texts and Journals
Lucey, T., /Costing / 7th ed. 2009 / Thomson Learning / ISBN 13-9781844809431 / ISBN
10-1844809439.
C. Drury / Management and Cost Accounting (7th edition) Cengage 2008 / ISBN 13-
9781844805662 / ISBN 10-1844805662.
Horngren, Foster & Datar/ Cost Accounting – A Managerial Emphasis/ Pearson 14th ed 2011
ISBN-10- 0132109174.
Useful Websites (as at date of publication)
www.accountingeducation.com
http://www.icparwanda.com/services.php
Page 11
L2.3 MANAGMENT ACCOUNTING
REVISION QUESTIONS AND SOLUTIONS

Page 12
PRINCIPLES OF COSTING
REVISION QUESTION
1. Answer any one of the following three questions.
(a) Imagine that you and a friend have recently established a small business. You are
the “financial brains” of the business and your friend is the “technical/production
expert”.
Prepare a briefing for your friend setting out the role you will play as the
management accountant in the business. Your answer should make reference to
issues such as:
• The importance of financial information to a business.
• The categories of financial information (Strategic, Tactical and Operational)
and the users of such information.
• The role of the management accountant in the organisation.
You may address any other issue(s) in your briefing, which you feel would be
important to your friend’s understanding of your role in the business.
5 marks
(b) “A graphical representation of cost/volume/profit [CVP] relationships has more
impact than a written statement”.
Briefly outline the major assumptions of CVP analysis.
Using a fictitious example, draw two fully labelled charts, one of which should be
a breakeven chart, which are commonly used in CVP analysis to represent
financial information. Use graph paper to prepare the charts.
5 marks
(c) Outline the principal differences between standard absorption costing and
standard marginal costing and the arguments offered in favour of each method.
Your answer should include a brief numerical example demonstrating the
differences you describe.
5 marks
Page 13
PRINCIPLES OF COSTING
ANSWER TO REVISION QUESTION
1. (a) The answer should address the following general issues:
• A wide range of entities may be interested in the financial activities of a
business- owner/manager, investors, suppliers, customers, banks and tax
authorities. In broad terms, financial information is an essential element in
the process of evaluation, formulation, development and implementation of
strategic plans. It is used for strategic planning purposes, for establishing
selling prices, costs and for product profitability analysis. It is also used for
evaluating performance of individuals and business units.
• Different information is required for different purposes. Information can be
conveniently categorised under three headings. Strategic information, which
is typically used by senior management is characterised as having a broad
focus (particularly looking at the ‘big global picture’ of the external
environment) with a long time frame, typically up to a decade ahead.
Strategic information consists of aggregated data rather than large amounts
of detail. Tactical information, which is typically used by middle
management, is narrower in its focus and has a significantly shorter time
frame (typically up to 1 year). It is more precise than strategic information
and focuses principally on the internal workings of the organisation with
some reference to the external environment. Low level employees use
operational information. It is principally concerned with the efficient use of
resources in order to achieve tactical plans.
• The role of the management accountant is to provide useful information to
assist management in planning, controlling and making decisions. The
management accountant fulfils this role in various ways. In the planning
field, the management accountant is a central figure in the budgeting
process. S/he will also contribute to determining product costs. The
management accountant assists in the control function by monitoring
outcomes of decisions or performance on an ongoing basis. A traditional
example of this is the preparation of periodic variance analysis reports by
means of which management can identify possible difficulties in the
manufacturing process. Management accountants in many world-class
Page 14
companies commonly monitor the quality of output for the purpose of
control.
(b) Assumptions of CVP analysis
• Selling price is constant throughout the entire relevant range.
• Total costs can be separated into fixed and variable components.
• Unit revenues and costs are known with certainty. Costs are linear
throughout the entire relevant range. Both variable cost per and total fixed
costs do not change.
• In multi-product companies, the sales mix remains constant.
• Stock levels do not change.
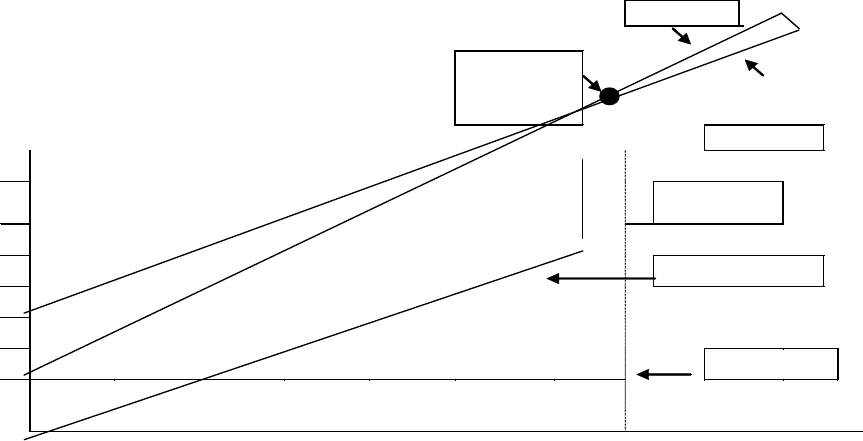
Candidates should draw the following breakeven chart and one of the other charts
following it:
1. Breakeven chart
Revenues
{Profit
RWFR
WF’00
0
Breakeven
Total costs
80
70
Contributio
n
60
50
Variable costs
40
30
20
Fixed costs
10
500
1000
1500
2000
2500
3000
Output
Page 15
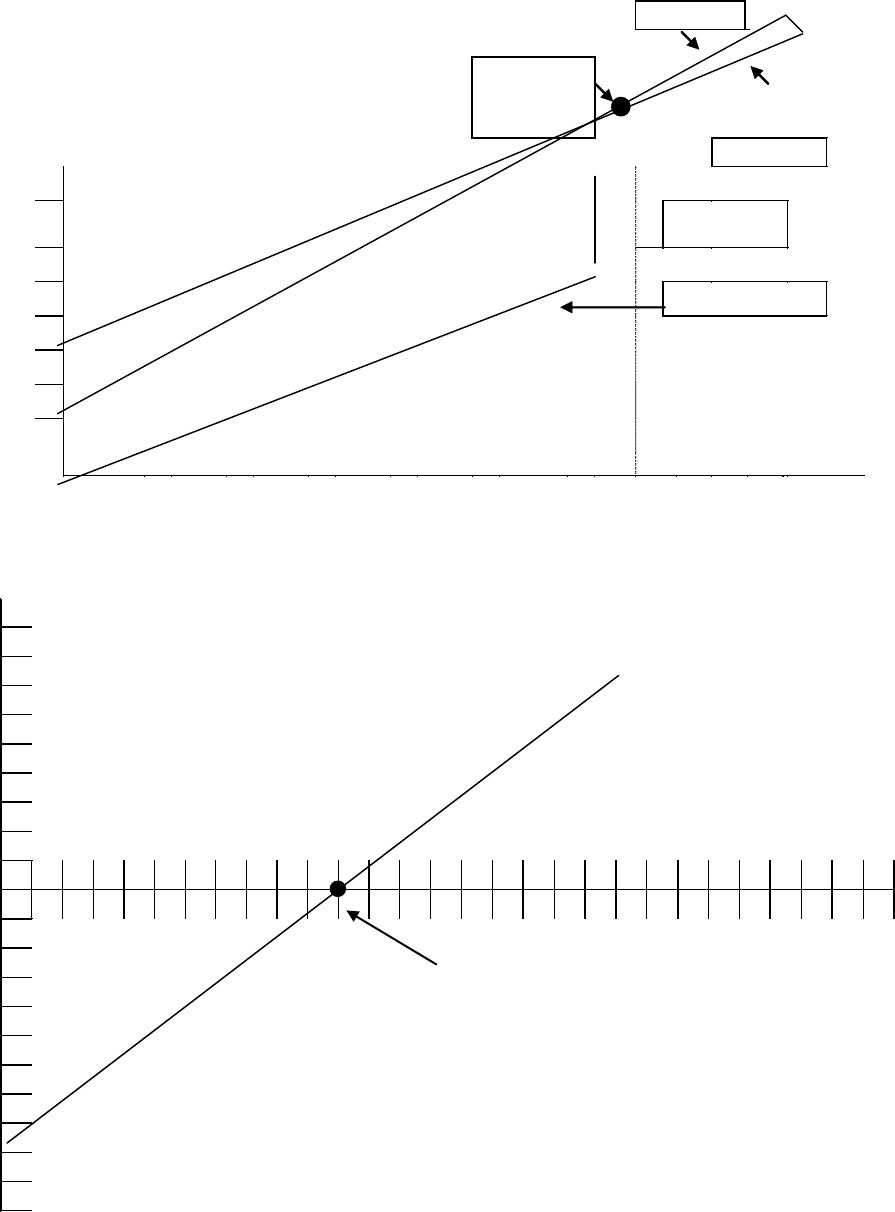
2. Contribution chart
3. Profit / volume chart
Profit/loss
Volume
Breakeven point
Revenues
{Profit
RWFR
WF’00
0
Breakeven
Total costs
80
70
Contributio
n
60
50
Variable costs
40
30
20
10
500
1000
1500
2000
2500
3000
Output
Page 16
(c) Marginal costing and absorption costing
Candidates should identify the following points in their solutions:
• Under absorption costing, all production costs - both fixed and variable- are
attributed to output. Under marginal costing, only variable production costs
are attributed to production, with fixed production costs treated as a period
cost rather than a product cost.
• Proponents of marginal costing argue that absorption of fixed costs is both
illogical and potentially confusing. They argue that it is illogical because
such costs do not accrue as production increases. Rather, they accrue as
time passes. Accordingly, the costs should be treated as a period cost rather
than as a product cost. Furthermore, the technique can be confusing to some
members of management, as it may imply that fixed costs vary in
accordance with production- the greater the level of production, the greater
the level of absorbed overhead and vice-versa. Marginal costing principles
are also considered to be more useful in a short-term decision making
context because they highlight contribution as opposed to profit. Under
absorption costing, short-term profits increase as stock levels are built up.
This may tempt managers to engage in stock building, with the associated
costs and risks of obsolescence and theft.
• Proponents of absorption costing argue that fixed costs are a necessary cost
of production. If such costs are ignored or overlooked, a business is likely
to face losses in the medium to long term. In a seasonal business, where
stock building occurs during periods of low revenues, absorption costing
avoids reporting ‘fictitious losses’ (which would arise under marginal
costing) because the fixed costs would be included as part of stock until the
stock itself is expensed when sold. Additionally, financial reporting
standards mandate the use of absorption costing for the purpose of external
reporting.
• Numerical example:
Candidates are expected to demonstrate their understanding of the impact of
increasing/decreasing and static stocks. This would be achieved by
preparing a three period financial statement for each system, with each
period demonstrating an aspect of the effect of stock movements.
Page 17
COST BEHAVIOUR PATTERNS
REVISION QUESTIONS
1. Answer all parts of this question.
(a) Select the statement that most precisely defines each of the following terms:
(i) A combined cost represents:
(a) Expenditure incurred in previous years which has no impact on
decisions affecting the future.
(b) The forecasted expenditure on acquiring assets of a capital nature.
(c) A future cash outflow that will be incurred regardless of current
decisions.
(d) Any cost which, within certain production limits, does not vary with
the production of goods.
(1 mark)
(ii) The master budget:
(a) Consists of the Capital Expenditure budgets of profit centres only.
(b) Comprises the summarised budgeted Profit & Loss account, budgeted
Balance Sheet and cash budget of the entire company.
(c) Consists of the budgeted Profit & Loss account, budgeted Balance
Sheet and cash budget of Head office only.
(d) Consists of the qualitative Mission Objectives of the entire company.
(1 mark)
(iii) A profit centre is:
(a) A business unit accountable for both costs and revenues.
(b) A committee established by management which is responsible for
overseeing the budgeting process.
(c) The area in a breakeven chart where total revenues exceed total costs.
(d) The sales quantity, expressed in numbers of units sold, after which a
company earns enough to cover total fixed costs.
(1 mark)
Page 18
(iv) The relevant range defines:
(a) The range of variation incorporated into sales forecasts to allow for
uncertainty of demand.
(b) The process of adjusting a budget for a period so that the budgeted
costs for the actual volume of production of the period can be
compared with the actual costs incurred.
(c) The activity levels within which assumptions about cost behaviour in
a breakeven chart remain valid.
(d) The budget period for the short to medium term, usually not
exceeding 12 months.
(1 mark)
(b) “Cost classifications and groupings help to identify relevant and irrelevant costs
and are important for the purposes of cost-volume-profit analysis”.
Explain (with the aid of appropriate diagrams) each of the following patters of
cost behaviour.
• Variable costs
• Fixed costs
• Step costs
• Semi-variable costs. (11 marks)
[Total: 15 marks]
Page 19
COST BEHAVIOUR PATTERNS
ANSWER TO REVISION QUESTIONS
1. (a) (i) c is correct
(ii) b is correct
(iii) a is correct
(iv) c is correct
(b) Main points to be discussed:
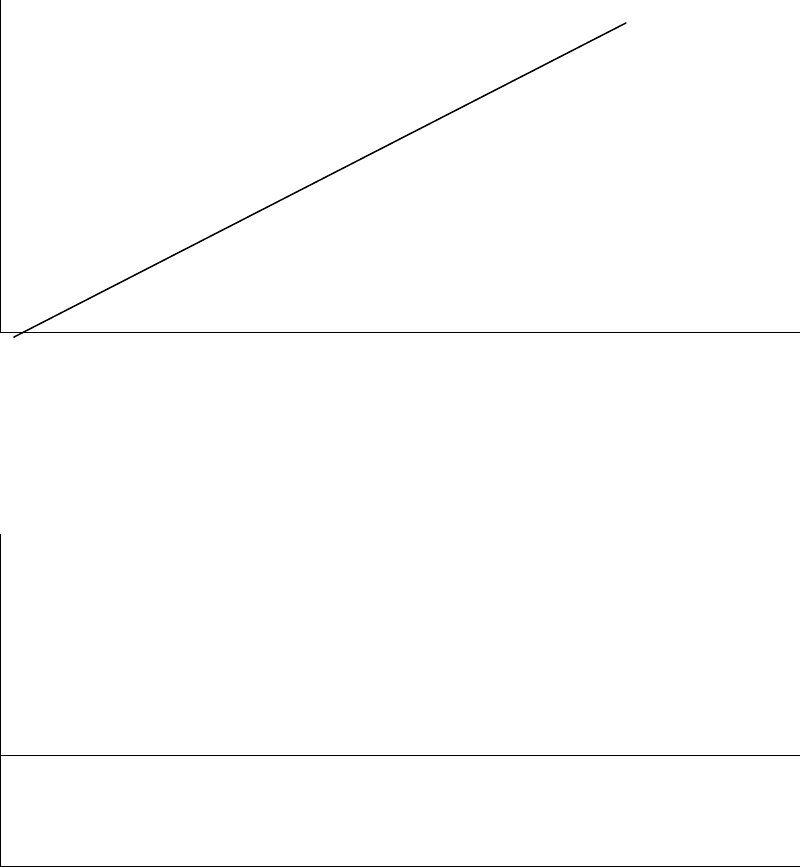
Variable costs vary as a function of the level of output or sales. Examples include
raw materials or labour paid on an hourly basis.
Cost
Output
Fixed costs are those costs which are likely to remain unchanged regardless of the
level of output or the particular decision under consideration. The term “fixed”
refers primarily to the short term. Examples of fixed costs include rent, directors
salaries.
Cost
Output
Page 20
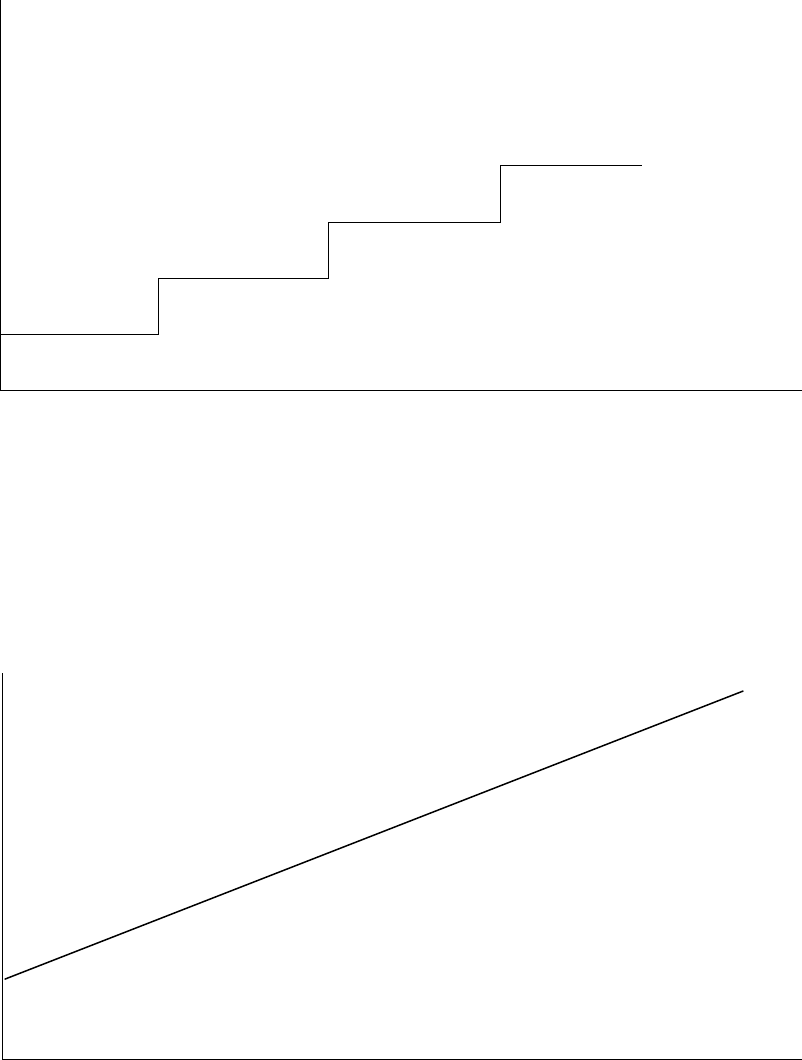
Step costs are costs which change in discrete “steps”. They are similar to variable
costs except that each change in the level of cost is usually caused by a larger
change in input levels than is the case for “true” variable costs. A typical example
would be a supervisors cost – for production of, say, 5,000 units 1 supervisor may
be required; for 5,001 to 10,000 units, a second supervisor may be required etc.
Cost
Output
Semi-variable costs are costs which possess both a fixed and variable cost
component. A typical example is telephone charges which have a fixed rental
charge and a variable unit rate. Note that the starting point is not at the origin as
for normal variable costs.
Cost
Output
Page 21
MATERIALS AND STOCK CONTROL
REVISION QUESTION
1. FN Distribution has recorded the following transactions in respect of raw material
“RM–01” for the month of April 2010:
Date
Details
No. of units
Apr 3
Materials received, RWF12,000
1,500
Apr 8
Materials issued
1,700
Apr 9
Materials received, RWF12,880
1,600
Apr 13
Materials issued
900
Apr 19
Materials issued
450
Apr 26
Materials received, RWF16,000
2,000
Apr 30
Materials issued
300
At the start of April, the company had 1,200 units of RM–01 in stock made up of the
following batches
Remainder of a batch purchased mid March:
200
units costing RWF7.95
each
Full batch received on 30th March:
1,000
units costing RWF7.97
each
REQUIREMENT:
(1) Briefly outline the advantages and disadvantages of the FIFO (First-in, First-out)
method and the LIFO (Last-in, First-out) method of valuing stocks.
(6 marks)
(2) Calculate the total value of each of the material issues in April (and of the
Closing Stocks of RM–01at the end of April using the FIFO method.
(6 marks)
(3) “It is necessary to set off the costs of holding a large stock against the advantages
derived from holding it”. List and briefly explain the typical advantages and
costs of holding large stocks. (8 marks)
[Total: 20 marks]

Page 22
MATERIALS AND STOCK CONTROL
ANSWER TO REVISION QUESTION
1. FN Distribution Ltd
(1) Workings
Supervisors costs.
Total costs 16,000
75 % production 12,000 = RWF150 per production employee
25 % service 4,000 = RWF200 per service employee
Note:
An equally acceptable basis of appropriating the production departments
supervisory overhead would be on the basis of production hours worked.
SOLUTION
Advantages of FIFO
1. Logical – it corresponds to what happens in most businesses as the older
stock is used up first.
2. Easy to understand
3. Generally results in closing stocks being valued at the most current price.
4. Required under SSAP 9.
Disadvantages of FIFO
1. Understates the cost of material issues in times of high inflation.
2. Cumbersome to operate.
3. Can cause some confusion for decision making purposes when the same
material is issued at varying prices.
Advantages of LIFO
1. Stock issues approximate current market price.
2. Decision making may be easier due to 1 above.
Disadvantages of LIFO
1. Cumbersome to operate.
2. Generally would not reflect actual practice in a stockroom.
3. Does not comply with the SSAP 9.
Page 23
(2)
Date
Details
Qty
in
Qty
out
Value (ref)
Cl.
balance
Aug 1
Opening
Balance
1,200
9,560
(1)
9,560
Aug 3
Receipt
1,500
12,000
21,560
Aug 8
Issue
1,700
(13,560)
(2)
8,000
Aug 9
Receipt
1,600
12,880
20,880
Aug 13
Issue
900
(7,200)
(3)
13,680
Aug 19
Issue
450
(3,618)
(4)
10,062
Aug 26
Receipt
2,000
16,060
26,122
Aug 31
Issue
300
(2,415)
(5)
23,707
Workings
1. (200 @ RWF7.95) + (1,000 @ RWF7.97) = RWF9,560
2. RWF9,560 + (500 @ (RWF12,000/ 1,500)) = RWF13,560
3. (900 @ (RWF12,000/1,500)) = RWF7,200
4. (100 @ (RWF12,000/1,500)) + (350 @ (RWF12,880/ 1,600))= RWF3,618
5. (300 @ (RWF12,880/1,600)) = RWF2,415
(3) Advantages of holding large stocks
1. Form a buffer against “stock-outs”.
2. Can enable discounts to be negotiated.
3. In some cases, quality will be more consistent as they originate from a
larger batch rather than from numerous small batches.
4. In times of inflation, large stockholding may provide a competitive edge to
a firm as their stocks will have cost less than stocks bought at current prices
Costs of holding large stocks
a. Large stockholding results in high financing costs.
b. Storage and insurance costs are higher.
c. Risks of obsolescence and theft/pilferage are greater.
d. Spoilage and obsolescence risks increase.
Page - 24 -
LABOUR
REVISION QUESTION
1. Given the following information, calculate for workers (A) to (J) using a Rowan
system:
(a) Time saved;
(b) Earnings (at RWF4 per hour);
(c) Effective hourly rate.
(A) (B) (C) (D) (E) (F) (G) (H) (J)
Time allowed 10 10 10 10 10 10 10 10 10
Time taken 9 8 7 6 5 4 3 2 1
3 marks

Page - 25 -
LABOUR
ANSWER TO REVISION QUESTION
1. You should concentrate on one of the formulae and use it constantly. I prefer the
second (see (c) below).
(a) Time saved:
(A) (B) (C) (D) (E) (F) (G) (H) (J)
1 2 3 4 5 6 7 8 9
(b) Earnings (at RWF4 per hour):
(A) RWF39.60 (D) RWF33.60 (G) RWF20.40
(B) RWF38.40 (E) RWF30.00 (H) RWF14.40
(C) RWF36.40 (F) RWF25.60 (J) RWF7.60
(c) Using the second formula, we find:
Time taken 9 +
Time taken 9 Time saved 1
Time allowed 10
×
× Time rate per hour RWF4
= 9 +
9 1
10
×
× 4 = RWF39.60
Effective hourly rate:
(A) RWF4.40 (D) RWF5.60 (G) RWF6.80
(B) RWF4.80 (E) RWF6 (H) RWF7.20
(C) RWF5.20 (F) RWF6.40 (J) RWF7.60
You should note that the effective hourly rate rises RWF0.40 for every hour
saved. It does not offer any special incentive for exceptional effort.
Page - 26 -
OVERHEADS AND ACTIVITY BASED COSTING
REVISION QUESTIONS
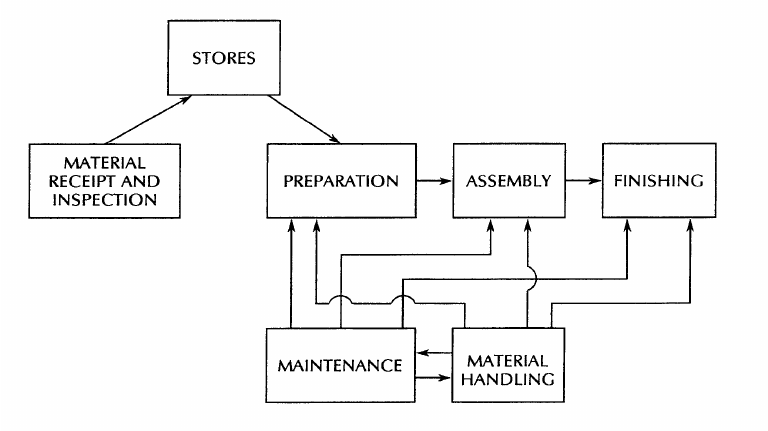
1. TBA Ltd manufactures and sells a range of steam, water and gas valves. The valves are
produced by passing components through a series of production processes -
preparation, assembly and finishing - which are backed up by service functions for
material receipt and inspection, maintenance and material handling.
REQUIREMENT:
(a) (i) Prepare a diagram to illustrate the physical and service flows of the existing
system.
(3 marks)
(ii) Explain the procedure by which product cost accumulation and
responsibility accounting will operate in the system if a traditional
absorption cost approach is used.
(7 marks)
(b) Explain how activity-based costing and the use of cost drivers may help to
improve both product cost data and the effectiveness of responsibility accounting
in TBA Ltd.
(10 marks)
[Total: 20 marks]
2. FVD Limited produces two products - 'Newthings' and 'Oldthings'. Each product uses
similar processes and equipment, but 'Newthings' are produced in large volumes whereas
'Oldthings' are produced in smaller volumes. At present, overheads are apportioned to
products using a traditional absorption costing basis.
You are the cost accountant at FVD Limited and, as a result of the large amount of
discussion in the management literature of Activity Based Costing; you are considering
changing from absorption costing to Activity Based Costing for the purposes of charging
overheads to production.

Page - 27 -
You have decided to prepare a comparison of the product costs using both the current
method and an Activity Based Costing method prior to making a final decision and have
accumulated the following summarised data from next year's budget:
Cost category
RWF
Current basis of
apportionment
Volume related costs
320,000
Machine hours
Purchasing related
costs
156,000
Labour hours
Set-up costs
44,000
Labour hours
520,000
Extracts from the standard cost cards for 'Newthings' and 'Oldthings' show the
following:-
Newthings
Oldthings
Labour hours per unit
3
2
Machine hours per unit
1
1
Budgeted production next year
30,000 units
10,000 units
Number of purchase orders per
annum
170
90
Number of machine set-up per
annum
76
56
REQUIREMENT:
(a) Prepare calculations showing the overheads charged to each product using:
(i) the proposed Activity Based Costing system
(ii) the current (traditional) costing system (12 marks)
(b) "The ABC system recognises that some activities are unrelated to volume by
using allocation bases that are independent of production volume."
Briefly explain how traditional costing systems can result in distorted product
costs using the example of FVD Limited to illustrate your point.
(8 marks)
[Total: 20 Marks]
Page - 28 -
OVERHEADS AND ACTIVITY BASED COSTING
ANSWERS TO REVISION QUESTIONS
1. TBA Ltd.
(a) (i)
Figure 4.1
(ii) Product cost responsibility accounting operates on a system of cost centres.
These cost centres are decided by breaking down the physical operations
under the responsibility of each manager and by attaching costs to product
units as they go through production. An appropriate absorption basis is
decided upon for the overhead costs.
Figure 4.1 illustrates production cost centres (e.g. preparation, assembly,
finishing) and service cost centres (maintenance and material handling).
Labour and overhead costs are allocated to specific cost centres if possible.
Where allocation is not possible an appropriate apportionment will be made (e.g.
maintenance at an apportionment rate per labour-hour and material handling per
unit of, say, 500 valves moved; material receipt and inspection could also be
charged to batches of valves).
Total labour and overhead costs of the production centres, together with
apportioned service centre costs, would then be charged to valve batches. It is
Page - 29 -
likely that this would be based on time spent on each batch of valves in the
appropriate cost centre.
The system can then be controlled by use of standard costing or budgetary control
(both of which we will look at later in the course) through the analysis of
variances.
(b) Activity-based costing links cost to activity and considers that costs incurred
above an acceptable minimum are due to lack of control of activities causing
costs to occur, known as cost drivers.
To take the process of receipt and inspection of material, cost drivers in this
activity could be:
• The relative importance of component inspection (e.g. glassware used in
valves might require a high degree of inspection, whereas moulded plastic
might need just a sampling).
• The bulk of material involved (e.g. it may require four trips to transport
1,000 valves of one size and a single trip to transport 1,000 smaller valves).
Any relationship between the cost drivers and the actual cost of material used is
likely to be simply accidental, so an apportionment using absorption costing
could bear no resemblance to the charge calculated using cost drivers under
activity-based costing. The examples above give illustrations of how this could
occur.
Looking at maintenance charges, these may not be driven by time spent (under
absorption costing), but by type of valve produced - some causing far more wear
on machines than others.
Actually identifying cost drivers can be difficult but, once identified, they are
useful in focusing on activities which cause costs to be incurred. This gives
management a target on which to concentrate when seeking to reduce costs which
are considered to be their responsibility. For instance, machines could be checked
carefully before producing batches of valves which usually cause high machine
maintenance, as a way of reducing breakdown and interruption of production.

Page - 30 -
2. FVD Ltd
(a) (i) Overhead per unit under an Activity Based Costing system
Overhead
Total
overhead
Cost driver
Cost
driver
total
Rate per
cost driver
Volume related
costs
RWF320,000
Total units
40,000
units
RWF8
Purchase related
costs
RWF156,000
Purchase
orders
260 orders
RWF600
Set-up costs
RWF44,000
Set-up qty.
132 set-ups
RWF333.33
∴
the overheads charged to the total units are as follows:
Newthings
Oldthings
Volume related costs
RWF240,000
RWF80,000
Purchase related
costs
RWF102,000
RWF54,000
Set-up related costs
RWF25,000
RWF18,667
RWF367,333
RWF152,667
Overhead per unit
RWF12.24
RWF15.27
Page - 31 -
(ii) Current costing system overheads per unit
Newthings
Oldthings
Total
Total labour hours
90,000
20,000
110,000
Total machine hours
30,000
10,000
40,000
∴the overhead rate per labour hour is RWF1.82 per hour (RWF200,000/110,000
hours) and the overhead rate per machine hour is RWF8 per hour
(RWF320,000/40,000 hours)
The overheads charged to production under this current basis are as follows:
Newthings
Oldthings
Labour
hours
3 hours @ RWF1.82 =
RWF5.46
2 hours @ RWF1.82 = RWF3.64
Machine
hours
1 hour @ RWF8 = RWF 8
1 hour @ RWF8= RWF 8
Overheads
per unit
RWF13.46
RWF11.64
(b) Traditional overhead costing systems use volume-related bases to trace overheads
to production
Many costs of production are not related to volume. These costs are allocated
using an inappropriate base under traditional systems. High-volume products
effectively subsidise the lower volume products.
ABC recognises this by using allocation bases, which are independent of volume.
In the example of FVD Limited, Set-up costs and purchase order costs were
traditionally charged to units using machine hours as a base. This is not an
appropriate base and resulted in Newthings being charged with more overheads
even though they consumed a lower proportion of total resources than Oldthings.
Page - 32 -
JOB COSTING/BATCH COSTING
REVISION QUESTION
1. PAS Limited is a small company which manufactures furniture to order. The company
uses Job costing in determining the costs and profit of each order. At the start of the
financial year, the cost accountant gathered the following information in respect of the
budgeted overheads for each of the three production departments as follows:
Department
Budgeted overheads
Overhead absorption basis
Carving
RWF15,000
1,000 machine hours
Assembly
RWF36,000
6,000 labour hours
Decoration
RWF19,000
1,000 labour hours
Note: These figures are based on normal activity levels.
Selling and distribution overheads are calculated as 20% of factory cost i.e. direct costs
plus production overheads.
The accountant is now calculating the total net profit or loss on a recently completed
order for 100 reproduction regency wardrobes. Details of this order are as follows:
• The selling price of each wardrobe was RWF270
• Materials consumed ……. RWF8,935
• Labour: Carving department 170 hours @ RWF10 per hour
Assembly department 210 hours @ RWF12 per hour
Decoration department 40 hours @ RWF8 per hour
• Machine usage in the carving department totalled 150 hours.
• A fee of RWF500 was paid to an expert furniture historian for consultancy
services provided in respect of the completion of this order.
REQUIREMENT:
(a) Calculate the overhead absorption rates for the production departments.
(3 marks)
(b) Calculate:
(i) The total cost of the batch, clearly identifying Prime Cost, Factory Cost
and Total Cost. (11 marks)
(ii) The unit cost. (3 marks)
(iii) The profit or loss per wardrobe. (3 marks)
[Total: 20 marks]

Page - 33 -
JOB COSTING/BATCH COSTING
ANSWER TO REVISION QUESTION
(a) Overhead absorption rates for each department
Department
Overhead
Budgeted no. of
Absorption units
Rate per
absorption
Carving
RWF15,000
1,000 machine hours
RWF15 per hour
Assembly
RWF36,000
6,000 labour hours
RWF6 per hour
Decoration
RWF19,000
1,000
RWF19 per hour
(b) (i)
Direct costs:
Materials
8,935
Labour-Carving
1,700
- Assembly
2,520
- Decoration
320
Consultancy fee
500
Prime cost
13,975
Production Overheads:
Machine time in carving
2,250
Labour time in assembly
1,260
Labour time in decoration
760
4,270
Factory cost
18,245
Add: 20% for selling/distribution expenses
3,649
Total cost
21,894
(ii)
Unit cost
Total cost of batch as per (a)
RWF21,894
No. of units in batch
100
∴ each unit cost RWF218.94

Page - 34 -
(iii)
Profit per unit
Sales price per unit
RWF270.00
Less:
Cost per unit
RWF218.94
Profit per unit
RWF51.06
Page 35
PROCESS COSTING
REVISION QUESTIONS
1. CB Limited manufactures a range of chemicals and fertilisers for agricultural
purposes.
The manufacture of one of the company’s products, “BeefEmUp”, involves three
distinct processes in which the output from Process 1 is used as the input into Process 2.
Similarly, the output from Process 2 is used as input into Process 3 by which stage the
final product is prepared and then packed for shipping.
The company has established standards for each process as follows:
Process 1 Process 2 Process 3
Normal loss (%)* 5% 5% 10%
Sales value of each unit lost RWF1.83 RWF2.00 RWF4.00
*Note: The normal loss for a process is calculated as a percentage of the units
processed in that process.
The following data is available for August 2011 in respect of each of the processes:
Process 1 Process 2 Process 3
Qty RWF Qty RWF Qty RWF
Units from previous process 1,150 2,980
Materials added 1,200 600 2,010 4,299 600 7,344
Labour incurred 1,500 1,800 900
Overheads incurred 2,000 2,200 600
At the end of process 3, a total of 3,190 fully completed units was transferred to
Finished Goods.
REQUIREMENT:
Prepare each of the Process Accounts for the month of August.
[Total: 15 marks]
Page 36
2. SLR Limited is a company that manufactures a range of tinned soups. The soups are
made by processing raw materials through two distinct processes, Blending and
Flavouring, and a process costing system is in place for the purpose of calculating the
costs of finished output.
Relevant details of each of these processes for the most recent month are as follows:
Blending
Flavouring
Expected output
95% of inputs
90% of inputs
Value of lost liquids per kg
Nil
RWF1
Materials added:
4,000 kgs
RWF11,950
500 kgs
RWF1,000
Labour charged
RWF1,700
RWF555
Machinery time:
@ RWF5 per
hour
300 hours
@ RWF7 per
hour
60 hours
Output
3,700 kgs to Flavouring
3,810 kgs Finished Goods
The total departmental overhead for the month was RWF960 and is absorbed into the
cost of each process using the cost of machinery for each process as a basis.
REQUIREMENT:
(a) Prepare the following accounts for the month:
(i) Blending process account (8 marks)
(ii) Flavouring process account (8 marks)
There are no stocks at either the start or the end of the period.
(b) Briefly outline the common features of most process costing systems. (4 marks)
[Total: 20 marks]

Page 37
PROCESS COSTING 1
ANSWERS TO REVISION QUESTIONS
1. CB LIMITED
Process 1
Units
RWF
Units
RWF
Materials
1,200
600
Normal loss
60
110
Labour
1,500
To process 2
1,150
4,025
Overheads
2,000
Abnormal gain
10
35
1,210
4,135
1,210
4,135
Process 2
Units
RWF
Units
RWF
From Process 1
1,150
4,025
Normal loss
158
316
Materials added
2,010
4,299
Abnormal loss
22
88
Labour
1,800
To process 3
2,980
11,920
Overheads
2,200
3,160
12,324
3,160
12,324
Process 3
Units
RWF
Units
RWF
From Process 2
2,980
11,920
Normal loss
358
1,432
Materials Added
600
7,344
Abnormal loss
32
192
Labour
900
To Finished
Goods
3,190
19,140
Overheads
600
3,580
20,764
3,580
20,764
Page 38
Calculations
Normal Loss units
Calculation
Abnormal loss/(gain) units
Value of good unit
Process
1
5% * 1,200
(1,200 * 95%)–1,150 = (10)
RWF4,100 – RWF110/(1,200 * 95%)
Process
2
5% * (1,150 + 2,010)
(3,169 * 95%) – 2,980 = 22
RWF12,324 – RWF316/(3,160 * 95%)
Process
3
10% * (2,980 + 600)
(3,580 * 90%) – 3,190 = 32
RWF20,764 – RWF1,432/(3,580 * 90%)
Page 39
2.
Blending Account
Details
Units
RWF
Details
Units
RWF
Material
4,000
11,950
Trfr. To Flav.
3,700
15,482
Labour
1,700
Norm. loss
200
---
Machine time
1,500
Abn. Loss
100
418
Overhead
750
4,000
15,900
4,000
15,900
Flavouring Account
Details
Units
RWF
Details
Units
RWF
Ex. Blending
3,700
15,482
Output to Stock
3,810
17,384
Material added
500
1,000
Norm. loss
420
420
Labour
555
Machine time
420
Overhead
210
Ab. Gain
30
137
4,230
17,804
4,230
17,804
Page 40
(b) Common features of process costing systems
Main points covered should include the following:
• Continuous processes are normally a feature of this costing system e.g.
chemicals.
• The output of one process is the input to a subsequent process until a
completed product is made.
• Valuation of Work-in-Process requires a method for valuing homogeneous
units rather than counting individual items.
• Process losses are a standard feature – evaporation, spoilage, spills etc.
• By product or joint products.
Page 41
PROCESS COSTING 2
REVISION QUESTIONS
1. Draw up the process accounts, normal loss account, abnormal loss/gain accounts and
scrap account in the following instance:
Process I Process II Finished Goods
Units going into process 8,000 7,000 6,800
Normal loss 10% 5%
Process I Process II Finished Goods
Cost of process RWF8,000 RWF4,000
Income from sale of
scrap per 100 units RWF4 RWF1
(You may assume that all output from Process I enters Process II.)
There is no work-in-progress at the beginning or end of the period.
(10 Marks)
2. Given the following information show the entries which would appear on Process 4
account for period 8 of the current year, and on the scrap account, abnormal loss/gain
account, and normal loss account.
Value of input to Process 4 RWF9,875
Number of units entering Process 4 9,400
Normal loss percentage 10%
Total process costs RWF4,500
Sales value of loss RWF5 per 100 units
Number of units entering Process 5 8,500
(10 Marks)
Page 42
PROCESS COSTING 2
ANSWERS TO REVISION QUESTIONS
Question 1
Workings
Process I
Input 8,000 units.
Normal loss 800 units, scrap value RWF32.
Expected output 7,200 units
Actual output 7,000 units, i.e. abnormal loss of 200 units.
Cost per unit of normal output = RWF(
8 000, 32
7,200
−
) =
200,7
968,7RWF
Cost of abnormal loss = 200 ×
200,7
968,7RWF
= RWF221
Cost transferred to Process II = 7,000 ×
200,7
968,7RWF
= RWF7,747.
Process II
Input 7,000 units.
Normal loss 350 units, scrap value RWF3.50, say RWF4.
Expected output 6,650 units.
Actual output 6,800 units, i.e. abnormal gain 150 units.
Cost per unit of normal output = RWF(
7 747, + 4,000 4
6,650
−
)
=
650,6
743,11RWF
Value of abnormal gain = 150 ×
11 743
6 650
,
,
= RWF265
Cost transferred to finished goods = 6,800 × RWF
11 743
6650
,
,
= RWF12,008
PROCESS I ACCOUNT
Units RWF Units RWF
Input in units
8,000
Normal loss
800
32
Cost of process
8,000
Abnormal loss
200
221
Process II
account
7,000
7,747
8,000
RWF8,000
8,000
RWF8,000
Page 43
PROCESS II ACCOUNT
Units RWF Units RWF
Input in units
7,000
7,747
Normal loss
350
4
Cost of process
4,000
Finished stock
6,800
12,008
Abnormal gain
150
265
7,150
RWF12,012
7,150
RWF12,012
NORMAL LOSS ACCOUNT
Units RWF Units RWF
Process I
800
32
Abnormal gain
150
2
Process II
350
4
Scrap a/c
800
32
Scrap a/c
200
2
1,150
36
1,150
36
ABNORMAL LOSS ACCOUNT
Units
RWF
Units
RWF
Process I
200
221
Scrap
200
8
Profit and loss
213
200
221
200
221
ABNORMAL GAIN ACCOUNT
Units RWF Units RWF
Normal loss
150
2
Process II
150
265
Profit and loss
263
150
265
150
265
SCRAP ACCOUNT
Units RWF Units RWF
Abnormal waste
200
8
Cash
42
Normal loss
Process I
800
32
Normal loss
Process II
200
2
42
42
Page 44
Question 2
PROCESS NO. 4 ACCOUNT
Units RWF
Value Units RWF
Value
Input
9,400
9,875
Normal loss
940
47
Process cost
4,500
Process No. 5
8,500
14,396
Abnormal gain
account
40
68
9,440
RWF14,443
9,440
RWF14,443
Calculations
(a) Normal output (9,400) less normal waste of 10% (940) = 8,460
Abnormal gain = 40 units.
(b) Normal cost in total = RWF9,875 + RWF4,500 – RWF47
Normal cost per good unit =
8,460
RWF47 RWF4,500 + RWF9,875 −
(c) Value of abnormal gain = Normal unit cost × Abnormal gain in units
=
8,460
RWF47 RWF4,500 + RWF9,875 −
× 40 = RWF68
(d) Value of units transferred to Process 5 = Normal unit cost × Output in units
=
8,460
RWF47 RWF4,500 + RWF9,875 −
× 8,500 = RWF14,396
ABNORMAL GAIN ACCOUNT
Units
RWF
Units
RWF
Normal loss
40
2
Process 4
40
68
Profit and loss
66
40
68
40
68
SCRAP ACCOUNT
Units RWF Units RWF
Normal loss
900
45
Cash
900
45
NORMAL LOSS ACCOUNT
Units RWF Units RWF
Process 4 a/c
940
47
Abnormal gain a/c
40
2
Scrap a/c
900
45
940
47
940
47

Page 45
MARGINAL V ABSORPTION COSTING
REVISION QUESTIONS
1. The following information is available for XY Ltd, which manufactures a standard
product. Quarterly budget for each of the quarters 3 and 4, Year 1:
RWF
Total
RWF
RWF
Per Unit
RWF
Sales (30,000 units)
30,000
1.00
Production cost of sales:
Variable
19,500
0.65
Fixed overhead
6,000
25,500
0.20
0.85
4,500
0.15
Selling and administration
cost (fixed)
2,100
0.07
Net profit
2,400
0.08
Actual production, sales and stocks in units for quarters 3 and 4, Year 1:
Quarter 3
Quarter 4
Opening stock
-
6,000
Production
34,000
28,000
Sales
28,000
32,000
Closing stock
6,000
2,000
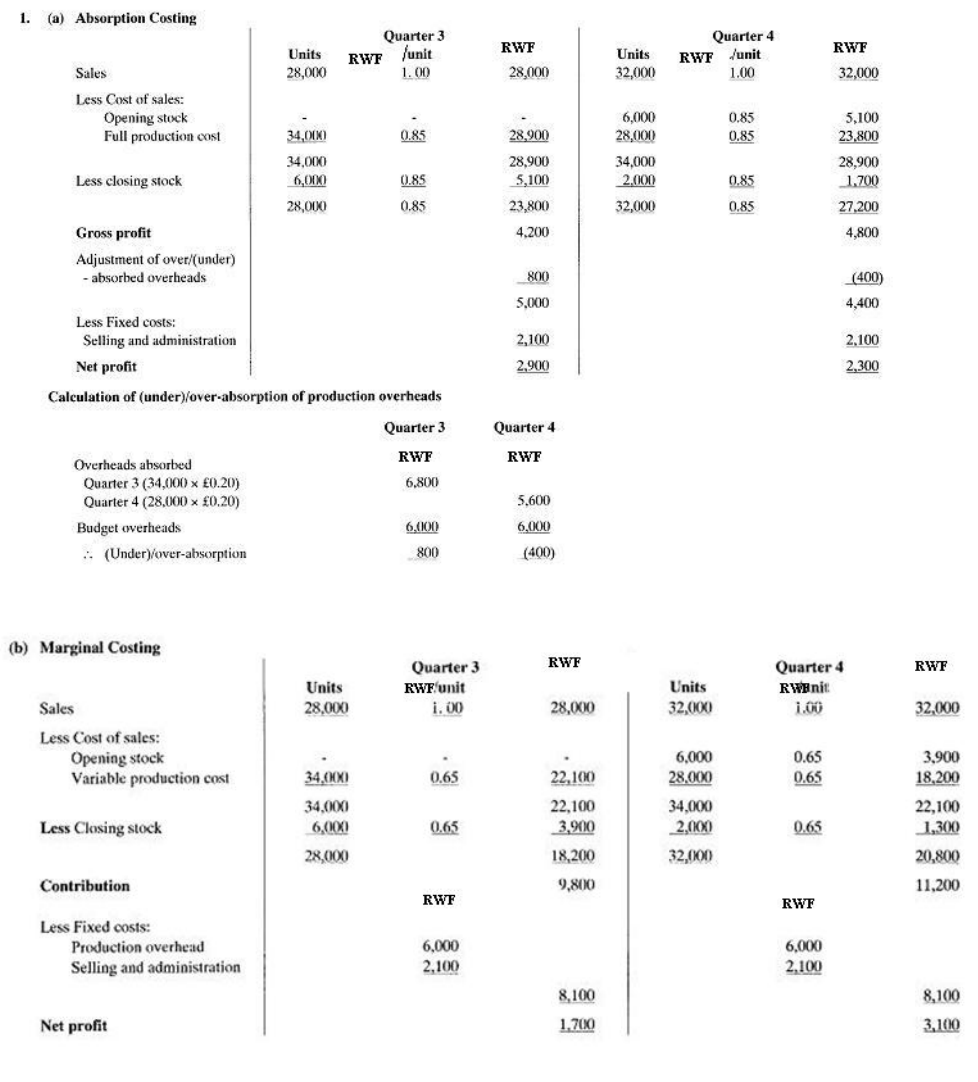
You are required to produce trading and profit and loss accounts for each of the
quarters:
(a) Using absorption costing
(b) Using marginal costing
(10 marks)
2. A manufacturer of leather handbags has been affected by competition from plastic
handbags and is currently operating at between 65 and 70 per cent of maximum
capacity.
The company at present reports profit on an absorption costing basis. The accountant
has been criticised for reporting widely different profits from month to month. He is
proposing to answer these criticisms by reporting differently in order to take into
consideration the impact of the nature of costs (fixed or variable) and, changes due to
seasonal fluctuations in sales volume. This, he hopes, will enable the management to
determine a more positive sales policy.

Page 46
The following information is available from the accounting records:
Standardised cost per unit:
RWF
Direct materials
8.00
Direct labour
7.20
Variable production overheads
3.36
Total variable cost of production
18.56
Fixed production overheads
7.52
Total cost of production
26.08
Fixed production overheads are based on annual budgeted overheads of RWF7,584,000
(RWF632,000 per month) and production volume of 1,008,000 handbags, which
represents 70% of maximum capacity.
There is some small element of flexibility in the fixed overheads, which could be
established at:
Activity level (% of
maximum capacity)
Amount of fixed overheads
RWF000
50 - 70%
632
76 - 90%
648
91 - 100%
656
Fixed overheads actually incurred were the same as budgeted.
Additional information:
March
April
Units sold
87,000
101,000
Units produced
115,000
78,000
Sales price per unit
RWF32
RWF32
Fixed selling costs
RWF120,000
RWF120,000
Fixed administration costs
RWF80,000
RWF80,000
There were no finished goods in stock at 1 March.
REQUIREMENT:
You are required to prepare monthly profit statements for March and April using:
Absorption costing
Marginal costing. (10 Marks)
Page 47
MARGINAL V ABSORPTION COSTING
ANSWERS TO REVISION QUESTIONS

Page 48
Note: You will notice that in this example the net profit in total for the two quarters is not the
same using both methods. This is because there was a net stock increase over the period, an
absorption costing would therefore show a higher profit because of the fixed production
overheads carried forward in stock.
Absorption
Costing
Marginal Costing
Difference - Overheads
Carried Forward in
Stock
RWF
RWF
RWF
Quarter 3 profit
2,900
1,700
1,200
Quarter 4 profit
2,300
3,100
(800)
Total net profit
5,200
4,800
400
Using absorption costing, fixed production overheads carried forward in Quarter 4:
Stock = 2,000 units × RWF0.20
=RWF400
2. (a) Absorption Costing
March
April
RWF000
RWF000
RWF000
RWF000
Sales
2,784.00
3,232.00
Opening stock
Nil
730.24
Direct materials
920.00
624.00
Direct labour
828.00
561.60
Variable production overhead
386.40
262.08
Fixed production overhead
864.80
586.56
2,999.20
2,764.48
Closing stock
(730.24)
(2,268.96)
(130.40)
(2,634.08)
Gross profit
515.04
597.92
Over/(under) absorption
208.80
(45.44)
723.84
552.48
Fixed selling cost
120.00
120.00
Fixed admin. cost
80.00
(200.00)
80.00
(200.00)
Net profit
523.84
352.48
Closing stock calculations:
March: (Units produced 115,000 − Units sold 87,000) × Total unit production
cost RWF26.08
= RWF730,240

Page 49
April: Opening stock 28,000 + Production 78,000 − Sales 101,000 = 5,000
5,000 × RWF26.08 = RWF130,400
Over/under-absorption of fixed production overhead:
Budgeted monthly production = 1 ,008,000/12 = 84,000 = 70% capacity
March production = 115,000 =
115
84
× 70% = 95.8% capacity
So budgeted fixed overheads = RWF656,000
April production = 78,000 so budgeted fixed overheads = RWF632,000
(b) Marginal Costing
March
April
RWF000
RWF000
RWF000
RWF000
Sales
2,784.00
3,232.00
Opening stock
Nil
519.68
Direct materials
920.00
624.00
Direct labour
828.00
561.60
Variable production overhead
386.40
262.08
2,134.40
1,967.36
Closing stock
(based on variable cost)
(519.68)
(1,614.72)
(92.80)
(1,874.56)
Contribution
1,169.28
1,357.44
Fixed costs:
Production overheads
656
632
Selling overheads
120
120
Admin. overheads
80
(856.00)
80
(832.00)
Net profit
313.28
525.44

Page 50
BREAK EVEN ANALYSIS
REVISION QUESTIONS
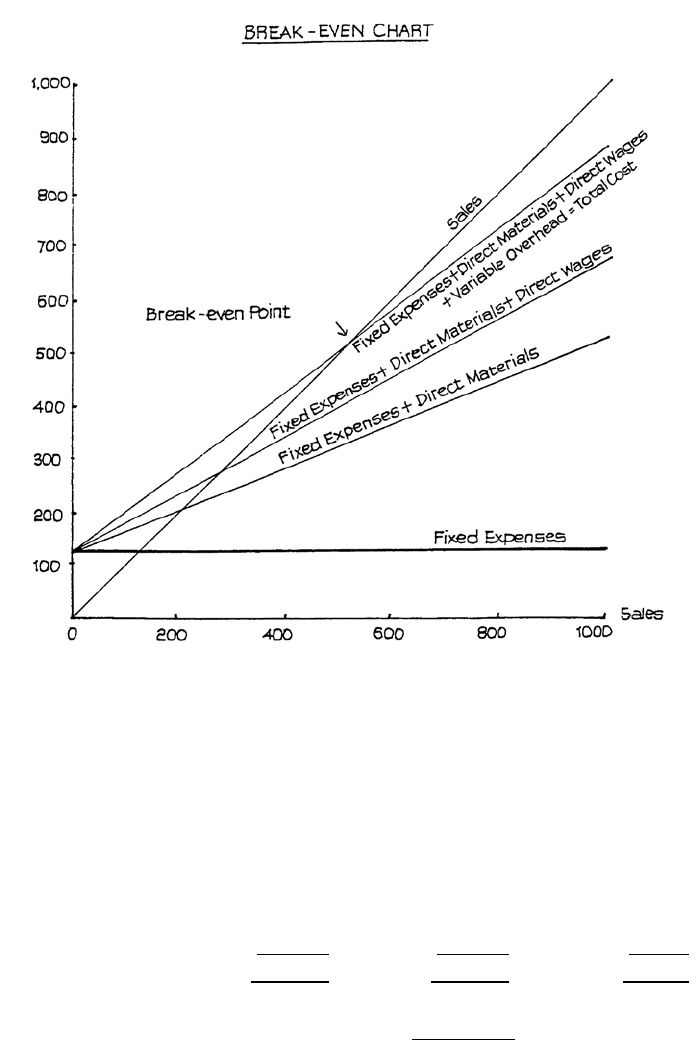
1. The following figures relate to one year's working in a manufacturing business:
RWF
Fixed overhead 120,000
Variable overhead 200,000
Direct wages 150,000
Direct materials 410,000
Sales 1,000,000
Represent each of these figures on a break-even chart, and determine from the chart the
break-even point.
(3 marks)
2. Production of a chemical product which sells at RWF2.70 per kg usually fluctuates
between 80,000 and 90,000 per month. Costs have been calculated as follows.
Monthly output (kg) 80,000 90,000
RWF RWF
Direct materials 60,000 67,500
Direct wages 72,000 81,000
Production overhead 57,000 58,500
Total production cost 189,000 207,000
The production overhead included in the above costs contains both fixed and variable
elements. The fixed production overhead is expected to remain unchanged up to a
monthly output level of 120,000 kg.
REQUIREMENT:
Calculate:
(a) The fixed overhead cost per month.
(b) The marginal cost per kg.
(c) The total cost if output is increased to 100,000 kg.
(d) The break-even point in kg per month.
(10 marks)
Page 51
3. A sealing compound is manufactured and marketed by Cohesive LTD. The factory has
a production capacity of 10,000,000 litres per annum but is at present working at 40%
capacity.
The compound is sold in 20-litre drums at RWF8.00 each.
The sales manager has suggested reducing the price per drum in order to capture a
larger share of the market. His forecast of sales levels at different prices is:
Price per drum Sales forecast
RWF (drums per annum)
8.00 200,000
7.20 300,000
6.40 400,000
5.60 500,000
Variable costs amount to RWF4.48 per drum whilst fixed costs would be expected to
remain constant at RWF640,000 over the range of output levels under consideration.
REQUIREMENT:
Present in column form a statement showing the forecast profit at each production level
and state which volume should be adopted as the target sales and production level per
annum.
(10 marks)
Page 52
BREAK EVEN ANALYSIS
ANSWERS TO REVISION QUESTIONS
Question 1 Break-even point occurs at RWF500,000 sales value. (See Figure 5.)
Figure 5
Question 2
Units 90,000 80,000 10,000
High Low Difference
RWF RWF RWF
Direct materials 67,500 60,000 7,500
Direct wages 81,000 72,000 9,000
Production overhead 58,500 57,000 1,500
Total 207,000 189,000 18,000
Variable cost per unit
000,10
000,18RWF
= RWF1.80
Page 53
At 80,000 units RWF
Total cost 189,000
Less Variable cost 80,000 × RWF1.80 =144,000
Total fixed cost 45,000
Direct materials cost 60,000
Less Variable cost 80,000 ×
000,10
500,7RWF
(60,000)
Fixed costs NIL
Direct wages cost 72,000
Less Variable cost 80,000 ×
000,10
000,9RWF
(72,000)
Fixed wages cost NIL
Production overhead cost 57,000
Less Variable cost 80,000 ×
000,10
500,1RWF
(12,000)
Fixed production overhead cost RWF45,000
(a) Fixed overhead cost per month = RWF45,000
(b) Marginal cost per kg RWF1.80
(c) Total cost of producing 100,000 kg RWF
Variable cost 100,000 × RWF1.80 180,000
Fixed cost 45,000
RWF225,000
(d) Break-even point in kg
Fixed cost
Contribution per unit
=
RWF1.80) 70.2(
000,45
−RWF
RWF
= 50,000 kg
Page 54
Question 3
Sales units 200,000 300,000 400,000 500,000
Sales unit price RWF8.00 RWF7.20 RWF6.40 RWF5.60
RWF RWF RWF RWF
Total sales 1,600,000 2,160,000 2,560,000 2,800,000
Total variable cost* (896,000) (1,344,000) (1,792,000) (2,240,000)
Contribution 704,000 816,000 768,000 560,000
Fixed costs (640,000) (640,000) (640,000) (640,000)
Profit/(Loss) 64,000 176,000 128,000 (80,000)
* Variable cost per unit = RWF4.48
Sales and production should be set at a target of 300,000 drums.

Page 55
DECISION MAKING
REVISION QUESTIONS
1. (a) Explain what is meant by a break-even chart, and describe its uses.
(b) Illustrate by a graph using the following information:
Sales Variable Cost
RWF RWF
Product A 10,000 4,000
B 5,000 4,000
C 15,000 12,000
RWF30,000 RWF20,000
Fixed expenses RWF6,000
On the same graph, show the effect of eliminating Product B and increasing the
sales of Product A by 100%, with an increase of RWF1,000 in fixed expenses.
(10 marks)
2. CTT Limited is involved in the manufacture of precision engineering machinery. It
Manufactures a substantial proportion of sub-components in-house and is currently
investigating the possibility of sub-contracting the manufacture of a key sub-component
to an outside supplier.
The budgeted annual costs of manufacturing 9,000 units (the annual requirement) of
this component in-house are as follows:
RWF
Direct labour
1,500 hours @ RWF36 per hour
54,000
Direct material
900 kgs @ RWF15 per kg
13,500
Variable overheads
200% direct labour
108,000
Fixed overheads
1,500 hours @ RWF12 per hour
18,000
193,500
Budgeted Fixed Overheads absorbed into this component consist of the following:
RWF
Factory rent (10 year lease)
12,000
Management charges
6,000
18,000
Page 56
If the manufacture of the sub-component is sub-contracted, CTT Ltd will be able to sub-
let the factory space currently used for its manufacture at an annual rent of RWF10,000.
The company will also sell some machinery which would become surplus to
requirements. This machinery has a book value of RWF18,700 and its sale would be
estimated to realise a book loss of RWF2,000.
CTT Ltd will also be able to sell 80kgs of the raw material currently in stock which is
used in the manufacturing process. The company will have the choice of either selling it
to the successful tenderer at a price to be negotiated or else, if no acceptable price is
offered by the successful tenderer, return it to the original supplier at cost less a 15%
restocking charge.
Additionally, two of the four workers currently employed in the manufacture of the
subcomponent would be redeployed within the company but the other two workers will
be made redundant. This will necessitate a redundancy payment of RWF17,000 to each
of these two workers.
The wage of each of the four workers, all of whom are highly skilled and have
considerable accumulated experience, is RWF27,000 per annum. Currently, each of
these workers spends half of his time making the sub-component and the remainder of
his time in the Quality Control department, where the two redeployed workers will now
spend all of their time.
CTT Ltd has prepared a shortlist of the following tenders and has decided that both of
them should be critically evaluated against the costs of in-house production with a view
to making a decision.
• MK Limited has quoted a price of RWF248,000 for the supply of 9,000 units per
annum. It has offered the sum of RWF1,100 for the 80kgs of raw materials. In
addition, it has offered to take on both of the workers due to be made redundant
and will pay each an annual wage of RWF24,000 if its tender is accepted. Both
workers have indicated their agreement to this proposal and, if the tender is
successful, will each receive a concessionary lump-sum payment from CTT
Limited of RWF7,000 instead of a redundancy payment.
• FB Limited has quoted a price of RWF245,000 for the production of 10,000 units
per annum. It has offered the sum of RWF1,000 for the raw materials. FB Ltd
will use its own staff to produce the component but would like to utilise the
machinery and floor space currently used by CTT Ltd for the manufacture of the
Page 57
subcomponent as it believes that such an arrangement would enable it to be better
placed to respond to fluctuations in demand for the sub-component.
The use of these facilities is a key provision of FB Limited tender and is not open
to negotiation. FB Limited has valued the annual use of these facilities at
RWF13,000 and has deducted this sum from the gross value of the tender to
arrive at the quotation of RWF245,000 above.
FB Limited has also agreed to a profit sharing scheme in respect of the 1,000
surplus subcomponents which would be made should the tender be accepted –
2.5% of the sales value of these surplus units will be paid to CTT Limited
annually in arrears. It is expected that these surplus units will be sold for RWF40
each on the open market.
REQUIREMENT:
(a) Determine which of the two external offers gives the lowest price per unit to CTT
Limited.
(18 marks)
(b) On the basis of your calculations in (a), state whether or not the company should
continue to make the sub-component in-house and briefly outline any qualitative
matters relevant to the decision.
(8 marks)
[Total: 26 marks]
Page 58
DECISION MAKING
ANSWERS TO REVISION QUESTIONS
1. Contributions are:
Present Product Sales Variable Cost Contribution
RWF RWF RWF
A 10,000 4,000 6,000
B 5,000 4,000 1,000
C 15,000 12,000 3,000
Revised Product Sales Variable Cost Contribution
RWF RWF RWF
A 20,000 8,000 12,000
B - - -
C 15,000 12,000 3,000
Present fixed expenses are RWF6,000.
Revised fixed expenses are RWF7,000.
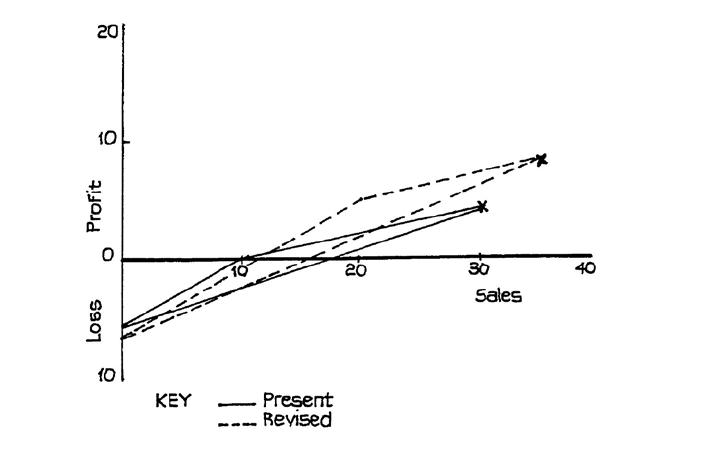
Figure 8
From the graph it can be read that:
(a) Present profit is RWF4,000 for sales of RWF30,000.
(b) Revised profit is RWF8,000 for sales of RWF35,000.
(c) Present BEP is RWF18,000.
(d) Revised BEP is RWF16,500 approx.
RWF 000s
Page 59
2. This question must be solved by initially evaluating each tender on the basis that it will
be accepted and comparing the resultant inflows/outflows with the current costs of
making the sub-component in-house.
This question tests the candidate’s ability to identify “relevant” costs and revenues in
the light of the particular terms of each tender, as well as examining candidates
knowledge of typical qualitative factors which impact upon many business decisions.
(a)
Accept
MK Ltd
Tender
Accept
FB Ltd
Tender
Quotation price
RWF248,000
RWF245,000
Sale of raw materials (note 1)
(1,100)
(1,020)
Rental income: (note 2)
(10,000)
None
Sale of machinery: (note 3)
(16,700)
None
Wages saved
(54,000)
(554,000)
Redundancy/lump sum (note 4)
14,000
34,000
Profit sharing: (note 5)
None
(1,000)
Total costs of accepting
180,200
222,980
Number of units
9,000
10,000
Cost per unit
RWF20.02
RWF22.30
Therefore, the offer from MK Ltd is the cheaper of the two tenders.
Notes:
1. Sale of raw materials
If CTT Ltd returns the raw materials to the supplier, it will receive RWF1,020
calculated as follows:
80 kgs @ RWF15 per kg 1,200
Less:
15% restocking charge (180)
Amount received 1,020
When this is compared to the offers from MK Ltd (RWF1,100) and FB Ltd
(RWF1,000), it can be seen that CTT Ltd will sell the material to MK Ltd if its
tender is accepted or else return the materials to the supplier if FB Ltd tender is
successful.
Page 60
2. Rental income
CTT Ltd will be able to sub-let the floor space if MK Ltd is successful; therefore,
the sum of RWF10,000 is shown as income in the above evaluation of that
company’s proposal. However, if FB Ltd succeeds, CTT ltd will not be able to
sub-let the floor space, as it will be used by FB Ltd as part of the overall deal. It
should be noted that, in either case, CTT Ltd will still have to pay the rent. This
sum does not differ under either decision, it has not been shown in the above
evaluation.
1. Sale of machinery
The cash proceeds realised on the sale of the machinery are calculated as follows:
RWF
Book value 18,700
Less
Book loss on disposal (2,000)
16,700
As per note 2, if FB Ltd is successful the machinery will not be sold; therefore, no
proceeds are shown under the evaluation of FB Ltd tender.
2. Redundancy/lump sum costs
Payment to staff if MK Ltd succeeds: 2 staff @ RWF7,000 each = RWF14,000
Payment to staff if FB Ltd succeeds: 2 staff @ RWF17,000 each = RWF34,000
3. Profit sharing
The cash which CTT Ltd will receive under the profit sharing arrangement is
calculated as follows:
1,000 units at RWF40 per unit x 2.5% = RWF1,000
(a) On a purely economic basis, CTT Ltd should not sub-contract the
manufacture of the sub-component to MK Ltd as the relevant (variable) cost
of so doing is approximately RWF0.50 higher (RWF175,500/9,000 =
RWF19.50 present cost per unit). This assumes a one year horizon.
Additionally, there may be other factors which the company might wish to
take into account. These include the following:
Page 61
1. Track record of MK Ltd – is the company a reliable, experienced
supplier?
2. Quality of the component manufactured by MK Ltd – as this is a key
component, it would be of paramount importance that clearly defined
Quality Assurance procedures are installed to ensure top quality.
3. Effect on the morale of staff if two fellow workers are made redundant.
There may be a decline in productivity if staff feel insecure in their
positions.
4. Are there opportunities for CTT Ltd to extract greater economies from
the current production process? Perhaps increased Capital investment
may lower the average unit cost.
5. CTT Ltd should consider the implications of a decision to sub-contract
the manufacture of the component, with special consideration of the
consequences of dependency upon one supplier.
Page 62
STANDARD COSTING AND VARIANCE ANALYSIS
REVISION QUESTION
1. ACM Co Limited manufacture a single product, product W, and have provided you
with the following information which relates to the period which has just ended:
Standard Cost per Batch of Product W
Materials:
Kilos
Price per kilo
RWF
Total
RWF
F
15
4
60
G
12
3
36
H
8
6
48
35
144
Less: Standard loss
3
Standard yield
32
Labour:
Hours
Rate per hour
RWF
Department P
4
10
40
Department Q
2
6
12
196
Budgeted sales for the period are 4,096 kilos at RWF16 per kilo. There were no
budgeted opening or closing stocks of product W.
The actual materials and labour used for 120 batches were:
Materials:
Kilos
Price per kilo
RWF
Total
RWF
F
1,680
4.25
7,140
G
1,650
2.80
4,620
H
870
6.40
5,568
4,200
17,328
Less: Actual loss
552
Actual yield
3,648
Labour:
Hours
Rate per hour
RWF
Department P
600
10.60
6,360
Department Q
270
5.60
1,512
25,200
All of the production of W was sold during the period for RWF16.75 per kilo.
REQUIREMENT:
(a) Calculate the following material variances:
• Price
• Usage
• Mix
• Yield (5 marks)
Page 63
(b) Prepare an analysis of the material mix and price variances for each of the
materials used. (3 marks)
(c) Calculate the following labour variances:
• Cost
• Efficiency
• Rate
for each of the production departments. (4 marks)
(d) Calculate the sales variances. (3 marks)
(e) Comment on your findings to help explain what has happened to the yield
variance. (5 marks)
[Total: 20 marks]
2. You have been assigned the task of assessing the performance of a division within the
company in which you work.
The division, which is a major production centre, uses standard absorption costing for
product costing and stock valuation purposes.
The cost card for the product line where you intend to start your assessment shows the
following data:
Quantity RWF
Direct materials 10 kgs 105
Direct labour -Category A 30 minutes 15
- Category B 45 minutes 9
Variable overheads 20% of material 21
Fixed overheads (note) 30 minutes @ RWF12 per hour 6
Standard absorption cost 156
Note: Fixed production overheads are absorbed on the basis of standard time allowed
for Category A labour. The monthly budget for Category A labour was 2,500 hours.
Page 64
In the most recent month, 4,977 units were made at the following costs:
RWF
Direct materials - Purchased 55,000 kgs 555,600
- Used 52,350 kgs
Direct labour - Category A 2,610 hours 77,648
- Category B 3,730 hours 45,000
Variable overheads 114,925
Fixed overheads 29,055
REQUIREMENT:
(a) Calculate the following variances:
(i) Direct materials price and usage. (3 marks)
(ii) Direct labour rate and efficiency variance for both categories of labour.
(3 marks)
(iii) Variable overheads expenditure and efficiency variance. (4 marks)
(iv) Fixed overheads expenditure and production volume variance. (4 marks)
Show all workings.
(b) Briefly comment on the information provided about the department’s
performance by the variance analysis. (6 marks)
[TOTAL: 20 MARKS]

Page 65
STANDARD COSTING AND VARIANCE ANALYSIS
ANSWERS TO REVISION QUESTIONS
1. (a) Material Variances
(i) Actual quantity at actual price (given)
RWF17,328
(ii) Actual quantity at standard price:
RWF
F 1,680 × RWF4
6,720
G 1,650 × RWF3
4,950
H 870 × RWF6
5,220
RWF16,890
(iii) Standard yield × Standard cost
(32 × 120) × RWF4.50 (see working)
RWF17,280
(iv) Actual yield × Standard cost
3,648 × RWF4.50
RWF16,416
Variances (A = Adverse, F = Favourable):
RWF
Price (i) − (ii)
438 A
Usage (ii) − (iv)
474 A
Cost (i) − (iv)
912 A
Mix (ii) − (iii)
390 F
Yield (iii) − (iv)
864 A
Usage (as above)
474 A
Workings:
Standard cost per kilo =
kilos32
144RWF
= RWF4.50
(b) Further Analysis of Material Variances
Mix
F
G
H
Standard (kilos)
1,800
1,440
960
Actual (kilos)
1,680
1,650
870
120 F
210 A
90 F
× Standard price (RWF)
4
3
6
RWF390 F
RWF480 F
RWF630 A
RWF540 F
Price
F
G
H
RWF
RWF
RWF
Standard
4.00
3.00
6.00
Actual
4.25
2.80
6.40
0.25 A
0.20 F
0.40 A
× Actual kilos used
1,680
1,650
870
RWF438 A
RWF420 A
RWF330 F
RWF348 A
Page 66
(c) Labour Variances
Cost variances
Total
RWF
Dept P
RWF
Dept Q
RWF
Standard cost
6,240
4,800
1,440
Actual cost
7,872
6,360
1,512
(1)
RWF1,632
A
RWF1,560
A
RWF72 A
Efficiency variances
Standard hours
480
240
Actual hours
600
270
120 A
30 A
× Standard rate per hour
(RWF)
10
6
(2)
RWF1,380
A
RWF1,200
A
RWF180 A
Rate variances
RWF
RWF
Standard rate
10.00
6.00
Actual rate
10.60
5.60
0.60 A
0.40 F
× Actual hours worked
600
270
(3)
RWF252 A
RWF360 A
RWF108 F
Proof: (1) + (2) = (3)
(d) Sales Variances
RWF
Budgeted sales for actual level of activity 120 × 32 × RWF16
61,440
Actual sales 3,648 × RWF16.75
61,104
RWF336 A
Made up of: Volume variance
(3,840 − 3,648 kilos) × RWF16
3,072 A
Price variance (RWF0.75 × 3,648)
2,736 F
RWF336 A
(e) The actual mix used had the same weight as the standard mix (4,200 kilos) but
used a different combination from the standard mix (as indicated in (b)). It used
less than planned of materials F and H, and more of material G, a lower-cost
material. In addition to substituting the lower-cost material for F and H, which
could affect the yield, the adverse yield variance could have also been caused by
using materials of a lower quality than planned, e.g. the lower price per kilo of G
gives a favourable price variance, but this could be due to buying a lower-quality
material.
Page 67
The labour efficiency variance may have been caused by poor-quality materials
taking longer to process. It could also be due to lack of motivation of employees,
e.g. those in department Q getting a lower pay rise than expected, could have
caused them to work more slowly and to waste more material by not taking as
much care as they should. This could also help explain the actual yield, 30.4
kilos per batch, being lower than the standard yield of 32 kilos per batch.
2. (a) Variance analysis calculations
Actual costs
incurred
Standard cost of
inputs
Standard cost
of production
Materials
RWF555,600
RWF577,500i
RWF549,675ii
RWF522,585iii
↑ Price: RWF21,900
(F) ↑
↑ Quantity: RWF27,090
(A) ↑
Labour:
Category A
RWF77,648
RWF78,300iv
RWF74,655v
↑ Rate: RWF652 (A)
↑
↑ Efficiency: RWF3,645
(A) ↑
Category B
RWF45,000
RWF44,760vi
RWF44,793vii
↑ Rate: RWF240 (A)
↑
↑ Efficiency: RWF33 (F)
↑
Variable Overheads
RWF114,925
RWF109,935viii
RWF104,517ix
↑ Expenditure: RWF4,990
(A) ↑
↑ Efficiency: RWF5,418
(A) ↑
Fixed Overheads
RWF29,0
55
RWF30,000x
RWF29,8
62xi
↑ Budget: RWF945 (F)
↑
↑ Volume: RWF138
(A) ↑
Page 68
(i) Standard cost of materials purchased: 55,000 kgs @ RWF10.50 per kilo
(ii) Standard cost of materials used: 52,350 kgs @ RWF10.50 per kilo
(iii) Standard materials cost of actual output: 4,977 units @ RWF105 per unit
(iv) Standard cost of category A hours used: 2,610 hours @ RWF30 per hour
(v) Standard category A labour cost of actual output: 4,977 units @ RWF15 per
unit
(vi) Standard cost of category B hours used: 3,730 hours @ RWF12 per hour
(vii) Standard category B labour cost of actual output: 4,977 units @ RWF9 per
unit
(viii) Standard cost of variable overheads (based on materials used): 20% of
RWF549,675 as calculated in note (ii)
(ix) Standard variable overhead cost of actual output: 4,977 units @ RWF21 per
unit
(x) Budgeted level of Fixed overheads per month: 2,500 category A hours @
RWF12 per hour
(xi) Standard Fixed cost of actual output: 4,977 units @ RWF6 per unit
(b) Commentary on the performance of the production centre should include the
following points:
Materials Variances
While the price being paid for the materials used is substantially lower than that
budgeted for, it is clear that the quantity of materials being used to make the
products is greater than allowed. Management should investigate the reasons for
this – perhaps the Purchasing Department is buying materials of a lower grade
which has occurred the levels of wastage experienced.
Labour Variances
Category A labour appears to be working at a level of efficiency which is less
than expected. This may be related to the previous point if the quality of
materials being used has resulted in the workers having to spend more time
reworking the units produced. However, management should investigate any
hypothesis in order to ascertain the precise reason for the adverse efficiency
variance. No material problems are evident in respect of Category B labour.
Page 69
Overhead Variances
Variable overheads appear to give cause for concern. The sizeable variances in
both expenditure and efficiency variances may be due to the use of an
inappropriate basis of applying such costs to output – it is possible that variable
overheads are incurred in proportion to some cost other than materials. In any
event, management should investigate the reasons for the substantial variances
and may need to reconsider the use of materials as a means of allocating such
costs to output.

Page 70
PREPARATION TECHNIQUES AND CONSIDERATIONS OF
BUDGETS
REVISION QUESTIONS
1. ALP Ltd is about to commence business to manufacture a standard product. The
following standards have been prepared:
RWF
per unit
Sales price 48
Direct materials 10
Direct wages 20
Variable overhead 15
Fixed overheads, excluding depreciation, are budgeted at RWF80,000 for the year.
The company will have a share capital of RWF100,000 all of which will be invested in
plant and equipment. Depreciation is to be calculated on a straight-line basis over a
five-year period, with no residual value.
The following budgeted sales and production figures for the coming year have been
prepared:
Quarter
(1)
(2)
(3)
(4)
units
units
units
units
Sales
9,000
9,000
15,000
21,000
Production
10,000
12,000
15,000
20,000
Customers will be given a two-month credit period, and suppliers of direct material will
allow three months’ credit.
Stock of finished goods will be valued at standard variable cost.
Wages and overheads will be paid as incurred. Fixed overheads will accrue evenly
throughout the year.
REQUIREMENT:
Prepare:
(a) Quarterly trading and profit and loss accounts
(b) A quarterly cash flow forecast
Page 71
2. The budgeted balance sheet of KTU Ltd is as follows:
1 March Yr 5
Cost
Depreciatio
n to date
Net
Fixed assets
RWF
RWF
RWF
Land and buildings
500,000
-
500,000
Machinery and equipment
124,000
84,500
39,500
Motor vehicles
42,000
16,400
25,600
666,000
100,900
565,100
Working capital:
Current assets
Stock of raw materials (100 units)
4,320
Stock of finished goods (110 units)*
10,450
Debtors (January RWF7,680, February
RWF10,400)
18,080
Cash and bank
6,790
39,640
Less Current liabilities
Creditors (raw materials)
3,900
35,740
600,840
Represented by:
Ordinary share capital (fully paid) RWF1
shares
500,000
Share premium
60,000
Profit and loss account
40,840
600,840
*The stock of finished goods was valued at marginal cost.
The estimates for the next four-month period are as follows:
March
April
May
June
Sales (units)
80
84
96
94
Production (units)
70
75
90
90
Purchases of raw materials (units)
80
80
85
85
Wages and variable overheads at
RWF65 per unit
RWF4,550
RWF4,875
RWF5,850
RWF5,850
Fixed overheads
RWF1,200
RWF1,200
RWF1,200
RWF1,200
The company intends to sell each unit for RWF219 and has estimated that it will have
to pay RWF45 per unit for raw materials. One unit of raw material is needed for each
unit of finished product.
Page 72
All sales and purchases of raw materials are on credit. Debtors are allowed two
months’ credit and suppliers of raw materials are paid after one month’s credit. The
wages, variable overheads and fixed overheads are paid in the month in which they are
incurred.
Cash from a loan secured on the land and buildings of RWF120,000 at an interest rate
of 7.5% is due to be received on 1 May. Machinery costing RWF112,000 will be
received in May and paid for in June.
The loan interest is payable half-yearly from September onwards. An interim dividend
to 31 March Yr 5 of RWF12,500 will be paid in June.
Depreciation for the four months, including that on the new machinery, is:
Machinery and equipment RWF15,733
Motor vehicles RWF3,500
The company uses the FIFO method of stock valuation. Ignore taxation.
REQUIREMENT:
(a) Calculate and present the raw materials budget and finished goods budget in
terms of units, for each month from March to June inclusive; and (5 marks)
(b) The corresponding sales budgets, the production cost budgets and the budgeted
closing debtors, creditors and stocks in terms of value. (5 marks)
(c) Prepare and present a cash budget for each of the four months. (6 marks)
(d) Prepare a master budget, i.e. a budgeted trading and profit and loss account for
the four months to 30 June Yr 5, and budgeted balance sheet as at 30 June Yr 5.
(10 marks)
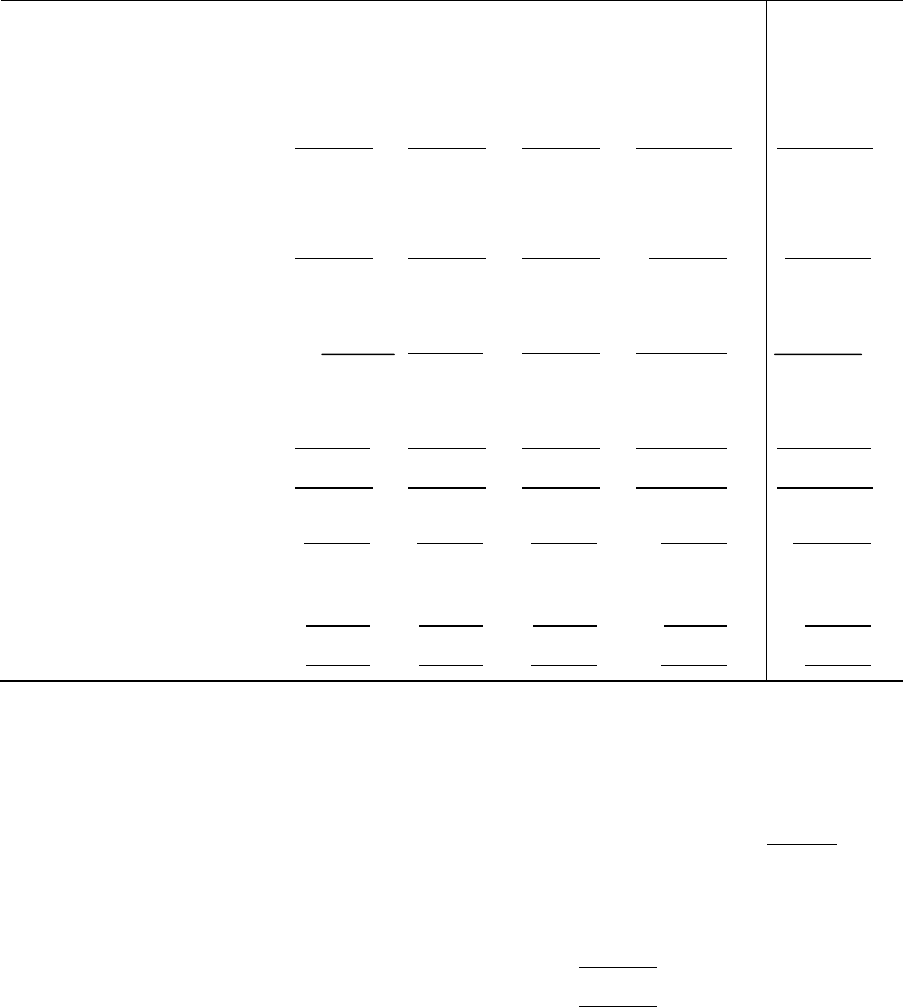
Page 73
PREPARATION TECHNIQUES AND CONSIDERATIONS OF
BUDGETS
ANSWERS TO REVISION QUESTIONS
1. ALP LTD: TRADING AND PROFIT AND LOSS ACCOUNTS
FOR THE YEAR ENDED . . . . .
Quarter
(1)
(2)
(3)
(4)
Total
RWF
RWF
RWF
RWF
RWF
Sales
432,000
432,000
720,000
1,008,000
2,592,000
Direct materials
100,000
120,000
150,000
200,000
570,000
Direct wages
200,000
240,000
300,000
400,000
1,140,000
Variable overheads
150,000
180,000
225,000
300,000
855,000
450,000
540,000
675,000
900,000
2,565,000
Opening stock of
finished goods
-
45,000
180,000
180,000
-
450,000
585,000
855,000
1,080,000
2,565,000
Less: closing stock of
finished goods
45,000
180,000
180,000
135,000
135,000
405,000
405,000
675,000
945,000
2,430,000
Gross profit
27,000
27,000
45,000
63,000
162,000
Fixed overheads
20,000
20,000
20,000
20,000
80,000
Depreciation
5,000
5,000
5,000
5,000
20,000
Net profit
2,000
2,000
20,000
38,000
62,000
BALANCE SHEET AS AT . . . .
RWF
RWF
Fixed Assets at cost
100,000
Less depreciation
20,000
80,000
Current Assets
Stock
135,000
Debtors
672,000
807,000
Current Liabilities
Creditors
200,000
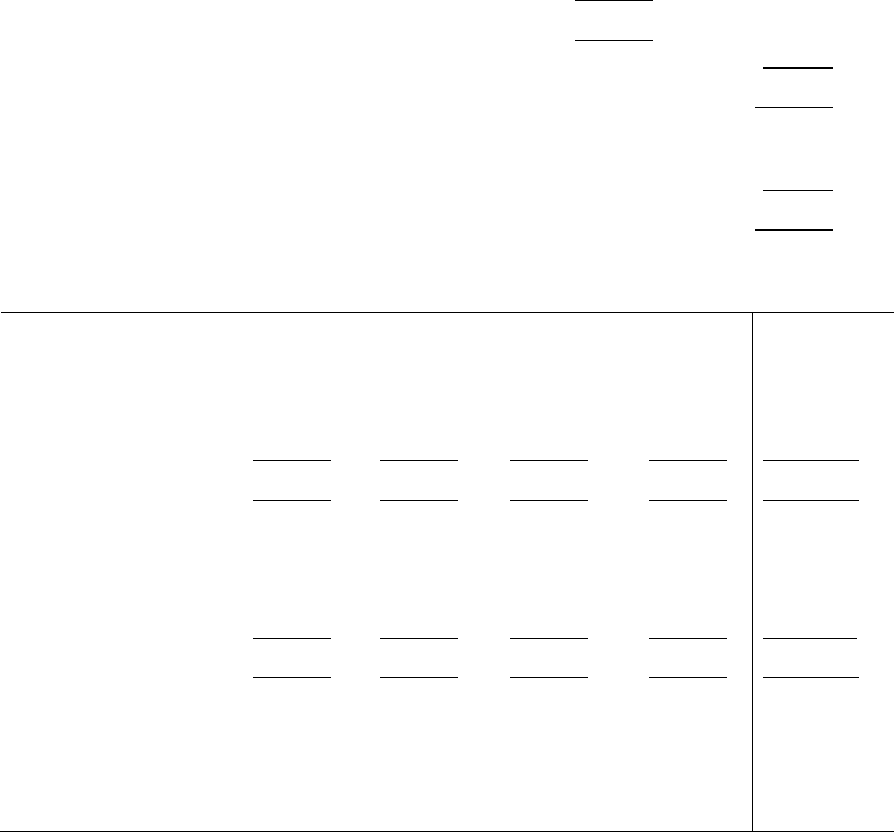
Page 74
Bank overdraft
525,000
725,000
Net current assets
82,000
162,000
Represented by:
Share capital
100,000
Profit
62,000
162,000
Cash Budget
Quarter
(1)
(2)
(3)
(4)
Total
RWF
RWF
RWF
RWF
RWF
Share capital
100,000
-
-
-
100,000
Debtors
144,000
432,000
528,000
816,000
1,920,000
244,000
432,000
528,000
816,000
2,020,000
Payments:
Plant
100,000
-
-
-
100,000
Creditors
-
100,000
120,000
150,000
370,000
Wages
200,000
240,000
300,000
400,000
1,140,000
Expenses
170,000
200,000
245,000
320,000
935,000
470,000
540,000
665,000
870,000
2,545,000
Balance on
quarter
(226,000) (108,000) (137,000) (54,000) -
Brought forward
-
(226,000)
(334,000)
(471,000)
-
Carried forward
(226,000)
(334,000)
(471,000)
(525,000)
(525,000)

Page 75
2. (a) Raw Materials Budget
(Units) March April May June
Opening stock 100 110 115 110
Add: Purchases 80 80 85 85
180 190 200 195
Less: Used in production 70 75 90 90
Closing stock 110 115 110 105
Finished Goods Budget (units)
Opening stock 110 100 91 85
Add: Production 70 75 90 90
180 175 181 175
Less: Sales 80 84 96 94
Closing stock 100 91 85 81
(b) Sales Budget Total
(at RWF219 per unit) RWF17,520 RWF18,396 RWF21,024 RWF20,586 RWF77,526
Production Cost Budget
Raw materials (using FIFO)3,024* 3,321** 4,050 4,050 14,445
Wages and variable costs 4,550 4,875 5,850 5,850 21,125
RWF7,574 RWF8,196 RWF9,900 RWF9,900RWF35,570
Budgeted Closing Debtors
May + June sales = RWF41,610
Budgeted Closing Creditors
June, raw materials = 85 units × RWF45 = RWF3,825
*
×100
70
320,4RWF
= RWF3,024
**
×100
30
320,4RWF
= RWF1,296 + 45 units at RWF45 = RWF3,321
Budgeted Closing Stocks
Raw materials: 105 units × RWF45 = RWF4,725
Finished goods: 81 units × RWF110 = RWF8,910
unitper RWF45
material
+
unitper RWF65
OH + Lab

Page 76
(c)
Cash Budget
March
April
May
June
RWF
RWF
RWF
RWF
Balance b/f
6,790
4,820
5,545
132,415
Add Receipts:
Debtors (two months’ credit)
7,680
10,400
17,520
18,396
Loan
-
-
120,000
-
(A)
14,470
15,220
143,065
150,811
Payments:
Creditors (one month’s credit)
3,900
3,600
3,600
3,825
Wages and variable overheads
4,550
4,875
5,850
5,850
Fixed overheads
1,200
1,200
1,200
1,200
Machinery
-
-
-
112,000
Interim dividend
-
-
-
12,500
(B)
9,650
9,675
10,650
135,375
Balance c/f (A) − (B)
4,820
5,545
132,415
15,436

Page 77
(d) Master Budget
BUDGETED TRADING AND PROFIT AND LOSS ACCOUNT
FOR FOUR MONTHS TO 30 JUNE YR 5
RWF RWF
Sales 77,526
Less: Cost of sales: Opening stock finished goods 10,450
Add Production cost 35,570
46,020
Less Closing stock finished goods 8,910
37,110
40,416
Less: Expenses
Fixed overheads (4 × RWF1,200) 4,800
Depreciation:
Machinery and equipment 15,733
Motor vehicles 3,500
Loan interest (two months) 1,500 25,533
14,883
Less: Interim dividends 12,500
2,383
Add: Profit and loss account balance b/f 40,840
43,223

Page 78
BUDGETED BALANCE SHEET AS AT 30 JUNE YR 5
Depreciation
Cost to date Net
Fixed Assets RWF RWF RWF
Land and buildings 500,000 - 500,000
Machinery and equipment 236,000 100,233 135,767
Motor vehicles 42,000 19,900 22,100
778,000 120,133 657,867
Current Assets
Stock of raw materials 4,725
Stock of finished goods 8,910
Debtors 41,610
Cash and bank balances 15,436
70,681
Less: Current Liabilities
Creditors 3,825
Loan interest owing 1,500 5,325 65,356
723,223
Capital employed
Ordinary share capital RWF1 shares (fully paid) 500,000
Share premium 60,000
Profit and loss account 43,223
603,223
Secured loan (7.5%) 120,000
723,223
Page 79
COST BOOK-KEEPING
REVISION QUESTION
1. The cost accounts of LMN Ltd are kept separately from its financial accounts. The
following balances have been brought forward at the beginning of Period 3.
RWF000 RWF000
Stores Control 200
Work-in-Progress Control 50
Finished Goods Control 100
Cost Ledger Control 350
The following transactions were recorded in the cost ledger for Period 3.
RWF000
Purchases for stores 93
Returns to suppliers 3
Stores issued - indirect materials 10
Stores issued - direct materials 110
Direct wages 35
Indirect wages 15
Indirect expenses 21
Production overhead absorbed 45
Work completed, at cost 185
Cost of goods sold 195
Sales 230
Required
Make the necessary entries in the Cost Ledger Control record, Stores Control account,
Work-in-Progress account, Finished Goods Control account and the Production
Overhead Control account, and in the Costing Profit and Loss account.
(10 marks)
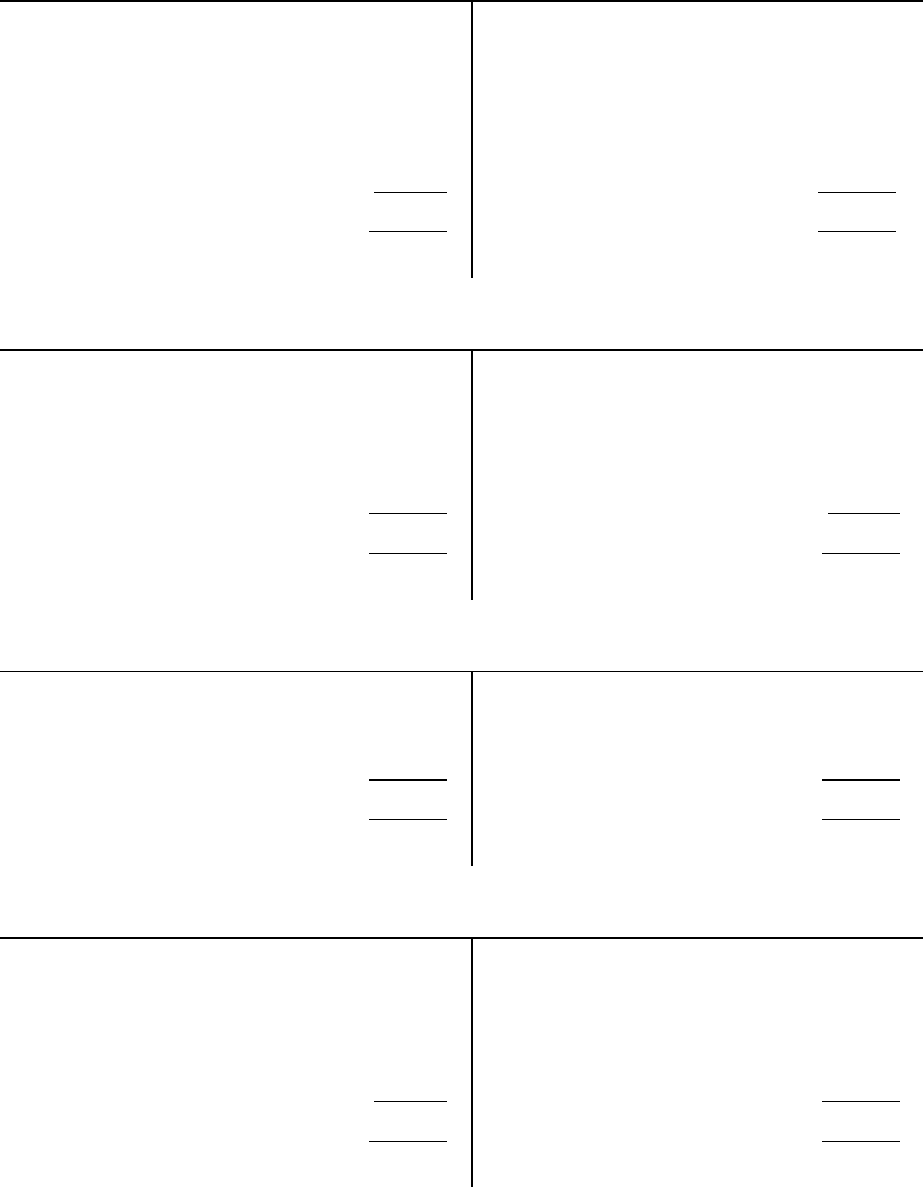
Page 80
COST BOOK-KEEPING
ANSWER TO REVISION QUESTION
COST LEDGER CONTROL ACCOUNT
RWF
RWF
Stores Control A/c
3,000
Balance b/f
350,000
Sales Control A/c
230,000
Stores Control A/c
93,000
Balance b/f
315,000
W-I-P Control A/c
35,000
Production Overhead A/c
15,000
Production Overhead A/c
21,000
Costing P & L A/c
34,000
548,000
548,000
Balance b/f
315,000
WORK-IN-PROGRESS CONTROL ACCOUNT
RWF
RWF
Balance b/f
50,000
Finished Goods Control A/c
185,000
Stores Control A/c
110,000
Balance c/f
55,000
Direct Wages:
Cost Ledger Control A/c
35,000
Production Overhead A/c
45,000
240,000
240,000
Balance b/f
55,000
FINISHED GOODS CONTROL ACCOUNT
RWF
RWF
Balance b/f
100,000
Costing P & L A/c
195,000
W-I-P Control A/c
185,000
Balance c/f
90,000
285,000
285,000
Balance c/f
90,000
STORES CONTROL ACCOUNT
RWF
RWF
Balance b/f
200,000
Returns Outwards - Cost
Purchases - Cost Ledger
Ledger Control A/c
3,000
Control A/c
93,000
Production Overhead A/c
10,000
W-I-P Control A/c
110,000
Balance c/f
170,000
293,000
293,000
Balance b/f
170,000
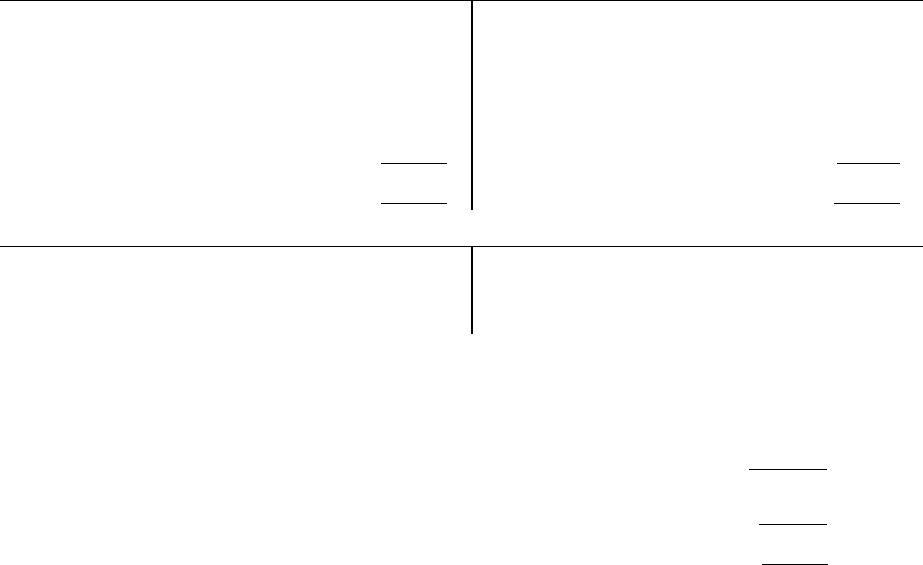
Page 81
PRODUCTION OVERHEAD CONTROL ACCOUNT
RWF
RWF
Stores Control A/c
10,000
W-I-P Control A/c
Direct Wages - Cost Ledger
(Overhead Absorbed)
45,000
Control A/c
15,000
Costing P & L A/c (Under-
Indirect Expenses - Cost
Absorbed)
1,000
Ledger Control A/c
21,000
46,000
46,000
SALES CONTROL ACCOUNT
RWF
RWF
Costing P & L A/c
230,000
Cost Ledger Control A/c
230,000
COSTING PROFIT & LOSS ACCOUNT
RWF
Sales 230,000
Less Costs of Sales (195,000)
Gross Profit 35,000
Less Production Overhead Under-Absorbed (1,000)
Net Profit - Cost Ledger Control A/c 34,000
Note: this account can be shown in “T” account format.

Page 82
MCQ
REVISION QUESTIONS
1. Answer all parts of this question.
The following information refers to questions (a) to (d):
RWF
Direct material
0.5 kg @ RWF10 per kg
5.00
Direct labour: Skilled
0.25 hour @ RWF8 per hour
2.00
Unskilled
0.25 hour @ RWF6 per hour
1.50
Variable overheads
100% of skilled cost per unit
2.00
Fixed overheads
0.25 hours skilled labour @ RWF4 per hour
1.00
Standard absorbed cost of production
11.50
Budgeted usage of skilled labour per month is set at 1,000 hours. The standard selling
price of a “Leviathan” is RWF20.
In a recent 4 week period, 3,800 “Leviathans” were produced at the following costs:
Direct material used:
2,000 kgs costing
RWF19,930
Direct labour: Skilled
1,000 hours costing
RWF7,820
Unskilled
1,100 hours costing
RWF6,370
Variable overheads incurred
RWF4,020
Fixed overheads incurred
RWF4,100
Answer the following multiple-choice questions:
(a) In the 4 week period, the efficiency ratio (or productivity ratio) of the skilled staff
was to one decimal place:
1. 97.8%
2. 95%
3. Not quantifiable with the information given.
4. 96.1%
5. None of the above (2 marks)
(b) The variable overhead efficiency variance was:
1. RWF3,580 adverse
2. RWF7,600 favourable
3. RWF3,600 favourable
4. RWF400 adverse
(3 marks)
Page 83
(c) The budgeted level of Fixed Overheads for the month was:
1. Over absorbed by RWF100
2. Under absorbed by RWF200
3. Over absorbed by RWF80
4. Under absorbed by RWF300
(3 marks)
(d) The budgeted level of production of “leviathans” each month in units was:
1. 3,580 units
2. 3,900 units
3. 4,000 units
4. 3,800 units
(3 marks)
(e) When considering the operating statements prepared under marginal costing with
those prepared under absorption costing, which of the following statements holds
true:
1. In the long run, total profits reported under both type of statement will be
the same.
2. SSAP 9 permits the use of marginal costing for external reporting
requirements.
3. If stocks are built up between one period and the next, the profits reported
under an absorption based system will be higher than those under a
marginal costing system.
4. Reported profits cannot be affected by stock changes under an absorption
costing system.
Choices: (a) Statement 1 only is correct
(b) Statements 3 and 4 only are both correct
(c) Statement 2 only is correct
(d) Statements 1 and 3 only are correct.
(1 mark)
[Total: 12 marks]

Page 84
2. Answer all parts of this question.
(a) WTT Limited is considering whether or not to continue with production of the
“Bauble” product line. Summarised budgeted results for the upcoming financial
year are as follows:
Baubles
Gadgets
Total
RWF
RWF
RWF
Sales revenue
120,000
190,000
310,000
- Variable costs
85,000
102,000
187,000
Contribution
margin
35,000
88,000
123,000
- Fixed overheads
42,000
45,000
87,000
Net Profit/(Loss)
(7,000)
43,000
36,000
It has been determined that of the RWF42,000 of Fixed Overheads deducted from
the contribution generated by the “Baubles” product, RWF5,000 is directly
attributable to the “Baubles” product line with the remaining RWF37,000 being
an allocation of general overheads (Rent, Insurance, Light/Fans, etc) currently
incurred by the company. By discontinuing production of the “Baubles” product
line the company will be able to begin production of “Whatsits”. It is expected
that sales of this new product will generate a contribution of RWF25,000 from
which Fixed Overheads of RWF19,000 will be deducted. Of this total of
RWF19,000, the sum of RWF12,000 represents a management allocation of part
of the RWF37,000 overheads currently deducted from the contribution of the
“Baubles” product (the remaining RWF25,000 of these overheads will be
allocated to the “Gadgets” product line) and RWF7,000 represents the cost of
hiring special purpose equipment to manufacture “Whatsits”.
REQUIREMENT:
If the decision is made to drop the “Baubles” product line in favour of
“Whatsits”, the effect on the total net profits of the company would be:
(a) An increase of RWF11,000.
(b) An increase of RWF6,000.
(c) A reduction of RWF12,000.
(d) An increase of RWF13,000.
(e) None of the above. (5 marks)
Page 85
(b) Which of the following items would appear in a cash flow statement only and not
in a Profit and Loss account for the same period:
(a) Rental income received.
(b) Dividends paid.
(c) Cost of Opening Stock held at the start of a financial year.
(d) Purchase of second-hand motor vehicles.
(e) None of the above.
(1 mark)
(c) Select the statement that most precisely defines each of the following terms:
(i) The contribution to sales ratio measures:
(a) The total sales value required to be achieved in order to breakeven.
(b) The total number of units which must be sold in order to breakeven.
(c) The percentage contribution earned on the selling price of one extra
unit.
(d) The percentage gross profit mark-up on sales.
(1 mark)
(ii) An accounting system which contains separate cost accounting and
financial accounting ledgers is called a/an:
(a) Integrated system.
(b) Marginal costing system.
(c) Interlocking system.
(d) Memorandum ledger control account.
(1 mark)
(iii) Equivalent units of production are defined as:
(a) Notional whole units representing uncompleted work which are used
to apportion costs between WIP and completed output.
(b) Partially completed units which may be further processed if the
additional costs of so doing are less than potential additional
revenues.
(c) Normal levels of losses expected in a typical process costing system
which can be sold as scrap.
(d) An average valuation calculated for stocks of materials using the
cumulative weighted average pricing system.
(1 mark)
Page 86
(iv) In the context of process costing, the split-off point is defined as:
(a) The point in a process beyond which it is uneconomic to incur
additional processing costs on work-in progress.
(b) The point in a process from which production overheads are charged
to work-in-progress.
(c) The point in a process at which joint products and by-products of the
process are separately identifiable.
(d) The point at which it is more appropriate to apportion common
process costs using a sales value basis rather than a physical units
basis.
(1 mark)
(v) In stock control the reorder level is calculated as:
(a) Average stock usage *Average lead time
(b) Reorder quantity – (minimum usage * minimum lead time)
(c) Maximum stock usage * maximum lead time
(d) Average stock usage * maximum lead time
(1 mark)
(vi) In the context of cost bookkeeping, a notional cost is defined as:
(a) A cost which cannot be affected by management within a given time
period.
(b) The value of a benefit where no actual cost is incurred.
(c) A standard cost of production calculated using ideal standards.
(d) The valuation of partly completed production.
(1 mark)
(d) “Standard costing systems are widely used because they provide cost data for
many different purposes.” Briefly outline the major purposes for which a
standard costing system can be used.
(8 marks)
[Total: 20 marks]

Page 87
MCQ
ANSWERS TO REVISION QUESTIONS
1. (a)
Efficiency ratio =
Hours allowed for actual production
Hours taken for actual production
=
(13,800*.25)/1,000 = 95% efficiency
(b)
Standard cost of variable overhead based on skilled hours used
1,000 hours @ RWF8 per hour
=
RWF8,000
Variable allowed for actual production
3,800 units @ RWF2 per unit
=
RWF7,600
Variable overhead efficiency variance
=
RWF400
adverse
(c)
Budgeted Fixed overheads per month
1,000 skilled hours @ RWF1 per quarter hour
=
RWF4,000
Per
month
Overheads absorbed by production
3,800 units @ RWF1 per unit
=
RWF3,800
Under absorbed Fixed overheads
=
RWF200
(d)
Budgeted usage of skilled hours per month = 1000
Time taken per unit: 15 minutes
Budgeted level of production
=
1000/0.25 = 4,000 units
(e) Statements 1 and 3 are correct.

Page 88
2. WTT LIMITED
(a) This requires the relevant costs and revenues to be identified if the decision is
made to drop the “Baubles” product line. The main point which candidates had
to identify was that the Fixed Costs were split between relevant and non-relevant
amounts.
Relevant costs/revenues Drop line
Contribution of “Baubles” foregone (RWF35,000)
Fixed costs attributable to “Baubles” saved RWF5,000
New contribution generated from “Whatsits” RWF25,000
Additional Fixed costs incurred on “Whatsits” (RWF7,000)
Net change in Net Profits if product line dropped(RWF12,000)
Therefore the correct answer is (c).
(b) Option (d) is correct.
(c) (i) c is correct
(ii) c is correct
(iii) a is correct
(iv) c is correct
(v) c is correct
(vi) b is correct
Contribution/Sales ratio (or Profit/Volume ratio)
Interlocking; Integrated
Equivalent units of production
Page 89
(d) Points which should be made in the candidates solution include the following:
• Assists in setting budgets and evaluating management performance.
• Acts as a control device and an aid to “management by exception”.
• Can help provide a prediction of future costs for decision making purposes.
• Can assist inventory valuation.
• Provides a target for individuals. This can aid motivation.
