COMPSs Tracing Manual
User Manual:
Open the PDF directly: View PDF ![]() .
.
Page Count: 32
COMP Superscalar
COMPSs Tracing Manual
Version: 2.4.rc1906
June 1, 2019

This manual only provides information about the COMPSs tracing system. Specifi-
cally, it illustrates how to run COMPSs applications with tracing (using Extrae tool 1)
and how to visualize, interpret and analyze the obtained traces (using Paraver tool2).
For further information about the application execution, please refer to the COMPSs
User Manual: Application execution guide available at http://compss.bsc.es/releases/
compss/latest/docs/COMPSs_User_Manual_App_Exec.pdf.
For further information about the application development, please refer to the COMPSs
User Manual: Application development guide available at http://compss.bsc.es/releases/
compss/latest/docs/COMPSs_User_Manual_App_Development.pdf.
1For more information: https://www.bsc.es/computer-sciences/extrae
2For more information: https://www.bsc.es/computer-sciences/performance-tools/paraver]
i
Contents
1 COMP Superscalar (COMPSs) 1
2 Tracing 2
2.1 BasicMode ................................... 2
2.2 AdvancedMode................................. 8
2.3 Custom Installation and Configuration . . . . . . . . . . . . . . . . . . . . 11
3 Visualization 12
3.1 TraceLoading.................................. 12
3.2 Configurations.................................. 12
3.3 ViewAdjustment................................ 12
4 Interpretation 16
5 Analysis 17
5.1 GraphicalAnalysis ............................... 17
5.2 NumericalAnalysis............................... 18
Appendices 22
A PAPI: Hardware Counters 22
B Paraver: configurations 24
C User Events in Python 26
ii

List of Figures
1 Basic mode tracefile for a k-means algorithm visualized with compss runtime.cfg 7
2 Advanced mode tracefile for a testing program showing the total completed
instructions ................................... 10
3 Paravermenu .................................. 13
4 Tracefile..................................... 13
5 Paraver view adjustment: Fit window . . . . . . . . . . . . . . . . . . . . . 14
6 Paraver view adjustment: View Event Flags . . . . . . . . . . . . . . . . . 14
7 Paraver view adjustment: Show info panel . . . . . . . . . . . . . . . . . . 15
8 Paraver view adjustment: Zoom configuration . . . . . . . . . . . . . . . . 15
9 Paraver view adjustment: Zoom configuration . . . . . . . . . . . . . . . . 15
10 Traceinterpretation............................... 16
11 Basic trace view of a Hmmpfam execution. . . . . . . . . . . . . . . . . . . 17
12 Data dependencies graph of a Hmmpfam execution. . . . . . . . . . . . . . 18
13 Zoomed in view of a Hmmpfam execution. . . . . . . . . . . . . . . . . . . 18
14 Original sample trace interval corresponding to the obtained Histogram. . . 19
15 Paraver Menu - New Histogram . . . . . . . . . . . . . . . . . . . . . . . . 19
16 Hmmpfam histogram corresponding to previous trace . . . . . . . . . . . . 19
17 Paraver histogram options menu . . . . . . . . . . . . . . . . . . . . . . . . 20
18 Hmmpfam histogram with the number of bursts . . . . . . . . . . . . . . . 21
iii
1 COMP Superscalar (COMPSs)
COMP Superscalar (COMPSs) is a programming model which aims to ease the develop-
ment of applications for distributed infrastructures, such as Clusters, Grids, and Clouds.
COMP Superscalar also features a runtime system that exploits the inherent parallelism
of algorithms at execution time.
For the sake of programming productivity, the COMPSs model has four main features:
•Sequential programming: COMPSs programmers do not need to deal with the
typical duties of parallelization and distribution, such as thread creation and syn-
chronization, data distribution, messaging or fault tolerance. Instead, the model
is based on sequential programming, which makes it appealing to users that either
lack parallel programming expertise or are looking for better programmability.
•Infrastructure unaware: COMPSs offers a model that abstracts the application
from the underlying distributed infrastructure. Hence, COMPSs programs do not
include any detail that could tie them to a particular platform, like deployment or
resource management. This makes applications portable between infrastructures
with diverse characteristics.
•Standard programming languages: COMPSs is based on the popular program-
ming language Java, but also offers language bindings for Python and C/C++
applications. This facilitates the learning of the model since programmers can reuse
most of their previous knowledge.
•No APIs: In the case of COMPSs applications in Java, the model does not require
to use any particular API call, pragma or construct in the application; everything
is pure standard Java syntax and libraries. With regard the Python and C/C++
bindings, a small set of API calls should be used on the COMPSs applications.
1
2 Tracing
COMPSs Runtime has a built-in instrumentation system to generate post-execution trace-
files of the applications’ execution. The tracefiles contain different events representing the
COMPSs master state, the tasks’ execution state, and the data transfers (transfers’ in-
formation is only available when using NIO adaptor), and are useful for both visual and
numerical performance analysis and diagnosis. The instrumentation process essentially
intercepts and logs different events, so it adds overhead to the execution time of the
application.
The tracing system uses Extrae to generate tracefiles of the execution that, in turn,
can be visualized with Paraver. Both tools are developed and maintained by the Perfor-
mance Tools team of the BSC and are available on its web page http://www.bsc.es/
computer-sciences/performance-tools.
For each worker node and the master, Extrae keeps track of the events in an inter-
mediate format file (with .mpit extension). At the end of the execution, all intermediate
files are gathered and merged with Extrae’s mpi2prv command in order to create the final
tracefile, a Paraver format file (.prv). See the visualization Section 3 of this manual for
further information about the Paraver tool.
When instrumentation is activated, Extrae outputs several messages corresponding to
the tracing initialization, intermediate files’ creation, and the merging process.
At present time, COMPSs tracing features two execution modes:
Basic, aimed at COMPSs applications developers
Advanced, for COMPSs developers and users with access to its source code or custom
installations
Next sections describe the information provided by each mode and how to use them.
2.1 Basic Mode
This mode is aimed at COMPSs’ apps users and developers. It instruments computing
threads and some management resources providing information about tasks’ executions,
data transfers, and hardware counters if PAPI is available (see PAPI counters Appendix A
for more info).
2.1.1 Usage
In order to activate basic tracing one needs to provide one of the following arguments to
the execution command:
•-t
•--tracing
•--tracing=basic
•--tracing=true
2

Examples given:
runcompss --tracing application_name application_args
Figure 1 was generated as follows:
runcompss \
--lang=java \
--tracing \
--classpath=/path/to/jar/kmeans.jar \
kmeans.KMeans
When tracing is activated, Extrae generates additional output to help the user ensure
that instrumentation is turned on and working without issues. On basic mode this is the
output users should see when tracing is working correctly:
*** RUNNING JAVA APPLICATION KMEANS
Resolved: /path/to/jar/kmeans.jar:
----------------- Executing kmeans.Kmeans --------------------------
Welcome to Extrae VERSION
Extrae: Parsing the configuration file (/opt/COMPSs/Runtime/configuration/xml/tracing/extrae_basic.xml)
begins
Extrae: Tracing package is located on /opt/COMPSs/Dependencies/extrae/
Extrae: Generating intermediate files for Paraver traces.
Extrae: PAPI domain set to USER for HWC set 1
Extrae: HWC set 1 contains following counters < PAPI_TOT_INS (0x80000032) PAPI_TOT_CYC (0x8000003b)
PAPI_LD_INS (0x80000035) PAPI_SR_INS (0x80000036) > - changing every 500000000 nanoseconds
Extrae: PAPI domain set to USER for HWC set 2
Extrae: HWC set 2 contains following counters < PAPI_TOT_INS (0x80000032) PAPI_TOT_CYC (0x8000003b)
PAPI_LD_INS (0x80000035) PAPI_SR_INS (0x80000036) PAPI_L2_DCM (0x80000002) > - changing every
500000000 nanoseconds
WARNING: COMPSs Properties file is null. Setting default values
[(751) API] - Deploying COMPSs Runtime v<version>
[(753) API] - Starting COMPSs Runtime v<version>
[(753) API] - Initializing components
[(1142) API] - Ready to process tasks
...
...
...
merger: Output trace format is: Paraver
merger: Extrae VERSION
mpi2prv: Assigned nodes < Marginis >
mpi2prv: Assigned size per processor < <1 Mbyte >
mpi2prv: File set-0/TRACE@Marginis.0000001904000000000000.mpit is object 1.1.1 on node Marginis assigned to
processor 0
mpi2prv: File set-0/TRACE@Marginis.0000001904000000000001.mpit is object 1.1.2 on node Marginis assigned to
processor 0
mpi2prv: File set-0/TRACE@Marginis.0000001904000000000002.mpit is object 1.1.3 on node Marginis assigned to
processor 0
mpi2prv: File set-0/TRACE@Marginis.0000001980000001000000.mpit is object 1.2.1 on node Marginis assigned to
processor 0
mpi2prv: File set-0/TRACE@Marginis.0000001980000001000001.mpit is object 1.2.2 on node Marginis assigned to
processor 0
mpi2prv: File set-0/TRACE@Marginis.0000001980000001000002.mpit is object 1.2.3 on node Marginis assigned to
processor 0
mpi2prv: File set-0/TRACE@Marginis.0000001980000001000003.mpit is object 1.2.4 on node Marginis assigned to
processor 0
mpi2prv: File set-0/TRACE@Marginis.0000001980000001000004.mpit is object 1.2.5 on node Marginis assigned to
processor 0
3

mpi2prv: Time synchronization has been turned off
mpi2prv: A total of 9 symbols were imported from TRACE.sym file
mpi2prv: 0 function symbols imported
mpi2prv: 9 HWC counter descriptions imported
mpi2prv: Checking for target directory existance... exists, ok!
mpi2prv: Selected output trace format is Paraver
mpi2prv: Stored trace format is Paraver
mpi2prv: Searching synchronization points... done
mpi2prv: Time Synchronization disabled.
mpi2prv: Circular buffer enabled at tracing time? NO
mpi2prv: Parsing intermediate files
mpi2prv: Progress 1 of 2 ... 5% 10% 15% 20% 25% 30% 35% 40% 45% 50% 55% 60% 65% 70% 75% 80% 85% 90% 95%
done
mpi2prv: Processor 0 succeeded to translate its assigned files
mpi2prv: Elapsed time translating files: 0 hours 0 minutes 0 seconds
mpi2prv: Elapsed time sorting addresses: 0 hours 0 minutes 0 seconds
mpi2prv: Generating tracefile (intermediate buffers of 838848 events)
This process can take a while. Please, be patient.
mpi2prv: Progress 2 of 2 ... 5% 10% 15% 20% 25% 30% 35% 40% 45% 50% 55% 60% 65% 70% 75% 80% 85% 90% 95%
done
mpi2prv: Warning! Clock accuracy seems to be in microseconds instead of nanoseconds.
mpi2prv: Elapsed time merge step: 0 hours 0 minutes 0 seconds
mpi2prv: Resulting tracefile occupies 991743 bytes
mpi2prv: Removing temporal files... done
mpi2prv: Elapsed time removing temporal files: 0 hours 0 minutes 0 seconds
mpi2prv: Congratulations! ./trace/kmeans.Kmeans_compss_trace_1460456106.prv has been generated.
[ API] - Execution Finished
Extrae: Tracing buffer can hold 100000 events
Extrae: Circular buffer disabled.
Extrae: Warning! <dynamic-memory> tag will be ignored. This library does support instrumenting dynamic
memory calls.
Extrae: Warning! <input-output> tag will be ignored. This library does support instrumenting I/O calls.
Extrae: Dynamic memory instrumentation is disabled.
Extrae: Basic I/O memory instrumentation is disabled.
Extrae: Parsing the configuration file (/opt/COMPSs/Runtime/scripts/user/../../configuration/xml/tracing/
extrae_basic.xml) has ended
Extrae: Intermediate traces will be stored in /home/kurtz/compss/tests_local/app10
Extrae: Tracing mode is set to: Detail.
Extrae: Successfully initiated with 1 tasks and 1 threads
It contains diverse information about the tracing, for example, Extrae version used
(VERSION will be replaced by the actual number during executions), the XML config-
uration file used (extrae_basic.xml), the amount of threads instrumented (objects
through 1.1.1 to 1.2.5), available hardware counters (PAPI_TOT_INS (0x80000032) ...
PAPI_L3_TCM (0x80000008) ) or the name of the generated tracefile (./trace/kmeans.
Kmeans_compss_trace_1460456106.prv). When using NIO communications adaptor
with debug activated, the log of each worker also contains the Extrae initialization infor-
mation.
N.B. when using Python, COMPSs needs to perform an extra merging step in order
to add the Python-produced events to the main tracefile. If Python events are not shown,
check runtime.log file and search for the following expected output of this merging process
to find possible errors:
[(9788)(2016-11-15 11:22:27,687) Tracing] @generateTrace - Tracing: Generating trace
[(9851)(2016-11-15 11:22:27,750) Tracing] @<init> - Trace’s merger initialization successful
[(9851)(2016-11-15 11:22:27,750) Tracing] @merge - Parsing master sync events
[(9905)(2016-11-15 11:22:27,804) Tracing] @merge - Proceeding to merge task traces into master
[(9944)(2016-11-15 11:22:27,843) Tracing] @merge - Merging finished,
[(9944)(2016-11-15 11:22:27,843) Tracing] @merge - Temporal task folder removed.
4
2.1.2 Instrumented Threads
Basic traces instrument the following threads:
•Master node (3 threads)
–COMPSs runtime
–Task Dispatcher
–Access Processor
•Worker node (1 + Computing Units)
–Main thread
–Number of threads available for computing
2.1.3 Information Available
The basic mode tracefiles contain three kinds of information:
Events, marking diverse situations such as the runtime start, tasks’ execution or syn-
chronization points.
Communications, showing the transfers and requests of the parameters needed by
COMPSs tasks.
Hardware counters, of the execution obtained with Performance API (see PAPI coun-
ters appendix A)
2.1.4 Trace Example
Figure 1 is a tracefile generated by the execution of a k-means clustering algorithm. Each
timeline contains information of a different resource, and each event’s name is on the
legend. Depending on the number of computing threads specified for each worker, the
number of timelines varies. However the following threads are always shown:
Master - Thread 1.1.1,
this timeline shows the actions performed by the main thread of the COMPSs ap-
plication
Task Dispatcher - Thread 1.1.2,
shows information about the state and scheduling of the tasks to be executed.
Access Processor - Thread 1.1.3,
all the events related to the tasks’ parameters management, such as dependencies
or transfers are shown in this thread.
Worker X Master - Thread 1.X.1,
this thread is the master of each worker and handles the computing resources and
transfers. Is is repeated for each available resource. All data events of the worker,
such as requests, transfers and receives are marked on this timeline (when using the
appropriate configurations).
5
Worker X Computing Unit Y - Thread 1.X.Y
shows the actual tasks execution information and is repeated as many times as
computing threads has the worker X
6
Figure 1: Basic mode tracefile for a k-means algorithm visualized with compss runtime.cfg
7

2.2 Advanced Mode
This mode is for more advanced COMPSs’ users and developers who want to customize
further the information provided by the tracing or need rawer information like pthreads
calls or Java garbage collection. With it, every single thread created during the execution
is traced.
N.B.: The extra information provided by the advanced mode is only available on the
workers when using NIO adaptor.
2.2.1 Usage
In order to activate the advanced tracing add the following option to the execution:
•--tracing=advanced
Examples given:
runcompss --tracing=advanced application_name application_args
Figure 2 was generated as follows:
runcompss \
--lang=java \
--tracing=advanced \
--classpath=/path/to/jar/kmeans.jar \
kmeans.KMeans
When advanced tracing is activated, the configuration file reported on the output is
extrae advanced.xml.
*** RUNNING JAVA APPLICATION KMEANS
...
...
...
Welcome to Extrae VERSION
Extrae: Parsing the configuration file (/opt/COMPSs/Runtime/scripts/user/../../configuration/xml/tracing/
extrae_advanced.xml) begins
This is the default file used for advanced tracing. However, advanced users can modify
it in order to customize the information provided by Extrae. The configuration file is read
first by the master on the runcompss script. When using NIO adaptor for communication,
the configuration file is also read when each worker is started (on persistent worker.sh or
persistent worker starter.sh depending on the execution environment).
If the default file is modified, the changes always affect the master, and also the work-
ers when using NIO. Modifying the scripts which turn on the master and the workers is
possible to achieve different instrumentations for master/workers. However, not all Extrae
available XML configurations work with COMPSs, some of them can make the runtime
or workers crash so modify them at your discretion and risk. More information about
8

instrumentation XML configurations on Extrae User Guide at: https://www.bsc.es/
computer-sciences/performance-tools/trace-generation/extrae/extrae-user-guide.
2.2.2 Instrumented Threads
Advanced mode instruments all the pthreads created during the application execution. It
contains all the threads shown on basic traces plus extra ones used to call command-line
commands, I/O streams managers and all actions which create a new process. Due to the
temporal nature of many of this threads, they may contain little information or appear
just at specific parts of the execution pipeline.
2.2.3 Information Available
The advanced mode tracefiles contain the same information as the basic ones:
Events, marking diverse situations such as the runtime start, tasks’ execution or syn-
chronization points.
Communications, showing the transfers and requests of the parameters needed by
COMPSs tasks.
Hardware counters, of the execution obtained with Performance API (see PAPI coun-
ters appendix A)
2.2.4 Trace Example
Figure 2 shows the total completed instructions for a sample program executed with the
advanced tracing mode. Note that the thread - resource correspondence described on
the basic trace example is no longer static and thus cannot be inferred. Nonetheless,
they can be found thanks to the named events shown in other configurations such as
compss runtime.cfg.
9
Figure 2: Advanced mode tracefile for a testing program showing the total completed instructions
10

For further information about Extrae, please visit the following site:
http://www.bsc.es/computer-science/extrae
2.3 Custom Installation and Configuration
2.3.1 Custom Extrae
COMPSs uses the environment variable EXTRAE_HOME to get the reference to its instal-
lation directory (by default: /opt/COMPSs/Dependencies/extrae ). However, if the
variable is already defined once the runtime is started, COMPSs will not override it. User
can take advantage of this fact in order to use custom extrae installations. Just set the
EXTRAE_HOME environment variable to the directory where your custom package is, and
make sure that it is also set for the worker’s environment.
Be aware that using different Extrae packages can break the runtime and executions
so you may change it at your own risk.
2.3.2 Custom Configuration file
COMPSs offers the possibility to specify an extrae custom configuration file in order to
harness all the tracing capabilities further tailoring which information about the execution
is displayed. To do so just pass the file as an execution parameter as follows:
•--extrae config file=/path/to/config/file.xml
The configuration file must be in a shared disk between all COMPSs workers because
a file’s copy is not distributed among them, just the path to that file.
11

3 Visualization
Paraver is the BSC tool for trace visualization. Trace events are encoded in Paraver
format (.prv) by the Extrae tool. Paraver is a powerful tool and allows users to show
many views of the trace data using different configuration files. Users can manually load,
edit or create configuration files to obtain different tracing views.
The following subsections explain how to load a trace file into Paraver, open the task
events view using an already predefined configuration file, and how to adjust the view to
display the data properly.
For further information about Paraver, please visit the following site:
http://www.bsc.es/computer-sciences/performance-tools/paraver
3.1 Trace Loading
The final trace file in Paraver format (.prv) is at the base log folder of the application
execution inside the trace folder. The fastest way to open it is calling the Paraver binary
directly using the tracefile name as the argument.
wxparaver /path/to/trace/trace.prv
3.2 Configurations
To see the different events, counters and communications that the runtime generates, di-
verse configurations are available with the COMPSs installation. To open one of them, go
to the “Load Configuration” option in the main window and select “File”. The configura-
tion files are under the following path for the default installation /opt/COMPSs/Dependencies/
paraver/cfgs/. A detailed list of all the available configurations can be found in Ap-
pendix B.
The following guide uses the compss tasks.cfg as an example to illustrate the basic
usage of Paraver. After accepting the load of the configuration file, another window
appears showing the view. Figures 3 and 4 show an example of this process.
3.3 View Adjustment
In a Paraver view, a red exclamation sign may appear in the bottom-left corner (see
Figure 4 in the previous section). This means that some event values are not being shown
(because they are out of the current view scope), so little adjustments must be made to
view the trace correctly:
•Fit window: modifies the view scope to fit and display all the events in the current
window.
–Right click on the trace window
–Choose the option Fit Semantic Scale / Fit Both
12
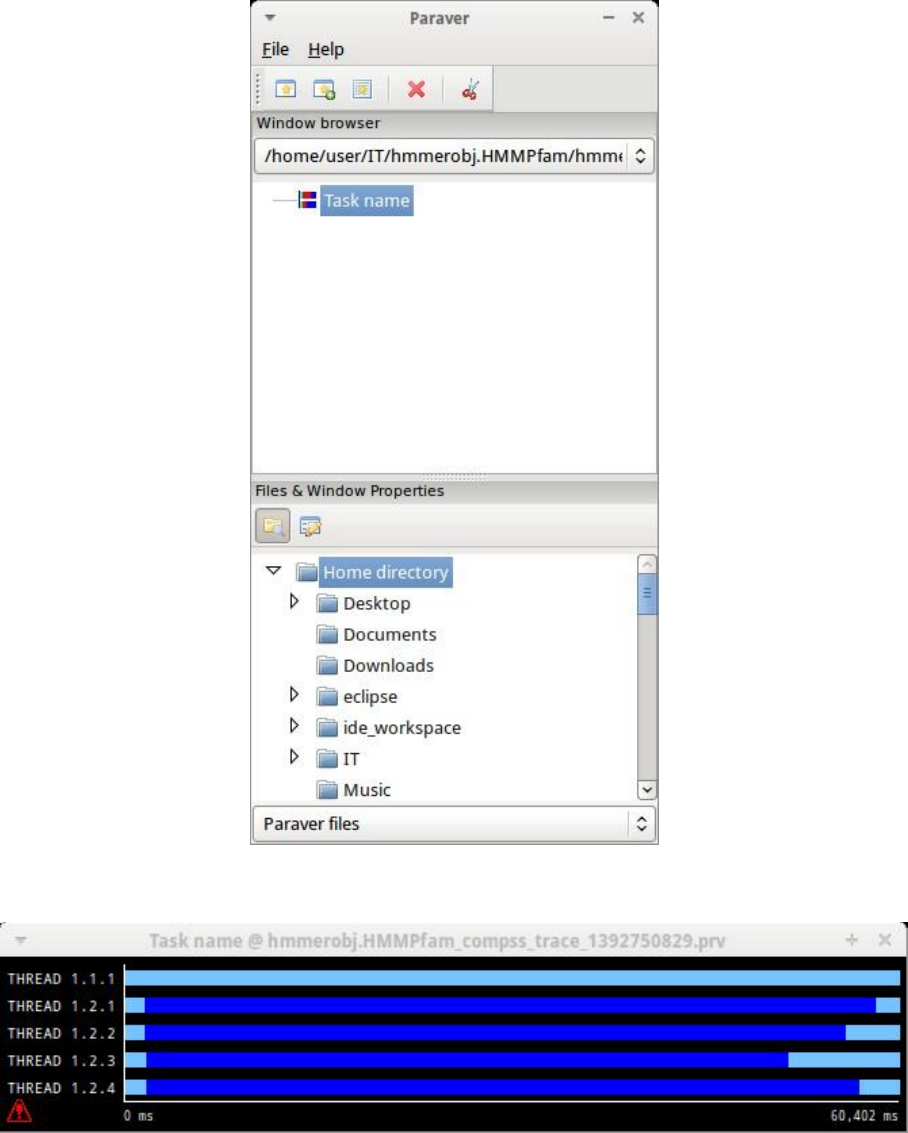
Figure 3: Paraver menu
Figure 4: Trace file
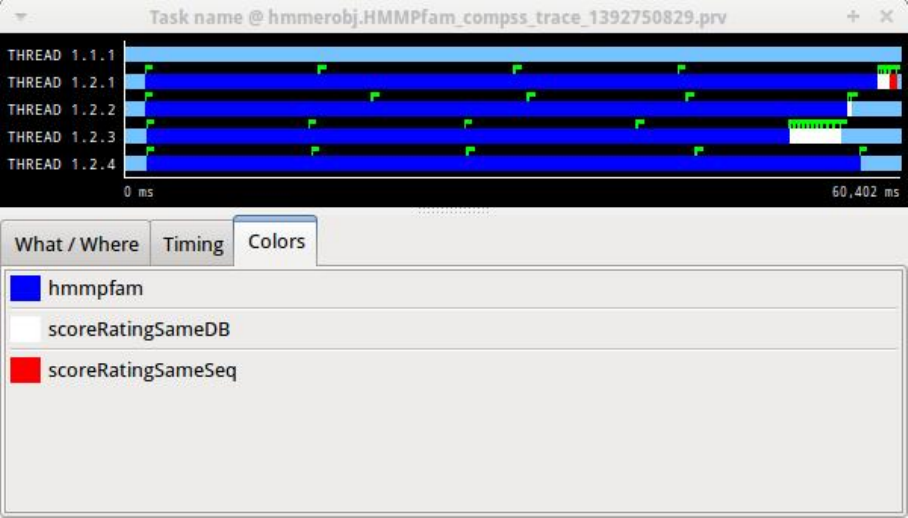
•View Event Flags: marks with a green flag all the emitted the events.
–Right click on the trace window
–Chose the option View / Event Flags
13
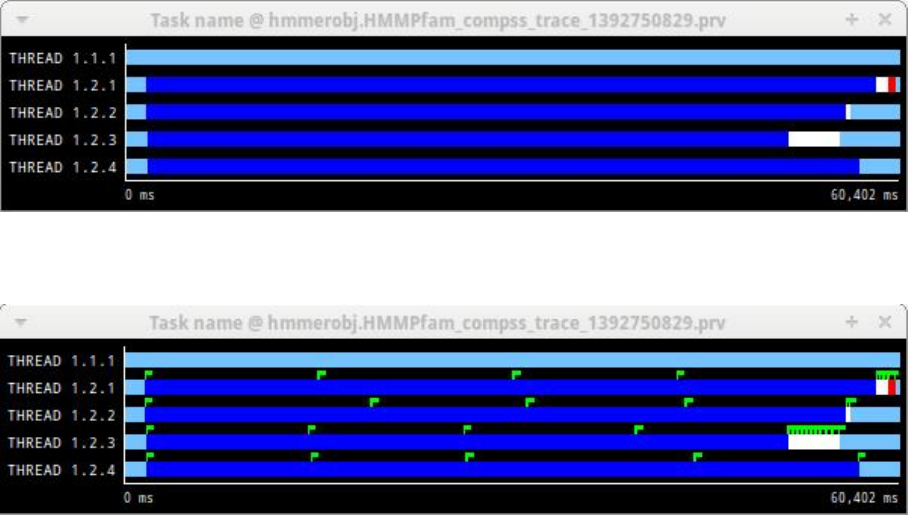
Figure 5: Paraver view adjustment: Fit window
Figure 6: Paraver view adjustment: View Event Flags
•Show Info Panel: display the information panel. In the tab “Colors” we can see the
legend of the colors shown in the view.
–Right click on the trace window
–Check the Info Panel option
–Select the Colors tab in the panel
•Zoom: explore the tracefile more in-depth by zooming into the most relevant sec-
tions.
–Select a region in the trace window to see that region in detail
–Repeat the previous step as many times as needed
–The undo-zoom option is in the right click panel
14

Figure 7: Paraver view adjustment: Show info panel
Figure 8: Paraver view adjustment: Zoom configuration
Figure 9: Paraver view adjustment: Zoom configuration
15
4 Interpretation
This section explains how to interpret a trace view once it has been adjusted as described
in the previous section.
•The trace view has on its horizontal axis the execution time and on the vertical axis
one line for the master at the top, and below it, one line for each of the workers.
•In a line, the light blue color is associated with an idle state, i.e. there is no event
at that time.
•Whenever an event starts or ends a flag is shown.
•In the middle of an event, the line shows a different color. Colors are assigned
depending on the event type.
•The info panel contains the legend of the assigned colors to each event type.
Figure 10: Trace interpretation
16

5 Analysis
This section gives some tips to analyze a COMPSs trace from two different points of view:
graphically and numerically.
5.1 Graphical Analysis
The main concept is that computational events, the task events in this case, must be well
distributed among all workers to have a good parallelism, and the duration of task events
should be also balanced, this means, the duration of computational bursts.
Figure 11: Basic trace view of a Hmmpfam execution.
In the previous trace view, all the tasks of type “hmmpfam” in dark blue appear to
be well distributed among the four workers, each worker executes four “hmmpfam” tasks.
However, some workers finish earlier than the others, worker 1.2.3 finish the first and
worker 1.2.1 the last. So there is an imbalance in the duration of “hmmpfam” tasks. The
programmer should analyze then whether all the tasks process the same amount of input
data and do the same thing in order to find out the reason for such imbalance.
Another thing to highlight is that tasks of type “scoreRatingSameDB” are not equally
distributed among all the workers. Some workers execute more tasks of this type than
the others. To understand better what happens here, one needs to take a look to the
execution graph and also zoom in the last part of the trace.
There is only one task of type “scoreRatingSameSeq”. This task appears in red in
the trace (and in light-green in the graph). With the help of the graph we see that the
“scoreRatingSameSeq” task has dependences on tasks of type “scoreRatingSameDB”, in
white (or yellow).
17
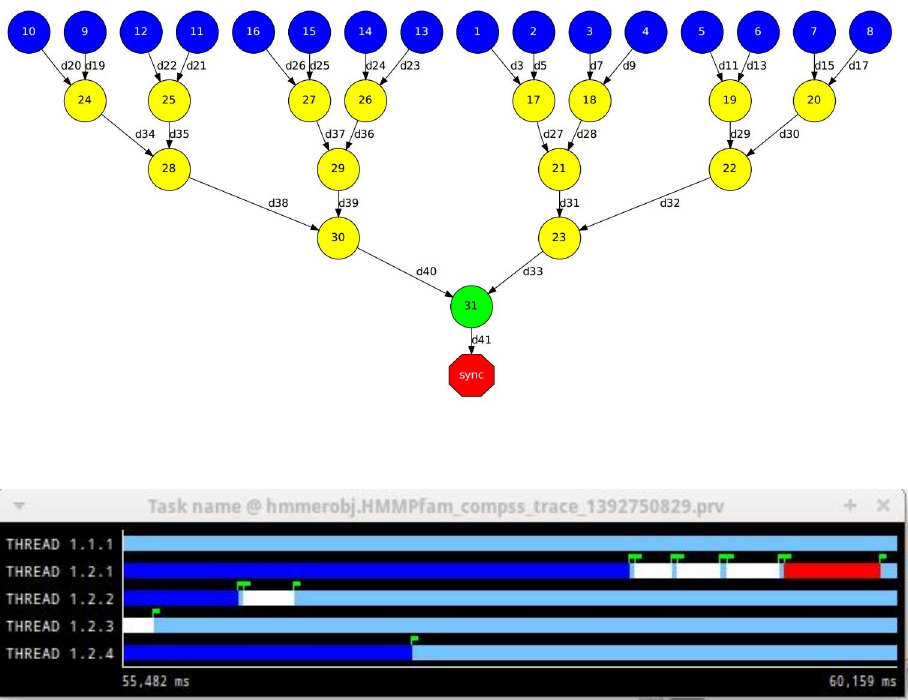
Figure 12: Data dependencies graph of a Hmmpfam execution.
Figure 13: Zoomed in view of a Hmmpfam execution.
When the last task of type “hmmpfam” (in dark blue) ends, the previous dependencies
are solved, and if we look at the graph, this means going across a path of three dependen-
cies of type “scoreRatingSameDB” (in yellow). Moreover, because these are sequential
dependencies (one depends on the previous) no more than a worker can be used at the
same time to execute the tasks. This is the reason of why the last three task of type
“scoreRatingSameDB” (in white) are executed in worker 1.2.1 sequentially.
5.2 Numerical Analysis
Here we show another trace from a different parallel execution of the Hmmer program.
Paraver offers the possibility of having different histograms of the trace events. Click
the “New Histogram” button in the main window and accept the default options in the
“New Histogram” window that will appear.
After that, the following table is shown. In this case for each worker, the time spent
executing each type of task is shown. Task names appear in the same color than in the
trace view. The color of a cell in a row corresponding to a worker ranges from light-green
for lower values to dark-blue for higher ones. This conforms a color based histogram.
The previous table also gives, at the end of each column, some extra statistical in-
formation for each type of tasks (as the total, average, maximum or minimum values,
18
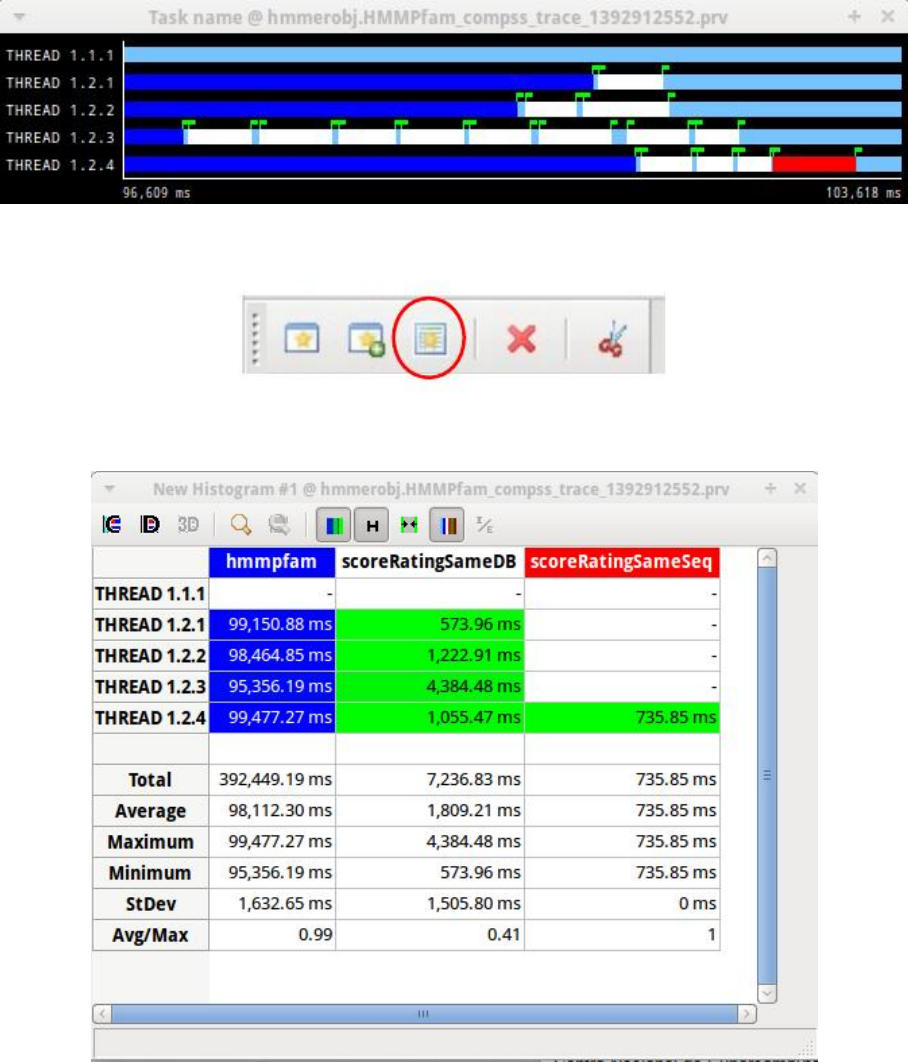
Figure 14: Original sample trace interval corresponding to the obtained Histogram.
Figure 15: Paraver Menu - New Histogram
Figure 16: Hmmpfam histogram corresponding to previous trace
etc.).
19
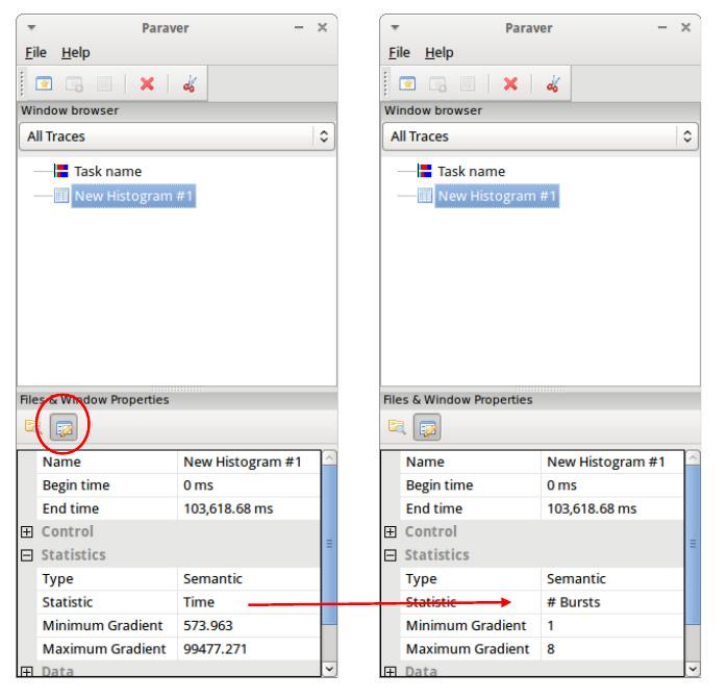
In the window properties of the main window, it is possible to change the semantic of
the statistics to see other factors rather than the time, for example, the number of bursts.
Figure 17: Paraver histogram options menu
20
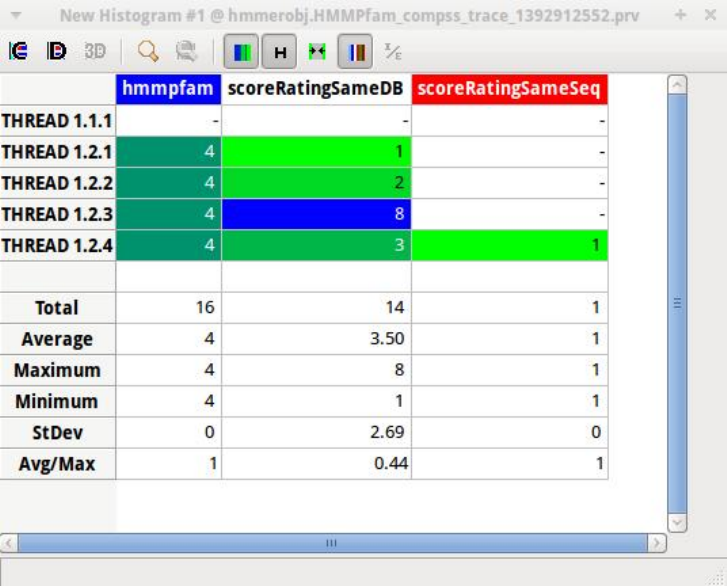
In the same way as before, the following table shows for each worker the number of
bursts for each type of task, this is, the number or tasks executed of each type. Notice
the gradient scale from light-green to dark-blue changes with the new values.
Figure 18: Hmmpfam histogram with the number of bursts
21
Appendices
Appendix A PAPI: Hardware Counters
The applications instrumentation supports hardware counters through the performance
API (PAPI). In order to use it, PAPI needs to be present on the machine before installing
COMPSs.
During COMPSs installation it is possible to check if PAPI has been detected in the
Extrae config report:
Package configuration for Extrae VERSION based on extrae/trunk rev. XXXX:
-----------------------
Installation prefix: /opt/COMPSs/Dependencies/extrae
Cross compilation: no
...
...
...
Performance counters: yes
Performance API: PAPI
PAPI home: /usr
Sampling support: yes
N.B. PAPI detection is only performed in the machine where COMPSs is installed.
User is responsible of providing a valid PAPI installation to the worker machines to be
used (if they are different from the master), otherwise workers will crash because of the
missing libpapi.so.
PAPI installation and requirements depend on the OS. On Ubuntu 14.04 it is available
under textitpapi-tools package; on OpenSuse textitpapi and textitpapi-dev. For more
information check https://icl.cs.utk.edu/projects/papi/wiki/Installing_PAPI.
Extrae only supports 8 active hardware counters at the same time. Both basic and
advanced mode have the same default counters list:
PAPI TOT INS Instructions completed
PAPI TOT CYC Total cycles
PAPI LD INS Load instructions
PAPI SR INS Store instructions
PAPI BR UCN Unconditional branch instructions
PAPI BR CN Conditional branch instructions
PAPI VEC SP Single precision vector/SIMD instructions
RESOURCE STALLS Cycles Allocation is stalled due to Resource Related reason
The XML config file contains a secondary set of counters. In order to activate it
just change the starting-set-distribution from 2 to 1 under the cpu tag. The second set
provides the following information:
22

PAPI TOT INS Instructions completed
PAPI TOT CYC Total cycles
PAPI L1 DCM Level 1 data cache misses
PAPI L2 DCM Level 2 data cache misses
PAPI L3 TCM Level 3 cache misses
PAPI FP INS Floating point instructions
To further customize the tracked counters, modify the XML to suit your needs. To
find the available PAPI counters on a given computer issue the command papi avail -a.
For more information about Extrae’s XML configuration refer to https://www.bsc.es/
computer-sciences/performance-tools/trace-generation/extrae/extrae-user-guide.
23
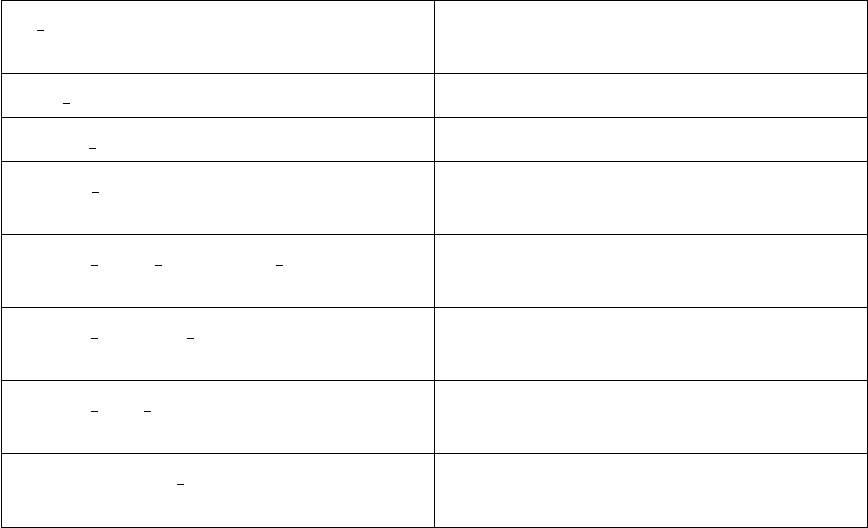
Appendix B Paraver: configurations
Tables 1, 2 and 3 provide information about the different pre-build configurations that are
distributed with COMPSs and that can be found under the /opt/COMPSs/Dependencies/
paraver/cfgs/ folder. The cfgs folder contains all the basic views, the python folder
contains the configurations for Python events, and finally the comm folder contains the
configurations related to communications.
2dp runtime state.cfg 2D plot of runtime state
2dp tasks.cf g 2D plot of tasks duration
3dh duration runtime.cfg 3D Histogram of runtime execution
3dh duration tasks.cf g 3D Histogram of tasks duration
compss runtime.cfg Shows COMPSs Runtime events (mas-
ter and workers)
compss tasks and runtime.cf g Shows COMPSs Runtime events (mas-
ter and workers) and tasks execution
compss tasks.cf g Shows tasks execution
compss tasks numbers.cf g Shows tasks execution by task id
Interval between runtime.cf g Interval between runtime events
thread cpu.cfg Shows the initial executing CPU.
Table 1: General paraver configurations for COMPSs Applications
3dh events inside task.cf g 3D Histogram of python events
3dh events inside tasks.cf g Events showing python information such
as user function execution time, modules
imports, or serializations.
Table 2: Available paraver configurations for Python events of COMPSs Applications
24
sr bandwith.cfg Send/Receive bandwith view for each
node
send bandwith.cfg Send bandwith view for each node
receive bandwith.cf g Receive bandwith view for each node
process bandwith.cfg Send/Receive bandwith table for each
node
compss tasks scheduling transfers.cf g Task’s transfers requests for scheduling
(gradient of tasks ID)
compss tasksID transf ers.cf g Task’s transfers request for each task
(task with its IDs are also shown)
compss data transfers.cf g Shows data transfers for each task’s pa-
rameter
communication matrix.cfg Table view of communications between
each node
Table 3: Available paraver configurations for COMPSs Applications
25
Appendix C User Events in Python
Users can emit custom events inside their python tasks. Thanks to the fact that python
isn’t a compiled language, users can emit events inside their own tasks using the available
extrae instrumentation object because it is already imported.
To emit an event first import pyextrae just use the call pyextrae.event(type, id)
or pyextrae.eventand counters (type, id) if you also want to emit PAPI hardware
counters. It is recommended to use a type number higher than 8000050 in order to avoid
type’s conflicts. This events will appear automatically on the generated trace. In order to
visualize them, take, for example, compss_runtime.cfg and go to Window Properties -> Filter -> Events
-> Event Type and change the value labeled Types for your custom events type. If you
want to name the events, you will need to manually add them to the .pcf file. Paraver
uses by default the .pcf with the same name as the tracefile so if you add them to one,
you can reuse it just by changing its name to the tracefile.q
More information and examples of common python usage can be found under the
default directory /opt/COMPSs/Dependencies/extrae/share/examples/PYTHON.
26
