THE INSTITUTE OF CPA A2.1 STRATEGIC CORPORATE FINANCE Study Manual
User Manual:
Open the PDF directly: View PDF ![]() .
.
Page Count: 206 [warning: Documents this large are best viewed by clicking the View PDF Link!]
- INTRODUCTION TO THE COURSE
- Definition of Risk
- 1. Adjust The Discount Rate
- 2. Payback Period – Applying A Time Limit
- 3. Sensitivity Analysis
- 4. Certainty Equivalent
- 5. Expected Values
- 6. Standard Deviation of the NPV
- 7. Simulation
- A. OVERVIEW OF WORKING CAPITAL MANAGEMENT
- B. CASH MANAGEMENT
- C. THE MANAGEMENT OF DEBTORS
- D. THE MANAGEMENT OF CREDITORS
- E. THE MANAGEMENT OF STOCKS
- A. INTRODUCTION
- C. EXCHANGE RISK
- D. METHODS OF REDUCING RISK
- Study Unit 14
- Present Value Table

CPA
Certified Public Accountant Examination
Stage: Advanced Level 2 A2.1
Subject Title: Strategic Corporate Finance
Study Manual
LOSSARY
INSIDE COVER - BLANK

Page 1
© iCPAR
All rights reserved.
The text of this publication, or any part thereof, may not be reproduced or transmitted in any
form or by any means, electronic or mechanical, including photocopying, recording, storage
in an information retrieval system, or otherwise, without prior permission of the publisher.
Whilst every effort has been made to ensure that the contents of this book are accurate, no
responsibility for loss occasioned to any person acting or refraining from action as a result of
any material in this publication can be accepted by the publisher or authors. In addition to
this, the authors and publishers accept no legal responsibility or liability for any errors or
omissions in relation to the contents of this book.
INSTITUTE OF
CERTIFIED PUBLIC ACCOUNTANTS
OF
RWANDA
Advanced Level 2
A2.1 STRATEGIC CORPORATE
FINANCE
First Edition 2012
This study manual has been fully revised and updated
in accordance with the current syllabus.
It has been developed in consultation with experienced lecturers.

Page 2
BLANK

Page 3
CONTENTS
Study Unit
Title
Page
Introduction to the Course
7
1
Objectives of Financial Management
11
Introduction
12
Agency Theory
12
Nationalised Industries/Public Sector
13
Corporate Social Responsibility (CSR)
13
Impact of Government on Activities
16
Composition of Shareholders
16
2
Corporate Governance
17
Introduction
18
Best Practice
18
3
Investment Appraisal – Introduction
19
Nature and Stages of Investment Appraisal
20
Investment Appraisal Techniques
21
Relevant Cash Flows
30
4
Investment Appraisal – Impact of Taxation
35
Introduction
36
Corporation Tax
36
Capital Allowances
36
Timing of Taxation Effects
37
Worked Examples
37
5
Investment Appraisal – Impact of Inflation
41
Introduction
42
Real v Nominal/Money Discount Rates
42
Handling Different Rates of Inflation
45
General Considerations – Inflation
45
6
Investment Appraisal – Risk & Uncertainty
47
Introduction
48
Methods of Treating Risk & Uncertainty
48
7
Working Capital Management
55
Overview of Working Capital Management
56
Cash Management
60
The Management of Debtors
66
The Management of Creditors
73
The Management of Stocks
74

Page 4
Study Unit
Title
Page
8
Capital Markets
77
Introduction
78
Main Functions of Capital Markets
78
Capital Providers
78
Company Flotation
78
Going Private
79
Efficient Markets
79
9
Long-Term Sources of Finance
81
Introduction
82
Share Capital
82
Loan Capital
84
Warrants
86
Methods of Share Issues
87
Bank Lending
88
10
Venture Capital
89
Introduction
90
Stages of Investment
90
Specialist Areas
91
Business Plan
91
Types of Financing Structure
91
Methods of Withdrawal by Venture Capitalist
92
Case Study
92
11
Dividend Policy
95
Introduction
96
Practical Considerations
96
Scrip Dividends
97
Share Repurchase (Share Buyback)
97
Share Splits
98
12
Leasing
99
Introduction
100
Operating and Finance Leases
100
Advantages of Leasing
100
Sale and Leaseback
101
Hire Purchase
101
Lease v Buy
101

Page 5
Study Unit
Title
Page
13
Foreign Exchange
105
Introduction
106
Factors to Consider – International Trade
107
Exchange Risk
108
Methods of Reducing Risk
111
14
Interest Rate Management
121
Introduction
122
Risk Management – Main Techniques/Instruments
123
15
Performance Appraisal
133
Introduction
134
Categories of Ratios
135
Z-Scores
139
16
Mergers and Acquisitions
141
Introduction
142
Types of Combinations
142
Reasons for Acquisition
142
Impact of Acquisition
143
Purchase Consideration
144
Defence Tactics
145
Management Buy Out (MBO)
145
Demergers
147
Mezzanine Finance
147
Due Diligence
148
Post-Acquisition Issues
149
Ethical Considerations
149
17
Company Valuations
151
Introduction
152
Valuation Bases
152
18
Cost of Capital
155
Introduction
156
Calculation of Cost of Capital
156
Weighted Average Cost of Capital (WACC)
159
19
Portfolio Theory
161
Introduction
162
Portfolio Risk and Return
162

Page 6
Study Unit
Title
Page
20
Capital Asset Pricing Model
165
Introduction
166
Systematic and Unsystematic Risk
166
21
Business Plans
169
Introduction
170
Structure of Business Plan
170
22
International Finance
175
Introduction
176
International capital Markets
176
International Franchises and Licences
177
International Money Markets
178
International (Foreign) Bonds
178
International Certificates of Deposit
178
Multicurrency Bonds
179
Multicurrency Cocktail Bonds
179
Foreign Exchange Risk
180
International Project Finance
189
23
Sundry Definitions
191
Introduction
192
Sundry Definitions
192
Present Value Table
203
Annuity Table
204
Page 7
INTRODUCTION TO THE COURSE
Stage: Advanced Level 2
Subject Title: A2.1 Strategic Corporate Finance
Aim
The aim of this subject is to enable students to understand the key responsibilities and
financing decisions facing today’s strategic financial manager. Students should be able to
develop detailed business plans, to assess the potential financial risks and to advise on
suitable risk management strategies for entrepreneurial activities and established
organisations.
Strategic Corporate Finance as an Integral Part of the Syllabus
Strategic Corporate Finance develops the financial management skills acquired by students
in Managerial Finance (A1) and other disciplines acquired in the earlier examination stages.
Strategic Corporate Finance requires students to integrate and expand that knowledge so as
to provide a framework for strategic financial management analysis and decisions.
Learning Outcomes
On successful completion of this subject students should be able to:
• Evaluate the financial objectives of an organisation, explain how they are determined
and interrelate with the non-financial objectives and stakeholder interests.
• Discuss the legal regulations, the professional and ethical considerations facing
financial managers.
• Value shares / businesses in the context of a proposed merger, acquisition or
management buyout.
• Analyse reasons for and advise on actions to prevent corporate failure.
• Evaluate and advise as to the optimum capital gearing structure, term structure and
dividend policy for an organisation.
• Advise as to appropriate exchange risk and interest rate risk management strategies and
discuss the use of derivatives in long term risk management.
• Discuss the relevance of portfolio theory and the Capital Asset Pricing Model to
financial managers.
• Prepare a business plan for an organisation given prescribed information.
• Evaluate the financial management of an organisation over a period of time and/or
relative to competitors / industry norms.
Page 8
Syllabus:
1. Financial Environment
• Determining financial objectives within the strategic planning process.
• Identify key stakeholders of organisations and the interests of each stakeholder
group.
• Corporate Social Responsibility, its relationship to the objective of maximising
shareholder wealth.
• Agency theory and its relevance to financial managers.
• The professional, regulatory and legal framework relevant to financial management
including stock exchange requirements, money laundering, directors’
responsibilities.
• Monetary regulation and its effect on Capital Markets.
• The key activities undertaken by treasury managers.
• Centralised treasury management and the arguments for and against.
• The efficient market hypothesis.
2. Mergers and Acquisitions
• Organic and acquisitive corporate growth.
• Mergers and acquisitions, the arguments for and against.
• Procedures to be complied with during an acquisition.
• Valuation of an organisation in the context of a potential takeover using both the
earnings and assets based methodologies.
• The significance of Value Gaps and the information efficiency of capital markets.
• Methods of financing mergers and takeovers including cash, debt, equity and
hybrids.
• Defence tactics used during a hostile takeover.
• The role of legal and financial due diligence during a merger/acquisition.
• The attractions and risks associated with Management Buy-outs (MBOs).
• Sources of finance for MBOs.
• The advantages and disadvantages of management buy-ins.
• The arguments for and against a quoted company going private.
3. Corporate Failure
• The symptoms and causes of corporate failure.
• Avoidance of corporate failure.
• The nature, scope and elements of working capital and the importance of effective
working capital management to corporate survival.
• Overtrading- symptoms, causes and remedies.
Page 9
4. Sources of Finance
• Equity and debt financing.
• The attractions and risks associated with each.
• Short, medium and long term funding.
• Optimising the gearing structure of an organisation.
• The optimum term structure of an organisation, taking into account strategic plans.
• Dividend policy - key considerations. Including theories of Mogdalini & Miller and
Myers Pecking Order Hypothesis.
• Advise on dividend policy.
• Investment from overseas.
5. Financial Risk Management
• The key financial risks facing an organisation.
• Currency risk - transaction, translation and economic exposure.
• The workings of the foreign exchange markets.
• The relationship between foreign exchange rates and interest rates in different
countries.
• Forward Exchange Contract and Money Market hedges.
• Other forms of exchange rate risk management including, netting, leading and
lagging, currency swaps, currency futures and currency options.
• Exchange risk management strategies.
• Interest rate options, swaps, forwards, futures and swap options.
• Interest rate risk management strategy.
6. Cost of Capital
• Weighted Average Cost of Capital (WACC) - calculate and discuss its uses and
limitations
• Portfolio diversification, estimate the risk and return of a portfolio
• The relevance of portfolio theory to practical financial management.
• The Capital Assets Pricing Model (CAPM) – application and limitations.
7. Financial Analysis and Business Planning
• Preparation of long-term business plans from prescribed information.
• Appraise capital investment options using NPV, IRR and Payback criteria.
• Evaluation of a business plan from the perspective of an equity investor or provider of
debt funding.
• Assessment an organisation’s current financial position.
• Comparison and evaluation of the financial management of an organisation with that
of competitors and industry norms.
• Preparation, evaluation and discussion of key financial management indicators based
on the published financial statements of an organisation.
• Benchmarking of selected financial KPIs against companies in the same industry
sector.
Page 10
8. International Managerial Finance
• International capital markets
• International money markets
• Euro Markets, Euro Equity Markets, Euro Currency Markets
• Foreign Bonds
• International CDs
• International Bond Markets
• Project Finance
• Currency Cocktails
• Foreign financial intermediaries
• International financial institutions
• Bilateral, multilateral and regional financial institutions
• Integration & Segmentation of financial markets
• Hedging Instruments

Page 11
Study Unit 1
Objectives of Financial Management
Contents
A. Introduction
B. Agency Theory
C. Nationalised Industries/Public Sector
D. Corporate Social Responsibility (CSR)
E. Impact of Government on Activities
F. Composition of Shareholders

Page 12
A. INTRODUCTION
It is often assumed that the single objective of commercial entities is:
To Maximise the Value of the Firm
Or
To Maximise the Wealth of the Shareholders
In reality, firms have multiple, and often conflicting, objectives and will seek to optimise
among those. The modern corporation is a complex entity which is responsible not only to
shareholders but to all stakeholders.
The main stakeholders are:
1. Shareholders
2. Loan Creditors – seek security, repayment of loan interest and principal.
3. Employees – seek fair wages, promotional opportunities, welfare & social facilities =>
improved motivation.
4. Management - job security; fair reward; job satisfaction.
5. Trade Creditors - payment within credit terms.
6. The Community - sponsorship; charities; install environmental measures.
7. The Government - payment of taxes, rates, provide employment.
8. Customers - provision of service/goods at fair price; quality; on time etc.
The relative importance of the various groups may differ, possibly depending on company
size and management style.
Management will be concerned with the value of the firm as it satisfies one of the important
stakeholders (shareholders). A low valuation may increase the possibility of an unwanted
takeover bid. Also, finance must be adequately rewarded and its market value maintained, so
that further finance is obtainable when required.
Non-financial objectives may conflict with financial objectives – e.g. provision of staff
recreational facilities; modern, safe working environment etc.
B. AGENCY THEORY
The managers/directors act as agents for the shareholders (owners) in running the company.
This separation of ownership from control may lead to certain problems if managers are not
monitored or constrained - e.g. management working inefficiently; adopting risk averse
policies such as ‘safe’ short-term investments and low gearing; empire building for
power/status; rewarding themselves with high salaries and fringe benefits; increased leisure
time etc.
Page 13
Managers’ and shareholders’ interests can be aligned by a number of measures - introducing
profit-related remuneration for management; offering bonus shares; share option schemes;
scrutiny of performance by the board of directors and banks who provide finance etc.
However, care must be taken to ensure that management does not take action to boost
performance in the short-term to the detriment of the long-term wealth of the shareholders
(‘short-termism’).
C. NATIONALISED INDUSTRIES/PUBLIC SECTOR
The objectives of nationalised industries are likely to be strongly influenced by the
government and not primarily financial. These organisations exist to provide a service and to
ensure that social needs are satisfied and financial requirements may be seen as constraints
and not objectives. They are not usually profit maximising, although subsidiary objectives
may be concerned with earning an acceptable return on capital employed.
In the private sector the effects of investments (and associated financing and dividend
decisions) on share price and shareholder wealth will be considered. As there are no share
prices in a nationalised industry and investor wealth maximisation is not the assumed
objective, some private sector investment appraisal techniques will not be appropriate.
However, some private sector financial management techniques can be used in the public
sector - e.g. discounted cash flow is often used.
D. CORPORATE SOCIAL RESPONSIBILITY (CSR)
Corporate Social Responsibility (CSR) is often used to describe the actions of a private,
commercial organisation assuming a responsible view of its wider obligations to society.
Corporate Social Responsibility has been otherwise defined as:
“fulfilling a role wider than your strict economic role” or “acting as a good corporate citizen”.
The theory of business finance is that the prime objective of management of a listed company
is to maximise the wealth of its ordinary shareholders. Agency theory dictates that
management, as agents of the company’s owners, must act in their best interests and, thus,
strive to maximise shareholders wealth at all times. In their attempt to achieve this prime
objective management will set financial objectives, including:
• Profit levels
• Sales and profit growth
• Margin improvement
• Cost releasing efficiency savings
• EPS growth
Page 14
Management will also set non-financial objectives, which should complement and support the
financial objectives. These may include:
• Brand awareness levels
• Research & development successes
• New product development
• New markets entered
• Customer satisfaction levels
• Employee motivation levels
Such objectives may also include the following:
• Providing for the welfare of employees and management
• Upholding responsibilities to customers and suppliers
• Provision of a service.
• Contributing to the welfare of society as a whole
• Environmental protection
• Which may be loosely described as acting in a socially responsible manner. This has led
to the development of the concept of Corporate Social Responsibility (CSR).
Examples of acting in a socially responsible manner may include:
• Such as KPMG International’s policy of purchasing over 90% of its electricity from
renewable sources.
• Junior Achievement Awards initiative.
Likewise, companies have been alleged to have acted in a less than socially responsible
manner. Examples include clothing and sports goods companies using sub-contractors who
employ child labour practices.
The extent to which organisations subscribe to CSR varies greatly both ideologically and in
practice. Recent research has shown that 90% of companies believed that CSR should be part
of a company’s DNA, yet only 30% thereof actually did anything about it.
Many organisations view CSR as a strategic investment and consider it necessary in order to
achieve the reputation that is gaining importance in attracting and retaining key staff and to
winning and retaining prestigious contracts and clients. Many such companies have moved
to operationalise CSR. This has been achieved in many ways including:
• Incorporating CSR in their mission statements
• Appointing a ‘champion’ of CSR
• Formally incorporating CSR objectives into its strategic planning process
• Dissemination of CSR targets and reporting of key performance indicators
Page 15
• Retaining consultants to advise on existing performance and to recommend
improvements
• Appointment of committees to implement and reviews CSR related policies.
Whilst, some organisations see social responsibility as a passing trend and are content to get
by with a bit of ‘lip service’ and tokenism, other organisations view CSR as the preserve of
multinationals and government. Part of the challenge in pursuing CSR related objectives lies
in the relative novelty of the concept. The critical debate is whether or not CSR detracts from
the objective of maximising shareholder wealth. As with all debates there are opposing views
including:
Arguments in favour of CSR include that it:
• Creates positive Public Relations for the organisation, or, as a minimum avoids bad P.R.
• Helps attract new and repeat custom
• Improves staff recruitment, motivation and retention
• Helps keep the organisation within the law,
All of which may be considered to support the drive to maximise profits.
However, there are many writers who vigorously oppose the notion that private organisations
should embrace social responsibility. Some of the main arguments against CSR are:
• Market capitalism is the most equitable form of society that has ever appeared
• The ethics of doing business are not those of wider society
• Governments are responsible for the well- being of society
• An organisation’s maximum requirement is to remain within the law, no more than this
is required.
Ultimately, they argue that business organisations are created and run in order to maximise
returns for their owners and that CSR detracts from the profit maximisation
Conclusion
The broad philosophical debate on the role of companies in society is still in its early days.
Depending on your viewpoint, CSR may be considered to support or detract from the
objective of maximising shareholder wealth. Neither viewpoint is definitive.
As the public debate on CSR and the changing role of business in society intensifies,
companies will need to determine their own view on CSR and adopt their own stance on the
subject. Ultimately, they will have to make policy decisions that are in the best interests of
the company and its owners, their shareholders.
Page 16
E. IMPACT OF GOVERNMENT ON ACTIVITIES
There are a number of areas where the Government plays a role in the financial arena:
• Taxation - Corporate (Capital Allowances etc.) & Personal (Business Expansion
Scheme, etc.)
• Monetary Policy – Rates of Inflation, Interest Rates, Exchange Rates etc.
• Investment Incentives Offered - Grants, etc.
• Legislation - Monopolies, Competition, Environmental etc.
• Wage Controls
• Duties, Tariffs etc.
F. COMPOSITION OF SHAREHOLDERS
Is there anything to be gained from a company knowing the composition of its shareholders.
Generally, it is useful as it may assist the company in framing its policy/approach in a number
of areas e.g.
• Dividend Policy
• Attitude to Risk/Gearing
• Unwelcome Bid - support critical
• How Performance is Measured
• Recent Shareholder Changes => Price Movements

Page 17
Study Unit 2
Corporate Governance
Contents
A. Introduction
B. Best Practice
Page 18
A. INTRODUCTION
Corporate Governance can be defined as the system by which organizations are directed and
controlled.
B. BEST PRACTICE
Financial aspects of corporate governance have introduced a “Code of Best Practice”
Some of the main recommendations are:
1. The roles of chairman and chief executive should generally be separate. Whether or not
the roles are combined, a senior non-executive director should be identified.
2. Non-executive directors should comprise at least one-third of the membership of the
board and the majority of non-executive directors should be independent.
3. Boards should establish a Remuneration Committee, made up of independent non-
executive directors, to develop policy on remuneration and devise remuneration
packages for individual executive directors.
4. Each company should establish an Audit Committee of at least three non-executive
directors, at least two of them independent. The audit committee should keep under
review the overall financial relationship between the company and its auditors, to
ensure a balance between the maintenance of objectivity and value for money.
5. Disclosure of directors’ total emoluments, including pension contributions and stock
options. Separate figures for salary and performance-related elements and the basis on
which performance is measured.
6. Directors should report on internal controls.
7. The accounts should contain a statement of how the company applies the corporate
governance principles and explain the policies, including any circumstances justifying
departure from best practice.

Page 19
Study Unit 3
Investment Appraisal - Introduction
Contents
A. Nature and Stages of Investment Appraisal
B. Investment Appraisal Techniques
______________________________________________________________
C. Relevant Cash Flows

Page 20
A. NATURE AND STAGES OF INVESTMENT APPRAISAL
Nature
• Replacement Investment
• Investment for Expansion
• Product Improvement/Cost Reduction
• New Ventures
• Strategic Investment – may satisfy overall objectives but might not satisfy normal
financial criteria.
• Statutory Requirements/Employee or Community Welfare – may not produce a positive
NPV but may be essential.
Stages
1. Identification.
Ideas may generate from all levels of the organisation. Initial screening may reject
those that are unsuitable - technically/too risky/cost/incompatible with company
objectives etc. The remainder are investigated in greater depth - assumptions required
regarding sales, costs etc./collect relevant data. Also consider alternative methods of
completing projects.
2. Evaluation
Identification of expected incremental cash flows. Measure against some agreed
criteria - Payback/Accounting Rate of Return/Net Present Value/Internal Rate of Return.
Consider effect of different assumptions - Sensitivity Analysis or other techniques.
Consultation with other interested parties (particularly if great organisational and/or
technological change) - accountants/production staff/marketing staff/trade unions etc.
3. Authorisation
Submit to appropriate management level for approval/rejection/modification. The
larger the expenditure, the higher the management level.. Reappraise investment -
reassess assumptions and cash flows (e.g. check for any "bias" in estimates)/evaluate
how investment fits within corporate strategy and capital constraints (if any). If
budgetary or other constraints exist rank as to how essential (financial and non-financial
considerations).
4. Monitor & Control
Regularly review to ascertain if any major variations from cash flow estimates. If
significant variations - consider continuation v abandonment. Post audits (one or two
years after implementation!) useful - encourage more realistic estimates at evaluation
stage/help to learn from past mistakes/basis for corrective action to existing
investments.

Page 21
B. INVESTMENT APPRAISAL TECHNIQUES
There are many techniques for evaluating investment proposals. These can be broadly
classified as:
Non-Discounting
Payback Period
Accounting Rate of Return (ARR)
Discounted Cash Flow
Net Present Value (NPV)
Internal Rate of Return (IRR)
Payback Period
Definition: The time taken in years for the project to recover the initial investment.
The shorter the payback, the more valuable the investment.
Example
An initial investment of RWF50,000 in a project is expected to yield the following cash
flows:
Cash Flow
Year 1 RWF20,000
Year 2 RWF15,000
Year 3 RWF10,000
Year 4 RWF10,000
Year 5 RWF8,000
Year 6 RWF5,000
The Payback Period is 3 1/2 years - the cash inflows for that period equal the initial outlay of
RWF50,000.
Is 3 1/2 years acceptable? - it must be compared to the target which management has set. For
example, if all projects are required to pay back within, say, 4 years this project is acceptable;
if the target payback is 3 years then it is not acceptable.
Although of limited use it is the most popular technique.
It is often used in conjunction with other techniques.
It may be used as an initial screening device.
Advantages
• Calculation is simple.
• It is easily understood
• It gives an indication of liquidity.
• It gives a measure of risk - later cash flows are more uncertain.
• It considers cash flow rather than profit – profit is more easily manipulated.

Page 22
Disadvantages
• Cash flows after the Payback Period are ignored.
• It ignores the timing of the cash flows (“Time Value of Money”).
• No clear decision is given in an accept/reject situation.
Accounting Rate of Return (ARR)
Definition:
ARR =
Average Annual Accounting Profits
= %
Initial Investment
(Alternative definitions may be used occasionally - e.g. ‘Average Investment’ may replace ‘Initial Investment’).
The Accounting Rate of Return is based upon accounting profits, not cash flows.
Example
A company is considering an investment of RWF100,000 in a project which is expected to
last for 4 years. Scrap value of RWF20,000 is estimated to be available at the end of the
project. Profits (before depreciation) are estimated at:
Year 1 RWF50,000
Year 2 RWF50,000
Year 3 RWF30,000
Year 4 RWF10,000
Find the Accounting Rate of Return
Total profits before
depreciation
RWF140,000
Less total depreciation
(RWF80,000)
Total accounting profits
RWF60,000
Average Annual Profits (4
years)
RWF60,000
= RWF15,000
4
ARR =
RWF15,000
= 15%
RWF100,000
To ascertain if the project is acceptable the ARR must be compared to the target rate which
management has set. If this target is less than 15% the project is acceptable; if greater than
15% the project is unacceptable.
Advantages
• Calculation is simple.
• It is based upon profits, which is what the shareholders see reported in the annual
accounts.
• It provides a % measure, which is more easily understood by some people.
• It looks at the entire life of the project.

Page 23
Disadvantages
• It is a crude averaging method.
• It does not take account of the timing of the profits.
• It is based on accounting profit which can be manipulated by creative accounting.
Shareholders’ wealth is determined ultimately by cash.
• Various definitions are used.
Discounted Cash Flow (DCF)
The main shortcomings of the non-discounting techniques of Investment Appraisal can be
summarised as:
they do not allow for the timing of the cash flows/accounting profits
they do not evaluate cash flows after the payback period
Discounted Cash Flow addresses these shortcomings, by allowing for the “time-value of
money” and looking at all cash flows. So what is discounting? Discounting can be regarded
as Compound Interest in reverse. To understand Compound Interest let us take a simple
example.
Example
If you invest RWF100 and are guaranteed a return of 10% per annum we can work out how
much your investment is worth at the end of each year.
Present Value
Future Value
End of Year 1 RWF100 x (1.10)
=
RWF110.00
End of Year 2 RWF100 x (1.10)(1.10)
=
RWF121.00
End of Year 3 RWF100 x
(1.10)(1.10)(1.10)
=
RWF133.10
For simplicity this can be re-written
End of Year 1 RWF10 x (1.10) 1
=
RWF110.00
End of Year 1 RWF10 x (1.10) 2
=
RWF121.00
End of Year 1 RWF10 x (1.10) 3
=
RWF133.10
In general terms we can express this as:
PV (1 + i) n = FV
Where: PV = Present Value
i = Rate of Interest
n = Number of Years/Periods
FV = Future Value
We are starting with a Present Value (RWF100) and depending on the rate of interest used
(10%) and the duration of the investment (n) we can find the Future Value, using Compound
Interest.

Page 24
As mentioned above, Discounting is Compound Interest in reverse. Thus, using the
statement
PV (1 + i) n = FV we can turn it around to get
FV 1
--------- = PV or FV x ------- = PV
(1 + i) n (1 + i) n
Again, taking the example above, if you are given the Future Value and asked to find the
Present Value
Future Value
Present Value
End of Year 1
RWF110.00 x
1
= RWF100
(1.10) 1
End of Year 2
RWF121.00 x
1
= RWF100
(1.10) 2
End of Year 3
RWF133.10 x
1
= RWF100
(1.10) 3
In effect, what you are doing is ascertaining the amount which must be invested now at 10%
per annum to accumulate to RWF110 in a year’s time (or RWF121.00 in two years; or
RWF133.10 in three years).
In converting the Future Value to a Present Value it is multiplied by a factor (Discount
Factor), which varies depending on the discount rate (i) selected and the number of
years/periods (n) into the future. Fortunately, it is not necessary to individually calculate each
factor, as these can be easily obtained from DISCOUNTING TABLES (attached). These
tables supply a factor for all % rates and periods.
The previous example is reproduced using the Discounting Tables, at 10%
Future Value
Present Value
End of Year 1
RWF110.00 x
0.909
=
RWF100
End of Year 2
RWF121.00 x
0.826
=
RWF100
End of Year 3
RWF133.10 x
0.751
=
RWF100
The compounding and discounting features shown above relate to single payments or receipts
at different points in time. Similar calculations can be done for a series of cash flows, where
a single present value can be calculated by aggregating the present value of several future
cash flows.

Page 25
ANNUITIES
An annuity is where there is a series of cash flows of the same amount over a number of
years.
The present value of an annuity can be found by discounting the cash flows individually (as
above).
Example
Using a discount rate of 10% find the present value of an annuity of RWF2,000 per annum
for the next four years, with the first payment due at the end of the first year.
Year Value
Cash Flow
Disc. Factor
Present
10%
1
RWF2,000
0.909
RWF1,819
2
RWF2,000
0.826
RWF1,653
3
RWF2,000
0.751
RWF1,502
4
RWF2,000
0.683
RWF1,366
Net Present
Value
RWF6,340
However, a much quicker approach is to multiply the annual cash flow by an annuity factor.
The annuity factor is simply the sum of the discount factors for each year of the annuity. In
this example the annuity factor is 3.17 (0.909 + 0.826 + 0.751 + 0.683). If you multiply the
RWF2,000 by the annuity factor of 3.17 you get RWF6,340, which is the same Net Present
Value as the longer approach adopted in the example. Annuity factors are available for all %
rates and periods in Annuity Tables (attached) and you will see the factor of 3.17 at period 4
under the 10% column.
In the above example the first receipt arose at the end of the first year. If this is not the case
you can still use the Annuity Tables but you must modify your approach. The present value
can be found by multiplying the annual cash flow by the annuity factor for the last date of the
annuity less the annuity factor for the year before the first payment.
Example
Using a discount rate of 10% find the present value of an annuity of RWF5,000 per annum,
which starts in year 5 and ends in year 10.
Annuity Factor Years 1 – 10
6.145
Annuity Factor Years 1 – 4
3.170
Annuity Factor Years 5 – 10
2.975
Therefore, the Present Value is RWF5,000 x 2.975 = RWF14,875.

Page 26
PERPETUITIES
A perpetuity is an annuity which continues forever. To find the present value of a perpetuity
which starts at year 1 you use the following simple formula:
PV =
a
i
Where: a = amount of the perpetuity
i = the discount rate
Example
The present value of a perpetuity of RWF1,000 per annum, which commences at the end of
year 1, at a discount rate of 10% is:
PV =
a
=
RWF1,000
= RWF10,000
i
0.10
If the perpetuity commences at a time other than year 1 a further calculation is required.
Example
Using a discount rate of 10% find the present value of a perpetuity of RWF1,000 per annum,
if it commences (a) end of year 1, or (b) end of year 6.
(a)
PV =
a
=
RWF1,000
= RWF10,000
i
0.10
(b) We can find this in two stages.
The PV in year 5 of a perpetuity of RWF1,000 from year 6 onwards is
PV =
a
=
RWF1,000
= RWF10,000
i
0.10
We must now convert this to a year 0 value, by discounting the RWF10,000 (year 5
value) at 10%.
PV = RWF10,000 x .621(Discount Factor for year 5 @ 10%) = RWF6,210
Net Present Value (NPV)
This technique converts future cash flows to a common point in time (Present Value), by
discounting them. The present values of the individual cash flows are aggregated to arrive at
the Net Present Value (NPV).
The NPV figure represents the change in shareholders' wealth from accepting the project. It
produces an absolute value (RWF) and therefore, the impact of the project is identified.

Page 27
For independent projects the decision rule is:
Accept if the NPV is positive
Reject if the NPV is negative
For mutually exclusive projects (where it is only possible to select one of many choices) -
calculate the NPV of each project and select the one with the highest NPV.
In calculating the NPV, the selection of a discount rate is vitally important. It is generally
taken as the cost to the business of long-term funds used to fund the project.
Example 1 - Independent Project
A company is considering a project, which is expected to last for 4 years, and requires an
immediate investment of RWF20,000 on plant. Inflows are estimated at RWF7,000 for each
of the first two years and RWF6,000 for each of the last two years. The company's cost of
capital is 10% and the plant would have zero scrap value at the end of the 4 years.
Calculate the NPV and recommend if the project should be accepted.
Year
Cash Flows
Disc. Factor 10%
Present Value
0
(20,000)
1.0
(20,000)
1
7,000
.909
6,364
2
7,000
.826
5,785
3
6,000
.751
4,508
4
6,000
.683
4,098
Net Present Value
+755
The project should be accepted as it produces a positive NPV. This indicates that the project
provides a return in excess of 10% (the discount rate used).
Example 2 - Mutually Exclusive Projects
A company has RWF100,000 to invest. It is considering two mutually exclusive projects
whose cash flows are estimated as follows:
Year
Project A
Project B
0
(100,000)
(100,000)
1
50,000
70,000
2
60,000
50,000
3
40,000
30,000
Which project should the company select if its cost of capital is 10%.

Page 28
Year
Disc Factor
10%
Pres Value
Pres.
Value
Project A
Project
B
0
1.0
(100,000)
(100,000
)
1
.909
45,450
63,630
2
.826
49,560
41,300
3
.751
30,040
22,530
Net Present Value
+ 25,050
+ 27,460
Project B should be selected as it has the higher NPV.
Advantages
• Correctly accounts for the time value of money.
• Uses all cash flows.
• Is an absolute measure of the increase in wealth
• Consistent with the idea of maximising shareholder wealth i.e. telling managers to
maximise NPV is equivalent to telling them to maximise shareholder wealth.
• It can be used for benchmarking in post-audit review.
Disadvantages
• Difficult to estimate cost of capital.
• Not easily interpreted by management i.e. managers untrained in finance often have
difficulty in understanding the meaning of a NPV.
Internal Rate of Return (IRR)
The NPV method produces an absolute value (RWF). A positive NPV indicates that the
project earns more than the required rate of return and should be accepted; a negative NPV
indicates a return less than the required rate and rejection of the proposal.
The IRR is another discounted cash flow technique. It produces a percentage return or yield,
rather than an absolute value. It determines the discount rate at which the NPV would be zero
-where the present value of the outflows = present value of the inflows. It can, therefore, be
regarded as the expected earning rate of the investment.
If the IRR exceeds the company's target rate of return it should be accepted. If less than the
target rate of return it should be rejected.
The IRR can be estimated by a technique called 'Linear Interpolation’. This requires the
following steps:
1. Calculate two NPV's, using two different discount rates.
2. Any two rates can be used but, ideally, one calculation will produce a positive NPV and
the other a negative NPV.

Page 29
3. Choosing the discount rate is a 'shot in the dark.' However, if the first attempt produces
a positive NPV, generally a higher discount rate will be required to produce a negative
NPV and vice versa.
Example 3 - Internal Rate of Return
Using the cash flows from example 1, a discount rate of 10% produced a positive NPV of
RWF755. In an attempt to find a negative NPV try a higher rate of 15%.
Year
Cash Flows
Disc. Factor 15%
Present
Value
0
(20,000)
1.0
(20,000)
1
7,000
.869
6,083
2
7,000
.756
5,292
3
6,000
.658
3,948
4
6,000
.572
3,432
Net Present Value
- 1,245
We now know that the real rate of return is > 10% (+ NPV) but < 15% (- NPV). The IRR is
calculated by 'Linear Interpolation.' It will only be an approximation of the actual rate as it
assumes that the NPV falls in a straight line (linear) from + RWF755 at 10% to - RWF1,245
at 15%. The NPV, in fact, falls in a curved line but nevertheless the interpolation method is
accurate. In this example the IRR is:
10% +
755
x (15% - 10%) = 11.9%
755 + 1,245
Advantages
• Often gives the same decision rule as NPV.
• More easily understood than NPV.
• Doesn’t require an exact definition of r in advance.
• Considers the time value of money.
• Considers all relevant cash flows over a project’s life.
Disadvantages
• Relative, not absolute return - ignores the relative size of investments.
• If a change in the sign of the cash flow pattern, one can have multiple IRR’s.
• NPV is much easier to use for benchmarking purposes in a post-audit situation then
IRR.
• It looks at projects individually – the results cannot be aggregated.
• It cannot cope with interest rate changes.
DCF Techniques V Non-DCF Techniques

Page 30
DCF techniques have advantages over non-DCF techniques:
1. They allow for the 'time value of money.'
2. They use cash flows, which result from an investment decision. The ARR technique is
affected by accounting conventions (e.g. depreciation, deferred expenditure etc.) and
can be susceptible to manipulation.
3. They take account of all cash flows. The Payback Period disregards cash flows after the
payback period.
4. Risk can be easily incorporated by adjusting the discount rate (NPV) or cut-off rate
(IRR).
Advantages of IRR Compared to NPV
It gives a percentage rate of return, which may be more easily understood by some.
To calculate the IRR it is not necessary to know in advance the required rate of return or
discount rate, as it would be to calculate the NPV.
Advantages of NPV Compared to IRR
It gives an absolute measure of profitability (RWF) and hence, shows immediately the change
in shareholders' wealth, this is consistent with the objective of shareholder wealth
maximisation. The IRR method, on the other hand, ignores the relative size of investments.
It always gives only one solution. The IRR can give multiple answers for projects with non-
conventional cash flows (a number of outflows occur at different times).
It always gives the correct ranking for mutually exclusive projects, whereas the IRR
technique may give conflicting rankings.
Changes in interest rates over time can easily be incorporated into NPV calculations but not
IRR calculations.
C. RELEVANT CASH FLOWS
In an examination question you will be given much information regarding the impact on the
organisation of a new investment proposal etc. Some of the information may not be relevant
to the decision and it is important that you are able to figure out which flows are relevant and
should be included in an investment appraisal calculation.
The following pointers and simple examples should assist in coping with the various items
which are presented to you in an examination:
1. CASH FLOWS v PROFITS
Shareholders’ wealth is based upon the movement of cash. Accounting policies and
conventions have no effect on the value of the firm and, thus, pure accounting or book
entries should be excluded from calculations. The most common of these is
depreciation, which should be excluded as it is a non-cash item.
Page 31
Example
A company is considering investing in a new project which requires the expenditure of
RWF12m immediately on plant. The project will last for 5 years and at the end of the
project the plant is expected to have a scrap value of RWF2m. The company normally
depreciates plant over 5 years using the straight-line method.
In this simple illustration the last sentence concerning depreciation can be ignored
completely as it does not affect the cash flows. It would be incorrect to show an
outflow of RWF2m. p.a. for depreciation. The relevant cash flows are the outflow of
RWF12m. on plant in year 0 and the inflow of RWF2m. as scrap in year 5.
2. CASH FLOWS SHOULD BE INCREMENTAL
The effect of a decision on the company’s overall cash flows must be considered in
order to determine correctly the changes in shareholders’ wealth.
Example
A company is considering a proposal which would require (amongst other cash flows)
the purchase of a new machine for RWF100,000. If it proceeds with the proposal it
could dispose of an existing machine which has a book written-down value of
RWF30,000. This machine could be sold immediately for RWF20,000 instead of
waiting for 5 years as planned and selling it for scrap value of RWF5,000.
Should the existing machine be taken into account in evaluating the new proposal ?
Undertaking the new proposal requires the purchase of a new machine which, in turn,
enables the existing machine to be sold, thereby generating an inflow for the
organisation. Thus, the cash flows associated with the existing machine are relevant in
evaluating the new proposal. The present written-down value of RWF30,000 is not
relevant as it is merely an accounting book entry. The sale proceeds of RWF20,000 is
obviously relevant as is the loss of RWF5,000 scrap value which the company would
have received in year 5 if the new proposal was not undertaken.
The relevant cash flows are:
Year
New Machine
Sale – Existing
Machine
Scrap
Foregone
Existing
Machine
Net Cash
Flows
0
(100,000)
20,000
(80,000)
1
2
3
4
5
(5,000)
(5,000)
3. OVERHEADS
Variable overheads will always be relevant in decision making. However, depending
on the situation fixed overheads may or may not be relevant. If fixed overheads are
Page 32
allocated on some arbitrary basis (e.g. on the basis of machine or labour hours) they are
not usually relevant. However, if the total fixed costs of the organisation are affected by
the proposal then they are relevant and should be incorporated as a cash flow.
Example
A company is considering the introduction of a new product to its existing range. Each
product will take two hours labour to manufacture. Fixed overheads are allocated
within the company on the basis of RWF1 per labour hour. Sales of the new product are
estimated at 12,000 units per annum. If the new product is manufactured the company
will have to employ an additional supervisor at a salary of RWF20,000 per annum.
The allocation of fixed overheads at the rate of RWF2 per unit has no effect on cash
flows and is not relevant. It is merely an accounting entry for costing or control
purposes.
The additional supervisory salary of RWF20,000 per annum is relevant, as it is incurred
solely as a result of the new proposal and must be taken into account.
Example
A company is considering the introduction of a new product to its existing range. It
currently rents a factory at an annual rental of RWF100,000. Only three-quarters of the
factory is used on production of its existing range of products and the remaining quarter
of the factory would be adequate in which to produce the new product. However, it will
be necessary to rent additional warehouse space at RWF20,000 per annum in order to
store the new production.
To produce the new product the organisation can utilise factory space which is currently
idle. No additional factory rental costs will be incurred by the company and it would
be incorrect to show an annual cash outflow of RWF25,000 (one-quarter) in respect of
rent when evaluating the new proposal.
On the other hand, the additional warehouse rent of RWF20,000 per annum is incurred
solely as a result of the new proposal and must be taken into account in the evaluation
process.
4. SUNK COSTS
Sunk costs (or past costs) are costs which have already been incurred. When making an
investment decision sunk costs can be ignored and you need only consider future
incremental cash flows.
Example
A company is considering the introduction of a new type of widget. Over the past two
years it has spent RWF100,000 on research and development work.
The RWF100,000 spent on research and development is a sunk cost and can be ignored
when evaluating the future inflows and outflows of the proposal. One way of looking at
it is that whether you decide to go ahead with the new proposal or not this will not alter
the position of the RWF100,000 - it has already been incurred.

Page 33
Example
A company uses a special raw material, named Nylon, in production. It currently has
5,000 tons in stock. The company is considering a once-off project which would use
2,000 tons of Nylon. The original cost of the Nylon in stock was RWF20 per ton; the
current purchase price is RWF17 per ton and its resale value is RWF10 per ton.
What is the relevant cost of the Nylon for the project if:
(a) It is regularly used by the company?
(b) It is no longer used and any remaining stock will be sold off immediately?
Solution:
(a) The original cost of RWF20 per ton is not relevant. The 2,000 tons used on this
project are taken out of stock and must be replaced at the current purchase price,
as the Nylon is regularly used by the company. Thus, current purchase price is
the relevant cost - 2,000 tons @ RWF17 = RWF34,000.
(b) Again, the original cost of RWF20 per ton is not relevant. If the company does
not use the existing stock in the new project the next best use is to dispose of it at
RWF10 per ton, as it is no longer used in production. Thus, current resale value
is the relevant cost - 2,000 tons @ RWF10 = RWF20,000.
5. OPPORTUNITY COSTS
The use of resources for a new project may divert them from existing projects, thereby
causing opportunity costs. These opportunity costs must be taken into account in
evaluating any new project.
Example
A company is considering the introduction of a new range of advanced personal
computer, which will be very competitively priced. While accepting that the new
machine is vital to remain competitive, the marketing manager has estimated that sales
of existing models will be reduced by 100 units per annum for the next three years as a
consequence. The existing model sells for RWF3,000 and variable costs are RWF1,750
per unit.
In evaluating the introduction of the new advanced machine, the lost contribution from
reduced sales of existing models must be included as an opportunity cost. In this case
the opportunity cost is RWF125,000 [100 units x (RWF3,000 - RWF1,750)] per annum
for the next three years.
6. INTEREST COSTS
In many examination questions you will be presented with all the costs of the proposed
project. These may be presented in the form of a standard Profit & Loss Account. One
of these costs may be ‘Interest.’ The figure for interest should not be included as a
Page 34
relevant cost because the cost of finance, no matter what its source, is encompassed
within the discount rate. Therefore, to include the annual interest charge as a relevant
cost and to also discount the cash flows would result in double counting.
7. WORKING CAPITAL
Where the project requires an investment of, say RWF50,000, for working capital it
should be remembered that working capital revolves around continuously in the project
(e.g. purchase of raw materials, which are used to manufacture goods, sold and
eventually generate cash to enable the purchase of more raw materials etc.. and
continuously repeat the cycle). Thus, the RWF50,000 flows back into the organisation
once the project ceases. In this example, if the project has a life of five years the cash
flows relating to working capital are:
Year Working Capital
0 (50,000)
5 50,000

Page 35
Study Unit 4
Investment Appraisal – Impact of Taxation
Contents
A. Introduction
B. Corporation Tax
C. Capital Allowances
D. Timing of Taxation Effects
E. Worked Examples

Page 36
A. INTRODUCTION
To appraise fully an investment, management must take account of the impact of taxation, as
it is the after-tax cash flows that are relevant to decision making.
As a result of accepting a project tax payments or savings will, generally, be made by the
company. These relate to:
1. Corporation Tax payments on profits.
2. Tax benefits due to capital allowances granted on certain expenditure.
B. CORPORATION TAX
Annual cash inflows from a project will cause an increase in taxable profits and, hence, a tax
payment. Annual cash outflows (e.g. cost of materials, labour etc.) will reduce taxable profits
and yield tax savings. However, tax payments or savings can be based upon the net cash
inflows or outflows each year.
One can assume that an annual cash flow (inflow or outflow) will produce a similar change in
taxable profits, unless the exam question specifically indicates otherwise. For example, you
may be told that a particular item of expenditure (say, a contract termination payment of
RWF100,000) is not allowable for tax purposes. In this instance, the RWF100,000 must be
shown as an outflow of the project but it is ignored when calculating the taxation effect.
It is important to appreciate that the taxation payment or saving is the cash flow multiplied by
the rate of Corporation Tax. For example, if the net cash inflow in a particular year is
RWF50,000 and the rate of Corporation Tax is 40% an outflow of RWF20,000 (RWF50,000 x
40%) is shown in the taxation column.
C. CAPITAL ALLOWANCES
The Revenue does not allow depreciation charges as a deduction in calculating the tax
payable. However, it does grant capital allowances, which can be quite generous. These
allowances on capital items can be set-off against taxable profits to produce tax savings (i.e.
cash inflows).
The capital allowances can take various forms. The most common are:
1. 100% initial allowance, whereby an allowance equivalent to the full cost of the item is
available up-front.
2. A writing-down allowance of, say, 25% per annum on a straight line basis. This
means that the benefit of the allowance is spread equally over 4 years.
3. A writing-down allowance of, say, 25% per annum on a reducing balance basis. This
means that the allowance is spread over a number of years but on a reducing basis.
25% of the expenditure is allowable in the first year (as under number 2) and a reducing
allowance thereafter.

Page 37
Again, it is important to appreciate that the cash flow effect is the capital allowance
multiplied by the rate of Corporation Tax. For example, if the capital expenditure (which
qualifies for 100% allowances) in a particular year is RWF50,000 and the rate of Corporation
Tax is 40% then a saving of RWF20,000 (RWF50,000 x 40%) is shown in the taxation
column.
The eventual sale of capital items will usually cause a balancing charge or a balancing
allowance, which must also be taken into account in the project appraisal.
D. TIMING OF TAXATION EFFECTS
Unless specifically advised to the contrary in an examination, assume that there is a time lag
of one year between a cash flow and the corresponding taxation effect. Thus, expenditure on
a capital item in year 0 will usually be accompanied by a tax saving in year 1.
E. WORKED EXAMPLES
Example 1
A company is considering a new project. It must purchase plant and machinery for
RWF48,000, which qualifies for 100% initial allowance. The project will generate net cash
inflows of RWF20,000 per annum before tax for three years. Corporation Tax is 40% and the
company makes large taxable profits from its existing operations. The after-tax cost of
capital is 10%.
The phrase ‘...the company makes large taxable profits from its existing operations’ is very
significant as it is an indicator that the taxation advantage of the capital allowance can be
utilised at the earliest opportunity, by reducing the existing tax liability.
Year
Plant
Profits
Taxation
Net C
Flows
D.F. – 10%
Pres.
Value
0
(48,000)
(48,000)
1.00
(48,000)
1
20,000
19,200
39,200
0.909
35,633
2
20,000
(8,000)
12,000
0.826
9,912
3
20,000
(8,000)
12,000
0.751
9,012
4
(8,000)
(8,000)
0.683
(5,464)
1,093
As the project produces a positive NPV it should be accepted.

Page 38
Example 2
Using the same data as Example 1 but now due to the nature of the expenditure assume that
the company can only claim a 25% per annum writing down allowance on a straight line
basis.
Year
Plant
Profits
Taxation
Net C
Flows
D.F. – 10%
Pres.
Value
0
(48,000)
(48,000)
1.00
(48,000)
1
20,000
4,800
24,800
0.909
22,543
2
20,000
(3,200)
16,800
0.826
13,877
3
20,000
(3,200)
16,800
0.751
12,617
4
(3,200)
(3,200)
0.683
(2,186)
(1,149)
Note: The year 1 figure under the Taxation column is the first year’s capital allowance
(RWF48,000 x 25% = RWF12,000) at the tax rate of 40% = RWF4,800.
The figure for years 2-4 consists of profits of RWF20,000 less capital allowance
(RWF12,000) multiplied by the tax rate of 40% = RWF3,200 payment.
Now due to the delay in receiving the benefit of the capital allowances they are not as
valuable (“Time Value of Money”) as in Example 1 and the project produces a negative NPV.
It should, therefore, be rejected.
Example 3
In Examples 1 and 2 we have assumed that the company is in a tax paying position and can
utilise the allowances as early as possible. However, if the company has tax losses or only
limited taxable profits from its existing operations this will affect the timing of the tax
savings.
A company is considering a project which will last for four years and produce annual net cash
inflows of RWF20,000. It must purchase a new machine for RWF45,000. The machine
qualifies for a 100% initial allowance and will have a scrap value of RWF8,000 at the end of
the project. Working capital of RWF12,000 is required. Corporation Tax is 40% and the
company earns no profits or losses from its other operations. The after-tax cost of capital is
10%.
While the machine qualifies for 100% allowances the company is unable to utilise this
initially as it is not currently in a tax paying position. As a result, it will have to spread the
advantage of the allowance by setting them off against the profits of the new project.

Page 39
The first task is to calculate the tax payments:
Year 1
Year 2
Year 3
Year
4
Cash Inflows
20,000
20,000
20,000
20,000
Capital Allowance
(20,000)
(20,000)
(5,000)
--
Scrap
8,000
Taxable
Nil
Nil
15,000
28,000
Tax @ 40%
6,000
11,200
Note: The capital allowances are set-off against the cash inflows of years 1 - 3.
As capital allowances are claimed in full over years 1-3, when the machine is sold for
RWF8,000 scrap in year 4 this generates a balancing charge.
The tax payments can now be incorporated in the main cash flow schedule.
Year
Machine
W.Cap
Profits
Taxation
Net C
Flows
D.F. –
10%
Pres.
Value
0
(45,000)
(12,000)
(57,000)
1.00
(57,000)
1
20,000
20,000
0.909
18,180
2
20,000
20,000
0.826
16,520
3
20,000
20,000
0.751
15,020
4
8,000
12,000
20,000
(6,000)
34,000
0.683
23,222
5
(11,200)
(11,200)
0.621
(6,955)
8,987
As the project produces a positive NPV it should be accepted.
Example 4
A company is considering a new project. It must purchase equipment for RWF80,000. Due
to the nature of the equipment it qualifies for a writing down allowance of 25% per annum on
a reducing balance basis. The project will generate net cash inflows of RWF35,000 per
annum for four years. Corporation Tax is 40% and the after-tax cost of capital is 10%. The
equipment will have no scrap value at the end of the project. Working capital of RWF10,000
is required.
Firstly, calculate the Capital Allowances available:
Year 1
Plant
80,000
Capital Allowance (80,000 x 25%)
20,000
Written Down Value
60,000
Year 2
Written Down Value
60,000
Capital Allowance (60,000 x 25%)
15,000
Written Down Value
45,000

Page 40
Year 3
Written Down Value
45,000
Capital Allowance (45,000 x 25%)
11,250
Written Down Value
33,750
Year 4
As the plant is disposed of in year 4 for zero value there is a Balancing Allowance of
RWF33,750 (written down value for tax purposes) available. Thus, over the four years,
allowances totalling RWF80,000 have been claimed.
Note
A quick method of calculating the capital allowances on a reducing balance basis is to take
the previous year’s capital allowance and multiply it by 75% (100% minus the rate at which
the allowance is available). Thus, in this example:
Year 1 Capital Allowance
20,000
Year 2 Allowance (20,000 x 75%)
15,000
Year 3 Allowance (15,000 x 75%)
11,250
Total Allowances Claimed Years 1-3
46,250
Year 4 Balancing Allowance (80,000 – 46,250)
33,750
Total Allowances Claimed
80,000
Secondly, calculate the tax payable as follows:
Year 1
Year 2
Year 3
Year 4
Cash Inflows
35,000
35,000
35,000
35,000
Capital Allowances
(20,000)
(15,000)
(11,250)
(33,750)
Taxable
15,000
20,000
23,750
1,250
Tax @ 40%
6,000
8,000
9,500
500
Thirdly, incorporate the tax payments in the main cash flow schedule:
Year
Machine
W.Cap
Profits
Taxation
Net C
Flows
D.F. –
10%
Pres.
Value
0
(80,000)
(10,000)
(90,000)
1.00
(90,000)
1
35,000
35,000
0.909
31,815
2
35,000
(6,000)
29,000
0.826
23,954
3
35,000
(8,000)
27,000
0.751
20,277
4
10,000
35,000
(9,500)
35,500
0.683
24,247
5
(500)
(500)
0.621
(310)
9,983
As the project produces a positive NPV it should be accepted.

Page 41
Study Unit 5
Investment Appraisal – Impact of Inflation
Contents
A. Introduction
B. Real v Nominal/Money Discount Rates
C. Handling Different Rates of Inflation
D. General Considerations - Inflation

Page 42
A. INTRODUCTION
To illustrate how inflation should be handled in Investment Appraisal we shall take a simple
example, under two different scenarios – an environment with no inflation and an
environment where inflation is present:
1. No Inflation – suppose you are considering the purchase of a television for RWF1,000.
I am undertaking a simple one-year project and I require RWF1,000. I approach you
and guarantee you a return of 5% on your investment. Your investment will have grown
to RWF1,050 at the end of the year and, in theory, because there has been no inflation
the price of the television should still be RWF1,000. Thus, you have made RWF50 in
the process and also got your television. Therefore, you have achieved a real return of
5%.
2. Inflation (assume 20% per annum) – using the same example as number 1. If you
had given me the RWF1,000 this would be worth RWF1,050 at the end of the year but
the price of the television would probably have risen to RWF1,200 (+20%) because of
inflation, so you would not be able to afford it. The value of your savings has been
eroded because of inflation – you have got a return of 5% in money terms but inflation
has been running at 20%. Therefore, you have not got a real return of 5% - this is only
a nominal (or money) return. In this instance, with inflation of 20% you would
require a nominal (money) return of 26% in order to obtain a real return of 5%.
Obviously, there is a link between the nominal (or money) rate of return (26%), the real rate
of return (5%) and the rate of inflation (20%). This relationship may be expressed as
follows:
(1 + Real Rate) =
(1 + Nominal Rate)
(1 + Inflation Rate)
Using the figures in the above example:
1.26
= 1.05
1.20
If you have any two variables you can find the third. For example, if you require a real return
of 5% from an investment and you estimate inflation to be 20% you can work out the
required nominal return at 26% as follows:
(1 + Real Rate)
x
(1 + Inflation Rate)
=
(1 + Nominal Rate)
(1.05)
x
(1.20)
=
(1.26)

Page 43
B. REAL v NOMINAL (MONEY) DISCOUNT RATES
Now that you know the difference between a real and a nominal rate of return (or discount rate) which rate
should be used in discounting the cash flows of a project? This really depends on how the
cash flows are expressed. They can be stated either as:
1. Real Cash Flows – stated in today’s prices and exclude any allowance for inflation.
2. Nominal/Money Cash Flows – these include an allowance for inflation and are stated
in the actual RWF’s receivable/payable.
As a very simple illustration, an examination question might state (amongst other things)
…….”materials for the project cost RWF10 per unit in terms of today’s prices. Inflation is
expected to run at the rate of 10% per annum and the project will last for three years.”
We can express the cash flows in either real or nominal terms:
Year
Real Cash Flows
Money Cash Flows
1
RWF10
RWF10 x (1.10)
=
RWF11.00
2
RWF10
RWF10 x (1.10) 2
=
RWF12.10
3
RWF10
RWF10 x (1.10) 3
=
RWF13.30
The rules for handling inflation are quite straightforward:
If the cash flows are expressed in real terms (today’s money), use the real discount rate.
If the cash flows are expressed in money terms (the actual number of RWF’s that will be
received/paid on the various future dates), use the nominal/money discount rate.
No matter which approach is used you should get the same result.
Example:
A company is considering a project which will last for three years. The initial cost is
RWF100,000 and cash inflows of RWF60,000, RWF50,000 and RWF40,000 respectively are
anticipated for the three years. These inflows are expressed in current values and do not
take account of any projected inflation. It is estimated that inflation will be 20% per annum
for the life of the project. The investment will have no residual value at the end of the
project. The company’s required rate of return in money terms is 26%.
First Approach – Real Cash Flows & Real Discount Rate
(1 + Real Rate) =
(1 + Nominal Rate)
(1 + Inflation Rate)
1.26
= 1.05
1.20

Page 44
Year
Real Cash Flows
Dis. Factor 5%
Present
Value
0
(100,000)
1.0
(100,000)
1
60,000
0.952
57,120
2
50,000
0.907
45,350
3
40,000
0.864
34,560
37,030
Second Approach – Money Cash Flows & Money Discount Rate
We already have a money rate (26%) but we need to re-express the cash flows in money
terms by inflating them at 20% per annum.
Year
Real Cash Flows
Money Flows
Dis. Factor
26%
Present
Value
0
(100,000)
(100,000)
1.0
(100,000)
1
60,000
x 1.20
= 72,000
0.794
57,168
2
50,000
x (1.20) 2
= 72,000
0.630
45,360
3
40,000
x (1.20) 3
= 69,120
0.499
34,491
37,019
Allowing for some rounding, the same answer is produced under each approach.
So which approach should be used? In most cases it is probably best to inflate the cash
flows to money cash flows and then discount at the money required rate of return. Among
the reasons for suggesting this are:
• Different inflation rates may apply to different variables. For example, raw materials
may inflate at 5% per annum, labour at 3% per annum etc. Thus, in converting a money
rate to a real rate, which inflation rate do you divide by – 5% or 3% ?
• When converting a money rate to a real rate you often end up with fractions. For
example, where the money rate of return is 15% and inflation is expected to be 5% per
annum, this translates to a real rate of 9.52%. This rate may be difficult to handle as
Discount Tables tend to be produced for whole numbers only.
• When taxation is included in the appraisal capital allowances are based on original,
rather than replacement cost and do not change in line with changing prices. Therefore,
if the cash flows are left in terms of present day prices and discounted at the real
discount rate it would understate the company’s tax liability.
C. HANDLING DIFFERENT INFLATION RATES
Where different inputs inflate at different rates the best approach is to inflate each element by
the appropriate inflation rate and then to discount the net cash flows (which are now in
money terms) by the money rate of return.

Page 45
Example:
A company is considering a new project which would cost RWF60,000 now and last for four
years. Sales revenue is expected to be RWF50,000 per annum. Raw materials will cost
RWF10,000 in the first year and will rise thereafter by 5% per annum because of inflation.
Labour costs will be RWF15,000 in year 1 and agreement has just been concluded with the
trade union, whereby increases of 4% per annum will apply for the following three years. No
residual/scrap value will arise at the end of the project. Due to the current competitive
environment it will not be possible to increase selling prices.
The general rate of inflation is expected to be 8% per annum for the next few years. The
company’s required money rate of return is 15%. Should the project be undertaken?
Year
Investment
Sales
Material
Labour
Net
D.F
15%
Pres.
Value
(Fixed)
(+5%)
(+4%)
0
(60,000)
(60,000)
1.0
(60,000)
1
50,000
(10,000)
(15,000)
25,000
0.870
21,750
2
50,000
(10,500)
(15,600)
23,900
0.756
18,068
3
50,000
(11,025)
(16,224)
22,751
0.658
14,970
4
50,000
(11,576)
(16,873)
21,551
0.572
12,327
7,115
As the project produces a positive NPV it should be accepted.
D. GENERAL CONSIDERATIONS - INFLATION
• Planning – more difficult
• Project Appraisal – another complication
• Interest Rates – higher nominal rates
• Capital – additional capital required
• Borrowings – extra borrowings => increased financial risk for shareholders
• Nature of Borrowings – long v short; fixed v floating; foreign borrowings?
• Selling Prices – can costs be passed on???
• Impact on Customers – delayed payment; bad debts; liquidations etc.

Page 46
BLANK

Page 47
Study Unit 6
Investment Appraisal – Risk & Uncertainty
Contents
A. Introduction
B. Methods of Treating Risk & Uncertainty
Page 48
A. INTRODUCTION
Definition of Risk
(a) (i) Risk occurs where it is not known what the future outcome will be but where the
likelihood of various possible future outcomes may be assessed with some degree
of confidence, probably based on a knowledge of past or existing events. In other
words, probabilities of alternative outcomes can be estimated.
(ii) Uncertainty occurs where the future outcome cannot be predicted with a degree
of confidence from a knowledge of past or existing events, so that no probability
estimates are available.
Risk and uncertainty are the business risk of an investment.
(b) Business risk can be defined as the potential volatility of profits caused by the nature
and types of business operations.
There are three elements of business risk:
(i) The inherent risk of the industry or market itself
(ii) The stage of the product life-cycle
(iii) The proportion of fixed costs in total costs
B. METHODS OF TREATING RISK OR UNCERTAINTY
1. Adjust The Discount Rate
This method requires that risky projects should earn a higher return than that required
for ongoing operations. By adding a safety margin into the discount rate, what were
marginally profitable projects, i.e. the riskier projects, are less likely to have a positive
NPV.
If, for example, the company’s cost of capital is 10% a premium of say, 5% might be
added for risk and the project evaluated using a discount rate of 15%. If the project still
produces a positive NPV at 15% it would be considered acceptable, even allowing for
its risk.
The main advantage of this method is that it recognises that risky projects should earn a
higher return to compensate for the additional risk.
The main drawback is in deciding the size of the premium to be added. Thus, it is
subjective and some may regard the method as unreliable.

Page 49
2. Payback Period – Applying A Time Limit
In addition to requiring projects to yield a positive NPV when discounted at the cost of
capital, management may apply a payback period as a means of limiting risk. Thus,
projects may be required to:
Provide a positive NPV when discounted at, say 10%
and
Have a Payback Period of, say, 5 years or less
One of the drawbacks to this approach is that projects with very good long-term
prospects may be rejected because they do not offer the required return in the short-
term.
3. Sensitivity Analysis
The impact of changes in individual variables is measured to see the extent of the
leeway before a project would only just breakeven. What would have to happen to the
variable for the NPV to change to zero?
In this way the key variables are highlighted so that management is aware of the
dangers of incorrect estimating and can perhaps make contingency plans in the event of
this happening.
Example
Your company is considering a project with the following cash flows:
Year
Machinery
Running Costs
Savings
0
(11,000)
1
(2,000)
6,000
2
(3,000)
8,000
3
(4,000)
9,000
The cost of capital is 10%. You are asked if the project should be accepted and what is
the scope for error as some of the estimates of cash flow may be open to question.
Ignore taxation.
Firstly, work out the present value of the cash flows:
Year
PV -
Machinery
PV – Costs
PV – Savings
PV Cash
Flows
0
(11,000)
(11,000)
1
(1,818)
5,455
3,637
2
(2,479)
6,611
4,132
3
(3,005)
6,762
3,757
(11,000)
(7,302)
18,828
526
The project has a positive NPV and would appear to be acceptable.

Page 50
Secondly, check each of the variables (machinery, costs and savings) to see how
sensitive they are to change – i.e. by how much can they alter before the NPV is just
zero. This can be done by relating the NPV to the present value of each of the
variables.
Machinery
526
= 4.8%
11,000
The cost of machinery could increase by 4.8%
Running Costs
526
= 7.2%
7,302
Running costs could increase by 7.2%
Savings
526
= 2.8%
18,828
Savings could reduce by 2.8%
If asked how sensitive the project is to changes in the cost of capital this can be found
by calculating the Internal Rate of Return (IRR). In the above example, the IRR is
12.5%. Thus, the cost of capital could increase by 25%, from the existing level of 10%,
before the NPV is just zero.
The conclusion is that savings are the most sensitive and particular attention must be
paid by management to the estimates of these as the margin for error is only 2.8%.
They could take measures in advance to ensure that they will be achieved – e.g. by
insisting on fixed price contracts.
Some of the drawbacks to Sensitivity Analysis are:
• It treats variables as if they are independent and does not consider the inter-
relationships that might exist between variables.
• There is no measure of the probability of changes in any of the variables
occurring.
• There is no automatic decision rule for managers. Managers do not know
whether their decisions should be altered because of the level of sensitivity of a
variable.

Page 51
4. Certainty Equivalent
The expected cash flows of the project are converted to riskless equivalent amounts.
The greater the risk of an expected cash flow, the smaller the certainty equivalent value
(for receipts) or the larger the certainty equivalent value (for payments).
Example:
Year
Cash
Flow
Certainty
Equivalent
D.F. 10%
Pres.
Value
0
(12,000)
(12,000)
1.0
(12,000)
1
7,000
x 90% =
6,300
0.909
5,727
2
5,000
x 80% =
4,000
0.826
3,304
3
5,000
x 70% =
3,500
0.751
2,629
(340)
The main drawback is that the adjustment to each cash flow is subjective.
5. Expected Values
Instead of just estimating individual cash flows for a project, probabilities could be
assigned to various outcomes and these could be used to find expected values.
Example
A company is considering the addition of a new product to its range. The marketing
manager has estimated sales for the next four years as:
Probability
Annual Sales (units)
.10
2,000
.30
4,000
.25
5,000
.20
7,000
.15
10,000
Once sales are established for the first year they will be maintained at that level.
Selling price and variable costs are estimated at RWF20 and RWF15 per unit
respectively. New machinery costing RWF70,000 must be purchased immediately and
this is expected to have a scrap value of RWF10,000 at the end of the project in four
years’ time. Additional fixed costs of RWF5,000 per annum will be incurred. The cost
of capital is 10%. Calculate the expected NPV.
Firstly, calculate the expected value of sales volume per annum.
Probability
Sales (units)
Expected Value (units)
.10
2,000
200
.30
4,000
1,200
.25
5,000
1,250
.20
7,000
1,400
.15
10,000
1,500
5,550

Page 52
Secondly, calculate the expected value of contribution => 5,550 units x (RWF20 -
RWF15)
= RWF27,750 per annum. Deducting fixed costs of RWF5,000 per annum gives net
cash flow of RWF22,750 per annum.
The expected value of NPV is:
Year
Cash Flow
D.F. 10%
Pres.
Value
0
(70,000)
1.000
(70,000)
1-4
22,750
3,170
72,118
4
10,000
0.683
6,830
8,948
The expected NPV is positive and the project would be acceptable.
The drawback to this technique is the difficulty in estimating probabilities of the
various outcomes for the key variables.
6. Standard Deviation of the NPV
It is unlikely that you will be expected to calculate the standard deviation of a project,
but you must be able to:
(a) Understand how a standard deviation might be used for risk analysis of individual
investment projects.
(b) Understand the relevance of standard deviations to risk measurement.
Example
Y Ltd is considering which of two mutually exclusive projects, A or B, to undertake.
There is some uncertainty about the running costs with each project and a probability
distribution of the NPV for each has been estimated as follows:
Project A
Project B
NPV
Probability
NPV
Probability
RWF’000
RWF’000
-20
0.15
+5
0.2
+10
0.20
+15
0.3
+20
0.35
+20
0.4
+40
0.30
+25
0.1
Which project should the company choose, if either?

Page 53
Begin by calculating the EV (Expected Value) of the NPV for each project.
Project A
Project B
NPV
Probability
EV
NPV
Probability
EV
RWF’00
0
RWF’000
RWF’000
RWF’000
-20
0.15
(3.0)
5
0.2
1.0
10
0.20
2.0
15
0.3
4.5
20
0.35
7.0
20
0.4
8.0
40
0.30
12.0
25
0.1
2.5
EV =
18.0
EV =
16.0
Project A has a higher EV of NPV, but what about the risk - i.e. the possible variations
in NPV above or below the EV that might occur? This can be measured by the standard
deviation.
The
σ
of the project NPV, S, can be calculated as:
S =
Σp (x x)
2
−
where
x
is the EV of the NPV.
Project A,
= 18.00
Project B,
= 16.00
x
P
x -
P(x -
)
2
x
P
x-
P(x -
)
2
RWF’000
RWF’000
RWF’000
RWF’0
00
-20
0.15
-38
216.6
5
0.2
-11
24.2
10
0.20
-8
12.8
15
0.3
-1
0.3
20
0.35
+2
1.4
20
0.4
+4
6.4
40
0.30
+22
145.2
25
0.1
+9
8.1
376.0
39.0
S
=
√
376
S
=
√
39.0
=
19.39
=
6.24
i.e. RWF19,390 approx
i.e. RWF6,240 approx
Although Project A has a higher EV of NPV, it also has a larger standard deviation of
NPV, and so has greater business risk associated with it.
Which project should therefore be selected? Clearly it depends on the attitude of the
company’s management to business risk.
7. Simulation
The Monte Carlo simulation technique is most appropriate for modelling cash flow
forecasting problems where there are several independent uncertain cash flows for
which discrete probability distributions can be estimated. The more independent cash
Page 54
flows there are, the more likely it is that simulation will be the only practical method
available to model the system.
Random numbers are allocated to the cash flows in proportion to their relative
probabilities. A stream of random numbers is then fed into the system to simulate
actual cash flows during a number of periods.
The numerical output from the application of simulation techniques is a range of
possible cash flow outcomes with an indication of the likelihood of each outcome – i.e.
a probability distribution of possible outcomes. This can be used to assess the
probabilities of particular events occurring during the review period.

Page 55
Study Unit 7
Working Capital Management
Contents
A. Overview of Working Capital Management
B. Cash Management
C. The Management of Debtors
D. The Management of Creditors
E. The Management of Stocks
Page 56
A. OVERVIEW OF WORKING CAPITAL MANAGEMENT
Definition of Working Capital
Working Capital (Net Current Assets) = Excess of Current Assets over Current Liabilities.
Current Assets: Stock (Finished Goods, WIP and Raw Materials), Debtors, Marketable
Securities and Cash/Bank.
Current Liabilities: Creditors Due Within One Year, Trade Creditors, Tax Payable, Dividends
Payable, Short-term Loans and Long-term Loans Maturing Within The Year..
It may be regarded loosely as: STOCKS + DEBTORS - CREDITORS.
Working Capital Management is basically a trade- off between ensuring that the business
remains liquid while avoiding excessive conservatism, whereby the levels of Working Capital
held are too high with an ensuing large opportunity loss. Obviously, the levels of Working
Capital required depend to a large extent on the type of industry within which the company is
operating -> contrast service industries with manufacturing industries.
Matching Concept
Long-term assets must be financed by long-term funds (debt/equity). Short-term assets can
be financed with short-term funds (e.g. overdraft, creditors) but it may be prudent to finance
partly with long-term funds. Working capital policies can be identified as conservative,
aggressive or moderate:
1. Conservative – financing working capital predominantly from long-term sources of
finance. Current assets are analysed into permanent and fluctuating; with long-term
finance used for permanent element and some of the fluctuating current assets. This
will increase the amount of lower risk finance, at the expense of increased interest
payments and lower profitability.
2. Aggressive – short-term finance used for all fluctuating and most of the permanent
current assets. This will decrease interest costs and increase profitability but at the
expense of an increase in the amount of higher-risk finance used.
3. Moderate (or matching approach) – short-term finance used for fluctuating current
assets and long-term finance used for permanent current assets.
Short-term finance is usually cheaper and more flexible than long-term finance. However,
the trade-off between the relative cheapness of short-term debt and its risks must be
considered. For example, it may need to be continually renegotiated as various facilities
expire and due to changed circumstances (e.g. a credit squeeze) the facility may not be
renewed. Also, the company will be exposed to fluctuations in short-term interest rates
(variable).
Overtrading/Undercapitalisation
This occurs where a company is attempting to expand rapidly but doesn’t have sufficient
long-term capital to finance the expansion. Through overtrading, a potentially profitable
business can quite easily go bankrupt because of insufficient cash.
Page 57
Output increases are often obtained by more intensive use of existing fixed assets and growth
is financed by more intensive use of working capital. Overtrading can lead to liquidity
problems that can cause serious difficulties if they are not dealt with promptly.
Overtrading companies are often unable/unwilling to raise long-term capital and rely more
heavily on short-term sources (e.g. creditors/overdraft). Debtors usually increase sharply as
credit is relaxed to win sales and while stocks increase as the company attempts to produce at
a faster rate ahead of increases in demand.
Symptoms of Overtrading
• Turnover increases rapidly
• The volume of current assets increases faster than sales (fixed assets may also increase)
• Increase in stock days and debtor days
• The increase in assets is financed by increases in short-term funds such as creditors and
bank overdrafts
• The current and quick ratios decline dramatically and Current Assets will be far lower
than Current Liabilities
• The cash flow position is heading in a disastrous direction.
Causes of Overtrading
• Turnover is increased too rapidly without an adequate capital base (management may
be overly ambitious)
• The long-term sources of finance are reduced
• A period of high inflation may lead to an erosion of the capital base in real terms and
management may be unaware of this erosion
• Management may be completely unaware of the absolute importance of cash flow
planning and so may get carried away with profitability to the detriment of this aspect
of their financial planning.
Possible means of alleviating overtrading are:
• Postponing expansion plans
• New injections of long-term finance either in terms of debt/equity or some combination
• Better stock/debtor control
• Maintaining/increasing proportion of long-term finance
Undertrading/Overcapitalisation
Here the organisation operates at a level lower than that for which it is structured. As a result
capital is inadequately rewarded. This can normally be identified by poor accounting ratios
(e.g. liquidity ratios too high or stock turnover periods too long).

Page 58
Assessment of Liquidity Position
The liquidity position of an organisation may be assessed using some key financial ratios:
Current Ratio =
Current Assets
Current Liabilities
Quick Ratio
=
Current Assets – Stock
(“Acid Test”)
Current Liabilities
Debtors Collection Period =
Debtors
x 365 Days
Sales
Creditors Payment Period =
Creditors
x 365 Days
Purchases
Stock Period =
Stock
x 365 Days
Cost of Sales
Alternatively:
Stock Turnover Period =
Cost of Sales
= x times
Stock
Benchmarks often quoted are a Current Ratio of 2 : 1 and a Quick Ratio of 1 : 1 but these
should not be adopted rigidly as organisations have vastly different circumstances (operating
in different industries, seasonal trade etc.).
Page 59
Working Capital Cycle
Often referred to as the “Operating Cycle” or the “Cash Cycle” this indicates the total length
of time between investing cash in raw materials and its recovery at the end of the cycle when
it is collected from debtors. This can be shown diagrammatically:
The Working Capital Cycle can also be expressed as a period of time, by computing various
ratios:
Stock
Average Stock
x 365 =
A days
Cost of Sales
Debtors
Average Debtors
x 365 =
B days
Sales
Less: Creditors
Average Creditors
x 365 =
(C days)
Purchases
Working Capital Cycle (days)
D days
It is difficult to determine the optimum cycle. Attention will probably be focussed more on
individual components than on the total length of the cycle. Comparison with previous
periods or other organisations in the same industry may reveal areas for improvement.
(1) RAW
MATERIALS
(3) WORK
IN
PROGRESS
(4) FINISHED
GOODS
(2)
CREDITORS
(5)
DEBTORS
(6)
CASH
Page 60
B. CASH MANAGEMENT
Cash is an idle asset and the company should try to hold the minimum sufficient for its needs.
Three motives are suggested for holding liquid funds (cash, bank deposits, short-term
investments):
• Transaction Motive - to meet payments in the ordinary course of business – pay
employees, suppliers etc. Depends upon the type of business, seasonality of trade etc.
• Precautionary Motive - to provide for unforeseen events e.g. fire at premises.
Depends upon management’s attitude to risk and availability of credit at short notice.
• Speculative Motive - to keep funds available to take advantage of any unexpected
“bargain” purchases which may arise - e.g. acquisitions, bulk-buying etc.
Cash Budget
This is a very important aid in cash management. Most organisations, whether small,
unsophisticated or large , will prepare a Cash Budget at least once a year. It is usually
prepared on a monthly/quarterly basis to predict cash surpluses/shortages.
Example
A company’s sales are RWF100,000 for November and these are expected to grow at the rate
of 10% per month. All sales are on credit and it is estimated that 60% of customers will pay
in the month following sale; the remainder will pay two months after sale but on average 10%
of sales will turn out to be bad debts. The company has some investments on which income
of RWF20,000 will be received in February.
Materials must be purchased two months in advance of sale so that demand can be met.
Materials cost 50% of sales value. The supplier of the materials grants one month’s credit.
Wages and overheads are RWF30,000 and RWF15,000 respectively per month.
A new machine costing RWF48,000 will be purchased in February for cash. The estimated
life of the machine is 4 years and there will be no scrap value at the end of its life.
Depreciation will be at the rate of RWF12,000 per annum and this will be charged in the
monthly management accounts at RWF1,000 per month.
Rent on the company’s factory is charged in the monthly management accounts at
RWF5,000. This is paid half-yearly in March and September.
The company’s fleet of cars will be replaced in January at a cost of RWF50,000.
At the 31st December the company expects to have a cash balance of RWF50,000.
Prepare a Cash Budget for the period January to March.

Page 61
(RWF’000)
Jan
Feb
Mar
Inflows
Sales Revenue:
November
100,000 x 30%
30
December
110,000 x 60%/30%
66
33
January
121,000 x 60%/30%
73
36
February
133,100 x 60%
80
Investment Income
20
96
126
116
Outflows
Materials:
February
133,100 x 50%
67
March
146,410 x 50%
73
April
161,051 x 50%
81
Wages
30
30
30
Overheads
15
15
15
Rent
30
Machine
48
Car Fleet
50
162
166
156
Opening Balance
50
(16)
(56)
Inflows – Outflows
(66)
(40)
(40)
Closing Balance
(16)
(56)
(96)
The opening cash surplus of RWF50,000 turns into a negative figure from end of January
onwards, mainly due to capital expenditure, and peaks at (RWF96,000) in March. Thus, the
company will have to arrange an overdraft in advance to cover the shortfalls. Alternatively,
the company could take action to avoid the potential negative results. Some possibilities are:
• Deferring replacement of fleet of cars.
• Deferring purchase of machine - impact on production and sales must be considered.
• Considering leasing cars/machine.
• Negotiating more generous credit period from supplier.
• Encouraging earlier payment by customers, possibly by offering a discount.
• Chasing bad debts and reducing to below 10%.
• Liquidating investments - consider yield etc.
• Selling any non-essential assets
• Rescheduling loan repayments
• Reducing dividend payments

Page 62
Bank Overdraft
This is one of the most important sources of short-term finance. It is a very useful tool in
cash management, particularly for companies involved in seasonal trades.
The main advantages are:
• Cost may be lower than other sources (generally, short-term finance is cheaper than
long-term).
• Less security required than for term loans - overdraft can be recalled at short notice.
• Repayment is easier as there are no structured repayments - funds are simply paid into
the account as they become available.
• Interest is only charged on the amount outstanding on a particular day.
• Extra flexibility is provided as all of the facility may not be used at any one time. The
unused balance represents additional credit which can be obtained quickly and without
formality.
The main disadvantages are:
• Renewal is not guaranteed.
• Technically, the advance is repayable on demand, which could lead to a strain on the
company’s cash flow.
• Variable rate of interest – the facility may be renewed on less favourable terms if
economic circumstances have deteriorated.
Term Loan
Finance is made available for a fixed term and usually, at a fixed rate of interest. Repayments
are in equal instalments over the term of the loan. Early repayment may result in penalties.
The main advantages are:
• The term can be arranged to suit the borrower’s needs.
• The repayment profile may be negotiable to suit the expected cash flow profile of the
company (e.g. interest only basis to keep on-going repayments lower).
• Known cash flows assist financial planning.
• The interest rate is fixed, so the company is not exposed to increases in rates.
Cash Lodgement
It is important that cash is lodged as quickly as possible so that the organisation gets the
benefit through an increase in investments or a reduction in overdraft. However, apart from
the security risk of cash lying idle there are costs of making lodgements (bank, clerical,
transportation etc.) It becomes a “Balancing Act” to minimise costs and maximise benefits
(interest).

Page 63
Example
A company always works off an overdraft which currently costs 15% p.a. Sales are
RWF600,000 per week (5 working days). Half the cash is received on Monday and Tuesday,
split equally between the two days. The remaining sales are split equally over the other three
days. At present all lodgements are made on Friday afternoon.
It is now proposed to lodge on Monday, Wednesday and Friday but this will increase
administration and bank costs by RWF200 per week. Should the company change policy?
Receipts(RWF’000)
Day Banked
Days
Saved
Overdraft Saving (RWF)
Monday
150
Monday
4
(150 x 4/365 x
15%) =
246
Tuesday
150
Wednesday
2
(150 x 2/365 x
15%) =
123
Wednesday
100
Wednesday
2
(100 x 2/365 x
15%) =
82
Thursday
100
Friday
0
0
Friday
100
Friday
0
0
600
451
Weekly saving of the new policy is (RWF451 - RWF200) = RWF251
Annual saving is RWF251 x 52 = RWF13,052.
The new proposal should be adopted.
Centralised Cash Management
If an organisation has decentralised operations e.g. multiple branches, there may be
advantages in centralising cash management at Head Office. These are:
• Economies of Scale - by avoiding duplication of skills among divisions.
• Expertise - specialist staff employed at Head Office.
• Higher Yield - increased funds available may provide a greater return and reduce
transaction charges. Likewise, borrowings can be arranged in bulk at keener interest
rates than for smaller amounts.
• Planning - a cash surplus in one division may be used to offset a deficit in another,
without recourse to short-term borrowings.
• Bank Charges - should be lower as the carrying of both balances and overdrafts should
be eliminated.
• Foreign Currency Risk - can be managed more effectively as the organisation’s total
exposure situation can be gauged.
Some disadvantages are:

Page 64
• Slower decision making
• Loss of local market knowledge
• Demotivation of local staff
Computerised Cash Management
This allows companies via a computer terminal to get up-to-date information on cleared
balances on their bank accounts. Three basic services are provided:
• Account Balances - information provided on all accounts within a group (domestic and
foreign). Details of un-cleared items which will clear the next day, forecast balances
and individual transactions are available.
• Decision Support - current money market and foreign exchange rates provided.
• Funds Transfer - some services offer a direct link to brokers/banks, permitting instant
deals to be made.
The service facilitates more efficient cash management as available cash balances are
identified and utilised to the maximum. Thus, overall cash flow planning is more accurate.
To obtain the full benefit cash management should be centralised. However, potential
benefits must be compared with the additional costs incurred.
Cash Management Models
A number of cash management models have been developed to determine the optimum
amount of cash that a company should hold. One approach is to use the Economic Order
Quantity (EOQ) Model, which is used in stock management (see Stock Management section
later). Another (and more sophisticated) approach is the Miller-Orr Model. This determines
a lower limit, an upper limit and a normal level on cash balances. If cash reaches the lower
limit the firm sells securities to bring the balance back to the normal level. On the other
hand, if the cash balance reaches the upper limit the firm should buy sufficient securities to
return to the normal level. The various limits are set by reference to the variance of cash
flows, transaction costs and interest rates.
(a) Baumol’s Model based on the EOQ
Assumes costs can be divided into fixed and variable elements
Total Cost =
Q x i
+
F x S
2
Q
S = cash required in each time period
F = fixed cost of new funds (e.g. cost of negotiating an overdraft)
i = opportunity interest cost of holding cash or near cash equivalents
Q = the total amount of cash to be raised
Like the EOQ, the optimum amount of new funds to raise (Q) =
i
FS 2
Suppose a company faces a fixed cost of RWF5,000 to obtain funds. Cash
requirements per annum are RWF40,000 for the foreseeable future. The opportunity

Page 65
interest cost is 5% per annum. How much should the company raise at each time and
how often will they have to raise it.
The Q level is √ {(2 x RWF5k x 40k)/.05} = RWF89k.
Therefore the company should raise RWF89k each time it raises cash. It will need to
raise cash once every 2¼ years approximately (RWF89k/RWF40k).
The difficulties of Baumol’s application of the EOQ to Cash Management are:
• Difficulties in predicting cash needs
• What if use of cash is ‘unsteady’
• Ignores costs of running out of cash
• Ignores the normal costs of holding cash which may increase in line with the
amounts held
• Ignores inflation
(b) The Miller-Orr Model
Typically cash balances will vary considerably over time. The Miller-Orr model
imposes limits on the amount within which the cash balance is allowed to vary. When
the cash balance reaches an upper limit, the firm buys securities so that the cash balance
returns to its ‘normal’ level (the return point). When the cash balance reaches a lower
limit the firm sells securities in order to bring the balance back to the return point. The
upper/lower limits and the return point are based on the following factors:
• The variance of cash flows (if high -> set wide limits)
• The level of transaction costs (if high -> set high limits to reduce the level of
transactions)
• Interest rates (if high -> set low limits to minimise interest costs and maximise
return on short-term investments
Steps in Using the Miller-Orr Model
1. Set lower limits for the cash balances (safety needs)
2. Estimate the variance of the cash flow over time
3. Calculate the transaction costs and interest rates applicable
4. Calculate the spread between upper and lower cash limits as follows:
1/3
3
RateInterest
FlowCash of Variance x Costsn Transactio x 3/4
5. Once you have the spread and the lower limit (LL), the return point is set as:
Page 66
Return Point = Lower Limit + (1/3 x Spread)
By keeping the return point at this level, you are helping to keep down the interest
costs of holding cash.
The Upper Limit (UL) = Lower Limit + Spread
When the cash flows reach the Upper/Lower limit you sell/buy securities to get to
the return point.
The Miller-Orr model, while reasonably sophisticated, is nevertheless quite
operational. While cash flows are more predictable in certain contexts than those
allowed by Miller-Orr, the model can save time and energy which would
otherwise be spent predicting these cash flows. The major difficulties are in
estimating the parameters of the model particularly the variance of the cash flows.
Investment of Short-Term Funds
In deciding the best approach consideration must be given to the quantity of funds; length of
time for which available; certainty of the funds; rate of return; risk and variability of return;
possibility and costs of early termination (liquidity).
Possible investments are:
• Short-Term Deposits - return depends on the period and amount.
• Certificates of Deposit (CD’s) - flexible as CD’s are negotiable.
• Short Gilts/Treasury Bills - known, fixed return if held to maturity. Early disposal may
result in capital gain/loss.
• Reduction in Overdraft
C. THE MANAGEMENT OF DEBTORS
Excess debtors are a wasted resource which should be avoided by careful management.
Managing means reducing it to the practical minimum, consistent with not damaging the
business. For example, it is no good simply refusing to give customers credit - they will go
elsewhere. A balanced approach is required which will reduce debtors to a minimum
acceptable level.
Debtors are often one of the largest items in a company’s Balance Sheet and also one of the
most unreliable assets, largely because company policies concerning them are often
inadequate or poorly defined and in the hands of untrained staff. Typically, a company could
have 20% - 25% of total assets as debtors.
Credit management is a problem of balancing profitability and liquidity. Credit terms can be
a sales attraction but higher debtors put a strain on liquidity. Management of debtors will be
concerned with achieving the optimum level of investment. This requires finding the correct
balance between:
• Extending credit to increase sales and, therefore profits and
Page 67
• The cost of investment in debtors (cost of finance, administration, bad debts etc.)
By setting the “terms of sale” the company can, to some extent, control the level of debtors.
However, the relative strengths of the credit-giver and the credit-taker are important.
Consideration must also be given to the industry norm.
The company has at least four factors to control debtors:
1. The customers to which it is prepared to sell.
2. The terms of credit offered.
3. Whether cash discounts will be offered?
4. The follow-up procedures for slow payment.
Evaluating Credit Risk
Before extending credit to new customers management will assess the risk of default in
payment/non-payment. This will be based upon experience and judgement but in addition,
the following sources may be used:
• Trade References - from other suppliers (at least two).
• Bank References - may be of limited use as banks are reluctant to supply adverse
references.
• Credit Agency Reports - specialist agencies (e.g. Dun & Bradstreet) will provide
detailed reports on the history, creditworthiness, business etc. of individuals and
organisations on payment of a fee.
• Published Information - annual accounts etc.
• Own Salesmen - useful source but views may be biased (commission receivable?).
• Newspapers and Trade Journals.
• Other Credit Controllers - many trade associations where controllers meet regularly
to exchange information about the state of the industry generally and slow/bad payers
in particular.
• Own Information - check old customer files to see if you have ever done business in
the past.
• Trial Period - on a "cash -only" basis.
• Credit Limit - fix at low level initially and only increase if payment record warrants.
• Site Visits - an opinion on the operations can be formed by visiting the premises.
• Credit Scoring - evaluate potential customer using credit scoring or other quantitative
techniques. Credit scores are risk indicators - the higher the score, the lower the risk.
Scores will be allocated based on the characteristics of the new customer (e.g. age,
occupation, length of service, married/single, home owner, size of family, income,
commitments etc.). Credit scoring is particularly suited to financial institutions and the
amount of credit offered, if any, will depend on whether the credit score is above a

Page 68
predetermined cut-off level. Computerised systems (“expert systems”) are especially
useful for this purpose.
Although terms and settlement discounts are often influenced by custom and practice within
an industry it is still possible to change them. Once defined, ensure that the customers are
aware of them - ideally, they should be informed when they order, when they are invoiced
and when they receive statements. Always try to enforce the specified discount policy.
Discounts
As extended credit facilities may be expensive to finance the firm may offer customers a
discount (cash/settlement discount) to encourage them to pay early. As with extended credit
discounts may also be used as a marketing tool in an effort to increase sales. To evaluate
whether it is financially worthwhile the cost of the discount should be compared with the
benefit of the reduced investment in debtors.
Example
A company offers its customers 40 days credit. On average they take 60 days to pay. To
encourage early payment the company now proposes to offer a 2 % discount for payment
within 10 days.
For each RWF100 of sales the cost is RWF2 and the company only receives a net RWF98. In
return the company receives payment 50 days earlier (day 60 - day 10). The annualised cost
of the discount is:
2
x
365
= 14.9% p.a.
98
50
The cost of 14.9% should be compared with other sources of finance. If, for example, the
cost of the company’s overdraft is 16% p.a. the discount would seem to be worthwhile. If, on
the other hand, the cost of the overdraft is only 10% p.a. the discount should not be offered as
it would be better to leave the debts outstanding and finance through the overdraft.
In industries that deal with both trade and retail customers (e.g. building supplies) it is usual
to offer trade discounts. This may reflect the economies of scale which derive from larger
orders and the greater bargaining power of the customer. Trade discounts are frequently
much larger than cash/settlement discounts and may be for as much as 25% of the quoted
price.
Debt Control
Good debt control can be summed up as ensuring that all sales are paid for within an agreed
period, without alienating customers, at the minimum cost to the company.
The company itself can take steps to “assist” the debtors to pay promptly:
1. Issue invoices and statements promptly.
2. Deal with customer queries/disputes immediately.
3. Issue credit notes as agreed.
4. Be flexible in billing arrangements to accommodate customers.

Page 69
There is no debt collection policy that is applicable to all companies. Policies will differ
according to the nature of the product and the degree of competition. A debt control system
will probably include:
1. Well trained credit personnel.
2. Measures to ensure that credit limits are not exceeded.
3. Formal set procedures for collecting overdue debts, which should be known by all staff
and applied according to an agreed time schedule. Care must be taken that the cost of
the debt collection does not exceed the amount of the debt, except where used as a
deterrent. Also over-zealous collection techniques may damage goodwill and lose
future sales.
4. Computerised monitoring systems to identify overdue accounts as early as possible.
For example, ratios, compared with the previous period to highlight trends in credit
levels and the incidence of overdue and bad debts; statistical data to identify causes of
default and the incidence of bad debts among different classes of customer and types of
trade. An “Aged Analysis of Debtors” is particularly useful in this regard.
Debtor
Total
Current
1-2 Months
2-3 Months
> 3 Months
xxxxx
RWF10,000
RWF5,000
RWF5,000
xxxxx
RWF20,000
RWF10,000
RWF5,000
RWF5,000
xxxxx
RWF50,000
RWF30,000
RWF20,000
xxxxx
RWF50,000
RWF10,000
RWF20,000
RWF20,000
xxxxx
RWF60,000
RWF30,000
RWF20,000
RWF10,000
xxxxx
RWF40,000
RWF10,000
RWF20,000
RWF10,000
xxxxx
RWF30,000
RWF10,000
RWF20,000
xxxxx
RWF50,000
RWF20,000
RWF20,000
RWF10,000
Total
310,000
95,000
65,000
85,000
65,000
%
31%
21%
27%
21%
Debt collection policies must not be regarded as completely inflexible and systems should be
modified as circumstances change.
Among the many debt collection techniques that can be used are:
1. Invoices - issued promptly following delivery of goods/service.
2. Statements - at monthly/other intervals to draw attention to unpaid debts.
3. Overdue Letters - carefully drafted to provoke an immediate response; individual
rather than obviously computer-produced; series of letters of varying degrees of
severity.
4. Telephone Calls – these ensure that customer has received the letter(s) and gives him
an opportunity to raise any queries or advise of any difficulties which may cause a
change of approach to help him out.
5. Mail or Email Reminders.
6. Visits by Sales Staff.
7. Visits by Credit Control Staff.

Page 70
8. Use of External Agencies - debt collection agency; factoring company etc.
9. Threaten Withdrawal of Credit Facilities/Discounts.
10. Threaten To Withhold Future Supplies.
11. Solicitor’s Letter.
12. Legal Action - beware cost of action does not exceed debt.
In most cases some extra spending on debt collection will reduce the overall cost of the
investment in debtors (e.g. reduction in bad debts/average collection period etc.). However,
beyond a certain level extra spending is not usually cost effective.
Credit Policy
Example 1
Current sales are RWF500,000 p.a. - all on credit. On average customers take 60 days credit.
Bad debts are 1% of sales.
Marketing manager suggests that if credit is relaxed to 90 days sales will increase by 20%.
However, bad debts will increase to 2%. It is estimated that 75% of existing customers will
take the 90 days. Variable costs are 90% of sales value and the company uses an overdraft
costing 10% p.a.
Should the new proposal be adopted?
RWF
RWF
Increased Sales (20%)
100,000
Increased Contribution (10%)
10,000
Bad Debts
- Existing
500,000 x 1%
5,000
- Revised
600,000 x 2%
12,00
(7,000)
Debtors
- Existing
500,00 x 60/365
82,192
- New
500,000 x 75% x 90/365
92,466
500,000 x 25% x 60/365
20,548
100,000 x 90/365
24,658
137,672
Increase in Debtors
55,480
Cost of Increased Debtors @ 10%
p.a.
(5,548)
Net Cost
(2,548)
The New Policy is Not Worthwhile
Example 2
Current sales are RWF500,000 p.a. - all on credit. 60 days credit allowed but on average 90
days taken.
New credit terms of a 4% discount for payment by day 10 are being considered. It is
estimated that 60% of the customers will take the discount. The new terms will increase sales
by 20%. Variable costs are 85% of sales value and the company uses an overdraft costing
11% per annum. Should the discount be offered?

Page 71
RWF
RWF
Increased Sales (20%)
100,000
Increased Contribution (15%)
15,000
Cost of Discount
600,000 x 60% x 4%
(14,400)
Debtors
- Existing
500,000 x 90/365
123,287
- New
600,000 x 60% x 10/365
9,863
600,000 x 40% x 90/365
59,178
69,041
Reduction in Debtors
54,246
Saving Due to Reduced Debtors @ 11% p.a.
5,967
Net Benefit
6,567
The New Policy Is Worthwhile.
Factoring
This involves the sale of trade debts for immediate cash to a “factor” who charges
commission. Factoring companies are financial institutions often linked with banks. Unlike
an overdraft the level of funding is dependent, not upon the fixed assets of the company, but
on its success for as the company grows and sales increase the facility offered by the factor
grows, secured against the outstanding invoices due to the company. Three basic services are
offered, although a company need not use all of them:
1. Finance - instruction on invoices that payment is to be made to the factor, who is
responsible for collection of the debt. When the factor receives the invoices 80%
approx. of value is advanced. The balance (less charges, including interest) is paid,
either when the invoice is settled or after a specified period.
2. Sales Ledger Management - the factor takes the place of the client’s accounts
department. Duplicate invoices are sent to the factor who maintains a full sales ledger
for each client handles invoices, chases outstanding payments etc. Commission of 1% -
2% is charged.
3. Credit Insurance - in return for a commission the factor provides a guarantee against
bad debts.
Recourse Factoring - the factor will reclaim the money advanced on any uncollected debt so
the business will retain the risk of non-recovery and, depending on the contract terms,
perhaps the administration burden as well.
Non-Recourse (Full) Factoring - the factor runs credit checks on the company’s customers
and agrees limits dependent on their creditworthiness. These can be adjusted in the light of
experience, once a pattern has been established. The factor will protect the client against bad

Page 72
debts on approved sales and will also take on all the administration burden. The balance
over the 80% advance is paid to the client an agreed number of days after the initial advance.
Recourse v Non-Recourse Factoring - with non-recourse factoring the business knows that it
will get paid, no matter what happens but protection only applies to credit-approved debts
and it is not always easy to get this approval for doubtful ones. Recourse factoring allows
more funding to be made available against less credit-worthy debtors and the business is in
control of when and how individual debts are to be pursued and collected.
The cost of finance through factoring is usually slightly above overdraft rates. The
administration charges vary, usually between 0.6% and 2.5% approx.
Advantages of Factoring
1. It is an alternative source of finance if other sources are fully utilised, particularly for a
company with a high level of debtors.
2. It is especially useful for growth companies where debtors are rising rapidly and funds
available from the factor will rise in tandem.
3. Security for the finance is the company’s debtors, leaving other assets free for
alternative forms of debt finance.
4. The factor may be able to manage the company’s sales ledger more efficiently by
employing specialist staff, leading to lower costs for the company and freeing
management to concentrate on growing the business.
5. Bad debts will be reduced or guaranteed by credit insurance.
6. Due to the greater guarantee of cash flow the company will have a better opportunity
for taking up cash discounts from suppliers.
7. The factor will be more efficient in collecting monies. Evidence suggests that, on
average, it takes over 75 days for an invoice to be paid, whereas the average debt turn
of companies using factoring is 60 days.
8. The company replaces a great many debtors with one - the factor - who is a prompt
payer.
Disadvantages of Factoring
1. It may be more expensive than other sources.
2. When fixing credit terms and limits the factor will be concerned with minimising risk
and, therefore, certain risky but potentially profitable business may be rejected.
3. The factor may be “pushy” when collecting debts. This may lead to ill-feeling by
customers.
4. Use of a factor might reflect adversely on a company’s financial stability in the eyes of
some people. Factoring is more acceptable nowadays but this problem could be
overcome by undisclosed factoring, which leaves the company to collect payment as
agent for the factor.

Page 73
Invoice Discounting
This is similar to factoring but only the finance service is used. Invoices are discounted (like
Bills Receivable) and immediate payment, less a charge, is received. The company still
collects the debt as agent for the financial institution and is also liable for bad debts. The
service tends to be used on an ad hoc basis and is provided by factors for clients who need
finance but not the administrative service or protection. Invoice Discounting is confidential
and solely a matter between the lender and borrower, unlike Factoring where the bank
assumes a direct and visible role between the company and its debtors. Also, the company
retains full control over the management of its debtor’s ledger, including credit control.
D. THE MANAGEMENT OF CREDITORS
Trade credit is an often used source of finance. The costs of this source of finance are the
costs of any discounts forgone and any interest charges which the creditor charges on overdue
bills. Of course, excessive use of this source may lead to poor relations with a supplier (or
even no relations) which can be damaging.
Credit from suppliers is a very important source of short-term finance.
The credit is mistakenly believed to be cost-free. The costs include the following:
1. Loss of Supplier’s Goodwill - this is difficult to quantify. If the credit period is
regularly overdone suppliers may be put a low priority on the quality of service given;
further orders may be refused; cash on delivery or payment in advance demanded.
2. Higher Unit Costs - the supplier may try to recoup the cost of longer credit by
charging increased prices.
3. Loss of Cash Discounts - if the credit period is used then discounts are not being taken.
Thus, the cost of credit is the cost of not taking the discount.
Example
Your company normally pays within 45 days. The supplier offers a 2% discount for payment
within 10 days. If the company refuses the discount the implied cost of not taking the
discount is:
2
x
365
= 21.3% p.a.
98
35
The cost of not taking the discount (opportunity cost) is 21.3% p.a.
Despite the above costs trade credit is the largest source of short-term funds for companies.
Among the advantages are:
1. Obtaining credit is informal.
2. It is a flexible source of finance - but payment should not be delayed regularly.
3. It is a relatively stable source of finance - it is available continuously.
4. No security is required - unlike other forms of credit.

Page 74
E. THE MANAGEMENT OF STOCKS
In many organisations stock requires the commitment of a large amount of resources. The
classic conflict often arises:
The Production manager desires a large stock of raw materials so that production is
uninterrupted.
The Sales manager desires a large stock of finished goods so that no sales are lost.
The Finance manager desires a low level of all types of stock so that costs are
minimised.
Ordering and Holding Costs
High levels of stock can only be achieved at a cost. The total cost of stock-holding has many
elements:
• Cost of financing
• Storage (warehousing)
• Handling
• Insurance
• Administration
• Obsolescence
• Deterioration
• Pilferage
Sound stock control entails having the right product available in the right quantity, at the
right time and at the right cost.
Fast and frequent replenishment of sales will minimise stock-holding.
Overall, reducing stock is likely to increase profitability rather than decrease it. Reducing
stock is almost totally within the control of management - unlike reducing debtors or
increasing creditors, it does not rely on the co-operation of third parties.
Economic Order Quantity (EOQ)
Total stock-holding costs could be broadly classified as “Holding” costs and “Ordering”
costs. The EOQ model attempts to minimise total costs by balancing between holding and
ordering costs. If large batches are ordered, this will result in high holding costs and low
ordering costs. Conversely, if small batches are ordered this will result in low holding costs
and high ordering costs.
EOQ =
√
2 cd
h
Where: c = cost per order
d = annual demand for item of stock

Page 75
h = annual cost of holding a unit in stock
The EOQ Model makes a number of assumptions:
• Order cost is constant regardless of the size of the order.
• Use of the item of stock is constant.
• No stock-outs occur.
• Purchase price is constant.
Example:
A company has annual demand for 2,000 units. Each unit can be purchased for RWF20. The
cost of placing each order is RWF20 and the annual cost of holding an item in stock is RWF2.
Calculate the Economic Order Quantity.
EOQ =
√
2 x 20 x 2,000
= 200 units
2
Discounts
If the supplier offers a discount for larger orders this may alter the position. The discount will
offer two savings - a reduced purchase price and lower ordering costs because fewer orders
are placed. Using the above example, suppose that a discount of 2% is offered on orders of
400 or more.
Calculate the total costs with and without the discount. Total costs will now consist of
ordering costs + holding costs + purchase price.
200 Units
Ordering: RWF20 x
2,000
RWF200
200
Holding: RWF2 x
200
RWF200
2
Purchase:
2,000 x
RWF20
RWF40,000
RWF40,400
400 Units
Ordering: RWF20 x
2,000
RWF100
400
Holding: RWF2 x
400
RWF400
2
Purchase:
2,000 x
RWF19.60
RWF39,200
RWF39,700
Page 76
The discount is worthwhile
Just In Time Stock Management (JIT)
The main purpose of JIT purchasing is to ensure that delivery of supplies occurs immediately
prior to the requirement to use them in manufacture, assembly or resale. Close co-operation
between user and supplier is essential. The supplier is required to guarantee product quality
and reliability of delivery while the user offers the assurance of firmer long-term sales. Users
will purchase from fewer and perhaps, only a single supplier, thus enabling the latter to
achieve greater scale economies and efficiency in production planning. The user expects to
achieve savings in materials handling, inventory investment and store-keeping costs since
(ideally) supplies will now move directly from unloading bay to the production line. There
may also be benefits from bulk purchasing discounts or lower purchase costs.
With a JIT system there is little room for manoeuvre in the event of unforeseen delays – e.g.
on delivery times. The buyer is also dependent on the supplier for the quality of materials, as
expensive downtime or a production standstill may arise, although guarantees and penalties
may be included in the contract as protection.

Page 77
Study Unit 8
Capital Markets
Contents
A. Introduction
B. Main Functions of Capital Markets
C. Capital Providers
D. Company Flotation
E. Going Private
F. Efficient Markets

Page 78
A. INTRODUCTION
Capital Markets are markets where long-term instruments are traded e.g. equities, preference
shares, debentures etc.
A good example of a Capital Market is the Stock Exchange.
B. MAIN FUNCTIONS
The main functions of the Stock Exchange are:
• PRIMARY MARKET - used to raise new finance/issue new securities
• SECONDARY MARKET - trade in second-hand securities. This is where most of the
day-to-day activity takes place.
• COMPANY FLOTATION
• SHARE SWAP - securities used as consideration in takeover of other companies
C. CAPITAL PROVIDERS
The main providers of capital are:
• Pension Funds
• Insurance Companies
• Investment Trusts
• Unit Trusts
• Other Financial Institutions
• Overseas Investors
• Venture Capital Organisations
• Business Expansion Scheme Funds
• Individuals
D. COMPANY FLOTATION
There are many reasons why a company may be floated on the Stock Market (“Going
Public”). Chief among these is access to capital.
1. Advantages - Shareholders
1. Cash for some shares.
2. Wider market for remaining shares.
3. Shares perceived as less risky.
4. Ready share price available.
Page 79
2. Advantages - Company
1. Possibility of new funds.
2. Better credit-standing.
3. Ability to “swap shares” on a takeover.
4. Ability to issue shares more easily at a later date.
5. Reduced risk & greater marketability leads to lower cost of capital.
6. Extra status.
7. Possibility of share options for top employees.
3. Disadvantages
1. Costs can be quite high.
2. Compliance with stringent regulations.
3. Dilution of control.
4. Additional administration.
5. Extra scrutiny of profitability/performance.
E. GOING PRIVATE
Some company shareholder(s) take a company from public ownership back to private
ownership. This happens when the major shareholder and possibly founder finds compliance
with the rules governing public limited companies and reporting to shareholders expensive
and time-consuming. Also public ownership also confers a pressure to maintain share price
through short-term profits or dividends. Where the major shareholder is also chief executive
officer or managing director this can be a disincentive to public ownership.
F. EFFICIENT MARKETS
A market is generally regarded as efficient if the following are present:
• Prices immediately reflect all relevant available information
• No individual investor dominates the market
• Transaction costs are not too high to discourage trading
Are the markets efficient? The Efficient Market Hypothesis (EMH) has been developed to
test different levels of efficiency. [Note: Hypothesis is defined as a supposition put forward
as a basis for reasoning or investigation.]
The Efficient Market Hypothesis tests three degrees of efficiency
1. Weak Form Efficiency
Prices reflect the information in past stock prices.
Page 80
2. Semi-strong Form Efficiency
Prices reflect past price information
Plus
All publicly available information.
3. Strong Form Efficiency
Prices reflect past price information
Plus
All publicly available information
Plus
Inside information
Most of the research suggests that capital markets are semi-strong-form efficient but not quite
strong-form efficient.

Page 81
Study Unit 9
Long-Term Sources of Finance
Contents
A. Introduction
B. Share Capital
C. Loan Capital
D. Warrants
E. Methods of Share Issues
F. Bank Lending

Page 82
A. INTRODUCTION
Example:
RWF’000
Average
Poor
Excellent
Profits
100
20
300
(i) Interest (200 x 10%)
20
20
20
80
0
280
Corporation Tax (20%)
16
0
56
Profits After Tax
64
0
224
(ii) Preference Dividend
10
0
10
(iii) Available for Equity
54
0
214
Note:
Comparing the Average with the Excellent performance it should be noted that while Profits
increase by 200%, the amount Available for Equity [at number (iii)] increases by more than
200%.
No matter what the level of performance, a fixed amount is paid to the Lenders and the
Preference Shareholders.
Interest on borrowings is allowable for Corporation Tax.
Note the ranking of the different providers of capital.
The Ordinary Shareholders (equity) are entitled to the “residue” after all others have been
rewarded.
B. SHARE CAPITAL
Ordinary Shares
The main features are:
• Issued to the owners of the company (equity).
• Nominal or “face” value (e.g. RWF1,000).
• Market value moves with market’s view of the company’s performance/prospects.
• Shareholders are not liable for the company’s debts on a winding-up (limited liability).
• Carry voting rights
• Ordinary shareholders are entitled to the residue after other parties have been rewarded.
This applies to both annual profits and capital on a winding-up.
• Subscription privileges apply in the event of a new issue of shares (“pre-emptive
rights”).
• Shareholders may be rewarded by dividends (income), or retained profits (capital gain)
which should be reflected in the market price of the shares. Some companies offer
concessions on their products to shareholders - e.g. discounts or vouchers.

Page 83
Some companies have different classes of ordinary shares. For example,
Non-Voting - similar to other shares in every respect, except holders cannot vote.
Advantages to the Company
• No fixed annual charges are payable - no legal obligation to pay a dividend.
• Do not have a maturity date and are not normally redeemable.
• Usually more attractive to investors than fixed interest securities.
• Might increase the creditworthiness of a company as they reduce gearing.
Disadvantages to the Company
• Issue might reduce EPS, especially if the assets acquired do not produce immediate
earnings.
• Extend voting rights to more shareholders.
• Lower gearing as a result of the issue might result in a higher overall cost of capital
than is necessary.
• Issues often involve substantial issue and underwriting costs.
• Dividends are not a tax allowable expense.
Preference Shares
The main features are:
• Holders are entitled to a fixed maximum dividend.
• Dividends are only paid if sufficient profits are available.
• Rank prior to ordinary shares (both dividends and capital on a winding-up).
• Cumulative Preference Shares have the right to any arrears of dividend and these are
carried forward and must be paid before any dividend is paid to the ordinary
shareholders. Preference Shares are cumulative, unless expressly stated to be non-
cumulative.
• Restricted voting rights - usually only available in a situation where the rights attaching
to the shares are being amended or if dividends are in arrears.
• Some companies have different classes of preference shares. For example:
Redeemable - generally redeemable subject to sufficient profits being available or sufficient
cash being raised from a new issue.
Convertible - the right to convert to ordinary shares as per the terms of the issue.
Advantages to The Company
• A fixed percentage dividend per year is payable no matter how well the company
performs, but only at the discretion of the company’s directors.
• Do not normally give full voting rights to holders.
• Preference shares are mostly irredeemable.

Page 84
Disadvantages To The Company
• Cumulative arrears of dividend are payable.
• Dividends are not a tax allowable expense.
C. LOAN CAPITAL
The main types are Loan Stock and Debentures.
• Loan Stock - long-term debt (usually > 10 years duration) on which a fixed rate of
interest (coupon rate) is paid. Generally unsecured.
• Debentures - a form of loan stock, legally defined as a written acknowledgement of
debt. Usually secured. Trustees appointed to look after investors’ interests. Can be
redeemable or irredeemable.
• Loan capital ranks prior to share capital (both interest and capital on a winding-up).
The ranking of individual debt will depend upon the specific conditions of each issue.
• Restrictive covenants are often included in the lending agreement (e.g. restrictions on
further borrowings, the payment of dividends, or major changes in operations; the
maintenance of certain key ratios in the accounts etc.).
• If security is provided the cost to the company may be cheaper. Security may be in the
form of a fixed or floating charge.
• Interest payments are allowable for Corporation Tax.
• If the net cost of debt is low why do companies not borrow more and more? Some of
the reasons are:
– A high level of debt will increase the financial risk for the shareholders.
– Interest charges at a particular point in time may be high.
– The company may have insufficient security for new debt.
– There may be restrictions on further debt - Articles of Association; restrictive
covenants; credit lines fully used etc.
Redemption of Loan Capital
• Most redeemable stocks have an earliest and a latest date for redemption.
• Redemption is at the company’s option anytime between these two dates.
• When should the company redeem? Generally, if the coupon rate is below current
interest rates, delay to the later date and vice versa. However, the following factors
should be considered:
– If internally generated funds are to be used, consider their availability.
– If a further issue of debt is to be used, consider issue costs.
– The trend in future interest rates.
– If new equity is to be used, shares should be issued when the price is relatively
high.
Page 85
Convertible Loan Stock
This is debt paying a fixed rate of interest but also providing the option to convert to equity at
a pre-determined rate on pre-determined date(s).
The main features are:
• Conversion is at the option of the holder.
• Conversion terms usually vary over time.
• Once stock is converted it cannot be converted back.
Advantages to the Company
• It is cheaper than straight debt, due to the conversion rights. The lower coupon rate
may suit projects with low cash flows in the early years.
• A high-risk company may have difficulty raising long-term finance no matter what
coupon rate is offered. Convertibles may attract investors due to the “upside potential”.
• If conversion takes place the debt is self-liquidating. Conversion will reduce gearing
and enable further debt to be raised in the future.
• Interest payments are tax deductible.
• Convertibles are often not secured and have less restrictive covenants than straight
debentures.
• The number of shares eventually issued on conversion will be smaller than if straight
equity is issued.
Advantages to the Investor
• If the market value of the company’s shares falls the value of the convertibles will not
fall below the market value of straight debt with the same coupon.
• If the market value of the company’s shares rises the value of the convertibles will rise
also.
• Convertibles rank before shares on a winding-up.
• If the company’s fortunes improve dramatically investors can share in this by
exercising their option.
Floating Rate Bonds
• These are debt securities whose interest is not fixed but is re-fixed periodically by
reference to some independent interest rate index - e.g. a fixed margin over NBR
Interbank rate or LIBOR (London Interbank Offered Rate). These are commonly
referred to as Floating Rate Notes or FRNs. Coupons are re-fixed, and coupon
payments made, usually every six months.
• When market interest rates fall the issuer (borrower) is not saddled with high fixed
coupon payments. Likewise, when interest rates rise the investor is not stuck with a
fixed income but will see his income rise in line with market rates.
• The market value of such securities should be fairly stable as interest rates will rise/fall
in line with market interest rates.
Page 86
Deep Discount Bonds
These are debt securities which are issued at a large discount to their nominal value but will
generally be redeemable at par on maturity. To compensate for the fact that a large capital
gain accrues on maturity, the ongoing coupon rate is substantially lower than other types of
loan stock. An example might be:
2% Bond 2020, which was issued in 2010 at a price of RWF70 per cent
• The price of the bond in the secondary market will gradually appreciate as the maturity
date approaches.
• Many projects require funding up-front, but are unlikely to give rise to an income
stream to service interest costs for some period of time - e.g. a building project where
income from rentals or sale of the building would be received much later. A Deep
Discount Bond can be a useful source of funding for such a project as it helps to match
cash flows.
• An attraction to the investor is the advantageous taxation treatment in certain countries
- e.g. the capital gain at maturity may be subject to Chargeable Gains Tax, which may
be at a lower rate than income tax, or the gain is taxed as income in one lump sum on
maturity or sale rather than as interest each year.
Zero Coupon Bonds
Zero Coupon Bonds are very similar to Deep Discount Bonds except that no interest is paid
during the life of the bond and are, therefore, issued at a large discount to their nominal value.
An example might be:
0% Bond 2021, which was issued in 2011 at a price of RWF50 per cent
Instead of interest payments the investor receives as a return the difference between the issue
price and the higher redemption proceeds.
D. WARRANTS
• Holder has the right (but not the obligation) to purchase a stated number of shares, at a
specified price, anytime before a specified date.
• If not exercised the warrants lapse.
• Warrants are often issued as a “sweetener” to make a loan stock issue more attractive,
or to enable the company to pay a lower coupon rate.
• The warrant-holder is not entitled to dividends/voting rights.
• Unlike convertibles, new funds are generated for the company if the warrants are
exercised.
• Generally, the warrant is detachable from the stock and can be traded separately.
• The value of the warrant is dependent on the underlying share price.

Page 87
E. METHODS OF SHARE ISSUE
Offer For Sale
• Public at Large
• Fixed Price
Offer For Sale By Tender
• Public at Large
• Not a Fixed Price
• Set a Minimum Price & Invite Tenders
• Shares Issued at Highest Price where All Taken-up
Placing
• Shares "Placed" with Target Audience – generally institutions
Rights Issue
Shares Issued to Existing Shareholders
Pro-rata to Existing Shareholding (e.g. One for Five Issue)
Example: One for Five Issue
Company
Shareholder
10m
shares
1m
shares (10%
holding)
2m
new shares
0.2m
new shares
12m
1.2m
(10% holding)
Possible Choices:
• Subscribe for new shares (exercise rights)
• Sell "rights" to new shares
• Exercise rights (part) & sell rights (part)
• Do nothing
Example:
Shares currently trading at RWF2.00 (cum rights). Rights issue on a one-for-four basis at a
price of RWF1.50. Examine the consequences for a shareholder who currently owns 1,000
shares.
Firstly, calculate the "Theoretical Ex-Rights Price"
4 shares
@ RWF2.00 =
RWF8.00
1 share
@ RWF1.50 =
RWF1.50
5 shares
RWF9.50
Theoretical Ex-Rights Price = RWF9.50/5 = RWF1.90

Page 88
Secondly, calculate the Value of The Rights
Ex-Rights Price
RWF1.90
Issue Price
RWF1.50
Value of Rights
RWF0.40
(i) Exercise Rights
Value of Shares (1,000 + 250) @ RWF1.90
RWF2,375.00
Less Cost of Purchase (250 @ RWF1.50)
(RWF375.00)
RWF2,000.00
Current Wealth (1,000 @ RWF2.00)
RWF2,000.00
(ii) Sell Rights
Sale of Rights (250 @ RWF0.40)
RWF100.00
Value of Shares (1,000 @ RWF1.90)
RWF1,900.00
RWF2,000.00
Current Wealth (1,000 @ RWF2.00)
RWF2000.00
(iii) Exercise Half & Sell Half
Sale of Rights (125 @ RWF0.40)
RWF50.00
Value of Shares (1,000 + 125 @ RWF1.90)
RWF2,137.50
Less Cost of Purchase (125 @ RWF1.50)
(RWF187.50)
RWF2,000.00
Current Wealth (1,000 @ RWF2.00)
RWF2,000.00
(iv) Do Nothing
Value of Shares (1,000 @ RWF1.90)
RWF1,900.00
Current Wealth (1,000 @ RWF2.00)
RWF2,000.00
Loss of Wealth
(RWF100.00)
F. BANK LENDING
The main considerations by the bank before advancing a loan can be summarized by the
mnemonic PARTS.
P URPOSE
A MOUNT
R EPAYMENT
T ERM
S ECURITY

Page 89
Study Unit 10
Venture Capital
Contents
A. Introduction
B. Stages of Investment
C. Specialist Areas
D. Business Plan
E. Types of Financing Structure
F. Methods of Withdrawal by Venture Capitalist
G. Case Study
Page 90
A. INTRODUCTION
Many new business ventures are considered too risky for traditional bank lending (term loans,
overdrafts etc.) and it is this gap that Venture Capital usually fills.
Venture Capital could be described as a means of financing the start-up, expansion or
purchase of a company, whereby the venture capitalist acquires an agreed proportion of the
share capital (equity) of the company in return for providing the requisite funding. To look
after its interests the venture capitalist will usually want to have a representative appointed to
the board of the company.
The venture capitalist’s financing is not secured – he takes the risk of failure just like other
shareholders. Thus, there is a high risk in providing capital in these circumstances and the
possibility of losing the entire investment is much greater than with other forms of lending.
The venture capitalist also participates in the success of the company by selling his
investment and realising a capital gain, or by the company achieving a flotation on the Stock
Market in usually five to seven years from making his investment. As a result, it will
generally take a long time before a return is received from the investment but to compensate
there is the prospect of a substantial return.
B. STAGES OF INVESTMENT
The various stages of investment by a venture capitalist can be defined as follows:
• Seed Capital – finance provided to enable a business concept to be developed, perhaps
involving production of prototypes and additional research, prior to bringing the
product to market.
• Start-Up – finance for product development and initial marketing. Companies may be
in the process of being set up or may have been in business for a short time but have not
sold their product commercially.
• Expansion – capital provided for the growth of a company which is breaking even or
possibly, trading profitably. Funds may be used to finance increased production
capacity, market or product development and/or provide additional working capital.
Capital for “turnaround” situations is also included in this category.
• Management Buy Out (MBO) – funds provided to enable current operating
management and investors to acquire an existing business.
• Management Buy In (MBI) – funds provided to enable a manager or group of
managers from outside the company to buy into the company.
Page 91
C. SPECIALIST AREAS
Venture Capitalists may specialise in areas in which they will invest. These may relate to:
• Preferred Business Sectors – e.g. consumer services, Information Technology,
property etc.
• Stage of Investment – many venture capitalists will finance expansions, MBO’s and
MBI’s but far fewer are interested in financing “Seed Capital,” start-ups and other early
stage companies, due to the additional risks and time/costs involved in refinancing
smaller deals as compared with the benefits.
• National or Regional Preferences – the preferred geographical location of the
investee.
• Amount of Investment – varies with the stage of the investment. Start-up and other
early stage investments are usually lesser in amount than expansion and MBO/MBI
investments.
D. BUSINESS PLAN
Before deciding whether an investment is worth backing the venture capitalist will expect to
see a Business Plan. This should cover the following:
• Product/Service – what is unique about the business idea? What are the strengths
compared to the competitors?
• Management Team – can the team run and grow a business successfully? What are
their relevant experience, qualifications, track record and motivation? How much is
invested in the company by the management team? Are there any non-executive
directors? Details of other key employees.
• Industry – what are the issues, concerns and risks affecting the business area?
• Market Research – do people want to buy the idea?
• Operations – how will the business work on a day-to-day basis?
• Strategy – medium and long-term strategic plans.
• Financial Projections – are the assumptions realistic (sales, costs, cash flow etc.)?
Generally, a three or even a five year period should be covered. Alternative scenarios,
using different economic assumptions. Also state how much finance is required, what it
will be used for and how and when the venture capitalist can expect to recover his
investment?
• Executive Summary – should be included at the beginning of the Business Plan. This
is most important as it may well determine the amount of consideration the proposal
will receive.
E. TYPES OF FINANCING STRUCTURE
There are various ways in which a deal can be financed:
Page 92
• Debt in Addition to Equity – a proportion of the required finance is obtained from a
debt provider (e.g. Clearing Bank, Merchant Bank, Factor, Government sources etc.)
• Mezzanine Debt – loan finance which is half-way between equity and secured debt in
that it either takes a second charge on the company’s assets or is unsecured. Due to the
higher risk the lender requires a higher rate of interest.
• Stage Financing – the venture capitalist provides rounds of finance when certain
achievements are met – e.g. product development, product launch, expansion of
manufacturing facilities etc.
• Preference Shares – these may include Redeemable/Convertible/Participating shares.
• Ratchets – these enable management to increase (or avoid a reduction in) their equity
holding when the company reaches specific financial stages in its business plan (e.g.
Preference Share redemption targets).
F. METHODS OF WITHDRAWAL BY VENTURE CAPITALIST
The various means by which an investment may be withdrawn after a number of years
include:
• The company is acquired by another company (probably through an arranged deal).
• A management buyout occurs and the venture capitalist’s shares are purchased by the
existing management team.
• A management buy in occurs.
• The investment is refinanced, possibly by another venture capitalist organisation.
• The company obtains a listing on a Stock Market.
• A minority equity stake is purchased in the company, possibly by a customer or other
company in the same industry. This is sometimes referred to as “Corporate Venturing.”
• The company is liquidated.
G. CASE STUDY
Balderton Capital Management, with $19bn. in assets under management is one of Europe’s
largest. In March 2008 it made more than nine times its initial investment when it sold a
15.7% stake in Bebo to Time Warner for $140m. It had made the investment less than two
years earlier.
The following is from an interview with Barry Moloney, MD Balderton Capital Management
29.11.2009 The Sunday Times, England
Balderton sold a stake in MySQL, a software company, to Sun Microsystems for a hefty
multiple and then made ten times its original stake when Cisco Systems bought Scansafe, an
online security business. Yoox, an online fashion retailer and another Balderton investment,
will be the first IPO on the Milan bourse for 18 months. Next year Balderton could yield one
of its biggest ever paydays when the online betting exchange Betfair debuts on London’s
Stock Market.
Page 93
Balderton’s model is “labour intensive” investing in early-stage companies with a view to big
returns. The goal for every investment is nine or ten times return. Of ten investments we
would expect three or four to lose money and three or four to return twice or three times our
money. Then we would expect two of the ten to make a return of eight, nine or ten times.
It’s not a fool-proof formula, however. In the past two years Balderton had two spectacular
blowouts Payzone and Setanta Sports. Payzone is still a live investment but the company is
so burdened with debt that equity holders are likely to be wiped out in an upcoming
restructuring. A $75m - $80m. loss at Setanta Sports is balanced by an earlier $50m. gain
that Balderton made from NASN, the sports network that Setanta sold to ESPN. The risk did
not pay off but that’s par for the Venture Capital course – if you are not prepared to take risk,
you shouldn’t be in the game.
Balderton has 67 investments, many of them in the “new economy” – wonga.com, a loans
company; Bling Nation, a mobile payments company; figleaves.com, which sells lingerie and
LoveFilm, a movie rentals business. It has backed a disproportionately high number of Irish
companies, with almost a quarter of its total funds ($450m) invested in them.

Page 94
BLANK

Page 95
Study Unit 11
Dividend Policy
Contents
A. Introduction
B. Practical Considerations
C. Scrip Dividends
D. Share Repurchase (Share Buyback)
E. Share Splits
Page 96
A. INTRODUCTION
Retained Earnings – -One of the most important sources of new equity funds for
companies. The more funds retained, the less available for the payment of dividends and vice
versa.
Prime Objective – To maximise the wealth of the shareholders.
Dilemma – Pay dividends now or retain earnings for future capital gain.
B. PRACTICAL CONSIDERATIONS
There are a number of practical considerations which a company must take into account in
setting its particular dividend policy. Chief among these are:
• Taxation – Income Tax v Capital Gains Tax. If shareholders pay high marginal rates of
Income Tax they may prefer low dividends. If subject to low tax rate or zero tax (e.g.
pension fund) they may prefer high dividends.
• Investment Opportunities – “Residual Theory” => retain sufficient funds until all
profitable investments (those with a positive NPV) have been funded. Balance to be
paid as dividends. Drawback is that dividends may vary dramatically from year to year.
Also, consider the timing of the cash flows from the investments as these will be
required to pay future dividends.
• Availability of Finance – If the company is highly geared it may have little option but
to retain. Retentions will build up the equity base, thus reducing gearing and assisting
future borrowing. Certain types of company (e.g. small/unquoted/private) may not
have access to external funds and may need to retain.
• Liquidity – Profits do not equal cash. Adequate cash must be available to pay
dividends. Also, for growth companies sufficient liquidity must be available for
reinvestment in fixed assets.
• Cost of New Finance – The costs associated with raising new equity/debt can be quite
high. If debt is raised interest rates may be high at that particular point in time.
• Transaction Costs – Some shareholders may depend on dividends. If earnings are
retained they can create “home-made” dividends by selling some shares (capital).
However, this may be inconvenient and costly (brokerage fees etc.).
• Control – If high dividends are paid the company may subsequently require capital and
this may be obtained by issuing shares to new shareholders. This may result in a
dilution of control for existing shareholders.
• Inflation – In periods of high inflation companies may have to retain funds in order to
maintain their existing operating capability. On the other hand, shareholders require
increased dividends in order to maintain their purchasing power.
• Information Content – The declared dividend provides information to the market
about the company’s current performance and expected future prospects. An increase
or a reduction will be reflected in the share price.
Page 97
• Existing Debt – Restrictive covenants in existing loan agreements may limit the
dividend payout or prohibit the company from arranging further borrowing. Existing
debt which may be due for repayment will require funds and may cause a reduction in
the level of dividend.
• Legal Restrictions – Dividends can only be paid out of realised profits. Past losses
must first be made good.
• Perceived Risk – The earnings from retained dividends may be perceived as being a
more risky return than actual cash dividends, thereby causing their perceived value to
be lower (the “Bird in the Hand Theory”).
• Stable Dividends – Generally, shareholders require a stable dividend policy and
hopefully, steady dividend growth.
Note: Some companies adopt a constant pay-out ratio, whereby a fixed percentage of
earnings are paid out as dividends. This has the drawback that dividends will rise and fall
with earnings. However, this may not be a problem for a company which is not subject to
cyclical factors and whose earnings grow steadily.
Conclusion
There is unlikely to be a single dividend policy which will maximize the wealth of all
shareholders. The company should try to ascertain the composition of its shareholders in
order to pursue a dividend policy which is acceptable. Maybe, the best is to adopt a
consistent policy and hope to attract a “clientele of shareholders” to whom it appeals.
C. SCRIP DIVIDENDS
A scrip dividend is where a company offers existing shareholders a choice of new shares in
lieu of their cash dividend. This effectively converts reserves into issued share capital.
The advantage for the company is that it conserves cash and increases the capital base,
thereby improving gearing. The shareholders can increase their holdings without incurring
brokerage fees and stamp duty.
Some companies have offered enhanced scrip dividends, where the value of the shares
offered is greater than the cash alternative. Thus the shareholder is enticed to choose the
scrip dividends.
D. SHARE REPURCHASE (“SHARE BUYBACK”)
Share repurchases are a way for companies to distribute earnings to shareholders other than
by a cash dividend. They are also a means of altering a target capital structure; supporting the
share price during periods of weakness; and deterring unwelcome take-over bids. Companies
typically repurchase shares either by making a tender offer for a block of shares, or by buying
the shares in the open market.
Page 98
In the absence of taxation and transactions costs, share repurchase and the payment of
dividends should have the same effect on share value. However, the different treatment of
taxation on dividends and capital gains in many countries may lead to a preference for share
repurchases by investors. If the repurchase of shares is by means of a tender offer, this will
often be at a price in excess of the current market value and may have a different effect on
overall company value.
The use of share repurchases and the payment of dividends will be influenced by the amount
of investment that the company undertakes. When a company does not have sufficient
investments to fully utilise available cash flow, the payment of dividends or share repurchases
are more likely. When a company buys back its shares it replaces equity with cheaper, tax-
deductible debt and raises Earnings per Share (EPS) by reducing the number of shares
outstanding. The practice is most often used by companies with surplus cash not needed for
further investment or to cut debt.
Analysts are believed normally to consider an increase in dividends or share repurchases as
good news, as they suggest that the company has more cash and possibly greater earnings
potential than previously believed. Buybacks are usually followed by share price
outperformance and evidence indicates that the market may be outperformed by an average
of 20% immediately after the buyback. However, if this subsequently proves not to be so,
share prices will adjust downwards. Share repurchases in themselves do not create value for
the company, but the market may see the information or the signals that they provide as
significant new information that will affect the share price.
E. SHARE SPLITS
These are the issue of additional shares at no cost to existing shareholders in proportion to
their current holdings, but with lower par value. Share splits have no effect on corporate cash
flows and, in theory, should not affect the value of the company. The share price, in theory,
should reduce proportionately to the number of new shares that are issued.
Motives for share splits include:
(i) A company wishes to keep its share price within a given trading range. It is sometimes
argued that investors might be deterred by a high share price and that lower share prices
would ensure a broader spread of share ownership.
(ii) Companies hope that the market will regard a share split as good news, and that the
share price will increase (relative to the expected price) as a result of the
announcement. Evidence suggests that even if such reaction occurs it is short-lived
unless the company improves cash flows, increases dividends etc. in subsequent
periods.

Page 99
Study Unit 12
Leasing
Contents
A. Introduction
B. Operating and Finance Leases
C. Advantages of Leasing
D. Sale and Leaseback
E. Hire Purchase
F. Lease v Buy
Page 100
A. INTRODUCTION
A lease is a contract between a lessor (bank/finance house) and a lessee (person/company to
whom the asset is leased) for the hire of a specific asset. The lessor retains ownership but
gives the lessee the right to use the asset for an agreed period in return for the payment of
specified rentals.
B. OPERATING AND FINANCE LEASES
Operating Lease
The lessee hires the asset for a period which is normally substantially less than its useful
economic life. The lessor retains most of the risks and rewards of ownership. Generally,
there will be more than one lessee over the life of the asset. An operating lease is “Off
Balance Sheet” finance.
Finance Lease
This transfers substantially all the risks and rewards of ownership, other than legal title, to
the lessee. It usually involves payment to the lessor over the lease term of the full cost of the
asset plus a commercial return on the finance provided by the lessor.
Both the leased asset and the corresponding stream of rental liabilities must be shown on the
lessee’s Balance Sheet. Other features include:
• The lessee is responsible for the upkeep, maintenance etc. of the asset.
• The lease has a primary period, covering the whole or most of the economic life of the
asset. The asset will be almost worn out at the end of the primary period, so the lessor
will ensure that the cost of the asset and a commercial return on the investment will be
recouped within the primary period.
• At the end of the primary period the lessee has the option to continue to lease at a very
small rent (“peppercorn rent”). Alternatively, he can sell the asset and retain about 95%
of the proceeds.
C. ADVANTAGES OF LEASING
1. The lessee’s capital is not tied up in fixed assets, so a cash flow advantage accrues.
2. Liquidity is improved as no down-payment is required.
3. The lessor can obtain capital allowances and pass the benefit to the lessee in the form
of lower lease rentals. This is especially important for a company with insufficient
taxable profits.
4. The whole of the rental payment is tax deductible.
5. Security is usually the asset concerned. Other assets are free for other forms of
borrowing.
6. Traditional forms of borrowing often impose restrictive covenants.
7. The cost of other forms of borrowing may exceed the cost of leasing.
Page 101
D. SALE AND LEASEBACK
This is an arrangement whereby a firm sells an asset, usually land or a building, to a financial
institution and simultaneously enters an agreement to lease the property back from the
purchaser. The seller receives funds immediately and retains use of the asset but is
committed to a series of rental payments over an agreed period. Thus, it is suited to capital-
rationed companies who are eager to finance expansion programmes before the opportunity is
lost.
The main disadvantages are the loss of participation in any capital appreciation and the loss
of a valuable asset which could have been used as security for future borrowing.
E. HIRE PURCHASE (HP)
The user pays a periodic hire charge to a finance house which purchases the asset. The
charge includes both interest and capital. Generally, the hirer must pay a deposit up-front.
Ownership of the asset passes to the user at the end of the contract period, unless he defaults
on repayments when the finance house will repossess the asset. The user may be able to
claim capital allowances on the cost of the asset and the interest element of the periodic
charge is tax deductible.
F. LEASE V BUY
Lease V Buy Decision
Traditional Method => Two stages – Acquisition & Financing Decisions
1. Acquisition Decision - Is the asset worth acquiring? Operational cash flows are
discounted by the cost of capital normally applied to project evaluations – after-tax
cost of capital. If a positive NPV results, then proceed to Financing Decision
2. Financing Decision – Cash flows of the financing decision (lease v buy) are discounted
by the after-tax cost of borrowing.
Example:
PTO wishes to replace a piece of equipment, costing RWF120,000. This will produce
operating savings of RWF50,000 per annum and will have a life of five years. PTO’s after-
tax cost of capital is 15% and operating cash flows are taxed at 30%, one year in arrears.
PTO can borrow funds at 13% to purchase the machine or alternatively, it could acquire it by
means of a finance lease costing RWF28,000 per annum for five years, the lease rentals
payable in advance. The machine is expected to have zero scrap value at the end of the five
years.
The machine qualifies for capital allowances on a reducing balance basis at the rate of 25%
per annum. However, due to its tax position PTO is unable to utilise any capital allowances
on the purchase until year one.
Should PTO replace the equipment and if so, should it buy or lease it?

Page 102
Capital Allowances
1
RWF120,000 x 25%
30,000
2
RWF30,000 x 75%
22,500
3
RWF22,500 x 75%
16,875
4
RWF16,875 x 75%
12,656
82,031
5
Balancing Allowance RWF120,000 – RWF82,031
37,969
120,000
Taxation
Savings
Capital
Allowance
Taxable
Tax @ 30%
1
50,000
30,000
20,000
6,000
2
50,000
22,500
27,500
8,250
3
50,000
16,875
33,125
9,937
4
50,000
12,656
37,344
11,203
5
50,000
37,969
12,031
3,609
Acquisition Decision
Equipment
Savings
Taxation
Net
D.F.
15%
Pres. Val.
0
(120,000)
(120,000)
1.0
(120,000)
1
50,000
50,000
0.870
43,500
2
50,000
(6,000)
44,000
0.756
33,264
3
50,000
(8,250)
41,750
0.658
27,471
4
50,000
(9,937)
40,063
0.572
22,916
5
50,000
(11,203)
38,797
0.497
19,282
6
(3,609)
(3,609)
0.432
(1,559)
24,874
As the NPV is positive PTO should acquire the machine.
Now examine the Financing Decision (Lease v Buy).
Financing Decision
The cash flows are discounted by a rate appropriate to a financing decision => the after-tax
cost of borrowing.
13% x (1 – t)
13% x .7
= 9.1% (say, 9%)

Page 103
Buy:
Item
Cash Flow
D.F. 9%
Pres.
Value
0
Purchase
(120,000)
1.0
(120,000)
2
Allowance 30,000 x 30%
9,000
0.842
7,578
3
Allowance 22,500 x 30%
6,750
0.772
5,211
4
Allowance 16,875 x 30%
5,063
0.708
3,585
5
Allowance 12,656 x 30%
3,797
0.650
2,468
6
Allowance 37,969 x 30%
11,390
0.596
6,788
Present Value of Cost
(94,370)
Lease:
Lease Rental
Tax Saving
D.F. 9%
Pres.
Value
0-4
(28,000)
4.239
(118,692)
1-5
8,400
3.890
32,676
Present Value of
Cost
(86,016)
Note:
The discount factor for years 0-4 can be found by adding 1.0 (for the first instalment paid up-
front) to 3.239 from the 9% Annuity Tables – year 3 (for the remaining three rentals paid at
the beginning of years 1, 2 and 3).
Conclusion:
It is cheaper to lease the machine rather than purchase.

Page 104
BLANK

Page 105
Study Unit 13
Foreign Exchange
Contents
A. Introduction
B. From Bretton Woods to the EMU
C. Factors to Consider – International Trade
D. Exchange Risk
E. Methods of Reducing Risk
Page 106
A. INTRODUCTION
In this study unit we will be looking at the workings of the foreign exchange market, and
examining the more practical aspects of the subject, such as the different exchange rate
systems, the calculation of exchange rates, the impact of international trade on an
organisation, various methods of expansion overseas, exchange risk and the various
techniques used to reduce this risk.
Exchange Rates
An exchange rate is the rate at which a unit of one currency can be exchanged for another -
for any currency there is an exchange rate for each currency it can be traded with.
Foreign Exchange Market (Forex)
The foreign exchange market is a world market and competition is freely applied. However,
governments do intervene in the market to influence prices, and some currencies are not
freely dealt in the market. The largest dealing centre is London followed by New York and
Tokyo. The main dealers on forex markets are banks.
Some countries have strict exchange control regulations and fix the exchange rate, often in an
arbitrary manner. Nevertheless the foreign exchange market exists to buy and sell currencies
and this it does efficiently and effectively.
Exchange Rate Systems
Governments have a choice of exchange rate policies that they can adopt in order to achieve
their economic (and political) aims.
The main exchange rate policies are:
• Fixed exchange rates, where governments which are members of the international
monetary system use their official reserves (which comprise foreign currency and gold)
to maintain a fixed exchange rate. By adding to, or using, the official reserves the
government ensures that the demand for, and the supply of, their currency are balanced
(thus maintaining its price). The exchange rate of each member currency is generally
set against a standard - which could be gold, a major currency (e.g. the US $) or a
basket of currencies. It is also possible for each currency in the system to be set against
each other. Fixed exchange rate systems encourage international trade by removing
uncertainty. However, they restrict member states’ independence in setting domestic
economic policies by requiring them to take appropriate action to maintain their
exchange rate.
• Floating exchange rate systems are those whereby exchange rates are left to, and are
determined by, market forces, there being no use of the official reserves in maintaining
the exchange rate level. Floating exchange rate systems may be either free floating or,
more commonly, managed floating. Wide fluctuations of exchange rate values can
occur under floating exchange rate systems creating problems of uncertainty for
international trade. However, it is likely that the underlying economic conditions
creating these fluctuations would have created severe problems for the working of a
fixed exchange rate system - even creating instability.

Page 107
• Adjustable (or moveable) peg system is a fixed exchange rate system which has
provisions for the devaluation and revaluation of currencies for countries with
persistent balance of payments’ deficits or surpluses. Adjustable peg systems allow
more flexibility than a fixed exchange rate system but still limit the choice of
government action to either maintaining the exchange rate or devaluing/revaluing the
currency. The ERM (Exchange Rate Mechanism - see below) is an example of such a
system.
B. FACTORS TO CONSIDER – INTERNATIONAL TRADE
Risk Factors
Apart from the normal problems which occur in any type of business there are further
complications when the organisation is involved in international trade. Among these are:
• Credit Risk - usually higher risk for foreign trade
• Physical Risk – there is a greater risk of goods in transit being lost, stolen or destroyed.
• Exchange Controls - may hinder movement of funds.
• Foreign Laws & Customs - different practices in certain countries.
• Taxation - different tax rates/rules. Double Taxation Treaty may apply.
• Political Risk - actions of a foreign government may prevent/delay payment being
made. This can take many forms, ranging from bureaucratic delays to war (e.g.
Iran/Iraq).
• Exchange Rate Risk - losses due to unforeseen movement in currency exchange rates.
Some forms of risk may be reduced/eliminated by insurance - e.g. normal commercial
insurance (physical risk), export credit insurance (credit risk). Credit risk may also be
reduced by screening customers or by the terms of trade (e.g. irrevocable letter of credit).
Methods of Expansion Overseas
Overseas expansion may be achieved by:
(i) Exporting – often used as a first step to direct investment.
• Advantages: uses spare capacity at existing plants; safe way to enter new market
as costs are relatively low if strategy fails.
• Disadvantages: high transportation costs; may be difficult or expensive due to
imposition of tariffs, quotas, taxes etc; consumers may prefer locally produced
goods; service, spare parts etc. normally less reliable with exports.
(ii) Foreign Direct Investment (FDI) – establish a new subsidiary or acquire existing local
company.
• Advantages: establish new markets & demand; benefit from economies of scale;
take advantage of relatively cheap labour or land; avoid tariffs and restrictions;
international diversification; highly skilled or educated workforce; use foreign

Page 108
raw materials & avoid high transport costs; take advantage of undervalued
foreign currency; exploit monopolistic or competitive advantage; react to
overseas investment by competitors.
• Disadvantages: commitment of substantial capital; significant risk.
(iii) Licensing - local company manufactures in return for a royalty. Often used where
countries have high import barriers.
• Advantages: penetration of foreign markets without large capital outlay; political
risk reduced as product is manufactured locally; transportation costs avoided
• Disadvantages: difficult to ensure quality control; local company might export
and compete with multinational’s exports; problems of technology transfer or
licensee may become a significant competitor when licence expires.
(iv) Joint Venture – two or more independent companies cooperate in an agreed manner in
a project/projects.
• Advantages: access to new markets at relatively low cost; use of joint venture
partner’s knowledge of the local environment, distribution network, technology,
patents, brands, marketing or other skills; risk and cost shared; easier access to
local capital markets/tax incentives/ grants in overseas country; may be the only
way to enter some markets - host government may impose requirements that any
direct investment must be a joint venture.
• Disadvantages: agreement on terms - percentage ownership of each partner,
transfer pricing rules, reinvestment decisions, nationality of key managers, where
raw materials and components are to be purchased etc; may be time consuming
and difficult to find a reliable partner; managerial freedom may be reduced.
C. EXCHANGE RISK
Exchange Rate Volatility
As an example of the volatility of exchange rates look at the US$/RWF exchange rate in the
period January 2006 – January 2012:
Average Bid price
for month RWF/GBP % change
from previous
% change since
Jan 2006
Jan 2006
933.6
Jan 2007
1009.43
8.12%
8.12%
Nov 2007
1086.44
7.63%
16.37%
Jan 2008
1029.94
2.03%
10.32%
Jan 2009
784.944
-23.79%
-15.92%
Jan 2010
890.19
13.41%
-4.65%
May 2010
820.194
-7.86%
-12.15%
Jan 2011
905.957
1.77%
-2.96%
Jan 2012
934.662
3.17%
0.11%

Page 109
The movements during the intervening period have been quite dramatic. In the period
January 2006 – January 2012 there was almost no change against the GB pound. But, within
each year the movements were quite volatile – Jan 2008 to Jan 2009 saw a 23.8% increase in
the value of the Rwf. In Jan 2008 GBP1,000 could have been exchanged for Rwf 1,029,100
but in Jan 09 the same GBP1,000 would have been exchanged for Rwf 785,000, a difference
of almost 240,000 francs. If you are selling in the currency of your purchaser volatility of this
magnitude can be expensive
Examples – Impact of Rate Movements
Before deciding what action, if any, we should take it is necessary to appreciate where the
problem arises. We shall examine a few very simple examples:
Example 1
An importer buys from the USA. He receives an invoice for $10,000, which must be paid
immediately. The importer must exchange his RWF’s for Dollars (he buys Dollars). His
bank quotes a selling rate of, for argument say, RWF560 per USD. The cost to the importer
is:
$10,000 x RWF560
= RWF5,600,000
Example 2
An exporter to the USA invoices his customer in Dollars ($10,000), which is paid
immediately. The exporter must exchange his Dollar receipt for RWF (he sells Dollars). His
bank quotes a buying rate of 540RWF per USD. The receipt to the exporter is:
$100,000 x RWF540
= RWF5,400,000
The difference between the payment and the receipt of RWF200,000 is the bank’s turn/profit.
This is achieved by quoting different buying and selling rates. In addition, the bank may also
charge a commission.
Examples 1 and 2 are quite straightforward. The account is settled immediately and the value
of the payment/receipt is known using the “spot” rate (basically, the current rate). However,
most international trade involves credit. Thus, there is a risk that the exchange rate may
move against the importer/exporter during the credit period. We will now restate examples 1
and 2 allowing for credit:
Example 3 (similar to Example 1)
An importer from the USA receives an invoice for $10,000. The supplier allows 90 days
credit. His bank quotes a “spot” (current) rate (selling) of 560RWF. Using the “spot” rate the
cost to the importer is RWF5,600,000 (as Example 1). However, during the 90 days credit
period assume that the Dollar strengthens and the rate settles at 565RWF. The cost to the
importer has now risen to:
$100,000 x 565
= RWF5,650,000 (an increase of RWF50,000)
Example 4 (similar to Example 2)
An exporter to the USA invoices his customer in Dollars ($10,000) and to remain
competitive allows 90 days credit. His bank quotes a “spot” rate (buying) of 540RWF. Using

Page 110
the “spot” rate the receipt to the exporter is RWF5,400,000 (as Example 2). However, during
the 90 days credit period assume that US $ weakens (the USD buys fewer RWF) and the rate
settles at 525RWF. The value of the receipt for the exporter has now fallen to:
$10,000 x 525 = RWF5,250,000 (an decrease of RWF150,000)
Examples 3 and 4 examine the situation where the spot rate moves against the
importer/exporter. Equally, the spot rate could turn out to be favourable and a windfall gain
would arise.
In international trade either the importer or the exporter must trade in a foreign currency.
Alternatively, both parties may if the deal is denominated in a third currency - e.g. an
company imports oil from a Mexican company and payment is in US$.
Classification of Exposure
Transaction Exposure - The above exposure is known as Transaction Exposure, which
exists because of the time lag between the initiation of the transaction and the actual
payment/receipt of the foreign currency.
Translation Exposure - The risk of profits and losses arising from the conversion of foreign
currency assets and liabilities from one Balance Sheet date to the next is known as
Translation Exposure.
Economic Exposure - This exists where there is the possibility that the value of the company
will change due to unexpected changes in exchange rates. Unexpected currency fluctuations
can affect both the future cash flows and their riskiness. Both of these are likely to result in a
change in the value of the company.
Exchange Rates – Spot v Forward
An exchange rate is the price of a currency expressed in terms of another currency. The spot
rate is the current rate of exchange. Two prices will be quoted by the bank - a buying rate and
a selling rate. The difference between the two prices is known as the “spread” and represents
the bank’s profit or turn.
For example, if the spot rate for GBP is quoted as:
$1.50 - $1.52
One is the bank’s buying rate and the other is the bank’s selling rate, but which is which?
Firstly, the rates are quoted from the bank’s perspective. Secondly, remember the phrase
HELLO : BYE-BYE. This translates to SELL LOW: BUY HIGH.
Thus, the bank’s rates are:
Sell Buy
$1.50 - $1.52

Page 111
If an exporter receives $100, 000 he can exchange it (the bank will buy) at the rate of $1.52
and receive GBP65,789. On the other hand, an importer who is due to pay an invoice of
$100,000 can buy (the bank sells) these at the rate of $1.50 and pay GBP66,666.
If a company wishes to contract to buy/sell foreign currency at some future date. The bank in
this case will quote a forward rate. Thus, the bank might quote:
Spot Rate $1.50 - $1.52
1 Month Forward $1.51 - $1.53
3 Month Forward $1.54 - $1.56
At these rates a customer could contract to buy $’s in 3 months at $1.54 or sell $’s at $1.56
An alternative way of quoting forward rates is to express them as an adjustment to the spot
rate. For example, the above may be quoted as:
Spot Rate $1.50 - $1.52
1 Month Forward 1 cent - 1 cent
3 Month Forward 4 cents - 4 cents
Therefore, to determine the outright forward rates, add or subtract 1 cent or 4 cents to/from
the spot rate. If the forward rates are quoted at a Discount => add to the spot rate. If quoted
at a Premium => subtract from the spot rate. Using the above example, the forward rates are
quoted at a discount. To recollect the approach, remember the word ADDIS (the tooth-brush
manufacturer) => Add a Discount (abbreviated to “dis”); Subtract a Premium (abbreviated
to “pm”). Note that the premiums and discounts are quoted in fractions of a currency – the $
is quoted in cents, Sterling in pence etc.
Beware the decimal point. If, in the above example, the 3 month forward rate was quoted as
.4 cents discount then the forward rate could be derived as
Spot Rate
1.500
Plus 3 month discount
0.004
3 month Forward Rate
1.504
D. METHODS OF REDUCING RISK
Exposure can, to a certain degree, be managed by “hedging”, which is the taking of any
action that protects against adverse movements in exchange/interest rates. This “action” may
take a number of forms, several of which we shall discuss.
Essentially there are three general courses of action available to the treasurer:
• Do nothing, i.e. leave exposed positions uncovered.
• Hedge everything.
• Hedge selectively.

Page 112
The course taken will depend on the organisation’s philosophy, the treasurer’s perception as
to future movements and the value of the potential exposure.
Remember that not all rate movements are detrimental; fortuitous gains often arise. A
company may seek to hedge or to be partially hedged in the hope of achieving high profits.
Risk management consists of the techniques and policies adopted by an organisation to
minimise its exposure to risk, and takes two main forms:
• The internal management of risks, or pooling. Here risks are aggregated and offset
against each other; this is the general method of dealing with normal business risks, and
is also used in areas such as insurance and portfolio diversification.
• The external management of risk, or hedging. This is where two or more parties make
an agreement in which their risks cancel each other out. This is used in areas outside
the company’s control, e.g. in exchange rate and interest rate risk. The parties involved
may be those facing the same risk but in opposite directions, or may include one or
more speculators.
Forward Exchange Contract
With this technique we take action to-day so as to “lock-in” a rate which will apply in the
future.
A Forward Exchange Contract is an agreement between two parties to exchange (buy/sell)
one currency for another at some future date. The exchange rate, amount involved, and
delivery date are agreed up-front but funds do not change hands until delivery date.
It is a straightforward contract and one of the most commonly used risk hedging mechanisms.
It is one of the best means of establishing a perfect hedge - full insurance is provided against
adverse rate movements. However, it is important to remember that these contracts are
binding on both parties and must be carried out. At the date that the agreement matures (the
value date), if rates have moved in the customer’s favour he cannot decide that he no longer
needs the forward contract.
It allows an importer/exporter to calculate up-front the precise domestic currency value of the
underlying commercial transaction.
Contracts are available in most markets for maturities up to one year in all major currencies.
For large amounts some banks will contract for several years forward, if they can match
buyers and sellers.
Advantages
• Facilitates perfect hedging of foreign currency payables/receivables.
• Can be tailor-made to suit a customer’s requirements (amount, currency, and timing).
• Simple implementation and standardised documentation.

Page 113
Disadvantages
• Legally binding contract which must be performed. It is usually non-transferable and
can only be cancelled with the consent of the counterparty and payment of a penalty.
• Opportunity costs arise if rates do not move as anticipated (see example below).
Example:
An company is due to receive $150,000 in June. It is now January and the following rates are
quoted:
Spot $1.00=RWF562
Six Month Forward $1.00=RWF585
Assume that the company arranges a forward contract.
In June when the $150,000 is received the then spot rate may be lower, higher or the same as
the spot rate in January. Let us examine the consequences:
Spot Rate 1st June
No Action
Forward Rate Fixed
1. Worsens to RWF555/USD
Sell $’s at spot
Delivery $’s to bank at $1.50
Proceeds RWF83,250,000
Proceeds RWF87,750,000
2. Improves to RWF590
Sell $’s at spot
As above RWF87,750,000
Proceeds RWF88,500,000
3. Static at RWF562
Sell $’s at spot
As above RWF87,750,000
Proceeds RWF84,300,000
No matter what happens to the spot rate in June an amount of RWF87,750,000 is guaranteed
if the forward rate is fixed. In scenario 2, with hindsight this turns out to be a disadvantage as
an additional RWF750,000 could be gained if the $’s are sold at the more favourable spot
rate. However, this only becomes known with the benefit of hindsight – scenarios 1 and 3
produce higher values with the forward contract.
If a Forward Contract is entered into and its ultimate performance cannot be carried out due
to a change in circumstances, what can happen?
Close Out The Contract - if an exporter had contracted to sell $1m forward but the customer
will not now make payment to the exporter (e.g. due to bankruptcy) the bank will arrange for
the exporter to buy the “missing” currency at the spot rate and thus perform his part of the
contract. The exporter will:
(1) Buy $1m at the prevailing spot rate, and
(2) Immediately sell $1m to the bank at the contracted forward rate.
A loss or a gain may arise depending on current spot rate at no.1 above.
Extend The Contract - if an exporter had contracted to sell $1m forward but the customer
will not now make payment until say, one month later. The bank will accept a request to

Page 114
extend the period of the existing contract, changing its rate to a new rate applicable to the
forward date when performance is now expected.
Option Dated Forward Contract - where a future cash flow is not known with certainty to the
day the “fixed” forward contract, as above, may cause problems. The option dated contract
allows the customer to call for settlement:
(1) At any date from contract date up to a specified future date, or
(2) At any date between two specified future dates.
However, there is a cost as the bank will quote the more favourable of the two applicable
rates (or less favourable to the customer).
Note: The option is not on the ultimate performance of the contract, it is on when it may be
performed.
Foreign Currency Option
A currency option gives the holder the right (but not the obligation) to buy or sell an
underlying currency at an agreed exchange rate (known as the “strike price”). Depending on
the terms, the option can be exercisable on a single date at expiry (European Option) or over
a period of time on any day (American Option).
Option is the key word because this particular instrument offers a good deal of flexibility. An
option is purchased for an up-front payment, known as a Premium (usually a flat percentage
fee of the amount to be covered). Thereafter, the holder exercises the option if it is in his
interest to do so, or allows it to lapse if the transaction can be carried out at a more favourable
rate in the spot market.
A Call Option is the right to buy the underlying currency.
A Put Option is the right to sell the underlying currency.
Options differ fundamentally from traditional risk-management tools such as forward cover,
as the company is not obliged to deal at an exchange rate which may turn out to be quite
unfavourable depending on how rates subsequently move. It is like a forward contract from
which the holder can walk away. Thus, it provides a mix of protection (guaranteed rate) and
opportunity (to trade at the spot rate if this turns out to be more favourable).
Note: Currency options are not the same as Forward Exchange Option contracts, which must
be completed at some date.
Advantages
• Highly flexible.
• Suited to uncertain cash flows.
• Does not absorb foreign exchange line, once the premium has been paid.
Page 115
Disadvantages
• Cost can be relatively high and must be paid up-front (cash flow?).
• Tailor-made options (OTC – Over The Counter) lack negotiability.
Example 1
An importer needs to buy $10k in three months. The following rates are quoted:
RWF/USD
Spot 575
3 Month Forward 584
The importer essentially has three alternatives:
(1) Leave The Exposure Open (do nothing) - he will gain if the $ weakens (pick them up
more cheaply), but lose if the $ strengthens.
(2) Arrange a Forward Contract - he will gain if the $ strengthens (pick them up at the
fixed forward rate), but lose if the $ weakens (lose the opportunity to pick them up at
the relatively cheap spot rate, as he must deal at the agreed fixed rate).
(3) Arrange An Option - he is protected if the $ strengthens but he also retains the
opportunity to benefit from a weaker $.
Suppose that the company buys a Call Option for $10k., expiring in 3 months time
(European), at a strike price of RWF579/$ for a premium of RWF10 per $. Therefore, a
premium of RWF100,000 must be paid up-front.
(i) If in 3 months time the spot rate has appreciated to, say 595/$, the company will
exercise its option at the more favourable rate of RWF584 and pay
RWF5,840,000 ($10k x 584). The cost of $10k at the spot rate of 595/$ would
have been RWF5,950,000. Thus, the company saves RWF110,000 over the cost
of spot $’s or a net saving of RWF10,000 if the premium is taken into account.
(ii) If in 3 months time the spot rate has weakened to, say RWF568/$, the company
will allow the option to lapse and buy the $10k at the more favourable spot rate
of RWF568, paying RWF5,680,000. The cost of forward cover would have been
RWF5,840,000, so the company saves RWF160,000 or a net RWF60,000, if the
premium is taken into account.
An option can never perform quite as well as forward cover if the spot moves against the
company, or an open exposure if the spot moves in its favour (because a premium must be
paid for the option). However, in a world of volatile and unpredictable exchange rates an
option can significantly outperform an unfavourable forward contract or an open position. At
the same time, it can capture a high percentage of the gains provided by a favourable covered
or open exposure, especially if there is a major move in the spot rate.

Page 116
Example 2
A construction company regularly tenders for contracts abroad. These are in $’s yet it often
does not know for quite some time in advance whether or not it will win the contract. If it
sells the anticipated $ income forward and the $ strengthens it runs the risk of being left with
an exchange loss if it is not awarded the contract.
On the other hand, if it neglects to sell the anticipated $ income forward and the $ weakens
then the company loses if it is awarded the contract.
The solution - purchase a put option on $’s with a strike price based on the spot rate
prevailing on the day of tender. Thus, the company will be able to sell the anticipated income
at a pre-determined rate, while the option may be allowed to expire without being exercised
should the tender be unsuccessful.
Another example of where options may be useful is where an exporter needs to have a pre-
determined exchange rate upon which to prepare accurate price lists in advance.
The premium payable on an option depends upon:
• How favourable the strike price is in relation to the outright forward rate - the more
favourable the higher the premium.
• The term of the option - the longer the time to expiry the higher the premium.
• The volatility of the exchange rate involved - e.g. RWF/USD expensive.
• Whether the option is European or American style.
Money Market Cover
This involves borrowing in one country, converting the funds borrowed at the spot rate into
the currency in which payment is due and investing it in the second country. The total
proceeds will then be used to make the payment or repay the loan.
Example 1
An exporter to the Burundi is due to receive BIF1m in 3 months time. The borrowing rate
for $BIFs is 8% per annum and RWF deposits can earn 10% per annum. The BIF/RWF spot
rate (buy) is 1.50.
1. Arrange a BIF loan to-day for 3 months. The cost is 8% per annum or 2% over the 3
month period. Sufficient BIF are borrowed to mature at $BIF1m in 3 months time.
This can be found by:
RWF1m
= BIF980,392
1.02
2. Convert the $BIF980,392 to RWF’s at the spot rate of 1.50, which will equate to
RWF653,595. This can be placed on deposit at 10% per annum to earn RWF16, 340
over the 3 months (or possibly used to reduce an overdraft, depending on the
company’s circumstances).
3. The eventual receipt of $BIF1m from the customer in 3 months can be used to repay
the $ loan which, with interest will mature at exactly BIF1m.
Thus, the exporter is guaranteed the value of his receipt and is not exposed to movements in
the BIF/RWF rate.

Page 117
Example 2
An importer buying from the Burundi is due to pay BIF1m in 3 months time. The deposit
rate for BIF is 5% per annum and RWF’s can be borrowed at 12% per annum. The BIF/RWF
spot rate (sell) is 1.50.
1. Deposit sufficient $BIF to-day which, with interest, will grow to BIF1m. in 3 months
time. Burundi francs earn 5% per annum or 1.25% over the 3 month period. The
required amount to place on deposit can be found:
RWF1m
= BIF987,654
1.0125
2. To obtain the BIF987,654 we must buy at the spot rate. This will cost RWF658,436
(BIF987,654/1.50).
3. The BIF deposit will mature in 3 months for a guaranteed BIF1m and will be used to
pay the supplier. The importer also knows that his cost is fixed at RWF658,436.
Note: If one wishes to compare the cost of Money Market Cover, under example 2, with
other techniques (e.g. Forward Cover) it is necessary to add the cost of borrowing
RWF658,436 for 3 months at 12% per annum. This is because the cost of acquiring the $ is
incurred up-front, whereas under a Forward Contract the terms are agreed up-front but the
cost will not be incurred until the end of the 3 month period.
The total cost will be:
Cost of Buying BIF spot
RWF658,436
Interest Cost (RWF658,436 x 12% x 3/12)
RWF19,753
RWF678,189
Currency Swap
• In a currency swap two counterparties exchange principal amounts of different
currencies, usually at the prevailing spot exchange rate. On the maturity of the swap
the principal amounts will be re-exchanged at the same exchange rate. Over the term of
the swap the counterparties make periodic exchanges of fixed rate interest in the
different currencies.
• Companies enter into currency swaps because it allows them to exploit their relative
strength (comparative advantage) in different markets and reduce each party’s funding
costs.
Example:
SM Inc. (a U.S. corporation) is about to commence operations in the EAC. It is well known
in the U.S. debt markets but relatively unknown in the East African markets. SM Inc. can
borrow at better rates in the $US than in the East African markets. If the company or its bank
can find an EAC company with the opposite profile (e.g. KK Ltd, wishing to finance a US
subsidiary but not well known in the US credit markets), both companies can obtain funds in
the currencies they want at cheaper cost by using a currency swap than if they raised them
directly themselves as follows:

Page 118
SM Inc. can raise $100m from a 10 year bond issue in the US markets at 7.50%.
Alternatively, it could raise RWF50bn. in the Rwanda bond market at 4.25%.
KK Ltd can raise RWF50bn for 10 years in the Rwanda market at 3.75%. It could raise
$100m at 8.20%.
SM Inc. will, therefore, issue a $US domestic bond and KK Ltd will make a Rwanda bond
issue. The two parties agree to swap the proceeds of these issues and to make periodic
payments to reflect each other’s interest liability in currency to the holders of the bonds. The
swap will be reversed after 10 years when the bonds are due for redemption.
The cash flows can be shown diagrammatically:
$100m.
RWF Interest - 3.75% p.a.
RWF50bn.
$ Interest - 7.5% p.a.
$ Interest $100m. RWF Interest RWF50bn.
7.5% p.a. Principal 3.75% p.a. Principal
The cash saving to SM Inc. is the difference between the RWF interest paid on the swap and
what would be payable if it made its own RWF issue (4.25% - 3.75% = 0.50% per annum).
Similarly, the saving to KK Ltd is 8.20% - 7.50% = 0.70% per annum.
It is possible that the rates would be adjusted so that both parties shared equally in the saving
or the stronger party (in this case SM Inc.) receives more of the saving.
• A bank may take a position between the two parties and make a profit by taking a turn
out of the funds paid on to one or both parties. Alternatively, the bank may act purely
as a broker and charge a fee or commission to one or both parties.
• Currency Swaps offer several advantages:
– Companies have a greater access to funds as they can borrow in any currency and
swap it into the currency they need.
– They are off-balance sheet instruments.
– They can enable a company to source cheap funding in one currency by
borrowing another currency and swapping it into the currency needed.
SM Inc.
KK Ltd.
$ Domestic
Bondholders
Rwanda
Bond
Holders

Page 119
– They can be tailored in terms of start date, maturity, principal, interest rates,
currencies etc.
Foreign Currency Invoicing
One way of avoiding exchange risk is for an exporter to invoice the customer in his domestic
currency, or for an importer to be invoiced in his domestic currency. However, only one
party can deal in his domestic currency, the other must accept the exchange risk.
It is more usual for the exporter to invoice in his own currency and the importer to be
invoiced in a foreign currency.
Consideration must be given to the bargaining position of the exporter/importer; the
company’s policy on price revisions etc.
Netting
A Rwandan company with receipts and payments in the same foreign currency should plan to
net them off against each other, where possible. Thus, it does not matter whether the
currency strengthens or weakens against the RWF as there is no purchase or sale of the
currency.
There is very little cost with this approach but it is only practicable to the extent that receipts
and payments can be matched. Any mismatch could be covered by some other method e.g.
forward contract.
Matching
Matching is an asset and liability management technique in which a company matches, say,
its dollar outflows with its dollar inflows, such that they correspond in size and the period in
which they occur. This particular strategy is valuable if the firm wishes to minimize the
impact of unanticipated exchange rate changes on its net cash flows. If the matching is
complete in terms of currency, size and timing, then changes in values of outflows will be
offset by equivalent changes in values of inflows.
An example is where the purchase of a U.S. subsidiary or property by a Rwandan company
would be financed by a U.S. $ loan, rather than a RWF loan.
Leading & Lagging
This involves altering the normal receipts/payments schedule by accelerating or delaying
foreign currency payments, in anticipation of exchange rate fluctuations.
Lead Payment - where the foreign currency is strengthening it may be worthwhile making an
early payment of an outstanding liability, rather than taking an extended credit period and
running the risk of having to pay more in RWF’s. However, account must be taken of any
additional financing costs, due to the early payment.
Lagged Payment - if it is felt that the foreign currency is weakening it may be worthwhile
delaying payment for as long as possible to obtain the benefit of a more favourable exchange
rate.

Page 120
Purchasing Power Parity Theory (PPP)
This theory is based on the idea that in terms of an international price a product should cost
the same wherever it is produced. Using this basic idea, expected exchange rate changes and
forecast inflation differentials can be linked. If the expected rate of inflation in country A is
greater than that in country B then the rate of exchange of the currency of country A will fall
against the currency of country B.
Example
The current $/RWF exchange rate is 1/550. The rate of inflation next year is expected to be
3% in the Rwanda and 9% in the USA. The Purchasing Power Parity Theory suggests that
the value of the $ will fall by approximately 6% (9% - 3%) against the RWF. This can be
shown more accurately as:
1.09
= 1.058 =5.8%
1.03
Thus, the rate of exchange next year is predicted at 550/ 1.058 = $1 /RWF520.

Page 121
Study Unit 14
Interest Rate Management
Contents
A. Introduction
B. Risk Management – Main Techniques/Instruments

Page 122
A. INTRODUCTION
Question
Suppose that you are the Finance Director of a large organisation wishing to raise RWF100m.
to finance a project for the next ten years. Your bank has evaluated the proposal and
approved the loan.
A number of options are open to you as follows:
1. A ten year term loan at a fixed rate of interest – 7%
2. A floating rate loan at a margin of 2% over 6-month INTERBANK (6-month
INTERBANK is currently 4.25%).
3. RWF5m ten year term loan at a fixed rate of 7% (as 1 above).
RWF5m floating rate loan at a margin of 2% over 6-month INTERBANK (as 2 above).
4. A five year term loan at a fixed rate of 6.5%.
REQUIREMENT:
Which would you choose and why?
Answer
• In deciding how one should manage interest rate movements it is necessary to
understand where the exposure arises and what would be the impact of change(s) in
interest rates.
• It is also important to appreciate that a depositor of surplus funds can be exposed to a
change in interest rates in the same manner as a borrower. We tend to only think of
borrowers.
• An understanding of where the exposure lies may be gleaned from the following:
Interest Movement
Exposure – Borrower
Exposure – Depositor
Increase
Variable Rate
Fixed Rate
Decrease
Fixed Rate
Variable Rate
• The following simple example of two companies with RWF15m. variable (floating)
rate borrowings may illustrate the impact of interest rate sensitivity:
Company A
Company B
Profit (RWF’000)
3,000
1,600
Interest @ 10% p.a.
1,500
1,500
Net Profit
1,500
100
Suppose that interest rates increase to 11% for the year, this would imply an additional
interest cost of RWF150,000 and Net Profit/Loss would be revised as follows:
Company A
Company B
Profit (RWF’000)
3,000
1,600
Interest @ 11% p.a.
1,650
1,650
Net Profit/Loss
1,350
(50)
Percentage Change
-10%
-150%
Thus, the management of interest rates is more critical for Company B.

Page 123
• The above example examines the negative aspect - where interest rates increase.
Should interest rates fall by 1% the percentage change in Net Profit would be Company
A + 10% and Company B + 150%. Variable rates are a twin-edged sword.
• The company can elect to carry the risk itself by doing nothing or decide to manage the
risk by using some of the techniques which we shall now examine. Much will depend
on the attitude of management to risk. Most management teams are risk-adverse.
B. RISK MANAGEMENT -MAIN TECHNIQUES/INSTRUMENTS
Interest Rate Guarantee (IRG)/Option
• These provide a degree of flexibility which is not provided by certain other
instruments. They protect one from adverse interest rate movements but also allow
one to profit from favourable movements.
(i) Interest Rate Cap - Borrower agrees with bank a ceiling to the interest rate on a
loan. If the interest rate turns out to be higher the bank pays the difference to
compensate. If the interest rate turns out to be lower than the agreed rate, the
company benefits by borrowing at the lower market rate. The effect of the Cap is
to ensure that the borrower pays no more than the agreed rate, no matter how high
interest rates move.
Unlike certain other techniques the buyer of the Cap must pay a premium (price)
up-front, when the agreement is set.
Example:
A borrower buys a Cap at 8%.
(1) If actual interest rates turn out to be 10% the borrower will receive
compensation of 2%.
(2) If actual interest rates turn out to be 7% the borrower will deal at this
favourable rate.
(ii) Interest Rate Floor - Similar to the Cap. Here an investor is protected by
receiving compensation if rates fall below an agreed floor. However, the investor
can take advantage of any upward movement in interest rates.
Example:
An investor sells a Floor at 5%.
(1) If actual interest rates turn out to be 4% the investor will receive
compensation of 1%.
(2) If actual interest rates turn out to be 6% the investor will deal at this
favourable rate.
(iii) Interest Rate Collar - An amalgamation of a Cap and a Floor. Simultaneously, a
borrower buys a Cap to limit the maximum rate of interest and sells a Floor to fix
the minimum borrowing cost. Thus, the borrower gives up the benefit of interest
rates falling below the floor. To compensate, the cost (premium) is less than the
equivalent Cap.

Page 124
Thus, the company will know both the maximum and minimum interest rate it
would have to pay during the life of the Collar.
Example:
A borrower buys a Cap at 8% and sells a Floor at 6%.
The difference represents a band of interest rates that the borrower might pay.
Future Rate Agreement (FRA)
• A Future Rate Agreement (sometimes called a Forward Rate Agreement) is an
agreement between a bank and a customer made to-day (contract date), whereby:
The customer can secure an agreed interest rate (contract rate)
On an agreed amount of its borrowings (principal amount)
For an agreed duration (period)
Commencing on an agreed future date (settlement date)
• The FRA does not require any outlay of cash.
• The guaranteed interest rate is achieved by the exchange of an amount of money
(settlement amount) between the parties.
• The FRA is ideal for:
Depositors seeking protection against a fall in interest rates, or
Borrowers who want to protect against a rise in interest rates.
(i) FRA Example - Deposit
On the 1st January a corporate treasurer places a deposit of RWF10m. for one
month fixed at 11%. He reckons interest rates will fall significantly over the
coming months and he wants to protect his current level of income. The six
month FRA rate, for the period commencing one month hence is quoted at 10%.
He decides to do an FRA for the period in question for RWF10m.
If interest rates fall as he predicts:
1st January
FRA agreed at
Contract Rate (10%)
1st February
Six month period of
FRA commences. Fix
Settlement Rate (say, 9%).
31st July
FRA cover
period ends

Page 125
At the start of the FRA period (1st February) interest rates have fallen and the
Settlement Rate turns out to be 9%. The bank will pay compensation of the
difference between the Contract Rate (10%) and the Settlement Rate (9%) for the
six month period.
Thus, the position is:
Actual rate received on deposit
9%
Compensation paid by bank under FRA (10% - 9%)
1%
Total Yield
10%
Should the Settlement Rate at the start of the FRA period on the 1st February rise
to, say, 13% the position would be:
Actual rate received on deposit
13%
Compensation paid to bank under FRA (13% - 10%)
(3%)
Total Yield
10%
Having entered into the FRA on the 1st January the total yield will always be
10%, by virtue of the compensation paid by/to the bank under the FRA, no matter
what the actual rate turns out to be on the 1st February.
(ii) FRA Example - Loan
On the 1st January a corporate treasurer realises that a loan of RWF10m. which
had been borrowed on a six month rollover basis has one month to run to the next
rollover. Currently, the loan is based upon an interbank rate of 10%. He reckons
interest rates will rise significantly over the coming months and he wants to
protect his current position. The six month FRA rate, for the period commencing
one month hence is quoted at 11%. He decides to do an FRA for the period in
question for RWF10m.
If interest rates rise as he predicts:
1st January
FRA agreed at
Contract Rate (11%)
1st February
Six month period of
FRA commences. Fix
Settlement Rate (say, 12%).
31st July
FRA cover
period ends
At the start of the FRA period (1st February) interest rates have risen and the
Settlement Rate turns out to be 12%. The bank will pay compensation of the

Page 126
difference between the Contract Rate (11%) and the Settlement Rate (12%) for
the six month period.
Thus, the position is:
Actual rate paid on loan
12%
Compensation paid by bank under FRA (12% - 11%)
1%
Total Cost
11%
Should the Settlement Rate at the start of the FRA period on the 1st February fall
to, say, 8% the position would be:
Actual rate paid on loan
8%
Compensation paid to bank under FRA (11% - 8%)
3%
Total Cost
11%
Having entered into the FRA on the 1st January the total cost will always be
11%, by virtue of the compensation paid by/to the bank under the FRA, no matter
what the actual rate turns out to be on the 1st February.
The position can be summarised:
Settlement Rate
*
*
14%
Borrower
13%
Compensated
12%
By Bank
Contract Rate
11%
-----------------------------------
10%
Borrower
9%
Makes Payment
8%
To Bank
*
*
• Rather than wait for six months to elapse (31st July in above examples) before
payment, a convention has developed that the settlement is paid on the FRA start date
(1st February), by discounting the settlement amount at the Settlement Rate.
• An FRA makes interest rate risk management possible by enabling one to protect one’s
business against adverse interest rate movements in the future.
• An FRA allows one to support one’s own views on interest rate movements and as a
result manage one’s affairs with a degree of certainty. Where forward interest rates are
attractive FRA’s can be used to lock in these rates.
• There is no need to borrow or lend cash to do an FRA, so it has very little impact on
existing bank credit lines.
• FRA’s are off Balance Sheet and extremely flexible as to size and maturity.

Page 127
• It is important to appreciate that an FRA is not a source or use of funds and can only be
used to manage the interest rate risk associated with an underlying borrowing or
investment.
• The FRA is ideal for:
– Borrowers who want to protect against a rise in interest rates.
– Depositors seeking protection against a fall in interest rates.
– Project managers who want to fix interest costs for the duration of a project but
cannot get a fixed rate loan.
– Fund managers who want to guarantee an interest rate to investors.
Interest Rate Swap
• An Interest Rate Swap is a transaction in which two parties agree to exchange their
respective fixed interest rate and floating rate borrowings at periodic intervals over a
specified time period in order to reduce the cost of borrowing for both. This may be
arranged to exploit different interest rates available in different markets or to change the
profile of the company’s debt.
• The Swap is based on a notional amount and does not involve any exchange of
principal - each party will still pay on its primary debt but they settle the adjustment in
the cash flows of interest rates between themselves. Interest payments are usually
netted so that only one payment has to be made between the parties.
Example
Company A has borrowings of RWF100m on which the rate is fixed at 11% per annum
for the next five years. The treasurer expects interest rates to fall and requests an
Interest Rate Swap from fixed to floating rate. Company B, on the other hand, (e.g. a
Hire Purchase company) has similar borrowings at a floating rate but is anxious to
borrow fixed more readily to match the fixed nature of its Hire Purchase advances.
The companies enter a five year Interest Rate Swap for a notional RWF100m for a five
year term.
The position might turn out as follows:
Company A
Borrowing:
Pay Fixed
(11%)
Swap:
(i) Pay Floating
INTERBANK
(ii) Receive Fixed
11%
Net Cost
INTERBANK
Company B
Borrowing:
Pay Floating
INTERBANK
Swap:
(i) Pay Fixed
(11%)
(ii) Receive Floating
INTERBANK
Net Cost
(11%)

Page 128
At End of First 6-Month Period
Let us assume that INTERBANK turns out to be 9%.
Company B pays A (11% - 9%) x 6/12 x RWF100m. = RWF1m.
The net result of combining the loan with the interest rate swap is that Company B’s
effective rate is 11% fixed (9% on borrowings + 2% on swap).
Company A’s effective rate is 9% (11% on borrowings less 2% from swap), which is
the same as INTERBANK.
The settlement figure will be adjusted every 6 months to reflect changes in the 6-
month INTERBANK rate. This will leave Company B with a fixed rate (11%) over
the entire five year period and Company A with a floating rate.
• Conceptually, a swap is the same as a series of FRA’s but it allows corporations to
hedge interest rate exposures for 10 years or longer.
• Swaps are easy to arrange, flexible (any size, maturity and can be reversed if required)
and transaction costs are low.
• The swap does not have to be arranged with the same bank from whom the original
borrowings have been arranged.
• There are many applications for, and variations of, an Interest Rate Swap. Swaps are
useful from both a liability management as well as an asset management perspective.
Companies that borrow on a fixed or floating rate basis can use a swap to alter the
interest rate profile (i.e. from floating to fixed or vice versa). Asset managers that
desire to alter the frequency at which their investments are re-priced can use the swap
market for this purpose.
• In addition to assisting in the management of interest rate risk, swaps offer several other
advantages including:
– Swaps can often reduce all-in financing costs or increase investment yields,
relative to alternative sources and uses of funds.
– Once credit approval has been obtained, swaps can be executed in a matter of
minutes. Documentation is standard, resulting in reduced administration.
– Swaps are typically off-balance sheet transactions.
– Swaps are customised transactions to meet the specific needs of the client,
including notional principal amount, tenor, indices (fixed/floating), frequency of
settlement etc.
– A liquid market exists making it easy to unwind transactions or close out
transactions early should interest rate views change.
• Some of the reasons why a swap may be used are:
– Borrowing costs may end up lower than direct borrowing in the market.
– The company can change its debt profile, without involvement in further debt.
– Availability of finance markets that are not open to the company directly.
Note: An Interest Rate Swap is not a source or use of funds.
Page 129
A swap is used to manage the interest rate risk associated with an underlying
transaction.
Swaption (Option on Swap)
• Swaptions are hybrid derivative products that integrate the benefits of swaps and
options.
• The buyer of a swaption has the right, but not the obligation, to enter an interest rate
or currency swap during a limited period of time and at a specified rate.
• Swaptions require the payment of a premium, normally upfront.
Example:
You have borrowed RWF500,000 for a three year period. You want to protect your
firm against rising interest rates and guarantee a maximum cost of funds of 8%. At the
same time you want to be able to take advantage of any possible fall in interest rates.
You buy a Swaption from your bank at a rate of 8% for a three month period.
(1) Assume that in three month’s time the Interest Rate Swap rate for 2 3/4 years is at
8.5%. You make use of your Swaption and arrange an Interest Rate Swap for
this period at the agreed rate of 8%. Thus, your 8% cost of funds for the period is
protected.
(2) Assume that in three month’s time the Interest Rate Swap rate for 2 3/4 years is at
7.5%. You do not want to take up your Swaption and instead you will borrow at
the cheaper rate of 7.5%. In these circumstances the Swaption protected you
against a higher borrowing cost and also allowed you to take advantage of the fall
in rates.
• Swaptions can also be used for cash managers (depositors) to protect against falling
interest rates while providing the freedom to enjoy any increase in interest rates.
• The Swaption will provide full protection against rising interest rates but the freedom
to benefit if rates move lower.
• Swaptions can be tailored to meet one’s needs.
• Swaptions can be provided in all major currencies for a wide range of maturities. The
option period can last for any length of time, but generally no longer than 12 months.
• A Swaption can be negotiated with any bank. It does not have to be with the bank who
lent the money.
• The premium will depend on the guaranteed rate compared with the Interest Rate Swap
rate, the duration of the Swaption and how interest rates may perform in the future.
Financial Futures
• The Futures Market has long been a risk management tool in the commodities markets,
used for forward buying/selling of everything from coffee beans to tin. Its advantages
will be familiar to a manufacturer who relies on raw materials whose prices are
susceptible to cyclical variances.

Page 130
• A futures contract can be described as a binding agreement to buy/sell through an
established Exchange, at a specified price, on a definite date, a standard quantity of a
commodity of predetermined quality on fixed conditions of delivery.
• In the case of Financial Futures the commodity is currency or financial paper. They
were first traded in the International Money Market in Chicago in 1972. In the U.K. the
London International Financial Futures Exchange (LIFFE) opened in September 1982.
• Futures contracts are standardised - the size of each contract and the maturity dates are
standard. They offer an alternative covering mechanism for currency and interest rate
risk. Actual or anticipated risks in money or foreign exchange markets (cash markets)
can be minimised by taking an equal and opposite position in the futures market. Any
cash market loss resulting from adverse exchange or interest rate movements should be
offset by profits on futures contracts (and vice versa).
• Although each futures deal is negotiated between the buying and selling parties, the
actual financial transaction is conducted by the Exchange’s clearing house. By
interposing itself between the two transacting parties it provides a guarantee against
default.
• Note: No exchange of principal takes place.
• To avoid the risk of default by holders of contracts a purchaser/seller of a futures
contract must deposit an Initial Margin with the clearing house, effectively as security.
This Initial Margin is very small relative to the size of the contract. As prices fluctuate
each day the value of the outstanding contracts will change. If the price has moved in
favour of the contract-holder, the surplus (called a variation margin) is added to the
Margin Account and is available for distribution to the contract-holder. Similarly, if the
price moves against the contract-holder he must cover any losses to ensure that at the
close of every business day his total margin, net of losses, is equal to the Initial Margin.
The Initial Margin is set at a level which is unlikely to be exceeded by losses arising
from the price movement of any one day

Page 131
Example
It is 1st June and a company treasurer has a RWF10m. loan which is rolled over every
quarter. The next rollover is end of August and he fears that rates will rise in the
interim. He wishes to hedge his exposure, using interest rate futures. The current price
of September RWF three month time deposit futures is 88.00. The standard contract
size is RWF500,000.
Cash Market
Futures Market
1st June
RWF10m borrowing – rollover end
August
Sell 20 INTERBANK September Futures
contracts
Rate = 12%
At 88.00 (Futures rate = 12%)
End August
Rollover loan
Buy 20 INTERBANK September Futures
contracts
Current rate = 14%
At 86.00 (Futures rate = 14%)
Higher Cost of Borrowing:
Profit on Futures contracts:
RWF10m x 2% x 3/12
20 contracts x interest rate movement x
3/12
= RWF50,000
= RWF50,000
* The additional cost of borrowing is offset by the profit on the Futures contracts.
Using the above example, if the treasurer gets it wrong and interest rates fall the
position is:
Cash Market
Futures Market
1st June
RWF10m borrowing – rollover end
August
Sell 20 INTERBANK September Futures
contracts
Rate = 12%
At 88.00 (Futures rate = 12%)
End August
Rollover loan
Buy 20 INTERBANK September Futures
contracts
Current rate = 10%
At 90.00 (Futures rate = 10%)
Lower Cost of Borrowing:
Loss on Futures contracts:
RWF10m x 2% x 3/12
10 contracts x interest rate movement x
3/12
= RWF50,000
= RWF50,000
* The unexpected “saving” on borrowing is offset by the loss on the Futures
contracts.
The Futures Market can also be used to cover Foreign Exchange risk.

Page 132
Example
A U.K. company which imports from the U.S.A. is due to pay $4m. in February. It is now
November and the company wishes to protect against a strengthening of the $.
The spot rate is $1.603 - $1.605 /£
The March $/£ Futures is quoted at $1.60 (Note: contracts are in units of £25,000).
Based on the spot rate $4m = £2,495,321 [$4m./1.603 (sell rate)].
The company can sell 100 March contracts at $1.60 ($4m/1.60 = £2.5m, requiring 100
£25,000 contracts).
Assume that in February the $ has strengthened and the following rates are quoted:
Spot Rate: $1.5500 - $1.5523
Futures Price: $1.5525
The company will:
1. Buy $4m. in the spot market at 1.5500 (sell rate). The cost is £2,580,645 (£85,324
dearer than the spot cost on 15th November.
2. Close-out the Futures contracts at 1.5525, by buying 100 Sterling March contracts.
The cost is $3,881,250 (£2.5m. x 1.5525). Thus, the gain on the Futures contracts is
$118,750 ($4m. - $3,881,250) or £76,499 [$118,750/1.5523 (spot buying rate)]. This
would be taken in margin surplus during the life of the contract.
Summary:
Cost – Spot Market
£2,580,645
Gain on Futures
£76,499
Net Cost
£2,504,146
* Compared with the spot cost in November this is only £8,825 dearer.

Page 133
Study Unit 15
Performance Appraisal
Contents
A. Introduction
B. Categories of Ratios
C. Z-Scores
Page 134
A. INTRODUCTION
To judge the performance of a company or group of companies the analysis of financial
statements is normally based largely on ratio analysis.
You may be expected to carry out a performance analysis on a set of company accounts.
Generally, this will require you to extract the relevant figures from financial statements and
notes to the statements. Having done this you must then calculate suitable trends and ratios.
Finally, and most importantly, you must be able to analyse and interpret the figures, trends
and ratios. This may require you to draft a report with supporting appendices.
You should be familiar with many of the important ratios from your other studies. This note
is intended to pull all the ratios together and to comment on their usefulness.
The purpose of ratio analysis is:
1. To appraise the performance of a business.
2. To highlight significant changes.
3. To reveal a company’s strengths and weaknesses.
4. To illustrate underlying trends in a company’s activities.
Financial analysis is undertaken by four main groups:
1. The company itself for management control.
2. Current and potential shareholders in order to make investment decisions.
3. Suppliers of capital (banks, trade creditors etc.).
4. Financial analysts (stockbrokers, business journalists etc.).
A ratio expresses the relationship of one figure to another. A change in the ratio represents a
change in the relationship. Ratios once computed should then be subjected to comparison.
The two broad areas of comparison are:
• Internal - present performance is compared with past performance and with budgets.
• External - present performance is compared with similar firms in the same industry or
with industry averages.
Ratio analysis has many limitations and care must be exercised in their use. Among the
limitations are:
1. Ratios are only a guide, they cannot be used to make absolute statements. For example,
if the Debtors Collection Period is lengthening it might be concluded that there is poor
credit control with additional costs incurred by the company. However, if other aspects
of performance are checked it may become apparent that longer credit has been used as
a marketing tool, which in turn has led to increased sales and profitability. Thus, ratios
should be used to provide support for other information.
2. A ratio represents the relationship between figures. Thus, both figures can alter the
ratio and this should be taken into account when indicating the reason for change. Also,

Page 135
note that proportionate changes in both figures will leave the ratio unaltered. For
example:
10
= 10% As is
100
100
1,000
3. For ratios to be fully comparable the figures used must be computed in like manner
from year to year or from firm to firm. Changes in accounting policies or firms
adopting different accounting policies will render the ratios not comparable.
4. A Balance Sheet represents a company’s financial position at one particular point in
time. A Balance Sheet drawn up one month, or even a day, earlier or later might reveal
a sharply contrasting situation, particularly for current assets and liabilities.
B. CATEGORIES OF RATIOS
Broadly, the basic ratios can be grouped into four categories:
1. Profitability
2. Debt & Gearing
3. Liquidity
4. Shareholders’ Investment Ratios
1. Profitability
To assess properly a company’s profits or profit growth it is necessary to relate them to
the capital employed in producing them. The most important profitability ratio is,
therefore, the Return on Capital Employed (ROCE), which shows the profit as a
percentage of the amount of capital employed.
ROCE =
PBIT
x 100%
Capital Employed
Where: PBIT = Profit Before Interest and Tax.
Capital Employed = Total Assets - Current Liabilities (Looking at the Liability side of
the Balance Sheet this is the same as Shareholders Funds + Long Term Debt).
ROCE is a measure of the efficiency with which the company is using its funds.
To look more deeply into the ROCE it can be divided into two secondary ratios:
(1)
Profit Margin =
PBIT
x 100%
Sales
(2)
Asset Turnover =
Sales
x times
Capital Employed
It may be appreciated that:
Profit Margin x Asset Turnover = ROCE

Page 136
PBIT
x
Sales
=
PBIT
Sales
Capital Employed
Capital Employed
Example
A company with net assets of RWF10m earns profits before interest and tax of
RWF2.5m on a turnover of RWF40m.
ROCE =
2.5m
= 25%
10m
Profit Margin =
2.5m
= 6.25%
40m
Asset Turnover =
40m
= 4 times
10m
Profit Margin
x
Asset Turnover
=
ROCE
6.25%
x
4 times
=
25%
A low profit margin can be caused by relatively low selling prices, high costs or both.
Asset Turnover indicates the efficiency with which the business is using its assets. A
low turnover shows that the volume of business is too low relative to the value of the
assets used.
Other profitability ratios used are:
(1)
Gross Profit Margin =
Gross Profit
x 100%
Sales
This gives an indication of the total margin available to cover operating expenses
and yield a profit.
(2)
Net Profit Margin =
Net Profit
x 100%
Sales
This shows the after-tax profits per RWF of sales. Low profit margins indicate
that the sales prices are relatively low or that costs are relatively high or both.
(3)
Return on Equity =
Earnings Available to Equity
x 100%
Equity Capital (including Reserves)
This shows the rate of return available to equity on their investment
2. Debt & Gearing
Gearing Ratio
This is concerned with a company’s long-term capital structure. There is no absolute
limit to what the gearing ratio ought to be. Many companies are highly geared but if

Page 137
such companies wish to borrow further they may have difficulties unless they can also
boost shareholders’ capital, either with retained profits or a new share issue.
Gearing Ratio can be expressed as:
(1)
Prior Charge Capital
Equity Capital (including Reserves)
or
(2)
Prior Charge Capital
Total Capital Employed
* Prior Charge Capital refers to long-term debt and includes Preference Shares but does
not normally include Bank Overdraft.
Interest Cover
This shows the financial risk in terms of profit rather than capital values. It
demonstrates whether a company is earning enough profits before interest and tax to
pay its interest costs comfortably.
Interest Cover =
PBIT
Interest Charges
As a general guide, an interest cover of less than 3 times is considered low, indicating
that profitability is too low given the gearing of the company.
3. Liquidity
A company requires liquid assets in order to meet its debts as they fall due. Liquidity is
the amount of cash a company can put its hands on quickly to settle its debts and
possibly meet other unforeseen demands.
Current Ratio
Indicates the extent to which the claims of short-term creditors are covered by assets
that are expected to be converted to cash in a period which corresponds roughly to the
maturity of the liabilities.
Current Ratio =
Current Assets
Current Liabilities
A benchmark of 2:1 is often quoted but this should not be adopted rigidly as
organisations have vastly different circumstances (e.g. operating in different industries,
seasonal trade etc.).
Quick Ratio (“Acid Test”)
This is a measure of the company’s ability to pay off short-term obligations without
relying upon the sale of its stocks, which may not be disposed of easily and for the
value at which they are being carried.

Page 138
Quick Ratio =
Current Assets – Stock
Current Liabilities
A benchmark of 1:1 is often quoted but, again, this should not be adopted rigidly.
Debtors Collection Period
This is a measure of the average length of time it takes for a company’s debtors to pay
what they owe. The credit period allowed may depend on the industry in which the
company operates.
Debtors Collection Period =
Debtors
x 365 days
Sales
Creditors Payment Period
This is a measure of the average credit period that a company takes before paying its
suppliers.
Creditors Collection Period =
Creditors
x 365 days
Purchases
Stock Turnover Period
This shows the number of times the stock is turned over during the year and indicates
how vigorously a business is trading.
Stock Turnover Period =
Cost of Sales
x times
Stock
Alternatively:
Stock Period =
Stock
x 365 days
Cost of Sales
4. Shareholders’ Investment Ratios
These ratios help equity shareholders and other investors to assess the value and quality
of an investment in the ordinary shares of the company.
Earnings Per Share (EPS)
EPS is the profit in Rwandan Francs attributable to each equity share. Following the
publication of FRS 3 this is the profit after tax, minority interests and extraordinary
items and after deducting preference dividends; divided by the number of equity shares
in issue and ranking for dividend.
EPS on its own does not tell us too much but it is widely used to measure a company’s
performance and to compare the results over a number of years.
Fully Diluted EPS can be calculated where a company has securities that might be
converted into equity at some future date. A hypothetical EPS is calculated as if the
options, warrants or convertible loan stock were converted and thus, the investor can
appreciate by how much the EPS may change.

Page 139
Price Earnings Ratio (P/E Ratio)
P/E Ratio =
Market Price per Share
EPS
All quoted companies have a P/E Ratio. It is equal to the number of years earnings
needed to cover the current market price. The value of the P/E Ratio reflects the
market’s appraisal of the share’s future prospects. A high P/E Ratio indicates strong
shareholder confidence in the company and its future (e.g. profit growth etc.), and a
lower P/E Ratio indicates lower confidence.
The P/E Ratio of one company can be compared with the P/E Ratio of other companies
in the same business sector or other companies generally.
Dividend Cover
This is the number of times the actual dividend could be paid out of current earnings. A
high rate of dividend cover means that a high proportion of earnings are being retained.
Dividend Cover =
EPS
or
Total Earnings
= x times
Dividend per Share
Total Dividends
Dividend Yield
Dividend Yield =
Gross Dividend per Share
x 100%
Market Price per Share
The gross dividend is the dividend paid plus the appropriate tax credit. The Gross
Dividend Yield is used so that investors can make a direct comparison with (gross)
interest yields from loan stock and Government Stocks (gilts).
C. Z-SCORES
One of the limitations of Ratio Analysis is that each ratio is examined in isolation and the
combined effects of several ratios are based solely on the judgement of the financial analyst.
Therefore, to overcome these shortcomings it is necessary to combine different ratios into a
meaningful predictive model.
Professor Altman established a model for predicting bankruptcy in the U.S. Using a sample
of sixty-six manufacturing firms, half of which went bankrupt, he identified five key
variables which contributed most. Each ratio is given a weighting to arrive at the Z-Score.
Page 140
Z = 1.2x1 + 1.4x2 + 3.3x3 +0.6x4 +1.0x5
Where: x1 = Working Capital/Total Assets
x2 = Retained Earnings/Total Assets
x3 = PBIT/Total Assets
x4 = Market Capitalisation/Book Value Of Debt
x5 = Sales/Total Assets
A score of 2.7 or greater indicates that the company should be safe. A score below 1.8
indicates potential problems. A score between 1.8 and 2.7 is a “grey area,” indicating that
remedial action may be required.

Page 141
Study Unit 16
Mergers and Acquisitions
Contents
A. Introduction
B. Types of Combinations
C. Reasons for Acquisition
D. Impact of Acquisition
E. Purchase Consideration
F. Defence Tactics
G. Management Buy Out (MBO)
H. Demergers
I. Mezzanine Finance
J. Due Diligence
K. Post-Acquisition Issues
L. Ethical Considerations
Page 142
A. INTRODUCTION
When an organisation decides on expansion the choice is between organic growth or
acquisition. Organic growth is internal growth by expansion of the existing business (e.g.
opening more outlets, major marketing/sales campaign, reduce prices to achieve additional
sales etc.) or investment in new projects. The alternative is to acquire a competitor (thus
reducing competition), or other companies in related or non-related lines of business.
Acquisition achieves the objective more quickly and avoids the risk of start-up. However, it
is generally more expensive than organic growth.
Merger – this is generally where two companies unite to form a single entity.
Acquisition/Takeover – generally where one company purchases a controlling interest in
another company.
B. TYPES OF COMBINATIONS
Generally, the combinations can be categorised as follows:
• Vertical Integration - combination of two firms in the same industry but at different
levels - e.g. a production company acquires its supplier of raw materials.
• Horizontal Integration - combination of two firms in the same industry and at the
same level - e.g. the acquisition of a direct competitor.
• Conglomerate Merger/Takeover - combination of two firms in unrelated/indirectly
related industries - e.g. a tobacco company acquires an insurance company.
C. REASONS FOR ACQUISITION
There are many reasons why one company may wish to acquire another. The following list is
not in any particular order as priorities may vary from one acquisition to another:
• Synergy => 2 + 2 = 5 (benefits accrue due to increased earnings or reduction in costs
e.g. reduced advertising & distribution costs; disposal of one H.O. etc.)
• Economies of Scale - Fixed operating costs spread over larger production volume;
equipment used more efficiently; bulk purchasing (production, marketing,
administration, R & D, finance etc).
• New Market - quick entry
• Management Acquisition - a company with a weak management team acquires a
company with a strong team.
• Diversification - reduction of risk. This may not be beneficial to shareholders who
already hold diversified portfolios. Can be beneficial if the acquired company is one in
which the shareholder could not previously invest.
• Increased Market Share & Market Power - gain some monopoly power which may
increase profitability (e.g. price leadership). In some markets to operate effectively
requires the achievement of a “critical mass” size. Beware of Monopolies legislation.

Page 143
• Bolster Asset Backing - a company with a high level of earnings relative to its assets
may wish to improve the overall risk profile by acquiring a company with substantial
assets.
• Growth - growth through acquisition may be cheaper and quicker than internal
expansion.
• Taxation - a company with unused tax allowances may wish to combine with a
company with large taxable profits. Similarly, a company with accumulated tax losses
may be acquired so that the losses can be offset against the taxable profits of the
acquiring company.
• Reduction of Competition – consider Monopolies legislation and attitude of
Competition Authority
• Asset Stripping – company broken up and assets sold off.
• Use of Surplus Cash – acquire “earnings enhancing” company.
• Lower Costs Of Financing - improved credit-rating following reduced variability of
returns may make it easier/cheaper to raise finance.
• Improvement In Gearing – highly geared company links up with “cash-rich”
company.
• Purchase of Patents/Brands
• Note: Evidence suggests that many acquisitions are financially unsuccessful. There is
often some abnormal return for the shareholders of the target (premium paid for their
shares) but very little for the bidding company shareholders. Also, acquisitions often
experience difficulties in integrating the operations of the companies. Research by the
London Business School indicates that 75% fail to reach their financial targets and 50%
of acquiring companies fail to recoup the premium they pay above market value.
D. IMPACT OF ACQUISITION
On Shareholders in Bidding Company
Approval may not be forthcoming if the shareholders regard the bid as unattractive because:
• It might reduce EPS
• The target company is in a risky business
• It might reduce the net asset backing per share
• It might dilute their control.
On Directors & Shareholders in Target Company
The Board and/or shareholders in the target company may regard the bid as unattractive
because:
• They regard the terms of the offer as poor
• The takeover has no obvious advantages
• The employees are strongly opposed to it.
Page 144
E. PURCHASE CONSIDERATION
There are a number of ways that the acquiring company can pay for the target. Briefly, these
are:
• Cash
• Share Exchange – e.g. three shares in company A for every five shares in company B
• Loan Stock - e.g. RWF100k of 10% Loan Stock for forty shares in company B
• Combination – some cash plus some shares etc.
• Deferred Expenditure - Performance Related.
Before deciding on the method of consideration there are a number of factors to consider:
1. Factors - Bidding Company & Shareholders
• Dilution in EPS - may occur in certain circumstances when the consideration is
equity (if the target company is bought on a higher P/E Ratio than the bidder).
• Cost - may be less with loan stock as the interest is allowable for Corporation
Tax. Also, dilution of EPS may be avoided.
• Gearing - a highly geared company may find it difficult to issue additional loan
stock.
• Control - may be diluted if a large number of shares is issued. Cash causes less
dilution of ownership.
• Cash Resources - use of equity conserves cash resources and may be the only
real alternative when the target company is large in relation to the bidding
company. The issue of Loan Stock will also conserve liquidity but will increase
gearing.
• Price - if equity is offered the value of the bid is dependent upon the share price -
fluctuations causing the attractiveness of the bid to alter. The cost of the bid is
more precise when cash is the consideration. Where shares are offered the
bidding company will be concerned that the market value of their shares should
not fall before the target company’s shareholders have accepted.
2. Factors - Shareholders in Target Company
• Taxation - if cash is offered an immediate C.G.T./Income Tax liability arises. If
paper (shares/stock etc.) is offered the tax liability is deferred.
• Income - if paper is offered, the bidding company should generally ensure that
the shareholders’ income is at least maintained.
• Future Investment - shareholders may prefer equity to maintain a continued
interest in their company, albeit as part of a larger group, without incurring
transaction costs of purchasing in the new group. Unless Loan Stock is issued as
“convertibles” or with warrants attached the shareholders will not maintain an
equity interest in the group.
Page 145
• Cash - if cash is offered the value is certain and the shareholder is free to invest
elsewhere, without incurring transaction costs of selling shares.
• Value - evidence suggests that the consideration is higher when equity rather than
cash is used as consideration.
• Risk - the receipt of fixed interest stock will change the risk of the shareholders’
portfolios which they may not wish.
F. DEFENCE TACTICS
Where an unwelcome or hostile bid is received a number of steps can be taken to thwart it:
• Reject the bid on the basis that the terms are not good enough.
• Issue a forecast of attractive future profits and dividends to persuade shareholders to
hold onto their shares.
• Revalue any undervalued assets.
• Attempt to have the offer referred under Monopolies legislation - at minimum this will
delay the bid.
• Mount an effective advertising and P.R. campaign.
• Find a “White Knight” that is more acceptable – where a company finds a more
suitable acquirer and deals with them rather than the original bidder.
• Make a counter bid - only possible if the companies are of a similar size.
• Arrange a Management Buyout.
• Attack the credibility of the offer or the offeror itself, particularly if shares are
offered - e.g. commercial logic of the takeover, dispute any claimed synergies, criticize
the track record, ethics, future prospects etc. of the offeror.
• Appeal to the loyalty of the shareholders.
• Encourage employees to express opposition to the merger
• Persuade institutions to buy shares.
Note: In fighting the bid, the company may be restricted by a Rwandan Stock Exchange
(RSE) Code on Takeovers and Mergers.
G. MANAGEMENT BUYOUT (MBO)
• This is the purchase of all or part of a business by one or more of its executive
management. The main factors to consider are the riskiness and the problems which
may arise when the new company becomes independent (e.g. loss of H.O. support;
customers may go elsewhere if they regard the firm as too risky.
• Management put up some of the capital themselves and obtain the remainder from other
sources (e.g. Venture Capital organisations). Equity from external investors will often
be in a form other than ordinary shares e.g. convertible redeemable preference shares.

Page 146
They will also require board representation and options on future share issues.
Management will to keep effective control by ceding <50% of voting rights to external
equity holders.
• External investors will need some potential exit route e.g. future listing, refinancing,
sale of entire business to another company or the management team.
• Originally used to dispose of poor performing subsidiaries at a discount but nowadays,
mostly used to dispose of successful operations which do not fit the “core” business.
• An MBO may also arise where a company or subsidiary is threatened with closure.
• There are usually three parties to an MBO:
– The management team who must possess the necessary skills and ability.
– The directors/owners who are willing to dispose of the entity.
– The financial backers (possibly more than one) who will usually require an
equity stake. They will review strategic business plans & cash flow projections
and assess the personal commitment and quality of the management team.
• The main reasons for an MBO are:
– The subsidiary no longer fits the group’s overall strategy.
– The parent’s desire to sell a loss-maker (MBO possibly cheaper than liquidation).
– The parent needs cash urgently.
– The subsidiary is too small for the level of time involved in managing it.
Management is unable to devote the time/capital necessary to develop the
subsidiary. Rather than run it down or sell it to a competitor it may arrange an
MBO (possibly on generous terms) in order to retain trading contacts with the
subsidiary in the future.
– A new parent wishes to sell unwanted parts, following acquisition.
– The best offer may come from the management team.
– There will generally be better co-operation in an MBO.
• The main advantages of an MBO are:
– Although high-risk, the potential for rewards is high
– Less risky than starting from scratch
– MBO firms tend to operate at a higher level of efficiency
Management Buy-In (MBI)
• This is a variation on the MBO theme and occurs when a team of outside managers
mounts a takeover bid and then assumes the executive responsibilities for running the
business themselves.
Page 147
H. DEMERGERS
• A demerger results in the splitting up of a firm into smaller legally separate firms.
• A demerger may arise:
– Where one part of a firm is of an unusual level of risk.
– Where one part of a firm has unusual financing requirements.
– Where a firm has grown too large for its management structure.
• Among the financial advantages are:
– Ensures the continued survival and viability of the profitable parts of a firm whose
existence could otherwise be threatened by a loss-making division.
– Enables management to have a direct investment in their activities and to observe
their performance as evidenced by the share price behaviour for their part of the
firm.
– May enable the separate and smaller firms to take advantage of lower tax rates,
government subsidies etc. applicable only to smaller firms.
– May enable risky but worthwhile activities to be separated from the rest of the less
risky firm. This will enable shareholders to choose the level of risk of their
investments.
• Among the financial disadvantages are:
– Any economies of scale may be lost.
– Total overheads may be greater.
– Total borrowing capacity may be reduced. Before demerger the portfolio effect of
many activities will help to smooth cash flows and, therefore, will assist in
boosting borrowing capacity.
I. MEZZANINE FINANCE
• This is a layer of funding between senior debt and equity.
• It ranks behind senior debt and usually has little or no asset backing.
• To compensate for the higher risk it normally carries an enhanced coupon rate together
with some participation in the equity of the business.
• In an MBO this allows the percentage of true equity in the total package to be smaller
and control of the company can be left in the hands of the management group.
• The major characteristics are:
– Floating interest rate, normally higher than senior debt.
– Equity participation, either by way of warrants or initial subscription, to give a
total return somewhere below straight equity but above straight debt.
– Repayment terms of eight to ten years or more.
– Security on the basis of second fixed and floating charges behind similar charges
in favour of senior lenders.
Page 148
J. DUE DILIGENCE
The main objective of Due Diligence is to confirm the reliability of the information which
has been provided and has been used in making an investment decision. Changes in these
primary assumptions may have a significant impact on the price to be paid and possibly even
raise questions on the wisdom of proceeding with the transaction. This is a very useful
process and at minimum will provide additional information on the potential target.
The following should be considered:
1. Earnings – audited financial statements are prepared to comply with statutory/tax
requirements. To assess the true quality of earnings an in-depth review of the business
and detailed management accounts must be performed. Adjustments may need to be
made for one-off events, lost customers, discontinued products, changes in cost
structure etc. Also, evaluate non-financial information e.g. quality of risk management,
quality of management, corporate governance etc.
2. Forecasts – may be prepared on a high-level basis with oversimplified assumptions.
The assumptions may be difficult to reconcile with historical performance.
3. Assets – write-offs for aged debtors, obsolete stock, idle assets, capitalised costs etc.
may need to be made. Also, clarify which assets are to be included in the transfer and
agree valuations.
4. Undisclosed Liabilities – substantial hidden tax liabilities, penalties and exposures
may subsequently arise. Evaluate and possibly, seek protection by obtaining warranties
or indemnities against future potential tax issues.
5. Trading Performance – related party transactions are often conducted under special
pricing terms (e.g. business support services not charged by parent company). The
impact on the business of a change in ownership should be assessed to reflect normal
commercial arrangements.
6. Controls – additional investment in new reporting systems may be required to obtain
the quality of information needed to properly monitor performance. Also, ensure the
necessary staff are locked-in for an appropriate period.
7. Balanced View – issues should be weighed against the upside potential in a balanced
way. Examples of the upside might include, synergies, optimal financing structure,
access to new markets, new management team etc.
8. Tax Structure – effective tax planning is a key component in delivering value as
quickly as possible.
Page 149
K. POST-ACQUISITION ISSUES
When one company successfully acquires another company it is very important to consider
the issues which may arise following the acquisition. Amongst these are:
• Organisation Structure
• Change Management
• Key Employees
• Major Customers
• Cultural Issues
• Technology
• Control
L. ETHICAL CONSIDERATIONS
When a company receives a bid from another company it is important that the board of the
target company take account of any ethical considerations. Examples might include:
• Any Issues which might be Illegal
• Any Issues which may Distort the Markets (price-manipulation)
• Insider Dealing
• Use of Price-Sensitive Information
• Terms of Confidentiality Agreements
• Any Incentives Offered to Ensure the Bid is Accepted (e.g. seats on the board of the
bidding company; enhanced salaries, bonuses)
• Impact on Shareholders and Other Stakeholders
• Impact on Employees

Page 150
BLANK

Page 151
Study Unit 17
Company Valuations
Contents
A. Introduction
B. Valuation Bases

Page 152
A. INTRODUCTION
• It may be necessary to carry out a valuation for:
– Quoted Companies - where a bid is made and the offer price is an estimated
“fair value” in excess of the current market price of the shares.
– Unquoted Companies - where the company is going public; a scheme of merger
is being considered; shares are being sold; taxation purposes (C.G.T., C.A.T.); to
establish collateral for a loan etc.
• The valuation of companies is not an exact science.
• It is, generally, necessary to use a number of bases to arrive at a range of values.
• In the end it is a matter of negotiation:
– How badly do you need the company?
– How badly do the existing owners wish to dispose?
• Depending on the circumstances different valuations may be applied to the company.
For example, where the bidder wishes to establish a presence in a new market it may be
prepared to pay a premium, which will be reflected in the valuation. Likewise, where a
company in the same industry makes a bid any synergistic benefits could reflect in the
valuation it places on the target.
B. VALUATION BASES
Broadly, the various methods of valuation may be based on:
1. Earnings
2. Assets
3. Dividends
4. Cash Flow
5. Combination of Other Methods
1. Earnings
*P/E Ratio - the P/E Ratio is the relationship of a company’s share price to its EPS.
P/E =
Price
EPS
Therefore: P/E x EPS = Price
If the prospective EPS can be estimated and a suitable P/E Ratio selected it should be
possible to arrive at a price (value) for the company. Where an unquoted company is
being valued a “best fit” P/E can be obtained from similar quoted companies (same
industry, similar size, gearing etc.). When an appropriate P/E has been selected this

Page 153
should then be reduced by 20% - 30% to recognise that shares in unquoted companies
are more risky and less marketable than those of quoted companies.
*Accounting Rate of Return (ARR) - the estimated maintainable earnings of the
target can be capitalised using the ARR.
Estimated Maintainable Earnings
= Value
ARR
Example:
If maintainable earnings are estimated at RWF1.5m and the ARR is 10% the value is:
RWF1.5m
= RWF15m
.10
RWF15m is the absolute maximum which could be paid in order to achieve the 10%
rate of return. When estimating the maintainable earnings it may be necessary to adjust
them to bring them into line with the bidder’s policies.
*Super Profits - if super profits are expected these are reflected in the valuation. A
normal rate of return for the industry is applied to the net tangible assets in order to
establish normal profits. These are then compared with the expected annual profits and
if the expected profits are higher the difference is regarded as a super profit. The
valuation is the net assets plus a number of years (say, 3) of super profits. This method
has become less fashionable than previously.
2. Assets
The valuation is based on the Net Tangible Assets which are attributable to the equity.
Any intangible assets and the interests of other capital providers are deducted.
Net Assets per Balance Sheet
X
Less Intangibles (e.g. Goodwill)
(X)
X
Less Other Parties:
Preference Shares
X
Loan Capital
X
(X)
Net Tangible Assets – Equity (Valuation)
X
The figure attached to an individual asset may vary considerably depending on whether
it is valued on a going-concern or a break-up (asset stripping?) basis.
While an earnings basis might be more relevant the Net Assets basis is useful as a
measure of the “security” in a share value.
3. Dividends
The Dividend Valuation Model may be used to value the company’s stream of expected
future dividends. It is suitable for the valuation of small shareholdings in unquoted
companies.

Page 154
(i) Constant Dividends
Value =
d
r
Where: d = dividend per share
r = company’s cost of equity
(ii) Growth In Dividends
Value =
d o (1 + g)
r – g
Where: d o = most recent dividend
g = expected growth rate in dividends
r = company’s cost of equity
4. Cash Flow
The valuation is based upon the expected net present value of future cash flows,
discounted at the required rate of return. However, accurate estimates of the cash flows
will rarely be available in an acquisition situation.
5. Combination
*Berliner Method - this takes the average of the prices calculated using the earnings
method and the Net Assets method.

Page 155
Study Unit 18
Cost of Capital
Contents
A. Introduction
B. Calculation of Cost of Capital
C. Weighted Average Cost of Capital (WACC)

Page 156
A. INTRODUCTION
It is important that a company is aware of its cost of capital. In certain cases it is not initially
apparent what this cost is (e.g. new share issue, retained earnings etc.) and a number of
models have been developed to assist in calculating the cost of individual sources of finance.
Having calculated the cost of each individual source of finance it is then important to
calculate an overall cost for the company, based on the mix of funds which it chooses to use.
B. CALCULATION OF COST OF CAPITAL
1. Equity
(i) Constant Dividends
r =
d
MV
Where: r = cost of capital
d = annual dividend
MV = market value (ex. div)
Example:
Dividend of 15c per share recently paid and expected to continue at this level for
the foreseeable future. Current market value of share is 80RWF ex. div.
r =
15
= 18.75%
80
(ii) Growth in Dividends
r =
do (1 + g)
+ g
MV
Where: r = cost of capital
do = most recent dividend
MV = market value (ex. div)
g = annual rate of growth in dividends
Example:
Dividend of 20RWF per share about to be paid. Dividends expected to grow by
10% per annum in the future. Current market value of share is RWF160.
r =
20RWF (1.10)
+ .10 = 25.71%
140RWF
Note:
Ex. div price (RWF160 - RWF20) must be used in calculation.

Page 157
2. Preference Shares
r =
d
MV
Where: r = cost of capital
d = annual dividend
MV = market value (ex. div)
Example:
7% Preference Shares RWF1; Current market value 70RWF ex. div
r =
7RWF
= 10%
70RWF
3. Irredeemable Debt
r =
k
(1 – t)
MV
Where: r = cost of capital
k = coupon rate
t = rate of corporation tax
MV = market value (ex. interest)
Example:
7% Irredeemable Debentures; Current market value RWF70 ex. Interest. Corporation
Tax 40%.
r =
RWF7
(1 – .40) = 6%
RWF70
4. Redeemable Debt
To find cost of capital calculate the Internal Rate of Return.
Example:
10% Redeemable Debentures
Redeemable at par in 5 years
Corporation Tax = 40%
Current Market Value RWF90 ex. Interest

Page 158
Year
Cash Flows
PV –
10%
PV –
8%
0
(90)
(90)
(90)
1-5
6
22.75
23.96
5
100
62.10
68.10
(5.15)
2.06
IRR = 8% +
2.06
x (10% - 8%) = 8.57%
2.06 + 5.15
5. Convertible Debt
To find cost of capital calculate the Internal Rate of Return.
Example:
6% Convertible Debentures
Convertible in 5 years into 12 shares per RWF100 Debentures
Alternatively, redeemed at par in 6 years
Current Market Value of Debentures is RWF102.50 ex. interest
Current Market Value of shares is RWF6.50. Share price is expected to grow at 8%
per annum for the foreseeable future.
Corporation Tax = 30%
Share price in 5 years expected to be RWF6.50 x (1.08) 5 = RWF9.55
Conversion Value = RWF9.55 x 12 = RWF114.60. As this is much greater than
redemption value, conversion appears likely.
Year
Cash Flows
PV – 10%
PV – 8%
0
(102.5)
(102.50)
(102.50)
1-5
RWF6 x .70 = 4.20
18.18
15.92
5
114.60
89.85
71.17
5.53
(15.41)
IRR = 5% +
5.53
x (10% - 5%) = 6.32%
5.53 + 15.41

Page 159
C. WEIGHTED AVERAGE COST OF CAPITAL (WACC)
Market Value
Weighting
Cost
WACC
Equity
RWF15m
75%
16%
12%
Debt
RWF5m
25%
8%
2%
RWF20m
100%
14%
Equity 16%
WACC 14%
Debt 8%
Assumptions:
• Weightings do not change.
• Business risk does not change.
“POOL”
OF
FUNDS

Page 160
BLANK

Page 161
Study Unit 19
Portfolio Theory
Contents
A. Introduction
B. Portfolio Risk and Return

Page 162
A. INTRODUCTION
A portfolio is a collection of different investments which comprise an investor’s total
investments. For example, a property investor’s portfolio may consist of many investment
properties in different locations and which are used for varied purposes. Other examples of a
portfolio are an investor’s holding of shares, or a company’s investment in many different
capital projects. Portfolio Theory is concerned with setting guidelines for selecting suitable
shares, investments, projects etc. for a portfolio.
B. PORTFOLIO RISK AND RETURN
By investing all of one’s funds in a single venture the whole investment may be lost if the
venture fails. However, by spreading the investment over a number of ventures the risk of
losing everything will be reduced. If one of the ventures fails only a proportion of the
investment will be lost and hopefully, the remainder will provide a satisfactory return.
Example
An investor has RWF100,000 to invest. He is considering two companies A and B but is
unsure as to which company to select. He expects that either company will produce a return
of 12%, which is acceptable. As he is a little worried about the risk of the investments he
eventually decides to invest RWF50,000 in each company.
What actually transpires is that company A produces a return of 22% but company B
produces a disappointing return of only 2%. By diversifying – i.e. by holding shares in both
companies - the investor achieves an overall return of 12% (1/2 x 22% + 1/2 x 2%). If he had
invested all of the RWF100,000 in company B a return of only 2% would have been
achieved. Thus, the risk of achieving a less than satisfactory return has been reduced by
investing in both companies. The exceptional return of company A has offset the poor return
of company B.
Investors are generally risk-averse and will seek to minimise risk where possible. The
objectives of portfolio diversification are to achieve a satisfactory rate of return at minimum
risk for that return.
A portfolio is preferable to holding individual securities because it reduces risk whilst still
offering a satisfactory rate of return – i.e. it avoids the dangers of “putting all your eggs in
one basket”
When investments are combined, the levels of risk of the individual investments are not
important. It is the risk of the portfolio which should considered by the investor. This
requires some measure of joint risk and one such measure is the coefficient of correlation.
The relationship between investments can be classified as one of three main types:
1. Positive Correlation – when there is positive correlation between investments if one
performs well (or badly) it is likely that the other will perform similarly. For example,
if you buy shares in one company making umbrellas and another which sells raincoats
you would expect fine weather to mean that both companies suffer. Likewise, bad
weather should bring additional sales for both companies.

Page 163
2. Negative Correlation – if one investment performs well, the other will do badly and
vice versa. Thus, if you hold shares in one company making umbrellas and another
which sells ice-cream, the weather will affect the companies differently.
3. No Correlation – the performance of one investment will be independent of how
another performs. If you hold shares in a mining company and a leisure company it is
likely that there would be no obvious relationship between the profits and returns from
each.
The Coefficient of Correlation can only take values between –1 and +1. A figure close to +1
indicates high positive correlation and a figure close to –1 indicates high negative correlation.
A figure of 0 indicates no correlation.
It is argued that if investments show high negative correlation then by combining them in a
portfolio overall risk would be reduced. Risk will also be reduced by combining in a
portfolio securities which have no significant correlation at all. If perfect negative correlation
occurs, portfolio risk can be completely eliminated but this is unlikely in practice.
Usually returns on securities are positively correlated, but not necessarily perfectly positively
correlated. In this case investors can reduce portfolio risk by diversification.

Page 164
BLANK

Page 165
Study Unit 20
Capital Asset Pricing Model
Contents
A. Introduction
B. Systematic and Unsystematic Risk

Page 166
A. INTRODUCTION
The Capital Asset Pricing Model (CAPM) is an extension of Portfolio Theory, which is
concerned with the risk and return of portfolios and the process by which risk can be reduced
by efficient diversification. The CAPM assumes that all investors are efficiently diversified
and examines the risk and return of any capital asset. A capital asset can be a portfolio, an
individual share or security, a portfolio of projects or investments made by a company or
even an individual project.
The CAPM gives the required rate of return on a capital asset, based on its contribution to
total portfolio risk, called systematic risk. It gives a very neat way of calculating risk-
adjusted discount rates.
B. SYSTEMATIC AND UNSYSTEMATIC RISK
When securities are combined in a portfolio part of each security’s total risk (its standard
deviation) is eliminated. This is the basis of diversification. That part of an individual
security’s total risk which can be eliminated by combining that security with an efficient
portfolio is called unsystematic (or specific) risk. The balance of an individual security’s
total risk (that part which cannot be eliminated by diversification) is called systematic (or
market) risk.
Unsystematic Risk – risk which can be eliminated by diversification. It is the variation in a
company’s returns due to specific factors affecting that company and not the market as a
whole, e.g. strikes, the breakdown of machinery, changes in fashion for that company’s
products etc. This specific risk is a random fluctuation uncorrelated with the returns on the
market portfolio (the market as a whole). Therefore, when a large number of shares are held
these random fluctuations tend to cancel out – i.e. there is risk reduction.
Systematic Risk – risk which cannot be eliminated by diversification. This is the fluctuation
in returns due to general factors in the market affecting all companies e.g. inflation,
government policy, economic conditions etc. It is that part of the fluctuations in returns
which is correlated with those of the market portfolio.
When a capital asset (s) is combined with no other assets, the risk of the portfolio is simply
the standard deviation of (s). When further assets are added, however, the contribution of (s)
to the portfolio risk is quickly reduced – diversification is eliminating the unsystematic risk.
It takes a surprisingly low number of shares in a portfolio to eliminate the majority of
unsystematic risk (twenty holdings/shares in a portfolio will eliminate approximately 94% of
unsystematic risk). All unsystematic risk could only be eliminated when the market portfolio
is held.
Only systematic risk is relevant in calculating the required return on capital assets. This is
because, on the assumption that investors hold efficient portfolios, unsystematic risk is
automatically eliminated when another asset is incorporated within that portfolio. The only
effect an asset has on portfolio risk is through its systematic risk.

Page 167
Some investments may be regarded as risk-free – such as investment in government securities
(“Gilts”). Investors in risky investments should expect to earn a higher return than investors
in risk-free investments, to compensate for the risks they are taking. Thus, if investors in
Gilts can obtain a return of, say, 6%, an investor in a risky asset should expect a yield in
excess of 6%. The Capital Asset Pricing Model uses this approach of rewarding investors in
risky assets with a premium on top of the yield on risk-free assets. The CAPM is:
Rs = Rf + β (Rm - Rf )
Where: Rs = the expected return on a capital asset (s)
Rf = the risk-free rate of return
β = a measure of the systematic risk of the capital asset (the Beta factor)
Rm = the expected return from the market as a whole
This is a very important formula. Note that the expected return (Rs) is equal to the risk-free
rate of return (Rf) plus an excess return or premium (Rm - Rf ) multiplied by the asset’s
Beta factor. You may see different symbols in many textbooks but the same principles apply.
The Beta factor is a measure of the systematic risk of the capital asset. Thus, if shares in
ABC plc tend to vary twice as much as returns from the market as a whole, so that if market
returns increase by, say, 3%, returns on ABC plc shares would be expected to increase by 6%.
Likewise, if market returns fall by 3%, returns on ABC plc shares would be expected to fall
by 6%. The Beta factor of ABC plc shares would, therefore, be 2.0.
Example
The returns from the market as a whole have been 15% for some time, which compares with
a risk-free rate of return of 7%. Alpha plc’s shares have a Beta factor of 1.25. What would
be the expected returns for Alpha’s shares if:
Market returns increased to 16%
Market returns slumped to 9%
1. Rs = Rf + β (Rm - Rf )
= 7% + 1.25(16% - 7%)
= 7% + 11.25%
= 18.25%
2. Rs = Rf + β (Rm - Rf )
= 7% + 1.25(9% - 7%)
= 7% + 2.5%
= 9.5%
Page 168
The CAPM provides a useful technique for calculating costs of capital and discount rates
appropriate to capital projects based on their individual levels of risk. However, there are two
drawbacks to the practical application of the CAPM. Firstly, the data necessary to calculate
Beta factors and the difficulty in obtaining them. Secondly, the assumptions on which the
model is based, which question the validity of the model itself. Among these assumptions
are:
1. Investors are rational and risk-averse – without this the whole idea of diversification
becomes meaningless.
2. There are no transaction costs – this is not true in practice e.g. brokers’ fees. It
effectively makes the attainment of the market portfolio impossible. However, by
holding only a limited number of well selected shares it should be possible to obtain a
fairly close approximation to the market portfolio.
3. All investors are efficiently diversified – the CAPM is based on the assumption that all
investors have eliminated unsystematic risk by diversification and hence only
systematic risk (measured by Beta) is relevant in determining returns.
In conclusion, although the CAPM can be criticised it is nevertheless a very useful model in
dealing with the problem of risk.

Page 169
Study Unit 21
Business Plans
Contents
A. Introduction
B. Structure of Business Plan
Page 170
A. INTRODUCTION
There are many reasons why companies prepare Business Plans. One of the most common
reasons is where the promoters of the company are intending to raise finance and a detailed
Business Plan is required for presentation to potential investors.
B. CONTENTS OF BUSINESS PLAN
The Business Plan must be well constructed and provide sufficient detail to enable a potential
investor to decide in principle, whether the company is a candidate for investment.
The Business Plan should include the following:
1. Executive Summary
Potential investors often make an initial judgement based on the content of the
Executive Summary and their decision to read the detailed content of the Business Plan
will depend on its content.
While the Executive Summary is shown at the front it should not be completed until the
Business Plan has been written. It will highlight all milestones in the company’s
development over the next five years. At minimum, it should summarise the following:
• Purpose of the Plan
• Product or Service and its advantages
• Market Opportunity
• Management Team
• Track record, if any
• Financial Projections – sales, net profit before tax, investment etc.
• Funding Requirements
2. Company Description
Promoters and Shareholders
Promoters
Management structure and areas of responsibility
Shareholders names, % shareholding, cash invested to date
Advisors
Financial, legal and other advisors with contact details
Products and Services
Explain the product/service
Background to development
Benefits and features
Unique selling point
Advantages to customers
Disadvantages or weak points
Future developments
Page 171
Long Term Aim of Business
Objectives
Specific objectives to be achieved over next five years (sales, exports, employment,
product development etc.)
SWOT Analysis
Analyse the strengths and weaknesses of the business and product/service, the
opportunities that exist in the marketplace and the threats to the viability of the project.
3. Market Analysis
This covers market research and competitor analysis and demonstrates that the research
undertaken justifies the projections made in the plan and indicates a viable market
exists for the product/service.
Target Market
Analyse the market:
Size of each segment
Is the segment growing or declining?
Characteristics of potential customers in each segment
Total Market Valuation
Show the total potential value of the market for the product/service, in all targeted
markets (domestic and international).
Target Company Revenue
The basis for the sales figures in the financial projections and must be based on realistic
assumptions. Include average deal size, length of sales cycle, recurring revenues.
Market Trends
Recent changes
Future predictions
Drivers – demographic changes, economic and legislative factors
Implications for company product/service
Plans to meet future demands and changes in the market
Profile of Competitors
What are the competing products/services
Profile of key players (size, turnover, profitability etc.) and their market share
Advantages and disadvantages of competitors’ offerings
Competitive Advantage
Why potential customers will choose company’s product
Unique features
Price
New technologies or systems
Better value (efficiency, ROI, cost/benefit)
Greater compatibility with existing systems
Include any independent validation
Page 172
Benefits to Clients
What does product/service provide to potential customers?
Increase sales
Increase efficiencies
Save money
Save time
Maximise resources
Reduce errors
Reduce downtime
Improve customer service, increase loyalty
4. Marketing/Sales Strategy
Strategies for reaching target market, generating interest in the product/service and
actually achieving sales.
Marketing Strategy
Which segments of the market will be targeted first and why
How will product/service be differentiated
What potential customers have already been targeted
Is test site in operation and what is feedback
What contacts can be used to generate market awareness and sales
Who will do the marketing – staff, agency, representatives
Sales Strategy
How will product/service be sold
Directly
Retail
Distributor
Agent
Sales Representatives
Website
State the advantages of the methods chosen
Pricing
How will price charged be set? Consider
Competitors’ prices
Level of competition in market
Perception of quality-price relationship by customers
Production costs and overheads
Marketing and Communications Strategy
How will product/service be promoted in the marketplace?
Advertising – where, when, how and whom
Public Relations
Direct Marketing
Website and internet marketing
Exhibitions and conferences
Word of mouth

Page 173
5. Research and Development
Intended future development of product/service. Detail plans for new
products/services. List all technical partners and indicate nature of involvement.
State any protection available for product/service – patented, copyright or trademark
registration and brand image to be built up as protection against competition.
6. Staffing and Operations
Outline intended structure of the company – management, number of employees and
physical operations.
Management (including Board) Organisation Chart
Areas of responsibility of each manager
Staffing
What employees will be hired over the next three years, skills and in which areas?
Training
Planned employee and management development. Should tie-in with future
product/market developments.
Operations
Premises
Equipment
Production facilities
Infrastructure
Communications facilities
Suppliers
7. Financial Projections
Key Assumptions
Income sources
Number of employees projected for each year and their salaries
Projected investment in equipment and materials
Projected R & D costs
Depreciation policy
Expected rent and rates charges
Creditor and Debtor days expected
Expense calculations
Profit & Loss Accounts
Projected for first three years of operations
Balance Sheets
Projected for first three years of operations
Cash flow
Monthly cash flow predicted for the first two years of operations
Page 174
8. Sales Pipeline
Analyse pipeline business – customer, size of deal, date expected, probability of
achieving sale etc.
9. Funding Requirements
Total funding requirements and how these are to be provided. Also state approximate
breakdown of how funds are to be spent.
Sources
Promoters’ funds
Bank lending
Grants or loans from agencies
Investment already received
Investment sought
Spending
Equipment
R & D
Marketing
Staffing
10. Appendices
Provide detailed data on which the main text of the plan is based and extra information
of interest to the readers. Details will vary from business to business but may include:
Promoters’ CVs
Detailed financial assumptions
Most recent company audited accounts
Share capital table and investment history
Term sheet from potential investors
Detailed market research findings
Promotional literature
Product or service information
Details of company website
Testimonials or letters of intent from customers

Page 175
Study Unit 22
International Managerial Finance
Contents
A. Introduction
_______________________________________________________________
B. International Capital Markets
______________________________________________________________
C. International Franchises Licences
______________________________________________________________
D. International Money Markets
________________________________________________________________
E. International (Foreign) Bonds
________________________________________________________________
F. Certificate of Deposit (CD)
________________________________________________________________
G. Multicurrency Bonds
________________________________________________________________
H. Multicurrency Cocktail bonds
________________________________________________________________
I. Foreign Exchange Risk – Hedging
________________________________________________________________
J. Project Finance
________________________________________________________________
Page 176
A. INTRODUCTION
Foreign currencies have a habit of changing relative to the domestic currency and therefore
add risk to dealing with foreign countries as sales markets or sources of supplies.
Foreign companies also can be a source of capital to facilitate capital investment and growth
Some foreign currencies are seen as more stable than domestic currencies and can be a more
predictable source of long term debt.
B. INTERNATIONAL CAPITAL MARKETS
Many developing countries do not have sufficient resources to finance their investment
needs. To meet these needs, they are depending on international capital markets, either from
official sources or from private capital sources. Governments in developed countries and the
international financial institutions (IFIs) are examples of official capital sources for
developing countries.
Examples of private sources are banks and companies. The latter, in particular, can play an
important role as suppliers of capital through Foreign Direct Investment.eg. Viz Heineken in
Bralirwa
For instance, Bralirwa is part owned by Heineken and a Belgian company whilst 25% is
owned by “others” who trade on the Rwandan Stock Exchange (RSE)
Foreign financial intermediaries
Banks, both domestic and international, play a part in the transfer of funds from overseas into
Rwanda, as Money Market Instruments (liquid) and Bonds (less liquid); but there other
financial institutions which arrange the transfer of capital from/to foreign organisations.
These could be Insurance companies, asset managers such as JP Morgan or BNY Mellon
The Financial Intermediary is important as an adviser as well as means of transferring funds.
Foreign Financial Intermediaries specialise in foreign funds and are very important in the
integration of financial markets.
Integrated financial markets
Financial markets all over the world have witnessed growing integration within as well as
across boundaries, spurred by globalisation and advances in information technology. Central
banks in various parts of the world have made concerted efforts to develop financial markets,
especially after the experience of several financial crises in the 1990s. As may be expected,
financial markets tend to be better integrated in developed countries. At the same time,
deregulation in emerging market economies (EMEs) has led to removal of restrictions on
pricing of various financial assets, which is one of the pre-requisites for market integration.
Harmonisation of regulations in line with international best practices, by enabling
competitive pricing of products, has also strengthened the market integration process.
Capital has become more mobile across national boundaries as nations are increasingly
relying on savings of other nations to supplement their domestic savings.
Integrated financial markets assume importance because:
Page 177
• Integrated markets can transmit important price signals – necessary for an efficient
market
• Efficient and integrated financial markets constitute an important vehicle for promoting
domestic savings, investment and consequently economic growth (Mohan, 2005).
• Financial market integration fosters the necessary condition for a country’s financial
sector to emerge as an international or a regional financial centre (Reddy, 2003).
• Financial market integration, by enhancing competition and efficiency of intermediaries
in their operations and allocation of resources, contributes to financial stability (Trichet,
2005).
• Integrated markets lead to innovations and cost effective intermediation, thereby
improving access to financial services for members of the public, institutions and
companies alike (Giannetti et al., 2002).
• Integrated financial markets induce market discipline and informational efficiency.
C. INTERNATIONAL FRANCHISES AND LICENCES
A business wishing to expand might consider being a franchisee for an international company
or a Rwandan company wanting to set up in a foreign country might consider offering a
franchise to a business in that foreign country
Franchise businesses for which franchising work best have one or several of the following
characteristics]:
• A good track record of profitability
• Ease of duplication
• Detailed systems, processes and procedures
• A unique or unusual concept
• Broad geographic appeal
• Relative ease of operation
• Relatively inexpensive operation.
As practiced in retailing, franchising offers franchisees the advantage of starting up business
quickly based on a proven brand or trademark, and immediate access to the tooling and
infrastructure, as opposed to having to develop them. Also the franchisor usually provides
publicity and advertisements and can offer preferential loans to help the franchisee get
started. The agreement is usually for a defined term and penalty clauses may be added to
discourage early departure from the agreement.
An alternative is for a local business to purchase a licence to make a product associated with
an international company. For instance Guinness is brewed all over the world and Bralirwa
has a licence to brew Guinness. At the same time it also brews local beer.
The Bralirwa story is a little more complicated. Heineken owns 45% of Bralirwa and
Heineken would have brought in overseas currency when the shares were acquired. So
another way to raise foreign finance is to sell part of the business to a foreign and probably
multi-national, however the local shareholders may lose control of their business.
Page 178
D. INTERNATIONAL MONEY MARKETS
Simply a market for the lending and borrowing foreign currencies. This, for a business,
would be carried out through a financial intermediary such as Bank of Kigali or KCB.
E. INTERNATIONAL FOREIGN BONDS
Again these would probably be purchased through a bank, but a member of the Rwandan
Stock Exchange should be able to effect the transaction.
The foreign bond would effectively be a loan from a bank or financial institution in a foreign
currency. The advantage might be lower and more stable interest rates and bonds are of
normally fixed interest rate – predictability helps with budgeting and pricing.
Variable interest rates such as might be offered with an overdraft can leave a financial
controller having to estimate for a more uncertain future.
Suppose Business A knew he had to pay GBP10,000 for a foreign supply, he could borrow
GBP10,000 by means of a bond
F. INTERNATIONAL CERTIFICATES OF DEPOSIT
The opposite of a Foreign Bond is an International Certificate of Deposit.
This is really a deposit in a foreign bank in the local currency of that bank.
A Certificate of Deposit (CD) is a time deposit, a financial product commonly offered to
businesses or other clients by banks.
CDs are similar to savings accounts; they are "money in the bank".
They are different from savings accounts in that the CD has a specific, fixed term (often
monthly, three months, six months, or one to five years) and usually at a fixed interest rate. It
is intended that the CD be held until maturity, at which time the money may be withdrawn
together with the accrued interest.
Sometimes CDs may be indexed to the stock market, the bond market, or other indices.
A few general guidelines for interest rates are:
• A larger principal should receive a higher interest rate.
• A longer term will usually receive a higher interest rate, except in the case of an
inverted yield curve (i.e. preceding a forecast recession)
• Smaller institutions tend to offer higher interest rates than larger ones.
Buying and selling bonds and shares on the RSE are done through a stock broker who is
registered as a member of the RSE
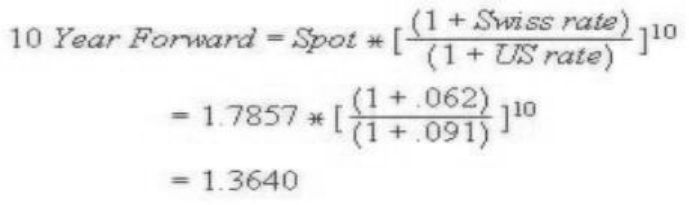
Page 179
G. MULTICURRENCY BONDS
A multi-currency is a type of bond, when interest is charged in one currency, but the payment
is made in another (based on a predetermined exchange rate, taking into account a certain
percentage of depreciation rates).
Dual currency bonds
•Traditional dual currency bonds: The traditional form for a dual currency bond specifies
that interest will be paid in the investor’s domestic currency, with the principal amount of the
bond denominated in the issuer’s domestic currency.
•Reverse dual currency bonds: A variant on the dual currency bond, the reverse dual
currency bond pays interest in the issuer’s domestic currency, while the principal amount of
the bond is denominated in the currency of the investor.
H. MULTICURRENCY COCKTAIL BONDS
Are bonds where the investor's income is a mixture of several currencies at predetermined
proportions, usually correlated with the special drawing rights (SDRs), or other international
institution/unit such as the ECU.
Example
Multicurrency Cocktail bonds Sperry Corporation issued a US$56 million dual currency bond
in February, 1985
•The interest rate, payable annually in dollars, was 6 3/4%.
•The principal was equal to 100 million Swiss francs. The final maturity was February, 1995.
•The spot exchange rate at the time was SF 1.7857 per US dollar, making SF100 million
equivalent to $56 million.
•The 10 year US dollar and Swiss franc interest rates at the time were 9.1% and 6.2 %.
Multicurrency Cocktail bonds: We need the Swiss franc/ US dollar 10-year forward
exchange rate to see what the repayment really cost Sperry. From interest rate parity, the
forward rate can be calculated as follows:
Page 180
I. FOREIGN EXCHANGE RISK – HEDGING
When companies conduct business across borders, they must deal in foreign currencies.
Companies must exchange foreign currencies for home currencies when dealing with
receivables, and vice versa for payables. This is done at the current exchange rate between
the two countries. Foreign exchange risk is the risk that the exchange rate will change
unfavourably before the currency is exchanged.
Hedging and financial markets
Hedging is defined here as risk trading carried out in financial markets. Businesses do not
want market-wide risk considerations – which they cannot control – to interfere with their
economic activities. They are, therefore, willing to trade the risks that arise from their daily
conduct of business. Whether in industrial, commercial or financial businesses, the financial
assets – loans, bonds, shares, stocks, derivatives – they trade, allow them to hedge the risks
that accumulate in their balance sheets in the course of business.
Investors’ holdings of securities – or long positions in shares, stocks, bonds or loans – expose
them to the sort of risks with which the securities are associated. Part of this risk stems from
the unique features of the security, but part is related to more common characteristics shared
across securities. Two common macroeconomic risks are those associated with the exchange
rate and the interest rate risk in a given economy.
Pooling securities together in portfolios takes advantages of the idiosyncratic nature of the
risks they bear to reduce the overall risk that investors face. For example, including the shares
of exporting companies and non-tradable services in an equity portfolio helps to reduce the
overall risk of the portfolio to a fall in external demand. From the economy’s point of view,
portfolio pooling spreads risk across investors.
Two cash markets typically help in the development of derivatives markets. The first is the
foreign exchange market.
A second market is the local currency bond market.
Hedging took a gigantic step forward with the development of derivative products in global
financial markets.
Derivatives are financial contracts that commit counterparties to exchange cash payments
related to the value of a commodity or financial asset (underlying asset) with no actual
delivery of the underlying asset (Kohn (2004)). They allow investors to deal with individual
sources of risks, or a more limited set of risks than other financial assets. There are four main
financial contracts: futures, forwards, swaps and options.
Futures are exchange-traded contracts for the sale or purchase of an asset at a future date.
They are written over a large range of underlying assets such as commodities, foreign
currency or interest rates. Forwards are also contracts that trade an underlying asset at a
future date but differ from futures in that they are traded in OTC (over the counter) markets
rather than on exchanges.
A swap is a contract in which the parties agree to a stream of payments determined with
reference to the price of an asset over time. In the case of all three contracts, payments are
netted and settled in cash.
Finally, options are contracts where one party buys/sells (for the payment of a fee) to the
counterparty the right to trade in the underlying asset.
Page 181
Foreign Exchange (FX):
Currencies are traded on international exchanges in a similar manner to stocks and shares.
The forces of supply and demand dictate the relative prices of each currency.
Exchange rates are the relative prices of different currencies.
Fixed exchange rates:
This is where a government intervenes in the international exchanges in such a way as to
keep the price of its currency stable. For example, if the price of its currency rises, it may sell
reserves of the currency.
This, effectively, increases the supply to the international markets and therefore keeps the
price down. Alternatively it may buy up currency and hold it if the price is becoming too low.
The price of the currency is usually calculated by reference to another major currency (US$),
a basket of currencies or a major commodity (usually gold).
E.g. The government of Utopia decide that they wish to maintain an exchange rate of 1
Utopian Dollar to 1 Euro. If the price of the Utopian Dollar climbs against the Euro (possibly
due to a growing demand for Utopian exports), the government will sell off some of their
reserves of Utopian dollars on the international exchanges until the rate returns to 1=1.
One of the advantages of fixing an exchange rate is that it promotes stability within the
economy. If, in the above example, Utopian Dollars rose sharply against the Euro, this would
make the cost of buying Utopian exports more expensive for Europeans. This would therefore
have an adverse effect on exports from Utopia and therefore profits and employment etc. If
the value of the Utopian dollar fell sharply, it would become very expensive for Utopians to
import supplies or goods as their dollars would be worth much less in terms of the Euro.
The problem with adopting a policy of fixing exchange rates is that if the value of the local
currency is depreciating, the government cannot keep buying it forever to keep the exchange
rate fixed. Eventually it will have to stop buying and when this happens, the value of the local
currency can depreciate rapidly. In Argentina, the government had to abandon fixing
exchange rates in December 2001. The value of the peso fell by over 70% in a few months.
The risk to importers is that big and sudden devaluation can be devastating.
(ii) Floating exchange rates:
Floating exchange rates can be either free floating or managed floating.
Under a free floating FX system, governments do not intervene in FX rates. Under a managed
floating FX system, governments will only intervene when the currency goes above or below
a certain value.
(iii) Adjustable peg system:
This is similar to the fixed rate system except that, on occasion, the government will move to
revalue/devalue the currency to what it believes is the real value of the currency (i.e. the price
that the currency would be if the exchange rates were floating).
E.g. Following a period of high inflation, the Utopian government may decide to revalue the
currency so that 1 Utopian Dollar equalled €0.80. The idea behind this method of FX system
is that currency movements take place in deliberate, once-off movements rather than
constantly moving up and down. It also keeps the FX rate in line with the real relative values
of the currencies.
Page 182
Understanding FX rates:
1. “Spot rate” and FX “spread”.
The spot rate is the current rate that a bank is offering. However, banks quote two rates – a
buy rate and a sell rate. Rates quoted by banks are always from the banks point of view.
Therefore if a bank quotes the following:
US Dollars:
We buy $0.0017
We sell $0.0015
This means that the bank will buy dollars from you and pay you Rwf1for every $0.0017 you
sell them and will sell dollars to you and charge you Rwf1for every $0.0015 you buy.
The foreign currency is effectively a product that the bank is buying and selling. Naturally, if
they want to make a profit, they will buy low and sell high. The rates banks quote (as shown
above) are not prices per se. Instead they are quantities of the product they are selling. The
price on their board will always in terms of the local currency; in Rwandan banks this will
obviously be Rwf.
The spread is the difference between the buy and sell rates and is effectively the profit the
bank makes on the transaction.
2. “Forward” rates
Companies can contract with a bank to buy or sell FX at a date in the future at an agreed
price. In this case the bank might quote as follows:
We Buy We Sell
Spot rate $0.0018 $0.0015
1 month forward rate $0.0019 $0.0016
6 month forward rate $0.0020 $0.0018
Forward rates can be quoted also be quoted at discounts and premiums to the spot rate. If
quoted at a discount, that means the forward rates are cheaper (discounted) and therefore the
number of dollars per Rwf will be higher (since they are worth less). The opposite is true for
a premium. Based on this, the above rates could be quoted as follows:
We Buy We Sell
Spot rate $0.0018 $0.0015
1 month forward rate $0.0001 $0.0001 Discount
6 month forward rate $0.0002 $0.0003 Discount
International Trade:
Companies engage in international trade through a variety of means:
1. Exporting:
Goods are shipped abroad and sold through an agent or wholesaler. This is the simplest and
most common method of carrying out international trade.
Page 183
Advantages:
• Little or no set-up costs – only the cost of shipping – therefore low risk;
• Takes advantage of the local knowledge of the agent or wholesaler;
Disadvantages:
• Import duties may be expensive;
• Transport costs may be high depending on the nature of the product;
• Customers may prefer locally produced goods.
2. Foreign Direct Investment (FDI)
This is where a company establishes a branch, manufacturing facility or other direct presence
in the foreign country.
Advantages:
•
Eliminates or reduces shipping costs and import duties;
•
Shorter lead-time in getting goods to market;
•
May be advantages to the business environment in the foreign country (fewer
regulations, lower taxes, cheaper raw materials);
•
Eliminates the commission/cut taken by an agent or wholesaler;
Disadvantages:
•
Expensive set-up costs – therefore high risk;
•
Involves book-keeping as well as dealing in foreign currencies;
•
Lack of knowledge of regulations, culture and local ethics etc. which are local to the
foreign country;
Licensing:
A licence is given to a foreign company to produce your patented/trademarked goods/services
in their country in return for an agreed royalty payment. E.g. Guinness is produced under
licence all over the world. In Rwanda the Bralirwa brew and sell Guinness.
Advantages:
•
Low set-up costs - therefore low risk;
•
Shipping costs are avoided;
•
Takes advantage of the local knowledge of the foreign company.
Disadvantages:
• The foreign company takes a high proportion of the profits;
• Quality control – If the foreign company produces sub-standard versions of the products,
the product brand names could be weakened;
• It involves handing over expertise to the foreign company.
Page 184
FX Risk:
Any company that has any dealings in a foreign currency is exposed to the risk that the
exchange rate between the foreign currency and the company’s local currency could move in
such a way as to affect adversely the company’s profitability.
E.g. A Rwandan company which imports from the USA is invoiced in US$ as per agreement
with the supplier. (Generally goods are paid for in the currency of the supplier).
The supplier issues an invoice for goods shipped totalling $100,000 and allows 30 days
credit. The spot rate on the date the invoice is received is $1=Rwf1,000. When the Rwandan
company arranges to make payment (30 days later) the spot rate has changed to $0.50 =
Rwf1,000. It now costs the company Rwf200,000,000 instead of Rwf100,000,000.
The risk of FX exposure to a company can be classified into three types:
1. Transaction exposure – As illustrated in the above example, this is the exposure resulting
from the time lag between the time the goods are ordered (at an agreed price) and the time
that the goods are paid for.
2. Translation exposure – This is the exposure that exists where a company has
assets/liabilities denominated in foreign currencies. E.g. A Rwandan company could have
taken out a loan in the USA to fund a marketing campaign. The liability (in Francs) could
increase or decrease over time simply as a result of FX movements. This obviously affects
the value of the company.
3. Economic exposure – This is the exposure of future cash flows to movements in FX rates.
E.g. A Rwandan company exports coffee to the USA. If the value of the Franc moves up
against the US Dollar, it will be more expensive for Americans to import coffee. Therefore
the expected future sales and profits of the company will decline and, in turn, the value of the
company will decline.
Methods of minimising FX risk:
Forward Exchange Contract
A forward contract is where a company agrees to buy or sell a given amount of foreign
currency at an agreed rate at an agreed date in the future. This is a very common method of
managing FX risk.
Advantages:
•
By estimating its FX requirements for a given period, a company can completely cover
itself against any FX rate movements for that period;
•
The company can budget in advance without fear of the budget becoming inaccurate due
to FX movements;
Page 185
Disadvantages:
•
The contract is legally binding and must be carried out – even if the FX rates turn out to
be more favourable than the rate contracted for or if the company incorrectly estimates
its foreign currency requirements;
•
Banks usually charge a premium on what they expect the rate to be at the date in the
future (E.g. Assume an economic environment where FX rates rarely move and that
Rwf1,000=$1. The bank may expect the same rate to rule in 3 months’ time but may
contract with a company to sell it dollars at the rate of Rwf1,100=$1 in 3 months). The
spot rate may turn out to be more or less favourable than the forward contract rate at the
date of maturity. Companies know this but still tend to enter into FX forward contracts.
The reason is that by entering into FX forward contracts, the companies know what rate
they can get in the future.
This eliminates risk. If a company with foreign currency exposure does not hedge against the
risk of FX rate movements, capital markets will perceive the company as having a higher risk
profile than might otherwise be the case and the company’s cost of capital will increase.
Special types of forward contracts called “Option dated forward contracts” are available.
These are similar to forward contracts except that the contracts can be completed at any point
during a range of dates. However, they are still legally binding and must be completed at
some point during the agreed range.
If it happens that a company cannot complete a contract, the following options are available:
(i) Close out the contract:
Assume a company has contracted with a US supplier to buy a shipment of chairs for
$100,000 at the end of 2011. In order to protect itself against currency fluctuations, at the end
of 2010 it contracts with the bank to buy $100,000 for Rwf66,000,000. If the contract falls
through for any reason (US supplier goes bankrupt), the company has the option simply to
buy the $100,000 from the bank as contracted for and sell it back to the bank at the same rate.
However, depending on what the spot rate is at the end of 2010, the company could make a
profit or loss on the transaction.
(ii) Extend the contract:
Take the example given above except that, instead of going bankrupt, the US supplier cannot
supply the chairs until 3 months later than expected for some reason. The company can
extend the contract for three months. The drawback with this method is that the bank will
charge a premium on the original price.
Foreign Currency Option
This is similar to a forward contract except that the holder has the option either to exercise
the option to buy/sell the foreign currency or allow it to lapse.
Example
In January 2011 a company buys a FX option to purchase $100,000 on 30 June 2011 for
Rwf100,000,000. On 30/6/11 the spot rate turns out to be $1=RWF500. By simply allowing
the option to lapse, the company can buy the $100,000 for Rwf50,000,000. If the company
had purchased a forward contract, it would have been obliged to pay Rwf100,000,000.
Page 186
A FX option can either be “European” – the option can only be exercised on a given date or
“American” – the option can be exercised at any point during a range of dates.
A “Put” option is the option to sell currency;
A “Call” option is the option to buy currency.
The FX option has the obvious advantage over a forward contract of not having to be
exercised. The disadvantage is that a premium is charged on options. The premium is usually
a fixed percentage of the amount of currency to be bought/sold.
Money Market Cover
If a company is contracted to purchase from, say, the USA for a fixed price in Dollars at
some date in the future, it is exposed to a potential loss if the Dollar appreciates against the
Rwf in the intervening period. Therefore, to balance out this risk, a company can borrow
money in Rwf and use it to purchase dollars. If the dollar appreciates the gain will cancel out
the loss due to the higher costs of paying the US company.
Example
A company is contracted to purchase a shipment of chairs from a US supplier at the end of
June 2012 for $100,000. The spot rate is currently Rwf1,000=$1. To cover against
fluctuations, the company immediately borrows Rwf100,000,000 and buys $100,000. At
31/6/12, the spot rate turns out to be Rwf1,000=$0.50. The company can now use the
$100,000 to pay the US. The cost of buying the chairs is therefore Rwf100,000,000. If the
company had done nothing and simply waited until 31/6/12, it would have cost
Rwf200,000,000 to buy the $100,000 necessary to pay the US company.
The borrowing of Rwf100,000,000 will attract interest. However, the $100,000 can be
invested and the return on investment will help offset the interest on the loan.
Example
A company is contracted to sell a shipment of chairs to the USA for $100,000 at the end of
2011. The spot rate is currently Rwf1,000=$1. The company borrows $100,000 and buys
Rwf100,000,000. The spot rate at 31/12/2011 turns out to be Rwf1,000=$1.50. When the
company receives the payment of $100,000 from the US customer, it uses this to repay the
loan of $100,000. It then keeps the Rwf100,000,000 for itself. If the company had done
nothing and waited until 31/12/11, the receipt from the US customer of $100,000 would have
been converted at the spot rate and the company would only have received Rwf66,666,667
instead of Rwf100,000,000.
Advantages:
•
Completely shelters the company against currency fluctuations;
•
Easy to arrange, low transaction fees;
Disadvantages:
•
The interest on the loan may not be completely matched by the return on the investment;
Page 187
Foreign Currency Invoicing
Another method that a company can use to hedge against FX fluctuations is to arrange for its
customers to pay in its domestic currency and its suppliers to invoice it in its domestic
currency.
Example
A company has contracted to purchase a shipment of chairs from the USA for $100,000. The
current FX rate isRwf1,000=$1. The company is worried about fluctuations in the FX rate
and changes the terms with the US supplier so that it will be invoiced Rwf100,000,000
(instead of $100,000) for the chairs. The US company is now exposed to FX rate fluctuations
instead of the Rwandan company.
Note that the norm in business is for goods to be paid for in the currency of the supplier.
Advantages:
•
Cheap to arrange – no transactions fees as no banks or other 3rd parties are involved;
•
Completely shelters a company against FX rate fluctuations.
Disadvantages:
• May be difficult to convince the foreign supplier/customer to invoice/pay in your
domestic currency (relative bargaining power of the companies will usually decide this
issue);
• This will not usually work if FX rates change substantially or for a long period as the
price in domestic currency will be forced to change.
Netting
If a Rwandan company buys and sells in US$ then the effects on the profitability of the
company are offset in terms of both increased/decreased costs and increased/decreased
revenues.
Example
A Rwandan company has annual sales to the USA of $100,000 and sales to Europe of
€50,000. It buys stock from the USA which is used for sales in both USA and Europe and its
costs for the year are $100,000 (for stock) and Rwf20,000,000 (for overheads). At the
beginning of the year, the FX rate is Rwf1,000=$1. Therefore the company budgets for a
profit for the year of Rwf30,000,000. Unexpectedly, the FX rate immediately moves to
Rwf1,000=$2. The Euro rate stays unchanged.
The sales to the USA now transpire to be worth only Rwf50,000,000 ($100,000 =
Rwf50,000,000). Similarly, the costs of buying the stock are also Rwf50,000,000.
The company’s profits are therefore as follows:
Revenues:
USA Rwf50,000,000
Europe Rwf50,000,000
-------------------
Rwf100,000,000
Costs:
Stock Rwf50,000,000
Overheads Rwf20,000,000
------------------
(Rwf70,000,000)
---------------------

Page 188
Profits Rwf30,000,000
The movement in the FX rate therefore has had no effect whatsoever on the profits of the
company.
Advantages:
•
Cheap to arrange – no banks or 3rd parties involved;
Disadvantages:
•
Rarely possible in practice exactly to match foreign currency inflows and outflows (any
mismatch should be hedged using some other means such as a forward contract);
Matching
This method involves trying to ensure that the value of a company’s foreign currency assets
and liabilities are matched. E.g. If a company was investing in property in the UK, it may
choose to borrow the funds in Sterling. If the Rwf value of the property was to rise/fall as a
result of a move in FX rates, the Rwf value of the loan would rise/fall by an equivalent
amount.
Leading and Lagging
Under this method a company tries to predict movements in the FX rates and time its cash
inflows and outflows accordingly.
Lead Payment:
If a Rwandan company expects, say, dollars to strengthen against the Franc over the coming
month, it may decide to pay its US supplier immediately before dollars get too expensive.
This may be done even if payment isn’t due until the end of the month.
Lagged Payment:
A lagged payment is made where a company is expecting the foreign currency to weaken
against the domestic currency. Therefore by waiting a while before making payment, the
company can buy the required amount of foreign currency cheaper.
The above technique is usually only used in relation to payments. It is not usually possible to
time receipts.
Advantages:
•
Cheap method of hedging – banks and other 3rd parties not involved;
•
Enables a company to profit from FX movements;
Disadvantages:
•
Can be a risky business trying to predict FX movements;
•
Can result in dis-satisfied suppliers;
•
Limited in terms of timeframe – a company can only alter the timing of its payments by
a few weeks, any more than that could result in being sued by a supplier.
• Market integration promotes the adoption of modern technology and payment systems
and vice versa.
Page 189
J. INTERNATIONAL PROJECT FINANCE
Project finance is finance for a particular project, such as a mine, railway, pipeline, power
station, hospital or prison, which is repaid from the cash-flow of that project.
Project financing techniques have been used on many high-profile corporate projects,
including Euro Disneyland. Increasingly, project financing is evolving as the preferred
alternative to conventional methods of financing infrastructure and other large-scale projects
internationally.
Project Financing includes understanding:-
• The basis for project financing
• How to prepare the financial plan
• Assess the Risks
• Design the financing mix
• Raise the funds
Project finance is different from traditional forms of finance because the financier principally
looks to the assets and revenue of the project in order to secure and service the loan. A most
important point to remember in project financing is the identification, analysis, allocation and
management of every risk associated with the project. Financiers and their advisers will go to
substantial measures to ensure that the risks associated with the project are reduced or
eliminated as far as possible.
The cost of project finance is generally higher and it is more time consuming for such finance
to be provided.
Possible risks associated with project finance would include:-
• Project not being finished on time, on budget, or at all
• Project not functioning at its full capacity
• Project failing to generate sufficient revenue to service the debt
• Project hastily comes to an end
Each project gives rise to its own unique risks and hence poses its own unique challenges,
therefore in every case all parties and those advising them need to act creatively to meet those
challenges and to effectively and efficiently minimise the risks embodied in the project in
order to ensure that the project financing will be a success.

Page 190
BLANK

Page 191
Study Unit 23
Sundry Definitions
Contents
A. Introduction
B. Sundry Definitions
Page 192
A. INTRODUCTION
You may be expected to write briefly on a number of topics, as part of one of the questions.
This is an opportunity to gain some very valuable marks for a small amount of effort. There
is a limited range of areas that can be examined and certain topics may repeat over a number
of examination sessions.
You do not need to write a thesis on the subject but a couple of well chosen sentences (as
below in Section B) will suffice. Where appropriate a numerical example will help you to get
your message across and put some order on your solution.
This section can also assist you in your revision, immediately prior to the exam.
B. SUNDRY DEFINITIONS
Adjusted Present Value
Adjusted Present Value (APV) represents an alternative approach to WACC in terms of
valuing a business and its operations. All DCF calculations involve discounting forecast
future cash flows to a present value equivalent at a discount rate which reflects accurately the
particular risk of the business. The approach taken under APV is to separate operational and
financial effects, and to discount the former at some base-line cost of capital in order to arrive
at a basic calculation of present value. As a separate and subsequent step, the cash flow
consequences of alternative project financing options are discounted and added to the base-
line present value. In effect the introduction of the term "adjusted" in APV reflects a concern
to evaluate separately, the side effects of project financing. The attempt to identify and trace
the consequence of each side effect involves the APV analyst in a series of separate DCF
calculations. This added computational burden might help to explain some earlier reluctance
to use APV, although the widespread use of sophisticated spreadsheets in recent years tends
to diminish the significance of this argument.
Altman’s Z-Scores
Professor I Altman researched 66 companies that experienced corporate failure to determine
whether or not their ultimate failure could have been predicted? His summarised findings are
known as Altman’s Z-Score Model. This model suggests that if five key financial ratios are
calculated and weighted, and, if the result lies outside stated parameters, then the business
faces a heightened risk of future corporate failure. The model is used by investors and
analysts to inform them of the financial risk associated with potential investments because of
its usefulness in predicting corporate failure.
Beta as a Measure of Market Risk
One of the fundamental principles of financial theory is that individual shares (or more
generally individual securities) will relate to the average market risk in a fairly consistent
manner. Empirical statistical research of a shares actual performance (in terms of its returns
and the variation in such returns) will indicate whether it is more prone to variation than the
market as a whole- i.e. either more or less risky than the market. The risk of a particular
share relative to the market as a whole is measured by that share’s unique "beta" value. The
beta value reflects differences in systematic risk characteristics and is most frequently used in
CAPM calculations. The beta value for the market as a whole is usually set at 1.0, and so any

Page 193
share with a Beta greater than 1.0 is considered to a relatively riskier investment than a
portfolio of shares representative of the market as a whole.
Call Option
A call option gives its owner the right to buy a financial instrument at a specified price -
sometimes referred to as the striked price. Where the call option can only be exercised on a
given date in the future, it is known as a European call option. Where the option can be
exercised on any day up to and including a defined future date, it is known as an American
call option. Where the exercise price of a call option is below the current market price of the
financial instrument in question, the option is said to be "in the money". Conversely where
the exercise price of the option is above the current market price of the financial instrument in
question, it is said to be "out of-the money".
Options are a secondary market activity affecting only the two parties involved - there are no
consequences for the company which originally issued the financial instrument. The party
which issues the call option is known as the "writer" of the call.
Capital Asset Pricing Model
The CAPM is a model which sets out in mathematical form the relationship between the
return on any individual security, the risk free rate of return, and the return on the market
portfolio. It may be summarised as follows:
Rp = Rf + β ( Rm - Rf)
β in the equation above (the ‘Beta’ factor) is a variable which attempts to capture the
Systematic Risk associated with the business activity of a company. The model is significant
in that it is premised on the view that the return on any given security is associated with the
non-diversifiable (systematic) risk associated with the security.
Centralised Treasury Management
Companies of significant size are often diverse in terms of trading activities and/or
geographic spread. Many such companies choose to centralise their treasury function. This
involves expert staff conducting the treasury management function for all parts of the
business, however diverse. This decision will be reached for a combination of the following
reasons:
• Ability to afford specialist staff
• Increased purchasing power given the increased value of borrowings/investments
• Foreign currency set-off potential
• Better control over activities
• Improved risk monitoring
• Improved tax planning
Convertible Loan Stock
Convertible loan stock is a debt instrument issued by firms which offers the holder the right
to have the debt redeemed in the usual way at the redemption date. Alternatively, the holder
of the loan stock may exercise a right to convert the debt into equity at some pre-determined
conversion rate. The buyer of convertible loan stock usually accepts a slightly lower rate of

Page 194
interest on the instrument as part of the price to be paid for holding what amounts to a bet on
the future movement of the share price - the holder of loan stock in effect enjoys an option on
the firm’s equity. This lower rate of interest makes loan stock attractive to the issuer, as does
the fact that conversion into equity represents an in-built form of liquidation of the instrument
and removes the necessity to raise further debt in order to redeem the initial loan stock.
Corporate Raider
Corporate raider is a title given to organisations/individuals who target companies to acquire,
and, if successful, will in the post acquisition period carve the business into its component
parts with a view to selling/strip the individual parts at a profit. Ultimately, the corporate
raider may retain ownership of a small element (if any) of the acquired enterprise.
Corporate raiders are also known as ‘asset strippers.’ Example of such a business would be
Hanson Industries Plc, quoted in the U.K.
Deep Discount Bonds
A Deep Discount Bond is a bond which is usually issued at a price considerably lower than
its par value. The investor in these bonds is, therefore given the opportunity to buy a bond at
a very cheap price. Typically, the trade-off for this benefit is that the bond will carry a lower
coupon rate of interest than other comparable debt instruments. The investor, therefore is
essentially attracted by a potential capital gain, while the issuer of the loan stock will be
attracted by the relatively lower service costs of the loan stock. This latter feature can be
particularly attractive to companies which wish to raise capital for a new business venture
and where the future cash flows may be uncertain in the early years of the project, thereby
putting a strain on servicing a higher cost loan stock.
Dividend Policy – Considerations In Determining
It should always be remembered that ordinary shareholders are not prima facie entitled to
receive an annual dividend. The decision whether or not to declare a dividend and if
declared, the extent of same, rests with the Board of Directors. Each year the Board will
consider the dividend decision. The key considerations when making this decision will
include:
• Profitability – what are the profits for the period for which the dividend is to be
decided?
• Legality – in short, only realised gains can be distributed
• Cash Flow – has the company the cash reserves from which to pay dividends?
• Taxation – is it more tax efficient for equity shareholders to receive dividends or
capital growth, or the optimum mix thereof?
• Signalling Effect – what will the declaration of any size dividend (including a nil
declaration) signal to the investment community?
• Expectations – what are shareholders expecting as a dividend and how any change
therefrom will impact on their investment behaviour?
• Residual Theory – can the company use profits to invest in projects which will
increase the capital value of shares by more than the dividend that could be paid?
Page 195
Dividend Yield as a Method of Company Valuation
The dividend yield is the ratio of the most recent dividend to the market price of the security
under review. In this sense the dividend yield is a measure of the "rate of return" on equity
capital which might serve as a comparable ratio to the percentage yield on loan stock.
However, as dividends are paid net, it is usually necessary to calculate the grossed up
equivalent of the dividend and use this figure in working out the dividend yield. Such an
approach allows yields on equity to be compared more directly to yields on interest bearing
loan stock. By convention, a normal yield gap implies that the return on equity should be
higher than that on debt. Nevertheless it can occasionally be observed that the dividend yield
can be less than yields on debt. In the long run, however, it is true to say that investors expect
their return on equity, in terms of dividend yield and capital gains, to exceed the yield debt.
Due Diligence
This is the process which should confirm the reliability of the information which has been
provided and has been used in making an investment decision. Changes in these primary
assumptions may have a significant impact on the price to be paid and possibly even raise
questions on the wisdom of proceeding with the transaction. This is a very useful process
and at minimum will provide additional information on the potential target.
Efficient Market Hypothesis
The efficiency of a stock market means the ability of the market to price shares quickly and
fairly to reflect all the available public information in respect of each share.
The Efficient Market Hypothesis proposes that a particular stock market is an efficient stock
market. This is because of the role that well informed institutional investors and their market
analysts’ play. Thus, the possibility of a “speculative bubble” is minimised.
How efficient the market is at responding to such information is considered to vary between:
• Strong form efficiency
• Semi-strong form efficiency
• Weak form efficiency
There has been much research carried out on the topic of measuring market efficiency, with
varying and sometimes contradictory findings.
Factoring of Debtors
The factoring of debtors is a financial service usually provided by a specialist agency, such as
a department within a bank. Typically, it involves the administration of a client companies
debtors, the collection of its debts, the elimination or at least tighter control of bad debts, and
the advancement of certain sums of cash on the basis of invoices issued to date. The
provision of factoring services therefore represents - on the part of the Factor - the ability to
develop specialist expertise, operating economies of scale, and an access to a level of
liquidity which is only likely to be available to a major financial institution such as a bank.
Factoring services are not however simply a means of resolving the problems of financially
distressed or illiquid companies, but rather are only likely to be available to reputable
companies with an established trading record. Most banks will be reluctant to take on the

Page 196
administration of a particularly troublesome debtors ledger containing many unknown client
firms.
Flotation Costs
Flotation costs arise in the context where a company is offering its securities - either debt or
equity - for sale in the capital market. These costs can be significant and in most cases the
amount of funds the firm receives is less than the aggregate value suggested by the price at
which the issue in question has been sold. Typically flotation costs can involve all or any of
the following items - underwriting expenses, audit and legal fees, fees to corporate bankers or
their financial advisors, stamp duties, public relations fees, costs of printing, advertising and
circulating the offer for sale, and stock market fees. Although these costs can be significant,
most firms tend to take the prudent view that they cannot afford to avoid them entirely. This
is particularly so in relation to underwriting costs and the fees associated with professional
advice on the issue price for the particular security in question. This latter aspect is especially
important as failure to strike the correct issue price could undermine the success of the entire
issue
Foreign Exchange Exposure
Foreign exchange exposure arises from exchange rate functions. Transaction exposure arises
where an exporter or importer is vulnerable to adverse movements in foreign exchange rates
when there is a period of credit involved (as there almost always is). For example if an
exporter sells goods to the USA for US$57,600 when the exchange rate is US $1.6 to RWF1,
he would expect to earn RWF36,000 from the sale.
However if the customer is allowed credit of three months and the exchange rate alters to US
$1.8 to RWF1 in this time, the eventual income would be only RWF32,000, which is
RWF4,000 less than expected.
Forward Exchange Rate
The risk inherent in foreign exchange dealings can be overcome by entering a forward
exchange contract which involves an importer/exporter in buying or selling a specified
amount of foreign currency, at some specified date in the future, and at an agreed and fixed
rate of exchange to be determined when the contract is established. Under these
arrangements therefore, the importer/exporter can lock in to a certain financial outcome and
does not have to live with the uncertainty of not knowing what spot rate may prevail on the
date of the anticipated transaction, thereby remaining unsure of the financial consequence of
the transaction itself. The Forward Exchange Rate is derived by adjusting the spot rate (ie the
rate prevailing on the day when the contract is made) by the interest rate differential which
exists between the two currencies. It always remains possible however that an
importer/exporter who enters into a Forward Rate agreement, may discover that s/he would
have been better off to have completed the transaction at the eventual spot rate on the date set
for final payment.
Forward Exchange Contracts
These are contracts entered into with a financial institution to reduce the risk associated with
foreign currency transactions. An organisation can guarantee the domestic currency value of
a future foreign currency receipt or payment. The rate agreed is essentially the spot rate as
Page 197
adjusted by a premium or discount to allow for the differential in the interest rates between
the economies of the two relevant currencies.
Interest Rate Options
Organisations with debt commitments will have to pay interest thereon. They may have
negotiated a fixed or variable rate of interest. However, such an organisation may wish to
purchase an option to vary the basis of their interest rate exposure at/by a future date. This is
known as an interest rate option.
An example would be in times of falling interest rates, an organisation presently paying
interest at a fixed rate may wish to exercise the interest rate option in order to pay interest at
the lowering variable rate
Interest Rate Parity Theorem
The Interest Rate Parity Theorem essentially says that differences in forward and spot rates of
exchange are caused by differences in interest rates in the economies in question. This may
be summarised as follows:
(1+r$) / (1+rRWF) = (For rate $ to RWF) / (Spot rate $ to RWF)
Under the terms of this relationship therefore, only a divergence between interest rates in the
$ and RWF economies will cause a difference to occur between the forward and spot rates.
Specifically, if interest rates are higher in the domestic country than in the foreign country,
then the foreign country’s currency will sell at a premium in the forward market. If on the
other hand, interest rates are lower in the domestic country, then the foreign currency will sell
at a discount in the forward market.
Interest Rate Swap
An interest rate swap arises where two parties (usually two firms) agree to exchange interest
repayment commitments on existing loans. This would often involve a situation where one
company with fixed rate interest commitments might wish to change to floating rate interest
commitments, and it would therefore seek out a counter-party with the correct fit. Swaps are
usually arranged by banks on behalf of client companies. Despite the fact that a Swap might
e arranged, both parties retain legal responsibility for the cost of servicing the original loans
taken out.
Internal Rate of Return
The internal rate of return is the discount rate that equates the present value of cash inflows
with the present value of cash outflows (often the initial investment associated with the
project ). In other words, it is the discount rate that yields an NPV of zero for the project. For
the investor, the IRR of a project represents a form of cut off rate for project financing. If the
investor concerned can manage to raise funds at a rate lower than the IRR, the NPV of the
project will be positive and the investor would proceed with the proposed investment. If on
the other hand the cost of funds was greater than the IRR then the investor would recognise
that the return on the investment would not be sufficient even to remunerate the capita,
committed, much less create additional wealth by way of a positive NPV outcome.

Page 198
Management Buyouts (MBOs)
When an organisation decides to divest itself of part of its business for whatever reason (cash
absorber, lack of strategic fit etc.) it may receive offers from many parties. Occasionally, the
management of the part of the business being sold may decide to mount a bid for the
purchase. This is known as a management buyout. Research has shown than MBOs tend to
be more successful than 3rd party acquisitions. This is for many reasons including,
knowledge of the industry and the specific business being bought as well as increased levels
of motivation to make the business a success.
Often with MBOs the most difficult challenge is to raise sufficient finance.
Money Markets and Capital Markets
The capital market is the market where various long term financial instruments (ordinary
shares, bonds etc.) are initially raised and subsequently traded. It is the market where
business seeks long term financial capital which will support the company and its ongoing
operations. The capital market also represents a structured interface between those with
surplus funds who are seeking out remunerative opportunities (investors), and those agents
with a capital deficit who need to raise additional finance (borrowers). By contrast, the
money market is essentially a market for short term investments only. The money market
does not necessarily need a physical location in which to operate, and is better understood as
a loose network of traders and financial institutions engaged in an ongoing process of
electronic trading. Typically the instruments traded mature in a matter of days or months, and
usually involve investors with short term surplus cash or those interested in tactical or
speculative trading. The instruments traded do not form part of the fundamental financial
structure of a business. Typical instruments traded on the money market are, short dated
government stock, certificates of deposit, repurchase agreements, and commercial paper.
Operating Gearing
Operating gearing describes the relationship between the fixed and variable costs of
production. Operating gearing can be measured either as the percentage change in earnings
before interest and tax for a percentage change in sales, or as the ratio of fixed to variable
costs. Companies whose costs are mostly fixed are said to have high operating gearing.
These companies are highly vulnerable to the need to generate consistently high revenue
earnings in order to cover the high fixed costs. High operating gearing therefore is perceived
to increase business risk, and empirical tests have tended to support the view that such
companies should have relatively higher betas. In terms of an influence on a companies beta,
the analogy between financial and operating gearing is quite strong.
Operating Lease
An operating lease is distinguished from a finance lease in that the lease period is usually less
than the useful life of the asset. The lessor therefore relies upon either subsequent leasing or
the eventual sale of the asset to cover the initial outlay involved in acquiring the asset. Under
an operating lease, the lessor is usually responsible for repairs and maintenance, and therefore
retains the risks and rewards of ownership of the asset. In effect then, an operating lease
involves the short term rental of an asset
Page 199
Overtrading
The term "overtrading" refers to a situation where a company is unable to finance the level of
operations which it has achieved. Usually this can arise where a company is under-
capitalised at the outset, or where providers of long-term capital remain unwilling to inject
further funds as the business grows and expands in volume terms. In such cases, the
continued growth of the business will put increasing strains upon working capital, as the
company realises it has little option but to have further recourse to short term borrowing and
securing finance through the non payment of creditors. Very often, overtrading occurs where
a company significantly expands its sales (and accordingly its volume of operations) through
the introduction of generous credit terms without enjoying any corresponding credit
concessions from its creditors. Such an arrangement will inevitably place a strain on the
company's liquidity which is only likely to be finally resolved through some form of financial
restructuring involving access to long term capital.
Portfolio Theory
A portfolio is the collection of different investments that make up an investor’s total holding.
A portfolio might be the investment in stocks and shares of an investor or the investments in
capital projects of a company. Portfolio theory is concerned with establishing guidelines for
building up a portfolio of stocks and shares, or a portfolio of projects. The same theory
applies to both stick market investors and to companies with capital projects to invest in.
There are five major factors to be considered when an investor chooses investments, no
matter whether the investor is an institutional investor, a company making an investment or a
private individual investor:
• Security. Investments should at least maintain their capital value.
• Liquidity. Where the investments are made with short-term funds, they should be
convertible back into cash at short notice.
• Return. The funds are invested to make money. The highest return compatible with
safety should be sought.
• Spreading Risks. The investor who puts all his funds into one type of security risks
everything on the fortunes of that security. If it performs badly his entire investment
will make a loss.
• Growth Prospects. The most profitable investments are likely to be businesses with
good growth prospects.
Price Earnings Multiple
This is a way of determining the worth of a share/a business. It is normally used in the
context of an acquisition whereby the target company is valued at a multiple of its profit
before tax. It is a widely recognised indicator of value by the investment community. The
multiple which will be used in each case is normally industry dependent. For example an IT
based industry may have a different P/E multiple than the retail industry, given the
differences in the two industries such as; risk profile, life cycle stage etc. In practice, the
final agreed multiple paid would be influenced greatly by the negotiation skills of both
parties. It should be noted that using the P/E multiple is not the only way in which
shares/business can be valued. Other methods include asset-based valuations.

Page 200
Public/Private Funding Partnerships
This is a new and increasingly popular method of funding public capital projects e.g. schools,
infrastructure projects etc. In essence, the capital cost of the project is borne by the private
enterprise and the public body will pay for the use of the facility over an extended contractual
period. At the end of the period the facility will revert to public ownership. The attraction to
the private enterprise is the security, and hopefully, the guaranteed financial return of
contracting with government departments. Examples of public/private partnerships include
the much delayed and much publicised new Cork School of Music.
Reverse Yield Gap
A Yield Gap refers to a position whereby it is normally expected that the yield on equities
will be greater than that available on debt. This is so because equity is considered to be more
risky than debt, and so in order to compensate shareholders for accepting this extra risk, a
higher level of reward must be offered. In some rare instances though, it can emerge to be
the case that the yield on debt is actually greater than the yields on equity - this position is
referred to as a reverse yield gap. However such a situation should emerge as a temporary
phenomenon only. If the yield position did not correct itself (i.e. showing a higher return on
equities once again),then the entire investment market for equities would eventually collapse.
It is likely that such a build up of sentiment against equities would serve as the very stimulus
necessary to depress share prices and so bring dividend yields into a more normal position.
Scrip Dividends
Scrip dividends are shares given to shareholders instead of - or in addition to - cash. Firms
may elect to pay a scrip dividend in circumstances where competing pressures on cash
reserves might render it unattractive to make a more conventional cash payment - this could
be the case where the firm is experiencing liquidity difficulties or where surplus cash may be
target on a potential capital investment. In such circumstances a firm may pay a scrip
dividend in order to be seen to be remunerating shareholders investment in the firm without
placing an unwelcome strain on current cash resources.
Semi-strong form Efficiency in Capital Markets
Semi-strong form efficiency is one of three categories described in that aspect of capital
market theory concerned with the efficiency with which the market processes relevant
information. This is a significant question as it allows analysts to arrive at a view as to how
well informed a particular capital market is. In this context, the phrase ‘well informed’ can be
taken to mean that actors on the market have access to all pertinent information, and that they
enjoy the capacity to understand and interpret that information with a view to basing
subsequent trade decisions on that insight. Semi-strong efficiency refers to a context where
investors are in possession of all historical information pertaining to a particular financial
instrument, as well as all published information relating to the instrument. This is considered
to be the circumstance which best describes most capital markets. To make any stronger
claims would move the investor into a position of privileged or insider information, which
would in turn move the market towards strong form efficiency.
Page 201
Strong Form Efficiency
Strong form efficiency refers to a position in the capital markets where the market is
considered to be so efficient at filtering relevant information, whether of a public or private
nature, that the prices of all financial securities traded on that market are thought to embody
all such information. In this sense then, and under conditions of strong form efficiency,
"insider trading" could not conceivably happen, since no sooner would an individual have
identified a reason to adopt a particular trading position, than market prices would have
immediately adjusted to reflect this rationale, and any envisaged gains from trade in such
securities would thereby be dissipated.
Systematic Risk
Systematic risk refers to the inherent risk of a particular investment which cannot be
diversified away. This systematic risk simply reflects the fact that some business activities
are naturally more risky than others and any investor wishing to invest in the financial
securities of such a business, must accept the associated level of risk which cannot be
detached from the business. Normally, investors will expect to earn a higher reward for
taking this additional level of risk. This need to earn a higher reward is captured by the beta
term of the capital asset pricing model which serves to quantify the amount of risk premium
to be associated with the particular financial security.
Traditional View of Gearing and the WACC
The traditional view of the relationship between gearing and the weighted average cost of
capital is that the two variables are directly correlated. Graphically this relationship is shown
as a “U” shaped curve, suggesting that as the level gearing rises from an initial level of zero
indebtedness, the WACC initially falls, bottoms out to a minimum position, and then begins
to rise again as the level of gearing rises with more and more debt being added to the capital
mix. The simple reason for this characterisation of events was that because the return on debt
was necessarily lower than the return on equity (because of the different risk profiles), then
introducing debt into the capital mix must inevitably lead to a fall in the overall cost of
capital. This view, of course, presupposes that that at low levels of gearing, equity holders
would not be alarmed by the initial introduction of debt and that accordingly their expected
rate of return would not change. However at high levels of gearing, the equity holders begin
to perceive a significantly changed risk environment and they therefore seek compensation by
way of higher returns. This then leads to a subsequent rise in the WACC.
The particular significance of the traditional view was that because it suggested that the
WACC could possess minimum point (i.e. a gearing level where the WACC was at its
lowest), then this in turn implied that the value of the firm would alter in line with changes in
gearing and that management could, by virtue of some creative financial engineering,
manipulate the value of the firm.
Value Gap
A Value Gap refers to a situation where the publicly quoted price for a company’s ordinary
share differs from the value which might be attributed to that share based upon one of the
conventional share valuation models (e.g. fundamental share valuation of price = d/r, P/E
basis , or free cash flows). Value gaps can arise in cases where a particular economic
significance might be attached to information about the business and its operations (e.g
investment in brands, new technologies, know how etc), but where capital markets are
Page 202
sufficiently information inefficient to allow the significance remain concealed. In such cases
investors on the capital market remain unaware of the underlying economic potential of a
particular company and so its share price might remain unduly low. Value gaps can also arise
in circumstances of poor "corporate parenting" where a business may simply be badly
managed thereby allowing a potential predator to believe that the company, under new and
improved management could be made to perform more profitably. In these circumstances the
predator could be motivated to make a take-over offer for the company in question at a price
in excess of the share’s publicly quoted market price. This would be done in the belief that
such a Value Gap will be more than adequately redeemed by way of an improved operating
performance.
Venture Capital
A Venture Capitalist, as the name suggests is an organisation which provides finance for new
and developing businesses. Venture Capitalists typically take the form of a department of an
established financial services organisation or as private asset management experts e.g.
Hibernia Capital Partners.
Venture Capitalists carefully vet proposals put to them by businesses that require funding.
Only those businesses that are operationally and technologically feasible, have market appeal
and are financially viable are likely to be backed by the Venture Capitalist.
Once backing is agreed the Venture Capitalist will fund an agreed percentage of the venture.
This funding typically will be a mixture of equity and debt. Venture Capitalists will require
board representation in order to help protect their interest by having influence (voting rights)
over policy and strategic decision-making. Venture Capitalists do not expect to retain
interests in businesses they back for the long term. A typical “get-out” to liquidate their
investment would be in the form of “going public”.
A classic example of a successful Venture Capital backing would be Cisco Systems, a
Californian based internet infrastructure provider, the most successful global company in its
field.
Page 203
Present Value Table
Present value of 1 i.e. (1 + r)-n
Where r = discount rate
n = number of periods until payment
Discount rates (r)
Periods
(n)
1%
2%
3%
4%
5%
6%
7%
8%
9%
10%
1
0·990
0·980
0·971
0·962
0·952
0·943
0·935
0·926
0·917
0·909
1
2
0·980
0·961
0·943
0·925
0·907
0·890
0·873
0·857
0·842
0·826
2
3
0·971
0·942
0·915
0·889
0·864
0·840
0·816
0·794
0·772
0·751
3
4
0·961
0·924
0·888
0·855
0·823
0·792
0·763
0·735
0·708
0·683
4
5
0·951
0·906
0·863
0·822
0·784
0·747
0·713
0·681
0·650
0·621
5
6
0·942
0·888
0·837
0·790
0·746
0·705
0·666
0·630
0·596
0·564
6
7
0·933
0·871
0·813
0·760
0·711
0·665
0·623
0·583
0·547
0·513
7
8
0·923
0·853
0·789
0·731
0·677
0·627
0·582
0·540
0·502
0·467
8
9
0·914
0·837
0·766
0·703
0·645
0·592
0·544
0·500
0·460
0·424
9
10
0·905
0·820
0·744
0·676
0·614
0·558
0·508
0·463
0·422
0·386
10
11
0·896
0·804
0·722
0·650
0·585
0·527
0·475
0·429
0·388
0·350
11
12
0·887
0·788
0·701
0·625
0·557
0·497
0·444
0·397
0·356
0·319
12
13
0·879
0·773
0·681
0·601
0·530
0·469
0·415
0·368
0·326
0·290
13
14
0·870
0·758
0·661
0·577
0·505
0·442
0·388
0·340
0·299
0·263
14
15
0·861
0·743
0·642
0·555
0·481
0·417
0·362
0·315
0·275
0·239
15
(n)
11%
12%
13%
14%
15%
16%
17%
18%
19%
20%
1
0·901
0·893
0·885
0·877
0·870
0·862
0·855
0·847
0·840
0·833
1
2
0·812
0·797
0·783
0·769
0·756
0·743
0·731
0·718
0·706
0·694
2
3
0·731
0·712
0·693
0·675
0·658
0·641
0·624
0·609
0·593
0·579
3
4
0·659
0·636
0·613
0·592
0·572
0·552
0·534
0·516
0·499
0·482
4
5
0·593
0·567
0·543
0·519
0·497
0·476
0·456
0·437
0·419
0·402
5
6
0·535
0·507
0·480
0·456
0·432
0·410
0·390
0·370
0·352
0·335
6
7
0·482
0·452
0·425
0·400
0·376
0·354
0·333
0·314
0·296
0·279
7
8
0·434
0·404
0·376
0·351
0·327
0·305
0·285
0·266
0·249
0·233
8
9
0·391
0·361
0·333
0·308
0·284
0·263
0·243
0·225
0·209
0·194
9
10
0·352
0·322
0·295
0·270
0·247
0·227
0·208
0·191
0·176
0·162
10
11
0·317
0·287
0·261
0·237
0·215
0·195
0·178
0·162
0·148
0·135
11
12
0·286
0·257
0·231
0·208
0·187
0·168
0·152
0·137
0·124
0·112
12
13
0·258
0·229
0·204
0·182
0·163
0·145
0·130
0·116
0·104
0·093
13
14
0·232
0·205
0·181
0·160
0·141
0·125
0·111
0·099
0·088
0·078
14
15
0·209
0·183
0·160
0·140
0·123
0·108
0·095
0·084
0·074
0·065
15

Page 204
Annuity Table
Present value of an annuity of 1 i.e.
1 – (1 +
r)–n
r
Where r = discount rate
n = number of periods until payment
Discount rates (r)
Periods
(n)
1%
2%
3%
4%
5%
6%
7%
8%
9%
10%
1
0·990
0·980
0·971
0·962
0·952
0·943
0·935
0·926
0·917
0·909
1
2
1·970
1·942
1·913
1·886
1·859
1·833
1·808
1·783
1·759
1·736
2
3
2·941
2·884
2·829
2·775
2·723
2·673
2·624
2·577
2·531
2·487
3
4
3·902
3·808
3·717
3·630
3·546
3·465
3·387
3·312
3·240
3·170
4
5
4·853
4·713
4·580
4·452
4·329
4·212
4·100
3·993
3·890
3·791
5
6
5·795
5·601
5·417
5·242
5·076
4·917
4·767
4·623
4·486
4·355
6
7
6·728
6·472
6·230
6·002
5·786
5·582
5·389
5·206
5·033
4·868
7
8
7·652
7·325
7·020
6·733
6·463
6·210
5·971
5·747
5·535
5·335
8
9
8·566
8·162
7·786
7·435
7·108
6·802
6·515
6·247
5·995
5·759
9
10
9·471
8·983
8·530
8·111
7·722
7·360
7·024
6·710
6·418
6·145
10
11
10·37
9·787
9·253
8·760
8·306
7·887
7·499
7·139
6·805
6·495
11
12
11·26
10·58
9·954
9·385
8·863
8·384
7·943
7·536
7·161
6·814
12
13
12·13
11·35
10·63
9·986
9·394
8·853
8·358
7·904
7·487
7·103
13
14
13·00
12·11
11·30
10·56
9·899
9·295
8·745
8·244
7·786
7·367
14
15
13·87
12·85
11·94
11·12
10·38
9·712
9·108
8·559
8·061
7·606
15
(n)
11%
12%
13%
14%
15%
16%
17%
18%
19%
20%
1
0·901
0·893
0·885
0·877
0·870
0·862
0·855
0·847
0·840
0·833
1
2
1·713
1·690
1·668
1·647
1·626
1·605
1·585
1·566
1·547
1·528
2
3
2·444
2·402
2·361
2·322
2·283
2·246
2·210
2·174
2·140
2·106
3
4
3·102
3·037
2·974
2·914
2·855
2·798
2·743
2·690
2·639
2·589
4
5
3·696
3·605
3·517
3·433
3·352
3·274
3·199
3·127
3·058
2·991
5
6
4·231
4·111
3·998
3·889
3·784
3·685
3·589
3·498
3·410
3·326
6
7
4·712
4·564
4·423
4·288
4·160
4·039
3·922
3·812
3·706
3·605
7
8
5·146
4·968
4·799
4·639
4·487
4·344
4·207
4·078
3·954
3·837
8
9
5·537
5·328
5·132
4·946
4·772
4·607
4·451
4·303
4·163
4·031
9
10
5·889
5·650
5·426
5·216
5·019
4·833
4·659
4·494
4·339
4·192
10
11
6·207
5·938
5·687
5·453
5·234
5·029
4·836
4·656
4·486
4·327
11
12
6·492
6·194
5·918
5·660
5·421
5·197
4·988
4·793
4·611
4·439
12
13
6·750
6·424
6·122
5·842
5·583
5·342
5·118
4·910
4·715
4·533
13
14
6·982
6·628
6·302
6·002
5·724
5·468
5·229
5·008
4·802
4·611
14
15
7·191
6·811
6·462
6·142
5·847
5·575
5·324
5·092
4·876
4·675
15
