CRS222_Financial_Analysis_Of_Systems_Integrators_Aug89 CRS222 Financial Analysis Of Systems Integrators Aug89
CRS222_Financial_Analysis_Of_Systems_Integrators_Aug89 CRS222_Financial_Analysis_Of_Systems_Integrators_Aug89
User Manual: CRS222_Financial_Analysis_Of_Systems_Integrators_Aug89
Open the PDF directly: View PDF ![]() .
.
Page Count: 33
FINANCIAL
ANALYSIS
OF
SYSTEMS
INTEGRATORS
CRS 0222
-For
Internal Use
Only-
By
Richard
D.
Buchanan
DTN
264-3663
Prepared
for Chris Sullilvan
CSS
August
1989
CONSULTING
and
RESEARCH
SERVICE
Andrea
Schulman, ManagerlEditor
MK01·11K11
DTN
264-6911
Martha Brunelle, Production
Editor
mamDama
Copyright 1989
by
Digital Equipment Corporation
All
rights reserved
FINANCIAL ANALYSIS
OF
SYSTEMS INTEGRATORS
TABLE OF CONTENTS
PURPOSE
AND METHODOLOGY
EXECUTIVE SUMMARY . . . . . .
.2
.3
SYSTEMS INTEGRATION: AN OVERVIEW. .
.4
Federal and Commercial Sectors Contrasted . . 6
Commercial Sector Segments
............................
7
FINANCIAL ANALYSIS
..................................
8
The Size of
the
U.S. Systems Integration Market: Input's Estimates . 9
Estimates of U.S. Systems Integration Market Growth . . . . .
.10
Input's Market
Share
Estimates for The U.S.
SI
Market . . .
.13
The Size of
the
U.S. Systems Integration Market: Computer
Systems News' Estimates . . . . . . 17
Top
50
Systems Integrators . 19
Hardware Vendors
..
. . 20
Systems Integrators . . . . . . 21
Integration Facilitators . . . . 22
VENDOR PROFILES
...........................
. . . . . . .
23
IBM Corp.. . . . . . . . . . . . .
.23
Electronic Data Systems, Corp.
.24
Anderson Consulting . . . . . . . . . . 25
AT&T.
. . . . . . . . . . . . .
.26
Bolt Beranek and Newman . .
.27
Computer
Task
Group, Inc. . . 28
Litton Industrial Automation Group . 29
SHL
System
House. Inc. . . . . .
.30
U nysis Corp.
..
. . . . . . . . . . 31
Digital Equipment Corporation .
.32
* * * CONSULTING and RESEARCH SERVICE * * *
- - For Internal Use Only - -
FINANCIAL ANALYSIS OF SYSTEMS INTEGRATORS
PURPOSE AND METHODOLOGY
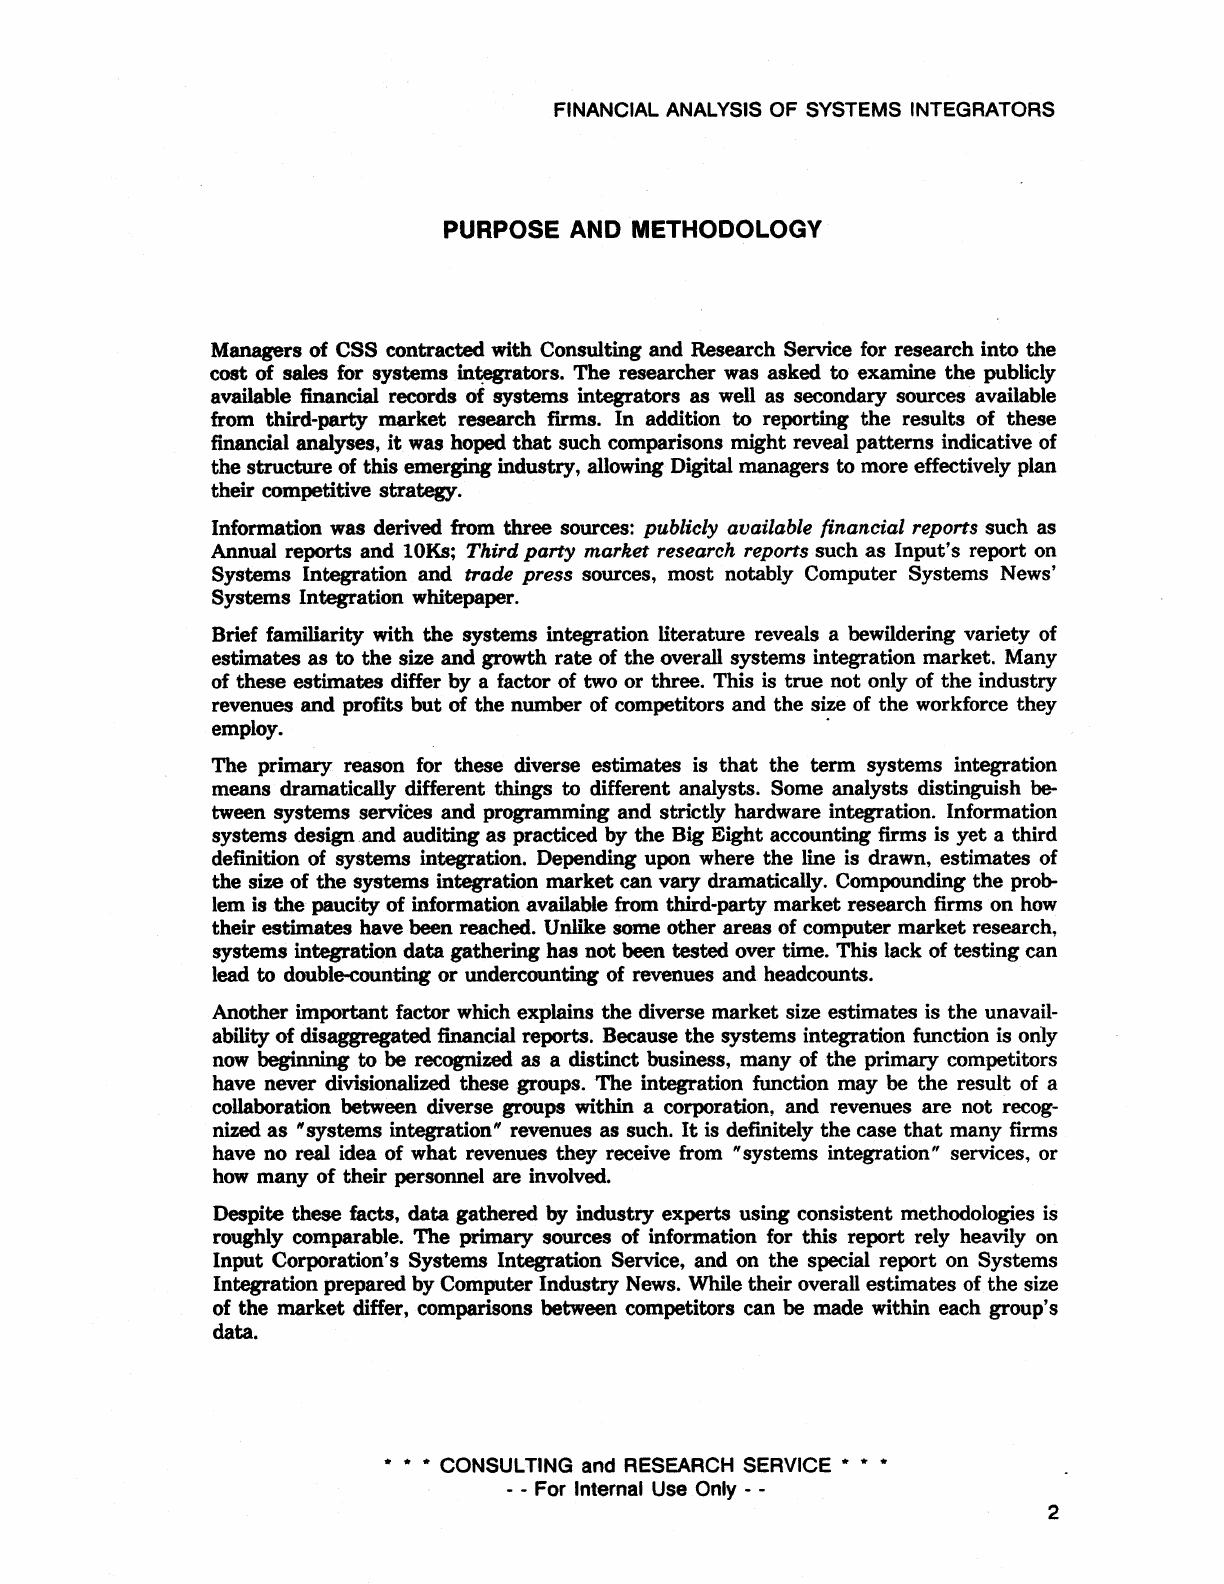
Managers of CSS contracted with Consulting and Research Service for research into
the
cost of sales for systems
in~ators.
The
researcher was asked
to
examine
the
pubHcly
available financial records of systems integrators
as
well as secondary sources available
from third-party
market
research firms. In addition
to
reporting
the
results of these
financial analyses,
it
was hoped
that
such comparisons might reveal patterns indicative of
the structure of this emerging industry, allowing Digital managers to more effectively plan
their competitive strategy.
Information was derived from three sources: publicly available financial reports such as
Annual reports and 10Ks; Third
party
market research reports such
as
Input's report on
Systems Integration and trade press sources, most notably Computer Systems News'
Systems Integration whitepaper.
Brief familiarity with
the
systems integration literature reveals a bewildering variety of
estimates as
to
the
size and growth
rate
of
the
overall systems integration market. Many
of these estimates differ by a factor of two or three. This is
true
not only of
the
industry
revenues and profits but of
the
number of competitors and
the
size of the workforce they
employ. .
The primary reason for these diverse estimates is
that
the
term
systems integration
means dramatically different things to different analysts. Some analysts distinguish be-
tween systems services and programming and strictly hardware integration. Information
systems design and auditing
as
practiced by
the
Big Eight accounting firms is
yet
a third
definition of systems integration. Depending upon where
the
line is drawn, estimates of
the size of
the
systems integration
market
can vary dramatically. Compounding
the
prob-
lem is
the
paucity of information available from third-party market research firms on
how
their estimates have been reached. Unlike some other areas of computer
market
research,
systems integration
data
gathering has
not
been tested over time. This lack of testing can
lead to douhle-counting
or
undercounting of revenues and headcounts.
Another important factor which explains
the
diverse market size estimates is
the
unavail-
ability of disaggregated financial reports. Because the systems integration function is only
now
beginning
to
be recognized as a distinct business, many of
the
primary competitors
have never divisionalized these groups. The integration function may
be
the result of a
collaboration between diverse groups within a corporation, and revenues
are
not recog-
nized
as
"systems integration" revenues as such.
It
is definitely
the
case
that
many firms
have no real idea of what revenues they receive from N systems integration" services, or
how
many of their personnel are involved.
Despite these facts,
data
gathered
by
industry experts using consistent methodologies is
roughly comparable.
The
primary sources of information for this report rely heavily on
Input Corporation's Systems Integration Service, and on
the
special report on Systems
Integration prepared by Computer Industry News. While their overall estimates of
the
size
of
the
market differ, comparisons between competitors can be made within each group's
data.
* * * CONSULTING and RESEARCH SERVICE *
- - For Internal Use Only - -
* *
2
FINANCIAL ANALYSIS OF SYSTEMS INTEGRATORS
EXECUTIVE SUMMARY
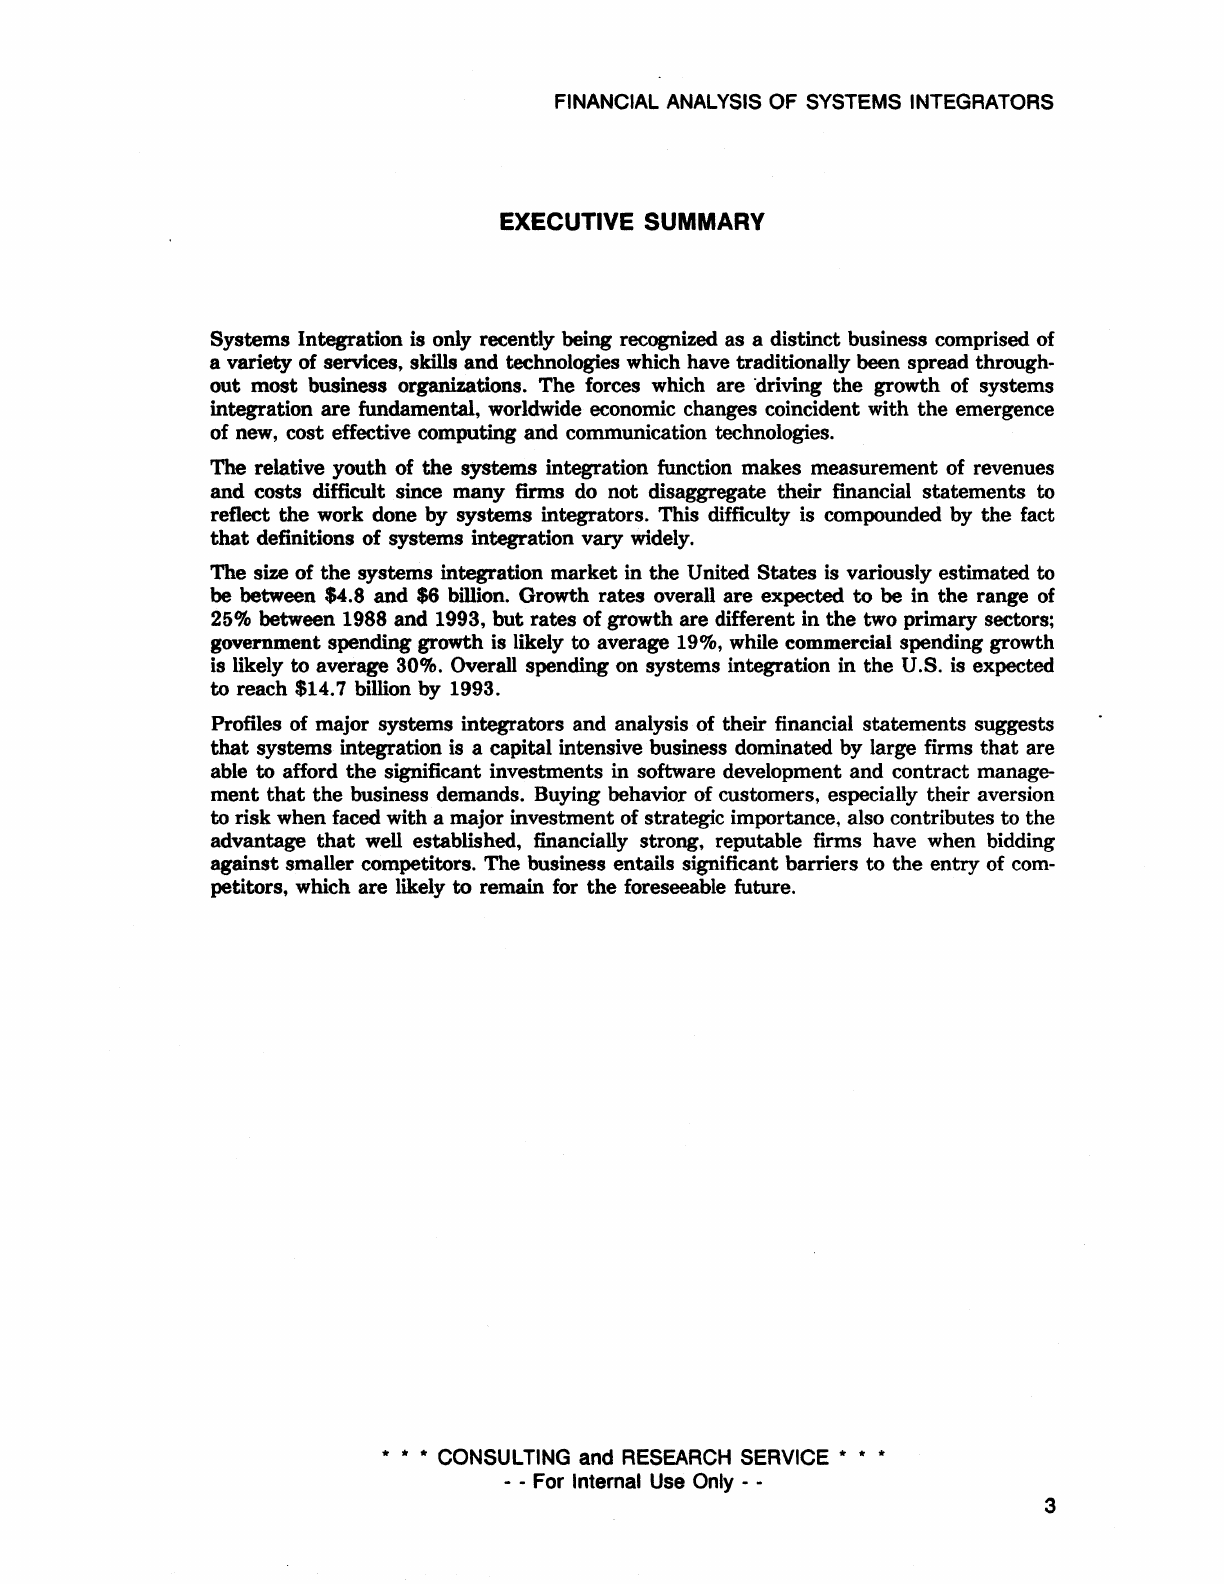
Systems Integration is only recently being recognized as a distinct business comprised of
a variety of services, skills and technologies which have traditionally been spread through-
out
most
business organizations. The forces which are driving
the
growth of systems
integration
are
fundamental, worldwide economic changes coincident with
the
emergence
of new, cost effective computing
and
communication technologies.
The relative youth of
the
systems integration function makes measurement of revenues
and
costs difficult since
many
firms do
not
disaggregate
their
financial
statements
to
reflect
the
work done by systems integrators. This difficulty is compounded by
the
fact
that
definitions of systems integration vary widely.
The size of
the
systems integration market in
the
United
States
is variously estimated to
be
between $4.8
and
$6
billion. Growth rates overall are expected
to
be
in
the
range of
25% between 1988 and 1993,
but
rates of growth are different in
the
two primary sectors;
government spending growth is likely to average 19%, while commercial spending growth
is likely to average
300/0.
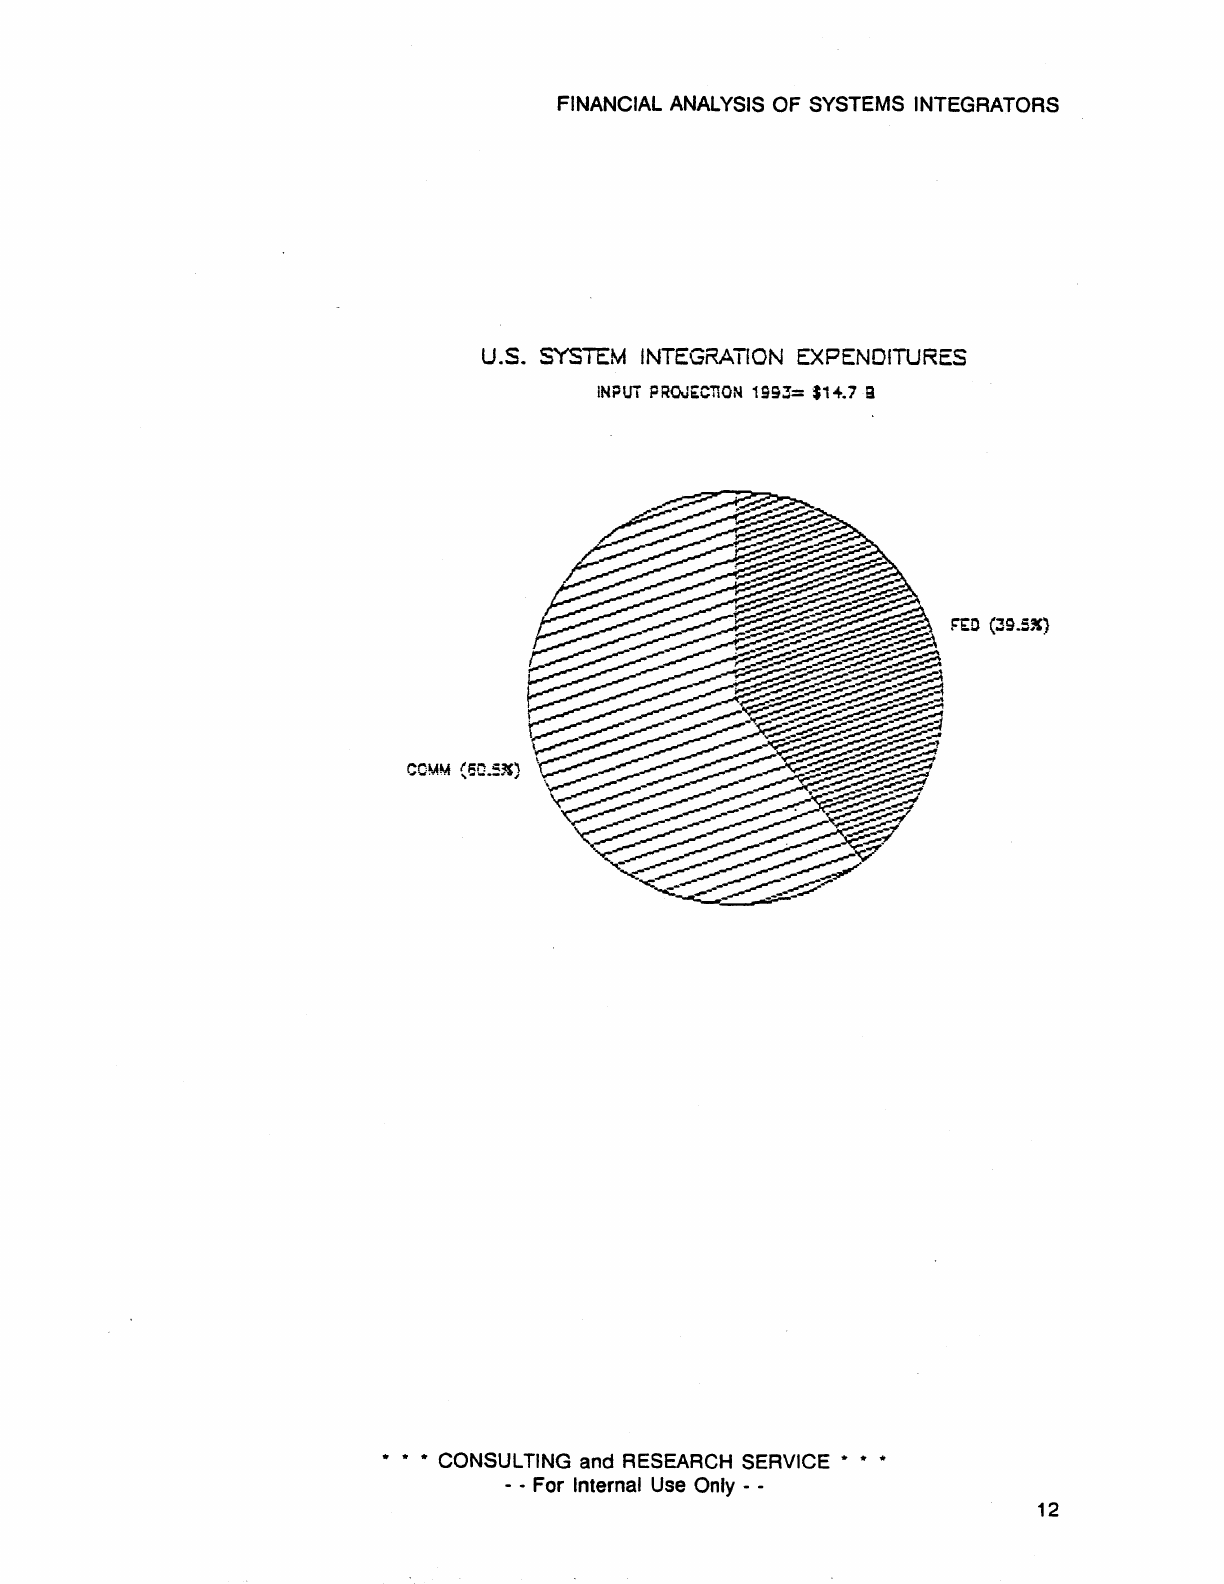
Overall spending on systems integration in
the
U.S. is expected
to
reach $14.7 billion by 1993.
Profiles of major systems integrators and analysis of their financial
statements
suggests
that
systems integration is a capital intensive business dominated by large firms
that
are
able
to
afford
the
significant investments in software development
and
contract manage-
ment
that
the
business demands. Buying behavior of customers, especially their aversion
to risk when faced with a major investment of strategic importance, also contributes
to
the
advantage
that
well established, financially strong, reputable firms have when bidding
against smaller competitors. The business entails significant barriers to
the
entry of com-
petitors, which
are
likely
to
remain for
the
foreseeable future.
* * * CONSULTING and RESEARCH SERVICE *
- - For Internal Use Only - -
* *
3
FINANCIAL ANALYSIS OF SYSTEMS INTEGRATORS
OVERVIEW OF THE SYSTEMS INTEGRATION FUNCTION
Systems
Integration is only recently beginning
to
be recognized
as
a distinct business.
From
a
marketing
perspective,
the
systems integration function is developing its own
identity, which
can
be defined in
terms
of
the
marketing
mix. Definable Products
are
being recognized
by
potential customers who choose
them
based upon Price, Distribution
and
Prom,otional attributes.
This was
not
always
the
case. Formerly, customers depended upon hardware vendors,
internal MIS managers
or
perhaps
their
accountants
to
recommend and possibly imple-
ment
information systems.
The
complexity
of
the
task
led initially
to
a centralized MIS approach. This solution
proved
to
be inappropriate for
many
decentralized organizations
and
for those businesses
whose operations required geographic
and
information
system
autonomy.
The
availability of
cost
effective alternatives
to
the
centralized mainframe encouraged
the
proliferation of diverse and,
at
times, internally inconsistent information systems.
Support
for
these
multiple
systems
came from professional service firms
that
were hired
to
provide
programming
and
system
design services
at
the
time of initial
startup
or conversion. This
relieved central MIS of
the
need
to
employ large staffs
to
support
the
irregular work-flow,
but
left
the
door open for
the
acquisition of disparate computer systems and software
packages.
Systems
integration
as
a distinct function handled
by
third-party contractors
is-
emerging
to
solve this constellation of technological
and
organizational problems.
The
growing importance of
systems
integration, especially in
the
commercial sector, re-
flects fundamental changes in
the
economic
and
organizational climate for large scale
computing.
Integration of
the
world economy
has
forced businesses to link operations
and
information
systems
for coordination of operations
and
financial strategies
and
to
achieve
the
econo-
mies of scale demanded by ...
Increased international competition. The diffusion of economic power
that
has accompa-
nied large scale economic development in
the
third
world
and
especially in Asia.
has
been
encouraged by a fundamental shift in
the
importance
of
the
traditional
Factors
of
Production.
The
relative importance of Physical Resources, Manpower, Capital, and Managerial Talent
has
changed such
that
Capital
and
Managerial
Talent
(especially
the
talented exploitation
of information),
can
overcome
the
limitations imposed by Physical Resources
and
raw
Manpower. Businesses
as
well
as
governments
are
recognizing
that
the
strategic
use
of
information is a critical success factor for
the
achievement of their goals.
Investments
in
computing resources
are
driven by
attempts
to
marshal
the
critical mass
of
information
required for strategic decision making.
* * * CONSULTING and RESEARCH SERVICE *
- - For Internal Use Only - -
* *
4
FINANCIAL ANALYSIS OF SYSTEMS INTEGRATORS
Ironically,
the
rapid development of computing technologies has often served
to
undercut
the
success of any particular organization's computing strategy. Shortened Computer
Product Life Cycles have left many computer customers with unintegrated computing
systems
and
with organizational problems
that
distract from
the
organization's fundamen-
tal
mission. Computers
are
expected by customers
to
be a means to
an
end,
not
an
end in
themselves. Increasingly, corporations
are
turning
to
third parties
to
manage their inter-
nal computing resources, allowing managers
to
address themselves
to
fundamental busi-
ness problems.
Kodak Company, recently hired Businessland, Inc.
to
manage Kodak's personal computer
operations, and Kodak managers are seeking third-party integrators to manage
DP
and
telecommunications functions as
well.
This is coincident with Kodak's desire, like
that
of
many modern corporations, to concentrate
their
resources and managerial
talent
on their
core business, photography.
"Such thinking
puts
Kodak in
the
vanguard of a movement reshaping
the
computer
industry. Hardware
and
software companies
that
have simply pushed
the
technology as
hard and
as
fast
as
they
could
are
finding
that
it
is
not
enough ... " 1 " Companies
are
getting increasingly bogged down running their own systems, and they
are
increasingly
willing
to
pay
the
price to be relieved of
these
headaches, which show no sign of dimin-
ishing." 2
The Federal Government was the first major organization to embrace systems integration
as
a solution to these problems. This
market
was
the
largest source of systems integration
revenues in 1988
but
a drastic decrease in government spending
will
allow commercial
systems integration revenues to surpass government market revenues during 1989.3
The differences between
the
Federal government
market
and
the
commercial
market
are
significant in
terms
of
the
buying behavior of
the
customers~
the
expertise of
the
vendors.
the
methods of doing business and
the
prospects for
market
growth. Because of these
differences, analysis of relative competitive
strength
of systems integration vendors
must
consider
the
proportion of their revenues derived from each sector. While
the
technological/systems design
task
may
be
similar, the marketing
task
is quite different.
1 "Computer Firms Find
That
Service is
What
Sells, Not Fancier Hardware"; Wall
Street
Journal; August 15, 1989; pp. 1; col.
6.
2 Naomi Karton, Computer Consultant; Quoted in "Computer Firms Find Service
..
",
ibid.
3 "Systems Integration- A Competitive Analysis"; Input, December 1988.
* * * CONSULTING and RESEARCH SERVICE *
- - For Internal Use Only - -
* *
5
FINANCIAL ANALYSIS OF SYSTEMS INTEGRATORS
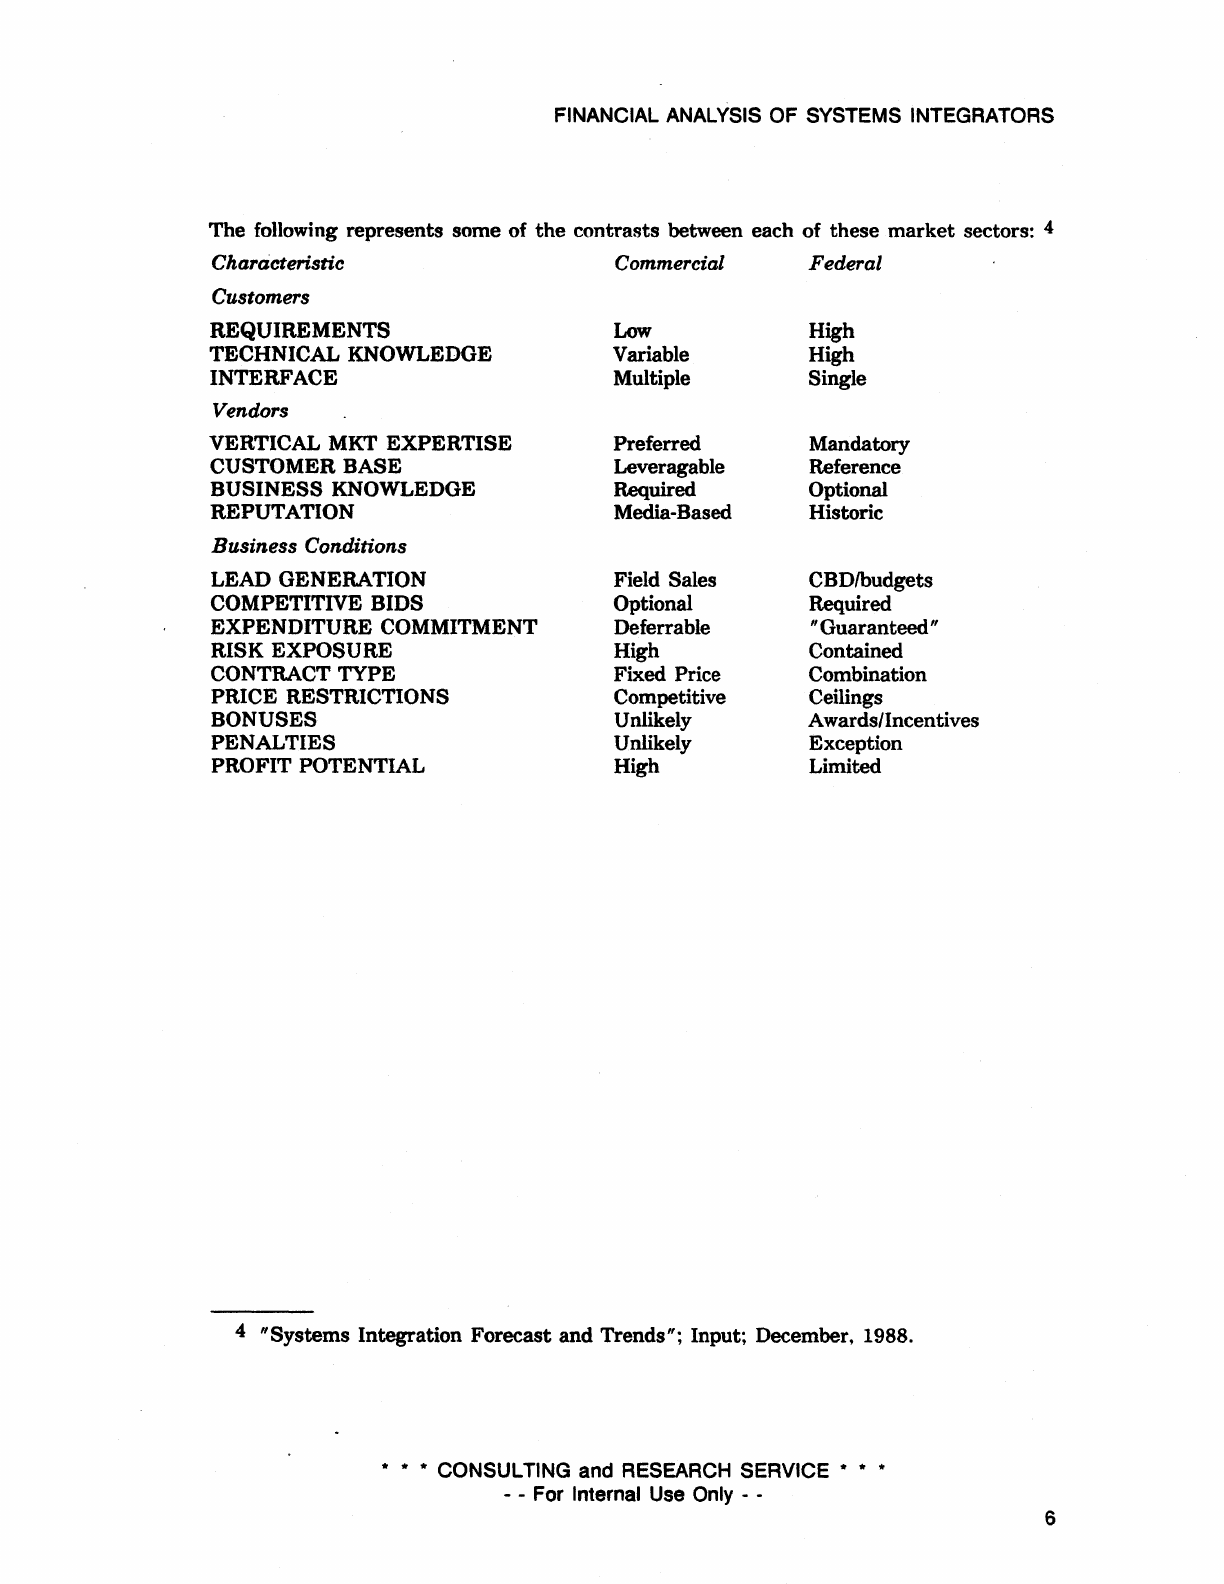
The following represents some of
the
contrasts between each of these
market
sectors: 4
Characteristic Commercial Federal
Customers
REQUIREMENTS
Low
High
TECHNICAL KNOWLEDGE Variable High
INTERFACE Multiple Single
Vendors
VERTICAL MKT
EXPERTISE
Preferred Mandatory
CUSTOMER BASE Leveragable Reference
BUSINESS
KNOWLEDGE Required Optional
REPUTATION Media-Based Historic
Business Conditions
LEAD GENERATION Field Sales CBDlbudgets
COMPETITIVE BIDS Optional Required
EXPENDITURE COMMITMENT Deferrable
II
Guaranteed"
RISK EXPOSURE High Contained
CONTRACT TYPE Fixed Price Combination
PRICE RESTRICTIONS Competitive Ceilings
BONUSES Unlikely Awards/Incentives
PENALTIES Unlikely Exception
PROFIT POTENTIAL High Limited
4 "Systems Integration Forecast and Trends"; Input; December, 1988.
* * * CONSULTING and RESEARCH SERVICE * * *
- - For Internal Use Only - - 6
FINANCIAL ANALYSIS OF SYSTEMS INTEGRATORS
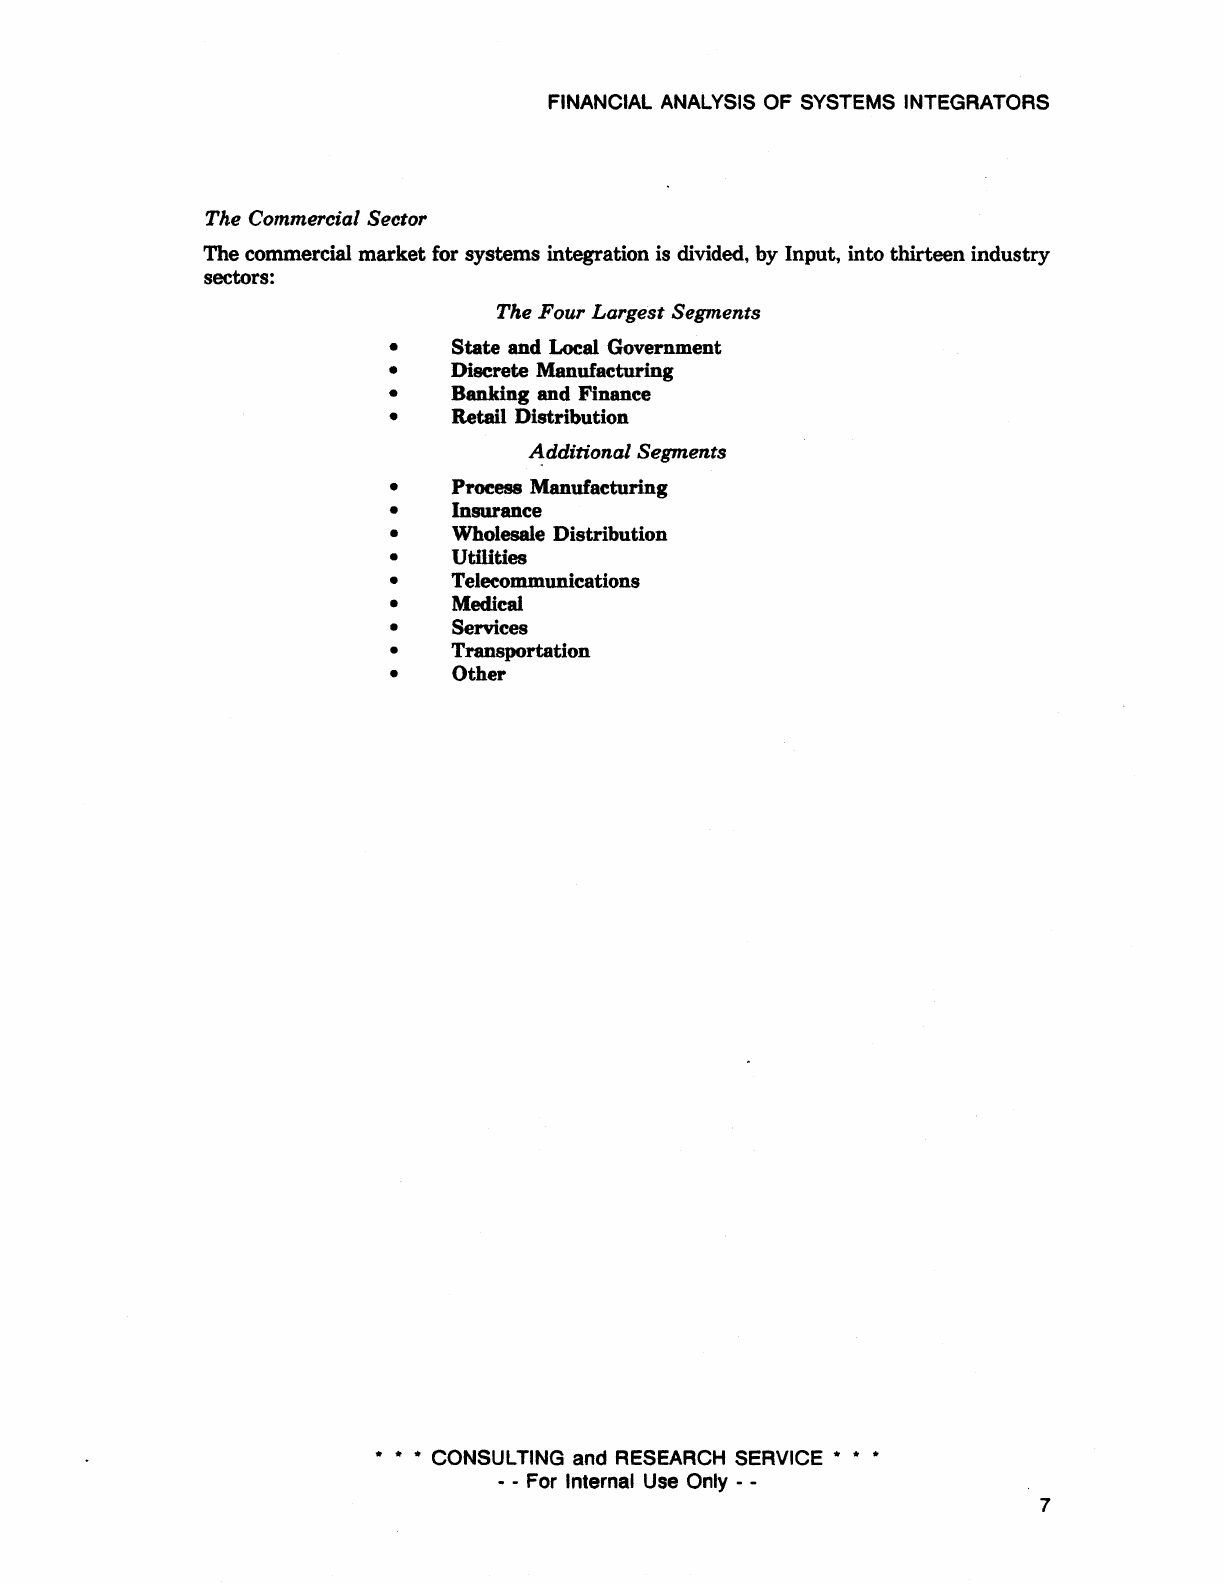
The Commercial Sector
The commercial
market
for
systems
integration is divided, by Input, into
thirteen
industry
sectors:
The Four Largest Segments
•
State
and
Local
Government
•
Discrete
Manufacturing
•
Banking
and
Finance
•
Retail
Distribution
A:dditional Segments
• Process
Manufacturing
•
Insurance
• Wholesale
Distribution
•
Utilities
• Telecommunications
• Medical
• Services
•
Transportation
•
Other
* * * CONSULTING and RESEARCH SERVICE *
- - For Internal Use Only - -
* *
7
FINANCIAL ANALYSIS OF SYSTEMS INTEGRATORS
FINANCIAL ANALYSIS
The Size
of
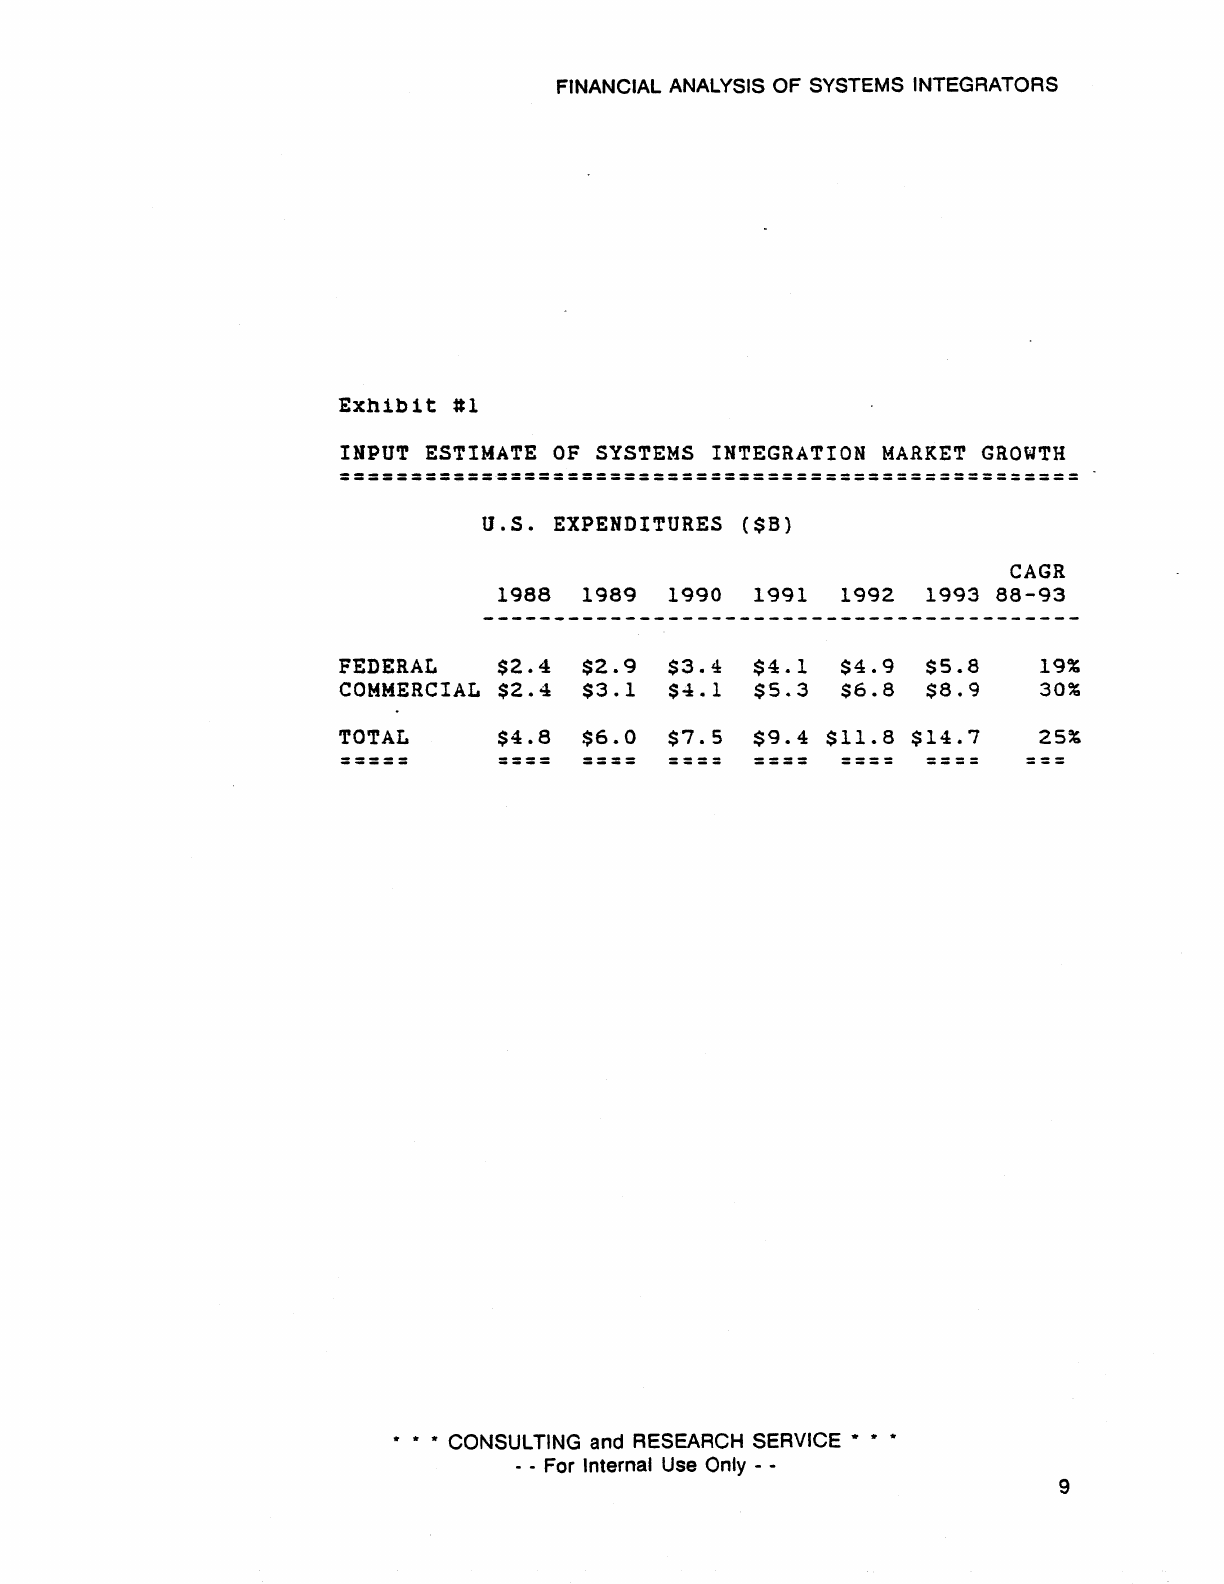
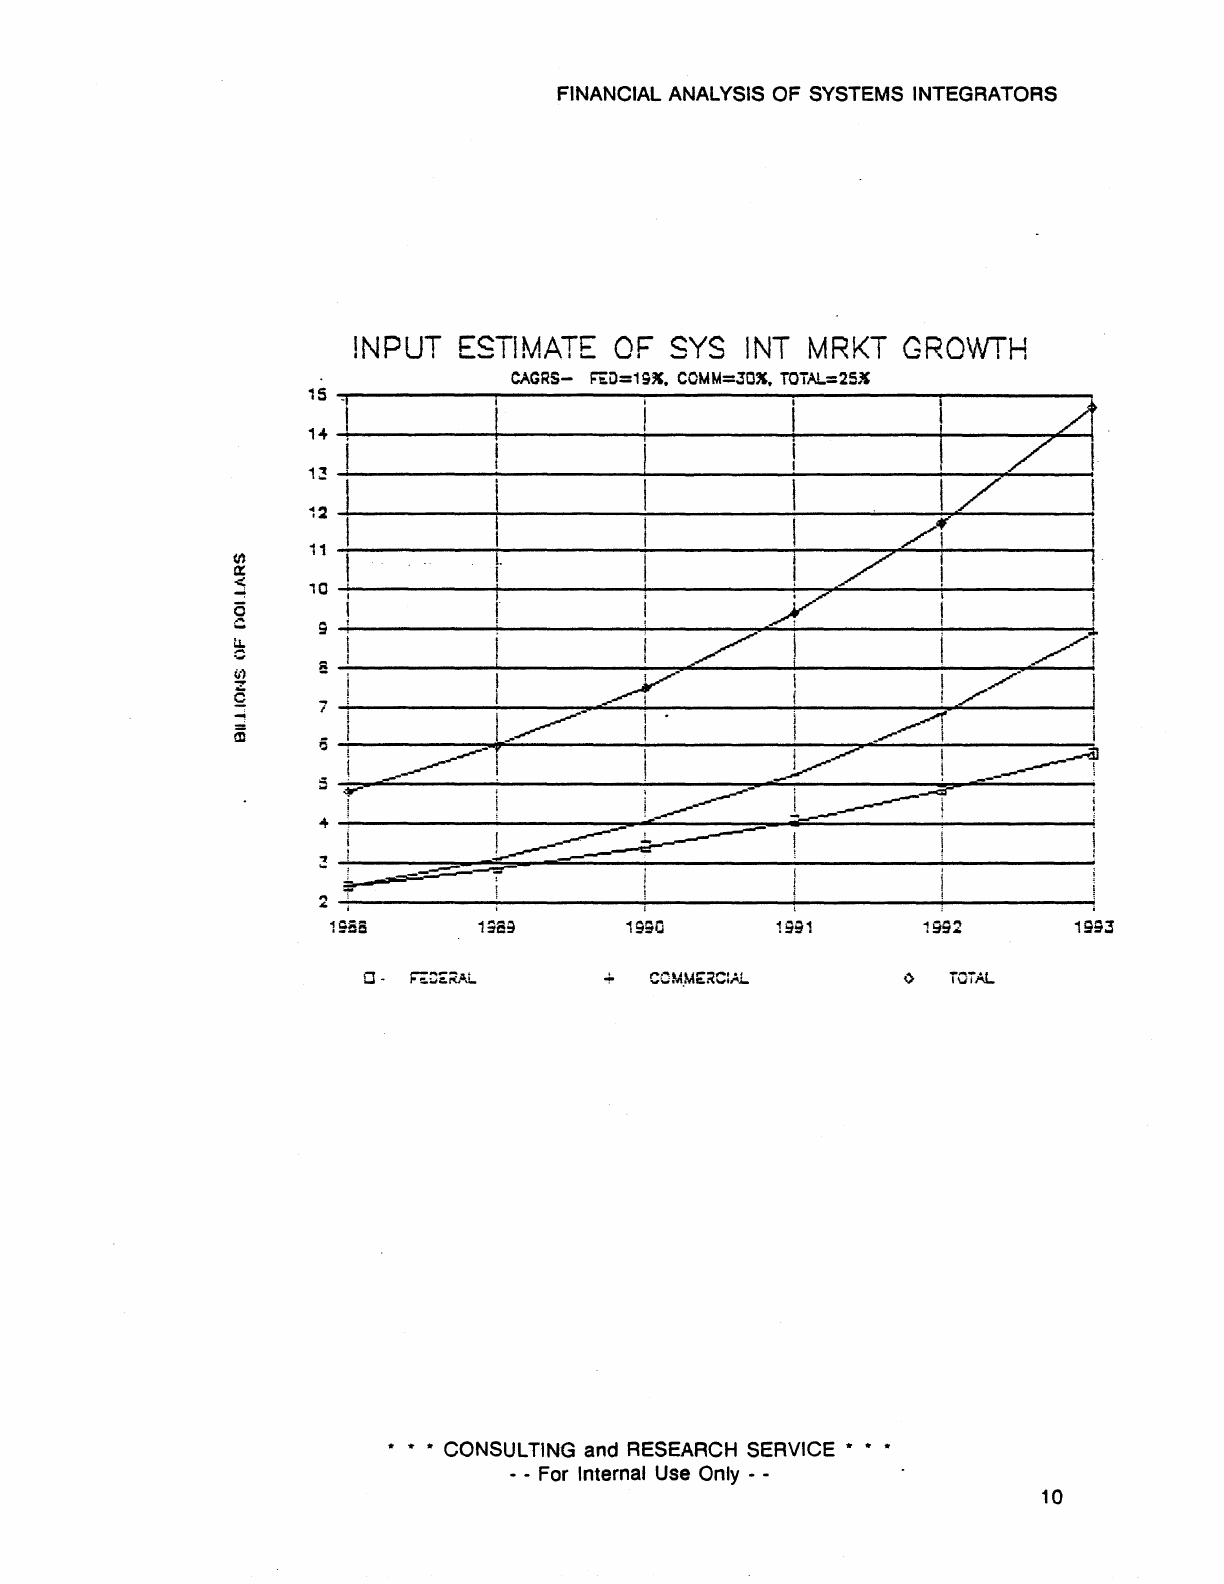
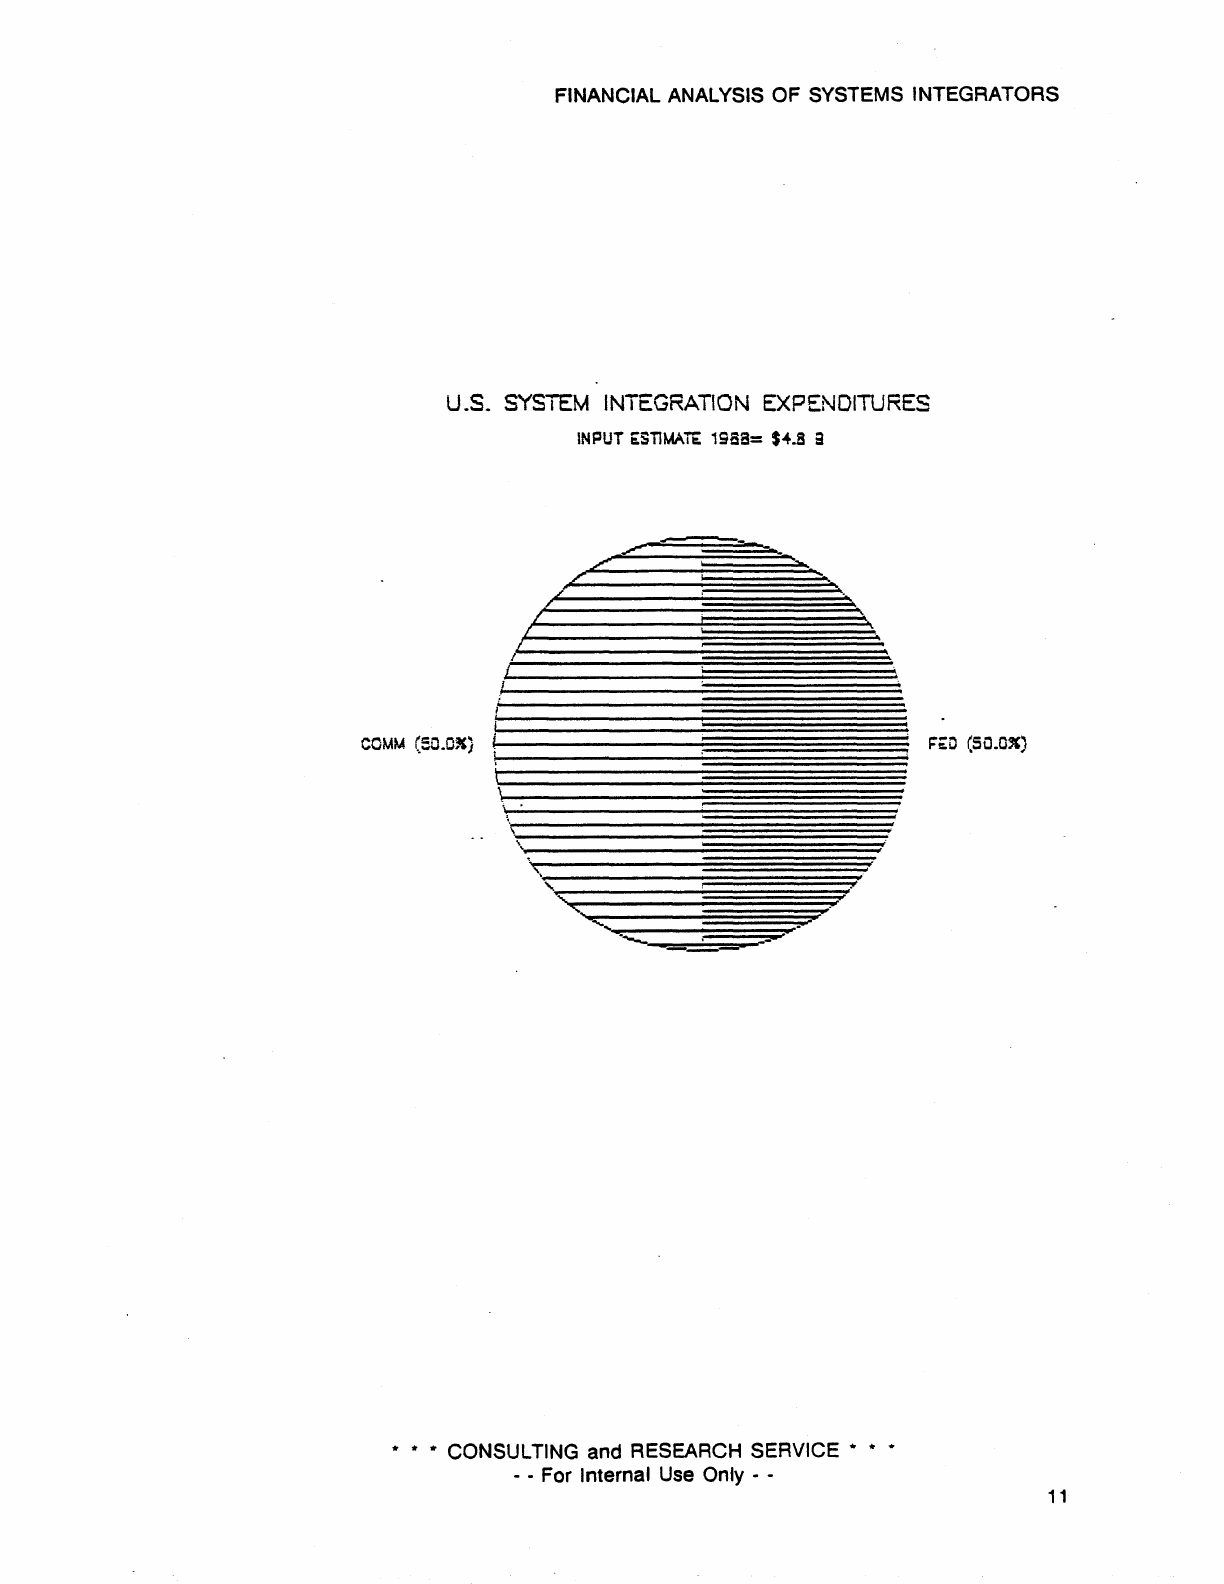
the U.S. Systems Integration Market;
Exhibit
II
details Input's estimates of
the
total size of the U.S. Systems Integration
Market. Exhibits 12, 13 and 14 portray these same data graphically.
Input estimates
the
entire U.S. expenditure on systems integration
to
have been $4.8
billion in 1988, approximately evenly divided between Commercial and Federal
Government sectors. Growth rates for the two sectors differ significantly. Input estimates
that
the
commercial segment will grow
at
a cumulative annual growth
rate
(CAGR)
of 30%
between 1988
and
1993, while
the
government sector
will
average
190/0
over
the
same
period.
For
the U.S. systems integration market as a whole, Input forecasts a 25% CAGR.
1r
1r
* CONSULTING and RESEARCH SERVICE
1r
* *
- - For Internal Use
Only
- - 8
FINANCIAL ANALYSIS OF SYSTEMS INTEGRATORS
Exhibit
#1
INPUT ESTIMATE
OF
SYSTEMS
INTEGRATION
MARKET
GROWTH
----------------------------------------------------
----------------------------------------------------
u.S.
EXPENDITURES
($8)
CAGR
1988
1989
1990
1991 1992
1993
88-93
FEDERAL
$2.4
COMMERCIAL
$2.4
TOTAL
$4.8
-----
-----
$2.9
$3.4
$3.1
$4.1
$6.0
$7.5
----
----
$4.1
$4.9
$5.3
$6.8
$9.4
$11.8
----
---
-
* CONSULTING and RESEARCH SERVICE *
- - For Internal Use Only - -
$5.8
$8.9
$14.7
--
--
19%
30%
25%
9
<t)
a::
<
0
c
~
ii)
Z
Q
-!
m
15
-I
1~
1~
I
i
J
12
11
10
9
S
i
0
5
...
FINANCIAL ANALYSIS OF SYSTEMS INTEGRATORS
!NPUT
ESTIMATE
OF
SYS
INT
MRKT
GROWTH
CAGRS-
!='iLl=1;".
COMM=JOX.
TOTAL=25~
L
I
I
I~--
~-
,.--
i .
!
t/
,
!
71
.;;-
/,
./
I
I
.~
1.---.::
I
3
~----~=-~=---==--------------~----------~--------~
~~::;:::-::..-------
-;=--
2
~'----------~!----------~--------~----------~--------~
1988
19;0
1·~"'1
.~~.
11
11 11
CONSULTING and RESEARCH SERVICE
11
11
11
- - For Internal Use Only - -
1992
1993
~
iCTAL
10
FINANCIAL ANALYSIS OF SYSTEMS INTEGRATORS
u.s. SYSTEM INTEGRATION EXPENDITURES
CCMM
(SO.03()
I
\
i
\
\ \
INPUT
6:SiiMAiE:
19B8= $
....
8 a
,.
\ "
===
.,
.,
.,
CONSULTING and RESEARCH SERVICE
.,
- - For Internal Use Only - -
1='6:0
(SO.OX)
11
FINANCIAL ANALYSIS
OF
SYSTEMS INTEGRATORS
U.S.
SYSTEM
INTEGRATION EXPENDITURES
INPUi
PROJECTION
1993=
$1
+.7 B
* * * CONSULTING and RESEARCH SERVICE * * *
- - For Internal
Use
Only - -
12
FINANCIAL ANALYSIS OF SYSTEMS INTEGRATORS
U.S.
Systems
Integration;
Input's
Market
Share
Estimates
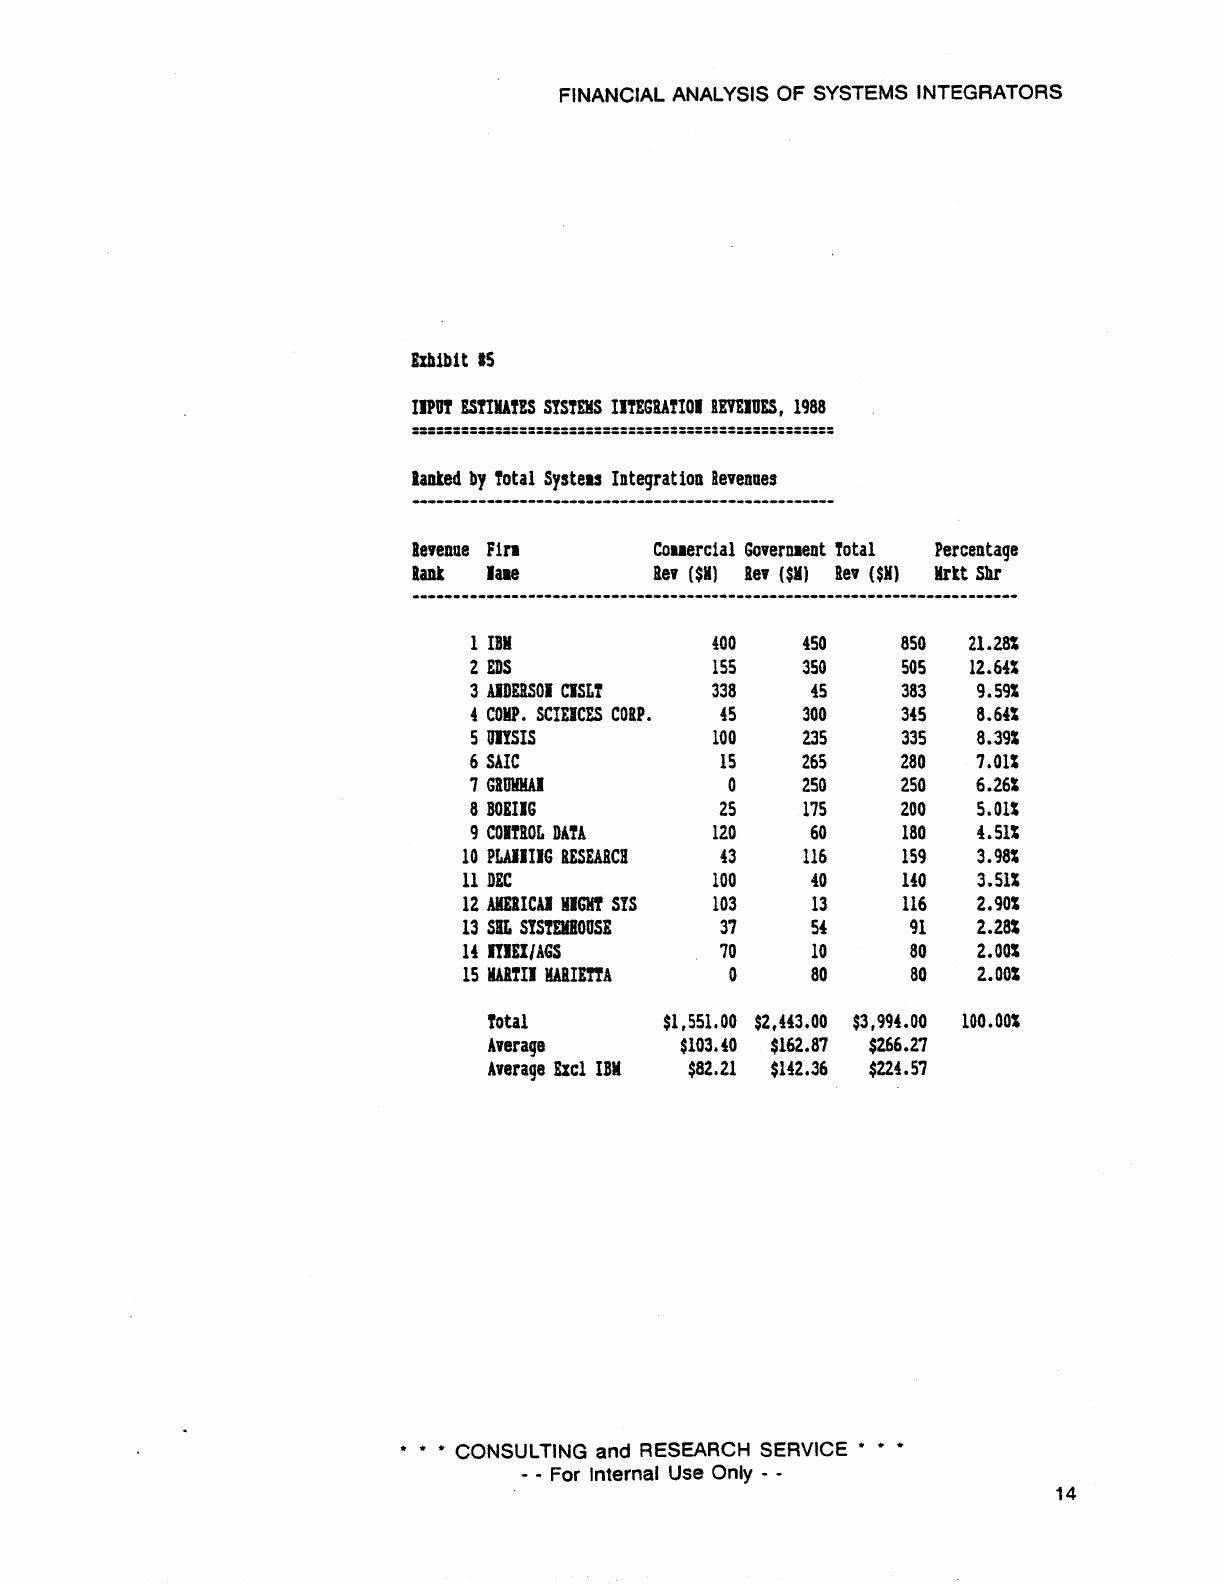
Exhibit
115
details
Input's
estimates of
the
1988 U.S. systems integration
market
shares
enjoyed by
the
fifteen
top
competitors, together with
the
portion of their systems integra-
tion revenues derived from commercial and federal government contracts. In this exhibit,
the
competitors
are
ranked
by
level of total systems integration revenue.
Note
that
the
percentage
market
share rankings
are
dominated by IBM and
EDS
with
21
% and 13% shares respectively, while other competitors trail significantly. Note
that
Digital's
share
of
the
overall systems integration
market
is estimated by Input to be only
3.5% of
the
total.
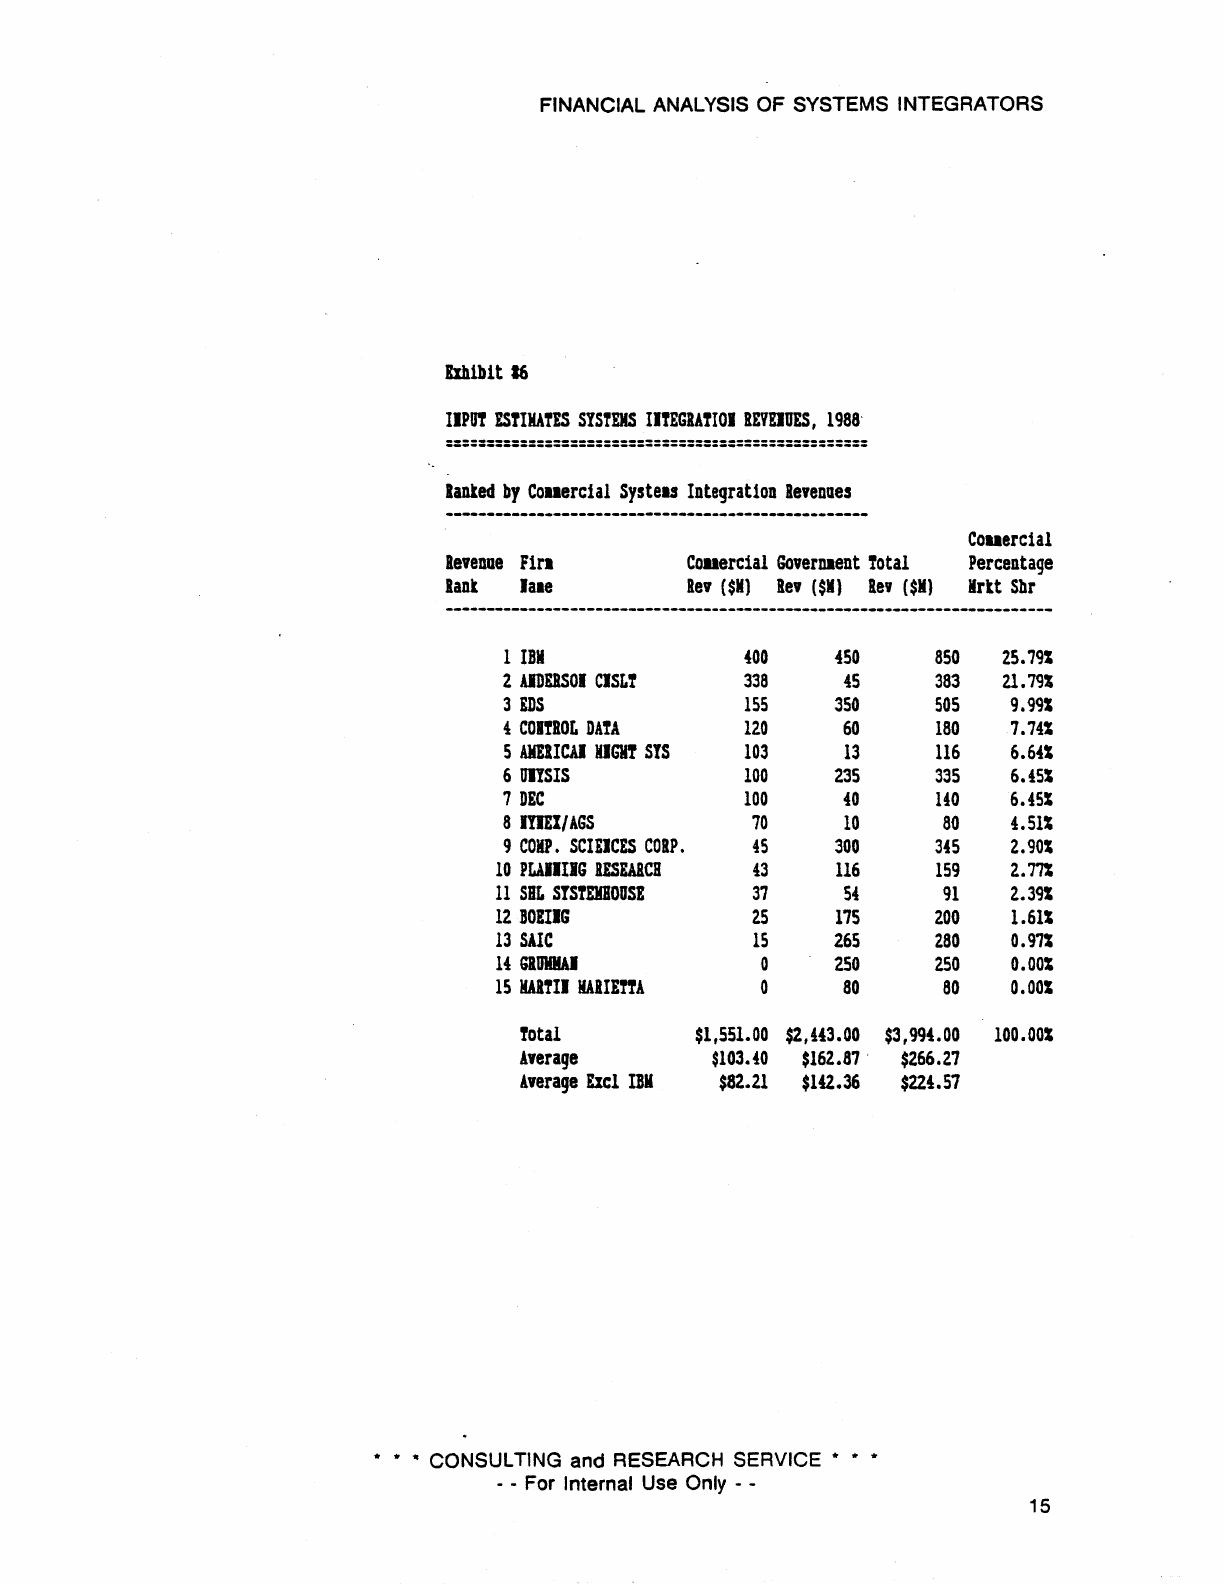
Exhibit
116
details
Input's
estimates of
the
1988 U.S. commercial systems integration
market. In this exhibit,
the
competitors have been reordered
to
reflect their commercial
market
share rankings. Here again, IBM dominates with a 26%
market
share, Anderson
Consulting shows a 22%
share
and EDS drops to number three with a 9.9% share. The
distribution of revenues is still highly concentrated
by
this ranking. Digital's share of this
portion of
the
market is estimated
to
be 6.5%.
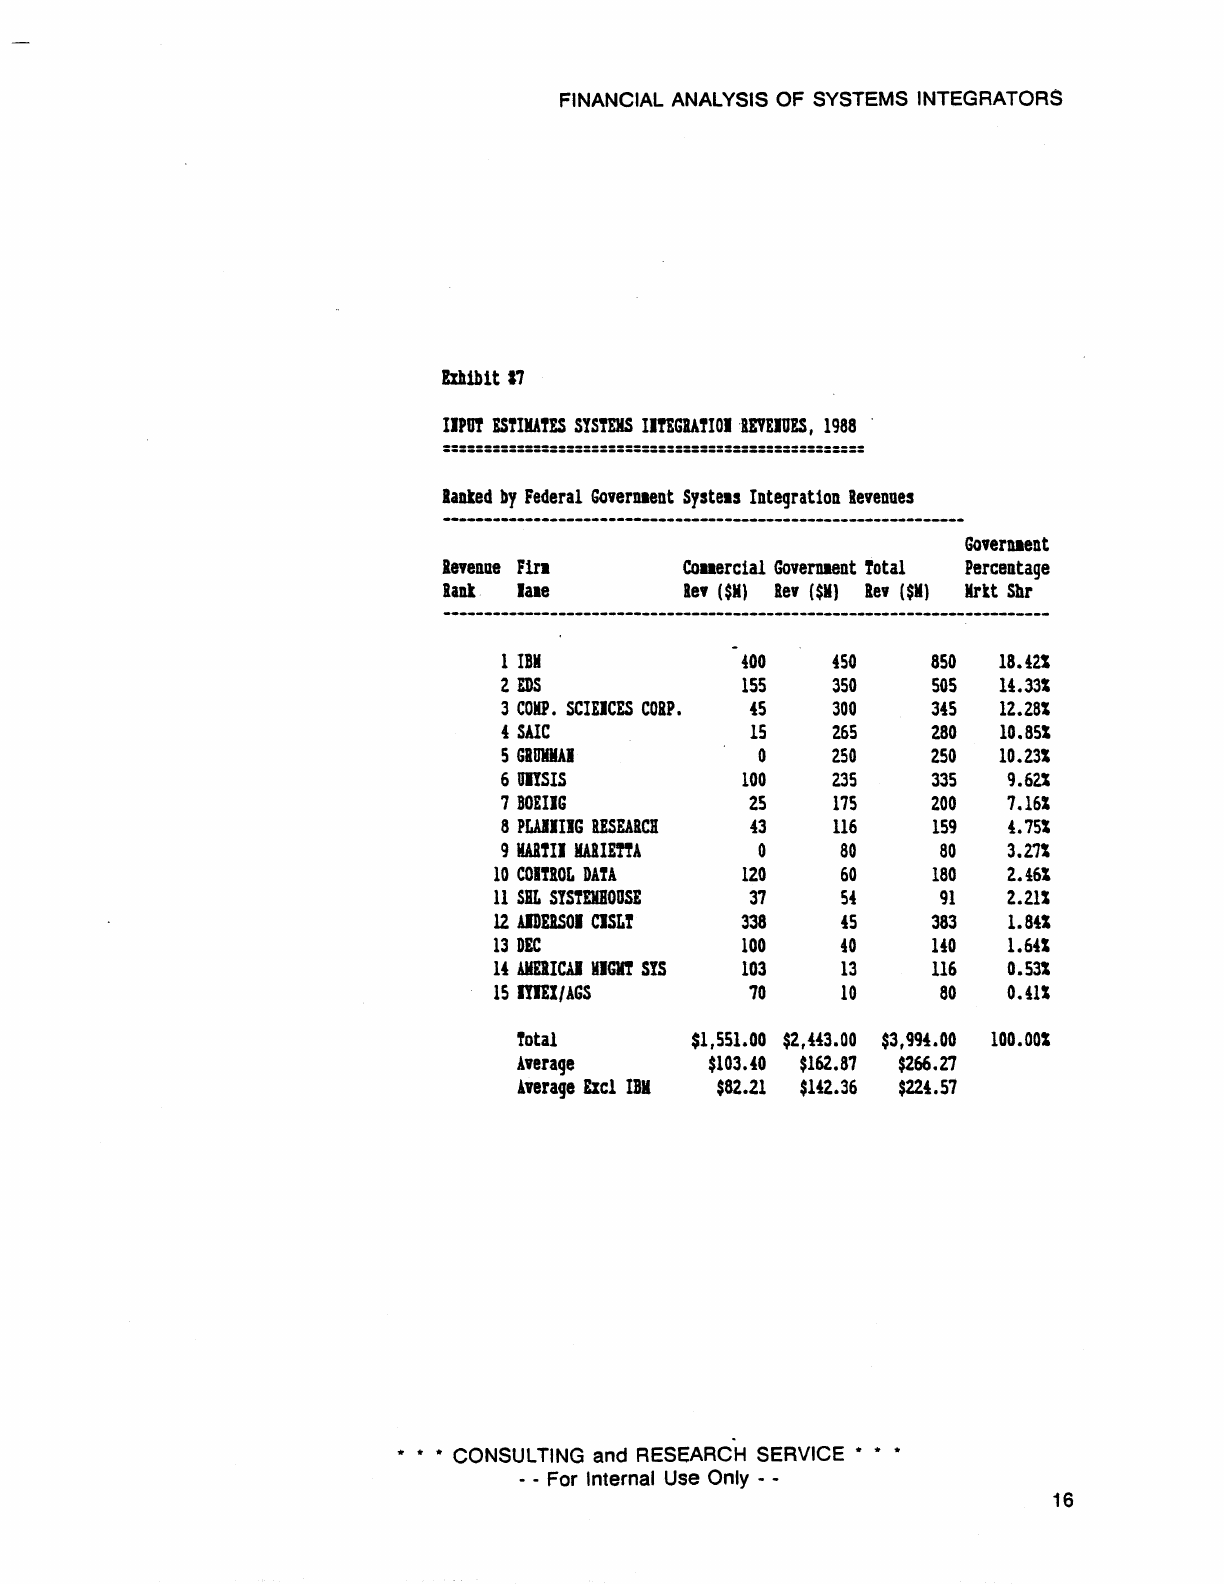
Exhibit
117
details
Input's
estimates of
the
1988 Federal Government systems integration
market. The competitors have been reordered according
the
Federal Government
market
shares. The distribution is significantly wider
than
the
commercial sector, with
the
top five
competitors garnering roughly 65% of
the
revenues. Digital's share of
the
government
systems integration
market
is estimated
to
be
1.60/0.
The differences in industry concentration suggested by
the
comparisons between
the
com-
mercial and government sectors highlights the contrasts between
the
markets previously
described.
* * * CONSULTING and RESEARCH SERVICE *
- - For Internal Use Only - -
* *
13
FINANCIAL ANALYSIS OF SYSTEMS INTEGRATORS
ExhIbIt
15
IIPI!
ESfIIA!ES
SYSTEMS
IITEGlAfIOI
lEVEIUES,
1988
===================================================
laDied
by
fatal
Systels
Integration
leveDoes
---------------------------------------------------
le,enoe
Fin
COllercia1
GoverDient
Total
Percentage
Rank
lale
Re,
($11)
Re,
($II)
lev
($11)
IIrtt
Shr
-------------------------------------------------------------------------
1
IBI
400
450
850
2
EDS
155
350
505
3
AlOERSOI
ClSLf
338
45
383
4
CaMP.
SCIEICES
CORP.
45
300
345
5 mSIS
100
235
335
6
SAlC
15
265
280
7
GRUWI
0
2.S0
250
8
BOEIIG
25
175
2.00
9
COI!IOL
DAfA
120
60
180
10
PLAlIIIG
RESEARCH
43
116
159
11
DEC
100
40
UO
12
AKElICAI
HIGHT
SIS
103
13
116
13
SBL
SYStEKBOUSE
37
5.
91
14
IYUI/AGS
70
10
80
15
IAI!I)
HAIIE!!A
0
80
80
fotal
$1,551.00
$2,443.00
$3,994.00
Average
$103.40
$162.87
Average
Exc1
IBI
$82.21
$142.36
* * * CONSULTING and RESEARCH SERVICE *
- - For Internal Use Only - -
$266.27
$224.57
21.28%
12.64%
9.591
8.64%
8.391
7.0lS
6.261
S.OlS
4.511
3.981
3.511
2.901
2.28S
2.00S
2.00S
100.00S
14
FINANCIAL ANALYSIS OF SYSTEMS INTEGRATORS
bhlbtt
16
IIPD!
EStlKATES
SYSTEMS
IltEGIATIOI
RIVElUES,
1988-
===================================================
lanted
by
COllerclal
Systels
Integrat10n
Revenues
---------------------------------------------------
Couerclal
levenue
Firl
COllercial
GQvernaent
Total
Percentage
lani
laae
lev
($11)
Rev
($11)
Rev
($1)
IIrit
Sbr
-------------------------------------------------------------------------
1
IBII
400
450
2
AlDERSOI
CISL!
338
45
3
EDS
155
350
4
COUIOL
DATA
120
60
5
AMEllCA)
liGHT
SIS
103
13
6
UlYSIS
100
235
7
DEC
100
40
8
ImI/AGS
70
10
9
COMPo
StIllCES
CORP.
45
300
10
PLAt.IIG
RESEARCH
43
116
11
SIL
SIStEKBOOSE
37
54
12
BOIIlG
25
175
13
SAlt
15
265
14
GlMAI
0
250
IS
HAITII
HAIIETTA
0
80
Total
$1,551.00
$2,U3.00
Average
$103.40
$162.87
'
Average
£Iel
IBM
$82.21
$142.36
* *
iI
CONSULTING and RESEARCH SERVICE * * *
- - For Internal Use Only - -
850
25.791
383
21.
79%
505
9.991
180
7.741
116
6.641
335
6.451
140
6.451
80
4.511
345
2.901
159
2.771
91
2.391
200
1.611
280
0.971
250
0.001
80
0.001
$3,994.00
100.001
$266.27
$224.57
15
FINANCIAL ANALYSIS OF SYSTEMS INTEGRATORS
Exhib1t
11
IIPUT
ESTIMATES
SYSTEMS
IITEGIATIOI
-IEVEIDES,
1988
===================================================
lanked
by
Federal
GoverDient
Syste.s
Integrat10n
levenues
GoverDient
Betenue
Fira
lank
lale
eollerc1al
Governaent
Total
Percentage
Rev
($Kl
lev
($K)
lev
($K)
Hrit
Shr
1
IBM
400
450
850
2
EnS
155
350
505
3
COIIP.
SCIEICES
COIP.
45
300
345
4
SAlC
15
265
280
5
GBUlUIAI
0
250
250
6
mSIS
100
235
335
7
BOEIIG
25
175
200
8
PLAlIIIG
RESEARCH
43
116
159
9
HAlTII
HAIIErT!
0
80 80
10
COITROr.
DATA
120
60
180
11
SiL
SYSfEKBOOSE
37
54
91
12
AlDEBSOI
ClSLT
338
45
383
13
DEC
100
40
liO
U
AMElICAI
OGlft
SIS
103
13
116
IS
IYIEI/AGS
70
10
80
Total
$1,551.00
$2,!43.00
$3,994.00
Average
$103.40
$162.87
$266.2.7
Average
£Icl
IBI
$82.21
$U2.36
$224.57
......
CONSULTING and RESEARCH SERVICE
......
- - For Internal Use Only - -
18.42S
14.33S
12.28S
10.85S
10.23S
9.62%
7.16S
4.75S
3.27S
2.46S
2.21S
1.84S
1.64S
0.531
O.41S
100.00S
16
FINANCIAL ANALYSIS OF SYSTEMS INTEGRATORS
The Size
of
the U.S. Systems integration Market; Computer Systems News' Estim,ates
Computer
Systems
News'
Systems
Integrators whitepaper, published in May
of
1989
provides interesting details
on
the
Top 50
Systems
Integrators
in
the
United
States.
Based upon mailed questionnaires,
the
data
includes information on employee head counts
as
well as revenues. This
data
enables calculation of a useful statistic;
Systems
Integration
Revenue
per
Systems Integration Employee. This statistic is
the
only available information
on
efficiency
or
costs.
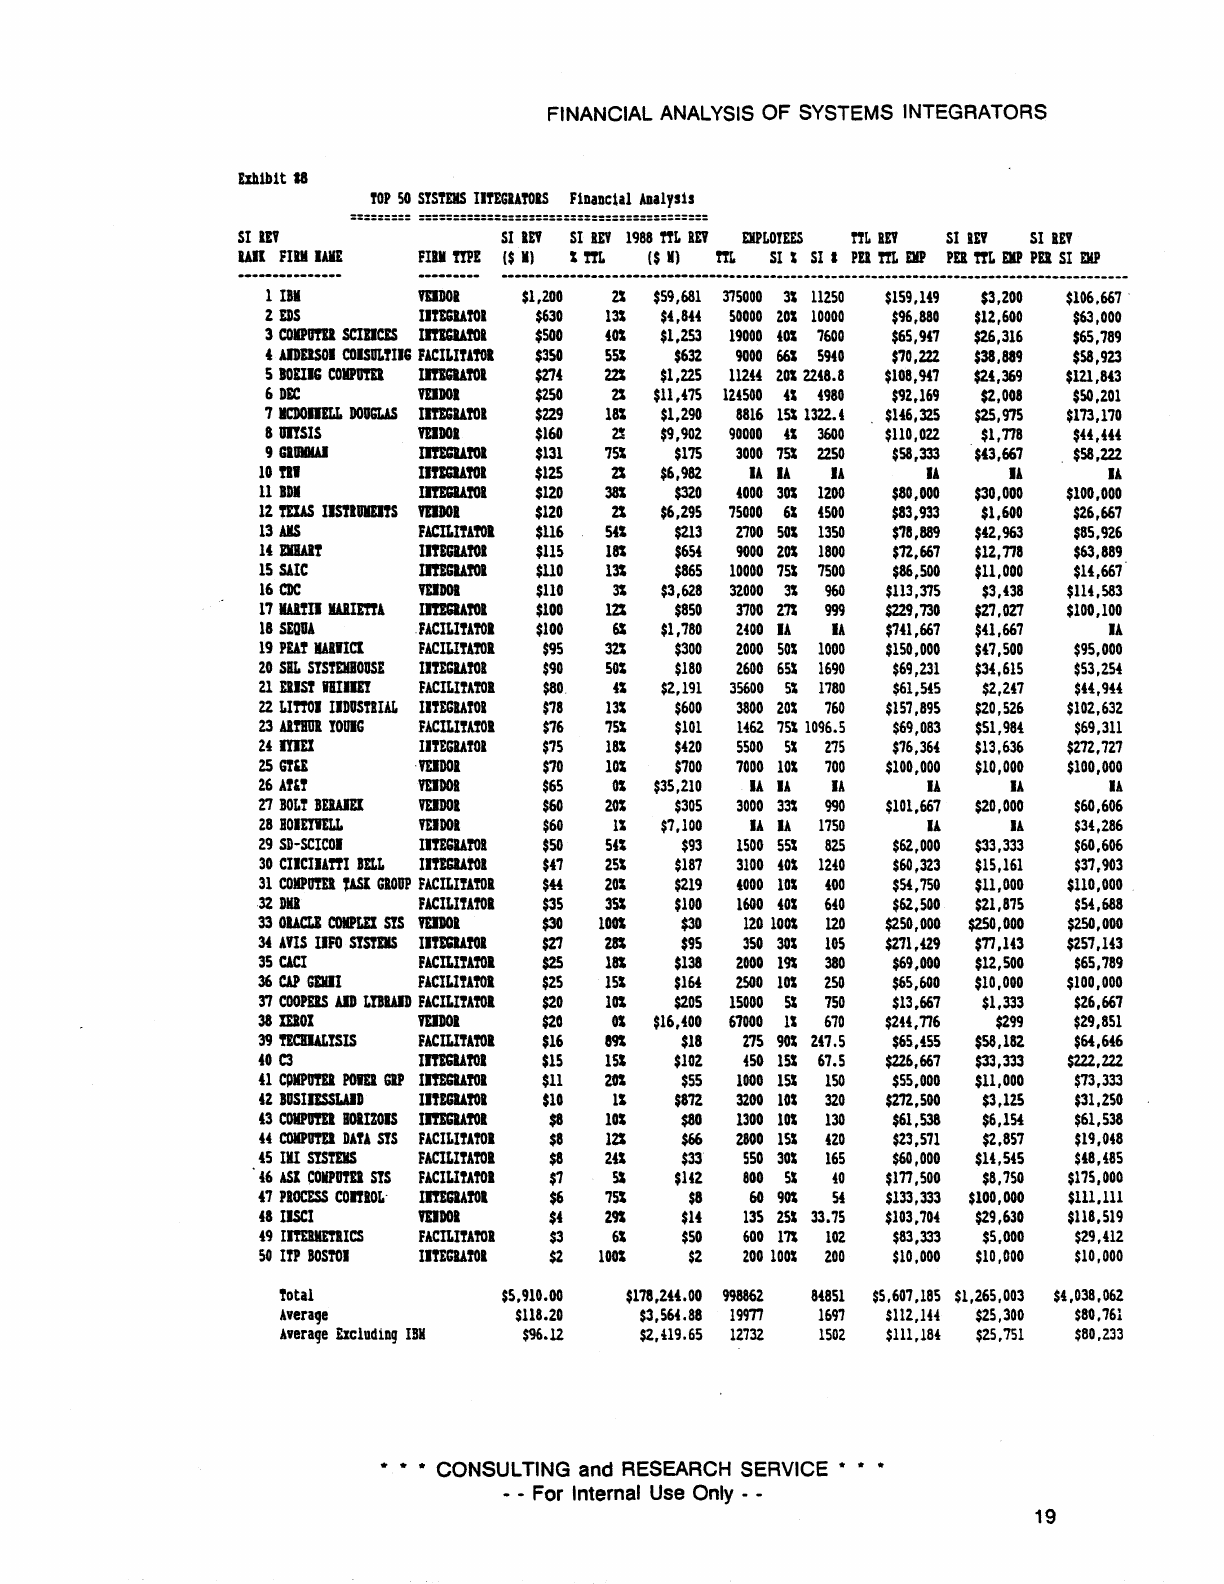
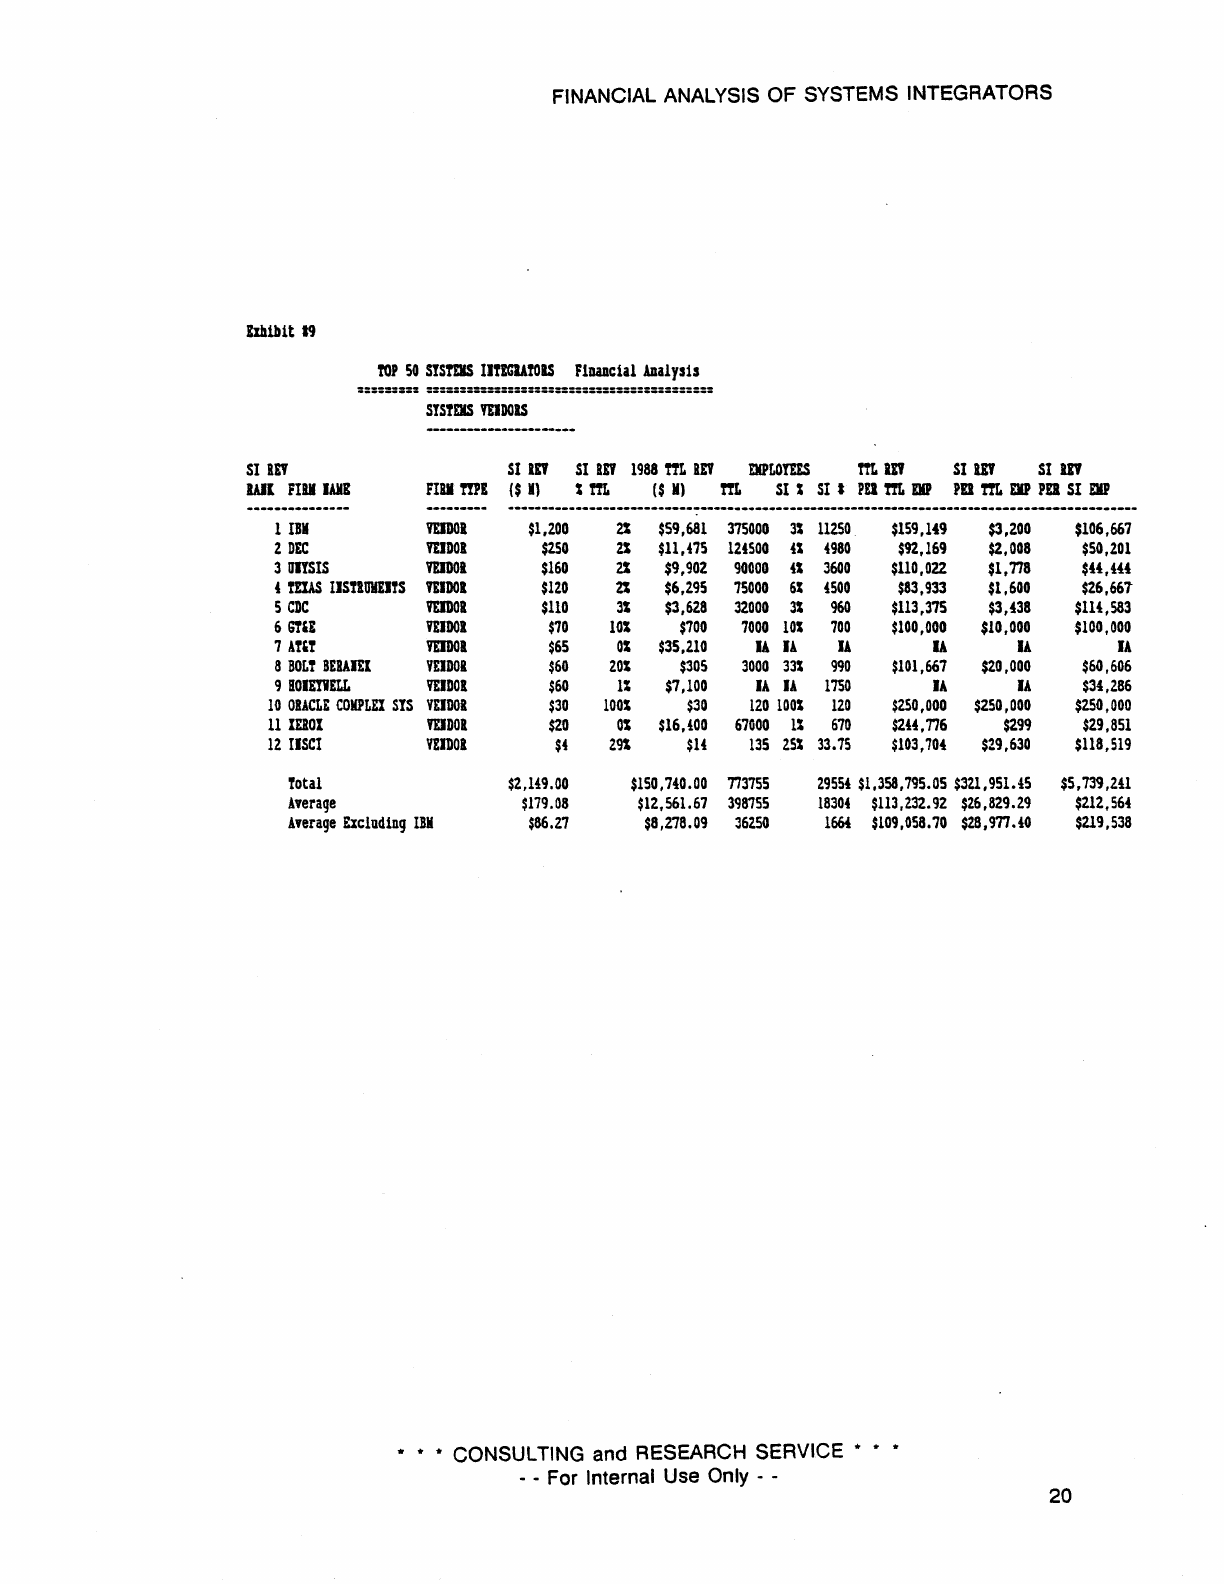
Exhibit
#8
ranks
the
Top 50 systems integrators by
total
systems
integration revenue.
The
estimated
amounts
of revenue differ significantly from those
estimated
by Input. This
is a result of
the
difference in definition
and
accounting
standards
previously alluded to.
The
Top 50
systems
integrators garnered $5.9 billion
in
revenues during 1988 according
to
Computer
System
News. This compares to
the
$4.8 billion
estimated
by Input. The
amounts
of
systems
integration revenue
attributed
to each firm also differ considerably.
Despite
these
discrepancies
the
top
systems integrators appear in both lists.
Computer
Systems
News distinguished competitors
by
type. Vendors
are
those firms
whose primary business mission is hardware sales. Facilitators, typically
the
Big
Eight
accounting firms, sell expertise
in
accounting information systems
and
auditing, with
systems
integration
as
a means
to
promote those services. Integrators,
per
se, have
identified
SI
to
be
their
primary business mission.
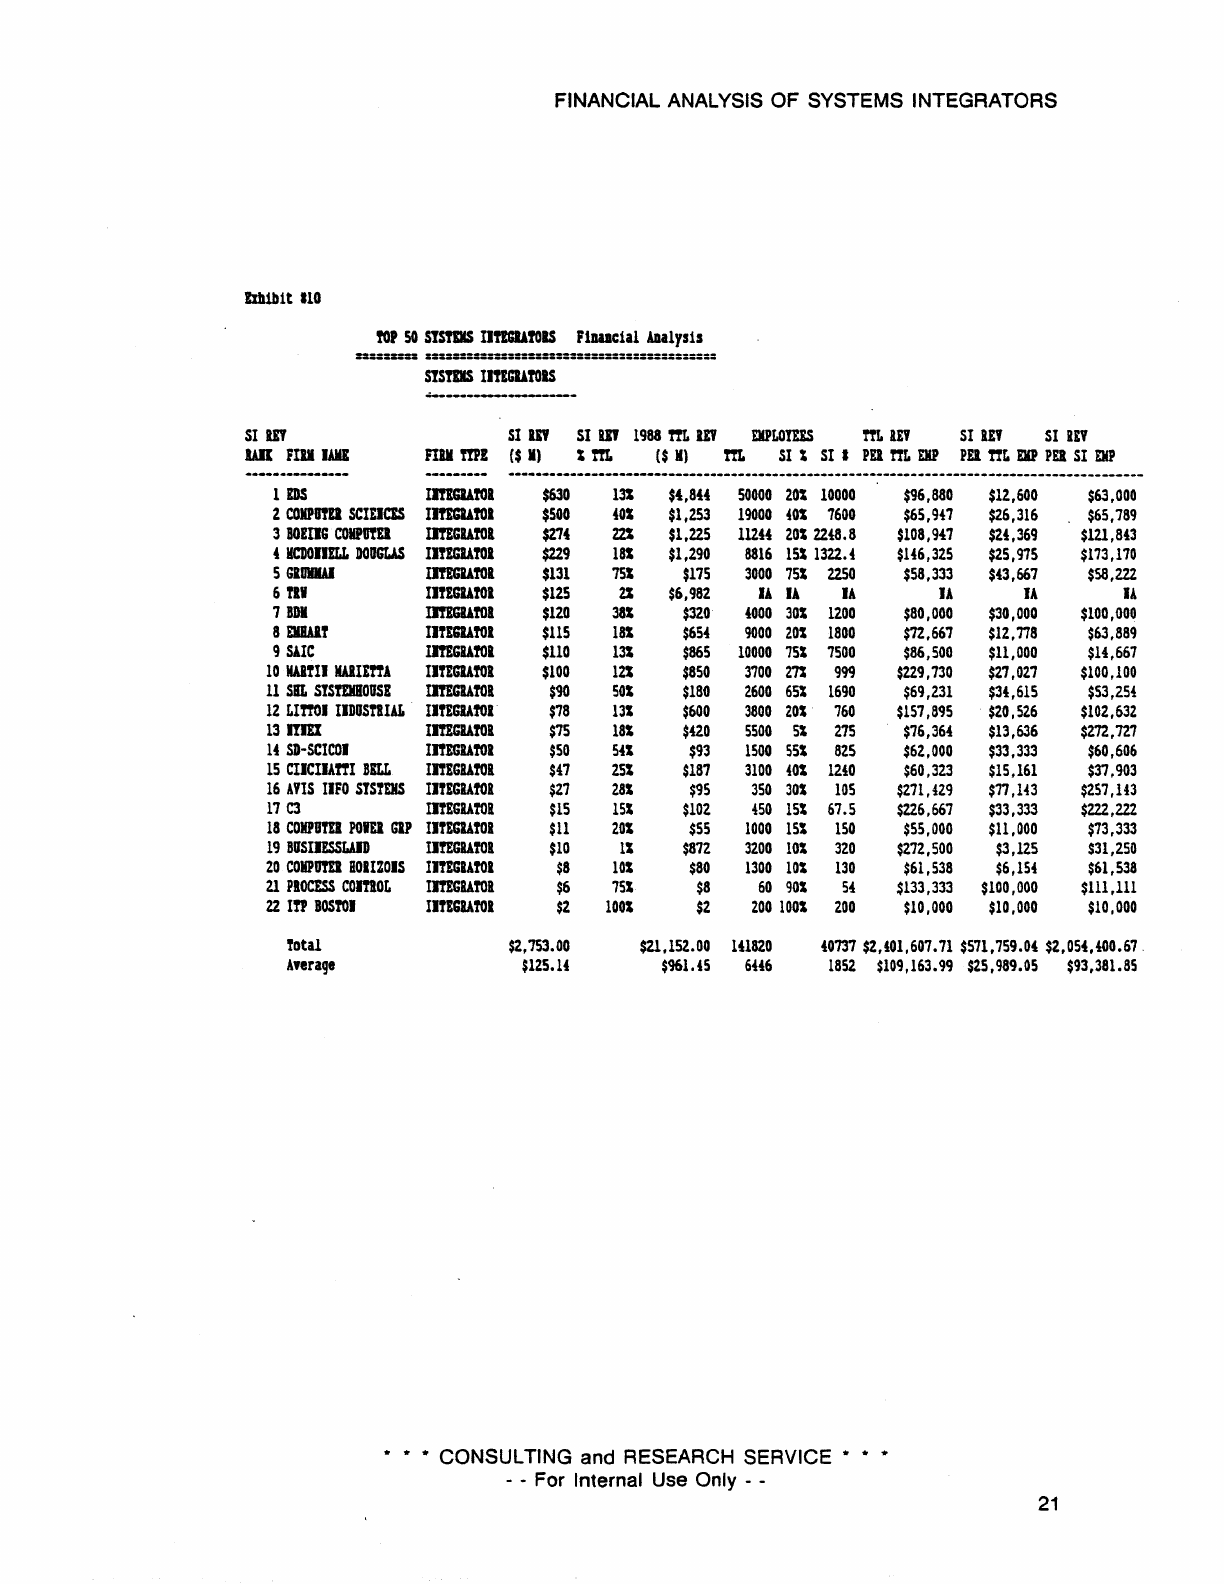
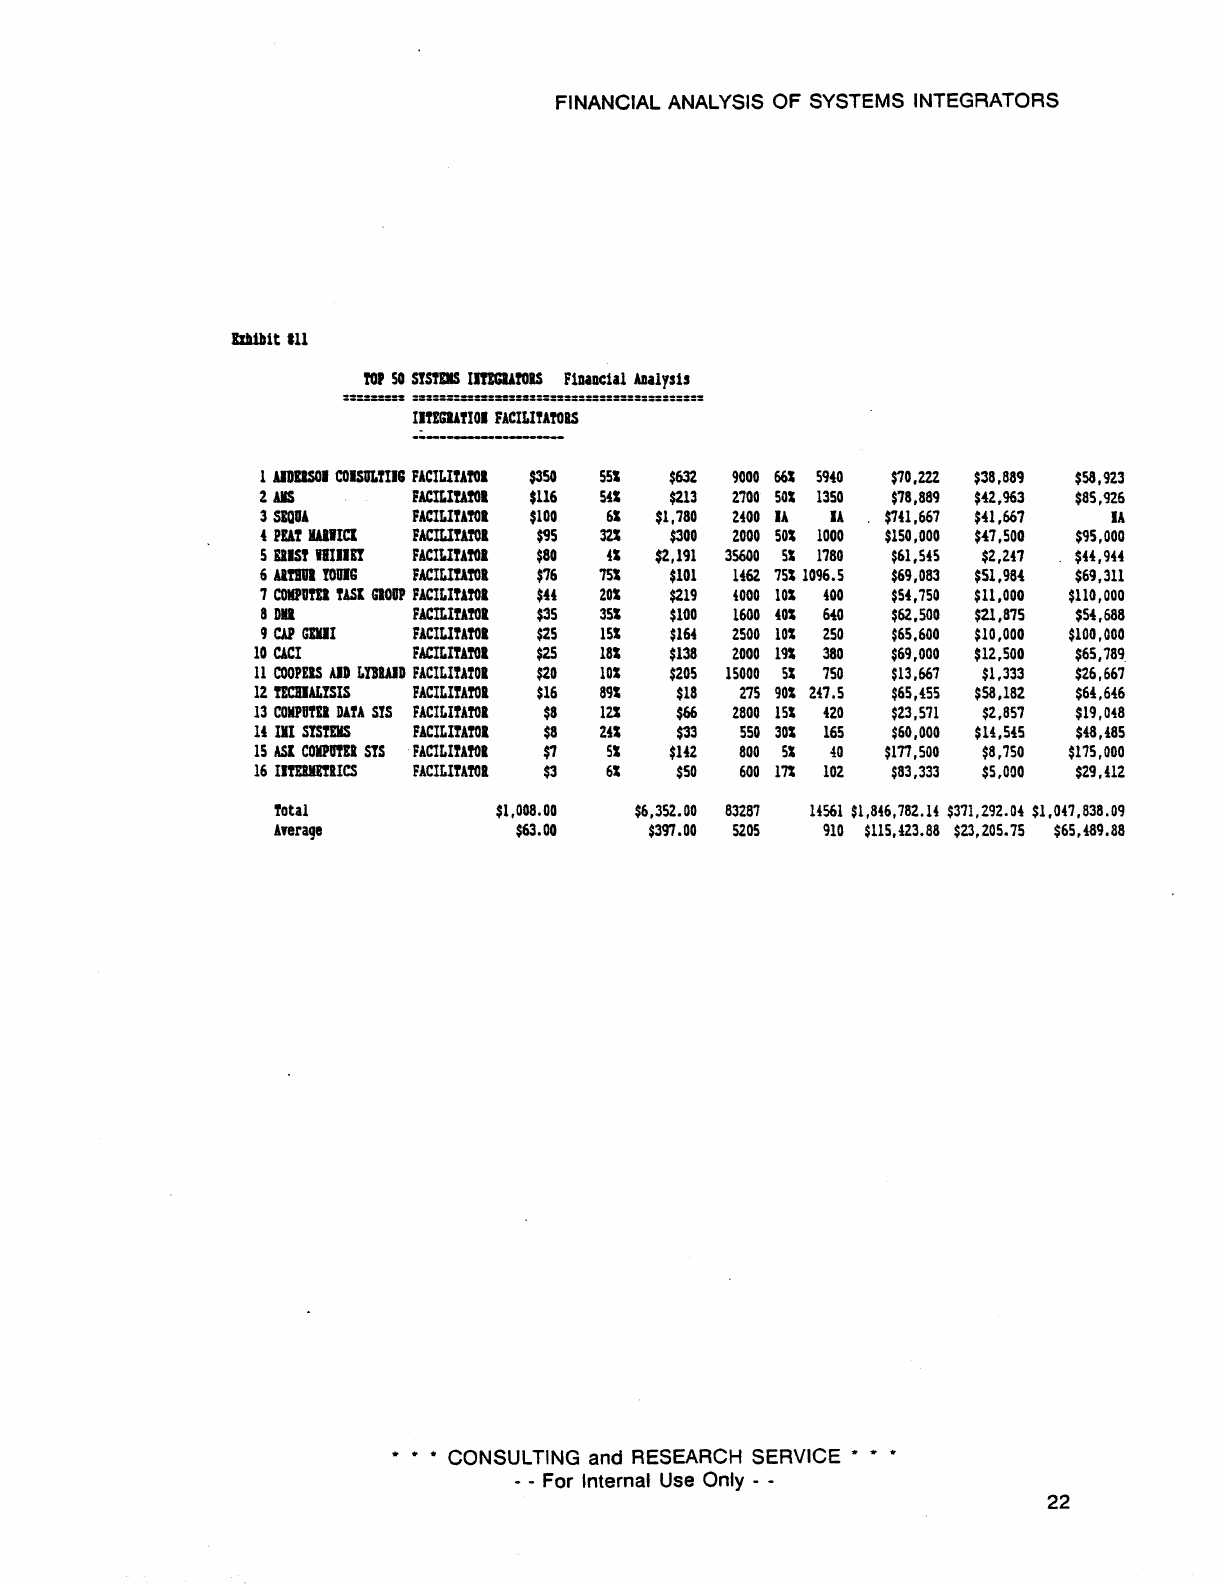
Exhibits
#9
through
# 11 detail some of
the
contrasts
among
these
three
segments.
Note first
the
differences in
the
number of competitors: twenty-two integrators, sixteen
facilitators,
and
twenty-two integrators.
Excluding IBM's systems integration revenue
of
over $1 billion,
the
average 1988
SI
revenue for each
segment
was: $63 million for facilitators, $86.27 million for vendors
and
$125.14 million for integrators. Average
SI
revenue per
SI
employee was
estimated
to
be
$212,564 for hardware vendors, $93,381 for integrators
and
$65,499 for facilitators. These
segment
averages compare
to
the
overall (Top
50~
SI
revenue
per
SI
employee
statistic
of
$80,761.
These statistics point
to
a fundamental fact about
the
systems
integration business. While
the
market
is growing quickly
and
while
systems
integration is generally considered
to
be
more profitable
than
pure professional services (10% margins vs services' 6%),
it
is very
capital intensive.
It
does
not
require investment in manufacturing plants like
the
hardware
business
but
most
systems integration firms fund software development programs.
testing
facilities and training programs. Project development costs
and
costs for bidding on con-
tracts
are
significant, amounting
to
up
to
4% of a given
contract's
value, according
to
Mark Hodges of G2 Research. 5
5 "Big Business Dominates
Systems
Integration Sector";
John
Moore;
Systems
Integration whltepaper; Computer
Systems
News; May 1989.
* * * CONSULTING and RESEARCH SERVICE *
- - For Internal Use Only - -
* *
17
FINANCIAL ANALYSIS
OF
SYSTEMS INTEGRATORS
By
contrast
with
the
systems integrators' 10%
to
12% margins. hardware manufacturers
typically receive margins on equipment in excess of 25%. This fact may account for
the
higher average
SI
revenue per employee enjoyed
by
the
vendor segment.
* * * CONSULTING and RESEARCH SERVICE *
- - For Internal Use
Only
- - * *
18
FINANCIAL ANALYSIS OF SYSTEMS INTEGRATORS
Elh1b1t
18
TOP
50
SYSTElIS
I1TEGIATOlS
F1nancla1
Ana1ys1s
=========
==========:::=:===========================
SI
lEV
51
lEY
51
lEY
1988
TTL
iEY
ElPLOtEES
nLiEY
SI
lEY
SI
iEV
un
FlU
lAKE
FIlII
mE
($
11)
tm.
($
If) ttL
SI
t;
51
I
PEl
TTL
DP
PEl.
TTL
ElP
PEl
SI
EYP
---------------
-------------------------------------------------------------------------------------------
1
III
YUDOI
$1,200
2t
$59,681
315000
31
11250
2
IDS
IITEGlAtol
$630
131
$4,844
50000
201
10000
3
COlPum
SCIDCES
ImGUTOI
$500
40t
$1,253
19000
401
7600
•
UDDSOI
COISULTlle;
FACILITATOR
$350
551
$632
9000
661
5940
5
BOElle;
COlPum
ImGbTOI
$274
m
$1,225
112U
2012248.8
6
DEC
YUDOl
$250
2t $ll,475
124500
U
4980
7
ICDOIIELI.
DOUGLAS
ImGlATOI
$229
18t
$1,290
8816
1511322.4
8
mSls
YDDOl
$160
2S
$9,902
90000
41
3600
9
GllDOIAI
IftEGWOI
$131
751
$175
3000
75t
2250
10
ft.
IITIGIATOI
$lZS
2S
$6,982
IA
Ii
IA
11
BDI
ImGlATOI
$120
381
$320
4000
301
1200
12
TEW
IIS'lIUIDTS
YDDOR
$120
2t
$6,295
75000
6t
4500
13
!IS
FACILItAtoR
$116
Sfl
$213
2700
50S
1350
UawT
I1fEGlAtol
$115
181
$654
9000
20t
1800
IS
SAlC
ImGIAtOI
$110
131
$865
10000
75t;
7500
16
CDC
'fEIIGI
$110
3S
$3,628
32.000
3S
960
17
lAUD
mImA
ImGlATOI
$100
121
$850
3700
2"
CJCJ9
18
SEOUA
FACILITATOR
$100
6S
$1,780
2fOO
IA
IA
19
PEAT
WIICl
FACILITATOR
$95
32t
$300
2.000
50S
1000
20
SBL
SYSTEHBOUSE
IIBGlAtol
$90
SOt
$180
2600
65S
1690
2.1
rusr
DIIm
FACILITATOR
$80.
4S
$2,191
35600
5%
1180
22
LITTOI
IIDUStiIAL
II!EGlATOI
$78
13t
$600
3800
20S
760
23
Al!ll1Jl
YOUIG
FACILItAtOR
$76
751
$101
1462
751
1096.5
24
mEl
I1BGlAfOl
$75
181
$420
5500
5S
275
ZS
CUE
·mOOl
$70
101
$700
7000
lOt;
700
26
AUT
mOOI
$65
OS
$35,210
IA
n
IA
21
BOLT
BEWEl
'fEID01
$60
20t
$305
3000
33%
990
28
HOlmELL
'fEIDOR
$60
IS
$7,100
IA
Ii
1750
29
SD-SCICOI
I1BGlATOR
$50
541
$93
1500
55S
825
30
CIICIIATrI
BELL
ll!EGlATOl
$47
25t
$187
3100
40%
12.40
31
COJIPom
fASt
GIOUP
FACILIUTOR
$44
201
$219
4000
lOS
400
32
DII
FACILITATOR
$35
351
$100
1600
40S
640
33
OUeLI
COIPLEI
SIS
mOOl
$30
lOGS
$30
120
lOot
120
34
AYIS
lIFO
SISTDS
I1!EGlATOI
$27
28S
$95
350
30t;
105
35
CACI
FACILIU'lOR
$2S
181
$138
2.000
1~
380
36
CAP
GEJIII
FACILIUTOI
$25
lSI
$164
2500
lOS
250
37
COOPEIS
AID
LtBWD
FACILItATOI
$20
lot
$205
15000
St;
750
38
mOl
mDDI
$20
01
$16,400
67000
11
670
39
TECBlALYSIS
FACILI!AtoR
$16
891
$18
275
90t;
2.47.5
400
ImGlATOI
$15
ISS
$102
4SO
15S
67.5
U
CPlIPum
POm
GIP
ImGlATOI
$11
20S
$55
1000
1St;
ISO
42
BUSIJlSSLAID
IIfEGUTOR
$10
IS
$872.
3200
lOS
320
43
COIIPUfEl
BOIIZOIS
ImGIAroR
$8
101
$80
1300
lOS
130
44
COIPOTEl
DATA
SIS
FACILItATOR
$8
121
$66
2800
ISS
420
45
III
mmlS
FACILITATOR
$8
241
$33
550
30S
165
46
ASI
COIfPUTEI
SIS
FACILITAtoR
$7
51
$142
800
5t;
fO
f7
PIOCESS
conlOL'
ImGlATOI
$6
751
$8
60
90s
54
48
IISCI
lEIDOl
$'
291
$1f
135
25t;
33.75
49
ImDmICS
FACILITAtoR
$3
61
$50
600
17S
102
50
ItP
BOSTOI
IIBGIATOR
$2.
IDOl
$2.
ZOO
lOOt;
200
Total
$5,910.00
$178,2.44.00
998862
84851
Average
$118.2.0
$3,564.88
19m
1697
Average
Excluding
IBH
$96.12
$2,419.65
12732
1502
. .
• CONSULTING and RESEARCH SERVICE •
- - For Internal Use Only - -
$159,H9
$3,200
$106,667
.
$96,880
$12,600
$63,000
$65,947
$26,316
$65,189
$70,222
$38,889
$58,923
$108,947
$2!,369
$121,8'3
$92,169
$2,008
$50,201
$146,325
$25,975
$173,170
$110,022
$1,178
$U,4tt
$58,333
$43,667
$58,222
IA
IA
Ii
$80,000
$30,000
$100,000
$83,933
$1,600
$26,667
$78,889
$'2,963
$85,92.6
$12,667
$12,178
$63,889
$86,500
$11,000
$H,667
$113,3'75
$3,438
$1U,583
$229,730
$27,027
$100,100
$141,667
$41,667
IA
$150,000
$41,500
$95,000
$69,231
$34,615
$53,254
$61,5!S
$2.,U7
$44,944
$151,895
$20,526
$102,632
$69,083
$51,984
$69,311
$76,364
$13,636
$2.12,727
$100,000
$10,000
$100,000
IA IA IA
$101,667
$2.0,000
$60,606
U IA
$34,286
$62,000
$33,333
$60,606
$60,323 $15,161
$37,903
$54,750
$11,000
$110,000
$62,500
$21,875
$54,688
$250,000
$250,000
$2.50,000
$271,429
$17,143
$251,143
$69,000
$12,500
$65,789
$65,600
$10,000
$100,000
$13.667
$1,333
$2.6,667
$244,776
$299
$2.9,851
$65,455
$58,182
$64,646
$22.6,667
$33,333
$222,222
$55.000
$11,000
$73,333
$212,500
$3,125
$31,250
$61,538
$6,154
$61,538
$2.3,571
$2,857
$19,Of8
$60,000
$14,545
$48,485
$177
,500
$8,750
$175,000
$133,333
$100,000 $111,111
$103,704
$29,630
$118,519
$83,333
$5,000
$29,412
$10,000
$10,000 $10,000
$5,607,185
$1,265,003
S4,038,062
$112,144
$25,300
$80,761
$111,18!
$25,751
$80.233
• *
19
FINANCIAL ANALYSIS OF SYSTEMS INTEGRATORS
EIh1blt
19
fOP
50
STSms
IItlGUtoRS
Financial
ADal
ysis
:=:::::::
===:===:::=======:==:===:===:=:==:=::==:==
STstE1lS
mOORS
51
lE'f
51
lEV
51
lEY
1988
TTL
lEV
EllPLOms
mm
51
lEY
51
m
Wl
FIll
lAME
FlumE
($
I)
S
HI.
($
JI)
m.
51
S
S1
1
PEl
m.
EJIP
PD
m.
EIIP
PD
51
DIP
---------------
------------------------------------_
....
----------------------------------------------------
1
IBI
VEJDOI
$1,200
2l
$59,681
375000
3S
11250
$159,H9
$3,200
2
DEC
VEIDOI
$250
2S
$11,.75
12i500
is
{980
$92,169
$2,008
3 mSIS
VDDOI
$160
2l
$9,902
90000
{S
3600
$110,022
$l.na
{
rms
I1StIUKEITS
VEIDaI
$iZO
21
$6,295
75000
61
{500
$83,933
$1,600
5
CDC
VDDOR
$110
3S
$3,628
32000
3S
960
$113,375
$3,f38
6
GTn
VEIDaI
$70
lOS
$700
7000
lOS
700
$100,000
$10,000
7
AnT
VEIDOI
$65
OS
$35,210
U
IA
U
IA
IA
8
BOLT
BEIlAHI
VEIDOR
$60
201
$305
3000
331
990
$101,667
$20,000
91l0lmELL
VEIDOI
$60
II
$7,100
IA IA
1750
IA
IA
10
OBACLE
COMPLEX
SIS
VEIDoa
$30
1001
$30
120
laOS
120
$250,000
$250,000
11
lElOl
VElDOI
$20
01
$16,!00
67000
IS
670
$2U,T16
$299
12
IISCI
VEIDOI
U
29%
$U
135
251
33.75
$103,70f
$29,630
Total
$2,149.00
$150,7{0.00
n375S
2955t
$1,358,795.05
$321,951.
45
Average
Average
Excluding
IBJI
$179.08
$12,561.67
398755
1830.
$86.27
$8,278.09
36250
166j
* CONSULTING and RESEARCH SERVICE *
- - For Internal Use Only - -
$113,232.92
$26,829.29
$109,058.70
$28,9n.!0
$106,667
$50,201
$U,Hf
$26,661
$114,583
$100,000
IA
$60,606
$34,286
$250,000
$29,851
$118,519
$S,739,2tl
$212,56.
$219,538
20
FINANCIAL ANALYSIS OF SYSTEMS INTEGRATORS
bh1btt
110
to.
SO
sysms
IlftGUfOlS FiDUcial
ADalysis
========
::::::::::::::::::::::::::::::::::::::::::
SI
lEY
lAB FlU
lAME
._-------------
1
EDS
2
COJIPutD
SCIEICIS
3
BOEIJG
COlIPutD
j
HCDOnEIJ.
DOUGLAS
5
GllIIIAJ
6 Til
7BDt
8
EJlW.T
9SlIC
10
WTII
WIEn!
11
SBL
SYSTEIIIIOUSE
12
LITtoI
IJDUSHIAL
13
ItIEI
14
SD-SClCOI
15
CIICIJAnr
BELL
16
AVIS
liFO
SYStEJlS
17
C3
18
COJIPUTEI
pom
GIP
19
BIJSllESSWD
20
COJIPUTEI
aOIIZOIS
21
PROCESS
comOL
22
In
BOS!OI
Total
A,eraqe
stsms
InEGUtolS
----------------------
SI
m
51
lEY
1988
m
lEY
ElPLOms
TTL
lEi
51
lE'
SI
lEV
FIlii
mE
($
II)
1m.
($ II) m
51
1
51
I
PEl
m.
DIP
PEl
nr.
EKP
PEl
51
m
-------------------------------------------------------------------------------------------
ImGlAfOl
$630
13%
$4,844
50000
201
10000
$96,880
$ll,600
$63,000
llTECUfOl
$500
jOS
$1,253
19000
401
7600
$65,947 $26,316
$65,789
ImGlAfOl
$274
m
$1,225
lllU
201
22{8.8
$108,947
$24,369
$121,843
II!EGlAtol
$229
In
$1,290
8816
15S
1322.{
$146,325
$25,975
$173,170
ImGUfOl
$131
751
$175
3000
75S
2250
$58,333
$43,667 $58,222
IJ!EGlAtol
$125
2S
$6,982
IA
U
IA
U U
IA
ImGlAfOl
$120
381
$320
4000
30S
1200
$80,000
$30,000
$100,000
IITEGlAfOl
$115
l8S
$654
9000
20S
1800
$72,667
$12,718
$63,889
ImGBAfOl
$110
13%
$865
10000
75S
7500
$86,500 $11,000
$14,667
I1TEGlAtol
$100
12S
$850
3700
271
999
$229,130
$27,027
$100,100
ImGlAfOl
$90
50S
$180
2600
65S
1690
$69,231
$34,615
$53,254
llTEGlAfOl·
$78
13S
$600
3800
20S
760
$157,895
$20,526
$102,632
llTEGlAfOl
$75
18S
$420
5500
Sl
275
$76,364
$13,636
$Z72,727
IITEGUfOl
$50
54S
$93
1500
55S
825
$6Z,000
$33,333 $60,606
IITEGlAfOl
$47
25S
$187
3100
40S
1240
$60,323 $15,161
$37,903
IITEGlAtol
$27
28S
$95
350
30S
105
$Z71,429
$77,143
$257,143
IITEGlAfOl
$15
ISS
$102
450
ISS
67.5
$226,667
$33,333
$222,222
IITEGUtol
$11
20S
$55
1000
ISS
150
$55,000
$11
,000
$73,333
llTEGlAfOl
$10
IS
$872
3200
lOS
3Z0
$272,500
$3,125
$31,250
I1TEGIA!01
$8
lOS
$80
1300
IDS
130
$61,538
$6,154
$61,538
IftEGlAfOl
$6
75S
$8
60
90S
54
$133,333 $100,000
$111,111
IITEGlAtol
$2
100S
$2
200
100S
200
$10,000
$10,000
$10,000
$2,753.00
$21,152.00
lU820
40737
$2,401,607.71
$571,759.04
$2,054,400.67 .
$125.14
$961.45
6U6
1852
* CONSULTING and RESEARCH SERVICE *
- - For Internal Use Only - -
$109,163.99
$25,989.05
$93,381.85
21
FINANCIAL ANALYSIS OF SYSTEMS INTEGRATORS
bJl1btt
III
!OP
50
SlstElS
ImGIA!OlS
FiDlDclal
ADal
ys1s
=:==::=:
=:==::==::==::==:==:=:::=::==:==:==:==::=:
IItEGU!IOI
FACILIUTOas
..
--------------------
1
AlDIISOI
COISULtIIG
FACILItAtol
$350
551
$632
9000
661
5940
$70,222
$38,889
$58,923
2 US
FACILItAtol
$116
541
$213
2100
sal
1350
$78,889
$42,963
$85,926
3
SlQUA
FACILItAtol
$100
61
$1,180
2.00
IA
I!
$741,667
$41,667
IA
4
PEl!
BIllet
FACILItAtoR
$95
32S
$300
2000
SOl
1000
$150,000
$47,500
$95,000
5 UIS! IBIIIEt
FACILItAtol
$80
.1
$2,191
35600
51
1780
$61,5.5
$2,2n
$H,9U
6 AI!BIII
toUlG
FACILIntoR
$76
751
$101
H62
751
1096.S
$69,083
$51,984
$69,311
7
COIIPUfEl
!ASI
GaOOP
FACILITAtoR
$44
20S
$219
4000
101
.00
$54,750
$11,000
$110,000
8DD
FACILItAtoR
$35
351
$100
1600
401
640
$62,500
$21,875
$54,688
9
CAP
GlUI
FACILItATOI
$25
lSI
$164
2500
101
Z50
$65,600
$10,000
$100,000
10
CACI
FACILITAtol
$25
181
$138
2000
191
380
$69,000
$12,500
$65,789
11
COOPEIS
AID
LYBWD
FACILItAtOR
$20
IDS
$205
15000
Sl
750
$13,667
$1,333
$26,667
12
fEClIIALYSIS
FACILIUtoR
$16
891
$18
275
90S
247.5
$65,455
$58,182
$64,646
13
COMPutER
DAt'
SIS
FACILIUtoR
$8
121
$66
2800
151
420
$23,511
$2,857
$19,048
14
III
SYStEJIS
FACILItAtoR
$8
241
$33
550
30S
165
$60,000
$14,545
$48,485
15
ASI
COlPUTEI
SIS
FAClLIUfOl
$7
51
$142
800
51
40
$177,500
$8,750
$175,000
16
IlnmtlICS
FACILIUtoR
$3
61
$SO
600
17%
102
$83,333
$5,000
$29,U2
total
$1,008.00
$6,352.00
83287
U561
$1,846,782.14
$371,292.04
$1,047,838.09
Ayerage
$63.00
$397.00
5205
910
CONSULTING and RESEARCH SERVICE
..
- - For Internal Use Only - -
$115,423.88
$23,205.75 $65,489.88
22
FINANCIAL ANALYSIS
OF
SYSTEMS INTEGRATORS
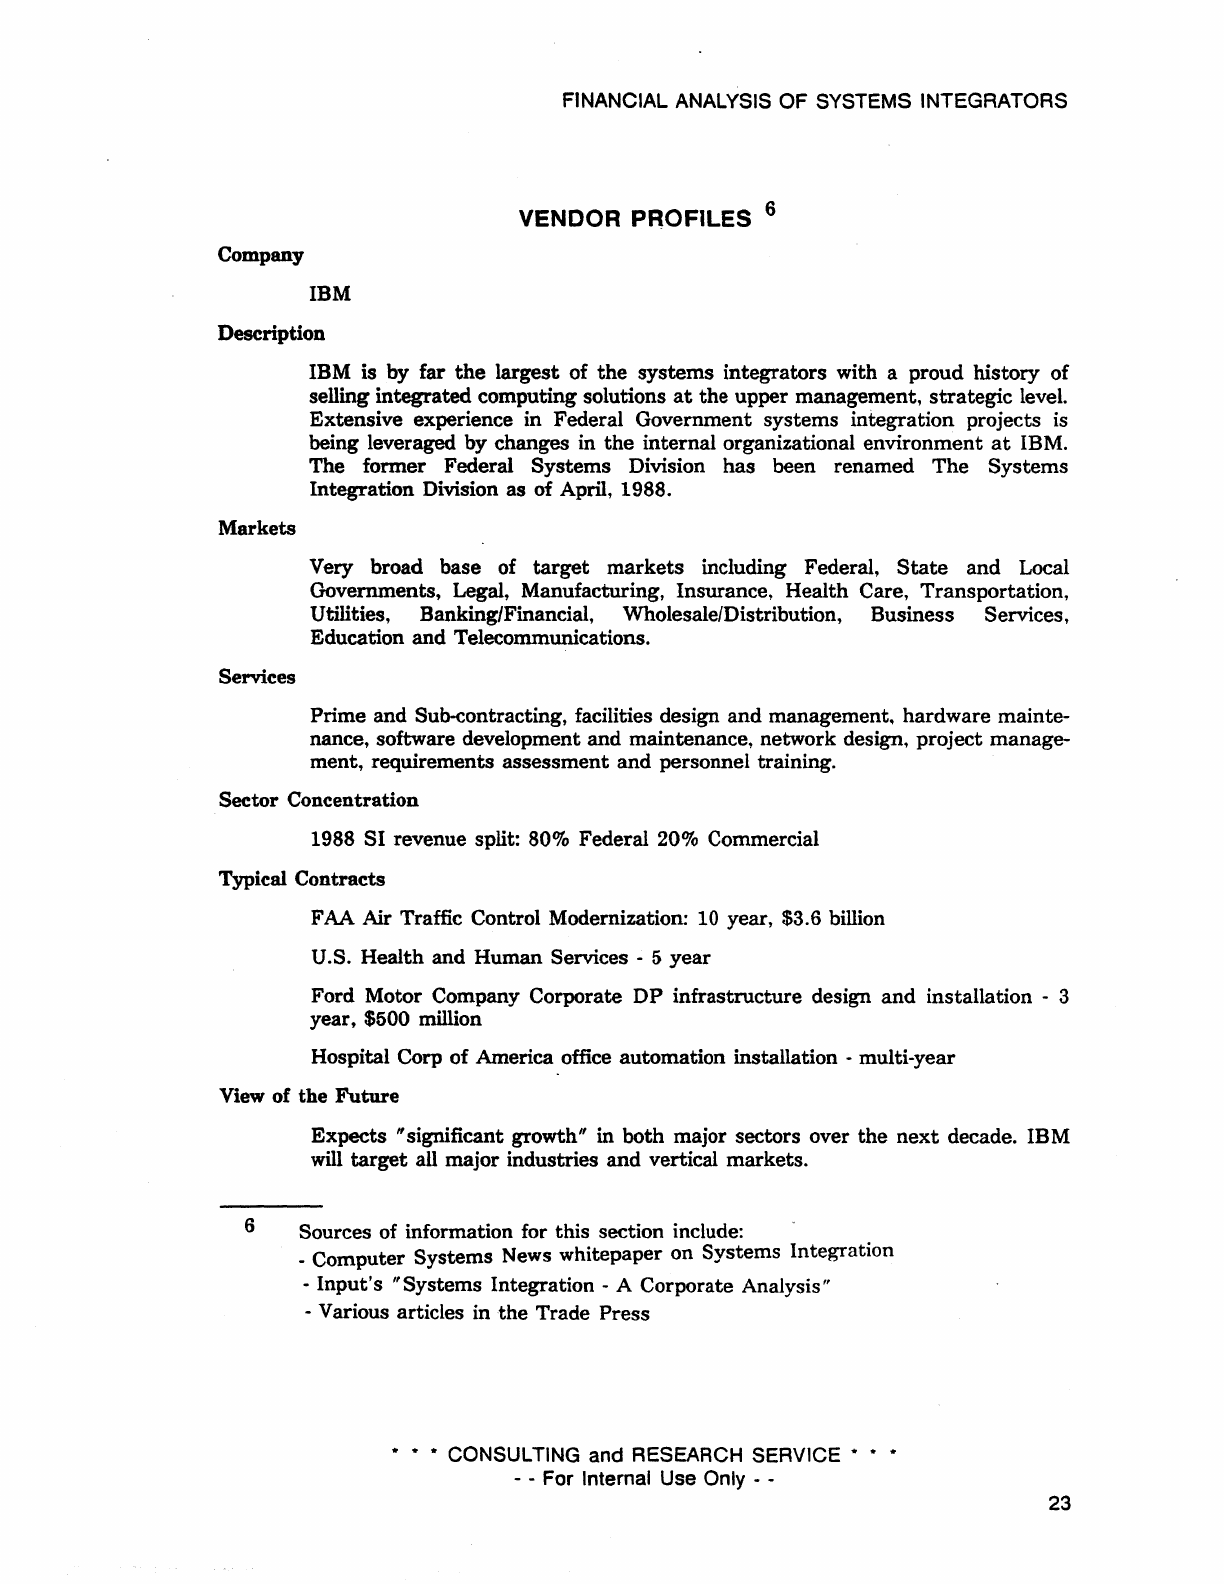
VENDOR PROFILES 6
Company
IBM
Description
Markets
Services
IBM
is
by
far
the
largest
of
the
systems
integrators
with
a
proud
history
of
selling
integrated
computing
solutions
at
the
upper
management,
strategic
level.
Extensive
experience
in
Federal
Government
systems
integration
projects
is
being leveraged
by
changes
in
the
internal
organizational
environment
at
IBM.
The
former
Federal
Systems
Division
has
been
renamed
The
Systems
Integration
Division
as
of
April,
1988.
Very
broad
base
of
target
markets
including Federal,
State
and
Local
Governments,
Legal, Manufacturing,
Insurance,
Health
Care,
Transportation,
Utilities, Banking/Financial, Wholesale/Distribution,
Business
Services,
Education
and
Telecommunications.
Prime
and
Sub-contracting, facilities design
and
management.
hardware
mainte-
nance, software
development
and
maintenance,
network
design,
project
manage-
ment,
requirements
assessment
and
personnel
training.
Sector
Concentration
1988
SI
revenue split:
80%
Federal
20%
Commercial
Typical
Contracts
FAA
Air Traffic Control Modernization: 10 year, $3.6 billion
U.S.
Health
and
Human
Services - 5
year
Ford
Motor
Company
Corporate
DP
infrastructure
design
and
installation
- 3
year,
$500
million
Hospital
Corp
of
America
office
automation
installation -multi-year
View
of
the
Future
Expects
"significant
growth"
in
both
major
sectors
over
the
next
decade.
IBM
will
target
all
major
industries
and
vertical
markets.
6 Sources of information for
this
section include:
_
Computer
Systems
News
whitepaper
on
Systems
Integration
-
Input's
"Systems
Integration
- A
Corporate
Analysis"
-Various articles in
the
Trade
Press
* CONSULTING and RESEARCH SERVICE
,.
- - For Internal Use Only - -
23
FINANCIAL ANALYSIS OF SYSTEMS INTEGRATORS
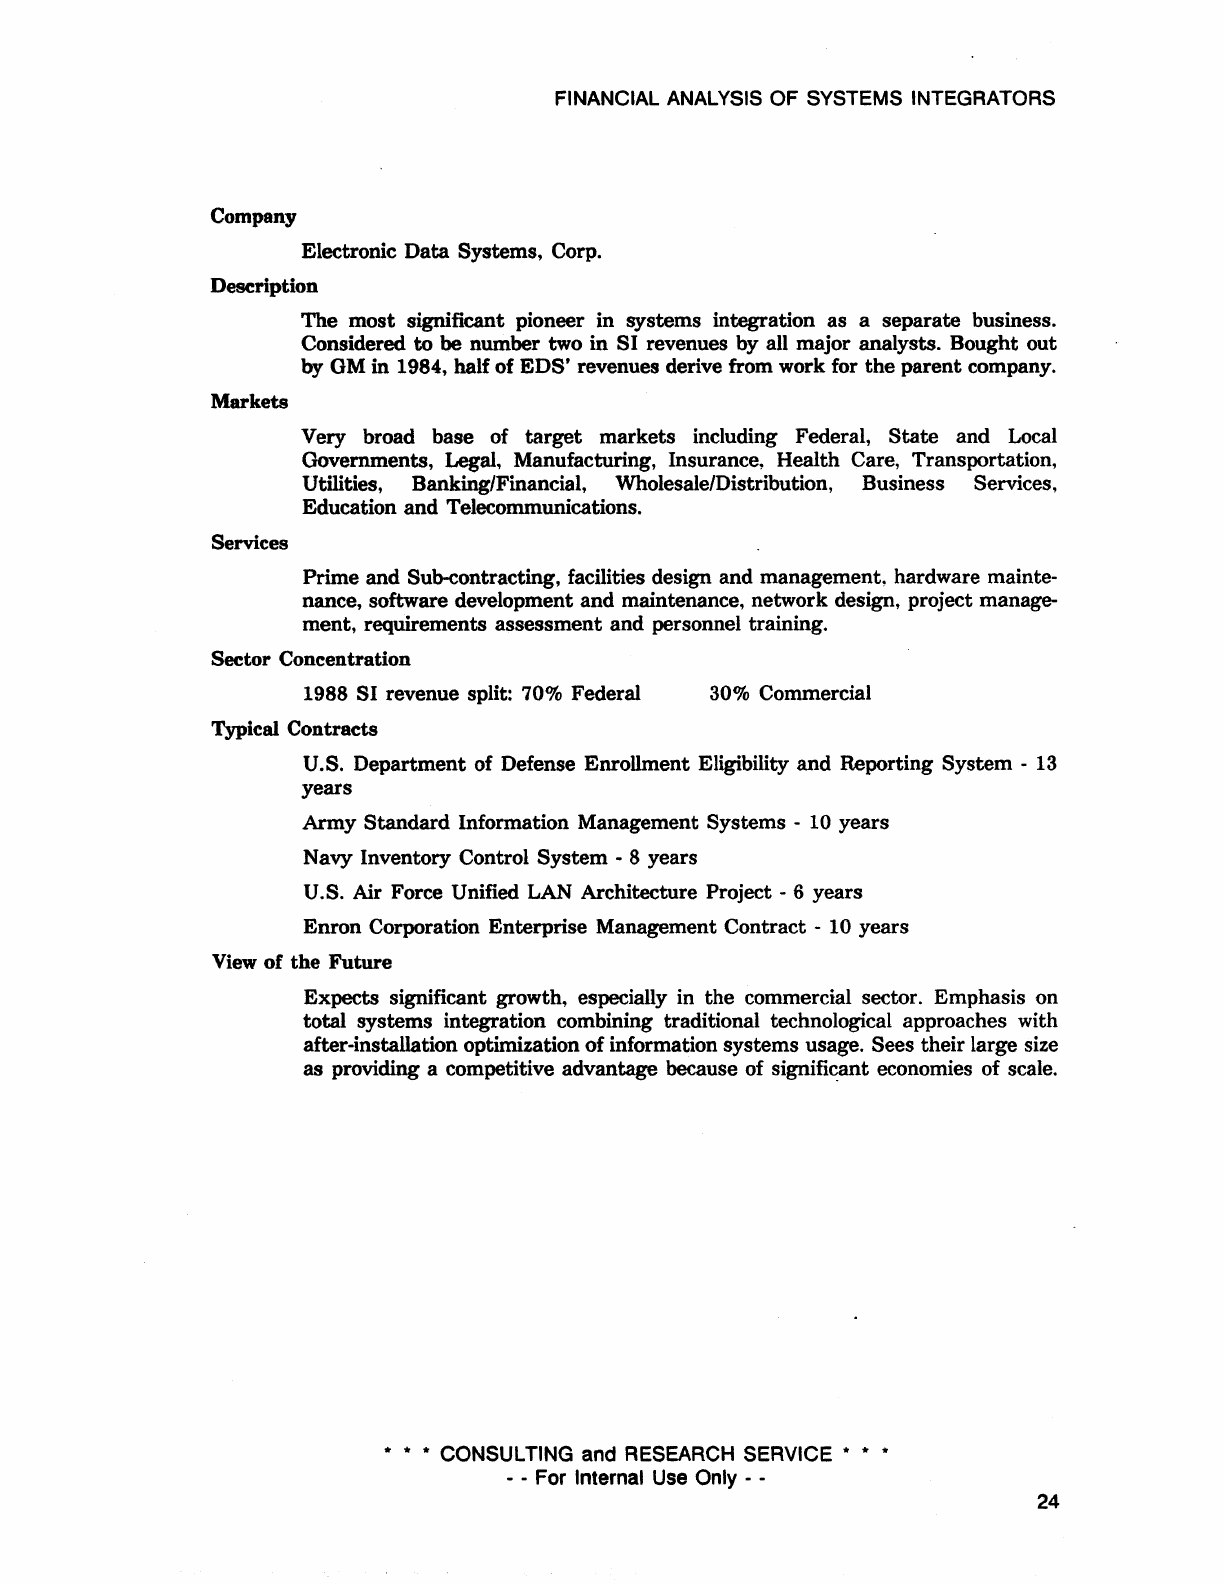
Company
Electronic
Data
Systems, Corp.
Description
Markets
Services
The
most
significant pioneer in systems integration as a
separate
business.
Considered to be number two
in
SI
revenues by all major analysts. Bought
out
by
OM
in
1984, half
of
EDS'
revenues derive from work for
the
parent
company.
Very broad
base
of
target
markets
including Federal,
State
and
Local
Governments, Legal, Manufacturing, Insurance, Health Care, Transportation,
Utilities, Banking/Financial, Wholesale/Distribution, Business Services,
Education
and
Telecommunications.
Prime
and
Sub-contracting, facilities design
and
management, hardware mainte-
nance, software development
and
maintenance, network design, project manage-
ment,
requirements
assessment
and
personnel training.
Sector Concentration
1988
SI
revenue split: 70% Federal
Typical Contracts
300/0
Commercial
U.S.
Department
of Defense Enrollment Eligibility
and
Reporting
System
-13
years
Army
Standard
Information Management
Systems
-10
years
Navy Inventory Control
System
-8 years
U.S. Air Force Unified LAN Architecture Project - 6 years
Enron
Corporation Enterprise Management Contract -
10
years
View
of
the
Future
Expects
significant growth, especially in
the
commercial sector. Emphasis
on
total
systems
integration combining traditional technological approaches with
after-installation optimization
of
information
systems
usage. Sees their large size
as
providing a competitive advantage because of
signifi~ant
economies of scale.
* * * CONSULTING and RESEARCH SERVICE *
- - For Internal Use Only - -
* *
24

FINANCIAL ANALYSIS OF SYSTEMS INTEGRATORS
Company
Anderson Consulting
Description
Markets
Services
A
separate
unit
of
Arthur
Anderson & Co., one of
the
world's
largest
accounting
firms, Anderson Consulting is
the
locus of
the
parent
firm's
management
con-
sulting business. Considered
by
analysts
to
be number two
or
three
in
SI
reve-
nues
and
enjoying
almost
100/0
of
the
market
for
SI
in
the
U.S. in 1988.
Broad
base
of
target
markets
including Federal,
State
and Local Governments,
Legal, Manufacturing, Insurance,
Health
Care, Transportation, Utilities,
Banking/Financial, Wholesale/Distribution, Education
and
Telecommunications.
Prime
and
Sub-contracting, facilities management, hardware maintenance, soft-
ware development and maintenance, network design, project
management,
re-
quirements
assessment
and
personnel training, business process change.
Sector
Concentration
1988
SI
revenue split: 12% Government
88%
Commercial
Typical
Contracts
Chicago Title
and
Trust
Co. WAN Project -4
years
Boeing Aerospace Factory/Office Integration
System
$2.7 million
U.S. Social Security Administration
Integrated
Financial Administrative
Systems: Subcontract with American Management
Systems
-
$12
million
View of
the
Future
Believes
there
will
be
consolidation within
the
industry
leaving a small
number
of
truly
excellent prime contractors
and
a
host
of
smaller niche
marketers
tar-
geting
specific industries or computing technologies.
Customers
will demand
strategic
solutions from
their
information systems.
* * * CONSULTING and RESEARCH SERVICE *
- - For Internal Use Only - -
* *
25
FINANCIAL ANALYSIS
OF
SYSTEMS INTEGRATORS
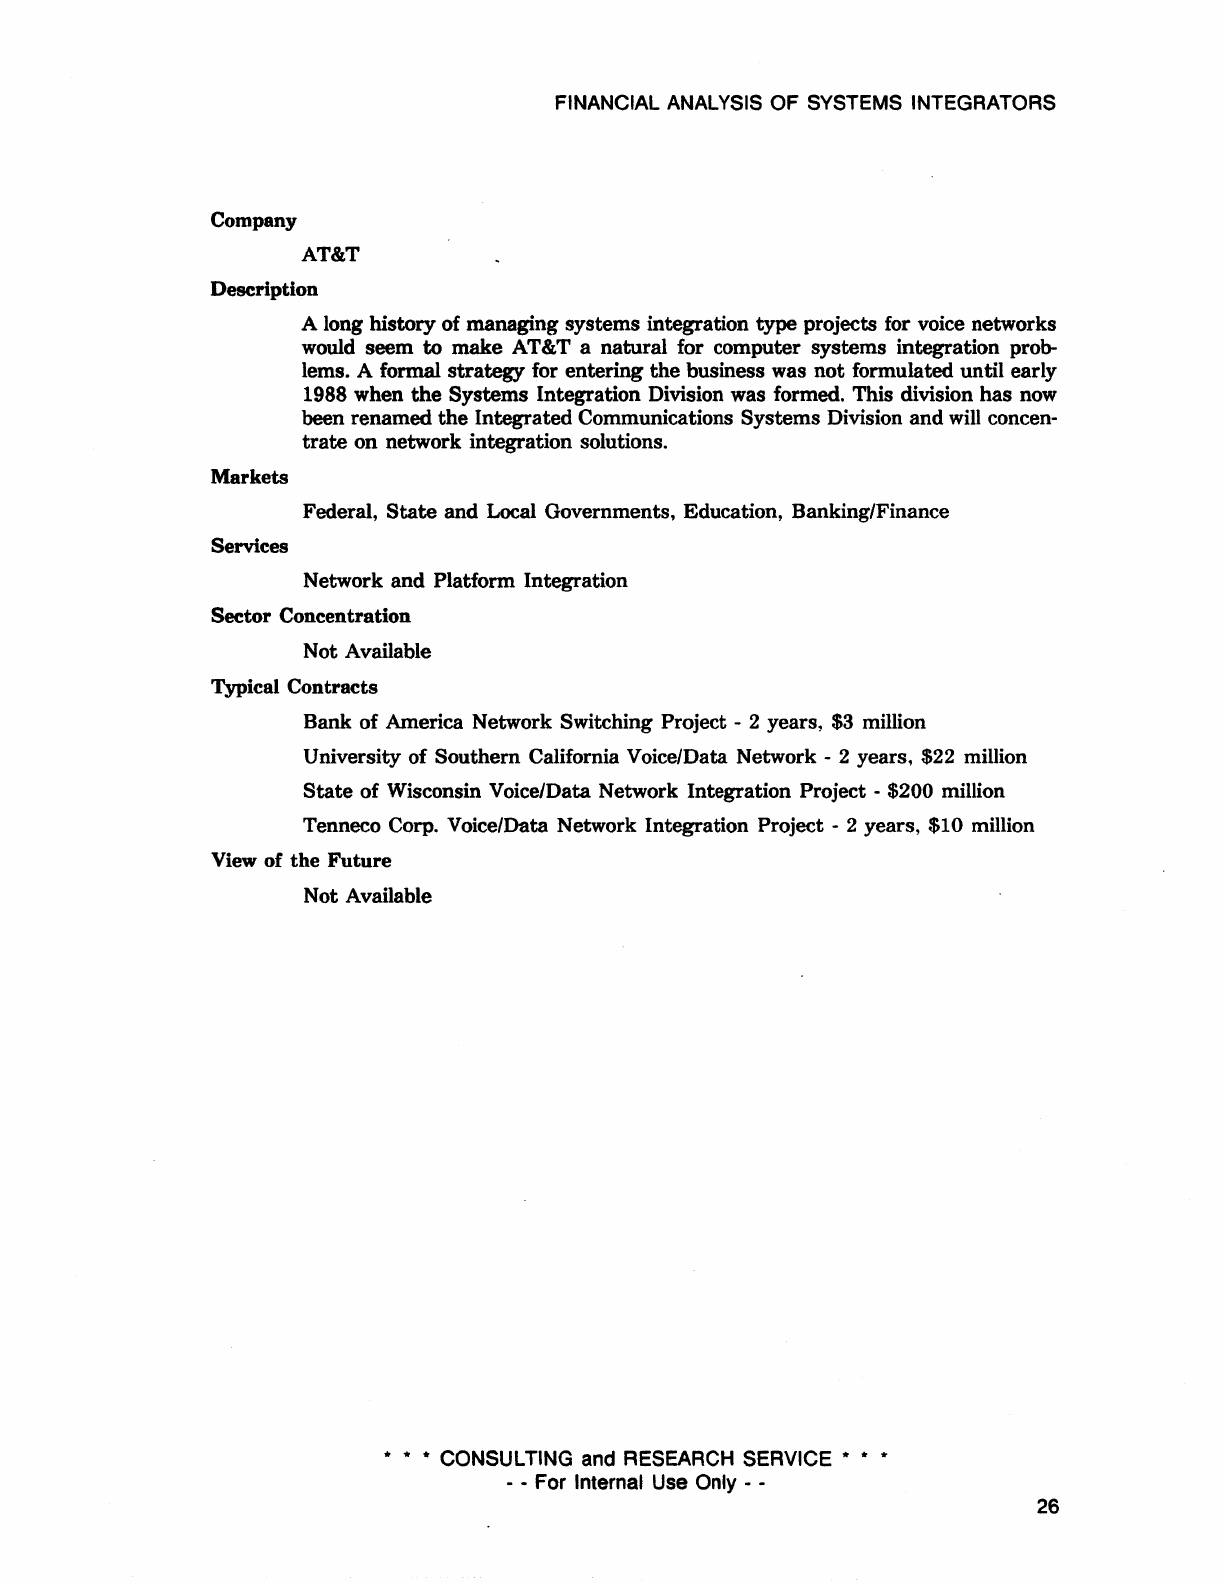
Company
AT&T
Description
Markets
Services
A long history of managing systems integration
type
projects for voice networks
would seem
to
make AT&T a natural for computer systems integration prob-
lems. A formal strategy for entering
the
business was not formulated until early
1988 when
the
Systems Integration Division was formed. This division
has
now
been renamed
the
Integrated Communications Systems Division
and
will
concen-
trate
on
network integration solutions.
Federal,
State
and Local Governments, Education, Banking/Finance
Network and Platform Integration
Sector
Concentration
Not Available
Typical
Contracts
Bank of America Network Switching Project -2 years, $3 million
University of Southern California Voice/Data Network -2 years,
$22
million
State
of Wisconsin Voice/Data Network Integration Project -
$200
million
Tenneco Corp. Voice/Data Network Integration Project -2 years,
$10
million
View of
the
Future
Not Available
* * * CONSULTING and RESEARCH SERVICE *
- -
For
Internal Use Only - -
* *
26
FINANCIAL ANALYSIS
OF
SYSTEMS INTEGRATORS
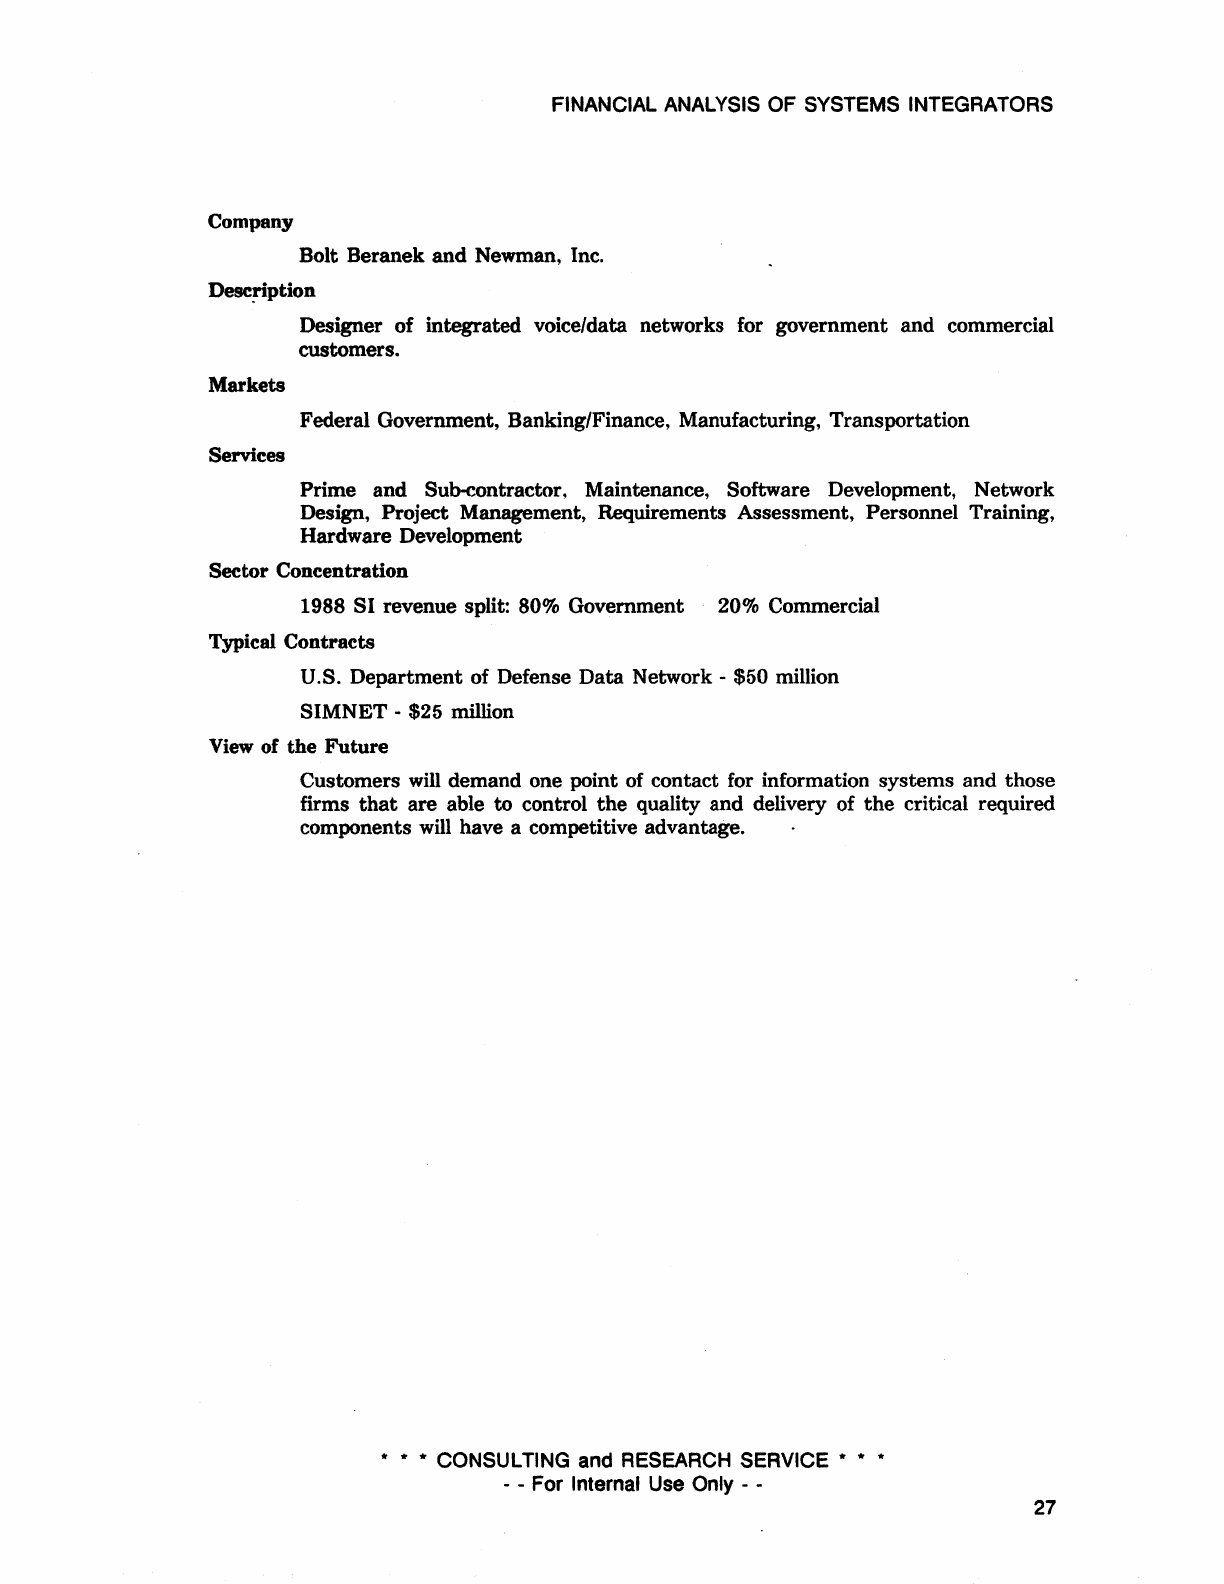
Company
Bolt
Beranek
and
Newman, Inc.
Dese~ption
Markets
Services
Designer
of
integrated voice/data networks for
government
and
commercial
customers.
Federal Government, Banking/Finance, Manufacturing,
Transportation
Prime
and
Sub-contractor. Maintenance, Software Development, Network
Design, Project Management, Requirements Assessment, Personnel Training,
Hardware Development
Sector Concentration
1988
SI
revenue split: 80% Government
20%
Commercial
Typical
Contracts
U.S.
Department
of Defense
Data
Network -
$50
million
SIMNET
-$25 million
View of
the
Future
Customers will demand one point of contact for information
systems
and
those
firms
that
are
able to control
the
quality
and
delivery of
the
critical required
components will have a competitive advantage.
* CONSULTING and RESEARCH SERVICE
'"
- - For Internal Use Only - -
'"
'"
27
FINANCIAL ANALYSIS OF SYSTEMS INTEGRATORS
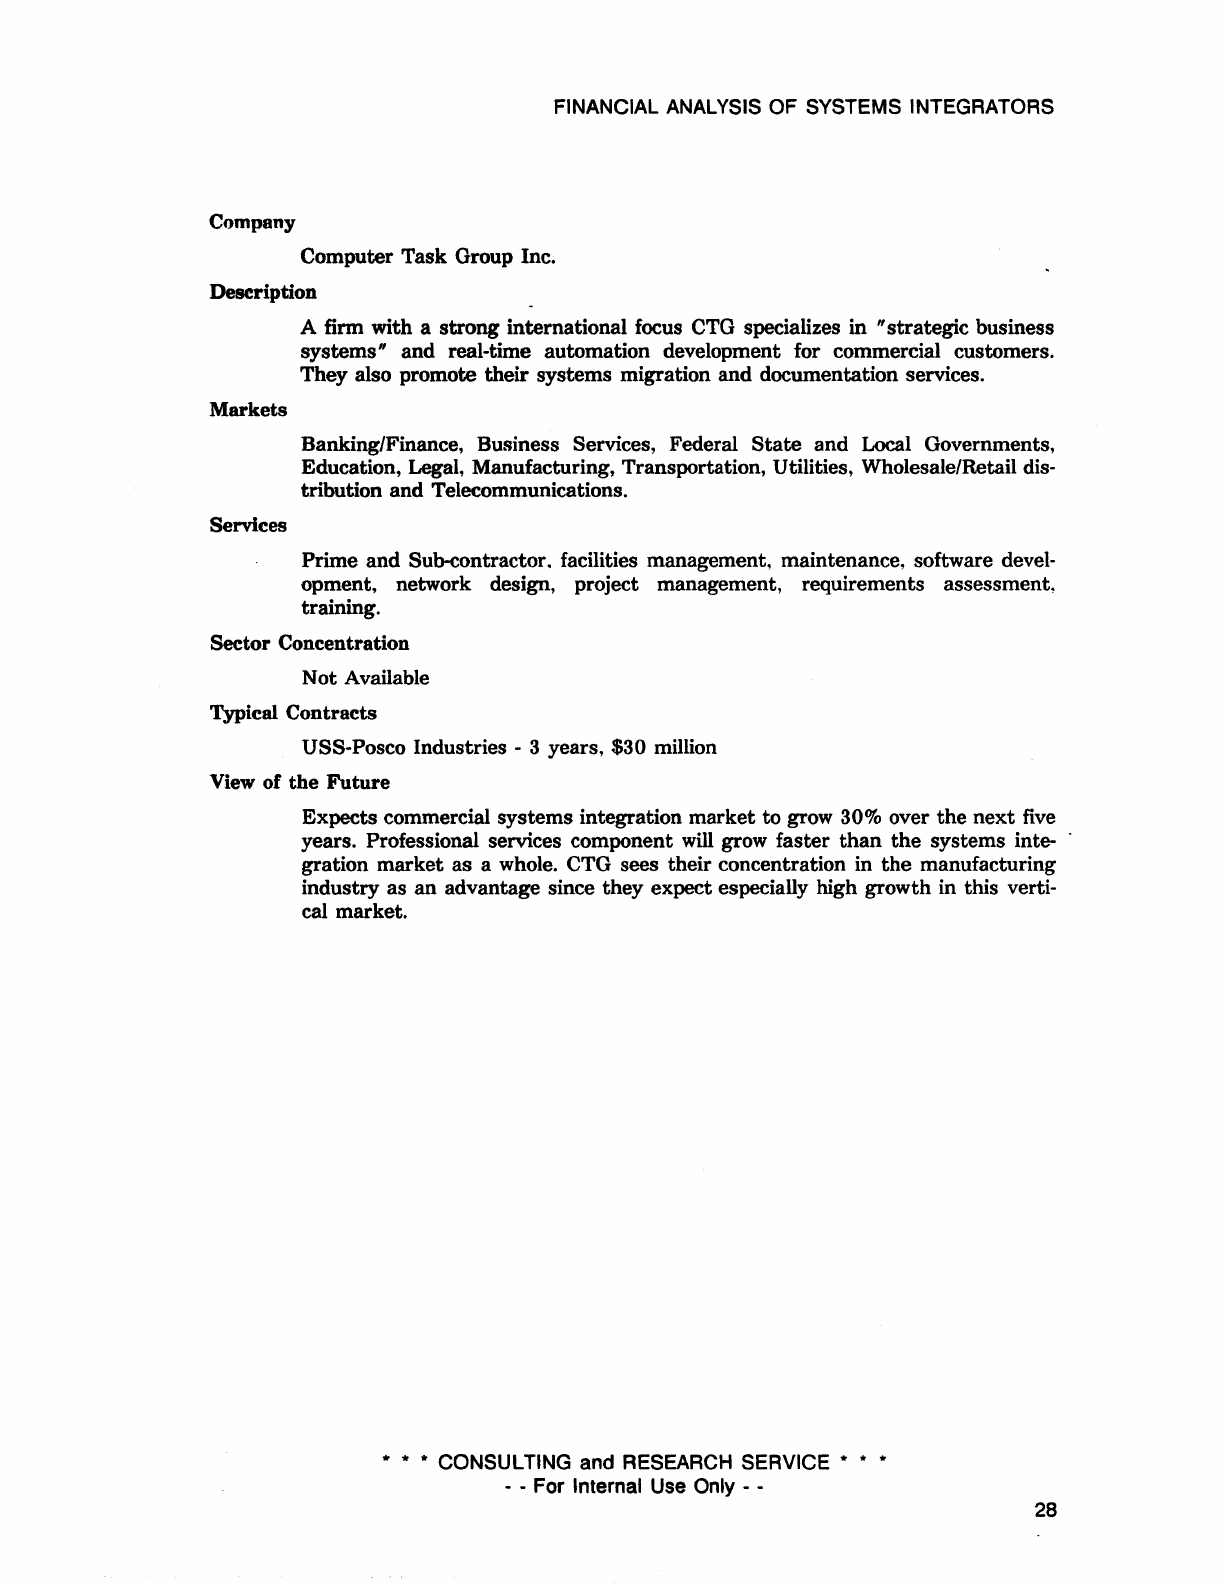
Company
Computer Task Group
Inc~
Description
Markets
Services
A firm with a
strong
international focus CTG specializes in "strategic business
systems" and real-time automation development for commercial customers.
They also promote their systems migration and documentation services.
Banking/Finance, Business Services, Federal
State
and
Local Governments,
Education, Legal, Manufacturing, Transportation, Utilities, Wholesale/Retail dis-
tribution and Telecommunications.
Prime and Sub-contractor. facilities management, maintenance, software devel-
opment, network design, project management, requirements assessment,
training.
Sector
Concentration
Not Available
Typical
Contracts
USS-Posco Industries - 3 years, $30 million
View
of
the
Future
Expects commercial systems integration market to grow 30% over
the
next five
years. Professional services component
will
grow faster
than
the
systems inte-
gration market
as
a whole.
eTG
sees their concentration in
the
manufacturing
industry as an advantage since they expect especially high growth in this verti-
cal market.
* * * CONSULTING and RESEARCH SERVICE
'"
- - For Internal Use Only - -
*
'"
28
FINANCIAL ANALYSIS OF SYSTEMS INTEGRATORS
Company
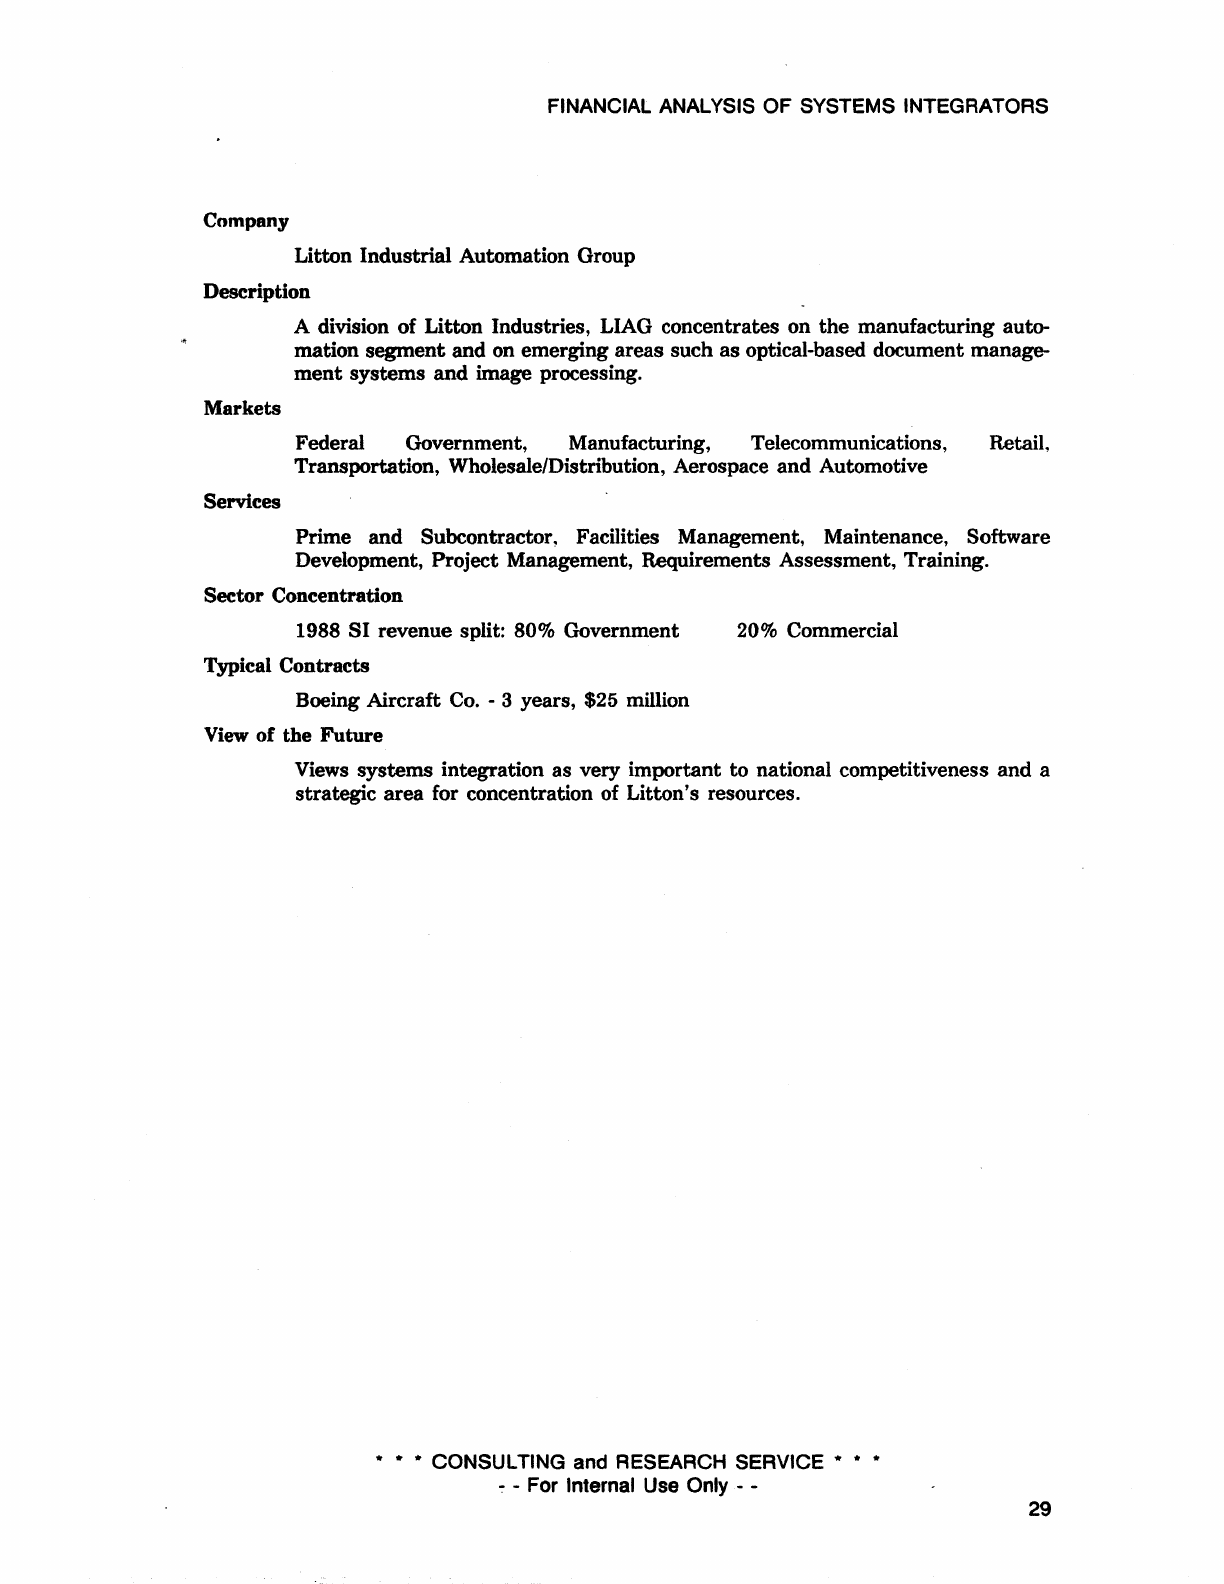
Litton Industrial Automation Group
Description
Markets
Services
A division of Litton Industries, LIAG concentrates on
the
manufacturing auto-
mation segment and on emerging areas such
as
optical-based document manage-
ment
systems
and
image processing.
Federal Government, Manufacturing, Telecommunications, Retail.
Transportation, Wholesale/Distribution, Aerospace
and
Automotive
Prime and Subcontractor, Facilities Management, Maintenance, Software
Development, Project Management, Requirements Assessment, Training.
Sector Concentration
1988
SI
revenue split: 80% Government
Typical Contracts
Boeing Aircraft
Co.
-3 years,
$25
million
View
of the Future
20% Commercial
Views systems integration as very important to national competitiveness
and
a
strategic area for concentration of Litton's resources .
... ...
...
CONSULTING and RESEARCH SERVICE
...
':'
-For Internal Use Only - -
...
...
29
FINANCIAL ANALYSIS OF SYSTEMS INTEGRATORS
Company
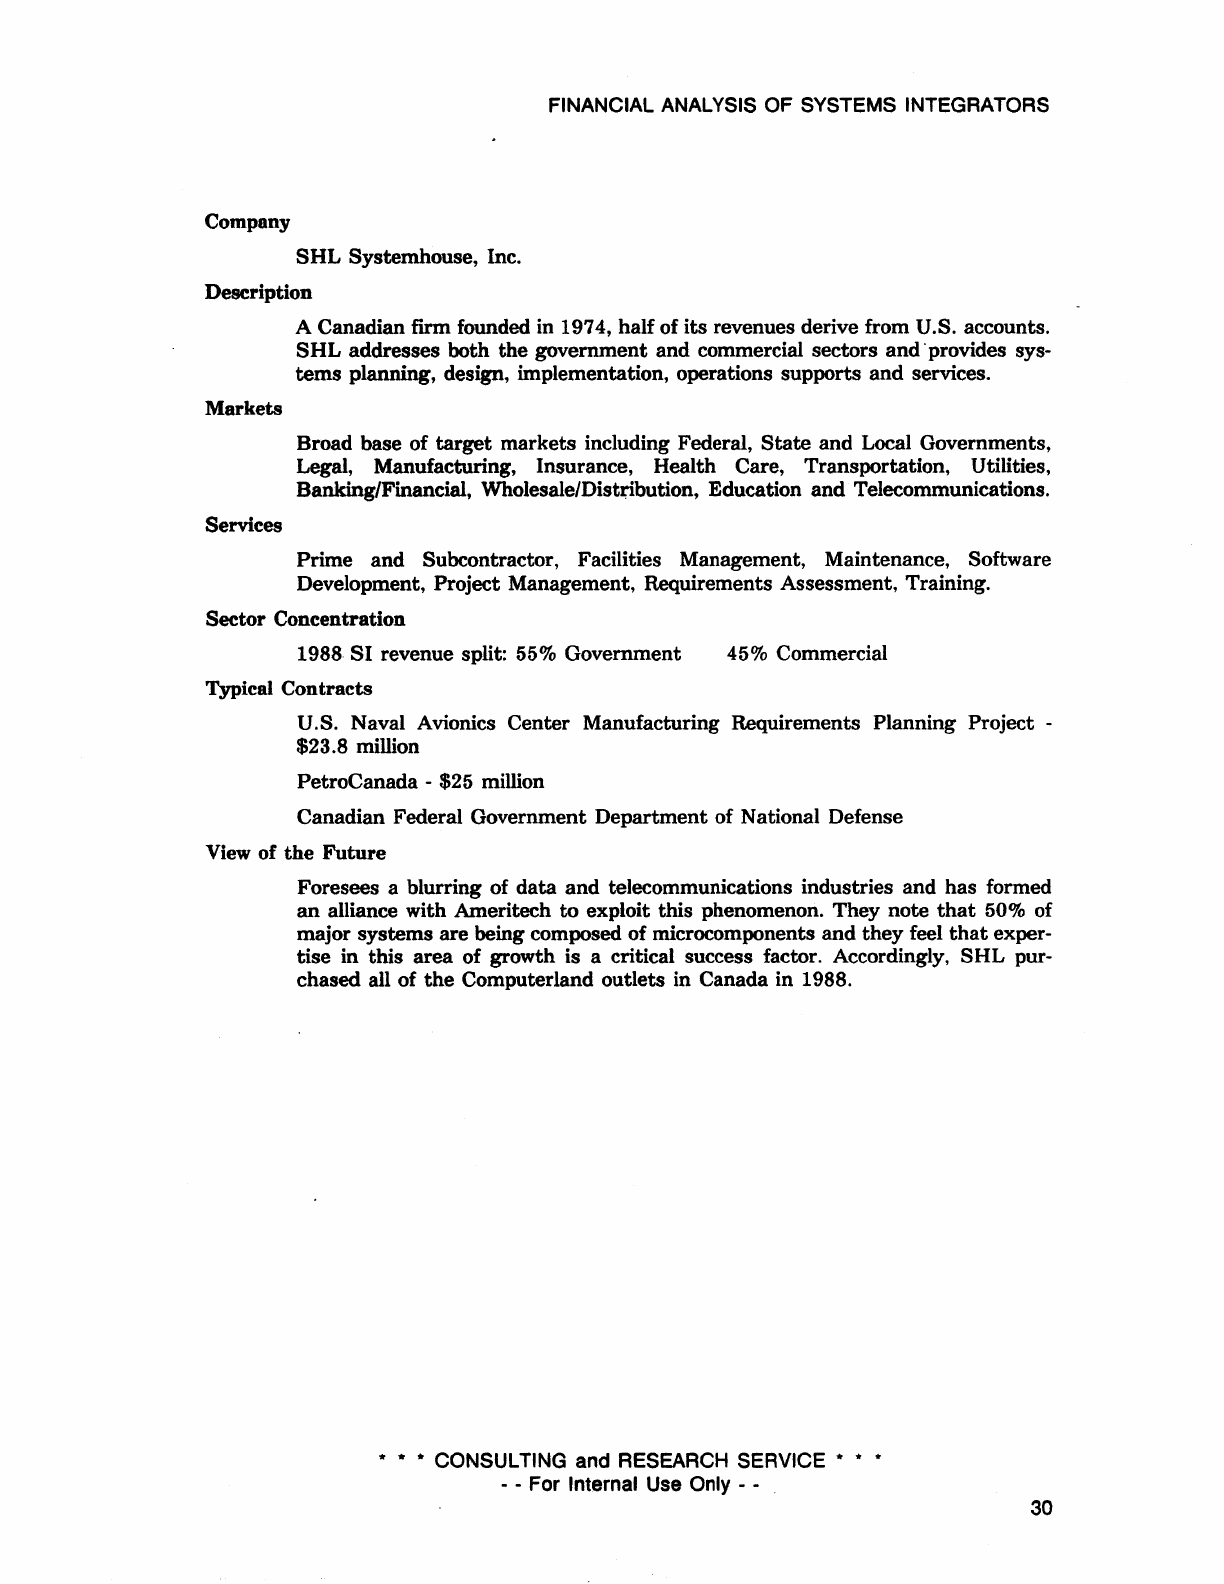
SHL
Systemhouse, Inc.
Description
Markets
Services
A Canadian
firm
founded in 1974, half of
its
revenues derive from U.S. accounts.
SHL
addresses both
the
government and commercial sectors
and'
provides sys-
tems
planning, design, implementation, operations supports and services.
Broad base of
target
markets including Federal,
State
and Local Governments,
Legal, Manufacturing, Insurance, Health Care, Transportation, Utilities,
Banking/Financial,
Wholesale/Dist~bution,
Education
and
Telecommunications.
Prime and Subcontractor, Facilities Management, Maintenance, Software
Development, Project Management, Requirements Assessment, Training.
Sector Concentration
1988
SI
revenue split: 55% Government 45% Commercial
Typical
Contracts
U.S. Naval Avionics Center Manufacturing Requirements Planning Project -
$23.8
million
PetroCanada -
$25
million
Canadian Federal Government Department of National Defense
View
of
the
Future
Foresees a blurring of data
and
telecommunications industries and has formed
an
alliance with Ameritech
to
exploit this phenomenon. They note
that
50% of
major systems
are
being composed of microcomponents and they feel
that
exper-
tise in this area of growth is a critical success factor. Accordingly, S HL pur-
chased all of
the
Computerland outlets in Canada in
1988
.
... ...
...
CONSULTING and RESEARCH SERVICE
...
- - For Internal Use Only - -
...
...
30
FINANCIAL ANALYSIS OF SYSTEMS INTEGRATORS
Company
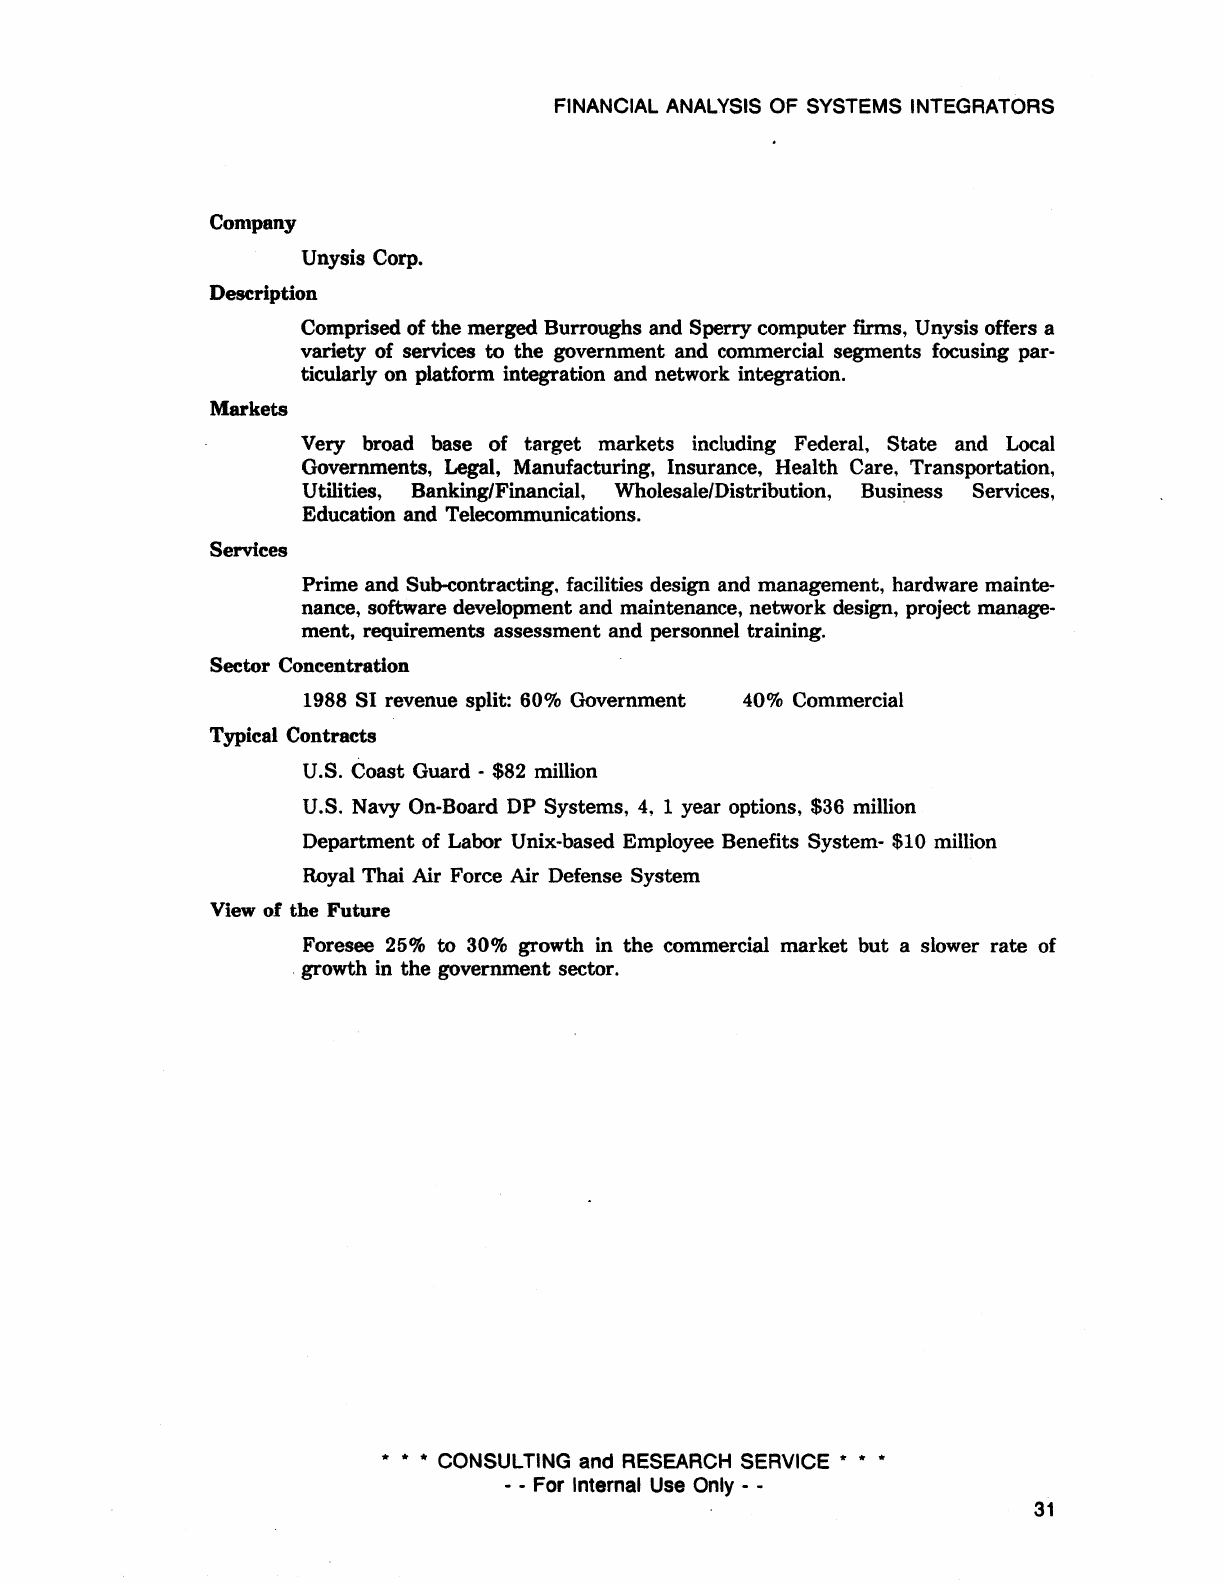
Unysis Corp.
Description
Markets
Services
Comprised of
the
merged Burroughs and Sperry computer firms, U nysis offers a
variety of services
to
the
government and commercial segments focusing par-
ticularly on platform integration and network integration.
Very broad base of
target
markets including Federal,
State
and Local
Governments, Legal, Manufacturing, Insurance, Health Care, Transportation,
Utilities, Banking/Financial, Wholesale/Distribution, Business Services,
Education and Telecommunications.
Prime and Sub-contracting. facilities design and management, hardware mainte-
nance, software development and maintenance, network design, project manage-
ment, requirements assessment
and
personnel training.
Sector Concentration
1988
SI
revenue split:
600/0
Government
Typical Contracts
U.
S. Coast Guard -$82 million
40% Commercial
U.S. Navy On-Board DP Systems, 4, 1 year options, $36 million
Department of Labor Unix-based Employee Benefits System-
$10
million
Royal Thai Air Force Air Defense System
View of the
Future
Foresee 25%
to
30% growth in
the
commercial
market
but a slower
rate
of
. growth in
the
government sector.
* * • CONSULTING and RESEARCH SERVICE *
- - For Internal Use Only - -
* *
31
FINANCIAL ANALYSIS OF SYSTEMS INTEGRATORS
Company
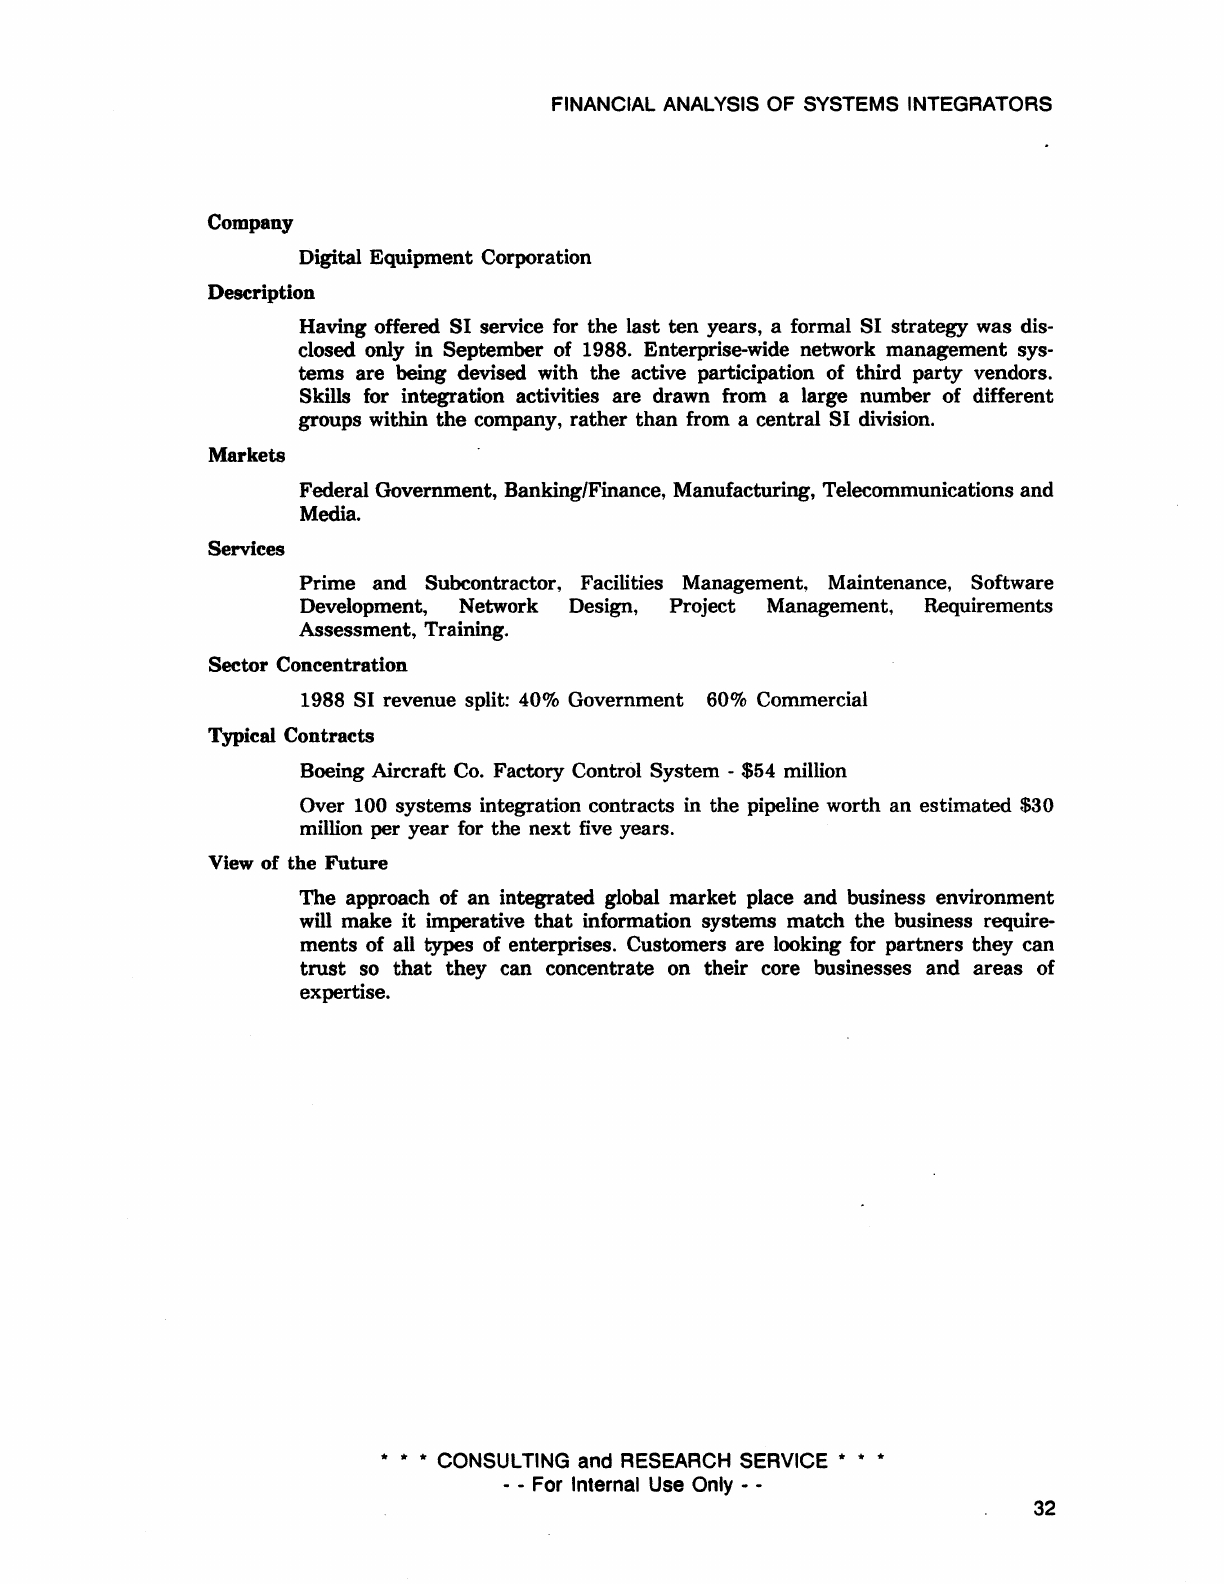
Digital Equipment Corporation
Description
Markets
Services
Having offered
SI
service for
the
last
ten
years, a formal
SI
strategy
was dis-
closed only in September of 1988. Enterprise-wide network management sys-
tems
are being devised with
the
active participation of third
party
vendors.
Skills for integration activities are drawn from a large number of different
groups within
the
company,
rather
than
from a central
SI
division.
Federal Government, Banking/Finance, Manufacturing, Telecommunications and
Media.
Prime
and
Subcontractor, Facilities Management, Maintenance, Software
Development, Network Design, Project Management, Requirements
Assessment, Training.
Sector Concentration
1988
SI
revenue split: 40% Government 60% Commercial
Typical Contracts
Boeing Aircraft Co. Factory Control
System
-$54 million
Over 100 systems integration contracts in the pipeline worth
an
estimated $30
million per
year
for the
next
five years.
View
of
the
Future
The
approach of
an
integrated global
market
place and business environment
will make
it
imperative
that
information systems
match
the
business require-
ments
of all types of enterprises. Customers are looking for partners
they
can
trust
so
that
they
can concentrate on their core businesses
and
areas
of
expertise.
* * * CONSULTING and RESEARCH SERVICE *
- - For Internal Use Only - -
..
..
32
