Getting Started With CodeXL Code XL Quick Start Guide
User Manual:
Open the PDF directly: View PDF ![]() .
.
Page Count: 35

CodeXL Quick Start Guide
Version 2.6
Revision 1
Table of Contents
INTRODUCTION ................................................................................................................... 2
LATEST VERSION OF THIS DOCUMENT ....................................................................... 2
PREREQUISITES ................................................................................................................... 2
DOWNLOAD AND INSTALL CODEXL ............................................................................. 3
CODEXL HELP ....................................................................................................................... 4
SYSTEM INFORMATION .................................................................................................... 4
TEAPOT SAMPLE PROJECT .............................................................................................. 6
Debug the Teapot Sample Application ........................................................................................ 6
Basic Debugging .......................................................................................................................... 7
Source Code View ....................................................................................................................... 8
Breakpoint View ......................................................................................................................... 9
Watch and Locals Views ............................................................................................................ 10
In Host debugging mode .......................................................................................................... 10
Explorer View ............................................................................................................................ 10
Call Stack View .......................................................................................................................... 13
Function Calls History View ....................................................................................................... 14
Debugged Process Events View ................................................................................................. 14
Memory View ........................................................................................................................... 15
Statistics View ........................................................................................................................... 15
PROFILE MODE ................................................................................................................. 16
GPU Profiling ............................................................................................................................. 16
Summary Tab ........................................................................................................................... 17
Performance Counters View .................................................................................................... 18
CodeXL Explorer Tree ............................................................................................................... 19
ANALYZE MODE ................................................................................................................ 20
Static Kernel and Shader Analysis ............................................................................................. 20
Switching to Analyze mode ...................................................................................................... 20
Creating a new project for Analysis ......................................................................................... 21
Working with the new CodeXL Analyzer Explorer Tree ........................................................... 21
Working with Programs ........................................................................................................... 23
Working with Folders ............................................................................................................... 25
Selecting target devices ........................................................................................................... 27
Build Options - defining kernel/shader compilation options ................................................... 28
Output Tab ............................................................................................................................... 30
Statistics Tab ............................................................................................................................ 31
Viewing compilation output: ISA and IL ................................................................................... 32
Navigating through ISA code with the Enhanced ISA View ...................................................... 33
KNOWN ISSUES ................................................................................................................. 34
SUPPORT ............................................................................................................................. 34

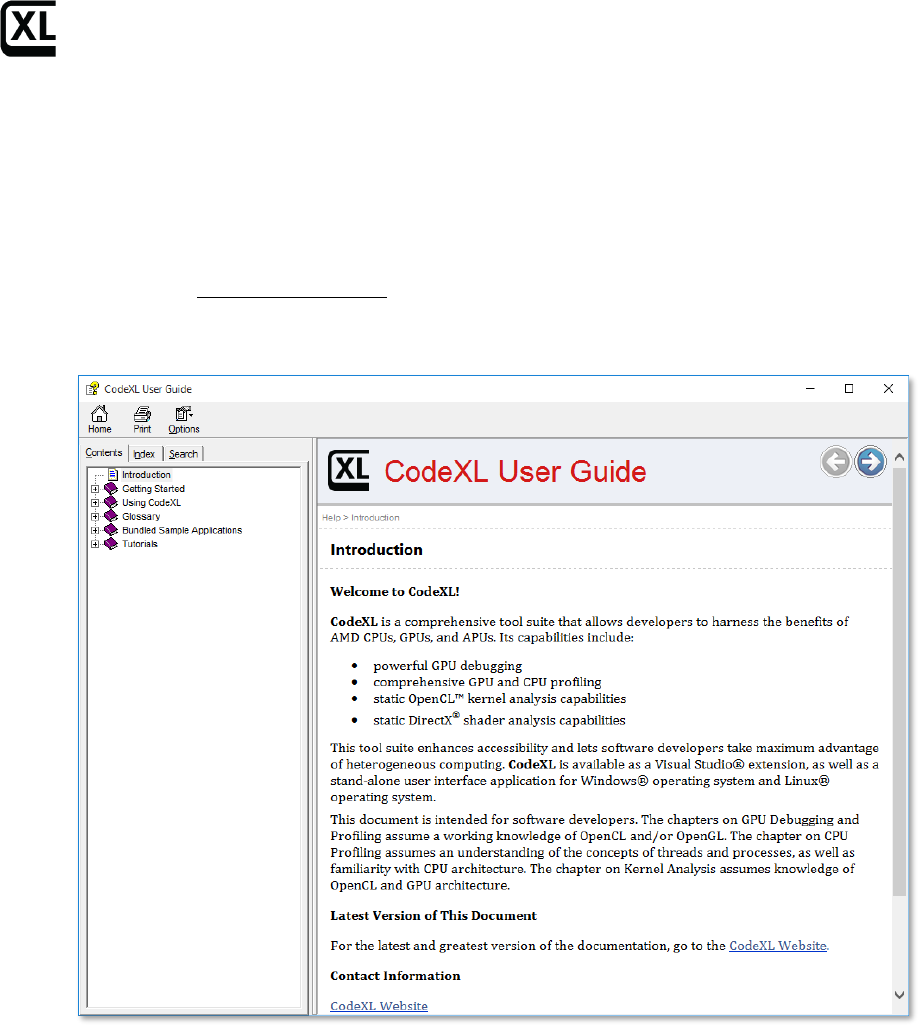
Getting Started with CodeXL
Introduction
CodeXL™ is a tool suite with a unified user interface that lets you harness the
benefits of CPUs, GPUs, and APUs. It has powerful capabilities for
• APU/GPU debugging,
• GPU profiling,
• and static OpenCL™/DirectX/OpenGL®/Vulkan kernels and shaders
analysis.
These features let you find bugs, optimize application performance, and easily
access heterogeneous computing.
CodeXL source code and released binaries are publically available on GitHub as
part of the GPUOpen initiative. CodeXL is available as a stand-alone application
for Windows® and Linux® Operating Systems.
Getting the most out of the CodeXL tool suite requires a relatively recent AMD
APU or GPU, a recent version of Radeon Software, and the OpenCL APP SDK.
This document describes how to
• get started using CodeXL
• find information about known CodeXL issues
• contact AMD for support
Latest Version of This Document
• For the latest and greatest version of the documentation, go to the CodeXL
Website.
Prerequisites
Operating Systems
• Microsoft Windows 7 64-bit
• Microsoft Windows 8.1 64-bit
• Microsoft Windows 10 64-bit
• Linux 64-bit (Red Hat, Ubuntu, SUSE)
For detailed system requirements see the CodeXL Release Notes in the CodeXL
installation folder or on the Documentation section of the CodeXL web page.
Profiling OpenCL™ Applications
• [GPU device] AMD Adrenaline driver with OpenCL™ GPU support
• [GPU device] AMD GCN-based Radeon™ device
For detailed system requirements see the CodeXL Release Notes in the CodeXL
installation folder or on the Documentation section of the CodeXL web page.
Getting Started with CodeXL
Download and Install CodeXL
Installation is system-specific (Windows or Linux); but once installed and
started, the CodeXL operation is system-independent.
Download the CodeXL installation package from the CodeXL GitHub repo.
For Windows
1. Download the .exe file CodeXL_Win*.exe.
2. When the download completes, double-click the .exe file to install
CodeXL.
The installer guides you through the installation process.
3. Launch CodeXL from C:\Program Files (x86)\CodeXL\CodeXL.exe or from
the created Desktop shortcut.
For Linux
Either install the dedicated distribution package or use the tar archive.
The default installation folder
For Red Hat and other Fedora based Linux distributions
1. Download the 64-bit Linux .rpm package CodeXL_Linux*.rpm.
2. If installed version 1. at the machine, remove it first:
$ rpm -qa | grep -i codexl
$ sudo rpm –e <package name>
3. Install the RPM package:
$ sudo rpm -Uvh CodeXL_Linux*.rpm
4. Navigate to /opt/CodeXL_X.Y-ZZZZ/
5. Launch CodeXL using ./CodeXL.
For Ubuntu and other Debian based Linux distributions
1. Download the 64-bit Linux .deb package codexl_*.deb.
2. If installed version 1. at the machine, remove it first:
$ dpkg -l |grep -i codexl
$ sudo dpkg –r <package name>
3. Install the DEB package:
$ sudo dpkg -i codexl_x.x-x_amd64.deb
$ sudo apt-get -f install
4. Navigate to /opt/CodeXL_X.Y-ZZZZ/
5. Launch CodeXL using ./CodeXL.
Use the tar archive
1. Download the 64-bit Linux .tar package CodeXL_Linux*.tar.gz.
2. Extract the tar package:
a. $ tar –xvzf CodeXL_Linux*.tar.gz
3. Navigate to <codexl-install-dir>
Getting Started with CodeXL
4. Launch CodeXL using ./CodeXL.
CodeXL Help
To bring up a CodeXL Help window:
1. Click on the CodeXLUser Guide link on the CodeXL startup Home Page.
OR
2. Select Help >> View Help from the CodeXL toolbar.
CodeXL Help provides some of the same information provided in this document,
but also includes additional details about CodeXL views and modules.
To bring up the CodeXL Help window for the Visual Studio extension:
1. Select CodeXL >> Help >> View Help from the VS menu.
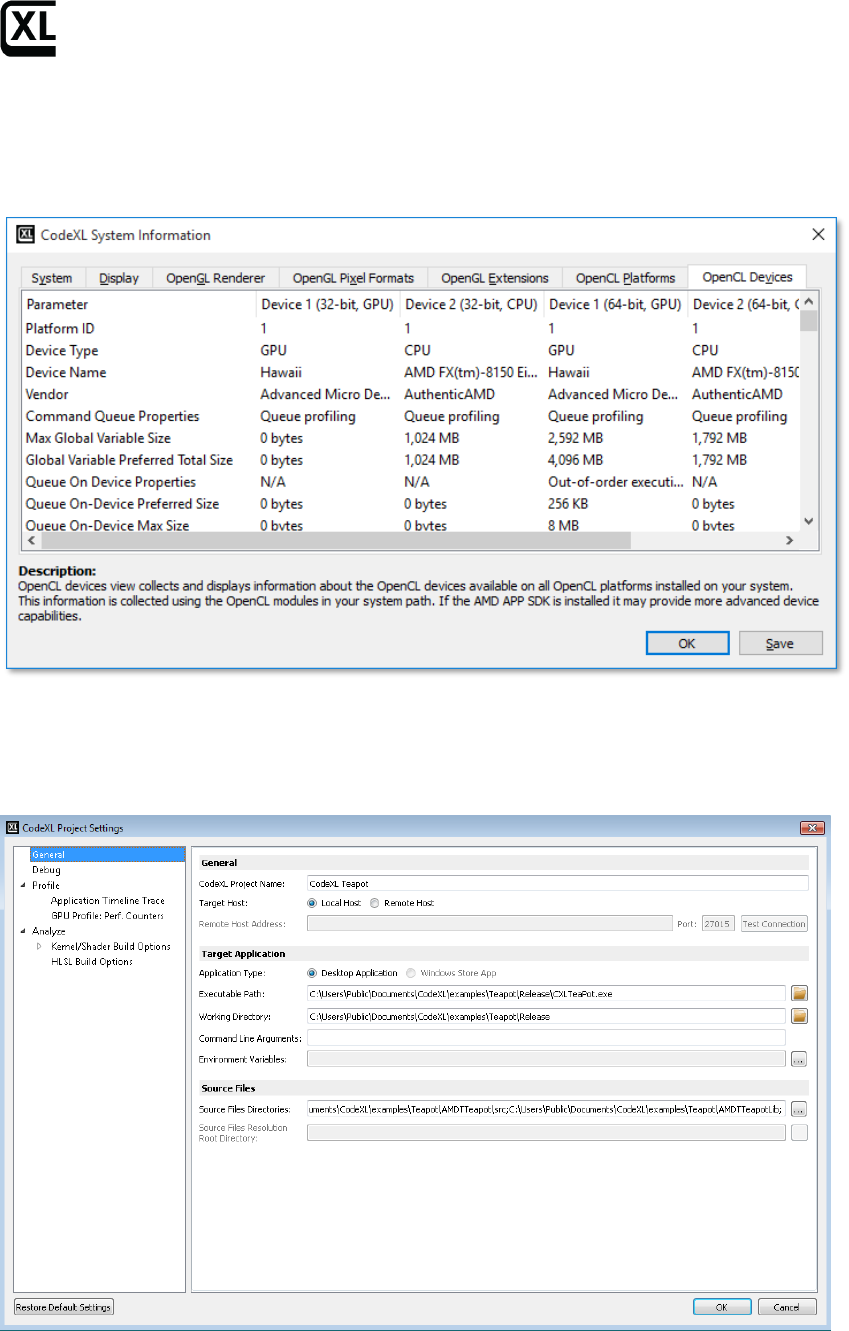
System information
To display system information:
1. Select Tools >> System Information from the CodeXL toolbar.
Getting Started with CodeXL
The tabs let you select a category of information. The following screenshot
shows OpenCL device information for a GPU device and a CPU device on the
runtimes available locally - a 32-bit and 64-bit runtime.
To display project settings, the project must be stopped.
To edit the settings of a project:
1. Select File >> Project Settings from the drop-down File menu.
See the CodeXL Help for more details about project settings.
Getting Started with CodeXL
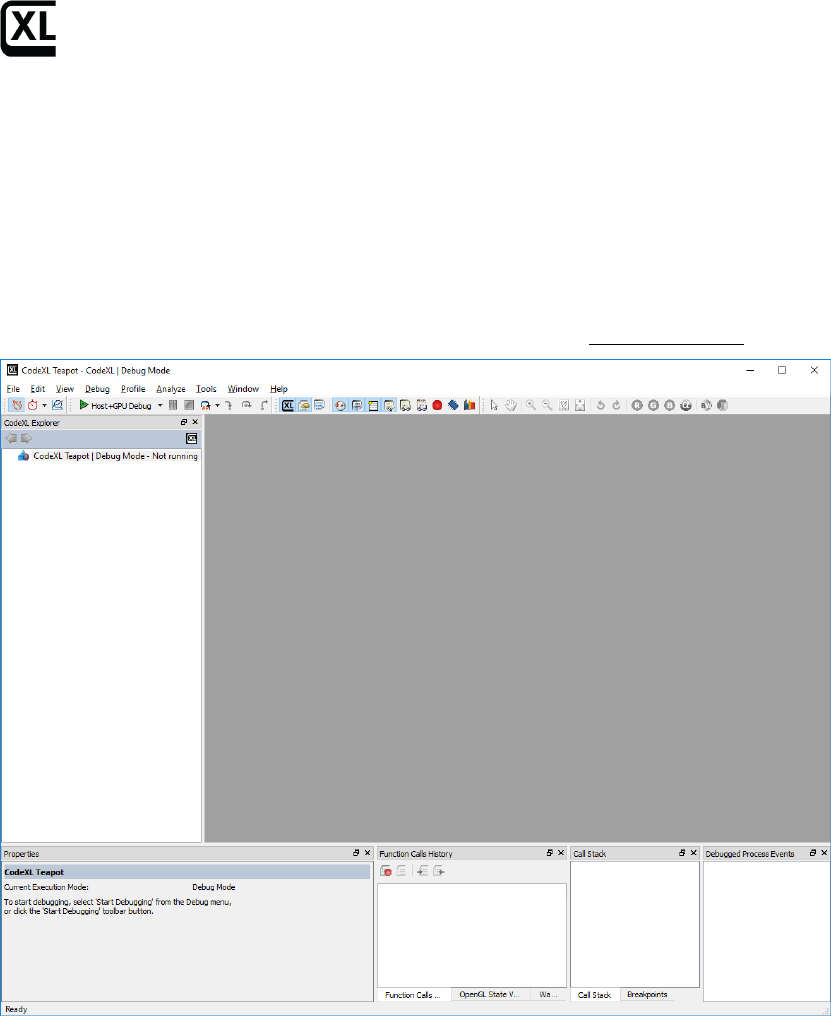
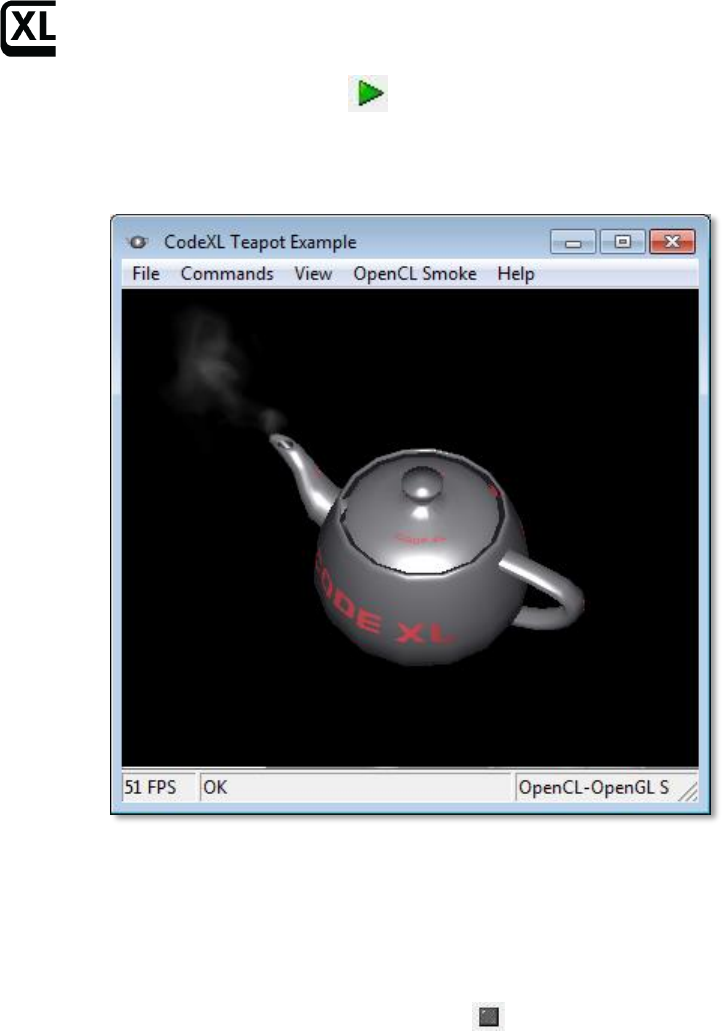
Teapot Sample Project
The CodeXL distribution includes a sample project that displays a smoking
teapot. The project uses OpenCL kernels to solve Navier-Stokes equations. It
shares a 3D texture between OpenCL and OpenGL, copies a density field grid into
the 3D texture, and renders the smoke using OpenGL.
For Windows or Linux:
1. In the CodeXL welcome page (in the CodeXL menu bar, click on File-
>Welcome Page), Under the Samples header, click the CodeXL Teapot link.
The CodeXL Explorer view now shows:
CodeXL TeaPot | Debug Mode - Not running
The CodeXL window also displays several other views, but since the program is
not running, those views do not display any information.
Debug the Teapot Sample Application
Note: Before debugging the Teapot sample application, you must load it (see the
previous section).
After the teapot sample is loaded, run the debug program:
1. Select Debug >> Start Debugging from the taskbar,
or
Getting Started with CodeXL
2. Click on the green right arrow taskbar.
The program begins execution, and soon displays a rotating smoking teapot in a
separate window.
To stop the program:
1. Select Debug >> Stop Debugging from the taskbar,
or
2. Click the black square taskbar Stop button ,
or
3. Click the close button in the upper-right corner of the teapot window.
Basic Debugging
The CodeXL GPU Debugger lets you examine the runtime behavior of your
OpenCL/OpenGL application in detail. You can use the information it provides to
find bugs and to improve application performance.
This quick start guide presumes you are familiar with the use of a GUI debugger;
so the guide provides only a quick introduction to the basic CodeXL debugging
features.
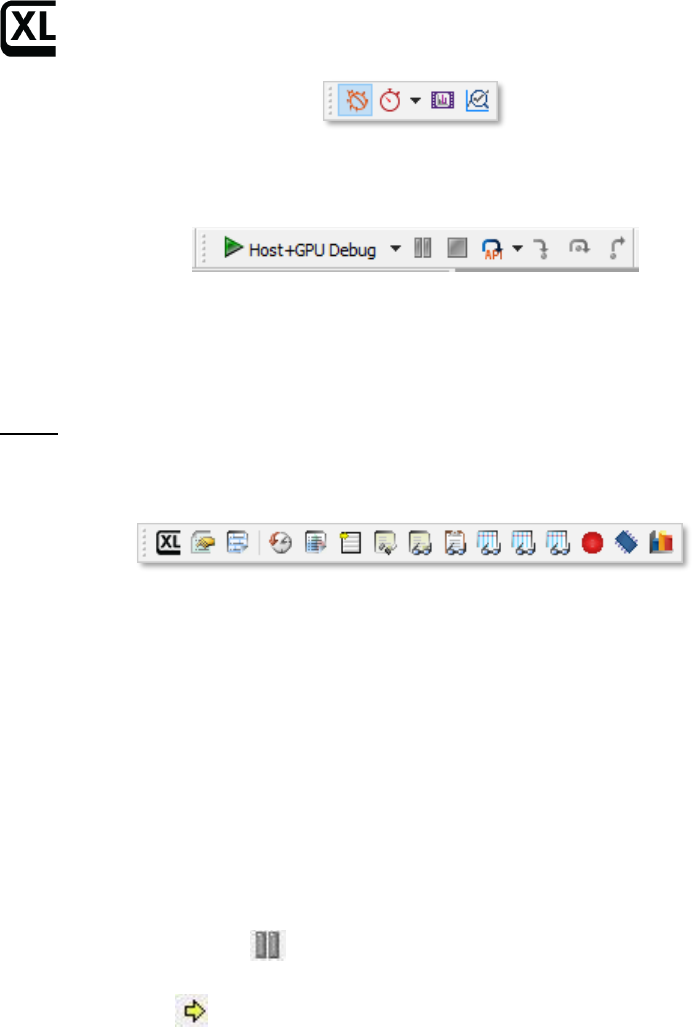
The following four buttons, at the far left of the CodeXL taskbar, let you select
Debug mode, Profile mode, Frame Analysis or Analyze mode.
Getting Started with CodeXL
Hovering over a taskbar button displays a pop-up help description.
The following taskbar buttons control program execution during debugging.
These controls are (left to right): start, pause and stop debugging, frame / api /
draw step (in drop-down menu), step in, step over, step out. You can also
perform these actions from the taskbar Debug pull-down menu, or by using
function keys.
Note: host code debugging (stepping and breaking in C/C++ code) is currently
only available in the Linux CodeXL standalone application.
The following taskbar buttons show, or hide, various views.
These buttons are (left to right): CodeXL Explorer , Properties, Function Calls
History, Debugged Process Events, Call Stack, Locals, Watch, OpenGL™ State
Variables, OpenCL Multi-Watch (1,2,3), Breakpoints, Memory, and Statistics.
You can resize views, drag, and drop views to rearrange them, or move them to a
separate window. The next sections of this guide describe individual CodeXL
views in more detail.
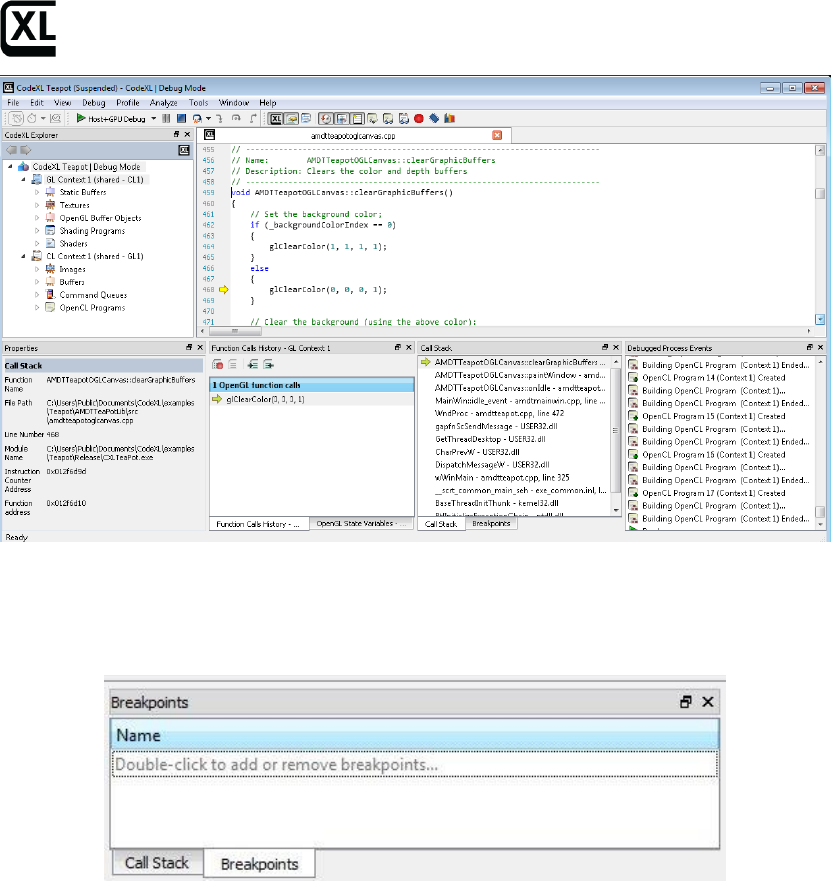
Source Code View
Source Code views display C, C++, or OpenCL code. To display the Source Code
view:
1. Start the teapot program, as described above.
2. Hit the Break button to interrupt it.
A Source Code view displays the source file where the break occurred, with a
yellow arrow indicating the current line number. In the following
screenshot, it is line 468 in the amdtteapottoglcanvas.cpp file.
3. In all configurations, you can now step to the next API call, OpenGL draw
function call, or Frame Terminator function call by choosing the appropriate
command from the API steps drop-down button (your last choice will be
remembered for quick access).
4. In configurations that allow Host debugging (see note above), you can also
step through the host code with the step in, step over and step out
commands.
Getting Started with CodeXL
Breakpoint View
The Breakpoint view shows active breakpoints. Initially, the Breakpoint view
shows no breakpoints:
To add a breakpoint:
1. Double-click “Double-click to add or remove breakpoints…”
A new Breakpoints window appears.
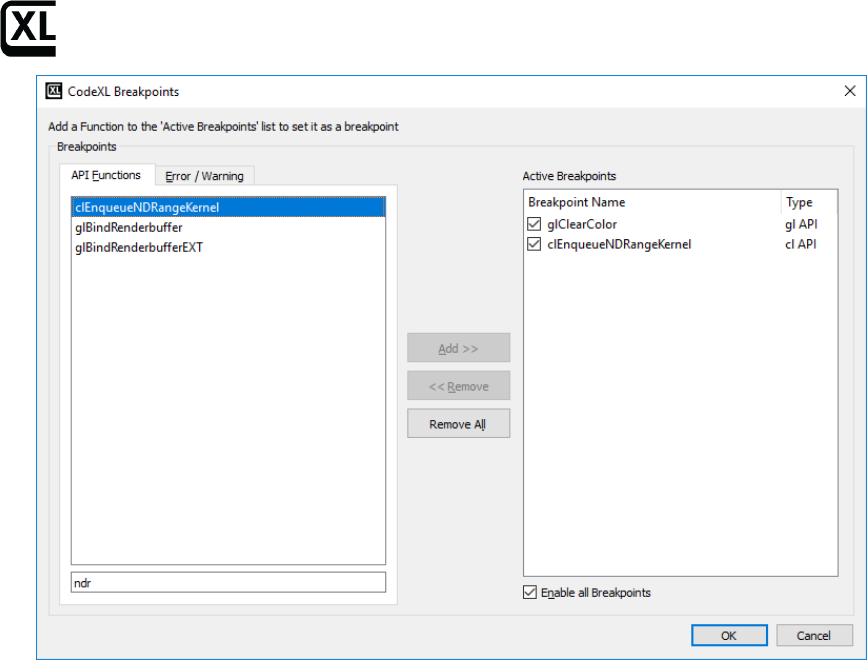
Getting Started with CodeXL
2. Select the API Functions tab to set a breakpoint on an API function.
When program execution hits a breakpoint, the Source view displays the line
where the breakpoint occurs. A yellow arrow indicates the current location.
A red dot next to the line number indicates a set breakpoint.
Watch and Locals Views
In Host debugging mode
In configurations where host debugging is supported (see note above), the
Watch and Locals views will show the currently selected host thread call stack
frame's variables.
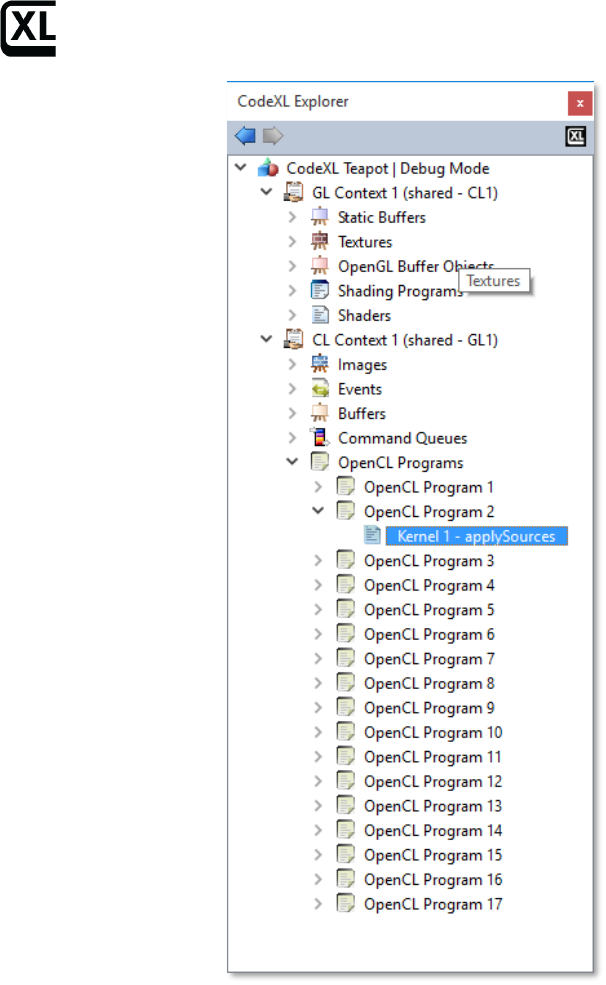
Explorer View
The Explorer view displays OpenCL-allocated objects and OpenCL/OpenGL
shared contexts.
Getting Started with CodeXL
1. Click on an object to bring up information about the object in the Properties
view.
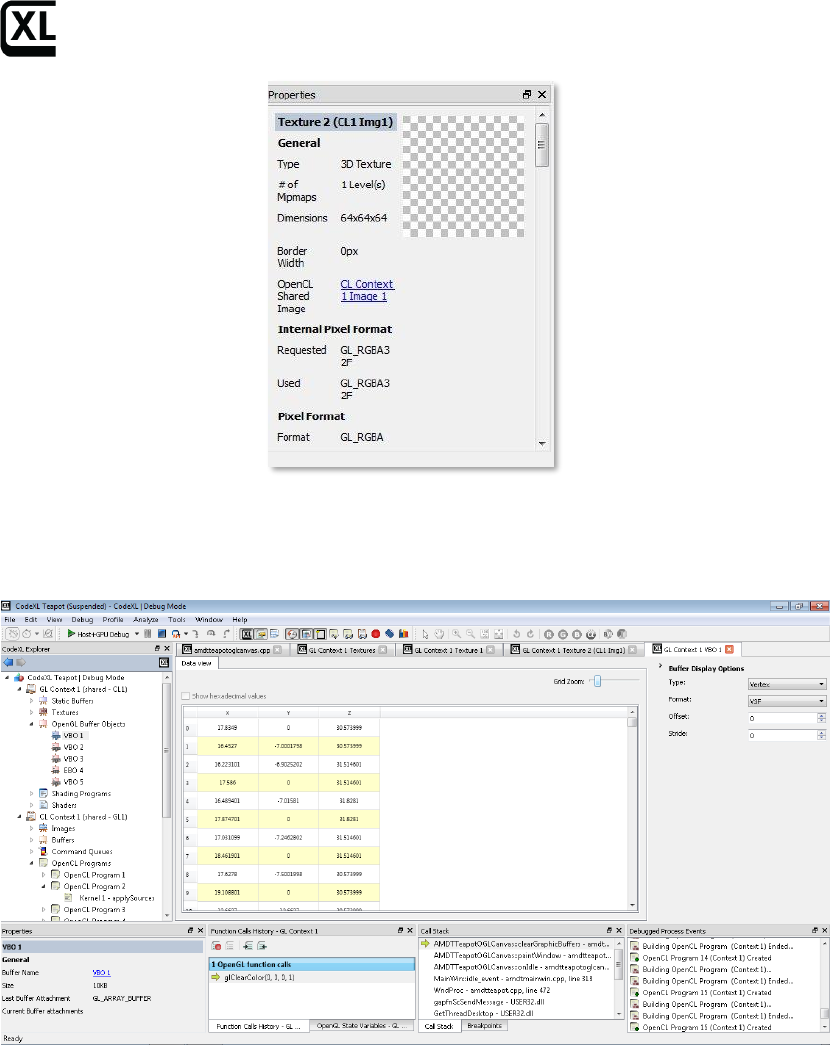
For example, clicking on Texture 2 in the view above brings up its properties,
as shown in the next screenshot.
Getting Started with CodeXL
2. Click on Vertex Buffer object VBO 1 to display its data, with a variety of
available drop-down menu display and format options in the right-
hand panel.
3. Double-click on an object to display an appropriate view.
For example, double-click on Vertex Shader 1 under Shaders to bring up a
Source Code view of its source file tpVertexSharder.glsl. Alternatively,
double-click on Depth buffer to bring up an Image view of the depth buffer.
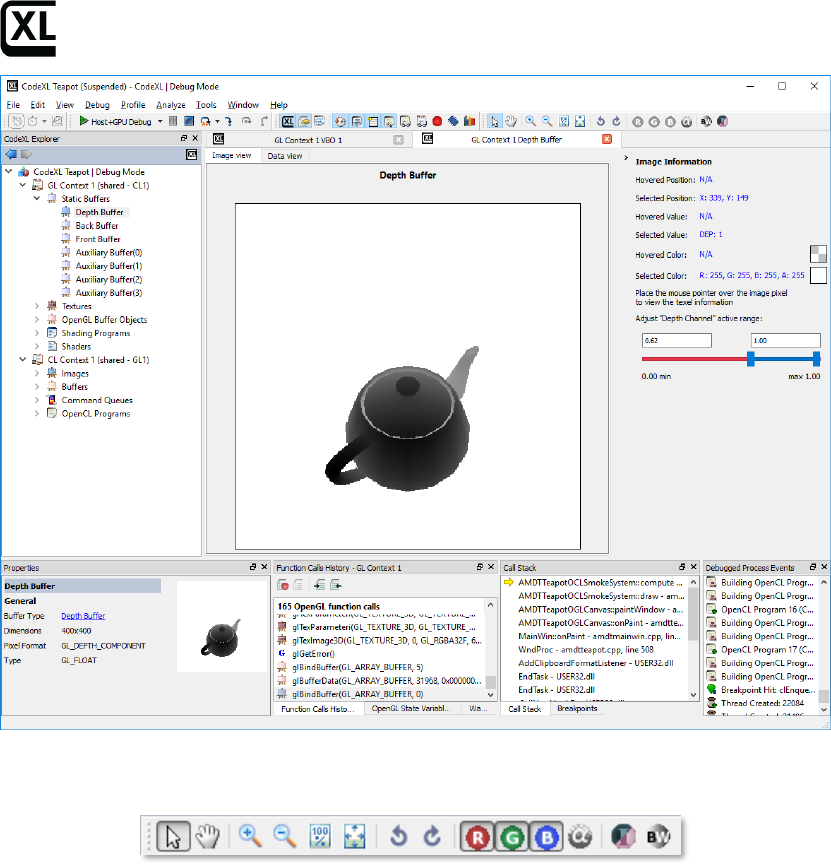
Getting Started with CodeXL
You can manipulate an Image view with the following image manipulation
buttons on the CodeXL toolbar:
These buttons let you select, zoom in, zoom out, pan, enable R/G/B/alpha
channels, enable grayscale mode, enable color invert mode, original size, best fit,
and rotate CCW/CW. Hovering over the image displays pixel-specific
information (position and color) in the Image Information panel.
Alternatively, select the Data view tab of the depth buffer to display the buffer as
raw spreadsheet data rather than as an image.
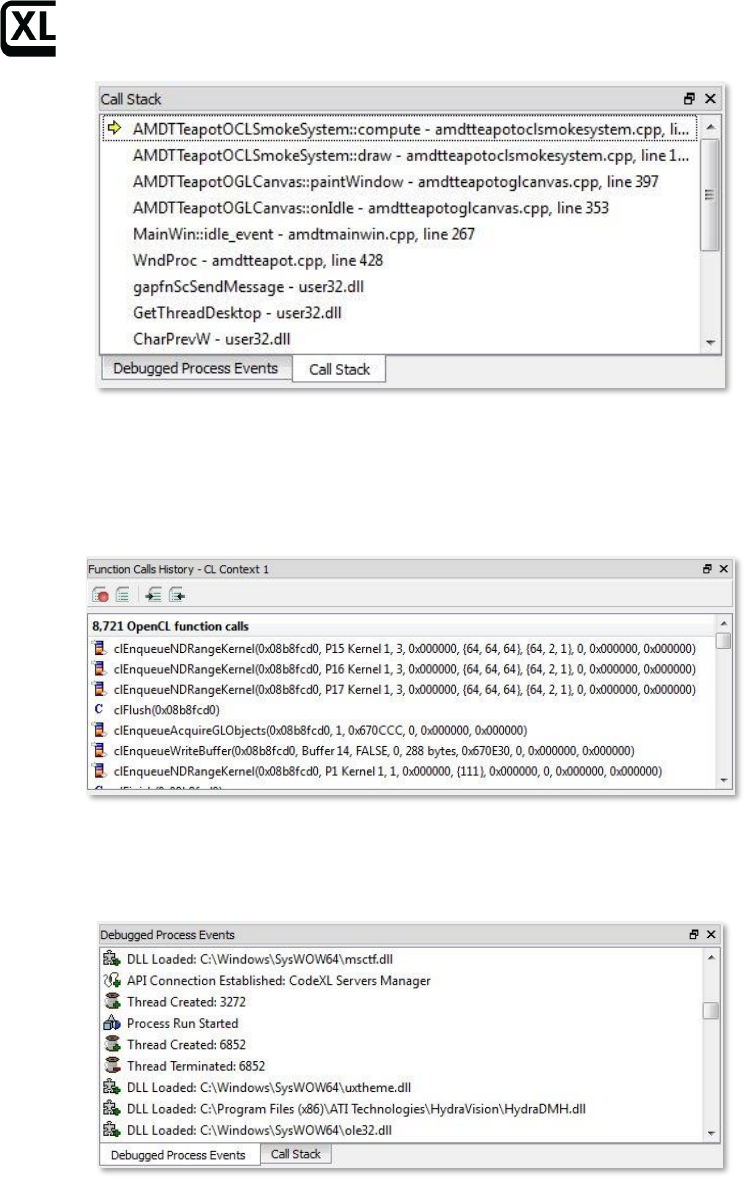
Call Stack View
The Call Stack view displays a combined C/C++/OpenCL call stack.
Getting Started with CodeXL
Function Calls History View
The Function Calls History view displays a log of OpenCL API calls.
1. Click on a function call to display call details in a Properties view.
Debugged Process Events View
The Debugged Process Events view displays process events.
Getting Started with CodeXL
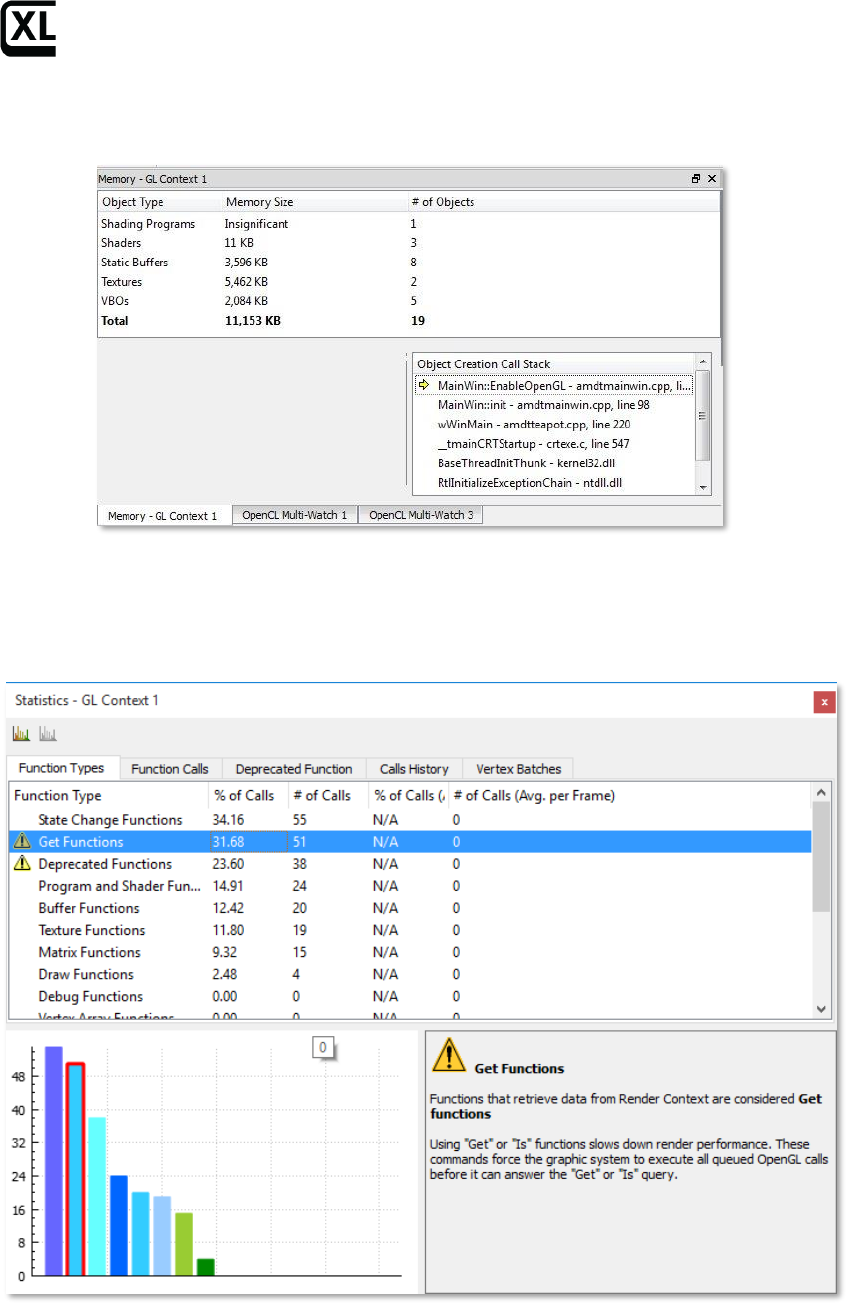
Memory View
The Memory view summarizes memory use.
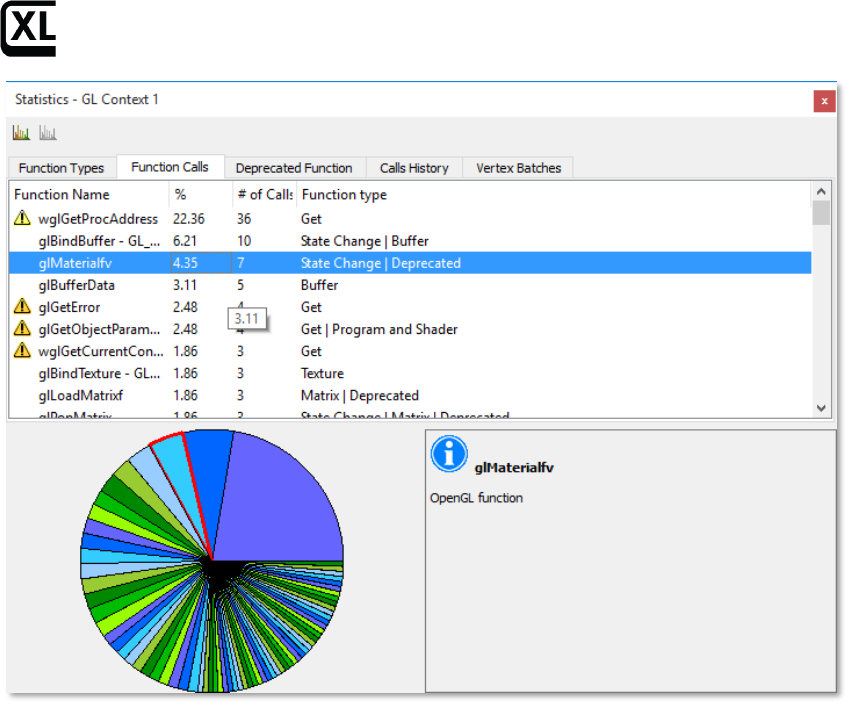
Statistics View
The Statistics view provides statistical information about the program. Select a
tab to choose among options, such as Function Types:
or Function Calls:
Getting Started with CodeXL
Profile Mode
CodeXL profile mode is a powerful performance analysis tool that supports GPU
profiling to provide program performance data. CodeXL profiling does not
require modifications to your source code or project. Profiling does not require
recompilation. Profiling lets you find performance hotspots and issues,
determine the top data transfer and kernel execution operations, and identify
problems such as failed API calls and resource leaks. You can use profiling to
improve application performance through proper synchronization, bottleneck
elimination, and load balancing.
GPU profiling provides application timeline trace and performance counter
modes.
The following is a quick introduction to GPU profiling. For further details, see the
CodeXL Help information.
GPU Profiling
For GPU application timeline trace profiling:
1. Click on the profiling mode taskbar button.
Getting Started with CodeXL
2. Select Profile >> GPU: Application Timeline Trace from the Profile drop-
down menu.
3. Run the program, then let it complete, or terminate it.
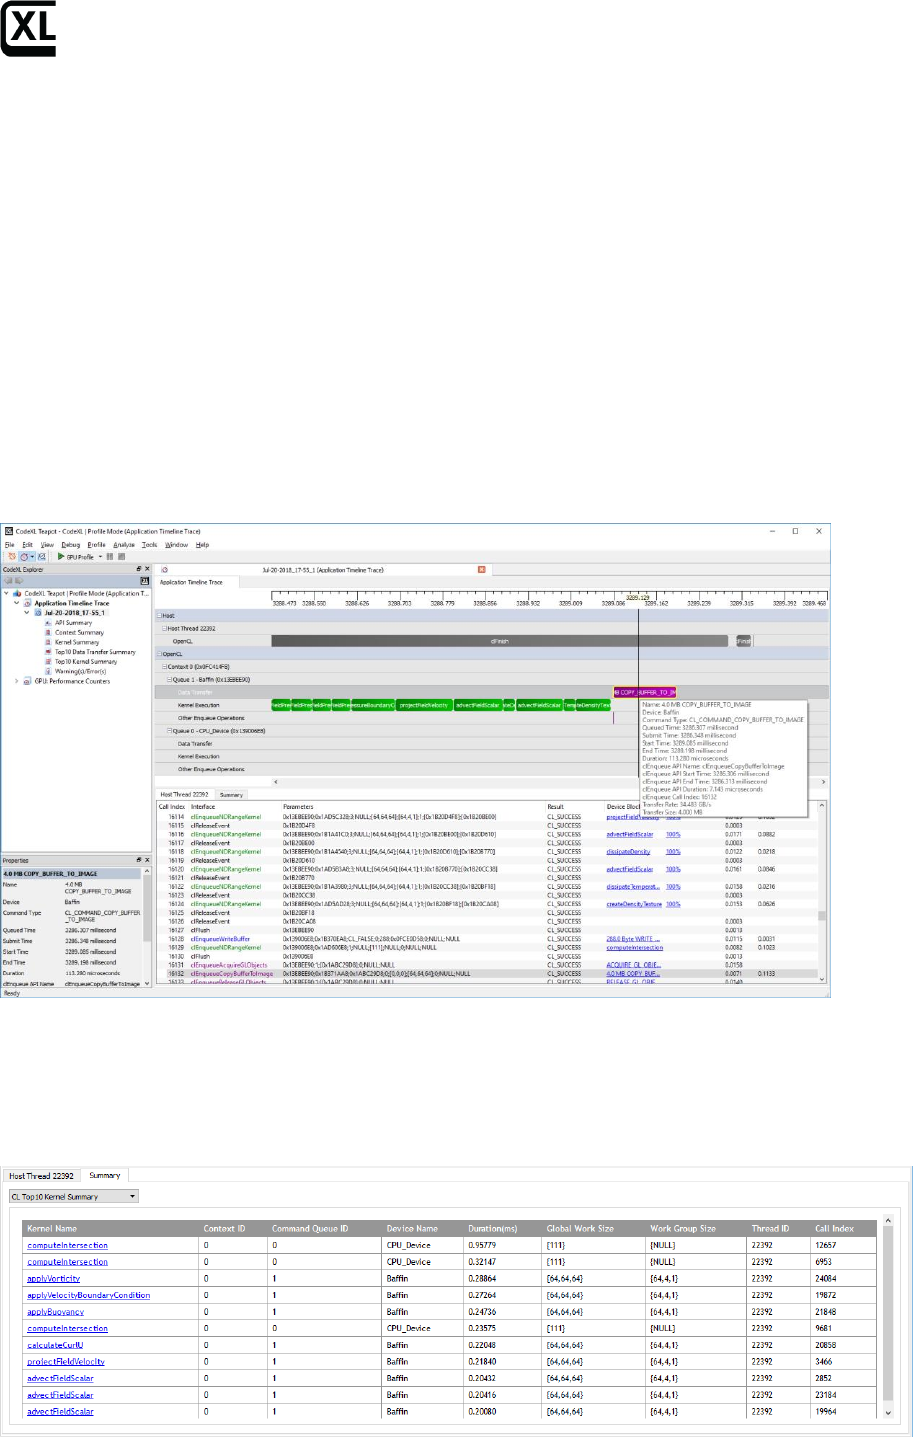
An Application Timeline Trace view appears with a timeline of the
program execution. This timeline shows the created OpenCL contexts
and command queues, as well as the relationships between them.
To select a subrange of the timeline, hold down <Ctrl>, and click and
drag on a section of the timeline.
To shift the timeline display left or right, simply click on it and drag.
To zoom in/out, use the mouse wheel or the +/- keys. Selecting a small
subrange lets you zoom in to see details about each event.
For additional information, hover over an event; this displays a pop-up.
The following screenshot is an example of a COPY_BUFFER_TO_IMAGE data
transfer event at 7752.980 ms on the timeline. The pop-up provides detailed
timing data.
Summary Tab
The Summary tab provides several options for viewing profiling data: API,
context, kernel, top 10 data transfer, top 10 kernel, warnings/errors.
The following screenshot shows an example of a Top 10 Kernel Summary.
Getting Started with CodeXL
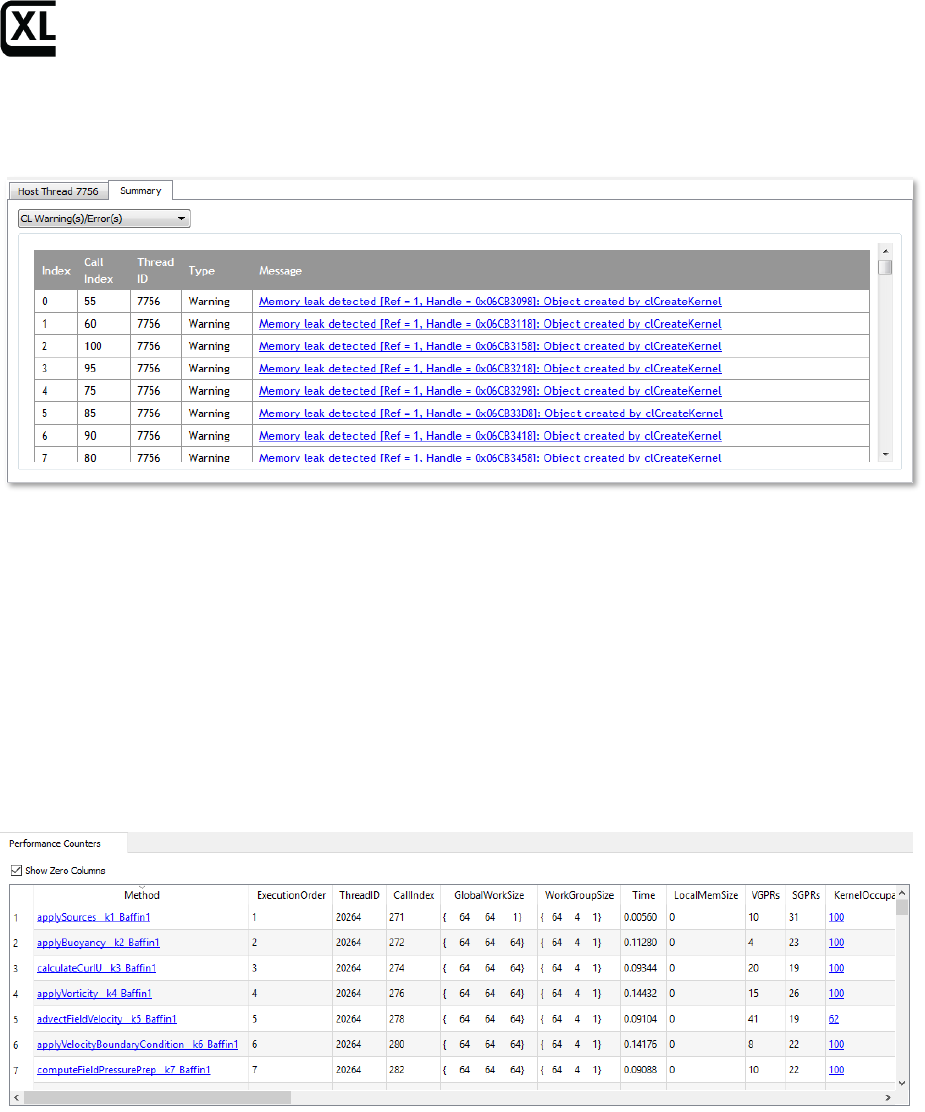
The Warning(s)/Error(s) summary also includes a helpful list of best practice
recommendations to improve program performance. The following example
indicates issues with blocking write calls and small global work size.
Performance Counters View
The Performance Counters view in a GPU Performance Counters profile provides
kernel performance details, including global work size and time. This mode
collects performance counters from the GPU or APU for each kernel dispatched
to the device. It also displays statistics from the shader compiler for each kernel
dispatched. The performance counters and statistics can be used to discover
kernel bottlenecks.
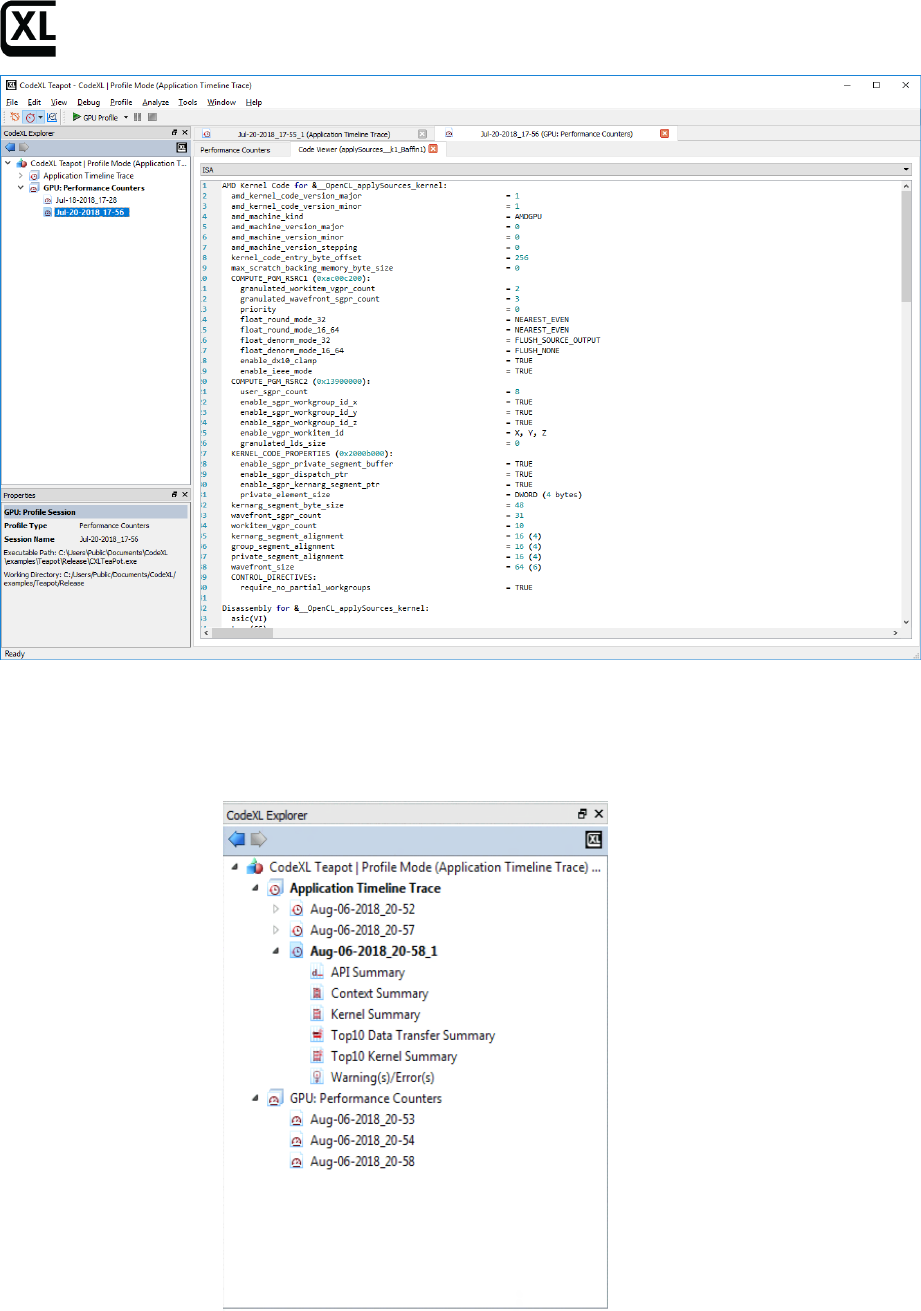
To display a Code viewer with kernel code:
1. Click on a kernel name (Method) in the Performance Counters view.
A pull-down bar at the top of the window under the Code Viewer tab (see
following screenshot) lets you select OpenCL source (CL), intermediate language
(IL), or instruction set architecture (ISA) code.
Getting Started with CodeXL
CodeXL Explorer Tree
The Explorer view lets you switch between profiling sessions. This view lists all
profiling sessions for the current project.
To display a session’s data, double-click on it. To rename or delete it, right-click
on it.
To import profiling data, right-click or drag/drop a session data file to the
Explorer.
Getting Started with CodeXL
Analyze Mode
Static Kernel and Shader Analysis
In Analyze mode, you can compile and generate performance statistics for
OpenCL kernels, DirectX Shaders, OpenGL Programs and Vulkan Programs. The
compilation and statistics generation process can be targeted at a variety of AMD
GPUs and APUs, independent from the actual type of GPU/APU that is installed
on your system. Using the Analyzer, you can generate and inspect performance
statistics, ISA code, IL code and D3D ASM code.
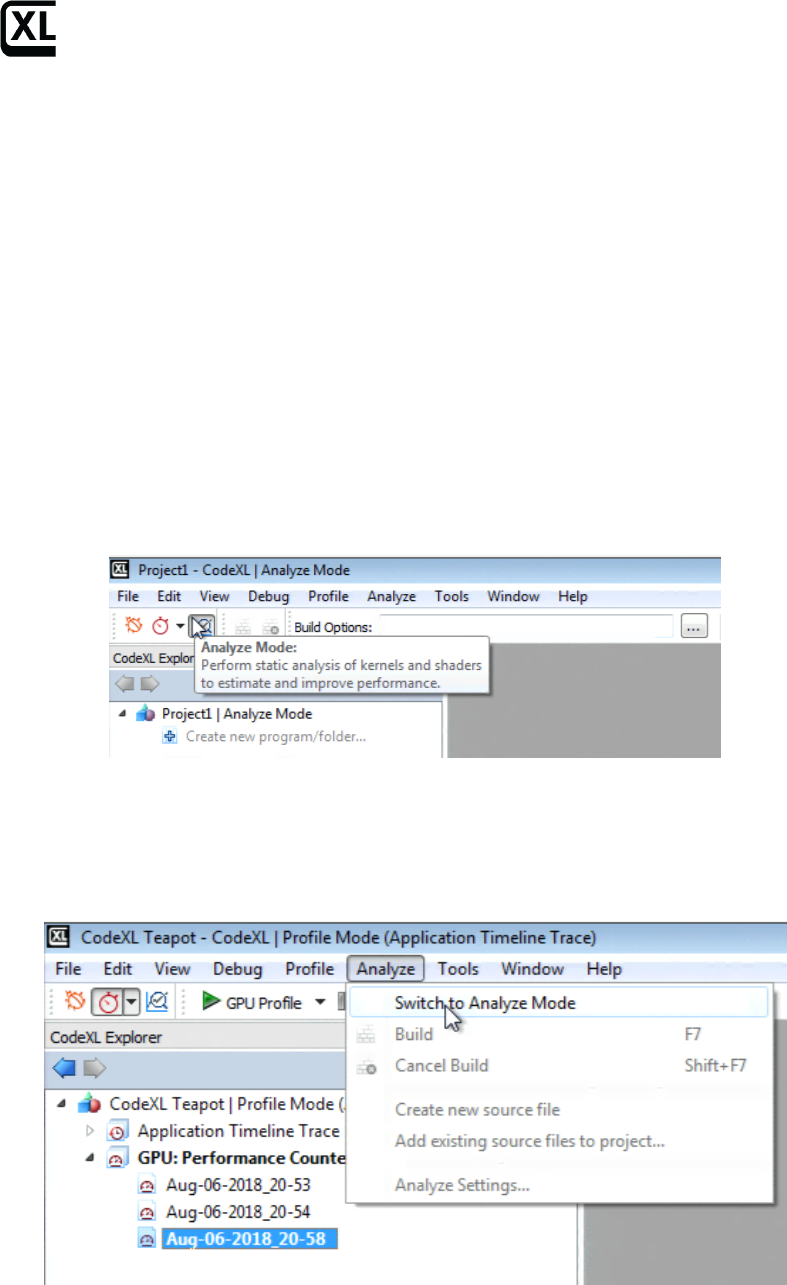
Switching to Analyze mode
Option 1:
Click on the Analyze Mode button in the CodeXL Mode toolbar.
Option 2:
Click Analyze in the main menu.
Once you switch to Analyze mode, you can create a new project, open a
previously saved project or load the Teapot sample.
Getting Started with CodeXL
Creating a new project for Analysis
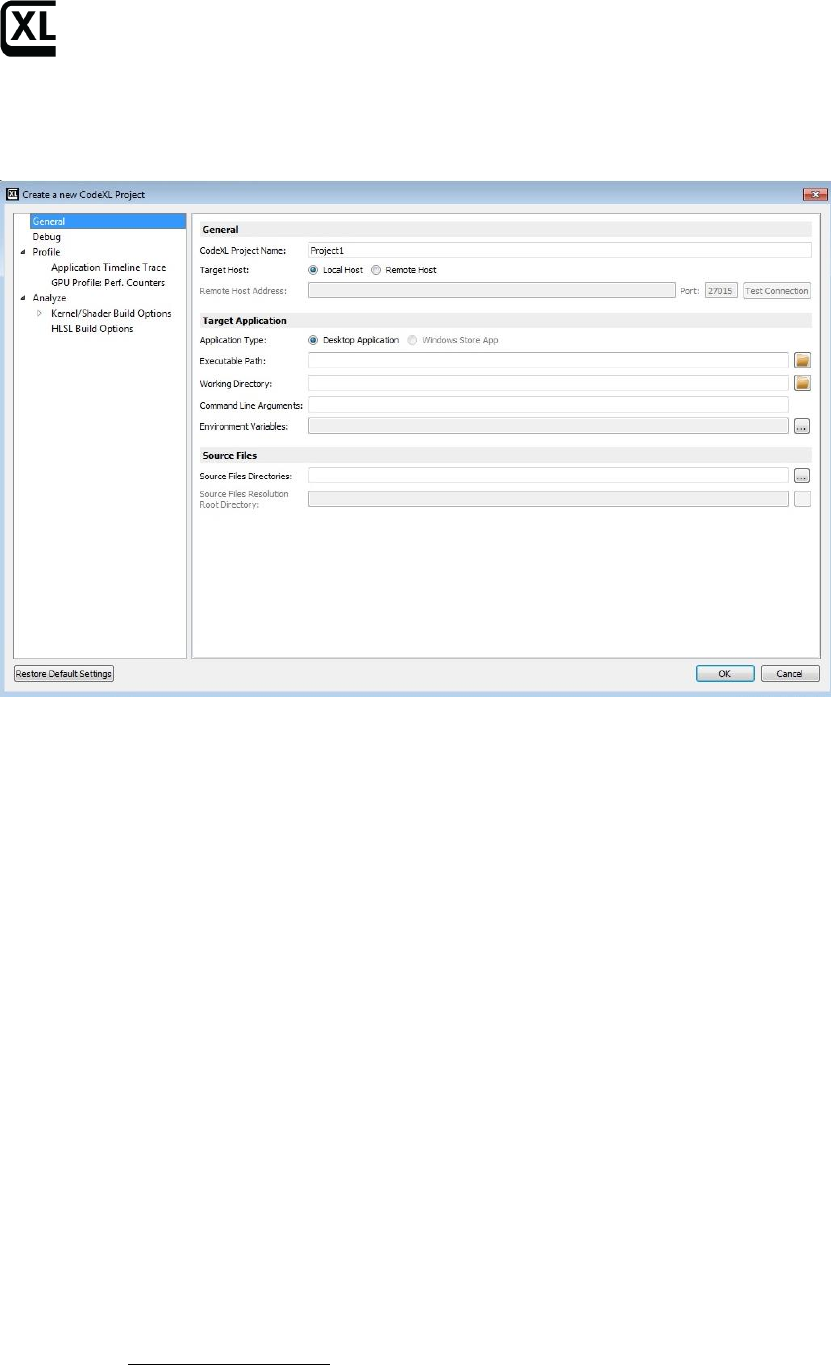
Click on the “File->Create Project”, or use the Ctrl+N shortcut. The following
CodeXL Project Settings dialog will appear:
Rename the project, and click on the OK.
After the new project has been created, the CodeXL Analyzer Explorer Tree
should appear in the left pane:
Working with the new CodeXL Analyzer Explorer Tree
If you are familiar with the former versions of the Analyzer, you probably noticed
that the tree has a different structure than the one used in previous versions.
Let’s examine the structure of the new CodeXL Analyzer Explorer:
1. Programs and Folders: before describing how to technically create Programs and
Folders, let’s first discuss what those objects are, and why they can be useful.
a. Programs (OpenGL, Vulkan):
As of version 2.0, CodeXL can compile and link together multiple
source files for OpenGL and Vulkan. This is especially important when
different shaders have mutual impact on one another’s ISA and
performance statistics. To provide that type of support, CodeXL
Analyzer introduced the concept of a Program. There are two types of
Programs in CodeXL 2.0:
- Rendering Programs
- Compute Programs
A Rendering Program represents a graphics pipeline, and can have a
single shader attached to each of its stages:
- Vertex
Getting Started with CodeXL
- Tessellation Control
- Tessellation Evaluation
- Geometry
- Fragment
A Compute Program represents a compute pipeline, and can have a
single compute shader attached to its single stage.
When you build a program that has multiple shaders attached to it, all shaders
are being compiled and linked together. This way, you get more accurate ISA
and performance statistics than those generated using previous versions of
CodeXL.
b. Folders (OpenCL, DirectX):
Folders are logical containers of source files. When you build a folder that has
multiple source files attached to it, the source files are simply being built one
after the other. Unlike programs, there is no kind of interdependency between
the source files in a given folder: when a folder is being built, each source file is
being compiled independently. Folders can be used to organize the project, by
serving as a logical separator. They can also be used to ease the process of
comparing build results, since now the build results are being maintained per-
folder: you can create two different Folders, each containing the same source
files, but have a different configuration (for example, create two DirectX Folders,
each with a different shader model). After building the two Folders, you can
toggle between the performance statistics of the two Folders to see the
differences.
You may ask yourself why CodeXL does not support the concept of DirectX
Programs, just like it does for OpenGL and Vulkan. This is a good point.
Supporting DirectX Programs is at a high priority in the Analyzer’s roadmap, and
we will do our best to add that feature in the upcoming versions of the product.
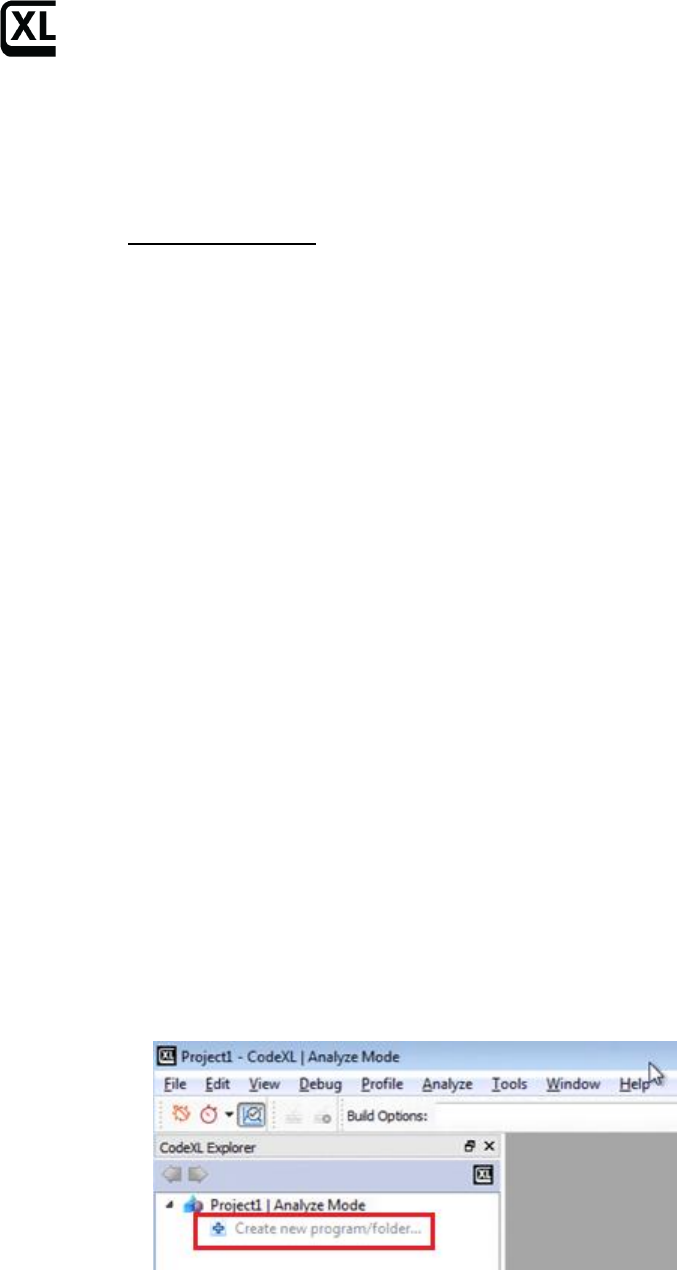
Creating a new Program or Folder
To create a new Program or a Folder, double-click on the “Create new
program/folder” item in CodeXL Analyzer Explorer Tree:
Then, the following dialog would pop-up:
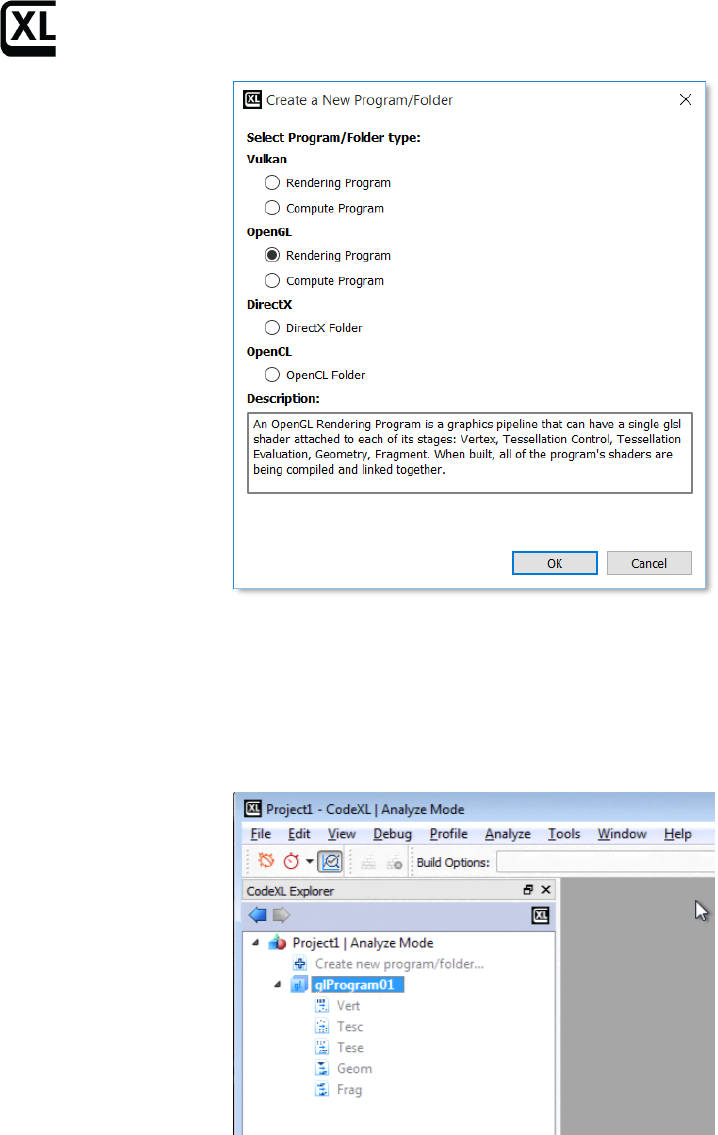
Getting Started with CodeXL
Select the Program/Folder type of choice, and click OK.
Then, the empty Program/Folder would appear in the Explorer Tree.
For Example, if you choose an OpenGL Rendering Program, you will
see an empty OpenGL Rendering Program created:
Working with Programs
After creating a new program, you will see that it contains an empty placeholder
for every pipeline stage. Right-click on any stage to add an existing shader or
create a new one:
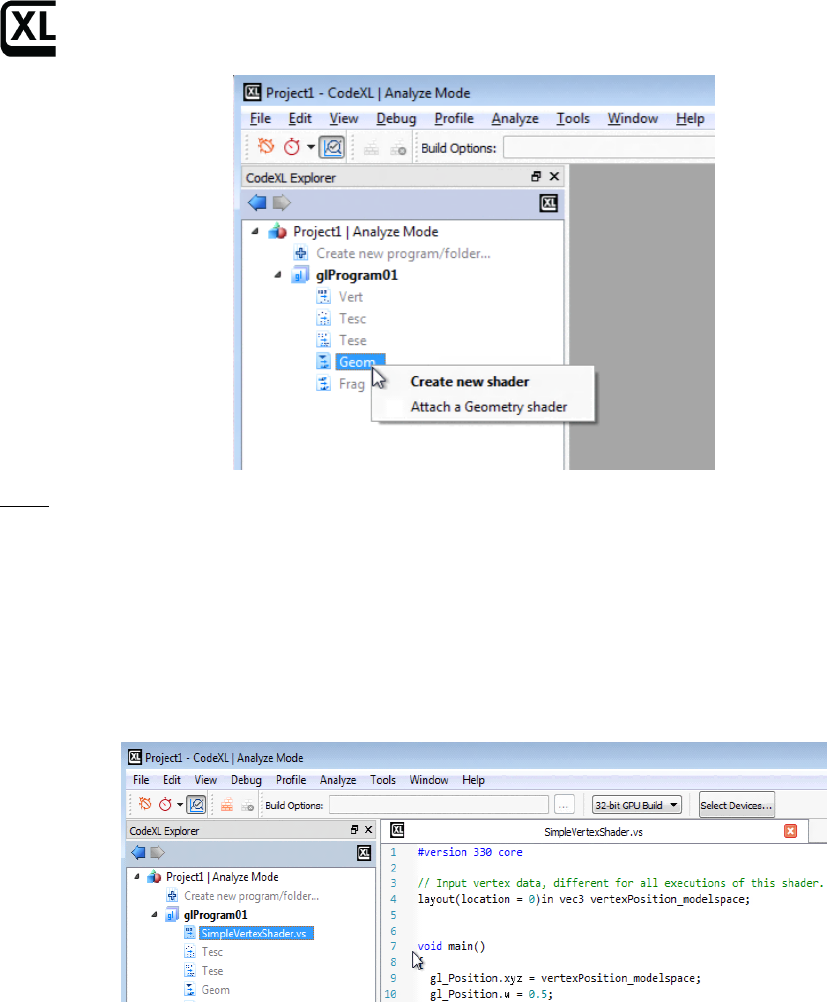
Getting Started with CodeXL
Note: You can also double-click on a stage to create a new shader and
automatically attach it to that Program’s stage.
Whether you chose to create a new shader or to attach an existing one, after the
shader is added to the program, it will also being listed under the Source Files
pool for future use. This will enable you to attach that specific shader to other,
future or existing, programs as well. There is no limit for the number of
programs that can reference the same shader.
As you can see in the above screenshot, we attached SimpleVertexShader.vs as
the vertex shader to our OpenGL Rendering Program, and it was also
automatically added to the Source Files pool. We can now drag
SimpleVertexShader.vs from the Source Files pool and drop it on the stage node
of any Program that we may add to the project, to reuse SimpleVertexShader.vs
(there is no dependency in the build process between different Programs).
To build the program, right-click on it and select the Build option, or use the F7
shortcut:
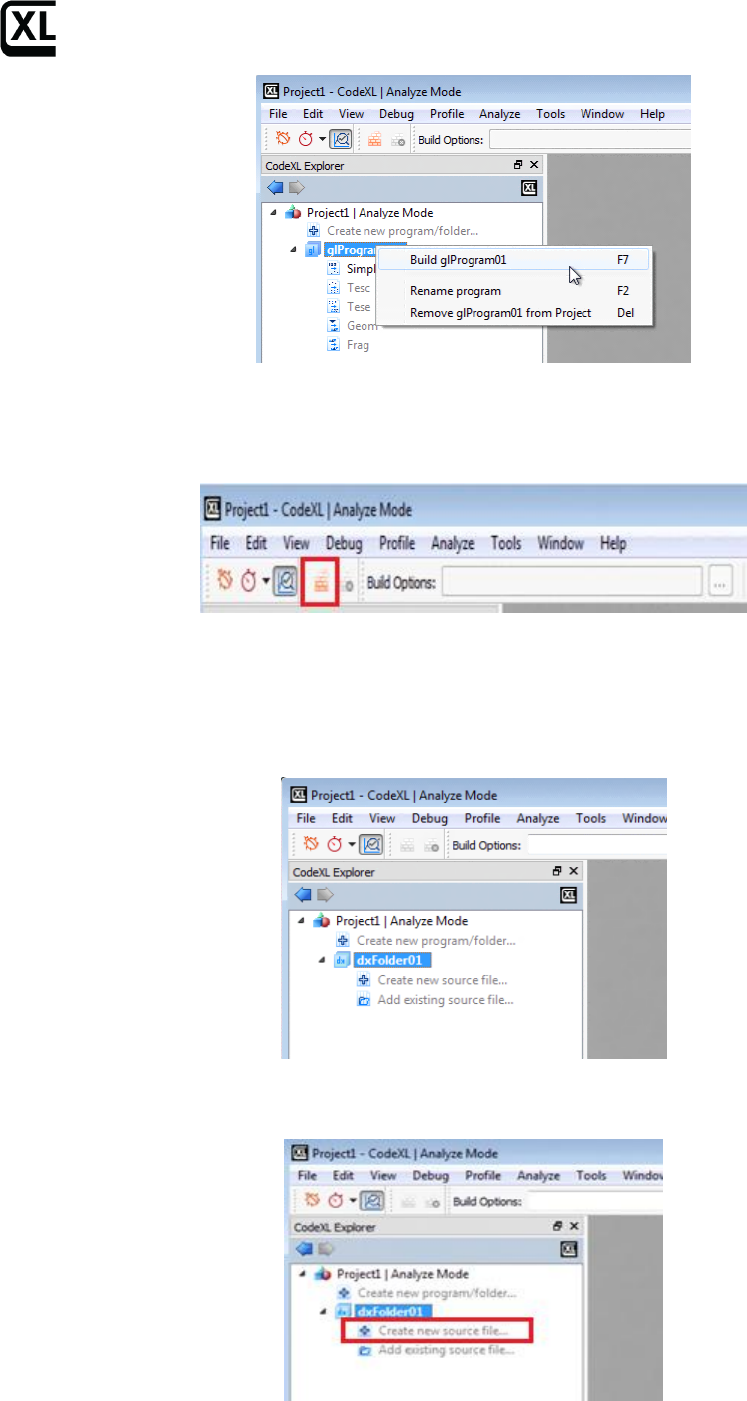
Getting Started with CodeXL
You can also select the Program and manually click on the Build button in the
Analyzer toolbar:
Working with Folders
After creating a new OpenCL or DirectX Folder, an empty Folder would be listed
in the Explorer Tree:
To create a new source file, and automatically add it to the Folder, double-click
on the “Create new source file item…” item of the folder:
Getting Started with CodeXL
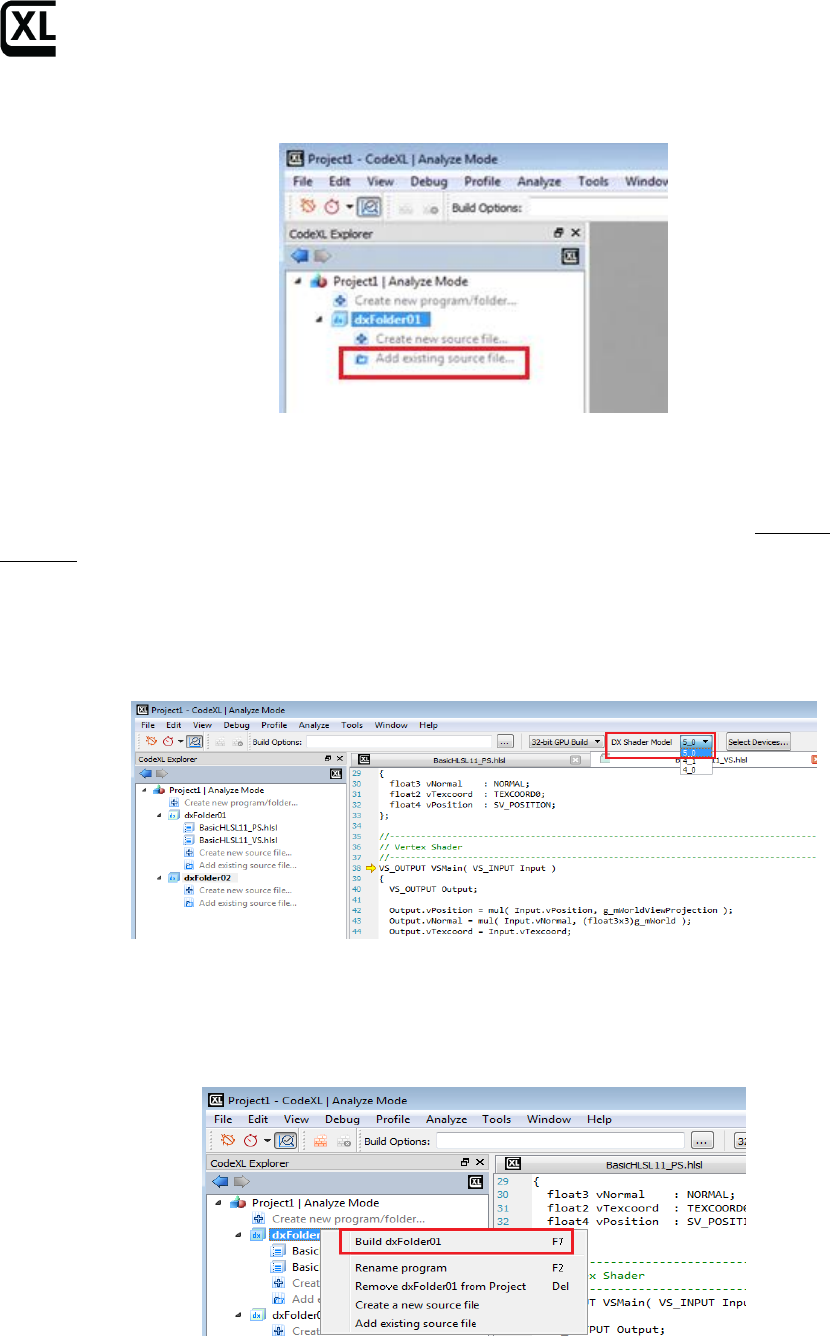
To add an existing source file, and automatically add it to the Folder, double-click
on the “Add existing source file item…” item of the folder:
To configure the build properties of a source file under a specific Folder, click on
that source file and use the Analyzer toolbar’s Type and Entry point drop-down
lists. The first sets the type of the shader and the latter specifies the specific
target shader (among the shaders in the source file). This configuration is Folder-
specific. That is, the same source file can be set with different properties under
different Folders. CodeXL will remember those configurations for you.
To configure the build properties of the Folder, click on the Folder and adjust the
enabled items in the Analyzer toolbar. For CodeXL 2.0, this is only relevant to the
DX Shader Model property of DX Folders:
Once set, the DX Shader Model value will hold for all the shaders in the selected
Folder. For example, if you choose 5_0 as the DX Shader Model, any D3D vertex
shader in that Folder will be compiled using shader model vs_5_0.
To build the whole Folder, right-click on it and select the Build item:
Unlike the case with Programs, Folders are more flexible as they allow you to
build selected source files, without being required to build the whole Folder. To
build selected source files, click on the selected source files under the program,
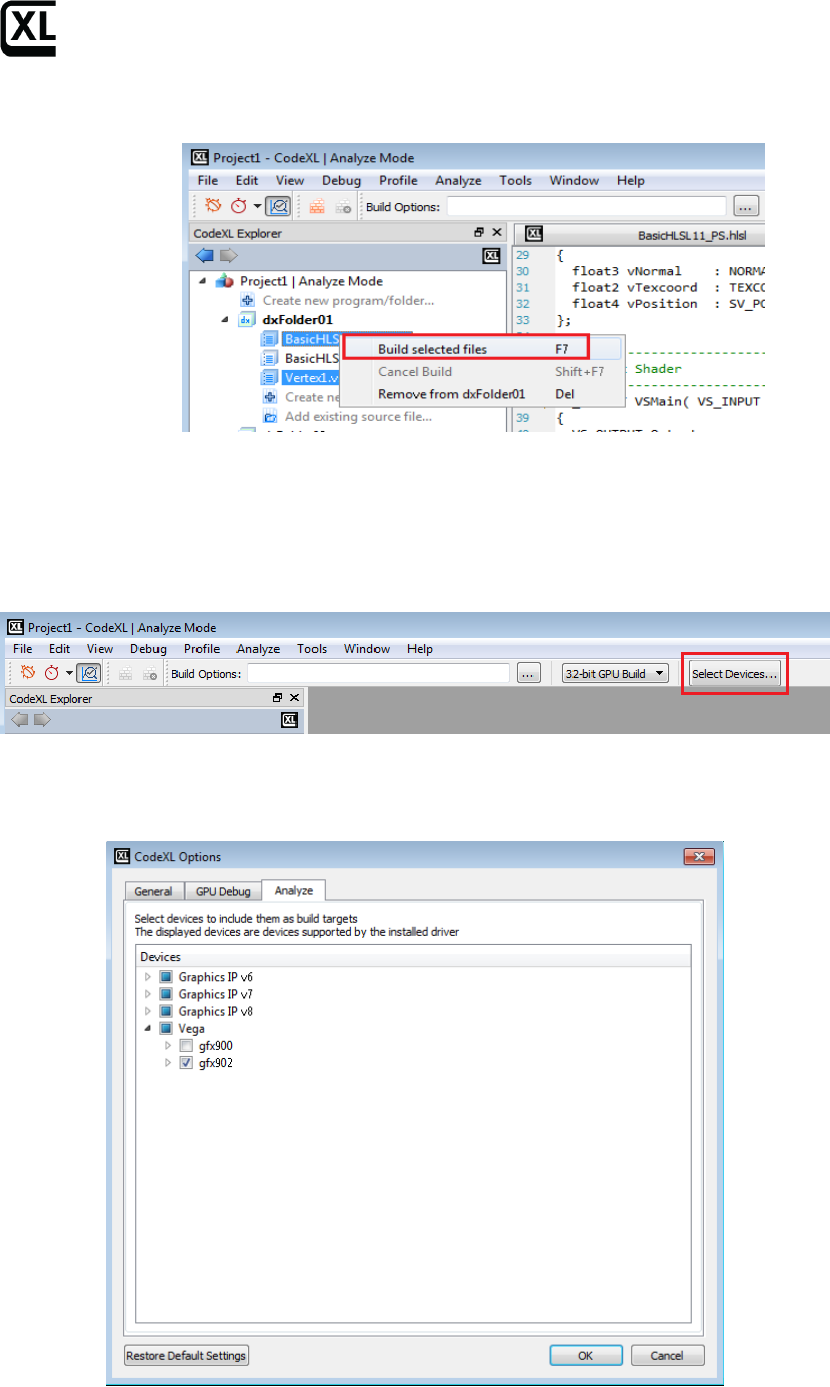
Getting Started with CodeXL
while holding the Ctrl key. Then, right-click on one of the selected files and select
the build option:
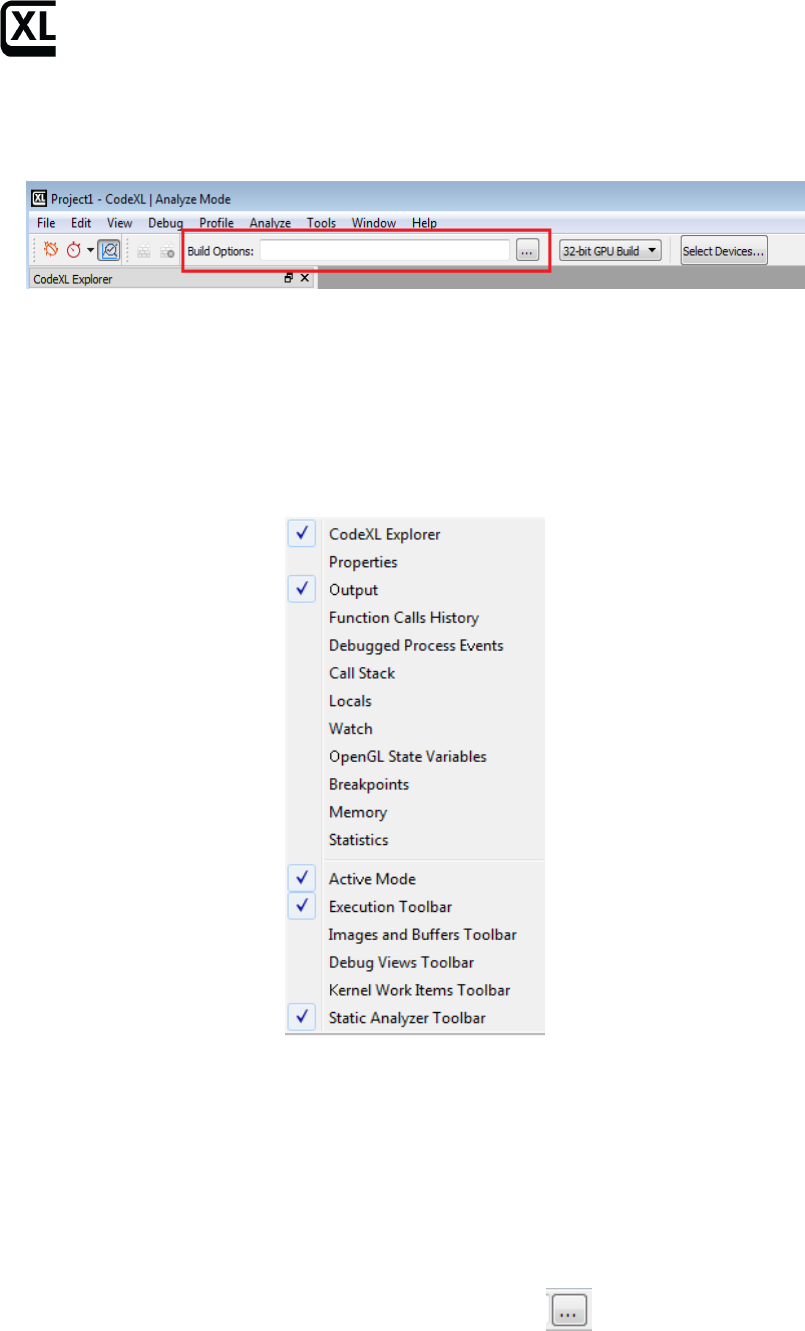
Selecting target devices
CodeXL Analyzer can target a variety of devices, independent of the device that is
physically installed on your system. To select the target devices, for which the
build would be performed, first click on the Select Devices button in the Analyzer
toolbar:
Then, the CodeXL Options dialog would pop-pup with its Analyze tab activated.
The devices are grouped by generations. You can use the check boxes to select
and remove devices:
Getting Started with CodeXL
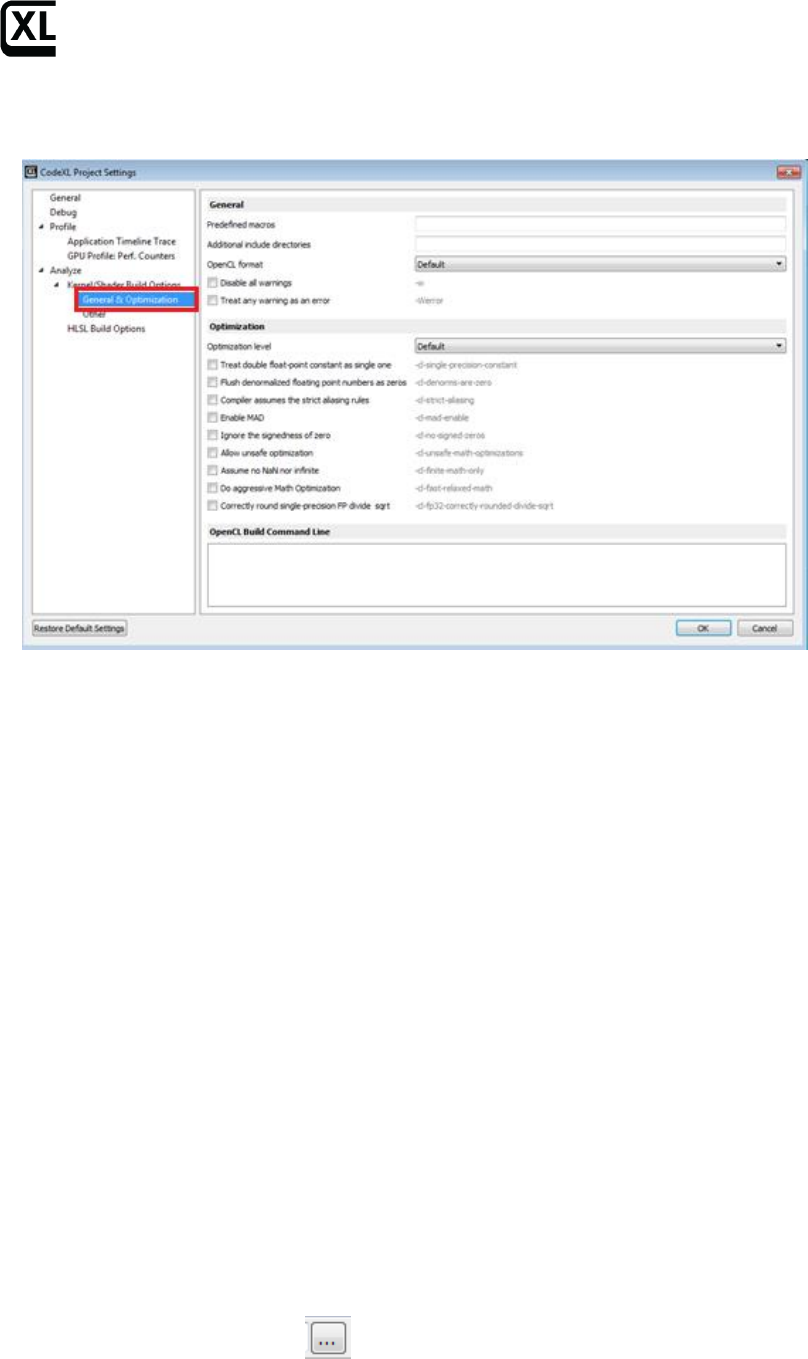
Build Options - defining kernel/shader compilation options
In the Static Analyze toolbar, there is a text box where you can manually define
specific OpenCL/HLSL build options (there is no support for GLSL build options):
DirectX (Direct3D) shaders written on high-level shader language (HLSL) are
supported on MS Windows only.
Note: The display of this toolbar is dynamic; you can set it from the right-click
menu in the main CodeXL frame:
The Build Options box is a place to set compiler build flags such as –x clc++ or
–o3. Any compiler build flag can be placed in this box.
OpenCL Build Options Dialog
This dialog will help you choose the correct OpenCL build options for you and
hopefully will prevent you from making spelling mistakes while typing the
options manually.
To open the OpenCL Build Options dialog, press the Button. You can
browse between the ‘General & Optimization’ tab and the ‘Other’ tab to view all
the available options. Once you choose an option, the option text will appear in
the text box below marked as ‘OpenCL Build Command Line’. This string will also
appear in the menu bar after you click the OK button.
Getting Started with CodeXL
Typing the command line in the text box will also mark the corresponding check
boxes in the dialog.
Examples of using build options
For building the tpAdvectFieldScalar.cl kernel from CodeXL TeaPot sample
project, enter the following options:
-D GRID_NUM_CELLS_X=64 -D GRID_NUM_CELLS_Y=64 -D GRID_NUM_CELLS_Z=64
-D GRID_INV_SPACING=1.000000f -D GRID_SPACING=1.000000f -D
GRID_SHIFT_X=6 -D GRID_SHIFT_Y=6 -D GRID_SHIFT_Z=6 -D
GRID_STRIDE_Y=64 -D GRID_STRIDE_SHIFT_Y=6 -D GRID_STRIDE_Z=4096 -D
GRID_STRIDE_SHIFT_Z=12 -I path_to_example_src
On windows, path_to_example_src should be:
C:\Users\Public\Public Documents\CodeXL\Examples\Teapot\res
On Linux, path_to_example_src should be:
/opt/ CodeXL_X.X/examples/Teapot/TeaPotLib/
Adding the option ‘-h’ will dump the list of OpenCL compiler available options in
the output tab.
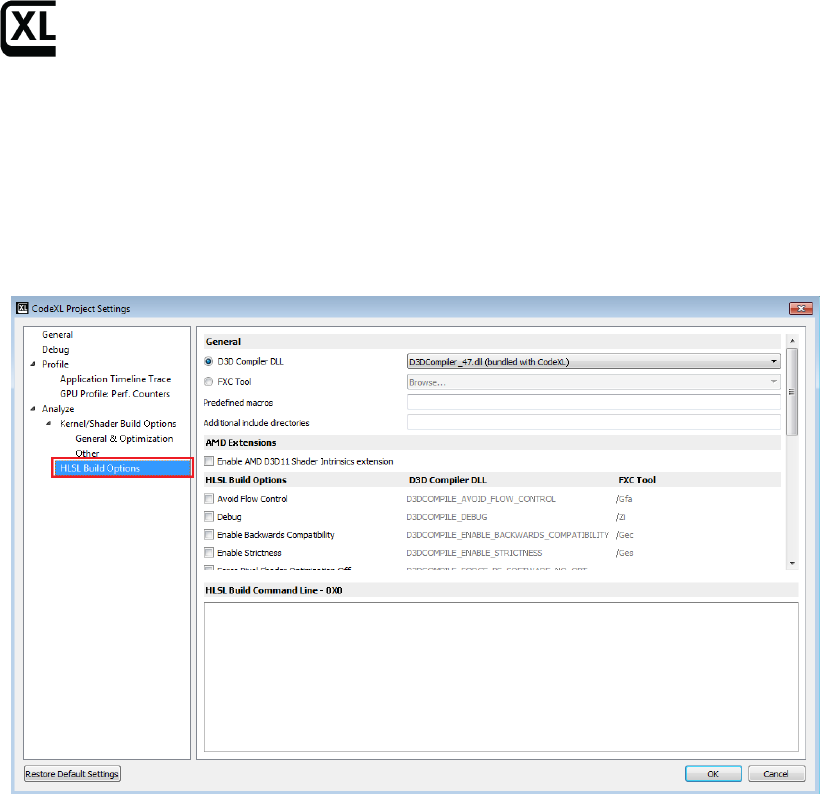
HLSL Build Options Dialog
This dialog will help you choose the correct DirectX build options for you and
hopefully will prevent making spelling mistakes while typing the options
manually.
To open the dialog, press The Button. The dialog will be opened. Click
the”HLSL Build Options” node to view the available options.
Once you choose an option, the option text is displayed in the”HLSL Build
Command Line” text box that appears below.
Getting Started with CodeXL
This build option string will also appear in the toolbar’s build options box after
you click the OK button.
As an alternative to selecting options through the radio buttons, it is possible to
type a command in the “HLSL Build Command Line” text box. Build options types
in the text box will automatically be translated to update of the relevant controls
accordingly. For example, typing “D3DCOMPILE_DEBUG” in the lower text box
automatically updates the “Debug” check box to be checked.
HLSL Compiler Tools
First select the build tool of choice for compiling the shader – D3d compiler / FXC
compiler.
The CodeXL installation includes a copy of the Microsoft DirectX compiler DLL:
d3dcompiler_47.dll. You may specify a different path if you want CodeXL to use a
different d3dcompiler module. If you select the FXC compiler tool you must
specify a path to the location of this tool.
To select the path of the compiler module, click the ‘Browse…” option from the
combo-box. When selecting Browse, a dialog box will open for selecting the
compiler file.
• For D3D compiler – any file called d3compiler_*.dll can be selected
• For FXC compiler – only FXC.exe file can be selected.
Note: for D3D compiler the bundled file is selected by default.
Output Tab
The compiler output appears in the Output tab. The example below shows
successful builds (no warnings or errors) for 4 devices.
If errors occur, the output will display the error and the line in which the error
occurred.
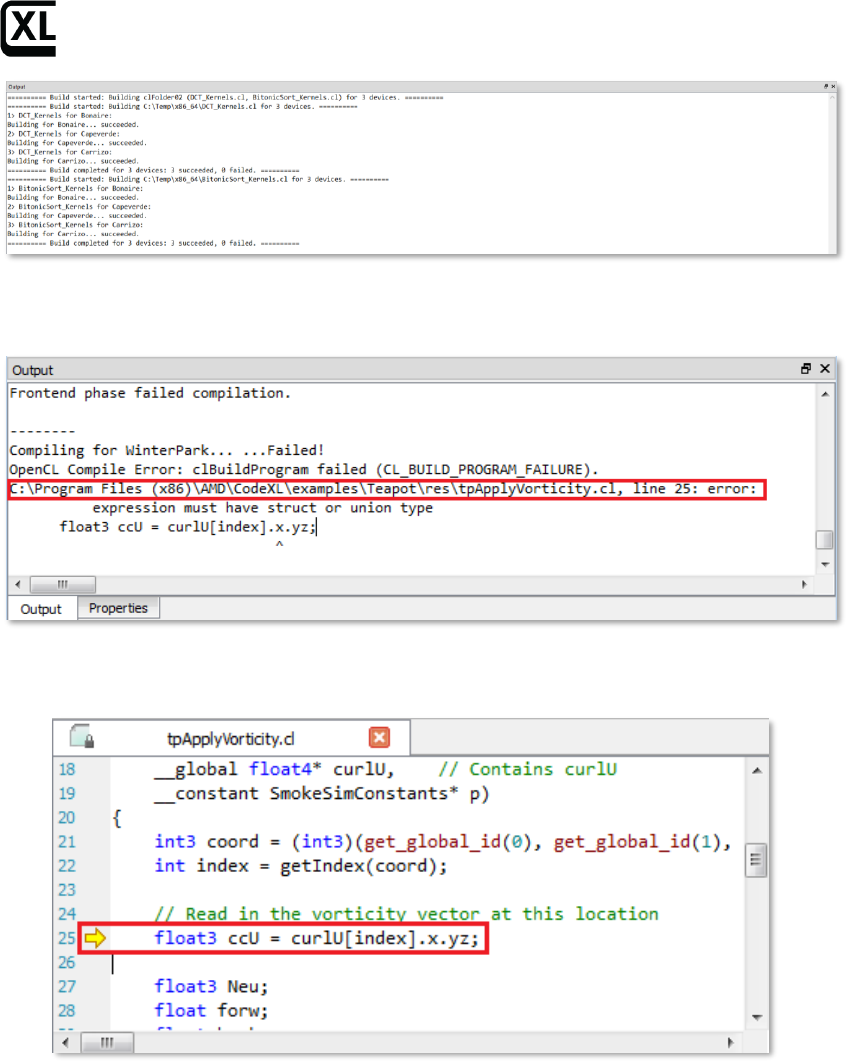
Getting Started with CodeXL
If there were errors, the output pane will display the error and the line where the
error occurred:
Double clicking on an error navigates the user to the Source Code view,
displaying the kernel/shader source code:
Statistics Tab
The Statistics tab gives detailed statistics for the selected kernel/shader for each
target device. To open the Statistics tab, expand the desired kernel in the project
tree, and double-click the Statistics node:
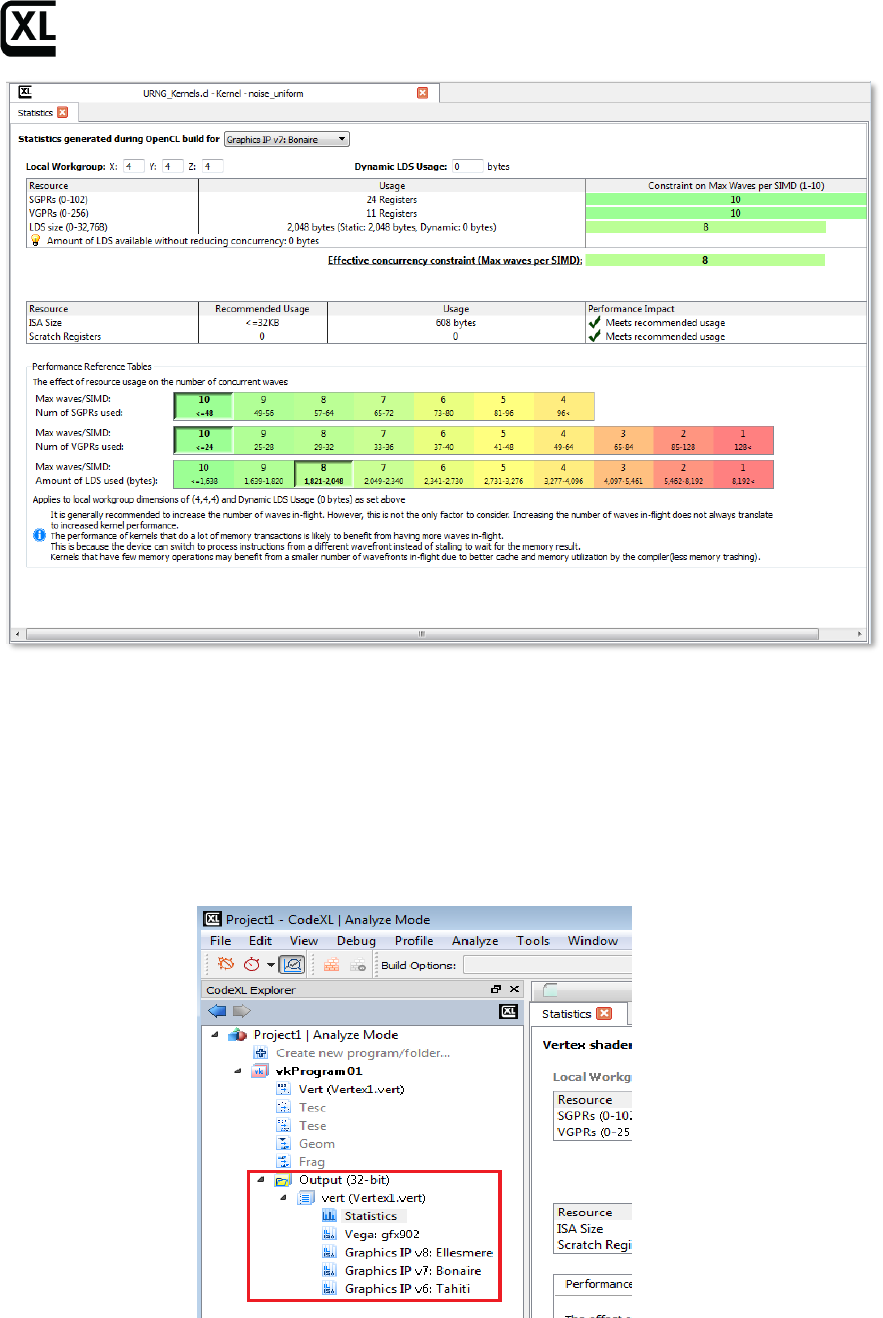
Getting Started with CodeXL
Note: the statistics tab for pre-GCN devices (v4 & v5 generations) is a bit
different. For more information, see the complete help manual document.
Viewing compilation output: ISA and IL
The performance statistics tab will be opened automatically when the build
process is over. To view the compilation output, double click the node of the
desired ASIC in the explorer tree, under the Program/Folder and configuration
(32-bit or 64-bit):
This will open a tab containing the source code, the IL and the ISA. The program
source code and the AMD IL code will be presented as standard text documents.
The ISA will be presented in the “Enhanced ISA View” for GCN devices, and as a
standard text document for pre-GCN devices.
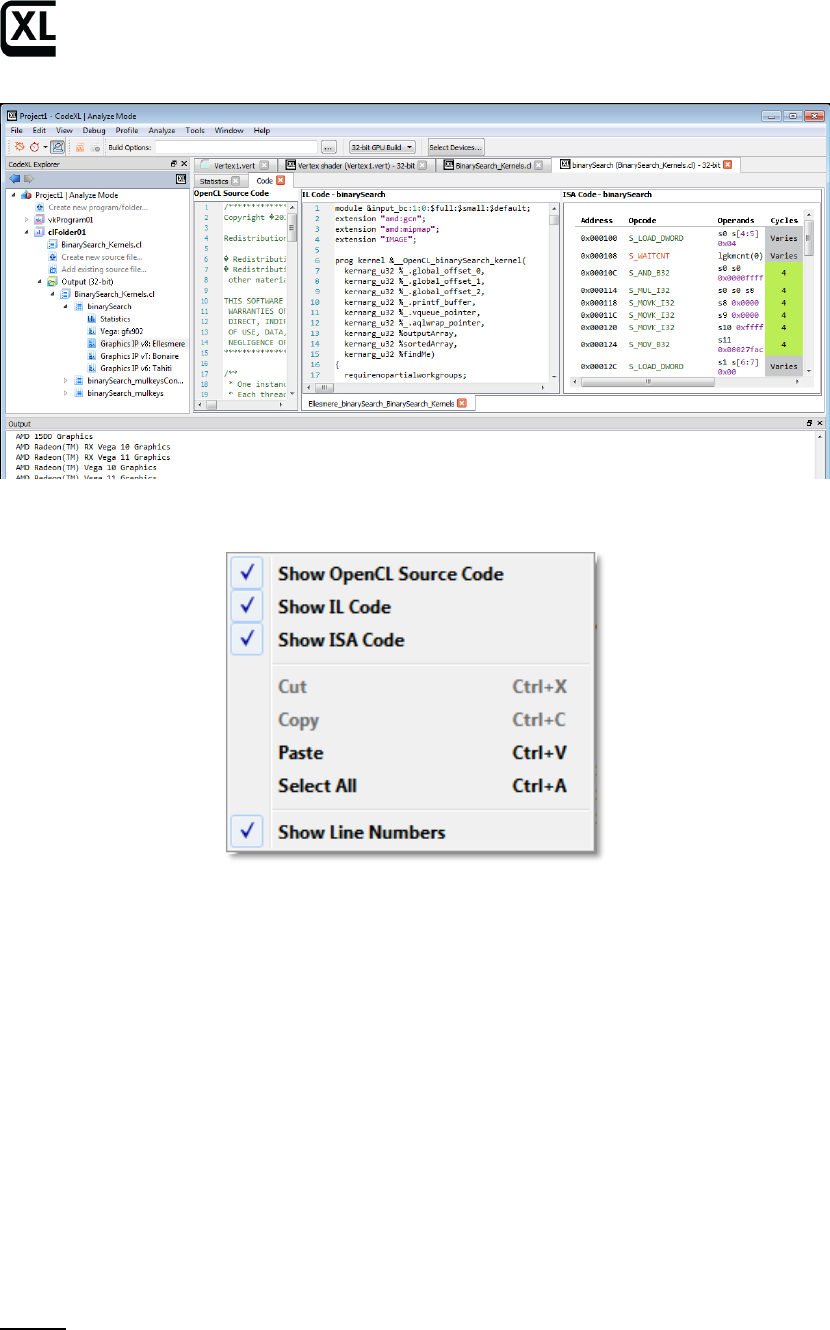
Getting Started with CodeXL
The context menu enables to display/hide line numbers for each source
code/IL/ISA tab.
Navigating through ISA code with the Enhanced ISA View
Using this view, you can inspect the ISA code of GCN devices and see the
estimation for instruction cost in clock cycle. The view contains 5 columns:
- Address: the instruction’s offset within the program (in bytes)
- Opcode: the operation to be performed
- Operands: the data for the operation
- Cycles: the number of clock cycles which are required by a Compute Unit
in order to process the instruction for a 64-thread Wavefront, while
neglecting the system load and any other runtime-related factor.
- Instruction Type: the category of instructions to which the instruction
belongs
- Hex: binary representation of the instruction, in hexadecimal format
Notes:
1. Note that code labels which appear in the Operands column are clickable. By
clicking on a label link, you can navigate to the label’s spot in the code.
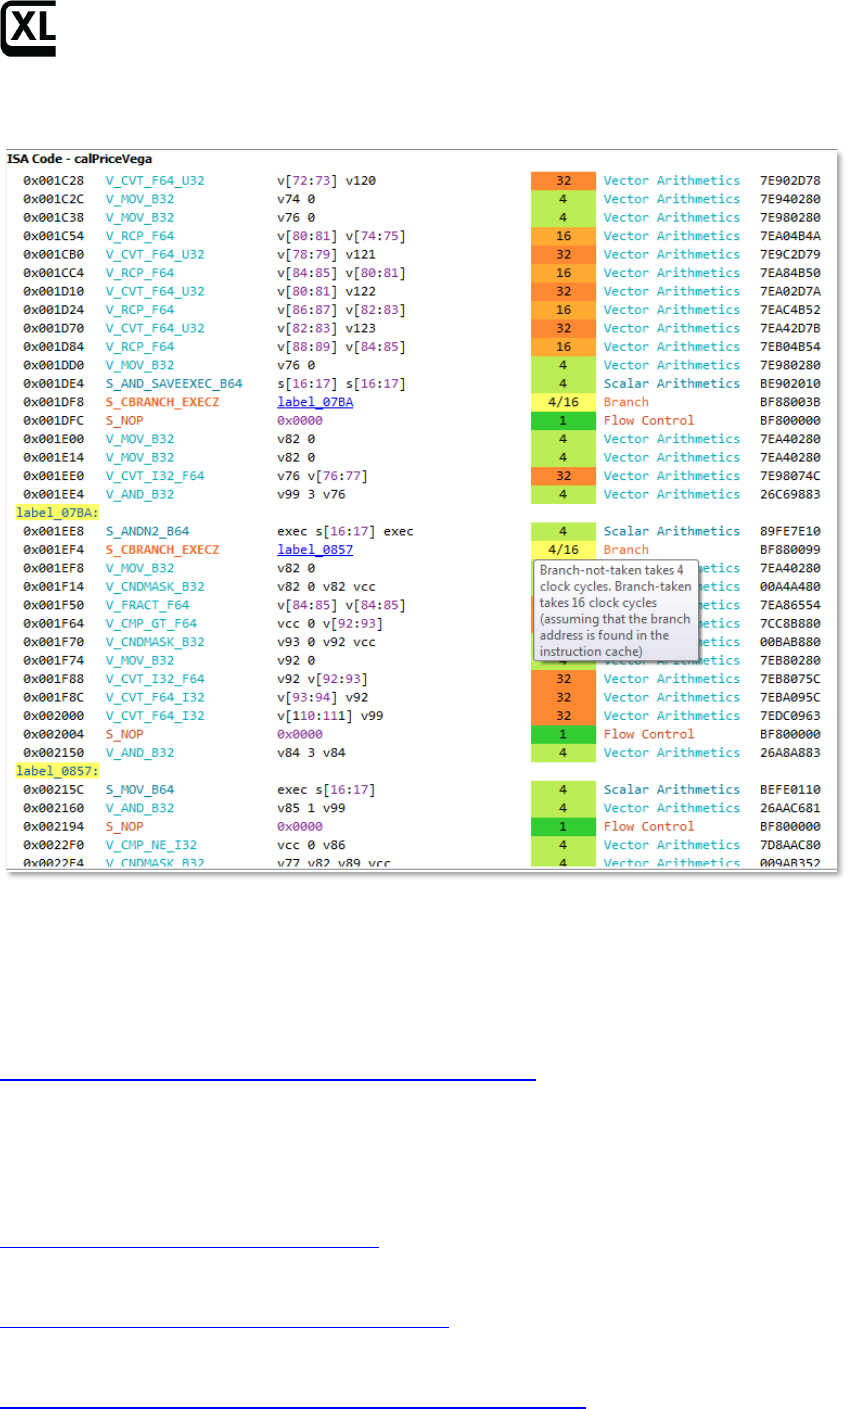
Getting Started with CodeXL
2. Note that this view is only available for GCN devices. For pre-GCN devices, the
plain textual ISA view will be displayed.
Known Issues
For a list of known CodeXL issues, review the release notes on the CodeXL web
page and the AMD Developer Tools CodeXL forum:
https://github.com/GPUOpen-Tools/CodeXL/issues
Support
AMD general developer support page:
http://developer.amd.com/support/
Tools & SDKs section in AMD Developer Tools website:
http://developer.amd.com/tools-and-sdks/
OpenCL Zone in AMD Developer Tools website:
http://developer.amd.com/tools-and-sdks/opencl-zone/
Getting Started with CodeXL
AMD Accelerated Parallel Processing OpenCL Programming Guide:
http://developer.amd.com/wordpress/media/2013/07/AMD_Accelerated_Paral
lel_Processing_OpenCL_Programming_Guide-rev-2.7.pdf
For GPU development issues relating to other AMD tools, see the AMD GPU
Developer Tools Forum:
community.amd.com/community/devgurus/gpu_developer_tools
To report a specific problem or request help with CodeXL, visit the CodeXL
Forum at:
https://github.com/GPUOpen-Tools/CodeXL/issues
DISCLAIMER
The information contained herein is for informational purposes only, and is
subject to change without notice. While every precaution has been taken in the
preparation of this document, it may contain technical inaccuracies, omissions
and typographical errors, and AMD is under no obligation to update or otherwise
correct this information. Advanced Micro Devices, Inc. makes no representations
or warranties with respect to the accuracy or completeness of the contents of
this document, and assumes no liability of any kind, including the implied
warranties of non-infringement, merchantability or fitness for particular
purposes, with respect to the operation or use of AMD hardware, software or
other products described herein. No license, including implied or arising by
estoppel, to any intellectual property rights is granted by this document. Terms
and limitations applicable to the purchase or use of AMD’s products are as set
forth in a signed agreement between the
parties or in AMD's Standard Terms and Conditions of Sale.
AMD, the AMD Arrow logo, AMD Radeon, AMD FirePro, gDEBugger, and
combinations thereof are trademarks of Advanced Micro Devices, Inc. OpenCL is
a trademark of Apple Inc. used by permission by Khronos. OpenGL is a registered
trademark of Silicon Graphics, Inc. in the United States and/or other countries
worldwide. Microsoft, Windows, DirectX and Visual Studio are registered
trademarks of Microsoft Corporation in the United States and/or other
jurisdictions. Vulkan is a registered trademark of Khronos Group Inc. in the
United States and/or other jurisdictions. Linux is the registered trademark of
Linus Torvalds in the United States and/or other jurisdictions. PCIe and PCI
Express are registered trademarks of PCI-SIG Corporation. Other product names
used in this publication are for identification purposes only and may be
trademarks of their respective companies.
