Cruz Plot Manual App
User Manual:
Open the PDF directly: View PDF ![]() .
.
Page Count: 25
CruzPlot
A Mapping Program in R
Tim Gerrodette
Samuel Woodman
NOAA National Marine Fisheries Service
Southwest Fisheries Science Center
La Jolla, California
September 13, 2018

INTRODUCTION AND SET-UP
CruzPlot is a utility program to create maps and plot data on them. The main feature of
the software is the ability to create publication-quality map graphics quickly and easily
with a user-friendly interface. The program’s features reflect its main use by the Marine
Mammal and Turtle Division of the Southwest Fisheries Science Center, NOAA
Fisheries (SWFSC) in La Jolla, California. In particular, CruzPlot is oriented to the
ocean and to data files in the “DAS” format produced by WinCruz, the data-entry
program used on line-transect surveys at the SWFSC. CruzPlot is specifically designed
to plot marine mammal and turtle sightings directly from DAS files. CruzPlot is not
meant to replace specialized map-oriented analytical software such as ArcView or Surfer.
CruzPlot can produce maps virtually anywhere in the world at any scale using the R
“maps” and “mapdata” packages. Visual details such as color fill, tick marks and tick
spacing, and tick and axis labels are controlled by the user. The main additional feature
of interest for marine studies is water depth. Using the R package “marmap”, CruzPlot
can either download bathymetric data from the ETOPO1 database hosted on the NOAA
website, or shade and/or contour depth data from a local file.
After a map has been created, marine mammal and turtle sightings and transect-line effort
can be plotted directly from DAS files. Sightings and effort may be filtered by Beaufort
sea state, date, cruise number, and perpendicular distance from the trackline. After data
have been plotted, sightings or effort can be identified interactively with the cursor.
CruzPlot can also plot points and/or lines from any file with latitude and longitude
coordinates.
CruzPlot is written in R using the Shiny web application framework through the “shiny”
and “shinydashboard” R packages. Shiny applications have two required files, a ui file
and a server file, that handle interface and calculations, respectively. Each time a new
value is entered through the interface, CruzPlot updates the plot. Shiny utilizes what are
called reactive functions. The reactive functions are “smart”, meaning that they cache
their values and rerun only when input variables they depend on change. This allows
CruzPlot to update quickly because the program does not have to do repetitive
calculations. However, the CruzPlot map must be regenerated each time an input is
changed, so something like plotting or replotting detailed depth data will always take a
long time.
CruzPlot requires a recent version of R (available at https://www.r-project.org/) and the
following R packages: shiny, shinydashboard, shinyjs, DT, maps, mapdata, marmap,
stringr, geosphere, and dplyr. In the same folder as the interface file ui.R and the
calculations file server.R, CruzPlot requires, at a minimum “SpCodes.dat” with SWFSC
species names and codes and this document “CruzPlot Manual.pdf”. The optional file
“StarterVals.csv” is useful to specify the default map shown when CruzPlot is launched.
For shipboard use, depth files of the area of interest should be downloaded/created to a
local file prior to the cruise.
To run CruzPlot, open either the ui.R or server.R file in an R editor such as RStudio or
Tinn-R. Enter “shiny::runApp()” on the command line or click “runApp” in the upper
right corner of the ui.R or server.R scripts in RStudio. CruzPlot will launch in a browser
window, but you can run CruzPlot in a separate browser window by clicking “Open in
Browser” on the top bar of RStudio. This “Open in Browser” action does not require
internet access; it simply runs the program through your default browser.
CRUZPLOT SIDEBAR MENU DETAILS
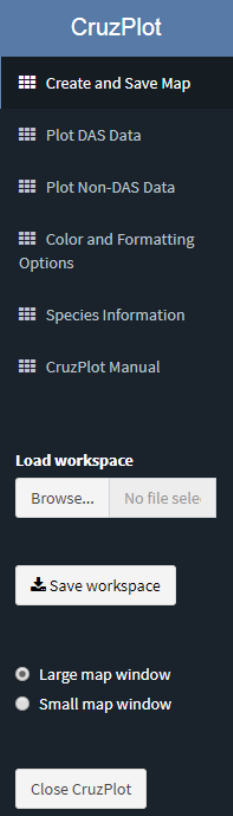
When CruzPlot is opened, the Create and Save Map page
will be selected, and you will see a map with the latitude and
longitude limits specified in StarterVals.csv. If StarterVals.csv
is not found, then the map will have default coordinates of -
160º, -75º, -20º, and 34º (the ETP). Geographic positions in
CruzPlot are given as signed decimal numbers in degrees.
South latitudes and west longitudes are negative; north latitudes
and east longitudes are positive. Thus, 124 30’ W longitude is
represented as -124.5.
Map size, labels, tick marks and colors can be modified using
the tabs at the top of the Map page. Details of the tab entries
are described below. At any time, you can plot data on the map
by selecting the Plot DAS Data or Plot Non-DAS Data pages
on the left sidebar menu. The tabs associated with these
plotting actions are also described below. As you explore
different options for plotting your data, the base map will
remain the same. If you wish to alter the map, you can reopen
the Create and Save Map page and make your changes while
the data plotted on the map stay the same. If you wish to return
to the default base map and remove plotted DAS or non-DAS
data, you can reload the program by reloading the web page if
CruzPlot is open in a browser or by clicking the circular arrow
if CruzPlot is open in an external window.
Also on the sidebar menu are ‘Load workspace’ and ‘Save
workspace’ options, a selection for making the map display
large or small, a button to close the program. A saved
workspace includes but is not limited to: planned transects,
coastline data, DAS data, non-DAS data, currently plotted
species, and currently plotted effort. A saved workspace must have a ‘.RDATA’ file
extension, and you can load any of these saved files using the ‘Load workspace’ option.
The ‘Large map’ setting is designed for desktop computers, while the ‘Small map’ setting
is designed for laptops.
Create and Save Map
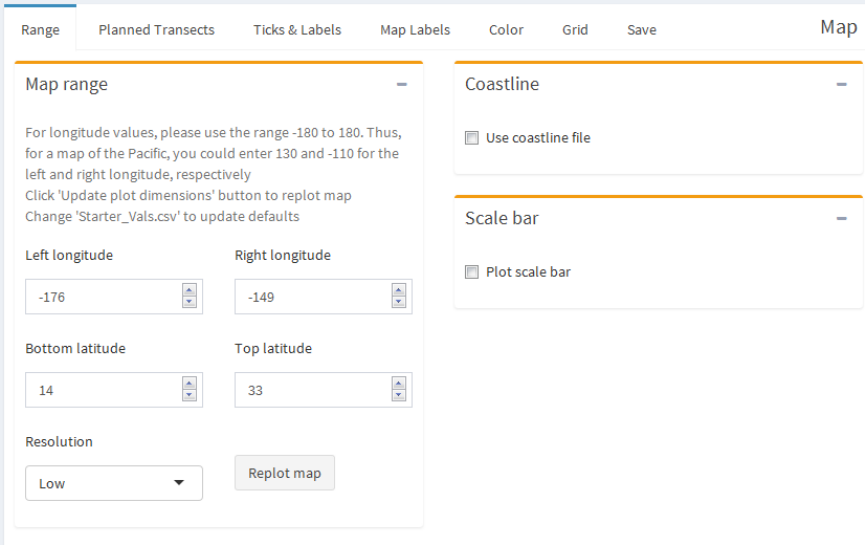
Range
Map range
Left and Right longitude – left and right limits of map in decimal degrees, using
negative for west. For a global map, set Left longitude to -180 and the Right
longitude to 180.
Bottom and Top latitude – bottom and top limits of map in decimal degrees, using
negative for south.
Resolution – choose the level of detail for the map appropriate for size of area.
Options are Low and High, which correspond to the normal and HiRes map,
respectively, from the R map package.
Replot map – Click to replot map with updated map range. If you resize your
browser window and the map is awkwardly sized, you can click this button to
regenerate the map for the new browser window size
Coastline
Load coastline file - Coastline .csv file must consist of a two columns with the
headers ‘lon’ and ‘lat’ representing longitude and latitude points. Currently
CruzPlot can only process coastline files with points are between -180° and 0°.
Scale bar
Plot scale bar – check to show a simple scale bar on the map. Strictly speaking,
the scale bar is accurate only at the latitude range at which it is located.
Longitude, Latitude – coordinates of left end of the scale bar, using negative for
south and west. The default values put the scale bar in the lower left corner of the
map. The values are recalculated when map limits are changed, while an error
message is produced if the entire scale bar is not in the map area.
Scale bar units – Specifies whether the length of the scale bar is in kilometer (km)
or nautical miles (nmi).
Length – length of scale bar in km or nmi, printed as a label below the bar. The
value is reset to the default when map limits are changed.
Width of bar – relative thickness of scale bar; appearance may vary with monitor
or printer.
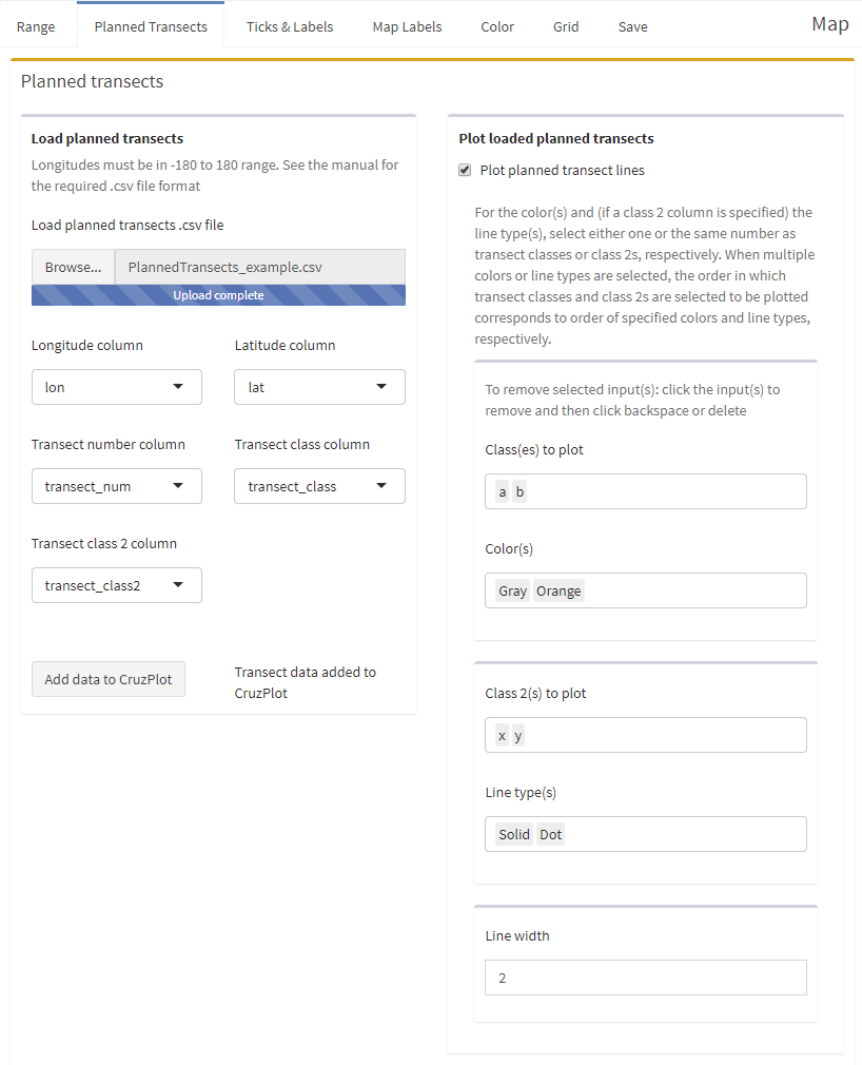
Planned Transects
Planned transects
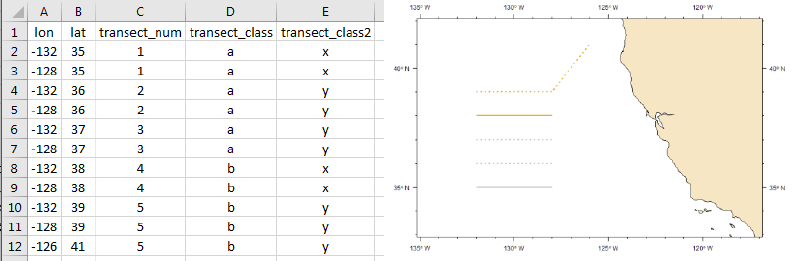
Example .csv file and resulting map given selections made in screenshot above
Load planned transects .csv file – Planned transect .csv file; must have headers
and consist of at least one column with longitudes, one with latitudes, one with
the transect number, and one with the transect class. There may also be a fifth
column with a second transect class (class 2). All longitude values must be in the
range [-180, 180]. A screenshot of an example planned transect .csv file is above.
Longitude column – Select the name of the column with longitude data
Latitude column – Select the name of the column with latitude data
Transect number column – Select the name of the column with the transect
number information. The transect number indicates which points make up a
planned transect and thus should be connected by CruzPlot; there must be at least
two points per transect
Transect class column - Select the name of the column with the transect class
information. You can color-code plotted planned transects by their class
Transect class 2 column - Select the name of the column with the transect class 2
information. You can line type-code the planned transects by their class 2 values.
Add data to CruzPlot – Add the planned transect data in the loaded file to
CruzPlot. This will overwrite any previously loaded planned transect data
Plot planned transect lines – Check the box to plot loaded planned transects
Class(es) to plot– Select transect class(es) to plot
Color(s) – Select color(s) of plotted transect(s). When multiple colors are
selected, the order in which transect classes are selected to be plotted corresponds
to the order of selected colors
Class 2(s) to plot– Select transect class 2(s) to plot
Line type(s) – Specify line width(s) of plotted transect(s). If no class 2 column
was specified, then you can only select one line type. When multiple line types
are selected, the order in which transect class 2s are selected to be plotted
corresponds to the order of selected line types
Line width – Specify line width of plotted transect(s). Must be a number. You can
only specify of line width for all plotted transects
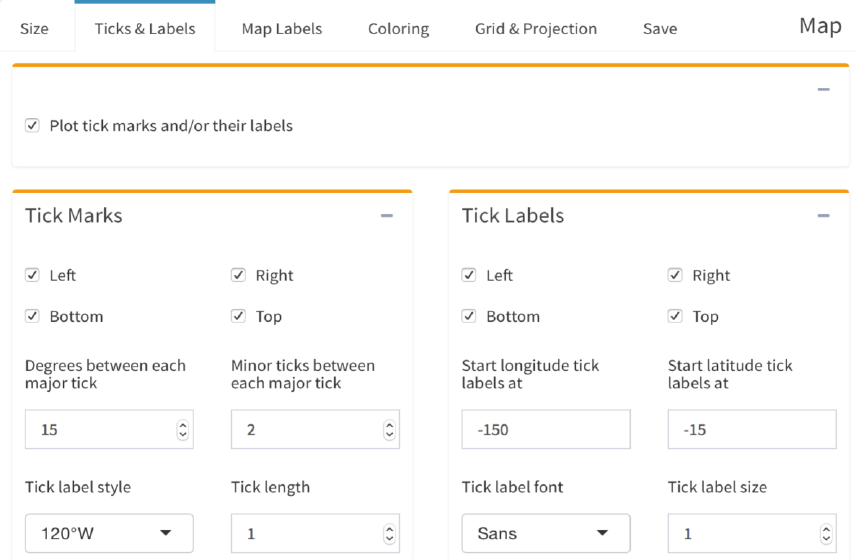
Ticks & Labels
Plot tick marks and/or their labels – uncheck to suppress all tick marks and labels
Tick Marks
Tick Marks: Left, Right, Bottom, Top – check or uncheck these boxes to control
display of tick marks.
Degrees between each major tick – the number of degrees between major
(labeled) tick marks; default depends on map size.
Minor ticks between each major tick – the number of tick marks between each
major (labeled) tick. Default is 2.
Tick label style – options for tick label style are 120, 120W, 120, and 120W.
Tick length – length of both major and minor tick marks relative to a standard of
1.0. Minor tick marks are 40% the length of major tick marks.
Tick Labels
Tick Labels: Left, Right, Bottom, Top – check or uncheck these boxes to control
display of tick labels
Start longitude tick labels at – left-most longitude on the map at which to start
labels on major tick marks, using negative for west. Default is the first major tick
to the east of Left longitude.
Start latitude tick labels at – bottom-most latitude on the map at which to start
labels on major tick marks, using negative for south. Default is the first major
tick north of Bottom latitude.
Tick label font – font for tick and axis labels. Open the Color/Formatting
Options page to display available fonts.
Tick label size – relative size of text for tick and axis labels.
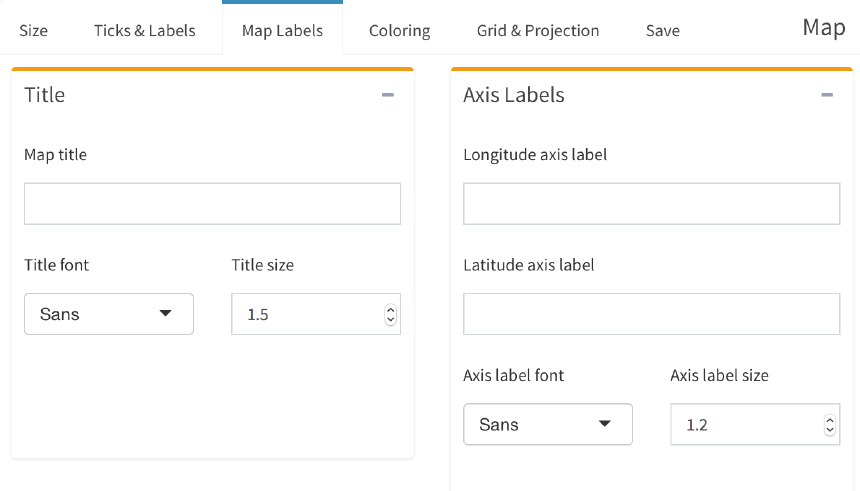
Map Labels
Title
Map title – enter text for optional title above the map.
Title font – font for map title.
Title size – relative size of text for map title.
Axis labels
Longitude axis label – enter text for optional label below the bottom axis.
Latitude axis label – enter text for optional label along the left axis.
Axis label font – font for axis label(s).
Axis label size – relative size of text for axis label(s).
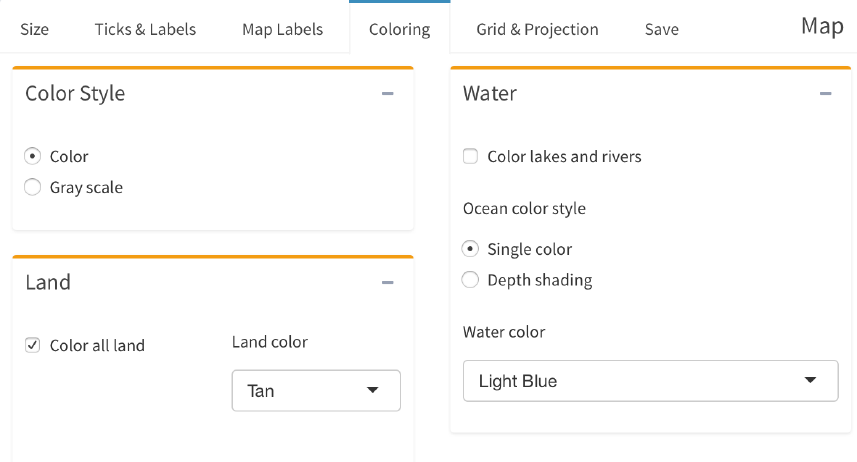
Coloring
Color style
Color style – select either Color or Gray scale for the map. The color style choice
applies to the map as well as to all symbols, lines and text plotted on it. Open the
Color/Formatting Options tab to display available colors for each color style.
Land
Color all land – check this box to fill all land with color; uncheck for white land.
Land color – select a color for land areas.
Water
Color lakes and rivers – check this box to include lakes and rivers on the map.
Ocean color style – “Single color” allows you to select a uniform color while
“Depth shading” allows you to choose bathymetric data to plot.
Water color – if Ocean color style is “Single color”, select the color for water
areas
Bathymetric data source – if Ocean color style is “Depth shading”, either select
“csv file” to load a csv file containing depth data for your map or select “NOAA
server” to download a depth file or load a already-downloaded depth file. If you
choose to load a csv file, it must contain three columns: longitude, latitude, and
depth titled V1, V2, and V3, respectively. You can load a csv file that is larger
than the given map area. You can also specify details about the csv file. If you
select “NOAA server”, CruzPlot will check if a csv file exists the CruzPlot folder
for a map with the latitude and longitude limits of the map and the selected
resolution. If this file exists, CruzPlot will load it. If not, CruzPlot will download
a file for the given latitude and longitude coordinates and resolution from the
NOAA server and automatically save the file in the CruzPlot directory. CruzPlot
can then use this file the next time that specific map is used.
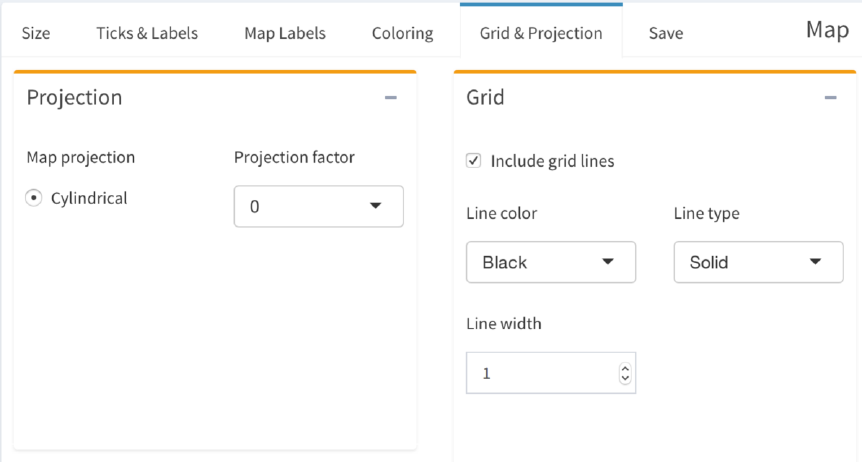
Grid & Projection
Map projection - not currently implemented
Projection factor – not currently implemented.
Grid
Include grid lines – check to show grid lines on the map at major tick intervals,
whether or not the tick labels for those major intervals are displayed.
Line color – select a color for the grid lines.
Line type – select a line type for the grid lines.
Line width – specify a thickness for the grid lines.
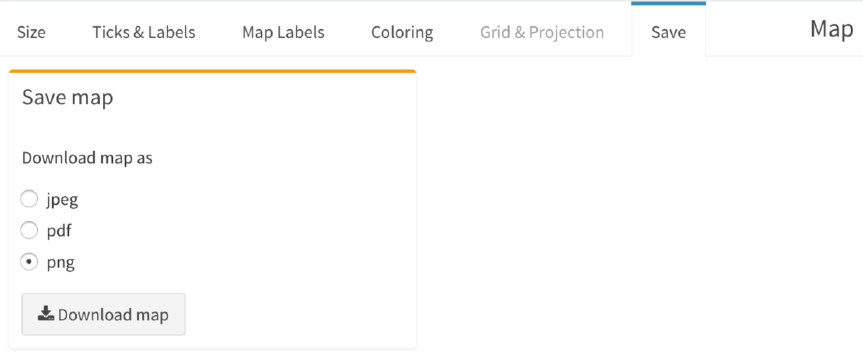
Save
Download map as –choose format for downloaded map
Download map – opens window that allows you to specify name and location of
saved map. The name specified for the saved map must include the proper format
extension (.jpg, .pdf or .png). In order to download and save a map, you might
have to run CruzPlot in a separate browser window by clicking “Open in
Browser” on the top bar of RStudio. Note: there have been issues downloading
maps when CruzPlot is run in an external window through RStudio on a Windows
computer. If you have these issues, try running CruzPlot in a browser and then
saving the map.
Note: Be sure to specify file extension if saving file through RStudio external
window
Plot DAS Data
DAS files are text files in a specific format produced by WinCruz, the data entry
program used on line-transect cruises at the SWFSC to record searching effort and
sightings of mammals, turtles, and boats.
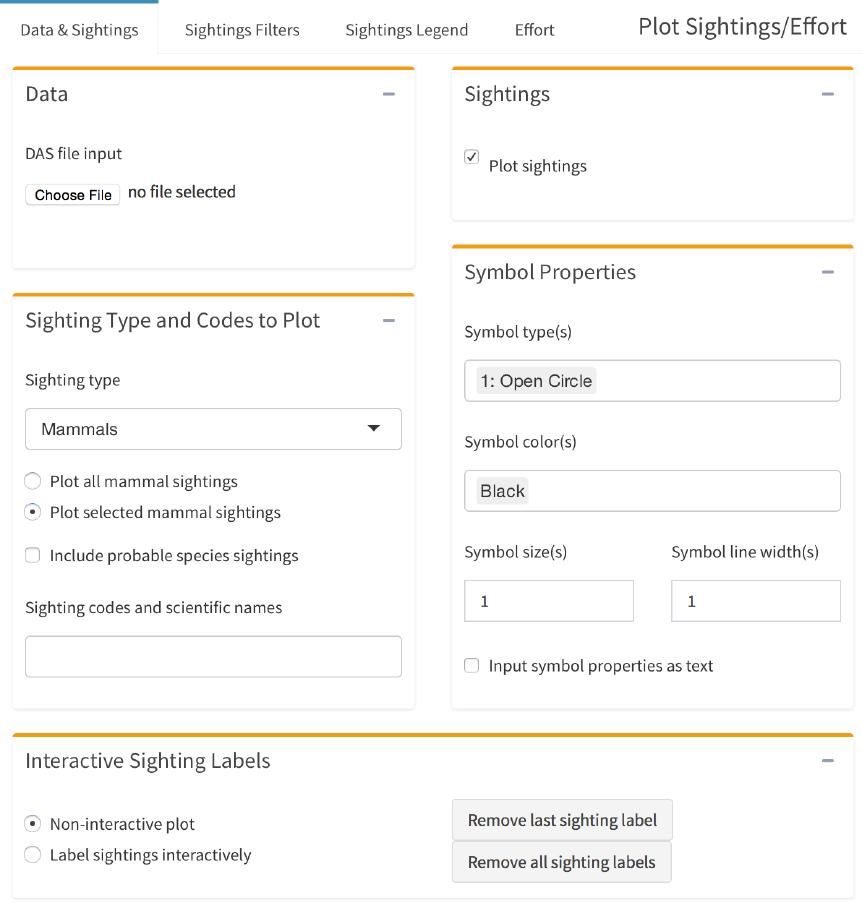
Data & Sightings
Data
DAS file input – click Choose File to select one or more DAS data files.
Sightings
Plot sightings – check to plot sightings, uncheck to plot effort only.
Sighting type & species
Sighting type – choose Mammals, Turtles or Boats. These sighting types are
recorded in different formats in DAS files.
Plot all sightings – plot all Mammal or Turtle sightings in the DAS file.
Plot selected sightings – plot only selected Mammal or Turtle species codes.
Include probable species sightings – if checked, plot will include “probable”
identifications.
Sighting codes and scientific names – if you select “Plot selected sightings” you
will be able to select species to plot. Each species is assigned a species code used
for identification in the DAS data; open the Species Information page to see the
species code, abbreviation, scientific name, and common name for each species.
The order of selection of the sighting codes in this box corresponds to the order of
choices for symbols and colors, as well as to the order in which they are listed in
the legend. If “Plot all species” is selected, sighting codes in the DAS file will
automatically be assigned various combinations of symbols and colors, but these
may not all be unique if the number of species is greater than 21. Use the legend
to identify sightings on the map. If you select “Boats”, there are no additional
selection options.
Symbol properties
Symbol type(s) – select symbol(s) to be plotted, one symbol for each species
code, or a single symbol for all species. If fewer symbol types than species codes
are selected, the symbol types are recycled from the beginning. If more symbol
types than species codes are selected, then a warning is printed and the extra
symbol types are ignored. Each symbol type is represented by a number; open the
Color/Formatting Options page to display the symbols. The order of the symbol
codes corresponds to the order of the sighting codes. A single comma must
separate multiple symbol types. For instance, “1, 3” would specify symbol types
1 (open circle) and 3 (plus sign). If “Boats” is selected, then you will only be able
to choose one symbol type.
Symbol color(s) – select color(s) for symbol(s), anywhere from one color for each
symbol to a single color for all symbols. The order of the selected colors
corresponds to the order of the sighting codes and thus the order of the symbols.
A single comma must separate multiple symbol colors. If fewer symbol colors
than species codes are selected, the symbol colors are recycled from the
beginning. If more symbol colors than species codes are selected, then a warning
is printed and the extra symbol colors are ignored. Open the Color/Formatting
Options page to display available colors. If “Boats” is selected, then you will
only be able to choose one symbol color.
Symbol size(s) – size(s) for all symbols relative to standard 1.0. The order of the
symbol sizes corresponds to the order of the sighting codes. If fewer symbol sizes
than species codes are selected, the symbol colors are recycled from the
beginning. If more symbol sizes than species codes are selected, then a warning
is printed and the extra symbol sizes are ignored. A single comma must separate
multiple symbol sizes. For instance, “1, 1.4” could be an entry for plotting two
symbol sizes.
Symbol line width(s) – line width(s) for all symbols relative to standard 1.0. The
order of the line widths corresponds to the order of the sighting codes. If fewer
symbol line widths than species codes are selected, the symbol line widths are
recycled from the beginning. If more symbol line widths than species codes are
selected, then a warning is printed and the extra symbol line widths are ignored.
A single comma must separate multiple line widths. For instance, “1, 2” could be
an entry for plotting two line widths.
Input symbol properties as text – if this box is checked, you must enter the symbol
types and colors as text; there is no dropdown menu. This allows you to enter the
same symbol property multiple times, which the dropdown menus do not permit.
Symbol properties must be entered as numbers separated by commas. Symbol
colors must be entered exactly as the color names, with a capital letter, also
separated by commas. The color names can be found in the drop down menu
when “Input symbol properties as text” is not selected, or in the
Color/Formatting Options page.
Interactive sighting labels
Interactive Sighting Labels – “Label sightings interactively” allows for interactive
identification and labeling of sightings. After sightings have been plotted, the
cursor will change to a cross over the map. A left-click of the mouse near a point
will identify the point by cruise number, sighting number and date. To exit
interactive mode, select “Non-interactive plot”. You can still change filter values,
or species plotted, or map parameters in interactive mode. The labels will remain
after “Non-interactive plot” is selected and can be removed using the “Remove”
buttons. If the map limits or filters are changed so that a labeled point is not
plotted anymore, then that label will be removed from the map.
Remove last sighting label – if clicked, the last interactive sighting label added to
the map will be removed.
Remove all sighting labels – if clicked, all interactive sighting labels will be
removed.
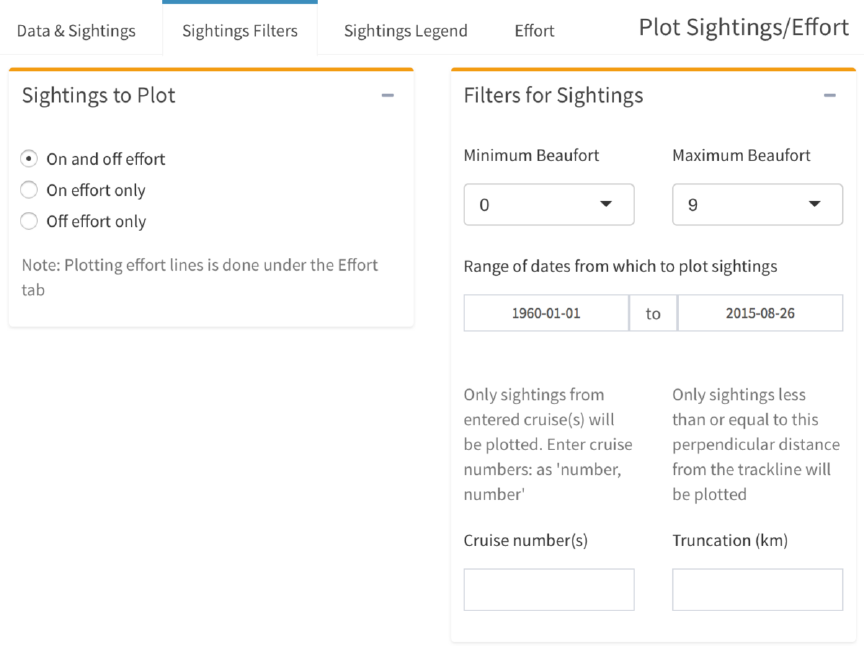
Sightings Filters
Sightings to plot
Choose one option: all sightings, only on-effort sightings, or only off-effort
sightings. To plot no sightings, uncheck the “Plot sightings” box on the Data &
Sightings page.
Filters for sightings
Minimum, Maximum Beaufort - only sightings with associated Beaufort sea state
values greater than or equal to the minimum and less than or equal to the
maximum will be plotted.
Range of dates from which to plot sightings – only sightings recorded on or
between the specified dates will be plotted.
Cruise number(s) – only sightings with this cruise number will be plotted.
Multiple cruise numbers can be specified if they are separated by a comma (i.e.
“1630, 1631”). A blank box (default) plots sightings with all cruise numbers.
Truncation (km) – only sightings less than or equal to this perpendicular distance
from the trackline will be plotted. A blank box (default) plots sightings at all
distances.
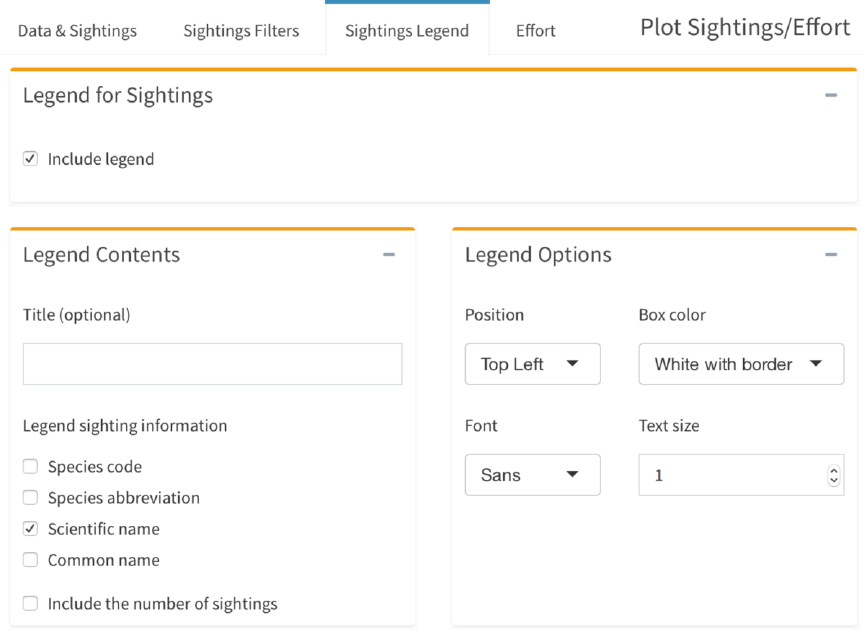
Legend
Legends
Include legend for sightings – as it sounds
Include legend for effort – as it sounds
Sighting legend contents
Title – title for legend (optional).
Legend sighting information – include the information to be included for each
species code in the legend (default is Scientific name only).
Include number of sightings – if checked, after the species name the legend will
include the number of plotted points as “n = ”. Note that this is the number of
sightings within the plotted area, and does not include sightings in the DAS file
outside the map limits.
Sighting legend options
Position – specify where to place the legend on the map. Choose a pre-set
position at a corner of the map or choose “Specify” to enter coordinates.
Latitude, Longitude – position of the upper left corner of the legend when
“Specify” is selected for legend position, using decimal numbers, negative for
south and west.
Box style – choose a white legend box with black border (default), white legend
box without border, or transparent background.
Font – font for text in the legend.
Legend size – relative size of legend text.
Effort legend options
Same options as ‘Sighting legend options’
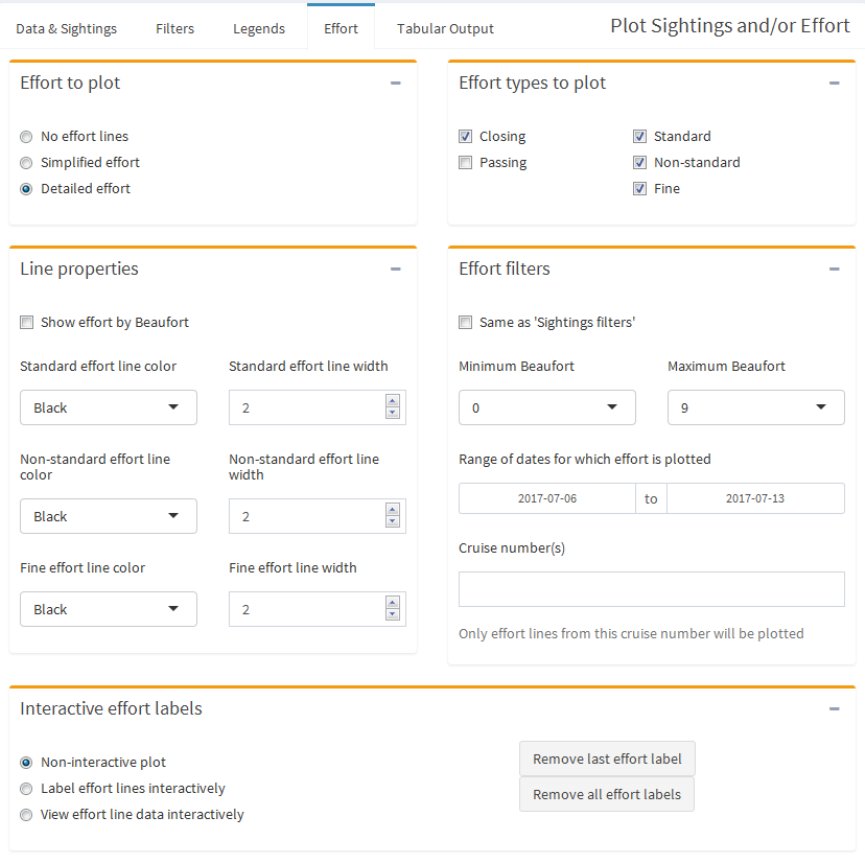
Effort
Effort to plot
No effort lines: effort is not plotted (default).
Simplified effort: lines are drawn between every R and E event. Filtering by
standard/non-standard/fine is not allowed, and all effort segments have the same
color and line width.
Detailed effort: for each pair of R and E events, lines are drawn from the R event
to the next V event, then to the next V event, etc., until the E event is reached.
This allows the user to color-code effort by Beaufort and filter pieces of R to E
effort segments by Beaufort.
Effort types to plot
Closing/Passing – select to plot effort in closing mode (default), passing
mode, or both, and/or sightings during such effort.
Standard/Non-standard/Fine. – for Detailed effort, select 1, 2, or all 3 of
standard effort (default), non-standard effort, or fine effort. Non-standard
effort is regular line-transect effort but, for any of several reasons, is not
considered part of the designed survey. Fine scale effort is effort in a
restricted area also not considered part of the designed survey.
Line properties
Show effort by Beaufort – Effort is color-coded by Beaufort levels 0 to 6. The
legend can be changed in ‘Legends’ tab
Standard / non-standard / fine line color and width
These options are displayed if the corresponding effort type is selected to plot
o Line color – color of effort lines. Open the Color/Formatting Options
tab for color choices.
o Line width – relative thickness of effort lines. Numerical entries only
Effort filters
Use filters from Sightings Filters – if checked, effort lines will be filtered by
filters from Sightings Filters. Cannot be checked if “Plot sightings” is
unchecked. If unchecked, effort filter options will appear.
Minimum and Maximum Beaufort – only effort with associated Beaufort sea
state values greater than or equal to the minimum and less than or equal to the
maximum will be plotted.
Range of dates from which to plot effort lines – only effort recorded on or
between the specified dates will be plotted.
Cruise number(s) – only effort from this cruise number will be plotted.
Multiple cruise numbers can be specified if they are separated by a comma
(i.e. “1630, 1631”). A blank box (default) plots effort from all cruise
numbers.
Interactive effort labels
“Label effort lines interactively” allows for interactive identification and
labeling of effort lines. After lines have been plotted, the cursor will change
to a cross over the map. A left-click of the mouse near a line will identify the
transect by cruise number and date. To exit interactive mode, select “Non-
interactive plot”. You can still change filter values, effort lines plotted, or
map parameters in interactive mode. The labels will remain after “Non-
interactive plot” is selected. If the map limits or filters are changed so that a
labeled line is not plotted anymore, then that label will be removed from the
map. “View effort lines interactively” is not implemented.
Remove last effort label – if clicked, the last interactive effort label added to
the map will be removed.
Remove all effort labels – if clicked, all interactive effort labels will be
removed.
Notes:
(1) Because mammal, turtle and boat sightings are recorded in different formats in
DAS files, only one type may be plotted at a time.
(2) If effort is plotted, the number of R (Resume effort) and E (End effort) records in
the DAS file must be equal (they should occur in pairs).
(3) Warnings are issued if more symbol properties than species codes are
selected/entered.
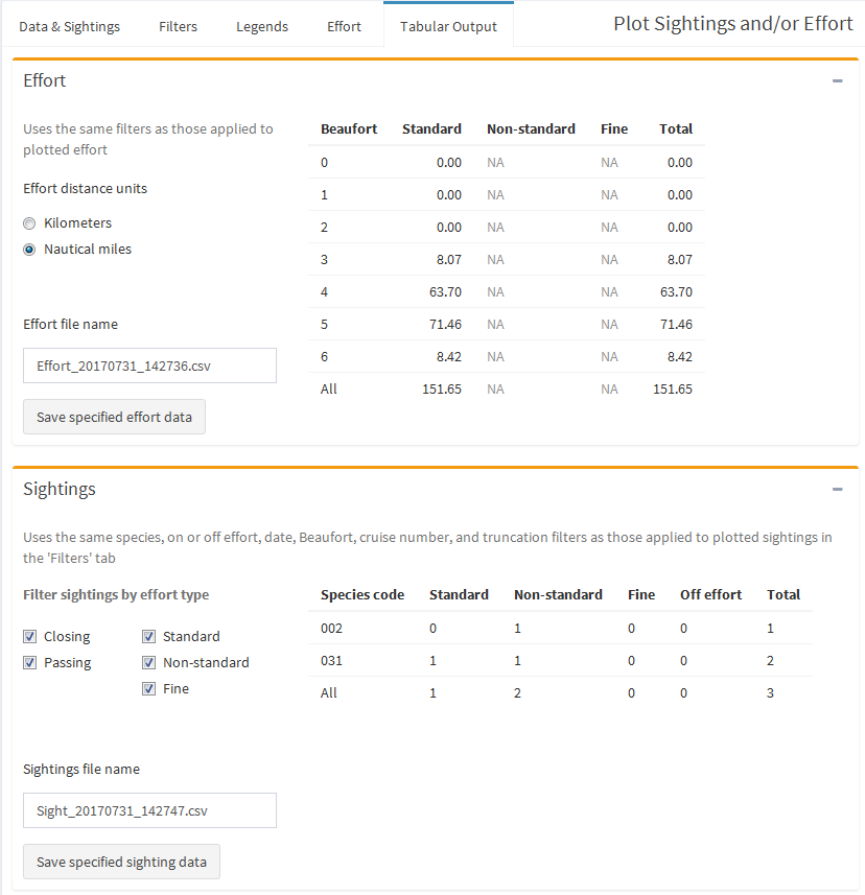
Tabular Output
Effort
Distance traveled while on effort summarized by Beaufort level during the
performed effort. The filters applied to the plotted effort are also applied to the
displayed effort distances.
The user can specify a file name and save the displayed table to the ‘Outputs’
folder in the CruzPlot folder
Sightings
Sightings summarized by species code and the effort when the sighting occurred.
The user can filter sightings counts by effort type. The filters applied to the
plotted sightings, including geographical extent, are also applied to the sightings
summarized in the displayed table.
The user can specify a file name and save the displayed table to the ‘Outputs’
folder in the CruzPlot folder
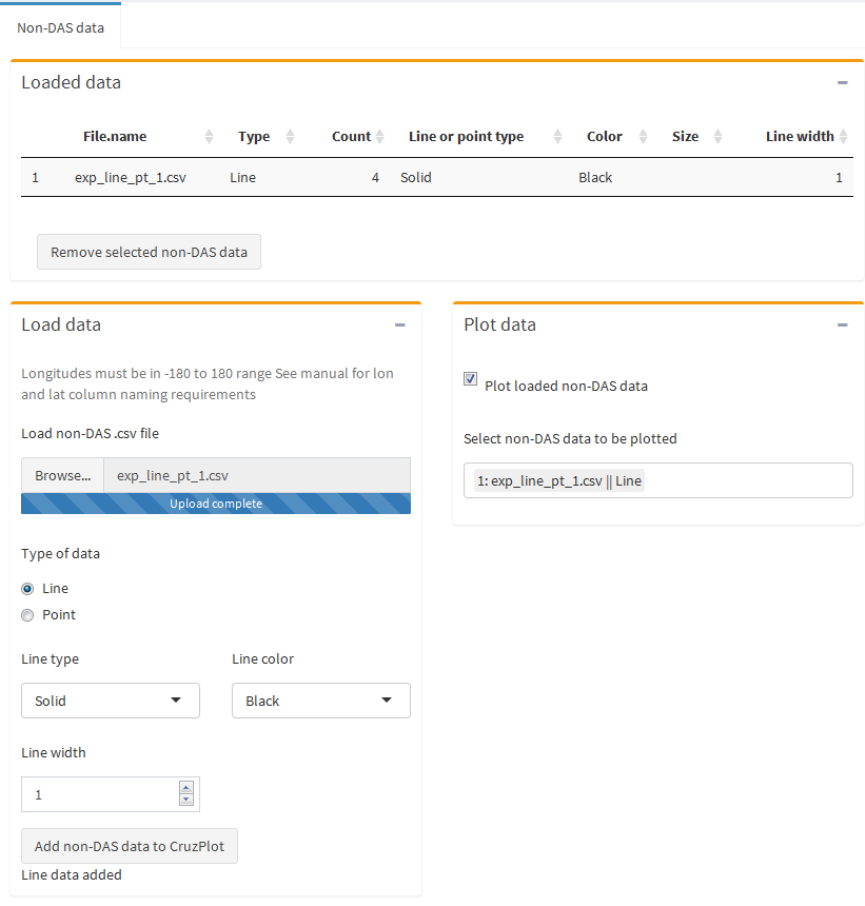
Plot Non-DAS Data
Any data associated with geographic positions (latitude and longitude) can be
plotted on the map. Positions may be plotted as points (to show locations of samples, for
example) or lines (to show boundaries of a study area, for example). After import into
CruzPlot, the data are saved and available for later plotting at any time.
Data
Loaded data
Table of loaded non-DAS data. These are what will be saves if user clicks ‘Save
current app data’. User can click on the table to select rows to remove loaded
data.
Load data
Non-DAS file input – click Choose File to select a non-DAS data file to plot. The
data file must have headers and two columns with longitude values and latitude
values as signed decimal values in degrees. The longitude column must be named
one of 'Longitude", "longitude", LONGITUDE", "Lon", "lon", or "LON", while
the latitude column must be named one of "Latitude", "latitude", "LATITUDE",
"Lat", "lat", or "LAT".
Type of data – choose whether you want to plot lines or points. If you select
“Points”, each longitude/latitude pair will be plotted as a point. If you select
“Lines”, a line will be drawn from the first longitude/latitude pair to the second
longitude/latitude pair, from the third pair to the fourth pair, and so on. Lines can
be separated with a missing record (NA,NA) in the data file.
Line/Point type – line or symbol type of lines or points, respectively.
Line/Point color – color of lines or points.
Point size – relative size of points.
Line/Point line width – relative line width of lines/points.
Plot data
Select loaded data to plot
Color/Formatting Options
Symbols, colors, line types and fonts are specified by numerical codes. A display of
available choices can be produced by clicking on the Color/Formatting Options tab,
either color or gray scale. Additional symbols may be created by using different
combinations of size and color.
The exact appearance of symbols, colors, line types and fonts will vary by monitor and
printer. Print the Color/Formatting Options page to see exactly how they will look for
your hardware. A larger range of gray scales can be produced by creating a color map
but printing it in black-and-white.
Species Information
Opening this tab will allow you to see a list of all the mammal species and their codes, all
of the turtle species and their codes, or both together. You also can search for certain
species by name or species code.
Species are identified in the DAS data by a species code consisting of a series of numbers
or letters. CruzPlot loads these codes and the species they correspond to from a file
named “SpCodes.dat”. This file can be updated with new species codes, but a file with
the name “SpCodes.dat” in the same format must be present in the CruzPlot folder. In
order to distinguish the mammal and turtle codes, the turtle codes were deemed less
likely to be changed so they are hard coded in the program and used to identify turtle
species versus mammal species. If the turtle species are changed, this code would also
need to be updated in the code.
CruzPlot Manual
Opening this tab will display this manual. If CruzPlot is open in an external RStudio
window, the manual is opened in an external window. If the user closes this external
manual, they cannot reopen the manual until they restart CruzPlot.
