CustomTicksGuide.nb Custom Ticks Guide
User Manual:
Open the PDF directly: View PDF ![]() .
.
Page Count: 11
CustomTicks package
Mark A. Caprio, Department of Physics, University of Notre Dame
Version 2.1.0 (March 12, 2016)
Introduction
Mathematica provides a powerful system for generating graphics but does not provide, in built-in form, the fine
formatting control necessary for the preparation of publication quality figures. The CustomTicks package provides detailed
customization of tick mark placement and formatting. The flexibility achieved matches or exceeds that available with most
commercial scientific plotting software. Linear, logarithmic, and general nonlinear axes are supported. Some tick mark
manipulation functions, for use in graphics programming, are also provided by the CustomTicks package.
The CustomTicks package is part of the SciDraw system for preparing publication-quality scientific figures with
Mathematica (http://scidraw.nd.edu). It was originally developed as part of LevelScheme [Comput. Phys.
Commun. 171, 107 (2005)].
Basic use for linear axes
The default tick marks produced by Mathematica's plotting functions are typically not ideal for publication. It is
often desirable to be able to change the tick spacing from that selected by Mathematica. The tick marks are also often too
short to be easily visible.
It is possible to override the default Mathematica ticks by specifying a list of tick marks, complete with formatting
information, as the value for the Ticks or FrameTicks option (see the Mathematica documentation for basic plotting
options). It is prohibitively tedious to construct such lists by hand. The CustomTicks package provides functions to
automatically construct lists of tick marks, with detailed control over formatting.
LinTicksx1,x2Produces linear tick specifications,
with automatically chosen major and minor tick intervals
LinTicksx1,
x2,interval,subdivs
Produces linear tick specifications, with manually chosen major and minor tick intervals
Tick specification function.
option name default value
TickRange Infinity,
Infinity
Limits the drawing of ticks
and their labelsto given coordinate range
ShowMinorTicks True Controls whether or not the minor ticks are drawn;
mainly for use with LogTicks see below
Options controlling the coordinates at which tick marks are displayed.
Version 2.1.0

option name default value
ShowTickLabels True Controls whether or not major tick labels are printed
ShowMinorTickLabe-
ls
True Controls whether or not minor tick labels are printed
TickLabelRange Infinity,
Infinity
Limits printing of major tick labels to given coordinate range
ShowFirst True Controls whether or not first major tick label is printed
ShowLast True Controls whether or not last major tick label is printed
TickLabelStep 1 Limits printing of major tick labels to
one in every TickLabelStep major ticks
TickLabelStart 0 Used in conjunction with TickLabelStep
chooses which subset of major tick labels are printed
Options controlling which tick marks are accompanied by labels.
option name default value
MajorTickLength 0.01 Length for the major ticks
may also be given as a list of two lengths,
into and out of the frame,
as described in the Mathematica documentation for Ticks
MinorTickLength 0.005 Length for the minor ticks
may also be given as a list of two lengths,
into and out of the frame,
as described in the Mathematica documentation for Ticks
TickDirection In Orientation of tick marks In for tick marks into the frame,
Out for tick marks out of the frame,
or All for tick marks both into and out of the frame
TickLengthScale 1 Additional scale factor by which to
lengthen both the major and minor ticks,
relative to the lengths given by the options
MajorTickLength and MinorTickLength above
MajorTickStyle List specifying the line style for the major ticks
MinorTickStyle List specifying the line style for the minor ticks
Options specifying the appearance of tick marks.
CustomTicks package 2
Version 2.1.0
option name default value
DecimalDigits Automatic Sets number of digits after
decimal place for major tick labels;
if Automatic , the maximum number of
digits needed for any label is used for all labels
NumberSigns Automatic Strings to use as signs for negative and positive numbers;
see Mathematica documentation and
discussion of FixedPointForm function below
NumberPoint . String to use as decimal point
Options specifying the numerical formatting of tick labels (if the default labeling function is used).
Logarithmic axes
The function LogTicks generates tick marks for logarithmic axes. LogTicks can produce tick marks for an
arbitrary logarithmic base (10 is the default, but e and 2 are other commonly useful bases). Unlike the Mathematica
LogPlot function, which produces cumbersome decimal labels (e.g., "0.0000001", "0.000001", …), LogTicks pro-
duces true exponential labels (e.g., "10-7", "10-6", …).
LogTicksn1,n2Produces logarithmic tick specifications, base 10
LogTicksbase,n1,n2Produces logarithmic tick specifications, arbitrary base
Logarithmic tick specification function.
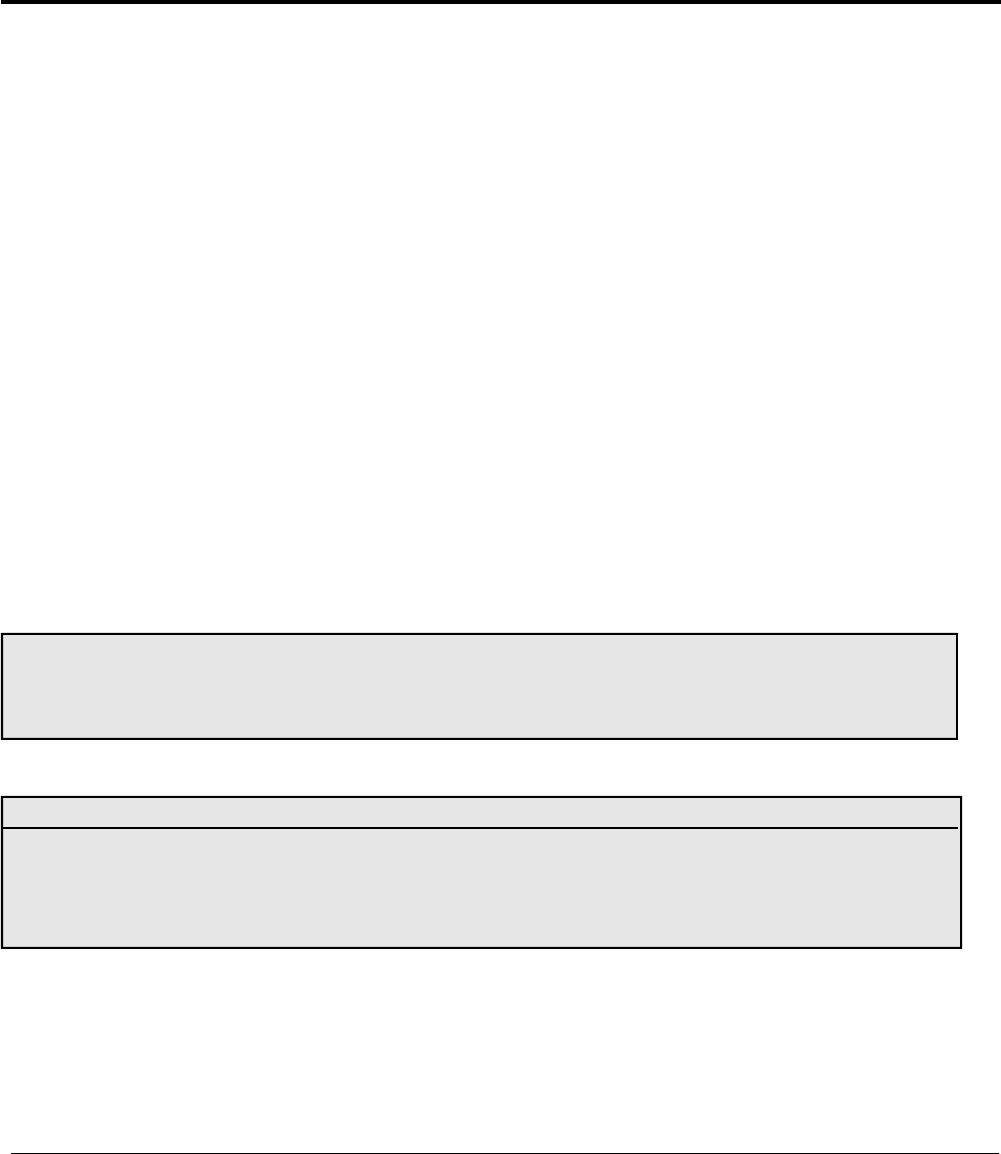
LogTicks must be given the starting power, ending power, and, optionally, the logarithmic base b. For base 10, a
total of eight minor ticks are produced in each major interval, at 2ä10n through 9ä10n. For an arbitrary base b, b-2
minor ticks are produced, at 2äbn, 3äbn, …. Display of the minor ticks may be suppressed by specifying the option
ShowMinorTicksFalse. Some examples are shown below.
100
101
102
Base 10
LogTicks0,2
10-8
10-4
100
104
108
Skipped labels
LogTicks8, 8,
TickLabelStep 4
10-8
10-4
100
104
108
No minor ticks
LogTicks8, 8,
ShowMinorTicks False,
TickLabelStep 4
e0
e1
e2
e3
e4
Base e
LogTicksE,0,4
This tick function was designed on the assumption that you will be generating your plots with logarithmic axes the
“manual” way. That is, as far as the plotting functions are concerned, you are actually generating linear plots, but you have
CustomTicks package 3
Version 2.1.0
taken the logarithm of either the x-axis or y-axis variable. Specifically, for base 10,
(1) a logarithmic (or linear-log) plot of f is obtained by plotting log10 f(x),
(2) a log-linear plot of f is obtained by plotting f10
x
, and
(3) a log-log plot of f is obtained by plotting log10 f10
x
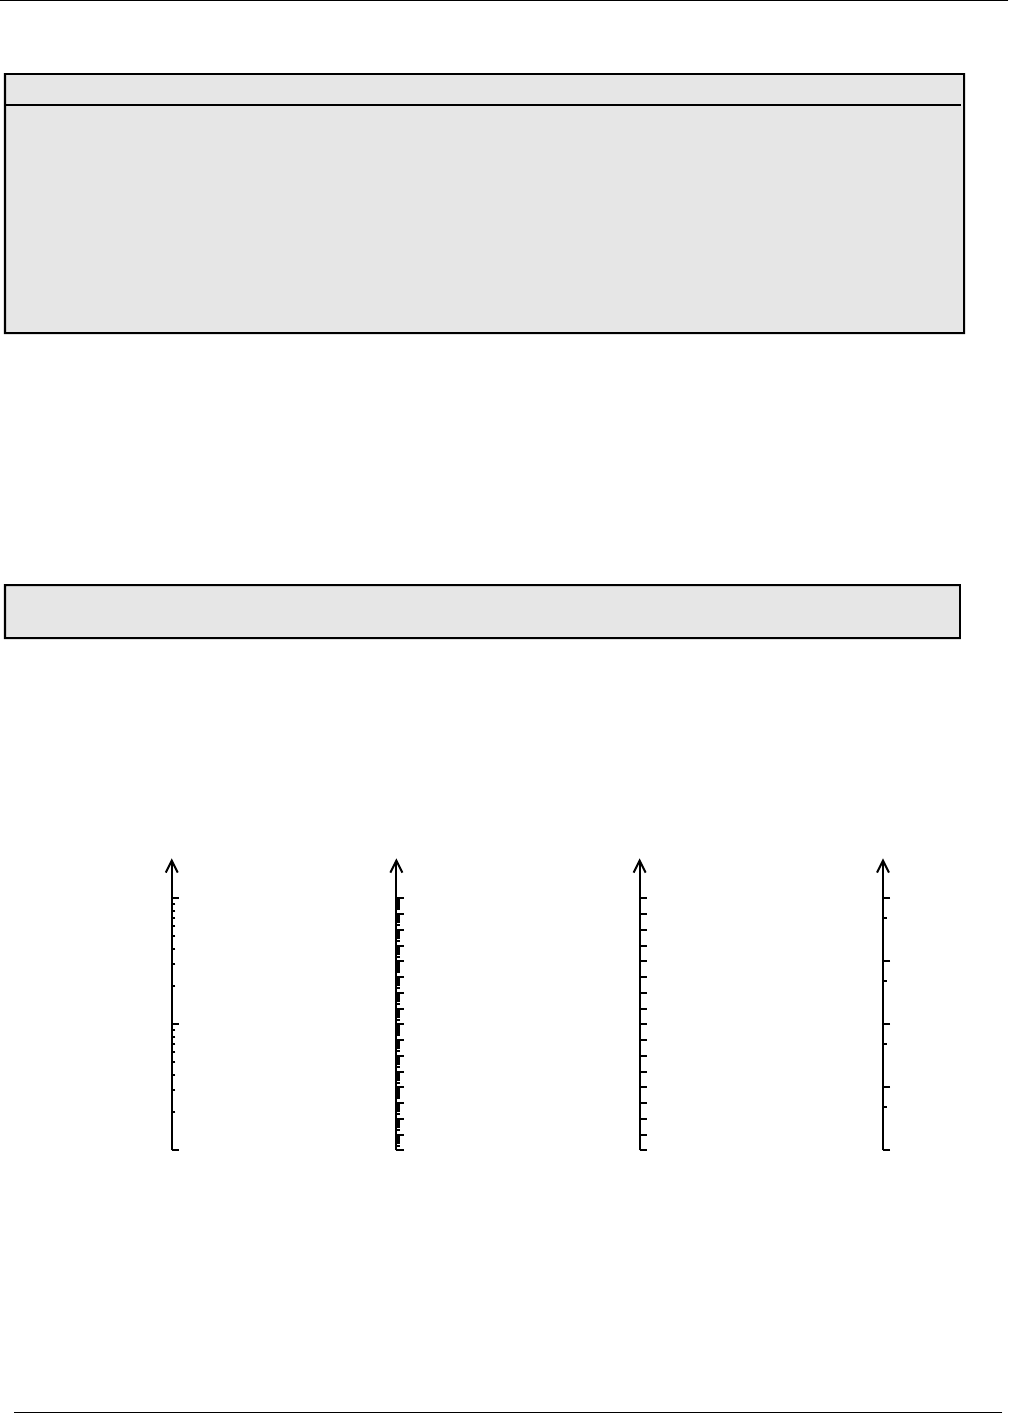
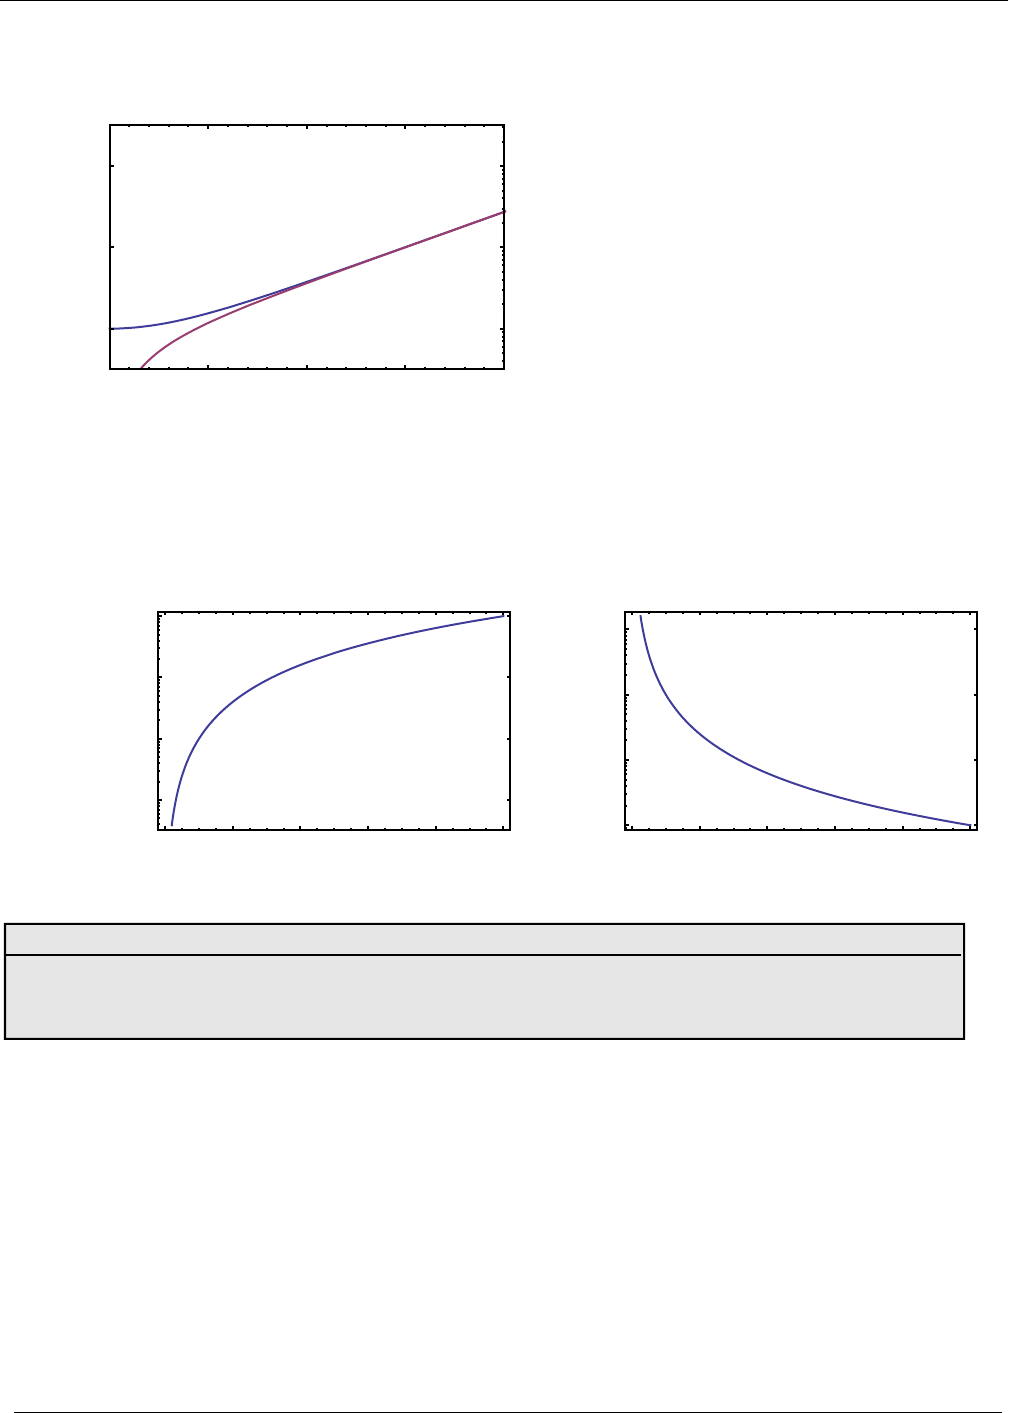
on ordinary linear axes. A similar procedure holds for bases other than 10. Examples of a logarithmic plot and a log-log
plot follow.
Plot[
{Log10[Cosh[x]],Log10[Sinh[x]]},{x,0,10},
PlotRange{{-0.0001,4},{-0.5,2.5}},
FrameTicks{
LinTicks[0,4],
LogTicks[10,-1,3],
LinTicks[0,4,ShowTickLabelsFalse],
LogTicks[10,-1,3,ShowTickLabelsFalse]
},
AxesFalse,FrameTrue,ImageSize72*3
]
01234
100
101
102
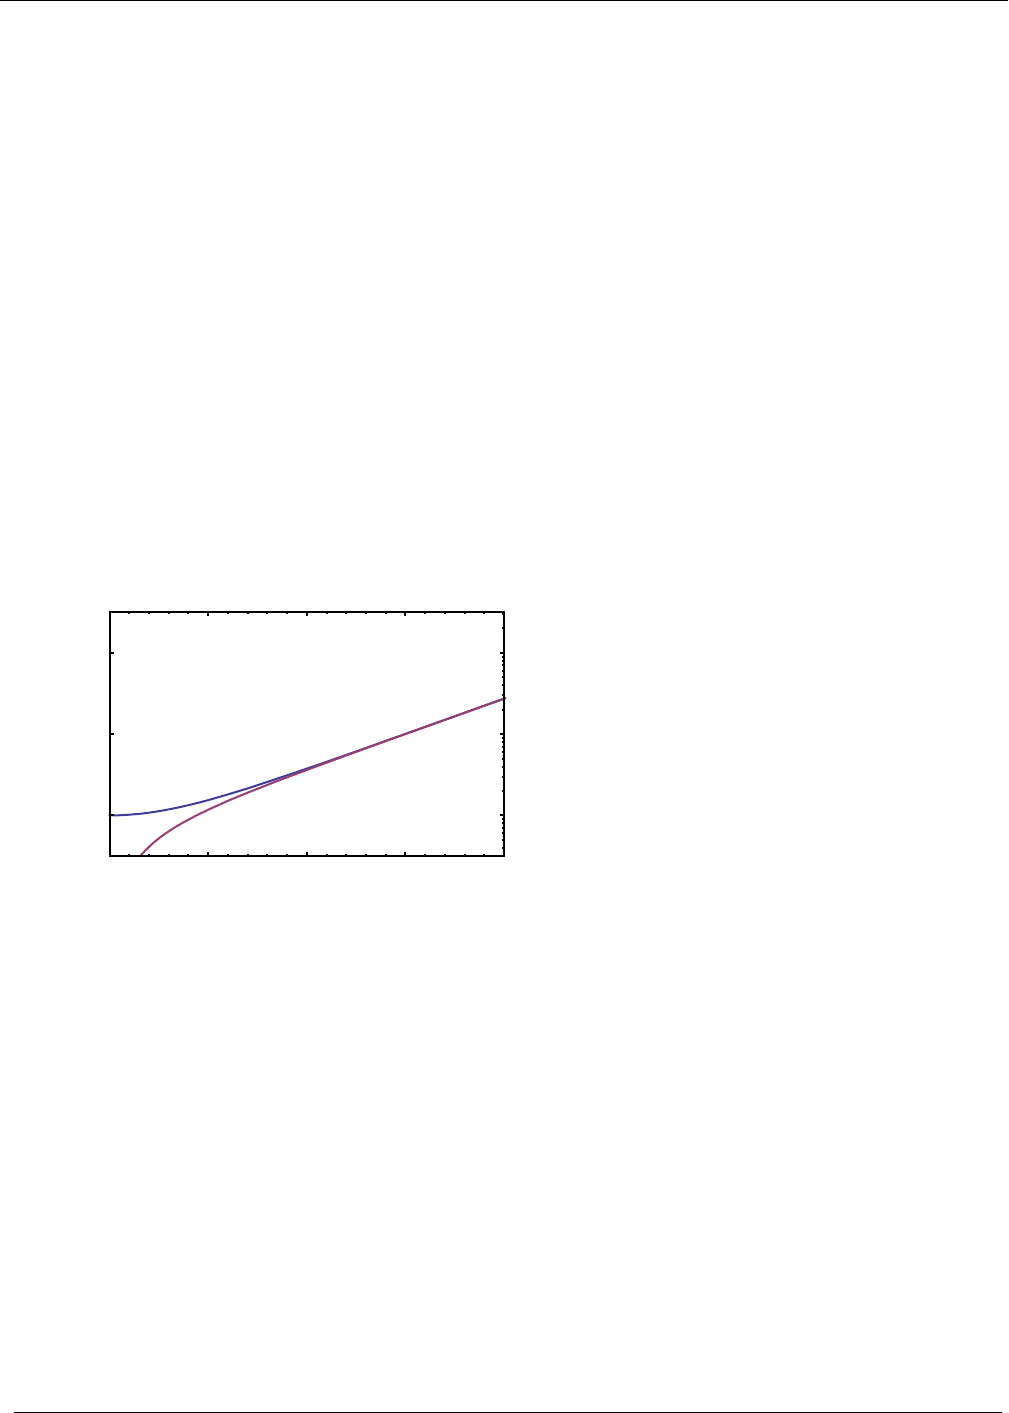
Plot[
{Log10[(10^x)^2],Log10[(10^x)^5]},{x,-1,3},
PlotRange{{-0.0001,3},{-0.5,4.5}},
FrameTicks{
LogTicks[10,0,3],
LogTicks[10,-1,5],
None,
None
},
AxesFalse,FrameTrue,ImageSize72*3
]
CustomTicks package 4
Version 2.1.0
100101102103
100
101
102
103
104
If, instead, you wish to use LogPlot or related Mathematica functions directly for your logarithmic plots, see the discus-
sion below, under “Use with LogPlot and related functions”.
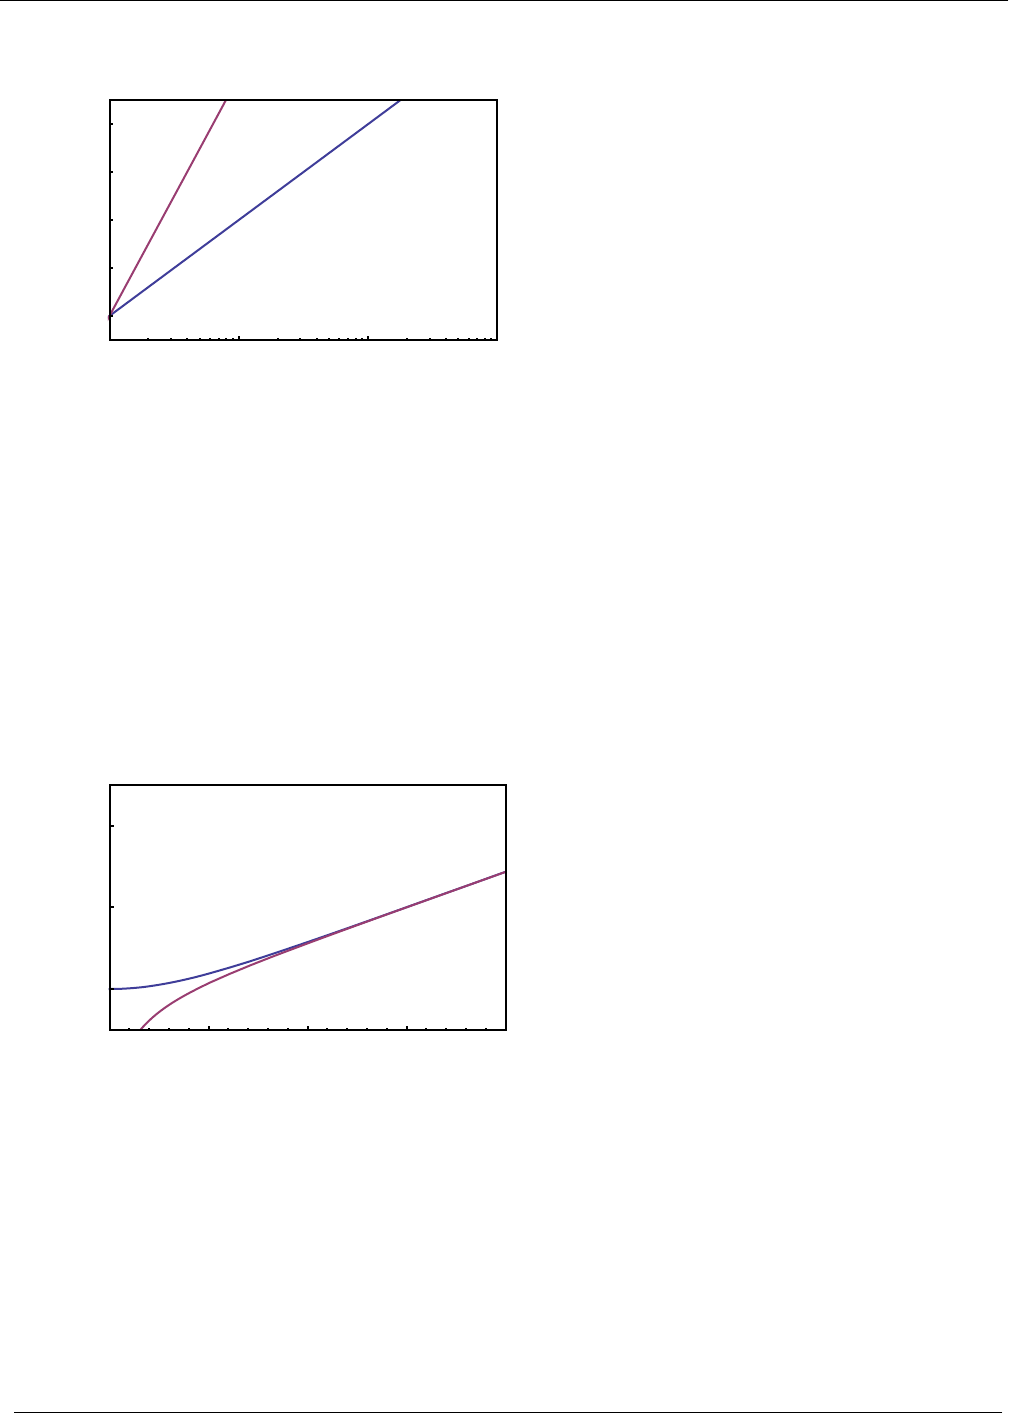
Automatic ticks for Mathematica plot functions
The functions LinTicks and LogTicks can also be specified as automatic tick generation functions for the
Mathematica plotting functions. This saves you typing the plot range explicitly each time, at least if you do not wish to
specify details such as the number of subdivisions.
Plot[
{Log10[Cosh[x]],Log10[Sinh[x]]},{x,0,10},
PlotRange{{-0.0001,4},{-0.5,2.5}},
FrameTicks{LinTicks,LogTicks,None,None},
AxesFalse,FrameTrue,ImageSize72*3
]
01234
100
101
102
What if you wish to have tick marks on the top and right as well, but without labels on them? Simply specifying
FrameTicks{LinTicks,LogTicks} or FrameTicks{LinTicks,LogTicks,LinTicks,LogTicks}
would unfortunately result in ticks with unsightly and redundant labels. This can be avoided with the CustomTicks
StripTickLabels function, as shown below.
Plot[
{Log10[Cosh[x]],Log10[Sinh[x]]},{x,0,10},
PlotRange{{-0.0001,4},{-0.5,2.5}},
FrameTicks
{LinTicks,LogTicks,StripTickLabels[LinTicks],StripTickLabels[LogTicks]},
AxesFalse,FrameTrue,ImageSize72*3
]
CustomTicks package 5
Version 2.1.0
01234
100
101
102
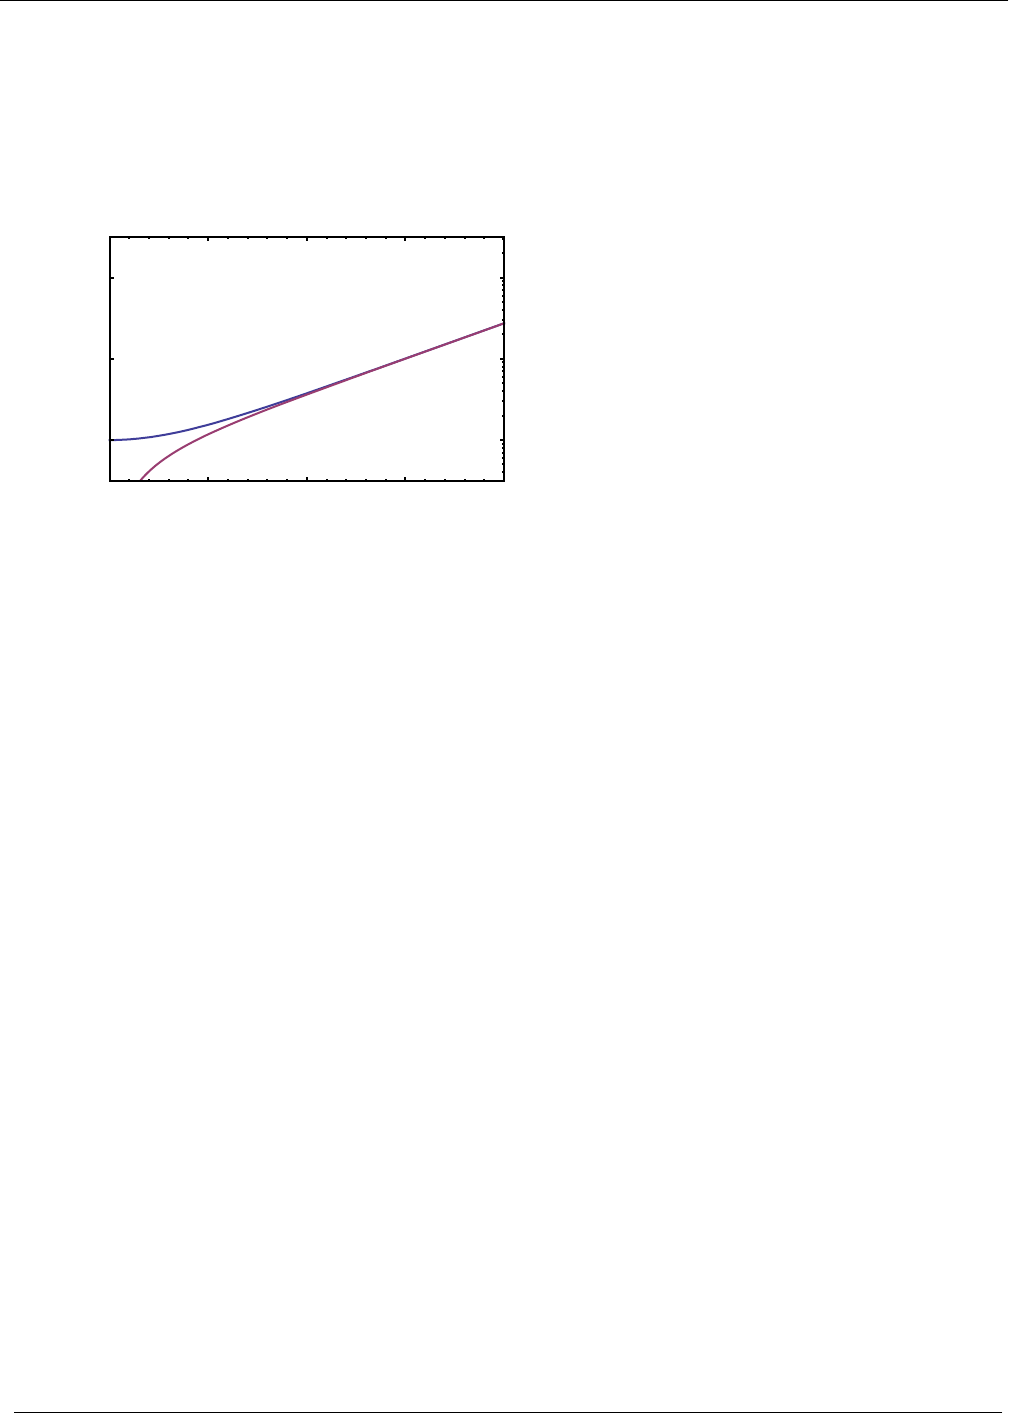
If you are doing many such plots, it is easiest to set the necessary options as the default options for Plot.
SetOptions[Plot,AxesFalse,FrameTrue,FrameTicks
{LinTicks,LogTicks,StripTickLabels[LinTicks],StripTickLabels[LogTicks]}];
GraphicsGrid[{{Plot[Log10[x^2],{x,0,10}],Plot[Log10[x^-2],{x,0,10}]}}]
0 2 4 6 8 10
10-1
100
101
102
0 2 4 6 8 10
10-2
10-1
100
101
option name default value
LogPlot False Controls whether LogTicks operates as it
should for standalone use or for automatic tick
mark generation with Mathematica'sLogPlot
LogTicks special option.
Use with LogPlot and related functions
If you wish to use LogPlot or related Mathematica functions directly for your logarithmic plots, you may also do
so. However, LogTicks must then be instructed to adjust its output accordingly. (LogPlot expects tick coordinates to
be specified as the true coordinate value, not the logarithm of the coordinate value. LogTicks must also interpret its n1
and n2 arguments differently in this case.) Automatic use with LogPlot can be accomplished by setting the option
LogPlot->True.
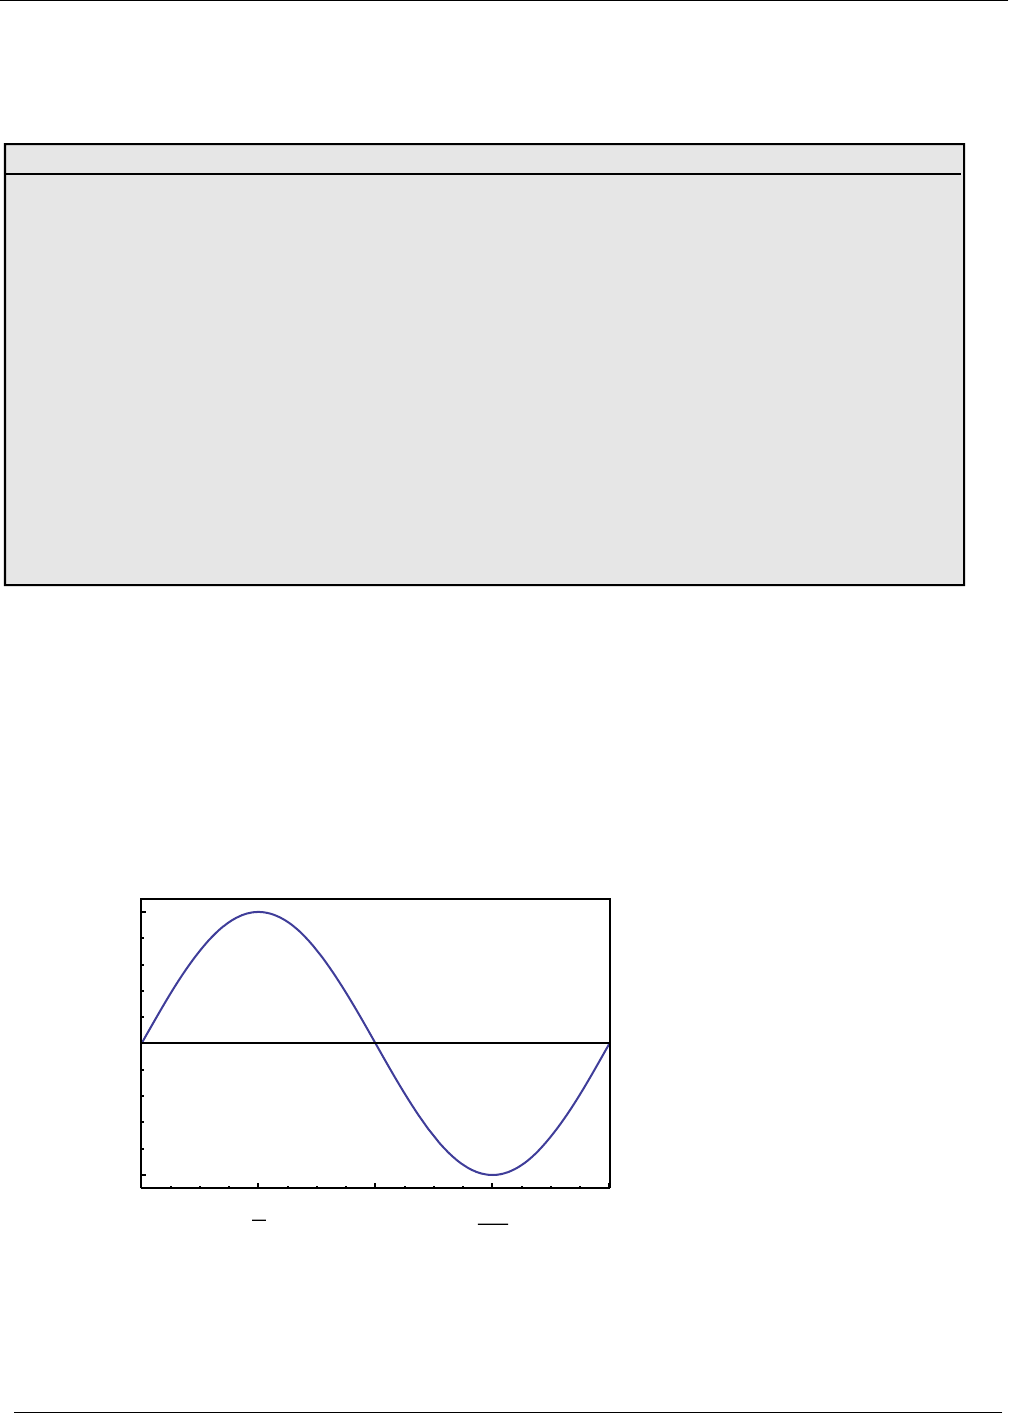
SetOptions[LogTicks, LogPlot -> True];
Plot[
{Cosh[x], Sinh[x]}, {x, 0, 10},
CustomTicks package 6
Version 2.1.0
PlotRange -> {{-0.0001, 4}, {10^-0.5, 10^2.5}},
FrameTicks -> {LinTicks, LogTicks, StripTickLabels[LinTicks],
StripTickLabels[LogTicks]},
Frame -> True, ImageSize -> 72*3
]
01234
100
101
102
Alternatively, if you are a SciDraw user, you might find yourself wanting to include the output of Mathematica’s
LogPlot in a SciDraw figure, via FigGraphics, and then put logarithmic ticks on this figure. (I generally just use the
manual approach above, instead, and do not bother with LogPlot, but you may be a diehard LogPlot user...) Similarly,
if you are a more advanced Mathematica graphics programmer, you might find yourself wishing to use LogPlot or
related Mathematica functions to generate graphics which you will then combine with other graphics to form a composite
figure, and you then may wish to put logarithmic ticks on this figure. It turns out that LogPlot and its ilk do essentially
what we described as the manual procedure above. That is, they generate linear plots in which they have taken the loga-
rithms of the coordinates. But, they actually take the logarithm base e, rather than base 10. (No matter that the ticks which
they generate by default are base 10 log ticks...) So, if you create ticks with LogTicks, the coordinates describing where
these ticks should be placed must be adjusted accordingly. For instance, the tick for “10”, instead of being located at
log1010=1 according to the procedure we described before, must now be at loge10º2.30259. This rescaling of coordinates
may be accomplished with the option setting LogPlot->E. Technical note: This option has the same effect as Tick-
PostTransformation(Log[10]*#&) (see below).
CustomTicks package 7
Version 2.1.0
Further control over tick placement and advanced customization
option name default value
TickLabelFunction Automatic Function used to generate major tick labels
first argument is the numerical coordinate, second
argument is the LinTicks default formatted label;
Automatic gives the default label
TickPreTransformation Identity Function to be applied to tick coordinates,
before range tests and label generation
TickPostTransformation Identity Function to be applied to tick coordinates,
after range tests and label generation
MinorTickIndexTransfo-
rmation
Identity Function to be applied to
minor tick indices originally 1, 2, …,
subdivs -1before minor tick coordinate is obtained
by linear interpolation between major tick positions
MinorTickIndexRange 1, InfinityLimits drawing of minor ticks to those with
indices before tranformationin given range
Advanced customization options.
LinTicks accepts several options for advanced customization, allowing fully customizable labels and general
nonlinear axis scales. The option TickLabelFunction is used to specify the function to be used to construct tick
labels (see the Mathematica documentation for Function for information on defining functions). The label function is
given as arguments both the raw numerical tick coordinate and the LinTicks default formatted label, so it can work with
whichever is more convenient. The label function may be used for simple tasks, such as attaching a prefix or suffix to the
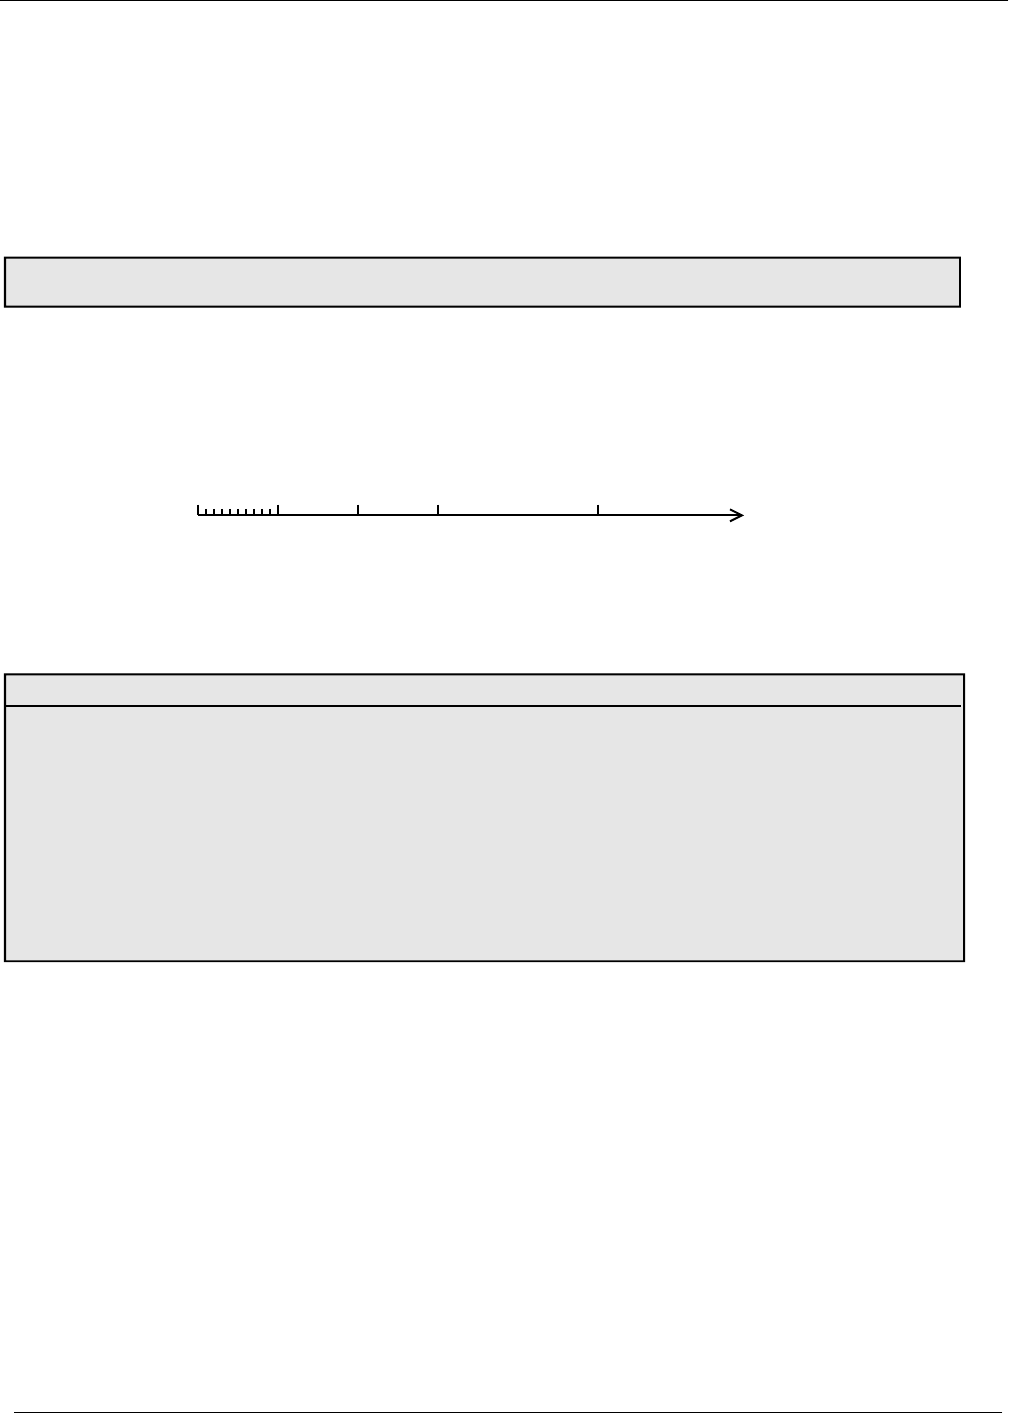
usual default label, or for more sophisticated formatting. In the following example, tick values are formatted as rational
multiples of p.
LinTicks[0,2*Pi,Pi/2,4,TickLabelFunction(Rationalize[#/Pi]*Pi&)]
0p
2
p3p
2
2p
-1
0
1
Nonlinear axes are constructed using the coordinate transformation functions. For instance, the LogTicks function
provided by the CustomTicks package is actually implemented as a special case of LinTicks, with transformed minor
tick positions. A very simplified implementation of LogTicks (base 10 logarithm only) is given below for illustration.
CustomTicks package 8
Version 2.1.0
Log10Ticks[p1_Integer,p2_Integer,Opts___?OptionQ]:=LinTicks[
p1,p2,1,9,
TickLabelFunction(DisplayForm[SuperscriptBox[10,IntegerPart[#]]]&),
MinorTickIndexTransformation(Log10[#+1]*9&),
Opts
];
LinTicks
majorticklist,minorticklist
Produces major and minor ticks at the specified coordinate values
Form of tick specification function for ticks at arbitrary locations.
Ticks may be placed at arbitrary coordinate locations by using the most flexible form of LinTicks, in which all
major and minor tick coordinates are specified explicitly in two lists. All the usual coordinate-transformation and customiza-
tion options described above (except MinorTickIndexRange) are still applicable.
0123 5
Manual choice of tick coordinates
LinTicks0,1,2,3,5,Range0.1,0.9,0.1
option name default value
ExtraTicks Additional coordinate values at which to insert tick marks
TickTest True &Logical test to be applied to coordinate values,
to select the coordinates at which tick marks
are displayed provides further control beyond the
simple range test provided by TickRange above
TickLabelTest True &Logical test to be applied to coordinate values,
to select the coordinates at which tick labels are
displayed provides further control beyond the simple
range test provided by TickLabelRange above
Further options controlling the placement of tick marks and labels.
Or, even without taking complete manual control of the choice of tick positions, some further control over tick
placement is provided through the options above.
Tick mark programming utilities
CustomTicks package 9
Version 2.1.0

LimitTickRange x1,x2 ,ticksSelects those tick mark with coordinates in the range specified;
approximate equality testing is used to avoid dropping ticks at the ends of the
interval due to roundoff; ticks must be specifies as lists rather than bare numbers
TransformTicks
coordfcn,lengthfcn,ticks
Applies the specified transformation functions to the tick coordinates and tick lengths,
respectively; ticks must be specified with an explicit pair of in and out lengths
StripTickLabelsticksRemoves any text labels from ticks;
ticks must be specified as lists rather than bare numbers
AugmentTickslabelfcn ,
l1,l2 ,stylelist,ticks
Upgrades all tick specifications to full specifications, complete with labels,
lengths into and out of the frame default 0 for out, and style directives
AugmentAxisTickOptions
numaxes,tickoptions
Given a list of tick options themselves lists of tick specificationsfor several axes,
replaces any None entries with null lists and appends
additional null lists as needed to make numaxes entries;
a value None for tickoptions is replaced by a list of null lists
TickQxTests whether or not xis a valid tick mark specificiation
TickListQxTests whether or not xis a list of valid tick mark specificiations
Tick manipulation utilities.
Several utility functions for tick mark manipulation and testing are provided. These are mainly intended for use in
graphics programming rather than for direct use by someone wishing to specify tick marks. They are used internally by the
LevelScheme figure preparation system.
FractionDigitsxReturns the number of digits to the right of the point in the decimal representation of x
Decimal digit counting function.
FractionDigits determines the number of digits to the right of the point in the decimal representation of a
number. It is of use in constructing fixed-point tick labels. It will, naturally, return large values, determined by Mathemati-
ca's Precision, for some numbers, such as non-terminating rationals. It accepts the option FractionDigitsBase,
by default 10, for work with non-decimal representations. Some examples follow:
FractionDigits100
FractionDigits1.25
FractionDigits13
0
2
17
FixedPointFormx,rFormats xas a fixed–point number with rdigits to the right of the decimal point.
FixedPointFormx,l,r Formats xas a fixed–point number with ldigits
or spacesto the left and rdigits to the right of the decimal point.
Decimal digit counting function.
FixedPointForm returns a string, consisting of the real number x formatted in fixed-point representation. It is
used internally by CustomTicks in constructing fixed-point tick labels, hence its inclusion in this package, but it may be
used to format numbers in many other contexts as well. Some examples follow:
CustomTicks package 10
Version 2.1.0

FixedPointFormPi N, 5
FixedPointFormPi N, 2
FixedPointFormPi N, 0
3.14159
3.14
3
FixedPointFormPi N, 2, 3
FixedPointForm4Pi N, 2, 3
3.142
12.566
FixedPointForm accepts options NumberSigns, SignPadding, and NumberPoint, which are defined much as
for the usual built-in Mathematica numerical formatting functions NumberForm, etc. (See the Mathematica documenta-
tion for further information on their usage.) By default, for positive numbers a blank padding space appears at left, where a
minus sign would be for negative numbers, to improve alignment with negative numbers. However, FixedPointForm
also accepts the special value NumberSignsAutomatic, which specifies that this space should be suppressed. In
general, this provides a better appearance for tick labels.
FixedPointFormPi N, 3
FixedPointFormPi N, 3
FixedPointFormPi N, 3, NumberSigns Automatic
3.142
3.142
3.142
Technical notes: FixedPointForm allows as many digits as necessary to the left of the decimal point, thereby avoiding
the rounding problem associated with PaddedForm[x,{n,f}] when n is specified too small (PaddedForm zeros out
some of the rightmost digits of the number). It also suppresses any trailing decimal point when r=0.
© Copyright 2016, Mark A. Caprio.
CustomTicks package 11
Version 2.1.0
