CustomTicksGuide.nb Custom Ticks Guide
User Manual:
Open the PDF directly: View PDF ![]() .
.
Page Count: 10
CustomTicks package
Mark A. Caprio, Department of Physics, University of Notre Dame
Version 1.62 (September 30, 2008)
Introduction
Mathematica provides a powerful system for generating graphics but does not provide, in built-in form, the fine
formatting control necessary for the preparation of publication quality figures. The CustomTicks package provides detailed
customization of tick mark placement and formatting. The flexibility achieved matches or exceeds that available with most
commercial scientific plotting software. Linear, logarithmic, and general nonlinear axes are supported. Some tick mark
manipulation functions, for use in graphics programming, are also provided by the CustomTicks package.
The CustomTicks package was developed as part of the LevelScheme system for preparing publication-quality
scientific figures [Comput. Phys. Commun. 171, 107 (2005)], available from http://wnsl.physics.yale.edu/
levelscheme.
Basic use for linear axes
The default tick marks produced by Mathematica's plotting functions are typically not suitable for publication.
Most notably, Mathematica drops trailing zeros after the decimal point in its default tick marks, leading to a series of ticks
of "ragged" lengths (e.g., "0.", "0.5", "1.", …). The tick marks are also often too short to be easily visible. (Note that the
default typewriter-style font used by Mathematica plotting functions is neither aesthetic or appropriate for publication, but
this can easily be remedied by setting $TextStyle={FontFamily->"Times"}.)
It is possible to override the default Mathematica ticks by specifying a list of tick marks, complete with formatting
information, as the value for the Ticks or FrameTicks option (see the Mathematica documentation for basic plotting
options). It is prohibitively tedious to construct such lists by hand. The CustomTicks package provides functions to
automatically construct lists of tick marks, with detailed control over formatting.
LinTicks@ x1,x2DProduces linear tick specifications,
with automatically chosen major and minor tick intervals
LinTicks@ x1,
x2,interval,subdivsD
Produces linear tick specifications, with manually chosen major and minor tick intervals
Tick specification function.
Version 1.62

option name default value
TickRange 8−Infinity,
Infinity<
Limits the drawing of ticks
Hand their labelsLto given coordinate range
ShowTickLabels True Controls whether or not major tick labels are printed
TickLabelRange 8−Infinity,
Infinity<
Limits printing of major tick labels to given coordinate range
ShowFirst True Controls whether or not first major tick label is printed
ShowLast True Controls whether or not last major tick label is printed
TickLabelStep 1 Limits printing of major tick labels to
one in every TickLabelStep major ticks
TickLabelStart 0 Used in conjunction with TickLabelStep
chooses which subset of major tick labels are printed
MajorTickLength 80.01, 0<List specifying the lengths for the
major ticks Hinto and out of the frame,
as described in the Mathematica documentation for TicksL
MinorTickLength 80.005, 0<List specifying the lengths for the
minor ticks Hinto and out of the frame,
as described in the Mathematica documentation for TicksL
MajorTickStyle 8< List specifying the line style for the major ticks
MinorTickStyle 8< List specifying the line style for the minor ticks
DecimalDigits Automatic Sets number of digits after decimal
place for major tick labels; if Automatic ,
the maximum number of digits needed for any label is used
ShowMinorTicks True Controls whether or not the minor ticks are drawn;
mainly for use with LogTicks Hsee belowL
ExtraTicks 8< Additional coordinate values at which to insert tick marks
Tick formatting options.
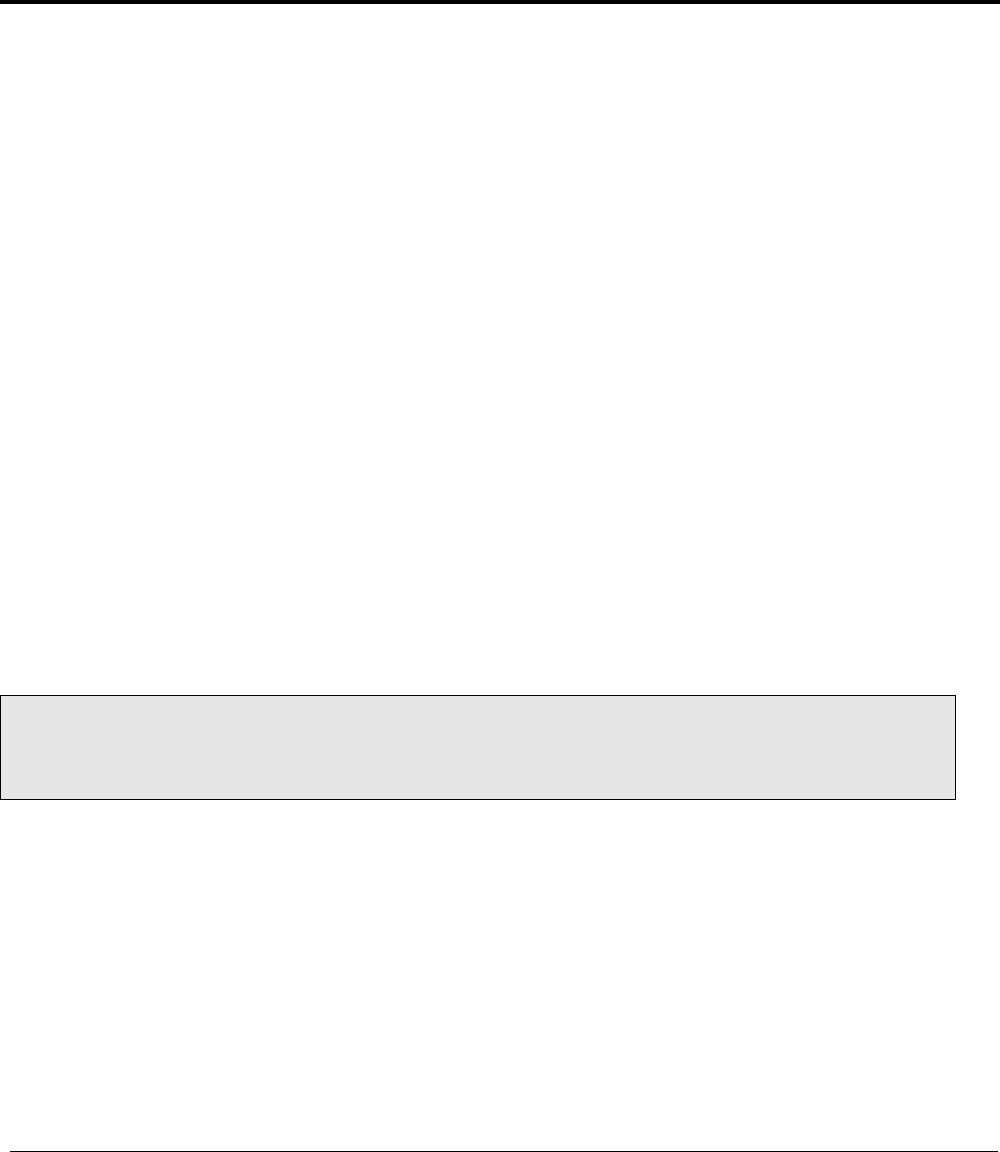
The LinTicks function, in its simplest form, is given a starting and an ending coordinate value as its arguments.
It then generates the same tick marks Mathematica would have for this coordinate range, except that the labels are given
with fixed decimal formatting (e.g., "0.0", "0.5", "1.0", … for the example above) and the tick marks lines are somewhat
longer. Alternatively, arguments may be given to manually specify the coordinate interval between major tick marks and
the number of minor subdivisions. Several further options, listed above, can be specified. These control which tick marks
are drawn, which major ticks have labels, and the formatting of the tick lines and labels. Some examples are shown below.
CustomTicks package 2
Version 1.62
0.
0.5
1.
1.5
2.
Mathematica
ragged labels
0.0
0.5
1.0
1.5
2.0
LinTicks
neat formatting
LinTicks@0, 2D
0
1
2
Manual choice
of spacing
LinTicks@0, 2, 1, 5D
0
1
2
Advanced
formatting options
LinTicks@0, 2, 0.5, 5,
TickLabelStep →2,
MinorTickStyle →8Red<D
N
ote: If you are using Mathematica 5 or earlier, the rightmost example assumes the Mathematica color names
p
ackage (Graphics`Colors`) has been loaded.
The tick specifications generated with the CustomTicks package can be used either with two-dimensional plots
(through the options Ticks or FrameTicks) or with three-dimensional plots (through the option Ticks). These
options are described further in the basic Mathematica documentation on plotting.
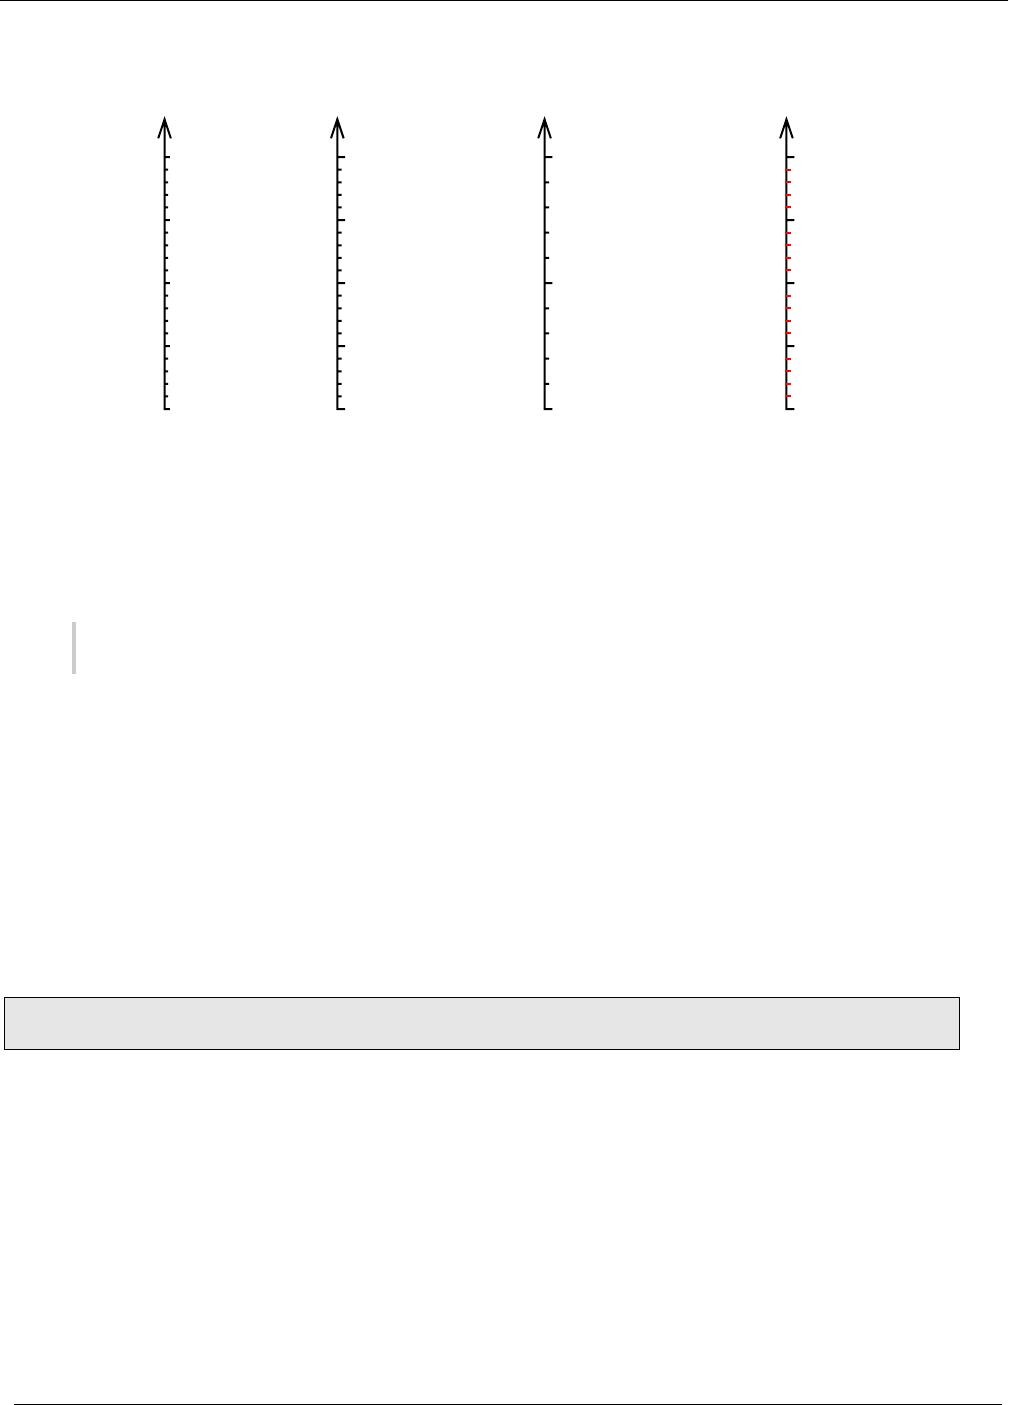
Logarithmic axes
The function LogTicks generates tick marks for logarithmic axes. LogTicks can produce tick marks for an
arbitrary logarithmic base (10 is the default, but e and 2 are other commonly useful bases). Unlike the Mathematica
LogPlot function, which produces cumbersome decimal labels (e.g., "0.0000001", "0.000001", …), LogTicks produces
true exponential labels (e.g., "10-7", "10-6", …).
LogTicks@ n1,n2DProduces logarithmic tick specifications, base 10
LogTicks@ base,n1,n2DProduces logarithmic tick specifications, arbitrary base
Logarithmic tick specification function.
LogTicks must be given the starting power, ending power, and, optionally, the logarithmic base b. For base 10, a
total of eight minor ticks are produced in each major interval, at 2ä10n through 9ä10n. For an arbitrary base b,
`bp-2
minor ticks are produced, at 2äbn, 3äbn, …. Display of the minor ticks may be suppressed by specifying the option
ShowMinorTicks→False. Some examples are shown below.
CustomTicks package 3
Version 1.62
100
101
102
Base 10
LogTicks@0,2D
10-8
10-4
100
104
108
Skipped labels
LogTicks@−8, 8,
TickLabelStep →4D
10-8
10-4
100
104
108
No minor ticks
LogTicks@−8, 8,
ShowMinorTicks →False,
TickLabelStep →4D
e0
e1
e2
e3
e4
Base e
LogTicks@E
,
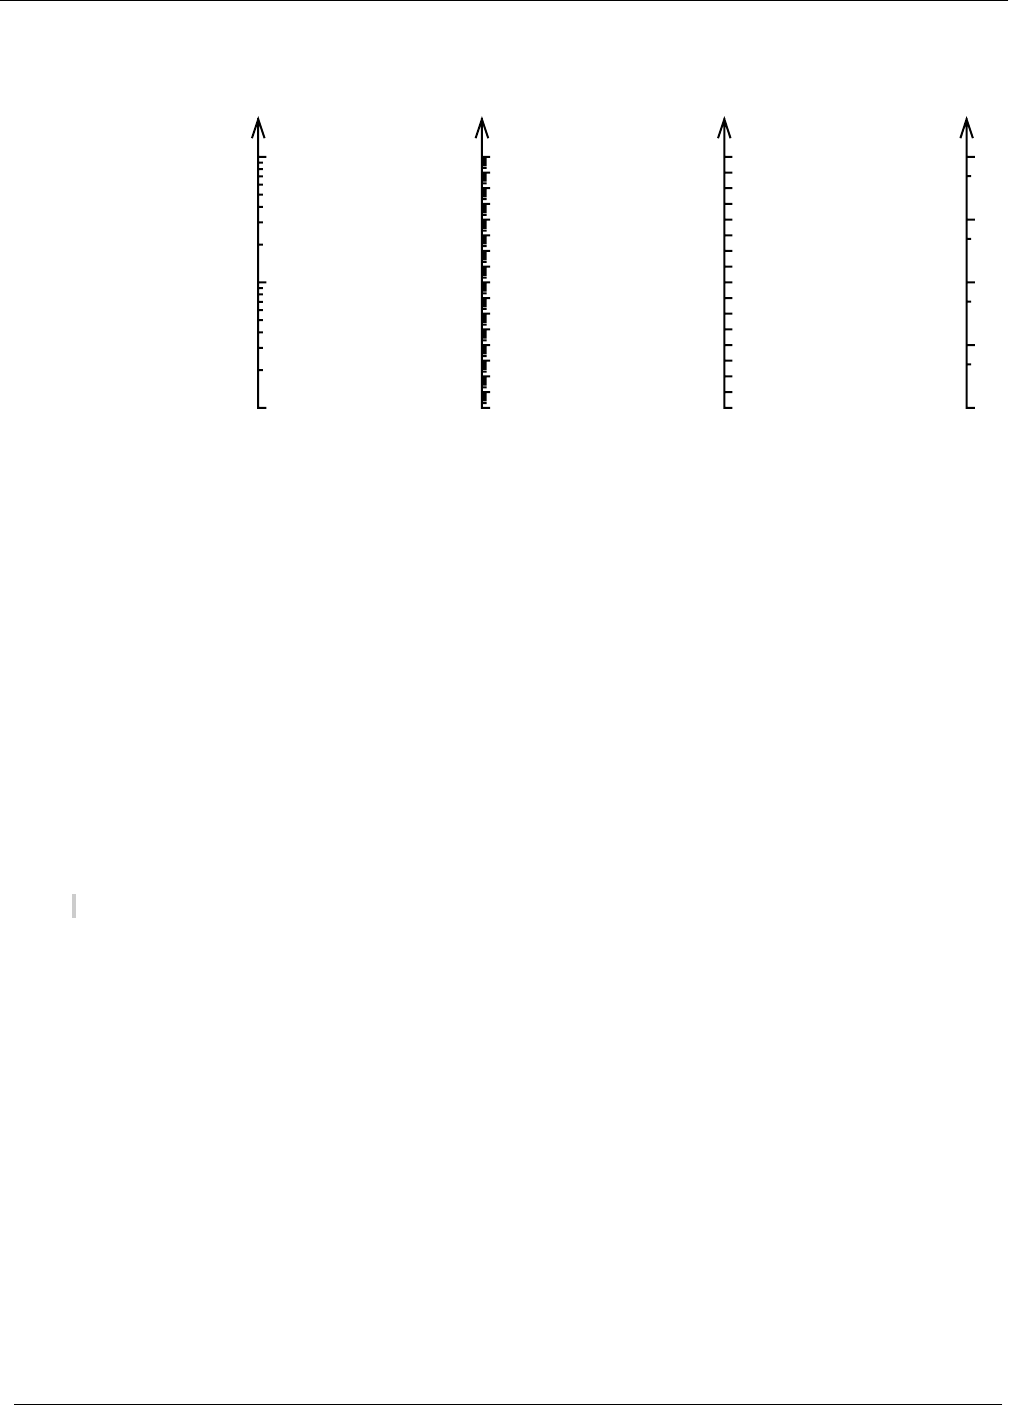
Note that plots with logarithmic axes are actually generated as linear plots, but where the logarithm has been taken
of either the x-axis or y-axis variable. Specifically, for base 10,
(1) a logarithmic (or linear-log) plot of f is obtained by plotting log10 f(x),
(2) a log-linear plot of f is obtained by plotting fI10xM, and
(3) a log-log plot of f is obtained by plotting log10 fI10xM
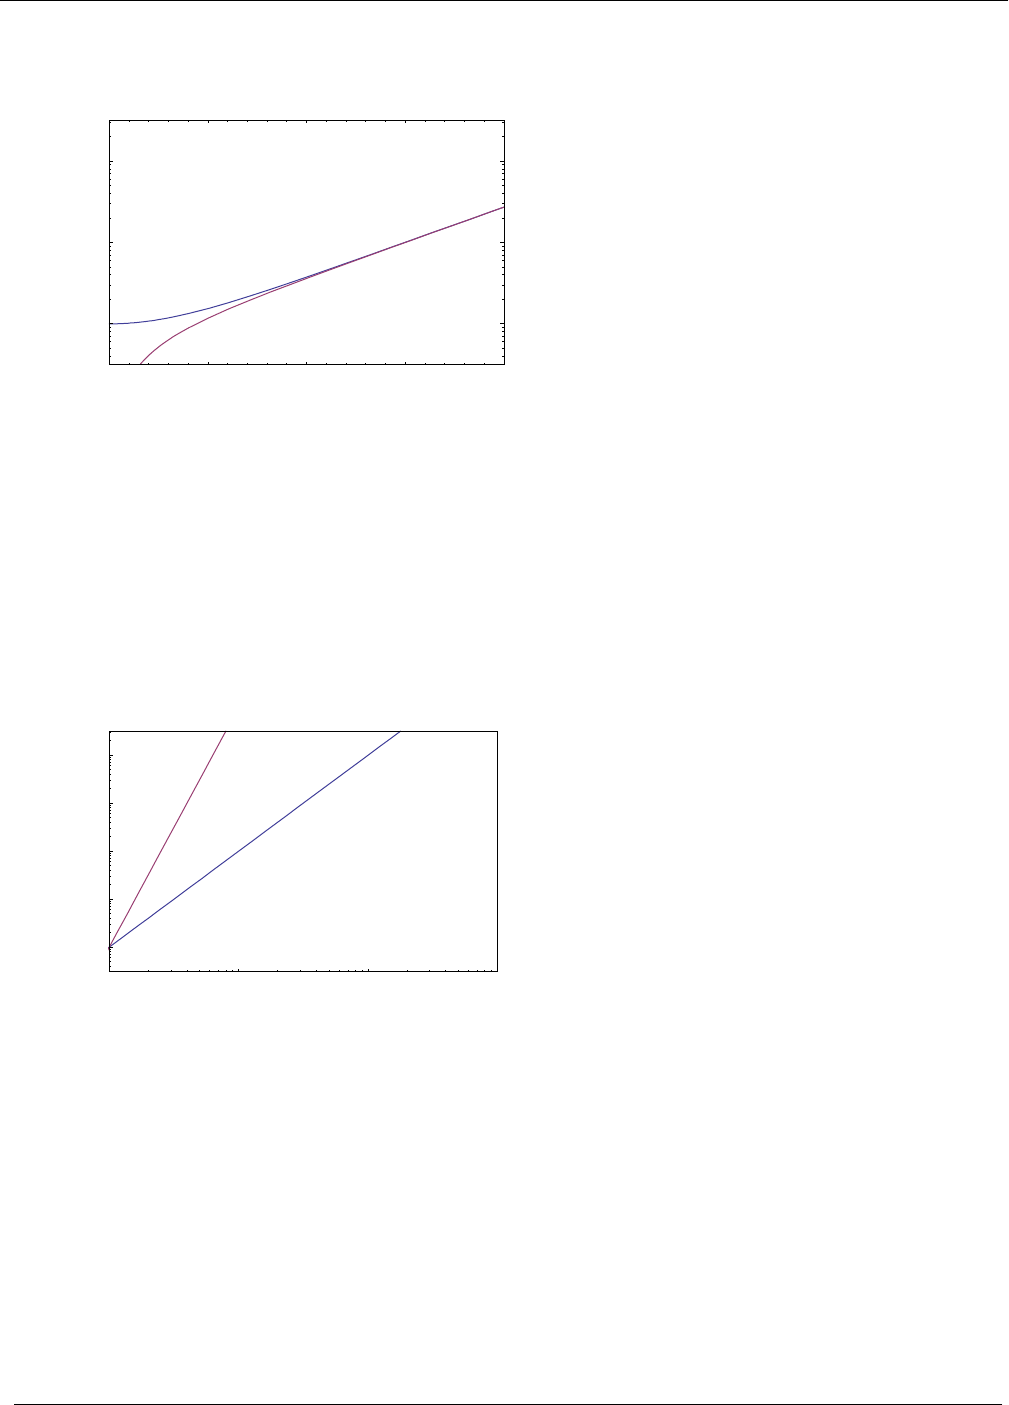
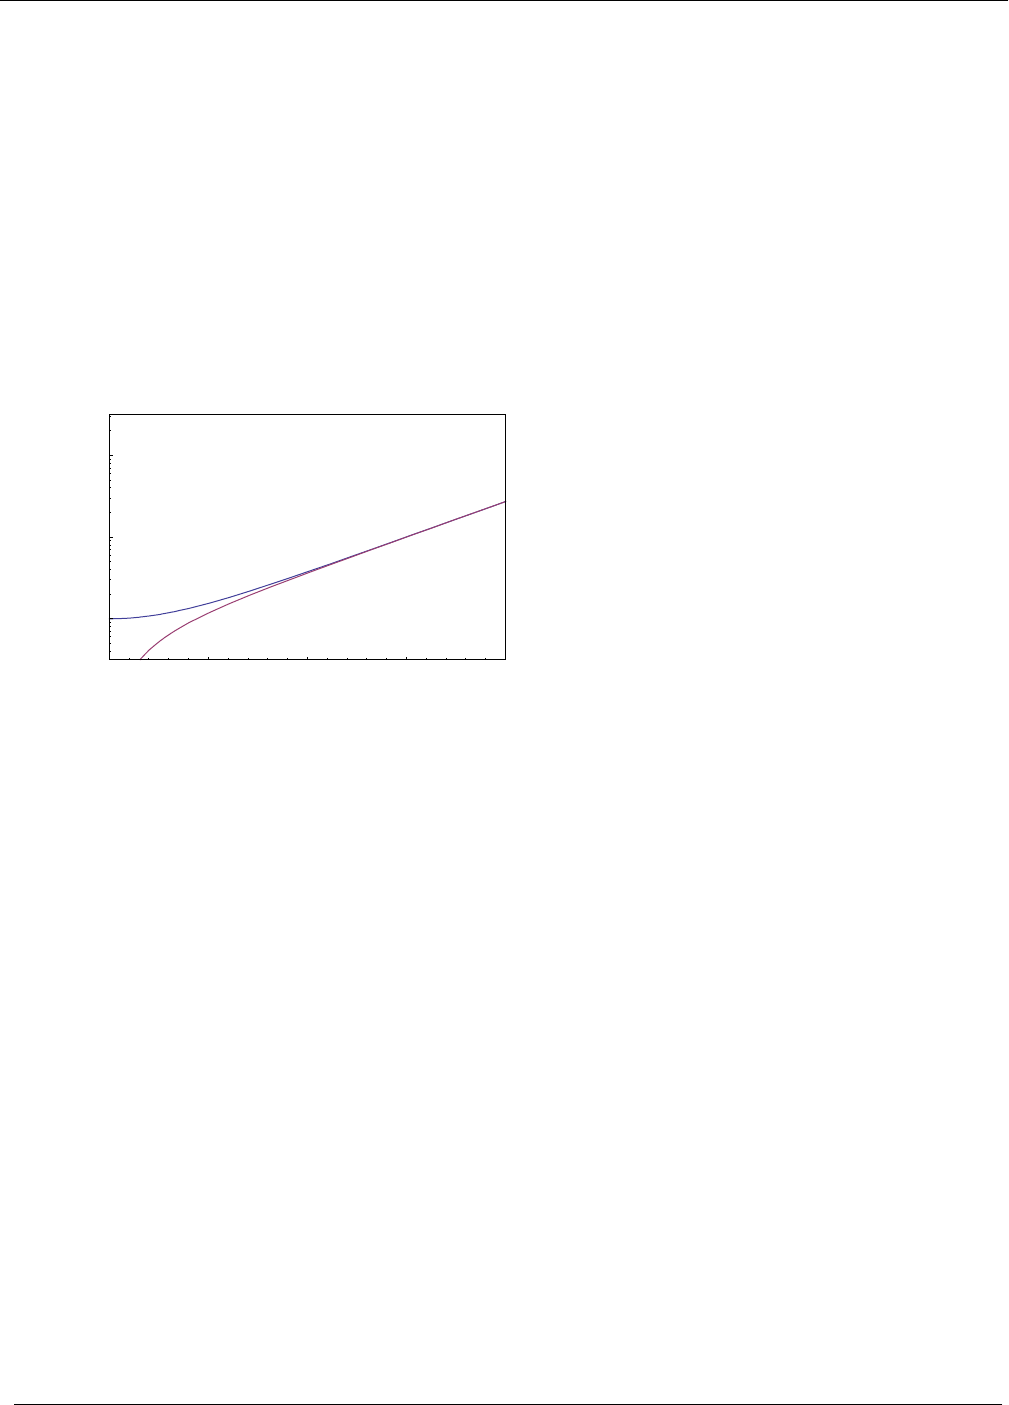
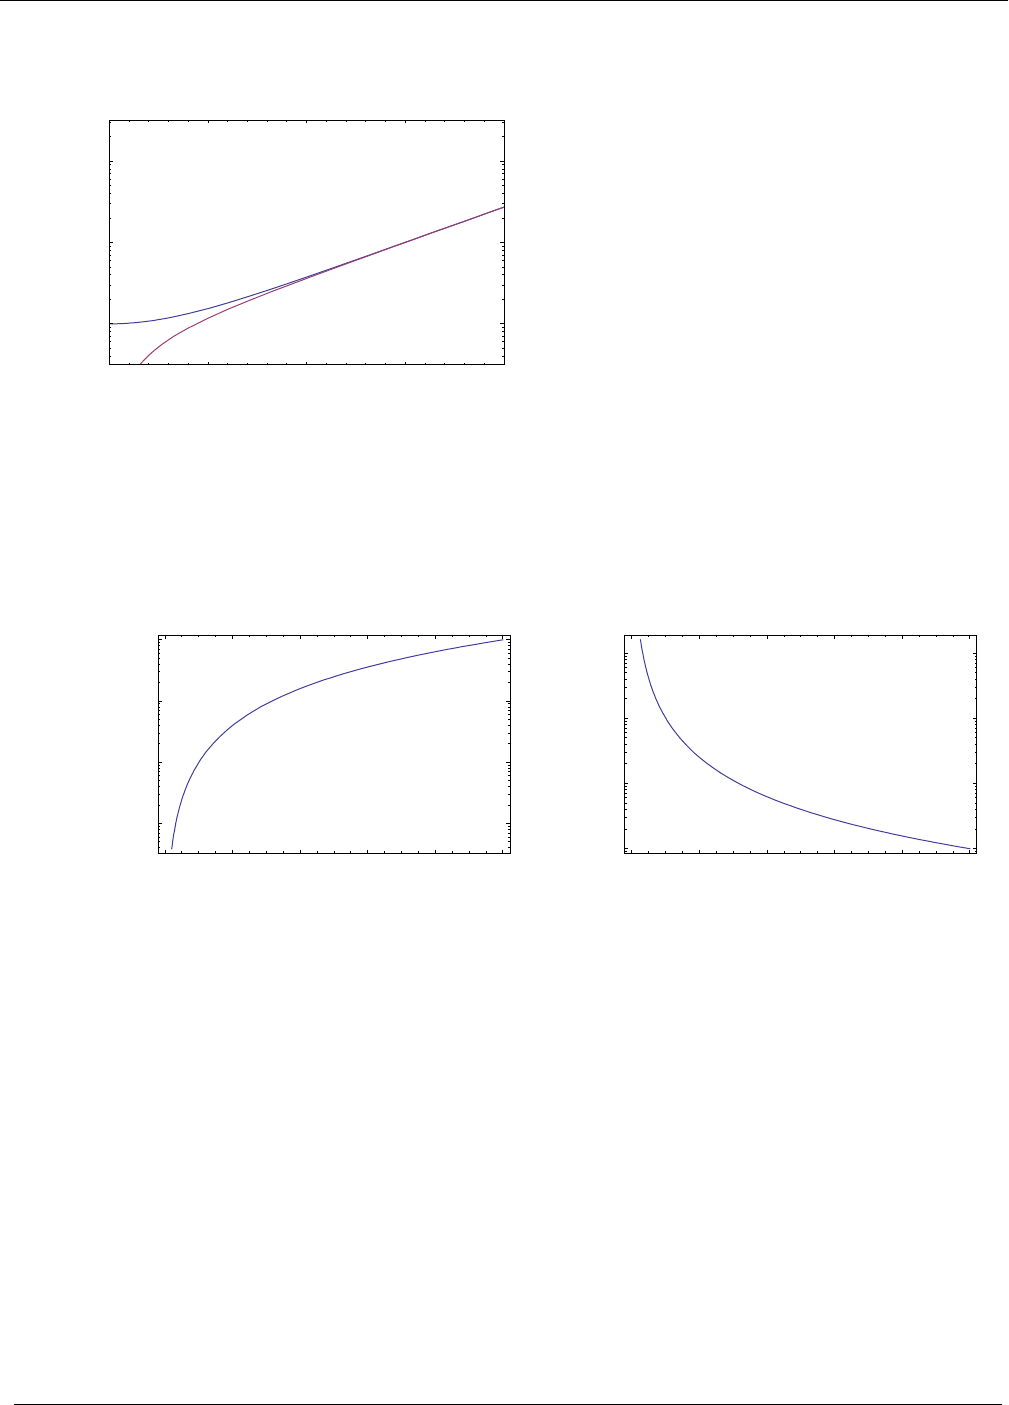
on ordinary linear axes. A similar procedure holds for bases other than 10. Examples of a logarithmic plot and a log-log
plot follow.
N
ote: If you are using Mathematica 5 or earlier, substitute "TextStyle" for "BaseStyle" in the following examples.
Plot[
{Log[10,Cosh[x]],Log[10,Sinh[x]]},{x,0,10},
PlotRange→{{-0.0001,4},{-0.5,2.5}},
FrameTicks→{
LinTicks[0,4],
LogTicks[10,-1,3],
LinTicks[0,4,ShowTickLabels→False],
LogTicks[10,-1,3,ShowTickLabels→False]
},
Axes→False,Frame→True,ImageSize→72*3,
BaseStyle→{FontFamily->"Times"}
]
CustomTicks package 4
Version 1.62
01234
100
101
102
Plot[
{Log[10,(10^x)^2],Log[10,(10^x)^5]},{x,-1,3},
PlotRange→{{-0.0001,3},{-0.5,4.5}},
FrameTicks→{
LogTicks[10,0,3],
LogTicks[10,-1,5],
None,
None
},
Axes→False,Frame→True,ImageSize→72*3,
BaseStyle→{FontFamily->"Times"}
]
100101102103
100
101
102
103
104
CustomTicks package 5
Version 1.62
Automatic ticks for Mathematica plot functions
The functions LinTicks and LogTicks can also be specified as automatic tick generation functions for the
M
athematica plotting functions. This saves you typing the plot range explicitly each time, at least if you do not wish to
specify details such as the number of subdivisions.
Plot[
{Log[10,Cosh[x]],Log[10,Sinh[x]]},{x,0,10},
PlotRange→{{-0.0001,4},{-0.5,2.5}},
FrameTicks→{LinTicks,LogTicks,None,None},
Axes→False,Frame→True,ImageSize→72*3,
BaseStyle→{FontFamily->"Times"}
]
0 1 2 3 4
100
101
102
What if you wish to have tick marks on the top and right as well, but without labels on them? Simply specifying
FrameTicks→{LinTicks,LogTicks} or FrameTicks→{LinTicks,LogTicks,LinTicks,LogTicks}
would unfortunately result in ticks with unsightly and redundant labels. This can be avoided with the CustomTicks Strip
-
TickLabels function, as shown below.
Plot[
{Log[10,Cosh[x]],Log[10,Sinh[x]]},{x,0,10},
PlotRange→{{-0.0001,4},{-0.5,2.5}},
FrameTicks→
{LinTicks,LogTicks,StripTickLabels[LinTicks],StripTickLabels[LogTicks]},
Axes→False,Frame→True,ImageSize→72*3,
BaseStyle→{FontFamily->"Times"}
]
CustomTicks package 6
Version 1.62
01234
100
101
102
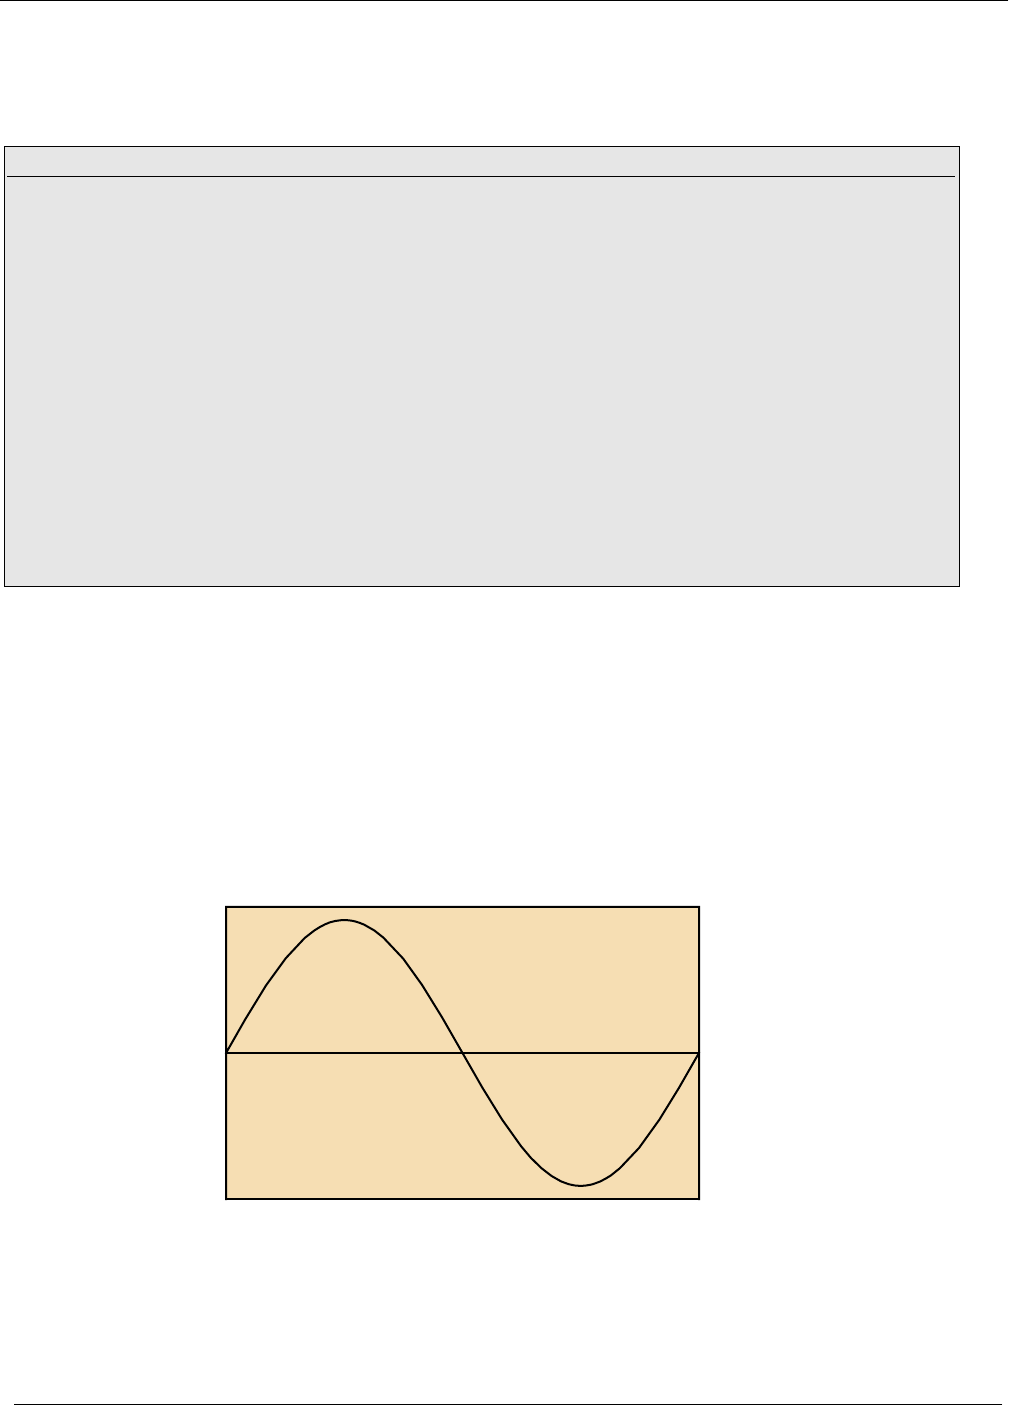
If you are doing many such plots, it is easiest to set the necessary options as the default options for Plot.
SetOptions[Plot,Axes→False,Frame→True,FrameTicks→
{LinTicks,LogTicks,StripTickLabels[LinTicks],StripTickLabels[LogTicks]},Bas
eStyle→{FontFamily→"Times"}];
GraphicsGrid[{{Plot[Log[10,x^2],{x,0,10}],Plot[Log[10,x^-2],{x,0,10}]}}]
0 2 4 6 8 10
10-1
100
101
102
0 2 4 6 8 10
10-2
10-1
100
101
CustomTicks package 7
Version 1.62
Advanced customization
option name default value
TickLabelFunction Automatic Function used to generate major tick labels
Hfirst argument is the numerical coordinate, second
argument is the LinTicks default formatted labelL;
Automatic gives the default label
TickPreTransformation Identity Function to be applied to tick coordinates,
before range tests and label generation
TickPostTransformation Identity Function to be applied to tick coordinates,
after range tests and label generation
MinorTickIndexTransfo
rmation
Identity Function to be applied to
minor tick indices Horiginally 1, 2, …,
subdivs
-1Lbefore minor tick coordinate is obtained by
linear interpolation between major tick positions
MinorTickIndexRange 81, Infinity<Limits drawing of minor ticks to those with
indices Hbefore tranformationLin given range
A
dvanced customization options.
LinTicks accepts several options for advanced customization, allowing fully customizable labels and general
nonlinear axis scales. The option TickLabelFunction is used to specify the function to be used to construct tick
labels (see the Mathematica documentation for Function for information on defining functions). The label function is
given as arguments both the raw numerical tick coordinate and the LinTicks default formatted label, so it can work with
whichever is more convenient. The label function may be used for simple tasks, such as attaching a prefix or suffix to the
usual default label, or for more sophisticated formatting. In the following example, tick values are formatted as rational
multiples of p.
LinTicks[0,2*Pi,Pi/2,4,TickLabelFunction→(Rationalize[#/Pi]*Pi&)]
0p
ÅÅÅÅÅÅ
2
p3p
ÅÅÅÅÅÅÅÅÅÅ
2
2p
-1
0
1
N
onlinear axes are constructed using the coordinate transformation functions. For instance, the LogTicks function
provided by the CustomTicks package is actually implemented as a special case of LinTicks, with transformed minor
CustomTicks package 8
Version 1.62
tick positions. A simplified version (base 10 logarithm only) is given below for illustration.
Log10Ticks[p1_Integer,p2_Integer,Opts___?OptionQ]:=LinTicks[
p1,p2,1,9,
TickLabelFunction→(DisplayForm[SuperscriptBox[10,IntegerPart[#]]]&),
MinorTickIndexTransformation→(Log[10,#+1]*9&),
Opts
];
LinTicks@
majorticklist,minorticklistD
Produces major and minor ticks at the specified coordinate values
Form of tick specification function for ticks at arbitrary locations.
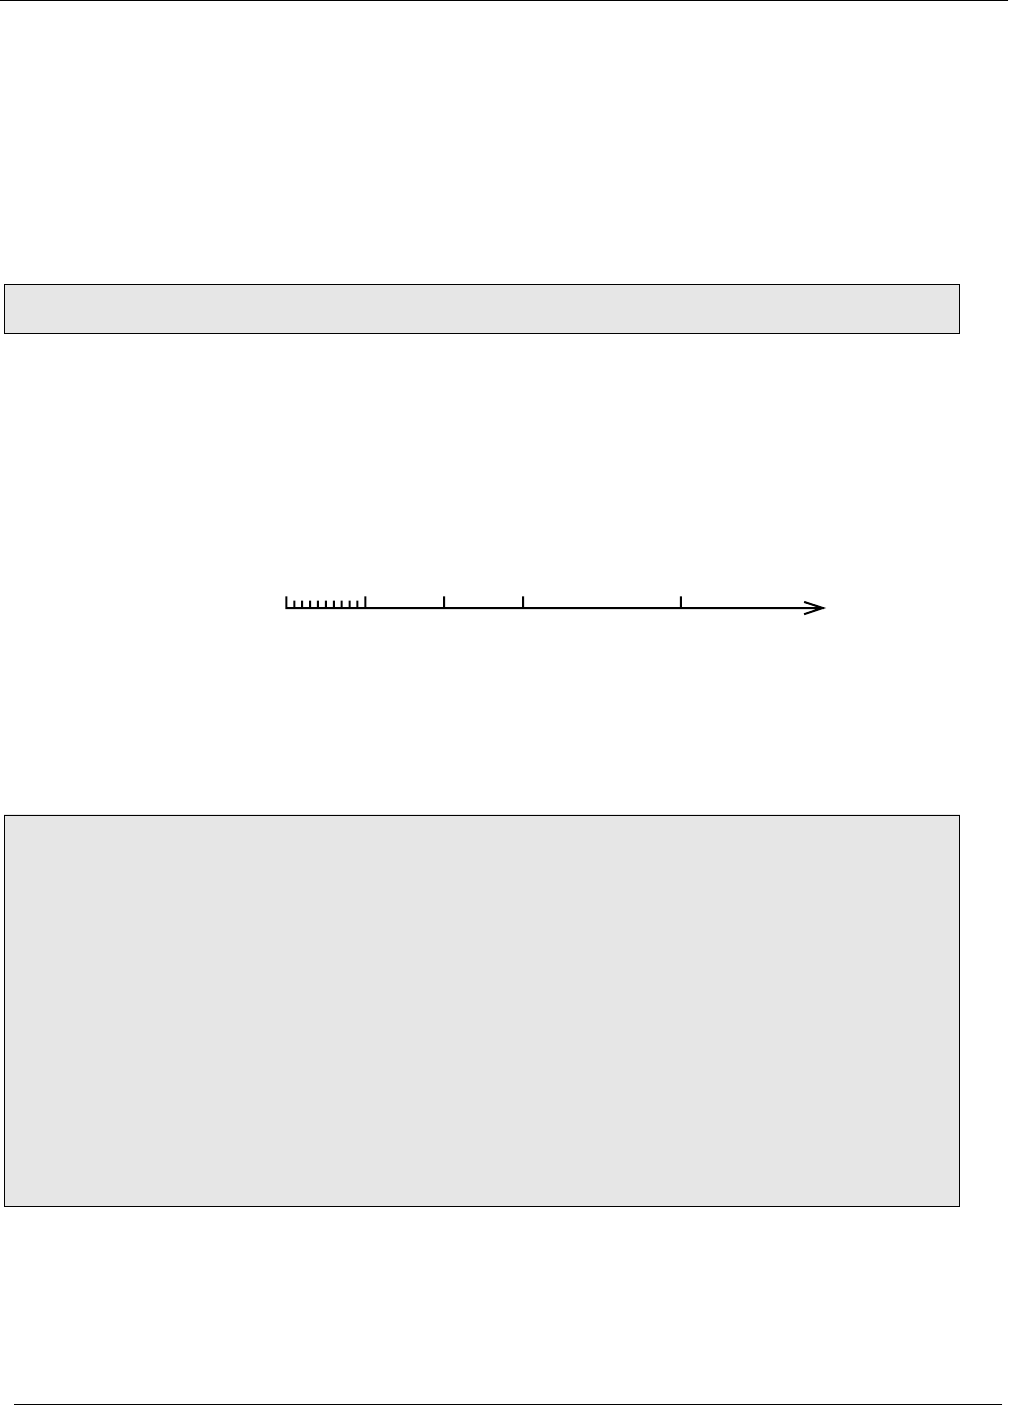
Ticks may be placed at arbitrary coordinate locations by using the most flexible
form of LinTicks, in which all major and minor tick coordinates are specified explic-
itly in two lists. All the usual coordinate-transformation and customization options
described above (except MinorTickIndexRange) are still applicable.
0123 5
Manual choice of tick coordinates
LinTicks@80,1,2,3,5<,Range@0.1,0.9,0.1DD
Tick mark programming utilities
LimitTickRange@8 x1,x2
<, ticksDSelects those tick mark with coordinates in the range specified;
approximate equality testing is used to avoid dropping ticks at the ends of the
interval due to roundoff ; ticks must be specifies as lists rather than bare numbers
TransformTicks@
coordfcn,lengthfcn,ticksD
Applies the specified transformation functions to the tick coordinates and tick lengths,
respectively; ticks must be specified with an explicit pair of in and out lengths
StripTickLabels@ ticksDRemoves any text labels from ticks;
ticks must be specified as lists rather than bare numbers
AugmentTicks@ labelfcn
,
8 l1,l2
<, stylelist,ticksD
Upgrades all tick specifications to full specifications, complete with labels,
lengths into and out of the frame Hdefault 0 for outL, and style directives
AugmentAxisTickOptions@
numaxes,tickoptionsD
Given a list of tick options Hthemselves lists of tick specificationsLfor several axes,
replaces any None entries with null lists and
appends additional null lists as needed to make numaxes entries;
a value None for tickoptions is replaced by a list of null lists
TickQ@ xDTests whether or not xis a valid tick mark specificiation
TickListQ@ xDTests whether or not xis a list of valid tick mark specificiations
Tick manipulation utilities.
Several utility functions for tick mark manipulation and testing are provided. These are mainly intended for use in
graphics programming rather than for direct use by someone wishing to specify tick marks. They are used internally by the
LevelScheme figure preparation system.
CustomTicks package 9
Version 1.62

FractionDigits@ xDReturns the number of digits to the right of the point in the decimal representation of x
Decimal digit counting function.
FractionDigits determines the number of digits to the right of the point in the decimal representation of a
number. It is of use in constructing fixed-point tick labels. It will, naturally, return large values, determined by Mathemati-
ca's Precision, for some numbers, such as non-terminating rationals. It accepts the option FractionDigitsBase,
by default 10, for work with non-decimal representations. Some examples follow:
FractionDigits@100D
FractionDigits@1.25D
FractionDigits@1ê3D
0
2
17
© Copyright 2008, Mark A. Caprio.
CustomTicks package 10
Version 1.62
