DASware_design_User Manual DASware Design User
User Manual: DASware_design_UserManual
Open the PDF directly: View PDF ![]() .
.
Page Count: 52
- HB_Cover_DASware design_en
- LeereSeite
- DASware_design_UM_text_neu
- UM_Cover_DASware design_en.pdf
User Manual
www DASGIP com
DASware® design

User Manual DASware® design
Copyright © 2012 DASGIP Information and Process Technology GmbH, Jülich, Germany
Publisher DASGIP Information and Process Technology GmbH
Rudolf-Schulten-Straße 5
52428 Jülich, Germany
Tel: +49 (0)2461 / 980-0
Fax: +49 (0)2461 / 980-100
www.dasgip.com
E-mail: service@dasgip.de
Version Dezember 2012, 1.0
Copyright Copyright © 2012 DASGIP Information and Process Technology
GmbH, Jülich
No part of this publication may be reproduced without the prior
permission of the copyright owner.
Mention of third-party products is for informational purposes only
and constitutes neither an endorsement nor a recommendation.
DASGIP Information and Process Technology GmbH assumes no
responsibility with regard to the performance or use of these
products. All understandings, agreements, or warranties, if any,
take place directly between the vendors and the prospective users.
Every effort has been made to ensure that the information in this
manual is accurate. DASGIP Information and Process Technology
GmbH is not responsible for printing or clerical errors.
Trademarks are not marked in all cases with ™ or ® in this manual.

User Manual DASware® design
Copyright © 2012 DASGIP Information and Process Technology GmbH, Jülich, Germany

User Manual DASware® design
Copyright © 2012 DASGIP Information and Process Technology GmbH, Jülich, Germany
Table of Contents
DASware® Solutions 5 1.
1.1. DASware® access 6
1.2. DASware® analyze 7
1.3. DASware® connect 8
1.4. DASware® design 9
1.5. DASware® discover 10
1.6. DASware® migrate 11
Introduction 13 2.
DASware® design 19 3.
3.1. DoE Builder 20
Selecting or Entering Factors 22 3.1.1.
Selecting Resources 22 3.1.2.
Saving DoE Settings 24 3.1.3.
Create Workflows 25 3.1.4.
3.2. Recipe Editor 27
Open 27 3.2.1.
Overview 27 3.2.2.
3.3. Starting a Workflow [Run] 29
3.4. Process Implementation 30
3.5. DASGIP Information Manager 31
3.6. DASGIP Documentation Wizard 35
Application Example 36 4.
4.1. Full Factorial DoE with Three Factors and Two Levels 36
Implementation without External DoE Software Tools 38 4.1.1.
Use of External DoE Tools (JMP) 41 4.1.2.
Index 49

User Manual DASware® design
Copyright © 2012 DASGIP Information and Process Technology GmbH, Jülich, Germany
User Manual DASware® design DASware® Solutions
Copyright © 2012 DASGIP Information and Process Technology GmbH, Jülich, Germany 5
Increasing process complexity coupled with rising cost pressures and rapidly evolving
regulatory requirements make today’s process development efforts a special challenge. The
pressure of achieving faster time to market for new and innovative biopharmaceuticals had
led to the need to optimize every element of the total development workflow.
DASGIP
DASware
was designed as a suite of smart and flexible software solutions to
accelerate bioprocess development. It enables interconnectivity of bioreactors with external
labdevices, comprehensive data- and information management, factorial design of
experiment and remote control of bioprocesses.
DASware
can be used with the
DASGIP
Parallel Bioreactor System
for benchtop applications in microbiology and cell culture as well
as with legacy benchtop bioreactor controllers.
In the past, bioreactor processing, recipe management, process and product analysis, data
generation, data mining and storage were poorly interconnected thus requiring time-intensive
manual work.
DASware
supports interconnectivity combined with sophisticated bioprocess
information management. The utilization of
DASware
enables streamlined process
development at benchtop scale in accordance with QbD standards.
DASware
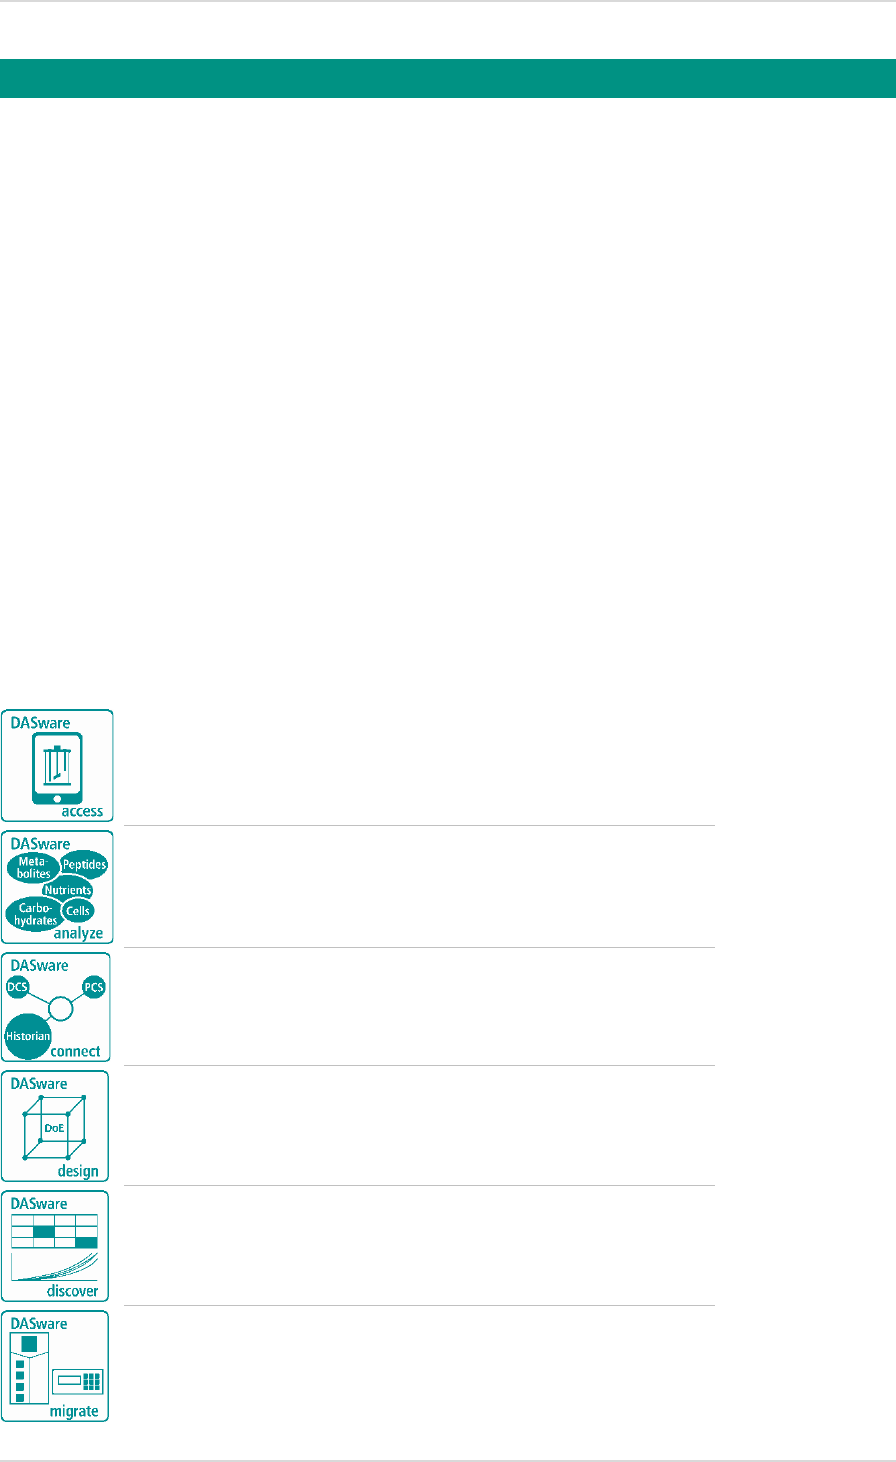
consists of…
- for remote monitoring and control of bioprocesses
- for integration of lab devices with
DASGIP Parallel Bioreactor Systems
- which facilitates a seamless interaction with legacy Corporate
Historians and Process Control Systems
- to apply the Design of Experiments concept
- a comprehensive and user-friendly data mining and information
management solution for bioprocessing
- to use all
DASware
solutions with legacy benchtop bioreactor control
units
DASware® Solutions 1.

DASware® Solutions User Manual DASware® design
6 Copyright © 2012 DASGIP Information and Process Technology GmbH, Jülich, Germany
1.1. DASWARE® ACCESS
DASware access
provides an unprecedented level of freedom and flexibility in the
management of bioprocesses. Each
DASGIP Control System
on-site is accessible remotely by
one or more remote clients simultaneously. Depending on the user-defined configuration and
associated authentication either monitor or monitor and control access can be enabled for any
network or mobile client.
Wi-Fi, Intranet, VPN and 4G connections can be used to provide web based access with
almost every browser to one or more bioreactor systems via PC, Notebook or Netbook. The
unique
DASGIP iApp
supports access from iPhone, iPod touch and iPad, optionally with
webcam support.
DASware access
DASGIP iApp
User Manual DASware® design DASware® Solutions
Copyright © 2012 DASGIP Information and Process Technology GmbH, Jülich, Germany 7
1.2. DASWARE® ANALYZE
DASware analyze
was designed for seamless integration of sampling and analytical laboratory
devices to the bioreactor system. A broad and growing range of analyzers can be integrated,
among them nutrient analyzers, cell counter (YSI Life Science, Nova Biomedical), automation
platform and autosampler (Bayer Technology and Services) biomass monitors (Aber
Instruments), HPLC (Waters, Shimadzu) and mass spectrometers (Thermo Scientific).
The OPC network protocol allows for interconnectivity between the bioreactor system and the
analyzer, including the possibility of direct feedback from the bioreactor system according to
online measured analytical data. This facilitates feedback control loops for e.g. nutrients,
biomass or product concentrations. Online calculations as well as event and data-driven
decisions are supported. The unique bidirectional OPC communication, available for
supporting devices enables sampling on demand and process dependent analyzer panel
selection.
DASGIP Control
Third Party Analytical Devices
Nutrient Analyzer
Cell Counter
HPLC
Mass Spectrometer
Gas Chromatograph
Autosampler
Etc.
DASware® Solutions User Manual DASware® design
8 Copyright © 2012 DASGIP Information and Process Technology GmbH, Jülich, Germany
1.3. DASWARE® CONNECT
DASware connect
was designed to integrate DASGIP’s Parallel Bioreactor Systems and 3rd
party bioreactor controllers into process control systems and legacy corporate historians. This
includes but is not limited to Emerson DeltaV®, Siemens SIMATIC PCS 7, ABB 800 xA, OSIsoft
PI System® and Matrikon OPC Historian.
DASware connect
facilitates company-wide access to
all relevant bioprocess data like set-points, process values, feed-profiles, calibration and
controller parameters as well as events and alarms.
DASGIP Parallel Bioreactor Systems
ABB DeltaV
Matrikon
OSIsoft
Pi System Siemens
Supervisory Control Systems
and Historians
User Manual DASware® design DASware® Solutions
Copyright © 2012 DASGIP Information and Process Technology GmbH, Jülich, Germany 9
1.4. DASWARE® DESIGN
DASGIP’s bioreactor systems serve as an ideal platform to carry out DoE on bioreactors in
parallel.
DASware
design automatically compiles DoE information from 3rd party DoE tools
into recipes and feeds-back response information into DoE and multivariate analysis and
reporting tools.
DASware design
comes with a Full Factorial DoE builder. Alternatively, a large variety of DoE
designs for screening, process development and optimization can be automatically imported
from most powerful 3rd party DoE tools like JMP and others. Parallel recipes incorporating the
DoE factor variations (i.e. pH, DO, T set points or feed rates) are automatically populated.
Following DASGIP’s Point-Click-Grow concept, they can be carried out on a set of bioreactors
with a single mouse-click. DoE response information is collected and prepared for an
automated export.
Individual Recipes
Export
Informations-
management
Prozess
Informationen
Parallele(s)
Bioreaktor System(e)
Design
Durchführung
Analyse
Resourcen Mapping
DoE Builder Recipe
l
DASware® Solutions User Manual DASware design
10 Copyright © 2012 DASGIP Information and Process Technology GmbH, Jülich, Germany
1.5. DASWARE® DISCOVER
DASware discover helps you to structure efficiently the assortment of process information like
o Process values
o Process events
o Recipes
o Biological,
o Chemical and
o Analytical information
Use this intuitive database query tool to initiate real-time retrievals and run-to-run com-
parisons. All critical process information is clearly listed as table and can be configured. In
addition, you can easily generate charts in Microsoft Excel® using
DASGIP Documentation
Wizard
.
User Manual DASware design DASware® Solutions
Copyright © 2012 DASGIP Information and Process Technology GmbH, Jülich, Germany 11
1.6. DASWARE® MIGRATE
A significant installed base of ageing bioreactor controllers offers rudimentary cultivation
control capabilities. However, recent advances such as bioprocess data management,
analytical device integration, DoE support and remote control, available from DASware
solutions, are often missing. Now users of 3rd party bioreactor controllers can also benefit
from DASGIP’s intelligent software solutions.
DASware migrate
integrates most common 3rd party bioreactor control units and systems (e.g.
Satorius Stedim Biotech & Applikon) as well as DASGIP modules into legacy bioreactor
controllers (e.g. Off-gas analyzer GA4, Gas-mixing station MX4/4, Mulitipump MP8 ).
DASware migrate
enables
o Access to the complete DASware solution suite
o Sharing recipes between different bioreactor controllers
o Powerful Microsoft Excel® reporting
o Comprehensive information management and process data historian
o Analytical lab device integration
o DoE and remote control
Bioprocess Control Systems
DASGIP Control

DASware® Solutions User Manual DASware design
12 Copyright © 2012 DASGIP Information and Process Technology GmbH, Jülich, Germany

User Manual DASware design Introduction
Copyright © 2012 DASGIP Information and Process Technology GmbH, Jülich, Germany 13
In current bioprocessing technologies, process-oriented criteria are playing an increasingly
important role in the assessment of product quality. Quality by Design (QbD) is a concept that
was highlighted, among others, in an FDA guideline on process validation (General Principles
and Practices, FDA, January 2011). It states the need for monitoring procedures already at the
development stage in order to achieve a controlled process and to ensure a defined product
quality.
This chapter outlines the concepts of design space, design of experiments (DoE) and DoE
fields of application. This is followed by a brief overview of the parallel bioreactor system
DASbox
and
DASware design
itself, including a schematic process flow.
Design space
In general, different process settings can be used to achieve good product results. This
multidimensional space which is defined by the factors and the corresponding levels is
referred to as design space (Fig 1). Within this space, the required quality of the product is
guaranteed.
The identification of a suitable design space requires a variety of implementations. Design of
experiments (DOE) can be helpful to reduce the extent of required testing – the total number
of individual experiments.
Introduction 2.
Fig 1: Design space with 3 factors in 2 levels
Design space
Introduction User Manual DASware design
14 Copyright © 2012 DASGIP Information and Process Technology GmbH, Jülich, Germany
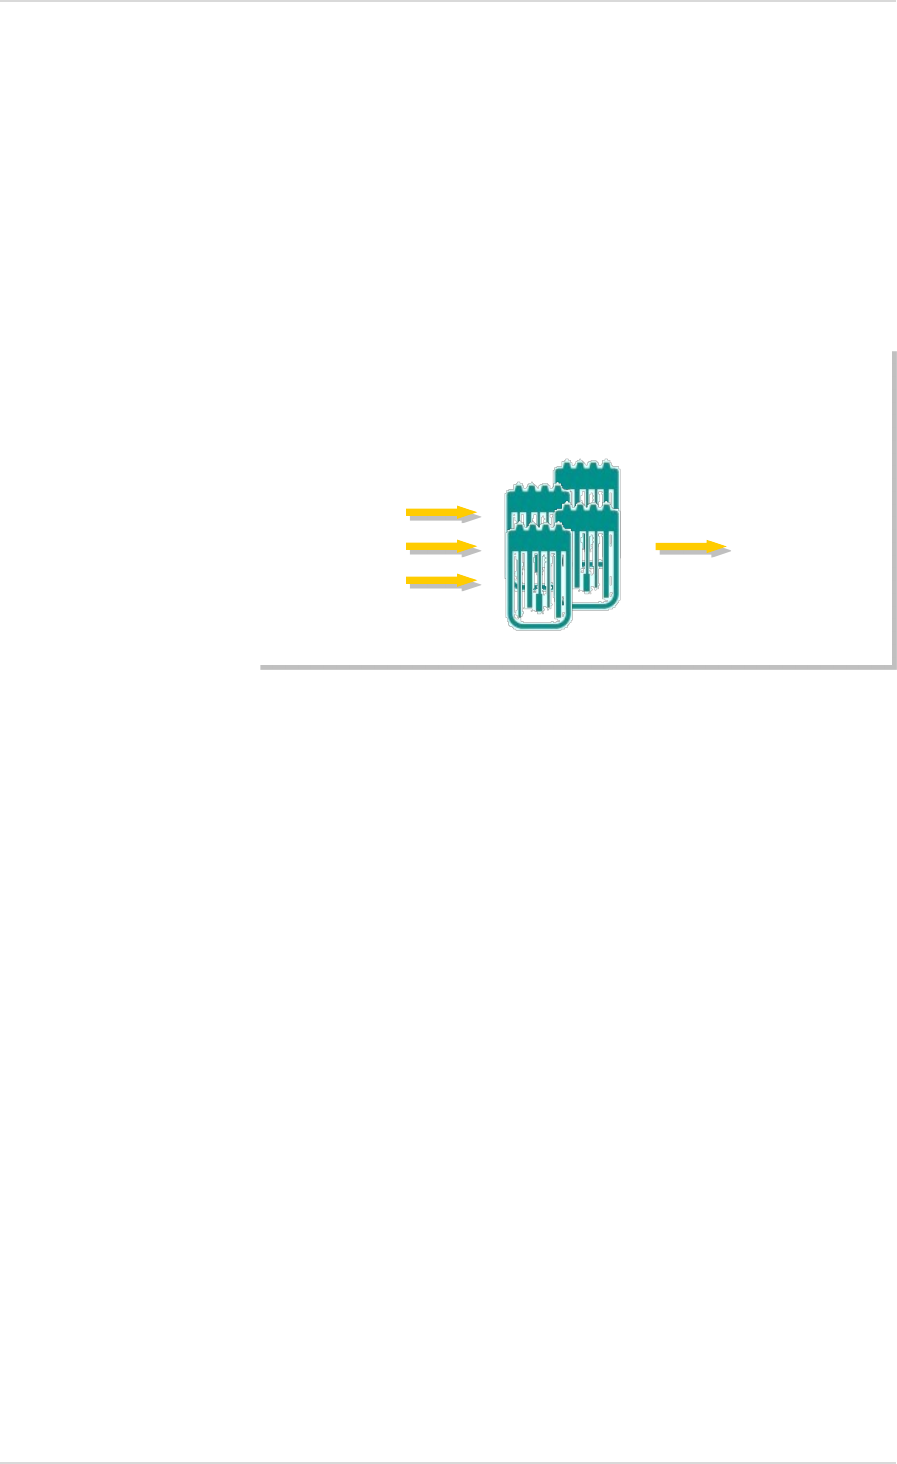
Design of experiments (DoE)
DoE (Fig. 2) is often used to reduce the number of process runs necessary to determine a
suitable design space (Fig 1) for the manufacture of a product. The amount of time saved by
using a multifactorial DoE approach, compared to the classical variation of individual
parameters (one factor at a time), significantly reduces the development overhead and helps
to shorten development times.
The advantages of DoE include:
o Fewer individual experiments required.
o Main effects and interactions are recorded.
o Effects of main factors can be quantified and statistically evaluated.
o Process knowledge is improved, allowing the development of more efficient procedures.
o The description of functional process connections facilitates the definition of a mathema-
tical model and thus the design space (Fig 1).
The following points are to be noted regarding DoE-based process development:
o The factors which have an influence on the target value(s) must be identified.
o The process settings must be varied meaningfully, e.g., within the physiologically
acceptable temperature or pH range of the used microorganisms/cells.
o Discrete factor values can be selected using prior knowledge or previous examinations.
Fig. 2: DoE scheme
Factor X1
Factor X2
Factor Xn
Process
Input
variable
Determine
output
Target value(s)
Y1, Y2, Yn
User Manual DASware design Introduction
Copyright © 2012 DASGIP Information and Process Technology GmbH, Jülich, Germany 15
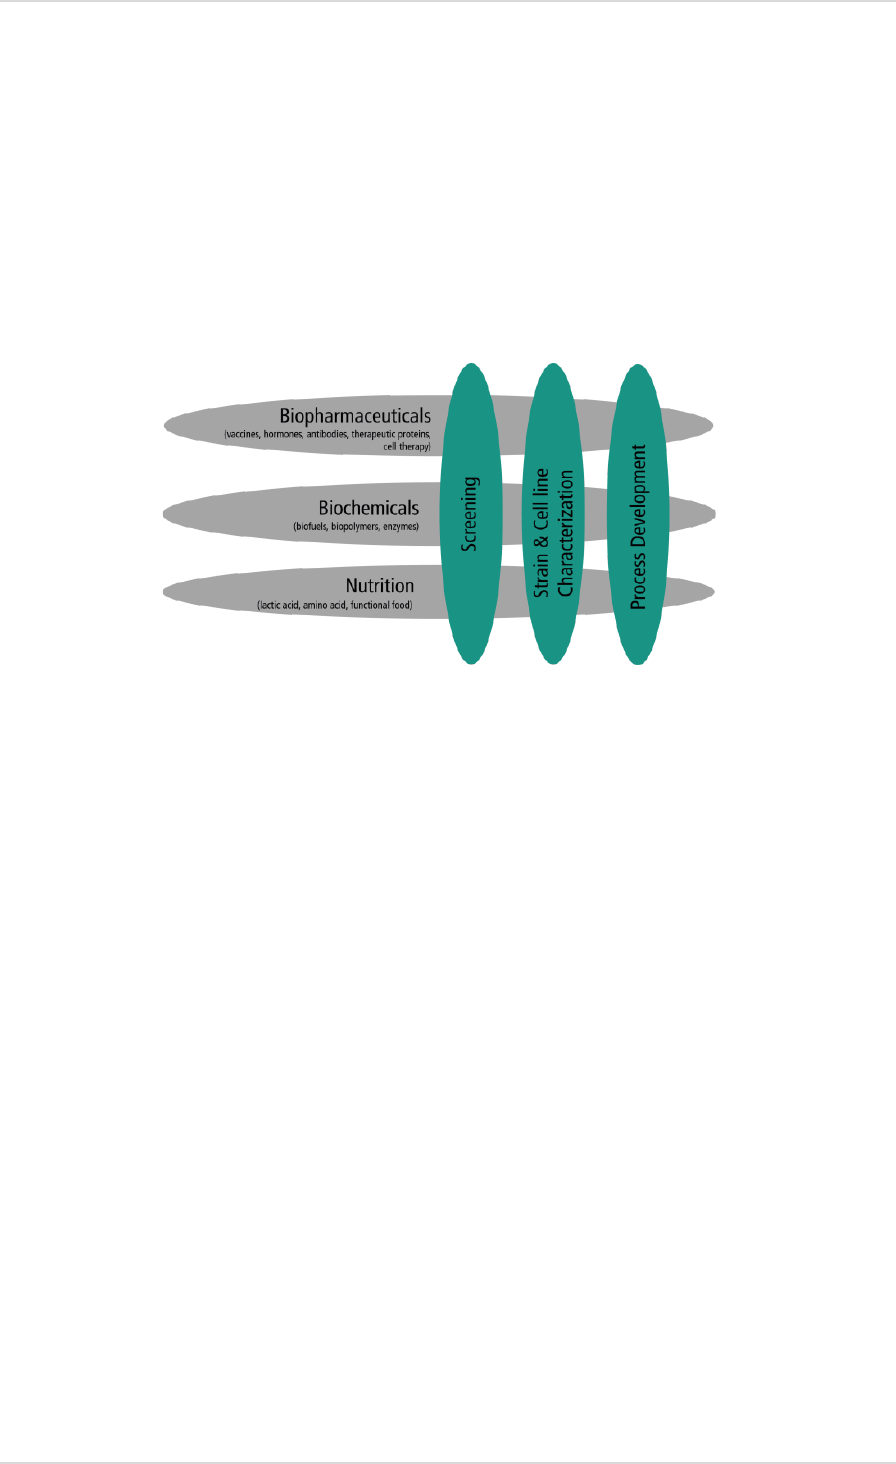
DoE Fields of Application
A DoE is used, for example, in the process development of biopharmaceuticals, such as
vaccines. Equally suitable is the production of biochemicals such as bioethanol or also
foodstuffs such as lactic acid. Individual fields of application for optimization are screening,
strain or cell line characterization as well as process development itself. The following figure
(Fig. 3) provides a schematic overview of the DoE fields of application.
Since DoE minimizes the number of process runs and optimizes the acquisition of knowledge,
a number of software products for DoE is available in the market. The following is a list of
some well-known products:
o JMP®
o Design Expert®
o Minitab™
o MODDE®
Fig. 3: DoE fields of application
Introduction User Manual DASware design
16 Copyright © 2012 DASGIP Information and Process Technology GmbH, Jülich, Germany
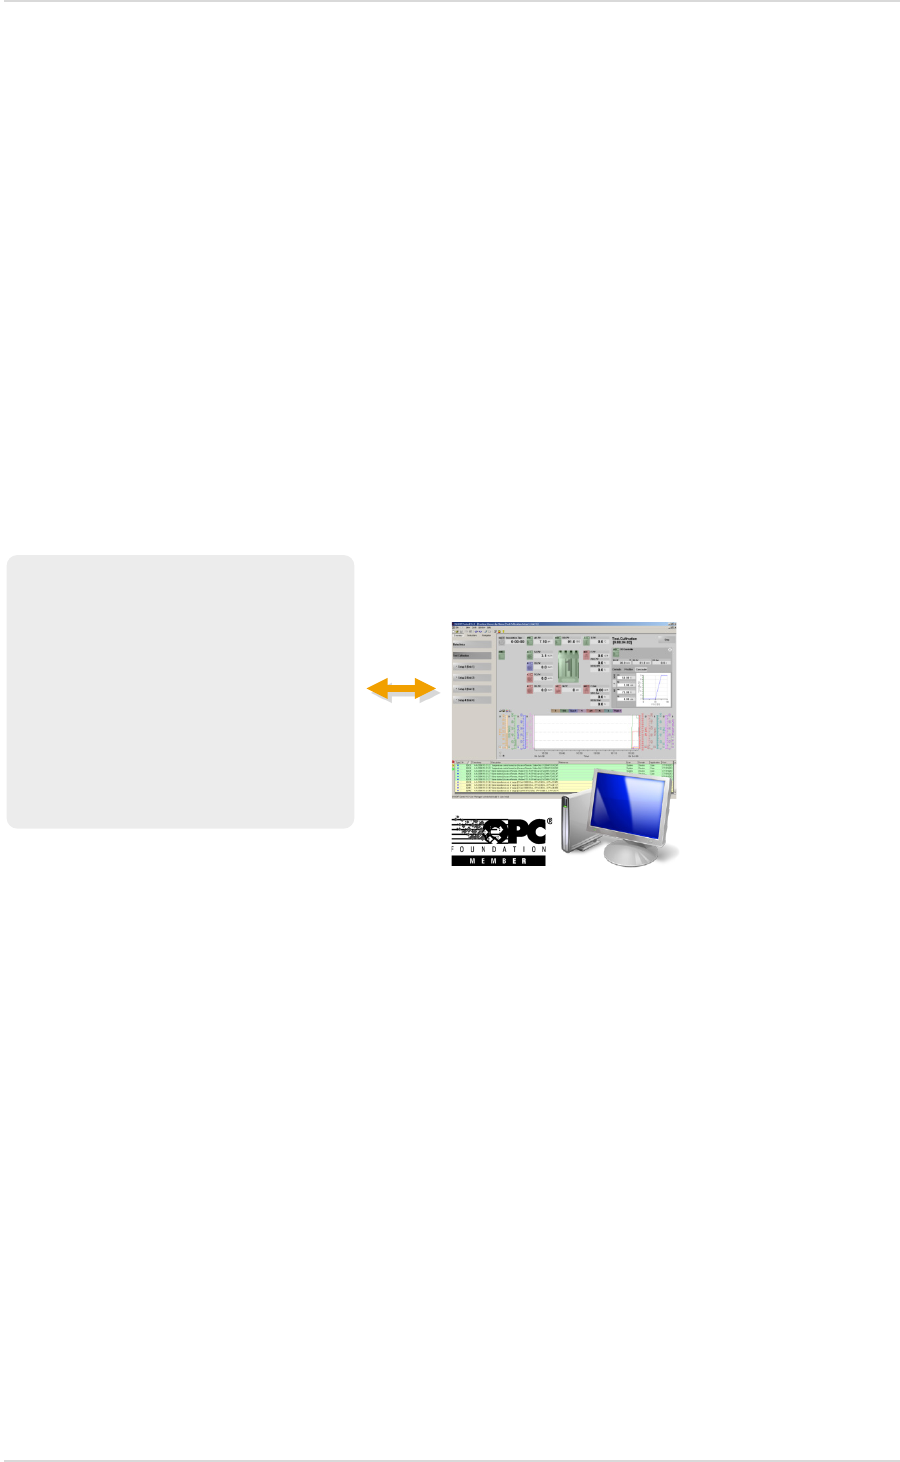
System Platform for DoE
Since in the field of bioprocess applications typical designs of experiments can be carried out
at the same time using a number of bioreactors, a parallel system is perfectly suited to
support the principle of DoE.
DASGIP Parallel Bioreactor Systems
ensure defined and controlled process conditions to
facilitate both the screening of bacteria or cell cultures and the optimization of media or
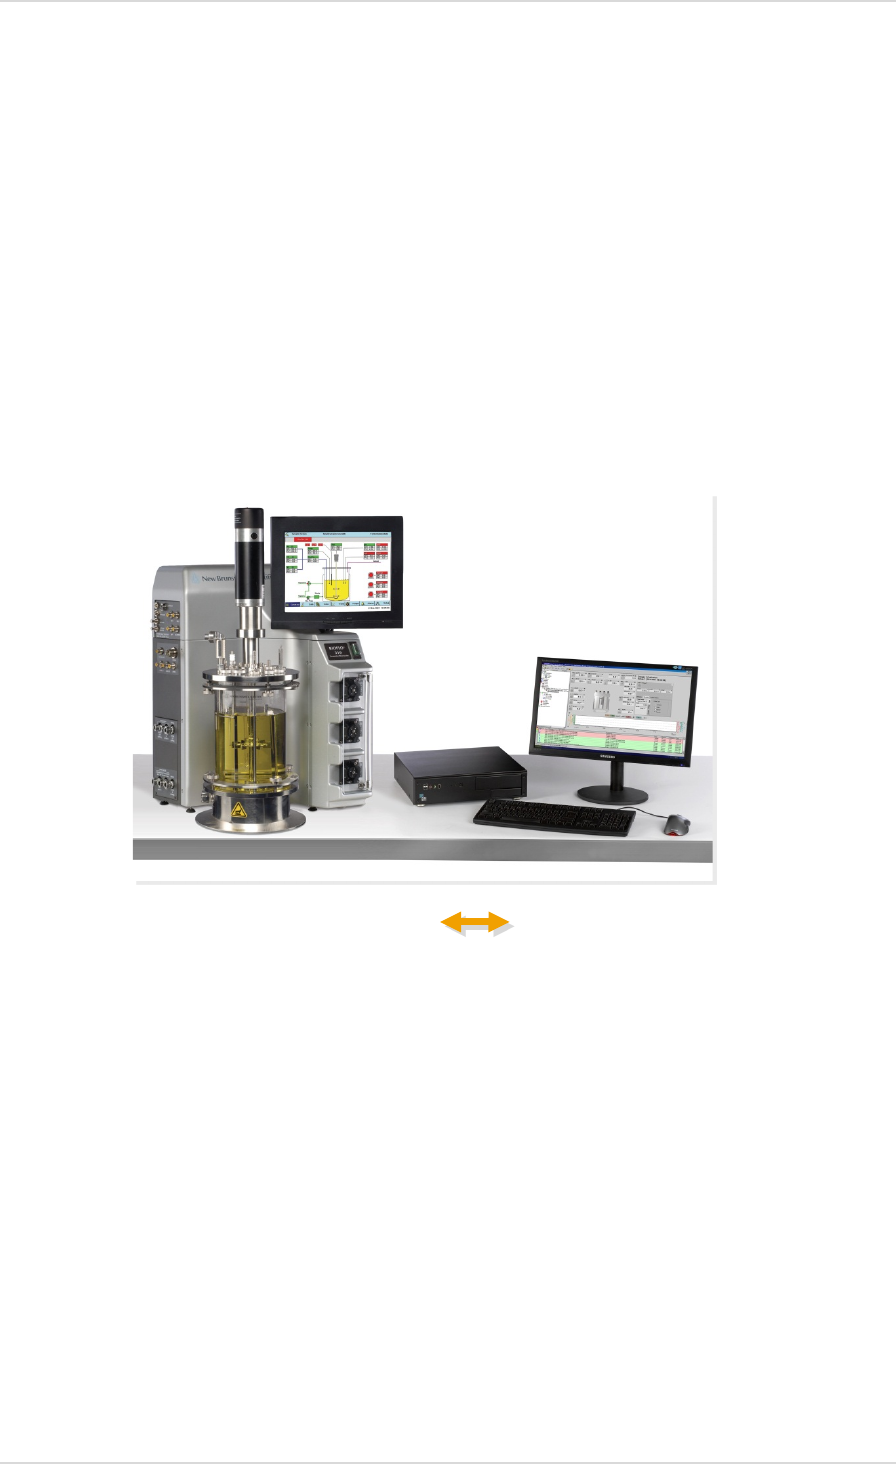
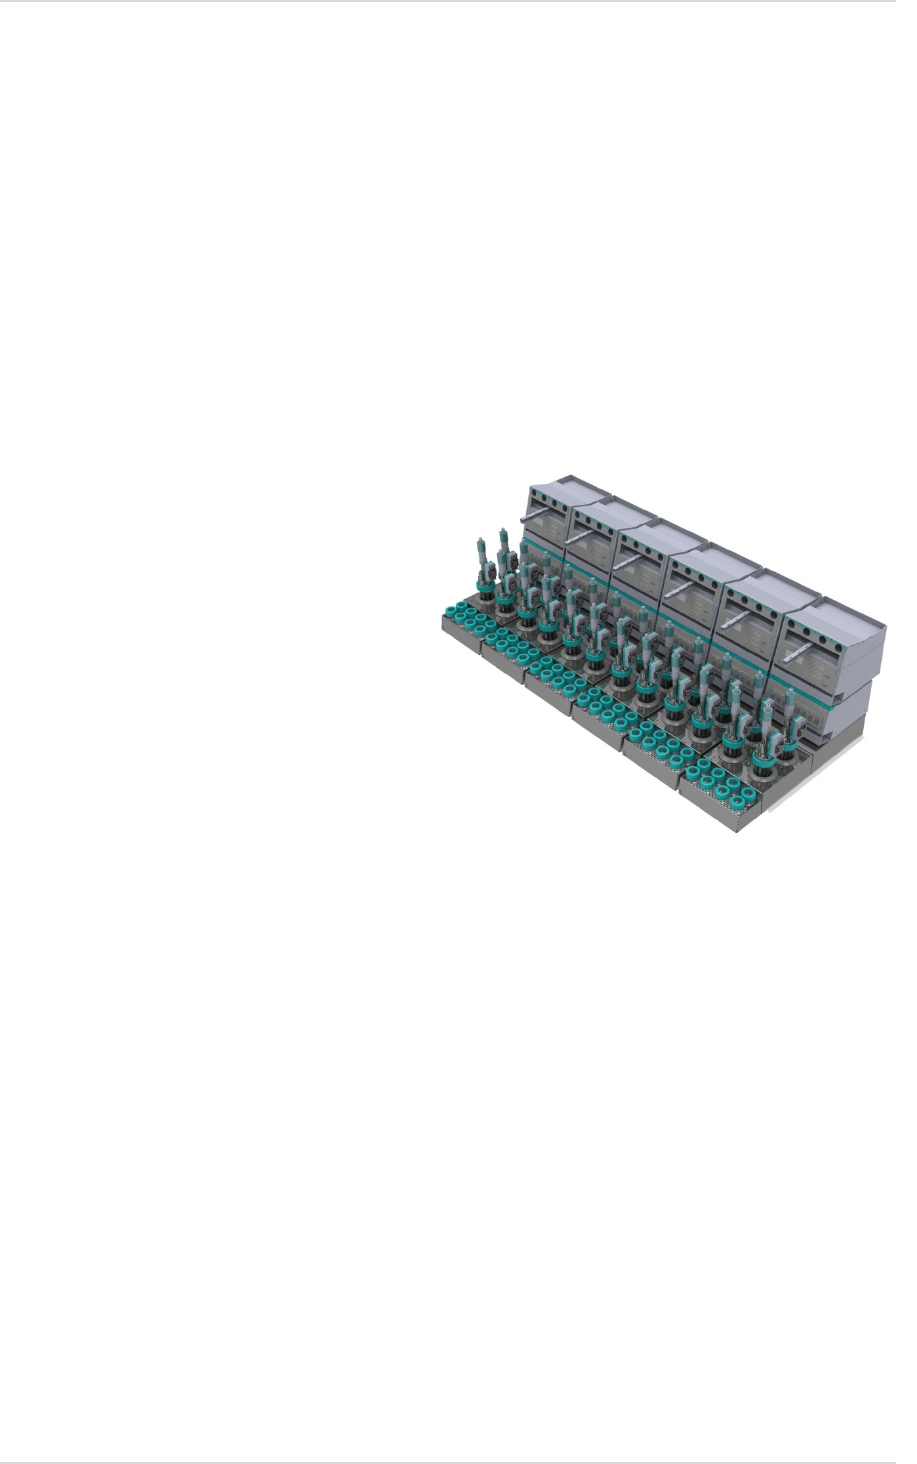
substrate quantities on a small scale. For example, the easily extendable modular
DASbox
System (four mini bioreactors per unit) offers controlled and reproducible cultivation results.
In
DASGIP Control
all processes can be precisely defined, optimized and adapted. In addition,
all results are accurately and precisely documented.
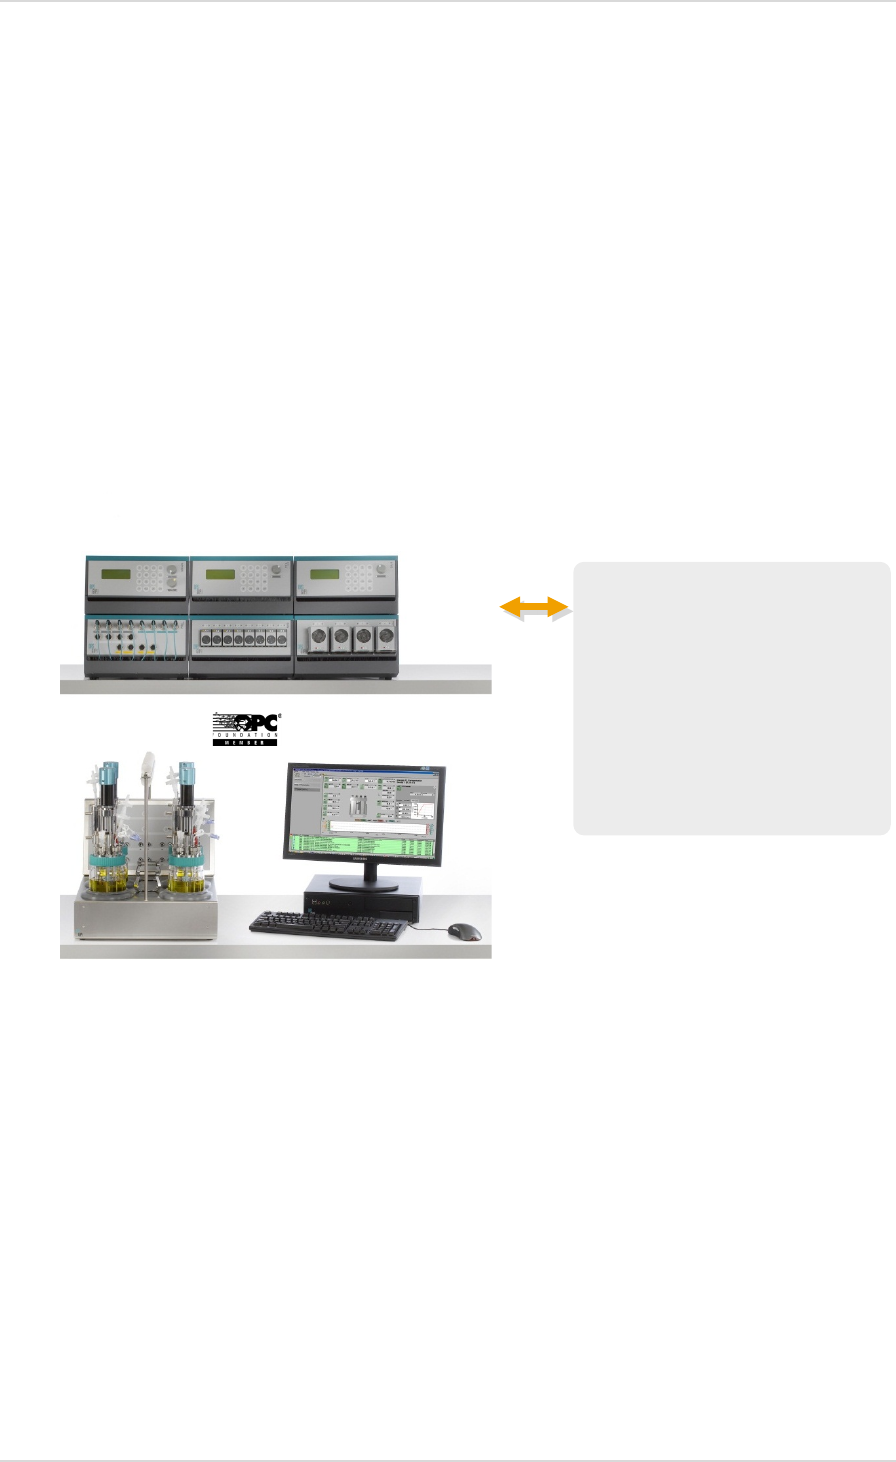
DASware design
DASware design
combines statistical design of experiments (DOE) with parallel bioreactor
systems, e.g., the
DASbox
or other modular parallel bioreactor systems from DASGIP. The
degree of automation achieved considerably simplifies and shortens the processes.
Fig. 4:
DASbox
System with 6 x 4 bioreactor units
User Manual DASware design Introduction
Copyright © 2012 DASGIP Information and Process Technology GmbH, Jülich, Germany 17
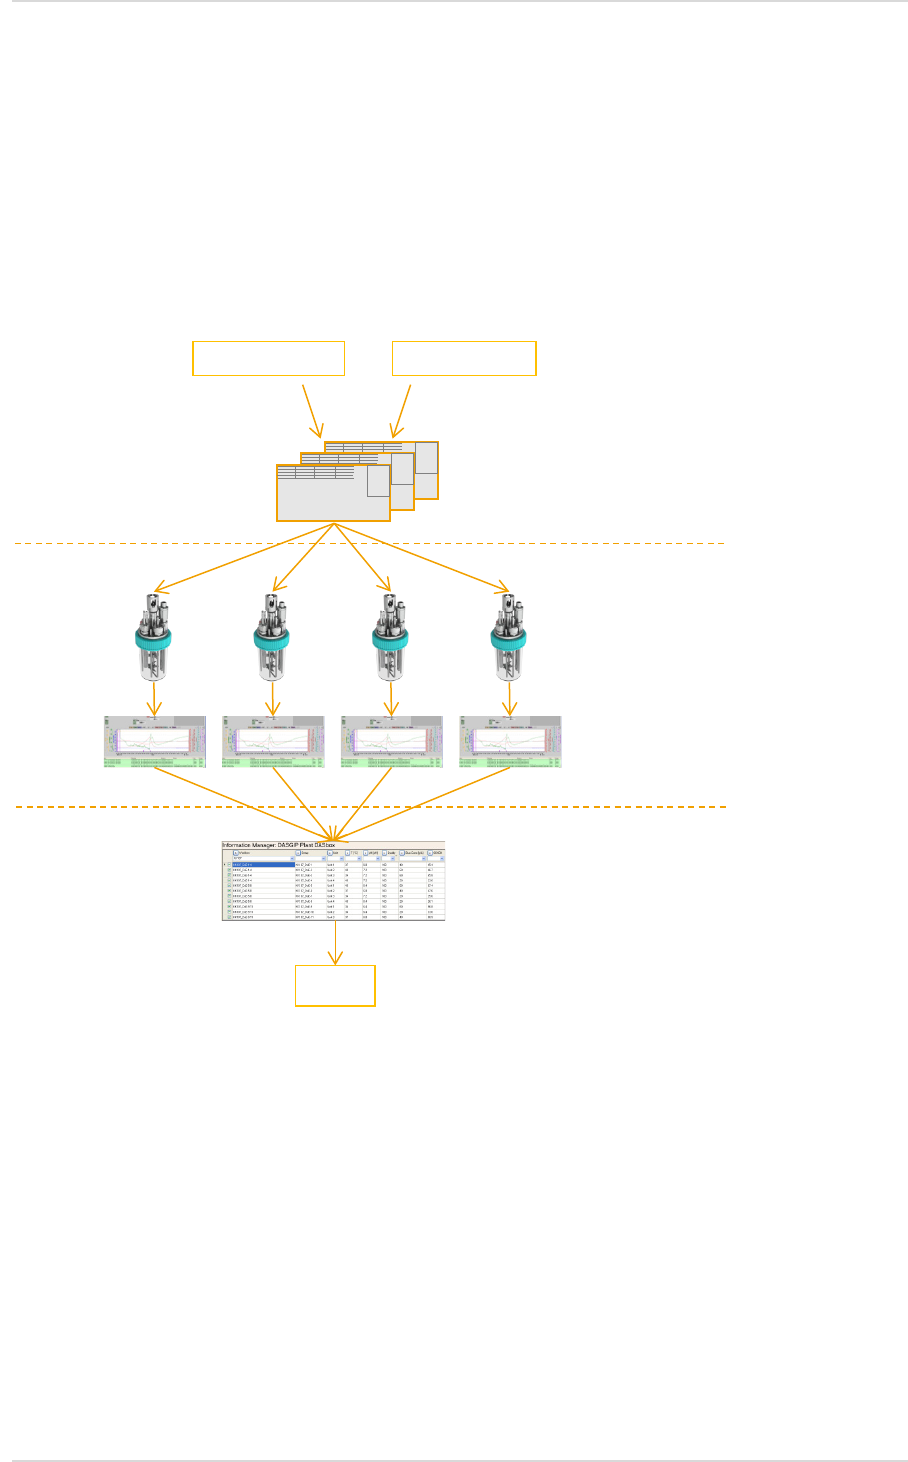
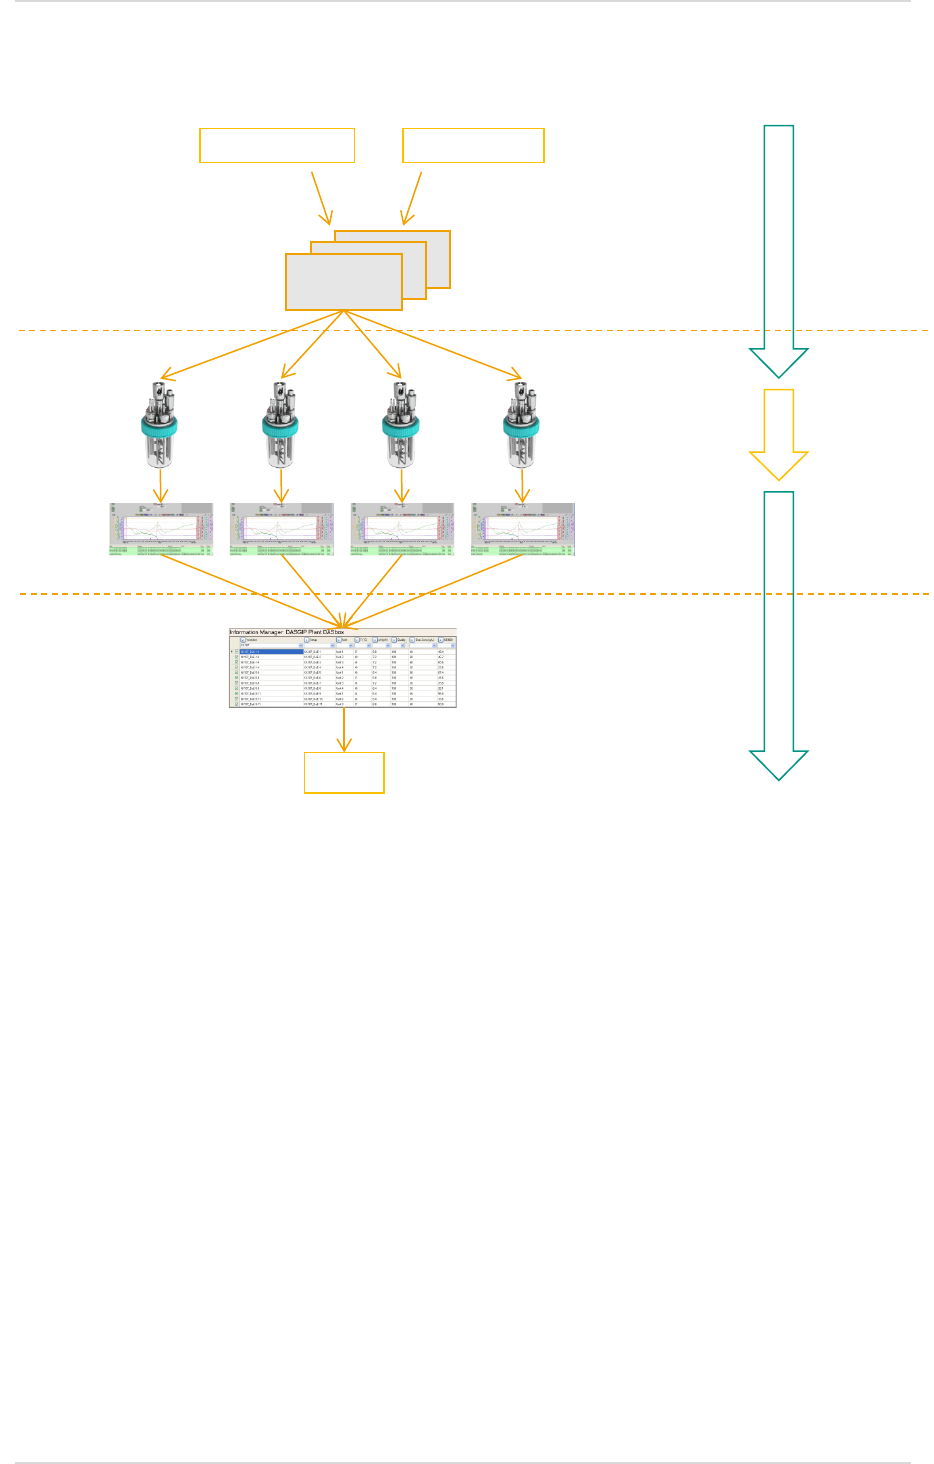
The following is a schematic outline of an experimental sequence (Fig 5).
o Within
DASware design
, the DoE Builder facilitates the input of all DoE-relevant
parameters. There is also an option to directly integrate files from DoE software tools.
o Individual recipes can be used and resources can be assigned.
o A generated workflow can be saved with one click and seamlessly integrated into
DASGIP
Control
via the Recipe Editor. Parallel and controlled process implementation is carried out
here, if desired, according to a SOP.
o All process information is automatically saved and can be analyzed and supplemented
directly in
DASGIP Control
using the
DASGIP Information Manager
.
o Afterwards, export options allow the process information gained to be traced in the
statistical analysis software. Improved process knowledge enables the development of
more efficient procedures.
Fig 5: Schematic process flow
Individual recipes
SOP
Export
Information
management
Process information
Parallel bioreactor
system(s)
Planning
Implementation
Analysis
Automation
Automation
Resource mapping
DoE Recipe
l

Introduction User Manual DASware design
18 Copyright © 2012 DASGIP Information and Process Technology GmbH, Jülich, Germany
User Manual DASware design DASware® design
Copyright © 2012 DASGIP Information and Process Technology GmbH, Jülich, Germany 19
The configuration, implementation and evaluation of complex experimental designs is a major
challenge in process development.
DASware design
helps implementing such designs by
seamlessly integrating DoE in
DASGIP Control
and using its precise, parallel process
implementation.
With DoE the most important process parameters are initially identified to enable optimal
process settings to be made. These parameters can be easily entered via the DoE Builder in
DASware design
. All values are then seamlessly transferred to the Recipe Editor, where they
can be supplemented. After a workflow has been started, the parallel bioreactor processes are
carried out under approved controlled conditions. Once this is completed, the process results
are documented and can be easily evaluated using the
DASGIP Information Manager
. In
addition, the evaluated data can be reimported into to a standard DoE software tool.
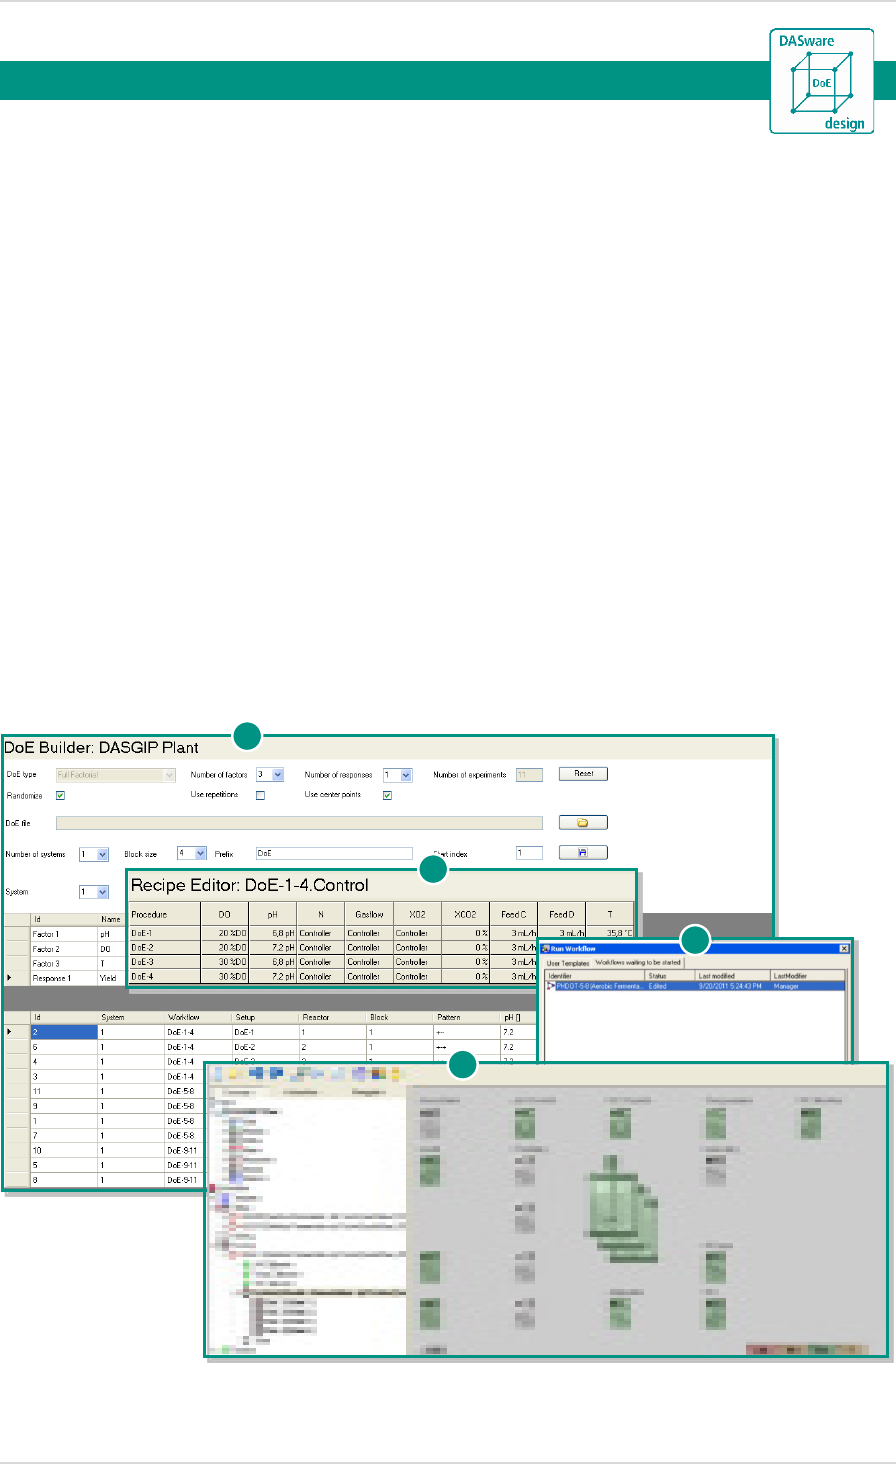
The following figure summarizes the sequence of a DoE-based process in
DASGIP Control
using
DASware design
. It also provides an overview of the structure of this chapter.
1. DoE Builder (3.1)
2. Recipe Editor (3.2)
3. Run workflow (3.3)
4. Monitoring and control of the cultivation processes in bioreactors (3.4)
DASware® design 3.
1
2
3
4
DASware® design User Manual DASware® design
20 Copyright © 2012 DASGIP Information and Process Technology GmbH, Jülich, Germany
5. Documentation using the Information Manager (3.5)
6. Analysis of historical cultivation data for the plausibility check in the
DASGIP
Documentation Wizard
(3.6)
7. DoE evaluation (4)
3.1. DOE BUILDER
The DoE Builder allows the direct
selection or input of all DoE-relevant
parameters.
Click on Tools in the
DASGIP Control
menu bar to open the DoE Builder by
clicking on Design of Experiments (DoE).
5
0,0
20,0
40,0
60,0
80,0
100,0
120,0
140,0
0:00:00 2:24:00 4:48:00 7:12:00
DO.PV [%DO]
Sync. Inoculation Time
6
0
10
20
30
40
50
60
70
-2 -1 0 1 2
OD600 (t1)
Gluc.-conc.
Temp 1
Temp -1
0
10
20
30
40
50
60
70
-2 -1 0 12
OD600 (t1)
Gluc.-conc.
pH 1
pH -1
0
10
20
30
40
50
60
70
-2 -1 0 1 2
OD600 (t1)
pH
Temp 1
Temp -1
7
Fig. 6:
Overview of a DoE-based process flow with
DASware design
User Manual DASware design DASware® design
Copyright © 2012 DASGIP Information and Process Technology GmbH, Jülich, Germany 21
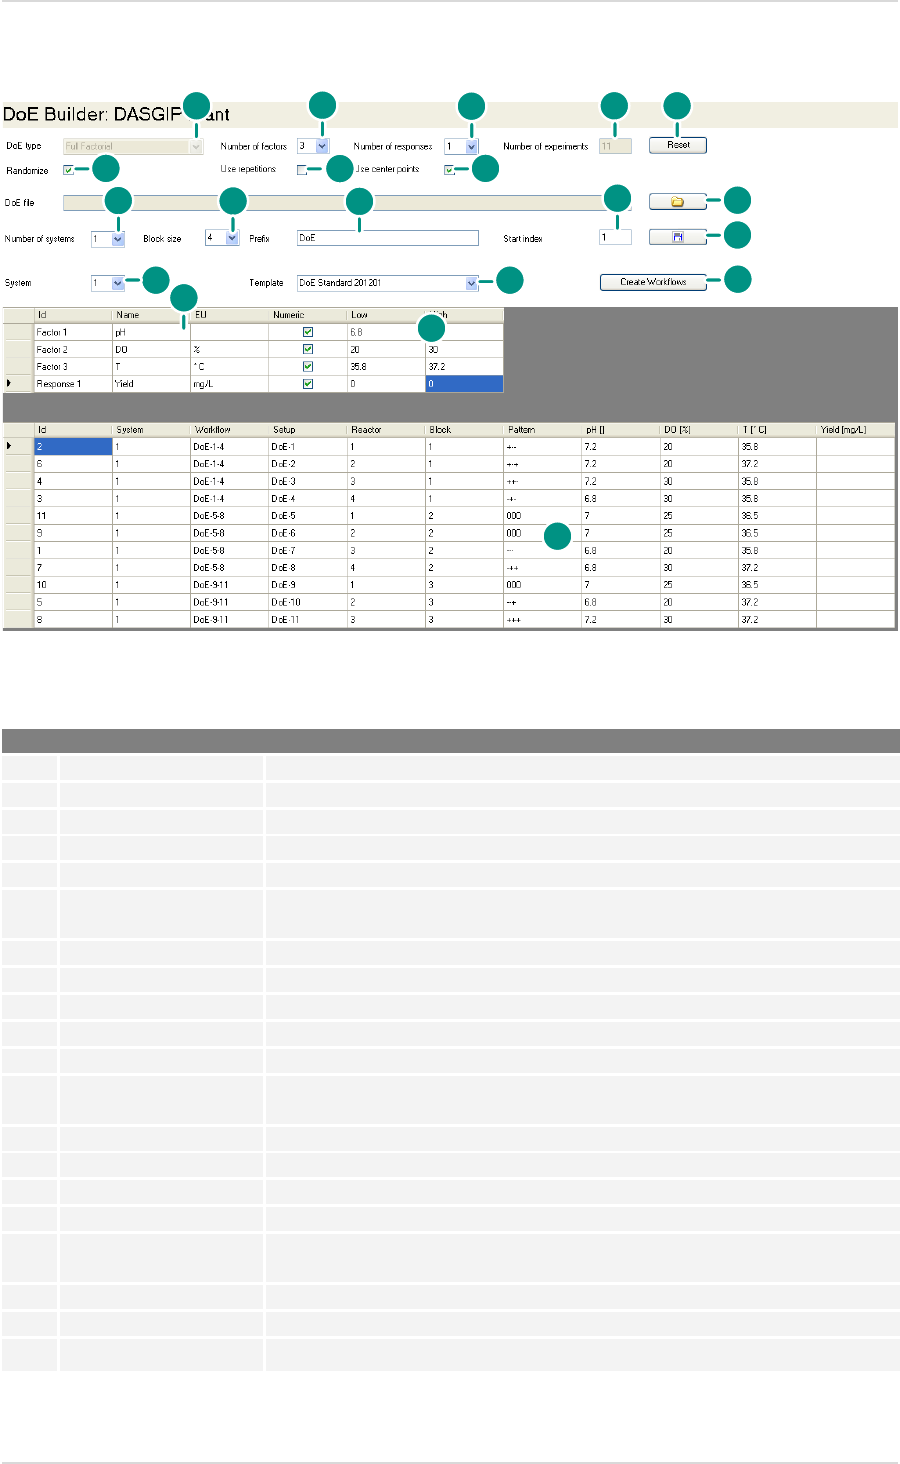
Structure of the DoE Builder:
Fig. 7: Overview of the DoE Builder
No. Control element Description
1.
DoE type For selecting a DoE type (e.g., Full Factorial).
2.
Number of factors Selects the number of factors
3.
Number of responses Selects the number of responses
4.
Number of experiments Indicates the number of individual experiments
5.
Reset Resets all entries.
6. Randomize If you select this checkbox, a random assignment of individual experiments takes
place to the existing bioreactors.
7.
Use repetitions If you select this checkbox, all experiment runs are automatically doubled.
8.
Use center points Here you can select the addition of a center point identification per reactor unit.
9.
Open Imports DoE data see 4.1.2.
10.
Number of systems For selecting the number of available systems see also 3.1.1.
11. Block size Indicates the number of bioreactors per unit/block
12. Prefix Here you can enter a prefix to be attached to the front of all workflow and setup
names.
13.
Start index Adjusts the numbering start point.
14.
Save Saves all entries see 3.1.3.
15.
System Limits the selection by system.
16.
Template Selects previously created recipe templates.
17. Creating workflows Uses the entered DoE data to automatically compile executable workflows for
DASGIP Control
see 3.1.4.
18.
Name For defining factor and response names.
19.
Low / High Level assignment for factors.
20. Table The DoE table is automatically adjusted and filled.
1
2
3
4
5
6
7
8
9
10
11
13
12
14
15
16
17
18
19
20
DASware® design User Manual DASware® design
22 Copyright © 2012 DASGIP Information and Process Technology GmbH, Jülich, Germany
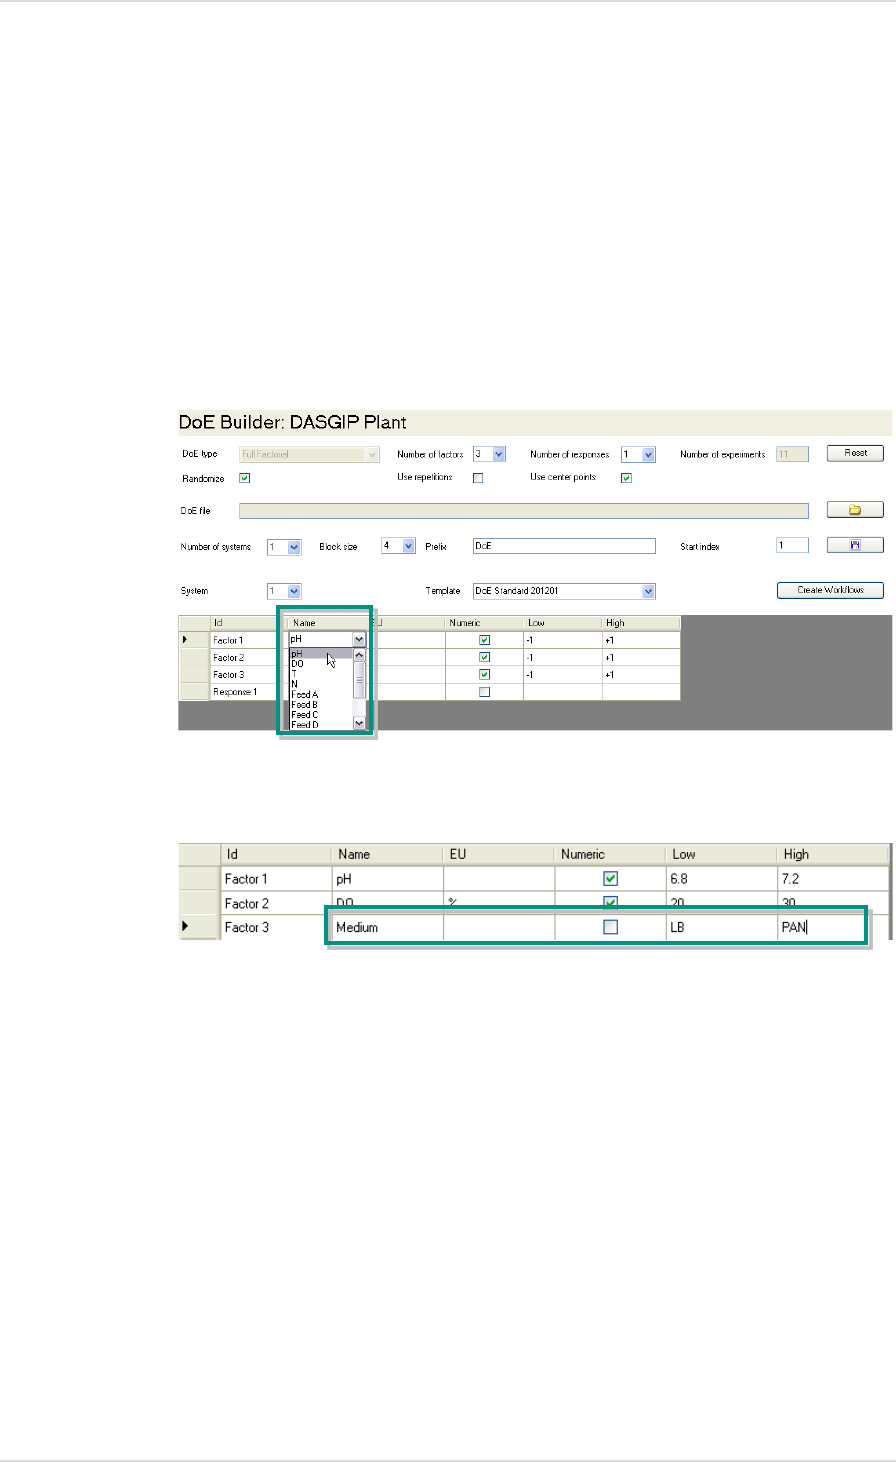
Selecting or Entering Factors 3.1.1.
The number of table rows in the lower part of the DoE Builder is adapted to the number of
factors and the response(s) that were selected.
Standard factor names that correspond to the
DASGIP Control
naming convention can be
selected in the dropdown menu in the Name column. The EU (unit), Low and High (level)
columns are then automatically filled with default values. You can click on these values and
adjust them as necessary.
You can also directly enter new factors which have not yet been stored.
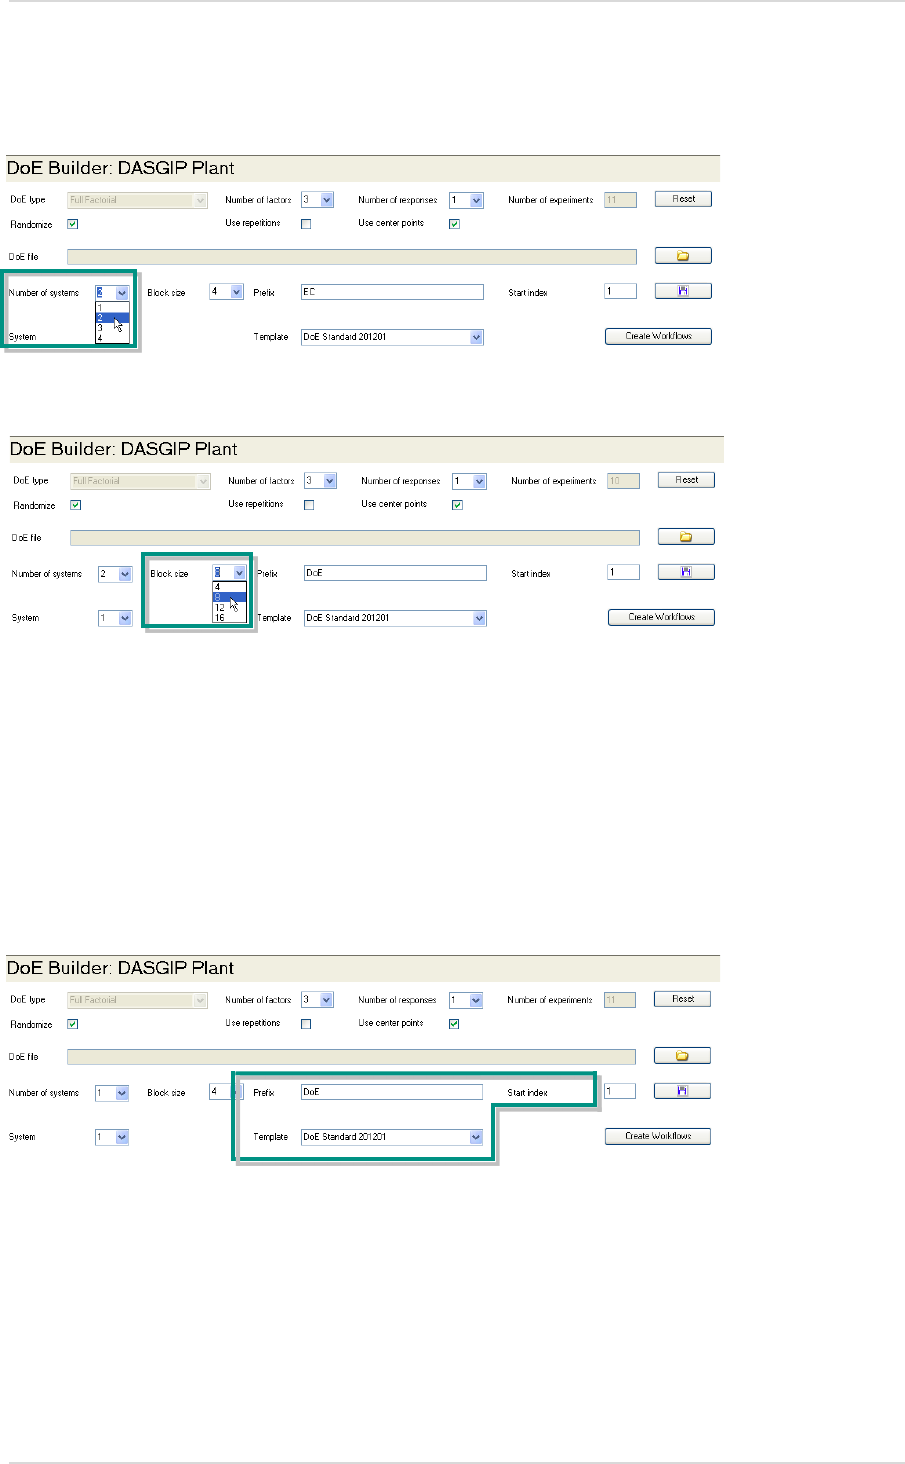
Selecting Resources 3.1.2.
The middle part of the DoE Builder allows the selection and assignment of existing resources.
User Manual DASware design DASware® design
Copyright © 2012 DASGIP Information and Process Technology GmbH, Jülich, Germany 23
Select the number of used systems in the dropdown menu next to Number of systems. If
several systems exist, you can select which system should be used via System.
Also select the number of reactors of a system unit next to Block size.
Enter a prefix to be attached to the front of all workflow and setup entries.
In the Template dropdown, select previously saved template files that contain all experiment-
relevant parameters (e.g., speed, temperature, feed rate etc.).
Next to Start index enter the number at which the setup numbering should start. It may be
useful to adjust this number if, e.g., different systems are used.
DASware® design User Manual DASware® design
24 Copyright © 2012 DASGIP Information and Process Technology GmbH, Jülich, Germany
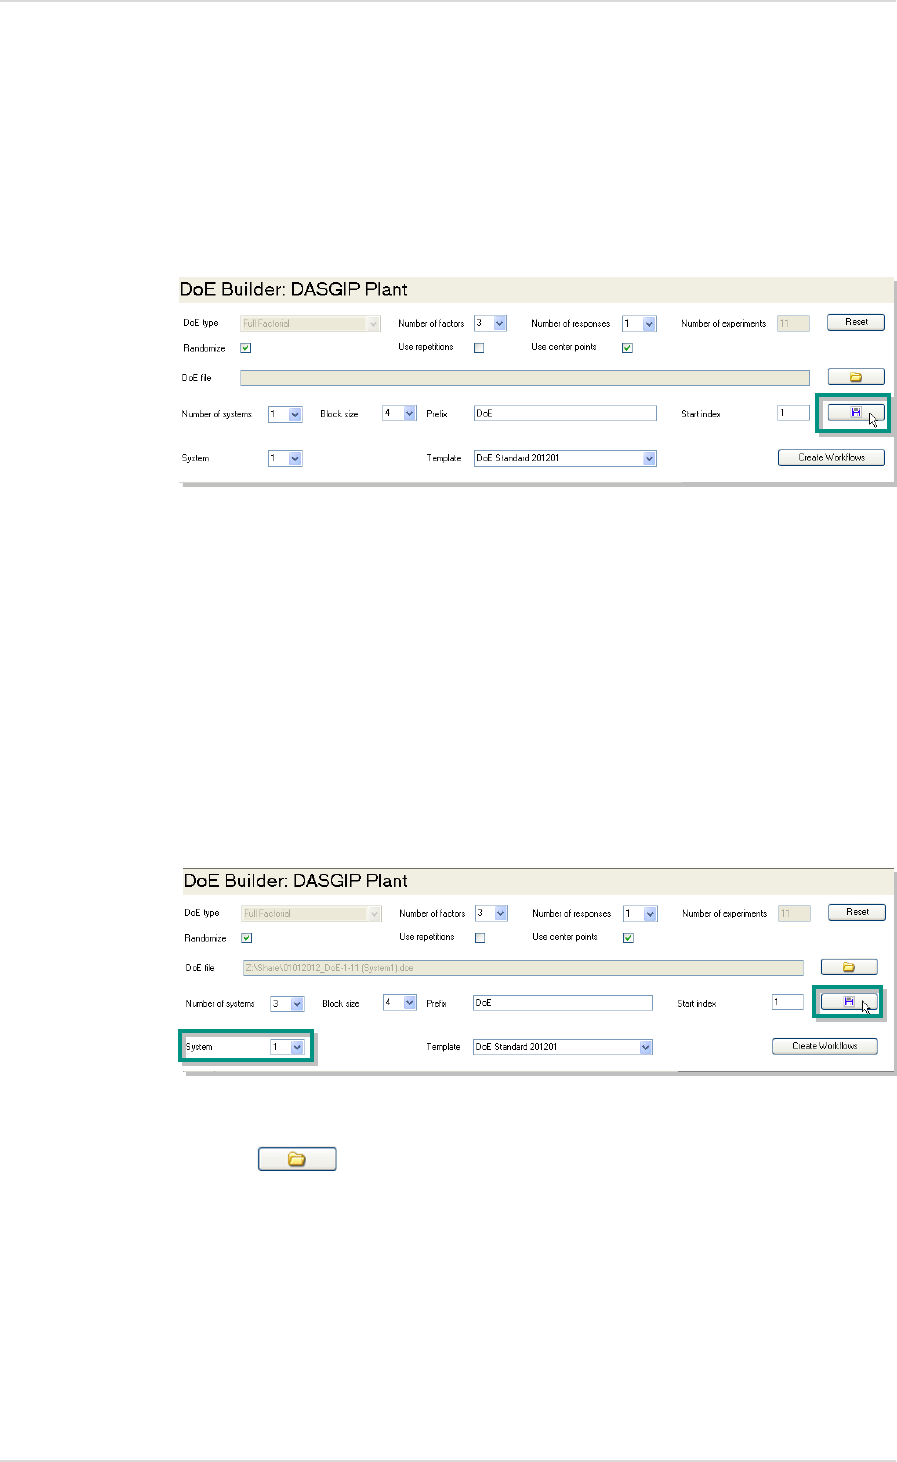
Saving DoE Settings 3.1.3.
To save all the settings you have made, click on the Save button. A file manager dialog
appears in which you can enter a file name and select a storage location.
Resource Example
The use of three systems with a block size of four reactors is shown as an example.
1. 3 is selected for Number of systems and 4 for Block size. To save the settings for the first
system, number 1 has to be selected for System.
The saved .doe file can be reimported at the desired process computer in the DoE Builder
using the button.
User Manual DASware design DASware® design
Copyright © 2012 DASGIP Information and Process Technology GmbH, Jülich, Germany 25
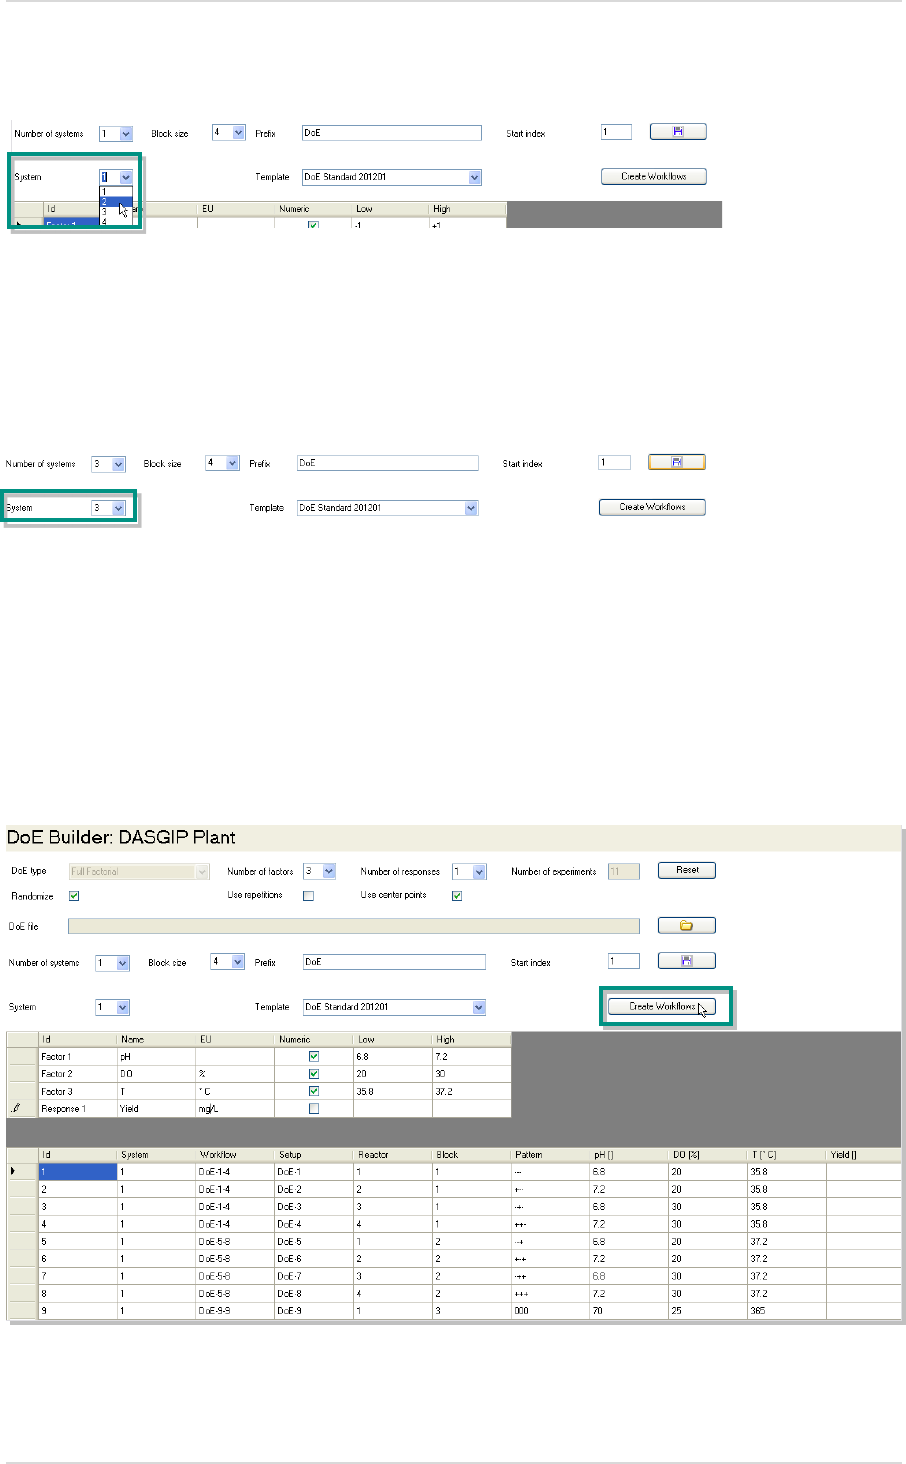
2. To save the entries for the second system, number 2 has to be selected for System.
This ensures that only the data relevant to the second system is saved and can be transferred
to a process computer.
3. The procedure with the data for the third system is identical. In this case, number 3 has to
be selected for System before saving.
Create Workflows 3.1.4.
After all DoE parameters have been entered, which are summarized in a table in the lower
part of the DoE Builder, they are merged into the selected recipe template using the Create
Workflows button.
DASware® design User Manual DASware® design
26 Copyright © 2012 DASGIP Information and Process Technology GmbH, Jülich, Germany
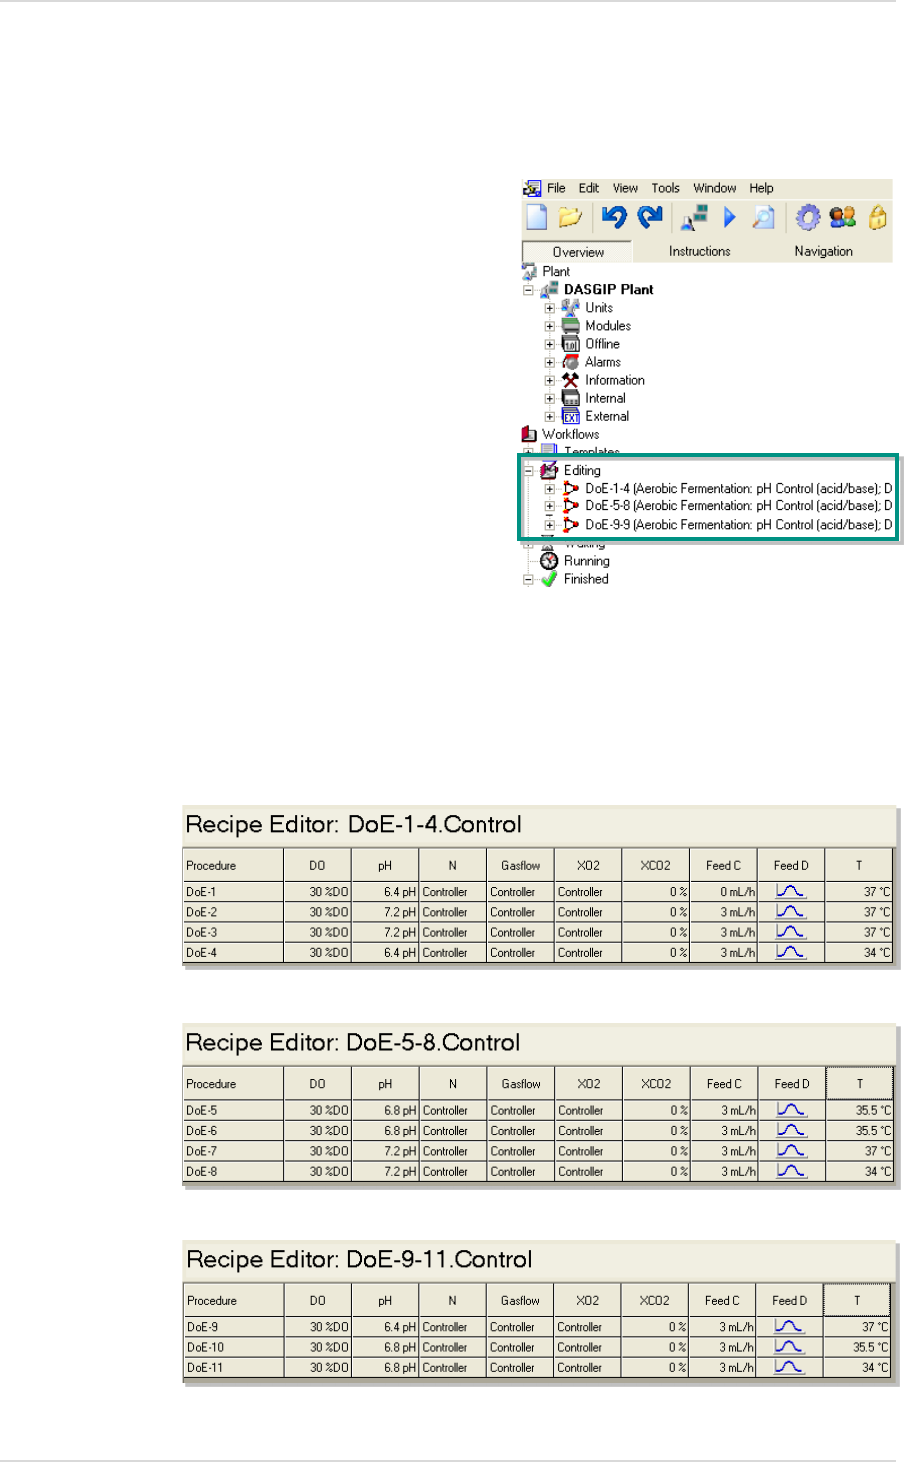
This ensures that several workflows are automatically created, e.g., if several systems are
used, or a single system with a low block size is used several times. Each workflow contains a
set of individual recipes containing the parameter variations of the design.
All automatically created workflows appear in
DASGIP Control
at the left under Editing in the
Navigation Tree.
Before carrying out the experiment, it is recommended that you check the individual entries in
the Recipe Editor (3.2) and complement them as necessary.
The workflows from the example are divided as follows:
System 1
System 2
System 3

User Manual DASware design DASware® design
Copyright © 2012 DASGIP Information and Process Technology GmbH, Jülich, Germany 27
3.2. RECIPE EDITOR
The Recipe Editor provides an intuitive interface representing all parameter variations of all
setups in a table. In the recipe editor any individual parameter adjustment is possible before
starting the process.
Open 3.2.1.
By right-clicking on the name of the main procedure (Control…), a context menu appears in
which you can click on Edit in order to open the Recipe Editor of
DASGIP Control
.
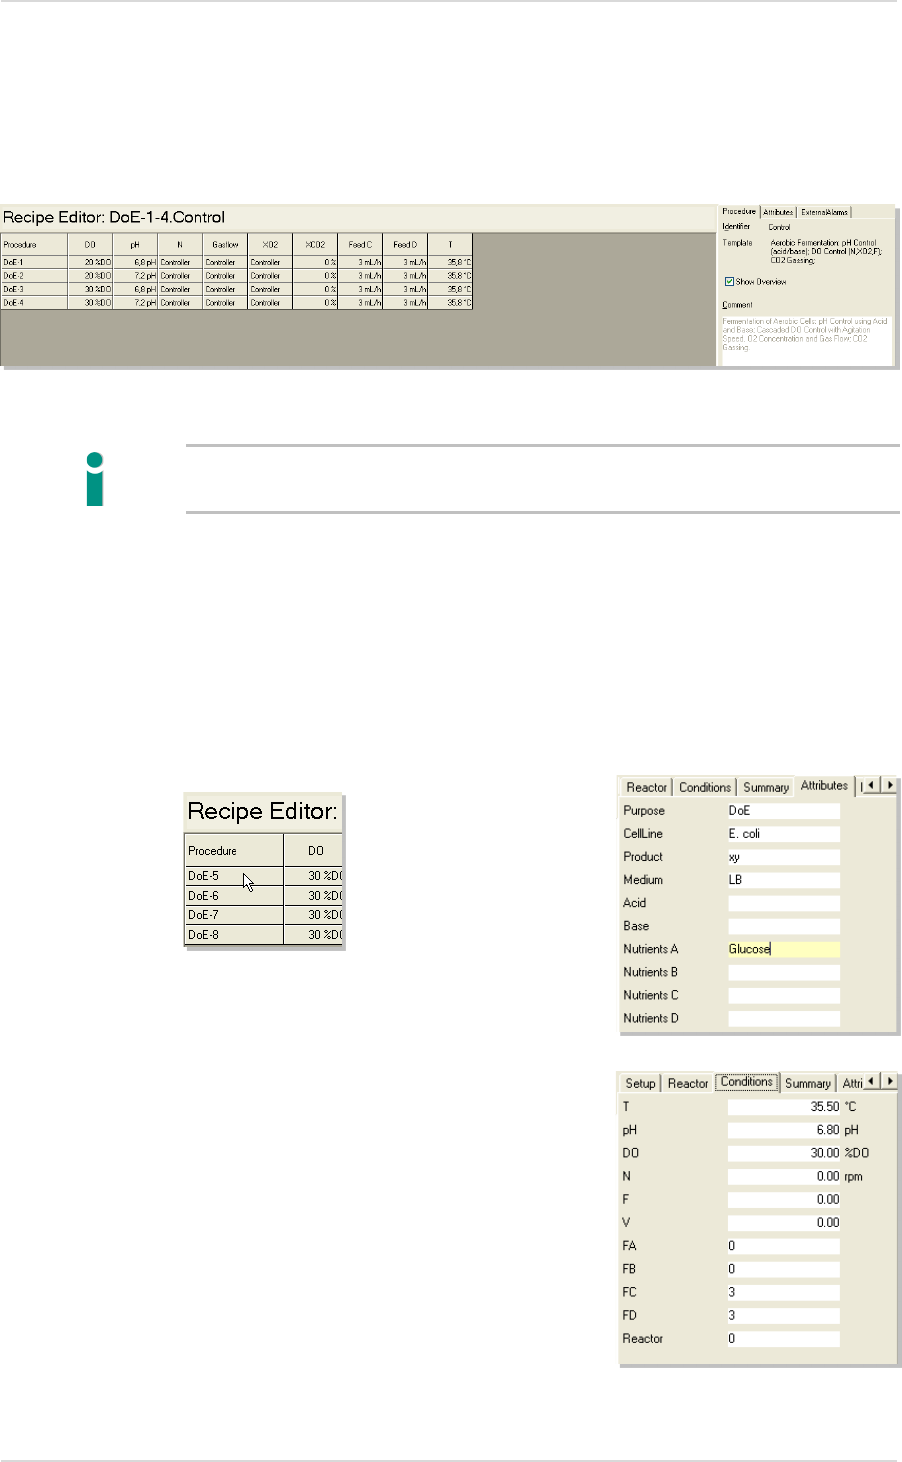
Overview 3.2.2.
During the experimental setup, in addition to the preconfigured DoE parameters, other
process parameters like PID or feed-rates can be adjusted either all descriptive key parameters
can be entered at this point. This includes details on the used strain, cell line, medium
composition, temperature etc. The Recipe Editor allows these entries to be made individually
for each setup/reactor.
DASware® design User Manual DASware® design
28 Copyright © 2012 DASGIP Information and Process Technology GmbH, Jülich, Germany
The appearance of the editor varies depending on the configuration of each
DASGIP Control
System
and according to the defined workflow. The table displayed contains different
columns and one row for each reactor (setup).
Comprehensive, detailed information on processes can be especially useful for the individual
comparison of historical process data.
Attributes and conditions for individual setups can be easily entered into predefined entry
fields. The fields which appear depend on the previous configuration in the Workflow Editor
(for more information see User Manual
DASware migrate
2.3.2.).
Clicking on a single setup cell displays the corresponding buttons (Attributes, Conditions) in
the right area of the editor. Information can be added here.
When a workflow has been created from the DoE
Builder via Create Workflow and the usual factor
names (e.g., pH, DO, T etc.) have been selected in
DASGIP Control
, the Recipe Editor is automatically
filled with the parameters.

User Manual DASware design DASware® design
Copyright © 2012 DASGIP Information and Process Technology GmbH, Jülich, Germany 29
3.3. STARTING A WORKFLOW [RUN]
To start a workflow created in the Workflow Editor, you can either click on Run Workflow
under File in the menu bar or click directly on the corresponding button in the toolbar.
The following dialog lists the workflows that have not yet been started under Workflows
waiting to be started.
Click on the Run button to continue the process.
DASware® design User Manual DASware® design
30 Copyright © 2012 DASGIP Information and Process Technology GmbH, Jülich, Germany
3.4. PROCESS MONITORING AND CONTROL
The selected procedures are started depending on workflow.
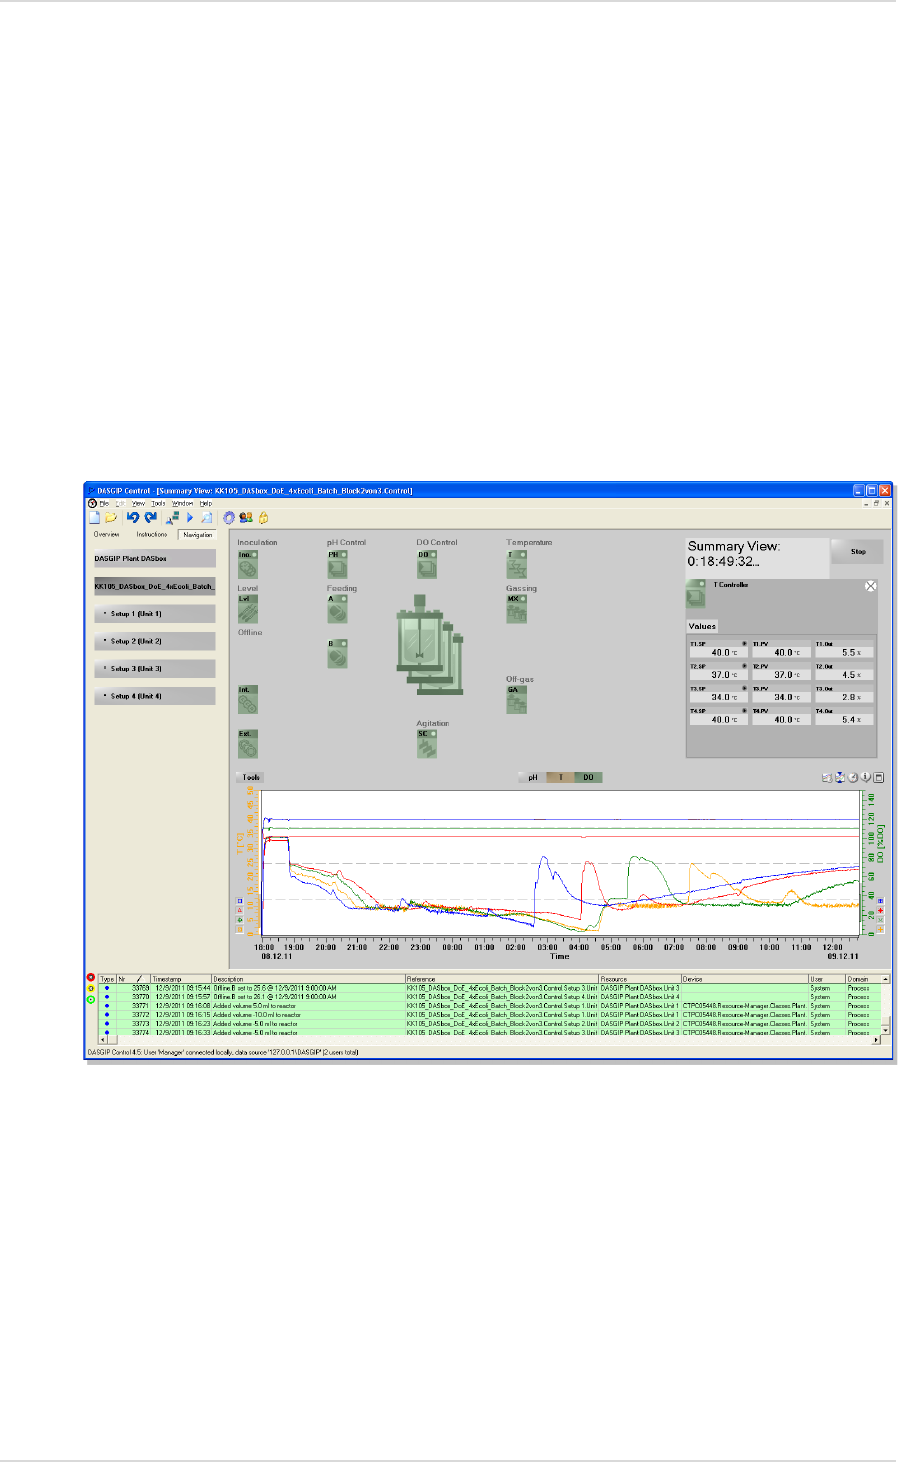
After the main procedure has started, the Summary View is displayed. It summarizes all the
important process operations at a glance.
A Summary View is shown below which is based on a DoE experiment setup with varied
temperature set points (Fig. 8). By clicking on the temperature symbol, the values of the
temperature controller are displayed on the right side. The diagram in the lower part
represents the course of the dissolved oxygen (DO) in the medium, in addition to the three
different temperature set points.
More information can be found in the
DASGIP Control
User Manual.
After completion of all processes, the process data is saved in
DASGIP Control
and can be
used for further analysis.
Fig. 8: Exemplary overview (Summary View) in
DASGIP Control
; bioreactor processes
of a variation of temperature set points
User Manual DASware design DASware® design
Copyright © 2012 DASGIP Information and Process Technology GmbH, Jülich, Germany 31
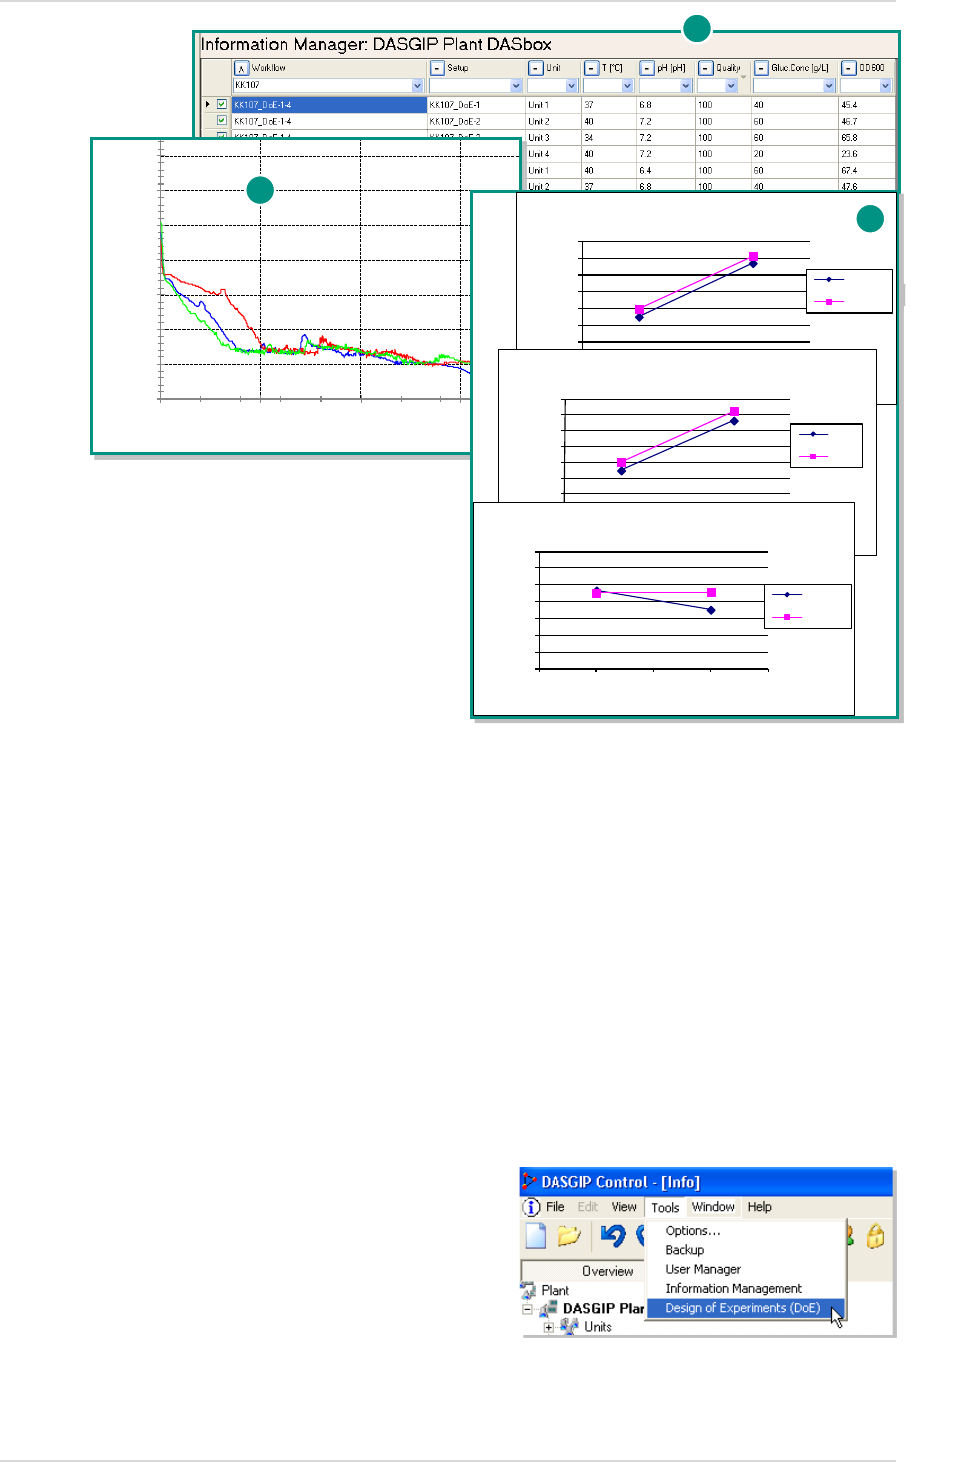
3.5. DASGIP INFORMATION MANAGER
In addition to the automatic documentation of all general process and DoE-relevant data, it is
also possible to supplement additional user-definable information such as the product yield,
the maximum density of vital cells (VCD.Max) or general quality data. This information is
entered in the
DASGIP Information Manager
. Such data can contain information on the DoE
responses to be exported in an analysis tool.
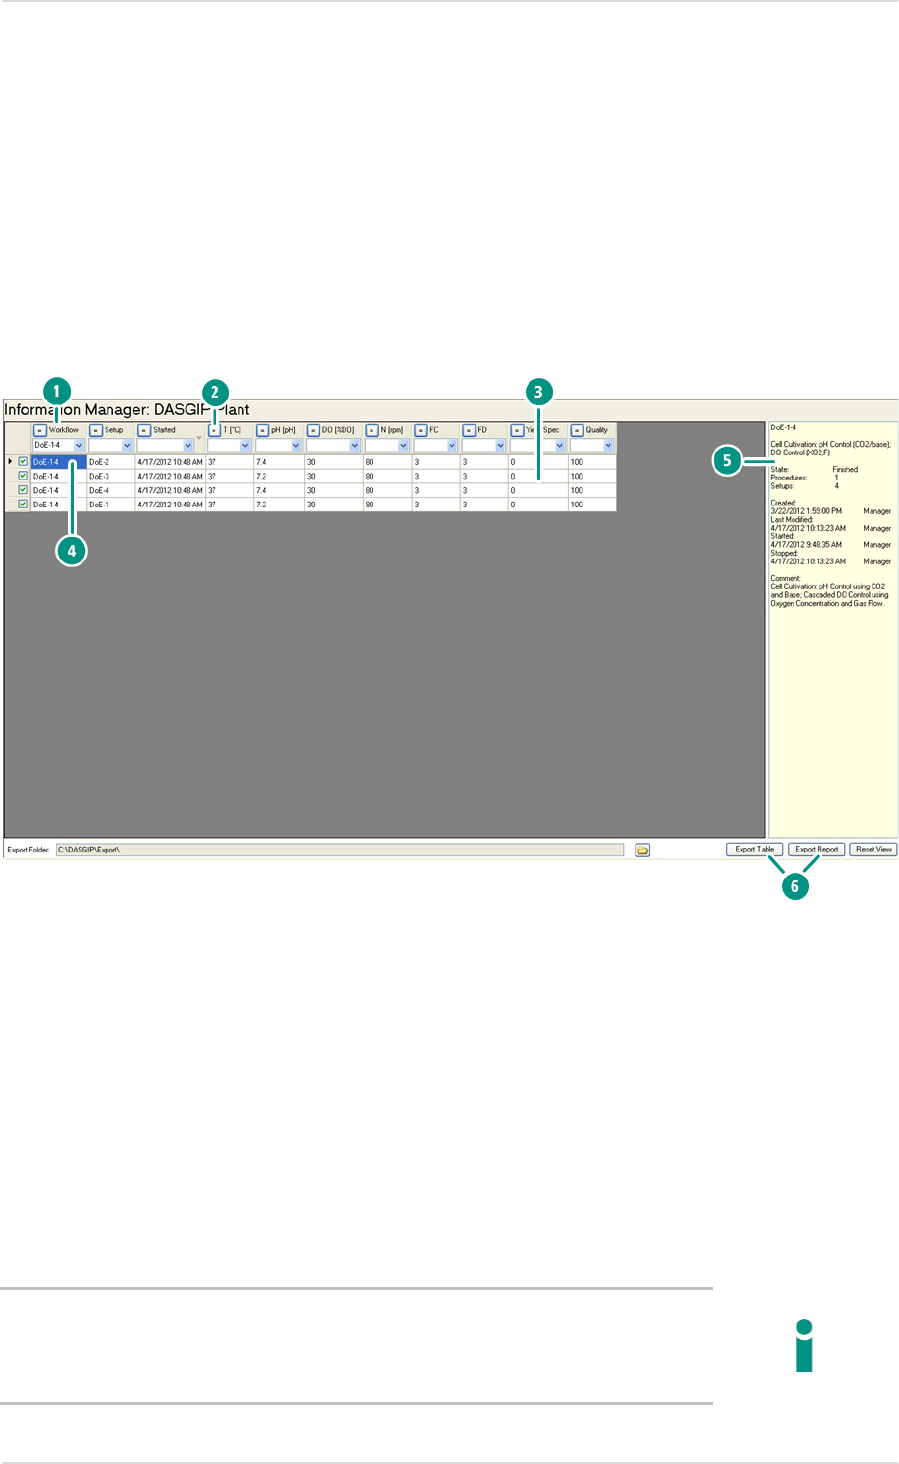
The following figure provides an overview of the
DASGIP Information Manager
.
1. Query criteria appear in the column headings.
2. You can use the buttons to select comparative operators in order to limit a query.
3. It is possible to subsequently enter values, such as Yield or Quality, that have been
determined based on process data. (Additional individual columns can be used if they
were defined before the start of the process. More information can be found in the
DASGIP Control Manual).
4. The query results are summarized in table form and can be selected individually.
5. General data on selected setups or workflows is displayed.
6. Export options.
In the
DASGIP Information Manager
it is also possible to carry out queries during an ongoing
experiment. However, note that the current data of this ongoing experiment cannot yet be
included in the query. This data will only be available after the experiment has been
completed.
Fig. 9: Overview of the
DASGIP Information Manager
DASware® design User Manual DASware® design
32 Copyright © 2012 DASGIP Information and Process Technology GmbH, Jülich, Germany
A query in the
DASGIP Information Manager
includes all the experiment runs with the
corresponding recipes and process data as well as the events and user-specific context
information. Only the procedure data of calibrations, CIP and Clean is not included. The result
of a query can then be exported to Microsoft Excel®.
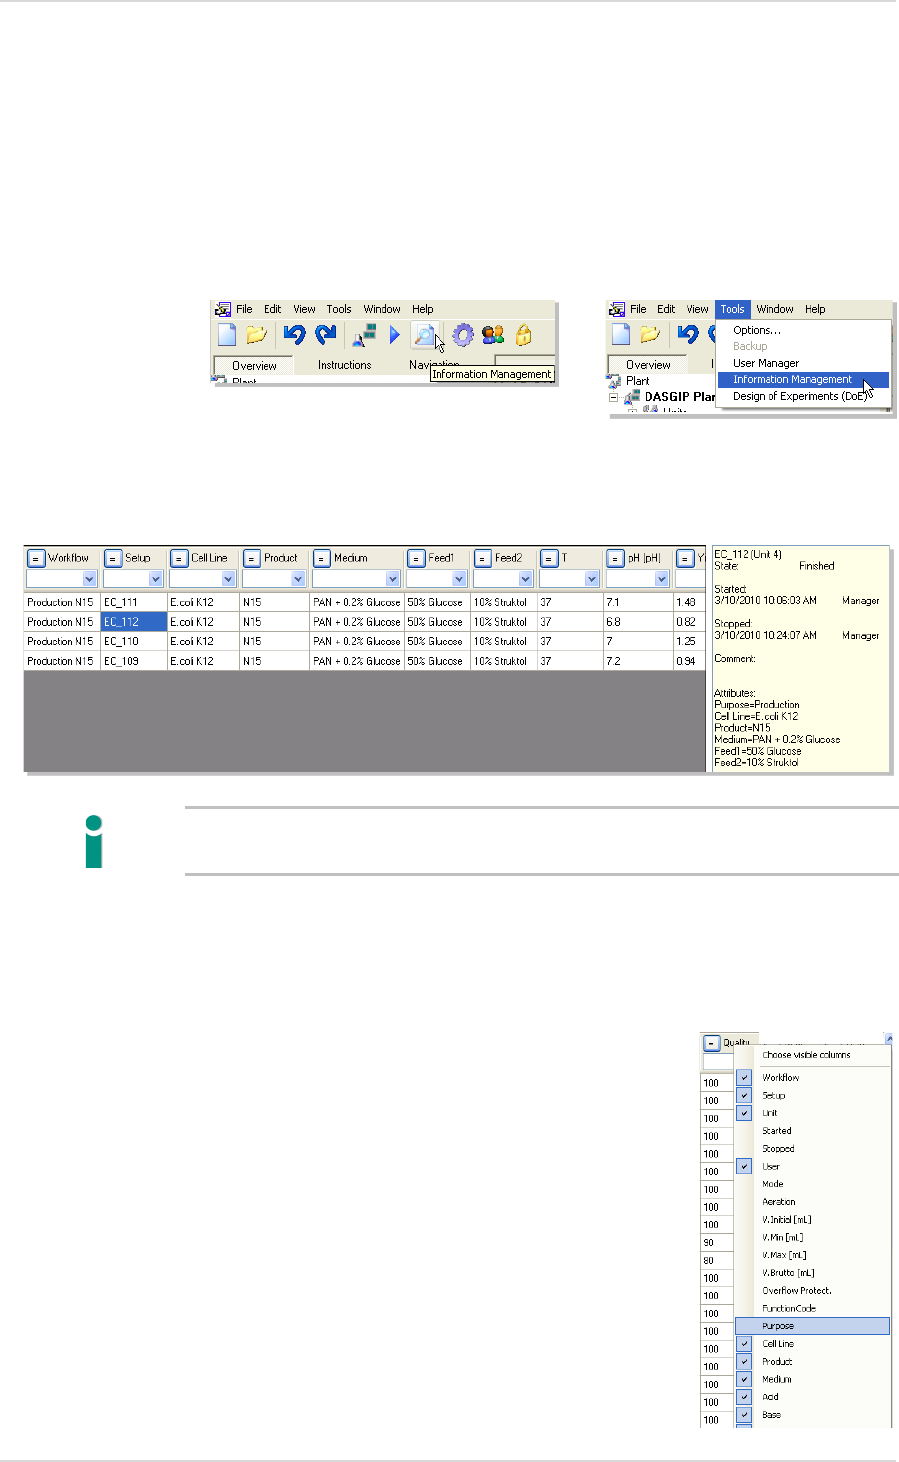
1. You can either click directly on the Information Management button in the taskbar to
open the
DASGIP Information Manager
or call the Tools menu and select the Information
Management menu item.
2. When you click on a corresponding cell, general information on a workflow or setup is
displayed on the right.
All entries can be edited, with the exception of the workflow, setup and unit names.
Please use this option with caution.
3. All available query criteria are displayed when you click with the right mouse button on a
column heading. From the dropdown menu, select the column headings to be displayed.
This allows the displayed data to be limited as needed and saved.
User Manual DASware design DASware® design
Copyright © 2012 DASGIP Information and Process Technology GmbH, Jülich, Germany 33
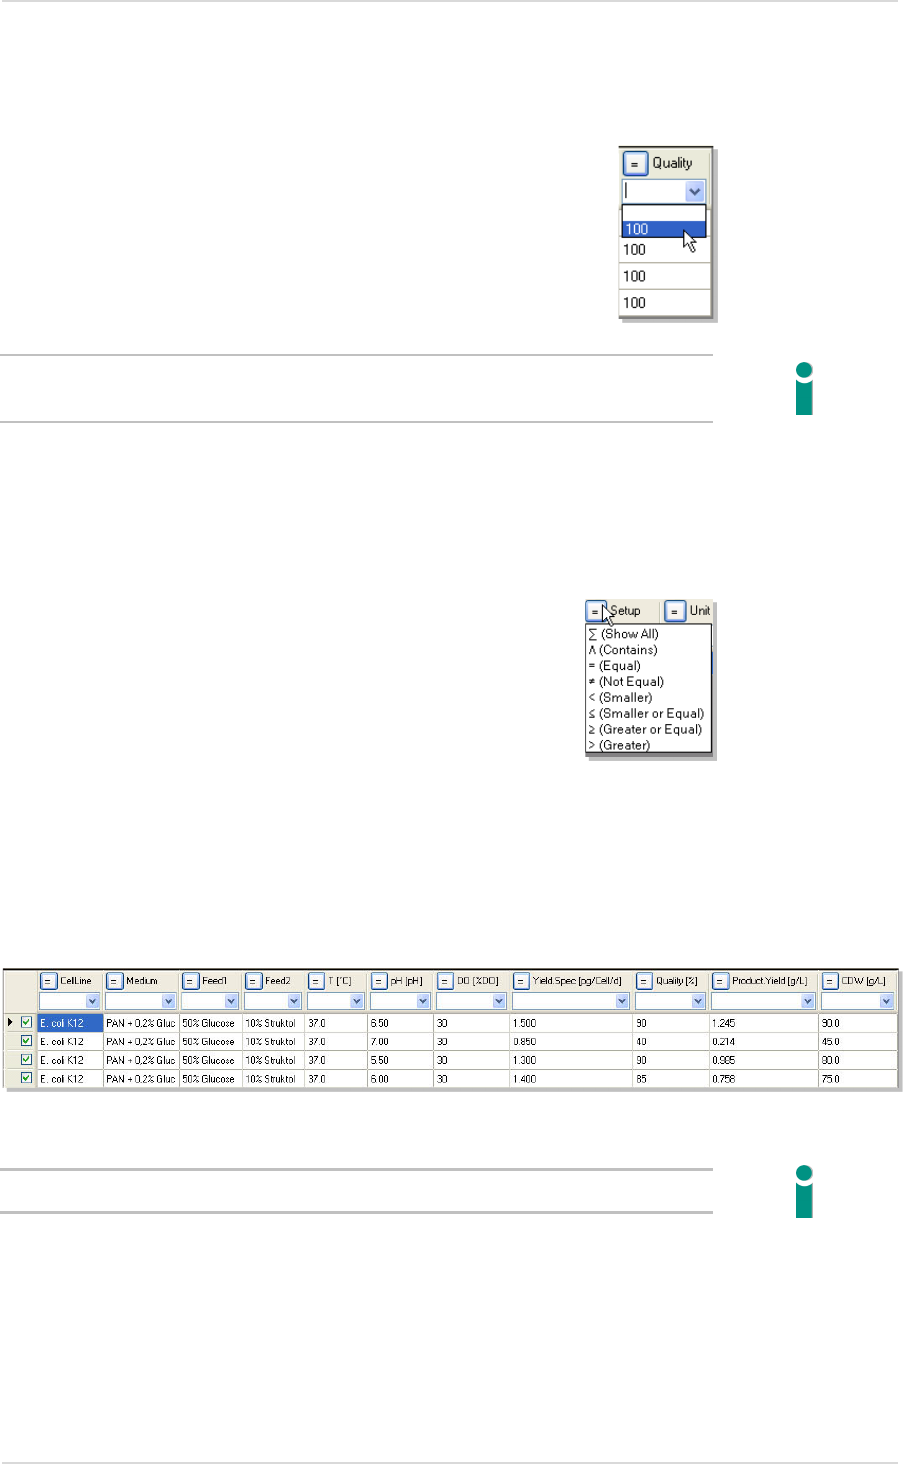
4. You can also directly enter query values below each column heading in the input field or
select values from the dropdown list which is automatically filled with existing values.
The additional entries for this process are saved together with the process values and are
available for additional analysis in each further export.
5. You can use the button to the left next to each column heading to select relational
operators for the qualification of a query.
Example: You want to select all process data where
E. coli
K12 was used and for which a
product yield of at least 0.2 g/ L was achieved. For this, the two query criteria are entered in
the corresponding CellLine and Product Yield [g/L]
columns. The table will then list all the
matching process data.
The entry of search criteria is not case-sensitive, but spaces are considered.
With the help of historical data you can, for example, also carry out a plausibility check of
new process runs using a batch to batch comparison. Selecting actual and historical runs at
the same time generates a combined report for subsequent independent analysis.
DASware® design User Manual DASware® design
34 Copyright © 2012 DASGIP Information and Process Technology GmbH, Jülich, Germany
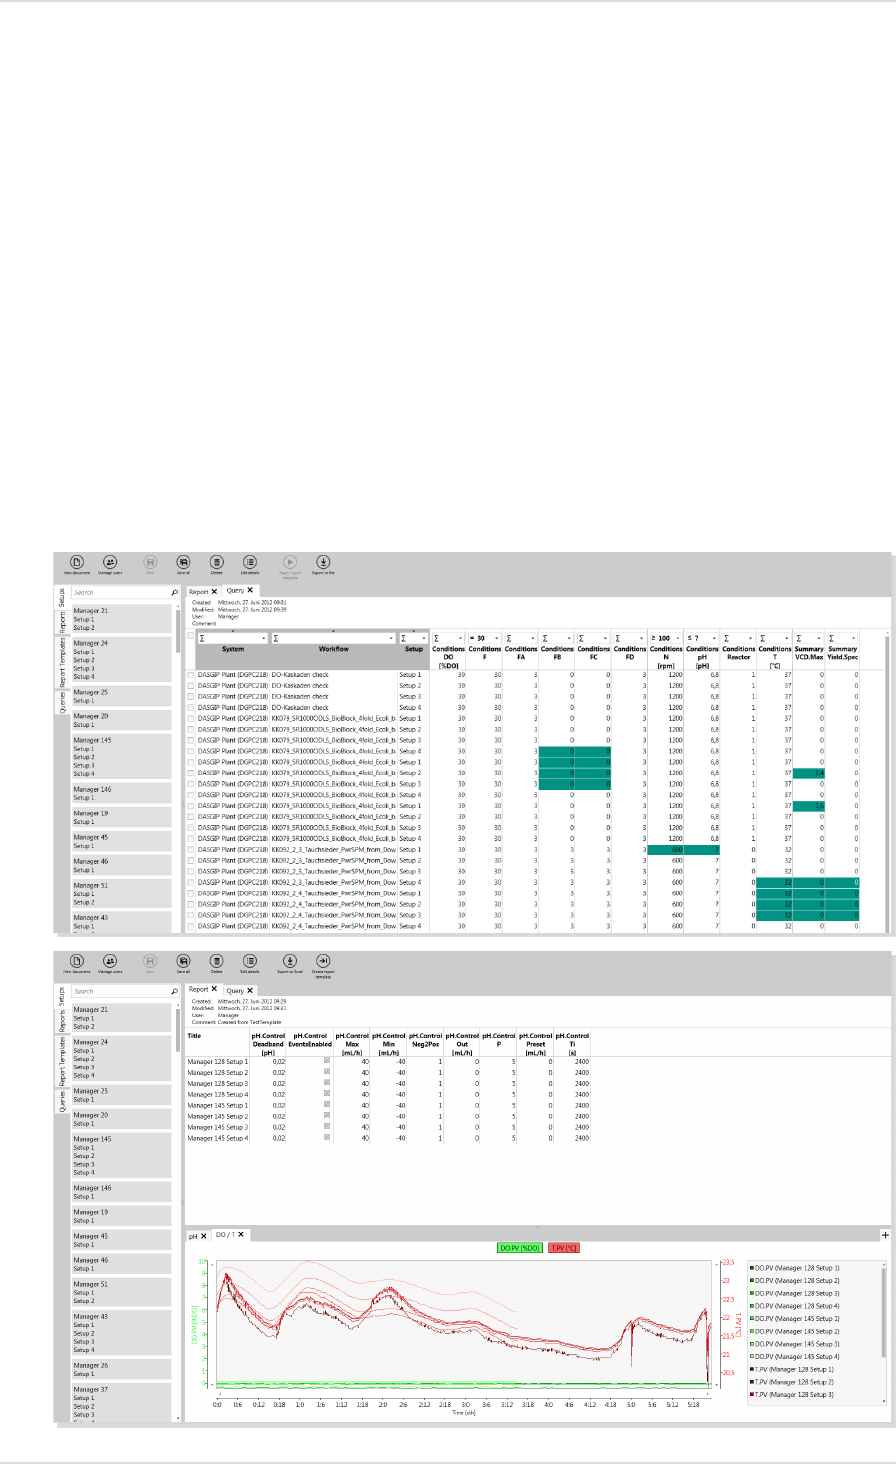
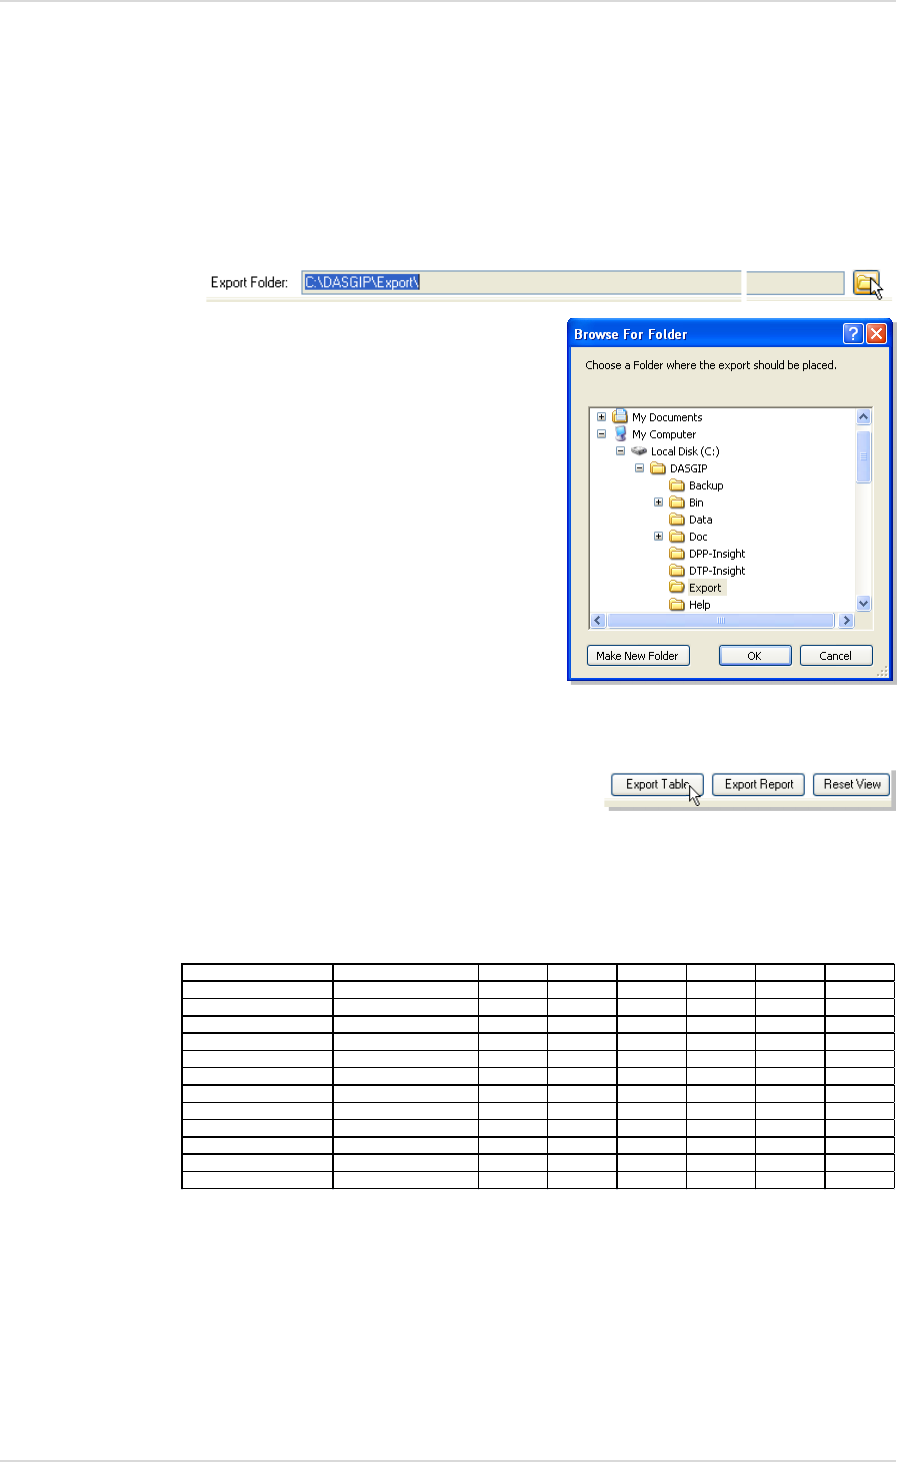
Exporting Data
You can export all query data using the Export Table or Export Report buttons (including all
process data).
In addition to Export Folder:, the storage path of the export file is displayed. This can be
changed using the Folder button in the Browse For Folder dialog window.
The compiled information that is listed in table form can be exported in various forms:
Select Export Table in order to export all DoE-relevant parameters as a .txt file.
An exported DoE table is shown below as an example. It is used as a basis for further
analysis in Microsoft Excel® or special DoE analysis tools, such as JMP.
Export Report exports the entire process data, including recipes, process data history and
events as a .csv file. This can be opened for further processing, e.g., for diagram creation
in the
DASGIP Documentation Wizard
.
Reset View resets all query settings.
Workflow Setup Unit User T [°C] pH [pH]
Gluc.Conc [g/
OD600
Contains Equal Equal Equal Equal Equal Equal Equal
KK107_DASbox_DoE-1-4 KK107_DASbox_DoE-1
Unit 1
Manager
37 6,8 40 45,4
KK107_DASbox_DoE-1-4 KK107_DASbox_DoE-2
Unit 2
Manager
40 7,2 60 46,7
KK107_DASbox_DoE-1-4 KK107_DASbox_DoE-3
Unit 3
Manager
34 7,2 60 65,8
KK107_DASbox_DoE-1-4 KK107_DASbox_DoE-4
Unit 4
Manager
40 7,2 20 23,6
KK107_DASbox_DoE-5-8 KK107_DASbox_DoE-5
Unit 1
Manager
40 6,4 60 67,4
KK107_DASbox_DoE-5-8 KK107_DASbox_DoE-6
Unit 2
Manager
37 6,8 40 47,6
KK107_DASbox_DoE-5-8 KK107_DASbox_DoE-7
Unit 3
Manager
34 7,2 20 25,6
KK107_DASbox_DoE-5-8 KK107_DASbox_DoE-8
Unit 4
Manager
40 6,4 20 26,1
KK107_DASbox_DoE-9-11 KK107_DASbox_DoE-9
Unit 1
Manager
34 6,4 60 56,8
KK107_DASbox_DoE-9-11 KK107_DASbox_DoE-10
Unit 2
Manager
34 6,4 20 33,6
KK107_DASbox_DoE-9-11 KK107_DASbox_DoE-11
Unit 3
Manager
37 6,8 40 50,9
User Manual DASware design DASware® design
Copyright © 2012 DASGIP Information and Process Technology GmbH, Jülich, Germany 35
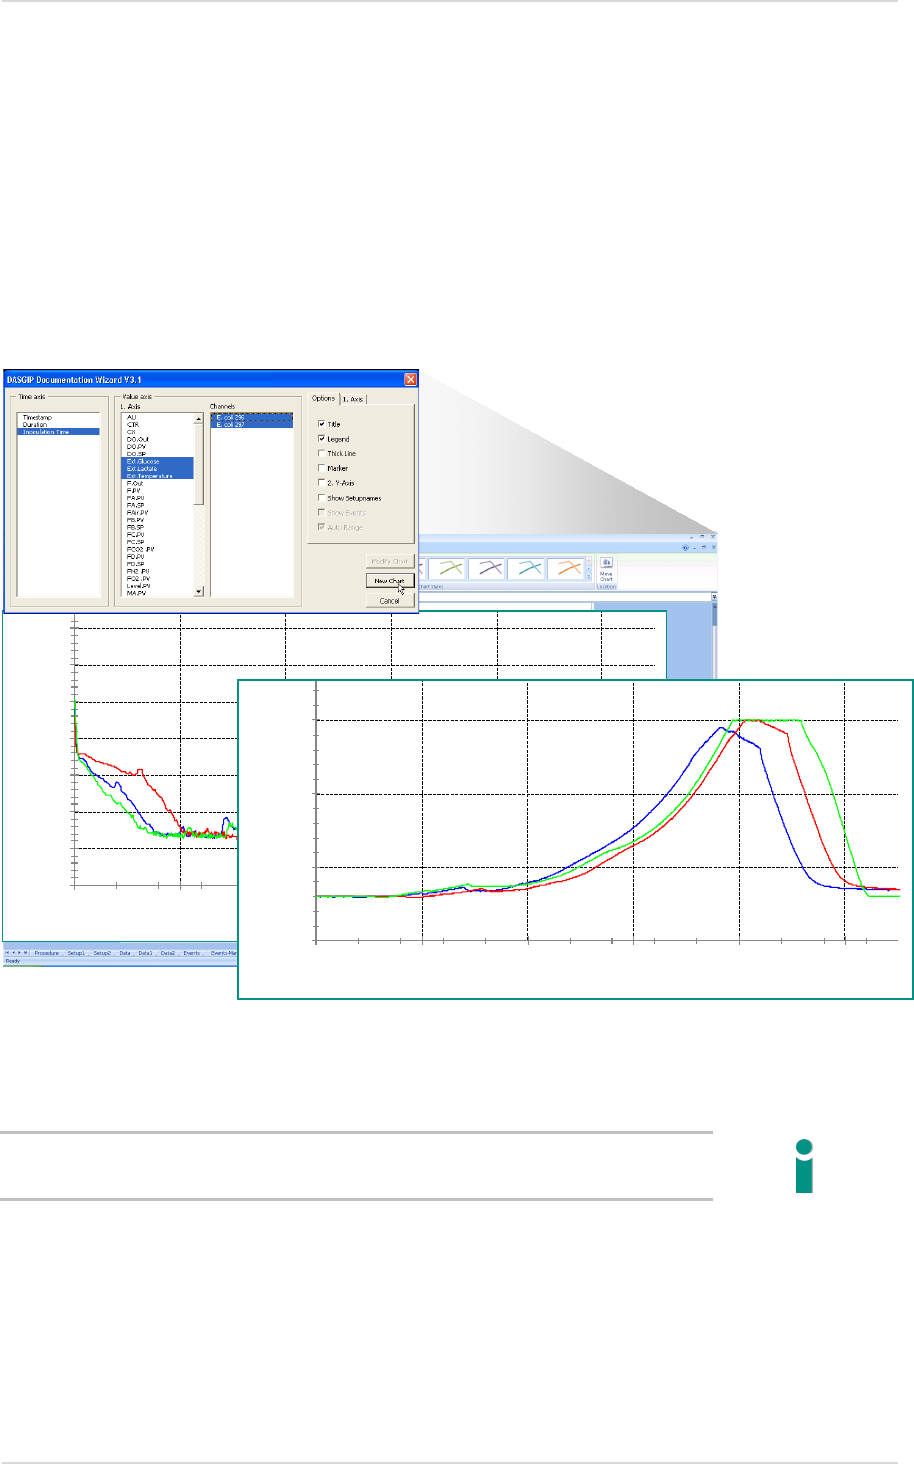
3.6. DASGIP DOCUMENTATION WIZARD
Evaluating and graphically displaying exported process data is particularly easy and
convenient using the Microsoft Excel® add-in
DASGIP Documentation Wizard
. Both current
and historical process data can be used and compared for the automatic creation of
cultivation reports. Even individual ranges of process values, such as pH or DO, can be
automatically grouped from different process datasets and displayed together graphically. It is
recommended to select the process duration or directly the inoculation time as basis to ensure
that the data series are automatically synchronized.
The synchronized process flows significantly facilitate plausibility checks.
All diagrams generated in the
DASGIP Documentation Wizard
can be formatted and edited
with the standard Microsoft Excel® options.
More information can be found in the DASGIP Documentation Wizard Manual.
0,0
20,0
40,0
60,0
80,0
100,0
120,0
140,0
0:00:00 2:24:00 4:48:00 7:12:00 9:36:00 12:00:00
DO.PV [%DO]
Sync. Inoculation Time
0,
1000,
2000,
3000,
0:00:00 2:24:00 4:48:00 7:12:00 9:36:00 12:00:00
N.PV [rpm]
Sync. Inoculation Time

Application Example User Manual DASware® design
36 Copyright © 2012 DASGIP Information and Process Technology GmbH, Jülich, Germany
Design of Experiments (DoE) is a method for the planning and statistical evaluation of
experiments/processes. The goal of DoE is to learn as much as possible about the
relationships between influencing variables (Input) and results (Output) with as little effort as
possible.
DASware design
, especially in combination with the
DASGIP Information Manager
, supports
and synchronizes process management through the seamless integration of DoE.
The experiment design, which has been either created in the DoE Builder or imported from
external DoE software tools, can be easily integrated and implemented in
DASGIP Control
.
DoE software tools can provide the experiment design that can be easily integrated and
implemented in
DASGIP Control
.
This chapter outlines the implementation of a DoE strategy with and without DoE software
tools (JMP) as an example.
4.1. FULL FACTORIAL DOE WITH THREE FACTORS AND TWO LEVELS
A full factorial experiment setup consists of two or more factors with discrete values that are
determined in two or more levels. In contrast to a fractional factorial setup, all factor
combinations are carried out. This approach allows the observation or calculation of the
effects of individual factors on the response as well as the interactions between the factors.
In the following, the cultivation of
Escherichia coli
is considered with three variable factors in
two levels for the determination of optimal growth conditions. The response used is the
bacteria biomass which is determined based on the determination of the optical density
(OD600). All possible combinations are carried out on
DASbox
System with three blocks.
Please keep in mind that this simple example is intended to teach - the outcome is evident.
Center Point Analysis
To obtain sufficient information about the accuracy of the process results, the use of
repetitions is recommended in literature. However, this significantly increases the work
involved. This is generally not feasible in industrial practice.
Application Example 4.
User Manual DASware® design Application Example
Copyright © 2012 DASGIP Information and Process Technology GmbH, Jülich, Germany 37
The selected experiment setup includes two levels per factor, so that a possible non-linear
relationship (curvature) between the factors and the response cannot be eliminated. A center
point determination will help to verify this. If the center point deviation is significant, then at
least one factor has a non-linear influence.
It is important that the center point experiments are carried out together with the other
experiments and not carried out later. If the experiment is divided into several blocks, a center
point experiment should be implemented in each block. This is the only way of distinguishing
between a deviation from the linearity and a change over time.
The threefold determination of the center point provides reliable information on the accuracy
of the data at an economically justifiable cost.
In addition, the influence of inoculation cultures (differences between reactor blocks) can be
determined.
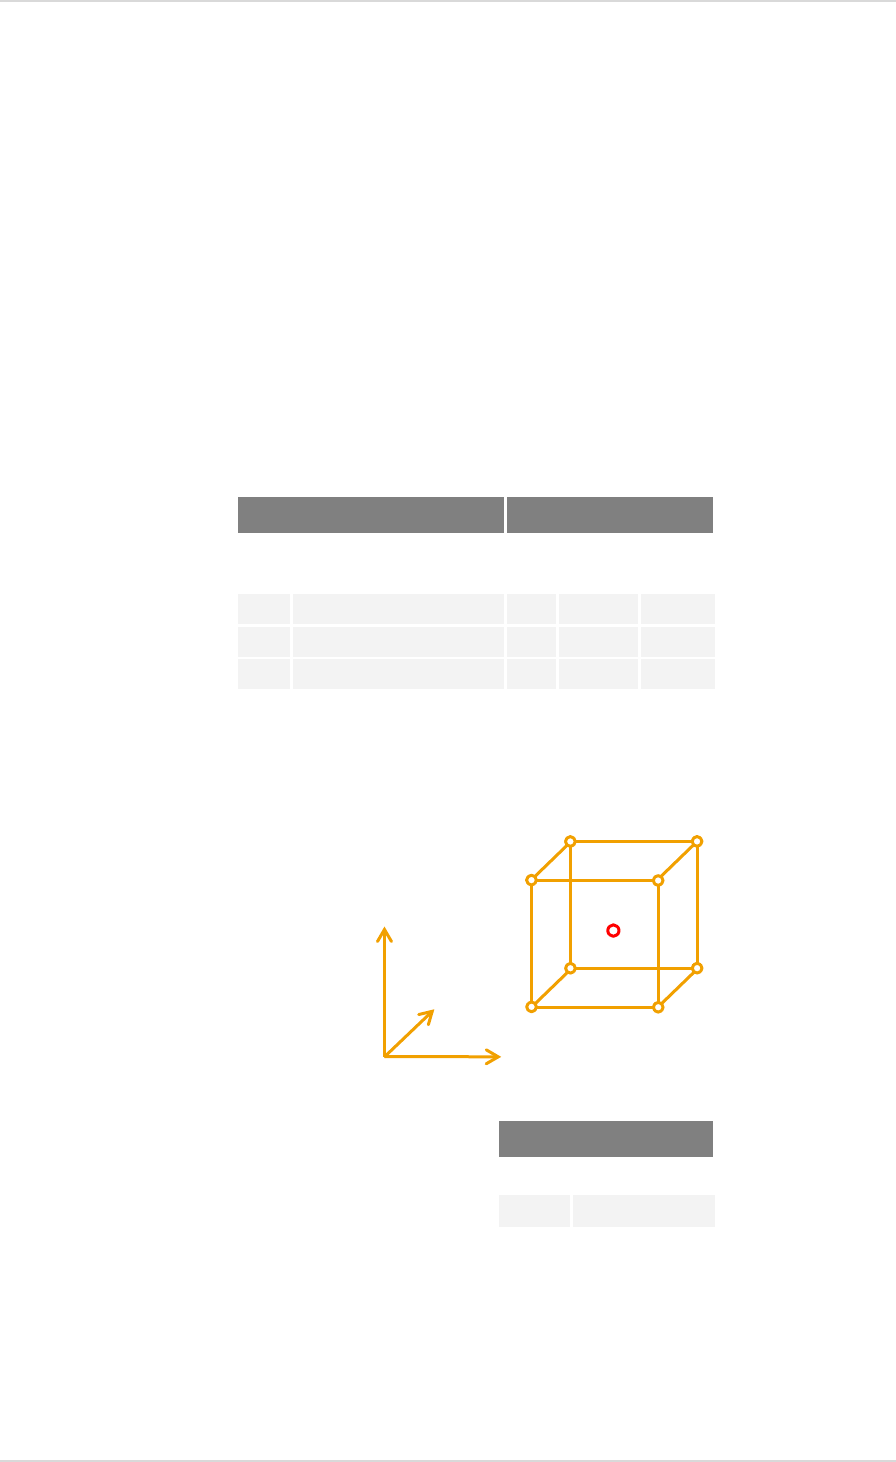
The selected settings are summarized below:
Three factors with two levels and center points
The corresponding three-dimensional experimental space (design space) with center point
looks as follows:
Response
Randomization
The reactor positions are assigned to the three blocks. The assignment is random within the
blocks to prevent a trend or any undetected fluctuation (e.g., sensor signal) from distorting
the estimation of the effects of the factors.
Factors Levels
No. Name - 1 1 Center
point
1 pH 6.8 7.2 7
2 T [° C] 34 37 35.5
3 Glucose concentration [g/L] 20 60 40
Response
No. Name
R Biomass (OD600)
Design space
Center point
Gluc.conc.
pH
T
Application Example User Manual DASware® design
38 Copyright © 2012 DASGIP Information and Process Technology GmbH, Jülich, Germany
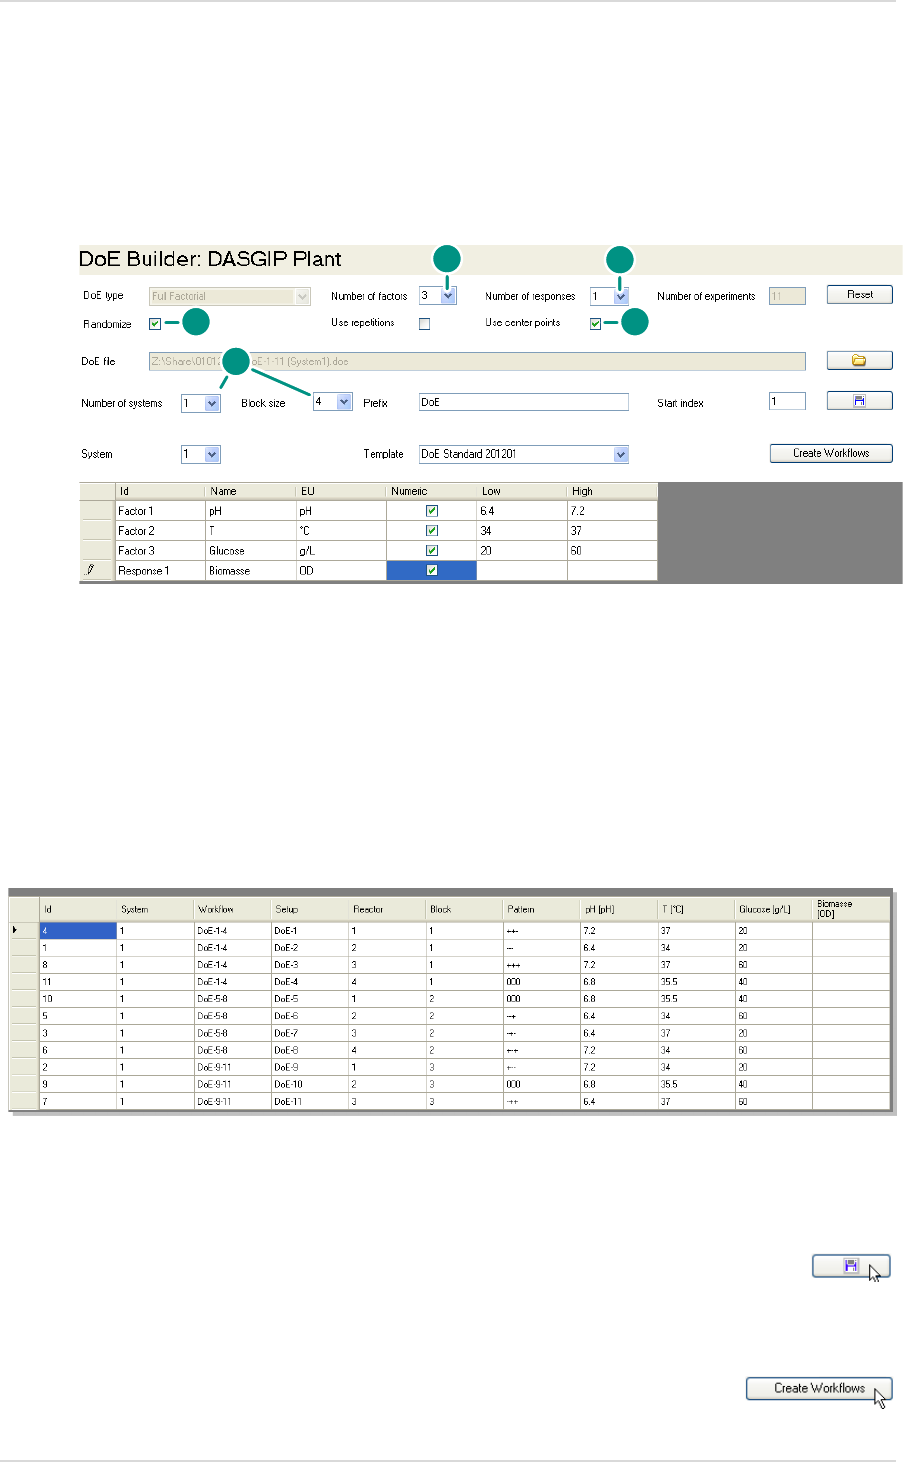
Implementation without External DoE Software Tools 4.1.1.
DoE Builder
The DoE Builder allows the desired entries to be entered directly:
1. Select the number of factors: 3
2. Select the number of responses: 1
3. Select Use center points
4. Select Randomize
5. Select Number of systems 1 and Block size 4.
23 = 8 runs are needed. In addition, a center point is determined for each block so that a total
of 11 runs are necessary. They are randomly distributed to system on an automatic basis and
summarized in table form as follows:
The entries in the DoE Builder can be saved using the Save button in order to transfer them if
required, e.g., to an additional
DASbox
PC.
After the suitable workflow has been selected as a template, all entries are transferred with
Create Workflow to the Recipe Editor.
2
1
3
4
5
User Manual DASware® design Application Example
Copyright © 2012 DASGIP Information and Process Technology GmbH, Jülich, Germany 39
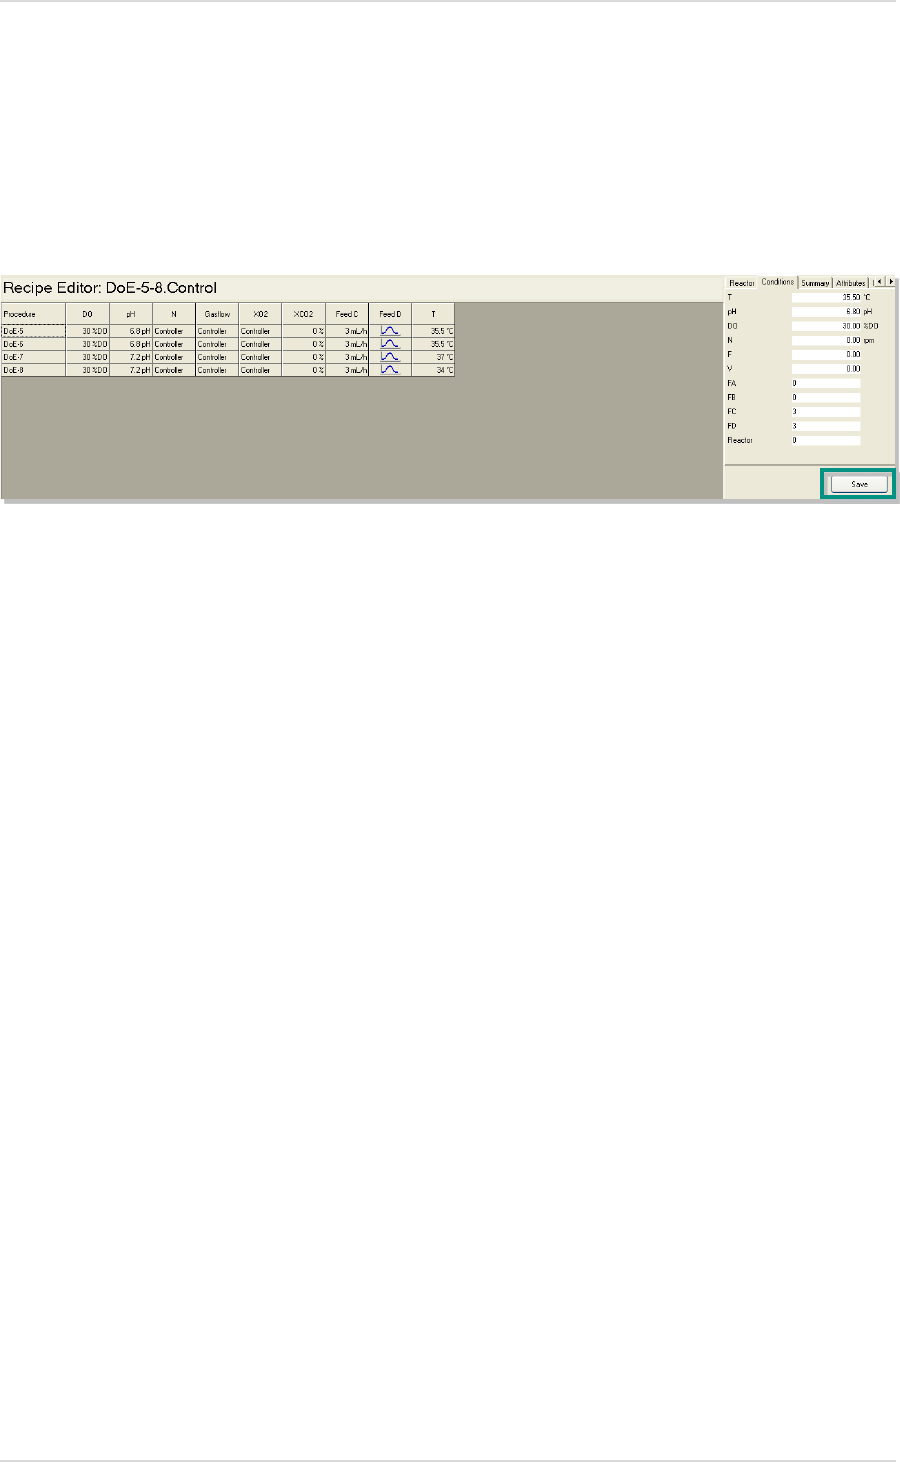
Recipe Editor
In the Recipe Editor, the entries can be adjusted or supplemented before the process is
implemented.
The second run (block) is shown as an example:
All entries are saved using the Save button and the process can be started using the Run
button.
Process Monitoring and Control
During a process any manual operation in the Reactor View is possible. However we
recommend avoiding any manual adjustment since they affect the DoE result potentially.
After all processes are completed, the process data is saved in
DASGIP Control
and can be
used for further analysis.
DASGIP Information Manager
The
DASGIP Information Manager
is a helpful tool for performing plausibility checks and for
complementing data. Process data can be grouped together with historical data and exported
(see also 3.5).
Data Analysis
The exported process data can be generated by using the Export Table function and analyzed
in Microsoft Excel®.
Application Example User Manual DASware® design
40 Copyright © 2012 DASGIP Information and Process Technology GmbH, Jülich, Germany
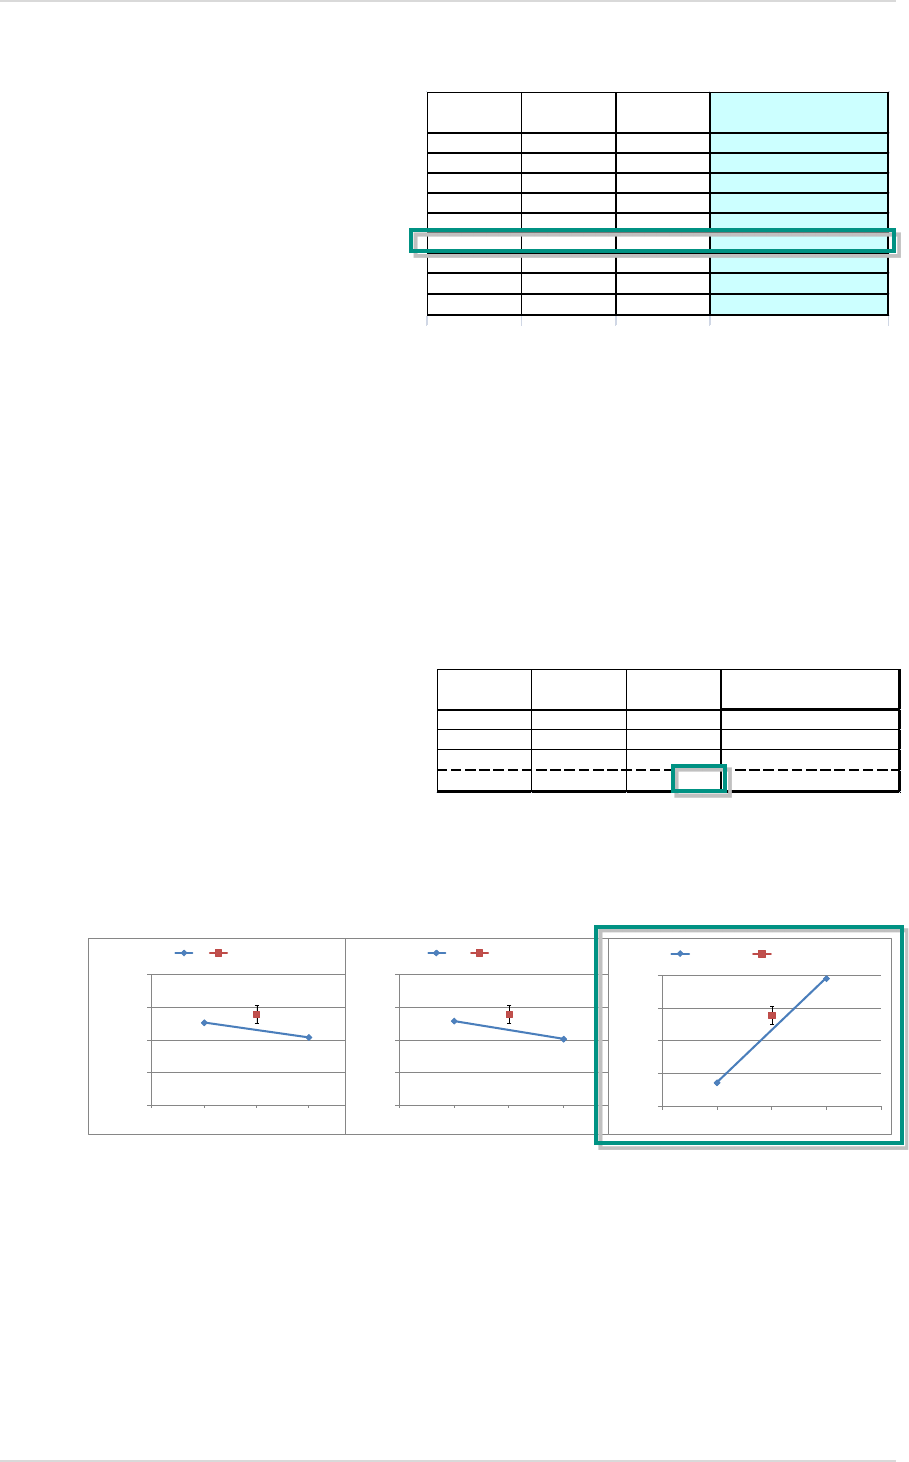
Most favorable factor combinations
The most favorable factor combination is determined by the highest biomass concentration.
Main effects
The main effects are analyzed by calculating the average values for the high (+) and the low
(-) factor level. The difference of the average values is the effect in question.
It is obvious that the factor glucose concentration has the largest effect on the response
biomass. This is represented graphically with 1 and -1 for the two levels below.
In addition, the determined center points provide information about a possible deviation from
linearity. The 3-fold implementation of the center point determination used in this example
provides an indication of the chance variation.
Temp
A
pH
B
Gluc.-conc.
C
OD600 (t1)
--- 33,6
+ - - 26,1
- + - 25,6
+ + - 23,6
- - + 56,8
+ - + 67,4
- + + 65,8
+++ 46,7
center center center 48,0
Temp
A
pH
B
Gluc.-conc.
C
41,0 40,4 59,2 Average Level "-"
48,0 48,0 48,0 Average Center Points
45,5 46,0 27,2 Average Level "+"
-4,5 -5,6 32,0 Effect
1
-1
20,0
30,0
40,0
50,0
60,0
OD600
Level
T
center point
1
-1
20
30
40
50
60
OD600
Level
pH
center point
1
-1
20
30
40
50
60
OD600
Level
Gluc.Conc
center point
User Manual DASware® design Application Example
Copyright © 2012 DASGIP Information and Process Technology GmbH, Jülich, Germany 41
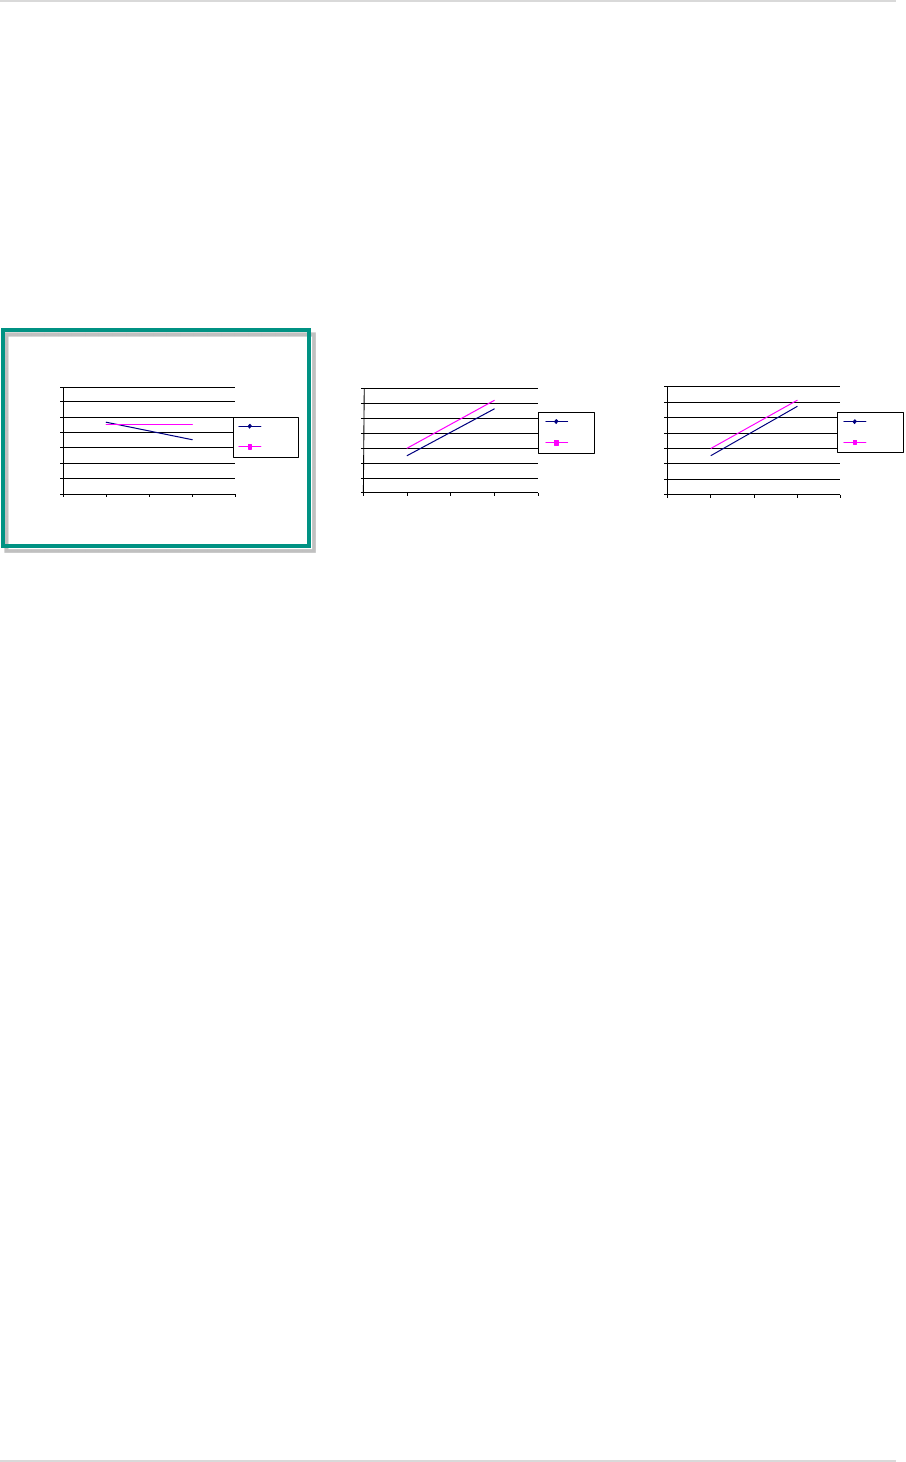
Interactions
The figures below show the average values of both levels of a factor depending on the setting
of an additional factor.
An indicator of an interaction is the degree of non-parallelism between the corresponding
straight lines. The greater the degree of parallelism between the straight lines, the lower the
interactions.
The presented results indicate an interaction between the factors pH and temperature,
because the straight lines intersect. In the subsequent stage of process optimization, these
two factors should be considered together.
Use of External DoE Tools (JMP) 4.1.2.
JMP is a standard software tool for the statistical planning of experiments, such as DoE. The
following screenshots briefly outline the procedure for an experiment setup using JMP.
0
10
20
30
40
50
60
70
-2 -1 0 1 2
OD600 (t1)
Gluc.-conc.
Temp 1
Temp -1
0
10
20
30
40
50
60
70
-2 -1 0 1 2
OD600 (t1)
pH
Temp 1
Temp -1
0
10
20
30
40
50
60
70
-2 -1 0 1 2
OD600 (t1)
Gluc.-conc.
pH 1
pH -1
Application Example User Manual DASware® design
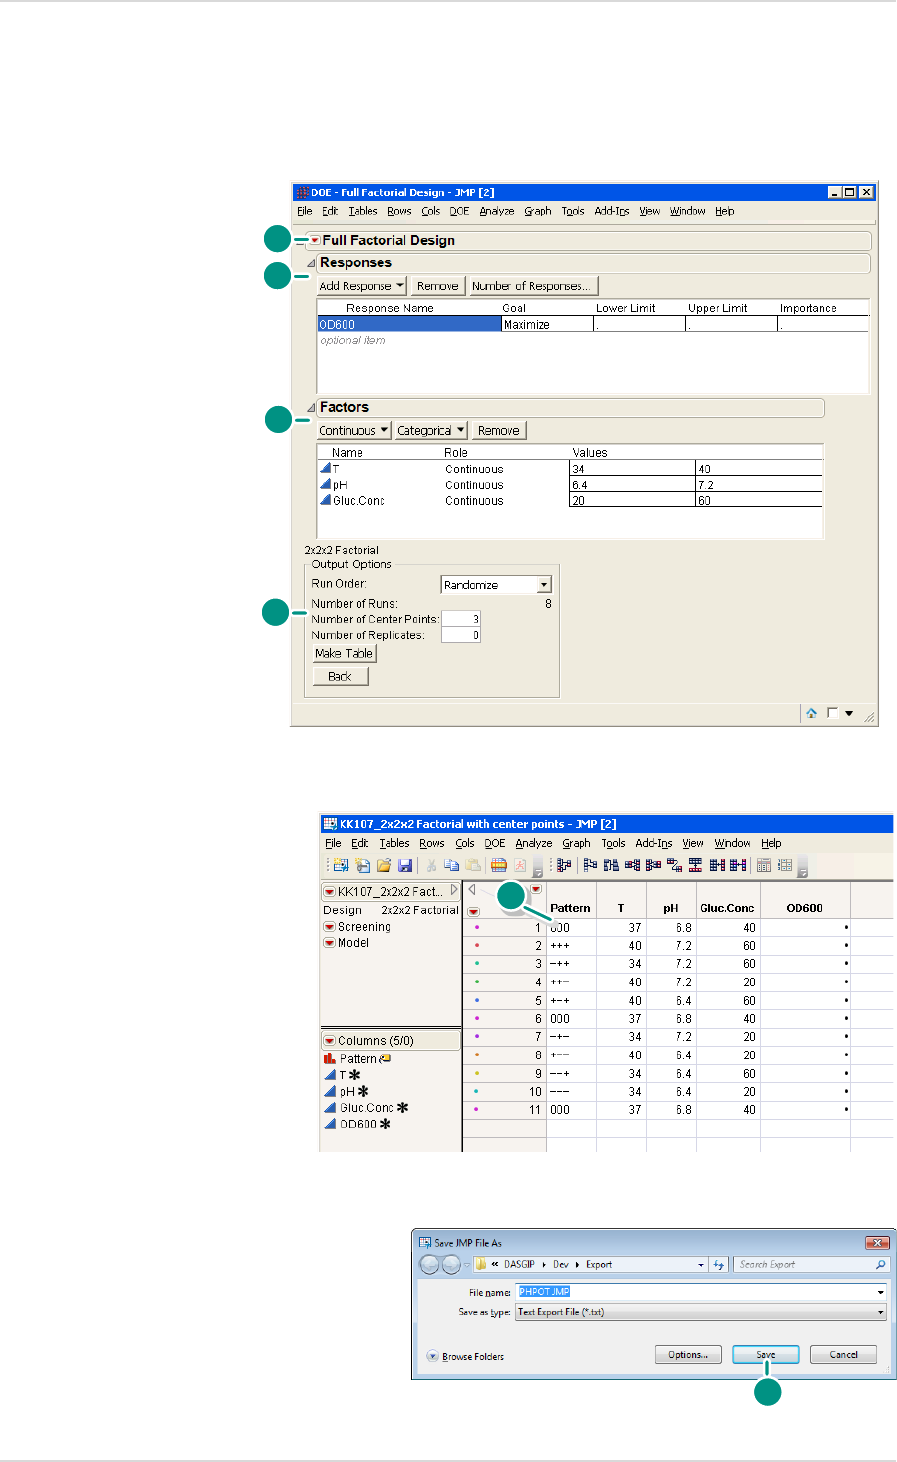
42 Copyright © 2012 DASGIP Information and Process Technology GmbH, Jülich, Germany
1. Define design
2. Define responses
3. Define factors
4. Define center points
5. Generate a table with all entries
Save the table as a Text Export File (*.txt) type.
1
2
3
4
5
6
User Manual DASware® design Application Example
Copyright © 2012 DASGIP Information and Process Technology GmbH, Jülich, Germany 43
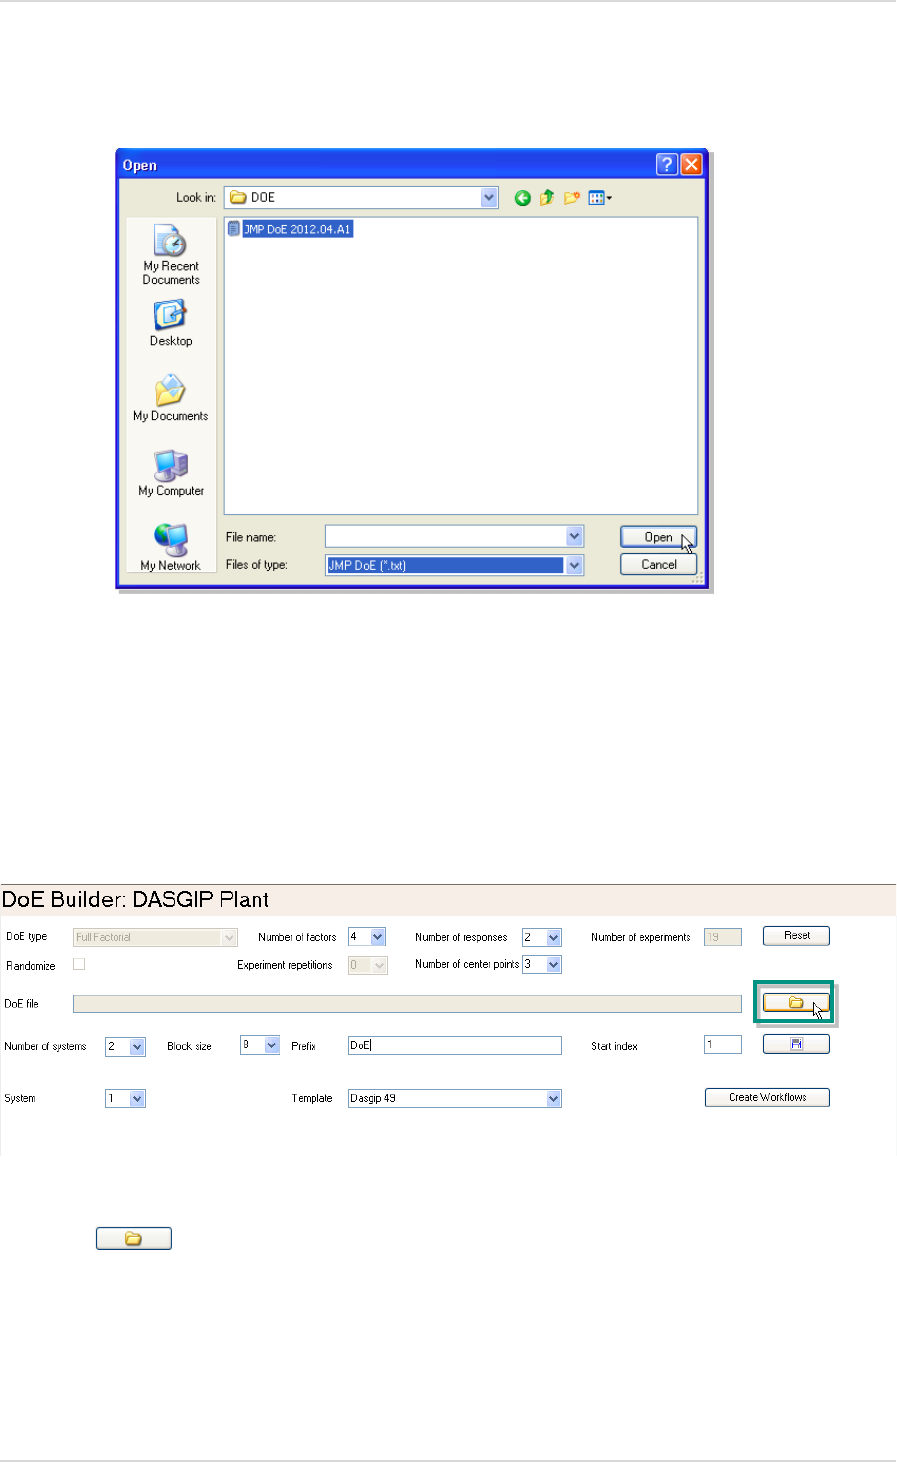
This table generated and saved in JMP can now be easily loaded to the DoE Builder (4.1.1) of
DASGIP Control
so that all entries are automatically adopted.
Loading External DoE Data to the DoE Builder
DASware design
offers the possibility to seamlessly integrate DoE data from different DoE
software tools, such as JMP, in
DASGIP Control
.
Click on the button to open the following dialog.

Application Example User Manual DASware® design
44 Copyright © 2012 DASGIP Information and Process Technology GmbH, Jülich, Germany
Select a file and click on the Open button to open the file choosing the appropriate File type.
The DoE data is then loaded into the DoE Builder and can still be adjusted if necessary.
Process Monitoring and Control
The process is executed as described under 4.1.1.
After all processes are completed, the process data is saved in
DASGIP Control
and can be
used for further analysis. Use the documentation wizard to select and export the factor and
response table.
User Manual DASware® design Application Example
Copyright © 2012 DASGIP Information and Process Technology GmbH, Jülich, Germany 45
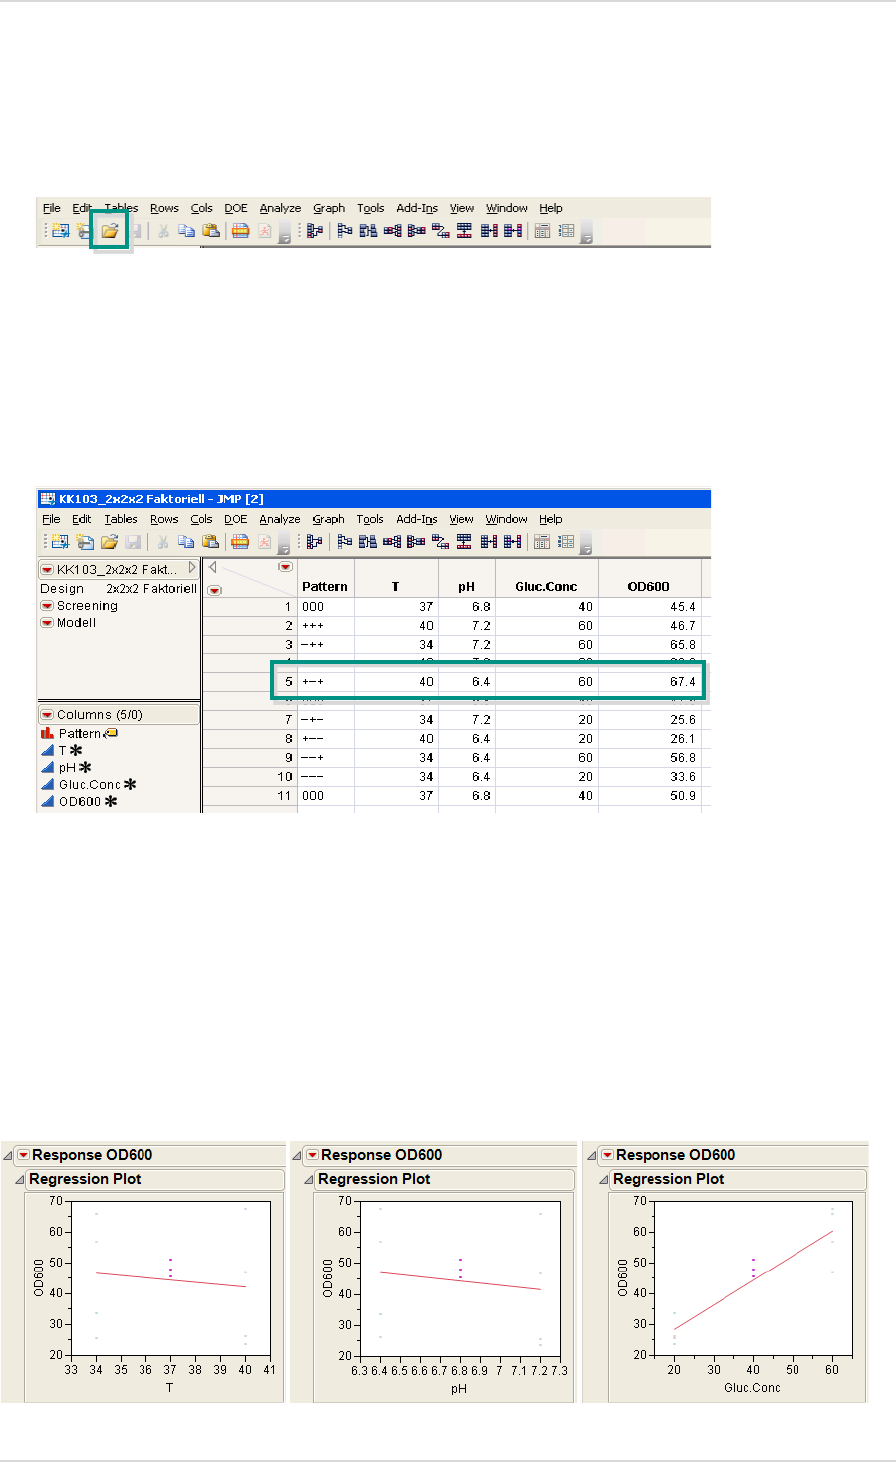
Data Analysis
The exported DoE text file can be opened using the Open button in JMP.
Most favorable factor combinations
The most favorable factor combination is determined by the highest biomass concentration.
Main effects
The main effects are analyzed at this point using a linear regression. The gradient is an
indication of the effect of a factor.
In the following, it can be seen that the glucose concentration has the largest effect on the
response biomass.
Application Example User Manual DASware® design
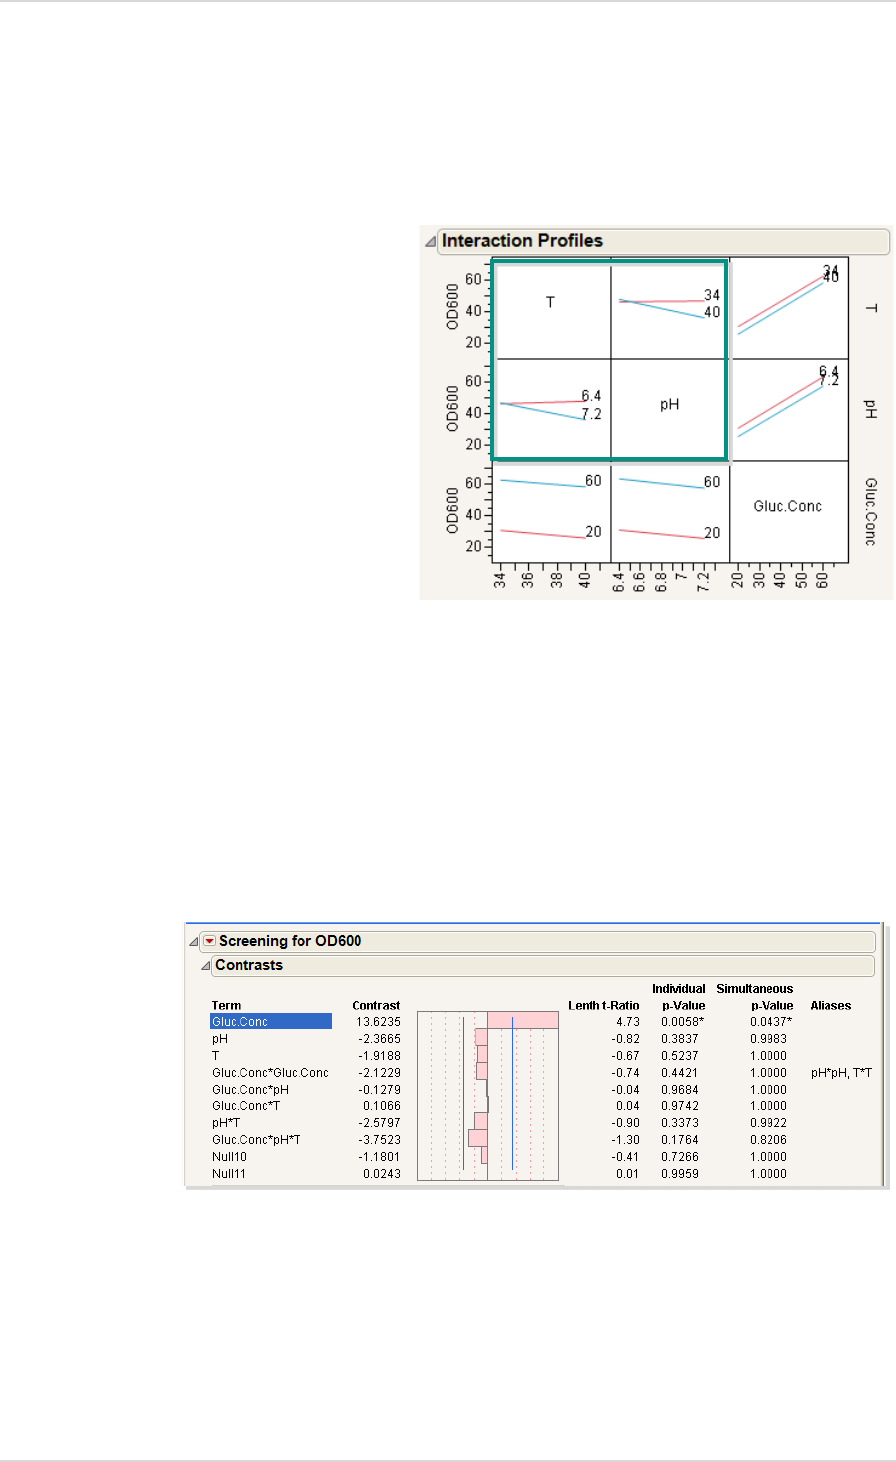
46 Copyright © 2012 DASGIP Information and Process Technology GmbH, Jülich, Germany
Interactions
The average values of both levels of a factor are also shown here depending on the setting of
another factor.
The results indicate an interaction between the factors pH and temperature. These should
therefore be considered together in a subsequent process optimization stage.
The following shows an additional display to determine the significance of effects, both of
individual factors as well as of factor-factor interactions.

User Manual DASware® design Application Example
Copyright © 2012 DASGIP Information and Process Technology GmbH, Jülich, Germany 47

Application Example User Manual DASware® design
48 Copyright © 2012 DASGIP Information and Process Technology GmbH, Jülich, Germany

User Manual DASware® design Index
Copyright © 2012 DASGIP Information and Process Technology GmbH, Jülich, Germany 49
A
Attributes, conditions, summary
Setup parameters ............................... 28
B
Block size
DoE Builder ........................................ 23
C
Create Workflows
DoE Builder ........................................ 25
D
DASGIP Documentation Wizard ............ 35
DASGIP Information Manager ............... 31
DASware design
Overview ............................................ 19
Data analysis
Factor combinations ........................... 40
Interactions ........................................ 41
JMP .................................................... 45
Main effects ....................................... 40
Microsoft Excel® ................................. 39
Data export ........................................... 34
Data preparation
JMP .................................................... 41
Definition
Design space ...................................... 13
Design space
Definition ........................................... 13
Documentation ..................................... 31
DoE
field of application ............................. 15
Full factorial ....................................... 36
DoE application example....................... 36
DoE Builder
Block size ........................................... 23
Creating workflows ............................ 25
Number of systems............................. 22
Prefix .................................................. 23
Saving settings ................................... 24
Start index .......................................... 23
Systems .............................................. 23
Template ............................................ 23
DoE Builder ........................................... 20
Overview ............................................ 21
Resource selection.............................. 22
Selection, entry of factors ................... 22
DoE Builder
Resource example .............................. 24
DoE Builder
Loading external DoE data ................. 43
F
Factor combinations
Data analysis ...................................... 40
JMP data analysis ............................... 45
Field of application
DoE..................................................... 15
I
Interactions
Data analysis ...................................... 41
JMP data analysis ............................... 46
J
JMP
Data analysis ...................................... 45
Data preparation ................................ 41
JMP data analysis
Interactions ........................................ 46
Main effects ....................................... 45
JMP data analysis
Factor combinations ........................... 45
L
Loading external DoE data
DoE Builder ........................................ 43
M
Main effects
Data analysis ...................................... 40
JMP data analysis ............................... 45
N
Number of systems
DoE Builder ........................................ 22
O
Open
Recipe Editor ...................................... 27
Overview
DASware design ................................. 19
DoE Builder ........................................ 21
Index

Index User Manual DASware® design
50 Copyright © 2012 DASGIP Information and Process Technology GmbH, Jülich, Germany
Recipe Editor ...................................... 27
P
Plausibility check ............................. 20, 35
Prefix
DoE Builder ......................................... 23
Process flow
schematic ........................................... 17
Process implementation ........................ 30
Q
QbD
Quality by Design ............................... 14
Quality by Design
QbD .................................................... 14
R
Recipe Editor ......................................... 27
Open ................................................... 27
Overview ............................................27
Resource example
DoE Builder .........................................24
Resource selection
DoE Builder .........................................22
S
Saving settings
DoE Builder .........................................24
Selection, entry of factors
DoE Builder .........................................22
Start index
DoE Builder .........................................23
Summary view .......................................30
System
DoE Builder .........................................23
T
Template
DoE Builder .........................................23
