IDirect_DrReddys_Q4FY15 4065R DRREDLAB 20150513
User Manual: 4065R
Open the PDF directly: View PDF ![]() .
.
Page Count: 15
May 13, 2015
ICICI Securities Ltd | Retail Equity Research
Result Update
Higher R&D, adverse product mix hit margins
• Revenues grew 11.2% YoY to | 3870.4 crore (I-direct estimate:
| 3993 crore) mainly on account of 15% growth in US formulation
sales to | 1715.4 crore
• EBITDA margins declined 111 bps YoY to 21.3% vs. I-direct estimate
of 26%. The delta was mainly due to higher R&D spend, change in
product mix and currency fluctuation. EBITDA in absolute terms
increased 5.7% to | 825.6 crore vs. I-direct estimate of | 1038.2 crore
• Net profit increased 7.7% to | 518.8 crore vs. I-direct estimate of
| 755.9 crore. The miss was on account of lower operational income
and higher finance expenses
Global generics to piggyback on strong, sustainable US traction
The global generics (GG) segment is expected to grow at a CAGR of 17%
in FY15-17E driven by strong US traction, which is likely to grow at a
CAGR of ~19% during the same period. DRL has developed a knack for
exclusivity/FTF launches on a fairly continuous basis in the US. We expect
this trend to continue further. However, the focus has now shifted to
more unique launches like OTC, complex generics, controlled releases,
etc. The US traction is also likely to nullify European slowdown. The US
pipeline includes 220 filed ANDAs including 68 pending approvals.
Russia CIS becomes volatile; India to provide more stability
Global generics (ex US, Europe) are likely to grow at a steady CAGR of
~17% in FY15-17E driven by growth in India as the Russian performance
remains volatile. These two markets are more or less identical in nature
(branded generics and OTC) with similar growth potential and similar
kinds of risks. DRL is well versed with the dynamics in Russia by virtue of
being an early mover. However, the recent currency volatility and political
unrest have caused disturbances in an otherwise safe market for the
company. For India, growth is expected to be largely from launches in the
oncology and biosimilars space besides an improvement in productivity
of the enhanced field force.
Portfolio realignment eminent
We envisage a fall in share of low margin/high risk segments such as
PSAI and European generics (especially Betapharm), going ahead. Thus,
growth in FY15-17E is likely to emanate from more productive and
sustainable segments such as US and India. Similarly, in terms of product
offering, we envisage more launches in the fields of injectables, OTC,
complex/limited competition products & biosimilars, besides legacy
generics.
US franchisee looks promising; India growth likely to sustain
US and India together hold the key for global generics growth as well as
DRL’s overall growth. Among them, the US is the main catalyst with a
pending product portfolio of 68 ANDAs, which includes 43 Para IVs and
13 FTFs. The company is investing heavily in R&D to bring more and
complex generics and limited competition products, mainly from the non-
oral category, which is likely to take care of sustained US growth for the
next two or three years. India is showing promising growth as well with a
recalibrated approach and the recent acquisition (UCB’s India business)
bodes well for the future. Russia, Europe and PSAI segments, however,
continue to pose challenges for being lumpy and volatile. We have
ascribed a target of | 3949 based on 22x FY17E EPS of | 179.5.
Rating matrix
Rating : Buy
Target : | 3949
Target Period : 12-15 months
Potential Upside : 13%
What’s Changed?
Target Changed from | 3332 to | 3949
EPS FY16E Changed from | 151 to 150.9
EPS FY17E Changing from | 185.1 to | 179.5
Rating Changed from Hold to Buy
Quarterly Performance
Q4FY15 Q4FY14 YoY (%) Q3FY15 QoQ (%)
Revenue 3,870.4 3,480.9 11.2 3,843.1 0.7
EBITDA 825.6 781.3 5.7 980.2 -15.8
EBITDA (%) 21.3 22.4 -111 bps 25.5 -417 bps
Net Profit 518.8 481.7 7.7 574.6 -9.7
Key Financials
(|crore) FY14 FY15 FY16E FY17E
Revenues 13217.0 14818.9 17291.5 19438.4
EBITDA 3312.7 3482.7 4065.1 4667.0
Net Profit 2151.3 2099.0 2562.6 3048.2
EPS (|) 126.7 123.6 150.9 179.5
Valuation summary
FY14 FY15 FY16E FY17E
PE (x) 27.5 28.2 23.1 19.4
Target PE (x) 31.2 31.9 26.2 22.0
EV to EBITDA (x) 14.8 13.9 11.7 9.8
Price to book (x) 5.3 4.4 3.7 3.0
RoNW (%) 23.7 19.3 19.6 19.4
RoCE (%) 19.2 18.1 20.2 21.3
Stock data
Particular
Market Capitalisation
Debt (FY15)
Cash & cash equivalents (FY15)
EV
52 week H/L 3808/2250
Equity capital | 85.0 crore
Face value | 5
| 59800 crore
Amount
| 59280 crore
| 3635 crore
| 3114 crore
Price performance (%)
1M 3M 6M 1Y
Dr Reddy's Labs -8.7 4.1 0.8 27.4
Sun Pharma -15.2 2.8 4.8 54.8
Lupin -11.0 8.1 22.9 82.3
Dr Reddy’s Laboratories (DRREDD) | 3485
Research Analyst
Siddhant Khandekar
siddhant.khandekar@icicisecurities.com
Mitesh Shah
mitesh.sha@icicisecurities.com
Nandan Kamat
nandan.kamat@icicisecurities.com
ICICI Securities Ltd | Retail Equity Research
Page 2
Variance analysis
Q4FY15 Q4FY15E Q4FY14 Q3FY15
Y
oY (%) QoQ (%) Comments
Revenue 3,870.4 3,993.0 3,480.9 3,843.1 11.2 0.7 The growth was mainly driven by 14.6% growth in the US and 15.7% growth in
India.
Raw Material 1,089.6 958.3 927.7 961.7 17.4 13.3 Raw material cost increase was mainly due to adverse product mix, inventory
write-off in the US and currency fluctuation
Other manufacturing expenses 658.8 678.8 561.0 646.2 17.4 1.9
SGNA 794.5 878.5 835.1 857.5 -4.9 -7.3
R & D cost 514.4 447.2 398.5 431.6 29.1 19.2 R&D cost as percentage of sales increased 184 bps to 13.3% on account of
planned scale up in overall R&D spend and filing of three NDAs
Write down of Intangible assets 0.0 0.0 0.0 0.0 0.0 0.0
Write down of goodwill 0.0 0.0 0.0 0.0 0.0 0.0
Other (income)/expenses -12.5 -8.0 -22.6 -34.1 NA NA
Total Expenditure 1,296.4 1,317.7 1,211.0 1,255.1 7.1 3.3
EBITDA 825.6 1,038.2 781.3 980.2 5.7 -15.8
EBITDA (%) 21.3 26 22.4 25.5 -111 bps -417 bps Fall in margins was mainly on account of increase in R&D spend, change in
product mix and currency volatility in the emerging markets
Depreciation 213.7 195.9 195.6 257.4 9.3 -17.0
Finance (income)/ expenses 23.3 -42.0 -16.4 -101.3 LP LP
Share of pr/(loss) to equity investee 4.4 5.0 4.8 4.7 -9.7 -6.2
Tax 74.2 133.4 125.2 254.1 -40.8 -70.8
Net Profit 518.8 755.9 481.7 574.6 7.7 -9.7 Increase in profit was mainly in line with lower operational performance
Key Metrics
North America formulations 1715.4 1945.3 1496.4 1681.9 14.6 2.0 Growth was on account of acquiring of Habitrol brand and increased market
shares in key products. Delta vis-à-vis estimates was on account of lower-than-
expected injectable sales
Europe formulations 234.1 147.2 177.4 194.7 32.0 20.2 Growth was mainly due to new CNS products launches in UK and Germany's
non tender business
India formulations 474.4 459.3 410.1 432.8 15.7 9.6 The growth was mainly on the back of volume expansion in focused brands and
new launches (three products)
Russia & Other CIS formulations 328.9 341.6 451.9 476.6 -27.2 -31.0 The decline was mainly on account of depreciation of Rouble and higher base.
On a constant currency basis, Russia grew 3% YoY
RoW markets formulations 346.5 382.2 196 383.2 76.8 -9.6 Growth was mainly due to robust growth in Venezuela on continuous volume
uptick
PSAI segment 741.5 630.5 664.1 611.2 11.7 21.3 Strong growth on the back of lower base
Proprietary products & Others 29.6 86.8 85.1 89.76 -65.2 -67.0
Source: Company, ICICIdirect.com Research
Change in estimates
(| Crore) Old New % Change Old New % Change
Revenue 17,036.9 17,291.5 1.5 19,538.3 19,438.4 -0.5
EBITDA 4,091.1 4,065.1 -0.6 4,789.3 4,667.0 -2.6
EBITDA Margin (%) 24.0 23.5 -50 bps 24.5 24.0 -50 bps
PAT 2,582.8 2,562.6 -0.8 3,143.6 3,048.2 -3.0
EPS (|) 152.1 150.9 -0.8 185.1 179.5 -3.0
FY16E FY17E
Source: Company, ICICIdirect.com Research
Assumptions
Comments
Growth (%) FY14 FY15 FY16E FY17E FY16E FY17E
North America formulations 73.4 17.1 23.9 15.0 20.0 22.0 We have reduced our US growth assumption due to higher base on account of
Habitrol acqusition and slow product approvals
Europe formulations -15.6 3.0 -0.7 -0.9 -0.5 -1.0
India formulations 21.5 13.7 21.3 16.7 15.0 15.0
Russia & Other CIS formulations 49.5 -10.6 0.9 5.0 0.9 5.0
RoW markets formulations 88.5 77.4 35.3 25.0 30.0 25.0
PSAI segment 0.7 6.2 1.7 2.0 1.7 2.0
Proprietary products & Other 13.1 -19.4 2.0 2.0 2.0 2.0
Current Earlier
Source: Company, ICICIdirect.com Research

ICICI Securities Ltd | Retail Equity Research
Page 3
Company Analysis
Established in 1984, Dr Reddy’s Laboratories (DRL) is one of India’s
pedigreed players with a firm footing in the US and other export markets.
DRL has deep rooted product and market knowledge across therapies.
Like Cipla, DRL also recognised the importance of having good
manufacturing practices (GMP) accreditation in the eighties and
eventually got USFDA approval (first of its kind approval for a formulation
facility in India) in 1987. The company owns 22 manufacturing facilities
and four developing centres across the globe. The facilities have been
approved by various agencies like the USFDA, WHO-Geneva, UKMHRA,
TGA-Australia, MCC-South Africa, DMA Denmark, Brail ANVISA, among
others. Over the years, along with generics, the company also established
itself in the field of discovery of new chemical entities (NCEs) but with
little success.
DRL’s business can be classified into three broad segments- 1) global
generics (GG), 2) pharmaceutical services and active ingredients (PSAI)
and 3) proprietary products (PP). GG (81% of revenues) includes branded
and unbranded prescription and over-the-counter (OTC) products
business. It also includes the operations of the biologics business. This
segment comprises formulation sales to regulated markets of the US,
Europe and emerging markets such as Russia/CIS, India and RoW.
PSAI (17% of revenues) consists of the active pharmaceutical ingredients
(API) business and custom pharmaceutical services (CPS) business. PP
(2% of revenues) consists of NCEs, differentiated formulations and
dermatology focused specialty business operated through Promius
Pharma.
DRL is one of the few Indian companies to foray into new drug discovery
& development (NDDS) and new chemical entity (NCE) research. The
company started research operations in 1992 through a non profit
organisation, Dr Reddy’s Research Foundation, which was later merged
into the company. Despite being an early entrant, the company is yet to
taste success in it. DRL is also the first Indian company to out-license
molecules to big pharma companies.
DRL has spent around 8-9% of the turnover on R&D in the last four years
but this figure is likely to touch 10-11%, going ahead. Beside ANDAs, it
has also filed 10 new drug applications (NDAs) in the 505 b (2) route that
are awaiting approval.
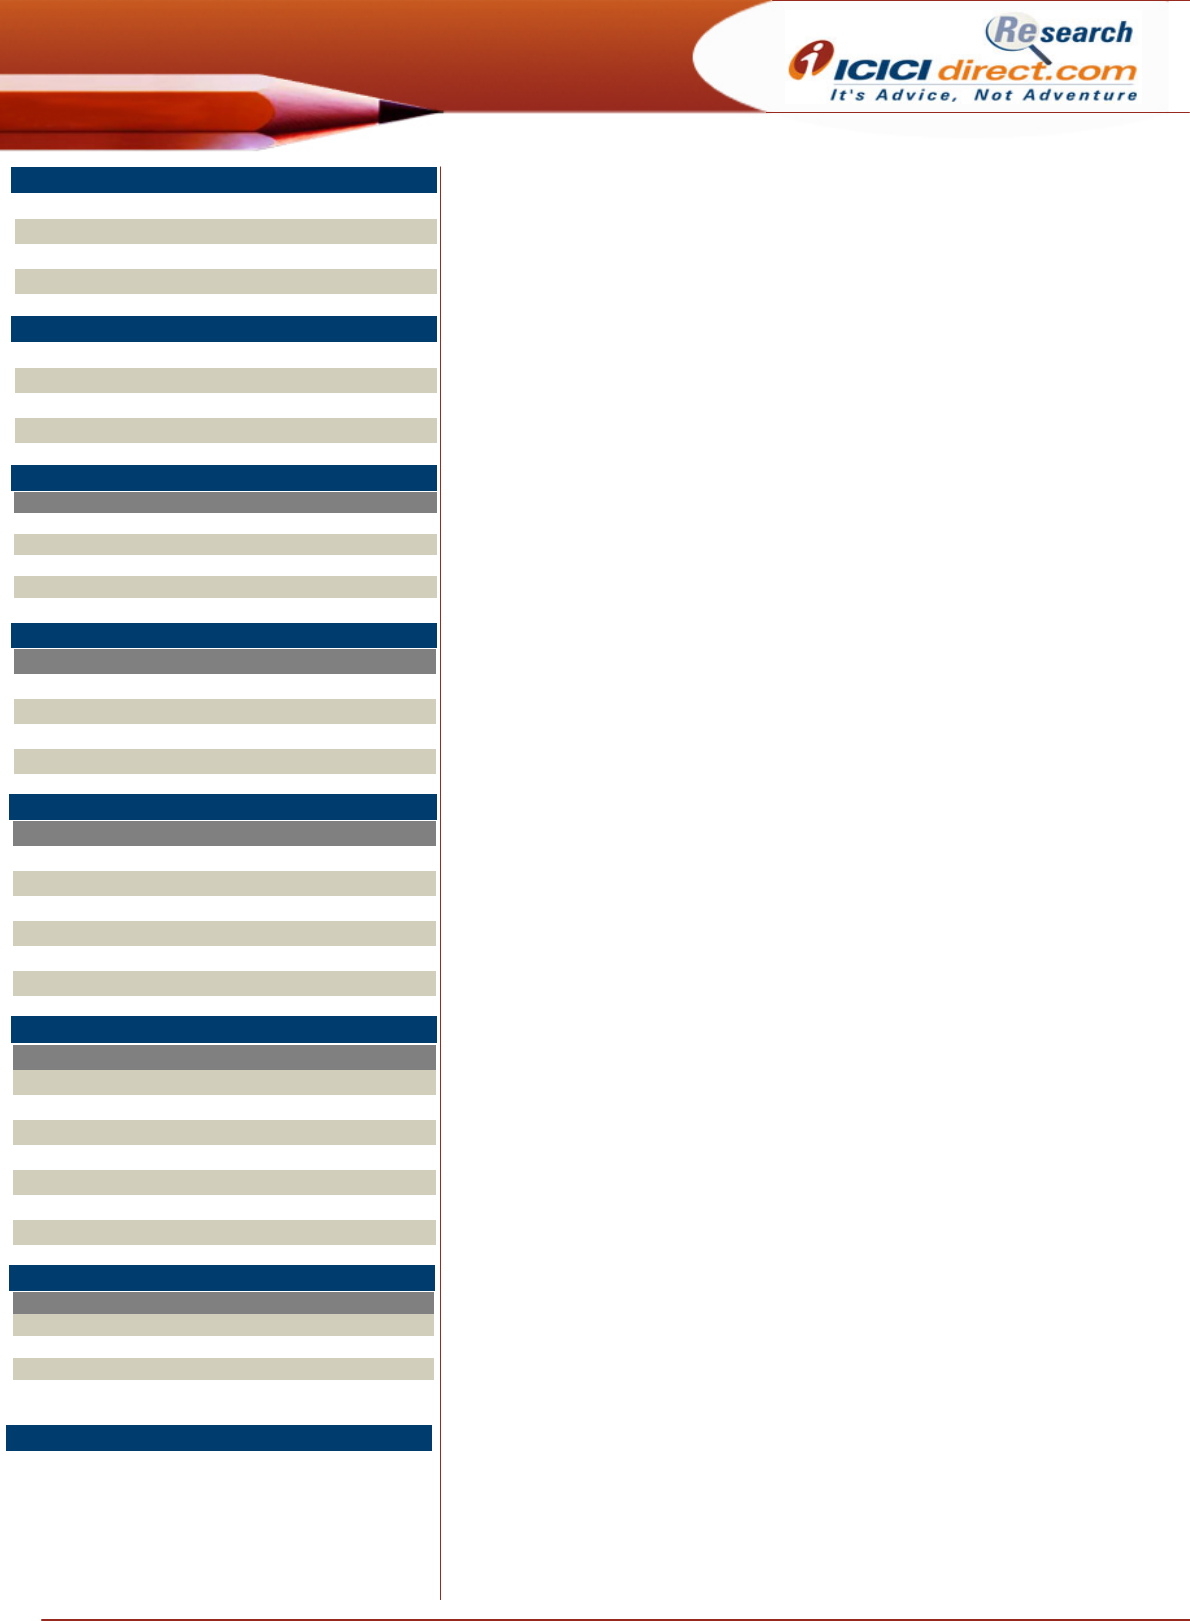
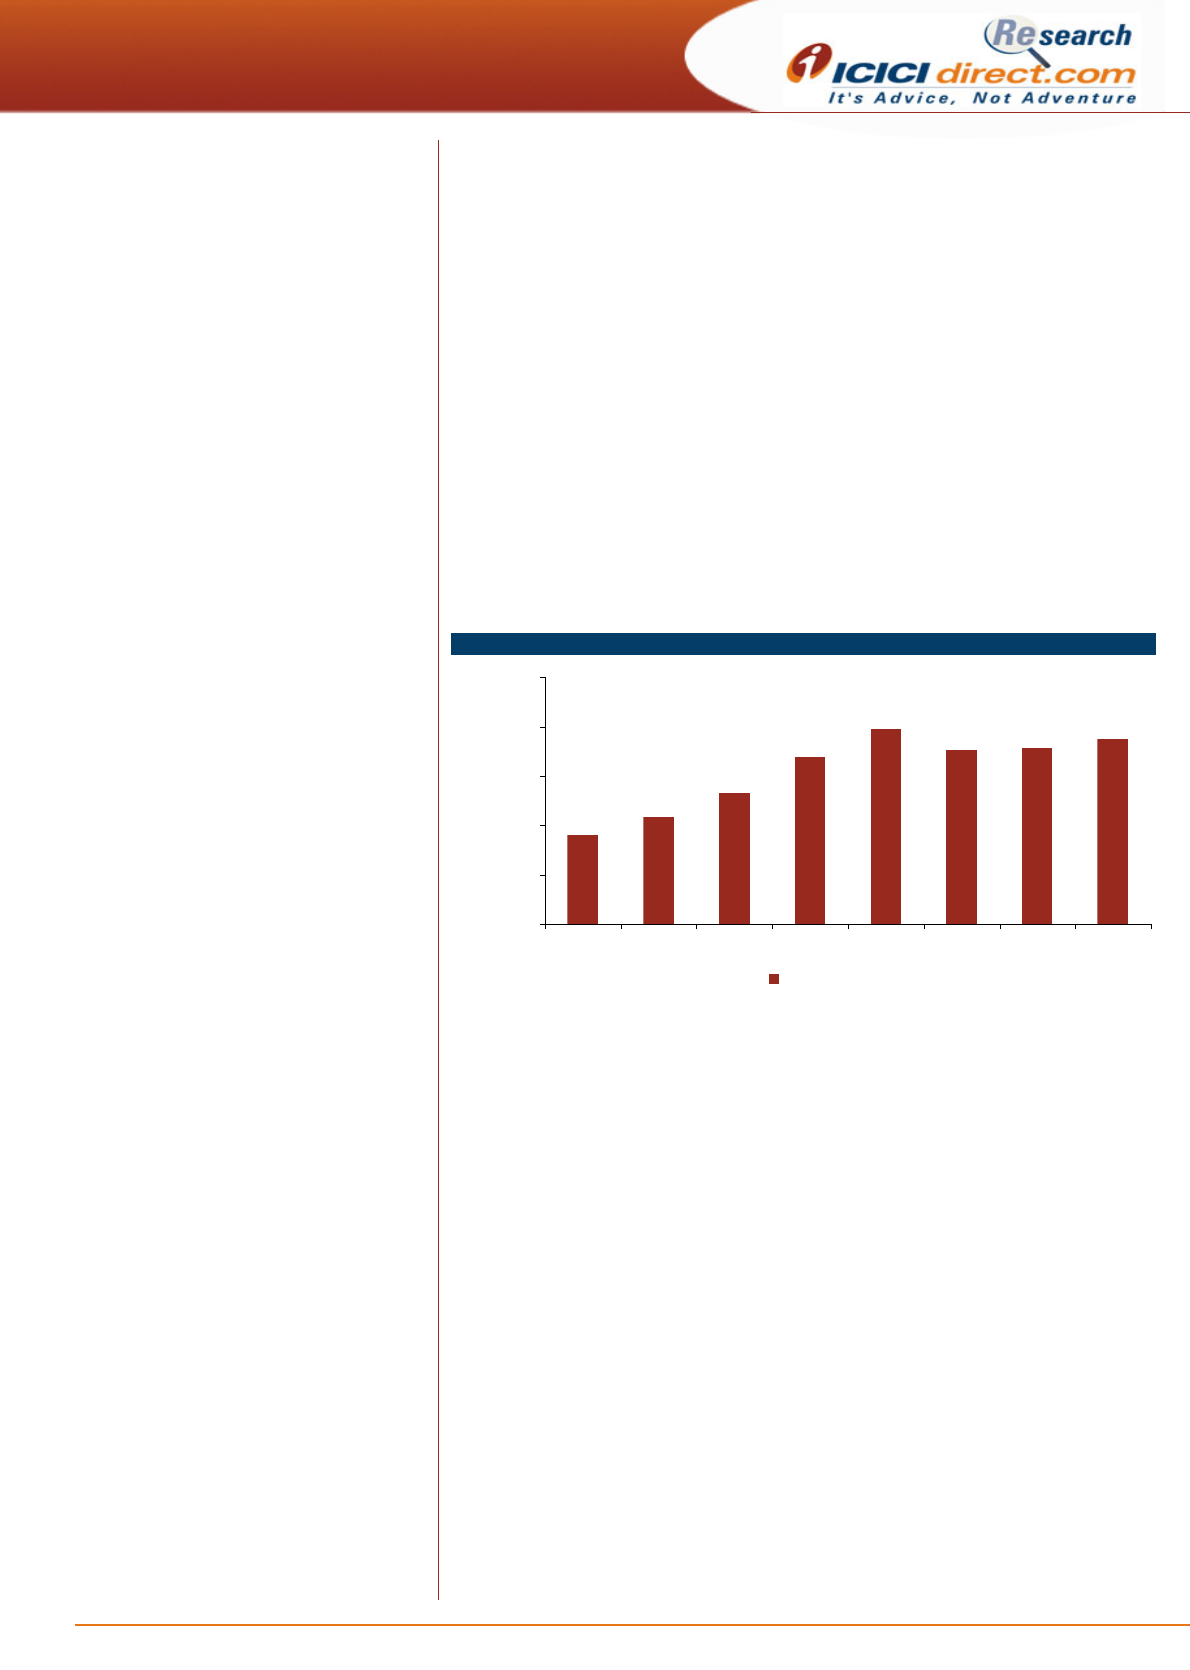
We expect revenues to grow at 15% CAGR to | 19438 crore in FY15-17E,
on the back of growth in the GG segment. This, in turn, will be driven by
the US. The GG is likely to grow at a CAGR of 17% to | 16544 crore
during the same period. On the other hand, the PSAI segment is likely to
slow down, mainly on the back of 1) higher internal consumption and 2)
pricing pressure/order uncertainty in the API and CPS segments,
respectively. The PSAI segment is likely to register 2% CAGR to | 2640
crore in FY15-17E.
ICICI Securities Ltd | Retail Equity Research
Page 4
Exhibit 1: Revenues to grow at CAGR of 15% in FY15-17E
7027.7 7469.3
9673.7
11626.6
13217.0
14818.9
17291.5
19438.4
0
4000
8000
12000
16000
20000
24000
FY10 FY11 FY12 FY13 FY14 FY15 FY16E FY17E
(| crore)
Revenues
Source: Company, ICICIdirect.com Research
Exhibit 2: Geography wise revenue break-up
(| crore) FY10 FY11 FY12 FY13 FY14 FY15 FY16E FY17E
North America 1681.7 1899.6 3188.9 3784.6 5530.3 6473.4 8018.7 9221.5
Europe 963.8 843.1 825.9 771.6 697.0 718.1 713.1 706.8
India 1015.8 1169.0 1293.1 1456.0 1571.3 1787.0 2167.6 2530.2
Russia & Other CIS 911.9 1085.8 1326.0 1690.8 1981.9 1771.4 1787.5 1876.9
RoW 287.3 336.5 390.4 553.3 735.9 1305.7 1766.9 2208.6
Global Generics 4860.5 5334.0 7024.3 8256.3 10516.4 12055.7 14453.8 16544.0
North America 367.3 317.0 427.2 574.4 435.4 460.5 469.7 479.1
Europe 665.2 702.0 842.4 1200.7 877.0 945.2 955.8 974.9
India 264.6 261.9 358.6 463.8 378.7 441.1 450.0 459.0
RoW 743.3 683.8 753.1 831.3 706.3 698.8 712.8 727.0
PSAI 2040.4 1964.7 2381.3 3070.2 2397.4 2545.7 2588.3 2640.0
Prop. Products & Others 126.8 170.5 268.2 300.1 303.3 244.6 249.5 254.4
Total 7027.7 7469.2 9673.8 11626.6 13217.1 14845.9 17291.5 19438.4
Source: Company, ICICIdirect.com Research
US remains in sweet spot; banking on capabilities and capacity
The US contributes more than 98% of North American sales while the
remaining sales are from Canada. DRL has four USFDA approved
formulations facilities including two in the US. The company operates in
the prescriptions (Rx) and OTC segments in the US market. The sales are
channelled through drug stores, drug wholesalers, health maintenance
organisations and pharmacy chains. DRL is also an authorised supplier to
the US government. After establishing itself in the US generics space, the
focus was shifted to the first to file (FTFs) and AG space.
From FY08 onwards, DRL started filing limited competition/niche products
like injections, controlled releases and complex generics in the US market
in order to reduce the dependence on plain generics. DRL also owns one
of the largest over the counter (OTC) product portfolios in the US.
DRL has a strong product pipeline of 220 ANDAs with 68 pending
approvals. Of these, 43 are Para IVs while 13 have first to file (FTF) status.
Beside ANDAs, DRL has also filed seven NDAs through the 505 b (2)
route, which are awaiting approval. We expect the company to file 18-20
ANDAs every year, going ahead. Going by the future pipeline, (we expect
DRL to launch eight to 10 products per annum, which includes at least
two or three complex products every year besides plain vanilla generic
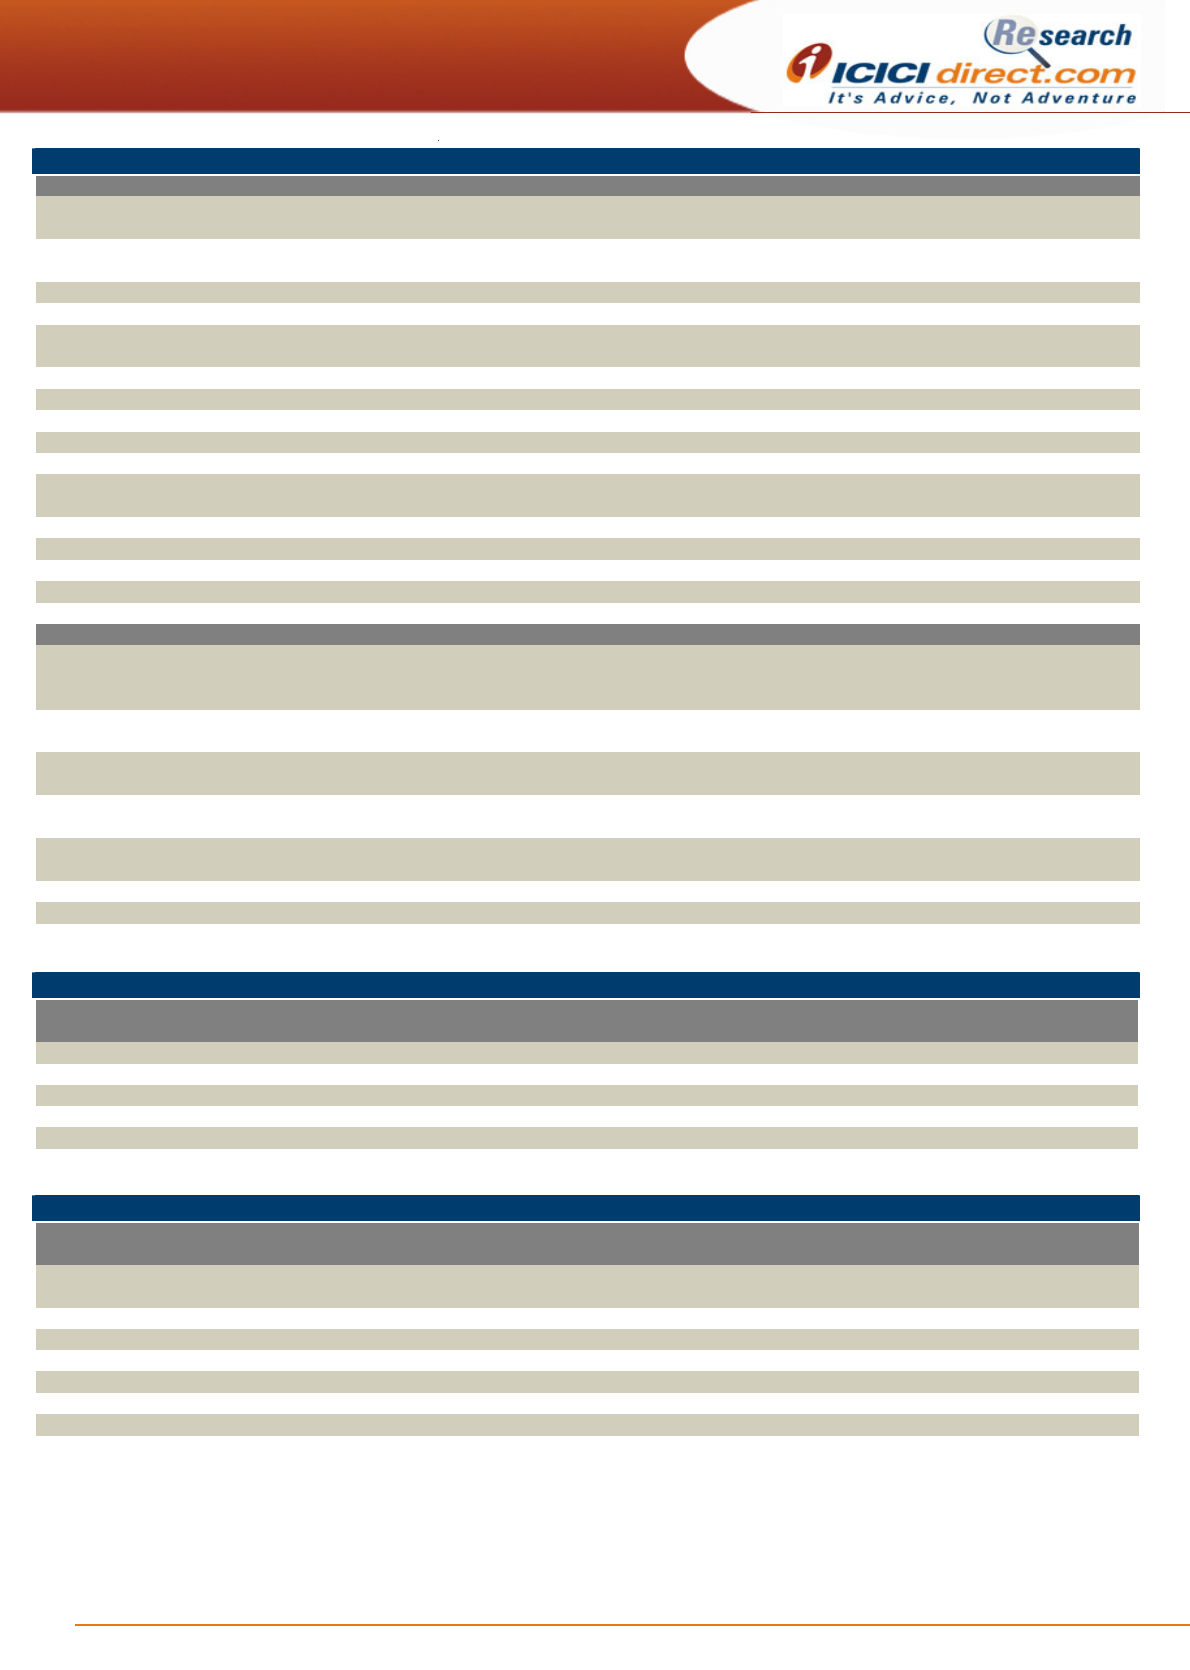
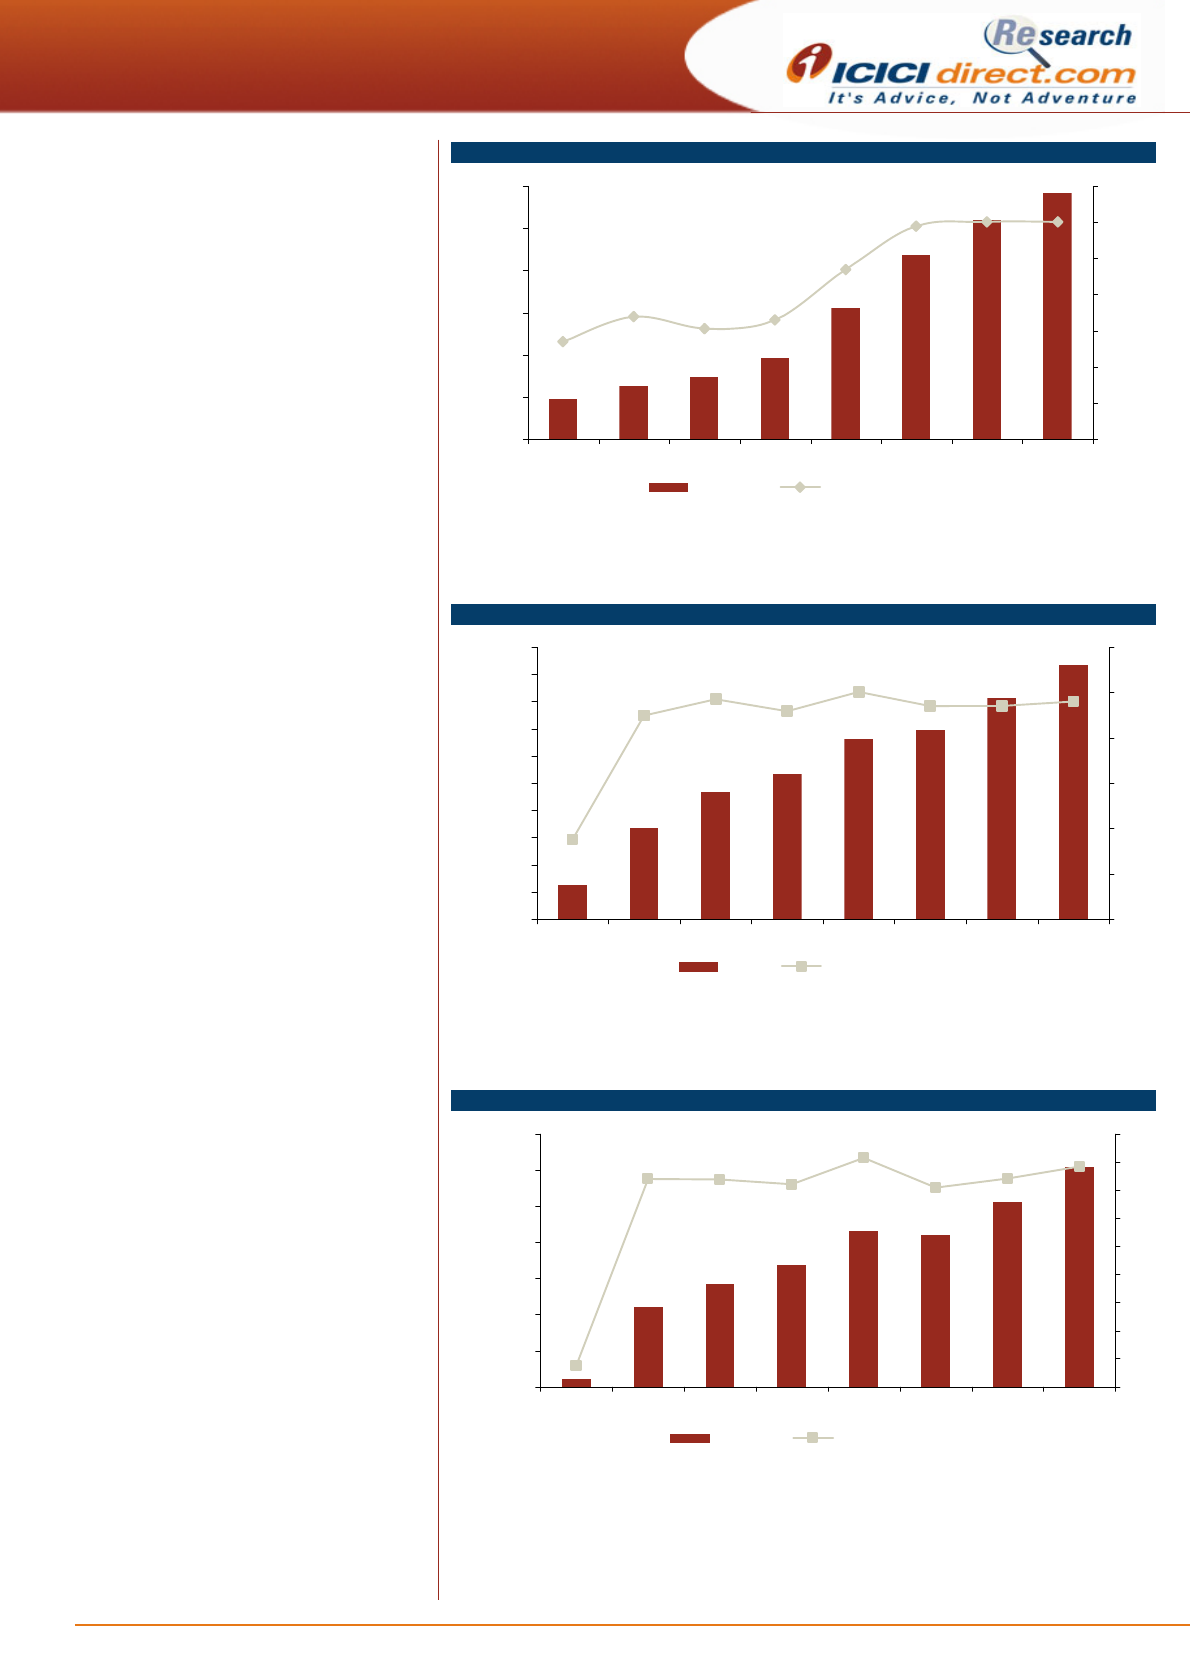
and FTF opportunities. We expect sales from North America to grow at a
CAGR of 19% in FY15-17E.
ICICI Securities Ltd | Retail Equity Research
Page 5
Exhibit 3: North America sales to be driven by robust pipeline
1681.7 1899.6
3188.9
3784.6
5530.3
6473.4
8018.7
9221.5
0
1000
2000
3000
4000
5000
6000
7000
8000
9000
10000
FY10 FY11 FY12 FY13 FY14 FY15 FY16E FY17E
(| crore)
North America
Source: Company, ICICIdirect.com Research
India: Field force expansion, niche forays to drive growth
DRL ranks seventeenth (in terms of market share, AIOCD, April, 2015)
with a market share of 2.16%. The acute-chronic ratio currently stands at
70:30. Gastrointestinal (GI) is the largest therapeutic group and the
company ranks fifth in this therapeutic group. In many other therapies,
however, it remains a marginal player. The only therapeutic category,
where it holds No. 1 position is anti-neoplastics (oncology), which as a
therapy remains an important but untapped opportunity. To bolster the
domestic franchise, DRL has almost doubled the MR strength from 2250
in FY09 to ~4300 as of today. In order to push domestic growth, DRL has
forayed into the complex biosimilars space, which till date has not
witnessed much crowding. At the same time, these products have not
witnessed the expected traction either. It launched the first biosimilar
oncology product Filgrastim under the brand name Grafeel in 2001. Again
in 2007, it launched another oncology product Rituximab, a biosimilar of
Roche’s blockbuster Mabthera under the brand name Reditux. Overall, it
has launched four biosimilars till date including these two.
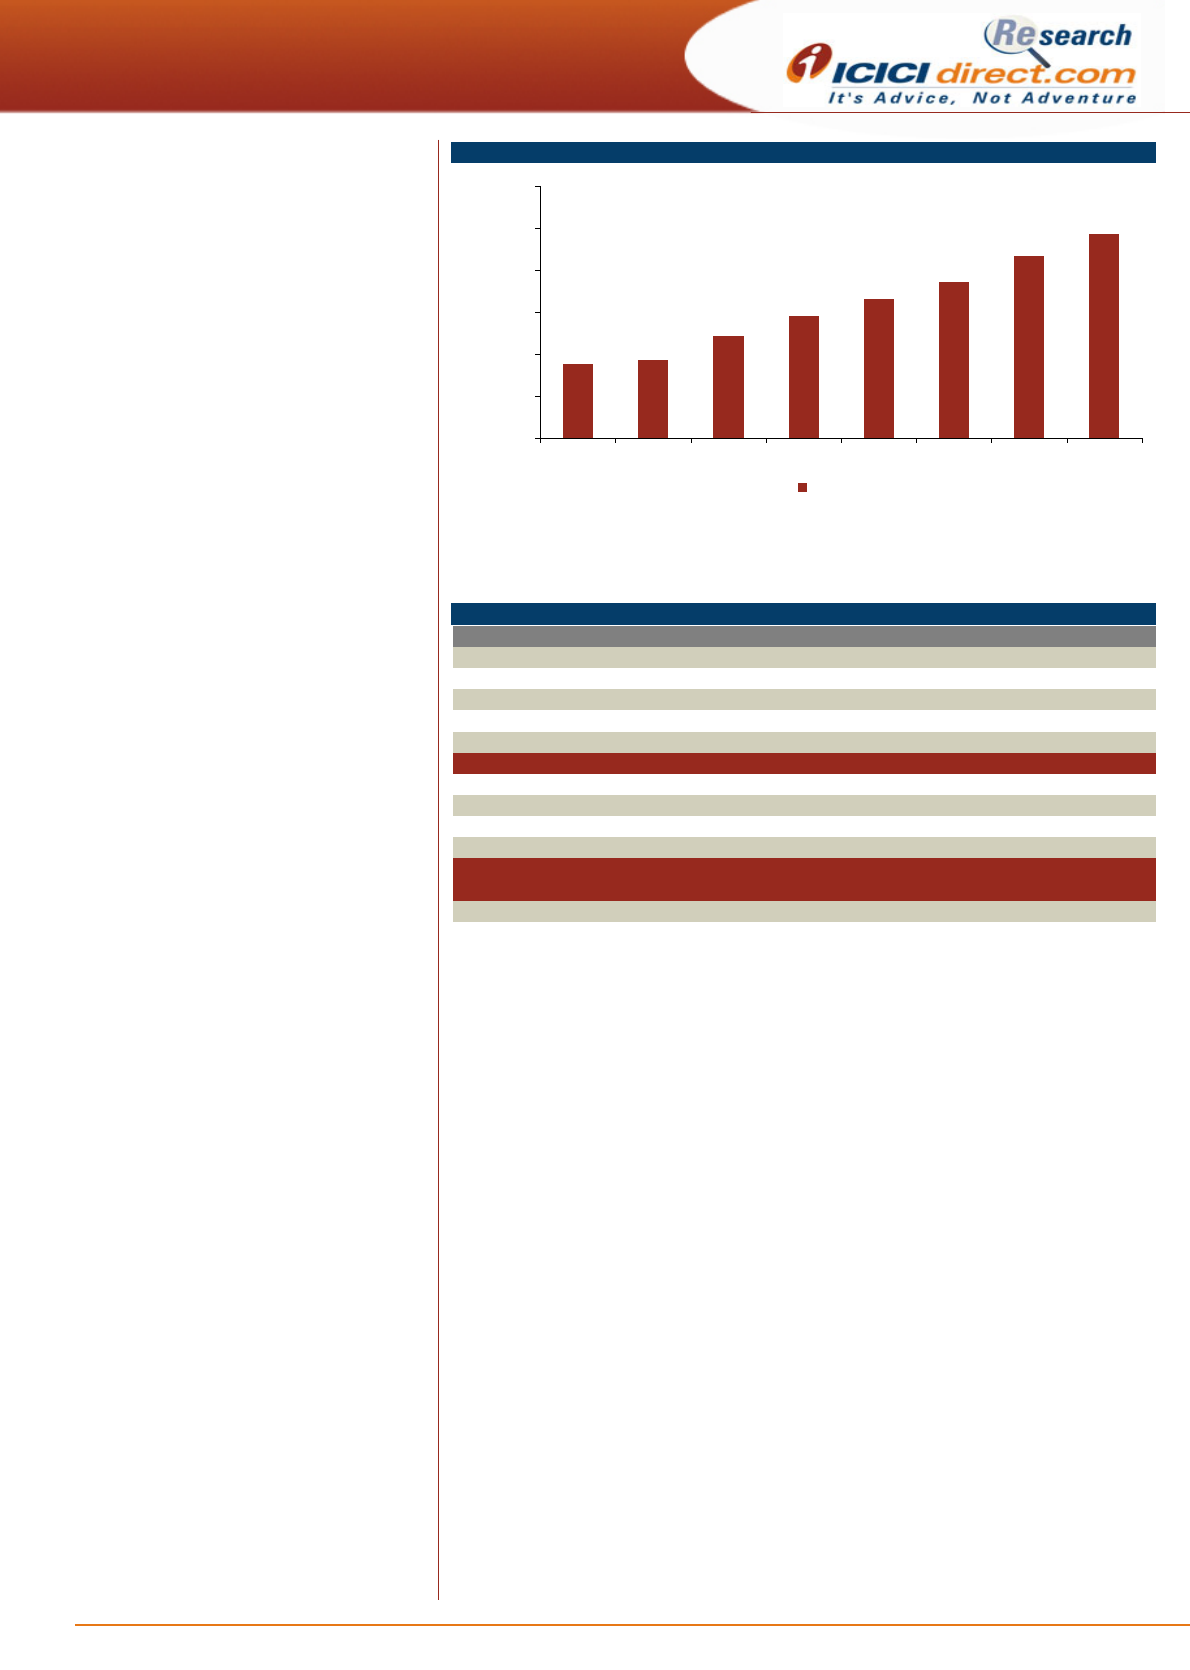
Exhibit 4: New launches, improved MR productivity to drive domestic growth
1015.8 1169.0 1293.1
1456.0 1571.3
1787.0
2167.6
2530.2
0
400
800
1200
1600
2000
2400
2800
FY10 FY11 FY12 FY13 FY14 FY15 FY16E FY17E
(| crore)
India
Source: Company, ICICIdirect.com Research
Another interesting high growth/low penetration space for DRL is
oncology. It owns the branded portfolio of products such as Capibine
(Capecitabine), Docetere (Docetaxel) and Cytogem (Gemcitabine).We
expect Indian formulations to grow at a CAGR of 19% in 2015-17E. As per
the management, the NLEM 2011 impact is confined to just ~3-5% of
domestic sales.
ICICI Securities Ltd | Retail Equity Research
Page 6
Russia & CIS - banking on experience; region of late has become volatile
DRL was the first Indian entrant in Russia and the CIS, dating back to
1992. Early entry into these markets has helped the company to get hold
of the changing dynamics of these high potential but notoriously volatile
territories. The CIS segment includes countries such as Ukraine, Belarus,
Kazakhstan and Uzbekistan. Russia comprises ~83% of the overall Russia
& CIS (RCIS) segment.
DRL has consolidated its position in the Russian market by focusing on
select therapies such as pain management, anti-infectives, gastro-
intestinal, respiratory, oncology and cardiovascular encompassing
prescription, OTC and hospital sales. The top four brands: Nise, Omez,
Ketorol and Cetrine constituted ~60% of overall Russian sales.
DRL has also struck in-licensing deals with other Indian companies such
as Cipla and Torrent. However, due to the political unrest and sanctions
due to Ukrainian invasion, the region has lost its safe haven status for DRL
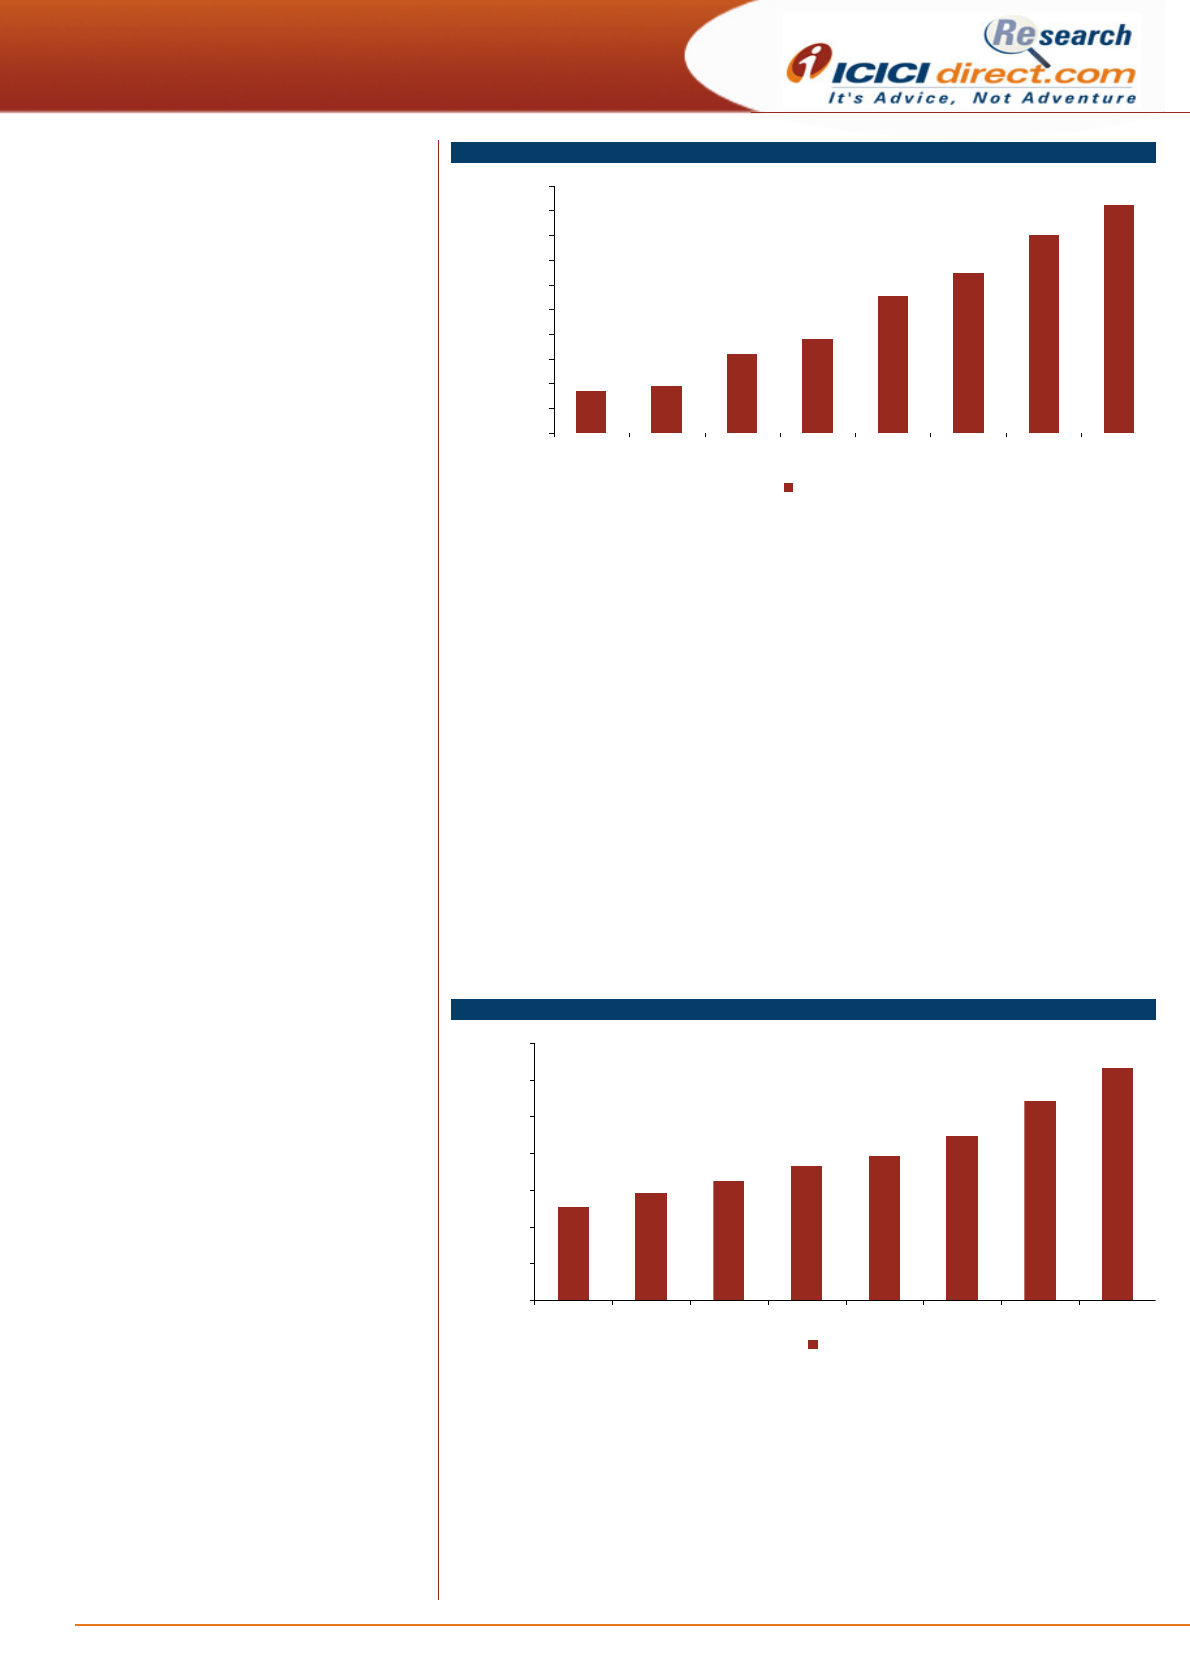
besides Rouble volatility. We expect sales from Russia CIS to grow at a
CAGR of 3% in FY15-17E.
Exhibit 5: Russia & CIS to witness tempered growth due to regional issues
911.9
1085.8
1326.0
1690.8
1981.9
1771.4 1787.5 1876.9
0
500
1000
1500
2000
2500
FY10 FY11 FY12 FY13 FY14 FY15 FY16E FY17E
(| crore)
Russia & Other CIS
Source: Company, ICICIdirect.com Research
R&D cost to increase further
Dr Reddy’s is one of the few Indian companies to foray into new drug
discovery & development (NDDS) and new chemical entity (NCE) research
with a focus on therapies like dermatology, anti-inflammatory and anti-
infectives from CVS and diabetics. DRL is also the first Indian company to
launch biosimilars in the domestic market.
The R&D cost is expected to be ~12% of turnover in FY16 mainly due to
higher spend in (i) complex generic including injectables and (ii)
biosimilars and novel drug discovery.
ICICI Securities Ltd | Retail Equity Research
Page 7
Exhibit 6: R&D cost to go up due to complex generics and biosimilars
379.3 506.0 591.1
767.4
1240.2
1744.8
2075.0
2332.6
5.4
6.8 6.1 6.6
9.4
11.8 12.0 12.0
0
400
800
1200
1600
2000
2400
FY10 FY11 FY12 FY13 FY14 FY15E FY16E FY17E
(| crore)
0
2
4
6
8
10
12
14
(%)
R & D cost R & D cost (% of revenues)
Source: Company, ICICIdirect.com Research
Exhibit 7: Higher R&D cost likely to restrict improvement in EBITDA margins
616.8
1677.7
2346.5
2666.1
3312.7 3482.7
4065.1
4667.0
8.8
22.5
24.3 22.9
25.1 23.5 23.5 24.0
0
500
1000
1500
2000
2500
3000
3500
4000
4500
5000
FY10 FY11 FY12 FY13 FY14 FY15 FY16E FY17E
(| crore)
0
5
10
15
20
25
30
EBITDA EBIDTDA Margins(%)
Source: Company, ICICIdirect.com Research
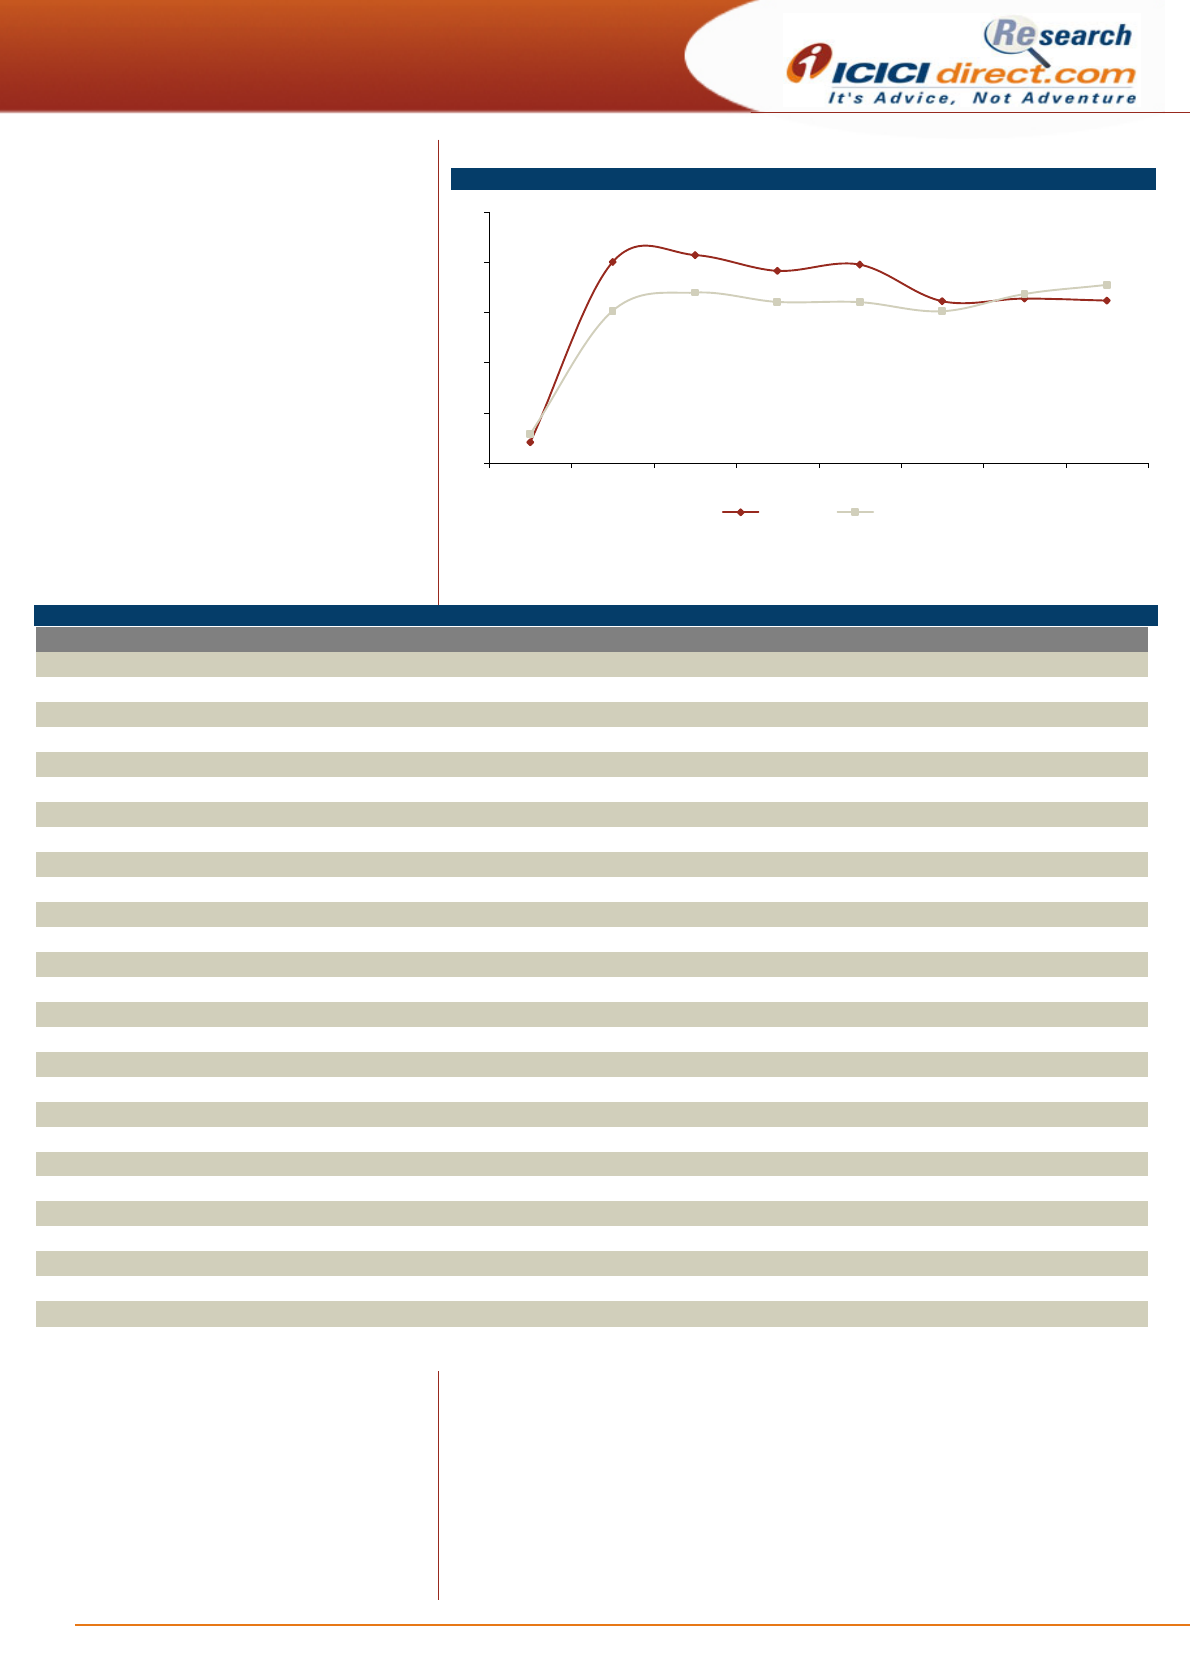
Exhibit 8: Net profit to grow at CAGR of 21% in FY14-17E on high base
1104.0
1426.2
1677.6
2151.3 2099.0
2562.6
3048.2
106.8
1.5
14.8 14.7 14.4
16.3
14.8 15.7
14.2
0
500
1000
1500
2000
2500
3000
3500
FY10 FY11 FY12 FY13 FY14 FY15 FY16E FY17E
(| crore)
0
2
4
6
8
10
12
14
16
18
Net Profit Net Profit Margins (%)
Source: Company, ICICIdirect.com Research
ICICI Securities Ltd | Retail Equity Research
Page 8
Exhibit 9: Trends in return ratios
2.5
24.0 24.8
19.3 19.6 19.4
18.2
20.4
18.1
21.3
23.0
23.7
3.5
19.2
19.2
20.2
0
6
12
18
24
30
FY10 FY11 FY12 FY13 FY14 FY15 FY16E FY17E
RoNW (%) RoCE (%)
Source: Company, ICICIdirect.com Research
Exhibit 10: Trend in quarterly financials
| Crore Q4FY12 Q1FY13 Q2FY13 Q3FY13 Q4FY13 Q1FY14 Q2FY14 Q3FY14 Q4FY14 Q1FY15 Q2FY15 Q3FY15 Q4FY15 YoY (%) QoQ (%)
Revenues 2658.4 2540.6 2880.9 2865.2 3340.0 2844.9 3357.5 3533.8 3480.9 3517.5 3587.8 3843.1 3870.4 11.2 0.7
(inc)/dec in SIT & WIP 13.7 -123.4 -75.1 -45.4 107.8 -118.8 -100.8 -33.6 -77.8 -69.3 -123.8 -127.0 264.5
Raw Material 844.0 902.8 959.9 943.7 1030.0 943.9 986.7 890.7 1005.5 853.6 968.8 1088.6 825.1 -17.9 -24.2
Other manufacturing exp. 403.6 407.2 465.6 478.1 517.6 517.8 524.7 537.5 561.0 648.8 644.2 646.2 658.8 17.4 1.9
Cost of Revenues 1261.4 1186.5 1350.4 1376.3 1655.5 1343.0 1410.6 1394.7 1488.7 1433.2 1489.2 1607.9 1748.4 17.4 8.7
% of Revenues 47.4 46.7 46.9 48.0 49.6 47.2 42.0 39.5 42.8 40.7 41.5 41.8 45.2 241 bps 333 bps
Gross Profit 1397.0 1354.1 1530.5 1488.8 1684.6 1501.9 1946.9 2139.1 1992.2 2084.4 2098.6 2235.2 2122.1 6.5 -5.1
Gross Profit Margins (%) 52.6 53.3 53.1 52.0 50.4 52.8 58.0 60.5 57.2 59.3 58.5 58.2 54.8 -241 bps -333 bps
SGNA 581.1 698.0 663.7 718.9 722.9 718.1 800.4 815.3 835.1 880.7 871.6 857.5 794.5 -4.9 -7.3
% of Revenues 21.9 27.5 23.0 25.1 21.6 25.2 23.8 23.1 24.0 25.0 24.3 22.3 20.5 -346 bps -179 bps
R & D cost 174.1 156.4 175.8 202.5 232.6 243.0 300.9 297.9 398.5 387.5 411.3 431.6 514.4 29.1 19.2
% of Revenues 6.6 6.2 6.1 7.1 7.0 8.5 9.0 8.4 11.4 11.0 11.5 11.2 13.3 184 bps 206 bps
Other (income)/expense -19.9 -21.8 -39.6 -23.3 -163.2 -37.6 -63.7 -17.7 -22.6 -18.5 -26.6 -34.1 -12.5 -44.6 -63.3
% of Revenues -0.7 -0.9 -1.4 -0.8 -4.9 -1.3 -1.9 -0.5 -0.7 -0.5 -0.7 -0.9 -0.3 33 bps 56 bps
Total Expenditure 2100.8 2019.1 2219.0 2274.5 2447.9 2266.5 2448.1 2490.1 2699.7 2682.9 2745.6 2862.9 3044.8 12.8 6.4
% of Revenues 79.0 79.5 77.0 79.4 73.3 79.7 72.9 70.5 77.6 76.3 76.5 74.5 78.7 111 bps 417 bps
EBITDA 557.6 521.5 661.8 590.7 892.1 578.5 909.3 1043.7 781.3 834.7 842.2 980.2 825.7 5.7 -15.8
EBITDA Margins (%) 21.0 20.5 23.0 20.6 26.7 20.3 27.1 29.5 22.4 23.7 23.5 25.5 21.3 -111 bps -417 bps
Depreciation 140.5 129.7 137.6 138.2 149.4 161.3 173.3 179.3 195.6 187.2 195.7 257.5 213.7 9.3 -17.0
EBITA 417.1 391.8 524.2 452.5 742.7 417.2 736.0 864.4 585.7 647.5 646.5 722.7 612.0 4.5 -15.3
Finace (income)/exp. -8.2 21.2 -37.1 9.7 -39.8 7.0 -29.1 -1.5 -16.4 -48.1 -42.1 -101.3 23.3 -242.2 -123.0
Share of pr./(loss) 1.1 1.9 2.8 3.1 2.5 3.6 4.4 4.7 4.8 5.3 5.1 4.7 4.4 -9.7 -6.2
EBT 426.4 372.5 564.2 446.0 785.0 413.7 769.5 870.6 606.9 700.9 693.7 828.6 593.0 -2.3 -28.4
Tax 83.7 36.5 156.7 82.7 214.1 52.8 79.3 252.1 125.2 150.5 119.6 254.1 74.2 -40.8 -70.8
Tax % 19.6 9.8 27.8 18.5 27.3 12.8 10.3 29.0 20.6 21.5 17.2 30.7 12.5
Net Profit 342.7 336.0 407.4 363.3 570.9 360.9 690.2 618.5 481.7 550.4 574.1 574.5 518.8 7.7 -9.7
% of Revenues 12.9 13.2 14.1 12.7 17.1 12.7 20.6 17.5 13.8 15.6 16.0 14.9 13.4
Source: Company, ICICIdirect.com Research

ICICI Securities Ltd | Retail Equity Research
Page 9
SWOT Analysis
Strengths – A seasoned player in the US generic space with a proven
track record. A strong US pipeline with many FTF/limited competition
products. The largest Indian player in Russia/CIS.
Weakness – The PSAI and European businesses remain a drag on
margins and growth. Higher R&D spends in future are expected to put
pressure on current margins. The Russian region has also become volatile
and unpredictable due to political unrest.
Opportunities - The US generics space has scope for complex/limited
competition products. The biosimilars space across the globe. Indian
franchise is still pretty small for a player of DRL’s calibre.
Threats - Increased USFDA scrutiny across the globe regarding cGMP
issues and consolidation in the US pharmacy space. Its Srikakulam API
plant has recently received Form 483 from the USFDA with nine
observations.
Conference call highlights
• DRL expects four or five meaningful USFDA approvals in FY16
• The company expects to complete the acquisition of UCB’s
domestic portfolio by Q1FY16
• The company has completed the site transfer and updated the
USFDA for gNexium API from Srikakulam facility (that received
Form 483 observations) to other API plant
• The company has registered balance sheet translation loss in
Venezuela to the tune of US$14 million in FY15 due to the
prevalence of three-tier currency system in Venezuela. DRL has
applied SIMADI rate of VEF193/US$ to translate its net monetary
assets, other than those which qualify for the CENCOEX rate of
VEF6.3/US$. This has been included in the financial income (net)
• The company expects its R&D cost at ~12% in FY16E. DRL
spends 60% of its R&D on generics & APIs and the remaining on
proprietary and biosimilar products
• The company has hedged US$440 million of cash flow (40-60% of
US forecasted cash flow) for the next 18 months and US$291
million of balance sheet in the range of | 60-64.5/US$. It has also
hedged Russian cash flows of RUB 1760 million (~30% of
forecasted cash flow) at the rate of | 1.16/RUB for FY16
• In Q4FY15, it filed and launched one product each in the US. Till
date, the company is awaiting 68 ANDA approvals, which
includes 43 Para IV filings comprising 13 products with FTF status.
Total ANDA filings stood at 220
• The company filed eight DMFs in Europe in Q4FY15. Global
cumulative DMF filings have reached 735
• The injectable business contribution was ~US$280 million (~27%
of total US sales) in FY15
• The OTC business contributed 36% in FY15 in Russia’s total sales
ICICI Securities Ltd | Retail Equity Research
Page 10
Valuation
The miss was on the back of slower US growth and negative Russian
growth. With Russia now struggling, the US and India together hold the
key for global generics growth as well as DRL’s overall growth. Among
them, the US is the main catalyst with a pending product portfolio of 68
ANDAs, which include 43 Para IVs and 13 FTFs. The company is investing
heavily in R&D to bring more and complex generics and limited
competition products mainly from non-oral category, which is likely to
take care of sustained US growth for the next two or three years. India is
showing promising growth as well with a recalibrated approach. On the
flip side, Russia has become a new matter of concern besides Europe and
the PSAI segment. We have ascribed a target price of | 3949 based on
22x FY17E EPS of | 179.5.
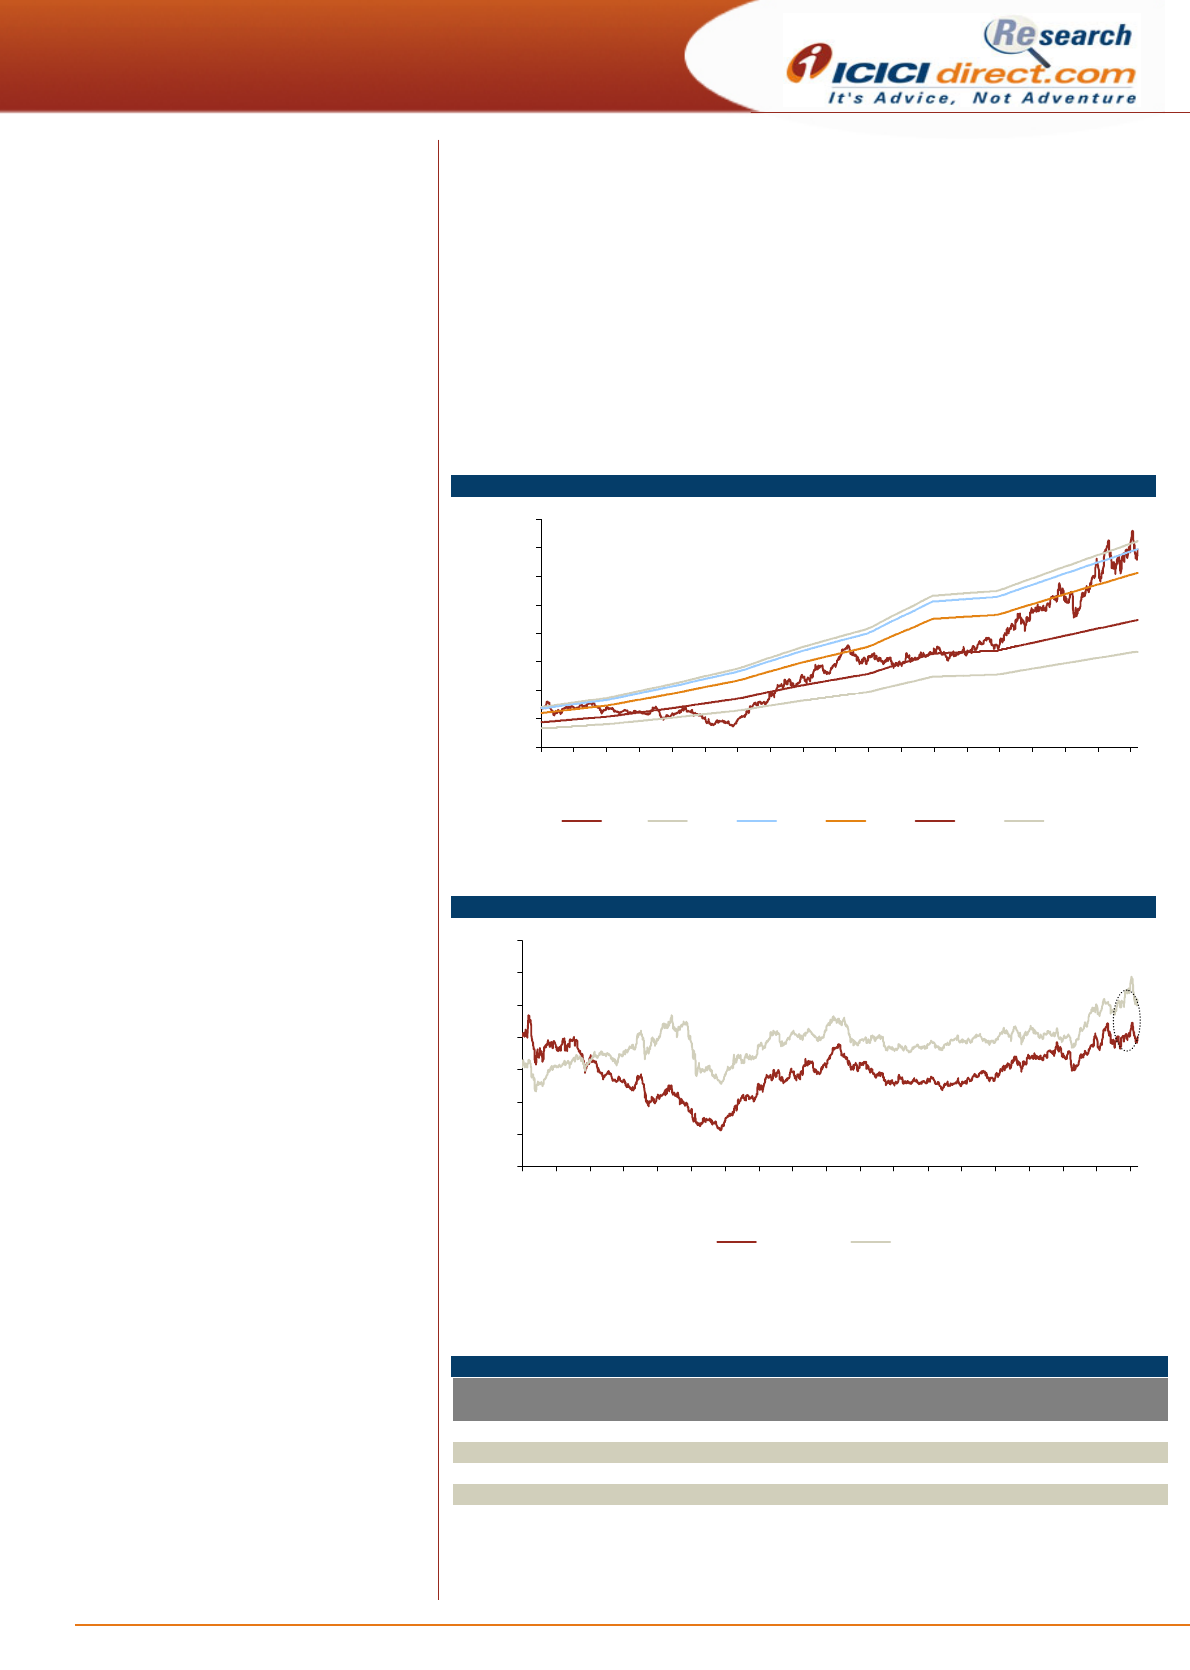
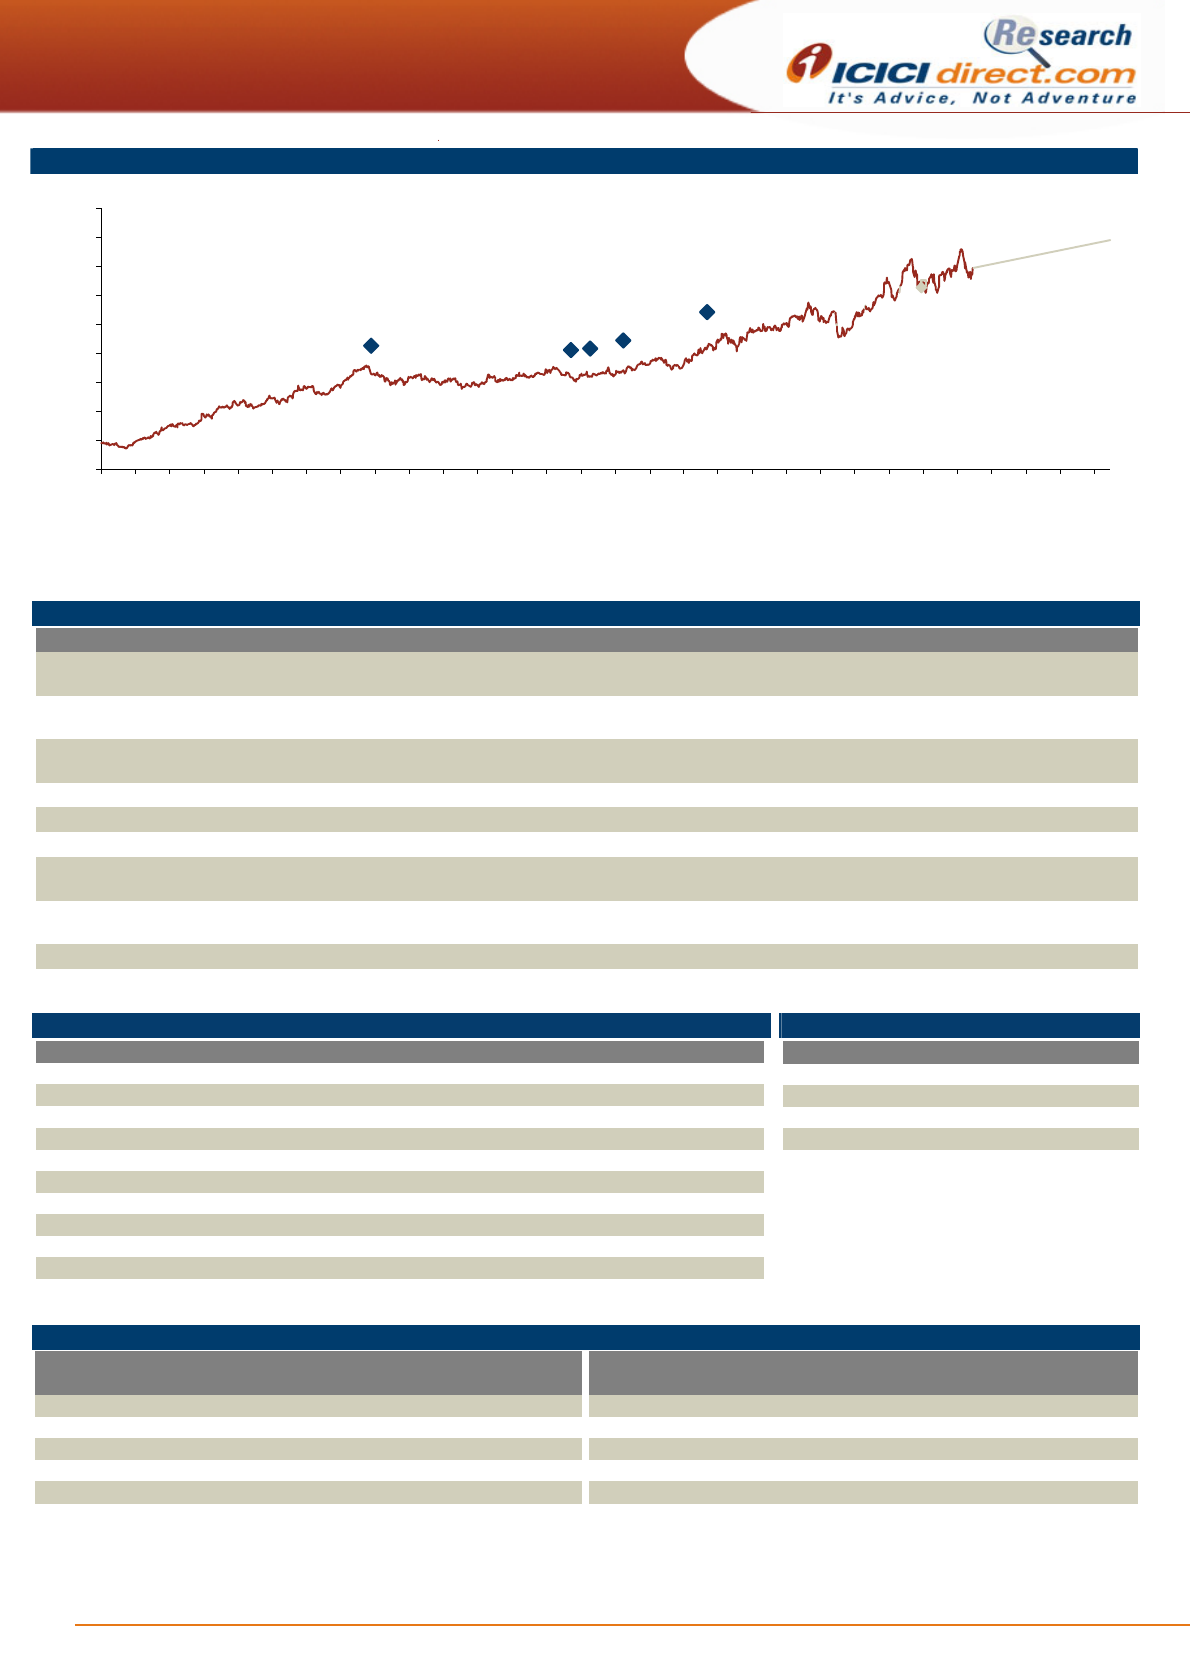
Exhibit 11: One year forward PE
0
500
1000
1500
2000
2500
3000
3500
4000
Mar-06
Sep-06
Mar-07
Sep-07
Mar-08
Sep-08
Mar-09
Sep-09
Mar-10
Sep-10
Mar-11
Sep-11
Mar-12
Sep-12
Mar-13
Sep-13
Mar-14
Sep-14
Mar-15
(|)
Price 21.0x 20.2x 17.7x 12.9x 9.7x
[
Source: Company, ICICIdirect.com Research
Exhibit 12: One year forward PE of company vs. BSE Healthcare Index
0
5
10
15
20
25
30
35
Mar-06
Sep-06
Mar-07
Sep-07
Mar-08
Sep-08
Mar-09
Sep-09
Mar-10
Sep-10
Mar-11
Sep-11
Mar-12
Sep-12
Mar-13
Sep-13
Mar-14
Sep-14
Mar-15
(x)
Dr Reddy's CNX Pharma
21.5% Discount
Source: Company, ICICIdirect.com Research
Exhibit 13: Valuation
Revenues Growth EPS Growth P/E EV/EBITDA RoNW RoCE
(| crore) (%) (|) (%) (x) (X) (%) (%)
FY14 13217 13.7 126.7 28.1 22.3 14.8 23.7 19.2
FY15 14819 12.1 123.6 3.2 22.8 13.9 19.3 18.1
FY16E 17291 16.7 150.9 16.6 18.7 11.7 19.6 20.2
FY17E 19438 12.4 179.5 14.9 15.7 9.8 19.4 21.3
Source: Company, ICICIdirect.com Research
ICICI Securities Ltd | Retail Equity Research
Page 11
Company snapshot
Target Price:| 3949
0
500
1,000
1,500
2,000
2,500
3,000
3,500
4,000
4,500
Jan-09
Apr-09
Jul-09
Oct-09
Jan-10
Apr-10
Jul-10
Oct-10
Jan-11
Apr-11
Jul-11
Oct-11
Jan-12
Apr-12
Jul-12
Oct-12
Jan-13
Apr-13
Jul-13
Oct-13
Jan-14
Apr-14
Jul-14
Oct-14
Jan-15
Apr-15
Jul-15
Oct-15
Jan-16
Apr-16
Source: Bloomberg, Company, ICICIdirect.com Research
Key events
Date Event
Jun-09 Announces a partnership with GSK to develop and market select products across emerging markets outside India. Under the tie-up, GSK will have access to more
than 100 branded products of DRL
Nov-10 Acquires GSK’s US oral penicillin facility and product portfolio. Under the agreement, GSK will transfer rights for Augmentin and Amoxil brands in the US market
Dec-10 Enters into licensing of technology transfer, manufacturing and marketing agreement with R-Pharm of Russia. The collaboration is in the area of high-technology and
will work on a profit sharing model
Jun-12 Dr Reddy’s and Merck Serono sign an agreement to co-develop and commercialise a portfolio of biosimilars compounds in oncology
Jul-12 USFDA lifts import alert for chemical manufacturing facility at Cuernavaca, Mexico
Oct-12 Acquires Netherland based specialty injectable company OctoPlus NV
Jun-13 Dr Reddy’s and Fujifilm Corporation call off their joint venture. The JV was started in July 2011 for developing and launching generic drugs in the Japanese market
Dec-14 Dr. Reddy's Labs closed the acquisition of Habitrol brand, an over-the-counter nicotine replacement therapy transdermal patch, from Novartis for a consideration of
US$ 80 million
Apr-15 Enters a €118 million (| 800 crore) definitive agreement to acquire a select portfolio of established products from UCB in India
Source: Company, ICICIdirect.com Research
Top 10 Shareholders Shareholding Pattern
Rank Name Latest Filing Date % O/S Position (m)
n
Change (m)
1 Dr Reddys Holdings Pvt. Ltd. 31-Mar-15 23.32 39.7 0.0
2 Commonwealth Bank of Australia 31-Dec-13 8.54 14.6 14.6
3 First State Investment Management (UK) Limited 31-Mar-15 8.45 14.4 0.0
4 OppenheimerFunds, Inc. 31-Mar-15 4.27 7.3 0.8
5 BlackRock Institutional Trust Company, N.A. 31-Mar-15 3.08 5.3 0.7
6 Abu Dhabi Investment Authority 31-Mar-15 2.09 3.6 -0.1
7 Capital World Investors 31-Mar-15 1.68 2.9 2.9
8 Life Insurance Corporation of India 31-Mar-15 1.65 2.8 -0.5
9 Franklin Templeton Asset Management (India) Pvt. Ltd. 31-Mar-15 1.59 2.7 0.6
10 Capital Research Global Investors 31-Dec-14 1.40 2.4 0.0
(in %) Mar-14 Jun-14 Sep-14 Dec-14 Mar-15
Promoter 25.5 25.5 25.5 25.5 25.5
FII 34.3 35.3 38.4 38.5 38.9
DII 6.3 5.4 5.4 5.7 5.4
Others 33.9 33.8 30.7 30.3 30.2
Source: Reuters, ICICIdirect.com Research
Recent Activity
Investor name Value Shares Investor name
V
alue Shares
Commonwealth Bank of Australia 596.68m 14.55m Investec Asset Management Ltd. -56.00m -1.28m
Capital World Investors 160.46m 2.86m Norges Bank Investment Management (NBIM) -34.58m -0.67m
OppenheimerFunds, Inc. 46.83m 0.84m Life Insurance Corporation of India -28.24m -0.50m
BlackRock Institutional Trust Company, N.A. 38.47m 0.69m J.P. Morgan Asset Management (Hong Kong) Ltd. -23.45m -0.45m
Franklin Templeton Asset Management (India) Pvt. Ltd. 34.91m 0.62m Schroder Investment Management (Hong Kong) Ltd. -16.08m -0.30m
Buys Sells
Source: Reuters, ICICIdirect.com Research
ICICI Securities Ltd | Retail Equity Research
Page 12
.
Financial summary
Profit and loss statement | Crore
(Year-end March) FY14 FY15E FY16E FY17E
Revenues 13217.0 14818.9 17291.5 19438.4
Growth (%) 36.6 12.1 16.7 12.4
Cost of Revenues 5636.9 6278.7 7217.6 8016.6
Gross Profit 7580.2 8540.2 10073.9 11421.9
Gross Profit Margins (%) 57.4 57.6 58.3 58.8
SGNA 3168.8 3404.4 3977.0 4470.8
R & D cost 1240.2 1744.8 2075.0 2332.6
Intangible write down 0.0 0.0 0.0 0.0
Goodwill write down 0.0 0.0 0.0 0.0
Other (income)/expense -141.6 -91.7 -43.2 -48.6
Total Expenditure 9904.4 11336.2 13226.4 14771.4
EBITDA 3312.7 3482.7 4065.1 4667.0
Growth (%) 41.2 5.1 16.7 14.8
EBITDA Margins (%) 25.1 23.5 23.5 24.0
Depreciation 709.5 854.0 880.8 908.9
PBIT 2603.2 2628.7 3184.3 3758.1
Finance Income 167.4 79.6 163.0 188.1
Finance Expenses 127.4 30.4 82.0 58.2
Net Finace (income)/expenses -40.0 -49.2 -81.0 -129.9
Profit/(loss) of ERI* 17.4 19.5 20.0 20.0
EBT 2660.6 2697.4 3285.4 3908.0
Tax 509.4 598.4 722.8 859.8
Net Profit 2151.3 2099.0 2562.6 3048.2
Growth (%) 50.8 -2.4 22.1 19.0
EPS (|) 126.7 123.6 150.9 179.5
Source: Company, ICICIdirect.com Research
Cash flow statement | Crore
(Year-end March) FY14 FY15E FY16E FY17E
Net Profit/(Loss) 2151.3 2099.0 2562.6 3048.2
Add: Depreciation 709.5 854.0 880.8 908.9
(Inc)/Dec in current assets -659.8 -1261.3 -1359.5 -1181.7
Inc/ (Dec) in Current Liailities 46.8 238.8 438.3 446.2
CF from Operating activities 2247.7 1930.4 2522.3 3221.7
(Inc)/Dec in Goodwill -23.5 0.0 0.0 0.0
(Purchase)/Sale of Liq. Inves. -812.0 0.0 0.0 0.0
Fixed Assets -1414.6 -970.2 -1200.0 -1200.0
Deferred Tax -164.1 20.0 20.0 20.0
Inc/(Dec) in MI -2.0 0.0 0.0 0.0
(Inc)/Decin Other Investments 20.9 0.0 0.0 0.0
Others 52.3 -66.6 11.1 9.7
CF from Investing activities -2343.0 -1016.8 -1168.9 -1170.3
Equity Shares 0.2 0.0 0.0 0.0
Inc/(Dec) in Share Premium 33.9 0.0 0.0 0.0
Dividend and Dividend Tax -298.5 -338.3 -378.2 -378.2
Debt 806.4 -839.5 -901.1 -792.0
Other components of equity
-124.7 25.2 0.0 0.0
Inc/(Dec) in Debenture Reserve -171.1 0.0 0.0 0.0
Adjustment Retained earnings 170.6 0.0 0.0 0.0
Others 10.0 0.0 0.0 0.0
CF from Financial activities 426.7 -1152.7 -1279.3 -1170.2
Net Cash flow 331.5 -239.1 74.1 881.2
Cash at the beginning 513.6 845.1 605.9 680.1
Cash 845.1 605.9 680.1 1561.3
Source: Company, ICICIdirect.com Research
Balance sheet | Crore
(Year-end March) FY14 FY15E FY16E FY17E
Equity Capital 85.1 85.1 85.1 85.1
Net Networth 8995.0 10780.8 12965.3 15635.3
Total share holder funds 9080.1 10865.9 13050.3 15720.4
Total Debt 4474.2 3634.7 2733.6 1941.6
Minority Interest 0.0 0.0 0.0 0.0
Deferred tax liabilities 274.4 314.4 354.4 394.4
Non current Liabilities & other 187.5 138.1 160.3 179.6
Total Liabilities 14016.2 14953.0 16298.6 18236.0
Gross Block 10335.4 11335.4 12635.4 13935.4
Acc.Depreciation 5433.6 6217.4 7098.2 8007.1
Net Bock 4901.8 5118.0 5537.2 5928.3
CWIP 667.5 567.5 467.5 367.5
Total Fixed Assets 5569.3 5685.5 6004.7 6295.8
inves in eq. acc. investees 80.6 80.6 80.6 80.6
Other investments-non current 0.0 0.0 0.0 0.0
Liquid Investments 2508.3 2508.3 2508.3 2508.3
Goodwill 342.8 342.8 342.8 342.8
Deferred tax assets 605.4 625.4 645.4 665.4
other non current assets 49.5 66.7 77.8 87.5
Inventories 2399.2 2842.0 3316.2 3727.9
Trade Receivables 3303.7 4060.0 4737.4 5325.6
Derivative financial instruments 55.4 55.4 55.4 55.4
Other current assets 1263.0 1325.3 1533.1 1714.9
Cash & Cash Equivalents 845.1 605.9 680.1 1561.3
Total Current Assets 7866.4 8888.6 10322.2 12385.0
Trade Payables 1050.3 1218.0 1421.2 1597.7
Derivative financial instruments 30.5 30.5 30.5 30.5
Bank overdraft 0.0 0.0 0.0 0.0
provision 281.9 311.2 363.1 408.2
other current liabilities 1643.4 1685.2 1868.3 2093.0
Total Current Liabilities 3006.1 3244.9 3683.2 4129.4
Net Current Assets 4860.3 5643.7 6639.0 8255.6
Total Assets 14016.2 14953.0 16298.6 18236.0
Source: Company, ICICIdirect.com Research
Key ratios
FY14 FY15E FY16E FY17E
Per Share Data (|)
EPS 126.7 123.6 150.9 179.5
Cash EPS 168.4 173.9 202.7 233.0
BV 534.6 639.8 768.4 925.6
Cash per Share 197.4 183.4 187.7 239.6
DPS 15.0 17.0 19.0 19.0
Operating Ratios
Gross Profit Margins 57.4 57.6 58.3 58.8
EBITDA margins 25.1 23.5 23.5 24.0
PBT margins 19.7 17.7 18.4 19.3
Net Profit margins 16.3 14.2 14.8 15.7
Return Ratios
RoE 23.7 19.3 19.6 19.4
RoCE 19.2 18.1 20.2 21.3
RoIC 26.0 23.3 25.2 27.2
V
aluation Ratios
P/E 22.3 22.8 18.7 15.7
EV / EBITDA 14.8 13.9 11.7 9.8
EV / Revenues 3.7 3.3 2.7 2.4
Market Cap / Revenues 3.6 3.2 2.8 2.5
Revenues / Equity 1.5 1.4 1.3 1.2
Price to Book Value 5.3 4.4 3.7 3.0
Dividend yield 11.8 13.8 12.6 10.6
Turnover Ratios
Inventory Days 66 70 70 70
Debtor days 91 100 100 100
Creditor days 29 30 30 30
Asset turnover ratio (x times) 2.2 2.5 2.7 2.9
Solvency Ratios
Debt / Equity 0.5 0.3 0.2 0.1
Debt/EBITDA 1.4 1.0 0.7 0.4
Current Ratio 2.6 2.7 2.8 3.0
Quick Ratio 1.8 1.9 1.9 2.1
Source: Company, ICICIdirect.com Research
ICICI Securities Ltd | Retail Equity Research
Page 13
ICICIdirect.com coverage universe (Healthcare)
ICICIdirect Healthcare coverage Universe
I-Direct CMP TP Rating M Cap
Code (|) (|) (| Cr) FY14 FY15E FY16E FY14 FY15E FY16E FY14 FY15E FY16E FY14 FY15E FY16E FY14 FY15E FY16E
Ajanta Pharma AJAPHA 1247 1488 BUY 11001.3 26.5 38.3 45.6 47.1 32.6 27.4 29.9 21.6 18.2 44.9 40.6 38.1 39.4 32.8 28.9
Apollo Hospitals APOHOS 1239 1455 BUY 17274.6 22.8 26.8 36.8 54.4 46.3 33.7 27.1 24.0 17.0 11.6 12.0 15.5 10.6 11.5 14.2
Aurobindo Pharma AURPHA 1322 1303 BUY 38690.2 47.3 57.4 70.5 28.0 23.1 18.7 19.8 16.4 13.3 24.1 23.4 24.4 31.3 31.6 28.6
Biocon BIOCON 431.8 447 HOLD 8654.9 20.7 20.1 22.5 35.1 29.2 32.4 21.2 21.1 18.0 12.2 10.7 11.7 13.7 15.2 12.4
Cadila Healthcare CADHEA 1650 1634 HOLD 33850.1 39.2 51.1 66.2 42.0 32.3 24.9 29.9 22.4 17.4 15.9 19.0 21.7 23.4 24.6 25.4
Cipla CIPLA 664.1 648 HOLD 53441.1 17.3 15.9 21.7 38.4 41.7 30.5 25.4 23.0 18.5 15.5 14.2 17.6 13.8 11.3 14.2
Dr Reddy's Labs DRREDD 3469 3949 BUY 59232.6 126.7 123.6 150.9 27.4 28.1 23.0 17.9 17.0 14.6 19.2 18.1 20.2 23.7 19.3 19.6
Glenmark Pharma GLEPHA 869.1 824 HOLD 23629.7 20.0 21.5 34.0 43.4 40.4 25.6 19.9 21.5 14.2 16.0 17.1 23.5 18.3 17.4 22.8
Indoco Remedies INDREM 325 375 BUY 2998.7 6.3 9.5 13.3 51.7 34.2 24.4 25.4 17.3 13.3 16.6 21.8 28.1 12.6 16.4 19.4
Ipca Laboratories IPCLAB 653.1 622 HOLD 8260.1 37.9 25.6 31.8 17.2 25.5 20.5 10.8 14.3 13.7 27.6 16.1 17.8 24.4 14.7 16.0
Jubilant Life Sciences VAMORG 170 138 SELL 2716.1 6.8 -6.5 20.0 24.9 -26.3 8.5 6.6 11.9 5.8 10.1 4.5 7.6 4.2 -3.5 7.6
Lupin LUPIN 1748 1866 BUY 78804.8 41.0 53.6 60.4 42.7 32.6 29.0 27.1 21.4 18.8 34.5 33.4 31.9 26.5 27.1 24.5
Natco Pharma NATPHA 2077 1354 HOLD 6918.5 30.3 32.5 44.9 58.5 54.6 39.5 39.9 33.1 26.7 15.3 16.7 18.7 14.1 13.5 16.1
Sun Pharma SUNPHA 949.7 1036 BUY 229025.2 29.0 34.8 39.9 32.7 27.3 23.8 23.6 22.9 19.6 32.4 31.2 28.8 27.0 25.3 23.1
Torrent Pharma TORPHA 1179 1165 HOLD 20001.7 39.2 47.2 50.4 30.1 25.0 23.4 21.2 18.9 15.1 28.5 21.4 26.7 34.9 32.4 28.0
Unichem Laboratories UNILAB 199.8 214 HOLD 1817.9 18.7 7.2 14.1 10.7 27.6 14.1 10.1 17.2 10.3 15.7 7.2 13.5 20.7 7.5 13.9
RoNW (%)
Company
EPS (|) PE(x) EV/EBITDA (x) RoCE (%)
Source: Company, ICICIdirect.com Research
ICICI Securities Ltd | Retail Equity Research
Page 14
RATING RATIONALE
ICICIdirect.com endeavours to provide objective opinions and recommendations. ICICIdirect.com assigns
ratings to its stocks according to their notional target price vs. current market price and then categorises them
as Strong Buy, Buy, Hold and Sell. The performance horizon is two years unless specified and the notional
target price is defined as the analysts' valuation for a stock.
Strong Buy: >15%/20% for large caps/midcaps, respectively, with high conviction;
Buy: >10%/15% for large caps/midcaps, respectively;
Hold: Up to +/-10%;
Sell: -10% or more;
Pankaj Pandey Head – Research pankaj.pandey@icicisecurities.com
ICICIdirect.com Research Desk,
ICICI Securities Limited,
1st Floor, Akruti Trade Centre,
Road No 7, MIDC,
Andheri (East)
Mumbai – 400 093
research@icicidirect.com

ICICI Securities Ltd | Retail Equity Research
Page 15
ANALYST CERTIFICATION
We /I, Siddhant Khandekar, CA INTER and Mitesh Shah, MS (finance), Nandan Kamat MBA Research Analysts, authors and the names subscribed to this report, hereby certify that all of the views expressed
in this research report accurately reflect our views about the subject issuer(s) or securities. We also certify that no part of our compensation was, is, or will be directly or indirectly related to the specific
recommendation(s) or view(s) in this report.
Terms & conditions and other disclosures:
ICICI Securities Limited (ICICI Securities) is a full-service, integrated investment banking and is,
inter alia,
engaged in the business of stock brokering and distribution of financial products. ICICI Securities is
a wholly-owned subsidiary of ICICI Bank which is India’s largest private sector bank and has its various subsidiaries engaged in businesses of housing finance, asset management, life insurance, general
insurance, venture capital fund management, etc. (“associates”), the details in respect of which are available on www.icicibank.com.
ICICI Securities is one of the leading merchant bankers/ underwriters of securities and participate in virtually all securities trading markets in India. We and our associates might have investment banking
and other business relationship with a significant percentage of companies covered by our Investment Research Department. ICICI Securities generally prohibits its analysts, persons reporting to analysts
and their relatives from maintaining a financial interest in the securities or derivatives of any companies that the analysts cover.
The information and opinions in this report have been prepared by ICICI Securities and are subject to change without any notice. The report and information contained herein is strictly confidential and
meant solely for the selected recipient and may not be altered in any way, transmitted to, copied or distributed, in part or in whole, to any other person or to the media or reproduced in any form, without
prior written consent of ICICI Securities. While we would endeavour to update the information herein on a reasonable basis, ICICI Securities is under no obligation to update or keep the information current.
Also, there may be regulatory, compliance or other reasons that may prevent ICICI Securities from doing so. Non-rated securities indicate that rating on a particular security has been suspended
temporarily and such suspension is in compliance with applicable regulations and/or ICICI Securities policies, in circumstances where ICICI Securities might be acting in an advisory capacity to this
company, or in certain other circumstances.
This report is based on information obtained from public sources and sources believed to be reliable, but no independent verification has been made nor is its accuracy or completeness guaranteed. This
report and information herein is solely for informational purpose and shall not be used or considered as an offer document or solicitation of offer to buy or sell or subscribe for securities or other financial
instruments. Though disseminated to all the customers simultaneously, not all customers may receive this report at the same time. ICICI Securities will not treat recipients as customers by virtue of their
receiving this report. Nothing in this report constitutes investment, legal, accounting and tax advice or a representation that any investment or strategy is suitable or appropriate to your specific
circumstances. The securities discussed and opinions expressed in this report may not be suitable for all investors, who must make their own investment decisions, based on their own investment
objectives, financial positions and needs of specific recipient. This may not be taken in substitution for the exercise of independent judgment by any recipient. The recipient should independently evaluate
the investment risks. The value and return on investment may vary because of changes in interest rates, foreign exchange rates or any other reason. ICICI Securities accepts no liabilities whatsoever for any
loss or damage of any kind arising out of the use of this report. Past performance is not necessarily a guide to future performance. Investors are advised to see Risk Disclosure Document to understand the
risks associated before investing in the securities markets. Actual results may differ materially from those set forth in projections. Forward-looking statements are not predictions and may be subject to
change without notice.
ICICI Securities or its associates might have managed or co-managed public offering of securities for the subject company or might have been mandated by the subject company for any other assignment
in the past twelve months.
ICICI Securities or its associates might have received any compensation from the companies mentioned in the report during the period preceding twelve months from the date of this report for services in
respect of managing or co-managing public offerings, corporate finance, investment banking or merchant banking, brokerage services or other advisory service in a merger or specific transaction.
ICICI Securities or its associates might have received any compensation for products or services other than investment banking or merchant banking or brokerage services from the companies mentioned
in the report in the past twelve months.
ICICI Securities encourages independence in research report preparation and strives to minimize conflict in preparation of research report. ICICI Securities or its analysts did not receive any compensation
or other benefits from the companies mentioned in the report or third party in connection with preparation of the research report. Accordingly, neither ICICI Securities nor Research Analysts have any
material conflict of interest at the time of publication of this report.
It is confirmed that Siddhant Khandekar, CA INTER and Mitesh Shah, MS (finance), Nandan Kamat MBA, Research Analysts of this report have not received any compensation from the companies
mentioned in the report in the preceding twelve months.
Compensation of our Research Analysts is not based on any specific merchant banking, investment banking or brokerage service transactions.
ICICI Securities or its subsidiaries collectively or Research Analysts do not own 1% or more of the equity securities of the Company mentioned in the report as of the last day of the month preceding the
publication of the research report.
Since associates of ICICI Securities are engaged in various financial service businesses, they might have financial interests or beneficial ownership in various companies including the subject
company/companies mentioned in this report.
It is confirmed that Siddhant Khandekar, CA INTER and Mitesh Shah, MS (finance), Nandan Kamat MBA, Research Analysts do not serve as an officer, director or employee of the companies mentioned in
the report.
ICICI Securities may have issued other reports that are inconsistent with and reach different conclusion from the information presented in this report.
Neither the Research Analysts nor ICICI Securities have been engaged in market making activity for the companies mentioned in the report.
We submit that no material disciplinary action has been taken on ICICI Securities by any Regulatory Authority impacting Equity Research Analysis activities.
This report is not directed or intended for distribution to, or use by, any person or entity who is a citizen or resident of or located in any locality, state, country or other jurisdiction, where such distribution,
publication, availability or use would be contrary to law, regulation or which would subject ICICI Securities and affiliates to any registration or licensing requirement within such jurisdiction. The securities
described herein may or may not be eligible for sale in all jurisdictions or to certain category of investors. Persons in whose possession this document may come are required to inform themselves of and
to observe such restriction.
