Dashboard Version 2.0 Manual Training
User Manual:
Open the PDF directly: View PDF ![]() .
.
Page Count: 132 [warning: Documents this large are best viewed by clicking the View PDF Link!]
ICDS-CAS Dashboard Manual
Ministry of Women and Child Development
Government of India
1
Table of Contents
1 Introduction .......................................................................................................................................... 7
2 ICDS-CAS Dashboard ............................................................................................................................. 9
3 Log-in instructions for the ICDS-CAS Dashboard ................................................................................ 11
4 Navigating the ICDS-CAS Dashboard ................................................................................................... 12
4.1 National Level View ..................................................................................................................... 14
4.2 State Level View .......................................................................................................................... 14
4.3 District Level View ....................................................................................................................... 15
4.4 Block Level view .......................................................................................................................... 15
5 Program Summary .............................................................................................................................. 16
6 Maternal and Child Nutrition .............................................................................................................. 19
6.1 Underweight (Weight-for-Age) ................................................................................................... 20
6.2 Wasting (Weight-for-Height) ...................................................................................................... 30
6.3 Stunting (Height-for-Age) ............................................................................................................ 32
6.4 Newborns with Low Birth Weight ............................................................................................... 33
6.5 Early Initiation of Breastfeeding ................................................................................................. 35
6.6 Exclusive Breastfeeding .............................................................................................................. 36
6.7 Children initiated appropriate Complementary Feeding ............................................................ 38
6.8 Institutional Deliveries ................................................................................................................ 39
6.9 Immunization Coverage (at age 1 year) ...................................................................................... 41
7 ICDS-CAS Reach ................................................................................................................................... 43
7.1 AWC Daily Status ......................................................................................................................... 43
7.2 AWCs Launched .......................................................................................................................... 51
8 Demographics ..................................................................................................................................... 53
8.1 Registered Households ............................................................................................................... 53
8.2 Children (0-6 years) who are enrolled for ICDS services ............................................................. 61
8.3 Pregnant Women enrolled for ICDS services .............................................................................. 63
8.4 Lactating Mothers enrolled for ICDS services ............................................................................. 65
8.5 Adolescent Girls (11-14 years) enrolled for ICDS services .......................................................... 66
8.6 Percent Aadhaar-seeded Beneficiaries ....................................................................................... 68
9 AWC Infrastructure ............................................................................................................................. 70
9.1 AWCs with Clean Drinking Water ............................................................................................... 70
2
9.2 AWCs with Functional Toilet ....................................................................................................... 78
9.3 AWCs with Medicine Kit .............................................................................................................. 80
9.4 AWCs with Weighing Scale: Infants ............................................................................................ 81
9.5 AWCs with Weighing Scale: Mother and Child ........................................................................... 83
10 AWC Report..................................................................................................................................... 85
10.1 Pre-School Education .................................................................................................................. 86
10.2 Maternal and Child Nutrition ...................................................................................................... 89
10.3 Demographics ............................................................................................................................. 90
10.4 AWC Infrastructure ..................................................................................................................... 91
10.5 Child Beneficiaries List ................................................................................................................ 92
11 LS Dashboard .................................................................................................................................. 95
12 ICDS-CAS Fact Sheet ........................................................................................................................ 96
12.1 Maternal and Child Nutrition ...................................................................................................... 97
12.2 Interventions ............................................................................................................................. 101
12.3 Behavior Change ....................................................................................................................... 102
12.4 Water, Sanitation and Hygiene ................................................................................................. 103
12.5 Demographics ........................................................................................................................... 104
12.6 All – ICDS-CAS Fact Sheet .......................................................................................................... 105
13 Tabular Reports ............................................................................................................................. 106
13.1 Tabular Report: Program Area – Child ...................................................................................... 107
13.2 Tabular Report: Program Area – Pregnant Women .................................................................. 108
13.3 Tabular Report: Program Area – Demographics ....................................................................... 109
13.4 Tabular Report: Program Area - System Usage ........................................................................ 109
13.5 Tabular Report: Program Area – AWC Infrastructure ............................................................... 110
13.6 Tabular Report: Program Area – Child Beneficiary List ............................................................. 110
13.7 Tabular Report: ICDS CAS Monthly Register ............................................................................. 111
13.8 Tabular Report: Program Area - AWW Performance Report .................................................... 112
14 MPR Block Report ......................................................................................................................... 113
15 ASR Block Report ........................................................................................................................... 116
16 Snapshot of Indicator Views on Dashboard .................................................................................. 117
17 Dashboard Usage Checklist ........................................................................................................... 125
18 Decision Making through Dashboard ........................................................................................... 126
Disclaimer.................................................................................................................................................. 131
3
List of Figures
Figure 1: Dashboard Reporting Structure ..................................................................................................... 8
Figure 2: Data Process Flow .......................................................................................................................... 9
Figure 3: Login Page .................................................................................................................................... 11
Figure 4: Landing Page ................................................................................................................................ 12
Figure 5: Landing Page: National Level View .............................................................................................. 14
Figure 6: Landing Page: State Level View .................................................................................................... 14
Figure 7: Landing Page: District Level View ................................................................................................ 15
Figure 8: Landing Page: Block Level View ................................................................................................... 15
Figure 9: Program Summary: Maternal and Child Nutrition ....................................................................... 16
Figure 10: Program Summary: ICDS-CAS Reach .......................................................................................... 17
Figure 11: Program Summary: Demographics ............................................................................................ 17
Figure 12: Program Summary: AWC Infrastructure .................................................................................... 18
Figure 13: Underweight (Weight-for-Age) KPI Card ................................................................................... 18
Figure 14: Link to view Maternal and Child Nutrition ................................................................................. 19
Figure 15: Link to view Underweight (Weight-for-Age) .............................................................................. 20
Figure 16: Underweight (Weight-for-Age): Map View - National ............................................................... 21
Figure 17: Underweight (Weight-for-Age): Map View - State .................................................................... 22
Figure 18: Underweight (Weight-for-Age): Map View - District ................................................................. 22
Figure 19: Underweight (Weight-for-Age): Block View .............................................................................. 23
Figure 20: Underweight (Weight-for-Age): Sector View ............................................................................. 24
Figure 21: Navigating to Chart View ........................................................................................................... 24
Figure 22: Underweight (Weight-for-Age): Chart View – National ............................................................. 25
Figure 23: Underweight (Weight-for-Age): Chart View – State .................................................................. 26
Figure 24: Underweight (Weight-for-Age): Chart View – District ............................................................... 27
Figure 25: Underweight (Weight-for-Age): Chart View – Block .................................................................. 28
Figure 26: Underweight (Weight-for-Age): Chart View – Sector ................................................................ 28
Figure 27: Additional Filters ........................................................................................................................ 29
Figure 28: Additional Filter - Gender .......................................................................................................... 29
Figure 29: Additional Filters – Screen Shot - “Female” selected ................................................................ 30
Figure 30: Wasting (Weight-for-Height): Map View - National .................................................................. 31
Figure 31: Wasting (Weight-for-Height): Chart View – National ................................................................ 31
Figure 32: Stunting (Height-for-Age): Map View – National ....................................................................... 32
Figure 33: Stunting (Height-for-Age): Chart View – National ..................................................................... 33
Figure 34: Newborns with Low Birth Weight: Map View – National .......................................................... 34
Figure 35: Newborns with Low Birth Weight: Chart View – National ........................................................ 34
Figure 36: Early Initiation of Breastfeeding: Map View – National ............................................................ 35
4
Figure 37: Early Initiation of Breastfeeding: Chart View – National ........................................................... 36
Figure 38: Exclusive Breastfeeding: Map View – National .......................................................................... 37
Figure 39: Exclusive Breastfeeding: Chart View – National ........................................................................ 37
Figure 40: Children initiated appropriate Complementary Feeding: Map View - National ........................ 38
Figure 41: Children initiated appropriate Complementary Feeding: Chart View - National ...................... 39
Figure 42: Institutional Deliveries: Map View – National ........................................................................... 40
Figure 43: Institutional Deliveries: Chart View – National .......................................................................... 40
Figure 44: Immunization Coverage (at age 1 year): Map View - National .................................................. 41
Figure 45: Immunization Coverage (at age 1 year): Chart View - National ................................................ 42
Figure 46: Link to view ICDS-CAS Reach ...................................................................................................... 43
Figure 47: Link to view AWC Daily Status ................................................................................................... 44
Figure 48: AWC Daily Status: Map View – National .................................................................................... 44
Figure 49: AWC Daily Status: Map View – State ......................................................................................... 45
Figure 50: AWC Daily Status: Map View – District ...................................................................................... 46
Figure 51: AWC Daily Status: Block View .................................................................................................... 46
Figure 52: AWC Daily Status: Sector View .................................................................................................. 47
Figure 53: Navigating to Chart View ........................................................................................................... 47
Figure 54: AWC Daily Status: Chart View – National .................................................................................. 48
Figure 55: AWC Daily Status: Chart View – State ........................................................................................ 49
Figure 56: AWC Daily Status: Chart View – District..................................................................................... 49
Figure 57: AWC Daily Status: Chart View – Block ....................................................................................... 50
Figure 58: AWC Daily Status: Chart View – Sector ...................................................................................... 51
Figure 59: AWCs Covered: Map View – National ........................................................................................ 52
Figure 60: AWCs Covered: Chart View – National ...................................................................................... 52
Figure 61: Link to view Demographics ........................................................................................................ 53
Figure 62: Link to view Registered Households .......................................................................................... 54
Figure 63: Registered Households: Map View – National .......................................................................... 54
Figure 64: Registered Households: Map View – State ................................................................................ 55
Figure 65: Registered Households: Map View – District ............................................................................. 56
Figure 66: Registered Households: Map View – Block View ....................................................................... 56
Figure 67: Registered Households: Map View – Sector View ..................................................................... 57
Figure 68: Navigating to Chart View ........................................................................................................... 57
Figure 69: Registered Households: Chart View – National ......................................................................... 58
Figure 70: Registered Households: Chart View – State .............................................................................. 59
Figure 71: Registered Households: Chart View – District ........................................................................... 59
Figure 72: Registered Households: Chart View – Block .............................................................................. 60
Figure 73: Registered Households: Chart View – Sector ............................................................................ 61
Figure 74: Children (0-6 years) who are enrolled for ICDS services: Map View – National ........................ 62
Figure 75: Children (0-6 years) who are enrolled for ICDS services: Chart View – National ...................... 63
Figure 76: Pregnant Women enrolled for ICDS services: Map View – National ......................................... 64
Figure 77: Pregnant Women enrolled for ICDS services: Chart View – National ........................................ 64
Figure 78: Lactating Mothers enrolled for ICDS services: Map View – National ........................................ 65
5
Figure 79: Lactating Mothers enrolled for ICDS services: Chart View – National ....................................... 66
Figure 80: Adolescent Girls (11-18 years) enrolled for ICDS services: Map View – National ..................... 67
Figure 81: Adolescent Girls (11-18 years) enrolled for ICDS services: Chart View – National .................... 67
Figure 82: Percent Aadhaar-seeded Beneficiaries: Map View – National .................................................. 68
Figure 83: Percent Aadhaar-seeded Beneficiaries: Chart View – National ................................................. 69
Figure 84: Link to view AWC Infrastructure ................................................................................................ 70
Figure 85: Link to view AWCs with Clean Drinking Water .......................................................................... 71
Figure 86: AWCs with Clean Drinking Water: Map View – National........................................................... 71
Figure 87: AWCs with Clean Drinking Water: Map View – State ................................................................ 72
Figure 88: AWCs with Clean Drinking Water: Map View – District ............................................................. 73
Figure 89: AWCs with Clean Drinking Water: Block View ........................................................................... 73
Figure 90: AWCs with Clean Drinking Water: Sector View ......................................................................... 74
Figure 91: Navigating to Chart View ........................................................................................................... 74
Figure 92: AWCs with Clean Drinking Water: Chart View – National ......................................................... 75
Figure 93: AWCs with Clean Drinking Water: Chart View – State .............................................................. 76
Figure 94: AWCs with Clean Drinking Water: Chart View – District ........................................................... 76
Figure 95: AWCs with Clean Drinking Water: Chart View – Block .............................................................. 77
Figure 96: AWCs with Clean Drinking Water: Chart View – Sector............................................................. 78
Figure 97: AWCs with Functional Toilet: Map View – National .................................................................. 79
Figure 98: AWCs with Functional Toilet: Chart View – National ................................................................. 79
Figure 99: AWCs with Medicine Kit: Map View – National ......................................................................... 80
Figure 100: AWCs with Medicine Kit: Chart View – National ..................................................................... 81
Figure 101: AWCs with Weighing Scale: Infants: Map View – National ..................................................... 82
Figure 102: AWCs with Weighing Scale: Infants: Chart View – National .................................................... 82
Figure 103: AWCs with Weighing Scale: Mother and Child: Map View – National .................................... 83
Figure 104: AWCs with Weighing Scale: Mother and Child: Chart View – National ................................... 84
Figure 105: AWC Report ............................................................................................................................. 85
Figure 106: AWC Report: Landing Page ...................................................................................................... 86
Figure 107: AWC Days Open ....................................................................................................................... 86
Figure 108: AWC Days Open per week ....................................................................................................... 87
Figure 109: PSE - Daily Attendance ............................................................................................................. 87
Figure 110: GPS Locations ........................................................................................................................... 88
Figure 111: PSE Photo Submissions ............................................................................................................ 88
Figure 112: Navigating to Maternal and Child Nutrition ............................................................................ 89
Figure 113: Maternal and Child Nutrition ................................................................................................... 90
Figure 114: Demographics .......................................................................................................................... 91
Figure 115: AWC Infrastructure .................................................................................................................. 91
Figure 116: Child Beneficiaries List ............................................................................................................. 92
Figure 117: Child Beneficiaries List – Select Beneficiary ............................................................................. 93
Figure 118: Beneficiary Information ........................................................................................................... 93
Figure 119: Weight for Age ......................................................................................................................... 94
Figure 120: Height for Age .......................................................................................................................... 94
6
Figure 121: Weight for Height .................................................................................................................... 94
Figure 122: ICDS-CAS Fact Sheets ............................................................................................................... 97
Figure 123: Landing Page View ................................................................................................................... 97
Figure 124: Maternal and Child Nutrition– National Level User View ........................................................ 98
Figure 125: Maternal and Child Nutrition– State Level User View ............................................................. 98
Figure 126: Maternal and Child Nutrition– District Level View .................................................................. 99
Figure 127: Maternal and Child Nutrition– Block Level View ................................................................... 100
Figure 128: Maternal and Child Nutrition– Sector Level View ................................................................. 100
Figure 129: Interventions .......................................................................................................................... 101
Figure 130: Intervention– National Level User View ................................................................................ 101
Figure 131: Behavior Change .................................................................................................................... 102
Figure 132: Behavior Change– National Level User View ......................................................................... 102
Figure 133: Water, Sanitation and Hygiene .............................................................................................. 103
Figure 134: Water, Sanitation and Hygiene– National Level User View ................................................... 103
Figure 135: Demographics ........................................................................................................................ 104
Figure 136: Demographics– National Level User View ............................................................................. 104
Figure 137: All Indicators .......................................................................................................................... 105
Figure 138: All Indicators– National Level User View ............................................................................... 105
Figure 139: Tabular Reports: Landing Page .............................................................................................. 106
Figure 140: Tabular Report - Filters .......................................................................................................... 106
Figure 141: Program Area - Child .............................................................................................................. 107
Figure 142: Program Area - Child: Excel Report Snapshot ........................................................................ 108
Figure 143: Program Area - Child: Excel Report “Export Info" Tab ........................................................... 108
Figure 144: Program Area - Child Beneficiary List..................................................................................... 111
Figure 145: Landing Page .......................................................................................................................... 114
Figure 146: Block MPR Report page filter ................................................................................................. 114
Figure 147: Block ASR Report page filter .................................................................................................. 116
Figure 148: Use Case 1 .............................................................................................................................. 126
Figure 149: Use Case 1 .............................................................................................................................. 127
Figure 150: Use Case 1 .............................................................................................................................. 127
Figure 151: Use Case 2 .............................................................................................................................. 128
Figure 152: Use Case 2 .............................................................................................................................. 128
Figure 153: Use Case 2 .............................................................................................................................. 129
Figure 154: Use Case 2 .............................................................................................................................. 129
Figure 155: Use Case 2 .............................................................................................................................. 130
Figure 156: Use Case 2 .............................................................................................................................. 130
7
1 Introduction
National Nutrition Mission targets reduction in the level of under-nutrition and other related problems
by ensuring convergence of various nutrition related schemes. The Mission will monitor and review
implementation of all such schemes. In this endeavour, the Mission seeks to utilize existing structural
arrangements of line Ministries wherever available. The NNM would primarily be a monitoring and
reviewing body for taking stock of monitorable indicators of nutrition centric schemes/programmes
requiring convergent actions for better and effective delivery to the targeted beneficiaries. Information
and Communication Technology enabled Real Time Monitoring (ICT-RTM) will be one of the tools
utilized for the above.
One of the key interventions of the project is the ICT-RTM of ICDS aimed at improving the service
delivery system of ICDS. ICT-RTM driven by Common Application Software (ICDS-CAS) largely comprises
of a mobile application installed on a smartphone for use by the Anganwadi Workers (AWWs) and the
Sector Supervisors. The data captured by AWWs is available on the centralized web-based ICDS-CAS
dashboard for monitoring and review across different administrative levels including Block, District,
State and Centre
With the deployment of ICDS-CAS, the usage of 10 out of 11 ICDS registers by the Anganwadi Workers
(AWWs) have been eliminated, thus improving the efficiencies in service delivery. The objective of this
initiative are as follows:
• Name-based registration of ICDS beneficiaries in each AWC catchment area
• Improvement in AWW efficiency and effectiveness by embedding job aids and tools in their
mobile phones (e.g. Nutrition Counseling of Pregnant Women, Infant and Young Child Feeding
practices, etc.)
• Monitor timelines and quality of service delivered to the beneficiaries by AWW
• Availability of reports and dashboards with information to various stakeholders for prompt action
and decision-making
This document is a user-manual for the ICDS-CAS Dashboard and has been designed to help the
Government at all levels (National Level to the Block level). This manual will enable the user to use the
ICDS-CAS Dashboard on their computers to view real time information collected by the Anganwadi
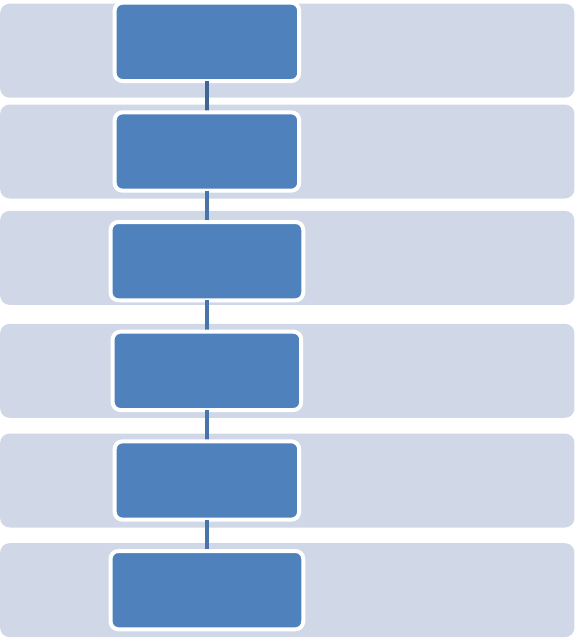
workers on their phones and provide timely supportive supervision. The six tier reporting structure
enabled by ICDS-CAS is provided in Figure 1 below:
8
Figure 1: Dashboard Reporting Structure
AWC level
Mobile Reports
Sector Specific
Mobile Reports
Block Specific
Web Reports
District Specific
Web Reports
State Specific
Web Reports
National Level
Web Reports
MWCD
State ICDS
District
Programme Officer
Child
Development
Project Officer
Supervisor
(Sector level)
AWW
(Village level)
9
2 ICDS-CAS Dashboard
The ICDS-CAS Dashboard has been created for use by MWCD officials at the National, State, District and
Block Levels to be able to access real time information in order to:
1. View raw data submitted by AWWs and Lady Supervisors in a useful and easily understandable
manner
2. Monitor and evaluate ICDS indicators in order to view progress and identify problem areas
3. Supervise the functioning of the ICDS program
4. Make prompt data-driven decisions to improve service delivery
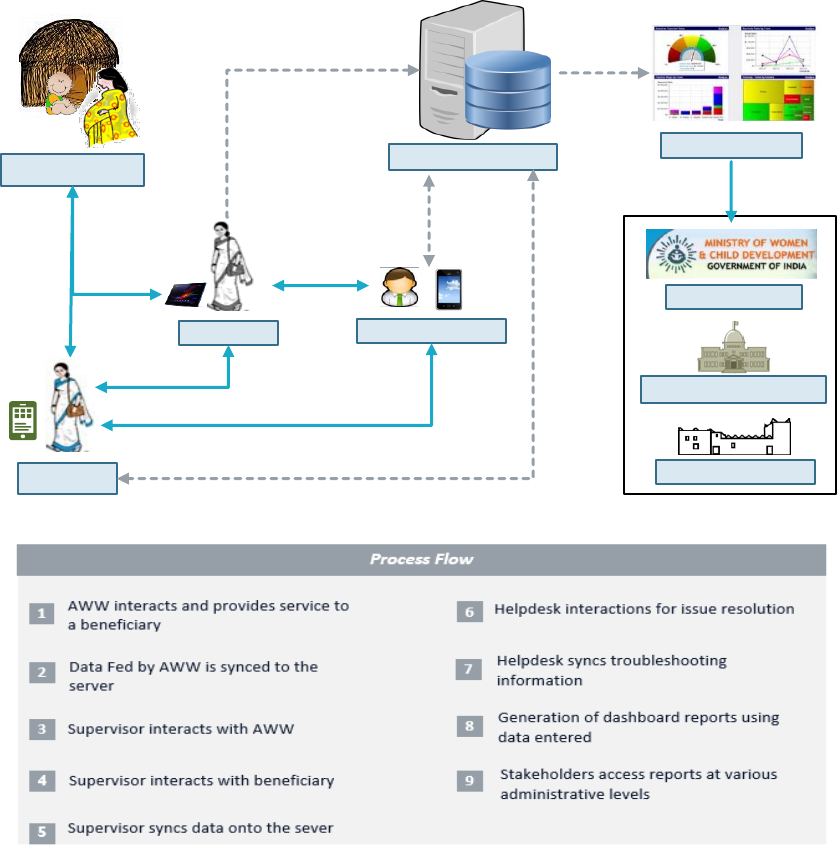
In the Figure 2 below, a high level process flow of data collection from the end beneficiaries to the
Dashboard has been depicted.
Figure 2: Data Process Flow
AWW
DM/DPO/CDPO
State ICDS
Directorate
Supervisor
Centre
Helpdesk
Beneficiaries
Dashboards
Central servers
5
3
1
2
6
7
8
9
4
6
10
When is data being sent to the server?
1. Data is sent to the central servers to update the Dashboards in real time (as user syncs with server)
2. Reports displayed on the dashboards will be updated once a day (Midnight IST) with data from
forms submitted by AWWs and Supervisors.
3. Data will be displayed in accordance to the reporting period (i.e. monthly data)
4. Dashboard users may view up-to-date data at any time. However, to gather the most accurate
picture of the ICDS program at the beginning of a month, dashboard users must view data for the
previous month.
11
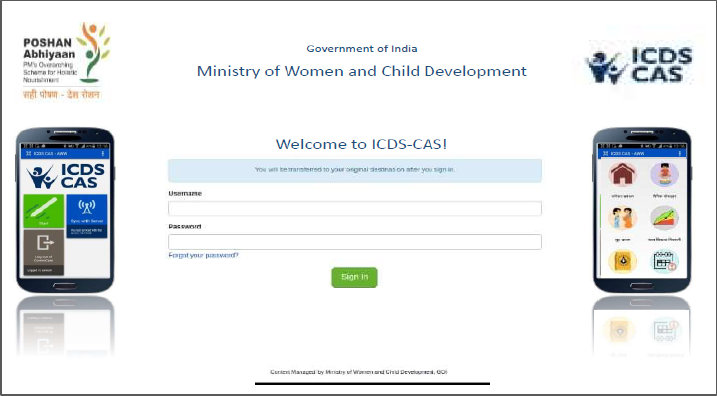
3 Log-in instructions for the ICDS-CAS Dashboard
The ICDS-CAS Dashboard is a web based system. Each dashboard user will be given a username and
password. The URL for accessing ICDS-CAS Dashboard is: www.icds-cas.gov.in/a/icds-cas. Navigate to this
URL on your web browser.
Note: The most suitable browser to view Dashboards is Google Chrome or Mozilla Firefox.
1. You will be prompted to sign in
2. Enter the dashboard username and password as communicated to you
3. Click on Reports -->View All
4. Click on ‘Dashboard ICDS-CAS’ to view the Dashboard
Figure 3: Login Page
12
4 Navigating the ICDS-CAS Dashboard
Program Summary will be the default selection on the landing page of the dashboard. Each page of the
dashboard displays data based on the administrative level of the user who logs in.
On the Program Summary page a National level user will view data for the entire country and can drill
down to lower administrative levels (State/District/Block/Sector). A State level user can view data for the
entire State and can drill down to lower levels (District/Block/Sector/AWC), a District level user can view
data for his/her District and can drill down to lower levels (Block/Sector), a Block level user can view data
for his/her Block and can drill down to lower levels (Sector).
The Left Hand Navigation Panel has the following main sections:
1. Program Summary
This section highlights the key performance indicators for each of the following program areas:
i. Maternal and Child Nutrition
ii. ICDS-CAS Reach
iii. Demographics
iv. AWC Infrastructure
2. Map and Chart Views
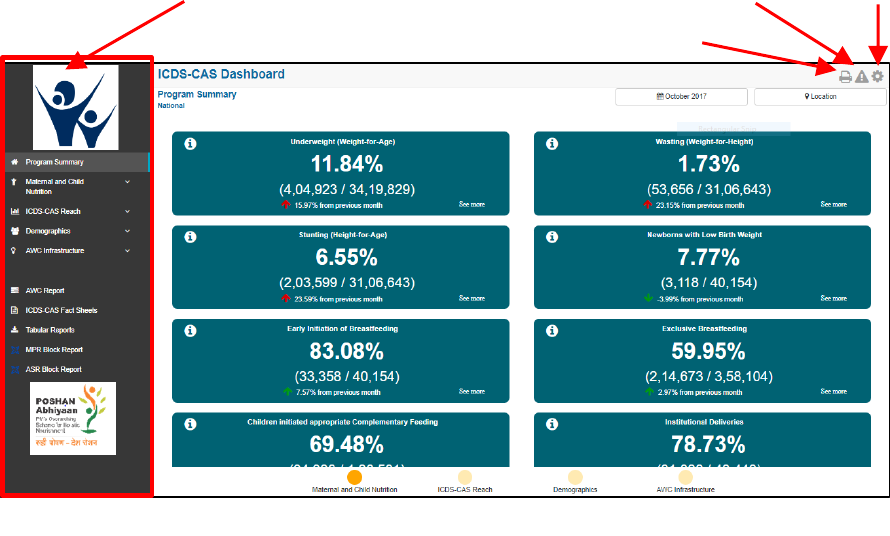
Figure 4: Landing Page
Left Hand Navigation
Panel
Print Page
Settings
Report an Issue

13
The following program areas are displayed on the panel with a dropdown menu of indicators under
each area. In this section, visual representation of each indicator is available as Map and Chart
views.
i. Maternal and Child Nutrition
ii. ICDS-CAS Reach
iii. Demographics
iv. AWC Infrastructure
3. AWC Report
This section highlights individual AWC level details across various areas like Pre-School Education,
Maternal and Child Nutrition, Demographics, etc.
4. ICDS-CAS Fact Sheets
This section highlights the time-series data for each indicator organized by outcome areas like
Behavior Change, Water, Sanitation and Hygiene, etc.
5. Tabular Reports
This section offers access to download excel reports across various program areas like
Demographics, System Usage, Child beneficiary list, etc.
6. MPR/ASR Block Report
This section provides user links to the Monthly Progress Report and Annual Summary Report.
The icons on the top right side of the page provide access to the following functionalities which are
explained below:
The ‘Download User Manual’ icon allows the user to download a PDF version of the user manual
The ‘Print Page’ functionality allows the user to print any page on the dashboard
The ‘Report an Issue’ functionality allows a Helpdesk user to log dashboard related issues via the
Issue Tracker Web Application. When a Helpdesk user clicks on ‘Report an Issue’, the dashboard
will direct the user to the Issue Tracker Web Application. The user will be required to follow the
steps on the web application to report a new issue. If an ICDS official (CDPO / DPO) intends to
report an issue, he/she should contact the nearest District / Block Helpdesk.
The ‘Settings’ functionality allows the user to manage account settings like updating personal
information, changing password, etc.
The views for each level of the stakeholders are explained in the subsequent sub-sections.
14
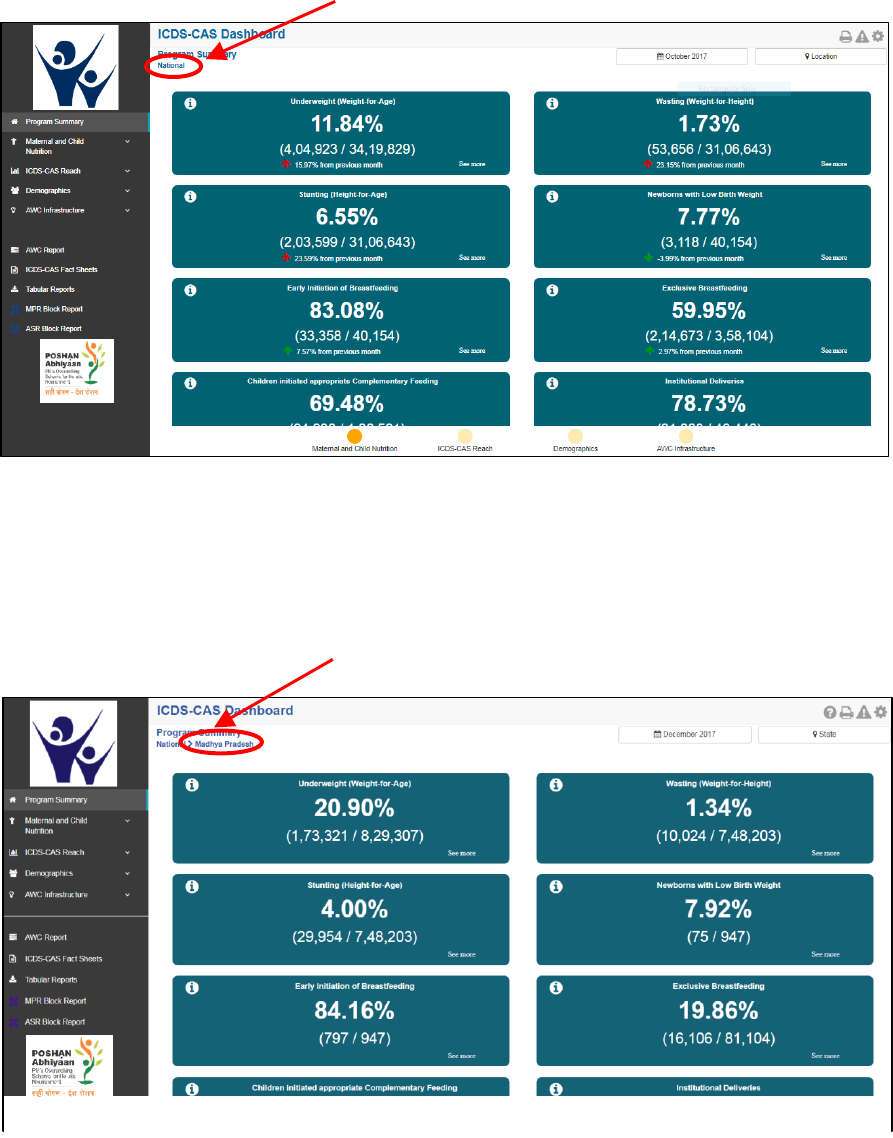
4.1 National Level View
If a National Level user (MWCD / CPMU) logs into the dashboard, the landing page will show a National
view as shown in the below snapshot.
Figure 5: Landing Page: National Level View
4.2 State Level View
If a State Level user (SPMU, State Helpdesk) logs into the dashboard, the landing page will show a State
level view as shown in the below snapshot.
National Level View
State Level View
Figure 6: Landing Page: State Level View
15
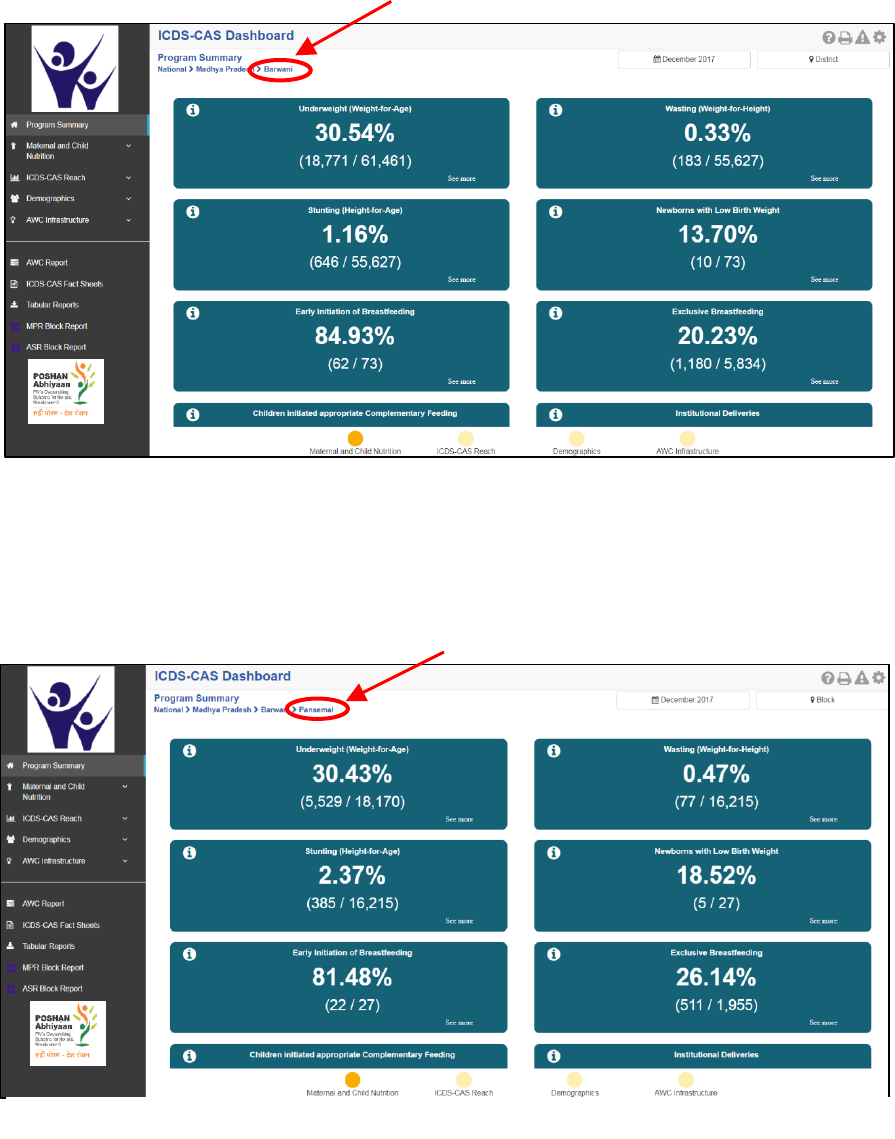
4.3 District Level View
If a District level user (DPO / District Helpdesk) logs into the dashboard, the landing page will show a
District level view as shown in the below snapshot.
4.4 Block Level view
If a Block level user (CDPO / Block Helpdesk) logs into the dashboard, the landing page will show a Block
level view as shown in the below snapshot.
District Level View
Figure 7: Landing Page: District Level View
Block Level View
Figure 8: Landing Page: Block Level View
16
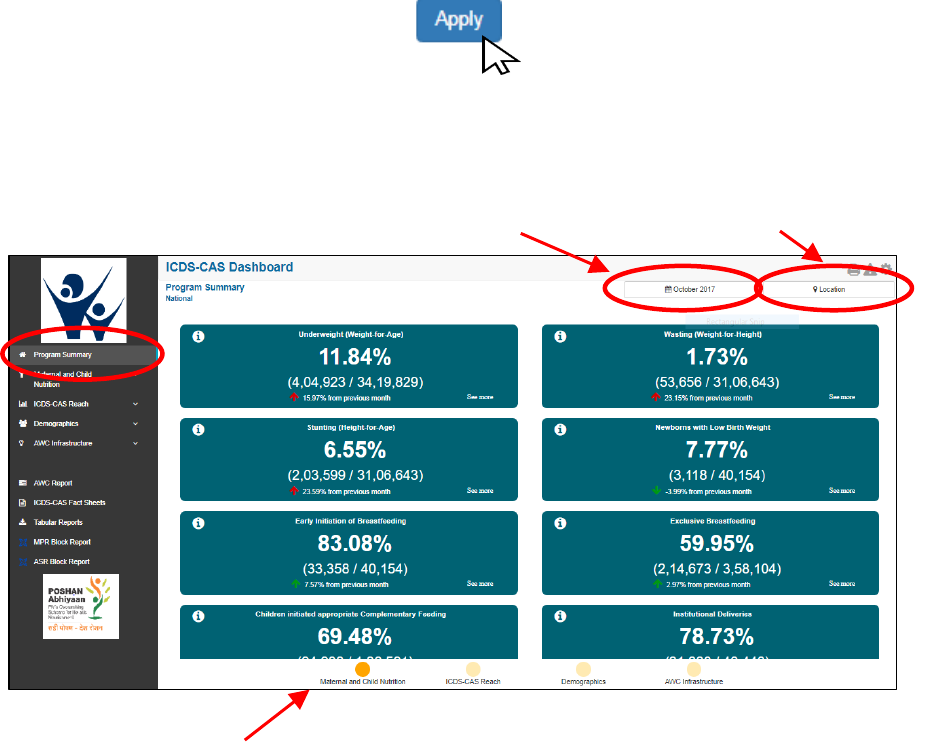
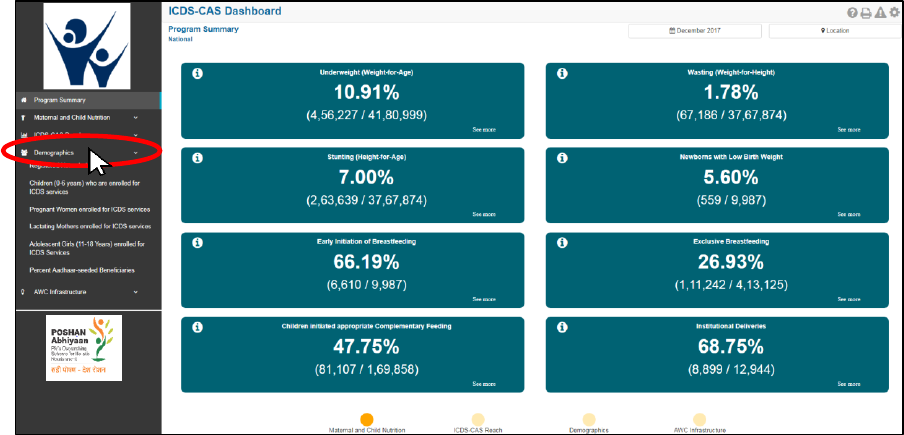
5 Program Summary
The section shows a consolidated snapshot of all the indicators in the form of Key Performance Indicator
(KPI) cards. The user is able to view data for current on previous months by using the ‘Select Month/Year’
filter and/or can view data for various locations by using the ‘Select Location’ filter. For example – A State
level user can drill down to District / Block / Sector / AWC but will not be able to view National level data.
Select Month / Year: The user can click on the time filter as shown in the figure below and select the
Month / Year for which the user intends to view the data and click on ‘Apply’. All the data on the page will
change according to the selected time period. In order to gather the most accurate scenario at the
beginning of a month, the user should view data for the previous month.
Select Location: The user can click on ‘Location’ as shown in the figure below and select the administrative
level for which the user intends to view the data and click on ‘Apply’
If the user selects an Anganwadi Centre (AWC) level, the dashboard will direct the user to the ‘AWC
Report’) which is explained in detail in Section 10.
Click bubble navigation to view key performance
indicators for each program area
Figure 9: Program Summary: Maternal and Child Nutrition
Time Filter: User may change the month
filter to view data for some other month
Location Filter: User may select any level
below and view data for selected level
17
Program Summary page will display KPI cards for various indicators organized by each of the following
program areas:
1. Maternal and Child Nutrition
2. ICDS-CAS Reach
3. Demographics
4. AWC Infrastructure
The user may navigate between the program areas using the bubble navigation provided at the bottom
of the Program Summary page.
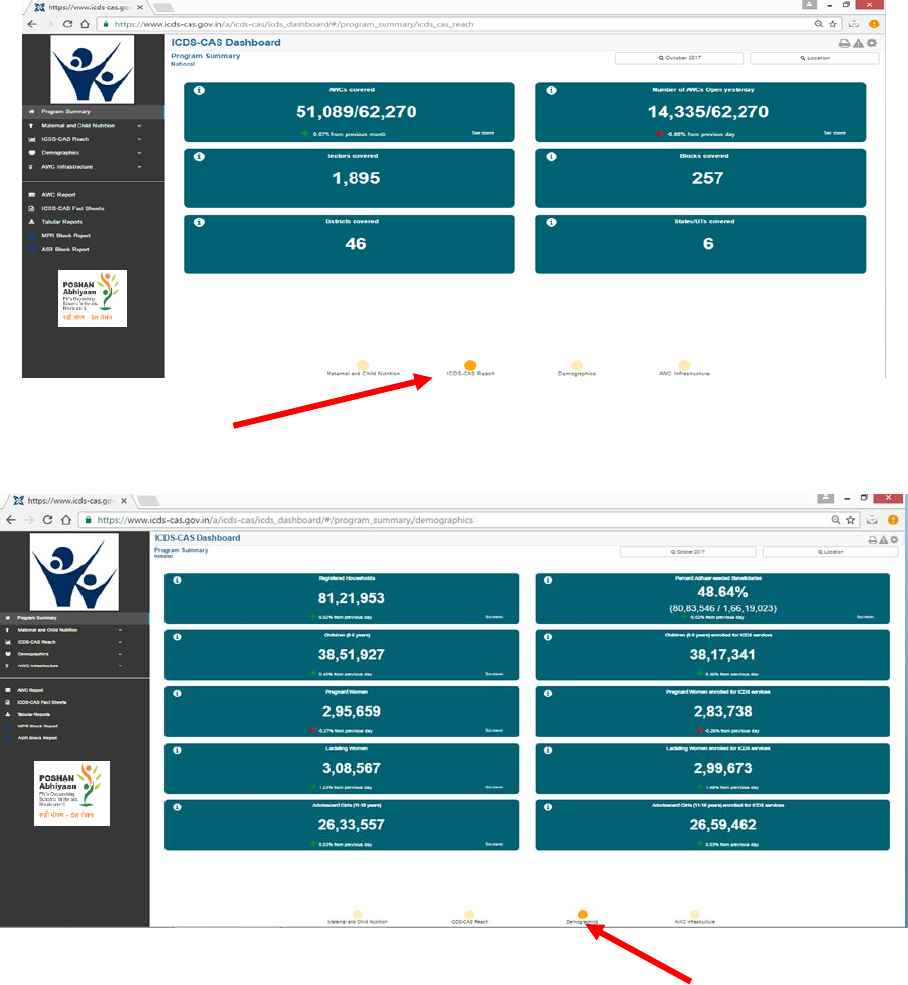
Figure 10: Program Summary: ICDS-CAS Reach
Figure 11: Program Summary: Demographics
Click bubble navigation to view KPI cards for ICDS-CAS Reach
Click bubble navigation to view KPI cards for Demographics
18
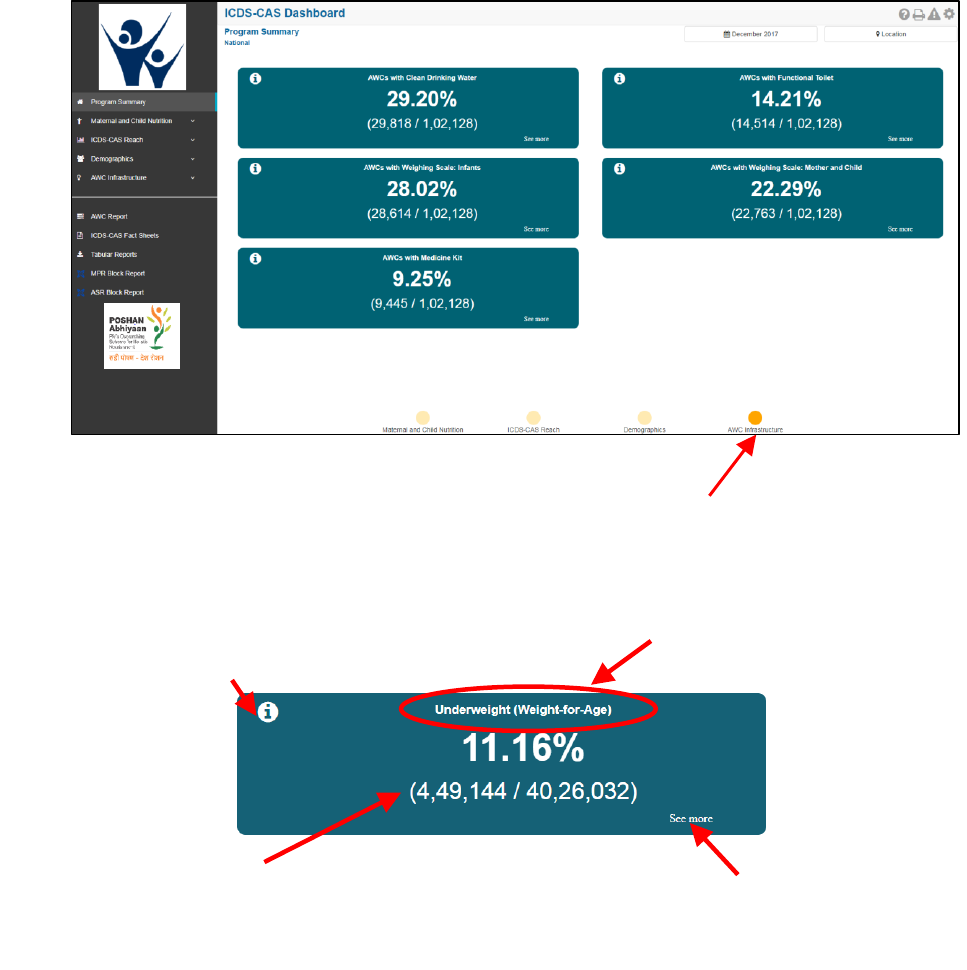
Figure 12: Program Summary: AWC Infrastructure
KPI Card: The below figure explains the ‘Underweight (Weight-for-Age)’ KPI card available under
‘Maternal and Child Nutrition on the Program Summary page.
Click on ‘See More’ to move to ‘Map View’ for this indicator. User will see the map view based on the
user level. For Example – A State level user will be able to see the State map and drill down to the lower
levels. He / she will not be able to see a National level map. Navigating to the Map and Chart Views for
each Program Area is explained in Sections 6-9.
Click bubble navigation to view KPI cards for AWC Infrastructure
Indicator Title
Info Button: Hover
for definition of
indicator
Figure 13: Underweight (Weight-for-Age) KPI Card
Numerator and Denominator
(whole number values)
Click here for Map and Chart view
19
6 Maternal and Child Nutrition
Maternal and Child Nutrition includes indicators that provide information about mother and child
health. The section has the following list of indicators:
1. Underweight (Weight-for-Age)
2. Wasting (Weight-for-Height)
3. Stunting (Height-for-Age)
4. Newborns with Low Birth Weight
5. Early Initiation of Breastfeeding
6. Exclusive Breastfeeding
7. Children initiated appropriate Complementary Feeding
8. Institutional Deliveries
9. Immunization Coverage (at age 1 year)
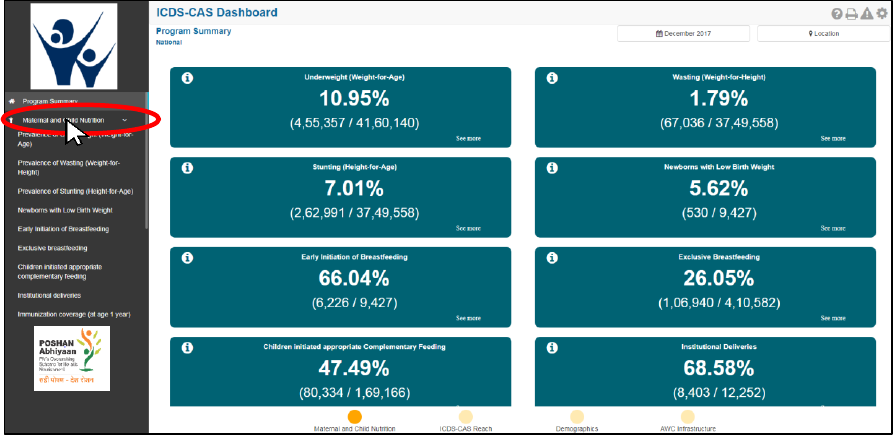
On the left hand navigation panel, click on ‘Maternal and Child Nutrition’ to see a detailed list of
indicators. Select the indicator to see a detailed ‘Map View’ for the selected indicator.
Figure 14: Link to view Maternal and Child Nutrition
20
6.1 Underweight (Weight-for-Age)
The first indicator under ‘Maternal and Child Nutrition’ is ‘Underweight (Weight-for-Age)’ which is
explained below.
Definition of indicator - Percentage of children between 0-5 years enrolled for ICDS services with weight-
for-age less than -2 standard deviations of the WHO Child Growth Standards median. Children who are
moderately or severely underweight have a higher risk of mortality.
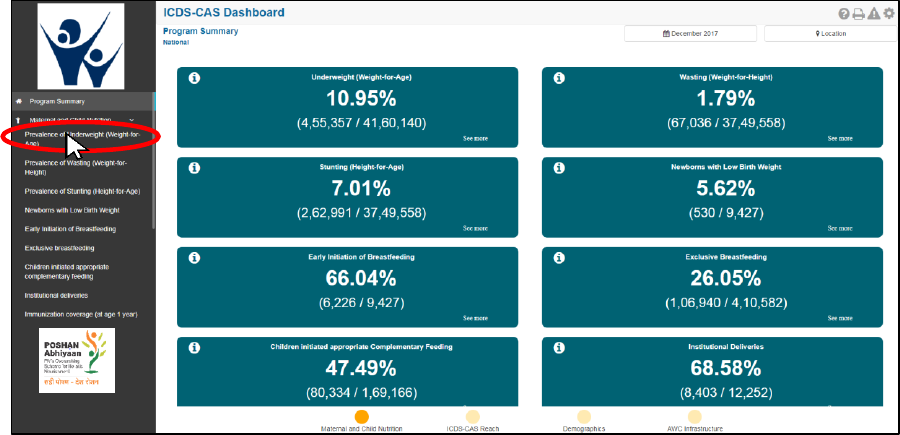
Click on the indicator ‘Prevalence of Underweight (Weight-for-Age) from the left hand navigation panel
under ‘Maternal and Child Nutrition’ to enter ‘Map View’.
Figure 15: Link to view Underweight (Weight-for-Age)
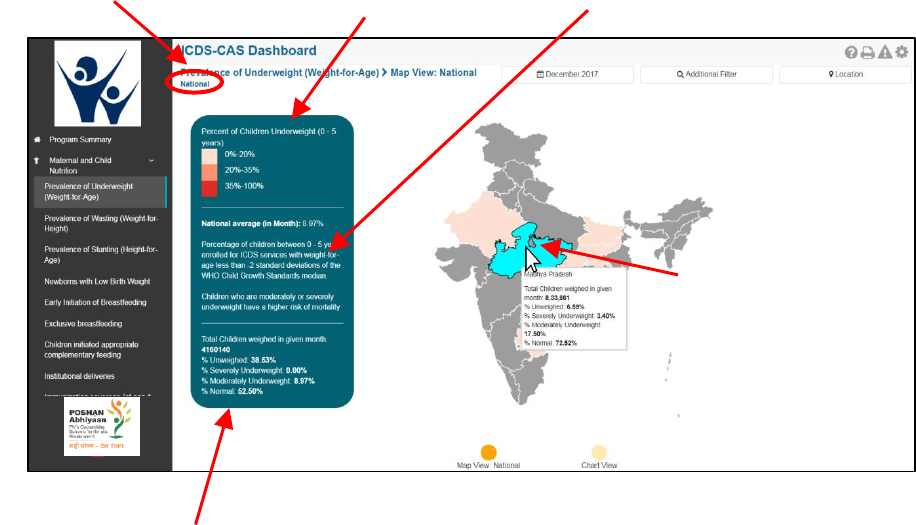
6.1.1 Underweight (Weight-for-Age): Map View – National
If a National level user (MWCD / CPMU) logs into the dashboard, the ‘Map View’ will show the Prevalence
of Underweight (Weight-for-Age) at the National level as shown in the below snapshot.
The National level user can click on the map or select locations from location filter and drill down to lower
levels (State / District / Block / Sector).
21
The Map View displays a color coded view of the map. The color coding is done based on certain threshold
values which are provided on the ‘Map View’ page. The colors and percentage ranges indicate
performance for each indicator. The user can hover over the color coded areas for further details.
The page also displays a detailed definition of the indicator along-with aggregate data for the level
(National / State / District) and the month being viewed.
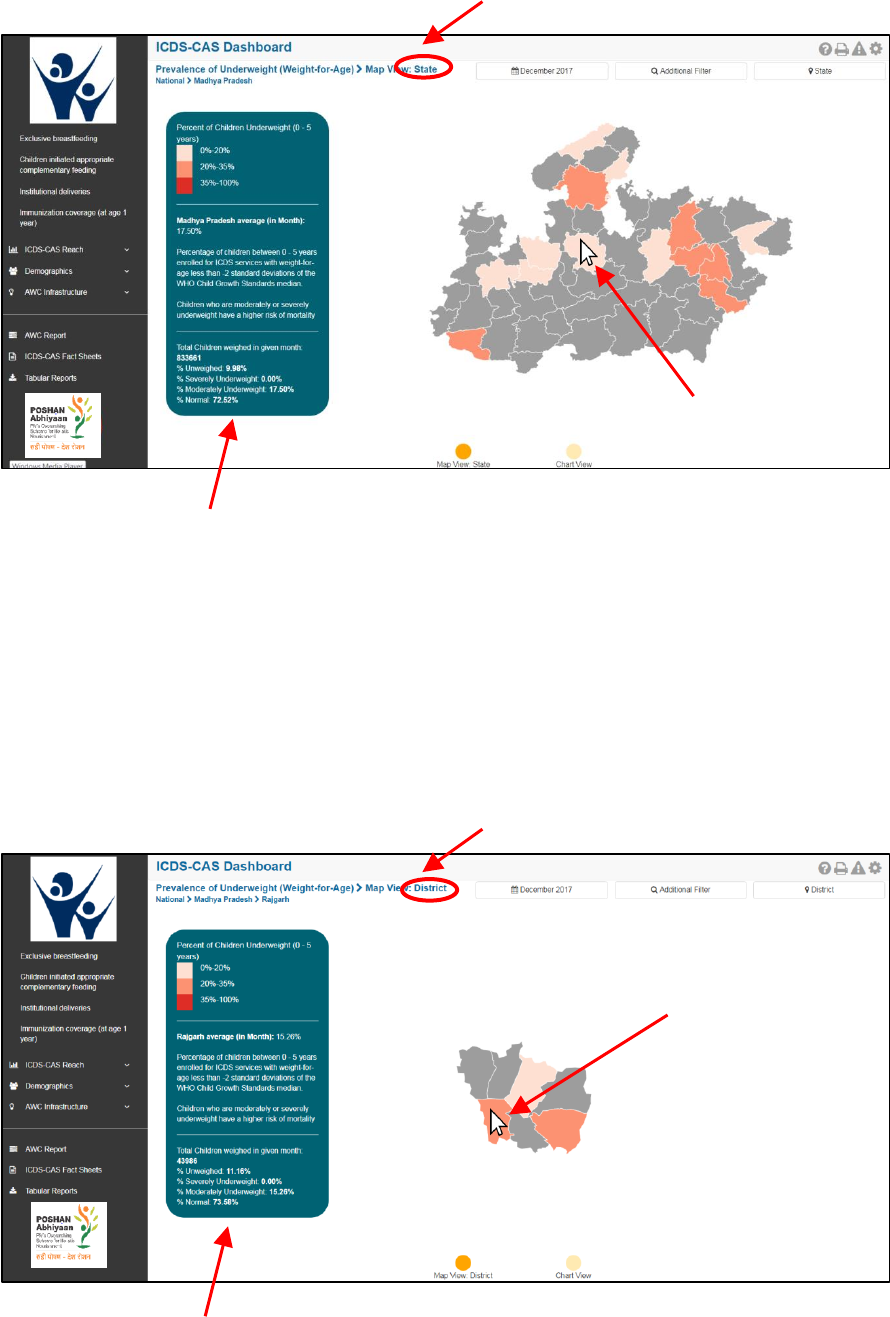
6.1.2 Underweight (Weight-for-Age): Map View – State
If a State level user (SPMU) logs into the dashboard, the ‘Map View’ will show a State view as shown in
the below snapshot.
The State level user can click on the map or select locations from location filter and drill down to lower
levels (District / Block / Sector).
National Level View
Figure 16: Underweight (Weight-for-Age): Map View - National
Definition of Indicator
Thresholds for Indicator
Aggregate data at National level
Click on map to
drill down to
State view
22
Figure 17: Underweight (Weight-for-Age): Map View - State
6.1.3 Underweight (Weight-for-Age): Map View – District
If a District level user (DPO / District Helpdesk) logs into the dashboard, the ‘Map View’ will show a District
view as shown in the below snapshot.
The District level user can click on the map or select locations from location filter and drill down to lower
levels (Block / Sector).
Figure 18: Underweight (Weight-for-Age): Map View - District
State Level View
Aggregate data at State level
District Level View
Aggregate data at District level
Click on map
to drill down
to Block view
Click on map to
drill down to
District view
23
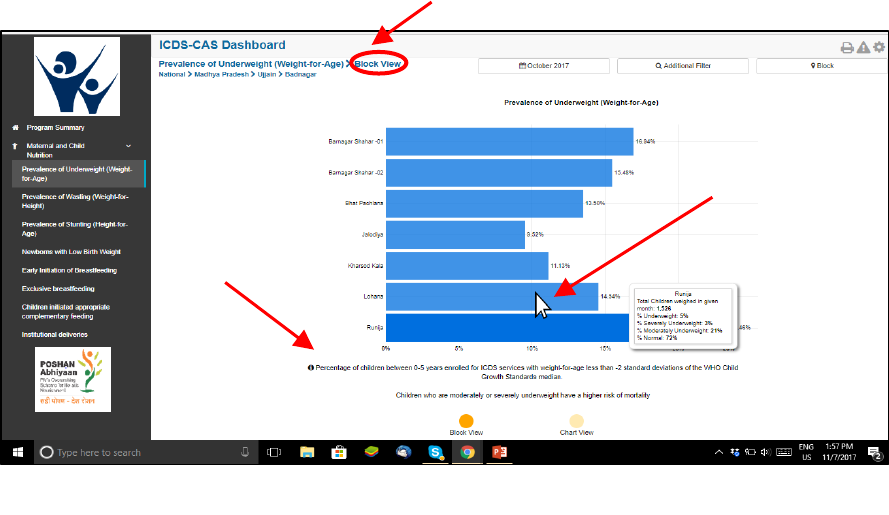
6.1.4 Underweight (Weight-for-Age): Block View
If a Block level user (CDPO / Block Helpdesk) logs into the dashboard, the ‘Map View’ will show a Block
view as shown in the below snapshot.
The Block view is a graphical view showing data for each Sector in the Block. The user can view the
definition of the indicator and hover over the graph for further details. The Block level user can click on
the bar for any Sector or use the location filter to drill down to Sector view.
6.1.5 Underweight (Weight-for-Age): Sector View
The Sector view is a graphical view showing data for each AWC in the Sector. The user can view the
definition of the indicator and hover over the graph for further details. For more information about a
particular AWC, the user can select the AWC by clicking on the bar chart or use the location filter. The
dashboard will direct the user to AWC Report which is explained further in Section 10.
Figure 19: Underweight (Weight-for-Age): Block View
Block Level View
Click on bar to
drill down to
Sector view
Definition of
Indicator
24
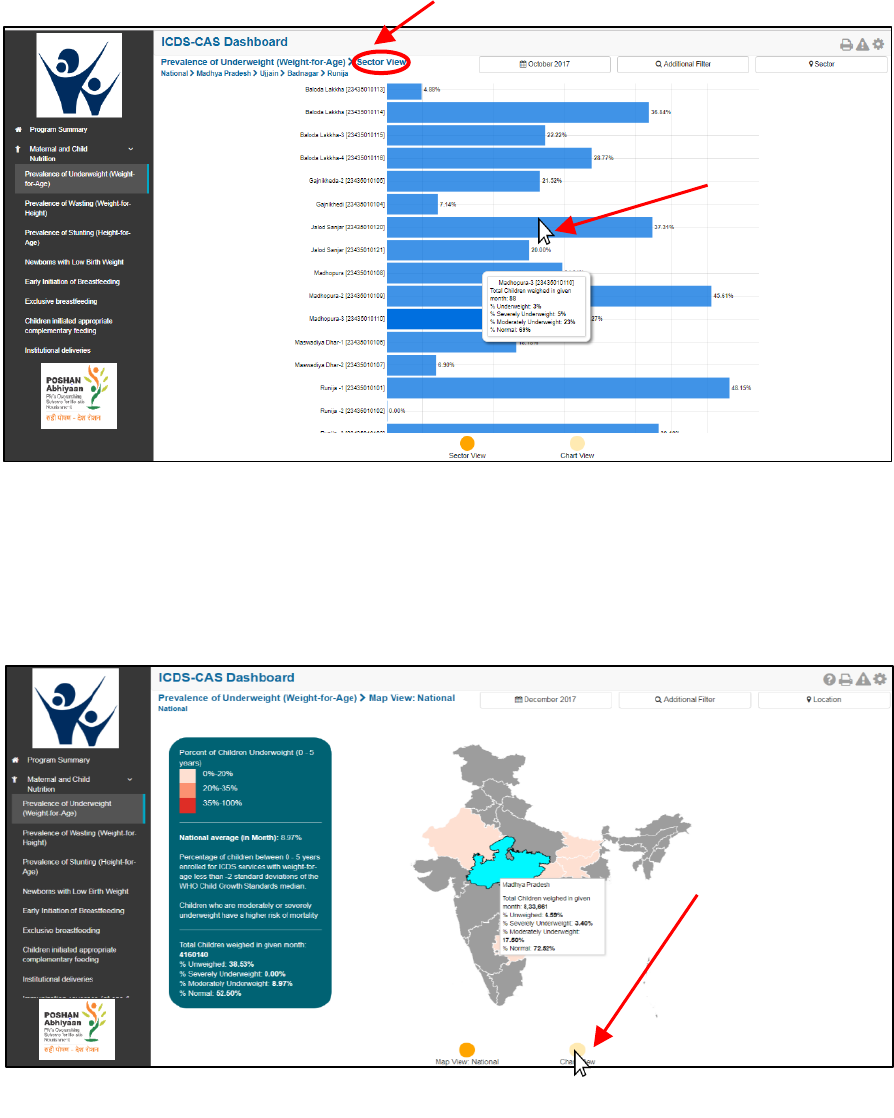
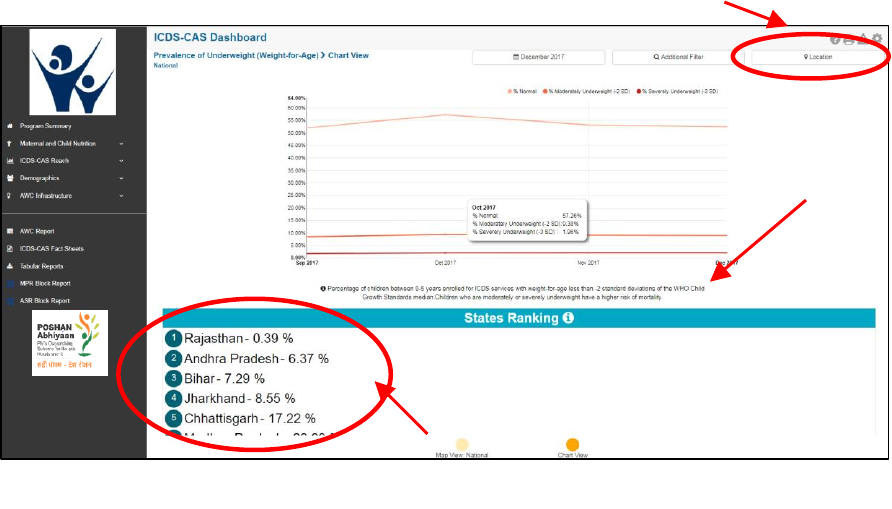
6.1.6 Underweight (Weight-for-Age): Chart View – National
On the Map view page, click on the ‘Chart View’ bubble navigation to see a chart view of the indicator.
If a National level user (MWCD / CPMU) logs into the dashboard, the ‘Chart View’ will show the Prevalence
of Underweight (Weight-for-Age) at the National level shown in the below snapshot.
Sector Level View
Click on bar to
navigate to
AWC Report
Figure 20: Underweight (Weight-for-Age): Sector View
Figure 21: Navigating to Chart View
Click on bubble
to navigate to
Chart View
25
The National level user can use the location filter and drill down to lower levels (State / District / Block /
Sector) or directly move from ‘Map View’ to ‘Chart View’ at any level by clicking on the ‘Chart View’ bubble
navigation on the ‘Map View’ page.
The Chart View displays a trend line for the ‘Underweight (Weight-for-Age)’ indicator (including trend
lines for normal, moderately underweight and severely underweight children) over the last three months.
The National view shows a National level trend line. The legend on the top right displays information on
the specific indicators and color keys shown by the trend line. The tooltip on hover provides more
information about the data for the particular point in time.
Below the chart view, the user can also see a performance based ranking of States based on Prevalence
of Underweight (Weight-for-Age) children in the States.
Note: This ranking is not meant to draw comparisons between performances in the different locations.
However, dashboard users are encouraged to identify issues and improve service delivery in poor
performing areas using this data.
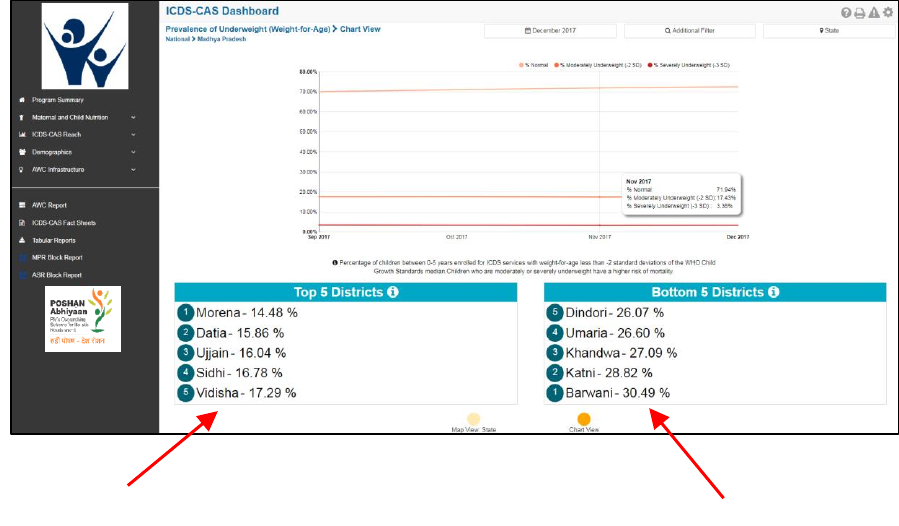
6.1.7 Underweight (Weight-for-Age): Chart View – State
If a State level user (SPMU) logs into the dashboard, the ‘Chart View’ will show a State view as shown in
the below snapshot.
Figure 22: Underweight (Weight-for-Age): Chart View – National
Location Filter: User may select any level
below and view data for selected level
Definition of
Indicator
Performance based ranking
26
The State level user can use the location filter and drill down to lower levels (District / Block / Sector) or
directly move from ‘Map View’ to ‘Chart View’ at any level by clicking on the ‘Chart View’ bubble
navigation on the ‘Map View’ page.
The State view shows a State level trend line and also shows a list of high performing and low performing
Districts based on Prevalence of Underweight (Weight-for-Age) children in the Districts.
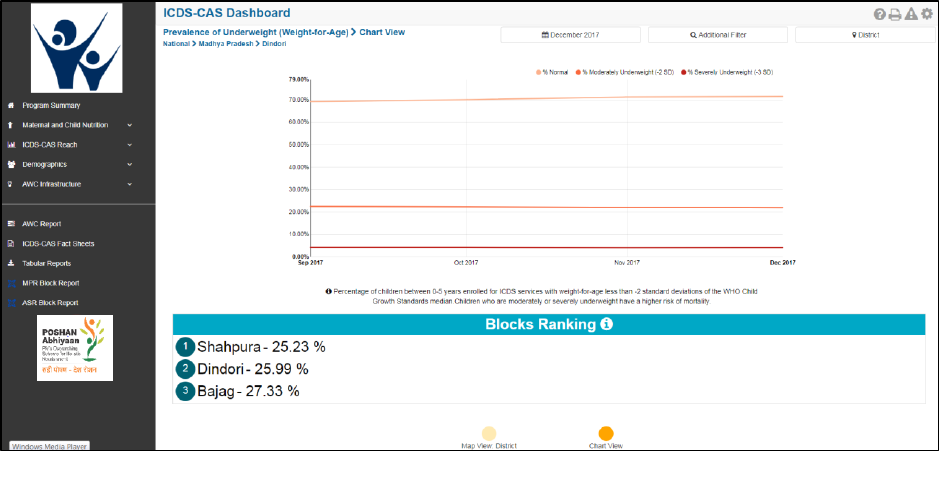
6.1.8 Underweight (Weight-for-Age): Chart View – District
If a District level user (DPO / District Helpdesk) logs into the dashboard, the ‘Chart View’ will show a District
view as shown in the below snapshot.
The District level user can use the location filter and drill down to lower levels (Block / Sector) or directly
move from ‘Map View’ to ‘Chart View’ at any level by clicking on the ‘Chart View’ bubble navigation on
the ‘Map View’ page.
The District view shows a District level trend line and also shows performance-based ranking of Blocks
based on Prevalence of Underweight (Weight-for-Age) children in the Blocks.
Figure 23: Underweight (Weight-for-Age): Chart View – State
High performing Districts
Low performing Districts
27
6.1.9 Underweight (Weight-for-Age): Chart View –Block
If a Block level user (CDPO / Block Helpdesk) logs into the dashboard, the ‘Chart View’ will show a Block
view as shown in the below snapshot.
The Block level user can use the location filter and drill down to lower levels (Sector) or directly move from
‘Map View’ to ‘Chart View’ at any level by clicking on the ‘Chart View’ bubble navigation on the ‘Map View’
page.
The Block view shows a Block level trend line and also shows performance-based ranking of Sectors based
on Prevalence of Underweight (Weight-for-Age) children in the Sectors.
Figure 24: Underweight (Weight-for-Age): Chart View – District
28
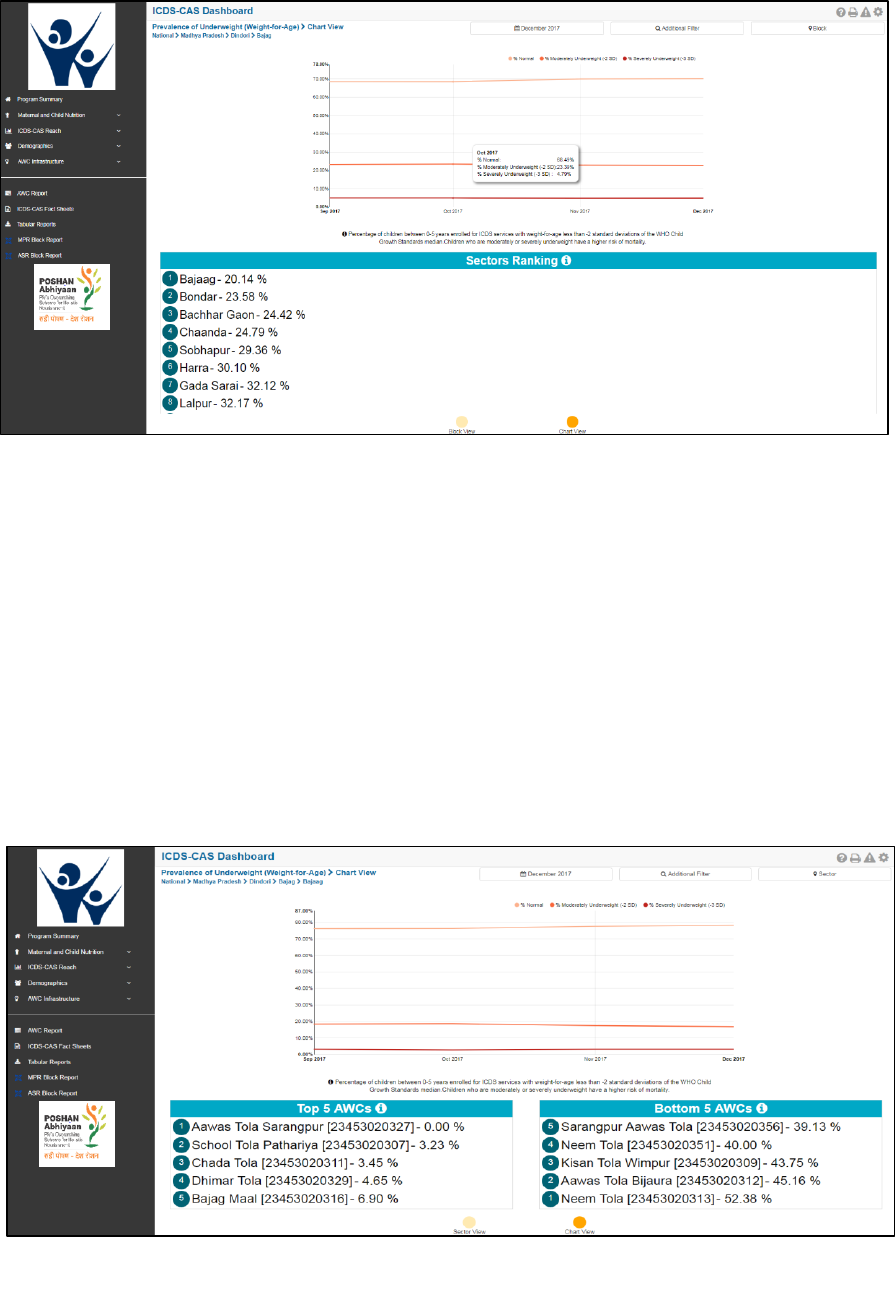
6.1.10 Underweight (Weight-for-Age): Chart View – Sector
The ‘Sector View’ will show a Sector level view as shown in the below snapshot. Any user level can use
the location filter and drill down to Sector level chart view.
The Sector view shows a Sector level trend line and also shows a list of high performing and low
performing Anganwadi Centers (AWCs) based on Prevalence of Underweight (Weight-for-Age) children in
the AWCs.
For more information about a particular AWC, the user can select the AWC using the location filter. The
dashboard will direct the user to AWC Report which is explained further in Section 10.
Figure 25: Underweight (Weight-for-Age): Chart View – Block
Figure 26: Underweight (Weight-for-Age): Chart View – Sector
29
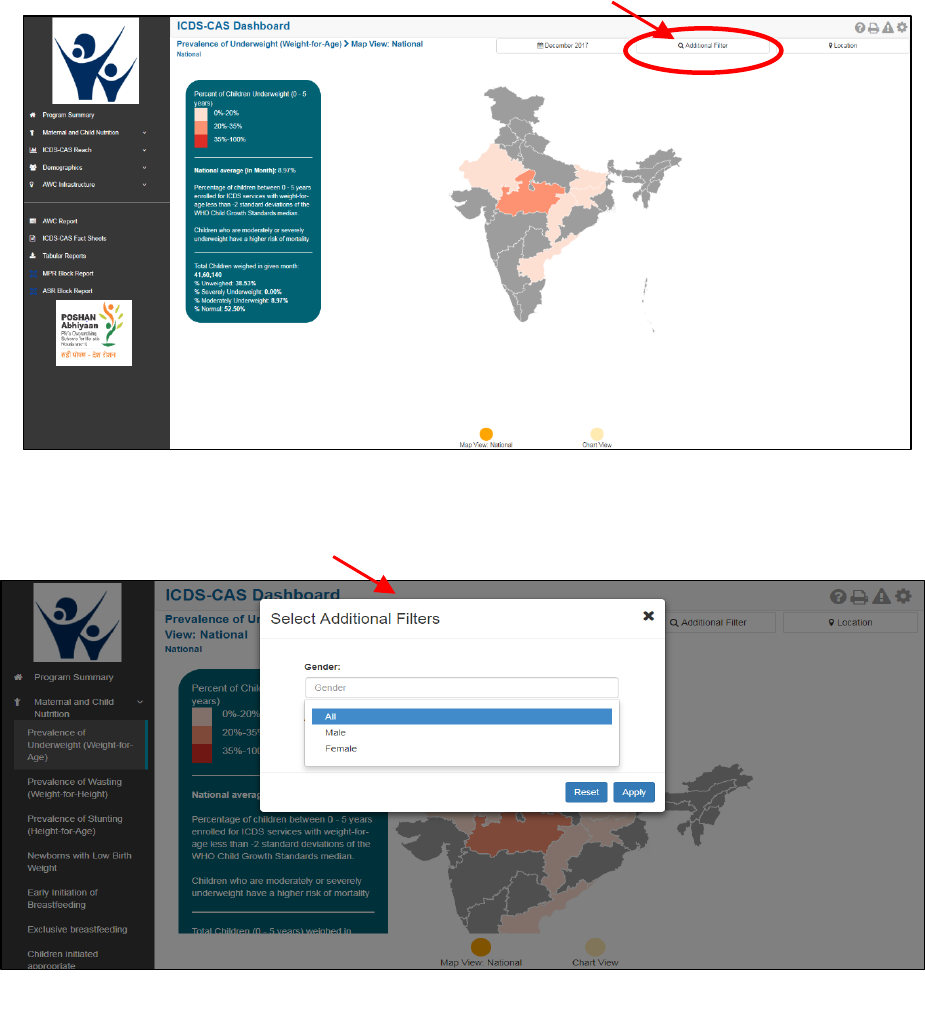
6.1.11 Underweight (Weight-for-Age): Additional Filters
On the ‘Map View’ or ‘Chart View’ page, the dashboard also provides additional filters to extract selected
information. For example – For Underweight (Weight-for-Age) indicator there are following additional
indicators on the dashboard – Gender and Age. Similarly, there are additional filters for other indicators
as well.
Click on Additional Filters
Figure 27: Additional Filters
Select ‘Gender’ and click on ‘Apply’
Figure 28: Additional Filter - Gender
30
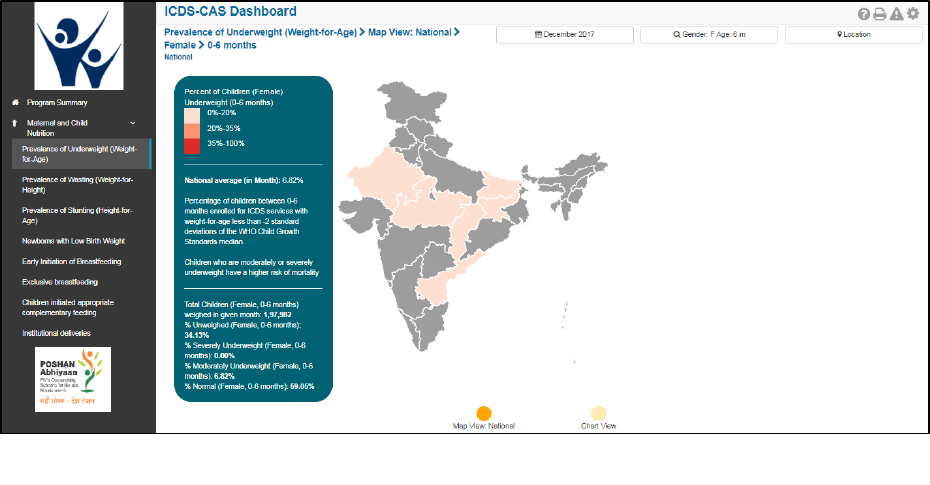
Once the user selects the gender as “Female” and selects Age group as “0-6 Months” the view is updated
and the below mentioned screen is displayed:
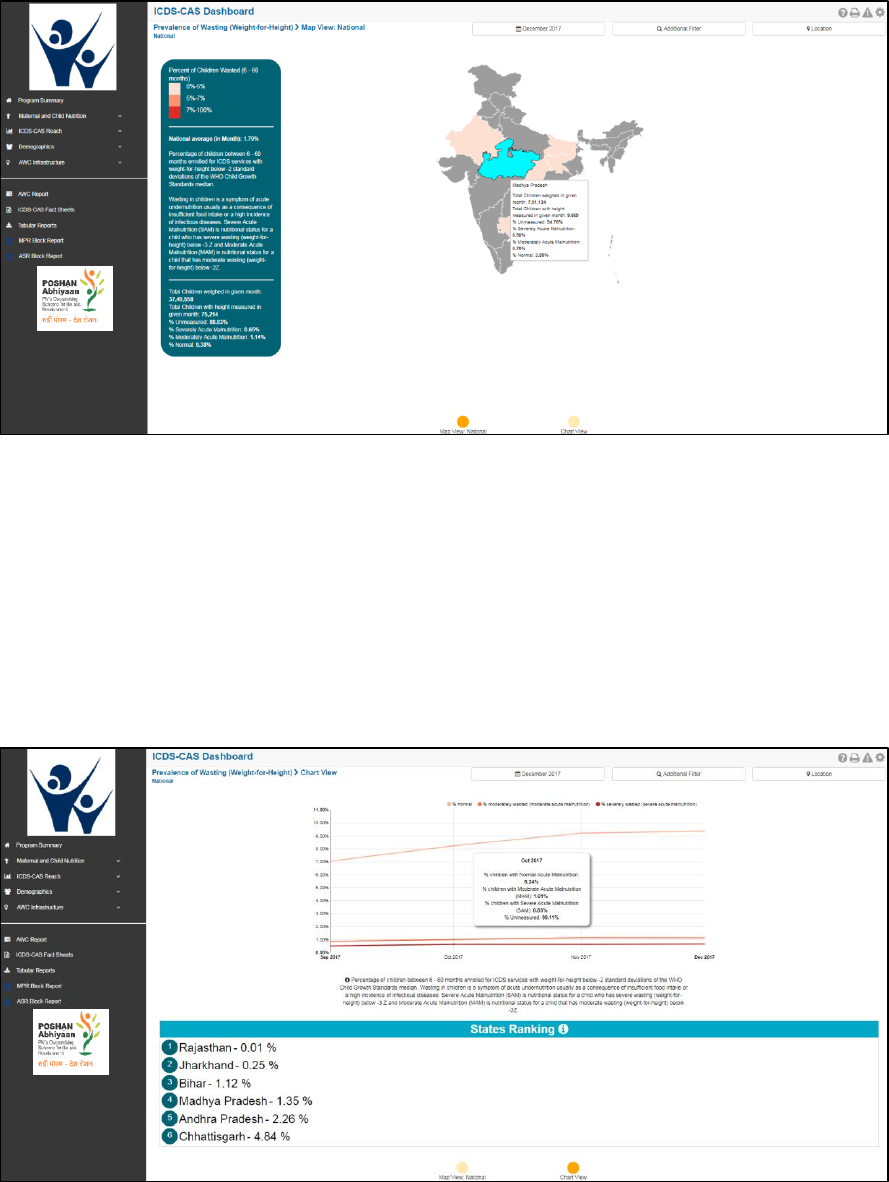
6.2 Wasting (Weight-for-Height)
The second indicator under ‘Maternal and Child Nutrition’ is ‘Wasting (Weight-for-Height)’ which is
explained below.
Definition of indicator - Percentage of children between 0-5 years with weight-for-height below -2
standard deviations of the WHO Child Growth Standards median. Severe Acute Malnutrition (SAM) or
wasting in children is a symptom of acute under nutrition usually as a consequence of insufficient food
intake or a high incidence of infectious diseases.
The navigation workflow for moving to ‘Map View’ or ‘Chart View’ is similar to as explained for the first
indicator – Underweight (Weight-for-Age) in Section 6.1.
6.2.1 Wasting (Weight-for-Height): Map View–National
If a National level user (MWCD / CPMU) logs into the dashboard, the ‘Map View’ will show the Prevalence
of Wasting (Weight-for-Height) at the National level as shown in the below snapshot.
Rest of the views (State / District / Block / Sector) are similar to as explained for the first indicator –
Underweight (Weight-for-Age) in Section 6.1.
Figure 29: Additional Filters – Screen Shot - “Female” selected
31
Figure 30: Wasting (Weight-for-Height): Map View - National
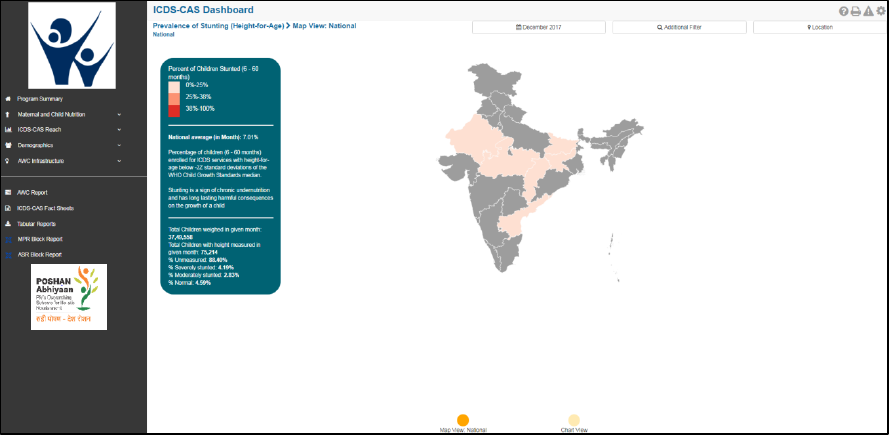
6.2.2 Wasting (Weight-for-Height): Chart View–National
If a National level user (MWCD / CPMU) logs into the dashboard, the ‘Chart View’ will show the Prevalence
of Wasting (Weight-for-Height) at the National level as shown in the below snapshot.
Rest of the views (State / District / Block / Sector) are similar to as explained for the first indicator –
Underweight (Weight-for-Age) in Section 6.1.
Figure 31: Wasting (Weight-for-Height): Chart View – National
32
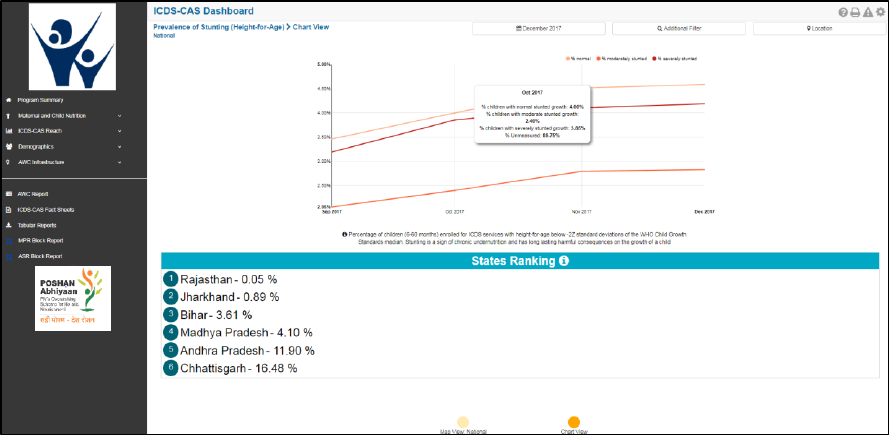
6.3 Stunting (Height-for-Age)
The third indicator under ‘Maternal and Child Nutrition’ is ‘Stunting (Height-for-Age)’ which is explained
below.
Definition of indicator - Percentage of children between 0-5 years with height-for-age below -2Z standard
deviations of the WHO Child Growth Standards median. Stunting is a sign of chronic under nutrition and
has long lasting harmful consequences on the growth of a child.
The navigation workflow for moving to ‘Map View’ or ‘Chart View’ is similar to as explained for the first
indicator – Underweight (Weight-for-Age) in Section 6.1.
6.3.1 Stunting (Height-for-Age): Map View–National
If a National level user (MWCD / CPMU) logs into the dashboard, the ‘Map View’ will show the Prevalence
of Stunting (Height-for-Age) at the National level as shown in the below snapshot.
Rest of the views (State / District / Block / Sector) are similar to as explained for the first indicator –
Underweight (Weight-for-Age) in Section 6.1.
Figure 32: Stunting (Height-for-Age): Map View – National
6.3.2 Stunting (Height-for-Age): Chart View – National
If a National level user (MWCD / CPMU) logs into the dashboard, the ‘Chart View’ will show the Prevalence
of Stunting (Height-for-Age) at the National level as shown in the below snapshot.
Rest of the views (State / District / Block / Sector) are similar to as explained for the first indicator –
Underweight (Weight-for-Age) in Section 6.1.
33
Figure 33: Stunting (Height-for-Age): Chart View – National
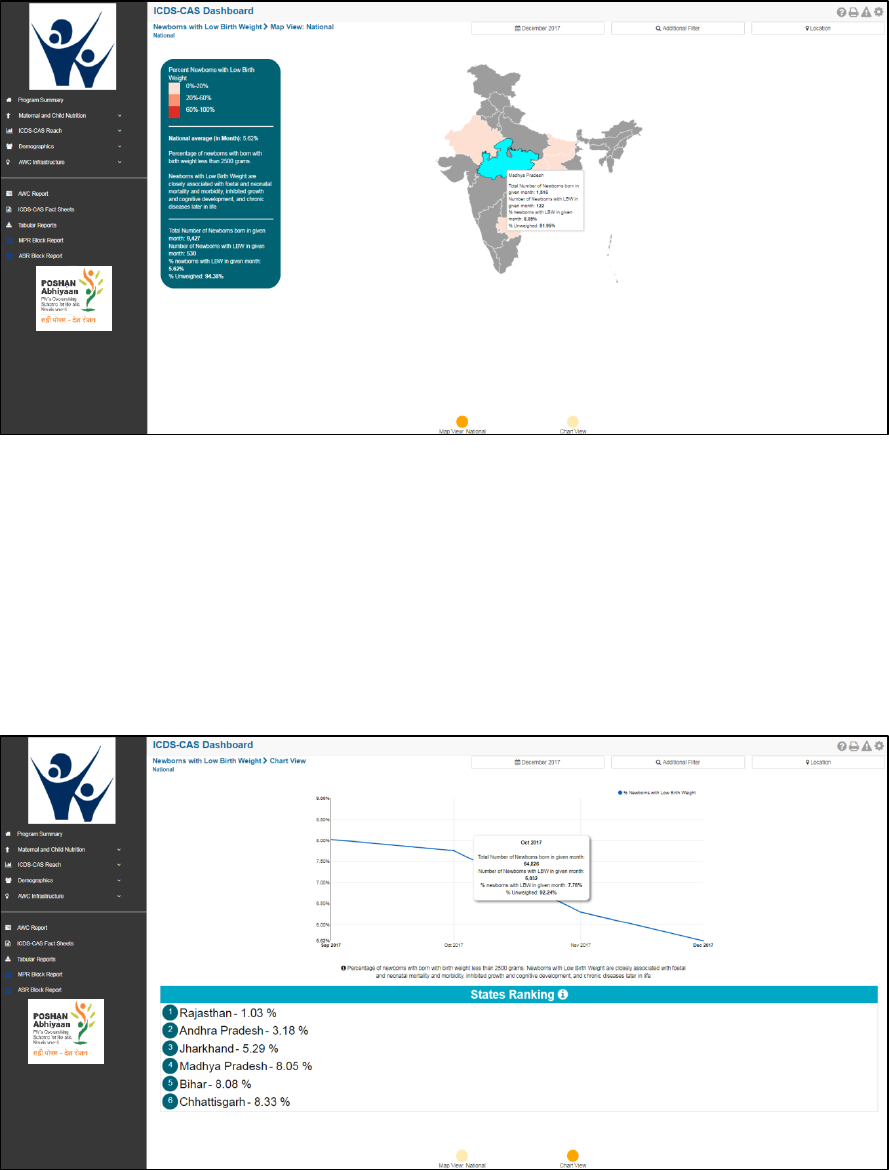
6.4 Newborns with Low Birth Weight
The fourth indicator under ‘Maternal and Child Nutrition’ is ‘Newborns with Low Birth Weight’ which is
explained below.
Definition of indicator - Percentage of newborns born with birth weight less than 2500 grams. Newborns
with Low Birth Weight are closely associated with fetal and neonatal mortality and morbidity, inhibited
growth and cognitive development, and chronic diseases later in life.
The navigation workflow for moving to ‘Map View’ or ‘Chart View’ is similar to as explained for the first
indicator – Underweight (Weight-for-Age) in Section 6.1.
6.4.1 Newborns with Low Birth Weight: Map View – National
If a National level user (MWCD / CPMU) logs into the dashboard, the ‘Map View’ will show a National view
as shown in the below snapshot.
Rest of the views (State / District / Block / Sector) are similar to as explained for the first indicator –
Underweight (Weight-for-Age) in Section 6.1.
34
Figure 34: Newborns with Low Birth Weight: Map View – National
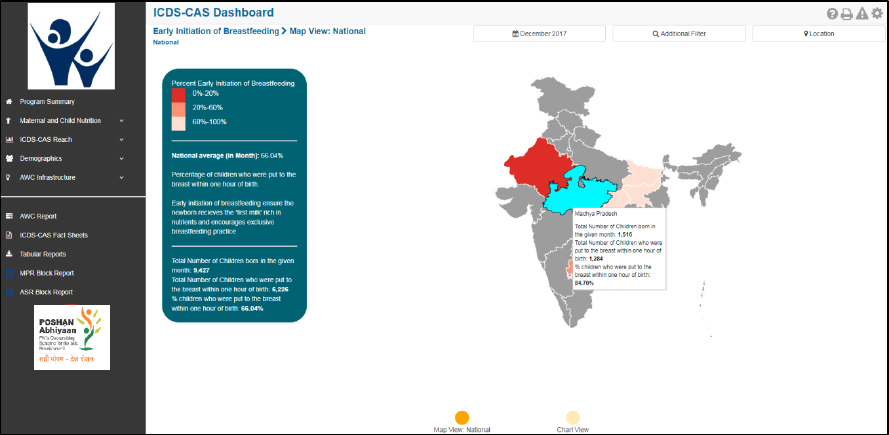
6.4.2 Newborns with Low Birth Weight: Chart View – National
If a National level user (MWCD / CPMU) logs into the dashboard, the ‘Chart View’ will show a National
view as shown in the below snapshot.
Rest of the views (State / District / Block / Sector) are similar to as explained for the first indicator –
Underweight (Weight-for-Age) in Section 6.1.
Figure 35: Newborns with Low Birth Weight: Chart View – National
35
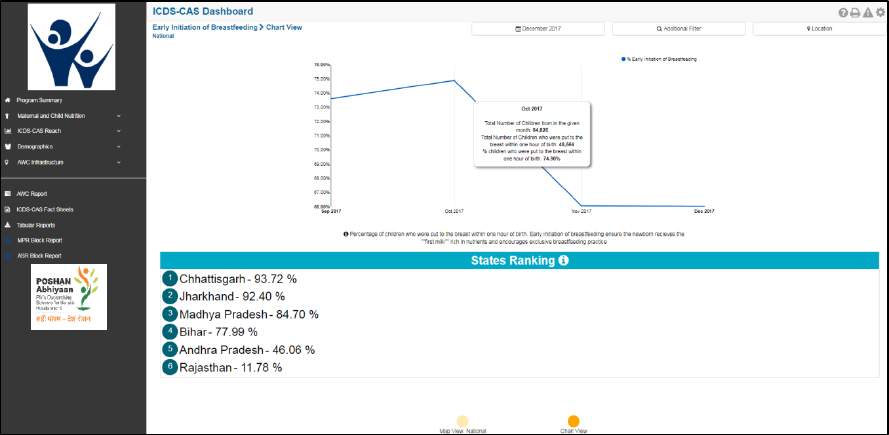
6.5 Early Initiation of Breastfeeding
The fifth indicator under ‘Maternal and Child Nutrition’ is ‘Early Initiation of Breastfeeding’ which is
explained below.
Definition of indicator - Percentage of children breastfed within an hour of birth. Early initiation of
breastfeeding ensures the newborn receives the ‘first milk’ rich in nutrients and encourages exclusive
breastfeeding practice.
The navigation workflow for moving to ‘Map View’ or ‘Chart View’ is similar to as explained for the first
indicator – Underweight (Weight-for-Age) in Section 6.1.
6.5.1 Early Initiation of Breastfeeding: Map View – National
If a National level user (MWCD / CPMU) logs into the dashboard, the ‘Map View’ will show a National view
as shown in the below snapshot.
Rest of the views (State / District / Block / Sector) are similar to as explained for the first indicator –
Underweight (Weight-for-Age) in Section 6.1.
Figure 36: Early Initiation of Breastfeeding: Map View – National
6.5.2 Early Initiation of Breastfeeding: Chart View – National
If a National level user (MWCD / CPMU) logs into the dashboard, the ‘Chart View’ will show a National
level view as shown in the below snapshot.
Rest of the views (State / District / Block / Sector) are similar to as explained for the first indicator –
Underweight (Weight-for-Age) in Section 6.1.
36
Figure 37: Early Initiation of Breastfeeding: Chart View – National
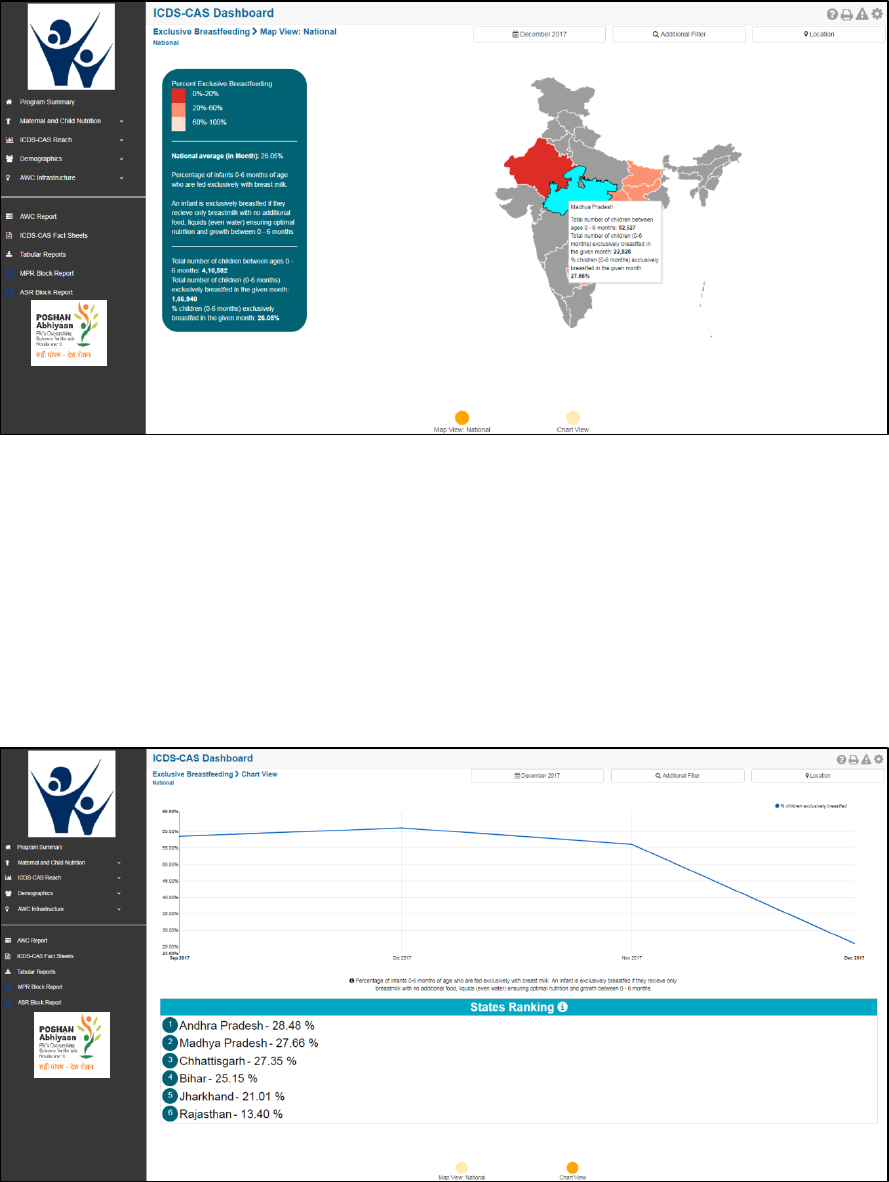
6.6 Exclusive Breastfeeding
The sixth indicator under ‘Maternal and Child Nutrition’ is ‘Exclusive Breastfeeding’ which is explained
below.
Definition of indicator - Percentage of children between 0-6 months exclusively breastfed. An infant is
exclusively breastfed id they receive only breast milk with no additional food, liquids (even water) ensuring
optimal nutrition and growth between 0-6 months.
The navigation workflow for moving to ‘Map View’ or ‘Chart View’ is similar to as explained for the first
indicator – Underweight (Weight-for-Age) in Section 6.1.
6.6.1 Exclusive Breastfeeding: Map View – National
If a National level user (MWCD / CPMU) logs into the dashboard, the ‘Map View’ will show a National view
as shown in the below snapshot.
Rest of the views (State / District / Block / Sector) are similar to as explained for the first indicator –
Underweight (Weight-for-Age) in Section 6.1.
37
Figure 38: Exclusive Breastfeeding: Map View – National
6.6.2 Exclusive Breastfeeding: Chart View – National
If a National level user (MWCD / CPMU) logs into the dashboard, the ‘Chart View’ will show a National
view as shown in the below snapshot.
Rest of the views (State / District / Block / Sector) are similar to as explained for the first indicator –
Underweight (Weight-for-Age) in Section 6.1.
Figure 39: Exclusive Breastfeeding: Chart View – National
38
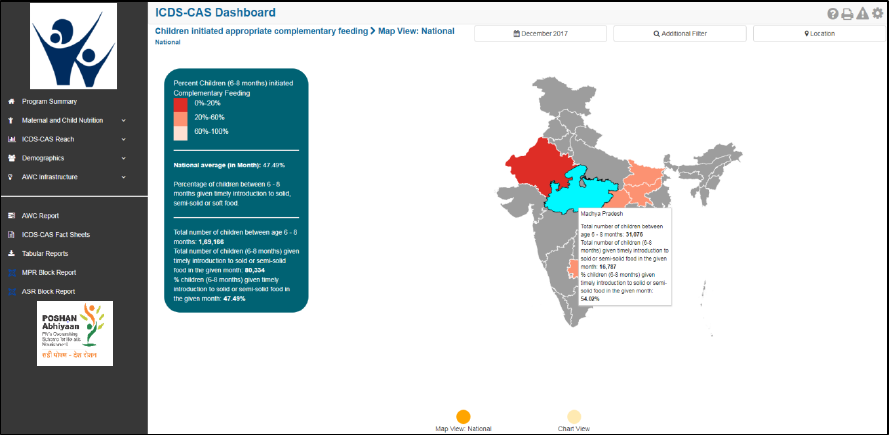
6.7 Children initiated appropriate Complementary Feeding
The seventh indicator under ‘Maternal and Child Nutrition’ is ‘Children initiated appropriate
Complementary Feeding’ which is explained below.
Definition of indicator - Percentage of children between 6-8 months given timely introduction to solid or
semi-solid food. Timely initiation of complementary feeding in addition to breast milk at 6 months of age
is a key feeding practice to reduce malnutrition.
The navigation workflow for moving to ‘Map View’ or ‘Chart View’ is similar to as explained for the first
indicator – Underweight (Weight-for-Age) in Section 6.1.
6.7.1 Children initiated appropriate Complementary Feeding: Map View – National
If a National level user (MWCD / CPMU) logs into the dashboard, the ‘Map View’ will show a National view
as shown in the below snapshot.
Rest of the views (State / District / Block / Sector) are similar to as explained for the first indicator –
Underweight (Weight-for-Age) in Section 6.1.
Figure 40: Children initiated appropriate Complementary Feeding: Map View - National
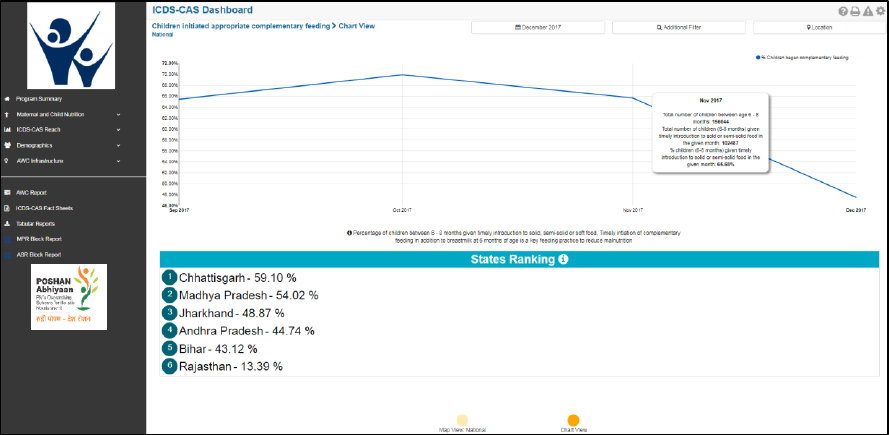
6.7.2 Children initiated appropriate Complementary Feeding: Chart View – National
If a National level user (MWCD / CPMU) logs into the dashboard, the ‘Chart View’ will show a National
view as shown in the below snapshot.
39
Rest of the views (State / District / Block / Sector) are similar to as explained for the first indicator –
Underweight (Weight-for-Age) in Section 6.1.
Figure 41: Children initiated appropriate Complementary Feeding: Chart View - National
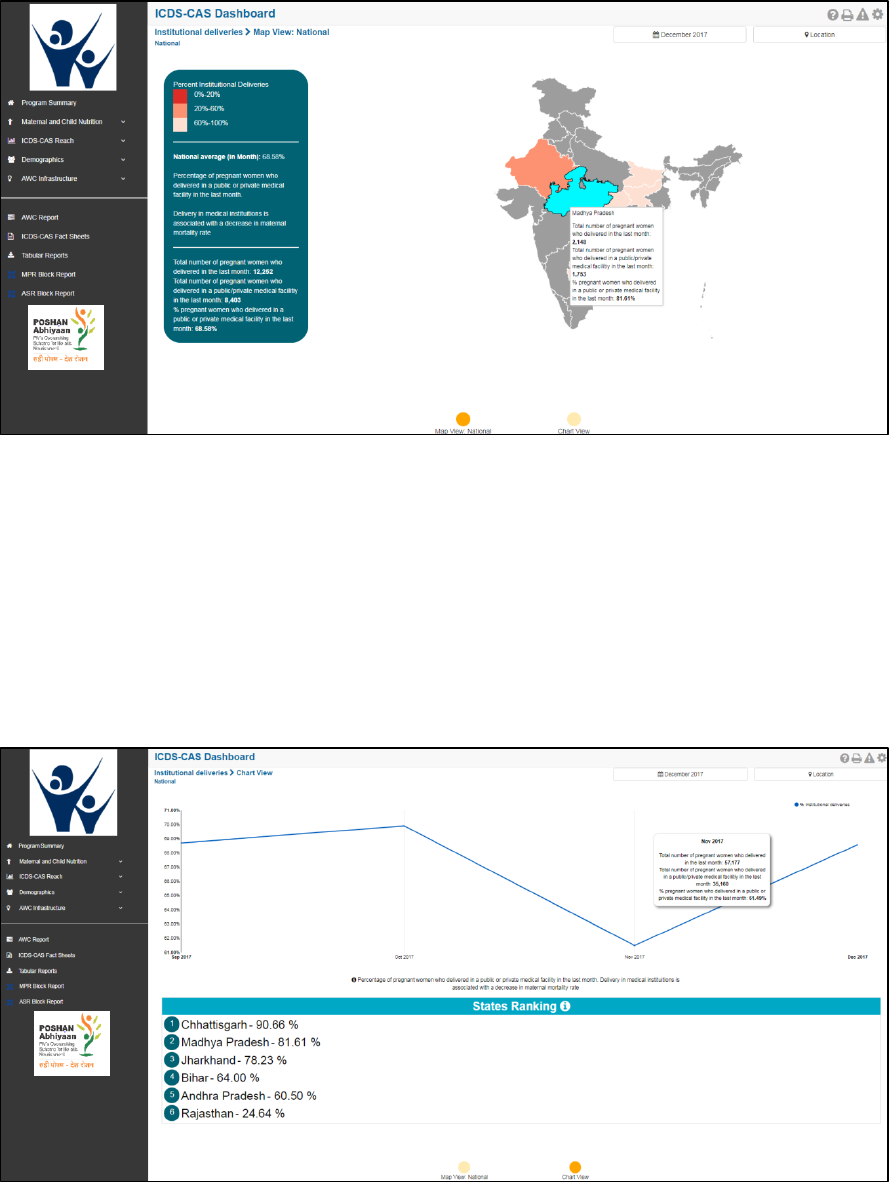
6.8 Institutional Deliveries
The eighth indicator under ‘Maternal and Child Nutrition’ is ‘Institutional Deliveries’ which is explained
below.
Definition of indicator – Percentage of pregnant women who delivered in a public or private medical
facility in the last month. Delivery in medical institutions is associated with a decrease in maternal
mortality rate.
The navigation workflow for moving to ‘Map View’ or ‘Chart View’ is similar to as explained for the first
indicator – Underweight (Weight-for-Age) in Section 6.1.
6.8.1 Institutional Deliveries: Map View – National
If a National level user (MWCD / CPMU) logs into the dashboard, the ‘Map View’ will show a National view
as shown in the below snapshot.
Rest of the views (State / District / Block / Sector) are similar to as explained for the first indicator –
Underweight (Weight-for-Age) in Section 6.1.
40
Figure 42: Institutional Deliveries: Map View – National
6.8.2 Institutional Deliveries: Chart View – National
If a National level user (MWCD / CPMU) logs into the dashboard, the ‘Chart View’ will show a National
view as shown in the below snapshot.
Rest of the views (State / District / Block / Sector) are similar to as explained for the first indicator –
Underweight (Weight-for-Age) in Section 6.1.
Figure 43: Institutional Deliveries: Chart View – National
41
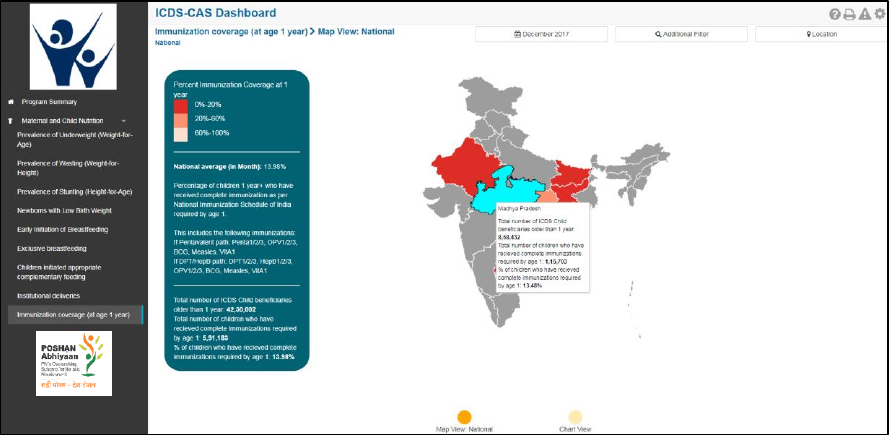
6.9 Immunization Coverage (at age 1 year)
The last indicator under ‘Maternal and Child Nutrition’ is ‘Immunization Coverage (at age 1 year)’ which
is explained below.
Definition of indicator – Percentage of children 1 year+ who have received complete immunization as per
National Immunization Schedule of India required by age 1.
The navigation workflow for moving to ‘Map View’ or ‘Chart View’ is similar to as explained for the first
indicator – Underweight (Weight-for-Age) in Section 6.1.
6.9.1 Immunization Coverage (at age 1 year): Map View – National
If a National level user (MWCD / CPMU) logs into the dashboard, the ‘Map View’ will show a National view
as shown in the below snapshot.
Rest of the views (State / District / Block / Sector) are similar to as explained for the first indicator –
Underweight (Weight-for-Age) in Section 6.1.
Figure 44: Immunization Coverage (at age 1 year): Map View - National
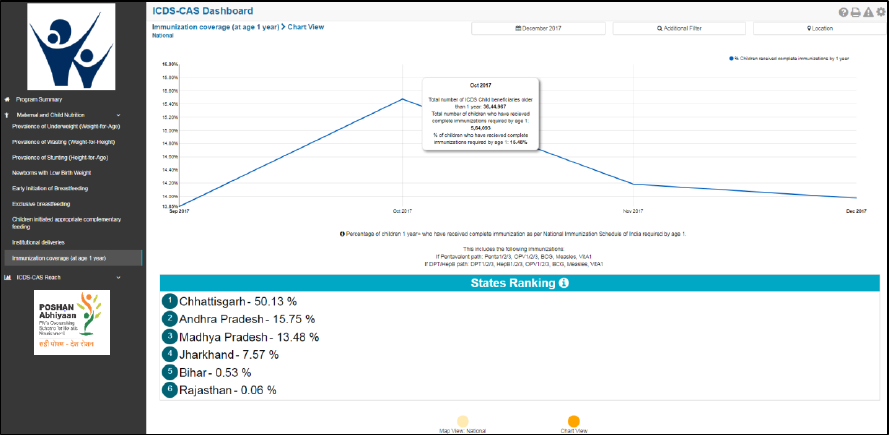
6.9.2 Immunization Coverage (at age 1 year): Chart View – National
If a National level user (MWCD / CPMU) logs into the dashboard, the ‘Chart View’ will show a National
view as shown in the below snapshot.
Rest of the views (State / District / Block / Sector) are similar to as explained for the first indicator –
Underweight (Weight-for-Age) in Section 6.1.
42
Figure 45: Immunization Coverage (at age 1 year): Chart View - National
43
7 ICDS-CAS Reach
ICDS-CAS Reach includes indicators that provide information about extent of coverage of ICDS-CAS
application. The section has the following list of indicators:
1. AWCs Daily Status
2. AWCs Launched
On the left hand navigation panel, click on ‘ICDS-CAS Reach’ to see a detailed list of indicators. Select the
indicator to see a detailed ‘Map View’ for the selected indicator.
Figure 46: Link to view ICDS-CAS Reach
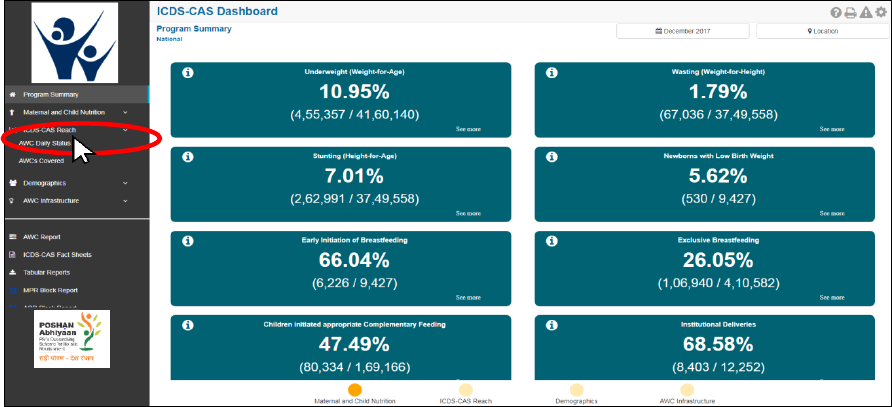
7.1 AWC Daily Status
The first indicator under ‘ICDS-CAS Reach’ is ‘AWC Daily Status’ which is explained below.
Definition of indicator – Percentage of Anganwadi Centers (AWCs) that were open yesterday
Click on the indicator ‘AWC Daily Status’ from the left hand navigation panel under ‘ICDS-CAS Reach’ to
enter ‘Map View’.
44
Figure 47: Link to view AWC Daily Status
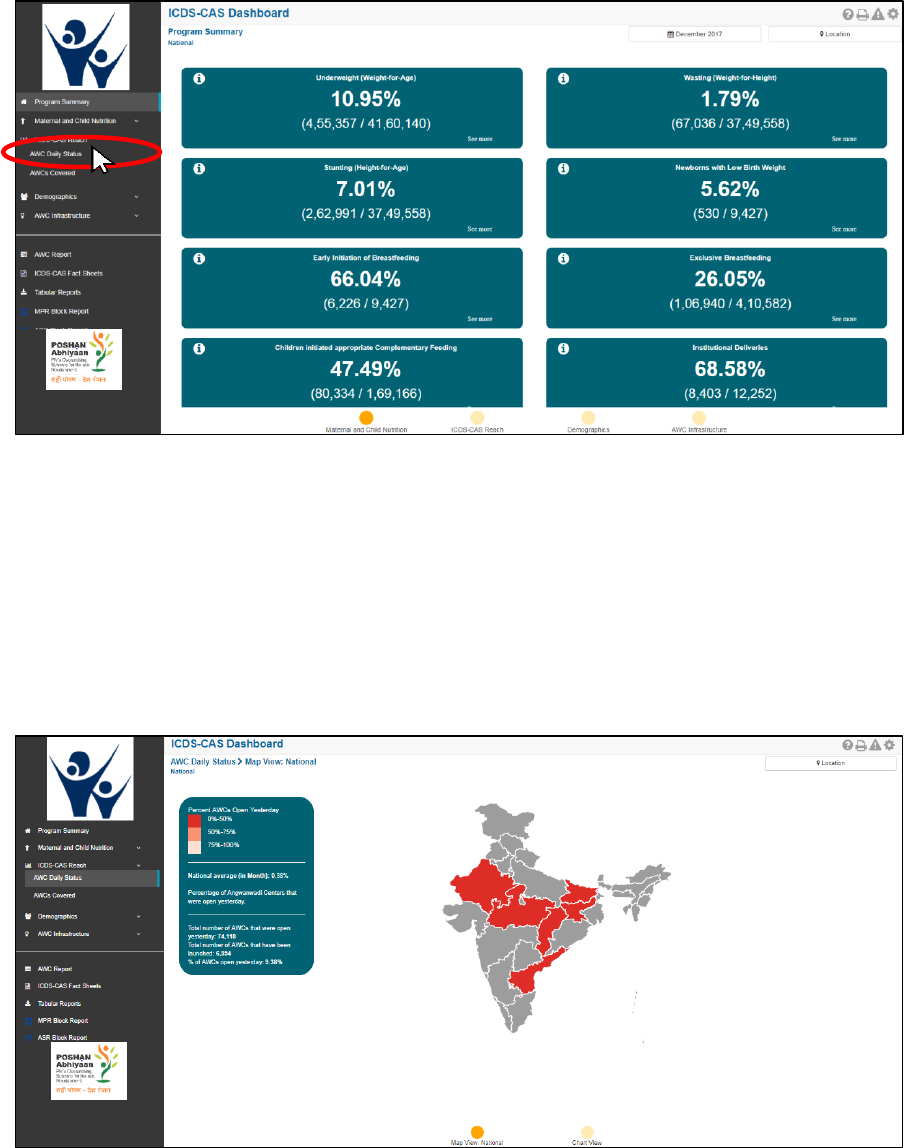
7.1.1 AWC Daily Status: Map View – National
If a National level user (MWCD / CPMU) logs into the dashboard, the ‘Map View’ will show a National view
as shown in the below snapshot.
The National level user can click on the map or select locations from location filter and drill down to lower
levels (State / District / Block / Sector).
Figure 48: AWC Daily Status: Map View – National
45
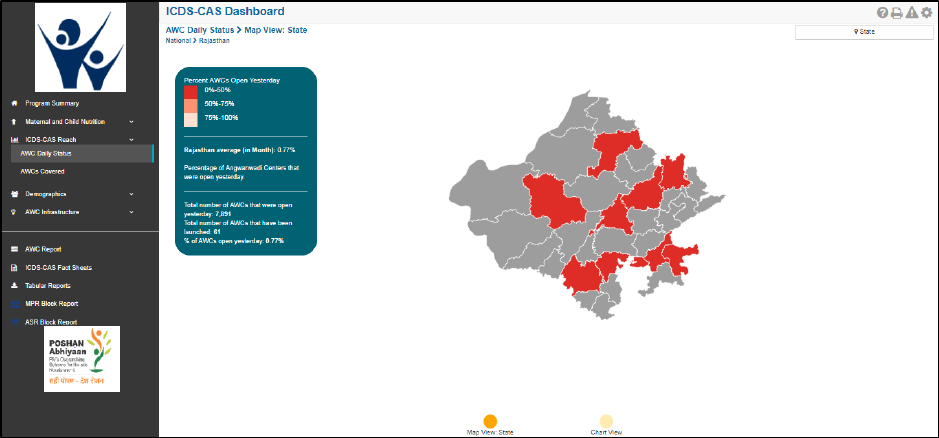
7.1.2 AWC Daily Status: Map View – State
If a State level user (SPMU) logs into the dashboard, the ‘Map View’ will show a State view as shown in
the below snapshot.
The State level user can click on the map or select locations from location filter and drill down to lower
levels (District / Block / Sector).
Figure 49: AWC Daily Status: Map View – State
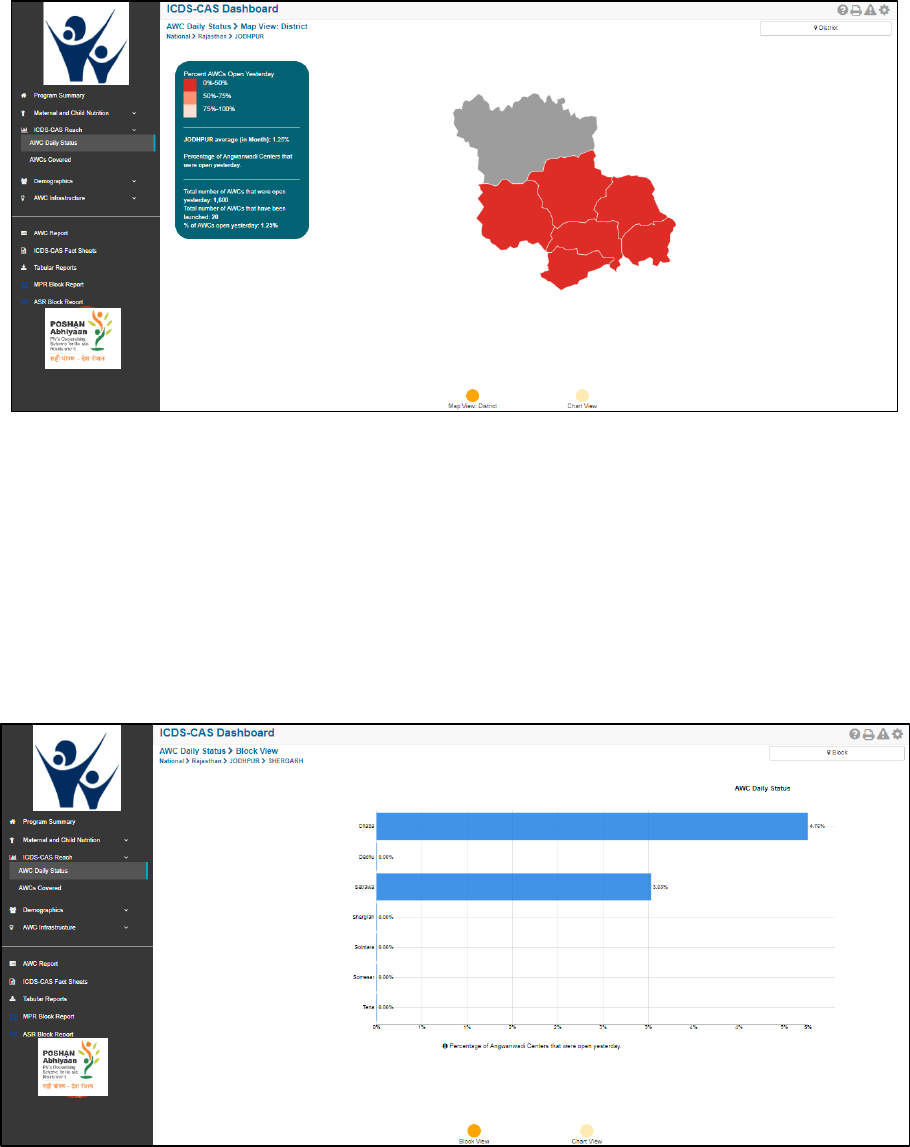
7.1.3 AWC Daily Status: Map View – District
If a District level user (DPO / District Helpdesk) logs into the dashboard, the ‘Map View’ will show a District
view as shown in the below snapshot.
The District level user can click on the map or select locations from location filter and drill down to lower
levels (Block / Sector).
46
Figure 50: AWC Daily Status: Map View – District
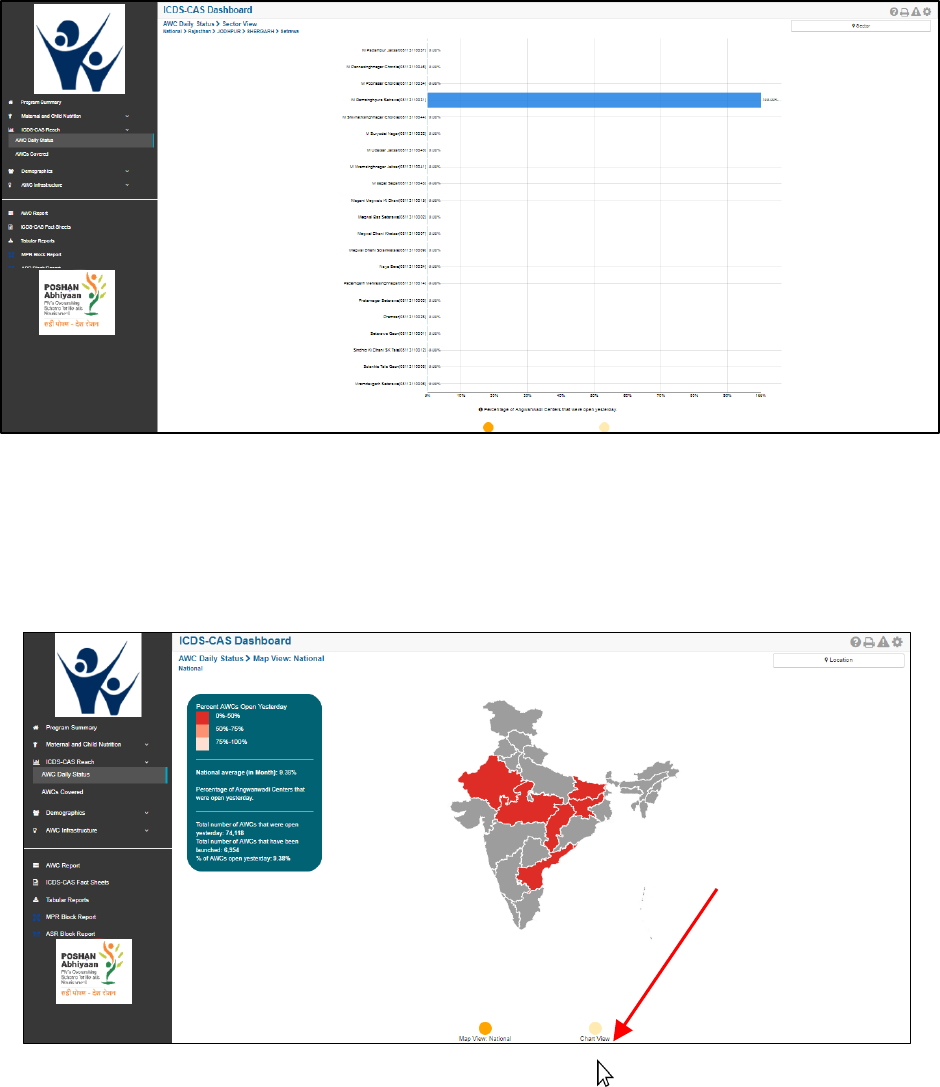
7.1.4 AWC Daily Status: Block View
If a Block level user (CDPO / Block Helpdesk) logs into the dashboard, the ‘Map View’ will show a Block
view as shown in the below snapshot.
The Block view is a graphical view showing data for each Sector in the Block. The Block level user can click
on the bar for any Sector or use the location filter to drill down to Sector view.
Figure 51: AWC Daily Status: Block View
47
7.1.5 AWC Daily Status: Sector View
The Sector view is a graphical view showing data for each AWC in the Sector. For more information about
a particular AWC, the user can select the AWC by clicking on the bar chart or use the location filter. The
dashboard will direct the user to AWC Report which is explained further in Section 10.
Figure 52: AWC Daily Status: Sector View
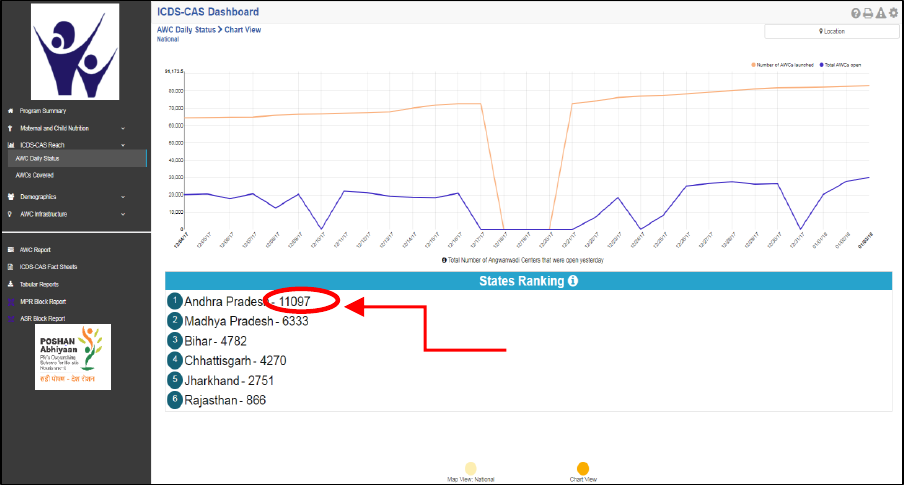
7.1.6 AWC Daily Status: Chart View – National
On the Map view page, click on the ‘Chart View’ bubble navigation to see a chart view of the indicator.
Figure 53: Navigating to Chart View
Click on bubble
to navigate to
Chart View
48
If a National level user (MWCD / CPMU) logs into the dashboard, the ‘Chart View’ will show a National
view as shown in the below snapshot.
The National level user can use the location filter and drill down to lower levels (State / District / Block /
Sector) or directly move from ‘Map View’ to ‘Chart View’ at any level by clicking on the ‘Chart View’ bubble
navigation on the ‘Map View’ page.
Figure 54: AWC Daily Status: Chart View – National
The x Axis on the chart view display the dates on which the AWC was open and Y axis displays the number
of AWCs which were open yesterday. The red trend displays the details of the AWCs which have been
launched till date and the blue trend line displays the number of AWC which were open from the total
number of AWCs launched.
The ‘States Ranking’ section below the graph ranks the states based on number of AWCs which were open
yesterday in each of the states.
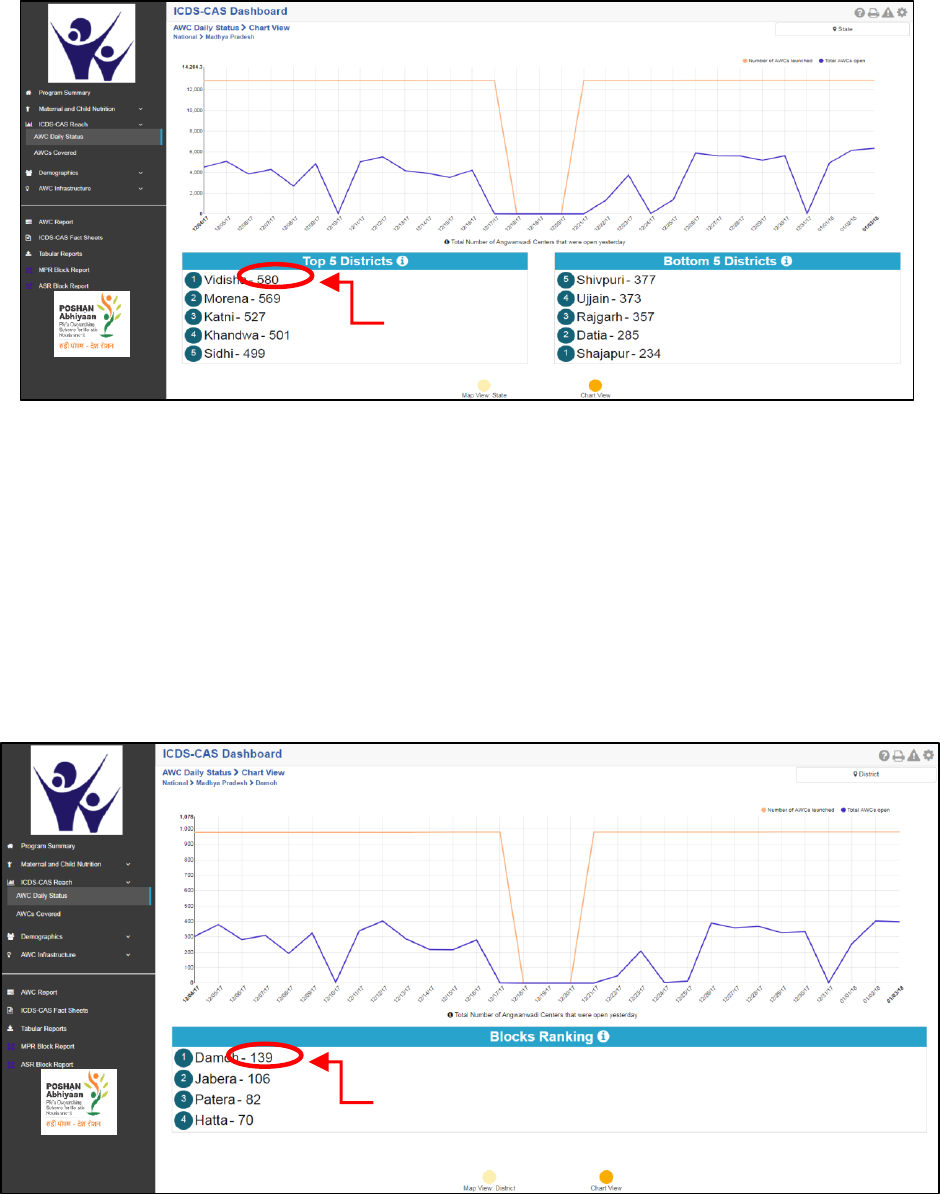
7.1.7 AWC Daily Status: Chart View – State
If a State level user (SPMU) logs into the dashboard, the ‘Chart View’ will show a State view as shown in
the below snapshot.
The State level user can use the location filter and drill down to lower levels (District / Block / Sector) or
directly move from ‘Map View’ to ‘Chart View’ at any level by clicking on the ‘Chart View’ bubble
navigation on the ‘Map View’ page.
Number of
AWCs open
yesterday
49
Figure 55: AWC Daily Status: Chart View – State
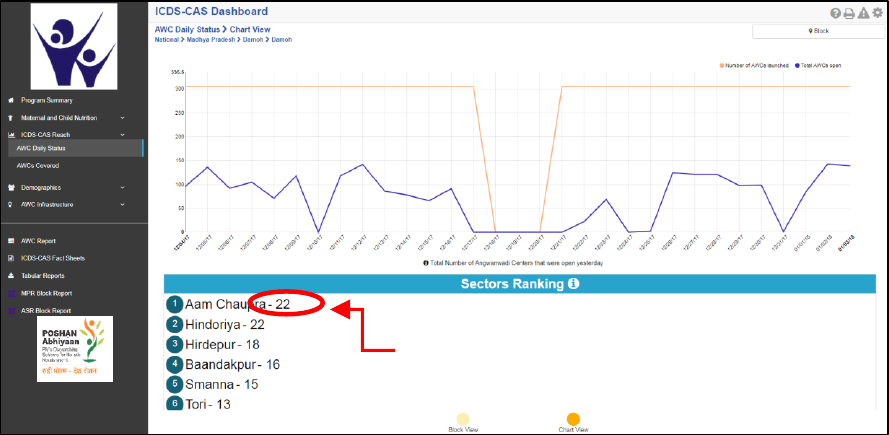
7.1.8 AWC Daily Status: Chart View – District
If a District level user (DPO / District Helpdesk) logs into the dashboard, the ‘Chart View’ will show a District
view as shown in the below snapshot.
The District level user can use the location filter and drill down to lower levels (Block / Sector) or directly
move from ‘Map View’ to ‘Chart View’ at any level by clicking on the ‘Chart View’ bubble navigation on
the ‘Map View’ page.
Figure 56: AWC Daily Status: Chart View – District
Number of
AWCs open
yesterday
Number of
AWCs open
yesterday
50
7.1.9 AWC Daily Status: Chart View – Block
If a Block level user (CDPO / Block Helpdesk) logs into the dashboard, the ‘Chart View’ will show a Block
view as shown in the below snapshot.
The Block level user can use the location filter and drill down to lower levels (Sector) or directly move from
‘Map View’ to ‘Chart View’ at any level by clicking on the ‘Chart View’ bubble navigation on the ‘Map View’
page.
Figure 57: AWC Daily Status: Chart View – Block
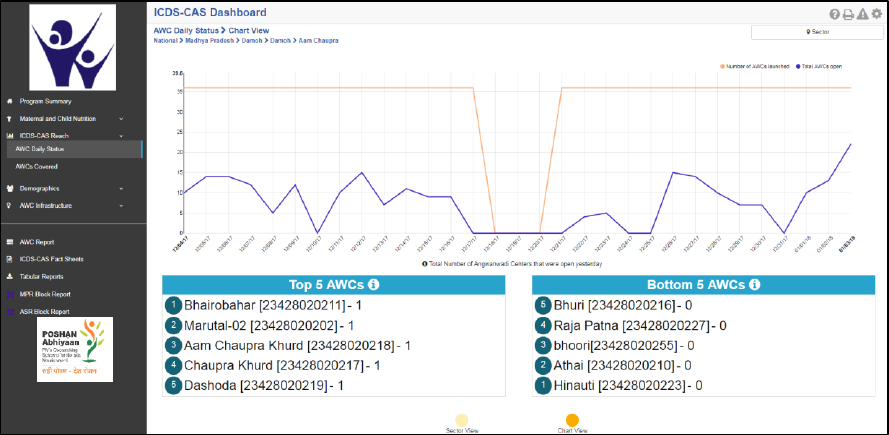
7.1.10 AWC Daily Status: Chart View – Sector
The ‘Sector View’ will show a Sector level view as shown in the below snapshot. Any user level can use
the location filter and drill down to Sector level chart view.
For more information about a particular AWC, the user can select the AWC using the location filter. The
dashboard will direct the user to AWC Report which is explained further in Section 10.
Number of
AWCs open
yesterday
51
Figure 58: AWC Daily Status: Chart View – Sector
In the above snapshot, the AWCs with ‘1’ written against them were open yesterday and the AWCs with
‘0’ written against them were closed yesterday.
7.2 AWCs Launched
The second indicator under ‘ICDS-CAS Reach’ is ‘AWCs Launched’ which is explained below.
Definition of indicator – Total AWCs that have launched ICDS-CAS. AWCs are considered launched if they
have submitted at least one Household Registration form.
The navigation workflow for moving to ‘Map View’ or ‘Chart View’ is similar to as explained for the first
indicator – AWC Daily Status in Section 7.1.
7.2.1 AWCs Covered: Map View – National
If a National level user (MWCD / CPMU) logs into the dashboard, the ‘Map View’ will show a National view
as shown in the below snapshot.
Rest of the views (State / District / Block / Sector) are similar to as explained for the first indicator – AWC
Daily Status in Section 7.1.
52
Figure 59: AWCs Covered: Map View – National
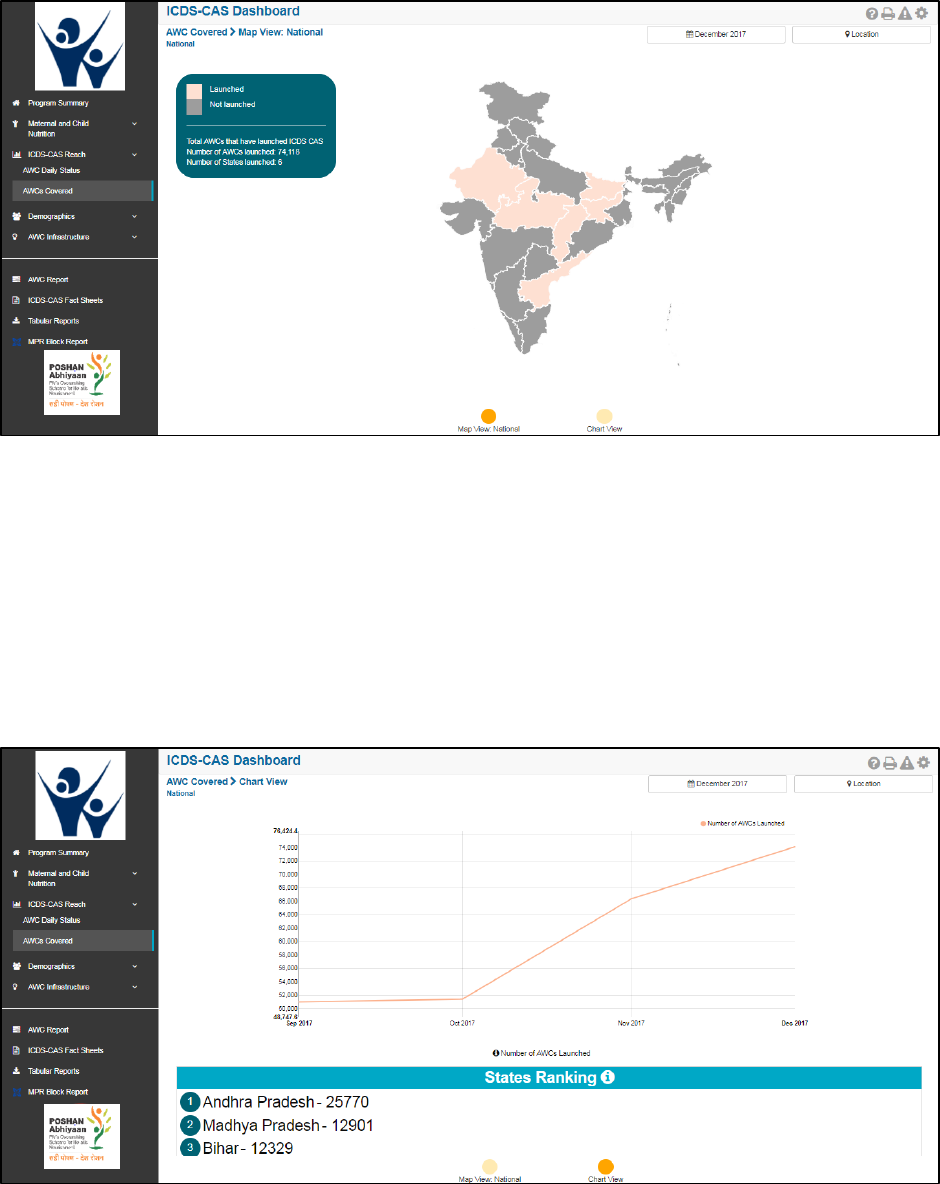
7.2.2 AWCs Covered: Chart View – National
If a National level user (MWCD / CPMU) logs into the dashboard, the ‘Chart View’ will show a National
view as shown in the below snapshot.
Rest of the views (State / District / Block / Sector) are similar to as explained for the first indicator – AWC
Daily Status in Section 7.1.
Figure 60: AWCs Covered: Chart View – National
53
8 Demographics
Demographics includes indicators that provide information about the number of beneficiaries covered
under ICDS-CAS across various categories. The section has the following list of indicators:
1. Registered Households
2. Children (0-6 years) who are enrolled for ICDS services
3. Pregnant Women enrolled for ICDS services
4. Lactating Mothers enrolled for ICDS services
5. Adolescent Girls (11-18 years) enrolled for ICDS services
6. Percent Aadhaar-seeded Beneficiaries
On the left hand navigation panel, click on ‘Demographics’ to see a detailed list of indicators. Select the
indicator to see a detailed ‘Map View’ for the selected indicator.
Figure 61: Link to view Demographics
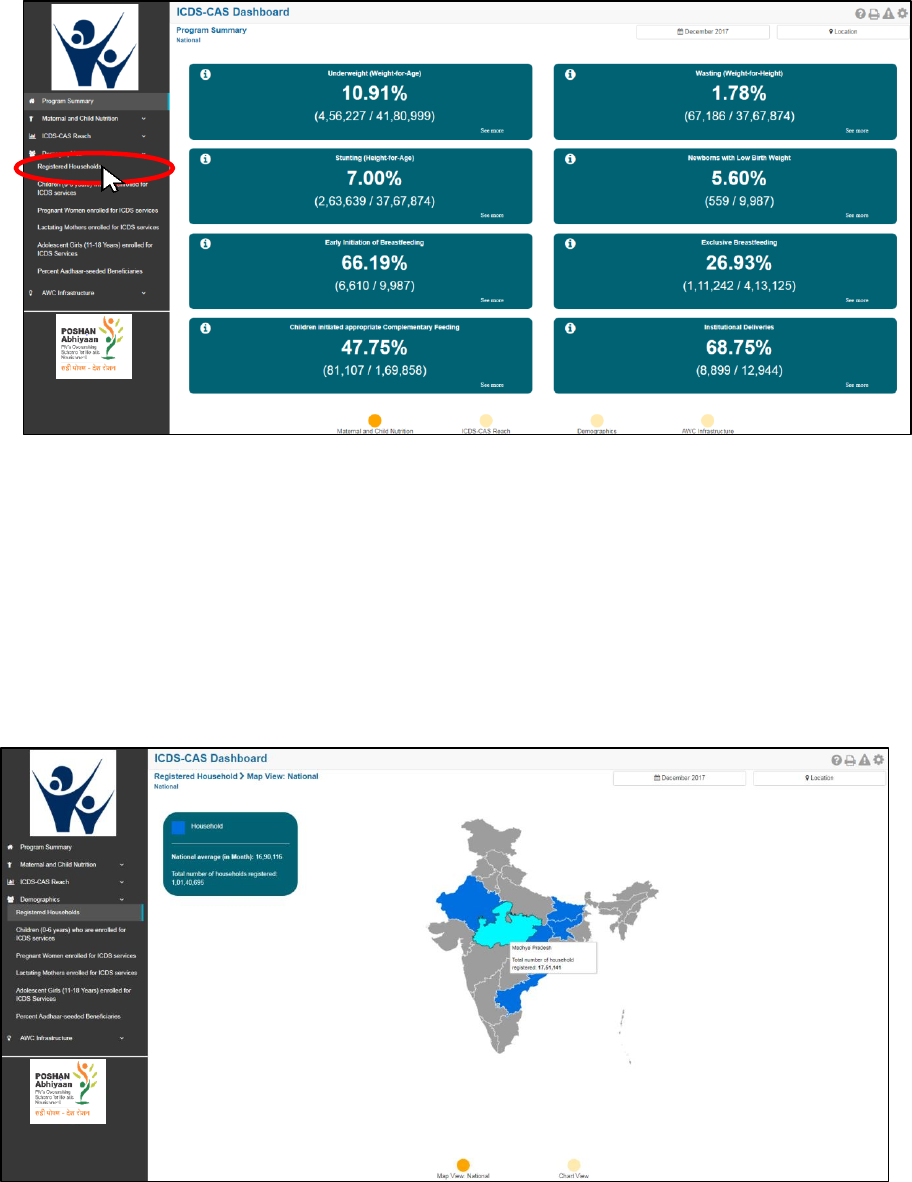
8.1 Registered Households
The first indicator under ‘Demographics’ is ‘Registered Households’ which is explained below.
Definition of indicator – Total number of households registered
Click on the indicator ‘Registered Households’ from the left hand navigation panel under ‘Demographics’
to enter ‘Map View’.
54
Figure 62: Link to view Registered Households
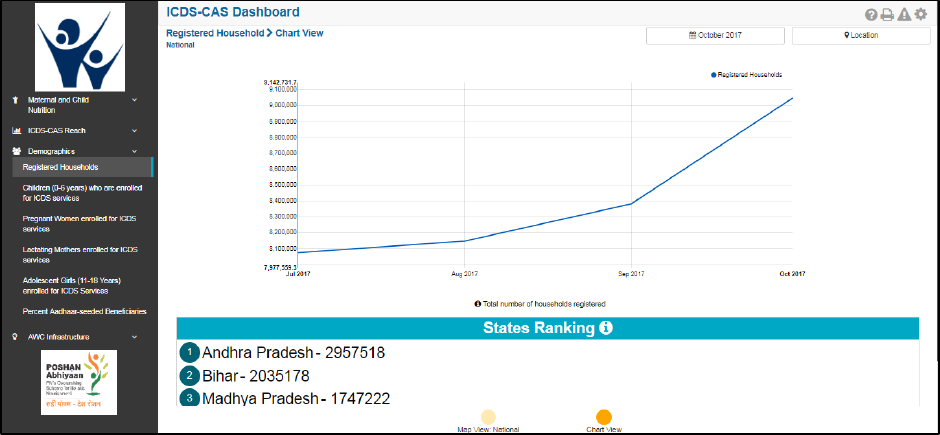
8.1.1 Registered Households: Map View – National
If a National level user (MWCD / CPMU) logs into the dashboard, the ‘Map View’ will show a National
view as shown in the below snapshot.
The National level user can click on the map or select locations from location filter and drill down to
lower levels (State / District / Block / Sector).
Figure 63: Registered Households: Map View – National
55
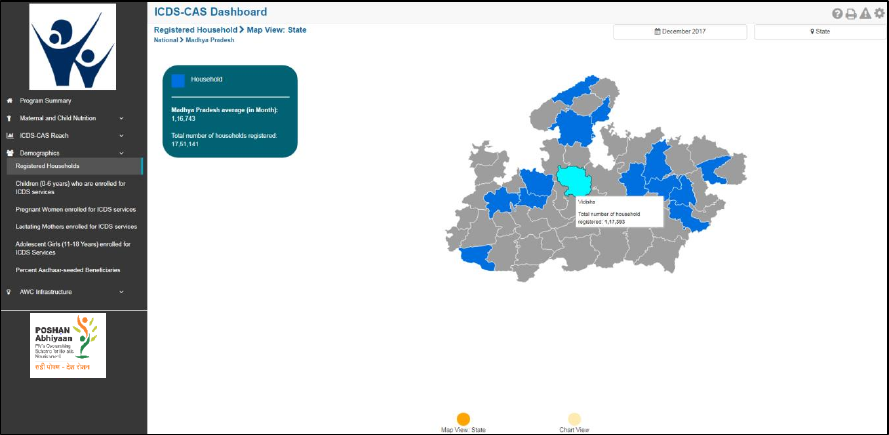
8.1.2 Registered Households: Map View – State
If a State level user (SPMU) logs into the dashboard, the ‘Map View’ will show a State view as shown in
the below snapshot.
The State level user can click on the map or select locations from location filter and drill down to lower
levels (District / Block / Sector).
Figure 64: Registered Households: Map View – State
8.1.3 Registered Households: Map View – District
If a District level user (DPO / District Helpdesk) logs into the dashboard, the ‘Map View’ will show a District
view as shown in the below snapshot.
The District level user can click on the map or select locations from location filter and drill down to lower
levels (Block / Sector).
56
Figure 65: Registered Households: Map View – District
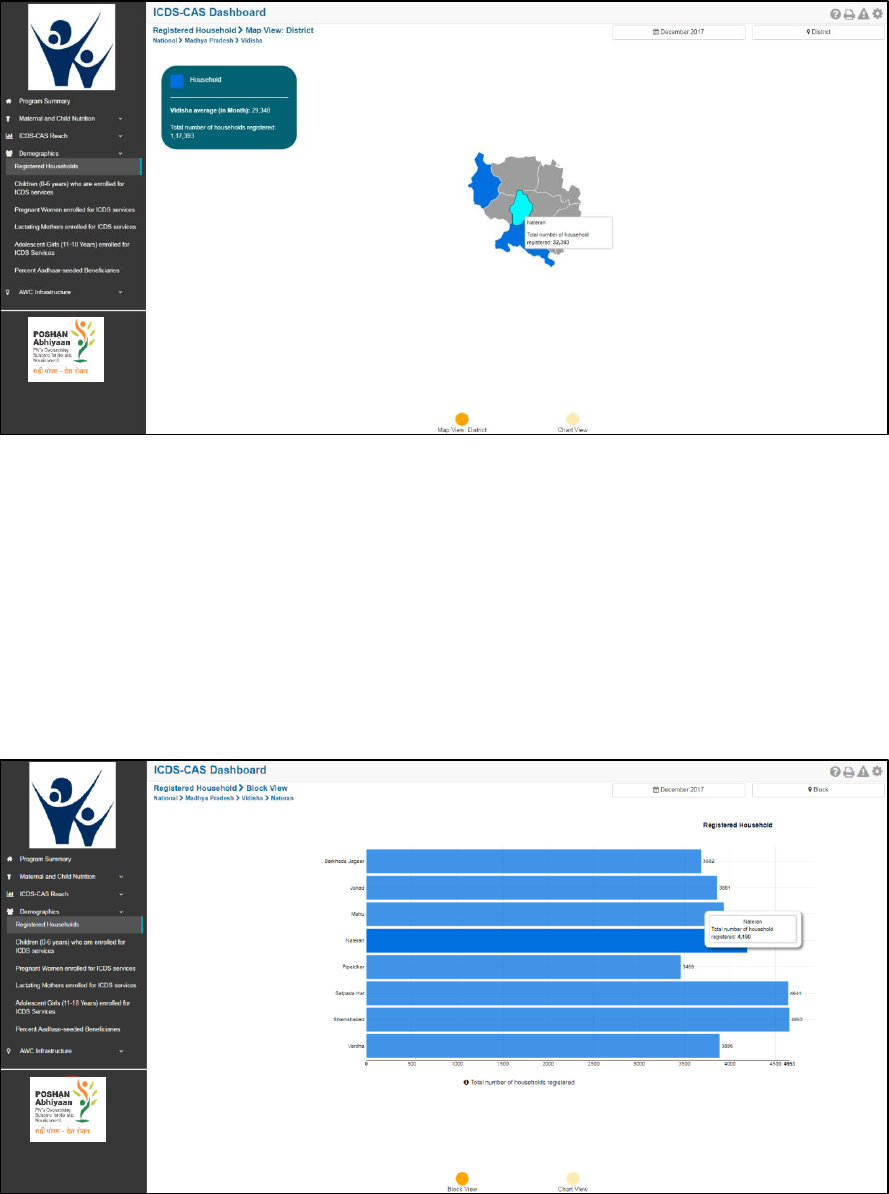
8.1.4 Registered Households: Block View
If a Block level user (CDPO / Block Helpdesk) logs into the dashboard, the ‘Map View’ will show a Block
view as shown in the below snapshot.
The Block view is a graphical view showing data for each Sector in the Block. The Block level user can click
on the bar for any Sector or use the location filter to drill down to Sector view.
Figure 66: Registered Households: Map View – Block View
57
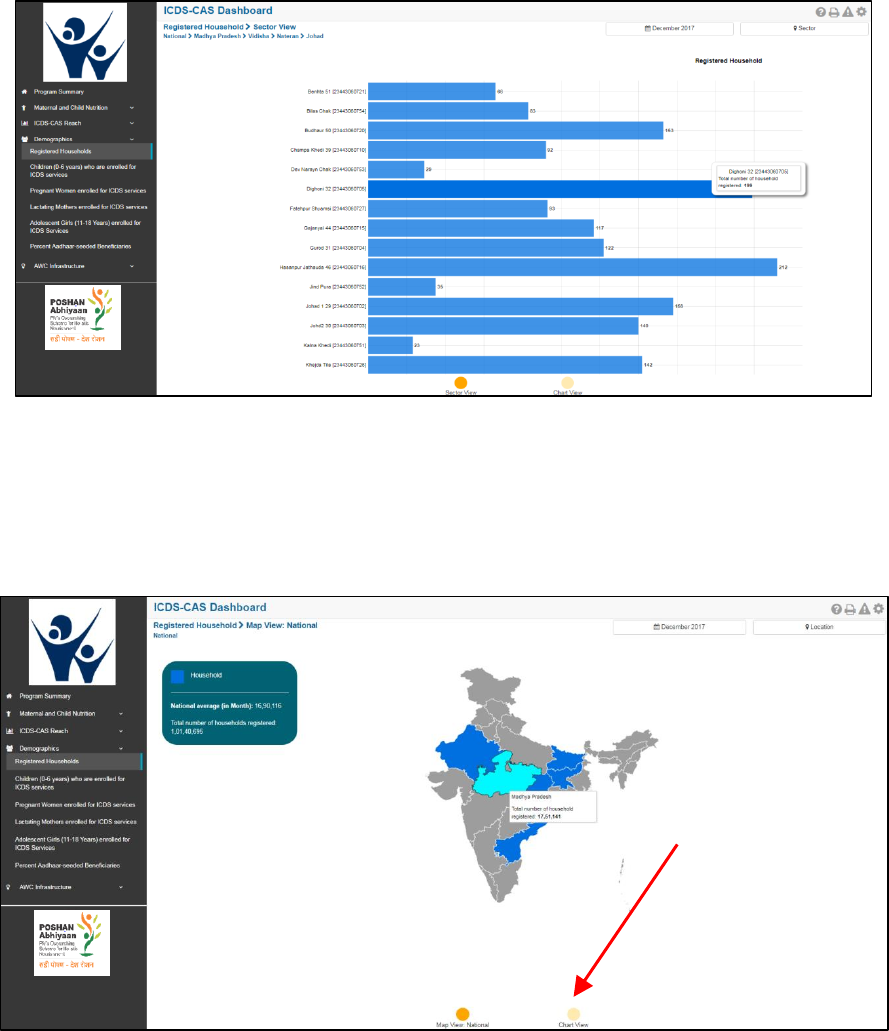
8.1.5 Registered Households: Sector View
The Sector view is a graphical view showing data for each AWC in the Sector. For more information about
a particular AWC, the user can select the AWC by clicking on the bar chart or use the location filter. The
dashboard will direct the user to AWC Report which is explained further in Section 10.
Figure 67: Registered Households: Map View – Sector View
8.1.6 Registered Households: Chart View – National
On the Map view page, click on the ‘Chart View’ bubble navigation to see a chart view of the indicator.
Figure 68: Navigating to Chart View
Click on bubble
to navigate to
Chart View
58
If a National level user (MWCD / CPMU) logs into the dashboard, the ‘Chart View’ will show a National
view as shown in the below snapshot.
The National level user can use the location filter and drill down to lower levels (State / District / Block /
Sector) or directly move from ‘Map View’ to ‘Chart View’ at any level by clicking on the ‘Chart View’
bubble navigation on the ‘Map View’ page.
Figure 69: Registered Households: Chart View – National
8.1.7 Registered Households: Chart View – State
If a State level user (SPMU) logs into the dashboard, the ‘Chart View’ will show a State view as shown in
the below snapshot.
The State level user can use the location filter and drill down to lower levels (District / Block / Sector) or
directly move from ‘Map View’ to ‘Chart View’ at any level by clicking on the ‘Chart View’ bubble
navigation on the ‘Map View’ page.
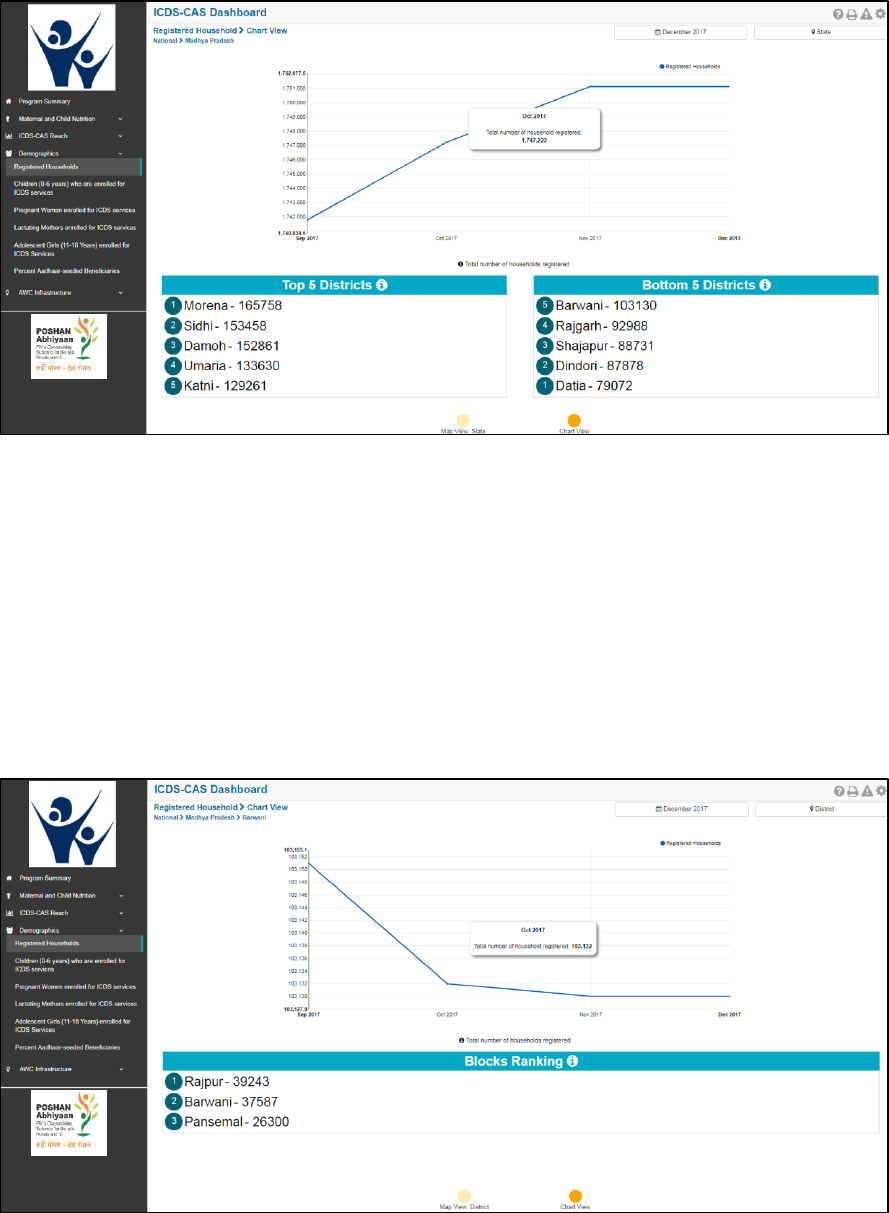
59
Figure 70: Registered Households: Chart View – State
8.1.8 Registered Households: Chart View – District
If a District level user (DPO / District Helpdesk) logs into the dashboard, the ‘Chart View’ will show a District
view as shown in the below snapshot.
The District level user can use the location filter and drill down to lower levels (Block / Sector) or directly
move from ‘Map View’ to ‘Chart View’ at any level by clicking on the ‘Chart View’ bubble navigation on
the ‘Map View’ page.
Figure 71: Registered Households: Chart View – District
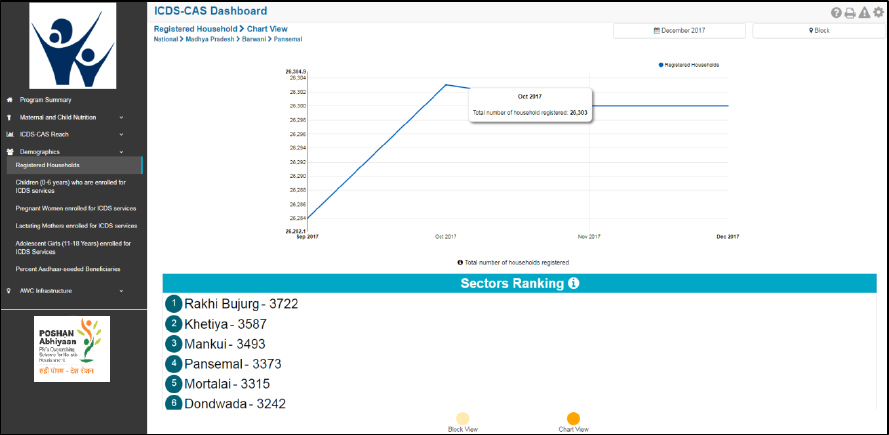
60
8.1.9 Registered Households: Chart View – Block
If a Block level user (CDPO / Block Helpdesk) logs into the dashboard, the ‘Chart View’ will show a Block
view as shown in the below snapshot.
The Block level user can use the location filter and drill down to lower levels (Sector) or directly move from
‘Map View’ to ‘Chart View’ at any level by clicking on the ‘Chart View’ bubble navigation on the ‘Map View’
page.
Figure 72: Registered Households: Chart View – Block
8.1.10 Registered Households: Chart View – Sector
The ‘Sector View’ will show a Sector level view as shown in the below snapshot. Any user level can use
the location filter and drill down to Sector level chart view.
For more information about a particular AWC, the user can select the AWC using the location filter. The
dashboard will direct the user to AWC Report which is explained further in Section 10.
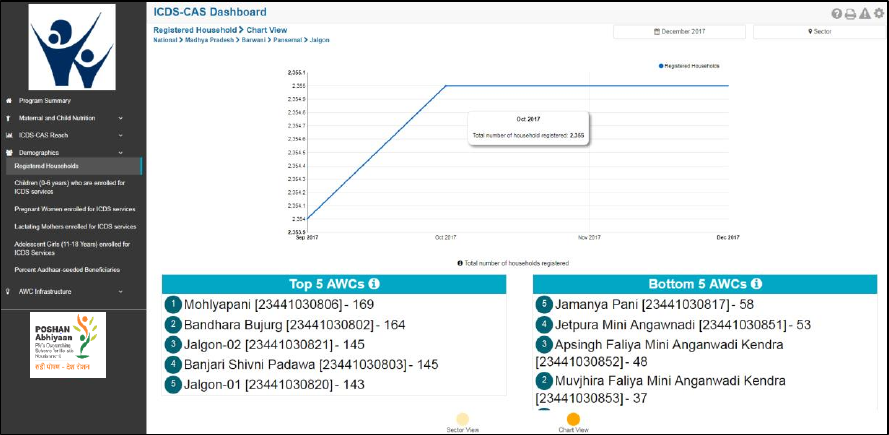
61
Figure 73: Registered Households: Chart View – Sector
8.2 Children (0-6 years) who are enrolled for ICDS services
The second indicator under ‘Demographics’ is ‘Children (0-6 years) who are enrolled for ICDS services’
which is explained below.
Definition of indicator – Number of children registered between 0-6 years old who are enrolled for ICDS
services
The navigation workflow for moving to ‘Map View’ or ‘Chart View’ is similar to as explained for the first
indicator – Registered Households in Section 8.1.
8.2.1 Children (0-6 years) who are enrolled for ICDS services: Map View – National
If a National level user (MWCD / CPMU) logs into the dashboard, the ‘Map View’ will show a National view
as shown in the below snapshot.
Rest of the views (State / District / Block / Sector) are similar to as explained for the first indicator –
Registered Households in Section 8.1.
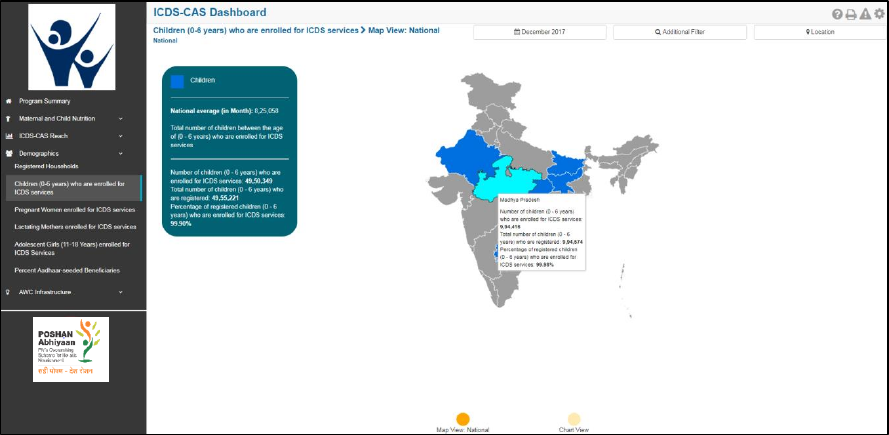
62
Figure 74: Children (0-6 years) who are enrolled for ICDS services: Map View – National
8.2.2 Children (0-6 years) who are enrolled for ICDS services: Chart View – National
If a National level user (MWCD / CPMU) logs into the dashboard, the ‘Chart View’ will show a National
view as shown in the below snapshot.
Rest of the views (State / District / Block / Sector) are similar to as explained for the first indicator –
Registered Households in Section 8.1.
The X axis shows bifurcation of children between (0-6 years) to display number of children in the following
age groups:
• Children between 0-1 Month
• Children between 1-6 Months
• Children between 6-12 months
• Children between 1-3 years
• Children between 3-6 years
The Y axis displays the total number of children (0-6 years) who are enrolled for ICDS services. The blue
bars displayed in the below mentioned snapshot display the % of children in various age groups i.e. (0-6
years) out of the total number of children who are enrolled for ICDS-CAS services.
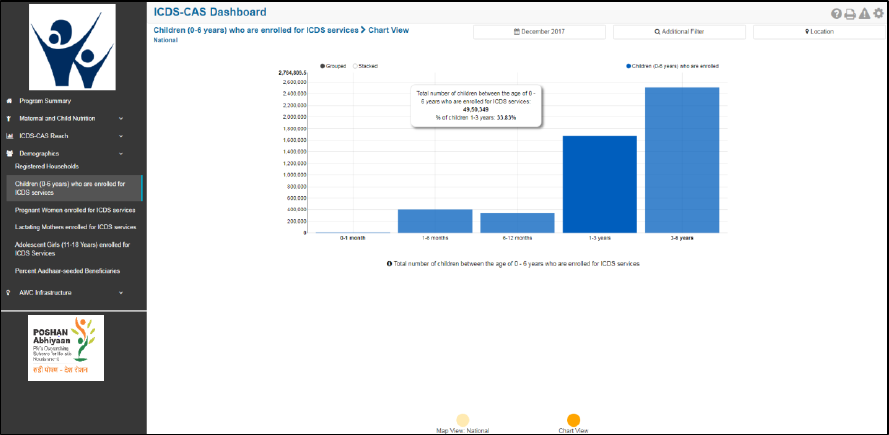
63
Figure 75: Children (0-6 years) who are enrolled for ICDS services: Chart View – National
8.3 Pregnant Women enrolled for ICDS services
The third indicator under ‘Demographics’ is ‘Pregnant Women enrolled for ICDS services’ which is
explained below.
Definition of indicator – Number of pregnant women registered who are enrolled for ICDS services
The navigation workflow for moving to ‘Map View’ or ‘Chart View’ is similar to as explained for the first
indicator – Registered Households in Section 8.1.
8.3.1 Pregnant Women enrolled for ICDS services: Map View – National
If a National level user (MWCD / CPMU) logs into the dashboard, the ‘Map View’ will show a National view
as shown in the below snapshot.
Rest of the views (State / District / Block / Sector) are similar to as explained for the first indicator –
Registered Households in Section 8.1.
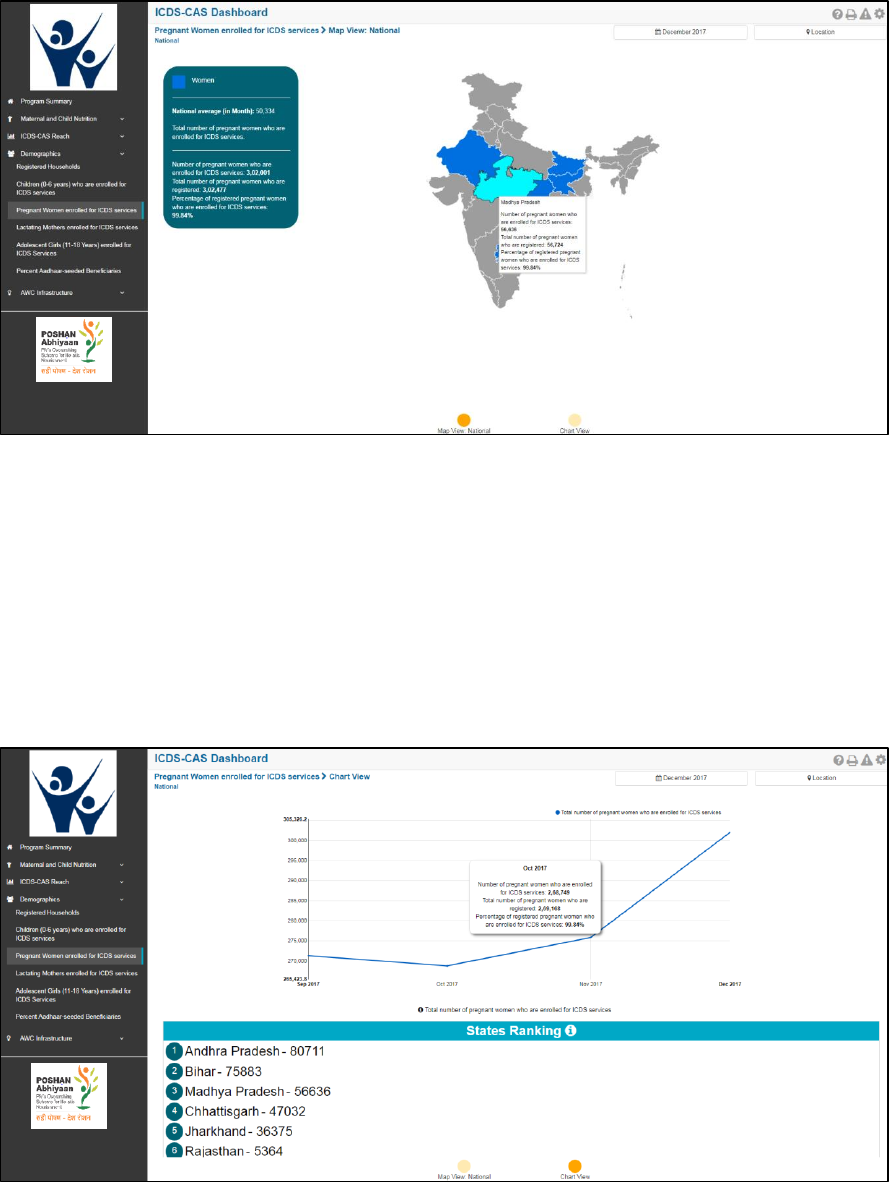
64
Figure 76: Pregnant Women enrolled for ICDS services: Map View – National
8.3.2 Pregnant Women enrolled for ICDS services: Chart View – National
If a National level user (MWCD / CPMU) logs into the dashboard, the ‘Chart View’ will show a National
view as shown in the below snapshot.
Rest of the views (State / District / Block / Sector) are similar to as explained for the first indicator –
Registered Households in Section 8.1.
Figure 77: Pregnant Women enrolled for ICDS services: Chart View – National
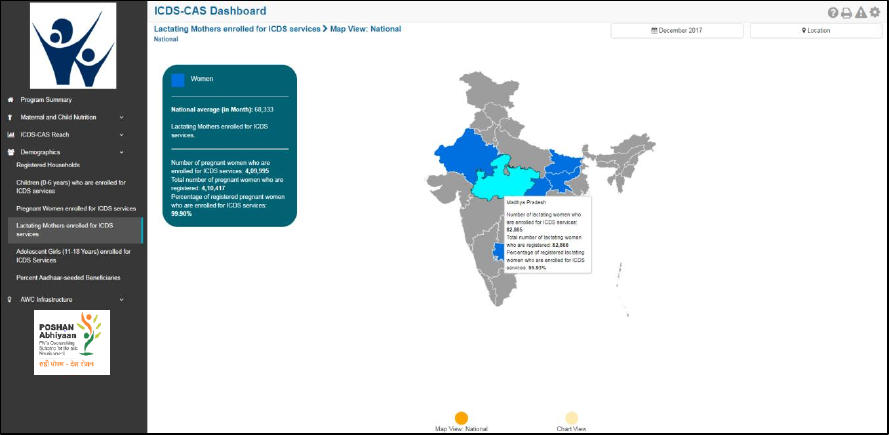
65
8.4 Lactating Mothers enrolled for ICDS services
The fourth indicator under ‘Demographics’ is ‘Lactating Mothers enrolled for ICDS services’ which is
explained below.
Definition of indicator – Number of lactating women registered who are enrolled for ICDS services
The navigation workflow for moving to ‘Map View’ or ‘Chart View’ is similar to as explained for the first
indicator – Registered Households in Section 8.1.
8.4.1 Lactating Mothers enrolled for ICDS services: Map View – National
If a National level user (MWCD / CPMU) logs into the dashboard, the ‘Map View’ will show a National view
as shown in the below snapshot.
Rest of the views (State / District / Block / Sector) are similar to as explained for the first indicator –
Registered Households in Section 8.1.
Figure 78: Lactating Mothers enrolled for ICDS services: Map View – National
8.4.2 Lactating Mothers enrolled for ICDS services: Chart View – National
If a National level user (MWCD / CPMU) logs into the dashboard, the ‘Chart View’ will show a National
view as shown in the below snapshot.
Rest of the views (State / District / Block / Sector) are similar to as explained for the first indicator –
Registered Households in Section 8.1.
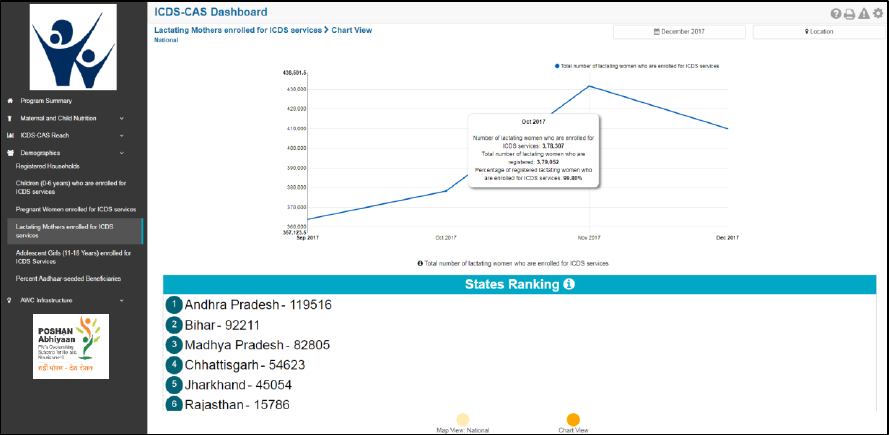
66
Figure 79: Lactating Mothers enrolled for ICDS services: Chart View – National
8.5 Adolescent Girls (11-14 years) enrolled for ICDS services
The fifth indicator under ‘Demographics’ is ‘Adolescent Girls (11-14 years) enrolled for ICDS services’
which is explained below.
Definition of indicator – Number of adolescent girls registered between 11-14 years old who are enrolled
for ICDS services
The navigation workflow for moving to ‘Map View’ or ‘Chart View’ is similar to as explained for the first
indicator – Registered Households in Section 8.1.
8.5.1 Adolescent Girls (11-14 years) enrolled for ICDS services: Map View – National
If a National level user (MWCD / CPMU) logs into the dashboard, the ‘Map View’ will show a National view
as shown in the below snapshot.
Rest of the views (State / District / Block / Sector) are similar to as explained for the first indicator –
Registered Households in Section 8.1.

67
Figure 80: Adolescent Girls (11-18 years) enrolled for ICDS services: Map View – National
8.5.2 Adolescent Girls (11-14 years) enrolled for ICDS services: Chart View – National
If a National level user (MWCD / CPMU) logs into the dashboard, the ‘Chart View’ will show a National
view as shown in the below snapshot.
Rest of the views (State / District / Block / Sector) are similar to as explained for the first indicator –
Registered Households in Section 8.1.
Figure 81: Adolescent Girls (11-18 years) enrolled for ICDS services: Chart View – National
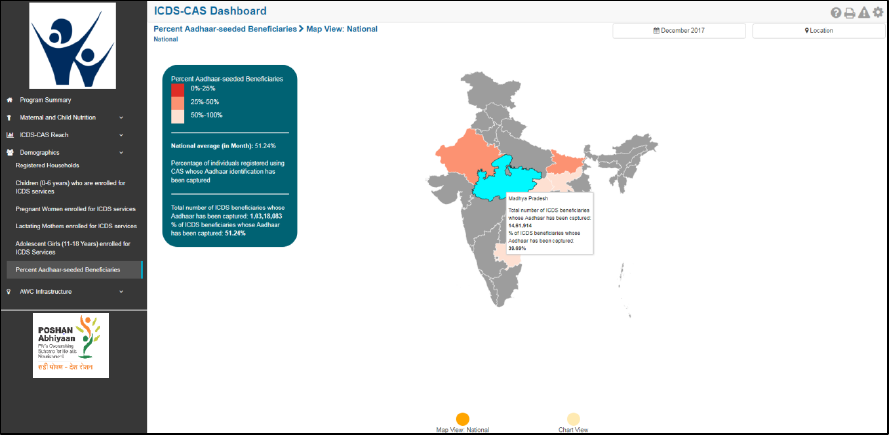
68
8.6 Percent Aadhaar-seeded Beneficiaries
The last indicator under ‘Demographics’ is ‘Percent Aadhaar-seeded Beneficiaries’ which is explained
below.
Definition of indicator – Percentage of ICDS beneficiaries whose Aadhaar identification has been captured
The navigation workflow for moving to ‘Map View’ or ‘Chart View’ is similar to as explained for the first
indicator – Registered Households in Section 8.1.
8.6.1 Percent Aadhaar-seeded Beneficiaries: Map View – National
If a National level user (MWCD / CPMU) logs into the dashboard, the ‘Map View’ will show a National view
as shown in the below snapshot.
Rest of the views (State / District / Block / Sector) are similar to as explained for the first indicator –
Registered Households in Section 8.1.
Figure 82: Percent Aadhaar-seeded Beneficiaries: Map View – National
8.6.2 Percent Aadhaar-seeded Beneficiaries: Chart View – National
If a National level user (MWCD / CPMU) logs into the dashboard, the ‘Chart View’ will show a National
view as shown in the below snapshot.
Rest of the views (State / District / Block / Sector) are similar to as explained for the first indicator –
Registered Households in Section 8.1.
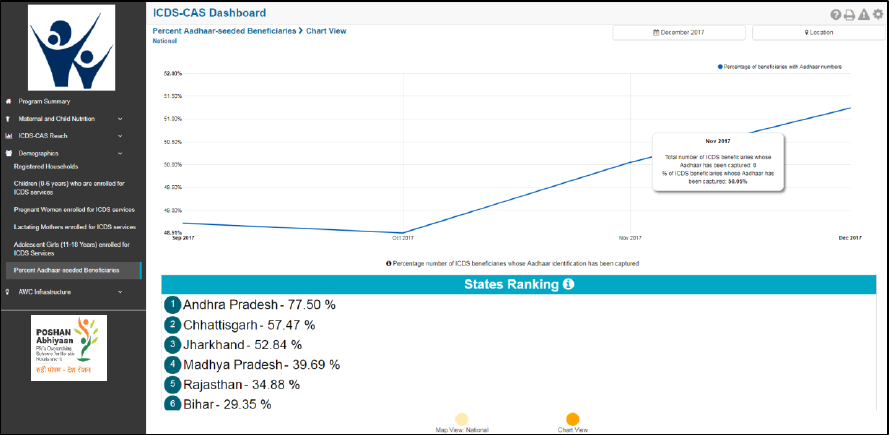
69
Figure 83: Percent Aadhaar-seeded Beneficiaries: Chart View – National
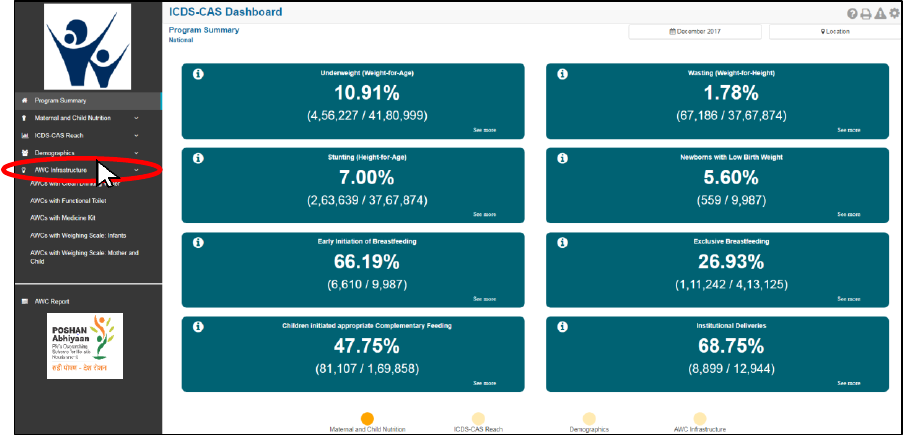
70
9 AWC Infrastructure
AWC Infrastructure includes indicators that provide information about infrastructure facilities available at
the Anganwadi Centres (AWCs). The section has the following list of indicators:
1. AWCs with Clean Drinking Water
2. AWCs with Functional Toilet
3. AWCs with Medicine Kit
4. AWCs with Weighing Scale: Infants
5. AWCs with Weighing Scale: Mother and Child
On the left hand navigation panel, click on ‘AWC Infrastructure’ to see a detailed list of indicators. Select
the indicator to see a detailed ‘Map View’ for the selected indicator.
Figure 84: Link to view AWC Infrastructure
9.1 AWCs with Clean Drinking Water
The first indicator under ‘AWC Infrastructure’ is ‘AWCs with Clean Drinking Water’ which is explained
below.
Definition of indicator – Number of AWCs with a source of clean drinking water
Click on the indicator ‘AWCs with Clean Drinking Water’ from the left hand navigation panel under ‘AWC
Infrastructure’ to enter ‘Map View’.
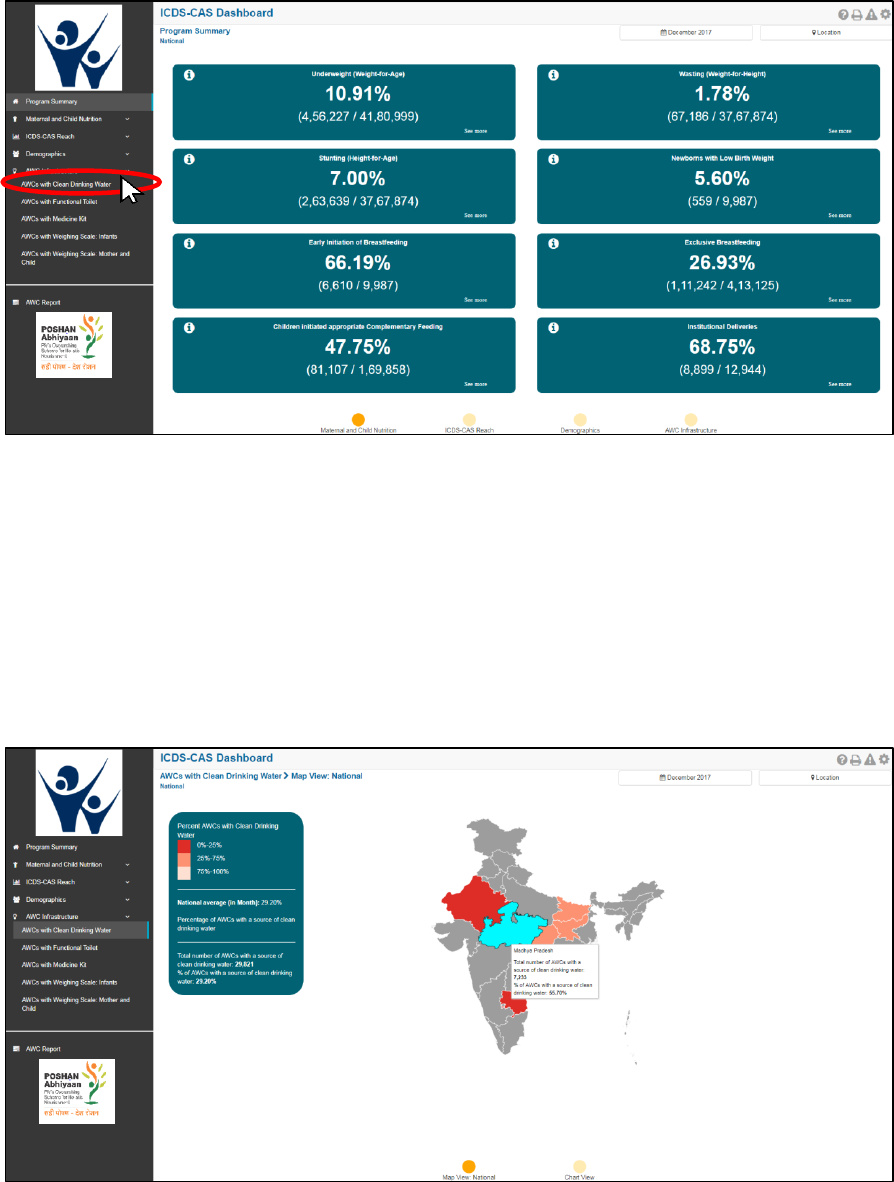
71
Figure 85: Link to view AWCs with Clean Drinking Water
9.1.1 AWCs with Clean Drinking Water: Map View – National
If a National level user (MWCD / CPMU) logs into the dashboard, the ‘Map View’ will show a National view
as shown in the below snapshot.
The National level user can click on the map or select locations from location filter and drill down to lower
levels (State / District / Block / Sector).
Figure 86: AWCs with Clean Drinking Water: Map View – National
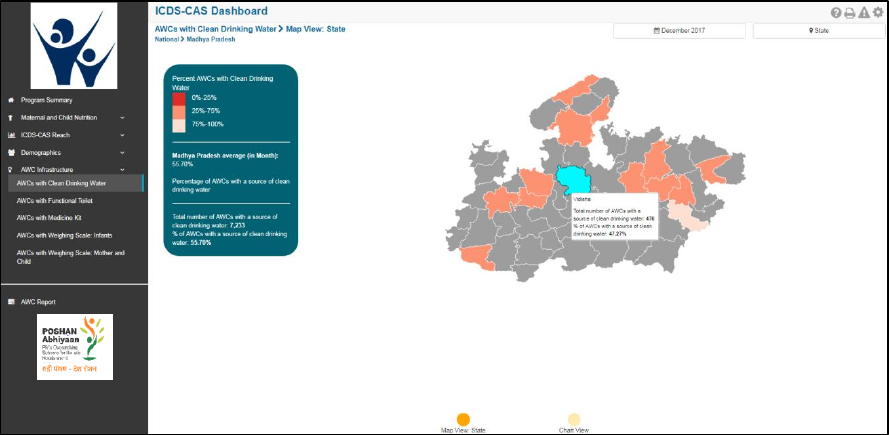
72
9.1.2 AWCs with Clean Drinking Water: Map View – State
If a State level user (SPMU) logs into the dashboard, the ‘Map View’ will show a State view as shown in
the below snapshot.
The State level user can click on the map or select locations from location filter and drill down to lower
levels (District / Block / Sector).
Figure 87: AWCs with Clean Drinking Water: Map View – State
9.1.3 AWCs with Clean Drinking Water: Map View – District
If a District level user (DPO / District Helpdesk) logs into the dashboard, the ‘Map View’ will show a District
view as shown in the below snapshot.
The District level user can click on the map or select locations from location filter and drill down to lower
levels (Block / Sector).
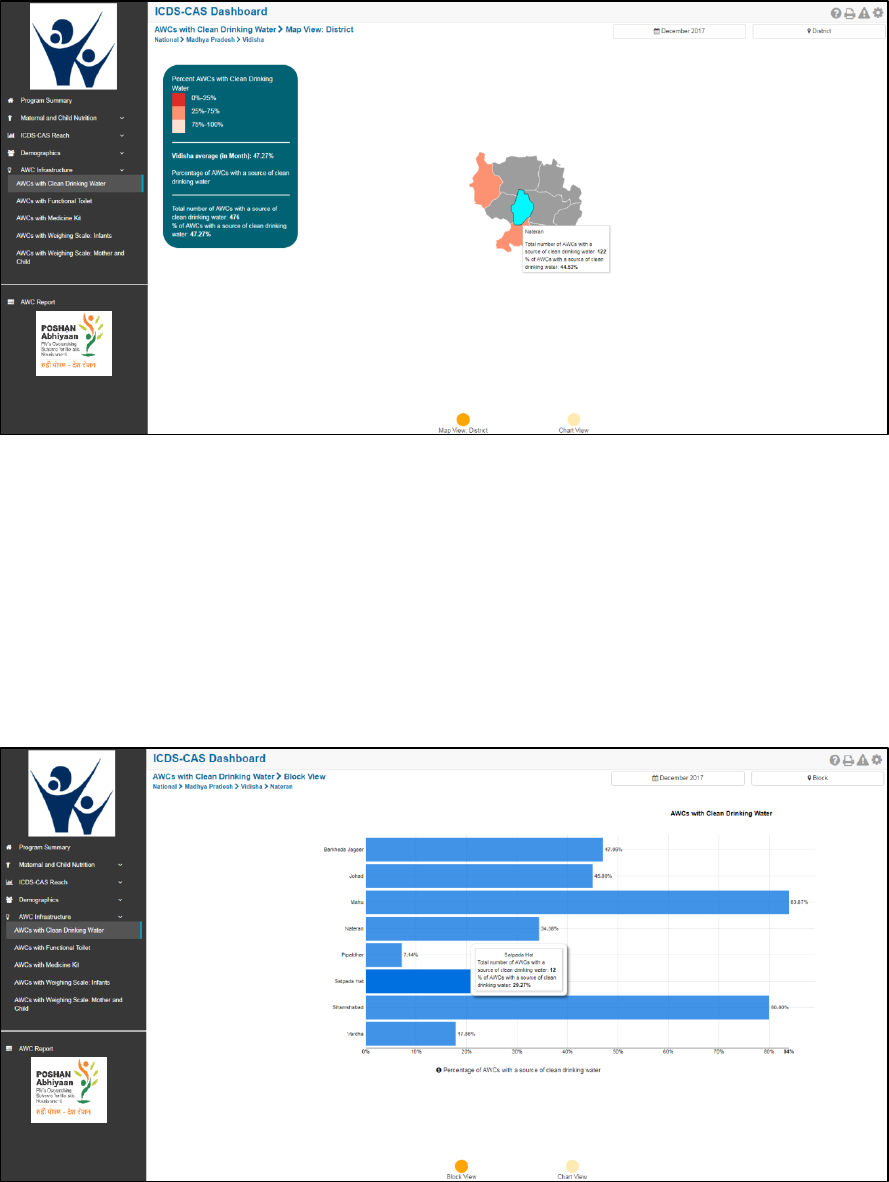
73
Figure 88: AWCs with Clean Drinking Water: Map View – District
9.1.4 AWCs with Clean Drinking Water: Block View
If a Block level user (CDPO / Block Helpdesk) logs into the dashboard, the ‘Map View’ will show a Block
view as shown in the below snapshot.
The Block view is a graphical view showing data for each Sector in the Block. The Block level user can click
on the bar for any Sector or use the location filter to drill down to Sector view.
Figure 89: AWCs with Clean Drinking Water: Block View
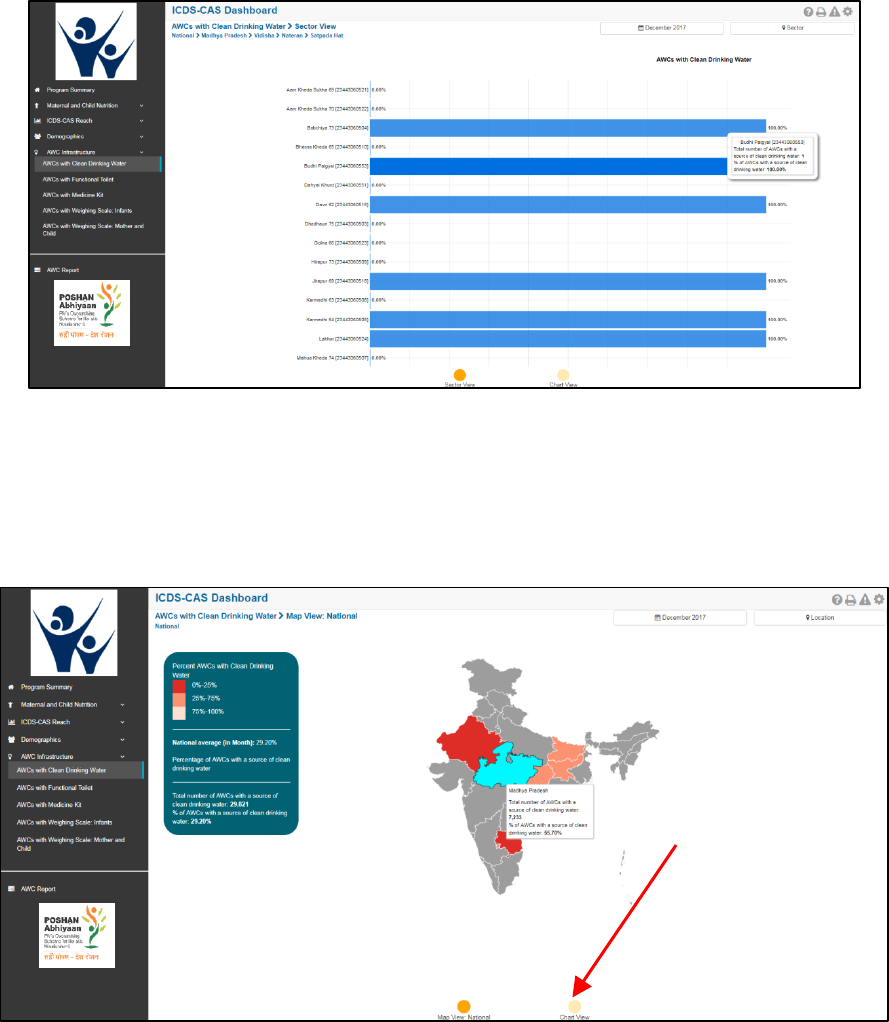
74
9.1.5 AWCs with Clean Drinking Water: Sector View
The Sector view is a graphical view showing data for each AWC in the Sector. For more information about
a particular AWC, the user can select the AWC by clicking on the bar chart or use the location filter. The
dashboard will direct the user to AWC Report which is explained further in Section 10.
Figure 90: AWCs with Clean Drinking Water: Sector View
9.1.6 AWCs with Clean Drinking Water: Chart View – National
On the Map view page, click on the ‘Chart View’ bubble navigation to see a chart view of the indicator.
Figure 91: Navigating to Chart View
Click on bubble
to navigate to
Chart View
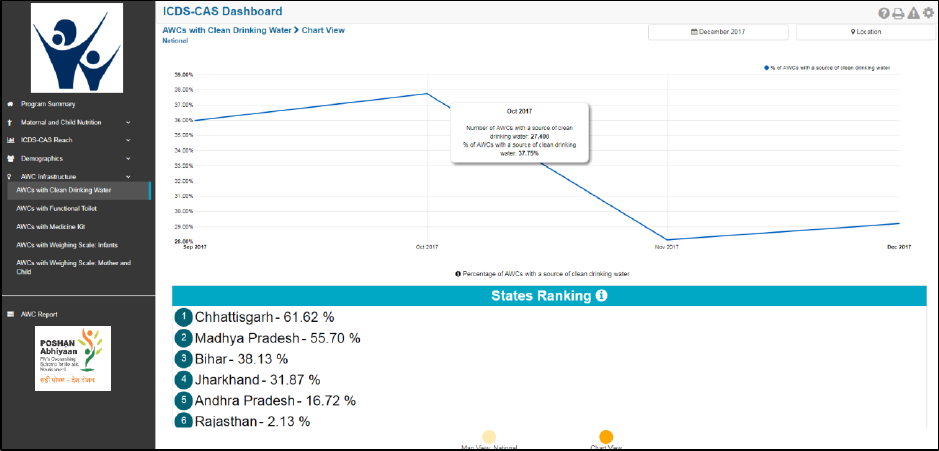
75
If a National level user (MWCD / CPMU) logs into the dashboard, the ‘Chart View’ will show a National
view as shown in the below snapshot.
The National level user can use the location filter and drill down to lower levels (State / District / Block /
Sector) or directly move from ‘Map View’ to ‘Chart View’ at any level by clicking on the ‘Chart View’ bubble
navigation on the ‘Map View’ page.
Figure 92: AWCs with Clean Drinking Water: Chart View – National
9.1.7 AWCs with Clean Drinking Water: Chart View – State
If a State level user (SPMU) logs into the dashboard, the ‘Chart View’ will show a State view as shown in
the below snapshot.
The State level user can use the location filter and drill down to lower levels (District / Block / Sector) or
directly move from ‘Map View’ to ‘Chart View’ at any level by clicking on the ‘Chart View’ bubble
navigation on the ‘Map View’ page.
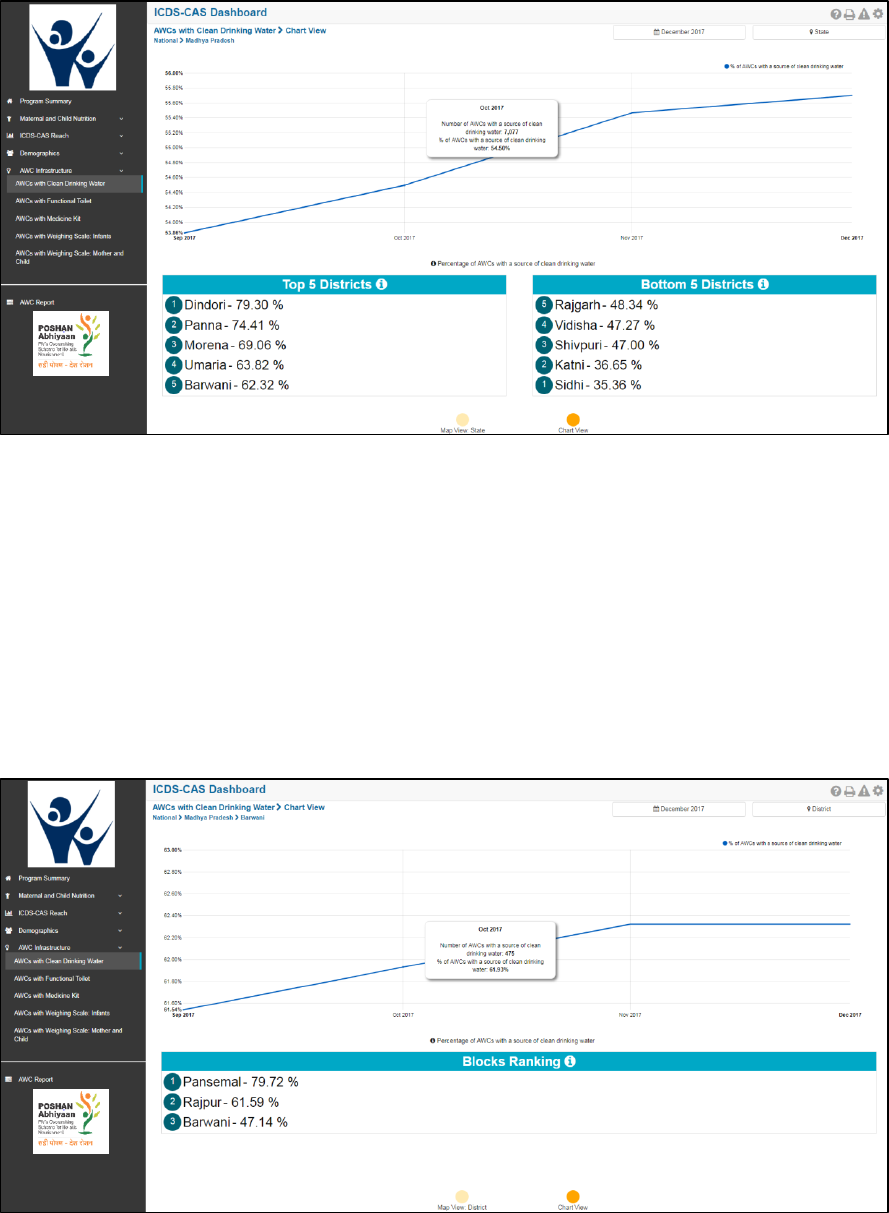
76
Figure 93: AWCs with Clean Drinking Water: Chart View – State
9.1.8 AWCs with Clean Drinking Water: Chart View – District
If a District level user (DPO / District Helpdesk) logs into the dashboard, the ‘Chart View’ will show a District
view as shown in the below snapshot.
The District level user can use the location filter and drill down to lower levels (Block / Sector) or directly
move from ‘Map View’ to ‘Chart View’ at any level by clicking on the ‘Chart View’ bubble navigation on
the ‘Map View’ page.
Figure 94: AWCs with Clean Drinking Water: Chart View – District
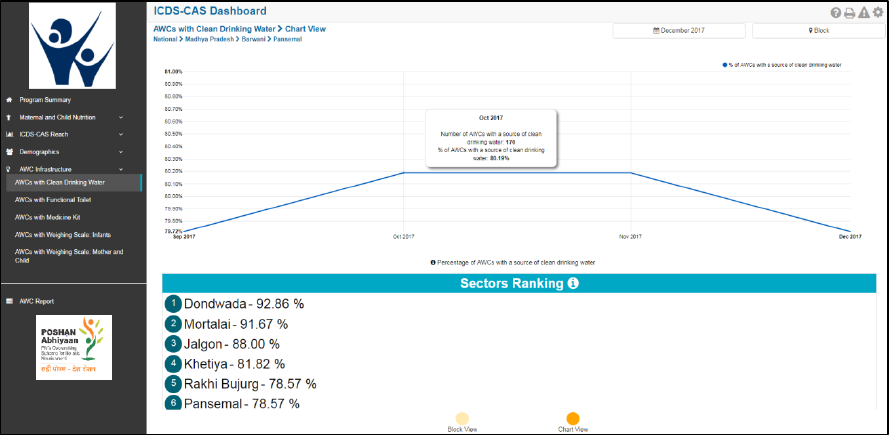
77
9.1.9 AWCs with Clean Drinking Water: Chart View – Block
If a Block level user (CDPO / Block Helpdesk) logs into the dashboard, the ‘Chart View’ will show a Block
view as shown in the below snapshot.
The Block level user can use the location filter and drill down to lower levels (Sector) or directly move from
‘Map View’ to ‘Chart View’ at any level by clicking on the ‘Chart View’ bubble navigation on the ‘Map View’
page.
Figure 95: AWCs with Clean Drinking Water: Chart View – Block
9.1.10 AWCs with Clean Drinking Water: Chart View – Sector
The ‘Sector View’ will show a Sector level view as shown in the below snapshot. Any user level can use
the location filter and drill down to Sector level chart view.
For more information about a particular AWC, the user can select the AWC using the location filter. The
dashboard will direct the user to AWC Report which is explained further in Section 10.
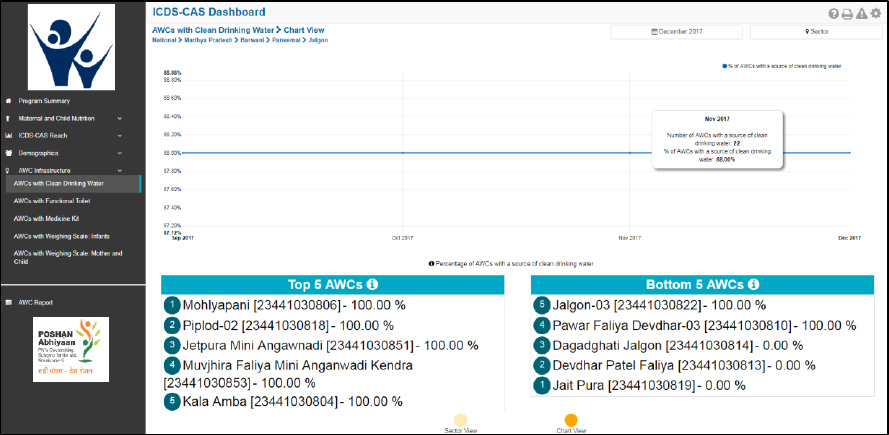
78
Figure 96: AWCs with Clean Drinking Water: Chart View – Sector
9.2 AWCs with Functional Toilet
The second indicator under ‘AWC Infrastructure’ is ‘AWCs with Functional Toilet’ which is explained
below.
Definition of indicator – Number of AWCs with a functional toilet
The navigation workflow for moving to ‘Map View’ or ‘Chart View’ is similar to as explained for the first
indicator – AWCs with Clean Drinking Water in Section 9.1.
9.2.1 AWCs with Functional Toilet: Map View – National
If a National level user (MWCD / CPMU) logs into the dashboard, the ‘Map View’ will show a National view
as shown in the below snapshot.
Rest of the views (State / District / Block / Sector) are similar to as explained for the first indicator – AWCs
with Clean Drinking Water in Section 9.1.
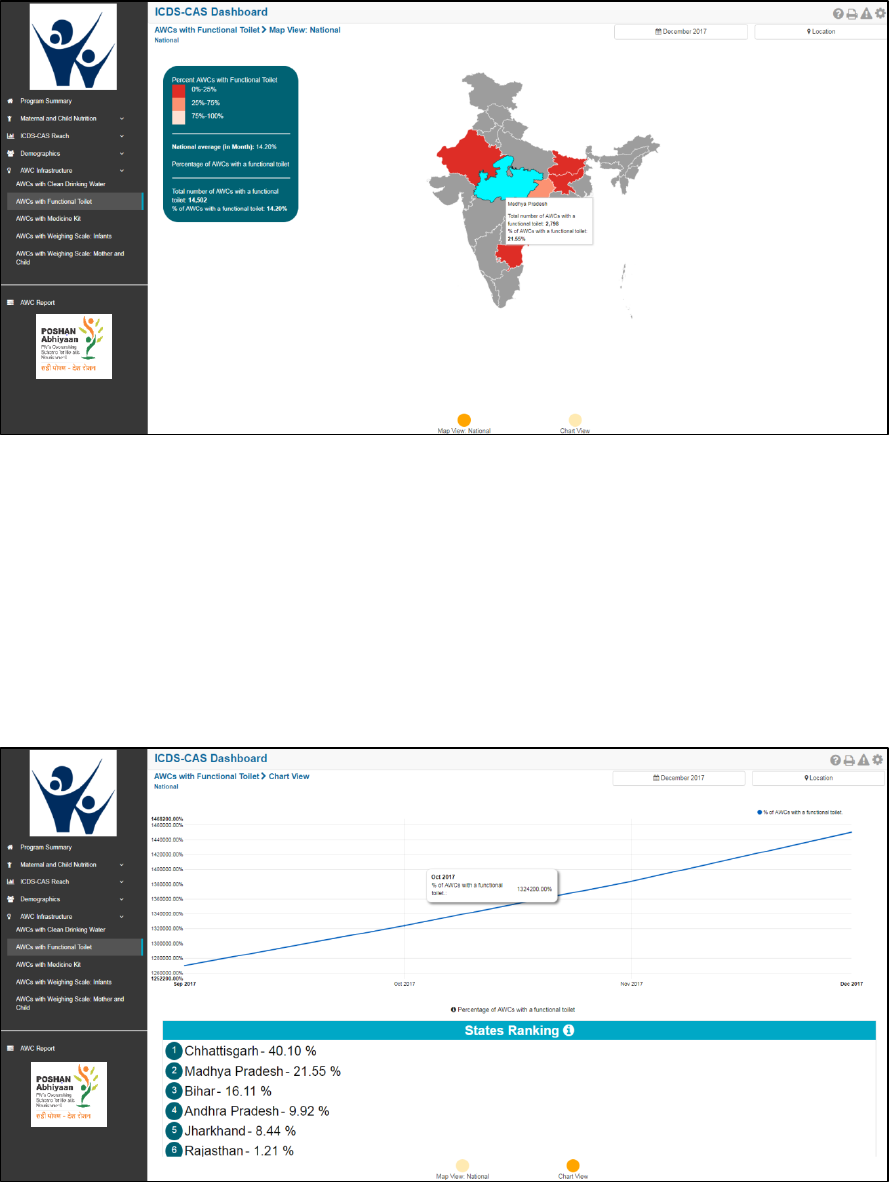
79
Figure 97: AWCs with Functional Toilet: Map View – National
9.2.2 AWCs with Functional Toilet: Chart View – National
If a National level user (MWCD / CPMU) logs into the dashboard, the ‘Chart View’ will show a National
view as shown in the below snapshot.
Rest of the views (State / District / Block / Sector) are similar to as explained for the first indicator – AWCs
with Clean Drinking Water in Section 9.1.
Figure 98: AWCs with Functional Toilet: Chart View – National
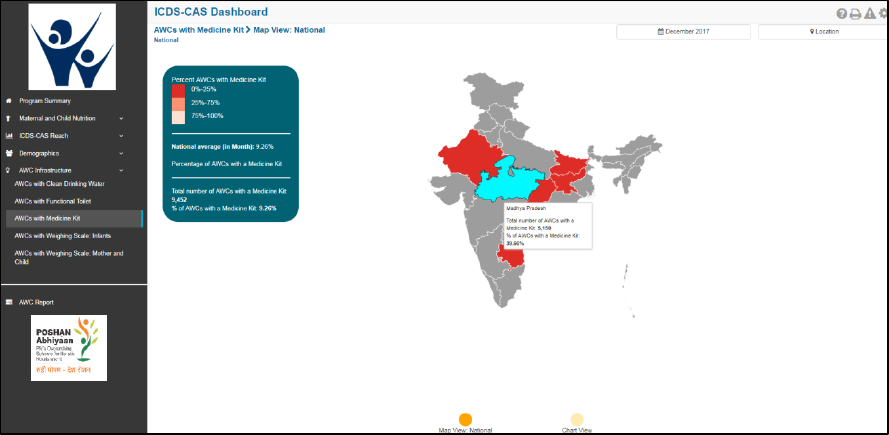
80
9.3 AWCs with Medicine Kit
The third indicator under ‘AWC Infrastructure’ is ‘AWCs with Medicine Kit’ which is explained below.
Definition of indicator – Number of AWCs with a medicine kit
The navigation workflow for moving to ‘Map View’ or ‘Chart View’ is similar to as explained for the first
indicator – AWCs with Clean Drinking Water in Section 9.1.
9.3.1 AWCs with Medicine Kit: Map View – National
If a National level user (MWCD / CPMU) logs into the dashboard, the ‘Map View’ will show a National view
as shown in the below snapshot.
Rest of the views (State / District / Block / Sector) are similar to as explained for the first indicator – AWCs
with Clean Drinking Water in Section 9.1.
Figure 99: AWCs with Medicine Kit: Map View – National
9.3.2 AWCs with Medicine Kit: Chart View – National
If a National level user (MWCD / CPMU) logs into the dashboard, the ‘Chart View’ will show a National
view as shown in the below snapshot.
Rest of the views (State / District / Block / Sector) are similar to as explained for the first indicator – AWCs
with Clean Drinking Water in Section 9.1.
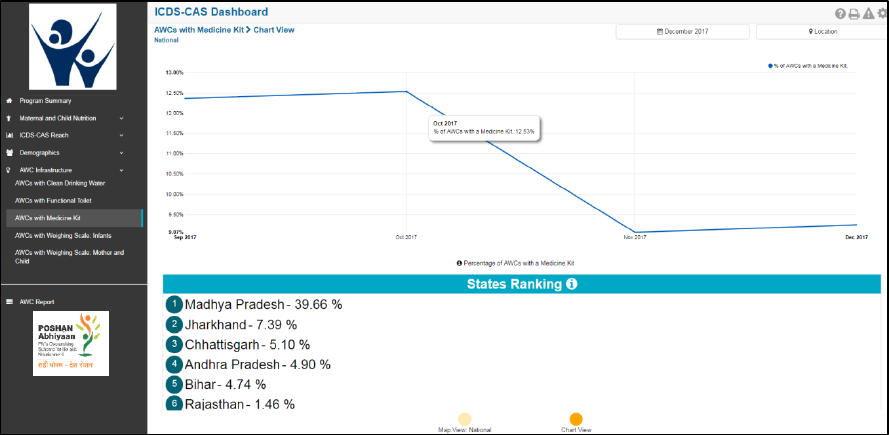
81
Figure 100: AWCs with Medicine Kit: Chart View – National
9.4 AWCs with Weighing Scale: Infants
The fourth indicator under ‘AWC Infrastructure’ is ‘AWCs with Weighing Scale: Infants’ which is explained
below.
Definition of indicator – Number of AWCs with weighing scale for infants
The navigation workflow for moving to ‘Map View’ or ‘Chart View’ is similar to as explained for the first
indicator – AWCs with Clean Drinking Water in Section 9.1.
9.4.1 AWCs with Weighing Scale: Infants: Map View – National
If a National level user (MWCD / CPMU) logs into the dashboard, the ‘Map View’ will show a National view
as shown in the below snapshot.
Rest of the views (State / District / Block / Sector) are similar to as explained for the first indicator – AWCs
with Clean Drinking Water in Section 9.1.
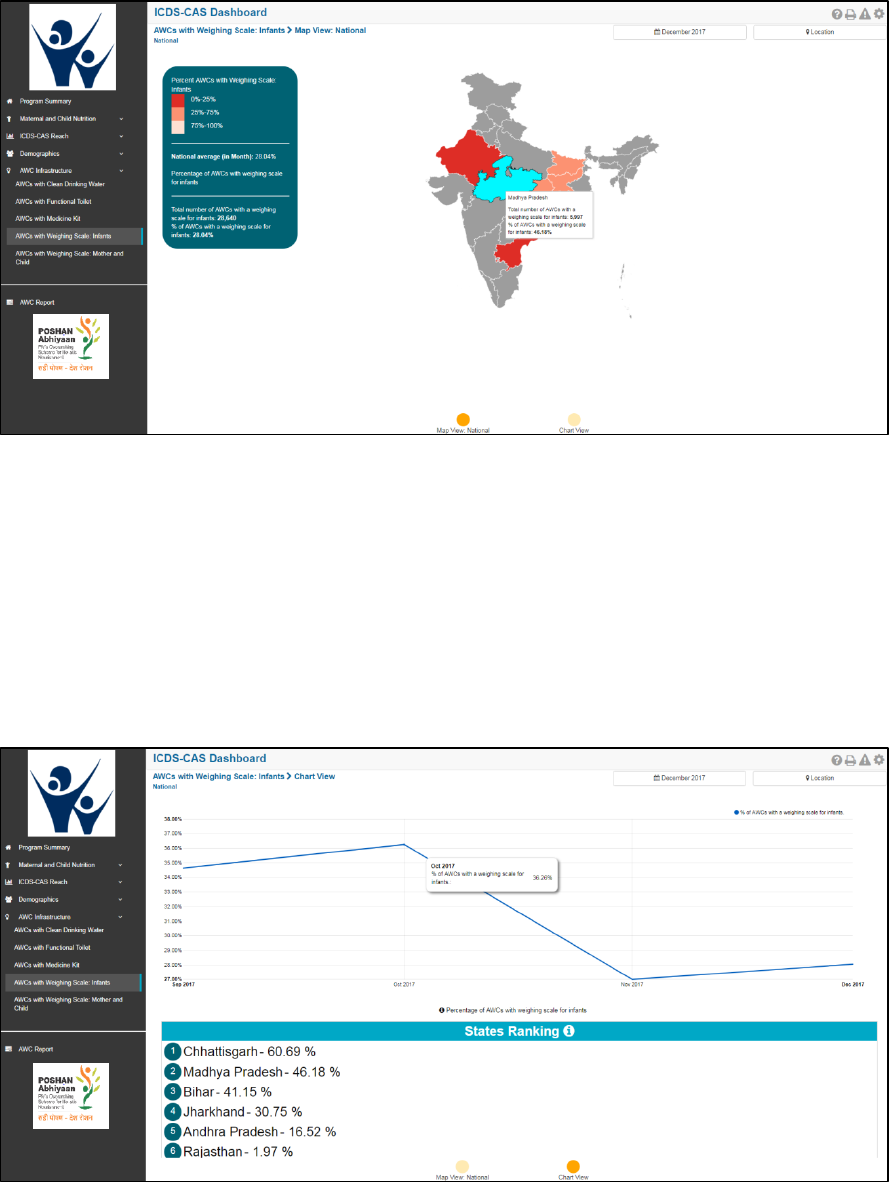
82
Figure 101: AWCs with Weighing Scale: Infants: Map View – National
9.4.2 AWCs with Weighing Scale: Infants: Chart View – National
If a National level user (MWCD / CPMU) logs into the dashboard, the ‘Chart View’ will show a National
view as shown in the below snapshot.
Rest of the views (State / District / Block / Sector) are similar to as explained for the first indicator – AWCs
with Clean Drinking Water in Section 9.1.
Figure 102: AWCs with Weighing Scale: Infants: Chart View – National
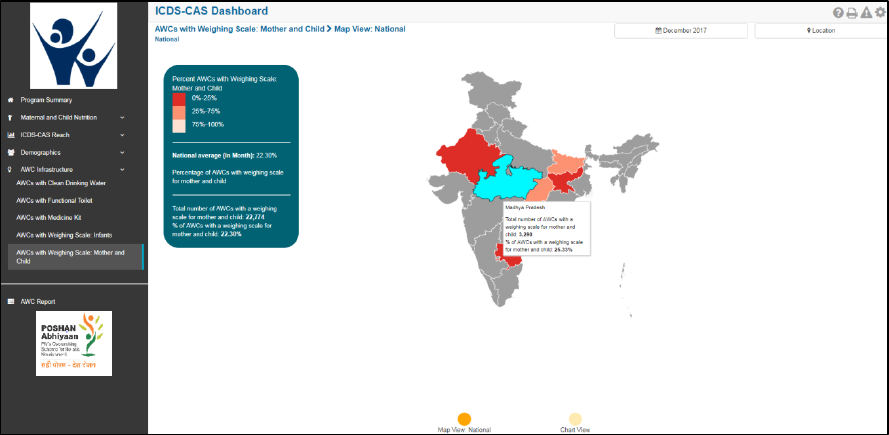
83
9.5 AWCs with Weighing Scale: Mother and Child
The last indicator under ‘AWC Infrastructure’ is ‘AWCs with Weighing Scale: Mother and Child’ which is
explained below.
Definition of indicator – Number of AWCs with weighing scale for mother and child
The navigation workflow for moving to ‘Map View’ or ‘Chart View’ is similar to as explained for the first
indicator – AWCs with Clean Drinking Water in Section 9.1.
9.5.1 AWCs with Weighing Scale: Mother and Child: Map View – National
If a National level user (MWCD / CPMU) logs into the dashboard, the ‘Map View’ will show a National view
as shown in the below snapshot.
Rest of the views (State / District / Block / Sector) are similar to as explained for the first indicator – AWCs
with Clean Drinking Water in Section 9.1.
Figure 103: AWCs with Weighing Scale: Mother and Child: Map View – National
9.5.2 AWCs with Weighing Scale: Mother and Child: Chart View – National
If a National level user (MWCD / CPMU) logs into the dashboard, the ‘Chart View’ will show a National
view as shown in the below snapshot.
Rest of the views (State / District / Block / Sector) are similar to as explained for the first indicator – AWCs
with Clean Drinking Water in Section 9.1.
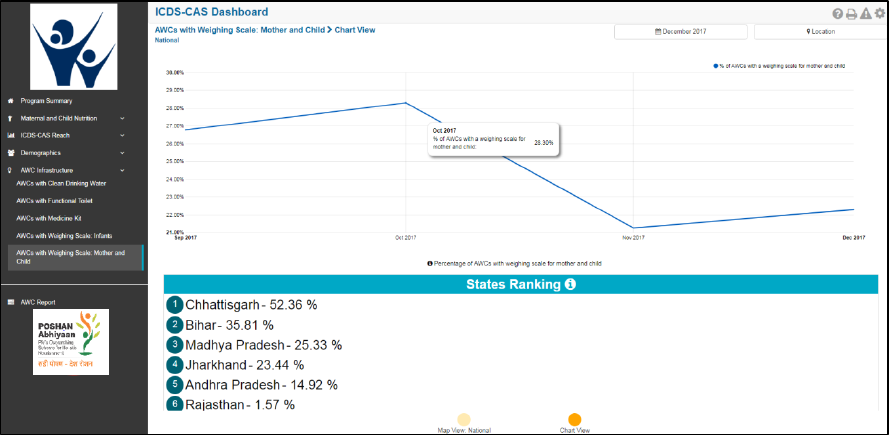
84
Figure 104: AWCs with Weighing Scale: Mother and Child: Chart View – National
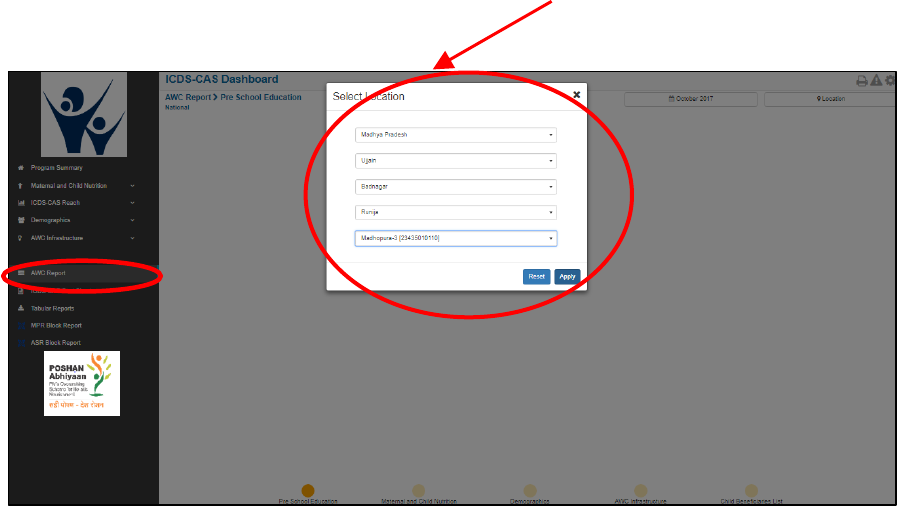
85
10 AWC Report
‘AWC Report’ provides detailed information on various indicators about an individual Anganwadi Centre
(AWC). The ‘AWC Report’ section covers the following indicators for each AWC:
1.
Pre-School Education
2.
Maternal and Child Nutrition
3.
Demographics
4.
AWC Infrastructure
5.
Child Beneficiaries List
Note:
1. The user will be automatically directed to the ‘AWC Report’ section when he/she selects an AWC
location using the location filter at the top right corner while viewing other reports.
2. The user must choose an individual AWC using the location filter to view an AWC Report.
From the left hand navigation panel, click on ‘AWC Report’ to view information for an individual AWC.
Figure 105: AWC Report
Select the ‘AWC’ for which you want to view the information and click on ‘Apply’. The landing page of
the ‘AWC Report’ will be the ‘Pre-School Education’ page.
Select the AWC using location
dropdown filters
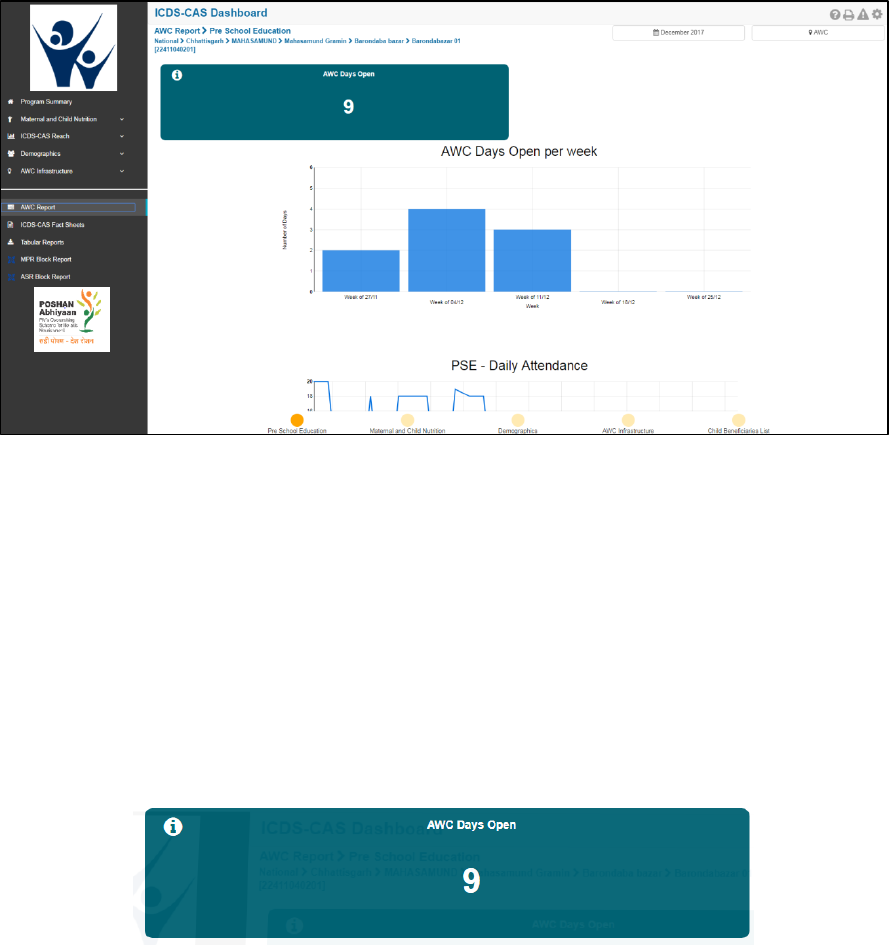
86
Figure 106: AWC Report: Landing Page
10.1 Pre-School Education
The ‘Pre-School Education’ section of the AWC Report provides information about the daily functioning
of the AWC.
On the PSE page, the user can view the following information:
AWC Days Open – A KPI card displays the number of days the AWC was opened in the selected month.
The AWC is expected to be opened 6 days a week (not on Sundays and public holidays).
Figure 107: AWC Days Open
AWC Days Open per Week – This is a graphical representation showing the number of days the AWC
was opened in each week of the selected month.
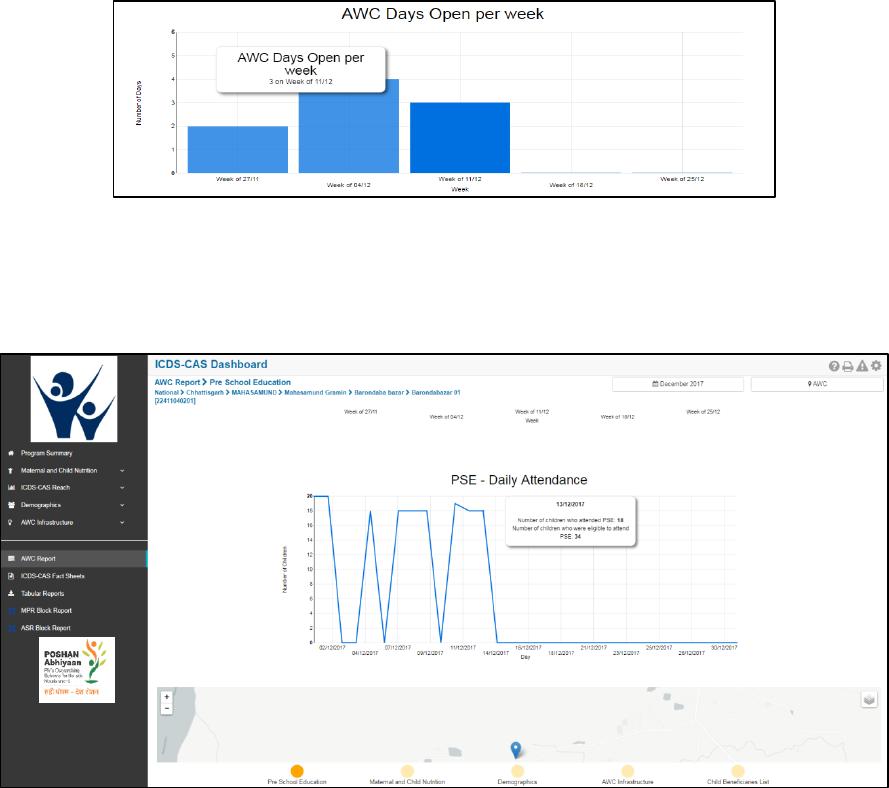
87
Figure 108: AWC Days Open per week
PSE – Daily Attendance –This is a graphical representation showing the number of children who
attended the pre-school education on each day of the selected month.
Figure 109: PSE - Daily Attendance
GPS locations –This section displays the GPS locations during ‘Daily Feeding’ form submissions in the
AWW application by the AWW.
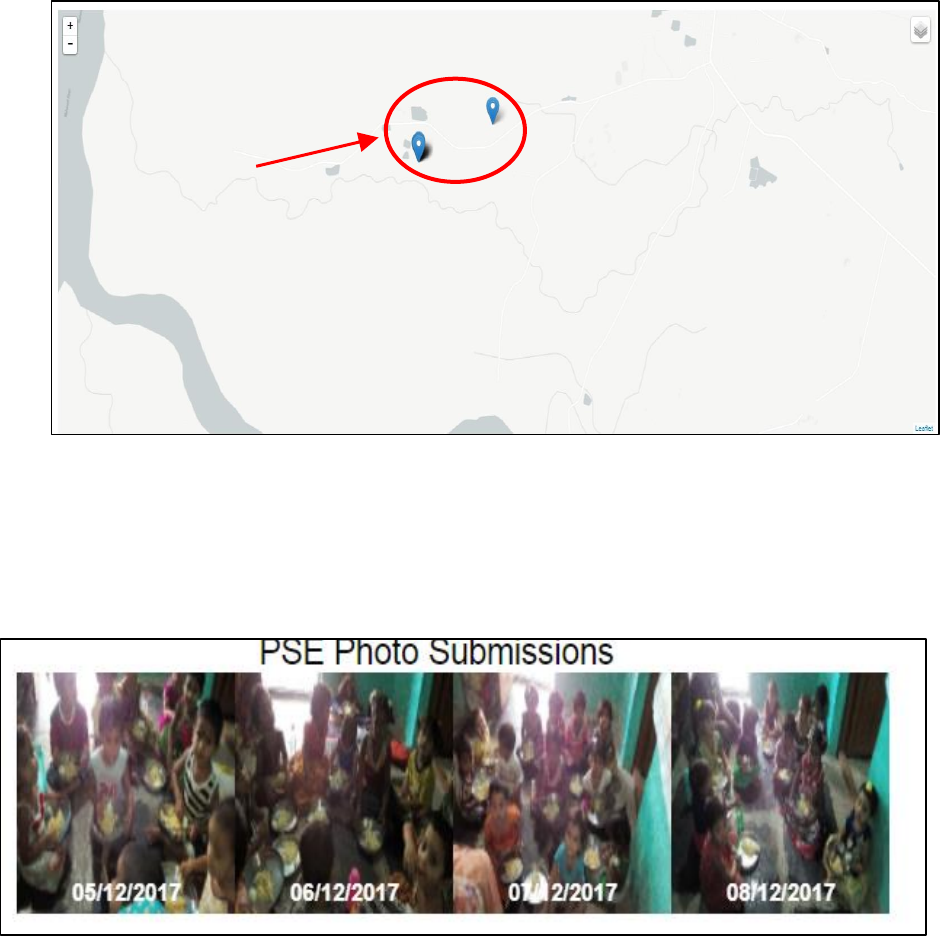
88
Figure 110: GPS Locations
Photographs from Daily Feeding form – This sections displays all the photographs captured by the AWW
while filling out the daily feeding form in the AWW application.
Figure 111: PSE Photo Submissions
Click on the bubble navigation to move to the next indicator i.e. ‘Maternal and Child Nutrition’.
GPS locations
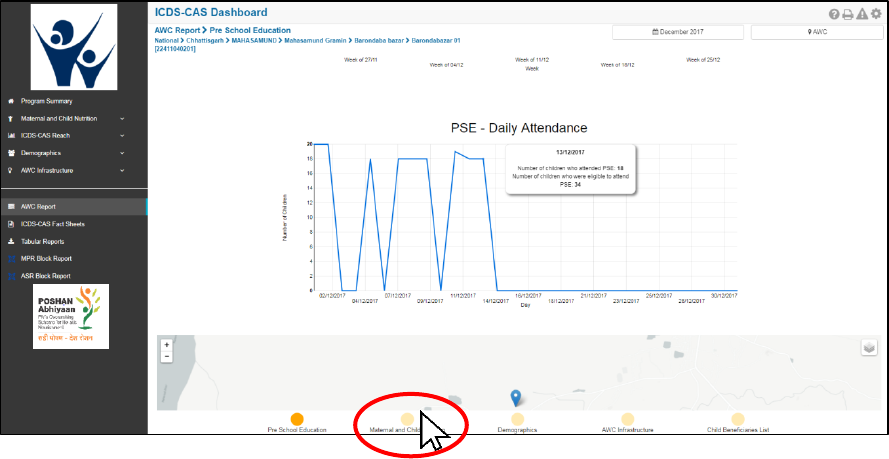
89
Figure 112: Navigating to Maternal and Child Nutrition
10.2 Maternal and Child Nutrition
The ‘Maternal and Child Nutrition’ section of the AWC Report provides information about indicators on
mother and child health who are beneficiaries for the selected AWC. This section displays KPI cards for
the following indicators:
1. Underweight (Weight-for-Age)
2. Wasting (Weight-for-Height)
3. Stunting (Height-for-Age)
4. Weighing Efficiency
5. Newborns with Low Birth Weight
6. Early Initiation of Breastfeeding
7. Exclusive Breastfeeding
8. Children initiated appropriate Complementary Feeding
9. Immunization Coverage (at age 1 year)
10. Institutional Deliveries
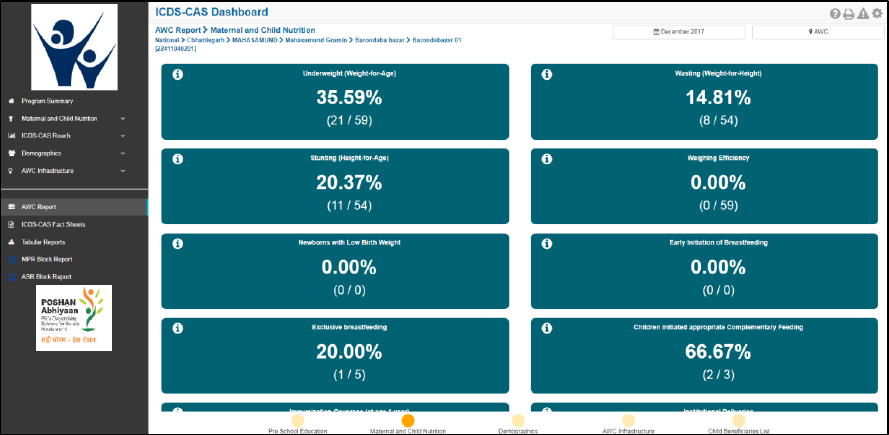
90
Figure 113: Maternal and Child Nutrition
10.3 Demographics
The ‘Demographics’ section of the AWC Report provides information about the number of beneficiaries
covered by the AWC under ICDS-CAS across various categories. This section displays KPI cards for the
following indicators:
1. Registered Households
2. Percent Aadhaar-seeded Beneficiaries
3. Percent children (0-6 years) who are enrolled for ICDS services
4. Percent pregnant women enrolled for ICDS services
5. Percent lactating women enrolled for ICDS services
6. Percent adolescent girls (11-14 years) enrolled for ICDS services
This section also displays a graphical representation for the number of children registered in the AWC
across five age groups: 0-1 month, 1-6 months, 6-12 months, 1-3 years and 3-6 years.
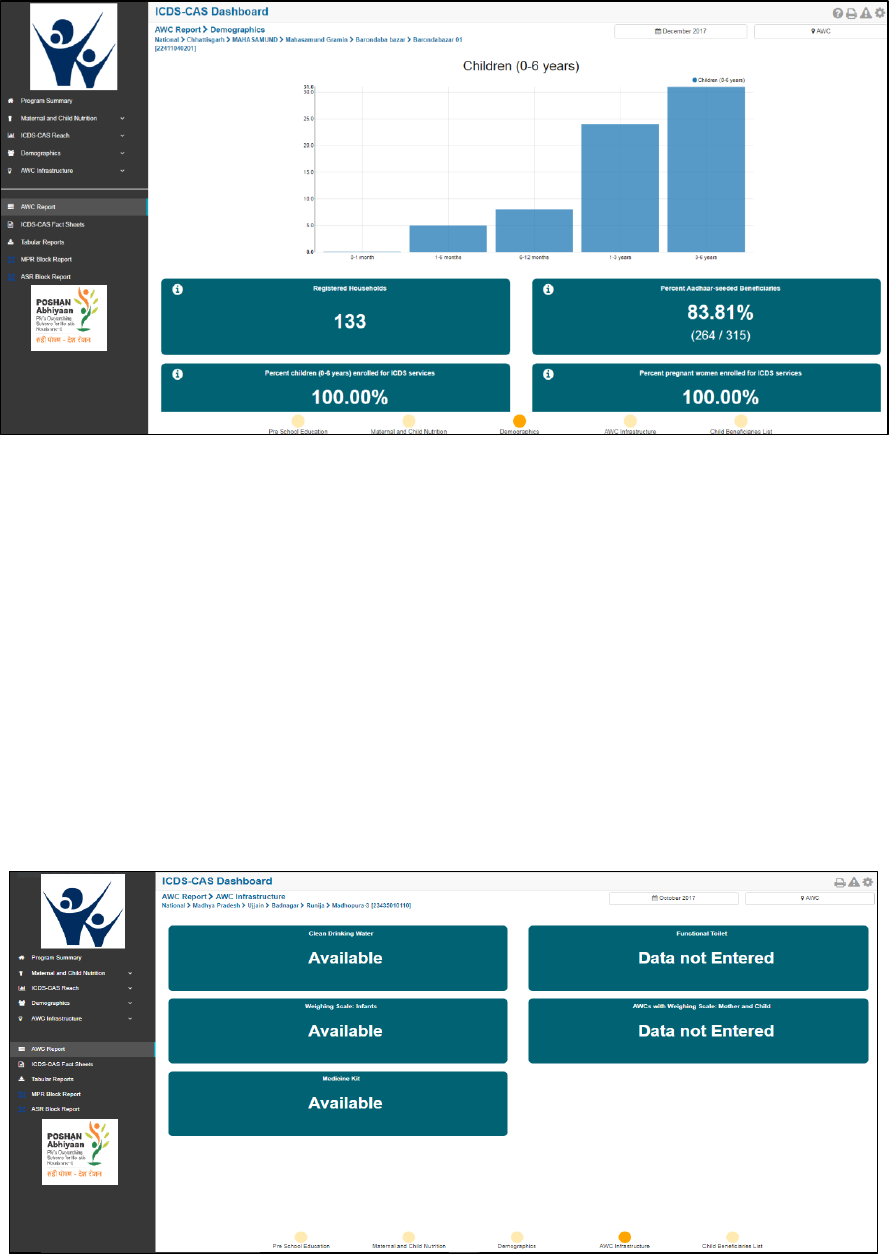
91
Figure 114: Demographics
10.4 AWC Infrastructure
The ‘AWC Infrastructure’ section of the AWC Report provides information about availability of
infrastructure facilities at the selected AWC. This section displays KPI cards for the following indicators:
1. Clean Drinking Water
2. Functional Toilet
3. Weighing Scale: Infants
4. Weighing Scale: Mother and Child
5. Medicine Kit
Figure 115: AWC Infrastructure
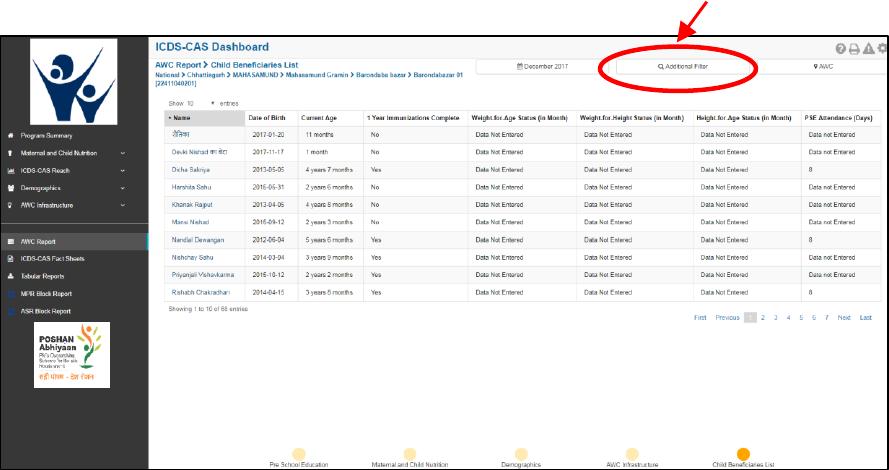
92
10.5 Child Beneficiaries List
The ‘Child Beneficiaries List’ section of the AWC Report provides a list of all the children (0-6 years)
registered at the AWC. Following information is provided about each child registered at the centre:
1. Date of Birth
2. Current Age
3. 1 Year Immunizations Complete (Yes / No)
4. Weight-for-Age status
5. Weight-for-Height status
6. Height-for-Age status
7. PSE Attendance (in days)
Note: If an AWW has not entered the relevant information for the specific month, ‘Data Not Entered’ for
the respective data.
Figure 116: Child Beneficiaries List
10.5.1 Child Beneficiary Details
The user can click on an individual child to view details about a particular child beneficiary. The user can
click in the individual beneficiary to review additional details by clicking on the name.
The user can filter the list for any age group
using the additional filter
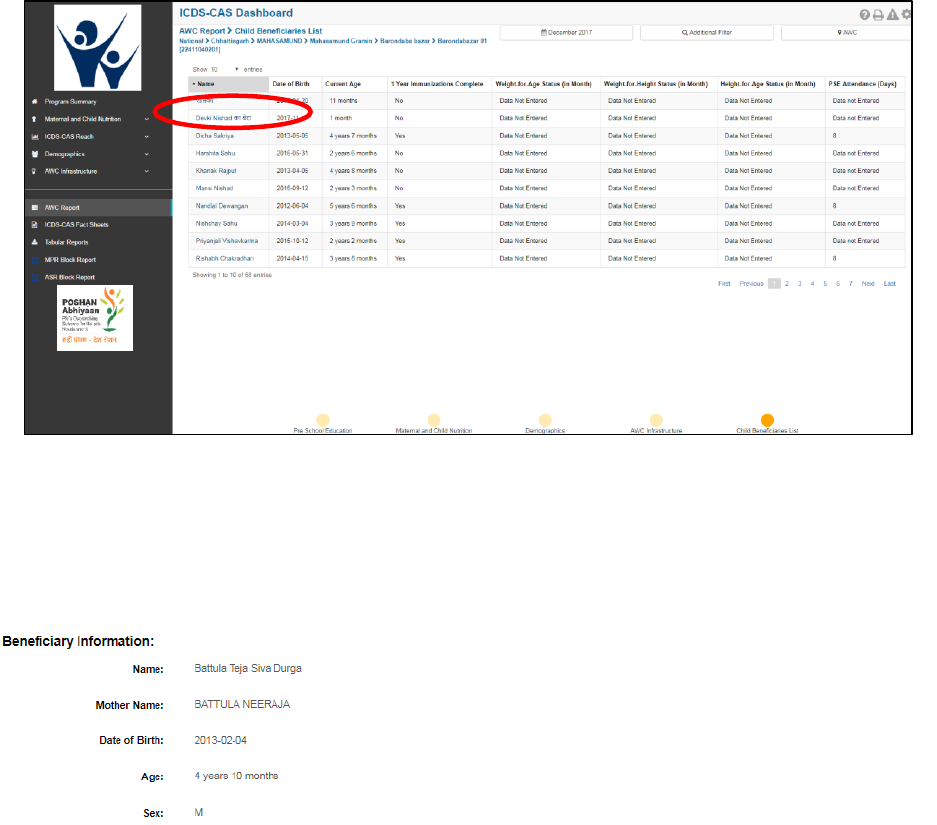
93
Figure 117: Child Beneficiaries List – Select Beneficiary
The ‘Child Beneficiary Details’ section provides the following information about the selected child:
1. Beneficiary Information – This section provides details like Name, Mother’s name, Date of Birth, Age
and Sex of the beneficiary child.
Figure 118: Beneficiary Information
2. Growth Monitoring Graphs – This section provides graphical plots for the selected child beneficiary
based on the following three indicators:
a. Weight for Age
b. Height for Age
c. Weight for Height
Note: The plot lines are displayed on the graph only as per the data entered by the AWW. Example -
if a child’s weight was not recorded in the application for a particular month, then there will not be a
plot for in the weight-for-age chart for the particular month.
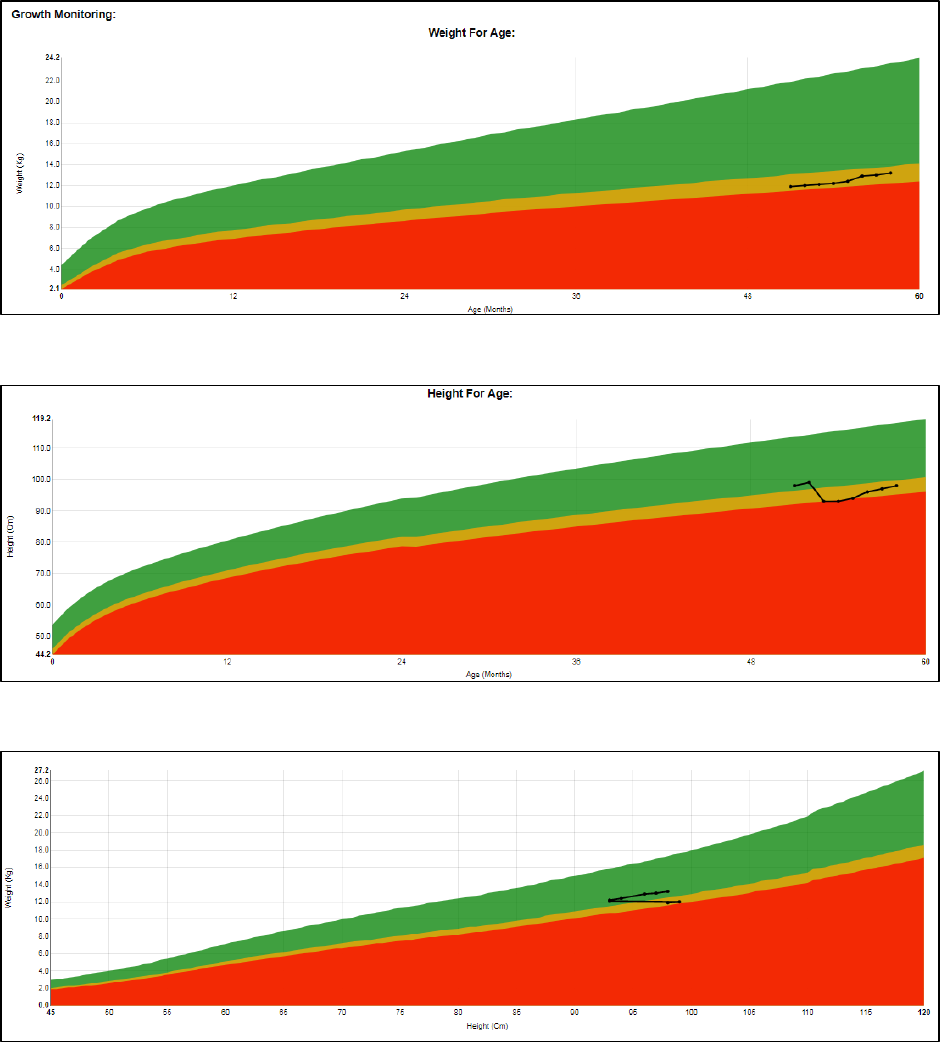
94
Figure 119: Weight for Age
Figure 120: Height for Age
Figure 121: Weight for Height
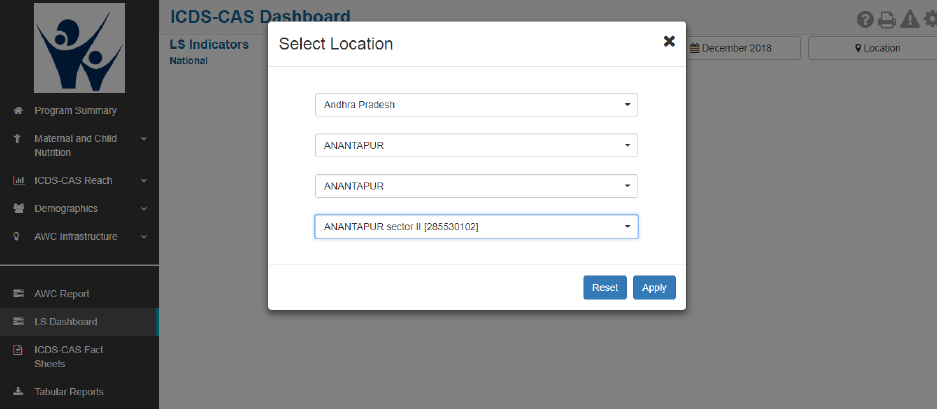
95
11 LS Dashboard
This section provides various indicators with respect to the Lady Supervisor activity on monthly basis. LS
Dashboard will be available at the left panel below the AWC Report section. Clicking on the “LS
Dashboard” prompts the user to select a sector level location for which he/she wants to view the
dashboard
Note: This report will be available only at sector level.
Once the location of the sector has been selected, the user should be able to view the following three
indicators
1. Number of AWCs visited
2. Number of Beneficiaries visited
3. Number of VHND observed
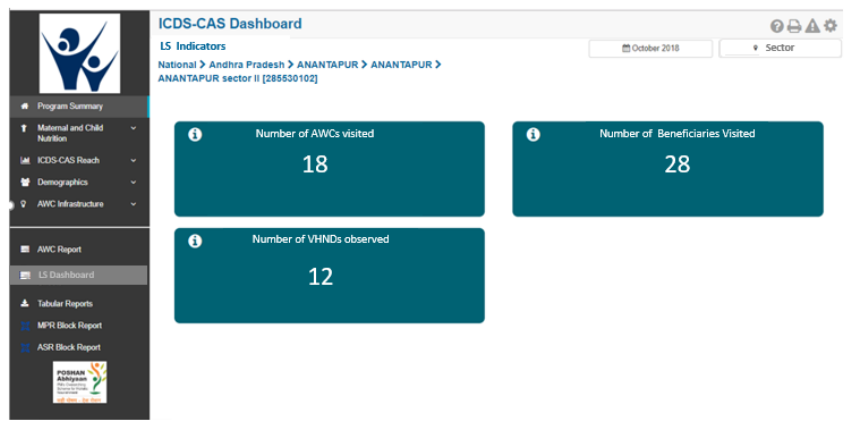
96
The three indicators are defined as following:
1. Number of AWCs visited: Number of AWC visit forms submitted by LS in current month
2. Number of Beneficiaries visited: Number of beneficiaries visited by LS in the current month
3. Number of VHND observed: Number of VHND observed by LS in the current month
12 ICDS-CAS Fact Sheet
This section provides the user at various levels (National/State/District/Block/Sector) access to ICDS-CAS
Fact Sheet to view indicators on the following outcome areas:
• Maternal and Child Nutrition
• Interventions
• Behavior Change
• Water, Sanitation and Hygiene
• Demographics
• All
The ICDS- CAS Fact Sheet provides the user access to indicator wise data for last 3 months period along
with National Average. The ICDS-CAS Fact Sheets can be easily printed and downloaded from the
dashboard by the user.
Note: The National Average displayed for the specific month chosen using the ‘Select Month/Year’ filter
is calculated using the data from the previous calendar month.
For Example – A National level user will see data for the entire country and can drill down to lower levels
(State/District/Block/Sector), a State level user will see data for the entire State and can drill down to
lower levels (District/Block/Sector), a District level user will only see data for his/her District and can drill
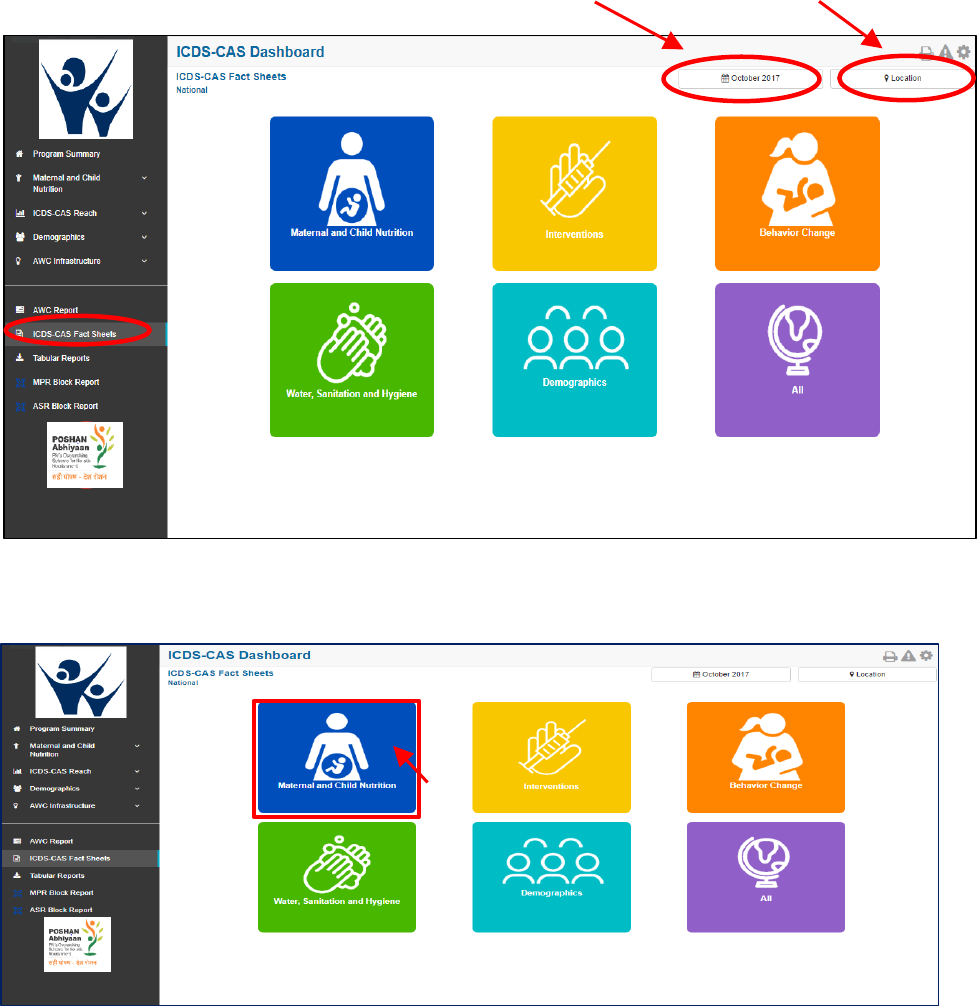
97
down to lower levels (Block/Sector), a Block level user will only see data for his/her Block and can drill
down to lower levels.
12.1 Maternal and Child Nutrition
In order to view the Mother and Child Nutrition indicators related ICDS-CAS Fact Sheet the user shall be
required to click on the following:
Figure 123: Landing Page View
Time Filter: User may select any month
to review the data for that period
Location Filter: User may select State/
District/Block/ Sector and review the data
Figure 122: ICDS-CAS Fact Sheets
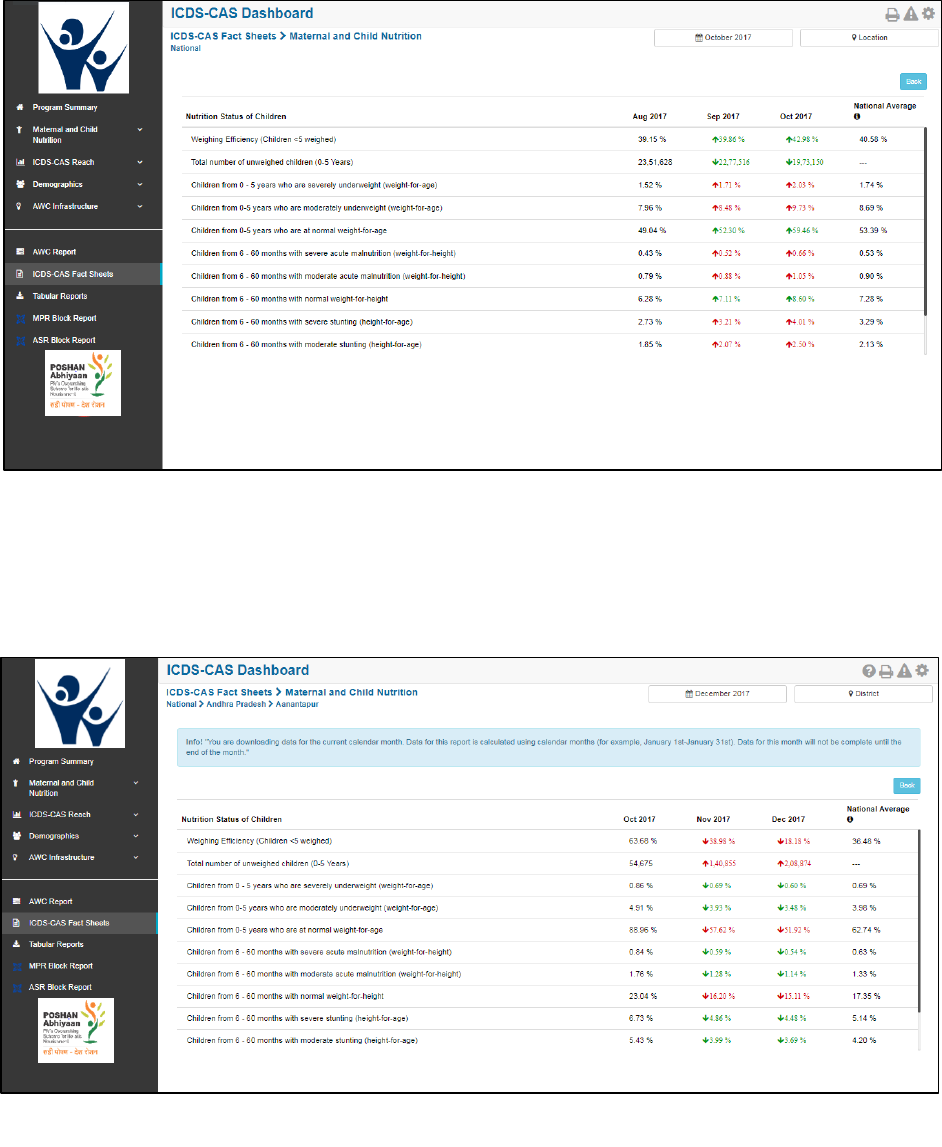
98
12.1.1 Maternal and Child Nutrition ICDS-CAS Fact Sheet –National Level View
In case National level (MWCD/CPMU) user clicks on the above mentioned box, the following ICDS-CAS
Fact Sheet shall be displayed.
Figure 124: Maternal and Child Nutrition– National Level User View
12.1.2 Maternal and Child Nutrition ICDS-CAS Fact Sheet –State View
In case State Level (MWCD/CPMU) user, the following ICDS-CAS Fact Sheet shall be displayed.
Figure 125: Maternal and Child Nutrition– State Level User View
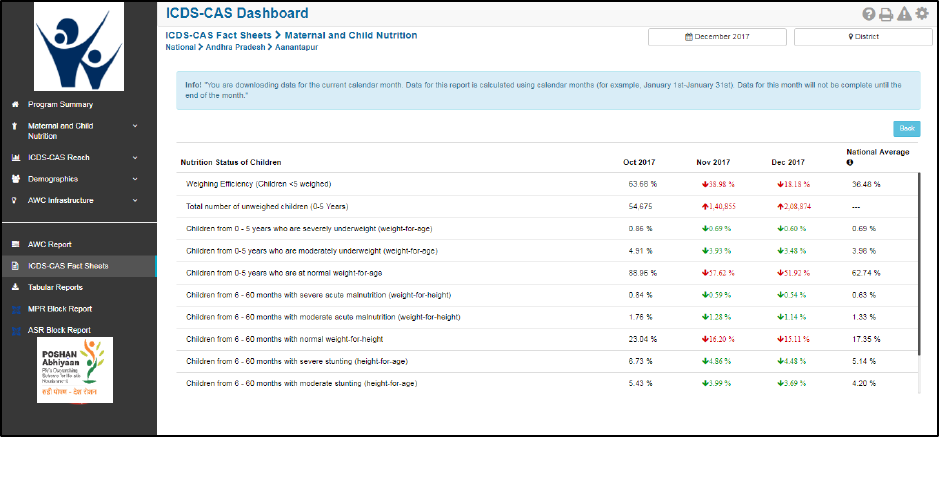
99
12.1.3 Maternal and Child Nutrition ICDS-CAS Fact Sheet –District View
In case of District level user (DPO / District Helpdesk), the following ICDS-CAS Fact Sheet shall be
displayed.
Figure 126: Maternal and Child Nutrition– District Level View
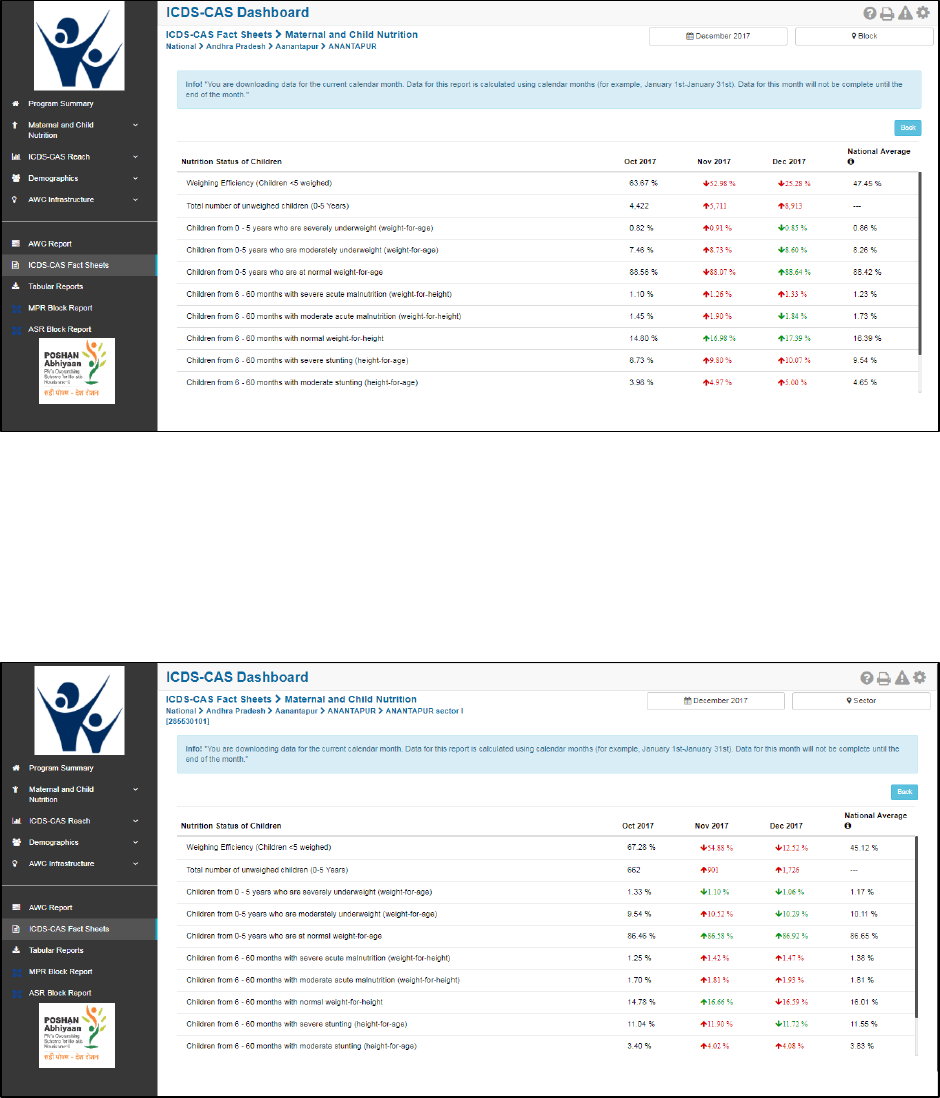
100
12.1.4 Maternal and Child Nutrition ICDS-CAS Fact Sheet –Block View
In case of Block level user (CDPO / Block Helpdesk), the following ICDS-CAS Fact Sheet shall be displayed.
Figure 127: Maternal and Child Nutrition– Block Level View
12.1.5 Maternal and Child Nutrition ICDS-CAS Fact Sheet –Sector View
In case any user at National/State/District/ Block wants to view the ICDS-CAS Fact Sheet of a Sector and
selects the Sector name in the location filter, the following ICDS-CAS Fact Sheet shall be displayed:
Figure 128: Maternal and Child Nutrition– Sector Level View
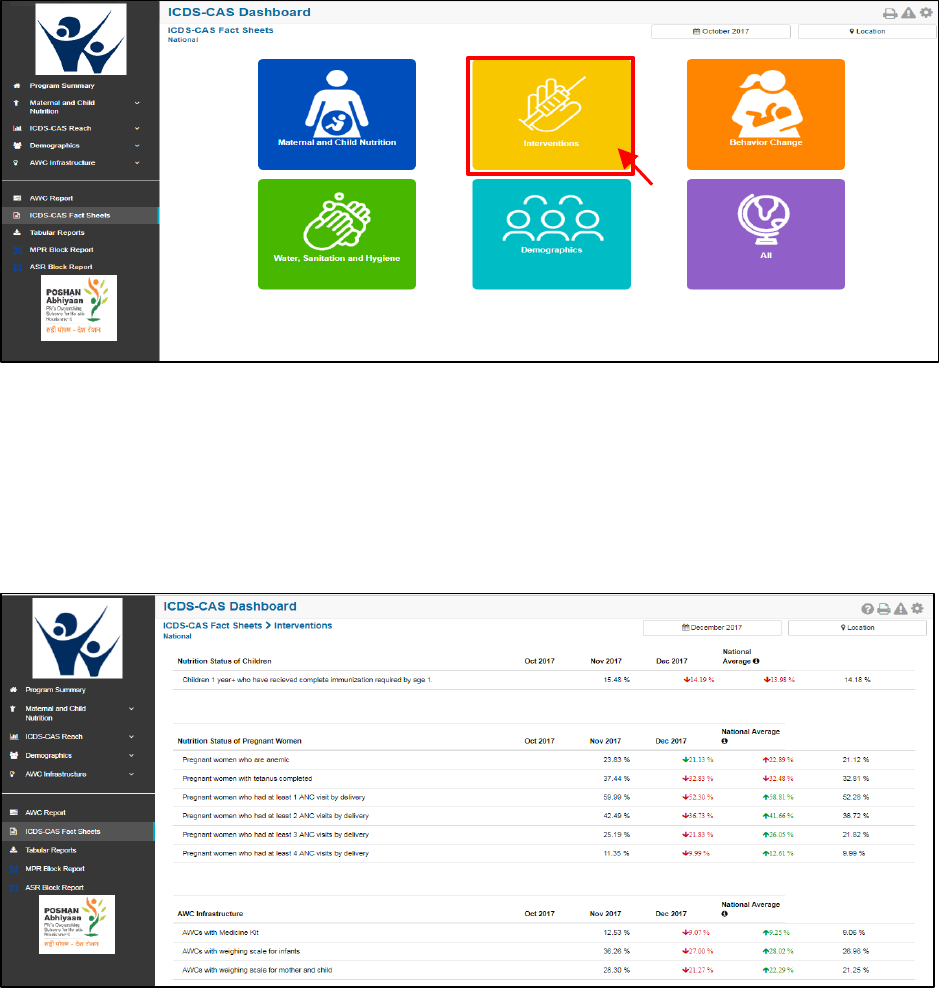
101
For more information about a particular AWC, the user can select the AWC using the location filter. The
dashboard will direct the user to AWC Report which is explained in Section 10.
12.2 Interventions
In order to view the Interventions related ICDS-CAS Fact Sheet the user shall be required to click on the
following:
Figure 129: Interventions
12.2.1 Interventions ICDS-CAS Fact Sheet –National Level View
In case National level (MWCD/CPMU) user clicks on the above mentioned box, the following ICDS-CAS
Fact Sheet shall be displayed.
Figure 130: Intervention– National Level User View
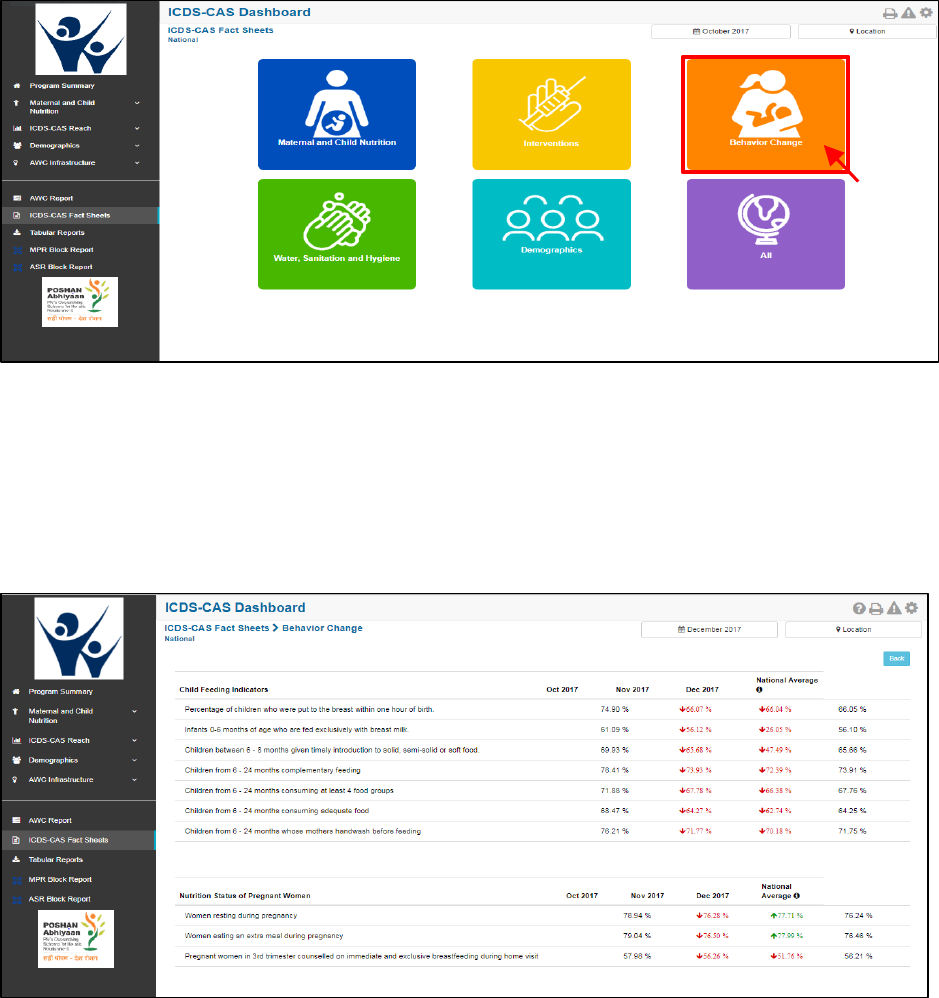
102
Please Note: The ICDS-CAS Fact Sheet s (State / District / Block / Sector) can be accessed by the user
using the location and time filters as explained in Section 5.
12.3 Behavior Change
In order to view the Behavior indicators related ICDS-CAS Fact Sheet the user shall be required to click on
the following:
Figure 131: Behavior Change
12.3.1 Interventions ICDS-CAS Fact Sheet –National Level View
In case National level (MWCD/CPMU) user clicks on the above mentioned box, the following ICDS-CAS
Fact Sheet shall be displayed.
Figure 132: Behavior Change– National Level User View
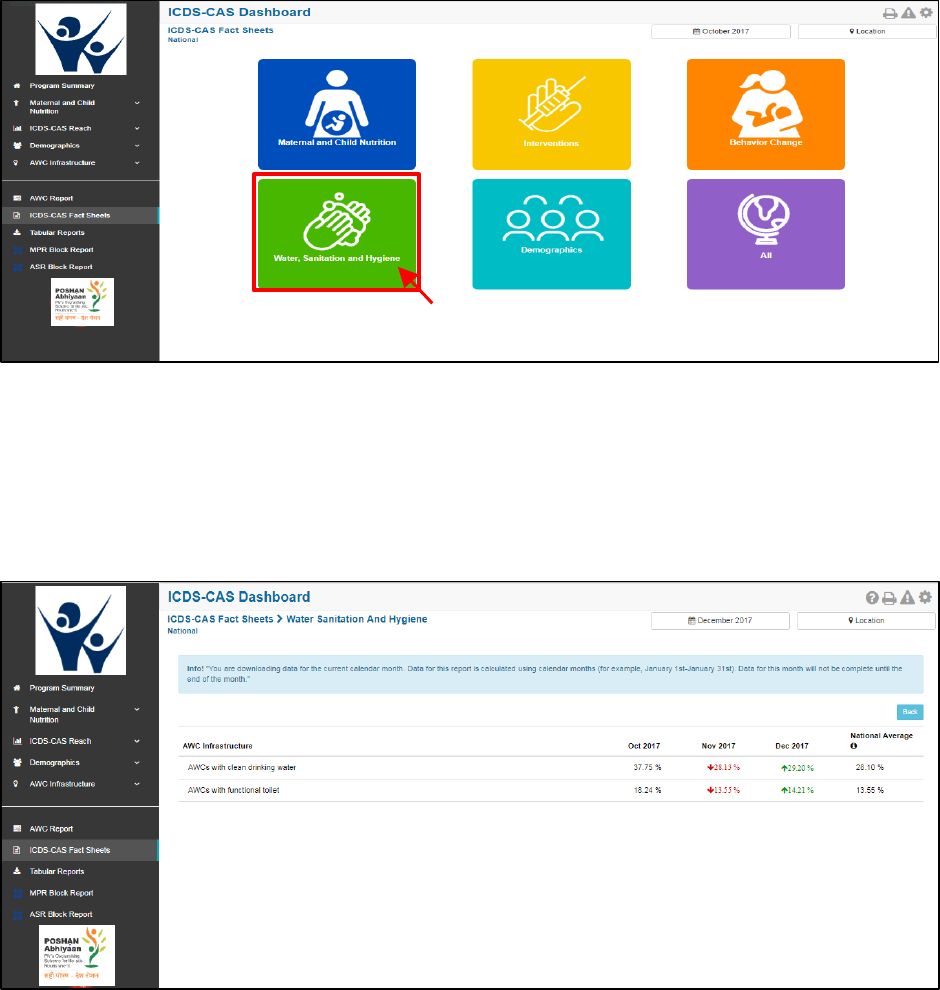
103
Please Note: The ICDS-CAS Fact Sheets (State / District / Block / Sector) can be accessed by the user using
the location and time filters as explained in Section 5.
12.4 Water, Sanitation and Hygiene
In order to view the Water, Sanitation and Hygiene indicators related ICDS-CAS Fact Sheet the user shall
be required to click on the following:
Figure 133: Water, Sanitation and Hygiene
12.4.1 Water, Sanitation and Hygiene ICDS-CAS Fact Sheet –National Level View
In case National level (MWCD/CPMU) user clicks on the above mentioned box, the following ICDS-CAS
Fact Sheet shall be displayed.
Figure 134: Water, Sanitation and Hygiene– National Level User View
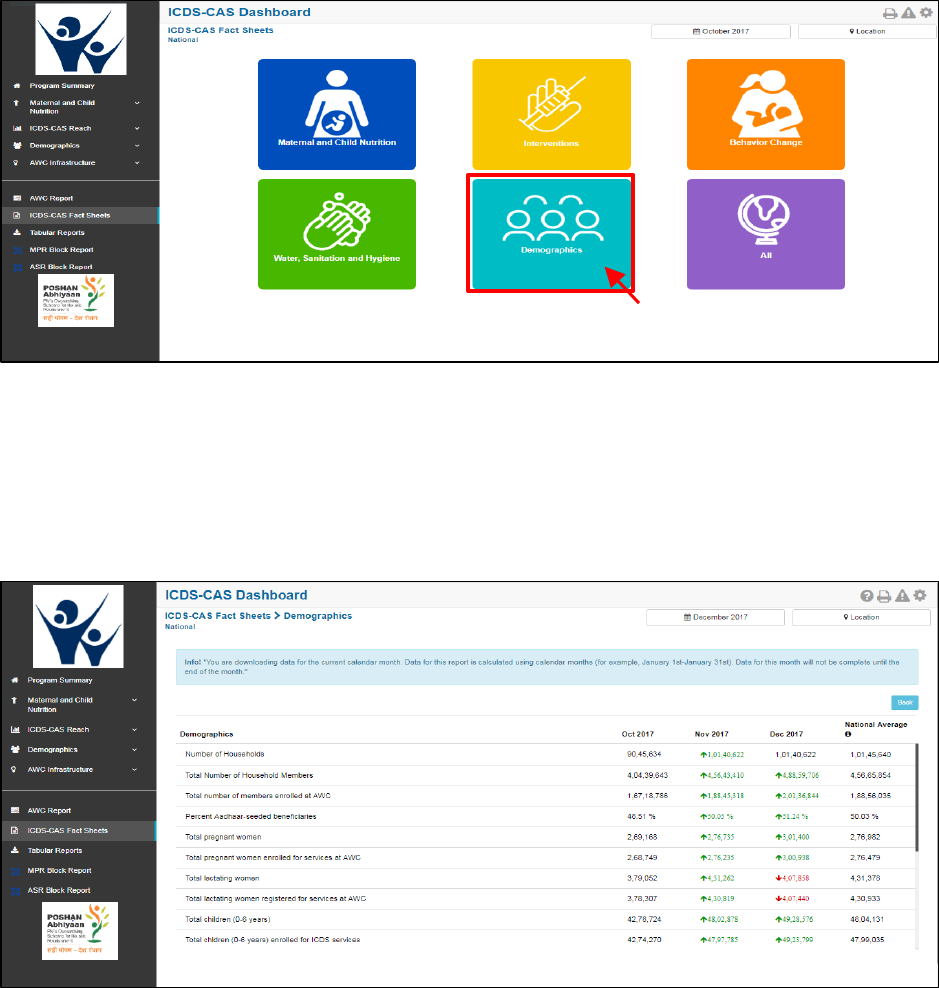
104
Please Note: The ICDS-CAS Fact Sheets (State / District / Block / Sector) can be accessed by the user using
the location and time filters as explained in Section 5.
12.5 Demographics
In order to view the Demographics indicators related ICDS-CAS Fact Sheet the user shall be required to
click on the following:
Figure 135: Demographics
12.5.1 Water, Sanitation and Hygiene ICDS-CAS Fact Sheet –National Level View
In case National level (MWCD/CPMU) user clicks on the above mentioned box, the following ICDS-CAS
Fact Sheet shall be displayed.
Figure 136: Demographics– National Level User View
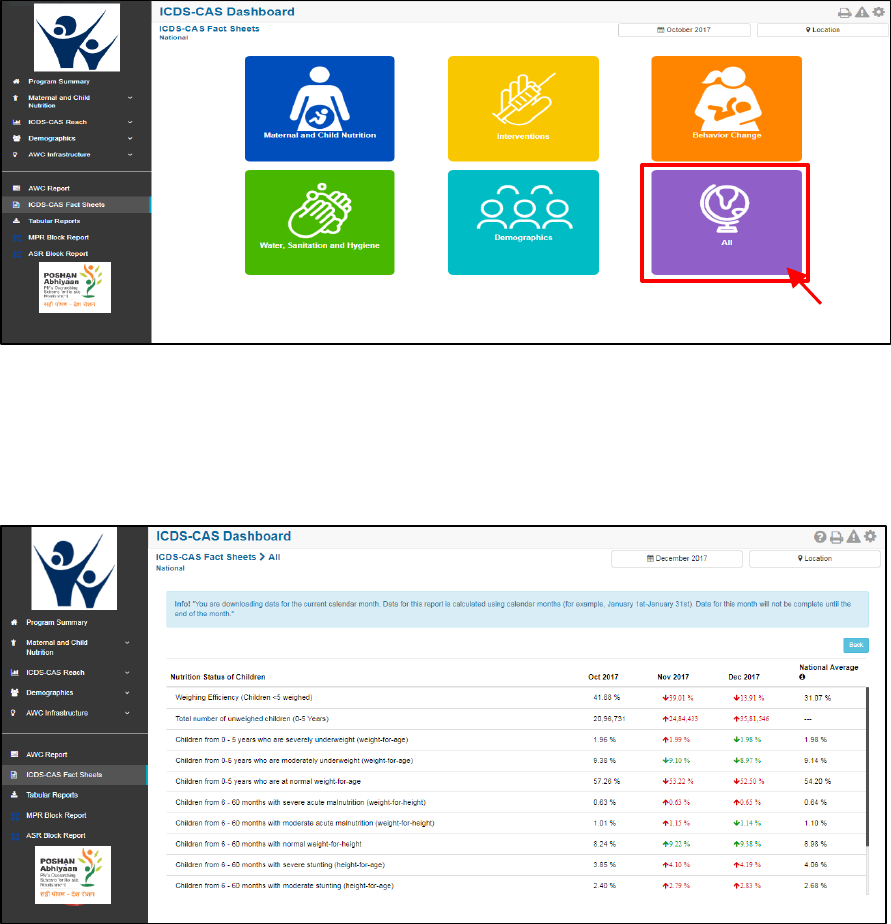
105
Please Note: The ICDS-CAS Fact Sheets (State / District / Block / Sector) can be accessed by the user
using the location and time filters as explained in Section 5.
12.6 All – ICDS-CAS Fact Sheet
In order to view the related ICDS-CAS Fact Sheet for all the indicators the user shall be required to click
on the following:
Figure 137: All Indicators
12.6.1 All Indicators ICDS-CAS Fact Sheet– National Level View
This ICDS-CAS Fact Sheet shall provide the user at National level information on all the indicators.
Figure 138: All Indicators– National Level User View
Please Note: The user based on his level of access shall have the option to select the month and location
and review the ICDS-CAS Fact Sheet accordingly.
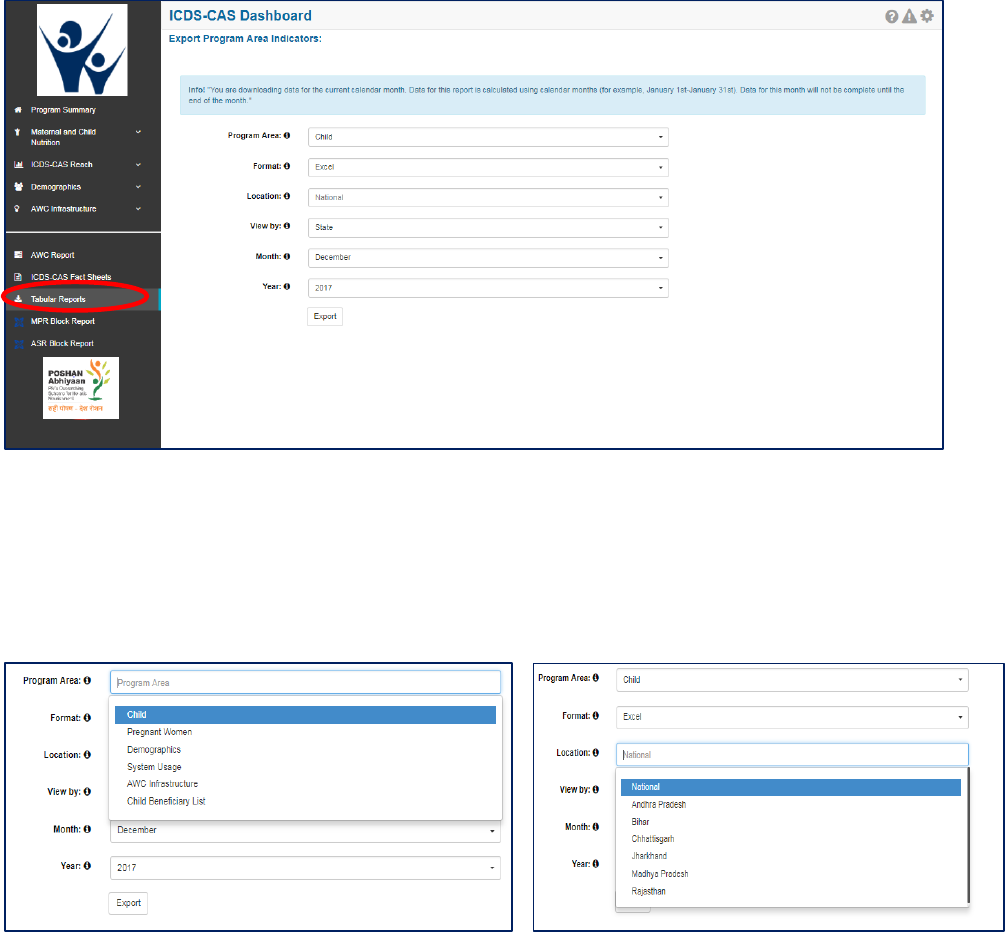
106
13 Tabular Reports
This section enables the user at various levels (National/State/District/Block/Sector) to download various
reports pertaining to key program area indicators such as Child, Pregnant Women, Demographics, System
Usage, AWC Infrastructure and Child Beneficiary List.
Once the user clicks on the “Tabular Reports” on the left hand navigation panel, the following screen shall
be displayed prompting the users to select from the multiple filters available:
Figure 139: Tabular Reports: Landing Page
On the landing page of “Tabular Reports” the user shall be provided access to various filters such as
Program Areas, Report, Location, View By, Month and Year each having drop down menus for selection
and requesting report exports. These drop downs are filters available to export selected data as per the
needs of the dashboard user.
Figure 140: Tabular Report - Filters
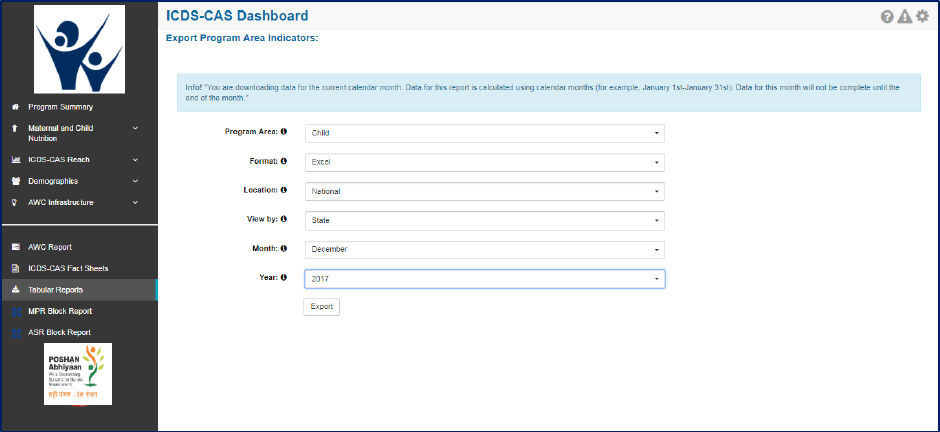
107
• Report filter allows the user to select CSV or Excel format for downloading the reports
• Location filter allows the user to select name of the State for which the report is required
• View By Filter allows the user to generate report for State/ District/ Block/ Supervisor/ AWC
• Month Filter allows user to generate report for any month of the year
• Year Filter allows user to select the year for which report is required such as 2016, 2017 etc.
Once the user has made his selection using the above mentioned filters he clicks on the “Export” button
the relevant reports are downloaded.
13.1 Tabular Report: Program Area – Child
The user based on his/her access (National/State/District/Block/Sector) can use the above mentioned
filters to download the report for program area pertaining to child indicators.
Figure 141: Program Area - Child
The filter selection shown above will automatically download the ‘Child’ Tabular Report in Excel format.
Each Excel sheet shows two tabs. The first shows aggregated data for child related indicators at the
National Level for December and the second tab shows ‘Export Info’, the filters that were chosen by the
user on the ‘Tabular Reports’ page.
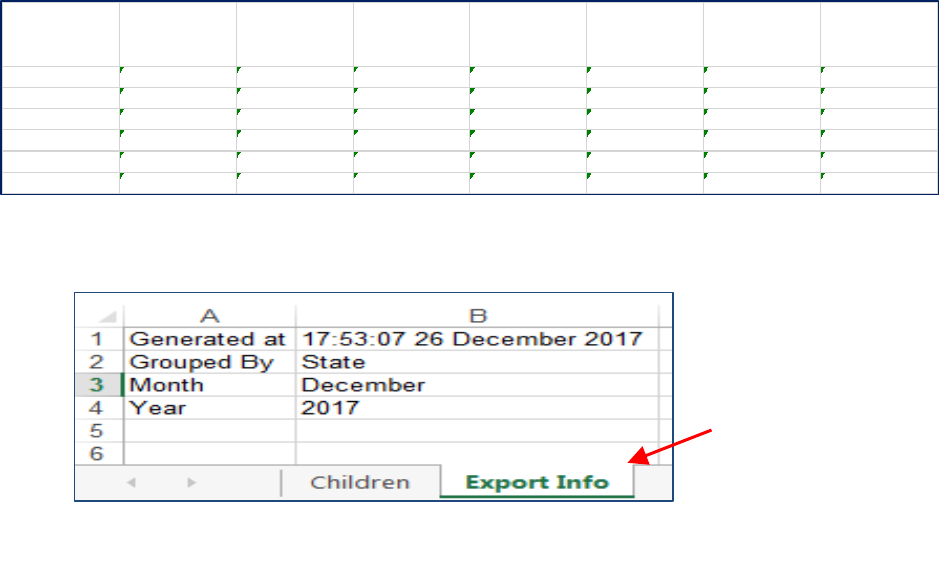
108
Figure 142: Program Area - Child: Excel Report Snapshot
13.2 Tabular Report: Program Area – Pregnant Women
The user can download the report for Pregnant Women related indicators by using the filters as explained
in Section 12.The key indicators available in this report are listed below:
• Name of State/ District/ Block/ Sector/ AWC
• Number of lactating women
• Number of pregnant women
• Number of postnatal women
• Percentage Anemia
• Percentage Tetanus Completed
• Percent women had at least 1 ANC visit by delivery
• Percent women had at least 2 ANC visit by delivery
• Percent women had at least 3 ANC visit by delivery
• Percent women had at least 4 ANC visit by delivery
• Percentage of women resting during pregnancy
• Percentage of women eating extra meal during pregnancy
• Percentage of trimester 3 women counselled on immediate breastfeeding
State
Weighing efficiency (in
month)
Height measurement
efficiency (in month)
Total number of
unweighed children (0-
5 Years)
Percentage of severely
underweight children
Percentage of
moderately
underweight children
Percentage of normal
weight-for-age children
Percentage of children
with severe wasting
Andhra Pradesh 24.34 % 5.79 % 821171 0.85 % 5.50 % 55.86 % 0.63 %
Bihar 5.13 % 0.87 % 1000426 2.11 % 5.21 % 19.14 % 0.56 %
Chhattisgarh 5.77 % 0.82 % 505087 2.68 % 14.54 % 80.61 % 1.66 %
Jharkhand 5.38 % 0.08 % 476522 1.65 % 6.88 % 67.51 % 0.14 %
Madhya Pradesh 26.23 % 1.35 % 615569 3.39 % 17.49 % 72.54 % 0.58 %
Rajasthan 1.53 % 0.06 % 164555 0.07 % 0.32 % 2.59 % 0.01 %
Figure 143: Program Area - Child: Excel Report “Export Info" Tab
Export Info: This displays the details of
filters selected by the user while
downloading the report
109
13.3 Tabular Report: Program Area – Demographics
The user can download the report for Demographic related indicators by using the filters as explained in
Section 12. The key indicators available in this report are listed below:
• Name of State/ District/ Block/ Sector/ AWC
• Number of households
• Total number of beneficiaries who have an Aadhaar ID
• Total number of beneficiaries (under 6 years old, pregnant women, and lactating women, alive
and seeking services)
• Percent Aadhaar-seeded beneficiaries
• Number of pregnant women
• Number of pregnant women enrolled for services
• Number of lactating women
• Number of lactating women enrolled for services
• Number of children 0-6 years old
• Number of children 0-6 years old enrolled for services
• Number of children 0-6 months old enrolled for services
• Number of children 6 months to 3 years old enrolled for services
• Number of children 3 to 6 years old enrolled for services
• Number of adolescent girls 11 to 14 years old
• Number of adolescent girls 15 to 18 years old
• Number of adolescent girls 11 to 14 years old that are enrolled for services
• Number of adolescent girls 15 to 18 years old that are enrolled for services
13.4 Tabular Report: Program Area - System Usage
The user can download the report for System Usage related indicators by using the filters as explained in
Section 12. The key indicators available in this report are listed below:
• Name of State/ District/ Block/ Sector/ AWC
• Number of days AWC was open in the given month
• Number of launched AWCs (ever submitted at least one HH registered form)
• Number of household registration forms
• Number of add pregnancy forms
• Number of birth preparedness forms
• Number of delivery forms
• Number of PNC forms
• Number of exclusive breastfeeding forms
• Number of complementary feeding forms
• Number of growth monitoring forms
110
• Number of take home rations forms
• Number of due list forms
13.5 Tabular Report: Program Area – AWC Infrastructure
The user can download the report for System Usage related indicators by using the filters as explained in
Section 12. The key indicators available in this report are listed below:
• Name of State/ District/ Block/ Sector/ AWC
• Percentage AWCs with drinking water
• Percentage AWCs with functional toilet
• Percentage AWCs with medicine kit
• Percentage AWCs with weighing scale: infants
• Percentage AWCs with weighing scale: mother and child
13.6 Tabular Report: Program Area – Child Beneficiary List
This report is an important and detailed report which allows the user at (National/State /District/ Block/
Sector) to export the child beneficiary list using the below mentioned filters and download the report.
On selecting the “Child Beneficiary List” in Program Area as explained in the above mentioned section the
user shall be provided the option to further filter and export the report as per requirement. The user can
select the filter such as:
• Data not entered for weight
• Data not Entered for height (Unmeasured)
• Severely Underweight
• Moderately Underweight
• Normal (weight-for-age)
• Severely Stunted
• Moderately Stunted
• Normal (height-for-age)
• Severely Wasted
• Moderately Wasted
• Normal (weight-for-height)
Note: This report is only available for download at the District, Block, Sector and AWC level locations.
Additionally, at least one filter must be chosen from the list mentioned above. This report provides the
user with list of individual beneficiaries by name that will be useful for monitoring and tracking the
nutritional status of each beneficiary.
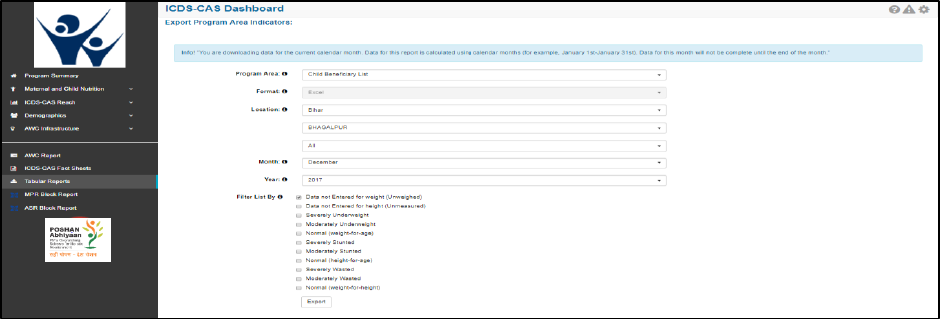
111
Figure 144: Program Area - Child Beneficiary List
13.7 Tabular Report: ICDS CAS Monthly Register
This report is meant to be a physical record kept of the activities taking place in the AWC for a month. It
has the following sections:
1. Basic Details: This includes identification information such as the AWW Location, Code, Name of
the AWW and her phone number etc. There is also provision for manually filling in additional
details such as the LGD code, the name of the supervisor, etc.
2. Infrastructure: This has details on the type of AWC building, toilet, kitchen and drinking water
available at the AWC.
3. Total Population: As per the Anganwadi Survey Register, this section breaks down the
beneficiaries availing services at the given AWC.
4. AWC Functioning and Services Delivered: This details the Breakfast, HCM and THR delivered to
the children and beneficiaries in the month, along with the days PSE was conducted and AWC
was opened.
5. Services: Detailed breakdown of the Supplementary Nutrition and PSE Education given by
gender and other demographic identifying data (such as SC/ST/OBC/General/Minority).
6. Classification of Nutritional Status of Children: Break-down of children (0-3 years; 3-5 years) into
whether they’re moderately/severely underweight, stunted, or wasted.
7. Village Health Sanitation and Nutrition Day Activity Summary: Details of the VHSND, including
immunizations conducted and ante-natal check ups taken place.
8. THR Distribution: There is a provision to input the details of THR distribution to children (both
normal as well as underweight) and to pregnant women.
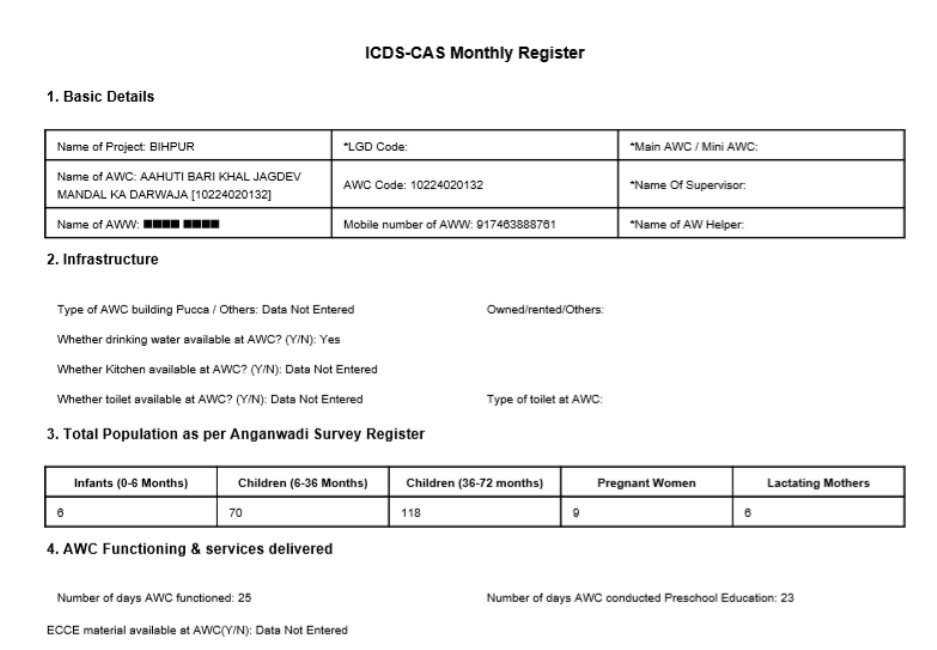
112
The report can be downloaded in two formats: one PDF per AWC, or as one combined PDF for all the
AWCs.
13.8 Tabular Report: Program Area - AWW Performance Report
This report will provide a list of Aanganwadi workers and their performance on 3 indicators. It will show
values for these 3 indicators which can be used to assess performance for Anganwadi workers and
Anganwadi helpers by CDPOs.
The three indicators are:
1. Number of home visits completed - An AWW should have completed at least 60% of the total
eligible beneficiary visits
2. Number of days the AWC was open - The Anganwadi center should have been opened for at
least 21 days in that month

113
3. Weighing efficiency - The weighing efficiency of the AWC should be more than 60% for that
month
If the first and third criteria above is met, the Anganwadi worker is recommended as eligible for
incentives for the given month. The table below provides examples for the eligibility calculation
AWW
Name
Home Visits
Conducted
Number of Days AWC was
Open
Weighing
Efficiency
Eligible for
Incentive
Sheela
10%
12 days
65%
No
Kamla
61%
21 days
62%
Yes
Sujata
65%
24 days
59%
No
Key points to note for the AWW Performance Report:
1. This report will be available only at Block level.
2. The data synced by the AWWs till 10th of every month will be considered for AWW
Performance Report. Any data synced post 10th (i.e. between 11th and 15th) will not be
considered for AWW Performance Report calculation.
3. For calculating home visits conducted value unscheduled home visits will not be counted.
4. The report will be available for download on and after 15th of every month for the performance
of last month. For example, to show October performance, report will be available only on or
after 15th November.
14 MPR Block Report
The user can select and click on the “MPR Block Report” on the left hand navigation panel, the screenshot
of the landing page visible to the user is provided below:
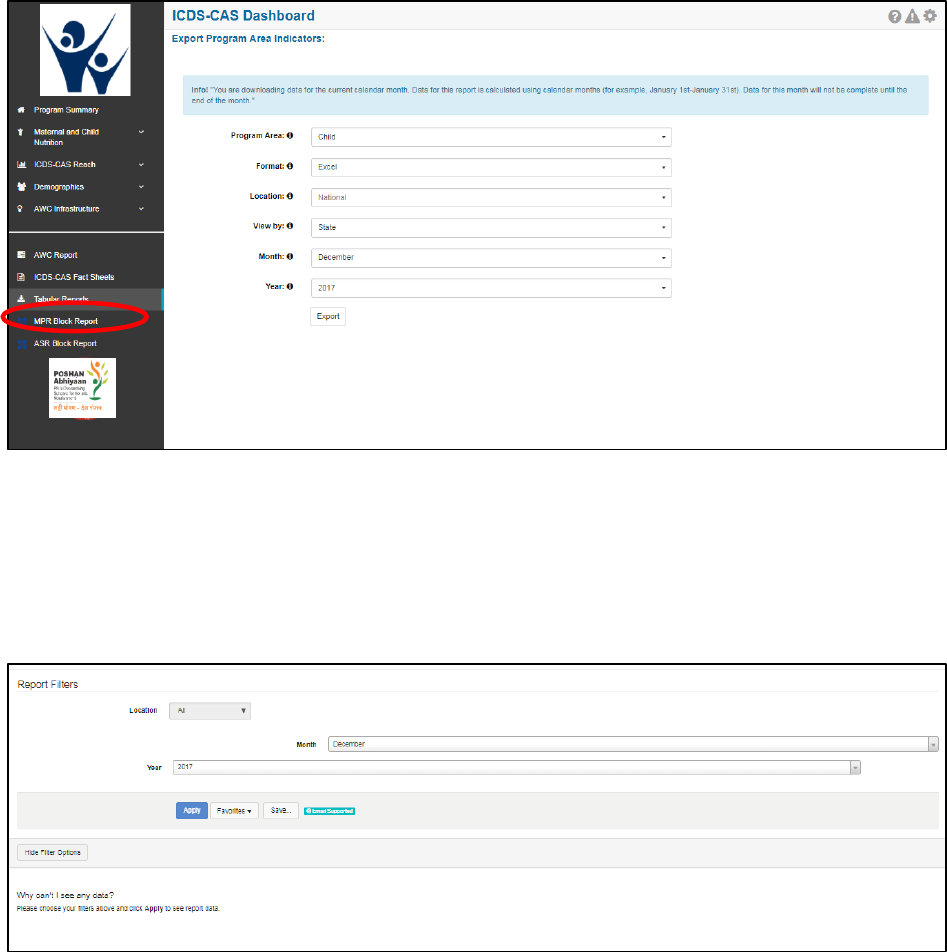
114
Figure 145: Landing Page
Once the user clicks on the “MPR Block Report” on the left hand navigation panel the user shall be
navigated to the below mentioned screen wherein the user shall be required to make selection using the
filters available on the page. The user is required to select the month and year to review his relevant Block
MPR in the dropdown.
Figure 146: Block MPR Report page filter
The Monthly Progress Reports displays the following information:
• Identification and Basic Information
• Details of Births and Deaths during the month
• Details of new registrations at AWCs during the month
• Delivery of Supplementary Nutrition and Pre-School Education
• Number of AWCs using Iodized salt
• Program Coverage
• Pre-School Education conducted for children 3-6 years
115
• Growth Monitoring and Classification of Nutritional Status of Children (as per growth chart
based on the WHO Child Growth Standards)
• Immunization Coverage
• Village Health and Nutrition Day (VHND) activity summary
• Referral Services
• Monitoring and Supervision During the Month
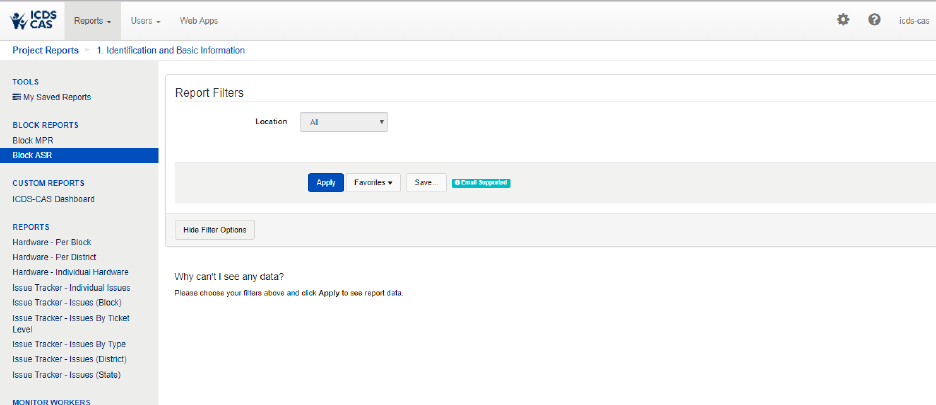
116
15 ASR Block Report
The user can select and click on the “ASR Block Report” on the left hand navigation panel and shall be
redirected to the below mentioned page where user would be required to choose the location, year,
month and accordingly the ASR shall be generated.
Figure 147: Block ASR Report page filter
Once the user has made the selection, the user shall be able to view and download the ASR report.
117
16 Snapshot of Indicator Views on Dashboard
This section provides a snapshot of key indicators available on the dashboard along with their definitions
and their location on the dashboard.
Indicator
Definition
Section in Dashboard
Map
and
Chart
Views
ICDS-
CAS
Fact
Sheet
Tabular
Report
AWC
Report
Program Area: Maternal and Child Nutrition
% Underweight
Children (weight-for-
age)
Of the total number of children who were
weighed in current month (0-5 years old,
alive, open in month, seeking services),
the percentage of children who were
moderately or severely underweight in
current month
% Wasting (weight-for-
height)
Of the total number of children who were
weighed and had height measured in
current month (0-5 years), the percentage
of children who were moderately or
severely wasted in current month
% Stunting (height-for-
age)
Of the total number of children who were
weighed in current month (0-5 years), the
percentage of children who were
moderately or severely stunted in current
month
% Newborns with Low
Birth Weight
Of the total number of children born in
the month and weighed, the percentage
of children who were born with a low
birth weight
% Weighing efficiency
(Children <5 weighed)
Of the total number of children who were
eligible to be weighed (0-5 years old, alive,
open in month, seeking services), the
percentage of children who were weighed
% Early Initiation of
Breastfeeding
Of the total number of children born in
the month, the percentage of children
who were breastfed at birth.

118
Indicator
Definition
Section in Dashboard
Map
and
Chart
Views
ICDS-
CAS
Fact
Sheet
Tabular
Report
AWC
Report
% Exclusive
breastfeeding
Of the total number of children eligible for
exclusive breastfeeding (0-6 months old),
the percentage of children who were
exclusively breastfed in the month
% Children initiated
appropriate
complementary
feeding
Of the total number of children eligible for
initiation of complementary feeding (6-8
months old), the percentage of children
who initiated complementary feeding
% Institutional
deliveries
Of the total number of women who were
seeking services and delivered in the
month, the percentage of institutional
deliveries in the month.
Total Number
Unweighed
Of the total number of children who were
eligible to be weighed (0-5 years old, alive,
open in month, seeking services), the total
number of children who were unweighed
% Immunization
coverage (at age 1
year)
Of the total number of children who are
eligible to be fully immunized (older than
12 months), the percentage of children
who are fully immunized (including late
and on time immunizations)
Program Area: ICDS-CAS Reach
Number of AWCs Open
yesterday
Of the total number of AWCs, the number
of AWCs that were open yesterday
AWCs covered
Number of launched AWCs (ever
submitted at least one Household
Registration form)
States/UTs covered
Number of launched States
Districts covered
Number of launched Districts
Block covered
Number of launched Blocks
119
Indicator
Definition
Section in Dashboard
Map
and
Chart
Views
ICDS-
CAS
Fact
Sheet
Tabular
Report
AWC
Report
Sectors covered
Number of launched Sectors
Program Area: Demographics
Registered Households
Number of households registered
Children (0-6 years)
Number of children 0-6 years old
Children (0-6 years)
enrolled for ICDS
services
Number of children 0-6 years old who are
enrolled for ICDS services
Pregnant Women
Number of pregnant women
Pregnant Women
enrolled for ICDS
services
Number of pregnant women who are
enrolled for ICDS services
Lactating Women
Number of lactating women
Lactating Women
enrolled for ICDS
services
Number of lactating women who are
enrolled for ICDS services
Adolescent Girls (11-14
years)
Number of adolescent girls 11-14 years
old
Adolescent Girls (11-14
years) enrolled for
ICDS services
Number of adolescent girls 11-14 years
old who are enrolled for ICDS services
Adolescent Girls (15-18
years)
Number of adolescent girls 15-18 years
old
Adolescent Girls (15-18
years) enrolled for
ICDS services
Number of adolescent girls 15-18 years
old who are enrolled for ICDS services
Adolescent Girls (11-18
years)
Number of adolescent girls 11-18 years
old

120
Indicator
Definition
Section in Dashboard
Map
and
Chart
Views
ICDS-
CAS
Fact
Sheet
Tabular
Report
AWC
Report
Adolescent Girls (11-18
years) enrolled for
ICDS services
Number of adolescent girls 11-18 years
old who are enrolled for ICDS services
Percent children (0-6
years) enrolled for
ICDS services
Of the total children registered between
the ages of 0-6 years old, the percentage
that are enrolled for ICDS services
Percent pregnant
women enrolled for
ICDS services
Of the total pregnant women registered,
the percentage that are enrolled for ICDS
services
Percent lactating
women enrolled for
ICDS services
Of the total lactating women registered,
the percentage that are enrolled for ICDS
services
Percent adolescent
girls (11-18 years)
enrolled for ICDS
services
Of the total adolescent girls registered
between 11-18 years old, the percentage
who are enrolled for ICDS services
% Aadhaar seeded
individuals
Of the total number of children 0-6 years
old, pregnant women, and lactating
mothers who are alive, open, and seeking
services percentage of those who have an
Aadhaar ID
Program Area: AWC Infrastructure
% AWCs Reported
Clean Drinking Water
Of the total number of AWCs that
submitted an Infrastructure Details form,
the percentage of AWCs who reported
having clean drinking water
% AWCs Reported
Functional Toilet
Of the total number of AWCs that
submitted an Infrastructure Details form,
the percentage of AWCs who reported
having a functional toilet
% AWCs Reported
Medicine Kit
Of the total number of AWCs that
submitted an Infrastructure Details form,

121
Indicator
Definition
Section in Dashboard
Map
and
Chart
Views
ICDS-
CAS
Fact
Sheet
Tabular
Report
AWC
Report
the percentage of AWCs who reported
having a medicine kit
% AWCs Reported
Weighing Scale:
Infants
Of the total number of AWCs that
submitted an Infrastructure Details form,
the percentage of AWCs who reported
having infant weighing scales
% AWCs with
Weighing Scale:
Mother and Child
Of the total number of AWCs, the
percentage of AWCs with mother and
child weighing scales
AWC Report: Pre-School Education
AWC Days Open
The number of days AWCs were open in
the month
AWC Days Open per
week
The number of days AWCs were open in
the week
PSE- Average Weekly
Attendance
The average number of children who
attended preschool education in the week
Outcome Area: Behavior Change
Percentage of children
complementary
feeding
Of the total number of children eligible for
complementary feeding (6-24 months
old), the percentage of children who were
complementary feeding
Percentage of children
consuming at least 4
food groups
Of the total number of children eligible for
complementary feeding (6-24 months
old), the percentage of children who were
consuming at least 4 food groups
Percentage of children
consuming adequate
food
Of the total number of children eligible for
complementary feeding (6-24 months
old), the percentage of children who were
consuming an adequate quantity of food
during their last visit (could have been in a
previous month)

122
Indicator
Definition
Section in Dashboard
Map
and
Chart
Views
ICDS-
CAS
Fact
Sheet
Tabular
Report
AWC
Report
Percentage of children
whose mothers hand
wash before feeding
Of the total number of children eligible for
complementary feeding (6-24 months
old), the percentage of children whose
mothers washed their hands prior to
feeding during their last visit (could have
been in a previous month)
Percent women
Resting during
pregnancy
Of the total number of pregnant women
that are seeking services, the percentage
of women who indicated that they are
resting during pregnancy at their last birth
preparedness visit (could have been in a
previous month)
Percent eating extra
meal during pregnancy
Of the total number of pregnant women
that are seeking services, the percentage
of women who indicated that they are
eating an extra meal during pregnancy at
their last birth preparedness visit (could
have been in a previous month)
Percent trimester 3
women Counselled on
immediate EBF during
home visit
Of the total number of pregnant women in
their third trimester, the percentage of
women who were counselled on
immediate exclusive breastfeeding during
their last home visit
Outcome Area: Interventions
Percent Anemic
Of the total number of pregnant women,
the percentage of women who were
moderately or severely anemic in their last
birth preparedness visit (could have been
in a previous visit)
Percent tetanus
complete
Of the total number of pregnant women,
the percentage of women who completed
their tetanus vaccinations
Percent women had at
least 1 ANC visit by
delivery
Of the total number of women who
delivered in the month and are seeking
services, the percentage of women who
123
Indicator
Definition
Section in Dashboard
Map
and
Chart
Views
ICDS-
CAS
Fact
Sheet
Tabular
Report
AWC
Report
had at least one ANC visit during their
pregnancy
Percent women had at
least 2 ANC visits by
delivery
Of the total number of women who
delivered in the month and are seeking
services, the percentage of women who
had at least two ANC visits during their
pregnancy
Percent women had at
least 3 ANC visits by
delivery
Of the total number of women who
delivered in the month and are seeking
services, the percentage of women who
had at least three ANC visits during their
pregnancy
Percent women had at
least 4 ANC visits by
delivery
Of the total number of women who
delivered in the month and are seeking
services, the percentage of women who
had at least four ANC visits during their
pregnancy
Tabular Report: System Usage
Number of days AWC
was open in the given
month
Number of days in which AWC was open
Number of household
registration forms
Number of Household registration forms
submitted
Number of early
initiation of
breastfeeding forms
Number of EBF forms submitted
Number of
complementary
feeding forms
Number of CF forms submitted
Number of growth
monitoring forms
Number of GMP forms submitted
124
Indicator
Definition
Section in Dashboard
Map
and
Chart
Views
ICDS-
CAS
Fact
Sheet
Tabular
Report
AWC
Report
Number of take home
rations forms
Number of THR forms submitted
Number of due list
forms
Number of Due List forms submitted
Number of add
pregnancy forms
Number of add pregnancy forms
submitted
Number of birth
preparedness forms
Number of birth preparedness forms
submitted
Number of delivery
forms
Number of delivery forms submitted
Number of PNC forms
Number of PNC forms submitted

125
17 Dashboard Usage Checklist
This section outlines the activities which need to be undertaken by dashboard users on daily, weekly and
monthly basis for effective monitoring of ICDS program.
Daily
• Review Program Summary and note whether data is increasing or decreasing.
• For indicators that are decreasing, view the Map/Chart view to look at trends.
• Go to the Chart view page and view top and bottom performing locations under your administrative
level.
• Follow up with these locations to understand reasons for poor performance and identify areas for
support.
Weekly
• Use the Map View to see if there are certain areas performing better than others.
• Consider if there are factors specific to those geographic areas influencing the trends.
• Use the Chart View to see how the indicator has changed in the past four months. If there has been
a consistent negative trend or significant negative change in the indicator.
• Investigate the reasons for this change.
• Follow up with the respective location leaders to offer support.
Monthly
• Review ICDS-CAS Fact Sheets to see how the current month’s progress compares to the past two
months.
• Select priority indicators to address in the coming month. Share information about these indicators
with your team so they have context on the problem.
o See Map View to show the status of the indicator across geographic areas.
o See Chart View to see historical trends on the indicator.
• Make a plan for addressing service delivery indicators that are stagnant or worsening over time.
o Work with the ICDS team in your administrative area to identify the service delivery inputs
that would lead to improved performance on outcomes indicators.
o Set reasonable targets for improvement. Remember that some indicators will be slower to
change than others. Some short-term targets could include increasing the number of AWCs
open daily, a high percentage of PSE attendance, and weighing efficiency.
o Agree on goals for service delivery improvement with the ICDS team in your administrative
area.
o Set up a time to review your progress on this month’s goals.
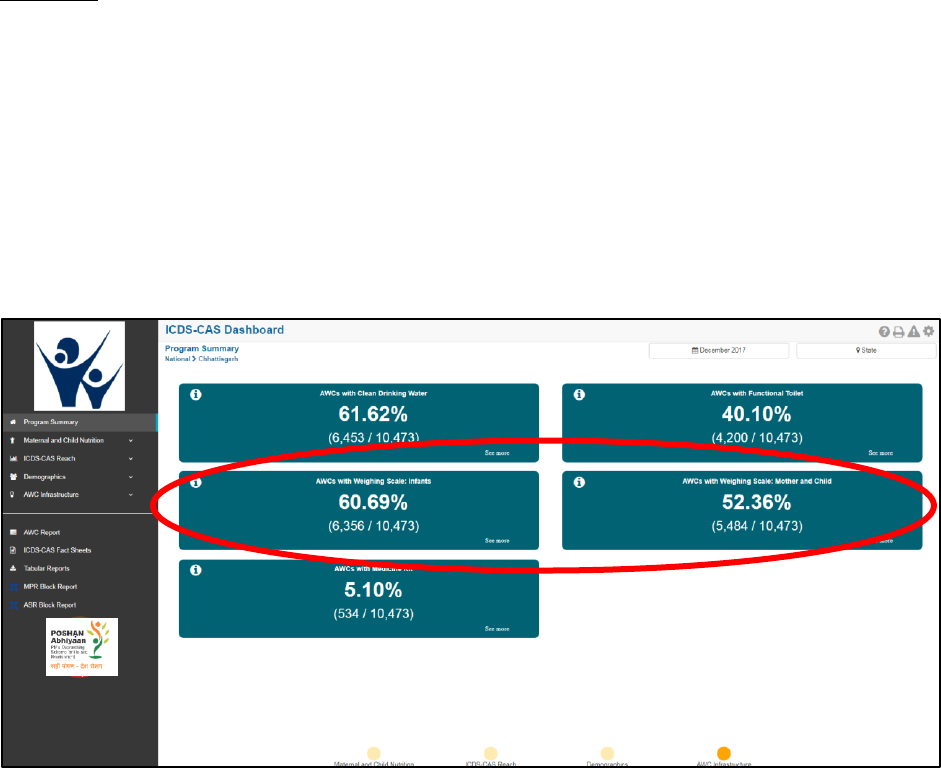
126
18 Decision Making through Dashboard
The ICDS-CAS Dashboard display data and provides reports on various program areas for administrative
officers to interpret as they see fit to the program. This section of the manual aims to provide some
support to administrative officials on how to interact with and understand the various data points and
reports available on the dashboard in order to make data-driven decisions in the ICDS program.
In order to provide a detailed understanding of how to navigate the dashboard for use in decision-making
to improve service delivery of the ICDS program, two use-cases are presented here:
Use Case 1: State Project Management Unit (AWC Infrastructure)
Scenario: SPMU wishes to complete procurement of weighing scales. In order to do so, the SPMU team
uses the ICDS-CAS Dashboard to investigate the current status of weighing scales available at AWCs in
the State. How can the team access this information from the dashboard?
Steps to be followed on the Dashboard:
• View State-level Program Summary for AWC Infrastructure to follow up on procurements of scales
that were made for several Districts.
• Select “See more” to see District-level data on a Map View.
Figure 148: Use Case 1
• Switch to Chart View to see a ranking of top- and bottom-performing Districts.
• Contact lowest-performing Districts to investigate potential bottlenecks in the distribution of scales.
• Encourage District officials to ensure that AWWs are completing the Infrastructure Details form in
the ICDS-CAS application.
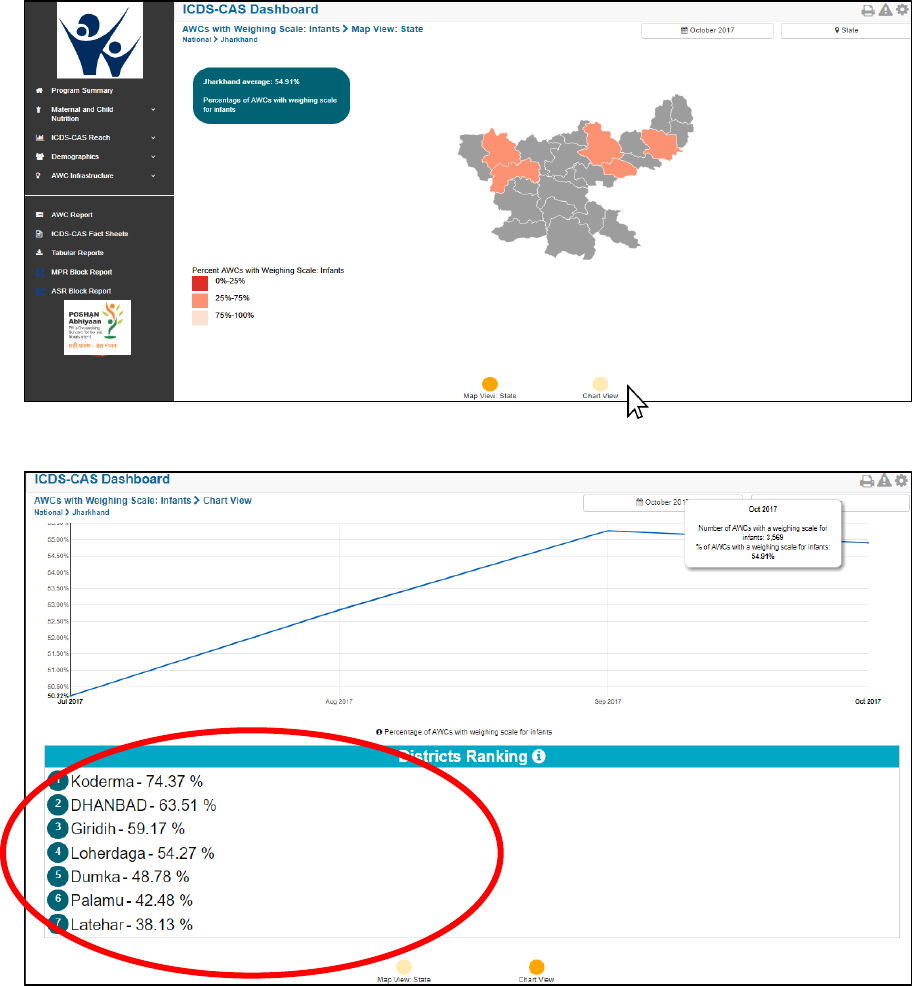
127
Figure 149: Use Case 1
Figure 150: Use Case 1
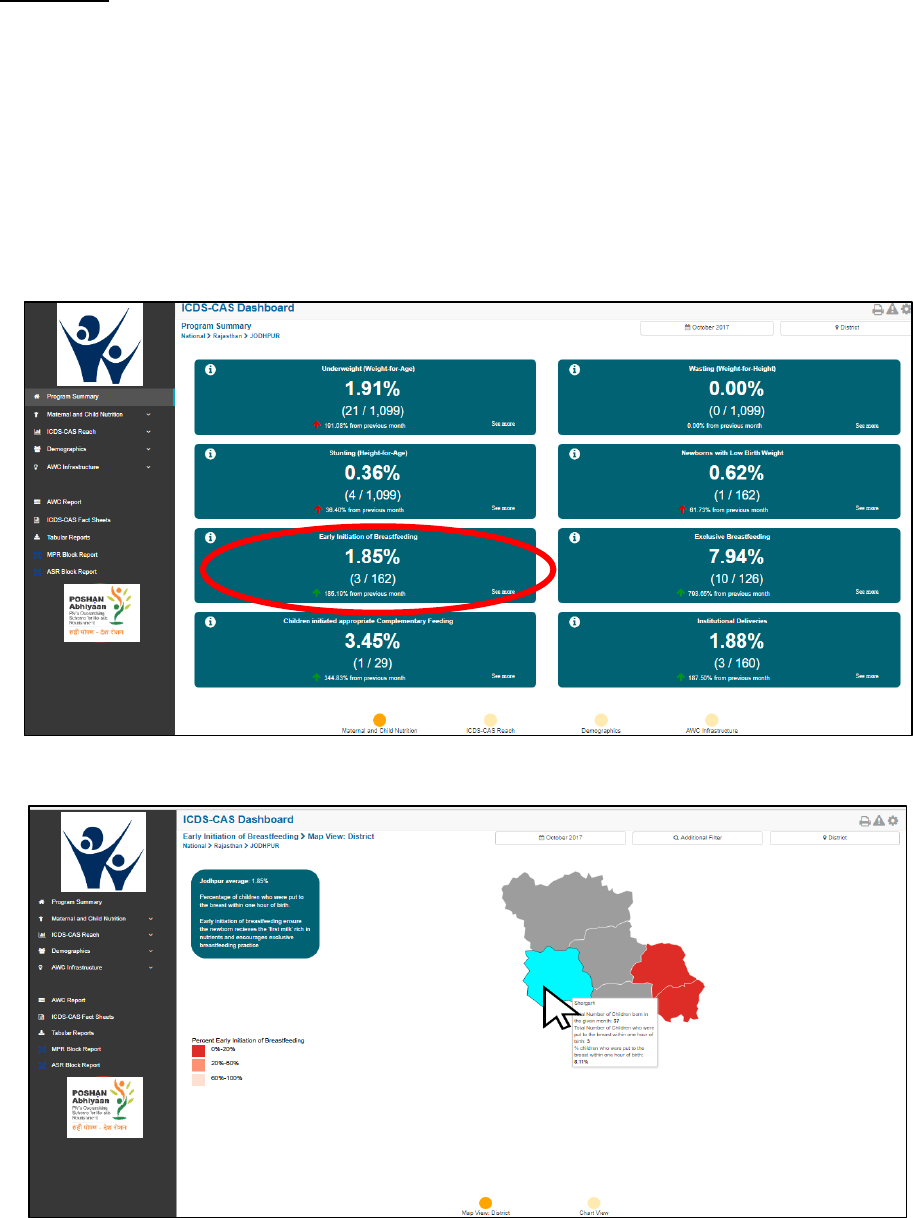
128
Use Case 2: District Program Officer (AWW Performance)
Scenario: DPO wishes to monitor the performance of AWWs and follow up with low performing
workers. How can the DPO access this information from the dashboard?
Steps to be followed on the Dashboard:
• Views District-level Program Summary for Maternal and Child Nutrition.
• Notice that the indicator Early Initiation of Breastfeeding is very low.
• Select “See more” to see the data on a Map View. Drill down to the Block that shows the lowest
percentage of Early Initiation of Breastfeeding.
Figure 151: Use Case 2
Figure 152: Use Case 2
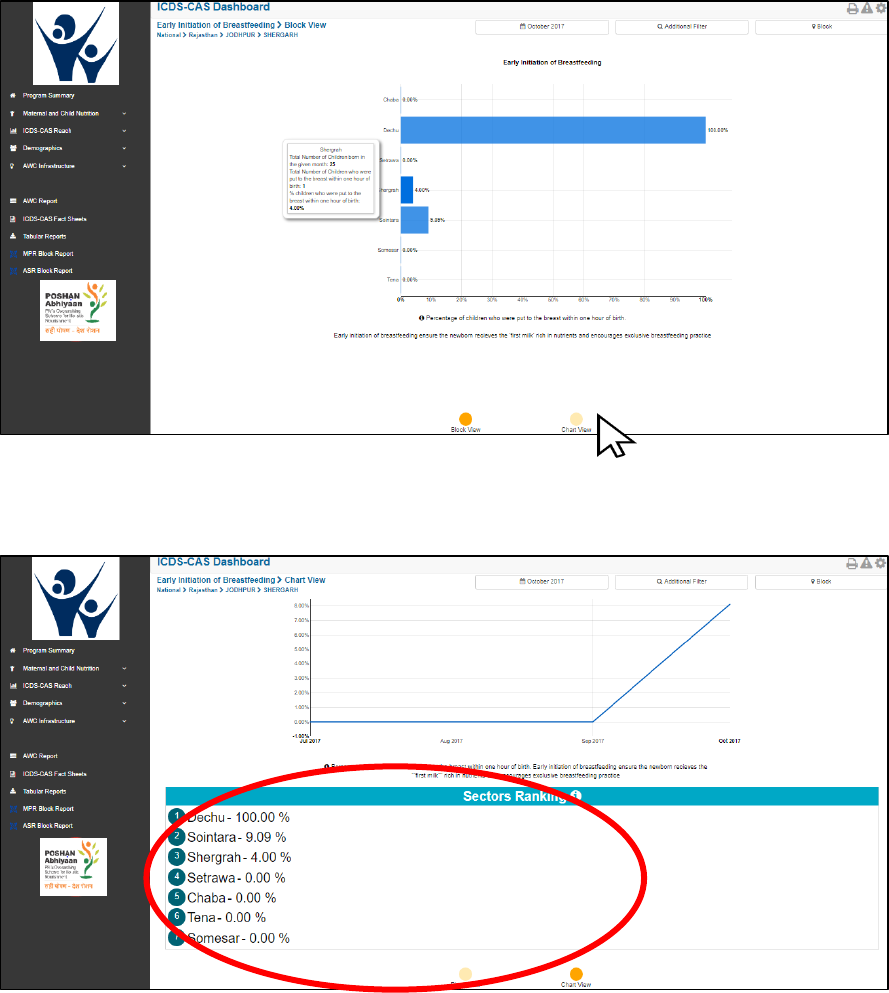
129
• Upon looking at the map, notice that one Sector has significantly lower performance on “Early
Initiation of Breastfeeding”.
• Switch to chart view to see a ranking of top- and bottom-performing AWCs.
Figure 153: Use Case 2
Figure 154: Use Case 2
• Go to Tabular Reports to download the ‘Child’ report by AWC level for the specific location
• Identify the lowest-performing AWCs
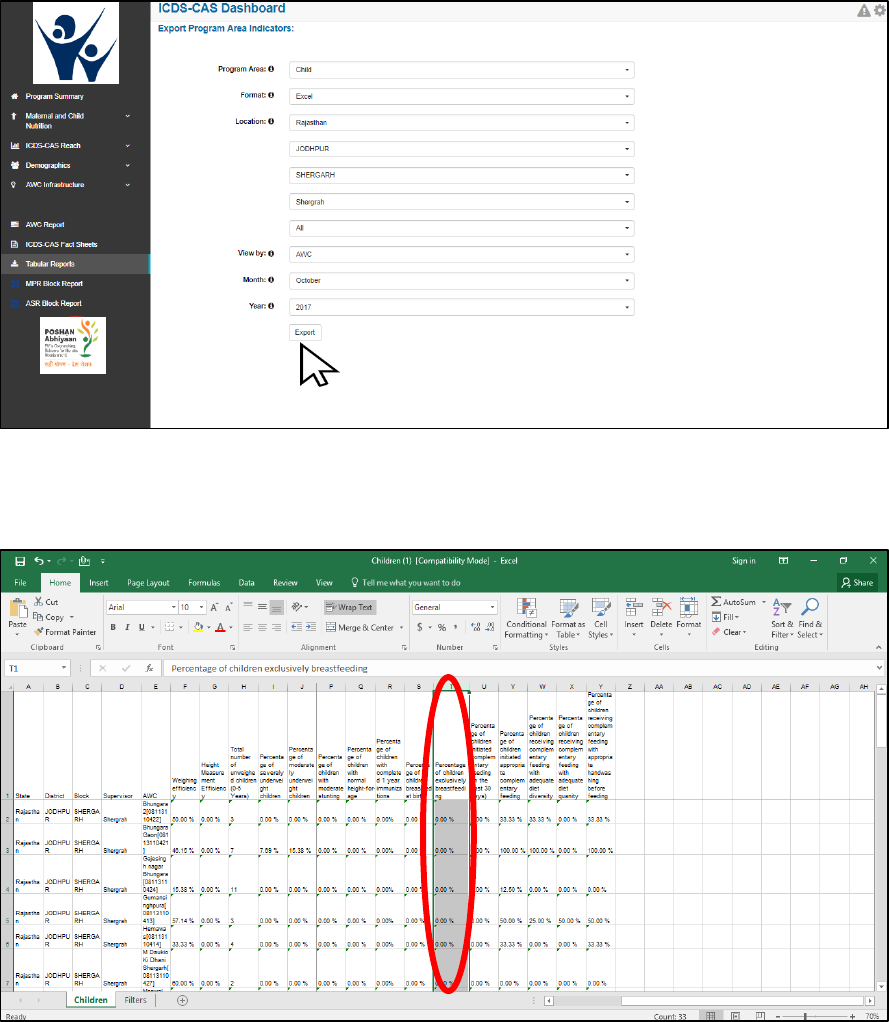
130
• Call the AWW’s supervisor and encourage her to give more mentoring to AWWs about the importance
of early initiation of breastfeeding as well as to improve app usage.
Figure 155: Use Case 2
Figure 156: Use Case 2
131
Disclaimer
The screenshots and figures shown in the manual are only for reference purpose. The user is requested
to visit the ICD-CAS Dashboard for actual and up-to date figures.
