Presentation Dashboards For Kx How To Guide
User Manual:
Open the PDF directly: View PDF ![]() .
.
Page Count: 127 [warning: Documents this large are best viewed by clicking the View PDF Link!]

Dashboards for Kx
“How to” Guide

Setup
Dashboards v4.0.1 – “How to” Guide
Kx.com
3
Dashboards for Kx – “How to” Guide
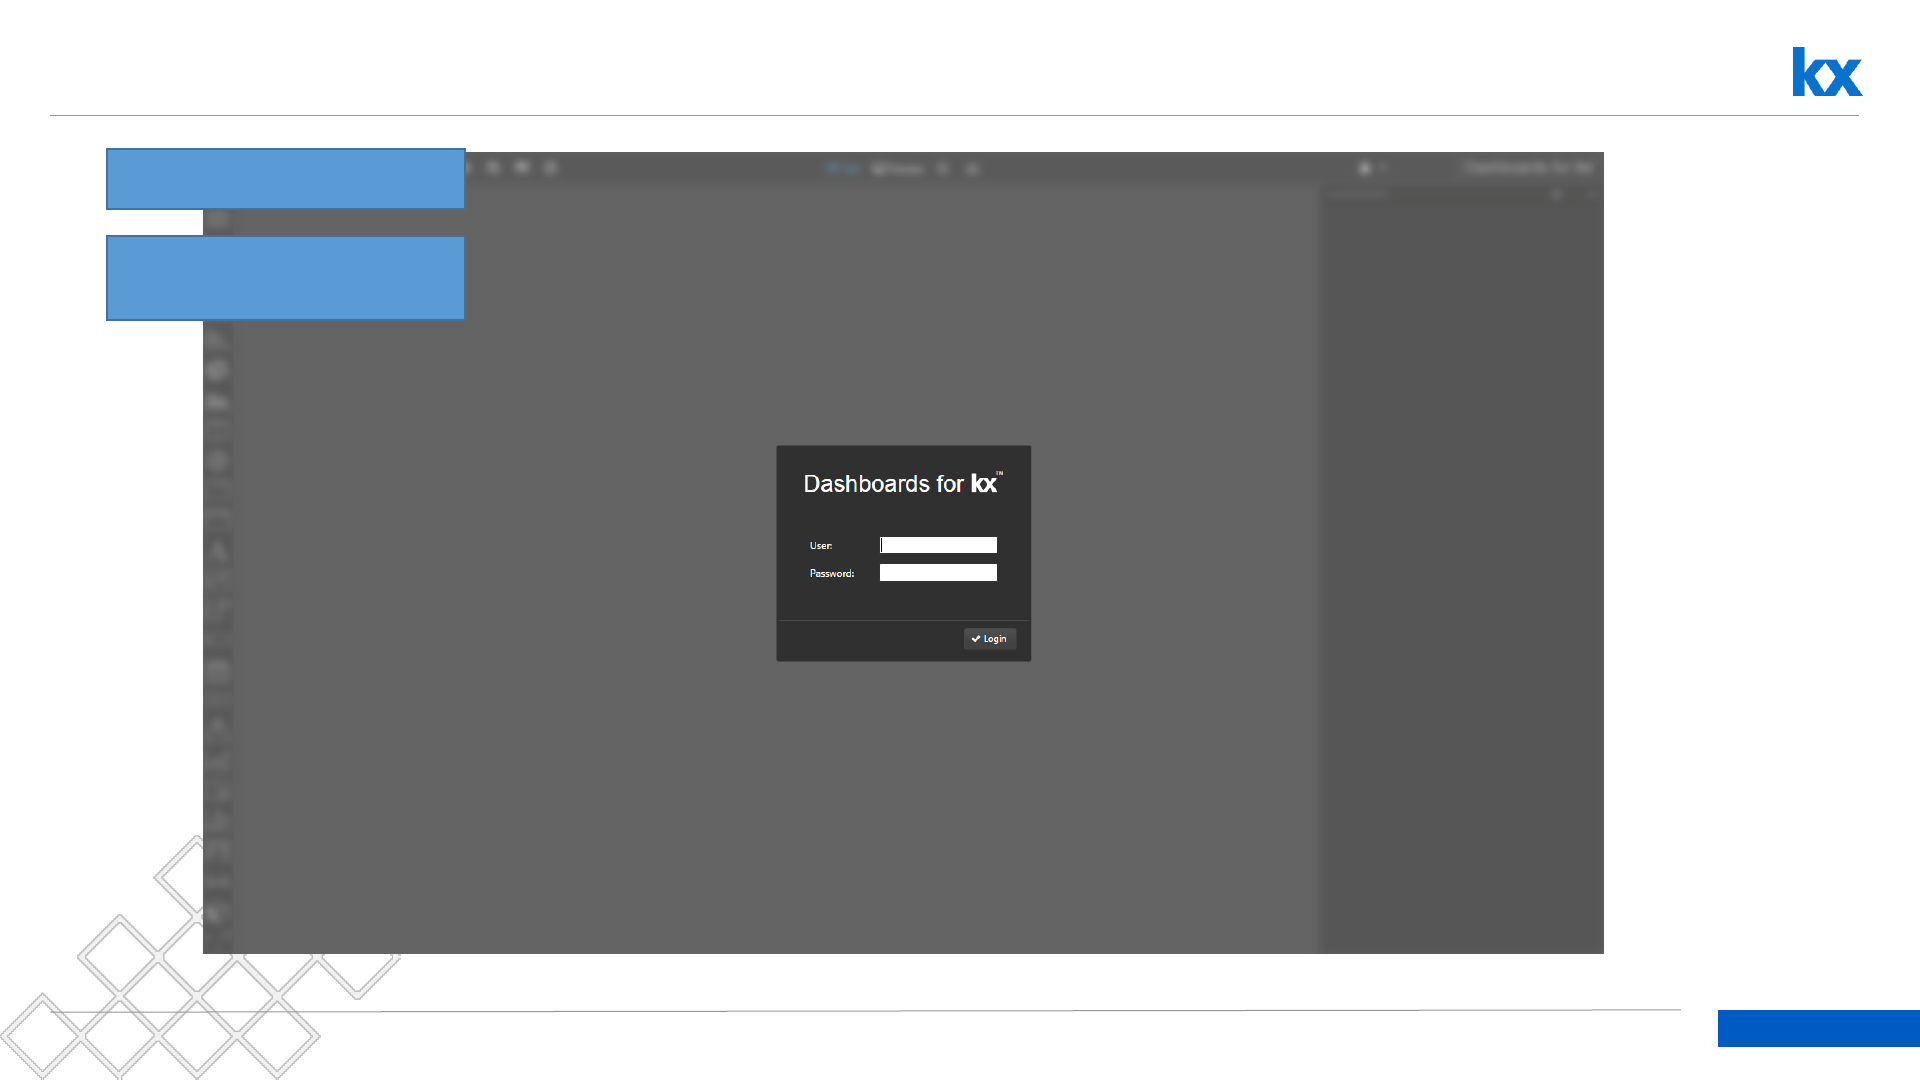
Getting Started
Login to Start
User: Administrator
Password: password
4
Dashboards for Kx – “How to” Guide
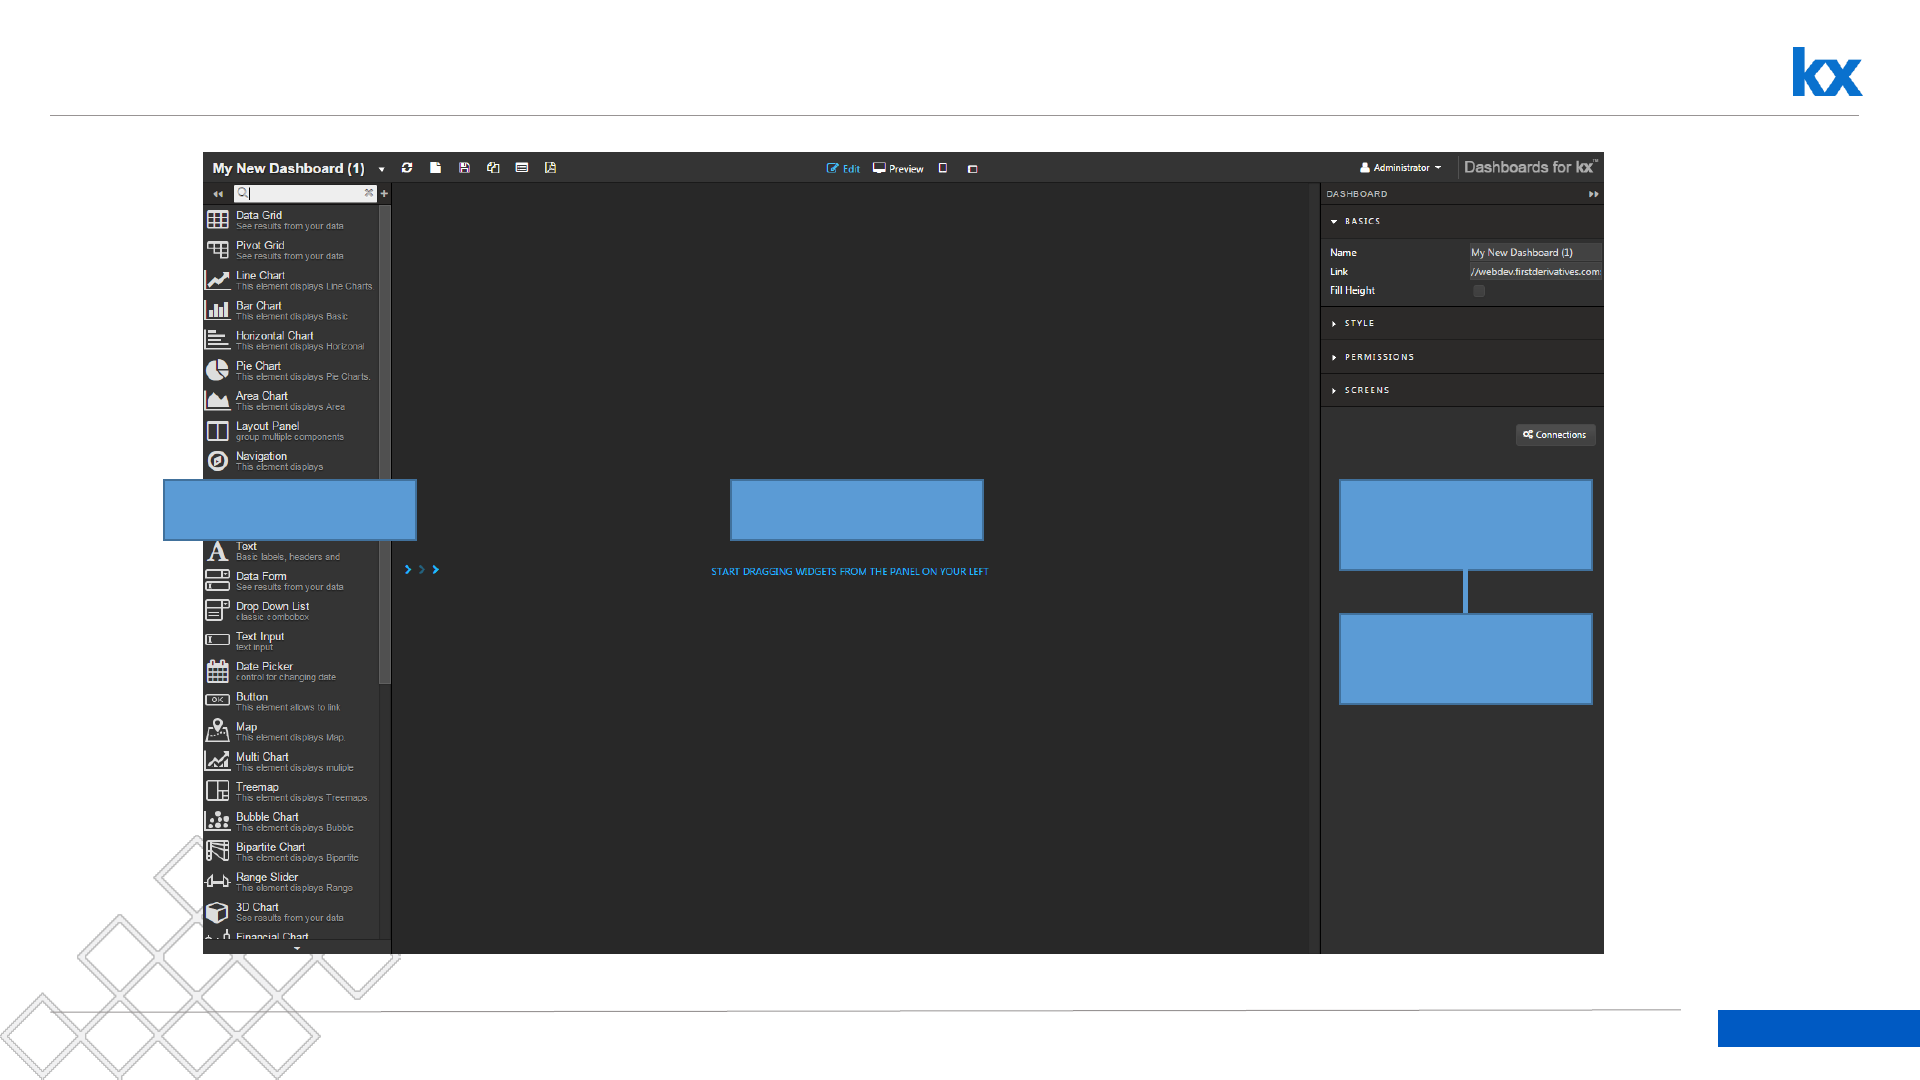
Layout
Components Workspace Component
Properties
Dashboard
Properties on Load

5
Dashboards for Kx – “How to” Guide
What’s in a Component Property?
The Property Panel is used to configure component
settings
In this document, screenshots of relevant sections of the
component will be used to illustrate where configurations
are required
Further information on configuring components
can be found at http://code.kx.com
6
Dashboards for Kx – “How to” Guide
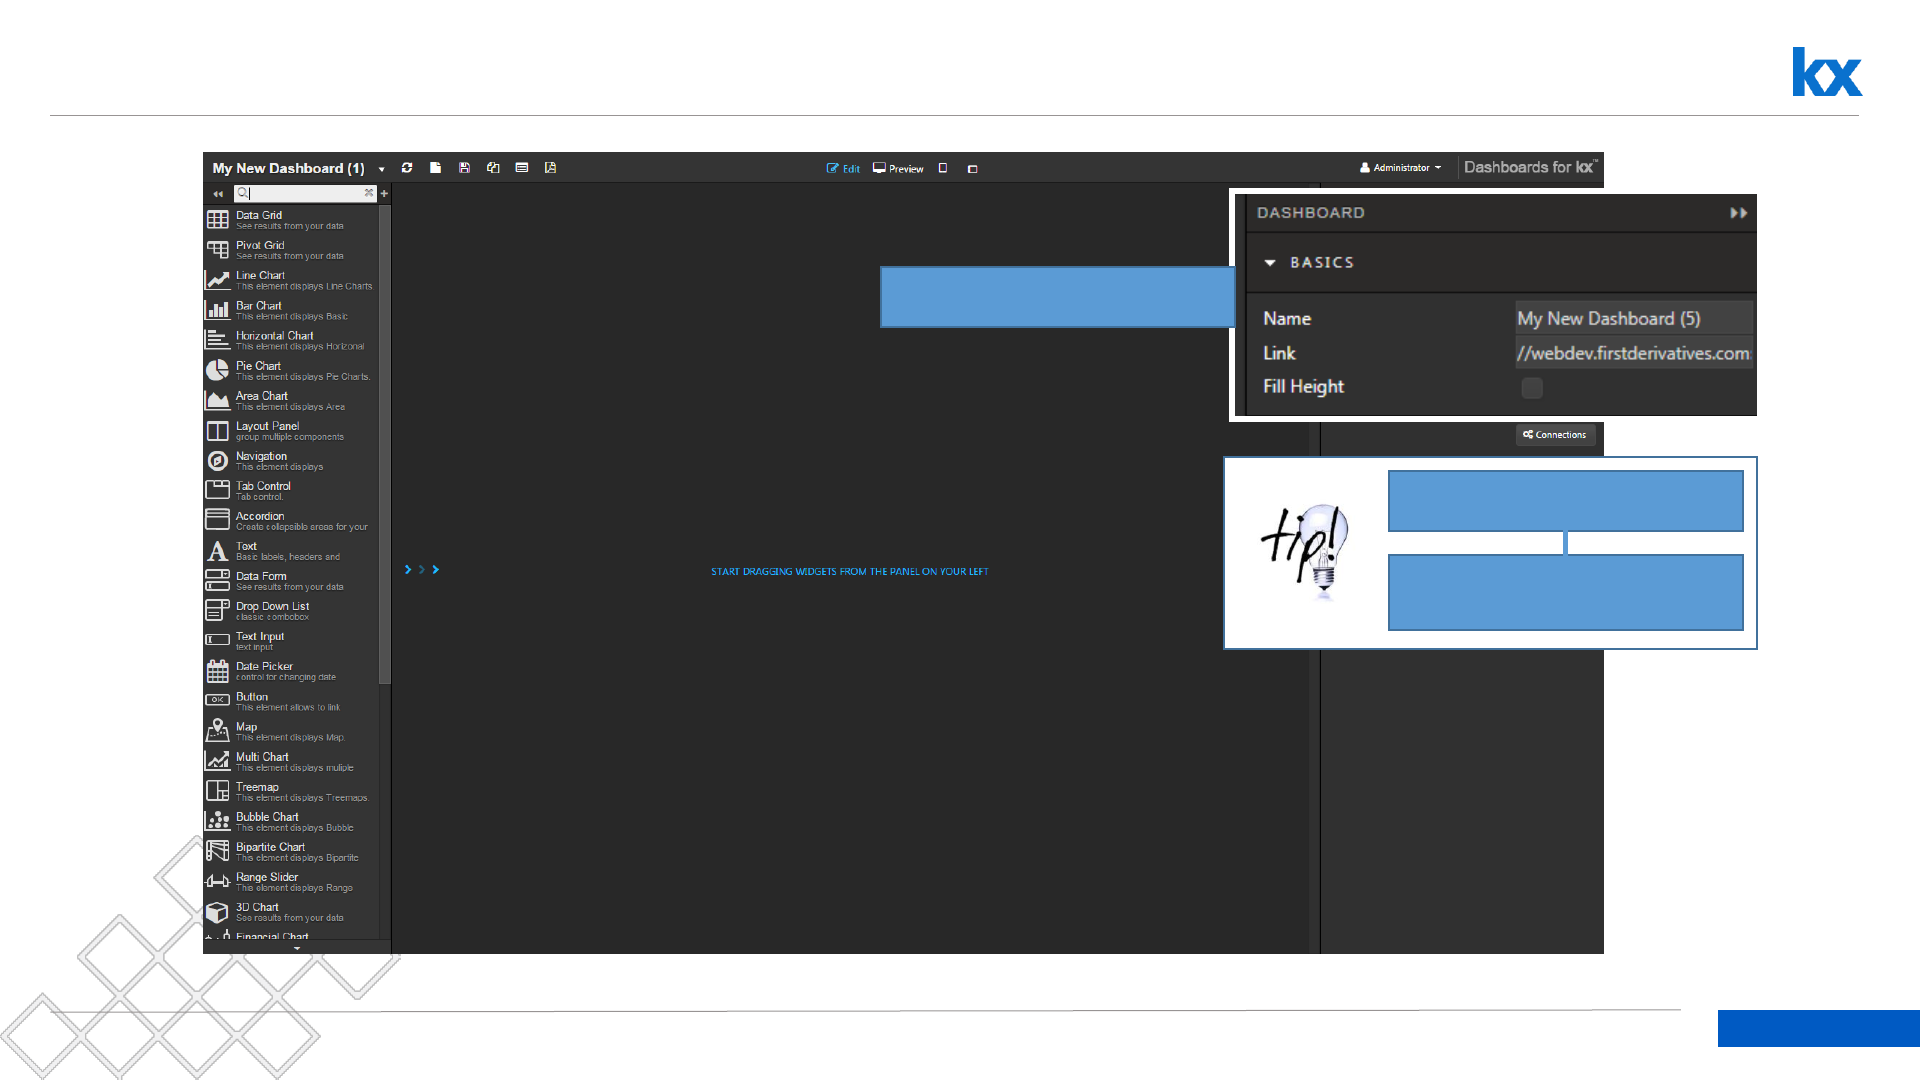
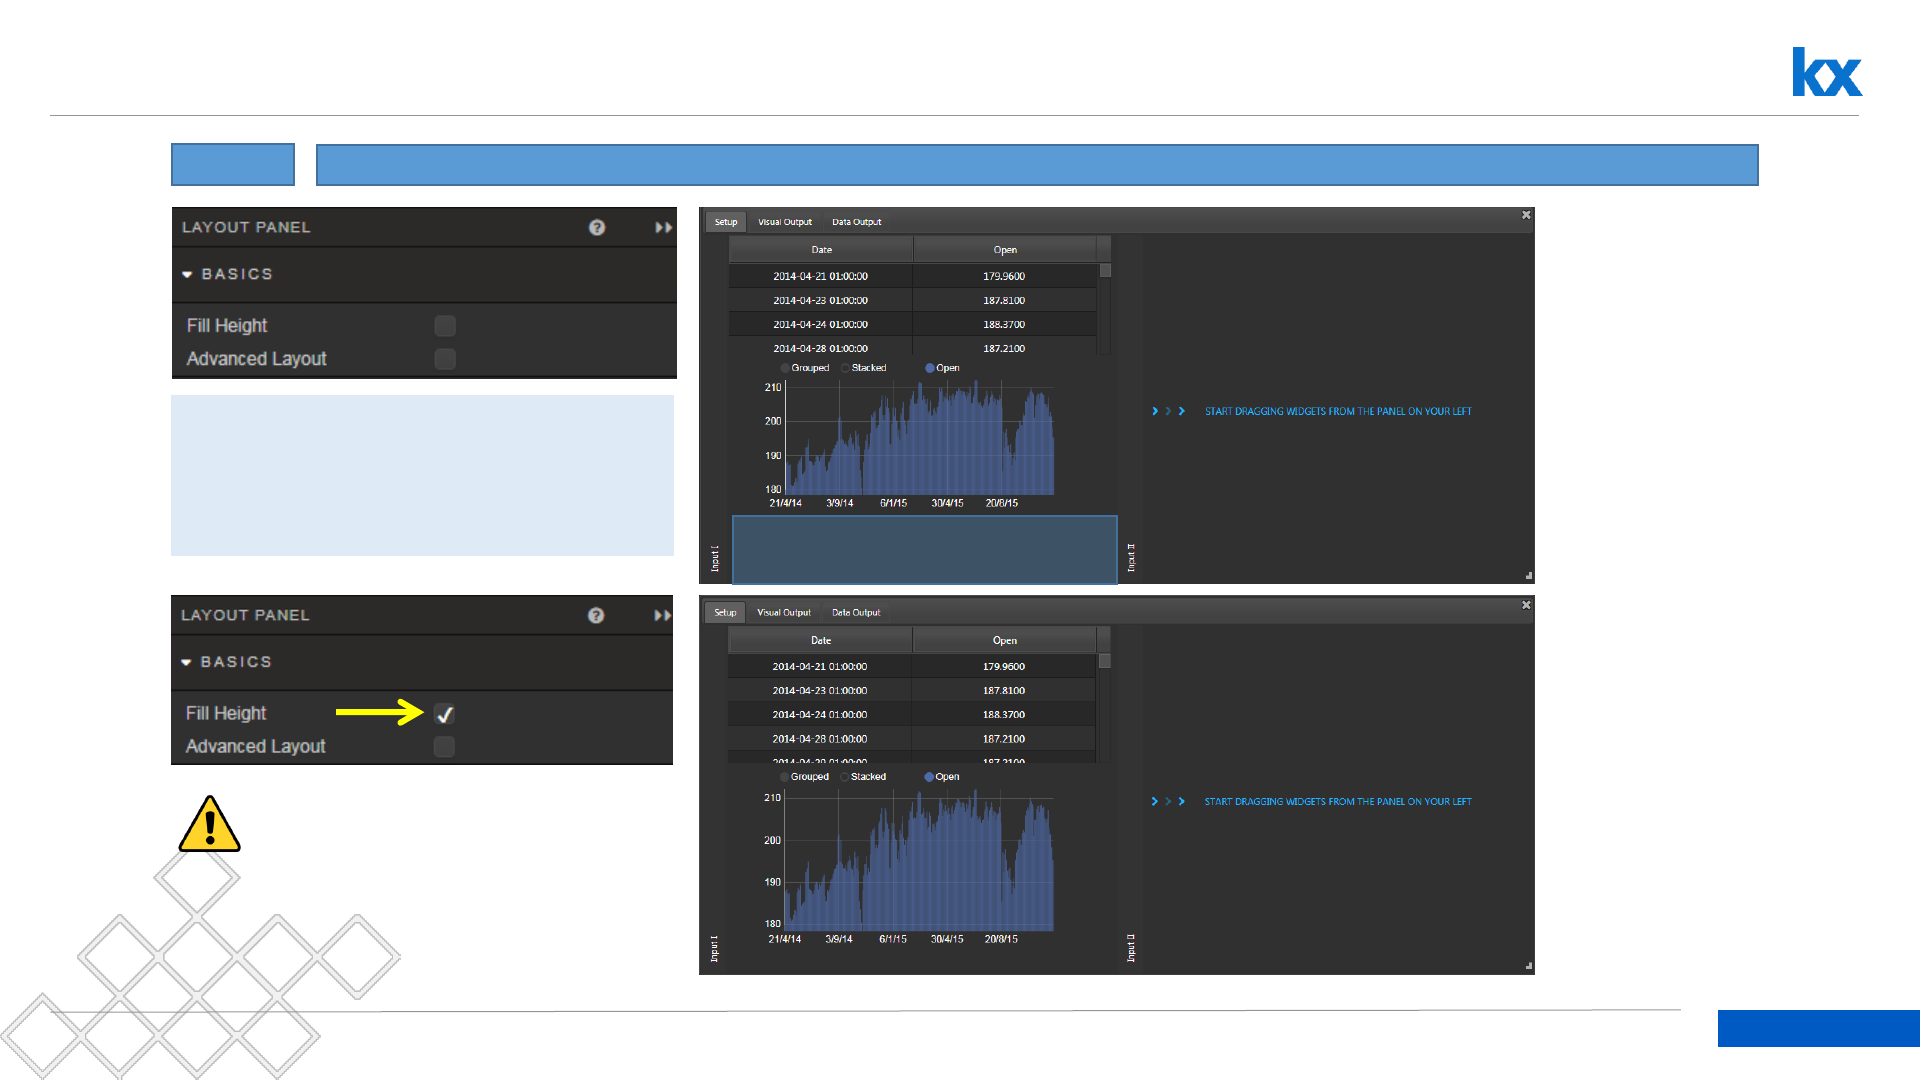
Define the Basics
Name Your Dashboard
Set check mark in Fill Height
This will auto-fit your dashboard to
different browser sizes
7
Dashboards for Kx – “How to” Guide
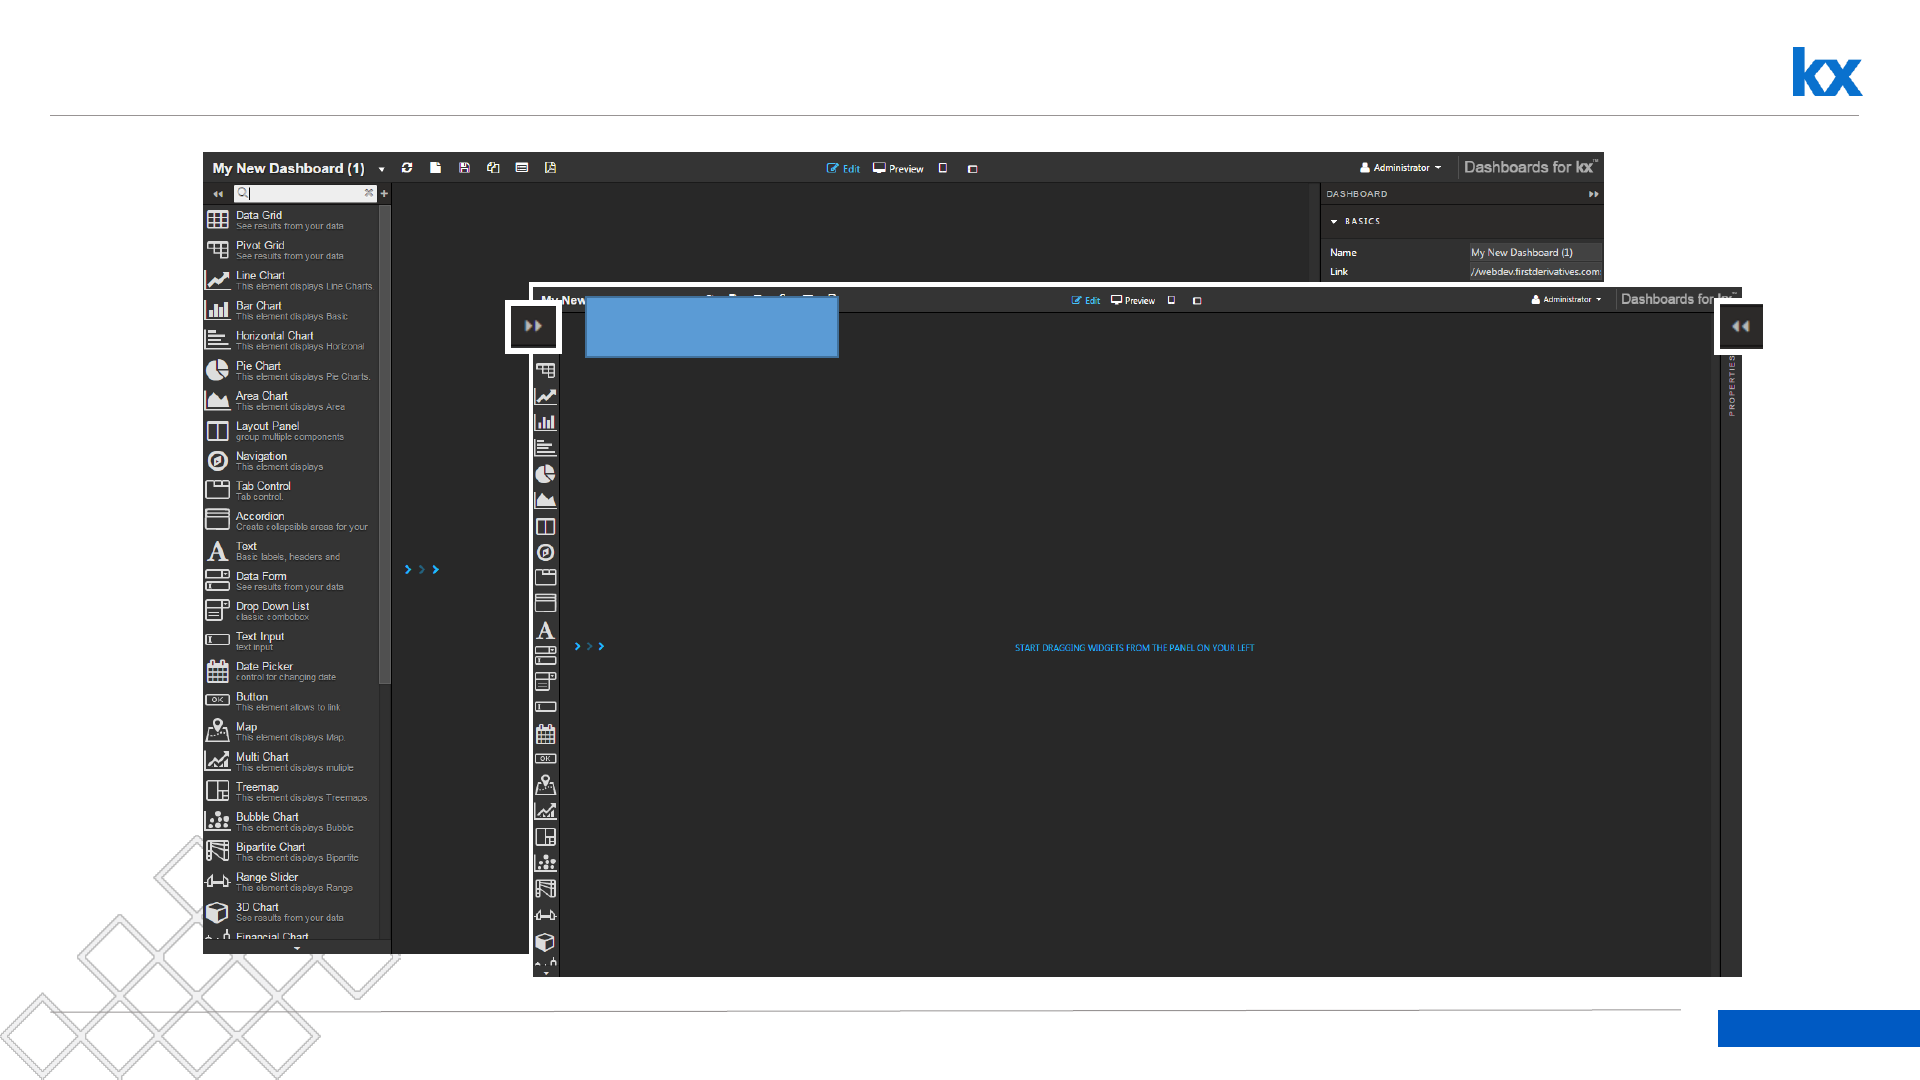
Slide Panel Control
Slider Controls
8
Dashboards for Kx – “How to” Guide
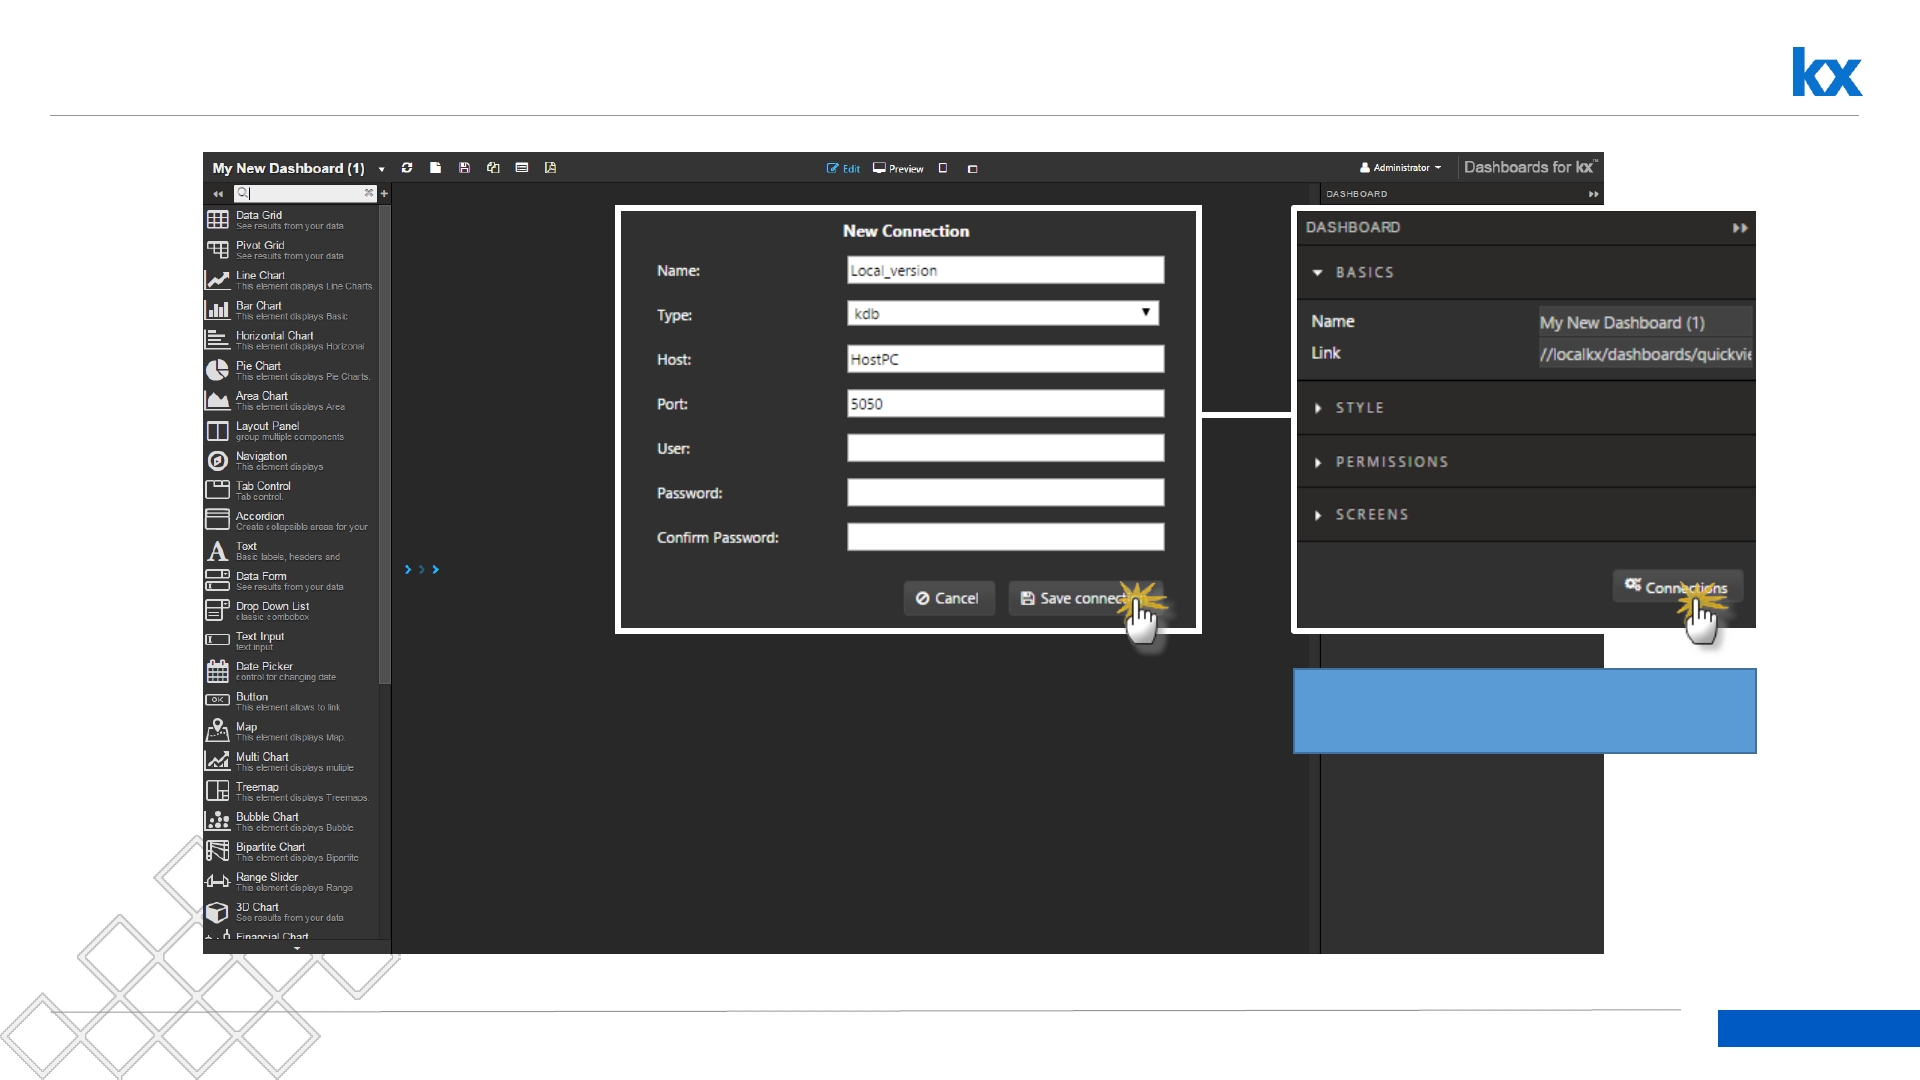
Create a Connection – Access to HTMLEvalPack required - contact Kx
Click Connections to set up
database access
9
Dashboards for Kx – “How to” Guide
Dashboard Connection Settings
Connection 1
Name: html5eval_x
Type: kdb
Host: webdev
Port: 20070*
User: Administrator
Password: password
Connection 2
Name: html5eval_y
Type: kdb
Host: webdev
Port: 20071*
User: Administrator
Password: password
Connection Group
Group Name: html5eval_grp
Type: Mastered
html5eval_x
html5eval_y
*Sample Port Numbers – ensure there is no clash with existing port connections
This step is optional. The Dashboard Eval Pack used for this tutorial uses the Connection Group:
htmlevalcongroup
10
Dashboards for Kx – “How to” Guide
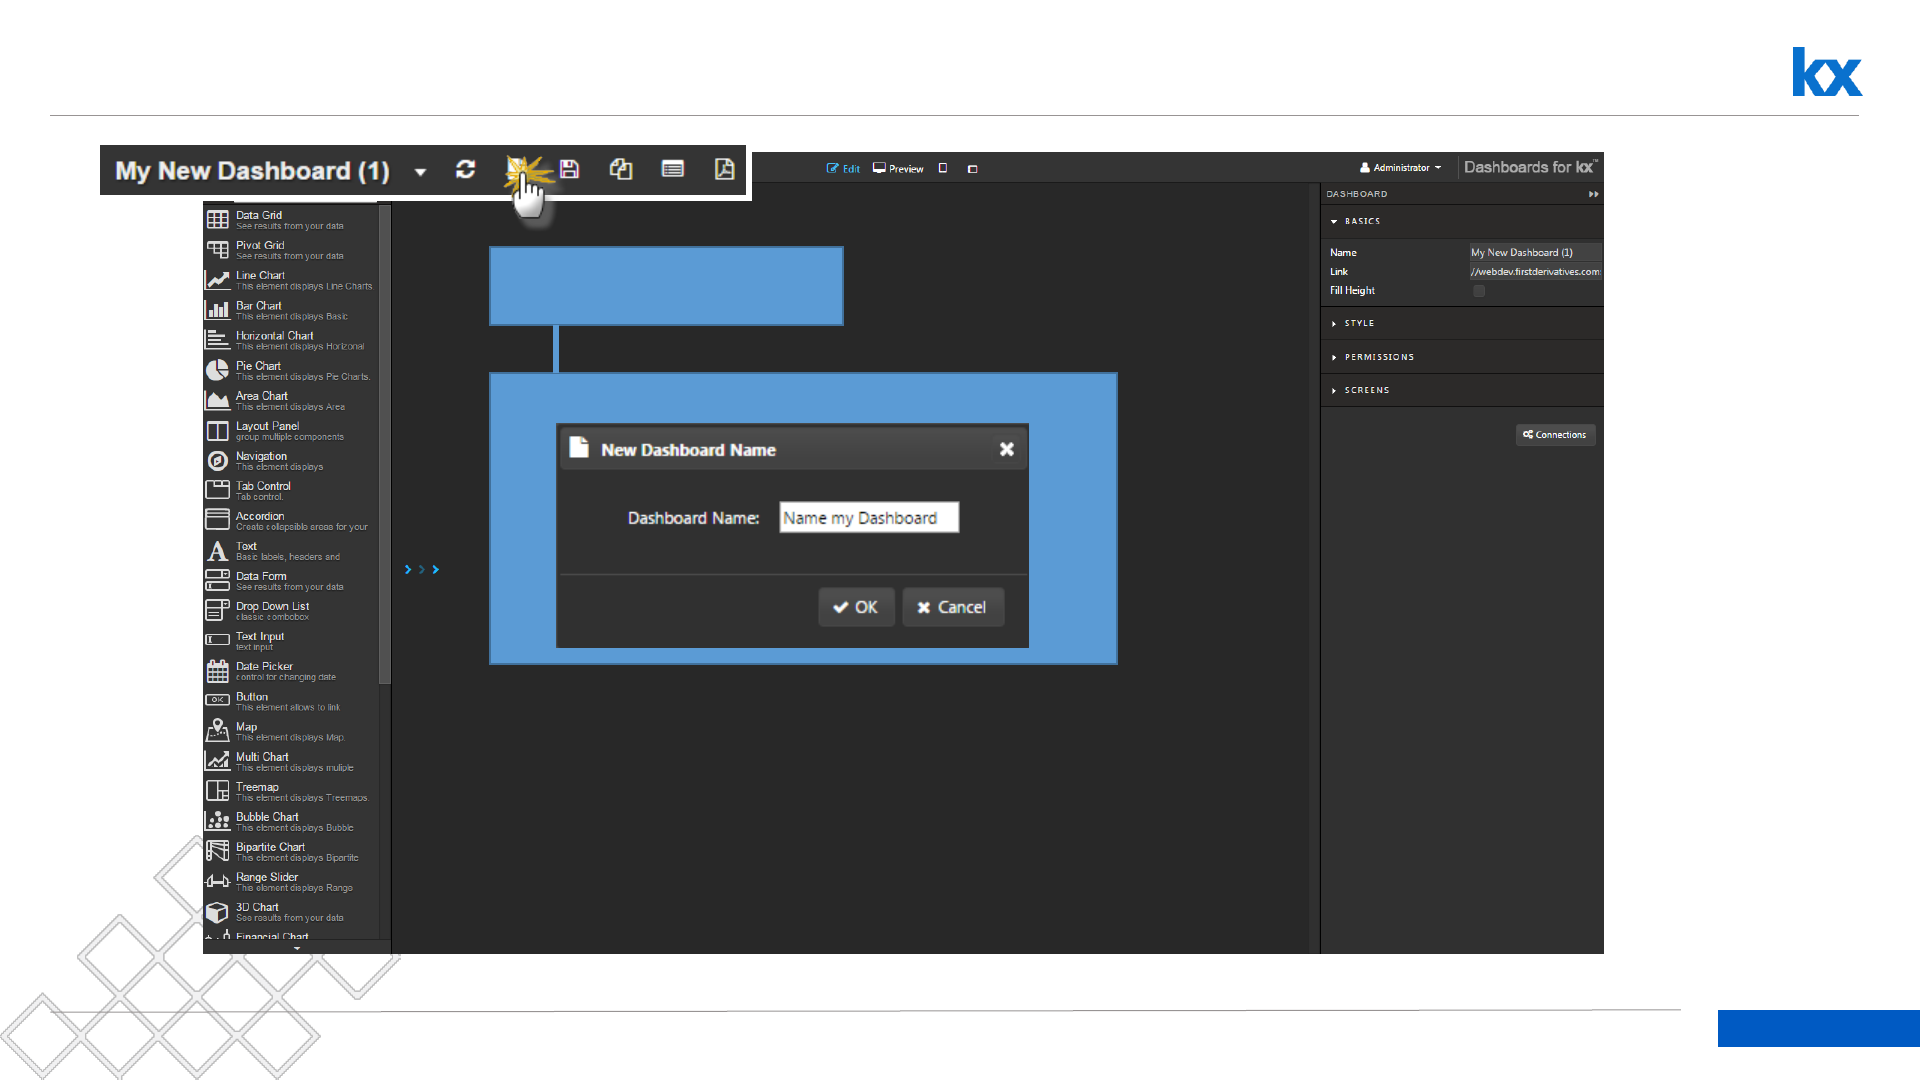
FYI: When you want to create a New Dashboard
To create a dashboard, click
the New dashboard icon
Name your dashboard
11
Dashboards for Kx – “How to” Guide
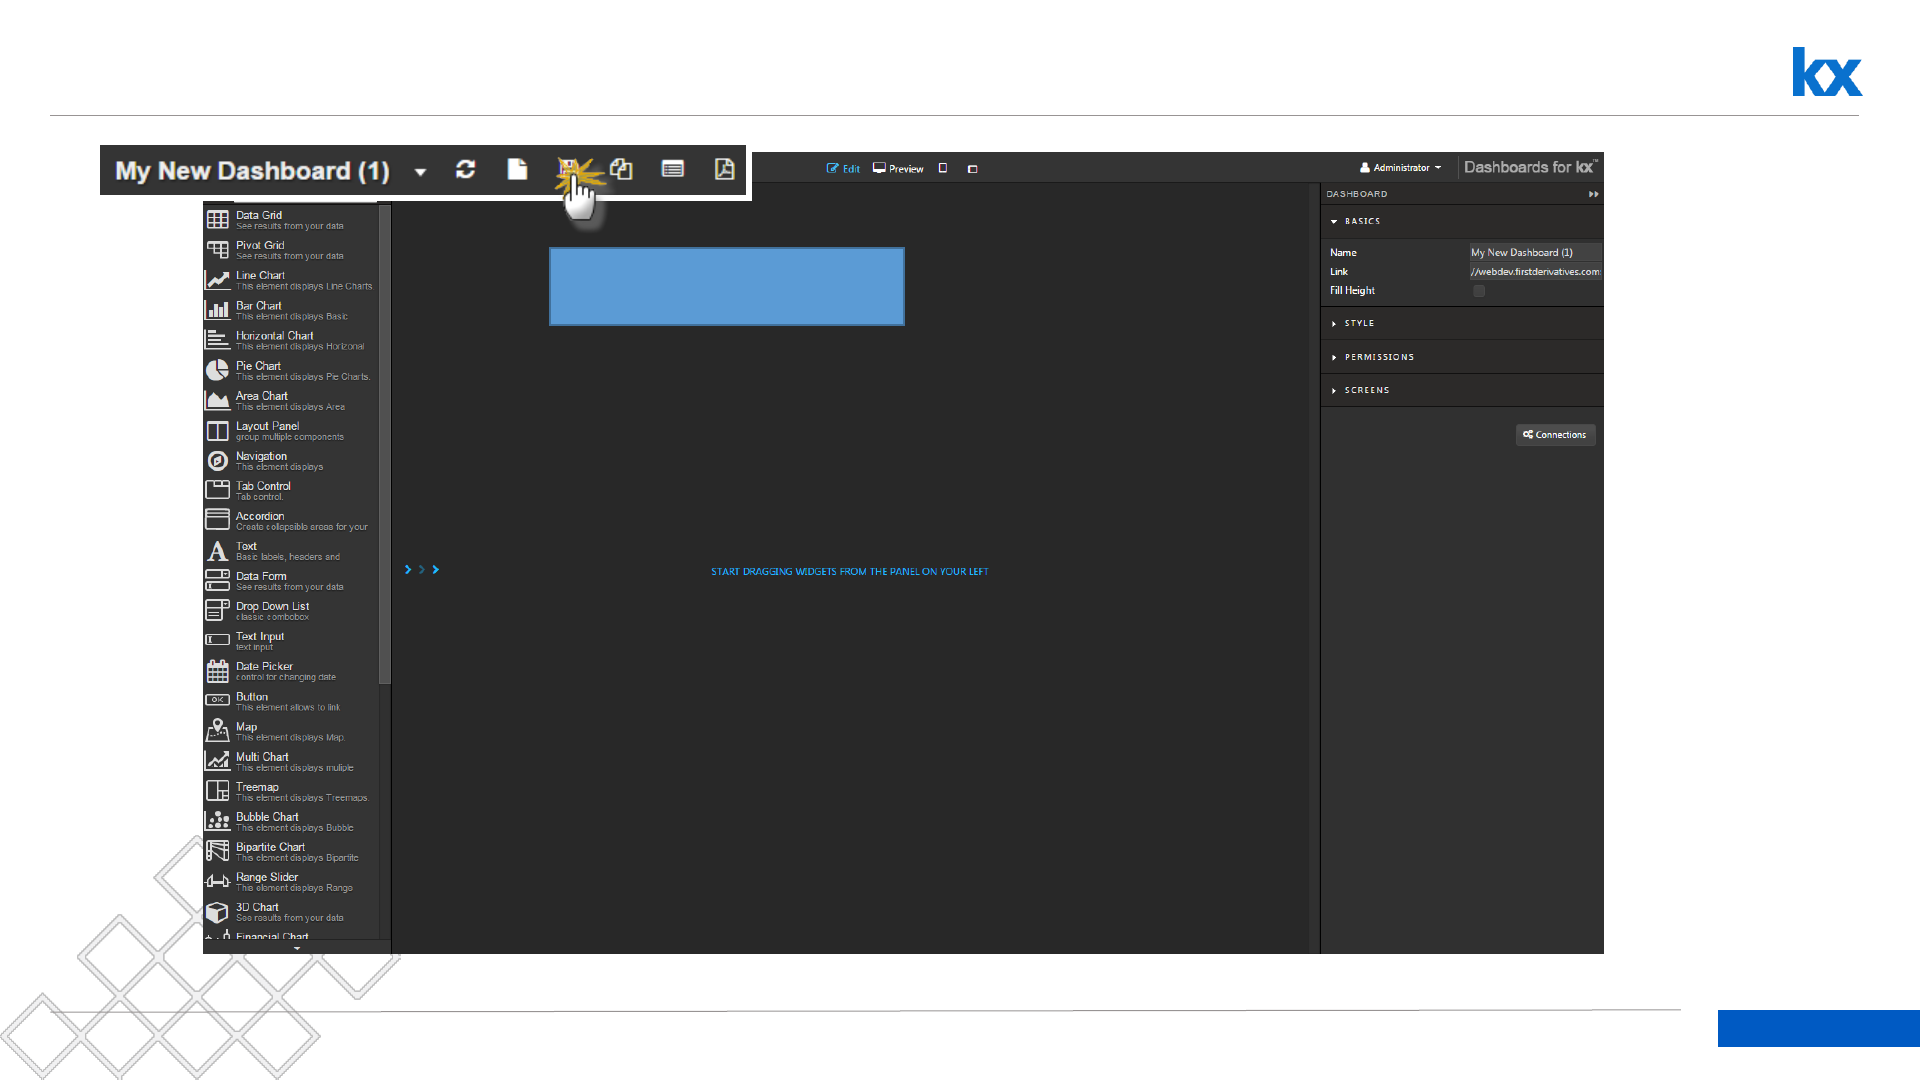
Save a Dashboard
Save work regularly so as
not to lose changes
12
Dashboards for Kx – “How to” Guide
Duplicate a Dashboard
Duplicating a dashboard will
create an exact copy
Duplicated dashboard name
will have “(1)” appended at
the end
13
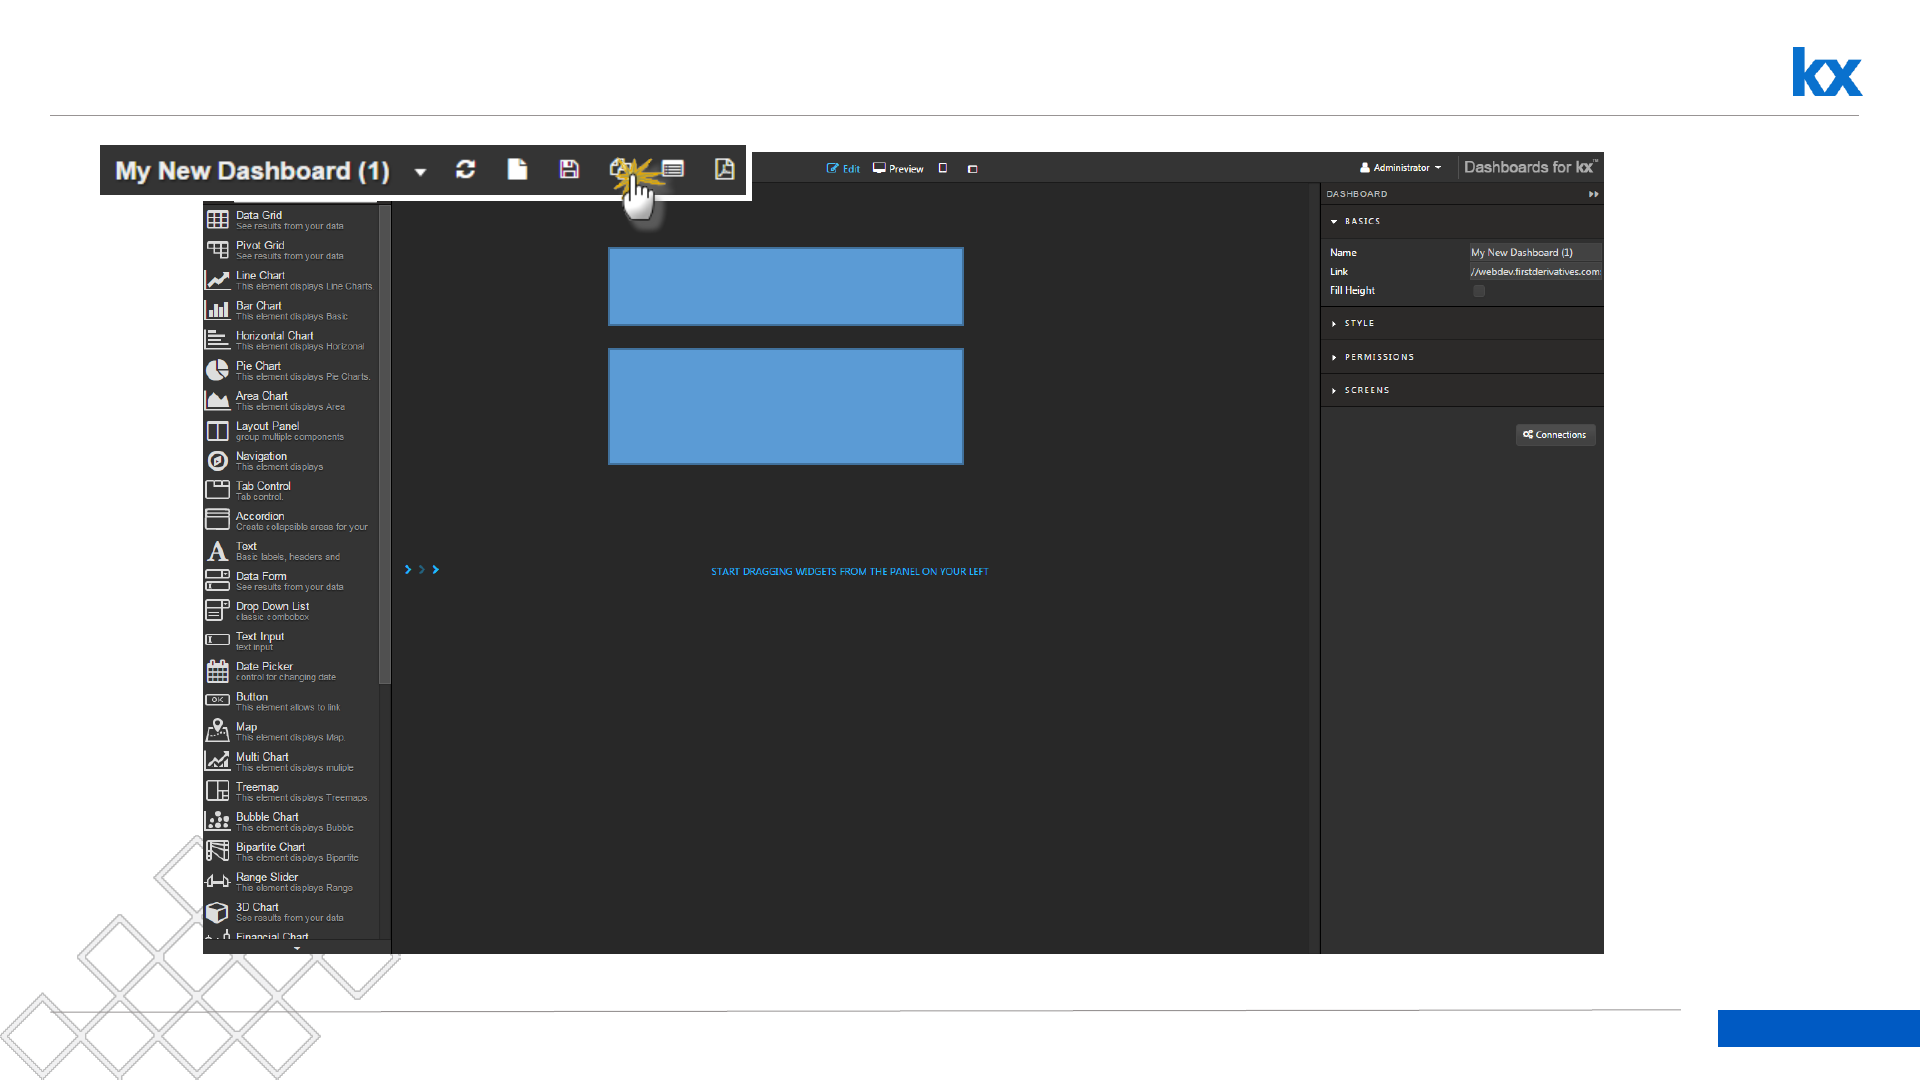
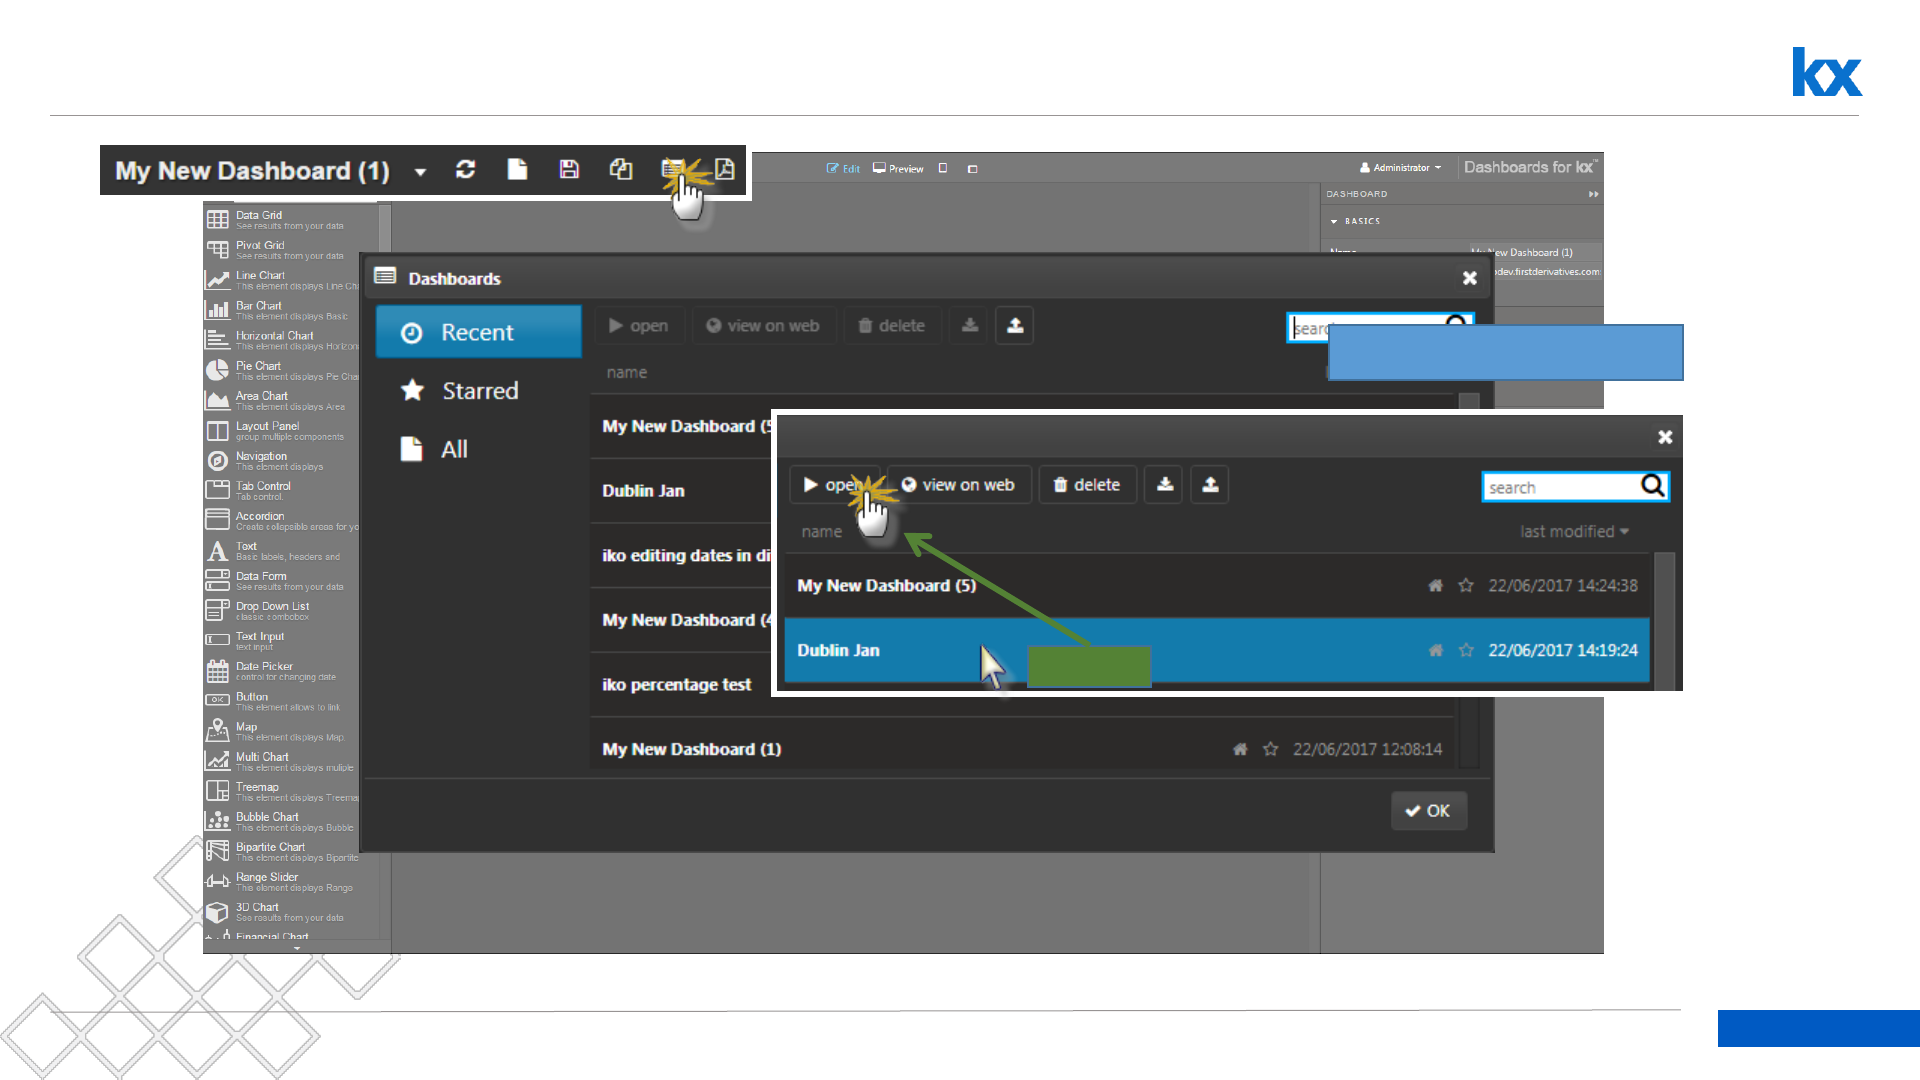
Dashboards for Kx – “How to” Guide
Open / Delete Dashboards
Manage Dashboards
Left-click
14
Dashboards for Kx – “How to” Guide
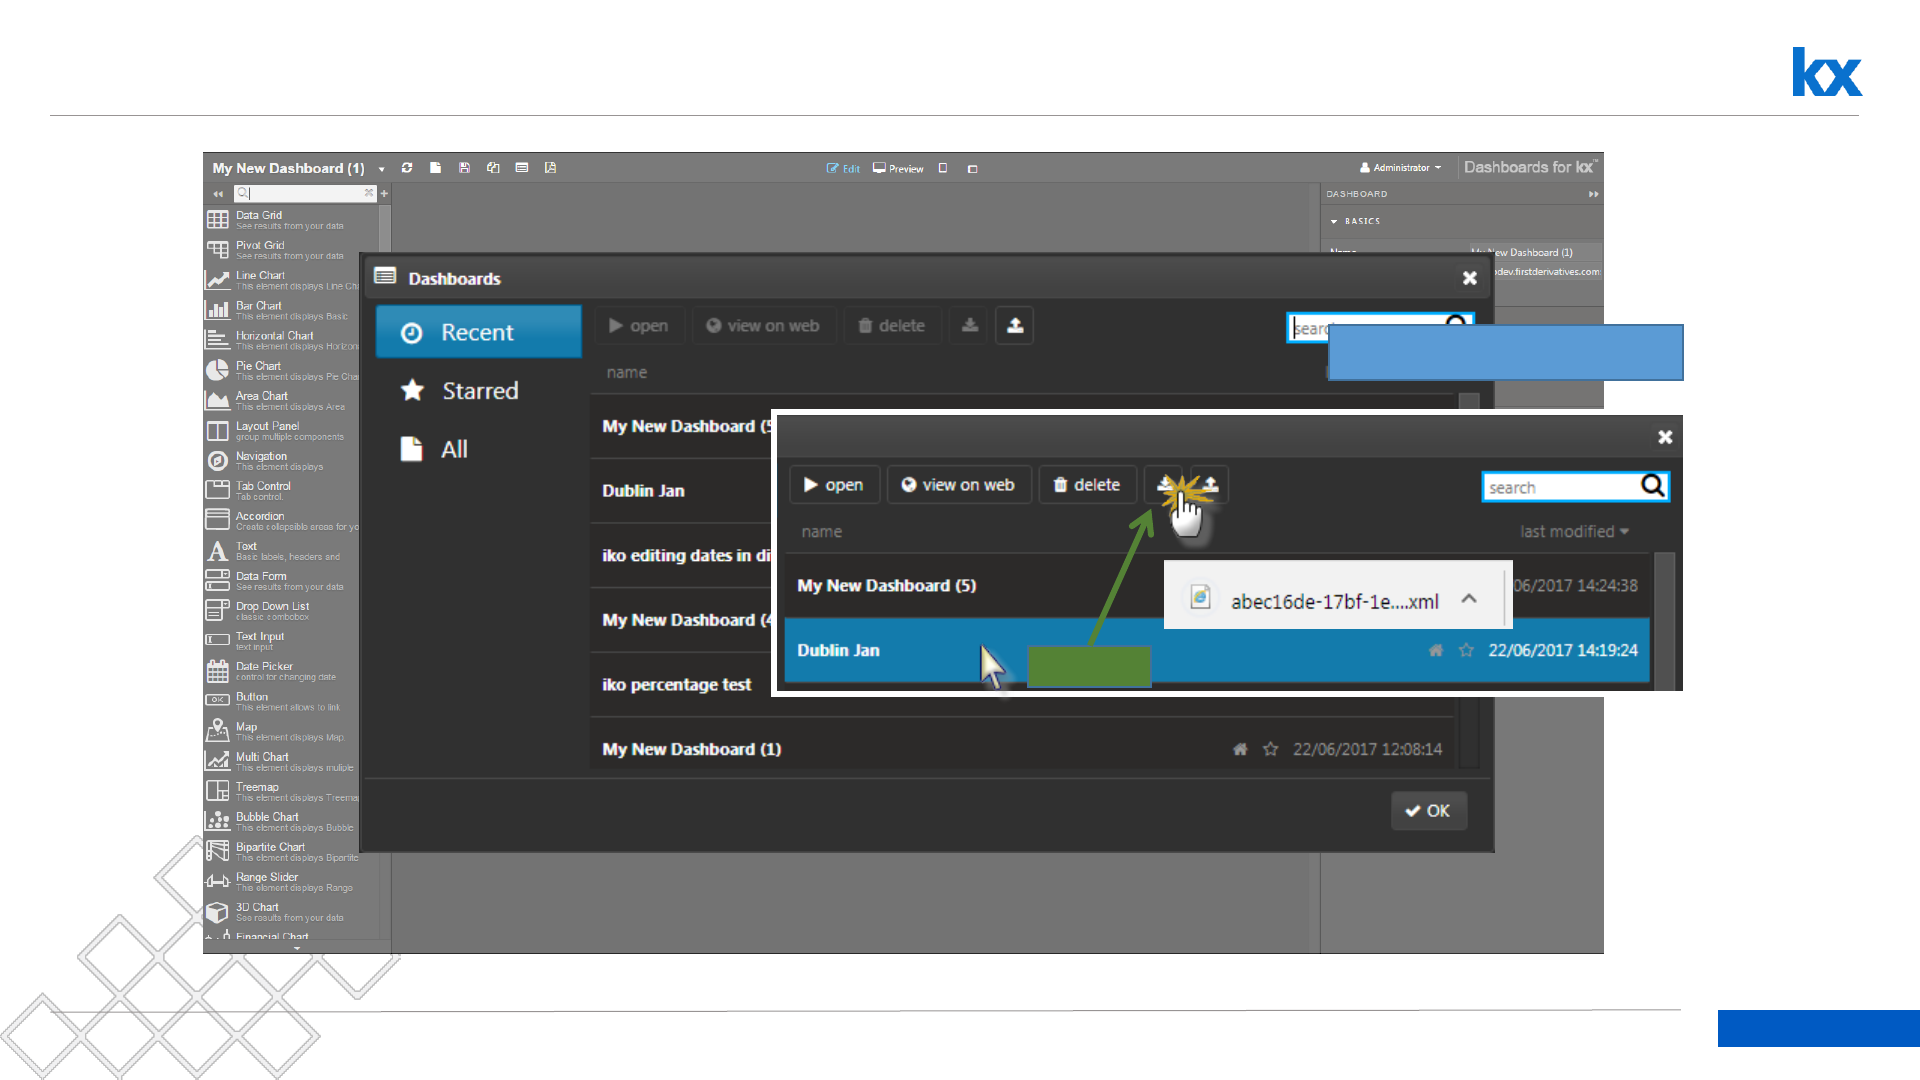
Export Dashboards
Left-click
Export Dashboard
15
Dashboards for Kx – “How to” Guide
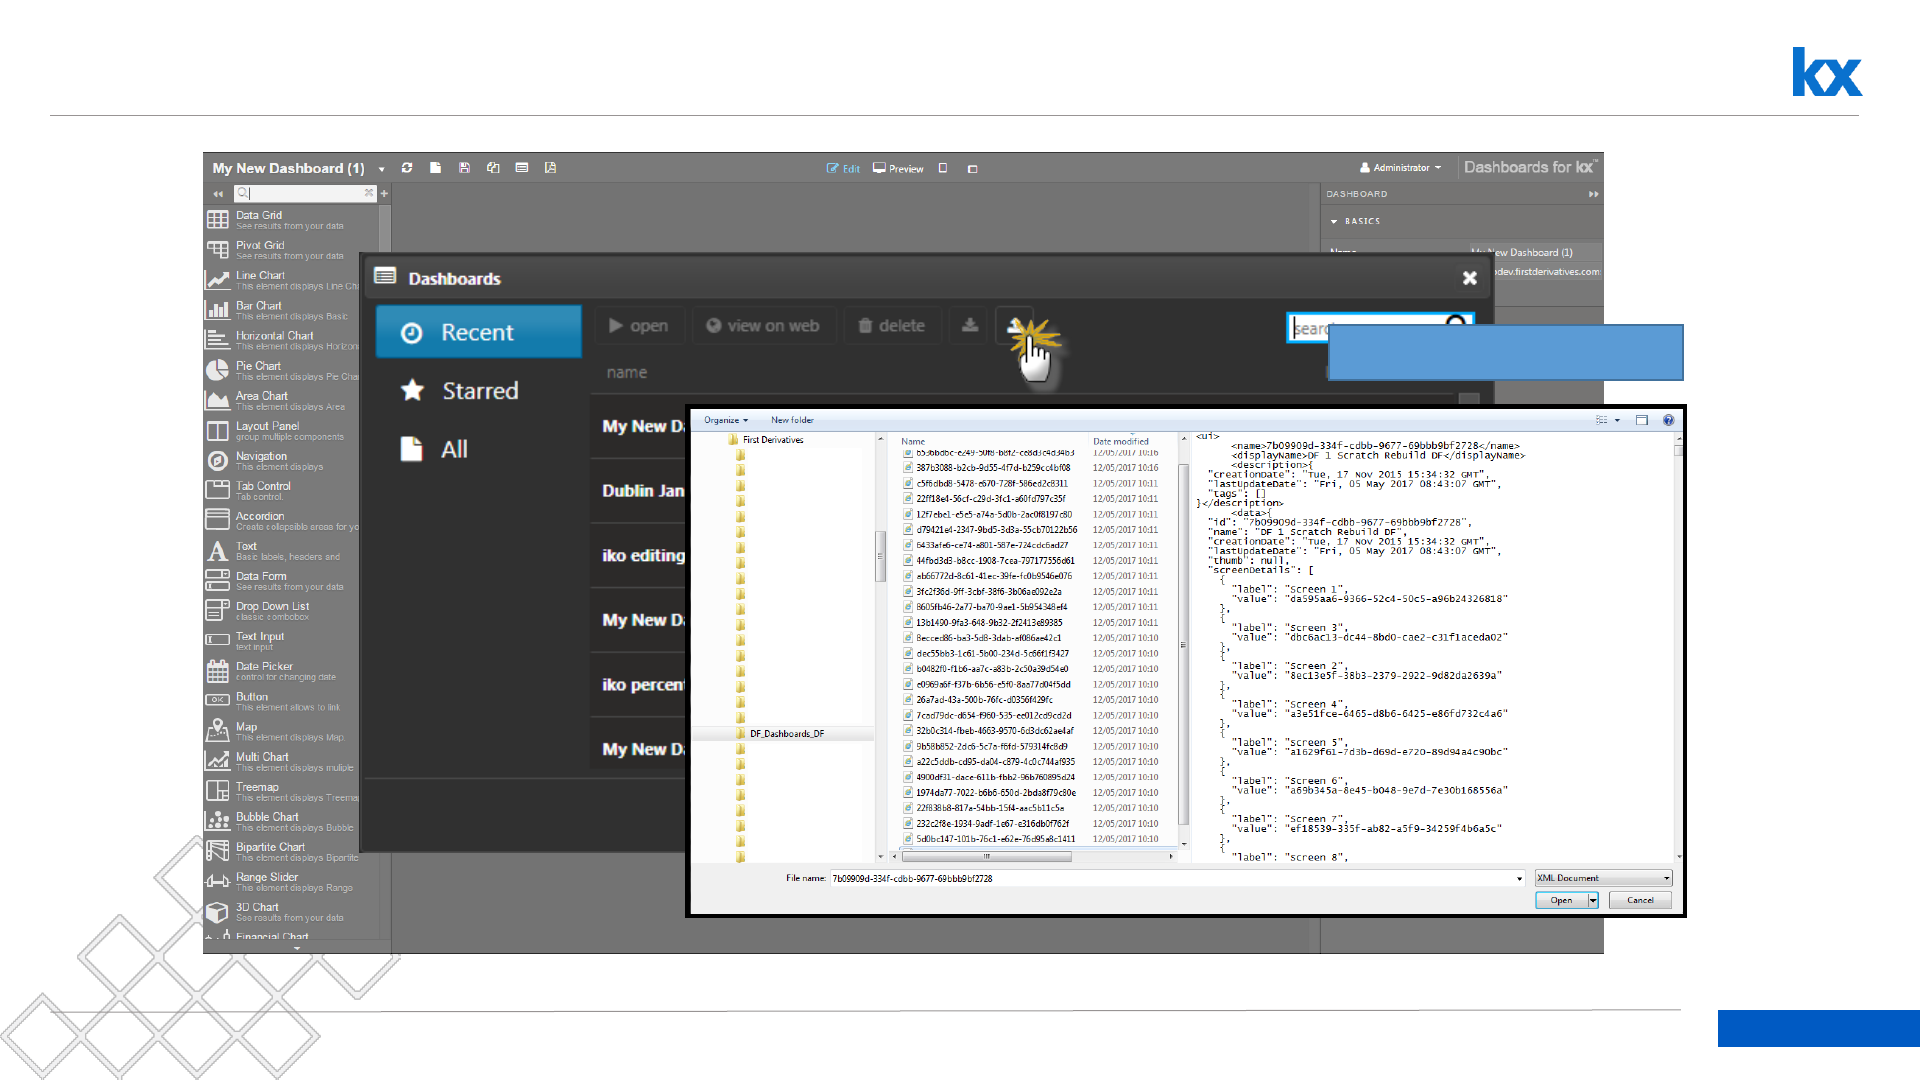
Import Dashboards
Import Dashboard

Add a Data Grid Component
Dashboards for Kx – “How to” Guide
Kx.com
17
Dashboards for Kx – “How to” Guide
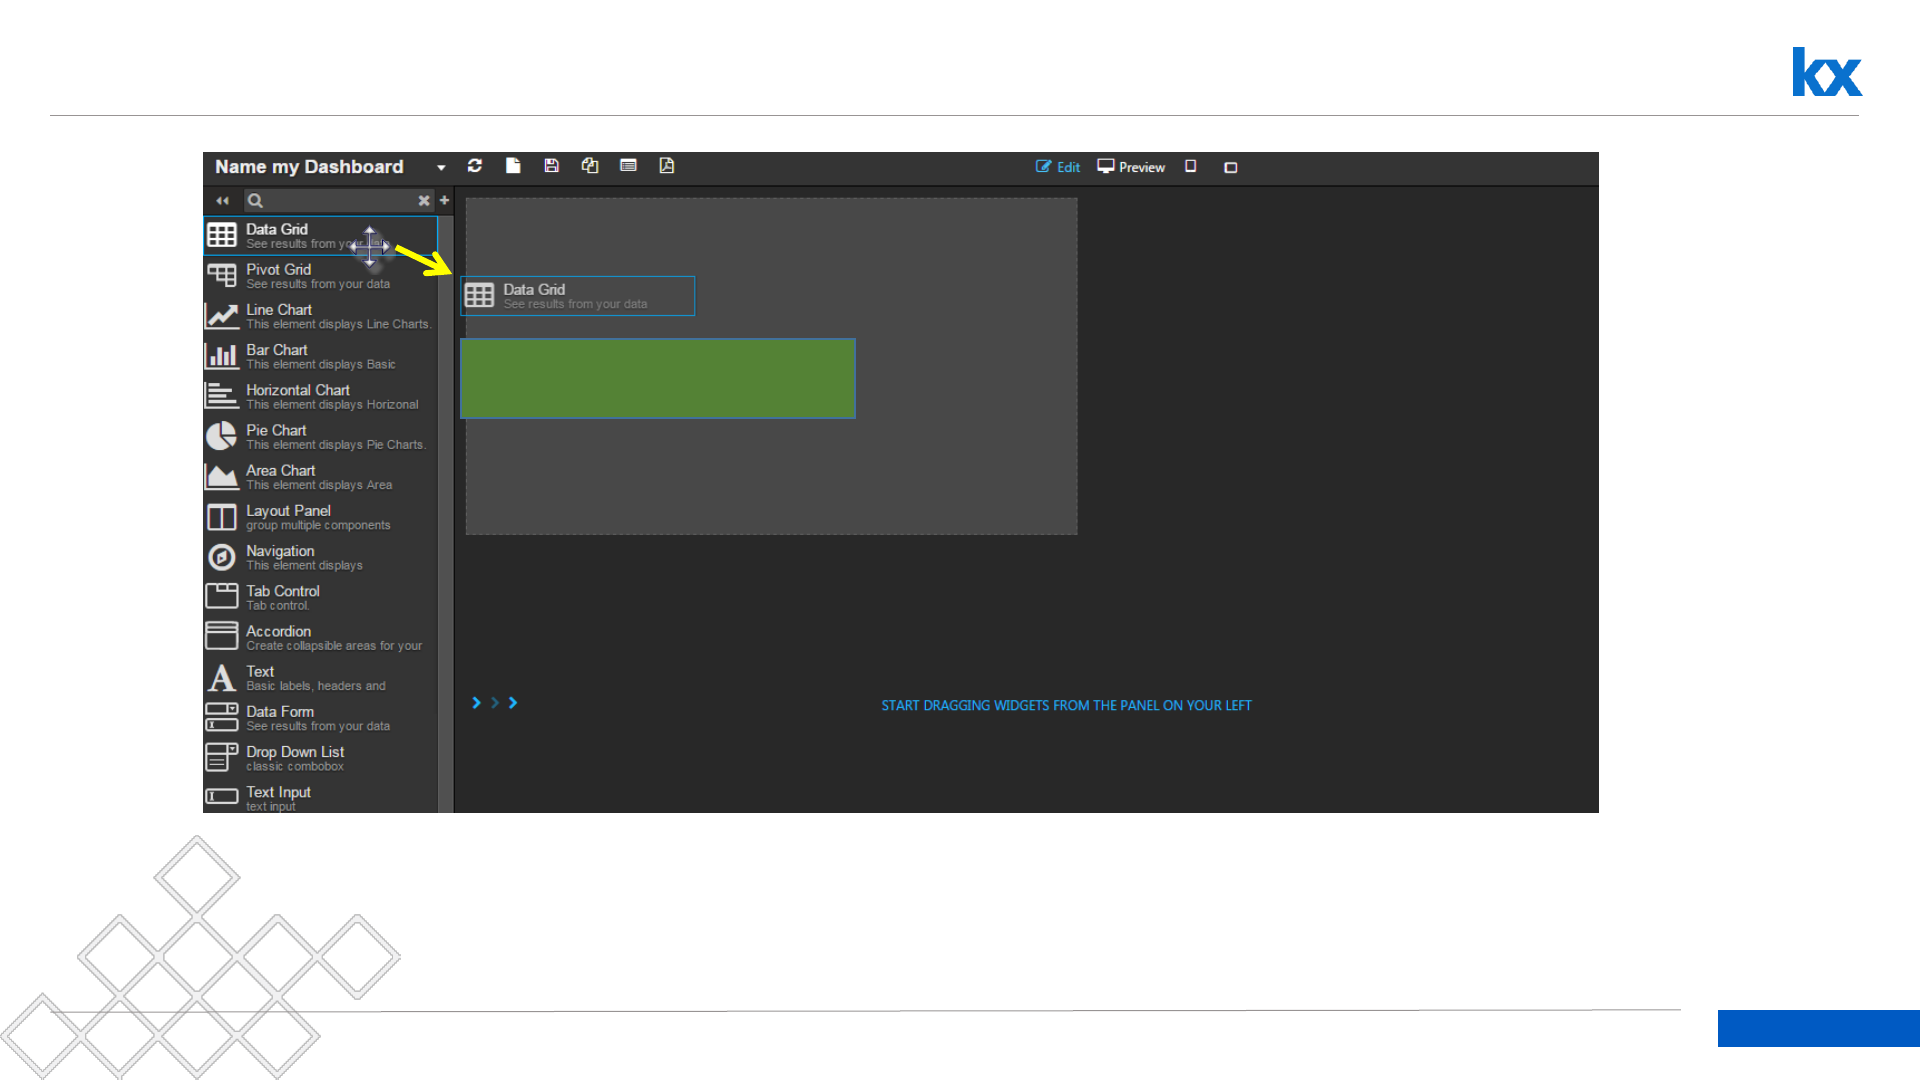
Drag a Component into the Workspace; e.g. Data Grid
Left-click-and-drag a
component into the workspace
18
Dashboards for Kx – “How to” Guide
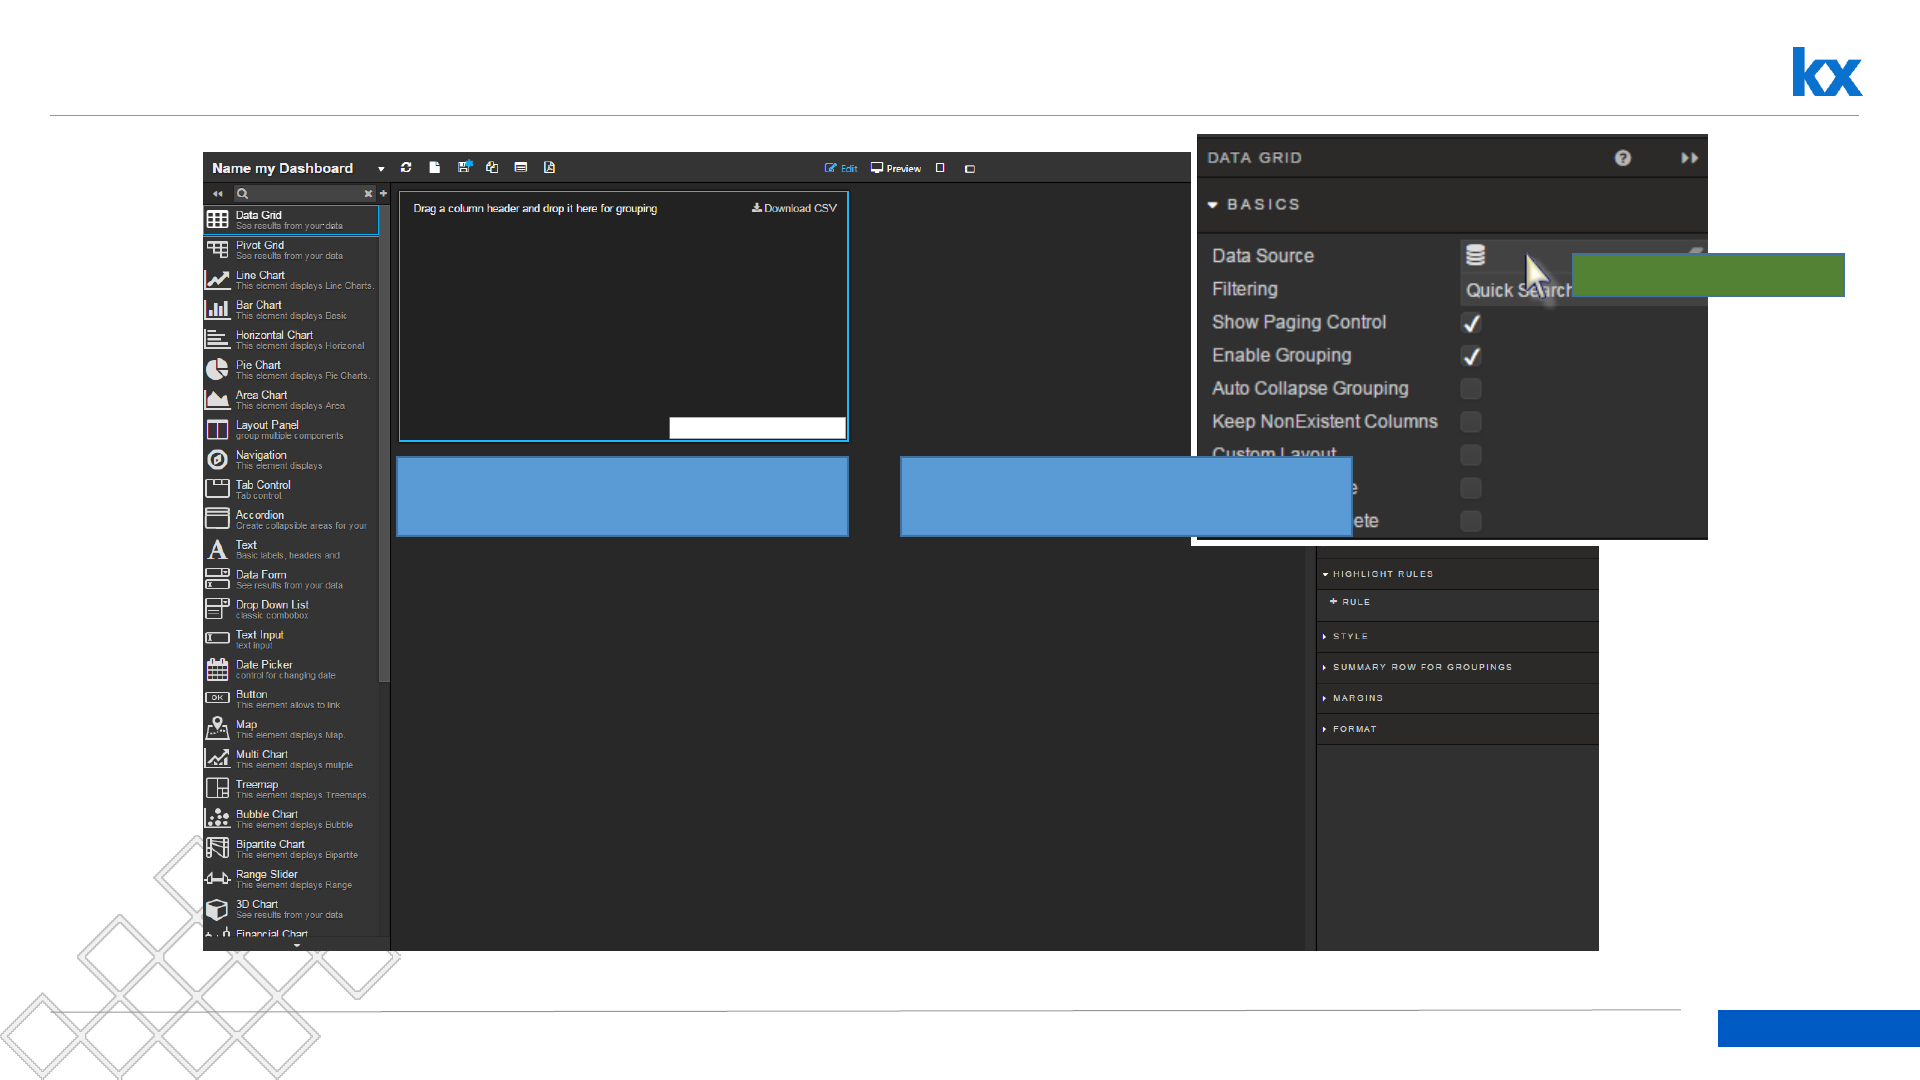
Configure Properties of a Data Grid
Selected component will have a light
blue border
Define a Data Source; left-click inside
the input box to edit
Left-click inside box

19
Dashboards for Kx – “How to” Guide
Create New Data Source: GroupName
Click on New to create a
Data Source
Give Data Source a name;
default is “New Node”
Name: GroupName
20
Dashboards for Kx – “How to” Guide
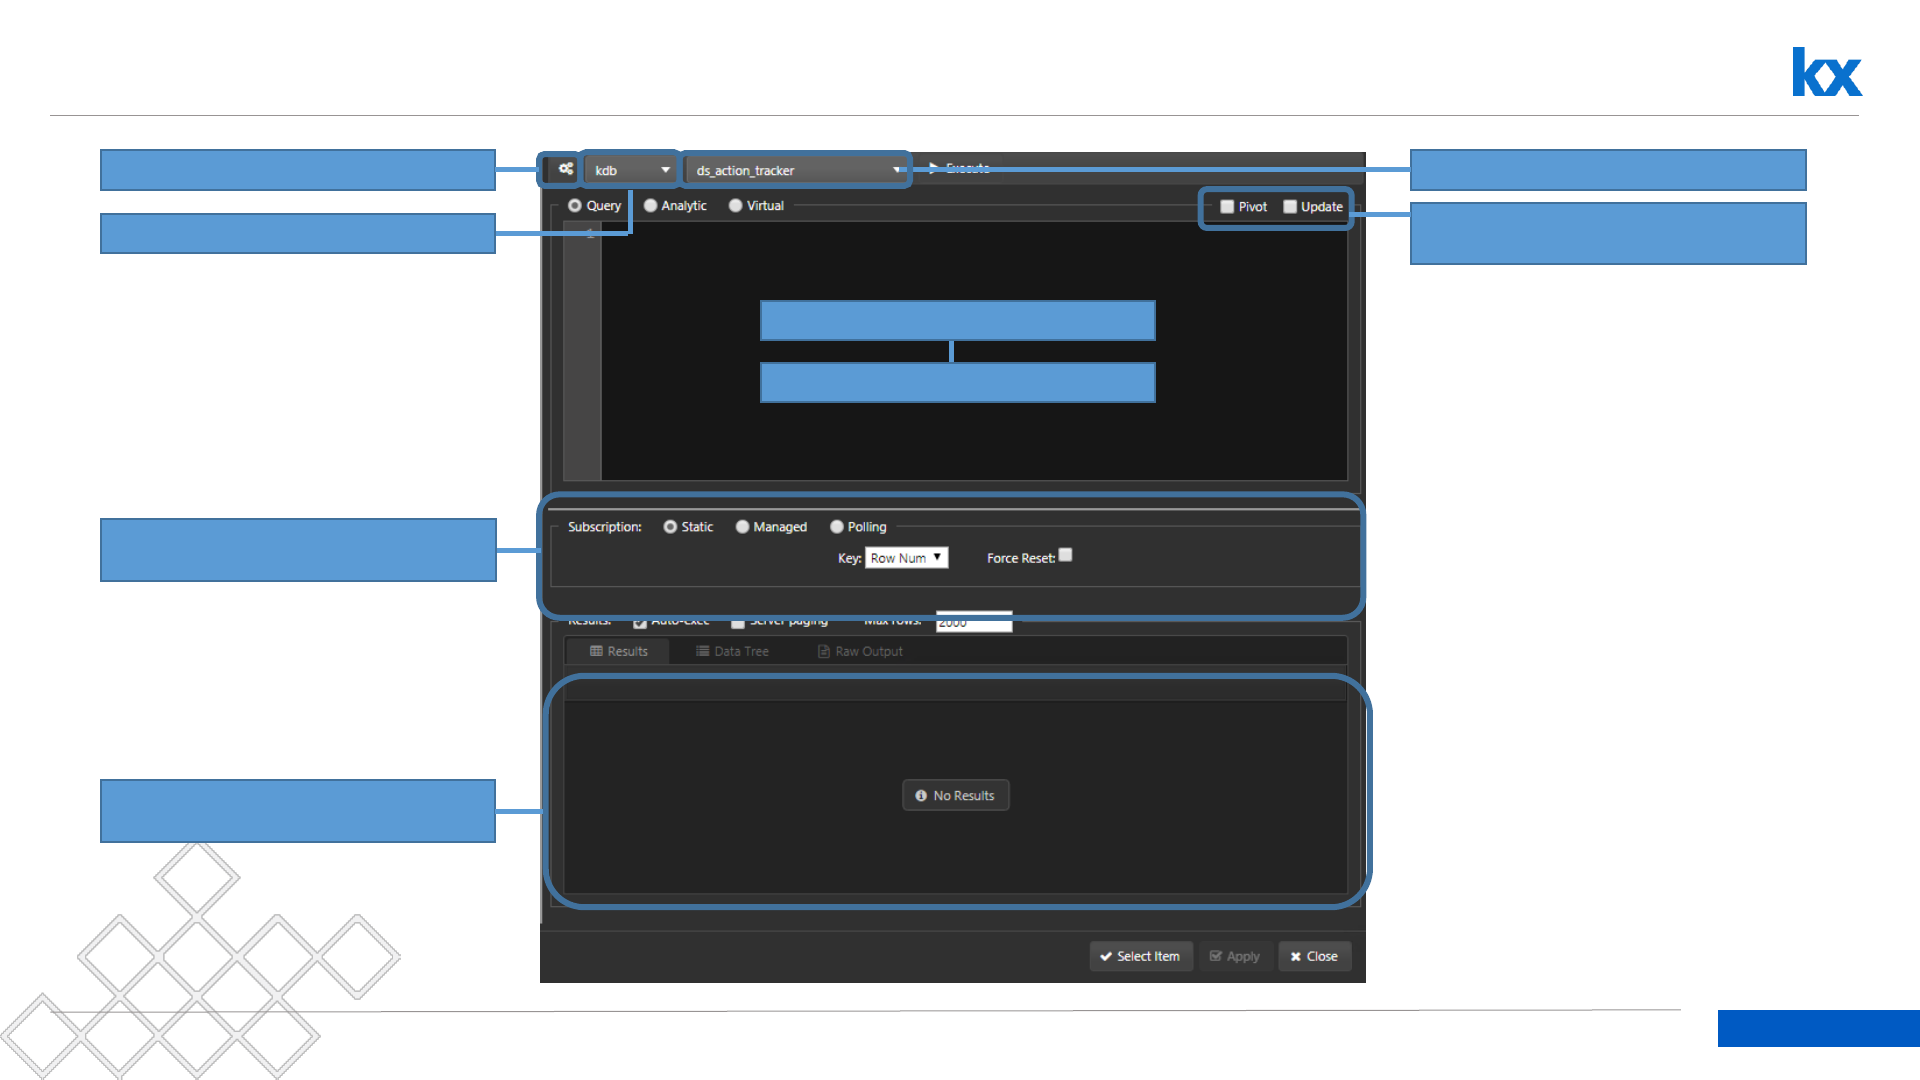
What’s in a Data Editor?
Connections Set Up
Database type
Database Name
Set Data Source update
frequency
Text-based q Editor
Or select predefined Analytic
Successful data query will
populate results in this panel
Check to enable Pivot and
Update Queries
21
Dashboards for Kx – “How to” Guide
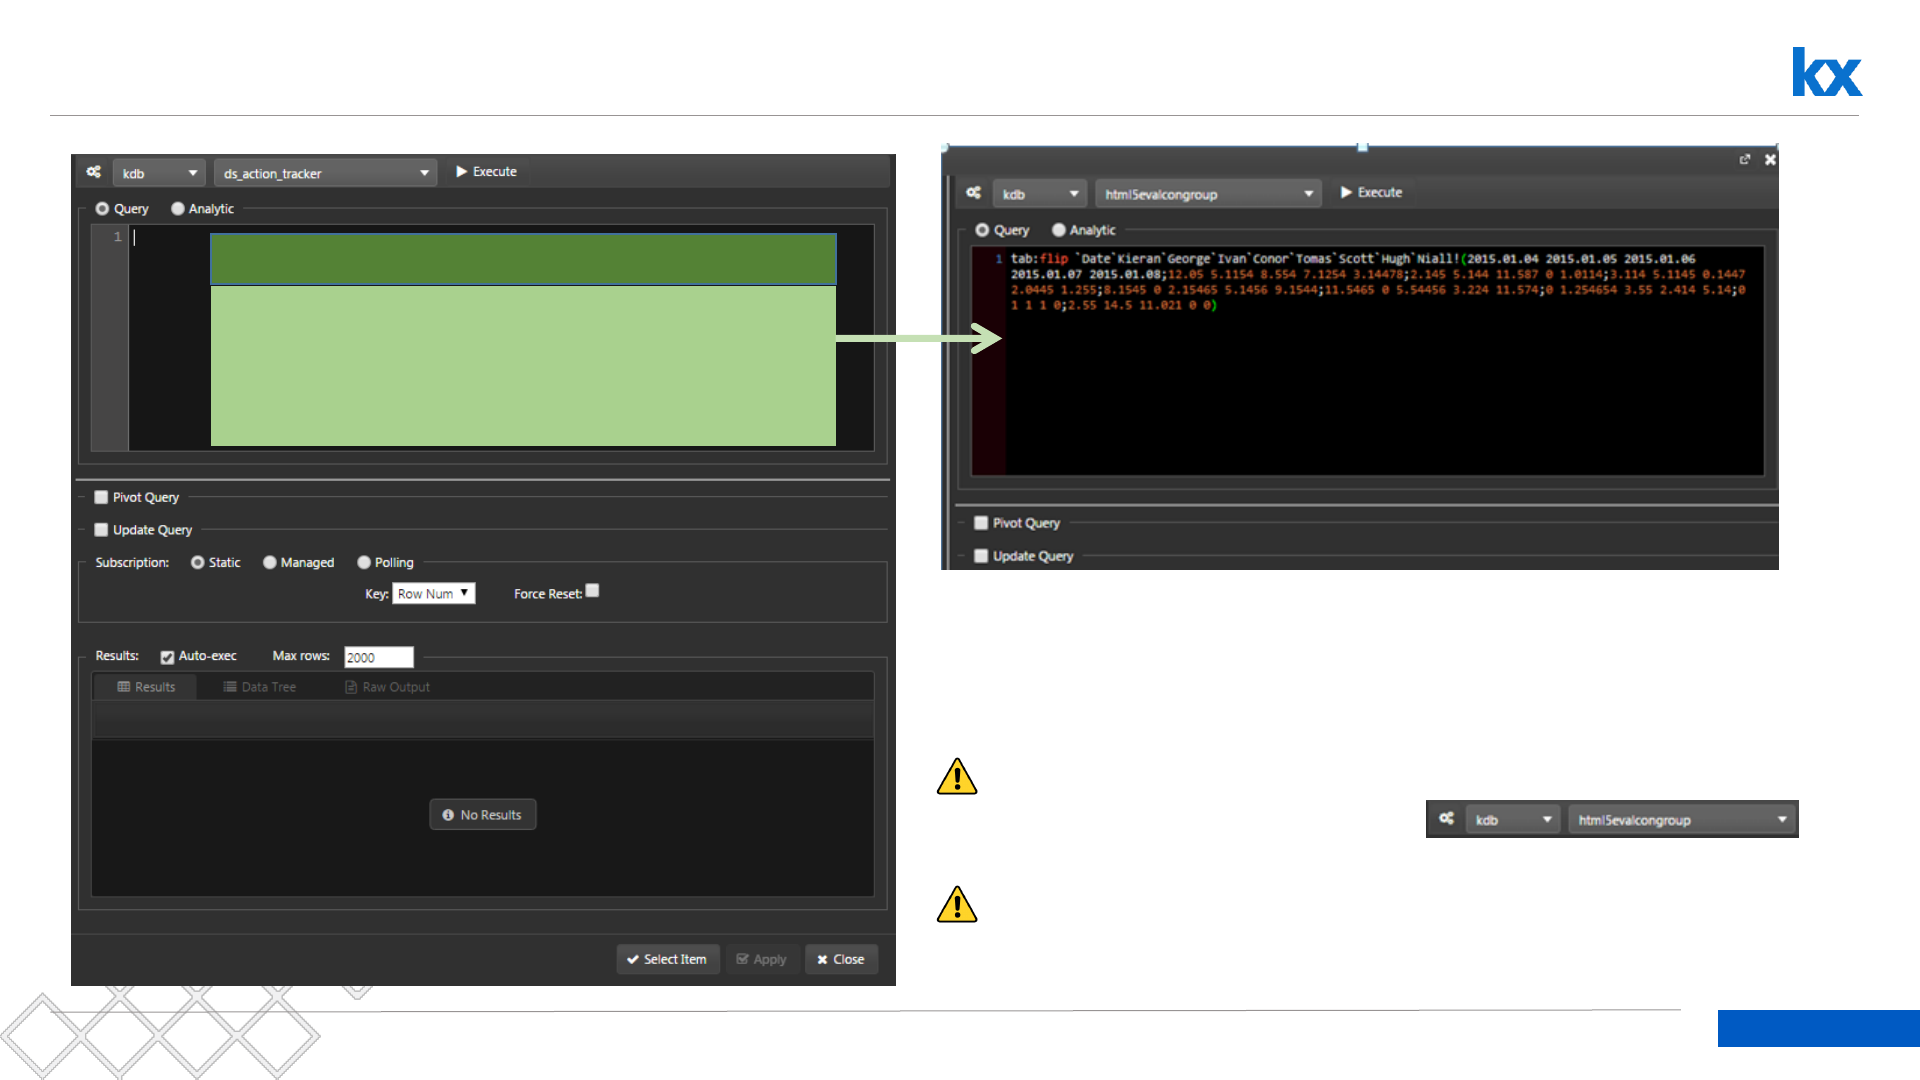
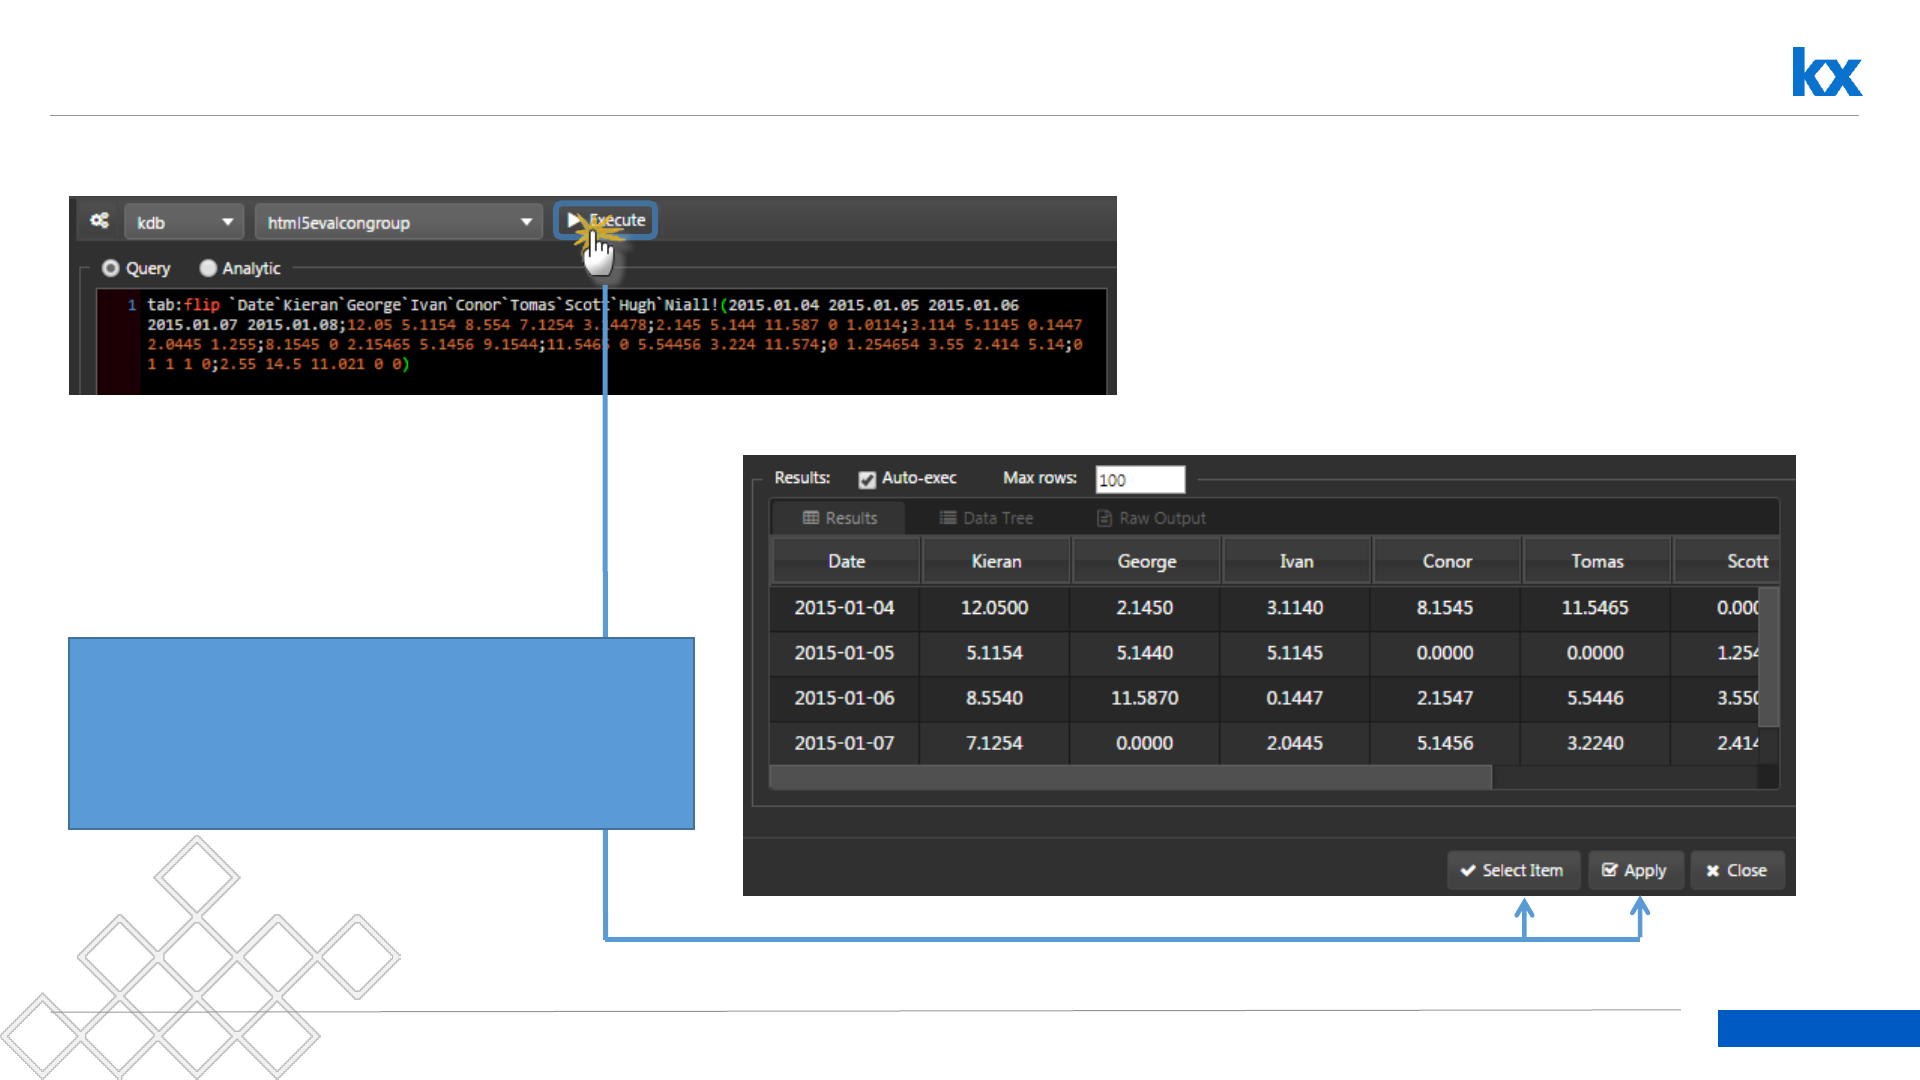
Sample Data Example: GroupName
tab:flip
`Date`Kieran`George`Ivan`Conor`Tomas`Scott`Hugh`Niall!(2015.01.04
2015.01.05 2015.01.06 2015.01.07 2015.01.08;12.05 5.1154 8.554
7.1254 3.14478;2.145 5.144 11.587 0 1.0114;3.114 5.1145 0.1447
2.0445 1.255;8.1545 0 2.15465 5.1456 9.1544;11.5465 0 5.54456 3.224
11.574;0 1.254654 3.55 2.414 5.14;0 1 1 1 0;2.55 14.5 11.021 0 0)
Cut-and-paste* into Editor the following:
Because this is a self-contained query, the database
connection doesn’t matter.
If you are pulling data from a database, ensure the
database connection is correct.
* When doing a cut-and-paste of queries into the editor watch
for line-breaks on new rows which may break the query; delete to
remove. Hand-typing a query will prevent this.
22
Dashboards for Kx – “How to” Guide
Execute a Data Source
Important to populate data using the correct order:
1. Execute
2. Apply
3. Select Item
23
Dashboards for Kx – “How to” Guide
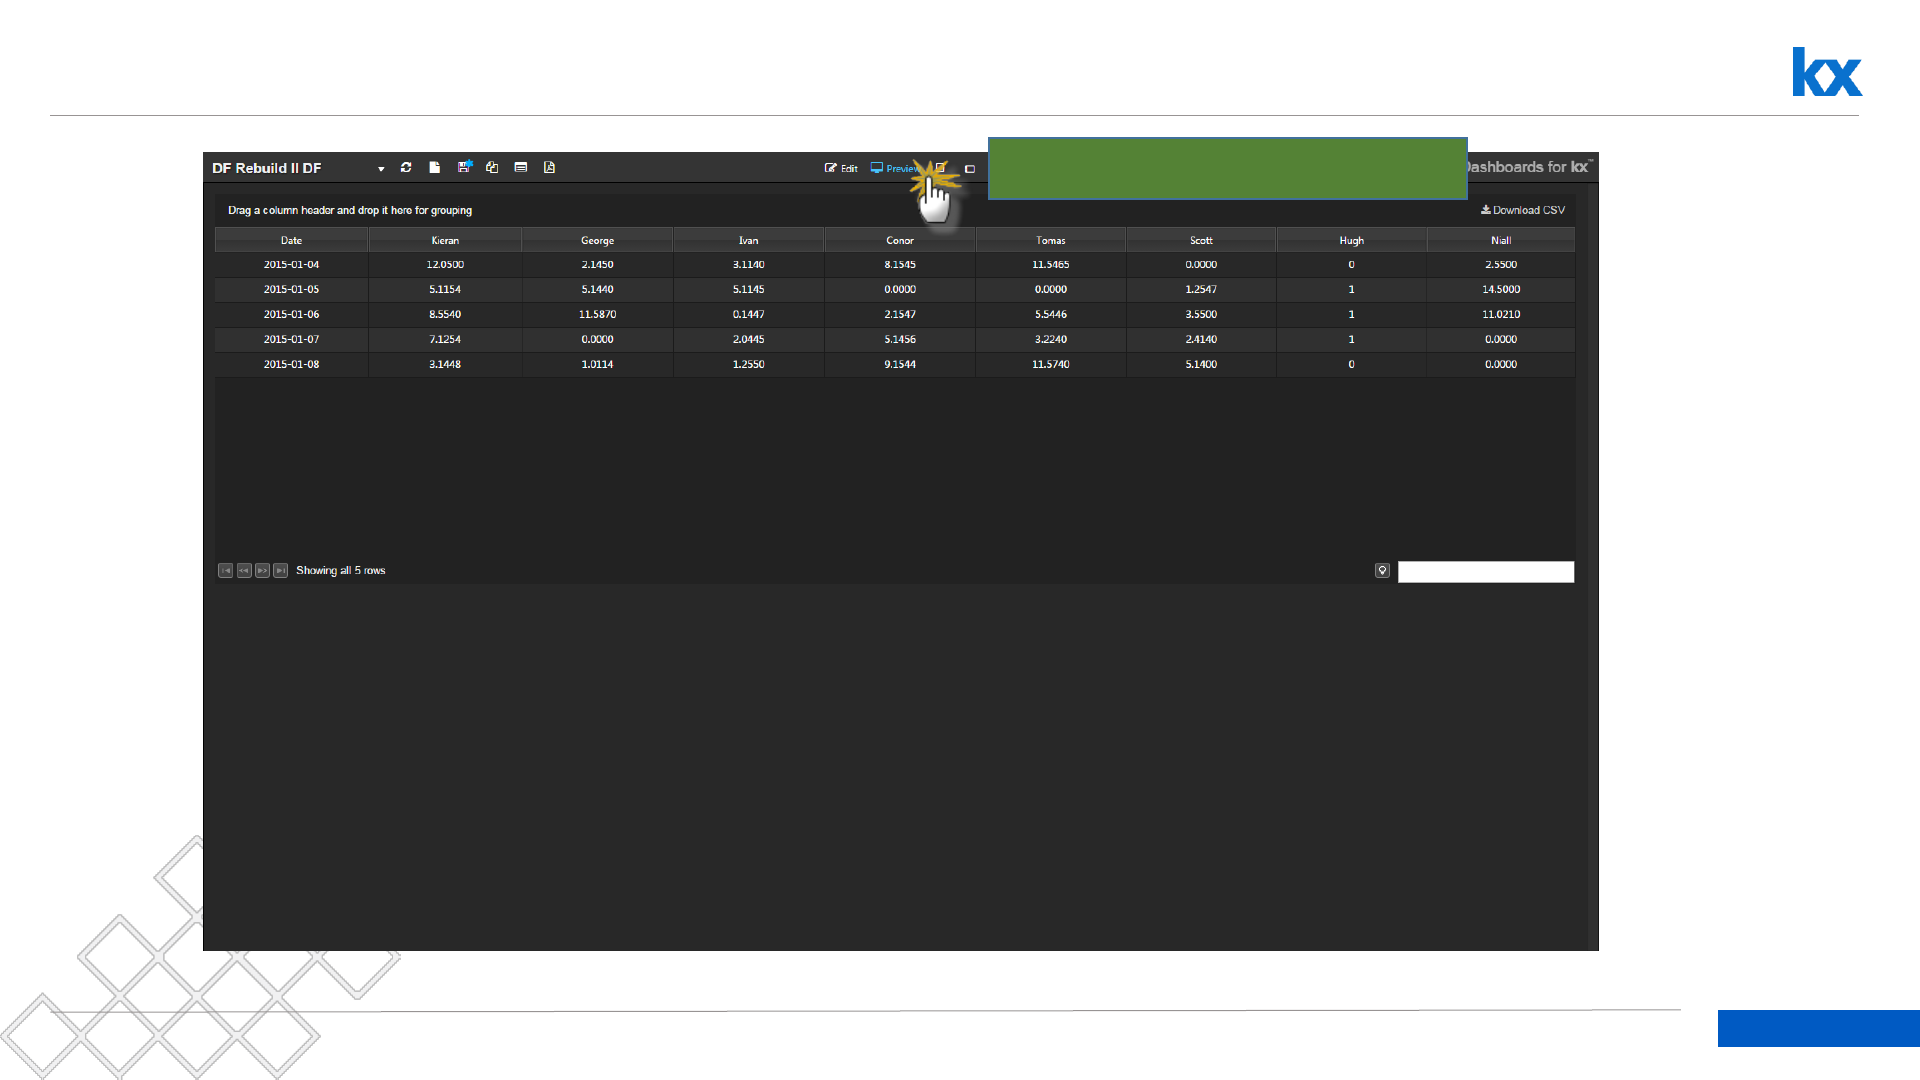
Executed Data Populates The Data Grid
Click Preview to test your Dashboard
24
Dashboards for Kx – “How to” Guide
Try This: Sourcing Data from a kdb+ database
•Name: DataGridData
•Connect to html5eval_grp (or html5evalcongroup)
•Max Rows: 1,000
•Execute -> Apply -> Select
select Type, Month, Group, Return, PerReturn, OpenDate, CloseDate
from TradeData
DataGridData
Data Grid
If doing a cut-and-paste of queries into the editor
watch for line-breaks which can break the query;
delete these line-breaks will restore functionality.
Hand-typing a query will prevent this.

Customize Data Grid
Dashboards for Kx – “How to” Guide
Kx.com
26
Dashboards for Kx – “How to” Guide
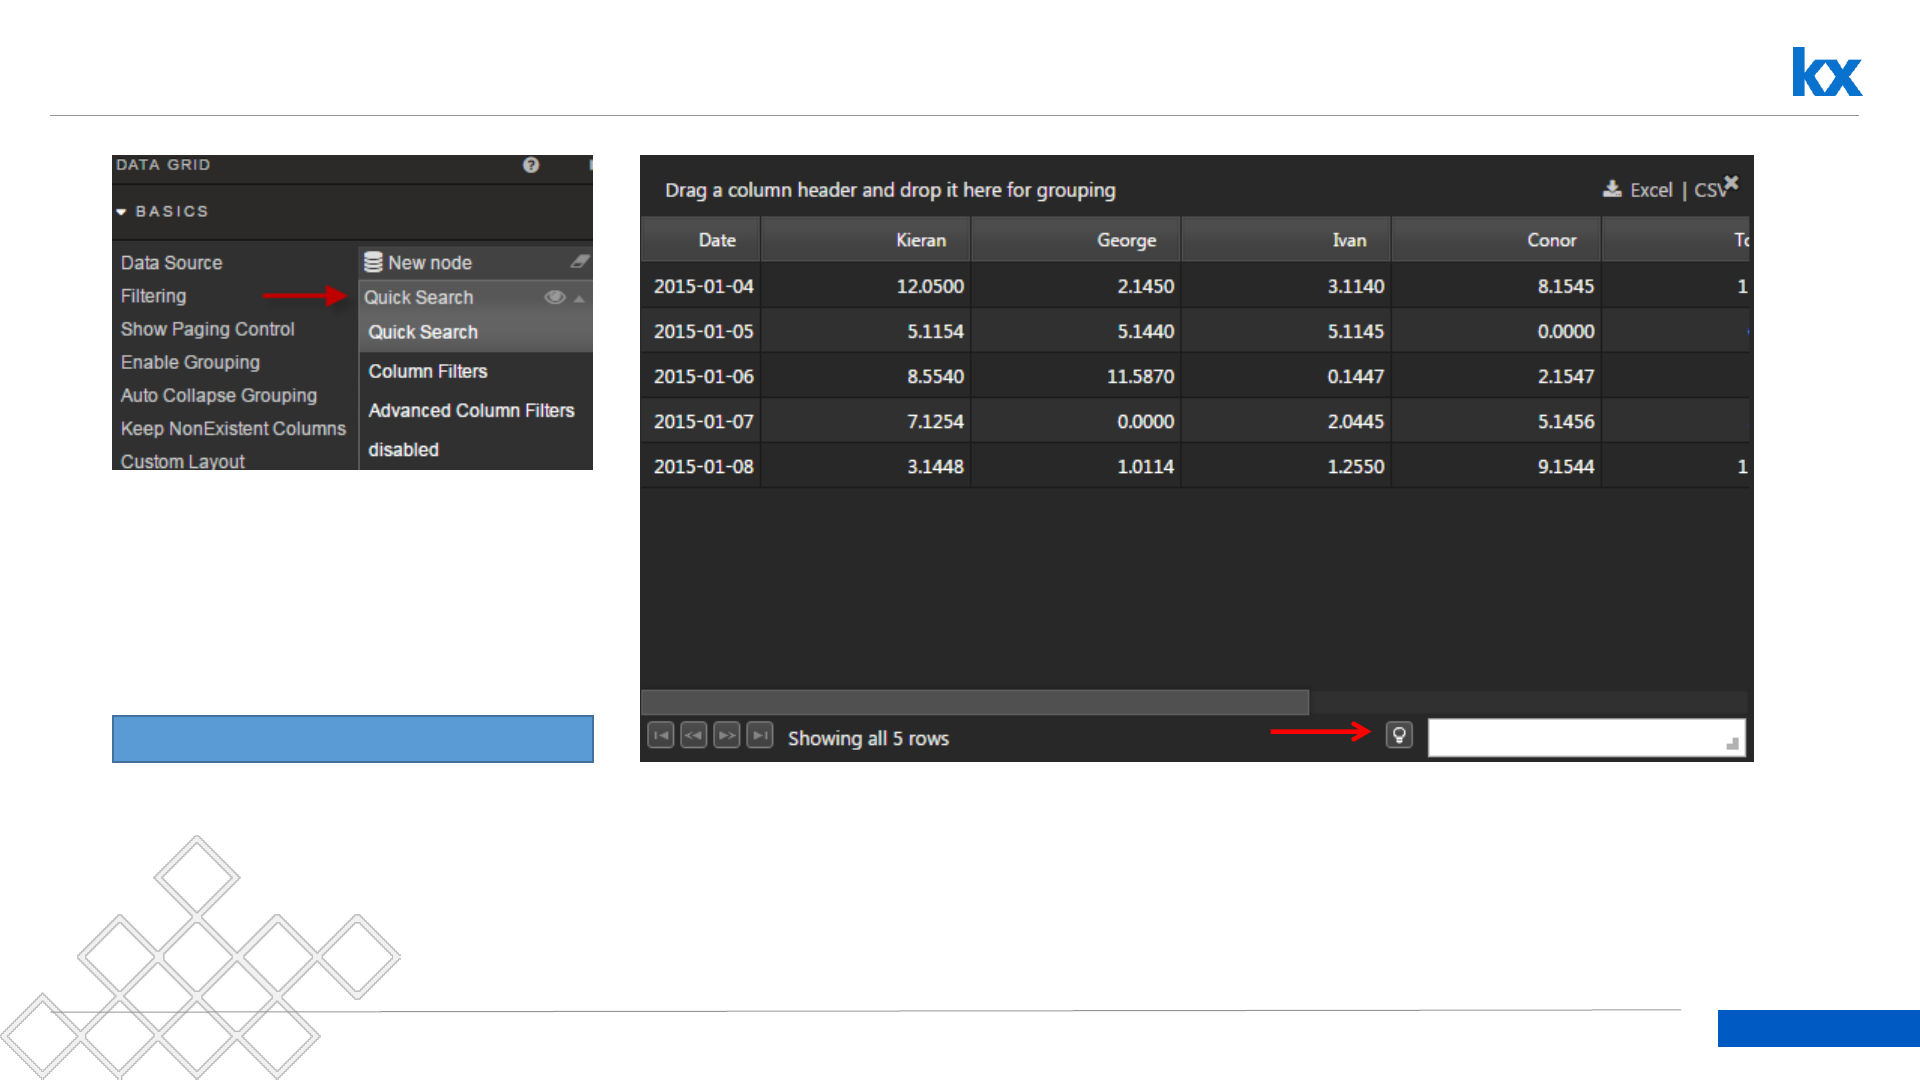
Configure Search Options for GroupName: Default is Quick Search
Toggle through Filter options
27
Dashboards for Kx – “How to” Guide
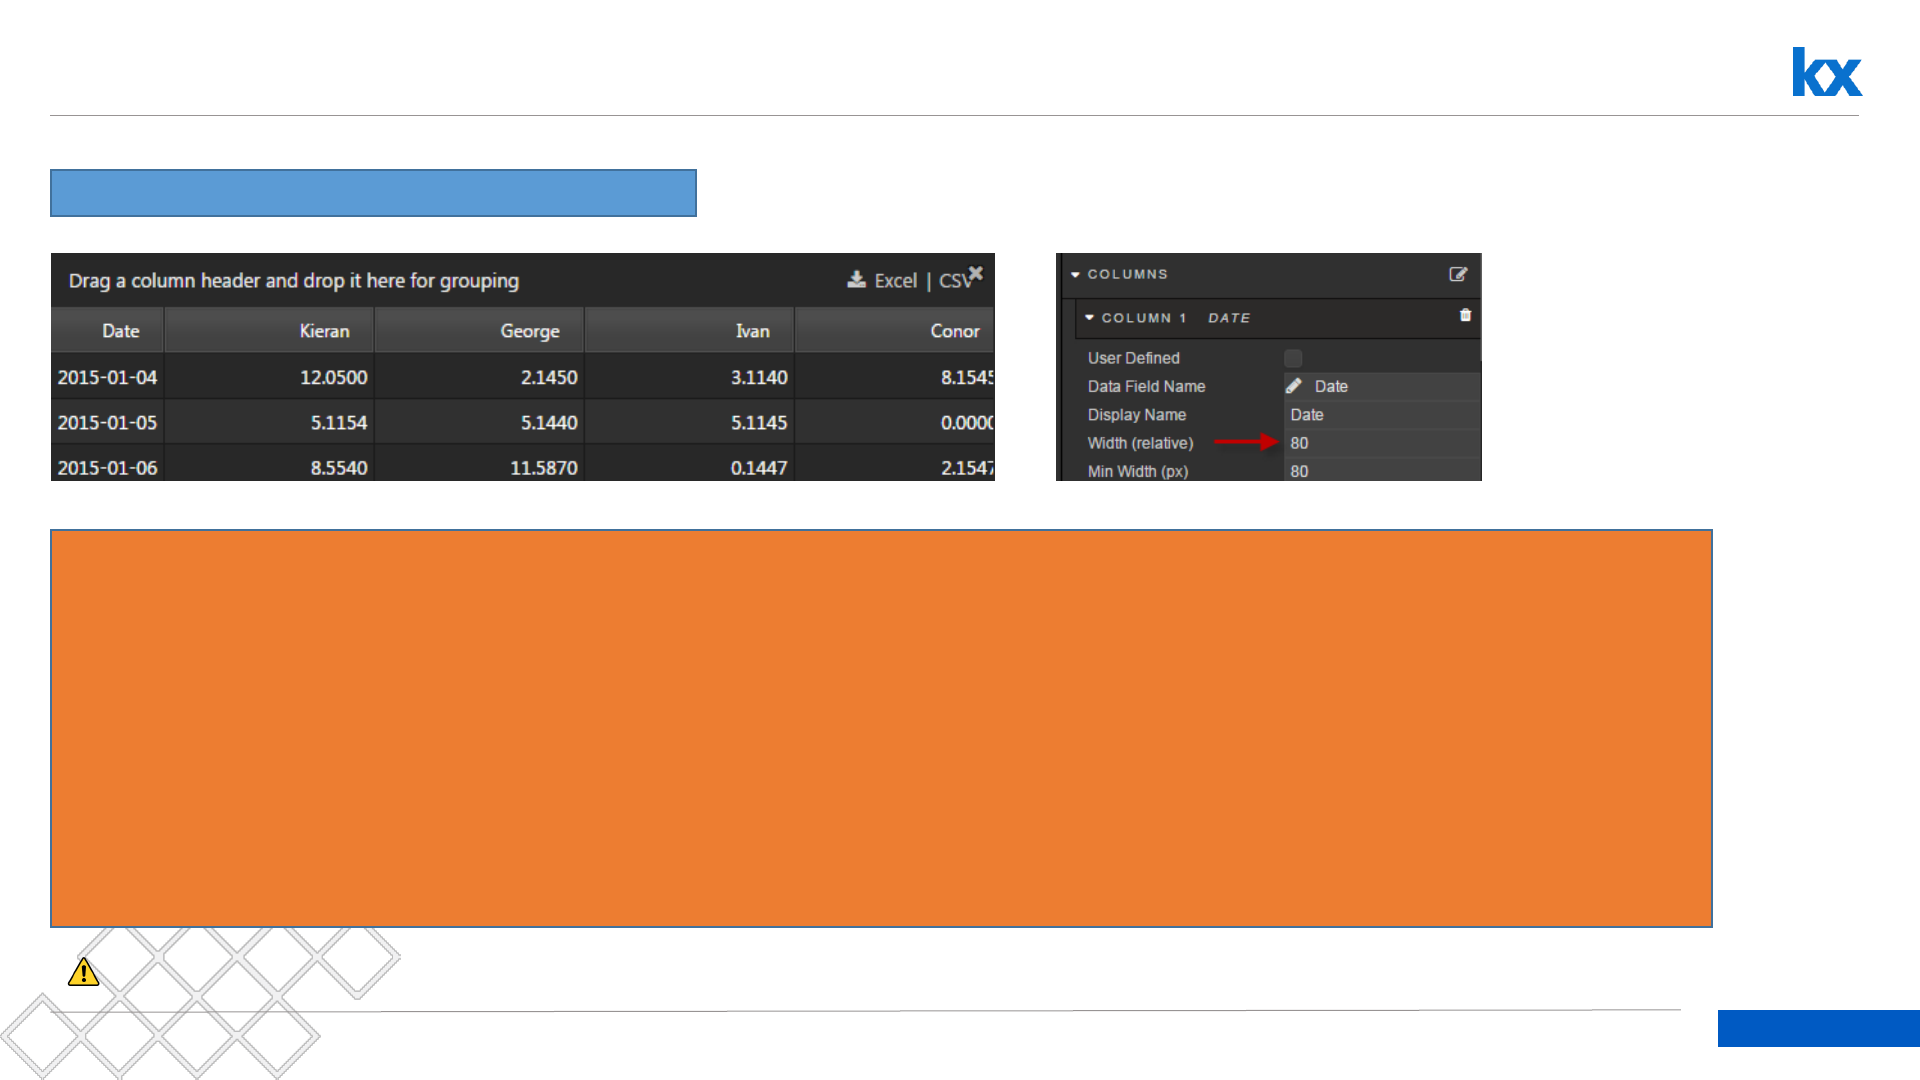
Optimize Column Widths to Best Display Data
Change Width (relative) to best display data
How does Width (relative) work?
Width (relative) applies a scale across all data columns. If Width (relative) is set to “1”; i.e. same value, then each column will have the same
width.
However, if one column is set to “2”, then the relative width of the column will change, contingent on the total number of columns displayed.
For example: Width (relative) for a five column data grid is “2”, “1”, “1”, “1”, “1”.
Total Width (relative) = 2+1+1+1+1 = 6
Relative width for each column is therefore: Width (relative) / Sum of Width (relative)
Relative width = (2/6), (1/6), (1/6), (1/6), (1/6)
Relative width = 33%, 16%, 16%, 16%, 16%
Note: Min Width (px) will also influence Width (relative). Set Min Width (px) to zero for all columns if only Width (relative) is to be used
28
Dashboards for Kx – “How to” Guide
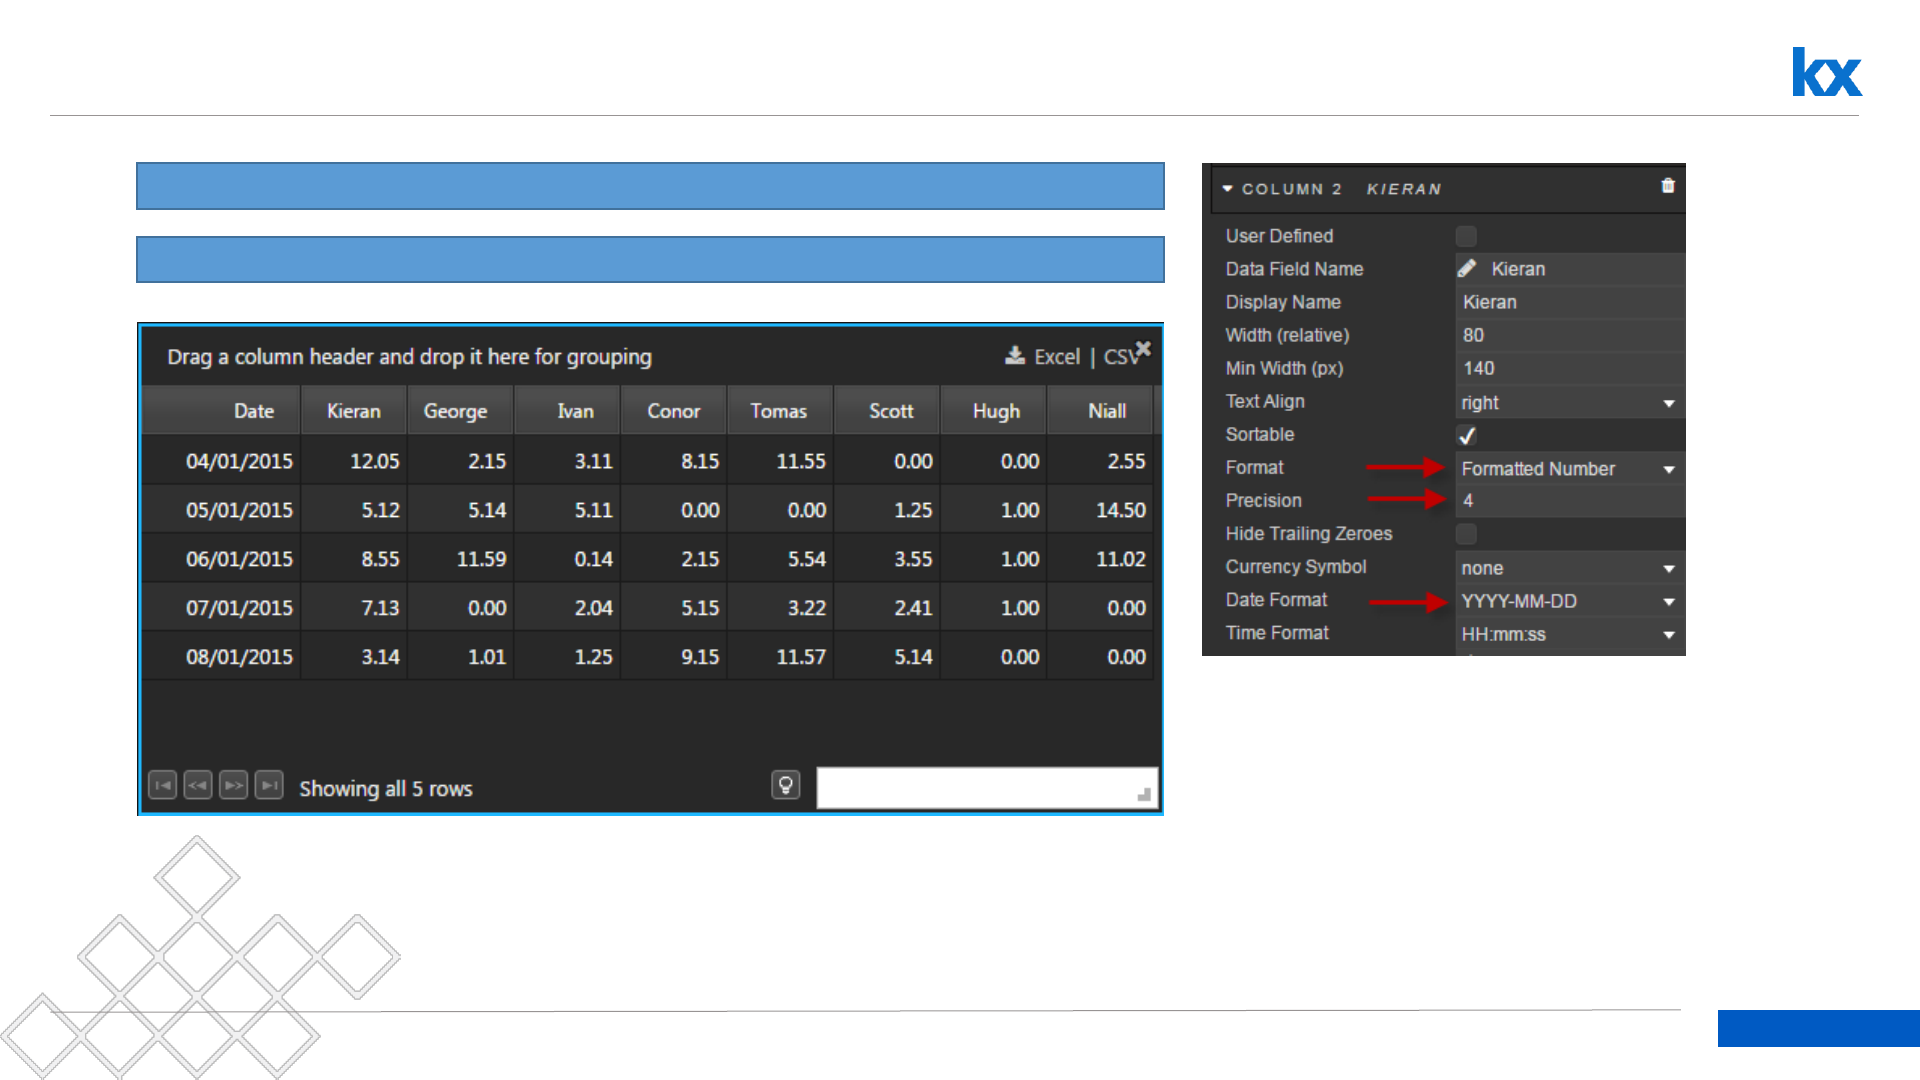
Define Column Data Types
Column 1 Date = Format: Date and Date Format: DD/MM/YYYY and Width (relative): 15
Columns 2-9 = Format: Formatted Number and Precision: 2 and Width (relative): 10
29
Dashboards for Kx – “How to” Guide
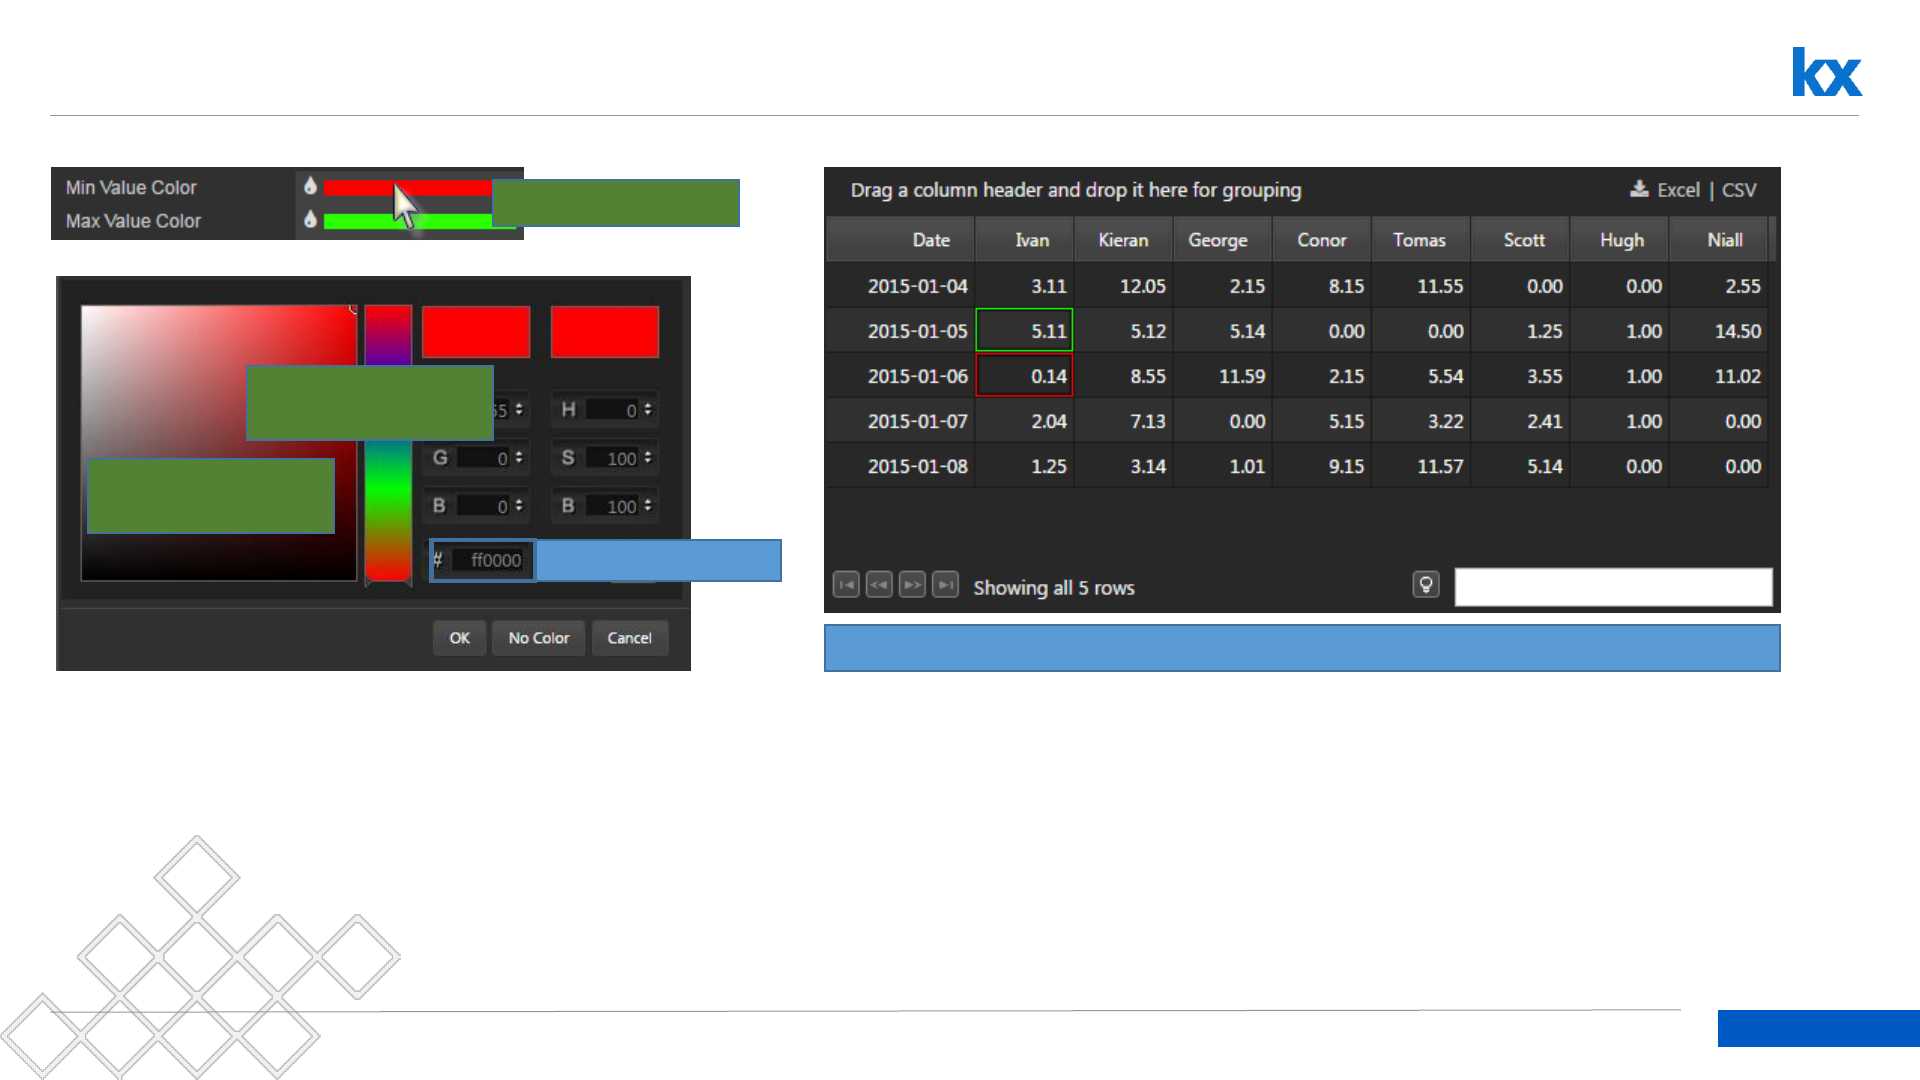
Set Min / Max value for a numeric column
Left-click color bar
Click-select colour
tone inside palette
Click-select base color
in color bar
…Or enter a Hex color
Set Min/Max Value color for each column
30
Dashboards for Kx – “How to” Guide
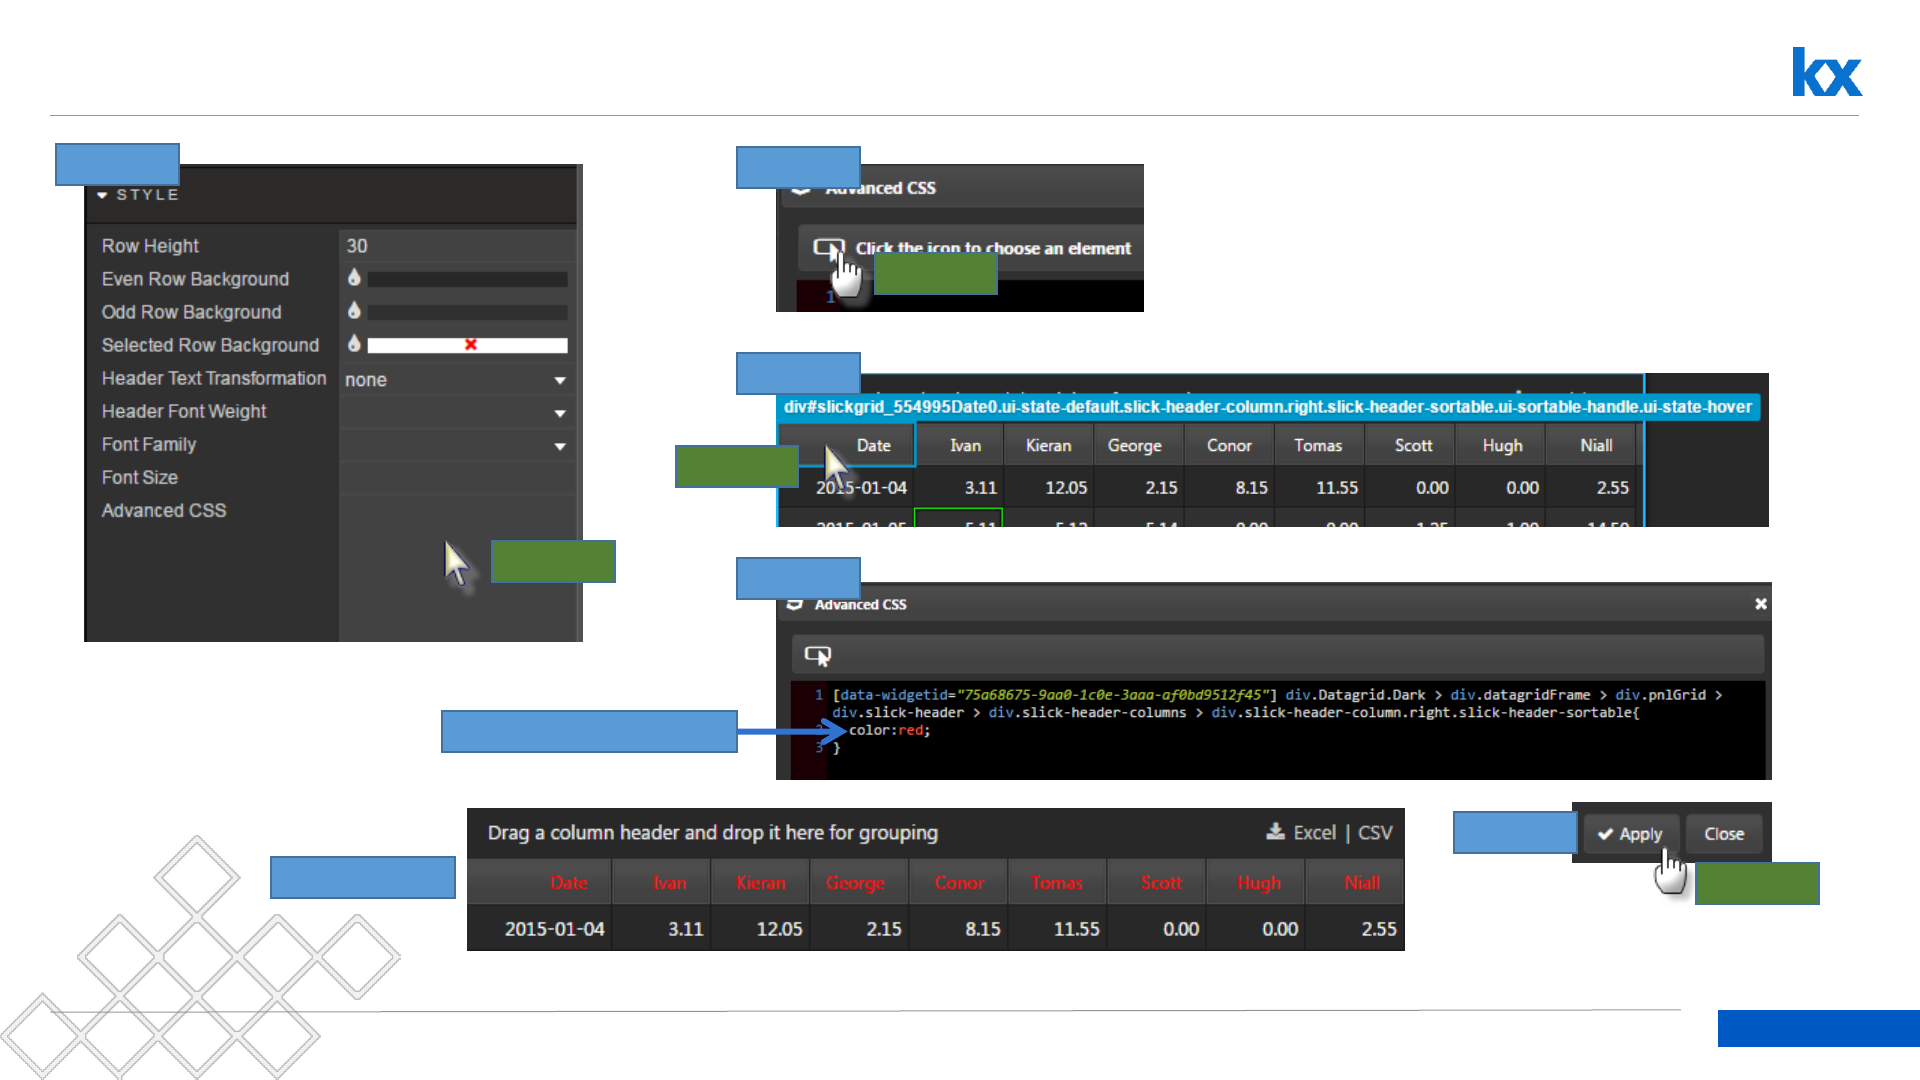
Apply CSS to Data Grid Header
Left-click
Step: 1 Step: 2
Left-click
Step: 3
Left-click
Step: 4
Add CSS: e.g. “color:red;”
Step: 5
Left-click
Step 6: RESULT:
31
Dashboards for Kx – “How to” Guide
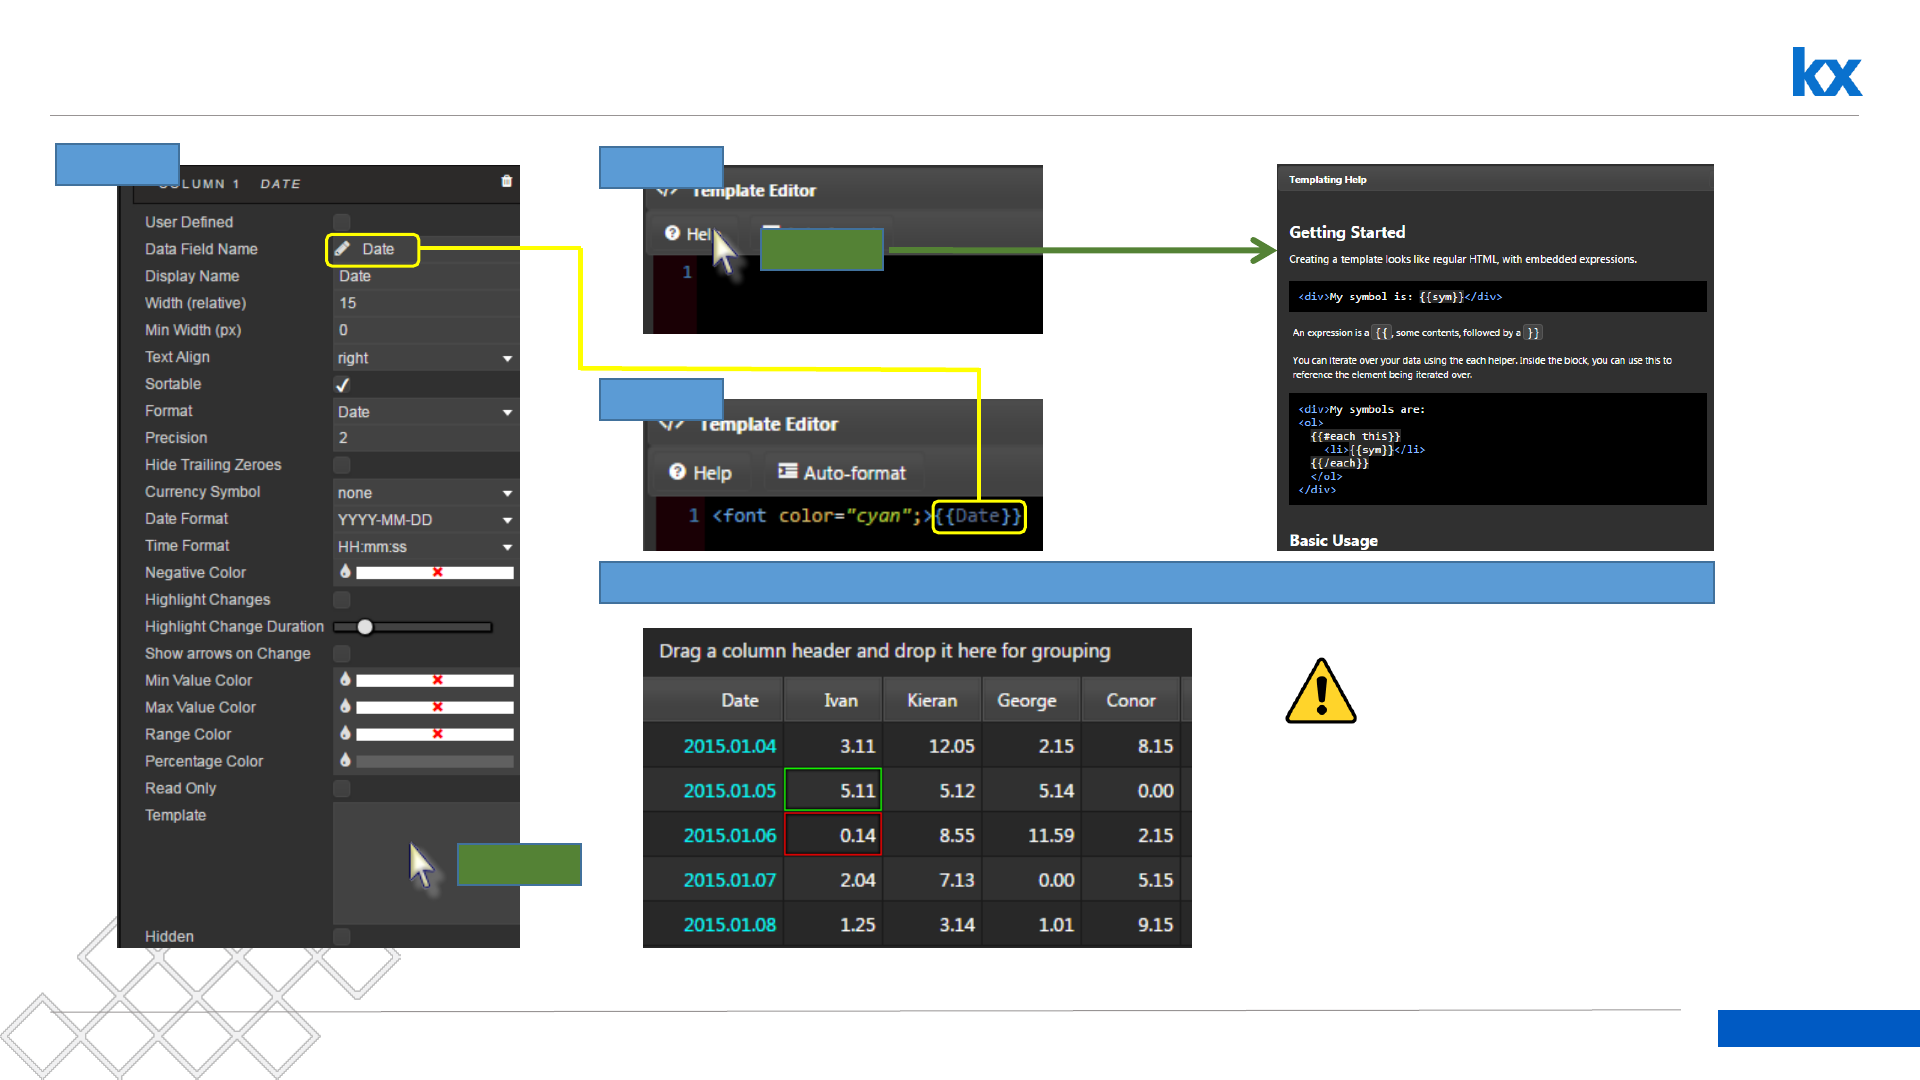
Use Template to Apply Format to Column
Left-click
Step: 1 Step: 2
Left-click
Step: 3
Set font color for Date column. Remember to enclose variable name inside {{ }} as it appears in database
Template formats will
overwrite any highlight rules
applied to the column
32
Dashboards for Kx – “How to” Guide
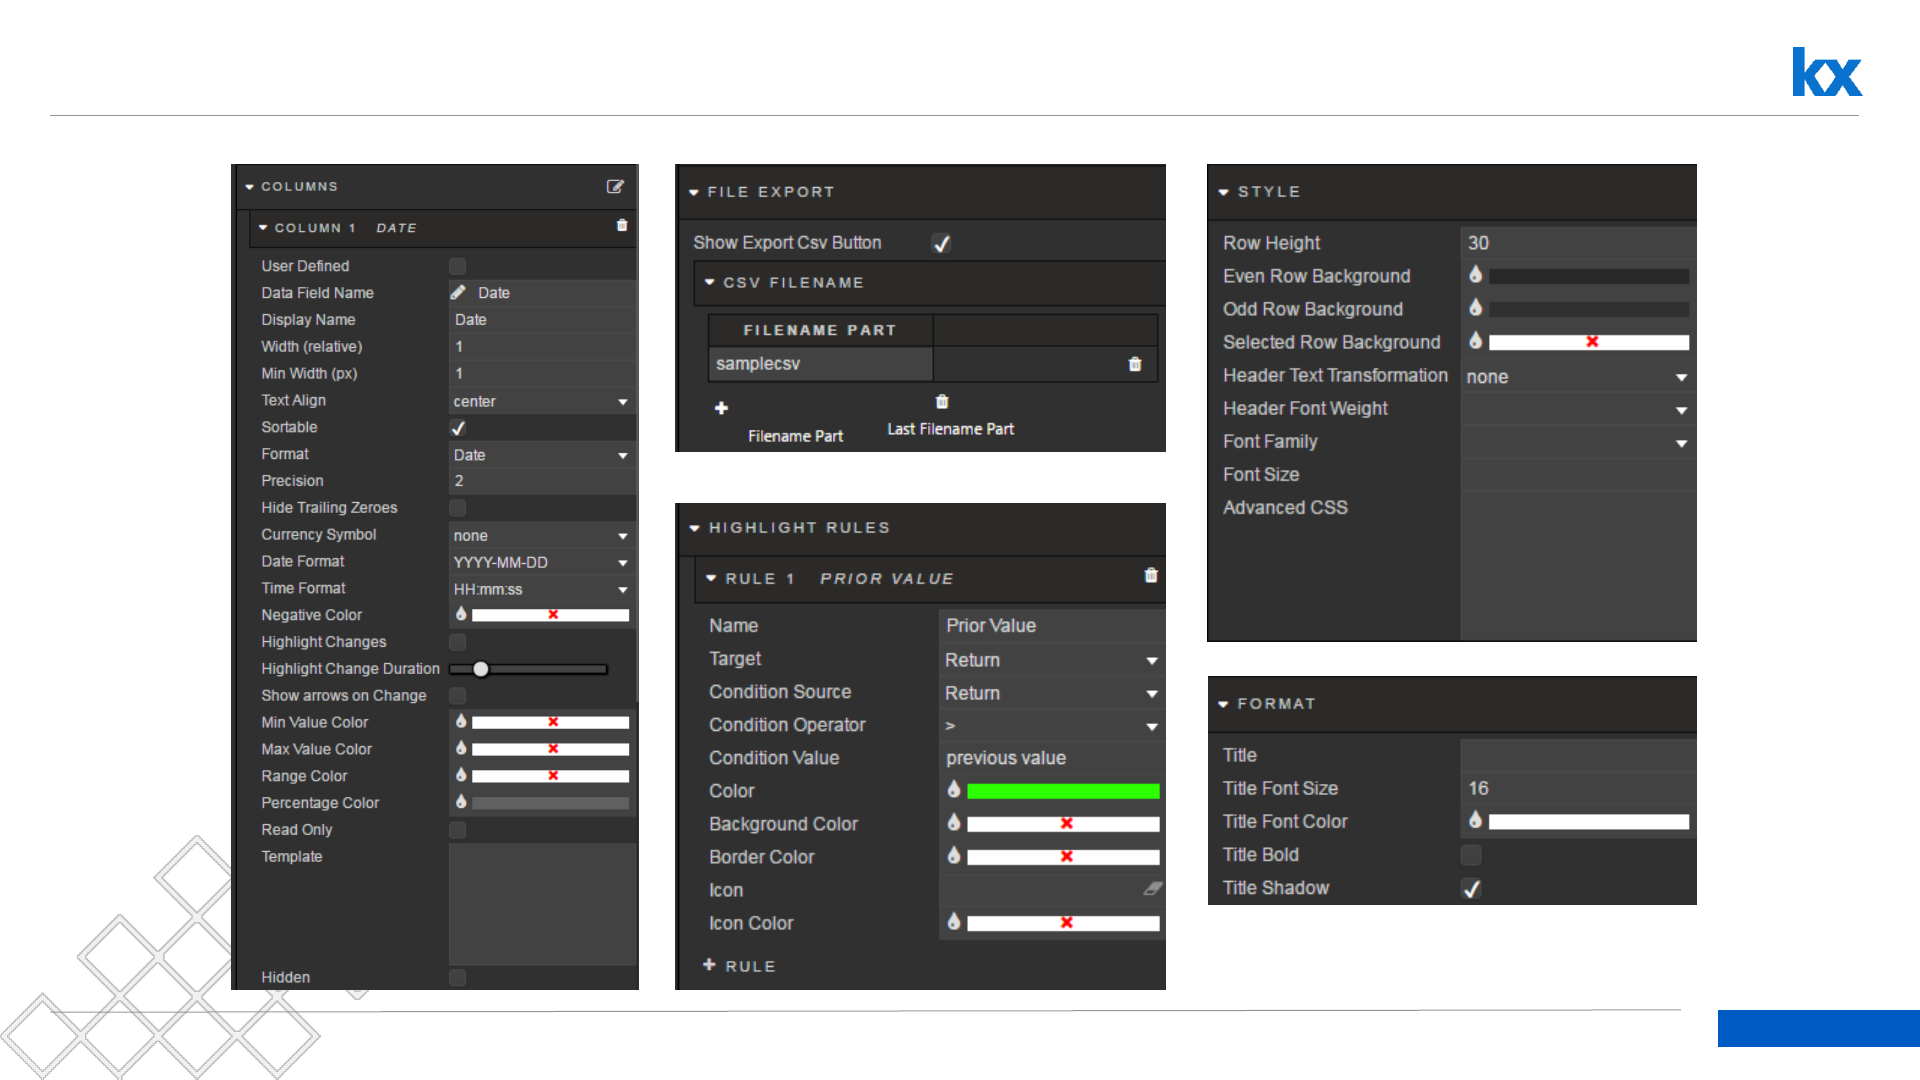
Check out Data Grid Properties
33
Dashboards for Kx – “How to” Guide
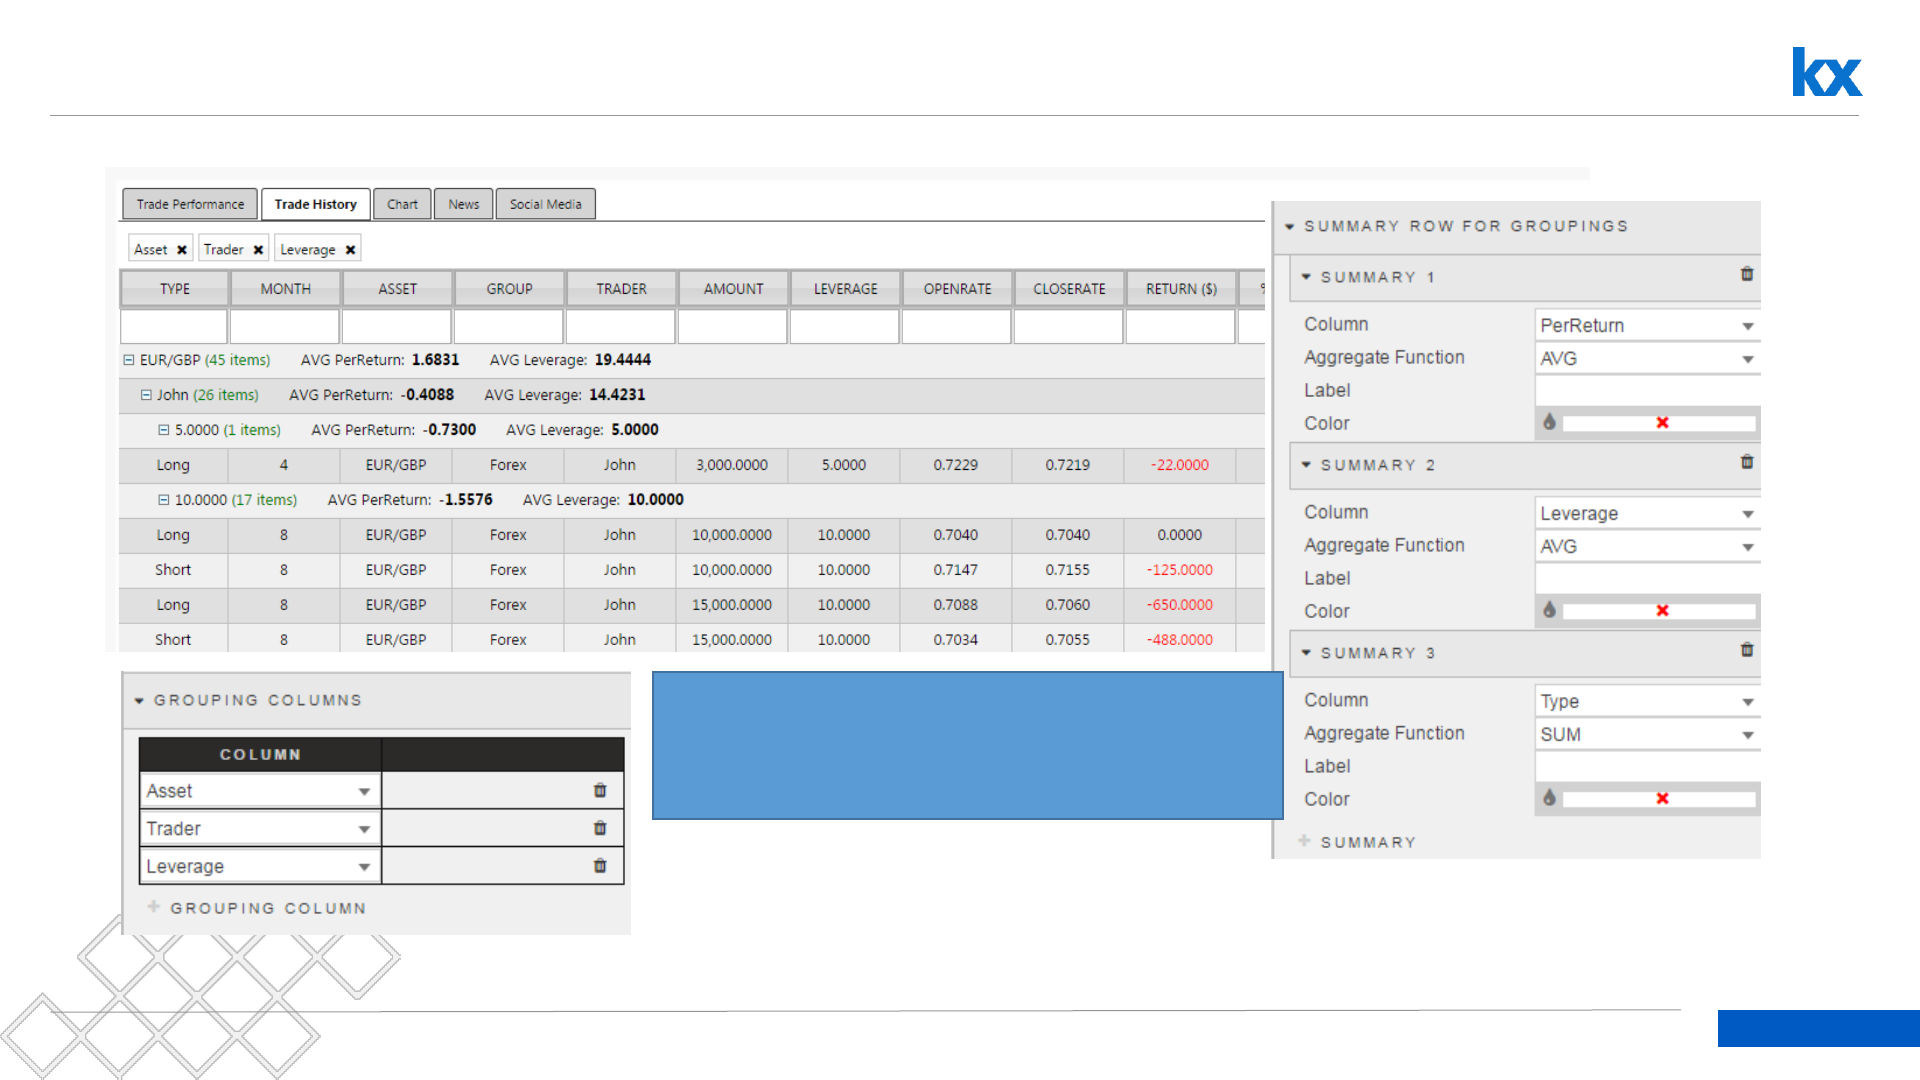
Data Grouping Example
Groupings are done by Data Source columns.
Groupings can include pre-determined calculations
of dependent data
34
Dashboards for Kx – “How to” Guide
Try This: In DataGridData
•For: DataGridData
•Ensure each column has a valid Display Name; e.g. PerReturn = “% Return”
•Format Month and Return at Precision: 0
•Format PerReturn as Percentage
•Apply a Range Color to Return
•Set a Negative Color to Return
•Create a Summary Grouping for Type and Group
•Create a Summary Row for Grouping for Avg Return

Adding Input Parameters
Dashboards for Kx – “How to” Guide
Kx.com

36
Dashboards for Kx – “How to” Guide
Parameter Query
•Create a new query: DataGrid2
•Connect to html5eval_grp (or html5evalcongroup)
• Add the following query
•Use pre-set values for added query Parameters:
•trade is Type symbol and Value = Long
•mnth is Type int and Value = 12
•asset is Type symbol and Value = Forex
•Execute -> Apply -> Select
{[trade;mnth;asset] select Type, Month, Group, Return, PerReturn, OpenDate, CloseDate
from TradeData where Type=trade, Month=mnth, Group=asset}

37
Dashboards for Kx – “How to” Guide
DataGrid2 : Data Editor View
Added Parameters will appear
below the data editor
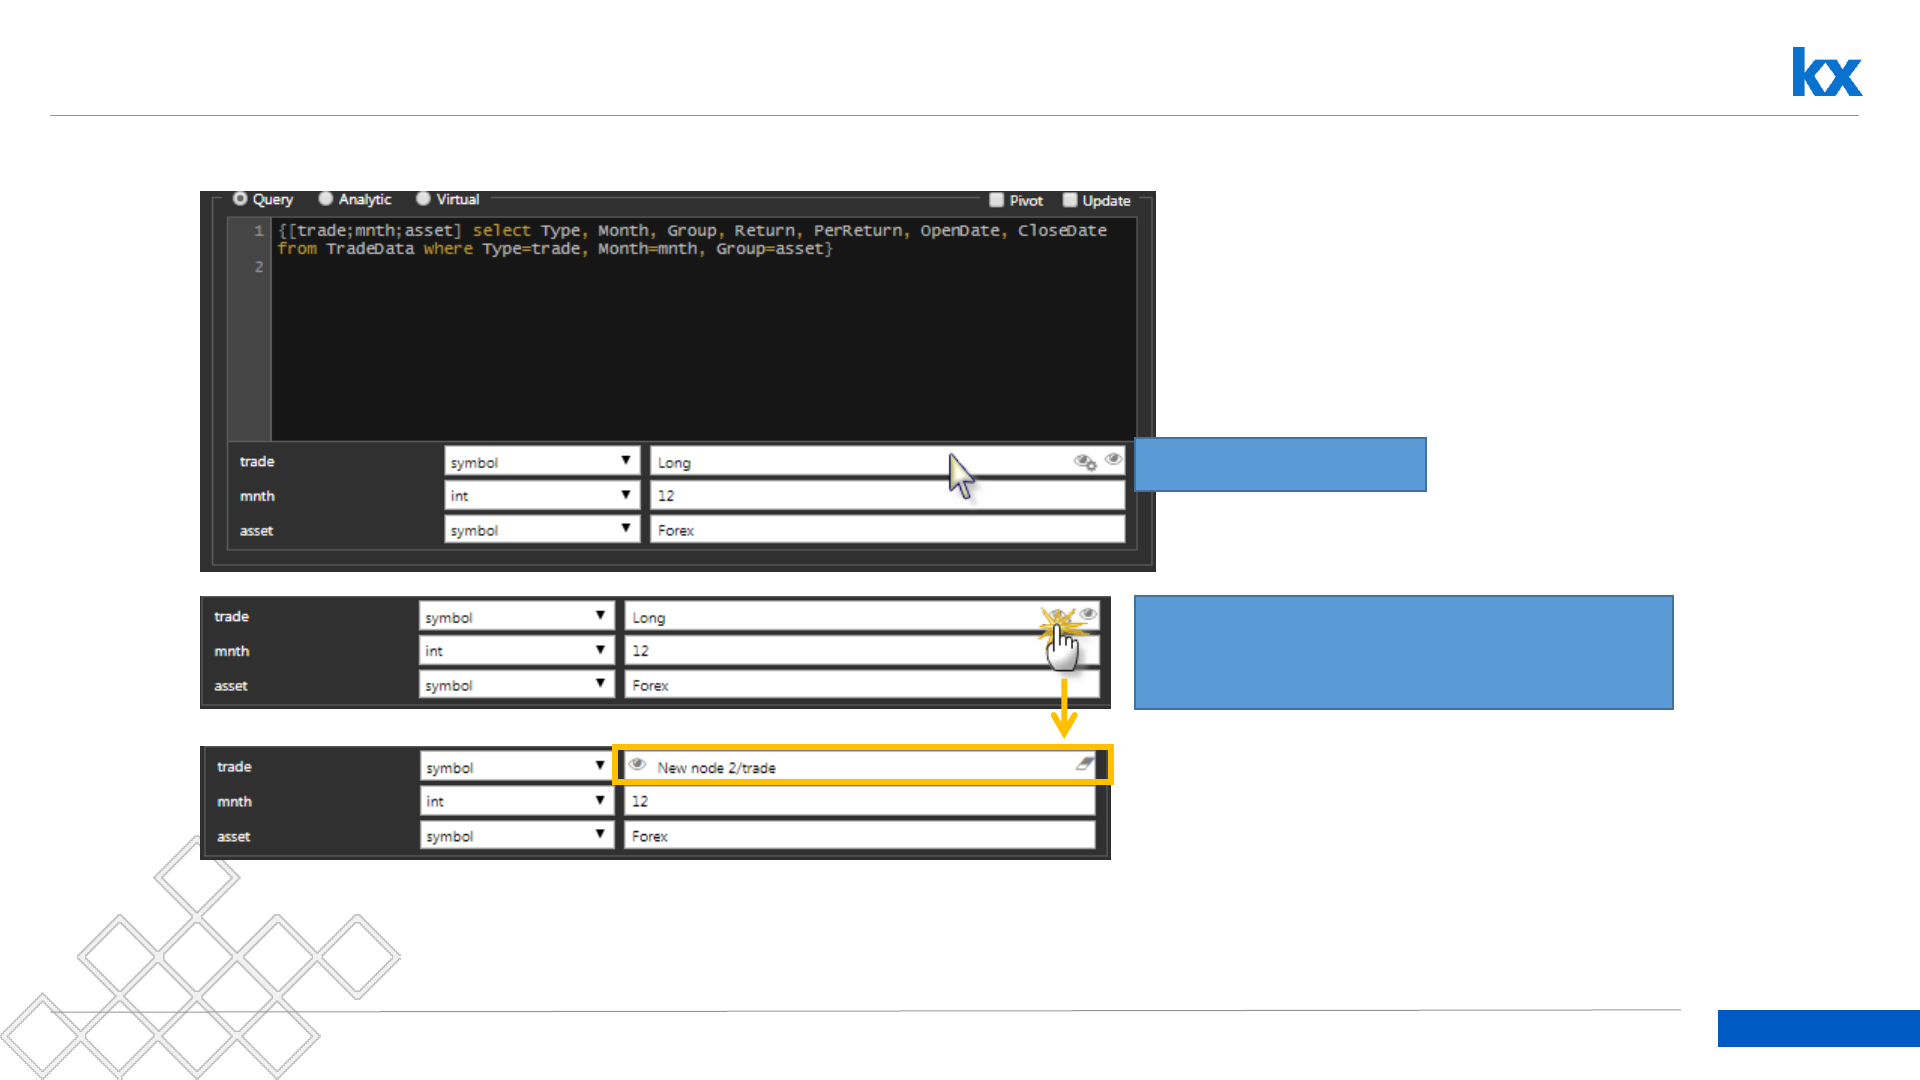
38
Dashboards for Kx – “How to” Guide
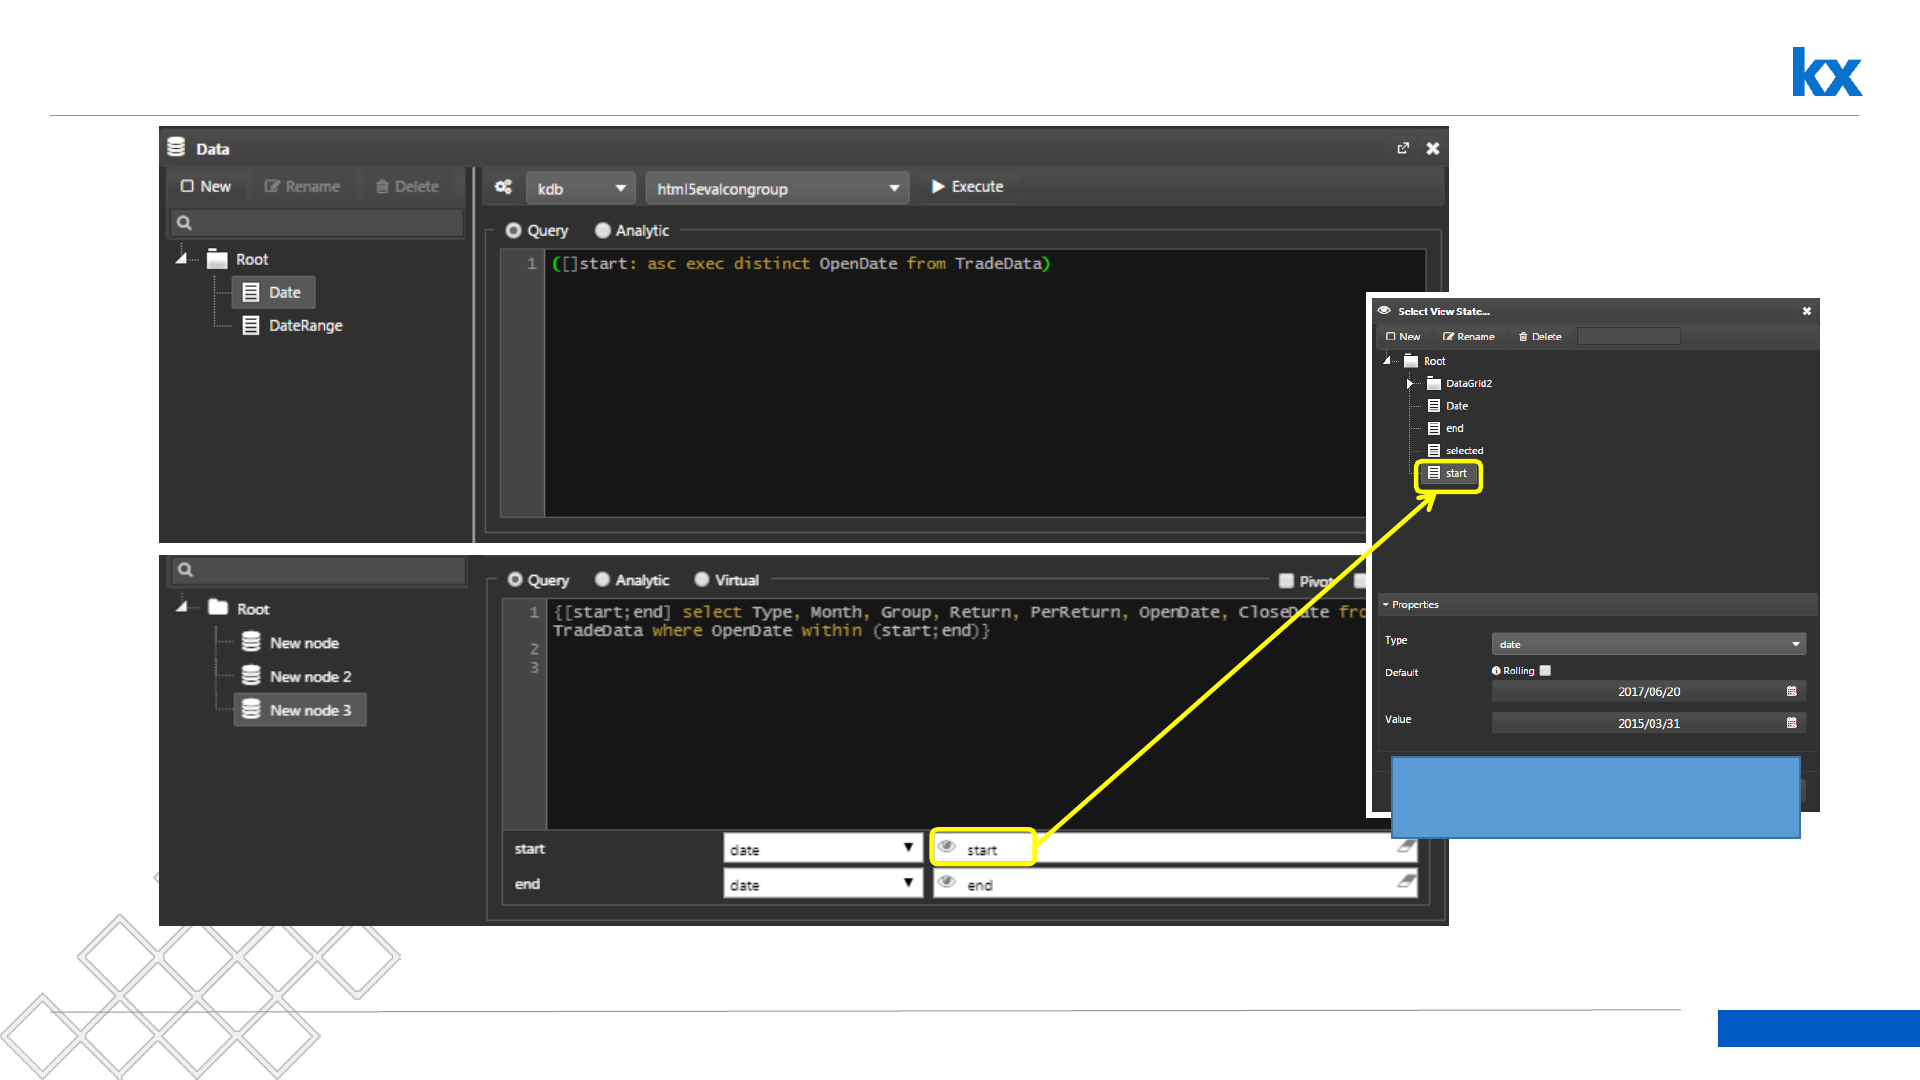
Map Query Parameters to Dashboard View State Parameters
Click the Eye icon+ to map the query
parameter to a dashboard View State
Parameter
Rollover to view Icons
39
Dashboards for Kx – “How to” Guide
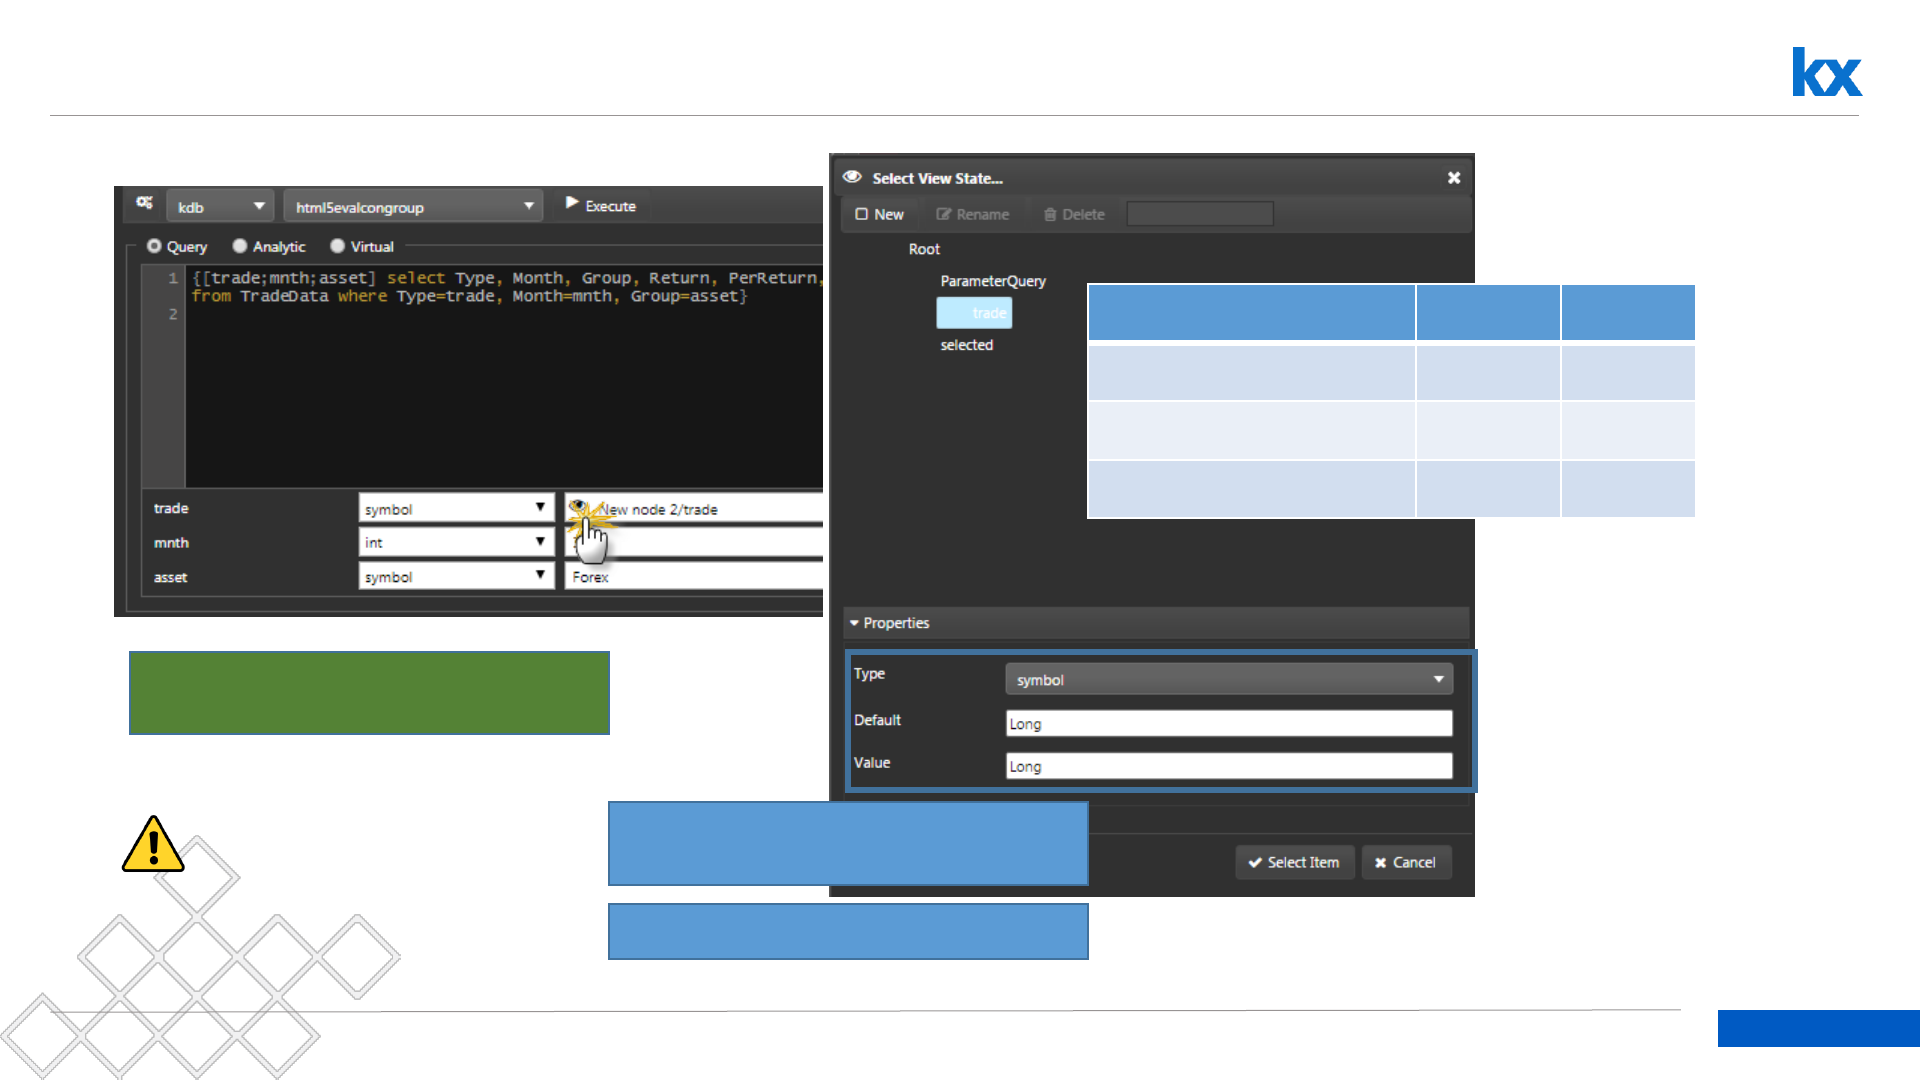
Set Dashboard View State Parameter Defaults
Click the Eye icon open the View State
Parameter menu
Set a Default Value which will carry to
the Value (filled on load)
Ensure the correct Type is
assigned to your data
View
State Parameter
Type
Value
Trade
symbol
Long
mnth
int
12
asset
symbol
Forex
Repeat for mnth and asset

40
Dashboards for Kx – “How to” Guide
Assigned View States for DataGrid2
41
Dashboards for Kx – “How to” Guide
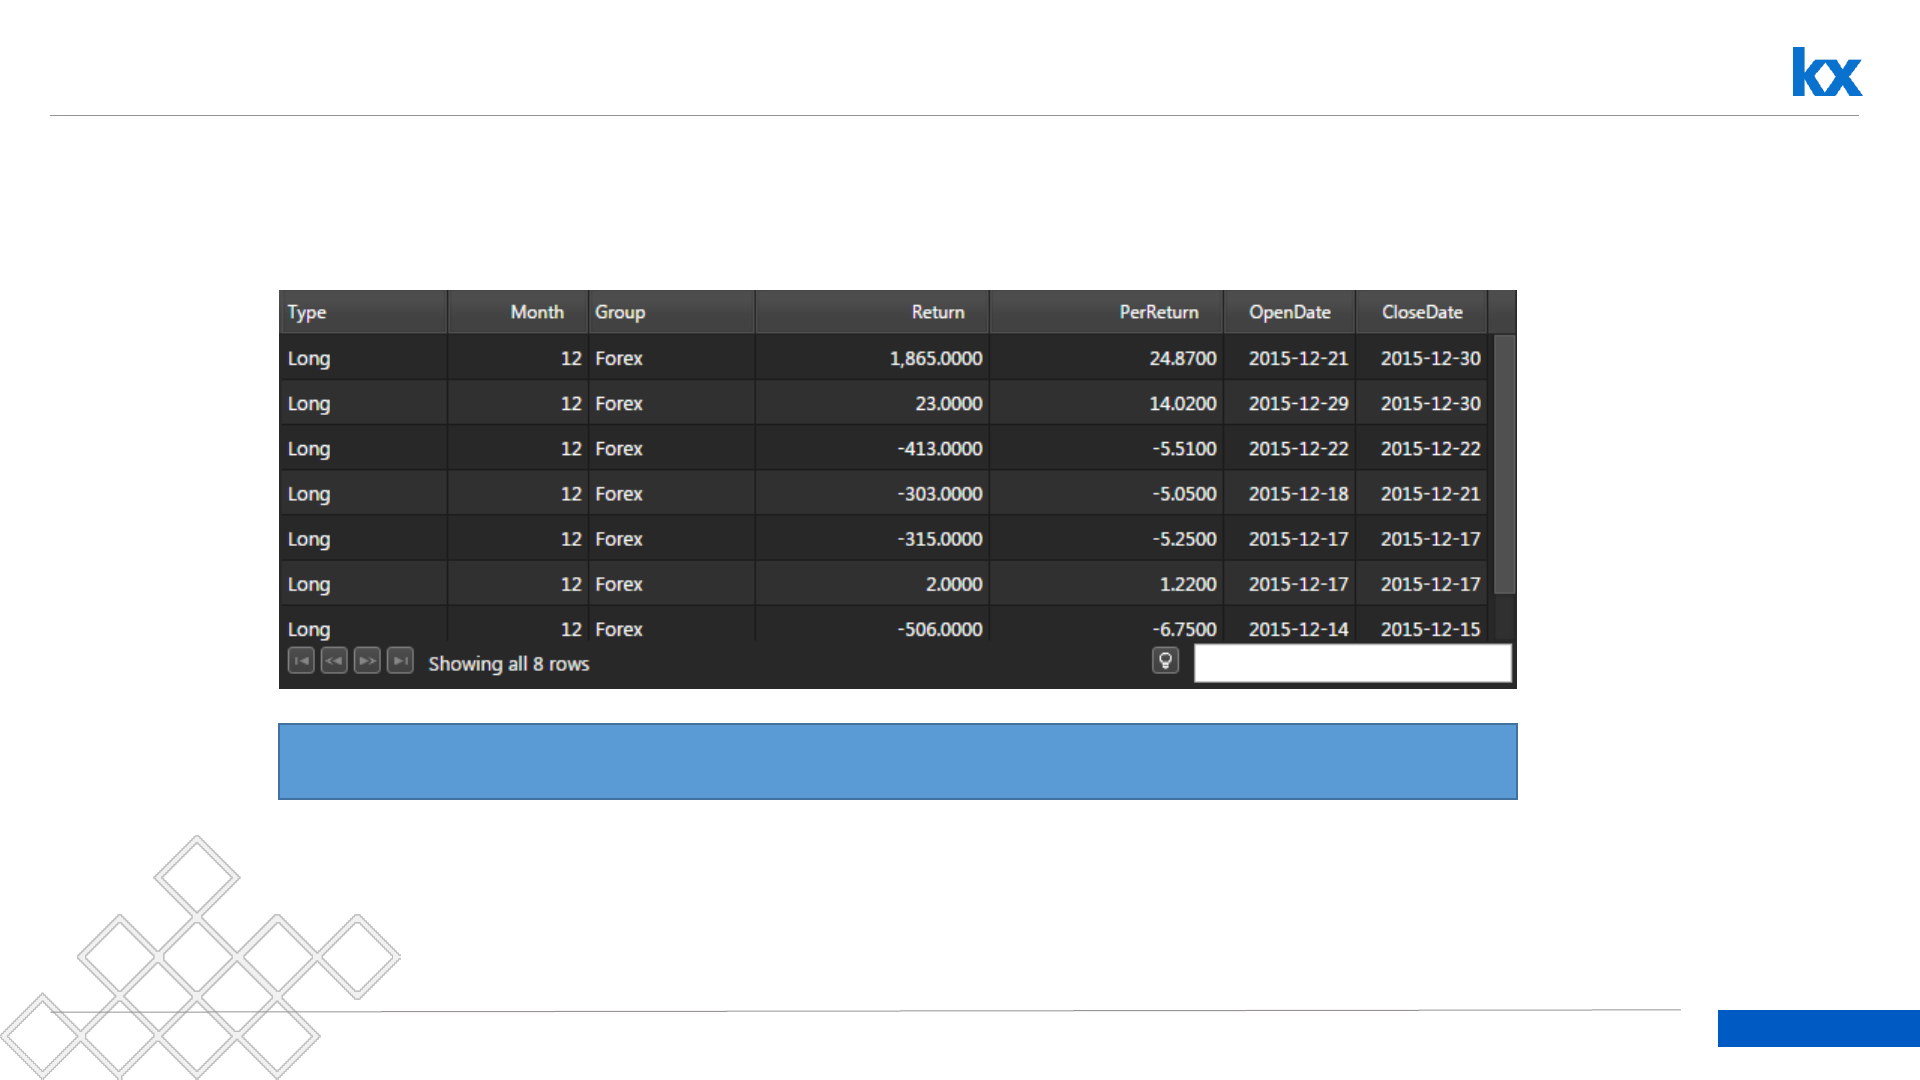
DataGrid2
Use Column Formats to improve the visual look of the Data Grid
42
Dashboards for Kx – “How to” Guide
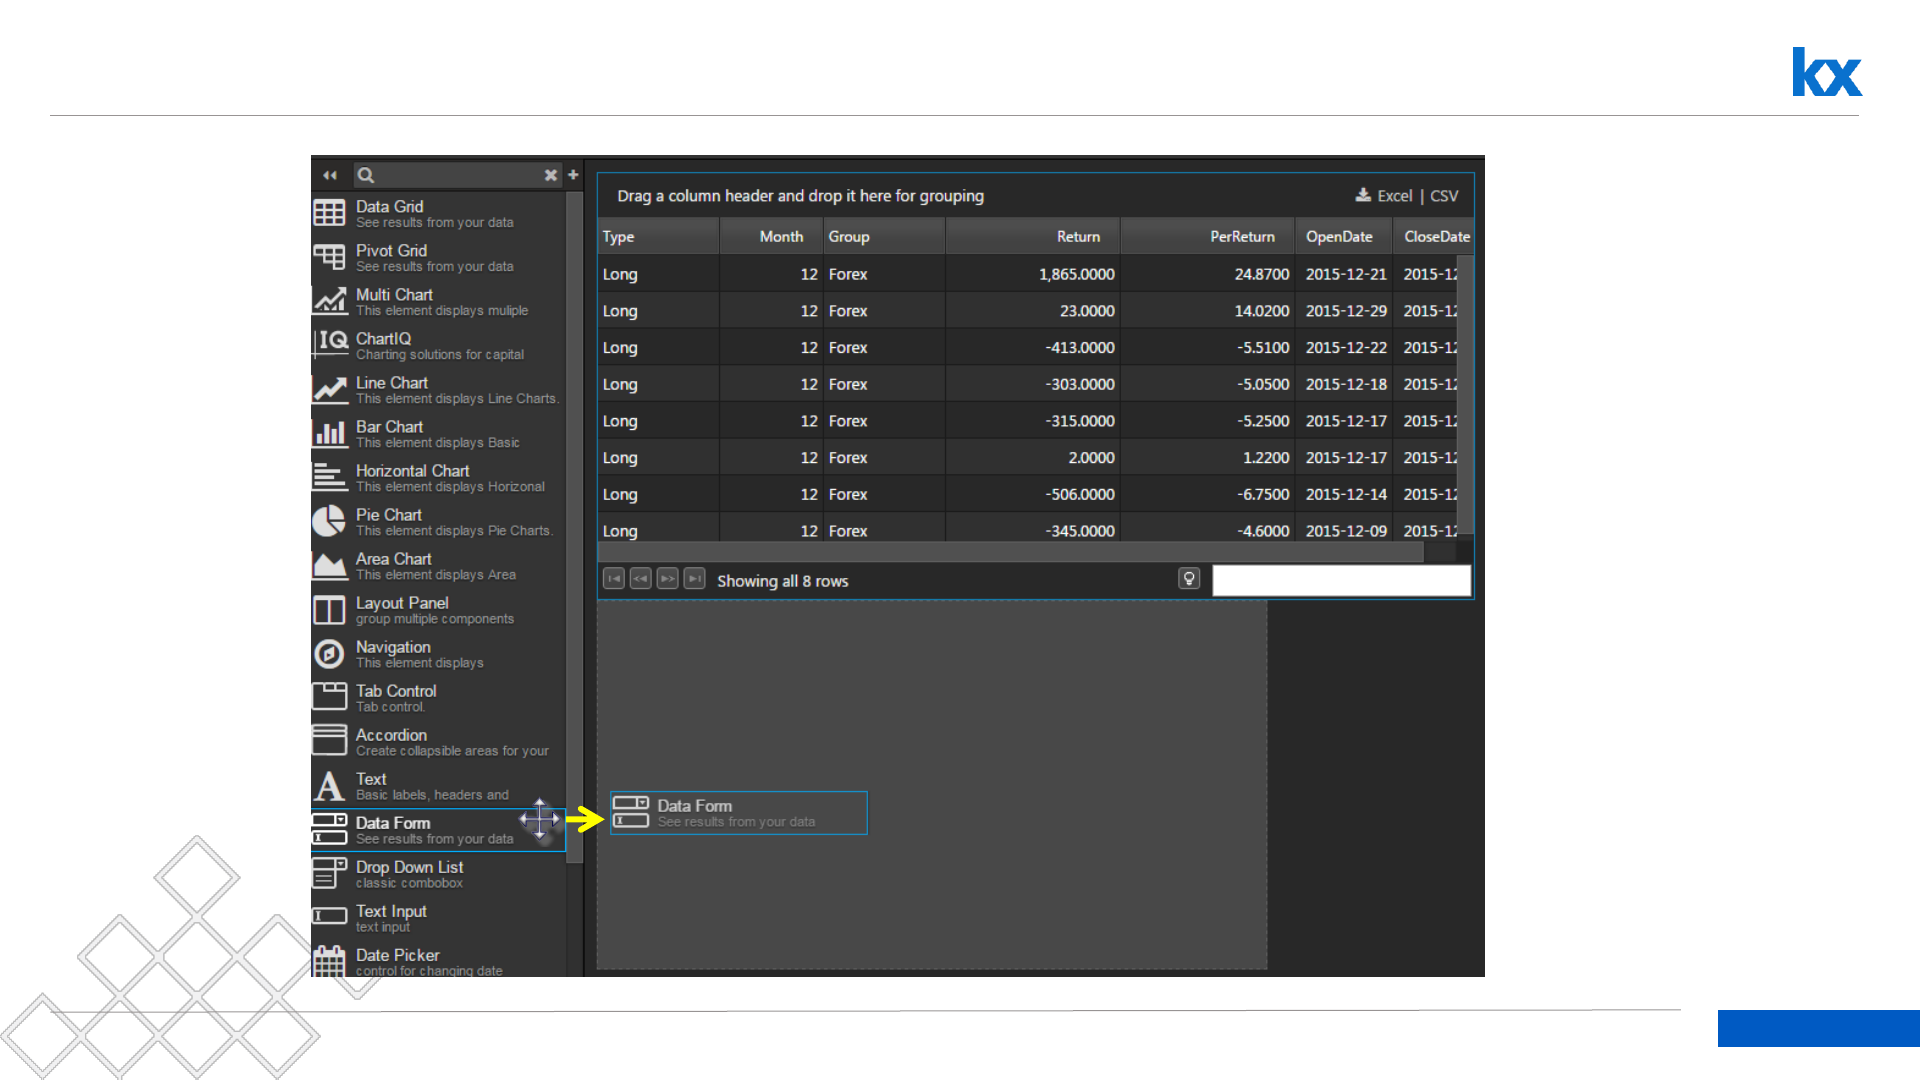
Add New Components: Data Form
43
Dashboards for Kx – “How to” Guide
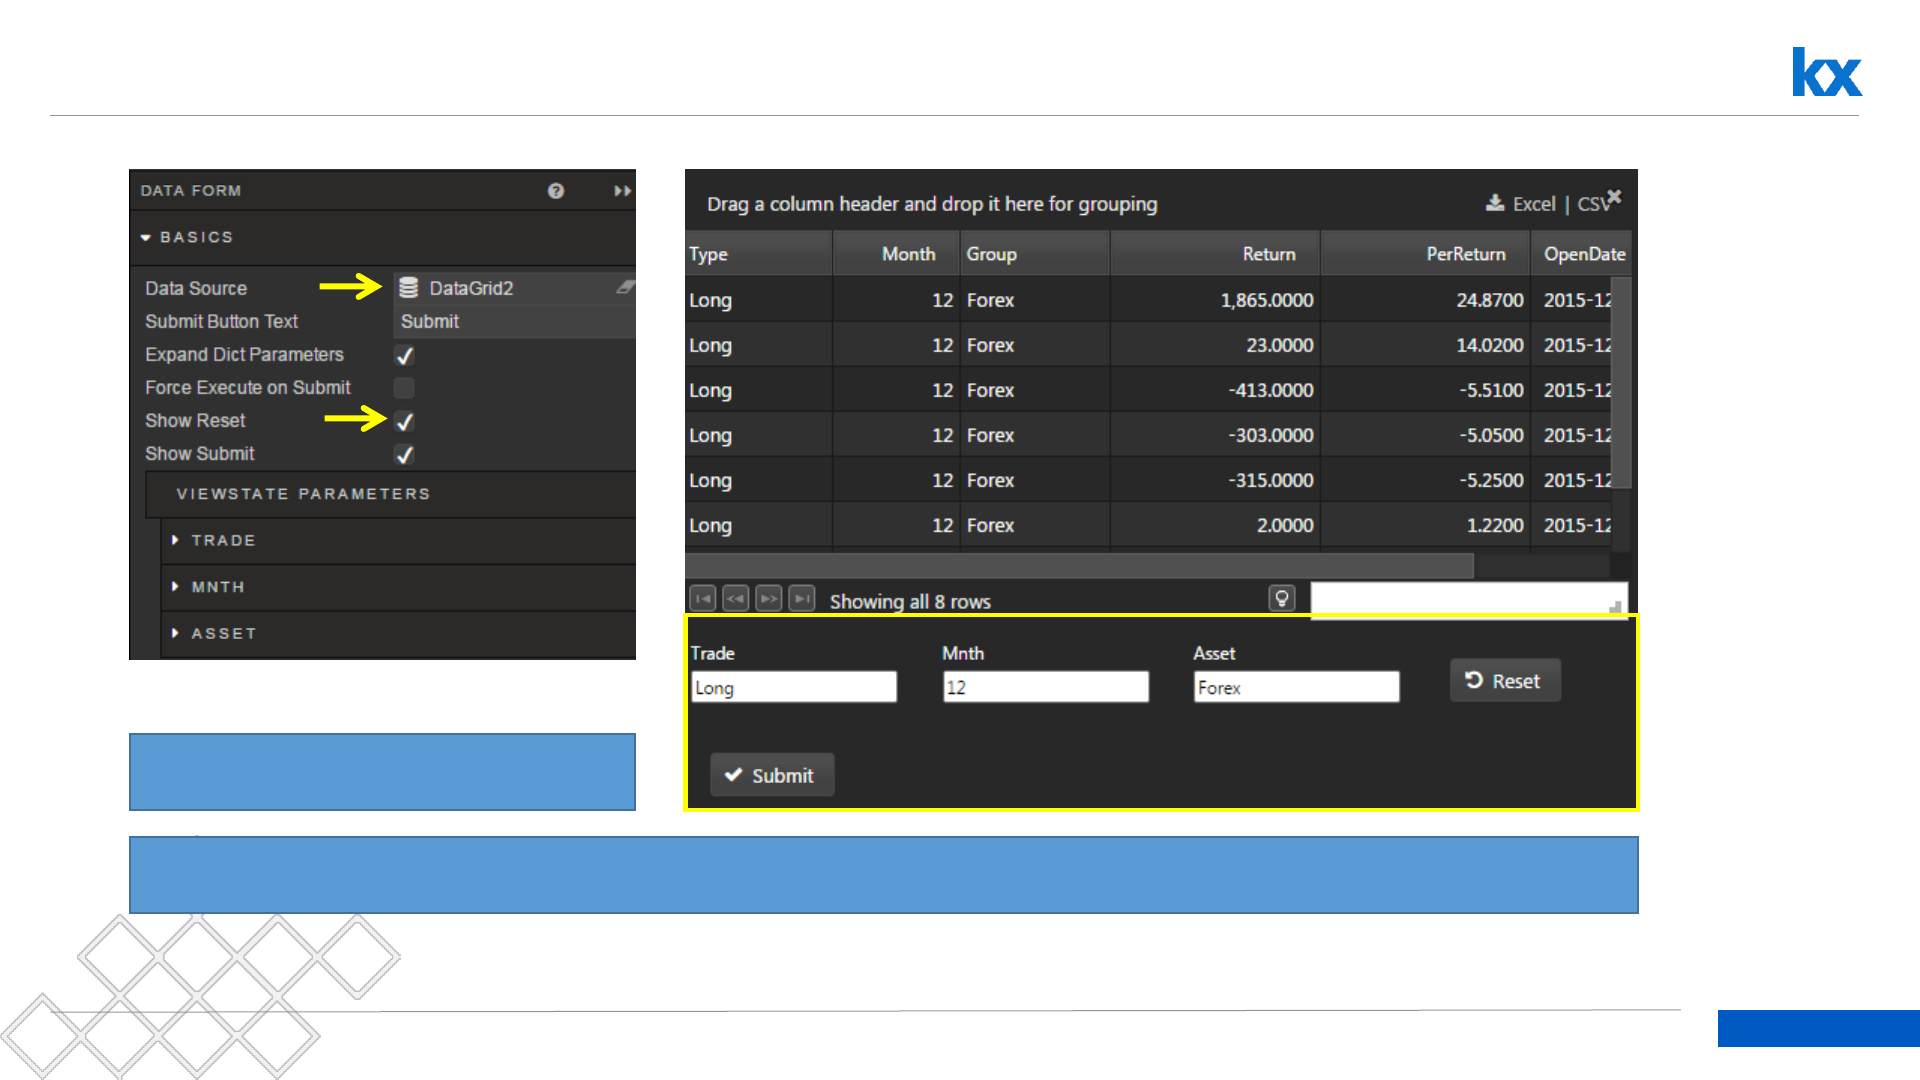
Configure: Data Form
DataGrid 2 applied to Data Source of
Data Form
Data Form will use default values of View State Parameters to populate Data Form input boxes.
44
Dashboards for Kx – “How to” Guide
Test Data Form Inputs
Asset
Mnth
Trade
Forex
12
Long
Commodity
11
Short
Equity
10
9
8
7
6
5
4
3
2
45
Dashboards for Kx – “How to” Guide
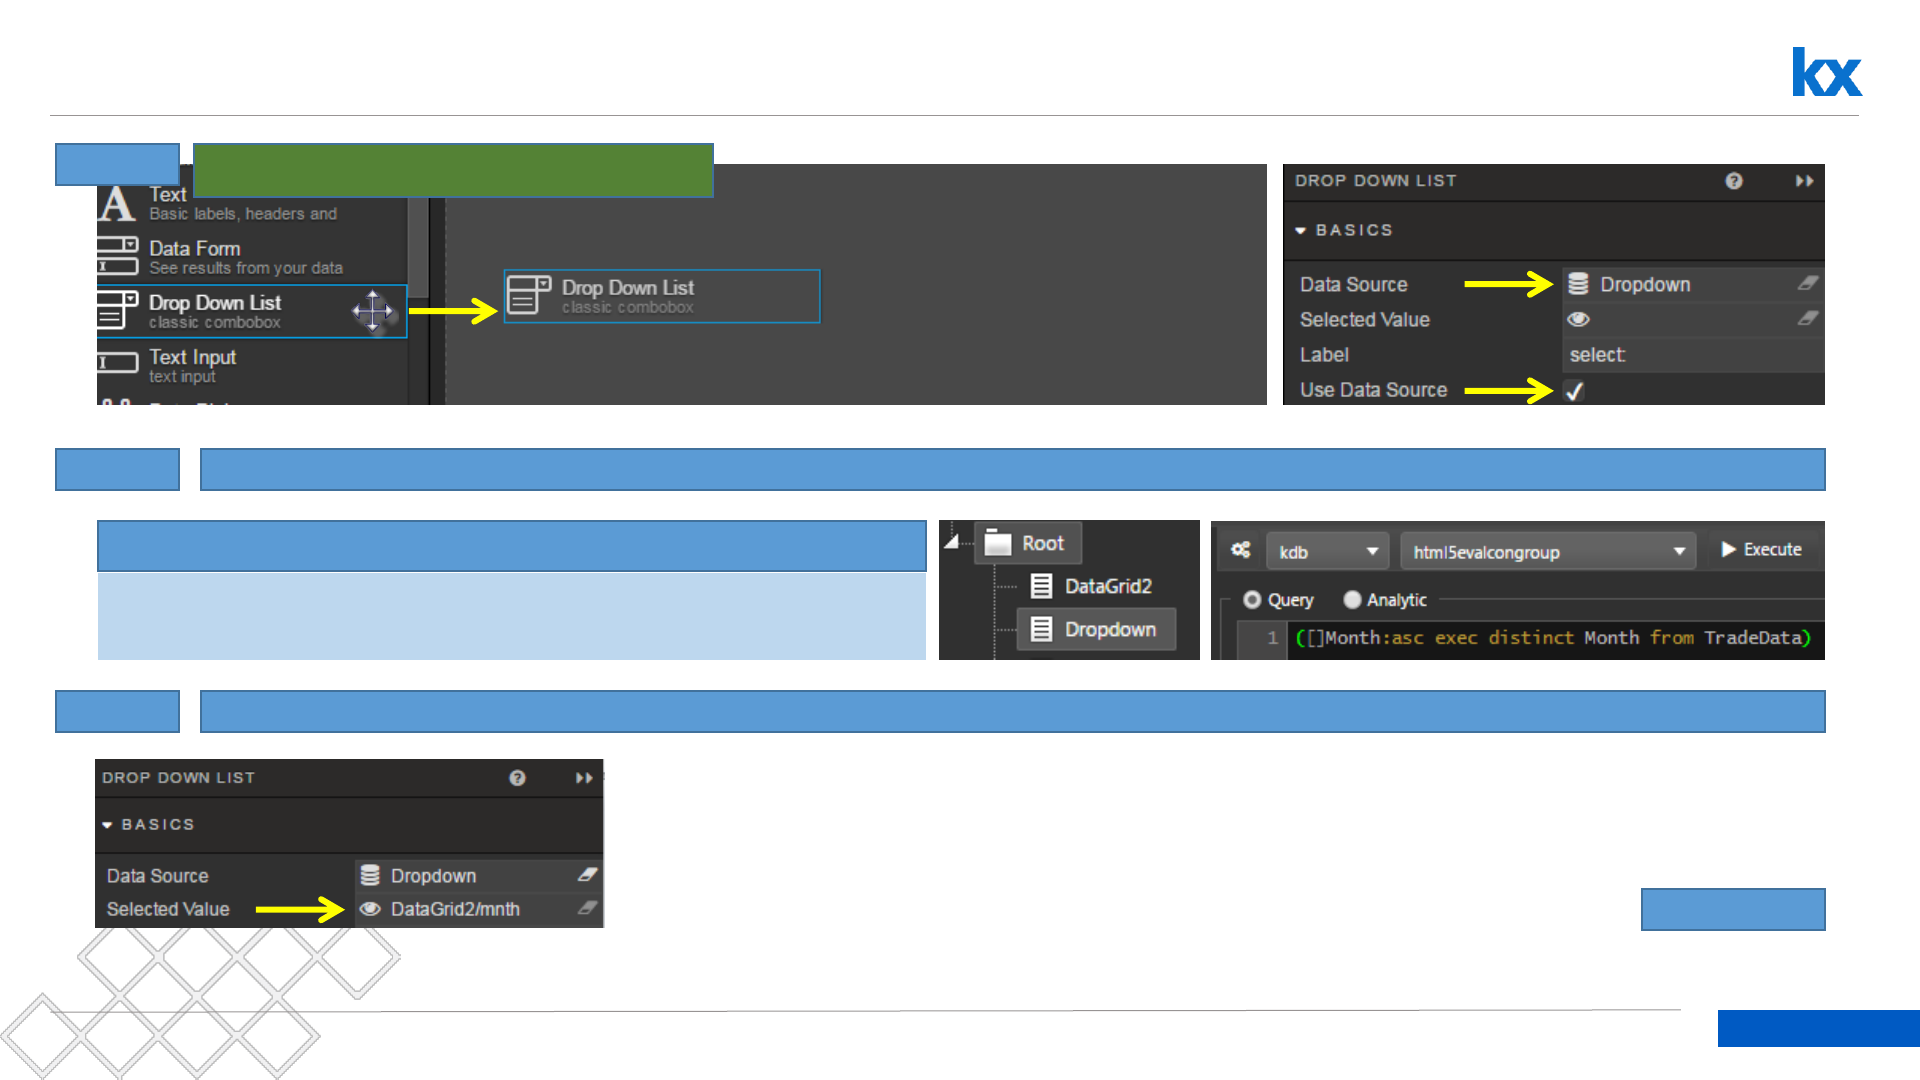
Use Dropdown component with a Data Source
Step: 1 Click-and-drag in a Drop Down component
Step: 2
([]Month: asc exec distinct Month from TradeData)
Create a Data Source which parses the individual categories – in this case, Month
Cut-and-paste into Dropdown Data Source Editor (html5evalcongroup)
Step: 3 Map the Selected Value of the dropdown to the View State Parameter of Mnth used by DataGrid2
Continued…

46
Dashboards for Kx – “How to” Guide
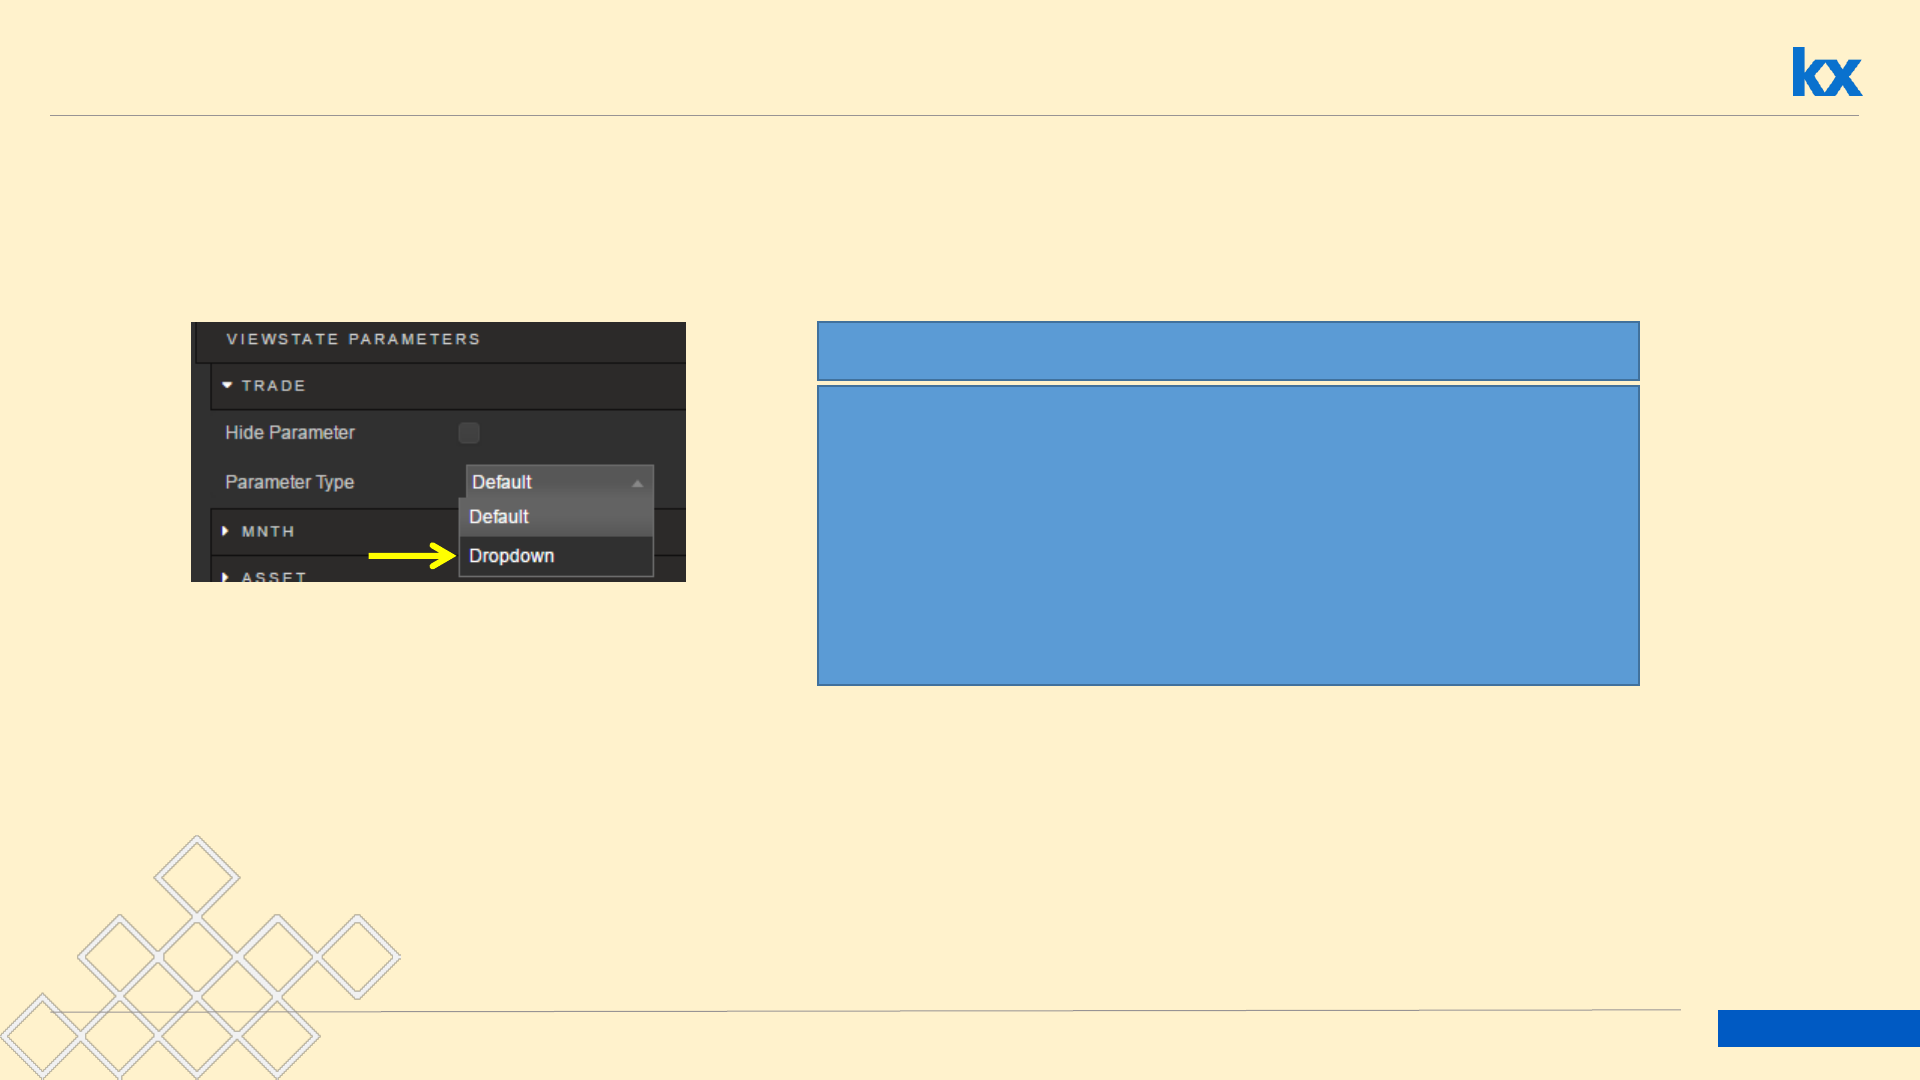
Use Dropdown component with a Data Source
Step: 4 Set the Data Source Mapping
Value and Text can be separate
columns if defined in Data Source
Step: 5 Preview
Change label size, dropdown width and description
Alternative
Step: 1 Set Selected Value to View State
Parameter to DataGrid2 Mnth
Step: 2 Uncheck Use Data Source
Step: 3 Define Items: Values and Text
Use Selected Row Viewstate Routing to assign selected
value to other view state parameters
47
Dashboards for Kx – “How to” Guide
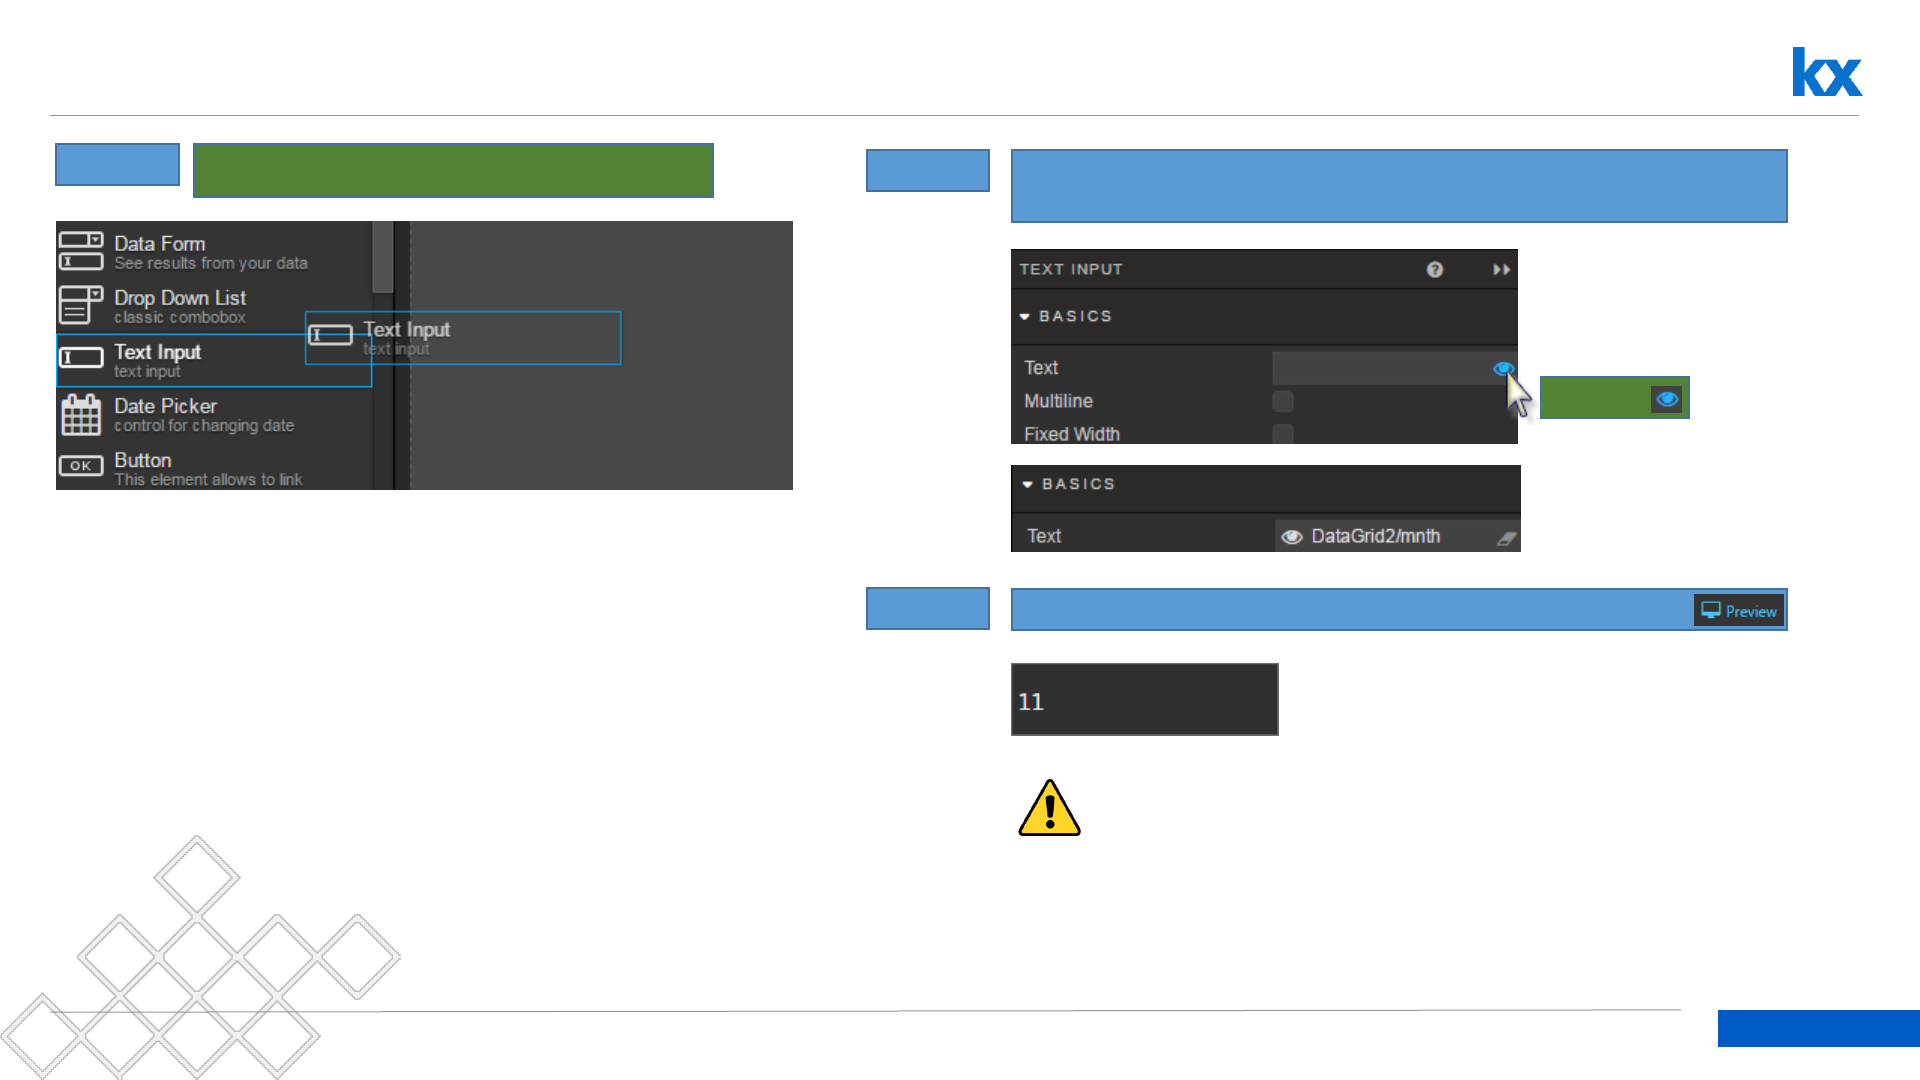
Use Text Input component with a View State Parameter
Step: 1 Click-and-drag in a Text Input component Step: 2 Map the Selected Value to the View State Parameter, Mnth used
by DataGrid2
Left-click
Step: 3 Preview
User has freedom to input any value; out of range values will return a
blank Data Grid
48
Dashboards for Kx – “How to” Guide
Try This for DataGrid2
•Using DataGrid2 configure a Dataform to use a dropdown for each View State of
mnth, asset and trade
DataGrid2
Data Grid
Data Form

Row Selection
Dashboards for Kx – “How to” Guide
Kx.com
50
Dashboards for Kx – “How to” Guide
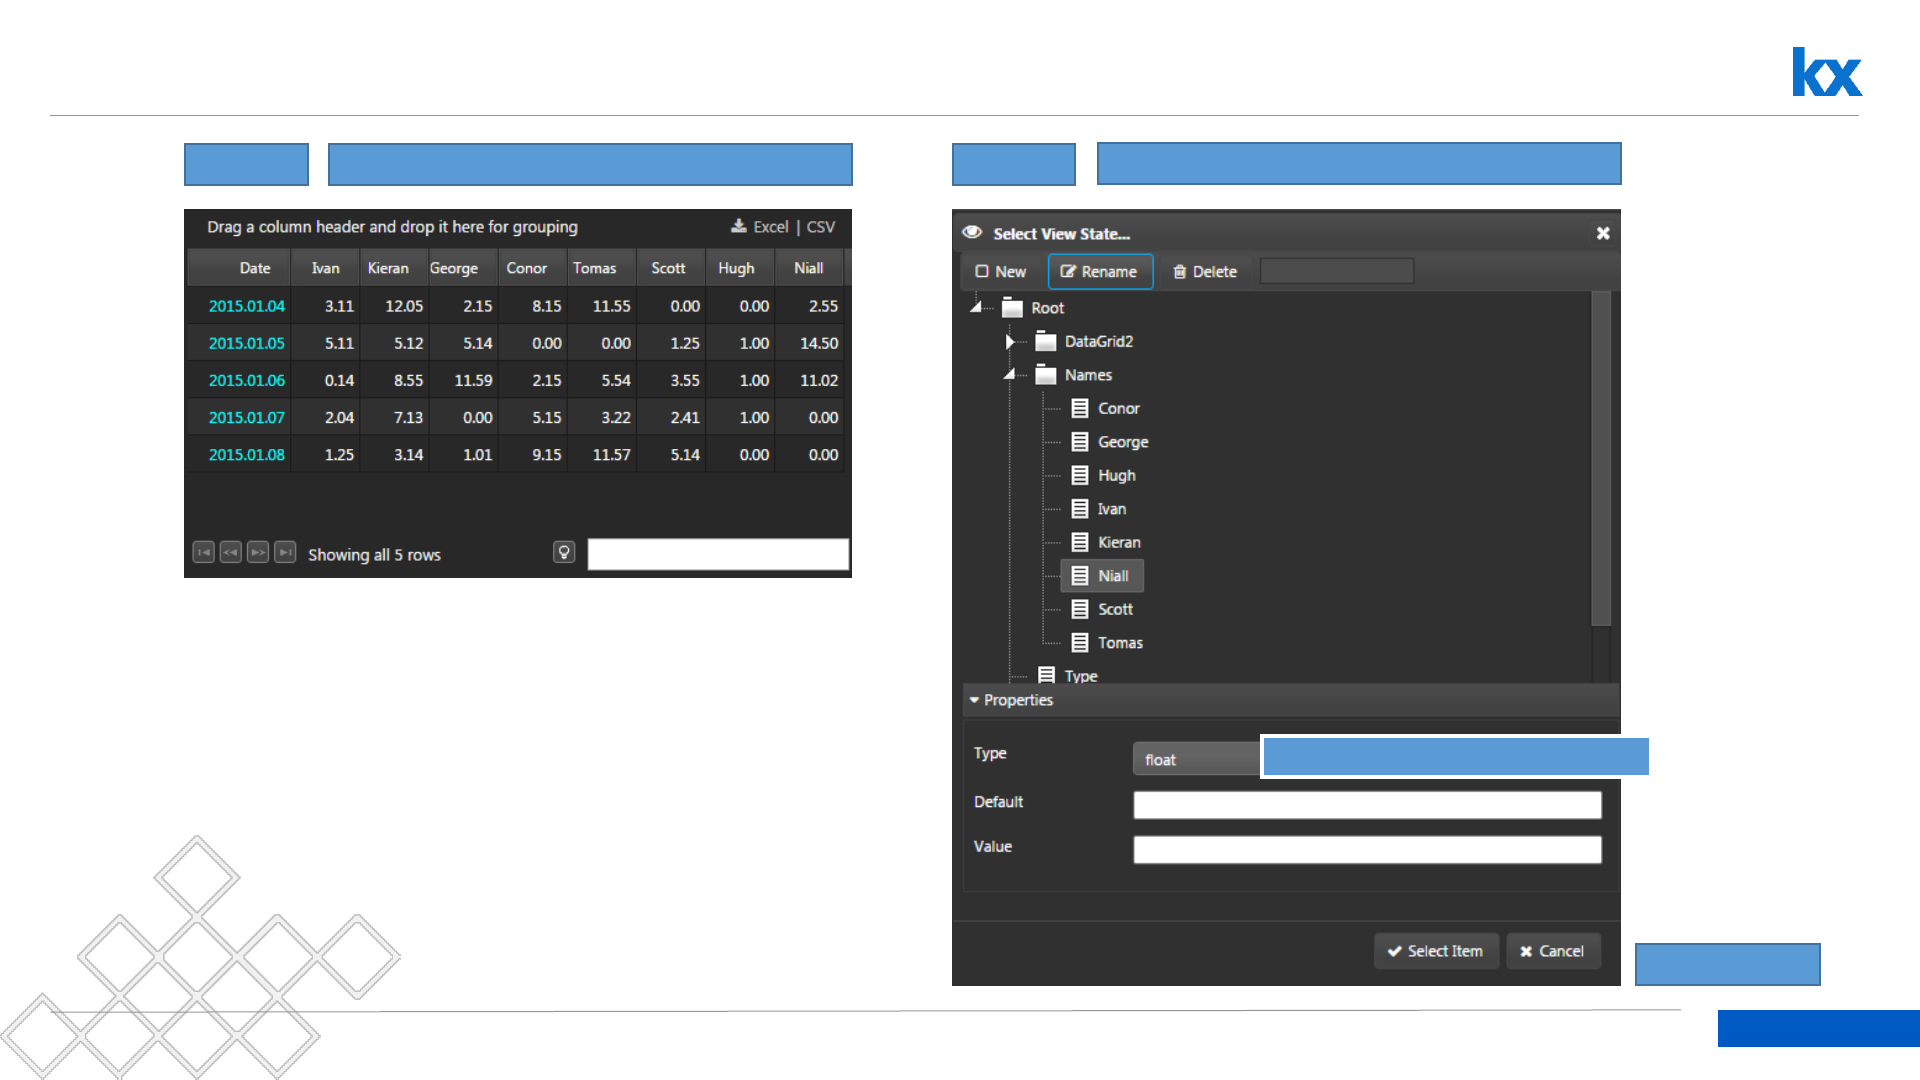
Row Selection: Data Grid populating View State Parameters
Step: 1 Open GroupName Data Grid Step: 2 Create View State Parameters for each user
Use Type: Float
Continued…
51
Dashboards for Kx – “How to” Guide
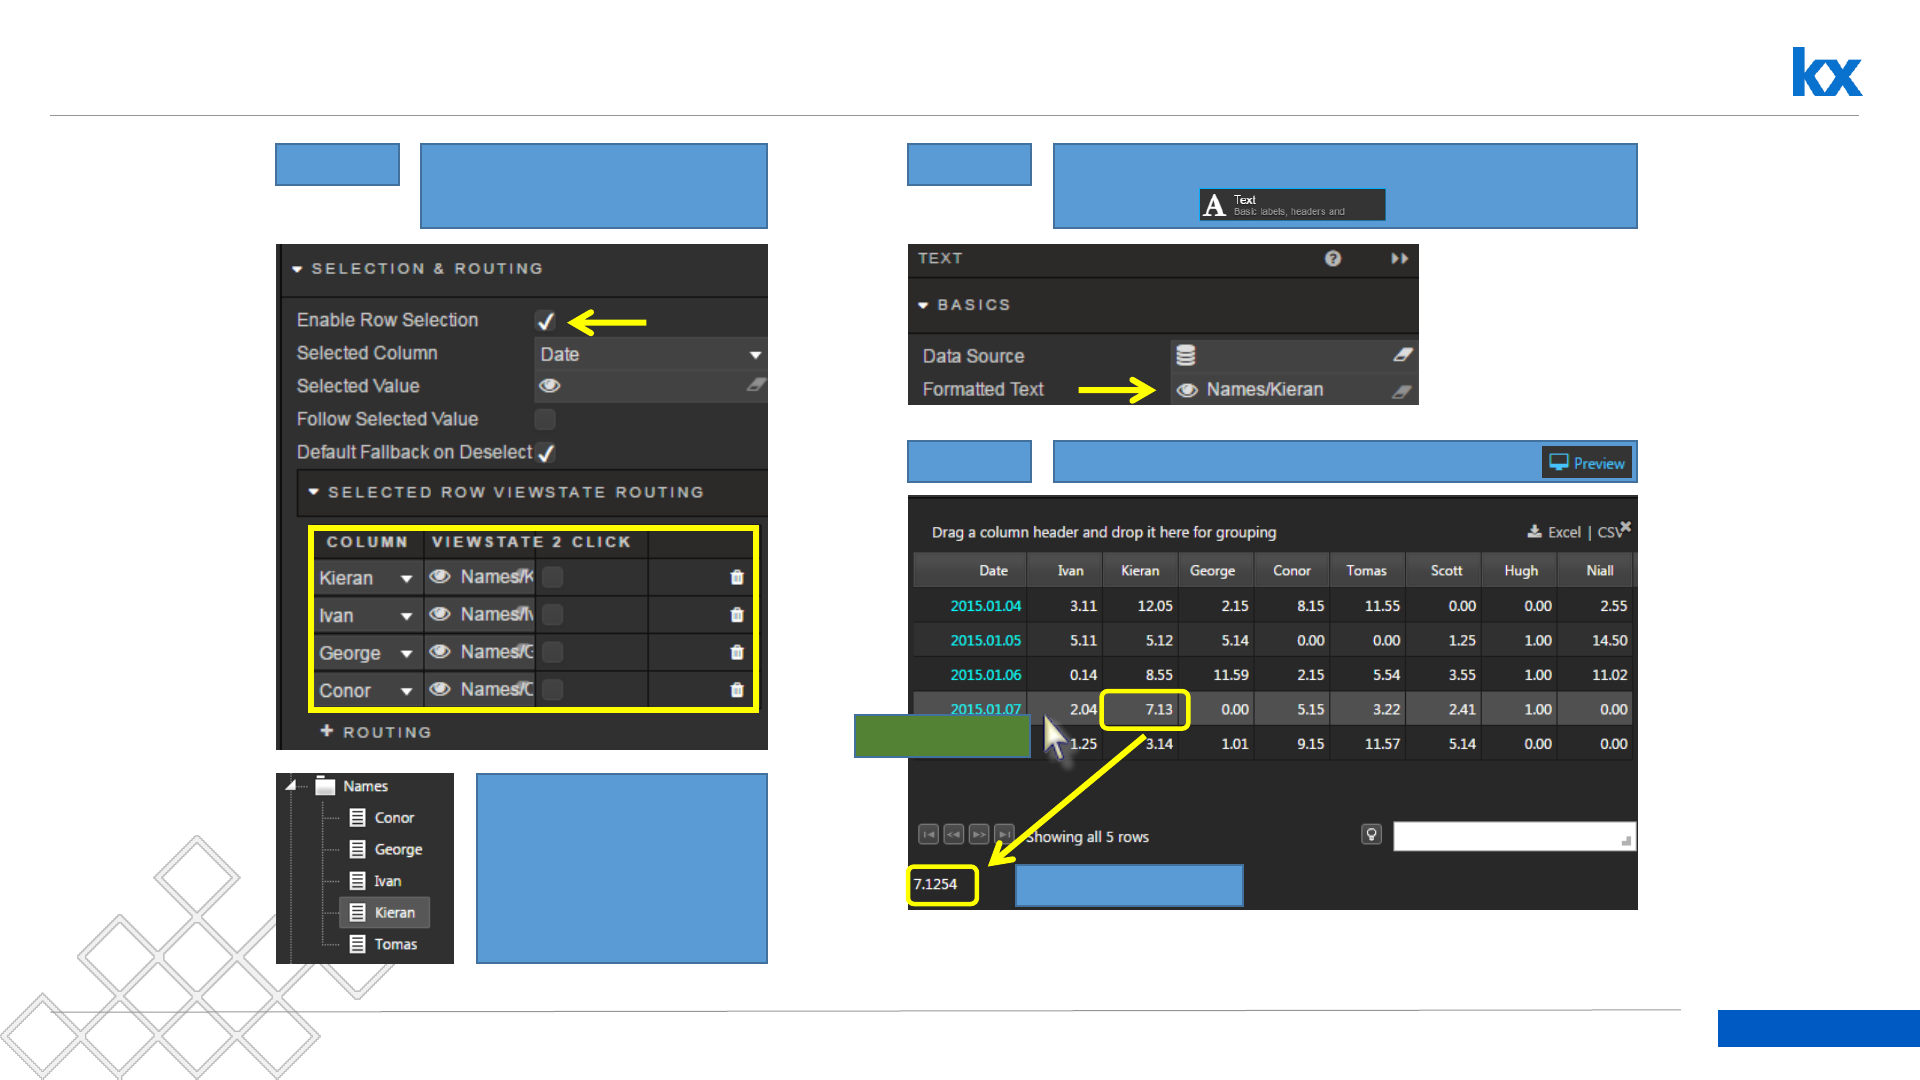
Row Selection: Data Grid populating View State Parameters, presented in a Text component
Step: 3 Enable Row Selection in
GroupName Data Grid
In Selected Row
Viewstate Routing
map Data Source
Column to named
Viewstate
Step: 4 Add a Text component and Link to a named
Viewstate
Step: 5 Preview: Select Row
Text Component
Click-on-row
52
Dashboards for Kx – “How to” Guide
Try This for GroupName
•Create a view state routing for each named individual
•Associate each view state with a text output, so user can view values for each
user when a row is selected.
GroupName
Data Grid
Name 1
Text Component
Name 2
Text Component
Name 3
Text Component
Name 4
Text Component

Date Picker
Dashboards for Kx – “How to” Guide
Kx.com

54
Dashboards for Kx – “How to” Guide
Date Picker: New Queries SourceDate and DateRange
•Create Data Source: SourceDate
•Connection: html5eval_grp (or html5evalcongroup)
•Create Data Source: DateRange
•Connection: html5eval_grp (or html5evalcongroup)
•Map query parameters, start and end to dashboard view states: start and end
([]start: asc exec distinct OpenDate from TradeData)
{[start;end] select Type, Month, Group, Return, PerReturn, OpenDate, CloseDate from
TradeData where OpenDate within (start;end)}
Support for date picker requires a little modification to the query to support a date range. Create two new
data sources:
55
Dashboards for Kx – “How to” Guide
Queries SourceDate and DateRange
Viewstate for start and end
should be of Type: Date

56
Dashboards for Kx – “How to” Guide
Add a Data Grid and Two Date Pickers
Step: 1
Add Two Date Pickers to the Dashboard
Step: 2 Add Data Grid: DateRange
Step: 3 Connect Data Source and Dashboard Viewstate parameter for each picker
Step: 4 In Preview mode, change Start and End Dates (Feb-Dec 2015)

Pivot Grid & Breadcrumbs
Dashboards for Kx – “How to” Guide
Kx.com
58
Dashboards for Kx – “How to” Guide
Pivot Grid: New Query PivotData
Pivot Grids create data groupings (independent variables) with summary statistics from dependent variables;
e.g. sum, average, count, min and max values. Navigation is controlled using the Breadcrumbs component.
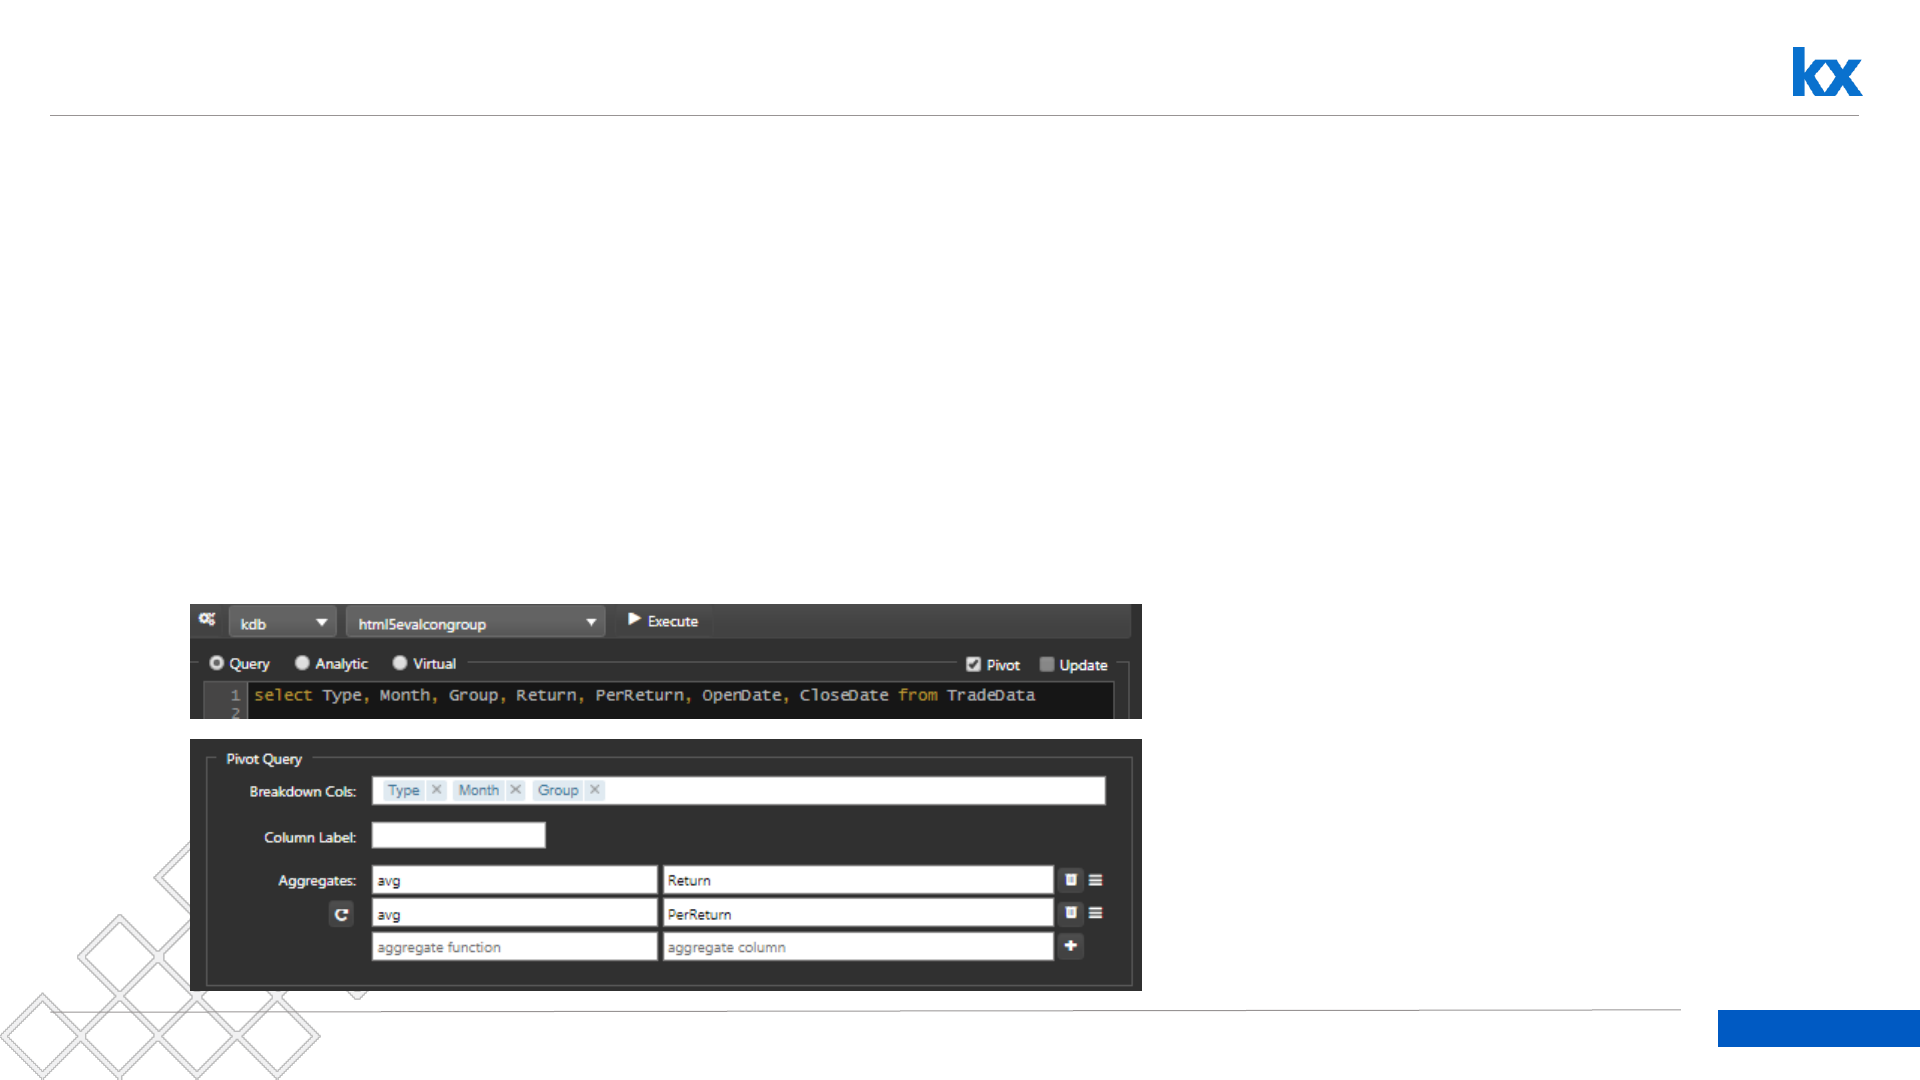
•Create Data Source: PivotData
•Connection: html5eval_grp (or html5evalcongroup)
•Check Pivot Query
select Type, Month, Group, Return, PerReturn, OpenDate, CloseDate from TradeData
Breakdown Cols: Type, Month, Group
Aggregates (avg): Return, PerReturn
59
Dashboards for Kx – “How to” Guide
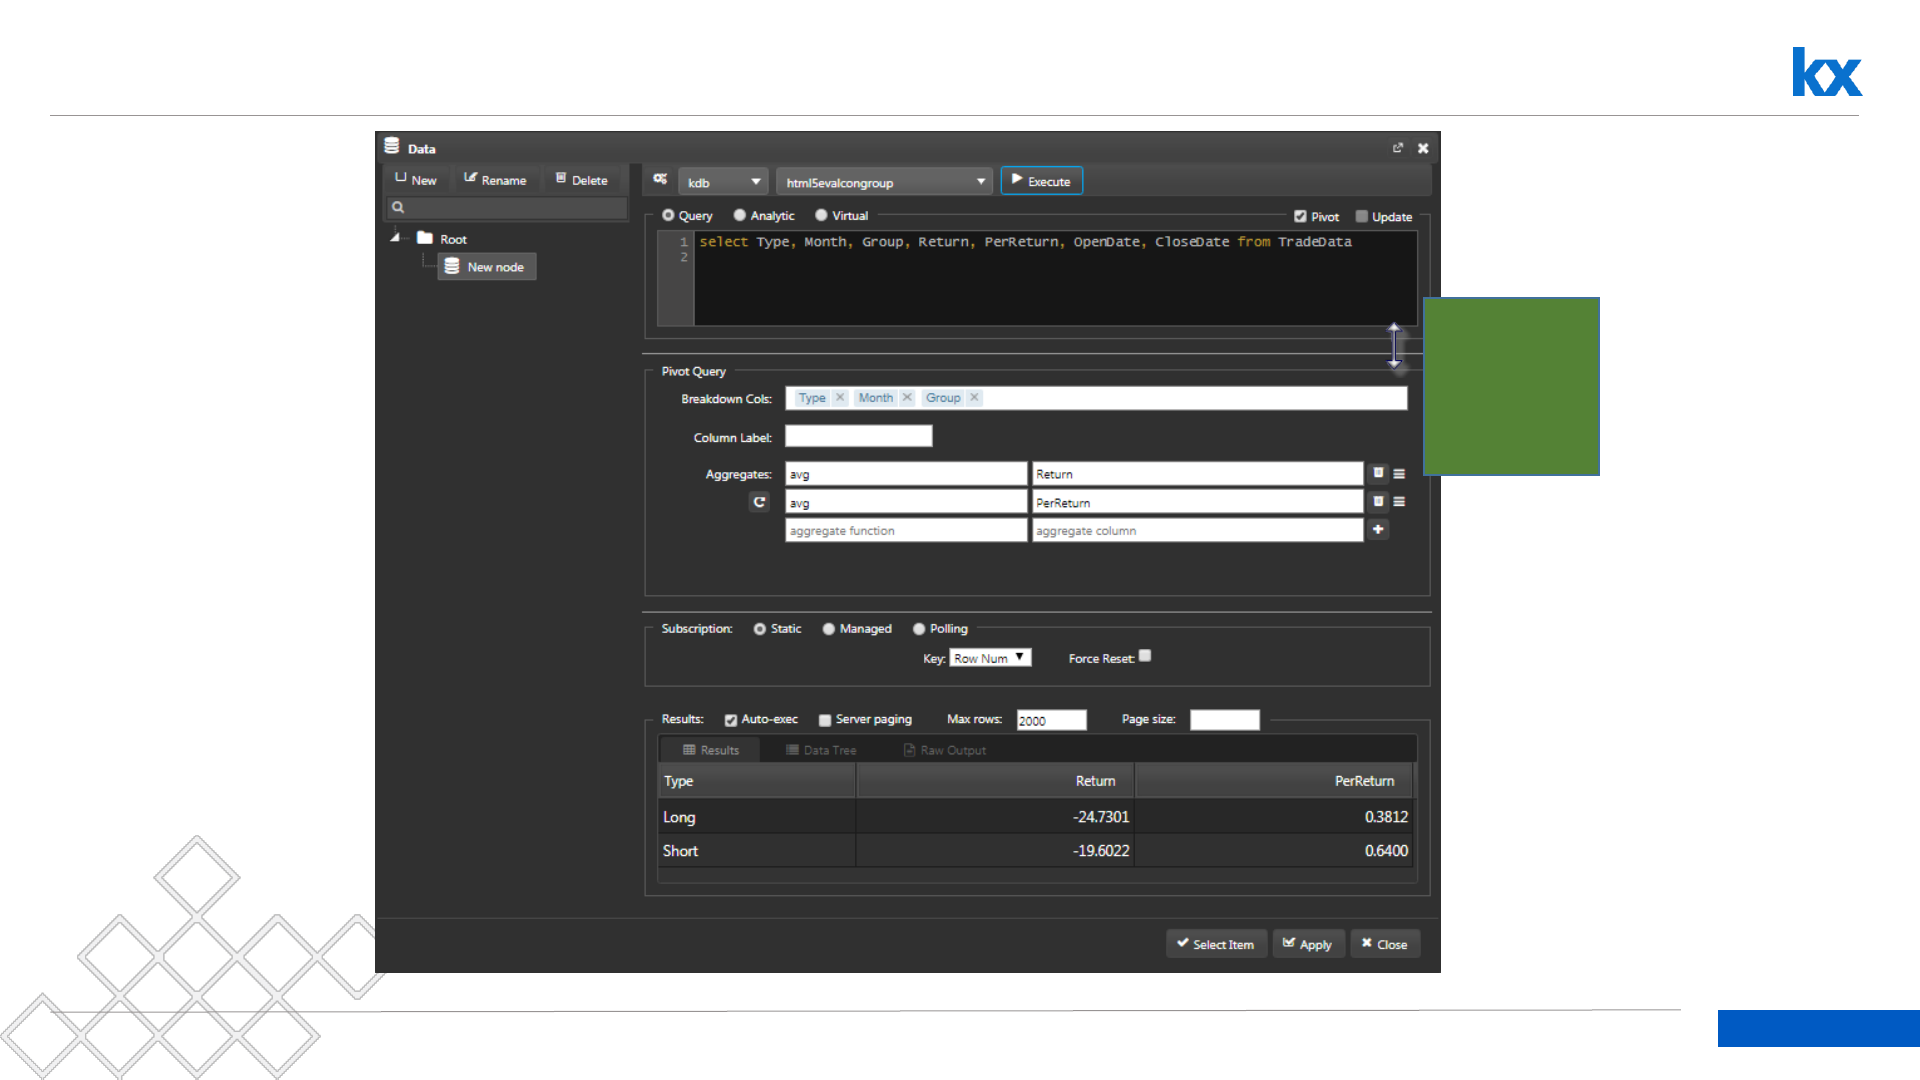
Complete Date Editor: PivotData
Left-click-
drag to
increase
viewable
area
60
Dashboards for Kx – “How to” Guide
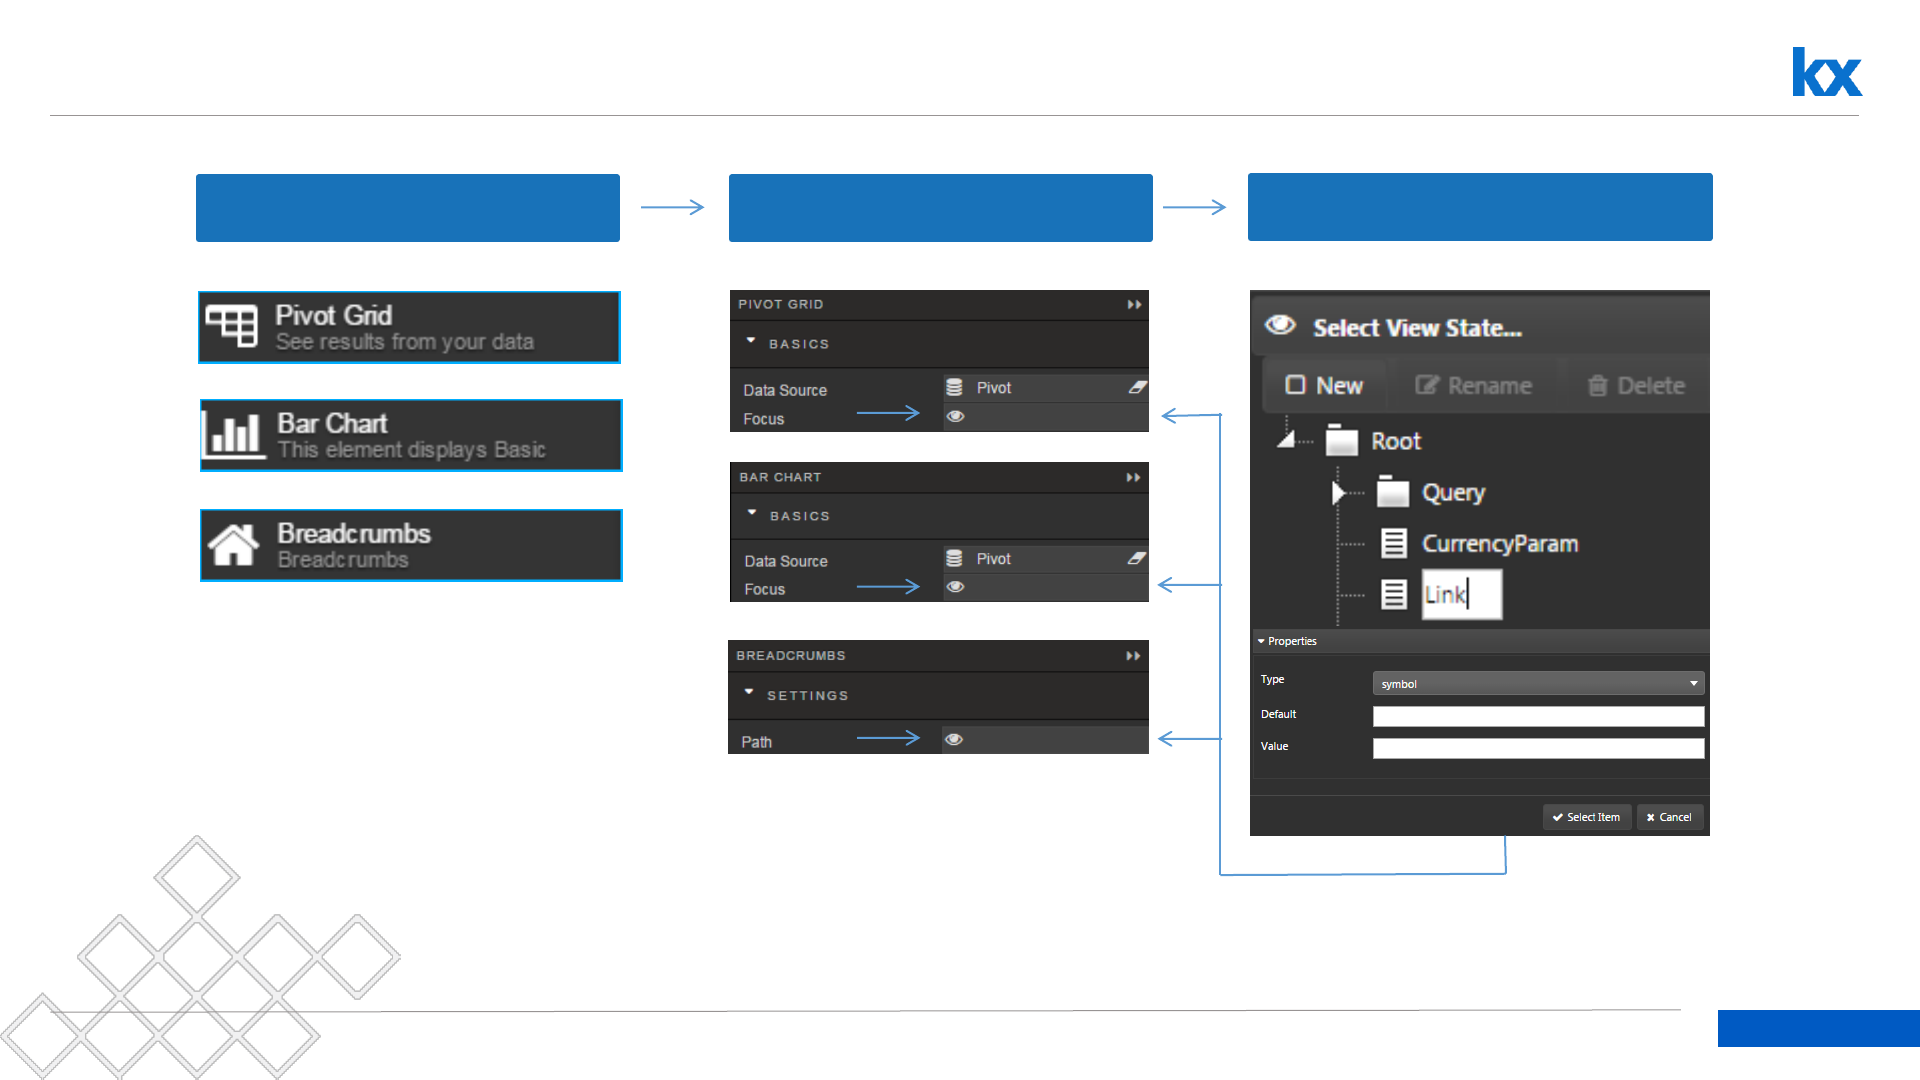
Linking Pivot Grid to Breadcrumbs
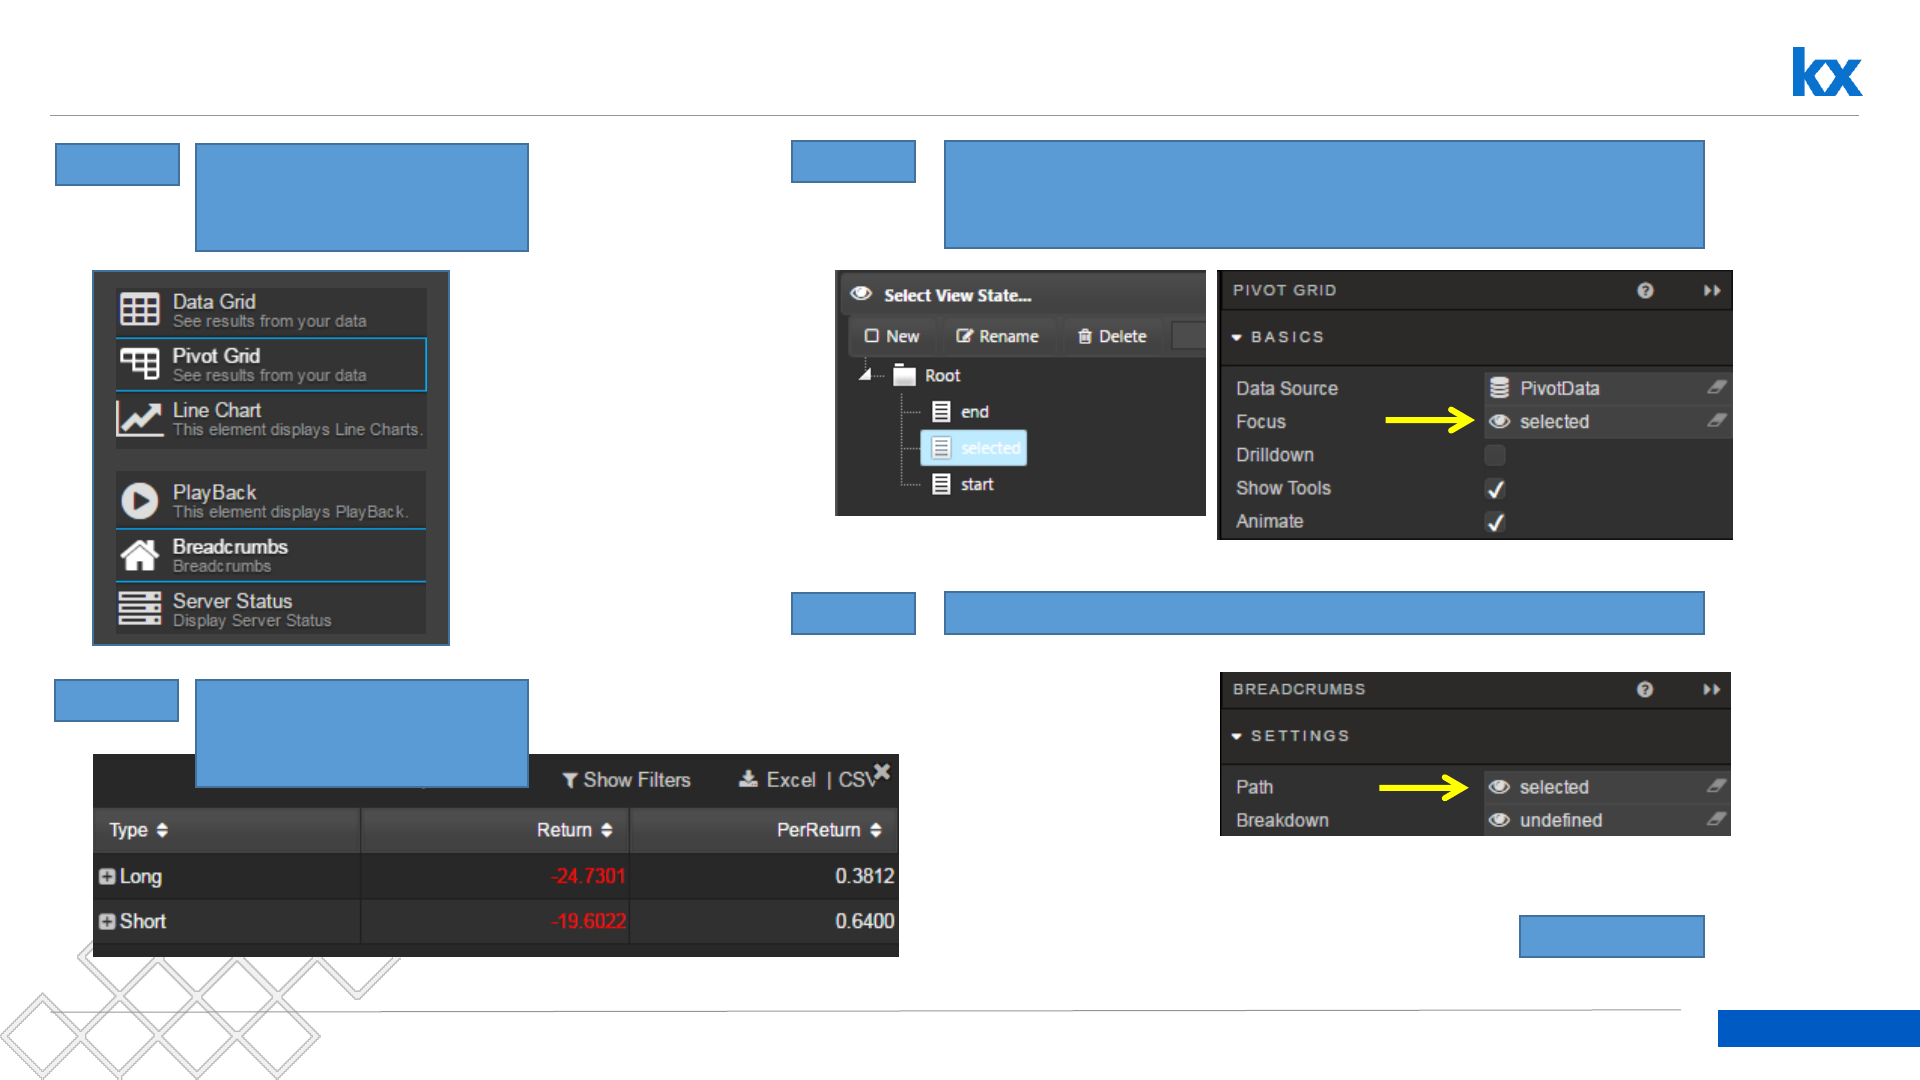
Step: 1 Drag a Pivot Grid and
Breadcrumbs component
into dashboard
Step: 2 Configure Pivot Grid as
PivotData
Step: 3 Create a Viewstate called selected of type symbol. Map to
Focus property of Pivot Grid.
Step: 4 Link selected property to Path of Breadcrumbs
Continued…

61
Dashboards for Kx – “How to” Guide
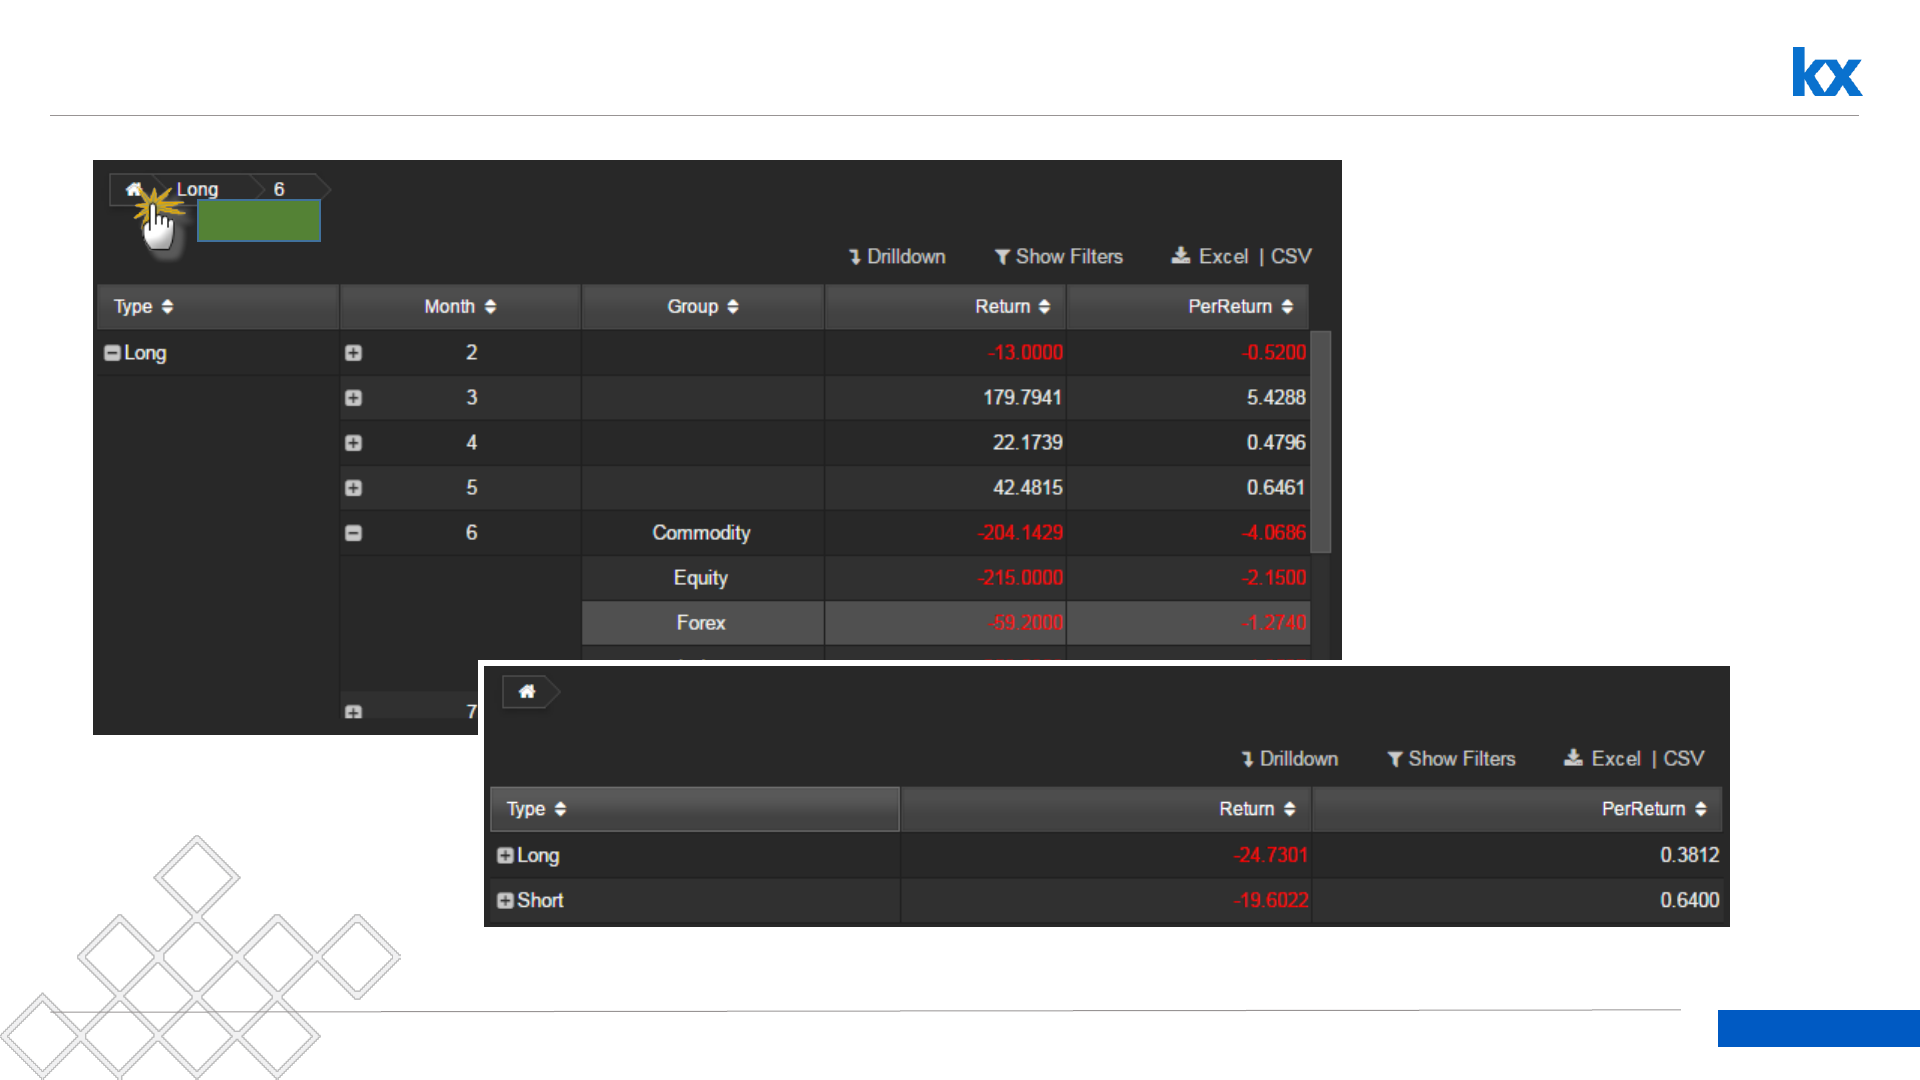
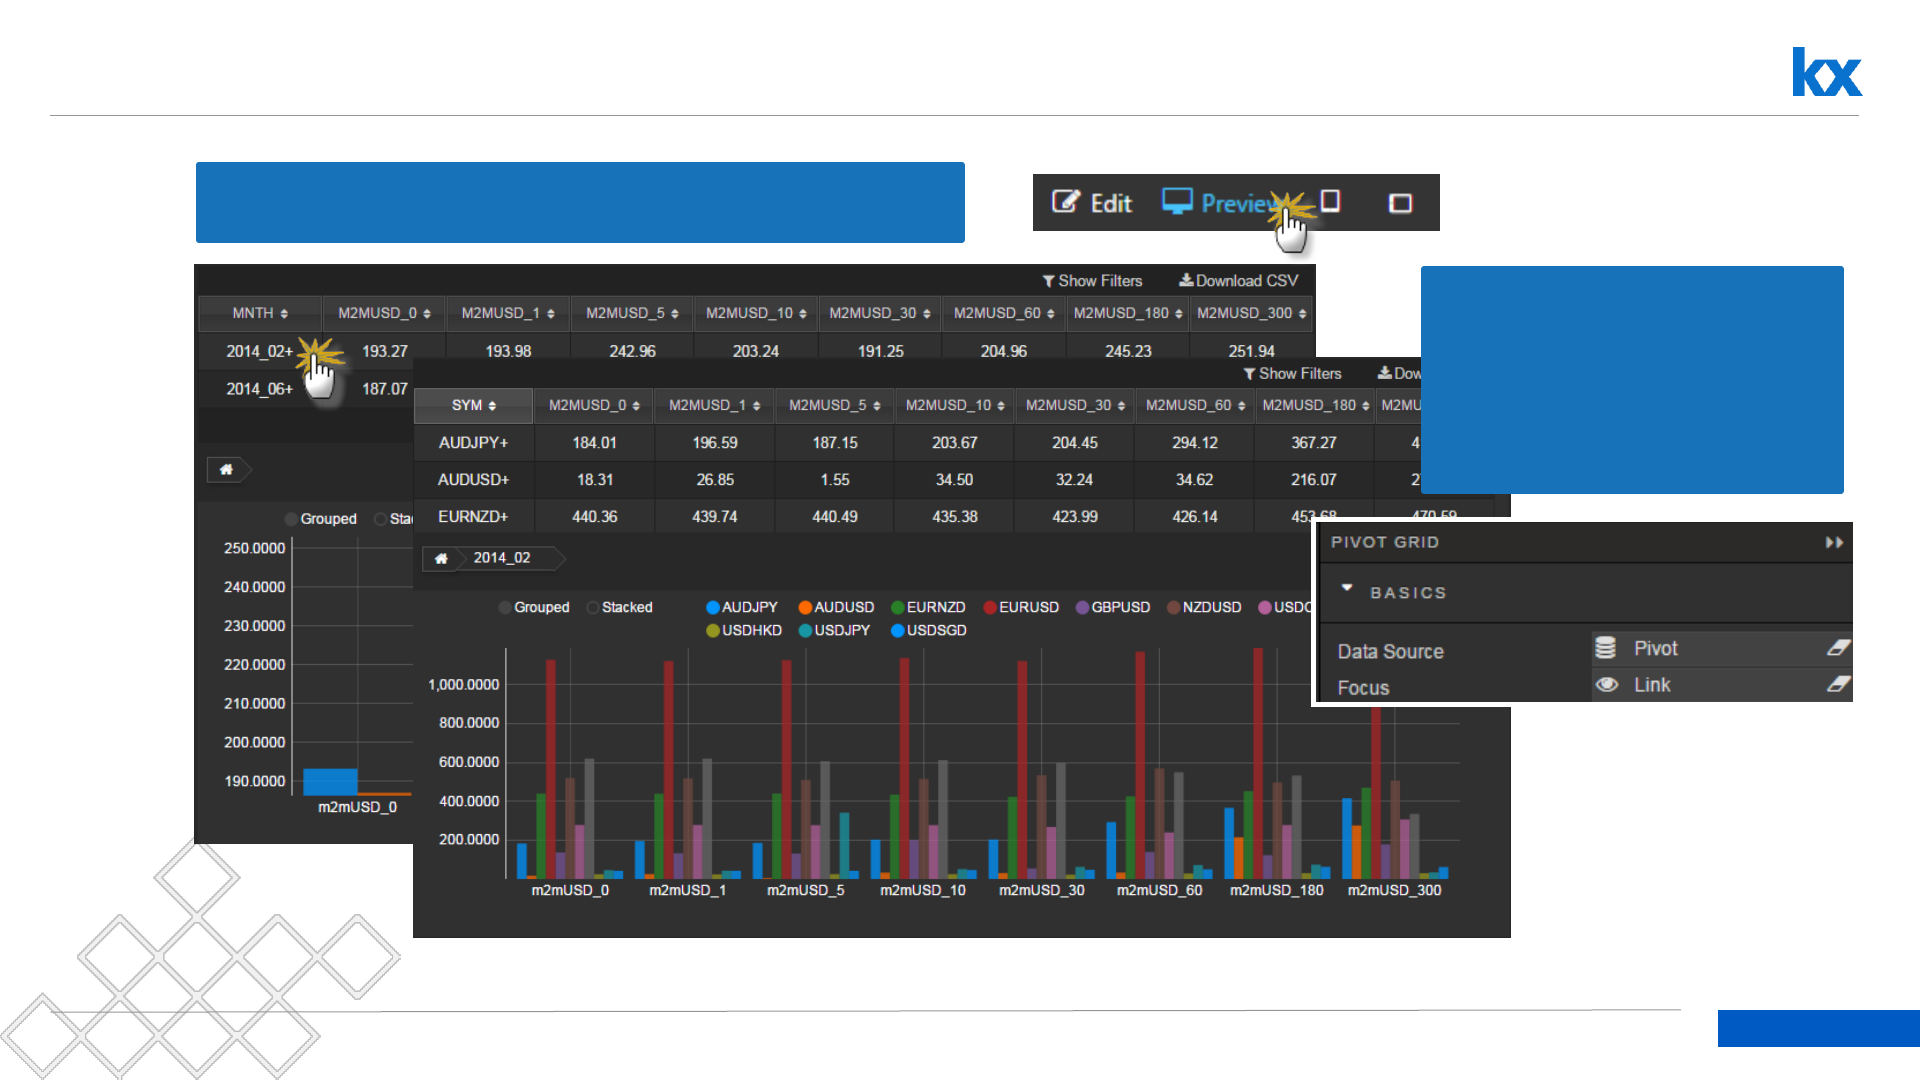
Preview Pivot Grid and Breadcrumbs Interaction
Left-click
62
Dashboards for Kx – “How to” Guide
Return to Home
Left-click
63
Dashboards for Kx – “How to” Guide
Try This
•Create a Pivot Query, “DemoDrill”, from (connect to html5evalcongroup):
{`sym`src`hour`minute xcols 0!select quoteCount:count i,quoteSpread:10000*avg
(ask-bid),quoteSize:avg (bsize+asize)%2 by hour:`$string time.hh,minute:`$string 10
xbar time.minute, sym,src from dfxQuote where sym in exec distinct sym from
dfxTrade}[]
Hint: Query from DemoDrillDown dashboard
DemoDrill
Pivot Grid
Breadcrumbs

Bar Chart
Dashboards for Kx – “How to” Guide
Kx.com

65
Dashboards for Kx – “How to” Guide
Visualising PivotData
Add Visuals to Data.
•Use Data Source: PivotData
•Connection: html5eval_grp (or html5evalcongroup)
•Breakdown Cols: Type, Month, Group
•Aggregates: Return, PerReturn
•Keep Breadcrumbs component; required for data navigation in Chart
select Type, Month, Group, Return, PerReturn, OpenDate, CloseDate from TradeData
66
Dashboards for Kx – “How to” Guide
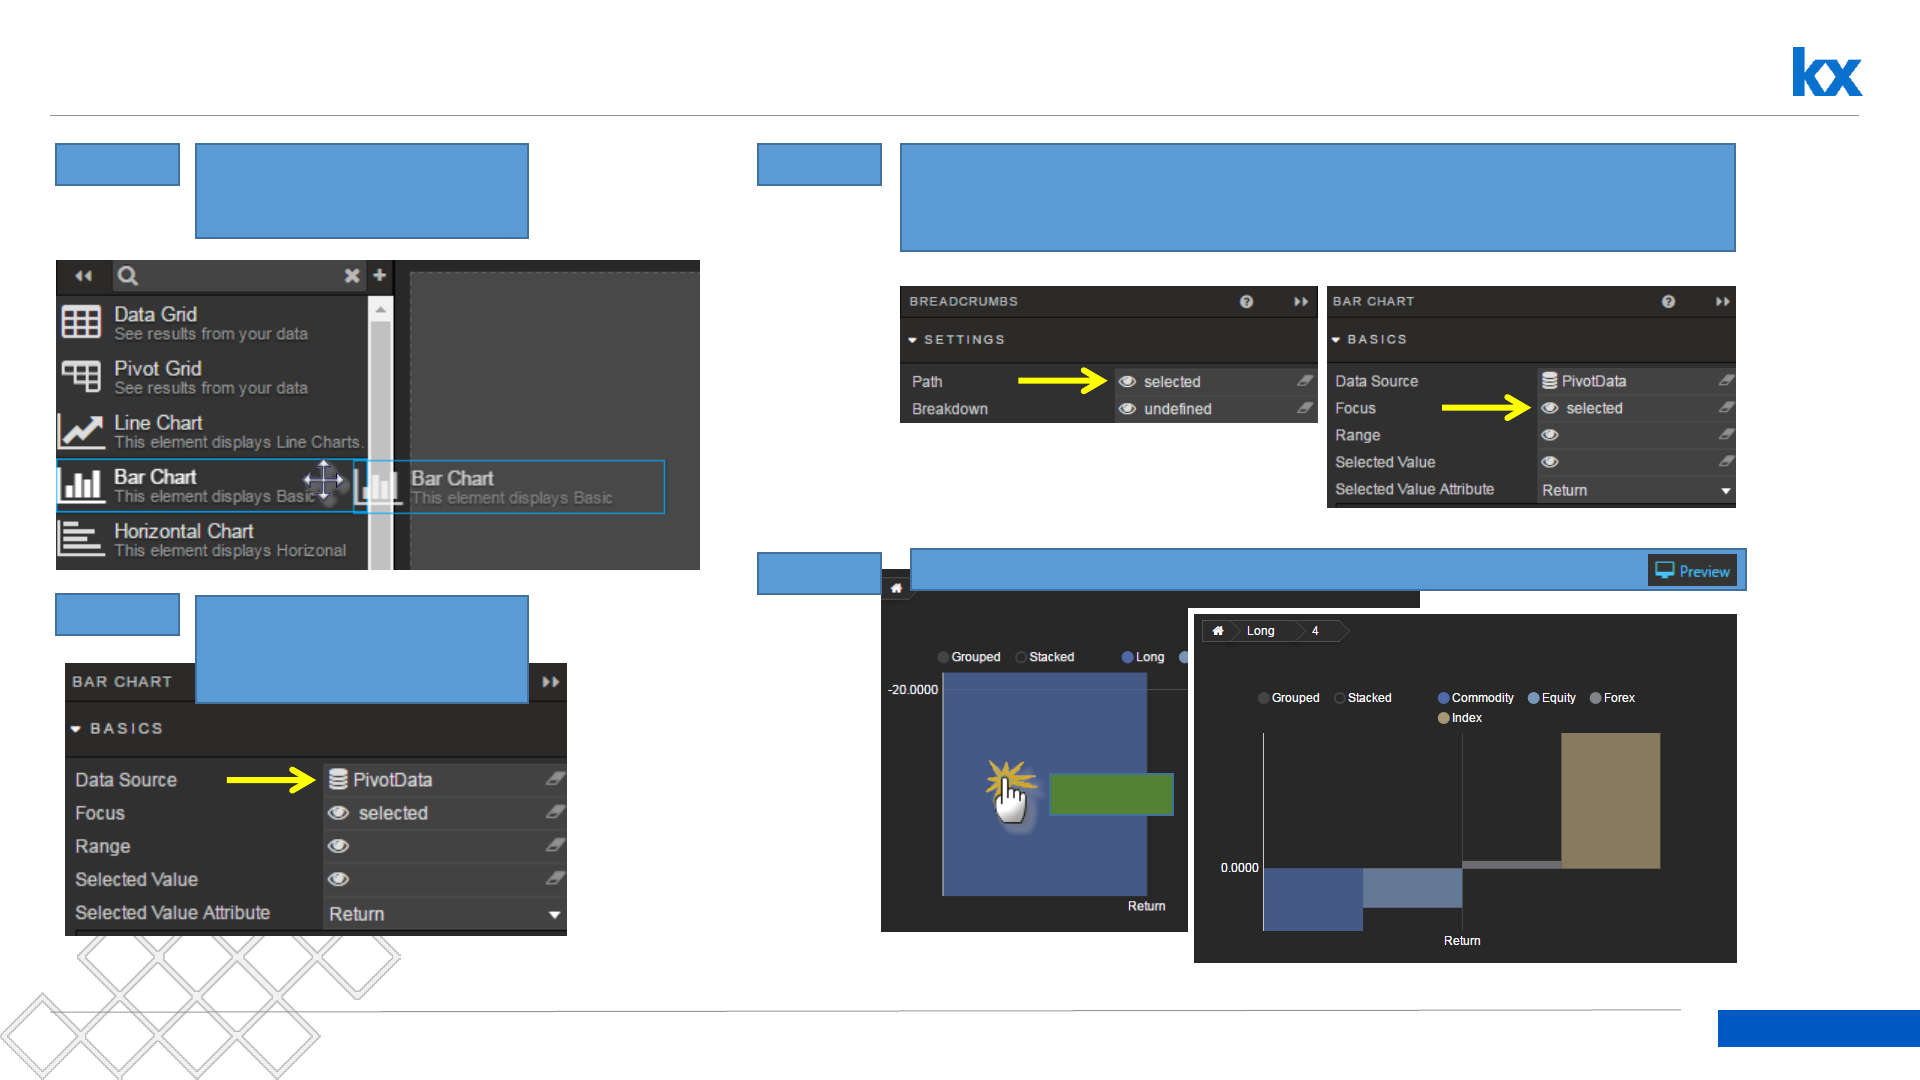
Visualising PivotData
Step: 1 Drag Bar Chart inside
dashboard
Step: 2 Configure Bar Chart as
PivotData
Step: 3 Add Breadcrumbs component (if not already). Create a linking
viewstate called selected (Type: Symbol); share with Bar Chart
Step: 4 Test Interactions in Preview
Left-click
67
Dashboards for Kx – “How to” Guide
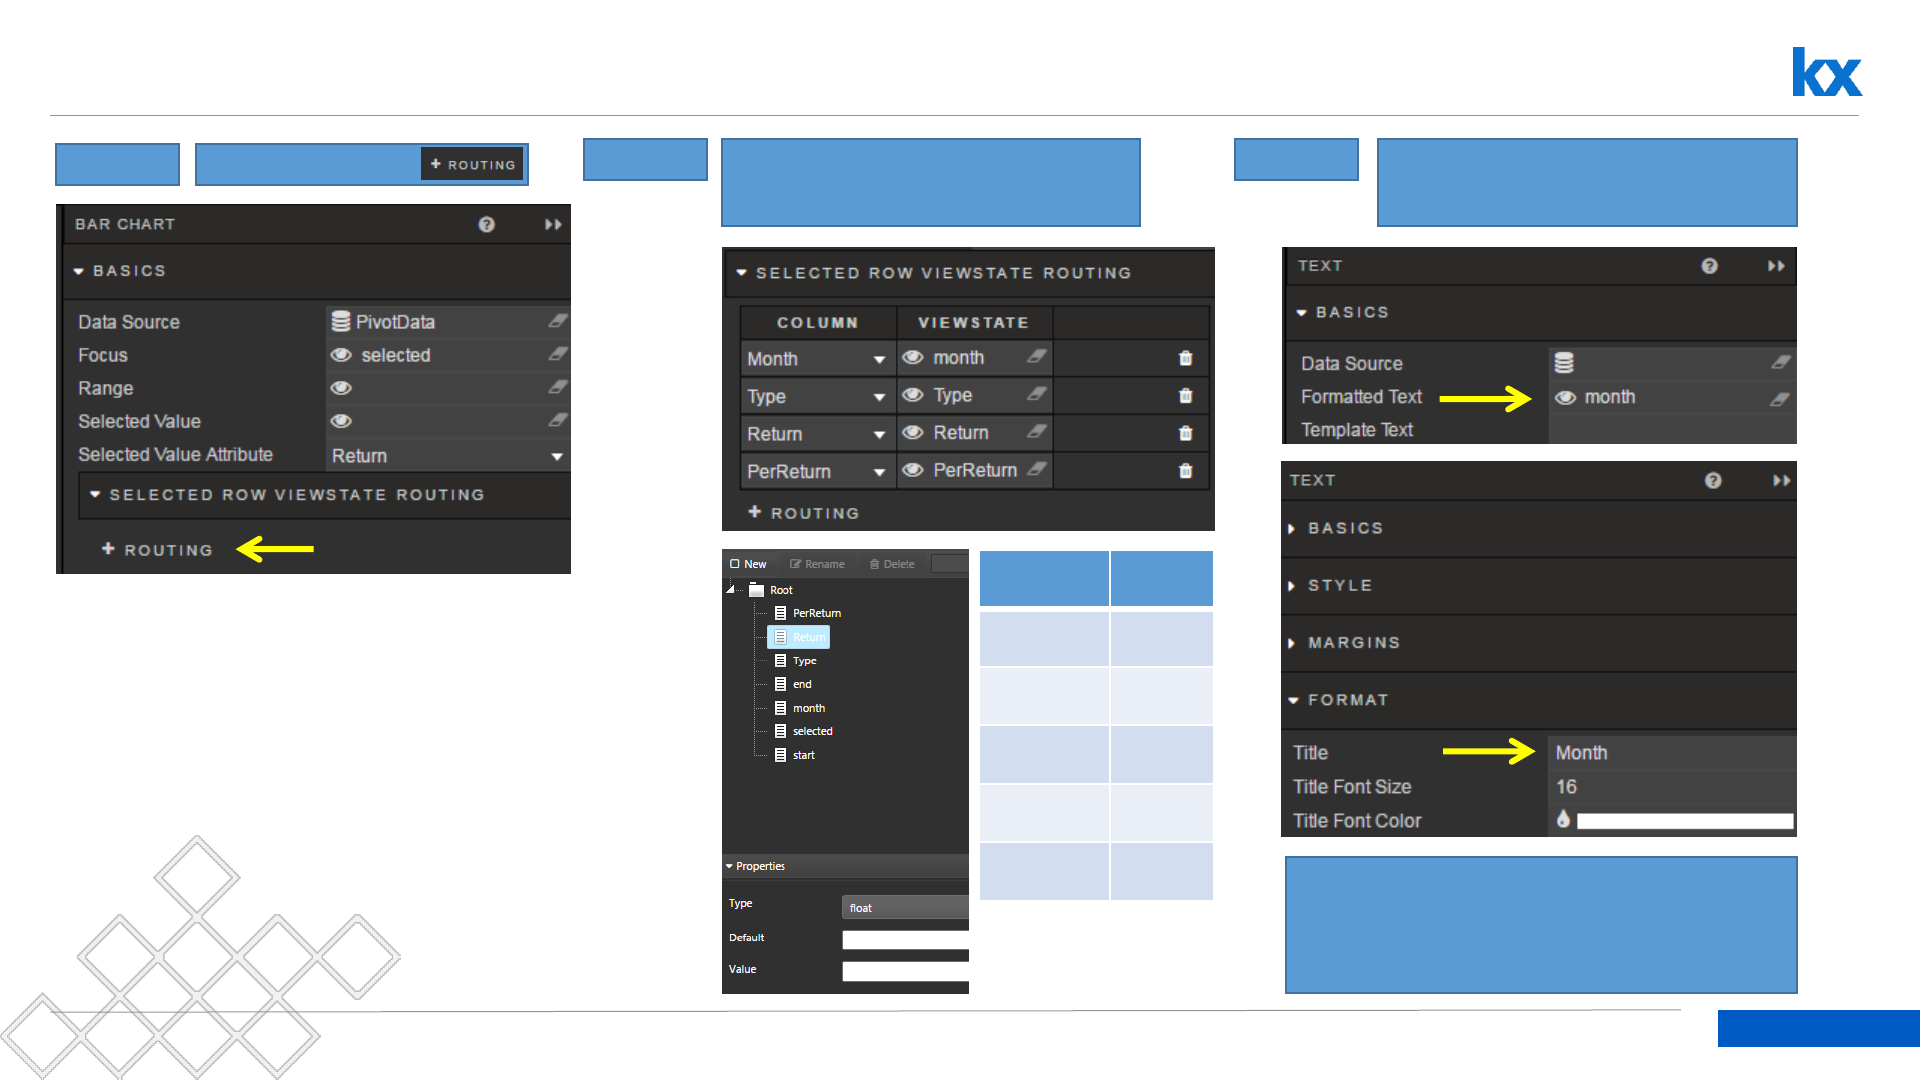
Mapping Bar Chart variables to Dashboard Viewstates
Step: 1 Click Step: 2 Link Chart Data Source variables
to Dashboard Viewstates
Viewstate
Type
Month Int
Type Symbol
Group Symbol
Return Float
PerReturn
Float
Step: 3 Display Viewstate values in a Text
component; add 5 components.
Configure a Text component for
viewstates: Month, Type, Group, Return
and PerReturn (% Return)
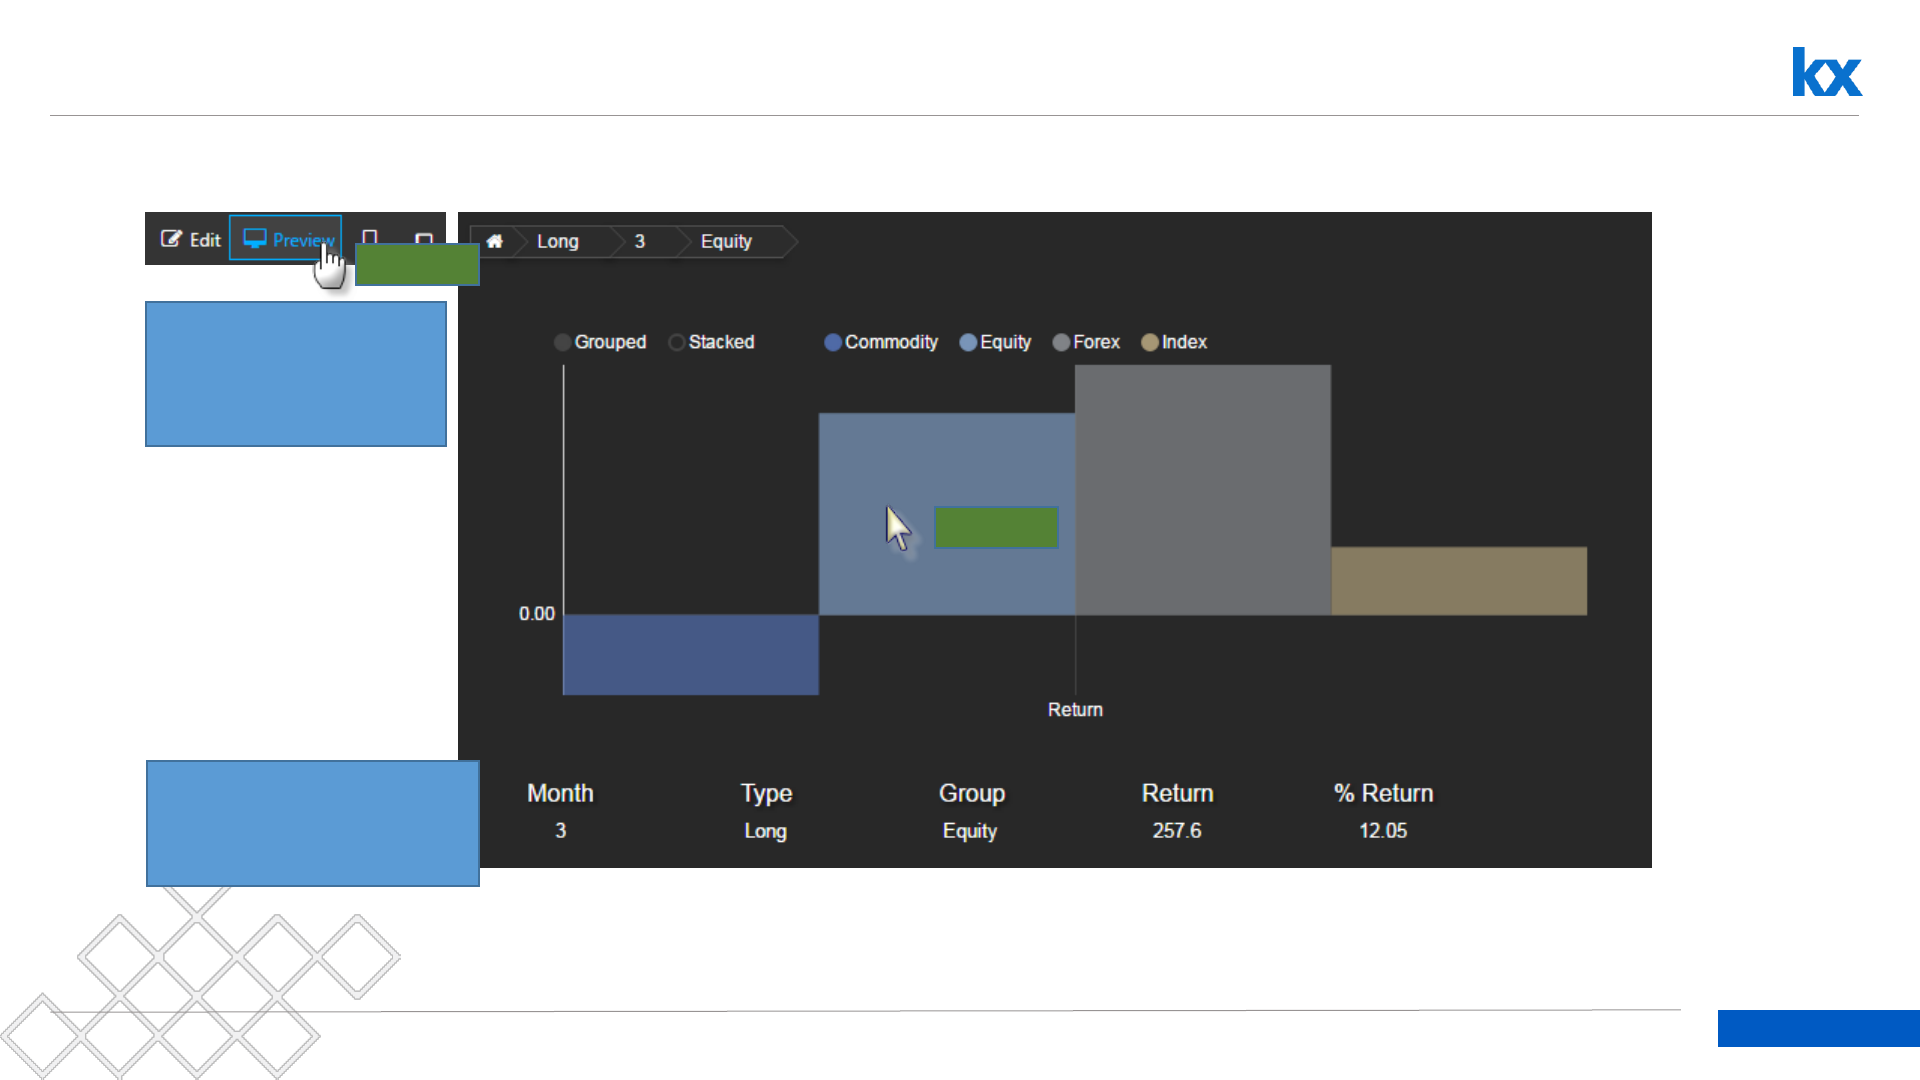
68
Dashboards for Kx – “How to” Guide
Interacting with Bar Chart; values assigned to Viewstates
Use Text component Titles
in Format menu to add
text header label
Left-click
Left-click
Preview to test
interactions and
populate Text
component
69
Dashboards for Kx – “How to” Guide
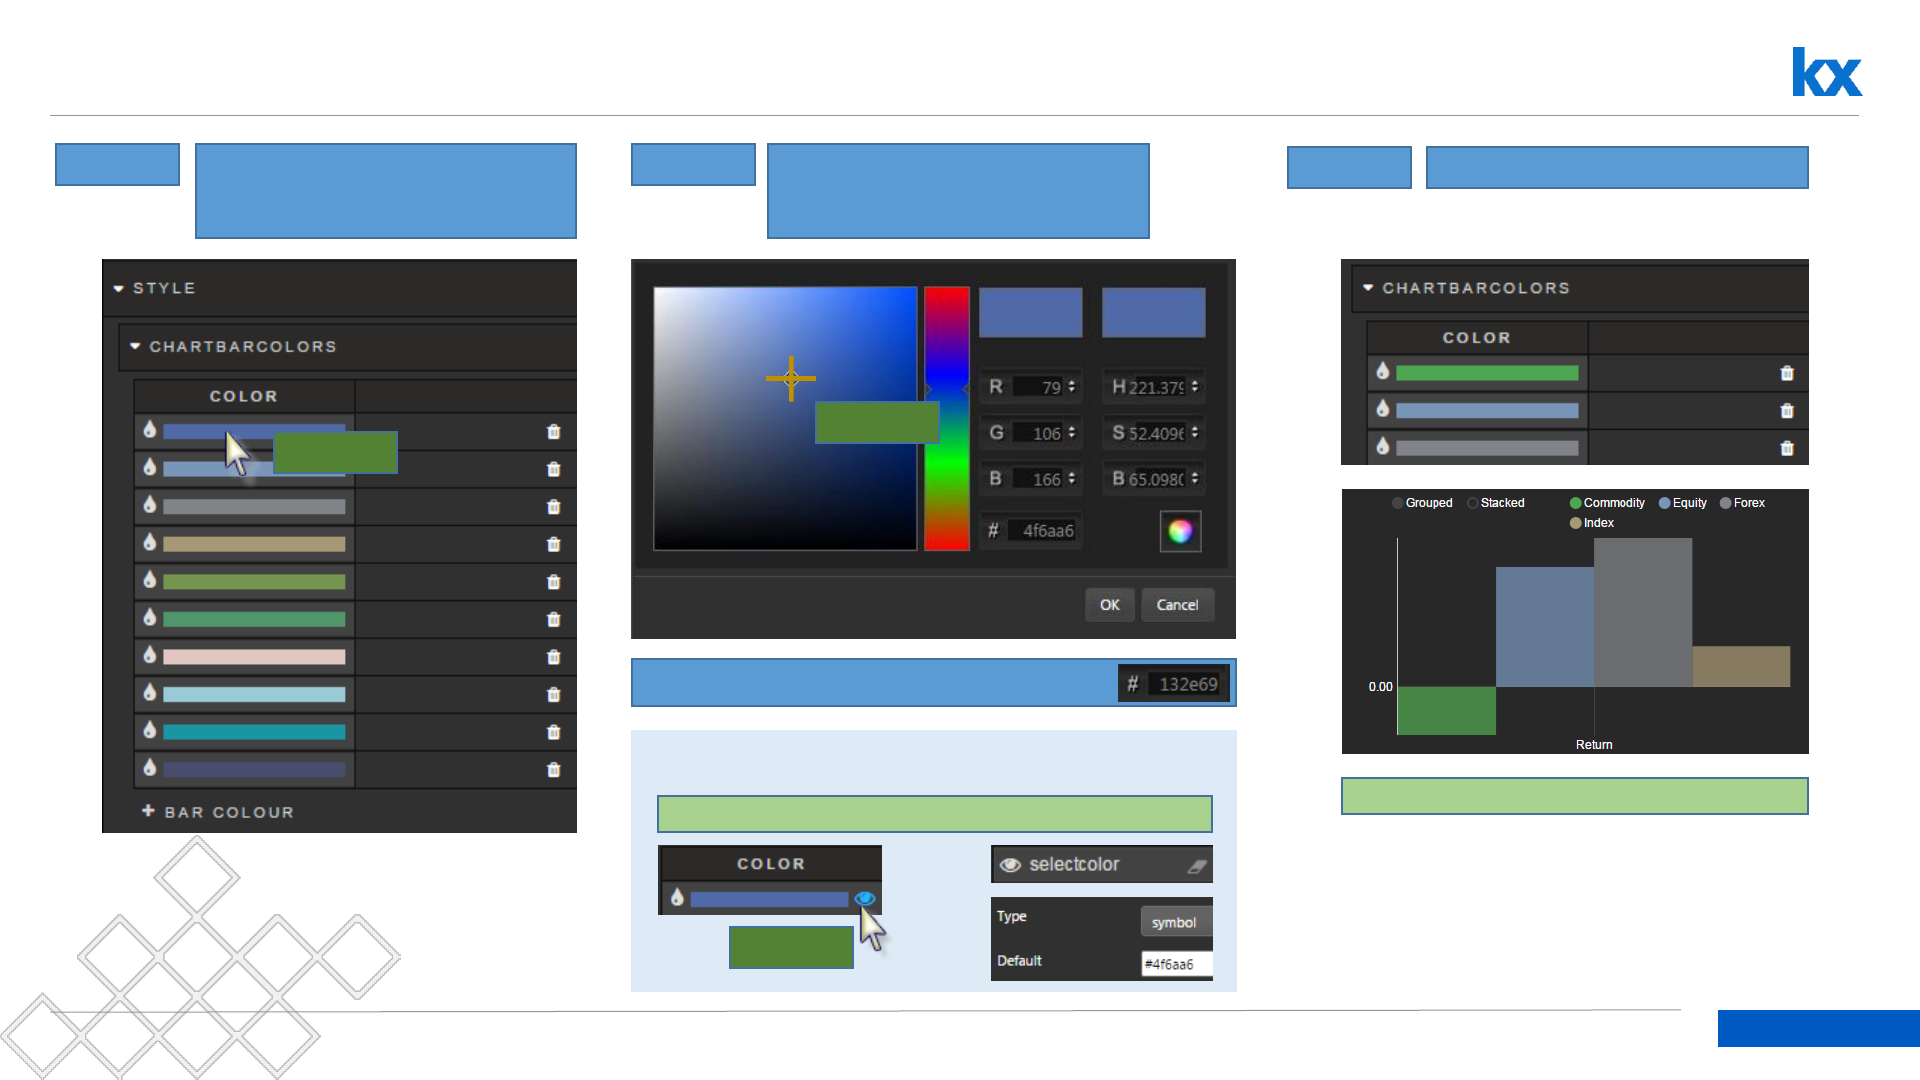
Change Bar Chart colors
Step: 1 Bar chart colors are displayed
in order from top to bottom
Step: 2 Left click to bring up palette
menu
Left-click
Left-click
Or enter Hex color reference
Alternative
Assign a color to a Viewstate; use Hex color
Left-click
Step: 3 Color Assigned
Hex color: #4fa652

Component Linking
Dashboards for Kx – “How to” Guide
Kx.com
71
Dashboards for Kx – “How to” Guide
Link Components to Share Interactions*
*Components must share same Data Source; e.g. PivotData
Add Components: Go To ‘Focus’ property Create Parameter ‘Link’
72
Dashboards for Kx – “How to” Guide
Test Interactions
Go to ‘Preview’ mode and test Dashboard
All linked
Components will
update when one is
changed
73
Dashboards for Kx – “How to” Guide
Try This
•Link a Pivot Grid, Bar Chart, Breadcrumbs and Treemap for “DemoDrill”:
{`sym`src`hour`minute xcols 0!select quoteCount:count i,quoteSpread:10000*avg
(ask-bid),quoteSize:avg (bsize+asize)%2 by hour:`$string time.hh,minute:`$string 10
xbar time.minute, sym,src from dfxQuote where sym in exec distinct sym from
dfxTrade}[]
Hint: Refer to code.kx.docs for information on configuring the Treemap component
DemoDrill
Pivot Grid
Breadcrumbs
DemoDrill
Bar Chart
DemoDrill
Treemap

Highlight Rules
Dashboards for Kx – “How to” Guide
Kx.com
75
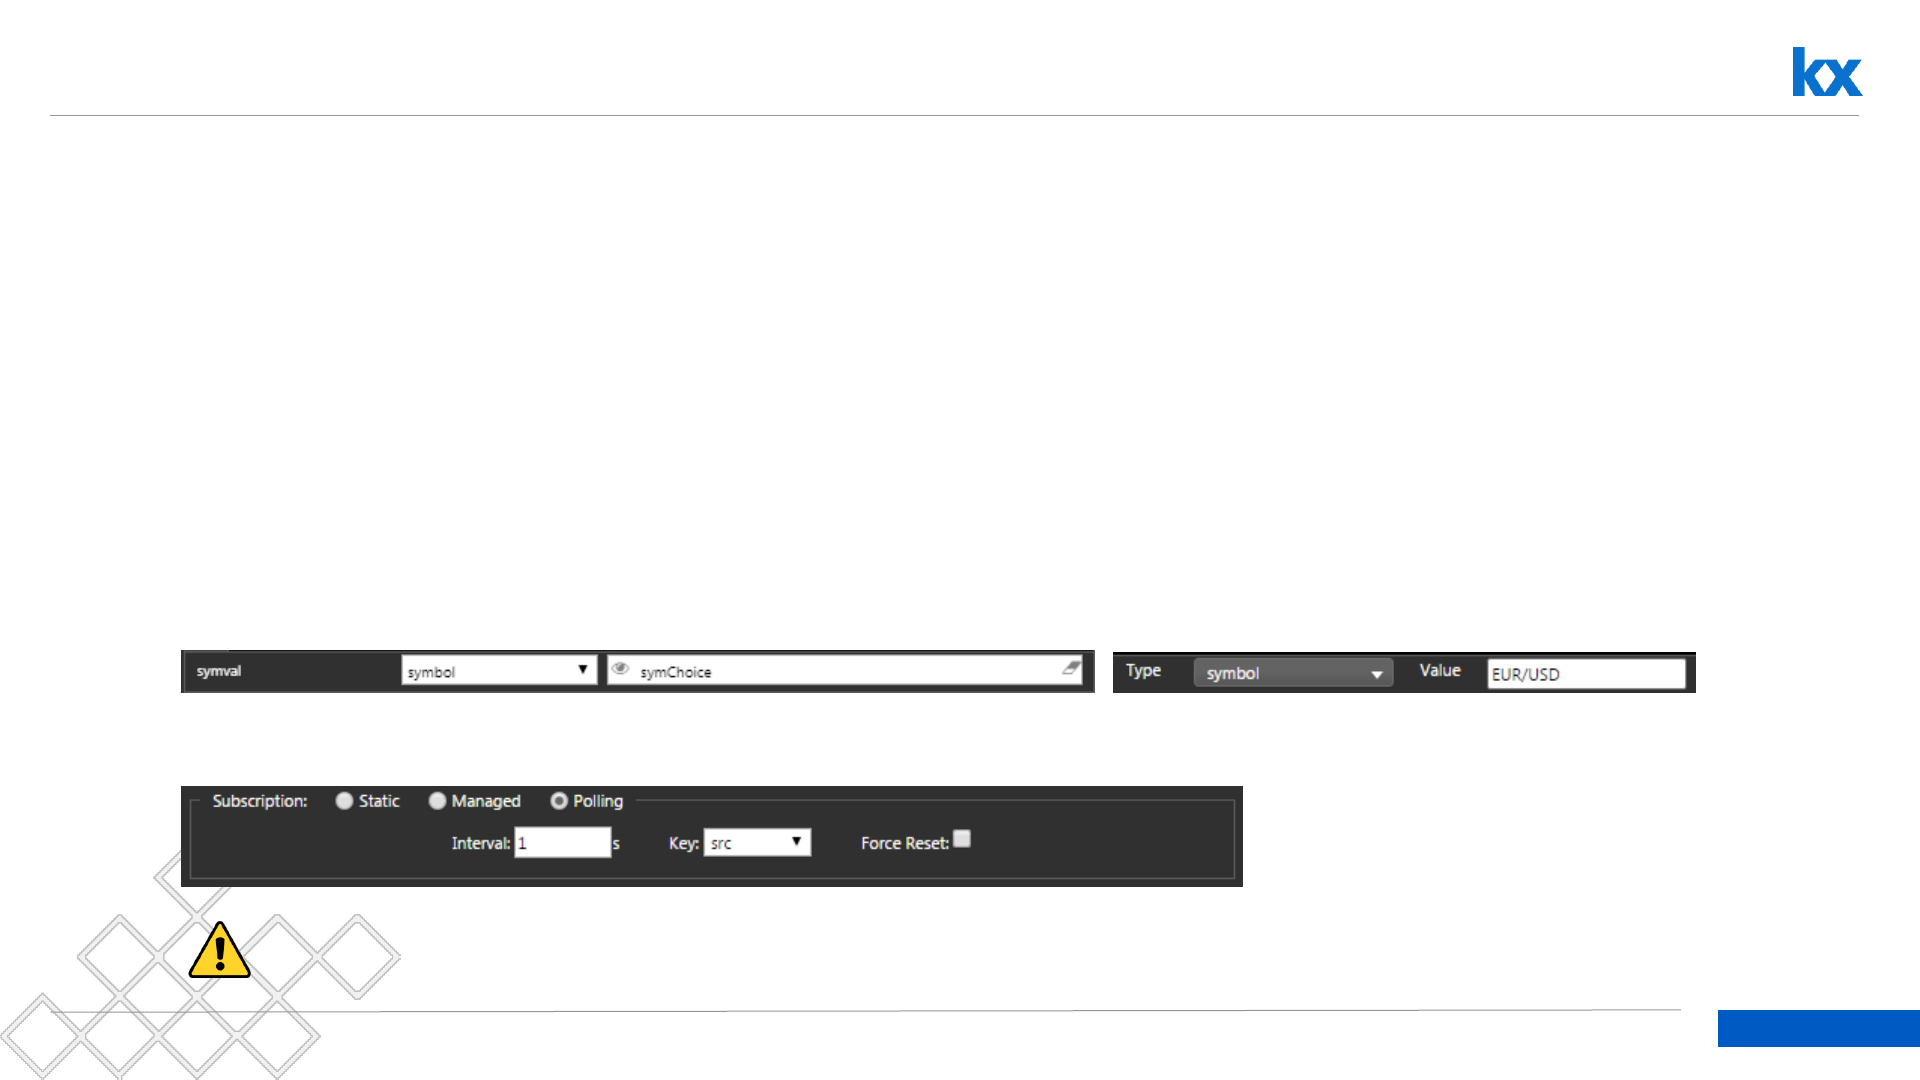
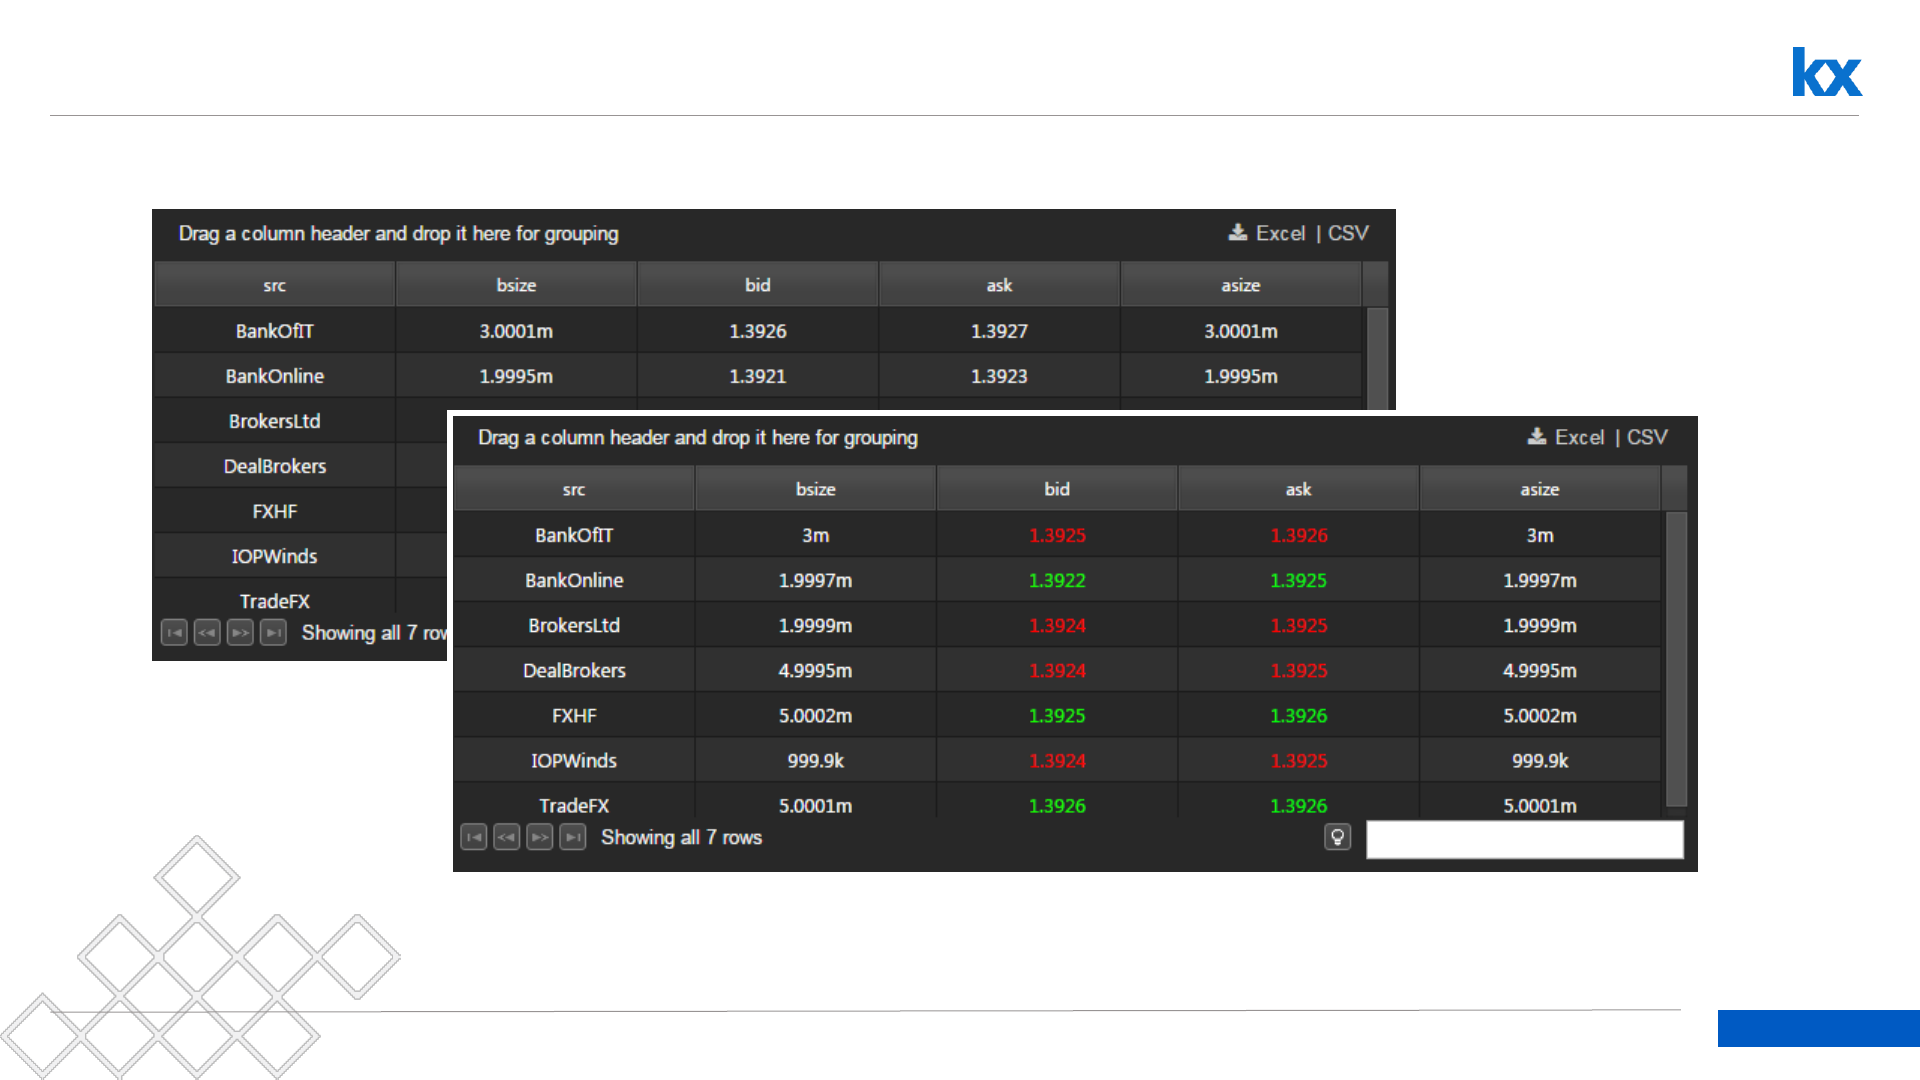
Dashboards for Kx – “How to” Guide
Highlighting Change in Your Data
Highlight rules help direct users to changes and updates in their data. It’s best used with streaming and polling
data
•Use Data Source: LatestPrices
•Connection: html5eval_grp (or html5evalcongroup)
•Map symval to viewstate, symChoice. Set Default symChoice to EUR/USD
•Set Subscription to Polling, 1 second. Part of Query Editor.
{[symval] `src xasc select last bsize, last bid, last ask, last asize by src from dfxRandomQuote where
sym=symval}
Ensure data is polling, managed or streamed for highlights rule to update
76
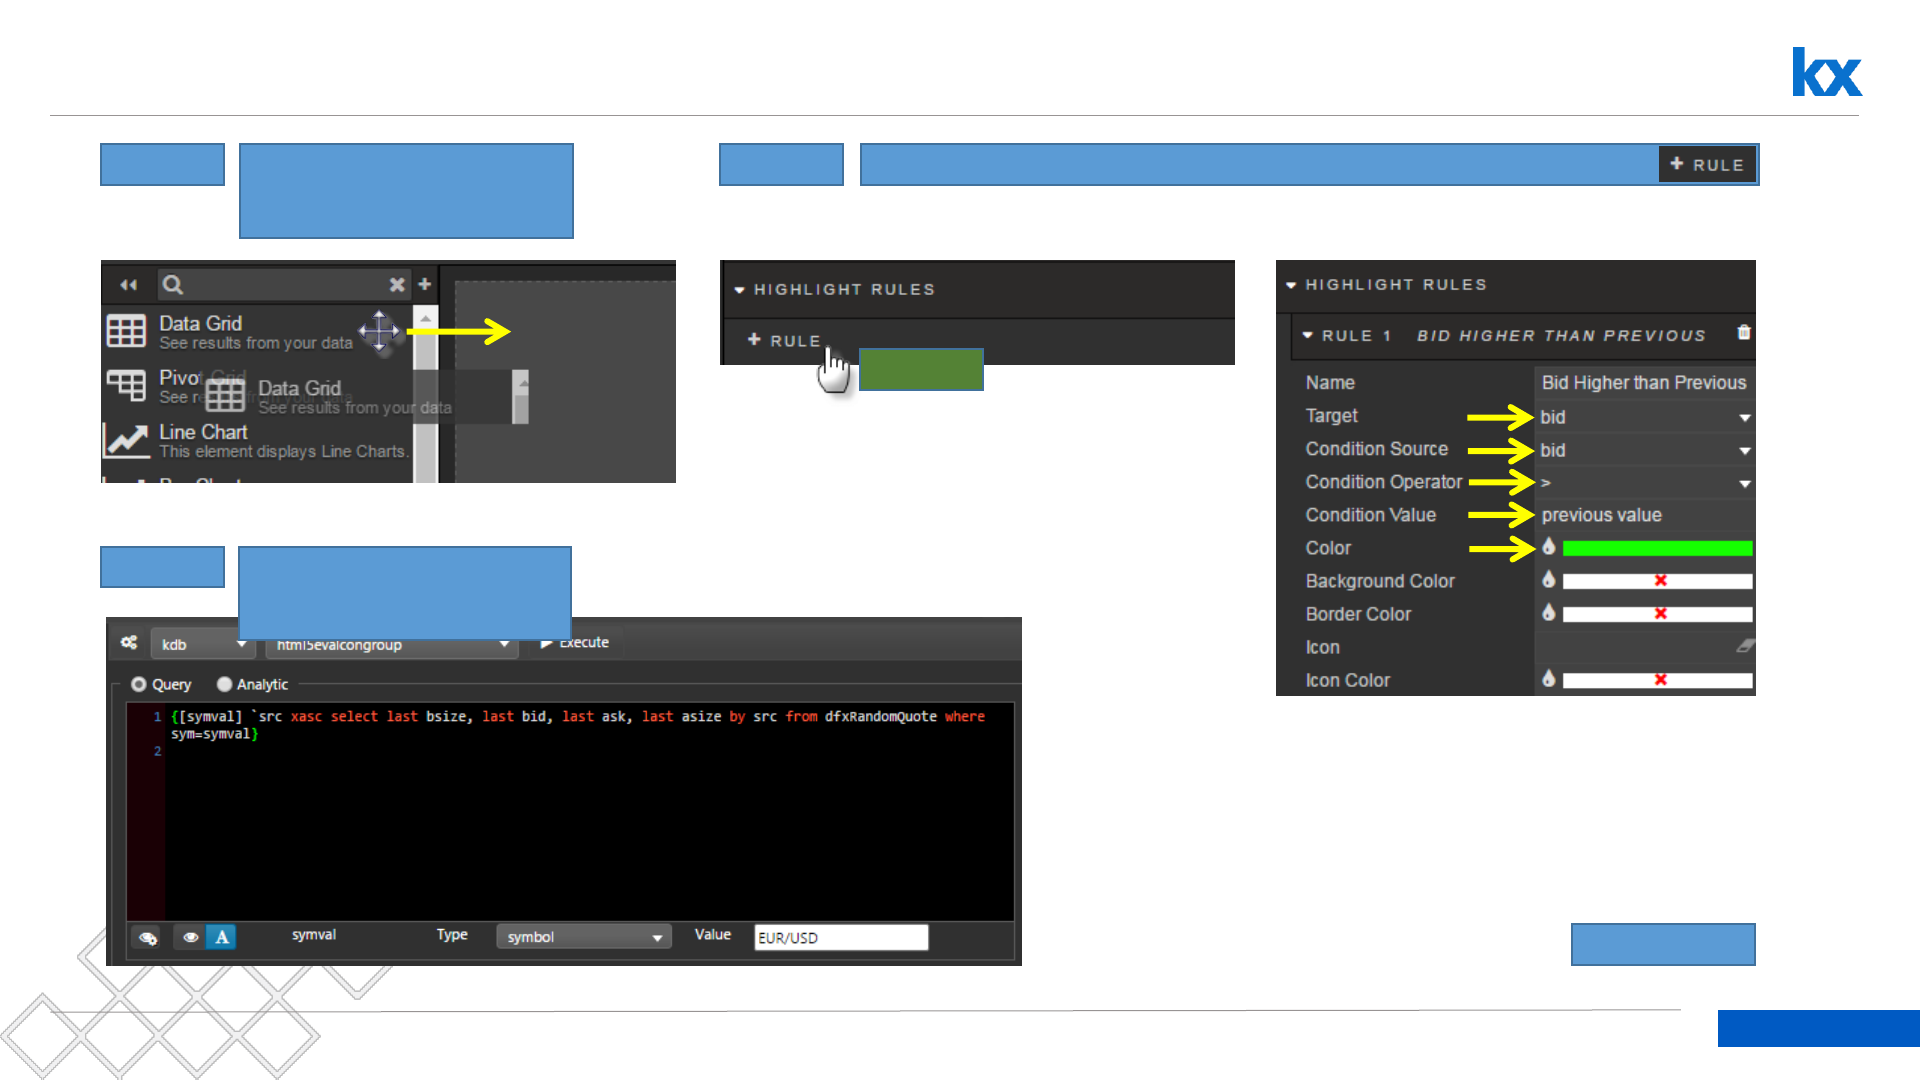
Dashboards for Kx – “How to” Guide
Highlighting Change in Your Data: Bid
Step: 1 Drag Data Grid inside
dashboard
Step: 2 Configure query
LatestPrices for EUR/USD
Step: 3 Create a Highlight Rule for Bid: Value greater than previous value
Left-click
Continued…
77
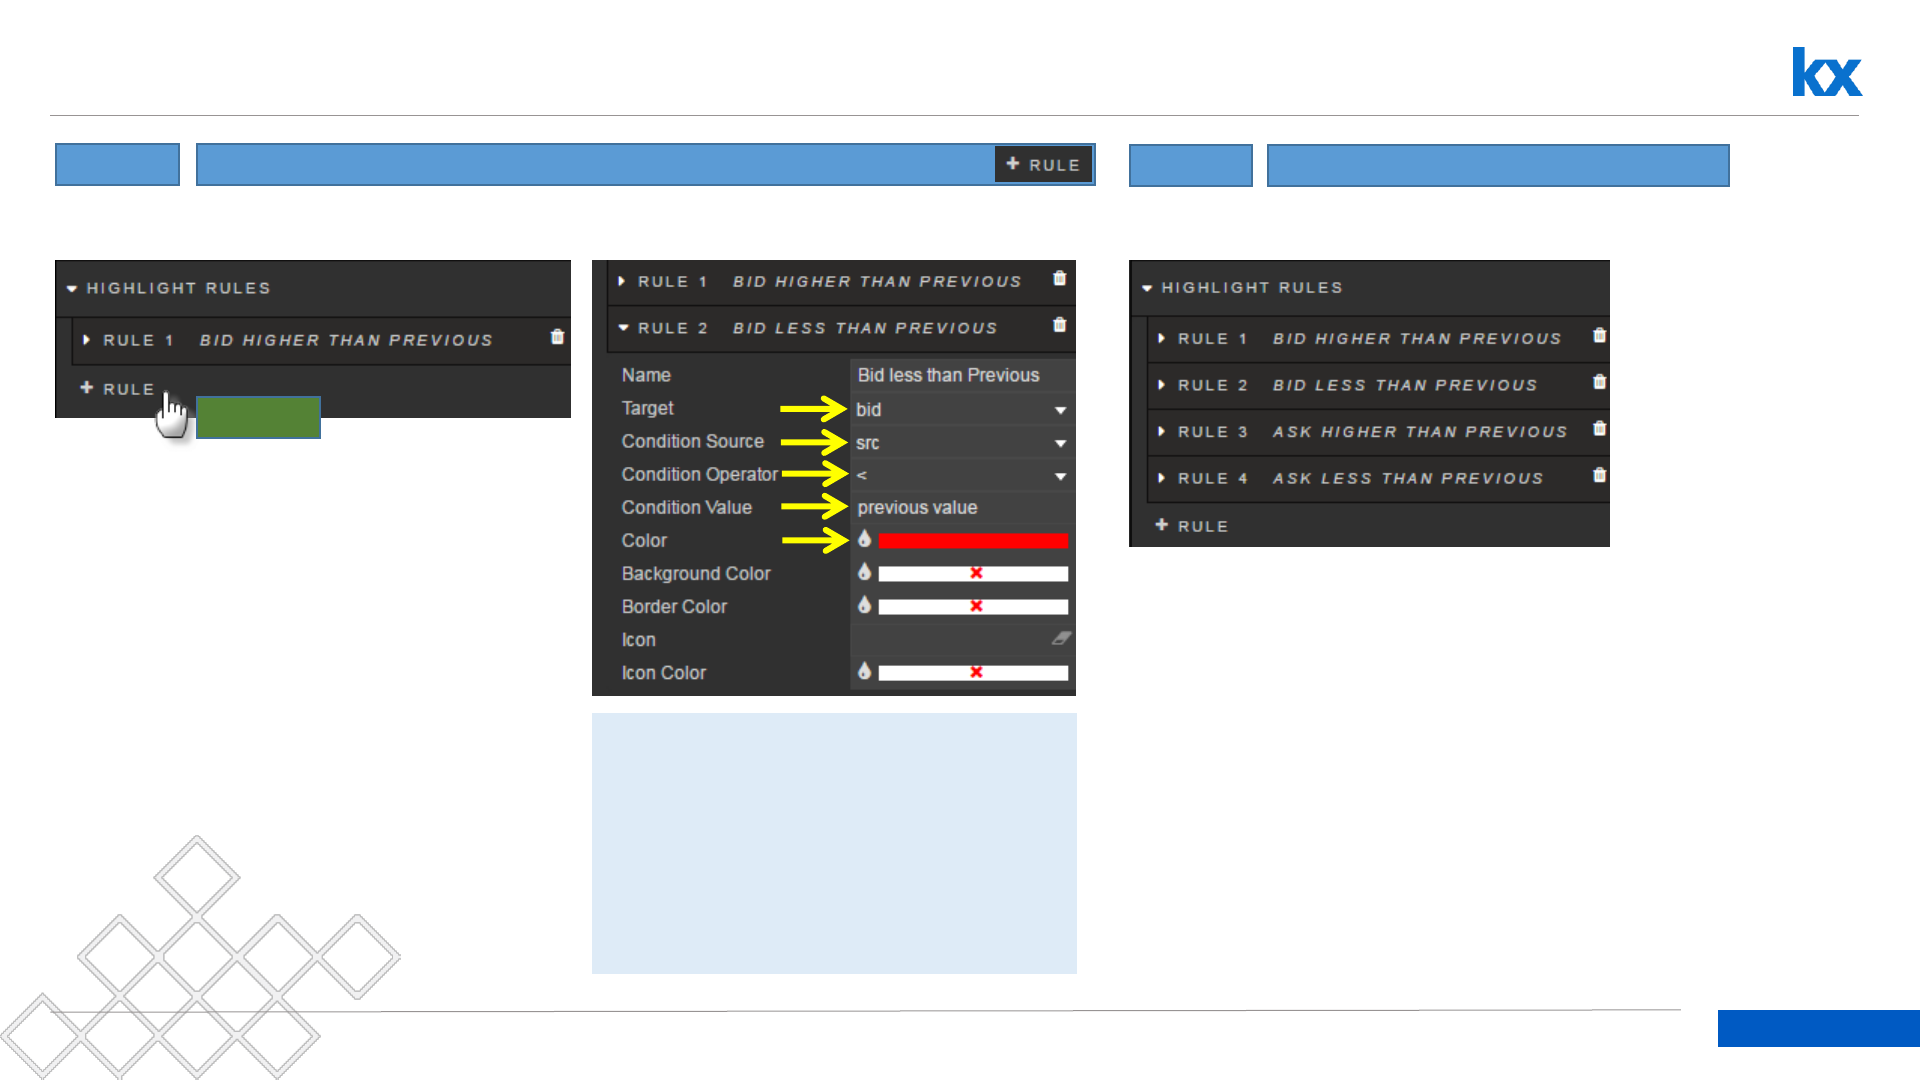
Dashboards for Kx – “How to” Guide
Highlighting Change in Your Data: Ask
Step: 4 Create a Highlight Rule for Bid: Value less than previous value
Left-click
Step: 5 Repeat Rules for Ask
Alternative
Background Color: changes cell color
Border Color: changes cell border color
Icon: Select from Icon menu, icon will appear
when highlight rule is true
Icon Color: Select color of icon to appear
when rule is true
78
Dashboards for Kx – “How to” Guide
Preview to see Highlight rules in action
79
Dashboards for Kx – “How to” Guide
Try This
•Using LatestPrices query, add a Dropdown component to feed symbols:
EUR/USD, GBP/USD, USD/CAD, USD/CHF and USD/CHF into symChoice
•Apply Red and Green Range color to columns A(sk)size and B(id)size respectively
•Apply Red and Green Max color to Ask and Bid columns
•Add Bar and Horizontal chart; use chart highlight rules to mark change
Hint: Query from DemoMarketMakers dashboard. See code.kx.docs for more information on configuring Horizontal charts
LatestPrices
Data Grid
Dropdown
LatestPrices
Bar Chart
LatestPrices
Horizontal Chart

Multi-Chart
Dashboards for Kx – “How to” Guide
Kx.com

81
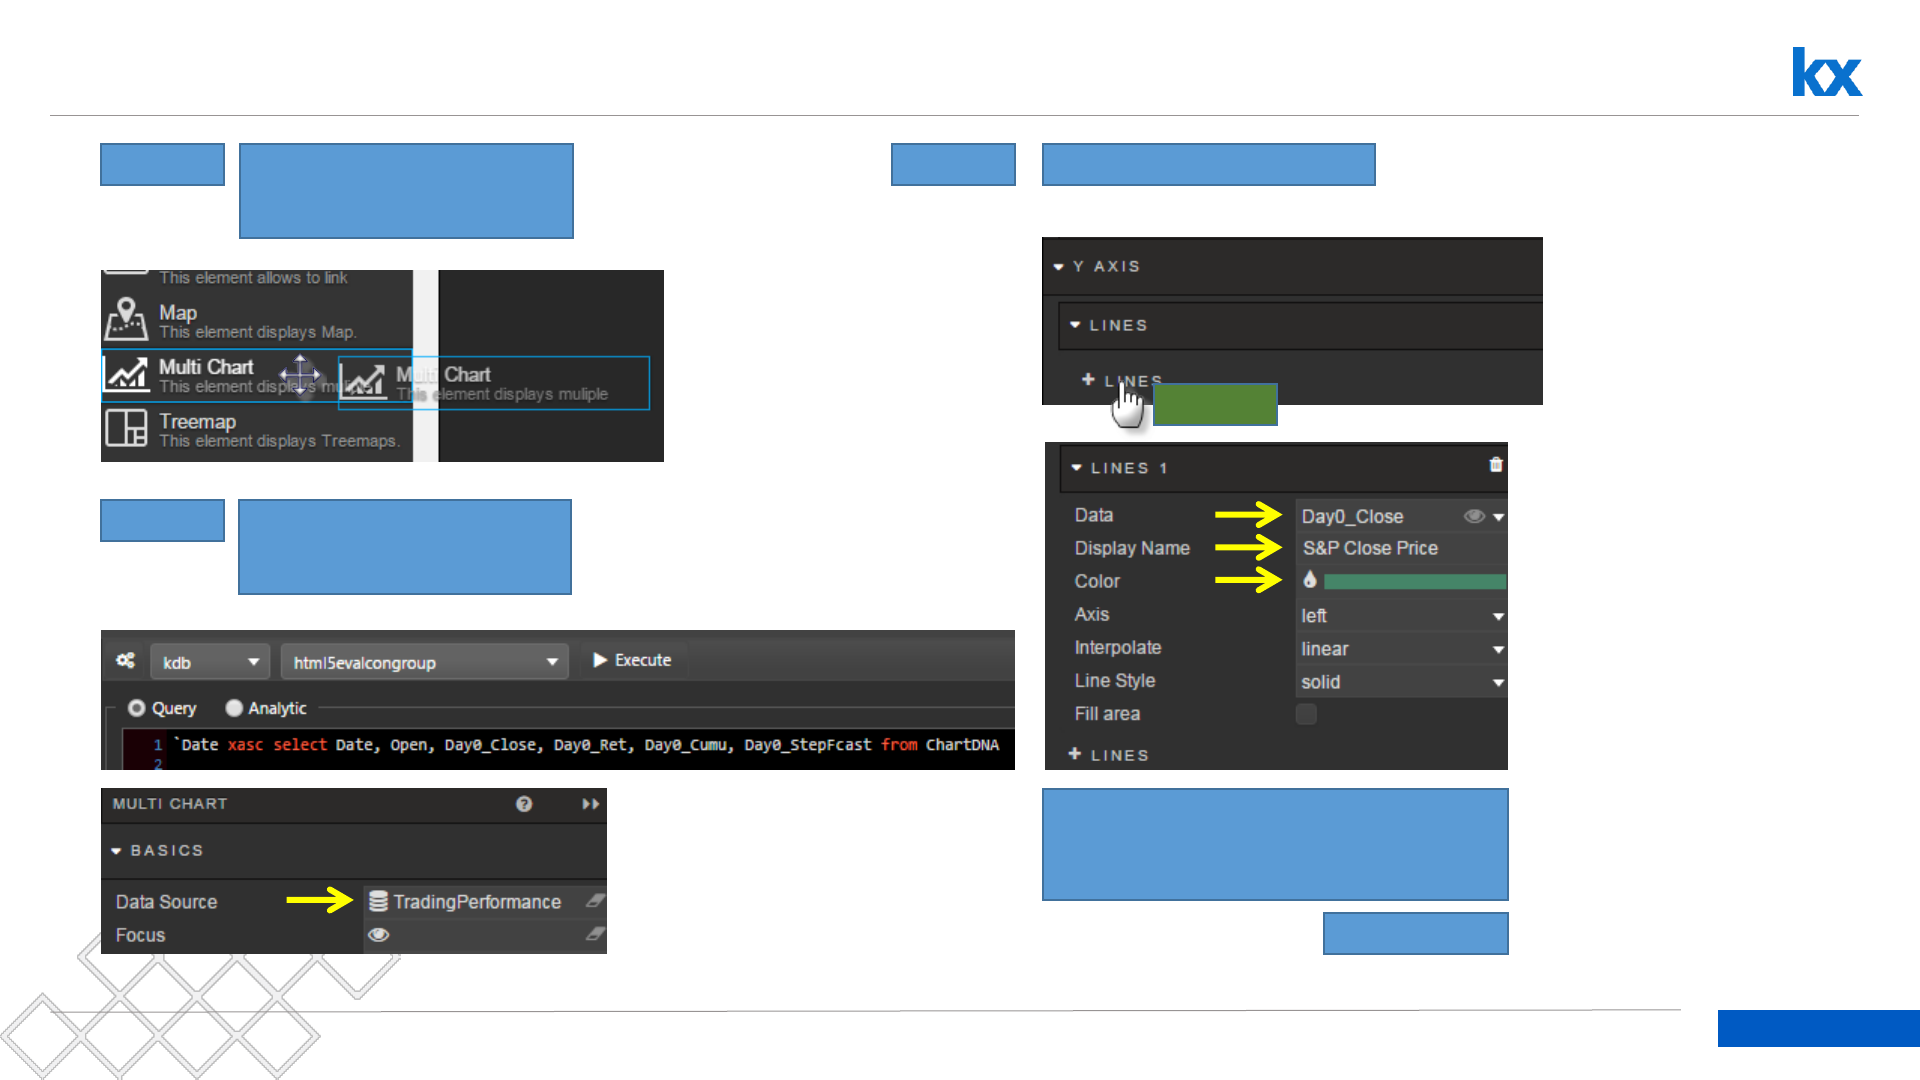
Dashboards for Kx – “How to” Guide
Multiple Chart overlays
Dashboard’s Multi-chart allows for different chart types including bar, bubble, candlesticks and lines to be
overlaid on a single chart. Includes dual axis support.
•Use Data Source: TradingPerformance
•Connection: html5eval_grp (or html5evalcongroup)
`Date xasc select Date, Open, Day0_Close, Day0_Ret, Day0_Cumu, Day0_StepFcast from ChartDNA
82
Dashboards for Kx – “How to” Guide
Configure Multi-Chart
Step: 1 Drag Multi Chart inside
dashboard
Step: 2 Configure query
TradingPerformance
Step: 3 Add a Line Chart
Left-click
Add prices for S&P Index. Update
color to #458568 and add Legend
name
Continued…
83
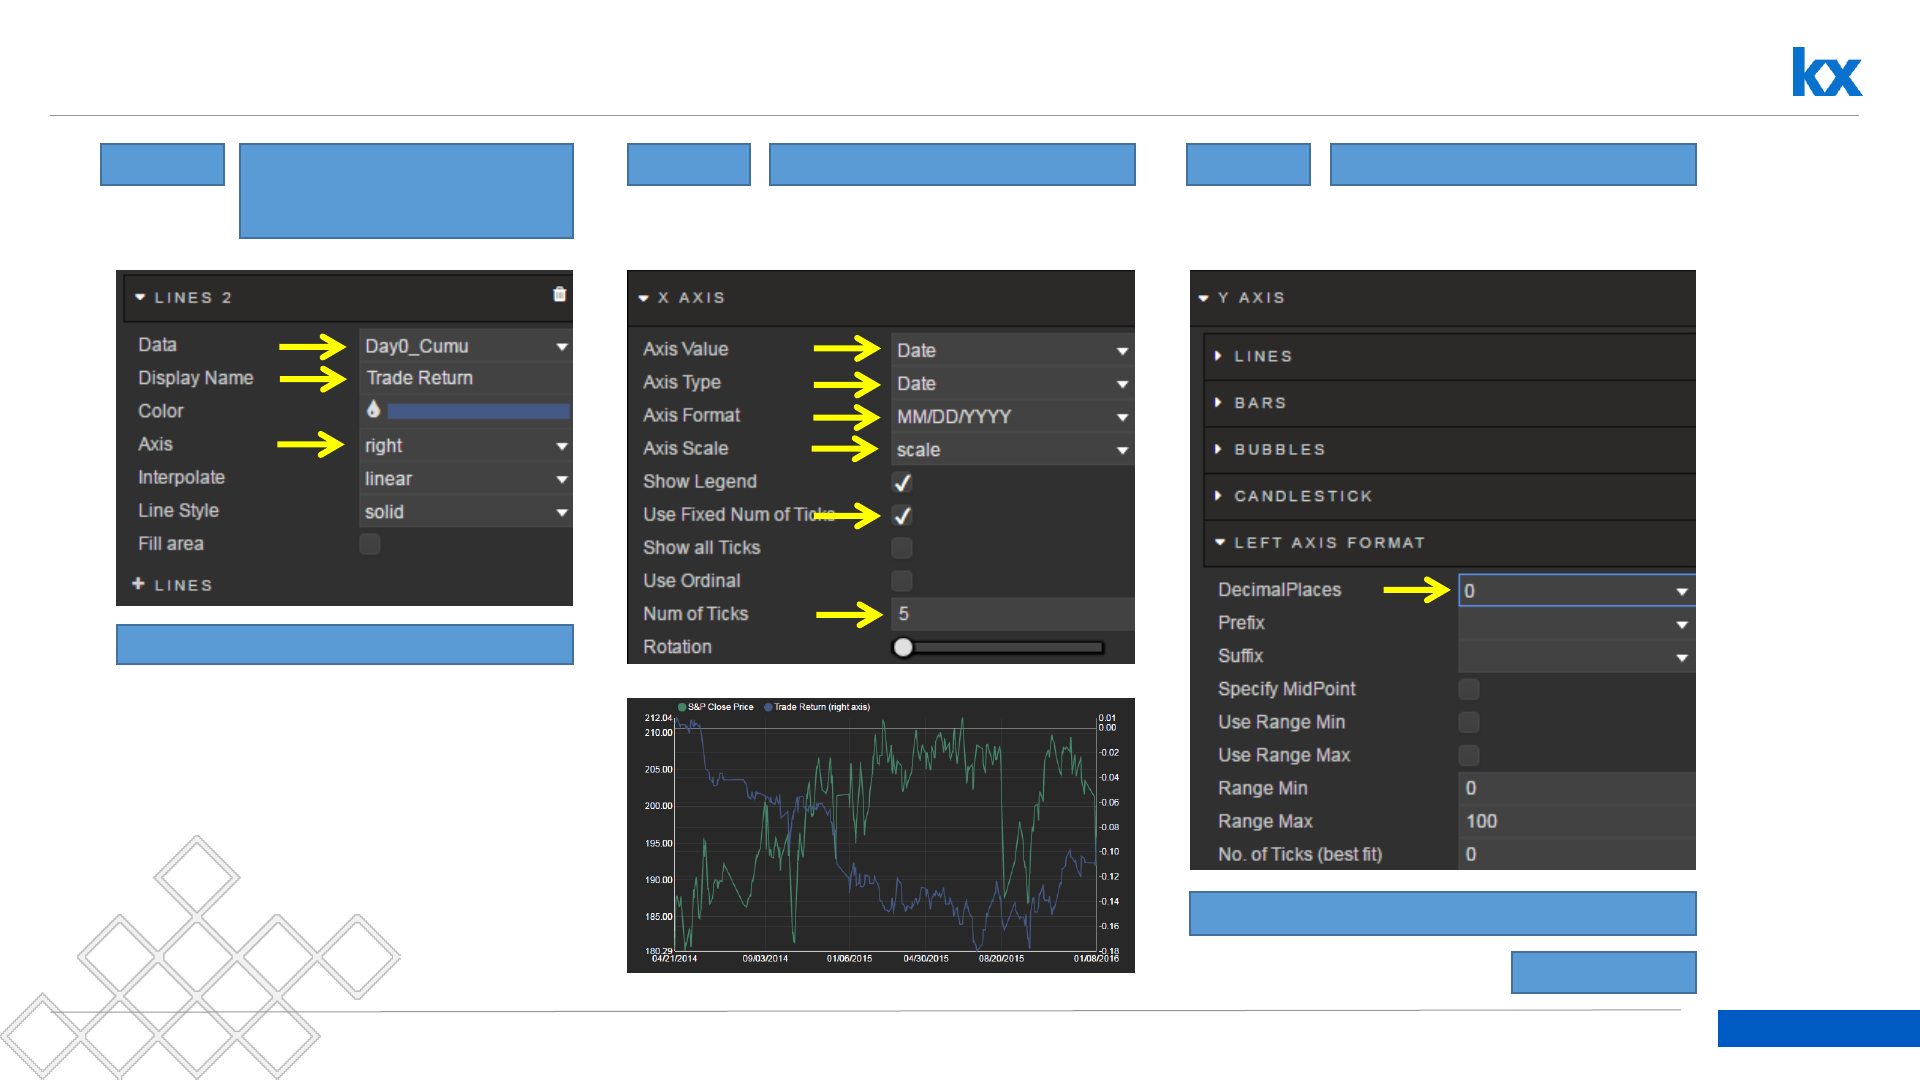
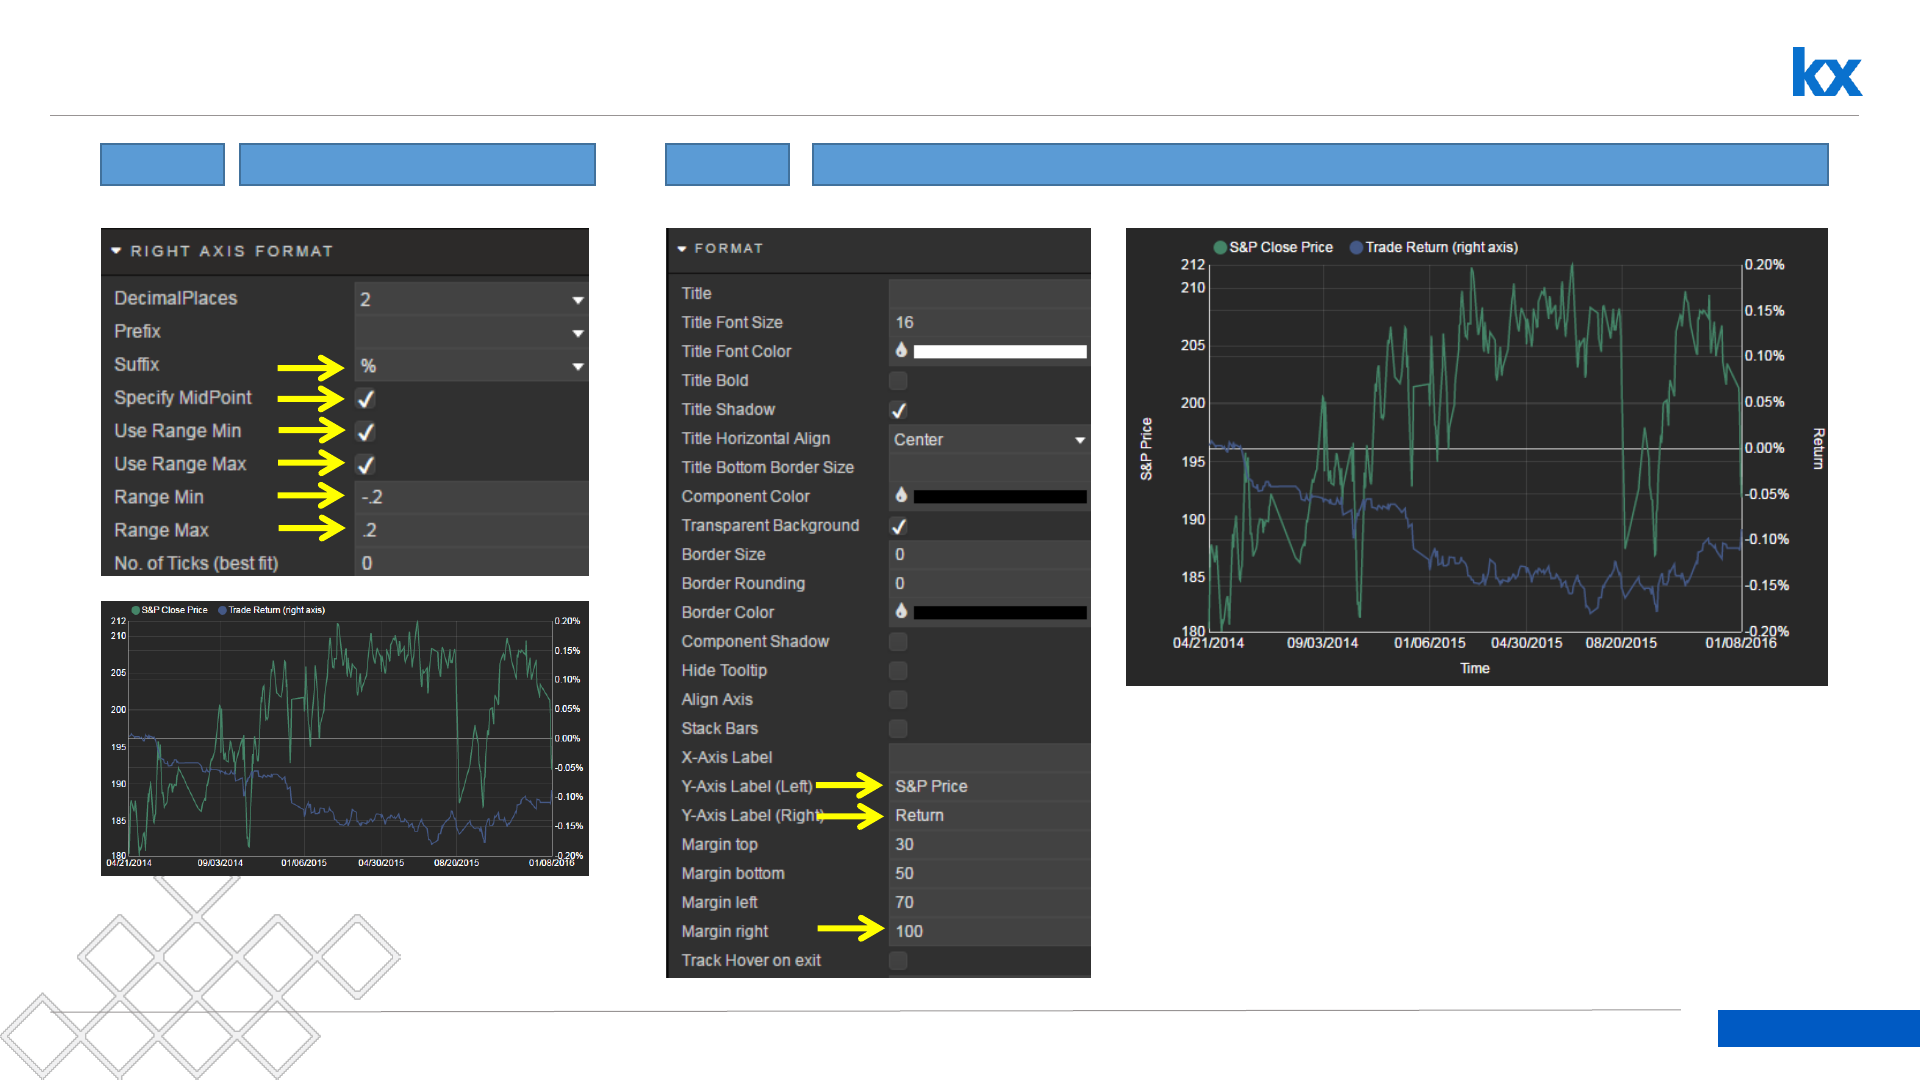
Dashboards for Kx – “How to” Guide
Configure Multi-Chart
Step: 4 Add a second Line chart
for Trade Return
Chart Trade Return on the right axis
Step: 5 Fix x-axis formatting Step: 6 Fix y-axis formatting: left
Single adjustment of left decimal places
Continued…
84
Dashboards for Kx – “How to” Guide
Configure Multi-Chart
Step: 7 Fix y-axis formatting: right Step: 8 Format Chart

85
Dashboards for Kx – “How to” Guide
Try This
•Add an Overlay data source (connection: html5evalcongroup)
•Change the chart type for Day0_Cumu to show fill while not obscuring S&P
prices
•Apply a date range filter to Multi-chart
`Date xasc select Date, Day4_Cumu from ChartDNA

Zoom and Pan
Dashboards for Kx – “How to” Guide
Kx.com

87
Dashboards for Kx – “How to” Guide
Zoom and Pan
Zoom and Pan provides built-in navigation focus. The zoom-and-pan range can be paired with dashboard
viewstates and used as filters in other dashboard queries.
•Create Data Source: ZoomandPan
•Connection: html5eval_grp (or html5evalcongroup)
`Date xasc select Date, Open from ChartDNA
88
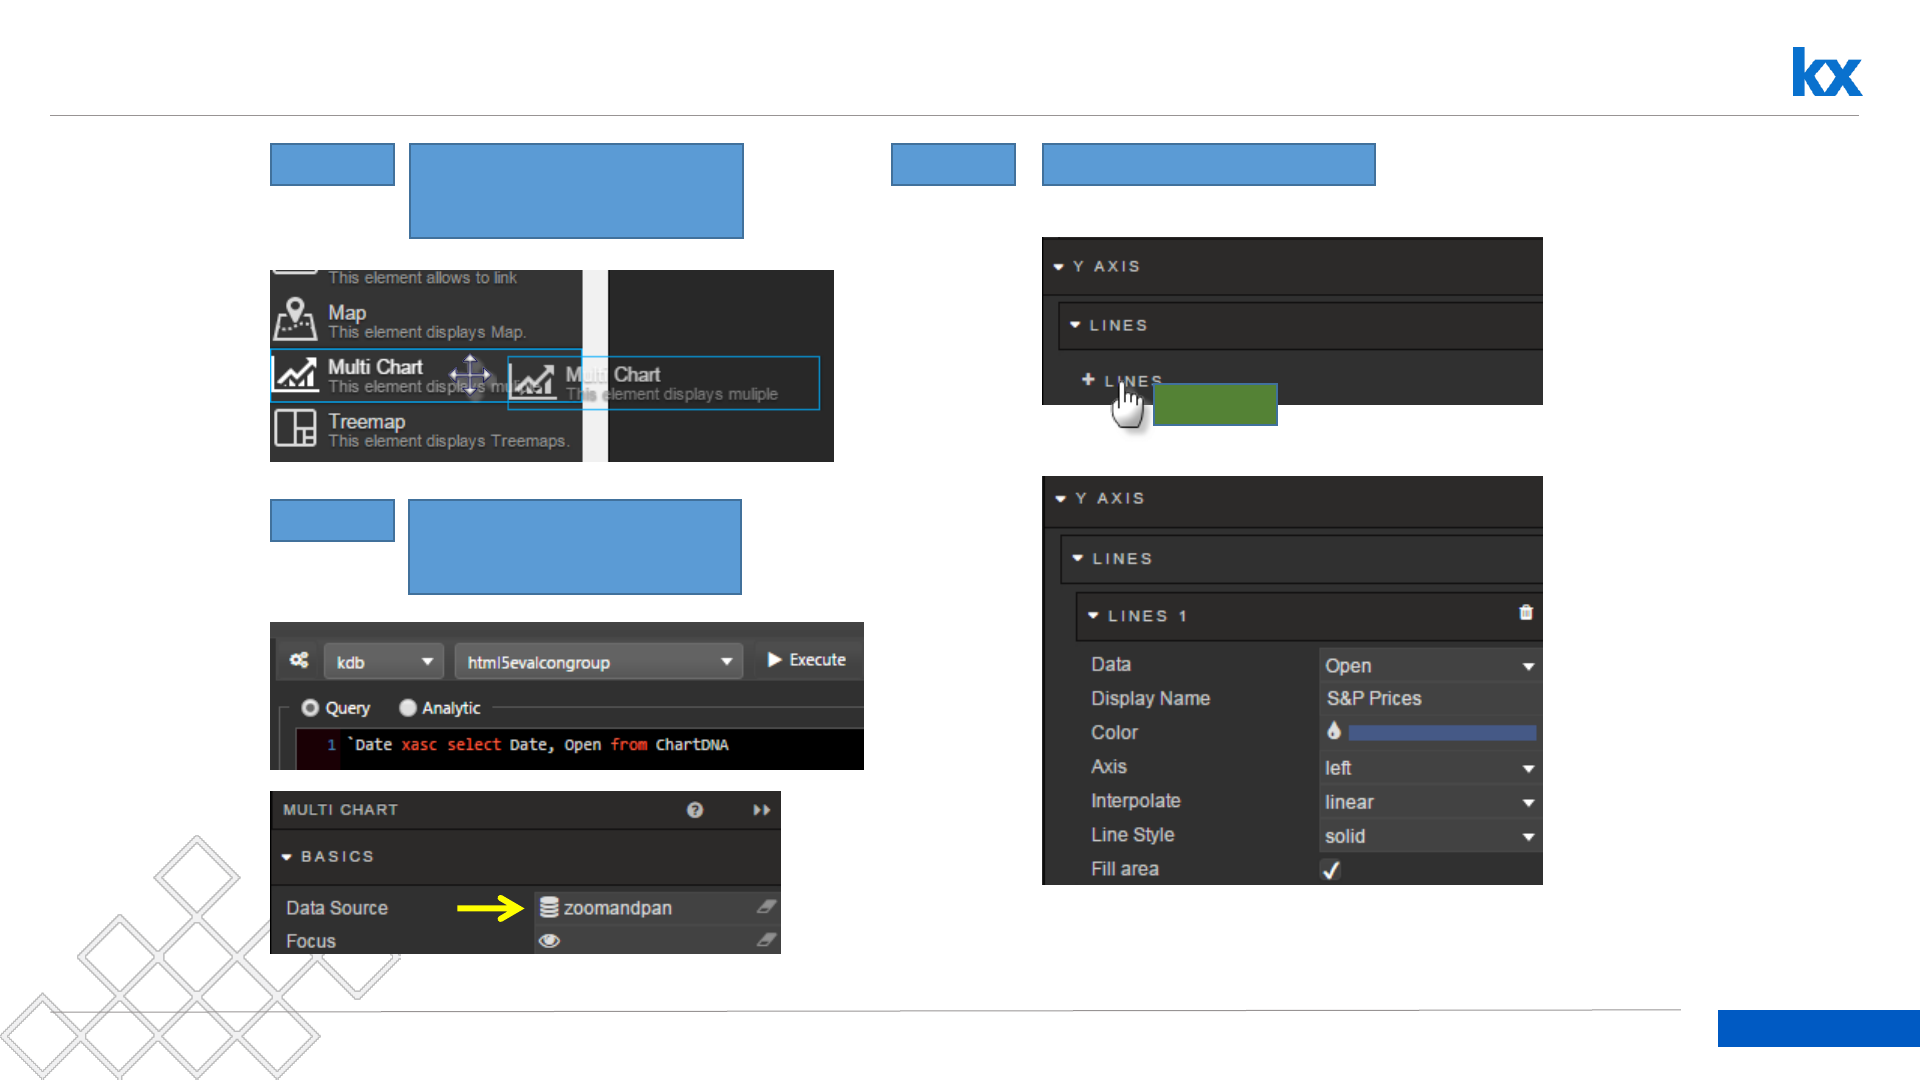
Dashboards for Kx – “How to” Guide
Configure Zoom and Pan
Step: 1 Drag Multi Chart inside
dashboard
Step: 2 Configure query
ZoomandPan
Step: 3 Add a Line Chart
Left-click

89
Dashboards for Kx – “How to” Guide
Configure Zoom and Pan
Step: 4 Switch on Zoom / Pan
Create Viewstate parameters for Min
Zoom and Max Zoom
Text component displaying viewstates, start and end
Left-click-drag

Range Slider
Dashboards for Kx – “How to” Guide
Kx.com

91
Dashboards for Kx – “How to” Guide
Breadcrumbs for Charts: Range Slider
Similar to Pan-and-Zoom, Range Slider is a separate component which is paired with a chart and can be used
to control the amount of data to display. It’s paired with a chart similar to how Breadcrumbs works.
•Use Data Source: ZoomandPan
•Connection: html5eval_grp (or html5evalcongroup)
`Date xasc select Date, Open from ChartDNA
92
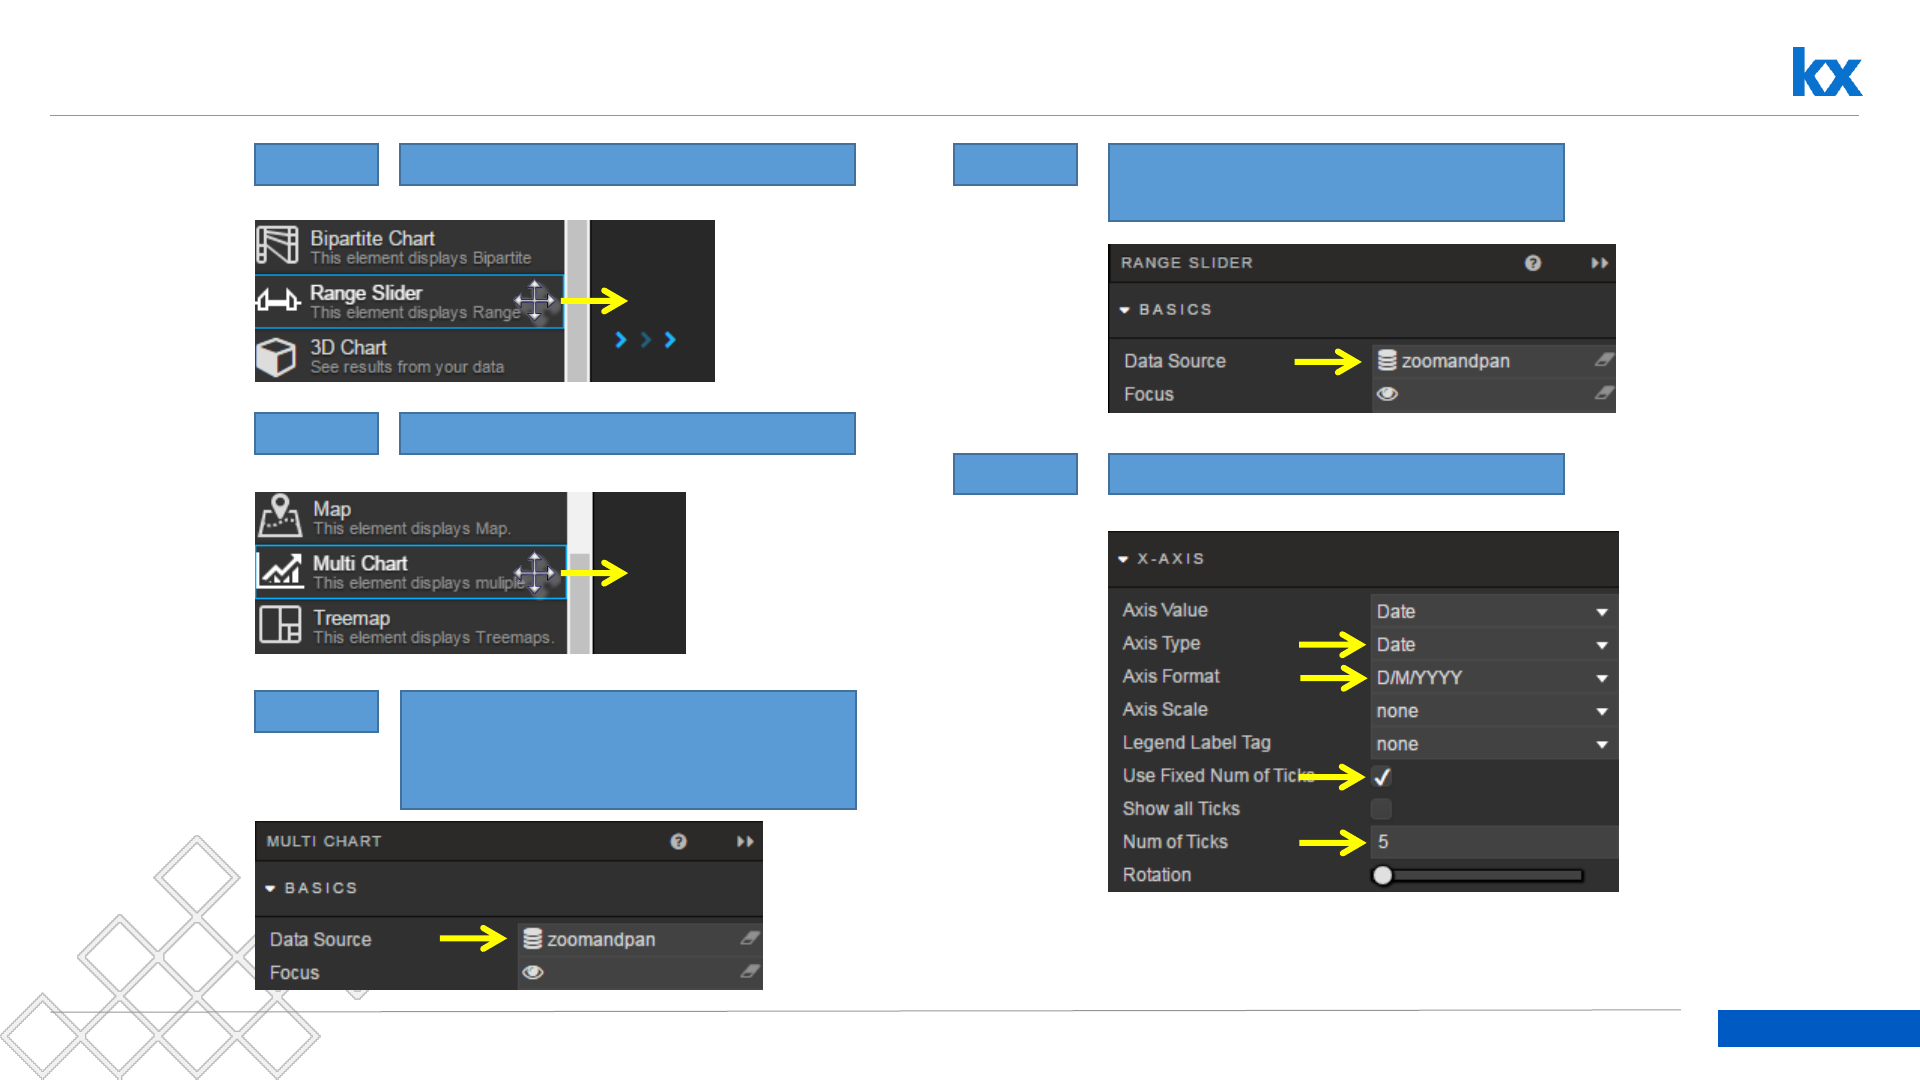
Dashboards for Kx – “How to” Guide
Breadcrumbs for Charts: Range Slider
Step: 1 Drag Range Slider inside dashboard
Step: 2 Add a Multi-Chart to the dashboard
Step: 3 Configure the Multi-Chart to use
ZoomandPan data source; create a
line chart for Open price
Step: 4 Likewise, configure the Range Slider
to use ZoomandPan data source.
Step: 5 Set X-Axis for Date for Range Slider
93
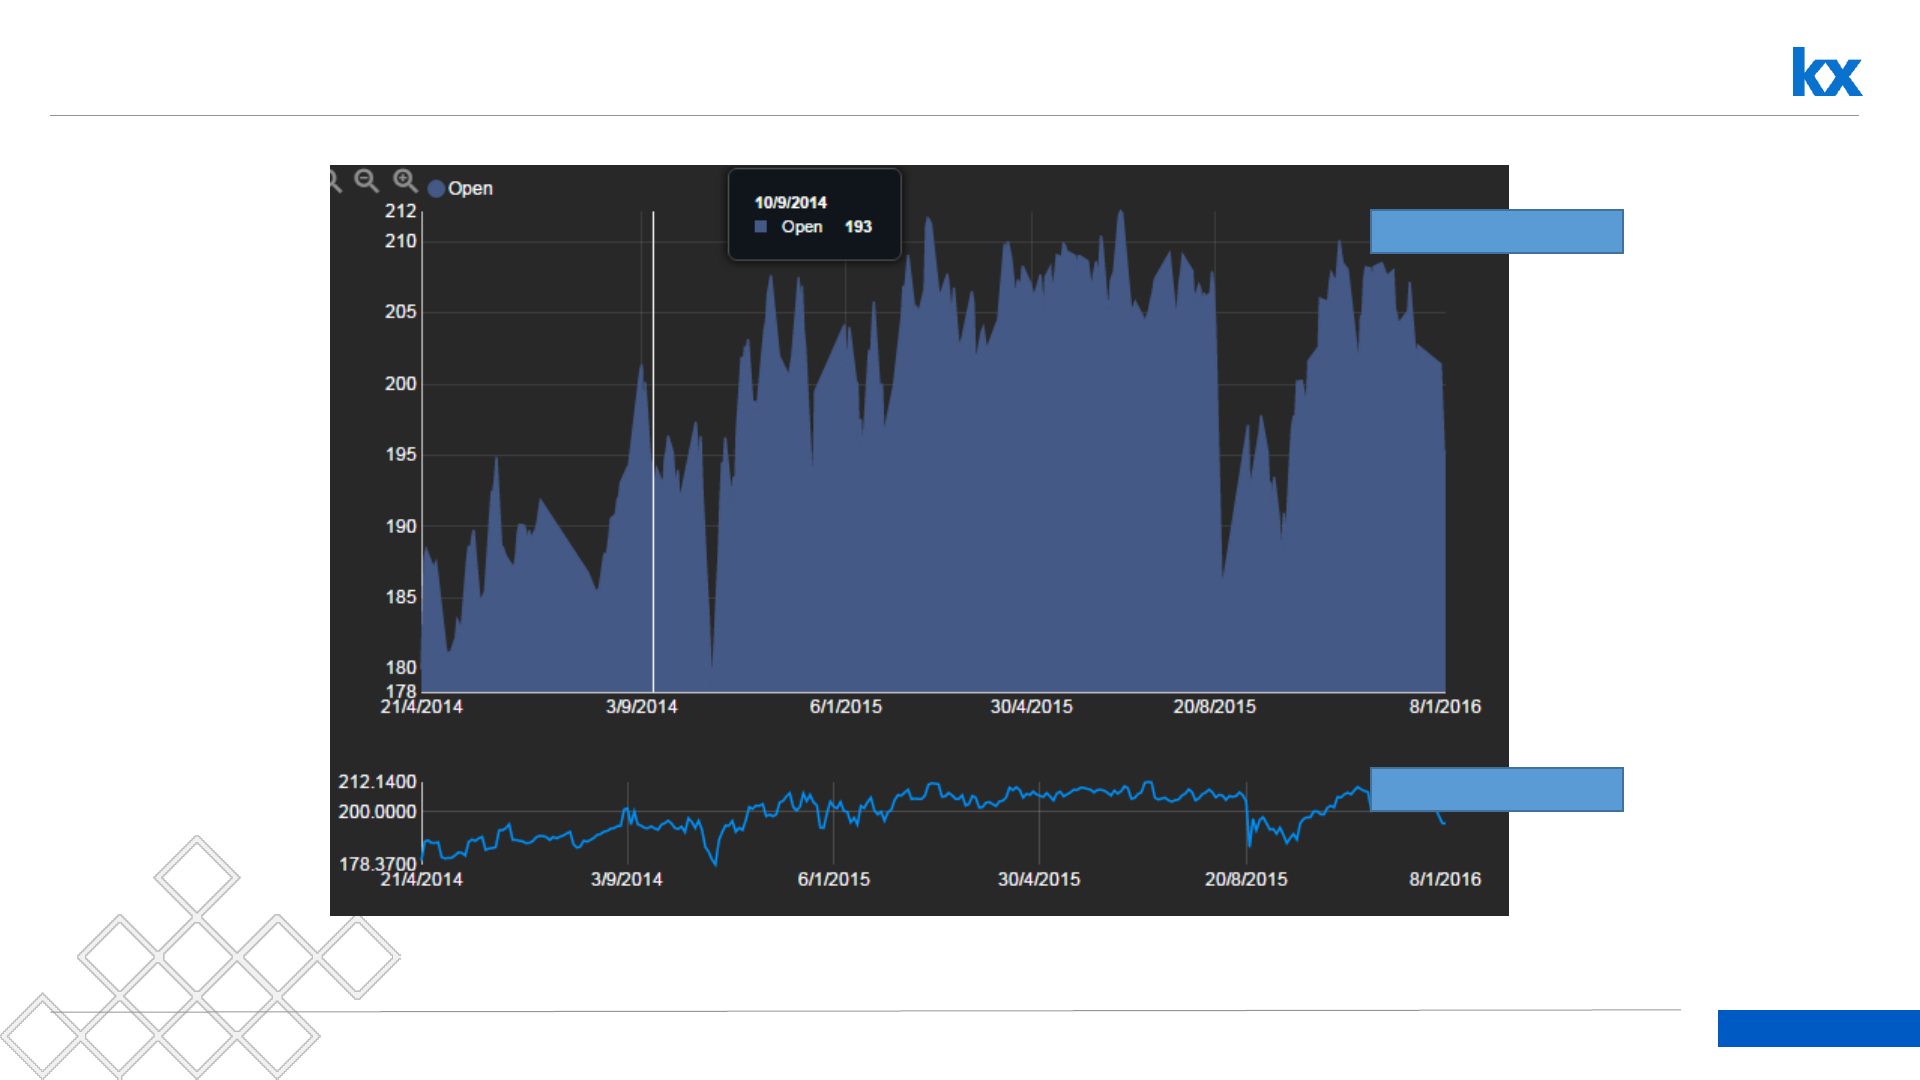
Dashboards for Kx – “How to” Guide
How It Looks So Far
Multi-Chart
Range Slider
94
Dashboards for Kx – “How to” Guide
Link Range Slider to Multi-Chart
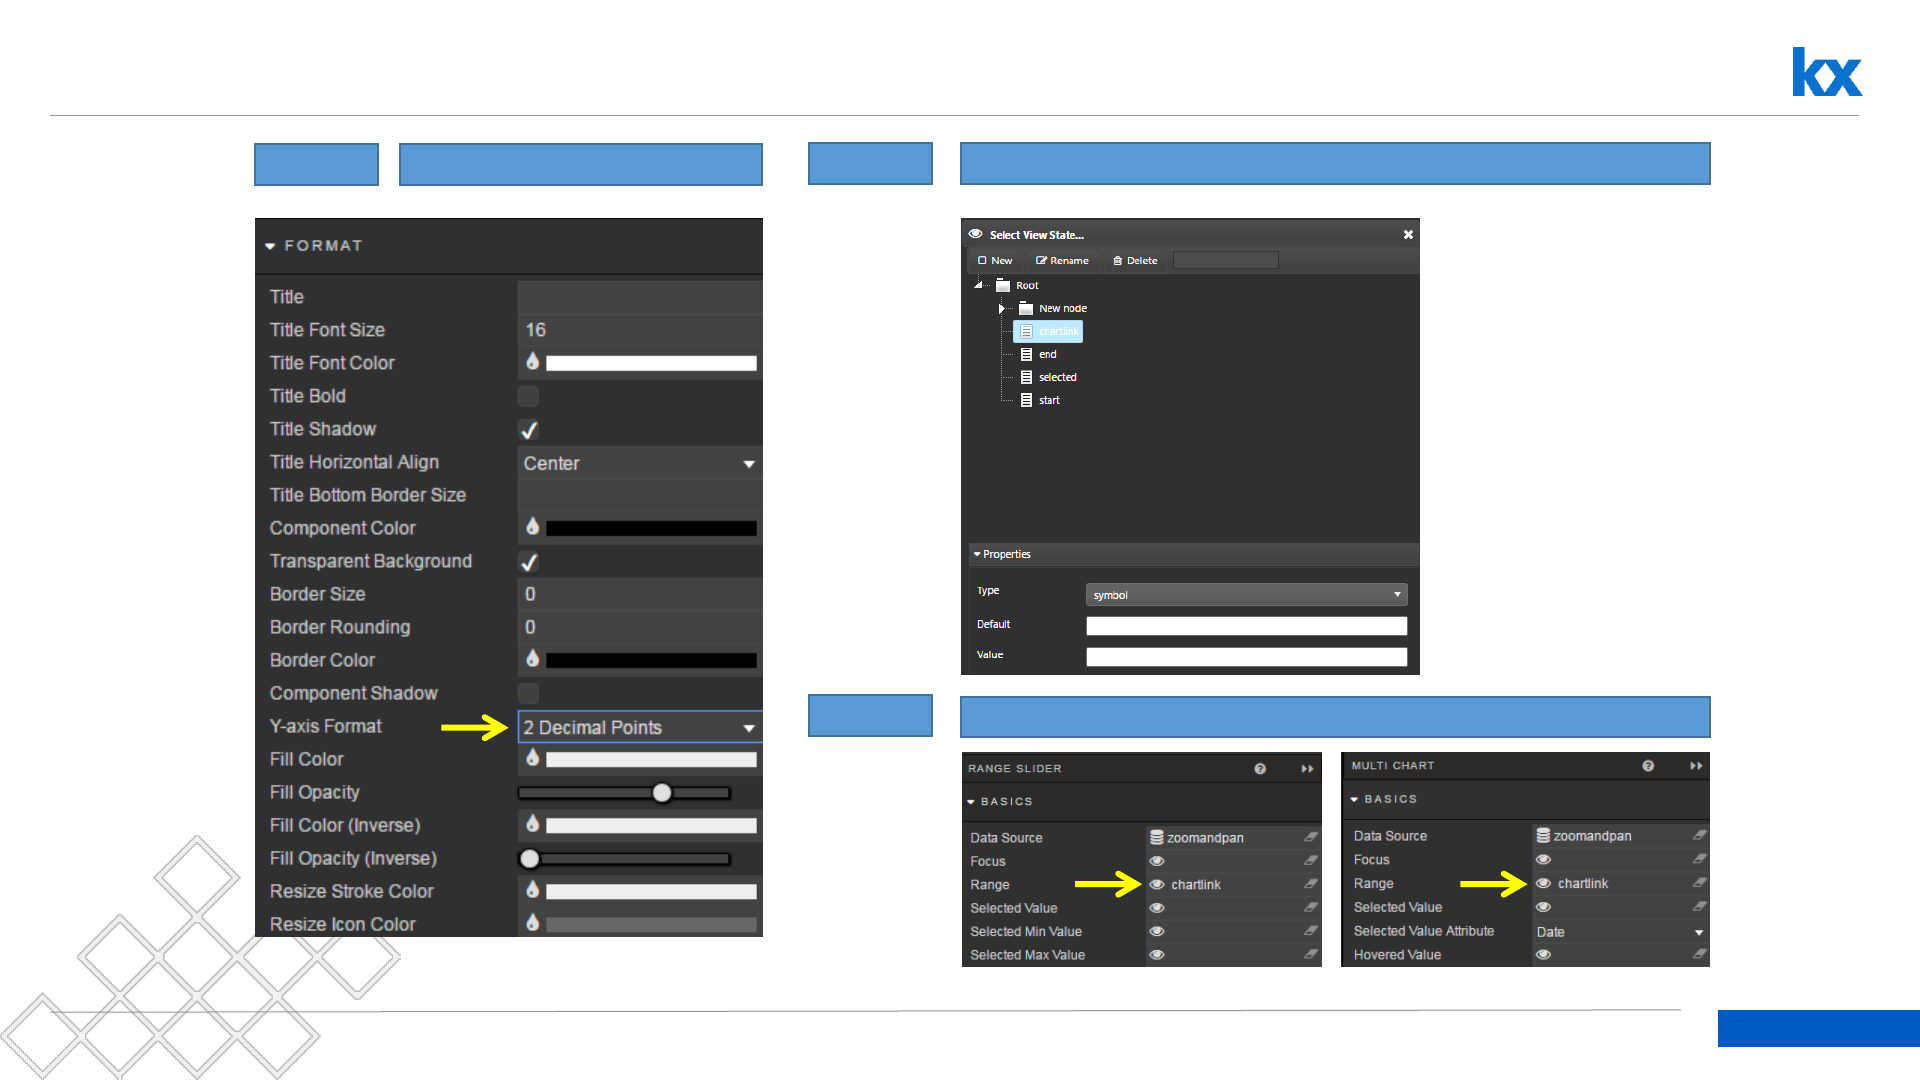
Step: 6 Format Y-Axis Step: 7 Create viewstate, “chartlink” of type Symbol
Link Range Slider to Multi-Chart using Range property
Step: 8
95
Dashboards for Kx – “How to” Guide
Try This
•Set Viewstate for Selected Min and Selected Max property
•Add a Data Grid. Configure it to display the values of the Range Slider
•Add a second Multi-chart; have it use the data source (TradePerform):
•Configure the second Multi-chart to display Day4_Cumu, Day3_Cumu,
Day2_Cumu, Day1_Cumu, Day0_Cumu (“Trade Performance for days 0 to 4”).
Connect it to the Range Slider
`Date xasc select Date, Day4_Cumu, Day3_Cumu, Day2_Cumu, Day1_Cumu, Day0_Cumu from
ChartDNA
ZoomandPan
Data Grid
ZoomandPan
Multi-Chart
TradePerform
Multi-Chart
ZoomandPan
Range Slider

96
Dashboards for Kx – “How to” Guide
Try This
•Create a set of Highlight Rules to Show Changes in VWAP

Navigation
Dashboards for Kx – “How to” Guide
Kx.com

98
Dashboards for Kx – “How to” Guide
Navigation: Jumping between dashboards
The Navigation component allows users to navigated between
different dashboards, and different screens in the same
dashboard. Viewstates can be shared across dashboards so
information from one can be passed into another.

99
Dashboards for Kx – “How to” Guide
Add Screens to support multiple dashboard views in a single dashboard
Step: 1 First create additional
screens within the parent
dashboard; these can be
populate with earlier
examples (optional)
Step: 2
Left-click
The star sets the
default screen to
use on load
Left click-and-drag the
Navigation component
into Screen 1
Continued…
Each Screen can be its own
dashboard with
components. For example,
each “Try Me” tutorial in
this document could be
done as a screen
100
Dashboards for Kx – “How to” Guide
Configure Button Style
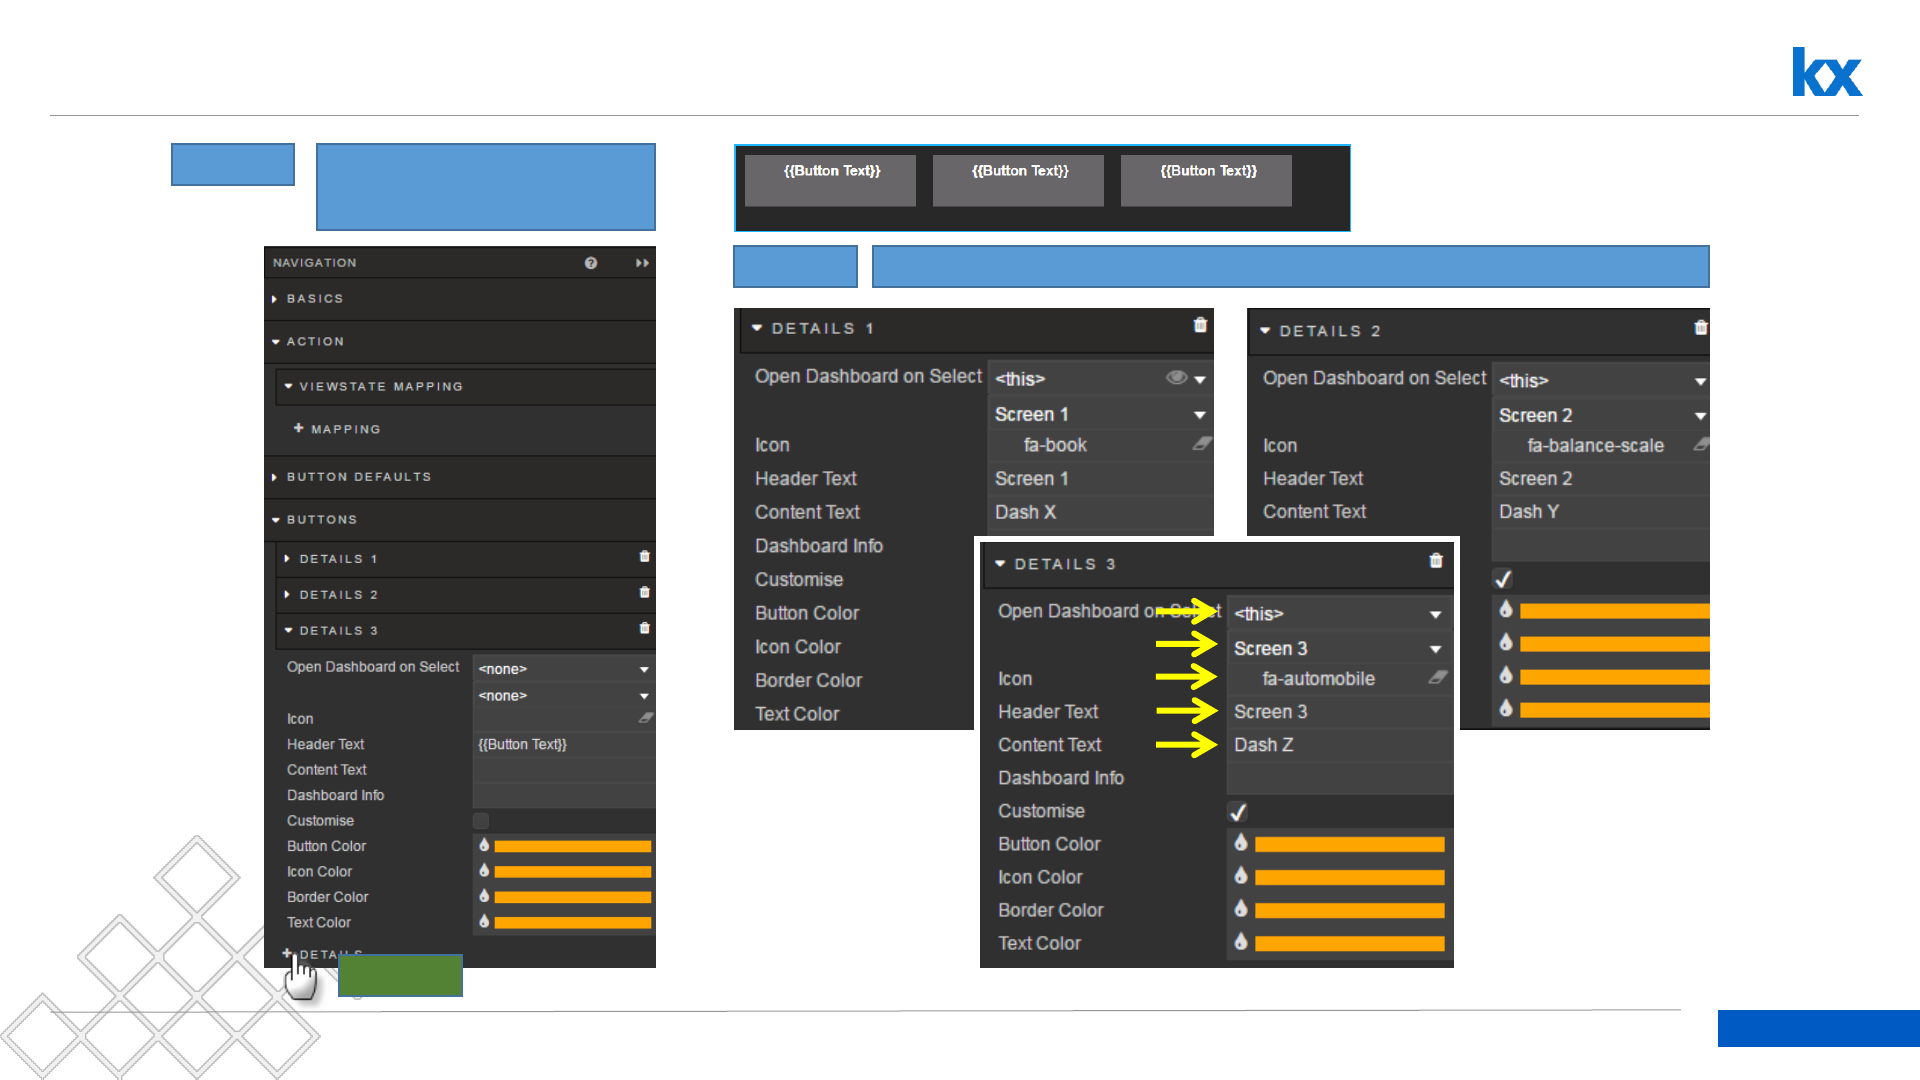
Step: 3 Add three Navigation
buttons
Left-click
Step: 4 Configure individual button links

101
Dashboards for Kx – “How to” Guide
Global vs Individual Button Styles
Step: 5 Change macro button styles; applied across all buttons Step: 6 Style Individual Buttons
Add a Navigation Component to each screen and dashboard
Use the keyboard cut-and-paste shortcut (CTRL+C / CTRL+V) to copy components within and
across Dashboard screens.

102
Dashboards for Kx – “How to” Guide
Alternatives
Alternative
Flexible Button Width
Step: 1 Uncheck Fixed Size
Step: 2 Set Columns to number of
buttons to display
A Column value of ‘1’ will stack buttons
Alternative
Navigate to other Dashboards
Step: 1 Select from Dropdown
Left-click
Alternative
Share View States Across Dashboards
Match dashboard viewstates to
destination dashboard viewstates
It’s necessary to create in the
destination dashboard viewstates
which match the name of the Target
103
Dashboards for Kx – “How to” Guide
Try This
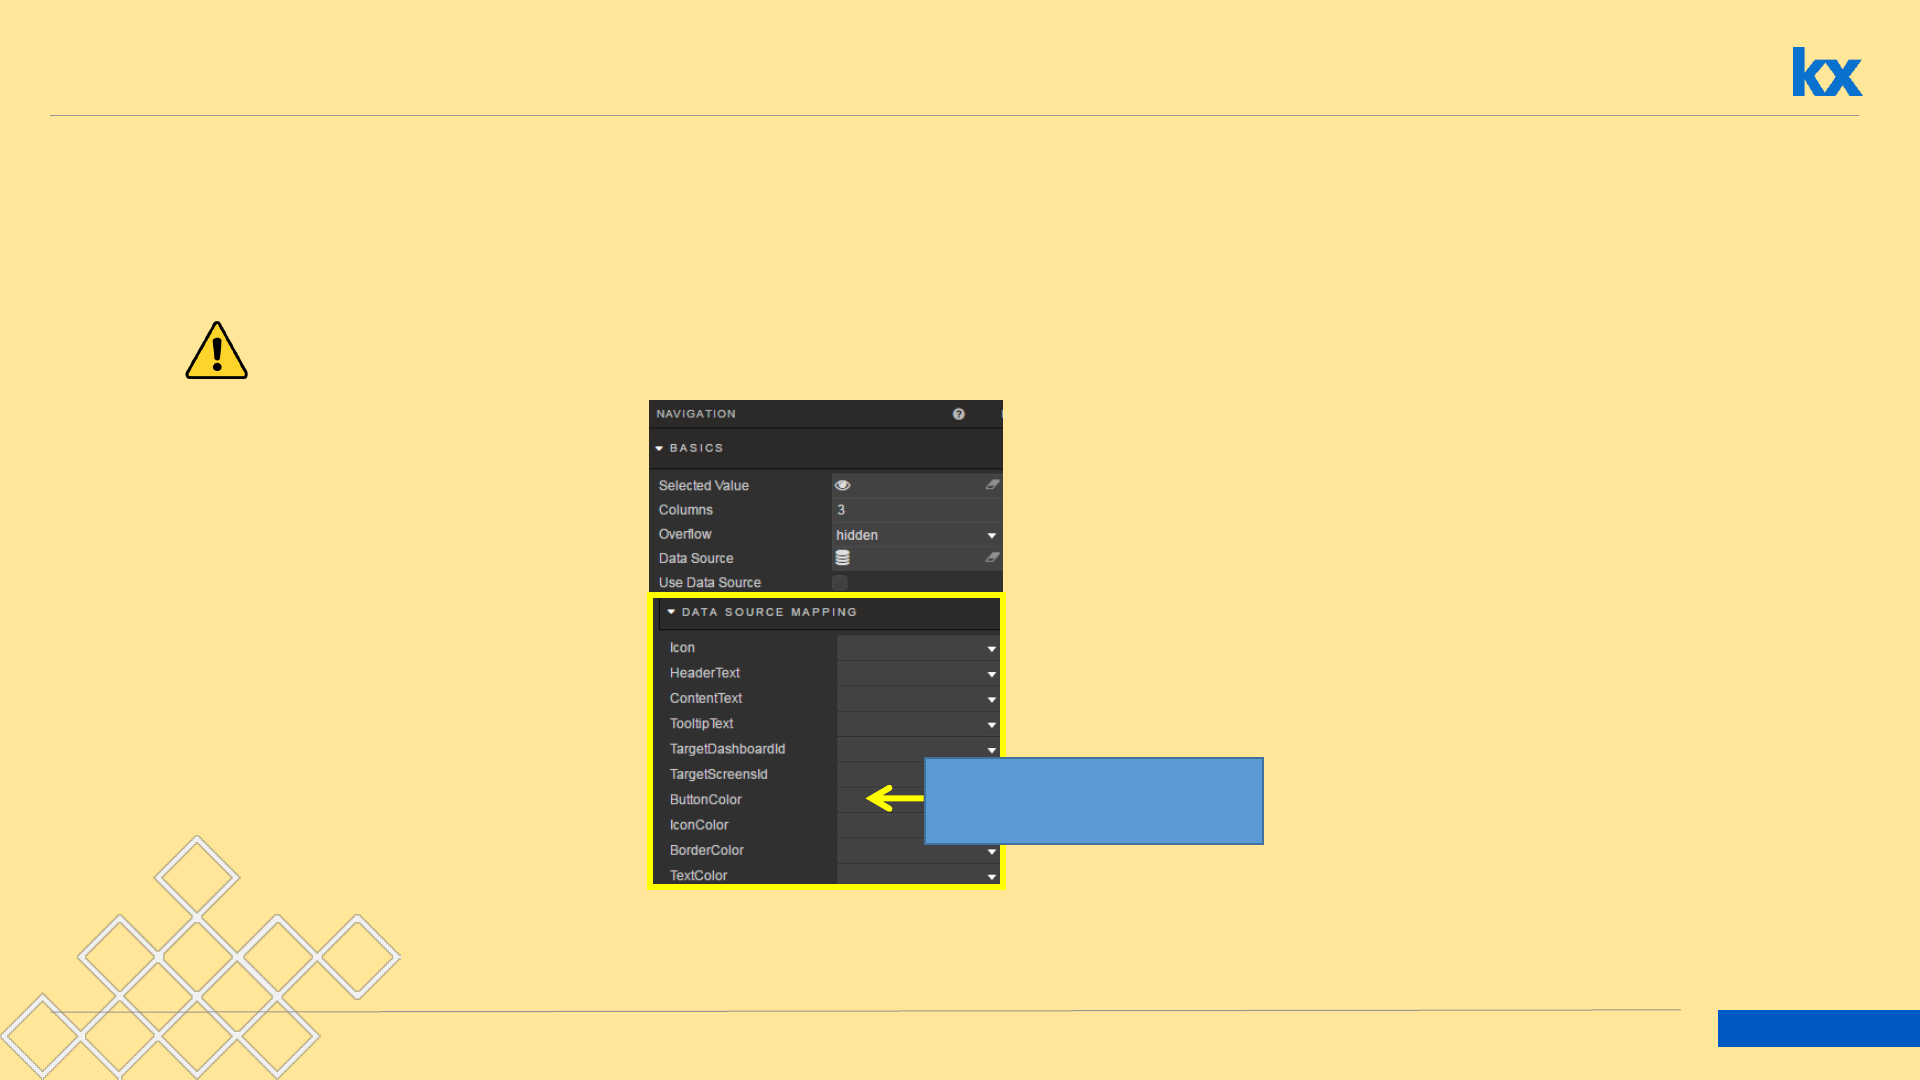
•Create a Navigation Panel using a Data Source, and map a View State so a value
from one dashboard is displayed in another.
There is no example in Html5evalcongroup which has a Navigation panel. This may require a local kdb connection for the Data Source
Data Source should include
variables for items listed

Tabs, Accordions & Layout Panels
Dashboards for Kx – “How to” Guide
Kx.com

105
Dashboards for Kx – “How to” Guide
Building Depth to Dashboards
Tabs, Accordion and Layout Panel allow for additional
functionality and space inside a single Dashboard screen
106
Dashboards for Kx – “How to” Guide
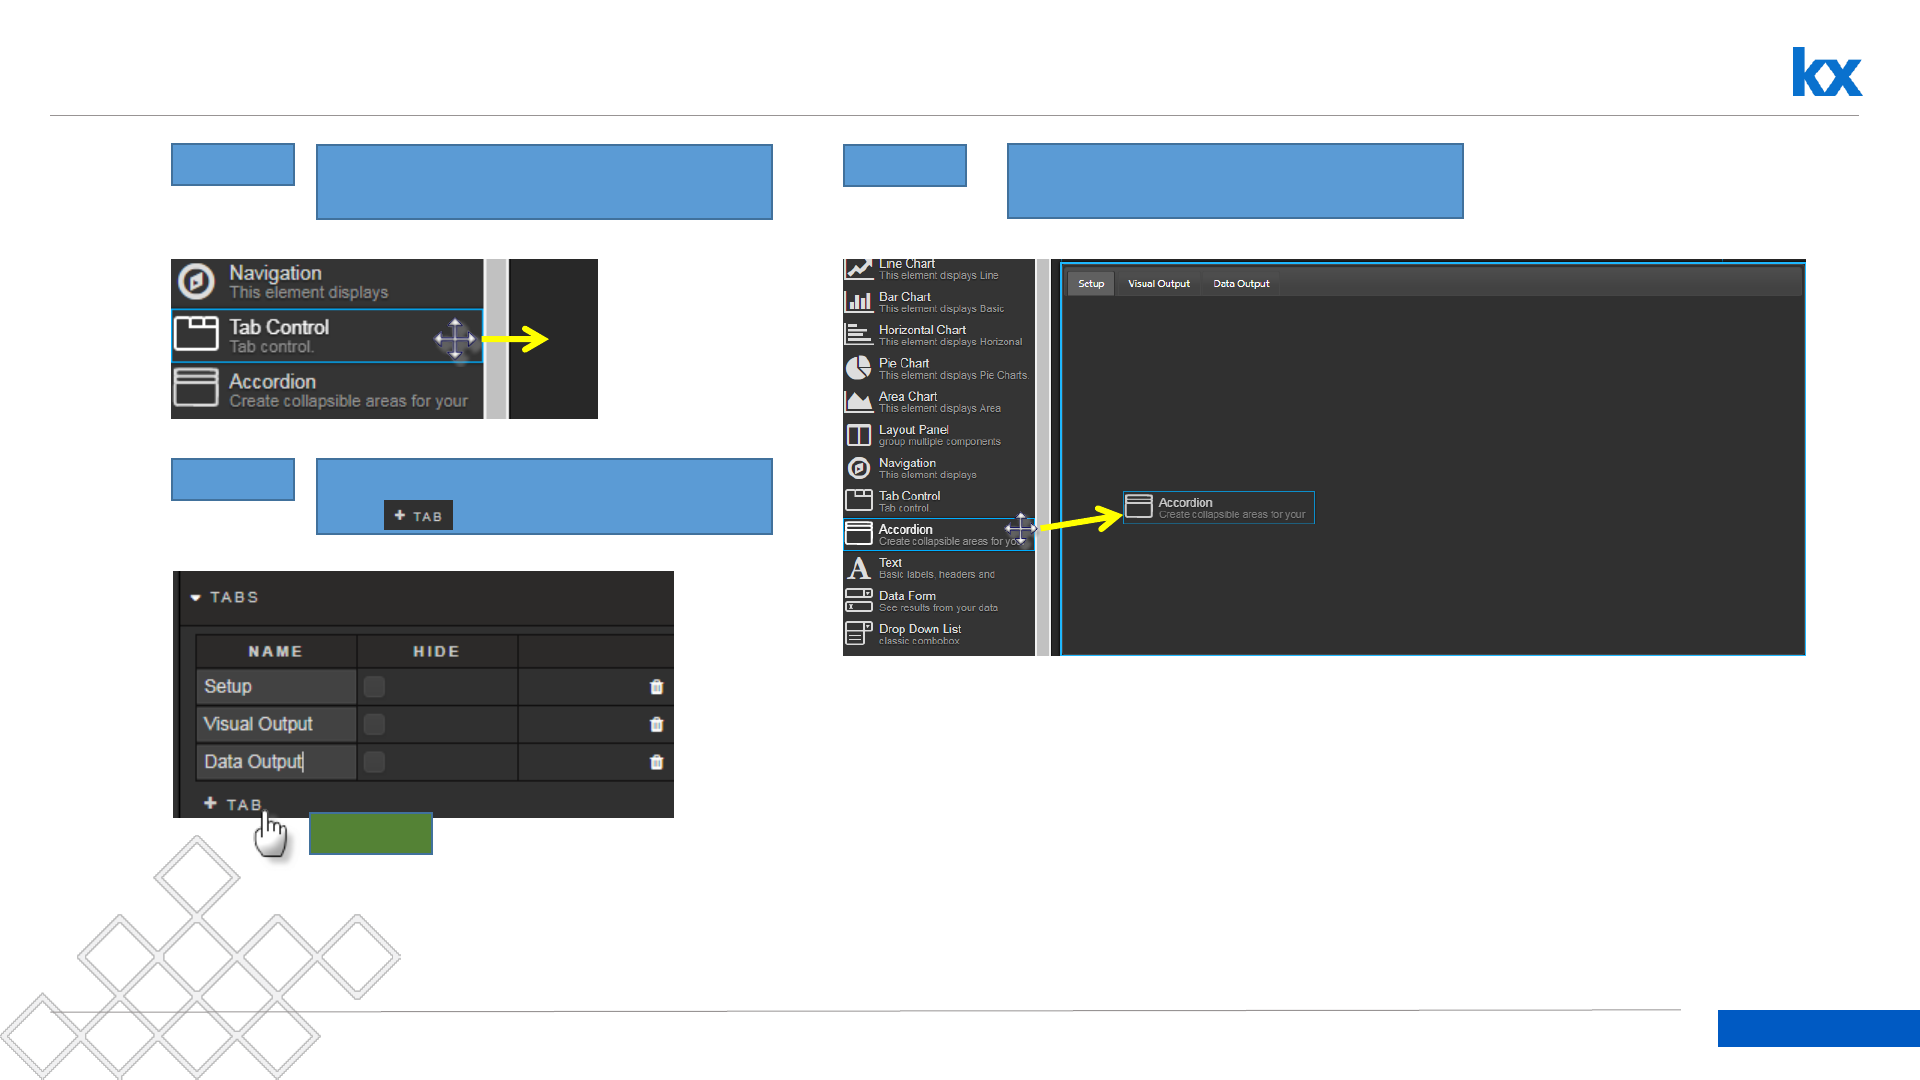
Adding a Tab
Step: 1 Drag the Tab component into the
dashboard
Step: 2 Add a new tab, and rename existing
tabs
Left-click
Step: 3 Select the first tab (“Setup”) and drag
inside the Accordion component
107
Dashboards for Kx – “How to” Guide
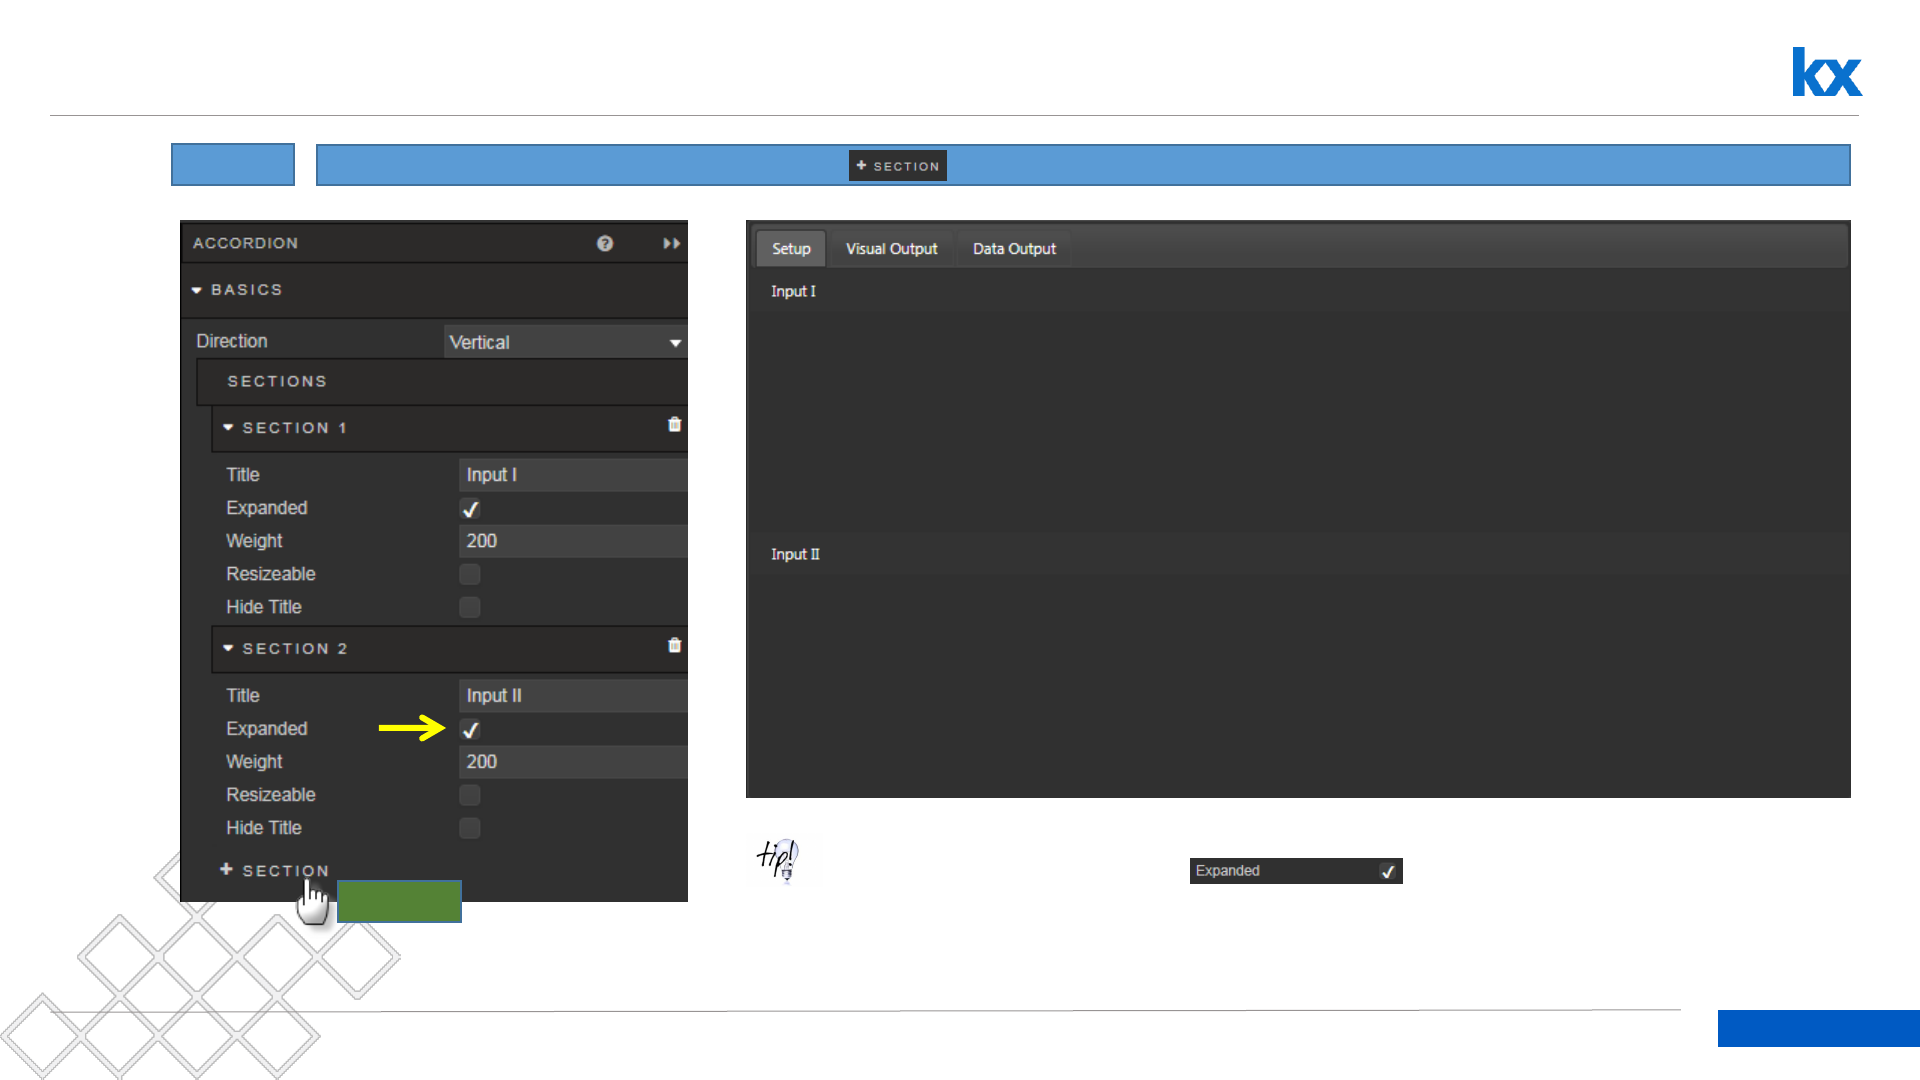
Adding an Accordion inside a Tab
Step: 4 Add a second section to the Accordion panel:
Left-click
When working with Accordion sections, it’s best to keep them in expanded mode so layout panel or
components can be added to them.
108
Dashboards for Kx – “How to” Guide
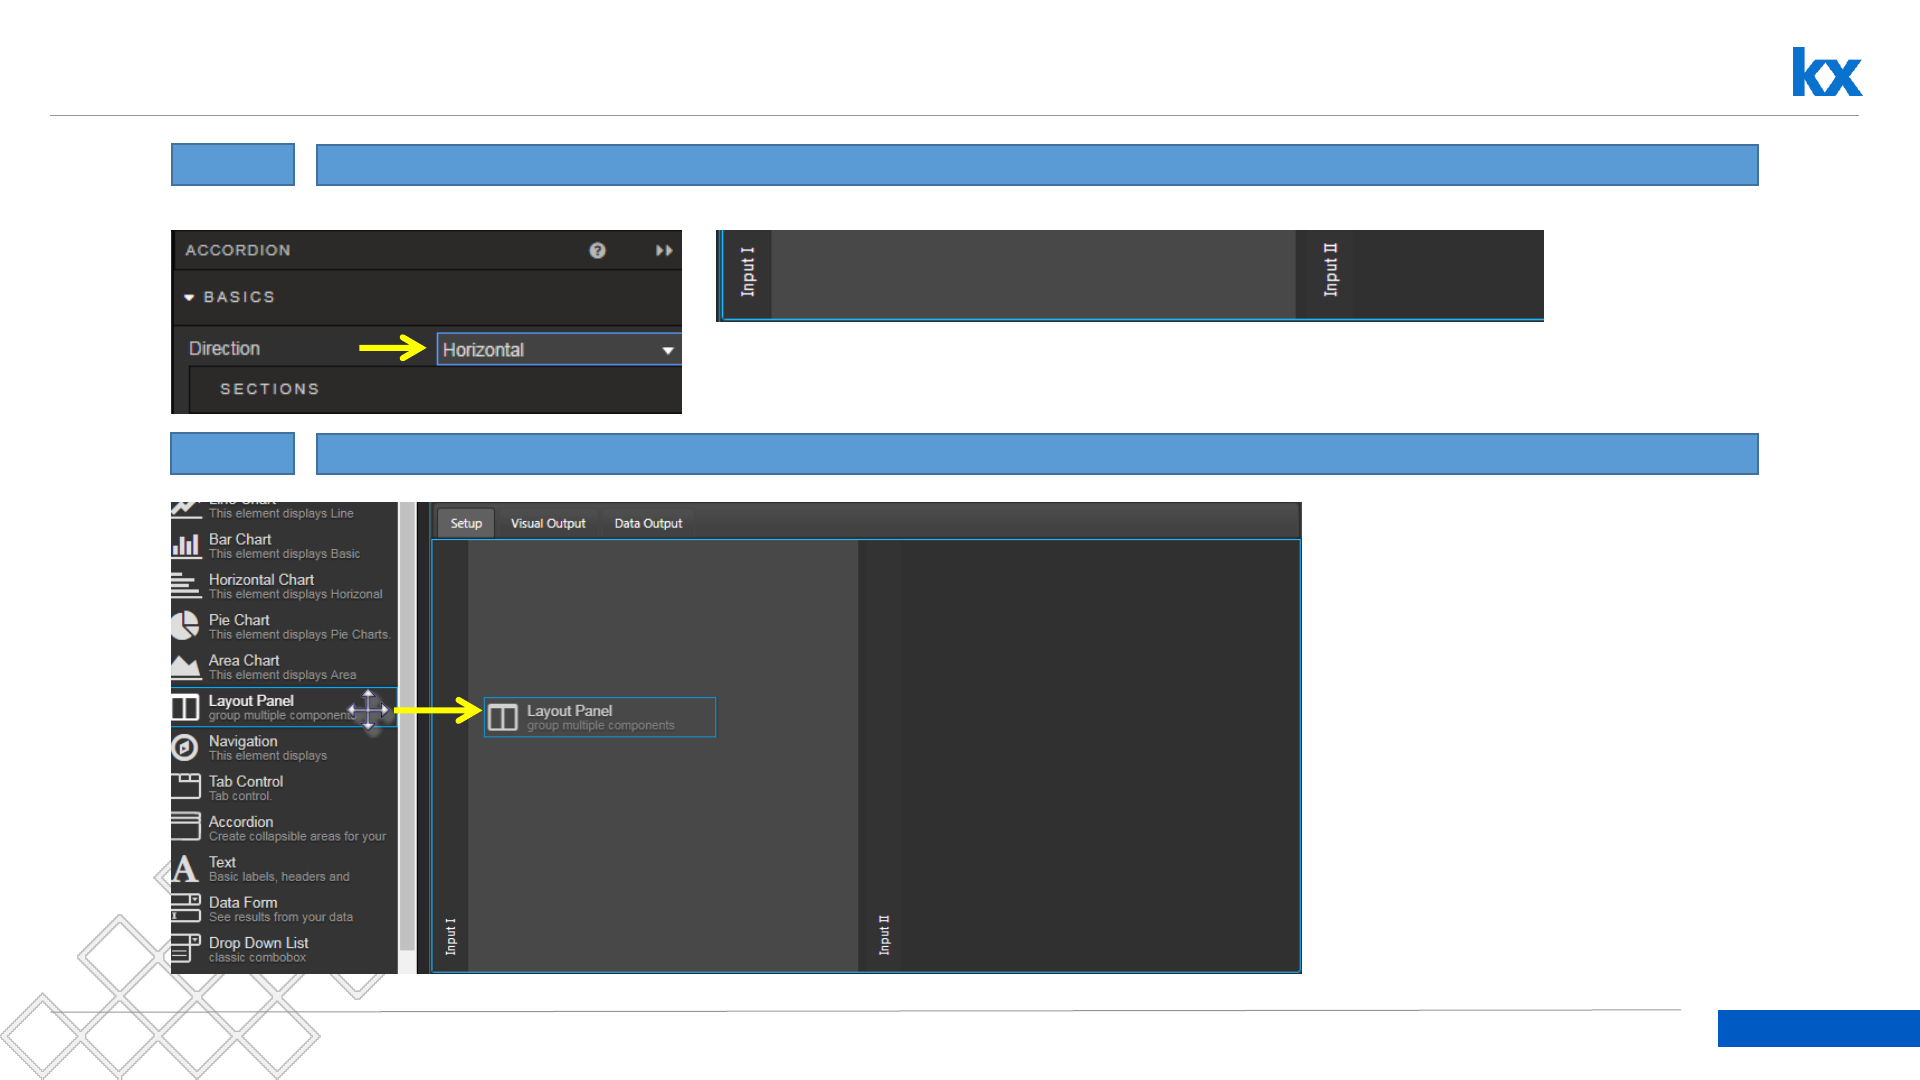
Adding an Layout Panel inside an Accordion section
Step: 5 Switch Accordion view to Horizontal for vertical controlled accordion slider
Step: 6 Add a Layout panel to each Accordion section
109
Dashboards for Kx – “How to” Guide
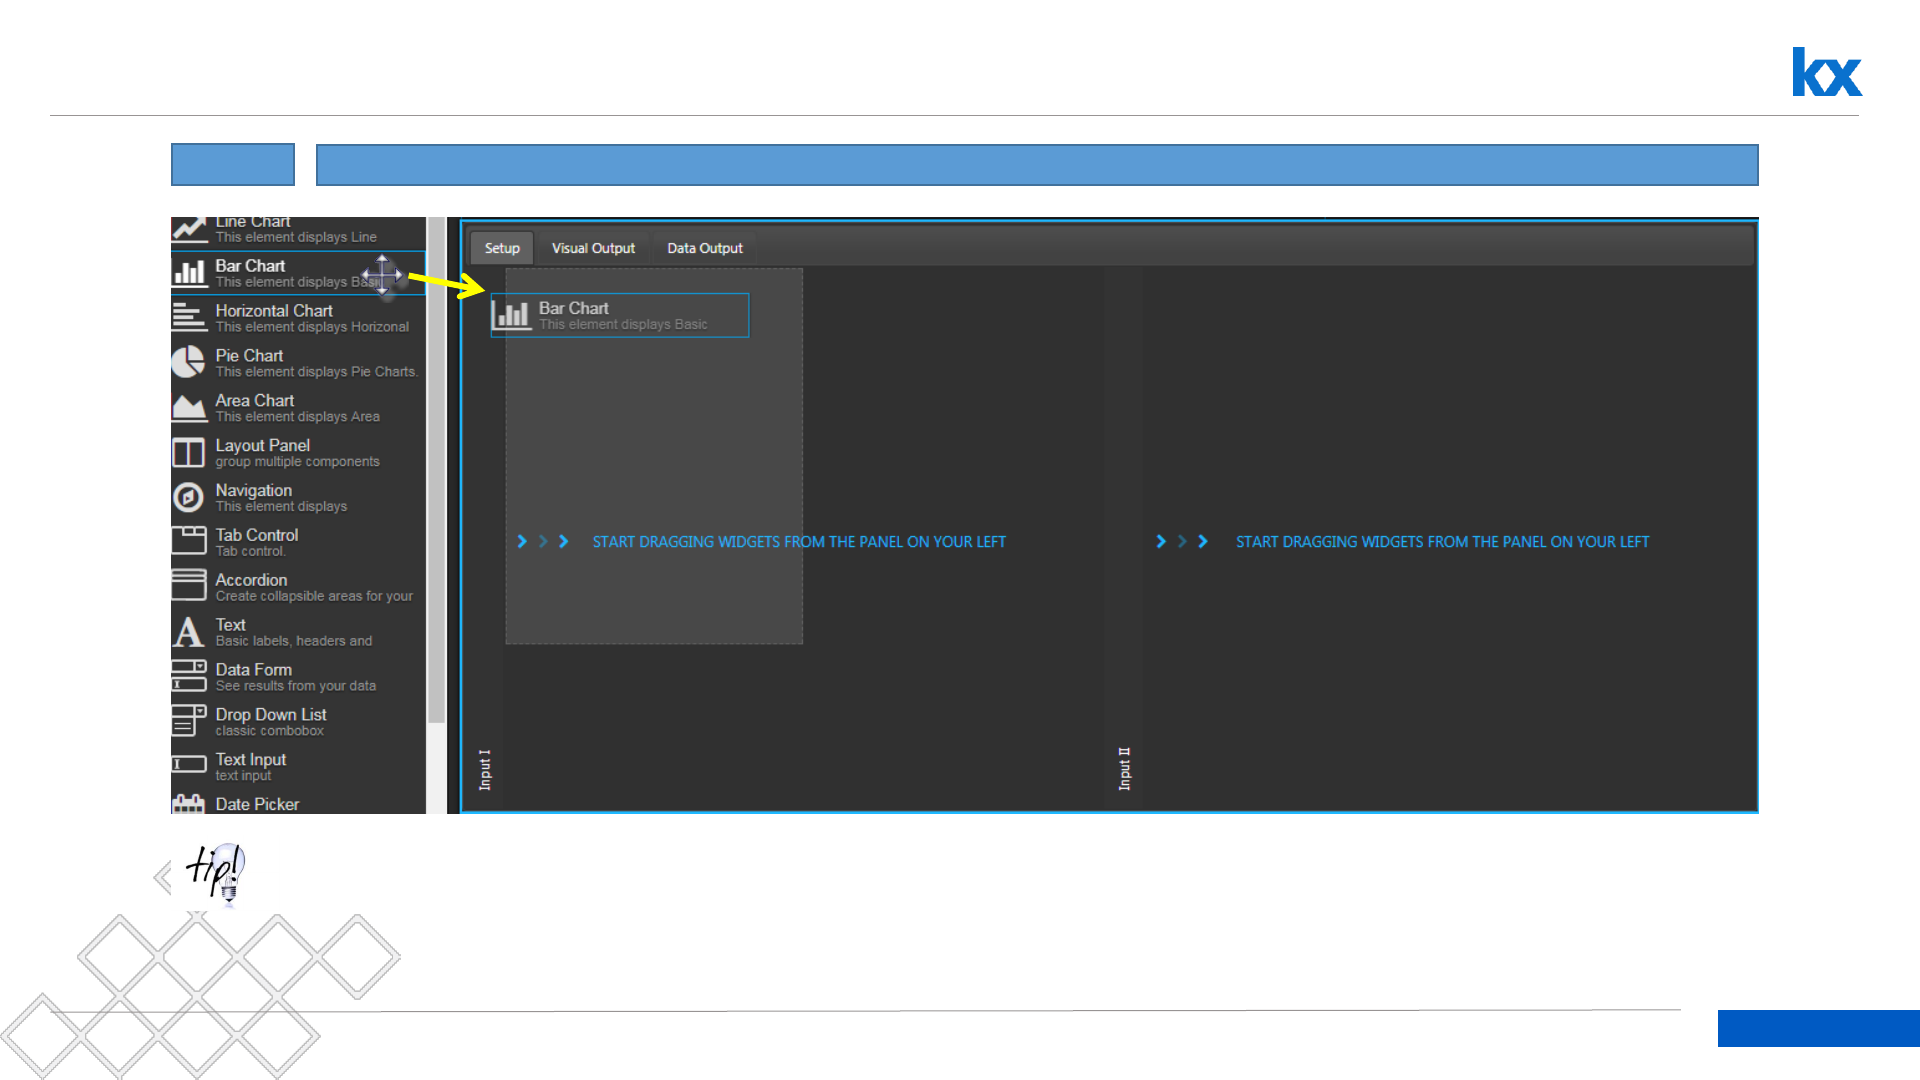
Add components inside the Layout Panel
Step: 7 Add components to your Layout section
No Layout Panel is required if a Tab or Accordion section is only to house one component; simply drag-and-drop the component inside the Tab or
Accordion section and the component will automatically resize to fill the Tab or Accordion panel.
110
Dashboards for Kx – “How to” Guide
Have added components fill out layout panel
Step: 8 In Layout Panel, check Fill Height for components to fill the space of the Layout panel
Blank Space
Once checked, it can be difficult to
re-select the layout panel to make
changes (1 px width selection area).
Therefore, check this box as a last
step when building dashboards
Alternative
Advanced Layout will stack components;
good for dashboards configured for
mobile use
111
Dashboards for Kx – “How to” Guide
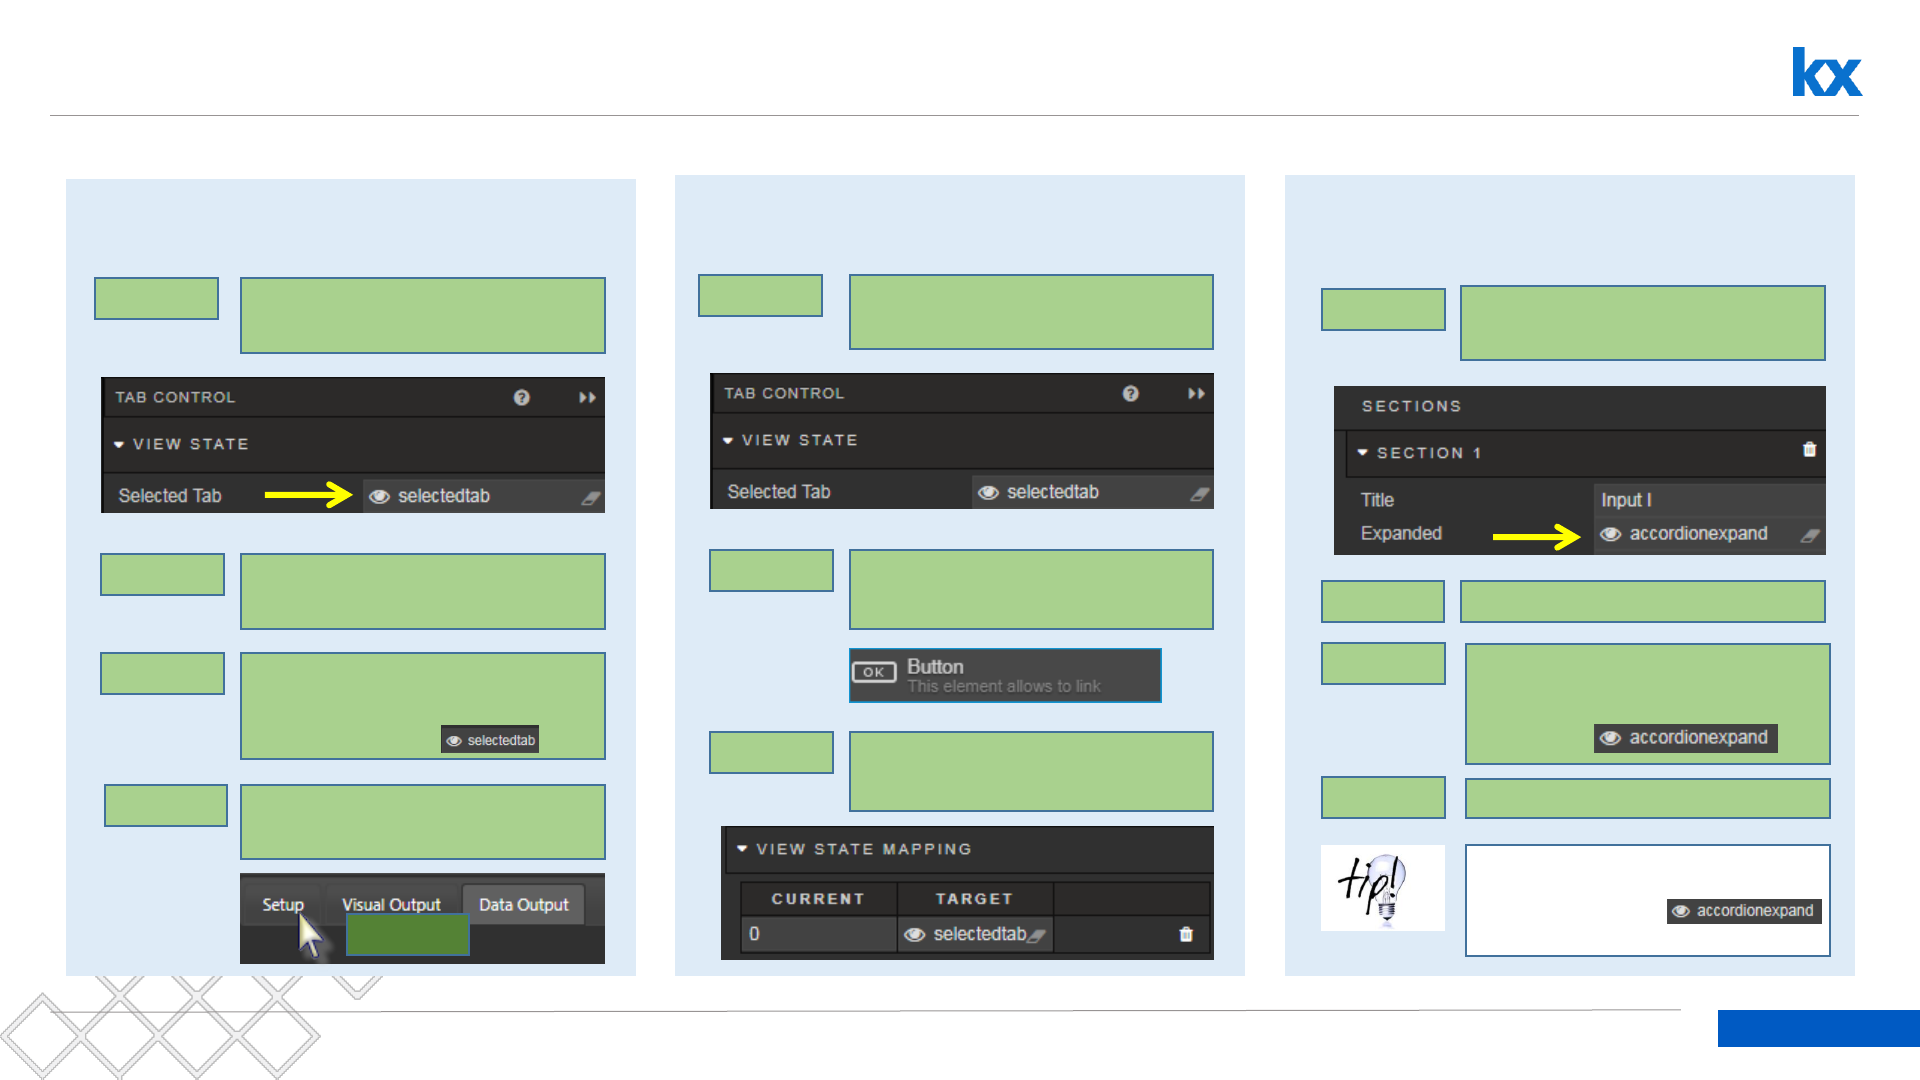
Tab and Accordion Alternatives
Alternative
Viewstate shared control of Tabs
Step: 1 Assign a viewstate to
Selected Tab
Step: 2 Add a Second Tab
Component
Step: 3 Assign the second tab
component Selected Tab the
same viewstate
Step: 4 Switch between tabs of
either Tab component
Alternative
Button control to open a particular Tab
Step: 1 Assign a viewstate to
Selected Tab
Step: 2 Add a Button Component
anywhere to the dashboard
Step: 3
Left-click
Set Button View State
Mapping; ‘0’ = Tab 1
Alternative
Accordion Expand control bound to Viewstate
Step: 1 Assign a viewstate to
Accordion expand
Step: 2 Add a second Accordion
Step: 3 In the second Accordion,
assign Expanded the
viewstate
Step: 4 Expand paired section
A Button can also be used to control
expansion. In Button View State
Mapping set Target to
and Current to “True”

Bring it Together
Dashboards for Kx – “How to” Guide
Kx.com
113
Dashboards for Kx – “How to” Guide
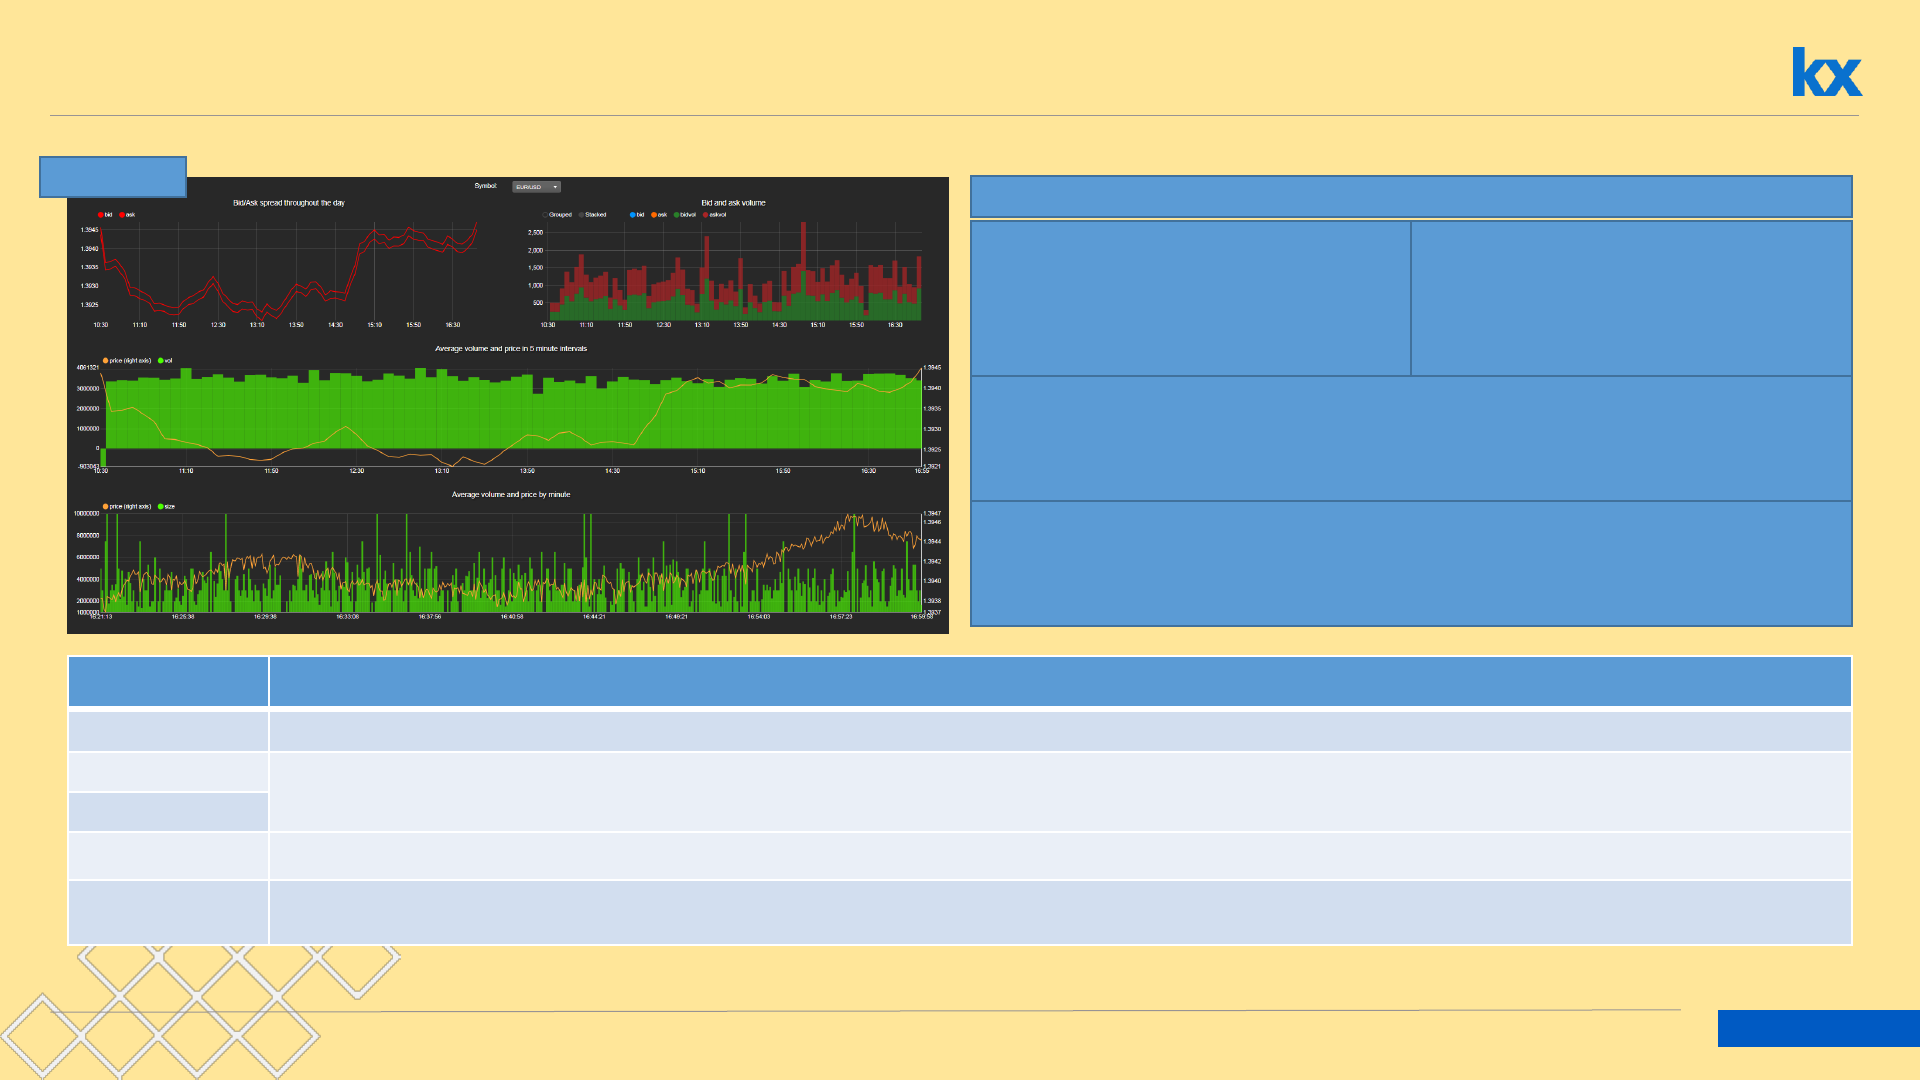
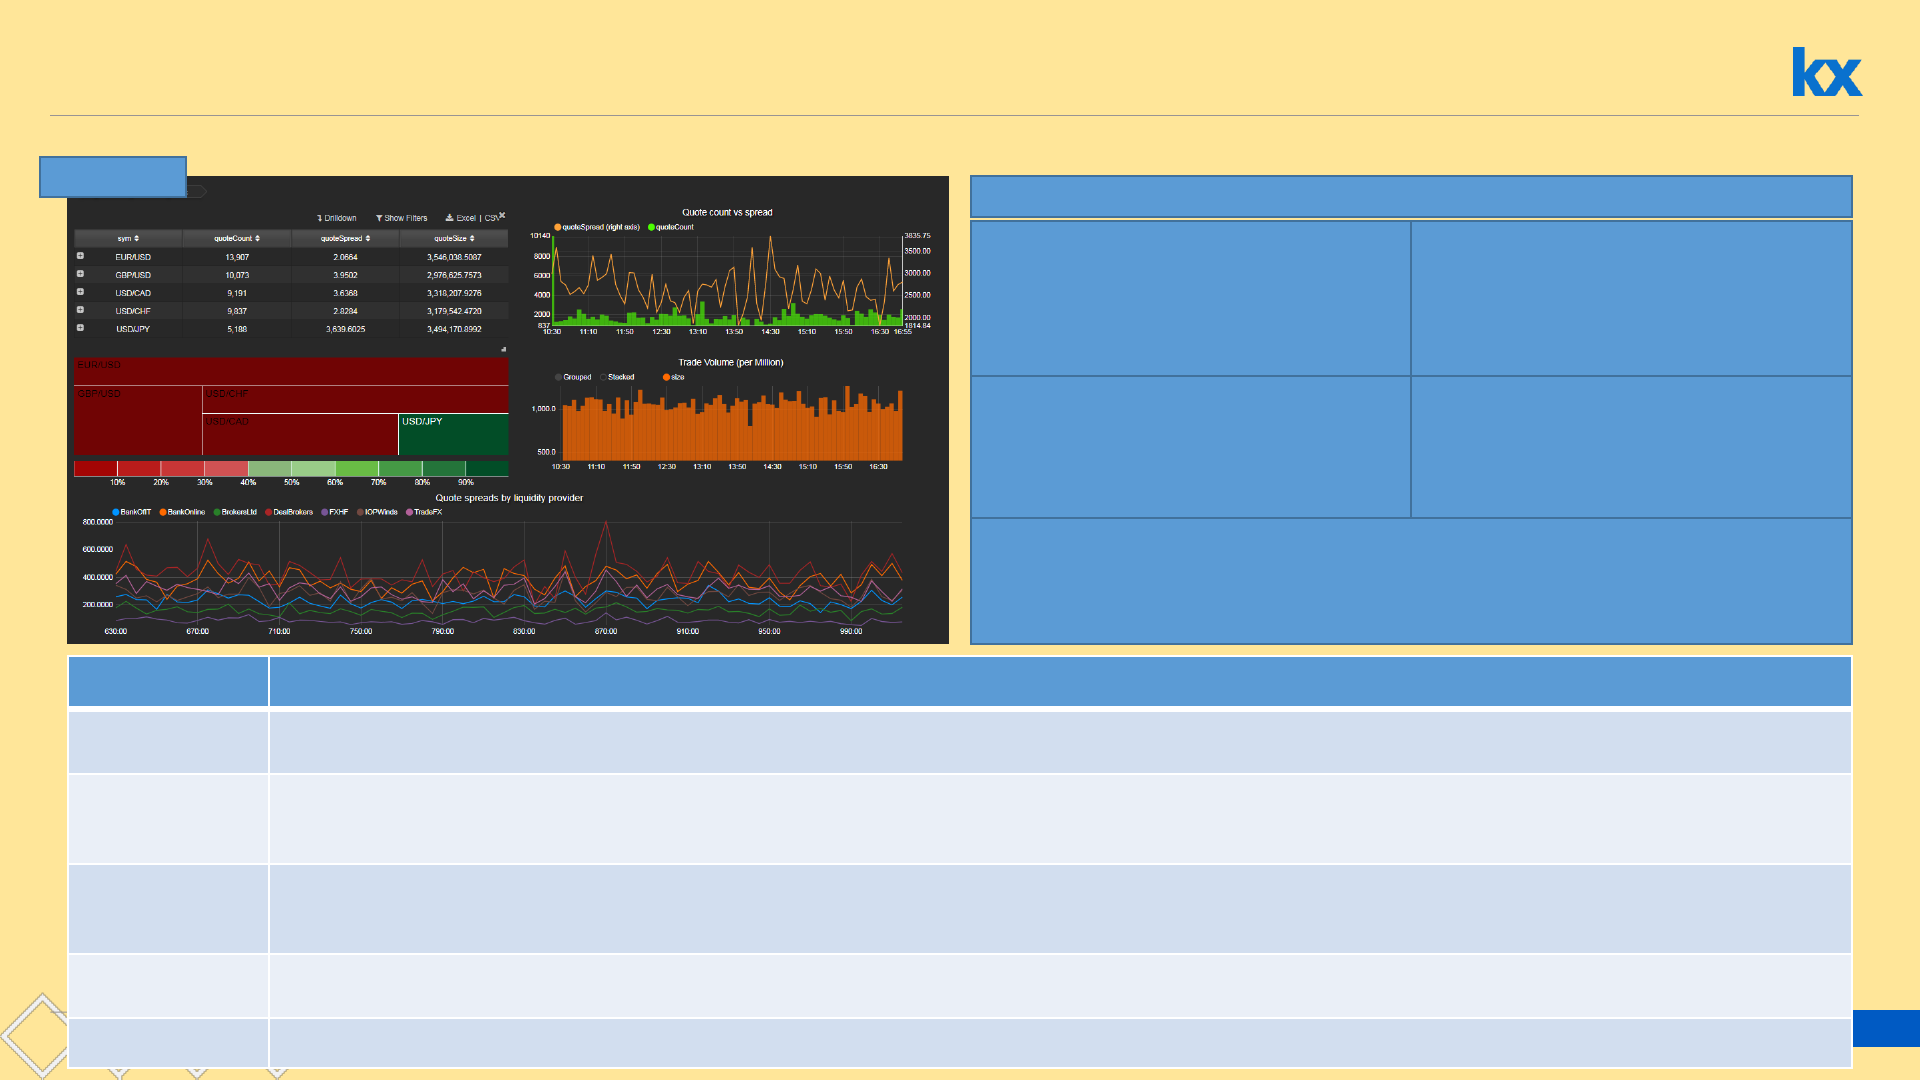
Try This: DemoLiquidity
Rebuild Dropdown
Line Chart Bar Chart
Component
All connect
to html5evalcongroup
Dropdown ([]sym:asc exec distinct sym from dfxTrade)
Multi-Chart
{[symval] `minute xasc select avg bid,avg ask, bidvol:max(0;sum bsize)%1e06, askvol:max(0;sum asize)%1e06 by 5 xbar time.minute from dfxQuote where sym=symval}
Bar Chart
Multi-Chart I {[symval] `minute xasc select price:avg bid,vol:(avg bsize) by 5 xbar time.minute from dfxQuote where sym=symval}
Multi-Chart II {[symval;side] -500 sublist $[side=`bid;select price:avg bid,size:avg bsize by time.second from dfxQuote where sym=symval;select price:avg ask,size:avg asize by time.minute from
dfxQuote where sym=symval]}
Multi-Chart I
Multi-Chart II
114
Dashboards for Kx – “How to” Guide
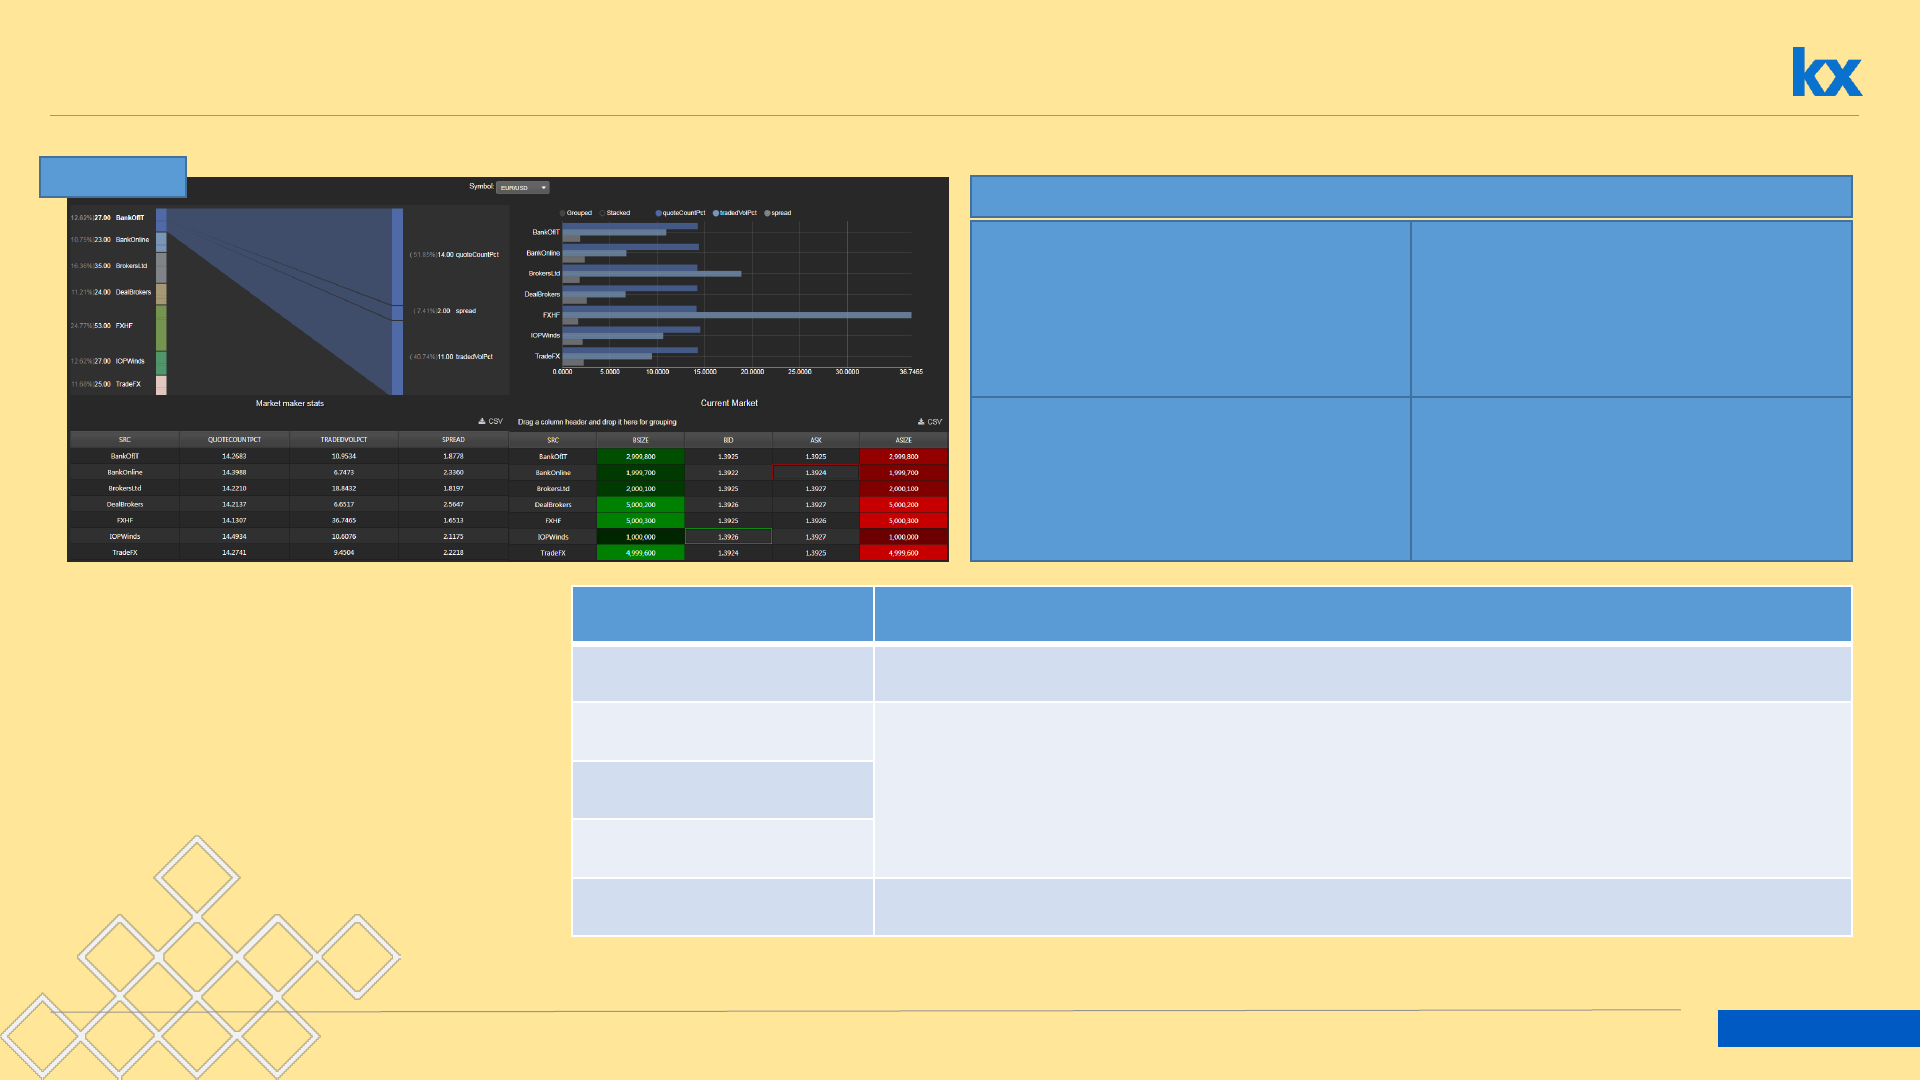
Try This: DemoMarketMakers
Rebuild Dropdown
Bipartite Chart
(Use lessons learned to configure)
Horizontal Chart
(Use lessons learned to configure)
Data Grid I Data Grid 2
Component
All connect
to html5evalcongroup
Dropdown
([]
sym:asc exec distinct sym from dfxTrade)
Bipartite Chart
{[
symval] select src,quoteCountPct:100*numQuotes%sum numQuotes,
tradedVolPct:100*
size%sum size,spread from t:(select numQuotes:sum i,size:sum
"
f"$size by src from dfxTrade where sym=symval) lj select spread:10000*avg (ask-
bid) by
src from dfxQuote where sym=symval}
Horizontal Chart
Data Grid I
Data Grid II
* {[symval] `src xasc select last bsize,last bid,last ask,last asize by src from dfxRandomQuote where sym=symval}
* Poll data at 1 second intervals

115
Dashboards for Kx – “How to” Guide
Try This: DemoMarketShare
Rebuild Dropdown
Multi-Chart Line Chart
Treemap Area Chart
Component
All connect
to html5evalcongroup
Dropdown ([]sym:`All,asc exec distinct sym from dfxTrade)
Multi-Chart {[symval] select vol:sum (`float$size)%1e6,avg price,avg spread by src from $[symval=`All;dfxTrade;select from dfxTrade where sym=symval] lj select spread:1000*avg(ask-bid) by
sym,src from dfxQuote}
Line Chart {[symval] `minute xasc (select distinct minute from t) pj/ {[t;x] ?[select from t where src=x;();(enlist `minute)!enlist `minute;(enlist x)!enlist (last;`spread)]}[t;] each exec distinct src
from t:select spread:1000*avg (ask-bid) by src,5 xbar time.minute from $[symval=`All;dfxQuote;select from dfxQuote where sym=symval]}
Treemap dfxTrade (Breakdown: sym and src; avg-> size and avg -> price)
Area Chart {[symval] `minute xasc (select distinct minute from t) pj/ {[t;x] ?[select from t where src=x;();(enlist `minute)!enlist `minute;(enlist x)!enlist (last;`vol)]}[t;] each exec distinct src from
t:select vol:sum (`float$size)%10e6 by src,5 xbar time.minute from $[symval=`All;dfxTrade;select from dfxTrade where sym=symval]}
116
Dashboards for Kx – “How to” Guide
Try This: DemoDrillDown
Rebuild Breadcrumbs
Pivot Grid Multi-Chart
Treemap Bar Chart
Component
All connect
to html5evalcongroup
Pivot Grid {`sym`src`hour`minute xcols 0!select quoteCount:count i,quoteSpread:10000*avg (ask-bid),quoteSize:avg (bsize+asize)%2 by hour:`$string time.hh,minute:`$string 10 xbar
time.minute, sym,src from dfxQuote where sym in exec distinct sym from dfxTrade}[]
Multi-Chart {[filters] filters:raze `$"," vs string .c.f:filters; :.c.res:select quoteCount:count i,quoteSpread:10000*avg (ask-bid),quoteSize:avg (bsize+asize)%2e6 by 5 xbar time.minute from
$[0=count filters;dfxQuote;1=count filters;$[null first filters;dfxQuote;select from dfxQuote where sym=first filters];2=count filters;select from dfxQuote where
sym=filters[0],time.hh="I"$string filters[1];3=count filters;select from dfxQuote where sym=filters[0],time.hh="I"$string filters[1],src=filters[2];()]}
Horizontal Chart {[filters] filters:raze `$"," vs string .c.ttf:filters; :select avg price,sum size%1e6 by 5 xbar time.minute from .c.t:$[0=count filters;dfxTrade;1=count filters;$[null first
filters;dfxTrade;select from dfxTrade where sym=first filters];2=count filters;select from dfxTrade where sym=filters[0],time.hh="I"$string filters[1];3=count filters;select from
dfxTrade where sym=filters[0],time.hh="I"$string filters[1],src=filters[2];()]}
Treemap {`sym`src`hour`minute xcols 0!select quoteCount:count i,quoteSpread:10000*avg (ask-bid),quoteSize:avg (bsize+asize)%2 by hour:`$string time.hh,minute:`$string 10 xbar
time.minute, sym,src from dfxQuote where sym in exec distinct sym from dfxTrade}[]
Data Grid II* {[symval] `src xasc select last bsize,last bid,last ask,last asize by src from dfxRandomQuote where sym=symval}
Linechart
117
Dashboards for Kx – “How to” Guide
Try This: Multi-screen & Tab
Tab Dashboards (Use Layout Panel)
Tab 1: Market Share Tab 2: Market Maker
Navigation Component: Market / Liquidity / Drill down jump point

118
Dashboards for Kx – “How to” Guide
Demo POC presentation
Dashboards for Kx – “How to” Guide
Kx.com


q install
Dashboards for Kx – “How to” Guide
Kx.com
122
Dashboards for Kx – “How to” Guide
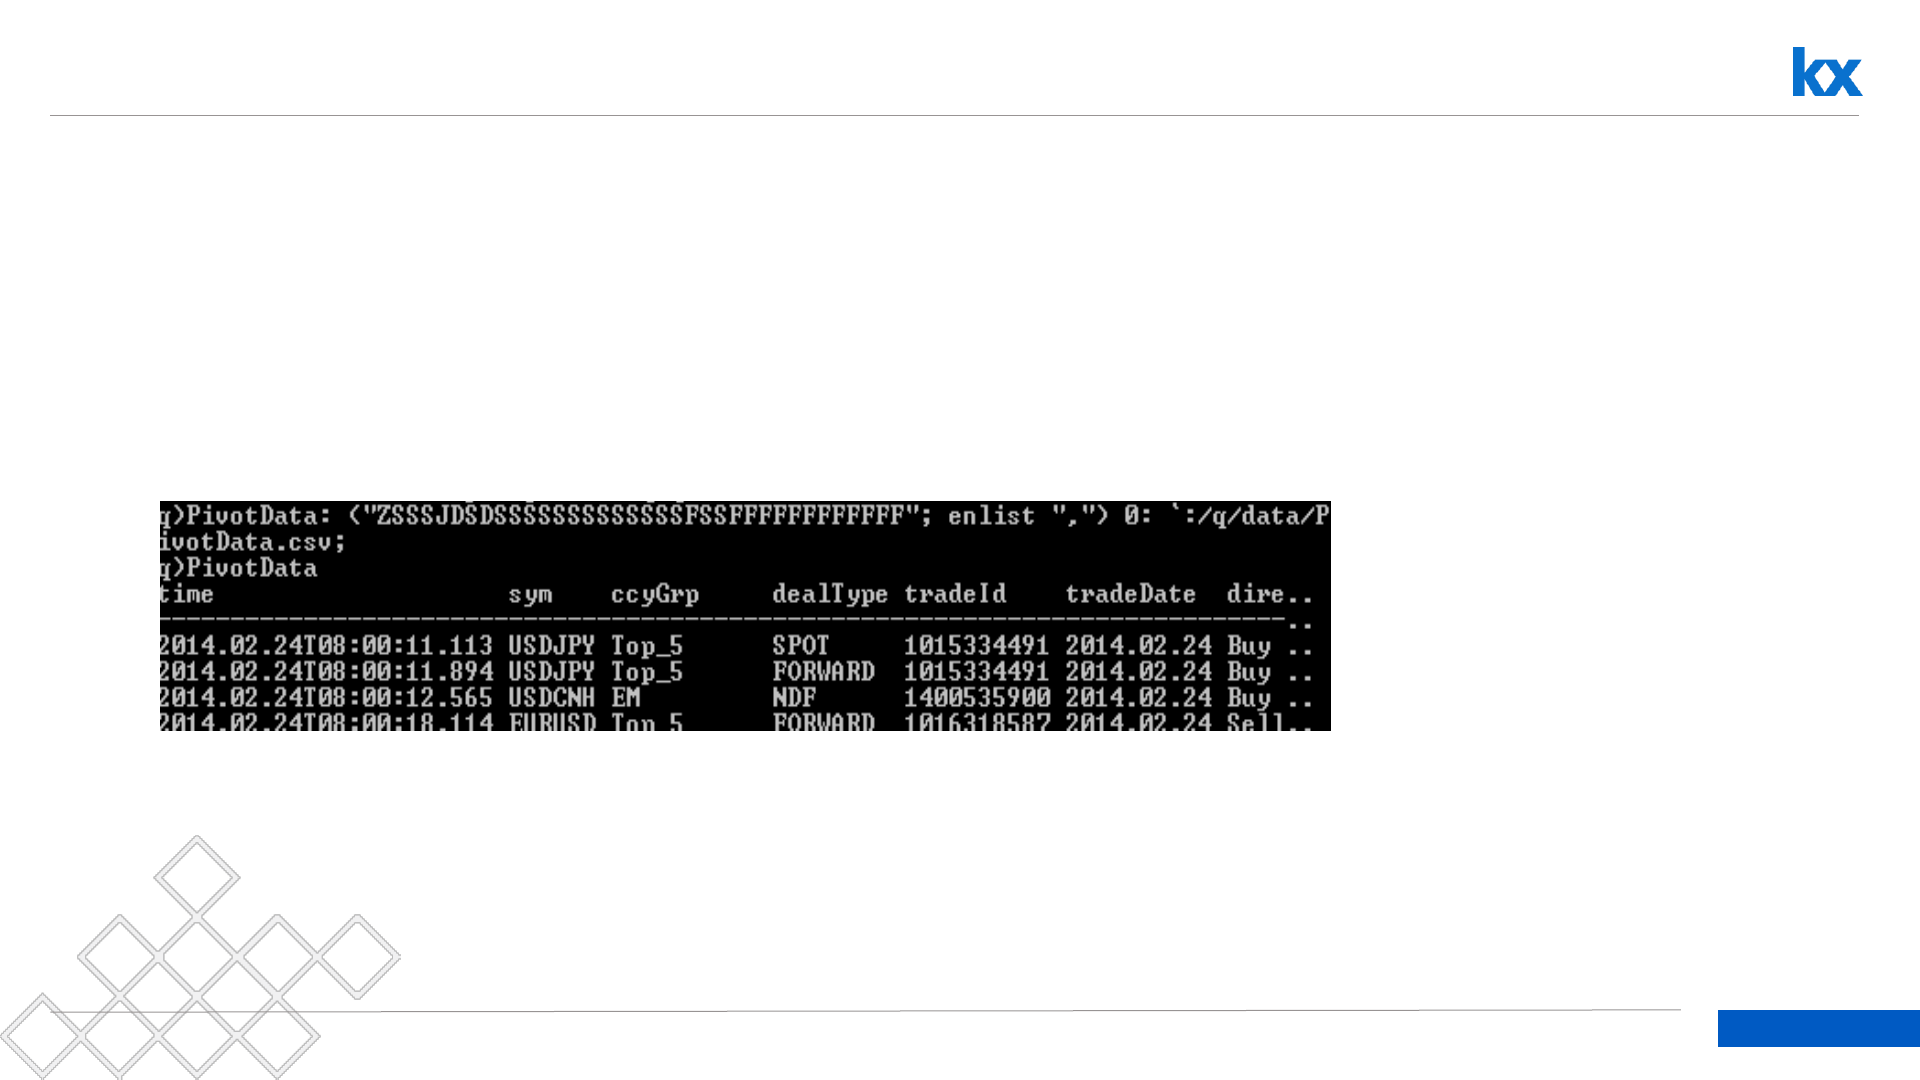
Create a Kdb file
1. Create a directory [Data] in q directory
2. Save or copy csv files to this directory
3. At q> prompt (in CMD window), run the data import; for example
•PivotData: ("ZSSSJDSDSSSSSSSSSSSSSFSSFFFFFFFFFFFF"; enlist ",") 0: `:/q/data/PivotData.csv;
Dashboard file name: (“column formats”; enlist “,”) 0: ‘:/source file name & address;

124
Dashboards for Kx – “How to” Guide
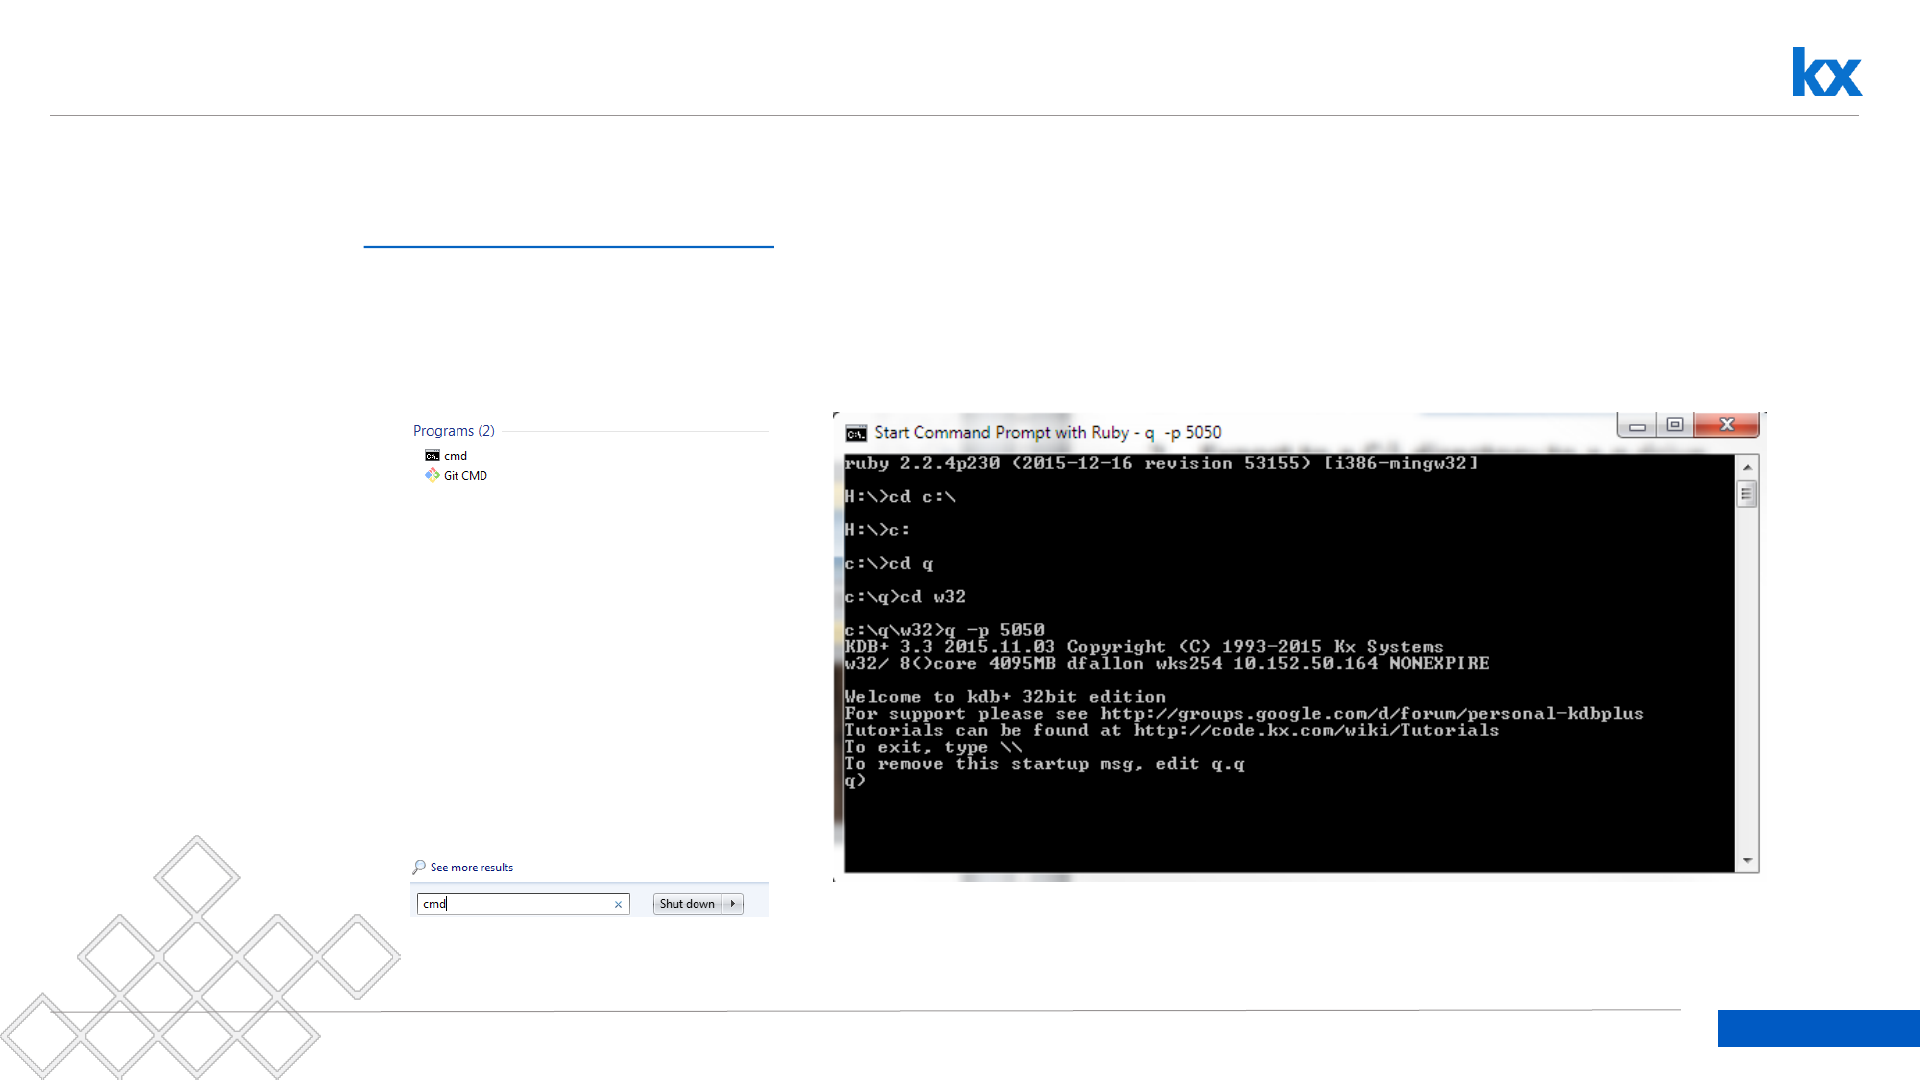
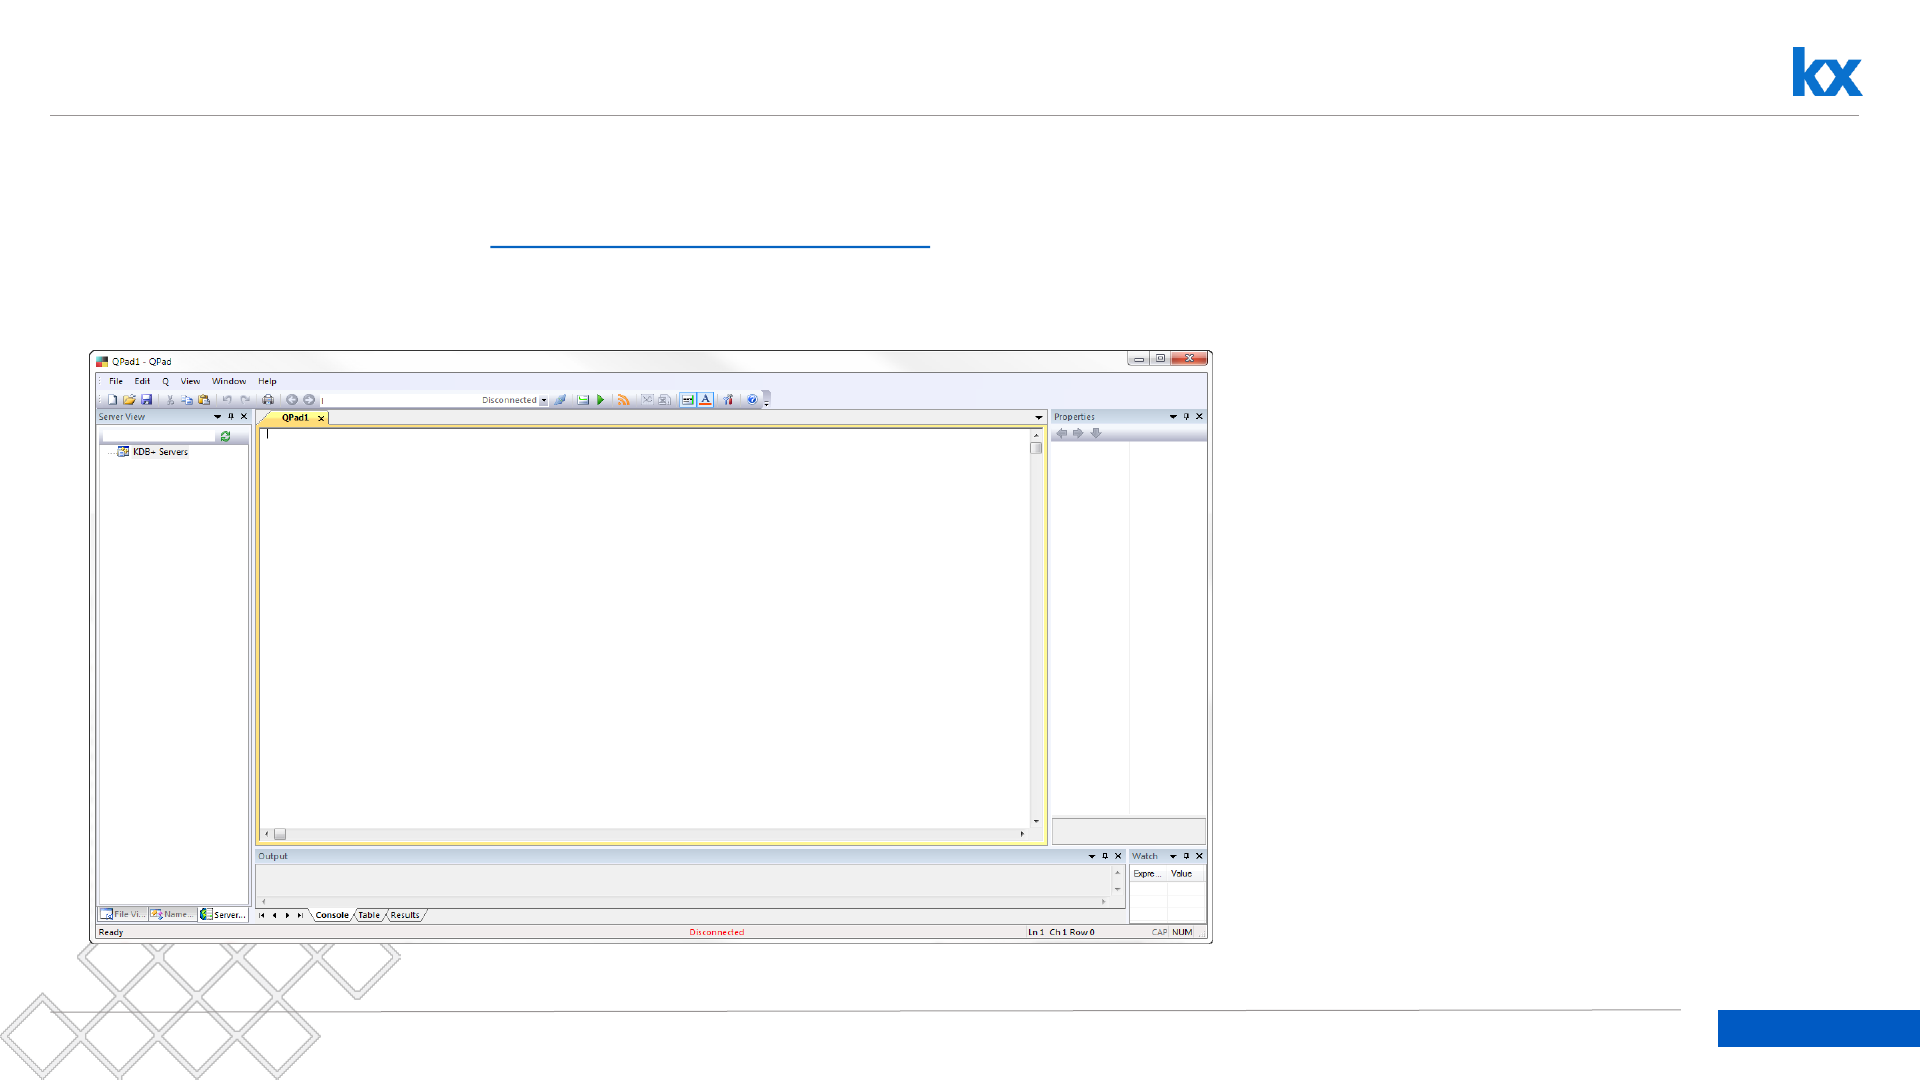
Configure QPad
1. Connect to Server:localhost on port 5050
2. Write into the editor
.pivot.pivotV3:{[t;w;d;a;f;n;o]
piv: () xkey ?[t;w;d!d;a!f];
if [(count o)>0;
[
field: o[0];
order: o[1];
piv:$[order>0;field xasc piv;field xdesc piv];
]
];
$[n<=0;piv;n#piv]};
125
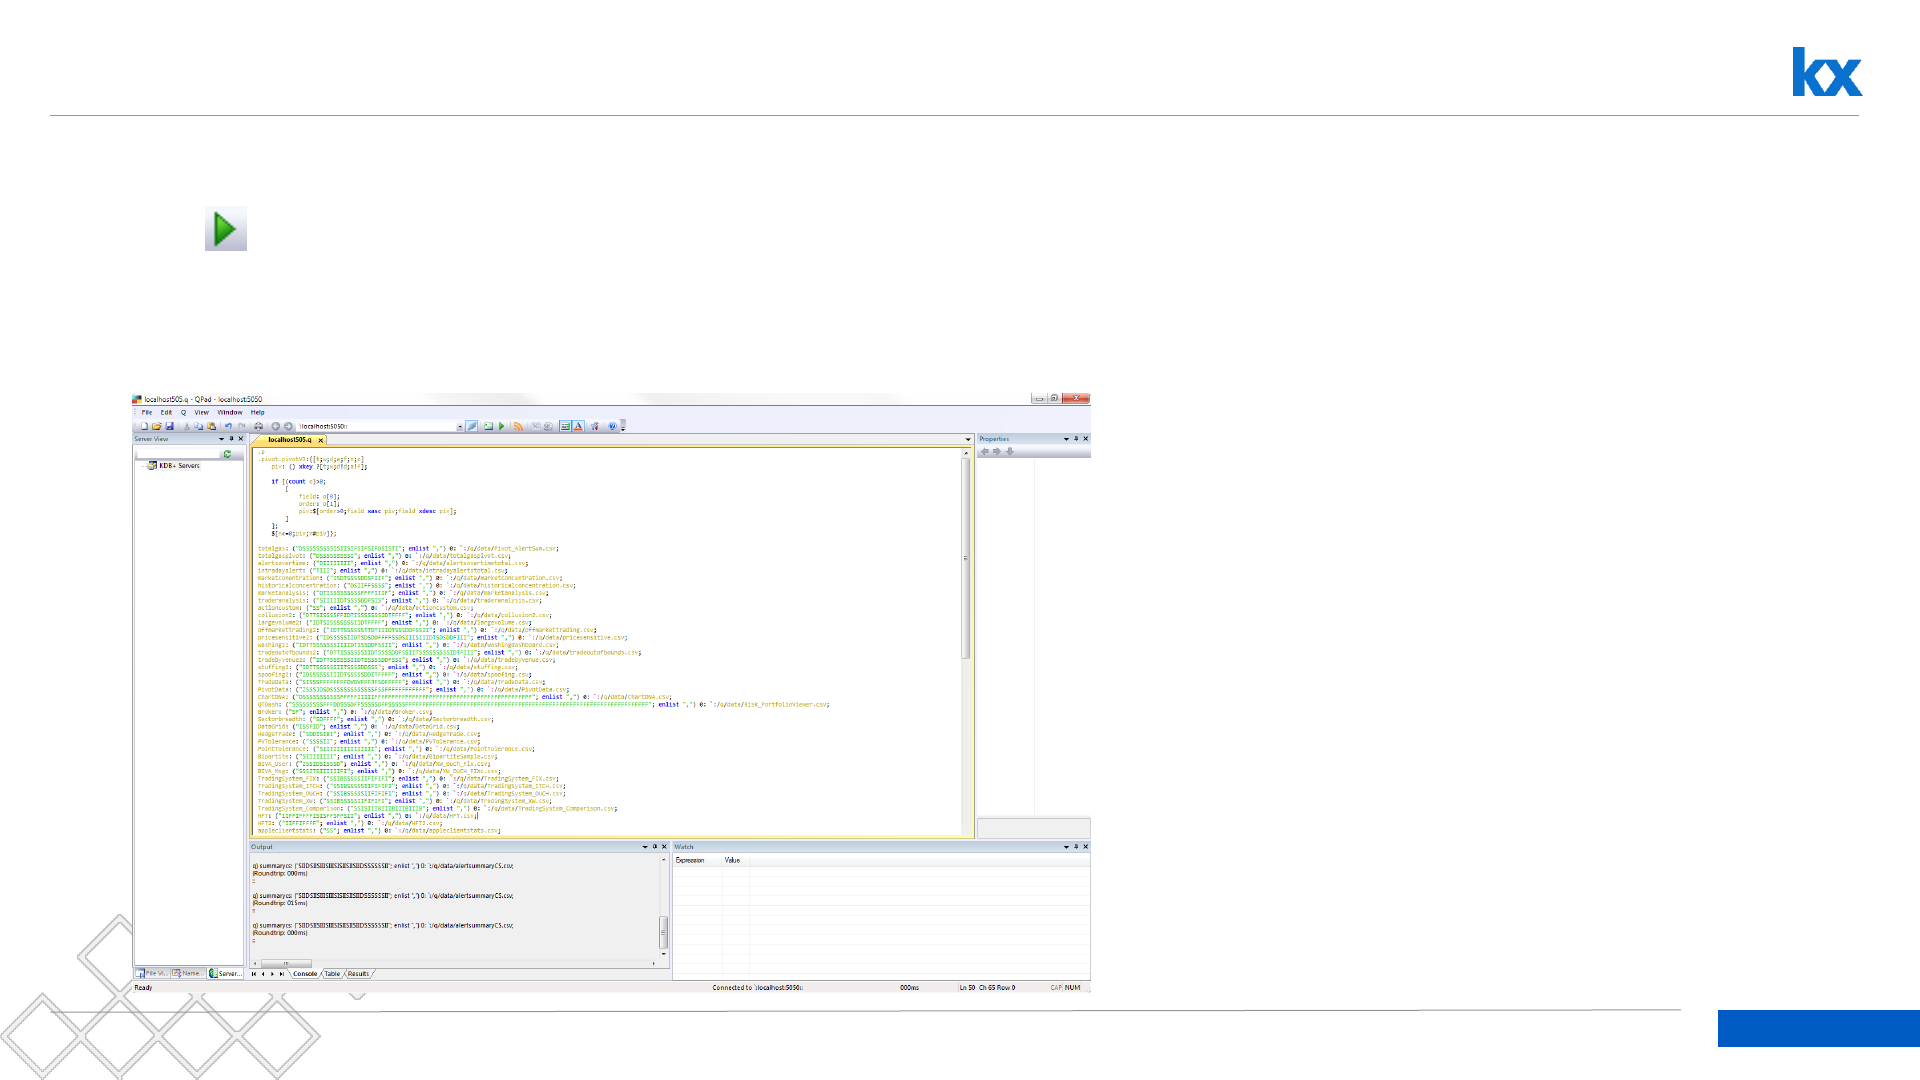
Dashboards for Kx – “How to” Guide
Configure QPad
1. Run
2. Add Data with; for example:
PivotData: ("ZSSSJDSDSSSSSSSSSSSSSFSSFFFFFFFFFFFF"; enlist ",") 0: `:/q/data/PivotData.csv;
126
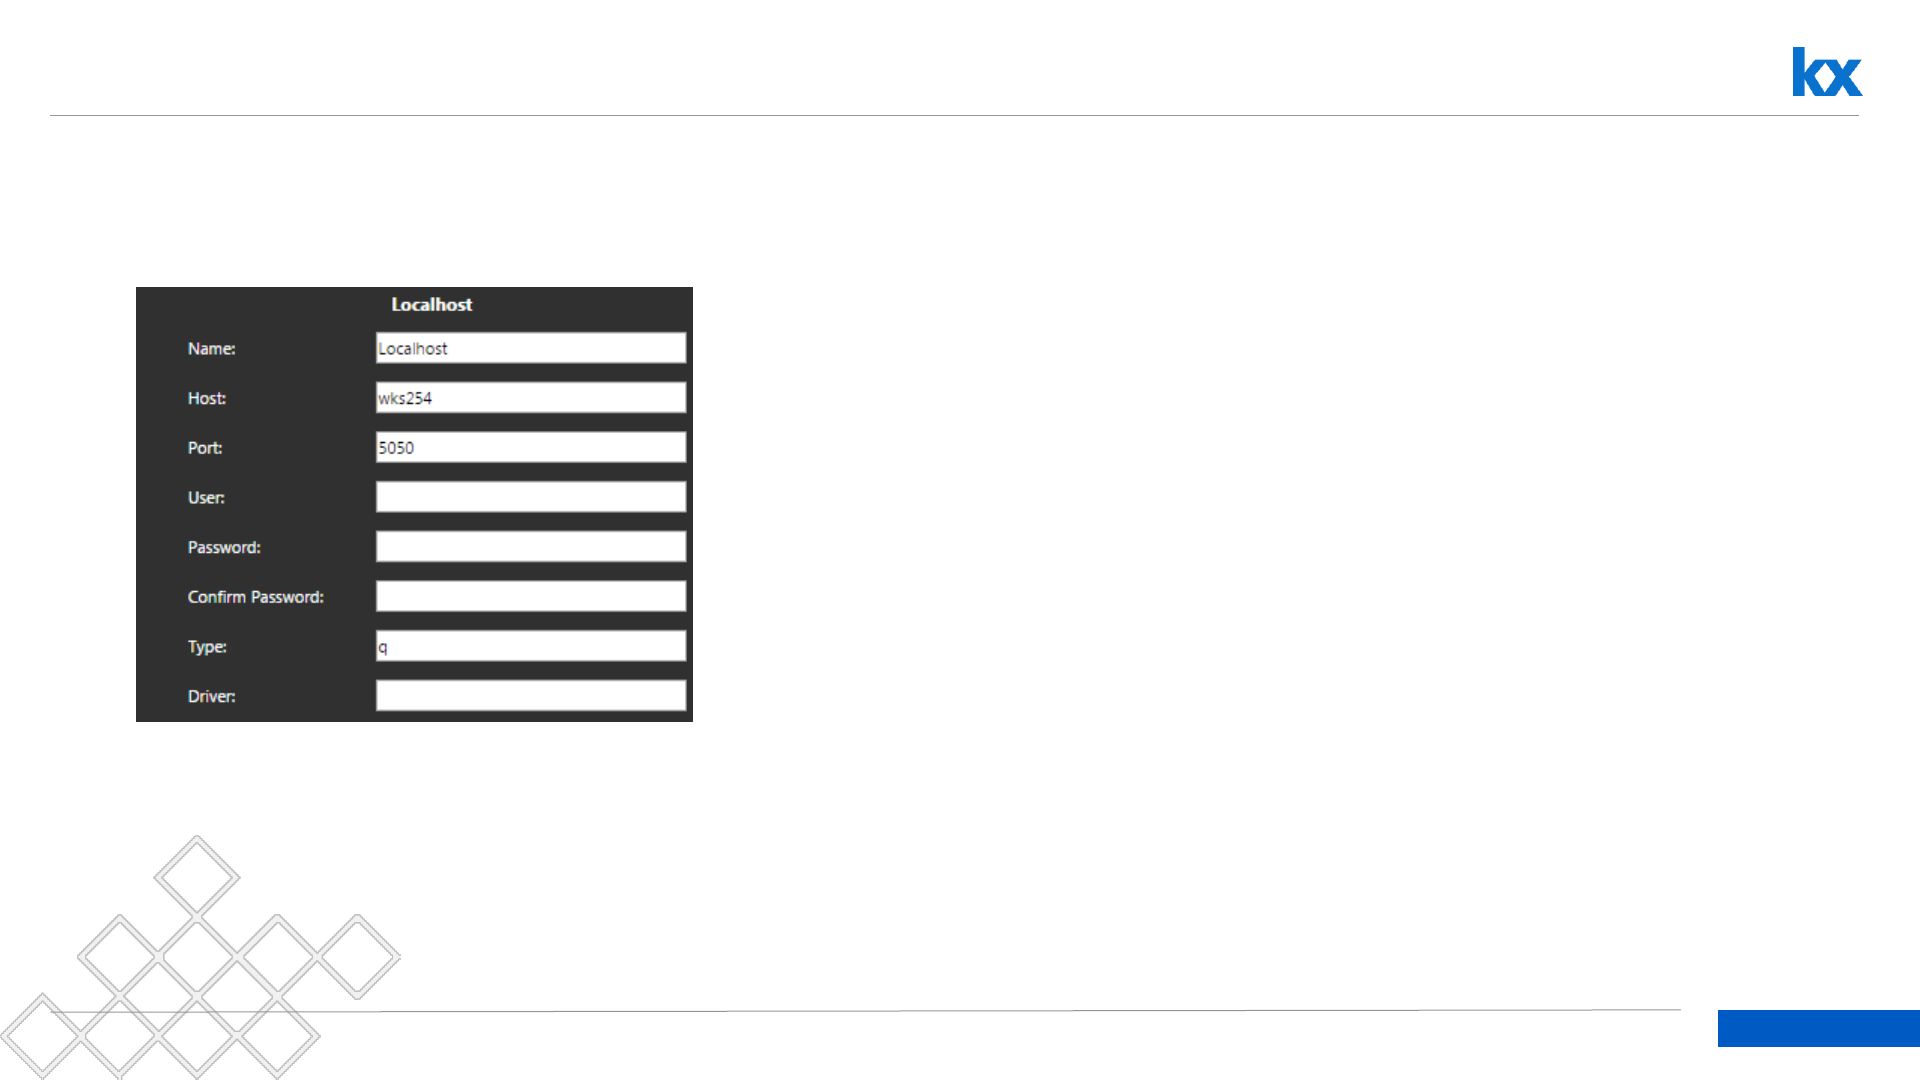
Dashboards for Kx – “How to” Guide
Create a connection for localhost
1. In Dashboards, create a connection for localhost
Host: is PC name (e.g. wks254). Do not use “localhost” for Host
127
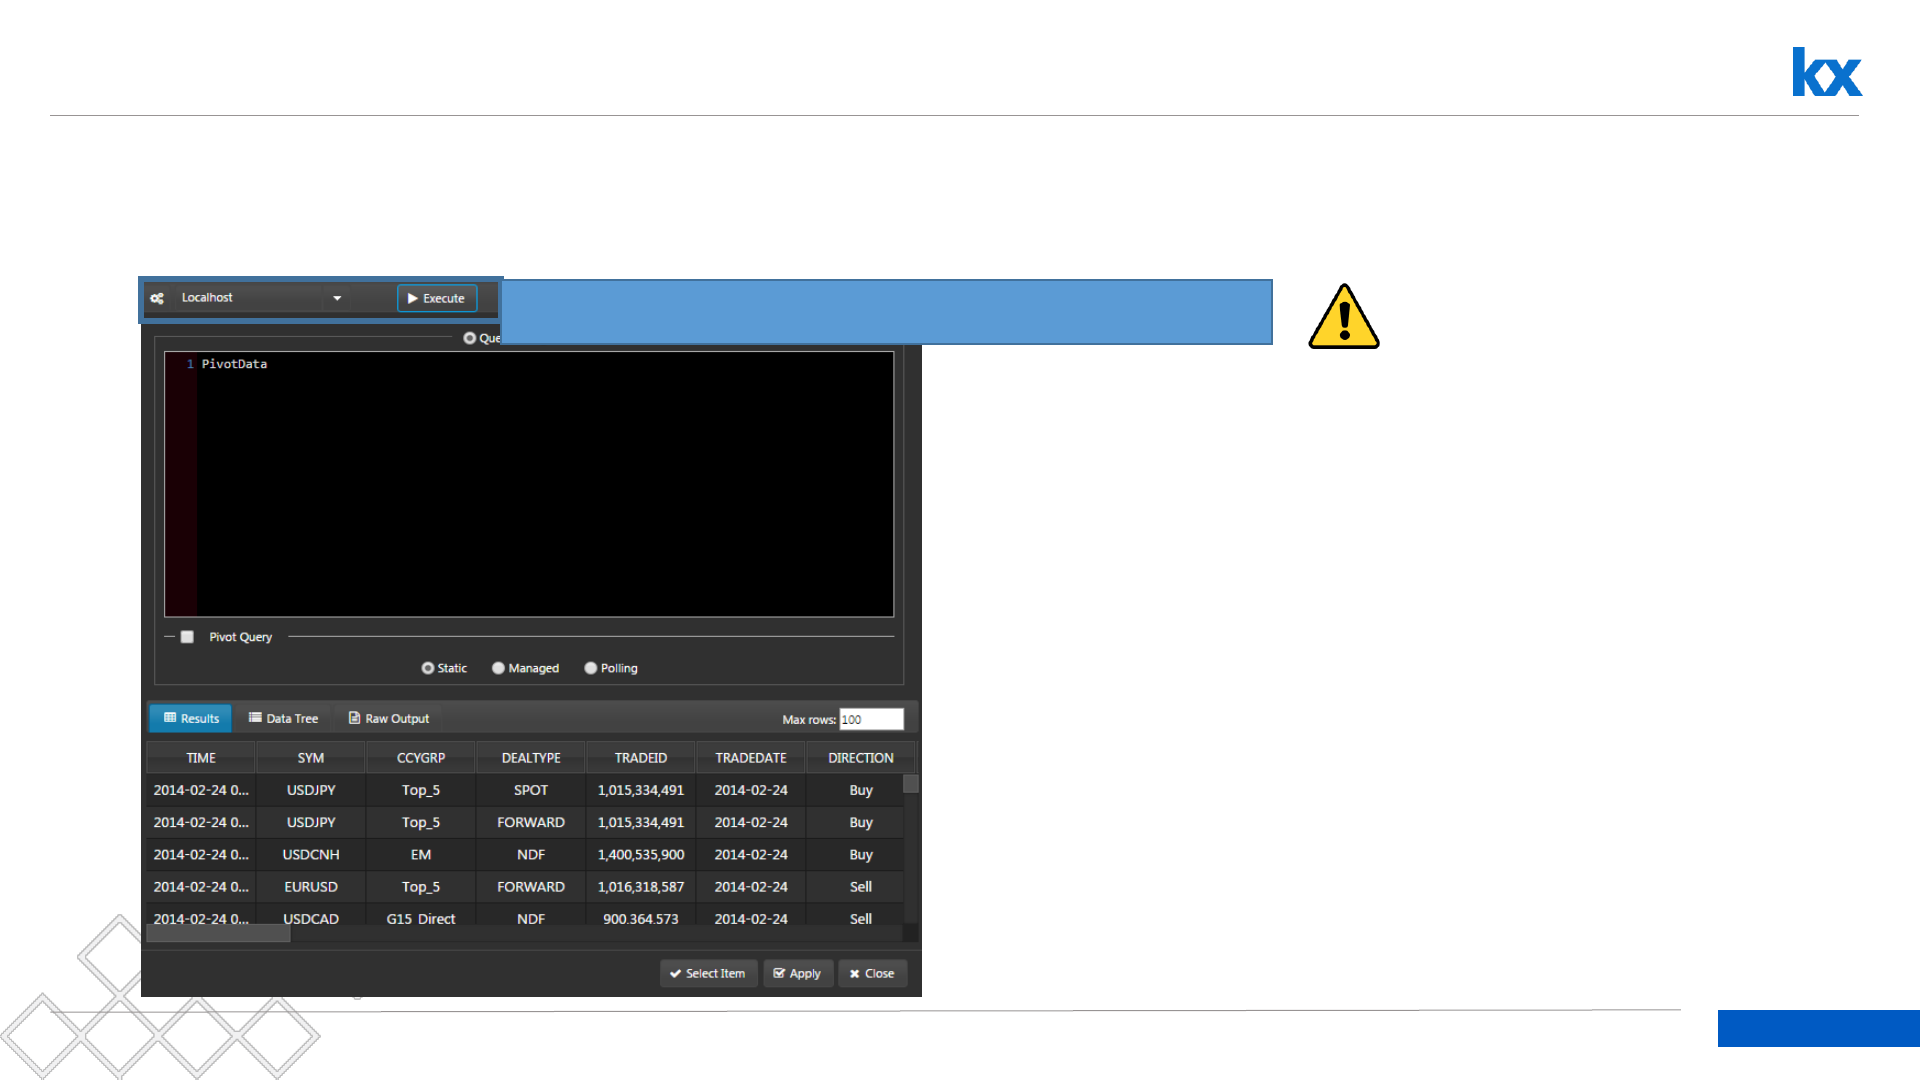
Dashboards for Kx – “How to” Guide
Set dropdown query connection to Localhost
1. In the Dropdown, select database connection
Connect to your newly added (local) kdb server If using a local
connection, Control
for Kx specific apps,
Action Tracker, and
Order Book Replay
won’t be configurable
