PE Design
User Manual: PE
Open the PDF directly: View PDF ![]() .
.
Page Count: 43

Design.1
PE Pipe Systems PE Pipe Systems PE Pipe Systems PE Pipe Systems PE Pipe Systems PE Pipe Systems PE Pipe Systems
design
contents
Pipe Selection 3
Pipe Dimensions 4
Allowable Operating Pressure 5
Temperature Influences 7
Service Lifetimes 7
Pipe Design for Variable Operating Conditions 8
E Modulus 10
Selection of Wall Thickness for Special Applications 10
Hydraulic Design 11
Flow Chart Worked Examples 13
Part Full Flow 15
Resistance Coefficients 16
Flow Charts 17-26
Surge and Fatigue 27
Celerity 28
Slurry Flow 29
Pipe Wear 30
Maintenance and Operation 31
Fittings 31
Pneumatic Flow 32
System Design Guidelines for the Selection of Vinidexair Compressed Air Pipelines 33
Expansion And Contraction 35
External Pressure Resistance
36
Trench Design
37
Allowable Bending Radius
38
Deflection Questionnaire – FAX BACK
39
Deflection Questionnaire – Vinidex locations
40
Thrust Block Supports
41
Electrical Conductivity
43
Vibration
43
Heat Sources
43
Irrigation Warehouse Group Pty Ltd
www.polypipe.com.au
Ph 1300 661 417

PE Pipe Systems PE Pipe Systems PE Pipe Systems PE Pipe Systems PE Pipe Systems PE Pipe Systems PE Pipe Systems
Design.2
design
Limitation of Liability
This manual has been compiled by Vinidex Pty
Limited (“the Company”) to promote better
understanding of the technical aspects of the
Company’s products to assist users in obtaining
from them the best possible performance.
The manual is supplied subject to
acknowledgement of the following conditions:
• The manual is protected by Copyright and may
not be copied or reproduced in any form or by
any means in whole or in part without prior
consent in writing by the Company.
• Product specifications, usage data and advisory
information may change from time to time with
advances in research and field experience. The
Company reserves the right to make such
changes at any time without notice.
• Correct usage of the Company’s products
involves engineering judgements which cannot
be properly made without full knowledge of all
the conditions pertaining to each specific
installation. The Company expressly disclaims
all and any liability to any person whether
supplied with this publication or not in respect
of anything and of the consequences of anything
done or omitted to be done by any such person
in reliance whether whole or partial upon the
whole or any part of the contents of this
publication.
• No offer to trade, nor any conditions of trading,
are expressed or implied by the issue of content
of this manual. Nothing herein shall override the
Company’s Conditions of Sale, which may be
obtained from the Registered Office or any Sales
Office of the Company.
• This manual is and shall remain the property of
the Company, and shall be surrendered on
demand to the Company.
• Information supplied in this manual does not
override a job specification, where such conflict
arises, consult the authority supervising the job.
© Copyright Vinidex Pty Limited
ABN 42 000 664 942
Irrigation Warehouse Group Pty Ltd
www.polypipe.com.au
Ph 1300 661 417

Design.3
PE Pipe Systems PE Pipe Systems PE Pipe Systems PE Pipe Systems PE Pipe Systems PE Pipe Systems PE Pipe Systems
design
Pipe Selection
Vinidex PE pipes are available in a
comprehensive range of sizes up to
1000mm diameter, and pressure classes
in accordance with the requirements of
AS/NZS 4130 - Polyethylene (PE) pipes
for pressure applications.
Additional sizes and pressure classes to
AS/NZS 4130 requirements are added
from time to time and subject to
minimum quantity requirements, pipes
made to specific sizes, lengths or
pressure classes are available.
The Standard AS/NZS 4130 includes a
range of PE material designations based
on the Minimum Required Stress (MRS),
and classified as PE63, PE80, and
PE100. When pipes are made to the
same dimensions, but from different
rated PE materials, then the pipes will
have different pressure ratings.
The relationship between the dimensions
of the pipes, the PE material
classification and the working pressure
rating are as shown in Table 4.1.
For simplicity, the dimensions of the pipe
have been referred in terms of the
Standard Dimension Ratio (SDR) where:
Outside Diameter
SDR =
Wall Thickness
Table 4.1 Comparison of SDR & Pressure Ratings (PN)
SDR 41 33 26 21 17 13.6 11 9 7.4
PE80 PN3.2 PN4 - PN6.3 PN8 PN10 PN12.5 PN16 PN20
PE100 PN4 - PN6.3 PN8 PN10 PN12.5 PN16 PN20 PN25
Notes:
PE Long term rupture stress at 20°C (MPa x 10) to which a minimum design factor
is applied to obtain the 20°C hydrostatic design hoop stress.
PN Pipe pressure rating at 20°C (MPa x10).
SDR Nominal ratio of outside diameter to wall thickness.
Irrigation Warehouse Group Pty Ltd
www.polypipe.com.au
Ph 1300 661 417
PE Pipe Systems PE Pipe Systems PE Pipe Systems PE Pipe Systems PE Pipe Systems PE Pipe Systems PE Pipe Systems
Design.4
design
Pipe Dimensions
Table 4.2 PE Pipe Dimensions AS/NZS 4130
Nominal
Size
DN
SDR 41 SDR 33 SDR 26 SDR 21 SDR 17 SDR 13.6 SDR 11 SDR 9 SDR 7.4
Min. Wall
Thickness
(mm)
Mean
I.D.
(mm)
Min. Wall
Thickness
(mm)
Mean
I.D.
(mm)
Min. Wall
Thickness
(mm)
Mean
I.D.
(mm)
Min. Wall
Thickness
(mm)
Mean
I.D.
(mm)
Min. Wall
Thickness
(mm)
Mean
I.D.
(mm)
Min. Wall
Thickness
(mm)
Mean
I.D.
(mm)
Min. Wall
Thickness
(mm)
Mean
I.D.
(mm)
Min. Wall
Thickness
(mm)
Mean
I.D.
(mm)
Min. Wall
Thickness
(mm)
Mean
I.D.
(mm)
16 1.6 13 1.6 13 1.6 13 1.6 13 1.6 13 1.6 13 1.6 13 1.8 12 2.2 11
20 1.6 17 1.6 17 1.6 17 1.6 17 1.6 17 1.6 17 1.9 16 2.3 15 2.8 14
25 1.6 22 1.6 22 1.6 22 1.6 22 1.6 22 1.9 21 2.3 20 2.8 19 3.5 18
32 1.6 29 1.6 29 1.6 29 1.6 29 1.9 28 2.4 27 2.9 26 3.6 24 4.4 23
40 1.6 37 1.6 37 1.6 37 1.9 36 2.4 35 3.0 34 3.7 32 4.5 31 5.5 28
50 1.6 47 1.6 47 2.0 46 2.4 45 3.0 44 3.7 42 4.6 40 5.6 38 6.9 35
63 1.6 60 2.0 59 2.4 58 3.0 57 3.8 55 4.7 53 5.8 51 7.1 48 8.6 45
75 1.9 71 2.3 70 2.9 69 3.6 67 4.5 66 5.5 63 6.8 61 8.4 58 10.3 53
90 2.2 86 2.8 84 3.5 83 4.3 81 5.4 78 6.6 76 8.2 73 10.1 69 12.3 65
110 2.7 105 3.4 103 4.3 101 5.3 99 6.6 96 8.1 93 10.0 89 12.3 84 15.1 78
125 3.1 119 3.9 117 4.8 115 6.0 113 7.4 110 9.2 106 11.4 101 14.0 96 17.1 89
140 3.5 133 4.3 131 5.4 129 6.7 126 8.3 123 10.3 118 12.7 114 15.7 108 19.2 99
160 4.0 152 4.9 150 6.2 148 7.7 144 9.5 140 11.8 136 14.6 130 17.9 123 21.9 114
180 4.4 171 5.5 169 6.9 166 8.6 163 10.7 158 13.3 153 16.4 145 20.1 138 24.6 128
200 4.9 190 6.2 188 7.7 184 9.6 180 11.9 175 14.7 170 18.2 162 22.4 154 27.3 143
225 5.5 215 6.9 211 8.6 207 10.8 203 13.4 198 16.6 191 20.5 183 25.1 173 30.8 161
250 6.2 238 7.7 235 9.6 230 11.9 225 14.8 219 18.4 212 22.7 203 27.9 192 34.2 179
280 6.9 267 8.6 263 10.7 258 13.4 253 16.6 246 20.6 238 25.4 228 31.3 215 38.3 200
315 7.7 300 9.7 296 12.1 290 15.0 285 18.7 278 23.2 268 28.6 256 35.2 242 43.0 226
355 8.7 338 10.9 333 13.6 328 16.9 320 21.1 311 26.1 301 32.2 289 39.6 273 48.5 255
400 9.8 380 12.3 376 15.3 370 19.1 362 23.7 351 29.4 340 36.3 326 44.7 307 54.6 287
450 11.0 429 13.8 422 17.2 415 21.5 406 26.7 395 33.1 382 40.9 366 50.2 347 61.5 322
500 12.3 476 15.3 470 19.1 462 23.9 452 29.6 440 36.8 424 45.4 407 55.8 384 - -
560 13.7 534 17.2 526 21.4 518 26.7 506 33.2 494 41.2 475 50.8 455 ----
630 15.4 600 19.3 592 24.1 582 30.0 570 37.3 554 46.3 535 57.2 512 - - - -
710 17.4 676 21.8 667 27.2 656 33.9 641 42.1 624 52.2 603 - - ----
800 19.6 762 24.5 752 30.6 739 38.1 723 47.4 704 58.8 679 - - - - - -
900 22.0 858 27.6 846 34.4 831 42.9 814 53.5 791 --------
1000 24.5 953 30.6 940 38.2 924 47.7 904 59.3 880 - - - - ----
Polyethylene Pipe Dimensions (based on AS/NZS 4130-1997, Polyethylene pipes for pressure applications.)
SDR – Nominal ratio of outside diameter to wall thickness. ID – internal diameter
Irrigation Warehouse Group Pty Ltd
www.polypipe.com.au
Ph 1300 661 417

Design.5
PE Pipe Systems PE Pipe Systems PE Pipe Systems PE Pipe Systems PE Pipe Systems PE Pipe Systems PE Pipe Systems
design
Allowable
Operating Pressure
Hydrostatic Design Basis
Vinidex pipes manufactured to AS/NZS
4130, Series 1 have wall thickness and
pressure ratings determined by the
Barlow formula as follows:
T = minimum wall thickness (mm)
P = normal working pressure
of pipe (MPa)
D = minimum mean OD (mm)
S = hydrostatic design stress
at 20°C (MPa)
See Table 4.2.
Hydrostatic Design Stress
The design of AS/NZS 4130 pipes has
been based on the static working
pressure operating continuously at the
maximum value for the entire lifetime of
the pipeline.
The value of maximum hoop stress used
in the selection of the pipe wall thickness
is known as the Hydrostatic Design
Stress (S). This value is dependent upon
the type of PE material being used and
the pipe material service temperature. In
AS/NZS 4131, materials are classified for
long term strength by the designation
Minimum Required Strength (MRS).
The MRS is the value resulting from
extrapolation of short and long term
tests to a 50 year point at 20°C.
Note: See Figure 2.1 for typical stress
regression curves.
Table 4.3 Hydrostatic Design Stress and
Minimum Required Strength – Values
Material Designation Minimum Required Strength Hydrostatic Design Stress
(MRS) MPa (S) MPa
PE63 5.0 6.3
PE80 6.3 8.0
PE100 8.0 10.0
These standard values are polymer
dependent and long term properties for
each pipe grade material are established
by long term testing to the requirements
of ISO/DIS 9080 by the polymer
producers. Individual PE grades may
exhibit different characteristics and PE
materials can be provided with enhanced
specific properties. In these cases the
advice of Vinidex engineers should be
obtained.
Maximum Allowable
Operating Pressure
where
MAOP is the maximum allowable
operating pressure in MPa.
PN is the pipe classification in
accordance with AS/NZS 4130.
F is the Design Factor.
For example, if the minimum value of F is
chosen (F = 1.25), a PN10 pipe will have
a MAOP of 1.0 MPa at 20°C.
T=PD
2S +P
S=MRS
F
MAOP =PN x 0.125
F
The Hydrostatic Design Stress (S) is
obtained by application of a Design or
Safety Factor (F) to the MRS.
See Table 4.3.
The specific value selected for the
Design Factor depends on a number of
variables, including the nature of the
transmitted fluid, the location of the
pipeline, and the risk of third party
damage.
The wall thickness values for Series 1
pipes to AS/NZS 4130 were derived
using a value of 1.25 for F, this being the
minimum value applicable.
AS/NZS 4131 specifics MRS values of
6.3 MPa, 8.0 MPa and 10.0 MPa for the
grades designated as PE63, PE80 and
PE100 respectively.
The relationship between the S and MRS
standard values in AS/NZS 4131 is as
shown in Table 4.3.
Irrigation Warehouse Group Pty Ltd
www.polypipe.com.au
Ph 1300 661 417

PE Pipe Systems PE Pipe Systems PE Pipe Systems PE Pipe Systems PE Pipe Systems PE Pipe Systems PE Pipe Systems
Design.6
design
Table 4.6 Design Factors – Gas Pipes
Installation Conditions Design Factor Value
Fluid type Natural Gas f0 2.0
LPG 2.2
Pipe Form Straight length f1 1.0
Coils 1.2
Soil Temperature (Av. °C) -10 < t < 0 f2 1.2
0 < t < 20 1.0
20 < t < 30 1.1
30 < t < 35 1.3
Designation Distribution f3 1.0
Transport 0.9
Rapid Crack Resistance f4 1.0
Population density & area loading
Open field f5 0.9
Less trafficed roads in inbuilt areas 1.05
Heavy trafficed roads in inbuilt areas 1.15
Roads in populated area 1.20
Roads in industrial area 1.25
Private area habitation 1.05
Private area industry 1.20
Note: Where factor values are not listed, consult with Vinidex engineers for
recommendations.
Where installation applications are used
to carry fluids other than water, then
another value of the Design Factor may
need to be selected. The value selected
will depend on both the nature of the
fluid being carried and the location of the
pipeline installation. For specific
installations, the advice of Vinidex
engineers should be obtained.
In the case of gas pipes in AS/NZS 4130,
both Series 2 and Series 3, a Design
Factor ranging between F = 2.0 and
F = 4.0 applies depending on the specific
installation conditions; see Table 4.6.
Table 4.4
Typical Design Factors
Pipeline Application Design Factor
20°CF
Water Supply 1.25
Natural Gas 2.0
Compressed Air 2.0
LPG 2.2
Where the Design Factor is varied, then
the MAOP for the particular Series 1 pipe
PN rating can be calculated as follows:
In the particular case of gas distribution,
then the type of gas, and the pipeline
installation conditions need to be
considered. In this case the Design
Factor is a combination of a number of
sub factors (fx) which must be factored
together to give the final value for F such
that:
F = f0 x f1 x f2 x f3 x f4 x f5
MAOP =PN x 0.125
F
Table 4.5 PE Pipe Pressure Ratings
PN Rating Number Nominal Working Pressure
MPa Head Metres
PN 3.2 0.32 32
PN 4 0.40 40
PN 6.3 0.63 63
PN 8 0.80 80
PN 10 1.00 100
PN 12.5 1.25 125
PN 16 1.60 160
PN 20 2.00 200
PN 25 2.50 250
Irrigation Warehouse Group Pty Ltd
www.polypipe.com.au
Ph 1300 661 417

Design.7
PE Pipe Systems PE Pipe Systems PE Pipe Systems PE Pipe Systems PE Pipe Systems PE Pipe Systems PE Pipe Systems
design
Temperature
Influences
The physical properties of Vinidex PE
pipes are related to a standard reference
temperature of 20°C. Where physical
property values are quoted to ISO and
DIN Standard test methods, these are for
the 20°C condition, unless otherwise
quoted. Wherever PE pipelines operate at
elevated temperatures, the pressure
ratings (PN) must be revised.
The temperature to be considered for the
re rating is the pipe material service
temperature, and the actual operating
conditions for each specific installation
must be evaluated.
For long length installations a
temperature gradient will exist along the
length of the pipe line. This gradient will
be dependent upon site conditions, and
the fluid being carried will approach the
ambient temperature of the surrounds.
The rate of temperature loss will be
determined by inlet temperature, fluid
flow rate, soil conductivity, ambient
temperature and depth of burial. As
these factors are specific to each
installation, the temperature gradient
calculations are complex and in order to
assist the designer, Vinidex have
developed computer software to predict
the temperature gradient along the
pipeline.
This is available on request to Vinidex
design engineers.
Service Lifetimes
The design basis used in AS/NZS 4130
for PN rating of PE pipes to determine
the minimum wall thickness for each
diameter and PN rating provides for the
steady and continuous application of the
maximum allowable working pressure
over an arbitrary period of 50 years.
The selection of the long term
hydrostatic design stress value (HDS) is
dependent on the specific grade of PE
and the pipe material service
temperature. For the grades of PE
materials contained in AS/NZS 4131
the specific values are contained in
Table 4.3.
As these values are polymer dependent,
individual grades may exhibit different
characteristics and materials can be
provided with enhanced properties for
crack resistance or elevated temperature
performance. In these cases the advice
of Vinidex design engineers should be
obtained.
Vinidex PE pipes are continually tested in
combinations of elevated temperature
(80°C water conditions) and pressure to
ensure compliance with specification
requirements.
The adoption of a 50 year design life in
AS/NZS 4130 to establish a value of the
HDS is arbitrary, and does not relate to
the actual service lifetime of the pipeline.
Where pipelines are used for applications
such as water supply, where economic
evaluations such as present value
calculations are performed, the lifetimes
of PE lines designed and operated within
the AS guidelines may be regarded as
70–100 years for the purpose of the
calculations. Any lifetime values beyond
these figures are meaningless, as the
assumptions made in other parts of the
economic evaluations outweigh the
effect of pipe lifetime.
The grades of PE specified in AS/NZS
4131 are produced by different
polymerisation methods, and as such
have different responses to temperature
variations.
Pipe Classification (PN) is based on
continuous operation at 20°C and the
pressure rating will be reduced for
higher temperatures. In addition, as PE
is an oxidising material, the lifetime of
some grades will be limited by elevated
temperature operation. Table 4.7 gives
temperature rerating data for Vinidex
pipes made to AS/NZS 4130.
In these tables, allowable working
pressures are derived from ISO 13761*
and assume continuous operation at the
temperatures listed.
Extrapolation limit is maximum allowable
extrapolation time in years, based on
data analysis in accordance with ISO/DIS
9080**, and at least two years of test at
80°C for PE80B and PE100. Actual
product life may well be in excess of
these values.
The performance of compounds used in
the manufacture of Vinidex pipes to
AS/NZS 4130 has been verified by
appropriate data analysis.
In addition, Vinidex offers pipes made
from specialised compounds for
particular applications, such as elevated
temperature use.
Contact Vinidex engineers for special
requirements.
Note:
* Plastics pipes and fittings – pressure
reduction factors for polyethylene
pipeline systems for use at
temperatures above 20°C.
** Plastics piping and ducting systems –
determination of long-term
hydrostatic strength of
thermoplastics materials in pipe form
by extrapolation.
Irrigation Warehouse Group Pty Ltd
www.polypipe.com.au
Ph 1300 661 417

PE Pipe Systems PE Pipe Systems PE Pipe Systems PE Pipe Systems PE Pipe Systems PE Pipe Systems PE Pipe Systems
Design.8
design
Pipe Design for
Variable
Operational
Conditions
The following examples assist in the
design and selection of polyethylene
pipes for variable operating conditions
Given Operating Conditions
Pressure/Temperature/Time Relationship
Determine
Material
Class of pipe
Life
Steps
1. Assume a material
2. Determine Class from
Temperature Rating Table 4.7
Note: For brief periods at elevated
temperature it may be appropriate to
decrease the safety factor to a value of x,
i.e. multiply the working pressure by:
3. By the following process,
assess whether life is ‘used up’
For each combination of time and
temperature, estimate the proportion of
life ‘used up’ by using the time/
temperature relationships in the table.
If the proportion is less than unity, the
material is satisfactory.
125.
x
The data in the tables are obtained from
the use of ISO 13761 and ISO/DIS 9080,
and are appropriate for compounds
typically used by Vinidex.
Example
Pumped system normally working at a
maximum head, including surge of 60m.
At startup, the mean pipe wall
temperature is 55°C, dropping to 35°C
after 1 hour. Pump operation is for 10
hours per day, with a system life of 15
years.
1. Assume PE 80B
2. Determine Pipe Class
The worst situation is operation at 55°C.
From Table 4.7, PN10 pipe at 55°C has
an allowable working head of 60m.
PN10 pipe is therefore satisfactory.
3. Determine Life
Total time at 55°C
= 1 x 365 x 15 = 5475h = 0.625y.
From
Table 4.7
, L
min
for 55°C is 24 years,
therefore proportion of time used is:
Total time at 35°C
= 9 x 365 x 15 = 49275h = 5.625y.
From the table, L
min
for 35°C is 100 years,
therefore proportion of time used is:
Total proportion is 8.2% of life used in
15 years (6.25 years actual operation).
0.625
24 = 0.026 = 2.6%
5.625
100 = 0.056 = 5.6%
Irrigation Warehouse Group Pty Ltd
www.polypipe.com.au
Ph 1300 661 417

Design.9
PE Pipe Systems PE Pipe Systems PE Pipe Systems PE Pipe Systems PE Pipe Systems PE Pipe Systems PE Pipe Systems
design
PE80B
Extrapolation Permissible System Operating Head (m)
Temp Limit PN 3.2 PN 4 PN 6.3 PN 8 PN 10 PN 12.5 PN 16 PN20
°
C Years
20 200 32 40 63 80 100 125 160 200
25 100 30 38 59 75 94 117 150 188
30 100 28 35 55 70 88 109 140 175
35 100 26 32 50 64 80 100 128 160
40 100 24 30 47 60 75 94 120 150
45 60 22 28 44 56 70 88 112 140
50 36 21 26 41 52 65 81 104 130
55 24 19 24 38 48 60 75 96 120
60 12 18 23 35 45 56 70 90 113
658 17213342536684105
705 1620313949617898
752 1418283645567290
802 1317263341526683
PE80C
Extrapolation Permissible System Operating Head (m)
Temp Limit PN 3.2 PN 4 PN 6.3 PN 8 PN 10 PN 12.5 PN 16 PN20
°
C Years
20 50 32 40 63 80 100 125 160 200
25 50 29 36 57 72 90 113 144 180
30 30 26 33 51 65 81 102 130 163
35 18 23 29 46 58 73 91 116 145
40 12 20 25 39 50 63 78 100 125
456 18233545567090113
PE100
Extrapolation Permissible System Operating Head (m)
Temp Limit PN 3.2 PN 4 PN 6.3 PN 8 PN 10 PN 12.5 PN 16 PN20 PN25
°
C Years
20 200 32 40 63 80 100 125 160 200 250
25 100 30 38 59 75 94 117 150 188 233
30 100 28 35 55 70 88 109 140 175 218
35 100 26 32 50 64 80 100 128 160 200
40 100 24 30 47 60 75 94 120 150 185
45 60 22 28 44 56 70 88 112 140 175
50 36 21 26 41 52 65 81 104 130 163
55 24 19 24 38 48 60 75 96 120 150
60 12 18 23 35 45 56 70 90 113 140
658 17213342536684105130
705 1620313949617898120
752 1418283645567290113
802 1317263341526683105
Table 4.7 Temperature Rating Tables
Irrigation Warehouse Group Pty Ltd
www.polypipe.com.au
Ph 1300 661 417

PE Pipe Systems PE Pipe Systems PE Pipe Systems PE Pipe Systems PE Pipe Systems PE Pipe Systems PE Pipe Systems
Design.10
design
E Modulus
The E modulus of polyethylene varies
with temperature, duration of loading,
stress, and the particular grade of
material.
However, in order to facilitate
engineering calculations, it is generally
appropriate to group materials into
categories and adopt ‘typical’ values of E.
Table 4.8 lists E values in MPa for
PE80B (MDPE), PE80C (HDPE), and
PE100 (HDPE).
PE 80B
Temp °C 3 min 1h 5h 24h 1y 20y 50y
0 1050 830 740 650 410 320 300
20 700 550 490 430 270 215 200
40 530 410 370 320 200 160 150
60 400 300 280 250 160 - -
PE 80C
Temp °C 3 min 1h 5h 24h 1y 20y 50y
0 1080 850 740 660 400 320 300
20 750 590 520 460 280 220 205
40 470 370 320 290 180 140 130
60 210 170 150 130 80 - -
PE 100
Temp °C 3 min 1h 5h 24h 1y 20y 50y
0 1380 1080 950 830 520 410 380
20 950 750 660 580 360 280 260
40 700 550 490 430 270 210 190
60 530 420 370 320 200 - -
Table 4.8 E Values (MPa)
Selection of Wall
Thickness for
Special
Applications
For a required nominal diameter (DN)
and working pressure, the necessary
wall thickness for special applications
may be calculated using the Barlow
formula:
where
t = minimum wall thickness (mm)
P = maximum working pressure (MPa)
DN = nominal outside diameter (mm)
S = design hoop stress (MPa)
where
F = design factor,
typically 1.25 for water
Example
P = 900kPa = 0.9MPa
DN = 630
MRS = 10 (PE100)
F = 1.25
tPDN
SP
=+
.
.2
SMRS
F
=
S MPa==
10
125 80
..
txmm=+=
0 9 630
16 0 9 33 6
.
..
Irrigation Warehouse Group Pty Ltd
www.polypipe.com.au
Ph 1300 661 417

Design.11
PE Pipe Systems PE Pipe Systems PE Pipe Systems PE Pipe Systems PE Pipe Systems PE Pipe Systems PE Pipe Systems
design
Hydraulic Design
Design Basis
Vinidex Polyethylene (PE) pipes offer
advantages to the designer due to the
smooth internal bores which are
maintained over the working lifetime of
the pipelines. The surface energy
characteristics of PE inhibit the build up
of deposits on the internal pipe surfaces
thereby retaining the maximum bore
dimensions and flow capacities.
The flow charts presented in this section
relate the combinations of pipe
diameters, flow velocities and head loss
with discharge of water in PE pipelines.
These charts have been developed for
the flow of water through the pipes.
Where fluids other than water are being
considered, the charts may not be
applicable due to the flow properties of
these different fluids. In these cases the
advice of Vinidex engineers should be
obtained.
There are a number of flow formulae in
common use which have either a
theoretical or empirical background.
However, only the Hazen-Williams and
Colebrook-White formulae are
considered in this section.
Hazen - Williams
The original Hazen-Williams formula was
published in 1920 in the form:
v = C1 r0.63 s0.54 0.001-0.04
where
C1= Hazen-Williams roughness
coefficient
r = hydraulic radius (ft)
s = hydraulic gradient
Colebrook - White
The development from first principles of
the Darcy-Weisbach formula results in
the expression
where
and
f = Darcy friction factor
H = head loss due to friction (m)
D = pipe internal diameter (m)
L = pipe length (metres)
v = flow velocity (m/s)
g = gravitational acceleration
(9.81 m/s2)
R = Reynolds Number
This is valid for the laminar flow region
(R 2000), however, as most pipe
applications are likely to operate in the
transition zone between smooth and full
turbulence, the transition function
developed by Colebrook-White is
necessary to establish the relationship
between f and R.
where
k = Colebrook-White roughness
coefficient (m)
The appropriate value for PE pipes is:
k = 0.007 x 10 -3 m
= 0.007 mm
This value provides for the range of
pipe diameters, and water flow
velocities encountered in normal
pipeline installations.
HfLv
Dg
=
2
2
fR
=
64
1237
251
12 10 12
f
k
DRf
//
log .
.
=− +
The variations inherent with diameter
changes are accounted for by the
introduction of the coefficient C2 so that
C2 = C1 r0.02
Adoption of a Hazen-Williams roughness
coefficient of 155 results in the following
relationship for discharge in Vinidex PE
pipes
Q = 4.03 x 10⁻⁵ D2.65 H0.54
where
Q = discharge (litres/second)
D = internal diameter (mm)
H = head loss (metres/100 metres
length of pipe)
Flow charts for pipe systems using the
Hazen - Williams formula have been in
operation in Australia for over 30 years.
The charts calculate the volumes of
water transmitted through pipelines of
various materials, and have been proven
in practical installations.
Irrigation Warehouse Group Pty Ltd
www.polypipe.com.au
Ph 1300 661 417

PE Pipe Systems PE Pipe Systems PE Pipe Systems PE Pipe Systems PE Pipe Systems PE Pipe Systems PE Pipe Systems
Design.12
design
Head Loss in Fittings
Wherever a change to pipe cross section,
or a change in the direction of flow
occurs in a pipeline, energy is lost and
this must be accounted for in the
hydraulic design.
Under normal circumstances involving
long pipelines these head losses are
small in relation to the head losses due
to pipe wall friction.
However, geometry and inlet/exit
condition head losses may be significant
in short pipe runs or in complex
installations where a large number of
fittings are included in the design.
The general relationship for head losses
in fittings may be expressed as:
where
H = head loss (m)
V = velocity of flow (m/s)
K = head loss coefficient
g = gravitational acceleration
(9.81 m/s2)
The value of the head loss coefficient K
is dependent on the particular geometry
of each fitting, and values for specific
cases are listed in Table 4.9.
The total head loss in the pipeline
network is then obtained by adding
together the calculations performed for
each fitting in the system, the head loss
in the pipes, and any other design head
losses.
Worked Example
What is the head loss occurring in a
250mm equal tee with the flow in the
main pipeline at a flow velocity of 2 m/s?
where
K = 0.35 (Table 4.9)
V = 2 m/s
g = 9.81 m/s
If the total system contains 15 tees
under the same conditions, then the total
head loss in the fittings is 15 x 0.07 =
1.05 metres.
Flow Variations
The flow charts presented for PE pipes
are based on a number of assumptions,
and variations to these standard
conditions may require evaluation as to
the effect on discharge.
Water Temperature
The charts are based on a water
temperature of 20°C. A water
temperature increase above this value,
results in a decrease in viscosity of the
water, with a corresponding increase in
discharge ( or reduced head loss )
through the pipeline.
An allowance of approximately 1%
increase in the water discharge must be
made for each 3°C increase in
temperature above 20°C. Similarly, a
decrease of approximately 1% in
discharge occurs for each 3°C step
below 20°C water temperature.
Pipe Dimensions
The flow charts presented in this section
are based on mean pipe dimensions of
Series 1 pipes made to AS/NZS 4130 PE
pipes for Pressure applications.
Surface Roughness
The roughness coefficients adopted for
Vinidex PE pipes result from
experimental programs performed in
Europe and the USA, and follow the
recommendations laid down in
Australian Standard AS2200 - Design
Charts for Water Supply and Sewerage.
HK
V
g
=
2
2
HK
V
g
=
2
2
H=×
×
035 2
2981
2
.
.
Irrigation Warehouse Group Pty Ltd
www.polypipe.com.au
Ph 1300 661 417
Design.13
PE Pipe Systems PE Pipe Systems PE Pipe Systems PE Pipe Systems PE Pipe Systems PE Pipe Systems PE Pipe Systems
design
Flow Chart
Worked Examples
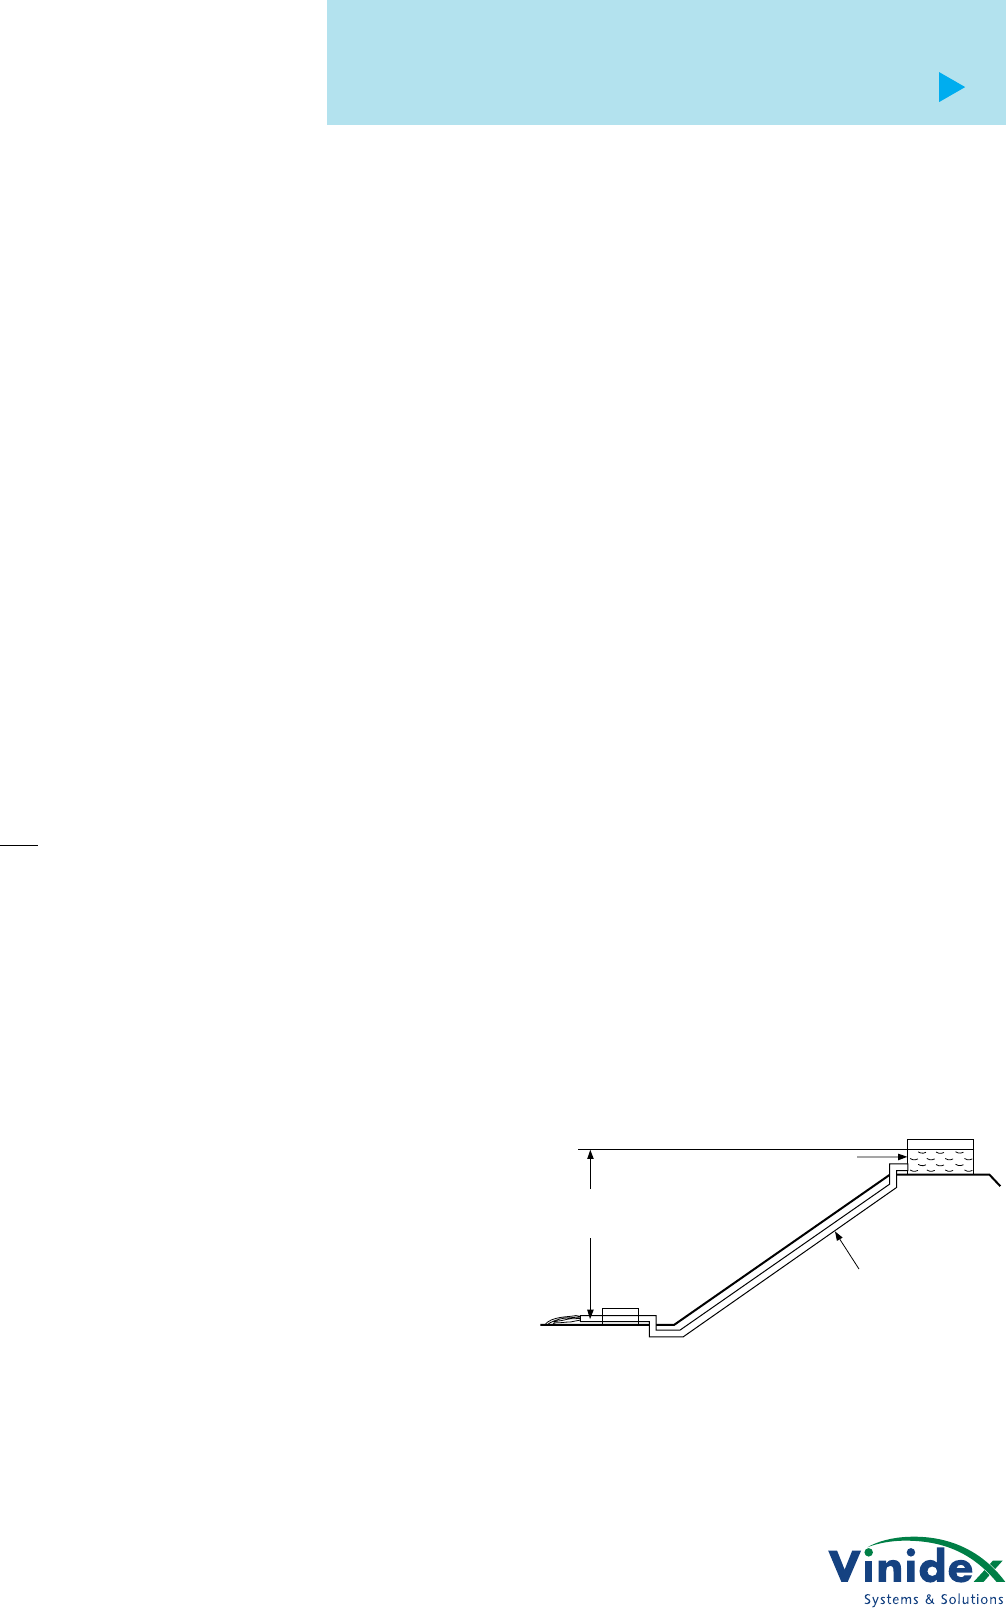
Example 1 - Gravity Main
(refer Figure 4.1)
A flow of water of 32 litres/second is
required to flow from a storage tank
located on a hill 50 metres above an
outlet. The tank is located 4.5 km away
from the outlet.
Hence the information available is :
Q = 32 l/s
Head available = 50 metres
Length of pipeline = 4500 metres
Minimum PN rating of pipe available to
withstand the 50 m static head is PN6.3.
Head loss per 100 m length of pipe is :
Use Table 4.1 to select the SDR rating of
PN6.3 class pipes in both PE80, and
PE100 materials.
50
4500 100 1 11 100xmm=./
Figure 4.1 Gravity Flow Example
Maximum difference
in water level
50m
Discharge
4,500m of
Vinidex PE Pipe
Storage
tank
PE80 Material Option
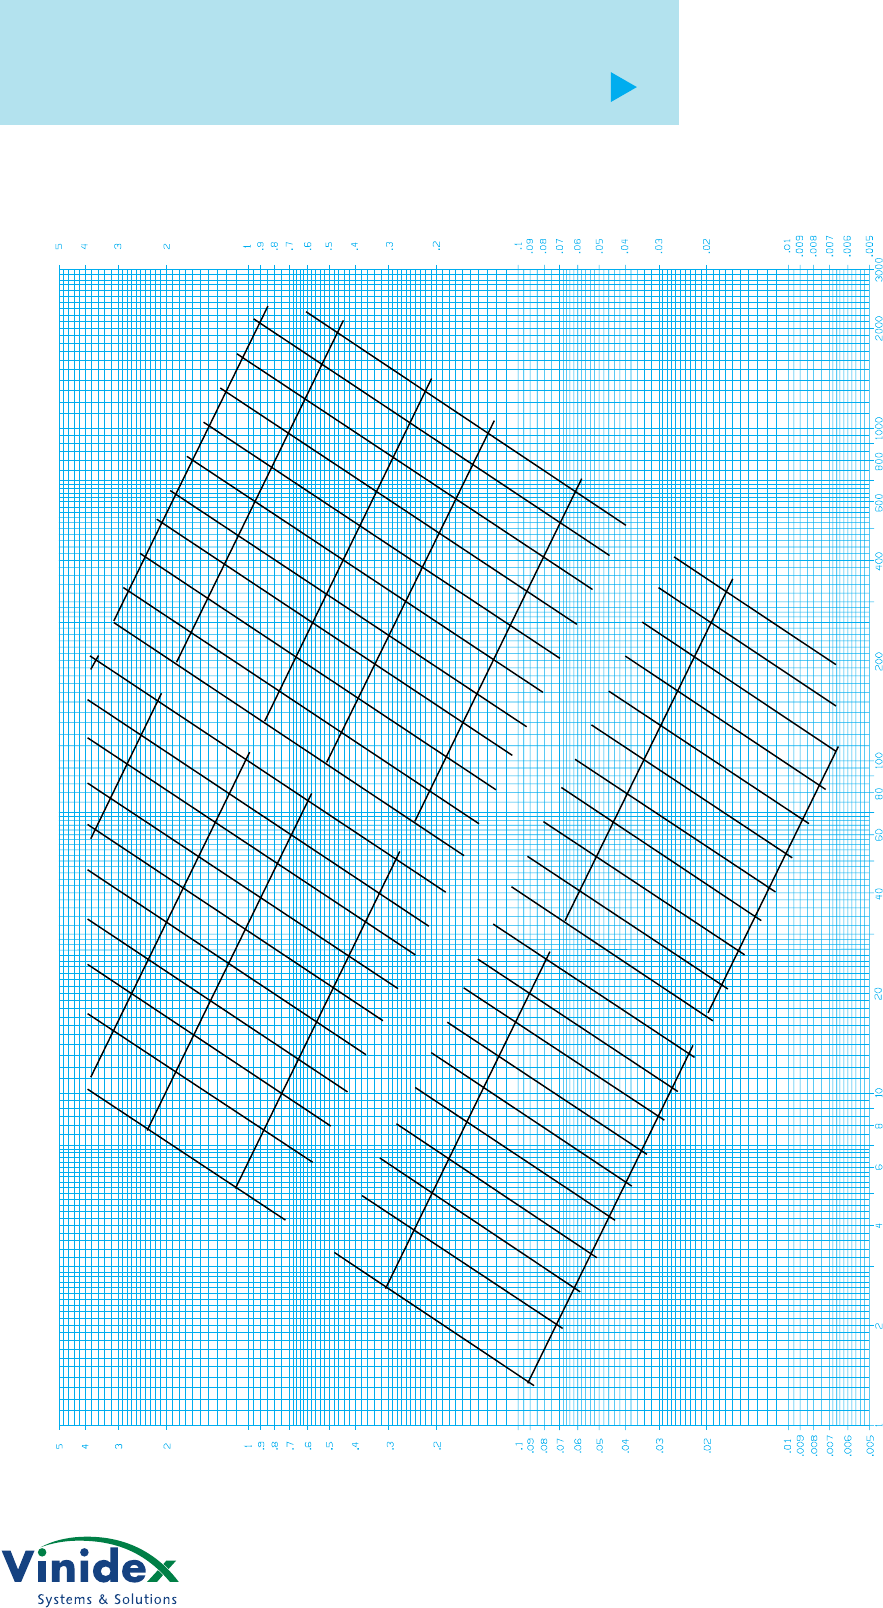
PE80 PN6.3 pipe is SDR 21.
Use the SDR 21 flow chart, read
intersection of discharge line at 32 l/s
and head loss line at 1.11m/100m of
pipe. Select the next largest pipe size.
This results in a DN200 mm pipe
diameter.
PE100 Material Option
PE100 PN6.3 pipe is SDR 26.
Use the SDR26 flow chart, read the
intersection of discharge line at 32 l/s
and head loss line at 1.11m/100m of
pipe. Select the next largest pipe size.
This results in a DN180 mm pipe
diameter.
Hence for this application, there are two
options available, either :
1. DN 200 PE80 PN6.3 or
2. DN 180 PE100 PN6.3
Irrigation Warehouse Group Pty Ltd
www.polypipe.com.au
Ph 1300 661 417
PE Pipe Systems PE Pipe Systems PE Pipe Systems PE Pipe Systems PE Pipe Systems PE Pipe Systems PE Pipe Systems
Design.14
design
3. Fittings head losses
From Figure 4.2, identify the type and
number of different fittings used in the
pipeline. Select the appropriate form
factor value K for each fitting type from
Table 4.9. Then:
Fitting Form Head Loss m
Factor K
Foot valve 15.0 15 x 0.05 = 0.75
Gate valve 0.2 2 x 0.2 x 0.05 = 0.02
Reflux valve 2.5 2.5 x 0.05 = 0.125
90° elbow 1.1 4 x 1.1 x 0.05 = 0.220
45° elbow 0.35 2 x 0.35 x 0.05 = 0.035
Square outlet 1.0 1.0 x 0.05 = 0.050
Total fittings head loss = 1.2
Velocity Head v
g
=2
2
==
10
2981005
2
.
..
x
05
100 5000 25
.xm=
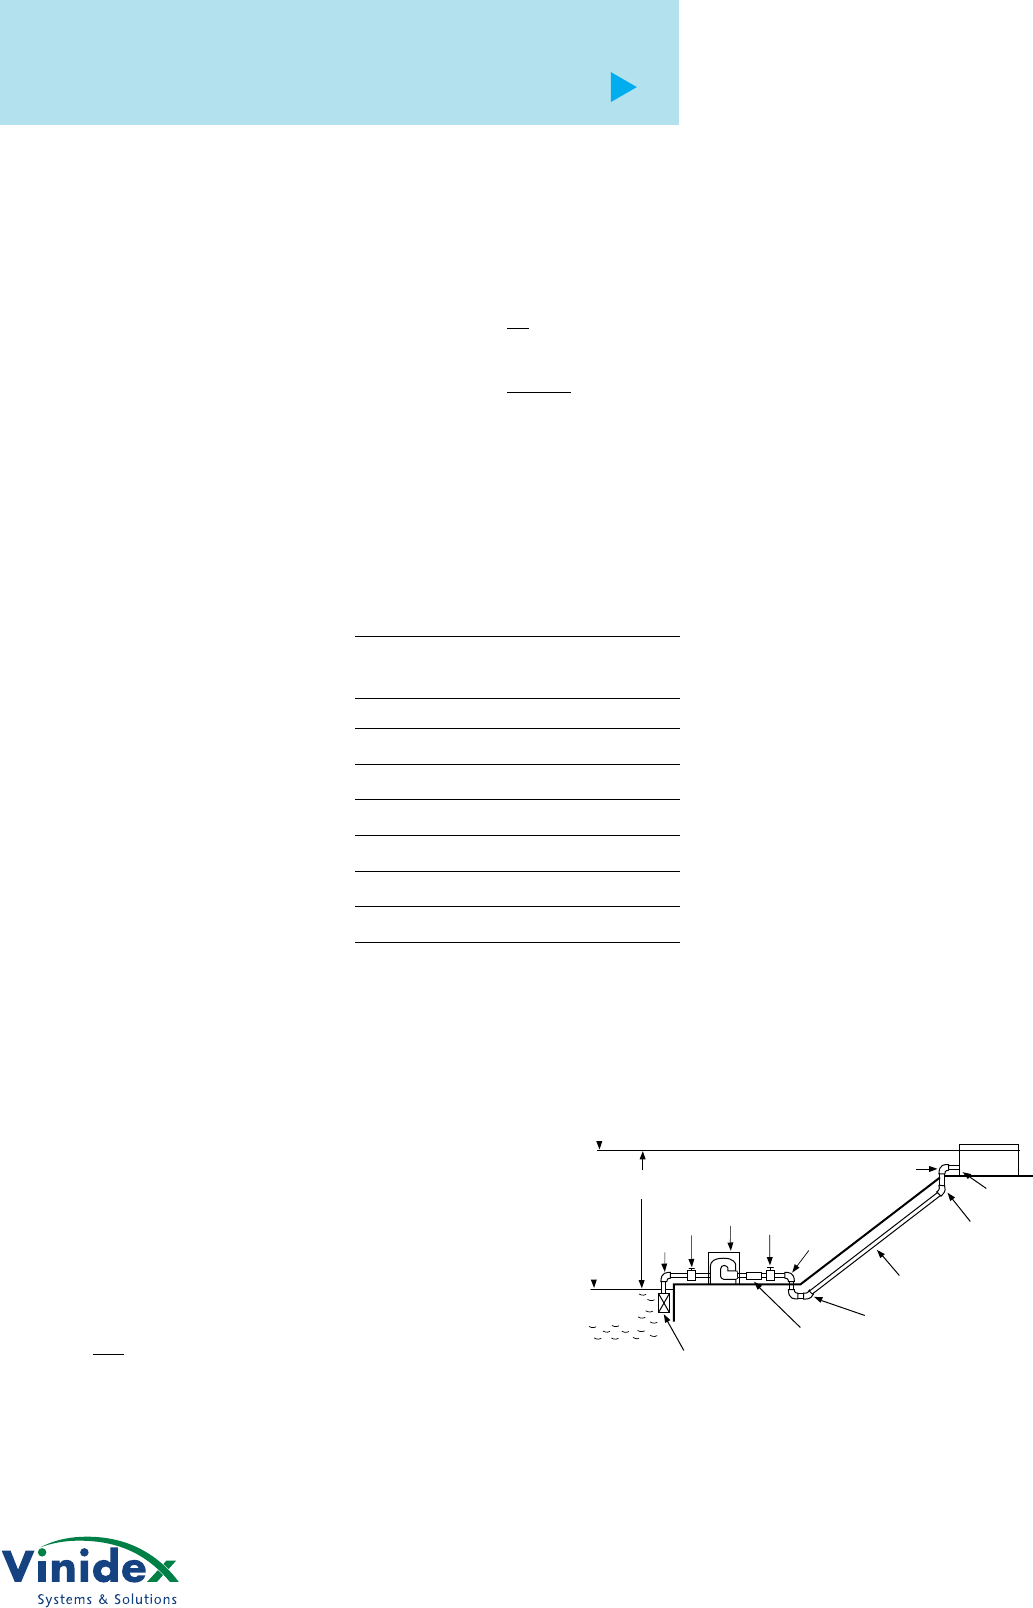
Example 2 - Pumped Main
(refer Figure 4.2)
A line is required to provide 20 litres/
second of water from a dam to a high
level storage tank located 5000 metres
away. The tank has a maximum water
elevation of 100 m and the minimum
water elevation in the dam is 70 m.
The maximum flow velocity is required to
be limited to 1.0 metres/second to
minimise water hammer effects.
The maximum head required at the pump
= static head + pipe friction head
+ fittings form loss
1. Static head
= 100 - 70 = 30 m
2. Pipe friction head
Considering the data available, start with
a PN6.3 class pipe.
PE80 Option
From Table 4.1, PE80 PN6.3 pipe is
SDR21.
Use the SDR 21 flow chart, find the
intersection of the discharge line at 20 l/s
and the velocity line at 1 m/s. Select the
corresponding or next largest size of
pipe. Where the discharge line intersects
the selected pipe size, trace across to find
the head loss per 100m length of pipe.
This gives a value of 0.5m/100m.
Calculate the total friction head loss in the
pipe:
Figure 4.2 Pumped Flow Example
Maximum difference
in water level - 30m
90°
Elbow
Gate
Valve Pump Gate
Valve 2x90°
Elbows
Hinged Disc
Foot Valve
with Strainer
RL 100m
RL 70m
Min Level
of Dam
Reflux Valve
45° Elbow
5,000m
of Vinidex PE Pipe
45° Elbow
Square
Outlet
90° Elbow
Storage Tank
Max Level of Tank
Then from the flow chart, estimate the
velocity of flow
This gives 1 m/s.
4. Total pumping head
= 30 + 25 + 1.2 = 56.2 m
allow 57 m.
Note: The example does not make any
provision for surge allowance in
pressure class selection.
Irrigation Warehouse Group Pty Ltd
www.polypipe.com.au
Ph 1300 661 417
Design.15
PE Pipe Systems PE Pipe Systems PE Pipe Systems PE Pipe Systems PE Pipe Systems PE Pipe Systems PE Pipe Systems
design
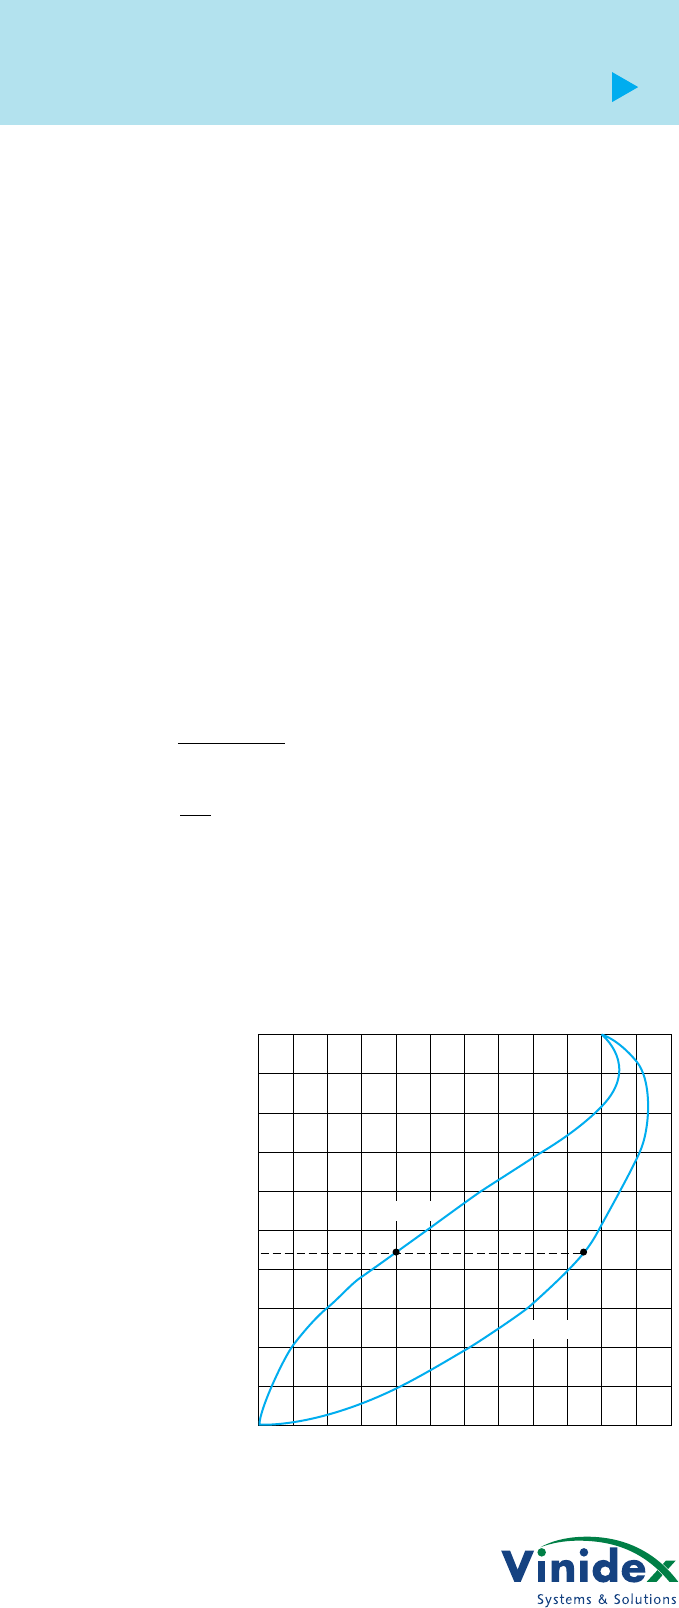
Part Full Flow
Non pressure pipes are designed to run
full under anticipated peak flow
conditions. However, for a considerable
period the pipes run at less than full flow
conditions and in these circumstances
they act as open channels with a free
fluid to air surface.
In these instances consideration must be
given to maintaining a minimum
transport velocity to prevent deposition
of solids and blockage of the pipeline.
For pipes flowing part full, the most
usual self cleansing velocity adopted for
sewers is 0.6 metres/second.
Example 3. Determine
flow velocity and
discharge under part full
flow conditions
Given gravity conditions:
Pipe DN 200 PE80 PN6.3
Mean Pipe ID 180 mm ( Refer Table XX
PE pipe dimensions, or AS/NZS 4130 )
Gradient 1 in 100
Depth of flow 80 mm
Problem:
Find flow and velocity
Solution:
Proportional Depth Depth of flow
Pipe ID
=
==
80
180 044.
1.0
0.9
0.8
0.7
0.6
0.5
0.4
0.3
0.2
0.1
0 0.1 0.2 0.3 0.4 0.5 0.6 0.7 0.8 0.9 1.0 1.1 1.2
Discharge
Velocity
Proportional Discharge & Velocity
Proportional Depth
Figure 4.3 Part Full Flow
From Figure 4.3 Part Full Flow, for a
proportional depth of 0.44, the
proportional discharge is 0.4 and the
proportional velocity if 0.95.
Refer to the Vinidex PE pipe flow chart
for the SDR 21 pipe.
For a gradient of 1 in 100 full flow is
39 l/s and the velocity is 1.6 m/s.
Then, for part full flow
Discharge = 0.4 x 39
= 15.6 l/s
Velocity = 0.95 x 1.6
= 1.52 m/s
Irrigation Warehouse Group Pty Ltd
www.polypipe.com.au
Ph 1300 661 417
PE Pipe Systems PE Pipe Systems PE Pipe Systems PE Pipe Systems PE Pipe Systems PE Pipe Systems PE Pipe Systems
Design.16
design
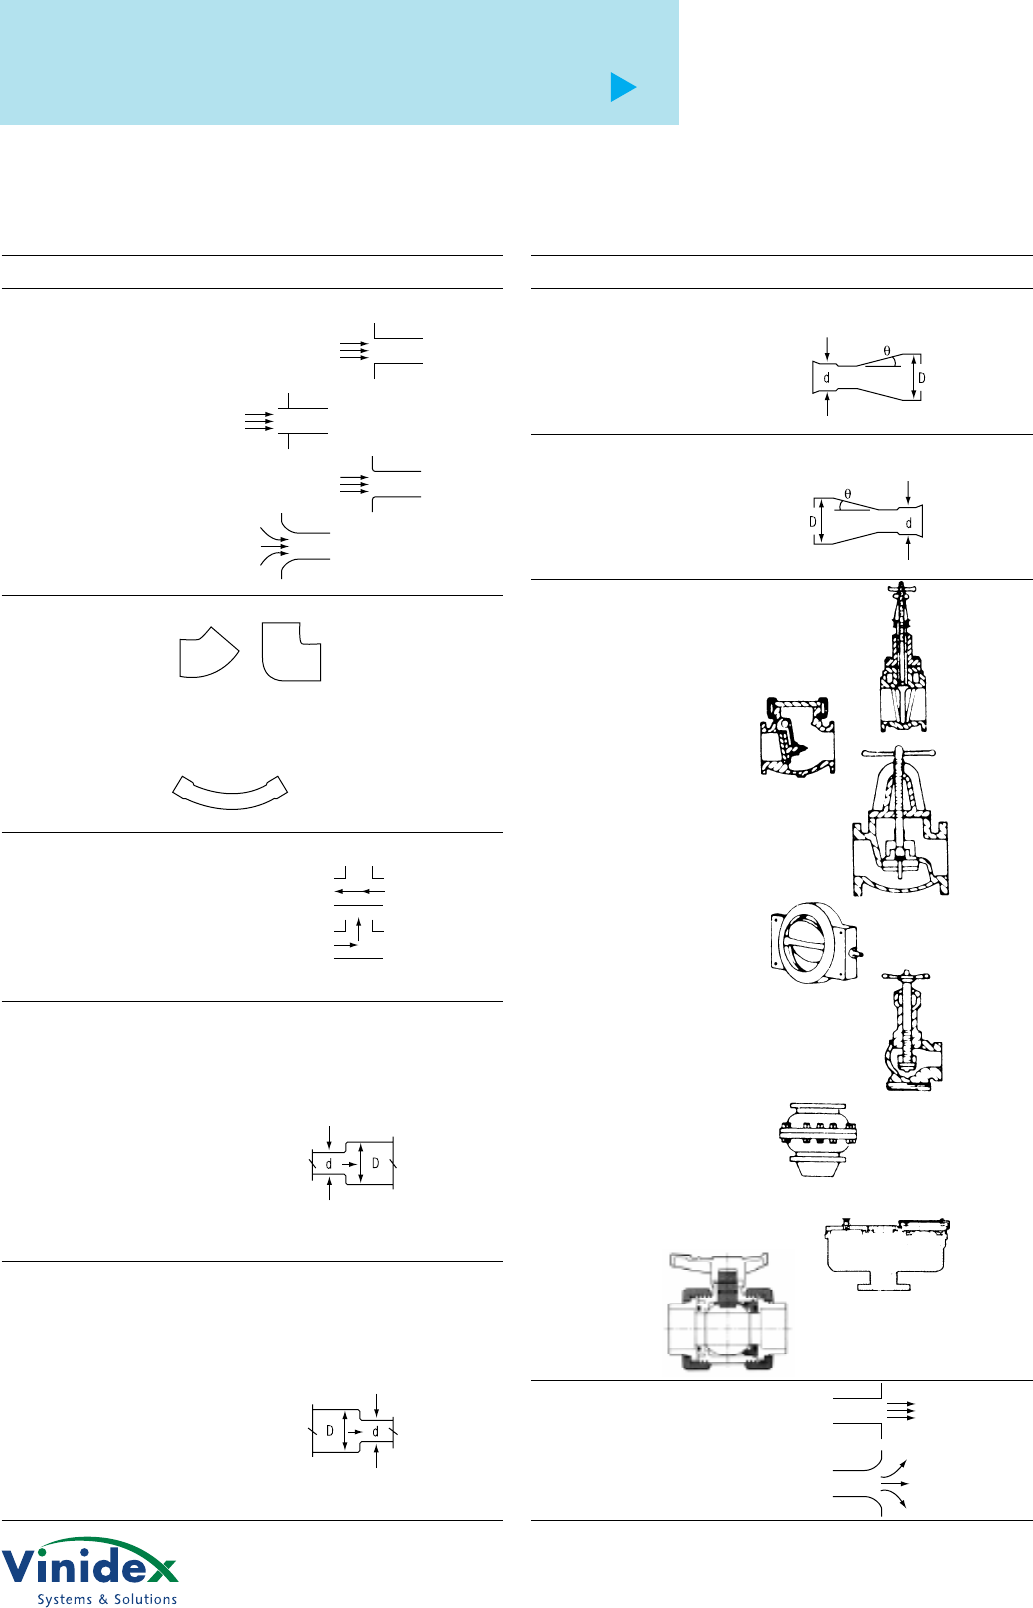
Fitting Type K
Pipe Entry Losses
Square Inlet 0.50
Re-entrant Inlet 0.80
Slightly Rounded Inlet 0.25
Bellmouth Inlet 0.05
Pipe Intermediate Losses
Elbows R/D < 0.6 45°0.35
90°1.10
Long Radius Bends (R/D > 2) 111/4°0.05
221/2°0.10
45°0.20
90°0.50
Tees
(a) Flow in line 0.35
(b) Line to branch flow 1.00
Sudden Enlargements
Ratio d/D
0.9 0.04
0.8 0.13
0.7 0.26
0.6 0.41
0.5 0.56
0.4 0.71
0.3 0.83
0.2 0.92
<0.2 1.00
Sudden Contractions
Ratio d/D
0.9 0.10
0.8 0.18
0.7 0.26
0.6 0.32
0.5 0.38
0.4 0.42
0.3 0.46
0.2 0.48
<0.2 0.50
Fitting Type K
Gradual Enlargements
Ratio d/D q = 10° typical
0.9 0.02
0.7 0.13
0.5 0.29
0.3 0.42
Gradual Contractions
Ratio d/D q = 10° typical
0.9 0.03
0.7 0.08
0.5 0.12
0.3 0.14
Valves
Gate Valve (fully open) 0.20
Reflux Valve 2.50
Globe Valve 10.00
Butterfly Valve (fully open) 0.20
Angle Valve 5.00
Foot Valve with strainer
hinged disc valve 15.00
unhinged (poppet) disc valve 10.00
Air Valves zero
Ball Valve 0.10
Pipe Exit Losses
Square Outlet 1.00
Rounded Outlet 1.00
Resistance Coefficients
Table 4.9 Valves, Fittings and Changes in Pipe Cross-Section
Irrigation Warehouse Group Pty Ltd
www.polypipe.com.au
Ph 1300 661 417
Design.17
PE Pipe Systems PE Pipe Systems PE Pipe Systems PE Pipe Systems PE Pipe Systems PE Pipe Systems PE Pipe Systems
design
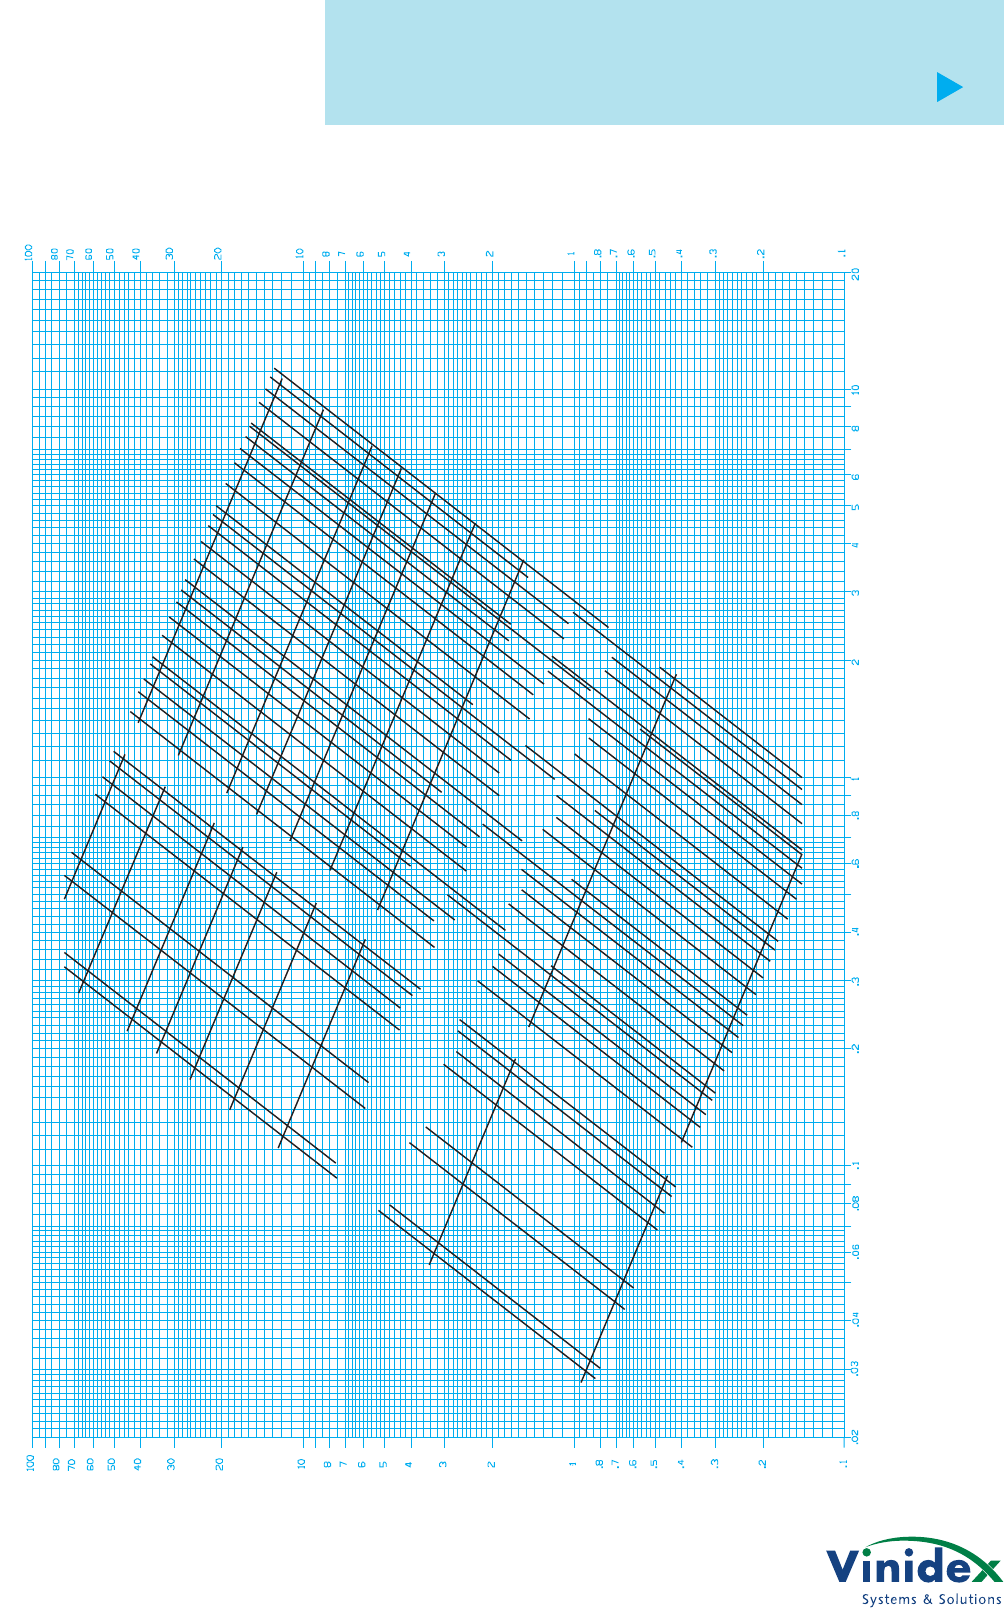
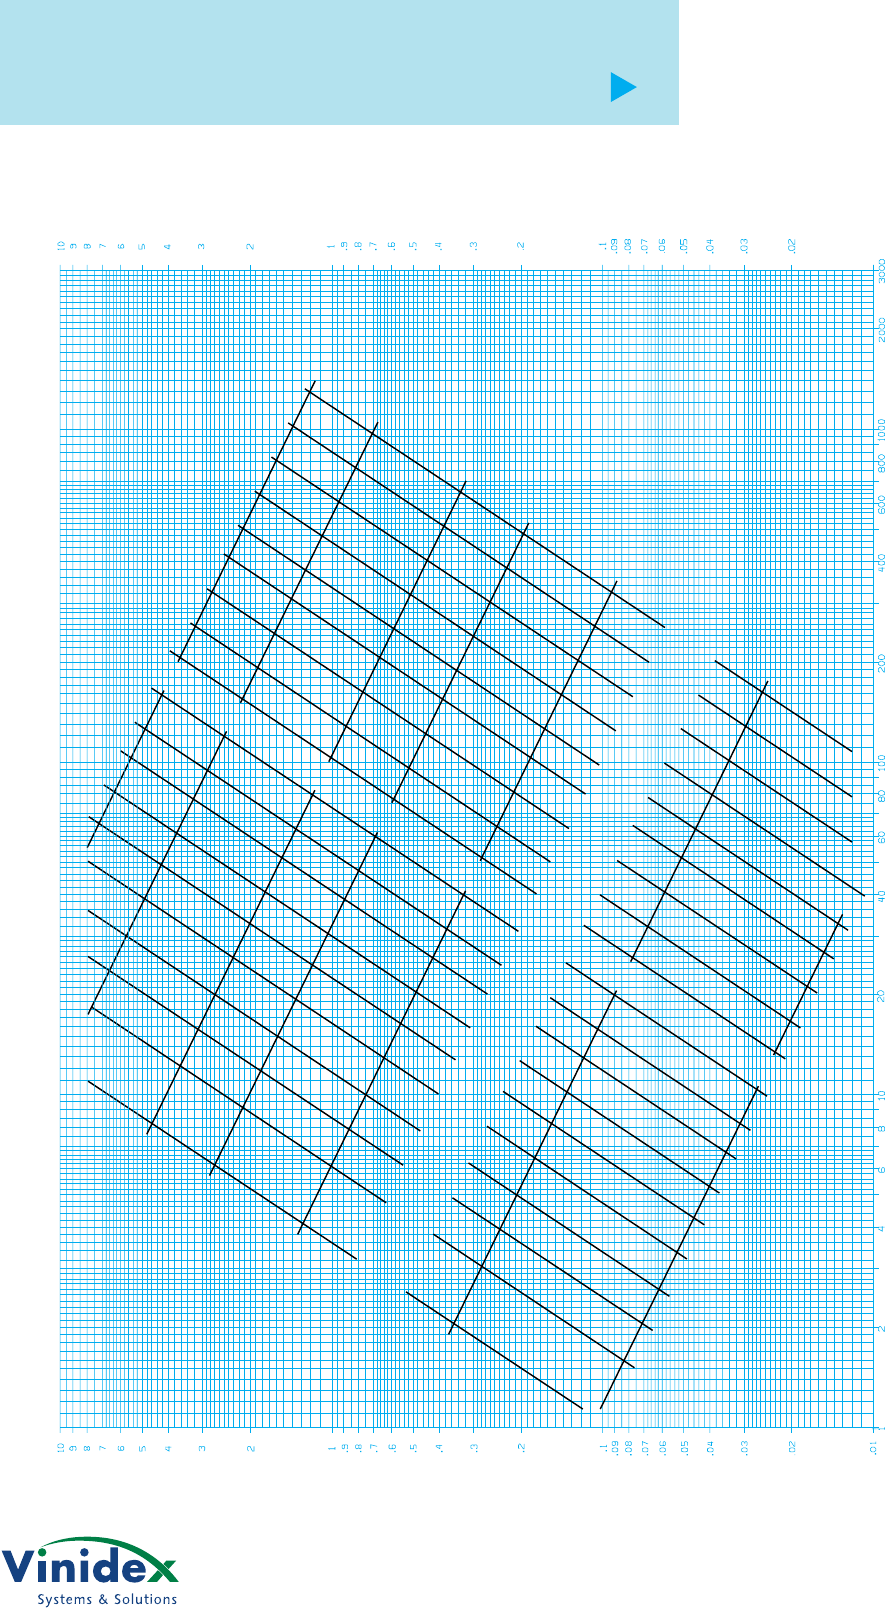
Discharge - Litres per Second (L/s)
Head Loss - Metres Head of Water per 100 metres of Pipe
NOMINAL SIZE AND CLASS (DN/PN)
NOMINAL SIZE AND CLASS (DN/PN)
VELOCITY m/s
1.5
3.0
2.5
2.0
1.75
1.25
1.0
0.5
0.25
16/16
16/12.5
20/16
20/12.5
25/16
25/12.5
25/10
25/8
32/16
32/12.5
32/10 32/8
32/6.3 40/16
40/12.5
40/10
40/6.3 50/16
40/8
50/12.5
50/10
50/8 50/6.3
63/16
63/12.5
63/10
63/6.3 63/8
75/16
75/12.5
75/10 75/8
75/6.3
Flow Chart for Small Bore Polyethylene Pipe – DN16 to DN75
(PE80B, PE80C Materials)
Flow Chart for Small Bore Polyethylene Pipe – DN16 to DN75 (PE80B, PE80C Materials)
Irrigation Warehouse Group Pty Ltd
www.polypipe.com.au
Ph 1300 661 417
PE Pipe Systems PE Pipe Systems PE Pipe Systems PE Pipe Systems PE Pipe Systems PE Pipe Systems PE Pipe Systems
Design.18
design
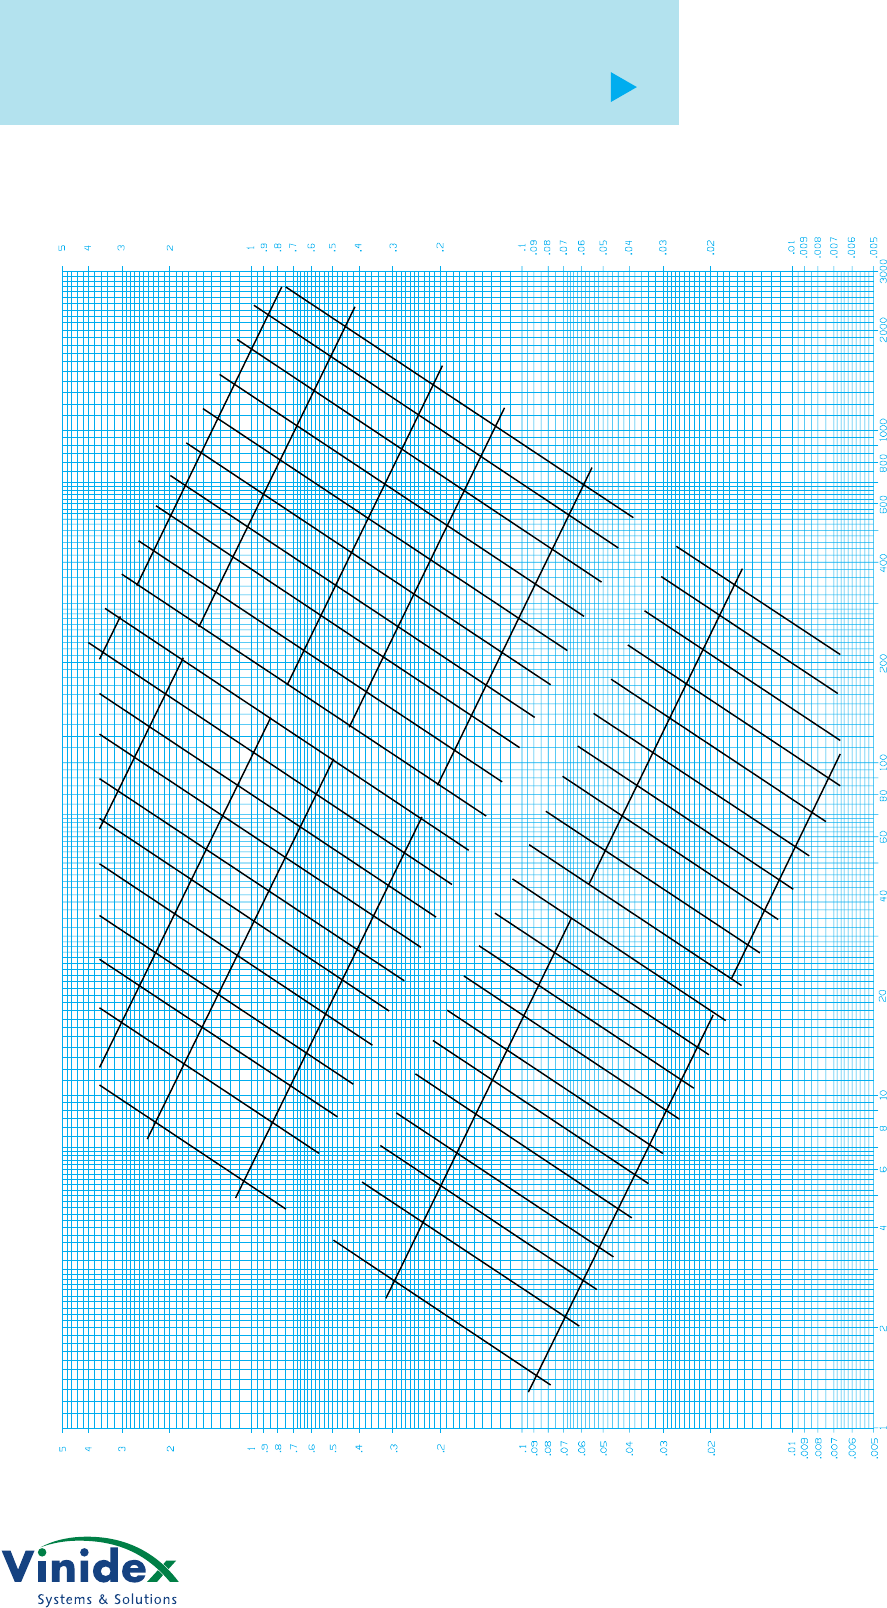
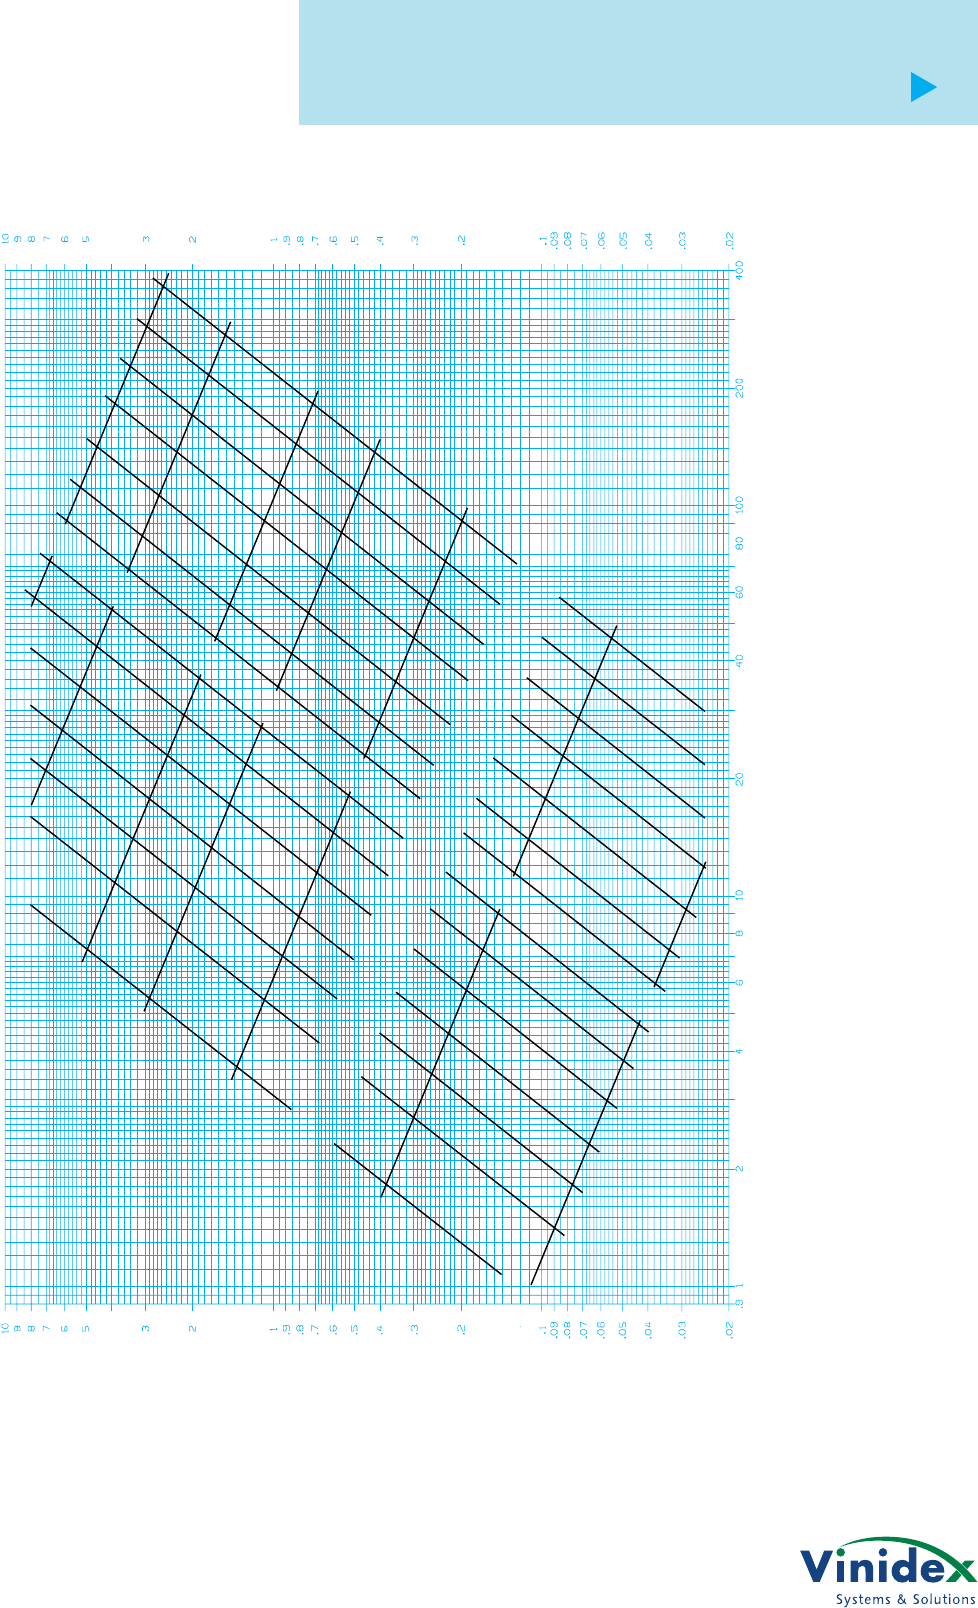
Flow Chart for Polyethylene Pipe – SDR 41
(PE80: PN3.2 & PE100: PN4)
Discharge - Litres per Second (L/s)
Head Loss - Metres Head of Water per 100 metres of Pipe
NOMINAL SIZE
NOMINAL SIZE
VELOCITY m/s
90
110
125
140
160
180
200
225
250
280
315
355
400
450
500
560
630
710
800
900
1000
4.0
2.0
3.0
1.5
1.0
0.5
0.25
Flow Chart for Polyethylene Pipe – SDR 41 (PE80: PN3.2 & PE100: PN4)
Irrigation Warehouse Group Pty Ltd
www.polypipe.com.au
Ph 1300 661 417
Design.19
PE Pipe Systems PE Pipe Systems PE Pipe Systems PE Pipe Systems PE Pipe Systems PE Pipe Systems PE Pipe Systems
design
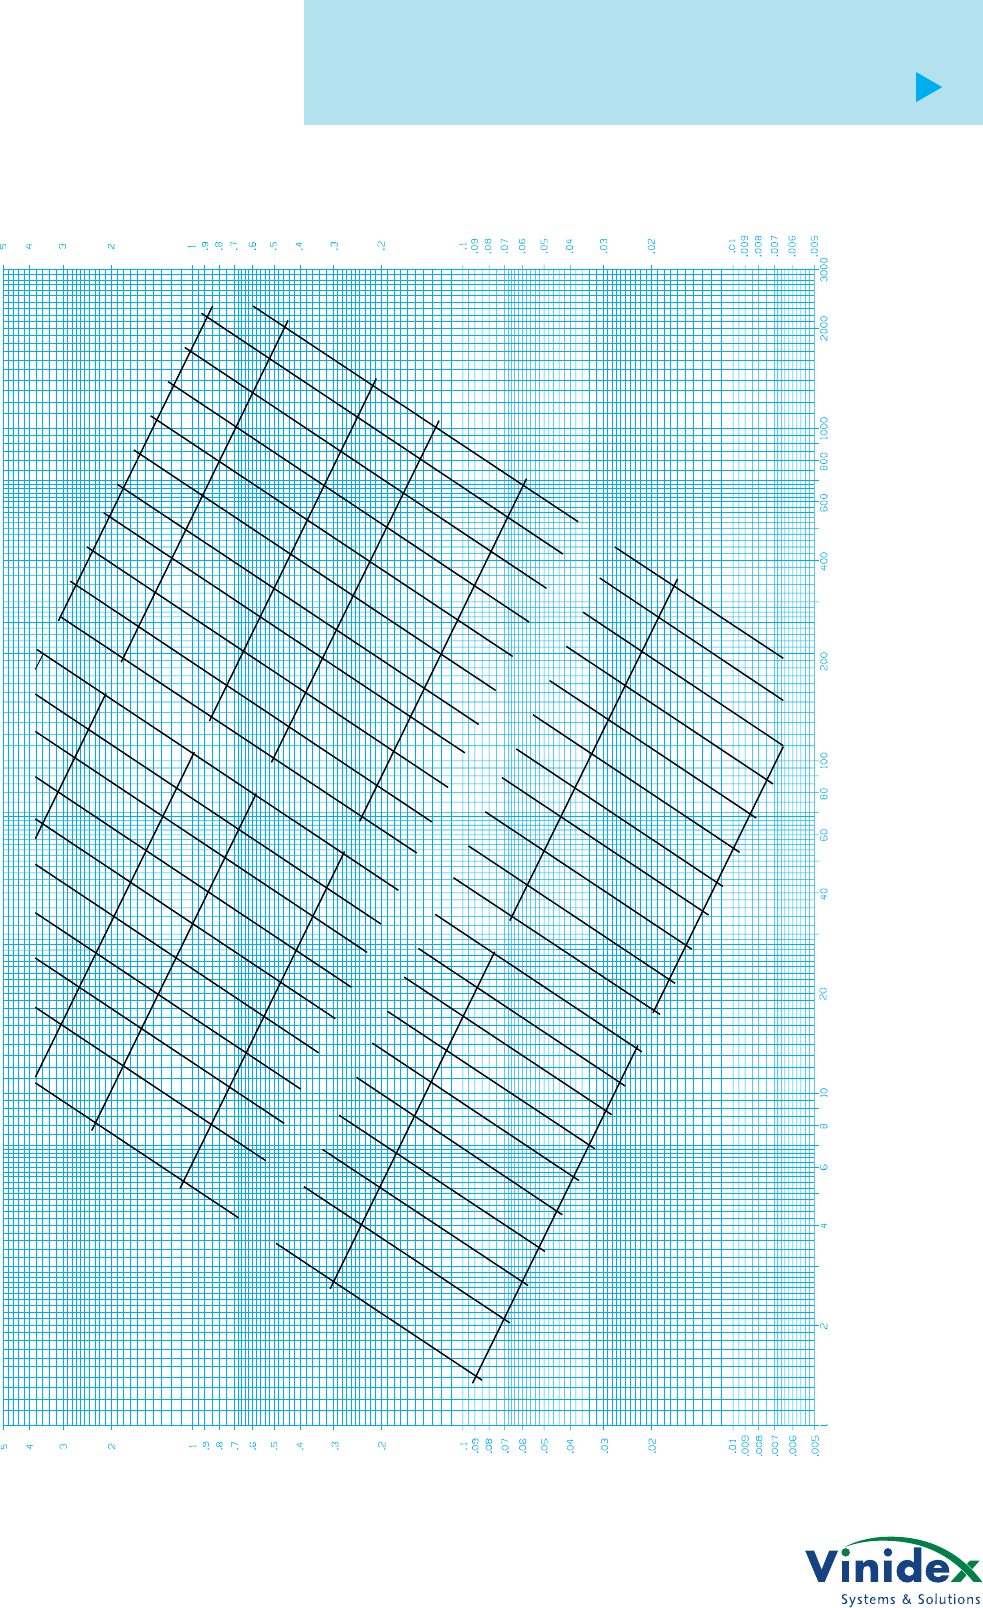
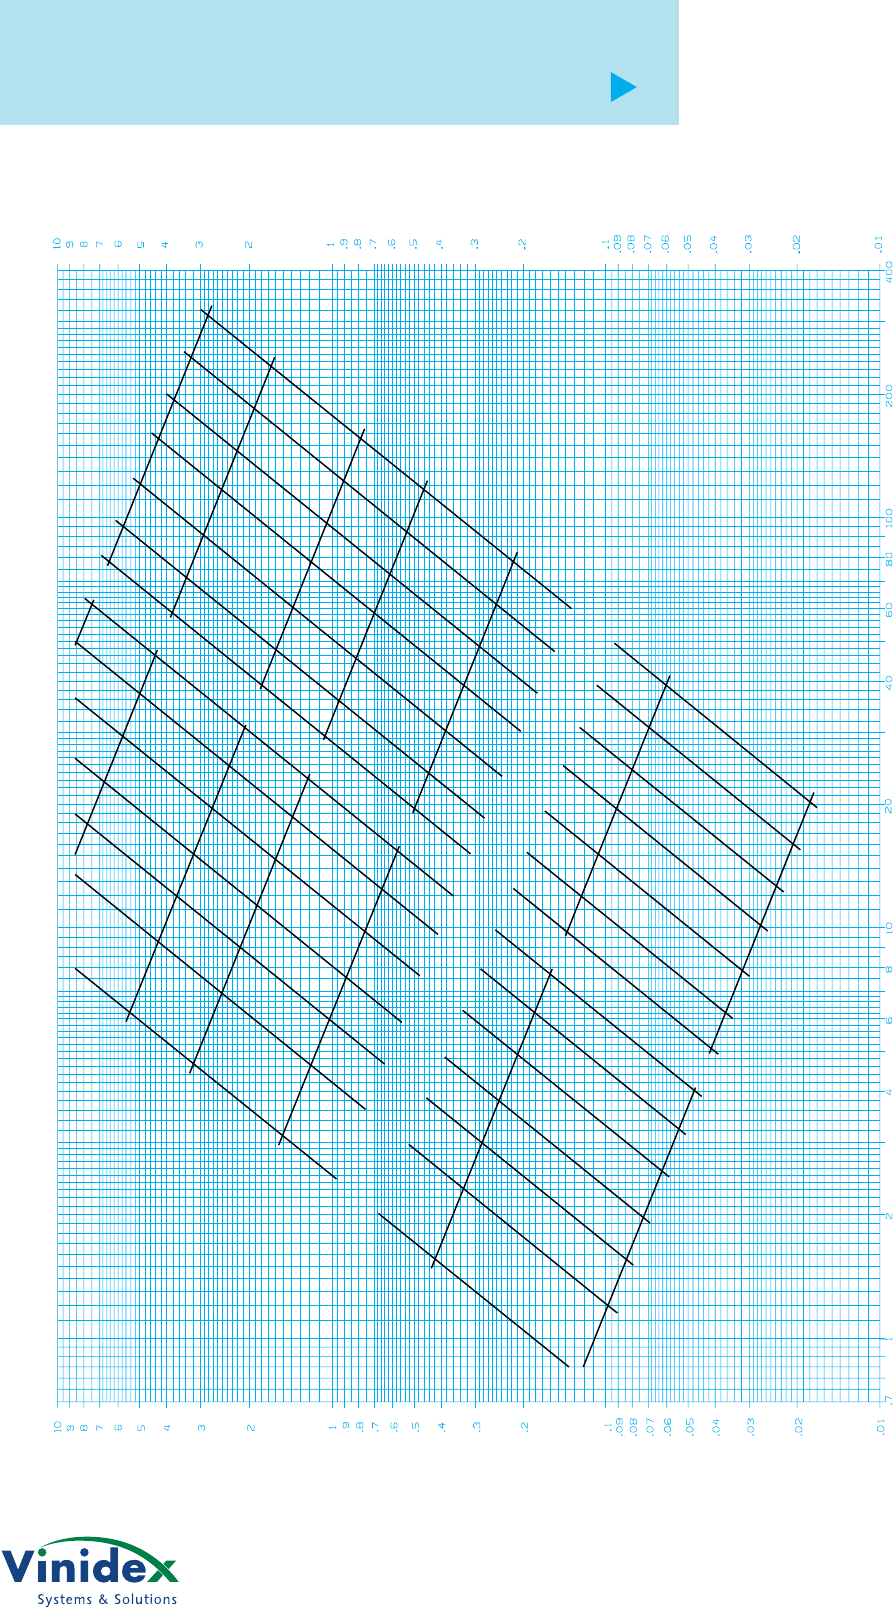
Flow Chart for Polyethylene Pipe – SDR 33
(PE80: PN4)
Discharge - Litres per Second (L/s)
Head Loss - Metres Head of Water per 100 metres of Pipe
NOMINAL SIZE
NOMINAL SIZE
VELOCITY m/s
4.0
2.0
3.0
1.5
1.0
0.5
0.25
90
110
125
140
160
180
200
225
250
280
315
355
400
450
500
560
630
710
800
900
1000
Flow Chart for Polyethylene Pipe – SDR 33 (PE80: PN4)
Irrigation Warehouse Group Pty Ltd
www.polypipe.com.au
Ph 1300 661 417
PE Pipe Systems PE Pipe Systems PE Pipe Systems PE Pipe Systems PE Pipe Systems PE Pipe Systems PE Pipe Systems
Design.20
design
Flow Chart for Polyethylene Pipe – SDR 26
(PE100: PN6.3)
Discharge - Litres per Second (L/s)
Head Loss - Metres Head of Water per 100 metres of Pipe
NOMINAL SIZE
NOMINAL SIZE
VELOCITY m/sec
4.0
2.0
3.0
1.5
1.0
0.5
0.25
90
110
125
140
160
180
200
225
250
280
315
355
400
450
500
560
630
710
800
900
1000
Flow Chart for Polyethylene Pipe – SDR 26 (PE100: PN6.3)
Irrigation Warehouse Group Pty Ltd
www.polypipe.com.au
Ph 1300 661 417

Design.21
PE Pipe Systems PE Pipe Systems PE Pipe Systems PE Pipe Systems PE Pipe Systems PE Pipe Systems PE Pipe Systems
design
Flow Chart for Polyethylene Pipe – SDR 21
(PE80: PN6.3 & PE100: PN8)
Discharge - Litres per Second (L/s)
Head Loss - Metres Head of Water per 100 metres of Pipe
NOMINAL SIZE
NOMINAL SIZE
VELOCITY m/s
4.0
2.0
3.0
1.5
1.0
0.5
0.25
90
110
125
140
160
180
200
225
250
280
315
355
400
450
500
560
630
710
800
900
1000
Flow Chart for Polyethylene Pipe – SDR 21 (PE80: PN6.3 & PE100: PN8)
Irrigation Warehouse Group Pty Ltd
www.polypipe.com.au
Ph 1300 661 417
PE Pipe Systems PE Pipe Systems PE Pipe Systems PE Pipe Systems PE Pipe Systems PE Pipe Systems PE Pipe Systems
Design.22
design
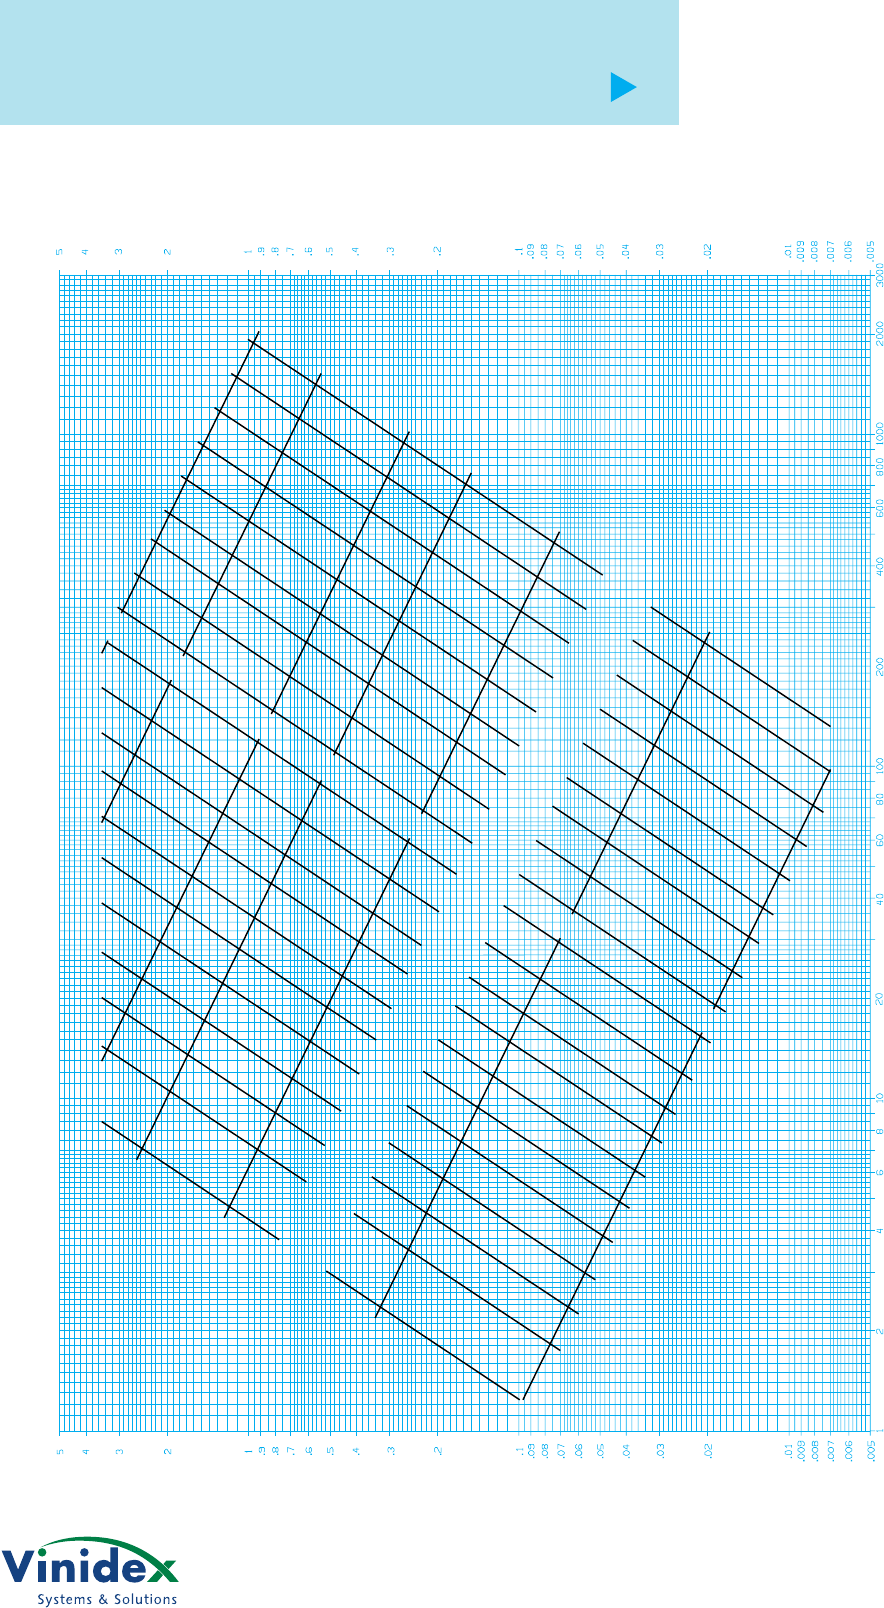
Flow Chart for Polyethylene Pipe – SDR 17
(PE80: PN8 & PE100: PN10)
Discharge - Litres per Second (L/s)
Head Loss - Metres Head of Water per 100 metres of Pipe
NOMINAL SIZE
NOMINAL SIZE
VELOCITY m/s
4.0
2.0
3.0
1.5
1.0
0.5
0.25
90
110
125
140
160
180
200
225
250
280
315
355
400
450
500
560
630
710
800
900
Flow Chart for Polyethylene Pipe – SDR 17 (PE80: PN8 & PE100: PN10)
Irrigation Warehouse Group Pty Ltd
www.polypipe.com.au
Ph 1300 661 417
Design.23
PE Pipe Systems PE Pipe Systems PE Pipe Systems PE Pipe Systems PE Pipe Systems PE Pipe Systems PE Pipe Systems
design
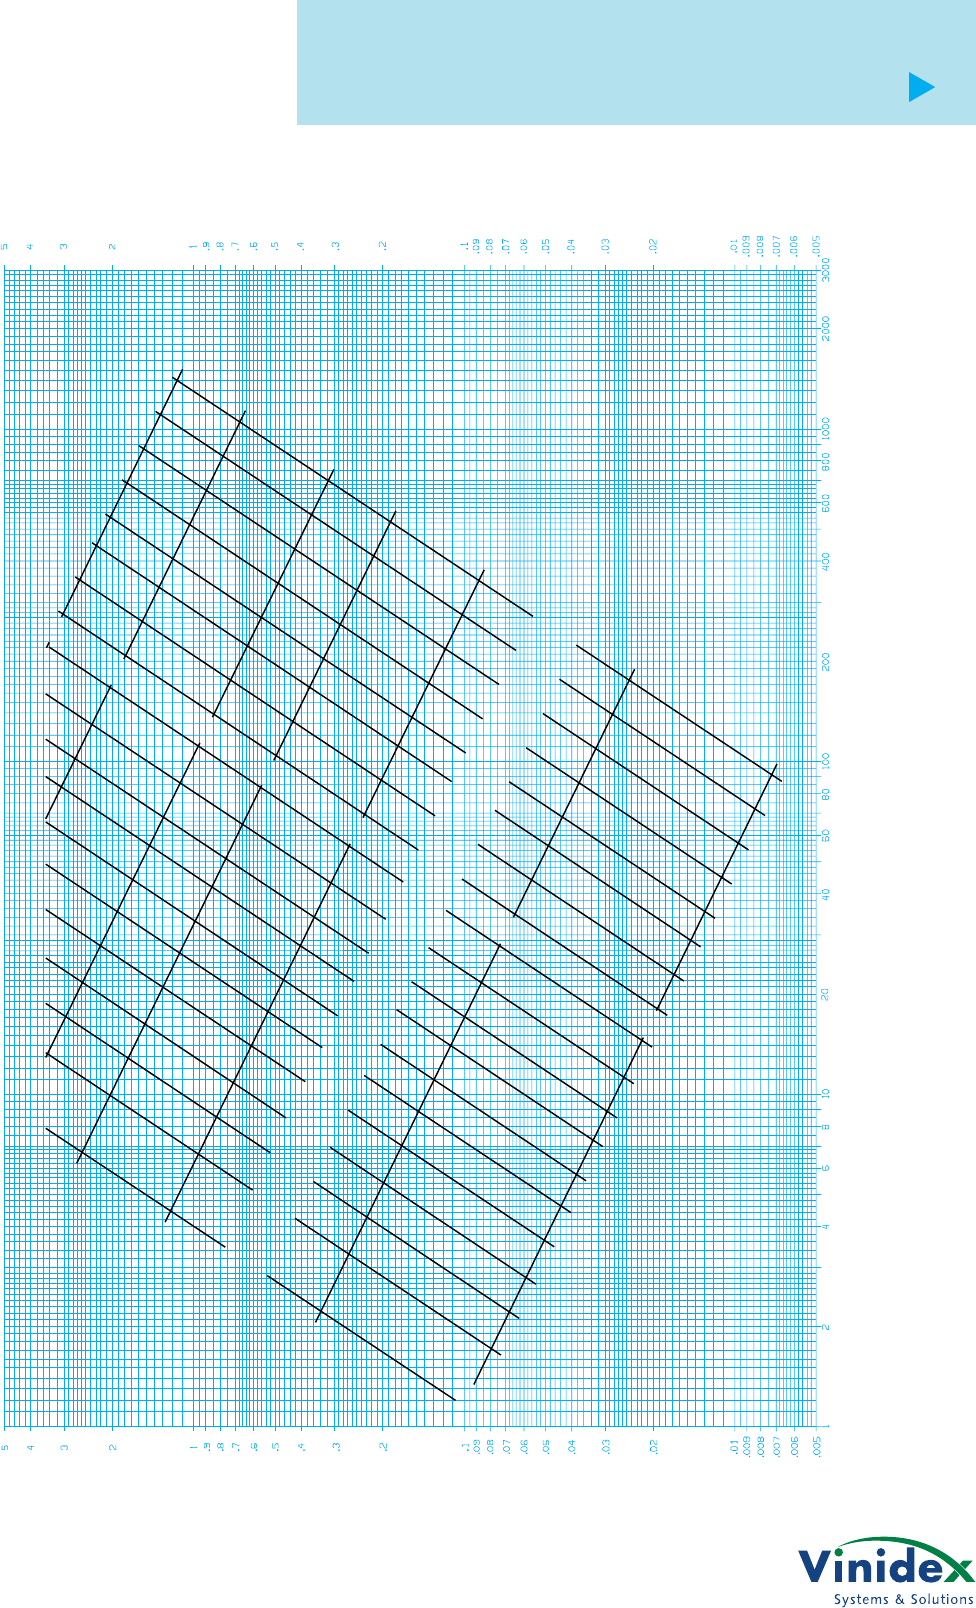
Flow Chart for Polyethylene Pipe – SDR 13.6
(PE80: PN10 & PE100: PN12.5)
Discharge - Litres per Second (L/s)
Head Loss - Metres Head of Water per 100 metres of Pipe
NOMINAL SIZE
NOMINAL SIZE
VELOCITY m/s
4.0
2.0
3.0
1.5
1.0
0.5
0.25
90
110
125
140
160
180
200
225
250
280
315
355
400
450
500
560
630
710
800
Flow Chart for Polyethylene Pipe – SDR 13.6 (PE80: PN10 & PE100: PN12.5)
Irrigation Warehouse Group Pty Ltd
www.polypipe.com.au
Ph 1300 661 417
PE Pipe Systems PE Pipe Systems PE Pipe Systems PE Pipe Systems PE Pipe Systems PE Pipe Systems PE Pipe Systems
Design.24
design
Flow Chart for Polyethylene Pipe – SDR 11
(PE80: PN12.5 & PE100: PN16)
Discharge - Litres per Second (L/s)
Head Loss - Metres Head of Water per 100 metres of Pipe
NOMINAL SIZE
NOMINAL SIZE
VELOCITY m/s
4.0
2.0
3.0
1.5
1.0
0.5
0.25
90
110
125
140
160
180
200
225
250
280
315
355
400
450
500
560
630
710
800
Flow Chart for Polyethylene Pipe – SDR 11 (PE80: PN12.5 & PE100: PN16)
Irrigation Warehouse Group Pty Ltd
www.polypipe.com.au
Ph 1300 661 417
Design.25
PE Pipe Systems PE Pipe Systems PE Pipe Systems PE Pipe Systems PE Pipe Systems PE Pipe Systems PE Pipe Systems
design
Flow Chart for Polyethylene Pipe – SDR 9
(PE80: PN16 & PE100: PN20)
Discharge - Litres per Second (L/s)
Head Loss - Metres Head of Water per 100 metres of Pipe
NOMINAL SIZE
NOMINAL SIZE
VELOCITY m/s
90
110
125
140
160
180
200
225
250
280
315
355
400
450
4.0
3.0
2.0
1.5
1.0
0.5
0.25
Flow Chart for Polyethylene Pipe – SDR 9 (PE80: PN16 & PE100: PN20)
Irrigation Warehouse Group Pty Ltd
www.polypipe.com.au
Ph 1300 661 417
PE Pipe Systems PE Pipe Systems PE Pipe Systems PE Pipe Systems PE Pipe Systems PE Pipe Systems PE Pipe Systems
Design.26
design
Flow Chart for Polyethylene Pipe – SDR 7.4
(PE100: PN25)
Discharge - Litres per Second (L/s)
Head Loss - Metres Head of Water per 100 metres of Pipe
NOMINAL SIZE
NOMINAL SIZE
VELOCITY m/s
90
110
125
140
160
180
200
225
250
280
315
355
400
450
4.0
3.0
2.0
1.5
1.0
0.5
0.25
Flow Chart for Polyethylene Pipe – SDR 7.4 (PE100: PN25)
Irrigation Warehouse Group Pty Ltd
www.polypipe.com.au
Ph 1300 661 417

Design.27
PE Pipe Systems PE Pipe Systems PE Pipe Systems PE Pipe Systems PE Pipe Systems PE Pipe Systems PE Pipe Systems
design
Surge & Fatigue
Surge, or ‘water hammer’, is a temporary
change in pressure caused by a change
in velocity of flow in the pipeline,
whereas fatigue is the effect induced in
the pipe or fitting by repeated surge
events.
For Vinidex PE pipes to AS/NZS 4130,
operating under the following limitations,
it is not necessary to make specific
allowance for fatigue effects:
(a) The maximum pressure in the pipe
from all sources must be less than the
pressure equivalent to the Classification
of the pipe (PN).
and
(b) The amplitude between minimum and
maximum pressure from all sources
must not exceed the pressure equivalent
to the Classification of the pipe (PN).
Care must be taken to ensure that the
minimum pressure does not reach a
level that may result in vacuum collapse
(see External Pressure Resistance, page
Design.36).
Surge may take the form of positive and/
or negative pressure pulses resulting
from change of flow velocity, such as
arising from valve or pump operation.
Such changes of flow velocity lead to
induced pressure waves in the pipeline.
Pt
tP
c
21
=
t
L
C
=
2
C=W
1
K
+
SDR
E
−0
3
.5
m
x 10 / sec
PCV
1
=.
This represents the case of a single
pipeline with the flow being completely
closed off. The pressure rises generated
by flow changes in PE pipelines are the
lowest generated in major pipeline
materials due to the relatively low
modulus values.
Further, as medium density materials
have lower modulus values than high
density materials, the pressure rise in
PE80B materials will be lower than that
in PE80C and PE100 materials.
Water hammer (surge) analysis of
pipeline networks is complex and beyond
the scope of this Manual. Where
required, detailed analysis should be
undertaken by experts.
The velocity of the pressure wave,
referred to as celerity (C), depends on
the pipe material, pipe dimensions, and
the liquid properties in accordance with
the following relationship:
where
W = liquid density (1000 kg/m3
for water)
SDR = Standard Dimension Ratio
of the pipe
K = liquid bulk modulus (2150 MPa)
E = pipe material short term
modulus (MPa) refer Table 4.8
The time taken for the pressure wave to
travel the length of the pipeline and
return is
where:
t = time in seconds
L = length of pipeline
If the valve closure time tc is less than t,
the pressure rise due to the valve closure
is given by:
where:
P1 = pressure rise in kPa
v = liquid velocity in m/sec
If the valve closure time tc is greater than
t, then the pressure rise is approximated
by:
Irrigation Warehouse Group Pty Ltd
www.polypipe.com.au
Ph 1300 661 417

PE Pipe Systems PE Pipe Systems PE Pipe Systems PE Pipe Systems PE Pipe Systems PE Pipe Systems PE Pipe Systems
Design.28
design
Celerity
The surge celerity in a polyethylene
pipeline filled with liquid can be
determined by:
where
W = liquid density (1000 kg/m3
for water)
SDR = Standard Dimension Ratio
of the pipe
K = liquid bulk modulus (2150MPa)
E = pipe material ‘instantaneous’
modulus (taken as 1000MPa for
PE80B, 1200MPa for PE80C,
1500MPa for PE100)
Table 4.10 Surge Celerity
Celerity m/s
SDR MDPE (PE 80B) HDPE (PE 80C) HDPE (PE 100)
41 160 170 190
33 170 190 210
26 190 210 240
21 220 240 260
17 240 260 290
13.6 270 290 320
11 300 320 360
9 330 350 390
7.4 360 390 430
CW
K
SDR
Exm=+
−
110
05
3
.
/ sec
Irrigation Warehouse Group Pty Ltd
www.polypipe.com.au
Ph 1300 661 417

Design.29
PE Pipe Systems PE Pipe Systems PE Pipe Systems PE Pipe Systems PE Pipe Systems PE Pipe Systems PE Pipe Systems
design
Slurry Flow
General Design
Considerations
The abrasion resistance characteristics
and flexibility of Vinidex PE pipes make
slurry flow lines, such as mine tailings,
ideal applications for the material and
such installations are in widespread use
throughout Australia.
The transportation of Non Newtonian
fluids such as liquids or liquid/liquid,
liquid/solid mixtures or slurries is a
highly complex process and requires a
detailed knowledge of the specific fluid
before flow rate calculations can be
performed.
As distinct from water, many fluids
regarded as slurries have properties
which are either time or shear rate
dependent or a combination of both
characteristics. Hence it is essential for
the properties of the specific fluid to be
established under the operating
conditions being considered for each
design installation.
In addition to water flow, slurry flow
design needs to take into account the
potential for abrasion of the pipe walls,
especially at changes of direction or
zones of turbulence.
The most usual applications of Vinidex
PE pipes involve liquid/solid mixtures
and these must first be categorised
according to flow type:
• Homogeneous Suspensions
• Heterogeneous Suspensions
Homogeneous Suspensions
Homogeneous suspensions are those
showing no appreciable density gradient
across the cross section of the pipe.
These slurries consist of material
particles uniformly suspended in the
transport fluid.
Generally, the particle size can be used to
determine the flow type and suspensions
with particle sizes up to 20 microns can
be regarded as homogeneous across the
range of flow velocities experienced.
Heterogeneous Suspensions
Heterogeneous suspensions are those
showing appreciable density gradients
across the cross section of the pipe, and
are those containing large particles
within the fluid.
Suspensions containing particle sizes of
40 microns and above may be regarded
as heterogeneous.
In addition to the fluid characterisations
for both types, the tendency for solids to
settle out of the flow means that a
minimum flow velocity must be
maintained.
This velocity, the Minimum Transport
Velocity, is defined as the velocity at
which particles are just starting to
appear on the bottom of the pipe.
The flow in short length pipelines differs
in that these lines may be flushed out
with water before shut down of
operations. Long length pipelines cannot
be flushed out in the same way and the
selection of operating velocities and pipe
diameter needs to address this aspect.
The design of slurry pipelines is an
iterative process requiring design
assumptions to be made initially, and
then repeatedly being checked and tested
for suitability. The specific fluid under
consideration requires full scale flow
testing to be conducted to establish the
accurate flow properties for the liquid/
particle combinations to be used in the
installed pipeline.
Without this specific data, the
assumptions made as to the fluid flow
behaviour may result in the operational
pipeline being at a variance to the
assumed behaviour. The principles of
slurry pipeline design as outlined in the
methods of Durand, Wasp, and Govier
and Aziz are recommended in the
selection of Vinidex PE pipes for these
applications.
Note:
The published Vinidex PE pipe flow
charts relate ONLY to water or other
liquids which behave as Newtonian
fluids.
They are not suitable for calculating the
flow discharges of other fluids, including
slurries.
For further information on slurry pipeline
design, the designer is referred to such
publications as Govier G.W. and Aziz K,
The Flow of Complex Mixtures in Pipes.
Rheinhold, 1972.
and Wasp E.J.
Solid
Liquid Flow - Slurry Pipeline
Transportation. Trans Tech Publications.
1977.
Irrigation Warehouse Group Pty Ltd
www.polypipe.com.au
Ph 1300 661 417

PE Pipe Systems PE Pipe Systems PE Pipe Systems PE Pipe Systems PE Pipe Systems PE Pipe Systems PE Pipe Systems
Design.30
design
Pipe Wear
Polyethylene pipe has been a proven
performer over many decades in
resisting internal abrasion due to slurry.
It is particularly resistant to abrasion
from particles less than 500 microns in
size depending on particle shape.
The abrasive wear of any slurry handling
system is heavily dependent on the
physical characteristics of the solids
being transported. These characteristics
include angularity, degree of particle
attrition, angle of attack, velocity, and the
concentration of solids in the
transporting fluid.
With metal pipes, corrosive wear
interacts synergistically with abrasive
wear, producing rates of wear that can be
many times greater than a simple
combination of the two modes of wear.
Corrosive attack on a piping material can
lead to increasing roughness of the
surface, loss of pressure and localised
eddying, and hence increase the abrasive
attack.
Factors Affecting Rates
of Wear
The wall of polyethylene pipes are worn
by contact with the solids particles. The
principal causes of wear are as follows:
• Particle Size
• Particle Specific Gravity
• Velocity
• Angle of Attack
Particle Size
The size of the particle combined with
the requisite velocity is one of the
principal factors which contribute to
wear. The rate of wear increases with
particle size with very little wear
occurring on polyethylene systems
below 300 microns. Above this size the
rate of wear will increase proportionally
with particle size with the maximum
practical D50 size around 1mm. Many
researchers have attempted to develop
relationships between particle size and
rates of wear, however, these have not
proven to be accurate due to the wide
variation of slurry characteristics. The
wear mechanism involved is not
thoroughly understood, however, it is
believed the higher impact energy
resulting from a combination of particle
mass and the high velocity required to
transport this larger particle are the
principal contributing factors.
Particle Specific Gravity
Similarly, the specific gravity will
increase the mass of the particle
resulting in increased wear. This is a
result of the increased impact energy
from the mass of the particle combined
with the faster carrier velocity.
Velocity
A minimum velocity is required to
provide the necessary uplift forces to
keep a solid particle in suspension. This
velocity also increases the impact energy
of the particle against the wall of the
pipe.
Angle of Attack
There are essentially two modes of wear,
impingement and cutting. Cutting wear
is considered to be caused by the low
angle impingement of particles. In
practice, cutting wear comprises a
cutting action, and the accommodation
of some of the energy of impact within
the matrix of the material being worn.
Hence, cutting wear also incorporates a
component of deformation wear. The
requirement for wear is that some of the
solid particles must have sufficient
energy to penetrate and shear a material,
perhaps gouging fragments loose. As a
result, a low modulus material such as
polyethylene has very good resistance to
cutting wear due to the resulting
deformation upon impact. In the case of
angular particles the cutting action is
increased resulting in increased pipe
wear.
The simple theory of abrasive wear
suggests that specific wear (wear per
unit mass transported) is proportional to
normal force at the pipe wall. Therefore
the wear rate will increase as the angle of
attack to the pipe wall increases. The
increase in angle will also increase the
amount of energy with which the particle
strikes the pipe wall. It is for this reason
that accelerated wear is caused by:
i) Fittings which effect a change in the
angle of flow such as tees and bends
ii) Butt weld joints. Butt weld internal
beads will cause eddying which will
result in increases in angle of attack
of the particle to the pipe wall. As a
result accelerated wear generally
occurs immediately downstream of
the bead. This is usually prominent in
D50 particle sizes over 300 microns.
For coarse particle slurries the
internal bead should be removed.
Irrigation Warehouse Group Pty Ltd
www.polypipe.com.au
Ph 1300 661 417

Design.31
PE Pipe Systems PE Pipe Systems PE Pipe Systems PE Pipe Systems PE Pipe Systems PE Pipe Systems PE Pipe Systems
design
Maintenance and
Operation
To reduce the cost of wear on a pipeline
asset it is general practice to rotate the
pipes at the appropriate intervals, this is
particularly important when transporting
sand slurries. In this respect mechanical
joints are useful, although re-welding of
pipes over 500mm has been preferred in
some cases to reduce capital costs.
These mechanical joints are usually
installed at every 20m pipe length to
assist the pipe rotation process and also
permit clearance of blockages.
Slurry pipelines are usually operated as
close to the critical settling velocity as
practical to reduce operating costs.
Unfortunately, if an increase in particle
size occurs, then saltation will
commence increasing friction loss
eventually resulting in a blockage. Other
factors that cause blockages are
increases in solids concentration, loss of
pump pressure due to power failure, or
pump impellor wear. Polyethylene
pipelines may be cleared of blockages by
clear water pumping provided they have
been installed on flat even ground.
Sudden vertical ‘V’ bends with angles
over 10° may cause an accumulation of
solids in the bore, preventing clearing by
clear water pumping. If vertical bends
are unavoidable then they should be
installed with mechanical joints to permit
their easy removal for clearing.
Fittings
A range of mechanical joints are
available for polyethylene slurry
pipelines. They include stub flanges and
backing rings, Hugger couplings,
shouldered end/Victaulic couplings,
compression couplings and rubber ring
joint fittings.
References
The Transportation of Flyash and Bottom
Ash in Slurry Form,
C G Verkerk
Relative Wear Rate Determinations for
Slurry Pipelines,
C A Shook, D B Haas,
W H W Husband and M Small
Warman Slurry Pumping Handbook,
Warman International Ltd.
iii) Fittings joints. At connections of
mechanical fittings some
misalignment of the mating faces
may occur resulting in increased
angles of attack of the particles.
iv) Change in velocity. Some
compression fittings cause a
reduction in the internal diameter of
the pipe under the fitting resulting in
turbulence. A mismatching valve
bore will also cause turbulence. It is
for this reason that the use of clear
bore valves such as knife gate valves
is preferred for slurry pipelines.
v) Increased velocity. High velocities
are required to create sufficient
turbulence for the suspension of
heavy particles. This turbulence
increases the angle of attack to the
pipe wall, resulting in increased wear
for large particles.
vi) Insufficient velocity. When a system
is operated near its settling velocity,
the heavier particles migrate towards
the lower half of the pipe cross
section. This will cause a general
increase in pipe wear in this area. If
saltation/moving bed occurs, then
the heavy particles will impact
against the pipe bottom, causing an
accelerated wave profile wear. Should
deposition occur on the floor of the
pipe, then the particles above this
deposition will cause the maximum
amount of wear as they interact with
the flow. This is characterised by the
formation of wave marks on the 5
and 7 o’clock position of the pipe.
Irrigation Warehouse Group Pty Ltd
www.polypipe.com.au
Ph 1300 661 417

PE Pipe Systems PE Pipe Systems PE Pipe Systems PE Pipe Systems PE Pipe Systems PE Pipe Systems PE Pipe Systems
Design.32
design
Pneumatic Flow
Vinidex PE pipe systems are ideal for the
transmission of gases both in the high
and low pressure range.
The use of compressible liquids in PE
pipes requires a number of specific
design considerations as distinct from
the techniques adopted in the calculation
of discharge rates for fluids such as
water.
In particular:
• Compressed air may be at a higher
temperature than the surrounding
ambient air temperature, especially
close to compressor line inlets, and
the pressure rating of the PE pipes
require temperature re rating
accordingly.
For air cooled compressors, the
delivered compressed air
temperature averages 15°C above the
surrounding air temperature. For
water cooled compressors, the
delivered compressed air
temperature averages 10°C above the
cooling water temperature.
• For underground applications where
the PE pipes are exposed to ambient
conditions, the surrounding air
temperature may reach 30°C, and the
pipe physical properties require
adjustment accordingly.
• High pressure lines must be
mechanically protected from damage
especially in exposed installations.
• Valve closing speed must be reduced
to prevent a build up of pressure
waves in the compressible gas flow.
• Where gaseous fuels such as
propane, natural gas, or mixtures are
carried, the gas must be dry and free
from liquid contamination which may
cause stress cracking of the PE pipe
walls.
• Vinidex PE pipes should not be
connected directly to compressor
outlets or air receivers. A 21 metre
length of metal pipe should be
inserted between the air receiver and
the start of the PE pipe to allow for
cooling of the compressed air.
• Dry gases, and gas/solids mixtures
may generate static electrical charges
and these may need to be dissipated
to prevent the possibility of
explosion. PE pipes will not conduct
electrical charges, and conducting
inserts or plugs must be inserted into
the pipe to complete an earthing
circuit.
• Compressed air must be dry, and
filters installed in the pipeline to
prevent condensation of lubricants
which can lead to stress cracking in
the PE pipe material.
Irrigation Warehouse Group Pty Ltd
www.polypipe.com.au
Ph 1300 661 417

Design.33
PE Pipe Systems PE Pipe Systems PE Pipe Systems PE Pipe Systems PE Pipe Systems PE Pipe Systems PE Pipe Systems
design
System Design
Guidelines for the
Selection of
Vinidexair
Compressed Air
Pipelines
It is customary to find the Inside
Diameter of the pipe by using formulas
such as shown below. The formulas used
are generally for approximation purposes
only, surmising that the temperature of
the compressed air corresponds roughly
to the induction temperature. An
acceptable approximation is obtained
through the following equation:
4 Using point (3) draw a diagonal
line to the separation line.
5 Go to top of nomogram and use
the point indicating the Length of
Pipe and draw a line down to
meet horizontal line from point
(4).
6 Move to the Pressure Decrease in
the Pipe (∆p) at the bottom of
nomogram and draw a vertical
line up to meet the diagonal
drawn from point (5).
7 The Nominal Diameter of Pipe can
now be found by reading from
point (6) across to the left hand
side of the nomogram. From this
example DN63 pipe should be
selected. If the completed
nomogram falls between two
sizes of pipe, always use the
larger size.
Correction factors for
fittings
Table 4.11 indicates the approximate
pressure loss for fittings in terms of an
equivalent length of straight pipe in
metres. For each pipeline fitting, add the
equivalent length of pipe to the original
length of pipeline. This length is used for
the calculation of the equation above or
for the nomogram, Figure 4.4.
The advantage of using the nomogram is
that no further conversion factors are
required for pipe sizing. Also, when four
of the parameters are known the fifth can
be determined by reading directly from
the nomogram.
Example for the use of
the air-line nomogram
(Figure 4.4) to determine
the required pipe size
Working Pressure 7 bar
Volumetric Flowrate 30 L/s
Nominal length 200 m
Pressure Decrease 0.05 bar
1 Utilising the above operating
figures, proceed to mark those
positions around the perimeter of
the nomogram.
2 Locate the separation line
between (∆p) & (p). (See base of
nomogram.)
3 Commencing at the lower right
hand side of the nomogram draw
a line up from the Working
Pressure (p) to the line indicating
the Volumetric Flowrate (Q).
where
d = Pipe Internal Diameter in mm
LE= Pipe Length in m
Q = Volumetric Flowrate in L/s
Dp = Pressure Decrease in bar
p = Working Pressure in bar
Table 4.11 Pressure Loss for Fittings
Fitting equivalent pipe length in m
DN 20 DN 25 DN 32 DN 40 DN 50 DN 63 DN 90
socket welding joint
0.2 0.2 0.3 0.4 0.5 0.6 1.1
45° bend 0.2 0.3 0.4 0.6 0.9 1.2 2.3
90° bend 0.4 0.7 1.0 1.3 1.8 2.3 4.5
tees 0.8 1.4 1.9 2.4 2.8 3.8 7.5
reducer 0.3 0.4 0.5 0.6 0.7 0.9 2.1
The use of a nomogram is a quicker and
easier method to source information (see
Figure 4.4). In this nomogram the
Pressure Decrease (∆p) is indicated in
bar, the Working Pressure (p) in bar, the
Volumetric Flowrate (Q)
in L/s, the Pipe
Length (L
E
) in m, and the Pipe Nominal
Diameter DN.
dLQ
pp
E
=450
185
5
..
.
.
∆
Irrigation Warehouse Group Pty Ltd
www.polypipe.com.au
Ph 1300 661 417
PE Pipe Systems PE Pipe Systems PE Pipe Systems PE Pipe Systems PE Pipe Systems PE Pipe Systems PE Pipe Systems
Design.34
design
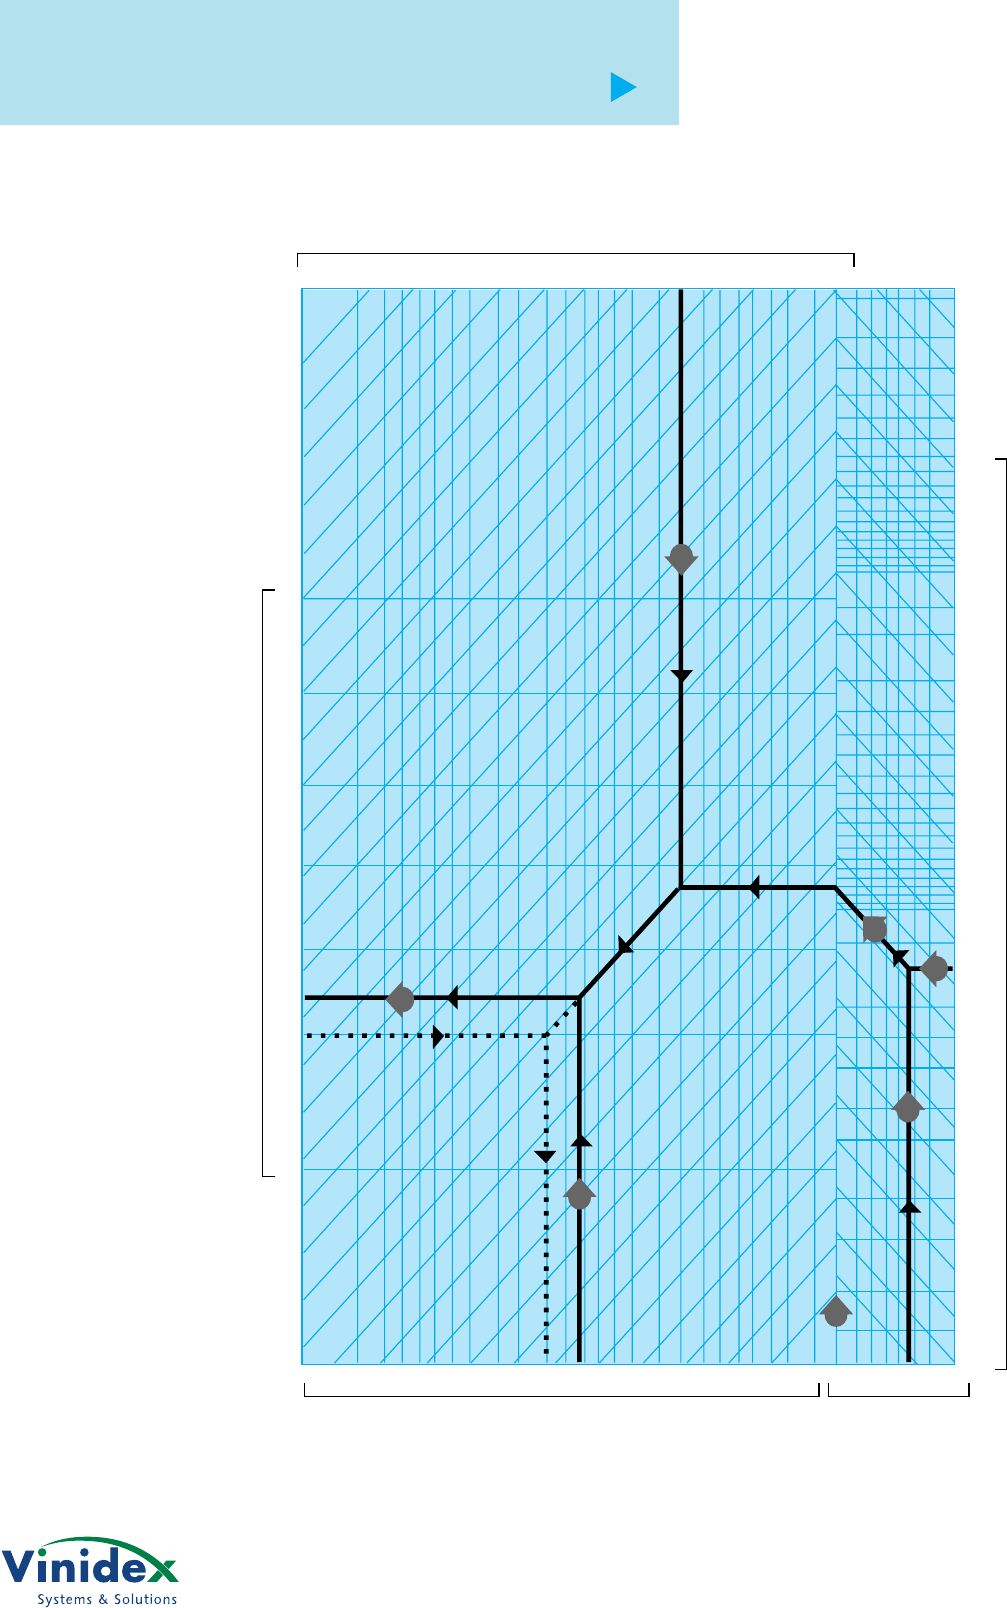
Figure 4.4
Compressed Air
Flow Nomogram
0.002 0.01 0.05 0.1 0.2 0.5 1 2 4 6 10 15500
400
300
63
90
50
40
32
25
20
200
100
50
30
20
15
10
5
3
2
1.5
1
1 2 5 10 20 50 100 200 500 1000 2000
3
3
7
4
6
5
2
nominal diameter DN
volumetric flow rate (Q) in L/s
pressure decrease in the pipe (∆p) in bar
length of the pipe (L) in m
working pressure (p) in bar
Sources:
Feldmann, K.H.:
Druckluftverteilung in der Praxis
(Munchen 1985)
Atlas Copco :
information sheets
Irrigation Warehouse Group Pty Ltd
www.polypipe.com.au
Ph 1300 661 417

Design.35
PE Pipe Systems PE Pipe Systems PE Pipe Systems PE Pipe Systems PE Pipe Systems PE Pipe Systems PE Pipe Systems
design
Expansion and
Contraction
Expansion and contraction of PE pipes
occurs with changes in the pipe material
service temperature.
This is in common with all pipe materials
and in order to determine the actual
amount of expansion or contraction, the
actual temperature change, and the
degree of restraint of the installed
pipeline need to be known.
For design purposes, an average value of
2.0 x 10⁻⁴/°C for Vinidex PE pipes may be
used.
The relationship between temperature
change and length change for different
PE grades is as shown in Figure 4.5.
Worked Example
A 100 metre long PE80C pipeline
operates during the day at a steady
temperature of 48°C and when closed
down at night cools to an ambient
temperature of 18°C. What allowance for
expansion/contraction must be made?
1. The temperature change experienced
= 48 - 18 = 30°C.
2. The thermal movement rate
(Figure 4.5) in mm/m for 30°C
= 6.0 mm/m.
3. The total thermal movement is then
6.0 x 100 = 600 mm.
Where pipes are buried, the changes in
temperature are small and slow acting,
and the amount of expansion/contraction
of the PE pipe is relatively small. In
addition, the frictional support of the
backfill against the outside of the pipe
restrains the movement and any thermal
effects are translated into stress in the
wall of the pipe.
Accordingly, in buried pipelines the main
consideration of thermal movement is
during installation in high ambient
temperatures.
Under these conditions the PE pipe will
be at it’s maximum surface temperature
when placed into a shaded trench, and
when backfilled will undergo the
maximum temperature change, and
hence thermal movement.
In these cases the effects of temperature
change can be minimised by snaking the
pipe in the trench for small sizes (up to
DN110) and allowing the temperature to
stabilise prior to backfilling.
For large sizes, the final connection
should be left until the pipe temperature
has stabilised.
Above ground pipes require no
expansion/contraction considerations for
free ended pipe or where lateral
movement is of no concern on site.
Alternatively, pipes may be anchored at
intervals to allow lateral movement to be
spread evenly along the length of the
pipeline.
Where above ground pipes are installed
in confined conditions such as industrial
or chemical process plants the
expansion/contraction movement can be
taken up with sliding expansion joints.
Where these cannot be used due to the
fluid type being carried ( such as slurries
containing solid particles ) the advice of
Vinidex design engineers should be
sought for each particular installation.
Figure 4.5 Thermal Expansion and Contraction for PE
0
2.5
5.0
7.5
10.0
12.5
15.0
17.5
20.0
Expansion and Contraction (mm/m)
Pipe Material Temperature Change (°C)
0 1020304050607080
Irrigation Warehouse Group Pty Ltd
www.polypipe.com.au
Ph 1300 661 417

PE Pipe Systems PE Pipe Systems PE Pipe Systems PE Pipe Systems PE Pipe Systems PE Pipe Systems PE Pipe Systems
Design.36
design
External Pressure
Resistance
The possibility of external pressure
(buckling) being the controlling design
condition must be evaluated in the
design of PE pipelines.
All flexible pipe materials can be subject
to buckling due to external pressure and
PE pipes behave in a similar fashion to
PVC and steel pipes.
For pipe of uniform cross-section, the
critical buckling pressure (Pc) can be
calculated as follows:
where
Pc= critical buckling pressure, kPa
E = modulus, MPa from Table 4.8
SDR = pipe SDR from Table 4.1
As the modulus is temperature and time
dependent, the advice of Vinidex
engineers should be sought for
appropriate values.
Where ovality exists in the PE pipes, the
effective value of the critical buckling
pressure will be reduced.
The reduction in Pc for various levels of
initial ovality are as follows:
Ovality % 0 1 2 5 10
Reduction 1.0 0.99 0.97 0.93 0.86
Where pipes are buried and supported
by backfill soil, the additional support
(Pb) may be calculated from:
Pb = 1.15 (Pc E´) 0.5
Where E´ = soil modulus from
AS/NZS2566 - Buried Flexible Pipelines.
P
c=
2380
•
E
SDR −1
()
3
Tabulations of the value of E´ for various
combinations of soil types and compac-
tions are contained in AS/NZS2566.
The value of Pc calculated requires a
factor of safety to be applied and a factor
of 1.5 may be applied for those
conditions where the negative pressure
conditions can be accurately assessed.
Where soil support is taken into account
then a factor of 3 is more appropriate
due to the uneven nature of soil support.
In general terms, PN10 PE pipe should
be used as a minimum for pump suction
line installations.
Where installation conditions potentially
lead to negative pressures, consideration
may need to be given to modification of
construction technique. For example,
ducting pipes may need to be sealed and
filled with water during concrete
encasement.
In operation, fluid may be removed from
the pipeline faster than it is supplied
from the source. This can arise from
valve operation, draining of the line or
rupture of the line in service. Air valves
must be provided at high points in the
line and downstream from control valves
to allow the entry of air into the line and
prevent the creation of vacuum
conditions. On long rising grades or flat
runs where there are no significant high
points or grade changes, air valves
should be placed at least every 500-1000
metres at the engineer’s discretion.
Soil Description E´ MPa
Gravel – graded 20
Gravel – single size 14
Sand and coarse-grained soil
with less than 12% fines 14
Coarse-grained soil
with more than 12% fines 10
Fine-grained soil (LL<50%)
with medium to no plasticity and
containing more than 25%
coarse-grained particles 10
Fine-grained soil (LL<50%)
with medium to no plasticity and
containing less than 25%
coarse-grained particles 10
Fine-grained soil (LL<50%)
with medium to high plasticity NR
Irrigation Warehouse Group Pty Ltd
www.polypipe.com.au
Ph 1300 661 417

Design.37
PE Pipe Systems PE Pipe Systems PE Pipe Systems PE Pipe Systems PE Pipe Systems PE Pipe Systems PE Pipe Systems
design
Trench Design
Minimum Cover
The recommended minimum cover
depths for Vinidex PE pipes are listed in
Table 4.12.
These cover depths are indicative only,
and specific installations should be
evaluated in accordance with AS/NZS
2566 - Buried Flexible Pipelines.
The minimum cover depths listed may
be reduced where load reduction
techniques are used, such as load
bearing beams, concrete slabs, conduit
sleeves, or increased backfill
compaction.
Trench Widths
In general practice, the trench width
should be kept to the minimum that
enables construction to readily proceed.
Refer to Figures 4.6 and 4.7.
The trench width used with PE pipe may
be reduced from those used with other
pipe types by buttwelding, or
electrofusion jointing above ground, and
then feeding the jointed pipe into the
trench. Similarly, small diameter pipe in
coil form can be welded or mechanically
jointed above ground and then fed into
the trench.
The minimum trench width should allow
for adequate tamping of side support
material and should be not less than
200mm greater than the diameter of the
pipe. In very small diameter pipes this
may be reduced to a trench width of
twice the pipe diameter.
Installation Condition Cover over Pipe Crown (mm)
Open country 300
Traffic Loading No pavement 450
Sealed pavement 600
Unsealed pavement 750
Construction equipment 750
Embankment 750
Table 4.12 Minimum Cover
Side Support
Material used for side support should
comply with the requirements of the
bedding materials.
The side support material should be
evenly tamped in layers of 75 mm for
pipes up to 250mm diameter, and 150
mm for pipes of diameters 315mm and
above.
Compaction should be brought evenly to
the design value required by AS/NZS
2566 for the specific installation.
Backfill
Once the sidefill has been placed and
compacted as required over the top of
the pipe, backfill material may be placed
using excavated material.
Trench backfills should not be used as a
dump for large rocks, builders debris, or
other unwanted site materials.
The maximum trench width should be
restricted as much as possible,
depending on the soil conditions. This is
necessary to reduce the cost of
excavation, and to develop adequate side
support.
Where wide trenches or embankments
are encountered, then the pipe should be
installed on a 75 mm layer of tamped or
compacted bedding material as shown
on the cross section diagrams. Where
possible a sub trench should be
constructed at the base of the main
trench to reduce the soil loads
developed. AS/NZS 2566 provides full
details for evaluating the loads developed
under wide trench conditions.
Bedding
PE Pipes should be bedded on a
continuous layer, 75 mm thick, of
materials complying with the following
requirements:
• Sand, free from rocks or other hard
or sharp objects retained on a
13.2mm sieve.
• Gravel or crushed rock of suitable
grading up to a max. size of 15mm.
•. The excavated material, free from
rocks and broken up such that it
contains no clay lumps greater than
75mm which would prevent adequate
compaction.
Irrigation Warehouse Group Pty Ltd
www.polypipe.com.au
Ph 1300 661 417
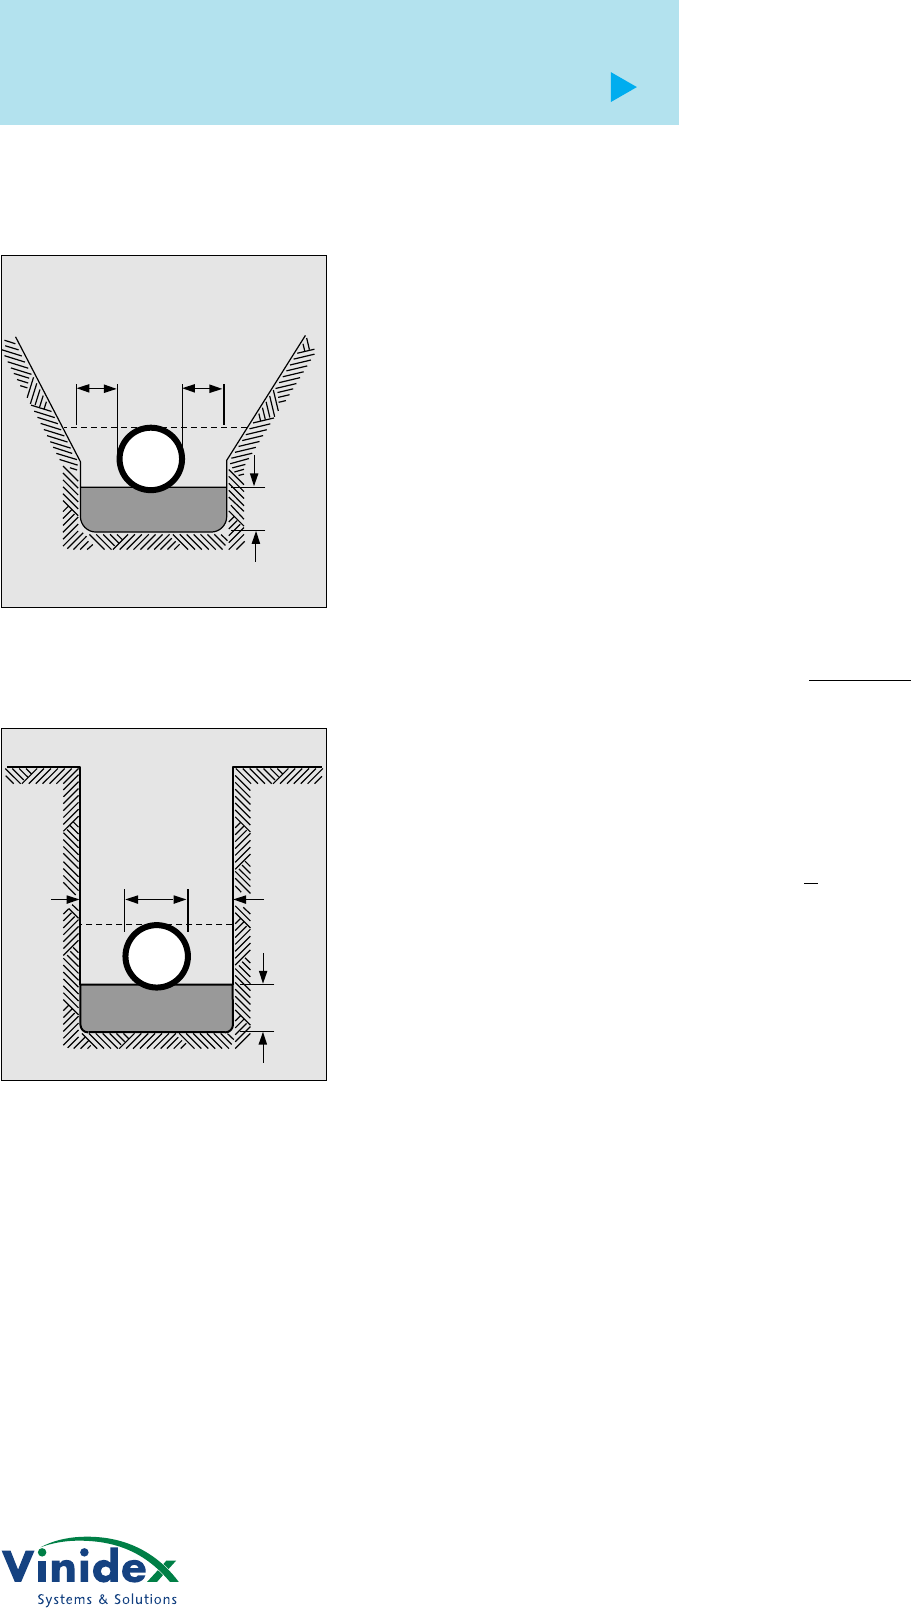
PE Pipe Systems PE Pipe Systems PE Pipe Systems PE Pipe Systems PE Pipe Systems PE Pipe Systems PE Pipe Systems
Design.38
design
Figure 4.7
Narrow Trench Condition
Figure 4.6
Wide Trench Condition
Allowable Bending
Radius
Vinidex PE pipes are flexible in
behaviour, and can be readily bent in the
field.
In general terms, a minimum bending
radius of 33 x outside diameter of the
pipe (33D) can be adopted for PE80C,
and PE100 material pipes, whilst a radius
of 20 x outside diameter of the pipe
(20D) can be adopted for PE63, and
PE80B material pipes during installation.
This flexibility enables PE pipes to
accommodate uneven site conditions,
and, by reducing the number of bends
required, cuts down total job costs.
For certain situations, the designer may
wish to evaluate the resistance to kinking
or the minimum bending radius arising
from strain limitation. The long term
strain from all sources should not exceed
0.04 (4%).
R
k
=SDR (SDR-1)
1.12
100mm
min
100mm
min
D
Bedding
75mm min
100mm
min
100mm
min
Bedding
75mm min
When bending pipes there are two
control conditions:
1. Kinking in pipes with high SDR
ratios.
2. High outer fibre strain in high
pressure class pipes with low SDR
ratios.
For condition 1
The minimum radius to prevent kinking
(Rk) may be calculated by:
For condition 2
The minimum radius to prevent excess
strain (Re) may be calculated by:
where
ε= outer fibre strain
(maximum allowable = 0.04)
D = mean Di (mm)
RD
e=2ε
Irrigation Warehouse Group Pty Ltd
www.polypipe.com.au
Ph 1300 661 417

Design.39
PE Pipe Systems PE Pipe Systems PE Pipe Systems PE Pipe Systems PE Pipe Systems PE Pipe Systems PE Pipe Systems
design
Deflection
Questionnaire
AS/NZS 2566 Deflection
Calculation for Buried
Flexible Pipes
The following questionnaire is to assist
designers in the calculation of deflection
for buried flexible pipe.
Company _______________________________________________________________________________
Name __________________________________________________________________________________
Phone ______________________ Fax ________________________ Email ________________________
PIPE DETAILS
Pipe Size and SDR or Class _________________________________________________________________
Pipe Material (ie. PE80/PE100) ______________________________________________________________
TRENCH DETAILS
Depth of Cover (from crown) _________________________________________________________________
Width (at pipe) ___________________________________________________________________________
Depth to Water Table (if above pipe) __________________________________________________________
LOADS
Live Load _______________________________________________________________________________
Dead Load ______________________________________________________________________________
SOIL TYPE
Native Soil ______________________________________________________________________________
Embedment Material ______________________________________________________________________
Degree of Compaction _____________________________________________________________________
Please photocopy before completing this form.
Retain this master for future use.
Complete all information and forward to your
nearest Vinidex office – refer over leaf.
Irrigation Warehouse Group Pty Ltd
www.polypipe.com.au
Ph 1300 661 417

PE Pipe Systems PE Pipe Systems PE Pipe Systems PE Pipe Systems PE Pipe Systems PE Pipe Systems PE Pipe Systems
Design.40
design
Vinidex Locations
Sydney
254 Woodpark Rd, Smithfield NSW 2164
Tel (02) 9604 2422, Fax (02) 9604 4435
Melbourne
86 Whiteside Road, Clayton VIC 3168
Tel (03) 9543 2311, Fax (03) 9543 7420
Mildura
5 Corbould Court, Mildura VIC 3500
Tel (03) 5022 2616, Fax (03) 5022 1938
Brisbane & Export
224 Musgrave Rd, Coopers Plains QLD 4108
Tel (07) 3277 2822, Fax (07) 3277 3696
Townsville
49 Enterprise Avenue, Bohle QLD 4816
Tel (07) 4774 5044, Fax (07) 4774 5728
Adelaide
550 Churchill Road, Kilburn SA 5084
Tel (08) 8260 2077, Fax (08) 8349 6931
Perth
Sainsbury Road, O’Connor WA 6163
Tel (08) 9337 4344, Fax (08) 9331 3383
Darwin
3846 Marjorie Street, Berrimah NT 0828
Tel (08) 8932 8200, Fax (08) 8932 8211
Launceston
15 Thistle St, Sth Launceston TAS 7249
Tel (03) 6344 2521, Fax (03) 6343 1100
Irrigation Warehouse Group Pty Ltd
www.polypipe.com.au
Ph 1300 661 417

Design.41
PE Pipe Systems PE Pipe Systems PE Pipe Systems PE Pipe Systems PE Pipe Systems PE Pipe Systems PE Pipe Systems
design
Thrust Block
Supports
PE pipes and fittings joined by butt
welding, electrofusion, or other end load
bearing joint system do not normally
require anchorage to withstand loads
arising from internal pressure and flow.
For joint types which do not resist end
loads, plus fabricated fittings which
incorporate welded PE pipe segments,
anchorage support must be provided in
order to prevent joint or fitting failure. In
addition, appurtenances such as valves,
should be independently supported in
order to prevent excessive shear loads
being transferred to the PE pipe.
Static Pressure Thrust
where
R = resultant thrust (kN)
P = pressure (MPa)
A = area of pipe cross section (mm2)
φ= angle of fitting (degrees)
For blank ends, tees and valves
R = PA 10-3
For reducers
R = P(A1 - A2) 10-3
R=2PA . sin φ.10
-
3
2
R=2waV
2
.sin φ.10
-
9
2
Soil Type Safe Bearing Capacity
(N/m2)
Rock and sandstone (hard thick layers) 100 x 105
Rock- solid shale and hard medium layers 90 x 104
Rock- poor shale, limestone 24 x 104
Gravel and coarse sand 20 x 104
Sand- compacted, firm, dry 15 x 104
Clay- hard, dry 15 x 104
Clay- readily indented 12 x 104
Clay/Sandy loam 9 x 10⁴
Peat, wet alluvial soils, silt Nil
Velocity (Kinetic) Thrust
The velocity or kinetic thrust applies only
at changes of direction.
where
w = fluid density (kg/m3)
a = inside pipe cross section area
(mm2)
V = flow velocity (m/s)
The velocity thrust is generally small in
comparison to the pressure thrust.
The pressure used in the calculations
should be the maximum working, or test
pressure, applied to the line.
Bearing Loads of Soils
The thrust developed must be resisted
by the surrounding soil. The indicative
bearing capacities of various soil types
are tabulated below:
The figures in the table below are for
horizontal thrusts, and may be doubled
for downward acting vertical thrusts. For
upward acting vertical thrusts, the
weight of the thrust block must
counteract the developed loads.
In shallow (<600mm) cover installations
or in unstable conditions of fill, the soil
support may be considerably reduced
from the values tabulated, and a
complete soil analysis may be needed.
Irrigation Warehouse Group Pty Ltd
www.polypipe.com.au
Ph 1300 661 417
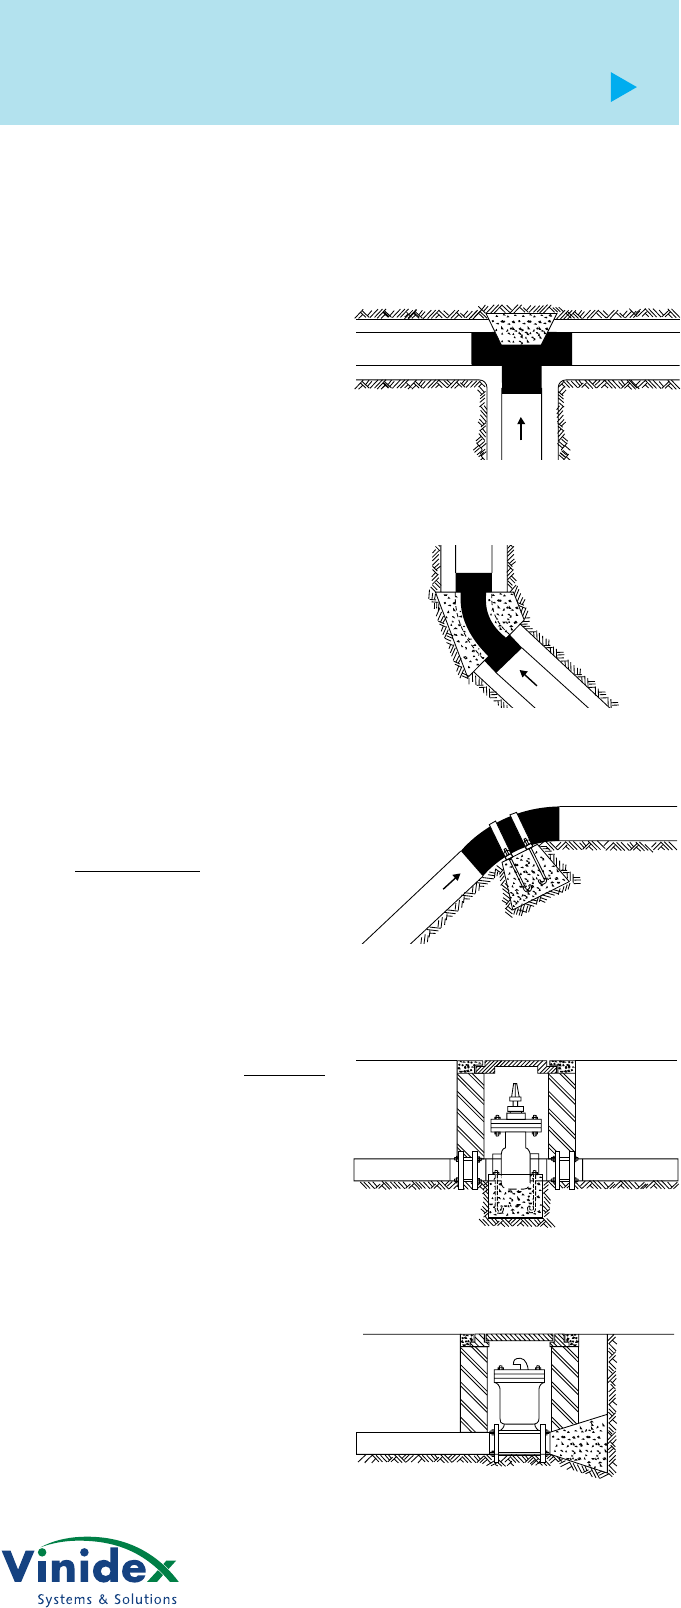
PE Pipe Systems PE Pipe Systems PE Pipe Systems PE Pipe Systems PE Pipe Systems PE Pipe Systems PE Pipe Systems
Design.42
design
Thrust Block
Size Calculations
1. Establish the maximum pressure to
be applied to the line
2. Calculate the thrust developed at the
fitting being considered
3. Divide (2) by the safe bearing
capacity of the soil type against
which the thrust block must bear.
Worked Example
What bearing area of thrust block is
required for a 160 mm PN12.5 90° bend
in hard, dry clay?
1. Maximum working pressure of
PN12.5 pipe is 1.25 MPa.
Test pressure is 1.25 x WP
= 1.56 MPa.
2.
3. Bearing capacity of hard, dry clay is
15x104 N/m2
Thrust blocks may be concrete or timber.
Where cast insitu concrete is used, an
adequate curing period must be provided
to allow strength development in the
concrete before pressure is introduced to
the pipeline. Where timber blocks are
used, test pressures may be introduced
immediately, but care needs to be taken
to ensure that the blocks will not rot and
will not be attacked by termites or ants.
=
4
Bearing area of thrust block 3.8 x 10
4
2
15 x 10
=0.25m
Figure 4.8 Thrust Blocks
Closed end and hydrant anchorage
Valve anchorage
Bend in vertical plane anchorage
Bend in horizontal plane anchorage
Tee anchorage
R=2PA.sin φ.10
2
=3.8 x10
-
4
-
3
N
Irrigation Warehouse Group Pty Ltd
www.polypipe.com.au
Ph 1300 661 417

Design.43
PE Pipe Systems PE Pipe Systems PE Pipe Systems PE Pipe Systems PE Pipe Systems PE Pipe Systems PE Pipe Systems
Electrical
Conductivity
Vinidex PE pipes are non conductive and
cannot be used for electrical earthing
purposes or dissipating static electricity
charges.
Where PE pipes are used to replace
existing metal water pipes, the designer
must consider any existing systems used
for earthing or corrosion control
purposes. In these cases the appropriate
electrical supply authority must be
consulted to determine their
requirements.
In dry, dusty, or explosive atmospheres,
potential generation of electricity must
be evaluated and static dissipation
measures adopted to prevent any
possibility of explosion.
Heat Sources
PE pipes and fittings should be protected
from external heat sources which would
bring the continuous pipe material
service temperature above 80°C.
Where the PE pipes are installed above
ground, the protection system used
must be resistant to ultra violet radiation
and the effects of weathering, PE pipes
running across roofing should be
supported above the roof sheeting in
order to prevent temperature build up.
See Table 4.7 Temperature Rating Table.
Vibration
Direct connection to sources of high
frequency such as pump outlet flanges
should be avoided. All fabricated fittings
manufactured by cutting and welding
techniques must be isolated from
vibration.
Where high frequency vibration sources
exist in the pipeline, the PE sections
should be connected using a flexible
joint such as a repair coupling,
expansion joint, or wire reinforced
rubber bellows joint. When used above
ground such joints may need to be
restrained to prevent pipe end pullout.
design
Irrigation Warehouse Group Pty Ltd
www.polypipe.com.au
Ph 1300 661 417
