Designing The Perfect Elasticsearch Cluster (almost) Definitive Guide
User Manual:
Open the PDF directly: View PDF ![]() .
.
Page Count: 21

6/30/2018 Designing the Perfect Elasticsearch Cluster: the (almost) Definitive Guide
https://thoughts.t37.net/designing-the-perfect-elasticsearch-cluster-the-almost-definitive-guide-e614eabc1a87 1/21
Fred de Villamil 🤔Follow
VP Engineering @LedgerHQ. Leadership, Blockchain & Big Data. Speaker. Writer. Compulsive Doer.
Startup advisor. Fluent in Sarcasm & Irony.
Jun 18, 2017 ·25 min read
Designing the Perfect Elasticsearch
Cluster: the (almost) Denitive Guide
Ever since I started to write about operating Elasticsearch, I have
answered many questions about cluster design. Every one of them we
asked by people who were already running Elasticsearch and ran into
trouble after the rst users came.
Cluster design is an overlooked part of running Elasticsearch. Ocal
documentation and blog posts focus on the magic of deploying a cluster
in a giy, while the rst problem people face when deploying in
production is memory management issues, aka garbage collection
madness. This guide answers most questions I was asked, and
summarises everything you should know about designing the perfect
Elasticsearch cluster.
That's the moment I'm supposed to stop writing and leave you with a
blank page.
Images haven’t loaded yet. Please exit printing, wait for images to load, and try to print again.

6/30/2018 Designing the Perfect Elasticsearch Cluster: the (almost) Definitive Guide
https://thoughts.t37.net/designing-the-perfect-elasticsearch-cluster-the-almost-definitive-guide-e614eabc1a87 2/21
There’s no way anyone can tell you how to design a
perfect cluster, and those who claim they do
are liars.
What you'll nd here is a list of things you need to know and
understand to design the cluster that ts your needs. And that's already
a lot.
Before we get into the details, there's one thing you need to
understand.
Unless you plan to use Elasticsearch to power the
search of your Wordpress blog or small e-
commerce website, your rst design will
suck. Always.
You can't design a cluster without knowing what your workload will be,
how much search and writes per second you'll get, how fast your
indexes will grow, and what kind of queries your users will run, against
what type of content. And you can't know about your workload unless
you've ran your cluster in production for a while. You'll most probably
have to iterate 2 or 3 times before you get the design right. I've been
running Elasticsearch in production since mid 2011 and I never got it
right the rst time.
...
Edits
2017–06–25:
Added use cases chapter
Added the event logging infrastructure chapter
2017–06–20:
Added a table of contents
Improved hardware.storage: when to use JBOD / RAID0 /
RAID1(0)?
Added a part about Lucene internals
•
•
•
•
•
...
Table of contents
Elasticsearch is elastic, for real
Design for Failure
A few things to know about Lucene

6/30/2018 Designing the Perfect Elasticsearch Cluster: the (almost) Definitive Guide
https://thoughts.t37.net/designing-the-perfect-elasticsearch-cluster-the-almost-definitive-guide-e614eabc1a87 3/21
Lucene segments
Lucene delete and updates
Hardware
CPU
Memory
Network
Storage
Software
The Linux (or FreeBSD) kernel
The Java Virtual Machine
The le system
Designing your indices
Sharding
Replication
Optimising allocation
Troubleshooting and scaling
CPU
Memory
Use cases
An event logging infrastructure
•
•
•
•
•
•
•
•
•
•
•
•
•
•
•
...
Elasticsearch is elastic, for real
There are 2 basic concepts you need to understand about Elasticsearch.
The rst one is: "you know, for search". This is the response you get
when you run an empty query on an Elasticsearch cluster, and that's for
a reason.
Elasticsearch is a search engine. Elasticsearch is
not a datastore and it won't replace MySQL.
If you're looking for a distributed data store, close your tab, you've hit
the wrong place.
There's another basic concept that's often poorly understood.
Elasticsearch is elastic, for real.

6/30/2018 Designing the Perfect Elasticsearch Cluster: the (almost) Definitive Guide
https://thoughts.t37.net/designing-the-perfect-elasticsearch-cluster-the-almost-definitive-guide-e614eabc1a87 4/21
There's 2 things about elasticity when you design your cluster.
The rst one is horizontal scaling. You can build a cluster with virtually
an innity of hosts, depending on your needs and the bottleneck you
face. Sometimes, running your dataset on a lot of small machines will
provide bette performances than using a few large hosts. Sometimes,
running on medium hosts with lots of disk is better. And sometimes,
you'll need gonzo CPU but storage and memory won't be a problem.
The other one is index sharding. Elasticsearch divides indexes in
physical spaces called shards. They allow you to easily split the data
between hosts, but there's a drawback as the number of shards is
dened at index creation. Elasticsearch default is 5 shards per index,
but only your workload will help you to dene the right number of
shards. Thankfully, there's a way to scale existing indexes in production
using reindexing and index aliases.
...
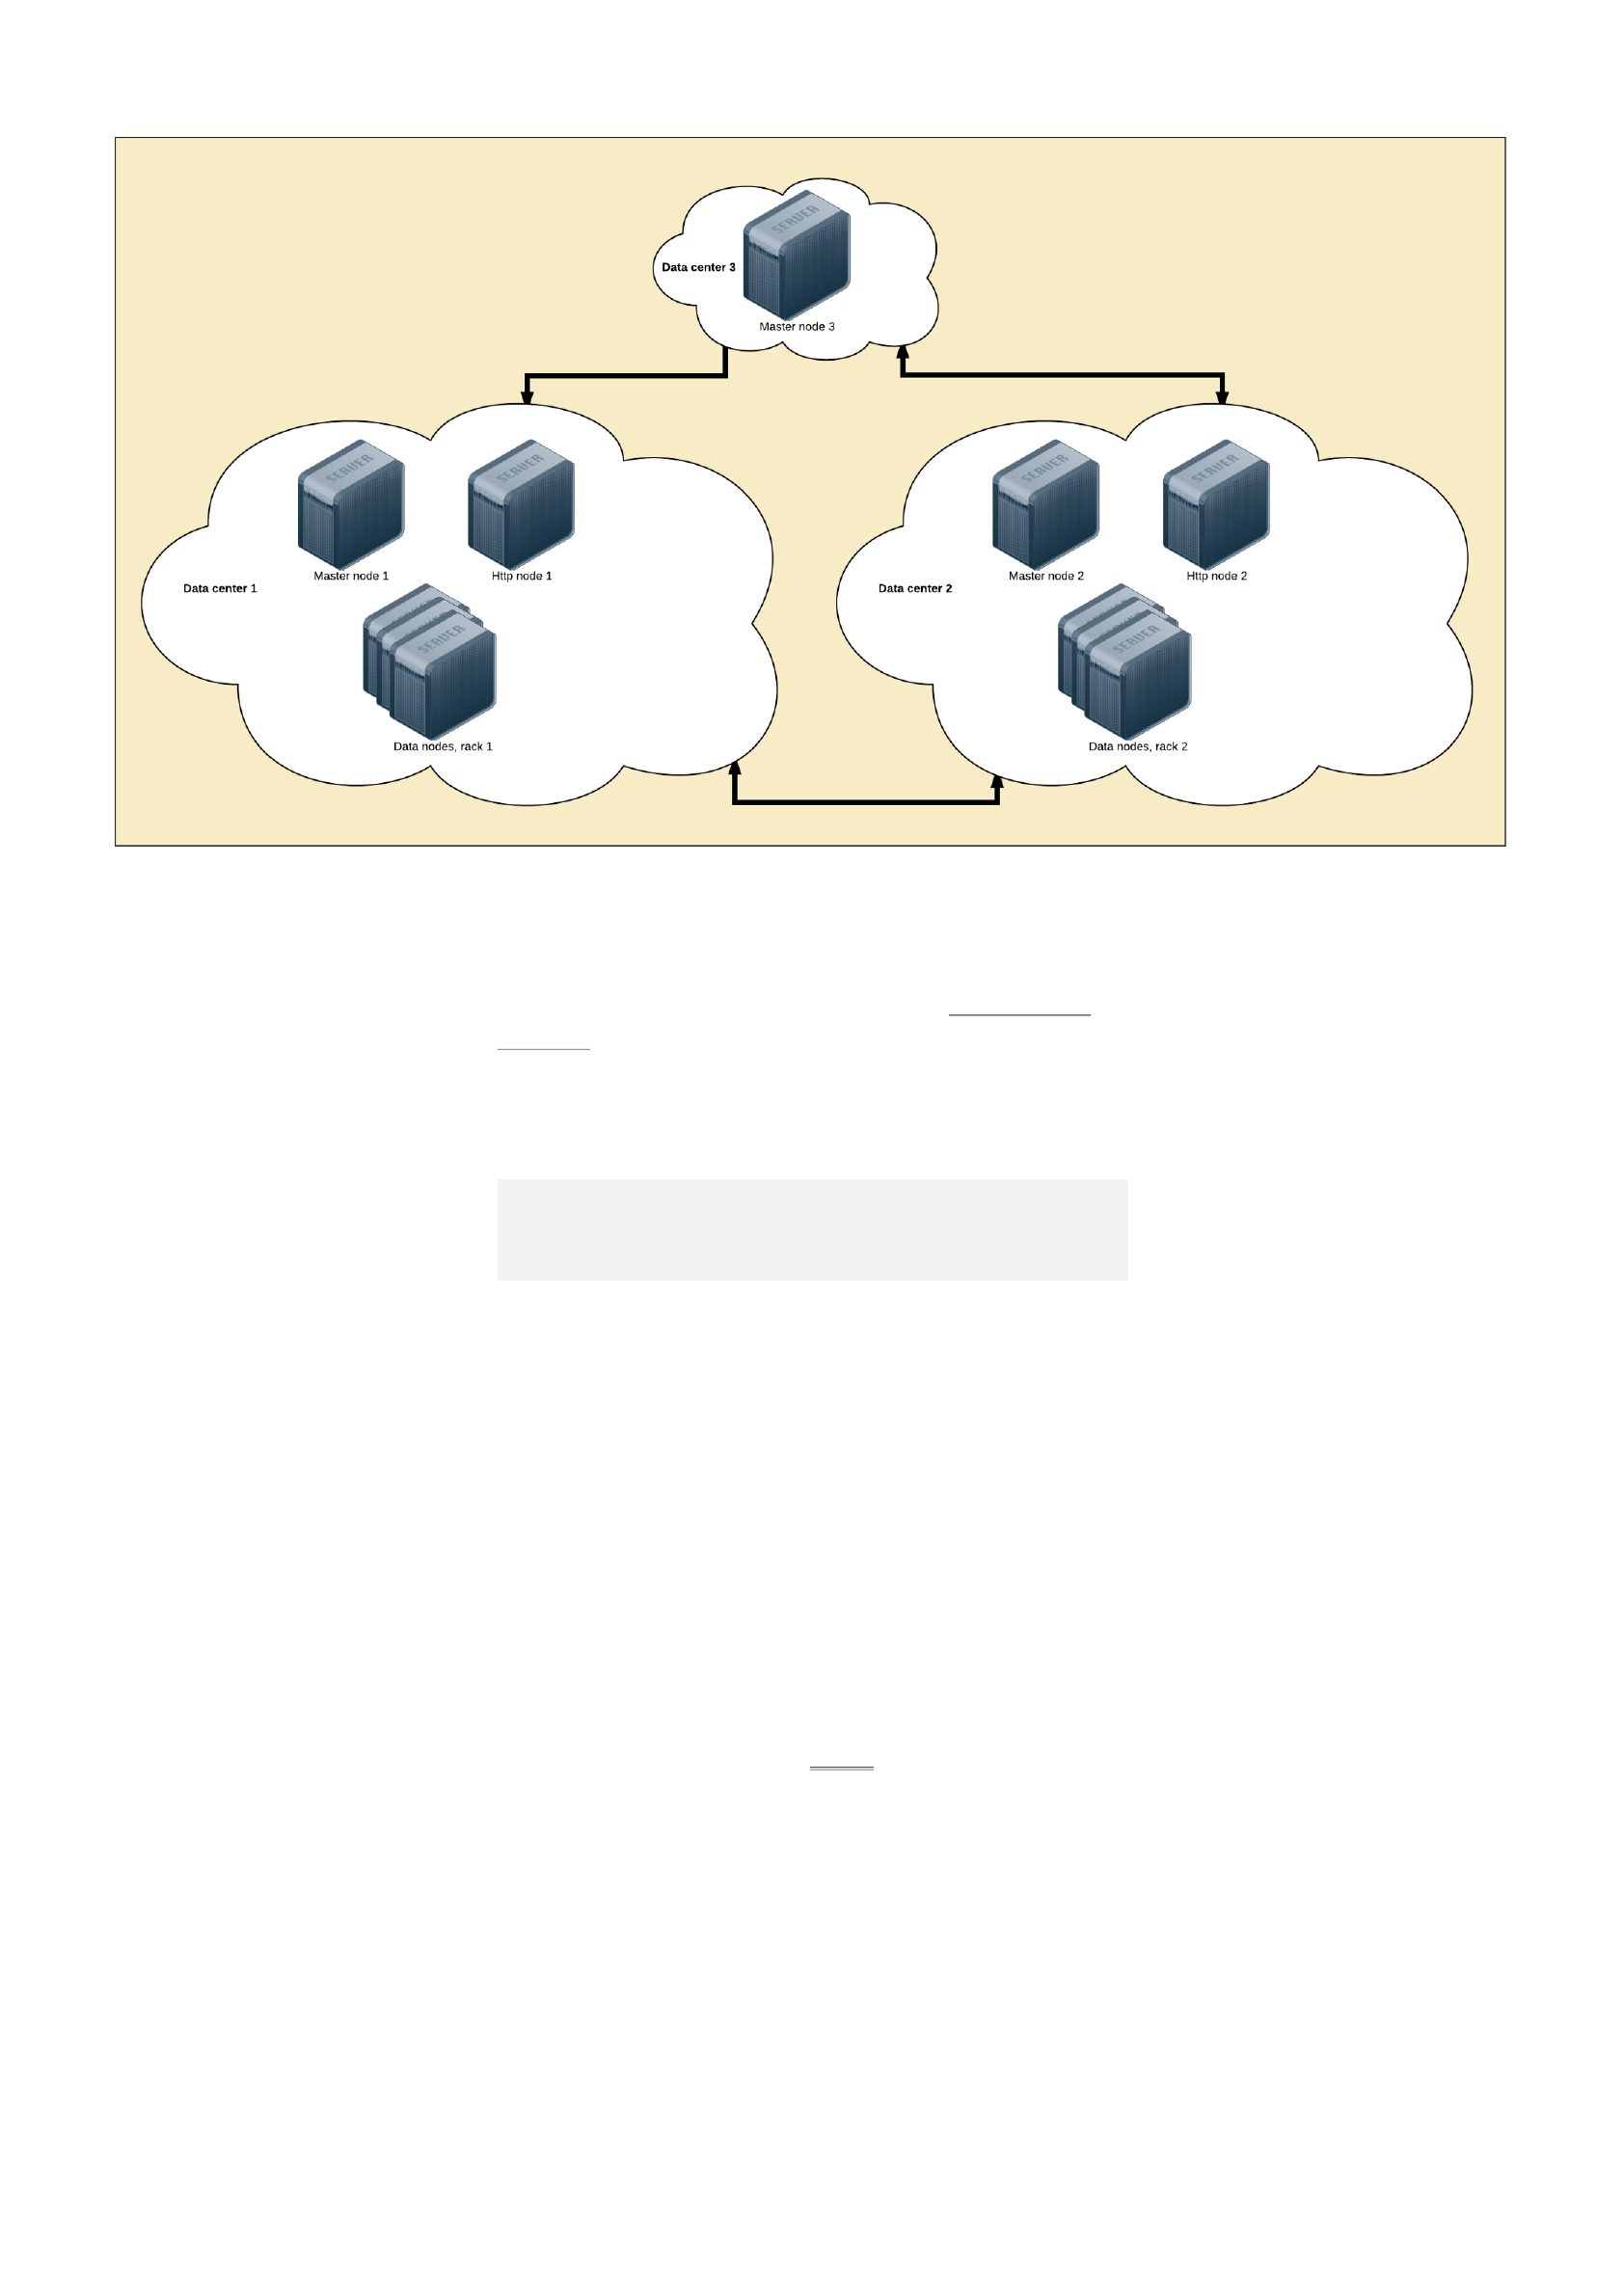
Design for failure
Unless you're running Elasticsearch on a single node, prepare to design
for failure. Designing for failure means running your cluster in multiple
locations and be ready to lose a whole data center without service
interruption. It's not theoretical thinking here. You WILL lose a whole
data center several times during your cluster's life.
Elasticsearch nodes come under 4 avors:
(Eligible) master nodes: controls the cluster.
Http nodes: to run your queries to.
Data nodes: the place data is stored, obviously.
Coordinating nodes: see them as smart load balancers.
The minimum requirement for a fault tolerant cluster is:
3 locations to host your nodes. 2 locations to run half of your
cluster, and one for the backup master node.
3 master nodes. You need an odd number of eligible master nodes
to avoid split brains when you lose a whole data center. Put one
master node in each location so you hopefully never lose the
quorum.
2 http nodes, one in each primary data center.
As many data nodes as you need, split evenly between both main
locations.
•
•
•
•
•
•
•
•
6/30/2018 Designing the Perfect Elasticsearch Cluster: the (almost) Definitive Guide
https://thoughts.t37.net/designing-the-perfect-elasticsearch-cluster-the-almost-definitive-guide-e614eabc1a87 5/21
Elasticsearch provides an interesting feature called shard allocation
awareness. It allows to split the primary shards and their replica in
separated zones. Allocate nodes within a same data center to a same
zone to limit the odds of having your cluster go red.
cluster.routing.allocation.awareness.attributes: "rack_id"
node.attr.rack_id: "dontsmokecrack"
Using rack_id on the http nodes is interesting too, as Elasticsearch will
run the queries on the closest neighbours. A query sent to the http node
located in the datacenter 1 will more likely run on the same data center
data nodes.
...
A few things you need to know
about Lucene
Before you start to think about choosing the right hardware, there are a
few things you need to know about Lucene.
Lucene is the name of the search engine that powers Elasticsearh. It is
an open source project from the Apache Foundation. There’s no need to
interact with Lucene directly, at least most of the time, when running
Elasticsearch. But there’s a few important things to know before
chosing the cluster storage and le system.
Lucene segments
Each Elasticsearch index is divided into shards. Shards are both logical
and physical division of an index. Each Elasticsearch shard is a Lucene
index. The maximum number of documents you can have in a Lucene
index is 2,147,483,519. The Lucene index is divided into smaller les
Elasticsearch design for failure

6/30/2018 Designing the Perfect Elasticsearch Cluster: the (almost) Definitive Guide
https://thoughts.t37.net/designing-the-perfect-elasticsearch-cluster-the-almost-definitive-guide-e614eabc1a87 6/21
called segments. A segment is a small Lucene index. Lucene searches in
all segments sequentially.
Lucene creates a segment when a new writer is opened, and when a
writer commits or is closed. It means segments are immutable. When
you add new documents into your Elasticsearch index, Lucene creates a
new segment and writes it. Lucene can also create more segments
when the indexing throughput is important.
From time to time, Lucene merges smaller segments into a larger one.
the merge can also be triggered manually from the Elasticsearch API.
This behavior has a few consequences from an operational point of
view.
The more segments you have, the slower the search. This is because
Lucene has to search through all the segments in sequence, not in
parallel. Having a little number of segments improves search
performances.
Lucene merges have a cost in terms of CPU and I/Os. It means they
might slow your indexing down. When performing a bulk indexing, for
example an initial indexing, it is recommended to disable the merges
completely.
If you plan to host lots of shards and segments on the same host, you
might choose a lesystem that copes well with lots of small les and
does not have an important inode limitation. This is something we’ll
deal in details in the part about choosing the right le system.
Lucene deletes and updates
Lucene performs copy on write when updating and deleting a
document. It means the document is never deleted from the index.
Instead, Lucene marks the document as deleted and creates another
one when an update is triggered.
This copy on write has an operational consequence. As you’ll update or
delete documents, your indices will grow on the disk unless you delete
them completely. One solution to actually remove the marked
documents is to force Lucene segments merges.
During a merge, Lucene takes 2 segments, and moves the content into a
third, new one. Then the old segments are deleted from the disk. It
means Lucene needs enough free space on the disk to create a segment
the size of both segments it needs to merge.
A problem can arise when force merging a huge shard. If the shard size
is > half of the disk size, you provably won’t be able to fully merge it,
unless most of the data is made of deleted documents.

6/30/2018 Designing the Perfect Elasticsearch Cluster: the (almost) Definitive Guide
https://thoughts.t37.net/designing-the-perfect-elasticsearch-cluster-the-almost-definitive-guide-e614eabc1a87 7/21
Hardware
If you want to get serious about Elasticsearch, you’ll have to learn about
hardware. It might be an unpopular opinion in 2017, but don’t run
Elasticsearch in the cloud. It has nothing to do with latency or losing
your AWS spot instances because Netix has just released a new show,
it has to do with picking up the right hardware for your needs. Cloud
providers such as AWS provides vCPU but there’s no way you know
what you’re going to get.
Because they have trouble with Java garbage collection, the rst thing
people ask advice about is memory management. What you should
actually care about is, in no particular order:
CPU
Memory
Network
Storage
CPU
Running complex ltered queries, intensive indexing, percolation and
queries against non latin charsets have a strong impact on the CPU, so
picking up the right one is critical.
Dive into the CPU specs to understand how they behave with Java. It’s
been more than a decade since I last read Intel specs — I even used to
have them as physical books — but it prove itself critical to pick up the
right hardware.
For example, Xeon E5 v4 provides 60% better performances than the
v3 version when running Java. Xeon D works well when you want to
scale your cluster horizontally as soon as heavy indexing is split evenly
amongst the cluster nodes. Prepare to get into trouble with nodes
popping out of the cluster like popcorn otherwise. So picking up the
right CPU and horizontal design is critical.
Speaking of CPU, Elasticsearch divides the CPU use into thread pools of
various types:
generic: for standard operations such as discovery
index: for indexing
get: for get operations, obviously
bulk: for bulk operations such as bulk indexing
percolate: for percolation
•
•
•
•
•
•
•
•
•

6/30/2018 Designing the Perfect Elasticsearch Cluster: the (almost) Definitive Guide
https://thoughts.t37.net/designing-the-perfect-elasticsearch-cluster-the-almost-definitive-guide-e614eabc1a87 8/21
… these are the most important ones you'll have to deal with,
RTFM for everything else
Each pool runs a number of threads, which can be congured, and has
a queue, which can be congured too. The default number of threads is
dened using a system variable called allocated_cpu, which is never
greater than 32, even though you have 48 core and the system variable
available_cpu shows 48.
I wouldn't recommend changing the thread pool size unless you really
know what you do, the defaults settings are quite sensible. You might
want to adapt the queue size though, as lling the queue size means
the operations will be rejected. You can get a glance of your thread pool
state using the thread_pool API.
GET /_cat/thread_pool/search?
v&h=host,name,active,rejected,completed
A special trick when your cluster is CPU bound and you can support a
replica of your data set on every node: run your cluster behind a
Haproxy and bypass the http nodes to hit the data node. If you have
heterogeneous nodes, give a greater weight to the nodes with the
highest number of cores.
Memory
Elasticsearch runs on Java, and Java is a garbage collected language.
Which means you'll run into memory management problems.
Memory is divided in 2 parts: what you allocate to the Java heap space,
and everything else. Elasticsearch does not rely on Java heap only. For
example, every thread created within the thread pool allocates 256Kb
of o-heap memory.
The basic thing to understand with heap allocation
is: the more memory you give it, the more time Java
spends garbage collecting.
Elasticsearch comes with Concurrent Mark Sweep as a default garbage
collector. CMS runs multiple concurrent threads to scan the heap for
objects that can be recycled. The main problem with CMS is how it
might enter “stop the world” mode in which the JVM becomes
unresponsive until it is restarted. The main reason for stop the world is
when the application has changed the state of the heap while CMS was
running concurrently, forcing it to restart from scratch until it has all
the objects marked for deletion. Let's put it this way: CMS sucks donkey
balls when the heap is over 4GB, which is almost always the case with
Elasticsearch.
Java 8 brings a brand new garbage collector called Garbage First, or
G1, designed for heaps greater than 4GB. G1 uses background threads
to divide the heap into 1 to 32MB regions, then scan the regions that
contain the most garbage objects rst. Elasticsearch and Lucene does
not recommend using G1GC for many reasons, one of them being a
nasty bug on 32bits JVM that might lead to data corruption. From an
operational point of view, switching to G1GC was miraculous, leading
to no more stop the world and only a few memory management issues.
•

6/30/2018 Designing the Perfect Elasticsearch Cluster: the (almost) Definitive Guide
https://thoughts.t37.net/designing-the-perfect-elasticsearch-cluster-the-almost-definitive-guide-e614eabc1a87 9/21
That said, choosing the right amount of memory to ll in the heap is
the most touchy part of designing an Elasticsearch cluster. Whatever
you pick up, never allocate more than 31GB to the heap.
Elasticsearch provides plenty of metrics to understand how the
workload wights on the memory.
GET /_nodes/stats
Elasticsearch uses multiple buers to perform in memory operations,
as well as caches to store the queries results with a system of LRU when
the cache becomes full. When the results are mostly large datasets and
the queries are not repeated often, disabling the caches might be a
good idea.
The caches you need to monitore are:
the query cache: dened per node, with a default of 10% of the
heap.
the shard request cache: used to compute the result of queries ran
on multiple shards.
the elddata cache: limited to 30% of the total heap.
Since version 5, Elasticsearch buers were simplied, and there are
only 2 buers to monitor:
the indexing buer: it is used to buer data during the indexing
process.
the buer_pools.
Elasticsearch is not idiotproof and won't tell you if you allocate more
than 100% of the heap to the multiple buers and caches, unless you
try to ll them all at the same time. Then you'll get an out of memory
error.
I said earlier that too much memory might lead to management issues.
Actually, the more memory the better when you play outside of the
heap. The o heap memory is used to manage threads and for the
lesystem to cache the data.
Elasticsearch le system storage has an important impact on the cluster
performances. After trying both ElasticSearch default_fs and mmapfs,
I’ve picked up niofs for le system storage.
The NIO FS type stores the shard index on the le
system (maps to Lucene NIOFSDirectory) using
NIO. It allows multiple threads to read from the
same le concurrently.
Niofs lets the kernel manage the le system cache instead of relying on
the broken, out of memory error generator mmapfs.
You might also want to commit the exact amount of memory you want
to allocate to the heap at startup. This prevents the node from
swapping when trying to allocate the memory it needs because no
more memory is available.
•
•
•
•
•

6/30/2018 Designing the Perfect Elasticsearch Cluster: the (almost) Definitive Guide
https://thoughts.t37.net/designing-the-perfect-elasticsearch-cluster-the-almost-definitive-guide-e614eabc1a87 10/21
boostrap.memory_lock (previously bootstrap.mlockall)
Network
Let's put it this way: you never have too much bandwidth. 1GB is good,
10GB is better, and a low latency is even better. Elasticsearch performs
lots of network consuming operations, from transferring data during
queries to reallocating shards, so networking matters.
The multicast discovery plugin was removed from Elasticsearch 5, so
discovery is done either using unicast or a cloud plugin, but you won't
run Elasticsearch in the cloud, will you?
If your hosting provider allows it, activate the Jumbo frames on your
network interfaces. Jumbo frames might reduces the network latency
by about 15% which is noticeable when transferring large amount of
data.
ifconfig eth0 mtu 9000
Elasticsearch comes with some interesting network related settings,
which are low by default and won't go over 2Gb/s, notably the recovery
transfer which is limited to 40mb/s
indices.recovery.max_bytes_per_sec: 2g
Raise this value only if your storage can handle it while serving queries,
indexing, and performing administrative tasks such as merges.
Storage
After memory, storage is often the bottleneck of an Elasticsearch
cluster. Unless you have a good reason to do it, don't use spinning disks.
Large SSD drives are now aordable with a decent life expectancy, and
you'll need fast IOs. Also, prefer local storage to anything else to reduce
the reads and writes latency. Consider your data nodes as disposable
when possible.
A question that comes often about storage design is: should I go with
RAID0, RAID1(0) or JBOD?
RAID0 oers the best cost / speed / storage space ratio. It ts perfectly
in large clusters where losing a node is not a problem. RAID0 oers the
maximum storage space on a single le system, which is convenient
when managing large shards. Without enough available storage on a
single node, operations like index optimisation won't be possible.
RAID0 also oers the maximum number of axes, without the RAID1(0)
replication overhead, useful for intensive indexing.
On the other hand, losing a single disk means losing a whole data node,
so choosing RAID0 implies to have enough spare data nodes to store
the whole dataset in case of crash.
JBOD oers the best cost / storage / security ratio. Each disk is aected
to a mountpoint, and the mountpoints are listed in Elasticsearch
conguration. JBOD is a good choice when you can't aord to lose a
whole data node, but losing a whole disk is OK, but provides less read

6/30/2018 Designing the Perfect Elasticsearch Cluster: the (almost) Definitive Guide
https://thoughts.t37.net/designing-the-perfect-elasticsearch-cluster-the-almost-definitive-guide-e614eabc1a87 11/21
and write performances. Running large shards on JBOD can also be a
problem to perform administrative tasks like index optimisation.
Depending on how many data nodes you can aord to lose, running
many hosts with software RAID0 is the best speed / storage space / cost
setup. Otherwise, use JBOD to reduce the I/Os involved by RAID 1 and
RAID10 replication.
RAID1(0) is the option for people who run Elasticsearch on a single
node. It provides the maximum security for the data availability as
losing a disk is possible, but at the cost of space and performances.
RAID1(0) implies to use half of the storage for the RAID replication,
and the replication overhead is something to take into account.
Elasticsearch comes with 2 storage related throttling protection. The
rst one limits the bandwidth of the storage you can use, and is as low
as 10mb/s. You can change it in the nodes settings:
indices.store.throttle.max_bytes_per_sec: 2g
The second one prevents too many merges from happening, which
slows down your indexing process. If you run bulk indexing or don't
care about search speed, you can disable merge throttling entirely.
indices.store.throttle.type: "none"
...
Software
Once done with the hardware, there's a few things you should have a
look at on the software level before you install Elasticsearch.
The Linux (or FreeBSD) kernel
The Linux kernel version you run on is important. Prefer the 4.9.x
version as it provides many interesting xes and performances
improvements, and comes with a great tracing framework you can rely
on when troubleshooting performances. Take the time to read the
Kernel CHANGELOG every time a new release is out, it and don't mind
upgrading often if it's worth it. For example, Linux 4.9.25 (or 4.9.0.0-
BPO3 on Debian) xed many regressions on XFS introduced with the
4.9.13 that screwed up the lesystem performances.
The Java Virtual Machine
The JVM you pick up is critical too, and you need to read and
understand their specications to get the best of your cluster.
Elasticsearch runs best on Java 1.8, which provides G1GC, and does not
support the unreleased Java 1.9 yet, but it supports various avors of
the Java virtual machine, so chose wisely. I usually run the Oracle JVM,
but OpenJDK is cool too. Once again, don't mind upgrading your Java
version often if a release xes bugs of improve performances.
Elasticsearch is not MySQL, and rebooting often is OK. Read the
CHANGELOG to stay up to date.
The lesystem

6/30/2018 Designing the Perfect Elasticsearch Cluster: the (almost) Definitive Guide
https://thoughts.t37.net/designing-the-perfect-elasticsearch-cluster-the-almost-definitive-guide-e614eabc1a87 12/21
Last but not least, choosing the lesystem is a critical part of designing
an Elasticsearch cluster. With small datasets on your disks, Ext4 is a
fast, reliable option that does not need tuning. If you plan to store lots
of indexes and more than 1TB of data per node, prefer a well tuned XFS
for better performances.
...
Designing your indices
Designing indices is the worst part of the cluster, because if you screw
up, all you have left is to scratch and reindex. This part won't deal
about designing a mapping, it's way beyond the cluster design. We'll
talk about 2 things: sharding and replication.
Sharding
Sharding is one of the reasons Elasticsearch is elastic. Elasticsearch
divides the data in logical parts, so he can allocate them on all the
cluster data nodes. The bad news is: sharding is dened when you
create the index. Once done, the only way to change the number of
shards is to delete your indices, create them again, and reindex. I've
written a comprehensive post about resizing your Elasticsearch clusters
in production which might help.
Choosing the right number of shards is complicated because you never
know how many documents you'll get before you start. When I know
more or less the future size of an index, I do the following:
less 3M documents: 1 shard
between 3M and 5M documents with an expected growth over
5M: 2 shards.
More than 5M: int (number of expected documents / 5M +1)
Having lots of shards can be both good and terrible for a cluster. Indices
and shards management can overload the master node, which might
become unresponsive, leading to some strange and nasty behaviour.
Allocate your master nodes enough resources to cope with the cluster
size. I try not to run more than 10.000 open indices and 50.000
primary shards on the same cluster.
If you plan to use Elasticsearch routing, don't create more shards than
you need, otherwise you'll end up having lots of empty shards that just
add useless pressure on the data and master nodes.
On the other hand, having lots of shards on huge indices is good too,
specially when you have a large cluster (20 data nodes and more).
Multiple shards allow a better allocation between nodes.
Small shards on multiple nodes make the cluster recovery much
faster when you lose a data node or shutdown the cluster.
Spreading smaller shards on lots of nodes might solve your
memory management problems when running queries on a large
data set.
Large shards makes indices optimization harder, specially when
you run force_merge with max_num_segments=1 since you need
twice the shard size in free space.
There's one more thing about sharding. Lucene, the search engine that
powers Elasticsearch, creates many les to manage parallel indexing on
the same shard. These les are called segments, and depending on your
•
•
•
•
•
•
•

6/30/2018 Designing the Perfect Elasticsearch Cluster: the (almost) Definitive Guide
https://thoughts.t37.net/designing-the-perfect-elasticsearch-cluster-the-almost-definitive-guide-e614eabc1a87 13/21
indexing workload, Lucene can create and open thousands of them at
the same time. That's why it's important to run Elasticsearch with
max_open_les at 32.000, if not more.
Replication
Elasticsearch has a built in replication system. Data is replicated
amongst the data nodes so losing one of them won't mean a data loss.
Elasticsearch default replication factor is 1, but it might be interesting
to have a higher replication factor.
Before you start playing with replication, you might want to
understand Elasticsearch replication consistency formula:
int( (primary + number_of_replicas) / 2 ) + 1
Going beyond the factor 1 can be extremely useful when you have a
small dataset and a huge amount of queries. By allocating the whole
data set to every node, you can leverage the search thread pools to run
much more queries in parallel. I once went to a replication factor of 51,
on 52 nodes, with the whole dataset in memory.
Optimising allocation
Once you use rack awareness, it might be interesting to optimise shard
allocations using elasticsearch zones.
For example, if you have indices that are accessed more frequently than
others, you might want to allocate more data nodes to those indices
while the less frequently accessed indices have less resources allocated.
This is extremely ecient with timestamped indices.
Let's say you have 20 data nodes, and 30 indices, you can create 3
zones. Allocate your 30 nodes to these zones according to the needed
resources:
new: 15 nodes
general: 10 nodes
old: 5 nodes
Every day, run a crontab to reallocate your indices to their new zone.
For example, move a less accessed index into the "general" zone:
PUT /index/_settings
{
"transient": {
"cluster.routing.allocation.include._zone" :
"general",
"cluster.routing.allocation.exclude._zone" :
"new,old"
}
}
•
•
•
...
Troubleshooting and scaling
Troubleshooting and scaling your cluster requires lots of investigation
and understanding of your workload and cluster behaviour. Here's
what you should care about:

6/30/2018 Designing the Perfect Elasticsearch Cluster: the (almost) Definitive Guide
https://thoughts.t37.net/designing-the-perfect-elasticsearch-cluster-the-almost-definitive-guide-e614eabc1a87 14/21
Buers
Cache (both lling, hit & miss, and eviction)
CPU use and load average
OOM errors
CPU
If you're CPU bound, there's a few things you need to pay attention to:
CPU consumption: > 90% you'll get into trouble. Your data node
need to perform frequent administrative tasks such as getting the
cluster state, sending information to the master or merging.
Load average: a high load average might imply an IO issue, a
context switching problem, some nasty Java or kernel bugs…
The state of your thread pools, especially the state of rejected
threads. And raising the queue size is never the right solution on
the long term.
The number of search / writes per second
The average time taken by your queries
A good way to know which queries take the more time is by using
Elasticsearch slow queries logs.
PUT /index/_settings
{
"index.search.slowlog.threshold.query.warn: 1s",
"index.search.slowlog.threshold.query.info: 500ms",
"index.search.slowlog.threshold.query.debug: 1500ms",
"index.search.slowlog.threshold.query.trace: 300ms",
"index.search.slowlog.threshold.fetch.warn: 500ms",
"index.search.slowlog.threshold.fetch.info: 400ms",
"index.search.slowlog.threshold.fetch.debug: 300ms",
"index.search.slowlog.threshold.fetch.trace: 200ms"
}
If you can't optimize your queries, then you'll have to add more
resources or rewrite everything to better use Elasticsearch, or
something else.
Memory
•
•
•
•
•
•
•
•
•

6/30/2018 Designing the Perfect Elasticsearch Cluster: the (almost) Definitive Guide
https://thoughts.t37.net/designing-the-perfect-elasticsearch-cluster-the-almost-definitive-guide-e614eabc1a87 15/21
Memory management issues used to be my worst nightmare.
Thankfully it's not anymore. There are many tools to investigate the
content of Elasticsearch memory, either in real time or after a crash. My
favourite is Yourkit Java Proler, which has a free trial version.
If you experience multiple memory related crashes, make sure
Elasticsearch dumps its memory when crashing. If you allocate 31GB to
the heap you'll get 31GB dumps, so expand your lesystem accordingly,
and activate memory dumps.
-XX:+HeapDumpOnOutOfMemoryError -
XX:HeapDumpPath=/srv/elasticsearch/heapdump.hprof
That's all for tonight folks, I hope I didn't forget anything. If so, I'll edit
the article and add the missing parts every once in a while. I hope
reading this was useful and you liked it as much as I liked writing it.
See you soon!
...
Use cases
Design for an event logging infrastructure
Elasticsearch has made a blast in the event analysis world thanks — or
because of — the famous Elasticsearch / Logstash / Kibana (ELK)
trinity. In this specic use cas, Elasticsearch acts as a hot storage that
makes normalized events searchable.
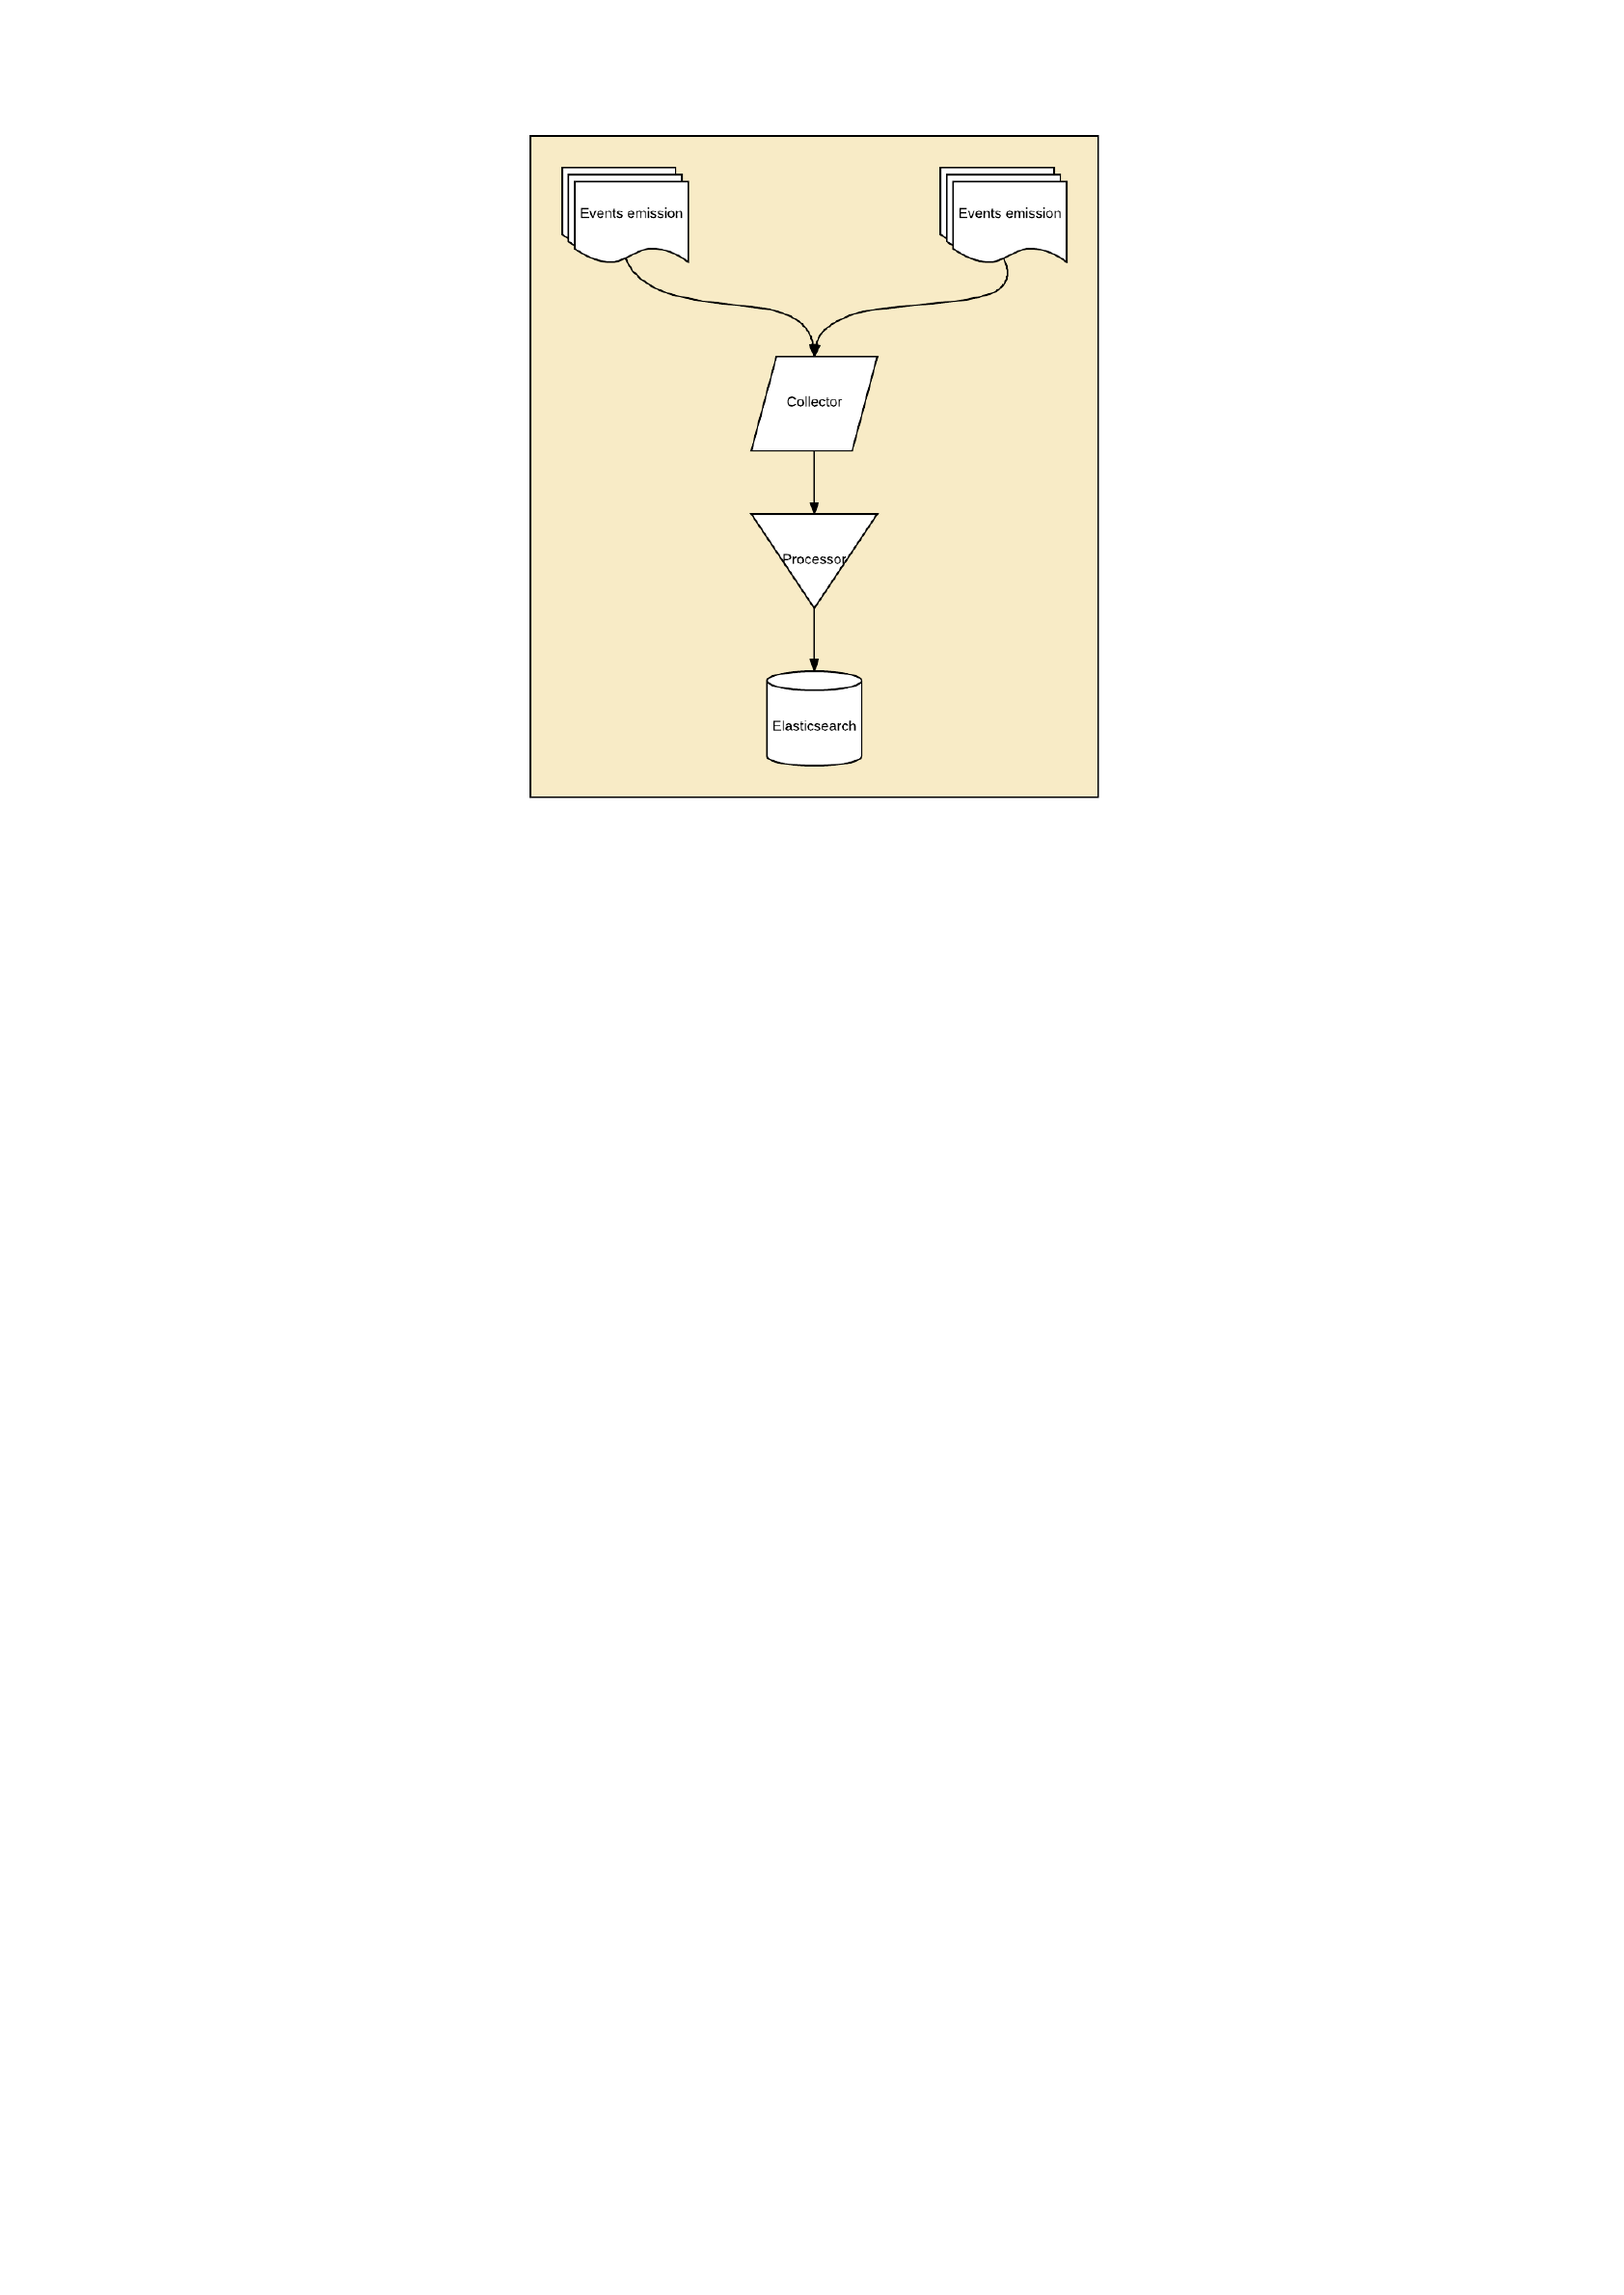
The usual topology of an event analysis infrastructure is more or less
the same whatever the technical stack.
Heterogeneous events are pushed from various location into a
queue. Queuing has 2 purposes: make sure the data processing
won’t act as a bottleneck in case of unexpected spike, and make
sure no event is lost if the data processing stack crashes.
A data processing tool normalises the events. You have 0 chance to
have homogeneous events in an event analysis infrastructure.
Events can be logs, metrics, or whatever you can think about, and
they need to be normalised to be searchable.
The data processing tool forwards the events to a hot storage
where they can be searched. Here, the hot storage is, indeed,
Elasticsearch.
1.
2.
3.
6/30/2018 Designing the Perfect Elasticsearch Cluster: the (almost) Definitive Guide
https://thoughts.t37.net/designing-the-perfect-elasticsearch-cluster-the-almost-definitive-guide-e614eabc1a87 16/21
Event analysis is the typical use case where you can start small, with a
single node cluster, and scale when needed. Most of the times, you
won’t collect all the events you want to analyse from day 1, so it’s OK
not to over engineer things.
The event logging infrastructure is the typical tricky use case that
might have you pull your hair for some times saying Elasticsearch is the
worst software ever. It's both extremely heavy on writes, with only a
few search query.
Writes can easily become the bottleneck of the infrastructure, either
from a CPU or storage point of view, one more reason to chose the
software prior to Elasticsearch wisely to avoid losing events.
Searches are performed on such an amount of data that one of them
might trigger an out of memory error on the Java heap space, or an
innite garbage collection.
Before you start, there’s a few things you need to think about. Since we
focus on designing an Elasticsearch cluster, we’ll start from the
moment events are normalised and pushed into Elasticsearch.
Throughput: how many events per second (eps) are you going to
collect?
This is not a question you can answer out of the box unless you already
have a central events collection platform. It’s an important one though,
as it will dene most of your hardware requirements. Events logging
varies a lot according to your platform activity, so I'd recommend
tracking them for a week or more before you start building your
Elasticsearch cluster.
One important things to know is: do you need realtime indexing, or can
you accept some lag. If the latter is an option, then you can let the lag
being indexed after a spike of events happen, so you don't need to build
for the maximum amount of events you can get.
Retention: how long do you want to keep your data, hot and cold?
Simple event logging infrastructure

6/30/2018 Designing the Perfect Elasticsearch Cluster: the (almost) Definitive Guide
https://thoughts.t37.net/designing-the-perfect-elasticsearch-cluster-the-almost-definitive-guide-e614eabc1a87 17/21
Hot data is data you can access immediately, while cold data is what
can be accessed within a reasonable amount of time. Retention
depends both on your needs and national regulation. For example, in
France, we're supposed to keep our access logs during a full year,
nancial transactions need to be kept for 3 to 5 years, etc.
On Elasticsearch, hot data means opened, accessible indexes. Cold data
means closed indexes, or backups of an index snapshot you can easily
and quickly transfer and reopen.
Size: what is the average size of a collected event?
This metric is important as well. Knowing about throughput * retention
period * events size will help you dene the amount and type of storage
you need, hence the cost of your events logging platform.
Storage = throughput * events size * retention
period.
Hot data is made of opened, searchable indices. They are the one you’ll
search into on a regular basis, for debugging or statistics purpose.
Fault tolerance: can you aord losing your indexed data?
Most of the time, losing your search backend is an option. Lots of
people use the ELK stack to store application logs so they are easier to
debug, and they are not a critical part of their infrastructure. Logs are
also stored somewhere else, for example on a central syslog server so
they are still searchable using some shell skills.
When you can lose your search backend for a few hours, or don't want
to invest in a full cluster, then a single Elasticsearch server is enough,
provided your throughput allows it.
The host minimal conguration is then:
master: true
data: true
index.number_of_replicas: 0
If you start combining events analysis with alerting, or if you need your
events to be searchable in realtime without downtime, then things get a
bit more expensive. For example, you might want to correlate your
whole platform auth.log to look for intrusion attempts or port
scanning, so you can deploy new rewall rules accordingly. Then you'll
have to start with a 3 nodes cluster. 3 nodes is a minimum since you
need 2 active master nodes to avoid a split brain.

6/30/2018 Designing the Perfect Elasticsearch Cluster: the (almost) Definitive Guide
https://thoughts.t37.net/designing-the-perfect-elasticsearch-cluster-the-almost-definitive-guide-e614eabc1a87 18/21
Here, the minimal hosts conguration for the master / http node is:
master: true
data: false
index.number_of_replicas: 1
And for the data nodes:
master: true
data: true
index.number_of_replicas: 1
If you decide to go cheap and combine the master
and data nodes in a 3 hosts cluster, never use bulk
indexing.
Bulk indexing can put lots of pressure on the server memory, leading
the master to exit the cluster. If you plan to run bulk indexing, then add
one or 2 dedicated http node.
The same applies to highly memory consuming queries. If you plan to
run such queries, then move your master nodes out of the data nodes.
Queries
The last thing you need to know about is the type of queries that are
going to be ran against your Elasticsearch cluster. If you need to run
simple queries, like looking for an error message, then memory
pressure won't be a real problem, even against large data. Things get
more interested when you need to perform complex ltered queries, or
aggregations against a large set of data. Then you'll put lots of pressure
on the cluster memory.
Which hardware do I need?
Once you've gathered all your prerequisites, it's time for hardware
selection.
Minimum cluster design

6/30/2018 Designing the Perfect Elasticsearch Cluster: the (almost) Definitive Guide
https://thoughts.t37.net/designing-the-perfect-elasticsearch-cluster-the-almost-definitive-guide-e614eabc1a87 19/21
Unless you're using ZFS as a lesystem to prot from compression and
snapshots, you should not need more than 64GB RAM. ZFS is popular
both to manage extremely large le systems and for its feature, but is
greedy on memory.
Chose the CPU depending on both your throughput and your
lesystem. ZFS is more greedy than ext4, for example. Elasticsearch
index thread pool is equal to the number of available processors + 1,
with a default queue of 200. So if you have a 24 core host, Elasticsearch
will be able to mange 25 indexing at once, with a queue of 200.
Everything else will be rejected.
You can choose to use bulk indexing, which will allow you to index
more events at the same time. The default thread pool and queue size
are the same as the index thread pool.
The storage part will usually be your bottleneck.
Indeed, local storage and SSD are preferred, but lots of people will
chose spinning disks or an external storage with berchannel to have
more space.
Whatever you chose, the more disks, the better. More disks provide you
more axis, hence a faster indexing. If you go with some RAID10, then
chose smaller disks, as very large disks such as 4TB+ spinning disks
will take ages to rebuild.
On a single node infrastructure, my favorite setup for a huge host is a
RAID10 with as many 3.8TB SSD disks possible. Some servers can host
up to 36 of them, which makes 18 available axes for more or less 55TB
of usable space.
On a multiple node infrastructure, I prefer to multiply the smaller hosts
with a RAID0 and 8TB to 10TB space. This works great with 8 data
nodes and more since rebuilding takes lots of time.
How to design my indices?
As usual, it depends on your needs, but this is the time to play with
aliases and timestamped indexes. For example, if you're storing the
output of your infrastructure auth.log, your indices can be:
auth-$(date +%Y-%m-%d)
You'll probably want to have 1 index for each type of event you want to
index, so you can build various, more adapted mappings. Event
collection for syslog does not require the same index topology as an
application event tracing, or even some temperature metrics you might
want to put in a TSDB.
While doing it, remember that too many indexes and too many shards
might put lots of pressure on a single host. Constant writing create lots
of Lucene segments, so make sure Elasticsearch won't have "too many
open les" issues.
What about some tuning?
Here starts the fun part.
Depending on your throughput, you might need a large indexing
buer. The indexing buer is a bunch of memory that stores the data to
index. It diers from the index and bulk thread pools which manage
the operations.

6/30/2018 Designing the Perfect Elasticsearch Cluster: the (almost) Definitive Guide
https://thoughts.t37.net/designing-the-perfect-elasticsearch-cluster-the-almost-definitive-guide-e614eabc1a87 20/21
Elasticsearch default index buer is 10% of the memory allocated to
the heap. But for heavy indexing operations, you might want to raise it
to 30%, if not 40%.
indices.memory.index_buffer_size: 40%
Elasticsearch provides a per node query cache. Let's put it this way: you
don't need caching on an event logging infrastructure. There's a way to
disable it completely and that's what we want.
indices.query.cache.enabled: false
You will also have a look at the indexing thread pool. I don't
recommend changing the thread pool size, but depending on your
throughput, changing the queue size might be a good idea in case of
indexing spike.
thread_pool.bulk.queue_size: 3000
thread_pool.index.queue_size: 3000
Finally, you will want to disable the store throttle if you're running on
enough fast disks.
store.throttle.type: 'none'
One more thing: when you don't need data in realtime, but can aord
waiting a bit, you can cut your cluster a little slack by raising the indices
refresh interval.
index.refresh_interval: "1m"
...
If you found this article helpful please tap or click “♥ ”, follow me on Twitter
or subscribe to my Engineering Weekly newsletter.

6/30/2018 Designing the Perfect Elasticsearch Cluster: the (almost) Definitive Guide
https://thoughts.t37.net/designing-the-perfect-elasticsearch-cluster-the-almost-definitive-guide-e614eabc1a87 21/21
