Desktop Specialist Exam Guide
DesktopSpecialist_ExamGuide
User Manual:
Open the PDF directly: View PDF ![]() .
.
Page Count: 13

Desktop Specialist
Exam Guide

Exam Details
This document provides information on the structure of the exam, along with the knowledge and skills
being measured. It will also guide you to resources to help you prepare for success. This document is not
intended to build product knowledge.
Awarded Credentials
Upon successful completion of this exam, you will be awarded the title of Tableau Desktop Specialist. This
title does not expire.
Target Audience
This exam is for those who have foundational skills and understanding of Tableau Desktop and at least three
months of applying this understanding in the product.
Prerequisites
There are no prerequisites for this exam.
System Preparation
For a successful exam experience, ensure your computer, network, and the physical environment are
properly congured. This includes running a system tech-check before the exam. Review our Required:
Exam Setup document for complete details.
Learning Resources
The best preparation is experience and time with the product. To be successful, we strongly encourage you to
complete the Desktop I: Fundamentals course.
We also recommend exploring these additional resources:
• Tableau Starter Kits
• Free How-To Training Videos
• Tableau Product Support
• Tableau Product Help
• Visual Analysis Best Practices Guidebook
Exam Format
Time Limit: 60 minutes
Question Format: Multiple choice, multiple response, hands-on
Number of Questions: 30
Scoring: Automatically scored; point value varies per question type with hands-on worth more
Passing Score: 70%
Language(s) Oered: English
Delivery Platform: Windows Virtual Machine containing Tableau Desktop
For questions, email certication@tableau.com or visit tableau.com/certication.
October 2018
Desktop Specialist Exam Guide

Skills Measured
Connecting to & Preparing Data
• Create and save data connections
• Create a live connection to a data source
• Explain the dierences between using live
connections versus extracts
• Create an extract
• Save metadata properties in a . TDS
• Modify data connections
• Add a join
• Add a blend
• Add a union
• Manage data properties
• Rename a data eld
• Assign an alias to a data value
• Assign a geographic role to a data eld
• Change data type for a data eld (number,
date, string, boolean, etc.)
• Change default properties for a data eld
(number format, aggregation, color, date
format, etc.)
Exploring & Analyzing Data
• Create basic charts
• Create a bar chart
• Create a line chart
• Create a scatterplot
• Create a map using geographic data
• Create a combined axis chart
• Create a dual axis chart
• Create a stacked bar
• Create a chart to show specic values
(crosstab, highlight table)
• Organize data and apply lters
• Create a visual group
• Create a group using labels
• Create a set
• Organize dimensions into a hierarchy
• Add a lter to the view
• Add a context lter
• Add a date lter
• Apply analytics to a worksheet
• Add a manual or a computed sort
• Add a reference line or trend line
• Use a table calculation
• Use bins and histograms
• Create a calculated eld (e.g. string, date,
simple arithmetic)
• Add a parameter
Sharing Insights
• Format view for presentation
• Use color
• Use bolding
• Use shapes
• Change size of marks
• Select fonts
• Create and modify a dashboard
• Create a dashboard layout
• Add interactive or explanatory elements
• Add dashboard actions
• Modify existing dashboard layout for mobile
devices
• Create a story using dashboards or views
• Share a twbx as a PDF
• Share a twbx as an image
Continued on next page.
October 2018
Desktop Specialist Exam GuideDesktop Specialist Exam GuideDesktop Specialist Exam Guide
Desktop Specialist Exam Guide

Skills Measured
Understanding Tableau Concepts
• Dimensions and measures
• Explain what kind of information dimensions
usually contain
• Explain what kind of information measures
usually contain
• Discrete and continuous elds
• Explain how discrete elds are displayed in
Tableau
• Explain how continous elds are displayed in
Tableau
• Explain the dierence between discrete date
parts and continous date values in Tableau
• Aggregation
• Explain why Tableau aggregates measures
• Describe how an aggregated measure changes
when dimensions are added to the view
Timeliness
Completing a task eectively and eciently has
become a standard that organizations expect from
employees. This exam is timed because we view time
as a critical competency needed to be successful.
October 2018Desktop Specialist Exam Guide

Sample Questions
The questions below are examples intended to give you a sense of how questions will look on the exam. It is
not a learning resource for the Desktop product, nor does it provide the experience needed to successfully
pass the exam.
You are encouraged to work through your own solutions rst before looking at the solutions provided.
1. Which of the following is the best reason to use an extract instead of a live connection?
a. Your data source only supports a live connection via ODBC.
b. You need the freshest possible data at all times.
c. You need to apply an aggregation that takes too long when using a live connection.
d. You need to join tables that are in the data source.
2. You created a group by selecting eld labels in a view. How can you remove members from the group?
a. In the view, right-click the group members you want to remove and select Exclude.
b. In the Data pane, right-click the group and select Edit Group.
c. In the view, right-click the group members you want to remove and select Format.
d. On a color legend, right-click a member you want to remove and select Format legends.
3. Which of the following can you use to create a calculated eld that returns data independent of the data
granularity in a view?
a. An INCLUDE LOD calculation
b. A table calculation
c. A basic calculation
d. A FIXED LOD calculation
4. Interactive elements that you can add to a dashboard for users include ______. (Select all that apply.)
a. URL actions
b. edit tooltip options
c. lter actions
d. hide and unhide all sheet options
5. A eld that shows average home values for the United States in 2016 is most likely:
a. A discrete date part dimension
b. A continuous date value dimension
c. A geographical dimension
d. An aggregated measure
Desktop Specialist Exam Guide October 2018

The following questions use the tables in the tds_sample_data_all.xlsx le, which can be downloaded here.
If you are unable to download the le, try accessing it from another internet browser.
6. Using the Stocks 2010-2013 table, create a chart to see the monthly change in volumes of stocks, beginning
of 2010 to the end of 2013. Which two consecutive months saw the least uctuation in increase or decrease?
a. December 2011 - January 2012
b. March 2012 - April 2012
c. November 2012 - December 2012
d. January 2012 - February 2012
7. Using the Stocks 2010-2013 table, create a crosstab showing the sum of Volume per Company per Year, then
add grand totals to the view. What was the total volume for Apple in 2013 and the total volume for Apple for
2010 through 2013, respectively?
a. 25,606,397,999 and 127,322,019,216
b. 25,606,397,999 and 26,695,067,569
c. 26,695,067,569 and 134,264,642,523
d. 365,212,953 and 134,264,642,523
8. Using the Stocks 2010-2013 table, create a chart that shows the percent dierence in Volume for each
company by year and quarter. How many quarters did Biogen Idec show a positive percent dierence in
volume?
a. 1
b. 2
c. 5
d. 6
9. Union the Stocks 2010-2013 and Stocks 2014 tables, and then create a chart showing the average Close
price by year and quarter for each Company from 2010 to 2014. How many quarters was Amazon’s average
closing price over $300?
a. 0
b. 4
c. 5
d. 6
10. Using the Flights table, create a bar chart showing the average of Minutes of Delay per Flight broken
down by Carrier Name, and ltered by State to only show Minnesota (MN). What was the average minutes of
delay per ight for United in Minnesota?
a. 2,582
b. 61.74
c. 62.98
d. 53.69
Desktop Specialist Exam Guide October 2018

Solutions
1. Which of the following is the best reason to use an extract instead of a live connection?
The correct answer is c. You need to apply an aggregation that takes too long when using a live
connection.
2. You created a group by selecting eld labels in a view. How can you remove members from the group?
The correct answer is b. In the Data pane, right-click the group and select Edit Group.
3. Which of the following can you use to create a calculated eld that returns data independent of the data
granularity in a view?
The correct answer is d. A FIXED LOD calculation.
4. Interactive elements that you can add to a dashboard for users include ______. (Select all that apply.)
The correct answers are a. URL actions & c. lter actions.
5. A eld that shows average home values for the United States in 2016 is most likely:
The correct answer is d. An aggregated measure.
Desktop Specialist Exam Guide October 2018
Below there is guidance on a suggested method of nding each answer. You may nd there are other ways
determine the correct answer. The focus for this exam is the destination (i.e. accuracy), rather than the
journey.
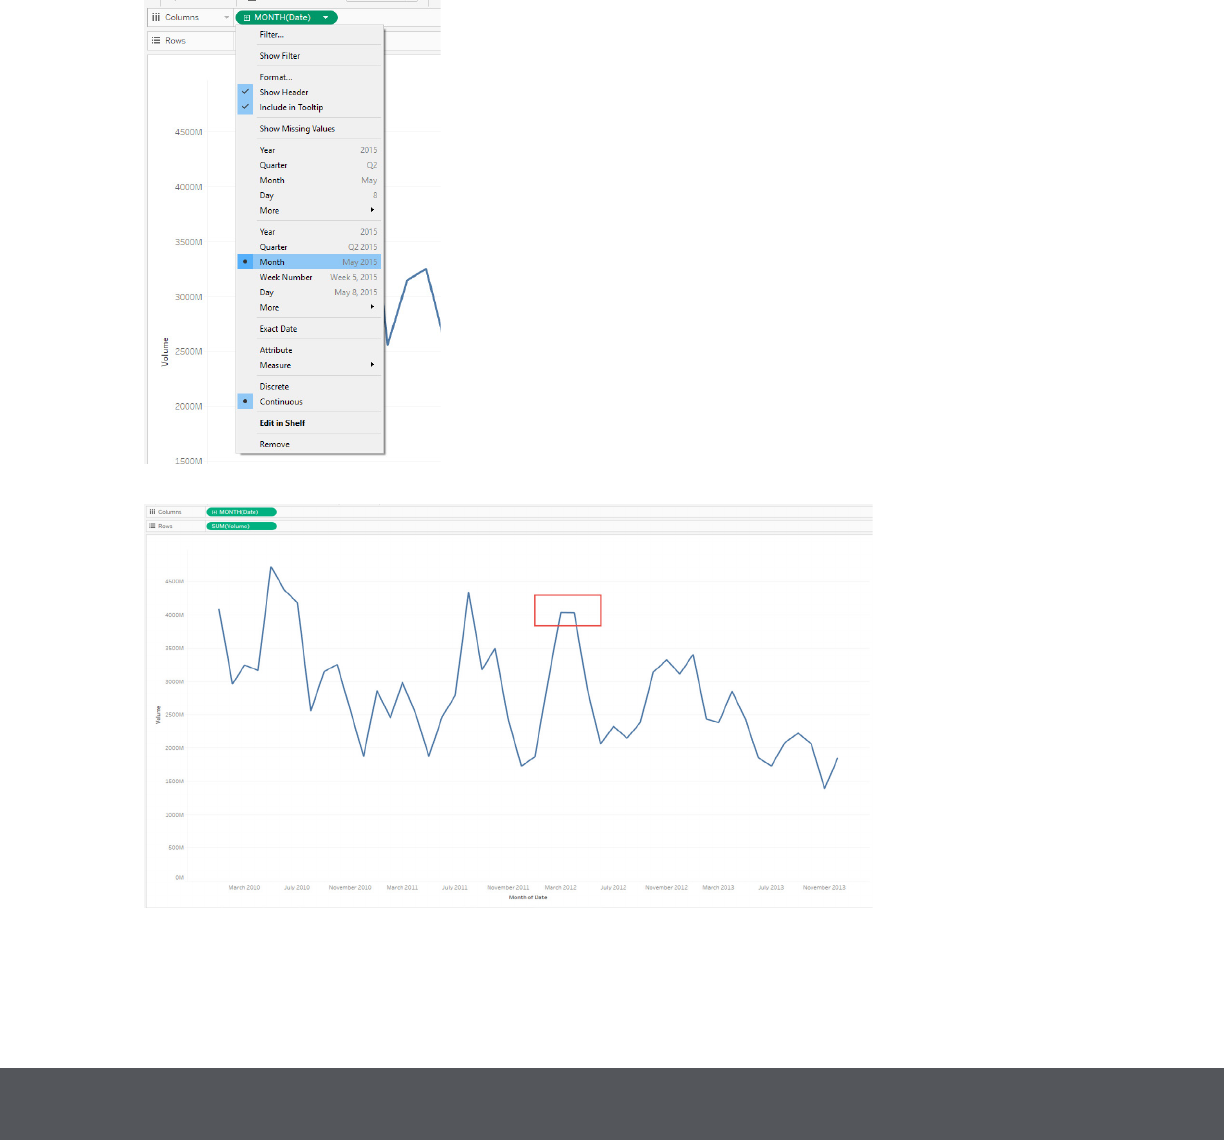
6. Using the Stocks 2010-2013 table, create a chart to see the monthly change in volumes of stocks, beginning
of 2010 to the end of 2013. Which two consecutive months saw the least uctuation in increase or decrease?
The correct answer is b. March 2012 - April 2012.
The answer to this question can be found by placing the continuous month date value (May 2015)
format on Columns, and placing SUM(Volume) on Rows.
Desktop Specialist Exam Guide October 2018
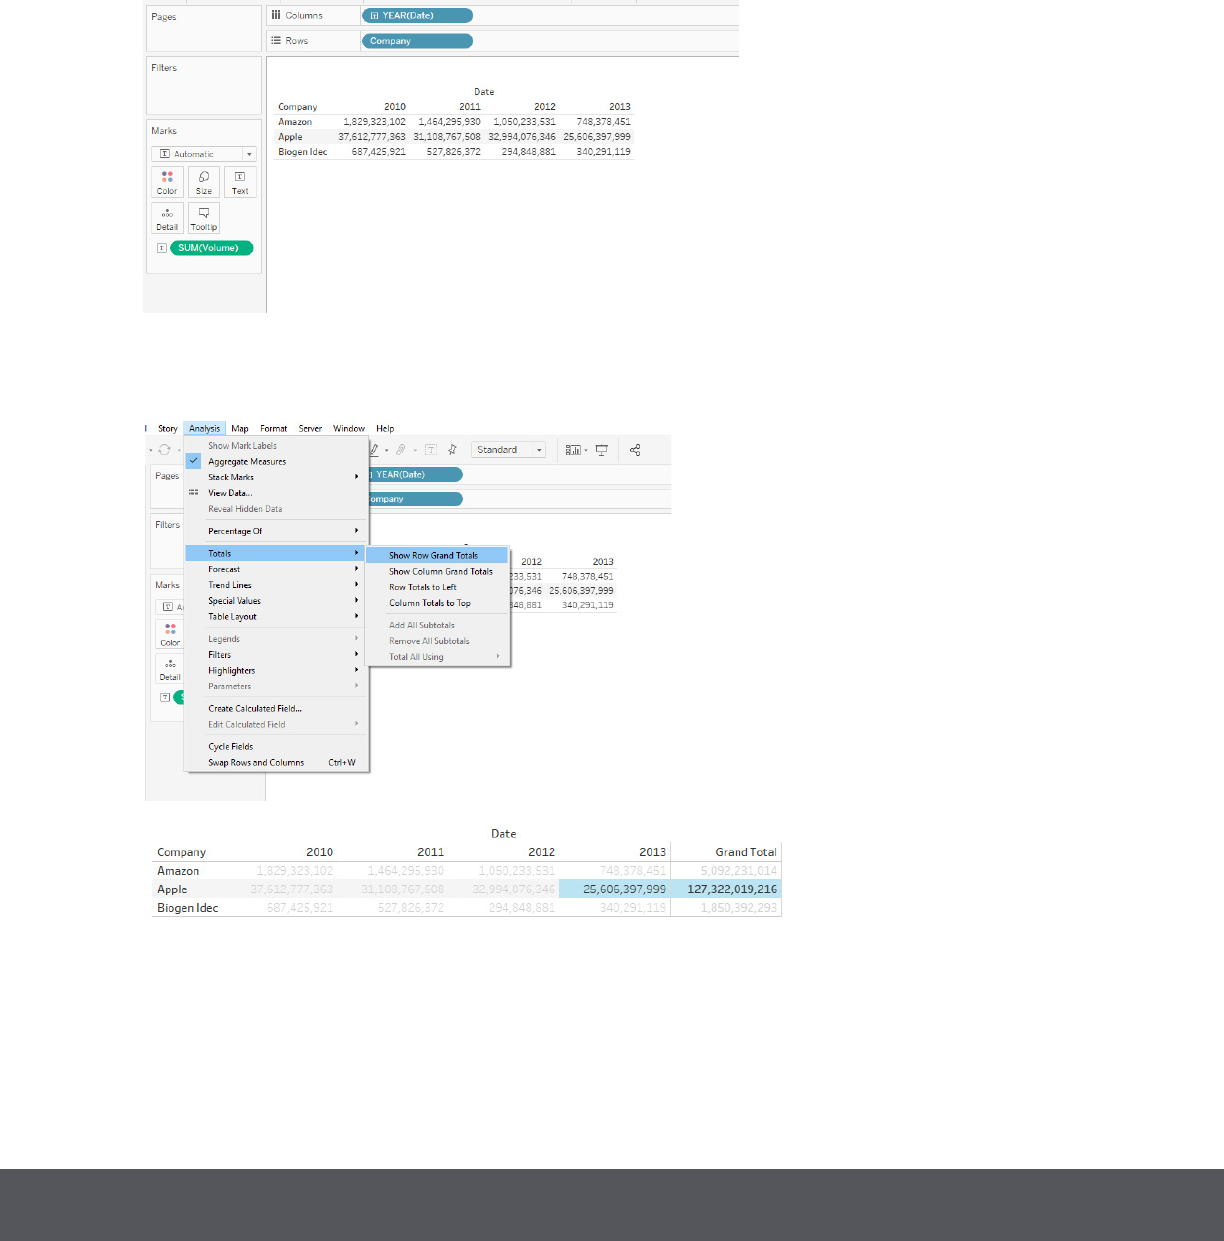
7. Using the Stocks 2010-2013 table, create a crosstab showing the sum of Volume per Company per Year, then
add grand totals to the view. What was the total volume for Apple in 2013 and the total volume for Apple for
2010 through 2013, respectively?
The correct answer is a. 25,606,397,999 and 127,322,019,216.
The answer to this question can be found by placing YEAR(Date) on columns and Company on rows.
Drag SUM(Volume) to labels.
Use the Analysis menu to add a grand total for rows.
Desktop Specialist Exam Guide October 2018
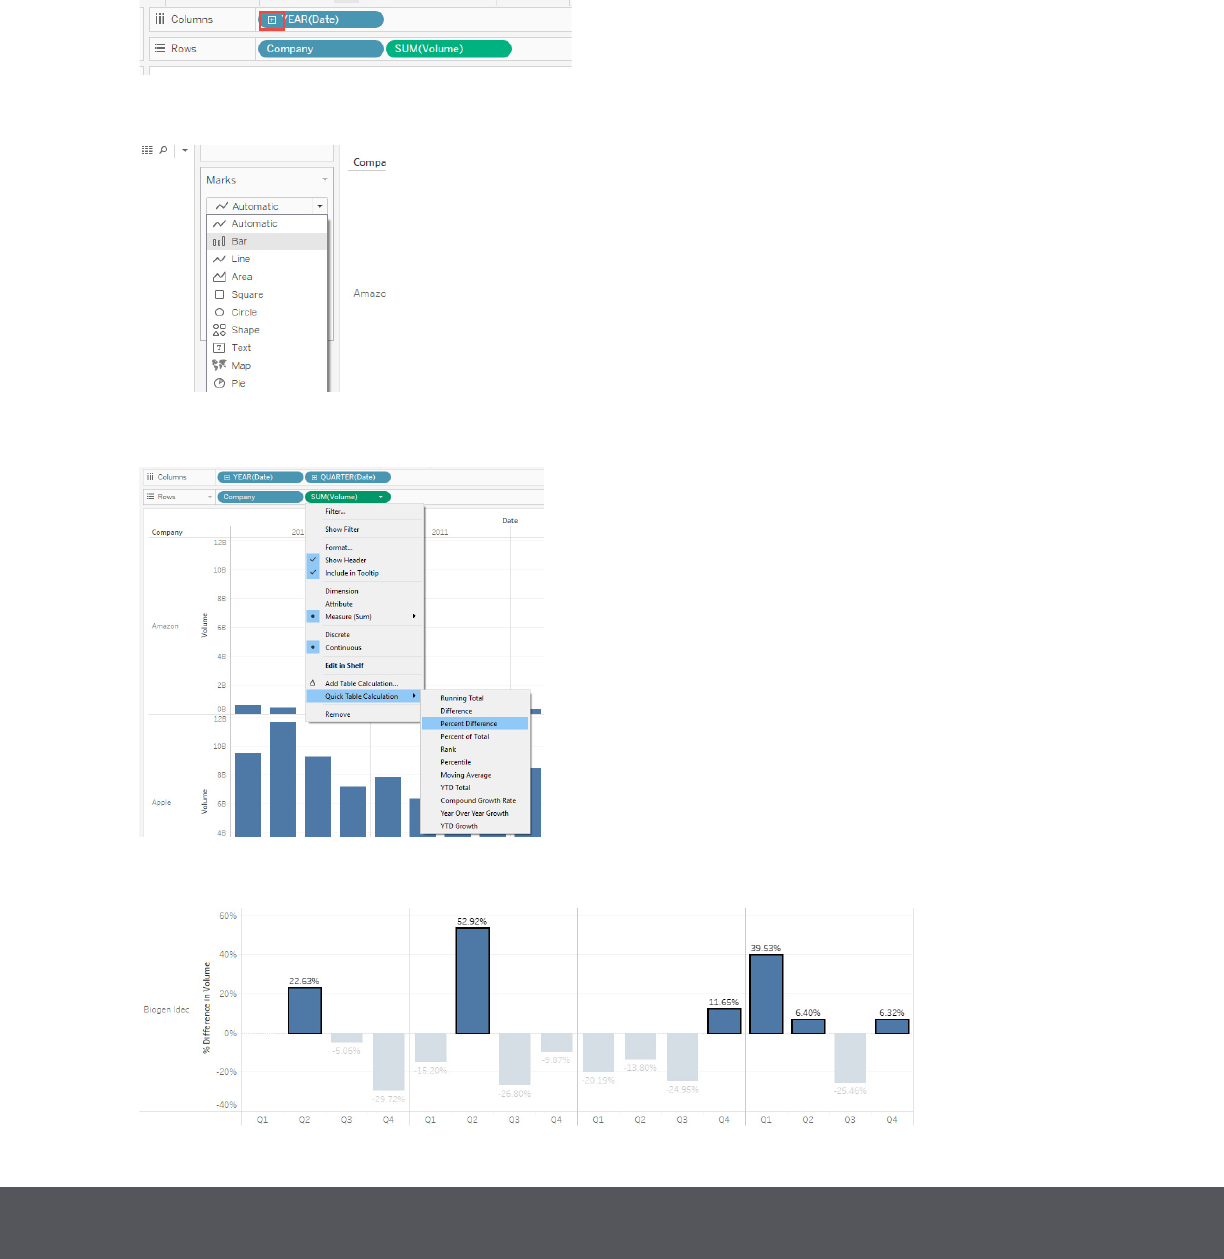
8. Using the Stocks 2010-2013 table, create a chart that shows the percent dierence in Volume for each
company by year and quarter. How many quarters did Biogen Idec show a positive percent dierence in
volume?
The correct answer is d. 6.
The answer to this question can be found by placing Company and Volume on Rows, and Date on
Columns. On Columns, click the plus sign on YEAR(Date) to add QUARTER(Date) to the view.
On the Marks card, change the chart type to Bar.
On Rows, right-click SUM(Volume), click Quick Table Calculation, and then select Percent Dierence.
Click Label on the Marks card, and then click Show mark labels.
Desktop Specialist Exam Guide October 2018
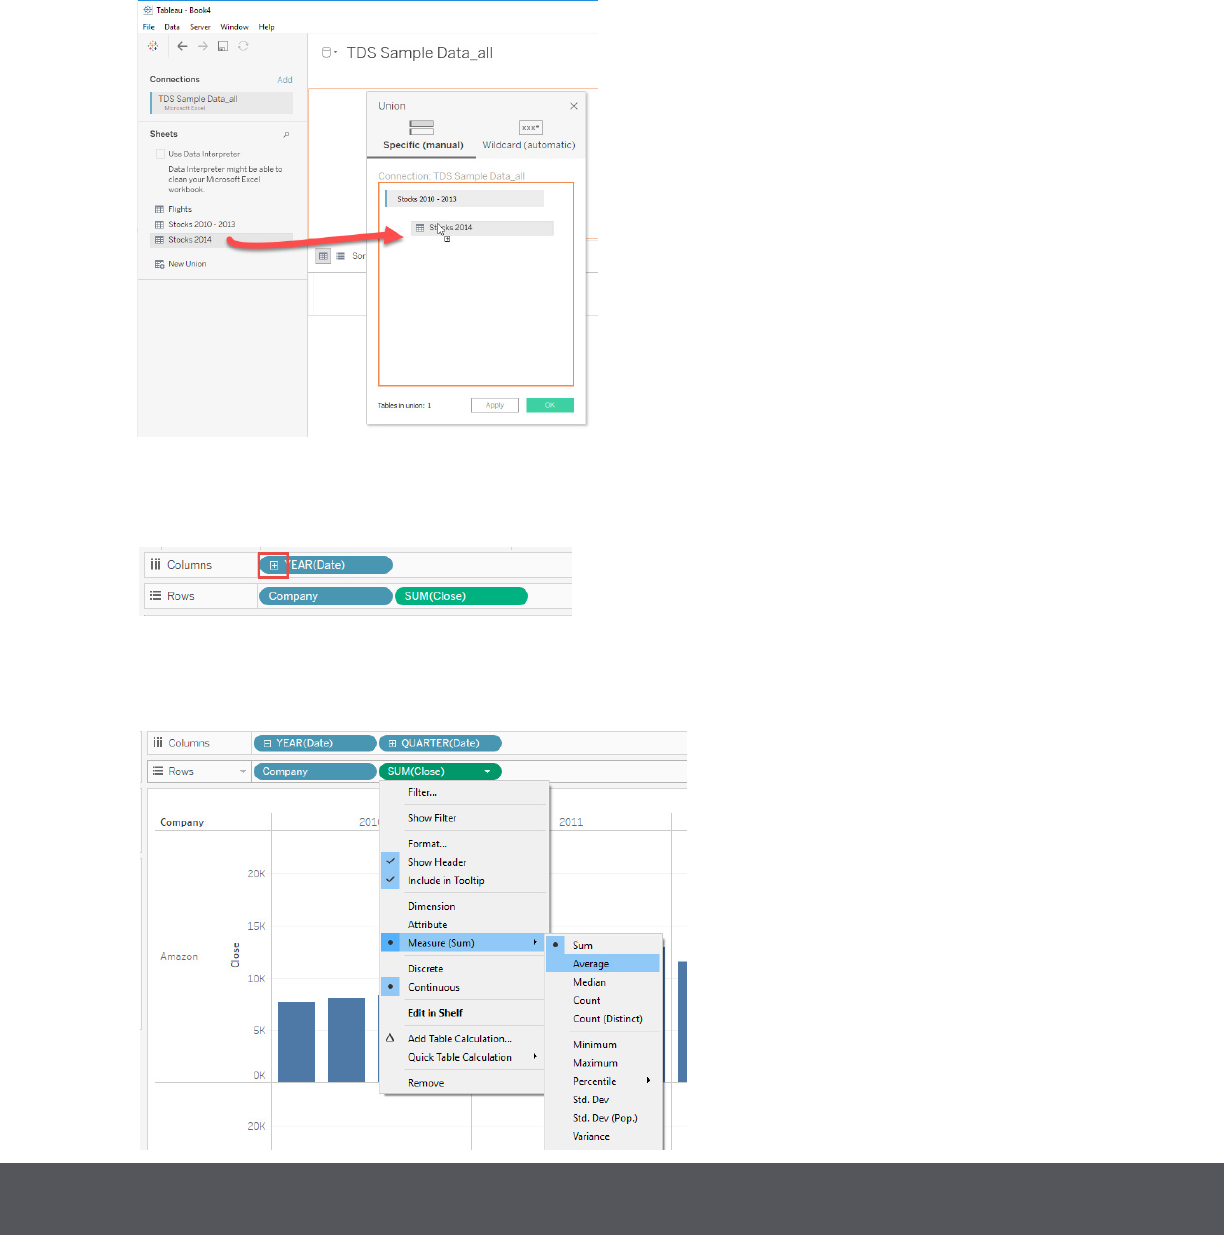
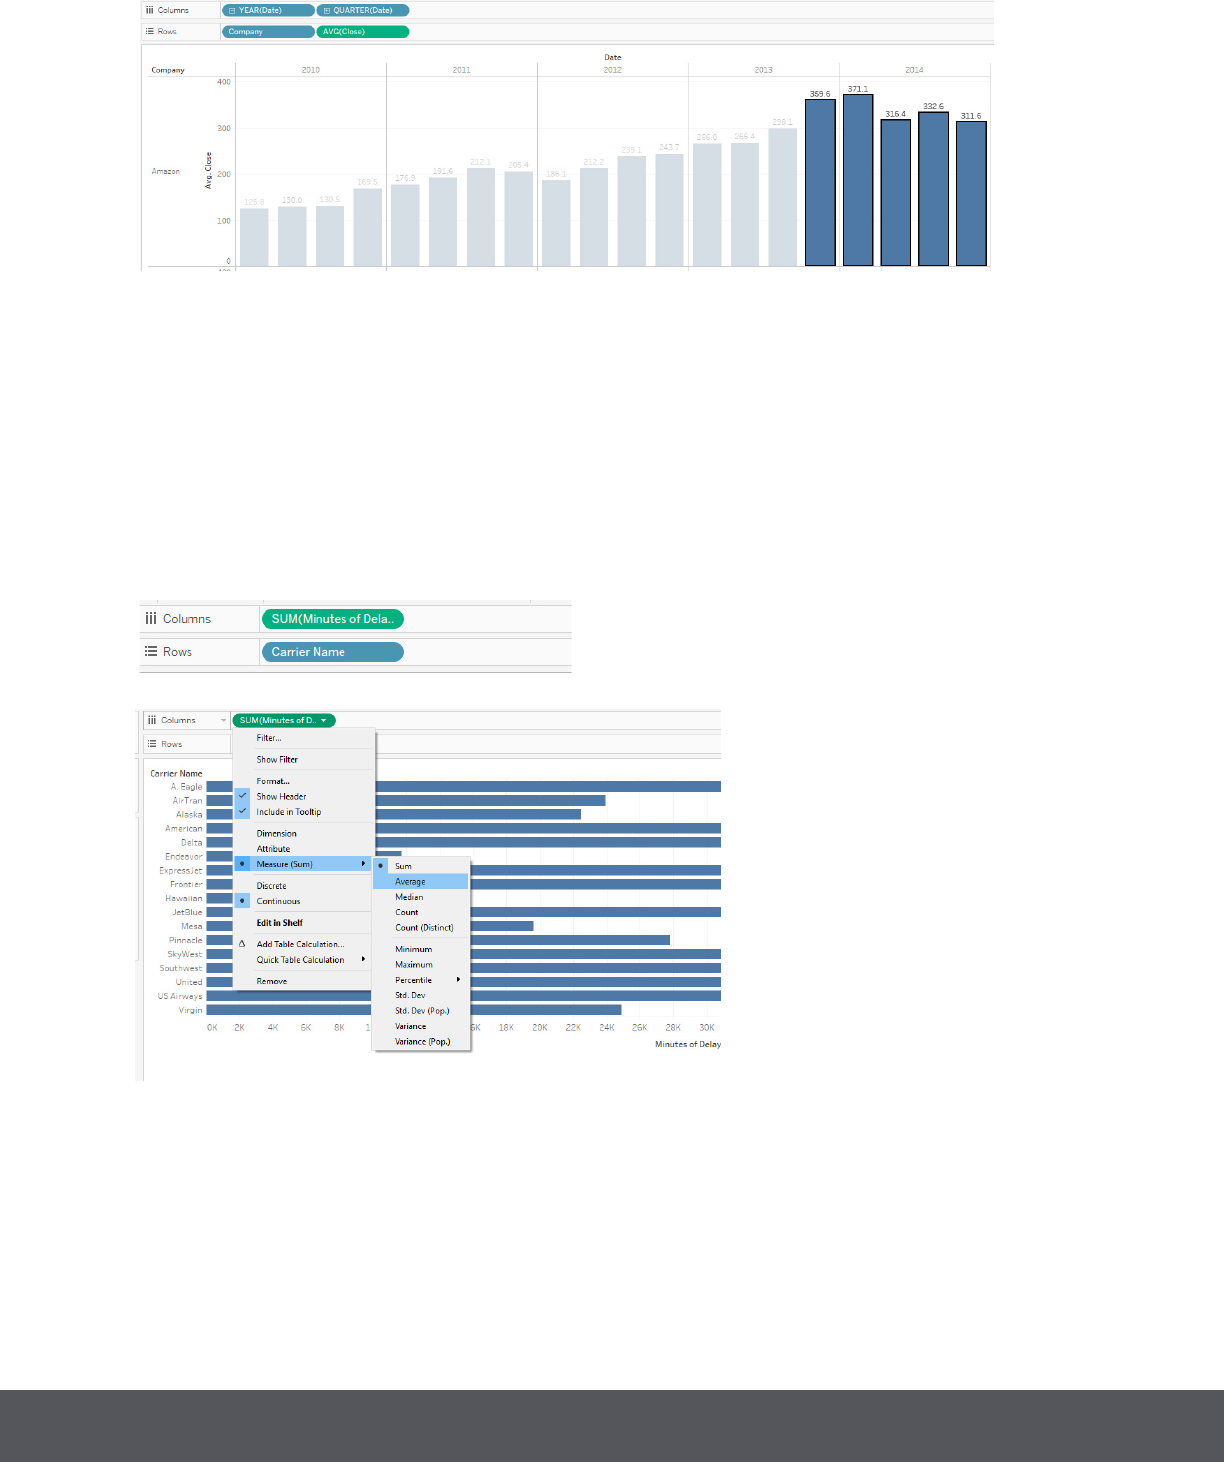
9. Union the Stocks 2010-2013 and Stocks 2014 tables, and then create a chart showing the average Close
price by year and quarter for each Company from 2010 to 2014. How many quarters was Amazon’s average
closing price over $300?
The correct answer is c. 5.
The answer to this question can be found by rst creating a union. On the Data Source tab, double-click
New Union. Drag Stocks 2010-2013 into the dialog box. Then drag Stocks 2014 into the dialog box, click
OK, and then click Sheet 1.
In the view, place Company and Close on Rows, and Date on Columns. On Columns, click the plus sign
on YEAR(Date) to add Quarter to the view.
On the Marks card, change the chart type to Bar. On Rows, right-click SUM(Close), click Measure (Sum), and
then select Average.
Desktop Specialist Exam Guide October 2018
Desktop Specialist Exam Guide January 2018
You can also add mark labels to the nal view to easily identify the average close for each quarter.
10. Using the Flights table, create a bar chart showing the average of Minutes of Delay per Flight broken
down by Carrier Name, and ltered by State to only show Minnesota (MN). What was the average minutes of
delay per ight for United in Minnesota?
The correct answer is c. 62.98.
The answer to this question can be found by placing Carrier Name on Rows. Then place SUM(Minutes of De-
lay per Flight) on Columns and change the measure’s aggregation to Average.
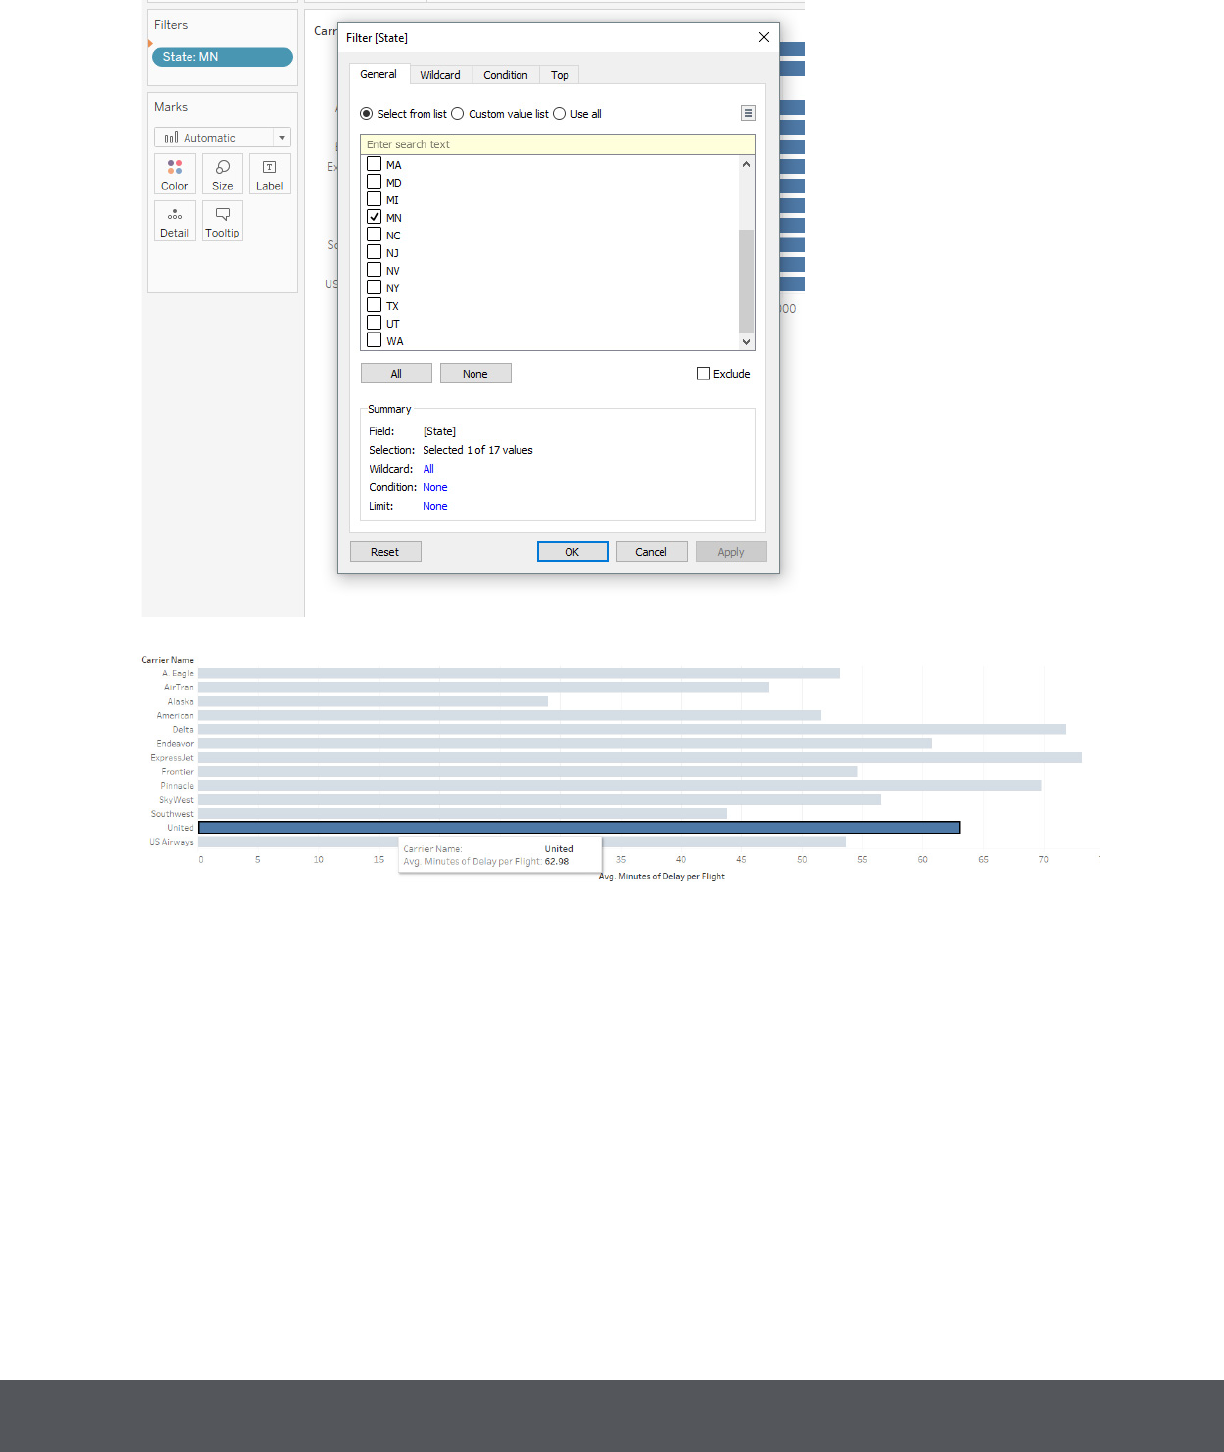
Drag State to Filters and then select ‘MN’ to lter to only show values for Minnesota.
Desktop Specialist Exam Guide October 2018
