E FAST Technical Manual
User Manual:
Open the PDF directly: View PDF ![]() .
.
Page Count: 147 [warning: Documents this large are best viewed by clicking the View PDF Link!]
Forward
Page | 1
www.fastbridge.org
© 2015 Theodore J. Christ and Colleagues, LLC. All rights
reserved.
Formative Assessment
System for Teachers™
(FAST™)
Abbreviated Technical Manual for Iowa
Version 2.0, 2015–2016
NOTICE: Information for measures that were not implemented
statewide is omitted from this publication at the request of
The Iowa Department of Education.
Forward
Page | 1
www.fastbridge.org
© 2015 Theodore J. Christ and Colleagues, LLC. All rights reserved.
Formative Assessment System for Teachers™ (FAST™): Abridged Technical Manual
Version for Iowa 2.0
Copyright © 2015 by Theodore J. Christ and
Colleagues, LLC. All rights reserved.
Warning: No part of this publication may be
reproduced or transmitted in any form or by any
means, electronic or mechanical, now known or later
developed, including, but not limited to,
photocopying, recording, or the process of scanning
and digitizing, transmitted, or stored in a database or
retrieval system, without permission in writing from
the copyright owner.
Published by Theodore J. Christ and Colleagues, LLC (TJCC)
Distributed by TJCC and FastBridge Learning, LLC (FBL)
43 Main Street SE Suite # 509
Minneapolis, MN 55414
Email: help@fastbridge.org
Website: www.fastbridge.org
Phone: 612-424-3714
Prepared by Theodore J. Christ, PhD as Senior Author and Editor with contributions from (alphabetic order)
Yvette Anne Arañas, MA; LeAnne Johnson, PhD; Jessie M. Kember, MA; Stephen Kilgus, PhD; Allyson J. Kiss;
Allison M. McCarthy Trentman, PhD; Barbara D. Monaghen PhD; Gena Nelson, MA; Peter Nelson, PhD; Kirsten
W. Newell, MA; Ethan R. Van Norman, PhD; Mary Jane White, PhD; and Holly Windram, PhD as Associate
Authors and Editors.
Citation:
Theodore J. Christ and Colleagues (2015). Formative Assessment System for Teachers: Abbreviated Technical
Manual for Iowa Version 2.0, Minneapolis, MN: Author and FastBridge Learning (www.fastbridge.org)

Forward
Page | 2
www.fastbridge.org
© 2015 Theodore J. Christ and Colleagues, LLC. All rights reserved.
Forward
Our Story
Over 15 years, our research team received competitive funding from the US Department of Education to build
knowledge and improve educational assessments. The Formative Assessment System for Teachers™ (FAST™) is
how we disseminate that work. It was developed to reduce the gap between research at universities and
results in the classroom, which can take 10 to 30 years in a typical cycle. FAST™ has reduced that to weeks or
months. We innovate today and implement tomorrow.
In 2010, Dr. Zoheb H. Borbora (Co-Founder) and I (Founder) conceptualized and created FAST™ as a cloud-
based system at the University of Minnesota. Our goal was to use research and technology to make it easier
for teachers to collect and use data to improve student outcomes. We initially tried to create and distribute for
free. That model was unsustainable. We had no resources to achieve our standard of excellence. The school
leadership and teachers that were our partners preferred an excellent low-cost system over a good free
system. With the University, we made this transition in early 2012. The demand for FAST™ was tremendous
and overwhelming. The demand quickly outpaced what we could support at the University. So, FastBridge
Learning was launched in the spring of 2015 to distribute and support FAST™.
FastBridge Learning is a partnership between the University of Minnesota, “Theodore J. Christ and Colleagues”
(TJCC), and the FAST™ team. In 2014–15, FAST™ was used in more than 30 states, which includes a statewide
adoption in Iowa (92% of schools). FAST™ users exceeded 5 million administrations in 2014–15. The feedback
has been tremendous. In partnership, we continue to strive for our vision: Research to Results™.
Our Mission
The University of Minnesota and TJCC continue with their mission to innovate with research and
development. FastBridge Learning continues to translate those innovations into practice for use by teachers.
We aspire to provide a seamless and fully integrated solution for PreK–12 teaching, learning, and assessment.
We are not just about assessment. We are about learning and optimization of teaching, parenting, and being.
FAST™ was the centerpiece of FastBridge Learning in 2014–15. It will soon be supplemented with teaching
and learning tools (e.g., materials, guides, reports, and automated software-based personalized instruction).
Like-minded researchers and trainers are encouraged to join our cause (ted@fastbridge.org,
www.fastbridge.org). Educators are invited to join FastBridge Learning and challenge us to innovate and
deliver solutions for the most challenging teaching and learning problems.
Our Values
We are values driven. We strive towards our values. Those are: Tell the Truth, Respect the Teacher, and
Deliver High-Value Solutions. These values inform our work, and we measure our successes against them.
We invite others to hold us accountable.

Forward
Page | 3
www.fastbridge.org
© 2015 Theodore J. Christ and Colleagues, LLC. All rights reserved.
We Tell the Truth
Perhaps more than at any time in the past, educators are bombarded with claims of research, evidence, data,
statistics, and assessments. These words relate to very important and lofty subject matter that is undermined
when they are misused or abused for marketing, sales, or self-promotion. We strive to know better and do
better. We strive to tell the truth. And, the truth is that all research has its limitations, as do the various types of
assessment and data. That is true regardless of any misleading claims. So, we acknowledge the limitations of
the tools we deliver, and we do not exaggerate our claims. Instead, we deliver multiple types of assessment in
one suite and provide guidance so users use the right tool for the right purpose. It is an honest and better
solution for teachers.
We Respect the Teacher
At the beginning, FAST™ (Formative Assessment System for Teachers) was named to make the value of
teachers explicit. They are the primary intended user so we include them and value their opinions that guide
our research, development and refinement. We are in service to the professional educator. We aspire to make
their work easier and more effective.
I (Dr. Christ) was a paraprofessional, residential counselor, and special education teacher. I earned my MA and
PhD degrees in school psychology as part of my professional development to be a better teacher for students
who are at risk. I always intended to return to the classroom but was drawn into a research career, which gives
me great joy. Our team respects, responds, and solicits input from teachers who work to solve difficult
problems with limited resources. We try to understand and meet their needs—and yours—with quality
research, engineering, training, and support.
We Deliver High-Value Solutions
We strive to provide systems and services that are effective, efficient, elegant and economical.
An effective solution improves child outcomes.
An efficient solution saves time and resources.
An elegant solution is pleasing and easy to use.
An economical solution is sustainable for us and our users.
Design and user focus are central tenets.

Forward
Page | 4
www.fastbridge.org
© 2015 Theodore J. Christ and Colleagues, LLC. All rights reserved.
Final Note from Dr. Christ
Thank you for considering our work. It is a compilation of efforts by many graduate and undergraduate
students, researchers, teachers, principals, and state agencies. This would not exist without them. I am very
thankful for their contributions. I hope it confers great benefit to the professional educator and the children
they serve. Education has the potential to be the great equalizer and reduce the gaps in opportunity and
achievement; however, we will only realize that potential if education is of high and equitable quality. I hope
we help in the pursuit of that.
Sincerely,
Ted
Theodore J. Christ, PhD
Co-Founder and Chief Scientific Officer

Table of Contents
Page | 5
www.fastbridge.org
© 2015 Theodore J. Christ and Colleagues, LLC. All rights reserved.
Contents
Forward ....................................................................................................................................................................................2
Our Story..................................................................................................................................................................................2
Our Mission .............................................................................................................................................................................2
Our Values ...............................................................................................................................................................................2
We Tell the Truth..............................................................................................................................................................3
We Respect the Teacher................................................................................................................................................3
We Deliver High-Value Solutions ...............................................................................................................................3
Final Note from Dr. Christ ..................................................................................................................................................4
Table of Figures..........................................................................................................................................................................8
Table of Tables............................................................................................................................................................................9
Section 1. Introduction to FAST™ and FastBridge Learning.................................................................................... 13
Chapter 1.1: Overview, Purpose, and Description ................................................................................................. 13
Background..................................................................................................................................................................... 13
All in One.......................................................................................................................................................................... 13
Support and Training .................................................................................................................................................. 14
Trusted Results............................................................................................................................................................... 14
Curriculum-Based Measurement (CBM) ............................................................................................................... 14
Prevention and Intervention .................................................................................................................................... 15
Chapter 1.2: Development ............................................................................................................................................. 15
Chapter 1.3: Administration and Scoring.................................................................................................................. 15
Setting Standards ......................................................................................................................................................... 15
Chapter 1.4: Interpretation of Test Results ............................................................................................................... 16
Standard Setting ........................................................................................................................................................... 16
Chapter 1.5: Reliability ..................................................................................................................................................... 20
Chapter 1.6: Validity.......................................................................................................................................................... 21
Chapter 1.7: Diagnostic Accuracy of Benchmarks ................................................................................................. 21
A Conceptual Explanation: Diagnostic Accuracy of Screeners..................................................................... 22
Decisions that Guide Benchmarks Selection: Early Intervention and Prevention ................................. 22
Area Under the Curve (AUC) ..................................................................................................................................... 23
Decision Threshold: Benchmark.............................................................................................................................. 23
Section 2. Reading and Language.................................................................................................................................... 25
Chapter 2.1: Overview, Purpose, and Description ................................................................................................. 25

Table of Contents
Page | 6
www.fastbridge.org
© 2015 Theodore J. Christ and Colleagues, LLC. All rights reserved.
earlyReading................................................................................................................................................................... 25
CBMreading .................................................................................................................................................................... 27
aReading .......................................................................................................................................................................... 29
Chapter 2.2: Development ............................................................................................................................................. 37
earlyReading................................................................................................................................................................... 37
CBMreading .................................................................................................................................................................... 38
aReading .......................................................................................................................................................................... 38
Chapter 2.3: Administration and Scoring.................................................................................................................. 43
earlyReading................................................................................................................................................................... 43
CBMreading .................................................................................................................................................................... 43
aReading .......................................................................................................................................................................... 44
Chapter 2.4: Interpreting Test Results........................................................................................................................ 44
earlyReading................................................................................................................................................................... 44
CBMreading .................................................................................................................................................................... 46
aReading .......................................................................................................................................................................... 47
Chapter 2.5: Reliability ..................................................................................................................................................... 49
earlyReading................................................................................................................................................................... 49
CBMreading .................................................................................................................................................................... 59
aReading .......................................................................................................................................................................... 72
Chapter 2.6: Validation..................................................................................................................................................... 72
earlyReading................................................................................................................................................................... 72
CBMreading .................................................................................................................................................................... 80
aReading .......................................................................................................................................................................... 86
Chapter 2.7: Diagnostic Accuracy..............................................................................................................................101
earlyReading.................................................................................................................................................................101
CBMreading ..................................................................................................................................................................108
aReading ........................................................................................................................................................................114
Section 6. FAST™ as Evidence-Based Practice ............................................................................................................121
6.1: Theory of Change ....................................................................................................................................................122
6.2: Formative Assessment as Evidence-Based Practice....................................................................................122
US Department of Education..................................................................................................................................122
Historical Evidence on Formative Assessment.................................................................................................123
Evidence Based: Contemporary Evidence on Formative Assessment.....................................................123
6.3: Evidence-Based: Formative Assessment System for Teachers ................................................................125
FAST™ Improves Student Achievement .............................................................................................................125

Table of Contents
Page | 7
www.fastbridge.org
© 2015 Theodore J. Christ and Colleagues, LLC. All rights reserved.
FAST™ Improves the Practice of Teachers..........................................................................................................126
FAST™ Provides High Quality Formative Assessments..................................................................................126
References...............................................................................................................................................................................127
Appendix A: Benchmarks and Norms Information...................................................................................................145
Appendix B: FastBridge Learning Reading Diagnostic Accuracy ........................................................................146

Table of Contents
Page | 8
www.fastbridge.org
© 2015 Theodore J. Christ and Colleagues, LLC. All rights reserved.
Table of Figures
Figure 1 A priori model for unified reading achievement ....................................................................................... 40
Figure 3. Example of a student's aReading report with interpretations of the scaled score....................... 48
Figure 14 Theory of Change .............................................................................................................................................122

Table of Contents
Page | 9
www.fastbridge.org
© 2015 Theodore J. Christ and Colleagues, LLC. All rights reserved.
Table of Tables
Table 1 Example Standards for Informational Text .................................................................................................... 42
Table 2 Foundational Skill Examples for Kindergarten and First Grade Students........................................... 42
Table 3 Cross-Referencing CCSS Domains and aReading Domains..................................................................... 42
Table 4 Weighting Scheme for earlyReading Composite Scores.......................................................................... 45
Table 5. Demographic Information for earlyReading Alternate Form Sample................................................. 49
Table 6 Alternate Form Reliability and SE
m
for earlyReading................................................................................ 50
Table 7 Internal Consistency for earlyReading subtests of variable test length.............................................. 52
Table 8 Internal Consistency for earlyReading subtests of fixed test length .................................................... 52
Table 9 Descriptive Information for earlyReading Test-Retest Reliability Sample.......................................... 54
Table 10 Test-Retest Reliability for all earlyReading Screening Measures ......................................................... 55
Table 11 Disaggregated Test Re-Test Reliability for earlyReading Measures ................................................... 56
Table 12 Inter-Rater Reliability by earlyReading Subtest ........................................................................................ 57
Table 13 Demographic Information for earlyReading Reliability of the Slope Sample................................. 57
Table 14 Reliability of the Slope for all earlyReading screening measures........................................................ 58
Table 15. Reliability of the Slope for earlyReading measures, Disaggregated by Ethnicity ........................ 59
Table 16. Demographic Information for CBMreading First Passage Reduction Sample .............................. 61
Table 17 Descriptive Statistics for First Passage Reduction..................................................................................... 62
Table 18. Demographic Information for Second Passage Reduction Sample.................................................. 62
Table 19 Cut-points used for assigning students to CBMreading passage level based on words read
correct per minute (WRC/min)........................................................................................................................................... 63
Table 20 Descriptive Statistics for Second CBMreading Passage Reduction Sample .................................... 64
Table 21 Alternate Form Reliability and SE
m
for CBMreading (Restriction of Range)................................... 64
Table 22 Internal Consistency for CBMreading Passages......................................................................................... 66
Table 23 Split-Half Reliability for CBMreading passages.......................................................................................... 66
Table 24 Evidence for Delayed Test-Retest Reliability of CBMreading................................................................ 67
Table 25 CBMreading Delayed Test-Retest Reliability Disaggregated by Ethnicity....................................... 68
Table 26 Evidence of Inter-Rater Reliability for CBMreading.................................................................................. 69
Table 27 Reliability of the Slope for CBMreading........................................................................................................ 69
Table 28 Reliability of the Slope of CBMreading by Passage using Spearman-Brown Split Half
Correlation ................................................................................................................................................................................ 70
Table 29 Reliability of the Slope for CBMreading by Passage using multi-level analyses............................ 71
Table 30 CBMreading Reliability of the Slope - Disaggregated Data................................................................... 72
Table 31 Demographics for Criterion-Related Validity Sample for earlyReading Composite Scores ......74
Table 32 Sample-Related Information for Criterion-Related Validity Data (earlyReading).......................... 74
Table 33 Concurrent and Predictive Validity for all earlyReading measures .................................................... 76
Table 34. Criterion Validity of Spring earlyReading Composite (Updated weighting scheme) with
Spring aReading: MN LEA 3 (Spring Data Collection)................................................................................................ 77
Table 35 Predictive Validity of the Slope for All earlyReading Measures ........................................................... 78
Table 36 Discriminant Validity for Kindergarten earlyReading Measures.......................................................... 78

Table of Contents
Page | 10
www.fastbridge.org
© 2015 Theodore J. Christ and Colleagues, LLC. All rights reserved.
Table 37. Discriminant Validity for First Grade earlyReading Subtests ............................................................... 79
Table 38 Concurrent and Predictive Validity for CBMreading................................................................................ 81
Table 39. Criterion Validity of Spring CBMreading with Spring CRCT in Reading: GA LEA 1 (Spring Data
Collection) ................................................................................................................................................................................. 82
Table 40. Criterion Validity of Spring CBMreading with Spring MCA-III in Reading: MN LEA 4 (Spring
Data Collection)....................................................................................................................................................................... 83
Table 41. Criterion Validity of Spring CBMreading with Spring MCA-III in Reading: MN LEA 3 (Spring
Data Collection)....................................................................................................................................................................... 83
Table 42. Criterion Validity of Spring CBMreading with Spring Minnesota Comprehensive Assessment
III (MCA-III) in Reading: MN LEA 2 (Spring Data Collection)..................................................................................... 84
Table 43. Criterion Validity of Spring CBMreading on Spring MAP in Reading: WI LEA 1 (Spring Data
Collection) ................................................................................................................................................................................. 84
Table 44. Criterion Validity of Spring CBMreading with Spring Massachusetts Comprehensive
Assessment (MCA): MA LEA 1 (Spring Data Collection)............................................................................................ 85
Table 45 Predictive Validity for the Slope of Improvement by CBMreading Passage Level........................ 85
Table 46 Correlation Coefficients between CBMreading Slopes, AIMSweb R-CBM, and DIBELS Next... 86
Table 47 School Data Demographics for aReading Pilot Test ................................................................................ 90
Table 48 Summarization of K–5 aReading Parameter Estimates by Domain.................................................... 90
Table 49 Item Difficulty Information for K-5 aReading Items ................................................................................. 91
Table 50 School Demographics for Field-Based Testing of aReading Items..................................................... 91
Table 51 Sample Sizes for K-5 aReading Field-Testing by Grade and School................................................... 92
Table 52 Descriptive Statistics of K–12 aReading Item Parameters...................................................................... 96
Table 53 Demographics for Criterion-Related Validity Sample for GMRT-4th and aReading....................... 97
Table 54 Sample-Related Information for aReading Criterion-Related Validity Data.................................... 98
Table 55 Correlation Coefficients between GMRT-4th and aReading Scaled Score ........................................ 98
Table 56 Content, Construct, and Predictive Validity of aReading....................................................................... 99
Table 57. Criterion Validity of Spring aReading with Spring Minnesota Comprehensive Assessment III
(MCA-III) in Reading: MN LEA 1 (Spring Data Collection) ......................................................................................... 99
Table 58. Criterion Validity for Spring aReading with Spring MCA-III in Reading: MN LEA 4 (Spring Data
Collection) ...............................................................................................................................................................................100
Table 59. Criterion Validity for Spring aReading with Spring MCA-III in Reading: MN LEA 3 (Spring Data
Collection) ...............................................................................................................................................................................100
Table 60. Criterion Validity of Spring aReading with Spring CRCT in Reading: GA LEA 1 (Spring to
Spring Prediction).................................................................................................................................................................100
Table 61.Criterion Validity of Spring aReading with Spring Massachusetts Comprehensive Assessment
(MCA): MA LEA 1 (Spring Data Collection)...................................................................................................................101
Table 62 Kindergarten Diagnostic Accuracy for earlyReading Measures.........................................................102
Table 63 First Grade Diagnostic Accuracy for earlyReading Measures .............................................................103
Table 64. Diagnostic Accuracy of Fall earlyReading Concepts of Print Subtest with Winter aReading:
MN LEA 3 (Fall to Winter Prediction)..............................................................................................................................104

Table of Contents
Page | 11
www.fastbridge.org
© 2015 Theodore J. Christ and Colleagues, LLC. All rights reserved.
Table 65. Diagnostic Accuracy of Fall earlyReading Onset Sounds Subtest with Winter aReading: MN
LEA 3 (Fall to Winter Prediction)......................................................................................................................................104
Table 66. Diagnostic Accuracy of Fall earlyReading Letter Names Subtest with Winter aReading: MN
LEA 3 (Fall to Winter Prediction)......................................................................................................................................104
Table 67. Diagnostic Accuracy of Fall earlyReading Letter Sounds Subtest with Winter aReading: MN
LEA 3 (Fall to Winter Prediction)......................................................................................................................................105
Table 68. Diagnostic Accuracy of Fall earlyReading Letter Sounds Subtest with Spring aReading: MN
LEA 3 (Fall to Spring Prediction)......................................................................................................................................105
Table 69. Diagnostic Accuracy of Winter earlyReading Letter Sounds Subtest with Spring aReading: MN
LEA 3 (Winter to Spring Prediction) ...............................................................................................................................105
Table 70. Diagnostic Accuracy of Winter earlyReading Rhyming Subtest with Spring aReading: MN LEA
3 (Winter to Spring Prediction)........................................................................................................................................105
Table 71. Diagnostic Accuracy of Fall earlyReading Word Segmenting Subtest with Winter aReading:
MN LEA 3 (Fall to Winter Prediction)..............................................................................................................................106
Table 72. Diagnostic Accuracy of Fall earlyReading Nonsense Words Subtest with Winter aReading: MN
LEA 3 (Fall to Winter Prediction)......................................................................................................................................106
Table 73. Diagnostic Accuracy of Fall earlyReading Sight Words Subtest with Winter aReading: MN LEA
3 (Fall to Winter Prediction) ..............................................................................................................................................106
Table 74. Diagnostic Accuracy of Fall earlyReading Sentence Reading Subtest with Winter aReading:
MN LEA 3 (Fall to Winter Prediction)..............................................................................................................................106
Table 75. Diagnostic Accuracy of Fall earlyReading Sentence Reading Subtest with Spring aReading:
MN LEA 3 (Fall to Spring Prediction)..............................................................................................................................107
Table 76. Diagnostic Accuracy of Winter earlyReading Sentence Reading Subtest with Spring
aReading: MN LEA 3 (Winter to Spring Prediction) ..................................................................................................107
Table 77. Diagnostic Accuracy of Winter earlyReading Composite with Winter aReading: MN LEA 3
(Fall to Winter Prediction)..................................................................................................................................................107
Table 78. Diagnostic Accuracy of Fall earlyReading Composite with Spring aReading: MN LEA 3 (Fall to
Spring Prediction).................................................................................................................................................................107
Table 79. Diagnostic Accuracy of Winter earlyReading Composite with Spring aReading: MN LEA 3
(Winter to Spring Prediction)............................................................................................................................................108
Table 80. Diagnostic Accuracy of Fall earlyReading Composite (2014–15 Weights) with Spring
aReading: MN LEA 3 (Fall to Spring Prediction).........................................................................................................108
Table 81. Diagnostic Accuracy of Winter earlyReading Composite (2014-15 Weights) with Spring
aReading: MN LEA 3 (Winter to Spring Prediction) ..................................................................................................108
Table 82 Diagnostic Accuracy by Grade Level for CBMreading Passages........................................................109
Table 83 Diagnostic Accuracy for CBMreading and MCA III..................................................................................110
Table 84. Diagnostic Accuracy on Fall CBMreading with Spring CRCT in Reading: GA LEA 1 (Fall to
Spring Prediction).................................................................................................................................................................111
Table 85. Diagnostic Accuracy on Winter CBMreading on Spring CRCT in Reading: GA LEA 1 (Winter to
Spring Prediction).................................................................................................................................................................111

Table of Contents
Page | 12
www.fastbridge.org
© 2015 Theodore J. Christ and Colleagues, LLC. All rights reserved.
Table 86. Diagnostic Accuracy of Fall CBMreading with Spring MCA-III in Reading: MN LEA 3 (Fall to
Spring Prediction).................................................................................................................................................................112
Table 87. Diagnostic Accuracy for Fall CBMreading with Spring Minnesota Comprehensive Assessment
III (MCA-III) in Reading: MN LEA 2 (Fall to Spring Prediction)................................................................................112
Table 88. Diagnostic Accuracy for Winter CBMreading with Spring Minnesota Comprehensive
Assessment III (MCA-III) in Reading: MN LEA 2 (Winter to Spring Prediction) ................................................113
Table 89. Diagnostic Accuracy for Winter CBMreading with MCA-III in Reading: MN LEA 3 (Winter to
Spring Prediction).................................................................................................................................................................113
Table 90. Diagnostic Accuracy of Winter CBMreading with Spring Massachusetts Comprehensive
Assessment (MCA): MA LEA 1 (Winter to Spring Prediction) ................................................................................114
Table 91 Diagnostic Accuracy statistics for aReading and GMRT-4th .................................................................115
Table 92 Diagnostic Accuracy Statistics for aReading and MAP..........................................................................116
Table 93 Diagnostic Accuracy for aReading and MCA-III .......................................................................................116
Table 94. Diagnostic Accuracy of Spring aReading with Spring MAP in Reading: WI LEA 1 (Spring Data
Collection) ...............................................................................................................................................................................117
Table 95. Diagnostic Accuracy of Fall aReading with Spring MCA-III in Reading: MN LEA 3 (Fall to Spring
Prediction)...............................................................................................................................................................................118
Table 96. Diagnostic Accuracy of Winter aReading with Spring MCA-III in Reading: MN LEA 3 (Winter to
Spring Prediction).................................................................................................................................................................118
Table 97. Diagnostic Accuracy Fall aReading with Spring Massachusetts Comprehensive Assessment
(MCA): Cambridge, MA (Fall to Spring Prediction) ...................................................................................................119
Table 98. Diagnostic Accuracy of Winter aReading with Spring Massachusetts Comprehensive
Assessment (MCA): MA LEA 1 (Winter to Spring Prediction) ................................................................................119
Table 99. Diagnostic Accuracy of Fall aReading with Spring CRCT in Reading: GA LEA 1 (Fall to Spring
Prediction)...............................................................................................................................................................................120
Table 100. Diagnostic Accuracy of Winter aReading with Spring CRCT in Reading: GA LEA 1 (Winter to
Spring Prediction).................................................................................................................................................................120
Table 101. Diagnostic Accuracy of Winter aReading with Spring Criterion-Referenced Competency
Tests (CRCT) in Reading: Georgia LEA 1 (Winter to Spring Prediction) .............................................................121
Table 102. Diagnostic Accuracy of Fall aReading with Spring Minnesota Comprehensive Assessment III
(MCA-III) in Reading: MN LEA 2 (Fall to Spring Prediction) ....................................................................................121
Table 103. Estimates of the Increase in the Percentage of Students who are Proficient or above with
the Implementation of Formative Assessment (Kingston & Nash, 2011, p. 35).............................................124
Table 104. FAST™ Statistical Significance and Effect Sizes.....................................................................................125
Table 105. Summary of Diagnostic Accuracy AUC Statistics and Validity Evidence.....................................146

Section 1. Introduction
Page | 13
www.fastbridge.org
© 2015 Theodore J. Christ and Colleagues, LLC. All rights reserved.
Section 1. Introduction to FAST™ and FastBridge Learning
This document provides a brief overview of FastBridge Learning and a detailed description of the
Formative Assessment System for Teachers™ (FAST™) measures. This document is partitioned into six
major sections:
Introduction to FAST™ and FastBridge Learning
Reading Measures
Math Measures
Social-Emotional-Behavioral Measures
Early Childhood and School Readiness
FAST™ as Evidence-Based Practice
The introduction and measurement sections are organized into chapters: (1) Overview, Purpose, and
Description, (2) Development, (3) Administration and Scoring, (4) Interpretation of Test Results, (5)
Reliability, (6) Validation, and (7) Diagnostic Accuracy of Benchmarks.
Chapter 1.1: Overview, Purpose, and Description
FAST™ was developed by researchers as a cloud-based system for teachers and educators.
Background
FAST™ assessments were developed by researchers at universities from around the country, which
include the Universities of Minnesota, Georgia, Syracuse, East Carolina, Buffalo, Temple, and Missouri.
FAST™ cloud-based technology was developed to support the use of those assessments for learning.
Although there is a broad set of potential uses, the system was initially conceptualized to make it
easier for teachers (see the Forward for more information).
FAST™ is designed for use within Multi-Tiered Systems of Support (MTSS) and Response to
Intervention (RTI) frameworks for early intervention and prevention of deficits and disabilities. It is
research- and evidence-based. FAST™ is distinguished and trusted by educators. It is transforming
teaching and learning for educators and kids nationwide.
All in One
FAST™ is one, comprehensive, simple cloud-based system with Curriculum-
Based Measurement (CBM) and Computer-Adaptive Tests (CAT) for universal
screening, progress monitoring, MTSS/RTI support, online scoring, and
automated reporting. It is easy to implement with online training and
resources, automated rostering and SIS integration, nothing to install or
maintain, and multi-platform and device support.

Section 1. Introduction
Page | 14
www.fastbridge.org
© 2015 Theodore J. Christ and Colleagues, LLC. All rights reserved.
Support and Training
Our school support team is accessible and responsive for support via live
chat, e-mail, or phone. When combined with our knowledge base—full of
quick tips, articles, videos, webinars, and flipped training for staff—in
addition to customized online or onsite training, your teachers and
administration are supported at every step.
Trusted Results
FAST™ is an evidence-based formative assessment system that was
developed by researchers at the University of Minnesota in cooperation
with others from around the country. They set out to offer teachers an
easier way to access and use the highest quality formative assessments.
Researchers and developers are continuously engaged with teachers and
other users to refine and develop the best solutions for them. (e.g., better
data, automated assessments, and sensible reports).
Curriculum-Based Measurement (CBM)
Our Curriculum-Based Measures (CBM) are highly sensitive to growth over
brief periods. We offer Common Core-aligned CBM measures with online
scoring and automated skills analysis in earlyReading and earlyMath (K-1),
CBMreading, CBMcomprehension, and CBMmath (1-6).
Automated Assessments
Our Computer-Adaptive Tests (CAT) provide a reliable measure of broad
achievement and predict high-stakes test outcomes with high accuracy.
Automatically adapting to students’ skill levels to inform instruction and
identify MTSS/RtI grouping, we offer aReading (K–12), aMath (K–6), and
Standards-Based Math (6–8).

Section 1. Introduction
Page | 15
www.fastbridge.org
© 2015 Theodore J. Christ and Colleagues, LLC. All rights reserved.
Prevention and Intervention
Designed for Multi-Tiered Systems of Support (MTSS) and Response to
Intervention (RTI), FAST™ makes program implementation easy and
efficient with automated scoring, analysis, norming and reporting;
customizable screening, benchmarking, instructional recommendations,
and progress monitoring.
Chapter 1.2: Development
FastBridge Learning has a strong foundation in both research and theory. FAST™ assessments were
created to provide a general estimate of overall achievement in reading and math, as well as provide a
tool to identify students at risk for emotional and behavioral problems. For reading and math
assessments, item banks have been created containing a variety of items, including those with
pictures, words, individual letters and letter sounds, sentences, paragraphs, and combinations of these
elements. Overall, FastBridge Learning aims to extend and improve on the quality of currently
available assessments.
Chapter 1.3: Administration and Scoring
FAST™ is supported by an extensive set of materials to support teachers and students, including self-
directed training modules that allow teachers to become certified to administer each of the
assessments. FAST™ assessments can be administered by classroom teachers, special education
teachers, school psychologists, and other individuals such as paraprofessionals with usually less than
an hour of training. Administration time varies depending on which assessment is being administered.
Online administrations require a hard copy of the student materials (one copy per student) and access
to the FAST™ system (i.e., iPad or computer with Internet connection). Paper-and-pencil assessment
administration materials and instructions are available upon request. As with any assessment, only
students who can understand the instructions and can make the necessary responses should be
administered FAST™ assessments. Assessments should be administered in a quiet area conducive to
optimal performance. The brevity of FAST™ assessments aims to minimize examinee fatigue, anxiety,
and inattention. For the majority of assessments, FAST™ produces automated reports summarizing
raw scores, percentile scores, developmental benchmarks, subscale and subtest scores, and composite
scores. The online system provides standardized directions and instructions for the assessment
administrator.
Setting Standards
Overall, FastBridge Learning uses standard-setting processes to summarize student performance.
Standards may be used to inform goal setting, identify instructional level, and evaluate the accuracy of
student performance. For the purpose of this technical manual, standards are the content or skills that
are expected (
content standards
), which are often defined by a score for purposes of measurement
(
performance standards
). A number of terms are used to reference performance standards, including:
benchmarks, cut scores, performance levels, frustrational, instructional or mastery levels, and

Section 1. Introduction
Page | 16
www.fastbridge.org
© 2015 Theodore J. Christ and Colleagues, LLC. All rights reserved.
thresholds. These terms each reference categories of performance with respect to standards and are
used throughout the technical manual. The method of standard setting is described below.
Chapter 1.4: Interpretation of Test Results
The FastBridge Learning software provides various resources to assist administrators with test result
interpretations. For example, a Visual Conventions drop down menu is available to facilitate
interpretation of screening and progress monitoring group and individual reports. Percentiles are
calculated for local school norms unless otherwise indicated. Local school norms compare individual
student performances to their same grade and school peers. For example, a student in the 72nd
percentile performed as well or better than 72 percent of his or her grade level peers at that school.
Methods of notation are also included to provide information regarding those students predicted to
be at risk. Exclamation marks (! and !!) indicate the level of risk based on national norms. One
exclamation mark refers to some risk, whereas two exclamation marks refer to high risk of reading
difficulties or not meeting statewide assessments benchmarks, based on the score. Interpreting
FastBridge Learning assessment scores involves a basic understanding of the various scores provided
in the FAST™ system and helps to guide instructional and intervention development. FAST™ includes
individual, class, and grade level reports for screening, and individual reports for progress monitoring.
Additionally, online training modules include sections on administering the assessments, interpreting
results, screen casts, and videos.
Results should always be interpreted carefully considering reliability and validity of the score, which is
influenced by the quality of standardized administration and scoring. It important to consider the
intended purpose of the assessment, its content, the stability of performance over time, scoring
procedures, testing situations, or the examinee. The FAST™ system automates analysis, scoring,
calculations, reporting and data aggregation. It also facilitates scaling and equating across screening
and progress monitoring occasions.
Standard Setting
It is necessary to address questions such as, “How much skill/ability defines proficiency?” There are
many methods used for standards setting; however, human judgment is inherent to the process
(Hambleton & Pitoniak, 2006) because some person(s) decide “how many” or “how much is enough”
to meet a standard. Because judgment is involved, there are some criticisms that standard setting is
arbitrary (Glass, 1978) and the results of standard setting are very often the source of debate and
scrutiny.
The Standards for Educational and Psychological Testing
(AERA, APA & NCME, 199) define the
basic requirements to set standards and therein recognize the role of human judgment: “cut scores
embody value judgments as well as technical and empirical considerations” (p. 54). The standard
setting process in designed to ensure those value judgments are well-informed. The
Standards
along
with the professional literature (e.g., Hableton & Pitoniak, 2006; Swets, Dawes & Monahan, 2000) guide
the standard setting processes for FAST™. A brief description of relevant concepts and methods are
below.

Section 1. Introduction
Page | 17
www.fastbridge.org
© 2015 Theodore J. Christ and Colleagues, LLC. All rights reserved.
Kane (1994, 2006, 2013) suggests that the rationale and reasons for the selected standard-setting
procedure are often the most relevant and important source of evidence for the validity of standards
to interpret scores. The method should be explicit, practical for the intended interpretation and use,
implemented with fidelity, and documented (Hambleton & Pitoniak, 2006). The convergence of
standards with other sources of information, such as criterion measures, also contributes to validation;
however, such evidence is often limited because the quality and standards from external sources are
often just as limited (Kane, 2001). Moreover, external sources, such as criterion measures, are often
unavailable or misaligned with the experimental measure or intended use for the standard.
Standard Setting Methods
There are methods to set relative or absolute standards.
Norm-referenced
methods are most familiar
to the general public. They are used to set a relative standard such that a particular proportion of a
population is above or below the standard. For example, if the standard is set at the 40th percentile
then 39% of the population is below and 60% is at or above. Norm-referenced standards are relative to
the performances in the population. As noted by Sereci (2005), “scores are interpreted with respect to
being better or worse than others, rather than with respect to the level of competence of a specific
test taker” (p. 118). Norm-referenced standards are used in FAST™ to guide resource allocation. Grade-
level norms are provided for the class, school, district, and nation.
Absolute- or criterion-referenced methods are less familiar to the general public. They are used to
define “how much is enough” to be above or below a standard. For example, if the standard is that
students should identify all of the letters in the alphabet with 100% accuracy then all of the students
in a particular grade might be above or below that standard. These methods often rely on the
judgment of experts who classify items, behaviors, or individual persons. Those judgments are used to
define the standard. For example, the expert is asked to consider a person whose performance is just
at the standard. They then estimate the probability that person would exhibit a particular behavior or
response correctly to a particular item. Another approach is to have that expert classify individuals as
above or below the standard. Once classified, the performance of the individuals is analyzed to define
the standard. The particular method is carefully selected based on the content and purpose of the
measure and standard. Careful selection of experts and panels, training, procedures, validation and
documentation are all important components of those expert-based approaches.
Norm-Referenced Standards
Norm-referenced
methods are used to set a relative standard such that a particular proportion of a
population is above or below the standard. For example, if the standard is set at the 40th percentile
then 39% of the population is below and 60% is at or above. Norm-referenced standards are relative to
the performances in the population. As noted by Sereci (2005), “scores are interpreted with respect to
being better or worse than others, rather than with respect to the level of competence of a specific
test taker” (p. 118). Norm-referenced standards are used in FAST™ to guide resource allocation. Grade-
level norms are provided for the class, school, district and nation.
Section 1. Introduction
Page | 18
www.fastbridge.org
© 2015 Theodore J. Christ and Colleagues, LLC. All rights reserved.
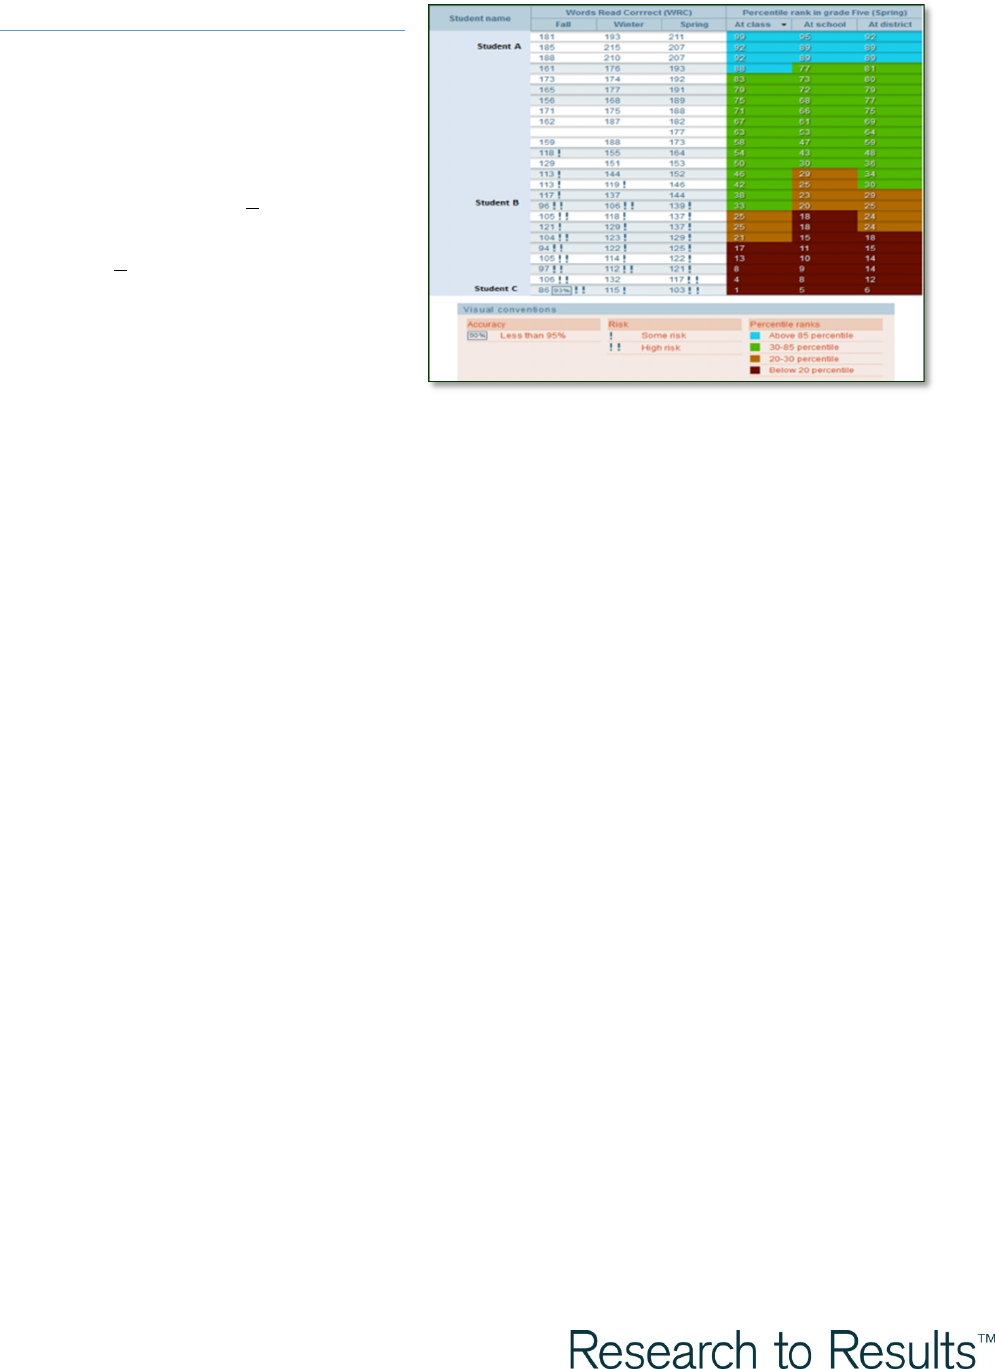
Norm-Referenced Interpretations
FAST™ calculates and reports the percentile
ranks, or percentiles, of scores relative to
same-grade peer performance in the class,
school, district, and FAST™ users around
the nation. Those percentiles are classified
and color-coded in bands: < 19.99th (red),
20th to 29.99th (orange), 30th to 84.99th
(green) and > 85th percentiles (blue). These
standards were set to guide resource
allocations for early intervention and
prevention within multi-tiered systems of
support (MTSS).
Most schools can provide supplemental and intensive supports for students at risk and enrichment for
the highest achieving students. Schools rarely have resources to support more than 30% of at-risk
learners with supplemental and intensive supports; even if a larger proportion would benefit (Christ,
2008; Christ & Arañas, 2014). The norm-referenced standards are applied to each norm group to
support decisions by individual teachers (class norms), school-based grade level teams (school norms)
and district-wide grade level teams (district norms) as to which students receive supports.
The percentiles and standards should be used to identify the individuals who will receive
supplemental support. The proportion of the population who receive supports depends on the
availability of resources. For example, one school might provide supplemental support to all students
below the 30th percentile (red and orange). Another school might provide supplemental support to all
students below the 20th percentile (red), but monitor those below the 30th percentile (orange). These
are local decisions that should be determined in consideration of the balance between student needs
and system resources.
National norms are used to compare local performance to that of an external group. The standards
(color codes) are applied to support decisions about core and system-level supports. Visual analysis of
color codes are useful to estimate the typicality of achievement in the local population. They are often
used in combination with benchmarks to guide school and district level decisions about instruction,
curriculum and system-wide services (e.g., are the school-wide core reading services sufficient to
prevent deficit achievement for 80% of students). If FAST™ data indicate that much more than 20% of
a school or district’s students are below the 20th percentile on national norms, then remediation efforts
in that area should be considered as the data suggest that the core instruction is not supporting
adequate achievement. If they observe that fewer than 20% of the total school population are below
the 20th percentile on national norms, their population is over-performing relative to others.
Subsequently, the school should continue using effective services, but identify another domain of
focus.

Section 1. Introduction
Page | 19
www.fastbridge.org
© 2015 Theodore J. Christ and Colleagues, LLC. All rights reserved.
Criterion-Referenced Standards (Benchmarks)
Absolute
or
criterion-referenced methods
are used to define “how much is enough” to be above or
below a standard. For example, if the standard is that students should identify all of the letters in the
alphabet with 100% accuracy then all of the students in a particular grade might be above or below
that standard. These methods often rely on the judgment of experts who classify items, behaviors, or
individual persons. Those judgments are used to define the standard. For example, the expert is asked
to consider a person whose performance is just at the standard. They then estimate the probability
that person would exhibit a particular behavior or response correctly to a particular item. Another
approach is to have that expert classify individuals as above or below the standard. Once classified,
the performance of the individuals is analyzed to define the standard. The particular method is
carefully selected based on the content and purpose of the measure and standard. Careful selection of
experts and panels, training, procedures, validation, and documentation are all important
components of those expert-based approaches.
FAST™ reports provide tri-annual grade-level benchmarks, which generally correspond with the 15th
and 40th percentiles on national norms. Scores below the 15th percentile are classified as “high-risk.”
Those at-or-above the 15th and below the 40th are “some risk;” and those at or above the 40th are “low
risk.” This is consistent with established procedures and published recommendations (e.g., RTI
Network). It is common practice to use norm-reference standards at the 15th and 40th percentiles; or to
use pre-determined standards on state achievement tests. As quoted from the RTI Network:
“Reading screens attempt to predict which students will score poorly on a future
reading test (i.e., the criterion measure). Some schools use norm-referenced test scores
for their criterion measure, defining poor reading by a score corresponding to a
specific percentile (e.g., below the 10th, 15th, 25th, or 40th percentile). Others define
poor reading according to a predetermined standard (e.g., scoring below “basic”) on
the state’s proficiency test. The important point is that satisfactory and unsatisfactory
reading outcomes are dichotomous (defined by a cut-point on a reading test given
later in the students’ career). Where this cut-point is set (e.g., the 10th or 40th
percentile) and the specific criterion reading test used to define reading failure (e.g., a
state test or SAT 10) greatly affects which students a screen seeks to identify”
(retrieved on 1-24-15 from
http://www.rtinetwork.org/essential/assessment/screening/readingproblems)
The procedure used by FAST™ is described in more detail below. Again, FAST™ establishes
benchmarks that approximate the 15th and 40th percentiles on national norms. This report provides
additional evidence on the correspondence with those standards and proficiency on state tests.
Interpreting Criterion-Referenced Standards
Benchmarks are often used to discern whether students are likely to perform sufficiently on a high-
stakes assessment, such as a state test. FastBridge Learning will estimate specific benchmarks for
states and districts if their state test data are provided (help@fastbridge.org). Another way to interpret

Section 1. Introduction
Page | 20
www.fastbridge.org
© 2015 Theodore J. Christ and Colleagues, LLC. All rights reserved.
benchmarks is to consider them the minimal level of performance that is acceptable. Anything less
places the student at risk. These standards should be met for all students. They are not based on the
distribution of performance unlike norms so
all
students can truly meet benchmark standards.
If more than 30% of students are below the “some risk” benchmark standard, then it is necessary to
modify core instruction and general education instruction to better serve all students. This is the most
efficient approach to remediate widespread deficits. If fewer than 15% of are below the “some risk”
benchmark standard in a specific content area, then core instruction is highly effective. It should be
maintained and other content areas should be considered the focus. Schools often focus on reading
and behavior and then move to math and other content areas as they achieve benchmark standards
for 85% of students in each domain.
Chapter 1.5: Reliability
Reliability refers to the stability with which a test measures the same skills across minimal differences
in circumstances. Nunnally and Bernstein (1994) offer a hierarchical framework for estimating the
reliability of a test, emphasizing the documentation of several forms of reliability. First and foremost,
alternate-form reliability with a two-week interval is recommended, assuming that alternate (but
equivalent) forms of the same test with different items should produce approximate scores. The
second recommended form of reliability is test-retest reliability, which also employs a two-week
interval of time. The same test administered at two different points in time (i.e., the difference of a
two-week interval) should produce approximately the same scores. Finally, inter-rater reliability is
recommended and may be evaluated by comparing scores obtained for the same student by two
different examiners. For many FastBridge Learning assessments, there is no threat to inter-rater
reliability because assessments are electronically scored. For the purpose of this technical manual,
error refers to unintended factors that contribute to changes in scores. Other forms of reliability
evidence include internal consistency (the extent to which different items measure the same general
construct and produce similar scores), and reliability of the slope (the ratio of true score variance to
total variance).
Overall, FastBridge Learning assessments show evidence of reliability coefficients that show promise
for producing little test error. Further, evidence supports the use of FastBridge Learning measures for
screening and progress monitoring, and for informing teachers of whether instructional practices
have been effective or if more and what kind of instruction may be necessary to advance student
growth in reading and math skills. Educators can be confident that the FastBridge Learning
assessments provide meaningful instructional information that can be quickly and easily interpreted
and applied to impact student learning. Current research on FastBridge Learning assessments is
encouraging, suggesting that these assessments may be used to reliably differentiate between
students who are or are not at risk for reading problems, math problems, or behavioral or emotional
problems.

Section 1. Introduction
Page | 21
www.fastbridge.org
© 2015 Theodore J. Christ and Colleagues, LLC. All rights reserved.
Chapter 1.6: Validity
To validate an interpretation or use of test scores is to evaluate the plausibility of the claims based on
those scores (Kane, 2013). According to Kane (2013), interpretations and uses can change over time in
response to evolving needs and new understandings. Additionally, consequences of the proposed
uses of a test score need to be evaluated. Validity refers to the extent to which evidence and theory
support the interpretations of test scores. Types of validity discussed in this technical manual are
content, criterion, predictive, and discriminant validity.
Content validity is the extent to which a test’s items represent the domain or universe intended to be
measured. Criterion-related validity is the extent to which performance on a criterion measure can be
estimated from performance on the assessment procedure being evaluated. Predictive validity is the
extent to which performance on a criterion measure can be estimated from performance across time
on the assessment being evaluated. Finally, discriminant validity is a measure of how well an
assessment distinguishes between two groups of students at different skill levels.
Establishing validity evidence of FastBridge Learning assessments is ongoing. Studies will continue to
provide information regarding the content and construct validity of each assessment. Validity
evidence will be interpreted as data is disaggregated across gender, racial, ethnic, and cultural groups.
All FastBridge Learning assessments were designed to be sensitive to student growth while also
providing instructionally relevant information. Current research supports the validity of FastBridge
Learning assessments across reading, math, and behavioral domains.
Chapter 1.7: Diagnostic Accuracy of Benchmarks
Campbell and Ramey (1994) acknowledged the importance of early identification through the use of
effective screening measures and intervention with those students in need. Early identification,
screening, and intervention have been shown to improve academic and social-emotional/behavioral
outcomes (Severson, Walker, Hope-DooLittle, Kratochwill, & Gresham, 2007). Effective screening is a
pre-requisite for efficient service delivery in a multi-tiered Response to Intervention (RTI) framework
(Jenkins, Hudson, & Johnson, 2007). RTI seeks to categorize students accurately as being at risk or not
at risk for academic failure. Inaccurate categorization can lead to consequences such as ineffective
allocation of already minimal resources.
Section 1. Introduction
Page | 22
www.fastbridge.org
© 2015 Theodore J. Christ and Colleagues, LLC. All rights reserved.
A Conceptual Explanation: Diagnostic Accuracy of Screeners
Within medicine, a diagnostic test can be used to determine the presence or absence of a disease. The
results of a screening device are compared with a “gold standard” of evidence. For instance, a doctor
may administer an assessment testing whether a tumor is malignant or benign. Based on a gold
standard, or later diagnosis, we can estimate how well the screener identifies cases in which the
patient truly has the ailment and cases in which he or she does not. When using any diagnostic test
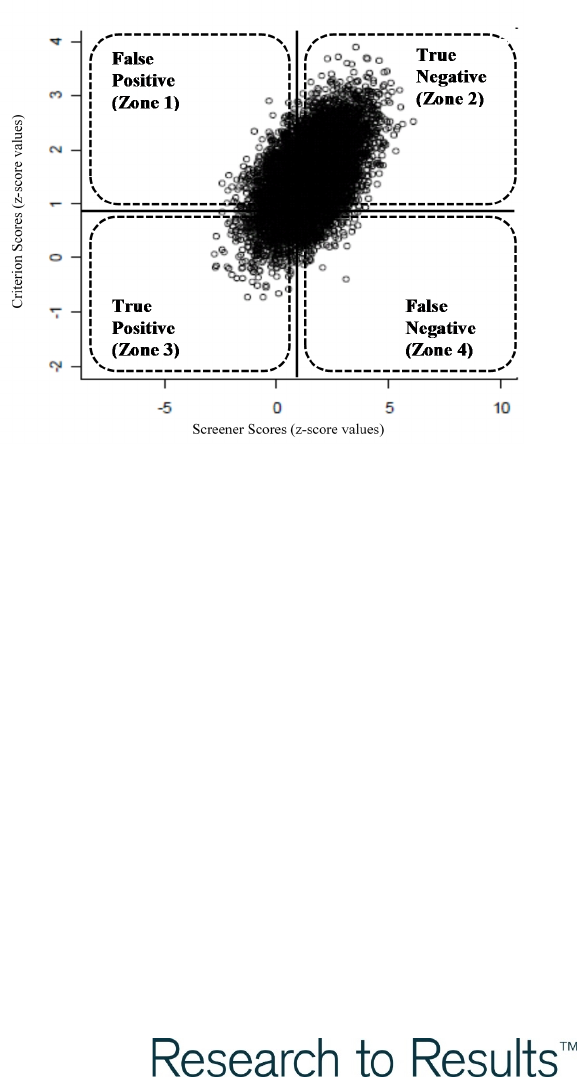
with a gold standard there are four possible outcomes: the test classifies the tumor as malignant when
in fact it is malignant (True Positive; TP), the test classifies the tumor as not malignant when in fact it is
not malignant (True Negative; TN), the test classifies the tumor as malignant when in fact it is benign
(False Positive; FP), and the test classifies
the tumor as benign when in fact it is
malignant (False Negative; FN). The rates of
each classification are directly tied to the
decision threshold, or cut-off score, of the
screening measure. The cut-off score is the
score at which a subject is said to be
symptomatic or not symptomatic. The
decision regarding placement of the
decision threshold is directly tied to the
implications of misclassifying a person as
symptomatic versus not-symptomatic
(Swets, Dawes, & Monahan, 2000). In the
case of the tumor, a FN may mean that a
patient does not undergo a lifesaving
procedure. Conversely, a FP may cause undue stress and financial expense for treatments that aren’t
needed.
Decisions that Guide Benchmarks Selection: Early Intervention and Prevention
It should be apparent from a review of the illustration above that decisions based on the screener are
inherently imperfect. The depiction in that particular figure illustrates a correlation of approximately
.70 between the predictor and criterion measure. In this example, CBMreading is an imperfect
predictor of performance on the state test. Regardless of the measures, there will always be an
imperfect relationship. This is also true for test-retest and alternate-form reliability (i.e., performance
on the same test on two occasions). Tests are inherently unreliable, and all interpretations of scores
are tentative. This is especially true for screening assessments, which are designed to be highly
efficient and, therefore, often have less reliability and validity than a more comprehensive, albeit
inefficient, assessment.
For the purposes of screening in education, students who are in need of extra help may be overlooked
(FN), and students who do not need extra help may receive unneeded services (FP). The performance
of diagnostic tests, and corresponding decision thresholds, can be measured via sensitivity, specificity,

Section 1. Introduction
Page | 23
www.fastbridge.org
© 2015 Theodore J. Christ and Colleagues, LLC. All rights reserved.
positive predictive value, negative predictive value, and area under the curve (AUC). All of the
following definitions are based on the work of Grzybowski and Younger (1997).
i.
Sensitivity
: The probability of a student testing positive given the true presence of a
difficulty. (TP / TP + FN)
ii.
Specificity
: The probability of a student testing negative if the difficulty does not exist.
(TN / TN + FP)
iii.
Positive Predictive Power
: The proportion of truly struggling students among those with
positive test results. (TP / TP + FP)
i.
Negative Predictive Power
: The proportion of truly non-struggling students among all
those with negative test results. (TN / TN + FN)
ii.
Area Under the Curve (AUC)
: Quantitative measure of the accuracy of a test in
discriminating between students at-risk and not at-risk across all decision thresholds.
Previous research in school psychology (e.g., Hintze & Silberglitt, 2005; VanDerHeyden, 2011) derives
decision thresholds by iteratively computing specificity and sensitivity at different cut scores.
Precedence would be given to maximize each criterion by computing sensitivity and specificity for
each point. A more psychometrically sound and efficient method is to compute scores via a receiver
operating characteristic (ROC) curve analysis.
Area Under the Curve (AUC)
Area Under the Curve (AUC) is used as a measure of predictive power. It is obtained by calculating the
sensitivity and specificity values for all possible cutoff points on the screener by fixing a cutoff point
on criterion measure and plotting
specificity
(or TPP) against
sensitivity
(or TNP). AUC is expected to
be .5 if the screener provided little or no information. AUC is expected to be 1 for a perfect diagnostic
method to identify the students at risk correctly. Although the criteria that are applied to interpret
AUCs are variable, values are considered excellent (.90 to 1.0), good (.80 to .89), fair (.70 to 79), or poor
(< .69). It seems reasonable and generally consistent with the standards outlined by the National
Center for Response to Intervention that an AUC of at least .85 is required for low-stakes decisions and
that an AUC of at least .90 is required for high-stake decisions.
Decision Threshold: Benchmark
A decision threshold is established to maximize the benefits of the decision process relative to its costs
(Swets, Dawes, & Monahan, 2000). That threshold is adjusted to establish a neutral, lenient, or strict
classification criterion for the predictor. A neutral threshold will balance the proportion of TP and FP,
although not all thresholds should be balanced. For example, screening measures for reading often
over-identify students (increase the rate of TP as well as FP) to ensure that fewer positive cases are
missed. This is a rational choice, because failure to identify TP outweighs the consequences of
increased FP.
Thresholds that are more lenient (over-identify) increase sensitivity, thereby increasing the proportion
of positive classifications (both TP and FP). Thresholds that are more strict (under-identify) increase

Section 1. Introduction
Page | 24
www.fastbridge.org
© 2015 Theodore J. Christ and Colleagues, LLC. All rights reserved.
specificity, thereby increasing the proportion of negative classifications (both TN and FN; Swets et al.,
2000). The decision threshold is adjusted to obtain the optimal ratio of positive and negative
classifications along with that of true and false classifications. For example, Silberglitt and Hintze
(2005) systematically modified the CBMreading benchmark scores in Third Grade to optimize the cut
score, which improved classification accuracy. In general, FAST™ uses a procedure to balance
sensitivity and specificity so that benchmarks neither over- nor under-identify individuals.
FastBridge Learning assessments predict performance on state accountability tests, including tests
administered in Iowa, Illinois, Vermont, Indiana, New York, Colorado, Minnesota, Georgia,
Massachusetts, and Wisconsin. For diagnostic accuracy analyses, cut scores were selected by
optimizing sensitivity at approximately .70, and then balancing it with specificity using methods
presented by Silberglitt and Hintze (2005). Overall, analyses suggest that current benchmarks for
FastBridge Learning assessments are appropriate, accurate, and reliable.
For a summary of Reading Diagnostic Accuracy statistics, see Appendix B: FastBridge Learning
Reading Diagnostic Accuracy.

Section 6. FAST as Evidence-Based Practice
Page | 25
www.fastbridge.org
© 2015 Theodore J. Christ and Colleagues, LLC. All rights reserved.
Section 2. Reading and Language
Chapter 2.1: Overview, Purpose, and Description
earlyReading
The earlyReading measure is designed to assess both unified and component skills associated with
Kindergarten and First Grade reading achievement. earlyReading is intended to enable screening and
progress monitoring across four domains of reading (Concepts of Print, Phonemic Awareness, Phonics,
and Decoding) and provide domain-specific assessments of these component skills as well as a
general estimate of overall reading achievement. earlyReading is an extension of CBMreading, which
was initially developed by Deno and colleagues to index the level and rate of reading achievement
(Deno, 1985; Shinn, 1989). The current version of earlyReading has an item bank that contains a variety
of items, including those with pictures, words, individual letters and letter sounds, sentences,
paragraphs, and combinations of these elements.
The research literature provides substantial guidance on instruction and assessment of alphabetic
knowledge, phonemic awareness, and oral reading. The objective of earlyReading measures is to
extend and improve on the quality of currently available assessments.
Aspects of Reading measured by earlyReading
Concepts of Print (COP)
COP is defined as the general understanding of how print works and how it can be used (Snow, Burns,
& Griffin, 1998). Concepts of print is the set of skills used in the manipulation of text-based materials,
which includes effective orientation of materials (directionality), page turning, identifying the
beginning and ending of sentences, identifying words, as well as identifying letters, sentences, and
sentence parts. Concepts of print are normally developed in the emergent literacy phase of
development and enable the development of meaningful early reading skills: “Emergent literacy
consists of skills, knowledge, and attitudes that are developmental precursors to conventional forms
of reading and writing” (Whitehurst & Lonigan, 1998). These skills typically develop from preschool
through the beginning of First Grade— with some more advanced skills that develop through Second
Grade, such as understanding punctuation, standard spelling, reversible words, sequence, and other
standard conventions of written and spoken language. Introductory level of logical and analytical
abilities as in understanding the concepts of print has an impact on early student reading
achievement (Adams, 1990; Clay, 1972; Downing, Ollila, & Oliver, 1975; Hardy et al., 1974; Harlin & Lipa,
1990; Johns, 1972; Johns, 1980; Lomax & McGee, 1987; Nichols et al., 2004; Tumner et al., 1988).
Phonemic Awareness (PA)
Phonemic Awareness involves the ability to identify and manipulate phonemes in spoken words
(National Reading Panel [NRP], 2000). Phonemes are the smallest units of sound in spoken language.
"Depending on what distinctions are counted, there are between 36-44 phonemes in English, which is
about average for languages" (Juel, 2006, p.418). According to Adams, “to the extent that children

Section 6. FAST as Evidence-Based Practice
Page | 26
www.fastbridge.org
© 2015 Theodore J. Christ and Colleagues, LLC. All rights reserved.
have learned to ‘hear’ phonemes as individual and separable speech sounds, the system will, through
the associative network, strengthen their ability to remember or ‘see’ individual letters and spelling
patterns” (1990, p. 304). Hearing and distinguishing individual letter sounds comes last (Goswami,
2000). Children who manipulate letters as they are learning to hear specific sounds have been shown
to make better progress in early reading development than those who do not (NRP, 2000, p. 2-4).
Phonemic awareness skills are centrally involved in decoding by processes of blending and
segmenting phonemes (NRP, 2000). Phonemic awareness also helps children learn how to spell words
correctly. Phonemic segmentation is required to help children retain correct spellings in memory by
connecting graphemes (printed letters) to phonemes (NRP, 2000).
Phonics
Phonics is the set of skills readers use to identify and manipulate printed letters (graphemes) and
sounds (phonemes). It is the correspondences between spoken and written language. This connection
between letters, letter combinations, and sounds enable reading (decoding) and writing (encoding).
Phonics skill development “involves learning the alphabetic system, that is, letter-sound
correspondences and spelling patterns, and learning how to apply this knowledge” to reading (NRP,
2000b).
Decoding
“Decoding ability is developed through a progression of strategies sequential in nature: acquiring
letter-sound knowledge, engaging in sequential decoding, decoding by recognizing word patterns,
developing word accuracy in word recognition, and developing automaticity and fluency in word
recognition” (Hiebert & Taylor, 2000, p. 467). When a child has a large and established visual lexicon of
words in combination with effective strategies to decode unfamiliar words, he/she can read fluently—
smoothly, quickly, and more efficiently (Adams, 1990; Snow et al., 1998). The reader can also focus
his/her attention on monitoring comprehension: “If there are too many unknown words in the
passage that require the child to apply more analytic (phonemic decoding) or guessing strategies to
fill in the blanks, fluency will be impaired” (Phillips & Torgesen, 2006, p. 105). According to RAND,
“readers with a slow or an inadequate mastery of word decoding may attempt to compensate by
relying on meaning and context to drive comprehension, but at the cost of glossing over important
details in the text” (2002, p. 104). Decoding is often linked with phonics with the emphasis on letter-
sound knowledge. Vocabulary contains common characteristics with decoding such as recognizing
word patterns, as in prefixes and suffixes.
Uses and Applications
earlyReading consists of 12 different evidence-based assessments for screening and monitoring
student progress.
Concepts of Print
Onset Sounds
Letter Names
Letter Sounds
Word Rhyming
Word Blending
Word Segmenting
Decodable Words

Section 6. FAST as Evidence-Based Practice
Page | 27
www.fastbridge.org
© 2015 Theodore J. Christ and Colleagues, LLC. All rights reserved.
Nonsense Words
Sight Words-Kindergarten (50 words)
Sight Words-1st Grade (150 words)
Sentence Reading
Oral Language (Sentence Repetition)
There are recommended combinations of subtests for fall, winter, and spring screening aimed to
optimize validity and risk evaluation. Similarly, there are recommended combinations of subtests for
fall, winter, and spring for monitoring of progress. Supplemental assessments may be used to
diagnose and evaluate skill deficits. Results from supplemental assessments provide guidance for
instructional and intervention development. earlyReading is often used by teachers to screen all
students and to estimate annual growth with tri-annual assessments (fall, winter, & spring). Students
who progress at a typical pace through the reading curriculum meet the standards for expected
performance at each point in the year. Students with deficit achievement can be identified in the fall
of the academic year so that supplemental, differentiated, or individualized instruction can be
provided.
earlyReading is designed to accommodate quick and easy weekly assessments, which provide useful
data to monitor student progress and evaluate response to instruction. The availability of multiple
alternate forms for various subtests of earlyReading make it suitable for monitoring progress between
benchmark assessment intervals (i.e., fall, winter, and spring) for those students that require more
frequent monitoring of progress. Onset Sounds has 13 alternate forms, and the following subtests
have a total of 20 alternate forms: Letter Naming, Letter Sound, Word Blending, Word Segmenting,
Decodable Words, Sight Words, and Nonsense Words. Concepts of Print, Rhyming, and Sentence
Reading progress monitoring forms have not yet been developed.
Target Population
earlyReading is designed for all students in the early primary grade levels. This includes students in
Kindergarten through Third Grade. earlyReading subtests are most relevant for students in
Kindergarten and First Grade, but they have application to students in later grades who have yet to
master early reading skills.
CBMreading
Curriculum-Based Measures of Reading (CBMreading) is a particular version of Curriculum-Based
Measurement of Oral Reading fluency (CBM-R), which was originally developed by Deno and
colleagues to index the level and rate of reading achievement (Deno, 1985; Shinn, 1989). The tool is an
evidence-based assessment for use to screen and monitor student progress in reading competency in
primary grades (1–6). CBMreading uses easy, time-efficient assessment procedures to determine a
student’s general reading ability across short intervals of time (i.e., weekly, monthly, or quarterly).
Students read aloud for one minute from grade or instructional- level passages. The words read
correct per minute (WRCM) functions as a robust indicator of a reading health and a sensitive indicator
of intervention effects. CBMreading includes standardized administration and scoring procedures
along with proprietary instrumentation, which was designed and developed to optimize the

Section 6. FAST as Evidence-Based Practice
Page | 28
www.fastbridge.org
© 2015 Theodore J. Christ and Colleagues, LLC. All rights reserved.
consistency of data collected across progress monitoring occasions. CBMreading provides teachers
with a direct link to instruction and allows them to determine if and when instructional adaptations
are needed, set ambitious but attainable goals for students, and monitor progress toward those goals
(Fuchs & Fuchs, 2002).
CBMreading emerged from a project funded by the Institute for Education Sciences in the US
Department of Education. That project was entitled
Formative Assessment Instrumentation and
Procedures for Reading
(FAIP-R), so they are sometimes described as the FAIP-R passages. Early
versions of those passages were used in published research (Ardoin & Christ, 2008; Christ & Ardoin,
2009). The goal in creating the CBMreading measures was to systematically develop, evaluate and
finalize research-based instrumentation and procedures for accurate, reliable, and valid assessment
and evaluation of reading rate.
For the remainder of the manual, CBM-R will refer to the general concept of Curriculum-Based
Measurement of Oral Reading while CBMreading will refer to the assessment in FastBridge Learning.
Aspects of Reading Measured by CBMreading
The Common Core State Standards for English Language Arts and Literacy in History/Social Studies,
Science and Technical Subjects (National Governors Association Center for Best Practices & Council of
Chief State School Officers, 2010) is a synthesis of information gathered from state departments of
education, assessment developers, parents, students, educators, and other pertinent sources to
develop the next generation of state standards of K–12 students to ensure that all students are college
and career literacy ready by the end of their high school education. This process is headed by the
Council of Chief State School Officers (CCSO) and the National Governors Association (NGA). The
Standards are an extension of a previous initiative by the CCSSO and NGA titled the College and
Career Readiness (CCR) Anchor Standards. The CCR Anchor Standards are numbered from one to ten.
The Standards related to fluency are found within Foundational Skills in Reading. These standards are
relevant to K–5 children and include the working knowledge of the following subcategories:
(1) Print Concepts: the ability to demonstrate the organization and basic feature of print.
(2) Phonological Awareness: demonstrate understanding of spoken words, syllables, and
sounds or phonemes.
(3) Phonics and Word Recognition: the skill of applying grade-level phonics and word analysis
skills in decoding words.
(4) Fluency: Reading on-level texts with sufficient purpose, accuracy, and fluency to support
comprehension.
Oral Reading Fluency
Reading involves simultaneous completion of various component processes. In order to achieve
simultaneous coordination across these component processes, instantaneous execution of each
component skill is required (Logan, 1997). Reading fluency is achieved so that performance is
speeded, effortless, autonomous, and achieved without much conscious awareness (Logan, 1997).
Oral reading fluency represents the automatic translation of letters into coherent sound
Section 6. FAST as Evidence-Based Practice
Page | 29
www.fastbridge.org
© 2015 Theodore J. Christ and Colleagues, LLC. All rights reserved.
representations, unitizing those sound components into recognizable wholes, and automatically
accessing lexical representations, processing meaningful connections within and between sentences,
relating text meaning to prior information, and making inferences in order to supply missing
information. Logan (1997) described oral reading fluency as the complex orchestration of these skills,
establishing it as a reliable measure of reading expertise.
As previously mentioned, CBMreading is a particular version of an oral reading fluency measure.
CBMreading is an effective tool used to measure rate of reading. Indeed, reading disabilities are most
frequently associated with deficits in accurate and efficient word identification. Although reading is
not merely rapid word identification or the “barking at words” (Samuels, 2007), the use of rate-based
measures provide a general measure of reading that can alert teachers to students who have
problems and are behind their peers in general reading ability. Overall, CBMreading provides a global
indicator of reading.
Uses and Applications
CBMreading is an evidence-based assessment for use to screen and monitor students’ progress in
reading achievement in the primary grades (1–6). Each assessment is designed to be highly efficient
and give a broad indication of reading competence. The automated output of each assessment gives
information on the accuracy and fluency of passage reading which can be used to determine
instructional level to inform intervention. At the school level, student growth can be tracked and
monitored, allowing administrators to look at improvements both across grades and academic years
for the purpose of accountability. Teachers and administrators may use this information to help
parents better understand their children’s reading needs.
Target Population
CBMreading is designed for all students in grades 1 through 6. For elementary grades 2 through 6,
measures of fluency with connected text (curriculum-based measure of oral reading; CBM-R) are often
used as a universal screeners for grade-level reading proficiency. Although strong evidence exists in
the literature to support the use of CBM-R (Fuchs, Fuchs, & Maxwell, 1988; Kranzler, Brownell, & Miller,
1998; Markell & Deno, 1997), support for CBM-R as a universal screener for students who are not yet
reading connected text is less robust (Fuchs, Fuchs, & Compton, 2004; National Research Council,
1998). Thus, CBMreading may not be appropriate for students not yet reading connected text with
some degree of fluency. For those students not yet reading connected text with fluency, CBMreading
results and scores should be interpreted with caution.
aReading
The Adaptive Reading (aReading) assessment is a computer-adaptive measure of broad reading ability
that is individualized for each student. aReading provides a useful estimate of broad reading
achievement from Kindergarten through twelfth grade. The question-and-response format used in
aReading is substantially similar to many statewide, standardized assessments. Browser-based
software adapts and individualizes the assessment for each child so that it essentially functions at the

Section 6. FAST as Evidence-Based Practice
Page | 30
www.fastbridge.org
© 2015 Theodore J. Christ and Colleagues, LLC. All rights reserved.
child’s developmental and skill level. The adaptive nature of the test makes it more efficient and more
precise than paper-and-pencil assessments.
The design of aReading has a strong foundation in both research and theory. During the early phases
of student reading development, the component processes of reading are most predictive of future
reading success (Stanovich, 1981, 1984, 1990; Vellutino & Scanlon, 1987, 1991; Vellutino, Scanlon,
Small, & Tanzman, 1991). Indeed, reading disabilities are most frequently associated with deficits in
accurate and efficient word identification. Those skills are necessary but not sufficient for reading to
occur. After all, reading is comprehending and acquiring information through print. It is not merely
rapid word identification or the “barking at words” (Samuels, 2007). As such, a unified reading
construct is necessary to enhance the validity of reading assessment and inform balanced instruction
throughout the elementary grades. aReading was developed based on a skills hierarchy and unified
reading construct (presented later in the technical manual).
Computer-Adaptive Testing (CAT)
Classroom assessment practices have yet to benefit from advancements in both psychometric theory
and computer technology. Today, almost every school and classroom in the United States provides
access to computers and the Internet. Despite this improved access to computer technology, few
educators use technology to its potential. Within an IRT based Computer-Adaptive Test (CAT), items
are selected based on the student’s performance on all previously administered items. As a student
answers each item, the item is scored in real time, and his or her ability (theta) is estimated. When a
CAT is first administered, items are selected via a “step rule” (Weiss, 2004). That is, if a student answers
an initial item correctly, his or her theta estimate increases by some value (e.g., .50). Conversely, if an
item is answered incorrectly, the student’s theta estimate decreases by that same amount. As testing
continues, the student’s ability is re-estimated, typically via Maximum Likelihood Estimation (MLE).
After an item is administered and scored, theta is re-estimated and used to select the subsequent
item. Items that provide the most information—based on the item information function—at that
theta level that have not yet been administered are selected for the examinee to complete. The test is
terminated after a specific number of items have been administered (a fixed-length test) or after a
certain level of precision—measured by the standard error of the estimate of theta—is achieved.
Subsequent administrations begin at the previous theta estimate and only present items that have
not been administered to that particular student. Research using simulation methods and live data
collections has been performed on aReading to optimize the length of administrations, the level of the
initial step size, and item selection algorithms to maximize the efficiency, and psychometric properties
of the assessment.
There are multiple benefits of CAT as compared to traditional paper-and-pencil tests or non-adaptive
computerized tests. The benefits that are most often cited in the professional literature include: (a)
individualized dynamic assessment, which does not rely on a fixed set of items across
administrations/individuals; (b) testing time that is reduced by one-half to one-third (or more) of
traditional tests because irrelevant items are excluded from the administration; (c) test applicability

Section 6. FAST as Evidence-Based Practice
Page | 31
www.fastbridge.org
© 2015 Theodore J. Christ and Colleagues, LLC. All rights reserved.
and measurement precision across a broad range of skills/abilities, and (d) more precise methods to
equate assessment outcomes across alternate forms or administrations (Kingsbury & Houser, 1999;
Weiss, 2004; Zickar, Overton, Taylor, & Harms, 1999).
IRT-based CAT can be especially useful in measuring change over time. CAT applications that are used
to measure change/progress have been defined as adaptive self-referenced tests (Weiss, 2004; Weiss &
Kingsbury, 1984) or, more recently, adaptive measurement of change (AMC; Kim-Kang & Weiss, 2007;
Kim-Kang, & Weiss, 2008). AMCs can be used to measure the change of an individual’s skills/abilities
with repeated CATs administered from a common item bank. Since AMC is a CAT based in IRT, it
eliminates most of the problems that result when measuring change (e.g., academic growth) using
traditional assessment methods that are based in classical test theory. Kim-Kang and Weiss (2007)
have demonstrated that change scores derived from AMC do not have the undesirable properties that
are characteristic of change scores derived by classical testing methods. Research suggests that
longitudinal measurements obtained from AMC have the potential to be sensitive to the effects of
treatments and interventions at the single-person level, and are generally superior measures of
change when compared to assessments developed within a classical test theory framework (VanLoy,
1996). Finally, AMC compiles data and performance estimates (θ) from across administrations to
enhance the adaptivity and efficiency of CAT.
Aspects of Reading measured by aReading
Concepts of Print (COP)
The assessment of Concepts of Print in aReading focuses on assessing types of instruction outlined in
the state and national standards and is based on relevant reading research for developing readers
including skills synthesized from the work of Marie Clay (e.g., 2007), Barbara Taylor (i.e., 2011), Levy et
al., (2006), and NWEA goals for Concepts of Print development (2009).
Concepts of Print is defined as the general understanding of how print works and how it can be used
(Snow, Burns, & Griffin, 1998). Concepts of print is the set of skills used in the manipulation of text-
based materials, which include effective orientation of materials (directionality), page turning, identify
the beginning and ending of sentences, identify words, identify letters, sentences, and sentence parts.
Concepts of print are normally developed in the emergent literacy phase of development and enable
the development of meaningful early reading skills: “Emergent literacy consists of skills, knowledge,
and attitudes that are developmental precursors to conventional forms of reading and writing”
(Whitehurst & Lonigan, 1998). These skills typically occur prior to or early in school years and are based
on the child’s exposure to printed materials and reading skills modeled by others, especially adults.
Development in this area from age 4 to age 6 has been documented using word and sentence
discrimination tasks that violated elements of word shape, word elements, and spelling (Levy, Gong,
Hessels, Evans, & Jared, 2006).
By age 4, few children are able to read any single words, but most can distinguish drawings from
writing and can detect abstract print elements such as letter spacing. These latter skills are related to

Section 6. FAST as Evidence-Based Practice
Page | 32
www.fastbridge.org
© 2015 Theodore J. Christ and Colleagues, LLC. All rights reserved.
letter reading skill but not phonological awareness. This suggests that print conventions may develop
before word reading skills (Rayner, et al., 2012).
At age 5, most can detect word-shape and letter-orientation violations and letter sequencing. At age
6, knowledge of spelling is a stronger predictor of word reading than for 5 year olds (Rayner et al.,
2012). According to Levy et al., “The data show clear development of print concepts from 48 to 83
months of age. This development begins with an understanding of figural and spatial aspects of
writing (word shape). Next, or in conjunction with the first development, comes development of more
abstract notions of word constituents, including letter orientation, and finally comes an understanding
of more detailed aspects of acceptable spelling patterns” (2006, p. 89).
Some more advanced skills can develop through Second Grade, such as understanding punctuation,
standard spelling, reversible words, sequence, and other standard conventions of written and spoken
language. Introductory level of logical and analytical abilities as in understanding the concepts of print
has an impact on early student reading achievement (Adams, 1990; Clay, 1972; Downing, Ollila, &
Oliver, 1975; Hardy et al., 1974; Harlin & Lipa, 1990; Johns, 1972; Johns, 1980; Lomax & McGee, 1987;
Nichols et al., 2004; Tumner et al., 1988).
Phonological Awareness (PA)
The assessment of Phonological Awareness in aReading focuses on assessing types of instruction
outlined in the state and national standards and is based on relevant reading research for developing
readers including skills that are
generally
ordered from broader segments of word sounds to smaller
sound distinctions and the ability to manipulate these smaller sounds.
Phonological Awareness is a broad term involving the ability to detect and manipulate the sound
structure of a language at the level of phonemes (i.e., smallest units of sound in spoken language),
onset-rimes, syllables, and rhymes. It is used to refer to spoken language rather than letter-sound
relationships, which are the focus of phonics. Most students, especially in preschool, Kindergarten, and
First Grade, benefit from systematic and explicit instruction in this area (Adams, 1990; Carnine et al.,
2009; NRP, 2000; Rayner et al., 2012; Snow, et al., 1998).
Phonemic awareness refers to the ability to know, think about, and use phonemes—individual sounds
in spoken words. It is a specific type of phonological skill dealing with individual speech sounds that
has been studied extensively and predicts success in reading development in languages that use
alphabetic writing systems (Adams, 1990; NRP, 2000; Rayner, et al., 2012). The conscious awareness of
phonemes as the basic units of sound in a language allows the reader to identify, segment, store, and
manipulate phonemes in spoken words and it is required for proficient reading—when phonemes are
linked to letters and letter combinations in the language’s orthography. According to Adams, “to the
extent that children have learned to ‘hear’ phonemes as individual and separable speech sounds, the
system will, through an associative network, strengthen their ability to remember or ‘see’ individual
letters and spelling patterns” (1990, p. 304). Unfortunately, this is a difficult task because the English
language does not follow an explicit one-to-one correspondence between phonemes and letters
(graphemes). English phonemes may be associated with various letters. Similarly, a single letter may
Section 6. FAST as Evidence-Based Practice
Page | 33
www.fastbridge.org
© 2015 Theodore J. Christ and Colleagues, LLC. All rights reserved.
be associated with several phonemes. This lack of one-to-one correspondence between phonemes
and graphemes creates a sense of ambiguity. Although the English alphabet is generally structured so
that many morphemes and words can be generated from relatively few letters (see Perfetti, 1985), the
simplicity of the grapheme-phoneme relations in English (i.e., 26 letters to 41 phonemes—across
numerous word combinations, letters or letter combinations with multiple sounds) makes it a less-
transparent system for learners to decode phonologically (Liberman, Cooper, Shankweiler, & Studdert-
Kennedy, 1967; Rayner et al., 2012). Rayner et al., (2012), provides a good example of this lack of
transparency, “American English has over a dozen vowel sounds but only five standard vowel letters.
That means that
a, e, i, o,
and
u
have to do double and triple duty…For example,
cat, cake, car, and call
each use the letter
a
for a different vowel phoneme” (2012, p.311).
Hearing and distinguishing individual letter sounds comes later in development (Goswami, 2000).
Children who manipulate letters as they are learning to hear the sounds make better progress in early
reading development (NRP, 2000, p. 2-4). Phonemic awareness skills are centrally involved in decoding
by blending and segmenting phonemes (NRP, 2000). Phonemic awareness also helps children learn
how to spell words correctly. Phonemic segmentation is required to help children retain correct
spellings in memory by connecting graphemes to phonemes (NRP, 2000).
Phonics
The assessment of phonics in aReading focuses on assessing types of instruction outlined in the state
and national standards and is based on relevant reading research about a student’s ability to identify
and manipulate printed letters (graphemes) and sounds (phonemes).
The correspondences between spoken and written language. This connection between letters, letter
combinations, and sounds enable reading (decoding) and writing (encoding). Phonic skill
development “involves learning the alphabetic system, that is, letter-sound correspondences and
spelling patterns, and learning how to apply this knowledge” to reading (NRP, 2-89).
Phonics most often refers to an instructional approach—a systematic, planned, explicit, sequential
method to teach beginning readers how to link written letters in words to the sounds of those letters
(i.e., understand the alphabetic principle) to decode regular words. This instruction is helpful to most
beginning readers in early primary grades (Christensen & Bowey, 2005; Juel & Minden-Cupp, 2000:
Mathes et al., 2005; NRP, 2000; Stahl, 2001) and helps “…foster full alphabetic processing to enable
children to handle the orthography” (Juel, 2006, p. 422). Indeed, early and systematic instruction in
phonics results in better achievement in reading (; NRP, 2000; and others).
For the purpose of aReading assessment, we operationalize phonics as skills associated with the
awareness and use of letter-sound (i.e., grapheme-phoneme) correspondence in relation to
development of successful spelling and reading using the language’s orthography. Assessment and
instruction of phonics explores how these skills are applied to decode (read) and encode (spell/write)
the language (NRP, 2000).

Section 6. FAST as Evidence-Based Practice
Page | 34
www.fastbridge.org
© 2015 Theodore J. Christ and Colleagues, LLC. All rights reserved.
Orthography and Morphology
The assessment of orthography and morphology in aReading focuses on assessing types of instruction
outlined in the state and national standards and is based on relevant reading research for readers
including development of correct spelling, word identification and discrimination, and application of
morphological and phonological knowledge.
Measures of orthography and morphology assist readers to recognize and decode or decipher words
in isolation and during reading. The ability to quickly recognize words and access their meanings
allows readers to focus their limited cognitive resources (e.g., attention, memory) on meaning instead
of decoding (e.g., Bear, Invernizzi, Templeton, & Johnston, 2012). For example, students whose reading
difficulties or disabilities persist into the secondary grades need explicit instruction in word
recognition skills to help them identify and understand new words—particularly across different
content areas. These skills contribute substantively to vocabulary and reading comprehension
development, therefore assessing students in these areas allows aReading to determine if a student is
able to accurately use and apply these skills.
Orthography
Orthography
is the relationship between a script (i.e., a set of symbols) and the structure of a language
(Katz & Frost, 1992). It typically refers to the use of letters and sounds to depict (i.e., write) a language.
In relation to word learning and vocabulary development however, it refers to the reader’s ability to
identify, develop, store and retrieve orthographic representations of words or word parts using
underlying
orthographic/visual
representations and
phonological
structures (Burt, 2006; Perfetti, 1992,
1997; Stanovich & West, 1989). Although phonological elements have been identified as central to
development of letter and word skills, they do not explain all of the variance in word recognition such
that, as Stanovich and West (1989) point out, “…phonological sensitivity is a necessary but not
sufficient condition for the development of word recognition processes” (p.404). Thus the underlying
visual element of orthographic representation is also important. Given older students’ exposure to
new words throughout the upper grade levels,
both
elements of sound and orthographic/visual
representations of letter/word identification need to be considered when discussing assessment of
orthography in older students.
Measures of orthography and morphology can assist readers in recognizing and decoding or
deciphering words in isolation and during reading. The ability to quickly recognize words and access
their meanings allows readers to focus their limited cognitive resources (e.g., attention, memory) on
meaning instead of decoding (Bear et al., 2012). Students whose reading difficulties persist into the
secondary grades need explicit instruction in word recognition skills to help them identify and
understand new words – particularly across different content areas. These skills contribute
substantively to vocabulary and reading comprehension development. Therefore, assessing students
in these areas using aReading orthography items helps to determine whether a student is able to
accurately use and apply these skills.

Section 6. FAST as Evidence-Based Practice
Page | 35
www.fastbridge.org
© 2015 Theodore J. Christ and Colleagues, LLC. All rights reserved.
Morphology
Morphology
is unique from orthography because it emphasizes recognition and manipulation of
word parts that help readers better understand a word’s meaning. Morphemes are the smallest unit of
meaning in a word and morphology is the study of these forms or parts of words. In relation to word
learning and vocabulary development, morphology refers to the reader’s ability to be morphologically
aware of word roots and affixes—suffixes and prefixes—and word origins (etymology). It also refers to
the structural analysis readers may use to segment and manipulate parts of words to identify new
words and help determine unknown word meanings (i.e., morphological analysis) (Carnine et al.,
2009).
Morphological awareness
is formally defined as “…awareness of morphemic structures of words and
the ability to reflect on and manipulate that structure” (Carlisle, 1995, p. 194, see also Carlisle 2011)
and
morphological processing
involves underlying cognitive processes involved in understanding and
using morphological information (Bowers, Kirby, & Deacon, 2010; Deacon, Parrila, & Kirby, 2008). In
their review of the literature on instruction in morphology, Bowers, Kirby, and Deacon (2010) use
morphological knowledge
instead of either the
awareness
or
processing
terms frequently used, due to
the ambiguity of the learning processes that may or may not be used by students in relation to
morphological instruction. aReading therefore typically refers to morphological knowledge and this
background guided development of items to assess students’ knowledge of the meaning behind parts
of a word.
Vocabulary
The assessment of vocabulary in aReading focuses on assessing word knowledge and vocabulary
outlined in the state and national standards and based on relevant reading research for K–12 readers
including understanding and recognition of words in context that are appropriate for students at
grade-level as well as appropriate for mature readers and writers to convey concepts, ideas, actions,
and feelings (NAEP, 2011). These words include academic and content-specific words, word
categories, word relations, and different parts of speech. The goal of vocabulary assessment should be
to measure word knowledge in context rather than in isolation due to the integrated nature of
reading comprehension in relation to vocabulary development.
Vocabulary is an oral language skill that involves understanding the semantic and contextual relations
of a word(s) in both general and content-specific domains (Storch & Whitehurst, 2002; Whitehurst &
Lonigan, 1998). Vocabulary knowledge develops through general oral communication, direct
instruction using contextual or decontextualized words and through reading connected texts in a
variety of contexts (Nagy, 2005; Stahl & Kapunis, 2001). As new words are incorporated, word
knowledge and efficiency of access is increased (Perfetti, 1994). Vocabulary is related to other reading
skills (Cain, Oakhill, & Lemon, 2004; Ricketts, Nation, & Bishop, 2007), and a particularly strong
interactive and reciprocal relation occurs between vocabulary and reading comprehension across
ages (Carroll, 1993; McGregor, 2004; Muter, Hulme, Snowling, & Stevenson, 2004; Nation, Clarke,
Marshall, & Durand, 2004; Nation & Snowling, 2004; Oakhill, et al., 2003).

Section 6. FAST as Evidence-Based Practice
Page | 36
www.fastbridge.org
© 2015 Theodore J. Christ and Colleagues, LLC. All rights reserved.
Indeed
,
“Vocabulary knowledge is fundamental to reading comprehension; one cannot understand
text without knowing what most of the words mean” (Nagy, 1988, p. 1). Developing a reading
vocabulary typically enlists one’s oral vocabulary: as a beginning reader comes across words that are
less familiar in print, these are decoded and “mapped onto the oral vocabulary the learner brings to
the task” (NRP, 2000, p. 4-3). If the word is not in the learner’s oral vocabulary, decoding becomes less
helpful and contextual information more important. Learning new words from text involves
connecting the orthography to multiple contexts and establishing a flexible definition. Vocabulary
knowledge, then, includes both definitional knowledge and contextual knowledge (Stahl, 1999). Some
words in text are so familiar that they no longer require explicit processing; these are referred to as a
sight word vocabulary (NRP).
Comprehension
The assessment of reading comprehension in aReading focuses on comprehension processes outlined
in the state and national standards and based on relevant reading research for K–12 readers including
the reader’s development of an organized, coherent, and integrated representation of knowledge and
ideas in the text through use of inferential processes and identification of key ideas and details in the
text as well as understanding its craft and structure.
The goal of reading comprehension is to understand the meaning of what is heard and read.
Comprehension is the process of understanding what is heard and read. Comprehension, or
constructing meaning, is the purpose of reading and listening. The NRP noted that “Comprehension
has come to be viewed as the ‘essence of reading’ (Durkin, 1993), essential not only to academic
learning but to lifelong learning as well” (NRP, 2000, p. 4-11). “Good readers have a purpose for
reading” (Armbruster, 2002, p. 34), like learning how to do something, finding out new information, or
for the enjoyment and entertainment that reading for pleasure brings. Good readers actively process
the test “to make sense of what they read, good readers engage in a complicated process. Using their
experiences and knowledge of the world, their knowledge of vocabulary and language structure, and
their knowledge of reading strategies . . ., good readers make sense of the text and know how to get
the most out of it. They know when they have problems with understanding” and they know “how to
resolve these problems as they occur” (Armbruster, 2002, p. 48). aReading items for grades 6–12
depended heavily on comprehension skills. Thus, the aReading team consulted with Dr. Paul van den
Broek in spring 2012 to learn from his expertise in cognitive processes involved in reading
comprehension. After meeting with Dr. van den Broek, the team ensured that questions about the
reading passages should ask students to (a) locate and recall broad and specific information in the
text, (b) integrate and interpret beyond the explicit information in the text, and (c) critique and
evaluate the quality of the author’s writing.
Uses and Applications
Each aReading assessment is individualized by the software and, as a result, the information and
precision of measurement is optimized regardless of whether a student functions at, above, or
significantly below grade level.

Section 6. FAST as Evidence-Based Practice
Page | 37
www.fastbridge.org
© 2015 Theodore J. Christ and Colleagues, LLC. All rights reserved.
Target Population
aReading is intended for use from Kindergarten through Twelfth Grades for screening. The aReading
item bank consists of approximately 2000 items that target the reading domains described in the
previous section. Items developed for Kindergarten through Grade Five target Concepts of Print,
Phonological Awareness, Phonics, Vocabulary, and Comprehension. Items developed for middle and
high school grade levels target Orthography, Morphology, Vocabulary, and Comprehension. Please
note, however, that the importance and emphasis on each reading domain will vary across children.
Chapter 2.2: Development
earlyReading
The results of the National Assessment of Educational Progress (NAEP) for 2011 suggest that among
Fourth Grade students, 3% perform below a basic level (partial mastery of fundamental skills) and 68%
perform below a proficient level of achievement (demonstrated competency over challenging subject
matter) (National Center for Education Statistics, 2013). Among eighth grade students, 25% perform
below basic and 68% perform below proficiency (Aud, Wilkinson-Flicker, Kristapovich, Rathbun, Wang,
& Zhang, 2013). Approximately 32% of students demonstrate reading proficiency at grade level. The
relatively low levels of reading proficiency and achievement within the general population are
reflected within the population receiving services under the Individuals with Disabilities Education Act
(IDEA), originally enacted in 1975. Among students who receive special education services, 91% of
Fourth Graders and 95% of eighth graders fail to achieve grade-level proficiency in reading. Moreover,
the majority of these students scored in the below basic range in reading achievement (National
Center for Educational Statistics, 2003). The incidence of reading-related disabilities is
disproportionately large when compared to other categories of disability under IDEA. Government
data suggests that almost 60% of the students who are served under IDEA are identified with a
specific learning disability, and 80% of those students are identified with a reading disability (U.S.
Department of Education, 2001, 2002). Of the nearly 3 million students served under IDEA and the 1.5
million students identified with a specific learning disability, approximately 1.3 million are identified
with a reading disability.
Reading instruction and reading development has never been better understood. Nevertheless, there
is a great deal of progress to be made in the future by building on our present knowledge-base. The
National Reading Panel identified five essential component skills that support reading development:
phonemic awareness, phonics, fluency, vocabulary, and comprehension. They did not, however,
define the relative scope and importance of each component within or across developmental phases.
It is likely that specific skill-sets are most relevant and more salient at particular points in the
developmental continuum (Paris, 2005). For elementary grades two through six, measures of fluency
with connected text (curriculum based measure of oral reading; CBM-R) are often used as a universal
screeners for grade-level reading proficiency. CBM-R requires students to read from a grade level
passage for one minute while the number of words read correctly is recorded. Strong evidence exists
in the literature to support the use of CBM-R (L.S. Fuchs, Fuchs, & Maxwell, 1988; Kranzler, Brownell, &
Miller, 1998; Markell & Deno, 1997); however, support for CBM-R as a universal screener for students

Section 6. FAST as Evidence-Based Practice
Page | 38
www.fastbridge.org
© 2015 Theodore J. Christ and Colleagues, LLC. All rights reserved.
not yet reading connected text is less robust (Fuchs, Fuchs, & Compton, 2004; National Research
Council, 1998). The research literature provides substantial guidance on instruction and assessment of
alphabetic knowledge, phonemic awareness, and oral reading. The objective of earlyReading
measures is to extend and improve on the quality of currently available assessments.
There is growing evidence that successful reading in elementary school grades depends on a
combination of code-related and language comprehension skills. Code-related skills include the
awareness that printed text is meaningful and the ability to translate the letters and words of the text
into such meaningful concepts. Language comprehension skills concern the ability, knowledge and
strategies necessary to interpret concepts and connect these concepts into a coherent mental
representation of the text (Gough & Tunmer, 1986; Oakhill & Cain, 2007; Whitehurst & Lonigan, 1998).
A long tradition of research support indicates that early code-related skills predict later reading
achievement (Adams, 1990; Chall, 1987; Juel, 1988; LaBerge & Samuels, 1974; National Reading Panel,
2000a; Stanovich, 1984). The design of earlyReading has a strong foundation in both research and
theory. During the early phases of student reading development, the component processes of reading
are most predictive of future reading success (Stanovich, 1981, 1984, 1990; Vellutino & Scanlon, 1987,
1991; Vellutino, Scanlon, Small, & Tanzman, 1991). Indeed, reading disabilities are most frequently
associated with deficits in accurate and efficient word identification.
CBMreading
The National Reading Panel identified five essential component skills that support reading
development: phonemic awareness, phonics, fluency, vocabulary and comprehension. Fluency (or
rate) in particular, is important because it establishes a connection between word identification and
comprehension. Despite research establishing CBM-R as a valid measure of general reading
achievement, as well as an effective tool for predicting later reading performance, research also
provides evidence for the necessity to improve CBM-R instrumentation and procedures. Estimates of
longitudinal growth for individual students can be more a function of the instrumentation (i.e.,
inequitable passages) as opposed to students’ actual response to intervention. Development of the
CBMreading passages, therefore, was based on findings from existing research and theory. This
provided clear guidance for ways to improve progress monitoring measures and outcomes that could
yield substantial and significant improvements for a widely used approach to progress monitoring.
These benefits are especially relevant within the evolving context of response to intervention, which
relies substantially on CBM-R and rate-based measures of reading. The goal in creating the
CBMreading measures, therefore, was to systematically develop, evaluate and finalize research-based
instrumentation and procedures for accurate, reliable, and valid assessment and evaluation of reading
rate.
aReading
Similar to CBMreading, aReading item development followed the process and standards presented by
Schmeiser and Welch (2006) in the fourth edition of Educational Measurement (Brennan, 2006).
Research assistants, teachers from each grade level (1st through 12th), and content experts in the area

Section 6. FAST as Evidence-Based Practice
Page | 39
www.fastbridge.org
© 2015 Theodore J. Christ and Colleagues, LLC. All rights reserved.
of reading served as both item writers and reviewers for those items at the Kindergarten through 5th
grade level. Items for grades 6 through 12 were constructed to reflect the Common Core State
Standards’ (National Governors Association Center for Best Practices & Council of Chief State School
Officers, 2010) specifications for various skills of interest, as well as the National Assessment of
Educational Progress’ (NAEP, 2011) guidelines for reading assessment items. After items were written
at all grade levels, they were reviewed for feasibility, construct relevance, and content balance. A
stratified procedure was used to recruit a diverse set of item writers from urban, suburban and rural
areas. The item writers wrote, reviewed, and edited assessment materials.
Item writing for aReading was a multi-year, collaborative, and iterative process. First the literature on
item writing guidelines used when developing assessments was reviewed. Next, the literature on
multiple-choice item writing was reviewed. Once the literature was reviewed, the guidelines were
applied to aReading to examine relevance and utility. Extensive guidelines and practice were provided
to item writers and the process outlined above was followed.
The Item Development Process: An a-priori Model
aReading targets the essential skills that enable reading. In its current form aReading provides general
estimate of overall reading achievement (i.e., a screening measure), which we define as the Unified
Measure of Reading Achievement (see Figure 1 below). The research team established an a priori
model of component skills and a unified measurement construct based on previous data and
assumptions regarding typical rates of reading achievement. The use of grade levels is a convenience
because the actual assessment is individualized to each student at the time of assessment (see later
section regarding computer adaptive testing). The grade levels indicate only the likely relevant
domains. These target skill components for assessment are derived from the research literature and
are consistent with the recommendation of the National Reading Panel (2000) and critical
components of most state standards for instruction and assessment.
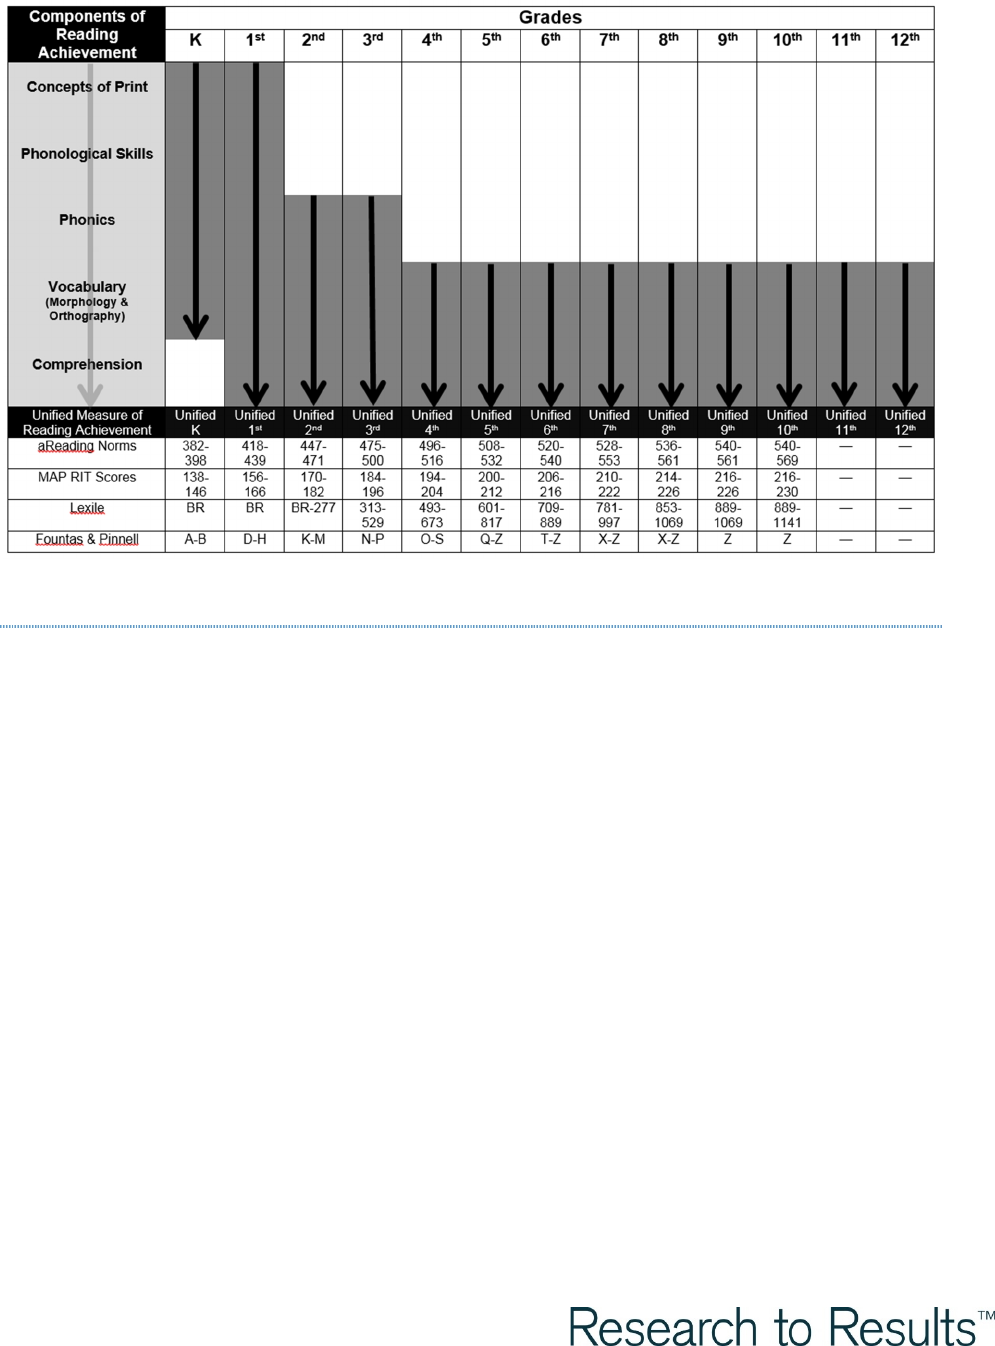
Section 6. FAST as Evidence-Based Practice
Page | 40
www.fastbridge.org
© 2015 Theodore J. Christ and Colleagues, LLC. All rights reserved.
Figure 1 A priori model for unified reading achievement
The Item Development Process: Alignment with Common Core State Standards
The Common Core State Standards for English Language Arts and Literacy in History/Social Studies,
Science and Technical Subjects (furthered referred to as the Standards) is a synthesis of information
gathered from state departments of education, assessment developers, parents, students, educators,
and other pertinent sources to develop the next generation of state standards of K–12 students to
ensure that all students are college and career literacy ready by the end of their high school education.
This process is headed by the Council of Chief State School Officers (CCSO) and the National Governors
Association (NGA). The Standards are an extension of a previous initiative by the CCSSO and NGA
titled the College and Career Readiness (CCR) Anchor Standards. The CCR Anchor Standards are
numbered from one to ten, and are as follows: (1) Read closely to determine what the text says
explicitly and to make logical inferences from it; cite specific textual evidence when writing or
speaking to support conclusions drawn from the text. (2) Determine central ideas or themes of a text
and analyze their development; summarize the key supporting details and ideas. (3) Analyze how and
why individuals, events, and ideas develop and interact over the course of a text. (4) Interpret words
and phrases as they are used in a text, including determining technical, connotative, and figurative
meanings, and analyze how specific word choices shape meaning or tone. (5) Analyze the structure of
texts, including how specific sentences, paragraphs, and larger portions of the text (e.g., a section,
chapter, scene, or stanza) relate to each other and the whole. (6) Assess how point of view or purpose
shapes the content and style of a text. (7) Integrate and evaluate content presented in diverse media
and formats, including visually and quantitatively as well as in words. (8) Delineate and evaluate the

Section 6. FAST as Evidence-Based Practice
Page | 41
www.fastbridge.org
© 2015 Theodore J. Christ and Colleagues, LLC. All rights reserved.
argument and specific claims in a text, including the validity of the reasoning as well as the relevance
and sufficiency of the evidence. (9) Analyze how two or more texts addresses similar themes or topics
in order to build knowledge or to compare the approaches the authors take. (10) Read and
comprehend complex literary and informational texts independently and proficiently. These anchor
standards were designed with three themes in mind: craft and structure, integration of knowledge
and ideas, and range of reading and level of text complexity.
The Standards add a level of specificity in the form of end of grade expectations for each of these ten
anchor standards. To do this, the Standards organize the 10 anchor standards in three ways. First, a
distinction is made between Literature and Information text. Secondly, the ten items are grouped into
relevant clusters which are the same for both literature and information text. Those clusters are: Key
Ideas and Details 1–3, Craft and Structure 4–6, Integration of Knowledge and Ideas 7–9, and Range of
Reading and Level of Text Complexity 10. Further, the Standards provide a corresponding end of
grade skill expectation by grade for each number within the cluster. A portion of the Readings
Standards for Information Text is presented inRelevant to reading standards for students in
Kindergarten through Fifth Grade, the CCSO and NGA identify foundational skills, including a working
knowledge of concepts of print, the alphabetic principle, and other basic conventions of the writing
system. Sub-categories under these foundational skills include print concepts, phonological
awareness, phonics and word recognition, and fluency. It is important to acknowledge that at this
point in time, fluency is not yet applicable to aReading. Print concepts encompass the ability to
demonstrate the organization and basic feature of print. Phonological awareness is the ability to
demonstrate an understanding of spoken words, syllables, and sounds or phonemes. Finally, phonics
and word recognition includes applying grade-level phonics and word analysis skills in the process of
decoding words. Within each category, there are specific end of the year expectations for each grade
level. Examples are shown in
Table 2. Table 3 specifies cross-references between Common Core State Standards and aReading item
domains.
Table 1 below. Similar, grade-level standards for all K–12 grade levels are available to view in the
Common Core State Standards (2010).
Relevant to reading standards for students in Kindergarten through Fifth Grade, the CCSO and NGA
identify foundational skills, including a working knowledge of concepts of print, the alphabetic
principle, and other basic conventions of the writing system. Sub-categories under these foundational
skills include print concepts, phonological awareness, phonics and word recognition, and fluency. It is
important to acknowledge that at this point in time, fluency is not yet applicable to aReading. Print
concepts encompass the ability to demonstrate the organization and basic feature of print.
Phonological awareness is the ability to demonstrate an understanding of spoken words, syllables,
and sounds or phonemes. Finally, phonics and word recognition includes applying grade-level
phonics and word analysis skills in the process of decoding words. Within each category, there are
specific end of the year expectations for each grade level. Examples are shown in
Section 6. FAST as Evidence-Based Practice
Page | 42
www.fastbridge.org
© 2015 Theodore J. Christ and Colleagues, LLC. All rights reserved.
Table 2. Table 3 specifies cross-references between Common Core State Standards and aReading item
domains.
Table 1. Example Standards for Informational Text
Reading Standards for Informational Text K–2
Kindergarten
Grade 1
Grade 2
Key Ideas and Details
1. With prompting and support,
ask and answer questions about
key details in a text.
1. Ask and answer questions about
key details in a text.
1. Ask and answer such questions
as who, what, where, when, why
and how to demonstrate
understanding of key details in a
text.
2. With prompting and support,
identify the main topic and retell
key details of a text.
2. Identify the main topic and
retell key details of a text.
2. Identify the main topic of a
multi-paragraph text as well as the
focus of specific paragraphs within
the text.
3. With prompting and support,
describe the connection between
two individuals, events, ideas, or
pieces of information in a text.
3. Describe the connection
between two individuals, events,
ideas, or pieces of information in a
text.
Describe the connection between
a series of historical events,
scientific ideas or concepts, or
steps in technical procedures in a
text.
Table 2. Foundational Skill Examples for Kindergarten and First Grade Students
Table 3. Cross-Referencing CCSS Domains and aReading Domains
Common Core Subgroups / Clusters
aReading Domains
Reading Standards: Foundational Skills (K–1)
Kindergarten
Grade 1
Print Concepts
1. Demonstrate understanding of the organization
and basic features of print.
1. Demonstrate understanding of the organization
and basic features of print.
a. Follow words from left to right, top to bottom, and
page by page.
a. Recognize the distinguishing features of a
sentence (e.g., first word, capitalization, ending
punctuation).
b. Recognize that spoken words are represented in
written language by specific sequences of letters.
c. understand that words are separated by spaces in
print.
d. Recognize and name all upper- and lowercase
letters of the alphabet.
Section 6. FAST as Evidence-Based Practice
Page | 43
www.fastbridge.org
© 2015 Theodore J. Christ and Colleagues, LLC. All rights reserved.
Foundational Skills
Print Concepts
Concepts of Print
Phonological Awareness
Phonemic Awareness
Phonetic Awareness
Phonetic Awareness
Vocabulary
Vocabulary
College and Career Readiness Reading Standards for Literature / Informational Text
Key Ideas and Details
Comprehension
Craft and structure
Comprehension & Vocabulary
Integration of Knowledge and Ideas
Comprehension & Vocabulary
Chapter 2.3: Administration and Scoring
earlyReading
Administration time varies depending on which earlyReading assessment subtest is being
administered. A timer is built into the software and is required for all subtests. For those assessments
that calculate a rate-based score (i.e., number correct per minute), the default test duration is set to
one minute. These subtests include Letter Names, Letter Sounds, Sight Words, Decodable Words, and
Nonsense Words. For those subtests that do not calculate a rate-based score (number correct), the
default test duration is set to open-ended. This includes Concepts of Print, Onset Sounds, Word
Rhyming, Word Segmenting, and Word Blending subtests. Although it is not recommended, those
administering the assessments can change the test duration by selecting options from a drop-down
menu. earlyReading is individually administered, and each subtest can take approximately one to
three minutes to complete; administration of the composite assessments for universal screening takes
approximately 5 minutes.
CBMreading
CBMreading includes standardized administration and scoring procedures along with proprietary
instrumentation, which was developed with funding from the US Department of Education and
Institute for Education Sciences. CBMreading takes approximately one minute to administer a single
passage. The administration of three passages takes approximately five minutes per student.
If a student stops or does not say a word aloud for three seconds, tell the student the word, mark the
word as incorrect, and instruct the student to continue. Aside from the three second rule, do not
provide the student with correct responses, or correct errors that the student makes. Alternate scoring
methods include word-by-word error analysis and performance analysis to evaluate the types of errors
committed by students.

Section 6. FAST as Evidence-Based Practice
Page | 44
www.fastbridge.org
© 2015 Theodore J. Christ and Colleagues, LLC. All rights reserved.
aReading
aReading can be group administered in a computer lab setting, or a student can complete an
administration individually at a computer terminal set up in a classroom. The aReading assessment
terminates on its own, informing students they have completed all items. A typical aReading
administration is approximately 30 items. Students in grades K–5 take an average of 10–15 minutes to
complete an assessment, and students in grades 6–12 take an average of 20–30 minutes.
Administration time may vary by student. Instructions for completing aReading are provided via
headphones to students. In addition to audible instructions, students are provided with an animated
example. No verbal instructions are required on behalf of the administrator.
Chapter 2.4: Interpreting Test Results
earlyReading
Raw Scores
Each earlyReading subtest produces a raw score. The primary score for each subtest is the number of
items correct and/or the number of items correct per minute. These raw scores are used to generate
percentile ranks.
Composite Scores
The best estimate of students’ early literacy skills is the earlyReading composite score. The composite
score consists of multiple subtest scores administered during a universal screening period. The
earlyReading composite scores were developed as optimal predictors of spring broad reading
achievement in Kindergarten and First Grade. A selected set of individual subtest scores were
weighted to optimize the predictive relationship between earlyReading and broad reading
achievement scores (See Table 4 below). The weighting is specific to each season. It is important to
emphasize that the weighting is influenced by the possible score range and the value of the skill. For
example, letter sounds is an important skill with a score range of 0 to 60 or more sounds per minute.
This represents a broad range of possible scores with benchmark scores that are fairly high (e.g.,
benchmarks for fall, winter, and spring might be 10, 28, and 42, respectively). In contrast, Concepts of
Print has a score range from 0 to 12 and benchmarks are relatively low in value (e.g., benchmarks for
fall and winter might be 8 and 11, respectively). As a result of both the score range
and
the relative
value of Concepts of Print to overall early reading performance, the subtest score is more heavily
weighted in the composite score. The weightings are depicted in Table 4 (below). The high (H),
moderate (M), and low (L) weights indicate the relative influence of a one point change in the subtest
on the composite score. A one point change for an H weighting is highly influential. A one point
change in an L weighting has low influence.
The composite scores should be interpreted in conjunction with specific subtest scores. A variety of
patterns might be observed. It is most common for students to perform consistently above or below
benchmark on the composite and subtests; however, it is also possible to observe that a particular
student is above benchmark on one or more measures but below the composite benchmark. It is also
Section 6. FAST as Evidence-Based Practice
Page | 45
www.fastbridge.org
© 2015 Theodore J. Christ and Colleagues, LLC. All rights reserved.
possible for a student to be below benchmark on one or more subtests but above the composite
benchmark. Although atypical, this phenomenon is not problematic. The recommendation is to
combine the use of composite and subtest scores in order to optimize the decision-making process.
Overall, composite scores are the best predictors of future reading success.
Table 4. Weighting Scheme for earlyReading Composite Scores
Kindergarten
First Grade
earlyReading Subtests
F
W
S
F
W
S
Concepts of Print
H
Onset Sounds
M
H
Letter Names
L
Letter Sounds
L
L
L
Word Segmenting
L
M
L
L
L
Nonsense/Decodable Words
M
M
H
H
H
Sight Words
L
M
M
M
Sentence Reading
L
CBMreading
L
L
Broad Score
Note. The weighting of subtests for the composite is represented above.
H – high weighting, M – moderate weighting, L – low weighting.
Kindergarten
The composite score for Kindergarten students in the fall includes Concepts of Print, Onset Sounds,
Letter Sounds, and Letter Naming. The composite score for winter includes Onset Sounds, Letter
Sounds, Word Segmenting and Nonsense Words. Finally, for spring of the Kindergarten year, the
following subtests are recommended in order to compute an interpretable composite score: Letter
Sounds, Word Segmenting, Nonsense Words, and Sight Words (50). The Decodable Words score may
be used in place of Nonsense Words for computing any of the composite scores specified.
First Grade
The composite score for First Grade students in the fall includes Word Segmenting, Nonsense Words,
Sight Words (150), and Sentence Reading. The composite score for winter includes Word Segmenting,
Nonsense Words, Sight Words (150), and CBMreading. Finally, for spring of First Grade, the following
subtests are recommended in order to compute an interpretable composite score: Word Segmenting,
Nonsense Words, Sight Words (150), and CBMreading. The Decodable Words score may be used in
place of Nonsense Words for computing any of the composite scores specified.
Section 6. FAST as Evidence-Based Practice
Page | 46
www.fastbridge.org
© 2015 Theodore J. Christ and Colleagues, LLC. All rights reserved.
Benchmark Scores
Benchmark scores are available for each earlyReading subtest for the specific grade level and month
for which they are intended for use. Thus, a benchmark is purposefully not provided for every subtest,
for each month, during Kindergarten and First Grade. Benchmarks were established for earlyReading
to help teachers accurately identify students who are at risk or not at risk for academic failure. These
benchmarks were developed from a criterion study examining earlyReading assessment scores in
relation to scores on the Group Reading Assessment and Diagnostic Evaluation (GRADE; Williams,
2001). Measures of diagnostic accuracy were used to determine decision thresholds using criteria
related to sensitivity, specificity, and area under the curve (AUC). Specificity and sensitivity was
computed at different cut scores in relation to maximum AUC values. Decisions for final benchmark
percentiles were generated based on maximizing each criterion at each cut score (i.e., when the cut
score maximized specificity ≥ .70, and sensitivity was also ≥ .70; see Silberglitt & Hintze, 2005). Based
on these analyses, the values at the 40th and 15th percentiles were identified as the primary and
secondary benchmarks for earlyReading, respectively. These values thus correspond with a prediction
of performance at the 40th and 15th percentiles on the GRADE™ (Group Reading Assessment and
Diagnostic Evaluation), a nationally normed reading assessment of early reading skills. Performance
above the primary benchmark indicates the student is at low risk for long-term reading difficulties.
Performance between the primary and secondary benchmarks indicates the student is at some risk for
long-term reading difficulties. Performance below the secondary benchmark indicates the student is
at high risk for long-term reading difficulties. These risk levels help teachers accurately monitor
student progress using the FAST™ earlyReading measures. Benchmarks are reported in the FastBridge
Learning: Benchmarks and Norms Guide.
CBMreading
Interpreting CBMreading scores involves a basic understanding of the various scores provided in the
FAST™ software.
Total Words Read
Total Words Read refers to the total number of words read by the student, including correct and
incorrect responses.
Number of Errors
This is the total number of errors the student made during the one minute administration time.
Words Read Correct per Minute (WRC/min)
This is the number of Words Read Correct per minute. This is computed by taking the total number of
words read and subtracting the number of errors the student made.
Benchmark Scores
Benchmark scores are available for CBMreading by grade level and time of the year (i.e., fall, winter,
spring) for which they are intended for use. A benchmark is provided for every grade level (1-6), for
each of the three time points throughout the school year. The assessment of oral reading rate with
Section 6. FAST as Evidence-Based Practice
Page | 47
www.fastbridge.org
© 2015 Theodore J. Christ and Colleagues, LLC. All rights reserved.
CBM-R is well established in the literature for use to benchmark student progress (Wayman et al.,
2007). Benchmarks were established for CBMreading to help teachers accurately identify students
who are at risk or not at risk for reading difficulties. All CBMreading forms are divided into Levels A, B
and C, which correspond to 1st grade (A), 2nd and 3rd grade (B), and 4th through 6th grade (C)
reading levels, respectively. There are 39 Level A passages, 60 Level B, and 60 Level C passages. Each
passage is assigned as a screening/benchmarking form for each grade level (1st to 6th) and a variety
of progress monitoring forms. The weekly passage set options include: one unique passage weekly (1x
weekly), two unique passages weekly (2x weekly), or three unique passages weekly (3x weekly).
Analyses were conducted to link CBMreading scores with DIBELS Next and AIMSweb benchmark and
target scores.
Measures of diagnostic accuracy were used to determine decision thresholds using criteria related to
sensitivity, specificity, and area under the curve (AUC). Specifically, specificity and sensitivity was
computed at different cut scores in relation to maximum AUC values. Decisions for final benchmark
percentiles were generated based on maximizing each criterion at each cut score (i.e., when the cut
score maximized specificity ≥ .70, and sensitivity was also ≥ .70; see Silberglitt & Hintze, 2005).
Benchmarks generally correspond to the 40th and 15th percentiles on nationally normed assessments
and FAST™ norms. Benchmarks are reported in the FastBridge Learning: Benchmark and Norms Guide.
aReading
Interpreting aReading scores involves a basic understanding of the various scores provided in the
FAST™ software.
Scaled Scores
Scores generated by the aReading computer-adaptive test (CAT) yield scores based on an IRT logit
scale. This type of scale is not useful to most school professionals; in addition, it is difficult to interpret
scores on a scale for which everything below the mean value yields a negative number. Therefore, it
was necessary to create an aReading scale more similar to existing educational measures. Such scales
are arbitrarily created with predetermined basal and ceiling scores. For instance, the Measure of
Academic Progress (MAP; NWEA) uses a scale from 150 to 300 and STAR Early Literacy (Renaissance
Learning) uses a scale from 300 to 850.
The aReading scale yields scores that are transformed from logits using the following formula:
y = 500 + (50 x Logit Score)
The logit scale has an
M
= 0 and
SD
= 1 and y is the new aReading scaled score, and (theta) is the
initial aReading logit theta estimate. Scores were scaled with a lower bound of 350 and a higher
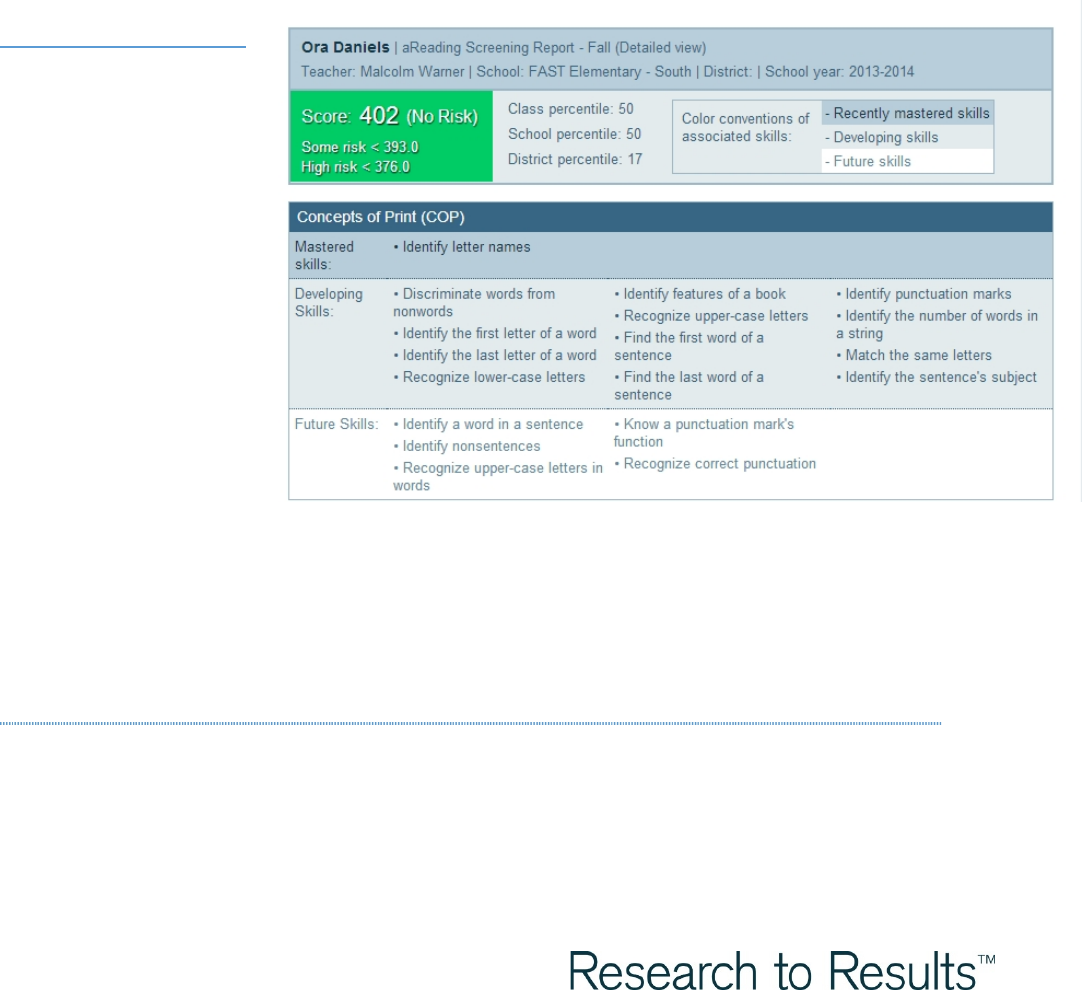
Section 6. FAST as Evidence-Based Practice
Page | 48
www.fastbridge.org
© 2015 Theodore J. Christ and Colleagues, LLC. All rights reserved.
bound of 650. The mean value is 500 and the standard deviation is 50. There are several shortcomings
in reporting logit scores to educational professionals. Among these are: (a) teachers are unfamiliar
with a measure ranging in six points with decimals and (b) using the current logit reporting scheme,
negative values demarcate ability estimates below average. Displaying negative values for ability
estimates may carry with it off-putting connotations. Thus, the researchers for aReading chose to
adopt an arbitrary scale upon which to report logit scores and theta estimates. The idea of reporting
scores on the same scale as standard intelligence tests was considered but ultimately dismissed. The
reason for dismissing this idea was two-fold; the researchers wanted to avoid educators and parents
inaccurately equating aReading scores with IQ scores. In addition, creating a novel and arbitrary scale
would encourage educators to refer to the current technical manual for assistance in interpreting such
scores accurately. Details on interpreting aReading scaled scores for instructional purposes is
delineated in the following section.
Interpreting Scaled Scores
aReading scaled scores
have an average of 500
and standard deviation of
50 across the range of
Kindergarten to twelfth
grades. Scores should be
interpreted with
reference to the
benchmarks and norms.
In addition, aReading has
descriptions regarding
the interpretation of a
student’s scaled score
with respect to mastered,
developing, and future
skill development. These
are intended to help
teachers better understand the developmental progression and student needs. FAST™ generates
individual reports to describe the reading skills that the student has mastered, is developing, and will
develop based on their scaled score Figure 2 shows an example of a student’s score report and her
mastered, developing, and future skills for Concepts of Print.
Benchmark Scores
Benchmark scores for aReading are available for Kindergarten through Twelfth Grade at three time
periods: fall, winter, and spring. Benchmarks were established for aReading to help teachers accurately
identify students who are at risk or not at risk for academic failure. Benchmarks are reported in the
FastBridge Learning: Benchmark and Norms Guide.
Figure 2. Example of a student's aReading report with interpretations of the scaled
score
Section 6. FAST as Evidence-Based Practice
Page | 49
www.fastbridge.org
© 2015 Theodore J. Christ and Colleagues, LLC. All rights reserved.
Chapter 2.5: Reliability
earlyReading
earlyReading measures were administered to Kindergarten and First Grade students from nine
elementary schools across three school districts in a metropolitan area in the Midwest. Kindergarten
students who participated in the study were enrolled in all-day Kindergarten programming. The
demographic information for each school district is provided in Table 5.
Table 5. Demographic Information for earlyReading Alternate Form Sample
Category
District A
District B
District C
White
56.1%
93%
79.5%
Black
13.5%
4%
6.8%
Hispanic
10.3%
3%
4.5%
Asian/Pacific Islander
19.4%
4%
10.5%
American Indian/Alaska Native
>.1%
1%
.25%
Free/Reduced Lunch
44.9%
17%
9%
LEP
15.8%
6%
6%
Special Education
12.6%
10%
10%
Classrooms were recruited by the reading coordinator within each school district. Teachers received a
$20.00 gift card for participating. Five progress monitoring alternate forms were randomly chosen for
each earlyReading measure (for which progress monitoring forms exist). Students were administered
five forms of one to two earlyReading measures consecutively in one sitting. Administration was
conducted by trained administrators who all attended a two-hour training session in addition to
completing integrity checks while working with students.
Evidence of reliability is available for Alternate Forms for all earlyReading subtests (see
Table 6). In order to effectively examine reliability coefficients, Standard error of measurement (SE
m
)
has also been provided. The SE
m
is an index of measurement error representing the standard
deviation of errors attributable to sampling. The SE
m
provides information about the confidence with
which a particular score can be interpreted, relative to a single individual’s true score. Thus, a small
SE
m
represents greater confidence that a score reflects the individual’s true performance and skill
level. The SE
m
is based on the formula =√1 − where SD represents the standard deviation
of the distribution and r represents the reliability of the measure. The SE
m
can be used by those
administering the measure to help interpret the score obtained by a student. The SE
m
for both
Kindergarten and First Grade are available for each subtest in
Table 6. To determine parallel form construction, ANOVAs were conducted to compare alternate forms
for each individual subtest. See below for a complete description of parallel form construction for the

Section 6. FAST as Evidence-Based Practice
Page | 50
www.fastbridge.org
© 2015 Theodore J. Christ and Colleagues, LLC. All rights reserved.
following earlyReading subtests: Onset Sounds, Letter Naming, Letter Sounds, Word Blending, Word
Segmenting, Decodable Words, and Nonsense Words.
Table 6. Alternate Form Reliability and SE
m
for earlyReading
Grade
N (range)
Coefficient
SE
m
(SD)
Range
Median
Kindergarten
Onset Sounds
25–29
.77–.89
.83
.99 (.86)
Letter Naming
36–37
.82–.92
.88
5.07 (3.77)
Letter Sound
34–36
.85–.94
.89
5.56 (4.89)
Word Blending
36–37
.59–.79
.71
.97 (.82)
Word Segmenting
37–38
.68–.92
.82
8.07 (6.21)
Decodable Words
29
.96–.98
.97
2.93 (2.71)
Nonsense Words
28
.86–.96
.93
2.15 (1.91)
Sight Words (50)
24–28
.94–.99
.97
4.40 (4.13)
Nonsense Words
28
.86–.96
.93
2.15 (1.91)
Grade 1
Word Blending
30–31
.15–.59
.26
Word Segmenting
40
.67–.87
.82
9.83
Decodable Words
36–37
.97–.98
.98
2.98
Nonsense Words
26–27
.69–.96
.85
3.05 (3.04)
Sight Words (150)
37
.91–.96
.94
4.14
Note. SD = Standard Deviation.
Alternate Form Reliability
Onset Sounds. To determine parallel form construction, a one-way, within-subjects (or repeated
measures) ANOVA was conducted to compare the effect of Onset Sounds alternate forms (
n
= 5) on
the number of correct responses within individuals. There was not a significant effect for forms
F
(1,109) = 1.81,
p
=.18. This indicates that different forms did not result in significantly different mean
estimates of correct responses.
Letter Names. To determine parallel form construction, a one-way, within-subjects (or repeated
measures) ANOVA was conducted to compare the effect of Letter Names alternate forms (
n
= 5) on the
number of correct responses within individuals. There was not a significant effect for forms
F
(1,146) =
.71,
p
=.40. This indicates that different forms did not result in significantly different mean estimates of
correct responses.
Letter Sounds. To determine parallel form construction, a one-way, within-subjects (or repeated
measures) ANOVA was conducted to compare the effect of Letter Sounds alternate forms (
n
= 5) on
the number of correct responses within individuals. There was not a significant effect for forms
F
(1,139) = .96,
p
=.33. This indicates that different forms did not result in significantly different mean
estimates of correct responses.

Section 6. FAST as Evidence-Based Practice
Page | 51
www.fastbridge.org
© 2015 Theodore J. Christ and Colleagues, LLC. All rights reserved.
Word Blending. To determine parallel form construction, a one-way, within-subjects (or repeated
measures) ANOVA was conducted to compare the effect of Word Blending alternate forms (
n
= 5) on
the number of correct responses within individuals. There was not a significant effect for forms
F
(1,121) = 1.60,
p
=.21. This indicates that different forms did not result in significantly different mean
estimates of correct responses.
Word Segmenting. To determine parallel form construction, a one-way, within-subjects (or repeated
measures) ANOVA was conducted to compare the effect of Word Segmenting alternate forms (n=5)
on the number of correct responses within individuals in both Kindergarten and grade 1. There was
not a significant effect for forms as used in either grade: Kindergarten =
F
(1,150) = 3.24,
p
=.07; grade 1
=
F
(1,121) = 1.60,
p
=.21. This indicates that different forms did not result in significantly different
mean estimates of correct responses.
Decodable Words. To determine parallel form construction, a one-way, within-subjects (or repeated
measures) ANOVA was conducted to compare the effect of Decodable Words alternate forms (
n
= 5)
on the number of correct responses within individuals. There was not a significant effect for forms
F
(1,145) = 1.72,
p
=.19. This indicates that different forms did not result in significantly different mean
estimates of correct responses.
Nonsense Words. To determine parallel form construction, a one-way, within-subjects (or repeated
measures) ANOVA was conducted to compare the effect of Nonsense Words alternate forms (
n
= 5) on
the number of correct responses within individuals. For Kindergarten, there was not a significant effect
for forms
F
(1,107) = .03,
p
=.86. For First Grade, there was not a significant effect for forms
F
(1,106) =
2.34,
p
=.13. This indicates that different forms did not result in significantly different mean estimates
of correct responses.
Internal Consistency (Item-Total Correlations)
Some earlyReading measures have fixed test lengths and are subject to typical internal consistency
analyses. Some earlyReading measures, however, are timed. Different students will therefore have
tests of different lengths. Internal consistency measures of reliability are inflated on timed measures
because of the high percentage of incomplete items at the end of the assessment, which are those for
which examinees did not respond (Crocker & Algina, 1986). As a solution to both illustrate the
potential inflation and also reduce it, estimates of internal consistency (reliability) were run on the
items completed by approximately 16% of students, the items completed by 50% of students, and
items completed by approximately 84% of students. Items not completed were coded as incorrect.
For both fixed test -length and inconsistent test-length analyses, data were derived from a random
sample of students from the FAST™ database from the 2012–13 academic year. Reliability of measures
with variable test length is reported in .

Section 6. FAST as Evidence-Based Practice
Page | 52
www.fastbridge.org
© 2015 Theodore J. Christ and Colleagues, LLC. All rights reserved.
Table 7. Reliability of measures with fixed test length is reported in Table 8.
Table 7. Internal Consistency for earlyReading Subtests of Variable Test Length
Measure
Grade
N
Alpha
Split-Half
Letter Names
K
444
18 items
.95
.96
35 items
.98
.99
52 items
.98
.99
Letter Sounds
K
683
10 items
.93
.93
30 items
.98
.98
50 items
.98
.99
Decodable Words
K-1
434
6 items
.76
.75
23 items
.95
.96
40 items
.98
.98
Nonsense Words
K–1
501
5 items
.74
.73
18 items
.93
.95
31 items
.96
.98
Sight Words (50)
K–1
505
11 items
.90
.91
29 items
.97
.98
47 items
.99
.99
Sight Words (150)
1
678
12 items
.90
.91
53 items
.99
.99
94 items
.99
.99
Table 8. Internal Consistency for earlyReading Subtests of Fixed Test Length
Measure
Grade
N
# of items
Alpha
Split-Half
Concepts of Print
K
336
12
.75
.76
Onset Sounds
K
597
16
.87
.91
Rhyming
K
586
16
.94
.91

Section 6. FAST as Evidence-Based Practice
Page | 53
www.fastbridge.org
© 2015 Theodore J. Christ and Colleagues, LLC. All rights reserved.
Word Blending
K–1
480
10
.90
.91
Word Segmenting
K–1
500
10
.95
.96
Section 6. FAST as Evidence-Based Practice
Page | 54
www.fastbridge.org
© 2015 Theodore J. Christ and Colleagues, LLC. All rights reserved.
Test-Retest Reliability
In fall 2012, data were collected to determine test-retest reliability for all earlyReading screening
measures. Participants included 85 Kindergarten and 71 First Grade students from two elementary
schools in a metropolitan area in the Midwest. Kindergarten students who participated in the study
were enrolled in all-day Kindergarten at two elementary schools within the same school district.
Table 9. Descriptive Information for earlyReading Test-Retest Reliability Sample
Grade
Measure
N
Min
Max
SD
Mean
Max Possible
Time 1 (
Note. Time 1 is based on fall screening data)
K
Concepts of Print
39
3
12
1.96
9.46
12
K
Onset Sounds
39
2
16
2.94
13.74
16
K
Letter Naming
39
2
52
15.91
32.23
52/min
K
Letter Sound
39
0
50
13.36
19.62
38/min
K
Rhyming
39
0
16
4.60
11.77
16
K
Word Blending
39
0
10
3.81
3.92
10
Time 2 (~3 weeks later)
K
Concepts of Print
40
5
12
2.07
9.7
12
K
Onset Sounds
40
5
16
2.35
14.15
16
K
Letter Naming
40
2
52
15.73
31.70
52/min
K
Letter Sound
40
1
39
11.23
19.43
38/min
K
Rhyming
40
4
16
3.74
12.18
16
K
Word Blending
34
0
9
3.13
3.71
10
Time 1
(Note. Time 1 is based on fall screening data)
1st
Word Blending
37
0
10
7.19
2.94
10
1st
Word Segmenting
37
4
34
55.81
7.50
32
1st
Decodable Words
37
0
49
12.82
14.10
50/min
1st
Nonsense Words
37
1
34
10.65
8.39
50/min
1st
Sight Words (150)
37
1
91
35.35
24.21
150/min
1st
Sentence Reading
37
1
181
42.68
38.60
1st
Composite
33
79
128
11.99
104.5
Time 2 (~3 weeks later)
1st
Word Blending
37
0
10
11.00
14.75
10
1st
Word Segmenting
37
14
34
27.57
5.28
32
1st
Decodable Words
37
0
50
17.22
13.95
50/min
1st
Nonsense Words
37
0
50
17.97
12.53
50/min
1st
Sight Words (150)
37
0
109
46.41
29.48
150/min
1st
Sentence Reading
37
0
220
55.81
50.13
1st
Composite
33
80
138
13.58
110.03
All First Grade students who participated in the study were from a single school. The majority of
students within the school district were White (78%), with the remaining students identified as either
Black (19%), or other (3%). Forty to fifty percent of students at each school were on free and reduced
lunch. For details regarding the demographic sample for this data collection, see Table 9. Coefficients

Section 6. FAST as Evidence-Based Practice
Page | 55
www.fastbridge.org
© 2015 Theodore J. Christ and Colleagues, LLC. All rights reserved.
in Table 10 with larger sample sizes (i.e., larger than the above specified sample) were derived from a
convenience sample from the FAST™ database. This sample was approximately 85% White.
Teachers randomly selected three to five students and sent home passive consent forms. The first
administration of earlyReading measures were given by classroom teachers during a two-week
screening period. All teachers attended a two-hour training session on earlyReading measures and
were observed by the lead teacher at each school for a percentage of the time to confirm
administration integrity. The second administration of the earlyReading measures were given by a
team of school psychology graduate students. All graduate students also attended a two-hour
training session related to earlyReading administration. This second administration took place two to
three weeks after the termination of the initial screening period. Due to ongoing data collections, test-
retest reliability evidence has been provided for additional time intervals: fall (F) to winter (W), winter
to spring (S), and fall (F) to spring (S). Sample sizes vary by time interval. Test-retest reliabilitis are
reported in Table 10.
Table 10. Test-Retest Reliability for all earlyReading Screening Measures
Measure
Grade
Test-Retest Coefficient (N)
2-3 Weeks
F to W
W to S
F to S
Concepts of Print
K
.42 (39)
.66 (89)
.58 (90)
.51 (168)
Onset Sounds
K
.79 (67)
.75 (89)
.67 (90)
.58 (167)
Letter Names
K
.94* (45)
.65 (1781)
.55 (951)
.45 (1141)
Letter Sounds
K
.92 (75)
.51 (1241)
.61 (1282)
.35 (1600)
Rhyming
K
.74 (39)
.68 (917)
.62 (946)
.46 (1130)
Word Blending
K
.73 (70)
.59 (832)
.59 (856)
.34 (1069)
Word Segmenting
K
.86 (37)
--
.61 (834)
--
Decodable Words
K
.98 (29)
.70 (56)
.68 (168)
--
Nonsense Words
K
.94 (27)
.70 (119)
.74 (321)
--
Sight Words (50)
K
.97 (34)
--
.73 (169)
--
Composite
K
--
.91 (191)
.68 (185)
.71 (220)
Word Blending
1
.77 (67)
.61 (592)
.78 (579)
.54 (568)
Word Segmenting
1
.83 (77)
.52 (589)
.70 (582)
.48 (573)
Decodable Words
1
.97 (73)
.80 (2152)
.84 (604)
.69 (1194)
Nonsense Words
1
.76 (64)
.78 (1977)
.82 (439)
.65 (1046)
Sight Words (150)
1
.94 (74)
.84 (913)
.82 (432)
.60 (1137)
Sentence Reading
1
.98 (37)
Pending
Pending
Pending
Composite
1
.97 (33)
.90 (153)
.92 (104)
.88 (118)
Note. Sample size provided in parentheses. F = Fall. S = Spring. W = Winter.
*Outliers that were +/- 2 standard deviations from the mean were removed from the test -retest reliability sample.
In this case 2 cases, making up 3% of the sample, were removed.
Section 6. FAST as Evidence-Based Practice
Page | 56
www.fastbridge.org
© 2015 Theodore J. Christ and Colleagues, LLC. All rights reserved.
Table 11. Disaggregated Test Re-Test Reliability for earlyReading Measures
Measure
Grade
Test-Retest Coefficient (N)
Ethnicity
2-3 Weeks
F to W
W to S
F to S
Letter Names
Black
K
--
.69 (293)
--
.57 (274)
Letter Names
Hispanic
K
--
.61 (194)
--
.44 (179)
Letter Names
White
K
--
.61 (1129)
--
.40 (1293)
Letter Sounds
Black
K
--
.53 (409)
--
.45 (408)
Letter Sounds
Hispanic
K
--
.46 (270)
--
.29 (292)
Letter Sounds
White
K
--
.50 (1410)
--
.31 (1687)
Nonsense Words
Black
K
--
.52 (23)
--
.28 (38)
Nonsense Words
Hispanic
K
--
.73 (91)
--
.54 (102)
Onset Sounds
Black
K
--
.53 (424)
--
--
Onset Sounds
Hispanic
K
--
.51 (274)
--
--
Onset Sounds
White
K
--
.49 (1418)
--
--
Word Segmenting
Black
K
--
.61 (49)
--
.32 (52)
Word Segmenting
Hispanic
K
--
.54 (15)
--
.28 (20)
Word Segmenting
White
K
--
.61 (163)
--
.24 (230)
Word Blending
Black
K
--
.56 (219)
--
.34 (222)
Word Blending
Hispanic
K
--
.48 (129)
--
.30 (134)
Word Blending
White
K
--
.56 (533)
--
.33 (778)
Nonsense Words
Black
1
--
.74 (337)
--
.60 (179)
Nonsense Words
Hispanic
1
--
.74 (225)
--
.66 (121)
Nonsense Words
White
1
--
.78 (1156)
--
.63 (624)
Decodable Words
Black
1
--
.80 (375)
--
.73 (206)
Decodable Words
Hispanic
1
--
.75 (260)
--
.63 (138)
Decodable Words
White
1
--
.79 (1220)
--
.67 (707)
Sight Words (150)
Black
1
--
.84 (172)
--
.62 (194)
Sight Words (150)
Hispanic
1
--
.73 (123)
--
.52 (133)
Sight Words (150)
White
1
--
.87 (501)
--
.59 (674)
Word Segmenting
Black
1
--
.60 (171)
--
.53 (205)
Word Segmenting
Hispanic
1
--
.57 (128)
--
.52 (142)
Word Segmenting
White
1
--
.48 (447)
--
.46 (692)
Word Blending
Black
1
--
.66 (172)
--
.51 (205)
Word Blending
Hispanic
1
--
.58 (130)
--
.50 (142)
Word Blending
White
1
--
.48 (452)
--
.36 (705)
Inter-Rater Reliability
earlyReading measures involve a small degree of subjectivity, given clear scoring guidelines and
software-assisted scoring mechanisms. Unreliable scoring in regards to earlyReading may be the result
Section 6. FAST as Evidence-Based Practice
Page | 57
www.fastbridge.org
© 2015 Theodore J. Christ and Colleagues, LLC. All rights reserved.
of clerical errors or differences in the interpretation of a student’s response. To alleviate such error,
examples and detailed responses are provided in the earlyReading Screening Administration
Technical Manual.
Evidence of inter-rater reliability is provided in Table 12. All coefficients represent Pearson product-
moment correlation coefficients (Pearson
r
). For demographic information on the sample from which
inter-rater reliability coefficients were derived, see Table 5.
Table 12. Inter-Rater Reliability by earlyReading Subtest
Subtest
Grade
Correlation Coefficient
N
Onset Sounds
K
.98
40
Letter Sounds
K
.99
47
Letter Names
K
.99
69
Word Blending
K
.98
95
Word Segmenting
K
.85
90
Sight Words (50)
K
.99
9
Word Blending
1
.89
159
Word Segmenting
1
.83
85
Decodable Words
1
.99
120
Sight Words (150)
1
.97
125
Nonsense Words
1
.99
51
Reliability of the Slope
Data collected during a normative information-aimed study was used to determine reliability of the
slope for earlyReading measures. Participants included Kindergarten and First Grade students from
various elementary schools. Students were administered one or more earlyReading measures at three
time points throughout the school year (see below)
Table 13. Demographic Information for earlyReading Reliability of the Slope Sample
Category
Kindergarten (N)
1st Grade (N)
Female
2086
1604
Male
2196
1555
White
2710
2114
Black
688
429
Hispanic
439
288
Asian/Pacific Islander
322
252
Other
123
77
General Education
2656
1727
Special Education
1345
1296
Unspecified
1626
1433
Reliability of the slope was calculated for earlyReading screening and progress monitoring data. This
data is shown in Table 14. Reliability of the slope data has also been disaggregated by ethnicity.
Disaggregated information is also provided (See Table 15).

Section 6. FAST as Evidence-Based Practice
Page | 58
www.fastbridge.org
© 2015 Theodore J. Christ and Colleagues, LLC. All rights reserved.
Table 14. Reliability of the Slope for All earlyReading Screening Measures
Subtest
Grade
N
Coefficient
Onset Sounds
K
2129
.91
Letter Names
K
1627
.81
Letter Sounds
K
2229
.88
Rhyming
K
904
.38
Word Blending
K
958
.73
Word Blending
1
824
.77
Word Segmenting
K
235
.60
Word Segmenting
1
824
.78
Decodable Words
K
52
.59
Decodable Words
1
918
.86
Sight Words (50)
K
167
.22
Sight Words (150)
1
624
.77
Nonsense Words
K
116
.75
Nonsense Words
1
664
.87
Note. All of the above information is based on three time points: fall, winter, and spring data.

Section 6. FAST as Evidence-Based Practice
Page | 59
www.fastbridge.org
© 2015 Theodore J. Christ and Colleagues, LLC. All rights reserved.
Table 15. Reliability of the Slope for earlyReading measures, Disaggregated by Ethnicity
Subtest
Grade
N
Coefficient
Ethnicity
Onset Sounds
K
342
.90
Black
253
.89
Hispanic
1253
.92
White
Letter Sounds
K
366
.93
Black
247
.86
Hispanic
1332
.89
White
Letter Names
K
256
.80
Black
177
.76
Hispanic
1049
.83
White
Nonsense Words
K
22
.70
Black
89
.81
White
Word Blending
K
206
.77
Black
125
.57
Hispanic
515
.74
White
Word Blending
1
156
.93
Black
123
.74
Hispanic
420
.77
White
Word Segmenting
K
156
.78
Black
122
.77
Hispanic
418
.73
White
Word Segmenting
1
48
.60
Black
15
.36
Hispanic
157
.65
White
Nonsense Words
1
153
.93
Black
92
.89
Hispanic
328
.85
White
Decodable Words
1
199
.88
Black
136
.91
Hispanic
449
.83
White
Sight Words (150)
1
130
.71
Black
103
.85
Hispanic
303
.79
White
Note. All of the above information is based on three time points: fall, winter, and spring data.
CBMreading
The CBMreading passages in FAST™ have been systematically developed and field tested over a
number of years to address the problems with pre-existing passage sets that introduced error into
measurement of student reading rate during screening and progress monitoring. The goal in creating
the CBMreading measures was to systematically develop, evaluate, and finalize research-based
instrumentation and procedures for reliable assessment and evaluation of reading rate. Christ and
Ardoin (2009) described their initial method for FAIP-R field testing and passage-set development,
which was designed to minimize variance due to instrumentation/passages and optimize progress
Section 6. FAST as Evidence-Based Practice
Page | 60
www.fastbridge.org
© 2015 Theodore J. Christ and Colleagues, LLC. All rights reserved.
monitoring reliability/precision. In a follow-up study, Ardoin and Christ (2009) directly compared
FAIP-R passages to DIBELS and AIMSweb passage sets in a peer-refereed publication. In the only
published study of its kind, they concluded that FAIP-R passages yielded less error and more precise
estimates than either AIMSweb or DIBELS—with the most substantial improvements over the DIBELS
system. Progress monitoring requires a set of equivalent reading passages, a schedule, graphing
procedures, and trend line or data-point decision rules due to the increased frequency of CBM-R
administration. The materials and decision rules guiding material use, selection, and schedule of
administration in CBMreading have all been developed with these core elements in mind.
The CBMreading passages in FAST™ were initially developed and field tested with 500 students per
level. All passages were designed with detailed specifications and in consultation with educators and
content experts. The researchers analyzed data from three rounds of field testing and edited passages
to optimize the semantic, syntactic, and cultural elements. Evidence of test-retest reliability and
reliability of the slope was derived from the same sample of participants.
Alternate Form Reliability
First Passage Reduction
Alternate forms of FAIP-R oral reading passages were administered in order to identify the best set of
passages to use when measuring oral reading rate with students at differing levels of ability in first
through Fifth Grades. Three passage sets of different difficulty level were constructed.
Student participants were from urban and suburban schools located in the Southeast, the upper
Midwest, and Northeastern regions of the US. A passive-consent procedure was used so that students
whose parents opted out of participation were excluded from the sample. The sample consisted of
177 participants from Kindergarten through Fifth Grades. Fifteen students were sampled from
Kindergarten and First Grades in the upper Midwest site. Across all three sites, 40 students were
selected from second and Third Grade classrooms (n=80) and 40 students were selected from fourth
and Fifth Grade classrooms (n=80; two extra participants were seen at the Northeastern site).
Information about participant characteristics in the overall and disaggregated sample is provided in
Table 16.

Section 6. FAST as Evidence-Based Practice
Page | 61
www.fastbridge.org
© 2015 Theodore J. Christ and Colleagues, LLC. All rights reserved.
Table 16. Demographic Information for CBMreading First Passage Reduction Sample
Grade
Sex
Age
Race
SESa
Special
Education
F
M
A
B
H
Am
W
Overall
K
3
2
6 years 5 months
0
1
0
0
4
0
0
1
3
7
7 years 2 months
0
1
0
0
9
1
0
2
15
21
7 years 11 months
1
7
3
1
28
14
0
3
15
27
8 years 10 months
1
3
1
0
37
14
0
4
21
21
10 years 2 months
2
7
0
0
33
12
1
5
14
26
10 years 10 months
3
4
1
1
31
10
1
Southeast
2
10
3
8 years 1 month
0
2
0
0
11
1
0
3
6
11
8 years 11 months
0
0
0
0
17
0
0
4
8
9
10 years 10 months
0
2
0
0
15
0
0
5
4
11
11 years 1 month
0
2
0
0
13
0
0
Upper Midwest
K
3
2
6 years 5 months
0
1
0
0
4
0
0
1
3
7
7 years 2 months
0
1
0
0
9
1
0
2
7
8
8 years 4 months
1
0
1
0
13
1
0
3
5
10
9 years 3 months
0
1
0
0
14
4
0
4
8
7
10 years 1 month
2
3
0
0
10
2
0
5
4
11
11 years 0 months
0
2
1
0
12
0
1 (not specified)
Northeast
2
2
10
7 years 5 months
0
5
2
1
4
12
0
3
4
6
8 years 4 months
1
2
1
0
6
10
0
4
5
5
9 years 7 months
0
2
0
0
8
10
1 (speech)
5
6
4
10 years 6 months
3
0
0
1
6
10
0
Note: A=Asian, B= Black, H= Hispanic, Am= American Indian, W= White.
aSES indicates the number of students receiving free and reduced price lunch.
Experimenters worked individually with students in separate, quiet areas within the schools at each
site. At the beginning of each session the experimenter provided a general introduction from a
prepared set of directions. Students were assigned to particular levels of passages based on grade
level. Students in Kindergarten and First Grades read passages in Level A. Students in second and
Third Grades read passages in Level B and Fourth and Fifth Graders read passages in Level C. Passage
order was random within student; each student read all passages to facilitate analysis of passage
specific performances and prepare for equating and linking of passages within and across levels.
Students in Kindergarten through Fifth Grades were seen for approximately 10 successive days of
testing. On each day of testing, students in second through Fifth Grades read 12 different passages
and students in Kindergarten and First Grades read six passages each day. This resulted in students at
Level A reading 63 total passages, and students at Levels B and C reading 120 total passages (i.e., three
linking passages plus the number of progress monitoring passages for each level).
Section 6. FAST as Evidence-Based Practice
Page | 62
www.fastbridge.org
© 2015 Theodore J. Christ and Colleagues, LLC. All rights reserved.
For each passage read, an appropriate paper version was placed in front of the student so s/he could
read aloud. The experimenter gave directions and then followed along and scored errors on his or her
paper or electronic copy for one minute. Each session lasted approximately 20 minutes. See Table 17
for descriptive statistics for the first passage reduction sample.
Table 17. Descriptive Statistics for First Passage Reduction
M
SD
Median
Trimmed
Min
Max
Skew
Kurtosis
SE
Level A Passages
All 60
66.63
33.08
57.30
64.89
23.88
132.0
0.51
-0.97
8.54
Reduced 40
65.47
30.97
57.83
63.88
24.83
126.8
0.50
-0.96
8.0
Level B Passages
All 117
117.76
42.40
117.80
117.36
23.88
219.47
0.07
-0.26
5.43
Reduced 80
114.92
43.90
116.20
114.92
10.00
225.0
-0.01
-0.07
5.0
Level C Passages
All 117
153.59
40.19
151.09
152.84
69.42
251.74
0.21
-0.34
5.37
Reduced 80
151.55
40.33
146.84
149.70
70.00
251.0
0.40
-0.29
4.79
Note. M = Mean; SD = Standard Deviation; Min = Minimum; Max = Maximum; SE = Standard Error
Second Passage Reduction
Screening
. Screening took place at the beginning of the year. Due to time constraints, only one
of the three screening passages were used to collect alternate form reliability coe fficients.
Experimenters worked individually with students in separate, quiet areas within the schools at
each site. At the beginning of each session, the experimenters provided an introduction
dialogue from a standardized set of directions. Each student was assessed during a single
session. The appropriate paper version of the screening story was placed in front of the student
so that s/he could read aloud. After instructions were delivered, the examiner followed along
and scored errors on his or her copy for one minute. Each student session lasted approximately
three to five minutes. Participants included students from urban and suburban schools located
in the Southeast, the upper Midwest, and Northeastern regions of the United States. A passive
consent procedure was used so that those students whose parents opted out of participation
were excluded from the sample. The sample consisted of 1,250 students from first through Fifth
Grades. Participant characteristics in the overall and disaggregated sample are provided in
Table 18.
Table 18. Demographic Information for Second Passage Reduction Sample
Grade
Level
Sex
Age
Race
SESa
Special
Education
F
M
A
B
H
Am
W
Overall
K
5
5
5 years 11 months
N/A*
1
159
157
6 years 9 months
10
51
49
3
203
21
14
2
154
164
7 years 9 months
9
41
44
3
221
23
13

Section 6. FAST as Evidence-Based Practice
Page | 63
www.fastbridge.org
© 2015 Theodore J. Christ and Colleagues, LLC. All rights reserved.
3
78
118
8 years 7 months
3
40
43
2
108
33
14
4
80
107
9 years 8 months
5
21
47
1
113
18
20
5
80
83
10 years 6 months
7
33
36
2
85
23
15
Southeast**
K
5
5
5 years 11 months
N/A*
1
67
83
6 years 11 months
2
9
16
0
116
N/A
7
2
67
84
7 years 10 months
3
8
16
0
120
N/A
10
3
18
30
8 years 10 months
0
3
5
0
40
N/A
4
4
19
12
9 years 11 months
1
1
2
1
26
N/A
2
5
10
16
11 years 2 months
1
0
4
0
21
N/A
4
Upper Midwest
1
58
56
6 years 10 months
3
14
28
0
69
9
17
2
57
58
7 years 8 months
6
16
28
2
63
16
14
3
44
54
8 years 9 months
3
13
33
2
47
23
30
4
38
69
9 years 10 months
3
8
40
1
55
6
25
5
41
48
10 years 5 months
4
13
30
2
40
17
21
Northeast
1
34
18
6 years 6 months
5
21
5
0
21
12
7
2
30
22
7 years 1 month
0
15
0
0
37
7
3
3
16
34
8 years 2 months
0
24
5
0
21
10
10
4
23
26
9 years 6 months
1
12
5
0
31
12
18
5
29
19
10 years 6 months
2
20
2
0
24
6
11
Note: A=Asian, B= Black, H= Hispanic, Am= American Indian, W= White.
aSES indicates the number of students receiving free or reduced price lunch.
*Not all schools were able to provide complete information about Race, SES, or Special Education.
**About 5% of the southeast demographics were not available and are not included in this table.
Leveling/Anchor Process
. On the first day of testing, three passages were sequentially administered to
the student at the beginning of the testing session. The experimenter immediately determined the
median score from these passages and compared it against the criterion points (established during
screening) to determine which level of progress monitoring passages to administer. Table 19 provides
the cut points used to assign students to passage difficulty level (i.e. Level A, B or C). Although
students were selected across grade level, student reading levels were restricted for each passage
level. Experimenters worked individually with students in separate, quiet areas within the schools at
each site.
Table 19. Cut-points Used for Assigning Students to CBMreading Passage Level Based on Words
Read Correct per Minute (WRC/min)
Level
Cut Point (WRC/min)
A
0 (5) to 20 (25)
B
26 to 70
C
71 to 140
Section 6. FAST as Evidence-Based Practice
Page | 64
www.fastbridge.org
© 2015 Theodore J. Christ and Colleagues, LLC. All rights reserved.
Process for Administering Progress Monitoring Passages
. All students read all passages to facilitate
analysis of passage-specific performances and prepare for equating and linking of passages within
and across levels respectively. Experimenters worked individually with students in separate, quiet
areas within the schools. Students completed approximately eight successive assessment sessions.
On the first day of testing, after the child had been leveled according to the anchor passages, the
experimenter also administered four to nine progress monitoring passages at the student’s
appropriate level. All other days of testing were used to complete administration of the progress
monitoring set at the appropriate level. This resulted in students at Level A reading a total of 42
passages, and students at Levels B and C reading a total of 83 passages. All progress monitoring
passages were administered randomly to each student. For each passage read, an appropriate paper
version was placed in front of the student so that he or she could read aloud. The experimenter gave
directions and then followed along and scored errors on the electronic or paper copy for one minute.
Each session lasted approximately 15–20 minutes. See Table 20 for Descriptive Statistics.
Table 20. Descriptive Statistics for Second CBMreading Passage Reduction Sample
Passages
Mean
SD
Median
Trimmed
Min
Max
Skew
Kurtosis
SE
Level A
Reduced 39
20.38
10.46
18.33
19.39
4.54
56.18
0.94
0.87
1.04
Reduced 30
19.54
9.96
17.55
18.60
4.40
55.30
0.99
1.16
0.99
Level B
Reduced 80
52.20
16.40
52.19
51.92
15.96
102.65
0.20
-0.18
1.13
Reduced 60
51.24
15.83
50.90
50.93
16.00
101.00
0.24
-0.06
1.09
Reduced 30
52.33
15.34
52.08
52.13
17.00
99.50
0.17
-0.20
1.06
Level C
Reduced 80
103.04
26.09
103.05
102.65
42.24
195.83
0.20
-0.21
1.32
Reduced 60
102.96
25.25
102.95
102.54
43.87
194.53
0.21
-0.15
1.28
Reduced 30
104.68
24.41
104.70
104.29
46.80
195.37
0.22
-0.10
1.24
Table 21 summarizes information accumulated across several studies. Data was collected from three
states: Minnesota, New York, and Georgia. The information represents evidence for alternate form
reliability of CBMreading, and overall reliability of the performance level score.
Table 21. Alternate Form Reliability and SE
m
for CBMreading (Restriction of Range)
Coefficienta
Grade and Passage
# of
passages
# of
Weeks
Range
Median
SE
m
Passage Level A (Grade 1)
Grade 1 (206)
Grade 2 (21)
Grade 3 (4)
Total N 231
39
< 2
.62 - .86
.74
5.40

Section 6. FAST as Evidence-Based Practice
Page | 65
www.fastbridge.org
© 2015 Theodore J. Christ and Colleagues, LLC. All rights reserved.
Passage Level B (Grades 2–3)
Grade 1 (138)
Grade 2 (179)
Grade 3 (126)
Grade 4 (32)
Grade 5 (13)
Total N 488
60
< 2
.65 - .82
.75
8.54
Passage Level C (Grades 4–6)
Grade 1 (3)
Grade 2 (135)
Grade 3 (79)
Grade 4 (156)
Grade 5 (140)
Total N 513
60
< 2
.78 - .88
.83
10.41
Passage Level A (Grade 1)
Grade (206)
Grade (21)
Grade 3 (4)
Total N 231
39
< 2
.89 - .94
.92
3.03
Passage Level B (Grades 2–3)
Grade 1 (138)
Grade 2 (179)
Grade 3 (126)
Grade 4 (32)
Grade 5 (13)
Total N 488
60
<2
.87 - .92
.90
4.97
Passage Level C (Grades 4–6)
Grade 1 (3)
Grade 2 (135)
Grade 3 (79)
Grade 4 (156)
Grade 5 (140)
Total N 513
60
< 2
.92 - .95
.94
7.06
Note: Alternate-Form Correlation – Individual Passages (Average Fisher z-transformed Inter-Passage Correlations). Sample
sizes by grade level are provided in parentheses.*Coefficients are reduced due to restriction of range. SEm estimates are
equivalent to published research (viz. Christ & Silberglitt, 2007; Wayman et al., 2007).
Internal Consistency (Item-Total Correlation)
Data collection for internal consistency is ongoing. Evidence of CBMreading internal consistency
across passages is provided in the table below. Similar to alternate-form reliability, information was
gathered across three states: Minnesota, New York, and Georgia. Table 22 provides evidence of the
reliability of the performance level score.

Section 6. FAST as Evidence-Based Practice
Page | 66
www.fastbridge.org
© 2015 Theodore J. Christ and Colleagues, LLC. All rights reserved.
Table 22. Internal Consistency for CBMreading Passages
Passage and Grade
# of
# of
Weeks
Coefficient
Passages
Range
Median
Passage Level A (Designed for Grade 1)
Grade 1(206)
Grade 2 (21)
Grade 3 (4)
Total N 231
60
< 2
.91 - .92
.92
Passage Level B (Designed for Grades 2 & 3)
Grade 1 (138)
Grade 2 (179)
Grade 3 (126)
Grade 4 (32)
Grade 5 (13)
Total N 488
60
< 2
.89 - .91
.90
Passage Level C (Designed for Grades 4-6)
Grade 1 (3)
Grade 2 (135)
Grade 3 (79)
Grade 4 (156)
Grade 5 (140)
Total N 513
60
< 2
.88 - .93
.91
Note. Sample sizes by grade level are provided in parentheses.
aCoefficients are reduced due to restriction of range. Participants were selected from a very narrow (low) ability range to
evaluate reliability with the intended population. SEm estimates are equivalent to those observed in published research (viz.
Christ & Silberglitt, 2007; Wayman et al., 2007).
See Table 23 below for evidence of split-half reliability for CBMreading passages.
Table 23. Split-Half Reliability for CBMreading passages
Grade
N
Range
Median
Grades 1st
500
.90 to .98
> .95
Grades 2 & 3
500
.90 to .98
> .95
Grades 4 to 6
500
.90 to .98
> .95
Test-Retest Reliability (Delayed)
Table 24 provides evidence of the reliability of the performance level score. Data was gathered across
three states: Minnesota, New York, and Georgia. The reliability range coefficients have been computed
with a 95% confidence interval. In addition, for the time lag, the mean number of weeks between data
collections is reported.

Section 6. FAST as Evidence-Based Practice
Page | 67
www.fastbridge.org
© 2015 Theodore J. Christ and Colleagues, LLC. All rights reserved.
Table 24. Evidence for Delayed Test-Retest Reliability of CBMreading
Grade
# Weeks Lag
Coefficient
N
Time Period
Mean
SD
Range
Median
1
428
Fall to Winter
18.68
3.03
.88 - .92
.90
2
414
Fall to Winter
18.56
2.44
.91 - .94
.93
3
435
Fall to Winter
18.98
2.50
.92 - .94
.93
4
475
Fall to Winter
19.00
2.32
.93 - .95
.94
5
481
Fall to Winter
19.00
2.51
.92 - .94
.93
6
220
Fall to Winter
17.45
0.86
.92 - .95
.94
1
408
Fall to Spring
35.57
2.02
.79 - .85
.82
2
386
Fall to Spring
35.93
1.61
.87 - .91
.90
3
403
Fall to Spring
35.79
1.47
.89 - .93
.91
4
406
Fall to Spring
35.67
1.41
.91 - .94
.93
5
411
Fall to Spring
35.67
1.41
.92 - .94
.93
6
218
Fall to Spring
35.01
0.96
.90 - .94
.92
Note. SD = Standard Deviation.
Table 25 provides evidence of delayed test-retest reliability, disaggregated by ethnicity. The sample
included students from urban, suburban, and rural areas in Minnesota.

Section 6. FAST as Evidence-Based Practice
Page | 68
www.fastbridge.org
© 2015 Theodore J. Christ and Colleagues, LLC. All rights reserved.
Table 25. CBMreading Delayed Test-Retest Reliability Disaggregated by Ethnicity
Grade
# Weeks Lag
Coefficient
N
Time Period
Range
Median
Ethnicity
2
1518
Fall to Winter
14
.91 - .92
.91
White
2
369
Fall to Winter
14
.90 - .94
.92
Black
2
210
Fall to Winter
14
.92 - .95
.94
Asian
2
308
Fall to Winter
14
.91 - .94
.93
Hispanic
3
1439
Fall to Winter
14
.91 - .92
.92
White
3
442
Fall to Winter
14
.90 - .93
.91
Black
3
197
Fall to Winter
14
.87 - .92
.90
Asian
3
314
Fall to Winter
14
.91 - .94
.93
Hispanic
4
1384
Fall to Winter
14
.88 - .91
.90
White
4
353
Fall to Winter
14
.89 - .92
.91
Black
4
204
Fall to Winter
14
.89 - .94
.92
Asian
4
268
Fall to Winter
14
.87 - .92
.90
Hispanic
5
1309
Fall to Winter
14
.91 - .93
.92
White
5
378
Fall to Winter
14
.91 - .94
.93
Black
5
205
Fall to Winter
14
.89 - .93
.91
Asian
5
247
Fall to Winter
14
.91 - .95
.93
Hispanic
2
1518
Fall to Spring
31
.83 - .86
.85
White
2
369
Fall to Spring
31
.75 - .83
.79
Black
2
210
Fall to Spring
31
.81 - .88
.85
Asian
2
308
Fall to Spring
31
.76 - .84
.80
Hispanic
3
1439
Fall to Spring
31
.88 - .90
.89
White
3
442
Fall to Spring
31
.82 - .87
.85
Black
3
197
Fall to Spring
31
.80 - .88
.84
Asian
3
314
Fall to Spring
31
.80 - .87
.84
Hispanic
4
1384
Fall to Spring
31
.85 - .88
.87
White
4
353
Fall to Spring
31
.82 - .88
.85
Black
4
204
Fall to Spring
31
.80 -.88
.85
Asian
4
268
Fall to Spring
31
.81 - .88
.85
Hispanic
5
1309
Fall to Spring
31
.87 - .90
.88
White
5
378
Fall to Spring
31
.77 - .84
.81
Black
5
205
Fall to Spring
31
.83 - .89
.86
Asian
5
247
Fall to Spring
31
.84 - .90
.87
Hispanic
Inter-Rater Reliability
Inter-rater reliability evidence was collected across three states: Minnesota, New York, and Georgia.
See Table 26.

Section 6. FAST as Evidence-Based Practice
Page | 69
www.fastbridge.org
© 2015 Theodore J. Christ and Colleagues, LLC. All rights reserved.
Table 26. Evidence of Inter-Rater Reliability for CBMreading
Passage
Coefficient
Sample Size
Range
Median
Passage Level A
146
.83 – 1.00
.97
Passage Level B
1391
.93 - 97
.97
Passage Level C
1345
.83 – 1.00
.98
Reliability of the Slope
Some may argue that alternate-form reliabilities may not accurately capture reliability of the slope due
to the small amount of variation in slope values, represented by low standard error of the estimate
and standard error of the slope values. This might be a result of the structure of passage
administration (Levels vs. Grades). By using passage levels as groups instead of grades, we may be
reducing variability within grades, decreasing the reliability of slope estimates. The following analysis
was conducted using HLM 7 software and used random slopes and random intercepts (See Table 27).
Table 27. Reliability of the Slope for CBMreading
Sample Size by Passage
Weeks
Observations
Coefficient
Range
Median
Passage Level A
N=34
~ 27 - 30
~25-30
NA
.95
N=39
~ 7 -10
~7-10
NA
.78
Passage Level B
N=53
~ 27 - 30
~25-30
NA
.98
~ 7 -10
~7-10
NA
.97
Passage Level C
~ 27 - 30
~25-30
NA
.98
~ 7 -10
~7-10
NA
.97
Table 28 provides a summary for reliability of the slope by grade (passage) level. Reliability of the
slope for multi-level analyses may be biased when standard error of the estimate and standard error of
the slope is minimal. CBMreading growth estimates are less prone to error than comparable progress
monitoring materials. As a result, increased precision (less error) is paradoxically detrimental to multi-
level reliability estimates (Raudenbush & Bryk, 2002). In such circumstances, the spearman brown
correlation is more appropriate. The following information includes participants across three states:
Minnesota, New York, and Georgia.
Section 6. FAST as Evidence-Based Practice
Page | 70
www.fastbridge.org
© 2015 Theodore J. Christ and Colleagues, LLC. All rights reserved.
Table 28. Reliability of the Slope of CBMreading by Passage using Spearman-Brown Split Half
Correlation
Passage Level
Weeks (range)
Coefficient
SE
m
Passage Level A
Grade 1 (68)
Grade 2 (12)
Grade 3 (2)
Total N = 82
Short Term
10
.71
.40
Passage Level B
Grade 1 (7)
Grade 2 (72)
Grade 3 (53)
Grade 4 (12)
Grade 5 (6)
Grade 6 (1)
Total N = 151
Short Term
10 - 20
.74
.31
Passage Level C
Grade 2 (3)
Grade 3 (31)
Grade 4 (81)
Grade 5 (68)
Grade 6 (28)
Total N = 211
Short Term
6 - 20
.65
.30
Passage Level A
Grade 1 (42)
Grade 2 (15)
Grade 3 (4)
Total N = 61
Long Term
14 - 30
.95
.21
Passage Level B
Grade 1 (6)
Grade 2 (41)
Grade 3 (38)
Grade 4 (15)
Grade 5 (8)
Grade 6 (1)
Total N = 109
Long Term
14 - 30
.70
.31
Passage Level C
Grade 2 (2)
Grade 3 (19)
Grade 4 (49)
Grade 5 (44)
Grade 6 (23)
Total N = 137
Long Term
18 - 30
.66
.32
Note. Sample sizes by grade level are provided in parentheses. SEm = |Even – Odd| / sqrt(2)
Section 6. FAST as Evidence-Based Practice
Page | 71
www.fastbridge.org
© 2015 Theodore J. Christ and Colleagues, LLC. All rights reserved.
Table 29 provides reliability of the slope evidence derived from multi-level analyses, strictly using true
slope variance divided by total slope variance. The following information includes participants across
three states: Minnesota, New York, and Georgia.
Table 29. Reliability of the Slope for CBMreading by Passage Using Multi-Level Analyses
Passage Level
Weeks (range)
Coefficient
Passage Level A
Grade 1 (68)
Grade 2 (12)
Grade 3 (2)
Total N = 82
Short Term
10
.75
Passage Level B
Grade 1 (7)
Grade 2 (72)
Grade 3 (53)
Grade 4 (12)
Grade 5 (6)
Grade 6 (1)
Total N = 151
Short Term
10–20
.74
Passage Level C
Grade 2 (3)
Grade 3 (31)
Grade 4 (81)
Grade 5 (68)
Grade 6 (28)
Total N = 211
Short Term
6–20
.63
Passage Level A
Grade 1 (42)
Grade 2 (15)
Grade 3 (4)
Total N = 61
Long Term
14–30
.94
Passage Level B
Grade 1 (6)
Grade 2 (41)
Grade 3 (38)
Grade 4 (15)
Grade 5 (8)
Grade 6 (1)
Total N = 109
Long Term
14–30
.86
Passage Level C
Grade 2 (2)
Grade 3 (19)
Grade 4 (49)
Grade 5 (44)
Grade 6 (23)
Total N = 137
Long Term
18–30
.45
Section 6. FAST as Evidence-Based Practice
Page | 72
www.fastbridge.org
© 2015 Theodore J. Christ and Colleagues, LLC. All rights reserved.
Table 30 provides evidence of reliability of the slope disaggregated by ethnicity. Participants included
those from Minnesota. Reliability of the slope for multi-level analyses may be biased when few
observations are used to estimate slope. In this instance, slopes were estimated from tri-annual
assessments (3 observations). Coefficients should be interpreted with caution (Raudenbush & Bryk,
2002). The sample included students from urban, suburban, and rural areas of Minnesota.
Table 30. CBMreading Reliability of the Slope - Disaggregated Data
Grade
N (range)
Coefficient
Ethnicity
Range
Median
Grades 2–5
1308–1518
.25 - .43
.28
White
Grades 2–5
353–442
.32 - .60
.43
Black
Grades 2–5
197–210
.38 - .52
.40
Asian
Grades 2–5
247– 314
.21 - .52
.45
Hispanic
aReading
The following sections provide a discussion of types of reliability obtained for aReading, as well as
sources of error. Data collection regarding reliability of the slope is ongoing.
Alternate-Form Reliability
Given the adaptive nature of aReading tests, a proxy for alternate-form reliability is provided by
Samejima (1994), based on the standard error of measurement of an instrument. Using this proxy, the
alternate-forms reliability coefficient for aReading is approximately .95 (based on approximately 2,333
students).
Internal Consistency (Item-Total Correlations)
Given the adaptive nature of aReading tests, a proxy for internal consistency is provided by Samejima
(1994), based on the standard error of measurement of an instrument. Using this proxy, the internal
consistency reliability coefficient for aReading is approximately .95 (based on approximately 2,333
students).
Test-Retest Reliability
Three month test-retest reliability resulted in the following coefficients for 2,038 students in grades 1 -
5 (Kindergarten and grades 6–12 results are coming soon). Growth was measured four times over the
academic year. The results by grade: one .71, two .87, three .81, four .86, five .75.
Chapter 2.6: Validation
earlyReading
Evidence for validity of the earlyReading subtest measures was examined using the Group Reading
Assessment and Diagnostic Evaluation (GRADE; Williams, 2001). The GRADE™ is a norm-referenced
diagnostic reading assessment that assists teachers in measuring pre-literacy, emerging reading and
core reading skills, as well as providing teachers with implications for instruction and intervention.
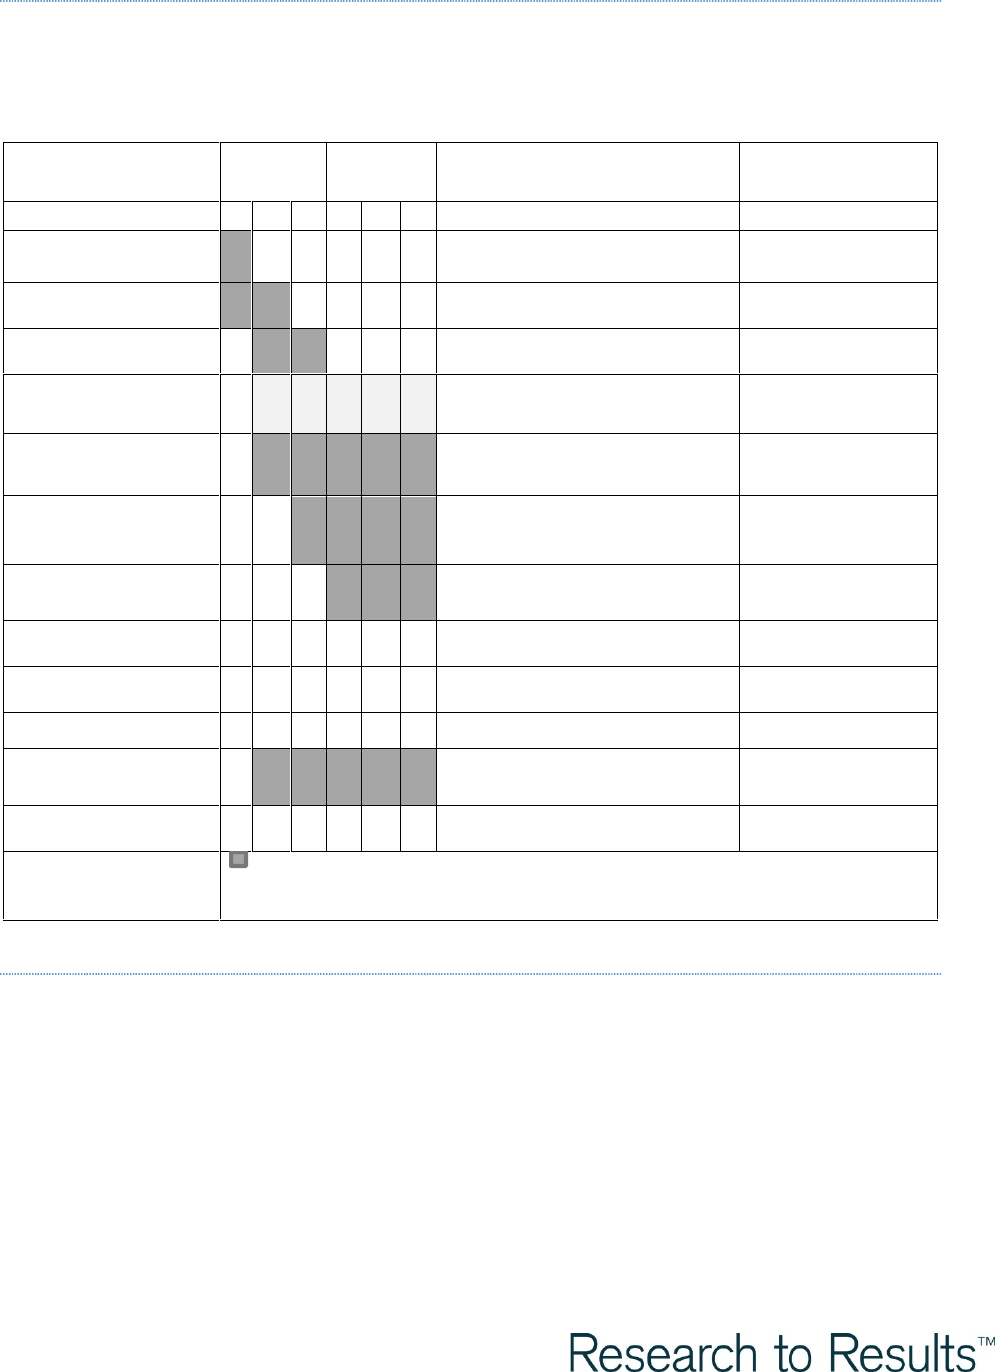
Section 6. FAST as Evidence-Based Practice
Page | 73
www.fastbridge.org
© 2015 Theodore J. Christ and Colleagues, LLC. All rights reserved.
Content Validity
The design specifications for earlyReading measures relate directly to their evidence of content
validity. Each subtest was designed with the intent to address specific criteria aimed to maximize both
utility and sensitivity.
earlyReading
K
1st
Common Core
State Standards
State Specific
Standards
Measures
F
W
S
F
W
S
Concepts of Print
RF.K1, RF.K.1.a, RF.K.1.b, RF.K.1.c,
RF.1.1, F.1.1.a
Letter Names
RF.K.1.d
Letter Sounds
RF.K.3.a
Decodable Words
O
O
O
O
O
R.F.K.3, RF.1.3, RF.1.3.b, RF.2.3,
RF.3.3
Nonsense Words
R.F.K.3, RF.1.3, RF.1.3.b, RF.2.3,
RF.3.3
Sight Words (50)
Sight Words (150)
RF.K.3.c, RF.1.3.g, R.2.3.f, RF.3.3.d
Available upon
request
Sentence Reading
(CBM W, S)
RF.K.4, RF.1.4, RF.1.4.b, RF.2.4,
RF.2.4.b, RF.3.4
Onset Sounds
RF.K.2.c, RF.K.2.D, RF.1.2.c
Rhyming
RF.K.2.a
Word Blending
RF.K.2.b, RF.K.2.c, RF.1.2.b
Word Segmenting
RF.K.2.b, RF.K.2.d, RF.1.2.c,
RF.1.2.d
Oral Repetition
SL.K.6, SL.1.6
Composite Broad Score
– recommended screening tools and composition of broad composite score
O – Optional measure to replace nonsense words
Criterion-Related Validity
Criterion-related validity of earlyReading subtests was examined using the GRADE™. The GRADE is an
untimed, group-administered, norm-referenced reading achievement test that is intended for children
in preschool through grade 12. Comprised of 16 subtests categorized within five components, the
GRADE utilizes particular subtest scores, depending on the testing level, to form the Total Test
composite score. Evidence for the validity of earlyReading is presented below on the external criterion
measure of the GRADE Total Test composite score. Validity is most often represented as a correlation
between the assessment and the criterion. Both concurrent and predictive validity are reported for all
earlyReading measures, where available (See Table 33).
Section 6. FAST as Evidence-Based Practice
Page | 74
www.fastbridge.org
© 2015 Theodore J. Christ and Colleagues, LLC. All rights reserved.
In order to establish criterion-related validity, students were recruited from school districts. In School
District 1, three elementary schools participated. Kindergarten students from District 1 who
participated in the study were enrolled in all-day or half-day Kindergarten. The majority of students
within the school district were White (78%), with the remaining students identified as either Black
(19%), or other (3%). Forty to fifty percent of students at each school were eligible for free and reduced
lunch. In school District 2, the majority of students within the school district were White (53%), with
the remaining students identified as Black (26%), Hispanic (11%), Asian (8%), or other (2%). Forty to
fifty percent of students at each school are on free and reduced lunch.
Students in Kindergarten were administered FAST™ earlyReading Concepts of Print, Onset Sounds,
Letter Naming, Letter Sound, Rhyming, Word Blending, Word Segmenting, Sight Words (50), Nonsense
Words, and Decodable Words subtests. Students in First Grade were administered FAST™ earlyReading
Word Blending, Word Segmenting, Sight Words (150), Decodable Words, Nonsense Word, and
Sentence Reading subtests. Teachers administered six to nine measures at each screening period (fall,
winter, and spring). See Table 31 for demographic information about the sample from which
earlyReading composite validity coefficients were derived, including predictive and concurrent
validity. Sample-related information for criterion-related validity data is provided in
Table 32
.
Predictive and concurrent validity coefficients are reported in Table 33.
Table 31. Demographics for Criterion-Related Validity Sample for earlyReading Composite
Scores
Category
District A
District B
White
78%
53%
Black
19%
26%
Hispanic
--
11%
Asian/Pacific Islander
--
8%
Other
3%
2%
Free/Reduced Lunch
40-50%
Table 32. Sample-Related Information for Criterion-Related Validity Data (earlyReading)
Measure
Fall
Winter
Spring
N
Mean
SD
N
Mean
SD
N
Mean
SD
Kindergarten
Concepts of Print
230
8.41
2.41
58
9.43
2.14
--
--
--
Onset Sounds
230
12.28
4.17
216
15.06
2.04
155
15.70
1.61
Letter Naming
230
28.57
15.60
210
39.51
13.35
230
54.80
18.40
Letter Sound
230
15.56
11.69
210
29.20
13.74
230
43.10
15.51
Rhyming
230
9.47
4.97
224
12.01
4.62
229
14.28
3.15
Word Blending
230
3.19
3.67
227
6.76
3.36
228
9.14
1.79
Word Segmenting
91
6.34
9.68
228
19.35
12.89
228
30.11
6.17
Decodable Words
--
--
--
--
--
--
228
16.04
15.15
Nonsense Words
--
--
--
2281
7.19
6.73
229
13.16
10.71

Section 6. FAST as Evidence-Based Practice
Page | 75
www.fastbridge.org
© 2015 Theodore J. Christ and Colleagues, LLC. All rights reserved.
Sight Words 50
--
--
--
--
--
--
227
44.29
29.38
Composite
173
40.78
9.91
173
49.41
13.74
173
59.79
14.37
First Grade
Word Blending
179
7.42
2.41
169
8.80
2.14
172
9.30
1.38
Word Segmenting
179
26.84
4.17
168
30.10
2.04
172
30.91
4.40
Decodable Words
179
14.43
15.60
168
26.19
13.35
186
40.80
21.12
Nonsense Words
179
10.91
11.69
166
20.69
13.74
131
24.26
14.31
Sight Words 150
179
34.57
4.97
168
60.10
4.62
173
77.03
21.93
Sentence Reading
179
43.89
3.67
30
67.62
3.36
--
--
--
CBM-R
(median of 3)
--
--
--
183
75.48
42.55
188
104.00
43.19
Composite
100
39.06
10.39
100
48.07
10.50
100
62.87
12.94
Note.1Nonsense words in the winter used partially imputed values.

Section 6. FAST as Evidence-Based Practice
Page | 76
www.fastbridge.org
© 2015 Theodore J. Christ and Colleagues, LLC. All rights reserved.
Table 33. Concurrent and Predictive Validity for all earlyReading Measures
Type of Validity
Grade
Criterion
N
Coefficient
Information
Onset Sounds
Concurrent
K
GRADEP
85
.62
Data collected in Fall
Predictive
K
GRADEK
230
.55
Fall to Spring prediction
Predictive
K
GRADEK
216
.60
Winter to Spring prediction
Concurrent
K
GRADEK
140
.03
Data collected in Spring
Letter Names
Concurrent
K
GRADEP
85
.41
Data collected in Fall
Predictive
K
GRADEK
230
.47
Fall to Spring prediction
Predictive
K
GRADEK
210
.63
Winter to Spring prediction
Concurrent
K
GRADEK
214
.18
Data collected in Spring
Letter Sounds
Concurrent
K
GRADEP
85
.53
Data collected in Fall
Predictive
K
GRADEK
230
.44
Fall to Spring prediction
Predictive
K
GRADEK
210
.63
Winter to Spring prediction
Concurrent
K
GRADEK
214
.19
Data collected in Spring
Word Blending
Predictive
K
GRADEK
227
.66
Winter to Spring prediction
Predictive
K
GRADEK
230
.41
Fall to Spring prediction
Concurrent
K
GRADEK
213
.23
Data collected in Spring
Concurrent
1
GRADE1
71
.22
Data collected in Fall
Predictive
1
GRADE1
179
.56
Fall to Spring prediction
Predictive
1
GRADE1
169
.53
Winter to Spring prediction
Concurrent
1
GRADE1
165
.12
Data collected in Spring
Word Segmenting
Predictive
K
GRADEK
228
.58
Winter to Spring prediction
Concurrent
K
GRADEK
213
.25
Data collected in Spring
Concurrent
1
GRADE1
71
.49
Data collected in Fall
Predictive
1
GRADE1
179
.32
Fall to Spring prediction
Predictive
1
GRADE1
168
.60
Winter to Spring prediction
Concurrent
1
GRADE1
165
.07
Data collected in Spring
Decodable Words
Concurrent
K
GRADEK
214
.27
Data collected in Spring
Concurrent
1
GRADE1
71
.22
Data collected in Fall
Predictive
1
GRADE1
179
.59
Fall to Spring prediction
Predictive
1
GRADE1
168
.78
Winter to Spring prediction
Concurrent
1
GRADE1
124
.46
Data collected in Spring
Sight Words 50
Concurrent
K
GRADEK
213
.19
Data collected in Spring

Section 6. FAST as Evidence-Based Practice
Page | 77
www.fastbridge.org
© 2015 Theodore J. Christ and Colleagues, LLC. All rights reserved.
Type of Validity
Grade
Criterion
N
Coefficient
Information
Sight Words 150
Concurrent
1
GRADE1
71
.59
Data collected in Fall
Predictive
1
GRADE1
179
.66
Fall to Spring prediction
Predictive
1
GRADE1
168
.80
Winter to Spring prediction
Predictive
1
GRADE1
179
.66
Fall to Spring prediction
Concurrent
1
GRADE1
166
.43
Data collected in Spring
Nonsense Words
Predictive
K
GRADEK
105
.44
Winter to Spring prediction
Concurrent
K
GRADEK
215
.27
Data collected in Spring
Predictive
1
GRADE1
179
.60
Fall to Spring prediction
Predictive
1
GRADE1
168
.67
Winter to Spring prediction
Concurrent
1
GRADE1
179
.43
Data collected in Spring
Composite
Predictive
K
GRADEK
173
.68
Fall to Spring prediction
Predictive
K
GRADEK
173
.69
Winter to Spring prediction
Concurrent
K
GRADEK
173
.67
Data collected in Spring
Predictive
1
GRADE1
100
.72
Fall to Spring prediction
Predictive
1
GRADE1
100
.81
Winter to Spring prediction
Concurrent
1
GRADE1
100
.83
Data collected in Spring
Note. All criterion coefficients were determined using the composite of the GRADE. Level is indicated in
superscript. For example, GRADEPrepresents GRADE Composite Level P.
More recently, criterion-related validity analyses was estimated for spring earlyReading composite
scores to predict spring aReading scores. These findings are summarized in the table below. Students
were recruited from several school districts in Minnesota. Cut score was selected by optimizing
sensitivity at about .70 and balancing sensitivity with specificity (Silberglitt & Hintze, 2005). In the table
below, dashes indicate unacceptable sensitivity and specificity due to low AUC. Criterion coefficients
ranged from .74 to .77.
Table 34. Criterion Validity of Spring earlyReading Composite (Updated weighting scheme) with
Spring aReading: MN LEA 3 (Spring Data Collection)
Grade
N
Composite
M (SD)
aReading
M (SD)
r(x,y)
Cut
AUC
Sens.
Spec.
Some Risk (<40th percentile)
KG
515
62.41 (12.53)
415.59 (27.13)
.74**
64.5
.87
.77
.80
1
169
56.08 (15.79)
459 (27.34)
.77**
--
.65
--
--
High Risk (<20th percentile)
KG
515
62.41 (12.53)
415.59 (27.13)
.74**
61.5
.84
.76
.73
1
169
56.08 (15.79)
459 (27.34)
.77**
51.5
.72
.70
.59
Section 6. FAST as Evidence-Based Practice
Page | 78
www.fastbridge.org
© 2015 Theodore J. Christ and Colleagues, LLC. All rights reserved.
Predictive Validity of the Slope
Validity of earlyReading subtests were examined using the GRADE. Table 31 presents the
demographic information from which the sample was derived, as this sample served multiple
purposes in establishing validity evidence for earlyReading.
Table 35 presents the correlation between the slope of performance using screening data (i.e.,
students were assessed three times per year, fall, winter and spring) and performance on the GRADE.
All correlations account for initial level of performance.
Table 35. Predictive Validity of the Slope for All earlyReading Measures
Measure
Grade
Criterion
N
Coefficient
Onset Sounds
K
GRADEK
217
.29
Letter Names
K
GRADEK
231
.44
Letter Sounds
K
GRADEK
231
.54
Word Blending
K
GRADEK
230
.48
Word Blending
1
GRADE1
178
.16
Word Segmenting
K
GRADEK
224
.49
Word Segmenting
1
GRADE1
178
.23
Decodable Words
1
GRADE1
179
.62
Sight Words (150)
1
GRADE1
180
.59
Nonsense Words
1
GRADE1
174
.61
Note. All coefficients were determined using the composite of the GRADE. Level is indicated in superscript. For
example, GRADEPrepresents GRADE Composite Level P.
Discriminant Validity
See Table 13 for demographic information on the sample. This study provided data for both reliability
of the slope and discriminant validity evidence for earlyReading measures. Table 36 and Table 37
display discriminant validity for earlyReading subtests in Kindergarten and First Grade, respectively.
Table 36. Discriminant Validity for Kindergarten earlyReading Measures
Measure by
Time of Year
Below 40th Percentile
Above 40th Percentile
Difference Stats
N
Mean
SD
N
Mean
SD
t
d
Concepts of Print
Beginning
204
6.42
1.60
240
10.29
1.08
30.24
2.88
Middle
-
-
-
-
-
-
-
-
End
-
-
-
-
-
-
-
-
Onset Sounds
Beginning
185
7.78
3.41
259
15.09
1.04
32.46
3.09
Middle
417
14.78
2.55
0
NA
NA
-
-
End
-
-
-
-
-
-
-
-
Letter Naming
Beginning
182
10.38
7.76
262
38.68
9.01
34.42
3.27
Middle
182
25.45
11.34
242
49.20
3.54
30.66
2.99

Section 6. FAST as Evidence-Based Practice
Page | 79
www.fastbridge.org
© 2015 Theodore J. Christ and Colleagues, LLC. All rights reserved.
End
193
34.62
12.55
271
65.98
28.85
14.17
1.32
Letter Sound
Beginning
187
3.77
3.48
257
23.81
10.40
25.33
2.41
Middle
173
14.16
7.85
251
36.82
8.58
27.66
2.69
End
212
26.13
10.65
252
51.85
10.90
25.59
2.38
Rhyming
Beginning
191
4.34
2.73
253
13.12
2.33
36.50
3.47
Middle
194
8.29
4.17
222
15.41
0.74
25.00
2.46
End
224
11.38
3.97
238
16.00
0.00
17.95
1.67
Word Blending
Beginning
209
0.00
0.00
234
5.85
2.92
28.96
2.76
Middle
179
2.29
2.18
254
8.93
1.09
41.72
4.02
End
206
6.50
2.97
256
10.00
0.00
18.86
1.76
Word Segmenting
Beginning
-
-
-
-
-
-
-
-
Middle
174
5.63
5.68
260
29.04
4.31
48.73
4.69
End
194
21.50
9.34
268
33.03
1.10
20.03
1.87
Decodable Words
Beginning
-
-
-
-
-
-
-
-
Middle
-
-
-
-
-
-
-
-
End
184
2.72
2.43
275
23.32
16.03
17.29
1.62
Nonsense Words
Beginning
-
-
-
-
-
-
-
-
Middle
107
1.01
1.01
142
12.23
9.47
12.20
1.55
End
191
3.53
2.86
269
19.80
12.33
17.96
1.68
Sight Words (50)
Beginning
-
-
-
-
-
-
-
-
Middle
-
-
-
-
-
-
-
-
End
177
9.58
7.29
253
57.66
22.59
27.33
2.64
Table 37. Discriminant Validity for First Grade earlyReading Subtests
Measure by
Time of Year
Below 40th Percentile
Above 40th Percentile
Difference Stats
N
Mean
SD
N
Mean
SD
t
d
Word Blending
Beginning
253
4.39
2.47
357
9.13
0.81
33.79
2.74
Middle
276
7.78
2.10
344
10
0
19.61
1.58
End
-
-
-
-
-
-
-
-
Word Segmenting
Beginning
252
17.89
7.62
358
30.67
2.15
30.09
2.44
Middle
278
27.38
5.47
340
33.22
10.79
8.23
0.66
End
269
26.84
5.60
356
33.35
0.78
21.66
1.74
Decodable Words
Beginning
256
2.92
1.93
343
19.65
13.78
19.28
1.58
Middle
265
11.29
4.92
353
34.22
10.79
32.17
2.59
End
262
17.88
7.74
386
51.37
15.19
32.9
2.59
Nonsense Words
Beginning
283
3.88
2.29
316
16.06
9.02
22.09
1.81
Middle
221
10.39
3.82
292
26.98
10.82
21.79
1.93
End
240
12.78
5.00
343
35.31
12.52
26.44
2.19

Section 6. FAST as Evidence-Based Practice
Page | 80
www.fastbridge.org
© 2015 Theodore J. Christ and Colleagues, LLC. All rights reserved.
Sight 150
Beginning
248
6.48
4.06
351
44.94
19.92
29.96
2.45
Middle
191
30.66
15.19
268
73.71
15.90
29.13
2.73
End
253
48.48
17.54
379
88.47
14.44
31.27
2.49
Sentence Reading
Beginning
223
12.77
4.98
332
57.05
37.68
17.44
1.48
Middle
-
-
-
-
-
-
-
-
End
-
-
-
-
-
-
-
-
CBMreading
Evidence for validity of the CBMreading passages was examined using the Test of Silent Reading
Efficiency and Comprehension (TOSREC), the Group Reading Assessment and Diagnostic Evaluation
(GRADE), Measures of Academic Progress (MAP), AIMSweb Reading CBM (R-CBM), and the Dynamic
Indicators of Basic Early Literacy Skills (DIBELS) Next. The TOSREC is a brief test of reading that assesses
silent reading of connected text for comprehension. The TOSREC can be used for screening purposes,
as well as for monitoring progress. The GRADE is a norm-referenced diagnostic reading assessment
that assists teachers in measuring pre-literacy skills, emerging reading skills, and core reading skills, as
well as providing teachers with implications for instruction and intervention. MAP is a compilation of
computerized adaptive assessments used to benchmark student growth and to serve as a universal
screener. AIMSweb is web-based and may be used for universal screening, monitoring progress, and
managing data for students in Kindergarten through twelfth grade. Like CBMreading, AIMSweb
Reading CBM probes are intended to measure oral reading fluency and provide an indicator of general
reading achievement. Finally, DIBELS Next are a set of procedures and measures for assessing the
acquisition of early literacy skills from Kindergarten through Sixth Grade. DIBELS Next was designed to
serve as a measure of oral reading fluency and a method for monitoring the development of early
literacy and early reading skills. Data collection to gather evidence of discriminant validity is ongoing.
Content Validity
The design specifications for CBMreading relate directly to their evidence of content validity. Each
passage set was designed with the intent to address specific criteria aimed to maximize both utility
and sensitivity. Specific guidelines were provided for paragraph and sentence structure. This was
necessary to ensure a parallel text structure across the passages. Each writer was instructed to use
three or four paragraphs within each passage and, when possible, include a main idea sentence at the
beginning of each paragraph that would introduce and help organize content for the reader. Writers
were also instructed to not use complex punctuation such as colons and semi-colons in order to
reflect text that is familiar to primary grade levels as well as to encourage a more direct style of writing.
The passages developed for the Grade 1 passages (Level A) could include 150–200 words overall in 2–
5 paragraphs. Sentences were structured to stay within a range of 3–7 words. Each paragraph was
strictly structured to stay within a range of 7–15 sentences. The number of words per sentence and
sentences per paragraph were varied across the story to result in the appropriate total number of
words.
Section 6. FAST as Evidence-Based Practice
Page | 81
www.fastbridge.org
© 2015 Theodore J. Christ and Colleagues, LLC. All rights reserved.
Passages developed for Grades 2 and 3 (Level B) could include between 230–300 words overall.
Sentences were structured to stay within a range of 6–11 words. Each paragraph was strictly
structured to stay within a range of 3–7 sentences. The number of words per sentence and sentences
per paragraph were varied across the story to result in the appropriate total number of words (i.e.,
230–300).
The passages developed for Grades 4 through 6 (Level C) could include between 240–300 words
overall. Sentences were strictly structured to stay within a range of 7–11 words. Each paragraph was
strictly structured to stay within a range of 3–7 sentences. In addition, the 2nd or 3rd sentence of each
paragraph of these passages was required to be a longer sentence, specifically from 12–19 words in
length. Once again, the number of words per sentence and sentences per paragraph were varied
across the story to result in the appropriate total number of words (i.e., 240–300). Overall evidence
supports that guidelines for development were accurately addressed and provided the FAST™ team
with passages that were consistent at each level in the full and reduced passage sets.
Criterion-Related Validity
Predictive and concurrent criterion validity for each grade level are available using a number of
different tests or criterion (i.e., TOSREC, MAP, AIMSweb and DIBELS Next), providing evidence of
criterion-related validity. Where applicable, the delay between CBMreading administration and
criterion administration is stated. Students scoring in the lower 40th percentile during screening were
assigned to either the long- or short-term condition. Approximately 20% of the students were
targeted within Level 1, 40% in Level 2, and 40% in Level 3. When possible, participants were selected
to ensure they read at the lower end of each score range for Level 1, 2, and 3, respectively. This
methodological constraint ensured that the students wouldn’t grow out of the range of equitable
scores across the time of data collection, which spanned two years.
Concurrent and Predictive Validity for CBMreading Grade-Level Passages is provided in Table 38. All
coefficients were derived from students across three states: Minnesota, New York, and Georgia.
Table 38. Concurrent and Predictive Validity for CBMreading
Type of
Validity
Grade
Criterion
N
Time Lapse (Weeks)
Coefficient
M
SD
Concurrent
1
TOSREC
218
.86
2
246
.81
3
233
.81
4
228
.79
5
244
.81
6
222
.82
Concurrent
1
DIBELS
399
.95
2
NEXT
463
.92
3
483
.96
4
485
.95
5
503
.95
6
225
.95
Concurrent
1
AIMSweb
399
.95
Section 6. FAST as Evidence-Based Practice
Page | 82
www.fastbridge.org
© 2015 Theodore J. Christ and Colleagues, LLC. All rights reserved.
2
425
.97
3
402
.95
4
445
.96
5
447
.96
6
229
.95
Concurrent
2
MAP
237
.81
3
231
.78
4
233
.73
5
219
.66
6
212
.69
Predictive
1
AIMSweb
385
18.68
3.04
.91
2
413
18.56
2.44
.93
3
391
18.98
2.50
.91
4
427
19
2.32
.94
5
431
19
2.51
.93
6
220
17.45
.86
.94
Predictive
1
DIBELS
425
35.57
2.02
.82
2
Next
80
35.93
1.61
.74
3
76
35.79
1.47
.91
4
74
35.67
1.41
.90
5
85
35.67
1.41
.93
Predictive
1
TOSREC
44
35.57
2.02
.47
2
35
35.94
1.61
.56
3
33
35.79
1.48
.69
4
35
35.67
1.41
.52
6
18
35.06
.96
.87
Predictive
2
MAP
240
35.23
1.42
.76
3
233
35.47
1.27
.73
4
235
35.23
.88
.69
5
220
35.29
1.13
.65
6
212
35.06
.96
.71
Note. SD = Standard Deviation; M = Mean.
Additional criterion-related validity evidence for CBMreading is summarized below.
Table 39. Criterion Validity of Spring CBMreading with Spring CRCT in Reading: GA LEA 1
(Spring Data Collection)
Grade
N
CBMreading
M (SD)
CRCT
M (SD)
r(x,y)
Cut
AUC
Sens.
Spec.
Some Risk (Meets Standards)
3
324
115.74 (43)
848.62 (28)
.61*
113.50
.77
.71
.70
4
310
135.74 (39)
848.30 (27)
.61*
131.50
.79
.71
.73
5
343
148.01 (38)
841.27 (25)
56*
151.50
.73
.69
.69
High Risk (Does Not Meet Standards)
3
324
115.74 (43)
848.62 (28)
.61*
79.00
.89
.80
.84
4
310
135.74 (39)
848.30 (27)
.61*
99.50
.89
.83
.83
5
343
148.01 (38)
841.27 (25)
56*
122.50
.81
.77
.77
Section 6. FAST as Evidence-Based Practice
Page | 83
www.fastbridge.org
© 2015 Theodore J. Christ and Colleagues, LLC. All rights reserved.
Table 40. Criterion Validity of Spring CBMreading with Spring MCA-III in Reading: MN LEA 4
(Spring Data Collection)
Grade
N
CBM-R
M (SD)
MCA-III
M (SD)
r(x,y)
Cut
AUC
Sens.
Spec.
Some Risk (Does not Meet or Partially Meets Standards)
3
852
139 (40)
348 (20)
.76
141.5
.86
.78
.76
4
818
165 (39)
447 (15)
.71
164.5
.83
.75
.71
5
771
165 (40)
552 (16)
.70
163.5
.84
.77
.76
High Risk (Does Not Meet Standards)
3
852
139 (40)
348 (20)
.76
131.5
.88
.80
.79
4
818
165 (39)
447 (15)
.71
153.5
.87
.80
.78
5
771
165 (40)
552 (16)
.70
151.5
.89
.80
.79
Table 41. Criterion Validity of Spring CBMreading with Spring MCA-III in Reading: MN LEA 3
(Spring Data Collection)
Grade
N
CBMreading
M (SD)
MCA-III
M (SD)
r(x,y)
Cut
AUC
Sens.
Spec.
Some Risk (Does Not Meet or Partially Meets Standards)
3
502
137.30 (44)
352.97 (22)
.74
131.5
.87
.80
.79
4
505
160.98 (48)
451.54 (18)
.74
161.5
.87
.78
.78
5
505
172.70 (41)
554.09 (15)
.70
164.5
.85
.76
.75
6
472
176.57 (41)
654.35 (19)
.64
173.5
.81
.72
.73
Some Risk (Partially Meets Standards)
3
502
137.30 (44)
352.97 (22)
.74
--
.58
--
--
4
505
160.98 (48)
451.54 (18)
.74
165.5
.63
.70
.55
5
505
172.70 (41)
554.09 (15)
.70
172.5
.66
.69
.53
6
472
176.57 (41)
654.35 (19)
.64
184.5
.60
.69
.56
High Risk (Does Not Meet Standards)
3
502
137.30 (44)
352.97 (22)
.74
121.5
.91
.82
.82
4
505
160.98 (48)
451.54 (18)
.74
144.5
.88
.78
.79
5
505
172.70 (41)
554.09 (15)
.70
151.5
.91
.83
.81
6
472
176.57 (41)
654.35 (19)
.64
165.5
.87
.77
.78

Section 6. FAST as Evidence-Based Practice
Page | 84
www.fastbridge.org
© 2015 Theodore J. Christ and Colleagues, LLC. All rights reserved.
Table 42. Criterion Validity of Spring CBMreading with Spring Minnesota Comprehensive
Assessment III (MCA-III) in Reading: MN LEA 2 (Spring Data Collection)
Grade
N
CBMreading
M (SD)
MCA
M (SD)
r(x,y)
Cut
AUC
Sens.
Spec.
Some Risk (Does Not Meet or Partially Meets Standards)
3
252
142.95 (39)
353.34 (23)
.69**
142.5
.83
.76
.77
4
240
165.98 (39)
451.83 (16)
.69**
165.5
.82
.75
.75
5
234
175.33 (35)
558.69 (15)
.62**
167.5
.83
.73
.72
Some Risk (Partially Meets Standards)
3
252
142.95 (39)
353.34 (23)
.69**
--
.58
--
--
4
240
165.98 (39)
451.83 (16)
.69**
--
.58
--
--
5
234
175.33 (35)
558.69 (15)
.62**
174.5
.66
.67
.54
High Risk (Does Not Meet Standards)
3
252
142.95 (39)
353.34 (23)
.69**
127.5
.85
.73
.71
4
240
165.98 (39)
451.83 (16)
.69**
150.5
.90
.76
.84
5
234
175.33 (35)
558.69 (15)
.62**
151.5
.93
.93
.88
Table 43. Criterion Validity of Spring CBMreading on Spring MAP in Reading: WI LEA 1
(Spring Data Collection)
Grade
N
CBMreading
M (SD)
MAP
M (SD)
r(x,y)
Cut
AUC
Sens.
Spec.
Some Risk (≤ 40th percentile)
2
33
76.88 (45)
181.61 (19)
.87**
66
.97
.91
.91
3
26
115.31 (54)
195.65 (17)
.89**
76
.99
.86
.95
4
31
132.55 (41)
208.23 (13)
.76**
123
.89
.86
.85
5
28
154.50 (33)
211.11 (13)
.66**
140
.89
.78
.79
6
25
155.76 (38)
215.08 (12)
.74**
149
1.00
1.00
.83
Some Risk (20th to 40th percentile)
2
33
76.88 (45)
181.61 (19)
.87**
58
.68
.67
.74
3
26
115.31 (54)
195.65 (17)
.89**
108.5
.85
1.00
.82
4
31
132.55 (41)
208.23 (13)
.76**
123
.72
.75
.74
5
28
154.50 (33)
211.11 (13)
.66**
144
.69
.80
.60
6
25
155.76 (38)
215.08 (12)
.74**
149
.92
1.00
.71
High Risk (≤ 20th percentile)
2
33
76.88 (45)
181.61 (19)
.87**
32
.99
.86
.96
3
26
115.31 (54)
195.65 (17)
.89**
62
1.00
1.00
.87
4
31
132.55 (41)
208.23 (13)
.76**
94
1.00
1.00
.93
5
28
154.50 (33)
211.11 (13)
.66**
127
.97
1.00
.92
6
25
155.76 (38)
215.08 (12)
.74**
140
.92
1.00
.77
Section 6. FAST as Evidence-Based Practice
Page | 85
www.fastbridge.org
© 2015 Theodore J. Christ and Colleagues, LLC. All rights reserved.
Table 44. Criterion Validity of Spring CBMreading with Spring Massachusetts Comprehensive
Assessment (MCA): MA LEA 1 (Spring Data Collection)
Grade
N
CBMreading
M (SD)
MCA
M (SD)
r(x,y)
Cut
AUC
Sens.
Spec.
Some Risk (“Warning” and “Needs Improvement”)
3
93
138.82 (38)
241.89 (14)
.72**
132.5
.86
.79
.78
4
94
145.85 (38)
238.40 (15)
.71**
143.5
.81
.73
.78
5
72
158.99 (28)
243.63 (13)
.59**
157
.87
.74
.76
Some Risk (“Needs Improvement”)
3
93
138.82 (38)
241.89 (14)
.72**
132.5
.74
.72
.69
4
94
145.85 (38)
238.40 (15)
.71**
144.5
.69
.69
.64
5
72
158.99 (28)
243.63 (13)
.59**
155.5
.86
.73
.76
High Risk (“Warning”)
3
93
138.82 (38)
241.89 (14)
.72**
103.5
.96
1.00
.93
4
94
145.85 (38)
238.40 (15)
.71**
128
.89
.78
.78
5
72
158.99 (28)
243.63 (13)
.59**
137.5
.80
1.00
.79
Predictive Validity of the Slope
Validity of CBMreading passages were examined using the TOSREC, AIMSweb R-CBM, Measures of
Academic Progress (MAP), and DIBELS Next. Table 45 depicts correlations between the slope and the
achievement outcome. Coefficients provided in
Table 46 were derived from progress monitoring data. Students were monitored with grade level
passages for AIMSweb and DIBELS Next. Correlation coefficients in
Table 46 may be underestimated due to differences in error (i.e., Standard Error of the Estimate and
Standard Error of the Slope) between passage sets (see Ardoin & Christ, 2009 and Christ & Ardoin,
2009). The increased precision of CBMreading passages may lead to less variable slopes compared to
more error prone progress monitoring passages. This in turn may deflate the measure of association
between the two measures.
Table 45. Predictive Validity for the Slope of Improvement by CBMreading Passage Level
Passage
Level
Test or Criterion
N
# CBMreading
Data Points
Weeks of
Monitoring
Coefficient
Level A
TOSREC Mid-Year
58
.43
Level B
98
.45
Level C
158
.36
Level A
TOSREC End of Year
58
.58
Level B
98
.22
Level C
158
.14
Level A
TOSREC*
85
1-24
.46
Level B
130
1-29
.56
Level C
186
1-29
.16

Section 6. FAST as Evidence-Based Practice
Page | 86
www.fastbridge.org
© 2015 Theodore J. Christ and Colleagues, LLC. All rights reserved.
Level A
DIBELS Next
57
10-30
10-30
.89
Level B
197
10-30
10-30
.82
Level C
152
10-30
10-30
.60
Level A
AIMSWEB
33
10-30
30
.98
Level B
39
10-30
30
.84
Level C
70
10-30
30
.78
Level A
MAP
49
10
10
.21
Level B
71
10-20
10
.23
Level C
112
6-20
10
.21
Level A
MAP
33
14-30
30
.03
Level B
42
14-30
30
.41
Level C
78
18-30
30
.17
Note. Reported coefficients are partial Pearson correlation coefficients. Or rxy.z where x is the slope of
improvement, y is the outcome measure and z is the intercept (initial level). TOSREC* coefficients are based on a
partial data set from students in Georgia and Minnesota.
Table 46. Correlation Coefficients between CBMreading Slopes, AIMSweb R-CBM, and
DIBELS Next
AIMSweb Slope
DIBELS Next Slope
Passage
Level
N
Weeks of
Monitoring
(range)
Coefficient
(95% CI)
N
Weeks of
Monitoring
(range)
Coefficient
(95% CI)
A
Grade 1 (42)
Grade 2 (15)
Grade 3 (4)
Total N = 59
10–30
.95
(.92 - .97)
Grade 1 (42)
Grade 2 (27)
Grade 3 (6)
Total N = 75
10–30
.76
(.65 - .85)
B
Grade 1 (6)
Grade 2 (41)
Grade 3 (38)
Grade 4 (15)
Grade 5 (7)
Grade 6 (1)
Total N = 108
10–30
.85
(.79 - .90)
Grade 1 (6)
Grade 2 (113)
Grade 3 (91)
Grade 4 (27)
Grade 5 (14)
Grade 6 (2)
Total N = 253
10–30
.75
(.69 - .80)
C
Grade 4 (49)
Grade 5 (44)
Grade 6 (23)
Total N = 116
10–30
.64
(.52 - .74)
Grade 4 (130)
Grade 5 (112)
Grade 6 (51)
Total N = 293
10–30
.50
(.38 - .61)
Note. CI = Confidence Interval. Samples are disaggregated by grade level.
aReading
Content Validity
The development and design of aReading has a strong basis in reading research and theory. Items
were created and revised by reading teachers and experts. See previous section on item writing
Section 6. FAST as Evidence-Based Practice
Page | 87
www.fastbridge.org
© 2015 Theodore J. Christ and Colleagues, LLC. All rights reserved.
processes. Extensive field testing has been conducted to establish appropriate items for aReading. For
instance, the National Reading Panel (NRP; 2000a) submitted a report detailing the current knowledge
base of reading, as well as information on effective approaches to teach children how to read and the
important dimensions of reading to be emphasized. Factor analysis of preliminary data provided
evidence for a large primary factor (i.e., unidimensionality) and several smaller factors, across the
aReading items. Thus, aReading is designed to provide both a unified and a component assessment of
these dimensions, specifically focusing on five main areas (as put forth by the NRP, 2000a): Concepts
of Print, Phonological Awareness, Phonics, Vocabulary, and Comprehension.
The following describes the field testing process in order to derive item parameters to examine both
difficulty and content areas that aReading items are addressing.
Common Core State Standards: Foundational Skills
Common Core Subgroups / Clusters
aReading Domains
Print Concepts
Concepts of Print
Phonological Awareness
Phonemic Awareness
Phonetic Awareness
Phonetic Awareness
Vocabulary
Vocabulary
Common Core State Standards: College and Career Readiness Reading Standards for
Literature / Informational Text
Common Core Subgroups / Clusters
aReading Domains
Key Ideas and Details
Comprehension
Craft and structure
Comprehension & Vocabulary
Integration of Knowledge and Ideas
Comprehension & Vocabulary
aReading
Common Core State Standards &
MN K–12 Standards
Concepts of Print:
RF K.1, RF 1.1
Familiarity with print/books
RI K.5, RF K.1a
Understands appropriate directionality and tracking in print
RF K.1a
Identifies organizational elements of text
RF K.1a,c,d; RF 1.1a, L 1.2b,c; L 2.2b,c,
etc.; L 5.2a,b,c,d, RI K.6
Letter recognition
RF K.1b,d; L K.1a, L 1.1a
Word recognition
RF K.1b; RF K.1d
Sentence recognition
Phonological Skills:
Letter and word recognition / identification
L 3.2f
Section 6. FAST as Evidence-Based Practice
Page | 88
www.fastbridge.org
© 2015 Theodore J. Christ and Colleagues, LLC. All rights reserved.
Syllabication
RF K.2b; RF 1.3d
Letter and word recognition/identification
L.3.2f
Onset-rime
RF k.2a, c
Phonemic categorization
RF K.3d
Phonemic isolation
RF K.2b,c,d; RF 1.2a,c
Phonemic identification
RF 1.2b,d
Phonemic manipulation
RF K.2e
Skills Related to Phonics:
Single consonant identification
RF K.2d; RF K.3a; RF 1.2c
Single vowel identification
RF K.2d; RF K.3b; RF 1.2a,c; RF 2.3a,c
Combined vowel identification
RF 1.3c; RF 2.3b
Consonant blends
RF 1.2b
Consonant digraphs
RF 1.3a; L K.2c
R-, L-, -gh controlled vowel identification
RF 1.2b
Vowel digraphs and diphthongs
RF 1.3c; RF 2.3b
Phonograms
Recognize and analyze word roots and affixes
RF 3.3b; L 4.4b; L 5.4b
Spelling
RF 2.3c
Skills Related to Vocabulary:
Single-meaning words
L K.4a,b
Double-meaning words
RF 1.3f; RF 2.3d; L K.4a,b
Compound words and contractions
L 2.4d
Base/root word identification and use
RF 3.3b; L K 4b; L1.4b,c; L 3.3a; L 3.4c; L
4.4b; L 5.4b
Word relationships
RL 3.4; RL 4.4; RL 5.4; L K.5a,b; L 1.5a,b; L
3.1a,c; L 3.4; L 2.5, 3.5, 4.5, etc.; L 4.4c; L
5.4a,c
Skills Related to Comprehension:
Identify and locate information
RL K.1, 1.1, 2.1, etc.; RI K.1, 1.1, 2.1, etc.
Using inferential processes
RL K.7; 1.7, 2.7, etc.; RL K.9, RL 2.2, 2.3; RL
3.2, 3.3; RI K.7, 1.7, 2.7, etc.
Comprehension monitoring
RL K.4; RI K.4; RI 1.4
Awareness of text/story structure
RL k.5, 1.5, 2.5, etc.; RI 4.5, RI 5.5
Awareness of vocabulary use
RL 2.4
Evaluative and analytical processes
RL 2.6, 3.6, 4.6, etc.; RI 3.6
aReading literary passages include the following text types:
Fiction / Literature
Literary Nonfiction / Narrative Nonfiction
Poetry
Informational text types include:
Exposition

Section 6. FAST as Evidence-Based Practice
Page | 89
www.fastbridge.org
© 2015 Theodore J. Christ and Colleagues, LLC. All rights reserved.
Argumentation and persuasive text
Procedural text and documents.
For Reading Comprehension items, both literary and informational text types were used.
For Vocabulary, Orthography and Morphology items, response types include:
Selected Response
Conventional Multiple Choice
Alternate Choice
Matching
Multiple True-False
Targeted standards include:
Identify common misspellings
Recognize and analyze affixes and roots to determine word meaning in context;
Use / recognize appropriate word change patterns that reflect change in meaning or
parts of speech (e.g., derivational suffixes)
Identify word meaning in context
Demonstrate ability to use reference materials to pronounce words, clarify word
meaning
Understand figurative language in context
Use word relations to improve understanding
Distinguish similar-different word connotations and/or denotations
Test items were created based upon the following categories from the Common Core State Standards:
Key Ideas and Details
Craft and Structure
Integration of Knowledge and Ideas
The test question types include the following:
Locate / Recall: Identify textually explicit information and make simple inferences
within and across texts
Integrate / Interpret: Make complex inferences and/or integrate information within
and across texts
Critique / Evaluate: Consider text(s) or author critically
Pilot Test
In 2007, there were seven data collections across four districts, six schools, and 78 classrooms with
1,364 total students. Those data were used to estimate item parameters using student samples from
Kindergarten through Third Grade. See Table 47 below.
Section 6. FAST as Evidence-Based Practice
Page | 90
www.fastbridge.org
© 2015 Theodore J. Christ and Colleagues, LLC. All rights reserved.
Table 47. School Data Demographics for aReading Pilot Test
Category
School A
School B
School C
School D
School E
School F
White
94%
60%
10%
71%
3%
19%
Black
<1%
11%
64%
16%
83%
51%
Hispanic
<1%
<1%
21%
4%
2%
1%
Asian/Pacific Islander
5%
23%
3%
8%
12%
28%
American
Indian/Alaska Native
<1%
<1%
2%
1%
<1%
<1%
Free/Reduced Lunch
13%
36%
89%
28%
96%
76%
Twelve to thirteen laptop computers were used in each data collection. The test was administered to
students by class. Each student used a mouse to navigate the computer and headphones to hear the
audio. Keyboards were covered so that students could not touch them, and each computer was
surrounded by a foam board to discourage students from looking on other student's computer
screens.
Data collections were proctored by two to three data collectors who entered each student's name and
identifying information. Proctors attended to the children if they had questions, but did not provide
help on any item. Tests consisted of 50–80 items across six domains of reading; 20 items, the linking
items, were on each test and administered to all students in all sites. The linking items make it possible
to import all items into a data super matrix, enabling each item parameter to be based directly and
inferentially on data from all participants across all tests.
A summarization of the mean, standard deviation, minimum and maximum values for the three IRT
parameters is presented in Table 48 for each reading domain. The number of items developed in each
reading domain for the different ability levels are presented in Table 49. From over 500 items
developed, 366 items were identified as being accurately developed and having residual values that
were less than 1.68.
Table 48. Summarization of K–5 aReading Parameter Estimates by Domain
Parameter (a)
Parameter (b)
Parameter (c)
Domain
N
M
SD
Min
Max
M
SD
Min
Max
M
SD
Min
Max
Phonics
198
1.49
.16
1.06
2.01
.19
1.0
-2.13
2.65
.17
.04
.09
.35
Comprehension
24
1.44
.17
1.17
1.94
.77
.37
.14
1.37
.17
.04
.09
.24
Vocabulary
34
1.55
.27
1.15
2.50
.83
.99
-2.55
2.95
.16
.05
.09
.30
Concepts of Print
38
1.50
.19
1.18
2.20
-1.55
.75
-2.67
.64
.16
.02
.13
.22
Decoding &
Fluency
65
1.57
.23
1.17
2.23
-.37
.68
-1.78
1.77
.18
.06
.11
.40
Phonemic
Awareness
6
1.28
.15
1.03
1.43
-.41
1.03
-2.22
.45
.21
.04
.14
.28
Note. M = Mean.
A summary of item difficulty information is provided in Table 49. Analysis on level of difficulty after
item parameterization for the five domains indicated that aReading items are representing domains as

Section 6. FAST as Evidence-Based Practice
Page | 91
www.fastbridge.org
© 2015 Theodore J. Christ and Colleagues, LLC. All rights reserved.
would be expected—with Concepts of Print being administered at the low end of ability and
Comprehension at the high end.
Table 49. Item Difficulty Information for K-5 aReading Items
Number of Items at Each Parameter b-Value of Difficulty
Domain
(b≤-3)
(-3<b≤-2)
(-2<b≤-1)
(-1<b ≤0)
(0<b≤1)
(1<b≤2)
(2<b≤3)
Phonics
0
2
23
54
75
39
5
Comprehension
0
0
0
0
16
8
0
Vocabulary
0
1
0
3
17
10
3
Concepts of Print
0
10
17
10
1
0
0
Decoding & Fluency
0
0
7
44
11
3
0
Phonemic Awareness
0
1
1
1
3
0
0
Field Testing and Item Parameterization
To derive item parameters, data were collected in the fall and winter of 2009–10 at seven different
schools in Minnesota, with similar methods used in pilot field testing data collection. Students in
Kindergarten through Fifth Grade were drawn from seven schools in the suburbs near Minneapolis,
Minnesota. As the goal was to test a large number of students (300 per item), project personnel
wanted to ensure that the majority of students in schools would be able to participate without getting
frustrated. Thus, English Language Learner (ELL) students would not be the best population to
participate. School demographics are presented in Table 50 below. Sample sizes by school and grade
are presented in Table 51 below.
Table 50. School Demographics for Field-Based Testing of aReading Items
Category
School
A
School
B
School
C
School
D
School
E
School
F
School
G
White
89%
68%
78%
72%
69%
76%
63%
Black
3%
16%
7%
7%
5%
4%
5%
Hispanic
3%
8%
8%
7%
6%
4%
26%
Asian
4%
8%
7%
13%
19%
15%
6%
American Indian
1%
<1%
<1%
1%
1%
1%
<1%
Free/Reduced Lunch
21%
42%
37%
24%
14%
20%
41%
LEP
Special Education
Grades Served
Total School Population
1%
10%
K-6
470
12%
8%
K-5
663
9%
8%
K-5
396
14%
11%
K-5
782
14%
10%
K-5
766
15%
11%
K-5
690
28%
13%
K-5
638
Note. LEP=Limited English Proficient
Section 6. FAST as Evidence-Based Practice
Page | 92
www.fastbridge.org
© 2015 Theodore J. Christ and Colleagues, LLC. All rights reserved.
Table 51. Sample Sizes for K-5 aReading Field-Testing by Grade and School
Grades
School A
School B
School C
School D
School E
School F
School G
K–1
100
203
128
243
278
216
215
2–3
130
238
123
255
258
180
174
4–5
150
212
114
243
238
180
182
Total
380
653
365
741
774
576
571
Field Testing to Establish Linking Items
IRT requires that each field-tested item be sampled on 300 individuals (Weiss personal
communication, 2009). Therefore, our goal was to reach 300 students tested per item; some items
were tested on more than 300 students. Sampling at this rate ensures that all three parameters (
a, b,
and
c
) are stable estimates (low levels of standard error).
The goal of the first data collection was to identify and establish parameters for linking items. Linking
items (
N
= 16) are those items that were included on each subsequent field test as necessary to use a
mixed-group common-item linking procedure (Kolan & Brennan, 2004). Without linking items,
examinee responses across alternate items and examinees samples could not be compared and used
to estimate item parameters. Linking items were developed and selected to represent all domains as
well as the range of item difficulties, which generally correspond with reading performance from
Kindergarten through Fifth Grade. Identification of linking items from the pilot data collection was
extremely important because they appear on each subsequent field test. Project personnel identified
16 linking items that spanned across a range of difficulty levels and were content-balanced.
aReading personnel systematically chose 55 items out of the entire bank of items (
N
= 638). First, they
individually chose what they determined were the best 55 items based on findings from previous
administrations and on literacy research. The number of items chosen per domain was calculated
based on the a priori model. For example, Concepts of Print and Phonological Awareness develop in
Kindergarten and First Grade. Therefore, the proportion of these item types should be much smaller
than the proportion of Comprehension items on tests; Comprehension develops across five grades,
not just two. The number of items per grade level was similarly determined.
aReading staff decided that some items would be too difficult for young students at the first data
collection in which 55 items were to be tested. Thus, the administration was structured to have five
tests with branching and termination criteria. Each test was content-balanced and successive tests
were sequenced so they became progressively more difficult (item difficulty was based on expert
judgment of project personnel). For instance, the first test included 15 items that were considered to
be the easiest. Based on performance within each test, students’ administration was either terminated
(due to the number of incorrect responses) after a test was completed and prior to subsequent tests,
or continued to the next, progressively difficult, test (if enough correct responses were given). If an
examinee’s test terminated, then it was assumed that the examinee would not respond to subsequent
items at a rate greater than chance.

Section 6. FAST as Evidence-Based Practice
Page | 93
www.fastbridge.org
© 2015 Theodore J. Christ and Colleagues, LLC. All rights reserved.
The results of this initial field testing were used to guide the selection of linking items. These results
were not included in the super matrix or to estimate the final item parameters.
Field Testing to Establish Item Parameters
Based on best estimates of the project team, items were sequenced by difficulty and divided into six
sets of three progressively more difficult tests [e.g., for Schools A & B there was a fall set of three tests
(K–1, 2–3, 4–5) and a spring set of three tests (K–1, 2–3, 4–5)]. While all reading domains were assessed
at all grade levels, grade-level tests were constructed with the particular domain emphasis for that
grade in mind. Specifically, personnel believed that Kindergarten and First Grade examinees should be
assessed in the domains of Concepts of Print, Phonological Awareness, and some Phonics skills. Thus,
it seemed reasonable to combine these grades and test them using the same set of items. Similarly, it
was expected that examinees in grades two and three and grades four and five were similar in reading
development. The most relevant domains for grades two and three seemed to be Phonics and
Vocabulary. Finally, the focus for grades four and five was Vocabulary and Comprehension. It is
important to note that each grade was tested on Vocabulary and Comprehension, but at varying
levels of difficulty corresponding with grade level.
Excluding the first data collection at School A, both the Kindergarten to First Grade (K–1) tests and the
second to Third Grade (2–3) tests had 39 new items on each. Thirty-one new items were on each
fourth to Fifth Grade (4–5) test. The number of items on the grade 4–5 tests was reduced due to the
majority of items belonging to the Comprehension domain. In general, Comprehension items require
more time because more reading is involved. This means that the grades K–1 and 2–3 tests each had a
total of 55 items, including the linking items, and the grades 4–5 test had a total of 47 items, including
the linking items.
Procedure: Data Collection Overview
Data were collected using a mobile computer lab (
N
= 28 laptops each) or the school’s computer lab.
At the time of administration, data collectors directed students to the appropriate computer, located
in a test carrel, and provided a brief set of directions. Visual stimuli are presented on a computer
monitor and auditory stimuli are presented with padded earphones (padding helps isolate students
from extraneous noises and helps ensure that the assessment could be conducted within a populated
area). The students receive oral directions from a proctor or teacher followed by automated directions
and on-screen demonstrations to guide them through the test. Students responded to items in
sessions of 15–30 minutes. Upon completion, students were free to return to their classroom.
FALL 2009 DATA COLLECTIONS: OCTOBER
School A.
The purpose of this initial data collection was to identify linking items (procedure described
above). Three hundred sixty four students participated in this data collection. Once linking items were
identified (
N
= 16), they were included in all subsequent tests for which items were field tested (with
one exception; School B fall data collection, grades 4–5 test).
School B.
As another early data collection in which aReading personnel had no data to aid in the
selection of items, items considered to be high quality and representative of a range of ability levels

Section 6. FAST as Evidence-Based Practice
Page | 94
www.fastbridge.org
© 2015 Theodore J. Christ and Colleagues, LLC. All rights reserved.
and content for this data collection were selected. Five linking items were unintentionally left out of
the grades 4–5 test. As a result, items from the grades 4–5 test were added to the Super matrix once all
data collections were completed. The researchers adjusted the parameters appropriately. Five
hundred and sixty total students participated in this data collection at this school; specifically, 153
students were administered the grade K–1 test, 211 students were administered the grades 2–3 test,
and 196 students were administered the grades 4–5 test.
FALL 2009 DATA COLLECTIONS: NOVEMBER
School C.
This elementary school served as a make-up school for items tested at School B. In other
words, the goal of 300 students per item was not achieved at School B due to the student population.
Students at School C took the same test set as those at School B in order to obtain the goal of 300
students per item. Three hundred and sixty two total students participated in this data collection at
this school; specifically, 128 students were administered the grades K–1 test, 123 students were
administered the grades 2–3 test, and 111 students were administered the grades 4–5 test.
School D.
Items were chosen with consideration for difficulty level and content balance. Seven
hundred and forty one total students participated in this data collection at this school; specifically, 243
students were administered the grades K–1 test, 255 students were administered the grades 2–3 test,
and 243 students were administered the grades 4–5 test.
FALL 2009 DATA COLLECTIONS: DECEMBER
School E.
Items were chosen with consideration for difficulty level and content balance. Seven
hundred and twenty seven total students participated in this data collection at this school; specifically,
217 students were administered the grades K–1 test; 238 students were administered the grades 2–3
test; 272 students were administered the grades 4–5 test.
WINTER 2010 DATA COLLECTIONS: JANUARY
School A.
Based on initial item analysis of the October data collection, more items that were very easy
(< -2.0) and very difficult items (> +2.0) were needed to expand the range of linking items. As a result,
project personnel focused on adding a majority of extremely easy items (in the domains of Concepts
of Print and Phonological Awareness) to the grades K–1 test. The 4–5th grade test included high level
Vocabulary items and Comprehension items considered very difficult due to length of passage,
vocabulary, and question type. The tests at this school consisted of an entirely new item set. Three
hundred and eighty total students participated in this data collection at this school; specifically, 100
students were administered the grades K–1 test, 130 students were administered the grades 2–3 test,
and 150 students were administered the grades 4–5 test.
WINTER 2010 DATA COLLECTIONS: FEBRUARY
School C.
Again, this school served as the make-up school for previous fall data collections (i.e., School
B, School D, and School E). Three hundred and sixty two total students participated in this data
collection at this school; specifically, 126 students were administered the grades K–1 test, 122 students
were administered the grades 2–3 test, and 114 students were administered the grades 4–5 test.

Section 6. FAST as Evidence-Based Practice
Page | 95
www.fastbridge.org
© 2015 Theodore J. Christ and Colleagues, LLC. All rights reserved.
School D.
Items were chosen with consideration for difficulty level and content balance. Tests
administered consisted of an entirely new item set. Seven hundred and ten total students
participated in this data collection at this school; specifically, 234 students were administered the
grades K–1 test, 252 students were administered the grades 2–3 test, and 224 students were
administered the grades 4–5 test.
School G.
Items were chosen with consideration for difficulty level and content balance. Five hundred
and seventy one total students participated in this data collection at this school; specifically, 215 were
administered the grades K–1 test, 174 students were administered the grades 2–3 test, and 182
students were administered the grades 4–5 test.
SPRING 2010 DATA COLLECTIONS: MARCH
School B.
Items were chosen with consideration for difficulty level and content balance. Tests
administered at School B were the same as those administered during the winter data collection at
School F. Six hundred and fifty three total students participated in this data collection at this school;
specifically, 203 students were administered the grades K–1 test, 238 students were administered the
grades 2–3 test, and 212 students were administered the grades 4–5 test.
School E.
School E served as the make-up school for all data collections in need of more
administrations for items. Seven hundred and sixty eight total students participated in this data
collection at this school; specifically, 278 students were administered the grades K–1 test, 258 students
were administered the grades 2–3 test, and 232 students were administered the grades 4–5 test.
School F.
Items were chosen with consideration for difficulty level and content balance. Tests
administered consisted of an entirely new item set. Five hundred and seventy six total students
participated in this data collection at this school; specifically, 216 students were administered the
grades K–1 test, 180 students were administered the grades 2–3 test, and 180 students were
administered the grades 4–5 test.
SPRING 2012 DATA COLLECTION
Analysis of the initial field parameterization indicated that the item bank provided the most
information for students with ability levels in the middle range on the theta scale (mostly between -2.0
and 2.0). However, the bank lacked items for students’ ability levels at the extreme ends of the theta
scale. Because the test bank needs more information for students with extremely low ability levels
(less than -2.0 on the theta scale) and those with extremely high ability levels (more than 2.0), the
aReading team developed additional items that targeted Kindergarten through early First Grade level
students and also late fifth through early Sixth Grade students. The new easy items focused on the
Concept of Print domain. The new items created for the higher grade students were all
Comprehension items that contained reading passages that reflect fifth through Sixth Grade reading
content.
The participants were students from two public schools in South St. Paul, Minnesota. The schools
provided a richly diverse group of students. The aReading team administered the Concept of Print
Section 6. FAST as Evidence-Based Practice
Page | 96
www.fastbridge.org
© 2015 Theodore J. Christ and Colleagues, LLC. All rights reserved.
items to 411 Kindergarten and First Grade students (
N
= 19 classrooms) and the Comprehension items
to 391 fifth and Sixth Grade students (
N
= 18 classrooms).
The team collected data for the Concept of Print items in November and December 2011 and the
Comprehension items in March 2012. A range of two to three group administrations were completed
in a day (during school hours and with transitions and scheduling conflicts). Research assistants and
other project personnel supervised the test administrations, ensuring student safety and the integrity
of collecting the data. Data collectors provided oral directions to the students. Students also received
automated directions and on-screen demonstrations before beginning the test. The students
completed the items on a web-based browser using laptops provided by the team. Each
administration lasted approximately 15 to 30 minutes for each student and all responses were
automatically saved in a secure online database.
FALL 2012 AND SPRING 2013 DATA COLLECTION
Over 9,000 students from six middle and junior high schools and four high schools in the upper
Midwest participated to test items generated for aReading grades 6–12 (N=70 unique classrooms).
Trained project personnel administered the assessments. Each test included linking items and 20
unique aReading items targeted to grade level spans from 6–8, 9–12, and 11–12. Each item was given
to approximately 300 students. Administration lasted 20 to 45 minutes per student. Criterion
measures were collected from each school and used for additional analyses.
Parameterization
All items were parameterized within a 3-PL IRT framework via the computer program Xcalibre (Guyer &
Thompson, 2012). Xcalibre allows for the use of a sparse data-matrix used with linking items
(described above) deriving item parameters for every item, even if all students did not complete each
item. Table 52 below shows descriptive statistics for item parameters for aReading. Item parameters
are used to calculate the level of information for each item at a given ability estimate (discussed in the
previous section). Based on a student’s current ability estimate during a CAT, the aReading algorithm
selects the item that is likely to provide the most information for that student.
Table 52. Descriptive Statistics of K–12 aReading Item Parameters
Domain
N
M
SD
Min
Max
M
SD
Min
Max
M
SD
Min
Max
Overall
1101
1.34
.40
.46
3.78
.11
1.02
-2.87
2.77
.24
.04
.06
.36
COP
98
1.5
.46
.63
2.82
-1.14
.96
-2.64
1.45
.21
.02
.11
.25
Comprehension
521
1.39
.4
.46
3.78
.39
.71
-1.28
2.77
.24
.04
.06
.36
Vocabulary
229
1.34
.37
.61
3.03
.33
1.13
-2.87
2.62
.22
.03
.06
.29
Phonics
128
1.38
.44
.52
2.73
-.34
1.09
-2.58
1.95
.21
.02
.13
.33
PA
66
1.11
.32
.61
1.9
-.61
.87
-2.56
1.24
.21
.01
.16
.23
OMF
57
1.31
.31
.76
2.27
.58
.72
-.76
2.63
.24
.06
.06
.29
Note. COP = Concepts of Print; PA = Phonological Awareness; OMF = orthography, morphology, and figurative
language.
Section 6. FAST as Evidence-Based Practice
Page | 97
www.fastbridge.org
© 2015 Theodore J. Christ and Colleagues, LLC. All rights reserved.
Criterion-Related Validity
Criterion-related validity of aReading tests was examined using the Gates MacGinitie Reading Tests-4th
Edition (GMRT-4th; MacGinitie, MacGinitie, Maria, & Dreyer, 2000). The GMRT-4th is a norm-referenced,
group administered measure of reading achievement distributed by Riverside Publishing Company. It
is designed to provide guidance in planning instruction and intervention and is typically used as a
diagnostic tool for general reading achievement. The GMRT-4th was normed with students in the pre-
reading stages through high school levels. The GMRT-4th was selected because of its strong criterion
validity. Correlations between the GMRT composite score and comprehension and vocabulary
subtests of the Iowa Test of Basic Skills and GMRT composite scores across grades is high (.76 and .78
respectively; Morsy, Kieffer, & Snow, 2010). A similar pattern of results were observed between the
GMRT and subscales of the California Tests of Basic Skills (.84 and .81 respectively; Morsy et al., 2010).
GMRT scores also correlate highly with Comprehensive Tests of Basic Skills vocabulary,
comprehension, and composite scores (.72, .79, and. 83 respectively; Morsy et al., 2010). Further, the
correlation between GMRT composite scores and reading scores on the Basic Academic Skills Samples
were strong as well (.79; Jenkins & Jewell, 1992).
The measure of interest with the GMRT-4th is the extended scale scores (ESS). The ESS puts the results
from the test on a single continuous scale to allow comparison across time and grades. All materials
were provided to students, including the test booklet and answer booklet.
Five trained aReading project team data collectors administered the GMRT-4th during February of 2011
at two separate schools. Participants included students in first through Fifth Grades. Three classrooms
per grade at School A participated (n = 622); all students in first through Fifth Grades at School B
participated (n = 760). The majority of students at Schools A and B were white (69%). Students were
administered the word decoding/vocabulary and comprehension subtests of the GMRT-4th during two
separate testing sessions. Some students were administered the word decoding/vocabulary section
first while other students were administered the comprehension subtest first. See the Table 53 below
for demographic information, disaggregated by school.
Table 53. Demographics for Criterion-Related Validity Sample for GMRT-4th and aReading
Category
School A
School B
White
70%
69%
Black
6%
5%
Hispanic
9%
6%
Asian/Pacific Islander
13%
19%
American Indian/Alaskan Native
3%
1%
Free/Reduced Lunch
19%
14%
LEP
14%
14%
Special Education
11%
10%
Note. LEP = Limited English Proficiency. Percentages are rounded to whole numbers and therefore may not add
to precisely 100.
Section 6. FAST as Evidence-Based Practice
Page | 98
www.fastbridge.org
© 2015 Theodore J. Christ and Colleagues, LLC. All rights reserved.
Descriptive information for the GMRT-4th and correlation coefficients between each scale and
aReading scores are provided in Table 63.
Table 54. Sample-Related Information for aReading Criterion-Related Validity Data
Decoding
Vocabulary
Comprehension
Composite
Grade
N
Mean
SD
N
Mean
SD
N
Mean
SD
N
Mean
SD
1
348
436
47
-
-
-
130
407
44
125
409
43
2
163
449
43
-
-
-
215
459
49
-
-
-
3
-
-
-
170
485
41
168
484
42
165
484
40
4
-
-
-
182
504
39
180
503
42
175
502
36
5
-
-
-
182
513
31
187
518
35
181
514
30
1–5
511
442.5
45
534
501
39
881
477
56
646
483
53
Note. M = Mean; SD = Standard Deviation
Table 55. Correlation Coefficients between GMRT-4th and aReading Scaled Score
Note. Sample size is denoted by ().
Overall, there appears to be a strong positive correlation between composite scores from the GMRT-
4th and aReading scaled scores. There is some variability between grades, with coefficient values
between .64 and .83. Subtests showed greater variability. Specifically, comprehension correlation
coefficients ranged from .58 to .81.
Content, construct, and predictive validity of aReading is summarized in.
Table 56.
Grade
Decoding
Vocabulary
Comprehension
Composite
1
.82 (131)
-
.73 (130)
.83 (125)
2
.68 (163)
-
.75 (215)
-
3
-
.79 (170)
.81 (168)
.84 (165)
4
-
.76 (182)
.72 (180)
.78 (175)
5
-
.65 (182)
.58 (187)
.64 (181)
1–5
.75 (348)
.74 (534)
.82 (881)
.86 (646)
Section 6. FAST as Evidence-Based Practice
Page | 99
www.fastbridge.org
© 2015 Theodore J. Christ and Colleagues, LLC. All rights reserved.
Table 56. Content, Construct, and Predictive Validity of aReading
Type of
Validity
Grade
Test or Criterion
N (range)
Coefficient
(if applicable)
Range
Median
Content
K–5
Reading teachers/experts
Content
K–3
Items administered by Theta Level
287
Predictive
1–5
1
2*
3
4
5
Gates-MacGinitie
125–215
125
215
165
175
181
0.64–0.84
0.83
0.75
0.84
0.78
0.64
0.78
Construct
1–5
1
2
3
4
5
Curriculum-Based Measurement of
Oral Reading Fluency
55–171
55
171
108
114
103
0.56–0.83
0.83
0.81
0.74
0.80
0.56
0.80
Construct
1-5
1
2
3
4
5
MAP
55–398
55
302
391
398
376
0.69–0.83
0.69
0.83
0.83
0.77
0.73
0.77
Note. Grade 2 Predictive validity for the GMRT-4th is based on the Comprehension subtest, whereas all other
grades are based on the overall composite score.
More recently, data collections have produced aReading criterion-related evidence with various other
criterion measures.
Table 57. Criterion Validity of Spring aReading with Spring Minnesota Comprehensive
Assessment III (MCA-III) in Reading: MN LEA 1 (Spring Data Collection)
Grade
N
aReading
M (SD)
MCA
M (SD)
r(x,y)
Cut
AUC
Sens.
Spec.
Some Risk (Meets Standards)
6
202
522.01 (15.45)
651.36 (15.07)
.72**
521.5
.86
.78
.77
7
126
522.81 (14.95)
742.01 (15.26)
.66**
528.5
.83
.77
.76
8
94
524.95 (14.11)
843.22 (11.88)
.58**
534.5
.85
.81
.79
High Risk (Does Not Meet Standards)
6
202
522.01 (15.45)
651.36 (15.07)
.72**
515.5
.83
.74
.74
7
126
522.81 (14.95)
742.01 (15.26)
.66**
523
.82
.75
.77
8
94
524.95 (14.11)
843.22 (11.88)
.58**
524.5
.84
.78
.78
Section 6. FAST as Evidence-Based Practice
Page | 100
www.fastbridge.org
© 2015 Theodore J. Christ and Colleagues, LLC. All rights reserved.
Table 58. Criterion Validity for Spring aReading with Spring MCA-III in Reading: MN LEA 4
(Spring Data Collection)
Grade
N
aReading
M (SD)
MCA-III
M (SD)
r(x,y)
Cut
AUC
Sens.
Spec.
Some Risk (Does Not Meet or Partially Meets Standards)
3
629
534 (27)
347 (21)
.82
532.5
.90
.83
.82
4
615
549 (28)
447 (16)
.81
550.5
.89
.82
.82
5
516
564 (32)
553 (16)
.84
556.5
.93
.84
.84
High Risk (Does Not Meet Standards)
3
629
534 (27)
347 (21)
.82
524.5
.90
.82
.81
4
615
549 (28)
447 (16)
.81
536.5
.92
.84
.84
5
516
564 (32)
553 (16)
.84
544.5
.96
.89
.86
Table 59. Criterion Validity for Spring aReading with Spring MCA-III in Reading: MN LEA 3
(Spring Data Collection)
Grade
N
aReading
M (SD)
MCA-III
M (SD)
r(x,y)
Cut
AUC
Sens.
Spec.
Some Risk (Does Not Meet or Partially Meets Standards)
3
156
504.97 (18.09)
351.56 (19.77)
.82
502.5
.89
.80
.79
4
63
508.17 (20.75)
447.33 (16.11)
.78
509.5
.86
.78
.74
5
148
528.02 (19.58)
557.91 (14.22)
.82
523.5
.91
.84
.83
6
152
529.18 (20.93)
655.09 (18.11)
.76
530.5
.86
.80
.78
Some Risk (Partially Meets Standards)
3
156
504.97 (18.09)
351.56 (19.77)
.82
--
.59
--
--
4
63
508.17 (20.75)
447.33 (16.11)
.78
--
.46
--
--
5
148
528.02 (19.58)
557.91 (14.22)
.82
522.5
.80
.75
.75
6
152
529.18 (20.93)
655.09 (18.11)
.76
530.5
.64
.68
.63
High Risk (Does Not Meet Standards)
3
156
504.97 (18.09)
351.56 (19.77)
.82
498.5
.92
.83
.82
4
63
508.17 (20.75)
447.33 (16.11)
.78
503.00
.95
.90
.85
5
148
528.02 (19.58)
557.91 (14.22)
.82
510.5
.96
.85
.87
6
152
529.18 (20.93)
655.09 (18.11)
.76
518.5
.95
.84
.87
Criterion-related validity evidence for aReading is not limited to the Midwest. See tables below.
Table 60. Criterion Validity of Spring aReading with Spring CRCT in Reading: GA LEA 1
(Spring to Spring Prediction)
Grade
N
aReading
M (SD)
CRCT
M (SD)
r(x,y)
Cut
AUC
Sens.
Spec.
Some Risk (Meets Standards)
3
327
501.56 (20)
848.62 (28)
.75*
501.50
.84
.78
.78
4
314
513.53 (20)
848.30 (27)
.77*
514.50
.86
.79
.79

Section 6. FAST as Evidence-Based Practice
Page | 101
www.fastbridge.org
© 2015 Theodore J. Christ and Colleagues, LLC. All rights reserved.
5
347
519.34 (19)
841.27 (25)
.74*
525.50
.83
.79
.78
High Risk (Does Not Meet Standards)
3
327
501.56 (20)
848.62 (28)
.75*
478.50
.95
.91
.85
4
314
513.53 (20)
848.30 (27)
.77*
493.00
.93
.83
.84
5
347
519.34 (19)
841.27 (25)
.74*
502.50
.90
.85
.84
Table 61.Criterion Validity of Spring aReading with Spring Massachusetts Comprehensive
Assessment (MCA): MA LEA 1 (Spring Data Collection)
Grade
N
aReading
M (SD)
MCA
M (SD)
r(x,y)
Cut
AUC
Sens.
Spec.
Some Risk (“Warning” and “Needs Improvement”)
3
93
508.96 (22.16)
241.89 (14.08)
.81**
503.5
.89
.76
.77
4
93
512.17 (19.09)
238.40 (19.09)
.78**
513.5
.88
.75
.75
5
74
524.04 (15.41)
243.63 (13.20)
.64**
523.5
.85
.76
.76
Some Risk (“Needs Improvement”)
3
93
508.96 (22.16)
241.89 (14.08)
.81**
504.5
.77
.76
.78
4
93
512.17 (19.09)
238.40 (19.09)
.78**
515
.73
.71
.63
5
74
524.04 (15.41)
243.63 (13.20)
.64**
522.5
.83
.75
.76
High Risk (“Warning”)
3
93
508.96 (22.16)
241.89 (14.08)
.81**
483.00
.97
.88
.92
4
93
512.17 (19.09)
238.40 (19.09)
.78**
496.5
.95
.89
.85
5
74
524.04 (15.41)
243.63 (13.20)
.64**
511.5
.84
1.00
.78
Chapter 2.7: Diagnostic Accuracy
earlyReading
earlyReading diagnostic accuracy information was derived from the sample described in Table 31.
earlyReading diagnostic accuracy information is provided for both Kindergarten and First Grade, using
the Group Reading Assessment Diagnostic Evaluation (GRADE™) as a criterion measure. Measures of
diagnostic accuracy were used to determine decision thresholds using criteria related to sensitivity,
specificity, and area under the curve (AUC). Specifically, specificity and sensitivity were computed at
different cut scores in relation to maximum AUC values. Decisions for final benchmark percentiles
were generated based on maximizing each criterion at each cut score (i.e., when the cut score
maximized specificity ≥ .70, and sensitivity was also ≥ .70; see Silberglitt & Hintze, 2005). In the
scenario for which a value of .70 could not be achieved for either specificity or sensitivity, precedence
was given to maximizing specificity.
Section 6. FAST as Evidence-Based Practice
Page | 102
www.fastbridge.org
© 2015 Theodore J. Christ and Colleagues, LLC. All rights reserved.
Table 62. Kindergarten Diagnostic Accuracy for earlyReading Measures
15th Percentile
40th Percentile
AUC
Cutpoint
Sens
.
Spec.
Classification
AUC
Cutpoint
Sens
.
Spec.
Classification
Concepts of Print
F to F1
.86
7
.80
.82
.82
.80
9
.74
.69
.72
F to S
.82
7
.76
.71
.71
.74
8
.75
.65
.68
Onset Sounds
F to F1
.94
8
.80
.81
.81
.79
12
.74
.69
.72
F to S
.88
7
.82
.89
.89
.74
12
.80
.77
.78
W to S
.76
14
.69
.86
.85
.73
15
.62
.78
.74
Letter Names
F to F1
.73
22
.60
.59
.59
.65
25
.60
.64
.62
F to S
.81
20
.76
.74
.74
.76
25
.69
.69
.69
W to S
.79
35
.72
.73
.73
.77
40
.73
.73
.73
S to S
.78
48
.71
.70
.70
.76
51
.71
.72
.72
Letter Sounds
F to F1
.95
1
.86
.14
.87
.68
7
.63
.60
.61
F to S
.81
6
.76
.78
.78
.75
10
.67
.71
.70
W to S
.85
22
.78
.75
.75
.82
28
.75
.73
.74
S to S
.85
34
.82
.80
.80
.71
42
.73
.59
.63
Rhyming
F to F1
.89
5
.80
.80
.80
.77
9
.72
.69
.71
F to S
.80
6
.76
.75
.75
.81
8
.79
.72
.74
W to S
.92
7
.88
.89
.89
.83
12
.75
.76
.76
S to S
.86
14
.88
.75
.76
.76
15
.71
.69
.70
Word Blending
F to S
.70
1
.88
.53
.56
.69
1
.77
.60
.65
W to S
.82
4
.82
.80
.80
.74
8
.73
.55
.60
S to S
.85
9
.88
.72
.73
.75
9
.64
.79
.75
Word Segmenting
W to S
.85
4
.82
.81
.81
.78
15
.75
.76
.76
S to S
.90
28
.94
.87
.87
.76
32
.72
.57
.61
Sight Words 50
S to S
.82
25
.78
.72
.72
.74
39
.71
.65
.66
Decodable Words
S to S
.90
3
.78
.87
.86
.77
9
.72
.68
.69
Nonsense Words
W to S
.86
3
.83
.79
.79
.76
5
.70
.72
.72
S to S
.90
6
.83
.81
.81
.78
8
.70
.79
.76
Composite
F to F1
.96
28
.80
.91
.91
.79
42
.74
.67
.71
F to S
.91
33
.88
.84
.84
.84
40
.80
.77
.78
W to S
.91
40
.94
.72
.77
.85
47
.84
.72
.75
S to S
.95
52
.75
.74
.74
.81
60
.75
.74
.74
Note. F = Fall; W = Winter; S = Spring;1Base rates below the 15th percentile were low and above the 40th
percentile were high. Note. Fall to Fall was concurrent and used the GRADE Level P as the criterion. All others
used the GRADE Level K.
Based on these analyses, the values at the 40th and 15th percentiles were identified as the primary
and secondary benchmarks for earlyReading, respectively. These values thus correspond with a
Section 6. FAST as Evidence-Based Practice
Page | 103
www.fastbridge.org
© 2015 Theodore J. Christ and Colleagues, LLC. All rights reserved.
prediction of performance at the 40th and 15th percentiles on the GRADE, a nationally normed
reading assessment of early reading skills. Performance above the primary benchmark indicates the
student is at low risk for long-term reading difficulties. Performance between the primary and
secondary benchmarks indicates the student is at some risk for long-term reading difficulties.
Performance below the secondary benchmark indicates the student is at high risk for long-term
reading difficulties. These risk levels help teachers accurately monitor student progress using the
FAST™ earlyReading measures. See
Table 62 below for Diagnostic Accuracy results using the GRADE as the criterion measure.
Table 63. First Grade Diagnostic Accuracy for earlyReading Measures
15th Percentile
40th Percentile
AUC
Cutpoint
Sens.
Spec.
Classification
AUC
Cutpoint
Sens.
Spec.
Classification
Word Blending
F to S
.87
6
.86
.80
.80
.82
7
.72
.72
.72
W to S
.82
8
.60
.80
.79
.78
8
.56
.84
.80
S1 to S2
.68
9
.55
.67
.66
.65
9
.50
.69
.66
Word Segmenting
F to S
.78
25
.71
.72
.72
.75
27
.72
.68
.68
W to S
.82
29
.70
.74
.74
.79
30
.67
.67
.67
S1 to S2
.71
30
.64
.71
.70
.67
30
.53
.74
.70
Sight Words 150
F to S
.97
5
.86
.92
.92
.91
14
.84
.81
.82
W to S
.97
21
.90
.95
.94
.95
44
.85
.89
.88
S1 to S2
.97
48
.91
.96
.96
.95
61
.87
.92
.91
Decodable Words
F to S
.90
2
.86
.85
.85
.88
5
.76
.74
.75
W to S
.93
10
.80
.91
.91
.95
15
.85
.86
.86
S1 to S2
.93
22
.82
.82
.82
.96
24
.84
.89
.88
Nonsense Words
F to S
.93
2
.86
.88
.88
.84
5
.76
.79
.79
W to S
.88
12
.80
.75
.75
.92
14
.93
.78
.81
S1 to S2
.87
14
.89
.80
.81
.87
17
.81
.77
.78
Sentence Reading/CBMR1
F to S
.97
10
.86
.93
.93
.93
18
.84
.84
.84
W to S
.98
192
1.0
.95
.95
.98
372
.96
.91
.92
S1 to S2
.98
362
.82
.98
.97
.98
652
.94
.93
.93
Composite
F to S
.98
25
1.0
.93
.93
.93
28
.76
.84
.83
W to S
.98
34
1.0
.82
.83
.97
37
1.0
.77
.81
Section 6. FAST as Evidence-Based Practice
Page | 104
www.fastbridge.org
© 2015 Theodore J. Christ and Colleagues, LLC. All rights reserved.
S1 to S2
.99
45
.89
.90
.90
.97
51
.92
.92
.92
Note. F = Fall; W = Winter; S = Spring; 1Sentence Reading was administered in the fall, CBMR was administered in
the winter and spring.2Scores shown are equated.
More recently, diagnostic accuracy analyses have also been conducted using earlyReading subtest
scores and composite scores to predict aReading. These findings are summarized in the tables below.
Students were recruited from several school districts in Minnesota. Cut score was selected by
optimizing sensitivity at about .70 and balancing sensitivity with specificity (Silberglitt & Hintze, 2005).
In the tables that follow, dashes indicate unacceptable sensitivity and specificity due to low AUC.
Table 64. Diagnostic Accuracy of Fall earlyReading Concepts of Print Subtest with Winter
aReading: MN LEA 3 (Fall to Winter Prediction)
Grade
N
Concepts of Print
M (SD)
aReading
M (SD)
r(x,y)
Cut
AUC
Sens.
Spec.
Some Risk (< 40th percentile)
KG
5173
8.31 (2.63)
430.28 (27.43)
.58**
6.5
.80
.77
.71
Some Risk (20th to 40th percentile)
KG
5173
8.31 (2.63)
430.28 (27.43)
.58**
6.5
.81
.74
.75
High Risk (< 20th percentile)
KG
5173
8.31 (2.63)
430.28 (27.43)
.58**
6.5
.81
.79
.70
Table 65. Diagnostic Accuracy of Fall earlyReading Onset Sounds Subtest with Winter aReading:
MN LEA 3 (Fall to Winter Prediction)
Grade
N
Onset Sounds
M (SD)
aReading
M (SD)
r(x,y)
Cut
AUC
Sens.
Spec.
Some Risk (< 40th percentile)
KG
13203
11.59 (4.28)
430.28 (27.43)
63**
8.50
.84
.79
.77
Some Risk (20th to 40th percentile)
KG
13203
11.59 (4.28)
430.28 (27.43)
.63**
8.50
.84
.79
.77
High Risk (< 20th percentile)
KG
13203
11.59 (4.28)
430.28 (27.43)
.63**
7.5
.83
.79
.77
Table 66. Diagnostic Accuracy of Fall earlyReading Letter Names Subtest with Winter aReading:
MN LEA 3 (Fall to Winter Prediction)
Grade
N
Letter Names
M (SD)
aReading
M (SD)
r(x,y)
Cut
AUC
Sens.
Spec.
Some Risk (< 40th percentile)
KG
5173
27.29 (22.38)
430.28 (27.43)
.69**
11.50
.78
.71
.70
Some Risk (20th to 40th percentile)
KG
5173
27.29 (22.38)
430.28 (27.43)
.69**
14.5
.79
.74
.73
High Risk (< 20th percentile)
KG
5173
27.29 (22.38)
430.28 (27.43)
.69**
9.5
.82
.73
.73

Section 6. FAST as Evidence-Based Practice
Page | 105
www.fastbridge.org
© 2015 Theodore J. Christ and Colleagues, LLC. All rights reserved.
Table 67. Diagnostic Accuracy of Fall earlyReading Letter Sounds Subtest with Winter aReading:
MN LEA 3 (Fall to Winter Prediction)
Grade
N
Letter Sounds
M (SD)
aReading
M (SD)
r(x,y)
Cut
AUC
Sens.
Spec.
Some Risk (< 40th percentile)
KG
5173
11.57 (11.76)
430.28 (27.43)
.62**
2.5
.80
.71
.73
1
842
34.83 (14.89)
466.04 (27.16)
.65
30.5
.73
.66
.65
Some Risk (20th to 40th percentile)
KG
5173
11.57 (11.76)
430.28 (27.43)
.62**
3.5
.77
.72
.67
High Risk (< 20th percentile)
KG
5173
11.57 (11.76)
430.28 (27.43)
.62**
1.5
.82
.79
.78
1
842
34.83 (14.89)
466.04 (27.16)
.65
17.5
.99
1.00
.89
Table 68. Diagnostic Accuracy of Fall earlyReading Letter Sounds Subtest with Spring aReading:
MN LEA 3 (Fall to Spring Prediction)
Grade
N
Letter Sounds
M (SD)
aReading
M (SD)
r(x,y)
Cut
AUC
Sens.
Spec.
Some Risk (< 40th percentile)
1
842
34.83 (14.89)
457.39 (25.21)
.31**
29.50
.75
.70
.69
High Risk (< 20th percentile)
1
842
34.83 (14.89)
457.39 (25.21)
.31**
27.50
.78
.74
.71
Table 69. Diagnostic Accuracy of Winter earlyReading Letter Sounds Subtest with Spring
aReading: MN LEA 3 (Winter to Spring Prediction)
Grade
N
Letter Sounds
M (SD)
aReading
M (SD)
r(x,y)
Cut
AUC
Sens.
Spec.
Some Risk (< 40th percentile)
1
208
43.62 (18.25)
457.39 (25.21)
.58**
40.50
.77
.70
.72
High Risk (< 20th percentile)
1
208
43.62 (18.25)
457.39 (25.21)
.58**
40.50
.76
.73
.70
Table 70. Diagnostic Accuracy of Winter earlyReading Rhyming Subtest with Spring aReading:
MN LEA 3 (Winter to Spring Prediction)
Grade
N
Rhyming
M (SD)
aReading
M (SD)
r(x,y)
Cut
AUC
Sens.
Spec.
Some Risk (< 40th percentile)
1
106
13.28 (3.34)
457.39 (25.21)
.53**
14.50
.75
.70
.70
High Risk (< 20th percentile)
1
106
13.28 (3.34)
457.39 (25.21)
.53**
14.50
.71
.70
.64
Section 6. FAST as Evidence-Based Practice
Page | 106
www.fastbridge.org
© 2015 Theodore J. Christ and Colleagues, LLC. All rights reserved.
Table 71. Diagnostic Accuracy of Fall earlyReading Word Segmenting Subtest with Winter
aReading: MN LEA 3 (Fall to Winter Prediction)
Grade
N
Word Segmenting
M (SD)
aReading
M (SD)
r(x,y)
Cut
AUC
Sens.
Spec.
Some Risk (< 40th percentile)
1
-
-
-
-
-
-
-
-
High Risk (< 20th percentile)
1
9843
26.20 (7.41)
466.04 (27.16)
.51**
22.50
.87
.78
.78
Table 72. Diagnostic Accuracy of Fall earlyReading Nonsense Words Subtest with Winter
aReading: MN LEA 3 (Fall to Winter Prediction)
Grade
N
Nonsense Words
M (SD)
aReading
M (SD)
r(x,y)
Cut
AUC
Sens.
Spec.
Some Risk (< 40th percentile)
1
7997
13.14 (22.13)
466.04 (27.16)
.62**
9.50
.66
.60
.61
High Risk (< 20th percentile)
1
7997
13.14 (22.13)
466.04 (27.16)
.62**
5.50
.89
.83
.78
Table 73. Diagnostic Accuracy of Fall earlyReading Sight Words Subtest with Winter aReading:
MN LEA 3 (Fall to Winter Prediction)
Grade
N
Sight Words
M (SD)
aReading
M (SD)
r(x,y)
Cut
AUC
Sens.
Spec.
Some Risk (< 40th percentile)
1
9685
32.76 (33.40)
466.04 (27.16)
.67**
26.50
.69
.71
.58
High Risk (< 20th percentile)
1
9685
32.76 (33.40)
466.04 (27.16)
.67**
4.5
.92
.85
.87
Table 74. Diagnostic Accuracy of Fall earlyReading Sentence Reading Subtest with Winter
aReading: MN LEA 3 (Fall to Winter Prediction)
Grade
N
Sentence Reading
M (SD)
aReading
M (SD)
r(x,y)
Cut
AUC
Sens.
Spec.
Some Risk (< 40th percentile)
1
9618
34.23 (37.43)
466.04 (27.16)
.70**
19.5
.71
.70
.60
High Risk (< 20th percentile)
1
9618
34.23 (37.43)
466.04 (27.16)
.70**
6.5
.94
.90
.87
Section 6. FAST as Evidence-Based Practice
Page | 107
www.fastbridge.org
© 2015 Theodore J. Christ and Colleagues, LLC. All rights reserved.
Table 75. Diagnostic Accuracy of Fall earlyReading Sentence Reading Subtest with Spring
aReading: MN LEA 3 (Fall to Spring Prediction)
Grade
N
Sentence Reading
M (SD)
aReading
M (SD)
r(x,y)
Cut
AUC
Sens.
Spec.
Some Risk (< 40th percentile)
1
-
-
-
-
-
-
-
-
High Risk (< 20th percentile)
1
9618
34.23 (37.43)
457.39 (25.21)
.66**
15.50
.72
.68
.66
Table 76. Diagnostic Accuracy of Winter earlyReading Sentence Reading Subtest with Spring
aReading: MN LEA 3 (Winter to Spring Prediction)
Grade
N
Sentence Reading
M (SD)
aReading
M (SD)
r(x,y)
Cut
AUC
Sens.
Spec.
Some Risk (< 40th percentile)
1
433
57.36 (36.69)
457.39 (25.21)
.78**
32.50
.82
.76
.76
High Risk (< 20th percentile)
1
433
57.36 (36.69)
457.39 (25.21)
.78**
22.50
.92
.85
.85
Table 77. Diagnostic Accuracy of Winter earlyReading Composite with Winter aReading:
MN LEA 3 (Fall to Winter Prediction)
Grade
N
Composite
M (SD)
aReading
M (SD)
r(x,y)
Cut
AUC
Sens.
Spec.
Some Risk (< 40th percentile)
KG
577
34.45 (12.86)
430.95 (27.353)
.70**
27.5
.84
.77
.78
1
589
30.44 (9.99)
466.74 (27.05)
.73**
24.5
.85
.85
.73
Some Risk (20th to 40th percentile)
KG
577
34.45 (12.86)
430.95 (27.353)
.70**
28.5
.79
.72
.70
1
590
30.44 (9.99)
466.74 (27.05)
.73**
24.5
.73
.75
.66
High Risk (< 20th percentile)
KG
577
34.45 (12.86)
430.95 (27.353)
.70**
25.5
.82
.79
.76
1
590
30.44 (9.99)
466.74 (27.05)
.73**
23.5
.89
.86
.77
Table 78. Diagnostic Accuracy of Fall earlyReading Composite with Spring aReading: MN LEA 3
(Fall to Spring Prediction)
Grade
N
Composite
M (SD)
aReading
M (SD)
r(x,y)
Cut
AUC
Sens.
Spec.
Some Risk (< 40th percentile)
KG
577
34.45 (12.86)
415.34 (27.16)
.64**
37.50
.73
.68
.70
High Risk (< 20th percentile)
KG
577
34.45 (12.86)
415.34 (27.16)
.64**
34.50
.76
.71
.70
Section 6. FAST as Evidence-Based Practice
Page | 108
www.fastbridge.org
© 2015 Theodore J. Christ and Colleagues, LLC. All rights reserved.
Table 79. Diagnostic Accuracy of Winter earlyReading Composite with Spring aReading:
MN LEA 3 (Winter to Spring Prediction)
Grade
N
Composite
M (SD)
aReading
M (SD)
r(x,y)
Cut
AUC
Sens.
Spec.
Some Risk (< 40th percentile)
KG
479
42.92 (15.6)
415.34 (27.16)
.74**
49.50
.84
.76
.76
High Risk (< 20th percentile)
KG
479
42.92 (15.6)
415.34 (27.16)
.74**
43.50
.84
.73
.77
Table 80. Diagnostic Accuracy of Fall earlyReading Composite (2014–15 Weights) with Spring
aReading: MN LEA 3 (Fall to Spring Prediction)
Grade
N
Composite
M (SD)
aReading
M (SD)
r(x,y)
Cut
AUC
Sens.
Spec.
Some Risk (<40th percentile)
KG
514
35.03 (6.28)
415.64 (27.24)
.69**
35.5
.75
.69
.70
1
170
40.23 (10.78)
459.89 (26.03)
.81**
34.5
.65
.63
.60
High Risk (<20th percentile)
KG
514
35.03 (6.28)
415.64 (27.24)
.69**
34.5
.78
.74
.70
1
170
40.23 (10.78)
459.89 (26.03)
.81**
34.5
.70
.69
.60
Table 81. Diagnostic Accuracy of Winter earlyReading Composite (2014-15 Weights) with Spring
aReading: MN LEA 3 (Winter to Spring Prediction)
Grade
N
Composite
M (SD)
aReading
M (SD)
r(x,y)
Cut
AUC
Sens.
Spec.
Some Risk (<40th percentile)
KG
522
48.02 (9.91)
415.34 (27.18)
.75
51.5
.85
.79
.75
1
171
49.77 (13.87)
459.25 (27.28)
.77
--
.65
--
--
High Risk (<20th percentile)
KG
522
48.02 (9.91)
415.34 (27.18)
.75
48.5
.86
.79
.77
1
171
49.77 (13.87)
459.25 (27.28)
.77
43.5
.71
.71
.62
CBMreading
CBMreading diagnostic accuracy information is provided for first through Sixth Grades, using the
TOSREC, and MAP as the criterion measures. Measures of diagnostic accuracy were used to determine
decision thresholds using criteria related to sensitivity, specificity, and area under the curve (AUC).
Specifically, specificity and sensitivity were computed at different cut scores in relation to maximum
AUC values. Decisions for final benchmark percentiles were generated based on maximizing each
criterion at each cut score (i.e., when the cut score maximized specificity ≥ .70, and sensitivity was also
≥ .70; see Silberglitt & Hintze, 2005). In the scenario for which a value of .70 could not be achieved for
either specificity or sensitivity, precedence was given to maximizing specificity.

Section 6. FAST as Evidence-Based Practice
Page | 109
www.fastbridge.org
© 2015 Theodore J. Christ and Colleagues, LLC. All rights reserved.
CBMreading diagnostic accuracy was determined based on a sample of 1,153 students in the state of
Minnesota, spanning across three regions. Data was collected during the 2012–13 school year. The
sample consisted of approximately 45% males and 55% females. Approximately 20% of the students
involved were eligible for free and reduced lunch. The majority of students were White (52%). The
remainder of the sample consisted of approximately 30% Hispanic, 12% Black, 4% Asian or Pacific
Islander, and 1% American Indian or Alaska Native. Approximately 15% of students were receiving
special education services. All participants were proficient in English. See Table 82 on the following
page for diagnostic accuracy results.
Table 82. Diagnostic Accuracy by Grade Level for CBMreading Passages
Grade Level
N
Cuta
AUC
Sens.
Spec.
Classif.
Lag Time
Criterion Measure
20th Percentile
1
171
16.5
0.81
0.75
0.63
0.71
2 to 4
TOSREC
2
206
42.5
0.93
0.88
0.87
0.88
2 to 4
3
188
75.5
0.89
0.84
0.83
0.84
2 to 4
4
181
108.5
0.87
0.78
0.82
0.79
2 to 4
5
202
107.5
0.90
0.84
0.79
0.83
2 to 4
6
205
118.5
0.90
0.92
0.72
0.88
2 to 4
1
171
17
0.77
0.63
0.82
0.74
4 months
MAP
2
206
57
0.82
0.63
0.85
0.76
4 mo.
3
188
88
0.8
0.77
0.75
0.76
4 mo.
4
181
113
0.88
0.82
0.81
0.81
4 mo.
5
202
101
0.89
0.7
0.91
0.86
4 mo.
6
205
126
0.89
0.83
0.82
0.82
4 mo.
1
171
21
0.79
0.78
0.7
0.73
8 mo.
2
206
63
0.82
0.83
0.68
0.72
8 mo.
3
188
67
0.77
0.51
0.88
0.75
8 mo.
4
181
104
0.89
0.8
0.86
0.84
8 mo.
5
202
97
0.89
0.74
0.92
0.88
8 mo.
6
205
126
0.89
0.85
0.82
0.83
8 mo.
1
171
16
0.8
0.66
0.81
0.76
~1 year
2
206
82
0.9
0.87
0.84
0.86
~1 year
3
188
88
0.89
0.82
0.81
0.82
~1 year
4
181
114
0.87
0.83
0.76
0.78
~1 year
5
202
108
0.89
0.8
0.85
0.84
~1 year
6
205
126
0.85
0.77
0.79
0.79
~1 year
30th Percentile
1
171
16.5
0.81
0.75
0.63
0.71
2 to 4
TOSREC
2
206
44.5
0.94
0.91
0.83
0.89
2 to 4
3
188
79.5
0.88
0.83
0.83
0.83
2 to 4
4
181
117.5
0.83
0.73
0.79
0.75
2 to 4
5
202
115.5
0.87
0.79
0.77
0.79
2 to 4
6
205
135.5
0.88
0.76
0.82
0.78
2 to 4
1
171
31
0.78
0.84
0.57
0.74
4 mo.
MAP
2
206
82
0.83
0.81
0.73
0.78
4 mo.
3
188
85
0.77
0.57
0.86
0.66
4 mo.
4
181
128
0.82
0.84
0.59
0.74
4 mo.
5
202
125
0.82
0.65
0.75
0.69
4 mo.
6
205
144
0.82
0.76
0.75
0.75
4 mo.
1
171
24
0.78
0.74
0.7
0.73
8 mo.
2
206
82
0.78
0.77
0.54
0.67
8 mo.
3
188
98
0.8
0.82
0.65
0.76
8 mo.
4
181
125
0.84
0.66
0.85
0.75
8 mo.
5
202
128
0.86
0.8
0.73
0.76
8 mo.
6
205
144
0.79
0.74
0.7
0.71
8 mo.
1
171
22
0.83
0.76
0.77
0.76
~1 year

Section 6. FAST as Evidence-Based Practice
Page | 110
www.fastbridge.org
© 2015 Theodore J. Christ and Colleagues, LLC. All rights reserved.
2
206
82
0.91
0.72
0.89
0.76
~1 year
3
188
104
0.85
0.63
0.92
0.71
~1 year
4
181
122
0.85
0.7
0.86
0.78
~1 year
5
202
135
0.82
0.77
0.68
0.73
~1 year
6
205
144
0.8
0.76
0.75
0.75
~1 year
Note.aCut score was selected by optimizing sensitivity and then balancing it with specificity using methods
presented by Silberglitt and Hintze (2005)
Further diagnostic accuracy analyses were conducted using the Minnesota Comprehensive
Assessment III. Students were administered the Minnesota Comprehensive Assessment III (MCA-III) in
Reading in grades 3, 4, and 5. The MCAs are state tests that help school districts measure student
progress toward Minnesota’s academic standards and meet the requirements of the Elementary and
Secondary Education Act (ESEA). Additionally, students completed three FastBridge Learning
CBMreading probes during the spring. The median score was computed. Only those students
providing complete data were utilized in the diagnostic accuracy analyses. More specifically, students
with incomplete data regarding CBM-R Words Read Correctly (WRC) per minute, or those students
with incomplete MCA-III Achievement Level Scores were excluded from analyses. ROC Analysis was
used to determine diagnostic accuracy of FastBridge Learning CBMreading probes with Spring MCA-III
scale scores serving as the criterion measure. Students were disaggregated by grade level. Diagnostic
accuracy was computed for students identified as being at “High Risk” and those identified as
“Somewhat at Risk” for reading difficulties using MCA-III Achievement Level Criteria (See Table 83).
Data collection is ongoing.
Table 83. Diagnostic Accuracy for CBMreading and MCA III
Grade
N
CBM-R
M (SD)
MCA-III
M (SD)
r(x,y)
Cuta
AUC
Sensitivity
Specificity
High Risk (Does Not Meet Standards)
K
--
--
NA
--
--
--
--
--
1
--
--
NA
--
--
--
--
--
2
--
--
NA
--
--
--
--
--
3
852
139 (40)
348 (20)
.76
131.5
.88
.80
.79
4
818
165 (39)
447 (15)
.71
153.5
.87
.80
.78
5
771
165 (40)
552 (16)
.70
151.5
.89
.80
.79
6 to 12
--
--
Pending
--
--
--
--
Somewhat High Risk (Does Not Meet or Partially Meets Standards)
K
--
--
NA
--
--
--
--
--
1
--
--
NA
--
--
--
--
--
2
--
--
NA
--
--
--
--
--
3
852
139 (40)
348 (20)
.76
141.5
.86
.78
.76
4
818
165 (39)
447 (15)
.71
164.5
.83
.75
.71
5
771
165 (40)
552 (16)
.70
163.5
.84
.77
.76
6 to 12
--
--
Pending
--
--
--
--
Note. M = Mean. SD = Standard Deviation. aCut score was selected to balance sensitivity and specificity using
methods modified from Silberglitt and Hintze (2005)

Section 6. FAST as Evidence-Based Practice
Page | 111
www.fastbridge.org
© 2015 Theodore J. Christ and Colleagues, LLC. All rights reserved.
Additional diagnostic accuracy analyses for various grade levels across multiple states is summarized
in the tables on the following page.
Table 84. Diagnostic Accuracy on Fall CBMreading with Spring CRCT in Reading: GA LEA 1 (Fall
to Spring Prediction)
Grade
N
CBMreading
M (SD)
CRCT
M (SD)
r(x,y)
Cut
AUC
Sens.
Spec.
Some Risk (Meets Standards)
3
329
115.96 (42)
848.65 (28)
.66*
116.50
.79
.72
.71
4
320
137.64 (41)
848.18 (27)
.65*
130.50
.81
.72
.73
5
353
149.27 (40)
841.22 (25)
.57*
150.50
.71
.66
.66
High Risk (Does Not Meet Standards)
3
329
115.96 (42)
848.65 (28)
.66*
80.50
.89
.82
.83
4
320
137.64 (41)
848.18 (27)
.65*
100.50
.85
.83
.85
5
353
149.27 (40)
841.22 (25)
.57*
128.50
.82
.79
.71
Table 85. Diagnostic Accuracy on Winter CBMreading on Spring CRCT in Reading: GA LEA 1
(Winter to Spring Prediction)
Grade
N
CBMreading
M (SD)
CRCT
M (SD)
r(x,y)
Cut
AUC
Sens.
Spec.
Some Risk (Meets Standards)
3
327
117.22 (43)
848.64 (28)
.64*
119.50
.76
.69
.69
4
318
136.52 (41)
848.33 (27)
.61*
133.50
.78
.70
.71
5
350
149.75 (40)
841.14 (25)
.57*
152.50
.71
.65
.66
High Risk (Does Not Meet Standards)
3
327
117.22 (43)
848.64 (28)
.64*
72.00
.92
.83
.87
4
318
136.52 (41)
848.33 (27)
.61*
101.00
.90
.83
.84
5
350
149.75 (40)
841.14 (25)
.57*
133.50
.80
.64
.68

Section 6. FAST as Evidence-Based Practice
Page | 112
www.fastbridge.org
© 2015 Theodore J. Christ and Colleagues, LLC. All rights reserved.
Table 86. Diagnostic Accuracy of Fall CBMreading with Spring MCA-III in Reading: MN LEA 3 (Fall
to Spring Prediction)
Grade
N
CBMreading
M (SD)
MCA-III
M (SD)
r(x,y)
Cut
AUC
Sens.
Spec.
Some Risk (Does Not Meet or Partially Meets Standards)
3
488
98.94 (42.72)
353.22 (22)
.71
89.5
.85
.74
.75
4
486
126.67 (46.38)
451.25 (22)
.70
126.5
.87
.79
.78
5
492
139.96 (40.73)
554.19 (16)
.73
131.5
.87
.78
.77
6
463
145.71 (39.80)
654.68 (19)
.68
143.5
.83
.76
.74
Some Risk (Partially Meets Standards)
3
488
98.94 (42.72)
353.22 (22)
.71
--
.57
--
--
4
486
126.67 (46.38)
451.25 (22)
.70
127.5
.64
.70
.59
5
492
139.96 (40.73)
554.19 (16)
.73
137.5
.68
.72
.58
6
463
145.71 (39.80)
654.68 (19)
.68
151.5
.62
.70
.53
High Risk (Does Not Meet Standards)
3
488
98.94 (42.72)
353.22 (22)
.71
77.5
.89
.78
.81
4
486
126.67 (46.38)
451.25 (22)
.70
109.5
.88
.80
.79
5
492
139.96 (40.73)
554.19 (16)
.73
116.5
.91
.82
.81
6
463
145.71 (39.80)
654.68 (19)
.68
132.5
.88
.77
.78
Table 87. Diagnostic Accuracy for Fall CBMreading with Spring Minnesota Comprehensive
Assessment III (MCA-III) in Reading: MN LEA 2 (Fall to Spring Prediction)
Grade
N
CBMreading
M (SD)
MCA
M (SD)
r(x,y)
Cut
AUC
Sens.
Spec.
Some Risk (Does Not Meet or Partially Meets Standards)
3
249
107.97 (42)
351.53 (28)
.71**
106
.82
.77
.77
4
236
134.75 (40)
452.51 (16)
.70**
131.5
.85
.76
.77
5
229
154.78 (36)
559.07 (15)
.65**
146.5
.85
.74
.73
Some Risk (Partially Meets Standards)
3
249
107.97 (42)
351.53 (28)
.71**
107.5
.62
.68
.58
4
236
134.75 (40)
452.51 (16)
.70**
132.5
.65
.69
.61
5
229
154.78 (36)
559.07 (15)
.65**
150.5
.71
.70
.62
High Risk (Does not meet Standards)
3
249
107.97 (42)
351.53 (28)
.71**
97.5
.82
.77
.76
4
236
134.75 (40)
452.51 (16)
.70**
117.5
.89
.81
.80
5
229
154.78 (36)
559.07 (15)
.65**
129.5
.91
.88
.85
Section 6. FAST as Evidence-Based Practice
Page | 113
www.fastbridge.org
© 2015 Theodore J. Christ and Colleagues, LLC. All rights reserved.
Table 88. Diagnostic Accuracy for Winter CBMreading with Spring Minnesota Comprehensive
Assessment III (MCA-III) in Reading: MN LEA 2 (Winter to Spring Prediction)
Grade
N
CBMreading
M (SD)
MCA
M (SD)
r(x,y)
Cut
AUC
Sens.
Spec.
Some Risk (Does Not Meet or Partially Meets Standards)
3
250
125.46 (41)
352.28 (26)
.73**
125.5
.83
.75
.76
4
240
149.38 (40)
451.76 (16)
.69**
148.5
.83
.76
.76
5
229
164.52 (34)
558.99 (15)
.65**
153.5
.87
.79
.77
Some Risk (Partially Meets Standards)
3
250
125.46 (41)
352.28 (26)
.73**
--
.59
--
--
4
240
149.38 (40)
451.76 (16)
.69**
--
.60
--
--
5
229
164.52 (34)
558.99 (15)
.65**
152.5
.74
.70
.69
High Risk (Does Not Meet Standards)
3
250
125.46 (41)
352.28 (26)
.73**
113.5
.85
.78
.79
4
240
149.38 (40)
451.76 (16)
.69**
135.5
.89
.80
.80
5
229
164.52 (34)
558.99 (15)
.65**
138.5
.91
.88
.85
Table 89. Diagnostic Accuracy for Winter CBMreading with MCA-III in Reading: MN LEA 3 (Winter
to Spring Prediction)
Grade
N
CBMreading
M (SD)
MCA-III
M (SD)
r(x,y)
Cut
AUC
Sens.
Spec.
Some Risk (Does Not Meet or Partially Meets Standards)
3
496
123.11 (44)
353.06 (22)
.73
117.5
.86
.77
.79
4
497
145.20 (48)
450.97 (22)
.69
144.5
.87
.78
.76
5
497
159.21 (42)
554.22 (15)
.72
150.5
.86
.77
.79
6
466
162.05 (41)
654.55 (19)
.67
162.5
.81
.73
.73
Some Risk (Partially Meets Standards)
3
496
123.11 (44)
353.06 (22)
.73
--
.56
--
--
4
497
145.20 (48)
450.97 (22)
.69
147.5
.63
.69
.56
5
497
159.21 (42)
554.22 (15)
.72
156.5
.65
.67
.54
6
466
162.05 (41)
654.55 (19)
.67
167.5
.58
.68
.50
High Risk (Does Not Meet Standards)
3
496
123.11 (44)
353.06 (22)
.73
105.5
.90
.81
.82
4
497
145.20 (48)
450.97 (22)
.69
129.0
.88
.80
.79
5
497
159.21 (42)
554.22 (15)
.72
134.5
.93
.85
.85
6
466
162.05 (41)
654.55 (19)
.67
148.5
.88
.81
.83
Section 6. FAST as Evidence-Based Practice
Page | 114
www.fastbridge.org
© 2015 Theodore J. Christ and Colleagues, LLC. All rights reserved.
Table 90. Diagnostic Accuracy of Winter CBMreading with Spring Massachusetts Comprehensive
Assessment (MCA): MA LEA 1 (Winter to Spring Prediction)
Grade
N
CBMreading
M (SD)
MCA
M (SD)
r(x,y)
Cut
AUC
Sens.
Spec.
Some Risk (“Warning” and “Needs Improvement”)
3
92
123.82 (38)
241.89 (14)
.71**
114
.82
.76
.75
4
93
134.33 (41)
238.40 (15)
.68**
132.5
.81
.73
.73
5
75
153.03 (26)
243.63 (13)
.66**
155.5
.90
.76
.74
Some Risk (“Needs Improvement”)
3
92
123.82 (38)
241.89 (14)
.71**
116.5
.68
.72
.64
4
93
134.33 (41)
238.40 (15)
.68**
134
.69
.72
.60
5
75
153.03 (26)
243.63 (13)
.66**
154.5
.88
.75
.77
High Risk (“Warning”)
3
92
123.82 (38)
241.89 (14)
.71**
90.5
.97
.88
.89
4
93
134.33 (41)
238.40 (15)
.68**
109.5
.89
.78
.79
5
75
153.03 (26)
243.63 (13)
.66**
130.5
.82
1.00
.80
aReading
aReading diagnostic accuracy was derived from a sample of 777 students in first through Fifth Grades
from two suburban schools in the Midwest. In the sample, 116 students were in First Grade, 188 in
second, 159 in third, 156 in fourth, and 158 in Fifth Grade. Gender of the sample was approximately
49% female and 51% male. Approximately 67% of students in the sample were White, 5% Black, 19%
Asian/Pacific Islander, 5% Hispanic, 2% American Indian, and 2% unspecified. In addition, 10% of
students were receiving special education services, and 10% of students were classified as having
limited English language proficiency. Socioeconomic status information was not available for the
sample, but the schools the students were drawn from had rates of free and reduced lunch of 13% and
23% in 2009–10. Cut scores for aReading to predict students “At Risk” and “Somewhat At Risk” for
reading difficulties were developed for the Gates-MacGinitie Reading Tests–Fourth Edition (GMRT-4th;
MacGinitie, MacGinitie, Maria, & Dreyer, 2000) and the Measures of Academic Progress (MAP).
Categories for the former were defined as students scoring below the 40th and 20th percentiles of the
local sample and cut scores for each category developed by an adjacent school district for MAP were
used on this sample. An additional analysis regarding diagnostic accuracy of aReading using The
Minnesota Comprehensive Assessments (MCAs) as the criterion measure is briefly discussed. At the
beginning of the school year (October, 2010) students completed an aReading assessment. The
measure was group administered via a mobile computer lab. Scaled scores were calculated for each
student. In February 2011, the same students completed the GMRT-4th. Composite scores were
available for all grades except Second Grade. Due to time constraints, one subtest could not be
administered to Second Grade students (the only grade that requires three subtests to yield a
composite score). As a result, comprehension subtest scores were used for analysis. The GMRT-4th was
group administered by a team of graduate students. Administrators completed advanced coursework
in psychological assessment and completed an in-service training to administer the test. Test booklets
Section 6. FAST as Evidence-Based Practice
Page | 115
www.fastbridge.org
© 2015 Theodore J. Christ and Colleagues, LLC. All rights reserved.
were hand scored and inter-rater reliability was 100% across all subtest and composite scores. MAP
scores for spring testing were provided to the aReading team from school administrators.
Table 91 below presents the ROC curve analysis results for each grade for students at high risk and
somewhat at risk using the Youden Index with the GMRT-4th. In addition, sensitivity, specificity, PPP
and NPP are displayed for the each grade for each cut score. ROC curves across grades and risk levels
were far from the diagonal line indicating that aReading predicts reading difficulties with much more
accuracy than chance. Evaluation of the table below indicated that across grades, AUC statistics were
extremely high, especially for students at high risk (Mdn = .92) and values were still high for students
somewhat at risk (Mdn = .87). In addition, Sensitivity was higher for each grade when determining
students at high risk compared to somewhat risk. Positive Predictive Power was higher across grades
when predicting students at somewhat risk (Mdn = .72 versus .56) while the opposite was true for
Negative Predictive Power (Mdn = .82 versus .96) respectively.
Table 91. Diagnostic Accuracy statistics for aReading and GMRT-4th
Grade
N
aReading Cut Score
Sensitivity
Specificity
PPP
NPP
AUC
High Risk – Below 20th Percentilea
1
116
430
.88
.87
.66
.96
.94
2
188
461
.70
.93
.74
.92
.88
3
159
490
.97
.77
.50
.99
.92
4
156
495
.85
.92
.72
.96
.94
5
159
506
.85
.84
.59
.95
.87
Somewhat at Risk – Below 40th Percentile
1
116
436
.76
.86
.81
.82
.91
2
188
477
.86
.71
.71
.86
.87
3
159
490
.82
.87
.78
.90
.89
4
156
506
.72
.82
.73
.81
.82
5
159
522
.83
.76
.71
.86
.85
Note.aThe 20th percentile was used for this sample, which should approximate the 15th percentile.
A similar pattern of results emerged when predicting performance on the MAP (See Table 92).
Compared to the GMRT-4th as a criterion, NPP was much higher when predicting MAP scores. This
could be attributed to the fact that the base rate of students at risk was much lower for MAP scores.
Data collection for Kindergarten and for grades 6–12 are ongoing, and results are pending.
Section 6. FAST as Evidence-Based Practice
Page | 116
www.fastbridge.org
© 2015 Theodore J. Christ and Colleagues, LLC. All rights reserved.
Table 92. Diagnostic Accuracy Statistics for aReading and MAP
Grade
N
aReading Cut Score
Sensitivity
Specificity
PPP
NPP
AUC
High Risk - 20th Percentilea
2
188
497
1
.73
.14
1
.89
3
159
517
.95
.76
.21
1
.95
4
156
537
.96
.78
.30
1
.94
5
159
537
1
.82
.20
1
.93
Somewhat at Risk - 40th Percentile
2
188
490
.77
.84
.41
.96
.89
3
159
527
.89
.77
.46
.97
.89
4
156
537
.82
.87
.65
.94
.92
5
159
547
.93
.77
.39
.99
.88
Note.aThe 20th percentile was used for this sample, which should approximate the 15th percentile.
Finally, diagnostic accuracy analyses were conducted with aReading and the Minnesota
Comprehensive Assessment (MCA) to determine if aReading predicted state reading assessments. The
MCA is a state test that helps school districts measure student progress toward academic standards
and meets the requirements of the Elementary and Secondary Education Act (ESEA).
The sample consisted of 1,786 students in third, fourth, and Fifth Grades from eight schools in the
upper Midwest (MCAs are not administered to students in grades K–1). In the sample, 631 students
were in third, 618 students were in fourth, and 537 students were in Fifth Grade. Gender of the sample
was approximately 50% female and 50% male. Ethnic breakdown was approximately 45% White, 23%
Black, 8% Asian/Pacific Islander, 15% Hispanic, 0.8% American Indian or Alaska Native, and 9%
multiracial. (These percentages were rounded and may not add to 100). In addition, 12% of students
were receiving special education services. Socioeconomic status information was not available for the
sample, but the schools the students were drawn from had rates of free and reduced lunch ranging
from 16% to 83% in 2013.
Students completed the Adaptive Reading (aReading) assessment and MCAs during the spring of
2013. Students with incomplete data in aReading, or those students with incomplete MCA
Achievement Level Scores were excluded from analyses.
ROC Analysis was used to determine diagnostic accuracy of FAST™ aReading with Spring MCA scale
scores serving as the criterion measure. Students were disaggregated by grade level. Diagnostic
accuracy was computed for students at “High Risk” and “Somewhat At Risk” on MCA Scale Scores.
“High Risk” includes those students that did not meet standards. “Somewhat At Risk” includes those
students who did not meet or only partially met standards. Diagnostic accuracy statistics are provided
in Table 93. Data collection is ongoing for all grade levels.
Table 93. Diagnostic Accuracy for aReading and MCA-III
Grade
Level
N
aReading
M (SD)
MCA-III
M (SD)
r(x,y)
Cuta
AUC
Sens.
Spec.
High Risk (Does Not Meet Standards)

Section 6. FAST as Evidence-Based Practice
Page | 117
www.fastbridge.org
© 2015 Theodore J. Christ and Colleagues, LLC. All rights reserved.
3
629
534 (27)
347 (21)
.82
524.5
.90
.82
.81
4
615
549 (28)
447 (16)
.81
536.5
.92
.84
.84
5
516
564 (32)
553 (16)
.84
544.5
.96
.89
.86
Somewhat High Risk (Does Not Meet or Partially Meets Standards)
3
629
534 (27)
347 (21)
.82
532.5
.90
.83
.82
4
615
549 (28)
447 (16)
.81
550.5
.89
.82
.82
5
516
564 (32)
553 (16)
.84
556.5
.93
.84
.84
More recently, the following diagnostic accuracy statistics were derived from samples of students
across various states, using various criterion measures.
Table 94. Diagnostic Accuracy of Spring aReading with Spring MAP in Reading: WI LEA 1 (Spring
Data Collection)
Grade
N
aReading
M (SD)
MAP
M (SD)
r(x,y)
Cut
AUC
Sens.
Spec.
Some Risk (≤ 40th percentile)
2
33
477.61 (22.09)
181.61 (19.34)
.90**
474.5
.96
.91
.86
3
26
496.19 (26.13)
195.65 (17.25)
.95**
499.00
1.00
1.00
.89
4
31
509.35 (13.51)
208.23 (13.25)
.83**
504.00
.94
.86
.87
5
28
514.29 (13.49)
211.11 (12.90)
.79**
514.5
.90
.89
.79
6
25
521.48 (19.44)
215.08 (11.56)
.85**
520.5
.92
.86
.83
Some Risk (20th to 40th percentile)
2
33
477.61 (22.09)
181.61 (19.34)
.90**
473
.79
1.00
.70
3
26
496.19 (26.13)
195.65 (17.25)
.95**
499
.86
1.00
.73
4
31
509.35 (13.51)
208.23 (13.25)
.83**
504
.79
.75
.78
5
28
514.29 (13.49)
211.11 (12.90)
.79**
514.5
.72
.80
.65
6
25
521.48 (19.44)
215.08 (11.56)
.85**
520.5
.74
.75
.71
High Risk (≤ 20th percentile)
2
33
477.61 (22.09)
181.61 (19.34)
.90**
466.00
.97
.86
.85
3
26
496.19 (26.13)
195.65 (17.25)
.95**
475.00
1.00
1.00
.92
4
31
509.35 (13.51)
208.23 (13.25)
.83**
501.00
1.00
1.00
.89
5
28
514.29 (13.49)
211.11 (12.90)
.79**
503.5
.95
.75
.87
6
25
521.48 (19.44)
215.08 (11.56)
.85**
514.5
1.00
1.00
.86

Section 6. FAST as Evidence-Based Practice
Page | 118
www.fastbridge.org
© 2015 Theodore J. Christ and Colleagues, LLC. All rights reserved.
Table 95. Diagnostic Accuracy of Fall aReading with Spring MCA-III in Reading: MN LEA 3 (Fall to
Spring Prediction)
Grade
N
aReading
M (SD)
MCA-III
M (SD)
r(x,y)
Cut
AUC
Sens.
Spec.
Some Risk (Does not Meet or Partially Meets Standards)
3
482
484.45 (19.73)
353.43 (21.78)
.77
478.5
.89
.82
.82
4
485
496.62 (22.72)
452.05 (17.67)
.77
499.5
.89
.80
.82
5
495
504.87 (19.72)
554.17 (15.46)
.80
503.5
.91
.82
.81
6
459
511.37 (22.43)
654.81 (18.75)
.73
508.5
.85
.75
.76
Some Risk (Partially Meets Standards)
3
482
484.45 (19.73)
353.43 (21.78)
.77
474.5
.89
.86
.71
4
485
496.62 (22.72)
452.05 (17.67)
.77
487.5
.94
1.00
.71
5
495
504.87 (19.72)
554.17 (15.46)
.80
499.5
.93
.94
.71
6
459
511.37 (22.43)
654.81 (18.75)
.73
504.5
.96
1.00
.70
High Risk (Does Not Meet Standards)
3
482
484.45 (19.73)
353.43 (21.78)
.77
475.5
.90
.79
.83
4
485
496.62 (22.72)
452.05 (17.67)
.77
490.5
.92
.82
.82
5
495
504.87 (19.72)
554.17 (15.46)
.80
497.5
.93
.84
.85
6
459
511.37 (22.43)
654.81 (18.75)
.73
504.5
.89
.83
.81
Table 96. Diagnostic Accuracy of Winter aReading with Spring MCA-III in Reading: MN LEA 3
(Winter to Spring Prediction)
Grade
N
aReading
M (SD)
MCA-III
M (SD)
r(x,y)
Cut
AUC
Sens.
Spec.
Some Risk (Does Not Meet or Partially Meets Standards)
5
134
519.97 (15.30)
560.84 (13.80)
.77
514.5
.89
.83
.84
6
160
524.56 (18.42)
661.15 (16.55)
.70
520.5
.80
.70
.74
Some Risk (Partially Meets Standards)
5
134
519.97 (15.30)
560.84 (13.80)
.77
514.5
.79
.71
.77
6
160
524.56 (18.42)
661.15 (16.55)
.70
522.5
.68
.74
.67
High Risk (Does Not Meet Standards)
5
134
519.97 (15.30)
560.84 (13.80)
.77
510.5
.93
.80
.82
6
160
524.56 (18.42)
661.15 (16.55)
.70
514.5
.92
.83
.84
aReading evidence of diagnostic accuracy is not limited to the Midwest. The following diagnostic
accuracy information was obtained from samples of students in other regions of the US.

Section 6. FAST as Evidence-Based Practice
Page | 119
www.fastbridge.org
© 2015 Theodore J. Christ and Colleagues, LLC. All rights reserved.
Table 97. Diagnostic Accuracy Fall aReading with Spring Massachusetts Comprehensive
Assessment (MCA): Cambridge, MA (Fall to Spring Prediction)
Grade
N
aReading
M (SD)
MCA
M (SD)
r(x,y)
Cut
AUC
Sens.
Spec.
Some Risk (“Warning” and “Needs Improvement”)
3
93
485.91 (17.59)
241.89 (14.08)
.63**
478.5
.79
.73
.73
4
93
492.68 (18.52)
238.40 (15.14)
.69**
492.5
.85
.75
.78
5
72
506.93 (18.58)
243.63 (13.20)
.69**
507.5
.90
.85
.79
Some Risk (“Needs Improvement”)
3
93
485.91 (17.59)
241.89 (14.08)
.63**
480.5
.71
.72
.63
4
93
492.68 (18.52)
238.40 (15.14)
.69**
494.5
.72
.71
.60
5
72
506.93 (18.58)
243.63 (13.20)
.69**
506.5
.88
.78
.87
High Risk (“Warning”)
3
93
485.91 (17.59)
241.89 (14.08)
.63**
475.5
.80
.75
.72
4
93
492.68 (18.52)
238.40 (15.14)
.69**
476.5
.92
.89
.84
5
72
506.93 (18.58)
243.63 (13.20)
.69**
495.5
.85
1.00
.79
Table 98. Diagnostic Accuracy of Winter aReading with Spring Massachusetts Comprehensive
Assessment (MCA): MA LEA 1 (Winter to Spring Prediction)
Grade
N
aReading
M (SD)
MCA
M (SD)
r(x,y)
Cut
AUC
Sens.
Spec.
Some Risk (“Warning” and “Needs Improvement”)
3
91
498.99 (18.66)
241.89 (14.08)
.76**
499.5
.85
.76
.74
4
94
504.33 (16.37)
238.40 (16.37)
.69**
505.5
.85
.76
.78
5
74
515.31 (14.42)
243.63 (14.42)
.61**
516.5
.83
.82
.78
Some Risk (“Needs Improvement”)
3
91
498.99 (18.66)
241.89 (14.08)
.76**
501.5
.71
.72
.64
4
94
504.33 (16.37)
238.40 (16.37)
.69**
506.5
.71
.78
.64
5
74
515.31 (14.42)
243.63 (14.42)
.61**
516.5
.81
.81
.76
High Risk (“Warning”)
3
91
498.99 (18.66)
241.89 (14.08)
.76**
476.5
.97
.88
.95
4
94
504.33 (16.37)
238.40 (16.37)
.69**
485.5
.94
.78
.88
5
74
515.31 (14.42)
243.63 (14.42)
.61**
506.00
.86
1.00
.80

Section 6. FAST as Evidence-Based Practice
Page | 120
www.fastbridge.org
© 2015 Theodore J. Christ and Colleagues, LLC. All rights reserved.
Table 99. Diagnostic Accuracy of Fall aReading with Spring CRCT in Reading: GA LEA 1
(Fall to Spring Prediction)
Grade
N
aReading
M (SD)
CRCT
M (SD)
r(x,y)
Cut
AUC
Sens.
Spec.
Some Risk (Meets Standards)
3
329
483.81 (18)
848.65 (28)
.73*
481.50
.83
.76
.76
4
320
491.37 (16)
848.18 (27)
.64*
490.50
.80
.73
.75
5
353
497.81 (16)
841.22 (25)
.64*
499.50
.75
.70
.68
High Risk (Does Not Meet Standards)
3
329
483.81 (18)
848.65 (28)
.73*
466.50
.94
.82
.86
4
320
491.37 (16)
848.18 (27)
.64*
478.50
.89
.83
.76
5
353
497.81 (16)
841.22 (25)
.64*
485.00
.89
.79
.79
Table 100. Diagnostic Accuracy of Winter aReading with Spring CRCT in Reading: GA LEA 1
(Winter to Spring Prediction)
Grade
N
aReading
M (SD)
CRCT
M (SD)
r(x,y)
Cut
AUC
Sens.
Spec.
Some Risk (Meets Standards)
3
327
495.67 (18)
848.64 (28)
.75*
498.50
.83
.76
.76
4
318
505.31 (16)
848.33 (27)
.71*
505.50
.82
.77
.78
5
351
512.19 (15)
841.14 (25)
.66*
516.50
.78
.71
.72
6
283
518.78 (13)
850.14 (23)
.67*
519.50
.87
.77
.80
High Risk (Does Not Meet Standards)
3
327
495.67 (18)
848.64 (28)
.75*
477.50
.95
.83
.86
4
318
505.31 (16)
848.33 (27)
.71*
487.50
.94
.83
.76
5
347
512.19 (15)
841.14 (25)
.66*
500.50
.92
.86
.85
6
283
518.78 (13)
850.14 (23)
.67*
NA
NA
NA
NA
These findings have also been demonstrated in higher grade levels. The following diagnostic accuracy
information was obtained from a sample of approximately 322 7th grade students (50.0% female) and
311 8th grade students (50.3%) in a Georgia Local Education Agency (LEA). Approximately 74.7% of 7th
grade students were White, 8.6% were Hispanic, 8.3% were African American, 5.6% were Multiracial,
2.5% were Asian, and .3% identified themselves as “Other.” Approximately 81.2% of 8th gradestudents
were White, 7.3% were African American, 5.7% were Hispanic, 4.1% were Multiracial, 1.3% were Asian,
and .3% identified themselves as “Other.” See Table 101 for diagnostic accuracy statistics.
Section 6. FAST as Evidence-Based Practice
Page | 121
www.fastbridge.org
© 2015 Theodore J. Christ and Colleagues, LLC. All rights reserved.
Table 101. Diagnostic Accuracy of Winter aReading with Spring Criterion-Referenced
Competency Tests (CRCT) in Reading: Georgia LEA 1 (Winter to Spring Prediction)
Grade
N
aReading
M (SD)
CRCT
M (SD)
r(x,y)
Cut
AUC
Sens.
Spec.
Some Risk (Meets Standards)
7
322
521.77 (14.86)
842.50 (24.09)
.64**
512.5
.91
.82
.81
8
311
524.69 (21.76)
850.36 (54.42)
.33**
517.5
.95
1.00
.73
High Risk (Does Not Meet Standards)
7
322
521.77 (14.86)
842.50 (24.09)
.64**
509.5
.92
.86
.86
8
311
524.69 (21.76)
850.36 (54.42)
.33**
511.5
.92
.86
.84
Table 102. Diagnostic Accuracy of Fall aReading with Spring Minnesota Comprehensive
Assessment III (MCA-III) in Reading: MN LEA 2 (Fall to Spring Prediction)
Grade
N
aReading
M (SD)
MCA
M (SD)
r(x,y)
Cut
AUC
Sens.
Spec.
Some Risk (Meets Standards)
10
66
527.91 (18.59)
1052.29 (12.99)
.55**
523.5
.82
.77
.75
High Risk (Does Not Meet Standards)
10
66
527.91 (18.59)
1052.29 (12.99)
.55**
521.5
.77
.75
.77
For additional diagnostic accuracy information for FastBridge Learning Reading Assessments, please
see Appendix B: FastBridge Learning Reading Diagnostic Accuracy.
Section 6. FAST™ as Evidence-Based Practice
This section provides a summary of some evidence for FAST™ as an evidence-based intervention. The
use of well-developed training and support with technology to deliver and automate the use of
formative assessments and data improve student outcomes. FAST™ improves teacher knowledge,
skills, and appreciation for data. The use of FAST™ changes teaching.
The graphic below is our theory of change, which relates to our hypothesis for systems change and
improved student outcomes caused by the adoption and use of FAST™.
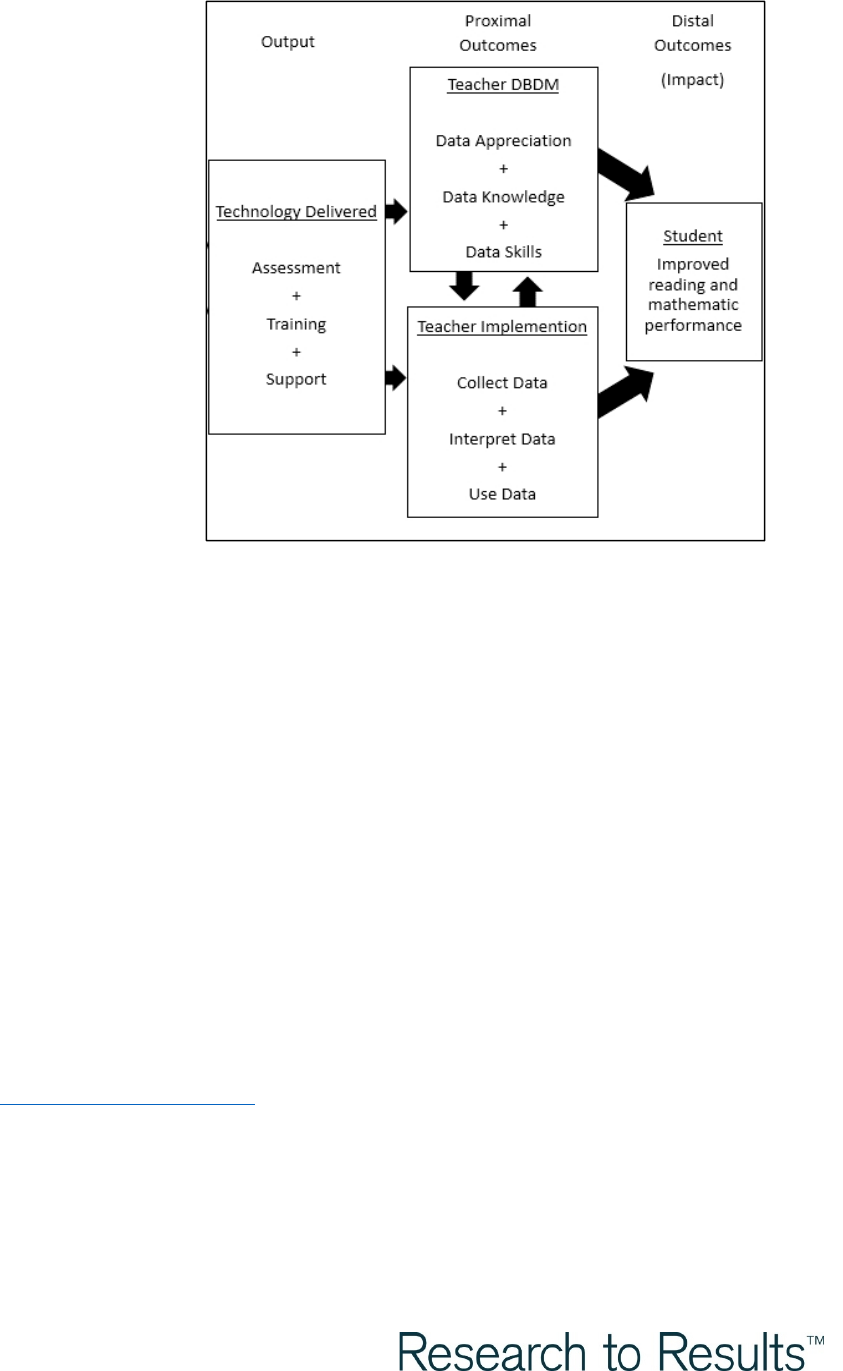
Section 6. FAST as Evidence-Based Practice
Page | 122
www.fastbridge.org
© 2015 Theodore J. Christ and Colleagues, LLC. All rights reserved.
6.1: Theory of Change
FastBridge Learning and our
researchers and developers have a
theory of change (right). Our theory is
that student outcomes improve when
teachers use evidence-based
formative assessments in conjunction
with technology-based training and
supports for data-based decision
making. We provide evidence for this
theory of change below.
FastBridge Learning’s researchers and
developers work continuously to
refine and improve the tools. They
work
with
teachers and educators to
evaluate their needs and satisfaction.
They collect and evaluate student data
to ensure alignment with standards
and improved student outcomes.
6.2: Formative Assessment as Evidence-Based Practice
Effective teachers use formative assessment to guide their practices. This is recommended and
supported in the empirical and professional literature. Teachers and students benefit less from
summative assessments, which occur infrequently, have little instructional relevance, and yield results
that are often delayed for days, weeks, or months (e.g., many state testing programs).
Teachers need an effective formative assessment system. Effective systems provide assessments,
reporting, and guidance for data interpretation and use. Moreover, they support the multi-method
and multi-source approach, which requires multiple types of assessments with varied methods across
the most relevant content areas.
US Department of Education
The US Department of Education’s
Practice Guides
summarize the evidence and recommendations for
effective practice (http://ies.ed.gov/pubsearch). They recommend formative assessment and
evaluation.
Those guides were developed by panels of national experts who “relied on the WWC Evidence
Standards” (Gersten, 2008, p. 2). After a review of the evidence, the expert panel for
Using Student
Achievement Data to Support Instructional Decision Making
recommended that educators: (1) make
data part of an ongoing cycle of instructional improvement, (2) have a clear vision for schoolwide data
Figure 3 Theory of Change

Section 6. FAST as Evidence-Based Practice
Page | 123
www.fastbridge.org
© 2015 Theodore J. Christ and Colleagues, LLC. All rights reserved.
use, (3) foster a data-driven culture, and (4) maintain a districtwide data system (Hamilton et al., 2009,
p. 8). The RTI reading panel found moderate evidence to recommend universal screening and
progress monitoring for students with deficits (Gersten et al., 2008, p. 13). The RTI math panel made
substantially similar recommendations (Gersten et al., 2009, p. 11)
.
All of the expert panels recommend the use of high-quality and highly efficient formative
assessments. They also recommend the use of assessment data to plan instruction, differentiate
instruction, titrate support (tiered services), devise instructional groups, monitor progress, and
evaluate instructional effects. Some recommendations had lower levels of evidentiary support, but
FAST™ is designed to facilitate the implementation of these recommended practices.
Historical Evidence on Formative Assessment
Effective teachers systematically collect and share student assessment data to help them make
instructional decisions that improve student performance (Lipson, Mosenthal, Mekkelsen, & Russ,
2004; Taylor et al., 2000) by 0.4 to 0.7 standard deviations (Black & Wiliam, 1998).
Teachers should be able to use data to inform their practice (Martone & Sireci, 2009). After a thorough
review of the pre-1990 research literature on effective instruction, Hoffman (1991) concluded that
there is persistent and consistent evidence that the use of instructionally relevant assessments
improved instructional effects and student achievement. Those findings converge with those of
contemporary research. For example, Pressley et al. (2001) identified 103 behaviors that distinguished
teachers who were either highly effective or moderately effective. Classroom assessment practices—
as opposed to external assessments—were a major distinguishing factor in instructionally relevant
assessments. That is, the use of formative assessment data to guide instruction contributes to more
effective instruction and higher student achievement (Jenkins, 2001; Taylor, Pearson, Clark, & Walpole,
2000a, 2000b; Taylor, Pearson, Peterson, & Rodriguez, 2003, 2005).
Formative assessments guide both instruction and student learning. They provide feedback that is
linked to explicit performance standards and provide guidance to achieve those standards (Sadler,
1989). Formative assessment helps establish a learning-assessment process, which is encapsulated by
three key questions (Atkin, Black, & Coffey, 2001; Deno, 2002, 2005; Sadler, 1989):
“What is the expected level of performance?”
“What is the present level of performance?” and
“What must be done to reduce that discrepancy?”
FAST™ provides useful data for educators to address each of these questions through screening, skills
analysis, and progress monitoring. It also provides training, supports, analysis, and reporting to
facilitate the use of data by teachers.
Evidence Based: Contemporary Evidence on Formative Assessment
Data-based decision making and formative assessment are evidence-based. Black and Wiliam (1998)
and other common sources of evidence were cited above; however, the most recent and rigorous
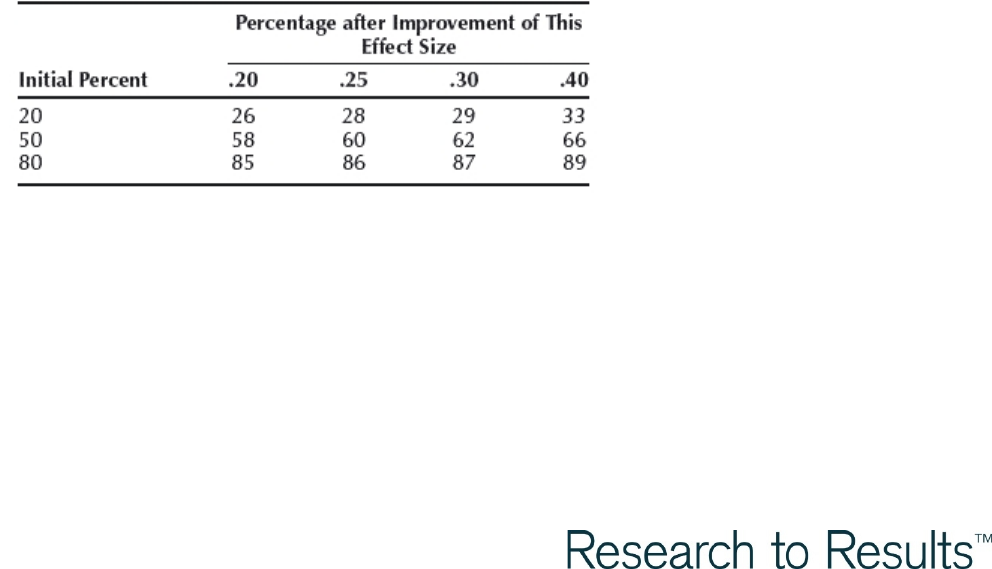
Section 6. FAST as Evidence-Based Practice
Page | 124
www.fastbridge.org
© 2015 Theodore J. Christ and Colleagues, LLC. All rights reserved.
meta-analysis on formative assessment was done by Kingston and Nash (2011). The inclusion criteria
for the meta-analysis were: (a)
formative assessment
was the intervention, (b) K–12 student samples,
(c) control or comparison group, (d) appropriate statistics to estimate effect size, and (e) published
1988 or later. They identified 13 studies with 42 independent effect sizes, which allowed them to
analyze the effects of professional development and computer-based formative assessment—among
other things.
In brief, the weighed mean effect of formative assessment was .20 (
Mdn
= .25). The largest effects
were observed in the content area of English language arts (.32) with less robust effects in
mathematics (.17); however, there were statistically significant (moderating) effects for both
professional development/training (.30) and technology-based formative assessments (.28). Results
improved when teachers received training and technology to support the implementation and use of
formative assessments. Preliminary evidence indicates that FAST™ is likely to confer even more
substantial effects.
Although recent research (Kingston & Nash, 2011) indicates more modest effects for formative
assessment, these are substantial and meaningful differences in student achievement.
As summarized in Table 103, if 80% of students are proficient (i.e., not in need of supplemental,
intensive, or special education services) and formative assessment is implemented as an intervention,
the proficiency rate is likely improve to 87% (assuming a .30 effect size). That is, the percentage of
students with deficits or disabilities who need RTI or special education is reduced from 20% to 13%.
That is a 35% reduction. Larger effects are observed with the implementation of FAST™. This is
described as follows.
Table 103. Estimates of the Increase in the Percentage of Students who are Proficient or above
with the Implementation of Formative Assessment (Kingston & Nash, 2011, p. 35)
Note. “While the weighted mean effect sizes found in this study are smaller than commonly reported in the
literature, they have great practical significance in today’s accountability climate. These improvements can be
restated in terms of the percentage of students achieving summative assessment results at or above the proficient
level. Table 350 shows the improvement that would result from several different effect sizes based on how many
students are currently proficient or above (assuming scores are distributed normally). If currently 20% of students
are proficient or above, then the weighted mean effect size of .20 would lead to an additional 6% of students
achieving proficient status. If currently 50% of students are proficient or above, then the increase would be 8%.
The .30 effect size associated with formative assessment based on professional development would lead to 9% and
12% of all students moving into the proficient category under these two scenarios.” (Kingston & Nash, pp. 34 -35).
Proficient
Section 6. FAST as Evidence-Based Practice
Page | 125
www.fastbridge.org
© 2015 Theodore J. Christ and Colleagues, LLC. All rights reserved.
Formative assessment is an evidence-based practice with the most robust effects when it is delivered
with technology, training, and support. The evidence summarized by Kingston & Nash (2011;
N
= 13
studies, 42 effect sizes) meets the What Works Clearinghouse criteria for “Positive effects: Strong
evidence of positive effect with no overriding contrary evidence” (WWC, 2014, p. 29).
6.3: Evidence-Based: Formative Assessment System for Teachers
FAST™ combines all aspects of those evidence-based practices described above: technology tools for
assessment, training, and support. Two sources of evidence are presented to illustrate that the
implementation and use of FAST™ is an evidence-based practice.
FAST™ Improves Student Achievement
We analyzed grade-level performance of suburban Midwestern local educational agencies (Schools =
8) with aReading data (broad measure of reading achievement). Performance data from the fall of year
1 implementation (i.e., pre-test) were compared to fall of year 2 implementation (e.g., post-test) to
evaluate the effect of FAST™. That is, the difference in performance between second graders in 2013
(control,
M
= 445) and second graders in 2014 (after teachers implemented FAST™ for one year;
M
=
451) might be attributed, in part, to the FAST™ implementation.
There were statistically significant differences with meaningful effect sizes in both general and special
education samples (Table 104, p. 125). This was observed at the district and school levels. Although
not all differences were statistically significant (viz., special education) that is attributed to statistical
power—as effect sizes were still robust. The observed effect sizes converge with the findings of
Kingston and Nash (2011). These are meaningful and important improvements that replicated across
all grades and populations except 6th grade special education.
If combined with the estimates in Table 103, FAST™ is likely to reduce the proportion of students at
risk and increase the proportion who achieve proficiency by 7 to 13%--or more.
Table 104. FAST™ Statistical Significance and Effect Sizes
2013
2014
Grade
Group
M
SD
N
M
SD
N
t
df
p
d
2nd
GenEd
463.3
25.8
578
469.5
27.7
523
3.80
1099
.00*
.23
SpEd
445.6
25.1
51
451.6
33.9
46
.10
95
.32
20
3rd
GenEd
484.5
19.3
507
492.4
24.3
559
5.83
1064
.00*
36
SpEd
470.2
25.7
46
474.6
26.6
57
.86
101
.40
17
4th
GenEd
498.3
22.0
507
504.6
21.7
513
4.61
1018
.00*
29
SpEd
476.7
26.1
62
487.9
28.8
52
2.17
112
.03*
41
5th
GenEd
504.3
19.4
483
514.7
23.2
505
7.54
986
.00*
48
SpEd
490.8
26.1
76
498.5
24.9
64
1.77
136
.08
30
6th
GenEd
508.8
25.1
431
522.3
24.1
475
8.23
904
.00*
.55
Section 6. FAST as Evidence-Based Practice
Page | 126
www.fastbridge.org
© 2015 Theodore J. Christ and Colleagues, LLC. All rights reserved.
2013
2014
Grade
Group
M
SD
N
M
SD
N
t
df
p
d
SpEd
506.3
20.0
71
506.1
29.5
80
-.04
149
.97
.01
Note. Adaptive Reading (aReading) is a computer-adaptive test of broad reading on a score scale range of 350 to
650, which spans K to 12th grade achievement. Aggregate data are presented for 8 schools. Grade level
performance was compared across the first two years of implementatio n.
FAST™ Improves the Practice of Teachers
An independent survey of teachers (
N
=2689 responses) by the Iowa Department of Education
indicates that 86% of educators believe FAST™ “may” or “will definitely” support increased student
achievement (Greg Felderman, Iowa Department of Education, personal communication, January
2015). It also indicated that teachers use data to guide instruction and improve student achievement.
82% of teachers used FAST™ assessment data to form instructional groups (
N
= 401 teachers
responded),
82% adjusted interventions for students with deficits or disabilities (
N
= 369); 66% used data at
least once per month (66%), and
25% used FAST™ data at least weekly (
N
= 376).
These results provide insight as to the effects of FAST™ implementation.
FAST™ Provides High Quality Formative Assessments
As summarized above, the IES practitioner guides recommend the use of high quality assessments.
The FAST™ assessments meet the IES recommendations for quality: reliability, validity, usability,
efficiency, diagnostic accuracy, specificity, sensitivity, efficiency, and instructional relevance.
The FAST™ assessments are evidence-based. Numerous studies were completed with diverse samples
of students across many geographic locations and LEAs (e.g., NY, GA, MN, IA, and WI). Consistent with
the definitions of “evidence-based,” there are many large, multi-site studies with student samples
from the populations and settings of interest (i.e., K–12 students). The samples size for almost all
studies well-exceeded the requirement of 50 students per condition (e.g., assessment, grade, LEA,
instructional condition). On aggregate, more than 15,000 students participated in well-controlled
psychometric research. In addition, norms were developed from samples of approximately 8,000
students per grade (K to 8th) per assessment, which aggregates to 72,000 student participants.
Consistent with the requirements for evidence, the psychometric qualities for reliability and validity
were statistically significant, and the various assessments are meaningful and statistically robust
indicators of relevant outcomes, such as state tests and future performance in school.

References
Page | 127
www.fastbridge.org
© 2015 Theodore J. Christ and Colleagues, LLC. All rights reserved.
References
Adams, M. J. (1990).
Beginning to read.
Cambridge, MA: MIT Press.
AERA, APA, NCME. (1999).
Standards for educational and psychological testing.
Washington DC:
American Educational Research Association.
AIMSWeb Benchmark and Progress Monitoring System for Grades K-8. Pearson Education Inc.
Ardoin, S. P., & Christ, T. J. (2009). Curriculum based measurement of oral reading: Estimates of
standard error when monitoring progress using alternate passage sets,
School Psychology Review
, 38,
266-283.
Ardoin, S. P., Carfolite, J., Christ, T. J., Roof, C. M., & Klubnick, C. (2010). Examining readability estimates’
predictions of students’ oral reading rate: Spache, Lexile, and Forcast.
School Psychology Review,
39
(2), 277-285.
Ardoin, S. P., Suldo, S. M., Witt, J. C., Aldrich, S., & McDonald, E. (2005). Accuracy of readability estimates'
predictions of CBM performance.
School Psychology Quarterly, 20
(1), 1-22.
Armbruster, B. (2002).
Put reading first
DIANE Publishing. Aud, S., Wilkinson-Flicker, S., Kristapovich, P.,
Rathbun, A., Wang, X., & Zhang, J. (2013).
The Condition of Education 2013
(NCES 2013-037). U.S.
Department of Education, National Center for Education Statistics. Washington, DC. Retrieved
[November 21st, 2013] from http://nces.ed.gov/pubsearch.
Atkin, J. M., Black, P., & Coffey, J. (2001). Classroom Assessment and the National Science Education
Standards. Washington, DC: National Academy Press.
Baroody, A. J. (2006). Why children have difficulties mastering the basic number combinations and
how to help them.
Teaching Children Mathematics, 13
, 22 – 31.
Bear, D.R., Invernizzi, M.A., Templeton S.R., & Johnston, F.R. (2012).
Words Their Way: Word Study for
Phonics, Vocabulary, and Spelling Instruction, 5th ed.
Upper Saddle, NJ: Pearson Education Inc.
Beitchman J, Wilson B, Johnson CJ, Atkinson L, Young A, Adlaf E, et al. (2001). Fourteen-year follow-up
of speech/language-impaired and control children: psychiatric outcome. Journal of the American
Academy of Child and Adolescent Psychiatry, 40, 75–82.
Berch, D. B., & Mazzocco, M. M. (Eds) (2008). Why is math so hard for some children? The nature and
origins of mathematical learning difficulties and disabilities. Baltimore, MD: Paul H. Brookes.
Betts, J., Pickart, M., & Heistad, D. (2009). An investigation of the psychometric evidence of CBM-R
passage equivalence: Utility of readability statistics and equating for alternate forms
Journal of School
Psychology
,
47
, pp. 1–17.

References
Page | 128
www.fastbridge.org
© 2015 Theodore J. Christ and Colleagues, LLC. All rights reserved.
Black, P., & William, D. (1998). Assessment and classroom learning.
Assessment in Education: Principles,
Policy & Practice, 5
(1), 7-74.
Bowers, P. N., Kirby, J. R., & Deacon, S. H. (2010). The Effects of Morphological Instruction on Literacy
Skills A Systematic Review of the Literature.
Review of Educational Research
,
80
(2), 144-179.
Bowman, B., Donovan, S., & Burns, M.S. (Eds.). (2000). Eager to learn: Educating our preschoolers.
National Research Council Commission on Behavioral and Social Sciences and Education. Washington,
D.C.: National Academy Press.
Brennan, R. L. (Ed.). (2006).
Educational Measurement
(4th ed.). Westport, CT: American Council on
Education and Praeger Publishers.
Brown, E.D., Sax, K.L. (2013). Arts enrichment and preschool emotions for low-income children at risk.
Early Childhood Research Quarterly, 28, 337-346.
Burt, J. S. (2006). What is orthographic processing skill and how does it relate to word identification in
reading?
Journal of Research in Reading
,
29
(4), 400-417.
Cain, K., Oakhill, J., & Bryant, P. E. (2004). Children's reading comprehension ability: Concurrent
prediction by working memory, verbal ability, and component skills.
Journal of Educational
Psychology
, 96, 31-42.
Campbell, F. A., & Ramey, C. T. (1994). Effects of early intervention on intellectual and academic
achievement: A follow‐up study of children from low‐income families.
Child Development
,
65
, 684-
698.
Carnine, D.W., Silbert, J., Kem’ennui, E.J., & Tarver, S.G. (2009).
Direct instruction reading
(5th ed.). , OR:
Pearson Education Ltd.
Carroll, J. B. (1993). Human cognitive abilities: A survey of factor-analytic studies. New York:
Cambridge University Press.
Carlisle, J.F. (1995). Morphological awareness and early reading achievement, L.B. Feldment, (ed.),
Morphological aspects of language processing,
(pp. 189-209). Hillsdale, NJ: Lawrence Erlbaum
Associates, Publishers.
Carlisle, J. F. (2011). Effects of instruction in morphological awareness on literacy achievement: An
integrative review.
Reading Research Quarterly
, 45 (4), 464-487.
Case, S.M., & Swanson, D.B. (2002).
Constructing written test questions for the basic and clinical
sciences, 3rd edition.
Philadelphia, PA: National Board of Medical Examiners.

References
Page | 129
www.fastbridge.org
© 2015 Theodore J. Christ and Colleagues, LLC. All rights reserved.
Cawley, J. F., Parmar, R. S., Lucas-Fusco, L. M., Kilian, J. D., & Foley, T. E. (2007). Place value and
mathematics for students with mild disabilities: Data and suggested practices.
Learning Disabilities: A
Contemporary Journal, 5,
21-39.
Chall, J. (1987). Two vocabularies for reading: Recognition and meaning. In M. McKeown & M. Curtis
(Eds.). The nature of vocabulary acquisition (pp. 7-17). Hillsdale, NJ: Lawrence Erlbaum.
Christ, T. J. (2006). Short term estimates of growth using curriculum-based measurement of oral
reading fluency: Estimates of standard error of the slope to construct confidence intervals.
School
Psychology Review
, 35, 128-133.
Christ, T. J., & Ardoin, S. P. (2009). Curriculum-based measurement of oral reading: Passage equivalence
and probe-set development.
Journal of School Psychology
, 47, 55-75.
Christ, T. J., & Boice, C. H. (2009). Rating scale items: A brief review of nomenclature, components and
formatting.
Assessment for Effective Intervention, 34
(4), 242-250.
Christensen, C. A., & Bowey, J. A. (2005). The efficacy of orthographic rime, grapheme–phoneme
correspondence, and implicit phonics approaches to teaching decoding skills.
Scientific Studies of
Reading
,
9
(4), 327-349.
Clements, D., Sarama, J., & DiBiase, A. M. (Eds.). (2004). Engaging young children in mathematics:
Findings of the 2000 national conference on standards for preschool and Kindergarten mathematics
education. Mahwah, NJ: Erlbaum.
Compton, D. L., Appleton, A. C., & Hosp, M. K. (2004). Exploring the relationship between text-leveling
systems and reading accuracy and fluency in second grade students who are average and poor
decoders.
Learning Disabilities Research & Practice
, 19(3), 176-184.
Clay, M. (1972). Reading, the Patterning of Complex Behavior. Auckland, New Zealand: Heinemann.
Crocker, L. M., & Algina, J. (1986).
Introduction to classical and modern test theory
(Vol. 6277). New
York: Holt, Rinehart and Winston.
Deacon, S. H., Parrila, R., & Kirby, J. R. (2008). A review of the evidence on morphological processing in
dyslexics and poor readers: A strength or weakness.
The Sage handbook of dyslexia
, 212-237.
Deno, S. L. (1985). Curriculum-Based measurement: The emerging alternative.
Exceptional Children
,
52, 219-232.
Deno, S. L. (1986). Formative evaluation of individual student programs: A new role for school
psychologists.
School Psychology Review
, 1(3), 358-374.
Deno, S. L. (2002). Problem solving as best practices. In A. Thomas & J. Grimes (Eds.), Best practices in
school psychology IV. (pp. 37-56). Bethesda, MD: National Association of School Psychologists.

References
Page | 130
www.fastbridge.org
© 2015 Theodore J. Christ and Colleagues, LLC. All rights reserved.
Deno, S. L. (2003). Developments in Curriculum-Based measurement.
The Journal of Special Education
,
37(3), 184-192.
Deno, S. L. (2005). Problem solving assessment. In R. Brown-Chidsey (Ed.), Assessment for intervention:
A problem-solving approach (pp. 10-42). New York: Guilford Press.
Deno, S. L. & Mirkin, P. K. (1977) Data-based Program Modification: A Manual.
Reston VA: Council for Exceptional Children
De Ayala, R. J. (2009). The theory and practice of item response theory. Guilford Press.
Dickinson, D., McCabe, A., & Essex, M. (2006). A window of opportunity we must open to all: The case
for high-quality support for language and literacy. In D. K. Dickinson & S. B. Neuman (Eds.), Handbook
of early literacy research (pp. 11-28). New York: Guilford Press.
Dominguez, X., Vitiello, V.E., Maier, M.F., & Greefield, D.B. (2010). Longitudinal examination of young
children’s behavior: Child-level and classroom-level predictors of change throughout the preschool
year. School Psychology Review, 39, 29-47.
Downing, J., Ollila, L., & Oliver, P. (1975). Cultural differences in children's concepts of reading and
writing.
British Journal of Educational Psychology
,
45
, 312-316.
Dunn, J. & Brown, J. (1994). Affect expression in the family, children's understanding of emotions, and
their interactions with others. Merrill-Palmer Quarterly, 40, pp. 120–137
Durkin, D. (1993).
Teaching them to read
(6th ed.). Boston, MA: Allyn and Bacon.
Dynamic Indicators of Basic Early Literacy Skills (DIBELS Next). Eugene, OR: Institute for the
Development of Educational Achievement. Available: https://dibels.org/next/index.php.
Eckoff, A. & Urback, J. (2008). Understanding imaginative thinking during childhood: Sociocultural
conceptions of creativity and imaginative thought. Early Childhood Education Journal, 36, 179-185.
Eisenberg, N., Shepard, S. A., Fabes, R. A., Murphy, B. C, & Guthrie, I. K. (1998). Shyness and children's
emotionality, regulation, and coping: Contemporaneous, longitudinal, and across-context relations.
Child Development, 69,
767-790.
Eisner, E. W. (2002). The arts and the creation of mind. New Haven, CT: Yale University Press.
Ekeland, E., Heian, F. & Hagen, K.B. (2004). Can exercise improve self-esteem in children and young
people? A systematic review of randomized control trials.
British Journal of Sports Medicine, 39,
792-
798.
Flesch, R. F. (1949). A new readability yardstick. Journal of Applied Psychology, 32(3), 221-233.

References
Page | 131
www.fastbridge.org
© 2015 Theodore J. Christ and Colleagues, LLC. All rights reserved.
Francis, D. J., Santi, K. L., Barr, C., Fletcher, J. M., Varisco, A., & Foorman, B. R. (2008). Form effects on the
estimation of students’ oral reading fluency using DIBELS.
Journal of School Psychology
, 46, 315-342.
Fry, E. B., & Kress, J. E. (2006).
The reading teacher's book of lists
. San Francisco: Jossey-Bass.
Fuchs, D., & Fuchs, L. S. (2006). Introduction to Response to Intervention: What, why, and how valid is
it?
Reading Research Quarterly
,
41
, 93-99.
Fuchs, L. S., & Fuchs, D. (2002) Curriculum-Based Measurement: Describing competence, enhancing
outcomes, evaluating treatment effects, and identifying treatment non-responders.
Peabody Journal
of Education
, 77:2, 64-84, doi: 10.1207/S15327930PJE7702_6
Fuchs, D., Fuchs, L. S., & Compton, D. L. (2004). Identifying reading disabilities by responsiveness-to-
instruction: Specifying measures and criteria.
Learning Disability Quarterly
,
27
(4), 216-227.
Fuchs, L. S., Fuchs, D., & Maxwell, L. (1988). The validity of informal reading comprehension
measures.
Remedial and Special Education
,
9
(2), 20-28.
Gajdamaschko, N. (2005). Vygotsky on imagination: Why an understanding of the imagination is an
important issue for schoolteachers. Teaching Education, 16, 13–22
Geary, D.C. (1999). Mathematical Disabilities: What we know and don’t know. Retrieved
August 23, 2011 from the LD Online Web site: http://www.ldonline.org/article/5881.
Geary, D.C. (2004). Mathematics and learning disabilities.
Journal of Learning Disabilities, 37,
(1), 4-15.
Gendron, M., Royer, E., Bertrand, R. & Potrin, P. (2004). Behavior disorders, social competence, and the
practice of physical activities among adolescents.
Emotional and Behavioral Difficulties, 9,
249-259.
Gersten, R., Clarke, B., Jordan, N. C., Newman-Gonchar, R., Haymond, K., & Wilkins, C. (2012). Universal
screening in mathematics for the primary grades: Beginnings of a research base.
Exceptional Children,
78
, 423-445.
Gersten, R., Jordan, N. C., & Flojo, J. R. (2005). Early identification and interventions for students with
mathematics difficulties.
Journal of learning disabilities
,
38
(4), 293-304.
Goswami, U. (2000). Phonological and lexical processes. In M. J. Kamil, P. B. Mosenthal, P. D. Pearson, &
R. Barr (Eds.).
Handbook of reading research, Volume III
(pp. 251-267) Mahwah, NJ: Lawrence Earlbaum.
Goswami, U. (2001). Early phonological development and the acquisition of literacy. In S. B. Neuman &
D. Dickinson (Eds.),
Handbook of Early Literacy Research
(pp. 111–125). New York: Guilford Press.

References
Page | 132
www.fastbridge.org
© 2015 Theodore J. Christ and Colleagues, LLC. All rights reserved.
Gough, P. B., & Tunmer, W. E. (1986). Decoding, reading, and reading disability.
Remedial and special
education
,
7
(1), 6-10.
Goldman, S. R., & Varnhagen, C. K. (1986). Memory for embedded and sequential episodes in stories.
Journal of Memory and Language
, 25, 401-418.
Group Reading Assessment and Diagnostic Evaluation (GRADE). Pearson Education Inc.
Graesser, A. C., Leon, J. A., & Otero, J. (2002). Introduction to the psychology of science text
comprehension. In J. Otero, J. A. Leon, & A. C. Graesser (Eds.), The Psychology of Science Text
Comprehension (pp. 1-15). Mahwah, NJ: Erlbaum.
Graesser, A. C., McNamara, D. S., & Louwerse, M. M (2003). What do readers need to learn in order to
process coherence relations in narrative and expository text? In A.P. Sweet and C.E. Snow (Eds.),
Rethinking reading comprehension (pp. 82–98). New York: Guilford Publications.
Graesser, A. C., McNamara, D. S., Lowerse, M. M., & Cai, Z. (2004). Coh-Metrix: Analysis of text on
cohesion and language.
Behavior Research Methods, Instruments, & Computers
, 36(2), 193-202
Graesser, A.C., Olde, B. A., & Klettke, B. (2002). How does the mind construct and represent stories? In
M. Green, J. Strange, and T. Brock (Eds.), Narrative Impact: Social and Cognitive Foundations. Mahwah:
NJ: Erlbaum.
Graesser, A. C., Singer, M., & Trabasso, T. (1994). Constructing inferences during narrative text
comprehension.
Psychological Review
, 101(3), 371-395.
Grzybowski, M., & Younger, J. G. (1997). Statistical methodology: III. Receiver operating characteristic
(ROC) curves.
Academic Emergency Medicine
,
4
, 818-826.
Griffin, S. (2008). Early intervention for children at risk of developing mathematical learning difficulties.
In D. Berch & M. Mazzocco (Eds.)
Why is math so hard for some children? The nature and origins of
mathematical learning difficulties and disabilities.
(pp. 373 – 395) Baltimore, MD: Paul H. Brookes.
Guyer, R., & Thompson, N.A. (2012).
User’s Manual for Xcalibre item response theory calibration
software, version 4.1.6
. St. Paul MN: Assessment Systems Corporation. Available from
http://www.assess.com/
Haladyna, T. M., Downing, S. M., & Rodriguez, M. C. (2002). A review of multiple-choice item-writing
guidelines for classroom assessment.
Applied measurement in education
,
15
, 309-333.
Haladyna, T.M. (2007). Roles and importance of validity studies in test development (pp. 739-760). In
S.M. Downing and T.M. Haladyna (Eds.)
Handbook of test development.
Mahwah, NJ: Lawrence
Erlbaum Associates.

References
Page | 133
www.fastbridge.org
© 2015 Theodore J. Christ and Colleagues, LLC. All rights reserved.
Hardy, M., Stennett, R., & Smythe, P. (1974). Development of auditory and visual language concepts
and relationship to instructional strategies in Kindergarten.
Elementary English Journal
, 51, 525-532.
Harlin, R., & Lipa, S. (1990). Emergent literacy: A comparison of formal and informal assessment
methods.
Reading Horizons,
20, 209-223.
Henard, D.H. (2000). Item response theory. In L. Grimm & P. Yarnold (Eds.), Reading and understanding
more multivariate statistics (pp. 67-97). Washington, DC: American Psychological Association.
Hiebert, E. H., & Taylor, B.M. (2000). Beginning reading instruction: Research on early interventions. In
M. J. Kamil, P. B. Mosenthal, P. D. Pearson, & R. Barr (Eds.).
Handbook of
reading
research, Volume III
(pp. 455-482) Mahwah, NJ: Lawrence Earlbaum.
Hiebert, E. H., & Fisher, C.W. (2007). The critical word factor in texts for beginning readers. Journal of
Educational Research
. 101(1), 3-11.
Hintze, J. M., & Christ, T. J. (2004). An examination of variability as a function of passage variance in
CBM progress monitoring.
School Psychology Review
, 33, 204-217.
Hintze, J. M., & Silberglitt, B. (2005). A longitudinal examination of the diagnostic accuracy and
predictive validity of R-CBM and high-stakes testing.
School Psychology Review
,
34
, 372-386.
Hoffman, K. I. (1993). The USMLE, the NBME subject examinations, and assessment of individual
academic achievement.
Academic Medicine
,
68
(10), 740-7.
Hosp, M. K., Hosp, J. L., & Howell, K. W. (2007). The ABC‟s of CBM: A practical guide to Curriculum-Based
measurement. New York, NY: The Guilford Press.
Hu, L.T., & Bentler, P.M. (1999). Cutoff criteria for fit indices in covariance structure analysis:
Conventional criteria versus new alternatives. STRUCTURAL EQUATION MODELING. 6, 1-55.
Jenkins, D. (2001). Impact of the implementation of the teaching/learning cycle on teacher decision-
making and emergent readers.
Reading Psychology
, 22(4), 267-288.
Jenkins, J. R., Hudson, R. F., & Johnson, E. S. (2007). Screening for at-risk readers in a Response-to-
Intervention (RTI) framework.
School Psychology Review
. 36(4).
Jenkins, J. R., Zumeta, R., Dupree, O., & Johnson, K. (2005). Measuring gains in reading ability with
passage reading fluency.
Learning Disabilities Research & Practice
, 20(4), 245-253.
Jenkins, J. R., Hudson, R. F., & Johnson, E. S. (2007). Screening for at-risk readers in a response to
intervention framework.
School Psychology Review
,
36
, 582-600.
Jenkins, J. R., & Jewell, M. (1992). An examination of the concurrent validity of the Basic Academic Skills
Samples (BASS).
Assessment for Effective Intervention
,
17
(4), 273-288.

References
Page | 134
www.fastbridge.org
© 2015 Theodore J. Christ and Colleagues, LLC. All rights reserved.
Johns, J. (1972). Children’s concepts of reading and their reading achievement.
Journal of Reading
Behavior
, 4, 56-57.
Johns, J. (1980). First Graders’ concepts about print.
Reading Research Quarterly
, 15, 529- 549.
Jordan, N. C., Kaplan, D., Ramineni, C., & Locuniak, M. N. (2009). Early math matters: Kindergarten
number competence and later mathematics outcomes.
Developmental Psychology, 45
, 850-867.
Juel, C. (1988). Learning to read and write: A longitudinal study of 54 children from first through fourth
grades.
Journal of educational Psychology
,
80
, 437-447.
Juel, C. (2006). The impact of early school experience on initial reading. In D. K. Dickinson, & S. B.
Neuman (Eds.).
The handbook of early literacy research
(v.2), (pp. 410-426). NY: Guilford Press.
Juel, C., & Minden‐Cupp, C. (2000). Learning to read words: Linguistic units and instructional
strategies.
Reading Research Quarterly
,
35
(4), 458-492.
Kane, M. T. (2013). Validating the interpretation and uses of test scores.
Journal of Educational
Measurement
,
50
(1), 1-73.
Katz, L., & Frost, R. (1992). The reading process is different for different orthographies: The
orthographic depth hypothesis.
Advances in Psychology-Amsterdam
, 94, 67.
Kendeou, P., van den Broek, P., White, M., & Lynch, J. (2007). Preschool and early elementary
comprehension: Skill development and strategy interventions. In D. S. McNamara (Ed.)
Reading
comprehension strategies: Theories, interventions, and technologies,
(pp. 27–45). Mahwah, NJ:
Erlbaum.
Kilgus, S.P., Chafouleeas, S.M., & Riley-Tillman, T.C. (2013). Development and initial validation of the
social and academic behavior risk screener for elementary grades.
School Psychology Quarterly, 28,
210-226.
Kilgus, S. P., Sims, W., von der Embse, N. P., & Riley-Tillman, T. C. (under review). Confirmation of
models for interpretation and use of the Social and Academic Behavior Risk Screener (SABRS).
School
Psychology Quarterly
.
Kilgus, S. P., Eklund, K., von der Embse, N. P., & Taylor, C. (2014). Diagnostic accuracy of the Social,
Academic, and Emotional Behavior Risk Screener (SAEBRS) in elementary and middle grades.
Manuscript in preparation.
Kilpatrick, J., Swafford, J., & Findell, B. (Eds.). (2001).
Adding it up
. Washington, DC: National Academy
Press.

References
Page | 135
www.fastbridge.org
© 2015 Theodore J. Christ and Colleagues, LLC. All rights reserved.
Kim-Kang, G., & Weiss, D. J. (2007). Comparison of computerized adaptive testing and classical
methods for measuring individual change. In
Proceedings of the 2007 GMAC Conference on
Computerized Adaptive Testing.
Available from www. psych. umn.edu/psylabs/CATCentral.
Kim-Kang, G., & Weiss, D. J. (2008). Adaptive measurement of individual change.
Zeitschrift für
Psychologie/Journal of Psychology
,
216
, 49-58.
Kingsbury, G. G., & Houser, R. L. (1999). Developing computerized adaptive tests for school children. In
F. Drasgow & J. B. Olson Buchanan (Eds.),
Innovations in computerized assessment
(pp. 93–115).
Mahwah, NJ: Erlbaum.
Kingston, N., & Nash, B. (2011). Formative assessment: A meta‐analysis and a call for research.
Educational Measurement: Issues and Practice
,
30
(4), 28-37.
Kintsch, W. (1998). Comprehension: A Paradigm for Cognition. Boulder, CO: Cambridge University
Press.
Kintsch, W. & van Dijk, T. A. (1978). Toward a model of text comprehension and production.
Psychological Review
, 35(5), 363-394.
Kirkcaldy, B.D., Shephard, R.J. & Siefen, R.G. (2002). The relationship between physical activity and self-
image and problem behavior among adolescents.
Social Psychiatry and Psychiatric Epidemiology, 37,
544-550.
Klare, G. R. (1974-1975). Assessing readability
. Reading Research Quarterly
, 10(1), 61-102.
Kolen, M. J., & Brennan, R. L. (2004). Test equating, scaling, and linking: Methods and practices (2nd
ed.). New York: Springer-Verlag.
Kranzler, J.H., Brownell, M.T., & Miller, M.D. (1998). The construct validity of curriculum-based
measurement of reading: An empirical test of a plausible rival hypothesis.
Journal of School
Psychology, 36
(4), 399-415.
Kuhl, J. & Kraska, K. (1989). Self-regulation and metamotivation: Computational mechanisms,
development, and assessment. In R. Kanfer, P. Ackerman, R. Cudeck (Eds.), Abilities, motivation, and
methodology: The Minnesota Symposium on learning and individual differences, Lawrence Erlbaum
Associates, Hillsdale, NJ, pp. 373–374.
LaBerge, D., & Samuels, S. J. (1974). Toward a theory of automatic information processing in reading.
Cognitive psychology
,
6
, 293-323.
Lee, J., Grigg, W., 8c Donahue, P. (2007). The nation's report card: Reading 2007 (NCES 2007-496).
Washington, DC: National Center for Education Statistics, U.S. Department of Education.

References
Page | 136
www.fastbridge.org
© 2015 Theodore J. Christ and Colleagues, LLC. All rights reserved.
Levy, B. A., Gong, Z., Hessels, S., Evans, M. A., & Jared, D. (2006). Understanding print: Early reading
development and the contributions of home literacy experiences.
Journal of Experimental Child
Psychology
,
93
(1), 63-93.
Liberman, A. M., Cooper, F. S., Shankweiler, D. P., & Studdert-Kennedy, M. (1967). Perception of the
speech code.
Psychological review
,
74
(6), 431.
Lipson, M.L., Mosenthal, J. H., Mekkelsen, J., & Russ, B. (2004). Building knowledge and fashioning
success one school at a time.
The Reading Teacher, 57
(6) 534-542.
Logan, G. D. (1997). Automaticity and reading: Perspectives from the instance theory of
automatization.
Reading and Writing Quarterly
, 13, 123–146.
Lomax, R. G., & McGee, L.M. (1987). Young children’s concepts about print and reading: Toward a
model of word reading acquisition.
Reading Research Quarterly,
22, 237-256.
MacGinitie, W., MacGinitie, R., Maria, K., & Dreyer, L.G. (2000).
Gates-MacGinitie Reading Tests.
4th ed.
Itasca, IL: Riverside Publishing Company.
Mandler, J. M. & Johnson, N. S. (1977). Remembrance of things parsed: Story structure and recall.
Cognitive Psychology
, 9(1), 111-151.
Markell, M. A., & Deno, S. L. (1997). Effects of increasing oral reading generalization across reading
tasks.
The Journal of Special Education
,
31
(2), 233-250.
Martone, A., & Sireci, S. G. (2009). Evaluating alignment between curriculum, assessment and
instruction.
Review of Educational Research, 79
(3), 1-76.
Mathes, P. G., Denton, C. A., Fletcher, J. M., Anthony, J. L., Francis, D. J., & Schatschneider, C. (2005). The
Effects of Theoretically Different Instruction and Student Characteristics on the Skills of Struggling
Readers.
Reading Research Quarterly
, 148-182.
Mazzeo D, Arens S, Germeroth C, Hein H. (2012). Stopping childhood obesity before it begins.
Phi
Delta Kappan
, 93(7):10-15.
Mazzocco, M. M. M., & Thompson, R. E. (2005). Kindergarten predictors of math learning disability
.
Learning Disabilities Research and Practice, 20,
142 – 155.
McGregor, K. K. (2004). Developmental dependencies between lexical semantics and
reading.
Handbook of language and literacy
, 302-317.
Measures of Academic Progress (MAP). Northwest Evaluation Association.
Messick, S. (1993). Validity. (In R. L. Linn (Ed), Educational measurement (2nd ed. pp. 13—104).
Phoenix: American Council on Education and Oryx Press.)

References
Page | 137
www.fastbridge.org
© 2015 Theodore J. Christ and Colleagues, LLC. All rights reserved.
Methe, S. A., Hojnoski, R., Clarke, B., Owens, B. B., Lilley, P. K., Politylo, B. C., White, K. M., & Marcotte, A.
M. (2011). Innovations and future directions for early numeracy curriculum-based measurement:
Commentary on the special series.
Assessment for Effective Intervention, 36,
367 - 385.
Miller, K. (2004, October).
Developing number names: A cross cultural analysis
. Presentation at the
Early Childhood Academy, University of Michigan, Ann Arbor.
Morsy, L., Kieffer, M., & Snow, C. (2010). Measure for Measure: A Critical Consumers' Guide to Reading
Comprehension Assessments for Adolescents. Final Report from Carnegie Corporation of New York's
Council on Advancing Adolescent Literacy.
Carnegie Corporation of New York
.
Morgan, P. L., Farkas, G., & Wu, Q. (2009). Five-year growth trajectories of Kindergarten children with
learning difficulties in mathematics.
Journal of Learning Disabilities, 42
, 306 321.
Muter, V., Hulme, C., Snowling, M. J., & Stevenson, J. (2004). Phonemes, rimes, vocabulary, and
grammatical skills as foundations of early reading development: evidence from a longitudinal
study.
Developmental psychology
,
40
(5), 665.
Nagy, W. E. (1988).
Teaching Vocabulary to improve reading comprehension
. National Council of
Teachers of English, 1111 Kenyon Rd., Urbana, IL 61801 (Stock No. 52384-015, $4.95 member, $7.50
nonmember--ISBN-0-8141-5238-4); International Reading Association, PO Box 8139, 800 Barksdale Rd.,
Newark, DE 19714-8139 (No. 151, $4.95 member, $7.50 nonmember--ISBN-0-87207-151-0).
National Center for Education Statistics (2013).
The Nation’s Report Card: A First Look: 2013
Mathematics and Reading
(NCES 2014-451).Institute of Education Sciences, U.S. Department of
Education, Washington, D.C.
National Center for Education Statistics (2013). The Nation’s Report Card: Trends in Academic Progress
2012 (NCES 2013 456). Institute of Education Sciences, U.S. Department of Education, Washington, D.C.
National Governors Association Center for Best Practices & Council of Chief State School Officers.
(2010).
Common Core State Standards for English Language Arts & Literacy in History/Social Studies,
Science, & Technical Subjects
. Washington, DC: National Governors Association Center for Best
Practices, Council of Chief State Officers.
National Center for Response to Intervention (2010). Screening Tools Chart. U.S. Office of Special
Education Programs. Retrieved from
http://www.rti4success.org/sites/default/files/Screening%20Tools%20Chart.pdf
National Governors Association Center for Best Practices & Council of Chief State School Officers.
(2010).
Common Core State Standards for Mathematics.
Washington, DC: Authors.
National Research Council. (2009). Mathematics learning in early childhood: Paths toward excellence
and equity. Washington, DC: Author.

References
Page | 138
www.fastbridge.org
© 2015 Theodore J. Christ and Colleagues, LLC. All rights reserved.
Nation, K., Clarke, P., Marshall, C. M., & Durand, M. (2004). Hidden language impairments in children:
Parallels between poor reading comprehension and specific language impairment?
Journal of Speech,
Language & Hearing Research
,
47
(1).
Nation, K., & Snowling, M. J. (2004). Beyond phonological skills: Broader language skills contribute to
the development of reading.
Journal of research in reading
,
27
(4), 342-356.
National Mathematics Advisory Panel [NMAP], (2008) Foundations for Success: The Final Report of the
National Mathematics Advisory Panel (No. ED04CO0015/0006): U.S. Department of Education:
Washington, D.C.
National Reading Panel (US), National Institute of Child Health, & Human Development (US). (2000a).
Report of the National Reading Panel: Teaching children to read: an evidence-based assessment of the
scientific research literature on reading and its implications for reading instruction: reports of the
subgroups. National Institute of Child Health and Human Development, National Institutes of Health.
National Reading Panel (US), National Institute of Child Health, & Human Development (US). (2000b).
Teaching children to read: An evidence-based assessment of the scientific research literature on
reading and its implications for reading instruction. National Institute of Child Health and Human
Development, National Institutes of Health.
NCTM. (2000).
Principles and standards for school mathematics
. Reston, VA: National Council for
Teachers of Mathematics.
Neuenschwander, R., Rothlisberger, M, Cimeli, P., Roebers, C.M. (2012). How do different aspects of
self-regulation predict successful adaptation to school? Journal of Experimental Child Psychology,
113, 353-371.
Neuman, S.B. & Roskos, K. (2005). The state of pre-Kindergarten standards.
Early Childhood Research
Quarterly, 20,
125-145.
Nichols, W. D., Rickelman, R.J., & Rupley, W. H. (2004). Examining phonemic awareness and concepts of
print patterns of Kindergarten students.
Reading Research and Instruction
. 43, 56-82.
McNamara, D. S., & Kintsch, W. (1996). Learning from texts: Effects of prior knowledge and text
coherence.
Discourse processes
,
22
(3), 247-288.
Northwest Evaluation Association (NWEA) (2011).
Measures of Academic Progress (MAP).
Portland, OR.
Nunnally, J. C., & Bernstein, I. H. (1994). Psychometric theory (3rd ed.). New York: McGraw-Hill.
Nydick, S. W., & Weiss, D. J. (2009). A hybrid simulation procedure for the development of CATs. In
Proceedings of the 2009 GMAC Conference on Computerized Adaptive Testing. Retrieved from www.
psych.umn.edu/psylabs/CATCentral.

References
Page | 139
www.fastbridge.org
© 2015 Theodore J. Christ and Colleagues, LLC. All rights reserved.
Oakhill, J., & Cain, K. (2007). Introduction to comprehension development. In K. Cain & J. Oakhill (Eds.),
Children’s comprehension problems in oral and written language: A cognitive perspective
(pp. 3–40)
.
New York: Guilford Press.
Oakhill, J. V., Cain, K., & Bryant, P. E. (2003). The dissociation of word reading and text comprehension:
Evidence from component skills.
Language and cognitive processes
,
18
, 443-468.
Okamoto, T. (1996, July). On relationships between statistical zero-knowledge proofs. In
Proceedings
of the twenty-eighth annual ACM symposium on Theory of computing
(pp. 649-658). ACM.
Paris, S. G. (2005). Reinterpreting the development of reading skills.
Reading Research Quarterly
,
40
(2),
184-202.
Perfetti, C. A. (1994). Psycholinguistics and reading ability. In M. Gernsbacher (Eds.),
Handbook of
psycholinguistics
(pp. 849-894). San Diego, CA: Academic Press.
Perfetti, C. A. (1992). The representation problem in reading acquisition.
Porges, S. (2003). The polyvagal theory: Phylogenetic contributions to social behavior. Physiology and
Behavior, 79, 503–513.
Phillips, B. M., & Torgesen, J. K. (2006). Phonemic awareness and reading: Beyond the growth of initial
reading accuracy.
Handbook of early literacy research
,
2
, 101-112.
Pratt, K., Martin, M., White, M.J., & Christ, T.J. (2010). Development of a FAIP-R First Grade Probe Set
(Technical Report No. 3). Minneapolis, MN: University of Minnesota, Department of Educational
Psychology.
Purpura, D. J., & Lonigan, C. J. (2013). Informal numeracy skills: The structure and relations among
numbering, relations, and arithmetic operations in preschool.
American Educational Research Journal,
50
, 178-209.
RAND Reading Study Group (2002). Reading for understanding: Toward an R&D program in reading
comprehension. Santa Monica, CA: RAND.
Raver, C. C. & Knitzer, J. (2002). Ready to enter: What research tells policymakers about strategies to
promote social and emotional school readiness among three- and four-year-old children. Promoting
the Emotional Well-being of Children and Families. Policy Paper No. 3. Columbia, New York: National
Center for Children in Poverty.
Rayner, K., Pollatsek, A., Ashby, J., & Clifton, C. Jr. (2012). Psychology of reading (2nd ed.). New York:
Psychology Press.
Raudenbush, S. W. and Anthony S. Bryk (2002). Hierarchical linear models: Applications and data
analysis methods, Second Edition. Newbury Park, CA: Sage

References
Page | 140
www.fastbridge.org
© 2015 Theodore J. Christ and Colleagues, LLC. All rights reserved.
Reschly, A. L., Busch, T.W., Betts, J., Deno, S. L., and Long, J.D. (2009). Curriculum-Based measurement
oral reading as an indicator of reading achievement: A meta-analysis of the correlational evidence.
Journal of School Psychology
, 47, 427-469.
Ricketts, J., Nation, K., & Bishop, D. V. (2007). Vocabulary is important for some, but not all reading
skills.
Scientific Studies of Reading
,
11
(3), 235-257.
Riddle Buly, M., & Valencia, S. W. (2002). Below the bar: Profiles of students who fail state reading tests.
Educational Evaluation and Policy Analysis, 24
, 219-239.
Renaissance Learning. (1998b).
STAR Math.
Wisconsin Rapids, WI: Renaissance Learning.
Rubin, D. C. (1995). Memory in oral traditions: The cognitive psychology of epic, ballads, and counting-
out-rhymes. New York: Oxford University Press.
Rydell, A., Berlin, L., & Bohlin, G. (2003). Emotionality, emotion regulation, and adaptation among 5- to
8-year-old children. Emotion, 3, 30–47.
Samejima, F. (1994). Some critical observations of the test information function as a measure of local
accuracy in ability estimation.
Psychometrika
,
59
(3), 307-329.
Samuels, S. J. (2007). The DIBELS tests: Is speed of barking at print what we mean by reading fluency?
Reading Research Quarterly, 42
, 563–566.
Sadler, D. (1989). Formative assessment and the design of instructional systems. Instructional Science,
18(2), 119-144.
Scarborough, H. (2001). Connecting early language and literacy to later reading (dis)abilities: Evidence,
theory, and practice. In S. B. Neuman & D. Dickinson (Eds.),
Handbook of early literacy research
(pp. 97–
110). New York: Guilford Press.
Schank, Roger C., and Robert P. Abelson. 1977. Scripts, plans, goals, and understanding: An inquiry into
human knowledge structures. Hillsdale, NJ: Lawrence Erlbaum.
Schmeiser, C. B., & Welch, C. J. (2006). Test development. In R. L. Brennan (Ed.), Educational
Measurement (4th ed., pp. 623-646). Westport, CT: American Council on Education and Praeger
Publishers.
Severson, H. H., Walker, H. M., Hope-Doolittle, J., Kratochwill, T. R., & Gresham, F. M. (2007). Proactive,
early screening to detect behaviorally at-risk students: Issues, approaches, emerging innovations, and
professional practices.
Journal of School Psychology
,
45
, 193-223.
Shinn, M. R. (Ed.). (1989). Curriculum-based measurement: Assessing special children. New York:
Guilford Press.

References
Page | 141
www.fastbridge.org
© 2015 Theodore J. Christ and Colleagues, LLC. All rights reserved.
Skiba, R. & Peterson, R. (2000). School discipline at a crossroads: From zero tolerance to early response.
Exceptional Children, 32
, 200-216.
Snow, C. E., Burns, M. S., & Griffin, P. (Eds.). (1998).
Preventing reading difficulties in young children
.
National Academies Press.
Stahl, S. A. (2001). Teaching phonics and phonological awareness.
Handbook of early literacy
research
,
1
, 333-347.
Snow, C. (1991). The theoretical basis for relationships between language and literacy in development.
Journal of Research in Childhood Education
,
6
, 5–10.
Snow, C. E., Burns, M. S., & Griffin, P. (1998).
Preventing reading difficulties in young children
. National
Academies Press.
Stanovich, K. E. (1981). Attentional and automatic context effects in reading. In A. M. Lesgold & C. A.
Perfetti (Eds.),
Interactive processes in reading.
Hillsdale, N.J.: Erlbaum.
Stanovich, K.E. (1984). The interactive-compensatory model of reading: A confluence of
developmental, experimental, and educational psychology.
Remedial and Special Education
, 5, 11-19.
Stanovich, K. E. (1986). Matthew effects in reading: Some consequences of individual differences in the
acquisition of literacy.
Reading Research Quarterly
, 360-407.
Stanovich, K. E. (1990). A call for an end to the paradigm wars in reading research.
Journal of Reading
Behavior
, 22, 221-231.
Stanovich, K. E., & West, R. F. (1989). Exposure to print and orthographic processing.
Reading Research
Quarterly
,
24
(4), 402-433.
Stein, N. L. & Glenn, C. G. (1975). An Analysis of Story Comprehension in Elementary School Children: A
Test of a Schema (Report No. PS 008 544). Washington University. (ERIC Document Reproduction
Service No. ED121474).
Stein, N. L. & Trabasso, T. (1982). What's in a story: An approach to comprehension and instruction. In
R. Glaser (Ed.), Advances in the psychology of instruction (Vol. 2). Hillsdale, N.J.: Erlbaum.
Storch, S. A., & Whitehurst, G. J. (2002). Oral language and code-related precursors to reading:
evidence from a longitudinal structural model.
Developmental psychology
,
38
, 934-947.
Sugai, G., Horner, R., & Gresham, F. (2002). Behaviorally effective school environments. In Shinn, M.R.,
Walker, H.M.,& Stoner, G. (Eds.), Interventions for academic and behavior problems II: Preventive and
remedial approaches (pp. 315–350). Bethesda, MD: National Association of School Psychologists.

References
Page | 142
www.fastbridge.org
© 2015 Theodore J. Christ and Colleagues, LLC. All rights reserved.
Sugden, D.A. (1986). The development of proprioceptive control. Themes in Motor Development, 35,
21-39.
Swets, J. A., R. M. Dawes, & J. Monahan (2000), “Psychological Science Can Improve Diagnostic
Decisions”, Psychological Science in the Public Interest 1: 1–26. Test of Silent Reading Efficiency and
Comprehension (TOSREC).
Taylor, B. M., Pearson, P., Clark, K., & Walpole, S. (2000). Effective schools and accomplished teachers:
Lessons about primary-grade reading instruction in low-income schools.
The Elementary School
Journal
, 101(2), 121-165.
Taylor, B. M., Pearson, P., Peterson, D. S., & Rodriguez, M. C. (2003). Reading growth in high-poverty
classrooms: The influence of teacher practices that encourage cognitive engagement in literacy
learning.
The Elementary School Journal
, 104(1), 3-28.
Taylor, B. M., Pearson, P., Peterson, D. S., & Rodriguez, M. C. (2005). The CIERA School Change
Framework: An evidence-based approach to professional development and school reading
improvement.
Reading Research Quarterly
, 40(1), 40-69.
Thompson, S. J., Johnstone, C. J., Thurlow, M. L., & Clapper, A. T. (2004).
State literacy standards,
practices, and testing: Exploring accessibility
(Technical Report 38). Minneapolis, MN: University of
Minnesota, National Center on Educational Outcomes.
Trabasso, T. & Nickels, M. (1992). The development of goal plans of action in the narration of a picture
story.
Discourse Processes
, 15, 249-275.
Trabasso, T. & Stein, N. L. (1997). Narrating, representing, and remembering event sequences. In P. W.
van den Broek, P. J. Bauer, & T. Bourg (Eds.), Developmental spans in event comprehension and
representation: Bridging fictional and actual events (pp. 237-270). Mahwah, NJ: Erlbaum.
Tumner, W. E., Herriman, M. L., & Nesdale, A. R. (1988). Metalinguistic abilities and beginning Reading.
Reading Research Quarterly
, 23, 134-158.
Van de Walle, J. A., Karp, K. S. & Bay-Williams, J. M. (2013). Elementary and middle school mathematics:
Teaching developmentally (8th ed.). New York, NY: Pearson.
van den Broek, P. & Trabasso, T. (1986). Causal networks versus goal hierarchies in summarizing text.
Discourse Processes
, 9, 1-15.
van den Broek, P. (1994). Comprehension and memory of narrative texts: Inferences and coherence. In
M. A. Gernsbacher (Ed.) Handbook of Psycholinguistics (pp. 539-588). New York: Academic Press.
VanDerHeyden, A. M. (2011). Technical adequacy of response to intervention decisions.
Exceptional
Children
,
77
, 335-350.

References
Page | 143
www.fastbridge.org
© 2015 Theodore J. Christ and Colleagues, LLC. All rights reserved.
VanLoy, W. J. (1996). A comparison of adaptive self-referenced testing and classical approaches to the
measurement of individual change (Doctoral dissertation, University of Minnesota).
Vellutino, F. R. (2003). Individual differences as sources of variability in reading comprehension in
elementary school children. In A. P. Sweet & C. E. Snow (Eds.), Rethinking Reading Comprehension (pp.
5-81). New York: Guilford Press.
Vellutino, F. R., & Scanlon, D. M. (1987). Phonological coding, phonological awareness, and reading
ability: Evidence from a longitudinal and experimental study.
Merrill-Palmer Quarterly: Journal of
Developmental Psychology,
33, 321-363.
Vellutino, F. R., & Scanlon, D. M. (1991). The preeminence of phonologically based skills in learning to
read. In S. Brady & D. Shankweiler (Eds.),
Phonological processes in literacy: A tribute to Isabelle
Liberman
(pp. 237–252). Hillsdale, NJ: Erlbaum.
Vellutino, F. R., Scanlon, D. M., Small, S. G., & Tanzman, M. S. (1991). The linguistic basis of reading
ability: Converting written to oral language.
Text
,
11
, 99–133.
Wayman, J., Cho, V. & Johnston, M. (2007). The Data-Informed District: A District-Wide Evaluation of
Data Use in the Natrona County School District. Austin: The University of Texas. Retrieved 3/12/08 from
http://edadmin.edb.utexas.edu/datause/
Weiss, D. J. (2004). Computerized Adaptive Testing for Effective and Efficient Measurement in
Counseling and Education.
Measurement & Evaluation in Counseling & Development (American
Counseling Association)
,
37
(2).
Weiss, D. J., & Kingsbury, G. (1984). Application of computerized adaptive testing to educational
problems.
Journal of Educational Measurement
,
21
(4), 361-375.
Weiss, D. J., & Kingsbury, G. (2005). Application of computerized adaptive testing to educational
problems.
Journal of Educational Measurement
,
21
(4), 361-375.
Westberg, K. L. (1993). An Observational Study of Instructional and Curricular Practices Used with
Gifted and Talented Students in Regular Classrooms. Research Monograph 93104.
Westberg, K. L., & Daoust, M. E. (2003). The results of the replication of the classroom practices survey
replication in two states.
The National Research Center on the Gifted and Talented Newsletter
, 3-8.
Whitehurst, G. J., & Lonigan, C. J. (1998). Child development and emergent literacy.
Child
development
,
69
(3), 848-872.
Williams, K.T. (2001). Group Reading Assessment and Diagnostic Evaluation (GRADE).Circle
Pines, MN: AGS Publishing.

References
Page | 144
www.fastbridge.org
© 2015 Theodore J. Christ and Colleagues, LLC. All rights reserved.
Williams, K.T. (2004). Group Mathematics Assessment and Diagnostic Evaluation (GMADE). Circle Pines,
MN: AGS Publishing.
Williford, A.P., Maier, M.F., Downer, J.T., Pianta, R.C., & Howes, C. (2013). Understanding how children’s
engagement and teacher’s interactions combine to predict school readiness. Journal of Applied
Developmental Psychology, 34, 299-309.
Zeno, S.M., Ivens, S.H., Millard, R.T., Duvvuri, R. (1995).
The educator’s word frequency guide.
Brewster,
NY: Touchstone Applied Science Associates.
Zickar, M. J., Overton, R. C., Taylor, L. R., & Harms, H. J. (1999). The development of a computerized
selection system for computer programmers in a financial services company. In F. Drasgow & J. B.
Olson-Buchanan (Eds.), Innovations in computerized assessment (pp. 7-33). Mahwah, NJ: Erlbaum.
Zwaan, R. A. & Rapp, D. N. (2008). Discourse comprehension. In M. J. Traxler & M. A. Gernsbacher (Eds.),
Handbook of Psycholinguistics, 2nd Edition (pp. 725-764). New York: Elsevier.

Appendix A: Benchmarks and Norms Information
Page | 145
www.fastbridge.org
© 2015 Theodore J. Christ and Colleagues, LLC. All rights reserved.
Appendix A: Benchmarks and Norms Information
Norms and benchmarks are reported in the FastBridge Learning Benchmarks and Norms Guide, 2015-
2016.
Appendix C: Diagnostic Accuracy Supplement for Reading
Page | 146
www.fastbridge.org
© 2015 Theodore J. Christ and Colleagues, LLC. All rights reserved.
Appendix B: FastBridge Learning Reading Diagnostic
Accuracy
Table 105. Summary of Diagnostic Accuracy AUC Statistics and Validity Evidence
Grade
Measure
Subtest
F to W
AUC
W to S
AUC
F to S
AUC
Concurrent
Validity
(Spring)
K
earlyReading
Concepts of Print
.80 -.81
—
—
pending
Onset Sounds
.83 - .84
—
—
pending
Letter Names
.78 - .82
—
—
pending
Letter Sounds
.80 - .82
—
—
pending
Composite
.82 - .84
.84
.73–.76
pending
1
earlyReading
Letter Sounds
.73 - .99
.76–.77
.75–.78
pending
Word Rhyming
—
.71–.75
—
pending
Word Segmenting
.87
—
—
pending
Nonsense Words
.66 - .89
—
—
pending
Sight Words
.69 - .92
—
—
pending
Sentence Reading
.71 - .94
.82–.92
.72
pending
Composite
.85 - .89
—
—
pending
2
aReading
—
—
—
.96–.97
CBMreading
—
—
—
.97 –.99
3
aReading
—
—
.83–.97
.76–.90
.78–1.00
CBMreading
—
—
.76–.97
.79–.97
.77 –1.00
4
aReading
—
—
.77–.94
.75–.92
.79–1.00
CBMreading
—
—
.78–.90
.81–.89
.71–1.00
5
aReading
—
—
.71–.93
.68–.93
.78–.96
CBMreading
—
—
.71–.93
.71–.91
.69–.97
6
aReading
—
—
.77–.92
.83–.89
.86–1.00
CBMreading
—
—
.81–.88
.83–.88
.81–1.00
7
aReading
—
—
.91–.92
.81–.85
pending
8
aReading
—
—
.92–.95
.69–.85
pending
9
aReading
—
—
—
.85–.87
pending
10
aReading
—
—
—
.77–.82
pending
Note. F = Fall; W = Winter; S = Spring
