MISCELLANEOUS/ELECTRODATA TTS 3 Operating ELECTRODATA
User Manual: MISCELLANEOUS/ELECTRODATA TTS 3 Operating
Open the PDF directly: View PDF ![]() .
.
Page Count: 171 [warning: Documents this large are best viewed by clicking the View PDF Link!]

23020 Miles Road Bedford Heights, Ohio 44128-5400
(216) 663-3333 (800) 441-6336 FAX: (216) 663-0507
e-mail: testsets@electrodata.com http://electrodata.com
TTS 3
EZ-TESTER DS
OPERATING MANUAL

TTS 3
EZ-TESTER DS
OPERATING MANUAL
Warranty Registration
Thank you for purchasing the TTS 3 EZ-TESTER®DS. To provide complete
service on your test set, we must have a record of warranty registration. Please take
a few moments to complete the warranty registration card in the back of this manual
and MAIL IMMEDIATELY. There are also two change of address cards that can be
used as required.
Trademarks Referenced in this Manual
“EZ-TESTER” and “OnCall” are trademarks of Electrodata, Inc.
“SLC-96” is a registered trademark of AT&T
“Windows” is a trademark of Microsoft Corporation
Electrodata, Inc.
23020 Miles Road
Bedford Heights, Ohio 44128-5400
Phone: 216-663-3333
Toll Free: 800-441-6336
FAX: 216-663-0507
www.electrodata.com
Part No. 610067 - June 2001 ©2001 Electrodata, Inc.
GETTING STARTED
This manual describes the functions and operation of the Electrodata TTS3, EZ-TESTER® DS
test set using firmware 325053. We assume the operator has some familiarity with T1 and DDS
circuit conventions and terminology.
To become fully acquainted with the many features of this versatile device, we recommend
that the operator read the entire manual. However, since operation of the TTS3, EZ-TESTER DS is
relatively straightforward, you will be able to perform many tests by turning to Operation in Chapter
2 and following the step-by-step procedures.
If you have questions concerning the proper operation of the TTS3, EZ-TESTER DS and cannot
find the information, contact the factory by any means shown in chapter 3 of this manual.

TABLE OF CONTENTS
(This page intentionally left blank)

TABLE OF CONTENTS
i
TABLE OF CONTENTS
Chapter/Paragraph Page
GETTING STARTED
LIST OF ILLUSTRATIONS............................................... ii
LIST OF TABLES..................................................... vi
1 INTRODUCTION
1.1 General.....................................................1-1
1.2 Functional Description...........................................1-1
1.3 Physical Description ............................................1-1
1.4 Receiving and Unpacking .........................................1-2
1.5 Options and Accessories.........................................1-2
2OPERATION
2.1 General ...................................................2-1
2.2 Controls and Indicators.........................................2-1
2.3 Turn On Procedure............................................2-4
2.4 Preparation for Use ...........................................2-4
2.5 Menu Operation .............................................2-5
2.6 MAIN MENU ................................................2-5
2.7 CONFIGURATION SETUP MENU ................................. 2-11
2.8 TEST INTERFACE SETUP MENU .................................2-12
2.9 DS1 Testing ............................................... 2-13
2.9.1 DS1 MENU................................................2-14
2.9.2 Connecting the Test Set to the T1 Line ............................2-21
2.9.3 Autoconfiguring the Test Set for DS1 Testing ........................2-25
2.9.4. DS1 In Service Monitoring Operations .............................2-26
2.9.5 DS1 Drop and Insert Operations ................................. 2-37
2.9.6 DS1 Out of Service Testing..................................... 2-42
2.9.7 Running Multiple Test Patterns ..................................2-45
2.9.8 DS1 Alarm and Error Injection ...................................2-46
2.9.9. Voice Frequency Channel Testing ................................ 2-48
2.9.10 24 Channel Signaling .........................................2-50
2.9.11 Viewing Channel Data ........................................2-50
2.9.12 Performing a Delay Measurement .................................2-51
2.9.13 CSU / NIU Emulation .........................................2-52
2.10 Test Set Options and Special Functions ............................2-52
2.10.1 Fractional T1 Monitoring and Testing (Option 01) .....................2-53
2.10.2 Pulse Shape Analysis (Option 02) ................................ 2-54
2.10.3 ESF / SLC 96 Monitor and Control (Option 03) .......................2-56
2.10.4 Performance Statistics Retrieval (Option 04) .........................2-59
2.10.5 Addressable Device Control (Option 05) ............................ 2-60
2.10.6 Dial Supervision (Option 06) .................................... 2-63
2.10.7 Computer Enhanced Testing (Option 07)............................2-65
2.10.8 Multiple Frequency (MF) Dial / Capture (Option 08) ....................2-66
2.10.9 Primary Rate ISDN (Option 09) .................................. 2-66
2.10.10 Terminal Emulation (Option 10) .................................. 2-74
2.10.11 DDS Channel Test (Option 11) ..................................2-75
2.10.12 GR-303 Test Access (Option 12) .................................2-77

TABLE OF CONTENTS
ii
TABLE OF CONTENTS - Continued
2.10.13 SS7 Capture / Analysis (Option 13).............................. 2-84
2.10.14 Frame Relay (Option 14) ..................................... 2-92
2.10.15 Addition of Second DS1 Port (Option 19)..........................2-96
2.11 DDS 4-Wire Local Loop Testing ................................2-96
2.11.1 DDS 4-WIRE MENU.........................................2-97
2.11.2 Autoconfiguring the Test Set for DDS Testing ..................... 2-100
2.11.3 Basic DDS Testing ........................................ 2-100
2.11.4 DDS Alarm and Error Injection ................................ 2-108
2.11.5 Using the Byte Decoder Feature ............................... 2-109
2.11.6 DDS Loopback Emulation .................................... 2-110
2.11.7 Frame Relay Testing from a DDS Access Point ..................... 2-111
2.12 Common Functions ........................................ 2-111
2.12.1 Capturing test Results ...................................... 2-111
2.12.2 Using the Test Set Print Function .............................. 2-113
2.12.3 Storing and Recalling Test Setups .............................. 2-113
2.13 Line Parametrics Testing (Option 40)............................ 2-115
2.13.1 Test Lead Calibration ....................................... 2-116
2.13.2 Cable Characteristics Setup .................................. 2-117
2.13.3 Line Voltage Measurements .................................. 2-118
2.13.4 Line Analysis ............................................ 2-119
2.13.5 Tine Domain Reflectometer (TDR) .............................. 2-120
2.13.6 Voice Frequency Services and Digital Services ..................... 2-123
2.13.6.1 Level / Frequency Measurements .............................. 2-124
2.13.6.2 Noise Measurements ....................................... 2-126
2.13.6.3 Spectrum Analysis ........................................ 2-127
3 MAINTENANCE
3.1 EZ-TESTER DS Warranty.........................................3-1
3.2 Routine Testing and Maintenance...................................3-1
3.3 Battery Recharging / AC Operation ..................................3-1
3.4 Self-Test Procedure ............................................3-2
3.5 Factory Service ...............................................3-3
APPENDICES
A TECHNICAL SPECIFICATIONS ..........................................A-1
B TEST PATTERN DESCRIPTIONS .........................................B-1
C GENERAL DATA TABLES..............................................C-1
D ACRONYMS AND ABBREVIATIONS ......................................D-1
LIST OF ILLUSTRATIONS
Figure Title Page
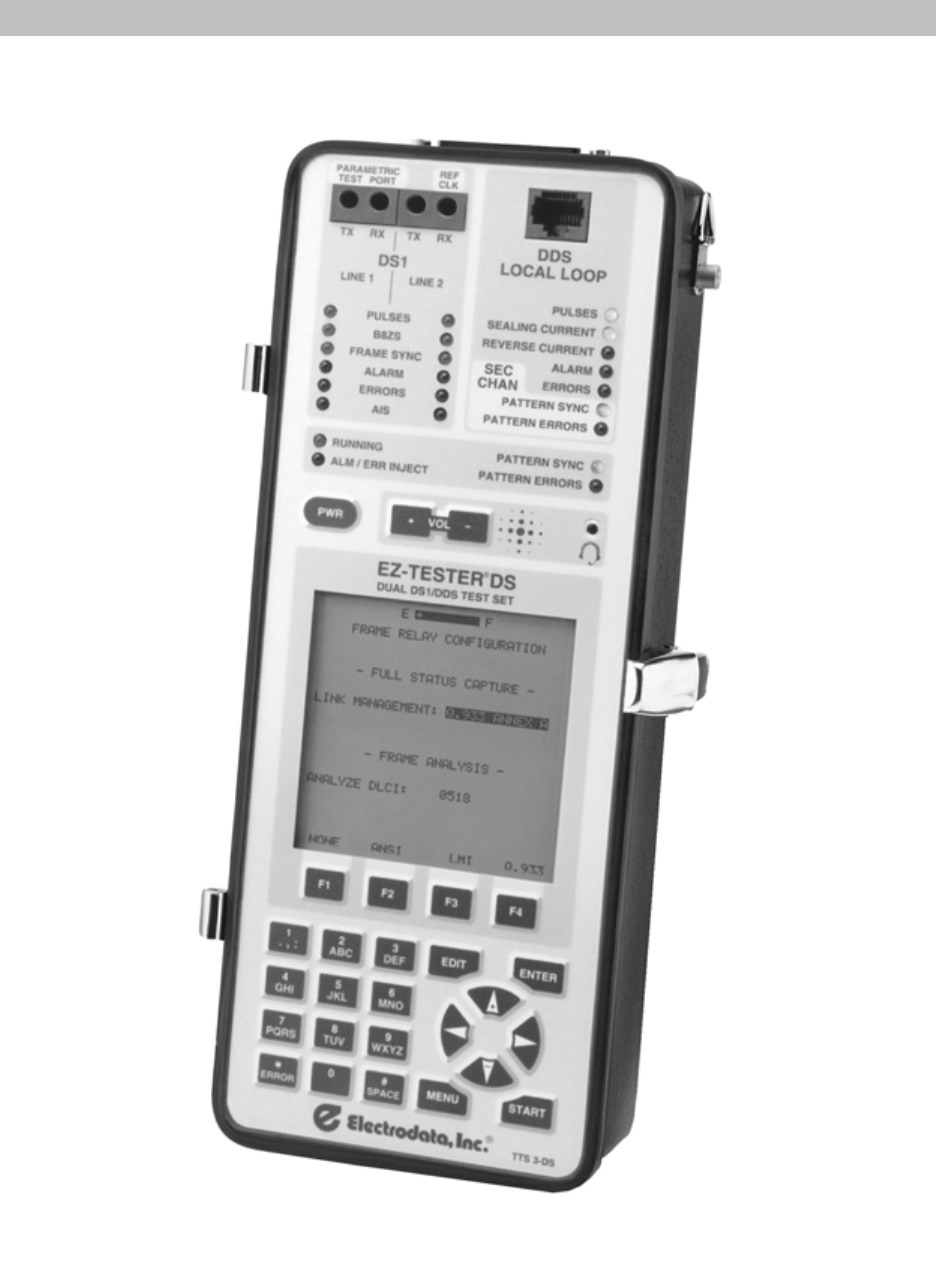
1-1 EZ-TESTER DS, DDS and Dual DS1 Test Set ...........................1-0
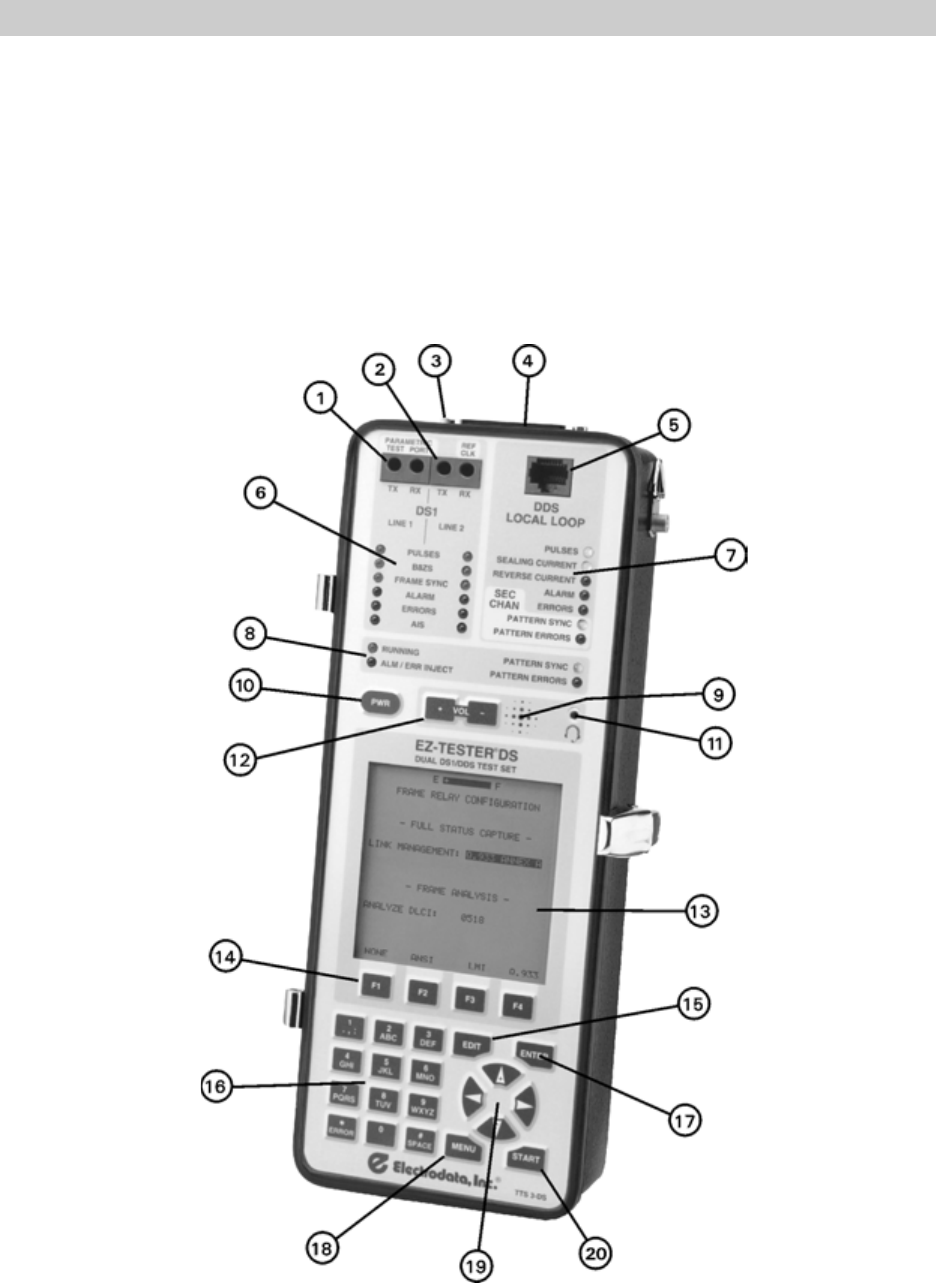
2-1 EZ-TESTER DS Controls and Indicators ...............................2-1
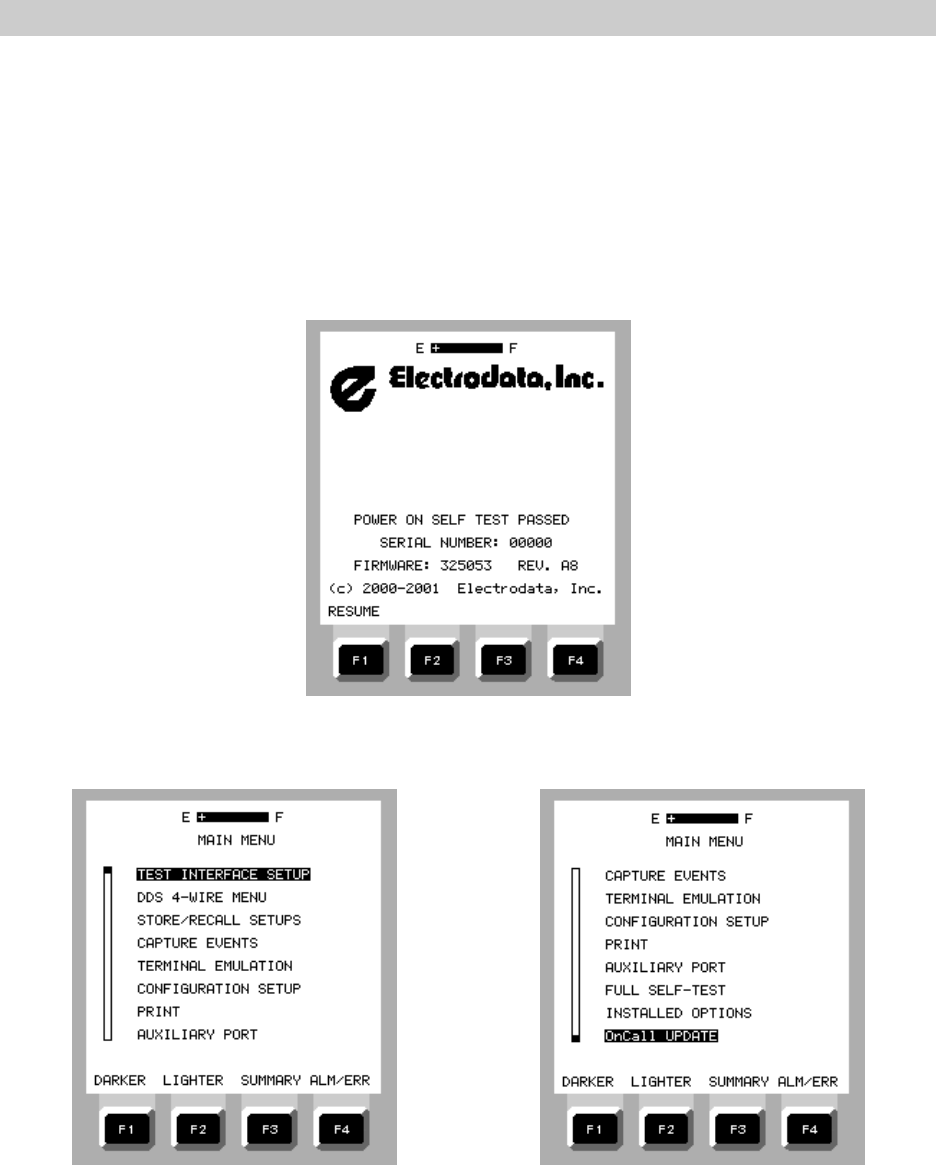
2-2 Power-On Screen in HLDSCRN Mode ................................2-4
2-3 MAIN MENU .................................................2-4
2-4 MAIN MENU (Scrolled) ..........................................2-4
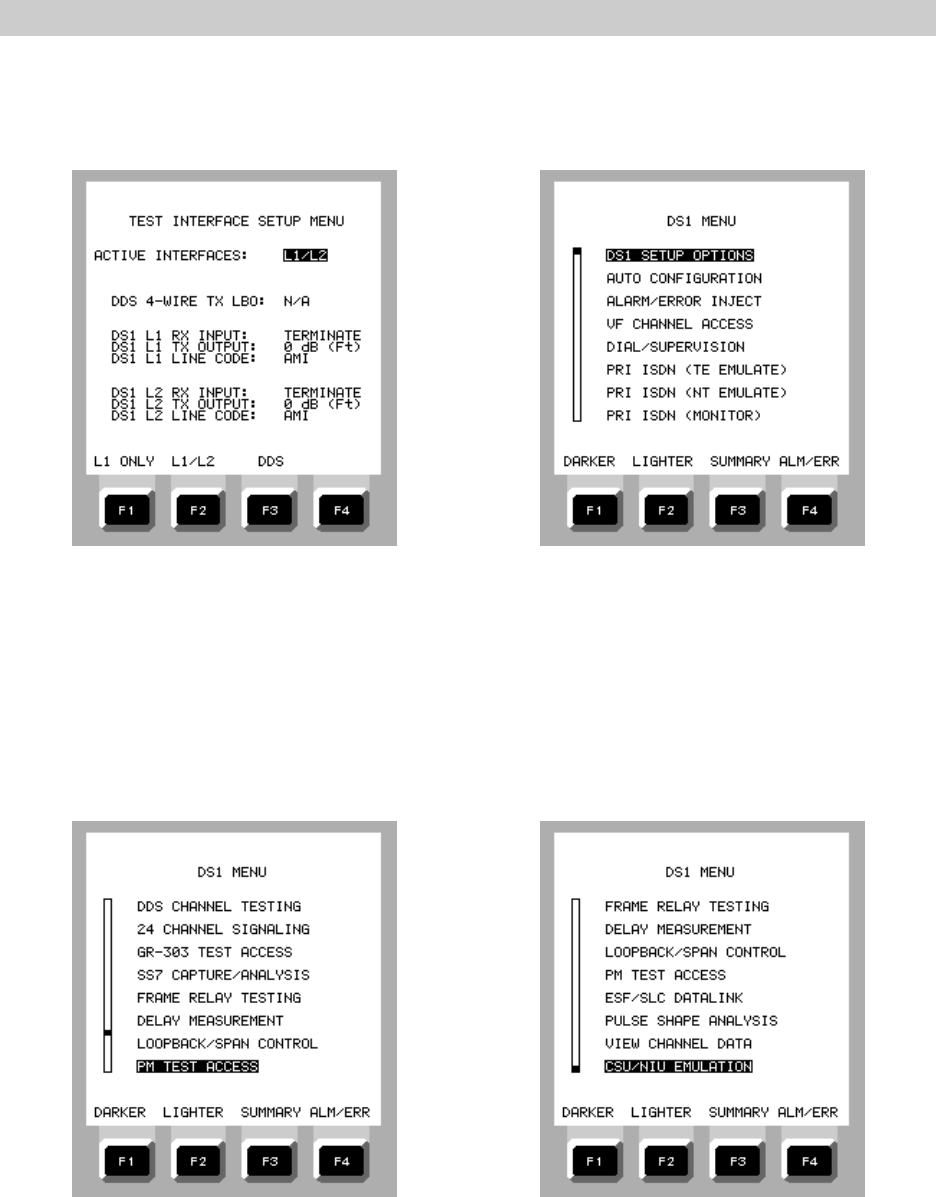
2-5 TEST INTERFACE SETUP MENU....................................2-7
2-6 DS1 MENU Screen .............................................2-7

TABLE OF CONTENTS
iii
LIST OF ILLUSTRATIONS - Continued
Figure Title Page
2-7 DS1 MENU Screen (Scrolled 1) ....................................2-7
2-8 DS1 MENU (Scrolled 2)..........................................2-7
2-9 DDS 4-WIRE MENU ............................................2-8
2-10 LINE PARAMETRICS Menu .......................................2-8
2-11 STORE / RECALL SETUPS Menu ...................................2-8
2-12 CAPTURE EVENTS Menu ........................................2-9
2-13 TERMINAL EMULATION Screen ....................................2-9
2-14 CONFIGURATION SETUP MENU....................................2-9
2-15 PRINT MENU .................................................2-9
2-16 AUXILIARY PORT MENU........................................2-10
2-17 FULL SELF TEST Screen ........................................2-10
2-18 INSTALLED OPTIONS Display ....................................2-10
2-19 OnCall® UPDATE ............................................. 2-10
2-20 CONFIGURATION SETUP MENU...................................2-11
2-21 TEST INTERFACE SETUP MENU................................... 2-12
2-22 DS1 TEST SETUP OPTIONS Screen ................................ 2-15
2-23 DS1 AUTOCONFIGURATION Screen................................ 2-15
2-24 DS1 ALARM / ERROR INJECT Menu................................2-16
2-25 DS1 ALARM / ERROR TYPE Menu .................................2-16
2-26 VF CHANNEL ACCESS Menu.....................................2-16
2-27 DIAL / SUPERVISION Screen ..................................... 2-16
2-28 PRIMARY RATE ISDN SETUP 1 Screen (TE and NT EMULATE)..............2-17
2-29 PRIMARY RATE ISDN SETUP 2 Screen (TE and NT EMULATE)..............2-17
2-30 PRIMARY RATE ISDN MONITOR Screen .............................2-17
2-31 DDS CHANNEL TESTING Screen .................................. 2-17
2-32 24 CHANNEL SIGNALING Display ................................. 2-18
2-33 GR-303 TEST ACCESS Menu ....................................2-18
2-34 SS7 CAPTURE / ANALYSIS Screen................................. 2-18
2-35 FRAME RELAY TESTING Menu ................................... 2-18
2-36 DELAY MEASUREMENT Display...................................2-19
2-37 LOOPBACK / SPAN CONTROL Screen...............................2-19
2-38 PM TEST ACCESS Screen....................................... 2-19
2-39 ESF / SLC 96 DATALINK Screen ..................................2-19
2-40 PULSE SHAPE ANALYSIS Display..................................2-20
2-41 VIEW CHANNEL DATA Display ...................................2-20
2-42 CSU / NIU EMULATION Screen ................................... 2-20
2-43 Sample DS1 TEST SETUP OPTIONS Menu............................ 2-22
2-44 Dual Line Unit Monitoring Network Using LINE 1 ONLY in MON Mode.........2-24
2-45 Dual Line Unit Monitoring Network Using L1 / L2 in TERM Mode ............2-24
2-46 Single Line Unit Running Pattern test Toward Network or Site ..............2-24
2-47 Dual Line Unit Running Pattern Test Toward Site .......................2-24
2-48 Dual Line Unit Set Up for a Drop and Insert Operation Toward Site ...........2-24
2-49 Single Line Unit Set Up for a Drop and Insert Operation Toward Site or Network . 2-24
2-50 RECALL FACTORY SETUP Screen ................................. 2-25
2-51 TEST INTERFACE SETUP SUMMARY Screen .......................... 2-27
2-52 DS1 TEST SETUP SUMMARY Screen ...............................2-27
2-53 Test Port Setup for Single Line, Monitoring Line 1 ......................2-28
2-54 RESULTS SUMMARY Screen Single Monitoring, LINE 1 BPV ...............2-28
2-55 RESULTS Screen 2 Single Monitoring, LINE 1 BPV ......................2-28
2-56 RESULTS Screen 3 Single Monitoring, LINE 1 BPV ......................2-29

TABLE OF CONTENTS
iv
LIST OF ILLUSTRATIONS - Continued
Figure Title Page
2-57 RESULTS Screen 4 Single Monitoring, LINE 1 BPV ......................2-29
2-58 RESULTS Screen 5 Single Monitoring, LINE 1 BPV ......................2-29
2-59 RESULTS Screen 6 Single Monitoring, LINE 1 BPV ......................2-29
2-60 DS1 LINE 1 RECEIVE ALARMS Screen .............................. 2-30
2-61 DS1 LINE 1 RECEIVE ERRORS Screen............................... 2-30
2-62 Test Port Setup for Dual Line, Monitoring Line 1........................ 2-31
2-63 RESULTS SUMMARY Screen Dual Monitoring, LINE 2 Pattern Errors.......... 2-31
2-64 RESULTS Screen 2 Dual Monitoring, LINE 2 PATTERN ERRORS ............. 2-31
2-65 RESULTS Screen 3 Dual Monitoring, LINE 2 PATTERN ERRORS ............. 2-32
2-66 RESULTS Screen 4 Dual Monitoring, LINE 2 PATTERN ERRORS ............. 2-32
2-67 RESULTS Screen 5 Dual Monitoring, LINE 2 PATTERN ERRORS ............. 2-32
2-68 RESULTS Screen 6 Dual Monitoring, LINE 2 PATTERN ERRORS ............. 2-32
2-69 RESULTS Screen 7 Dual Monitoring, LINE 2 PATTERN ERRORS ............. 2-33
2-70 RESULTS Screen 8 Dual Monitoring, LINE 2 PATTERN ERRORS ............. 2-33
2-71 RESULTS Screen 9 Dual Monitoring, LINE 2 PATTERN ERRORS ............. 2-33
2-72 RESULTS Screen 10 Dual Monitoring, LINE 2 PATTERN ERRORS ............ 2-33
2-73 DS1 LINE 1 RECEIVE ALARMS Screen .............................. 2-34
2-74 DS1 LINE 1 RECEIVE ERRORS Screen............................... 2-34
2-75 DS1 LINE 2 RECEIVE ALARMS Screen .............................. 2-34
2-76 DS1 LINE 2 RECEIVE ERRORS Screen............................... 2-34
2-77 Test Port Setup for Single Line, Monitoring Line 1 ......................2-36
2-78 Test Port Setup for Drop and Insert Toward the Customer Site.............. 2-40
2-79 Test Port Setup for Drop and Insert Toward the Network.................. 2-42
2-80 Test Port Setup for Typical Pattern test Toward the Network............... 2-44
2-81 QUICK TEST Display........................................... 2-45
2-82 LONG TEST Display ...........................................2-45
2-83 ALARM / ERROR INJECT Menu ................................... 2-47
2-84 ALARM / ERROR TYPE Screen.................................... 2-47
2-85 ALARM / ERROR TYPE Screen (Scrolled)............................. 2-47
2-86 24 CHANNEL SIGNALING Display ................................. 2-49
2-87 VIEW CHANNEL DATA Display ...................................2-50
2-88 DELAY MEASUREMENT Display...................................2-51
2-89 CSU / NIU EMULATION Screen ................................... 2-52
2-90 TIME SLOT SELECT Screen for Fractional T1..........................2-53
2-91 PULSE SHAPE ANALYSIS Screen 1 ................................2-55
2-92 PULSE SHAPE ANALYSIS Screen 2 ................................2-55
2-93 T1.403 ESF DATALINK Display, LIVE Mode ...........................2-56
2-94 T1.403 ESF DATALINK Display, UNSCHD Mode ....................... 2-56
2-95 SLC-96 DATALINK Display ...................................... 2-58
2-96 PM TEST ACCESS Screen....................................... 2-59
2-97 LOOPBACK SPAN CONTROL Menu ................................2-61
2-98 OPERATING REGION Menu ...................................... 2-61
2-99 REPEATER CONTROL Menu......................................2-61
2-100 DIAL / SUPERVISION Menu ......................................2-63
2-101 DIAL / SUPERVISION SETUP .....................................2-63
2-102 DS1 MENU with PRIMARY RATE ISDN ..............................2-66
2-103 PRIMARY RATE ISDN SETUP 1 Menu ...............................2-67
2-104 PRIMARY RATE ISDN SETUP 2 Menu ...............................2-68
2-105 PRIMARY RATE ISDN Call Initiation Screen ........................... 2-70
2-106 PRIMARY RATE ISDN MONITOR Screen .............................2-72

TABLE OF CONTENTS
v
LIST OF ILLUSTRATIONS - Continued
Figure Title Page
2-107 VIEW CAPTURED DATA - CONDENSED Display........................ 2-73
2-108 Expanded Display (Frame 3)...................................... 2-73
2-109 Expanded Display (Frame 7)...................................... 2-73
2-110 TERMINAL EMULATION Menu .................................... 2-74
2-111 DDS CHANNEL TESTING Menu ...................................2-75
2-112 DDS LOOPBACK CODES Menu ................................... 2-75
2-113 DDS CONTROL CODES Menu .................................... 2-76
2-114 DDS CONTROL CODES Menu (Scrolled) ............................. 2-76
2-115 GR-303 TEST ACCESS Menu ....................................2-77
2-116 TMC / CSC MONITORING Menu...................................2-78
2-117 EOC CHANNEL MONITORING Menu ................................ 2-78
2-118 CRAFT INTERFACE ACCESS Screen................................2-78
2-119 T1.403 ESF DATALINK Display ................................... 2-79
2-120 HYBRID SIGNALING SETUP Menu ................................. 2-79
2-121 VIEW CAPTURED DATA - CONDENSED Screen ........................2-80
2-122 VIEW CAPTURED DATA - EXPANDED Screen ......................... 2-81
2-123 VIEW CAPTURED DATA - EXPANDED Screen (Scrolled) .................. 2-81
2-124 TMC / CSC CAPTURED STATISTICS Display ..........................2-81
2-125 VIEW CAPTURED DATA - EXPANDED Screen (EOC).....................2-83
2-126 EOC CAPTURED STATISTICS Screen ............................... 2-83
2-127 HYBRID SIGNALING SETUP Menu ................................. 2-84
2-128 24 CHANNEL SIGNALING Display ................................. 2-84
2-129 DECODED ABCD BITS Display ....................................2-84
2-130 SS7 CAPTURE / ANALYSIS Screen................................. 2-85
2-131 SS7 MSU CAPTURE FILTER SETUP Screen ........................... 2-85
2-132 MSU CAPTURE FILTER SUMMARY Before Capture......................2-86
2-133 MSU CAPTURE FILTER SUMMARY After Capture.......................2-86
2-134 VIEW CAPTURED DATA - CONDENSED Screen ........................2-87
2-135 VIEW CAPTURED DATA - EXPANDED Screen ......................... 2-88
2-136 VIEW CAPTURED DATA - EXPANDED Screen (Scrolled) .................. 2-88
2-137 SU ANALYSIS Display .........................................2-89
2-138 SU ANALYSIS - LEGEND........................................2-89
2-139 MSU ANALYSIS Display ........................................ 2-90
2-140 MSU ANALYSIS - LEGEND ......................................2-90
2-141 FRAME RELAY TESTING Menu ................................... 2-92
2-142 FRAME RELAY CONFIGURATION Screen............................. 2-92
2-143 FULL STATUS CAPTURE Display ..................................2-93
2-144 FRAME RELAY ANALYSIS Screen .................................2-93
2-145 IP PING CONFIGURATION Screen..................................2-93
2-146 FRAME RELAY LINK TURN UP Screen...............................2-94
2-147 FRAME RELAY STATUS Screen ...................................2-94
2-148 DDS 4-WIRE MENU ........................................... 2-97
2-149 DDS SETUP OPTIONS Screen ....................................2-97
2-150 DDS 4-WIRE AUTOCONFIGURATION Screen .......................... 2-98
2-151 Sample DDS ALARM / ERROR INJECT Menu .......................... 2-98
2-152 DDS ALARM / ERROR INJECT TYPE Menu ........................... 2-98
2-153 DDS 4-WIRE BYTE DECODER Display ...............................2-98
2-154 DDS 4-WIRE LOOPBACK CONTROL Screen...........................2-99
2-155 DDS LOOPBACK EMULATION Screen............................... 2-99
2-156 FRAME RELAY TESTING Menu ................................... 2-99

TABLE OF CONTENTS
vi
LIST OF ILLUSTRATIONS - Continued
Figure Title Page
2-157 TEST PATTERN SELECTION Menu ................................ 2-101
2-158 DDS 4-WIRE LOOPBACK CONTROL Screen.......................... 2-103
2-159 DDS RESULTS - SUMMARY No Errors.............................. 2-104
2-160 DDS RESULTS Page 2 ........................................ 2-104
2-161 DDS RESULTS Page 3 ........................................ 2-104
2-162 DDS RESULTS Page 4 ........................................ 2-104
2-163 DDS RESULTS Page 5 ........................................ 2-105
2-164 DDS RESULTS Page 6 ........................................ 2-105
2-165 DDS TEST SETUP SUMMARY Screen .............................. 2-106
2-166 DDS TEST INTERFACE SETUP SUMMARY Screen ..................... 2-106
2-167 Metal Short and Metal Loop Selections, DDS 4-WIRE SETUP OPTIONS ....... 2-107
2-168 DDS ALARM / ERROR INJECT Menu............................... 2-108
2-169 DDS ALARM / ERROR TYPE Menu (Scrolled) ......................... 2-108
2-170 DDS 4-WIRE BYTE DECODER Screen .............................. 2-109
2-171 DDS LOOPBACK EMULATION Screen, No Loopback.................... 2-110
2-172 DDS LOOPBACK EMULATION Screen, Circuit Looped Up ................ 2-110
2-173 CAPTURE EVENTS Menu Before Capture Operation .................... 2-111
2-174 CAPTURE EVENTS Menu After Capture Operation ..................... 2-111
2-175 AUXILIARY PORT MENU....................................... 2-113
2-176 PRINT MENU ............................................... 2-113
2-177 STORE / RECALL USER SETUP Screen ............................. 2-114
2-178 Updating or Erasing a Stored User Test Setup ........................ 2-114
2-179 RECALL FACTORY SETUPS Menu ................................ 2-114
2-180 LINE PARAMETRICS Menu ..................................... 2-115
2-181 TEST LEAD CALIBRATION Screen ................................ 2-116
2-182 CABLE CHARACTERISTICS Setup Screen ........................... 2-117
2-183 Typical LINE VOLTAGE Screen................................... 2-118
2-184 Typical LINE ANALYSIS Screen .................................. 2-119
2-185 LINE ANALYSIS Display, Typical Vacant Line ......................... 2-120
2-186 LINE ANALYSIS Display, Results Showing a Resistive Load ............... 2-120
2-187 A Typical TDR Display ........................................ 2-121
2-188 TDR Delta Measurement of Same Line with Gain Increased ............... 2-121
2-189 LEVEL / FREQUENCY Measurement SEND Mode ...................... 2-125
2-190 LEVEL / FREQUENCY Measurement FULL Mode ....................... 2-125
2-191 Typical NOISE Measurement Display ............................... 2-127
2-192 Typical SPECTRUM ANALYSIS Display ............................. 2-128
LIST OF TABLES
Number Title Page
1-1 EZ-TESTER DS Options..........................................1-2
1-2 Accessories..................................................1-3
2-1 Controls and Indicators ..........................................2-2
2-2 ISUP and SCCP Message Types and Priorities ......................... 2-91
2-3 History Events Types ......................................... 2-112
A-1 Technical Specifications .........................................A-1
D-1 Trunk Type Summary ...........................................C-1
D-2 DTMF Frequencies .............................................C-2
D-3 MF Frequencies ...............................................C-2

TABLE OF CONTENTS
vii
LIST OF TABLES - Continued
Number Title Page
D-4 AT&T ISDN Facility Option Codes...................................C-3
D-5 AT&T National ISDN-2 Facility Option Codes ...........................C-3
D-6 National ISDN-2 (Except AT&T) Option Codes ..........................C-3
D-7 Northern Telecom ISDN Facility Option Codes ..........................C-4
D-8 ANSI VT Channel Numbering Scheme................................C-4
D-9 Bellcore VT Channel Numbering Scheme ..............................C-4
INTRODUCTION
Figure 1-1. EZ-TESTER DS
DDS, Dual DS1Test Set

INTRODUCTION
1-1
1.1 General
The portable hand-held EZ-TESTER® DS, is designed to perform in-service and out-of-service
testing and monitoring of DS1circuits, and out-of-service testing of 4 -wire DDS communications
equipment and circuits. It is used during installation to verify acceptable performance and during
maintenance to isolate problems to the communications components or end user equipment. The EZ-
TESTER DS incorporates the following design features:
• Rugged metal case minimizes damage from drops and similar accidents
• Weather-resistant construction protects test set in wet or dusty field conditions
• Menu driven setup and operation for ease of use
• Auto configuration feature determines line characteristics and reduces setup time
• Can be configured as a single or dual line test set.
• Dedicated storage for eight custom test setups
• Includes 26 stored test patterns vital to DS1 testing
• Controls and simulates CSU / NIU loopback functions
• Includes built in speaker, with jack for an optional headset
• Provides DS0 channel access
• Software upgrades can be field installed using OnCall® with a telephone line and modem
1.2 Functional Description
The EZ-TESTER DS performs comprehensive testing of DS1, 4-wire DDS circuits and
equipment, plus optional line parametric testing. As a T1 test set, it can be configured with single or
dual T1 test ports with single or paired transmitters and receivers. The receiver section can monitor
customer data or received test data to identify current line coding and framing information, and to
detect and display standard alarms and errors. The transmitter section can be used to send standard
test patterns, inject errors into the data stream, and generate loopback commands to NIUs and CSUs
to enhance isolation of network impairments. Dual transmit and receive jacks allow simultaneous bi-
directional monitoring and the ability to perform a drop and insert with a single instrument.
As a DDS test set, the EZ-TESTER DS provides full out-of-service testing capabilities for 4-wire
DDS local loops. When connected to terminate a 4-wire DDS local loop, the test set can autoconfigure
to match the loop rate, identify an existing test pattern, and confirm the status of the secondary status
and test pattern. It will also detect alarm and error conditions; transmit typical DDS test patterns;
inject errors and alarms; decode control bytes; perform local or remote loopback functions; and allow
frame relay testing from a DDS access point.
The optional line parametric test feature enables the test set to perform line level and frequency
measurements, noise measurements, spectrum analysis, time domain reflectometry tests, and test lead
calibration.
During operation, a capture memory stores selected events, periodic test summaries, and end
of test results. All events are date and time stamped from an internal real time clock and can be
reviewed locally, remotely, or output to a printer. Eight user defined test setups can be stored and
recalled for ease of operation. An auto configuration function is available to determine line
characteristics. Remote control operation and printer output is provided through an auxiliary RS-232
port.
1.3 Physical Description
The EZ-TESTER DS is housed in a rugged aluminum case with a removable cover and folding
stand. A positive latch keeps the test set securely closed and protected when it is not in use. A
power jack and a 25-pin RS-232 jack are mounted externally at the top of the case. The power jack
is used for recharging the internal nickel-metal hydride (NiMH) batteries using the PS-6 Battery
Eliminator/Charger. The RS-232 jack can be used for a printer or a remote control device. When the
jack is configured as a printer port, an 80 column printer can be supported. When configured as a
remote control port, the test set can be connected directly to a terminal or modem for remotely
controlled operation.

INTRODUCTION
1-2
The water resistant front panel of the EZ-TESTER DS has a keyboard and display on the lower
portion. The twenty-seven button keypad is used to operate the test set, and a 24 line x 32 character
liquid crystal display presents the setup options, test results, configuration setups, and history events
on a 2-5/8 inches square viewing area. During setup and operation, the speaker sounds an audible
tone when each key is depressed. The tone level is adjustable in amplitude and may be disabled by
the user if desired.
The upper portion of the EZ-TESTER DS front panel is divided into three areas. The two top
fields contain Bantam jack fields and LED indicators for the LINE 1 and LINE 2 test interfaces. The
LEDs for each test interface serve as status and alarm indicators for its associated receive (RX) line
and are active whenever the test set is turned on. During operation, these LEDs provide information
on signal presence, line coding, framing, and the presence of alarms and errors in the received data
stream The indicators also provide history information by blinking when a status or alarm condition
has changed state while running a test. Below and separate from the line indicators are four LEDs that
provide the status of tests in progress such as test running, the presence of pattern sync, alarm or
error injection, and detection of errors in the received test pattern.
1.4 Receiving and Unpacking
The EZ-TESTER DS should be unpacked when received and visually inspected for any damage.
If the test set appears to be damaged and the outside of the shipping container is damaged, contact
the carrier and submit a claim. The serial number on the bottom of the test set should correspond with
the packing list. If there are any problems noted, contact the factory or your sales representative.
Immediately prior to shipment, Electrodata, Inc. ensures that the battery pack in each test set is fully
charged. To be certain your test set is ready for use, however, we recommend that the test set be
placed on charge using the supplied battery eliminator/charger as described in paragraph 3.3 before
attempting any extended operation. The test set may be used while the batteries are on charge.
1.5 Options and Accessories
The EZ-TESTER DS is designed with forward compatibility. Sixteen options can be added to
the basic test set to meet specific testing needs beyond basic span testing. Table1-1 lists the options
available for the EZ-TESTER DS .
Table 1-1. EZ-TESTER DS Options
Option Description
01 Adds FT1 (Fractional T1)
02 Pulse Shape Analysis
03 ESF / SLC 96 Monitor and Control
04 Performance Statistics Retrieval
05 Addressable Repeater and Maintenance Switch Control
06 Dial Supervision
07 Computer Enhanced Test (Windows®)
08 MF Dial / Capture (Must also have option 6 installed)
09 Primary Rate ISDN
10 Terminal Emulation
11 DDS Channel Testing
12 GR-303 Test Access
13 SS7 Capture / Analysis
14 Frame Relay
19 Line 2 Enable (Dual T1 Transmit and Receive)
40 Line Parametric Testing
To identify the currently installed options, turn the test set on and select INSTALLED OPTIONS on the MAIN MENU.

INTRODUCTION
1-3
Table 1-2 lists the accessories provided with each instrument, provided with specific options,
or which are available for use with the EZ-TESTER DS at extra cost.
Table 1-2. Accessories
Part No. Provided with Every Instrument
140082 Padded Carrying Case w/Shoulder Strap
140072 Removable Test Set Carrying Strap
400021 PS-6 Battery Eliminator/Charger
600031 RS-232 “Y” Ribbon Cable, 5 ft.
600041 Bantam to Bantam Patch Cable (1 pair per enabled DS1 port), 5 ft.
600042 Bantam to 310 Adapter (1 pair per enabled DS1 port)
(none) Removable Plastic Stand (tilt bail)
610060 EZ TESTER DS Technical Manual
Provided with Option 10 (Terminal Emulation)
600064 DB-25 to DB-9 Interconnect Cable, 3 ft.
Accessories Available at Extra Cost
130010 Headset w/microphone
210076 TAC Test Apparatus Connector
600049 Bantam to Alligator Clip Patch Cord, 6 ft.
600053 Station Protector to Dual Bantam, 6 ft.
630047 Thermal Printer
630048 RE1 Repeater Extender
630049 Thermal Paper for LP1 Printer (5 rolls)
630051 Cigarette Lighter Charger/Adapter
630053 LIU Line Interface Unit, Model 735
600058 Bantam to Wire Wrap Post, 6 ft.
600059 Dual Bantam to RJ48, 6 ft.

INTRODUCTION
1-4
(This page intentionally left blank)
OPERATION
2-1
2.1 General
This chapter describes the operation and use of the EZ-TESTER® DS. It includes a detailed
explanation of the test set controls and indicators, instrument turn-on, and the use of the display
screen and menus for test setup and execution of DS1 and DDS line testing.
2.2 Controls and Indicators
The controls and indicators for the EZ-TESTER DS comprise electrical jacks, front panel LEDs,
a liquid crystal display, an audio speaker, and water-resistant key pad. Figure 2-1 shows the general
control layout. Refer to table 2-1 and figure 2-1 for the function and location of each item.
Figure 2-1. EZ-TESTER DS Controls and Indicators

OPERATION
2-2
Table 2-1 . Controls and Indicators
Index
No. Item Function
1 Line 1 DS1 Jacks
TX Provides a Bantam ring/tip connection point to a T1 transmit line
and serves as the transmit side of the parametric test port
RX Provides a Bantam ring/tip connection point to a T1 receive line
and serves as the receive side of the parametric test port
2 Line 2 DS1 Jacks
TX Provides a Bantam ring/tip connection point to a T1 transmit line
RX Provides a Bantam ring/tip connection point to a T1 receive line
Serves as a reference clock input during a timing comparison
3 12 VDC Provides an input for a 12 VDC PS-6 Battery Eliminator/Charger
4 AUXILIARY
PORT Provides a 25-pin RS-232 connection point for the following:
- Modem connection for OnCall® updates
- Data output to a local printer
- Remote control using a PC and Windows® software
5 RJ48 DDS Jack Provides an RJ48 connection point to a DDS local loop
6 LINE 1, LINE 2 LED Clusters
PULSES Indicates presence of data on the T1 line.
B8ZS Indicates the presence of B8ZS codes in the receive data
stream.
FRAME SYNC Indicates that the test set recognizes a DS1 signal and has
synchronized with the DS1 framing.
ALARM Indicates an alarm condition is detected at the line RX jack.
ERROR Indicates an error condition is detected at the line RX jack.
AIS Indicates an AIS is being detected at the line RX jack.
7 DDS LOCAL LOOP LED Cluster
PULSES Indicates presence of pulses on the DDS line.
SEALING CURRENT Indicates sealing current has been detected.
REVERSE CURRENT Indicates sealing current polarity is reversed.
ALARM Indicates that a DDS alarm has been detected on the line.
ERRORS Indicates than a DDS error has been detected on the line.
Secondary Channel
PATTERN SYNC Indicates the DDS secondary is enabled and the test set has
synchronized with a pattern that is present.

OPERATION
2-3
Table 2-1 . Controls and Indicators (Continued)
Index
No. Item Function
Secondary Channel
PATTERN ERRORS Indicates the test set has detected errors in the secondary
channel test pattern.
8 Lower LED Cluster
RUNNING Indicates a test is in progress
ALM/ERR INJECT Indicates the test set is injecting an alarm or error into the data
stream
PATTERN SYNC Indicates the test set has synchronized with the received test
pattern
PATTERN ERRORS Indicates an error has been detected in the received test pattern
9 Internal Speaker Internal speaker allows aural monitoring of received signals
without the headset
10 PWR Turns test set power on and off
11 Audio Input/Output Standard cell phone style head set jack used during voice
frequency testing
12 +VOL - Increases and decreases test set speaker and headset speaker
volume
13 Display Screen shows specific test set identification data, all MAIN MENU and
sub-menu selections, configuration setups, alarm and error data,
and test progress reports and results
14 F1, F2, F3, F4 Soft keys add or redefine variations to MAIN MENU or sub-
menu selections. Functions are software controlled and vary
with the selected menu item. In some screen displays, the F1
and F2 keys provide means for screen contrast adjustment
15 EDIT Allows selection of menu item when values exceed number
easily handled with soft keys
16 Numeric Keypad Allows entry of alphanumeric and punctuation data required by
various editable data entry functions. Serves as a telephone
keypad when test set is in the appropriate mode
17 ENTER Directs test set to go to selected menu item or to store data
manually entered on keypad
18 MENU Causes menu display to step back through previous menu levels
to the MAIN MENU
19 Up, Down, Left,
Right Allows operator to scroll up, down, left and right through the
menu selections. Also increments or decrements numerical
values on screen setups
20 START Initiates each selected test cycle
OPERATION
2-4
2.3 Turn On Procedure
Turn on the test set by pressing the PWR key. The EZ-TESTER DS will briefly display unit
identification data, perform a short power-on self-test, and display the MAIN MENU screen. By
pressing the F1(HOLDSCREEN) key before the self-check sequence is completed, the unit identification
data will remain displayed and will not change until the F1 (RESUME) key is pressed. When the self-
test is complete and the MAIN MENU is displayed, the operator can adjust the screen contrast by
pressing F1 (DARKER) or F2 (LIGHTER), and begin setting up the test set for operation. Refer to
figures 2-2 and 2-3 for examples of the Power On screen and MAIN MENU.
Figure 2-2. Power-On Screen
in HLDSCRN Mode
Figure 2-3. MAIN MENU Figure 2-4. MAIN MENU (Scrolled)
2.4 Preparation for Use
Before placing the test set into service, check the battery charge status by viewing the “fuel
gauge” shown at the top of each menu screen. The fuel gauge is displayed during the power on self-
test, and at all times if enabled on the CONFIGURATION SETUP MENU (Figure 2-14 ). If the fuel gauge

OPERATION
2-5
indicates a low charge status, plug the PS-6 battery eliminator/charger into the 12VDC jack on the end
of the test set, and connect the PS-6 power cord to a convenient AC outlet. The test set may be used
while the battery eliminator/charger is in use. Whenever charging is in progress, the fuel gauge will
display a plus sign on the left side of the charging status bar. The CONFIGURATION SETUP MENU
is discussed in more detail in paragraph 2.7.
2.5 Menu Operation
The EZ-TESTER DS is operated by manipulating the multi-level menu shown on the display
screen using the keys located below the display screen. Most operations are performed by simply
scrolling through various menus and selecting preset options. During setup and operation, the speaker
sounds an audible tone when each key is depressed to assure the user that the test set has recorded
each selection. The EZ-TESTER DS menu is designed to guide the user through a logical decision
sequence when preparing a test setup. In many cases, when a selection or decision is made, the
highlight will automatically move on to the next logical line item. The menu headings and text lines
are also worded to be as self-explanatory as possible to eliminate the need for lengthy operating
instructions. This operating manual will describe each primary menu screen in detail and provide
illustrations of each screen.
The following rules apply when using the EZ-TESTER DS menus:
a. Movement through the menu selections is usually done with the arrow keys. If an arrow key
is held down for more than one second, it will cause the highlight to move through the menu
items at a rate of ten times a second.
b. Only menu items that require a decision, or which can be edited, will be highlighted.
c. Use the ENTER key to select a line item.
d. Use the soft keys (F1, F2, F3, and F4) to select a desired parameter for a line item that has
multiple conditions. The functions of these keys change depending on the menu item currently
highlighted.
e. Watch for screens with special instructions appearing on the line second from the bottom.
These instructions often appear when a highlighted item on the menu has a range of selections
too great to fill with the four soft keys (Example: figure 2-38). Use the EDIT key to select or
modify a desired parameter when directed by the prompt.
f. Use the START key to begin a test when all setup requirements and connections are complete.
g. Pressing the MENU key several times will cause the display to step backwards through the
menu to the MAIN MENU screen.
2.6 MAIN MENU
The MAIN MENU (Figure 2-3, 2-4) is the beginning point for all applications of the test set.
All setup selections, including test mode, line parameters, monitoring, and display criteria begin with
this menu. The scroll bar on the left side of the screen shows the position of the display window in
the overall menu and indicates more selections are available before or after the current menu window.
The eleven items contained on the MAIN MENU are arranged in the general order of most frequent
usage and are explained in the order in which they appear.

OPERATION
2-6
The following selections are available on the MAIN MENU:
a. TEST INTERFACE SETUP MENU - for selecting the front panel test jacks (LINE 1 or LINE 2)
that will be activated, and setting the termination type, output level, and line code for the
selected jacks (Figure 2-5).
b. DS1 MENU - gives access to DS1 setup options and specific test modes (Figures 2-6, 2-7, and
2-8).
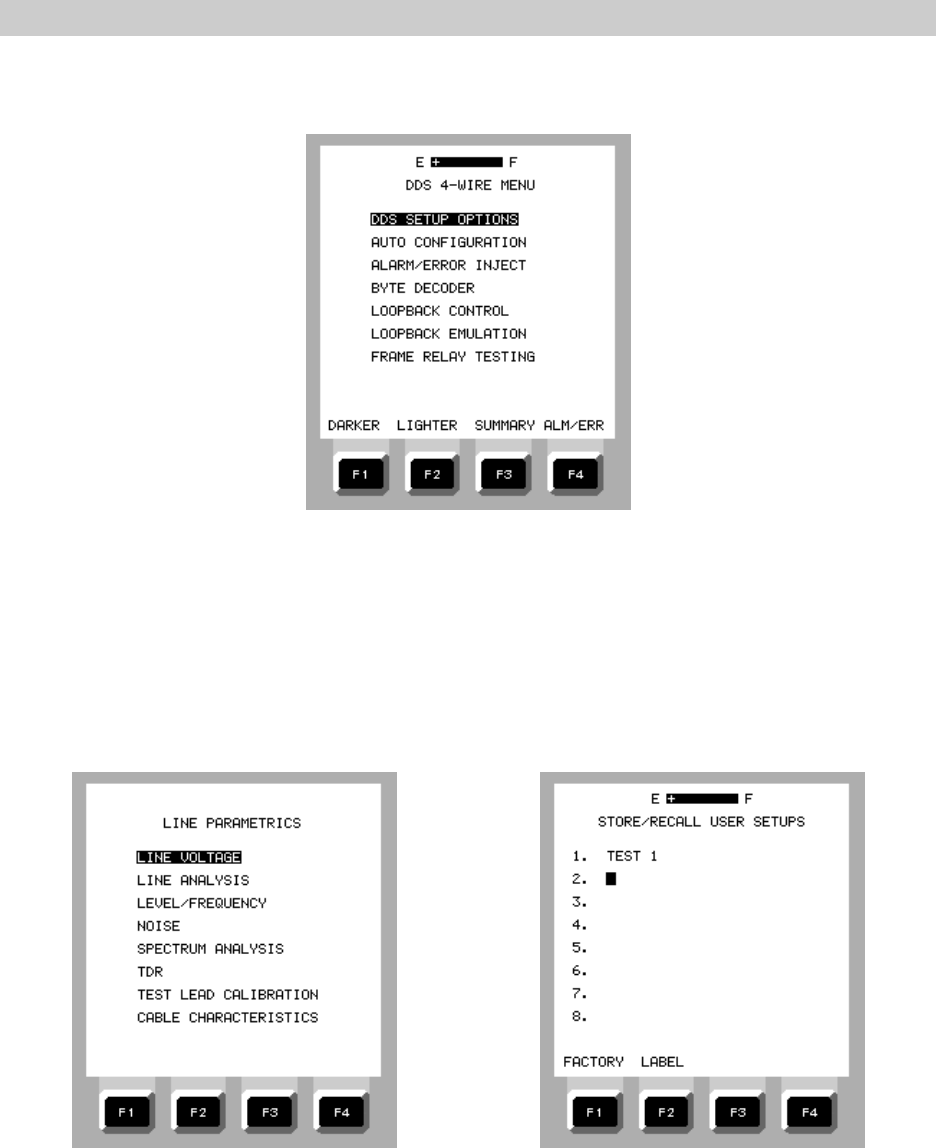
c. DDS 4-WIRE MENU - gives access to DDS 4-WIRE MENU and specific test features (Figure 2-9)
d. LINE PARAMETRICS - gives access to line parametric testing menu to enable line voltage
measurements, line analysis, signal level and frequency measurements, noise measurements,
and spectrum analysis (Figure 2-10)
e. STORE/RECALL SETUPS menu - to store or recall a user-defined custom test setup or a
preprogrammed factory test setup (Figure 2-11).
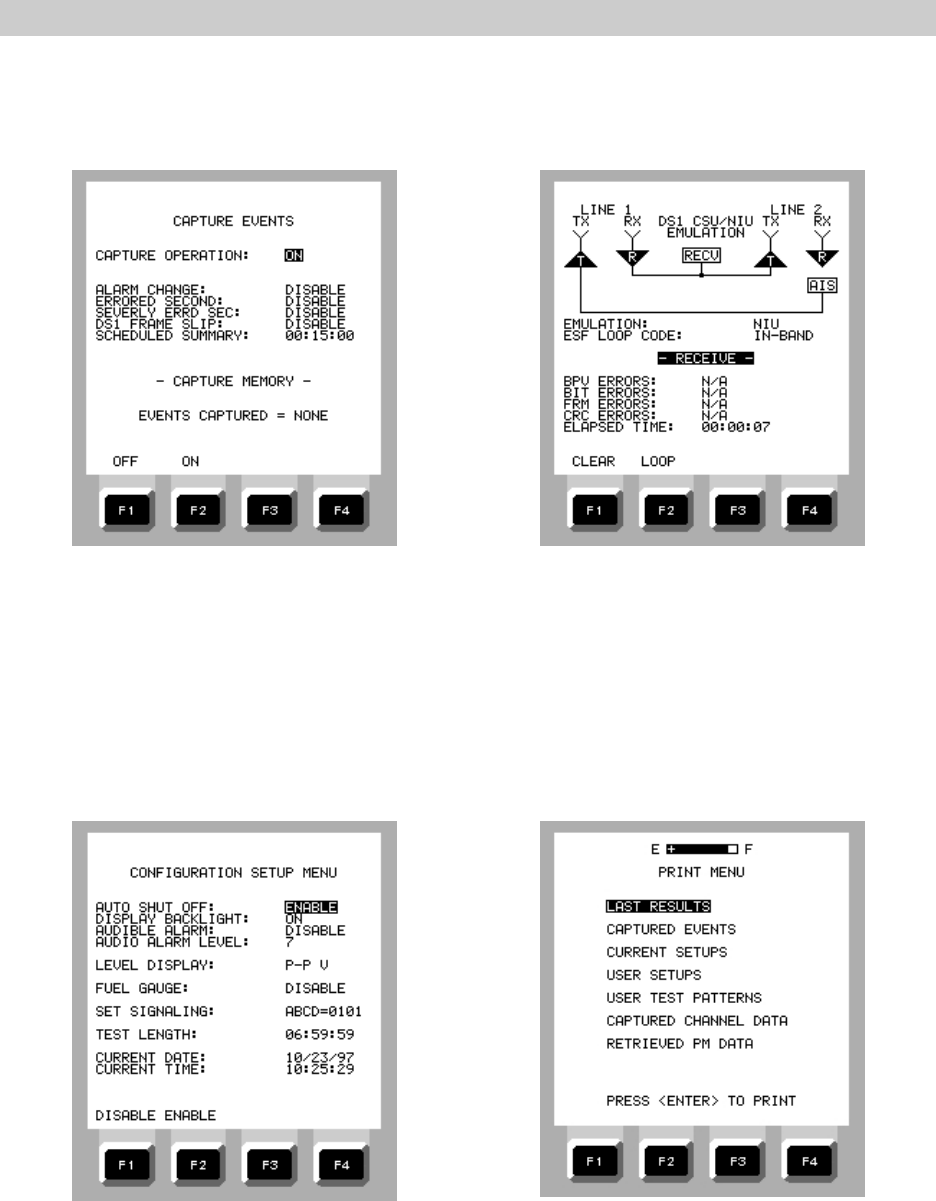
f. CAPTURE EVENTS menu - for selecting specific events that may occur during testing or
monitoring for storage and later review (Figure 2-12).
g. TERMINAL EMULATION - provides access to the performance monitoring, provisioning, and
system maintenance capabilities of HDSL equipment and performance information in the Digital
Network Inteface (DNI) (Figure 2-13)
h. CONFIGURATION SETUP menu - for turning on or off certain test set functions and features
such as Auto Shut Off, Display Backlight, Fuel Gauge, date and time, test length, and to set
signaling bits (Figure 2-14).
i. PRINT menu - for selecting which test results and setup data will be printed at a remote printer
(Figure 2-15).
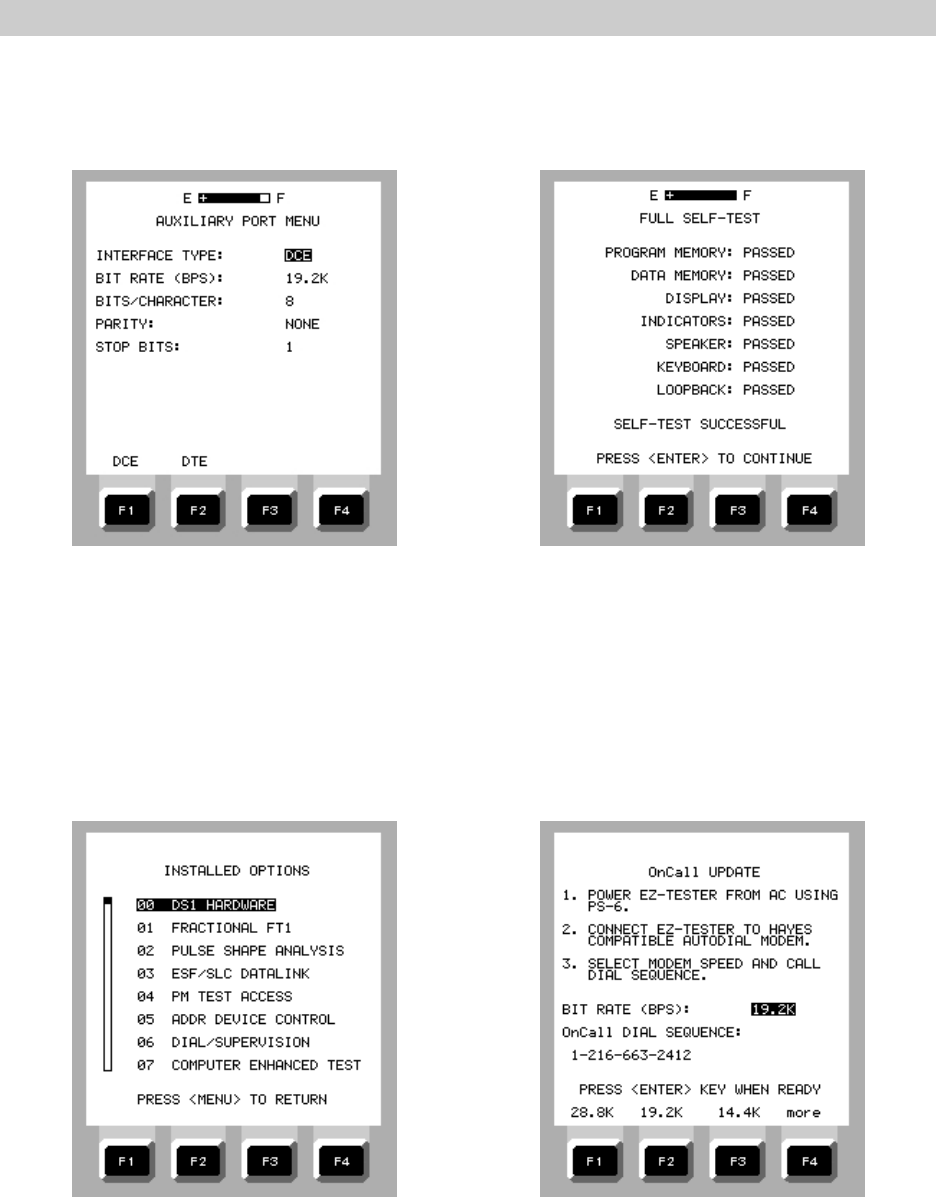
j. AUXILIARY PORT menu - for selecting the proper communications parameters for the RS-232
port (Figure 2-16).
k. FULL SELF-TEST menu - for displaying the setup instructions, and executing the instrument
confidence test (Figure 2-17).
l. INSTALLED OPTIONS - Displays all test options currently installed in test set (Figure 2-18)
m. OnCall® UPDATE menu - for displaying the setup instructions, and executing the automatic
update feature (Figure 2-19).
n. Associated Soft Keys (MAIN MENU)
F1 = DARKER Adjusts the screen contrast
F2 = LIGHTER Adjusts the screen contrast
F3 = CONFIG Displays the current instrument setup.
F4 = ALM/ERR Displays all alarms or errors that have occurred since the last time the
display was cleared.
OPERATION
2-7
Figure 2-5. TEST INTERFACE SETUP Figure 2-6. DS1 MENU
MENU
Figure 2-7. DS1 MENU (Scrolled 1) Figure 2-8. DS1 MENU (Scrolled 2)
OPERATION
2-8
Figure 2-9. DDS 4-WIRE MENU
Figure 2-10. LINE PARAMETRICS Menu Figure 2-11. STORE / RECALL SETUPS Menu
OPERATION
2-9
Figure 2-12. CAPTURE EVENTS Menu Figure 2-13. TERMINAL EMULATION Screen
Figure 2-14. CONFIGURATION SETUP Figure 2-15. PRINT MENU
MENU
OPERATION
2-10
Figure 2-16. AUXILIARY PORT MENU Figure 2-17. FULL SELF TEST Screen
Figure 2-18. INSTALLED OPTIONS Figure 2-19. OnCall UPDATE
Display
OPERATION
2-11
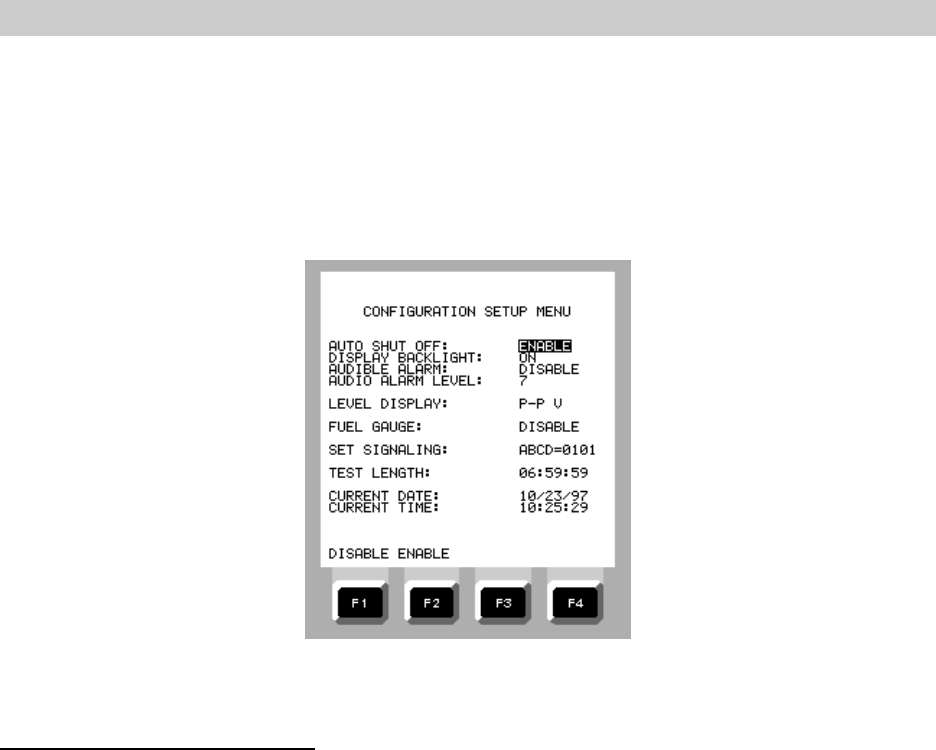
2.7 CONFIGURATION SETUP MENU
The CONFIGURATION SETUP MENU (Figure 2-20 ), selected on the MAIN MENU, provides the
user a convenient location for setting test set display preferences that are common to all test modes
and which may remain unchanged for long periods of time. Certain important test settings, SET
SIGNALING and TEST LENGTH, are located on this menu and should not be forgotten.
Figure 2-20. CONFIGURATION SETUP MENU
To Perform a Configuration Setup
1. On the MAIN MENU, move the cursor to CONFIGURATION SETUP and press ENTER.
2. Move the cursor to AUTO SHUT OFF and select or de-select the battery-saving shut off
function.
F1 = DISABLE Prevents automatic shut off.
F2 = ENABLE Shuts off test set automatically when 15 minutes passes with no
pulses sensed at the RX jacks.
3. Move the cursor to DISPLAY BACKLIGHT and select the desired control for the display
illumination.
F1 = ON Backlight is always on and the intensity can be controlled by the F1/F2
keys on the MAIN MENU.
F2 = OFF Backlight is off.
F3 = AUTO The backlight is on, but turns off automatically to conserve battery
power if 60 seconds pass without a keypad operation. If the backlight
shuts off automatically, it will return to the user setting when any key
is opera The intensity can be controlled by the F1/F2 keys on the
MAIN MENU.
4. Move the cursor to AUDIBLE ALARM LEVEL and select the desired loudness of the front
panel speaker in level increments from 1 (low) to 7 (high).
OPERATION
2-12
5. Move the cursor to LEVEL DISPLAY and select the signal level unit of measurement.
F1 = P-P V Volts peak-to-peak
F2 = dBdsx dB as measured at the DSX panel
6. Move the cursor to FUEL GAUGE and enable or disable the fuel gauge display.
F1 = DISABLE F2 = ENABLE
7. Move the cursor to SET SIGNALING . If the test requires, set the signaling bits (ABCD)
using the EDIT key and keypad to set each to 0 or 1
8. Move the cursor to TEST LENGTH and select the desired time duration for the test.
F1 = TIMED Press the EDIT key and use the arrow keys or numeric keypad to enter
the time (hh:mm:ss) All spaces must be filled in before pressing the
ENTER key.
F2= CONT When selected, the test set will run the test continuously until stopped
by the operator or by an auto shutdown.
9. Move the cursor to CURRENT DATE and et in the current date by pressing the EDIT key
and using the arrow keys or numeric keypad to enter the date (mm/dd/yy). All spaces
must be filled in before pressing the ENTER key.
10. Move the cursor to CURRENT TIME and set in the correct time by pressing the EDIT key
and using the arrow keys or numeric keypad to enter the time (hh:mm:ss). All spaces
must be filled in before pressing the ENTER key.
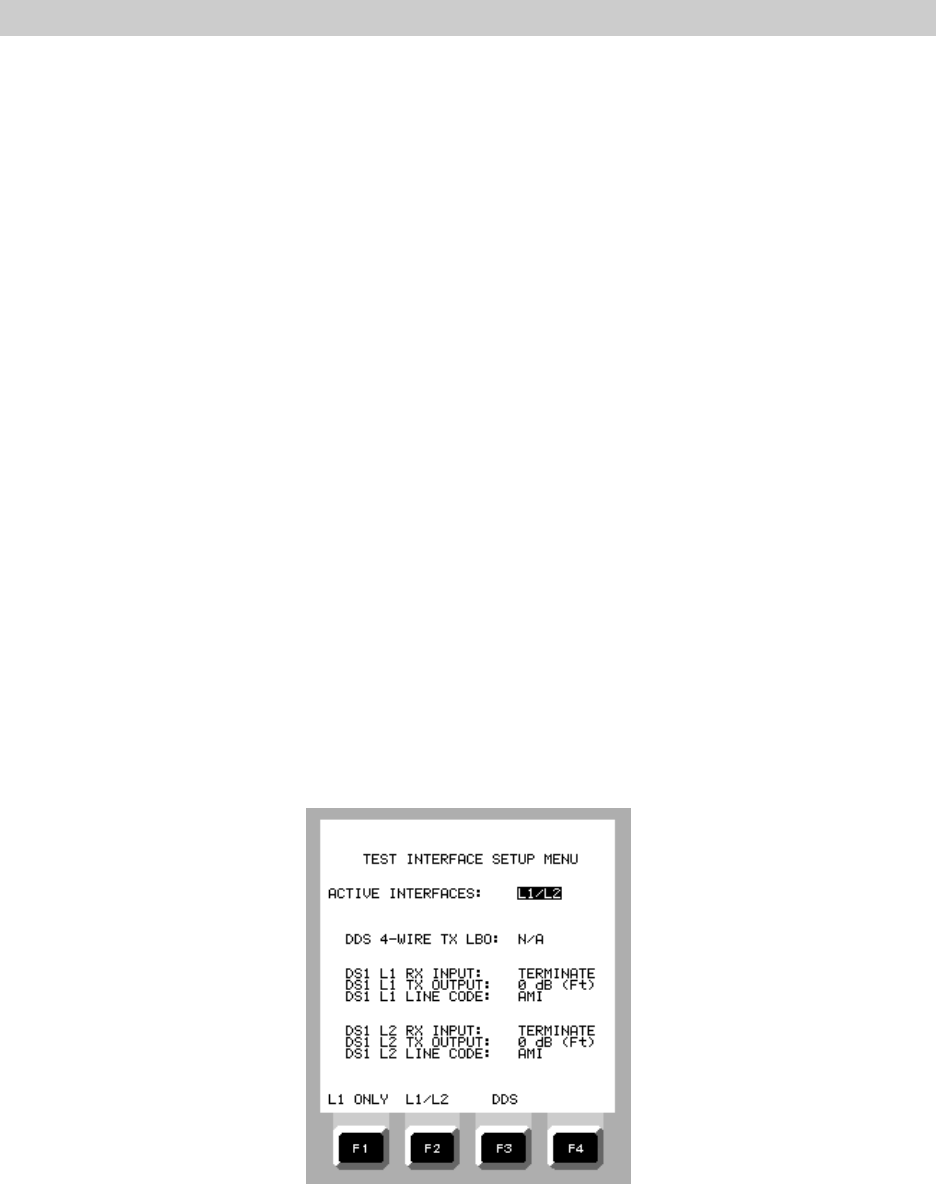
2.8 TEST INTERFACE SETUP MENU
Figure 2-21. TEST INTERFACE SETUP MENU
Depending on the configuration of your test set, the DS1 LINE 1 only, DS1 LINE 1 and DS1
LINE 2, and DDS test ports are available for operation. T1 line testing or monitoring in a single
direction, and line parametric testing require only LINE 1 to be active. T1 line testing or monitoring
in both directions, such as a drop and insert operation, requires that both LINE 1 and LINE 2 be

OPERATION
2-13
activated. DDS 4-wire testing enables the RJ45 jack. For T1 testing, Paragraph 2.9.2, Connecting
the Test Set to the T1 Line, provides a detailed discussion of connecting the Line 1 and Line 2 jacks
to the circuit being tested.
To Perform the Test Interface Setup
As choices are made for each menu item , the choices for later menu items may be altered.
1. On the MAIN MENU, move the cursor to TEST INTERFACE SETUP and press ENTER.
2. On the TEST INTERFACE SETUP menu, use the soft keys to activate the desired ports:
F1 = L1 ONLY F2 = L1/L2 F3 = DDS
3. Use the soft keys to set DS1 L1 RX INPUT for the type of connection required.
F1 = TERM Use this selection if the span is to be terminated at the test set.
F2 = BRIDGE Use this selection when the test set is to be connected to the line
through a bridging jack or across the conductors of a normally
terminated span with alligator clips.
F3 = MONITOR Use this selection when the test set RX jack is to be connected to a
DSX monitor jack
4. Use the soft keys to set the DS1 L1 TX OUTPUT signal level. Signal level is shown in
dB or feet. The value in feet is used to simulate line loss as if signal injection is made
at a distance from the DSX.
F1 = 0 dB (0 FEET) F2 = -7.5 dB F3 = -15 dB F4 = more
F1 = 133 FEET F2 = 266 FEET F3 = 399 FEET F4 = more
5. Use the soft keys to sets the applicable line code.
F1 = AMI F2 = B8ZS
6. If LINE 2 is activated, repeat step 3 through 5 for L2.
NOTE: Selections made on the TEST INTERFACE SETUP MENU are critical to
the test set’s ability to properly measure and report signal status and events. Only use
the MON setting on L1 and L2 RX INPUT if the jack is connected to a T1 MONITOR
jack. The test set is designed to amplify the input signal by 20 dB to compensate for
the monitor jack’s 20 dB attenuation caused by its isolation resistor. After connecting
the test set, check the signal level on the RESULTS screen. If a signal level appears
high, the MONITOR jack may be misnamed, offering no signal attenuation, and may
require the L1 or L2 RX INPUT to be set to BRIDGE.
2.9 DS1 Testing
The DS1 MENU is used to set up the EZ-TESTER DS for DS1 testing. Most DS1 testing can
be performed using the DS1 LINE 1 TX and RX jacks only, connected via test cables to the T1 access
point. Other test configurations are available for the EZ-TESTER DS if Option 19 is installed, enabling
the second DS1 test port. Dual line testing is particularly useful when the user wishes to monitor both
directions of an ISDN “D” channel or SS7 link channel to monitor command and control messages, or
when drop and insert operations are necessary, during which one RX port is used for routing the T1
line data into the test set to allow the DS0 drop, and the second RX port is used to monitor the
channel that has been modified for the DS0 insertion.

OPERATION
2-14
NOTE: The step-by-step test procedures in this section include specific selection
requirements on the TEST INTERFACE SETUP MENU and DS1 SETUP OPTIONS menu
that are vital for successful performance of the test. The initial test procedures include
the basic setup requirements. To avoid repetition of basic setup steps, later
procedures require the user to apply his or her knowledge of the T1 circuit being tested
to perform the basic setup without prompting. Setup steps for the TEST INTERFACE
SETUP MENU and DS1 TEST SETUP OPTIONS menus only list line items that are
required for successful performance of the test being described. Items that appear on
the menus, but which are not called out in the procedure may be ignored without
affecting the results of the test.
2.9.1 DS1 MENU
The DS1 MENU (Figures 2-6, 2-7, and 2-8) includes up to twenty items depending on installed
options. It is the menu used to select the type of T1 test to be performed and for preparing the test
set for the specific test selected. This paragraph lists the primary menu selections. Figures 2-22
through 2-42 show the initial screen displayed for each selection.
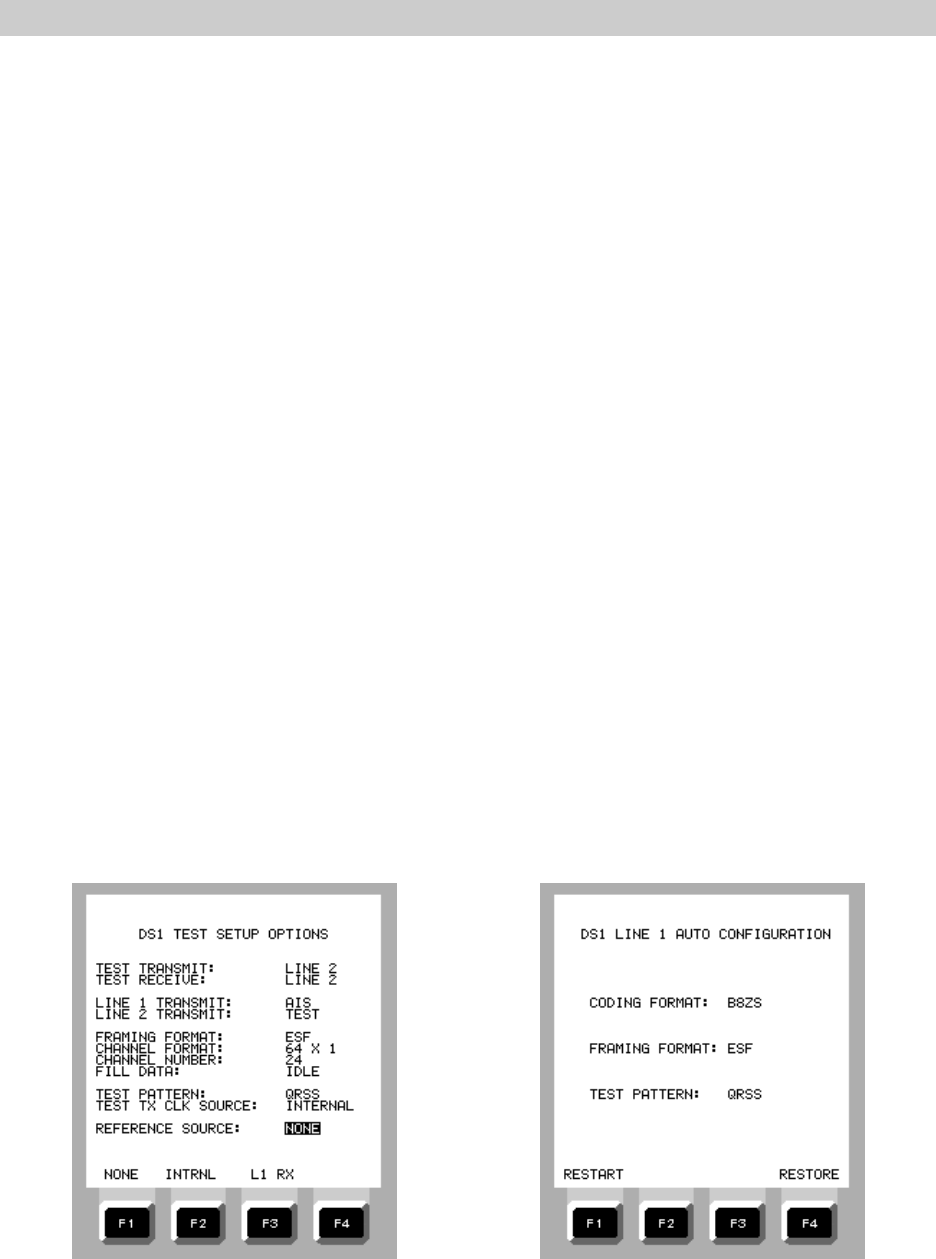
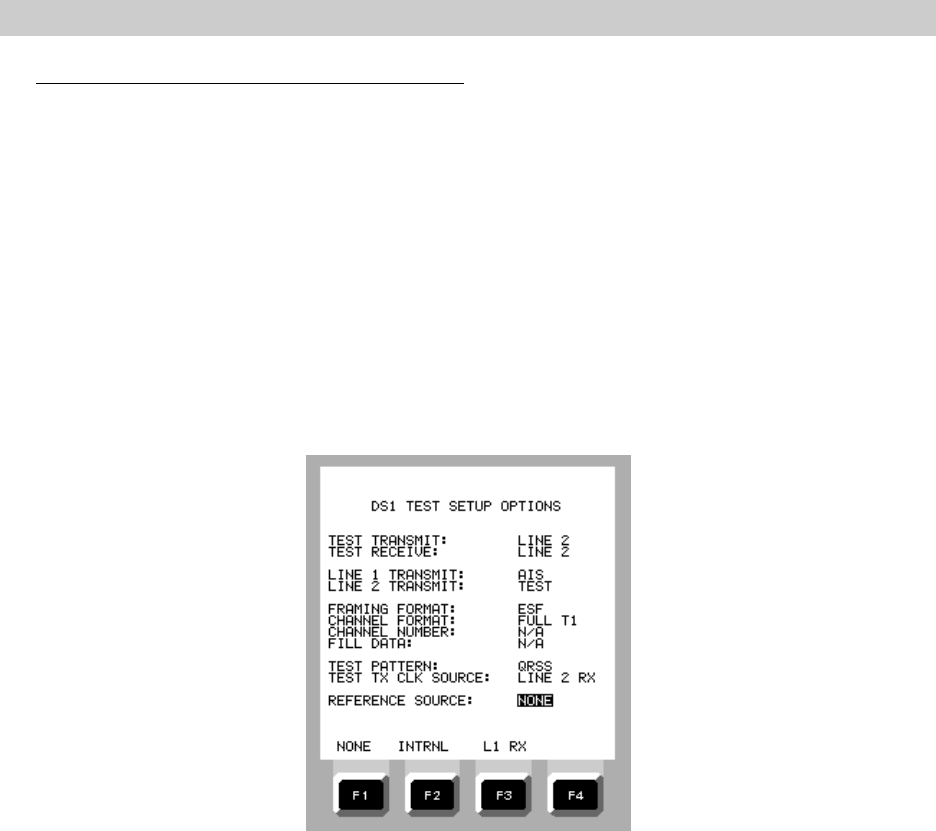
a. DS1 SETUP OPTIONS - Used to select the send and receive test ports, framing and channel
formats, test channel number, fill data, test pattern, clock source, and reference source. (Figure
2-22).
b. AUTO CONFIGURATION - Initiates automatic sensing of signal coding and framing formats,
and presence of a recognizable test pattern (Figure 2-23).
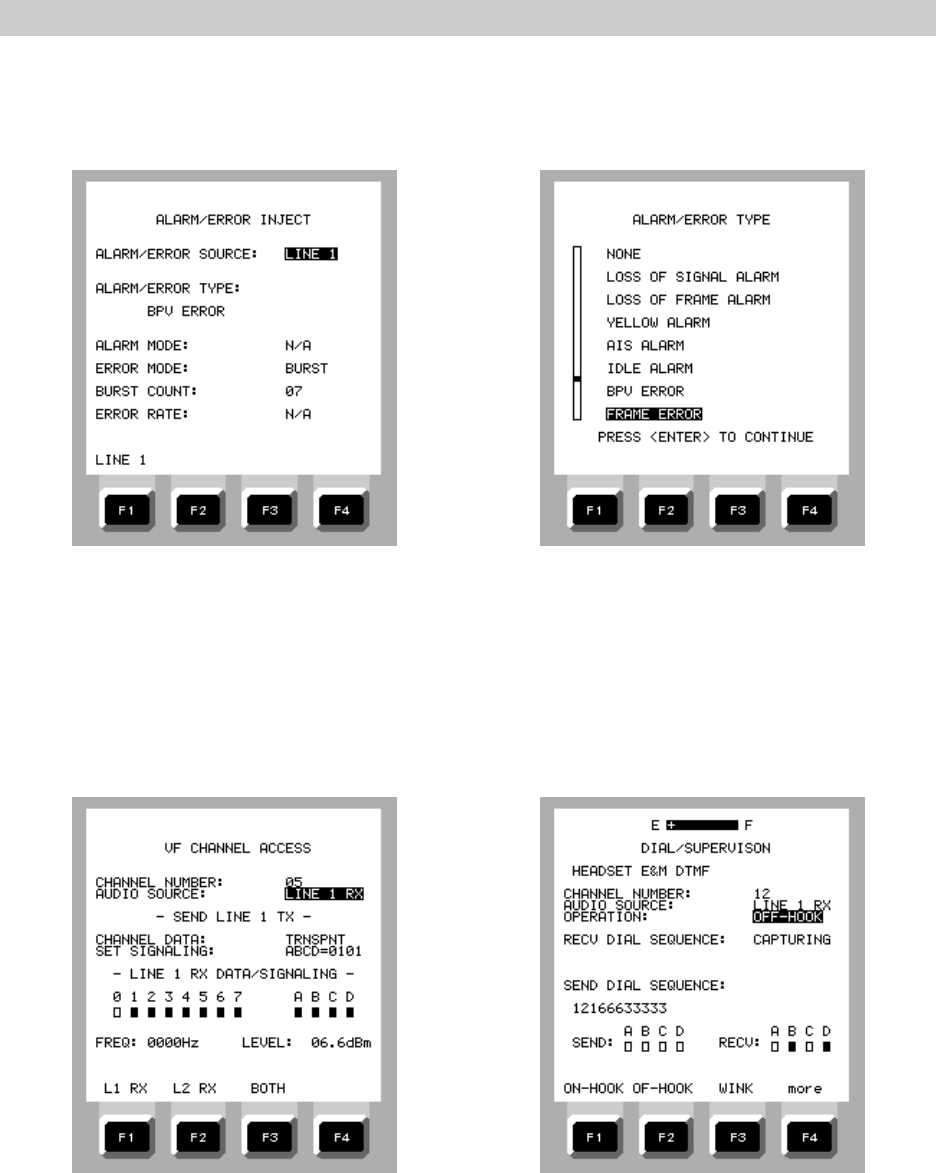
c. ALARM/ERROR INJECT - Allows selection of the type of alarms or errors to be injected into
test data stream, including rate of error insertion (Figures 2-24 and 2-25).
d. VF CHANNEL ACCESS - Allows selection of a specific 56Kb/s or 64 Kb/s DS0 channel for test
and measurement (Figure 2-26)
e. DIAL SUPERVISION (Option 06) - Allows test set to originate or terminate calls into a digital
switch or PBX from a T1 access point. (Figure 2-27)
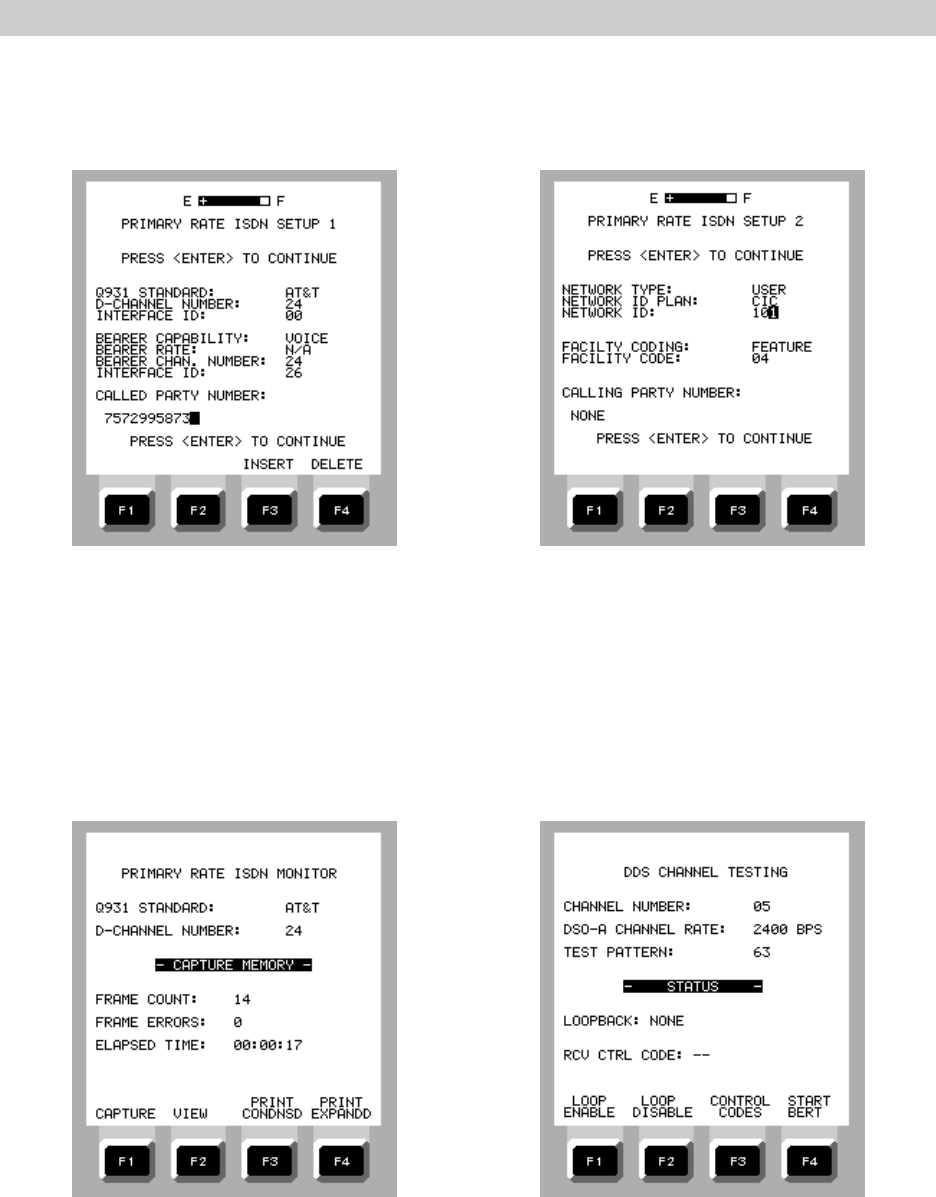
f. PRI ISDN, TE EMULATE (Part of Option 09) - Allows test set to place voice and data calls
toward the network to test “B” and “D” channel operation (Figures 2-28 and 2-29).
g. PRI ISDN, NT EMULATE (Part of Option 09) - Allows test set to place voice and data calls
toward the customer to test “B” and “D” channel operation (Figures 2-28 and 2-29).
h. PRI ISDN, MONITOR (Part of Option 09) - Allows the test set to capture, view, and print
control data contained in the ISDN D-channel (Figure 2-30).
i. DDS CHANNEL TESTING (Option 11) - Allows testing of 56K and 64K DDS circuits (Figure 2-
31).
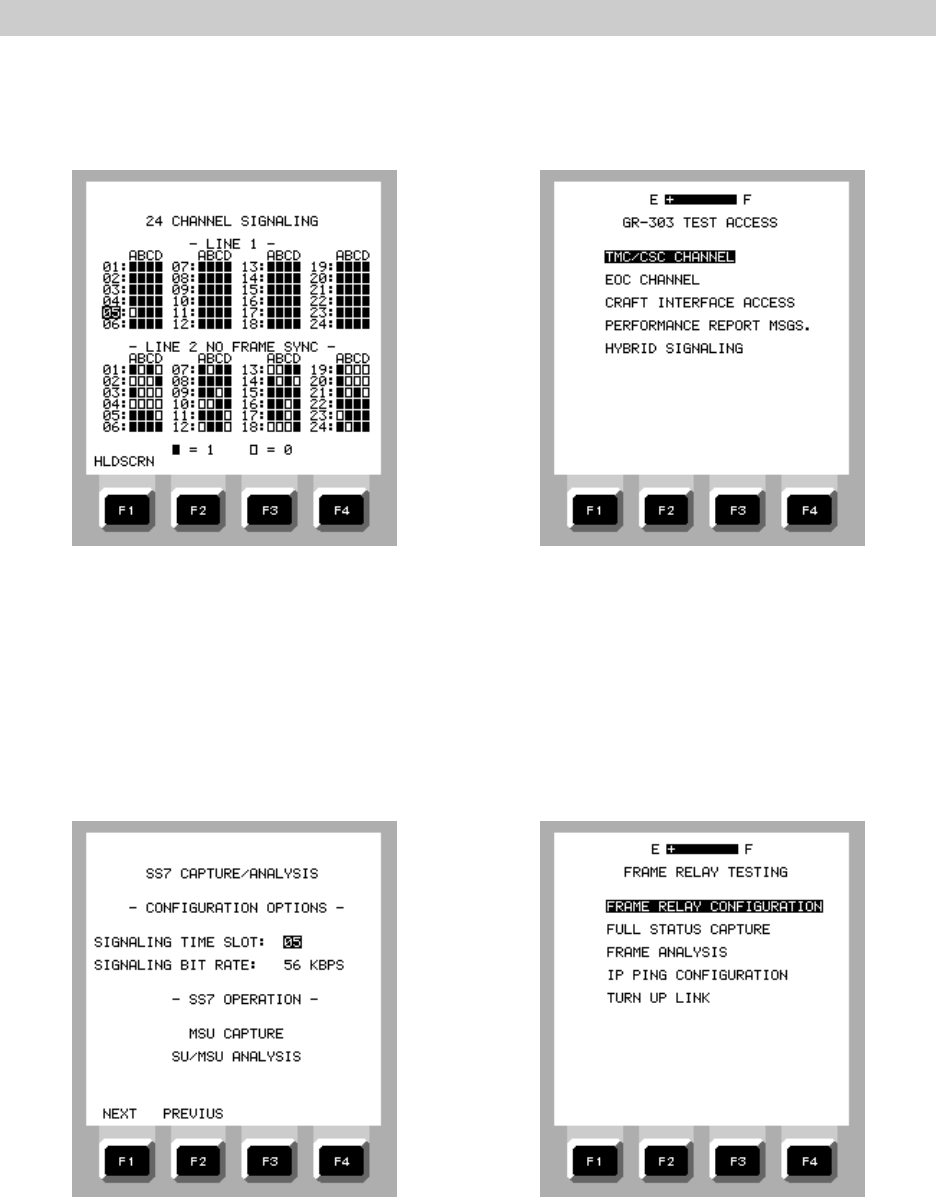
j. 24 CHANNEL SIGNALING - Displays the status of signaling bits on each channel. F1
(HLDSCRN) freezes display (Figure 2-32).
k. GR-303 TEST ACCESS (Option 12) - Captures and displays Time-slot Management Channel
(TMC) and Embedded Operations Channel (EOC). Features pre- and post-capture filtering
(Figure 2-33).
OPERATION
2-15
l. SS7 CAPTURE / ANALYSIS (Option 13) - Captures and displays Message Signal Unit (MSU)
messages. Provides statistical data for Fill-in Signal Units (FISU), Link Status Signal Units
(LISU), inverted Forward Indicator Bits (FIB) and Backward Indicator Bits (BIB) (Figure 2-34).
m. FRAME RELAY TESTING (Option 14) -Identifies link protocol, captures and displays full status
messages, displays Data Link Connection Identifier (DLCI) statuses, provides IP ping capability
Figure 2-35).
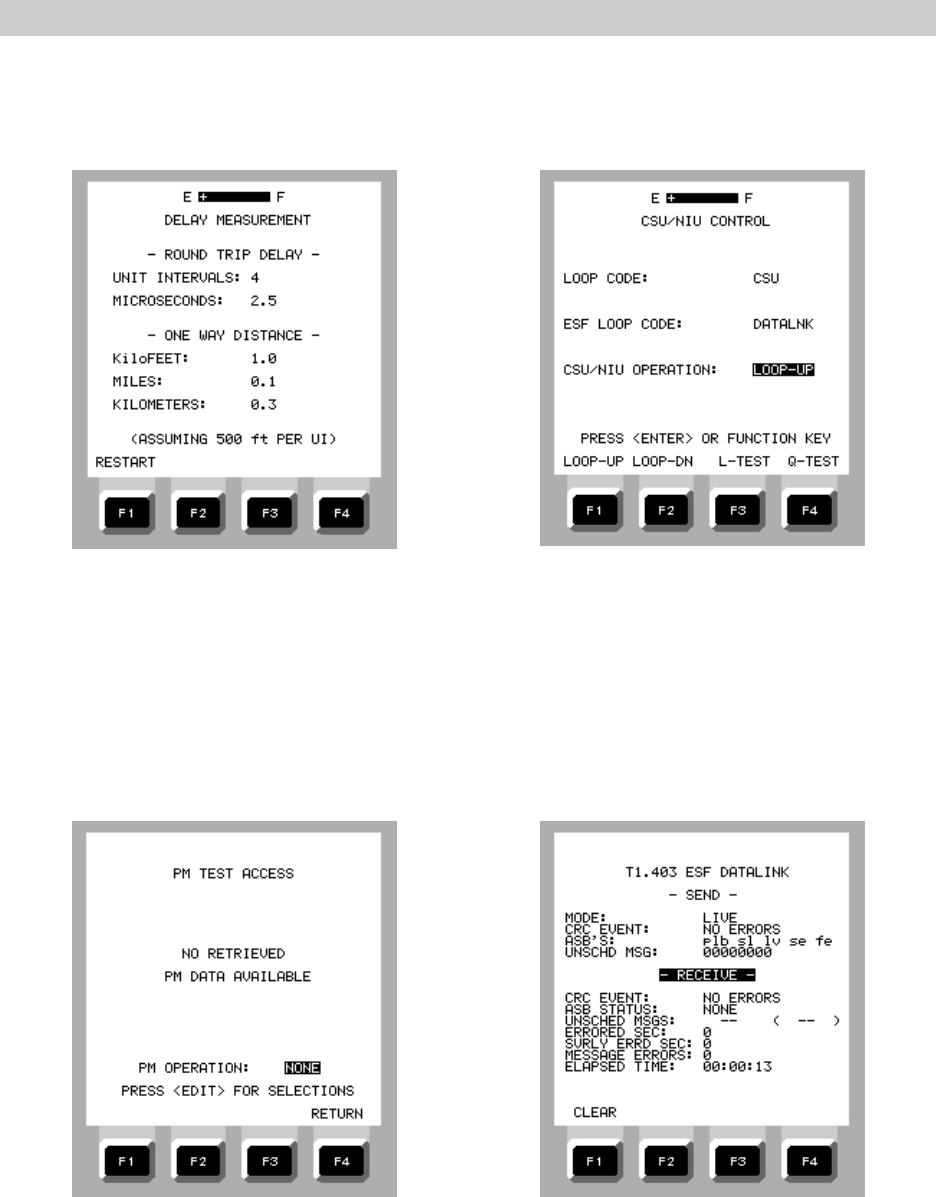
n. DELAY MEASUREMENT - Provides measurement of “round trip” delay through a network
loopback. Computes the “one way” distance based upon standard delays in a copper local loop
(Figure 2-36).
o. LOOPBACK / SPAN CONTROL - Allows designation of equipment type to be looped back during
trouble isolation (Figure 2-37).
p. PM TEST ACCESS (Option 04) - Enables the test set to retrieve and display line performance
data, set the performance monitor clock, and clear memory of Westell and Teltrend network
interface unit/performance monitors (NIU / PM) (Figure 2-38).
q. ESF/SLC DATALINK (Option 03) - Enables the test set to access an ESF or SLC 96 facility data
link (Figure 2-39).
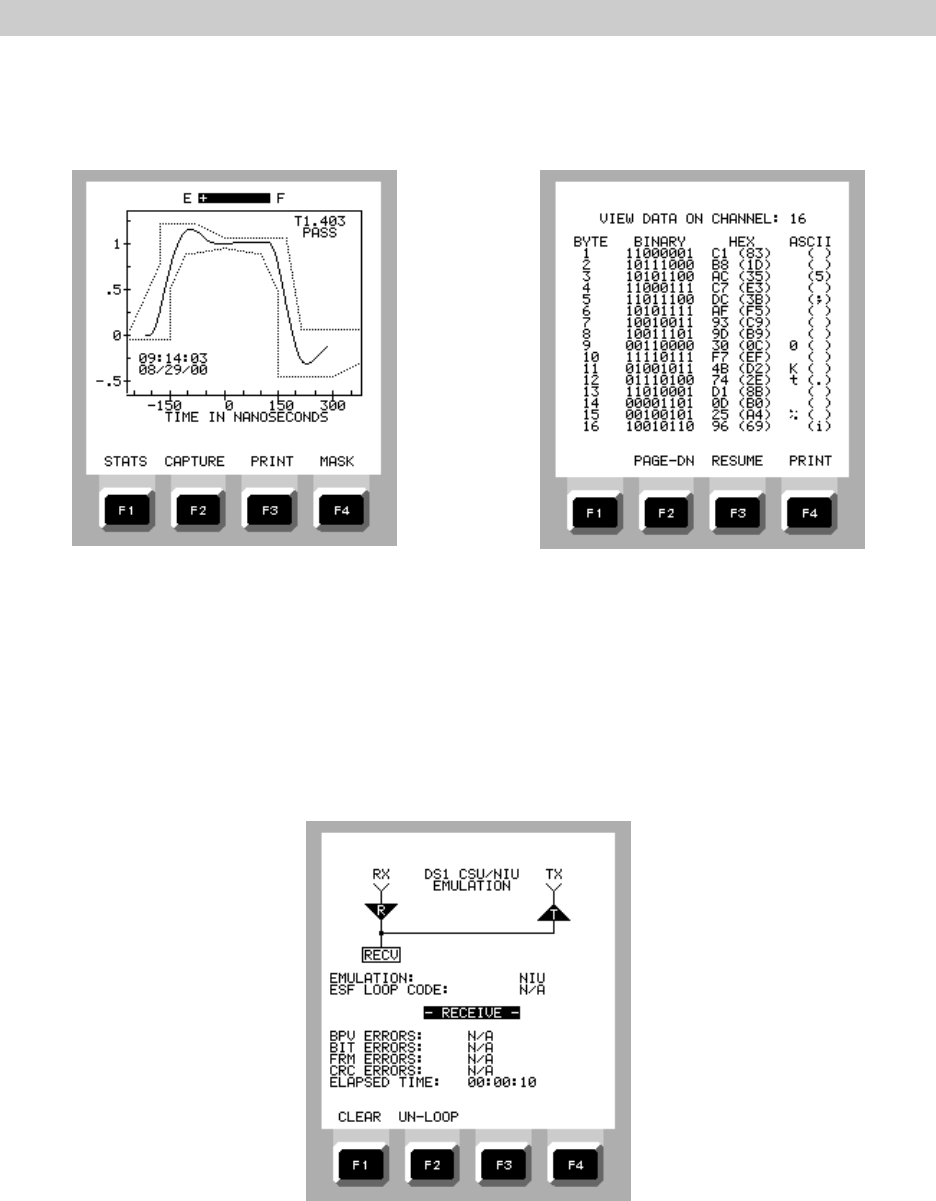
r. PULSE SHAPE ANALYSIS - Captures and displays sampled pulse against one of two standard
masks, AT&T Compatibility Bulletin 119 for cross-connects, or ANSI Specification T1.403 for
the Network Interface (Figure 2-40).
s. VIEW CHANNEL DATA - Allows real time display of individual channel data in binary,
hexadecimal, and ASCII format. Hexadecimal and ASCII formats include both least-significant-
bit-first and most-significant-bit-first coding formats (Figure 2-41).
t. CSU / NIU EMULATION - Allows test set to serve as a CSU or NIU for loopback testing
purposes (Figure 2-42).
Figure 2-22. DS1 TEST SETUP OPTIONS Figure 2-23. DS1 AUTOCONFIGURATION
Screen Screen
OPERATION
2-16
Figure 2-24. DS1 ALARM / ERROR INJECT Figure 2-25. DS1 ALARM / ERROR TYPE
Menu Menu
Figure 2-26. VF CHANNEL ACCESS Figure 2-27. DIAL / SUPERVISION
Menu Screen
OPERATION
2-17
Figure 2-28. PRIMARY RATE ISDN SETUP 1 Figure 2-29. PRIMARY RATE ISDN SETUP 2
Screen (TE and NT EMULATE) Screen (TE and NT EMULATE)
Figure 2-30. PRIMARY RATE ISDN MONITOR Figure 2-31. DDS CHANNEL TESTING
Screen Screen
OPERATION
2-18
Figure 2-32. 24 CHANNEL SIGNALING Figure 2-33. GR-303 TEST ACCESS
Display Menu
Figure 2-34. SS7 CAPTURE / ANALYSIS Figure 2-35. FRAME RELAY TESTING
Screen Menu
OPERATION
2-19
Figure 2-36. DELAY MEASUREMENT Figure 2-37. LOOPBACK / SPAN CONTROL
Display Screen
Figure 2-38. PM TEST ACCESS Screen Figure 2-39. ESF / SLC DATALINK Screen
OPERATION
2-20
Figure 2-40. PULSE SHAPE ANALYSIS Figure 2-41. VIEW CHANNEL DATA
Display Display
Figure 2-42. CSU / NIU EMULATION Screen

OPERATION
2-21
2.9.2 Connecting the Test Set to the T1 Line
The EZ-TESTER DS appears in two basic configurations, either as a single line or dual line DS1
tester. Both units have two sets of DS1 line jacks and are identical appearance (Figure 2-1). The dual
line unit is capable of transmitting and receiving with both sets of LINE jacks, while the single line unit
uses only LINE 1 for DDS1 testing. Although full T1 testing is available with both units, the dual line
unit has the advantage of being able to transmit and receive in both directions of a T1 simultaneously.
Single Line EZ-TESTER DS
When using the single line EZ-TESTER DS, monitoring is usually performed with a single test
cable connected between the DS1 LINE 1 RX jack and a customer or network monitor jack. Bit error
rate (BER) testing is usually performed with two test cables by connecting the DS1 LINE 1 TX jack to
a customer or network DSX IN jack and the DS1 LINE 1 RX jack to the customer or network DSX OUT
jack. With the far end looped up, the test set effectively transmits the test pattern out its TX jack and
receives the signal back through the RX jack. If the test is to be monitored at the far end, only the TX
jack and a single cable are required. A T1 drop and insert can be performed by diverting the DS1
signal from a customer or network DSX OUT jack, selecting the DS0 to be tested, and then returning
the modified DS1 signal to the opposite DSX IN jack via the test set’s DS1 LINE 1 TX jack. In order
to monitor the results of the test, a second test set is required.
Dual Line EZ-TESTER DS
When using the dual line EZ-TESTER DS, always connect the DS1 LINE 1 jacks to the network
DSX jacks of the line being tested, and the DS1 LINE 2 jacks to the customer DSX jacks. Signals
from both the network and the site can be monitored simultaneously by connecting the DS1 LINE 1
RX jack to the network monitor jack and the DS1 LINE 2 RX jack to the customer monitor jack. This
is especially useful for monitoring both directions of a primary rate ISDN D-channel or SS7 link channel.
Pattern testing with a dual port EZ-TESTER DS can be performed using one or both sets of TX
and RX jacks. Using both sets of jacks when testing from a DSX panel is especially useful since the
pattern test can be performed in one direction using one set of jacks while the other direction can be
terminated and kept alive with the other TX and RX jacks.
Drop and insert operations are performed by a dual line EZ-TESTER DS in a similar manner as
the single line unit except that the connections to the network side are made via the test set LINE 1
jacks and connections to the customer site are made via the test set LINE 2 jacks. If a drop and insert
is performed toward a customer site, the T1 is routed from the network OUT jack into the test set DS1
LINE 1 RX jack. The DS0 is selected and modified by the test set. The modified T1 is then passed
out of the test set via the DS1 LINE 2 TX jack to the customer IN jack. To monitor the test results,
the DS0 is looped back at the customer site and the return DS1 is monitored at the test set by
connecting the DS1 LINE 2 jack to the customer MON jack.
If the drop and insert is made toward the network, the T1 is routed from the site OUT jack into
the test set DS1 LINE 2 RX jack. The DS0 is selected and modified by the test set. The modified T1
is then passed out of the test set via the DS1 LINE 1 TX jack to the network IN jack. To monitor the
test results, the DS0 is looped back at the network far end and the return DS1 is monitored at the test
set by connecting the DS1 LINE 1 jack to the network MON jack.
OPERATION
2-22
Using the DS1 TEST SETUP OPTIONS Screen
The DS1 TEST SETUP OPTIONS menu is used to establish the following details of the test to
be run:
a. Designates the send and receive test ports and controls T1 signal routing through the test set
during drop and insert operations.
b. Matches the framing and channel formats to the line being tested
c. Designates the DS0 test channel number
d. Assigns the type of fill data to be placed on the remaining DS0 channels
e. Selects the test pattern to be used
f. Designates the test set’s transmit clock source
g. Designates a clock reference source if one is required.
Figure 2-43 . Sample DS1 TEST SETUP OPTIONS Menu
On the DS1 TEST SETUP OPTIONS menu, the settings for each menu line item must be
selected based upon the requirements of the test to be performed.
TEST TRANSMIT: F1 (OFF) No test pattern is transmitted. L1 RX or L2 RX
data will pass unmodified through the test set
F2 (LINE 1) Test data is transmitted via the LINE 1 TX jack
F3 (LINE 2) Test data is transmitted via the LINE 2 TX jack
TEST RECEIVE: F1 (LINE 1) Selects the LINE 1 RX jack for receive test data
F2 (LINE 2) Selects the LINE 2 RX jack for receive test data
LINE 1 TRANSMIT: F1 (AIS) Sends an AIS signal from the LINE 1 TX jack.
F2 (L2 RX) The signal being received at the LINE 2 RX jack
is passed out the LINE 1 TX jack
F3 (L1 RX) The signal being received at the LINE 1 RX jack
is passed out the LINE 1 TX jack

OPERATION
2-23
LINE 2 TRANSMIT: F1 (AIS) Sends an AIS signal from the LINE 2 TX jack.
F2 (L2 RX) The signal being received at the LINE 2 RX jack
is passed out the LINE 2 TX jack
F3 (L1 RX) The signal being received at the LINE 1 RX jack
is passed out the LINE 2 TX jack
FRAMING FORMAT: Set to match line under test.
F1 (D3/D4) F2 (SLC-96) F3 (ESF0 F4 (more)
F1 (UNFRMD) F2 (D1D) F3 (D2) F4 (more)
CHANNEL FORMAT: Set as required by the test.
F1 (FULL T1) F2 (56 X 1) F3 (64 X 1) F4 (FT1)
CHANNEL NUMBER: Set to DS0 channel to be tested.
FILL DATA: Determines what data will be transmitted over the remaining
channels not selected for testing.
F1 (ALL 1'S) Places an ALL 1'S pattern on all remaining
channels
F2 (IDLE) Places an idle signal on all remaining channels
F3 (L1 RX) Passes all remaining channels received at the L1 RX
jack to the output unmodified
F4 (L2 RX) Passes all remaining channels received at the L2 RX
jack to the output unmodified.
TEST PATTERN: Set for the desired test pattern. Use EDIT key for full selection
TEST TX CLOCK SOURCE: Selectable if channel format is FULL T1
F1 (INTERNL) F2 (L1 RX) F3 (L2 RX)
REFERENCE SOURCE: Selects timing source during clock slip measurements to
compare with the TEST RECEIVE signal timing.
F1 (NONE)
F2 (INTERNAL)
F3 (L1 RX) or (L2 RX) The selection will vary depending on
which LINE RX jack is designated the TEST RECEIVE jack.
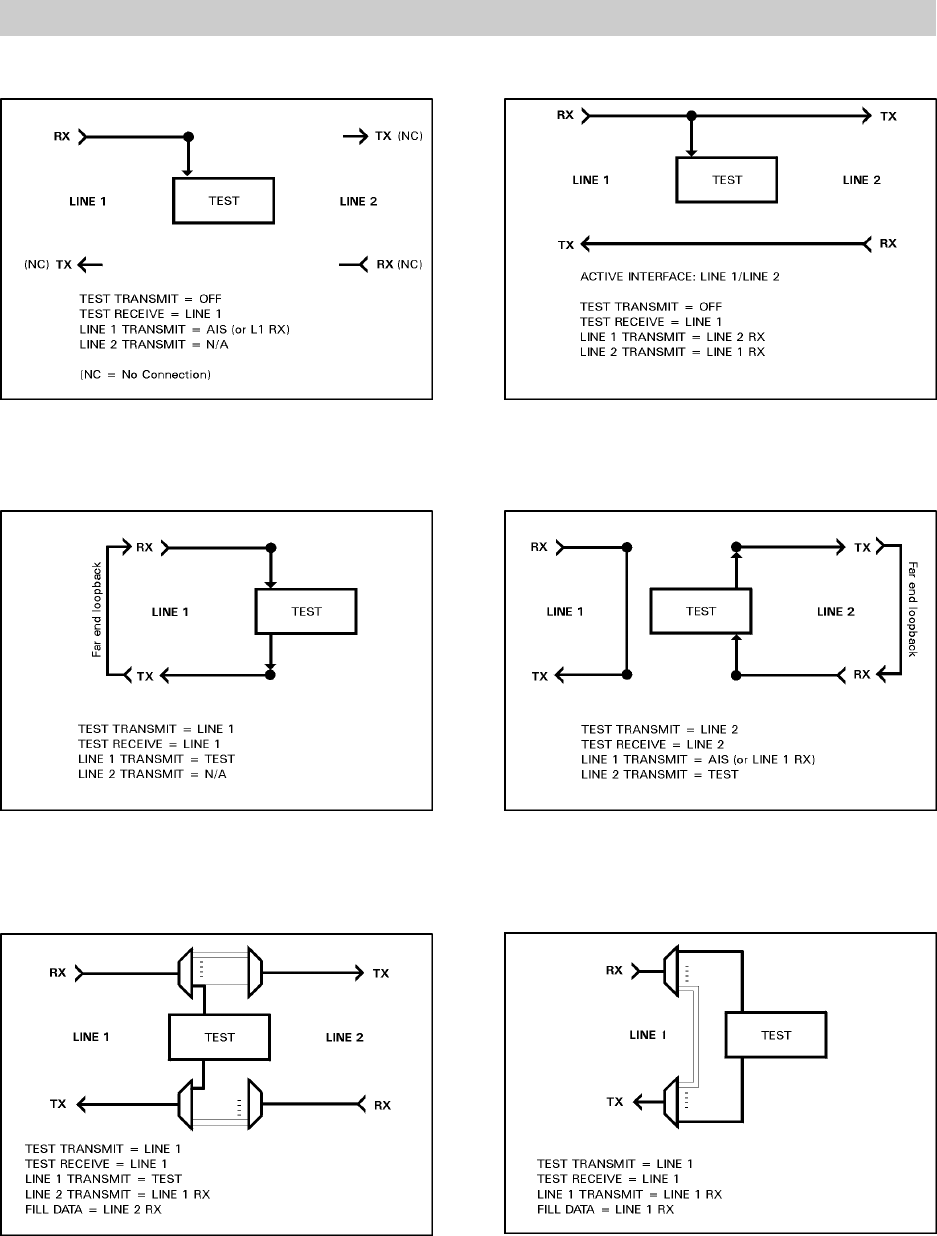
Figures 2-44 through 2-49 are examples of how the LINE TRANSMIT, TEST TRANSMIT, and
TEST RECEIVE setup affects signal flow through the test set. Similar diagrams will appear throughout
the manual to illustrate specific test setups. To further aid the user, a diagram is attached to the inside
of the test set lid with illustrations that represent the FACTORY default setups that are available from
the STORE / RECALL SETUPS menu found on the MAIN MENU (Figure 2-3).
OPERATION
2-24
Figure 2-44. Dual Line Unit Monitoring Figure 2-45. Dual Line Unit Monitoring
Network Using LINE 1 ONLY in MON Mode Network Using L1/L2 in TERM Mode
Figure 2-46. Single Line Unit Running Figure 2-47. Dual Line Unit Running
Pattern Test Toward Network or Site Pattern Test Toward Site
Figure 2-48. Dual Line Unit Set Up for a Figure 2-49. Single Line Unit Set Up for a
Drop and Insert Operation Toward Site Drop and Insert Operation Toward
Site or Network
OPERATION
2-25
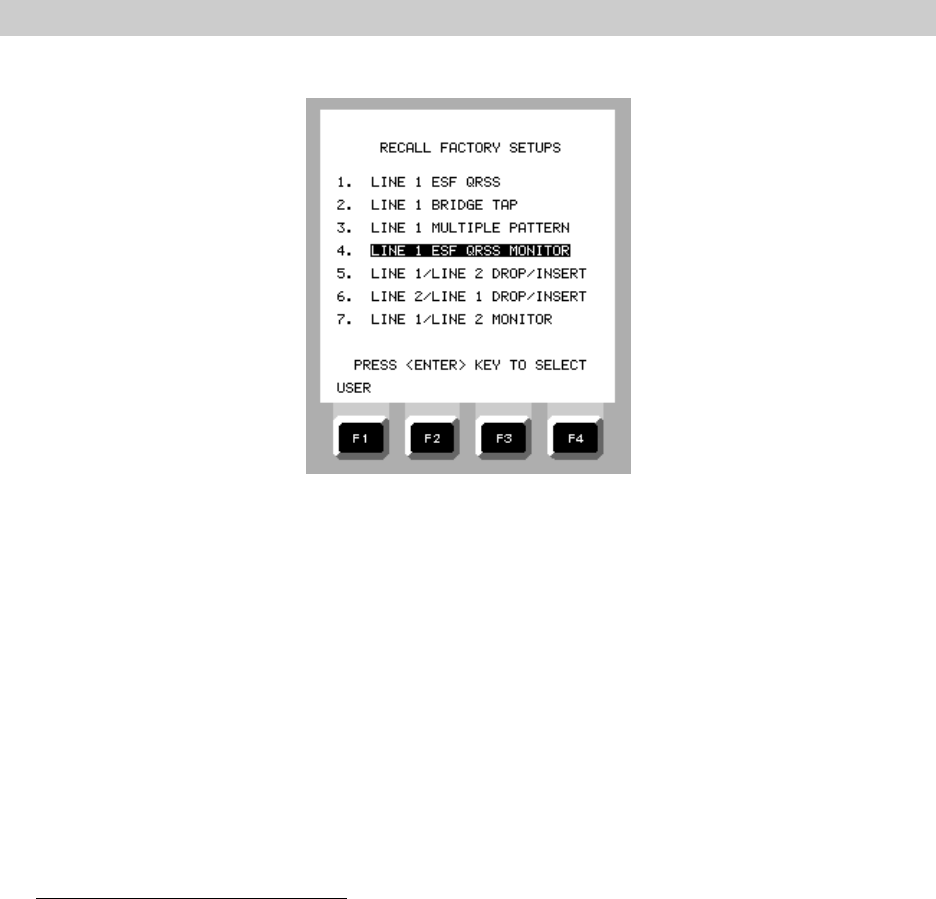
Figure 2-50 . RECALL FACTORY SETUP Screen
2.9.3 Autoconfiguring the Test Set for DS1 Testing
Autoconfiguring allows the test set to automatically sense the line code and framing format
of the line under test and identifies standard test patterns that may be present on the line when such
information is uncertain or unknown. Autoconfiguring can be performed in the L1 ONLY and the L1
/ L2 mode of operation. During the autoconfiguring operation, the test set automatically sets the test
signal output of the line designated as the TEST TRANSMIT line on the DS1 TEST SETUP OPTIONS
screen to match the framing format and line code of the line designated as the TEST RECEIVE line.
Autoconfiguring a dual line test set with both lines enabled will only set affect the designated TEST
line output, so the operation is not recommended for routinely setting up a dual line test. Whenever
possible, set the framing and line code manually during test set up using locally provided, up to date,
reference documents as a guide.
Performing an Autoconfiguration:
This procedure describes a typical autoconfiguration operation from a DSX MON jack using
a single test cable and only the LINE 1 ports enabled.
1. On the MAIN MENU, move the cursor to TEST INTERFACE SETUP and press ENTER.
2. On the TEST INTERFACE SETUP MENU, set the following:
ACTIVE INTERFACES: F1 (L1 ONLY)
DS1 L1 RX INPUT: F3 (MONITOR)
(If a monitor jack is not available and the test set is to be bridged across the line, set the
DS1 L1 RX INPUT to BRIDGE.)
3. Press MENU to return to the MAIN MENU
4. On the MAIN MENU, move the cursor to DS1 MENU and press ENTER.

OPERATION
2-26
5. Connect the test set DS1 LINE 1 RX jack to the network or site DSX monitor jack.
6. On the DS1 MENU, move the cursor to AUTO CONFIGURATION and press ENTER.
10. Use the F1 (RESTART) key to repeat the operation, or the F4 (RESTORE) key to return
to the MAIN MENU.
Note: The test set will attempt to identify the framing format, line coding, and test
pattern. If a test pattern is not present on the line, the test set will report
“UNKNOWN”. The test set will only recognize a B8ZS line coding if the test set
detects a B8ZS byte in the received signal during the autoconfiguration cycle. If no
B8ZS byte is detected, the test set will report AMI. To confirm B8ZS, the signal
source must include eight zeros in a row or its transmitter will not transmit the
necessary B8ZS byte.
2.9.4 DS1 In Service Monitoring Operations
The preferred setup for monitoring a DS1 circuit uses a single test cable connected between
the test set RX jack and the DSX monitor jack for each line being monitored. This hookup prevents
an accidental disruption of site data since the normal signal flow through the DSX is not interrupted
while the test set is being connected to the line. In the event that a DS1 monitor jack is unavailable,
the test set may be connected to the line using multiple test cables in such a way that the line data
passes from the line, through the test set, and back onto the line. Using either method, Full T1and
individual DS0 voice frequency channels can be monitored from the T1 access point.
The first procedure is used by a single DS1 test set and allows the user to monitor the transmit
line from the network or site from a DSX MON jack. The second procedure allows the user to monitor
the network and site transmit lines simultaneously from the DSX MON jacks.
Single Line Monitoring of a Full DS1 from a DSX MON Jack:
1. On the MAIN MENU, move the cursor to TEST INTERFACE SETUP and press ENTER.
2. On the TEST INTERFACE SETUP MENU, set the following:
ACTIVE INTERFACES: F1 (L1 ONLY)
DS1 L1 RX INPUT: F3 (MON)
3. Press MENU to return to the MAIN MENU.
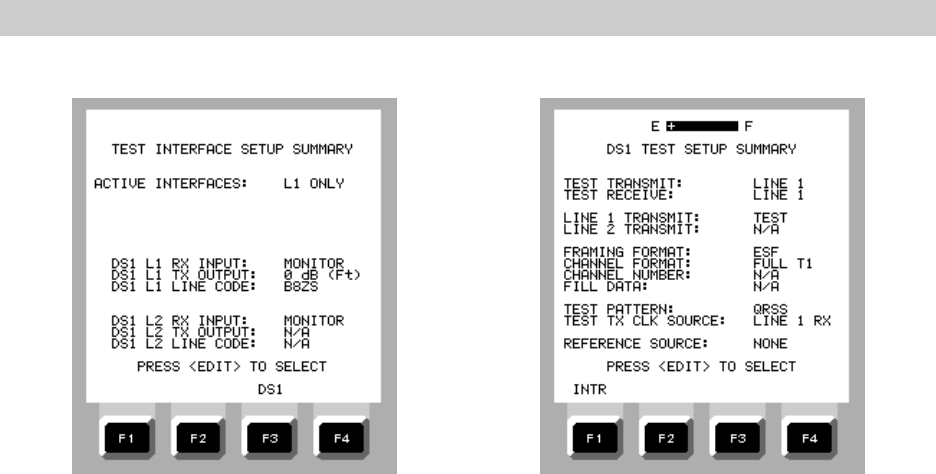
4. On the MAIN MENU, press F3 (SUMMARY) to view the TEST INTERFACE SETUP
SUMMARY screen (Figure 2-51), and then F3 (DS1) to view the DS1 TEST SETUP
SUMMARY screen (Figure 2-52).
5. Connect the test set DS1 L1 RX jack to the network or site DSX monitor jack.
6. On the MAIN MENU, move the cursor to DS1 MENU and press ENTER.
7. On the DS1 MENU, move the cursor to AUTO CONFIGURATION and press ENTER.
When the autoconfiguration is complete, confirm a green PULSES lamp. Unless the
signal is unframed, the FRAME SYNC lamp should also be lit.
OPERATION
2-27
Figure 2-51. TEST INTERFACE SETUP Figure 2-52. DS1 TEST SETUP SUMMARY
SUMMARY Screen Screen
8. When the autoconfiguration is complete, press START.
The display will change to the RESULTS - SUMMARY screen and will report NO ERRORS
if all conditions are normal.
If an error or alarm condition occurs, the RESULTS screen will report the occurrence of
the problem and various LEDs will change depending upon the nature of the problem.
When the RESULTS - SUMMARY screen reports a problem:
(a) Press F1 (PAGE-UP) and F2 (PAGE-DN) to review all the RESULTS screens.
(b) Press F3 (ALM/ERR) to view the DS1 LINE 1 RECEIVE ALARMS screen, then press
F4 (ERRORS) to view the DS1 LINE 1 RECEIVE ERRORS screen.
(c) Press F3 (RETURN) to return to the RESULTS screen.
If the alarm or error condition persists, the alarm and/or error lamps will remain lit. If the
line returns to normal, any indicators that were affected by the problem will flash until
reset by the user. The lamps can be reset several ways:
(a) Press STOP. The test will be terminated and all history will remain for viewing and
printout.
(b) Press START. The test will be terminated and restarted. All alarm / error history
will be lost.
(c) While the test is running, from the RESULTS - SUMMARY screen, press F4 (more)
two times, then press F3 (CLR-HST). The test will continue running, but the test
history will be lost.
OPERATION
2-28
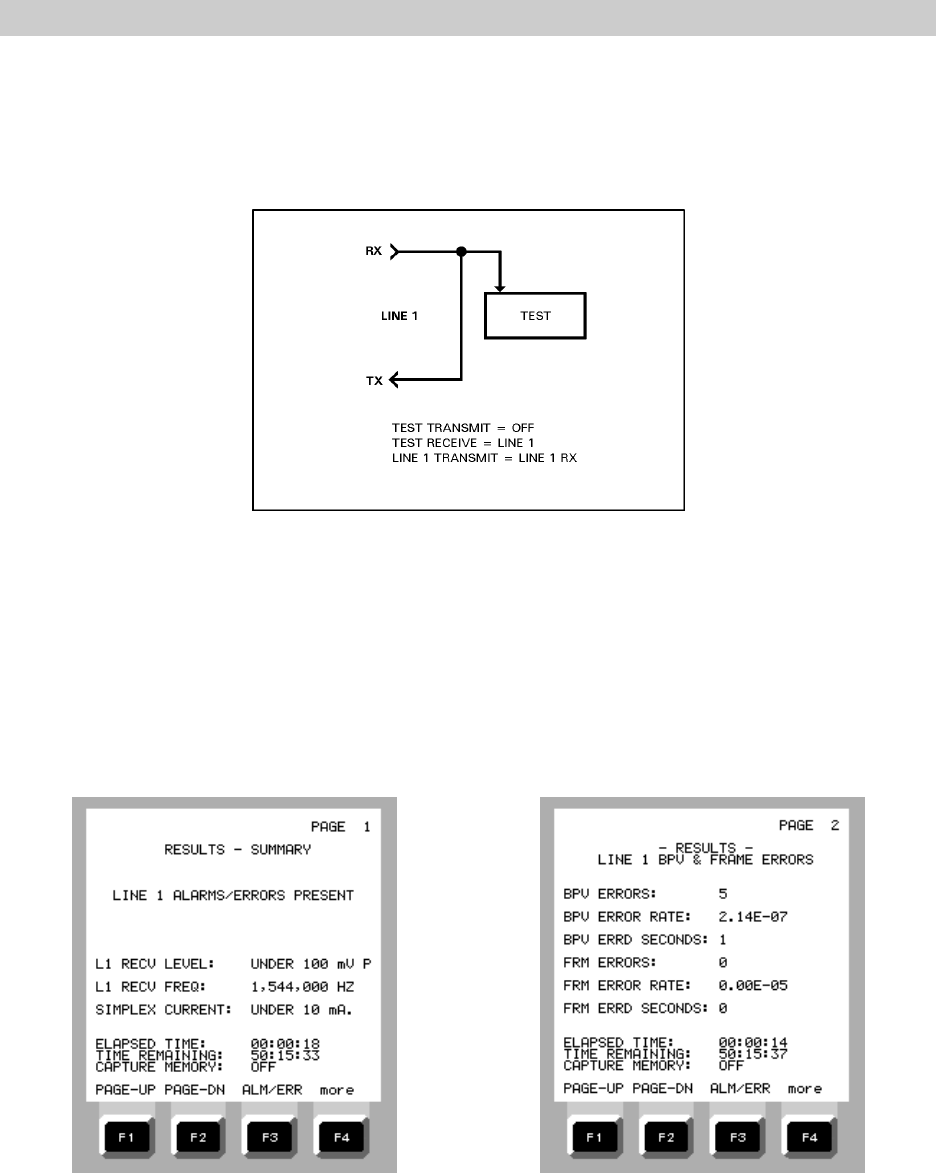
Figure 2-53 illustrates the test port setup for single line monitoring from a DSX monitor jack.
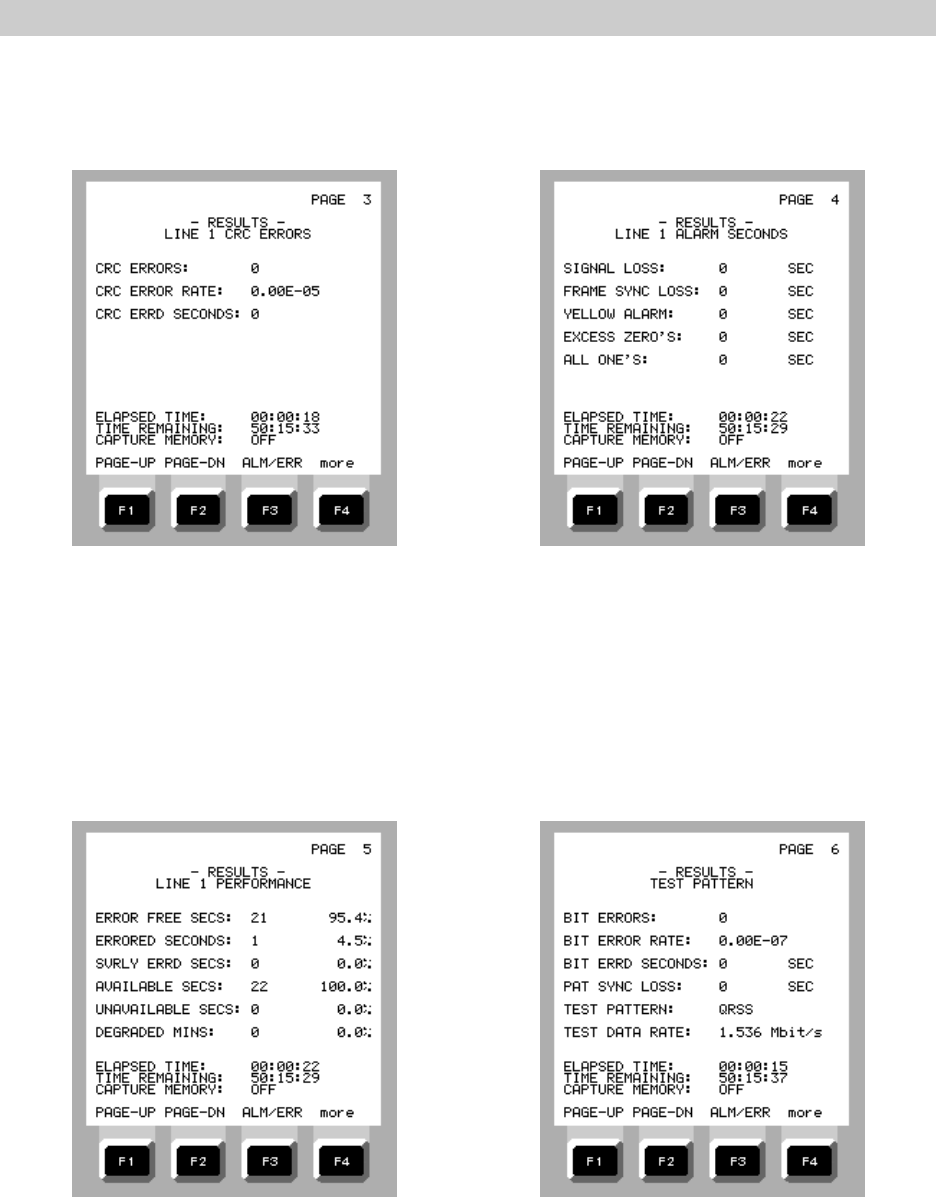
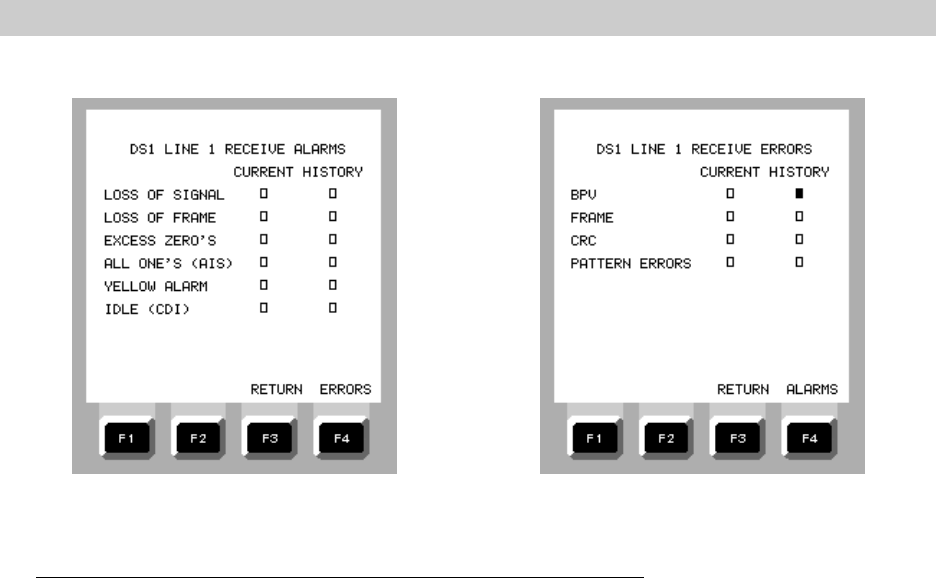
Figures 2-54 through 2-61 represent all the RESULTS and ALARM / ERROR screen displays following
the detection of a BPV during a single line monitoring operation.
Figure 2-53 . Test Port Setup for Single Line, Monitoring Line 1
Figure 2-54. RESULTS SUMMARY Screen Figure 2-55. RESULTS Screen 2
Single Monitoring, LINE 1 BPV Single Monitoring, LINE 1 BPV
OPERATION
2-29
Figure 2-56. RESULTS Screen 3 Figure 2-57. RESULTS Screen 4
Single Monitoring, LINE 1 BPV Single Monitoring, LINE 1 BPV
Figure 2-58. RESULTS Screen 5 Figure 2-59. RESULTS Screen 6
Single Monitoring, LINE 1 BPV Single Monitoring, LINE 1 BPV
OPERATION
2-30
Figure 2-60. DS1 LINE 1 RECEIVE ALARMS Figure 2-61. DS1 LINE 1 RECEIVE ERRORS
Screen Screen
Dual Line Monitoring of a Full DS1 from Two DSX Monitor Jacks:
1. On the MAIN MENU, move the cursor to TEST INTERFACE SETUP and press ENTER.
2. On the TEST INTERFACE SETUP MENU, move the cursor to ACTIVE INTERFACES and
press F2 (L1 / L2)
3. Move the cursor to DS1 L1 RX INPUT and press F3 (MON)
4. Move the cursor to DS1 L2 RX INPUT and press F3 (MON), then press MENU to return
to the MAIN MENU.
5. On the MAIN MENU, press F3 (SUMMARY) to view the TEST INTERFACE SETUP
SUMMARY screen, and then F3 (DS1) to view the DS1 TEST SETUP SUMMARY screen.
6. Connect the test set DS1 L1 RX jack to the network DSX monitor jack.
7. Connect the test set DS1 L2 RX jack to the site DSX monitor jack.
8. On the MAIN MENU, move the cursor to DS1 MENU and press ENTER.
9. On the DS1 MENU, move the cursor to AUTO CONFIGURATION and press ENTER.
When the autoconfiguration is complete, confirm a green PULSES lamp. Unless the
signal is unframed, the FRAME SYNC lamp should also be lit.
10. When the autoconfiguration is complete, press START.
The display will change to the RESULTS - SUMMARY screen and will report NO ERRORS
if all conditions are normal.
If an error or alarm condition occurs, the RESULTS screen will report the occurrence of
the problem and various LEDs will change depending upon the nature of the problem.
OPERATION
2-31
When the RESULTS - SUMMARY screen reports a problem:
(a) Press F1 (PAGE-UP) and F2 (PAGE-DN) to review all the RESULTS screens.
(b) Press F3 (ALM/ERR) to view the DS1 LINE 1 RECEIVE ALARMS screen, then press
F4 (ERRORS) to view the DS1 LINE 1 RECEIVE ERRORS screen.
(c) Press F2 (LINE 2) to view the LINE 2 ALARMS and ERRORS screens.
(d) Press F3 (RETURN) to return to the RESULTS screen.
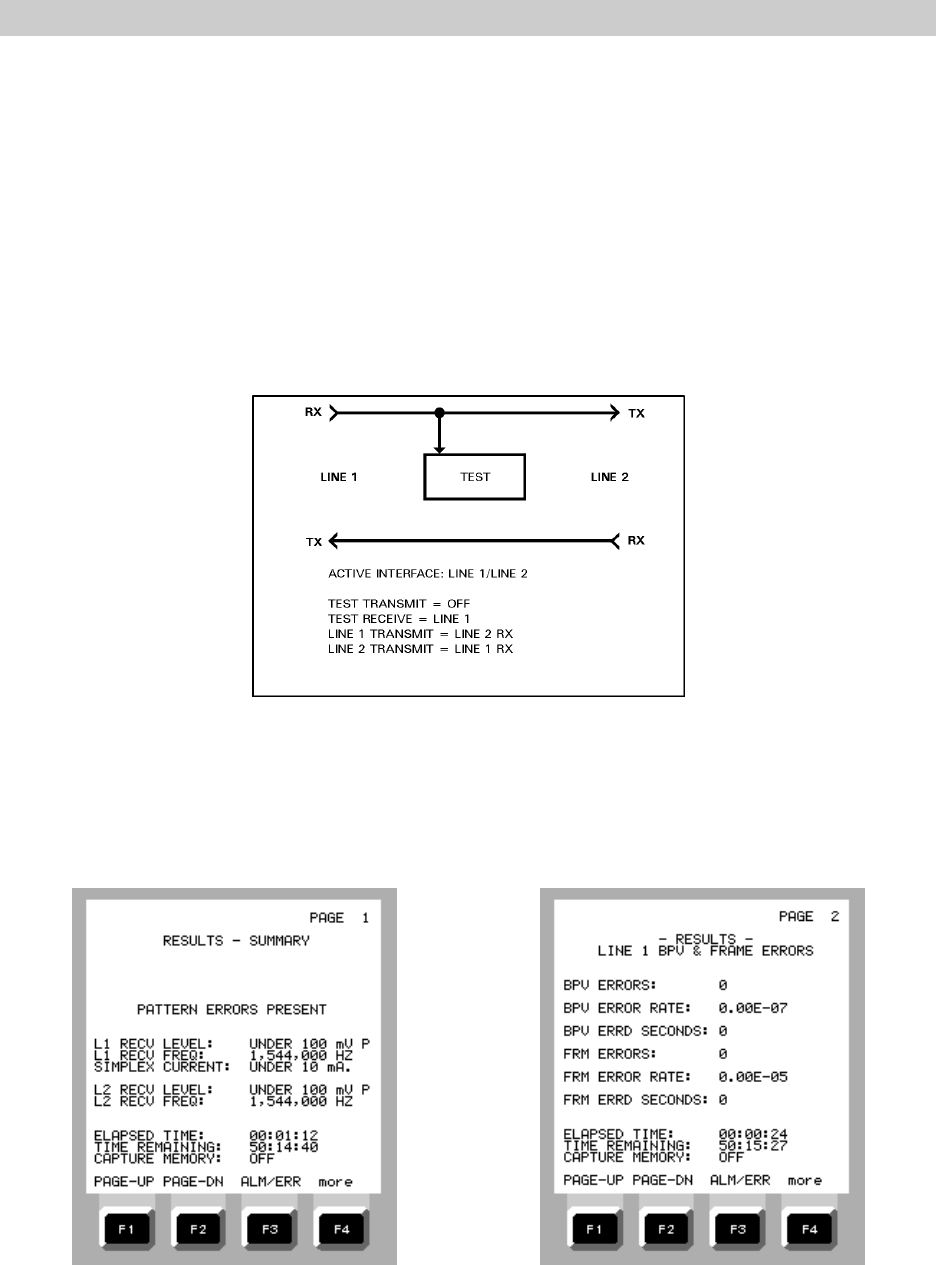
Figure 2-62 illustrates the test port setup for dual line monitoring from DSX monitor jacks.
Figure 2-62 . Test Port Setup for Dual Line, Monitoring Line 1
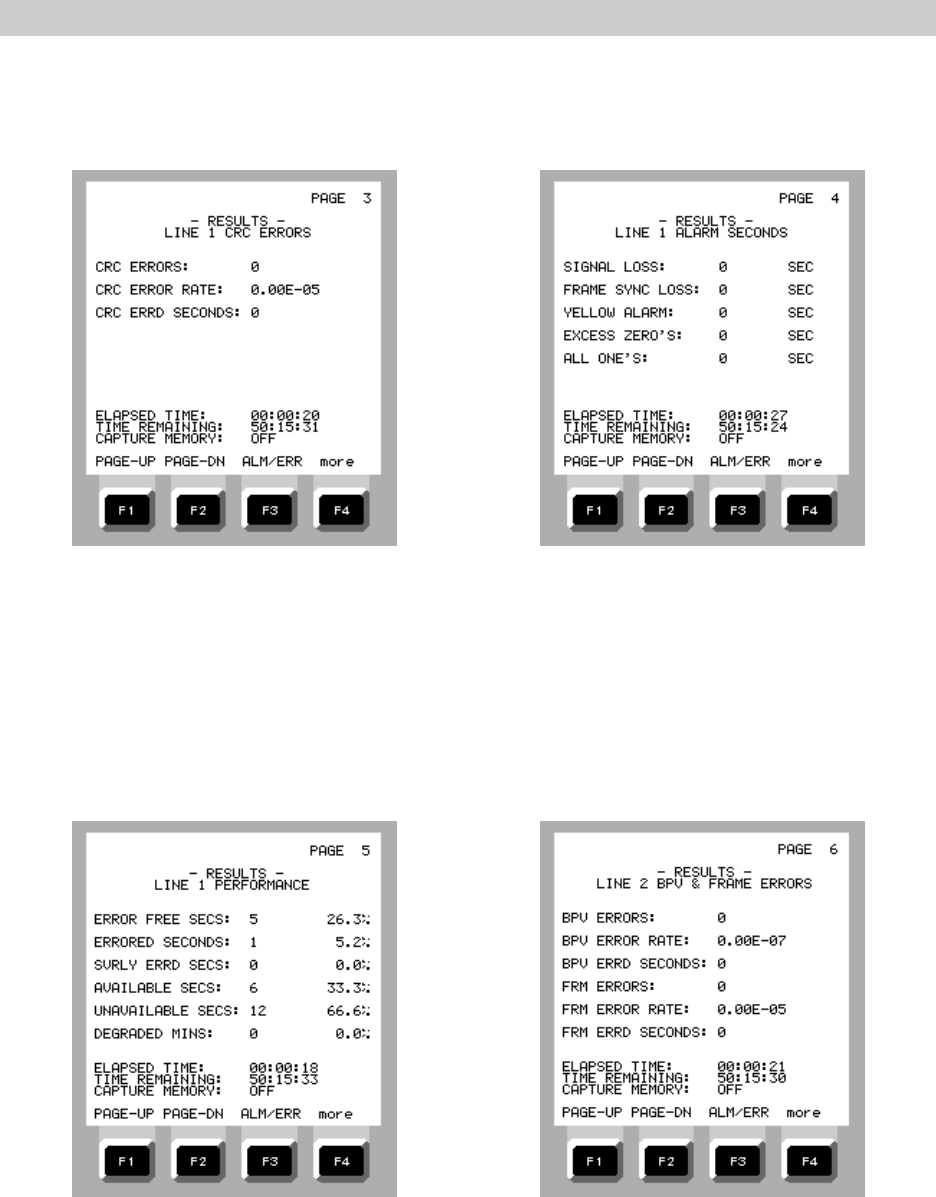
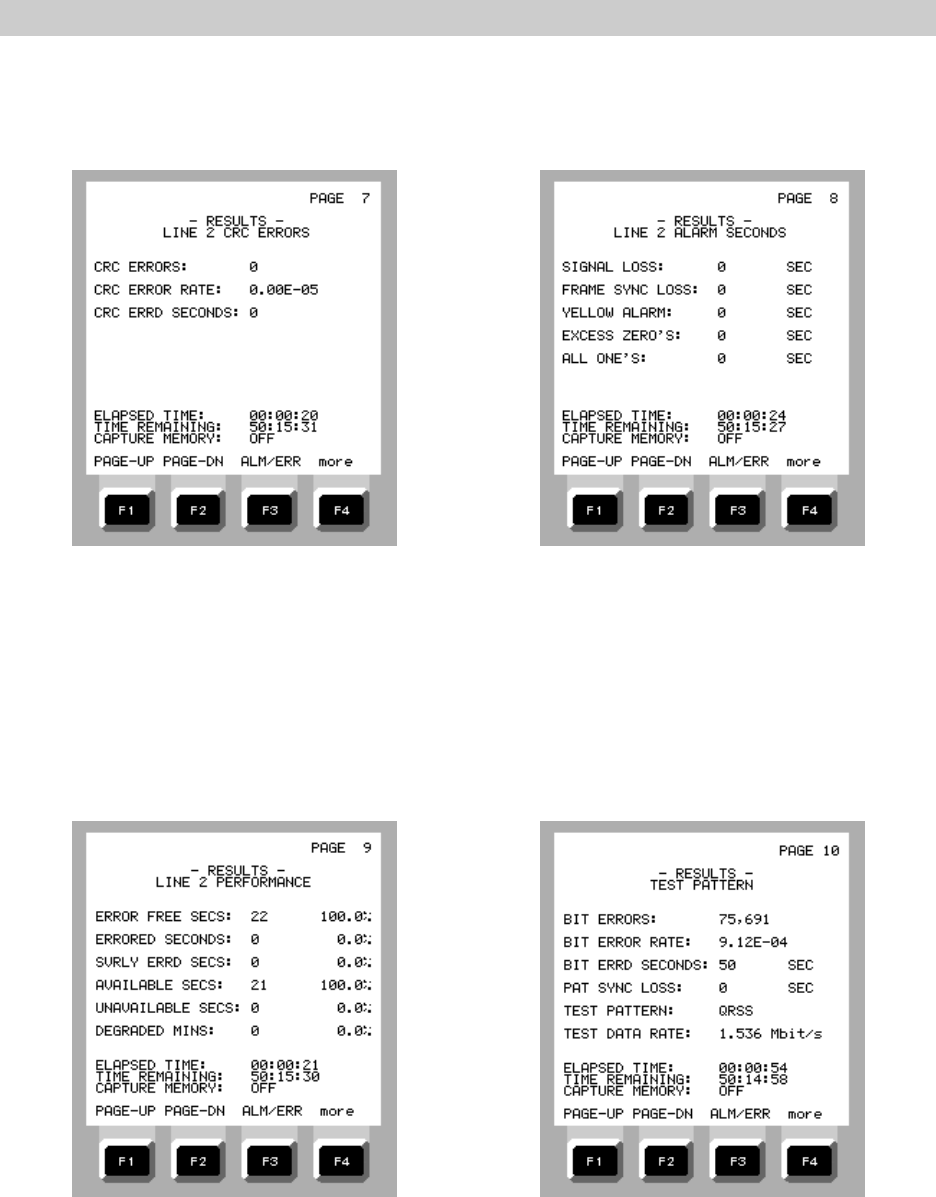
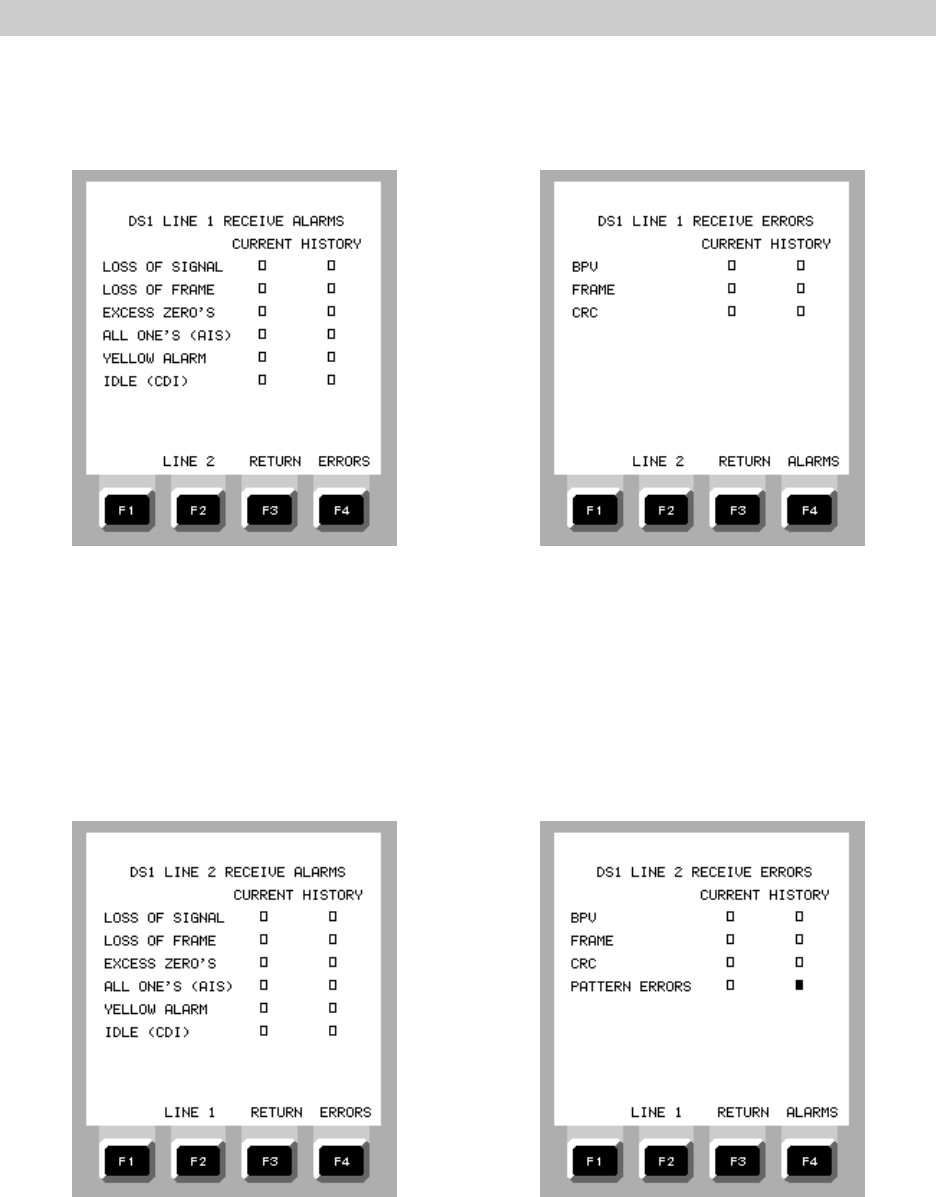
Figures 2-63 through 2-76 represent all the RESULTS and ALARM / ERROR screen displays
following the detection of a pattern error on line 2 during a dual line monitoring operation.
Figure 2-63. RESULTS SUMMARY Screen Figure 2-64. RESULTS Screen 2
Dual Monitoring, LINE 2 Pattern Error Dual Monitoring, LINE 2 Pattern Error
OPERATION
2-32
Figure 2-65. RESULTS Screen 3 Figure 2-66. RESULTS Screen 4
Dual Monitoring, LINE 2 Pattern Error Dual Monitoring, LINE 2 Pattern Error
Figure 2-67. RESULTS Screen 5 Figure 2-68. RESULTS Screen 6
Dual Monitoring, LINE 2 Pattern Error Dual Monitoring, LINE 2 Pattern Error
OPERATION
2-33
Figure 2-69. RESULTS Screen 7 Figure 2-70. RESULTS Screen 8
Dual Monitoring, LINE 2 Pattern Error Dual Monitoring, LINE 2 Pattern Error
Figure 2-71. RESULTS Screen 9 Figure 2-72. RESULTS Screen 10
Dual Monitoring, LINE 2 Pattern Error Dual Monitoring, LINE 2 Pattern Error
OPERATION
2-34
Figure 2-73. DS1 LINE 1 RECEIVE ALARMS Figure 2-74. DS1 LINE 1 RECEIVE ERRORS
Screen Screen
Figure 2-75. DS1 LINE 2 RECEIVE ALARMS Figure 2-76. DS1 LINE 2 RECEIVE ERRORS
Screen Screen

OPERATION
2-35
Dual Line Monitoring a Full DS1 from DSX OUT Jacks:
When DSX monitor jacks are not available for testing purposes, the test set can be connected
to the network and site line jacks for dual line monitoring using four test cables. Customer data will
be briefly interrupted while the test set is being connected. so the framing format and line code
should be set manually prior to connecting the test set to the circuit. Single line test sets can monitor
in a single direction using the same setup procedure by ignoring references to LINE 2.
NOTE: When monitoring in-service lines, customer data is interrupted briefly during the
connection process. Autoconfiguring the test set is not recommended if the test set
is connected to the circuit at DSX IN or OUT jacks since the autoconfiguring will
increase the length of time customer data is interrupted.
This procedure monitors a clear channel T1. If a channelized T1 is to be monitored, the
channel format and channel number must also be entered during the setup.
1. On the MAIN MENU, move the cursor to TEST INTERFACE SETUP and press ENTER.
2. On the TEST INTERFACE SETUP MENU, set the following:
ACTIVE INTERFACES: F2 (L1 / L2)
DS1 L1 RX INPUT: F1 (TERM)
DS1 L1 TX OUTPUT: F1 (0dB)
DS1 L1 LINE CODE: As required
DS1 L2 RX INPUT: F1 (TERM)
DS1 L2 TX OUTPUT: F1 (0dB)
DS1 L2 TX LINE CODE: As required
3. On the MAIN MENU, move the cursor to DS1 MENU and press ENTER.
4. Move the cursor to DS1 SETUP OPTIONS and press ENTER.
5. On the DS1 TEST SETUP OPTIONS menu, set the following:
TEST TRANSMIT: F1 (OFF)
TEST RECEIVE: F1 (LINE 1) or F2 (LINE 2)
LINE 1 TRANSMIT: LINE 2 RX
LINE 2 TRANSMIT: LINE 1 RX
FRAMING FORMAT: As required
CHANNEL FORMAT: FULL T1
REFERENCE SOURCE: NONE
6. Press MENU to return to the MAIN MENU.
7. On the MAIN MENU, press F3 (SUMMARY) to view the TEST INTERFACE SETUP
SUMMARY screen, and then F3 (DS1) to view the DS1 TEST SETUP SUMMARY screen.
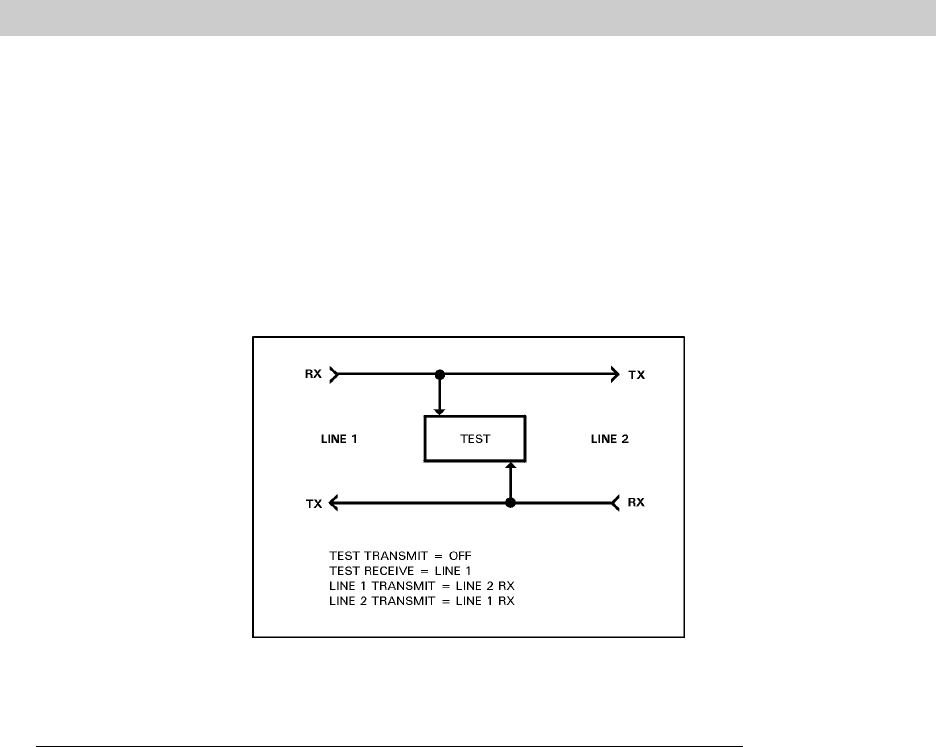
OPERATION
2-36
8. Connect the test set as follows:
DS1 LINE 1 RX jack to the network DSX OUT jack
DS1 LINE 1 TX jack to the site DSX IN jack
DS1 LINE 2 RX jack to the site DSX OUT jack
DS1 LINE 2 RX jack to the network DSX IN jack
9. Press START and view the RESULTS screens as before.
Figure 2-77 illustrates the test port setup for dual line monitoring from DSX In and OUT jacks.
Figure 2-77 . Test Port Setup for Dual Line, Monitoring Line 1
Monitoring a Voice Frequency Channel (DS0) from Two DSX Monitor Jacks
Dual line voice frequency monitoring allows the user to access a DS0 voice channel within a
DS1 to observe the data and signaling bits for a selected channel and direction, and aurally monitor
the signal from each direction individually or together, either from the front panel speaker or a headset
connected to the front panel headset jack.
1. On the MAIN MENU, move the cursor to TEST INTERFACE SETUP and press ENTER.
2. On the TEST INTERFACE SETUP MENU, move the cursor to ACTIVE INTERFACES and
press F2 (L1 / L2).
3. Move the cursor to DS1 L1 RX INPUT and press F3 (MON).
4. Move the cursor to DS1 L2 RX INPUT and press F3 (MON), then press MENU to return
to the MAIN MENU.
5. On the MAIN MENU, move the cursor to DS1 MENU and press ENTER.
6. Connect the test set as follows:
DS1 LINE 1 RX jack to the network DSX monitor jack.
DS1 LINE 2 RX jack to the site DSX monitor jack.
7. Perform a DS1 autoconfiguration and confirm a green DS1 PULSES lamp. Unless the
signal is unframed, the DS1 FRAME SYNC lamp should also be lit.

OPERATION
2-37
8. If the autoconfiguration is successful and no alarm or error lamps are lit, press MENU to
return to the MAIN MENU.
9. Move the cursor to DS1 SETUP OPTIONS and press ENTER.
10. On the DS1 TEST SETUP OPTIONS menu, set the following:
TEST TRANSMIT: F1 (OFF)
FRAMING FORMAT: As required
CHANNEL FORMAT: F2 (56 X 1) or F3 (64 X 1) to match circuit
11. Press MENU to return to the DS1 MENU.
12. On the DS1 MENU, move the cursor to VF CHANNEL ACCESS and press ENTER.
13. On the VF CHANNEL ACCESS menu, set the following:
CHANNEL NUMBER: Set for the channel to be monitored
AUDIO SOURCE: F1 (L1 RX) to listen to the line 1 signal
F2 (L2 RX) to listen to the line 2 signal
F3 (BOTH) typical to listen to both sides of a voice line
- LINE (n) RX DATA/SIGNALING -
F1 (LINE 1) displays LINE 1 data and signaling bits
F2 (LINE 2) displays LINE 2 data and signaling bits
NOTE: If a digital milliwatt was being received on the line designated as the AUDIO
SOURCE, the FREQ and LEVEL values shown at the bottom of the screen may be used.
If the input signal is NOT a digital milliwatt, the values should be ignored.
2.9.5 DS1 Drop and Insert Operations
When testing must be performed on an individual voice channel on an in-service T1 line, a drop
and insert operation can be performed. A drop and insert operation uses one test connection to divert
the T1 line data through the test set so that the DS0 channel to be tested can be dropped out of
service, and a second connection to return the remaining channels undisturbed to the line. Test data
can then be placed on the dropped DS0 for testing purposes. During a drop and insert operation, the
live traffic is disturbed momentarily while the test set is being connected, but with minimum effect to
the customer.
A drop and insert can be performed using two different hookups. The first procedure allows
the test set to synchronize to the framing format of the line before making the second connection, but
requires the use of a 100 ohm impedance matching plug. This procedure uses the DSX monitor jack
for the receive connection. The second procedure does not require the plug, but causes loss of line
synchronization briefly during test set hookup.
The following setup demonstrates a drop insert operation, testing toward the customer site on
DS0 channel 3. To minimize interruption of customer data, the test set RX jacks will be connected
to the DSX MON jacks. After checking the test setup on setup summary screens, the test set TX

OPERATION
2-38
jacks will be simultaneously plugged into their respective DSX IN jacks. Finally, to correct the
impedance mismatch resulting from the now open DSX OUT jacks, matching plugs will be inserted.
With the setup and connection complete, testing can begin on the dropped DS0.
Setting up for Drop and Insert Testing Using the DSX Monitor Jacks
1. On the MAIN MENU, move the cursor to TEST INTERFACE SETUP and press ENTER.
2. On the TEST INTERFACE SETUP MENU, set the following:
ACTIVE INTERFACES: F2 (L1 / L2)
DS1 L1 RX INPUT: F3 (MONITOR)
DS1 L1 TX OUTPUT: F1 (0 dB)
DS1 L1 LINE CODE: As required by circuit
DS1 L2 RX INPUT: F3 (MONITOR)
DS1 L2 TX OUTPUT: F1 (0 dB)
DS1 L2 LINE CODE: As required by circuit
3. Press MENU to return to the MAIN MENU.
4. On the MAIN MENU, move the cursor to DS1 MENU and press ENTER.
5. On the DS1 MENU, move the cursor to DS1 SETUP OPTIONS and press ENTER.
6. On the DS1 TEST SETUP OPTIONS menu, set the following:
TEST TRANSMIT: F3 (LINE 2)
TEST RECEIVE: F2 (LINE 2)
LINE 1 TRANSMIT: F3 (LINE 2 RX)
LINE 2 TRANSMIT: TEST (Selected automatically)
FRAMING FORMAT: As required by circuit
CHANNEL FORMAT: As required by circuit
CHANNEL NUMBER: Set to DS0 channel to be tested
FILL DATA: F3 (LINE 1 RX)
TEST PATTERN: Select pattern as desired
7. Connect the test set RX jack to the DSX MON jacks:
DS1 LINE 1 RX jack to the network DSX monitor jack
DS1 LINE 2 RX jack to the site DSX monitor jack
The LINE 1 and LINE 2 PULSES and FRAME sync lamps should be lit.
8. Press MENU to return to the DS1 MENU.
9. On the DS1 MENU, press F3 (SUMMARY) to view the TEST INTERFACE SETUP
SUMMARY screen, and then F3 (DS1) to view the DS1 TEST SETUP SUMMARY screen.

OPERATION
2-39
10. If the test setup is correct simultaneously connect the test set TX jacks to the DSX IN
jacks:
DS1 LINE 1 TX jack to the network DSX IN jack
DS1 LINE 2 TX jack to the site DSX IN jack
Then insert 100 ohm impedance matching plugs into the DSX OUT jacks.
Testing the Selected DS0 During the Drop and Insert Operation
To complete testing, have a technician at the far end loop up the selected DS0. When the loop
up is complete, the test set pattern sync lamp should come on.
1. Press the START key. The display will change to the RESULTS - SUMMARY screen and
will report NO ERRORS if all conditions are normal.
2. If the RESULTS - SUMMARY screen reports a problem, view the RESULTS and ALARM
/ ERROR screens as before.
3. To change the test pattern, press the MENU key to return to the DS1 MENU.
4. On the DS1 MENU, move the cursor to DS1 SETUP OPTIONS and press ENTER.
5. On the DS1 TEST SETUP OPTIONS menu, move the cursor to TEST PATTERN and select
a new pattern using the F keys or by pressing EDIT and choosing a pattern from the
TEST PATTERN SELECTION menu, then press ENTER.
Viewing and Changing the Selected DS0 Channel Data and Signaling Bits
With the selected DS0 dropped, other operations can be performed besides running test
patterns. Using the VF CHANNEL ACCESS feature on the DS1 MENU, channel data and signaling bits
can be monitored and changed.
1. On the MAIN MENU, move the cursor to DS1 MENU and press ENTER.
2. On the DS1 MENU, move the cursor to VF CHANNEL ACCESS and press ENTER.
3. On the VF CHANNEL ACCESS MENU, the CHANNEL NUMBER will the one set in step
6 of the test setup. Observe the data bits and condition of the signaling bits, and listen
to the channel with the speaker or headset. If a digital milliwatt is being transmitted on
the channel under test, observe FREQ: and LEVEL: for the transmitted tone frequency
and received signal level.
WARNING: As long as CHANNEL DATA is set to TRANSPARENT, the channel number
may be changed to allow monitoring of each channel without affecting the data on the
line. Any other setting will disrupt the selected channel.
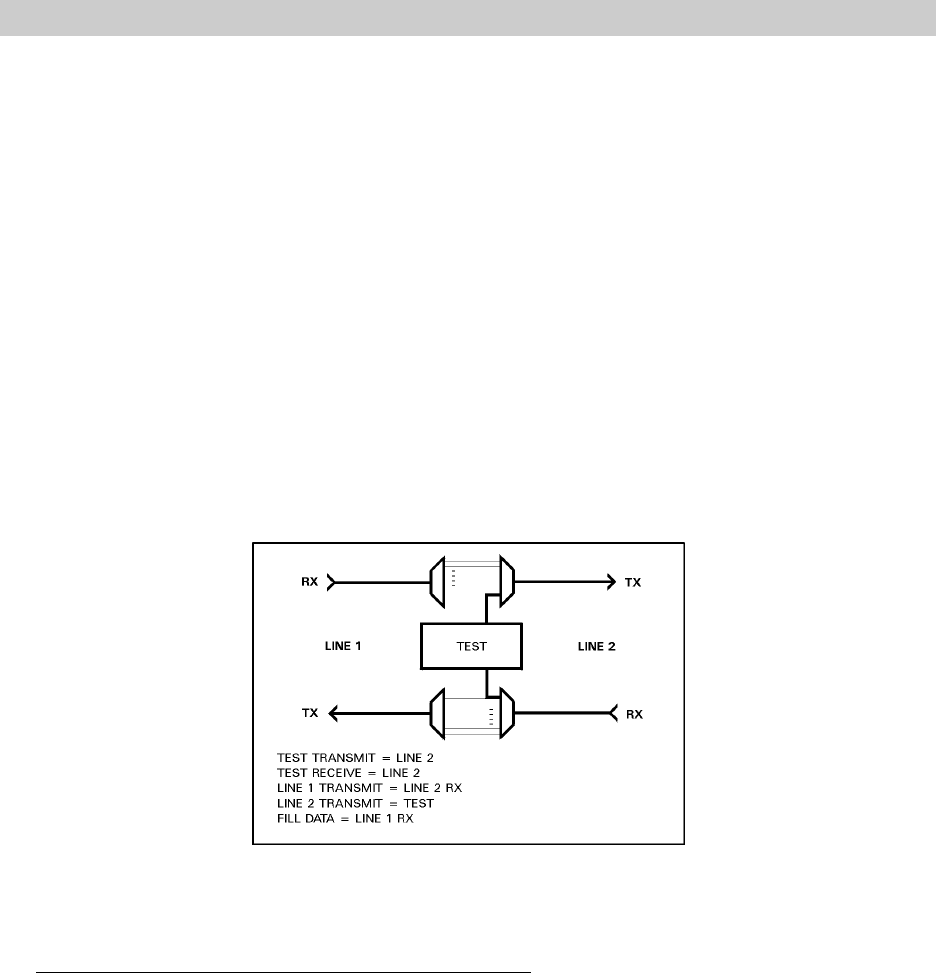
OPERATION
2-40
4. To modify the data on the selected DS0 channel, move the cursor to CHANNEL DATA
as select as required:
TRNSPNT Allows channel data to pass through the instrument unchanged
DIG-MW: Places a 1000 Hz, 0 dB tone on the selected channel
FIXED: Places a user defined 8-bit pattern on the selected channel.
Use the EDIT key, F1 (SET=1), and F2 (SET=2) to change the
pattern.
more: Offers more selections
HEADSET: Allows user to talk on selected channel using a headset
IDLE: Places an IDLE signal on the selected channel
ALL 1'S: Places an ALL 1'S pattern on the selected channel
5. To change the signaling bits on the selected channel, move the cursor to SET
SIGNALING. Use the EDIT key, F1 (SET=1), and F2 (SET=0) to change the setting.
For more detailed information on VF channel testing, refer to paragraph 2.9.9.
Figure 2-78. Test Port Setup for Drop and Insert
Toward the Customer Site
Drop and Insert Testing Without DSX Monitor Jacks
This procedure differs from the first in that pre-synchronizing the test set is not possible,
therefore the T1 line may take longer to re-synchronize after the test set is plugged in. As before, the
line code and framing format should be entered manually but the test set input termination is different.
If connecting to line jacks, the test set will terminate the DSX OUT jacks. If the connections must be
bridged, the BRIDGE selection will be made. In either case, the 100 ohm terminating plugs are not
required.
The following setup demonstrates a drop insert operation, testing toward the network on DS0
channel 5. The test set RX jacks will be connected to the DSX IN and OUT jacks or may bridge the
line at some other access point. After checking the test setup on setup summary screens, the test
set RX and TX jacks will be quickly plugged into their respective DSX OUT and IN jacks. With the
setup and connection complete, testing can begin on the dropped DS0.

OPERATION
2-41
Setting Up for a Drop and Insert Without DSX Monitor Jacks
1. On the MAIN MENU, move the cursor to TEST INTERFACE SETUP and press ENTER.
2. On the TEST INTERFACE SETUP MENU, set the following:
ACTIVE INTERFACES: F2 (L1 / L2)
DS1 L1 RX INPUT: F1 (TERM) or F2 (BRIDGE)
DS1 L1 TX OUTPUT: F1 (0 dB)
DS1 L1 LINE CODE: As required by circuit
DS1 L2 RX INPUT: F1 (TERM) or F2 (BRIDGE)
DS1 L2 TX OUTPUT: F1 (0 dB)
DS1 L2 LINE CODE: As required by circuit
3. Press MENU to return to the MAIN MENU.
4. On the MAIN MENU, move the cursor to DS1 MENU and press ENTER.
5. On the DS1 MENU, move the cursor to DS1 SETUP OPTIONS and press ENTER.
6. On the DS1 TEST SETUP OPTIONS menu, set the following:
TEST TRANSMIT: F2 (LINE 1)
TEST RECEIVE: F1 (LINE 1)
LINE 1 TRANSMIT: TEST (Selected automatically)
LINE 2 TRANSMIT: F3 (LINE 1 RX)
FRAMING FORMAT: As required by circuit
CHANNEL FORMAT: As required by circuit
CHANNEL NUMBER: Set to DS0 channel to be tested
FILL DATA: F2 (LINE 2 RX)
TEST PATTERN: Select pattern as desired
5. Connect the test set RX and TX jacks to the DSX OUT and IN jacks:
DS1 LINE 1 RX jack to the network DSX OUT jack
DS1 LINE 2 RX jack to the site DSX OUT jack
DS1 LINE 1 TX jack to the network IN jack
DS1 LINE 2 TX jack to the site IN jack
The LINE 1 and LINE 2 PULSES and FRAME sync lamps should be lit after the line re-
synchronizes.
6. Press MENU to return to the DS1 MENU.
7. On the DS1 MENU, press F3 (SUMMARY) to view the TEST INTERFACE SETUP
SUMMARY screen, and then F3 (DS1) to view the DS1 TEST SETUP SUMMARY screen.
The circuit is ready for voice frequency testing as in the previous example.
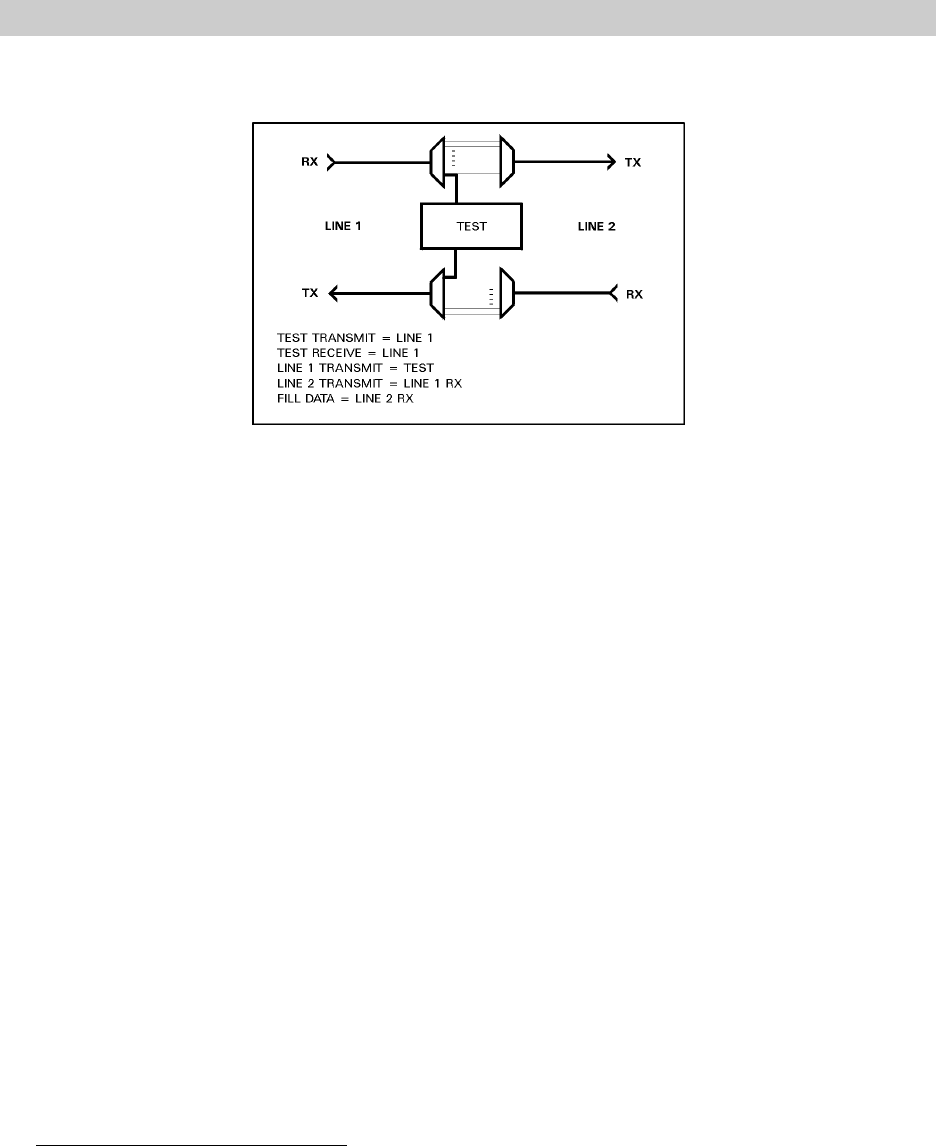
OPERATION
2-42
Figure 2-79. Test Port Setup for Drop and Insert
Toward the Network
2.9.6 DS1 Out of Service Testing
During circuit installation or turn up, or when the performance an in-service T1 span is
sufficiently degraded that it must be taken out of service, testing of the entire T1 can be performed
end-to-end using two test sets, or in a loopback mode by a single test set. While loopback testing may
not provide results that can be related to actual in-service performance, it is useful for testing sections
of a span and isolating sources of trouble. Loopback testing allows an operator to measure T1 signal
level and frequency, check for loop timing display status and alarm conditions, and check for bit. BPV,
and frame and CRC errors.
When out-of-service testing is performed, a wide variety of test patterns can be transmitted
over the T1 span. T1 test patterns are transmitted to confirm normal operation, detect marginal or
substandard performance, or identify incorrectly optioned circuit components. The EZ-TESTER DS can
generate all standard T1 test patterns and monitor the results to perform those functions. To
understand the application of each test pattern type, refer to Electrodata’s T1 Test Pattern Application
Note available from the factory or internet web site at www.electrodata.com.
An advantage of performing out-or-service testing with a dual line EZ-TESTER DS is that one
test set DS1 LINE can test circuit components in one direction, and the other test set DS1 LINE can
be used to terminate the span in the other direction, thereby keeping it alive while testing is in
progress.
The following setup describes testing a full T1 from a DSX panel by looping up the line at the
network far end and transmitting a standard T1 test pattern. The span toward the customer is kept
alive by an AIS transmitted from the test set LINE 2:
Setup for Out-of-Service Testing:
1. On the TEST INTERFACE SETUP MENU set the following:
ACTIVE INTERFACES: F2 (L1 / L2)
DS1 L1 RX INPUT: F1 (TERM)
DS1 L1 TX OUTPUT: F1 (0 dB)
DS1 L1 LINE CODE: As required by circuit

OPERATION
2-43
DS1 L2 RX INPUT: F1 (TERM)
DS1 L2 TX OUTPUT: F1 (0 dB)
DS1 L2 LINE CODE: As required by circuit
3. Press MENU to return to the MAIN MENU.
4. On the MAIN MENU, move the cursor to DS1 MENU and press ENTER.
5. On the DS1 MENU, move the cursor to DS1 SETUP OPTIONS and press ENTER.
6. On the DS1 TEST SETUP OPTIONS menu, set the following:
TEST TRANSMIT: F2 (LINE 1)
TEST RECEIVE: F1 (LINE 1)
LINE 1 TRANSMIT: TEST (Selected automatically)
LINE 2 TRANSMIT: F1 (AIS)
FRAMING FORMAT: As required by circuit
CHANNEL FORMAT: F1 (FULL T1)
TEST PATTERN: Select pattern as desired
7. Press MENU to return to the DS1 MENU
8 Connect the test set RX and TX jacks to the DSX OUT and IN jacks:
DS1 LINE 1 RX jack to the network DSX OUT jack
DS1 LINE 1 TX jack to the network DSX IN jack
DS1 LINE 2 RX jack to the site DSX OUT jack
DS1 LINE 2 TX jack to the site DSX IN jack
The LINE 1 and LINE 2 PULSES and FRAME sync lamps should be lit after the line re-
synchronizes.
Sending a Loop-Up Command to the Far End
1. To loop up the network far end with the test set, press START, press F4 (more), then
F2 (DS1 LOOP).
2. On the CSU / NIU CONTROL menu, move the cursor to LOOP CODE and select the
device to be looped.
3. If the line is ESF, select DATALINK or IN-BAND as the means of sending the loopback
code.
On an ESF line, most far end devices will only respond to a datalink command, while
others may require an in-band command. If IN-BAND is selected, the test set display will
include “WARNING: FRAMING SET TO ESF”. This is simply a reminder that an IN-BAND
selection may not work and that DATALINK may have to be selected if the loopback
operation is not successful.
Response to a loopback command sent via the ESF datalink will be immediate. Response
to a command sent in-band will require up to six seconds to complete.
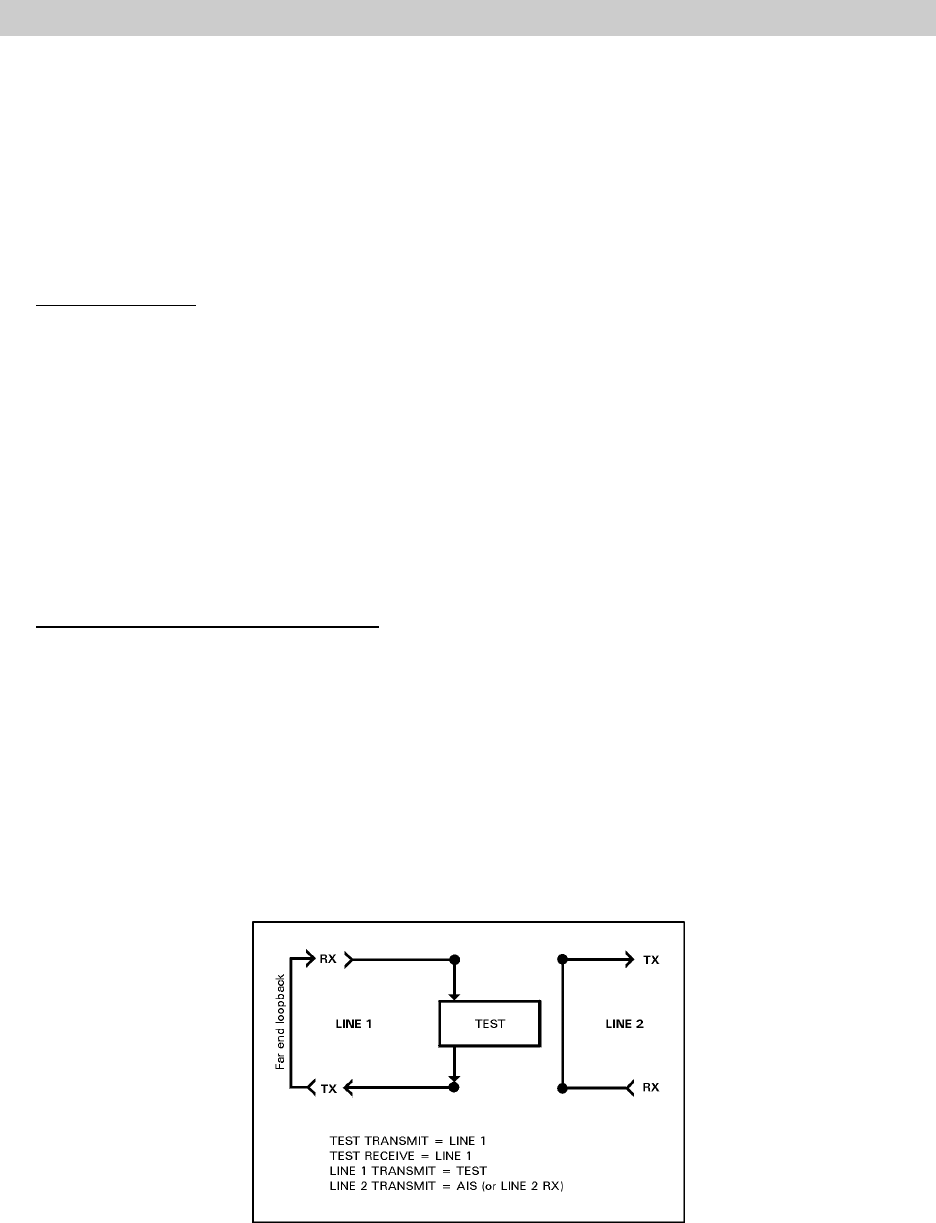
OPERATION
2-44
4. Move the cursor to CSU / NIU OPERATION and press F1 (LOOP-UP) to initiate the
loopback operation. The loopback command will be transmitted via the line designated
as the TEST line. When loop-up is successful, the test set will emit two short beeps and
will briefly display “OPERATION COMPLETE”.
If a loop-up already exists at the far end before the loopback operation is initiated, the
test set screen will report “PRE-EXISTING LOOP-UP” after the loop-up command is
transmitted.
Running the Test
When setup is complete and the far end is looped up, the selected test pattern may be
transmitted to the far end, looped back, and monitored by the test set receiver.
1. Press the START key. The display will change to the RESULTS - SUMMARY screen and
will report NO ERRORS if all conditions are normal. Review the RESULTS and the
ALARMS and ERRORS screens as before.
Individual tests can be sent from the EZ-TESTER DS by selecting the desired test pattern
on the DS1 TEST SETUP OPTIONS screen and initiating the test with the START button
and monitoring the results on the RESULTS-SUMMARY screen.
Removing the Loop-Up After Testing
When testing is complete, remove the loop-up at the far end by transmitting a loop down
command from the test set.
1. On the RESULTS - SUMMARY screen, press F4 (more) several times until DS1 LOOP
appears, then press F2 (DS1LOOP).
2. Move the cursor to CSU / NIU OPERATION and press F2 (LOOP-DN) to transmit the loop-
down command. When loop-down is successful, the test set will emit two short beeps
and will briefly display “OPERATION COMPLETE”.
Figure 2-80. Test Port Setup for Typical Pattern Test
Toward the Network
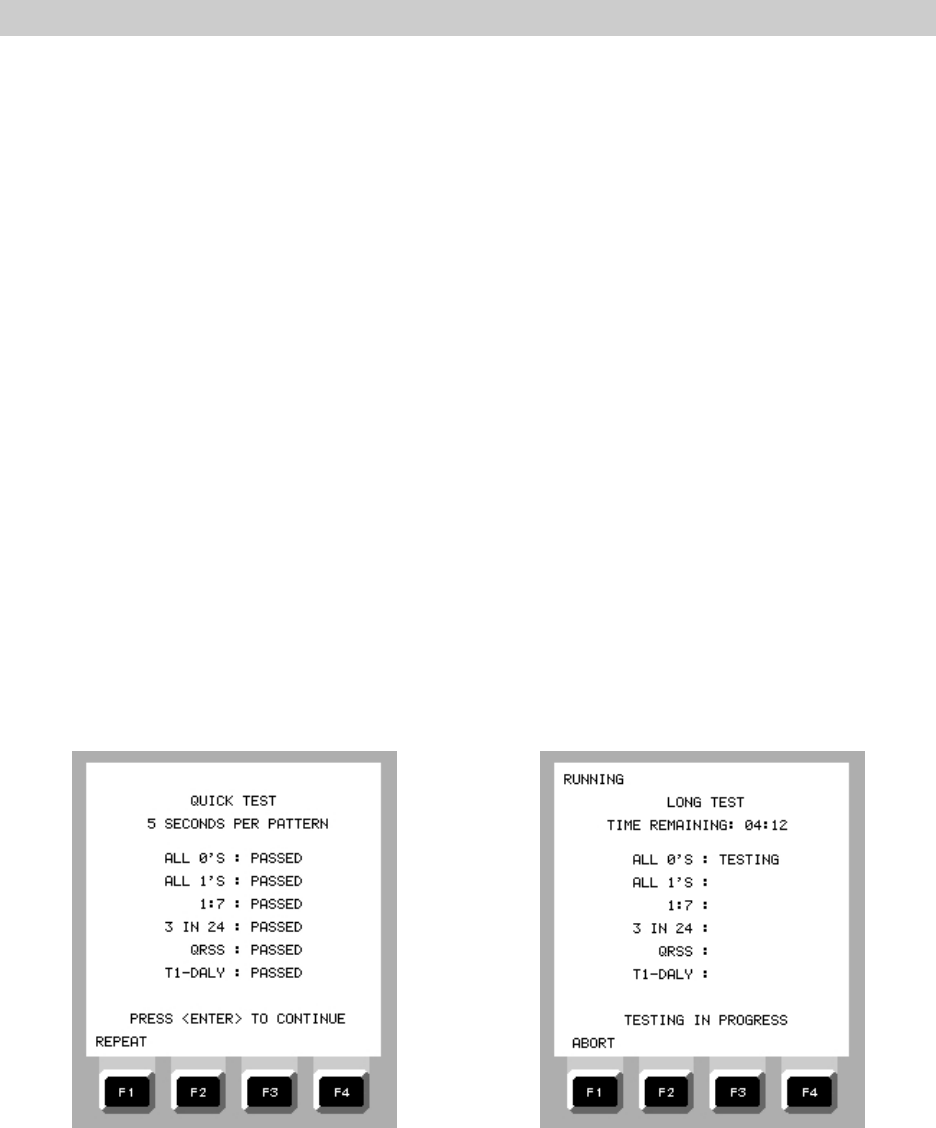
OPERATION
2-45
2.9.7 Running Multiple Test Patterns
Running a single test pattern on a T1 may not detect marginal performance of the span that
may result in problems detectable only under specific circumstances. Automatic Line Build Out (ALBO)
circuits may only fail when the one’s density of the data stream changes rapidly. Receiver timing may
only fail if the one’s density of the data stream is low. Running multiple test patterns is vital to
detecting marginal performance of a T1 span. The EZ-TESTER DS has two built in test sequences, the
Long Test (L-TEST) and Quick Test (Q-TEST), that makes running multiple test patterns simple.
After performing a typical out of service test setup, The Q-TEST can be performed by pressing
F4 (Q-TEST) on the CSU / NIU CONTROL menu. The EZ-TESTER DS will run the following sequence
of tests for a period of five seconds each:
ALL 0's (Only available if line code is B8ZS) 3 in 24
ALL 1's QRSS
1:7 T1-DALY
During the execution of the test, the QUICK TEST screen will be displayed showing the result
of each test as it is completed.
If a longer test is desired, press F3 (L-TEST) on the CSU / NIU CONTROL menu. The same
sequence of tests will be run, but the time duration of the tests can be extended by changing the
highlighted value shown on the LONG TEST screen. The time duration can be set by changing the
highlighted value with the F1 (HIGHER) and F2 (LOWER) keys, or by selecting preset values with the
F3 (5-MIN) or F4 (15-MIN) key during the L-TEST setup.
Figure 2-81. QUICK TEST Display Figure 2-82. LONG TEST TIME SETUP
Display

OPERATION
2-46
2.9.8 DS1 Alarm and Error Injection
The EZ-TESTER DS can generate signals with simulated alarm and error conditions to test the
response of T1 circuit elements. Error signals are also useful to confirm a loop-ups.
The available selection on the ALARM/ERROR TYPE menu are:
NONE LOSS OF SIGNAL ALARM LOSS OF FRAME ALARM
YELLOW ALARM AIS ALARM IDLE ALARM
BPV ERROR FRAME ERROR CRC ERROR
PATTERN ERROR
Injecting an Alarm or Error into a Test Data Stream
1. Set up the test set to perform a typical pattern test and connect the test set to the line
under test.
2. Perform a far end loop-up if required.
3. On the DS1 MENU, move the cursor ro ALARM / ERROR INJECT and press ENTER.
4. On the ALARM / ERROR INJECT menu, move the cursor to ALARM / ERROR SOURCE
and press F1 (LINE 1) or F2 (LINE 2), depending on the direction of the test.
5. Move the cursor to ALARM / ERROR TYPE and press EDIT. Use the arrow keys to scroll
through the ALARM / ERROR TYPE screen and press ENTER to select the desired type.
6. If an alarm type is selected, move the cursor to ALARM MODE and press F1 (SINGLE)
or F2 (CONT) to generate a momentary or continuous alarm condition.
7. If an error type is selected, move the cursor to ERROR MODE and press F1 (SINGLE), F2
(BURST), or F3 (RATE) to generate a single error, burst of errors, or errors that occur
continuously at a set rate.
When BURST COUNT or ERROR RATE are available, move the cursor to each line and
use F1 (HIGHER) or F2 (LOWER) to set the count or rate.
8. Begin the test by pressing the START key. The test sequence will begin and the
RESULTS - SUMMARY screen should report NO ERRORS unless there is a pre-existing
problem.
9. Press the ERROR key to inject the selected error or alarm. The ERROR INJECT lamp will
light for the duration of the set alarm or error condition. If the circuit is looped up, the
RESULTS / SUMMARY screen will report the type of alarm or error detected and various
lamps will change.
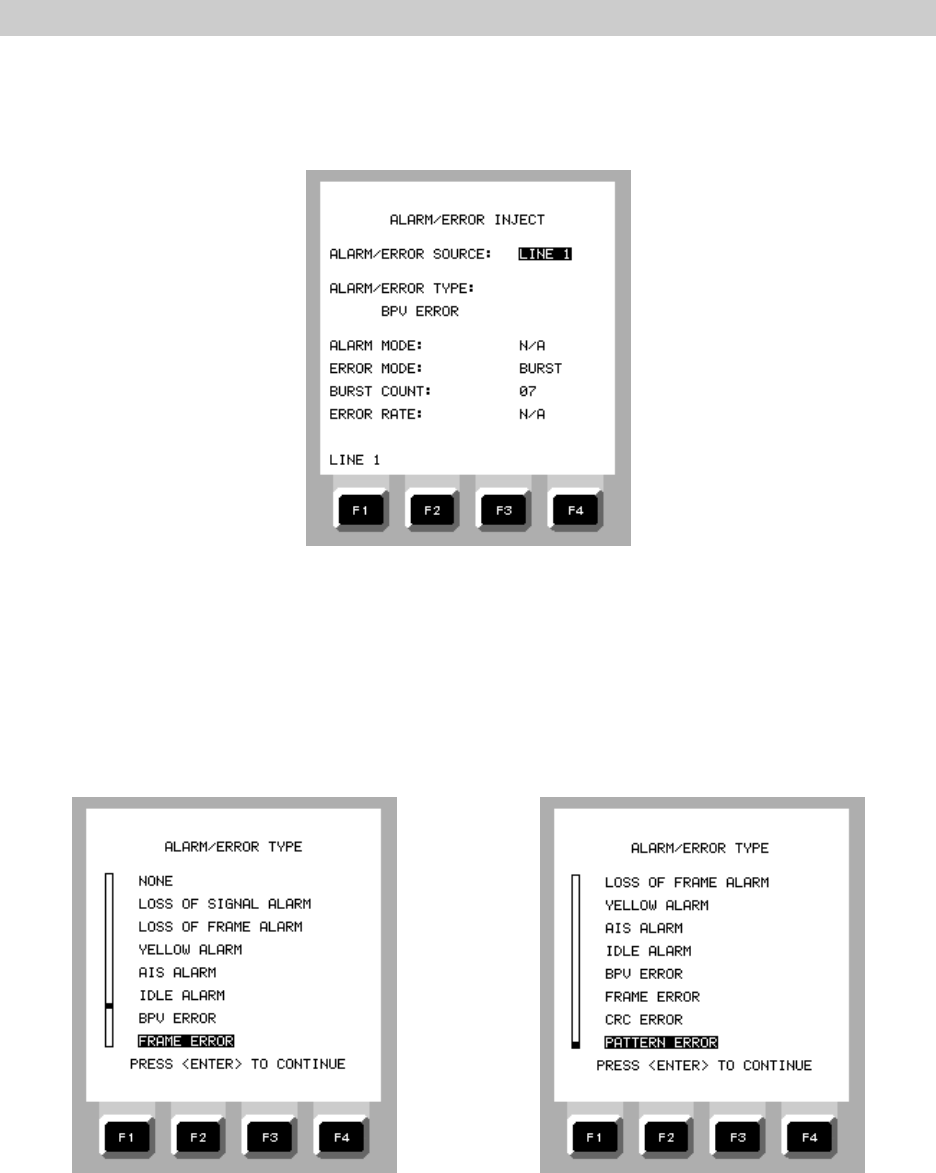
OPERATION
2-47
Figure 2-83. ALARM / ERROR INJECT Menu
Figure 2-84. ALARM / ERROR TYPE Screen Figure 2-85. ALARM / ERROR TYPE Screen
(Scrolled)

OPERATION
2-48
2.9.9 Voice Frequency Channel Testing
The DS0 channel access functions of the EZ-TESTER DS provide a means of performing voice
frequency (VF) transmission and signaling tests on T1 lines terminated with a channel bank, remote
terminal, digital switch, or PBX. Channel tests can be performed with the T1 line in or out of service.
In the in-service mode, the test set is connected in series with one side of the T1 line using the
RX/TX jacks. After the connection is made, the DS1 bit stream passes through the in/out circuits of
the EZ-TESTER DS undisturbed. A single channel can then be taken out-of-service for one-way
drop/insert testing without disturbing the remaining 23 channels.
In the out-of-service mode, the test set terminates both the transmit and receive sides of the
T1 line. This mode allows the user to perform full two-way channel transmission and signaling tests
during installation of new trunk circuits, and to troubleshoot existing channel banks and digital
switches.
The standard VF channel test functions are listed below:
a. Set outgoing AB or ABCD signaling bits (on/off hook signaling)
b. View incoming signaling bits (test channel or all channels)
c. View incoming data or information bits in test channel
d. Transmit standard test tones / Measure frequency and level of test tones
e. Talk and listen on the channel
Setup and Patching (T1 out-of-service)
1. In the TEST INTERFACE SETUP MENU, move the cursor to DS1 RX INPUT, press F1
(TERM), and then MENU.
2. On the MAIN MENU, move the cursor to DS1 MENU and press ENTER.
3. On the DS1 MENU, move the cursor to DS1 SETUP OPTIONS and press ENTER.
4. On the DS1 TEST SETUP OPTIONS menu, move the cursor to CHANNEL FORMAT and
press F3 (64 x 1).
5. Connect the DS1 RX and TX jacks to the T1 line DSX IN / OUT jacks. (The T1 line is
now out of service and terminated by the test set.)
Basic Channel Testing (Channel Alignment / Talk & Listen)
NOTE: Have someone assist you at the far end channel bank with a VF test set and/or
a butt set.
1. On the DS1 MENU, move the cursor to VF CHANNEL ACCESS and press ENTER.
2. On the VF CHANNEL ACCESS menu (Figure 2-12), move the cursor to CHANNEL
NUMBER and use the F1 (NEXT) key or F2 (PREVIOUS) key to select the desired channel
for testing.
3. If you need to go off-hook to hold the channel for testing, move the cursor to SET
SIGNALING and press EDIT. Set the signaling bits to the appropriate off-hook format
using the left/right arrow keys and the F1 and F2 keys, then press ENTER.
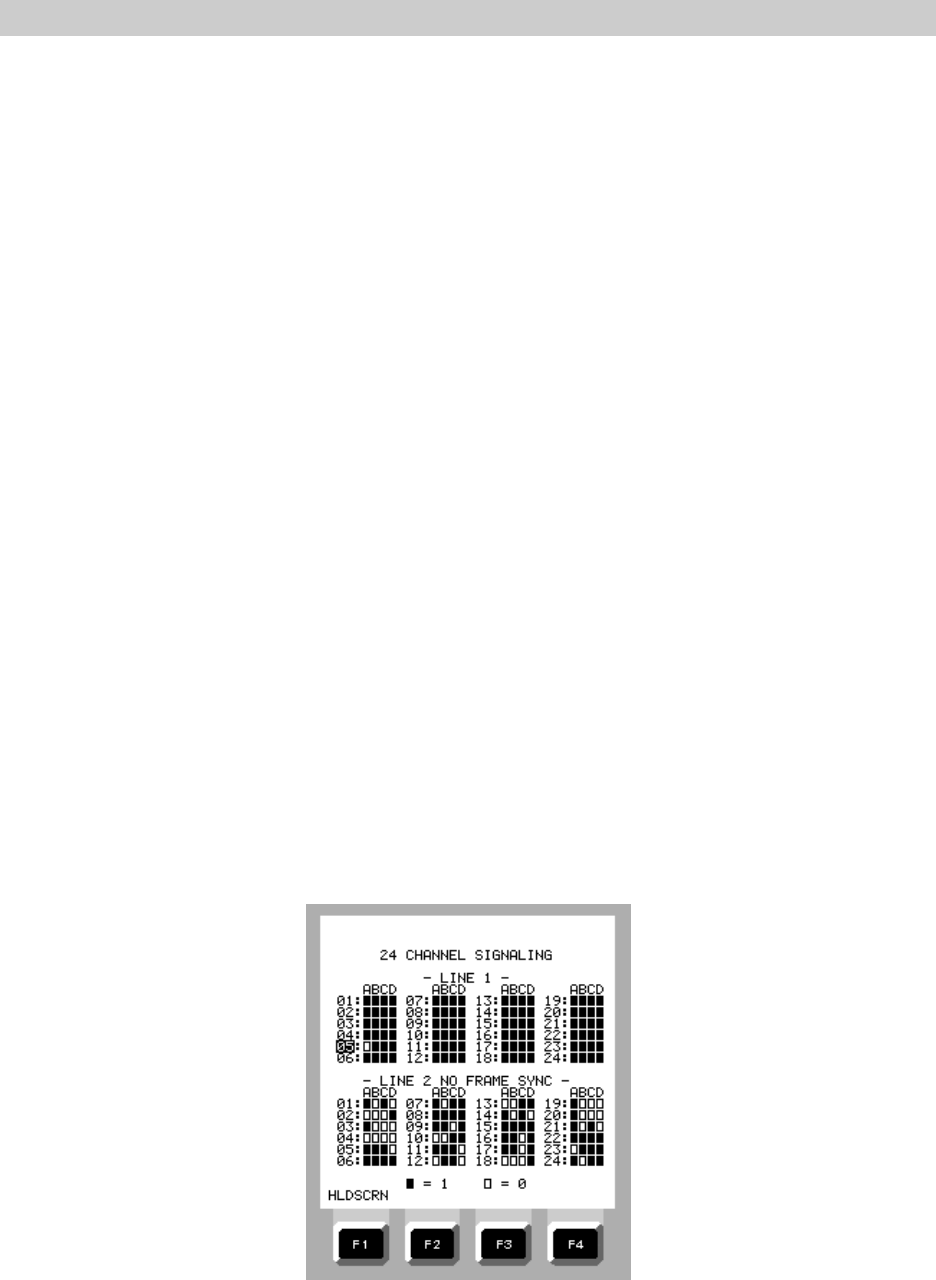
OPERATION
2-49
4. Move the cursor to CHANNEL DATA and press use the F1 through F4 to select the
desired test signal or tone:
F1=TRANSPARENT F1=HEADSET F1=TONE F1=1804Hz
F2=DIG-MW F2=IDLE F2=404Hz F2=2713Hz
F3=FIXED F3=ALL 1's F3=1004Hz F3=2804Hz
F4=MORE F4=MORE F4=MORE F4=MORE
F3 (FIXED) is used to set a user-defined 8-bit test pattern. Use the EDIT key, F1/F2
keys, arrow keys, and ENTER key to set the desired pattern.
F1 (TONE) is used to set a variable tone. Use the EDIT key, numeric keypad, arrow keys,
and ENTER key to set the tone.
F1 (HEADSET) is used to enable a voice input at the test set. Connect the optional
headset to the front panel headset jack to transmit voice over the channel.
The 2713 Hz tone is used to loop up and loop down a Bell 829 device. The tone should
be applied for about 5 seconds to complete the loopback operation. When the loop up
is complete, the tone will be heard on the test set speaker.
5. A test set at the far end can now measure the audio level and frequency of the test tone,
monitor the test pattern and signaling bits, or establish voice communications.
6. To perform the measurement in the opposite direction, have the far-end test set inject
a test signal at the VF output of the channel under test. The local test set will display
the frequency and level of the incoming test tone, the bit pattern and signaling bits, and
make the tones audible at the front panel speaker or headset. If listening to the tone
from the front panel speaker, adjust the volume with the VOL key.
7. Have the far-end tester connect a butt set to the VF output of the channel under test.
You can talk and listen over the channel using a headset with microphone plugged into
the EZ-TESTER DS headset jack.
Figure 2-86. 24 CHANNEL SIGNALING Display
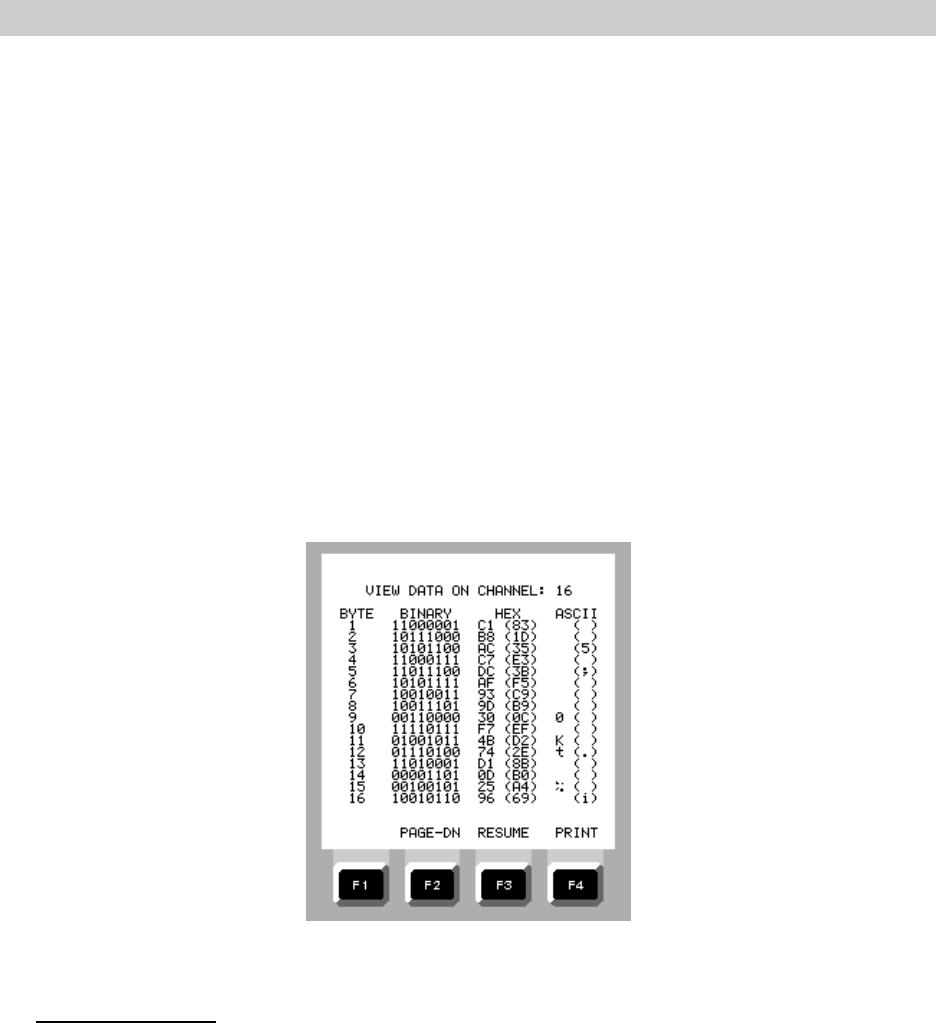
OPERATION
2-50
2.9.10 24 Channel Signaling
The EZ-TESTER DS DS1 option includes a 24 channel signaling feature that allows the user to
quickly identify active channels by viewing the signaling bits on all 24 channels on a single screen.
On D3/D4, SLC-96, and D1D circuits, the screen displays the AB signaling bits. For ESF circuits, the
screen displays the ABCD signaling bits. To view 24 channel signaling, perform the following steps.
1. Set up the test set for DS1 testing.
2. On the MAIN MENU, move the cursor to 24 CHANNEL SIGNALING and press ENTER.
A dark box represents a 1 bit. A light box represents a 0 bit. To freeze the display,
press F1 (HLDSCRN). To resume, press F1 (RESUME).
2.9.11 Viewing Channel Data
The EZ-TESTER DS can display individual DS0 channel data on 56K or 64K channels. The data
can be captured in 256 byte segments and is displayed in binary, hexadecimal, and ASCII format.
Figure 2-87. VIEW CHANNEL DATA Display
View Channel Data
1. Set up the test set for DS1 testing.
2. On the DS1 TEST SETUP OPTIONS menu, set the following:
CHANNEL FORMAT: 56 X 1 or 64 X 1 as required
3. When the DS1 setup is complete, return to the DS1 MENU.
4. On the DS1 MENU, move the cursor to VIEW CHANNEL DATA and press ENTER. The
display will change to VIEW CHANNEL DATA: with the selected channel number shown.
5. To change the channel being viewed, press F1 (NEXT) or F2 (PREV).
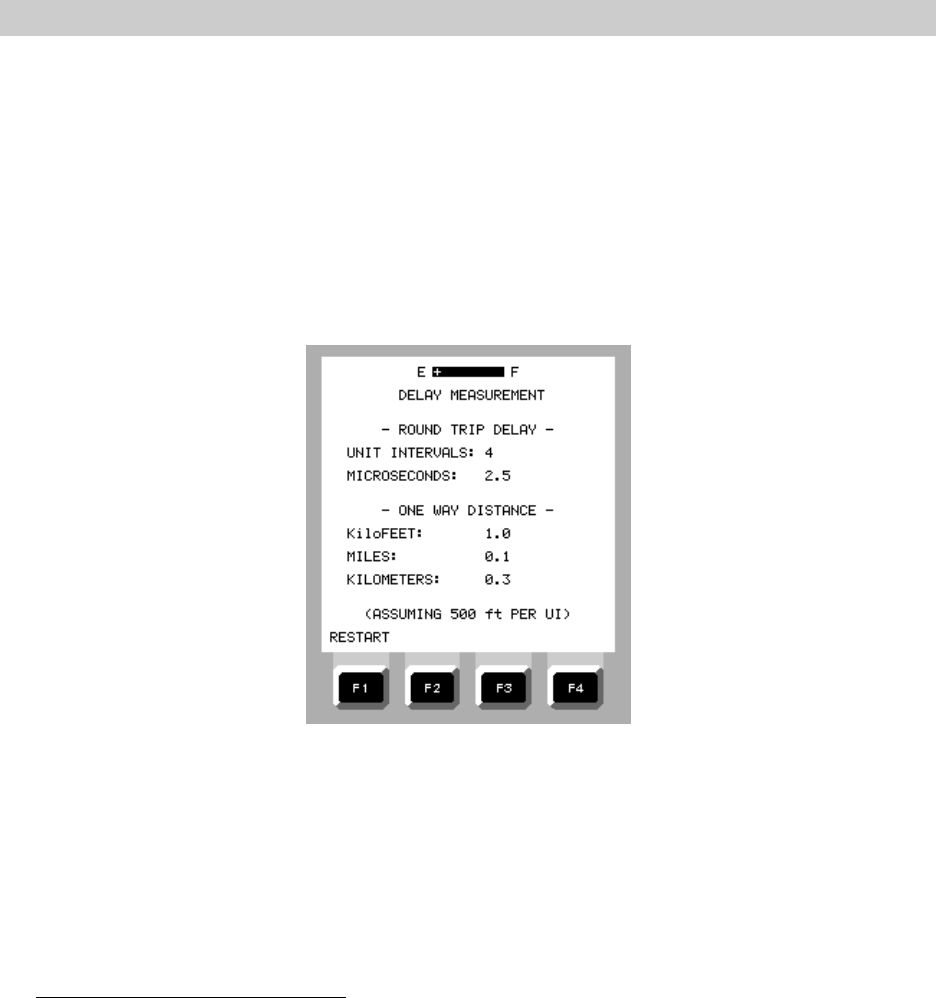
OPERATION
2-51
6. To freeze the display, press F3 (PAUSE). After pausing, use the F keys to page up and
down, resume scanning, or to initiate a print operation.
2.9.12 Performing a Delay Measurement
The EZ-TESTER DS includes a delay measurement feature that can be used to measure the
distance to a hard or soft loopback. The test set transmits a pulse and measures the length of time
the pulse takes to complete a round trip. The time delay is displayed in unit intervals and
microseconds. The calculated distance is displayed in kilofeet, miles, and kilometers.
Figure 2-88. DELAY MEASUREMENT Display
When making a delay measurement, remember that circuit components in the signal path may
introduce time delays that will affect the computed distance. For this reason, the final distance shown
represents a “maximum” distance and will not be accurate to feet or yards. The measurement is
designed to inform the user as to whether the loopback is nearby (in the building), in a repeater three
blocks away, or at the far end of the span.
Performing a Delay Measurement
1. Set up the test set for DS1 testing.
2. On the MAIN MENU, move the cursor to DELAY MEASUREMENT and press ENTER. The
measurement cycle will begin immediately.
3. To repeat the measurement, press F1 (RESTART).
4. To abort a measurement before it is completed, press F1 (ABORT)
If the test set does not detect a loopback, the screen will report (LOOPBACK NOT
PRESENT)
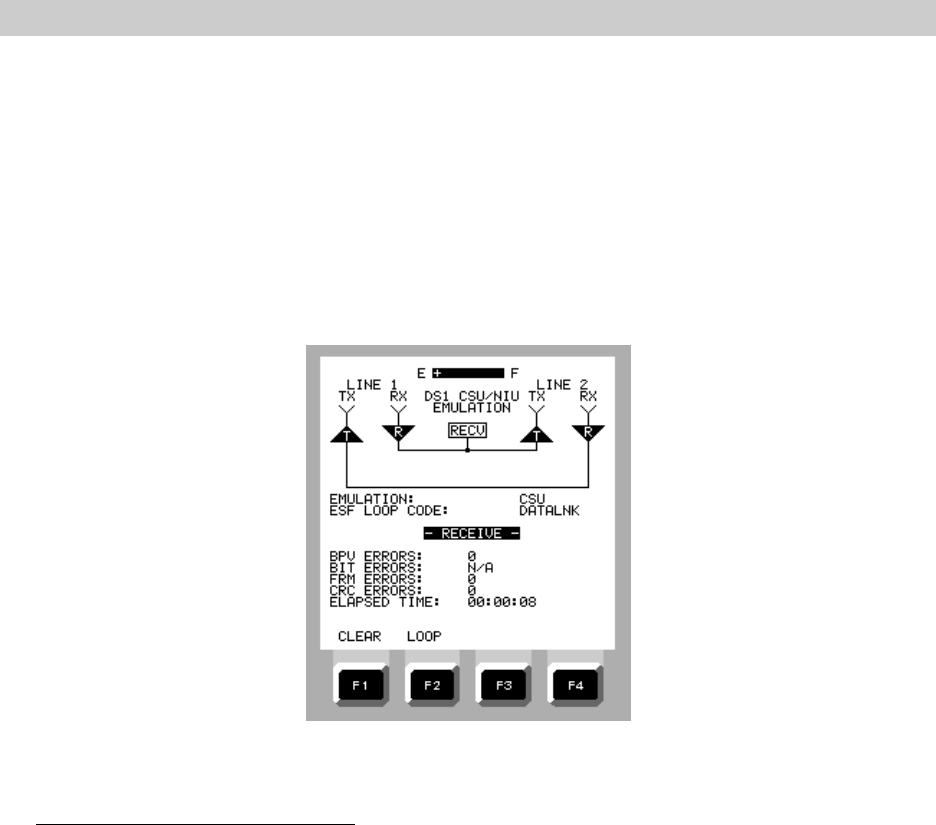
OPERATION
2-52
2.9.13 CSU / NIU Emulation
During T1 installations, it is often convenient to test the span before the customer equipment
is connected. The EZ-TESTER DS can be used to terminate the line and emulate a customer service
unit (CSU) or network interface unit (NIU). In the CSU / NIU Emulation mode of operation, the test set
can establish a local loop from the front panel or by responding to a loopback command from the far
end. The test set will display the elapsed time and will count and display the number of BPVs, bit
errors, frame errors, and CRC errors that have occurred since the loopback operation was performed.
A CSU / NIU emulation operation should be performed on a full T1 line. The operation can be
performed from an STS-1 or DS3 access point.
Figure 2-89. CSU / NIU EMULATION Screen
Performing a CSU / NIU Emulation
1. Set up the test set for DS1 testing.
2. On the DS1 MENU, move the cursor to CSU / NIU EMULATION and press ENTER.
3. On the DS1 CSU/NIU EMULATION screen, set the following:
EMULATION: NIU, CSU, or NET-NIU as required
ESF: IN-BAND or DATALINK This selection should match the circuit
requirements. If the test set does not respond to the command
from the far end, change the selection and try again. This
selection will be available on ESF and SLC-96 circuits.
4. The test set is ready to respond.
2-10 Test Set Options and Special Functions
The EZ-TESTER DS can be configured with sixteen special add-on options to enhance the test
set’s basic T1 testing capabilities. Each option is available for purchase separately from the basic
instrument, and most can be added to test set in the field using the Electrodata’s built-in OnCall®
feature. Each of the add-on options is described in the following paragraphs
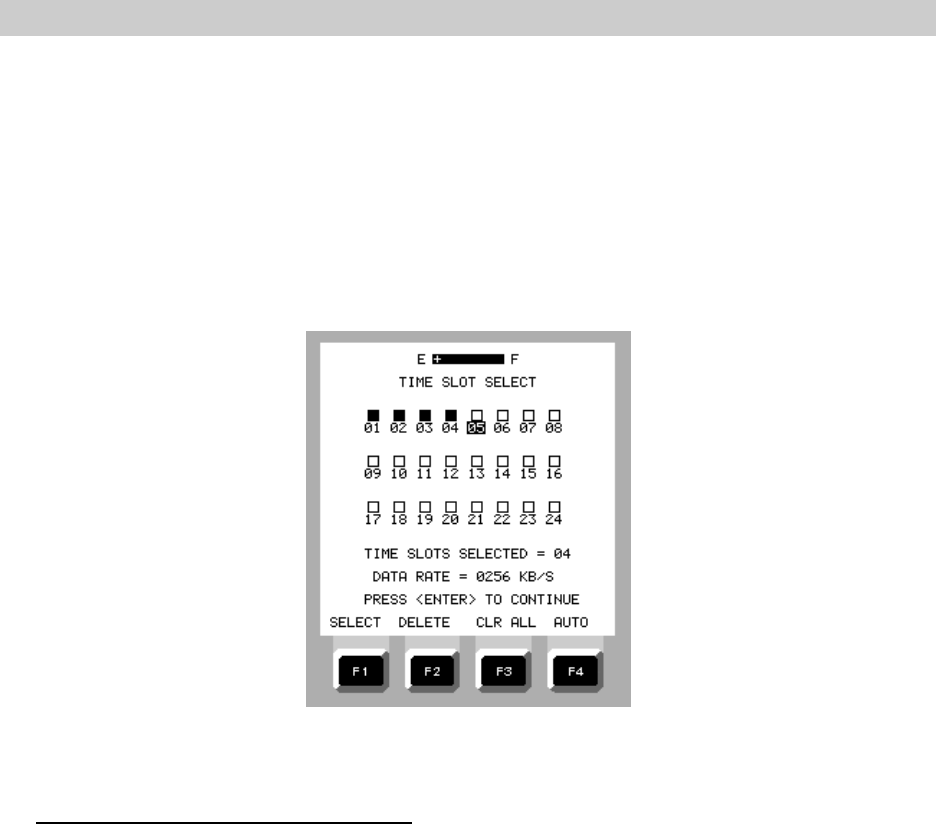
OPERATION
2-53
2.10.1 Fractional T1 Monitoring and Testing (Option 01)
This option allows the user to monitor and test fractional T1 (FT1) circuits using contiguous
or noncontiguous 56 x N or 64 x N time slots. The EZ-TESTER DS will automatically identify the time
slot assignments in the FT1 circuit, and display the channel assignments on the screen. Identification
of the channels assigned to the FT1 circuit is based on the assumption that the remaining unassigned
channels will be idle. FT1 circuits can be monitored in-service to verify channel assignments and to
measure error performance, or taken out-of-service for bit error testing.
Figure 2-90. TIME SLOT SELECT Screen for Fractional T1
Identifying the FT1 Channel Assignment
1. Set up and connect the test set for DS1 testing.
2. On the DS1 TEST SETUP OPTIONS menu, set the following:
CHANNEL FORMAT: F4 (FT1) NOTE: The cursor will not change until
the data rate is selected next.
3. Press F1 (56 X 1) or F2 (64 X 1) to set the channel data rate.
When the channel data rate is selected the screen will change to the TIME SLOT SELECT
screen
4. On the TIME SLOT SELECT screen, press F4 (AUTO).
The test set display will mark the channels comprising the FT1 channel with black
squares, identify the number of time slots used, and compute the channel bandwidth.

OPERATION
2-54
In-Service Monitoring
Set up the EZ-TESTER DS for in-service monitoring and patch to the circuit under test.
(PULSES and FRAME SYNC LEDs should light.)
1. Set up and connect the test set for DS1 testing.
2. On the DS1 TEST SETUP OPTIONS menu, set the following:
CHANNEL FORMAT: F4 (FT1) NOTE: The cursor will not change until
the data rate is selected next.
3. Press F1 (56 X 1) or F2 (64 X 1) to set the channel data rate.
When the channel data rate is selected the screen will change to the TIME SLOT SELECT
screen
4. Select FT1 channels to be tested by using arrow keys to move from channel to channel,
then press F1 (SELECT), or press F4 to let test set auto-configure to the time slots of the
incoming FT1 signal. For manual setup use the F keys to:
F1 = Select channel
F2 = Delete a previously selected channel
F3 = Clear all currently selected channels
F4 = Automatically detect and displays active channels
NOTE: On the DS1 TEST SETUP OPTIONS menu, FILL DATA (ALL 1's or IDLE) must
be selected. When the test set auto configures, it tests for the fill data as it scans
each channel. The test set considers any channel that DOES NOT contain the selected
fill data to be part of the Fractional T1 circuit.
6. Press ENTER to return to DS1 TEST SETUP MENU.
7. Press START to initiate a test run to measure the error performance of the FT1 circuit.
When the test is complete, the results will be displayed on the screen or may be sent to a local
printer.
2.10.2 Pulse Shape Analysis (Option 02)
Distorted T1 pulses are a source of transmission errors, so their shape should be analyzed when
troubleshooting problems in T1 facilities. T1 pulse shape has been standardized at two interface points
on a T1 line: at a DSX interface (AT&T Compatibility Bulletin CB-119/ANSI specification T1.102) and
at a customer premises network interface (ANSI Specification T1.403). The two standards each
include a pulse shape mask that defines the boundaries of the respective pulse shape specifications
(pulse width, rise / fall time, and percent overshoot / undershoot). Both of these masks are stored in
the EZ-TESTER DS.
During a test, the T1 pulses are superimposed on the selected mask and displayed on the
screen for easy comparison. Pulse shape graphs and measurements can be passed to an external
printer for a hard copy record.
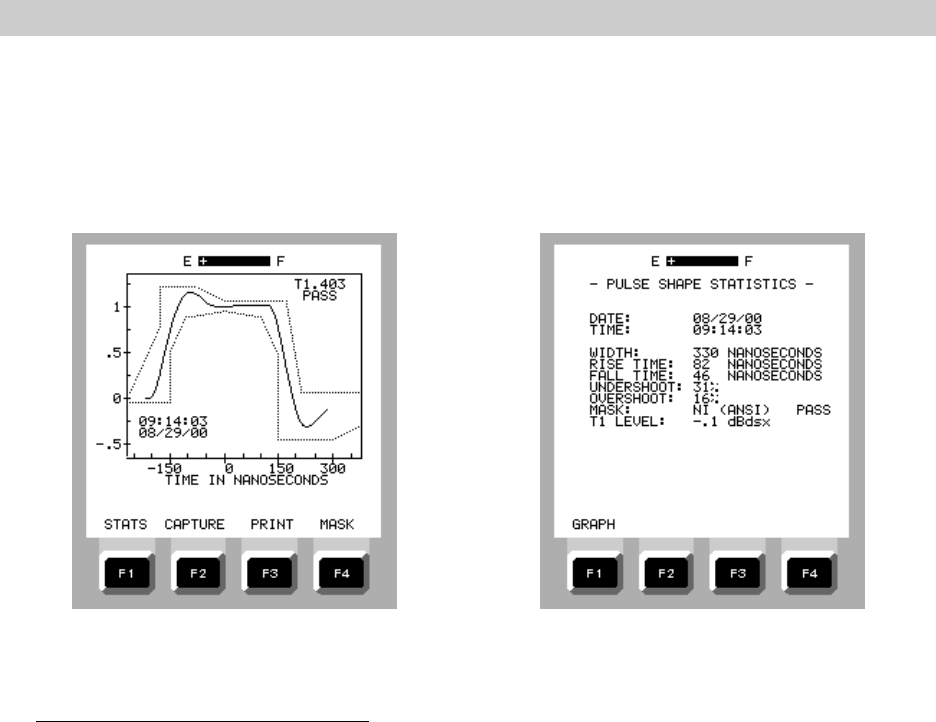
OPERATION
2-55
Comparative pulse shape tests can be performed only at the specified interface points. For
accurate measurements, the T1 line must be taken out of service so that it can be properly terminated
in 100 ohms by the EZ-TESTER DS.. It is very important to use a low ones-density test pattern (1:7)
to eliminate adjacent pulse interference during the measurement.
Figure 2-91. PULSE SHAPE ANALYSIS Figure 2-92. PULSE SHAPE ANALYSIS
Screen 1 Screen 2
To Perform a Pulse Shape Analysis:
1. On the MAIN MENU, move the cursor to TEST INTERFACE SETUP and press ENTER.
2. On the TEST INTERFACE SETUP MENU, set the following:
ACTIVE INTERFACES: F1 (L1 ONLY)
DS1 LI LINE CODE: As required
DS1 L1 RX INPUT: F1 (TERM)
3. Press MENU to return to the MAIN MENU.
4. On the MAIN MENU, move the cursor to DS1 MENU and press ENTER.
5. On the DS1 MENU, move the cursor to PULSE SHAPE ANALYSIS and press ENTER.
6. On the PULSE SHAPE ANALYSIS screen, use the F4 (MASK) key to select the mask
required for the test.
F1 = NO MASK To be used to view shape and measure pulse characteristics
without mask
F2 = CB-119
F3 = T1.403
7. Connect the DS1 LINE 1 RX jack to the DSX test point.
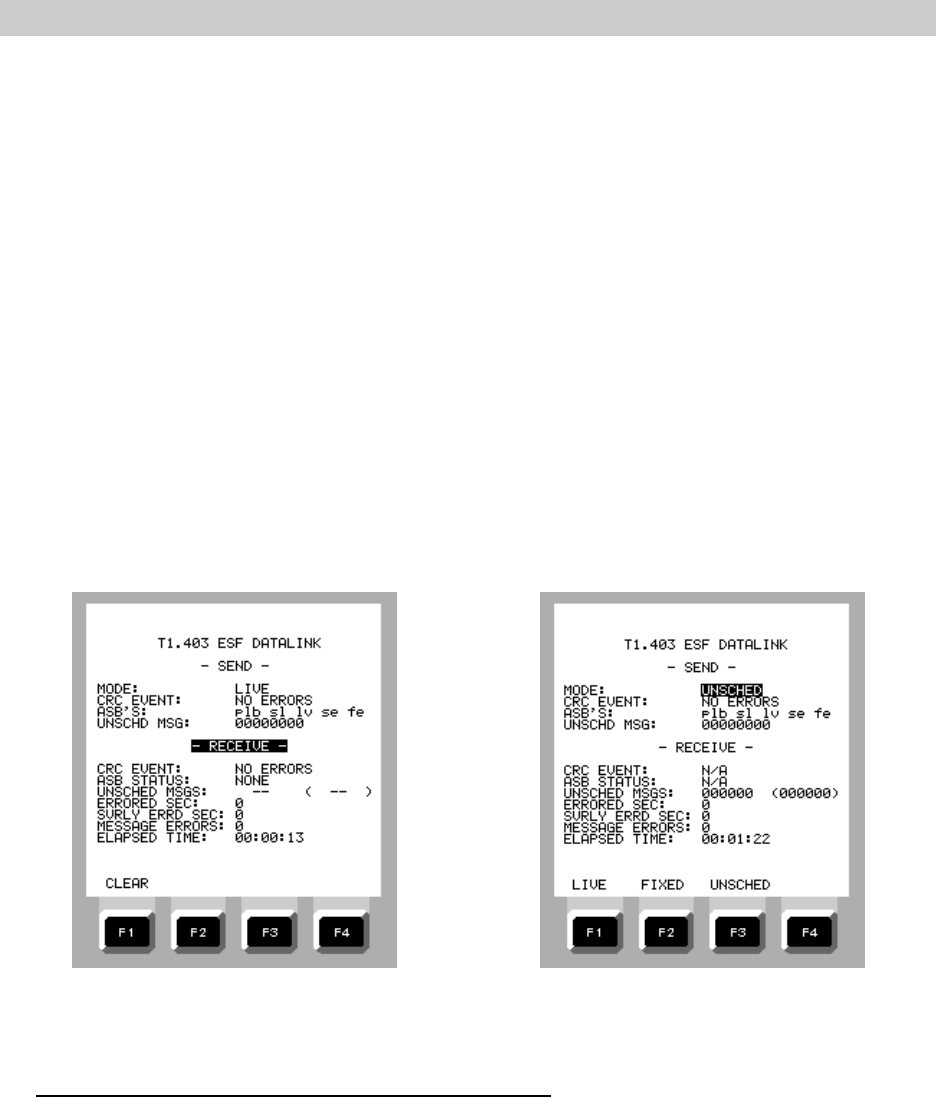
OPERATION
2-56
8. On the PULSE SHAPE ANALYSIS screen, press F4 (more) and then F2 (CAPTURE) to
initiate the capture sequence.
When the capture is complete, the test set will emit a double beep and present the pulse
on the mask.
(a) Press the F1 (STATS) key to view the pulse shape statistics, then press F1
(GRAPH) to return to the main screen again.
(b). Press F2 (CAPTURE) to initiate another capture. Refer to paragraph 2.10.17 for
printing instructions.
(c) Press F3 (PRINT) to initiate a print operation to generate a hard copy record.
2.10.3 ESF/SLC 96 Monitor and Control (Option 03)
This option allows the monitoring and control of information in the Facility Datalink when ESF
or SLC-96 framing is used. This includes the ability to detect or force Performance Report Messages
(PRM), Application Specific Bits (ASB) and alarms, as well as far-end loop commands, maintenance
messages, and protection switch commands with the T1 line taken out of service.
Figure 2-93. T1.403 ESF DATALINK Display, Figure 2-94. T1.403 ESF DATALINK Display,
LIVE Mode UNSCHD Mode
Monitoring ESF Datalink Performance Report Messages
1. Set up the EZ-TESTER DS for in-service monitoring and patch to the circuit under test.
2. On the MAIN MENU, move the cursor to DS1 MENU and press ENTER.
3. On the DS1 MENU, select DS1 SETUP OPTIONS and press ENTER.
4. On the DS1 TEST SETUP OPTIONS menu, select FRAMING FORMAT and press F3 (ESF)
and then MENU.

OPERATION
2-57
5. On the DS1 MENU, scroll down to ESF/SLC DATALINK and press ENTER.
6. On the T1.403 ESF DATALINK screen (Figure 2-93), move the cursor to MODE and press
F1 (LIVE).
Emulating the T1.403 ESF Performance Report Function
1. Set up the EZ-TESTER DS for out-of-service testing and patch to the circuit under test.
2. On the MAIN MENU, move the cursor to DS1 MENU and press ENTER.
3. On the DS1 MENU, select DS1 SETUP OPTIONS and press ENTER.
4. On the DS1 TEST SETUP OPTIONS menu, select FRAMING FORMAT and press F3 (ESF)
and then MENU.
5. On the DS1 MENU, scroll down to ESF/SLC DATALINK and press ENTER.
6. On the T1.403 ESF DATALINK screen, move the cursor to MODE and press F2 (FIXED)
or F3 (UNSCHED)
7. Move the cursor to CRC EVENT and select the number of events desired using the F
keys:
None 11 to 100 errors
1 error 101 to 319 errors
2 to 5 errors 320 or more errors
6 to10 errors
8. Move the cursor to ASB’s and set the desired bits using the EDIT key:
The ASB abbreviations shown on the display are explained below:
plb = Payload Loopback Active sl = Controlled Slip
lv = Line Code Violation se = Severely Errored Framing Bit Event
fe = Framing Bit Error
9. Move the cursor to UNSCHD MSG and enter the desired 8-bit priority or command
response codeword message using the F keys.
The menu selections are explained below:
YEL-ALM Yellow Alarm
PLPK-UP CSU payload loopback switch activated
PLPK-DN CSU payload loopback switch deactivated (circuit restored)
LLPK-UP CSU line loopback switch activated
LLPK-DN CSU line loopback switch deactivated (circuit restored)
NLPK-UP NIU (smart jack) loopback switch activated
NLPK-DN NIU (smart jack) loopback switch deactivated (circuit restored)
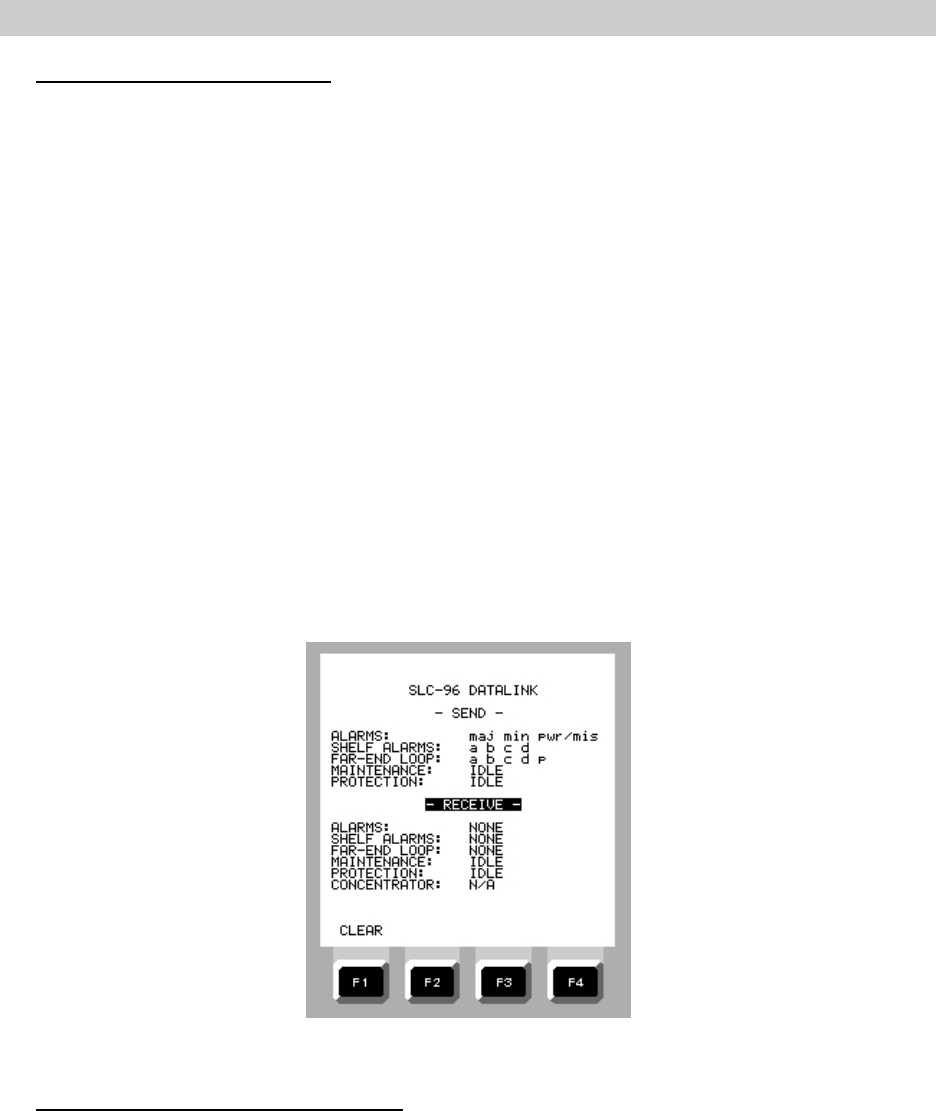
OPERATION
2-58
Monitoring the SLC-96 Datalink
1. Set up the EZ-TESTER DS for in-service monitoring and patch to the DSX MON jack of
the SLC-96 Digroup A. Check to see that the PULSES and FRAME SYNC LEDs are lit.
2. On the MAIN MENU, move the cursor to DS1 MENU and press ENTER.
3. On the DS1 MENU, select DS1 SETUP OPTIONS and press ENTER.
4. On the DS1 TEST SETUP OPTIONS menu, move the cursor to FRAMING FORMAT and
press F2 (SLC-96) and then MENU.
5. On the DS1 MENU, scroll down to ESF/SLC 96 DATALINK and press ENTER.
6. You can now view the current datalink alarm and maintenance messages displayed in the
RECEIVE section of the screen.
ALARMS System major, minor, power/miscellaneous, and alarms
SHELF ALARMS Individual A, B, C, and D shelf alarms
FAR-END LOOP Message indicates if any shelf is in loopback
MAINTENANCE Standard decoded maintenance messages
PROTECTION Message indicates if A, B, C, or D shelf has been
switched to the protection shelf
Figure 2-95. SLC-96 DATALINK Display
Emulate the SLC-96 Datalink Functions
1. Set up the EZ-TESTER DS for out-of-service testing and patch it to the DSX-1 IN/OUT
jacks of the SLC-96Digroup A (shelf A).
2. On the MAIN MENU, move the cursor to DS1 MENU and press ENTER.
3. On the DS1 MENU, select DS1 SETUP OPTIONS and press ENTER.
4. On the DS1 TEST SETUP OPTIONS menu, move the cursor to FRAMING FORMAT and
press F2 (SLC-96), and then MENU.
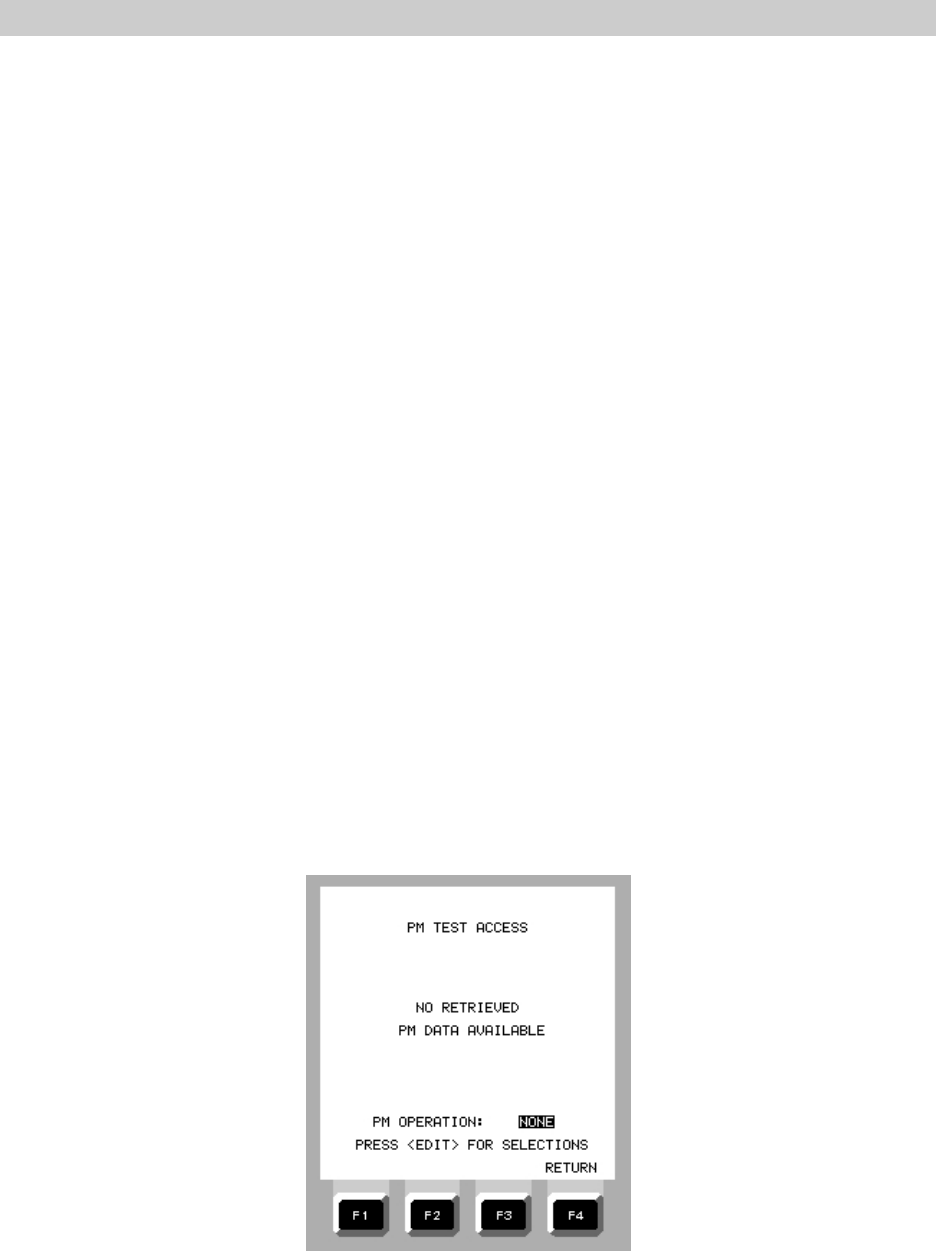
OPERATION
2-59
5. On the DS1 MENU, scroll down to ESF / SLC 96 DATALINK and press ENTER.
7. On the SLC-96 DATALINK screen, move the cursor to ALARMS and set or reset any of
the three alarm functions using the EDIT, F1 (SET) and F2 (RESET) keys. A current alarm
will show as an UPPERCASE letter. A lower case letter indicates a previous alarm
condition that is now cleared.
When a major alarm is activated, the RECEIVE ALARMS message will display MAJ to
indicate the alarm condition.
8. Repeat this process to send SHELF, FAR-END LOOP, MAINTENANCE, and PROTECTION
alarm and maintenance messages from the SEND function menu while observing the
RECEIVE messages.
When a SEND message is reset to a lower case letter, the RECEIVE message should also
reset to lower case. A RECEIVE lower case message indicates that an alarm or
maintenance message was present but is now reset (e.g. prior alarm condition is now
cleared).
9. To clear any lower case RECEIVE messages from the screen, move the cursor to
RECEIVE and press F1 (CLEAR).
2.10.4 Performance Statistics Retrieval (option 04)
This option is used to retrieve T1 span historic performance data, collected and stored in a local
or remote Westell or Teltrend network interface unit/performance monitor (NIU / PM). Refer to vendor
documentation for descriptions of the data collected and stored in the NIU / PM. During remote
loopback, data retrieval is performed in the out-of-service test mode. If retrieval is performed locally,
customer data need not be interrupted if connection can be made between the test set and the NIU/PM
using a special cable provided with Option 04.
Figure 2-96. PM TEST ACCESS Screen

OPERATION
2-60
The EZ-TESTER DS sends coded commands to the PM to perform the following three functions:
a. Retrieve historic performance data stored in the PM’s memory
b. Set the PM’s clock
c. Clear the PM’s memory
Retrieving PM Data
1. Set up the EZ-TESTER DS for out-of-service testing and patch to the circuit under test.
2. On the MAIN MENU, move the cursor to DS1 MENU and press ENTER.
3. On the DS1 MENU, move the cursor to PM TEST ACCESS and press ENTER.
4. On the PM TEST ACCESS menu, press EDIT.
5. On the PM OPERATION menu, move the cursor to RETRIEVE PM STATISTICS.
6. Press ENTER to send the NIU loopback code and the PM retrieval command code. When
the NIU loopback switch activates and the return signal is detected by the EZ-TESTER
DS, the DS1 PULSES, DS1 FRAME SYNC, and PATTERN SYNC LEDs will light.
When the data retrieval operation is complete, the test set automatically transmits the
NIU loop down code to restore the T1 span.
Setting the PM Clock
1. On the PM TEST ACCESS menu, press EDIT.
2. Move the cursor to SET PM CLOCK and press ENTER.
3. Press F1 (YES) to answer the question on the screen. Loop up, set clock, and loop down
operations occur automatically.
Clearing the PM’s Memory File
1. On the PM TEST ACCESS menu, press EDIT.
2. Move the cursor to CLEAR PM STATISTICS and press ENTER.
3. Press F1 (YES) to answer the question on the screen. Loop up, clear PM memory file,
and loop down operations occur automatically.
2.10.5 Addressable Repeater and Maintenance Switch Control (Option 05)
This option is used to enhance the basic loopback capability to include addressable repeaters
and maintenance switches used in intelligent T1 spans. These devices are operated remotely using
binary-coded command and response signals. The binary-coded command signals are stored in the
EZ-TESTER DS and are activated by simple keystroke commands. Coded response signals are
translated automatically and displayed on the test set screen in plain text.
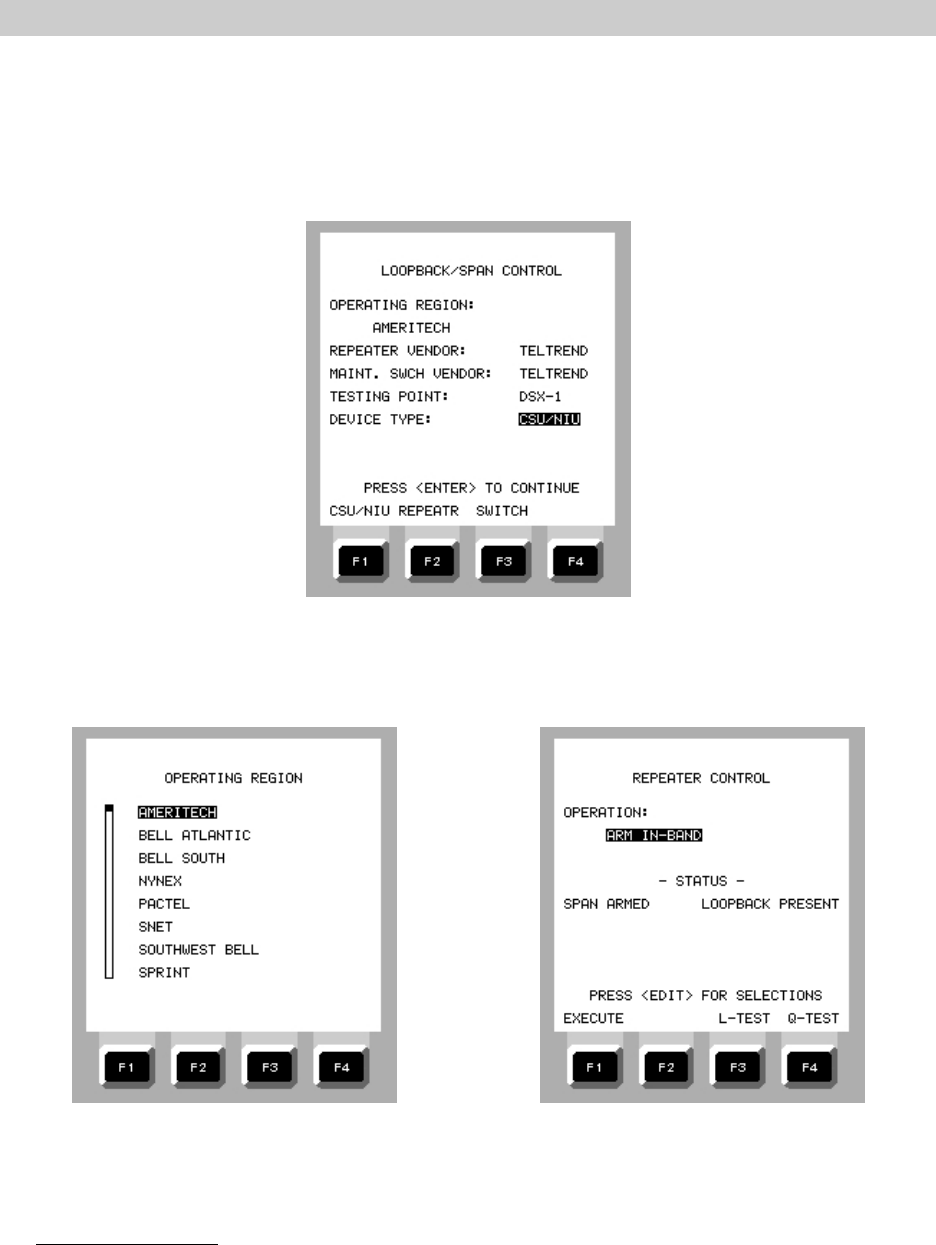
OPERATION
2-61
The command and response signals used by addressable devices are not standardized, and
manufacturers develop their own system of binary codes. Option 05 supports the major manufacturers
of these devices. The following procedures use a Westell addressable device as an example of
operation. All addressable devices operate similarly and you should have no difficulty in applying these
test procedures to T1 spans using other types of devices.
Figure 2-97. LOOPBACK / SPAN CONTROL Menu
Figure 2-98. OPERATING REGION Menu Figure 2-99. REPEATER CONTROL Menu
(more selections than shown)
Setup and Patching
1. On the MAIN MENU move the curser to DS1 MENU and press ENTER.
2. On the DS1 MENU move the cursor to DS1 SETUP OPTIONS and press ENTER.

OPERATION
2-62
3. On the DS1 TEST SETUP OPTIONS menu move the cursor to CHANNEL FORMAT and
press F1 (FULL TI).
4. Press MENU once to return to the DS1 MENU, then scroll down to LOOPBACK/SPAN
CONTROL and press ENTER.
5. On the LOOPBACK/SPAN CONTROL menu (Figure 2-97), move the cursor to OPERATING
REGION and press EDIT for the OPERATING REGION menu (Figure 2-98). Move the
cursor to the system used in your region and press ENTER.
6. Set the REPEATER VENDOR and MAINT. SWCH VENDOR, in step (5) using the EDIT key
and menu that appears.
NOTE: It is important to properly specify the device manufacturer in this step because
the menu of test operations that may be performed on the repeaters and maintenance
switches in later steps of this procedure varies depending upon the manufacturer
entered.
7. Set the TESTING POINT using F1 (DSX-1) or F2 (NIU).
8. On the LOOPBACK/SPAN CONTROL menu, move the cursor to DEVICE TYPE. If the
DEVICE TYPE is set to REPEATER, press ENTER. If DEVICE TYPE is not set to
REPEATER, press F2 (REPEATER), and then press ENTER.
9. On the REPEATER CONTROL menu, confirm that REPEATER OPERATIONS is set to ARM
IN-BAND. If not, press EDIT, move the cursor to ARM IN-BAND on the REPEATER
OPERATION menu and press ENTER.
10. On the REPEATER CONTROL menu, press ENTER or F1 (EXECUTE) to initiate the loop-up
sequence. The display will report PERFORMING OPERATION, then OPERATION
COMPLETE. The REPEATER CONTROL STATUS will report LOOPBACK PRESENT.
This function “arms” the loopback devices in the office and line repeaters, and loops up
the NIU at the far end. PULSES, DS1 FRAME SYNC, and PATTERN SYNC LEDs should
be lit. The line is ready for testing.
NOTE: When a loopback command is sent in-band, some NIUs and CSUs will not
respond if ESF framing is detected. If the loopback is unsuccessful, the arming
command should be changed to ARM ESF DATALINK in step (9).
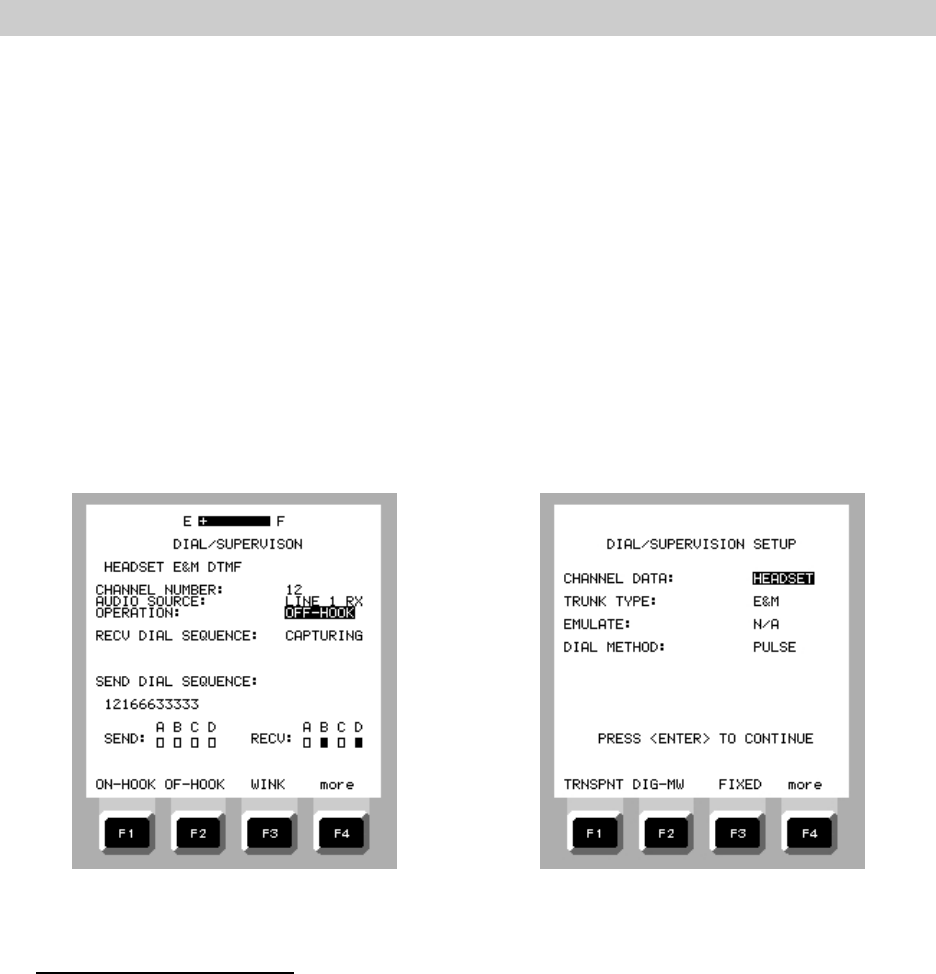
OPERATION
2-63
2.10.6 Dial Supervision (Option 06)
Option 06 enhances the EZ-TESTER DS basic voice frequency testing by allowing the user to
perform the following tests:
a. Display incoming and outgoing AB or ABCD signaling bits
b. Send wink, dialing, and ringing signals
c. Emulate ground start / loop start signaling operations
d. Measure wink duration and wink delay
e. Display incoming dialed digits in test channel
f. Disable echo cancelers
Figure 2-100. DIAL / SUPERVISION Menu Figure 2-101. DIAL / SUPERVISION SETUP
2-Way Trunk Testing Setup
1. On the DS1 MENU, move the cursor to DIAL/SUPERVISION and press ENTER.
2. On the DIAL/SUPERVISION menu (Figure 2-100), move the cursor to the first line and
press EDIT to set the channel data, trunk type, emulation, and dial method.
3. On the DIAL/SUPERVISION SETUP menu (Figure 2-101), the following selections are
available:
Channel Data:
F1=TRANSPARENT F1=HEADSET F1=TONE F1=1804Hz
F2=DIG-MW F2=IDLE F2=404Hz F2=2713Hz
F3=FIXED F3=ALL 1's F3=1004Hz F3=2804Hz
F4=MORE F4=MORE F4=MORE F4=MORE

OPERATION
2-64
Trunk Type:
F1=E&M F2=G-START F3=L-START
Emulation:
F1=FXS F2=FXO F3=SLC-STA F4=SLC-OFF
Dial Method:
F1=PULSE F2=DTMF
4. Press ENTER to return to the DIAL/SUPERVISION menu.
Signaling Supervision, Dial & Talk Testing on Trunk Circuits
NOTE: If you are testing on an in-service span, the CHANNEL DATA selection should
be set to TRNSPNT (transparent) before the channel number is changed. To talk using
this procedure, a headset with microphone is required.
1. On the DIAL/SUPERVISION menu, move the cursor to CHANNEL NUMBER and use the
F1 (NEXT) key and F2 (PREVIOUS) key to select the channel (01 - 24).
2. Move the cursor to SEND DIAL SEQUENCE and press EDIT to enter a telephone number
using the numeric keypad. After entering the number, press ENTER.
If a number was previously stored, press F1 (USER) and move the cursor to the file
containing the number. Then press ENTER and the telephone number will appear under
SEND DIAL SEQUENCE.
3. Move the cursor to OPERATION and press F1 (DIAL). Press F4 (more) if DIAL does not
appear on the screen.
The signaling protocol is sent automatically and the dial sequence is transmitted when
a dial tone is received from the far end.
When the called party answers, the user can talk and listen using a headset with
microphone plugged into the front panel headset jack.
NOTE: In the above procedure, the user can: select other TRUNK TYPES; emulate
other LOOP/GROUND START trunks; draw dial tone and transmit a telephone number
toward a digital switch; or send RING signals in the channel toward the station
equipment to ring the local loop.
Wink Testing Interoffice Digital Trunks
1. On the DS1 MENU, move the cursor to DIAL/SUPERVISION and press ENTER.
2. On the DIAL/SUPERVISION menu, move the cursor to the first line and press EDIT. Use
the F keys to select the desired setting for each item.
3. Press ENTER to return to the DIAL/SUPERVISION menu.
4. On the DIAL/SUPERVISION menu, move the cursor to CHANNEL NUMBER and use the
F1 (NEXT) key and F2 (PREVIOUS) key to select the channel (01 - 24).

OPERATION
2-65
5. Move the cursor to OPERATION and press F3 (ME-WINK). Press F4 (more) if ME-WINK
does not appear on the screen.
The EZ-TESTER DS automatically sends an off-hook signal to the far end and waits for
the wink back signal. The delay to wink (delay from time of seizure to receipt of wink)
and the duration of the wink are displayed on the screen in milliseconds.
Originating Calls on Wink Start Digital Trunks
1. On the DS1 MENU, move the cursor to DIAL/SUPERVISION and press ENTER.
2. On the DIAL/SUPERVISION menu, move the cursor to the first line and press EDIT. Use
the F keys to select the desired setting for each item.
3. Press ENTER to return to the DIAL/SUPERVISION menu.
4. On the DIAL/SUPERVISION menu, move the cursor to CHANNEL NUMBER and use the
F1 (NEXT) key and F2 (PREVIOUS) key to select the channel (01 - 24).
5. Move the cursor to SEND DIAL SEQUENCE and press EDIT to enter a telephone number
using the numeric keypad. After entering the number, press ENTER.
If a number was previously stored, press F1 (USER) and move the cursor to the file
containing the number. Then press ENTER and the telephone number will appear under
SEND DIAL SEQUENCE.
6. Move the cursor to OPERATION and press F2 (WINK-OR).
The EZ-TESTER DS automatically sends an off-hook signal to the far end switch and
waits for wink back. When the wink back is detected, the SEND DIAL SEQUENCE
number on the screen is transmitted. When the called party answers, the user can talk
and listen using a microphone headset plugged into the front panel headset jack.
2.10.7 Computer Enhanced Testing (CET) (Option 07)
Option 07, Computer Enhanced Testing (CET), allows the user to operate the EZ-TESTER DS
from a personal computer equipped with a Microsoft Windows® operating system. The graphical
features, interfaces, and operations used in this Windows-based application program follow the
standard format found in all other Windows applications programs. These procedures assume that you
are experienced in running Microsoft Windows application programs, and have read and understand
chapters 1 and 2 of this manual. The computer can be connected directly to the EZ-TESTER DS for
local operation, or can be connected via a dial-up modem and telephone line for remote operation. The
test set is connected to the computer or modem using the AUXILIARY PORT and the ribbon cable
supplied with the test set.
The EZ-TESTER DS Windows software is supplied on a 1.44MB high-density 3-1/2 inch disk
for installing the program to the hard disk in your personal computer system. After installation, an
Electrodata EZ-TESTER DS program icon is added to the Windows Program Manager. The program
follows the operations and graphics familiar to all Windows applications and greatly enhances the use
and operation of the test set. For example, you can dedicate an EZ-TESTER DS to a DACS test port
and connect the AUXILIARY PORT of the tester to a dial-up modem and telephone line. Now you can
have a suspected line switched to the test port and then accessed and tested remotely from a field
technician’s laptop computer or from a centralized computer work station.
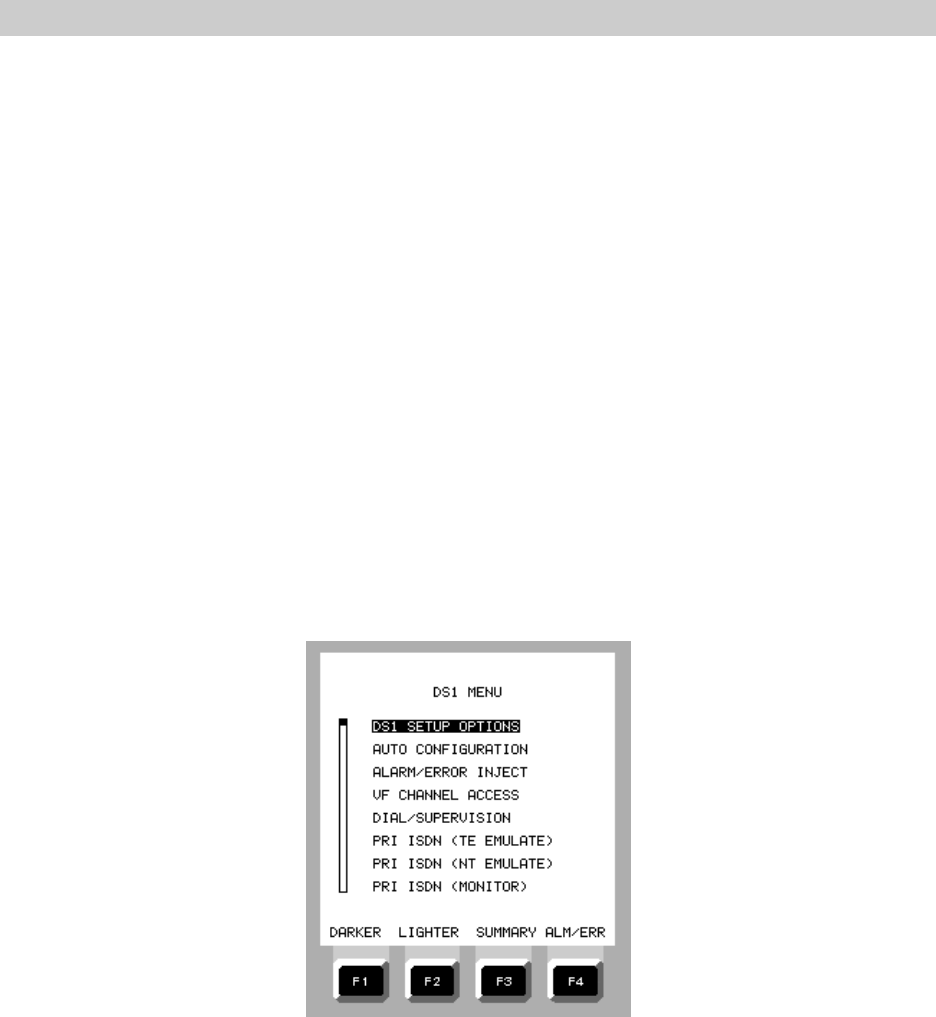
OPERATION
2-66
2.10.8 Multiple Frequency (MF) Dial / Capture (Option 08)
Option 08 enhances the Dial / Supervision function of the EZ-TESTER DS by adding an MF dial
capability. If Option 08 is available on the test set, the MF DIAL selection appears on the DIAL /
SUPERVISION SETUP menu and is selectable by pressing F3 (MF).
2.10.9 Primary Rate ISDN (Option 09)
This option is used to test Primary Rate ISDN circuits at the central office or the customer
location. It can monitor the D channel or simulate the network or customer equipment and allows the
placing and receiving of either data or voice calls. It will test 23B+D circuit configurations or 23B+D
and 24B circuits (non-associated facilities signaling (NFAS). The test set will receive a call while
placing a call so that a loopback on the same span can be set up. The D-channel location is selectable
so that individual trunk groups, with their own D-channels, can also be tested.
Figure 2-102 shows the DS1 MENU with three Primary Rate ISDN functions. PRI ISDN (TE
EMULATE) should be used when testing from the terminal end of the line toward the network. PRI
ISDN (NT EMULATE) should be used when testing from the network toward the terminal. The setup
menus are identical, and operational differences between the modes are transparent to the user. When
a dual port test set is used for NFAS testing, LINE 1 is reserved for the T1 containing the D-channel,
and LINE 2 is reserved for testing an associated T1. The PRI ISDN (MONITOR) mode should be used
when observing the D-channel only to capture, view, and print control data.
Figure 2-102. DS1 MENU with PRIMARY RATE ISDN
This procedure is useful during an ISDN circuit installation to confirm that the circuit is
functional. A successfully placed call confirms the T1 span is operational and that the ISDN D-channel
is up. A call placed over the circuit can be used to coordinate further testing if required. Sometimes,
during setup, the user may not be familiar with specific information such as interface I.D. or network
type. In many cases, leaving those selections set to zero or none will result in a successful setup and
testing may continue. The final portion of the procedure lists the steps necessary to run pattern tests
over selected bearer channels.

OPERATION
2-67
Placing an ISDN Call, Testing Toward the Network or the Local Terminal
1. On the MAIN MENU, move the cursor to TEST INTERFACE SETUP and press ENTER.
2. On the TEST INTERFACE SETUP MENU, set the following:
ACTIVE INTERFACES: F1 (L1 ONLY) for single port operation or
F2 (L1/L2) for NFAS testing
DS1 L1 RX INPUT: F1 (TERM)
DS1 L1 TX OUTPUT: F1 (0dB)
DS1 L1 LINE CODE: As required
(Set the following for a T1 dual port test set during NFAS testing)
DS1 L2 RX INPUT: F1 (TERM)
DS1 L2 TX OUTPUT: F1 (0dB)
DS1 L2 LINE CODE: As required
3. On the MAIN MENU, move the cursor to DS1 MENU and press ENTER.
4. Move the cursor to DS1 SETUP OPTIONS and press ENTER.
5. On the DS1 TEST SETUP OPTIONS menu, set the following:
FRAMING FORMAT: As required
6. Press MENU to return to the DS1 MENU.
7. On the DS1 MENU, move the cursor to PRI ISDN (NT EMULATE) if testing toward the
local terminal, or PRI ISDN (TE EMULATE) if testing toward the network.
Figure 2-103. PRIMARY RATE ISDN
SETUP 1 Menu
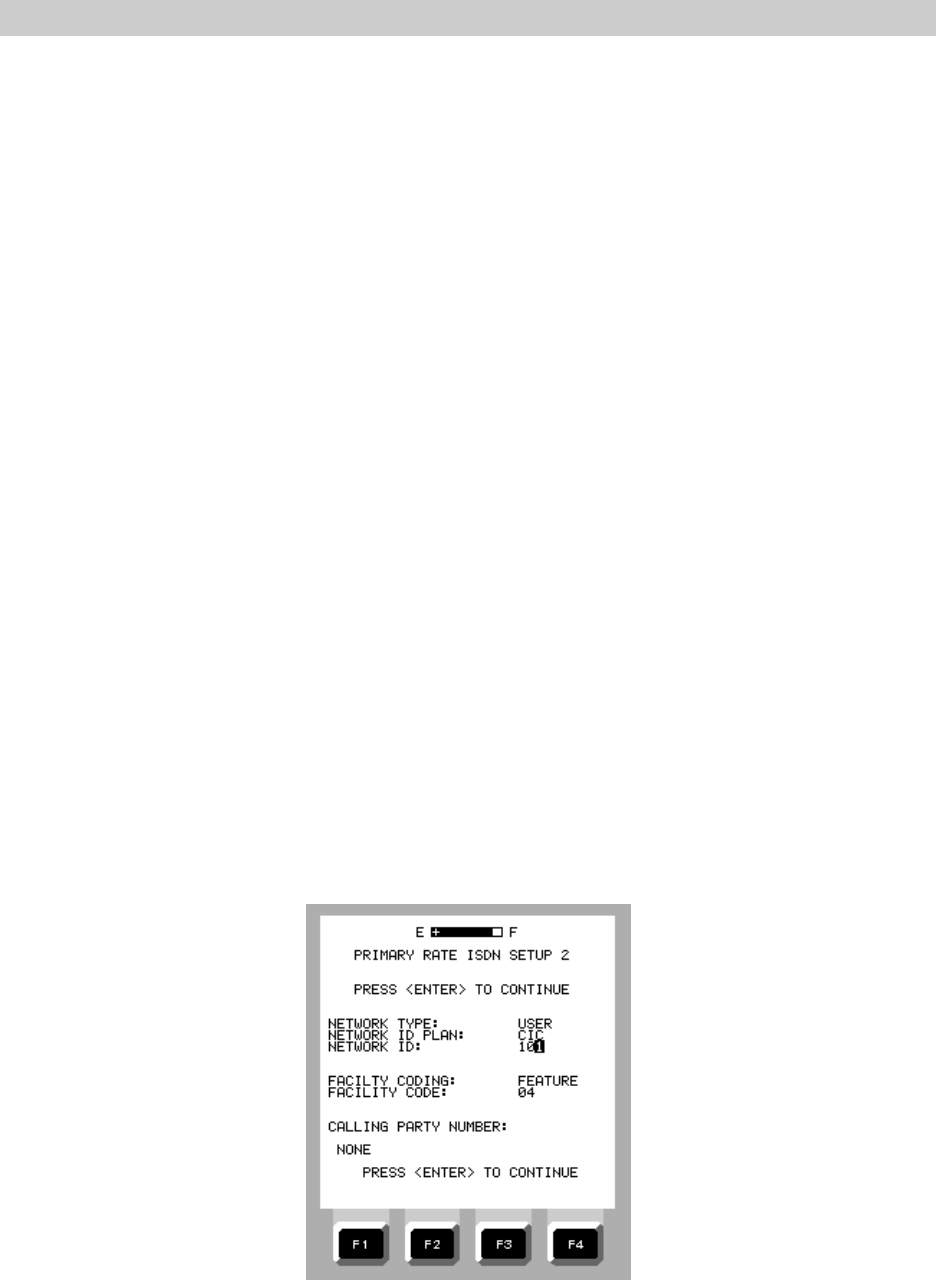
OPERATION
2-68
8. On the PRIMARY RATE ISDN SETUP 1 menu, move the cursor to Q931 STANDARD and
use the F keys to select the type of switch at the central office.
9. Move the cursor to D-CHANNEL NUMBER and use the F keys to select the D-channel of
the span. This is normally 24.
10. Move the cursor to INTERFACE ID and use the F keys to enter the ID number for the T1
containing the D-channel selected in step (3). If you are unsure of the number, set 00.
11. Move the cursor to LINE 2 INTERFACE ID and enter the ID number for the T1 containing
the channel to be tested.
12. Move the cursor to BEARER CAPABILITY and use the F keys to select the type of call to
be made.
F1 = Voice - allows use of headset for voice communications
F2 = Data
F3 = 3.1KHz - allows operation of 3.1KHz service.
13. If a DATA call is to be placed, move the cursor to BEARER RATE and use the F keys to
select the desired rate.
NOTE: 64 X N and H0 channels will only be available if the EZ-TESTER HD has Option
01 Fractional T1 installed. Verify switch capability to make sure that the BEARER
RATE selected is compatible.
14. If a voice call or single channel data call is to be placed, move the cursor to BEARER
CHAN. NUMBER and use the F keys to select the B-channel number.
15. Move the cursor to CALLED PARTY NUMBER and press EDIT. Use the keypad to enter
the desired number, or press F1 (USER) to select a number stored previously.
16. Press ENTER to go to the PRIMARY RATE ISDN SETUP 2 menu.
Figure 2-104. PRIMARY RATE ISDN
SETUP 2 Menu

OPERATION
2-69
17. On the PRIMARY RATE ISDN SETUP 2 menu, move the cursor to NUMBERING PLAN and
select the plan required by the network under test.
18. Move the cursor to NETWORK TYPE. If network-specific information is to be entered, use
the F keys to select the type. If none is desired, press F1 (NONE). For selections other
than NONE, make the appropriate entries for:
NETWORK ID PLAN: F1 = UNKNOWN
F2 = CIC
F3 = DATA
NETWORK ID: Press EDIT and enter required value
FACILITY CODING: F1 = NONE
F2 = FEATURE
F3 = SERVICE
FACILITY CODE: F1 = NEXT
F2 = PREVIOUS
19. If required, move the cursor to CALLING PARTY NUMBER, press EDIT and enter the local
number.
20. Press ENTER
If the setup is successful, the screen will display LAYER 2: READY.
Placing the Call
1. On the PRIMARY RATE ISDN screen, press F2 (CALL). The screen will report CALL
STATE: RINGING. The test set will display the type of call, selected bearer channel, and,
if the call is to an associated NFAS T1, the appropriate interface ID number.
If the call is accepted, the screen will indicate CALL STATE: CONNECTED. If the call is
rejected, the screen will report CALL STATE: REJECTED, and CAUSE VALUE will display
a cause code number.
2. If the call was rejected, and the user setup is suspect, press F1 (SETUP) to return to the
setup screens, change settings as required, and retry connecting.
Receiving an Incoming Call
If an incoming call is received, the CALL STATE will change to INCOMING CALL and the test
set will emit a ringing sound. The lower half of the screen will display the type, rate, and
channel identification of the incoming call.
1. To answer the call, press F1 (ACCEPT). To reject the call, press F2 (REJECT). If the call
is accepted, CALL STATE will change to CONNECTED.
2. If the incoming call is a multi-rate 64 X N call, press and hold down F3 (REVIEW) to
display the selected channels.
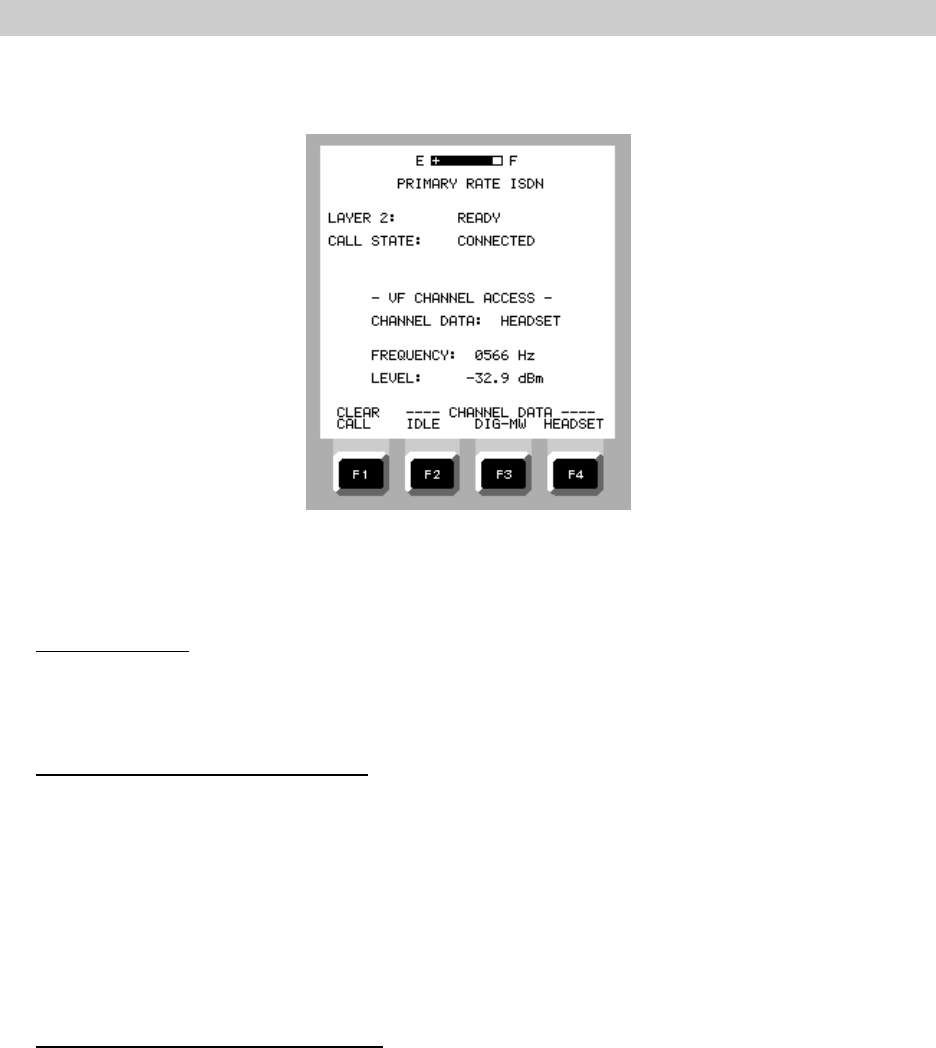
OPERATION
2-70
Figure 2-105. PRIMARY RATE ISDN Screen
with Call in Progress
Clearing the Call
1. To clear the call, press F1 (CLEAR). The screen will display LAYER 2: READY and CALL
STATUS: CALL CLEARED.
Looping a Call Back to the Test Set
Any type of call can be connected and looped back to the test set. This is especially useful
for DATA calls, which must be selected to perform bit error rate (BER) testing. To loop a call
back to the test set, do one of the following during setup:
a. Enter the special test number, assigned by the central office as the CALLED PARTY
NUMBER on the SETUP 2 screen.
b. Enter your own local number as the CALLED PARTY NUMBER on the SETUP 2 screen
BER Testing of Connected Data Calls
If a connected ISDN call is a data call and the channel or channels are in the same Primary Rate
interface as the D-channel (as indicated by the INTERFACE ID information), the lower half of
the screen will display BERT information.
F2 = CHANGE PATTERN Toggles through the available test patterns (QRSS, ALL
O’S, 1:7, 2 IN 8, 55OCTET, ALL 1'S, 2047, and 2E15-
1)
F3 = CLEAR RESULTS Clears previous test results
F4 = INSERT ERROR Inserts a pattern error (bit error) into the data stream

OPERATION
2-71
The test pattern currently selected will be transmitted on the selected channel as soon as the
call is connected. The results of the BER test can be monitored locally if the call is looped back
to the test set. The test set displays totals for BPV errors, bit errors, frame errors, CRC errors,
and elapsed time.
If the call placed is being looped back, the PATTERN SYNC LED should be lit for any pattern
selected. If the connected call is from another test set, and the PATTERN SYNC LED is not
lit, press F2 (CHANGE PATTERN), to identify the pattern being received. Once the PATTERN
SYNC LED is lit, press F3 (CLEAR RESULTS) to clear accumulated results and start a test run.
Any errors will be displayed. Pressing F4 (INSERT ERROR) will inject one error into the
outgoing data stream.
When testing is complete, Press F1 (CLEAR CALL) to terminate the call. The CALL STATUS
will change to CALL CLEARED.
Primary Rate ISDN Monitoring Operations
The EZ-TESTER ST’s Primary Rate ISDN feature includes a monitoring function that allows the
user to capture, view, and print control data contained in the ISDN D-channel. An advantage of the
dual line tester is that when both RX lines are enabled, the monitor screen will display messages from
both ends of the circuit in sequence, allowing the user to see how each end of the circuit responds to
the other.
The PRIMARY RATE ISDN MONITOR screen is used to set up and initiate the data capture
sequence (Figure 2-105). The VIEW CAPTURED DATA - CONDENSED screen displays, in chronological
order, a list of Layer 2 command codes that were present on the line during the capture period (Figure
2-106). The VIEW CAPTURED DATA - EXPANDED screen (Figures 2-108 and 2-109) provide a visual
display of the data and codes contained in the address, control, and information fields within the ISDN
frame for each event listed on the VIEW CAPTURED DATA - CONDENSED display.
During setup, the user can specify capturing all D-channel messages, or selecting only Layer
3, thereby enabling selection of messages related only to specific CRVs (Call Reference Value, or
caller). This selection is often used when troubleshooting problems with a single customer line.
Test Setup for ISDN Monitoring
1. On the MAIN MENU, move the cursor to TEST INTERFACE SETUP and press ENTER.
2. On the TEST INTERFACE SETUP MENU, set the following:
ACTIVE INTERFACES: F2 (L1 / L2)
DS1 L1 RX INPUT: F3 (MON)
DS1 L1 LINE CODE: As required
DS1 L2 RX INPUT: F3 (MON)
DS1 L1 LINE CODE: As required
3. On the MAIN MENU, move the cursor to DS1 MENU and press ENTER.
4. Move the cursor to DS1 SETUP OPTIONS and press ENTER.
5. On the DS1 TEST SETUP OPTIONS menu, set the following:
FRAMING FORMAT: As required
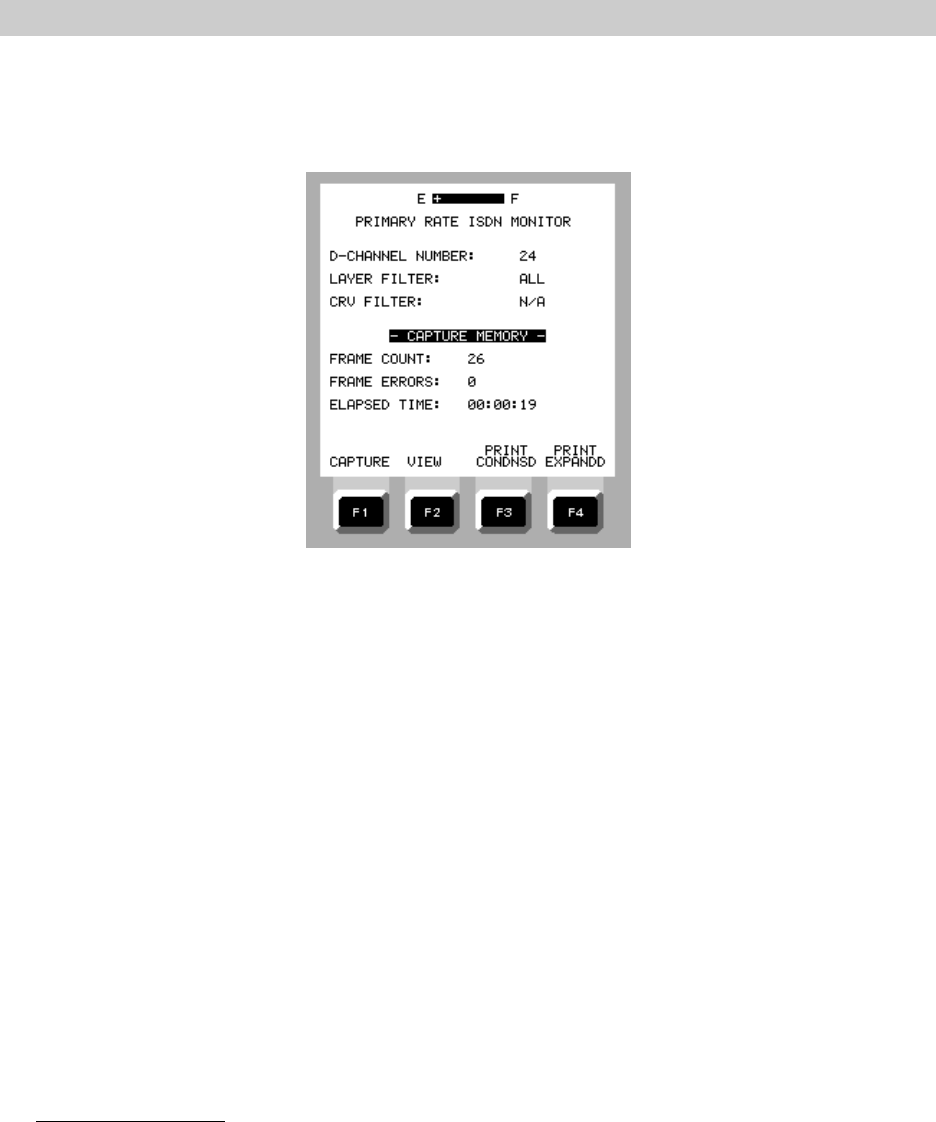
OPERATION
2-72
6. Press MENU to return to the DS1 MENU.
7. On the DS1 MENU, move the cursor to PRI ISDN (MONITOR) and press ENTER.
Figure 2-106. PRIMARY RATE ISDN
MONITOR Screen
8. On the PRIMARY RATE ISDN MONITOR screen, set the following:
D-CHANNEL NUMBER: Set as required (Usually channel 24)
LAYER FILTER: F1 (ALL) to capture all messages
F2 (3 ONLY) to enable specifying a specific CRV
CRV FILTER: F1 (ALL)
F2 (SPECIFIC) If SPECIFIC is selected for the CRV,
move the cursor back to CRV FILTER and enter the
code for the CRV desired.
9. Connect the test set to the line:
DS1 LINE 1 RX jack: Network DSX MON jack
DS1 LINE 2 RX jack: Site DSX MON jack
The test set is now ready to capture messages.
Capturing Messages
1. Press F1 (CAPTURE) to begin the capture operation. As messages are captured, the
FRAME COUNT will increment. If a specific CRV was entered during setup, the FRAME
COUNT will increment more slowly, storing only those messages related to the CRV.
When F1 is pressed, the ELAPSED TIME counter will begin to increment and the F1 key
function will change to STOP. The capture sequence will run until the user presses F1
(STOP) or the test set memory is filled.
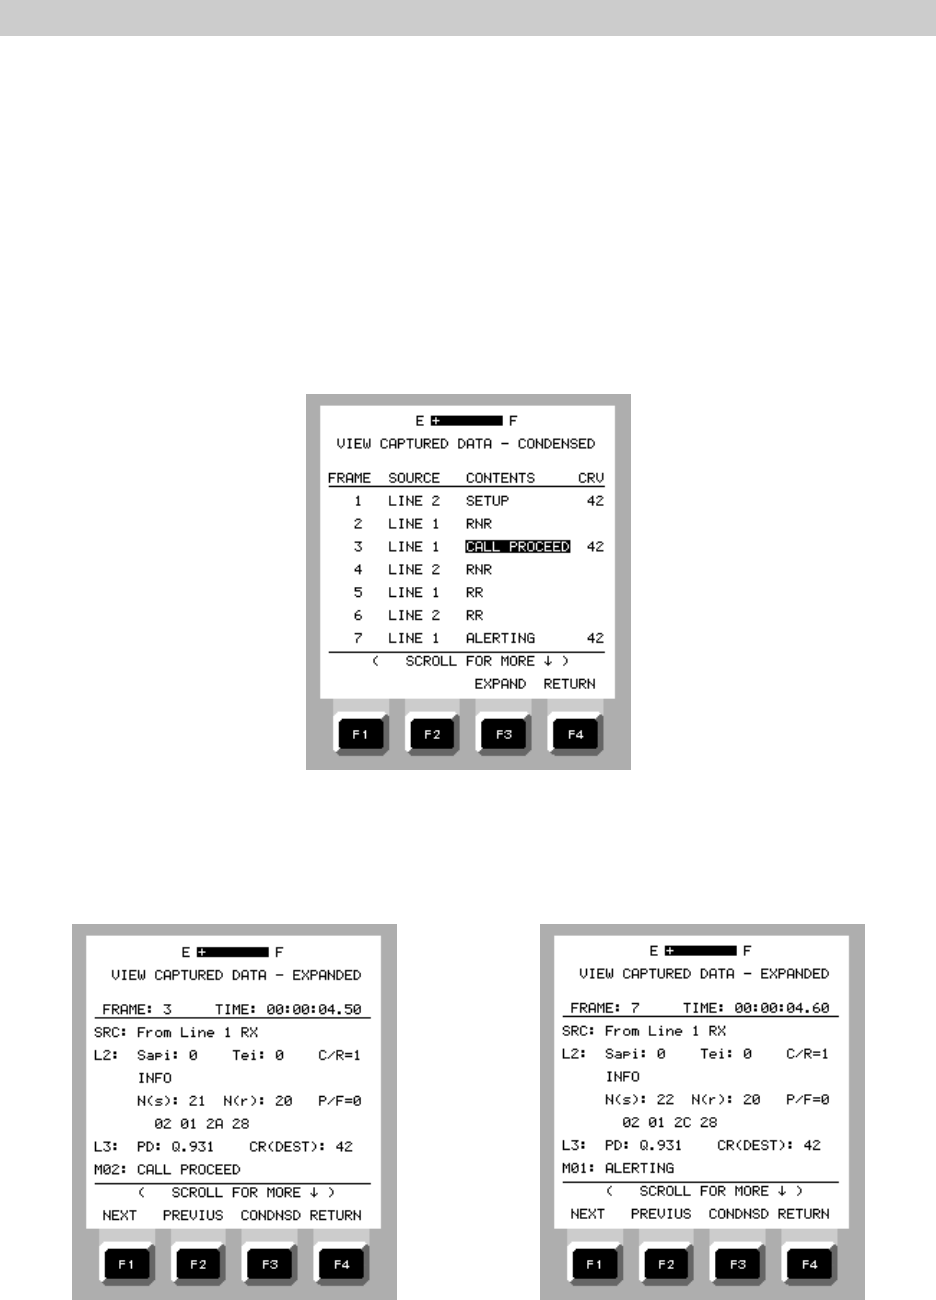
OPERATION
2-73
2. Press F1 (STOP) to stop the operation.
3. Press F2 (VIEW) to display the VIEW CAPTURED DATA - CONDENSED screen. From this
screen, highlight a desired event and press F3 (EXPAND).
4. On the VIEW CAPTURED DATA - EXPANDED screen, details of the selected event are
displayed. Use the arrow keys to scroll up and down to view the entire display.
5. On the VIEW CAPTURED DATA - EXPANDED screen, press F4 to return to the
MONITOR screen.
6. To print out the stored data, press F3 (PRINT CONDNSD), or F4 (PRINT EXPANDD).
Figure 2-107. VIEW CAPTURED DATA -
CONDENSED Display
Figure 2-108. Expanded Display (Frame 3) Figure 2-109. Expanded Display (Frame 7)
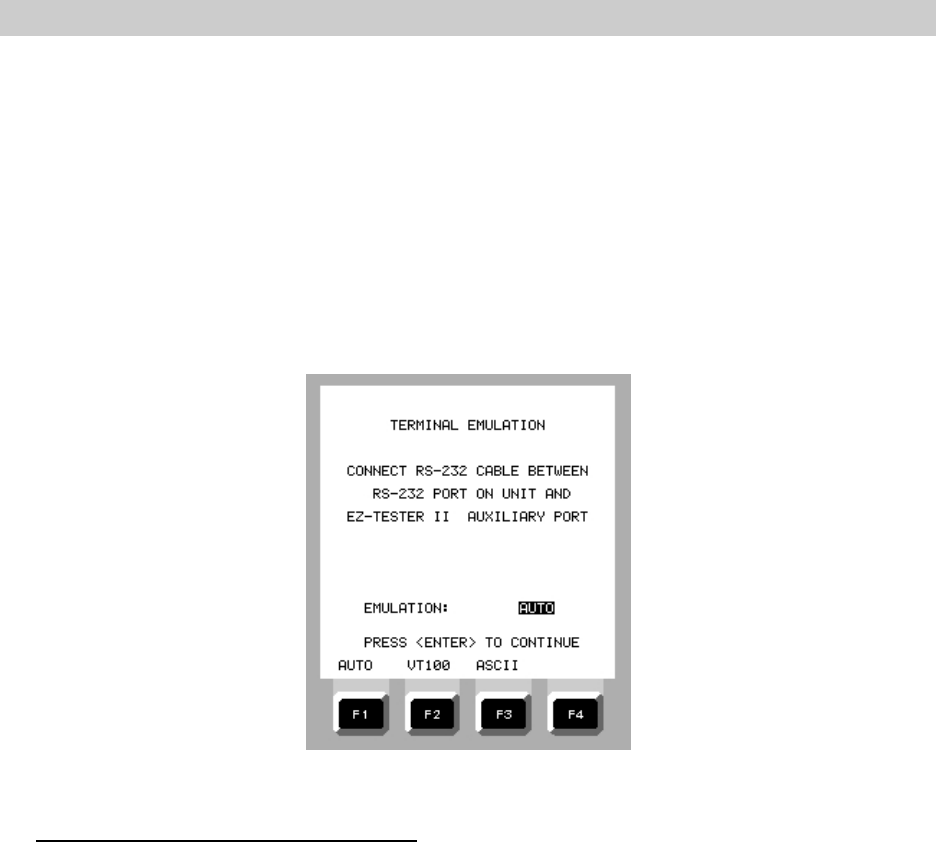
OPERATION
2-74
2.10.10 Terminal Emulation (Option 10)
This option allows the EZ-TESTER DS to function as a dumb ASCII or VT 100 terminal which
can be connected to the RS-232 port on HDSL equipment such as provided by ADTRAN, Inc. or
PairGain Technologies, Inc. and the Digital Network Interface (DNI) equipment provided by Teltrend.
Once connected, the EZ-TESTER DS provides access to the performance monitoring, provisioning, and
system maintenance capabilities of the HDSL equipment and performance information in the DNI. The
test set emulates a terminal for displaying data and entering control commands. The option is fully
supported by Electrodata’s OnCall® feature which allows installation and upgrades via a simple modem
connection. Figure 2-110 illustrates the TERMINAL EMULATION menu. With the terminal emulation
option, the EZ-TESTER DS serves as a display terminal. Refer to vendor documentation for instructions
involving system particulars.
Figure 2-110. TERMINAL EMULATION Menu
To Use the Terminal Emulation Function:
1. On the MAIN MENU, move the cursor to TERMINAL EMULATION and press ENTER.
2. Connect the RS-232 cable (PN: 600064) between the HDSL unit or NIU and the EZ-
TESTER DS AUXILIARY PORT jack.
3. The test set will initialize and display the MAINTENANCE TERMINAL MENU.
4. Use the arrow keys to position your viewing area on the larger VT100 display area.
5. Use keypad or the F1 and F2 keys to choose the character for the menu item you wish
to view, then press F4 (SELECT) to transmit the displayed character. Use the START
key to send an ESC character and the ENTER key to send a C/R.
NOTE: The user may use the keypad or the F1, F2, and F4 keys to enter character
strings when necessary, such as for data or threshold settings. Use F3 (BACKSPACE)
if an error is made. Use the * (star) key to display special characters - = & / which do
not appear on the test set keypad. When transmitting control characters A through Z,
press the EDIT button, the desired letter character, then F4 (SELECT). Perform these
three steps for each character transmitted. To transmit an ESC character, press the
START key only. To enter a C/R, press the ENTER key only. To insert an “arrow”
sequence, press EDIT, then the desired arrow key.
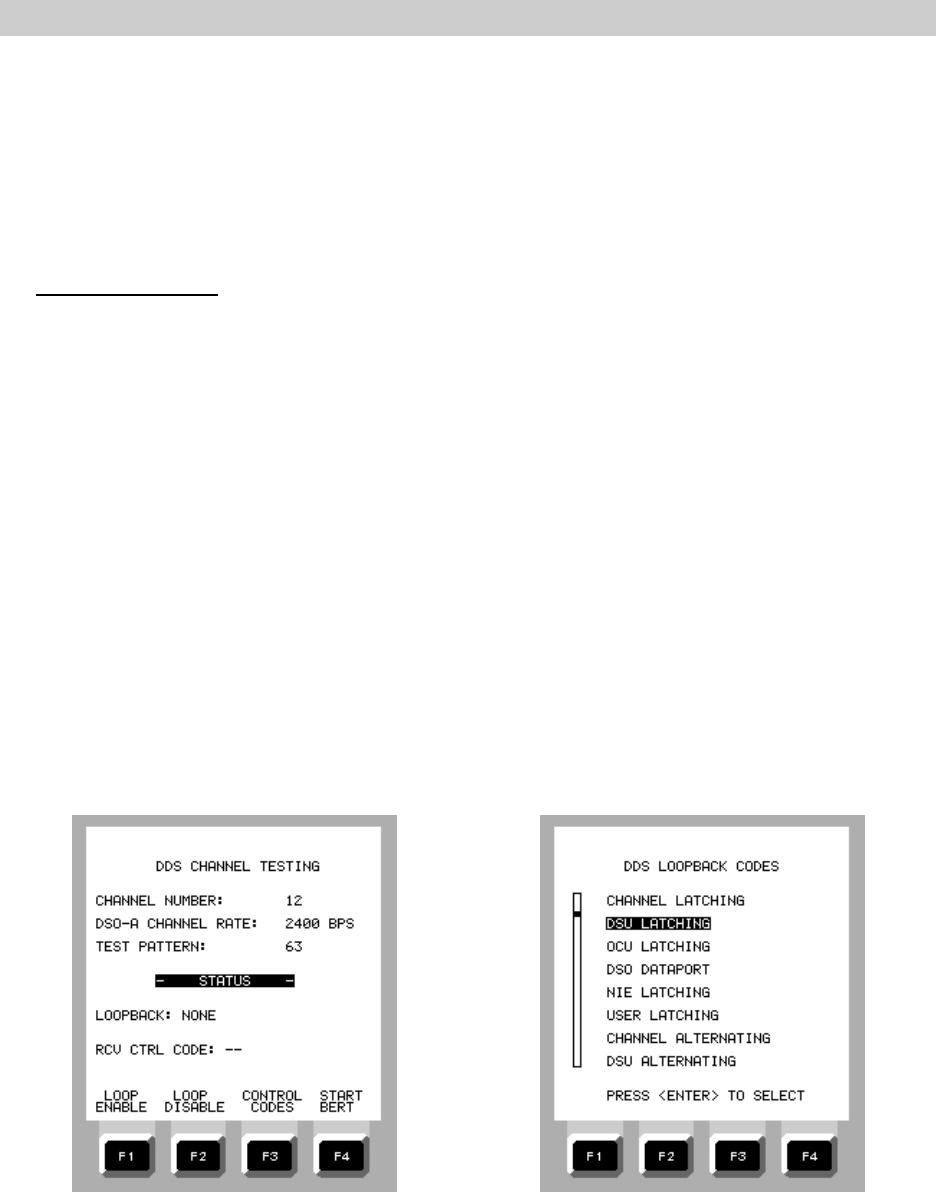
OPERATION
2-75
2.10.11 DDS Channel Testing (Option 11)
This option is used to test DDS circuits and components from a T1 access point. Both latching
and non-latching loopback codes can be sent to loopback various pieces of equipment. In addition,
control codes, such as the repeater release code, can be sent to further sectionalize problems. The
EZ-TESTER DS will also detect and display the presence of any control codes being received. Full
BERT capability is supported using 28 standard patterns as well as user defined patterns up to 2048
bits in length.
Setup and Patching
1. On the TEST INTERFACE SETUP MENU, move the cursor to DS1 RX INPUT and press
F1 (TERM).
2. Move the cursor to DS1 TX OUTPUT and select the appropriate output signal level with
an F key according to the requirements at the T1 line test access point.
3. Patch the test set RX and TX jacks of the test set to the DSX OUT/IN jacks associated
with the T1 line under test (The T1 line is now out-of-service and terminated with the
EZ-TESTER DS).
4. Move the cursor to DS1 LINE CODE and select the required line coding with the F1 (AMI)
key or F2 (B8ZS) key, then press MENU.
5. On the MAIN MENU, move the cursor to DS1 MENU and press ENTER.
6. On the DS1 MENU, move the cursor to DDS CHANNEL TESTING and press ENTER.
7. On the DDS CHANNEL TESTING menu (Figure 2-111), set the CHANNEL NUMBER and
DSO-A CHANNEL RATE required by the line under test using the F keys for each
selection.
Figure 2-111. DDS CHANNEL TESTING Figure 2-112. DDS LOOPBACK CODES
Menu Menu
8. Move the cursor to TEST PATTERN and use the EDIT key to display the selections.
Move the cursor to the desired DDS test pattern and press ENTER.
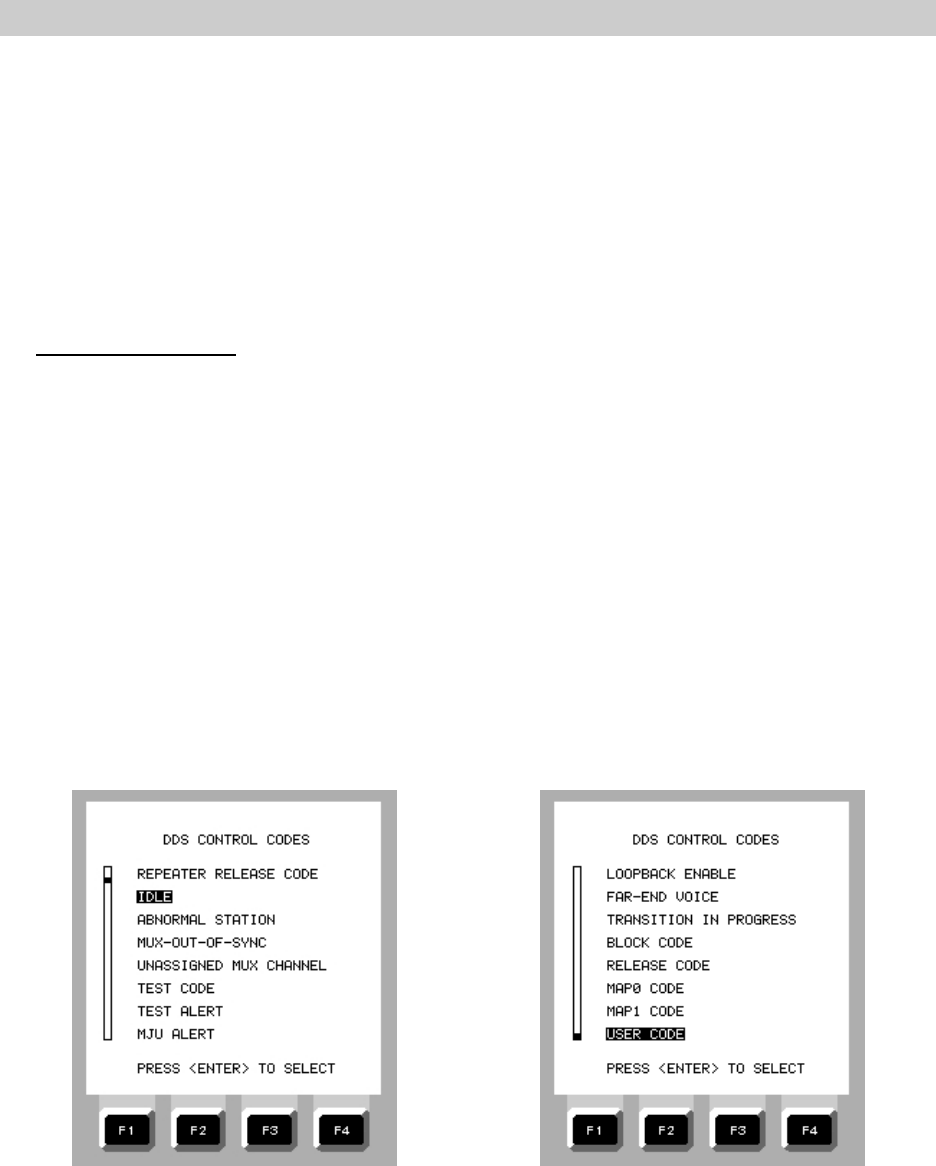
OPERATION
2-76
9. To place the channel in loopback, press F1 (LOOP ENABLE) to display the available
loopback codes (Figure 2-112). Move the cursor to either CHANNEL LATCHING or
CHANNEL ALTERNATING and press ENTER.
The display will return to the DDS CHANNEL TESTING screen and display the status of
the loopback enable operation. If the loopback is successful, the user will hear a double
beep and the message LOOPBACK ENABLE COMPLETE will be briefly displayed. The
DS1 PULSES, DS1 FRAME SYNC, and PATTERN SYNC LEDs should all be on. Under
STATUS, LOOPBACK will display the last loopback enabled or attempted and RCV CTRL
CODE will display the presence of any control codes in the receive data stream.
DDS Bit Error Testing
1. On the DDS CHANNEL TESTING menu, press F4 (START BERT) to start a bit error test.
The bottom half of the screen will be replaced by BERT RESULTS. All the counts should
remain at zero.
2. To verify that the line is in loopback, press F3 (INSERT ERROR), to insert a single bit
error. Press F2 (CLEAR RESULTS) to return all the counts to zero.
3. After completing the BERT test, press F4 (STOP BERT) to display STATUS.
4. To clear the loopback on the first repeater or device on the channel and move to the next
device, press F3 (CONTROL CODES), move the cursor to REPEATER RELEASE CODE,
and press ENTER. The screen will change to DDS CHANNEL TESTING with the message
SENDING CONTROL CODE being displayed.
5. After about one second, press F1 (CANCEL) to stop sending the selected control code.
Figure 2-113. DDS CONTROL CODES Figure 2-114. DDS CONTROL CODES
Menu Menu (Scrolled)
6. If another device is in loopback, the DS1 PULSES, DS1 FRAME SYNC, and PATTERN
SYNC LEDs should be on again.
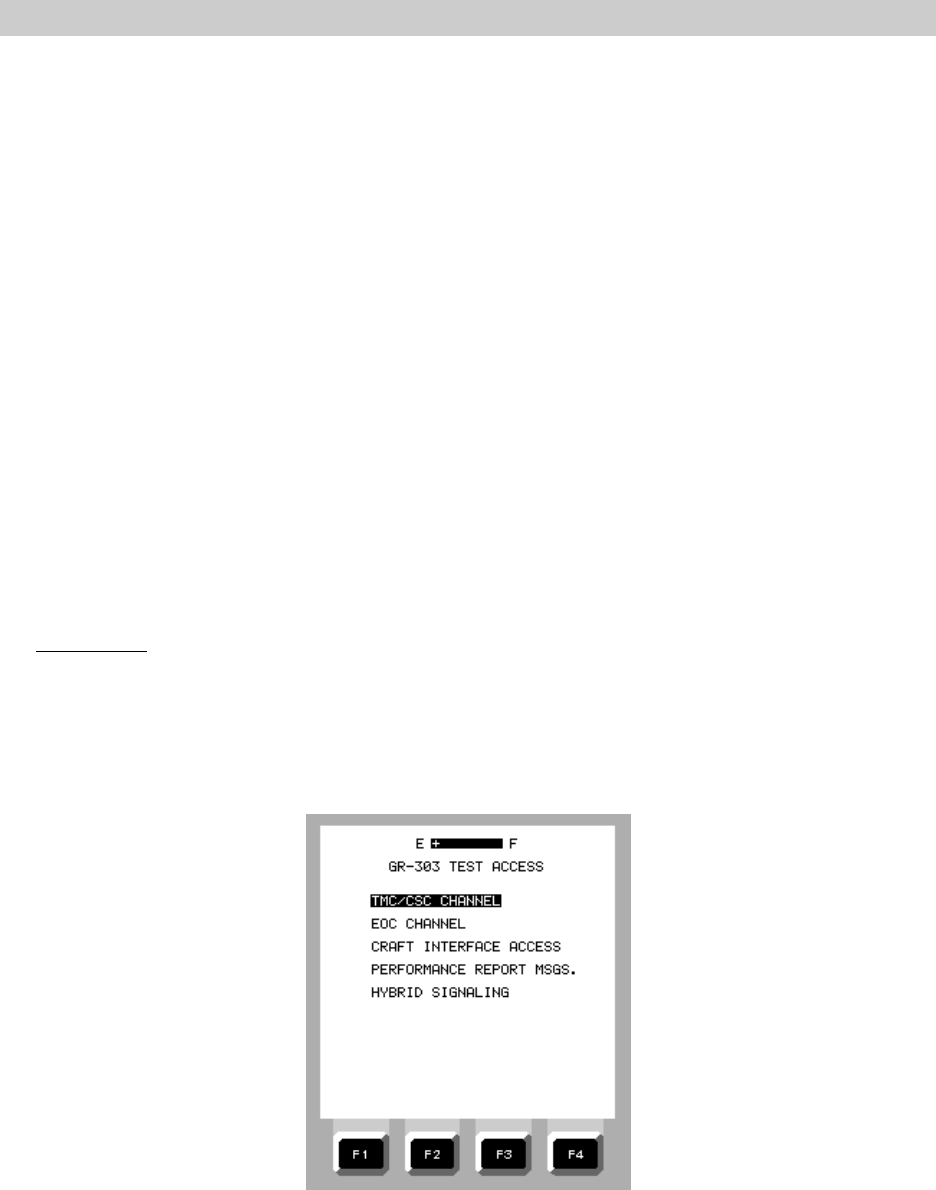
OPERATION
2-77
7. This procedure can be repeated as necessary to test each device in the channel. When
all testing is complete, press F2 (LOOP DISABLE) to remove the channel loopback and
return the channel to normal operation.
By using the other control codes, other devices on the channel, such as the OCU, DSO-
DP, and CSU can be placed in loopback and tested (Figures 2-113 and 2-114).
NOTE: When the DS0-A CHANNEL RATE is set to 64 KBPS, the alternating loopback
codes are not available.
2.10.12 GR-303 Test Access (Option 12)
The GR-303 Test Access option provides functions for testing loop access systems as
described in Bellcore's GR-303-CORE, "IDLC Generic Requirements, Objectives, and Interface." With
this option, the EZ-TESTER DS is able to capture and display timestamped Time-slot Management
Channel (TMC) and Embedded Operations Channel (EOC) data. The setup menu allows the user to
select all retrievable protocol layer 2 and 3 data, or to filter a narrower range of specific data based
upon layer, call reference value (CRV), and abnormal cause codes. The Hybrid Signaling Channel is
supported by displays of raw and decoded signaling (ABCD) bits. If the test set configuration includes
Option 03, (ESF / SLC 96 Monitor and Control), the test set can display performance report messages.
If Option 10 (Terminal Emulation) is installed, craft interface access is also available.
Initial Setup
When installed in the EZ-TESTER DS, GR-303 TEST ACCESS is available on the DS1 MENU.
Starting from the DS1 MENU, move the cursor to GR-303 TEST ACCESS and press ENTER. The test
set automatically selects ESF framing and B8ZS line code. Figure 2-115 illustrates the GR-303 TEST
ACCESS Menu.
Figure 2-115. GR-303 TEST ACCESS Menu
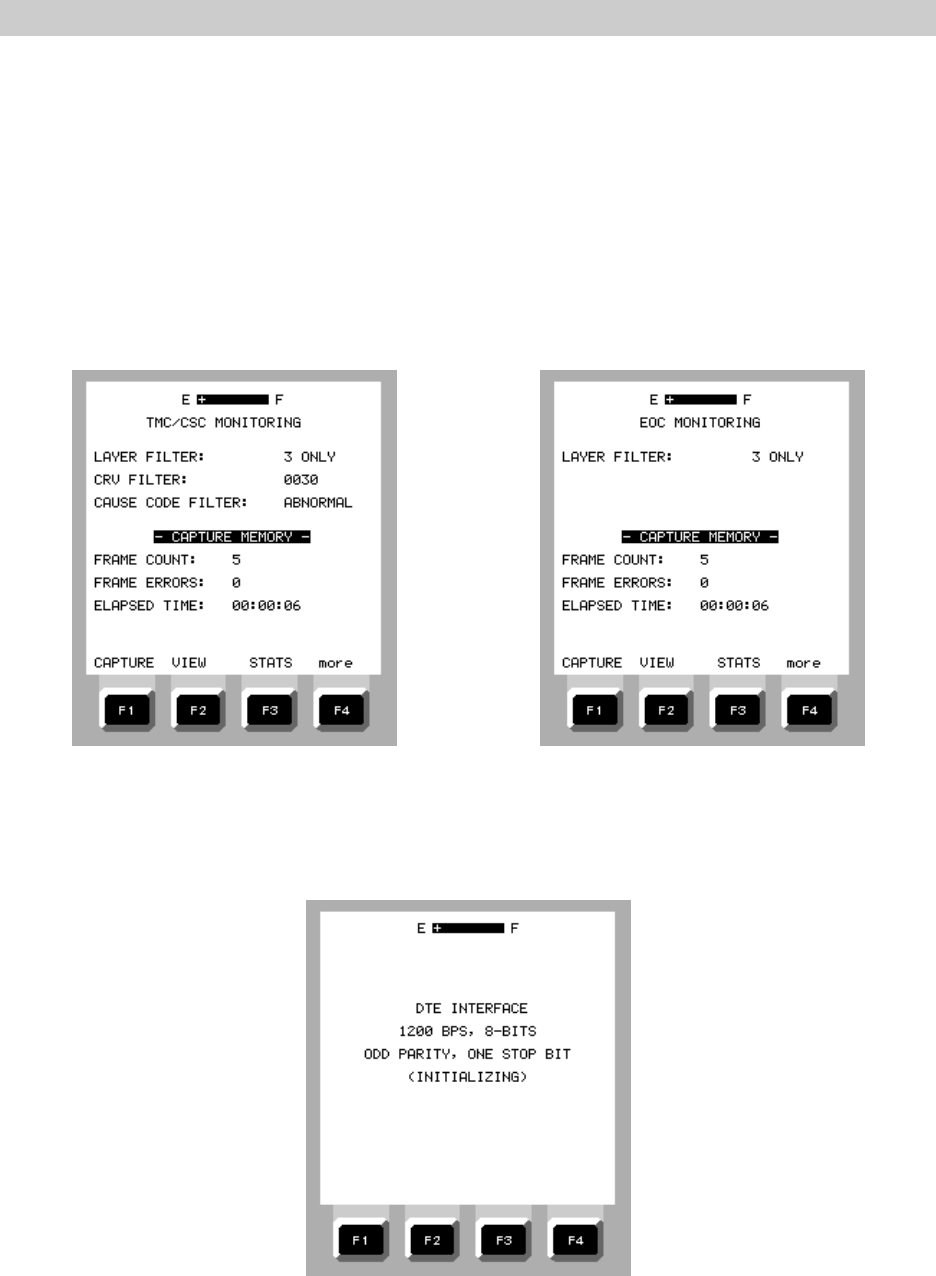
OPERATION
2-78
Depending upon what other options are installed in the test set, five selections are available.
a. TMC / CSC CHANNEL - Allows capture and display of layers (protocol stacks), call reference
value (CRV) filtering, and cause code filtering (Figure 2-116).
b. EOC CHANNEL - Allows capture and display of layer 2 (LAPD) messages on the EOC (Figure
2-117).
c. CRAFT INTERFACE ACCESS - If Option 10 (Terminal Emulation) is installed in the test set, the
craft interface, as specified in GR-303-CORE is enabled using the test set RS-232 port (Figure
2-118). This menu selection is not available without option 10.
Figure 2-116. TMC / CSC MONITORING Figure 2-117. EOC CHANNEL MONITORING
Menu Menu
Figure 2-118. CRAFT INTERFACE ACCESS
Screen
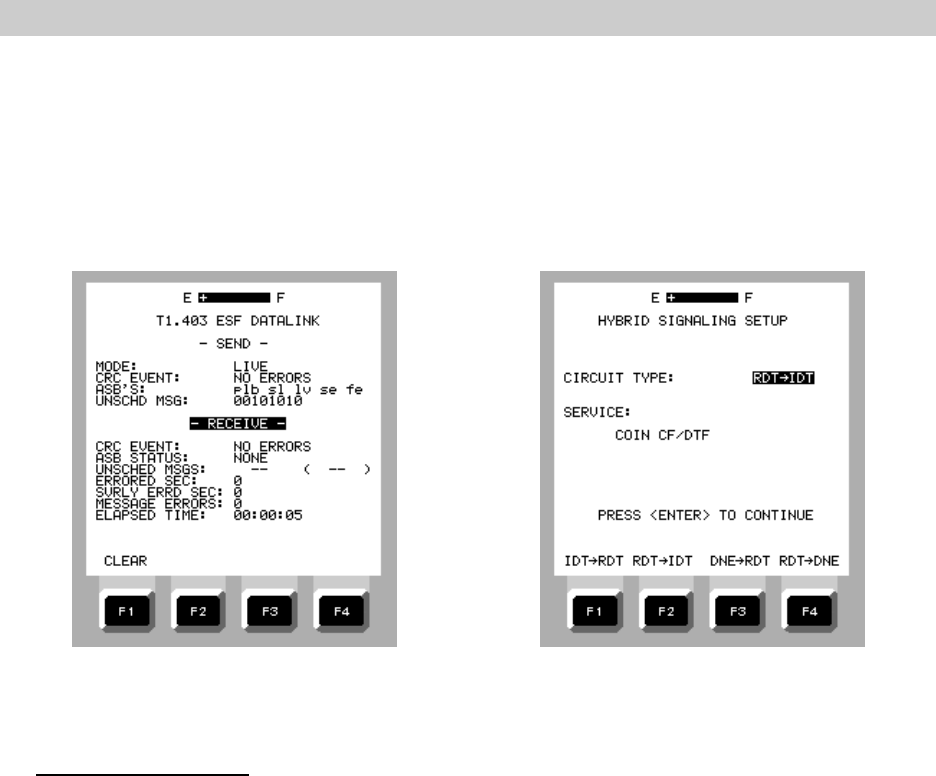
OPERATION
2-79
d. PERFORMANCE REPORT MSGS. - If Option 03 (ESF / SLC 96 Monitor and Control) is installed
in the test set, access of the ESF datalink for performance report messages is enabled (Figure
2-119). This menu selection is not available without option 03.
e. HYBRID SIGNALING - Enables display and decoding of the Hybrid Signaling Channel (ABCD
signaling bits) between the integrated digital terminal (IDT) and the remote digital terminal
(RDT) (Figure 2-120).
Figure 2-119. T1.403 ESF DATALINK Figure 2-120. HYBRID SIGNALING SETUP
Display Menu
TMC / CSC Monitoring
GR-303 testing begins with the TMC / CSC MONITORING menu (Figure 2-116) where layer,
CRV (Call Reference Value), and cause code filtering are selected. The test set is designed to allow
the user to filter (select) specific data for capture and display on the VIEW CAPTURED DATA-
CONDENSED or VIEW CAPTURED DATA-EXPANDED displays. Filters may be applied before or after
the data is captured. Even if pre-capture filtering selects all messages, filters may be reset afterwards
(post-capture) to narrow the range of messages actually displayed.
a. Layer Filter - By moving the cursor to LAYER FILTER, layer selection is performed by pressing
F1 (ALL) or F2 (3 ONLY), Layer 2 messages deal with information flow control and data
integrity of the circuit. Layer 3 messages are derived from the ISDN layer 3 protocol. The
majority of message types and message elements are identical. If ALL is selected, both layer
2 and 3 messages will be captured. If 3 ONLY is selected, only layer 3 messages will be
captured.
b. CRV - CRV filtering allows data related to a single customer, or to all customers, to be
captured or viewed. If F1 (ALL) is selected before initiating the capture, the user can still post-
filter for a single customer for display purposes. If F2 (SPECIFIC) is pressed, messages related
to an individual customer can be filtered by entering the appropriate CRV for that customer.
c. Cause Code Filter - By highlighting CAUSE CODE, the user may filter on ALL (F1) or
ABNORMAL (F2). This filter is post-capture only and is selected after the capture is complete.
ABNORMAL is used if only messages related to an abnormal event are desired for display.
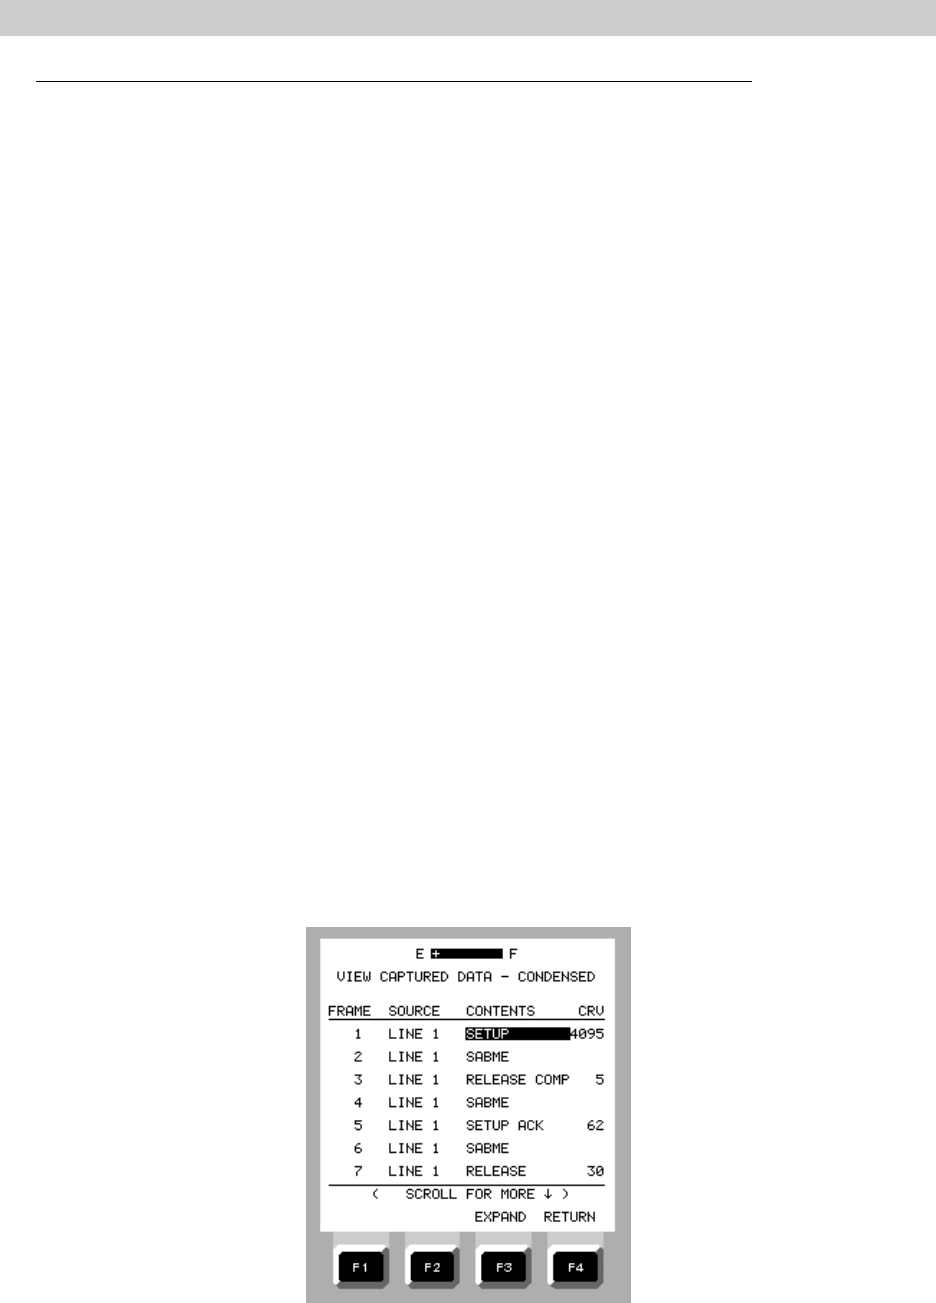
OPERATION
2-80
To execute a GR-303 TMC / CSC data capture, perform the following steps:
1. Set up the test set for dual line DS1 monitoring.
2. Select GR-303 TEST ACCESS on the DS1 MENU.
3. On the GR-303 TEST ACCESS menu, move the cursor to TMC / CSC CHANNEL and
press ENTER.
4. On the TMC/CSC MONITORING menu, select the desired filters, and move the cursor to
- CAPTURE MEMORY -.
5. Connect the test set to the appropriate monitor jack of the DSX and press F1
(CAPTURE).
When F1 is pressed, the data capture is initiated and the F1 key function changes to
STOP. The capture routine will run until F1 (STOP) is pressed, or the test set display
reports CAPTURE BUFFER FULL.
6. Press F1 (STOP)
Once data has been captured, the test set can present the results on four different displays.
(a) TMC / CSC MONITORING menu
(b) VIEW CAPTURED DATA - CONDENSED screen
(c) VIEW CAPTURED DATA - EXPANDED screen
(d) TMC / CSC CAPTURED STATISTICS screen
During capture, or after the capture is stopped, the TMC / CSC MONITORING menu displays
the FRAME COUNT, FRAME ERRORS, and ELAPSED TIME of the data capture (Figure 2-117). By
pressing F2 (VIEW) on the TMC / CSC MONITORING menu, the VIEW CAPTURED DATA -
CONDENSED screen is displayed (Figure 2-121).
Figure 2-121. VIEW CAPTURED DATA - CONDENSED Screen
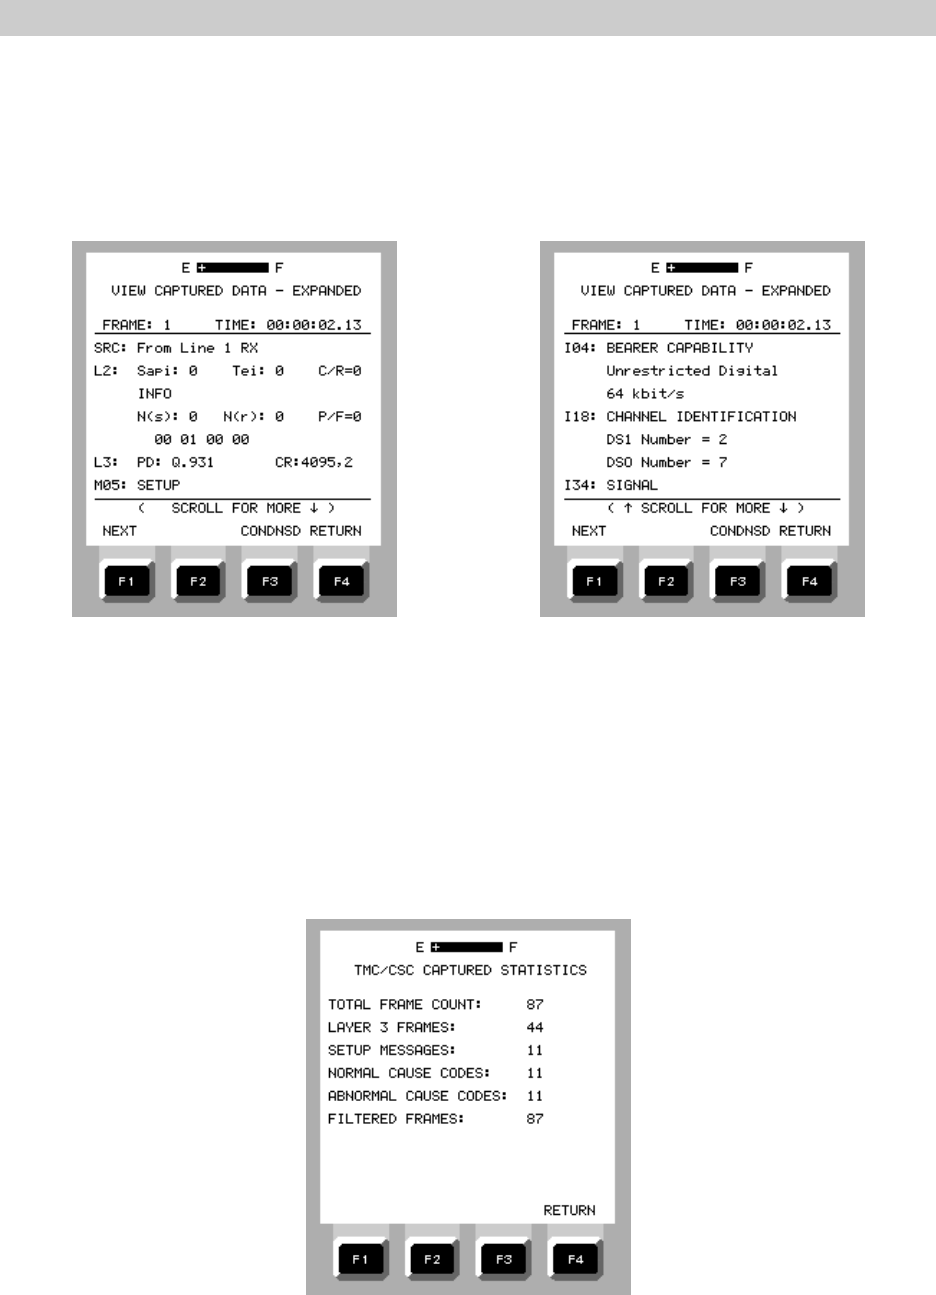
OPERATION
2-81
The scrollable VIEW CAPTURED DATA - CONDENSED screen displays the timestamp of each
captured event, the message, and the associated call reference value (abbreviated to CR on the
screen). Pressing F3 (EXPAND) changes the display to the VIEW CAPTURED DATA - EXPANDED
screen. Pressing F4 (RETURN) restores the TMC/CSC MONITORING menu. The scrollable VIEW
CAPTURED DATA - EXPANDED screen (Figures 2-122 and 2-123) enables the user to view more
detailed information concerning any highlighted event on the ‘CONDENSED’ screen.
Figure 2-122. VIEW CAPTURED DATA Figure 2-123. VIEW CAPTURED DATA
- EXPANDED Screen - EXPANDED Screen (Scrolled)
The VIEW CAPTURED DATA - EXPANDED screen is divided into two sections. The first
section of the screen begins with the frame number of the message, and the timestamp of the frame.
The next four lines contain layer 2 (L2) data. This data includes the service access point identifier
(Sapi) code, the terminal endpoint identifier (Tei), the control/response indication bit (C/R), the frame
type, the send sequence number (N(s)), the receive sequence number (R(s)), and the poll/final (P/F)
bit. The last line displays the raw data. The second section of the VIEW CAPTURED DATA -
EXPANDED screen contains layer 3 (L3) data. It includes the protocol discriminator (PD), call reference
value plus bearer channel number, message type, and information elements with related details.
Figure 2-124. TMC / CSC CAPTURED STATISTICS Display

OPERATION
2-82
The TMC/CSC Captured Statistics display (Figure 2-124) appears if F3 (STATS) is pressed on
the TMC/CSC MONITORING menu. It displays the total number of frames captured, the number of
layer 3 frames captured, as well as the number of setup messages, normal and abnormal cause codes,
and filtered frames.
EOC CHANNEL Monitoring
EOC channel monitoring allows monitoring of management communications between the
switch and the remote terminal. Test set operation is performed in the same manner as TMC/CSC
monitoring except that CRV and CAUSE CODE filtering are not performed. Layer selection is performed
by pressing F1 (2 and 3) or F2 (3 ONLY), and once the capture has been performed, FRAME COUNT,
FRAME ERRORS, and ELAPSED TIME are displayed on the EOC MONITORING menu. To perform a GR-
303 EOC data capture perform the following steps:
1. Select GR-303 TEST ACCESS on the DS1 MENU.
2. On the GR-303 TEST ACCESS menu, move the cursor to EOC CHANNEL and press
ENTER.
3. On the EOC MONITORING menu, select the layers to be filtered, and move the cursor to
- CAPTURE MEMORY -.
4. Connect the test set to the appropriate monitor jack of the DSX and press F1
(CAPTURE).
When F1 is pressed, the data capture is initiated and the F1 key function changes to
STOP. The capture routine will run until F1 (STOP) is pressed, or the test set display
reports CAPTURE BUFFER FULL.
5. Press F1 (STOP)
Once data has been captured, the test set can present the results on four different displays.
(a) EOC MONITORING menu
(b) VIEW CAPTURED DATA - CONDENSED screen
(c) VIEW CAPTURED DATA - EXPANDED screen
(d) EOC CAPTURED STATISTICS screen
During capture, or after the capture is stopped, the EOC MONITORING menu displays the
FRAME COUNT, FRAME ERRORS, and ELAPSED TIME of the data capture (Figure 2-125). By pressing
F2 (VIEW) on the EOC MONITORING menu, the VIEW CAPTURED DATA -CONDENSED screen is
displayed (same as Figure 2-120). By pressing F3 (EXPAND) on the “CONDENSED” screen, the VIEW
CAPTURED DATA - EXPANDED screen is displayed (Figure 2-125). By pressing F3 (STATS) on the
EOC MONITORING menu, the EOC CAPTURED STATISTICS display appears (Figure 2-126).
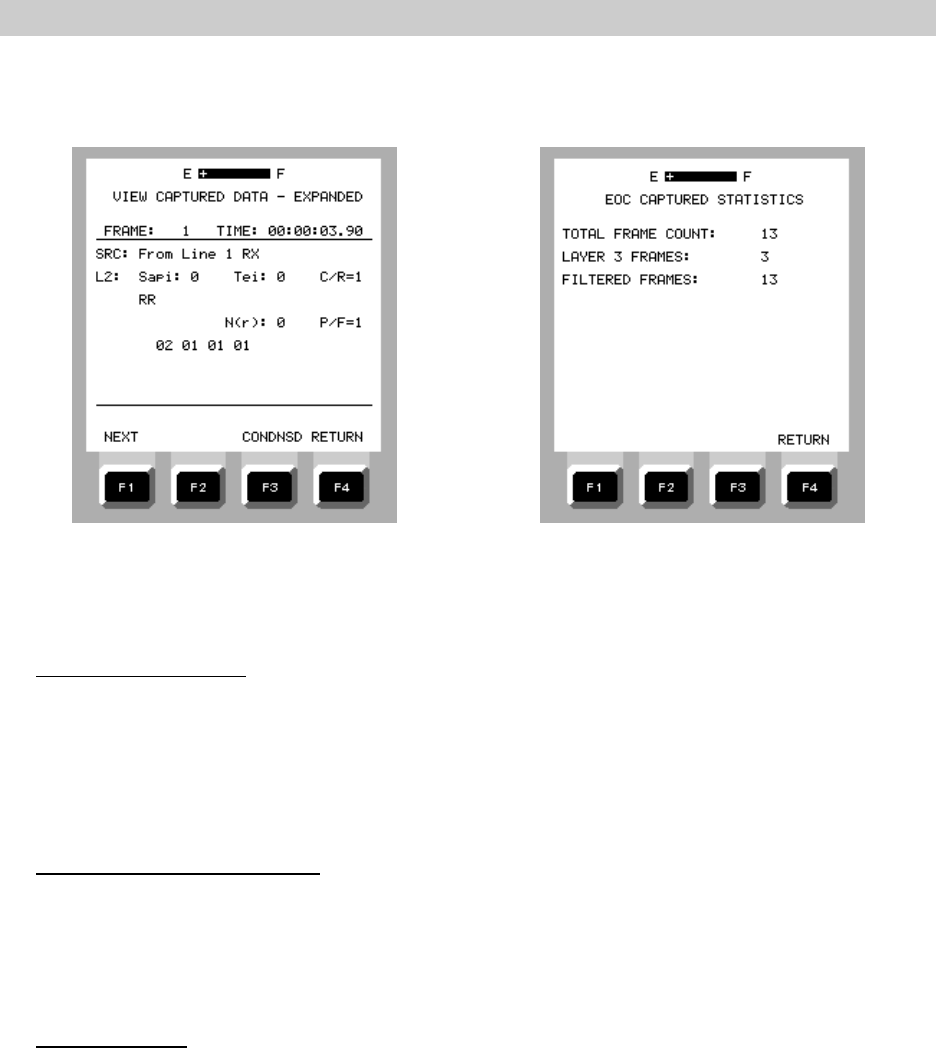
OPERATION
2-83
Figure 2-125. VIEW CAPTURED DATA Figure 2-126. EOC CAPTURED STATISTICS
- EXPANDED Screen (EOC) Screen
Craft Interface Access
If Option 10 (Terminal Emulation) is installed, CRAFT INTERFACE ACCESS can be selected on
the GR-303 TEST ACCESS menu, allowing the EZ-TESTER DS to perform terminal emulation functions.
The test set automatically sets the bit rate, word length, parity and stop bit. Figure 2-118 illustrates
the CRAFT INTERFACE ACCESS screen. Refer to the EZ-TESTER DS Operating Manual for a review
of terminal emulation operations.
Performance Report Messages
If Option 03 (ESF/SLC 96 Monitor and Control) is installed, PERFORMANCE REPORT MSGS
can be selected on the GR-303 TEST ACCESS menu. The test set will display the T1.403 ESF datalink
screen used with option 03. In GR-303 testing, the screen will display performance report messages,
bit oriented alarm codes, and protection line switching commands.
Hybrid Signaling
When HYBRID SIGNALING is selected on the GR-303 TEST ACCESS menu, the EZ-TESTER
DS can display the ABCD signaling bits used for call processing messages including hook state, ringing
control, coin control, ANI, and dial pulse digit transmission. The HYBRID SIGNALING SETUP menu
(Figure 2-126) allows selection of the circuit type, using F1 through F4, and the service desired using
the EDIT key. After circuit type and service have been selected, pressing the ENTER key enables the
raw 24 CHANNEL SIGNALING display (Figure 2-128). Pressing F1 (HLDSCRN) on the 24 CHANNEL
SIGNALING display freezes the display. Pressing F3 (DECODED) displays the decoded format (Figure
2-129).
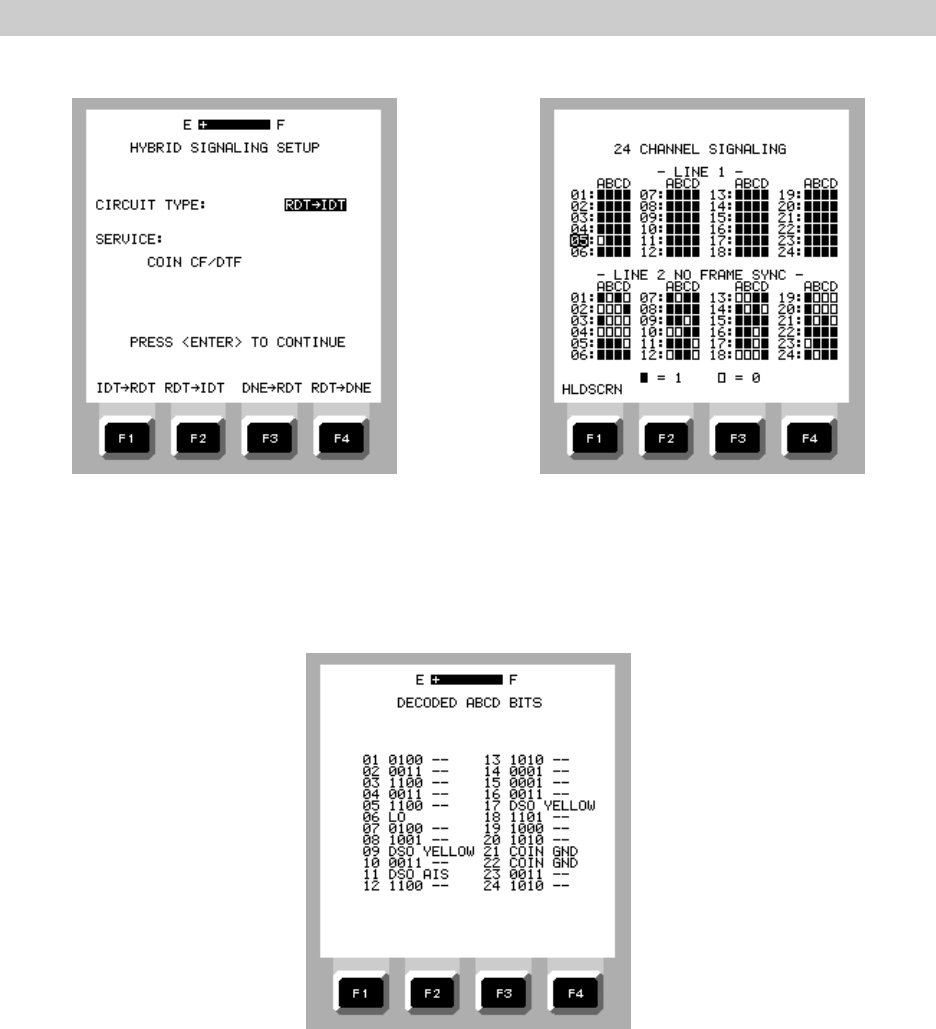
OPERATION
2-84
Figure 2-127. HYBRID SIGNALING Figure 2-128. 24 CHANNEL SIGNALING
SETUP Menu Display
Figure 2-129. DECODED ABCD BITS Display
2.10.13 SS7 Capture / Analysis (Option 13)
Option 13 provides functions for analyzing common channel signaling as described in Bellcore’s
GR-246-CORE, “Bell Communications Research Specification of Signalling System Number 7.”
Signalling System Number 7 (SS7) uses signaling links for transfer of messages between exchanges
or other nodes in the telecommunications network served by the system. The EZ-TESTER DS’s SS7
testing feature enables a technician to capture and analyze messages present on an SS7 56K or 64K
signaling channel and to monitor the performance of the link in real time to help isolate typical
problems.
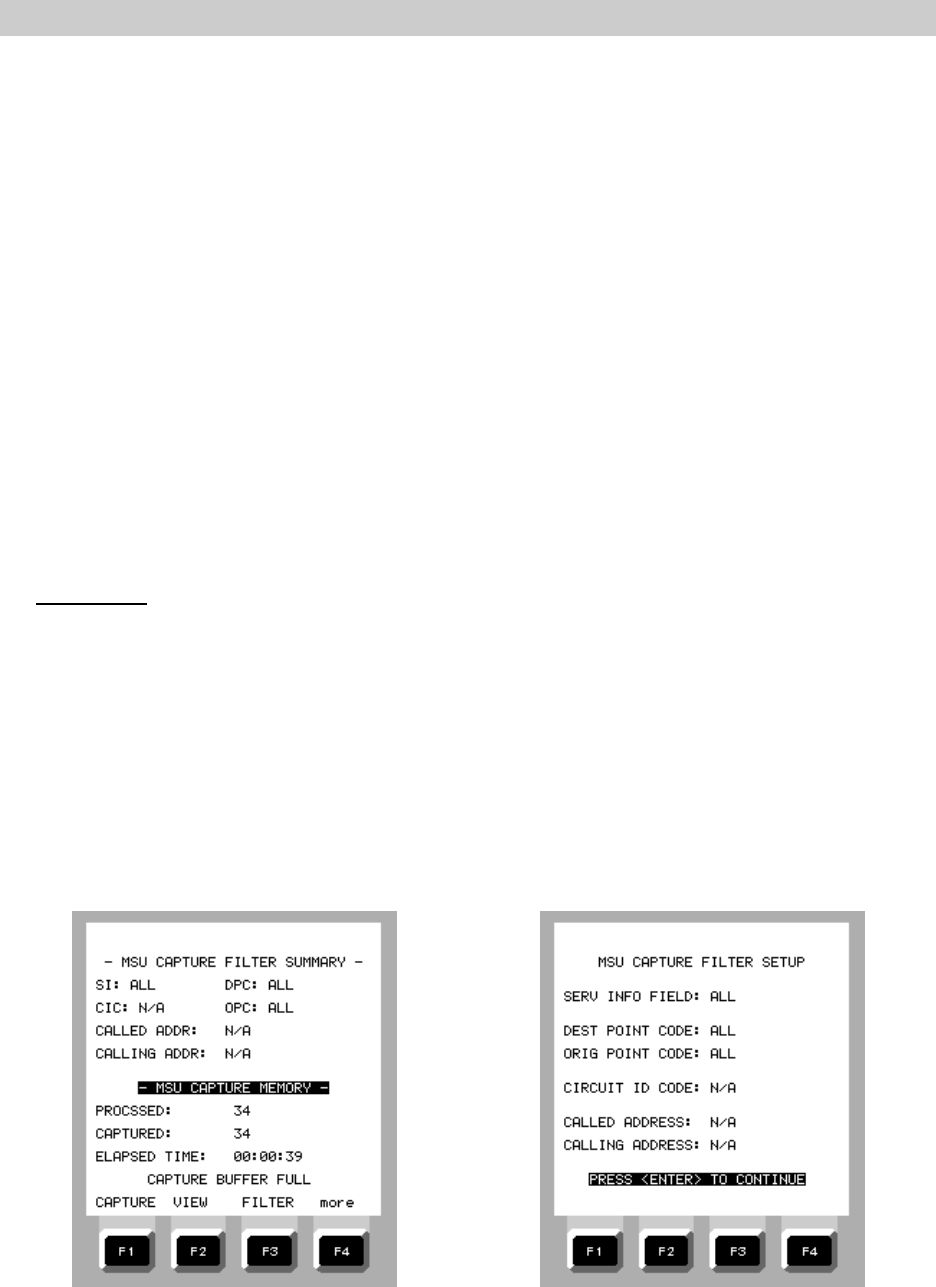
OPERATION
2-85
During SS7 capture / analysis, two specific operations can be performed. The first operation,
MSU CAPTURE, enables the test set to capture and time stamp Message Signaling Units (MSU) that
appear on the SS7 link to which the test set is attached. Captured messages, selected by pre- and
post-capture filtering, can be displayed in detail on an “expanded” screen to show the contents of all
available message fields. The second operation, SU / SMU ANALYSIS, provides running totals on
two separate screens of signaling unit (SU) messages and MSUs appearing on the SS7 link as the test
set monitors the line. During the monitoring period, which begins as soon as SU / MSU ANALYSIS is
selected, the test set counts the messages as they are detected and continuously increments a series
of counters showing the results as totals, subtotals, and percentage of message types. The SU
ANALYSIS screen also displays the number of message re-transmissions by counting inverted Forward
Indicator Bits (FIB INV) and Backward Indicator Bits (BIB INV). Legends are provided for both the SU
and MSU analysis screens. Appendix E also provides an explanation of signal-related acronyms that
do not appear on the LEGEND screens. Table 2-3 explains the signal acronyms that appear on the
VIEW CAPTURED DATA - CONDENSED screen.
Because the EZ-TESTER DS uses a capture-and-display strategy for SS7 analysis, there is no
need to make any connection between the test set TX jack and the signal access point. For this
reason, it is recommended that the test set be used in the monitor mode, using a monitor jack as the
signal access point. This eliminates any possibility of disrupting customer traffic through incorrect set
up of the test set. When installed in the EZ-TESTER DS, SS7 CAPTURE/ANALYSIS is available on the
DS1 MENU.
Initial Setup
1. Enable the appropriate test set interface for the available signal access point.
2. On the DS1 MENU, move the cursor to SS7 CAPTURE / ANALYSIS and press ENTER.
The display changes to the SS7 CAPTURE / ANALYSIS screen (Figure 2-129).
3. On the SS7 CAPTURE / ANALYSIS setup screen, move the cursor to SIGNALING
TIMESLOT and use the F1 (NEXT) and F2 (PREVIOUS) keys or number keys to select the
SS7 link channel.
4. Move the cursor to SIGNALING BIT RATE and use F1 (56KBPS) or F2 (64KBPS) to select
the required bit rate.
Figure 2-130. SS7 CAPTURE / ANALYSIS Figure 2-131. SS7 MSU CAPTURE FILTER
Screen SETUP Screen
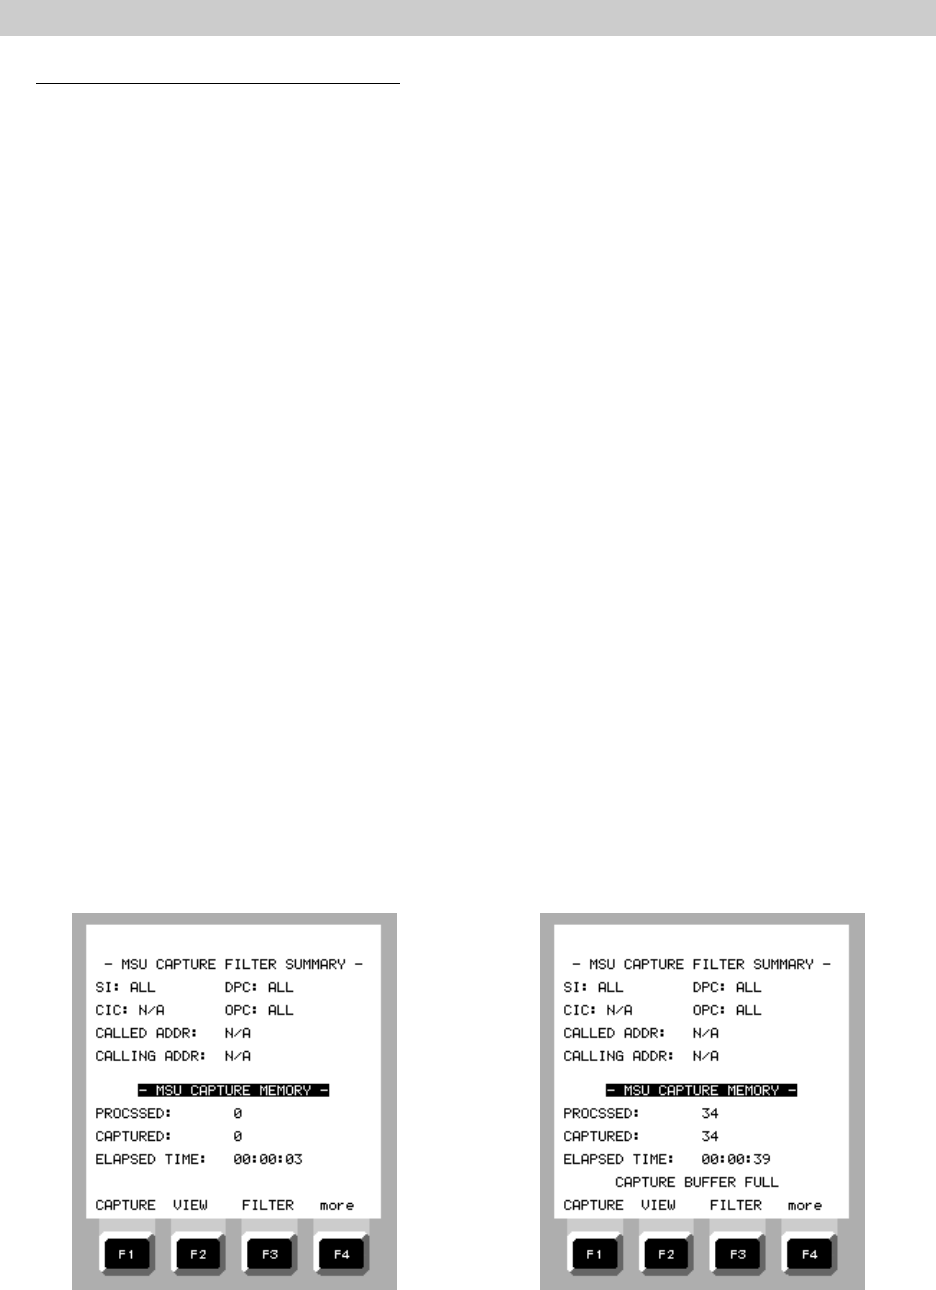
OPERATION
2-86
Message Signaling Unit (MSU) Capture
The value of capture / analysis lies in the user’s ability to examine key data fields in the MSUs
and identify codes such as Service Indicator (SI) or Destination Point Codes (DPC) that are incorrect
for the circuit being monitored. The EZ-TESTER DS captures the messages. Recognition of incorrect
codes is dependent upon knowledge of the normal operating conditions and intended function, and
proper routing of SS7 link data.
Before an MSU capture is performed, the messages to be captured may be filtered for viewing
based upon message type, originating point code or destination point code, circuit ID code, and called
or calling address. Prepare the test set for MSU capture by performing the following steps:
1. On the SS7 CAPTURE / ANALYSIS setup screen, move the cursor to MSU CAPTURE and
press ENTER.
2. On the MSU CAPTURE FILTER SETUP screen (Figure 2-131), move the cursor to SERV
INFO FIELD and select the message type from which the Service Indicator (SI) is to be
viewed: F1 (ALL), F2 SCCP), F3, ISUP), F4 (more), F1 (SNT), or F2 (SNM).
3. Move the cursor to DEST POINT CODE and select messages by destination address: F1
(ALL) or F2 (SPECIFIC). If F2 is selected, use the EDIT key and numerical keypad to
enter the address.
4. Move the cursor to ORIG POINT CODE and select messages by originator: F1 (ALL) or
F2 (SPECIFIC). If F2 is selected, use the EDIT key and numerical keypad to enter the
address.
5. Move the cursor to CIRCUIT ID CODE and select messages by identification code: F1
(ALL) or F2 (SPECIFIC). If F2 is selected, use the EDIT key and numerical keypad to enter
the CI code.
6. Move the cursor to CALLED ADDRESS to select messages going to a specific called
address. Use the EDIT key and numerical keypad to specify the address.
Figure 2-132. MSU CAPTURE FILTER Figure 2-133. MSU CAPTURE FILTER
SUMMARY Before Capture SUMMARY After Capture
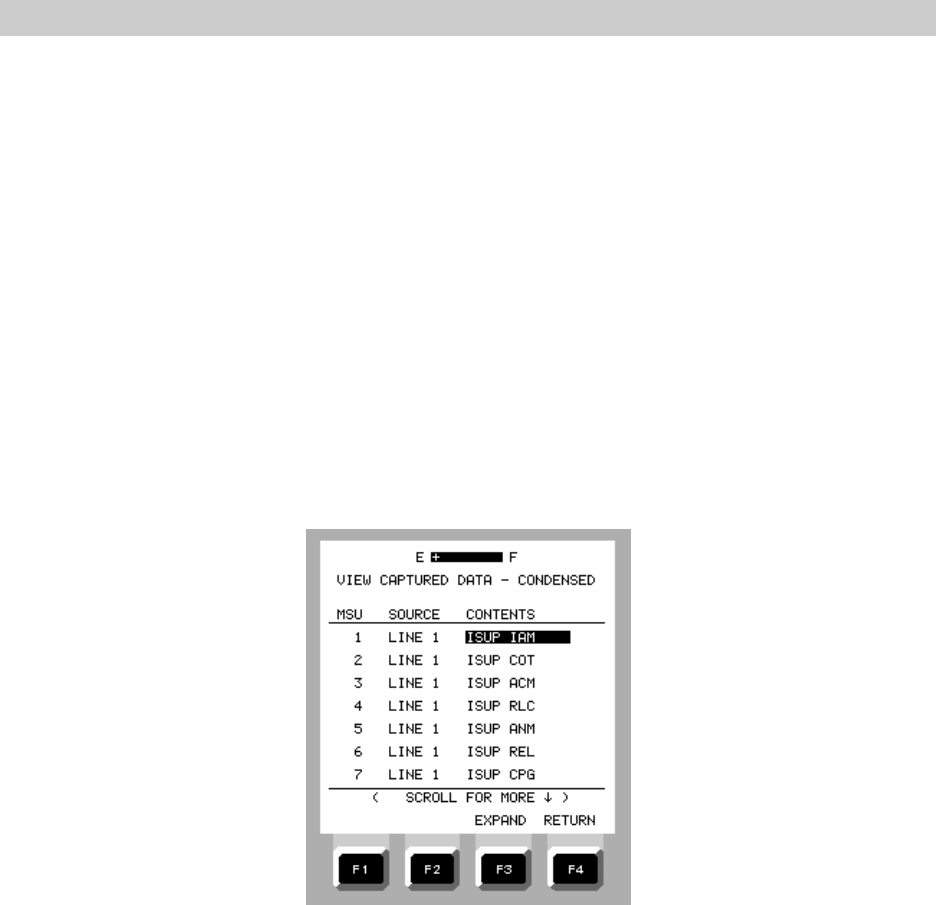
OPERATION
2-87
7. Move the cursor to CALLING ADDRESS to select messages coming from a specific
calling address. Use the EDIT key and numerical keypad to specify the address.
8. Press ENTER and confirm that the filtering selections is set correctly by checking the
setup on the MSU CAPTURE FILTER SUMMARY screen (Figure 2-132).
9. On the MSU CAPTURE FILTER SUMMARY screen, press F1 (CAPTURE) to initiate the
capture operation. The PROCESSED and CAPTURED message counters will increment
as each message is detected on the line and as selected messages are captured based
upon the selected filters (Figure 2-133). The ELAPSED TIME counter will increment until
the capture operation is stopped by pressing F1 (STOP) again or when the capture
memory is filled.
After the MSU capture is stopped, post-capture filtering may be performed to redefine
messages available for viewing by pressing F3 (FILTER) and making new selections on
the MSU CAPTURE FILTER SETUP screen.
Figure 2-134. VIEW CAPTURED DATA - CONDENSED Screen
10. Press F2 (VIEW) to change the screen to VIEW CAPTURED DATA - CONDENSED (Figure
2-134). Use the arrow keys to scroll through the list of captured messages.
11. On the VIEW CAPTURED DATA - CONDENSED screen, move the cursor to any message
and press F3 (EXPAND) to change the screen to the VIEW CAPTURED DATA -
EXPANDED screen (Figures 2-135, 2-136) or F4 (RETURN) to return to the filter
summary screen.
12. On the VIEW CAPTURED DATA - EXPANDED screen, use the F1 (NEXT) or F2
(PREVIOUS) keys to scroll through the expanded screen. Press the F3 (CONDNSD) key
to return to the condensed screen for a new message selection, or F4 (RETURN) to go
back to the filter summary screen.
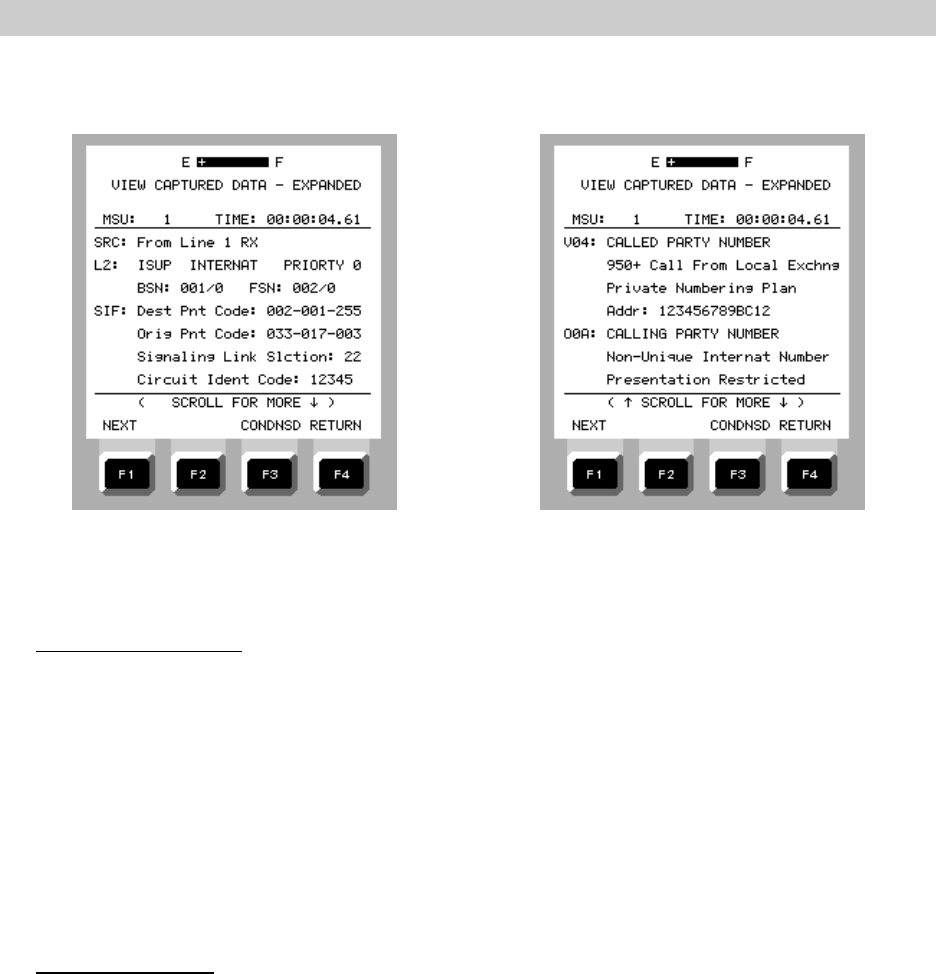
OPERATION
2-88
Figure 2-135. VIEW CAPTURED DATA - Figure 2-136. VIEW CAPTURED DATA -
EXPANDED Screen EXPANDED Screen, Scrolled
MSU Screen Printouts
The MSU capture function includes a printing feature that allows the user to print out the entire
contents of the MSU captured data buffers on a standard printer with an 80 column print width via
the RS-232 auxiliary port located on the end of the test set. Begin the print operation after the capture
operation is stopped and any desired post-capture filtering has been performed:
1. On the MSU CAPTURE FILTER SUMMARY screen, press F4 (more).
2. Press F1 (PRINT CONDENSED) or F2 (PRINT EXPANDD) to print out the contents of the
condensed or expanded data buffers. The printout will be in the format as viewed on the
test set condensed and expanded data screens.
SU / MSU Analysis
SU / MSU analysis is performed in real time by monitoring the number and type of messages
being passed over the SS7 link during each monitoring period. The value of this type of analysis lies
in recognizing the normal volume of various message types appearing on the link. Large numbers of
Fill-In Signal Unit (FISU) messages, for instance, implies a low link efficiency since fill-in messages
generally appear when the link is idle. Inverted BIBs and FIBs indicate requests for re-transmission of
messages, therefore increasing numbers may indicate decreasing line quality and a need for
maintenance.
The SU (signal Unit) analysis function provides a running tally of all three types of SU messages
appearing on the link: Fill-In Signal Units (FISU), Link Status Signal Unit (LISU), and Message Signal
Unit (MSU). The bottom of the screen shows a running tally of MSU re-transmissions by counting the
inverted Forward Indicator Bits (FIB INV)) and Backward Indicator Bits (BIB INV).
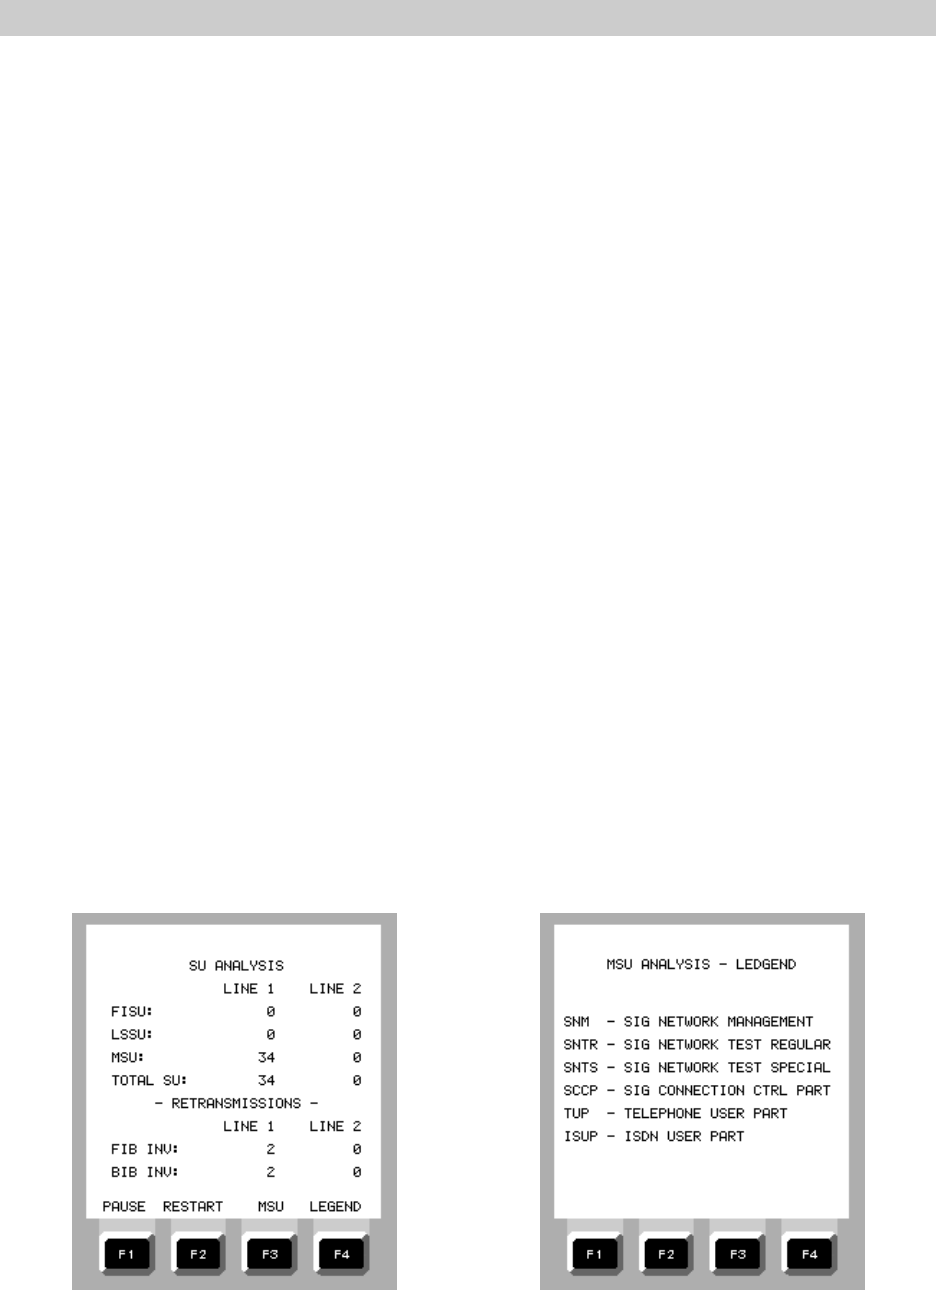
OPERATION
2-89
1. Starting from the SS7 CAPTURE/ANALYSIS setup screen, arrow down to SU/MSU
ANALYSIS and press ENTER. The display changes to the SU ANALYSIS display (Figure
2-137).
2. The total number of SUs detected are shown in real time on the FISU, LISU, MSU,
TOTAL SU, FIB INV, and BIB INV counters.
3. On the SU ANALYSIS display, press F1 (PAUSE) to freeze the display. F1 toggles from
PAUSE to RESUME. When F1 (RESUME) is pressed the counters on the display continue
to increment with no messages having been lost during the pause.
4. Press F2 (RESTART) to reset the counters and begin counting from zero.
5. Press F4 (LEGEND) to view the SU ANALYSIS - LEGEND display (Figure 2-138)
The MSU analysis function provides a running tally of specific types of MSUs detected on the
SS7 link: Signal Network Management (SNM), Signal Network Test Regular (SNTR), Signal Network
Special (SNTS), Signal Connection Control Part (SCCP), Telephone User Part (TUP), ISDN User Part
(ISUP), and other undesignated messages.
1. Starting from the SU ANALYSIS display, press F3 (MSU). The display changes to the
MSU ANALYSIS display (Figure 2-139).
2. The total number of MSUs are shown in real time on the SNM, SNTR, SNTS, SCCP, TUP,
ISUP, OTHER, and TOTAL MSU counters.
3. On the MSU ANALYSIS display, press F1 (PAUSE) to freeze the display. F1 toggles from
PAUSE to RESUME. When F1 (RESUME) is pressed the counters on the display continue
to increment with no messages having been lost during the pause.
4. Press F2 (RESTART) to reset the counters and begin counting from zero.
5. Press F4 (LEGEND) to view the MSU ANALYSIS - LEGEND display (Figure 2-140).
Figure 2-137. SU ANALYSIS Display Figure 2-138. SU ANALYSIS - LEGEND
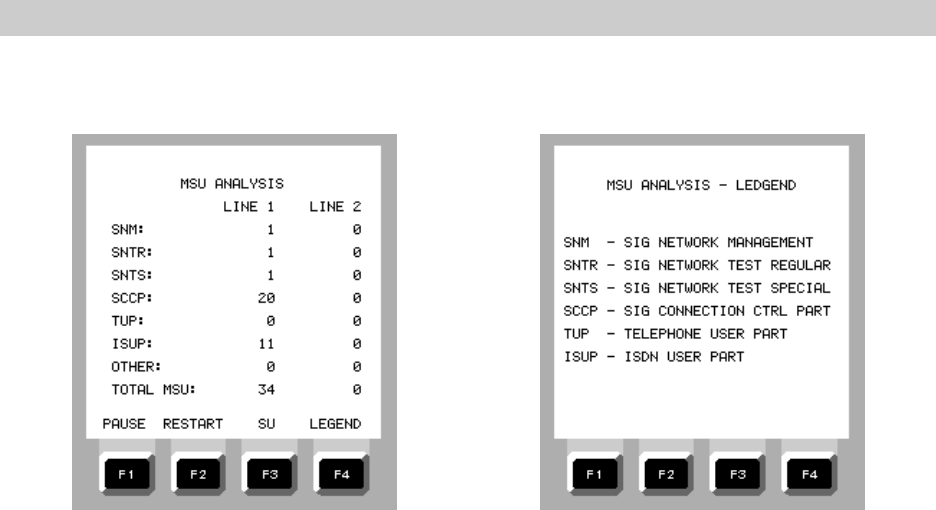
OPERATION
2-90
Figure 2-139. MSU ANALYSIS Display Figure 2-140. MSU ANALYSIS - LEGEND

OPERATION
2-91
Table 2-2. ISUP and SCCP Message Types and Priorities
ISUP MESSAGES SCCP MESSAGES
Message Type Priority Message Type Priority
ACM Address Complete 1 AK Data Acknowledgment 0-1
ANM Answer 2 CC Connection Confirm 1
BLA Blocking Acknowledge 0 CR Connection Request 0-1
BLO Blocking 0 CREF Connection Refused 1
CCR Continuity Check Request 1 DT1 Data Form 1 0-1
CFN Confusion 0 DT2 Data Form 2 0-1
CGB Circuit Group Block 0 EA Expedited Data 1
CGBA Circuit Group Block 0 ED Expedited Data 1
CGU Circuit Group Unblock 0 ERR Error 1
CGUA Circuit Group Unblock 0 IT Inactivity Test 1
CIQR Circuit Group Query 0 LUDT Long Unit Data 0-2
CIQU Circuit Group Query 0 LUDTS Long Unit Data Service 0-2
COT Continuity 1 RLC Release Complete 2
CPG Call Progress 1 RLSD Released 2
CRA Circuit Reservation 0 RSC Reset Confirmation 1
CRES Circuit Reservation 0 RSR Reset Request 1
CVAR Circuit Validation 0 UDT Unit Data 0-2
CVT Circuit Validation Test 0 UDTS Unit Data Service 0-2
EXIT Exit 1 UNKNOWN Unknown
FOT Forward Transfer 1 XUDT Extended Unit Data 0-2
GRA Group Reset Acknowledge 0 XUDTS Extended Unit Data 0-2
GRS Circuit Group Reset 0
IAM Initial Address 0
INF Information 1
INR Information Request 1
LBAC Loopback Acknowledge 1
PAM Pass Along 0-2
REL Release 1
RES Resume 1
RLC Release Complete 2
RSC Reset Circuit 0
SUS Suspend 1
UBA Unblocking Acknowledge 0
UBL Unblocking 0
UCID Unequip Circuit 1
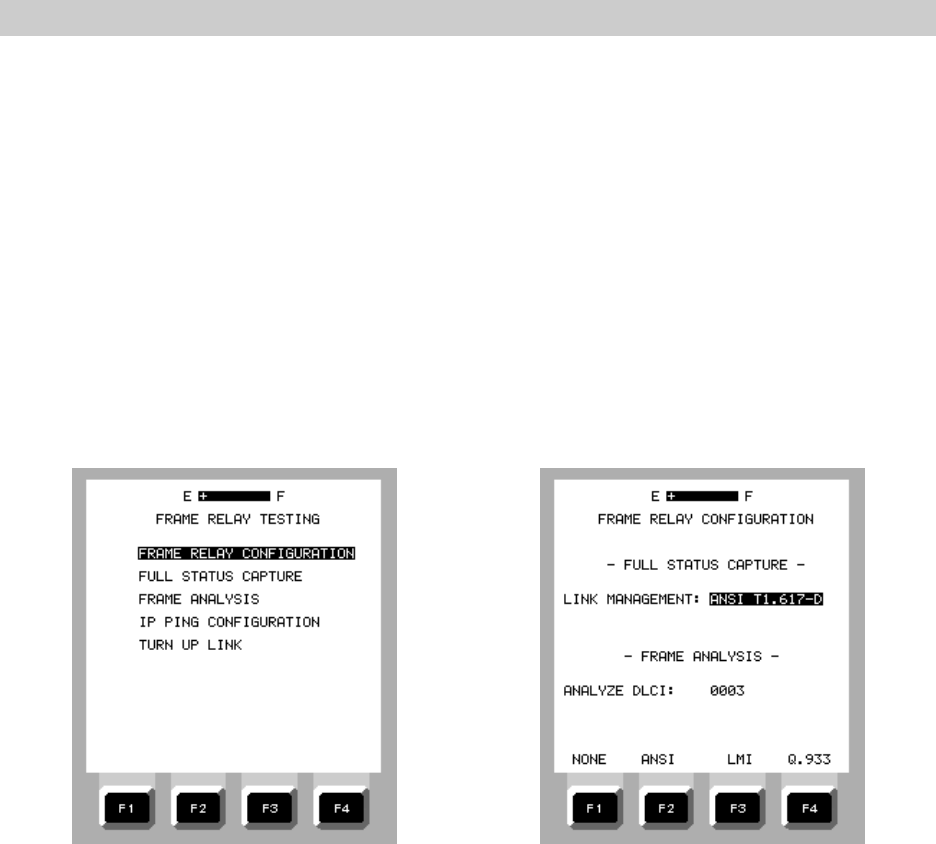
OPERATION
2-92
2.10.14 Frame Relay Testing (Option 14)
The EZ-TESTER DS’s frame relay testing feature (Option 14) provides basic frame relay test
and analysis capability to verify link connectivity and functionality on permanent virtual circuits (PVC).
The following operations can be performed from the FRAME RELAY TESTING menu (Figure 2-141):
a. Set up the test set for a specific link protocol and filter messages by specific data link
connection identifier (DLCI)
b. Capture and display full status messages
c. Perform a statistical analysis of frame relay link data
d. Turn up a frame relay link, display statistical link data, initiate and respond to IP PINGs, and
display DLCI statuses
Figure 2-141. FRAME RELAY Figure 2-142 FRAME RELAY
TESTING Menu CONFIGURATION Screen
When FRAME RELAY CONFIGURATION is selected on the FRAME RELAY TESTING menu, the
display changes to the FRAME RELAY CONFIGURATION screen (Figure 2-142). This operation allows
the user to match the test set to the protocol of the link under test and to select message frames for
analysis. The selectable frame relay protocols are FRF-LMI (Frame Relay Forum-Local Management
Interface), ANSI T1.617 D, and ITU-T Q.933 A. All link messages can be selected for analysis, or can
be filtered to a specific DLCI. When the test set configuration is complete, the test set is ready for
FULL STATUS CAPTURE and FRAME ANALYSIS.
NOTE: Because the frame relay configuration setup is performed separately from the
DS1 setup, the user must always be sure to visit the DS1 TEST SETUP OPTIONS menu
and insure that the appropriate framing, channel format, and line code are selected
before attempting frame relay testing.
When FULL STATUS CAPTURE is selected on the FRAME RELAY TESTING MENU, the test set
will wait for a full status message and then display each DLCI that is detected on the link by DCLI
value (10 bit) and status (Figure 2-143). Possible statuses are NEW, DELETED, ACTIVE, and
INACTIVE.
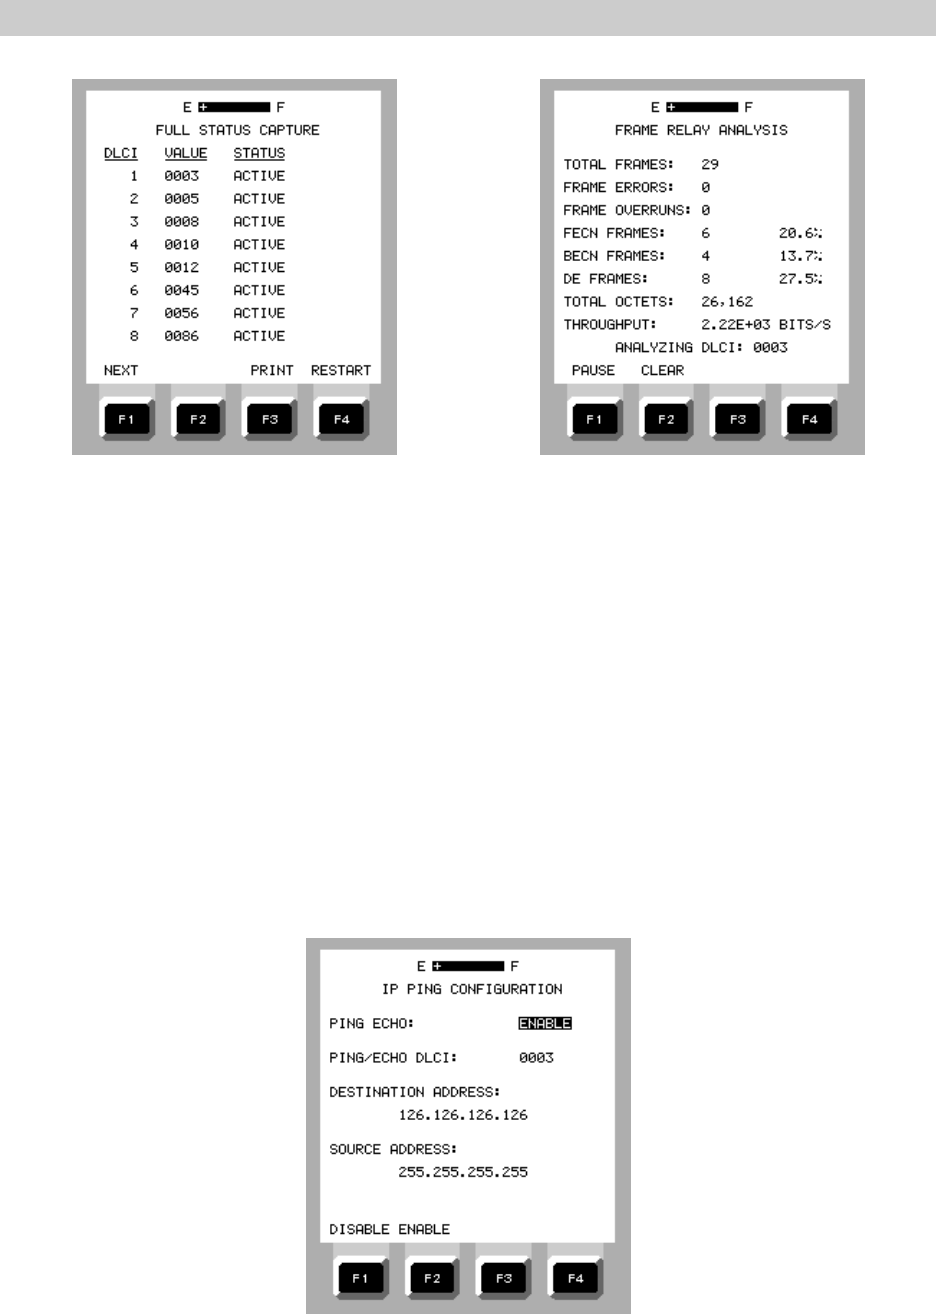
OPERATION
2-93
Figure 2-143. FULL STATUS Figure 2-144. FRAME RELAY
CAPTURE Display ANALYSIS Screen
When FRAME ANALYSIS is selected, The FRAME RELAY ANALYSIS screen appears (Figure
2-144). This screen presents a running total of frames counted, frame errors, frame overruns, forward
explicit congestion notification (FECN) frames, backward explicit congestion notification (BECN)
frames, discard eligibility (DE) frames, total octets, and line throughput. Depending upon the FRAME
ANALYSIS settings selected during the configuration setup, the RELAY FRAME ANALYSIS screen will
display statistics on all or specific DLCIs detected.
When IP PING CONFIGURATION is selected, the IP PING CONFIGURATION screen (Figure 2-
145) is used to enable the test set’s response to incoming pings from a remote location, and to set
up the source and destination addresses required to execute a locally generated ping. With PING ECHO
enabled, the test set will automatically respond to an incoming ping. When the user’s source address
and a destination address are entered, the test set can initiate a ping on the FRAME RELAY LINK TURN
UP screen (Figure 2-146), recording the number of pings initiated and the number of responses
received.
Figure 2-145. I P PING CONFIGURATION Screen
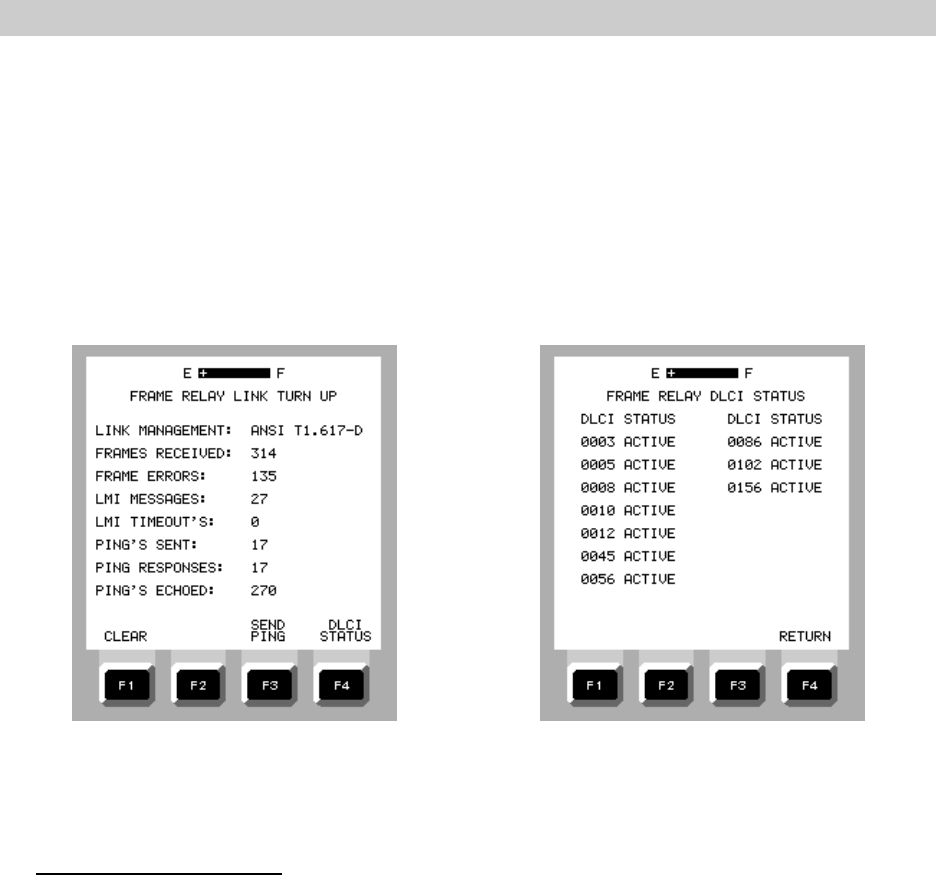
OPERATION
2-94
When TURN UP LINK is selected on the FRAME RELAY TESTING menu, the FRAME RELAY
LINK TURN UP screen appears and the test set performs an operation similar to an auto-configuration.
During the LINK TURN UP operation, the test set performs the following: (a) checks for signal present,
frame sync, and flags; (b) polls the link and watches for responses to identify the link protocol; (c)
requests a status report every ten seconds and a full status report after every sixth request. From the
FRAME RELAY LINK TURN UP screen, pings can be initiated to test connectivity with specific DLCIs,
displaying the status of the first fourteen DLCIs detected on the link (Figure 2-146). During a LINK
TURN UP operation, the test set displays the link protocol and statistical information of: frames
received, frame errors, local management interface (LMI) messages, LMI timeouts, pings sent, ping
responses, and pings echoed.
Figure 2-146 FRAME RELAY LINK Figure 2-147 FRAME RELAY
TURN UP Screen STATUS Screen
Frame Relay Configuration
1. On the DS1 MENU, move the cursor to FRAME RELAY TESTING and press ENTER.
2. On the FRAME RELAY CONFIGURATION screen, select the appropriate link protocol for
the line under test.
F2 = ANSI T1.617-D
F3 = FRF - LMI
F4 = Q.933 ANNEX A
3. Move the cursor to ANALYZE DLCI and press F1 (ALL) to select all messages for
analysis, or press F2 (SPECIFIC) to filter a single DLCI for analysis. If F2 (SPECIFIC) is
selected, press the EDIT key and use the numeric keypad and arrow keys to enter the
desired DLCI.
4. he test set configuration is complete. Press the MENU key to return to the FRAME
RELAY TESTING menu.

OPERATION
2-95
Full Status Capture
1. On the FRAME RELAY TESTING menu, move the cursor to FULL STATUS CAPTURE and
press ENTER. After the capture process is initiated, the screen may remain inactive for
up to sixty seconds before presenting data. The screen will include an internal sequence
number, DLCI value, and the status of the DLCI.
2. Press F1 (NEXT) to view additional screens.
3. If the test set is connected to a standard printer, press F3 (PRINT) to print out the FULL
STATUS CAPTURE screens.
4. Press F4 (RESTART) to clear the FULL STATUS CAPTURE screen and initiate a new
capture operation.
Frame Analysis
1. On the FRAME RELAY TESTING menu, move the cursor to FRAME ANALYSIS and press
ENTER.
If the link is active, and depending upon the types of frames detected, various counters
on the FRAME RELAY ANALYSIS display will begin to increment immediately, and the
test set will continuously update the throughput for the duration of the operation. If all
DLCIs were selected for analysis on the FRAME RELAY CONFIGURATION screen, the
analysis data will refer to all frames detected on the link. If a specific DLCI was selected
during the configuration setup, the analysis data will refer only to frames detected from
that specific DLCI.
2. Press F1 (PAUSE) to freeze the display during a monitoring cycle. When F1 (RESUME)
is pressed, the counters will continue to increment again with no frames having been lost
during the pause.
3. Press F2 (CLEAR) to reset the counters to zero. Counters will begin to increment
immediately.
IP PING Configuration
The IP PING CONFIGURATION menu is used to enable the test set’s PING ECHO feature, and
to prepare the test set to generate and respond to a ping in the LINK TURN UP mode.
Setting up PING ECHO:
1. On the FRAME RELAY TESTING menu, move the cursor to IP PING CONFIGURATION and
press ENTER.
2. On the IP PING CONFIGURATION screen, move the cursor to PING ECHO and press F2
(ENABLE).
3. Move the cursor to PING/ECHO DLCI and press EDIT.
4. Use the numeric keypad and arrow keys to enter the DLCI and press ENTER.

OPERATION
2-96
5. Move the cursor to SOURCE ADDRESS, press EDIT, and use the numeric keypad and
arrows to enter the correct SOURCE ADDRESS for the test access point, then press
ENTER. The test set will now respond to a ping generated by a remote station on the
link.
Setting up IP PING for the LINK TURN UP mode:
1. On the FRAME RELAY TESTING MENU, move the cursor to IP PING CONFIGURATION
and press ENTER.
2. On the IP PING CONFIGURATION screen, move the cursor to PING/ECHO DLCI and use
the numeric keypad and arrow keys to enter the link DLCI, then press ENTER.
3. Move the cursor to DESTINATION ADDRESS, press EDIT, and use the numeric keypad
and arrow keys to enter the destination address of the ping, then press ENTER.
4. Move the cursor to SOURCE ADDRESS, press EDIT, and use the numeric keypad and
arrow keys to enter the SOURCE ADDRESS for the test access point, then press ENTER.
The test set is ready for initiating an IP PING in the TURN UP LINK mode.
5.Press MENU to return to the FRAME RELAY TESTING menu.
Turn Up Link
1. On the FRAME RELAY TESTING menu, move the cursor to TURN UP LINK and press
ENTER. The test set will automatically configure itself to the link and begin to display
link statistics.
2. Press F3 (SEND PING) to ping a specific, or all DLCIs, depending upon the IP PING
CONFIGURATION setup.
3. Press F4 (DLCI STATUS) to view the FRAME RELAY DLCI STATUS screen.
2.10.15 Addition of Second DS1 Port (Option 19)
The basic EZ-TESTER DS is a single line DS1 test set. If purchased as a single port test set,
only the LINE 1 TX and RX jacks are enabled, though both sets of jacks are physically installed. The
test set can be quickly converted to a dual line tester by contacting the factory and purchasing Option
19. The second port can be enabled without returning the test set to the factory by using the OnCall®
update feature built in to every EZ-TESTER.
2.11 DDS 4-WIRE Local Loop Testing
The EZ-TESTER DS is designed to provide comprehensive testing of 4-wire local loop DDS
circuits with the same ease of operation as the T1 testing functions. The DDS testing function
includes an autoconfiguration mode to determine circuit characteristics and simply setup; alarm and
error injection to test circuit component responses; a byte decoder to enable the user to confirm active
data, framing, and control bits; a loopback control feature to allow the user to loop up and loop down
the circuit from the test set; a loopback emulation mode enables the test set to respond to loopback
commands transmitted from the far end to facilitate line testing from a remote location; and frame
relay testing from a DDS access point.
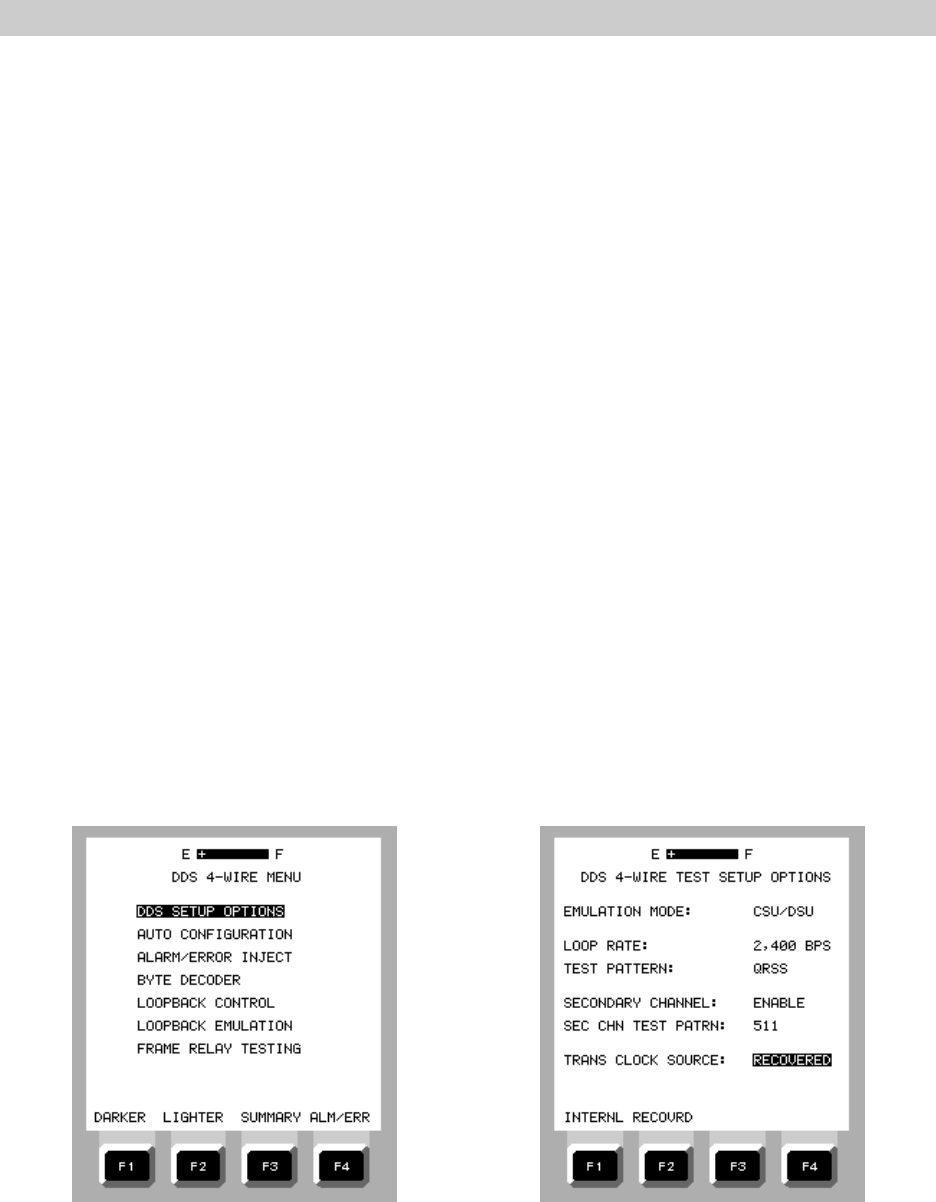
OPERATION
2-97
2.11.1 DDS 4-WIRE MENU
DDS testing is enabled at the TEST INTERFACE SETUP MENU. After the test interface is set
up, all DDS test functions are performed from the DDS 4-WIRE MENU (Figure 2-148). From this menu,
the following selections are made:
a. DDS SETUP OPTIONS - For selecting the test set emulation mode, loop rate, test pattern,
specifying a secondary channel and test pattern, and selecting the transmit clock source
(Figure 2-149).
b. AUTO CONFIGURATION - Initiates automatic sensing of the loop rate, test pattern, secondary
channel number and test pattern (Figure 2-150).
c. ALARM / ERROR INJECT - Allows selection of the type of alarm and errors to be injected into
the test data stream, including the rate of error insertion (Figures 2-151 and 2-152).
d. BYTE DECODER - Displays the value of the data (D), framing (F), and control (C) bits in the
signal data stream (Figure 2-153).
e. LOOPBACK CONTROL - Provides control screen for transmitting CSU or V.54 loopback
commands (Figure 2-154 ).
f. LOOPBACK EMULATION - Enables test set to respond to loopback commands from the far end
to facilitate far end testing (Figure 2-155).
g. FRAME RELAY TESTING (Option 14) - Identifies link protocols, captures and displays full
status messages, displays Data Link Connection Identifiers (DLCI), and provides IP ping
capability from a DDS access point (Figure 2-156).
Figure 2-148. DDS 4-WIRE MENU Figure 2-149. DDS SETUP OPTIONS Screen

OPERATION
2-98
Figure 2-150. DDS 4-WIRE AUTO Figure 2-151. Sample DDS ALARM / ERROR
CONFIGURATION Screen INJECT Menu
Figure 2-152. DDS ALARM / ERROR INJECT Figure 2-153. DDS 4-WIRE BYTE DECODER
TYPE Menu Display
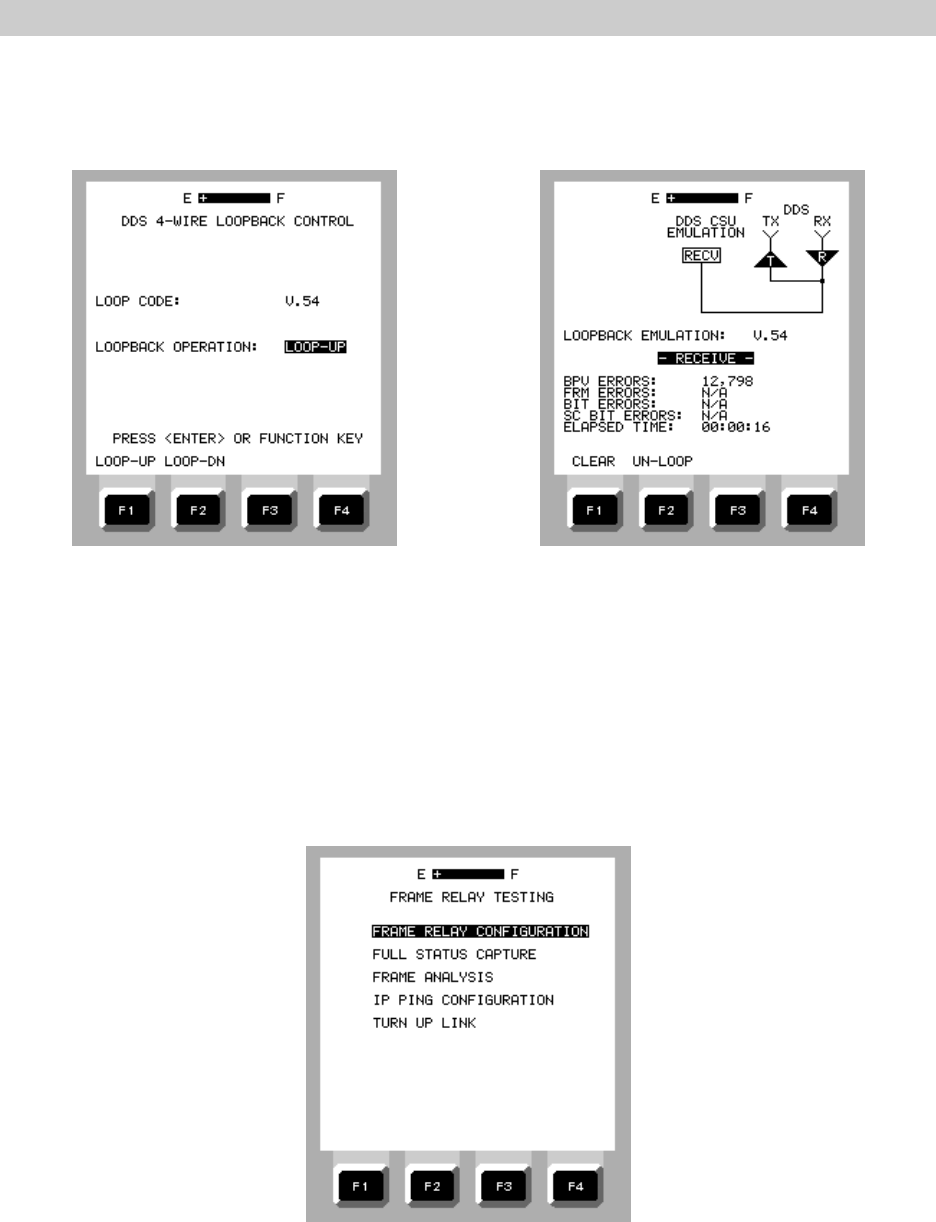
OPERATION
2-99
Figure 2-154. DDS 4-WIRE LOOPBACK Figure 2-155.DDS LOOPBACK EMULATION
CONTROL Screen Screen
Figure 2-156. FRAME RELAY TESTING Menu

OPERATION
2-100
2.11.2 Autoconfiguring the Test Set for DDS Testing
The EZ-TESTER DS includes a DDS autoconfiguration feature that may be used to automatically
determine the circuit loop rate, existing test pattern, confirm the secondary channel is enabled, and
what pattern the secondary channel is carrying. Autoconfiguration may also be used to simplify setup
during typical testing operations.
To Perform a DDS Autoconfiguration:
1. On the MAIN MENU, move the cursor to TEST INTERFACE SETUP and press ENTER.
2. On the TEST INTERFACE SETUP MENU, set the following:
ACTIVE INTERFACES: F3 (DDS)
DDS 4-WIRE TX LBO: F1 (0 dB)
3. Press MENU to return to the MAIN MENU.
4. On the MAIN MENU, move the cursor to DDS 4-WIRE MENU and press ENTER.
5. Connect the test set to the line to be tested using the front panel DDS LOCAL LOOP
jack.
6. On the DDS 4-WIRE MENU, move the cursor to AUTO CONFIGURATION and press
ENTER.
The test set will determine the loop rate, and test pattern being transmitted, determine
if a secondary channel is active, and will identify a test pattern being transmitted over
the secondary channel.
7. When the autoconfiguration cycle is complete, press F1 (RESTART) to repeat the cycle,
or F4 (RESTORE) to return to the DDS 4-WIRE MENU.
2.11.3 Basic DDS Testing
Basic DDS testing confirms the ability of a DDS circuit to successfully send and receive data
at the proper data rate and signal level, and helps identify circuit problems and isolate the cause. DDS
testing can be performed with two test sets terminating opposite ends of the span; with a single test
set testing a circuit looped back on itself; or with a single test set acting as a customer service unit
(CSU), digital service unit (DSU), or office control unit (OCU) to facilitate testing from the far end.
If tests are being performed by a test set at the far end, the EZ-TESTER DS can also be used to
provide a metal loopback of the transmit and receive line, or a metal short between the transmit tip
and ring and the receive tip and ring to aid in fault isolation .
The following test procedure is used to test the DDS circuit by terminating the DDS circuit with the
test set, placing a test pattern on the line to be monitored at the far end, and simultaneously observing
test results.
Setting Up a Basic DDS Test
1. Connect the test set to the line to be tested using the front panel DDS LOCAL LOOP
jack.
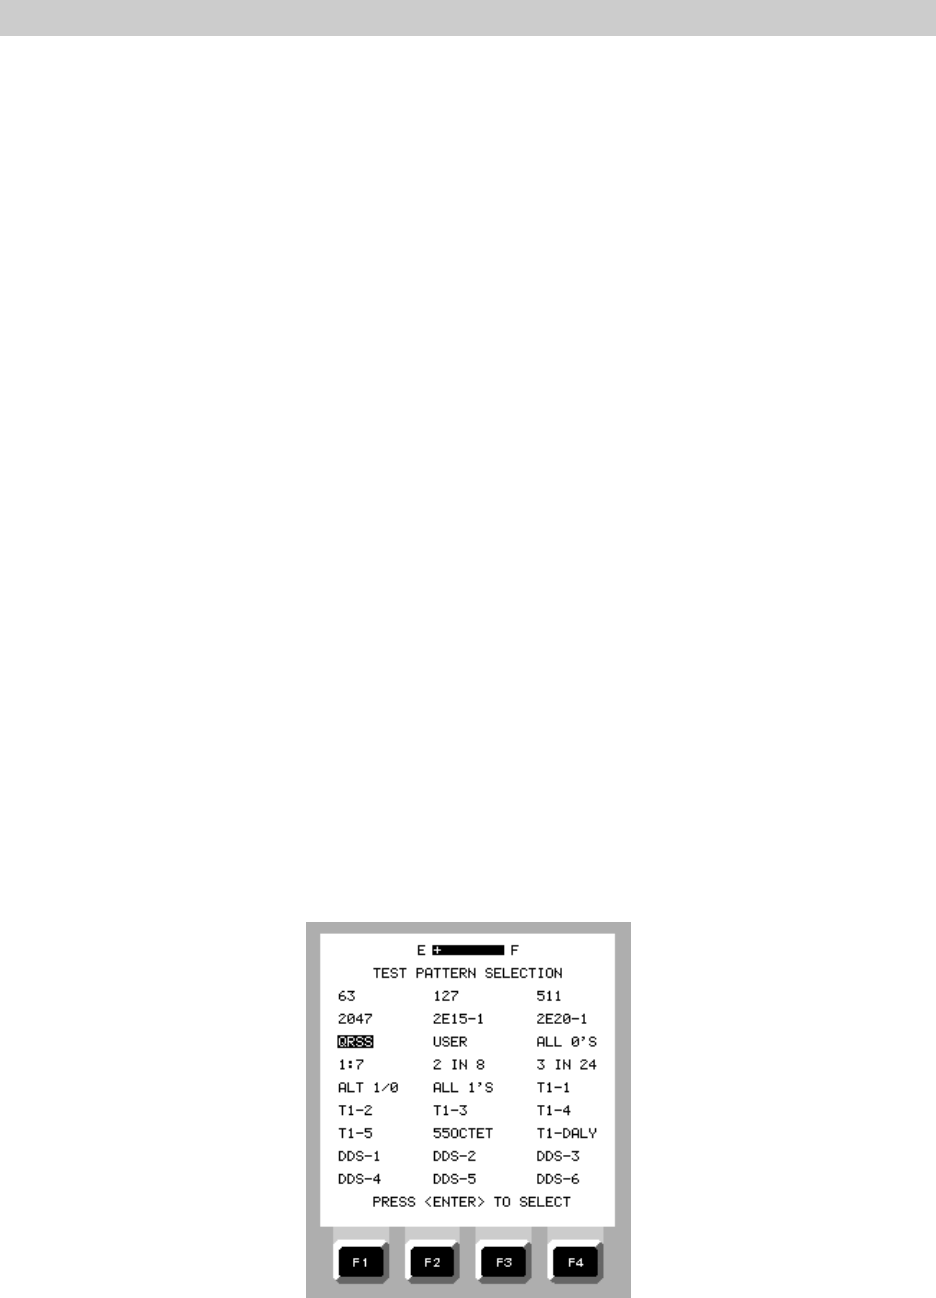
OPERATION
2-101
2. On the MAIN MENU, move the cursor to TEST INTERFACE SETUP and press ENTER.
3. On the TEST INTERFACE SETUP MENU, set the following:
ACTIVE INTERFACES: F3 (DDS)
DDS 4-WIRE TX LBO: Set as required.
F1 (0 dB) F2 (-3 dB) F3 (-6 dB) F4 (-9 dB)
4. Press MENU to return to the MAIN MENU.
5. On the MAIN MENU, move the cursor to DDS 4-WIRE MENU and press ENTER.
6. On the DDS 4-WIRE MENU, move the cursor to DDS SETUP OPTIONS and press ENTER.
7. On the DDS 4-WIRE TEST SETUP OPTIONS menu (Figure 2-148), move the cursor to
EMULATION MODE and select:
F1 (CSU / DSU) if testing toward the customer site from the network
F2 (OCU) if testing from the site toward the network
8. Move the cursor to LOOP RATE and use the F keys to select the correct rate in bits per
second:
F1 = 2,400 F1 = 19.2K F1 = 64K
F2 = 4,800 F2 = 38.4K
F3 = 9,600 F3 = 56K
F4 = more F4 = more
9. Move the cursor to TEST PATTERN and use the F keys to select one of four basic test
patterns, or the EDIT key to view and select from a broader list of available patterns
(Figure 2-157).
F1 = 511 F3 = QRSS
F2 = 2047 F4 = ALL 1'S
Figure 2-157. TEST PATTERN SELECTION Menu

OPERATION
2-102
10. Depending on the requirements of the test, move the cursor to SECONDARY CHANNEL
and use the F keys to enable or disable the secondary channel.
F1 = DISABLE F2 = ENABLE
11. If the secondary channel is enabled, move the cursor to SEC CHN TEST PATRN and use
the F keys to select one of four test patterns.
F1 = IDLE F3 = 511
F2 = 63 F4 = 2047
12. If the EMULATION MODE was set to CSU / DSU in step 6, move the cursor to TRANS
CLK SOURCE and set the timing source as required by the circuit being tested.
F1 = INTERNL F2 = RECOVRD
If the test is to be monitored at the far end only, setup is complete. Press START to begin the
test.
If the test is to be monitored locally using a loopback at the far end, the EZ-TESTER DS can
transmit loopback commands, or a hard loop can be established by a technician at the far end.
Performing Loopback Operations with the Test Set
The EZ-TESTER DS can perform loopback operations to loop up customer service units (CSU),
digital service units (DSU), and office channel units (OCU). Use the following procedure to perform
remote loopback operations:
1. Set up the test set as shown in basic DDS test setup procedure.
2. When setup is complete, press the MENU button to return to the DDS 4-WIRE MENU.
3. On the DDS 4-WIRE MENU, move the cursor to LOOPBACK CONTROL and press ENTER.
4. On the DDS 4-WIRE LOOPBACK CONTROL screen (Figure 2-158) select the type of loop
code required. If the tester is set up for OCU emulation, use the F keys to select the
type of loop code.
F1 = CSU F2 = V.54
If the tester is set up for CSU / DSU emulation, the loop code will always be V.54.
5. Move the cursor to LOOPBACK OPERATION and press F1 (LOOP-UP) to transmit the loop
up command to the far end device. If LOOP-UP was already selected prior to this step,
press ENTER to execute the command.
The test set will send the loopback code and will report the status of the operation at the
bottom of the screen.
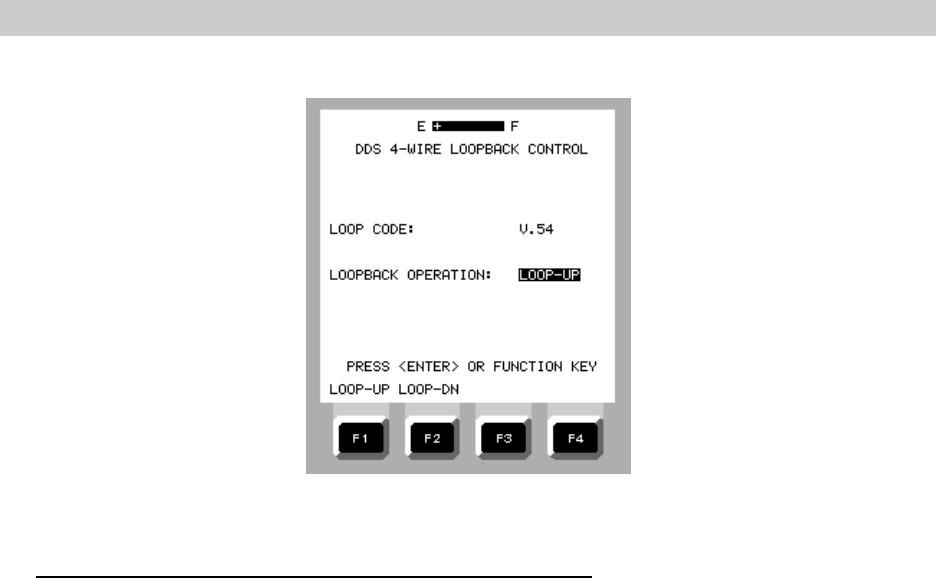
OPERATION
2-103
Figure 2-158. DDS 4-WIRE LOOPBACK
CONTROL Screen
Observing the Results of the Test on the RESULTS Screens
1. When the loop up is successful, begin the DDS test by pressing the START key.
The display will change to the RESULTS - SUMMARY screen and will report NO ERRORS
if all conditions are normal.
If an error or alarm condition occurs, the RESULTS screen will report the occurrence of
the problem and various LEDs will change depending upon the nature of the problem.
When the RESULTS - SUMMARY screen reports a problem:
(a) Press F1 (PAGE-UP) and F2 (PAGE-DN) to review all the RESULTS screens.
(b) Press F3 (ALM / ERR) to view the DDS RECEIVE ALARMS screen, then press F4
(ERRORS) to view the DDS RECEIVE ERRORS screen.
(c) Press F3 (RETURN) to return to the RESULTS screen.
2. If the alarm or error condition persists, the alarm and/or error lamps will remain lit. If the
line returns to normal, any indicators that were affected by the problem will flash until
reset by the user. The lamps can be reset several ways:
(a) Press STOP. The test will be terminated and all history will remain for viewing and
printout.
(b) Press START. The test will be terminated and restarted. All alarm / error history
will be lost.
(c) While the test is running, from the RESULTS - SUMMARY screen, press F4 (more)
two times, then press F3 (CLR-HST). The test will continue running, but the test
history will be lost.
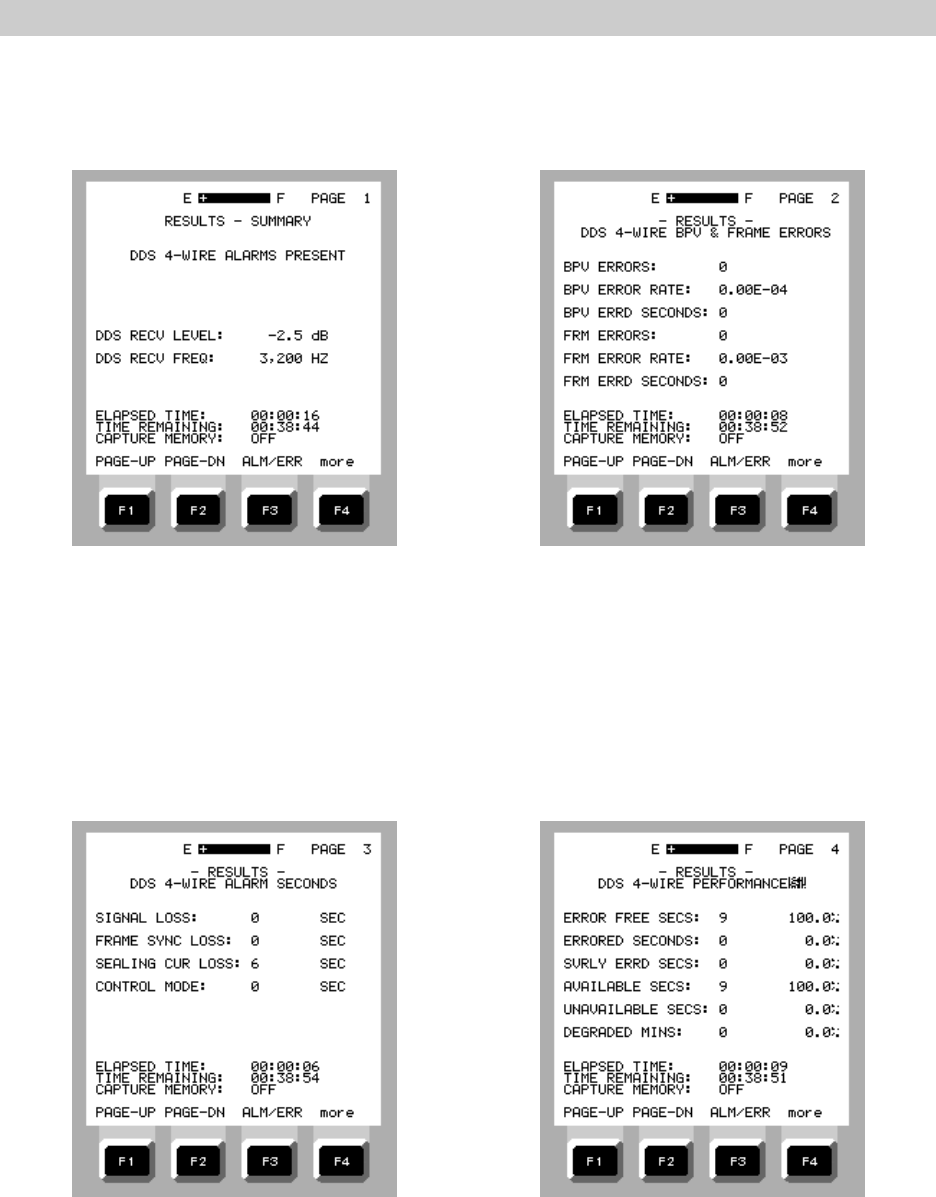
OPERATION
2-104
Figure 2-159. DDS RESULTS - SUMMARY Figure 2-160. DDS RESULTS Page2
No Errors
Figure 2-161. DDS RESULTS Page 3 Figure 2-162. DDS RESULTS Page 4
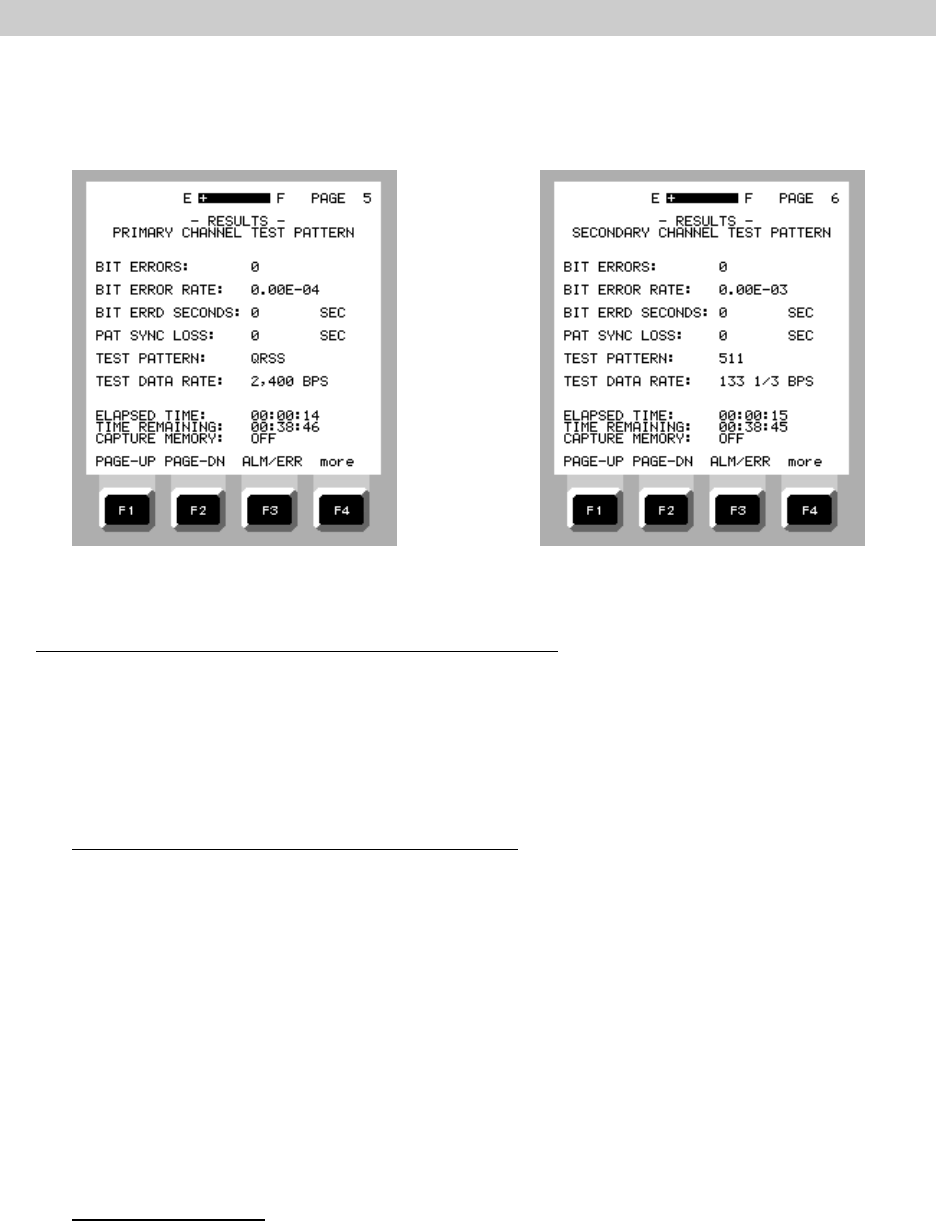
OPERATION
2-105
Figure 2-163. DDS RESULTS Page 5 Figure 2-164. DDS RESULTS Page 6
Other Selections on the RESULTS - SUMMARY Screens
Besides displaying the test results, the RESULTS - SUMMARY screens allow other
functions such as loopback operations, viewing and changing the test setup using the
SUMMARY screen, and printing out test results. These features are available using the F keys
after a test cycle has been initiated by the START key and the RESULTS screens are being
displayed.
Initiating a Loopback from the RESULTS Screen
This feature is useful when a test has been set up and started before establishing a loop-
up at the far end.
1. With the test set already prepared for DDS testing, press START to initiate a test cycle.
2. Press F4 (more) until DDSLOOP appears at F1.
3. Press F1 (DS1LOOP).
4. On the DDS 4-WIRE LOOPBACK CONTROL menu, select the loop code and loopback
operation as desired, the use F1 (LOOP-UP) or F2 (LOOP-DN) as required to complete the
loopback operation
Printing Test Results
If a test results printout is desired, perform the following procedure. More information
concerning printer operations is available in paragraph 2.12.2, Using the Test Set Print
Function.
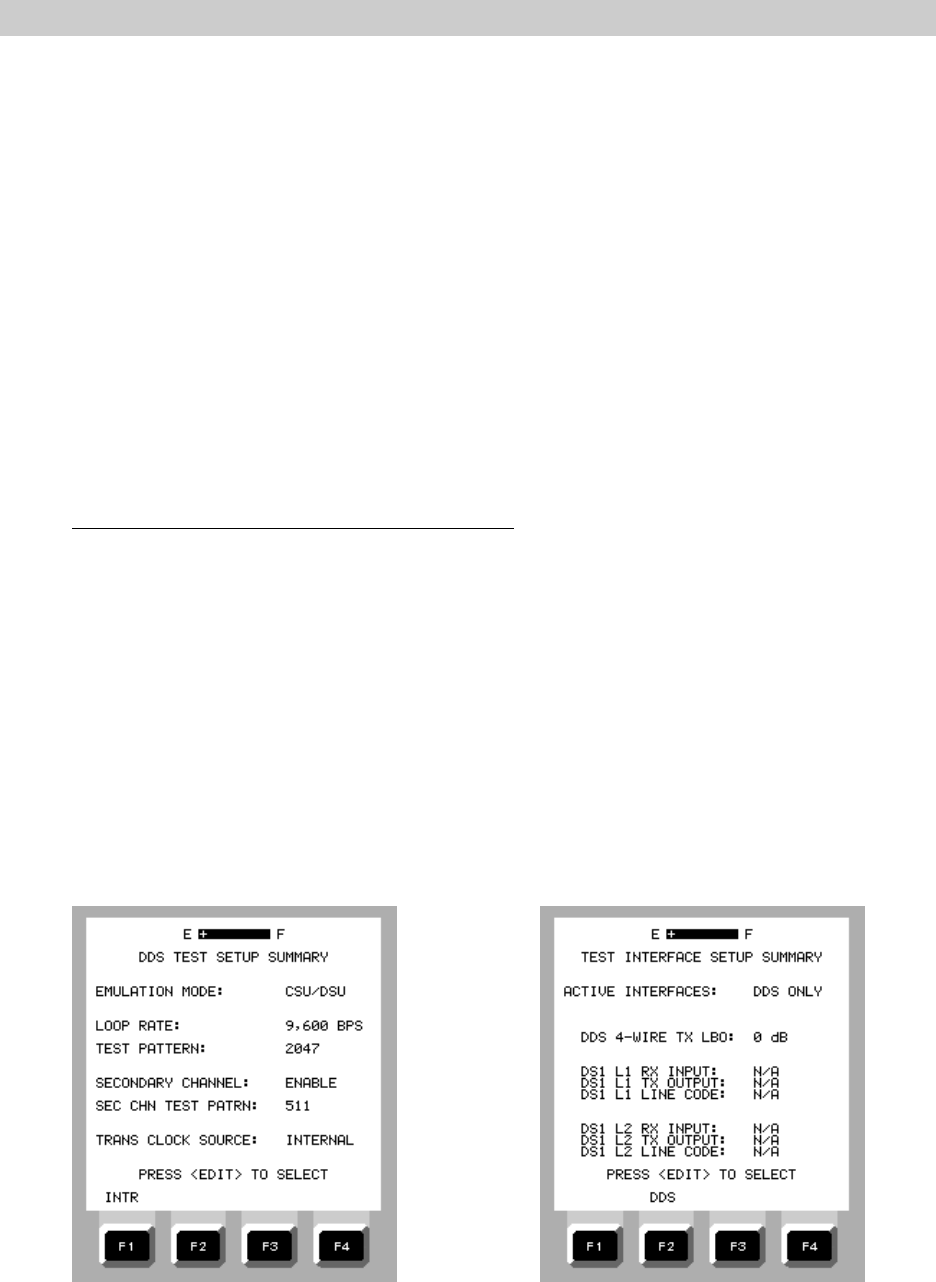
OPERATION
2-106
1. Perform the DDS test setup.
2. Go to the MAIN MENU, move the cursor to AUXILIARY PORT and press ENTER.
3. Perform the auxiliary port setup as described in paragraph 2.12.2, Using the Test Set
Print Function.
4. Connect the test set AUXILIARY PORT to a standard printer equipped with an RS-232
connection using the RS-232 cable provided with the test set.
5. Begin the DDS test by pressing the START key.
6. Stop the test when desired by pressing F4 (more) twice until F1 (STOP) appears. Press
F1 (STOP)
7. Print the test results by pressing F2 (PRINT). When the print operation stops, eject the
page from the printer manually.
Editing a Test Setup from the RESULTS Screen
Sometimes, usually because of a setup error, it may be necessary to change a particular
test setup selection after a test has been begun. The RESULTS screen offers a quick method
to review the setup and make corrections without stepping back through many menu screens.
1. While the RESULTS screens are being displayed, press F4 (more) until SUMMARY
appears at F3. Press F3 (SUMMARY).
2. The screen displayed is a summary of the most recent setup menu used, such as DDS
TEST SETUP SUMMARY. Review the items shown. Notice that any related setup
screens will be available by pressing one of the F keys.
3. To change a setting on the screen, press the EDIT key, move the cursor to the item to
be changed, then press START to restart the test cycle.
Figure 2-165. DDS TEST SETUP Figure 2-166.TEST INTERFACE SETUP
SUMMARY Screen SUMMARY Screen
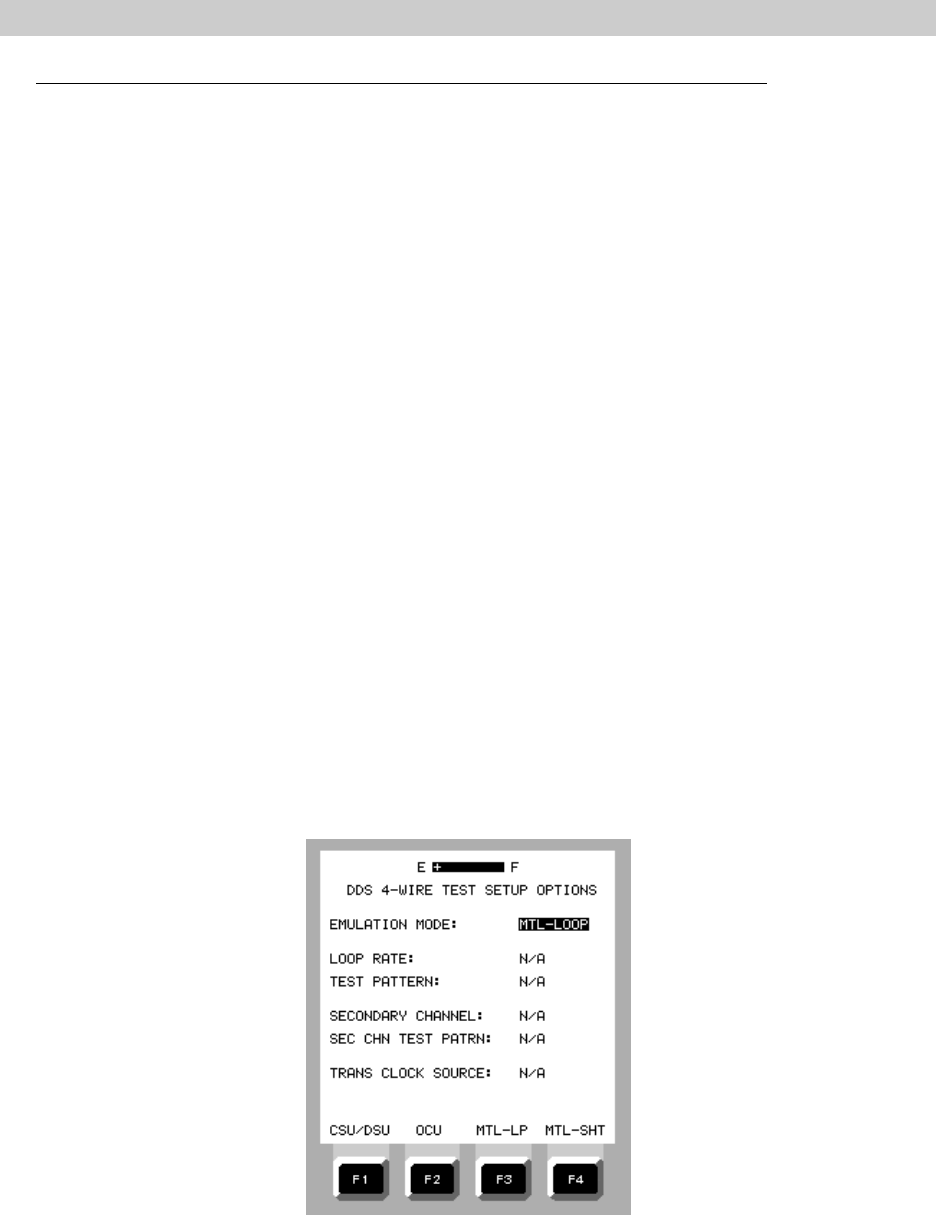
OPERATION
2-107
Providing a Metal Loopback or Tip-to-Ring Shorts for Testing from the Far End
In this procedure, the EZ-TESTER DS is used to provide a send-to-receive loopback or ring-to-tip
shorts to assist with fault isolation by a technician at the far end. When setup is complete, the test
screen will be illuminated, but no indicator lamps will be lit. The test set should be removed from the
circuit as required by the technician at the far end.
1. Connect the test set to the line to be tested.
2. On the MAIN MENU, move the cursor to TEST INTERFACE SETUP and press ENTER.
3. On the TEST INTERFACE SETUP MENU, set the following:
ACTIVE INTERFACES: F3 (DDS)
DDS 4-WIRE TX LBO: Set as required.
F1 (0 dB) F2 (-3 dB) F3 (-6 dB) F4 (-9 dB)
4. Press MENU to return to the MAIN MENU.
5. On the MAIN MENU, move the cursor to DDS 4-WIRE MENU and press ENTER.
6. On the DDS 4-WIRE MENU, move the cursor to EMULATION MODE and select:
F3 (MTL-LP) to provide a metal loopback of the send and receive lines
F4 (MTL-SHT) to provide a tip-to-ring short of the transmit and receive lines
NOTE: When F3 or F4 are pressed, the test set front panel lamps will turn off.
7. Setup is complete. Disconnect the test set when directed by the technician at the far
end.
Figure 2-167. Metal Short and Metal Loop Selections,
DDS 4-WIRE SETUP OPTIONS
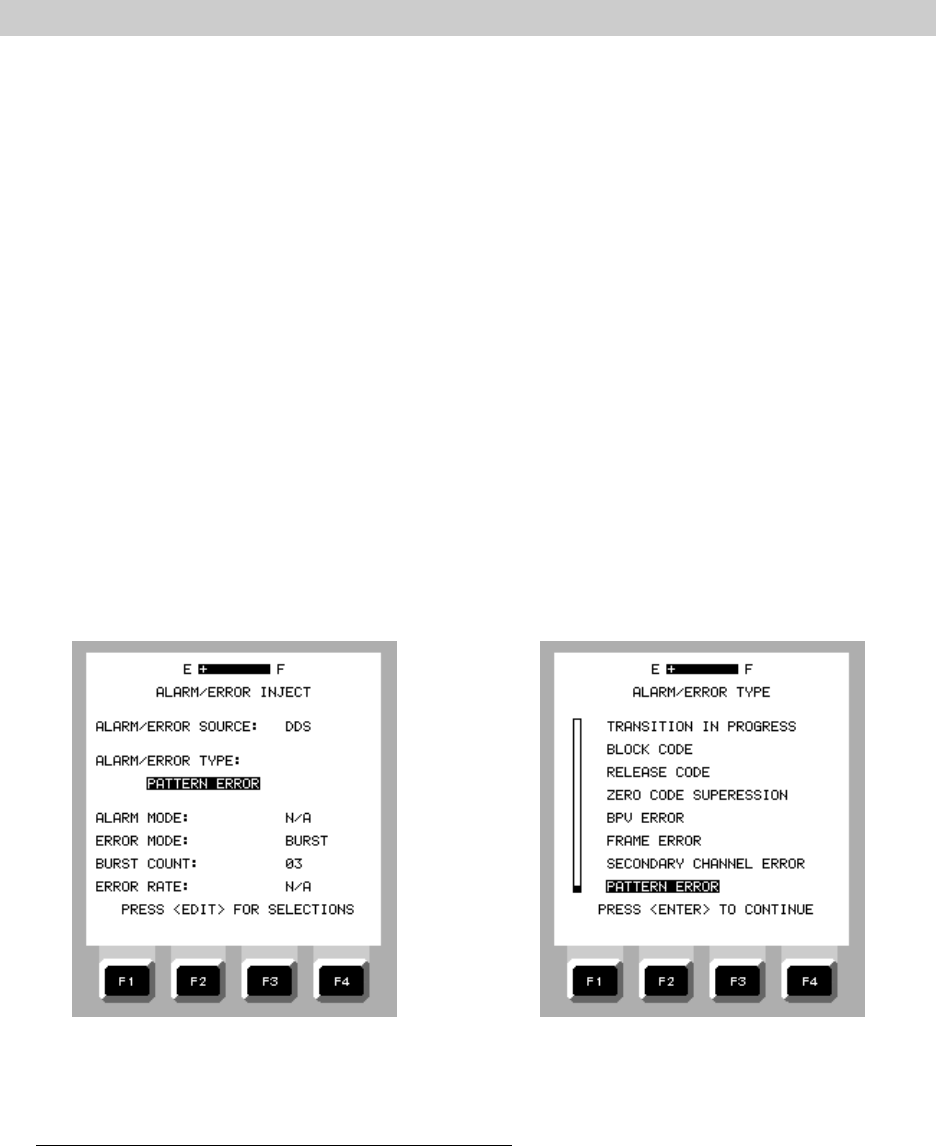
OPERATION
2-108
2.11.4 DDS Alarm and Error Injection
Injecting an alarm or error into a test data stream is used to test the ability of circuit
components to recognize and respond properly, and to confirm a successful loopback operation or the
presence of an unwanted loop. The selection of alarms and errors that may be transmitted are:
a. NONE l. MJU ALERT
b. LOSS OF SIGNAL ALARM m LOOPBACK ENABLE.
c. LOSS OF FRAME ALARM n. FAR-END VOICE
d. LOSS OF SEALING CURRENT o. TRANSITION IN PROGRESS
e. CONTROL MODE IDLE p. BLOCK CODE
f. DSU LOOPBACK q. RELEASE CODE
g. OCU LOOPBACK r. ZERO CODE SUPPRESSION
h. ABNORMAL STATION t. BPV ERROR
i. MUX-OUT-OF-SYNC u. FRAME ERROR
j. UNASSIGNED MUX CHANNEL v. SECONDARY CHANNEL ERROR
k. TEST ALERT w. PATTERN ERROR
Each alarm and error type can be modified to simulate various conditions. The LOSS OF
SIGNAL ALARM through ZERO CODE SUPPRESSION can be transmitted as SINGLE or CONT
(continuous) events with selectable burst counts. The BPV through PATTERN ERROR can be
transmitted singly, in bursts, or a selectable rates.
Figure 2-168. DDS ALARM / ERROR INJECT Figure 2-169. DDS ALARM / ERROR TYPE
Menu Menu (Scrolled)
Injecting an Alarm or Error into a Test Data Stream
1. Set up the test set for DDS testing.
2. On the DDS 4-WIRE MENU, move the cursor to ALARM / ERROR INJECT and press ENTER.
3. Move the cursor to ALARM / ERROR TYPE. To change the currently selected alarm or error,
press EDIT. Move the cursor to the desired alarm or error type and press ENTER. The display
will change back to the ALARM / ERROR INJECT screen.
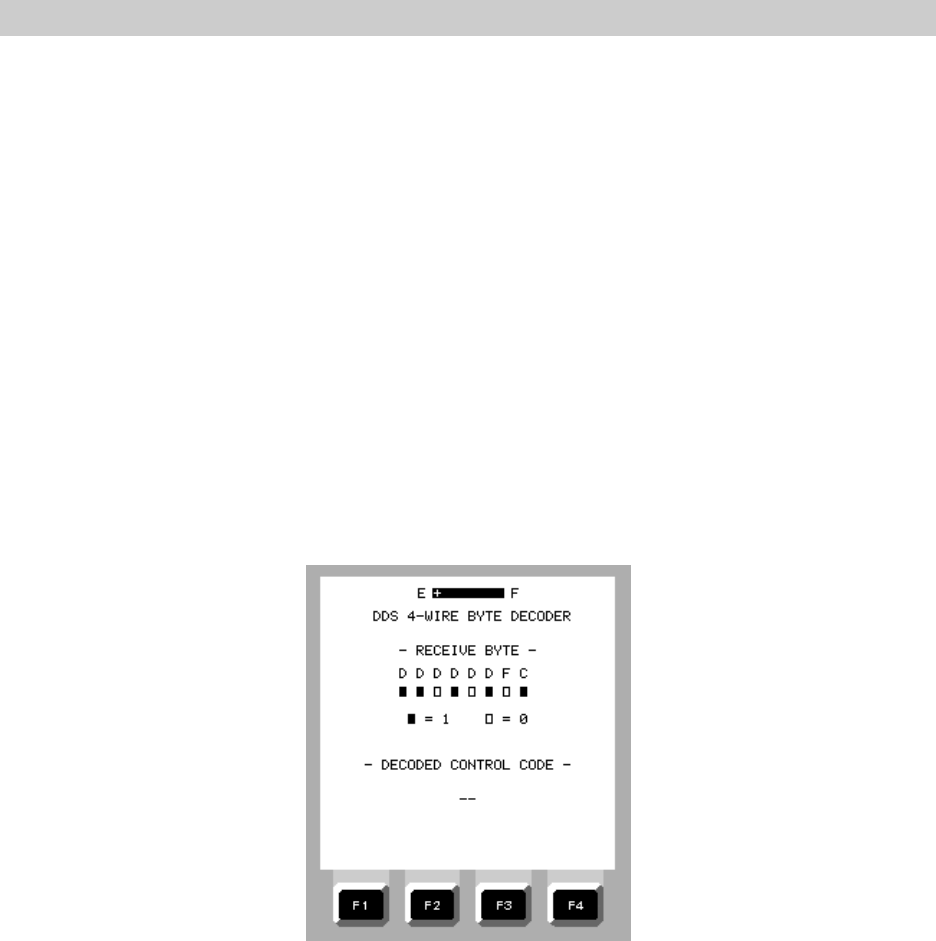
OPERATION
2-109
4. If available for the type of alarm selected, set the ALARM MODE by pressing F1 (SINGLE) or
F2 (CONT). Set the BURST COUNT, if applicable by pressing F1 (HIGHER) or F2 (LOWER).
If available for the type of error selected, select the ERROR MODE by pressing F1 (SINGLE),
F2 (BURST), or F3 (RATE). Set the BURST COUNT, if applicable by pressing F1 (HIGHER) or
F2 (LOWER). Set the ERROR RATE by pressing F1 (HIGHER) or F2 (LOWER).
5 Press the START key to begin the test, then press the ERROR key to inject the error or alarm.
If the circuit under test is looped back, the test set will detect and report the presence of the
error or alarm on the RESULTS screen.
2.11.5 Using the Byte Decoder Feature
The byte decoder feature, available on the DDS-4-WIRE MENU, allows the test set to decode
and display network control codes present on the line. During byte decoder operation, the EZ-TESTER
DS screen displays the eight code bits plus the C (control) bit.
Figure 2-170. DDS 4-WIRE BYTE DECODER Screen

OPERATION
2-110
To perform a byte decoder operation, select BYTE DECODER on the DDS 4-WIRE MENU and
press ENTER. Table 2-3 lists the control bits that can be displayed by the EZ-TESTER DS.
Table 2-3. Network Control Definitions and Codes
DEFINITIONS DS0 CODES
Bit 1.....................8 C
Control Mode Idle (CMI) I 1 1 1 1 1 1 0 0
DSU Loopback I 0 1 0 1 0 0 0 0
OCU Loopback I 0 1 0 1 1 0 0 0
Abnormal Station (ASC) I 0 0 1 1 1 1 0 0
Mux-Out-of-Sync (MOS) I 0 0 1 1 0 1 0 0
Unassigned Mux Channel (UMC) I 0 0 1 1 0 0 0 0
Test Alert (TA) I 1 1 0 1 1 0 0 0
MJU Alert (MA) I 1 1 1 0 0 1 0 0
Loopback Enable (LBE) I 1 0 1 0 1 1 0 0
Far-End Voice (FEV) I 1 0 1 1 0 1 0 0
Transition in Progress (TIP) I 0 1 1 1 0 1 0 0
Block Code (BLK) I 0 0 0 1 0 1 0 0
Release Code (RLS) I 1 1 1 1 0 0 0 0
Zero Code Suppression (ZCS) I 0 0 1 1 0 0 0 0
Notes:
1. I = Substrate framing bit as appropriate, or don’t care otherwise, except for CMI per note 2
2. I = 1 when receiving CMI as part of a 56K DSOA signal.
3. Control bit (C) will always be 0
2.11.6 DDS Loopback Emulation
To facilitate line testing at the far end. the EZ-TESTER DS can emulate a CSU / SU or an OCU
by looping up the line when it receives a loopback command from the far end. Loopback emulation
is available on the DDS 4-WIRE and, when selected, reflects the emulation mode selected on the DDS
4-WIRE SETUP OPTIONS screen. During loopback emulation, the test set responds to loopback
commands sent from the far end, to loop up or loop down the line inside the test set. The test set
screen displays a schematic diagram.
Figure 2-171. DDS LOOPBACK Figure 2-172. DDS LOOPBACK
EMULATION Screen, No Loopback EMULATION Screen, Circuit Looped Up
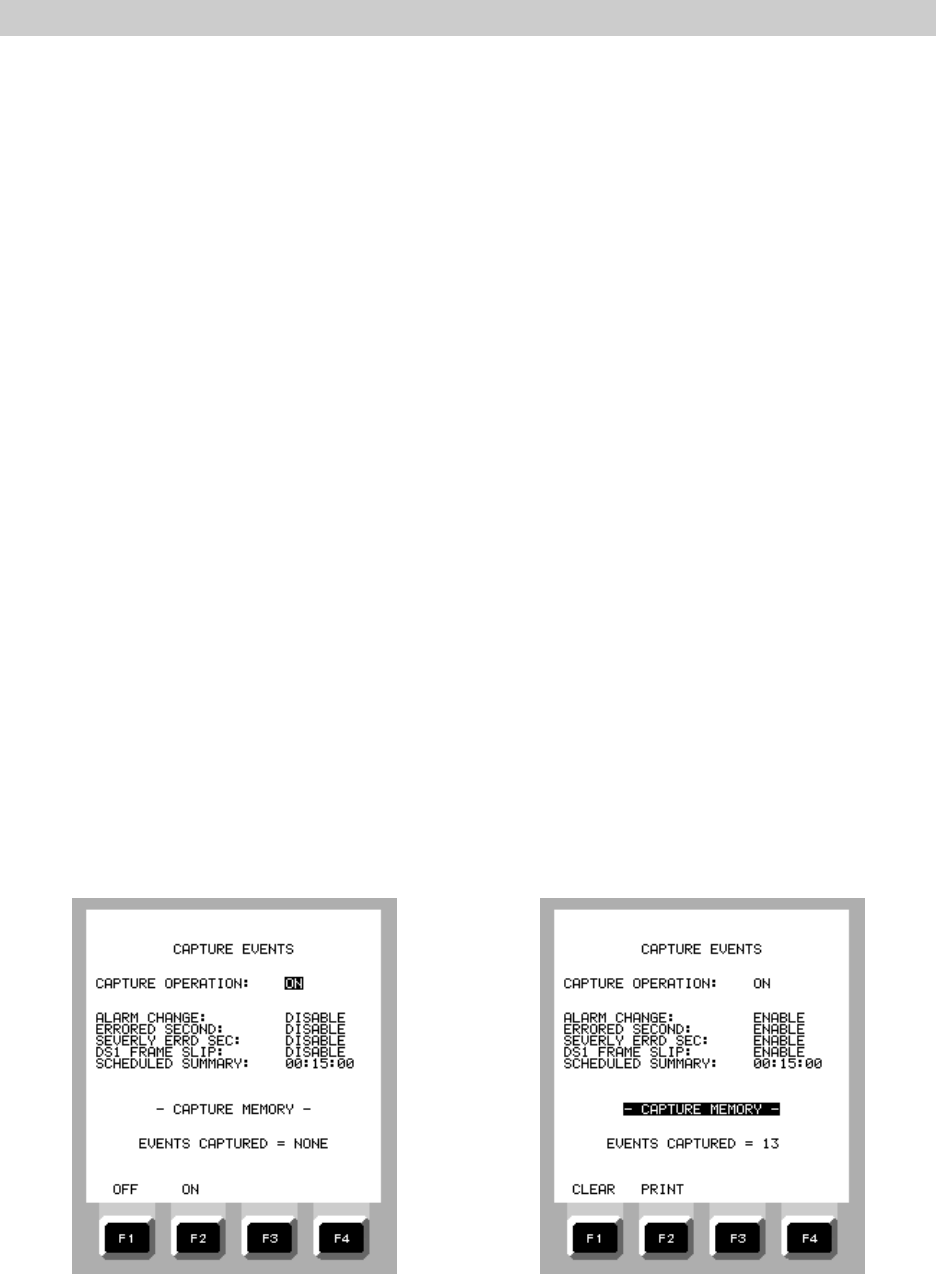
OPERATION
2-111
2.11.7 Frame Relay Testing
The EZ-TESTER DS provides access to frame relay circuits through its DDS interface and the
DDS LOCAL LOOP jack. Frame relay testing from a DDS access point is identical in procedure as
described in paragraph 2.10.14, Frame Relay Testing, with the following exceptions. DDS must be
selected on the TEST INTERFACE SETUP MENU, and FRAME RELAY TESTING must be selected on
the DDS 4-WIRE MENU instead of the DS1 MENU. Refer to paragraph 2.10.14 for the complete frame
relay testing procedures.
2.12 Common Functions
Certain test set functions are common to DS1 and DDS testing, such as capturing, displaying,
and printing out test results, and storing or recalling user test setups saved in the test set memory.
Those features are explained in detail here, and are referred to in less detail in the previous sections
of the manual.
2.12.1 Capturing Test Results
The Capture Events feature of the EZ-TESTER DS allows the user to save and print selected
events and test results data accumulated during one or more test cycles. Enabling the capture
operation prevents the loss of test result data that otherwise occurs when the START button is
pressed to begin a new test cycle. As long as the Capture Events feature is enabled, and captured
data is not erased, the number of captured events will continue to accumulate and be available for
printout.
When Capture Events is enabled, event and test result data is stored in the test set’s history
memory which can store up to 1,500 events depending on the event type. The contents of the test
results screens are also stored in the history memory and can be saved at preset intervals of time
determined by the user. If the history memory should become full, one last event will be written into
the memory indicating that events were lost, the alarm will sound, and a warning message will be
displayed. If the history memory is full when a test run is started, the alarm will sound and the same
warning message will be displayed. Table 2-4 lists each type of event reported on the Capture Events
printout. In order to view the captured information, the test set must be connected to a printer via the
Auxiliary Port and the print command must be executed from the test set or from the Windows screen
if operating the test set remotely.
Figure 2-173. CAPTURE EVENTS Menu Figure 2-174. CAPTURE EVENTS Menu
Before Capture Operation After Capture Operation

OPERATION
2-112
Capture Events Setup
1. On the MAIN MENU (Figure 2-3), move the cursor to CAPTURE EVENTS and press
ENTER.
2. On the CAPTURE EVENTS menu Figure 2-173), move the cursor to CAPTURE
OPERATION and press F1 (OFF) to disable the function, or F2 (ON) to enable it.
3. Move the cursor to each of the events shown on the CAPTURE EVENTS menu and press
F1 (DISABLE) or F2 (ENABLE) as desired.
4. Move the cursor to SCHEDULED SUMMARY and press F1 (DISABLE) to turn off the
feature or F2 (TIMED) to set the time interval for periodic test summaries to occur during
a test run.
5. Press the EDIT key, then use the arrow keys to set the time interval in hours, minutes,
and seconds (00:00:00) from start of the test run.
NOTE: The timed summary reports include all the data shown on the test results screens. The
shorter the interval set in step (5), the greater the number of summaries will be stored. Since
the history memory is limited in size, the more summaries that are saved, the sooner the
history buffer will be filled and the fewer number of events will be saved.
6. The CAPTURE EVENTS setup is complete. Confirm that the test operation to be run is
set up as desired and press START. The display changes to RESULTS - SUMMARY
screen and the CAPTURE MEMORY counter increments each time an event is captured.
7. To stop the test, press MENU or wait for the TIME REMAINING counter to count down
to zero.
8. When the capture operation is complete (Figure 2-174), press F1 (CLEAR) to empty the
history memory, or F2 (PRINT) to print out the contents of the history memory.
Table 2-4. History Events Types
Event Type Description
START OF TEST Reports the start of a test run.
ALARM CHANGE Reports a change in the alarm condition.
ERRORED SECOND Reports the detection of an errored second.
SVRLY ERRS SEC Reports the detection of a severely errored second.
FRAME SLIP Reports the detection of a frame slip.
SCHD SUMMARY Identifies a summary generated at the end of a timed summary
MANUAL SUMMARY Identifies a summary generated when F2 (PRINT) is pressed on the
MANUAL STOP Reports test run was stopped with the F1 (STOP) key.
TEST END SUMMARY Identifies a summary generated at the end of a timed test.
BRIDGE SUMMARY Identifies a summary generated by a BRIDGE test pattern.
MULTIPLE SUMMARY Identifies a summary generated by a MULTIPLE test pattern.
LOST EVENTS Reports lost events resulting from history memory overflow.
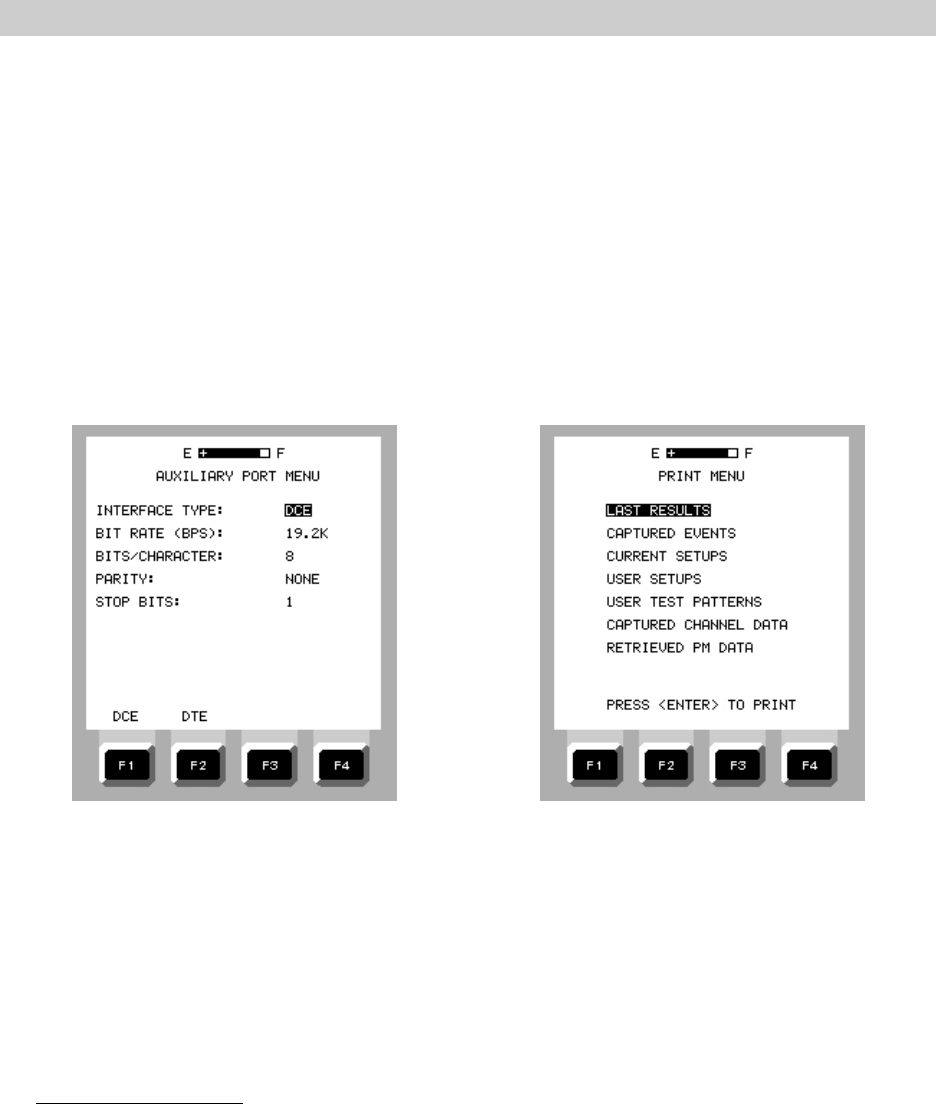
OPERATION
2-113
2.12.2 Using the Test Set Print Function
The EZ-TESTER DS includes printing functions that allow the user to obtain a hard copy
record of current user-defined setups and various test results that have been captured in memory. Any
standard RS-232 serial printer with an 80 column print widths should work with the test set. A small
battery-operated thermal printer is available from Electrodata that can be carried with your EZ-TESTER
DS. Contact Electrodata or your local representative for information about this handy printer.
Before printing, the user must set up the test set RS-232 interface by selecting AUXILIARY
PORT (Figure 2-175) on the MAIN MENU and then matching the test set parameters to those of the
printer. When the AUXILIARY PORT has been set up, the user must then select PRINT from the MAIN
MENU and press ENTER to view the PRINT MENU (Figure 2-176). The print function is also available
from all of the RESULTS screens by pressing F4 (more) until the PRINT selection is shown. Besides
test results, the print feature can be used to record captured events, current test set setup information,
customized user setups, user test patterns, and captured channel data.
Figure 2-175. AUXILIARY PORT MENU Figure 2-176. PRINT MENU
2.12.3 Storing and Recalling Test Setups
If certain test setups are used frequently, they can be easily stored for later recall at the push
of a button instead of having to reset all the test parameters whenever the test is required. Up to eight
user defined setups can be stored and named as desired. When a testing situation requires one of the
stored setups, select STORE/RECALL SETUP from the MAIN MENU, move the cursor to the desired
test name and, by pressing ENTER, the test set automatically sets up for the test. The STORE/RECALL
feature also includes seven pre-stored factory default test setups.
To Store a Test Setup
1. Manually set the required test parameters into the test set.
2. Go to the MAIN MENU, select STORE/RECALL SETUPS, and press ENTER.
3. On the STORE/RECALL USER SETUPS screen (Figure 2-177), select a vacant line and
press F2 (LABEL).
4. Use the numeric keypad or arrow keys to enter the desired name onto the line and press
ENTER to store.
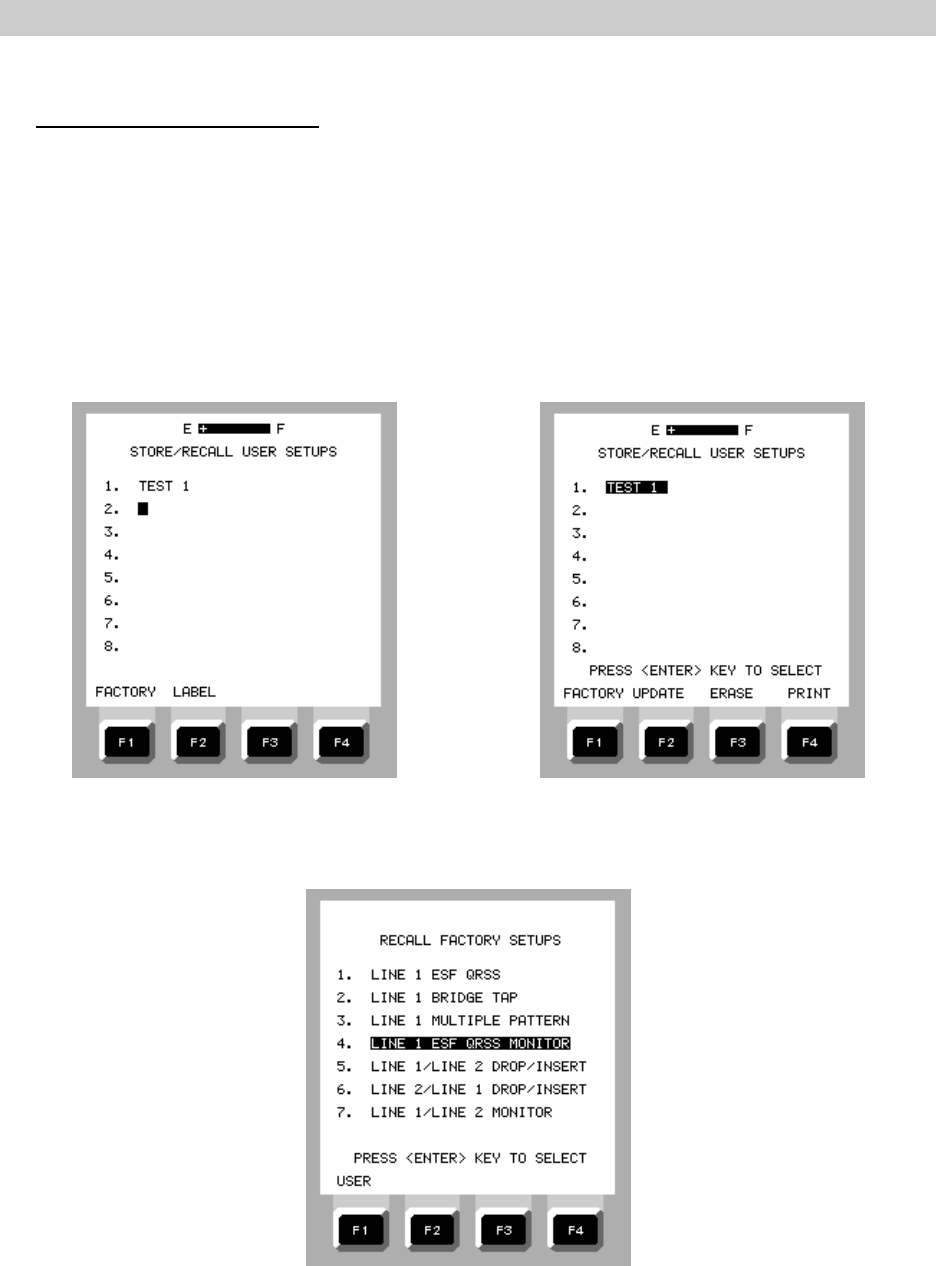
OPERATION
2-114
5. Press MENU to return to the MAIN MENU.
To Select a Stored Test Setup
1. On the MAIN MENU, select STORE/RECALL SETUPS and press ENTER.
2. On the STORE/RECALL USER SETUPS screen, select the desired test name and press
ENTER.
After user test setups have been stored, They can be updated or erased by selecting the
appropriate title on the STORE / RECALL USER SETUPS screen (Figure 2-177) and pressing F2
(UPDATE) or F3 (ERASE) (Figure 2-178). Pressing F4 (PRINT) will allow the test set to output the test
setup parameters to a standard printer and pressing F1 (FACTORY) calls up seven factory pre-set tests
(Figure 2-179).
Figure 2-177 STORE / RECALL USER SETUP Figure 2-178 Updating or Erasing a Stored
Screen User Test Setup
Figure 2-179 Recall Factory Setups Menu
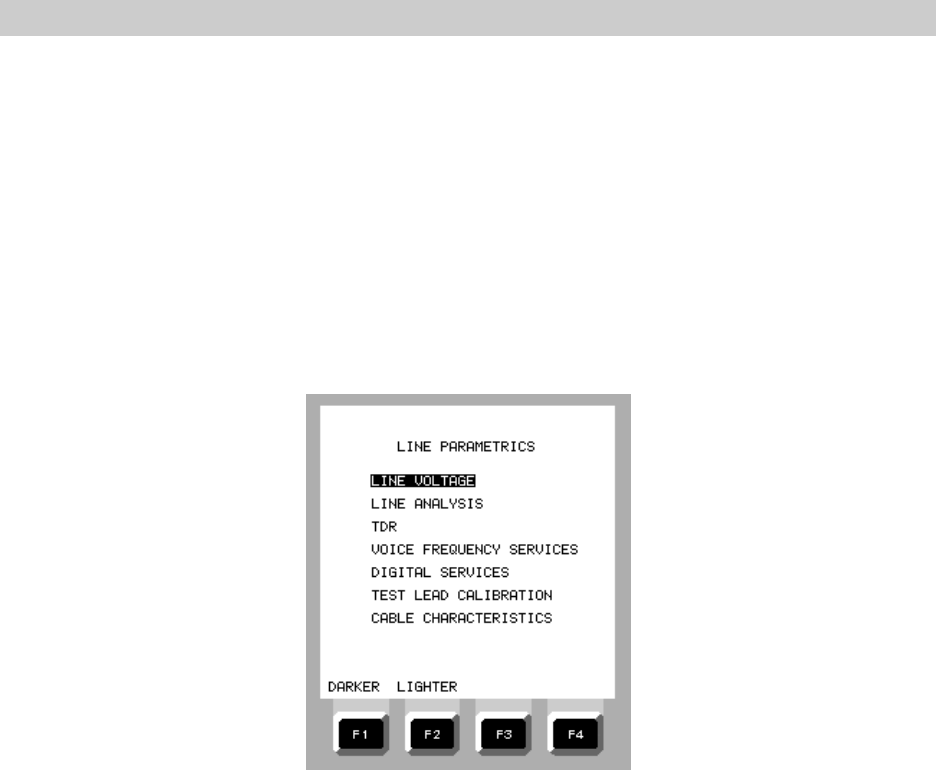
OPERATION
2-115
2.13 Line Parametrics Testing (Option 40)
The LINE PARAMETRICS test feature of the EZ-TESTER HD provides a transmission impairment
measurement set (TIMS) function used for qualification of copper lines used in voice frequency or
digital service applications. The tests offered by the line parametrics feature are designed to measure
electrical and physical characteristics of the transmission line and to help identify and isolate potential
or existing problems by detecting and displaying abnormalities that may exist. Types of tests that may
be performed are:
a. Line Voltage d. Level and Frequency
b. Line Analysis e. Noise Measurement
c. Time Domain Reflectometry f. Spectrum Analysis
Figure 2-180. LINE PARAMETRICS Menu
Of the six test types, the last three are available under the menu headings of VOICE
FREQUENCY SERVICES and DIGITAL SERVICES. If the tests are to be performed on lines set up for
voice frequency service, the test set interface impedance is set to 600 ohms automatically when
VOICE FREQUENCY SERVICES is selected. If testing is to be performed on lines set up for digital
services, the test set interface impedance is changed to 100 ohms when DIGITAL SERVICES is
selected. (Testing of lines intended for ADSL service may require a test set impedance of 135 ohms.
This impedance may be ordered specially as a hardware modification.)
The test cable most frequently used for parametric testing comprises a Bantam plug, wired for
tip, ring, and sleeve (ground), with alligator clips on the other end, since the line being tested is often
accessible at a punch down block. Before testing a line, the conductor pairs should be disconnected
from the network at both ends. If the line is left terminated at either end, or is tested in sections with
intermediate devices still attached, test results will be inconclusive or confusing.
During line parametrics testing, the test set LINE 1 TX and RX jacks are used to connect the
test set to the line. Depending on the test to be performed, the test cable is connected to either the
TX or RX jack of the LINE 1 Bantam pair. The specific jack required for each test is shown as “TX”
or RX” at the top left corner of the display after the type of test is selected from the LINE
PARAMETRICS menu.
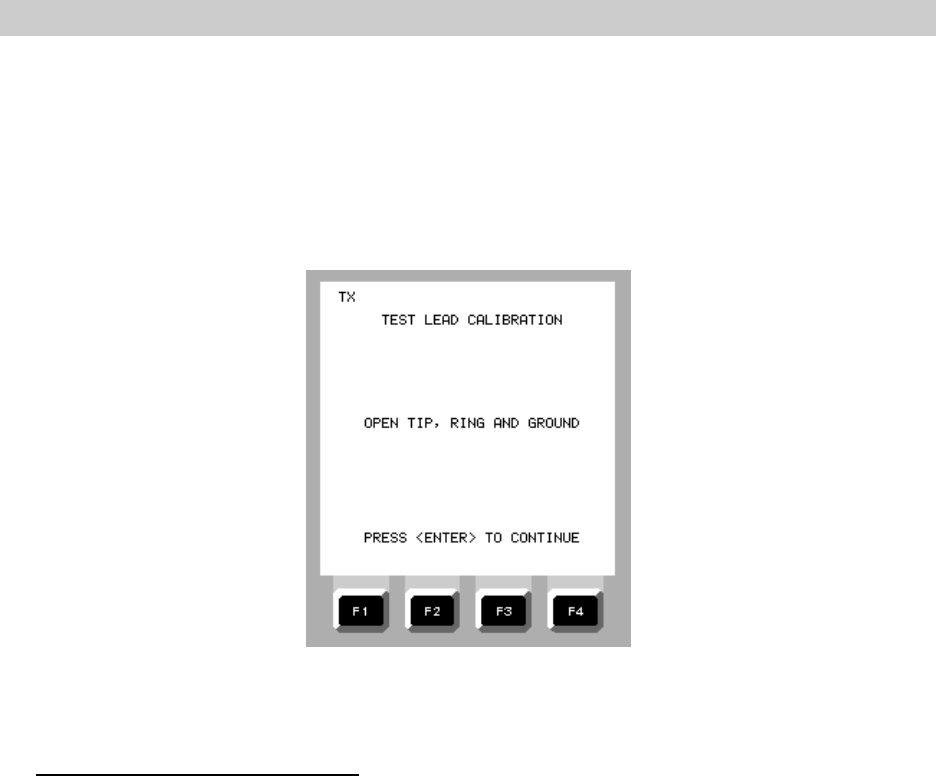
OPERATION
2-116
2.13.1 Test Lead Calibration
When performing parametric tests of transmission lines, the electrical characteristics of the test
lead used between the test set and the line under test can significantly affect the measurements. The
test lead should always be calibrated before beginning a series of tests. Once the test lead is
calibrated, it isn’t necessary to repeat the calibration unless a new line is to be tested. Failure to
perform a test lead calibration may result in inconclusive results.
Figure 2-181. TEST LEAD CALIBRATION Screen
Performing a Test Lead Calibration
1. On the Main Menu, move the cursor to LINE PARAMETRICS and press ENTER.
2. On the LINE PARAMETRICS menu, move the cursor to TEST LEAD CALIBRATION and
press ENTER.
3. On the LINE PARAMETRICS menu, move the cursor to TEST LEAD CALIBRATION and
press ENTER.
4. Connect the test lead to the LINE 1 TX jack on the test set.
5. Make certain the tip, ring, and ground contacts of the test lead are open and press
ENTER, then wait for the test set to beep twice.
6. Short the test lead tip, ring, and ground contacts together, then press ENTER.
When the calibration is complete, the test set will beep twice. The screen will briefly
display OPERATION COMPLETE and then return to the LINE PARAMETRICS menu.
The test lead is now calibrated and does not need to be repeated
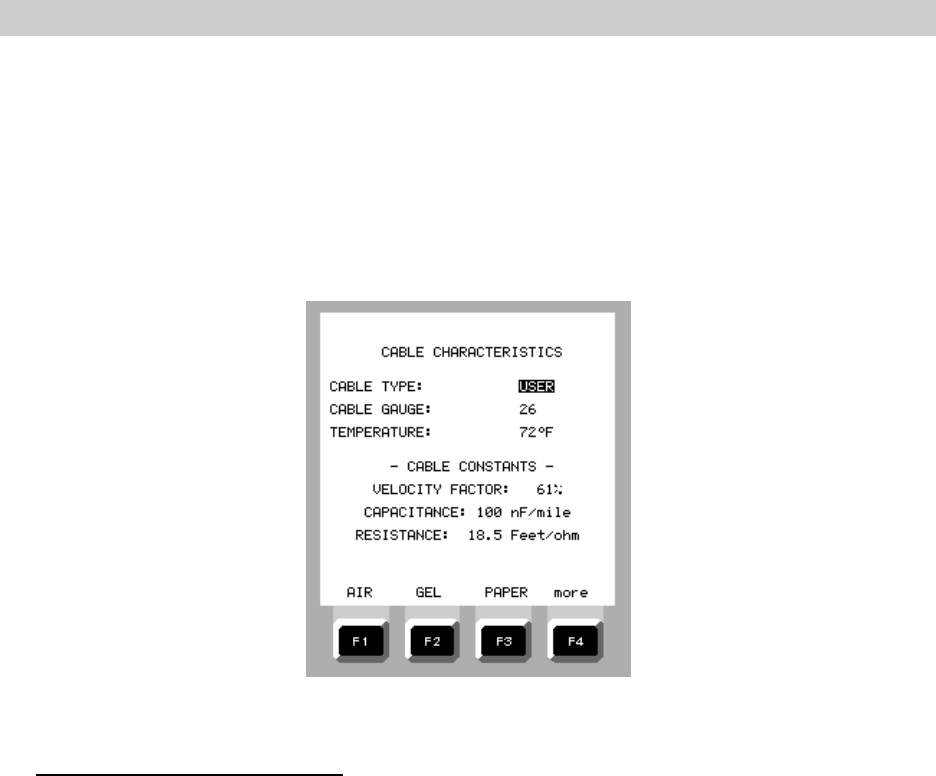
OPERATION
2-117
2.13.2 Cable Characteristics Setup
The electrical characteristics of a cable, as well as the physical temperature of the cable being
tested affect signal transmission. Before accurate test measurements can be made, specific known
characteristics of the cable must be set into the test set. In many cases, when the cable type and
gauge are selected in step 2 of the setup procedure, the test set will automatically set the CABLE
CONSTANTS shown at the bottom of the screen. If a unique cable type is to be tested, and its type
is not shown, F2 (USER) should be selected, and the CABLE CONSTANTS must be edited by the
technician using information obtained from the cable manufacturer’s documentation.
Figure 2-182. CABLE CHARACTERISTICS Setup Screen
Setting the Cable Characteristics
1. On the Main Menu, move the cursor to LINE PARAMETRICS and press ENTER.
2. On the LINE PARAMETRICS menu, move the cursor to CABLE CHARACTERISTICS and
press ENTER.
3. Move the cursor to CABLE TYPE and use the F keys to enter the correct type:
F1 = AIR F2 = GEL F3= PAPER F4 = more
F1 = JKT F2 = CAT3 F3 = CAT5 F4 = more
F1 = STATION F2 = USER F4 = more
4. Move the cursor to CABLE GAUGE and use the F keys to enter the correct gauge:
F1 = 19 F2 = 22 F3 = 24 F4 = more
F1 = 26 F2 = 28 F4 = more
5. Move the cursor to TEMPERATURE and press EDIT to enter the estimated air temperature
at the time of the test. Use the arrow keys and numeric keypad to enter the value.
6. IF F2 (USER) was selected in step 3, move the cursor to VELOCITY FACTOR,
CAPACITANCE, and RESISTANCE and enter the values assigned by the manufacturer’s
documentation.
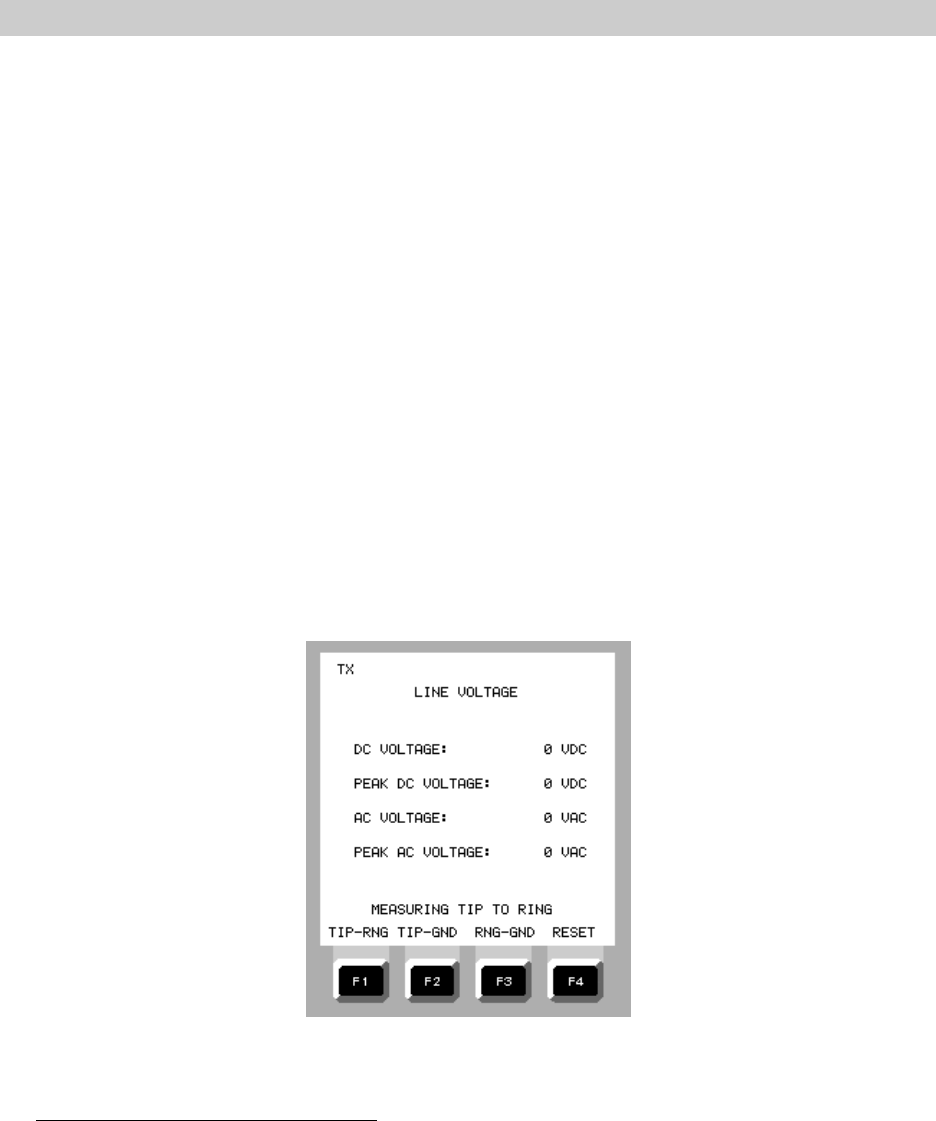
OPERATION
2-118
NOTE: When entering the figure for RESISTANCE, if the value is less than 100, be
certain to enter the value preceded by a zero, ie: 099.5 Feet/ohm. When entered the
test set will show 99.5 Feet/ohm.
When all steps have been completed, the test set is ready to perform parametrics testing.
2.13.3 Line Voltage Measurements
Line voltage measurements are performed to detect crossed connections, shorts due to cable
damage, water intrusion, or other failures that allow voltages from adjacent conductor pairs or other
sources to appear on the line being tested. When the LINE VOLTAGE test is performed, the test set
will measure each voltage component detected and display their values on a single screen. The
voltages measured and displayed are:
a. DC VOLTAGE
b. PEAK DC VOLTAGE
c. AC VOLTAGE
d. PEAK AC VOLTAGE
NOTE: Whenever parametric testing is performed, the LINE VOLTAGE test should be
performed before any of the remaining tests so that voltages sufficient to damage the
test set or cause injury to the user may be detected.
Figure 2-183. Typical LINE VOLTAGE Screen
Making a Line Voltage Measurement
1. On the MAIN MENU, move the cursor to LINE PARAMETRIC and press ENTER.
2. If not already performed, run the TEST LEAD CALIBRATION and CABLE
CHARACTERISTICS procedures.
3. ON the LINE PARAMETRICS menu, move the cursor to LINE VOLTAGE and press ENTER.
4. Connect a test cable between the test set LINE 1 RX jack and the line to be tested.
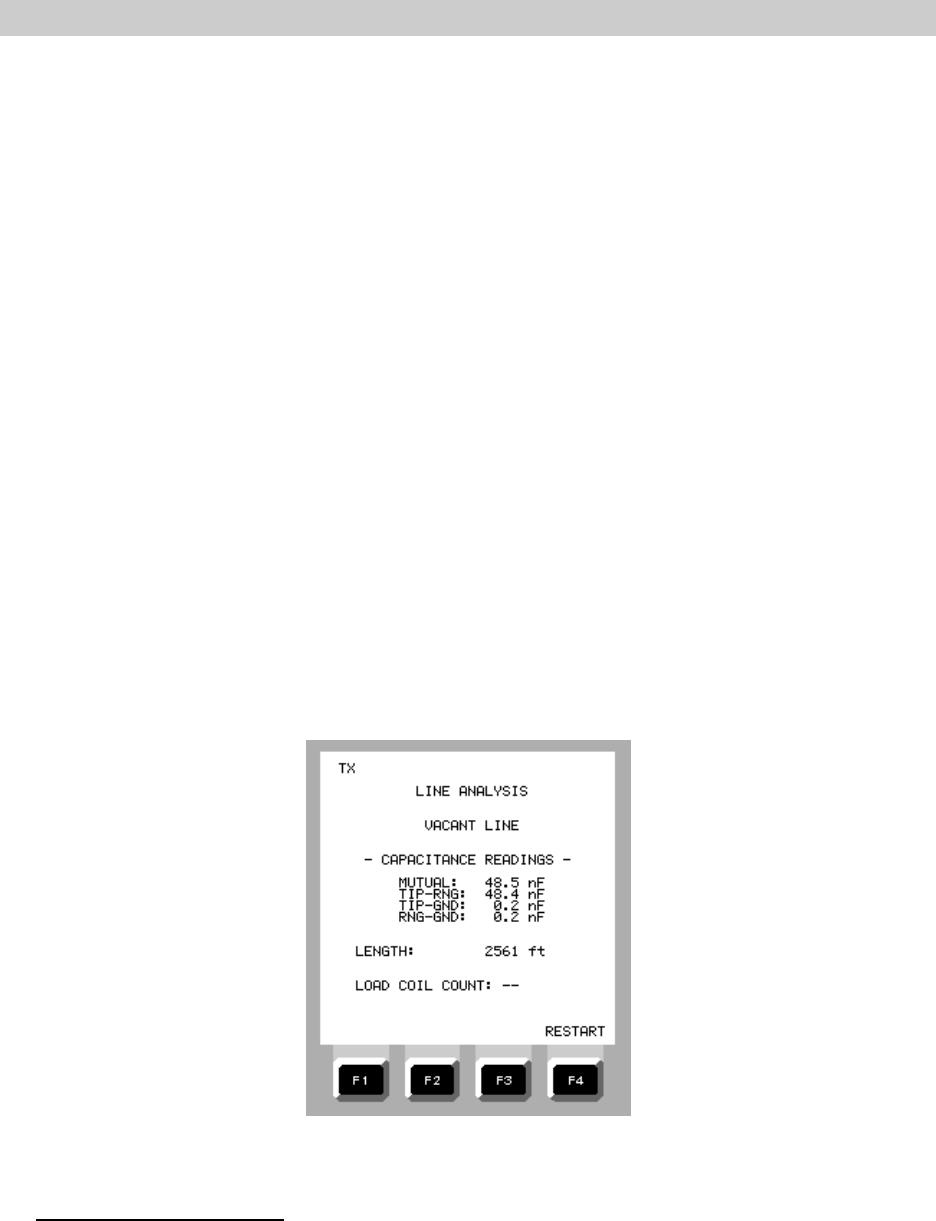
OPERATION
2-119
5. On the LINE VOLTAGE screen, select the line conductors to be measured using the F
keys.
F1 = TIP-RNG F2 = TIP-GND F3 = RNG-GND
The test set will display all voltage components present.
6. To clear the display between measurements, press F4 (RESET).
2.13.4 Line Analysis
The LINE ANALYSIS test is used to establish the electrical characteristics of a line under test,
determine the approximate length of the cable being tested, and to detect the presence and number
of load coils on the line. When the test is run on a typical cable, disconnected at both ends, the screen
displays the capacitance measured between the tip and ring, tip and ground, ring and ground, and the
mutual capacitance between all three. If sufficient conductivity between conductors is present, the
screen will display resistance values instead. The number of load coils detected is presented at the
bottom of the screen. During the test, the test set also makes DC and AC Vrms measurements. If
a value of 10 volts or more is detected, the screen will display the measured results.
During a LINE ANALYSIS test, if the line being tested is open at the far end, the length
measurement shown will be the total length of all copper in the path, including unknown branches that
may be present. If the length shown is unreasonably high compared to the known length of the line
being tested, branches in the line may be present. If a hard short is placed at the far end, the length
shown will represent the accurate distance between the test set and the short. Different lengths
shown when testing the line open, and then shorted, will confirm the presence of a branch in the line.
Figure 2-184. Typical LINE ANALYSIS Screen
Performing a Line Analysis
1. On the MAIN MENU, move the cursor to LINE PARAMETRIC and press ENTER.
2. If not already performed, run the TEST LEAD CALIBRATION and CABLE
CHARACTERISTICS procedures.
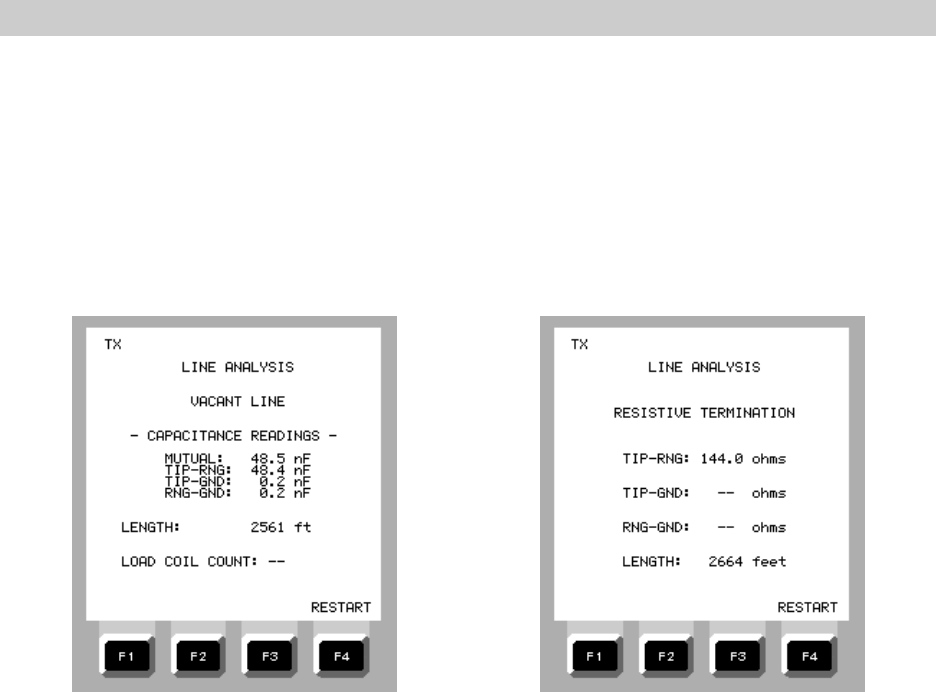
OPERATION
2-120
3. (Recommended) Perform a LINE VOLTAGE measurement as described in paragraph
2.13.3. to confirm that voltages sufficient to cause harm to personnel or equipment are
not present, then press MENU to return to the LINE PARAMETRICS menu.
4. Connect the test cable to the LINE 1 TX jack and to the conductors of the line being
tested.
5. On the LINE PARAMETRICS menu, move the cursor to LINE ANALYSIS and press ENTER.
The test set will perform its measurements automatically and display the results.
Figure 2-185. LINE ANALYSIS Display Figure 2-186. LINE ANALYSIS Display
Typical Vacant Line Results Showing a Resistive Load
2.13.5 Time Domain Reflectometer (TDR)
The time domain reflectometer (TDR) feature is used to detect abnormalities in the line
impedance and to determine the distance from the test location to points along the transmission path
where the abnormalities occur. Such abnormalities may indicate damage to the line, opens, shorts
between conductors, the presence of splices, or the presence of electrical devices such as line
repeaters. The effective measurement range is from under five feet to 32,000 feet.
When TDR is selected on the LINE PARAMETRICS menu, the display presents a typical TDR
screen with the horizontal axis representing distance, and the vertical axis representing impedance
variations along the length of the cable. The typical trace for a normal line without connectors,
splices, or electrical devices connected, is a relatively smooth flat trace beginning toward the left side
of the display, with the height of the trace being determined by the impedance of the cable. Splices,
connectors, cable damage, or electrical devices along the pathway appear as spikes or irregularities
in the normally flat trace. A movable vertical line, or marker, can be moved along the sweep trace
using the left and right arrow keys until it is aligned to the leading edge of the disturbance. The
position of the cursor represents the distance along the cable to the disturbance, and the measurement
in feet is shown on the DISTANCE line beneath the graph. The cursor can then be moved manually
to determine the distance to other irregularities.
Before performing a TDR measurement, all equipment and components should be removed from
the line to ensure maximum reflection of the test pulse back to the test set.
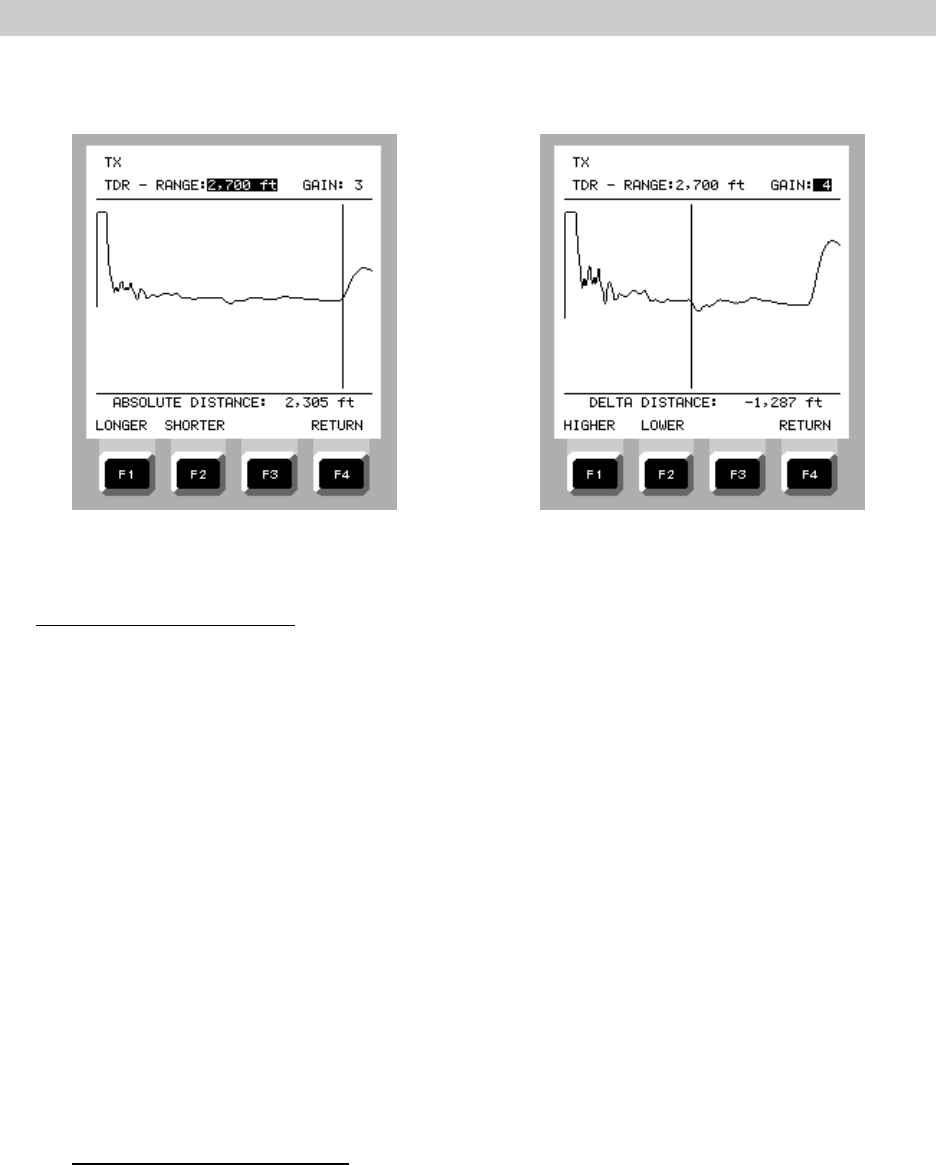
OPERATION
2-121
Figure 2-187. A typical TDR Display Figure 2-188. TDR Display Showing
Delta Distance Measurement
Characteristics of the Trace
The TDR trace has several significant characteristics. The high, flat portion at the left edge
of the trace represents the launch duration of the test pulse, which is immediately followed by an
irregular or rough curve leading to the level part of the trace extending to the right edge of the screen.
The irregular curve is caused by the test pulse charging the line. These two parts of the trace are
referred to as the “blind area”where useful information is not presentable by the test set. The longer
the range setting of the test setup, the longer the pulse duration is, generating a “blind” period. At
the shortest range setting of 750 feet, the blind area is about 40 feet. At the longest range setting
of 32,000 feet, the blind area is about 1,000 feet long.
After the blind area, the trace should form a relatively flat line until the pulse reaches the open
connection at the far end of the line. the energy of the pulse is reflected back to the test set where
the time duration is measured and the distance is computed. The open end of the line should appear
as a sharp peak on the trace. A dead short at the end should appear as a sharp dip. Any other change
in the impedance of the line will appear as a lesser peak or dip along the trace. Each peak or dip may
represent the presence of a connector or splice along the line, physical damage due to crushing or
spreading of conductor pairs, or some other feature that causes a change in the impedance of the line.
The greater the irregularity of the trace, the less detectable are irregularities beyond that point.
Because a TDR cannot read beyond a direct short or a complete open, or detect a smaller fault beyond
a larger one, testing from both ends is recommended.
Manipulating the TDR Display
When the test set is connected to the line being tested, and TDR is first selected on the LINE
PARAMETRICS menu, a trace will immediately appear on the screen. The F keys offer four ways to
manipulate the TDR display or operation.
F1 = ZOOM F3 = RANGE
F2 = CURSOR F4 = GAIN

OPERATION
2-122
When F1 ( ZOOM) is selected, the F1 key changes to ZOOM IN. By pressing F1 several times,
the screen will zoom in on the cursor to show more detail of the trace at that point. After zooming
in, use F2 to zoom back out. F4 (RETURN) causes the display to return to the main TDR screen.
When F2 (CURSOR) is selected, the user may select between an absolute measurement from
the test set to a desired point on the trace by selecting F2 (ABSOLUTE), or a difference measurement
(DELTA DIFFERENCE) between the initial position of the cursor to a second point on the trace by
selecting F1 (MARK). The zero point of a DELTA measurement is the starting position of the cursor.
If the cursor is then moved left or right to another part of the trace, the DELTA DISTANCE will
represent the distance between the starting and ending position of the cursor. F4 (RETURN) causes
the display to return to the main TDR screen.
When F3 (RANGE) is selected, the user may change the distance scale of the trace. The
selectable ranges are:
750 ft.
1,500 ft.
2,700 ft.
5,500 ft.
11,000 ft.
22,000 ft.
32,000 ft.
When TDR is first selected on the LINE PARAMETRICS menu, the range displayed will be the same as
the last setting used. By pressing F3 (RANGE), the user may select F1 (LONGER) or F2 (SHORTER)
to change the range of the display. The distance shown on the RANGE line at the top of the display
is the distance represented by the right side of the screen and should not be confused with the
DISTANCE line at the bottom of the display. F4 (RETURN) causes the display to return to the main
TDR screen.
When F4 (GAIN is selected, the user can increase the vertical deflection of the trace to make
less noticeable peaks and valleys easier to see. This is particularly useful to improve the detection of
smaller peaks and valleys that occur before a much larger peak or valley. After F4 (GAIN) is pressed,
use the F1 (HIGHER) key to increase the gain and the F2 (LOWER) key to reduce the gain. F4
(RETURN) causes the display to return to the main TDR screen.
Some Basic Rules:
Experiment with the test set connected to good cable with known lengths, such cable on a
new spool, to become familiar with the display waveform.
During the CABLE CHARACTERISTICS set up, enter the most accurate velocity of propagation
(VOP) for the cable as possible to obtain the most accurate distance measurement.
Always begin testing with the shortest range setting, even if the line being tested is much
longer. This will improve the likelihood of detecting a fault close to the test set.
When testing a line composed of multiple segments, isolate the fault to an individual segment
and retest to improve the accuracy of the fault location.
Test from both ends of the line or segment whenever possible. Measuring from both ends will
reduce the distance error caused by an inaccurate VOP entry during setup.
Retest the cable after each repair in case a second fault is present.

OPERATION
2-123
Performing a TDR Measurement
1. On the MAIN MENU, move the cursor to LINE PARAMETRIC and press ENTER.
2. If not already performed, run the TEST LEAD CALIBRATION and CABLE
CHARACTERISTICS procedures. Enter the most accurate cable characteristics
information possible. A correct velocity of propagation (VOP) is critical for an accurate
distance measurement.
3. (Recommended) Perform a LINE VOLTAGE measurement as described in paragraph
2.13.3. to confirm that voltages sufficient to cause harm to personnel or equipment are
not present, then press MENU to return to the LINE PARAMETRICS menu.
4. Connect the test cable to the LINE 1 TX jack and to the conductors of the line being
tested.
5. On the LINE PARAMETRICS menu, move the cursor to TDR and press ENTER.
The test set will perform its measurements automatically and display a trace on the
screen.
6. Press F3 (RANGE) and use the F1 (LONGER) key and F2 (SHORTER) key to locate the
peak on the trace representing the end of the line and stop when the peak or valley is
visible as close to the right edge of the display as possible.
If an assistant is available at the far end of the line, apply a short to the conductors and
repeat the test by pressing MENU and then ENTER. The new trace should now show a
dip representing the short on the line.
7. Use the right and left arrow keys to move the cursor to the leading edge of the peak, if
the line is not shorted, or the dip, if it is. The distance between the test set and the end
of the line is shown at the bottom of the screen.
8. Move the cursor using the right and left arrow keys to make a distance measurement
from the test set to any desired point along the trace. Manipulate the display as desired
to increase the accuracy of the measurement.
2.13.6 Voice Frequency Services and Digital Frequency Services
The VOICE FREQUENCY SERVICES and DIGITAL SERVICES selections on the LINE
PARAMETRICS menu enables three additional tests:
a. LEVEL / FREQUENCY
b. NOISE
c. SPECTRUM ANALYSIS
These three tests are used to measure line loss, noise levels on the span, and to quantify the
level of noise on different portions of the frequency spectrum, and are available after the user has
selected VOICE FREQUENCY SERVICES or DIGITAL SERVICES on the LINE PARAMETRICS menu.
Because voice frequency circuits and digital services circuits require different bandwidths for optimum
performance, the test set automatically selects the required impedance when VOICE FREQUENCY
SERVICES (600 ohms) or DIGITAL SERVICES (100 ohms) is selected. It is important for the user to
know the type of service the line is expected to carry in order to select the appropriate menu item.
Regardless of which menu item is used to access the three tests, the procedure for the selected test
is identical.

OPERATION
2-124
2.13.6.1 Level / Frequency Measurements
The LEVEL / FREQUENCY measurement feature is used to perform signal loss measurements
at various test frequencies in three modes of operation. When operated from the VOICE FREQUENCY
SERVICES menu, the test set can be used in a SEND ONLY mode or RECEIVE ONLY mode to transmit
test signals to a receiver at the far end of the line, or to measure level of a signal transmitted from a
source at the far end of the line. When operated from the DIGITAL SERVICES menu, it can also be
used in the FULL mode for full duplex measurements. The selectable frequencies for the SEND ONLY
mode are different in the voice frequency or digital service operation. Twenty-three frequencies are
available for voice frequency testing, eleven frequencies digital service testing, SEND ONLY, and
nineteen in digital service testing, FULL.
TX Test Frequencies for Voice Frequency Service:
104 Hz
304 Hz
404 Hz
1004 Hz
1804 Hz
2317 Hz
2804 Hz
3404 Hz
7000 Hz
8000 Hz
9000 Hz
10 kHz
11 kHz
12 kHz
13 kHz
14 kHz
15 kHz
16 kHz
17 kHz
18 kHz
19 kHz
20 kHz
TX Test Frequencies for Digital Service - SEND ONLY:
28.8 kHz
48 kHz
72 kHz
120 kHz
196 kHz
398.4 kHz
600 kHz
772.8 kHz
1.2 MHz
1.584 MHz
2.04 MHz
TX Test Frequencies for Digital Service - FULL:
28.8 kHz
32 kHz
44.8 kHz
56 kHz
60.8 kHz
68.8 kHz
88 kHz
100.8 kHz
124.8 kHz
176 kHz
196 kHz
206.4 kHz
224 kHz
257.6 kHz
275.2 kHz
315.2 kHz
385.6 kHz
512 kHz
722.8 kHz
Sending a Test Signal
1. On the MAIN MENU, move the cursor to LINE PARAMETRIC and press ENTER.
2. If not already performed, run the TEST LEAD CALIBRATION and CABLE
CHARACTERISTICS procedures.
3. (Recommended) Perform a LINE VOLTAGE measurement as described in paragraph
2.13.3. to confirm that voltages sufficient to cause harm to personnel or equipment are
not present, then press MENU to return to the LINE PARAMETRICS menu.
4. On the LINE PARAMETRICS menu, move the cursor to VOICE FREQUENCY SERVICES
or DIGITAL SERVICES as required and press ENTER.
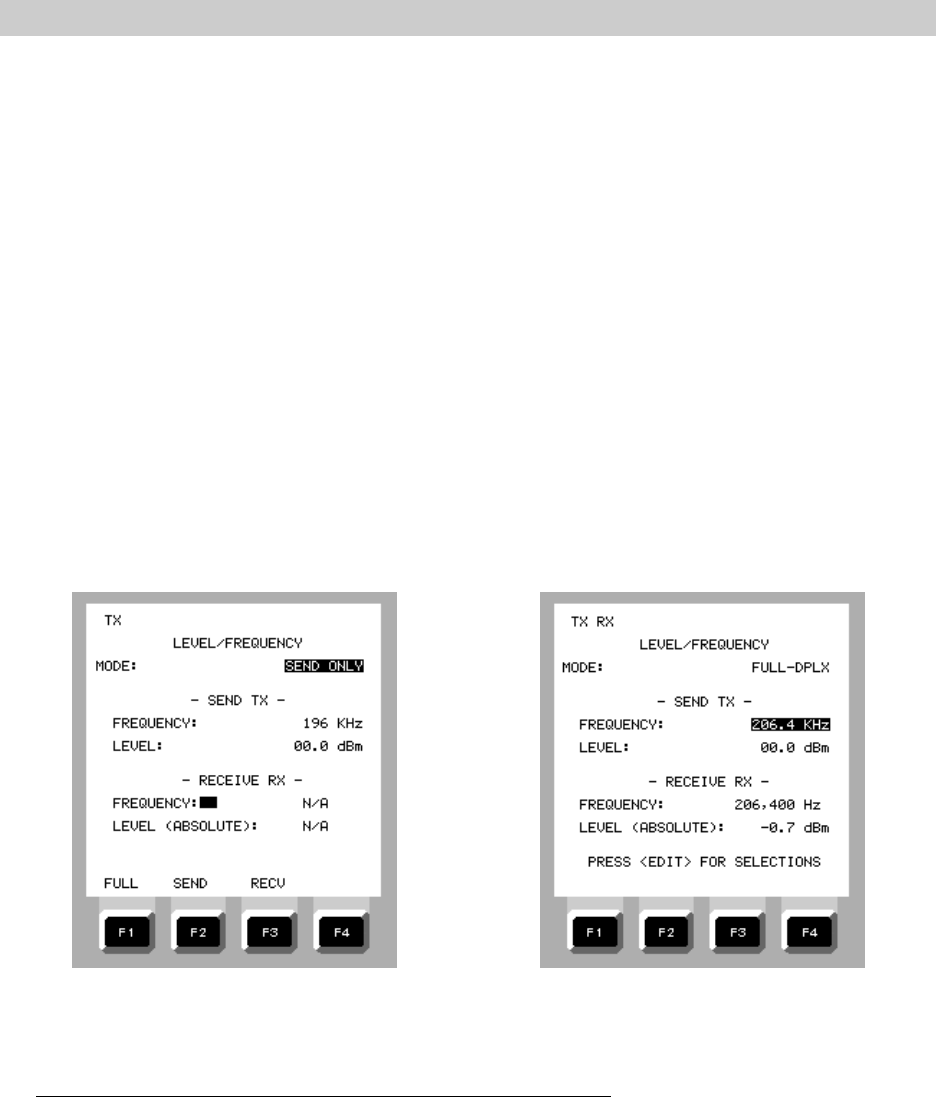
OPERATION
2-125
5. On the VOICE or DIGITAL SERVICES menu, move the cursor to LEVEL / FREQUENCY and
press ENTER.
6. On the LEVEL / FREQUENCY menu, press F2 (SEND). The display will show MODE:
SEND ONLY.
7. Move the cursor to highlight the SEND TX frequency and press the EDIT key to view the
SEND FREQUENCY menu. Use the up and down arrows to move the cursor to the
desired test frequency and press ENTER.
8. Move the cursor to the SEND TX level and press EDIT. Use the arrow keys to set the
desired transmit level, adjustable in .1 dB increments from -10 dBm to +10 dBm, then
press ENTER.
9. Connect the test cord between the test set to the LINE 1 TX jack and the line to be
tested.
The line is ready to be tested at the selected signal frequency and level by a second
instrument at the far end or by a second instrument at the near end if the line is looped
back at the far end.
Figure 2-189. LEVEL / FREQUENCY Figure 2-190. LEVEL / FREQUENCY
Measurement SEND Mode Measurement FULL Mode
Measuring the Frequency and Level of a Received Test Signal
1. On the MAIN MENU, move the cursor to LINE PARAMETRIC and press ENTER.
2. If not already performed, run the TEST LEAD CALIBRATION and CABLE
CHARACTERISTICS procedures.
3. (Recommended) Perform a LINE VOLTAGE measurement as described in paragraph
2.13.3. to confirm that voltages sufficient to cause harm to personnel or equipment are
not present, then press MENU to return to the LINE PARAMETRICS menu.

OPERATION
2-126
4. On the LINE PARAMETRICS menu, move the cursor to VOICE FREQUENCY SERVICES
or DIGITAL SERVICES as required and press ENTER.
5. With the test cable connected between the test set LINE 1 RX jack and the line to be
tested, move the cursor to LEVEL / FREQUENCY and press ENTER.
6. On the LEVEL / FREQUENCY menu, press F3 (RECV). The display will show MODE:
RECV ONLY.
7. To display the received signal level in dB (ABSOLUTE) or dBm (RELATIVE) toggle the F4
key until the desired unit appears. To change from one unit to the other toggle the F4
key.
The test set will measure the received signal level and display the result within a few
seconds of the time of connection.
2.13.6.2 Noise Measurements
The NOISE MEASUREMENT feature provides a simple, rapid indication of line noise levels using
eight different measurement types divided into two groups dependent upon the type of line service
selected on the LINE PARAMETRICS menu. Each group of tests is performed automatically, providing
an indication of general noise levels present as well as noise is specific frequency bands most likely
to interfere with particular circuit formats.
Noise Measurements for Voice Frequency Service
C-Message D-Filter
C-Message / Notch Notch
C-MESSAGE - Readings greater than 20 dBrnc may indicate presence of electromagnetically
induced noise such as cross-talk or power line harmonics.
C-MESSAGE / NOTCH - Requires a 1010 Hz signal be applied to the line, generally from the
far end. Readings greater than 20 dBrnc may indicate signal distortion due to presence of
faulty equipment attached to line such as lightening protectors and ringers.
D-FILTER - Readings greater than 20 dBrnc may indicate presence of induced lower frequency
noise that may affect operation of devices such as analog modems and fax machines.
NOTCH - Requires a 1010 Hz signal be applied to the line, generally the far end. Readings
greater than 30 dBrnc indicate distortion caused by devices attached to the line.
Noise Measurements for Digital Service Lines
772 KHz Flat F-Filter (HDSL)
E-Filter (ISDN) G-Filter (ADSL)
772 kHz FLAT - This reading represents the amount of noise measured at the 772 kHz point,
critical during an idle condition (all 1's) when the highest pulse density would be encountered
on the line.
E-FILTER (ISDN) - Reading indicates the amount of noise in the ISDN frequency band of 1000
Hz to 50kHz
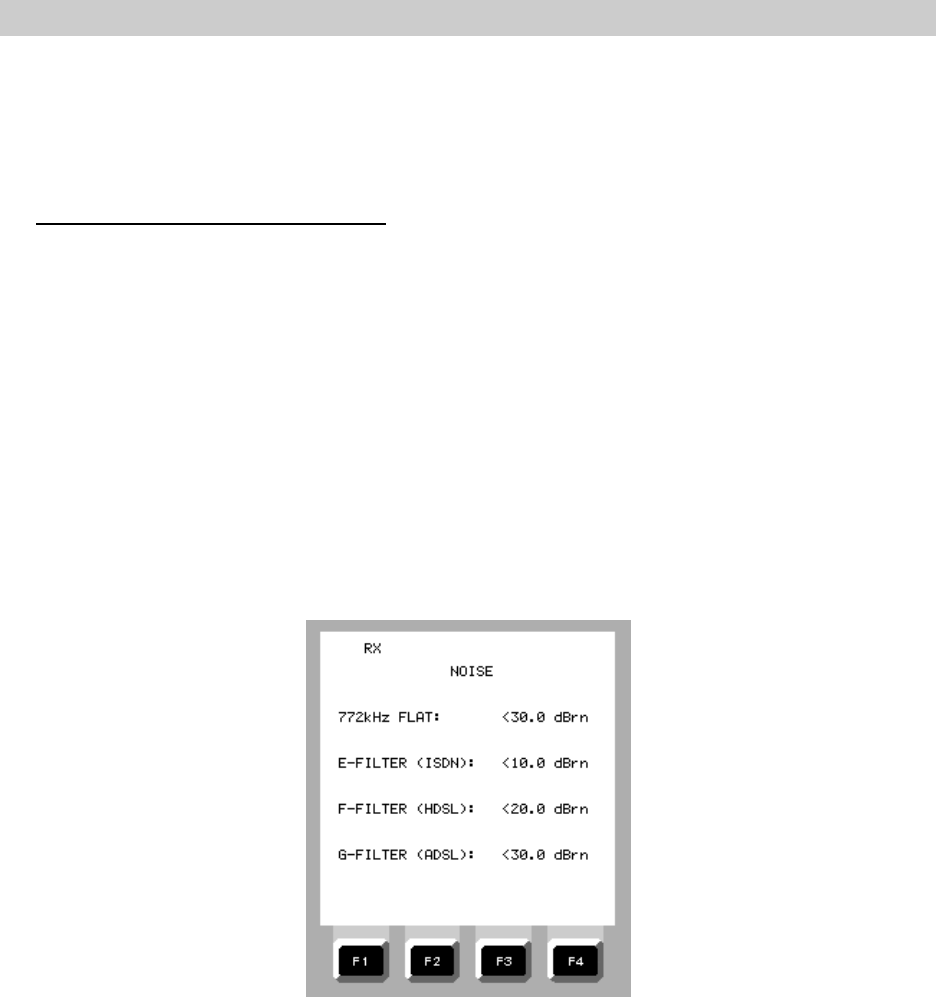
OPERATION
2-127
F-FILTER (HDSL) - Reading indicates the amount of noise measured in the HDSL bandwidth of
4.9 kHz to 245 kHz.
G-FILTER (ADSL) - Reading indicates the noise measured in the ADSL bandwidth of 20 kHz to
1.1 MHz.
Performing Noise Measurement Tests
1. On the MAIN MENU, move the cursor to LINE PARAMETRIC and press ENTER.
2. If not already performed, run the TEST LEAD CALIBRATION and CABLE
CHARACTERISTICS procedures.
3. (Recommended) Perform a LINE VOLTAGE measurement as described in paragraph
2.11.3. to confirm that voltages sufficient to cause harm to personnel or equipment are
not present, then press MENU to return to the LINE PARAMETRICS menu.
4. On the LINE PARAMETRICS menu, move the cursor to VOICE FREQUENCY SERVICES
or DIGITAL SERVICES as required and press ENTER.
5. With the test cable connected between the LINE 1 RX jack and the line to be tested,
move the curser to NOISE and press ENTER. The test set will measure the received
signal level and display the result within a few seconds of the time of connection.
Figure 2-191. Typical Noise Measurement Display
2.13.6.3 Spectrum Analysis
The SPECTRUM ANALYSIS feature is used to detect the presence of noise on the span, to
determine the portions of the frequency spectrum of the line bandwidth most affected, and to provide
an indication of the level of interference at specific points within the frequency band. During a
SPECTRUM ANALYSIS operation, the test set display presents a graph with the horizontal axis
representing the frequency spectrum from 0 to 25 kHz (VOICE FREQUENCY SERVICES) or 2.5 MHz
(DIGITAL SERVICES), and the vertical axis representing the power level in ten dB increments. When
a test is initiated, narrow peaks representing noise appear along the frequency axis. The two highest
peaks are marked by triangular pointers, the black representing the highest level and the plain one
representing the second highest. The noise level in dBm for each pointer is shown immediately below
the graph. Figure 2-220 illustrates a typical spectrum analysis display.
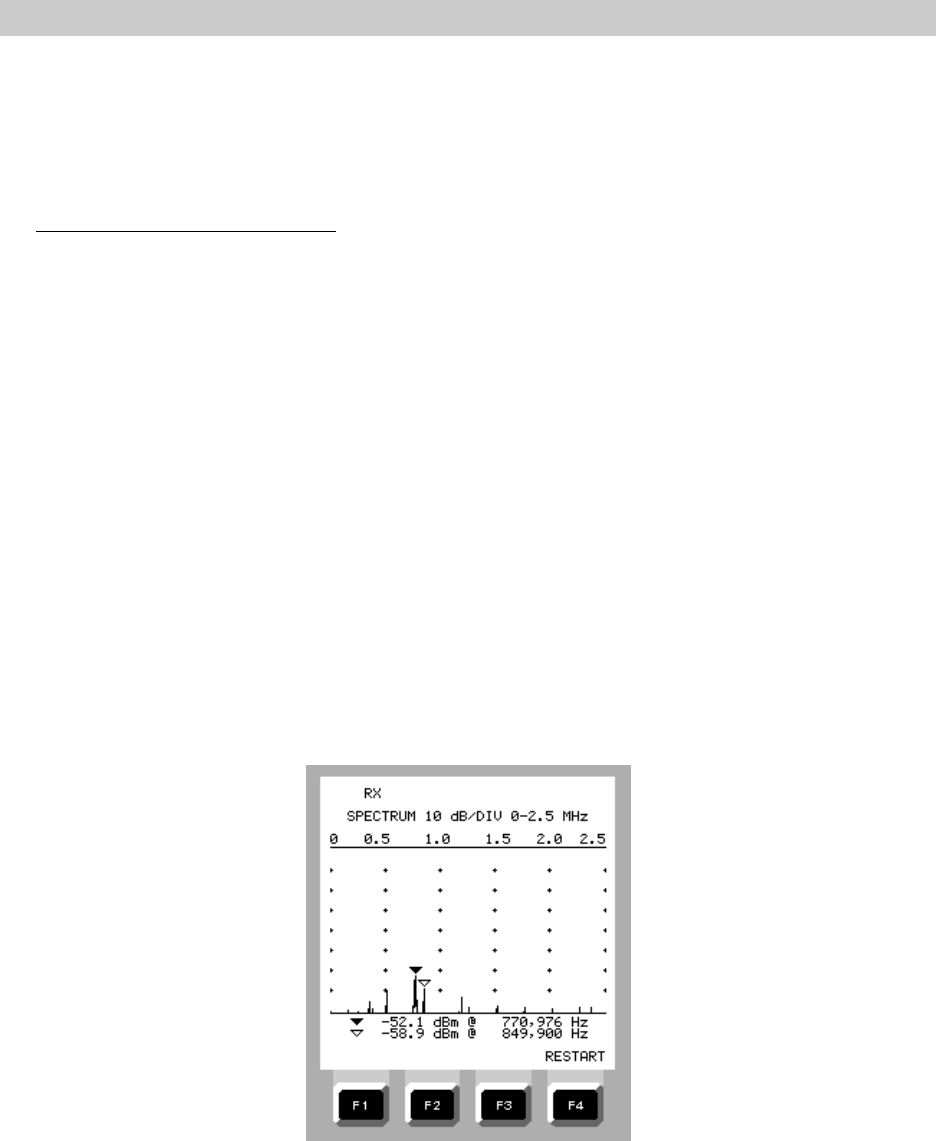
OPERATION
2-128
The SPECTRUM ANALYSIS feature is available under the menu titles VOICE FREQUENCY
SERVICES and DIGITAL SERVICES. If the tests are to be performed on lines set up for voice frequency
service, the test set interface impedance is set to 600 ohms automatically when VOICE FREQUENCY
SERVICES is selected. If testing is to be performed on lines set up for digital services, the test set
interface impedance is changed to 100 ohms when DIGITAL SERVICES is selected.
Performing a Spectrum Analysis
1. On the MAIN MENU, move the cursor to LINE PARAMETRIC and press ENTER.
2. If not already performed, run the TEST LEAD CALIBRATION and CABLE
CHARACTERISTICS procedures.
3. (Recommended) Perform a LINE VOLTAGE measurement as described in paragraph
2.11.3. to confirm that voltages sufficient to cause harm to personnel or equipment are
not present, then press MENU to return to the LINE PARAMETRICS menu.
4. On the LINE PARAMETRICS menu, move the cursor to VOICE FREQUENCY SERVICES
or DIGITAL SERVICES as required and press ENTER.
5. With the test cable connected between the LINE 1 RX jack and the line to be tested,
move the curser to SPECTRUM ANALYSIS and press ENTER. The test set will detect
and display spikes representing noise peaks on the line.
6. Press F4 (RESTART) to begin a new test. If suspected noise sources can be turned off
or if shielding can be improved, re-run the test to determine the effectiveness of the
action.
Figure 2-192. Typical Spectrum Analysis Display

MAINTENANCE
3-1
3.1 EZ-TESTER DS Warranty
The EZ-TESTER DS is warranted to be free of defects in material and workmanship for a period
of three (3) years from date of shipment to the original purchaser. The internal battery assembly and
all test set accessories are warranted to be free of defects for a period of one (1) year from date of
shipment to the original purchaser. During the warranty period, Electrodata, Inc. will, at its option,
either repair or replace your EZ-TESTER DS if it proves to be defective due to material or
workmanship.
Electrodata, Inc. will pay the inbound and out-bound freight charges to return your EZ-TESTER
DS to the factory for warranty service, providing you obtain a RETURN MATERIAL AUTHORIZATION
(RMA) number and ship in accordance with instructions from Electrodata, Inc.
The EZ-TESTER DS warranty does not apply to defects resulting from misuse or abuse; to
dents and scratches to the cover, case, or front panel; or to field repairs or modifications not performed
by, or approved in writing by Electrodata, Inc.
Electrodata, Inc. shall not be liable for damages greater than the cost or replacement value of
the EZ-TESTER DS .
3.2 Routine Maintenance and Testing
The EZ-TESTER DS is a highly reliable solid state device that requires no adjustment. The only
routine maintenance required is the periodic recharging of the internal batteries as described in
paragraph 3.3.
In case of problems with the test set, the self-test programs described in paragraph 3.4 should
be run to verify that the test set is operational. If the test set is found to be non-operational, it should
be returned to the factory for repair. Return authorization and shipping instructions must be obtained
from the factory before returning the test set. A note indicating the suspected failure or symptoms
and return address should be included with the unit when shipped.
3.3 Battery Recharging/AC Operation
The internal batteries in the EZ-TESTER DS will provide many hours of service on a full charge.
As the battery level decreases, the display fuel gauge will indicate the relative charge level. The
internal batteries of the test set should be recharged when the FUEL GAUGE begins to flash. When
recharging the batteries with the PS-6 Battery Eliminator/Charger, be sure the PS-6 is connected to the
test set 12 VDC jack before it is plugged into an AC receptacle. The batteries should be charged for
at least 12 hours to assure a full charge. The test set can be used while the batteries are being
recharged, and can be left on charge continuously without damage. When convenient to do so, the
EZ-TESTER DS can be operated with the PS-6 Battery Eliminator/Recharger indefinitely, thereby
guaranteeing a fully charged battery any time the test set must be used at a remote location.
CAUTION - For best results use the PS-6 Battery Eliminator/Charger provided with the
test set. Other battery chargers with similar connectors may not be compatible with
the EZ-TESTER DS and may cause damage. Rechargeable batteries are not user
replaceable. If a problem occurs, the test set should be returned to the factory for
repair by a qualified service person.

MAINTENANCE
3-2
Fuel Gauge Calibration
The EZ-TESTER DS employs a sophisticated electronic fuel gauging circuit that may be
calibrated to provide the most accurate indication of battery charge available. Calibration is easy to
perform by following the steps on page 3-2. It is important to understand that calibration requires that
the test set batteries must first be fully charged and then discharged until the test set executes a low
power automatic shutoff. Calibration is aborted whenever the PS-6 Battery Eliminator/Charger is
connected during the discharge period.
To Perform a Fuel Gauge Calibration
1. Assure a full battery charge by charging the test set with the PS-6 Battery
Eliminator/Charger for at least 12 hours.
2. Disconnect the PS-6 from the EZ-TESTER DS .
3. Turn on the EZ-TESTER DS .
4. Loopback the test set by connecting a test cable between the LINE 1 TX and RX jacks to
ensure a constant input signal for the duration of the procedure. The PULSES indicator
should be lit. (If the test set is not looped back, it will turn off automatically after a short
period and halt the calibration procedure. AUTO SHUT OFF can be disabled on the
CONFIGURATION SETUP MENU.)
5. Allow the test set to run until the depleted battery level forces an automatic shut off.
6. The fuel gauge is now fully calibrated. Reconnect the PS-6 Battery Eliminator/Charger and
charge the test set over night.
3.4 Self-Test Procedure
The EZ-TESTER DS is designed to perform a short power-on self-test that runs each time the
test set is turned on. In addition, the EZ-TESTER DS is designed with a comprehensive FULL SELF-
TEST that can be run by selecting FULL SELF-TEST on the MAIN MENU screen.
The power-on self-test is initiated by turning on the test set, the Electrodata logo is displayed
at the top of the screen display. Also displayed are the fuel gauge, the POWER ON SELF-TEST status
line, the unit serial number, the firmware revision number, the Electrodata copyright line, and the
HLDSCRN (hold screen) command. The test runs for approximately three seconds, after which the
speaker emits two short beeps and the word PASS appears on the self-test status line. If the test
fails, charge the batteries as described in paragraph 3.3 and run the test again. If the test still fails,
contact the factory or your local Electrodata representative.
The comprehensive FULL SELF-TEST consists of seven sections and takes approximately 1.5
minutes to complete.

MAINTENANCE
3-3
To Perform the FULL SELF-TEST
1. Turn on the EZ-TESTER DS using the PS-6 as the power source.
2. Connect one test cable between the LINE 1 TX and RX jacks and, if the unit is configured
for LINE 1 and LINE 2, a second test cable between the LINE 2 TX and RX jacks.
3. Press ENTER to begin the test, then watch the test set as it performs each sub-test.
4. Following the DISPLAY, INDICATORS, and SPEAKER sub-tests, use the F1 (YES) and F2
(No) keys to respond as instructed on the screen.
5. During the KEYBOARD sub-test, press each key when instructed on the screen.
When the FULL SELF-TEST is complete, the test set will emit two short beeps and will
display FULL SELF-TEST SUCCESSFUL if the test is successful, or one long beep and SELF-TEST
FAILED if the test fails. Under most circumstances the FULL SELF-TEST will run successfully. If this
is the case, it usually means that what was thought to be incorrect operation of the test set may have
been the result of conflicting setup parameters when the test set was being prepared for a specific
test.
If the unit fails a FULL SELF-TEST, repeat the test being careful to follow each step carefully.
If the unit fails again, an error occurs during the comprehensive self-test, contact the factory or your
local Electrodata representative. Always obtain authorization from the factory before returning
equipment for repair.
3.5 Factory Service
Where to Get Help
If you need any assistance operating your EZ-TESTER DS , or if you suspect a problem, or to
inquire about options or new features, contact either your local Electrodata representative or
Electrodata by mail, e-mail, or directly by our FAX or toll-free telephone number.
Electrodata, Inc.
23020 Miles Road
Bedford heights, Ohio 44128-5400
Telephone: 216-663-3333
Toll Free: 800-441-6336
FAX: 216-663-0507
E-Mail: testsets@electrodata.com
Field Software Upgrades
Your EZ-TESTER DS is equipped with Flash EPROMs that can be reprogrammed remotely via
a dial-up modem and telephone line. This software update service, called OnCall® is available to you
at no charge and can be performed at any time of day, including Saturday and Sunday. This special
feature allows you to add software changes and enhancements to your test set quickly and easily.
While software upgrades are performed at no charge, enhancements or options must be ordered by
calling the factory prior to performing the software update. After setup, the On Call function dials the
factory and completes the upgrade automatically.

MAINTENANCE
3-4
To perform the OnCall function, simply connect a Hayes compatible dial-up modem to the test
set and turn it on. On the MAIN MENU, scroll down to OnCall UPDATE (last menu selection), press
ENTER, and follow the setup instructions displayed on the screen. Make sure the transmission speed
matches your modem and that the call prefix is correct for the particular telephone line that you are
using.
After the setup, press ENTER to initiate the dialing function. When the call is answered, the
OnCall function automatically starts downloading the latest software applicable to your test set.
A screen message informs you about the progress of the downloading and when the operation is
complete.
To Perform an OnCall Operation
1. Turn on the EZ-TESTER DS using the PS-6 as the power source.
2. Connect the AUXILIARY PORT of the test set to a Hayes compatible modem.
3. Connect the modem to a functioning telephone wall jack.
4. Use the soft keys to select the BIT RATE (BPS) setting required by the modem
F1 = 28.8K F1 = 9600
F2 = 19.2K F2 = 2400
F3 = 14.4K F3 = 1200
F4 = more F4 = more
5. Use the soft keys to set in the OnCall phone number.
F1 = DEFAULT Factory set to 1-216-663-2412
F2 = EDIT Uses same phone number but allows addition of
characters when special dialing requirements exist.
The number can be edited with the numeric key pad,
arrow keys, and keys.
6. Press ENTER to initiate the call and begin the update. During the update, a status line will
appear on the screen indicating the progress of the update. When the update is complete,
the status bar will indicate 100%.
7. Turn off the test set to clear the status screen and turn it back on to commence operation
with the updated firmware.
If you experience any problems with OnCall, call the factory for assistance during regular
working hours (Eastern Time Zone).
Returning Your EZ-TESTER DS to the Factory
When Electrodata, Inc. confirms that you need to return your EZ-TESTER DS to the factory
for service, make sure that you obtain a Return Material Authorization (RMA) number. Package the
test set carefully in a shipping carton (preferably its original shipping carton), mark the RMA number
on the outside of the carton, and send it to the address shown above or as directed by factory
personnel.
It is not necessary to return accessories (e.g. cables or printer), with the exception of the PS-6
AC adapter, unless they are suspected of being defective.

APPENDIX A
A-1
APPENDIX A. TECHNICAL SPECIFICATIONS
DS1 SPECIFICATIONS
Electrical Interface
Connectors: RX, TX ..........
Output Pulse Shape ...........
Line Code..................
Line Build Out ...............
Input Terminate ............
Monitor ..............
Bridge ...............
Bantam Jacks, Dual port. Line 1 TX is parametric test
port, Line 2 RX is reference clock
Conforms to ITU-T Recommendation G.703; AT&T
Publications CB113, CB119, CB132, CB143,
PUB62508, and PUB62411 pulse shape specifications
when terminated in 100 ohms and 0 dB Line Buildout
is selected.
AMI, B8ZS
0 dB, -7.5 dB, -15 dB
DSX +6 dB to DSX -36 dB, 100 ohms
DSX -14 dB to DSX -40 dB, 100 ohms
DSX +6 dB to DSX -36 dB, >1000 ohms
Clock.....................
Internal ..............
External..............
Recovered ............
1.544 MHz
±5 ppm
±300 ppm
±300 ppm
Transmitter and Receiver
Framing ...................
Channel Formats .............
Test Patterns ...............
Error Injection
Type ................
BPV Error Rate .........
Alarms ....................
Unframed, D3/D4, ESF, & SLC96*
56x1, 64x1
Full T1, Fractional T1 (56xN, 64xN) (opt. 01 required)
2047, 2E15-1, 2E20-1, 2E23-1, QRSS, Bridge, Multiple,
All 0's, 1:7, 2 in 8, 3 in 24, Alt 1/0, All 1's, T1-1,
T1-2, T1-3, T1-4, T1-5, 55 Octet, T1-Daly, DDS-1,
DDS-2, DDS-3, DDS-4, DDS-5, DDS-6, User defined
patterns up to 2048 bits
BPV, Frame, CRC, Pattern
Single, Fixed Rate, Burst
LOS, LOF, Yellow, AIS, Idle

A-2
APPENDIX A
DS0 SPECIFICATIONS
Interface
VF In/Out Connector.......... Headset Access Jack
RS-232 INTERFACE
Connector .................
Pin Assignments .............
Configuration ...............
DB-25 female
See Table A-1
DTE or DCE
Bit Rates (transmission speeds) . . .
Bits Per Character (word length) . .
Stop Bits ..................
150, 300, 600, 1200, 2400, 4800, & 9600
7 or 8
1 or 2
ESF/SLC DATALINK MONITORING AND CONTROL (Option 03)
ESF T1.403 Performance Report Messages (ANSI STANDARD)
Send Functions
Operating Mode ........
PRM Selections
(Fixed/Unscheduled)
CRC Errors .
Live, Fixed, or Unscheduled
No errors, 1 error, >1 to #5 errors, >5 to # 10
errors, >10 to #100 errors, >100 #319 errors, $320
errors
Application
Specific Bits
LB .
SL .
LV .
FE . .
SE .
Unscheduled
Messages .......
Receive Functions ............
Payload Loopback Active
Controlled Slip $1
Line Code Violation
Framing Bit Error
Severely Errored Framing Bit Event
Any, including Yellow Alarms
CRC Events, ASB Status, Unscheduled, Errored
Seconds, Severely Errored Seconds, Message Errors,
Elapsed Time
SLC-96 Datalink Control and Monitoring
Send Functions (Alarm and Maintenance Messages)
Alarms ..............
Shelf Alarms ..........
Far-End Loopbacks ......
Maintenance Messages . . .
Protection Messages .....
Major, Minor, Power/Miscellaneous
A, B, C, and D
A, B, C, D, and P
Idle, On-Hook/Seize, Proceed, Test Alarm
Idle, Line A RX, Line B TX, Line C TX, Line D TX,
Line B TX/RX, Line C TX/RX, Line D TX/RX

APPENDIX A
A-3
Receive Functions (Display decoded
messages) ................. Alarms (Major, Minor, Power, Miscellaneous), Shelf
Alarms, Far-End Loopback, Maintenance Messages,
Protection Messages, Concentrator Messages
(SLC 96 II)
PM TEST ACCESS (Option 04)
Operations ..................... Retrieve PM statistics, Clear PM Statistics, Set PM
Clock
LOOPBACK/SPAN CONTROL
Device Type ...................
User-Defined Loopback Codes .......
Vendors (Intelligent T1 span devices) . .
CSU, NIU, Repeater and Maintenance Switch
(Requires Option 05)
Stores up to 8 with alphanumeric labels
(Contact factory for current list)
PRIMARY RATE ISDN (option 09)
D-Channel .....................
Loop-back ..................... Selectable
Supports simultaneous call placement and receipt to
provide a loopback for voice or BERT testing
Test Mode .....................
Interface Type ..................
Call Type ........................
Terminate (Dead end or Out-of-service)
23B+D (24B with second instrument)
23B+D and 24B (if LINE 2 enabled)
Voice Call Data Call
56 Kbit/s
64 Kbit/s
N x 64 Kbit/s (opt. 01 required)
H0 - 6 B-channels or 384 Kbit/s (Option 01 rq’d.)
H11 - 24 B-channels or 1.536 Mbit/s
Call Control .................... AT&T, Northern Telecom, National ISDN-2
Test Mode .....................
Loop-Back .....................
Terminate (Dead or out-of-service
Supports simultaneous call placement and receipt to
provide a loopback for voice or BERT testing
Dial Sequence ..................
Store Telephone Numbers in Memory
Number of memory files . . .
Length (Each number) ....
Alphanumeric Labels (Each
file).................
Up to 30 digits
8
Up to 30 digits
Up to 16 alphanumeric characters
Transaction Display .............. Cause Value, Layer 2 Status, Call State

A-4
APPENDIX A
BERT
Patterns ....................
Results .....................
All 0's, All 1's, 1:7, 2 in 8, 2047, 2E15-1, QRSS,
55 Octet
BPV Errors, BIT Errors, Frame Errors, CRC Errors,
Elapsed Time
Voice Channel Data ..............
Status Display ..................
Programmable Options ............
Digital Milliwatt, Idle Code, External VF, Push-to-Talk
Microphone
Layer 2 Status, Call State, Cause Value (Both numeric
and plain language)
Network Options, Facility Options, Calling Numbers
TERMINAL EMULATION (Option 10)
Interface Type ..................
Display .....................
Emulation .....................
Responses .....................
RS-232 25-pin to 9-pin interconnect cable supplied
LCD screen of 32 characters by 20 lines
Virtual display of 80 characters by 24 lines
Auto, VT100, ASCII
Standard character responses are provided
Equipment Supported ............ Adtran, Inc.
HDSL Central Office Customer Premises Unit
Models: HTU-R, T400HTU-R, HFAC
PairGain Technologies, Inc.
HDSL Central Office and Customer Premises Unit
Models:HLU-231, 319, 388, 611, 612, D41;
HRU-412, 512; HLIU-960; HDU-451
Teltrend, Inc.
PMDNI Digital Network Interface
DDS CHANNEL TESTING (Option 11)
Electrical Interface
Connector ................. RJ-45
DS0-A Channel Rates .............
Loopbacks (Latching and alternating) . .
Control Codes ..................
2.4, 4.8, 9.6, 19.2, 38.4, 56, and 64 Kbps
Channel, DSU, OCU, DS0-DP, NEI, 8-bit user defined
Repeater Release, Idle, Abnormal Station, Mux-Out-of-
Sync, Unassigned MUX Channel, Test Code, Test
Alert, MJU Alert, Loopback Enable, Far-End-Voice,
Transition in Progress, Block Code, Release Code,
MAP0 Code, MAP1 Code, Eight-bit user defined

APPENDIX A
A-5
BERT Patterns ..................
BERT Results ...................
63, 127, 511, 2047, 2E15-1, 2E20-1, QRSS, All 0's,
1:7, 2 in 8, 3 in 24, Alt 1/0, All 1's, T1-1, T1-2, T1-
3, T1-4, T1-5, 55 Octet, T1-Daly, DDS-1, DDS-2,
DDS-3, DDS-4, DDS-5, DDS-6, User defined patterns
up to 2048 bits
BPV, Bit, Frame, CRC Errors, Elapsed Time
PRINTING
Print Functions .................. Last Results, Captured Events, Current Setup, User
Setups, User Test Patterns, Captured Channel Data,
Retrieved PM Data
Captured Events
Types of Events (Input
Signal)...............
Number of Events .......
Event Triggers .........
Printer Interface .................
Alarm changes, Errored Second, Severely Errored
Second, DS1 Frame Slip
100 to 1500 (Depending on type of event)
Automatic, Selectable, Manual
See AUXILIARY PORT
AUXILIARY PORT
Function ......................
Connector .....................
Type of Interface ................
Transmission Speeds .............
Bits per Character ................
Parity ........................
Stop Bits ......................
Flow Control ..................
RS-232 Interface/Remote Control or Printer
25-pin D female
DTE or DCE
1200, 2400,9600,14.4K, 19.2K, 28.8K
7 or 8
Odd, Even, or None
1 or 2
XON/XOFF; CTS/DTR
POWER
Batteries ......................
Battery Life.................
AC Operation ...................
Rechargeable nickel-metal hydride (NiMH)
Basic unit - 4 hours/charge
100 - 240 VAC, 50/60 Hz (PS-6)
A-6
APPENDIX A
PHYSICAL SPECIFICATIONS
Size .........................
Weight .......................
Display Screen ..................
Operating Temperature ............
Storage Temperature .............
Humidity ......................
10.2"L x 3.8"W x 3"H
3 lbs. (1.35 kilograms)
Backlit LCD, 24 lines x 32 characters
-20° C to +60° C
-30° to + 90° C
10% to 90% non-condensing
Table A-1. Auxiliary Port Pin Assignments (RS-232)
PIN EIA
DESIG. DESCRIPTION PIN EIA
DESIG. DESCRIPTION
1 AA Frame ground 7 AB Signal Ground
2 BA Transmit Data 8 CF Receive Carrier Detect
3 BB Receive Data 11 (none) Internal Use
4 CA Request to Send 18 (none) Internal Use
5 CB Clear to Send 20 CD Data Terminal Ready
6 CC Data Set Ready 22 RI Ring Indicator

APPENDIX B
B-1
APPENDIX B - TEST PATTERN DESCRIPTIONS
BRIDGE Automatically generated sequence of test patterns used to detect bridge taps
on analog lines that are being converted to digital service. Bridge taps will
selectively attenuate the higher frequencies associated with T1 transmission
causing bit and bipolar violations to occur for specific patterns. During a
Bridge Tap test, which takes less than 11 minutes to perform, each pattern
is transmitted and monitored for errors. Each pattern is transmitted for 30
seconds and monitored for only 23 seconds. Results are kept on each of
the individual patterns and on the entire test sequence.
ALL 1'S F1111 ...
1:1 F0101 ...
1:3 F0100 ...
1:5 F0100 00 ...
1:6 F0100 000 ...
1:7 F0100 0000 ...
2:8 F1100 0000 00 ...
2:9 F1100 0000 000 ...
2:10 F1100 0000 0000 ...
2:11 F1100 0000 0000 0 ...
2:12 F1100 0000 0000 00 ...
2:13 F1100 0000 0000 000 ...
2:14 F1100 0000 0000 0000 ...
3 IN 18 F1101 0000 0000 0000 00 ...
3 IN 19 F1100 1000 0000 0000 000 ...
3 IN 20 F1100 0100 0000 0000 0000 ...
3 IN 21 F0100 0100 0000 0000 0000 1 ...
3 IN 22 F0100 0100 0000 0000 0000 10 ...
3 IN 23 F0100 0100 0000 0000 0000 100 ...
3 IN 24 F0100 0100 0000 0000 0000 0100 ...
QRSS 2E20-1 with 15 zero suppression
MULTIPLE Automatically generated sequence of test patterns used by technicians to
perform acceptance testing on a new T1 span or trouble shooting on an existing
span. During a Multiple Pattern test, which takes 15 minutes to perform, each
test pattern is transmitted and monitored for errors. Each pattern is transmitted
for three minutes or 180 seconds and monitored for only 175 seconds. Results
are kept on each of the individual patterns and on entire test sequence.
ALL 1'S F1111 ...
1:7 F0100 000 ...
2 IN 8 F0100 0100 ...
3 IN 24 F0100 0100 0000 0000 0000 0100 ...
QRSS 2E20-1 with 15 zero suppression

APPENDIX B
B-2
ALL 0'S F0000 ...
1:7 F0100 0000 ...
2 IN 8 F0100 0100 ...
3 IN 24 F0100 0100 0000 0000 0000 0100 ...
ALT 1/0 F1010 ...
ALL 1'S F1111 ...
T1-1 (MIN/MAX) A 72 octet pattern that generates rapid transitions from low ones
density octets to high ones density octets. It is commonly used to test repeater
pre-amplification, equalization, and automatic line build out (ALBO) circuitry.
80H 80H 80H 80H 01H 00H 01H 01H 01H 03H
80H 01H 80H 01H 01H 80H 01H 22H 00H 20H
22H 00H 20H AAH AAH AAH AAH AAH 55H 55H
55H 55H AAH AAH AAH AAH 55H AAH AAH 55H
55H 55H 80H 80H FFH FFH FFH FFH FFH FFH
FFH FEH FFH FFH 24H 49H 92H 88H 88H 88H
10H 42H 08H 21H 84H 20H 08H 82H 40H 20H
10H 80H
T1-2 (TRIP TEST) - A 96 octet pattern that generates a long series of high ones
density octets followed by quick changes from average ones density to low
density octets. It is commonly used to detect faulty M12 cards in DS3
equipment.
FFH FFH FFH FFH FFH FFH FFH FFH FFH FFH
FFH FFH FFH FFH FFH FFH FFH FFH FFH FFH
FFH FFH FFH FFH FFH FFH FFH FFH FFH FFH
FFH FFH FFH FFH FFH FFH FFH FFH FFH FFH
FFH FFH FFH FFH FFH FFH FFH FFH AAH AAH
AAH AAH 80H 01H 80H 01H 80H 01H 80H 01H
80H 01H 80H 01H 80H 01H 80H 01H 80H 01H
80H 01H AAH AAH AAH AAH 80H 01H 80H 01H
80H 01H 80H 01H 80H 01H 80H 01H 80H 01H
80H 01H 80H 01H 80H 01H

APPENDIX B
B-3
T1-3 (54 OCTET) - A 54 octet pattern that consists of rapid transitions from low
ones density octets to high ones density octets. It is commonly used to test
repeater pre-amplification, equalization, and automatic line build out (ALBO)
circuitry.
01H 01H 01H 01H 01H 01H 00H 01H 01H 01H
01H 01H 01H 03H 01H 01H 01H 01H 07H 01H
01H 01H 01H 55H 55H 55H 55H AAH AAH AAH
AAH 01H 01H 01H 01H 01H 01H FFH FFH FFH
FFH FFH FFH 80H 01H 80H 01H 80H 01H 80H
01H 80H 01H 80H
T1-4 (120 OCTET) - A 120 octet pattern that consists of rapid changes from high
ones density to minimum ones density. It is commonly used to stress the
equalization circuits between T1 multiplexers.
FFH FFH FFH FFH FFH FFH FFH FFH FFH FFH
FFH FFH FFH FFH FFH FFH FFH FFH FFH FFH
FFH FFH FFH FFH FFH FFH FFH FFH FFH FFH
FFH FFH FFH FFH FFH FFH FFH FFH FFH FFH
FFH FFH FFH FFH FFH FFH FFH FFH FFH FFH
FFH FFH FFH FFH FFH FFH FFH FFH FFH FFH
FFH FFH FFH FFH FFH FFH FFH FFH FFH FFH
FFH FFH AAH AAH AAH AAH 10H 10H 10H 10H
10H 10H 10H 10H 10H 10H 10H 10H 10H 10H
10H 10H 10H 10H 10H 10H AAH AAH AAH AAH
10H 10H 10H 10H 10H 10H 10H 10H 10H 10H
10H 10H 10H 10H 10H 10H 10H 10H 10H 10H
T1-5 A 53 octet pattern that generates rapid transitions from high ones density octets
to low ones density octets. It is commonly used to test repeater pre-
amplification, equalization, and automatic line build out (ALBO) circuitry.
80H 01H 80H 01H 80H 01H 80H 01H 80H 01H
80H 01H 80H 01H 80H 01H 80H 01H 80H 01H
80H 01H 80H 01H 80H 01H 80H 01H 80H 01H
01H AFH AAH AFH 01H 01H 01H 01H FFH FFH
FFH FFH 01H 01H 01H 01H FFH FFH FFH FFH
FFH FFH CBH
55OCTET (T1-6) - A 55 octet pattern that generates rapid transitions from high ones
density octets to low ones density octets. It is commonly used to stress repeater
automatic line build out (ALBO) and timing recovery circuits. When framed, this
pattern will generate excess zero's.
01H 01H 01H 01H 01H 01H 00H 01H 01H 01H
01H 01H 01H 03H 01H 01H 01H 01H 07H 01H
01H 01H 01H 55H 55H 55H 55H AAH AAH AAH
AAH 01H 01H 01H 01H 01H 01H FFH FFH FFH
FFH FFH FFH 80H 01H 80H 01H 80H 01H 80H
01H 80H 01H 80H 01H

APPENDIX B
B-4
T1-DALY A 55 octet pattern identical to T1-6 except the seventh octet is changed from
00H to 80H. This pattern is specified by ANSI and meets ones density and
excess zero's criteria.
01H 01H 01H 01H 01H 01H 80H 01H 01H 01H
01H 01H 01H 03H 01H 01H 01H 01H 07H 01H
01H 01H 01H 55H 55H 55H 55H AAH AAH AAH
AAH 01H 01H 01H 01H 01H 01H FFH FFH FFH
FFH FFH FFH 80H 01H 80H 01H 80H 01H 80H
01H 80H 01H 80H 01H
DDS-1 A 200 octet pattern that consists of 100 octets of FFH followed by 100 octets of
00H. It is commonly used to stress DDS circuit signal recovery capability.
DDS-2 A 200 octet pattern that consists of 100 octets of 7EH followed by 100 octets of
00H. This pattern simulates bit oriented protocol flags for DDS testing.
DDS-3 A 16 octet pattern that provides a continuous stream of medium ones density
4CH octets. It is commonly used to simulate a typical DDS signal.
DDS-4 A 16 octet pattern that provides a continuous steam of low density 40H octets.
It is commonly used to stress DDS clock recovery circuits.
DDS-5 A 2000 octet pattern that is a compilation of patterns DDS-1 through DDS-4 as
follows: 800 of DDS-1, 800 of DDS-2, 200 of DDS-3, and 200 of DDS-4. It is
commonly used to provide a quick test of DDS circuit operation.
DDS-6 An 8 octet pattern that consists of seven octets of FEH followed by one octet of
FFH. It is commonly used to simulate a DDS signal transition from IDLE mode
to DATA mode.

APPENDIX C
C-1
APPENDIX C - GENERAL DATA TABLES
Table C-1. Trunk Type Summary
OPERATION STANDARD (E&M)
ON-HOOK
OFF-HOOK A=0
A=1 B=0
B=1 C=0
C=1 D=0
D=1
OPERATION GROUND START - FXS
ON-HOOK
SERVICE REQUEST
OFF-HOOK
A=0
A=0
A=1
B=1
B=0
B=1
C=0
C=0
C=1
D=1
D=0
D=1
OPERATION GROUND START - FXO
ON-HOOK
OFF-HOOK
RING
A=1
A=0
A=0
B=1
B=1
B=0
C=1
C=0
C=0
D=1
D=1
D=0
OPERATION GROUND START - SLC STATION
ON-HOOK
OFF-HOOK A=0
A=1 B=0
B=0
OPERATION GROUND START - SLC OFFICE
ON-HOOK
OFF-HOOK
RING
A=0
A=0
A=1
B=0
B=0/1
B=0/1
OPERATION LOOP START - FXS
ON-HOOK
OFF-HOOK A=0
A=1 B=1
B=1 C=0
C=1 D=1
D=1
OPERATION LOOP START - FXO
IDLE
RING A=0
A=0 B=1
B=0 C=0
C=0 D=1
D=0
OPERATION LOOP START - SLC STATION
ON-HOOK
OFF-HOOK A=0
A=1 B=0
B=0
OPERATION LOOP START - SLC OFFICE
IDLE
RING A=1
A=1 B=1
B=0/1

APPENDIX C
C-2
Table C-2. DTMF Frequencies
DIGIT FREQUENCIES
LOW HIGH
1
2
3
4
5
6
7
8
9
0
A
B
C
D
#
*
697Hz
697Hz
697Hz
770Hz
770Hz
770Hz
852Hz
852Hz
852Hz
941Hz
697Hz
770Hz
852Hz
941Hz
941Hz
941Hz
1209Hz
1336Hz
1477Hz
1209Hz
1336Hz
1477Hz
1209Hz
1336Hz
1477Hz
1336Hz
1633Hz
1633Hz
1633Hz
1633Hz
1477Hz
1209Hz
Table C-3. MF Frequencies
DIGIT FUNCTION FREQUENCIES
LOW HIGH
1
2
3
4
5
6
7
8
9
0
A
B
C
D
#
*
ST3P
STP
ST2P
ST
KP
700Hz
700Hz
900Hz
700Hz
900Hz
1100Hz
700Hz
900Hz
1100Hz
1300Hz
700Hz
900Hz
1300Hz
--
1500Hz
1100Hz
900Hz
1100Hz
1100Hz
1300Hz
1300Hz
1300Hz
1500Hz
1500Hz
1500Hz
1500Hz
1700Hz
1700Hz
1700Hz
--
1700Hz
1700Hz

APPENDIX C
C-3
Table C-4. AT&T ISDN Facility Option Codes
AT&T Custom Facility Options
Feature Code
Operator Telephone Co.
Operator Common Carrier 5
6
Service Code
Access for Virtual Private network
MEGACOM 800 service
MEGACOM service
IN WATS
WATS Maximal subscriber band
ACCUNET
International Long Distance Service
International 800
Electronic Tandem Network
Private Virtual Network
DIAL-IT NOVA
1
2
3
4
5
6
7
8
11
13
16
Table C-5. AT&T National ISDN-2 Facility Option Codes
AT&T National ISDN-2 Facility Options
Service Code
WATS Band
National ISDN Banded OUTWATS
Foreign Exchange
Tie Trunk Selection
National ISDN INWATS
National ISDN Unbanded OUTWATS
1
18
19
20
17
18
Table C-6. National ISDN-2 (Except AT&T Option Codes)
National ISDN-2 (Except AT&T) Options
Service Code
In WATS
Out WATS
Foreign Exchange
Tie Trunk
17
18
19
20
APPENDIX C
C-4
Table C-7. Northern Telecom ISDN Facility Option Codes
Northern Telecom Facility Options
Service Code
Private
In WATS
Out WATS
Foreign Exchange
Tie Trunk
1
2
3
4
5

APPENDIX D
D-1
APPENDIX D - ACRONYMS AND ABBREVIATIONS
ACM Address Complete
AIS Alarm Indication Signal
AK Acknowledgment
ALM Alarm
ALM/ERR Alarm/Error
AMI Alternate Mark Inversion
ANM Answer
ANSI American National Standards Institute
ASB Application Specific Bits
ASCII American Standard for Communications Information Interchange
B3ZS Bipolar 3 Zero Substitution
B8ZS Bipolar 8 Zero Substitution
BECN Backward Explicit Congestion Notification
BERT Bit Error Rate Test
BIB Backward Indicator Bits
BIB INV Backward Indicator Bits Inverted
BIP Bit Interleaved Parity
BLA Blocking Acknowledgment
BLO Blocking
BPS Bits Per Second
BPV Bipolar Violation
C/R Control/Response indication bit
CC Connection Confirm
CCR Continuity Check Request
CFN Confusion
CGB Circuit Group Blocking
CGBA Circuit Group Blocking Acknowledgment
CGU Circuit Group Unblocking
CGUA Circuit Group Blocking Acknowledgment
CLK Clock
CLR Clear
CLR-HST Clear History
CLR CHAN Clear Channel
CONT Continuous
COT Continuity
CPG Call Progress
CQM Circuit Query
CQR Circuit Query Response
CR Call Reference
CR Connection Request
CRA Circuit Reservation Acknowledgment
CRC Cyclic Redundancy Checksum
CRF Connection Refused
CRM Circuit Reservation
CRV Call Reference Value
CSC Common Signaling Channel
CSU Channel Service Unit
CVR Circuit Validation Response
CVT Circuit Validation Test
DACS Digital Access and Cross-Connect

APPENDIX D
D-2
DCE Data Communications Equipment
DDS Digital Data Service
DE Discard Eligibility
DIG-MW Digital Milliwatt
DLCI Data Link Connection Identifier
DPC Destination Point Code
DSU Digital Service Unit
DSX Digital Signal Cross-Connect
DT1 Data Form 1
DT2 Data Form 2
DTE Data Terminal Equipment
DTMF Dual Tone Multiple Frequency
EA Expedited Data Acknowledgment
ED Expedited Data
EOC Embedded Operations Channel
ERR Error
ESF Extended Superframe
EXM Exit (Intra Network Applications Only)
EXT External
FAC Facility
FDL Facilities Data Link
FEAC Far End Alarm and Control
FEBE Far End Block Error
FECN Forward Explicit Congestion Notification
FIB Forward Indicator Bits
FIB INV Forward Indicator Bits Inverted
FISU Fill-In Signal Unit
FOT Forward Test
FREQ Frequency
FRM Frame
Ft Feet
GRA Circuit Group Reset Acknowledgment
GRS Circuit Group Reset
HBER High Bit Error Rate
HDSL High (Bit Rate) Digital Subscriber Line
Hz Hertz
IAM Initial Address Message
ID Identification
IDT Integrated Digital Terminal
INF Information
INR Information Request
INTERNL Internal
ISDN Integrated Services Digital Network
ISUP ISDN User Part
IT Inactivity Test
KBPS Kilobits Per Second
L-Test Long Test
LBO Line Build-Out
LDS Local Digital Switch
LED Light Emitting Diode
LFEBE Line FEBE
LMI Local Management Interface

APPENDIX DAPPENDIX E
D-3
LOF Loss of Frame
LOP Loss of Pointer
LOP-L Loss of Pointer - Line
LOP-P Loss of Pointer - Path
LOP-S Loss of Pointer - Section
LOS Loss of Signal
LPA Loopback Acknowledgment
LSSU Link Status Signal Unit
LUDT Long Unit Data
LUDS Long Unit Data Service
MF Multiple Frequency
MJU Multipoint Junction Unit
MON Monitor
MSU Message Signaling Unit
MUX Multiplex
N/A Not Applicable
N(r) Receive sequence number
N(s) Send sequence number
NiMH Nickel-Metal Hydride
NEI Network Element Interface
NIU Network Interface Unit
NSA Non-Service Affecting
NT Network
OCU Office Channel Unit
P/F Poll/Final bit
PAM Pass Along Message
PBX Private Branch Exchange
PD Protocol Discriminator
PDI Payload Defect Indicator
PFEBE Path FEBE
PM Performance Monitor
PRBS Pseudo Random Bit Sequence
PRM Performance Report Message
QRSS Quasi-Random Signal Source
Q-Test Quick Test
RDI Remote Defect Indicator
RDT Remote Digital Terminal
RECVRD Recovered
REL Release
RES Resume
RLC Release Complete
RLSD Released
RPTR Repeater
RSC Reset Circuit
RSC Reset Confirmation
RSR Reset Request
RX Receive
Sapi Service Access Point Indicator
SBR Subsystem-Backup-Routing
SCCP Signaling Connection Control Part
SEC Second
SI Service Indicator

APPENDIX E
D-4
SNM Signaling Network Maintenance
SNM Signaling Network Management
SNR Subsystem-Normal-Routing
SNT Signaling Network Testing
SNTR Signaling Network Test Regular
SNTS Signaling Network Test Special
SOG Subsystem-Out-Of-Service-Grant
SONET Synchronous Transport Signal
SOR Subsystem-Out-Of-Service-Request
SPE Synchronous Payload Envelope
SRT Subsystem-Routing-Status-Test
SSA Subsystem-Allowed
SSP Subsystem-Prohibited
SST Subsystem-Status-Test
STX SONET Cross-Connect
SU Signaling Unit
SUS Suspend
SYNC Synchronization
TDR Time Domain Reflectometer
TE Terminal
Tei Terminal Endpoint Indicator
TERM Terminate
TMC Time Management Channel
TRNSPNT Transparent
TUP Telephone User Part
TX Transmit
UBA Unblocking Acknowledgment
UBL Unblocking
UCIC Unequipped Circuit Identification Code
UDT Unit Data
UDS Unit Data Service
UNSCHED Unscheduled
VF Voice Frequency
VOL Volume
VT Virtual Tributary
YEL-ALM Yellow Alarm
XUDT Extended Unit Data
XUDTS Extended Unit Data Service

APPENDIX D
D-1
APPENDIX D - ACRONYMS AND ABBREVIATIONS
ACM Address Complete
AIS Alarm Indication Signal
AK Acknowledgment
ALM Alarm
ALM/ERR Alarm/Error
AMI Alternate Mark Inversion
ANM Answer
ANSI American National Standards Institute
ASB Application Specific Bits
ASCII American Standard for Communications Information Interchange
B3ZS Bipolar 3 Zero Substitution
B8ZS Bipolar 8 Zero Substitution
BECN Backward Explicit Congestion Notification
BERT Bit Error Rate Test
BIB Backward Indicator Bits
BIB INV Backward Indicator Bits Inverted
BIP Bit Interleaved Parity
BLA Blocking Acknowledgment
BLO Blocking
BPS Bits Per Second
BPV Bipolar Violation
C/R Control/Response indication bit
CC Connection Confirm
CCR Continuity Check Request
CFN Confusion
CGB Circuit Group Blocking
CGBA Circuit Group Blocking Acknowledgment
CGU Circuit Group Unblocking
CGUA Circuit Group Blocking Acknowledgment
CLK Clock
CLR Clear
CLR-HST Clear History
CLR CHAN Clear Channel
CONT Continuous
COT Continuity
CPG Call Progress
CQM Circuit Query
CQR Circuit Query Response
CR Call Reference
CR Connection Request
CRA Circuit Reservation Acknowledgment
CRC Cyclic Redundancy Checksum
CRF Connection Refused
CRM Circuit Reservation
CRV Call Reference Value
CSC Common Signaling Channel
CSU Channel Service Unit
CVR Circuit Validation Response
CVT Circuit Validation Test
DACS Digital Access and Cross-Connect

APPENDIX D
D-2
DCE Data Communications Equipment
DDS Digital Data Service
DE Discard Eligibility
DIG-MW Digital Milliwatt
DLCI Data Link Connection Identifier
DPC Destination Point Code
DSU Digital Service Unit
DSX Digital Signal Cross-Connect
DT1 Data Form 1
DT2 Data Form 2
DTE Data Terminal Equipment
DTMF Dual Tone Multiple Frequency
EA Expedited Data Acknowledgment
ED Expedited Data
EOC Embedded Operations Channel
ERR Error
ESF Extended Superframe
EXM Exit (Intra Network Applications Only)
EXT External
FAC Facility
FDL Facilities Data Link
FEAC Far End Alarm and Control
FEBE Far End Block Error
FECN Forward Explicit Congestion Notification
FIB Forward Indicator Bits
FIB INV Forward Indicator Bits Inverted
FISU Fill-In Signal Unit
FOT Forward Test
FREQ Frequency
FRM Frame
Ft Feet
GRA Circuit Group Reset Acknowledgment
GRS Circuit Group Reset
HBER High Bit Error Rate
HDSL High (Bit Rate) Digital Subscriber Line
Hz Hertz
IAM Initial Address Message
ID Identification
IDT Integrated Digital Terminal
INF Information
INR Information Request
INTERNL Internal
ISDN Integrated Services Digital Network
ISUP ISDN User Part
IT Inactivity Test
KBPS Kilobits Per Second
L-Test Long Test
LBO Line Build-Out
LDS Local Digital Switch
LED Light Emitting Diode
LFEBE Line FEBE
LMI Local Management Interface

APPENDIX DAPPENDIX E
D-3
LOF Loss of Frame
LOP Loss of Pointer
LOP-L Loss of Pointer - Line
LOP-P Loss of Pointer - Path
LOP-S Loss of Pointer - Section
LOS Loss of Signal
LPA Loopback Acknowledgment
LSSU Link Status Signal Unit
LUDT Long Unit Data
LUDS Long Unit Data Service
MF Multiple Frequency
MJU Multipoint Junction Unit
MON Monitor
MSU Message Signaling Unit
MUX Multiplex
N/A Not Applicable
N(r) Receive sequence number
N(s) Send sequence number
NiMH Nickel-Metal Hydride
NEI Network Element Interface
NIU Network Interface Unit
NSA Non-Service Affecting
NT Network
OCU Office Channel Unit
P/F Poll/Final bit
PAM Pass Along Message
PBX Private Branch Exchange
PD Protocol Discriminator
PDI Payload Defect Indicator
PFEBE Path FEBE
PM Performance Monitor
PRBS Pseudo Random Bit Sequence
PRM Performance Report Message
QRSS Quasi-Random Signal Source
Q-Test Quick Test
RDI Remote Defect Indicator
RDT Remote Digital Terminal
RECVRD Recovered
REL Release
RES Resume
RLC Release Complete
RLSD Released
RPTR Repeater
RSC Reset Circuit
RSC Reset Confirmation
RSR Reset Request
RX Receive
Sapi Service Access Point Indicator
SBR Subsystem-Backup-Routing
SCCP Signaling Connection Control Part
SEC Second
SI Service Indicator

APPENDIX E
D-4
SNM Signaling Network Maintenance
SNM Signaling Network Management
SNR Subsystem-Normal-Routing
SNT Signaling Network Testing
SNTR Signaling Network Test Regular
SNTS Signaling Network Test Special
SOG Subsystem-Out-Of-Service-Grant
SONET Synchronous Transport Signal
SOR Subsystem-Out-Of-Service-Request
SPE Synchronous Payload Envelope
SRT Subsystem-Routing-Status-Test
SSA Subsystem-Allowed
SSP Subsystem-Prohibited
SST Subsystem-Status-Test
STX SONET Cross-Connect
SU Signaling Unit
SUS Suspend
SYNC Synchronization
TDR Time Domain Reflectometer
TE Terminal
Tei Terminal Endpoint Indicator
TERM Terminate
TMC Time Management Channel
TRNSPNT Transparent
TUP Telephone User Part
TX Transmit
UBA Unblocking Acknowledgment
UBL Unblocking
UCIC Unequipped Circuit Identification Code
UDT Unit Data
UDS Unit Data Service
UNSCHED Unscheduled
VF Voice Frequency
VOL Volume
VT Virtual Tributary
YEL-ALM Yellow Alarm
XUDT Extended Unit Data
XUDTS Extended Unit Data Service

23020 Miles Road Bedford Heights, Ohio 44128-5400
(216) 663-3333 (800) 441-6336 FAX: (216) 663-0507
e-mail: testsets@electrodata.com http://electrodata.com
Printed in U.S.A.
