ArcSight Command Center User's Guide ESM User 7.0
User Manual:
Open the PDF directly: View PDF ![]() .
.
Page Count: 213 [warning: Documents this large are best viewed by clicking the View PDF Link!]
- Chapter 1: Welcome to the ArcSight Command Center
- Chapter 2: Viewing System Information
- Managing Dashlets in the Dashboard Page
- Managing Dashboards in the Dashboard Navigator Page
- Using the Security Operation Center (SOC) Dashboard
- Using the Cluster View Dashboard
- Chapter 3: Monitoring Events Through Active Channels
- Viewing Events On an Active Channel
- Viewing a Channel Condition Summary
- Viewing the Event Priority for a Channel
- Evaluate the Network Route of a Event in a Channel
- Accessing Integration Commands from an Event List
- Accessing ArcSight Investigate or ArcSight Investigate Search from an Event List
- About the Active Channel Header
- Using the Active Channel Radar
- Annotating an Event
- Viewing Additional Event Information
- Managing Channels
- Adding an Event to a Case
- Marking an Event as Reviewed
- Visualizing an Event Graphically
- Chapter 4: Searching for Events in the ArcSight Command Center
- The Need to Search for Events
- The Process of Searching for Events
- Elements of a Search Query
- Search Helper
- Searching for Events
- Understanding the Search Results Display
- Exporting Search Results
- Saved Queries (Search Filters and Saved Searches)
- Indexing
- Chapter 5: Using Reports
- Chapter 6: Cases
- Chapter 7: Applications
- Chapter 8: Administration Configuration
- Chapter 9: Using the SOC Manager
- Appendix A: Search Operators
- Appendix B: Using the Rex Operator
- Appendix C: Frequently Asked Questions
- What happens if I'm investigating a channel that has event fields that are no...
- Can I change the default start time and end time for an event channel?
- What do I do if a channel is taking long to load?
- How many channels can I have open at one time?
- What fields are supported in Command Center channels?
- Does Command Center support non-ASCII payload data?
- How do I get my ArcSight Marketplace credentials?
- Why are channels not current in a new ESM session?
- Does the change to or from Daylight Savings Time effect an open active channe...
- Why does the right end of the top menu bar appear overlapped?
- Send Documentation Feedback

HPE SecurityArcSightESM
Software Version: 7.0
ArcSight Command Center User's Guide
April 20, 2018

Legal Notices
Warranty
The only warranties for Hewlett Packard Enterprise products and services are set forth in the express warranty statements
accompanying such products and services. Nothing herein should be construed as constituting an additional warranty.
Hewlett Packard Enterprise shall not be liable for technical or editorial errors or omissions contained herein.
The information contained herein is subject to change without notice.
The network information used in the examples in this document (including IP addresses and hostnames) is for illustration
purposes only.
HPE Security ArcSight products are highly flexible and function as you configure them. The accessibility, integrity, and
confidentiality of your data is your responsibility. Implement a comprehensive security strategy and follow good security
practices.
This document is confidential.
Restricted Rights Legend
Confidential computer software. Valid license from Hewlett Packard Enterprise required for possession, use or copying.
Consistent with FAR 12.211 and 12.212, Commercial Computer Software, Computer Software Documentation, and Technical
Data for Commercial Items are licensed to the U.S. Government under vendor's standard commercial license.
Copyright Notice
© Copyright 2018 Hewlett Packard Enterprise Development, LP
Follow this link to see a complete statement of copyrights and acknowledgements:
https://community.softwaregrp.com/t5/Discussions/Third-Party-Copyright-Notices-and-License-Terms/td-p/1589228
Support
Phone A list of phone numbers is available on the Technical Support
Page:
https://softwaresupport.softwaregrp.com/support-contact-information
Support Web Site https://softwaresupport.softwaregrp.com/
ArcSight Product Documentation https://community.softwaregrp.com/t5/ArcSight-Product-Documentation/ct-
p/productdocs
Contact Information
ArcSight Command Center User's Guide
HPE ESM 7.0 Page 2 of 213

Contents
Chapter 1: Welcome to the ArcSight Command Center 10
Starting the ArcSight Command Center 10
Configuring Your Browser 10
Launching ArcSight Command Center 10
Logging in to ArcSight Command Center 11
Basic Navigation 12
Using the Site Map 12
Monitoring Usage Metrics (Stats) 13
Chapter 2: Viewing System Information 14
Managing Dashlets in the Dashboard Page 14
Adding a Data Monitor Dashlet to the Dashboards Page 14
Adding the My Cases Dashlet to the Dashboard Page 15
Adding My Dashboards to the Dashboard Page 16
Rearrange ArcSight Command Center Dashboard If Charts and Tables Overlap 17
Adding My Notifications to the Dashboards Page 17
Adding a Query Viewer to the Dashboards Page 18
Changing the Dashboards Layout 19
Managing Dashboards in the Dashboard Navigator Page 19
Viewing Dashboards in the Dashboard Navigator 19
Navigate from a Dashboard to a Channel in a Data Monitor 21
Specifying a Dashlet Chart Type 22
Downloading a Dashlet to a CSV File 25
Using the Security Operation Center (SOC) Dashboard 26
Using the Cluster View Dashboard 27
Chapter 3: Monitoring Events Through Active Channels 30
Viewing Events On an Active Channel 31
Viewing a Channel Condition Summary 33
Viewing the Event Priority for a Channel 33
Evaluate the Network Route of a Event in a Channel 34
Accessing Integration Commands from an Event List 37
HPE ESM 7.0 Page 3 of 213

Accessing ArcSight Investigate or ArcSight Investigate Search from an Event List 38
About the Active Channel Header 39
Using the Active Channel Radar 41
Annotating an Event 42
Viewing Additional Event Information 43
Viewing Event Details 43
Viewing Event Annotation History 44
Viewing Event Payload 45
Managing Channels 45
Creating an Event Channel 45
Specifying Columns For the Active Channel Event List 47
Specifying Filter Conditions for an Active Channel 48
Creating a Channel Based on an Event Attribute 53
Editing an Event Channel 54
Deleting an Event Channel 57
Copying an Event Channel 57
Adding an Event to a Case 57
Marking an Event as Reviewed 58
Visualizing an Event Graphically 59
Chapter 4: Searching for Events in the ArcSight Command Center 61
The Need to Search for Events 61
The Process of Searching for Events 61
Simple Query Example 62
Query Example Using a Chart 62
Elements of a Search Query 63
Query Expressions 63
Search Expressions 64
Keyword Search (Full-Text Search) 64
Field-Based Search 67
Searching Internet Protocol (IP) Addresses 71
Searching Media Access Control (MAC) Address 72
Search Operators 72
Time Range 72
Fieldsets 74
Creating Custom Fieldsets 75
Constraints 76
ArcSight Command Center User's Guide
HPE ESM 7.0 Page 4 of 213

Using the Advanced Search Tool 85
Accessing Advanced Search 85
Nested Conditions 87
Alternate Views for Query Building in Advanced Search 88
Search Helper 89
Autocomplete 90
Search History 91
Search Operator History 91
Examples 91
Usage 91
Suggested Next Operators 92
Help 92
Searching for Events 92
Granting Access to Search Operations and Event Filters 94
Advanced Search Options 95
Searching Peers (Distributed Search) 95
Tuning Search Performance 95
Understanding the Search Results Display 96
User-defined Fields in Search Results 97
Viewing Search Results Using Fieldsets 98
Using the Histogram 98
Multi-line Data Display 99
Auto Updating Search Results 99
Chart Drill Down 100
Field Summary 101
Understanding Field Summary 101
Refining and Charting a Search from Field Summary 103
Exporting Search Results 105
Example PDF output 107
Scheduling an Export Operation 108
Saved Queries (Search Filters and Saved Searches) 109
Saving a Query 109
Using a Search Filter or a Saved Search 110
Predefined Search Filters 111
Indexing 113
Full-text Indexing (Keyword Indexing) 113
Field-based Indexing 113
Chapter 5: Using Reports 114
ArcSight Command Center User's Guide
HPE ESM 7.0 Page 5 of 213

Running and Viewing Reports 114
Report Parameters 115
Archived Reports 117
Deleting Archived Reports 118
Chapter 6: Cases 119
Case Navigation and Features 119
Creating or Editing a Case 120
Case Editor Initial Tab 120
Case Editor Follow Up Tab 124
Case Editor Final Tab 124
Case Editor Events Tab 126
Case Editor Attachments Tab 126
Case Editor Notes Tab 127
Granting Permission to Delete Cases 127
Deleting a Case 127
Viewing Notes and Updates in Case History 128
Case Management in the ArcSight Console 128
Chapter 7: Applications 130
Chapter 8: Administration Configuration 131
Content Management 131
Planning for Content Management 132
Content Management Tabs 132
Packages Tab 132
Subscribers Tab 133
Schedule Tab 134
Pushing Content Packages 134
Pushing a Package Automatically 134
Editing an Automatic Push Schedule 135
Pushing a Package Manually 135
Best Practices for Content Management 135
Storage and Archive 136
Overview 137
Storage 138
Storage Groups 140
ArcSight Command Center User's Guide
HPE ESM 7.0 Page 6 of 213

Turning Archiving On and Off 141
Setting the Time to Archive Storage Groups 141
Adding a Storage Group 142
Editing a Storage Group 143
Allocating Storage Volume Size 143
Storage Mapping 145
Adding a Storage Mapping 145
Editing a Storage Mapping 146
Deleting a Storage Mapping 146
Alerts 146
Archive Jobs 147
Archives 147
Statuses and Actions 148
Filtering the List of Archives 149
Creating an Archive Manually 150
Scheduling an Archive 151
Making an Offline Archive Searchable or Unsearchable 151
Canceling an Action in Progress 151
Archive Storage Space 152
Moving Archives to a New Location 152
Backing Up Your Archive Configuration 152
Search Filters 152
Granting Access to Search Filter Operations 153
Managing Search Filters 153
Saved Searches 155
Granting Access to Saved Search Operations 155
Managing Saved Searches 156
Scheduled Searches 157
Granting Access to Scheduled Search Operations 157
Managing Scheduled Searches 157
Currently Running Scheduled Searches 160
Ending Currently Running Searches 160
Finished Searches 160
Saved Search Files 161
Search 161
Tuning Search Options 161
Managing Fieldsets 163
Granting Access to Fieldset Operations 164
Viewing the Default Fields 164
Currently Running Tasks 165
ArcSight Command Center User's Guide
HPE ESM 7.0 Page 7 of 213

Ending Currently Running Tasks 166
Peers 166
Configuring Peers 166
Guidelines for Configuring Peers 167
To Enable Peering 168
Authenticating Peers 168
Selecting a Peer Authentication Method 169
Authenticating a Peer 169
Adding and Deleting Peer Relationships 169
Adding a Peer 170
Deleting a Peer 171
Granting Access to Peer Operations 171
Log Retrieval 172
License 173
Chapter 9: Using the SOC Manager 174
Case Metrics 174
Analysts 176
Server Property Settings for the SOC Manager Dashboards 177
Appendix A: Search Operators 179
cef (Deprecated) 179
chart 180
Aggregation Functions 182
Multi-Series Charts 183
The Span Function 183
dedup 186
eval 187
extract 188
fields 190
head 191
keys 191
rare 193
regex 194
rename 194
ArcSight Command Center User's Guide
HPE ESM 7.0 Page 8 of 213

replace 196
rex 198
sort 200
tail 201
top 201
transaction 202
where 204
Appendix B: Using the Rex Operator 206
Syntax of the rex Operator 206
Understanding the rex Operator Syntax 206
Creating a rex Expression Manually 207
Appendix C: Frequently Asked Questions 209
What happens if I'm investigating a channel that has event fields that are not supported in
Command Center? 209
Can I change the default start time and end time for an event channel? 209
What do Ido if a channel is taking long to load? 210
How many channels can I have open at one time? 210
What fields are supported in Command Center channels? 210
Does Command Center support non-ASCII payload data? 211
How do I get my ArcSight Marketplace credentials? 211
Why are channels not current in a new ESMsession? 211
Does the change to or from Daylight Savings Time effect an open active channel? 211
Why does the right end of the top menu bar appear overlapped? 212
Send Documentation Feedback 213
ArcSight Command Center User's Guide
HPE ESM 7.0 Page 9 of 213

Chapter 1: Welcome to the ArcSight Command
Center
The ArcSight Command Center is a web-based user interface that enables you to perform many of the
functions found in the ArcSight Console. ArcSight Command Center provides dashboards, several kinds
of searches, reports, case management, notifications, and administrative functions for managing active
channels, content, connectors, storage, archives, search filters, saved searches, peer configuration, and
system logs.
Starting the ArcSight Command Center
Configuring Your Browser
For best results, specify the same language for the browser as you did for the Manager. If the browser
allows you to select a priority language, select the same language defined by Manager.
Most browsers will give you a certificate error if you have not imported the Manager's certificate into the
browser. You can ignore the error and choose to continue. Exporting a certificate is covered in the
ESM
Administrator's Guide. In the Edge browser in Windows 10, you do not import the certificate from
the browser. From the Start icon, search for "internet options" and select Content > Certificates >
Import and follow the wizard. (You cannot open the Edge browser as user administrator, but you may
log in as a user other than administrator with administrative privileges.)
To view this user interface properly, configure your browser to at least 1920 by 1080 pixels. The
ArcSight Command Center top menu bar appears to have the right-most Top menu bar options
overlapped if the browser window dimensions are smaller than 1920 by 1080 pixels.
Launching ArcSight Command Center
From a supported browser, go to https://<IP address>:8443/
Where <IP address> is the host name or IP address that you specified when you first configured ESM.
Note: Host names with underscores do not work on Microsoft Internet Explorer, so use the IP
address.
HPE ESM 7.0 Page 10 of 213

Logging in to ArcSight Command Center
After you have logged in, there is a logout link in the upper right corner of the window, under <user
name> menu.
General Prerequisites
lIf the Manager is using FIPS, then configure your browser to use TLS.
lIf you are using FIPS and SSL, use the runcertutil command on the Manager to export a client
certificate for the browser machine. If you are not using FIPS, export certificates with the
keytoolgui command. Refer to the ESM
Administrator’s Guide for more information.
Logging in with Password Authentication
Log in with your User ID and password. Your user type controls your resource access.
Logging in with SSL Authentication
Make sure you have exported a client certificate from an ArcSight Console. Specify the certificate to use
and click OK. When you get to the Command Center user ID and Password screen, click Login without
specifying anything.
Logging in with Password Authentication or SSL
To log in with an SSL certificate, make sure you have exported a client certificate from an ArcSight
Console machine. Specify the certificate to use, and click OK. When you get to the Command Center
User ID and Password screen, leave the fields blank and click Login .
To log in with a user ID and password, click Cancel on the certificate dialog, then provide your user ID
and password on the User ID and Password screen.
Note: If you are using Microsoft Internet Explorer, and you import a certificate, you must always
use SSL (cancelling fails to load the page). If you do not import a certificate, you can only use
password authentication.
Logging in with Password Authentication and SSL
Make sure you have exported a client certificate from an ArcSight Console machine. Specify the
certificate to use and click OK. When you get to the User ID and Password screen, specify your User ID
and password.
Note: While logging into a Manager that has been configured to use Password-based or SSL Client
Based authentication, if you try to log in using a certificate and the login fails, all subsequent
attempts to use the username/password login will also fail during the same session. To work around
this, restart the browser and clear its cache.
ArcSight Command Center User's Guide
Chapter 1: Welcome to the ArcSight Command Center
HPE ESM 7.0 Page 11 of 213

Basic Navigation
Use the Dashboards, Events, Reports, Cases, Applications, Administration, Stats, and Notifications links
at the top of the display to go to those features. If you hover over most of those links, a menu of
included functions appears. The links in the upper right corner provide these features:
lUser: (Your User ID) Use this link to add or update your name, contact information, role,
department or notification groups. Also, there are buttons to enable you to change your password or
turn off (disable) session timeouts (default is On).
oHelp
Click Help to get context-sensitive help for the page you are viewing.
The help for those applications is accessible from the Help link when you view the integrated
application from the Applications tab. Such help has its own appearance and navigation.
Hover over the Help link to see a list of options.
oWhat’s New: Displays the online help system open to a list of new features in this release.
oDocumentation: Displays the main online documentation page, with a description of each book
and a table of contents in the left panel.
oOnline Support: Takes you to the HPE online support web site in a separate window.
oAbout: Displays the current ESM product version number.
oLogout: Log out of the current session and display the login dialog. You can log in again or browse
elsewhere. If you leave the client idle for a period of time, you may need to log in again because of
an automatic security time-out.
lStats:Displays Traffic Volume metrics as Events per Second and GB data per day.
lSite Map: Provides a mechanism to access Command Center primary landing pages using keyboard-
navigation only.
lDark Theme : Changes the Command Center display from the default light to dark theme. The
dark theme reduces glare from the screen, providing visual comfort in dark room environments.
Using the Site Map
The Site Map link provides a mechanism to access ArcSight Command Center pages using keyboard-
navigation only. The Site Map link opens the Site Map page which displays a list of links to the primary
landing pages in the Command Center.
ArcSight Command Center User's Guide
Chapter 1: Welcome to the ArcSight Command Center
HPE ESM 7.0 Page 12 of 213

Monitoring Usage Metrics (Stats)
Command Center monitors the event data flowing through ArcSight Manager. Click Stats to see
information presented in a graph for a detailed view, or you can click Show Calendar to display a color-
coded calendar (red, yellow, green) to get a quick overall view of the usage metrics.
The information in the Event Statistics page as two metrics:
lEPS The average number of Events Per Second (EPS), which is calculated daily for the past 30 days.
lGB/Day :This is the size of event data received each day for the past 30 days.
The event data is captured each day in a rolling 30 day window. A day is a full 24 hour period. Data is
displayed for only the number of days that it is available. There will be less than 30 days of data
available when ESMis newly installed. Data older than 30 days are not displayed.
To access the Event Statistics page, click Stats in the Command Center header. The page displays a
summary of data in multiple formats.
lHistogram:Displays daily values of either Total Event Data received, in gigabytes (GB), or average
Events Per Second (EPS). The measure used is determined by the usage limits defined in the
ESMsoftware license installed on the system. Some licenses define usage limits by GB and others by
EPS.
lDaily Usage table: Displays the last 30 days of data. Each row contains the Date, the average
Events Per Second (EPS) for that day, and the total size of event data received for that day, in
gigabytes (GB).
lLicensed:The usage limit defined in by the ESM software license installed on the system, displayed
as either GB or EPS.
lNumber of license overages: The number of days in the past 30 day period that amount of event
data received has exceeded the ESMsoftware license usage limit.
lLicensed GB per day: The usage limit defined by the ESM software license installed on the system,
displayed as GB per day. This metric is displayed if the ESMsoftware license is based on the size of
event data.
lLicensed EPSper day: The usage limit defined by the ESMsoftware license installed on the system,
displayed as EPS. This metric is displayed if ESMsoftware license is based on EPS.
ArcSight Command Center User's Guide
Chapter 1: Welcome to the ArcSight Command Center
HPE ESM 7.0 Page 13 of 213

Chapter 2: Viewing System Information
ArcSight Command Center provides the Dashboard page and Dashboard Navigator page to allow you
to view system information. Information appears in these two pages in the form of dashlets.
From the Dashboard page, you can add any available dashlets while from the Dashboard Navigator
page you can view dashboards comprised of data monitor and query viewer dashlets. Unlike the
Dashboard page, dashboards in the Dashboard Navigator page cannot be modified since they originate
in the ArcSight Console.
Command Center opens in the Dashboard page. You can return to this page any time by clicking
Dashboards in the top menu bar.
Managing Dashlets in the Dashboard Page
The My Cases, My Dashboards, and My Notifications dashlets provide workflow information while Data
Monitor and Query Viewer dashlets provide system information. You can customize the Dashboard
page by adding or removing any available system-monitoring and workflow-based dashlets.
The Dashboard page is where you monitor your workflow. By default, the Dashboard page displays the
My Cases and My Dashboards dashlets.
Adding a Data Monitor Dashlet to the Dashboards Page
About:
A data monitor dashlet can display information for events, filters, rules, and other types of information.
Note: Note:You can customize the look of a data monitor and query viewer dashlets in the
Dashboard Navigator page (see "Managing Dashboards in the Dashboard Navigator Page" on
page19).
Prerequisite:
lCreate one or more data monitors in ArcSight Console.
See "Creating a Data Monitor" in the ArcSight ESM User's Guide.
Procedure:
Location: Dashboards > Dashboard page
1. Click Add Content.
2. From the Add Content to Home popup, select Data Monitors.
HPE ESM 7.0 Page 14 of 213

3. Navigate to the data monitor folder containing the desired data monitor.
4. Select the desired data monitor in the Name column and then click Add Content.
5. Add any additional data monitors and then close the popup.
6. To change a data monitor view, make a selection from the available drop-down in the data monitor
title bar.
Note: Not all chart options that are supported in the ArcSight Console are available in the
Command Center.
More:
lAvailable data monitor views vary based on the data monitor type.
See Also:
lESM 101:
Section on "Correlation Evaluation" > "Data Monitors"
lArcSight Console User's Guide:
Section on "Monitoring Events" > "Using Data Monitors"
Adding the My Cases Dashlet to the Dashboard Page
About:
Cases track individual or multiple related events and export event data to third-party products. Cases
can stand alone or are integrated with a third-party case management system.
A case contains information about an incident, usually with one or more events attached. Use cases to
track, investigate, and resolve events. Where cases are similar, you can copy events directly from one
case to another. You assign cases of interest to analysts, who can investigate and resolve them based
on severity and enterprise policies. You can also use rules to automatically open or update a case when
certain conditions are met.
You can assign cases to groups of users who receive a notification with access to the case and its
associated data. Those users can take action on the assigned case and specify other actions to be taken,
assign it to another user, or resolve the case.
Note:The My Cases dashlet does not display assigned cases if these cases are assigned to only to a
group. To access these cases, go to the Cases area of the ArcSight Command Center, as described
in the chapter "Cases" on page119.
Procedure:
Location: Dashboards > Dashboard page
1. Click Add Content.
2. From the Add Content to Home popup, select My Cases and then click Add Content.
ArcSight Command Center User's Guide
Chapter 2: Viewing System Information
HPE ESM 7.0 Page 15 of 213

Command Center displays the cases assigned to you.
3. Close the popup.
More:
lThe link in the My Cases dashlet title bar opens the Cases page where you can see the list of cases,
create new ones, and perform other functions. This is the same as selecting Cases from the top menu
bar.
lIf you would like to add an existing case to your personal folder, go to the ArcSight Console, edit the
case, and then add yourself as the owner in the Assign section.
See Also:
l"Cases" on page119 in this guide
lESM 101:
"Workflow" > "Cases"
lArcSight Console User's Guide:
"Case Management and Queries" to create and edit cases in the ArcSight Console.
Adding My Dashboards to the Dashboard Page
About:
Dashboards display data gathered from data monitors or query viewers. Dashboards can display data in
a number of formats, including pie charts, bar charts, line charts, and tables, and you can rearrange and
save the dashboard element display. You can edit the existing dashboards and create new ones from
the ArcSight Console.
Procedure:
Location: Dashboards > Dashboard page
1. Click Add Content.
2. From the Add Content to Home popup, select Dashboards and then click Add Content.
Command Center displays the list of dashboards that are in your personal folder.
More:
lYou can also see the list of dashboards under Dashboards > Navigator, along with all the other
dashboards.
lUse the ArcSight Console to create dashboards under your personal folder.
lThe link in the My Dashboards widget title bar opens the Dashboard Navigator where you can see
the list of dashboards created in the ArcSight Console. This is the same as selecting Dashboards >
Navigator from the top menu bar.
lIf you would like to add another dashboard to your personal folder, go to the ArcSight Console and
drag it into your folder.
lAccess ArcSight Investigate from a dashboard by clicking on a field name and selecting ArcSight
ArcSight Command Center User's Guide
Chapter 2: Viewing System Information
HPE ESM 7.0 Page 16 of 213

Investigate. The fields that enable this access must be supported ArcSight Investigate fields. Not all
ESM fields are supported for search in ArcSight Investigate. These unsupported fields are disabled
for selection in an ArcSight Investigate search.
Note: The Target Address and Attacker Address fields have no ArcSight Investigate option.
If the field you are searching is empty, the ArcSight Investigate popup automatically uses
=",'None as the search condition. For example, for an empty deviceVendor field, the search
statement in ArcSight Investigate is
deviceVendor =",'None
See Also:
l"Viewing System Information" on page14 in this guide
lArcSight Console User’s Guide:
To create and edit dashboards, refer to “Monitoring Events” > “Using Dashboards”
Rearrange ArcSight Command Center Dashboard If Charts and Tables
Overlap
In some cases, data monitors and query viewers on the dashboard will overlap. When this happens,
switch to tab view. You can also edit the dashboard in the ArcSight Console as follows:
1. Log in to the ArcSight Console and display the dashboard.
2. Click the blue arrow at the bottom right corner of the dashboard and select Tile Best Fit.
3. Save the dashboard and exit the Console.
Adding My Notifications to the Dashboards Page
About:
Notifications and their content are created using rules configured with the Send Notification rule action.
Notifications come in the form of pending, undelivered, acknowledged, not acknowledged, resolved,
and informational.
Procedure:
Location: Dashboards > Dashboard page
1. Click Add Content.
2. From the Add Content to Home popup, select My Notifications and then click Add Content.
Command Center displays the list of notifications that are in your personal folder.
More:
ArcSight Command Center User's Guide
Chapter 2: Viewing System Information
HPE ESM 7.0 Page 17 of 213
lThe link in the My Notifications dashlet title bar opens the Notifications page where all the
notifications are listed.
lYou can also click the Notifications button in the upper right corner to open the Notifications page.
The number of pending notifications are indicated within a red circle:
lBy default, the My Notifications dashlet is filtered by the Pending, Acknowledged and Resolved
statuses of the Notifications page.
lFrom the Notifications page you can:
oAdjust the filter that controls which notifications appear
oAcknowledge notifications
oMark notifications as resolved
oDelete notifications
lNotifications are configured in the ArcSight Console. For more information, see the ArcSight
Console User’s Guide topic, “Managing Notifications.”
Adding a Query Viewer to the Dashboards Page
About
A query viewer is a resource for defining and running SQL queries on other resources, such as trends,
assets, cases, connectors, and events. Each query viewer contains a SQL query along with other logic for
establishing and comparing baseline results, analyzing historical data to find patterns in network
activity, and performing drill-down investigations on a particular aspect of the results. Query viewers are
defined in the ArcSight Console.
Procedure:
Location: Dashboards > Dashboard page
1. Click Add Content.
2. From the Add Content to Home popup, select Query Viewers.
3. Navigate to the query viewer folder containing the desired query viewer.
4. Select the desired query viewer in the Name column and then click Add Content.
5. Add any additional query viewers and then close the popup.
More:
Query viewers use specific types of queries, and some are not supported. Depending on the query used,
not all query viewers are displayed.
Query viewers are available in the Command Center in tabular and chart formats. For charts, the x and y
axes display only aggregated fields (such as count).
ArcSight Command Center User's Guide
Chapter 2: Viewing System Information
HPE ESM 7.0 Page 18 of 213

Query viewers displaying bar charts support only aggregated fields in the bar chart's y-axis and z-axis.
See Also:
lArcSight Console User’s Guide:
“Query Viewers” and " Building Queries"
Changing the Dashboards Layout
About:
Dashlets can appear in either one, two, or three columns.
Procedure:
Location: Dashboards > Dashboard page
lClick Change Layout and specify the number of columns to display.
More:
lYou can reposition widgets using drag and drop.
Managing Dashboards in the Dashboard Navigator
Page
About:
The Dashboard Navigator page is where you can access ArcSight Console dashboards and view the
data monitor and query viewer dashlets for each dashboard. It displays the information view that is
shown in the ArcSight Console. This information is in view-only mode.
See Also:
lCommand Center User's Guide:
- "Monitoring Events"
- "Query Viewers"
- See the HPE Support Matrix for a list of supported Web browsers.
lESM 101:
- "Monitoring and Investigation" > "Dashboard"
lArcSight Console User's Guide:
- "Monitoring Events" > "Managing Dashboards"
Viewing Dashboards in the Dashboard Navigator
About:
ArcSight Command Center User's Guide
Chapter 2: Viewing System Information
HPE ESM 7.0 Page 19 of 213
From the Dashboard Navigator, you can view dashboard information based on that in the ArcSight
Console. The Dashboard Navigator displays the ArcSight Console view as much as possible. You will be
prompted to refresh your Dashboard Navigator view if there are changes to resources on the ArcSight
Console.
Note: If a resource changes on the ArcSight Console that you are displaying in the Command
Center Dashboard Navigator page, you will have to refresh your view of the Dashboard Navigator
to be able to see the changes.
Prerequisite:
lCreate one or more data monitors or query viewers in ArcSight Console in a dashboard.
See "Monitoring Events" >"Monitoring Dashboards" in the ArcSight Console User's Guide.
Procedure:
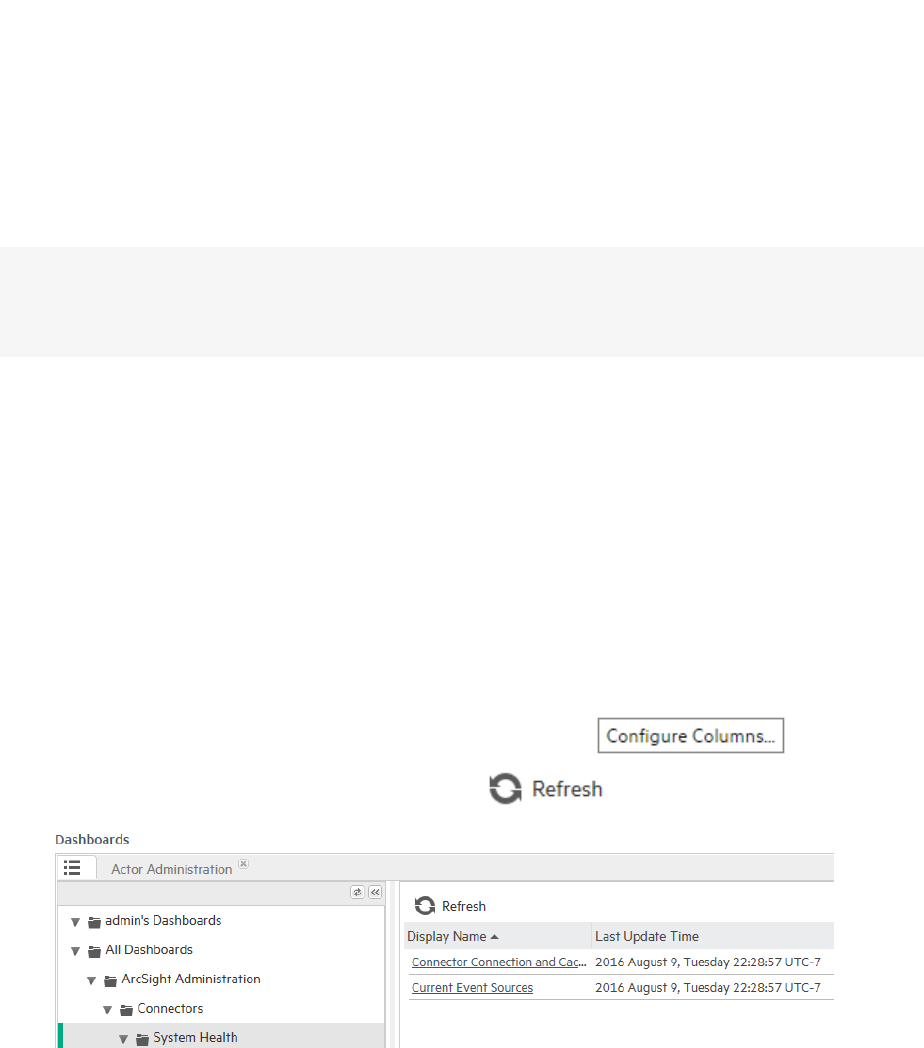
Location: Dashboard menu > Navigator > Dashboard - list screen >resource tree
1. Click Dashboard > Navigator.
2. Expand the dashboard folder in the resource tree and then click the desired folder.
Dashboards associated with the folder appear in a table in the center of the screen, as seen in the
following example of dashboards listed in the navigator. Click to change the
columns in the table listing the dashboards. Click to update the dashboard data.
3. Click the Display Name link for the desired dashboard.
The dashboard screen for the selected dashboard opens, displaying dashlets the events for the
dashboard. For example:
ArcSight Command Center User's Guide
Chapter 2: Viewing System Information
HPE ESM 7.0 Page 20 of 213
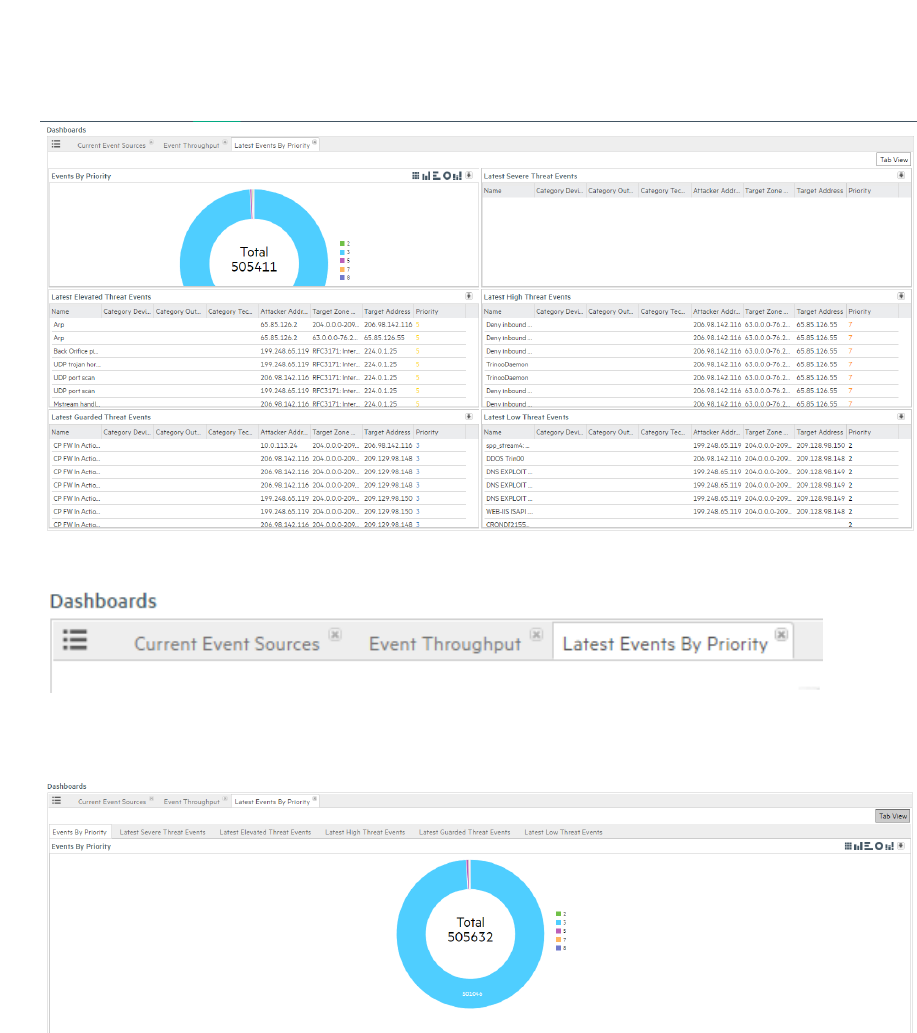
4. If you have multiple dashboards open, these will appear in tabs, as seen in the following example.
Click Tab View to change the dashboard view to show dashlets in individual tabs, as shown in the
following example. You can click the various tabs to view each tab.
Click Tab View to change back to the tiled view of the dashboards.
Navigate from a Dashboard to a Channel in a Data Monitor
Procedure:
1. Add a data monitor, per steps in "Adding a Data Monitor Dashlet to the Dashboards Page" on
page14
2. In a dashboard data monitor dashlet, right-click in a data display (for example, right-click in a
segment of a pie chart).
3. Select Create Channel, and enter a name for the channel. This will create and display a temporary
ArcSight Command Center User's Guide
Chapter 2: Viewing System Information
HPE ESM 7.0 Page 21 of 213

channel.
4. Click Save As to save the channel as a resource that you can access again.
Note: Some data monitors do not support navigation directly to a channel. These are:
lAsset Category Count
lEvent Correlation
lSystem Monitor
lSystem Monitor Attribute
lRules Partial Match
Also, some of fields are not supported for drilldown. These include:
lData Viewer fields
lAggregated fields
Specifying a Dashlet Chart Type
About:
Command Center enables you to specify the dashlet chart type.
Procedure:
Location: Dashboards > Navigator > Dashboard Navigator page
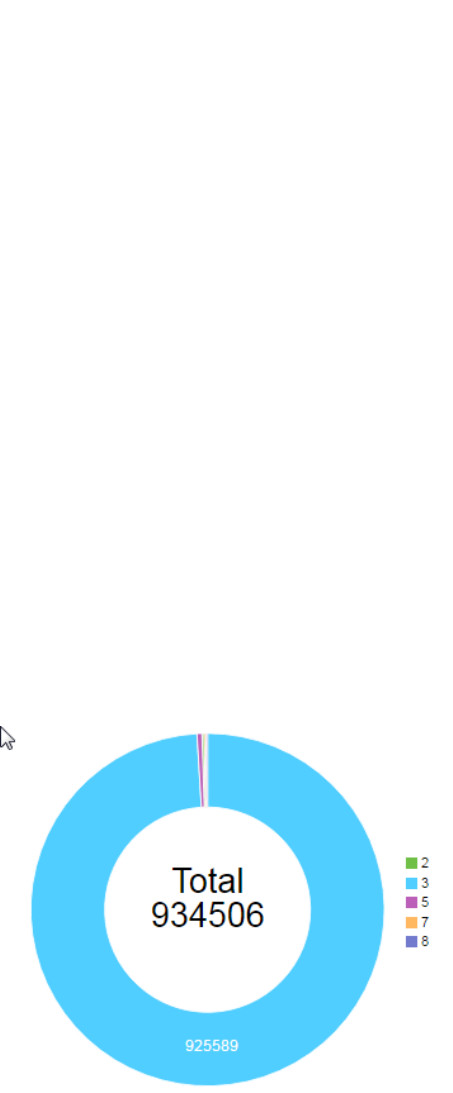
1. In the upper right corner of the dashboard page dashlet, select a chart type from the icon choices.
For example: or . The chart type currently displayed
is highlighted in green.
2. Click the icon again to change the chart type, or return to the original view of a chart.
More:
The available view options vary based on the dashlet type, and other selections made when it was
created in the ArcSight Console. They might show different kinds of charts, if the data monitor can be
displayed in those formats. Below are the possible data presentation formats.
ArcSight Command Center User's Guide
Chapter 2: Viewing System Information
HPE ESM 7.0 Page 22 of 213

Display
Format Description
Bar Chart Shows data as a series of proportional bar elements and may include bar segmentation to subdivide the
data.
Applies to data monitors and query viewers.
Horizontal
Bar Chart
Shows data as a series of proportional bar elements and may include bar segmentation to subdivide the
data. This format forces the bars to run left-to-right rather than up-and-down.
Applies to data monitors and query viewers.
Pie Chart or
Do Nut Chart
Shows data as a circle with proportional wedges for elements and a hole in the middle.
Applies to data monitors and query viewers.
Statistics
Chart
Overlays Moving Average data graphs on a data monitor, when multiple graphs are present. Compare
this display format to the Tiles format, which arranges individual-graph monitors into fixed arrays.
Applies to data monitors.
Table Displays data as a grid.
Applies to data monitors and query viewers.
Stacking Bar
Chart
Shows data from a query viewer as a series of proportional bar elements and may include bar
segmentation to subdivide the data.
Geographical
Event Map
Shows a map of the world with lines connecting the origin and destination of each event. You can zoom
in and hover over individual events for details.
Applies to geographical event graphs.
Event Graph Displays the event endpoints like nodes on a spider web. You can hover over individual events
endpoints for details.
Topology
Graph
A variation of the Event Graph that displays event endpoints in relation to each other, in terms of
Source Nodes, Event Nodes, and Target Nodes. This graph allows you to explore the relationships and
connections among the nodes. Hover over a node to highlight that node's connections. Click individual
nodes to drill down and explore the relationships among the nodes.
You can pause auto-refresh so that data will stop updating and remain stable during an investigation.
Click play to restart data update.
Right-click on any individual node to copy node information to the clipboard; you can use this data later
in filter, or for another purpose.
Note: You can configure a display limit for Event Graphs in the ArcSight Console. Depending on your
monitor size, you might have to adjust this value to yield usable data in the Topology Graph view.
Dashlet Types
Points to consider:
lCharts may appear differently in the Command Center than they do in the ArcSight Console. The
default chart view in the Command Center is the bar chart.
ArcSight Command Center User's Guide
Chapter 2: Viewing System Information
HPE ESM 7.0 Page 23 of 213
lNot all chart options are available in the Command Center that are supported in the ArcSight
Console. For example, the 3D bar chart is not available in the Command Center, and a regular bar
chart will display instead.
lIn the Command Center, the display limit for all charts is 20 entries. The grid view limit is 1000.
lCharts in the Command Center Dashboard navigator provide a view of charts, but do not allow
drilldown into the data; this is provided in the ArcSight Console.
lIf you refresh the Dashboard Navigator view when displaying several dashboards, the refreshed view
will subsequently display the last dashboard viewed.
lYou can use your browser's bookmark capability to bookmark a dashboard view. Use the bookmark
to log in and the bookmarked view will display.
lRight-click and copy is not available in Topology Graphs.
lFor Topology Graphs, if the source node and attacker node are the same node, the source and
attacker nodes in this case are shown as separate nodes in the graph (are not depicted as one node).
Tip: You can click an entry in a chart to filter data.
For example, in this chart:
If you click on the entry labeled 3, this is the result:
ArcSight Command Center User's Guide
Chapter 2: Viewing System Information
HPE ESM 7.0 Page 24 of 213

The data you choose is filtered out. Click again to turn the filter off and the filtered data is again
considered in the chart. This filtering persists only for the current session.
See Also:
ArcSight ConsoleArcSight Command Center User's Guide:
Topic "Monitoring Events" > "Using Dashboards"
Downloading a Dashlet to a CSV File
About:
From a data monitor or query viewer dashlet, Command Center enables you to save dashlet data to a
CSV file.
Procedure:
Location: Dashboards > Navigator > Dashboard Navigator page
1. In the data monitor or query viewer dashlet, click the icon.
2. Follow any further prompts to save the data to a CSV file.
Note: The Safari browser blocks popups by default, and does not give notification that it does so.
You must enable popups in Safari for them to function.
ArcSight Command Center User's Guide
Chapter 2: Viewing System Information
HPE ESM 7.0 Page 25 of 213
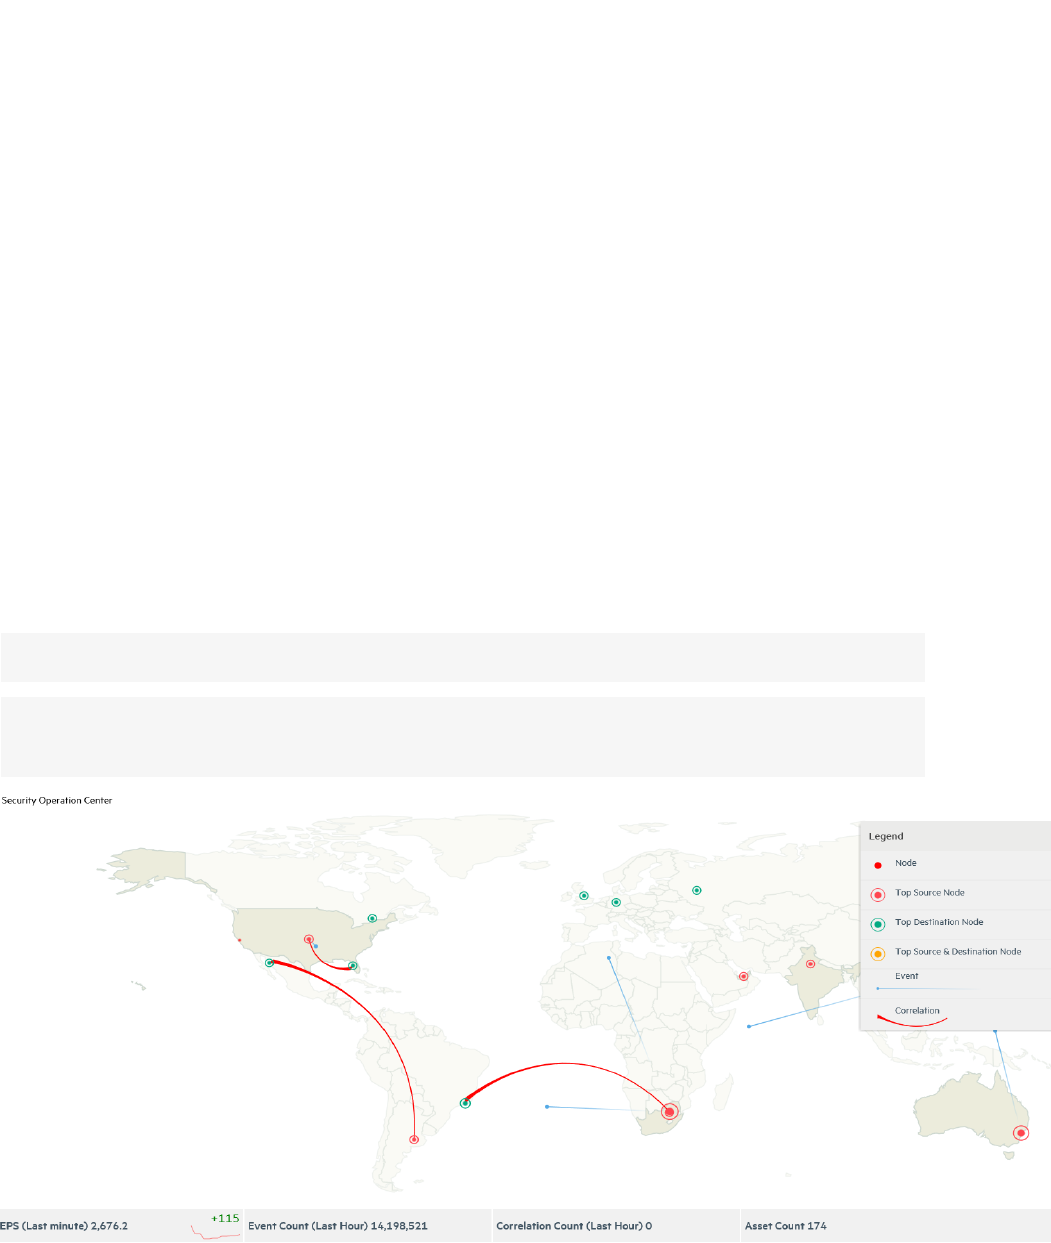
Using the Security Operation Center (SOC)
Dashboard
About:
This view-only dashboard enables an administrative user to see the sources and distribution of events.
It includes a geographic map, which is a color-coded visualization of the top source addresses and top
destination addresses of events. Also, the top source geographic regions are highlighted in a different
background shade. When event transmission occurs, the dashboard animates the source and
destination of the event activity with a flashing blue streak; hover over this streak to see the correlation
rule that generated the activity. Correlation events are indicated with animated red streaks that persist
until the data is refreshed.
The events must come from external addresses with genuine geographic locations in order for the SOC
Manager to display the paths accordingly.
Tip: Users may turn Legend on to see what each icon means.
Note: Scheduled Rules not show up in the Rules Activity data monitor as the SOC view shows rules
activity in real time.
Procedure:
Location: Dashboards > Security Operation Center
More:
The SOC Dashboard also displays:
ArcSight Command Center User's Guide
Chapter 2: Viewing System Information
HPE ESM 7.0 Page 26 of 213

Attribute Description
EPS (Last
Minute)
Trend over the last 12 entries. Indicates an increase or decrease for the last value (upward arrow for
increase; downward arrow for decrease.
Event Count (Last
Hour)
Cumulative count of events over the last hour.
Correlation Count
(Last Hour)
Number of rules fired in the last hour.
Asset Count Number of assets involved in the event accumulation.
Correlation
Activity/Malicious
View
Source and destination data for the dashboard animations. Click the arrow to switch to Malicious
View, which displays a malicious action, its target, the file that could have been affected, the action
taken for mitigation, and the vendor application that took the action.
Correlation Correlation event sources and destinations.
Top Attack Types Port and protocol for combination events (without totals).
Top Source Top 10 sources (without totals).
Top Destination Top 10 destinations (without totals).
Using the Cluster View Dashboard
About:
This dashboard provides a visual map of your cluster configuration, EPS, available node services,
connections, and cluster audit events. The cluster is made up of nodes that represent systems on which
the cluster services run. Hover over each node with your mouse to see details.
Procedure:
Location: Dashboards > Cluster View
The screen displays three main sections: Distributed Correlation Stats, Cluster and Live View of
Audit Events.
More:
•Distributed Correlation Stats shows the ESM nodes that are part of the Distributed Correlation
Cluster and the various services (persistor, aggregator, correlator, message bus, or distributed cache)
that are running on each node and from. The status of the services are indicated in two colors: green
(available or running) or red (unavailable or not running). Dcache and Mbus status do not throw results
in this section, hence, they are grayed out.
Tip: Users may turn Legend on to see what each icon means.
As shown in the example, the left panel shows the graph of a cluster topology. There are four nodes
identified by hostnames, and the installed services are identified as follows:
ArcSight Command Center User's Guide
Chapter 2: Viewing System Information
HPE ESM 7.0 Page 27 of 213
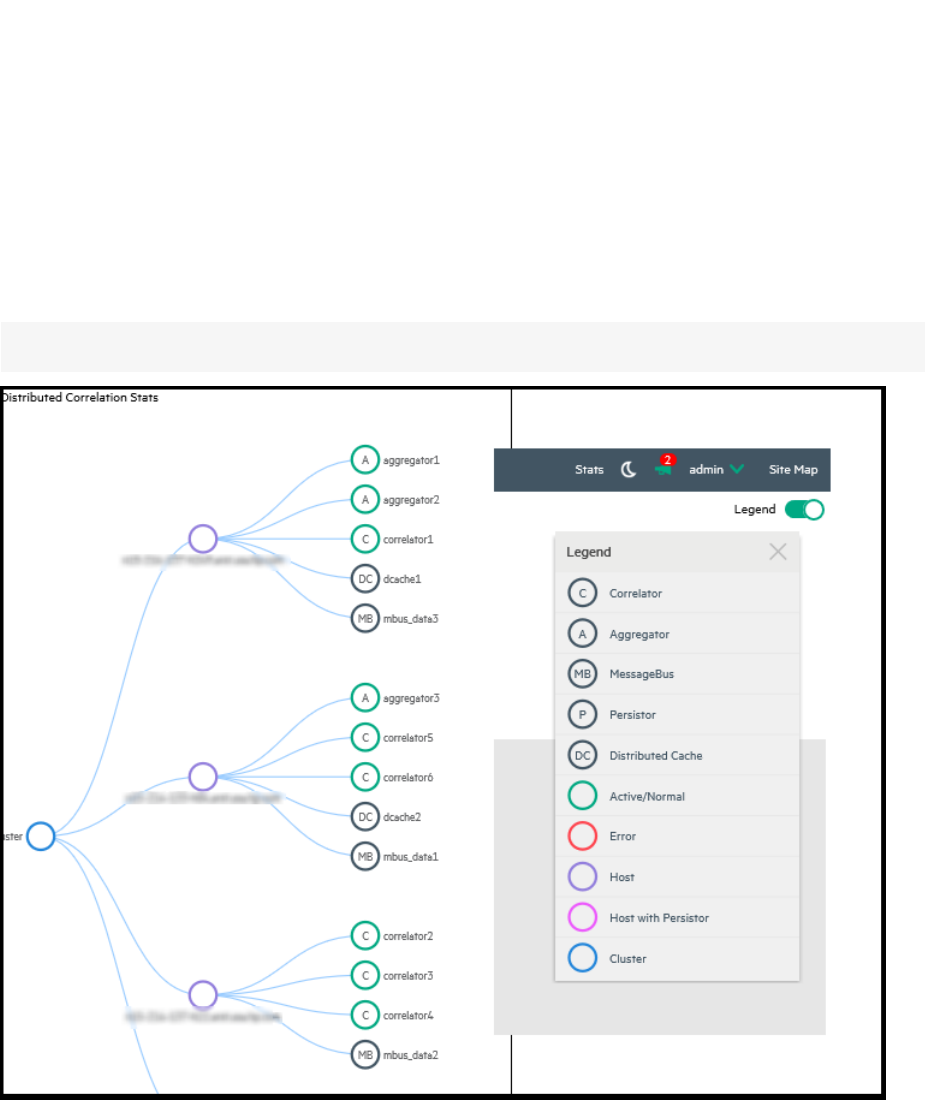
P = Persistor. In Distributed Mode, Persistor = Manager. There is only one Persistor/Manager per
cluster.
A = Aggregator. You can have multiple instances.
C = Correlator. You can have multiple instances.
DC = Distributed cache. You can have multiple instances.
Note: The Persistor node shows the service ID as manager.
•Cluster shows Metrics, Services Configured and Health Check.
ArcSight Command Center User's Guide
Chapter 2: Viewing System Information
HPE ESM 7.0 Page 28 of 213

The Metrics displayed are:
1. EPS – incoming EPS to Manager.
2. Lag Aggregator – Messages remaining in the Mbus for the Aggregator to consume.
3. Lag Correlator – Events remaining in the Mbus for the Correlator to consume.
4. GB/Day – incoming GB/day.
Note: Lag is shown as a metric on this dashboard. Lag indicates items waiting to be processed. The
lag numbers shown for correlators are for events per second (EPS). Those shown for aggregators
are messages per second.
Services configured is a summary of the total correlator and aggregator services configured for the
cluster. The count should match those on the cluster topology graph. It also indicates if the services are
running (Active) or (Stopped)
Health Check indicates if connections to and from the distributed cache and the message bus are good
and if the events are transmitted within the cluster.
• The Live View of Audit Events is updated every 15 minutes. The changing status of the cluster
nodes and services generate audit events, which are displayed in the bottom right of the dashboard. For
details on audit events, see the Reference Section of the ArcSight Console User's Guide > Audit Events >
Distributed Correlation.
ArcSight Command Center User's Guide
Chapter 2: Viewing System Information
HPE ESM 7.0 Page 29 of 213
Chapter 3: Monitoring Events Through Active
Channels
ArcSight Command Center recognizes event channels. You can create, edit, or delete active channels
(event channels).
Also, you can copy a channel (create a new channel with the same properties as a selected channel), and
refresh the channel view to get the latest data.
lCommand Center provides the following channel and event functionality:
Channel creation, editing, deleting: Event channels can be newly created with empty attributes or
created from an existing active channel. Channel attributes can be edited. You can change the name,
start time, end time, timestamp displayed, time evaluation type, the configured filter, and the
configured field set. You can also delete channels.
Channel filtering: Event channels can be filtered using conditions based on fields, filters, assets, and
vulnerabilities.
Condition Summary: Performs like a channel filter, where a raw string represents the conditions for
the channel. This summary displays the filter conditions defined for a channel.
Header: Each active channel has a header section containing several features you can use to
understand the channel and manipulate associated event information.
Radar display: The radar consists of a bar chart overview of events on the active channel. It is
divided into time segments sorted by event end time, each segment representing groups of events
with the same end time.
lTo use event channels
Priority statistics: Rating events of a channel based on their priority.
Annotation: Annotating an event and viewing event annotation history
Payload summary: An event payload is the information carried in the body of the event's network
packet.
Adding an event to a case: While monitoring suspicious events, you can choose an event on an
active channel and add this event to an existing, locked case.
Reviewed flag: Mark an event as reviewed, which can be helpful in the investigation process.
Graphical visualization: Through the use of widgets, you can view field information for events. You
can choose the type of field information to display and the range of events for which this information
should appear.
Event search: Search for events from the Events menu. See "Searching for Events in the ArcSight
Command Center" on page61.
HPE ESM 7.0 Page 30 of 213
Viewing Events On an Active Channel
About:
Viewing events on an active channel is done from the active channel screen. From this screen, you can
also view related event information and perform functions using events.
Note:
lSome channels in Command Center may not be current when accessed in a new ESM session. To
ensure current event information, refresh the channel by clicking the stop and play buttons.
lIf an active channel is open when Daylight Savings Time goes into or out of effect, the active
channel will not reflect the correct start and end times until the channel is closed and re-opened.
lThe Country Flag URL is not displayed in active channel information for the Geo Active Channel
in the Command Center, but is displayed in the ArcSight Console.
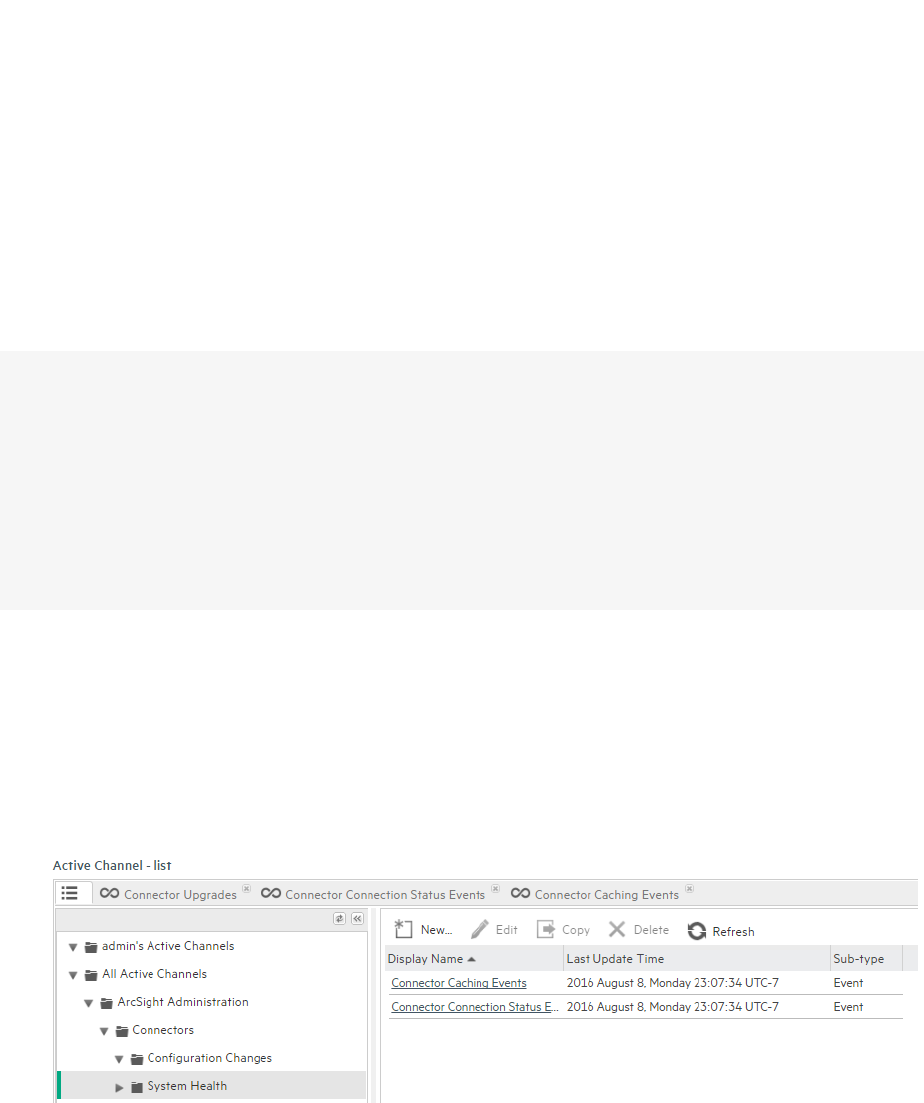
Procedure:
Location: Events menu > Active Channels > Active Channel - list screen > resource tree
1. Click Events > Active Channels.
2. Expand the appropriate active channel folder in the resource tree and then click the desired folder.
Channels associated with the folder appear in a table in the center of the screen, as seen in the
following example of active channels.
3. Click the Display Name link for the desired channel.
The Active Channel screen for the selected channel opens, displaying all the events for the channel
in the Event List tab. This is commonly known as the channel grid view.
If you have multiple channels open, these will appear in tabs, as seen in the following typical view
open channel tabs.
ArcSight Command Center User's Guide
Chapter 3: Monitoring Events Through Active Channels
HPE ESM 7.0 Page 31 of 213

4. To add a specific field to the channel grid view, choose Customize > Fields.
lFrom the Select popup, select the desired field from the appropriate field set.
The Selected Fields list contains the fields that comprise the columns in the channel grid view.
You can click the left arrow button (!) to remove any of these fields.
Use the up and down arrows in the Selected Fields list to sort the columns and control the order
in which the columns are displayed in the grid.
lClick OK.
The selected field appears as a column in the channel grid view, after the original columns.
5. To add the fields of a field set to the channel grid view, choose Customize > Field Set.
lFrom the Select popup, select the desired field set.
The Selected Fields list contains the fields that comprise the columns in the channel grid view.
You can click the left arrow button (!) to remove any of these fields.
lClick OK.
The fields appear as columns in the channel grid view, after the original columns.
Columns for the channel grid view are originally specified during the creation or edit of a channel
(see "Specifying Columns For the Active Channel Event List" on page47).
Note:
lSome channels can be resource intensive, such as those with a time range of an hour or so. If a
channel takes long to load in a high-traffic environment, open this channels in the ArcSight
Console. To view a resource-intensive channel in ArcSight Command Center, narrow the time
range to 5 - 10 minutes to reduce the event volume.
lFor optimum performance, limit open channels to 3 per browser, though ArcSight Command
Center can support up to 10 moderate-traffic channels or up to 15 light-traffic channels per
browser. Between ArcSight Command Center and ArcSight Console, ESM can support up to 25
open channels.
lArcSight Command Center does not support custom columns in the Event List (Events menu >
Active Channels > Active Channel - list). If the channel has Custom Columns configured in
Console, these will not appear in Command Center.
ArcSight Command Center User's Guide
Chapter 3: Monitoring Events Through Active Channels
HPE ESM 7.0 Page 32 of 213
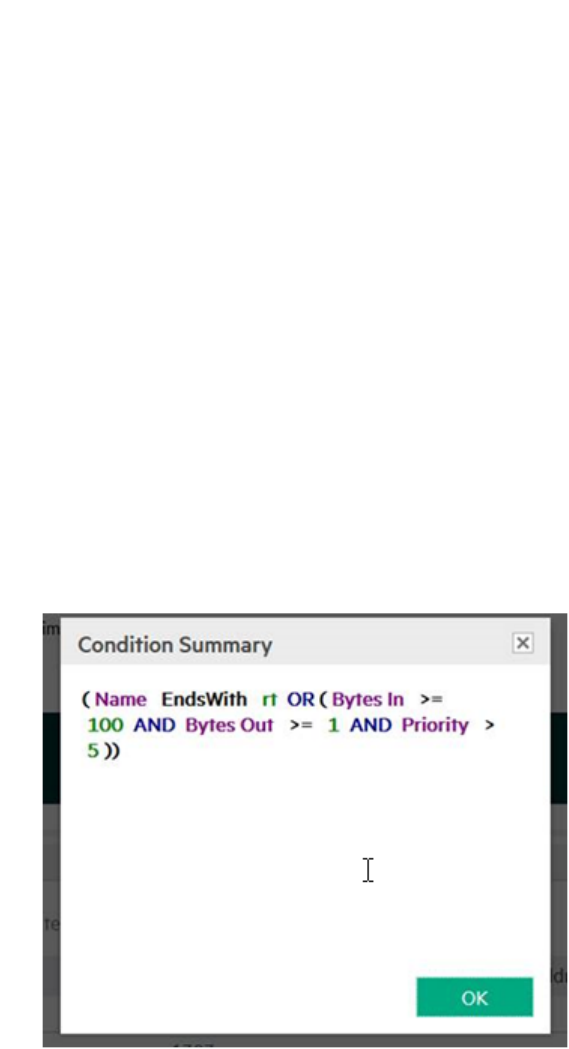
Viewing a Channel Condition Summary
About:
A channel condition summary displays in a raw string represents the filter conditions for the channel.
The syntax is slightly different than that displayed in Configure Filter > Operations > Summary when
editing a channel or creating a new channel. However, the attributes and logic are the same.
Procedure:
1. Open the desired channel.
See "Viewing Events On an Active Channel" on page31.
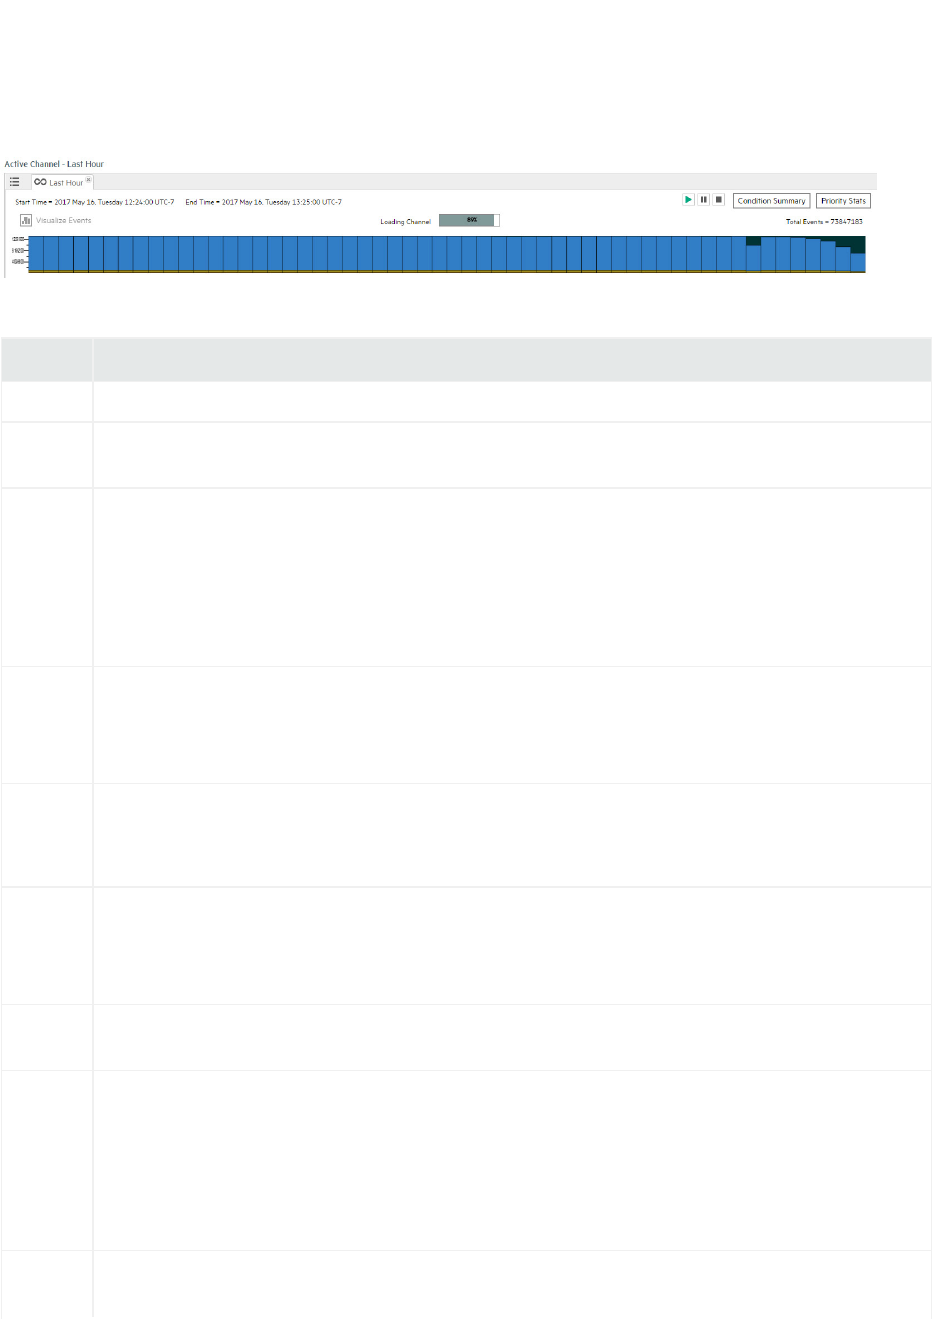
2. From the Active Channel screen, click Condition Summary.
3. From the Condition Summary popup, view the condition statements of the active channel.
Example of an active channel condition summary
The Condition Summary provides a read-only view of the channel condition so that you can verify the
syntax of the operators and their operands. See “Common Conditions Editor” in the ArcSight Console
User’s Guide.
Access ArcSight Console to change any filter conditions.
Viewing the Event Priority for a Channel
During the normalization process, the SmartConnector collects data about the level of danger
associated with a particular event, as interpreted by the data source that reported the event to the
connector.
ArcSight Command Center User's Guide
Chapter 3: Monitoring Events Through Active Channels
HPE ESM 7.0 Page 33 of 213
ESM normalizes the various event-rating scales into the default scale of Very Low,Low,Medium,High,
and Very High. An event can also be classified as Unknown if the data source does not provide a priority
rating.
For additional details, see “Event Priority” in ESM 101 and “Setting Special Severity Levels” in the
ArcSight Console User’s Guide.
1. Open the desired channel.
See "Viewing Events On an Active Channel" on page31.
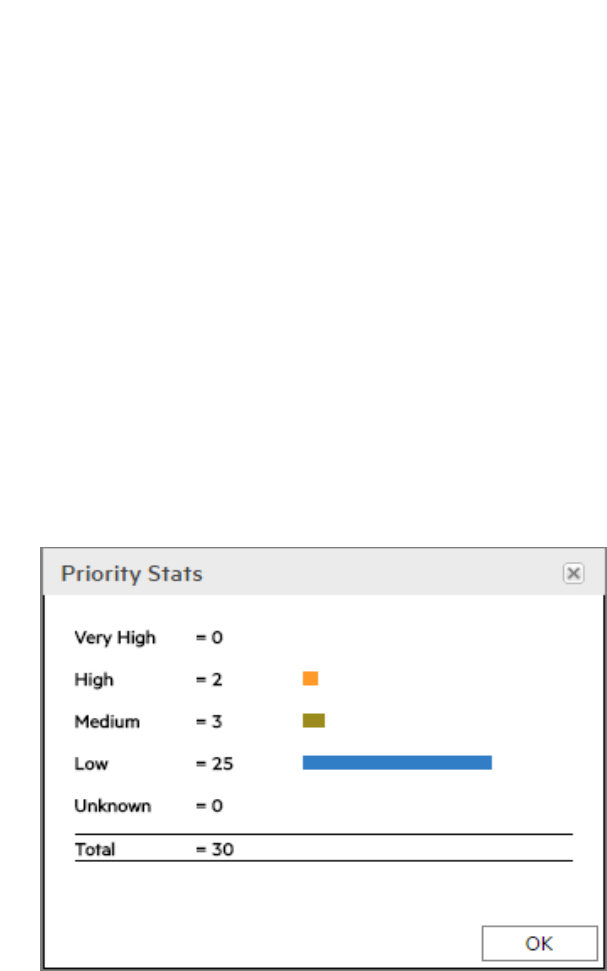
2. Click Priority Stats.
The Priority Stats popup opens, displaying the total number of events that are in each priority
scale.
The bar colors in the popup match the corresponding bars of the event rows and radar display.
Example of a view of the Priority Stats popup
Evaluate the Network Route of a Event in a Channel
About:
Command Center Tool Commands enable you to evaluate the connections on the network used by a
event in a channel.
Tool Commands are in a zip file included in the installation package. Unzip this file in a folder on the
product server or some other server. The Tool Commands utilities are supported on the same platforms
that ArcSight Console is supported. See the ESMSupport Matrix for the Console supported platforms.
Traceroute: Shows the path from Command Center to the IP address of the selected channel event,
reporting the IP addresses of all routers in between.
ArcSight Command Center User's Guide
Chapter 3: Monitoring Events Through Active Channels
HPE ESM 7.0 Page 34 of 213
Ping: Determines whether the IP address of a channel event is active. Tests and debugs a network by
sending a packet and waiting for a response.
Nmap (Network Mapper): This security scanner discovers hosts and services on a network, thus
creating a "map" of the network. To accomplish its goal, Nmap sends special packets to the target host
and then analyzes the responses.
Prerequisite:
Check to see that the nmap utility is installed on the client. Open a terminal or command window and
type:
nmap --version.
If nmap is installed, the version will be returned. If you get an error indicating that the command is not
recognized, download and install the nmap binary from http://nmap.org.
Procedure:
1. Open the desired channel and view the associated events.
See "Viewing Events On an Active Channel" on page31.
2. From the Active Channel screen > Event List tab, click the desired event link.
For easier selection, click the pause button to freeze the Event List.
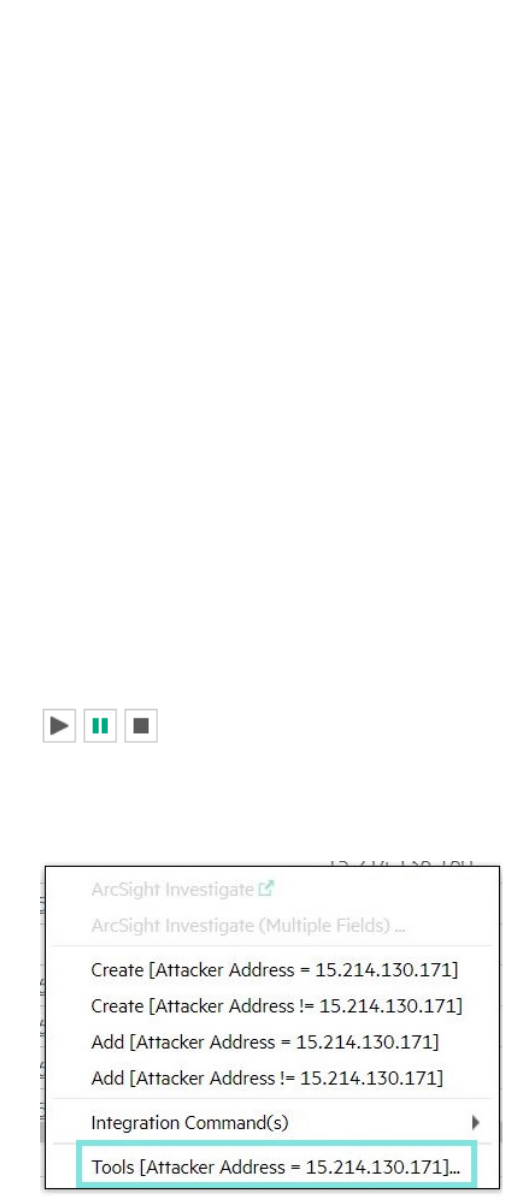
3. Identify an event, click on any field that contains an IP Address (such as Target Address,
Destination Address), and then select Tools from the extended menu. A popup displays the Tools
option.
4. Click Tools. From the Tools popup, click Download Tools Command Webapp.
You will be taken to ArcSight Marketplace.
5. Enter your ArcSight Marketplace login credentials.
If you do not have these credentials, contact Support.
ArcSight Command Center User's Guide
Chapter 3: Monitoring Events Through Active Channels
HPE ESM 7.0 Page 35 of 213

If the download page does not display, go to
https://marketplace.microfocus.com/arcsight/content/tool-commands-web-app and locate the
HPEArcSight Tools Command Web App download link for your specific operating system, and
download the file to your local system. Unpack the file (either unzip or untar).
6. Change these default property values of the self-signed certificate in the config.properties
file:
ping.app.hostname=localhost
ping.app.port=3000
The authentication certificate is valid for ten years.
7. If you are on a Linux and Mac system, give root user execute permissions on the node directory.
chmod +x node
On MAC OS steps to enable root user account:
% dsenableroot
username = Paul
user password:
root password:
verify root password:
dsenableroot:: ***Successfully enabled root user.
On MAC OS steps to disable root user account:
% dsenableroot -d
username = Paul
user password:
dsenableroot:: ***Successfully disabled root user.
8. Start the Web App by running the command:
<download directory>/node app.js
9. If using Internet Explorer Microsoft Edge, see the following Note section for browser configuration
details.
Otherwise, to test the Webapp, you must run the Webapp on the web browser. Enter the URL from
the configure.properties file (https://localhost:3000) in a web browser, ensure to
reach the Tools Command page. You might need to rerun node app.js and start a new
browser session afterward.
10. Specify the URL of the Tools Command panel and then click Set.
The URL is the one you specified in the config.properties file (https://localhost:3000).
11. Select the desired tool command or commands and then click Run.
The panel contains the results of the tool command. The panel displays within a tab by the same
name as the tool command.
ArcSight Command Center User's Guide
Chapter 3: Monitoring Events Through Active Channels
HPE ESM 7.0 Page 36 of 213
Note: If your operating system does not provide Nmap, then download the utility.
12. To change the URL of the tool command panel, click the gear icon, re-enter the URL, and then click
Set.
13. To copy the contents of the tool command panel, click Select All in the tool command tab (or select
the text manually), and then copy and paste the content into the destination.
Note:
If you are using the Tool Commands utility with Internet Exploreror Microsoft Edge and get the error
"Content was blocked because it was not signed by a valid security certificate", perform these steps to
clear the error:
1. In Internet Explorer, go to Internet options > Security Tab > Trusted Sites > Sites button.
2. In the Trusted Sites dialog, add the Tool Commands URL to the list Websites (Add button), then
click Close.
3. Click OK to close the Internet Options dialog.
4. Open the Tool Commands URL in a separate tab. When prompted, click "Continue to this website".
5. Click on the Certificate Error icon in the browser address bar, then select View Certificates.
6. In the Certificate dialog > General tab, click the Install Certificate button.
7. In Certificate Import Wizard, navigate to Next > Place all certificates in the following store > Trusted
Root Certification Authorities folder, and then click OK.
8. In the Security Warning dialog, click Yes. Close any open dialogs and return to Internet Explorer by
clicking OK.
9. In Internet Explorer, click Tools > Internet options. The Internet Options dialog opens.
10. Go to Advanced Tab and scroll to the end of the Settings list.
11. Uncheck the “Warn about certificate address mismatch*" setting, then click OK.
12. In Internet Explorer, reload the page to check the result. You should see the Tool Commands
Utility.
Accessing Integration Commands from an Event List
You can access Integration Commands from event links in the Event List. Integration Commands are
defined in the ArcSight Console.
Procedure:
1. Open the desired channel and view the associated events.
See "Viewing Events On an Active Channel" on page31.
ArcSight Command Center User's Guide
Chapter 3: Monitoring Events Through Active Channels
HPE ESM 7.0 Page 37 of 213

2. From the Active Channel screen > Event List tab, click the desired event link.
3. Select Integration Command > <command>.
Note these limitations:
lOnly Integration Commands of type URL are supported; when executed, the command URL is
launched in tab or new window based on browser preferences.
lThe ability to save parameters to a user or a target is not supported in the context of the Integration
Commands.
Accessing ArcSight Investigate or ArcSight
Investigate Search from an Event List
You can access ArcSight Investigate event links in the Event List. See the ArcSight Investigate
documentation for details.
Note:Be sure to have pop ups enabled for your browser. ArcSight Investigate opens in a separate
browser window.
Accessing ArcSight Investigate
The fields that enable ArcSight Investigate access must be supported ArcSight Investigate fields.
Procedure:
1. Open an active channel.
See "Viewing Events On an Active Channel" on page31.
2. Right-click an event, select Integration Commands, and select ArcSight Investigate Search.
3. Click ArcSight Investigate Search (Single Field.)
The ArcSight Investigate browser window opens for single field search.
Or
1. Click ArcSight Investigate (Multiple Fields.)
The ArcSight Investigate pane opens and displays a list of supported fields for the search.
The list is based on the columns available in the channel.
Tip: Users may enter the field name in Search Fields, instead of scrolling through the list. Enter
the first few characters until the full name is displayed.
2. Drag and drop the fields from the Available Fields pane to the Selected Fields pane.
3. Select up to five fields.
ArcSight Command Center User's Guide
Chapter 3: Monitoring Events Through Active Channels
HPE ESM 7.0 Page 38 of 213

4. Click ArcSight Investigate.
The ArcSight Investigate browser window opens for multiple fields search.
Note: Users might need to click 'allow the blocked pop-up' in order to open a browser for ArcSight
Investigate Search Login page.
Accessing Integration Command(s) from ArcSight Investigate Search
Note that not all ESM fields are supported for search in ArcSight Investigate. These unsupported fields
are disabled for selection in an ArcSight Investigate search. For ArcSight Investigate searches on active
channels, instead of Attacker Address, search Source Address instead. Instead of Target
Address, search Destination Address instead.
Procedure:
1. Open the desired channel and view the associated events.
See "Viewing Events On an Active Channel" on page31.
2. From the Active Channel screen Event List tab, click the desired event Name.
3. Click Integration Command(s) >ArcSight Investigate Search....
4. The Integration Commands popup displays. Select a command to determine your search, such ass
By Source and Destination, or By Vendor and Product.
5. Select a target implementation of ArcSight Investigate. For example, ArcSight Investigate 1.
6. Click OK. The ArcSight Investigate browser window opens.
If the previous steps are not performed in Configure target with target parameters, then, you are
prompted in another pop-up to enter the IP address for the ArcSight Investigate host. The pop-up
also shows the option to save the IP address parameter to the target. For more information, refer
to ArcSight Console User's Guide, topic on Integration Commands > Entering/ Saving Command
Parameters at Runtime.
Note: Users might need to click 'allow the blocked pop-up' in order to open a browser for ArcSight
Investigate Search Login page.
Note: On the ArcSight Investigate page, the time range for the search is the last 30 minutes by
default, which may not yield any search results. If necessary, edit the active channel by changing the
Start Time and End Time values for your search. See "Creating an Event Channel" on page45 for
details on setting those values.
About the Active Channel Header
Each active channel has a header section with features you can use to understand and manipulate what
the channel displays.
ArcSight Command Center User's Guide
Chapter 3: Monitoring Events Through Active Channels
HPE ESM 7.0 Page 39 of 213
Elements on the active channel header
Feature Usage
Name Indicates the resource type (active channel) and active channel name.
Time
Span
The Start Time and End Time show the chronological range of the channel.
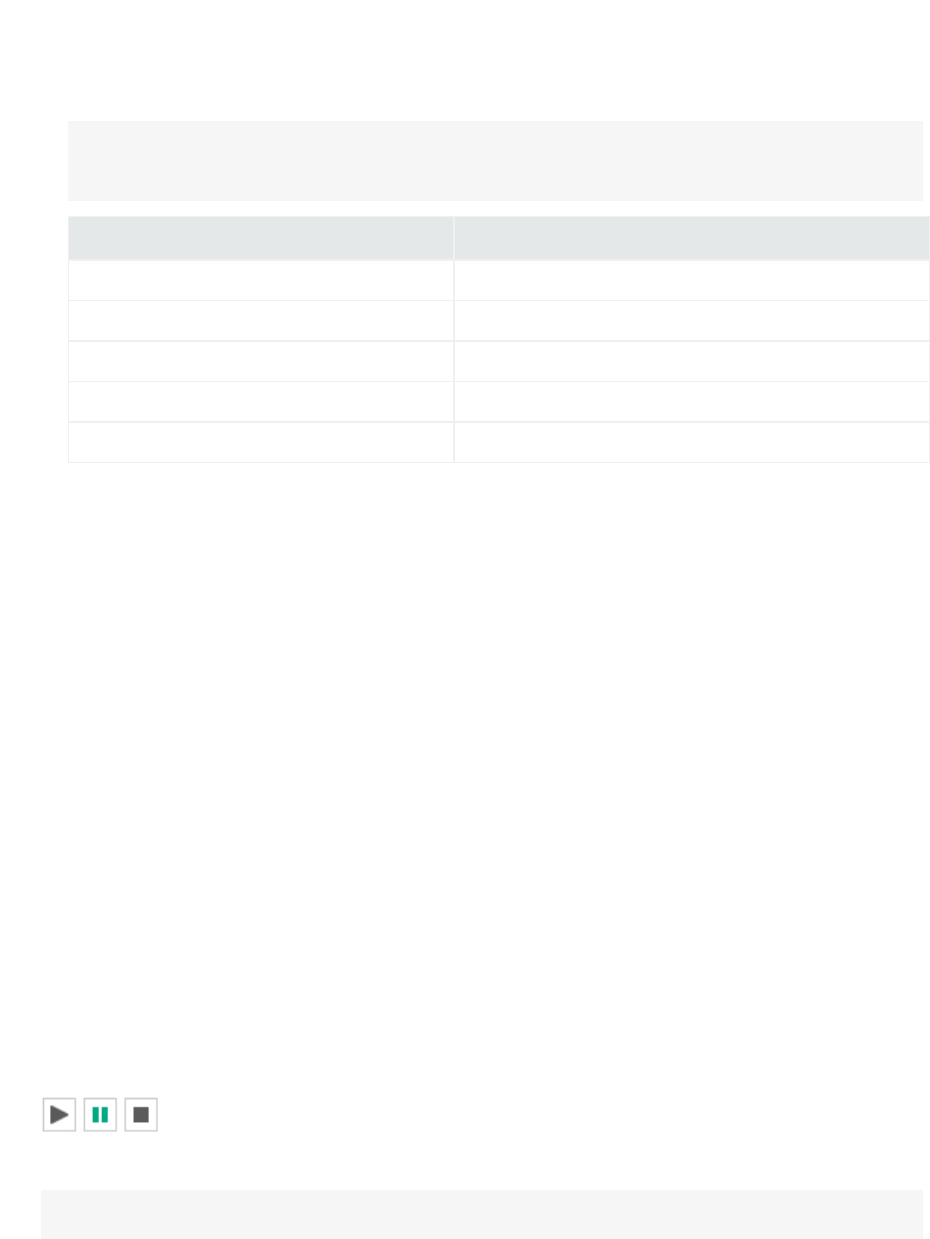
Play,
pause,
and stop
buttons
Controls updates to the channel with live events.
Play: Events are continuously sent to update the channel.
Pause: Temporarily stops updates to the channel. Click the play button to restore the update process.
Stop: Stops updating the channel and removes all events from the grid. Click the play button to reload the
channel.
Condition
Summary
Displays the filter conditions defined for the channel. Filter conditions determine the amount of
information to be displayed for events. Filters are either filter resources, in which case the URI to the filter is
also supplied; or in-line filter for the exclusive use of the active channel. For details on filter resources, see
“Filtering Events” in the ArcSight Console User’s Guide.
Priority
Stats
Displays event priority statistic indicators and their corresponding event count.
For details about event priority scoring, see the topic, “Priority Calculations and Ratings” in the Reference
Guide section of the ArcSight Console User’s Guide.
Visualize
Events
button
Allows selection of up to four event fields (columns) on the channel to display in the graphical format of
widgets. The results are displayed in the "Visualize Events tab" on the next page. In the Select Fields to
Visualize Events popup, drag and drop to move field names from Available Fields to Selected Fields. Then
click Visualize Events.
Channel
status
Indicates status, for example, Channel Loaded.
Total
Events
The total number of events received in the timeframe.
Note: The event count function on active channels only reports live events, not replay events. If you prefer
to see a count of all events coming through during a particular period, you should create a query viewer or
report. If you want a count of only replay events, the event count in a replay channel will provide an
accurate count of all replay events within a specific time window. Refer to the topics, “Building Reports” and
“Query Viewers” in the ArcSight Console User’s Guide.
Selected
Events
The events within a time segment selected on the radar. If a segment is not selected, the value equals
Total Events. See "Using the Active Channel Radar" on the next page for details.
Active Channel Header Features
ArcSight Command Center User's Guide
Chapter 3: Monitoring Events Through Active Channels
HPE ESM 7.0 Page 40 of 213
Feature Usage
Radar
display
operation
A bar chart overview of events in the active channel. See "Using the Active Channel Radar" below for
details.
Event
Grid tab
Displays a grid view of incoming events.
Visualize
Events
tab
Created after you click Visualize Events and select the event fields (columns) to be rendered in the
graphical format of these widgets:
lEvent Count
lTop 10 Row Chart for each selected event fields (up to four)
lPie chart for the Priority event field
Note: You can access ArcSight Investigate from the Visualize Events tab by clicking supported ArcSight
Investigate fields and selecting ArcSight Investigate. Not all ESM fields are supported for search in
ArcSight Investigate. These unsupported fields are disabled for selection in an ArcSight Investigate search.
The Target Address and Attacker Address fields have no ArcSight Investigate option.
Active Channel Header Features, continued
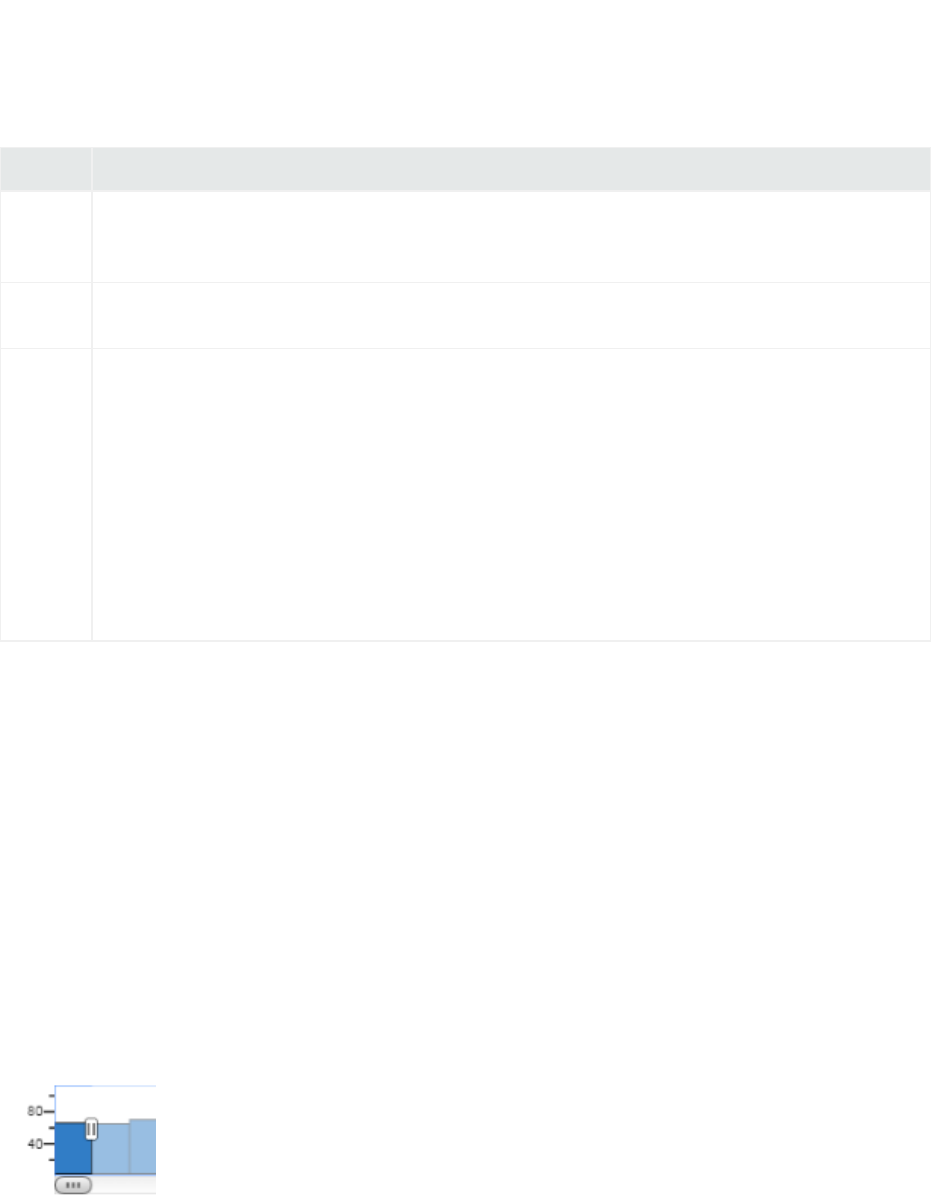
Using the Active Channel Radar
The radar consists of a bar chart overview of events on the active channel. It is divided into time
segments sorted by event end time, each segment representing groups of events with the same end
time.
The radar indicates the activity taking place in the entire channel, not just the current page. Its graphics
represent units of time horizontally, and numbers of events vertically representing Priority attribute-
value counts. The time and quantity scales in the graphic automatically adjust to accommodate the
scope of the channel. The broader the scope, the smaller the graphical units.
Use the radar to focus events on selected time segments.
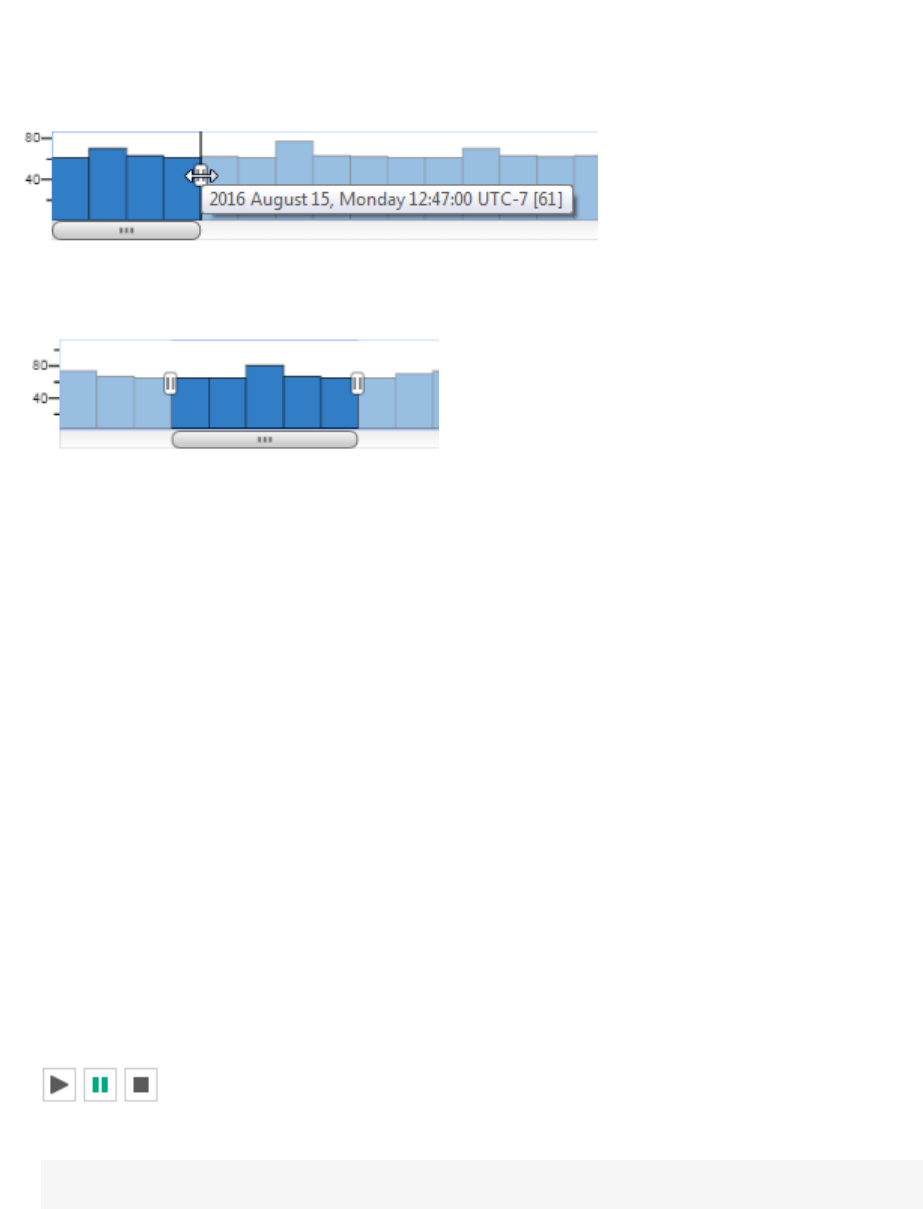
lTo focus the grid on the event of one segment, click its corresponding bar on the radar as shown:
The selected time segment displays a handler widget. Depending on the location of the selected
segment, handler widgets for both left and right boundaries are displayed.
lTo select multiple segments, contiguous or not, press Ctrl-click on the desired segments.
lTo focus the grid on multiple contiguous segments, drag the right or left handler to select more
segments:
ArcSight Command Center User's Guide
Chapter 3: Monitoring Events Through Active Channels
HPE ESM 7.0 Page 41 of 213
lTo move a block of selected segments to a different area on the radar, drag the slider under the
selected radar segments the to the left or right along the radar:
The grid adjusts to display only the events within that segment. The Selected Events total also
adjusts to display only the count of events within that same segment.
lTo restore the radar to display all events, press Ctrl-a.
The grid adjusts to display all events matching the count in Total Events (the default view).
Annotating an Event
About:
When annotating an event, you can change the stage, add comments, specify a user, and mark the
event as reviewed (see "Marking an Event as Reviewed" on page58). You can only annotate events to
which you have permission.
Procedure:
1. Open the desired channel.
See "Viewing Events On an Active Channel" on page31.
2. From the Active Channel screen > Event List tab, select the desired event and then click Annotate.
For easier selection, click the pause button to freeze the Event List.
Use the Ctrl or Shift key to select multiple events.
Note: If you scroll a selected event out of view in the Event List, the event becomes deselected.
3. Add annotation information as necessary.
a. Change the stage if this event is related to a case. If you applied the Code text tag to Queued,
when do the same for the other stages.
By default, the event stage is Queued. Other stages are Initial, Follow-Up, Final, and Closed.
Your organization may have customized stages to suite your business requirements.
ArcSight Command Center User's Guide
Chapter 3: Monitoring Events Through Active Channels
HPE ESM 7.0 Page 42 of 213
If a Stage is not available in this list, use the ArcSight Console to move the case to that
stage.
Default Collaboration Stages Description
Queued The event has not yet been inspected.
Initial The event has been inspected.
Follow-up The event is under investigation.
Final The investigation has concluded.
Closed The investigation is closed.
b. Assign the event to a user as required.
Viewing Additional Event Information
Additional information is available for each event in the form of details, annotation history, and payload.
Viewing Event Details
About:
Event information is grouped by Event, Agent, Category, Device, Device Custom, Event Annotation,
File, File Device, Original Agent, and Threat.
Procedure:
1. Open the desired channel.
See "Viewing Events On an Active Channel" on page31.
2. From the Active Channel screen > Event List tab, select the desired event and then click View
Details.
For easier selection, click the pause button to freeze the Event List.
To select multiple events, use the Ctrl or Shift key.
Note: If you scroll a selected event out of view in the Event List, the event becomes deselected.
3. View details in the Event Details popup.
From the Event Tree, select the desired event if multiple are present.
The Details tab of the Event Details popup shows attribute details related to the selected event.
4. To filter event information based on fields, use the Show Fields Containing field.
ArcSight Command Center User's Guide
Chapter 3: Monitoring Events Through Active Channels
HPE ESM 7.0 Page 43 of 213

5. To filter event information by field set, specify the desired field-set field.
a. Click the Field Set drop-down.
b. From the Please Select a Field Set popup, select the desired field set and then the desired field.
The field set appears in the Selected Resource list.
You can select only one field set.
c. Click OK.
To clear the field-set filter, open the field set selector popup again and click the left arrow
button. The selected field returns to the Name list.
6. To hide and show empty attribute rows, click Hide Empty Rows.
More:
lAccess ArcSight Investigate from Event Details by clicking on a field name and selecting ArcSight
Investigate or ArcSight Investigate (Multiple Fields). The fields that enable this access must be
supported ArcSight Investigate fields. Not all ESM fields are supported for search in ArcSight
Investigate. These unsupported fields are disabled for selection in an ArcSight Investigate search.
Viewing Event Annotation History
Event annotation is a workflow style of recording different ESM users’ analysis on an event. This is
useful when analysts are collaborating on the same event for case management. See "Annotating an
Event" on page42.
1. Open the desired channel.
See "Viewing Events On an Active Channel" on page31.
2. From the Active Channel screen > Event List tab, select the desired event and then click View
Details.
For easier selection, click the pause button to freeze the Event List.
To select multiple events, use the Ctrl or Shift key.
Note: If you scroll a selected event out of view in the Event List, the event becomes deselected.
3. Click the Annotation History tab in the Event Details popup.
From the Event Tree, select the desired event if multiple are present.
“Hidden” appears in the Flags column if you specified “Flagged as Similar” for the event stage
name. This event is hidden from all but the assigned users.
“Is Reviewed” appears under Flags if you marked an event as reviewed (see "Marking an Event as
Reviewed" on page58).
ArcSight Command Center User's Guide
Chapter 3: Monitoring Events Through Active Channels
HPE ESM 7.0 Page 44 of 213
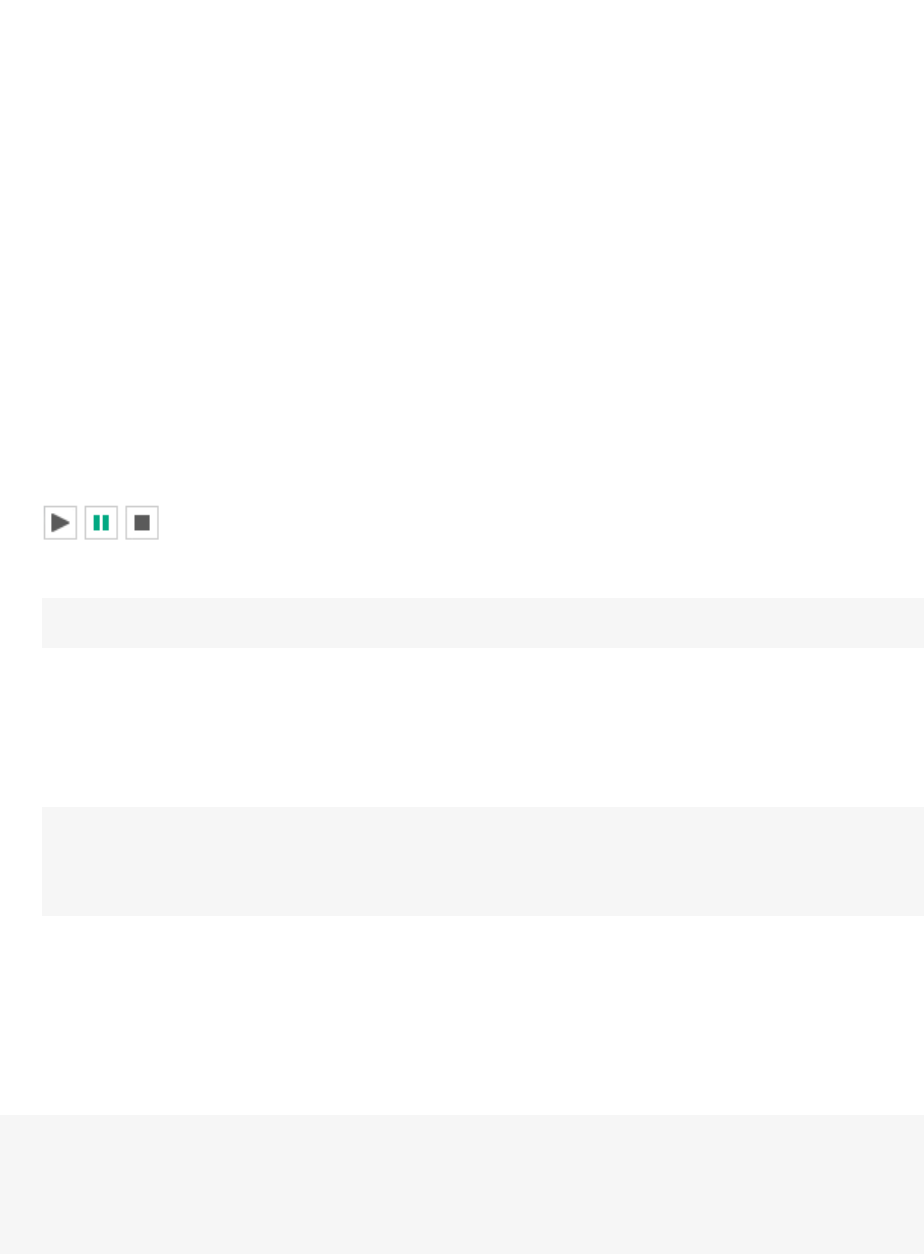
Viewing Event Payload
An event payload is the information carried in the body of the event's network packet, separate from
the packet's header data. See “Payload” in the “Reference Guide” section of the ArcSight Console User’s
Guide.
1. Open the desired channel.
See "Viewing Events On an Active Channel" on page31.
2. From the Active Channel screen > Event List tab, select the desired event and then click View
Details.
For easier selection, click the pause button to freeze the Event List.
To select multiple events, use the Ctrl or Shift key.
Note: If you scroll a selected event out of view in the Event List, the event becomes deselected.
3. Click the Payload tab in the Event Details popup.
A preserved payload remains attached to the event.
When you download a payload to a desired location, the payload still remains attached to the
event.
Note: Command Center may not display non-ASCII payload data. Therefore, if the Download
Payload button is enabled, but no data appears in the Event Details popup, click Download
Payload to download the data to a simple text editor, such as Notepad.
Managing Channels
You can create two types of event channels: one based on the attributes of an existing channel and one
created new.
NOTE:If a channel has not been locked, it is possible for multiple users to edit a Channel's attributes
in both at the same time. If another user saves changes to a channel while you are editing it, you will
be prompted that the channel has changed. If you are actively editing the channel, the page may
return to the Channel resource list (for example, if the user changed the Channel name).
Creating an Event Channel
About:
Create an event channel to monitor events on a network.
ArcSight Command Center User's Guide
Chapter 3: Monitoring Events Through Active Channels
HPE ESM 7.0 Page 45 of 213

Procedure:
Location: Events menu > Active Channels > Active Channel - list screen > resource tree
1. Select the desired active channel folder.
2. Click New.
The New Channel popup opens.
3. Specify the channel name.
4. To specify the channel time attributes, refer to the following information:
Time
Attribute Usage
Start Time The relative or absolute time reference that begins the period to track events in the channel. To
specify the time expression, make a selection from the Start Time drop-down menu.
Note: If a channel is open when Daylight Savings Time starts or ends, it does not show the correct
start time until you restart it.
For a list of possible time values see the Start Time: field pull-down menu.
End Time The relative or absolute time that ends the period to actively track the events in the channel. To
specify the time expression, make a selection from the End Time drop-down menu.
Note:
If a channel is open when Daylight Savings Time starts or ends, the live channel does not show the
correct start time until you restart it.
Use as
Timestamp
Choose the event-timing phase that best supports your analysis. End Time represents the time the
event ended, as reported by the device. Manager Receipt Time is the recorded arrival time of an
event at the ArcSight Manager.
Time
Evaluation
Choose whether the channel will Continuously Evaluate (like $Now) to show events that are
qualified by Start and End times which are re-evaluated constantly while the channel is running, or
Snapshot to show only the events that qualify when the channel is first run.
A channel set to Continuously evaluate is also known as a sliding channel, and typically has
its End Time option set to $Now.
Start Time Period Description
$Now - 30m The current minute minus 30 minutes
$Now The current minute
$Now - 1h The current minute minus one hour
$Now - 1d The current minute minus one day
$Today Midnight (the beginning of the first minute) of the current day
Start Time Attributes
ArcSight Command Center User's Guide
Chapter 3: Monitoring Events Through Active Channels
HPE ESM 7.0 Page 46 of 213

Start Time Period Description
$Today - 1d Midnight (the beginning of the first minute) of the current day minus one day
$Today - 1w Midnight (the beginning of the first minute) of the current day minus one week
Custom The day and time for the start time.
Start Time Attributes, continued
Start Time Unit Description
m (lowercase) Minutes (Do not confuse with M, meaning months.)
h Hours
d Days
w Weeks
M (uppercase) Months (Do not confuse with m, meaning minutes.)
Start Time Units
5. To specify columns for the active channel grid view, click Configure Field Set.
See "Specifying Columns For the Active Channel Event List" below.
6. To add a filter to the channel, click Configure Filter to add filter conditions in the Common
Conditions Editor (CCE).
See " Specifying Filter Conditions for an Active Channel" on the next page.
7. To validate the filter, choose Operations > Validate.
Command Center interactively checks condition statements as you add them. The validate option
checks the condition statements collectively to ensure operators are used correctly.
The Validate Filter popup appears with the status of the filter. If there is a violation, edit the filter
conditions.
8. To edit filter conditions, choose either Operations > Summary and make changes directly in the
SQL code, or right click the desired condition statement and make a selection form the extended
menu.
Specifying New Condition from the extension menu creates a condition, at the specified location,
that is in agreement with the selected condition.
9. Click Update Filter Configuration and then Save in the top half of the dialog box.
See Also:
"Creating a Channel Based on an Event Attribute" on page53
Specifying Columns For the Active Channel Event List
About:
ArcSight Command Center User's Guide
Chapter 3: Monitoring Events Through Active Channels
HPE ESM 7.0 Page 47 of 213

The columns in the active channel Event List are based on the fields in a configured field set.
Prerequisite:
Create an event channel.
See "Creating a Channel Based on an Event Attribute" on page53 or "Creating an Event Channel" on
page45.
Procedure:
Location: Events menu > Active Channels > Active Channel - list screen > resource tree
1. Select the desired active channel folder.
Note: By default, Command Center stores active channels in the folder of the user who
created the channels.
2. Do one of the following:
lClick New.
The New Channel popup opens.
lFrom the channel table, select the desired channel without clicking the Display Name link, and
then click Edit.
The Edit Channel popup opens.
3. Click Configure Field Set.
4. From the navigation folders on the bottom left, select the desired field set folder and then select
the desired field set from the Display Name column.
5. Click Update Field Set and then Save Channel.
Specifying Filter Conditions for an Active Channel
About:
You can specify filter conditions at channel creation or during a channel edit.
Prerequisite:
Create an event channel in order to edit filter conditions.
See "Creating an Event Channel" on page45 or "Creating a Channel Based on an Event Attribute" on
page53.
Procedure:
Location: Events menu > Active Channels > Active Channel - list screen > resource tree
ArcSight Command Center User's Guide
Chapter 3: Monitoring Events Through Active Channels
HPE ESM 7.0 Page 48 of 213

1. Select the desired active channel folder.
Note: For a channel based on the attribute of an existing channel, Command Center stores the
channel in the [user]'s Active Channel" folder, by default. The [user] value is the currently
logged in username.
2. Do one of the following:
lClick New.
The New Channel popup opens.
lFrom the channel table, select the desired channel without clicking the Display Name link, and
then click Edit.
The Edit Channel popup opens.
3. Click Configure Filter.
The Common Conditions Editor (CCE) opens in the lower half of the popup, where you specify the
conditions for the channel filter. You can refine your view of a channel to show only the events you
want to see. For instance, suppose you have an active channel that includes both system and non-
system events, but you want to see only the non-system events. You can filter out the system
events.
From the CCE, Boolean logic is represented in a user-friendly manner, giving you the ability to
easily create conditions.
Since the filter is created within the channel, the filter works only for the channel.
To edit a Condition in the filter, double-click on the condition. The statement editor will appear in
the popup.
4. From the CCE, add a logical operator from the Operators button area.
You must include an Operator if you create two or more condition statements in the filter. An
Operator is not required if the filter contains one condition statement only. Use the AND, OR, and
NOT operators to define the full condition statement.
Logical
Operator Name Use
{} New Event Definition Creates a new condition tree.
& AND The new condition has to match in addition to existing conditions.
|| OR Either the new condition or any existing conditions have to occur.
!= NOT All but the new condition has to occur.
5. From the toolbar in the Conditions button area, specify a condition.
ArcSight Command Center User's Guide
Chapter 3: Monitoring Events Through Active Channels
HPE ESM 7.0 Page 49 of 213

Filter
Condition Description
Fields You can specify fields with particular values as part of conditions statements.
Filters A filter limits what events a channel displays. If the criteria of the condition are met, the
evaluation returns true or false. Events that do not meet the condition or conditions are not
evaluated further, but they are preserved in the data store.
If there are existing filter conditions, you can tie them to the added filter condition with a logical
operator.
Assets After assets are added to your network model, you can select them in order to write conditions
that help you analyze their role in the event traffic they process. You can select an asset to add to
filters as a new condition.
Asset conditions state whether your enterprise assets are targets or sources of events. An asset
condition states “if an event occurs and the selected asset is the source or target, generate a
correlation event.”
If there are existing filter conditions, you can tie them to the asset condition with a logical
operator. If AND is used, all the existing conditions and the asset condition must occur in the
event. If OR is used, either the existing conditions or the asset condition must occur. If NOT is
used, all but the asset condition must occur.
Vulnerabilities Specify the conditions of any hardware, firmware, or software state that leaves an asset open for
potential exploitation.
If there are existing filter conditions, you can tie them to the vulnerability condition with a logical
operator. If AND is used, all the existing conditions and the vulnerability condition must occur in
the event. If OR is used, either the existing conditions or the vulnerability condition must occur. If
NOT is used, all but the vulnerability condition must occur.
a. To specify a Field Condition, select the Current Filter node or position the cursor in the desired
location in the condition statements, click the Fields condition button , and then select the
desired field from the area at the bottom right.
You can use the Show Fields Containing field to locate a field. Start typing the name of the
field, and the list will be actively filtered based on the text entered. Select a field from the list by
double-clicking it in the field table.
Note: Field types of BitSet and Enumeration are not supported in Command Center. In
addition, the Customer ID, Domain, Event Annotation Flags, and Generator fields are not
supported. None of these appear in the field table. You cannot edit them in the Edit
Channel popup. Certain fields, such as Event ID, have a limited set of operators provided.
You will see a reduce set of operators in the Operator drop-down, compared to the
Console.
b. Specify the field value in the Value field.
To change the field or operator, use the Field and Operator fields, respectively.
c. Click Apply Condition.
ArcSight Command Center User's Guide
Chapter 3: Monitoring Events Through Active Channels
HPE ESM 7.0 Page 50 of 213
Starting with the addition of a logical operator, use the above steps to add any other field
conditions.
d. Click Update Filter Configuration.
e. To specify a Filter Condition, select a location in the condition statements list, and then click the
Filters condition button . Select the desired filter from the area at the bottom right.
f. Click Apply Condition to add the condition to the filter.
g. To specify an Asset Condition, select a location in the condition statements list, and then click
the Asset condition button . Select the desired asset from the area at the bottom right. This
list of Assets is larger than in console.
The value selected from the <xxx> Asset ID drop-down menu, the checkbox, the value
selected in the NULL/NOTNULL drop-down menu, and the Selected Resource group (under
the Asset Category, Asset, or Zones tab) work together to define the Asset Condition
statement. Selecting the checkbox enables the is NULL qualifier of the statement. When
enabled, it the statement evaluates whether the attribute does not exist in the Selected
Resource group. When the checkbox is not selected, the statement evaluates whether the
attribute value does exist.
Asset Condition filters select Events where the attribute you specified contains a value that is
also found in the:
- Asset Category (if you selected an item under the Asset Categories tab)
- Asset Group (if you selected an item under the Assets tab)
- Zone Group (if you selected an item under the Zones tab)
To create a condition that selects an individual Asset by its unique IDor name, use the Field
Condition and then specify the value directly.
h. Select an asset or group and then click Apply Condition.
i. Click Update Filter Configuration.
j. To specify a Vulnerability Condition, select a location in the condition statements list, and then
click the Vulnerability condition button . Select the desired vulnerability from the area at
the bottom right.
k. To include any assets in the filter that could be impacted by the selected vulnerability, select the
a value from the <xxx> Asset ID drop-down list (for example, Agent Asset ID).
Repeat this step for each condition statement you want to include in the channel filter.
6. To validate the filter, choose More Options: Operations > Validate.
Command Center interactively checks condition statements as you add them. The validate option
checks the condition statements collectively to ensure operators are used correctly.
The Validate Filter popup appears with the status of the filter. If there is a violation, edit the filter
conditions.
7. To edit filter conditions, right click the desired condition statement and then choose either Edit or
ArcSight Command Center User's Guide
Chapter 3: Monitoring Events Through Active Channels
HPE ESM 7.0 Page 51 of 213

Remove.
This choice displays the appropriate work area at the bottom right.
8. To view the logic of the filter conditions, choose More Options: Operations > Summary.
9. Click Update Filter Configuration and then Save Channel in the top portion of the dialog box.
Note
When creating an Asset Filter, Command Center will not display Assets (under the Assets tab) that have
the Asset Disabled flag set. You access this list in the New (or Edit) Channel pop up >Configure Filter >
Asset Filter Condition statement options.
You can create a Field condition statement for any field that stores an IP Address and then use the
InSubnet operator to match IP addresses in an address range. See the following topic for valid IP
address ranges.
IP Address Ranges
The insubnet operator uses a range of IP addresses. Use the following guidelines to input IP address
ranges in a single string.
Caution: The IP address range must be in the same family, for example, a range of IPv4 addresses
or a range of IPv6 addresses.
Two-
address
range
A two-address range is in the format firstAddress - lastAddress, meaning any address between
an arbitrary range of any two addresses, inclusive.
IPv4 range: 192.168.0.0 - 192.168.255.255
IPv6 range: 2001:db8:fd0c:: - 2001:db8:fd0c:ffff:ffff:ffff:ffff:ffff
CIDR
notation
The CIDR notation is in the format address/prefix-length. This format is more restrictive than the
two-address range format where the range starts and ends.
IPv4 range: 192.168.0.0/24
IPv6 range: 2001:db8:fd0c::/64
Wildcard
expressions
Fields on the right end of an address may be replaced with an asterisk, with no numeric data to the right
of the first asterisk. The wildcard represents the range of all values for the field, from all-zero bits to all-
one bits. This format is more restrictive than the two-address range format in where the range starts and
ends.
IPv4 range: 192.168.*.*
IPv6 range: 2001:db8:fd0c:*:*:*:*:*
See Also:
"Editing an Event Channel" on page54
ArcSight Command Center User's Guide
Chapter 3: Monitoring Events Through Active Channels
HPE ESM 7.0 Page 52 of 213
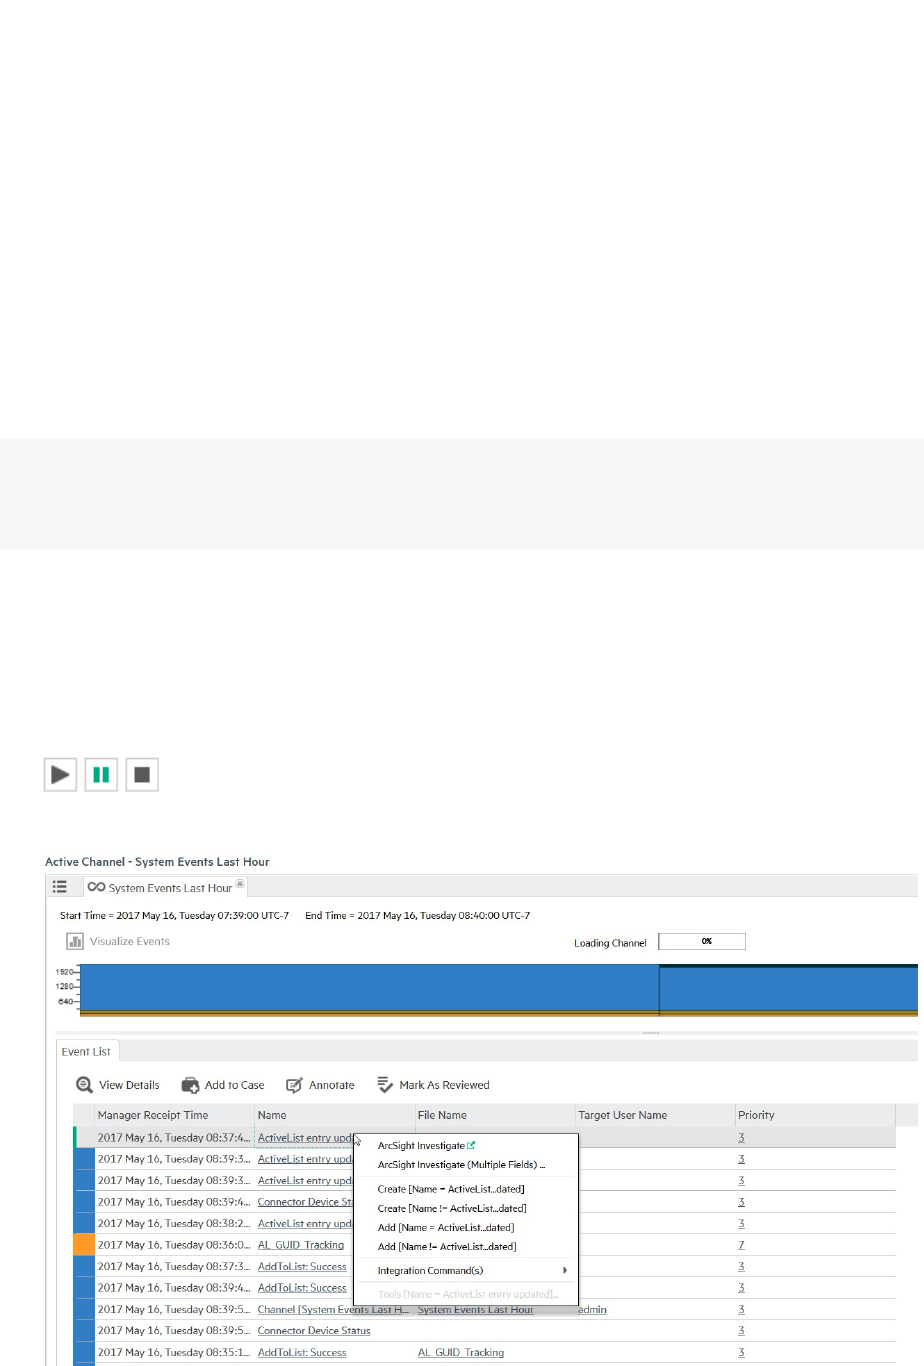
Creating a Channel Based on an Event Attribute
About:
You can further investigate a channel event attribute by creating a new channel based on that attribute.
In addition to all the attributes of the originating channel, the new channel now collects greater detail
on the specified attribute.
Because Command Center only supports basic event fields, such as name, attacker address, target
address, target port, and priority, channel creation is limited to the attributes provided by these fields.
Note: If the channel that you are investigating originated in the ArcSight Console and contains
event fields not supported in Command Center, these unsupported event fields will not be lost and
can be viewed in the ArcSight Console.
Procedure:
1. Open the desired channel.
See "Viewing Events On an Active Channel" on page31.
2. From the Active Channel screen > Event List tab, click the desired event link.
For easier selection, click the pause button to freeze the Event List.
3. Select the desired command from the extended menu.
ArcSight Command Center User's Guide
Chapter 3: Monitoring Events Through Active Channels
HPE ESM 7.0 Page 53 of 213

A new view that is a subset of the main active channel is created. Note that the total events count is
less than the parent channel’s total.
Option Use
Create Channel
[attribute=value]
Show only those events in which the selected attribute matches the value in the
selected event.
Create Channel
[attribute!=value]
Show only those events in which the selected attribute does not match the value in
the selected event.
Add [attribute=value] to
Channel
Show only those events that match both the prior and new filter elements.
Add [attribute!=value] to
Channel
Show only those events that do not match both the prior and new filter elements.
4. To save the new channel, click Save As and do one the following in the Save Channel As dialog:
lAccept the default channel location - Specify the channel name and accept “[user’s] Active
Channels” in the Location drop-down.
lSpecify an alternate channel location - Specify the channel name, click the Location drop-down
and then make the appropriate selection from the Select popup.
Note: If you choose a folder that has a parent, you must first select the parent folder from
the left folder navigation and then select the child folder from the "Display Name" column.
Direct selection of a child folder is not supported. This design helps to simplify the selection
of a child folder that is multiple levels deep in a folder structure.
5. Click OK.
6. To view the new channel in the default folder, or alternative folder that you may have specified,
click the resource tree tab.
See Also:
"Editing an Event Channel" below
"Creating an Event Channel" on page45
Editing an Event Channel
About:
You can edit an event channel either created from an attribute of an existing channel or one created
afresh.
Procedure:
Location: Events menu > Active Channels > Active Channel - list screen > resource tree
ArcSight Command Center User's Guide
Chapter 3: Monitoring Events Through Active Channels
HPE ESM 7.0 Page 54 of 213
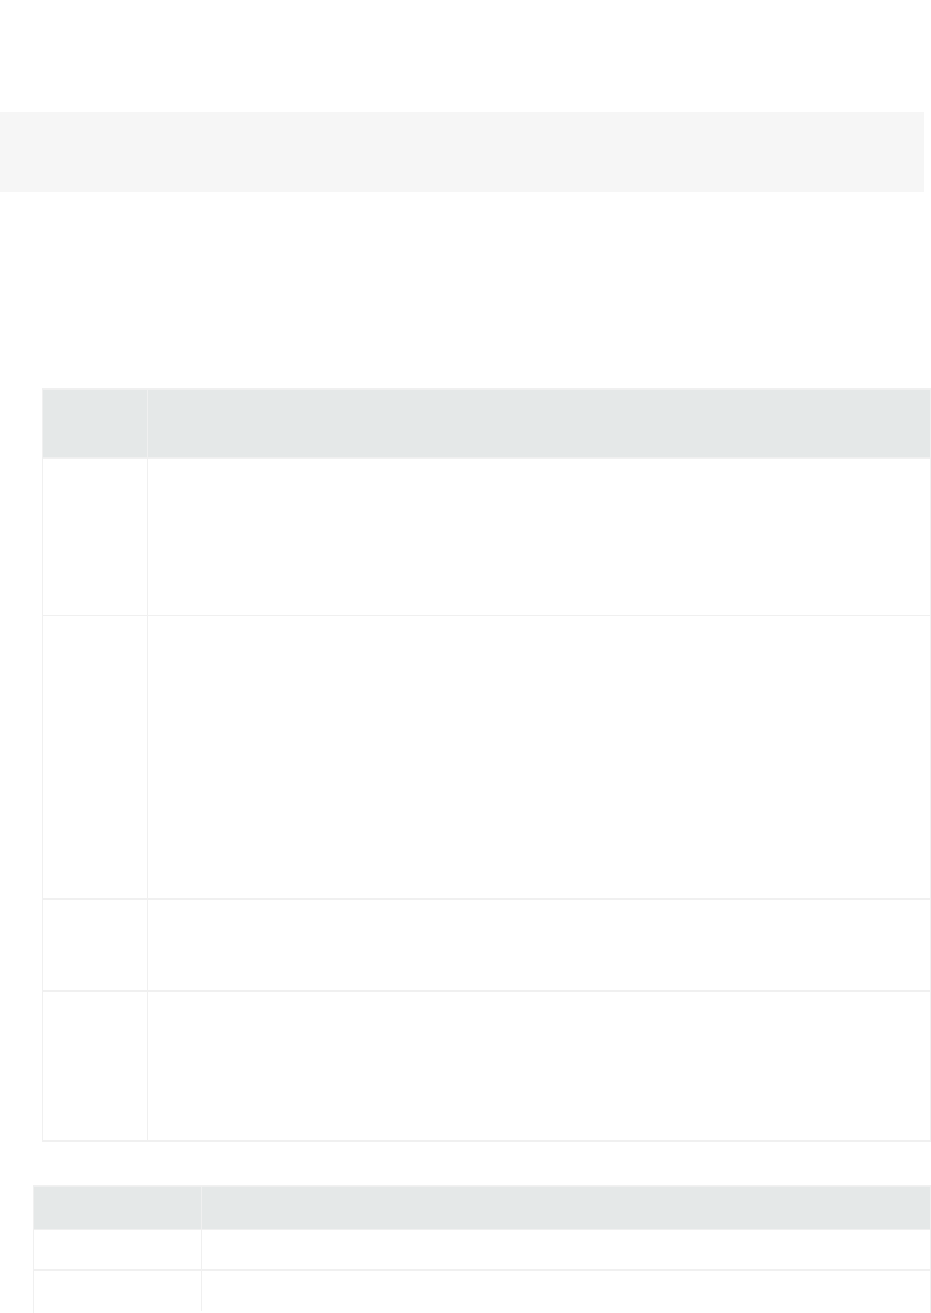
Note: For a channel based on the attribute of an existing channel, Command Center stores the
channel in the "[user's] Active Channel" folder, by default.
1. Select the desired active channel folder.
2. From the channel table, select the desired channel without clicking the Display Name link, and
then click Edit.
The Edit Channel popup opens.
3. To change the channel name and or time attributes, refer to the following information:
Time
Attribute Usage
Start Time The relative or absolute time reference that begins the period to track events in the channel. To
specify the time expression, make a selection from the Start Time drop-down menu.
Note: If a channel is open when Daylight Savings Time starts or ends, it does not show the correct
start time until you restart it.
For a list of possible time values see the Start Time: field pull-down menu.
End Time The relative or absolute time that ends the period to actively track the events in the channel. To
specify the time expression, make a selection from the End Time drop-down menu.
Notes:
lIf a channel is open when Daylight Savings Time starts or ends, the live channel does not show
the correct start time until you restart it.
lIf setting the End Time results in the message “Invalid end date for sliding channel,” the
channel is set to Continuous evaluation instead of Evaluate once. Either re-set the End
Time or change the Time Parameters option for the channel to Continuous evaluation.
lAvoid creating an active channel that queries more than once per day.
Use as
Timestamp
Choose the event-timing phase that best supports your analysis. End Time represents the time the
event ended, as reported by the device. Manager Receipt Time is the recorded arrival time of an
event at the ArcSight Manager.
Time
Evaluation
Choose whether the channel will be Continuously Evaluate (like $Now) to show events that are
qualified by Start and End times which are re-evaluated constantly while the channel is running, or
Snapshot to show only the events that qualify when the channel is first run.
A channel set to Continuously evaluate is also known as a sliding channel, and typically has
its End Time option set to $Now.
Period Description
$Now The current minute
$Today Midnight (the beginning of the first minute) of the current day
Current Period
ArcSight Command Center User's Guide
Chapter 3: Monitoring Events Through Active Channels
HPE ESM 7.0 Page 55 of 213
Period Description
$CurrentWeek Midnight of the previous Monday (or same as $Today if today is Monday)
$CurrentMonth Midnight on the first day of the current month
$CurrentYear Midnight on the first day of the current year
Current Period, continued
Unit Description
m (lowercase) Minutes (Do not confuse with M, meaning months.)
h Hours
d Days
w Weeks
M (uppercase) Months (Do not confuse with m, meaning minutes.)
Units
4. To specify columns for the active channel grid view, click Configure Field Set.
See "Specifying Columns For the Active Channel Event List" on page47.
5. To add a filter to the channel, click Configure Filter to add filter conditions in the Common
Conditions Editor (CCE).
See " Specifying Filter Conditions for an Active Channel" on page48.
6. To validate the filter, choose Operations > Validate.
Command Center interactively checks condition statements as you add them. The validate option
checks the condition statements collectively to ensure operators are used correctly.
The Validate Filter popup appears with the status of the filter. If there is a violation, edit the filter
conditions.
7. To edit filter conditions, right click the desired condition statement and make a selection from the
extended menu.
Selecting a New Condition button creates a condition, at the specified location, that is in
agreement with the selected condition.
8. Click Update Filter Configuration and then Save Channel in the top half of the dialog box.
See Also:
l"Creating an Event Channel" on page45
l"Creating a Channel Based on an Event Attribute" on page53
ArcSight Command Center User's Guide
Chapter 3: Monitoring Events Through Active Channels
HPE ESM 7.0 Page 56 of 213

Deleting an Event Channel
About:
You can delete an event channel either created from an attribute of an existing channel or one created
afresh.
Procedure:
Location: Events menu > Active Channels > Active Channel - list screen > resource tree
1. Click Events > Active Channels.
2. Expand the appropriate active channel folder in the resource tree and then click the desired folder.
Channels associated with the folder appear in a table in the center of the screen, as seen in the
following typical view of active channels.
3. Click in the row of the desired channel, without clicking on the Display Name link.
4. With the channel row highlighted, click Delete.
Copying an Event Channel
About:
You can create a new channel by copying an existing event channel. The Copy feature is disabled if the
channel or the folder storing the channel have been locked.
Procedure:
Location: Events menu > Active Channels > Active Channel - list screen > resource tree
1. Click Events > Active Channels.
2. Expand the appropriate active channel folder in the resource tree and then click the desired folder.
Channels associated with the selected folder appear in a table in the center of the scree.
3. Select the row of the desired channel, without clicking on the Display Name link.
4. With the channel row highlighted, click Copy. Anew channel will be created in that folder with the
same specifications as the original channel.
Adding an Event to a Case
About:
While monitoring suspicious events, you can choose an event on an active channel and add this event to
an existing, locked case.
ArcSight Command Center User's Guide
Chapter 3: Monitoring Events Through Active Channels
HPE ESM 7.0 Page 57 of 213
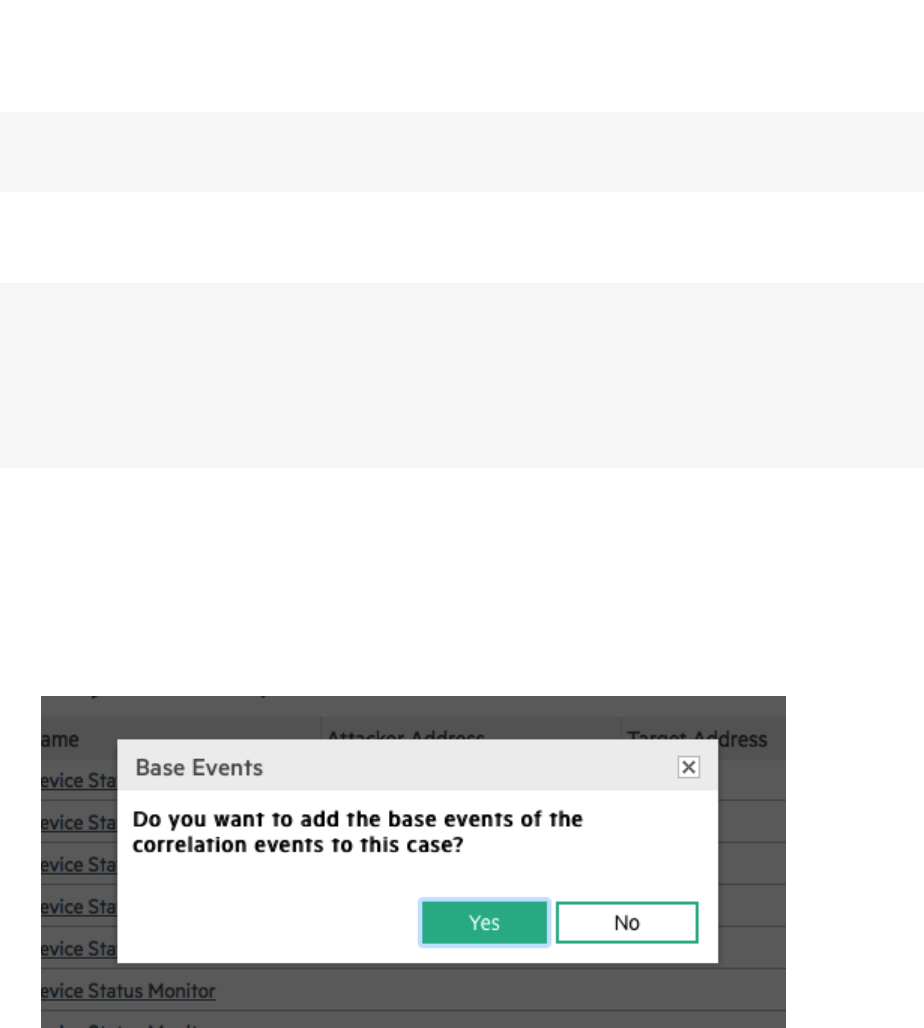
Note: A case must be locked in order to edit it. This prevents other users from modifying the case
while you are adding an event.
On the channel, the events are available based on the retention period of the Default Storage Group
(see "Storage" on page138).
Caution: Events added to a case are accessible in the context of that case to any user who has
permissions to view or edit the case. Even users who do not have permissions on the events
themselves have permissions to view full events in the context of a case to which they have
permissions.
Consider this when adding events to a case and setting access control lists (ACLs) on cases.
Procedure:
1. Open the desired channel.
See "Viewing Events On an Active Channel" on page31.
2. From the Active Channel screen > Event List tab, select the desired event and then click Add to
Case.
When adding base events of the correlation events, a pop-up appears.
3. Click OK to add the base events of the correlation events to the case.
4. From the popup, select the desired case from the appropriate case folder and then click OK.
5. To verify the events in the case, open the case in the Cases tab.
Marking an Event as Reviewed
Procedure:
1. Open the desired channel.
See "Viewing Events On an Active Channel" on page31.
2. From the Active Channel screen > Event List tab, select the desired event and then click Mark as
ArcSight Command Center User's Guide
Chapter 3: Monitoring Events Through Active Channels
HPE ESM 7.0 Page 58 of 213
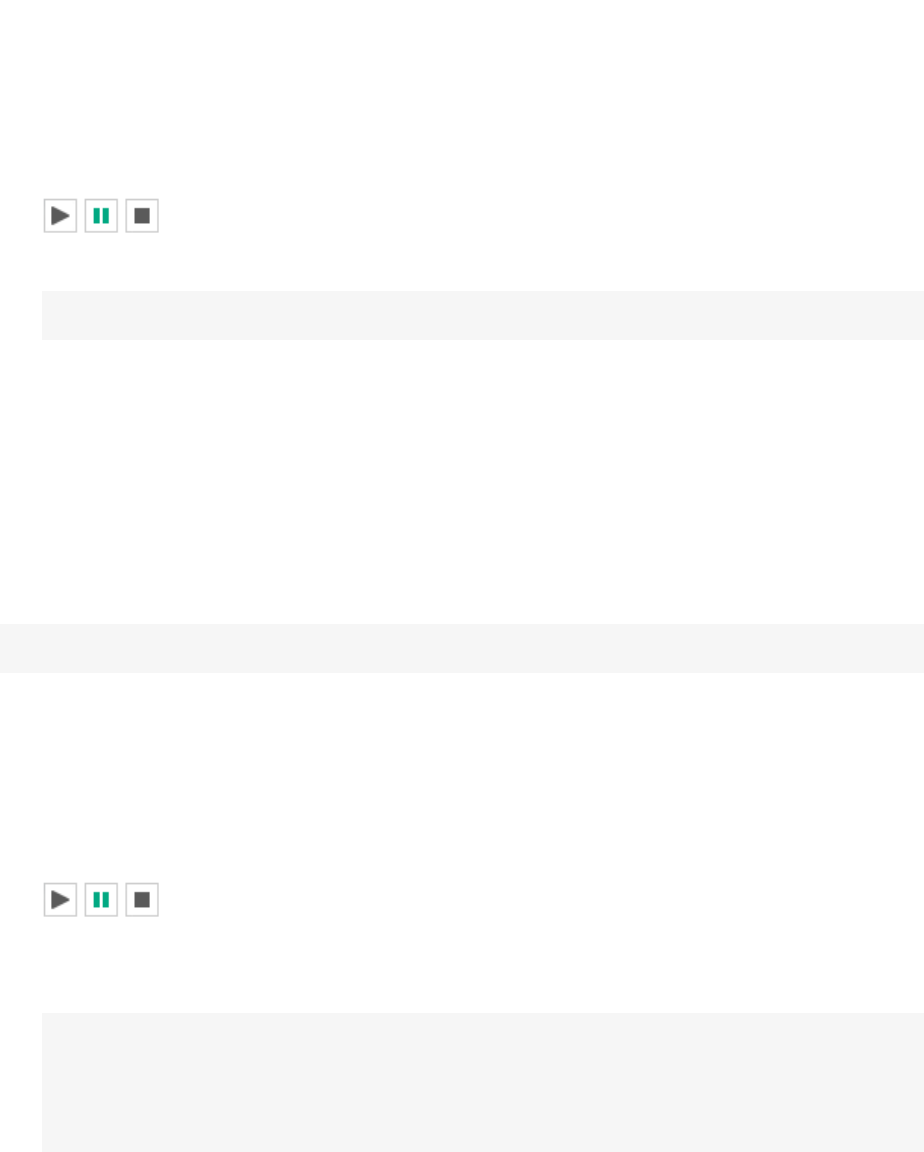
Reviewed.
Click the pause button to freeze the Event List for easier selection.
Use the Ctrl or Shift key to select multiple events.
Note: If you scroll a selected event out of view in the Event List, the event becomes deselected.
The Is Reviewed flag appears in the Annotation History tab of the Events Details popup.
Visualizing an Event Graphically
About:
Through the use of widgets, you can view field information for events. You can choose the type of field
information to display and the range of events for which this information should appear.
Note: Command Center can support only one visualization view per browser window session.
Procedure:
1. Open the desired channel.
See "Viewing Events On an Active Channel" on page31.
2. From the Active Channel screen, click the pause button.
Pausing the channel event flow helps to ensure the proper selection of time intervals (buckets).
3. To select events over a specific period of time, make a selection from the Active Channel Radar.
See "Using the Active Channel Radar" on page41.
Note: Command Center can accept a maximum of 100,000 events for visualization. Any
events in excess of this limit will cause event visualization to be disabled. In this case, reduce
the range of events on the Active Channel Radar. If a channel has too many events, using the
correct filter can reduce the amount of events and make visualization possible.
4. Click the Visualize Events panel heading.
5. From the Select Fields to Visualize Events popup, specify the desired event field(s) by dragging and
dropping. Click Visualize Events. The Field list is displayed is that same as the columns in the
Event List.
A new tab appears. The selected event fields are represented graphically in the Visualize Events
tab of the Active Channel panel. The graphs presented are "Top 10"values chart for the selected
fields.
ArcSight Command Center User's Guide
Chapter 3: Monitoring Events Through Active Channels
HPE ESM 7.0 Page 59 of 213
6. To limited the number of events, double click on the selected time bucket in the Event Count
histogram.
The selected range appears between handles. Use these handles to change the event range.
Note: If the specified time range is very narrow and the number of events in this range is low,
the Event Count widget will be empty.
Click Reset All Filters to restore all open widgets to reflect the full range of events.
You can create an Active Channel using the chart data in the Visualize Events tab.
1. Under the Visualize Events tab, right-click on a histogram bar in any chart.
2. In the context menu that appears, select one of the options to add filtering to the existing channel
filter.
NOTE:When accessing Command Center using Firefox 38 from a Linux client, this context
menu does not persist sufficiently to enable a selection. The work around is to access this
capability using a browser on a non-Linux platform.
ArcSight Command Center User's Guide
Chapter 3: Monitoring Events Through Active Channels
HPE ESM 7.0 Page 60 of 213
Chapter 4: Searching for Events in the
ArcSight Command Center
This chapter describes how to search for specific events. It describes the methods available for search,
how to query for events, how to save a defined query, and the events that the query finds for future
use. This chapter also describes how to set up alerts to be notified when events matching the criteria
you specified are received.
The Need to Search for Events
When you want to analyze events matching specific criteria, include them in a report, or forward them to
another system, you need to search for them. To search for events, you create queries. The queries you
create can vary in complexity based on your needs. Queries can be simple search terms or they can be
complex enough to match events that include multiple IP addresses or ports, and that occurred between
specific time ranges from a specific storage group.
The Process of Searching for Events
The search process uses an optimized search language that allows you to specify multiple search
commands in a pipeline format. In addition, you can customize the display of search results, view search
results as charts, and so on.
To run a search, enter the keywords or information you are searching for (the query) in the Search text
box, select the time range, and click Go!
You can enter a simple keyword, such as hostA.companyxyz.com or a complex query that includes
Boolean expressions, keywords, fields, and regular expressions. The system searches for data that
matches the criteria you specified and displays the results on the page where you entered your query.
The search results are displayed in a table and as a histogram as soon as they are returned, even if the
query has not finished scanning all data. For an example, see "Simple Query Example" on the next page.
You can also add a chart to your search to display the most important information in a more meaningful
fashion. Charts are not displayed until all the data is returned. For an example, see "Query Example
Using a Chart" on the next page.
There are several convenient ways to enter a search query: typing the query in the Search text box,
using the Search Builder tool to create a query, or using a previously saved query (referred to as a filter
or saved search).
HPE ESM 7.0 Page 61 of 213
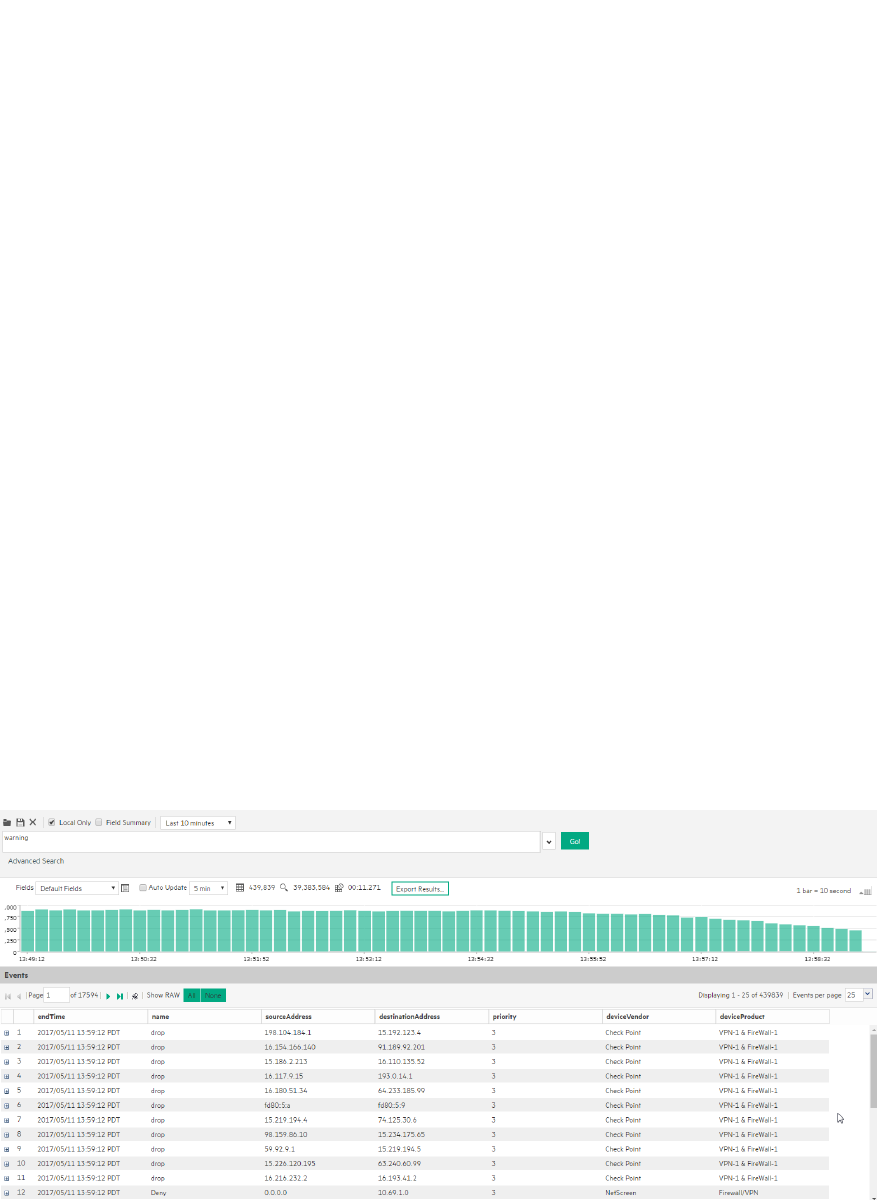
When you type a query, the Search Helper provides suggestions and possible matches to help you build
the query expression. (See "Search Helper" on page89 for more information.)
In addition to typing the query in the Search text box, you can do the following:
lCreate queries by using the Advanced Search tool. For more information, see "Using the Advanced
Search Tool" on page85.
lSave queries and use them later. For more information, see "Saved Queries (Search Filters and Saved
Searches)" on page109.
lCreate new queries from the predefined queries that come with your system. For more information,
see "Predefined Search Filters" on page111
Although a search query can be as simple as a keyword, you will be better able to utilize the full
potential of the search operation if you are familiar with all the elements of a query, as described in the
next section, "Elements of a Search Query" on the next page.
Simple Query Example
This example query finds events containing the word warning.
Click Events >Events Search to open the search page. Enter the following query in the search box:
warning
Then click Go!
Query Example Using a Chart
Aggregated search operators such as chart, top, and rare generate charts of search results. This
example query finds events containing the word warning and charts the number of warnings for each
name.
ArcSight Command Center User's Guide
Chapter 4: Searching for Events in the ArcSight Command Center
HPE ESM 7.0 Page 62 of 213
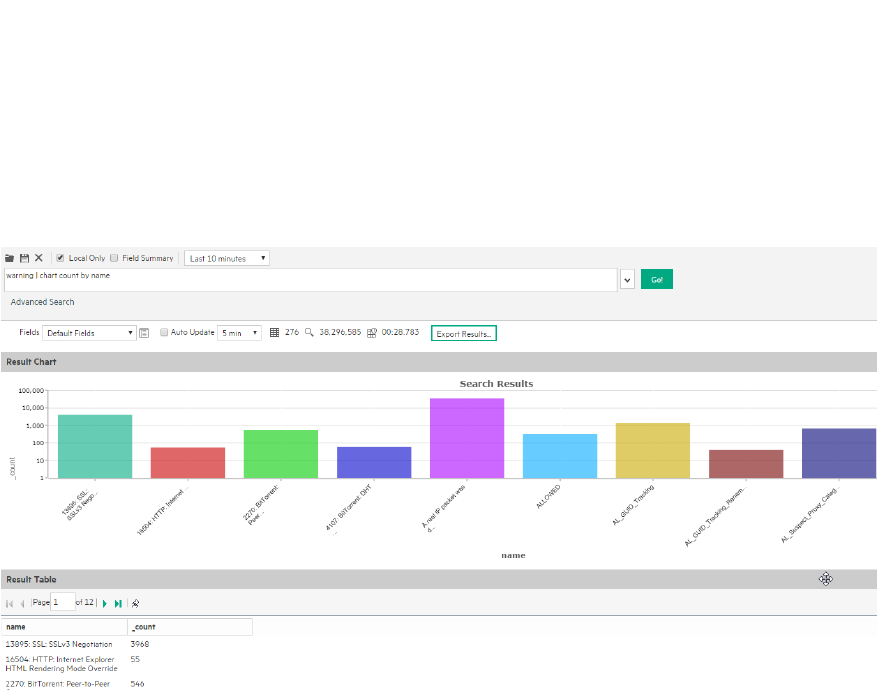
Enter the following query in the search box:
warning | chart count by name
Then click Go!
For more information on the search operators, see "Search Operators" on page179. For more
information on creating and using charts, see "Chart Drill Down" on page100 and "Refining and
Charting a Search from Field Summary" on page103.
Elements of a Search Query
A simple search query consists of these elements:
lQuery expression
lTime range
lFieldset
An advanced search query can also include constraints that limit the search to specific storage groups
and peers. For information about storage groups and peers, see "Storage" on page138 and "Peers" on
page166.
Query Expressions
A query expression is a set of conditions that are used to select events when a search is performed. An
expression can specify a very simple term to match such as “login” or an IP address; or it can be more
complex enough to match events that include multiple IP addresses or ports, and that occurred
between specific time ranges from a specific storage group.
ArcSight Command Center User's Guide
Chapter 4: Searching for Events in the ArcSight Command Center
HPE ESM 7.0 Page 63 of 213

Specify the query in the Search text box by using the following syntax:
<Search Expression> | <Search Operators>
The query expression is evaluated from left to right in a pipeline fashion. First, events matching the
specified search expression are found. The search operator after the first pipe (“|”) character is then
applied to the matched events followed by the next search operator, and so on to further refine the
search results.
The search results table and the histogram display the events that match the query as they are found.
As additional events are matched, the search results table and the histogram are refreshed. Certain
search operators such as head and tail, require a query to finish running before search results can be
displayed.
lSearch Expressions are described in "Search Expressions" below.
lSearch Operators are described in "Search Operators" on page72.
Search Expressions
The Search Expression section of the query uses fields to search for relevant data quickly and
efficiently. You can use a search expression to specify keywords to search for in the event text or to
search using field-based expressions in a Boolean format.
l"Keyword Search (Full-Text Search)" below
l"Field-Based Search" on page67
Keyword Search (Full-Text Search)
Keywords are the words you want to search for, such as failed, login, and so on. You can specify multiple
keywords in one query expression by using Boolean operators (AND, OR, or NOT) between them.
Boolean expressions can be nested; for example, (John OR Jane) AND Doe*. If you need to search
for the literal occurrence of AND, OR, or NOT (in upper-, lower-, or mixed case), enclose them in double
quotes (“”) so the search engine does not interpret them as operators. For example, “and”, “Or”, and so
on.
Note: Although the Boolean operators AND, OR, and NOT can be specified in upper-, lower-, or
mixed case when used as an operator, HPE recommends that you use uppercase for ease of reading
the query.
When specifying keyword search expressions:
lBe sure to follow the requirements described in "Syntax reference for query expressions" on page77.
lKeyword search is not case sensitive.
lYou cannot use the EventId field or any of the timestamps in a keyword search, because these are
generated fields, and not part of the actual event. To find events with a specific Event Id or a specific
timestamp, use a Field-based search instead. For example, instead of searching for
ArcSight Command Center User's Guide
Chapter 4: Searching for Events in the ArcSight Command Center
HPE ESM 7.0 Page 64 of 213

"4611686024177419642", search for EventId="4611686024177419642".
lUse Boolean operators (AND, OR, or NOT) to connect multiple keywords. If no Boolean operator is
specified between two keywords, the AND operator is applied by default. Also, use the Boolean
operators to connect keywords to fields you specify.
lUse double quotes (“ ”) to enclose a single word for an exact match. Otherwise, the word is treated as
<search string>*. For example, to search for log, enter “log”. If you enter log (without the double
quotes), the search will match all words that begin with log; for example, log, logger, logging, and so
on.
lWhen specifying Boolean operators (AND, OR, or NOT) as keywords, enclose them in double quotes
(“ ”). For example, “AND”.
lUse the backslash (\) as an escape character for \, “, and *. However, backslash will not escape these
characters if the keyword is enclosed in double quotes. For example, “log\\ger” and log\\ger will
match the same values—log\ger in both cases. Likewise, log\*ger and “log\*ger” will match the same
values—log*ger, in this case.
lThe following table summarizes how special characters are treated in a keyword search.
ArcSight Command Center User's Guide
Chapter 4: Searching for Events in the ArcSight Command Center
HPE ESM 7.0 Page 65 of 213

Character Usage
Space
Tab
Newline
,
;
(
)
[
]
{
}
“
|
*
You cannot specify keywords that contain the characters in the left column. Therefore, to search for a
phrase such as failed login, enter “failed” AND “login”.
Note: * is a valid character for wildcard character searches.
=
:
/
\
@
-
?
#
$
&
_
%
>
<
!
To specify a keyword that contains any of the characters in the left column, enclose the keyword in
double quotes (“ ”). You can also specify an asterisk (*) at the end of the keyword for an exact match.
Examples:
o“C:\directory”
o“result=failed”
Special Characters in Searches
ArcSight Command Center User's Guide
Chapter 4: Searching for Events in the ArcSight Command Center
HPE ESM 7.0 Page 66 of 213

Character Usage
* You can use the wildcard character asterisk (*) to search for keywords, however, the wildcard cannot be
the leading character in the keyword. Therefore, the following usage is valid:
olog*
o"log*"
olog\*
olog\\*
olog*app
olog*app*app
However, the following usage is not valid:
o*log
o*log*app*
Special Characters in Searches, continued
Field-Based Search
You can search any field defined in the schema. A list of the schema fields, along with their field
descriptions is available from the Administration > Search > Default Fields tab.
For instructions on how to view the fields, see "Viewing the Default Fields " on page164.
Note: Not all ESM event information is available for searching. To search for fields not included in
the Default Fields list, use the ArcSight Console through a query viewer. Refer to the Query Viewers
topic in the ArcSight Console User’s Guide.
You can specify multiple field conditions and also connect keywords to field conditions in a query
expression; when doing so, connect them with Boolean operators. For example, the following query
searches for events with keyword “failed” (without double quotes) or events with “name” fieldset to
“failed login” (lowercase only; without double quotes) and the message field not set to “success”
(lowercase only; without double quotes):
failed OR (name=“failed login” AND message!=“success”)
Note: If a query includes the Boolean operator OR and the metadata identifiers (discussed in
"Constraints" on page76), the expression to be evaluated with OR must be enclosed in parentheses,
as shown in this example:
(success OR fail) _storageGroup IN [“Default Storage Group”]
If the expression is not enclosed in parentheses, an error message is displayed.
The field operators you can use in a query expression are listed in the following table.
Note: In addition to these operators, you can use search operators, as discussed in "Search
ArcSight Command Center User's Guide
Chapter 4: Searching for Events in the ArcSight Command Center
HPE ESM 7.0 Page 67 of 213

Operators" on page72.
Multiple field conditions can be specified in one query expression by using the listed operators between
them. The conditions can be nested; for example, (name=“John Doe” OR name=“Jane Doe”) AND
message!=“success”.
Any literal operator in the following list can be specified in upper-, lower-, or mixed case. To search for
these words as literals in events, enclose them in double quotes (“”). For example, message CONTAINS
“Between”.
Operator Example Notes
AND name=“Data List” AND
message=“Hello” AND
1.2.3.4
Valid for all data types.
OR (name=“TestEvent” OR
message=“Hello”) AND
type=2 AND 1.2.4.3
Valid for all data types.
NOT NOT name=“test 123” Valid for all data types.
!= destinationPort != 100
message!=“failed
login”
message!=failed*login
(* means wildcard)
“test”
message!=failed\*login
(* is literal in this case)
Valid for all data types.
= bytesIn = 32
message=“failed login”
message=“failed*login”
(* means wildcard)
Valid for all data types.
The size of each field in the schema is predetermined. If the string you are
searching for is longer than the field-length, you should use a STARTSWITH
rather than an = search, and include no more than the number of characters
in the field size. To determine the size of a default field, see "Viewing the
Default Fields " on page164.
Operators for field based search
ArcSight Command Center User's Guide
Chapter 4: Searching for Events in the ArcSight Command Center
HPE ESM 7.0 Page 68 of 213

Operator Example Notes
> bytesIn > 100 Valid for all data types.
The operators >, <, >=, <=, IN, and BETWEEN evaluate the condition
lexicographically. For example, deviceHostName BETWEEN AM AND EU
searches for all devices whose names start with AM, AMA, AMB, AN, AO, AP
and so on, up to EU. Therefore, any device whose name starts with AK, AL,
and so on is ignored. Similarly, devices with names EUA, EUB, FA, GB, and so
on will be ignored.
< startTime <“$Now - 1d”
>= endTime
>=“01/13/2009 07:07:21”
endTime
>=“2009/13/01
00:00:00 PDT”
endTime >=“Sep 10
2009 00:00:00 PDT”
<= startTime <=“$Now -
1d”
IN priority IN [2,5,4,3]
destinationAddress IN
[“10.0.20.40”,
“209.128.98.147”]
_deviceGroup IN
[“DM1”]
_storageGroup NOT IN
[“Internal Event
Storage Group”, “SG1”]
_peerLogger IN
[“192.0.2.10”, “192.0.2.11”]
BETWEEN priority BETWEEN 1
AND 5
For BETWEEN, the minimum value for the range must appear first in the
expression before the maximum. For example, 20 BETWEEN -100 AND
100.
STARTSWITH message
STARTSWITH “failed”
Valid for all String data types only.
To determine the data type of a field, see "Viewing the Default Fields " on
page164.
ENDSWITH message ENDSWITH
“login”
Valid for all String data types only.
CONTAINS message CONTAINS
“foobar”
Valid for all String data types only.
Operators for field based search, continued
ArcSight Command Center User's Guide
Chapter 4: Searching for Events in the ArcSight Command Center
HPE ESM 7.0 Page 69 of 213

Operator Example Notes
INSUBNET agentAddress
INSUBNET
“127.0.0.1-
127.0.0.100”
agentAddress
INSUBNET
“127.0.0.*”
agentAddress
INSUBNET
“127.*.*.*”
agentAddress
INSUBNET
“127.0.0.0/24”
IPv4 and IPv6 address ranges only. For best results, the IP address range
must be in the same family, for example, a range of IPv4 addresses or a
range of IPv6 addresses. See IP Address Ranges, below.
Note: Do not use INSUBNET to look for NULLaddresses.
IS sessionId IS NULL
sessionId IS NOT NULL
Valid for all data types.
IS NULL sourceUserId IS
NULL
Valid for all data types.
IS NOT NULL sourceUserId IS
NOT NULL
Valid for all data types.
Operators for field based search, continued
IP Address Ranges
The insubnet operator uses a range of IP addresses. Use the following guidelines to input IP address
ranges in a single string.
Caution: The IP address range must be in the same family, for example, a range of IPv4 addresses
or a range of IPv6 addresses.
Two-
address
range
A two-address range is in the format firstAddress - lastAddress, meaning any address between
an arbitrary range of any two addresses, inclusive.
IPv4 range: 192.168.0.0 - 192.168.255.255
IPv6 range: 2001:db8:fd0c:: - 2001:db8:fd0c:ffff:ffff:ffff:ffff:ffff
CIDR
notation
The CIDR notation is in the format address/prefix-length. This format is more restrictive than the
two-address range format where the range starts and ends.
IPv4 range: 192.168.0.0/24
IPv6 range: 2001:db8:fd0c::/64
ArcSight Command Center User's Guide
Chapter 4: Searching for Events in the ArcSight Command Center
HPE ESM 7.0 Page 70 of 213
Wildcard
expressions
Fields on the right end of an address may be replaced with an asterisk, with no numeric data to the right
of the first asterisk. The wildcard represents the range of all values for the field, from all-zero bits to all-
one bits. This format is more restrictive than the two-address range format in where the range starts and
ends.
IPv4 range: 192.168.*.*
IPv6 range: 2001:db8:fd0c:*:*:*:*:*
Guidelines for Field-based Search Expressions:
lBy default, field-based search is case sensitive. You can change the sensitivity from the Field Search
Options section of the Administration > Search > Search Options tab. For more information, see
"Tuning Search Options" on page161.
lFor faster searches, follow the recommendations in "Tuning Search Performance" on page95.
lA query expression (Field Search | Search Operators) is evaluated from left to right in pipeline
fashion.
lOther requirements and guidelines are listed in "Syntax reference for query expressions" on page77.
Searching Internet Protocol (IP) Addresses
The following fields can contain IPv4 or IPv6 addresses. You can use any operator, including the
INSUBNET operator, to search these fields.
Note: If you are using connectors that support IPv4 only, HPE recommends that you do not send
IPv4 addresses using the Device Custom IPv6 addresses 1 through 4 (dvc_custom_ipv6_
address1,dvc_custom_ipv6_address2,dvc_custom_ipv6_address3,dvc_custom_ipv6_address4).
Caution: For the INSUBNET operator, the IP address range must be in the same family, for
example, a range of IPv4 addresses or a range of IPv6 addresses.
agentAddress agt_trans_address
destinationAddress destinationTranslatedAddress
dvc_custom_ipv6_address1 dvc_custom_ipv6_address2
dvc_custom_ipv6_address3 dvc_custom_ipv6_address4
dvc_trans_address f_dvc_address
f_dvc_trans_address o_agt_address
o_agt_trans_address sourceAddress
sourceTranslatedAddress
Address Fields
ArcSight Command Center User's Guide
Chapter 4: Searching for Events in the ArcSight Command Center
HPE ESM 7.0 Page 71 of 213

Examples:
deviceAddress = 192.0.2.1
agentAddress INSUBNET “127.0.0.1-127.0.0.100”
destination_Address = 2001:0DB8:85A3:0042:1000:8A2E:0370:7334
Search results are displayed in the standard IPv6 format.
Note: IPv6 addresses stored in fields dvc_custom_ipv61-4 in previous versions of ESM are still
searchable, but IPv4 addresses are not.
Searching Media Access Control (MAC) Address
The following fields are for MAC addresses.
agt_mac_address destinationMacAddress
dvc_mac_address o_agt_mac_address
Address Fields
Examples:
agt_mac_address = 00-00-5E-00-53-00
dvc_mac_address = 00-00-5E-00-53-FF
Search Operators
Search Operators enable you to refine the data that matched the Field Search search filter. The rex
search operator is useful for syslog events (raw or unstructured data) or if you want to extract
information from a specific point in an event, such as the 15th character in an event. The other
operators, such as head,tail,top,rare,chart,sort,fields, and eval are applied to the fields you
specify or the information you extract using the rex operator. See "Search Operators" on page179 for a
list of search operators and examples of how to use them.
Time Range
The endTime timestamp indicates when the event occurred. A search query uses this time to search for
matching events.
A search operation requires you to specify the time range within which events would be searched. You
can select from many predefined time ranges or define a custom time range to suit your needs.
ArcSight Command Center User's Guide
Chapter 4: Searching for Events in the ArcSight Command Center
HPE ESM 7.0 Page 72 of 213
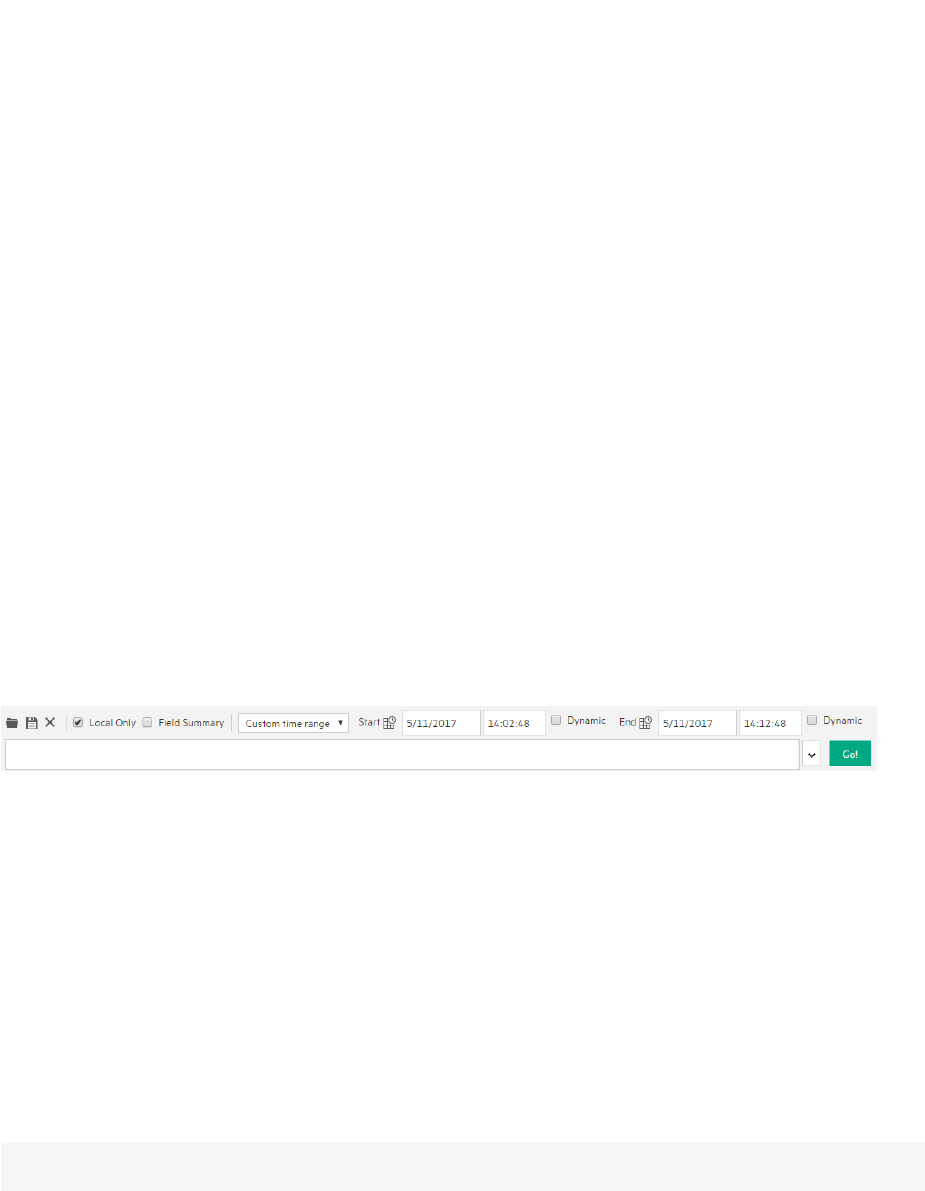
Predefined time range: When you select a predefined time range such as “Last 2 Hours” or “Today”,
the time range is relative to the current time. For example, if you select “Last 2 Hours” at 2:00:00 p.m. on
July 13th, events from 12:00:00 to 2:00:00 p.m. on July 13th will be searched. If you refresh your search
results at 5:00:00 p.m. on the same day, the time window is recalculated. Therefore, events that match
the specified criteria and occurred between 3:00:00 and 5:00:00 p.m. on July 13th are displayed.
Custom time range: You can specify a time range in a 24-hour format to suit your needs. For example,
a custom time range is:
Start: 8/13/2016 13:36:30
End: 8/13/2016 22:36:30
By default, the end time for a custom time range is the current time on your system and the start time is
two hours before the current time.
You can also use variables to specify custom time ranges. For example, a dynamic date range might start
at $Now - 2h (two hours ago) and end at $Now (the current time). The dynamic search is relative to
when the query is run. Scheduled search operations use this mechanism to search through newer event
data each time they are run.
The “Dynamic” field in the user interface enables you to specify the dynamic time, as shown in the
following figure:
Following is a typical example of a dynamic search that limits results to the last two hours of activity:
Start: $Now - 2h
End: $Now
The syntax for dynamic search is:
<current_period> [ +/- <units>]
Where <current_period>, such as $Now, either stands alone or is followed by either a plus (‘+’) or minus
(‘-’) and a number of units, such as 2h for two hours. The <current_period> always starts with a ‘$’ and
consists of a word, case-sensitive, with no spaces, as shown in the following table. The <units> portion, if
given, consists of an integer and a single, case-sensitive letter, as shown in Units table.
Note: Use the <= and >= operators to narrow down the time range. Do not use =or !=.
ArcSight Command Center User's Guide
Chapter 4: Searching for Events in the ArcSight Command Center
HPE ESM 7.0 Page 73 of 213

Period Description
$Now The current minute
$Today Midnight (the beginning of the first minute) of the current day
$CurrentWeek Midnight of the previous Monday (or same as $Today if today is Monday)
$CurrentMonth Midnight on the first day of the current month
$CurrentYear Midnight on the first day of the current year
Current Period
Unit Description
m (lowercase) Minutes (Do not confuse with ‘M’, meaning months.)
h Hours
d Days
w Weeks
M (uppercase) Months (Do not confuse with ‘m’, meaning minutes.)
Units
Fieldsets
A fieldset determines the fields that are displayed in the search results for each event that matched a
search query. The system provides a number of predefined fieldsets. These fieldsets are for use when
searching from ArcSight Command Center. For information about field sets for ArcSight Console, refer
to the ArcSight Console User’s guide.
Note: The first time you open the search page in a new browser window the fieldsets lists are
hidden and you cannot select them. Run a short search to display the hidden options.
lTo view the current list of available fieldsets, click the down arrow in the Fields dialog box. The
current System Fieldsets list is displayed.
lTo see the fields included in each of the predefined fieldsets, click the (Customize Fields) icon.
lTo view a list of fields that are included for each fieldset type, select the fieldset from the drop-down
list and mouse over the Field’s label.
Note: Only fields available for matched events are displayed in a Search Results display (or the
exported file). Therefore, even if you select the All Fields fieldset, you might not see all fields
displayed in the search results.
lWhen you use a search operator that defines a new field, such as rex, rename, or eval, a new column
ArcSight Command Center User's Guide
Chapter 4: Searching for Events in the ArcSight Command Center
HPE ESM 7.0 Page 74 of 213
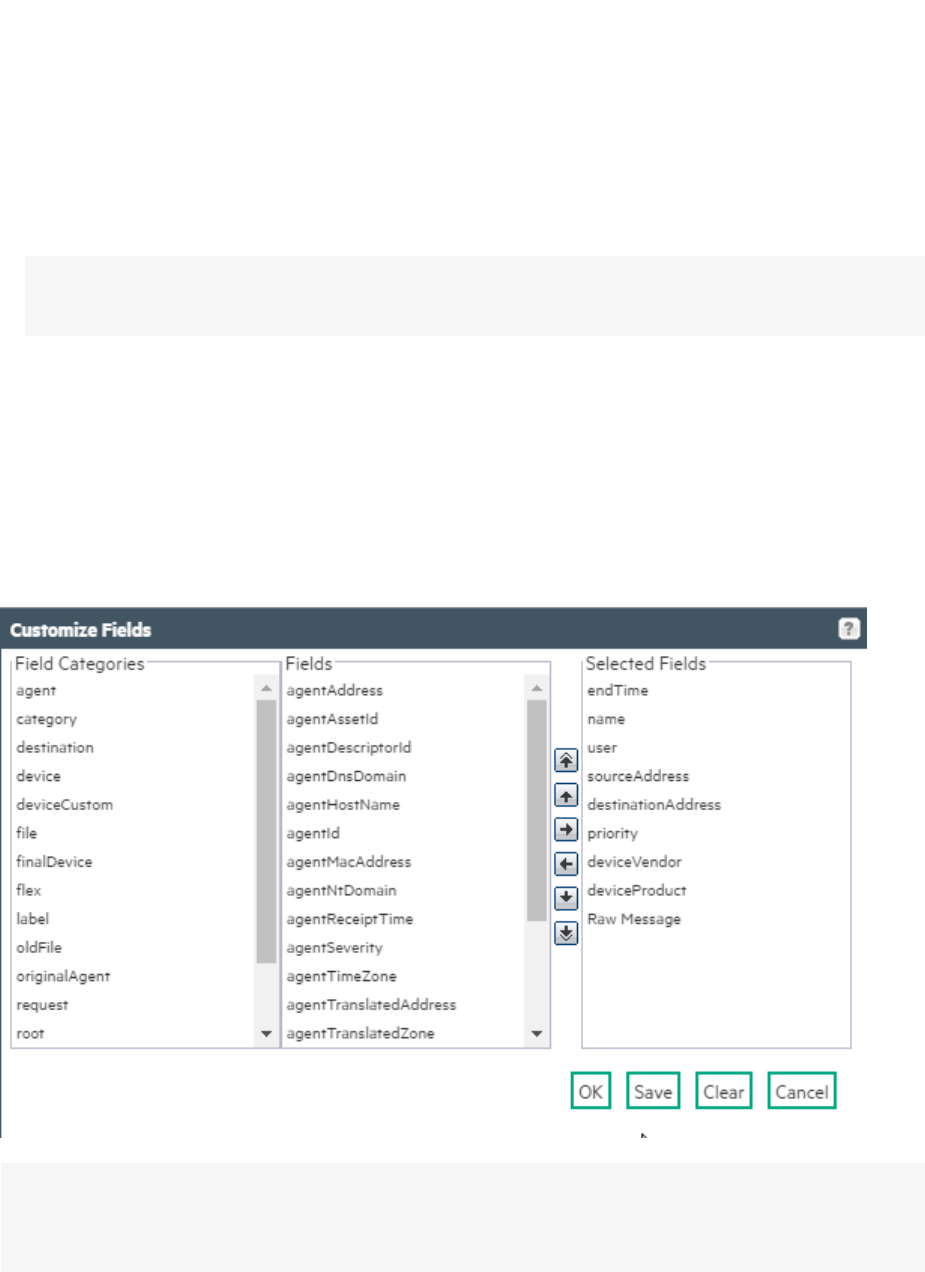
for each field is added to the currently selected display. These newly defined fields are displayed by
default. The User Defined Fields fieldset enables you to view only the newly defined fields.
lThe Raw Event fieldset displays the complete raw syslog event in a column called rawEvent. The
event is formatted to fit in the column.
Note: To see the raw events in the rawEvent column, enable the Search Option, “Populate
rawEvent field for syslog events”. See "Tuning Search Options" on page161 for more information.
Although the Raw Event field is most applicable for syslog events, you can also display the raw event
associated with CEF events in the rawEvent column. To do so, make sure the connector that is sending
events to the system populates the rawEvent field with the raw event.
Creating Custom Fieldsets
You can also create your own fieldsets by selecting “Customize...” from the “Fields” drop-down menu.
You can select and move event fields to include them in a fieldset, as shown in the following figure.
Note: Fields beginning with scr_ are included in the list of fields available in the “Source” field
category, but if you include them in a custom fieldset, they will display no data. View these field
values in the ArcSight Console.
You can save the custom fieldset or use it only for the current session.
If you click OK, the fieldset appears in the Custom category. It is labeled as “Custom (not saved)” and is
not visible to other users. It will remain available to you for this session. Once you log out of the current
ArcSight Command Center User's Guide
Chapter 4: Searching for Events in the ArcSight Command Center
HPE ESM 7.0 Page 75 of 213
session, the temporary fieldset will be deleted. You can only have one temporary custom fieldset at a
time.
If you click Save, the fieldset appears under the Shared Fieldsets category and is visible and available to
the other users, as shown in the following figure. After a fieldset is saved, you can edit and delete it.
When saving a custom fieldset, you can specify it as the default for this system. If you do so, it is the
default fieldset for all users on that system.
If do not select it as the default, the fieldset is used only for your search results and does not affect
other users connecting to the same system.
For information about deleting custom fieldsets, see "Managing Fieldsets" on page163.
Fieldset selection is specific to a user’s interface. For example, UserA and UserB are connected to the
same manager and are using the default fieldset for search results display. UserA changes his selection
to a custom fieldset. This change will only affect UserA’s display; UserB will continue to see the search
results in the All Fields format.
Constraints
Using constraints in a query can speed up a search operation as they limit the scope of data that needs
to be searched. Constraints enable you to limit a query to events from one or more of the following:
lStored in particular storage groups
lStored on specific peers
For example, you might want to search for events in the SG1 and SG2 storage groups on the local
system only.
For information about storage groups and peers, see "Storage" on page138 and "Peers" on page166.
ArcSight Command Center User's Guide
Chapter 4: Searching for Events in the ArcSight Command Center
HPE ESM 7.0 Page 76 of 213

Follow these guidelines when specifying constraints:
lUse the following operators to specify constraints in a search query expression:
Metadata Identifier Example
_storageGroup _storageGroup IN [“Internal Event Storage Group”, “SG1”]
_peerLogger _peerLogger IN [“192.0.2.10”, “192.0.2.11”]
lIf a query includes the Boolean operator OR and metadata identifiers, the expression to be evaluated
with OR must be enclosed in parentheses, as shown in this example:
(success OR fail) _storageGroup IN [“Default Storage Group”]
If the expression to be evaluated with OR is not enclosed in parentheses, an error message is
displayed on the user interface screen.
lWhen specifying multiple groups in a constraint, ensure that the group names are enclosed in square
brackets; for example, _storageGroup IN [“SGA”, “SGB”].
lYou can apply constraints to a search query by:
oTyping the constraint in the Search text box.
Once you type “_s” (for storage group) or “_p” (for peer) in the Search text box, Search Helper
automatically provides a drop-down list of relevant terms and operators from which you can select.
Caution: If a search query contains constraints and a regular expression, make sure that the
constraints are specified before the regular expression. For example, _peerLogger IN
[“192.0.2.10”] name contains abc | REGEX=“:\d31”
oSelecting Storage Groups or peers from the Advanced Search tool. (To access the Advanced
Search tool, click Advanced Search beneath the text box where you type the query.) For more
information about the Advanced Search, see "Using the Advanced Search Tool" on page85.
oSyntax reference for query expressions
To create valid and accurate query expressions, follow these requirements.
ArcSight Command Center User's Guide
Chapter 4: Searching for Events in the ArcSight Command Center
HPE ESM 7.0 Page 77 of 213

Behav
ior Full Text Search Field Search
Regular
Expression
Case
sensiti
vity
Insensitive
(Cannot be changed.)
Sensitive
(Can be changed using Tuning options. See
"Tuning Search Options" on page161.)
Insensitive
(Can be
changed
using
Tuning
options. See
"Search
Operators"
on
page179.)
Escap
e
charac
ter
\
Use to escape \. You cannot escape any other
character.
\
Use to escape \, “, and *.
Examples:
lname=log\\ger (matches log\ger)
lname=logger\* (matches logger*)
\
Use to
escape any
special
character.
Example:
To search
for a term
with the
character “[”
:
|REGEX=
“logger\[”
Escapi
ng
wildca
rd
charac
ter
Cannot search for *
Example:
log\* is invalid
Can search for * by escaping the character
name=log\* is valid
Can search
for * by
escaping
the
character
Exact
Match
/Searc
h
string
includ
es an
operat
or or a
special
charac
ter
Enclose keyword in double quotes; Otherwise,
keyword treated as keyword*.
Example:
log (matches log, logging, logger, and so on)
“log” (matches only log)
Note: See the list of special characters that
cannot be searched even when enclosed in
double quotes, later in this table.
Enclose value in double quotes
Example:
message=“failed login”
No special
requiremen
t.
Query Syntax Requirements
ArcSight Command Center User's Guide
Chapter 4: Searching for Events in the ArcSight Command Center
HPE ESM 7.0 Page 78 of 213

Behav
ior Full Text Search Field Search
Regular
Expression
Nestin
g
(includ
ing
parent
hetical
clause
s, such
as (a
OR b)
AND c
Allowed
lUse Boolean operators to connect and nest
keywords.
lMetadata identifiers (_storageGroup and _
peerLogger), but can only appear at the
top level in a query expression). If the
query contains a regular expression, the
metadata identifiers need to precede the
regular expression.
Allowed
lUse any operator listed in the "Field-Based
Search" on page67 section to connect and
nest field search expressions.
lMetadata identifiers (_storageGroup and _
peerLogger), but can only appear at the top
level in a query expression
Multiple
regular
expressions
can be
specified in
one query
using this
syntax:
|REGEX=
“<REGEX1>”
|REGEX=“<
REGEX2>”|...
Operat
ors
Upper-, lower-, or mixed case Boolean
operators—AND, OR, NOT. If an operator is
not specified, AND is used.
To search for literal operator AND, OR, NOT,
in an event, enclose them in double quotes.
Example: “AND”, “or”, “Not”
Note: If a query includes the Boolean operator
OR and the metadata identifiers (_
storageGroup and _peerLogger), the
expression to be evaluated with OR must be
enclosed in parentheses, as shown in this
example:
(success OR fail) _storageGroup
IN [“Default Storage Group”]
Use any operator listed in the "Field-Based
Search" on page67 section.
lUnless a value is enclosed between double
quotes, a space between values is
interpreted as an AND. For example,
name=John Doe is interpreted as John AND
Doe.
lIf an operator is not specified between
multiple field expressions, AND is used.
lTo search for literal operator, enclose the
operator in double quotes. Examples:
message STARTSWITH=“NOT”
message=“LOGIN DID NOT SUCCEED”
lIf a query includes the Boolean operator OR
and the metadata identifiers (_storageGroup
and _peerLogger), the expression to be
evaluated with OR must be enclosed in
parentheses, as shown in this example:
(success OR fail) _storageGroup
IN [“Default Storage Group”]
| and the
operators
described in
"Search
Operators"
on page179.
Use this
operator to
AND
multiple
regular
expressions
in one
query
expression.
Query Syntax Requirements, continued
ArcSight Command Center User's Guide
Chapter 4: Searching for Events in the ArcSight Command Center
HPE ESM 7.0 Page 79 of 213

Behav
ior Full Text Search Field Search
Regular
Expression
Primar
y
Delimi
ters:
Space
,
;
(
)
[
]
}
“
|
*
>
<
!
You can search for keywords containing
primary delimiters by enclosing the keywords
in double quotes.
Example:
“John Doe”
“Name=John Doe”
“www.hpe.com”
You can search for these characters. Enclose
value in double quotes if value contains any of
these characters.
Example: name=“John*”
lCannot
contain ^
in the
beginnin
g and $
at the
end as a
matchin
g
character
unless
the
regular
expressi
on you
specify
must
look for
an event
that
contains
only the
pattern
you are
specifyin
g; for
example,
|REGEX
=
“^test
$” will
search
for
events
containi
ng the
word
“test”
(without
quotes)
only.
lSpecial
regular
expressi
on
character
Query Syntax Requirements, continued
ArcSight Command Center User's Guide
Chapter 4: Searching for Events in the ArcSight Command Center
HPE ESM 7.0 Page 80 of 213
Behav
ior Full Text Search Field Search
Regular
Expression
s such as
\ and ?
need to
be
escaped.
Query Syntax Requirements, continued
ArcSight Command Center User's Guide
Chapter 4: Searching for Events in the ArcSight Command Center
HPE ESM 7.0 Page 81 of 213

Behav
ior Full Text Search Field Search
Regular
Expression
Secon
dary
Delimi
ters:
=
.
:
/
\
@
-
?
#
$
&
_
%
You can also search for keywords containing
secondary delimiters once you have
configured the full-text search options as
described in "Tuning Search Options" on
page161.
Example: You can search for hpe.com in a
URL http://www.hpe.com/apps by specifying
hpe.com as the search string.
You can search for these characters. Enclose
value in double quotes if value contains any of
these characters.
Example: name=“John.”
lCannot
contain ^
in the
beginnin
g and $
at the
end as a
matchin
g
character
unless
the
regular
expressi
on you
specify
must
look for
an event
that
contains
only the
pattern
you are
specifyin
g; for
example,
|REGEX
=
“^test
$” will
search
for
events
containi
ng the
word
“test”
(without
quotes)
only.
lSpecial
regular
expressi
on
character
Query Syntax Requirements, continued
ArcSight Command Center User's Guide
Chapter 4: Searching for Events in the ArcSight Command Center
HPE ESM 7.0 Page 82 of 213
Behav
ior Full Text Search Field Search
Regular
Expression
s such as
\ and ?
need to
be
escaped.
Syntax keyword1 boolean_operator
keyword2 boolean_operator
keyword3...
field_name operator field_value
(For instructions on how to view the fields, see
"Viewing the Default Fields " on page164.
section.)
(List of operators in the "Field-Based Search"
on page67 section.)
|REGEX=“
<REGEX1>”
| REGEX=“
<REGEX2>
”|..
Query Syntax Requirements, continued
ArcSight Command Center User's Guide
Chapter 4: Searching for Events in the ArcSight Command Center
HPE ESM 7.0 Page 83 of 213

Behav
ior Full Text Search Field Search
Regular
Expression
Tab
Newlin
e
{
“
*
Cannot search for these characters.
Examples:
“John{Doe” is invalid
No restrictions.
Enclose special character in double quotes.
Escape the wildcard character and double
quotes.
Example:
name=“John\* \“Doe” (matches John* “Doe)
No
restrictions.
Special
regular
expression
characters
such as (,),
[,], {,}, ", |,
and * need
to be
escaped.
Time
forma
t,
when
search
ing for
events
that
occurr
ed at a
particu
lar
time
No specific format. The query needs to
contain the exact timestamp string. For
example, “10:34:35”.
Note: The string cannot contain spaces. For
example, “Oct 19” is invalid.
Use this format to specify a timestamp in a
query (including double quotes):
“mm/dd/yyyy hh:mm:ss”
OR
“yyyy/mm/dd hh:mm:ss timezone”
OR
“MMM dd yyyy hh:mm:ss timezone”
where mm=month
dd=day
yyyy=year
hh=hour
mm=minutes
ss=seconds
timezone=EDT, CDT, MDT, PDT.
MMM=First three letters of a month’s name; for
example, Jan, Feb, Mar, Sep, Oct, and so on.
Use the <= and >= operators to narrow down
the time range. Do not use =or !=.
No
restrictions.
Wildca
rd
* Cannot be the leading character; only a
suffix or in between a keyword.
Examples:
l*log is invalid
llog* is valid
llo*g* is valid
* Can appear anywhere in the value.
Examples:
name=*log (searches for ablog, blog, and so
on.)
name=“\*log”
name=\*log
(both search for *log)
* Can
appear
anywhere.
Query Syntax Requirements, continued
ArcSight Command Center User's Guide
Chapter 4: Searching for Events in the ArcSight Command Center
HPE ESM 7.0 Page 84 of 213
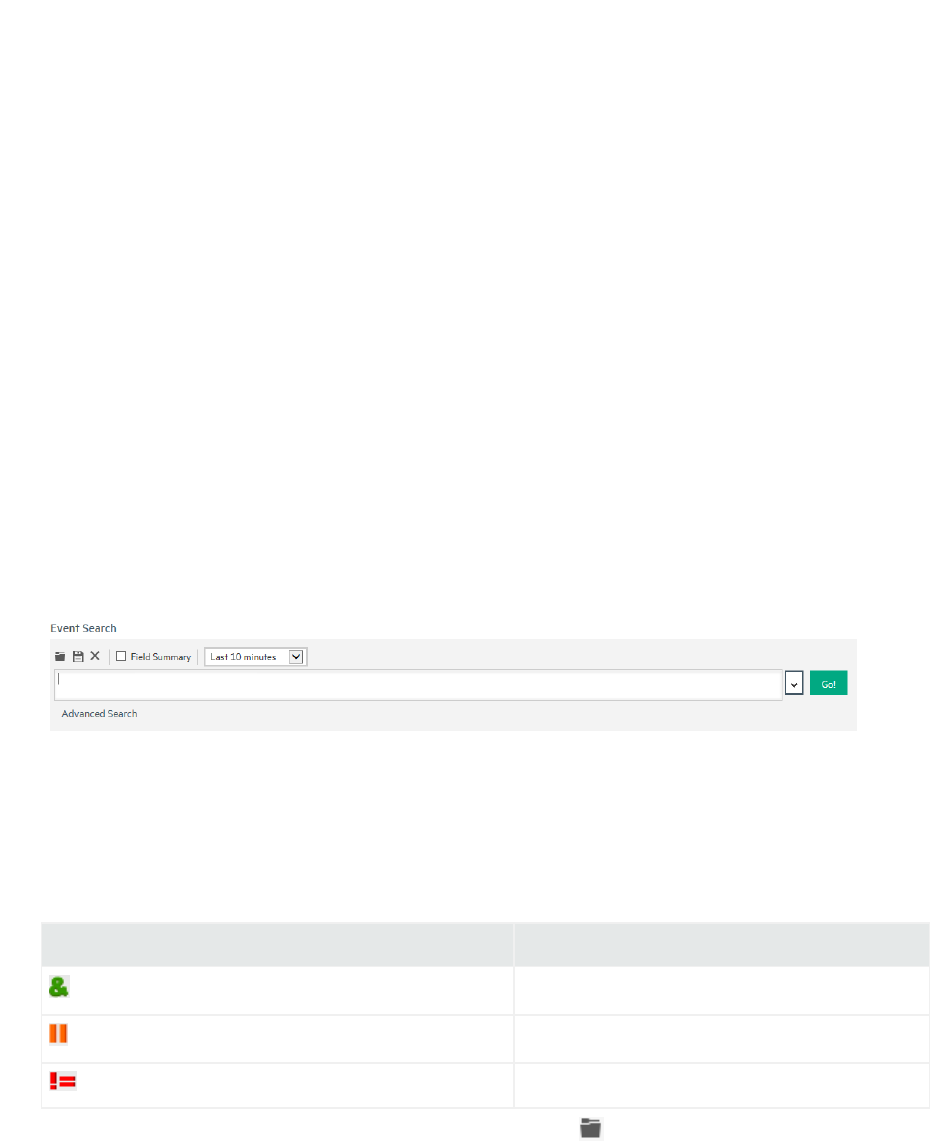
Using the Advanced Search Tool
The Advanced Search tool is a Boolean-logic conditions editor that enables you to build search queries
quickly and accurately. The tool provides a visual representation of the conditions you are including in a
query. You can specify keywords, field-based conditions, and regular expressions using this tool. You
can also specify search constraints such as peers, device groups, and storage groups (see "Constraints"
on page76). This section describes how to use the tool.
Accessing Advanced Search
To display the Advanced Search tool:
1. Click Events >Event Search to open the search page.
2. Click Advanced Search, below the Search text box, as shown in the following figure.
To build a new search query in the Advanced Search tool:
1. Click Events >Event Search to open the search page, and then click Advanced Search.
2. Select the Boolean operator that applies to the condition you are adding from the top of Advanced
Search dialog box. You can select these operators:
Operator Meaning
AND
OR
NOT
3. If you want to load a search filter or a saved search, click the icon. Select the search filter or the
saved search from the displayed list and click Load+Close.
4. For more information, see "Saved Queries (Search Filters and Saved Searches)" on page109 and
"Predefined Search Filters" on page111.
5. To add a keyword (full-text search) or field condition:
a. Locate the field you want to add under the Name column.
To specify a keyword (full-text search), use the fullText field under the Name column, as shown
in the following figure.
ArcSight Command Center User's Guide
Chapter 4: Searching for Events in the ArcSight Command Center
HPE ESM 7.0 Page 85 of 213
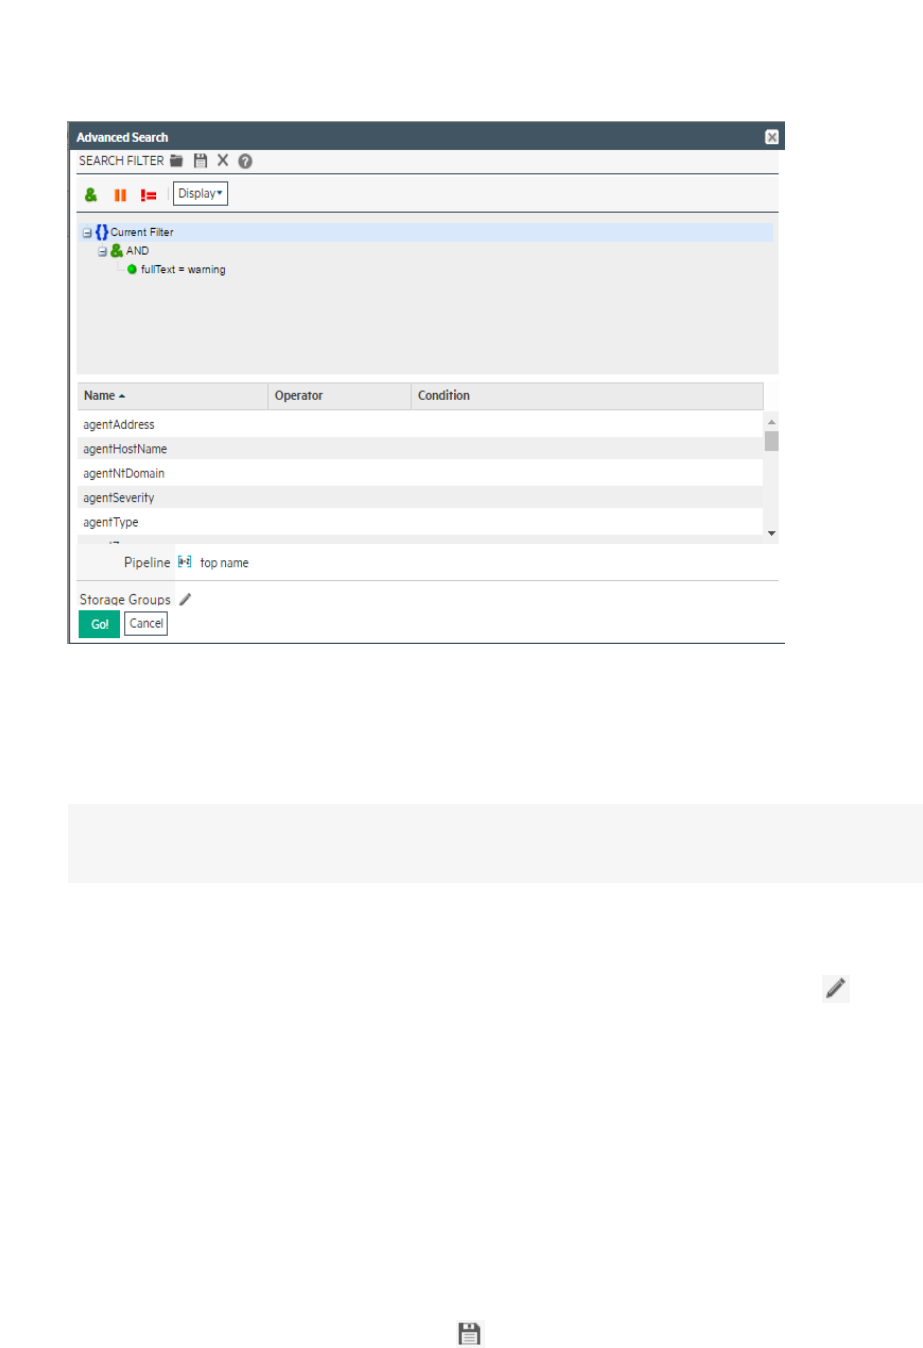
b. Click the Operator column associated with the field, select the operator from the displayed list,
and press Enter.
c. Only operators applicable to a field are displayed in the list.
d. In the Condition column associated with the field, enter a value and press Enter.
Note: To edit a condition, right-click on the condition for a drop-down menu that enables
you to edit, cut, copy, or delete the condition.
6. Repeat step 1 through step 5 until you have added all the conditions.
7. If your search query will also include a regular expression, type it in the Regex field.
8. If you want to constrain your search query to specific storage groups or peers, click the icon
next to the constraint category. Select the relevant groups and peers. (To select multiple groups,
hold the Ctrl-key down.)
The Peer constraint category is displayed only if peers are configured on your system.
If multiple values are selected for a constraint, those values are linked together with OR. For
example, if you specify peers A, B, C, the query will find events in peers A, B, or C.
For information about storage groups and peers, see "Storage" on page138and "Peers" on
page166.
9. Click Go! to save and run the query. The query is automatically displayed in the Search text box and
run.
To save the query without running it, click the icon. The Save query dialog box opens. For more
information, see "Saving a Query" on page109.
ArcSight Command Center User's Guide
Chapter 4: Searching for Events in the ArcSight Command Center
HPE ESM 7.0 Page 86 of 213
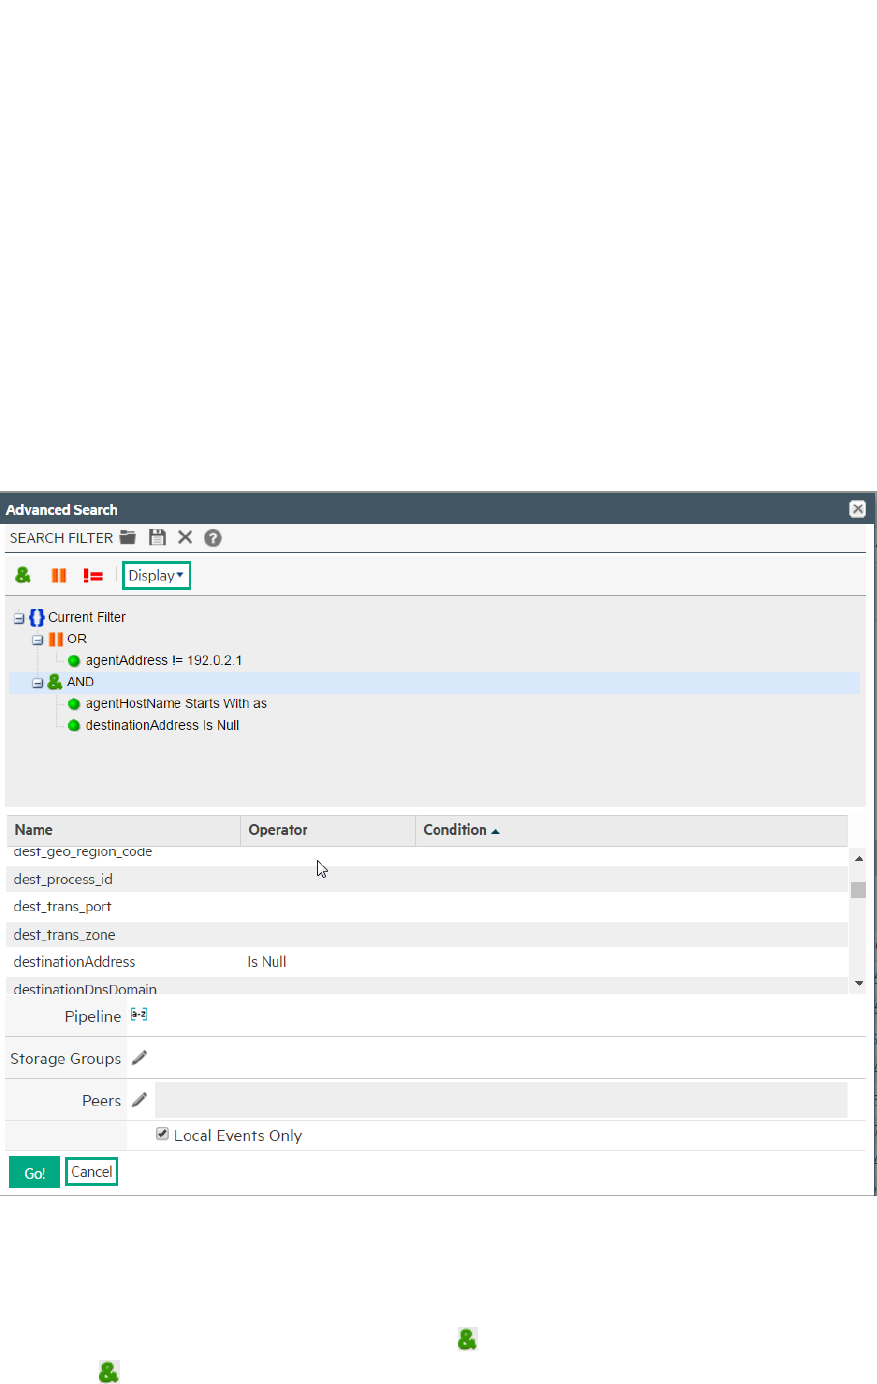
Nested Conditions
You can create search queries with nested conditions in the Advanced Search dialog box. To do so, click
the operator under which you want to nest the next condition and add the condition as described in
"Accessing Advanced Search" on page85.
For example, use the steps below to add the following query:
( ( agentAddress != 192.0.2.1 ) OR ( agentHostName STARTSWITH "as" AND
destinationAddress IS NULL ) )
Nested conditions in the Advanced search dialog box
Adding a nested query:
1. Click Events > Event Search to open the search page, and then click Advanced Search.
2. Clear any current search. For example if AND ( ) is displayed under the current filter, right-click
AND ( ) and select Delete. Confirm the deletion.
ArcSight Command Center User's Guide
Chapter 4: Searching for Events in the ArcSight Command Center
HPE ESM 7.0 Page 87 of 213
3. Click the Current Filter and then click OR ( ) to add an OR clause to the query.
4. Click the OR in the query to define it. For the example, add the following:
lName: agentAddress,
Operator: !=
Condition:192.0.2.1
lClick the OR in your query and then click AND ( ) to add a nested AND clause.
lClick the AND to define it. For the example, add the following:
lName: agentHostName
Operator: STARTSWITH
Condition: as
lName: destinationAddress
Operator: STARTSWITH
Condition: as
5. Click GO! to run the query.
Alternate Views for Query Building in Advanced Search
By default, the conditions are displayed in a tree view, as shown in the previous figures in this section.
You can change the view to a color-block scheme and adjust whether the fields you select are displayed
in the lower part of the screen or to the right of where conditions are displayed, as shown in the
following figure.
Note:Color block views are not available in the dark theme display.
ArcSight Command Center User's Guide
Chapter 4: Searching for Events in the ArcSight Command Center
HPE ESM 7.0 Page 88 of 213
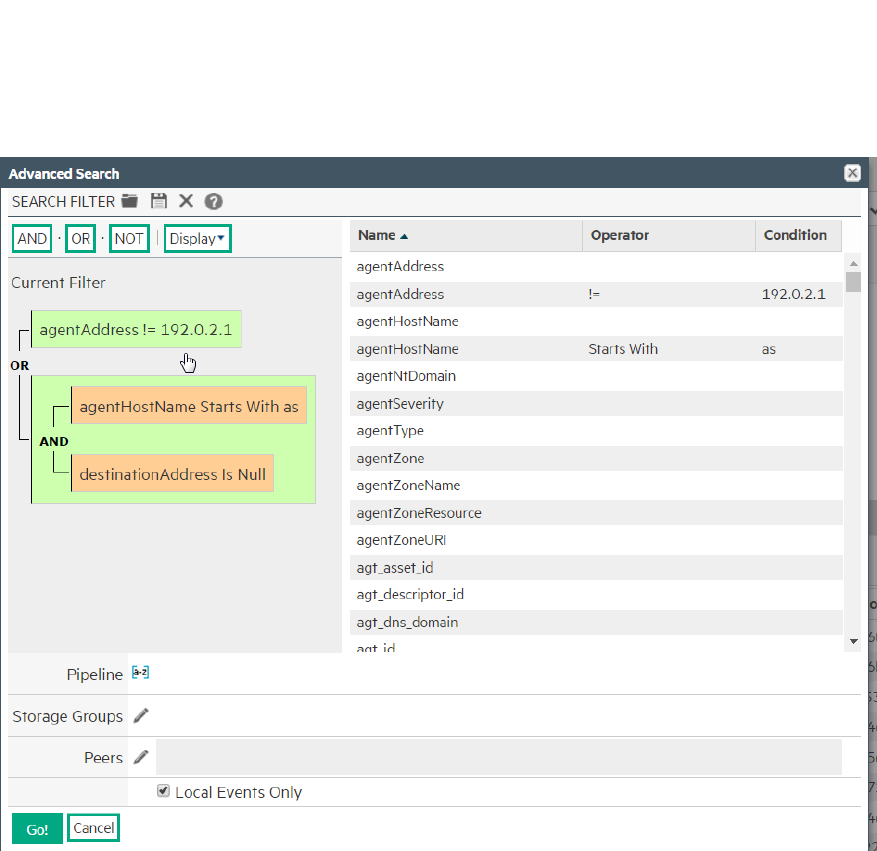
Vertical color block view for the query in as seen in the previous figure
To change views:
1. Click Events >Event Search to open the search page and select an open Search tab or open a new
tab.
2. Click Advanced Search to open the Advanced Search tool.
3. Click Display and select the view of your choice.
Search Helper
Search Helper is a search-specific utility that automatically displays relevant information based on the
query currently entered in the Search text box.
ArcSight Command Center User's Guide
Chapter 4: Searching for Events in the ArcSight Command Center
HPE ESM 7.0 Page 89 of 213
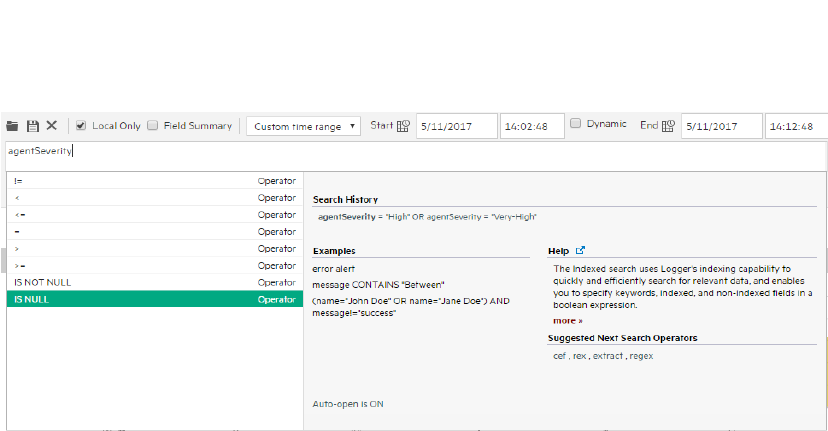
Search Helper is available by default. If you do not want the Search Helper to display information
automatically, click the “Auto-open is ON” link (in the Search Helper window). The link toggles to “Auto-
open is OFF”. To access Search Helper on demand (once it has been turned off), click the down arrow
button to the right of the Search text box.
Search Helper includes following the types of information:
lAutocomplete
lSearch history
lSearch operator history
lExamples
lSuggested next operators
lHelp
Autocomplete
The autocomplete functionality provides full-text keywords and field suggestions based on the text
currently entered in the Search box. The suggestions enable you to select keywords, fields, field values,
search operators, or metadata terms from a list instead of typing them in, thus enabling you to build a
query expression more quickly.
When you start typing, the suggestion list displays many types of entries. Event IDs and timestamps are
not supported by the autocomplete feature, so the dates, times, and Event IDs will not be included in
the suggestion list. As you continue to type, the suggestions narrow to include only the relevant items.
lIf you enter a field name, the suggestion list includes operators and possible field values.
lIf you enter a pipe (|), the suggestion list displays operators.
lIf you enter an underscore, the suggestion list displays metadata terms, such as _storageGroup or _
peerLogger.
lIf you enter a keyword or a field value, the suggestion list displays a count.
ArcSight Command Center User's Guide
Chapter 4: Searching for Events in the ArcSight Command Center
HPE ESM 7.0 Page 90 of 213

lThe count represents the number of values stored for a field. The count is dependent on many
factors and may not be exact. It does not indicate how many events might match the query. Many
factors determine the number of event matches, including the time range, search constraints, and
search operators for the query.
Note: Consider the following:
oThe autocomplete suggestions and counts are based on data stored on the local system only.
Peer data is not included.
oAutocomplete suggestions and counts are reset when the system restarts.
To use an autocomplete suggestion:
Click the suggestion to move it up to the Search box. Then click Go! to run that search or continue
typing in the search box to narrow your search further.
Search group filters (that restrict privileges on storage groups) are not enforced on the autocomplete
list. Therefore, the list includes keywords, fields, field values, and counts of events in storage groups to
which a user might not have privileges.
Search History
The search history displays recently run queries that match the currently entered search. Click a recent
query to run it again.
Search Operator History
Displays the fields used previously with the search operator that is currently typed in the Search text
box. The Search Operator History only displays if you have previously used the operator you have
currently typed to perform searches on this system. Click the operator to add it to your search.
Examples
Lists examples relevant to the latest query operator you have typed in the Search text box.
Usage
Provides the syntax for the search operator.
ArcSight Command Center User's Guide
Chapter 4: Searching for Events in the ArcSight Command Center
HPE ESM 7.0 Page 91 of 213
Suggested Next Operators
List of operators that generally follow the currently typed query. For example, if you type logger |,
the operators that often follow are rex,extract, or regex. Click one of the listed operators to append
to the currently typed query in the Search text box. This list saves you from guessing the next possible
operators and manually typing them in.
Help
Provides context-sensitive help for the last-listed operator in the query that is currently typed in the
Search text box. Additionally, click the icon to launch the online Help.
Searching for Events
To search for events, you need the search operation permission and permissions to certain event filters.
If you cannot search or do not find the events you need, ask your administrator to grant you access. For
instructions on how to grant search access, see "Granting Access to Search Operations and Event
Filters" on page94.
Note:
lThe fields displayed in the search results vary based on the selected fieldset. The fields you see
may differ from the ones displayed in the documentation.
lCommand Center Search enables you to search for events that have been stored in the
database. However, Active Channels enable you to view events as they come in, before they are
stored. During times of high event input, you may be able to view events in Active Channels
before they are available for search. Should this occur, wait a few minutes and try the search
again.
To include null values in your search:
By default, if you choose to exclude certain values in your search with the Alt-Click feature, fields with
null values are also automatically excluded from the results. If you want to include the null values, add
this statement to the logger.properties file in ESM's
/opt/arcsight/logger/userdata/logger/user/logger/ directory:
sqlgenerator.querystr.addnullcondition = true
Restart all ArcSight services after editing the file.
Refer to the topics, "Editing Properties Files" and "ArcSight_Services Command" in the ESM
Administrator's Guide for instructions.
ArcSight Command Center User's Guide
Chapter 4: Searching for Events in the ArcSight Command Center
HPE ESM 7.0 Page 92 of 213

To search for events:
1. Click Events >Event Search to open the search page.
2. Use the following default values or change them to suit your needs:
a. Local Only: When peers have been configured for your system, the Local Only checkbox will
display. Local Only is checked by default. If you want to include peers in your search, uncheck
the Local Only checkbox. If you do not see this checkbox, no peers have been configured. For
information on adding peers, see "Configuring Peers" on page166.
b. Time Range: By default, the query is run on the data received in the last 10 minutes . Click the
drop-down list to select another predefined time range or specify a custom time range. For more
information about time ranges, see "Time Range" on page72.
c. Fieldset: By default, all fields (All Fields) are displayed in the search results. However, you can
select another predefined fieldset or specify a customized fieldset. For more information about
fieldsets, see "Fieldsets" on page74.
Note: This option is only displayed after you have run a search in this session.
3. Specify a query expression in the Search text box using one or more of the following methods.
Refer to "Query Expressions" on page63 for information on how to create a valid query expression.
a. Type the query expression in the Search text box. For information about building a query
expression, including lists of applicable operators, see "Elements of a Search Query" on page63.
b. When you type a query, Search Helper enables you to build the query expression by
automatically providing suggestions, possible matches, and applicable operators. See "Search
Helper" on page89 for more information.
c. Use these guidelines to include various elements in a search query:
lTo view the fields in the schema, see "Viewing the Default Fields " on page164.
lMetadata terms (_storageGroupzo or _peerLogger)
Enter _s (for storage group) or _p (for peers) in the Search text box to obtain a drop-down
list of constraint terms and operators.
For information about storage groups and peers, see "Storage" on page138 and "Peers" on
page166.
lNote: If your query expression includes multiple storage groups to which search should
be constrained, make sure that the group names are enclosed in square brackets; for
example, _storageGroup IN [“SGA”, “SGB”].
lClick Advanced Search. (See "Using the Advanced Search Tool" on page85 for more
information.) Use this option to specify storage groups and peers to which the search should
be limited.
d. Click the icon to load a search filter or a saved search. Select the search filter or the saved
search from the displayed list and click Load+Close.
ArcSight Command Center User's Guide
Chapter 4: Searching for Events in the ArcSight Command Center
HPE ESM 7.0 Page 93 of 213

For more information, see "Saved Queries (Search Filters and Saved Searches)" on page109 and
"Predefined Search Filters" on page111.
4. Click Go!
The search results are displayed in the bottom section of same screen in which you ran the search.
For more information about how search results are displayed and the various controls available, see
"Understanding the Search Results Display" on page96.
5. You can save the search as a search filter or saved search. Click the icon to do so. For more
information, see "Saved Queries (Search Filters and Saved Searches)" on page109.
Granting Access to Search Operations and Event Filters
To perform local searches, a user must belong to a Logger Search Group with the “Search for events”
user right set to Yes.
To perform searches on peers and view the search results, a user needs to belong to these user groups
with the listed permissions:
lLogger Search Group with “Search for events on remote peers” user right set (checked).
lLogger Rights Group with the “View registered peers” user rights set (checked).
Access to the search feature is granted at the user group level. In addition to the search operation
permission, a user needs permissions to event filters to enable access to the appropriate events. By
default, Administrative users have access to all events, but other users might not have access to any
events.
To grant access to search events:
1. In the ArcSight Console, select a system filter or create a filter to provide access to the appropriate
events. For more information, refer to the Managing Permissions >Adding or Removing Enforced
Filters section of the ArcSight Console User's Guide.
2. In ArcSight Command Center:
a. Create the user under a group.
b. Edit the Access Control List (ACL) for the group and add the filter you selected or created in
Step 1 to the Events tab in the ACL Editor.
c. Edit the Access Control List (ACL) for the group and add the following permission to the
Operations tab in the ACL Editor.
/All Permissions/ArcSight System/Search Operations/Search
For more information on editing access control lists (ACLs), granting or removing permissions
for events, and other permissions-related topics, refer to the ArcSight Console User's Guide
chapter, "Managing Users and Permissions."
ArcSight Command Center User's Guide
Chapter 4: Searching for Events in the ArcSight Command Center
HPE ESM 7.0 Page 94 of 213

Advanced Search Options
The advanced search options enable you to tune search operations to suit your environment. The
options are discussed in "Tuning Search Options" on page161.
Searching Peers (Distributed Search)
By default, all administrators can view, create, and edit peers; and run searches on remote peers. For
other users, access to this feature is controlled by user permissions. If you need access to this feature,
ask your administrator. For instructions on how to grant access to peer operations, see "Granting Access
to Peer Operations" on page171.
When you run a search query, by default, only your local system is searched for matching events.
However, when specifying a query, you can select an option to run the search on configured peers. You
can also select the peers to which the search should be constrained, as described in "Searching for
Events" on page92.
Note when searching across peers:
lRefer to the Release Notes for an updated list of supported peer versions, both for ESM and Logger
peers.
lDistributed searches for fields that do not exist in the peer are not supported.
lStorage groups on peers must have identical names.
lOnly storage groups with identical names are searched. If a peer does not have identical storage
group names, the search operation skips searching for events for those groups on those peers.
Tuning Search Performance
Search performance depends on many factors and will vary from query to query. The amount of time it
takes to search depends on the size of the data set to be searched, the complexity of the query, and
whether the search is distributed across peers.
To optimize search performance, follow these recommendations:
lAvoid specifying a time range that results in a query that needs to scan multi-millions of events.
lLimit the search to specific storage groups and peers.
lReduce other load on the system when your query needs to run, such as scheduled jobs, large
number of incoming events, and multiple reports being run.
ArcSight Command Center User's Guide
Chapter 4: Searching for Events in the ArcSight Command Center
HPE ESM 7.0 Page 95 of 213
Understanding the Search Results Display
After you have initiated a search, the search results are displayed in the bottom section of the same
screen in which you ran the search.
While the search is in progress, the Go! button changes to Cancel. Click Cancel to terminate a search. As
the query runs, matching events display as they are found. If you are sure the partial search results
contain the events you are looking for, you can cancel the search. You can further process the displayed
(partial) results; for example, export the results, use the histogram to drill-down on the results, or click
on any text in the Search Results to add it to the query for further drill-down of the search results.
Note: If a query includes chartable operators such as chart, rare, or top, and you cancel the query, a
chart of the partial results is not displayed. Additionally, if a query includes the head, tail, or sort
operators, partial results are not generated.
A search operation can take time when millions of events need to be searched. When the first screen of
events that match the specified conditions is available, the system automatically pauses the search and
displays the matched events. By default, 25 events are displayed on one screen. Event data is
categorized by field name with each field displayed as a separate column, as shown in the following
figure. For example, time when the event was received on the system (Event Time) is displayed under
Time (Event Time). Each event is also available in its raw form and can be viewed by clicking the icon in
the left most column.
To see all raw events, click All at the top of the Search Results display. To collapse raw events, click
None. The column width for each column is adjustable.
To see the next screen of events, click ; or to go to the last page. After you are past the first
screen of events, you can click to go back to the previous screen; or to go to the first page.
To change the number of events displayed per screen, open the Events per Page drop down menu and
select the number of events to display.
The Search Results page displays a histogram that provides a graphical representation of the events
that match a search query. The distribution is based on the time range specified in the query. That is,
the X-axis represents event time and Y-axis represents the number of matching events.
Drill down to events in a specific time period by clicking the histogram bar representing the time period.
When you mouse over a bar in the histogram, the number of events scanned and number of events
matching the query and the time it took to run the search is displayed.
Note: IPv6 Address columns cannot be expanded enough to see all of the address. If you select the
plus sign on the left to see the raw event, you can see the entire IPv6 address.
ArcSight Command Center User's Guide
Chapter 4: Searching for Events in the ArcSight Command Center
HPE ESM 7.0 Page 96 of 213

Below the histogram, events are shown in table form, one row per event. Terms that match your query
are highlighted in blue to make it easy to see why an event matched the query.
To view the raw event of a listed event, click the icon to the left of the matching event. You can also
view the Syslog raw events in a formatted column called rawEvent if you have enabled the “Populate
rawEvent field for syslog events” option on the Search Options page, as discussed in "Tuning Search
Options" on page161. Also, see "Fieldsets" on page74 to learn more about the rawEvent field.
As you roll the mouse over other terms in the events table, they highlight in green. The user interface
allows you to drill-down into the displayed search results by clicking a green-highlighted term to add it
to the current query. For example, if you search for “login” and roll over the word “fail” in the search
results, “fail” will highlight in green. Click the word “fail” to change the query to “login AND fail.” You can
also highlight and copy text from any displayed column. This feature is handy when you need to copy
an IP address or a URL. (Highlight the term by scrolling over it. Then, right-click your mouse to display
the Copy option.) You can select any fields from the search results. Search results are sorted by receipt
time.
Use these keyboard shortcuts to select terms from the displayed search result columns or the raw
events to refine your search query:
lClick the term in search results to add the selected term to the search query, and rerun the search.
lCtrl+click to replace the entire search query with <field name> + "CONTAINS" + <selected term>, and
rerun the search.
lAlt or Shift + click the term in search results to add NOT to the term, and rerun the query, thus
eliminating the events that match the term you selected.
lYou can add multiple NOT conditions by holding the Alt key and selecting terms in search results.
When multiple conditions are added, they are joined by AND operators.
lYou can combine Ctrl+Alt, (or Ctrl+Shift) to replace the search query with NOT + <field name> +
"CONTAINS" + <selected term>.
A Field Summary panel is displayed on the left side of the matched events. This section lists the fields
that occur in matching events and the number of unique values for each in those events. For more
information, see "Field Summary" on page101.
User-defined Fields in Search Results
When a search query matches events that were received from a defined source type and were parsed
using a pre-defined or user-defined parser, the search results include a parser field, and may include
fields for the source type, and source, depending on the setting in the Search Options tab. For more
information, see "Tuning Search Options" on page161.
The following table describes the purpose of these fields.
ArcSight Command Center User's Guide
Chapter 4: Searching for Events in the ArcSight Command Center
HPE ESM 7.0 Page 97 of 213

Field Description
parser Indicates whether an event was parsed or not, and which parser was used.
If the event was parsed, this field contains the name of the parser. If the event was not parsed successfully, this
field contains “Not parsed”. If no parser is defined for the source type or if there is no source type, the field is
blank.
source
type
The type of file from which the event was received, as defined on the Source Type page (Configuration >
Event Input > Source Types).
If no source type was applied when the event was received, this field is blank. You can control whether this
field is displayed from the Search Options tab.
source The name of the log file from which the event was received. For example, /opt/mnt/testsoft/web_server.out.log.
If no source was applied when the event was received, this field is blank. You can control whether this field is
displayed from the Search Options tab.
User-defined fields are created when a search query includes operators such as rex,extract, and
rename. See "Search Operators" on page179 for information on these operators.
These fields are displayed as additional columns in the All Fields view (of the System Fieldsets). To view
only these columns, select User Defined Fieldsets from the System Fieldsets list.
Viewing Search Results Using Fieldsets
By default, the Search Results are displayed using the All Fields fieldset, which displays all fields
contained in an event. Once you select another fieldset, it becomes your default view until you change it
the next time. For a detailed discussion about fieldsets, see "Fieldsets" on page74.
If you view the Search Results using the Raw Event fieldset, even though the rawEvent column displays
the raw event, this column is not added to the database and is not indexed. Therefore, you can only run
a keyword (full-text) or regular expression to search on the event.
Using the Histogram
Guidelines for using histograms:
lHistogram of the matching events is generated automatically. You cannot disable it, however, you
can click to the upper-right corner of the histogram to hide it. To display a hidden histogram,
click the icon.
lHistogram is based on the device receipt time of the events (similar to search queries that also use the
device receipt time to search for events).
lThe time distribution on the X-axis is determined automatically.
lYou can mouse-over any histogram bar to view the number of matching events and the date and
time period that the bar represents.
ArcSight Command Center User's Guide
Chapter 4: Searching for Events in the ArcSight Command Center
HPE ESM 7.0 Page 98 of 213

lYou can drill-down to events in a specific time period by clicking the bar on the histogram that
represents that time period. The selected section is highlighted and the events matching that time
period are listed below the histogram. The histogram continues to display the distribution of all of
the matching events, as shown in the following figure. For example, if you select a bar that represents
11,004 events on 2/22/2010 from 12:25:49 a.m. to 12:26:49 a.m. in the following histogram, the details
of those events are listed below the histogram; however, the histogram displays all time units and the
associated bars. You can also select multiple consecutive bars on the histogram to view matching
events in all of the selected time units.
lTo deselect a selected bar, click it.
lA histogram is progressively built and displayed as events match a search query. If the search query
needs to scan a large amount of data or a large time period, the displayed histogram could refresh
multiple times while the query is running. To view the complete (and final) histogram of a search
query, wait until the query has finished running (when the screen does not display the circular
“waiting” icon anymore).
lThe time range on the X-axis might not match the time range specified in the search query because
the start and end times on the X-axis are determined by the event times of the first and last matching
events of the search query.
lThe first one million matching events are plotted on the histogram. If a search query matches more
than one million events, an informational message is displayed on the screen.
lIf you need to use the histogram view the results of a search query that matches more than one
million events, adjust the time range specified in your search query so that fewer than one million are
matched to obtain a complete and meaningful histogram. Or, use a pipeline operator such as top,
head, or chart to further refine search results so that the total number of hits is fewer than one
million.
Multi-line Data Display
An event message might span multiple lines separated by characters such as newline (\n) or carriage
return (\r). For example,
0x0000: 0000 0100 0000 0000 0000 0000 0000 0000 ................
0x0010: 0000 0000 0000 0000 0000 0000 0000 0000 ................
0x0020: 0000 0000 0000 0000 0000 0000 0000 ..............
The user interface displays such a message in the expected multi-line format and does not remove the
line separators and collapse the message into one line.
Auto Updating Search Results
The Auto Update feature executes the search over specified intervals, updating the search results if
new events match the query.
Depending on your needs, you can auto update the search results every:
ArcSight Command Center User's Guide
Chapter 4: Searching for Events in the ArcSight Command Center
HPE ESM 7.0 Page 99 of 213
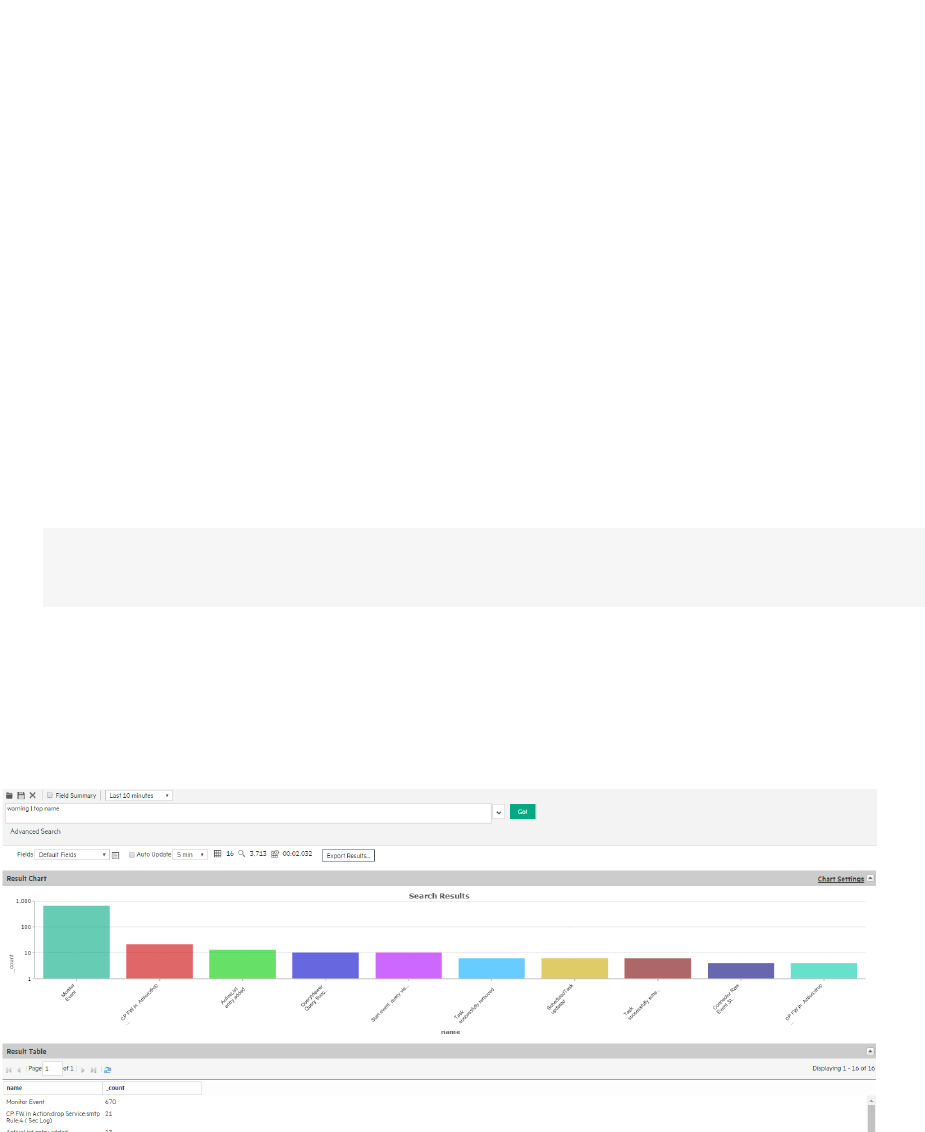
l30 seconds
l60 seconds
l2 minutes
l5 minutes (default)
l15 minutes
You can enable this option for a search operation before or after running it. Once you enable this
option, the setting persists for all search operations until you disable it.
To auto update search results:
1. Click Events >Event Search to open the search page.
2. Check the Auto Update box and select the refresh interval if different from the default, 5 minutes.
Note: The Auto Update checkbox is available only when search results are shown. It will be
available then, even if there were no hits.
Chart Drill Down
The chart drill down feature enables you to quickly filter down to events with specific field values.
Identify a value on a search results chart and click it to drill-down to events that match the value.
When you click on a chart value (a column, bar, or pie section), the existing search query is modified to
include the WHERE operator with the field name and value, and automatically rerun.
ArcSight Command Center User's Guide
Chapter 4: Searching for Events in the ArcSight Command Center
HPE ESM 7.0 Page 100 of 213
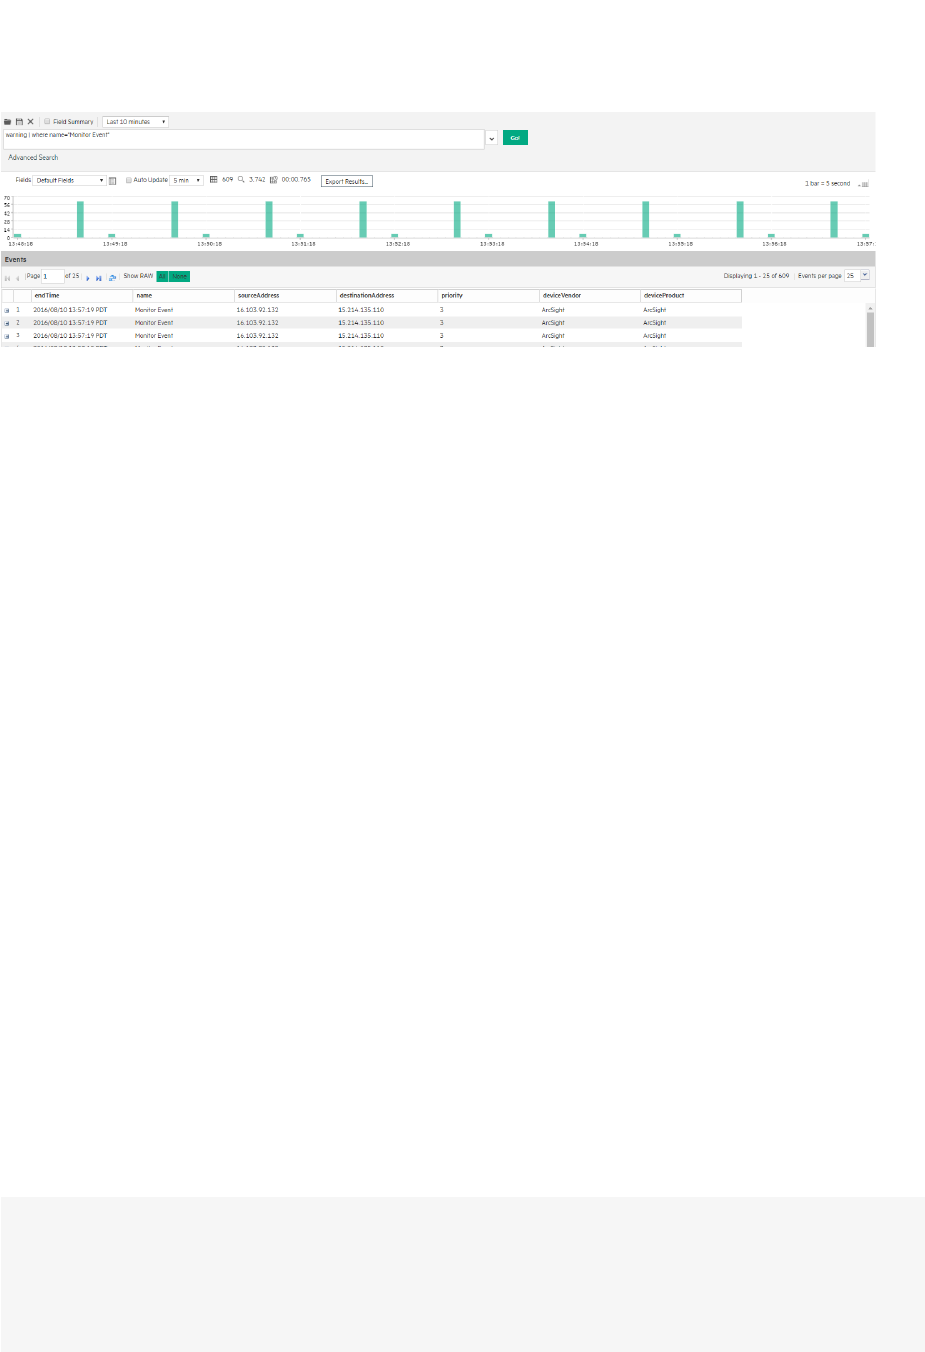
If you need to return to the original query from the drill-down screen, use the Back function of your
browser.
Field Summary
If the Field Summary checkbox is marked, when a query is run the Field Summary panel lists the CEF and
non-CEF fields that occur in matching events and the number of unique values for each in those events.
This panel is only displayed for queries that do not generate charts. If a peer search is performed, the
summarized field values include counts from peers.
Granting Access to Field Summary Operations
Access to Summary Operations is granted at the user group level. Edit the Access Control List (ACL) for
the group and add the following permission to the Operations tab in the ACL Editor.
View Field Summary:
/All Permissions/ArcSight System/Summary Operations/Field Summary Read
Understanding Field Summary
The Field Summary panel can contain one or two sections depending on whether you mark the Discover
Fields checkbox. For both sections, by default, the top 10 values for each field are listed.
The Selected Fields section lists the CEF fields. By default, the Selected Fields list contains these fields:
destinationAddress, deviceProduct, deviceVendor, name, priority, and sourceAddress. You can edit this
list to suit your needs, as described in "To change the default Selected Fields list:" on page103.
The Field Summary feature can automatically discover non-CEF fields from a raw event. When this box
is checked, the Discovered Fields section lists the non-CEF fields discovered in raw events.
Note: The Discover Fields option is useful for events that have raw, unstructured (non-CEF) data,
such as events from a peer Logger.
However, note that the Discover Fields option in the ArcSight Command Center Search feature is
not supported. To use the Discover Fields option, run the search from Logger.
ArcSight Command Center User's Guide
Chapter 4: Searching for Events in the ArcSight Command Center
HPE ESM 7.0 Page 101 of 213
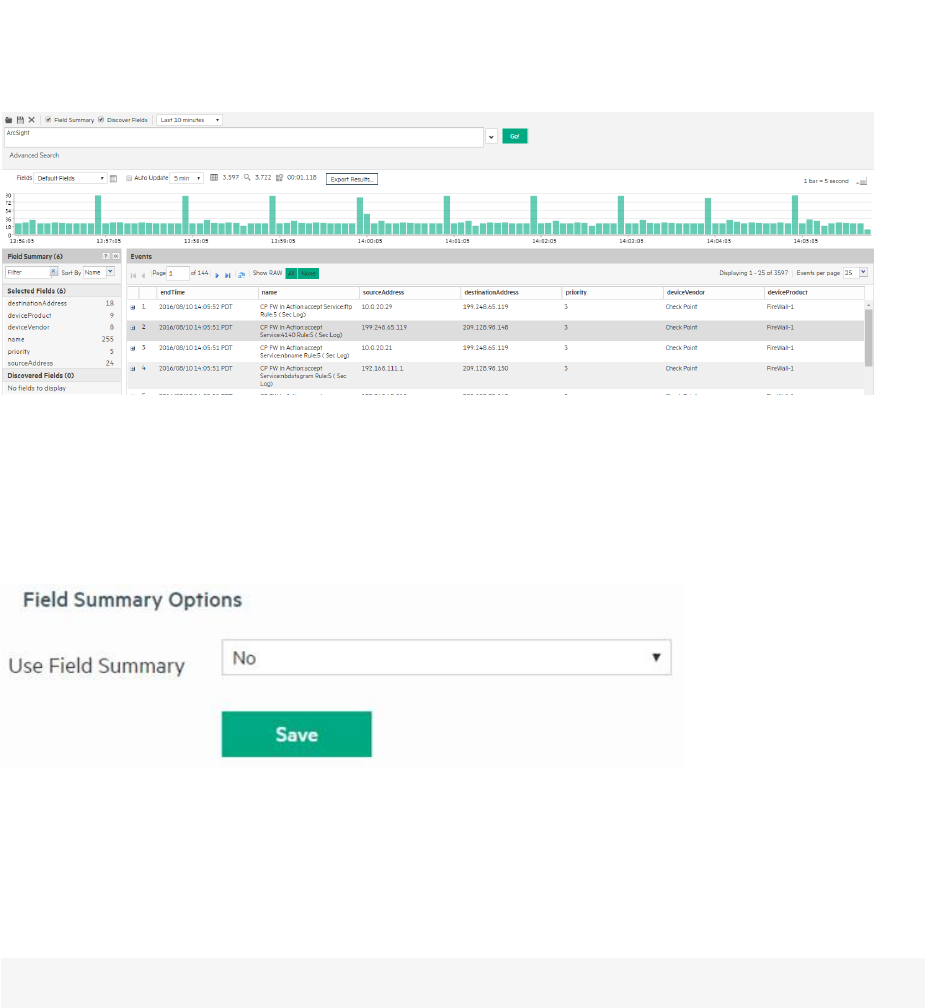
By default, the Field Summary and its Discover Fields options are disabled. If you need to enable the
Field Summary for all searches on your system, change the default value (“No”) on the Search Options
page (Administration > Search > Search Options) to the desired value for this option, as shown in
the following figure. (The Discover Fields is not supported in this release. To use the Discover Fields
option, run the search from Logger.)
However, if you need to use the Field Summary only occasionally—not for all searches—you can enable
the option for one-time use on the user interface page from where you run the Search query. To do so,
click the Field Summary checkbox above the Search text box before clicking Go! to run the query.
Selecting these options on the Search page overrides the setting for these options on the Search
Options page.
Note: Setting these options to Yes can impact search performance.
To auto-discover fields, the raw events must contain data in the “key=value” format, and none of these
characters can be the first character of the “value”: comma, space, tab, and semicolon. For each
“key=value” pair found in a raw event, a new field of the name “key” is created. The Field Summary
includes a summary of the values for all the new fields under the Discovered Fields section. The
discovered fields are assigned the type “String” by default. The auto-discovery capability works only if
at least 2,500 of the first 10,000 matching events contain “key=value” pairs. If this threshold is not met,
auto discovery is automatically turned off. However, this threshold does not apply if there are less than
10,000 matching events; in that case, fields are discovered regardless.
You can drill-down on any of the listed fields or a specific value of the listed fields. For example, you
might want to view all events containing destinationAddress (specific field) or you might want to
view events of name “Report updated” (specific value in a field).
ArcSight Command Center User's Guide
Chapter 4: Searching for Events in the ArcSight Command Center
HPE ESM 7.0 Page 102 of 213
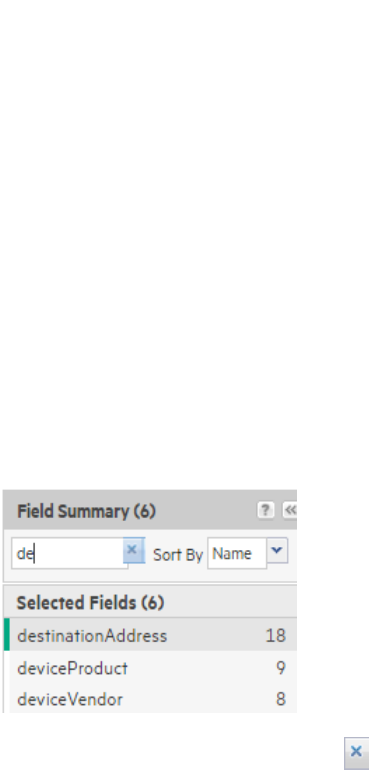
When you click one of the fields under Selected the Field Summary, various options become available.
The available options vary by field type. When field is the data type String (Text), you can choose the
following options Display events containing <field>, view the top 10, or view the values by time. When
field is the data type Number (Long, Integer or Double), you can also perform mathematical operations
such as average, min, and max. For more information about the available fields and data types, see
"Viewing the Default Fields " on page164.
Every time you run a query or drill-down on a specific field or value, a new query using the newly
selected criteria is run and the Field Summary list is updated.
You can limit the search to a specific field or filter the listed fields by specifying a filter criteria in the
Search Filter text box located at the top of the Field Summary panel. For example, if you want to see
fields that begin with de, enter de in the Search Filter text box.
To go back to the default list, click the icon. You can sort the field list by Name or Count. To do so,
select the sort criteria from the drop-down menu.
To change the default Selected Fields list:
1. Click Events > Event Search to open the search page.
2. Define or update an existing custom fieldset to include fields you want the Selected Fields list to
contain. See "Fieldsets" on page74 for information on creating custom fieldsets.
3. Select the custom fieldset you defined to view search results.
4. After running a search query, if you select a different fieldset, the Field Summary panel displays the
following message: "The Field Summary is out of sync with the Events table."
This message indicates that the fields listed in the Field Summary panel do not match the ones
specified in the newly selected fieldset. To display the fields specified in the new fieldset, click
Update now.
Refining and Charting a Search from Field Summary
When you click a field in the Field Summary, a dialog box labeled <fieldname><number of values>
displays information about the field. From here, you can drill down to see more details and create a chart
of the search results.
ArcSight Command Center User's Guide
Chapter 4: Searching for Events in the ArcSight Command Center
HPE ESM 7.0 Page 103 of 213
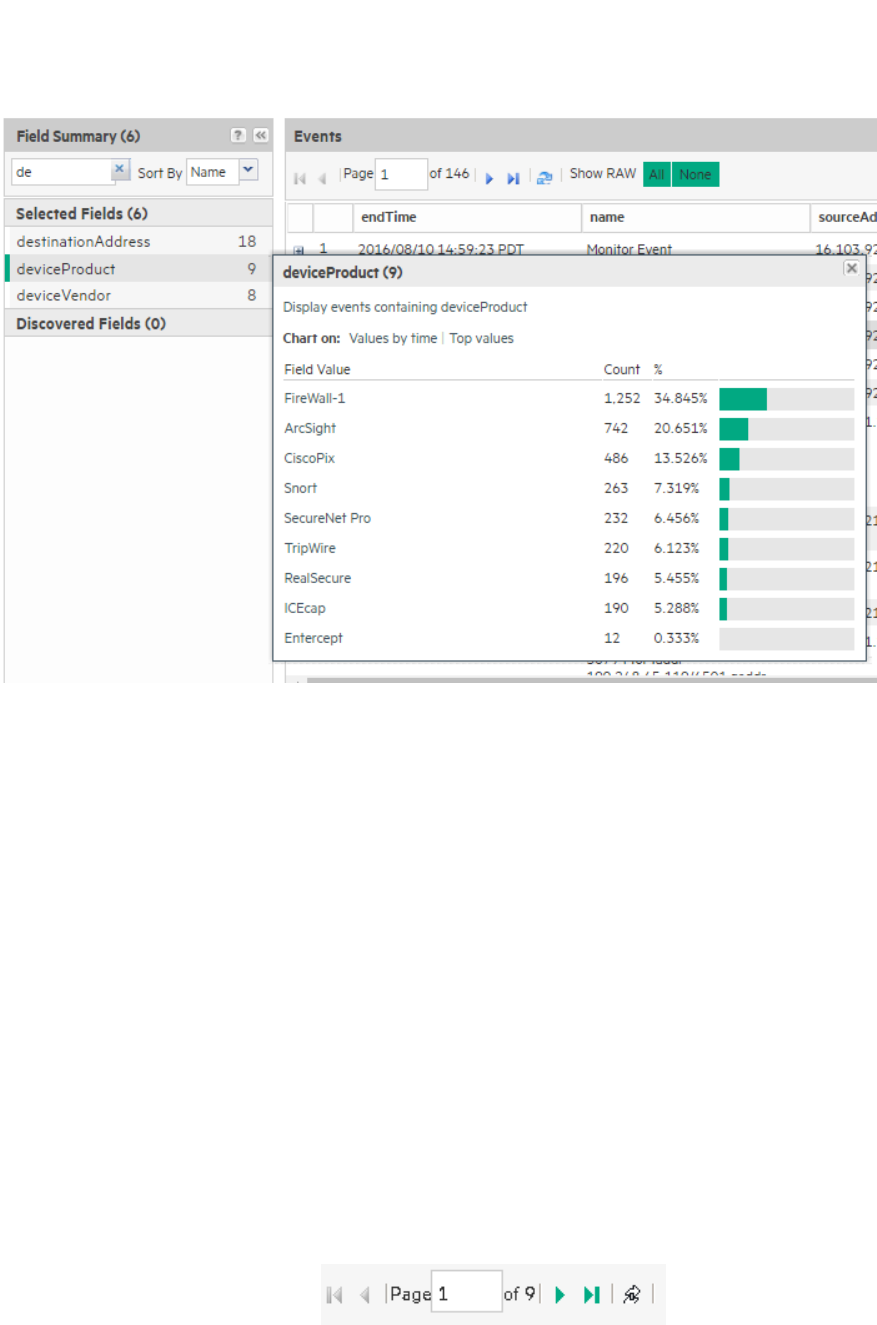
To view field details from field summary:
1. Click Events >Event Search to open the search page.
2. Check the Field Summary checkbox and then run a search.
3. Click the field name in the Field Summary.
4. The<fieldname><number of values> dialog box displays the top ten field values.
5. Optionally, click a field value to append it to the query and rerun the search.
6. To create a chart of the search results, click one of the Chart on values, such as Values by time or
Top values.
7. The results display in a Result Chart and a Result Table.
8. In the Result Chart, click Chart Settings to adjust the chart.
9. Enter a useful Chart Title.
lSelect the Chart Type best suited to your data.
lSet the Display Limit. The highest valid value is 100.
10. In the Result Table, you can use navigation buttons to move forward and backward through list of
results, and refresh the search.
11. To create a PDF or CSV file containing the search results, click Export Results. For more
information, see "Exporting Search Results" on the next page.
ArcSight Command Center User's Guide
Chapter 4: Searching for Events in the ArcSight Command Center
HPE ESM 7.0 Page 104 of 213

Exporting Search Results
You can export search results in these formats:
lPDF: Useful in generating printable output of the search results. The report includes a table of
search results and any charts generated for the results. Both raw (unstructured data) and CEF
(structured data) events, can be included in the exported report.
lCSV file: Useful for further analysis with other software applications. The report includes a table of
search results. Charts cannot be included in this format.
Data for the following time fields is exported in human-readable format: deviceReceiptTime, startTime,
endTime, agentReceiptTime. For example, 2014/03/21 20:22:09 PDT.
To export search results:
1. Click Events >Event Search to open the search page.
2. Run a search query.
3. Click Export Results.
4. Select from the following export options.
Option Description
Save to
local disk
The file is saved to a local system or it is sent to the browser for viewing or saving.
Save to
ArcSight
Command
Center
The file is written to local storage.This option saves the results to a directory accessible to every ESM
user regardless of permissions. To prevent that, add the following property to
/opt/arcsight/logger/current/arcsight/logger/user/logger/logger.propertie
s:
search.export.saveToServer.enabled=false
Restart all ArcSight services after editing the file.
Refer to the topics, "Editing Properties Files" and "ArcSight_Services Command" in the ESM
Administrator's Guide for instructions.
File
Format
CSV, for comma-separated values file.
PDF, for a report-style file that contains search results as charts and in tables. Charts are only
included in the PDF file if the search query contains an operator that creates charts, such as chart,
top, and so on.
ArcSight Command Center User's Guide
Chapter 4: Searching for Events in the ArcSight Command Center
HPE ESM 7.0 Page 105 of 213

Option Description
Export file
name
(Available only when the “Export to remote location” option is selected)
Specify the name of the file to which events will be exported.
If a file of the specified name does not exist, it is created. If a file of the specified name exists and the
Overwrite box is not checked, an error is generated. If the Overwrite box is checked, the existing file is
overwritten.
You do not need to specify an extension. The extension .pdf or .csv is added for you based on the file
format you selected.
Title (Optional, available only when the File Format is “PDF”)
A meaningful name that appears on top of the PDF file. If no title is specified, “Untitled” is included.
Fields A list of event fields that will be included in the exported file.
By default, all fields are included.
You can enter fields or edit the displayed fields by deselecting All Fields.
To export fields created as a result of rex,extract,rename, or eval operators, or field created
when a parser is applied to an event, ensure that *user is selected in the Fields list.
Chart
Type (for
PDF only)
(Available only when a chart is available in search results)
Type of chart to include in the PDF file. You can select from:
Column, Bar, Pie, Area, Line, Stacked Column, Stacked Bar.
Note: If the Chart Type is different from the chart displayed on the Search Results screen, the value
selected for this option overrides the one shown in the screen. Therefore, the exported PDF contains
the chart you specify for this option and not the one shown on the screen.
Chart
Result
Limit (for
PDF only)
(Available only when a chart is available in search results)
Number of unique values to plot. Default: 10
If the configured Chart Result Limit is less than the number of unique values for a query, the top
values equal to the Chart Result Limit are plotted. That is, if the Chart Result Limit is 5 and 7 unique
values are found, the top 5 values will be plotted.
Include
Summary
Include an event count in the exported search results.
Include
only CEF
Events
Only include CEF events in the exported search results.
ArcSight Command Center User's Guide
Chapter 4: Searching for Events in the ArcSight Command Center
HPE ESM 7.0 Page 106 of 213

Option Description
Include
base
events
(alerts
only)
Include base events for Alerts in the exported search results.
Rerun
query
Rerun query when exporting the results.
It may be significantly faster to leave the "Rerun query" box checked for some types of log data—
events for which the receive time is significantly different from the actual time when the event
occurred on the device.
Note: When the receipt time and end time differ significantly, the export may be faster if you check
this option.
Include
Base
Events
Include base events in the exported search results.
5. Click Export.
Example PDF output
The following is an example of a generated in PDF format. The chart is displayed first, followed by a
table of matched events. All generated charts (including stacked charts) can be exported.
The example uses the Chart Type Pie, and the following query.
ESM | where name is not null | top name
ArcSight Command Center User's Guide
Chapter 4: Searching for Events in the ArcSight Command Center
HPE ESM 7.0 Page 107 of 213
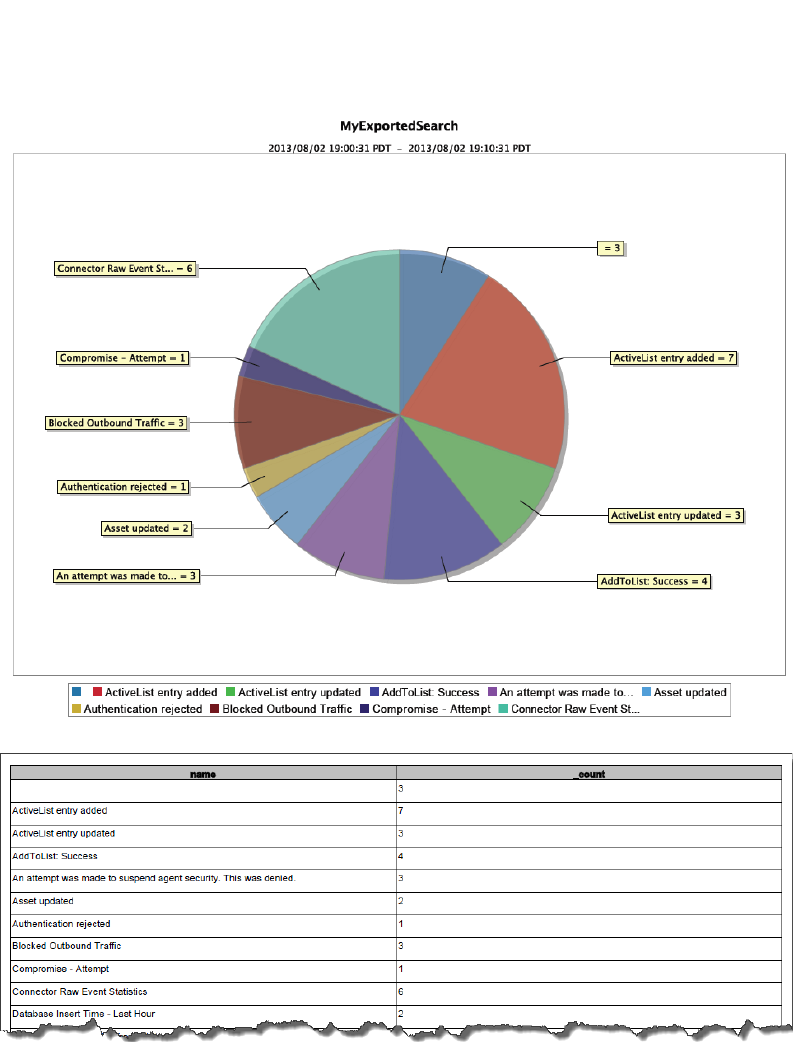
Scheduling an Export Operation
The time it takes to export search results is proportional to the number of events being exported. For a
large number of events, HPE recommends that you schedule the export operation to be performed at a
later time by saving the query and time parameters as a saved search, and then scheduling a saved
search job. For more information about saved search jobs, see "Scheduled Searches" on page157.
ArcSight Command Center User's Guide
Chapter 4: Searching for Events in the ArcSight Command Center
HPE ESM 7.0 Page 108 of 213

Saved Queries (Search Filters and Saved Searches)
If you need to run the same search query regularly, you can save it as a search filter or as a saved search.
A search filter includes just the query expression. A saved search includes the specified time range as
well as the query.
Saved searches and search filters are displayed in the ArcSight Console and can be packaged for
distribution to peers.
By default, all administrators can view, create, and edit saved searches and search filters. For other
users, access to these features is controlled by user permissions. If you need access to search filters or
saved searches, ask your administrator.
For instructions on how to grant access to these features, see "Granting Access to Search Filter
Operations" on page153 and "Granting Access to Saved Search Operations" on page155.
For information about saved search Alerts, see "Scheduled Searches" on page157.
Saving a Query
To save a query:
1. Define a query as described in "Searching for Events" on page92 or "Using the Advanced Search
Tool" on page85.
2. Click the Save icon ( ) and enter a name for the query in the Name field.
3. In the Save as field, select whether to save this query as a Search Filter, as a Saved Search , or as a
Dashboard panel.
4. Select Search Filter to save just the query.
5. Select Saved Search to save the time range along with the query.
Optionally, specify when to run the query by selecting Schedule it. If you mark schedule it, you can
save it as a Scheduled Search or a Scheduled Alert.
If the search query includes an aggregation operator such as chart or top, a third option to save the
query for a Dashboard panel is also displayed. If you select this option, you need to enter the
following parameters.
ArcSight Command Center User's Guide
Chapter 4: Searching for Events in the ArcSight Command Center
HPE ESM 7.0 Page 109 of 213

Parameter Description
Title Enter a meaningful name for the panel that will be added to the Dashboard.
Saved
search
Select an existing saved search from the drop-down box that will be overwritten with this query.
OR
Select “New saved search” to create a new saved search query. Enter the new name in the text box.
Dashboard Select an existing Dashboard from the drop-down box to which the Search Results panel will be
added.
OR
Select “New dashboard” to add the Search Results panel to a new Dashboard. Enter the name of the
new Dashboard in the “Dashboard Name” field.
Panel type Select the type of panel:
lChart—Displays search results in a chart form
lTable—Displays search results in a table form
lChart and Table—Adds two panels, one for displaying search results in the chart form and the
other for displaying search results in the table form
Chart type Type of chart to display matching events. You can select from:
Column, Bar, Pie, Area, Line, Stacked Column, Stacked Bar.
Default: Column
Chart limit Only applicable to Search Result Chart panels.
Number of unique values to plot. Default: 10
6. Click Save.
7. If you selected Schedule it, a dialog box opens asking if you want to edit the schedule settings.
8. Click OK to edit them now or Cancel to edit them later.
Note: In some cases, the browser adds a message to this dialog box asking if you want to
prevent the page from creating additional dialogs. If you select this option, you might be
unable to proceed. In that case, close the browser and restart it.
9. Edit the scheduling options and then click Save. For more information about the Scheduled
Searches and the Schedule options, see "Scheduled Searches" on page157.
Using a Search Filter or a Saved Search
The Load Search Filter/Saved Search interface enables you to quickly locate system filters, search filters,
and saved searches. Your system provides pre-defined search filters that you can select to run. These
are explained in "Predefined Search Filters" on the next page.
ArcSight Command Center User's Guide
Chapter 4: Searching for Events in the ArcSight Command Center
HPE ESM 7.0 Page 110 of 213

To use a search filter or a saved search:
1. Click Events >Event Search to open the search page.
2. Click the Load a saved search filter icon ( ) to view a list of the available Search Filters and
Saved Searches.
3. Open the tab for the list you want to display.
Click any column name to sort the information. To view details of a query, click its row. Details are
displayed in the text box below.
To load a search filter, select the system filter or search filter you want to use and click Load+Close.
The search filter rows display the search query.
To load a saved search, click the Saved Searches tab, select a search, and click Load+Close.
4. After you load the saved search or filter, you can edit it or run it like any other search. For
instructions, see "Searching for Events" on page92.
Predefined Search Filters
Your system provides predefined search filters, known as System Search Filters. These filters define
queries for commonly searched events such as unsuccessful login attempts or the number of events by
source. The following is a list of System Search Filters. The filters available on your system may vary.
Search filters can have one of two different types of query:
lUnified Query: Unified Query (Unified) search queries specify keywords and fields.
lRegular Expression: Regular Expression (Regex Query) search queries specify a regular expression.
Regular expression based search filters are useful for creating real time alerts, which accept only
regex queries.
lCEF:Searches for CEF formatted events.
Category Search Filter Name
Login Status use case All Logins (Unified)
Unsuccessful Logins (Unified)
Successful Logins (Unified)
Configuration Configuration Changes (Unified)
Events use case High and Very High Severity Events (Unified)
Event Counts by Source
Event Counts by Destination
Intrusion use case Malicious Code (Unified)
System Filters
ArcSight Command Center User's Guide
Chapter 4: Searching for Events in the ArcSight Command Center
HPE ESM 7.0 Page 111 of 213

Category Search Filter Name
Firewall use case Deny (Firewall Deny)
Network use case DHCP Lease Events
Port Links Up and Down
Protocol Links Up and Down
UNIX Server use case CRON related events
IO Errors and Warnings
PAM and Sudo Messages
Password Changes
SAMBA Events
SSH Authentications
User and Group Additions
User and Group Deletions
Windows Events
use case
Account Added to Global Group (CEF)
Audit Policy Change (CEF)
Change Password Attempt (CEF)
Global Group Created (CEF)
Logon Bad User Name or Password (CEF)
Logon Local User (CEF)
Logon Remote User (CEF)
Logon Unexpected Failure (CEF)
New Process Creation (CEF)
Pre-Authentication Failure (CEF)
Special Privileges Assigned to New Logon (CEF)
User Account Changed (CEF)
User Account Password Set (CEF)
Windows Events (CEF)
System Filters, continued
ArcSight Command Center User's Guide
Chapter 4: Searching for Events in the ArcSight Command Center
HPE ESM 7.0 Page 112 of 213

Indexing
Events are indexed for full-text search and for field-based search. For full-text (keyword) search, each
event is tokenized and indexed. For field-based search, the event fields are indexed based on a
predetermined schema.
Full-text Indexing (Keyword Indexing)
For full-text indexing, each event received on the system is scanned and divided into keywords and
stored on the system. The full-text search options control the manner in which an event is tokenized as
described in "Tuning Search Options" on page161.
Note: The eventId field and the DATETIME fields such as deviceReceiptTime and endTime are not
indexed and, therefore, are not available for full-text search. To search these fields, use a field-
based search.
Field-based Indexing
Field searches utilize the schema fields.
You can search any field defined in the schema. A list of the schema fields, along with their field
descriptions is available from the Administration> Search > Default Fields tab. For instructions on
how to view the fields, see "Viewing the Default Fields " on page164.
Note: Not all ESM event information is available for searching. To search for fields not included in
the Default Fields list, use the ArcSight Console through a query viewer. Refer to the Query Viewers
topic in the ArcSight Console User's Guide.
ArcSight Command Center User's Guide
Chapter 4: Searching for Events in the ArcSight Command Center
HPE ESM 7.0 Page 113 of 213
Chapter 5: Using Reports
The ArcSight Command Center interface enables you to view the hierarchy of reports created in the
ArcSight Console, run them, and view the results.
To create a report to appear on this page, refer to the topic, “Building Reports,” in the ArcSight Console
User’s Guide. The reports available to you are organized in the tree in the left panel. Click the group
folders in the tree to open or close them. Click a folder to see a list of its reports in the right-hand pane.
•Running and Viewing Reports 114
•Report Parameters 115
•Archived Reports 117
Running and Viewing Reports
The reports that are available were created in the ArcSight Console. Refer to the ArcSight Console
User’s Guide for information on creating and managing reports.
To run and view a report:
1. Click Reports in the top menu bar.
2. Navigate to a report folder in the resource tree at the left.
3. Click a report folder to show a list of that folder’s reports in the right pane.
4. Select a report and click Run to run it with the default parameters and display the results.
For focused reports ( ), you can also click the report name to run it.
For regular reports ( ) you can click the report name to change the output parameters before you
run it. The report parameters dialog is described in "Report Parameters" on the next page.
If you have run reports recently you can select one from Reports > Recent.
Note: In Command Center, if you have a report that is currently in the process of generating
and you select and run another report, it cancels the first report.
If you run a report that takes more than approximately 30 minutes to execute, Command
Centermay display a Manager Unresponsive error. The report continues to run on the server.
You can view the finished report in the Archives > Archives tab > reports tree > [user]'s Archive
Reports folder > Temporary Reports folder (the [user] string is the currently logged in
Username).
HPE ESM 7.0 Page 114 of 213

Report Parameters
For regular reports ( ) you can change the output parameters by double-clicking the report name. It
brings up a dialog that enables you to change selected parameters before running it.
Parameter Description
Basic Tab
Start Time To set a start time that overrides the one set in the query, specify a start time here.
For example, if you want all the report elements to report on events for the past 2 hours, you can create a
start-time parameter of $Now-2h, which sets both table and chart start times to $Now-2h.
This setting is saved locally as part of the report definition, not as part of the original query upon which
the report is based.
End Time To set an end time that overrides the one set in the query, specify an end time here.
This setting is saved locally as part of the report definition, not as part of the original query or trend upon
which the report is based.
Other
options
The other options that might appear vary according to the report, for example you might see License
Type for licensing reports, or Row Limit, Filter By, or other options with choices appropriate to the report.
Run as
User
Run the report as a particular user. From the drop-down menu, select the user name by which you would
like to run the report.
For example, this option would allow an administrator for an Managed Security Service Provider (MSSP) to
run report for a customer. The administrator would need write permissions to the user.
Email Tab
Format Specify how the report is to be accessed by the recipient.
lChoose URL if you want to point users to the report. Use this option if the report is large and is saved
(archived) to a network-accessible location
You can provide URLs for all report formats: PDF, XLS, RTF, CSV, and HTML.
lChoose Attachment if you want to send the report directly to the user's e-mail box.
You can only attach PDF, XLS, RTF, and CSV report formats.
lChoose Embedded if you want to display the report on the e-mail message body so that the recipient
immediately sees the report upon opening the e-mail. You can only embed CSV and HTML report
formats.
lChoose Attachment_Compressed if you want the PDF, XLS, RTF, or CSV report to be compressed
(zipped) first before mailing.
Note: If you select an email format for an unsupported report format, the notification automatically uses
the URL.
Subject Specify the subject on the notification. Defaults to the report’s Name attribute (denoted by
$ReportName). If you want to use a customized subject, type the text either in addition to the default or
to replace the default entirely.
ArcSight Command Center User's Guide
Chapter 5: Using Reports
HPE ESM 7.0 Page 115 of 213

Parameter Description
Addresses Send the report to one or more comma-separated or semicolon-separated e-mail addresses. This option
does not require the recipient to be an ArcSight Console user.
Note: The recipient will only see his or her e-mail address in the To field even if there are multiple
recipients for this report.
To You can have the report sent as email to one or more Console users.
From the drop-down menu, select the Console users to whom the report should be e-mailed. The selection
list is read from the Users resource.
The recipient will only see his or her user name in the To field even if there are multiple recipients for
this report.
Note: By default, an e-mail is sent even if the report is empty.
Archive
Tab
Save
Output to
Archive
Check this box to elect to save (archive) the report results. This enables you to retrieve it later for viewing
without having to re-run it. Reports that are run on demand are saved on the Archives tab just like
scheduled reports. If the Save Output option is chosen for an on-demand report, the archived report has
an expiration date of 6 months from the time it was run (by default). If the Save Output option is not
chosen for an on-demand report, the report is maintained in the archive for one day only.
Archived reports can also be sent to a notification group after the scheduled report is run.
For information on how to archive and maintain reports, see “Managing Reports” in the ArcSight Console
User’s Guide.
Folder Select a resource folder in which to archive this report.
Name By default the name of the report is ${Today}/${ReportName}, where Today is today’s date/time and
ReportName is the name given to the report when it was created. You can type in an different name.
Expiration
Time
The report is archived until the date/time selected here, after which the archive is deleted.
ArcSight Command Center User's Guide
Chapter 5: Using Reports
HPE ESM 7.0 Page 116 of 213

Parameter Description
Presentation Tab
Format From the drop-down menu, select one of the following report output formats:
lpdf - Displays the report as an Adobe PDF file.
Note: In Internet Explorer, reports displayed in PDF are always on top. If you open the Help > About
dialog or another report parameters dialog, it might be partially hidden by the PDF report. However,
you can drag these dialogs out from under the PDF report and they work normally.
lxls - Generates a Microsoft Excel file for tables and charts.
Note: XLS reports you run with Microsoft Excel 2002 might have page break format problems
(misalignments, column spillover) due to default page size settings in Excel. To correct this problem,
open the resulting XLS report in Excel, choose File>Page Setup from the menus, change the paper
size to Letter (instead of Legal), and click OK to save your changes. The report has the appropriate
page break formatting. This problem does not occur in newer versions of Microsoft Excel.
Note: XLS report formats display speedometer charts as pie charts. This is a known limitation in
Microsoft Excel.
lrtf - Produces a rich-text format document.
lcsv - Creates tabular data as a list of comma-separated values.
Note: Reports generated in CSV format are not the full equivalent of exports to other formats like PDF
or HTML. CSV format is useful for loading report data into a spreadsheet for further manipulation.
Since CSV is meant to contain tabular data, only the table data of a report is normally useful. Therefore,
ArcSight exports only the table data portion of a report to CSV format, ignoring any other report
information such as charts or text, including report titles.
lhtml - Generates the report in HTML format.
Your selection affects your choice for e-mail formats.
Page Size From the drop-down menu, select a paper size.
Changing any of these defaults is optional.
For focused reports ( ), you cannot change the output parameters, so clicking on the report name
runs it.
Archived Reports
The archived report results that are available were archived in the ArcSight Console. Whenever you run
a report it is archived for six months. Refer to the ArcSight Console User’s Guide for information on
archiving reports.
To show an archived report result:
1. Click Reports in the top menu bar.
2. Click the Archives tab.
3. Navigate to an archived-report folder in the resource tree at the left.
ArcSight Command Center User's Guide
Chapter 5: Using Reports
HPE ESM 7.0 Page 117 of 213

4. Click a folder to show a list of that folder’s archived reports in the right pane.
5. Click an archived report to highlight it.
6. Click Show to show the report results in the bottom pane.
Deleting Archived Reports
1. Click Reports in the top menu bar.
2. Click the Archives tab.
3. Navigate to an archived-report folder in the resource tree at the left.
4. Click a folder to show a list of that folder’s archived reports in the right pane.
5. Click an archived report to highlight it.
6. Click Delete to delete the archive.
ArcSight Command Center User's Guide
Chapter 5: Using Reports
HPE ESM 7.0 Page 118 of 213
Chapter 6: Cases
Cases track individual or multiple related events and export event data to third-party products. Cases
can stand alone or integrate with a third-party case management system.
A case contains information about an incident, usually with one or more events attached. Use cases to
track, investigate, and resolve events. you can assign cases of interest to analysts, who can investigate
and resolve them based on severity and enterprise policies. You can also use rules to automatically open
a case when certain conditions are met.
You can assign cases to groups of users who receive a notification with access to the case and its
associated data. Those users can take action on the assigned case and specify other actions to be taken,
assign it to another user, or resolve the case.
•Case Navigation and Features 119
•Creating or Editing a Case 120
•Granting Permission to Delete Cases 127
•Deleting a Case 127
•Viewing Notes and Updates in Case History 128
•Case Management in the ArcSight Console 128
There are some case-related operations that you can do from the ArcSight Console. For more
information on cases, see the topic "Managing Cases" in the ArcSight Console User's Guide section,
"Case Management and Queries".
NOTE:If a case has not been locked, it is possible for multiple users to edit it at the same time. If
another user saves changes to a case while you are editing it, you will be prompted that the case has
changed.
Case Navigation and Features
To view lists of cases, click Cases in the top menu bar.
View — Navigate the case tree, in the left panel, and click on any group to see a list of cases in that
group. A case group can have a maximum of 10,000 cases.
Customize the List — To add or remove the columns or fields displayed in the list, click the Configure
Columns button in the upper right corner of the case list.
Create or Edit — To create a new case or edit an existing one. See "Creating or Editing a Case" on the
next page.
HPE ESM 7.0 Page 119 of 213

Delete — Highlight a case and click Delete above the list. The case cannot be locked for editing.
Add a note — Highlight a case and click Add Note above the list.
View notes — Highlight a case and click History above the list.
Lock for Editing — Highlight a case and click Lock above the list. Now no other user can edit this case,
and it cannot be deleted. Click Unlock when you are done.
Sort — You can sort the list by any column. Click on the column heading.
To export an ESM case as an XML file:
If you have an integration to an external case management system, you can transfer cases from the
Command Center to the external system as XML by doing the following.
1. From Cases, highlight your case and click Export.
2. The output file is stored in the Manager’s archives/exports.
Note: You are responsible for configuring your external case management system to consume the
XML file.
Creating or Editing a Case
1. Click Cases in the top menu bar.
2. In the resource tree at the left, navigate to the folder where you want to create a new case and click
New.
To edit an existing case, navigate to it and click on the case name to open the case editor, described
in the next topic. You can click up to three cases in this way to have the case editor display them in
three tabs in the lower half of the page. If you want to view another one, you have to close one of
the three: click the X in the tab.
The sections below describe the tabs and options available when creating or editing a case.
Case Editor Initial Tab
The fields on the Attributes subtab provide basic case information.
Attributes Subtab
Field Description
Case:
Name Specify a case name (required field).
ArcSight Command Center User's Guide
Chapter 6: Cases
HPE ESM 7.0 Page 120 of 213

Attributes Subtab
Field Description
Display ID This ID is assigned automatically when you create a case and save it. For imported cases, it is provided
by the external tracking system.
Ticket:
Ticket Type Select from a drop-down list that includes Internal, Client, and Incident types.
Stage Select the workflow stage of ticket; default selections include Queued, Initial, Follow-Up, Final, and
Closed.
Frequency Select how often the reported issue occurs. Values assigned are 0 (never or once), 1 (less than 10 times),
2 (10 to 15 times), 3 (15 times), 4 (more than 15)
Operational
Impact
Select the impact of the reported issue. Values assigned are 0 (no impact), 1 (no immediate impact), 2
(low priority impact), 3 (high priority impact), 4 (immediate impact)
Security
Classification
Assign a value of 1 (Unclassified), 2 (Confidential), 3 (Secret), 4 (Top Secret)
Consequence
Severity
Assign a value of 0 (None), 1 (Insignificant), 2 (Marginal), 3 (Critical), 4 (Catastrophic)
Reason for
Closure
Assign a value of 0 (False Positive), 1 (True Positive - Resolved), 2 (Duplicate), 3 (True Positive - Other)
These values are placeholders for you to customize, if you want to use this field.
Refer to the Cases Editor UI Customization Tech Note. Familiarize yourself with the entire process of UI
customization. Applicable information is covered in the topic, "Customizing Field Labels," specifically
the procedure "To replace a list of string options."
Category of
Situation
Default is 0 (None). The value assigned is a placeholder for you to customize, if you want to use this
field.
Refer to the Cases Editor UI Customization Tech Note. Familiarize yourself with the entire process of UI
customization. Applicable information is covered in the topic, "Customizing Field Labels," specifically
the procedure "To replace a list of string options."
Reporting
level
The level number is calculated by the system based on the other Ticket values entered.
Incident Information:
Detection
Time
Automatically assigned based on the first event that is added to a case. Time is based on the
Manager’s system time. Once assigned, the value does not change even if you add events or remove
existing events.
Estimated
Start Time
Automatically assigned based on the Manager Receipt Time (MRT) of the oldest event attached to the
case, even if more recent events have been added to the case prior to this oldest event. If you remove
this oldest event from the case, Estimated Start Time takes the MRT of the next oldest event in the
case, and so on. If you remove all events from the case, the field will be blank.
Estimated
Restore Time
This is a user-entry field to denote the date when the case is resolved. Select a timestamp from the
calendar popup.
ArcSight Command Center User's Guide
Chapter 6: Cases
HPE ESM 7.0 Page 121 of 213

Attributes Subtab
Field Description
Common
Resource ID Read-only field that shows the ID that the system assigned to this resource when it was created.
External ID An identification string suitable for, and which can be referenced by, systems outside ESM. Common
applications of External IDs include appropriate naming for Case and Asset resources that are tracked
in common with defect reporting or vulnerability-management systems. If your system interfaces with a
third-party incident tracking system, such as Remedy, enter an ID that corresponds to that system. Your
administrator can advise you on the correct values for this field, if applicable.
Alias
(Display
Name)
An optional alternate identification string used for referencing resources. If given, this alias appears in
place of the resource's name everywhere it may be seen. Your administrator can advise you on the
correct values for this field, if applicable.
If you use an alternate event naming scheme in your environment, enter an alias for this resource here.
Description Description of the resource.
You can use this field to communicate the purpose of this resource to other users. For example, if this is a
resource that leverages or depends on another resource (for example, a query viewer or trend that uses
an SQL query), this is a good place to make note of that relationship.
Version ID The globally unique version ID for this resource. Version IDs are assigned when you export a resource as
part of a package, if the resource has changed.
Deprecated Toggle to indicate whether the resource is current or deprecated (obsolete).
Assign
Owner A user selected from the Users resource tree.
Owner
Groups
A group selected from the Users resource tree. Users gain access to resources according to the user
groups they belong to, and it is also at the Users resource where the administrator creates and manages
user groups. Permissions to view and edit resources are granted to user groups. If a group owner is
specified, the group the owner belongs to is automatically added to the group assignment; if a user
belongs to multiple groups, these groups are added. Any other linked groups are included in the
assignment as well. You can specify a group alone, with no user specified.
Owner Groups will appear on Field Sets of type "Case Field Set' as an optional field, and on Case queries
as a selectable Field. In Rules, the option to select either a User or a Group as the owner of the case to be
created is available; in the Rules context, Owner Groups are displayed only when you create a new case.
For Case Channels, the Owner Groups field is available to be set as a column.
Notification
Groups
The user groups selected from the Users resource tree who should be notified about this resource.
Parent
Groups
Parent Group Read-only field that shows the name and path to parent group of this resource.
Creation
Information
ArcSight Command Center User's Guide
Chapter 6: Cases
HPE ESM 7.0 Page 122 of 213

Attributes Subtab
Field Description
Created By Read-only field that shows the user who created this resource.
Creation
Time
Read-only field that shows the date/time when this resource was created or imported and installed.
Last Update Information
Last
Updated By
Read-only field that shows the user who last updated the resource.
Last Update
Time
Read-only field that shows the date/time when this resource was last updated.
The fields on the Description subtab further describe a case.
Description Subtab
Field Description
Affected Services Text field allowing entry of up to 4000 characters.
Affected Elements Text field allowing entry of up to 4000 characters.
Estimated Impact Text field allowing entry of up to 4000 characters.
Affected Sites Text field allowing entry of up to 4000 characters.
The fields on the Security Classification subtab describe the security classification for a case.
Field Description
Security Classification:
Attack Mechanism Selections include: P(Physical), O(Operational), I(Information), and U(Unknown).
Attack Agent Selections include: I(Insider), C(Collaborative), O(Outsider), and U(Unknown).
Incident Source 1 Editable text.
Incident Source 2 Editable text.
Vulnerability Selections include: D(Design), O(Operational), E(Operational Environment), and U
(Unknown).
Sensitivity Selections include: U(Unclassified), C(Confidential), S(Secret), and T(Top Secret).
Associated Impact Selections include: A(Availability), C(Confidentiality), I(Integrity), and U(Unknown).
Action Selections include: B(Block/Shutdown), M(Monitoring), and O(Other).
Security Classification Code:
Security Classification
Code
Value automatically calculated from other Security Classification field entries.
ArcSight Command Center User's Guide
Chapter 6: Cases
HPE ESM 7.0 Page 123 of 213

Case Editor Follow Up Tab
The four fields on the Follow Up tab are free-form data entry fields that can take up to 4,000
characters. Use them to keep track of follow-up actions taken and planned.
Case Editor Final Tab
The fields on the Attack Mechanism subtab provide final ticket resolution and reporting information
for the attack mechanism associated with a case.
Attack Mechanism Subtab
Field Description
Attack
Mechanism
Auto-populated from Security Classification tab. Possible values are P(Physical), O(Operational), I
(Informational), and U(Unknown).
Attack
Protocol
Text field allowing entry of up to 64 characters.
Attack OS Text field allowing entry of up to 64 characters.
Attack
Program
Text field allowing entry of up to 255 characters.
Attack Time Date field.
Actions
Target
Text field allowing entry of up to 4000 characters.
Attack Service Text field allowing entry of up to 4000 characters.
Attack Impact Text field allowing entry of up to 4000 characters.
Final Report
Action
Text field allowing entry of up to 4000 characters.
Fields on the Attack Agent subtab provide ticket resolution and reporting information related to the
attack agent associated with a case.
Attack Agent Tab
Field Description
Attack Agent Auto-populated from Security Classification tab. Possible values are Insider, Collaborative, Outsider,
and Unknown.
Attack Location
Id
Text field allowing entry of up to 255 characters.
Attack Node Text field allowing entry of up to 4000 characters.
Attack Address Text field allowing entry of up to 4000 characters.
ArcSight Command Center User's Guide
Chapter 6: Cases
HPE ESM 7.0 Page 124 of 213

The fields on the Incident Information subtab provide final incident information associated with a case.
Incident Information Tab
Field Description
Incident Source 1 Auto-populated from Security Classification tab.
Incident Source 2 Auto-populated from Security Classification tab.
Incident Source Address Text field allowing entry of up to 4000 characters.
The fields on the Vulnerability subtab provide final ticket resolution and reporting information related
to the vulnerabilities associated with a case.
Vulnerability Tab
Field Description
Vulnerability Auto-populated from Security Classification tab. Possible values are D(Design), O(Operational), E
(Operational Environment), and U(Unknown).
Vulnerability
Type 1
Selections include: Accidental or Intentional.
Vulnerability
Type 2
Selections include: EMI/RFI, Insertion of Data, Theft of Service, Unauthorized, Probes, Root Compromise,
DOS Attack, User Account, Virus, Illegal Worms, Spams, Replay/Reroute, Wiretapping, Hardware/Software,
Spoofing, and Unknown/New.
Vulnerability
Evidence
Text field allowing entry of up to 4000 characters.
Vulnerability
Source
Text field allowing entry of up to 4000 characters.
Vulnerability
Data
Text field allowing entry of up to 4000 characters.
The fields on the Other subtab provide miscellaneous ticket resolution and final reporting information.
Other Tab
Field Description
History Selections include: Known Occurrence and Unknown.
No Occurrences Specifies the number of occurrences..
Last Occurrence Time Enterable time or selector.
Resistance Selections include: High, Low, or Unknown.
Consequence Severity Auto-populated from Initial Attributes tab.
Sensitivity Auto-populated from Initial Attributes tab.
ArcSight Command Center User's Guide
Chapter 6: Cases
HPE ESM 7.0 Page 125 of 213
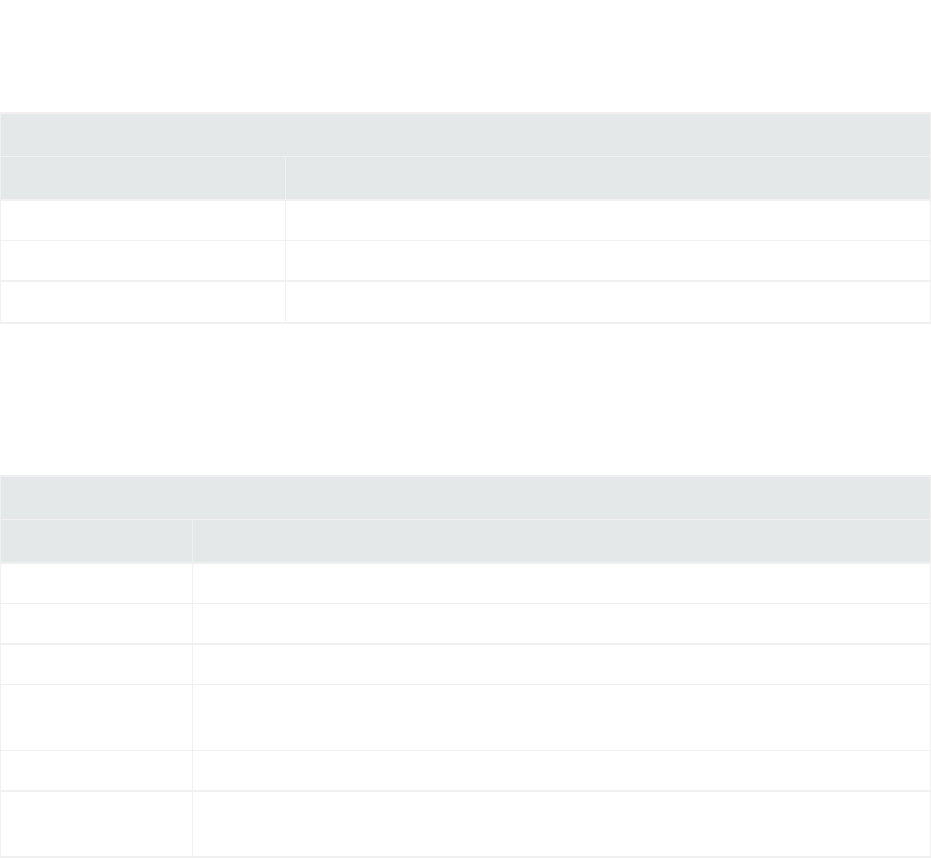
Other Tab
Field Description
Recorded Data Text field allowing entry of up to 4000 characters.
Inspection Results Text field allowing entry of up to 4000 characters.
Conclusions Text field allowing entry of up to 4000 characters.
Case Editor Events Tab
The fields on the Events tab provide a list of the events included in a case.
Events Tab
Field Description
Event Tree Events auto-populated from events included in a case.
Remove Event Removes the highlighted event from the case.
Details tab Shows the value for every field in the event.
Show Fields
Containing
Filters the list of fields to only those that contain the value that you enter.
Field Set Select a field set to display. You define Field sets in the ArcSight Console.
Annotations Tab Shows all the annotations for the selected event. You annotate events from the ArcSight
Console.
To view event payloads use the ArcSight Console.
Case Editor Attachments Tab
The Attachments tab lists any attachments to the case, and provides options to:
lLocal file — Choose files from your local drive or networked drives.
lArcSight File — Choose a file from within ESM. Expand the ESM file resource tree to choose a file
resource, then click OK.
lDownload — Download attached files to another location. You can only download saved
attachments.
lDetach — Remove the attached file from this list.
Once a file is attached to a case, anyone viewing the case can view details about the file and download it.
If the case attachment was also added as a shared resource, the file is available in the ArcSight Manager
Files resource folders.
ArcSight Command Center User's Guide
Chapter 6: Cases
HPE ESM 7.0 Page 126 of 213

Case Editor Notes Tab
The Notes tab lists all the notes that have been added to this case, with the most recent note at the top
of the list. Select a note to highlight it and then you can perform the following actions:
Read a Note — Click the Plus icon to read a note.
Add a Note — Click Add Note to open the Note dialog.
Delete a Note — Click Delete Note to delete a note you created. You cannot delete notes added by
the system or other users.
Save Changes — As soon as you add a note the Save Changes button activates.
Granting Permission to Delete Cases
By default, new user groups added under Custom User Groups are not allowed to delete cases. The
ability to delete cases is controlled by the permission, /All Permissions/ArcSight System/Case
Operations/Case Delete, set in the group’s Advanced Permissions on the Operations tab.
A user can belong to multiple groups. If at least one of those groups have permission to delete cases,
then the user will have the ability to do so; the permission to delete cases takes precedence.
User groups created in older releases (prior to ESM 6.5c SP1) carry over their legacy permission to delete
cases.
To grant or remove permission to delete cases:
1. Edit the user group.
2. Click Advanced Permissions at the top left of the Group Edit panel to display the group’s
Advanced Permissions panel.
3. On the Operations tab, grant or remove the /All Permissions/ArcSight System/Case
Operations/Case Delete permission as applicable.
4. If you are granting permission to delete cases:
a. Go to the Resources tab.
b. Locate the /All Cases/All Cases resource and check the Rand Wboxes.
Deleting a Case
Caution: Prior to deleting cases, decide if you want to preserve them after deletion. If so, add this
ArcSight Command Center User's Guide
Chapter 6: Cases
HPE ESM 7.0 Page 127 of 213

property (or ask an administrator to add it) in the server.properties file before deleting any
cases:
case.archive_ondelete.enabled=true
The archived deleted cases are stored as read-only snapshots for historical purposes in the
Manager’s archive/cases directory. The filename format of the archived case is
YYYY-MM-DD <deleted case name>.xml
For important details on changing properties files, refer to the topic, “Managing and Changing
Properties File Settings” under the “Configuration” section of the ESM Administrator’s Guide.
If you belong to a user group that is authorized to delete cases, you can delete a case. See "Granting
Permission to Delete Cases" on the previous page for related information.
Make sure to unlock the case before deleting it.
Viewing Notes and Updates in Case History
The Case History popup lists notes and updates related to a case, grouped by date of note creation or
update, in descending order.
1. Click Cases in the top menu bar.
2. In the resource tree at the left, navigate to the folder that contains the case you want to access .
3. Select a case.
4. Click History. You can filter the notes or update actions by a selected date or by a specified user.
5. Click Clear Filter to revert to default filtering criteria.
Case Management in the ArcSight Console
There are a number of additional features and functions you can perform with cases using the ArcSight
Console:
lManaging case groups
lRunning case queries
lCopying event details from one existing case to another
lShowing event details for cases in channels
lCreating a channel for a case
lIncluding base events through a rule
lEdit case by ID
lRunning a simple report off of a case
ArcSight Command Center User's Guide
Chapter 6: Cases
HPE ESM 7.0 Page 128 of 213

Refer to the “Case Management and Queries” section of the ArcSight Console User’s Guide for more
information on these features.
ArcSight Command Center User's Guide
Chapter 6: Cases
HPE ESM 7.0 Page 129 of 213
Chapter 7: Applications
If you have licensed another application to integrate with ESM, its user interface appears on the
Applications tab.
When viewing an application on the Applications tab, you can access the application’s online help by
clicking the help link in the upper right corner of the ArcSight Command Center window. Such
documentation is separate from the Command Center online documentation.
For information on licensing an application contact your HPE representative.
HPE ESM 7.0 Page 130 of 213

Chapter 8: Administration Configuration
This section describes the features available in the Administration module, which enables you to control
administrative functions such as users, storage, connectors, and configuration. You can also create and
configure storage groups, event archives, search filters, saved searches, peers, and retrieve logs.
This section includes information on the following areas of administration:
•Content Management 131
•Storage and Archive 136
•Search Filters 152
•Saved Searches 155
•Search 161
•Peers 166
•Log Retrieval 172
•License 173
The Administration home page gives a high-level description of the available administrative features
and provides links to them. To access the administration home page, click Administration from the menu
bar.
Content Management
You must be an administrative user to access this feature.
You may have multiple ArcSight Managers deployed either hierarchically or in parallel across your
enterprise, in widely dispersed geographical locations. Using ArcSight Command Center, you can
manage and synchronize custom content packages across all of these Managers. For example, you have
ArcSight Managers in San Francisco, London, and Tokyo. You update some rules on the Tokyo
Manager and can include those rules in a custom content package. Then, using Content Management,
you can synchronize the package to the ArcSight Managers in San Francisco and London.
Synchronization of a custom content package can be performed either manually, at an administrator’s
command, or automatically, at regular scheduled intervals. Synchronizing packages from one ArcSight
Manager to another is also referred to as pushing. The Manager that is the source of custom packages
is called the publisher, and the peers receiving packages are called the subscribers.
HPE ESM 7.0 Page 131 of 213

Planning for Content Management
Before you can use Content Management, you must enable peers for each ArcSight Manager
participating in the content synchronization. Peer Managers are eligible to synchronize content
through ESM packages. See "Configuring Peers" on page166 for more information.
Use the following guidelines to help you plan content management:
lYou have a choice of designating only one Manager where content authoring, packaging, and
publishing are done; or you can distribute the responsibility among different peers.
lAll peers (that includes the publisher and subscribers) must be at the same ESM version. From the
publisher’s standpoint, the subscriber list will consist only of peers at the same version.
lNot all ESMresources, are supported for synchronization. For a list of eligible resources, refer to
ArcSight Console User's Guide, topic on Managing Packages > Supported Packages for Content
Synchronization.
lWhen creating packages for synchronization, make sure these packages are created in the
contentsync format.
Caution: Before publishing ESM packages to ESM peers, make sure these packages were
created in the same ESM version. If the packages were created in an older version, first upgrade
the source ESM, so that the resources are properly validated as part of the upgrade process.
Then add these validated resources to contentsync-formatted packages.
If you do not upgrade, publishing the packages to subscribers may succeed, but the resources'
functionality may fail when subscribers start using the resources.
Refer to the ArcSight Console User’s Guide's topic on “Managing Packages” for detailed instructions.
Content Management Tabs
To access Content Management, click Administration > Content Management.
Tip: Custom content packages are created and managed on the ArcSight Console. For information
on creating and managing packages, see the “Managing Packages” section of the ArcSight Console
Guide.
Packages Tab
The Packages tab lists all custom content packages currently available for distribution. Each package
listed includes the following descriptors:
ArcSight Command Center User's Guide
Chapter 8: Administration Configuration
HPE ESM 7.0 Page 132 of 213

lPackage: Name of the package.
lURI: Path indicating the location of the package file.
lLast Push: Date of the last package push.
lPush Status: Indicates the success or failure of the latest push attempt. Click the link to view details.
Note that if a subscriber is not online, the push date displays in the Push History, but not the push
status.
lFollow Schedule: If selected, the package will be automatically pushed to subscribers at the
scheduled time.
lDescription: Brief description of the package.
Click the header of the Package,URI, or Last Push columns to sort the tab contents by that column.
Click Refresh to show the first package in the table.
Note: Synchronization is not available for system content packages. It is available for custom
content packages, but the following resources are not supported and the outcome is unpredictable:
Actors, Assets or Asset Ranges, Cases, Connectors, Partitions, Active or Session Lists, Database
Table Schemas, or Users.
For a list of packages that are eligible for synchronization, refer to “Managing Packages” in the
ArcSight Console Guide.
Subscribers Tab
The Subscribers tab lists all peers to which packages may be pushed from this ArcSight Manager. By
default, subscribers must be of the same ESM version as the publisher.
The list of subscribers includes the following descriptors:
lSubscriber: Host name of the ESM subscriber. (Although Loggers may be enabled as peers, a
Content Management subscriber must be an ArcSight Manager.) Click a subscriber name to view the
push history of all packages pushed to that subscriber.
Tip: If the Push Status field in Push History is blank, the subscriber might be offline.
lActive: During a push, packages are pushed to all Active subscribers.
Tip: To push a package selectively (that is, to only some subscribers instead of all), ensure that
the Active checkbox is selected only for the subscribers to which you wish to push.
Click the header of the Subscribers column sort the tab contents by that column. Click Refresh to
refresh the page view.
Note: To enable peers, click the Peering link on the Subscribers tab.
ArcSight Command Center User's Guide
Chapter 8: Administration Configuration
HPE ESM 7.0 Page 133 of 213

Schedule Tab
The Schedule tab includes controls for setting automatic push intervals. If Follow Schedule for the
package is enabled on the Packages tab, the package push will be performed automatically at the
chosen interval. All packages (with Follow Schedule enabled) are pushed on a single schedule.
Select one of the following settings for a push schedule:
lOn/Off: If On, scheduled pushes for packages are enabled. If Off, the package will not be pushed
automatically, even to Active subscribers.
lHourly: The push is performed on the hour (:00), or, if you specify minutes, at :15, :30, or :45 minutes
past the hour.
lDaily: The push is performed once every 24 hours at the selected time.
lWeekly: The push is performed once every 7 days at the selected day and time.
Pushing Content Packages
You synchronize content across ArcSight Managers by the push process. Packages can be scheduled
for automatic pushes, or can be pushed manually. Pushing a package, either automatically or manually,
will overwrite the existing package on any Active subscribers.
Note: In order for a package to be pushed from an ArcSight Manager to a subscriber, both
Managers must be in the same mode (for example, FIPS to FIPS).
A pushed package will include any dependencies in the package.
Pushing a Package Automatically
Packages can be enabled for automatic pushes to all Active subscribers. All packages are pushed on a
single schedule.
To enable an automatic push:
1. Click Packages.
2. From the list of packages, select the package or packages to be pushed automatically.
3. Under Follow Schedule, ensure that the check box is enabled.
4. Click the Schedule tab.
5. Select On, and then choose settings for a date or time at which the package will be pushed.
At each scheduled date or time, all packages will be pushed to all Active subscribers.
Note: A package may not be pushed if it includes required features which are not enabled by the
ArcSight Command Center User's Guide
Chapter 8: Administration Configuration
HPE ESM 7.0 Page 134 of 213

license on the subscriber.
Editing an Automatic Push Schedule
You can edit your schedule for automatic package pushes.
To edit the schedule for an automatic push:
1. Click Packages.
2. From the list of packages, select the package for which you wish to edit the schedule.
3. Click the Schedule tab.
4. Using the drop-down controls, edit the schedule as needed. (To disable a schedule, but keep its
settings, select Off).
5. Click Save to save changes.
Pushing a Package Manually
Packages can be pushed manually to all Active subscribers. You may manually push only one package at
a time.
To push a package manually:
1. Click Packages.
2. From the list of packages, select the package to be pushed manually.
3. Click Push.
4. On the Push Package dialog, click OK to confirm the push. The package is pushed to all Active
subscribers.
Note: Once successfully pushed, a package is always installed on the subscriber, even if it is not
installed on the publishing Manager. To see the status or history updated, click Refresh.
Best Practices for Content Management
Content management is a powerful tool for ensuring that content is synchronized across multiple
ArcSight Managers. These best practices will help ensure that the tool is used effectively.
lConfigure peers before using Content Management. Setting up peers is a prerequisite to using
the feature. Peering is automatically mutual, so a group of peers may be enabled from a single
Manager. Content Management is certified with up to five subscribers, with one additional Manager
as a publisher.
lUse only one Manager as a publisher. Since subscribers are defined as peers, any Manager may be
ArcSight Command Center User's Guide
Chapter 8: Administration Configuration
HPE ESM 7.0 Page 135 of 213

a publisher to other Managers. To preserve the integrity of packages, as part of your workflow
process, use one Manager as the publisher. The publisher would keep the definitive version of each
package and would never receive pushes from other Managers. Use all other ArcSight Managers as
subscribers. Subscribers would receive the definitive packages from the publisher.
lSchedule automatic pushes prudently. Exercise caution when scheduling frequent automatic
package pushes. Package pushes overwrite previously-pushed packages on subscribers. For
example, if an automatic push occurs hourly, subscribers would receive packages (and have their own
versions overwritten) every hour.
lRetry failed pushes. Occasionally, an automatic or manual package push can fail. If a package push
fails, uninstall the package on the subscriber and then retry the push.
lReduce network impact. Package pushing to multiple subscribers is performed in parallel. As a
result, heavy, simultaneous package pushing runs the risk of a network impact. Schedule or perform
manual pushes only during times when network demand is low.
lAudit events. Audit events are logged in several circumstances, which can make troubleshooting
easier. These circumstances include when a peer becomes a publisher or subscriber, a package is
pushed manually, a package push is scheduled, or after the success or failure of a push. For a
complete discussion of audit events, consult the ArcSight Console User's Guide.
lBackups. As with all critical, sensitive systems, run frequent backups on your ArcSight Managers to
ensure that their content can be easily restored, if necessary.
Tip: You can resolve push failures by setting larger values in server.properties.
oSome failed pushes which include Queries can return an error: Cache size for Queries
is insufficient to import this archive. Fix this issue by changing the value in
server.properties of resource.broker.cache.size.Query to 3000.
oA large package push may fail because of the value of archive.export.max.size. The
default value is 30000, but you can increase this value to accommodate large packages.
For more information on setting values in server.properties, see the ESM Administrator’s
Guide.
Storage and Archive
You must be an administrative user to access these features.
The Correlation Optimized Retention and Retrieval Engine (CORR-Engine) is a proprietary data storage
and retrieval framework that receives and processes events at high rates and performs high-speed
searches. You can access the CORR-Engine archive functions from the Administration menu by
clicking Storage and Archive.
ArcSight Command Center User's Guide
Chapter 8: Administration Configuration
HPE ESM 7.0 Page 136 of 213
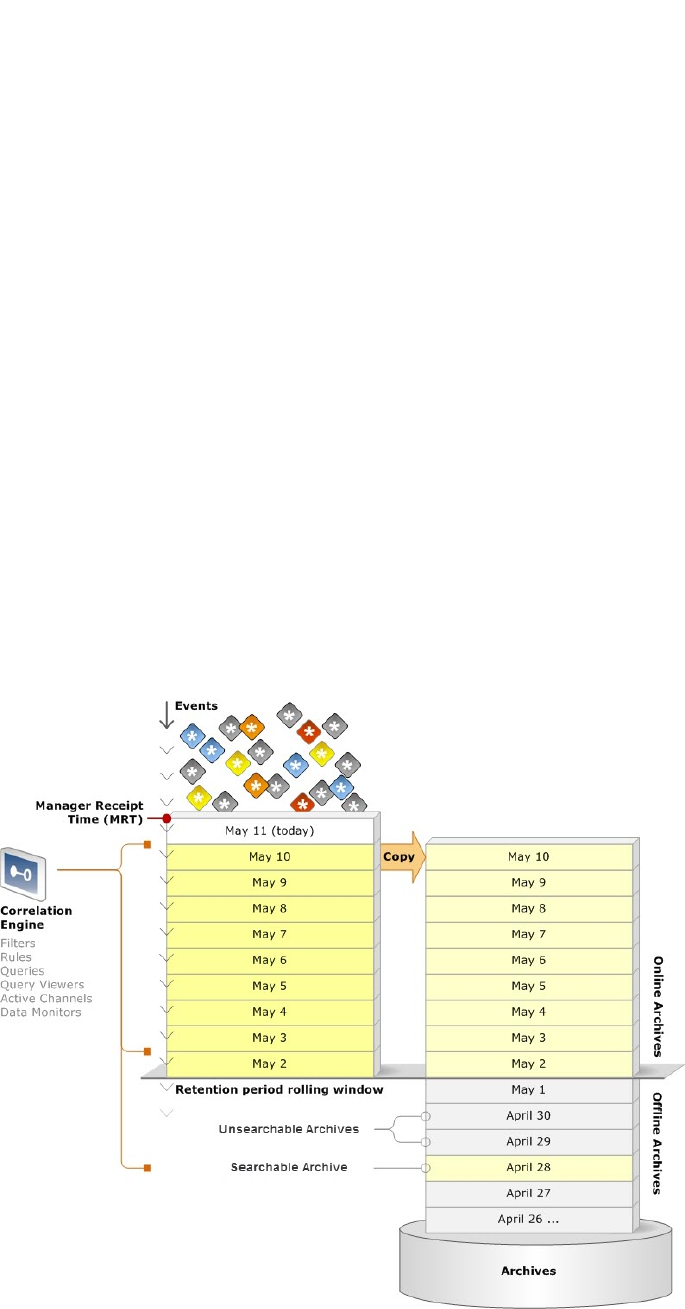
Overview
Incoming events are stored in the CORR-Engine database for search and correlation analysis. By
default, all events are sent to the Default Storage Group, where they are retained for thirty days, after
which they are deleted. You can use the storage and archive functionality to send events from different
connectors to different storage groups and configure the retention period of each storage group.
Additionally, you can archive the daily events from each storage group as needed, so that you can retain
all necessary events as long as needed. You can create one archive per day per storage group.
Events that are online in the CORR-engine are available for search and correlation analysis. Unless an
archive is created for them, events exist online in the CORR-Engine database only. Events remain online
in the CORR-Engine database until their retention period expires. Once events have passed their
retention period and are removed from CORR-engine database, one of two things might happen.
lIf they have been archived, they will no longer be searchable, but will still be backed up in off-line
storage. These archives can be made searchable again, if necessary.
lIf they have not been archived, they are permanently deleted.
The following figure depicts the flow of daily event archives over time.
In the figure above, events come in to event storage, on the left at the top. They are kept in the online
database until the limits of the retention period or space, and then deleted. As you archive daily events,
ArcSight Command Center User's Guide
Chapter 8: Administration Configuration
HPE ESM 7.0 Page 137 of 213

they are copied to the archive storage area, on the right. They remain in both locations online until their
retention period expires. After the retention period expires, archived events remain in offline storage.
All the daily events in online event storage, plus any offline archives that have been made searchable are
available for search and correlation analysis.
The Storage and Archive page includes four tabs:
l"Storage" below — The Storage tab allows you to create and edit storage groups, set their retention
periods, specify the locations where event archives will be stored, and select the time for daily archive
jobs to run. Additionally, you can view and edit the allocated size of the storage volume from here.
l"Storage Mapping" on page145 — By default, all events are saved in the Default Storage Group. This
tab allows you to send events to different storage groups based on where they come from.
l"Alerts" on page146 — Your system can email notifications to a user when event storage is becoming
too low. This tab allows you to configure the thresholds and recipients for these storage alerts.
l"Archive Jobs" on page147 — This tab provides a list of all events in the system as daily archives for
each storage group. From here, you can filter the list to find a particular day’s events and create and
manage the daily event archives for each storage group.
Note: Events that were not archived before their retention period expired are not displayed,
because the are no longer in the system and can not be made available.
Storage
Location: Administration menu > Storage and Archive >Storage tab
On the Storage tab, you can add and edit storage groups, view the current and maximum system
storage, increase the allocated size of the event storage volume, and set the time for archive jobs to run.
The Maximum Size of the event storage volume, shown in the center, below the storage groups, is the
smaller of:
lThe maximum size specified in the ESM license property,
logger.limit.maximum-capacity
lThe value is calculated based on disk size and the reserved space
(Maximum Size = “Size of /opt/arcsight” x 0.9 – “System Storage” – “Event Archives”)
oThe size of the /opt/Archive partition is controlled by the size of the disk drive.
oYou set System Storage Size and Online Event Archive Size when you installed ESM.
Allocated Size refers to the amount of disk space actually set aside for the event storage volume. (The
text that appears if you hover over the question mark next to Allocated Size uses the word “memory.” It
should say “disk space.”) This is the value called Event Storage Size that is set on the CORR-Engine
Configuration panel of the Configuration Wizard, during installation. You can increase this size, but you
cannot make it smaller.
ArcSight Command Center User's Guide
Chapter 8: Administration Configuration
HPE ESM 7.0 Page 138 of 213
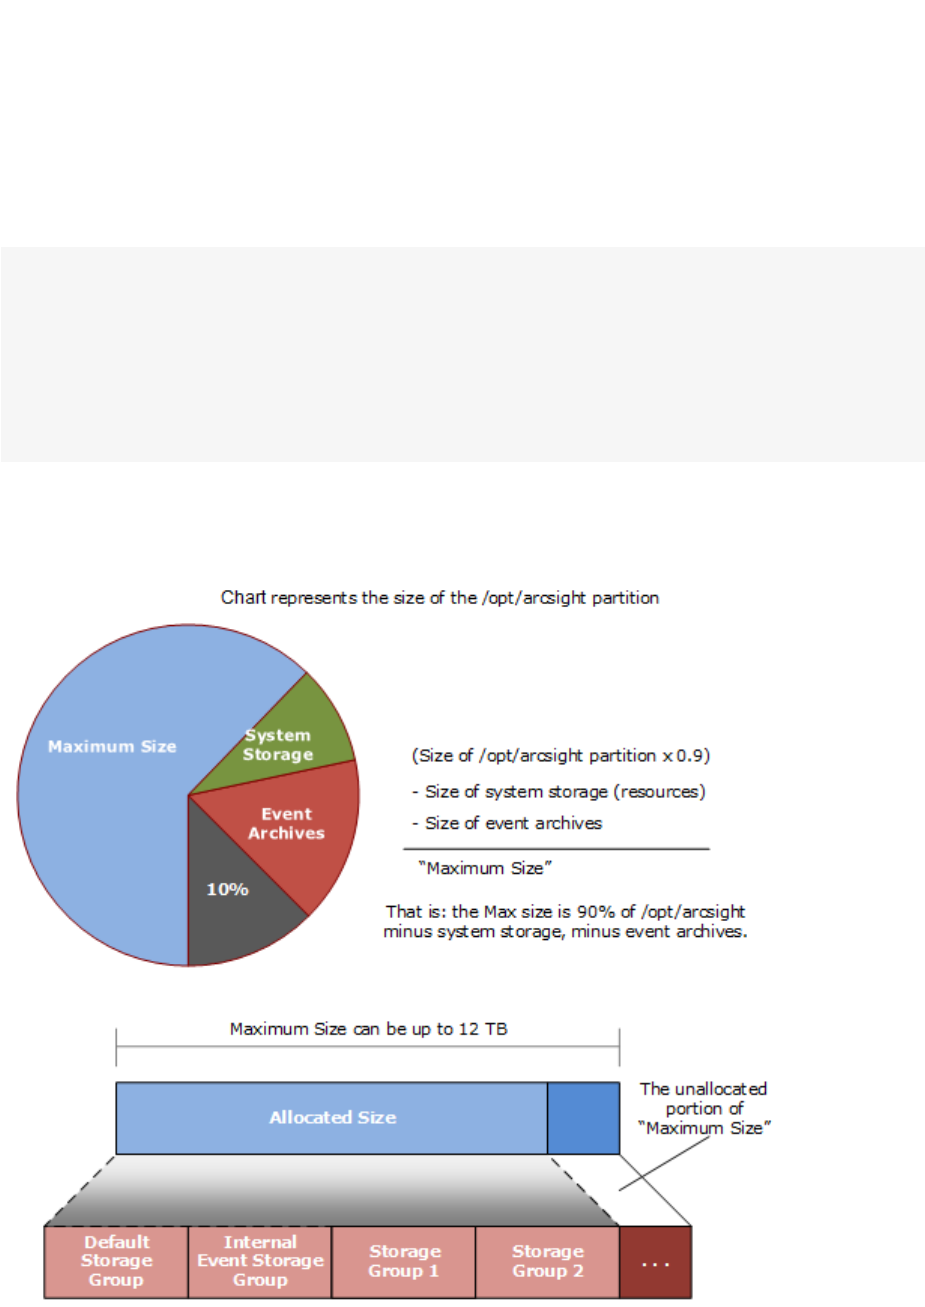
If you get a new license that allows for additional event storage, it increases the Maximum Size value, if
you have that much disk space available. If so, you can increase the Allocated Size to reflect the new
maximum. So if you are licensed for 12 TB, and your hard disk is large enough, you can edit the
Allocated Size to be that large, and add or enlarge storage groups to take up the 12 TB Allocated Size.
Caution: The 12 TB (or licensed determined) storage limit includes any events in an online state,
whether these events are in current memory or archives that have been brought back online.
Be sure to take into account that any events that are brought from an offline archive into the online
archive count as part of the total storage limit. You do not want the online archives that you bring
back online to encompass the entire storage limit. Use discretion when bringing offline archives
online, and be sure to make them offline again when you are done working with them.
Conversely, if you get a bigger hard drive and allocate that space to the/opt/arcsight partition, it
increases the Maximum Size value (at the next restart), if your license allows that much storage. If so,
you can increase the Allocated Size to reflect the new maximum.
ArcSight Command Center User's Guide
Chapter 8: Administration Configuration
HPE ESM 7.0 Page 139 of 213

You can add a maximum of four storage groups and expand them until they equal the Allocated Size. If
you need more space, increase the Allocated Size to equal the Maximum Size. Then increase the size of
one or more storage groups until the new Allocated Size is reached.
Storage Groups
You can have a maximum of six storage groups, two that come with your system, and four that you can
create.
lDefault Storage Group — By default, all incoming events are captured in the Default Storage Group.
Along with the incoming events, it also includes ESM internal health events and ESM internal events.
After installation, the size of this group does not fill available space. That is so that you have room to
create other groups. You can change storage group size, but you cannot make them smaller than 5
GB.
lInternal Storage Group — This storage group supports the ability to peer with Loggers, which have
an Internal Storage Group.
lUser-created storage groups — You can add up to four storage groups and configure them as
needed.
Each storage group takes up part of the total allocated size of the storage volume. Therefore, the
combined storage group volume cannot exceed the total allocated storage volume. When determining
the size of a storage group, consider the total allocated storage size. For information on changing the
storage volume size, see "Allocating Storage Volume Size" on page143.
Having different storage groups enables you to implement multiple retention policies, because each
storage group can have a different retention policy and storage mapping. Storage Mappings send
events from selected connectors to separate storage groups, and are covered in detail in "Storage
Mapping" on page145.
By default, all incoming events are stored in the Default Storage Group. You can add new storage
groups and create storage mapping to send events from different connectors to any storage group,
except the Internal Storage Group.
For each storage group, you can define a maximum size and a retention period to retain events. Older
event archives are deleted from the storage group when they reach the age set as the retention period
or storage runs out of disk space, whichever comes first.
Note: When creating a storage group, do not nest this new group under an existing group. The
archiving path of one group must not be suborinate to the archiving path of a another storage
group. Nesting storage groups increases the archive space utilization for the existing parent group.
lIf a day’s events have been archived when this deletion occurs, the daily archive will still be in the
Archive Jobs list, with the Offline status. A daily event archive will only be removed from the Archive
Jobs list if it has not been archived by the time its retention period expires or the storage group
exceeds the maximum size. For more information about archive jobs, see "Archive Jobs" on page147.
ArcSight Command Center User's Guide
Chapter 8: Administration Configuration
HPE ESM 7.0 Page 140 of 213

lOnce events are older than the specified retention period, the oldest events are deleted at the next
retention cycle. The retention process triggers periodically, therefore, events might not be deleted
immediately when the retention period expires.
lIf storage group space runs out, the oldest day’s events are deleted each day, even if they have yet to
reach retention age.
lIf the number or size of daily events is high or your retention period is sufficiently long, you may run
out of disk space allocated for Event Storage before the oldest events reach the end of the retention
period. When the Event Storage size exceeds the maximum size limits, the events will be immediately
truncated. If that happens, the oldest events are deleted first.
Turning Archiving On and Off
You can enable and disable the archiving functionality from the Storage tab.
Caution: It is not likely that you will ever need to turn archiving off. When you turn archiving off, no
event archives are created, and when the retention period expires, the event data is lost forever.
Turning it off turns it off for all storage groups regardless of any other settings.
Making copies of event data before the retention period expires is not useful. If ESM does not
create the archive, the necessary metadata is absent and restoring event data backed up by other
means does not work.
To turn archiving on or off:
1. Click Administration > Storage and Archive, and then open the Storage tab. The Storage tab
displays the current on or off status on the Archiving button (Status On or Status Off.
2. Click Status On to turn archiving off. Click Status Off to turn archiving on.
Setting the Time to Archive Storage Groups
You can set the hour of the day that scheduled archive jobs run. You should select a time when the load
on the system is lower.
To set the schedule time:
1. Click Administration > Storage and Archive, and then open the Storage tab. The Storage tab
displays the current Schedule Time.
2. Select the time that you want the Archive Jobs to run from the drop-down list.
The list of storage groups on the storage tabs includes a check-box for each group under Follow
Schedule. You can turn archiving off for individual storage groups by unchecking this box.
Caution: If you do not follow the archiving schedule, you are not archiving that group at all. All
ArcSight Command Center User's Guide
Chapter 8: Administration Configuration
HPE ESM 7.0 Page 141 of 213

events in that group older than the retention period are lost forever. The only circumstance under
which you would want to turn off archiving for a storage group is when the group is specifically set
up to collect event data that you will never need later.
Adding a Storage Group
HPE recommends that you create all four of the additional storage groups that you can create, so that
you can have five storage groups available for event storage and one for internal system storage.
If you intend to use an NFS or CIFS mount point, ensure that the external storage point is mounted on
the machine on which the system is installed. See your operating system documentation for more
information.
Important: Nesting of the archive space for storage groups is not recommended. Adding a storage
group archive space folder to an exisiting storage group archive space folder causes the space used by
the original folder to be counted twice. Do not add the archiving path of one group under the archiving
path of another group. To do so results in an incorrect calculation of the maximum storage size in
relation to the total allocated size allowed for your storage group archive space.
To add a storage group:
1. Click Administration > Storage and Archive and then open the Storage tab. The Storage tab
displays the current storage groups.
2. Click New. The New Storage Group... dialog box opens.
3. Specify a Name for the storage group.
4. Specify the desired Retention Period.
The Retention Period is the number of days that your events are kept in event storage. After that,
they are deleted. To save events beyond this retention period, you must archive them.
5. Specify the Maximum Size for the storage group.
6. Mark the Follow Schedule check box to archive the storage group daily at a regular time. If you
decide not to archive daily, you can archive the storage group manually, or change the setting later.
Note: If you do not turn archiving on for a storage group or archive it manually, events are
deleted when they reach the end of the retention period.
7. Specify the Archive Location. Event archives are saved to the specified directory. This can be a
path to a local directory or to a mount point on the machine on which the system is installed.
8. Click Save to add the storage group, or Cancel to exit without saving.
ArcSight Command Center User's Guide
Chapter 8: Administration Configuration
HPE ESM 7.0 Page 142 of 213

Editing a Storage Group
Once a storage group is created, it cannot be deleted and its name cannot be changed. However, you
can change its other attributes at any time.
Note: The combined Maximum Sizes of all storage groups cannot exceed the Allocated Size of the
Storage Volume. When increasing the size of storage groups, consider the Allocated Size of the
Storage Volume.
To edit (including resizing) a storage group:
1. Click Administration > Storage and Archive and then open the Storage tab. The Storage tab
displays the available storage groups.
2. Click the storage group you want to modify, and then click Edit. The Edit Storage Groups dialog
box opens.
3. Change the desired parameters such as the retention period or the maximum size.
Archive locations can be changed anytime. However, if you change the archive location, the
archives that were created on the previously configured location cannot be moved to the new
location.
If you reduce the size of a storage group, and the new size is smaller than the current size, archived
events will be maintained in the archive location, and any events that have not been archived are
lost.
4. Click Save to store the changes, or Cancel to exit without saving.
Allocating Storage Volume Size
The Allocated Size, displayed on Storage and Archive tab, is the Storage Volume space available for
creating and extending Storage Groups. It is the current size of the Storage Volume. The Allocated Size
cannot exceed the Maximum Size of a Storage Volume. If the Allocated Size is less than the Maximum
Size, the difference is available for other data on the hard drive.
You can increase or decrease the Allocated Size. If a storage group reaches its maximum size, the oldest
events will be deleted as new events come into the system. To prevent this, first increase the Allocated
Size of the volume, and then use that newly allocated space to extend the storage groups' size.
Storage allocations within the total storage volume are described in the following table.
Note: When allocating the total storage volume, the installation reserves about 10% of the total
disk size for the operating system and installed software, by using the following formula:
MaximumSizeOfStorageVolume = TotalDiskSize * 0.9 - SystemStorageSize - EventArchiveSize
ArcSight Command Center User's Guide
Chapter 8: Administration Configuration
HPE ESM 7.0 Page 143 of 213

Storage
Area Size Purpose
System
Storage
Configured during
installation, can
range from 3 GB
to 1500 GB.*
Includes static content and resources. There is no retention period; this data is always
retained.
You can see the Current size and the Maximum size at the bottom of the "Storage" on
page138 tab.
If the current size reaches the configurable warning and error levels, and you have
configured "Alerts" on page146, the system issues an email warning that available
space is getting low.
* Size is limited by smallest of 1500 GB, the license limit, and the disk size.
Event
Storage
Configured during
installation, can
range from 10 GB
to 8192 GB.*
Includes collected daily events that accumulate until the end of each day’s retention
period or until space runs out. At either point, the oldest day’s events are deleted. If
Event Storage space runs out, the oldest day’s events are deleted each day, even if they
have yet to reach retention age.
These events can be in the Default Storage Group or in user-created storage groups.
You can save a copy of these events by archiving the storage group. For more
information, see "Creating an Archive Manually" on page150 and "Scheduling an
Archive" on page151).
If the used space reaches the configurable warning and error levels, and you have
configured "Alerts" on page146, the system issues an email warning that available
space is getting low.
You can view and manage storage groups on the "Storage" on page138 tab.
* Size is limited by smallest of 8 TB, the license limit, and the disk size.
Online
Event
Archives
200 GB Includes daily events that have been archived (copied) from Event Storage. By default,
the archives are located under /opt/arcsight/logger/data/archives. You can
specify the directory for each storage group.
You can manage the archives from the "Archive Jobs" on page147 tab.
There is an audit event when it is too full to archive another day’s events. Audit events
are described in the ArcSight Console User’s Guide, in “Reference Guide” > “Audit
Events” > "Logger Components" > "Archives"
Caution: If you routinely restore archived events back to online storage, make sure you
allocate enough space for those events.
The instructions below describe how to increase the Allocated Size for the entire storage volume. If you
want to change the size of an individual storage group, see "Editing a Storage Group" on the previous
page.
To increase the Allocated Size:
1. Click Administration > Storage and Archive and then open the Storage tab.
The Storage tab displays the current Allocated Size.
2. Click the Edit link next to the Allocated Size.
ArcSight Command Center User's Guide
Chapter 8: Administration Configuration
HPE ESM 7.0 Page 144 of 213

3. Increase the allocation as necessary up to the Maximum Size. You cannot decrease it.
4. Click the Save link.
Storage Mapping
Use this tab to create a mapping between connectors and storage groups. Doing so enables you to
store events from specific sources to a specific storage group.
You can configure these storage groups with different retention policies, and thus retain event data
based on the source of incoming events. For example, all events from firewall devices can be subject to a
short retention period. To accomplish this, manually assign the firewall devices to a connector and then
create a storage mapping to map the connector to a storage group with the desired short retention
period.
Tip: Events not subject to storage mapping are sent to the Default Storage Group.
Adding a Storage Mapping
The connector whose events you want to store must already be registered to ESM before you create a
storage mapping.
Note: The number of storage mappings you can create is unlimited.
To add a storage mapping for a connector:
1. Click Administration > Storage and Archive and then open the Storage Mapping tab.
2. Click New in the Connectors section to add a new connector mapping.
3. You will see a dialog that says "Do you want to manually add a storage mapping?"
Select No to automatically add one of the configured connectors.
4. Select a storage group from the drop-down list. The storage groups must already be set up before
any storage mappings are added.
5. Click Save to add the new storage mapping.
To manually add a storage mapping for an Event Broker-related Connector ID
1. Click Administration > Storage and Archive and then open the Storage Mapping tab.
2. Click New in the Connectors section to add a new connector mapping.
3. You will see a dialog that says "Do you want to manually add a storage mapping?"
Select Yes to manually add a storage mapping for a specific connector ID that is related to Event
Broker data. The connector ID is the Agent ID shown in the Event Details popup; see "Viewing
ArcSight Command Center User's Guide
Chapter 8: Administration Configuration
HPE ESM 7.0 Page 145 of 213

Additional Event Information" on page43 for information on viewing event details. Enter the
Agent ID in the Connector ID field and add a Connector Name. The name can be any name you
choose. Click Save.
Note: The Connector ID you enter is not validated by the Command Center; be sure to enter
the correct value . The Connector ID must be the Agent ID you derived from the Event Details.
4. Select a storage group from the drop-down list to associate with the connector you added
manually. The storage groups must already be set up before any storage mappings are added.
5. Click Save to add the new storage mapping.
Editing a Storage Mapping
You can edit an existing Storage Mapping or change its priority order at any time.
To edit a storage mapping:
1. Click Administration > Storage and Archive and then open the Storage Mapping tab.
2. Find the storage mapping you want to edit and change the information.
3. Click Save to keep the changes or Reset to undo them.
Deleting a Storage Mapping
You can delete Storage Mappings that you no longer need or want.
To delete a storage mapping:
1. Click Administration > Storage and Archive and then open the Storage Mapping tab.
2. Find the storage mapping you want to delete and click Delete.
3. Click OK to confirm the delete.
Alerts
On the Alerts tab, you can add, edit, or remove email addresses of users to notify when any of the data
storage thresholds are crossed and when any archive processing operation fails.
You can configure the threshold for warning and error notifications in terms of percentage of used
space for both event and system storage.
Archives have a fixed warning threshold that triggers notification when the system attempts to add an
archive for which there is insufficient storage space.
ArcSight Command Center User's Guide
Chapter 8: Administration Configuration
HPE ESM 7.0 Page 146 of 213

To configure Alerts:
1. Click Administration > Storage and Archive and then open the Alerts tab.
2. Change the following settings as appropriate:
lWarning Threshold — When used space rises above this percentage, the system sends a
notification email. This percentage must be lower than the usage Error Threshold.
lError Threshold — When usage rises above this percentage, the system sends a notification
email.
lSend Warnings To — The email addresses to send a notification to when the Warning Threshold
is reached. Use a comma-delimited list.
lSend Errors To — The email addresses to send a notification to when the Error Threshold is
reached. Use a comma-delimited list.
3. Click Save at the bottom to save your changes.
Archive Jobs
The Archive Jobs page shows a list of each day’s events for each storage group as an archive job, and
indicates their status. The list displays the archive jobs still in Event Storage as well as the archives that
are only maintained in Archive Storage.
You can filter the list to display only the archive jobs you want to see. For more information about
archives, see "Archives" below.
When you mouse over an Archive Job, a small box appears showing archive details. These include the
date of the events collected in this archive, when the archive was last made searchable or unsearchable,
the event count, and the disk space.
Archives
Archives are directories that contain a copy of one day’s events. When the system creates an archive
copy of a day’s events (and their related indexing information), it creates a subdirectory containing that
day’s events in the archive storage directory that you configured for each group. The default archive
location is under /opt/arcsight/logger/data/archives/<Storage Group ID>. For example, if
the Storage Group ID was 666 then the root directory would be
/opt/arcsight/logger/data/archives/666/.
The events exist both there in Archive Storage and in Event Storage until their retention date has
passed or until the storage location runs out of space, whichever comes first.
Events that have been archived remain available in event storage until they age out due to the
configured retention policy. Therefore, archived events continue to be searchable until they age out.
Archives that are still in Event Storage have the status “Online”.
ArcSight Command Center User's Guide
Chapter 8: Administration Configuration
HPE ESM 7.0 Page 147 of 213

When the retention date has passed for a particular day's events, the archive is removed from Event
Storage and is maintained in Archive Storage only, the status of the Archive changes to “Offline”.
Offline archives have been deleted from their storage group and are not included in search operations.
To include such events in search operations, you can make the archives searchable. When an archive is
made searchable, the events in it are included in searches, but the archive itself remains in the archive
storage.
Archiving daily events is optional. You can allow the daily event archives to be deleted at the end of the
retention period or when their storage group runs out of space. If you do not create the archive, events
are deleted at those points and cannot be recovered. Alternatively, you can archive daily events
manually or automatically at a scheduled time for each storage group.
ESM uses the manager receipt time of an event to determine its archival day. For example, an event with
timestamp of 11:55:00 p.m. on October 19 is received at 12:01:00 a.m. on October 20 on the system. This
event is archived in the archive directory created for October 20th and not October 19th.
At the scheduled time, one archive directory per storage group is created at the location specified in the
storage group. Each archive directory contains events from 12:00:00 a.m. to 11:59:59 p.m. for a single
storage group.
If an archive directory is not created, either because you did not turn archiving on or because the
archive job failed, the daily events are deleted when they reach the retention period specified for the
storage group or when you run out of event storage space, whichever comes first.
If you need to save older events, consider these three tasks:
lTurn archiving on so that daily events are copied to an archive directory you can back up.
lRegularly back up the Archives Storage directories to another storage device.
lDelete older, offline archives as they are backed up, so that the archive area does not fill up.
For information on managing Archive storage space, see "Archive Storage Space " on page152. For
information on managing Storage Group storage space, see "Storage" on page138.
Statuses and Actions
Action buttons become available at the top of the list based on the job or jobs that you select.
The following table describes archive statues and available actions:
ArcSight Command Center User's Guide
Chapter 8: Administration Configuration
HPE ESM 7.0 Page 148 of 213

Status Description
Available
Actions
Online This day’s events have been archived, that is, a copy of the events has been stored in the
Archive directory. The day’s events are still available in Event Storage (online). As long as
the day’s events remain in event storage, they are available for search and analysis.
None.
Not
Scheduled
The archiving status is Off or the Follow Schedule check box is not checked.
Events that are not archived will be deleted when they reach the retention period age, so
make sure to archive any days’ events that you want to keep.
If you click Archive Now, the status changes to Archiving (In progress).
If you click Archive on Schedule, the status changes to Scheduled. (This button is not
enabled unless the archiving status is On and the Follow Schedule check box is checked.)
Archive:
lArchive
Now
lArchive on
Schedule
Scheduled This day’s events are currently scheduled for automatic daily archival, but have not
reached the time when they are to be scheduled archived. This includes today’s events,
which are still being collected.
Cancel is available if scheduled archiving is enabled.
If you click Cancel, the status changes to Archiving (Cancelled)but collection of events
continues for that day and at midnight the status changes to Not Scheduled.
If scheduled archiving is not enabled for the storage group, no action is available.
Cancel
Offline This day’s events have been archived, but the events are only in Archive Storage. These
events are not available for analysis. They are preserved until you delete them.
Click Make Searchable if you need access to the events. When you no longer need access
to the events, click Make Unsearchable.
There are about 193 GB of storage set aside for archives.\
Make
Searchable/
Make
Unsearchable.
In
Progress
Any of several actions, including making searchable, making unsearchable, and archiving,
may be in progress.
If you click Cancel, the status changes as appropriate. For example, if the action in
progress is Archiving, and you click Cancel, the status changes to Archiving (Cancelled).
Cancel
Made
Searchable
This archive is offline. The events are in still archive storage, but have made searchable
for analysis.
Make
Unsearchable.
Filtering the List of Archives
The filters that you use to select the archives to display are to the left side of the screen. You can filter
the archives displayed in the list by date, storage group, or status.
To filter the list of archives:
1. Click Administration > Storage and Archive and then open the Archive Jobs tab.
2. Click the arrow next to the type of filter to hide or display the available filters.
3. Specify the dates of the archives you want to display.
ArcSight Command Center User's Guide
Chapter 8: Administration Configuration
HPE ESM 7.0 Page 149 of 213

lFrom — Display archives from this date forward.
lTo — Display archives up to this date.
4. Select the storage groups you want to display. The content of this list varies based on the storage
groups on your system. Check the boxes to display archives for the desired storage groups.
Uncheck the boxes to hide archives you do not want to display.
5. Select the Statuses you want to display. There are several available statuses. Check the boxes to
display archives with the desired statuses. Uncheck the boxes to hide archives you do not want to
display.
lStatus — This set of filter applies to Archived, Canceled, In Progress, and Failed archive jobs.
lScheduled
lNot Scheduled
lArchived — This set of filters applies to daily event archives that have already had been copied to
an archive directory.
lOnline
lOffline
lMade Searchable
lCancelled — This set of filters displays actions that have the status “Canceled”.
lArchiving (cancelled)
lMake Searchable (cancelled)
lMake Unsearchable (cancelled)
lIn Progress — This set of filters displays actions that have the status “In Progress”.
lArchiving (in progress)
lMake Searchable (in progress)
lMake Unsearchable (in progress)
lFailed — This set of filters displays actions that have the status “Failed”.
lArchiving (failed)
lMake Searchable (failed)
lMake Unsearchable (failed)
6. Click Refresh to see the updated list.
Creating an Archive Manually
If you do not need a particular storage group to be archived on a daily basis, you can archive it manually,
as needed.
ArcSight Command Center User's Guide
Chapter 8: Administration Configuration
HPE ESM 7.0 Page 150 of 213

To create an archive:
1. Click Administration> Storage and Archive and then open the Archive Jobs tab.
2. Filter the list to find the date and storage group archive you want to add to archive storage archive.
3. Select the desired archive or archives. The action buttons available for your selection become
active.
4. Click Archive Now to create the archive.
Scheduling an Archive
If you want particular storage group to be archived on a daily basis, you can set it to run at the
scheduled time at any point. This option is only available if archiving is enabled. For information on how
to enable archiving, see "Turning Archiving On and Off" on page141.
To schedule an archive:
1. Click Administration > Storage and Archive and then open the Archive Jobs tab.
2. Filter the list to find the date and storage group archive you want to archive on schedule.
3. Select the desired archive or archives. The action buttons available for your selection become
active.
4. Click Archive on Schedule to schedule the archive.
Making an Offline Archive Searchable or Unsearchable
Once an archive is moved Offline, it is no longer available for searches. However, if you need to search it
you can make it searchable. When you finish searching, make it unsearchable again.
To make an archive searchable or unsearchable:
1. Click Administration> Storage and Archive and then open the Archive Jobs tab.
2. Filter the list to find the date and storage group archive you want to make searchable or
unsearchable.
3. Select the desired archive or archives. You can use Ctrl+Click or Shift+Click to select multiple
archives. The action buttons available for your selection become active.
4. Click Make Searchable or Make Unsearchable.
Canceling an Action in Progress
You can cancel an archive action in progress at any point.
ArcSight Command Center User's Guide
Chapter 8: Administration Configuration
HPE ESM 7.0 Page 151 of 213

To cancel an action:
1. Click Administration> Storage and Archive and then open the Archive Jobs tab.
2. Filter the list to find the archive or archives on which you want to cancel an action.
3. Select the desired archive or archives. The action buttons available for your selection become
active.
4. Click Cancel to cancel the action.
Archive Storage Space
When archive storage space is too full to allow addition of another day’s events, these things happen:
lAn email to the notification list warns that there is no longer enough archive space.
lScheduled archiving fails.
lYou are unable to archive any jobs manually.
Since archives are ordinary directories containing a day’s events, it is easy to manage them using
ordinary file operations. You can keep space available by deleting older archives. Be sure to make them
unsearchable before you delete them. You may want to make a copy elsewhere (or redundant copies)
before deleting them.
Deleting an archive directory does not remove it from the Archive Jobs list, but if you try to make a
deleted archive searchable, you get an error message. Copy the directory back and try again.
Moving Archives to a New Location
Archives are ordinary directories containing a day’s events. Use basic operating system file commands
to move the /opt/arcsight/logger/data/archives directories to another location, and to move
them back at a later point.
Backing Up Your Archive Configuration
Use basic operating system file commands to back up your archive files. For information on how to back
up your archive configuration data and recover it later, refer to the configbackup and disasterrecovery
sections in the “Administrative Commands” section of the ESM Administrator’s Guide.
Search Filters
By default, all administrators can view, create, and edit search filters. For other users, access to this
feature is controlled by user permissions. If you need access to this feature, ask your administrator.
ArcSight Command Center User's Guide
Chapter 8: Administration Configuration
HPE ESM 7.0 Page 152 of 213

You can create search filters to save specific queries so that you can easily use them again. Search filters
are similar to saved searches. However, filters save the query only, while saved searches save the time
range information in addition to the query. The Search Filters page provides a convenient place to
manage search filters.
Granting Access to Search Filter Operations
Access to Search Filter Operations is granted at the user group level. Edit the Access Control List (ACL)
for the group and add the following permissions, as appropriate, to the Operations tab in the ACL
Editor.
To view, add, and edit search filters, a user needs the following permissions:
lView Search Filters:
/All Permissions/ArcSight System/Search Filter Operations/Search Filter Read
lAdd or edit Search Filters:
/All Permissions/ArcSight System/Search Filter Operations/Search Filter Write
Note: The Search Filter Write permission requires the Search Filter Read permission. If you want
to give a user write permission, be sure to enable read permission as well.
To load search filters from the Search page, a user needs the following permissions:
lView Saved Searches:
/All Permissions/ArcSight System/Saved Search Operations/Saved Search Read
To save a search filter from the Search page, a user needs this additional permission:
lAdd or Edit Saved Searches:
/All Permissions/ArcSight System/Saved Search Operations/Saved Search Write
For more information on editing access control lists (ACLs), granting or removing permissions for
events, and other permissions-related topics, refer to the ArcSight Console User's Guide section,
"Managing Permissions."
Managing Search Filters
Your system comes with a set of predefined search filters. For more information about these filters, see
"Predefined Search Filters" on page111. You can add new filters and edit the existing ones from the
Search Filters page.
You can add a search filter here or directly from the Search tab. For information on how to save a search
filter from the Search tab, see "Saved Queries (Search Filters and Saved Searches)" on page109.
ArcSight Command Center User's Guide
Chapter 8: Administration Configuration
HPE ESM 7.0 Page 153 of 213

For information on how to use the search filters created on this tab, see "Using a Search Filter or a
Saved Search" on page110.
To add a search filter:
1. Click Administration > Search Filters.
2. Click Add to display the Add Search Filter dialog box.
3. Enter a name for the new filter in the Name field. Filter names are case sensitive.
Note: Non-administrator users cannot create search group filters.
4. Click Next.
5. Enter the query for the new filter.
lWhen you type a query, Search Helper enables you to quickly build a query expression by
automatically providing suggestions, possible matches, and applicable operators. See "Search
Helper" on page89 for more information.
lClick Advanced Search to use the Search Builder Tool to create the query. For details about
using the Search Builder Tool, see "Using the Advanced Search Tool" on page85.
6. Click Save.
The filter you created is displayed in the list of search filters.
To create a new search filter by copying an existing one:
1. Click Administration > Search Filters.
2. Locate the filter to copy from the list of search filters. Click the Copy icon ( ).
A new search filter with the name “Copy of <filtername>” is created.
3. Change the name of the search filter and edit the query for the new filter as necessary.
4. Click Save.
To edit a search filter:
1. Click Administration > Search Filters.
2. Find the search filter you want to edit and click the Edit icon ( ) on that row.
3. Change the information in the form and click Save.
To delete a search filter:
1. Click Administration > Search Filters.
2. Find the search filter you want to delete and click the Delete icon ( )
3. Confirm the delete.
ArcSight Command Center User's Guide
Chapter 8: Administration Configuration
HPE ESM 7.0 Page 154 of 213

Saved Searches
A saved search, like a search filter, recalls a specific query. However, in addition to the query, a saved
search saves the time range and the fieldset to display in the search results. Saving the time range
supports scheduled searches that run at a specific interval. For more information, see "Scheduled
Searches" on page157.
Granting Access to Saved Search Operations
Access to Saved Search Operations is granted at the user group level. Edit the Access Control List
(ACL) for the group and add the following permissions, as appropriate, to the Operations tab in the
ACL Editor.
To view, add, and edit saved searches, a user needs the following permissions:
lView Saved Searches:
/All Permissions/ArcSight System/Saved Search Operations/Saved Search Read
lAdd or Edit Saved Searches:
/All Permissions/ArcSight System/Saved Search Operations/Saved Search Write
Note: The Saved Search Write permission requires the Saved Search Read permission. If you
want to give a user write permission, be sure to enable read permission as well.
To load saved searches from the Search page, a user needs this additional permission:
lView Search Filters:
/All Permissions/ArcSight System/Search Filter Operations/Search Filter Read
To save a search from the Search page, a user needs this additional permission:
lAdd or edit Search Filters:
/All Permissions/ArcSight System/Search Filter Operations/Search Filter Write
To schedule a saved search from the Search page, a user needs these additional
permissions:
lView Scheduled Searches:
/All Permissions/ArcSight System/Scheduled Search Operations/Scheduled Search Read
lAdd or Edit Scheduled Searches:
/All Permissions/ArcSight System/Scheduled Search Operations/Scheduled Search Write
ArcSight Command Center User's Guide
Chapter 8: Administration Configuration
HPE ESM 7.0 Page 155 of 213

For more information on editing access control lists (ACLs), granting or removing permissions for
events, and other permissions-related topics, refer to the ArcSight Console User's Guide chapter,
"Managing Users and Permissions."
Managing Saved Searches
The Saved Searches tab displays all saved searches and supports adding, editing, and deleting saved
searches.
You can add a saved search here or directly from the Search tab. For information on how to save a
search from the Search tab, see "Saved Queries (Search Filters and Saved Searches)" on page109.
For information on how to use the saved searches created on this tab, see "Using a Search Filter or a
Saved Search" on page110.
To add a saved search:
1. Click Administration > Saved Searches and then open the Saved Searches tab.
2. Click Add and enter the following parameters:
Parameter Description
Name A name for this saved search. This name is used for exported output files, with the date and time
appended.
Start Time Absolute date and time of the earliest possible event. Alternatively, check Dynamic to specify the
start time relative to the time when the saved search job is run.
End Time Absolute or dynamic date and time of the latest possible event, as described above.
Query Enter a query in the text field, or select one or more filters from the Search Filter list.
When you type a query, the Search Helper enables you to quickly build a query expression by
automatically providing suggestions, possible matches, and applicable operators. See "Search
Helper" on page89 for more information.
Search
Filters
Select one or more filters from the Search Filter list, or enter a query in the text field. The search
filter(s) you select are used in the search.
Local
Search
Check this box to limit the saved search to the local system. If the Local Search box is not checked,
the saved search includes all peers.
3. Click Save to add the new saved search, or Cancel to quit.
To edit a saved search:
1. Click Administration> Saved Searches and then open the Saved Searches tab.
2. The Saved Searches tab displays the existing searches. Find the saved search you want to edit and
click the Edit icon ( ) on that row.
3. Change the information in the form and click Save.
ArcSight Command Center User's Guide
Chapter 8: Administration Configuration
HPE ESM 7.0 Page 156 of 213

To delete a saved search:
1. Click Administration> Saved Searches and then open the Saved Searches tab.
2. The Saved Searches tab displays the existing searches. Find the saved search you want to delete.
3. Click the Delete icon ( ) and then confirm the deletion.
Scheduled Searches
By default, all administrators can view, create, and edit scheduled searches. For other users, access to
this feature is controlled by user permissions. If you need access to this feature, ask your administrator.
Granting Access to Scheduled Search Operations
Access to Scheduled Search operations is granted at the user group level. Edit the Access Control List
(ACL) for the group and add the following permissions, as appropriate, to the Operations tab in the
ACL Editor.
To view, add, and edit scheduled searches, a user needs the following permissions:
lView Scheduled Searches:
/All Permissions/ArcSight System/Scheduled Search Operations/Scheduled Search Read
lAdd or Edit Scheduled Searches:
/All Permissions/ArcSight System/Scheduled Search Operations/Scheduled Search Write
Note: The Scheduled Search Write permission requires the Scheduled Search Read permission. If
you want to give a user write permission, be sure to enable read permission as well.
For more information on editing access control lists (ACLs), granting or removing permissions for
events, and other permissions-related topics, refer to the ArcSight Console User's Guide section,
"Managing Permissions."
Managing Scheduled Searches
You can schedule a saved search to be run at a later time. The Scheduled Searches tab displays the
currently scheduled searches. The results of a scheduled search are written to a file, as described in
"Saved Search Files" on page161.
A scheduled Saved Search can be also configured to generate an alert. You can only schedule Alerts
from the ESM interface.
Before you schedule a Saved Search, you must have created or saved at least one Saved Search. You
can schedule a saved search to run at any time.
ArcSight Command Center User's Guide
Chapter 8: Administration Configuration
HPE ESM 7.0 Page 157 of 213

To schedule a saved search:
1. Click Administration> Saved Searches and then open the Scheduled Searches tab.
2. Click Add.
3. Enter the following parameters:
Parameter Description
Name A name for this scheduled search job.
Schedule Choose Everyday or Days of Week from the first pulldown menu.
If Everyday, select Hour of Day or Every from the second pulldown menu. Enter the hours (1-23) in
the text box.
If Days of Week, enter the days (day 1 is Sunday) in the text box. Then choose Hour of Day or Every
from the second pulldown menu. Enter the hours (1-23) in the second text box.
For example, to perform the search every day at 2 a.m., select Everyday in the first pulldown menu,
then choose Hour of Day from the second pulldown menu and enter 2 in the text box. To perform
the saved search every day at 2 a.m. and 3 p.m., enter 2,15 in the text box.
For another example, to perform the search Tuesdays and Thursdays at 10 p.m., select Days of Week
from the first pulldown menu and enter 3,5 for days. Then choose Hour of Day from the second
pulldown menu and enter 22 in the text box.
Saved
Searches
Select from the list of saved searches. If none of the saved searches suit your needs, click the Saved
Searches tab (to the left of Scheduled Searches tab) to save a new search. Then come back to this
tab to schedule it.
For more information about defining a saved search query, see "Managing Saved Searches" on
page156.
You can use Ctrl+Click to select and deselect one or more items from the list.
Note: When multiple saved searches are specified in one scheduled search job, the resulting file
contains the number of hits for each saved search and not the actual events.
Export
Options
For ESMon an appliance:
Select from one of these options:
lExport to remote location—The file is written to an NFS mount, a CIFS mount, or a SAN system.
lSave to ESM—The file is saved to the ESM’s onboard disk. If the file is saved locally, use the
Saved Search Files ("Saved Search Files" on page161) feature to access those files.
For the software version of ESM:
The option Save to ArcSight Command Center is preselected for you.
The search results are saved on the Saved Search Files tab. For more information, see "Saved Search
Files" on page161.
ArcSight Command Center User's Guide
Chapter 8: Administration Configuration
HPE ESM 7.0 Page 158 of 213

Parameter Description
File Format Select a format for the exported search results.
CSV, for comma-separated values file.
PDF, for a report-style file that contains search results as charts and in tables. You must specify a
title for the report in the Title field. If the search query contains an operator that creates charts such
as chart, top, and so on, charts are included in the PDF file. In that case, you can also set the Chart
Type and Chart Result Limit fields. These fields are described later in this table.
Export
Directory
Name
For ESMon an appliance, select the directory where the search results will be exported from the
pulldown menu.
By default all saved searches are stored in
/opt/arcsight/logger/userdata/logger/user/logger/data/savedsearch. To group your searches in
folders, indicate a subdirectory in which to store them.
If a directory of that name does not exist, it is created.
Title (Optional) Enter a title to appear at top of the PDF file. If no title is specified, the default “Untitled” is
used.
(This field becomes available when you select the PDF output format.)
Fields A list of event fields that will be included in the exported file. By default, all listed fields are
included.
You can enter fields or edit the displayed fields by deselecting All Fields.
Chart Type
(for PDF
only)
Type of chart to include in the PDF file. You can select from:
Column, Bar, Pie, Area, Line, Stacked Column, Stacked Bar.
Note: This option overrides the Chart Type displayed on the Search Results screen.
(If the search query includes an operator that creates a chart, this field is meaningful; otherwise, it is
ignored.)
Chart
Result
Limit (for
PDF only)
The maximum number of unique values to include on the chart. The default is 10.
(If the search query includes an operator that creates a chart, this field is meaningful; otherwise, it is
ignored.)
If the configured Chart Result Limit is less than the number of unique values for a query, the top
values equal to the Chart Result Limit are plotted. That is, if the Chart Result Limit is 5 and 7 unique
values are found, the top 5 values will be plotted.
Include
Summary
Check this box to include an event count with the saved search, or a total when more than one
saved search is specified.
Include
only CEF
Events
Check this box to include only Common Event Format (CEF) events. Uncheck the box to include all
events in the output. Non-CEF events may be found on peers that are Loggers.
For more information about CEF, refer to Implementing ArcSight CEF. For a downloadable a copy of
this guide, search for ”ArcSight Common Event Format (CEF) Guide” on the Protect 724 Community
at https://community.softwaregrp.com/t5/ArcSight-Product-Documentation/ct-p/productdocs.
4. Click Save to add the new scheduled search, or Cancel to quit.
5. Enable the Scheduled Search to run by clicking the Disabled icon ( ) at the end of the row. To
disable the search, click the Enabled icon ( ).
ArcSight Command Center User's Guide
Chapter 8: Administration Configuration
HPE ESM 7.0 Page 159 of 213

To edit a scheduled search:
1. Click Administration > Saved Searches and then open the Scheduled Searches tab.
2. Locate the scheduled search job you want to edit and click the Edit icon ( ) on that row.
3. Change the parameters of the scheduled search job.
4. Click Save to update the scheduled search job, or Cancel to abandon your changes.
To delete a scheduled search:
1. Click Administration > Saved Searches and then open the Scheduled Searches tab.
2. Click Scheduled Searches in the right panel.
3. Locate the scheduled search you want to delete and click the Delete icon ( ) on that row.
4. Confirm the deletion by clicking OK, or click Cancel to retain the scheduled search job.
Currently Running Scheduled Searches
When a scheduled search is initiated, the Running Searches tab displays the currently running
scheduled search tasks. If no task is running, the list will be empty.
When a task finishes, its entry on the Running Searches tab is removed. The task entry is removed
upon page refresh, when you click Refresh or when you navigate away from this page and come back to
it.
To view running scheduled searches:
Click Administration> Saved Searches, and then open the Running Searches tab. The running tasks
are displayed.
Ending Currently Running Searches
If you need to end a Running Search task, follow the instructions in "Ending Currently Running Tasks"
on page166.
Finished Searches
The completion status of searches that were scheduled to run is listed on the Finished Searches tab.
The entries are updated upon page refresh, when you click Refresh, or when you navigate away from
this page and come back to it.
ArcSight Command Center User's Guide
Chapter 8: Administration Configuration
HPE ESM 7.0 Page 160 of 213

Saved Search Files
This tab displays links to the saved search results that were saved with the Saved Search Files command.
Saved Search Files can be retrieved (streamed to the browser) or deleted.
Saved Search Files
Access the saved search results:
1. Click Administration > Saved Searches and then open the Saved Search Files tab. The files
containing the search results are displayed.
2. To download and open a file, click a link in the Name column or click the Retrieve icon in the row.
Search
The Search screen enables you to tune advanced search options, view the schema, and end currently
running search tasks.
For general search information, see "Searching for Events in the ArcSight Command Center" on page61.
For information on how to grant search access, see "Granting Access to Search Operations and Event
Filters" on page94.
Tuning Search Options
You must be an administrative user to access this feature.
The Search Options tab displays options that affect the search operation. You can set several different
types of search options, including options to support internationalization (i18n). The settings you select
apply to all users.
Note: Changing the default search options may affect search performance.
To change the search options:
1. Click Administration > Search, and then open the Search Options tab.
2. The following table lists the search options you can view and configure. Select the necessary
options and click Save.
Several of the options on this screen will require you to restart the system.
ArcSight Command Center User's Guide
Chapter 8: Administration Configuration
HPE ESM 7.0 Page 161 of 213

Option Description
Field Search Option
Case sensitive Default: Yes
Controls whether to differentiate between upper- and lower-case characters during a search.
When this option is set to No, searching for "login" will find "login," "Login," and "LOGIN".
You must restart the systemfor this change to take effect.
Notes:
lCase-sensitive search only applies to the local system. Peers will continue to use case-
insensitive search.
lFull-text search (keyword search) is case insensitive. You cannot change its case sensitivity.
lSet this option to Yes to increase local query performance.
Full-text Search Options
Use primary
delimiters
Default: Yes
Controls whether primary delimiters are applied to an event when tokenizing it for indexing.
For information about Indexing, see "Indexing" on page113.
A primary delimiter tokenizes an event for indexing. For example, an event "john doe the first"
is tokenized into "john" "doe" "the" "first" using the “space” primary delimiter.
Users can search for keywords containing primary delimiters by enclosing the keywords in
double quotes.
Supported primary delimiters: space, tab, newline, comma, semi-colon, (, ), [, ], {, }, “, |, *, >, <, !
Use secondary
delimiters
Default: No
Controls whether secondary delimiters are applied to an event to further tokenize a token
created by a primary delimiter. Thus enabling searches that can match a part of a primary
token.
Users can search for keywords containing secondary delimiters by enclosing the keywords in
double quotes.
Supported secondary delimiters: =, . ,:, /, \, @, -, ?, #, $, &, _, %
Regular Expression Search Options
Case sensitive Default: No
You must restart the system for this change to take effect.
See Case Sensitive in the Field Search Options, above.
Unicode case
sensitive
Default: No
Controls whether events in languages other than English are matched in a case-sensitive way.
Caution: HPEstrongly recommends that you do not change this option.
You must restart the system for this change to take effect.
ArcSight Command Center User's Guide
Chapter 8: Administration Configuration
HPE ESM 7.0 Page 162 of 213

Option Description
Check for
canonical
equality
Default: No
Controls whether events in languages other than English should be compared using locale-
specific algorithms.
Caution: Do not change this option.
You must restart the system for this change to take effect.
Search Display Options
Populate
rawEvent field
for syslog events
Default: No
For syslog events only, controls whether raw events are displayed in a column called rawEvent,
formatted by the Raw Event fieldset.
To view the raw events associated with CEF events, you must configure the connector that
sends the events to ESM to populate the rawEvent field.
Note: Even though the rawEvent column displays the raw event, this column is not added to
the database and is not indexed. Therefore, you can only run a keyword (full-text) or regular
expression search on the event.
Show Source and
SourceType
fields
Default: No
Controls whether the Source and SourceType fields are included in the Field Summary and
query results.
You must restart the system for this change to take effect.
Note: Setting this option to Yes can impact query performance.
Field Summary Options
Use Field
Summary
Default: No
Controls whether the Field Summary panel is included in the search results by default. This
option can be overridden by using the Fields Summary check box on the Search screen.
When you select this field, the Discover Fields option becomes available.
Discover Fields Default: No
Controls whether the Field Summary feature automatically detects non-CEF fields in raw
events. This option can be overridden by using the Discover Fields check box on the Search
screen.
This field is hidden if Use Field Summary is set to No.
Note: Setting this option to Yes can impact query performance.
Managing Fieldsets
By default, all administrators can view, create, edit, and delete custom fieldsets. For other users, access
to this feature is controlled by user permissions. If you need access to this feature, ask your
administrator.
You can view both user-created and predefined fieldsets on the Fieldsets tab. You can delete the user-
created fieldsets from here. For information on how to add a fieldset, see "Fieldsets" on page74.
ArcSight Command Center User's Guide
Chapter 8: Administration Configuration
HPE ESM 7.0 Page 163 of 213
Note: These fieldsets are for use when searching from ArcSight Command Center.
Field sets in ArcSight Console are different.
To delete a custom fieldset:
1. Click Administration> Search, and then open the Fieldsets tab.
2. Identify the fieldset you want to delete and click the Delete ( ) icon.
Note: You can only delete the fieldsets you create, and not the predefined ones available on
your system.
3. Confirm the deletion.
Granting Access to Fieldset Operations
Access to Fieldset Operations is granted at the user group level. Edit the Access Control List (ACL) for
the group and add the following permissions, as appropriate, to the Operations tab in the ACL Editor.
To use a fieldset from the Search page, a user needs the following permissions:
lSearch for events:
/All Permissions/ArcSight System/Search Operations/Search
lView Fieldsets:
/All Permissions/ArcSight System/Fieldset Operations/Fieldset Read
To create, edit and delete fieldsets, a user needs this additional permission:
lAdd or edit Fieldsets:
/All Permissions/ArcSight System/Fieldset Operations/Fieldset Write
Note: The Fieldset Write permission requires the Fieldset Read permission and the Search
permission. If you want to give a user write permission, be sure to enable those permissions as
well.
For more information on editing access control lists (ACLs), granting or removing permissions for
events, and other permissions-related topics, refer to the ArcSight Console User's Guide section,
"Managing Permissions."
Viewing the Default Fields
You must be an administrative user to access this feature.
ArcSight Command Center User's Guide
Chapter 8: Administration Configuration
HPE ESM 7.0 Page 164 of 213
The schema contains a set of predefined fields. A field-based search can only use fields in the schema.
The Default Fields tab displays the predefined fields included in the schema. It includes the Display
Name, Type, Length, and Field Name for each default field.
Note: The size of each field in the schema is predetermined. If the string you are searching for is
longer than the field length, use a STARTSWITH rather than an = search, and include no more than
the number of characters in the field size. For more information, see "Field-Based Search" on
page67.
The Default fields tab display includes the database data type for each field. These data types map to
the ArcSight data types as indicated in the following table.
ArcSight
Data type
Type on Default
Fields tab Notes
DATETIME DATETIME Includes Date, DateTime, and Timestamp.
NUMBER DOUBLE Includes dvc_custom_floating_point1, dvc_custom_floating_point2, dvc_custom_
floating_point3, and dvc_custom_floating_point4.
INTEGER Includes asset_criticality, dest_trans_port, dest_process_id, and so on.
LONG Includes agentSeverity, locality, geo location, and so on.
MAC
Address
LONG Includes MAC addresses.
STRING TEXT Includes deviceVendor, deviceProduct, deviceVersion, and so on.
IP Address VARBINARY Includes IPv4 and IPv6 addresses.
For more information about ArcSight data types, refer to the reference section of the ArcSight Console
User’s guide.
To view the default schema fields:
1. Click Administration > Search, and then open the Default Fields tab.
2. The Default Fields tab displays the default fields. You can sort the fields by clicking the column
headers.
Currently Running Tasks
You must be an administrative user to access this feature.
The Running Tasks tab displays the search tasks that are currently running. If no task is running, the
list will be empty. These tasks include searches initiated by any of the following operations.
lManual search (Events >Event Search)
lAdministration > Saved Searches > Scheduled Searches)
ArcSight Command Center User's Guide
Chapter 8: Administration Configuration
HPE ESM 7.0 Page 165 of 213

lSearch export, with the “Rerun query” option checked (Events >Event Search > Export Results)
The table shows the session ID, the user who started the tasks, the date and time that the task started,
the number of hits, the number of scanned events, the elapsed time, and the query.
When a task finishes, its entry on the Running Tasks tab is removed. The task entry is removed upon
page refresh, when you click the Refresh button shown above or when you navigate away from this
page and come back to it.
To view running tasks:
Click Administration> Search, and then open the Running Tasks tab. Any tasks currently running
tasks are displayed.
Ending Currently Running Tasks
You might need to end a currently running task when it is taking too long to run, or appears to be stuck
and slowing overall performance.
To end running tasks:
1. Click Administration> Search, and then open the Running Tasks tab.
2. Select the task you want to end, and click the End ( ) icon.
Peers
By default, all administrators can view, create, and edit peers; and run searches on peers. For other
users, access to this feature is controlled by user permissions. If you need access to this feature, ask your
administrator.
An ArcSight Manager can establish peer relationships with one or more Managers or Loggers to enable
distributed searches and Content Management. ArcSight Managers can send content to, or receive
content from, other Managers when they are in a peer relationship. To search other Managers or
Loggers or to use the Content Management feature, you must define one or more peers.
Note: Both Peering and Content Management are disabled if ESM is running in FIPS Suite B Mode.
When two systems peer with each other, one initiates the relationship. The initiator sends credentials to
authenticate itself to the target system. If the authentication succeeds, a peer relationship is established
between the two systems. For more information, see "Authenticating Peers" on page168.
Configuring Peers
The following steps are required to set up peer relationships.
ArcSight Command Center User's Guide
Chapter 8: Administration Configuration
HPE ESM 7.0 Page 166 of 213

Overview steps for configuring peers:
1. Be sure the system supports peering. See "Guidelines for Configuring Peers" below
2. Determine which Manager will initiate the peer relationship. Manager A is the initiator in this
example, and Logger B is the target.
3. Decide on a peer authentication method, based on the information in "Selecting a Peer
Authentication Method" on page169.
lTo authenticate with a user name and password:
Determine which user name and password Manager A should to use to authenticate itself when
peering with B, or set up a user.
lTo authenticate with an Authorization ID and Code:
On Manager or Logger B, generate an Authorization ID and Code for A to use to authenticate
itself when peering with B. For instructions, see "Authenticating a Peer" on page169.
4. On Manager A, add the authentication information from B, as described in "Adding a Peer" on
page170.
lIf authenticating with a user name and password, use the user name and password that you
determined in the previous step.
lIf authenticating with an Authorization ID and Code, use the Authorization ID and Code that you
generated in the previous step.
5. If you use a self-signed SSL certificate with the host's fully qualified domain name (FQDN), follow
these additional configuration steps:
a. Open the file,
/opt/arcsight/logger/current/local/apache/conf/httpd.conf
b. Search
ServerName arcsight:9000
c. Change arcsight to the host's fully qualified domain name and save the file.
d. Restart Apache server by running
/etc/init.d/arcsight_services restart logger_httpd
Guidelines for Configuring Peers
Consider these guidelines when configuring peers:
lRefer to the Release Notes for the supported versions in peer relationships.
lThe system time and date on each Manager or Logger in the peer relationship must be set correctly
for its time zone. HPErecommends that you configure your system to synchronize its time with an
NTP server regularly.
lPeers cannot be edited, however you can delete and re-add a peer.
ArcSight Command Center User's Guide
Chapter 8: Administration Configuration
HPE ESM 7.0 Page 167 of 213

lWhen user name and password are used for authenticating to a remote peer, changes to the user
name and password after the peer relationship is established do not affect the relationship. However,
if you delete the peer relationship or it breaks for other reasons, you will need to provide the changed
credentials to re-establish the relationship.
lUsers performing search operations on peers have the same privileges on the peer that they have on
the system that they are logged into.
lPeer log information is recorded in the log files in
/opt/arcsight/logger/current/arcsight/logger/logs
To Enable Peering
To enable peering to work you must have an ESM license that includes peering and enable port 9000
on the server. Run the following commands as user root:
firewall-cmd --zone=public --add-port=9000/tcp --permanent
firewall-cmd --reload
Check that port 9000 is enabled:
iptables-save | grep 9000
You should get a response similar to this:
-A IN_public_allow -p tcp -m tcp --dport 9000 -m conntrack --ctstate NEW -j
ACCEPT
Authenticating Peers
Authentication happens only once, at the time the peer relationship is created. The authorization to use
peer services is implicit each time a remote system receives peer requests from a system that previously
authenticated as a peer.
You can authenticate a peer in one of two ways:
lPeer Authorization ID and Code — These credentials are generated on one Manager or Logger
and used on another to configure peering between the two. When generating the Authorization ID
and Code, enter the IP address of the Manager or Logger you will use to initiate peering in the Peer
Authorization page of the one you want to peer with. The IP address is used to generate a unique ID
and code that can be used only for peering from that address. Therefore, this method is more secure
than using a user name and password.
Note: HPE recommends using Peer Authorization ID and Code for authentication.
lUser name and password — A user name and password already configured on the target system is
used for authentication.
ArcSight Command Center User's Guide
Chapter 8: Administration Configuration
HPE ESM 7.0 Page 168 of 213

Note: This user must have the following permissions:
View registered peers:
/All Permissions/ArcSight System/Peer Operations/Peer Read/
Edit, save, and remove registered peers:
/All Permissions/ArcSight System/Peer Operations/Peer Write/
Selecting a Peer Authentication Method
lWhen using a user name and password to configure peering, you must use the user password for
local authentication, even if your system is configured to use LDAP or RADIUS authentication.
lIf the peer Manager or Logger is configured for SSL Client authentication (CAC), you must configure
an Authorization ID and Code on the target Manager or Logger. You cannot use a user name and
password.
lFIPS-enabled systems are not limited to a specific authentication method.
Note: FIPS Suite B Mode is not supported for peering.
Authenticating a Peer
Use the following procedure to generate the Authorization ID and Code on the target Manager or
Logger with which you want to establish a peer relationship. (Manager A or Logger B in the example in
"Configuring Peers" on page166.) After that, use the ID and Code on the initiating Manager or Logger
when configuring the peer relationship. (Manager Logger A in that example.)
To generate the Authorization ID and Code:
1. Click Administration> Peers and then open the Peer Authorization tab.
2. In the Peer Authorization tab, click Add.
3. Enter the hostname or IP address and port for the Manager or Logger you want to peer with this
system.
4. Click Save.
The authorization ID and authorization Code are displayed. Copy this information and use it on
the other Manager or Logger when adding this system as a peer.
5. Click Done to return to the Peer Authorization list.
Adding and Deleting Peer Relationships
The Peer Configuration tab displays the current peer relationships. From here, you can add and delete
peers.
ArcSight Command Center User's Guide
Chapter 8: Administration Configuration
HPE ESM 7.0 Page 169 of 213

Adding a Peer
Adding a peer creates a peer relationship between ArcSight Managers, or between Managers and
Loggers. After a peer is added, you can delete, but not edit it. See "Configuring Peers" on page166 for
more information.
To add a peer:
1. Click Administration > Peers and then open the Peer Configuration tab.
2. Click Add and enter the following parameters.
Parameter Description
Peer Host
Name
Enter the target Manager or Logger’s hostname or IP address.
Peer Port For peering with a Manager, use the default port, 9000.
For peering with a Logger, use the configured port.
Peer Login
Credentials
Peer
Authorization
Credentials
Select Peer Login Credentials for password-based authentication.
OR
Select Peer Authorization Credentials to use an Authorization ID and Code.
lOn systems using local or RADIUS authentication, you can use either authentication method,
although peer Authorization ID and Code are recommended.
lOn systems using SSL Client Authentication (CAC), Authorization ID and Code is the only way
to authenticate a peer. You cannot use a user name and password.
lFIPS-enabled systems are not limited to a specific authentication method.
If you selected Peer Login Credentials...
Peer User
Name
Enter a user name already configured on the target system to use for authentication.
This user must have the following permissions:
View registered peers:
/All Permissions/ArcSight System/Peer Operations/Peer Read/
Edit, save, and remove registered peers:
/All Permissions/ArcSight System/Peer Operations/Peer Write/
Peer Password Enter the password for the user specified in the Peer User Name field.
If you selected Peer Authorization Credentials...
Peer
Authorization
ID
Enter the authorization ID generated on the target Manager or Logger. (See "To generate the
Authorization ID and Code:" on the previous page for more information.)
ArcSight Command Center User's Guide
Chapter 8: Administration Configuration
HPE ESM 7.0 Page 170 of 213

Parameter Description
Peer
Authorization
Code
Enter the authorization code generated on the target Manager or Logger. (See "To generate the
Authorization ID and Code:" on page169 for more information.)
These fields need to be updated in rare circumstances.
External IP
Address
In most cases, the value in this field matches the IP address in your browser when you logged
into this system (the initiating Manager or Logger), and you do not need to do anything.
However, if the IP address does not match that address, (for example, when the Manager or
Logger is behind a VPN concentrator), change the value to match the IP address in your browser.
Local Port This should always be 9000.
3. Click Save to add the new peer relationship, or Cancel to quit. The peer relationship is also added
on the peer.
Deleting a Peer
Deleting a peer removes the peer relationship between defined peers. You can perform this process
from either peer.
To delete a peer:
1. Click Administration > Peers and then open the Peer Configuration tab.
2. Locate the peer you want to delete the peer relationship to and click the Delete icon ( ) on that
row.
3. Confirm the deletion by clicking OK, or click Cancel to retain the relationship.
The peer relationship is deleted on both peers.
Note: Deleting the peer relationship will only delete this Manager's knowledge of the
relationship if the peer cannot be reached. When the target system is reachable, you can log
into it and delete the peer relationship from there.
Granting Access to Peer Operations
Access to Peer Operations is granted at the user group level. Edit the Access Control List (ACL) for the
group and add the following permissions, as appropriate, to the Operations tab in the ACL Editor.
Note: Be sure to apply all appropriate permissions. For example:
lThe Write permission requires the Read permission. If you want to give a user Peer Write
permission, be sure to enable Peer Read permission as well.
ArcSight Command Center User's Guide
Chapter 8: Administration Configuration
HPE ESM 7.0 Page 171 of 213

lThe Search Remote permission requires the Search permission and the Peer Read permission. If
you want to give a user Search Remote permission, be sure to enable Search and Peer Read.
To search for peers from the Search page, a user needs these permissions:
lSearch for events:
/All Permissions/ArcSight System/Search Operations/Search
lSearch for events on remote peers:
/All Permissions/ArcSight System/Peer Operations/Search Remote
To add and remove peers, a user needs these additional permissions:
lView registered peers:
/All Permissions/ArcSight System/Peer Operations/Peer Read
lEdit, save, and remove registered peers:
/All Permissions/ArcSight System/Peer Operations/Peer Write
For more information on editing access control lists (ACLs), granting or removing permissions for
events, and other permissions-related topics, refer to the ArcSight Console User's Guide section,
"ManagingPermissions."
Log Retrieval
You must be an administrative user to access this feature.
ESM records some audit and debug information, including details of any issues that occur in system logs
(which differ from event logs). Customer support may ask you to retrieve logs as part of an incident
investigation. If so, follow the steps below and provide the resulting .zip file to customer support.
When retrieving logs, you have the option to sanitize the log files by obfuscating the IP addresses,
hostnames, and email addresses. However, sanitizing adds extra time to log retrieval. Each sanitized IP
address, hostname, and email address is replaced by the symbols xxx.xxx.xxx.xxx (for IP addresses),
sanitized@email (for emails) and sanitized.host.name (for hostnames).
To retrieve the system logs:
1. Click Administration > Log Retrieval.
2. Select the Log Retrieval options to use when creating the Log file.
lIf you select Do not sanitize logs (fastest), then all IP addresses, hostnames and email
addresses will be kept in the log file.
lIf you select Remove IP addresses, all IP addresses in the log will be obfuscated. You cannot
specify individual IP addresses.
ArcSight Command Center User's Guide
Chapter 8: Administration Configuration
HPE ESM 7.0 Page 172 of 213

lIf you select Remove IP addresses, hostnames and email addresses, you must specify the
suffixes of the hostnames and email addresses in the text box.
Separate multiple suffixes with comma, space, or line-break. For example, to obfuscate all
hostnames and email addresses that end with ourcompany.com and gmail.com, specify the
following:
ourcompany.com, gmail.com
All IP addresses, hostnames, and email addresses with the specified suffixes will be obfuscated.
Specifying individual email addresses like name@hpe.com is not supported. Individual email
addresses and their suffixes will be ignored. If a suffix is not provided, the retrieval behavior is the
same as selecting "Remove IP address".
3. Click Retrieve Logs. The page will display a progress bar while the logs are being retrieved.
4. When the collection is complete, the system log files have been compressed into a single zip file. A
link to this file is displayed on the Log Retrieval page. Click the link to download the fie.
License
You must be an administrative user to access this feature.
To view the license information:
1. Click Administration > License.
2. View the license information.
ArcSight Command Center User's Guide
Chapter 8: Administration Configuration
HPE ESM 7.0 Page 173 of 213
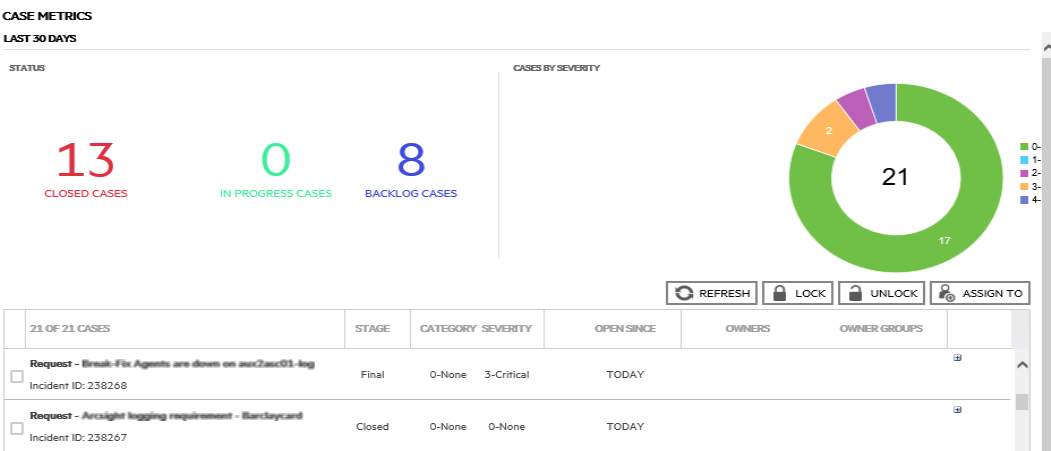
Chapter 9: Using the SOC Manager
About:
The SOCManager Dashboard displays your data by Case Metrics and Analysts
The Case Metrics view offers a general summary of the cases created and/ or closed within the last 30
days.
Case Metrics
The screen is divided in three main sections: Status, Cases by Severity and a list of the cases with their
corresponding metrics.
Procedure:
From Dashboards > SOC Manager, click Case Metrics on the upper left side of your screen.
This view displays three types of cases:
Closed— The case was resolved, no further actions are required.
In Progress— One or more owners are assigned to the case and it is being updated.
Backlog— The case is not closed. Owners are not assigned to the case or current owners are not
updating it.
HPE ESM 7.0 Page 174 of 213

Case Metrics Descriptions Setting
Stage— indicates the status of the
case.
- Initial
- Queued
- In progress
- Follow-Up
- Final
- Closed
Category— - Instead of the default value provided by the installation, you can use your own
list of values by following the customization tech note.
- The default value is 0-None.
Severity— scores the vulnerability
of the case.
- Insignificant
- Marginal
- Critical
- Catastrophic
Open Since— shows the date in
which the case was opened.
- Three day count
- Date
Owners— are displayed
individually.
- Round name badges
Owner Groups— are displayed in
this column.
- Round name badges
The Case Metrics available are:
ArcSight Command Center User's Guide
Chapter 9: Using the SOC Manager
HPE ESM 7.0 Page 175 of 213
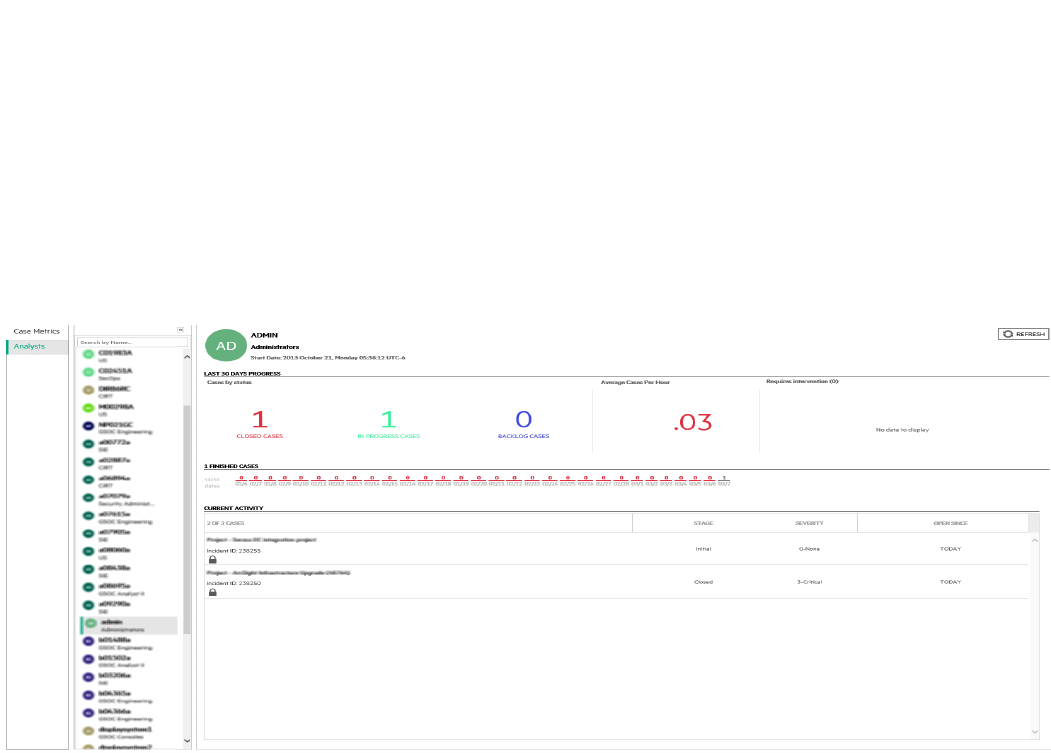
Analysts
The SOCManager Dashboard displays your data by Analysts and Case Metrics.
The Analysts view offers a more detailed summary of the cases created and/ or closed per User.
The screen is divided in:
Last 30 Days Progress:
lCase status— closed, in progress and backlog.
lAverage Cases per Hour— Calculation formula
lRequires Intervention— If a case is not updated within a previously selected period, it will be
displayed in this section.
Finished Cases
Number of cases closed per day.
Current activity
Recent case history.
ArcSight Command Center User's Guide
Chapter 9: Using the SOC Manager
HPE ESM 7.0 Page 176 of 213

Server Property Settings for the SOC Manager
Dashboards
About:
Server properties are set on the ESM Manager. Properties for the SOC Manager dashboards are used to
define parameters that meet your SOC environment policies, so that the appropriate data about
analysts is displayed. This topic describes the purpose of each property, the default values, and
acceptable entries if you want to change the default values.
Prerequisite:
You need access to the Manager's server.properties file. Otherwise, ask the ESM administrator to
make changes for you.
Procedure:
1. Refer to the following table for properties you can configure for your SOC Manager, then decide
what settings meet your SOC environment's policies:
Property Description
socmetrics.number.of.days Amount of days for which to request data. Default is 30,
maximum is 30, and minimum is 1.
The value you enter affects all calculations on dashboards.
This also determines the amount of days displayed on the
Case Metrics and Analysts dashboards.
socmetrics.requires.intervention.
time
Amount of inactive time that has passed for a case to be
marked as Requires Intervention on the Analysts
dashboard.
Default is 3days, minimum is 0days. If you want to
calculate time in hours, see the
socmetrics.requires.intervention. usehours
property.
socmetrics.requires.intervention.
usehours
Whether or not to use hours as the unit of measure for the
"Requires Intervention" dashboard calculations.
Default is false, meaning the unit of measure is days.
Changing to true means hours will be used. With this
default setting, only cases that have been inactive for three
days will show up on the dashboard.
Property Settings
ArcSight Command Center User's Guide
Chapter 9: Using the SOC Manager
HPE ESM 7.0 Page 177 of 213

Property Description
socmetrics.finished.cases.lower.
end
Threshold for closed cases, below which the number of
closed cases on the dashboard shows as red. This is seen
on the Analyst dashboard, specifically the Finished Cases
section.
Default is 0, minimum is 0.
socmetrics.finished.cases.higher.
end
Threshold for closed cases, above which the number of
closed cases on the dashboard shows as blue. This is seen
on the Analyst dashboard, specifically the Finished Cases
section.
Default is 100, minimum is 0.
socmetrics.monthly.working.hours Monthly working hours for the analysts. Used to calculate
the average of worked cases per hour.
Default is 160 hours, minimum value is 0.
Property Settings, continued
2. Refer to the ESM Administrator's Guide, topic on "Managing and Changing Properties File
Settings." Follow the instructions on how to add settings to the server.properties file, then
restart the Manager to implement your changes.
ArcSight Command Center User's Guide
Chapter 9: Using the SOC Manager
HPE ESM 7.0 Page 178 of 213

Appendix A: Search Operators
This appendix describes the operators you can use in search queries you specify in the Search box and
gives examples of their use.
This appendix provides information on the following search operators.
•cef (Deprecated) 179
•chart 180
•dedup 186
•eval 187
•extract 188
•fields 190
•head 191
•keys 191
•rare 193
•regex 194
•rename 194
•replace 196
•rex 198
•sort 200
•tail 201
•top 201
•transaction 202
•where 204
cef (Deprecated)
In most cases, you do not need to explicitly extract event fields using the CEF operator and then apply
other search operators to those fields. You can simply specify the event fields directly.
Note: If you run a peer search on Loggers, one of which is running version 5.1 or earlier (in which
CEF was not deprecated), the query that does not contain CEF defined fields will run without any
issues in the circumstance when the query is initiated on a Logger running version 5.2; however, if
the query is initiated on a version 5.1 Logger, it will fail.
Extracts values for specified fields from matching CEF events. If an event is non-CEF, the field value is
set to NULL.
HPE ESM 7.0 Page 179 of 213

Usage:
...| cef <field1> <field2> <field3> ...
Notes:
If multiple fields are specified, separate each field name with a white space or a comma.
To identify the name of a CEF field, use the Search Builder tool (click Advanced Search under the
Search text box), which lists the names of all fields alphabetically.
The extracted fields are displayed as additional columns in the All Fields view (of the System FieldSets).
To view only the extracted columns, select User Defined Fieldsets from the System Fieldsets list.
Example 1:
...| cef categorySignificance agentType
Example 2:
...| cef deviceEventCategory name
chart
Displays search results in a chart form of the specified fields.
Usage:
...| chart <field>
...| chart count by <field1> <field2> <field3> ...
[span [<time_field>]=<time_bucket>]
...| chart {{sum | avg | min | max | stdev} (<field>)}+ by <field1>,
<field2>, <field3> ...[span [<time_field>]= <time_bucket>]
...| chart {<function> (<field>)} as <new_column_name> by <field>
[span [<time_field>]=<time_bucket>]
where
ArcSight Command Center User's Guide
Appendix A: Search Operators
HPE ESM 7.0 Page 180 of 213

<field>, <field1>, <field2> are the names of the field that you want to chart. The fields can be
either event fields available in the ESM schema or a user-defined fields created using the rex or eval
operator prior in the query.
Note: The specified fields must contain numeric values. If a field you specify is of the wrong data
type, you will receive an error message like the following: "The search cannot be run, there is an
error in your query: Invalid field type for field [field name].”
<time> is the bucket size for grouping events. Use d for day, h for hour, m for minute, s for seconds.
For example, 2h, 5d, 1m. (See Notes for details.)
<function> is one of these: count, sum, avg (or mean), min, max, stdev
<new_column_name> is the name you want to assign to the column in which the function’s results are
displayed. For example, Total.
Deprecated Usage:
The following deprecated usage contains “_count”. The recommended usage, as shown above, is
“count”.
...| chart _count by <field1> <field2> <field3> ...
Notes:
By default, a column chart is displayed. Other chart types you can select from: bar chart, line chart, pie
chart, area chart, stacked column, or stacked bar.
To change the chart settings (including its type), click the Chart Settings link in the upper right corner
of the Result Chart frame of the screen. You can change these settings:
-Title: Enter a meaningful title for the chart.
-Type: Column, Bar, Pie, Area, Line, Stacked column, Stacked Bar. The last two types create stacked
charts in which multiple values are plotted in a stack form. These charts are an alternate way of
representing multi-series charts, which are described below.
-Display Limit: Number of unique values to plot. Default: 10
If the configured Display Limit is less than the number of unique values for a query, the top values equal
to the specified Display Limit are plotted. That is, if the Display Limit is 5 and 7 unique values are found,
the top 5 values will be plotted.
All chart commands except “count by” accept only one field in the input. The specified field must
contain numeric values.
If multiple fields are specified, separate the field names with a white space or a comma.
ArcSight Command Center User's Guide
Appendix A: Search Operators
HPE ESM 7.0 Page 181 of 213

The chart <field> command does not aggregate field values. It simply lists and charts each
occurrence of the values of the specified field. For example, chart sourcePort. However, when you
use an aggregation function such as count by,sum,avg (or mean), and so on, an aggregation of
the specified fields is performed and charted, as illustrated in "Example 1: " on page184.
You can click on a charted value to quickly filter down to events with specific field values. For more
information, see "Chart Drill Down" on page100.
Aggregation Functions
If an aggregation function such as count,sum, or avg is specified, a chart of the aggregated results is
displayed along with the tabular results of the aggregation operation in a Results Table. For example,
for the aggregation function sum(deviceCustomNumber1), the sum_deviceCustomNumber1
column in the Results Table displays the sum of unique values of the deviceCustomNumber1 field. If
this field had two unique values 1 and 20, occurring 2 times each, the sum_deviceCustomNumber1
column displays sum of those two values. For the values:
deviceCustomNumber1 sum_deviceCustomNumber 1
1 2
20 40
Aggregation functions can only be used on numeric fields.
The mathematical operators avg and mean are identical.
You can include multiple functions in the same chart command. When doing so, separate each function
with a comma, as shown in this example:
...| chart count, sum(deviceCustomNumber3) by deviceEventClassId
When you include multiple functions, one column per function is displayed in the search Results Table.
The Results Chart, however, plots the chart for the field specified in the “by” clause.
You can use the “as new_column_name” clause to name any column resulting from the aggregation
functions, as shown in this example:
...| chart sum(deviceCustomNumber3) as TotalStorage, avg(deviceCustomNumber3) as
AverageStorage by deviceCustomNumber3
Once defined, the newly defined column can be used in the pipeline as any other field. For example,
...| chart sum(deviceCustomNumber3) as TotalStorage, avg(deviceCustomNumber3) as
AverageStorage by deviceCustomNumber3 | eval UpdatedStorage = TotalStorage + 100
ArcSight Command Center User's Guide
Appendix A: Search Operators
HPE ESM 7.0 Page 182 of 213

When you export the search results of a chart operator, the newly defined column name (using the
chart function as new_column_name command) is preserved.
Multi-Series Charts
A multi-series chart can plot the values of multiple aggregation functions in a single chart.
If you include multiple aggregation functions in a chart command, ESM generates a multi-series chart
that plots the values of the specified aggregation functions along the Y-axis, as illustrated in "Example 2:
" on page185. Multi-series charts can be any of the chart types except Pie charts. For example, you can
choose to plot a multi-series chart as a stacked chart — Stacked column or Stacked Bar — in which
multiple values are plotted in a stack form, as illustrated in "Example 3: " on page185.
The Span Function
In addition to grouping events by the ESM schema fields (or the ones defined by the rex or eval
operators), the span function provides an additional way to group events by a time field (such as
EventTime or deviceReceiptTime) and a time bucket. In the following example, deviceReceiptTime is the
time field and 5m (5 minutes) is the time bucket:
...| chart count by deviceEventCategory span (deviceReceiptTime) = 5m
If a time field is not specified for the span function, EventTime is used as the default. For example, the
following query uses EventTime by default:
...| chart count by deviceEventCategory span = 5m
By default, the chart command displays the first 10 unique values. If the span function creates more
than 10 unique groups, not all of them will be displayed. If you want to view all of the unique groups,
increase the Display Limit value under Chart Settings. (Click Chart Settings in the upper right corner of
the Result Chart frame of the screen.)
Grouping with span is useful in situations when you want to find out the number of occurrences in a
specific time span.
If you want to find out the total number of incoming bytes every 5 minutes on a device, you can specify
a span of 5m, as shown in this example:
...| chart sum(deviceCustomNumber1) span=5m
The above example assumes that deviceCustomNumber1 field provides the incoming bytes information
for these events.
ArcSight Command Center User's Guide
Appendix A: Search Operators
HPE ESM 7.0 Page 183 of 213

The span field can be used for grouping in conjunction with or without the event fields that exist in
ESM schema or user-defined fields using the rex or eval operators. When a span field is specified in
conjunction with an event field, the unique sets of all those fields is used for grouping. The following
example uses deviceCustomNumber3 and deviceAddress in conjunction with span to find out the
number of events (using deviceCustomNumber3) from a specific source (using deviceAddress) in one
hour:
...| chart sum (deviceCustomNumber3) by deviceAddress span=1h
When span is included in a query, search results are grouped by the specified time bucket. For example,
if span=5m, the search results will contain one row for each 5-minute span. If there are no events within
a specific 5-minute span, that row will be empty.
Additionally, the span function assumes a 24-hour day, all year long. If span=1d or 24h, on the day of
daylight savings time change, the event time indicated by the span_eventTime field in the search results
will be different from the previous day by one hour. On the day when there are 23 hours in a day (in
March), the span bucket will still include events from the last 24 hours. Similarly, on the day when there
are 25 hours in the day (in November), the span bucket will include events from the last 24 hours. The
following example illustrates the span_eventTime field when the span time bucket is 1d and the daylight
savings times occurs on
March 9th, 2014 and November 2, 2014:
span_eventTime | avg_logins
3/6/2014 12am | 8
3/7/2014 12am | 10
3/8/2014 12am | 4
3/9/2014 1am | 6
3/15/2014 1am | 7
….
10/31/2011 1am | 4
11/1/2011 1am | 2
11/2/2011 12am | 5
11/3/2011 12am | 7
….
Example 1:
Use the default chart setting (Column Chart) to specify multiple fields. In this example, a count of
unique groups of deviceEventCategory and name fields is displayed and plotted.
... | chart count by deviceEventCategory name
ArcSight Command Center User's Guide
Appendix A: Search Operators
HPE ESM 7.0 Page 184 of 213
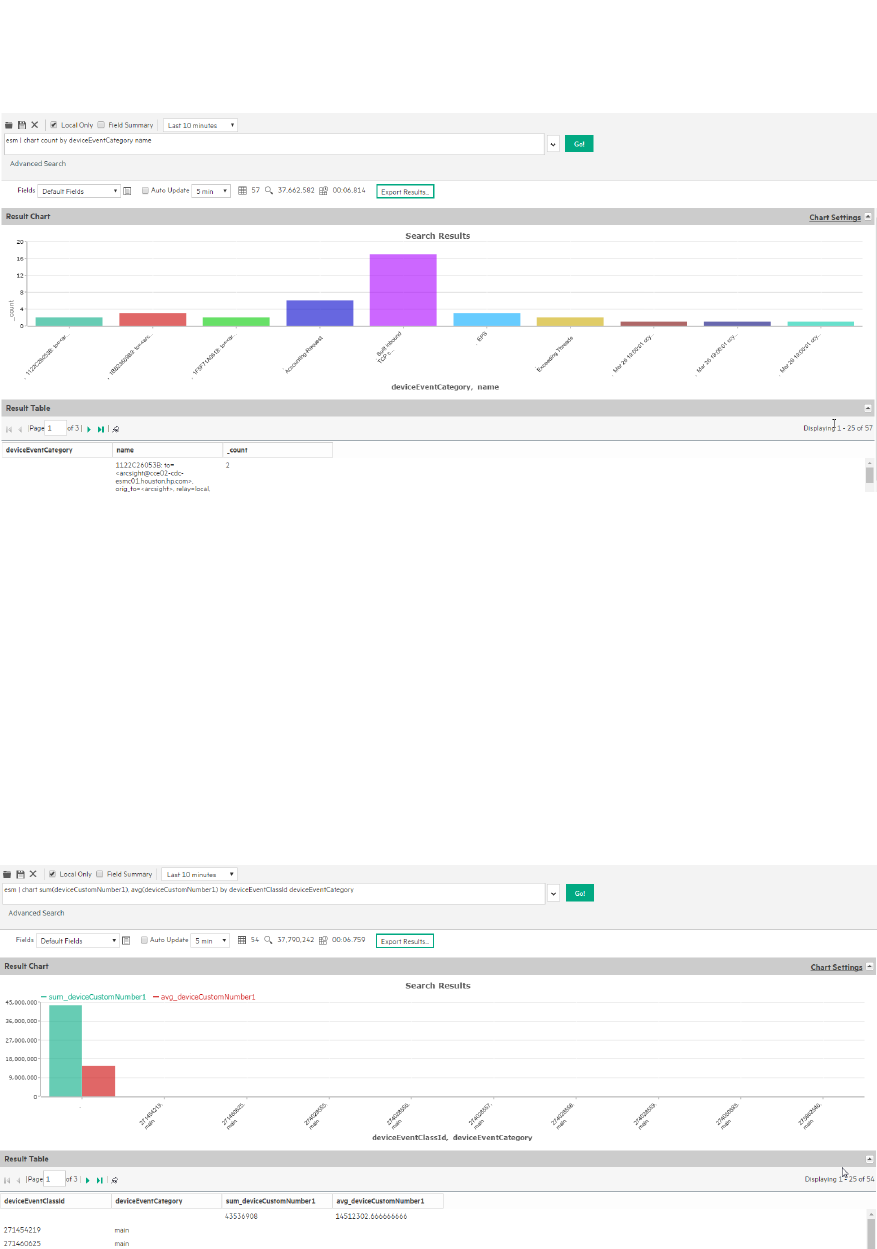
Example 2:
Include average and sum in a chart command, to generate a multi-series chart that plots the values of
these functions along the Y-axis in a single chart.
In the following query, unique groups of deviceEventClassId and deviceEventCategory are plotted
along the X-axis, and the sum of deviceCustomNumber1 and average of deviceCustomNumber2 is
plotted along the Y-axis.
... | chart sum(deviceCustomNumber1), avg(deviceCustomNumber1) by deviceEventClassId
deviceEventCategory
Example 3:
Plot a multi-series chart as a stacked chart — Stacked column or Stacked Bar — in which multiple values
are plotted in a stack form, as shown in the following figure.
ArcSight Command Center User's Guide
Appendix A: Search Operators
HPE ESM 7.0 Page 185 of 213
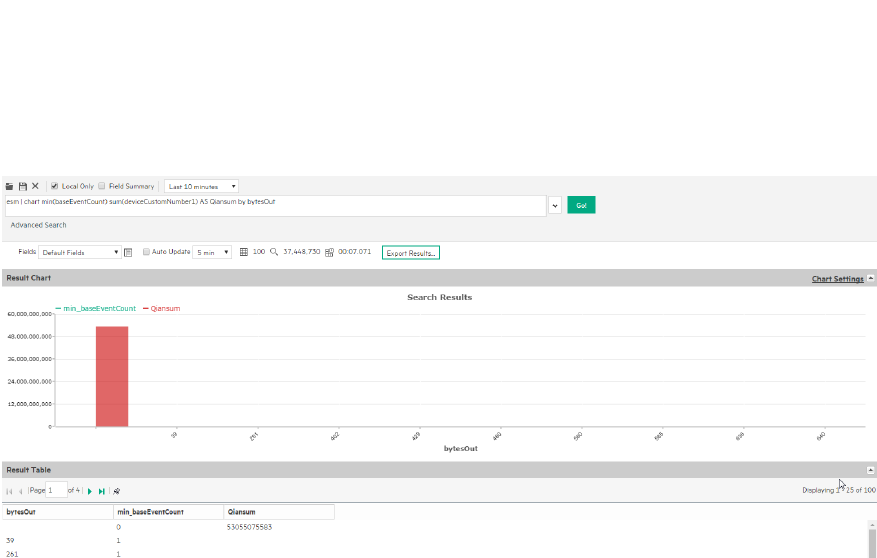
...|chart min(baseEventCount) sum(deviceCustomNumber1) AS Qiansum by bytesOut
dedup
Removes duplicate events from search results. That is, events that contain the same value in the
specified field. The first matching event is kept, and the subsequent events with the same value in the
specified field are removed.
Usage:
... | dedup [N] <field1>,<field2>, ... [keepevents=(true|false)] [keepempty=
(true|false)]
Nis an optional number that specifies the number of duplicate events to keep. For example, “dedup 5
deviceEventClassId” will keep the first five events containing the same deviceEventClassId values for
each deviceEventClassId, and remove the events that match after the first five have been kept. Default:
1.
field1, field2 is a field or a comma-separated field list whose values are compared to determine
duplicate events. If a field list is specified, the values of the unique sets of all those fields are used to
remove events. For example, if name and deviceCustomNumber1 are specified, and two events contain
“Network Usage - Outbound” and “2347896”, only the first event is kept in the search results.
keepevents specifies whether to set the fields specified in the field list to NULL or not. When this
option is set to True, the values are set to NULL and events are not removed from search results.
However, when this option is set to False, duplicate events are removed from the search results. Default:
False.
ArcSight Command Center User's Guide
Appendix A: Search Operators
HPE ESM 7.0 Page 186 of 213

keepempty specifies whether to keep events in the search results whose specified fields contain NULL
values. When this option is set to True, events with NULL values are kept, however if this option is set to
False, events with NULL values are removed. Default: False.
Example 1:
To view events from unique devices:
... | dedup deviceAddress
Example 2:
To view unique deviceEventClassId events from unique devices:
... | dedup deviceEventClassId deviceAddress
Example 3:
To view the className in events with Java exceptions in the message field:
exception | <rex_expression> | dedup 5 className
In the above example, rex expression is not shown in detail however this expression extracts the class
name in a field called className, which the dedup operator acts upon.
eval
Displays events that match the resultant of the specified expression. The expression can be a
mathematical, string, or Boolean operation and is evaluated when the query is run. The resulting value
of the expression is assigned to a field name (as specified in the expression). Once a new field has been
defined by the eval operator in a query, this field can be used in the query for further refining the search
results (see Example #3 below, in which a new field “Plus” is defined by the eval operator; this field is
then used by the sort operator.)
Usage:
... | eval <expression>
<expression> is a mathematical, string, or Boolean operation; for example, total_bytes=bytesIn +
bytesOut.
ArcSight Command Center User's Guide
Appendix A: Search Operators
HPE ESM 7.0 Page 187 of 213

Notes:
Typically, a cef or rex operator (to extract fields from matching events) precedes the eval operator,
as shown in the examples below. However, you can use the eval operator on a field that has been
defined by a previous eval operator in a query.
Example 1:
If the Category Behavior is “Communicate”, then assign the value “communicate” to a new field “cat”;
otherwise, assign the value “notCommunicate” to it.
_storageGroup IN [“Default Storage Group”] | cef categoryBehavior | eval cat=if
(categoryBehavior== “/Communicate”, “communicate”, “notCommunicate”)
Example 2:
Append the word, “END”, at the end of extracted event name. For example, if event name is “ESM
Internal Event”, after the eval operation it is “ESM Internal EventEND” and is assigned to a new field,
“fullname”.
logger | cef msg name | eval fullname=name + “END”
Example 3:
Add 100 to the value of bytesIn and assign it to a new field, “Plus”. Then, sort the values assigned to
“Plus” in ascending order.
_storageGroup IN [“Default Storage Group”] | cef bytesIn bytesOut name | eval
Plus=bytesIn +100 | sort Plus
extract
Extracts key value pairs from raw events.
Usage:
...| extract [pairdelim=“<delimiters>”] [kvdelim=“<delimiters>”] [maxchars=<n>]
fields=“key1,key2,key3...”
pairdelim is a delimiter (or a list of delimiters) that separates one key-value pair from another key-
value pair in an event. By default, semi colon, pipe, and comma (; | ,) are used.
ArcSight Command Center User's Guide
Appendix A: Search Operators
HPE ESM 7.0 Page 188 of 213

kvdelim is a delimiter (or a list of delimiters) that separates a key from its value. By default, “=".
maxchars is the maximum number of characters in an event that would be scanned for extracting key
value pairs. By default, 10240.
fields is a key (or a list of comma-separated keys) whose values you want to display in the search
results. For example, if you want to display the Name Age, and Location values from this event:
Name:Jane | Age:30 | Location:LA
Then, extract the “Name”, “Age”, and “Location” keys and list them in the fields list.
Understanding how the operator works:
The key represents a field in the raw event and its value consists of the characters that appear after the
key until the next key in the event. The following raw event is used to illustrate the concept:
[Thu Jul 30 01:20:06 2009] [error] [client 69.63.180.245] PHP Warning:
memcache_pconnect() [<a href='function.memcache-pconnect'>function.memcache-
pconnect</a>]: Can't connect to 10.4.31.4:11211
To extract the URL from the above event, you can define these key-pair delimiters, which separate the
key-value pairs in the event:
Greater than sign (“>”)
Square bracket (“[“)
And, define this key delimiter, which separates the key from its value:
Equal to sign (“=")
Thus, the following command will extract the URL
... | extract pairdelim= “>\[” kvdelim= “=" fields=“<a href”
The key value pairs in the event will be: [<a href='function.memcache-pconnect'>
The key in the event will be: <a href
The extracted URL will be: 'function.memcache-pconnect'
Notes:
This operator only works on raw events. That is, you cannot extract key value pairs from structured
data in CEF events or from fields defined by the rex operator. For raw CEF events, you can use the CEF
name as the fieldname.
You can specify the pairdelim and kvdelim delimiters in the extract operator command to extract
keys and their values. However, if you want to determine the key names that these delimiters will
ArcSight Command Center User's Guide
Appendix A: Search Operators
HPE ESM 7.0 Page 189 of 213

generate, use the keys operator as described in "keys" on the next page. The keys operator can only be
used to determine keys; you cannot pipe those keys in the extract operator. That is, ...| keys |
extract fields=field1 is incorrect.
The keys specified in the fields list can be used further in the pipeline operations. For example, ...|
extract pairdelim= “|” kvdelim= “:” fields= “count” | top count
If none of the specified pairdelim characters exist in an event, the event is not parsed into key value
pairs. The whole event is skipped. Similarly, if the specified kvdelim does not exist, values are not
separated from the keys.
To specify double quotes (“) as the delimiter, enter it within the pair of double quotes with backslash(\)
as the escape character. For example, “=\”|”. Similarly, use two backslashes to treat a backslash character
literally. For example, “\\”.
Example:
... | extract pairdelim= “|” kvdelim= “:” fields= “Name,Age,Location”
Extracts values from events in this format:
Name:Jane | Age:30 | Location:LA
fields
Includes or excludes specified fields from search results.
Usage:
... | fields ([(+ | -)] <field>)+
+ includes only the specified field or fields in the search results. This is the default.
- excludes only the specified field or fields from the search results.
Notes:
Typically, the <field> list contains event fields available in the ESM schema or user-defined fields created
using the rex operator prior in the query, as shown in the examples below. However, fields might also
be defined by other operators such as the eval operator.
The + and - can be used in the same expression when multiple fields are specified. For example, | fields +
name - agentType
ArcSight Command Center User's Guide
Appendix A: Search Operators
HPE ESM 7.0 Page 190 of 213

A complete field name must be specified for this operator; wildcard characters in a field name are not
supported.
When this operator is included in a query, select User Defined Fieldsets from the System Fieldsets list
to view the search results.
Example 1:
... | fields - agentType + categorySignificance
Example 2:
... | fields - name
head
Displays the first <N> lines of the search results.
Usage:
... | head [<N>]
<N> is the number of lines to display. Default: 10, if <N> is not specified.
Notes:
When this operator is included in a query, the search results are not previewable. That is, the query must
finish running before search results are displayed.
Example:
... | head
keys
Identifies keys in raw events based on the specified delimiters.
ArcSight Command Center User's Guide
Appendix A: Search Operators
HPE ESM 7.0 Page 191 of 213

Usage:
... | keys [pairdelim= “<delimiters>”] [kvdelim= “<delimiters>”] [limit=<n>]
pairdelim is a delimiter (or a list of delimiters) that separates one key-value pair from another key-
value pair in an event. By default, semi colon, pipe, and comma (; | ,) are used.
kvdelim is a delimiter (or a list of delimiters) that separates a key from its value. By default, “=”.
limit is the maximum number of key value pairs to find. There is no default or maximum number for
this parameter.
Notes:
When searching across peers using the keys operator, the number of events returned when a search is
initiated on a Logger 5.3 SP1 (or earlier version) may not be the same as when the search is initiated on
Logger 6.0 or ArcSight Manager 6.5c (or later versions). This happens because of the updated schema.
Logger 6.0 and ESM 6.5c use the End Time for searches; Logger 5.3 SP1 and earlier used the Receipt
Time.
This operator only works on raw events. That is, you cannot identify key value pairs from CEF events or
fields defined by the rex operator.
Although this operator is not required to determine keys, it is recommended that you use it to first
determine the keys whose values you want to obtain using the extract operator. This operator
returns aggregated results. Therefore, the search results list the keys found in the matching events and
their counts.
The keys operator can only be used to determine keys; you cannot pipe those keys in the extract
operator. That is, | keys | extract fields=field1 is incorrect.
If a key value is blank (or null), it is ignored and not counted toward the number of hits.
For example, for the following event data:
Date=3/24/2014 | Drink=Lemonade
Date=3/23/2014 | Drink=
Date=3/22/2014 | Drink=Coffee
Search Query: keys pairdelim= “|” kvdelim= “=”
Search Result: Date, 3 hits and Drink, 2 hits
If none of the specified pairdelim characters exist in an event, the event is not parsed into key value
pairs. The whole event is skipped. Similarly, if the specified kvdelim does not exist, values are not
separated from the keys.
ArcSight Command Center User's Guide
Appendix A: Search Operators
HPE ESM 7.0 Page 192 of 213

To specify double quotes (“) as the delimiter, enter it within the pair of double quotes with backslash(\)
as the escape character. For example, “=\”|”. Similarly, use two backslashes to treat a backslash character
literally. For example, “\\”.
Example 1:
...| keys pairdelim= “|” kvdelim= “=”
Identifies keys (Date and Drink) in event of this format:
Date=3/24/2014 | Drink=Lemonade.
Example 2:
...| keys pairdelim= “,” kvdelim= “>=”
Identifies keys (Path and IPAddress) in the event of this format:
Path>c:\usr\log, IPAddress=1.1.1.1
rare
Lists the search results in a tabular form of the least common values for the specified field. That is, the
values are listed from the lowest count value to the highest.
When multiple fields are specified, the count of unique sets of all those fields is listed from the lowest to
highest count.
Usage:
...| rare <field1> <field2> <field3> ...
Notes:
Typically, the <field> list contains event fields available in the ESM schema or user-defined fields created
using the rex or eval operators prior in the query, as shown in the examples below. However, fields
might also be defined by other operators such as the eval operator.
A chart of the search results is automatically generated when this operator is included in a query. You
can click on a charted value to quickly filter down to events with specific field values. For more
information, see "Chart Drill Down" on page100.
If multiple fields are specified, separate the field names with a white space or a comma.
ArcSight Command Center User's Guide
Appendix A: Search Operators
HPE ESM 7.0 Page 193 of 213

Example:
... | rare deviceEventCategory
regex
Selects events that match the specified regular expression.
Usage:
...| regex <regular_expression>
OR
...| regex <field> (=|!=) <regular_expression>
Notes:
Regular expression pattern matching is case insensitive.
The first usage (without a field name) is applied to the raw event. While the second usage (with a field
name), is applied to a specific field.
If you use the second usage (as shown above and in the Example #2 below), either specify an event field
that is available in the ESM schema or a user-defined field created using the rex or eval operators.
Example 1:
... | regex “failure”
Example 2:
... | regex deviceEventCategory != “fan”
rename
Renames the specified field name.
ArcSight Command Center User's Guide
Appendix A: Search Operators
HPE ESM 7.0 Page 194 of 213

Usage:
...| rename <field> as <new_name>
<field> is the name of an event field that is available in the ESM schema or a user-defined field created
using the rex or eval operator.
<new_name> is the new name you want to assign to the field.
Notes:
An additional column is added to the search results for each renamed field. The field with the original
name continues to be displayed in the search results in addition to the renamed field. For example, if
you rename deviceEventCategory to Category, two columns are displayed in the search results:
deviceEventCategory and Category.
You can include the wildcard character, *, in a field name. However, you must enclose the field that
contains a wildcard character in double quotes (“ ”). For example:
...| rename “*IPAddress” as “*Address”
- or -
...| rename “*IPAddress” as Address
If a field name includes a special character (such as _, a space, #, and so on), it should be included in
double quotes (“ ”) in the rename operator expression. For example:
...| rename src_ip as “Source IP Address”
If the resulting field of a rename operation includes a special character, it must be enclosed in double
quotes (“ ”) whenever you use it in the pipeline operator expression. For example,
...| rename src_ip as “Source IP Address” | top “Source IP Address”
The internal field names (that start with “_raw”) cannot be renamed.
The renamed fields are valid only for the duration of the query.
The resulting field of a rename operation is case sensitive. When using such a field in a search
operation, make sure that you the same case that was used to define the field.
When you export the search results of a search query that contains the rename expression, the
resulting file contains the renamed fields.
ArcSight Command Center User's Guide
Appendix A: Search Operators
HPE ESM 7.0 Page 195 of 213

Example 1:
...| rename src_ip as IPAddress
Example 2:
...| rename src_ip as “Source IP Address”
replace
Replaces the specified string in the specified fields with the specified new string.
Usage:
<orig_str> with <new_str> [in <field_list>]
<orig_str> is the original string you want to replace. (See Notes for more details.)
<new_str> is the new string you want to replace with. (See Notes for more details.)
<field_list> is the optional, however highly recommended. See Notes for details.
Notes:
Even though the field list is optional for this command, specify the fields on which the replace
operator should act in this command.
If you skip the field list, the replace operator acts on the fields that have been either explicitly defined
using the cef,rex, and eval operators preceding the replace command, or any fields that were used
in other operator commands that preceded the replace operator command. For example, the
replace command acts on deviceEventCategory in all of the following cases and replaces all
instances of “EPS” with “Events”:
...| replace *EPS* with *Events* in deviceEventCategory
...| cef deviceEventCategory | replace *EPS* with *Events*
...| top deviceEventCategory | replace *EPS* with *Events*
An additional column of the same name is added to the search results for each field in which string is
replaced. The column with the original value continues to be displayed in the search results in addition
to the column with replaced values. For example, if you replace “err” with “Error” in the “message”
column, an additional “message” column is added to the search results that contains the modified value.
ArcSight Command Center User's Guide
Appendix A: Search Operators
HPE ESM 7.0 Page 196 of 213

If you want to replace the entire string, specify it in full (as it appears in the event). For example,
“192.168.35.3”.
If you want to replace a part of the string, include wildcard character (*) for the part that is not going to
change.
For example, if the original string (the string you want to replace) is “192.168*”, only the 192.168 part in
an event is replaced. The remaining string is preserved. As a result, if an event contains 192.168.35.3,
only the first two bytes are replaced. The rest (35.3) will be preserved. Similarly, if the event contains
192.168.DestIP, DestIP will be preserved. However, if the event contains the string 192.168, it will not be
replaced.
If both, the original and the new strings contain wildcard characters, the number of wildcard characters
in the original string must match the number of wildcard characters in the new string.
...| replace “*.168.*” with “*.XXX.*
If the original or the new string includes a special character such as / or ?, enclose the string in double
quotes (“ ”):
...| replace “/Monitor” with Error
You can replace multiple values for multiple fields in a single operation by separating each expression
with a comma (,). Note that you must specify the field list after specifying the “with” expression for all
values you want to replace, as shown in the following example:
...| replace "Arc*" with HPE, "cpu:100" with EPS in deviceVendor, deviceEventClassId
The original string is case-insensitive. Therefore, the string “err” will replace an event that contains “Err”.
Example 1:
Replace any occurrence of “a” with “b” but the characters preceding “a” and succeeding it are preserved.
...| replace *a* with *b*
Example 2:
Replace any occurrence of “a” with “b” without retaining any characters preceding or succeeding “a”.
...| replace *a* with b in name
ArcSight Command Center User's Guide
Appendix A: Search Operators
HPE ESM 7.0 Page 197 of 213

rex
Extracts (or capture) a value based on the specified regular expression or extract and substitute a value
based on the specified “sed” expression. The value can be from a previously specified field in the query
or a raw event message.
Usage:
... | rex <regular_expression containing a field name>
OR
... | rex field = <field> mode=sed “s/<string to be substituted>/<substitution value>”
Understanding how extraction works:
When the value is extracted based on a regular expression, the extracted value is assigned to a field
name, which is specified as part of the regular expression. The syntax for defining the field name is
?<fieldname>, where fieldname is a string of alphanumeric characters. Using an underscore (“_”) is not
recommended.
We use the following event to illustrate the power of rex.
[Thu Jul 30 01:20:06 2009] [error] [client 69.63.180.245] PHP Warning: Can't connect to
10.4.31.4:11211
If you want to extract any IP address from the above event and assign it to a field called “IP_Address”,
you can simply specify the following rex expression:
| rex “(?<IPAddress>\d{1,3}\.\d{1,3}\.\d{1,3}\.\d{1,3})”
However, if you wanted to extract the IP address after the word “client” from the following event and
assign it to a field called “SourceIP”, you will need to specify a start and end point for IP address
extraction so that the second IP address in the event is not captured. The starting point in this event
can be “[client” and the end point can be “]”. Thus, the rex expression will be:
| rex “\[client (?<SourceIP>[^\]]*)”
In this rex expression ?<SourceIP> is the field name defined to capture IP address and “client ” specifies
the text or point in the event AFTER which data will be extracted. The [^\]]* expression will match every
character that is not a closing right bracket, therefore, for our example event, the expression will match
until the end of the first IP address and not the second IP address that appears after the word “to”.
ArcSight Command Center User's Guide
Appendix A: Search Operators
HPE ESM 7.0 Page 198 of 213

Understanding how substitution works:
When the rex operator is used in sed mode, you can substitute the values of extracted fields with the
values you specify. For example, if you are generating a report of events that contain credit card
numbers, you might want to substitute the credit card numbers to obfuscate the real numbers.
The substitution only occurs in the search results. The actual event is not changed.
In the following example, the credit card numbers in the CCN field are substituted with “xxxx”, thus
obfuscating sensitive data:
| rex field=CCN mode=sed “s/*/XXXX/g”
The “/g” at the end of the command indicates a global replace, that is, all occurrences of the specified
pattern will be replaced in all matching events. If “/g” is omitted, only the first occurrence of the specified
pattern in each event is replaced.
Multiple substitutions can be performed in a single command, as shown in the following example. In this
example, the word “Authentication” is substituted with “xxxx” globally (for all matching events), the first
byte of the agent address that start with “192” is substituted with “xxxx” and an IP address that starts
with “10” is substituted with “xxxx”.
| rex field=msg mode=sed “s/Authentication/xxxx/g” | rex field=agentAddress
mode=sed “s/192/xxxx/g” | rex field=dst mode=sed “s/10.*/xxxx/g”
Notes:
A detailed tutorial on the rex operator is available at "Using the Rex Operator" on page206.
The extracted values are displayed as additional columns in the All Fields view (of the System FieldSets).
To view only the extracted columns, select User Defined Fieldsets from the System Fieldsets list. In the
above example, an additional column with heading “SourceIP” is added to the All Fields view; IP address
values extracted from events are listed in this column.
If you want to use other search operators such as fields, sort, chart, and so on to refine your search
results, you must first use this operator to extract those fields.
Example 1:
The following example extracts name and social security number from an event that contains data in
name:John ssn:123-45-6789 format and assigns them to Name and SSN fields:
... | rex “name: (?<Name>.*) ssn: (?<SSN>.*)”
Example 2:
The following example extracts URLs from events and displays the top 10 of the extracted URLs:
ArcSight Command Center User's Guide
Appendix A: Search Operators
HPE ESM 7.0 Page 199 of 213

... | rex “http://(?<URL>[^ ]*)” | top URL
Example 3:
The following example substitutes the last four digits of social security numbers extracted in the first
event with XXXX:
... | rex field=SSN mode=sed “s/-\d{4}/-XXXX/g”
sort
Sorts search results as specified by the sort criteria.
Usage:
... | sort [<N>] ((+ | -) field)+
+ Sort the results by specified fields in ascending order. This is the default.
- Sort the results by specified fields in descending order.
<N> Keep the top N results, where N can be a number between 1 and 10,000. Default: 10,000.
Notes:
Typically, the <field> list contains event fields available in the ESM schema or user-defined fields created
using the rex operator prior in the query, as shown in the examples below. However, fields might also
be defined by other operators such as the eval operator.
Sorting is based on the data type of the specified field.
When multiple fields are specified for a sort operation, the first field is used to sort the data. If there are
multiple same values after the first sort, the second field is used to sort within the same values, followed
by third field, and so on. For example, in the example below, first the matching events are sorted by “cat”
(device event category). If multiple events have the same “cat”, those events are further sorted by
“eventId”.
When multiple fields are specified, you can specify a different sort order for each field. For example, |
sort + deviceEventCategory - eventId.
If multiple fields are specified, separate the field names with a white space or a comma.
Sorting is case-sensitive. Therefore, “Error:105” will precede “error:105” in the sorted list (when sorted in
ascending order).
ArcSight Command Center User's Guide
Appendix A: Search Operators
HPE ESM 7.0 Page 200 of 213

When a sort operator is included in a query, only the top 10,000 matches are displayed. This is a known
limitation and will be addressed in a future ESM release.
When this operator is included in a query, the search results are not previewable. That is, the query must
finish running before search results are displayed.
Example:
... | sort deviceEventCategory eventId
tail
Displays the last <N> lines of the search results.
Usage:
...| tail [<N>]
<N> is the number of lines to display. Default: 10, if <N> is not specified.
Notes:
When this operator is included in a query, the search results are not previewable. That is, the query must
finish running before search results are displayed.
Example:
... | tail 5
top
Lists the search results in a tabular form of the most common values for the specified field. That is, the
values are listed from the highest count value to the lowest.
Usage:
...| top [<n>] <field1> <field2> <field3> ...
<n> limits the matches to the top nvalues for the specified fields. Default: 10, if <N> is not specified.
ArcSight Command Center User's Guide
Appendix A: Search Operators
HPE ESM 7.0 Page 201 of 213

Notes:
The fields can be either event fields available in the ESM schema or user-defined fields created using the
rex or eval operators prior in the query. If multiple fields are specified, separate the field names with a
white space or a comma.
When multiple fields are specified, the count of unique sets of all those fields is listed from the highest to
lowest count.
A chart of the search results is automatically generated when this operator is included in a query. You
can click on a charted value to quickly filter down to events with specific field values. For more
information, see "Chart Drill Down" on page100.
To limit the matches to the top nvalues for the specified fields, specify a value for n. For example, ...|
top 5 deviceEventCategory
Example 1:
... | top deviceEventCategory
Example 2:
... | top 5 categories
transaction
Groups events that have the same values in the specified fields.
Usage:
... | transaction <field1> <field2>... [maxevents=<number>] [maxspan=<number>[s|m|h|d]]
[maxpause=<number>[s|m|h|d]] [startswith=<reg_exp>] [endswith=<reg_exp>]
field1, field2 is a field or a comma-separated field list whose values are compared to determine
events to group. If a field list is specified, the values of the unique sets of all those fields are used to
determine events to group. For example, if host and portNum are specified, and two events contain
“hostA” and “8080”, the events are grouped in a transaction.
maxevents specifies the maximum number of events that can be part of a single transaction. For
example, if you specify 5, after 5 matching events have been found, additional events are not included in
the transaction. Default: 1000
ArcSight Command Center User's Guide
Appendix A: Search Operators
HPE ESM 7.0 Page 202 of 213

maxspan specifies the limit on the duration of the transaction. That is, the difference in time between
the first event and all other events in a transaction will never be more than the specified maxspan limit.
For example, if you specify maxspan=30s, the event time of all events within the transaction will be at
most 30 seconds more than the event time of the first event in the transaction. Default: Unlimited
maxpause specifies the length of time by which consecutive events in a transaction can be apart. That
is, this option ensures that events in a single transaction are never more than the maxpause value from
the previous event in the transaction. Default: Unlimited
startswith specifies a regular expression that is used to recognize the beginning of a transaction. For
example, if a transaction operator includes startswith= “user [L|l]ogin”, all events are scanned for this
regular expression. When an event matches the regular expression, a transaction is created, and
subsequent events with matching fields are added to the transaction.
Note: The regular expression is applied to the raw event, not to a field in an event.
endswith specifies a regular expression that is used to recognize the end of an existing transaction.
That is, an existing transaction is completed when an event matches the specified “endswith” regular
expression. For example, if a transaction operator includes endswith= “[L|l]ogout”, any event being
added to a transaction is checked, and if the regular expression matches the event, the transaction is
completed.
Notes:
Several of the above options specify “conditions to end” a transaction. Therefore, when multiple “end
conditions” are specified in a transaction operator, the first end condition that occurs will end the
transaction even if the other conditions have not been satisfied yet. For example, if maxspan is reached
but maxevents has not been reached, or if the endswith regular expression is matched but
maxevents has not been reached.
Understanding how the transaction operator works:
A transaction is a set of events that contain the same values in the specified fields. The events may be
further filtered based on the options described above, such as maxspan, maxpause, and so on. In
addition to grouping events, the transaction operator adds these fields to each event: transactionid,
duration, and eventcount. These fields are displayed in the Search Results as separate columns.
A transactionid is assigned to each transaction when the transaction completes. Transaction IDs are
integers, assigned starting from 1 for the transactions (set of events) found in the current query. All
events in the same transaction will have the same transaction ID.
If an event does not belong to any transaction found in the current query, it is assigned the transaction
ID 0. For example, in a transaction operator with a startswith regular expression, if the first event
in the pipeline does not match the regular expression, that event is not part of the transaction, and is
assigned transaction ID 0.
ArcSight Command Center User's Guide
Appendix A: Search Operators
HPE ESM 7.0 Page 203 of 213

The duration is the time in milliseconds of the duration of a transaction, which is the difference between
the event time of the last event in the transaction and the first event in the transaction. The duration
field for all events in a transaction is set to the duration value of the transaction.
The eventcount displays the number of events in a transaction.
Example 1:
To view source addresses accessed within a 5-minute duration:
... | transaction sourceAddress maxspan=5m
Example 2:
To group source addresses by source ports and view 5 events per group:
...| transaction sourceAddress sourcePort maxevents=5
Example 3:
To group users and URLs they accessed within a 10-minute duration:
... | transaction username startswith= “http://” maxspan=10m
Example 4:
To view login transactions from the same session ID and source address in a 1-hour duration:
... | transaction sessionID sourceAddress maxspan=1h startswith= “user [L|l]ogin”
where
Displays events that match the criteria specified in the “where” expression.
Usage:
...| where <expression>
<expression> can be any valid field-based query expression, as described in "Field-Based Search" on
page67.
ArcSight Command Center User's Guide
Appendix A: Search Operators
HPE ESM 7.0 Page 204 of 213

Notes:
<expression> can only be a valid field-based query expression. Arithmetic expressions or functions
are not supported.
Example 1:
... | where eventId is NULL
Example 2:
... | where eventId=10006093313 OR deviceVersion CONTAINS “5.3.1.0.0”
Example 3:
... | where eventId >=10005985569 OR categories= “/Agent/Started”
ArcSight Command Center User's Guide
Appendix A: Search Operators
HPE ESM 7.0 Page 205 of 213

Appendix B: Using the Rex Operator
The rex operator is a powerful operator that enables you to extract information that matches a
specified regular expression and assigns it to a field, whose field name you specify. You can also specify
an optional start point and an end point in the rex expression between which the information matching
the regular expression is searched.
When a rex expression is included in a search query, it must be preceded by a basic search query that
finds events from which the rex expression will extract information. For example:
failed | rex “(?<srcip>[^ ]\d{1,3}\.\d{1,3}\.\d{1,3}\.\d{1,3})”
Syntax of the rex Operator
| rex “text1(?<field1>text2regex)”
text1 — The text or point in the event AFTER which information extraction begins. The default is the
beginning of the event.
text2 — The text or point in the event at which information extraction ends.
field1 — The name of the field to which the extracted information is assigned.
regex — The pattern (regular expression) used for matching information to be extracted between text1
and text2.
Note: If you are an experienced regular expression user, see the Note in the next section for a quick
understanding of how rex enables you to capture named input and reference it for further
processing.
Understanding the rex Operator Syntax
Extract all information AFTER text1 and until text2 that matches the specified regex (regular
expression) and assign TO field1.
ltext1 and [text2] can be any points in an event — start and end of an event, specific string in an
event (even if the string is in the middle of a word in the event), a specific number of characters from
the start or end of an event, or a pattern.
lTo specify the next space in the event as text2, enter [^ ].
This is interpreted as “not space.” Therefore, entering a “not” results in the capture to stop at the
point where the specified character, in this case, a space, is found in the event.
lTo specify [text2] to be the end of the line, enter [^$].
HPE ESM 7.0 Page 206 of 213

This is interpreted as “not end of line.” Therefore, when an end-of-line in an event is encountered,
the capture will stop at that point. The [^$] usage only captures one character if it is not an end-of-
line character. However, by specifying [^$]* in a rex expression, the usage captures all characters until
end-of-line.
You can also specify .* to capture all characters in an event instead of [^$]. Examples in this document,
however, use [^$].
lAny extra spaces within the double quotes of the rex expression are treated literally.
lThe characters that need to be escaped for rex expressions are the same as the ones for regular
expressions. Refer to a regular expressions document of your choice to obtain a complete list of such
characters.
lInformation captured by a rex expression can be used for further processing in a subsequent rex
expression as illustrated in the following example in which an IP address is captured by the first rex
expression and the network ID (assuming the first three bytes of the IP address represent it) to
which the IP address belongs is extracted from the captured IP address:
logger | rex “(?<srcip>[^ ]\d{1,3}\.\d{1,3}\.\d{1,3}\.\d{1,3})” | rex
field=srcip “(?<netid>\d{1,3}\.\d{1,3}\.\d{1,3})”
Note: If you are an experienced regular expression user, you can interpret the rex expression
syntax as follows:
rex “(?<field1>regex)”
where the entire expression in the parentheses specifies a named capture. That is, the captured
group is assigned a name, which can be referenced later for further processing. For example, in
the following expression “srcip” is the name assigned to the capture.
failed | rex “(?<srcip>[^ ]\d{1,3}\.\d{1,3}\.\d{1,3}\.\d{1,3})”
Once named, use “srcip” for further processing as follows:
failed | rex “(?<srcip>[^ ]\d{1,3}\.\d{1,3}\.\d{1,3}\.\d{1,3})” | top
srcip
Creating a rex Expression Manually
Start with a simple search that finds the events that contains the information in which you are
interested. Once the events are displayed, identify a common starting point in those events that
precedes the information.
For example, you are interested in extracting the client IP address, which always appears after the word
“[client” in the following event.
ArcSight Command Center User's Guide
Appendix B: Using the Rex Operator
HPE ESM 7.0 Page 207 of 213

[Thu Jul 30 01:20:06 2009] [error] [client 69.63.180.245] PHP Warning:
memcache_pconnect() [<a href='function.memcache-pconnect'>function.memcache-
pconnect</a>]: Can't connect to 10.4.31.4:11211
Therefore, “[client” is the starting point. A good end point is the “]” after the last byte of the client IP
address. Now, we need to define the regular expression that will extract the IP address. Because in this
example, only the client IP address appears after the word “client”, we use “*” as the regular expression,
which means “extract everything”. (We could be more specific and use \d{1,3}\.\d{1,3}\.\d
{1,3}\.\d{1,3} for the IP address.) We assign the extracted IP address to a field name “clientIP”. We
are almost ready to create a rex expression, except that we need to escape the “[” and “]” characters in
the expression. The escape character to use is “\”.
Now, we are ready to create the rex expression to extract the IP address that appears after the word
“client” in the event shown above.
| rex “\[client(?<clientip>[^\]]*)”
ArcSight Command Center User's Guide
Appendix B: Using the Rex Operator
HPE ESM 7.0 Page 208 of 213
Appendix C: Frequently Asked Questions
What happens if I'm investigating a channel that has
event fields that are not supported in Command
Center?
If the channel that you are investigating originated in the ArcSight Console and contains event fields
not supported in Command Center, these unsupported fields are not lost and can be viewed in the
ArcSight Console.
Related Topic:
"Creating an Event Channel" on page45
Can I change the default start time and end time for
an event channel?
The default start and end times cannot be changed in Command Center. These changes have to be
made in the ArcSight Console. Command Center recognizes any changes you make to the default times.
To change the default start time for new channels, edit the console.properties file in the
<ArcSight_Console_HOME>/ current/config directory. For example, add the this line...
console.channel.newChannel.defaultSubtractTime="$Now - 2h"
... to change the start time to two hours ago. For a list of possible time values see the Start Time: field
pull-down menu.
If setting the End Time results in the message “Invalid end date for sliding channel,” the channel is set to
Continuously evaluate instead of Evaluate once at attach time. Either re-set the End Time
or change the Time Parameters option for the channel to Continuously evaluate.
Avoid creating an active channel that queries more than once per day. For active channels that query
more than once per day, use Evaluate time parameters once at attach time instead of
Continuously evaluate. Better yet, use trends for these types of active channels.
Related Topic:
"Creating an Event Channel" on page45
HPE ESM 7.0 Page 209 of 213

What do Ido if a channel is taking long to load?
Some channels can be resource intensive, such as those with a time range of an hour or so. If a channel
takes long to load in a high-traffic environment, open this channels in the ArcSight Console. To view a
resource-intensive channel in Command Center, narrow the time range to 5 - 10 minutes to reduce the
event volume.
Related Topic:
"Viewing Events On an Active Channel" on page31
How many channels can I have open at one time?
For optimum performance, limit open channels to 3 per browser, though Command Center can support
up to 10 moderate-traffic channels or up to 15 light-traffic channels per browser. Between Command
Center and ArcSight Console, ESM can support up to 25 open channels.
Related Topic:
"Viewing Events On an Active Channel" on page31
What fields are supported in Command Center
channels?
The ArcSight Command Center does not support global and local variables. The ArcSight Command
Center supports only standard event fields for viewing. Variables (global or local) are not supported.
Use the ArcSight Console instead. See the following table:
User Interface Standard Event Fields Local Variables Global Variables
ArcSight Command Center Yes No No
ArcSight Console Yes Yes Yes
Fields
Related Topic:
"Viewing Events On an Active Channel" on page31
ArcSight Command Center User's Guide
Appendix C: Frequently Asked Questions
HPE ESM 7.0 Page 210 of 213

Does Command Center support non-ASCII payload
data?
Command Center may not display non-ASCII payload data. Therefore, if the Download Payload
button is enabled, yet no data appears in the Event Details popup, click Download Payload to
download the data to a simple text editor, such as Notepad.
Related Topic:
"Viewing Event Payload" on page45
How do I get my ArcSight Marketplace credentials?
Access to ArcSight Marketplace is necessary in order to download an app which enables you use Tool
Commands. To receive your ArcSight Marketplace credentials (user name and password), contact
ArcSight Support or your reseller.
Related Topic:
"Evaluate the Network Route of a Event in a Channel" on page34
Why are channels not current in a new ESMsession?
Some channels in Command Center may not be current when accessed in a new ESM session. To ensure
current event information, refresh the channel by clicking the stop and play buttons.
Related Topic:
"Viewing Events On an Active Channel" on page31
Does the change to or from Daylight Savings Time
effect an open active channel?
If an active channel is open when Daylight Savings Time goes into or out of effect, the active channel
will not reflect the correct start and end times until the channel is closed and reopened.
Related Topic:
"Viewing Events On an Active Channel" on page31
ArcSight Command Center User's Guide
Appendix C: Frequently Asked Questions
HPE ESM 7.0 Page 211 of 213

Why does the right end of the top menu bar appear
overlapped?
To view this user interface properly, configure your browser to at least 1920 by 1080 pixels. The
ArcSight Command Center top menu bar appears to have the right-most Top menu bar options
overlapped if the browser window dimensions are smaller than 1920 by 1080 pixels.
ArcSight Command Center User's Guide
Appendix C: Frequently Asked Questions
HPE ESM 7.0 Page 212 of 213
Send Documentation Feedback
If you have comments about this document, you can contact the documentation team by email. If an
email client is configured on this system, click the link above and an email window opens with the
following information in the subject line:
Feedback on ArcSight Command Center User's Guide (ESM 7.0)
Just add your feedback to the email and click send.
If no email client is available, copy the information above to a new message in a web mail client, and send
your feedback to arc-doc@hpe.com.
We appreciate your feedback!
HPE ESM 7.0 Page 213 of 213
