Distribution Of Organic Carbon In Soil Profile Data 23980 EUR23980
User Manual: 23980
Open the PDF directly: View PDF  .
.
Page Count: 148 [warning: Documents this large are best viewed by clicking the View PDF Link!]
- 1 Introduction
- 2 Vertical Distribution of SOC
- 3 Analysis of Soil Profile Datasets
- 3.1 Soil Profile Analytical Database of Europe / Measured Data (SPADE/M)
- 3.2 Forest Monitoring Soil Survey Data
- 3.3 ISRIC-WISE
- 3.4 UK Soil Database for CO2 Inventory
- 4 Summary and Conclusions
Distribution of Organic Carbon in
Soil Profile Data
Roland Hiederer
Horizon 4
Horizon 3
Horizon 2
Horizon 1
d
OC
D
e
p
th
OC Content
Soil Surface
EUR 23980 EN - 2009
2

The mission of the JRC-IES is to provide scientific-technical support to the
European Union’s policies for the protection and sustainable development of
the European and global environment.
European Commission
Joint Research Centre
Institute for Environment and Sustainability
Contact information
Address: R. Hiederer
E-mail: roland.hiederer@jrc.ec.europa.eu
http://ies.jrc.ec.europa.eu/
http://www.jrc.ec.europa.eu/
Legal Notice
Neither the European Commission nor any person acting on behalf of the
Commission is responsible for the use which might be made of this
publication.
Europe Direct is a service to help you find answers
to your questions about the European Union
Freephone number (*):
00 800 6 7 8 9 10 11
(*) Certain mobile telephone operators do not allow access to 00 800 numbers or these calls may be billed.
A great deal of additional information on the European Union is available on the Internet.
It can be accessed through the Europa server http://europa.eu/
JRC Catalogue number: LB-NA-23839-EN-C
EUR 23980 EN
ISBN 978-92-79-13352-7
ISSN 1018-5593
DOI 10.2788/33102
Luxembourg: Office for Official Publications of the European Communities
© European Communities, 2009
Reproduction is authorised provided the source is acknowledged.
Printed in Italy
3
4
This document may be cited as follows:
Hiederer, R. (2009) Distribution of Organic Carbon in Soil Profile Data. EUR 23980
EN. Luxembourg: Office for Official Publications of the European Communities.
126pp.
European Commission Joint Research Centre
Institute for Environment and Sustainability
TP 261
21027 Ispra (VA)
Italy
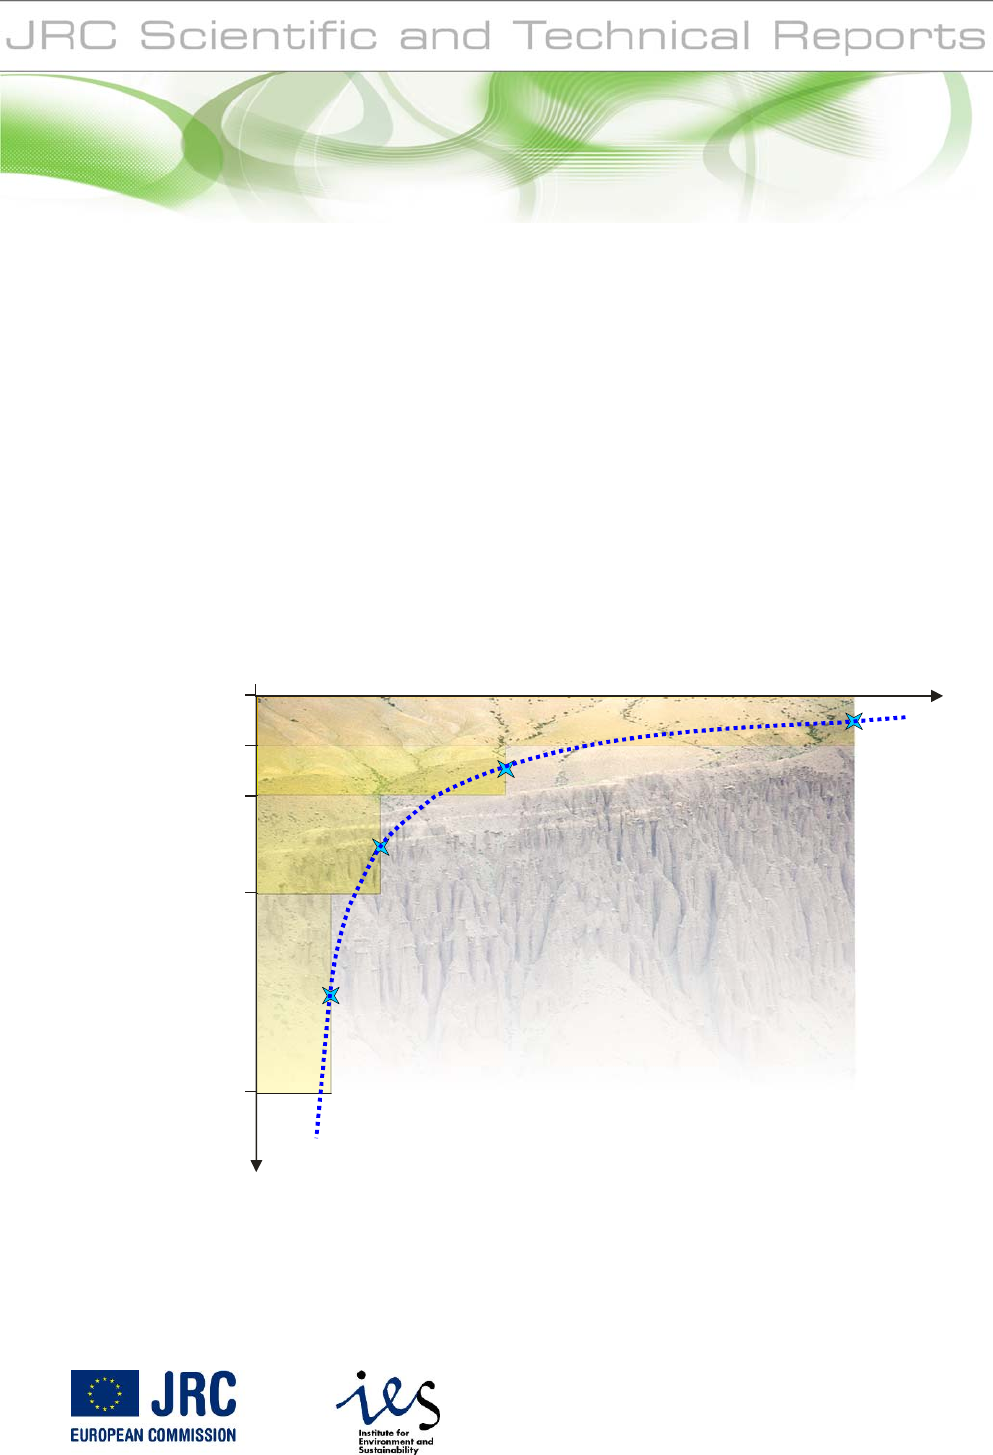
COVER PAGE:
The cover page shows the distribution organic carbon in pedological horizons of an idealized
mineral soil and the regression curve through the mid-points of the horizon depths from
logarithmically transforming the depth parameter.
5
6
Distribution of Organic Carbon in Soil Profile Data
Table of Contents
Page
1 INTRODUCTION................................................................................................... 1
2 VERTICAL DISTRIBUTION OF SOC ............................................................... 3
2.1 VERTICAL DISTRIBUTION OF SOC IN TOPSOIL AND SUBSOIL.............................. 4
2.2 FACTORS INFLUENCING SOC VERTICAL DISTRIBUTION ..................................... 6
3 ANALYSIS OF SOIL PROFILE DATASETS..................................................... 7
3.1 SOIL PROFILE ANALYTICAL DATABASE OF EUROPE / MEASURED DATA
(SPADE/M) .................................................................................................................. 9
3.1.1 SOC Content in Profile Horizons................................................................. 10
3.1.2 SOC Content and Depth Transformation..................................................... 12
3.1.3 Influence of Land Cover............................................................................... 14
3.1.4 Influence of Mean SOC Content in Soil Layers ........................................... 17
3.1.5 Influence of Depth of Soil Stratum............................................................... 26
3.1.6 Influence of Clay Content............................................................................. 27
3.1.7 SOC Content by Major Soil Category.......................................................... 28
3.2 FOREST MONITORING SOIL SURVEY DATA ....................................................... 31
3.2.1 Soil Condition Survey Data.......................................................................... 31
3.2.2 Pre-Processing Data.................................................................................... 32
3.2.3 Layer Sampling vs. Pedological Horizons................................................... 40
3.2.4 Intensive Monitoring - Level II..................................................................... 45
3.2.5 Systematic Monitoring Plots - Level I.......................................................... 60
3.3 ISRIC-WISE .................................................................................................... 75
3.3.1 SOC in Plot Horizons................................................................................... 76
3.3.2 SOC Content and Depth Transformation..................................................... 77
3.3.3 Influence of Land Cover............................................................................... 80
3.3.4 Influence of Mean SOC Content in Soil Section .......................................... 83
3.3.5 Influence of Depth of Soil............................................................................. 94
3.3.6 Influence of Clay Content............................................................................. 96
3.3.7 SOC Content by Major Soil Category.......................................................... 97
i

Distribution of Organic Carbon in Soil Profile Data
3.4 UK SOIL DATABASE FOR CO2 INVENTORY ....................................................... 99
3.4.1 SOC Data in Profile Layers ....................................................................... 102
3.4.2 SOC Content and Depth Coefficient .......................................................... 104
3.4.3 Influence of Land Cover............................................................................. 106
3.4.4 Influence of Mean SOC Content in Soil Layer........................................... 107
3.4.5 Influence of Depth of Soil........................................................................... 113
3.4.6 Influence Clay Content............................................................................... 114
4 SUMMARY AND CONCLUSIONS ................................................................. 117
ii
Distribution of Organic Carbon in Soil Profile Data
List of Figures
Page
Figure 1: Relationship between Soil Organic Carbon Quantity in the 0-30 cm
Topsoil Layer and the 30-100 cm Subsoil Layer (based on figures
from: Batjes, 1996).........................................................................................4
Figure 2: Spatial Distribution of SPADE/M Profiles .......................................................9
Figure 3: Horizon Depth vs. Soil Organic Carbon (SPADE/M) ....................................10
Figure 4: Frequency Distribution of Combinations of Logarithmic SOC and
Central Horizon Depth Transformation and Transformation of Depth
by Land Use (SPADE/M).............................................................................12
Figure 5: Relationship between Standard Deviation (SD) and Coefficient of
Variation (CV) and Profile SOC Content with Varying Cover of
Profile Depth (SPADE/M) ...........................................................................13
Figure 6: Frequency Distribution of Land Cover Types by Profile Depth
(SPADE/M) ..................................................................................................15
Figure 7: Frequency Distribution of Relative Occurrence of Slope Coefficient m
by Land Cover Type (SPADE/M)................................................................16
Figure 8: Relationship between Mean SOC Content of Topsoil and Subsoil and
Combined Soil Segment (SPADE/M) ..........................................................18
Figure 9: Relationship between Mean SOC Content and Model Slope
Coefficient and Constant for Soil Section 0-30 cm by Land Cover
Type (SPADE/M).........................................................................................21
Figure 10: Relationship between Mean SOC Content and Model Slope
Coefficient and Constant for Soil Section 30-100 cm by Land Cover
Type (SPADE/M).........................................................................................22
Figure 11: Relationship between Mean SOC Content and Model Slope
Coefficient and Constant for Soil Section 0-100 cm by Land Cover
Type (SPADE/M).........................................................................................23
Figure 12: Relationship between Mean SOC Content for Topsoil and Model
Slope Coefficient and Constant for Subsoil by Land Cover Type
(SPADE/M) ..................................................................................................24
Figure 13: Mean SOC Content for Profile and Change in Model Slope
Coefficient with Depth of Profile (SPADE/M) ............................................26
Figure 14: Relationship Between Increasing and Decreasing Clay and SOC
Content in Profile Subsoil Section ...............................................................27
iii
Distribution of Organic Carbon in Soil Profile Data
Figure 15: Effect of Various Limits of the Std. Dev. on Profile Number and x-
Coefficient of the SOC Content vs. Depth Slope Factor when
Including Organic Layers (Level II).............................................................38
Figure 16: Change in Model Slope Coefficient and Constant with Mean SOC for
Complete Soil Section 0-100 cm (Level II)..................................................39
Figure 17: Sampling Soil Properties by Fixed Layers vs. Pedological Horizons...........40
Figure 18: Distribution of Profiles of Forest Focus Level II Soil Profiles with
Subsoil Data..................................................................................................45
Figure 19: Horizon Depth vs. Soil Organic Carbon for Forest Focus Level II
Layers ...........................................................................................................46
Figure 20: Frequency Distribution of Profile Depth and Relative Depth Cover ...........47
Figure 21: Frequency Distribution of Regression Coefficient of Determination
for Logarithmic Transformation of SOC Content and Central Layer
Depth for Mineral Layers and for Merged Organic Layers (Forest
Focus Level II) .............................................................................................48
Figure 22: Frequency Distribution of Relative Occurrence of Slope Coefficient
m (Level II)...................................................................................................49
Figure 23: Relationship Between Mean SOC Content in Topsoil and Soil
Segment 0-100 cm and Subsoil (Level II)....................................................50
Figure 24: Relationship between Mean SOC Content and Model Slope
Coefficient and Constant for Topsoil Applying SD Threshold of 10
(Level II).......................................................................................................51
Figure 25: Relationship between Mean SOC Content and Model Slope
Coefficient and Constant for Soil Section 0-100 cm Applying SD
Threshold of 10 and 100 (Level II) ..............................................................52
Figure 26: Relationship between Mean SOC Content and Model Slope
Coefficient and Constant for Subsoil Applying SD Threshold of 10
and 100 (Level II).........................................................................................53
Figure 27: Relationship between Mean SOC Content for Topsoil and Model
Slope Coefficient and Constant for Subsoil Applying SD Threshold
of 10 and 100 (Level II)................................................................................54
Figure 28: Relationship between Mean SOC Content for Topsoil and Model
Slope Coefficient and Constant for Soil Section 0-100 cm (Level II) .........55
Figure 29: Relative Frequency Distribution of End of Deepest Layer ..........................57
Figure 30: Change in Model Slope Coefficient with Depth of Profile Applying
SD Threshold of 10 and 100 (Level II) ........................................................58
Figure 31: Relationship between Clay and SOC Content and the Slope
Coefficient for Soil Section 0-100 cm by Decreasing and Increasing
Clay Content with Depth (Level II)..............................................................59
iv
Distribution of Organic Carbon in Soil Profile Data
Figure 32: Distribution of Profiles of Level I Soil Profiles with Subsoil Data ..............61
Figure 33: Horizon Depth vs. Soil Organic Carbon for Forest Focus Level I
Layers ...........................................................................................................62
Figure 34: Frequency Distribution of Profile Depth and Relative Depth Cover............63
Figure 35: Frequency Distribution of Regression Coefficient for Logarithmic
Transformation of SOC Content and Central Layer Depth for all
Layers and for Merged Organic Layers (Forest Focus Level I)...................64
Figure 36: Frequency Distribution of Relative Occurrence of Regression Slope
Coefficient m (Forest Focus Level I) ...........................................................65
Figure 37: Relationship between Mean SOC Content in Topsoil and Soil
Segment 0-100 cm and Subsoil (Level I) .....................................................66
Figure 38: Relationship between Mean SOC Content and Model Slope
Coefficient and Constant for Topsoil applying SD Threshold of 10
(Level I) ........................................................................................................67
Figure 39: Relationship between Mean SOC Content and Model Slope
Coefficient and Constant for Soil Section 0-100 cm applying SD
Threshold of 10 and 100 (Level I)................................................................68
Figure 40: Relationship between Mean SOC Content and Model Slope
Coefficient and Constant for Subsoil applying SD Threshold of 10
and 100 (Level I) ..........................................................................................69
Figure 41: Relationship between Mean SOC Content for Topsoil and Model
Slope Coefficient and Constant for Soil Section 0-100 cm applying
SD Threshold of 10 and 100 (Level I)..........................................................70
Figure 42: Relationship between Mean SOC Content for Topsoil and Model
Slope Coefficient and Constant for Subsoil applying SD Threshold of
10 and 100 (Level I) .....................................................................................71
Figure 43: Relative Frequency Distribution of End of Deepest Layer in Profile
(Level I) ........................................................................................................72
Figure 44: Change in Model Slope Coefficient with Depth of Profile applying
SD Threshold of 10 and 100 (Level I)..........................................................73
Figure 45: Distribution of Profiles Used from ISRIC-WISE Database..........................75
Figure 46: Horizon Depth vs. Soil Organic Carbon (ISRIC-WISE) ..............................77
Figure 47: Frequency Distribution of Combinations of Logarithmic SOC and
Central Horizon Depth Transformation and Transformation of Depth
by Land Use (ISRIC-WISE).........................................................................78
Figure 48: Relative Occurrence of Profile Depth (ISRIC-WISE)..................................79
Figure 49: Relationship between Standard Deviation (SD) and Coefficient of
Variation (CV) and Profile SOC Content with Varying Cover of
Profile Depth (ISRIC-WISE) .......................................................................80
v
Distribution of Organic Carbon in Soil Profile Data
Figure 50: Frequency Distribution of Land Cover Types by Profile Depth
(ISRIC-WISE) ..............................................................................................82
Figure 51: Frequency Distribution of Relative Occurrence of Slope Coefficient
m by Land Cover Type (ISRIC-WISE)........................................................83
Figure 52: Relationship between Mean SOC Content of Topsoil and Subsoil and
Combined Soil Segment (ISRIC-WISE) ......................................................84
Figure 53: Relationship between Mean SOC Content and Model Slope
Coefficient and Constant for Topsoil by Land Cover Type (ISRIC-
WISE) ...........................................................................................................88
Figure 54: Relationship between Mean SOC Content and Model Slope
Coefficient and Constant for Subsoil by Land Cover Type (ISRIC-
WISE) ...........................................................................................................89
Figure 55: Relationship between Mean SOC Content and Model Slope
Coefficient and Constant for Soil Section 0-100 cm by Land Cover
Type (ISRIC-WISE).....................................................................................90
Figure 56: Relationship between Mean SOC Content for Topsoil and Model
Slope Coefficient and Constant for Subsoil by Land Cover Type
(ISRIC-WISE) ..............................................................................................91
Figure 57: Maximum Profile Depths vs. Mean SOC Content for Soil Segment 0-
100 cm and Change in Model Slope Coefficient with Depth of Profile
(ISRIC-WISE) ..............................................................................................94
Figure 58: Regressions Coefficient of Linear Function between Soil Depth and
Mean SOC Content for Soil Segment 0-100 cm vs. Coefficient of
Determination of Correlation (ISRIC-WISE)...............................................95
Figure 59: Relationship between Clay Content and Subsoil SOC Content and the
Coefficient of the Relationship Clay Content vs. Depth and the
Subsoil SOC Content for Profiles with an Increase in Clay Content
with Depth (ISRIC-WISE) ...........................................................................96
Figure 60: Table Records with Data for Soil Organic Carbon Content by Land
cover Type and Region (UK) .....................................................................101
Figure 61: Relative Frequency of Mean SOC Content for Topsoil and Subsoil by
Land Cover Type and Region.....................................................................103
Figure 62: Coefficient of Subsoil over Topsoil SOC Content .....................................105
Figure 63: Relationship between Mean SOC Content of Topsoil and Subsoil
(UK)............................................................................................................108
Figure 64: Relationship between Mean SOC Content and Coefficient for SOC
Content (UK) ..............................................................................................113
Figure 65: Relationship between Clay Content and Subsoil SOC Content and the
Ratio of Topsoil to Subsoil Clay Content (UK) .........................................115
vi

Distribution of Organic Carbon in Soil Profile Data
Figure 66: Relationship between Soil Organic Carbon Content in the 0-30 cm
Topsoil Layer and the 30-100 cm Subsoil Layer for SPADE/M and
ISRIC-WISE Major Soil Types..................................................................118
Figure 67: Relationship between Soil Organic Carbon Content in the 0-30 cm
Topsoil Layer and the 30-100 cm Subsoil Layer for Forest Focus
Level I and Level II and ISRIC-WISE Forest Profiles by Major
FAO90 Soil Types......................................................................................119
vii
Distribution of Organic Carbon in Soil Profile Data
viii

Distribution of Organic Carbon in Soil Profile Data
List of Tables
Page
Table 1: Global Soil Organic Carbon Estimates by Depth...........................................3
Table 2: Distribution of Soil Profiles by Land Cover Class under Two
Treatments for Soil Segment 0-100 cm........................................................14
Table 3: Parameters of Linear Regression between SOC Content of Topsoil,
Soil Segment 0-100 cm and Subsoil (SPADE/M)........................................19
Table 4: SOC Content by Soil Category (SPADE/M)................................................29
Table 5: Effect of Treating Organic Layer on Number of Profiles and x-
Coefficient of the SOC Depth Slope ............................................................36
Table 6: Distribution of Central Depths of Horizons and Layers in SPADE/M ........43
Table 7: Effect of Layer Sampling at Various Intensities on Mean SOC
Content and on Relationship of SOC Content with Depth...........................44
Table 8: SOC Content by Soil Category (Forest Focus Level II)...............................60
Table 9: SOC Content by Soil Category (Forest Focus Level I)................................74
Table 10: Distribution of Soil Profiles by Land Cover Class under Two
Treatments for Soil Segment 0-100 cm........................................................81
Table 11: Parameters of Linear Regression between SOC Content of Topsoil
and Soil Segment 0-100 cm and Subsoil (ISRIC-WISE).............................87
Table 12: Parameters of Linear Regression between Soil Depth and Mean SOC
Content for Soil Segment 0-100 cm vs. Coefficient of Determination
of Correlation (ISRIC-WISE).......................................................................95
Table 13: SOC Content by Soil Category (ISRIC-WISE)............................................98
Table 14: Soil Class Data in Tables............................................................................102
Table 15: Distribution of Mean SOC Content Ratio by Land Cover .........................107
Table 16: Parameters of Linear Regression between SOC Content of Topsoil
and Subsoil for Mineral Soils(UK).............................................................112
ix
Distribution of Organic Carbon in Soil Profile Data
x

Distribution of Organic Carbon in Soil Profile Data
List of Acronyms
ACRONYM TEXT
CV Coefficient of Variation
HYPRES Hydraulic Properties of European Soils
IPCC Intergovernmental Panel on Climate Change
JRC European Commission Joint Research Centre
ISRIC International Soil Reference and Information Centre
OC Organic carbon
PTF Pedo-transfer function
PTR Pedo-transfer rule
SC Soil carbon
SD Standard Deviation
SGDBE Soil Geographic Database of Eurasia
SOC Soil Organic Carbon
SOM Soil Organic Matter
SPADE/M Soil Profile Analytical Database of Europe, Measured
profiles
WISE World Inventory of Soil Emission Potentials
xi
Distribution of Organic Carbon in Soil Profile Data
xii

Distribution of Organic Carbon in Soil Profile Data
1 INTRODUCTION
Soil organic carbon (SOC) content has been estimated at pan-European scale for the soil
layer from 0 to a depth of 30 cm (Jones et al., 2005). The methodology used to generate
the data layer relied on a combination of a pedo-transfer rule (PTR) and pedo-transfer
functions (PTF). The PTR has been developed based on PTR No. 21 of the PTR
database of the Soil Geographic Database of Eurasia (SGDBE). The original conditions
of the rule system have been revised and amended to accommodate organic soils and
peat. The revised PTR for topsoil SOC content comprises 120 ordered conditions of
combinations of 5 soil and environmental parameters with an output to one of 6 classes
of SOC content. Differences in SOC content due to temperature differences are allowed
for by the PTF on temperature variations with a continuous output. The methodology
has been verified using measured data from soil profiles from sites across Europe, but
the conditions and function parameters are only applicable to the topsoil layer.
Analyses of measured soil profiles suggests that the subsoil layer contains significant
quantities of OC. The 30-100 cm depth layer is estimated to contain as much OC as the
topsoil layer (Batjes, 1996; FAO, 2001; Jobbagy & Jackson, 2000). An approach was
therefore explored how the existing methodology could be advanced to allow extending
the SOC content to a depth of 100 cm. Rather then developing a PTR for subsoil SOC
content it was investigated whether the rule-based system could be substituted by a
function linking the SOC content of the topsoil to the subsoil. Where the influencing
factors are discrete parameters, e.g. land cover classes, a function can be defined based
on the statistical analysis of soil profiles for each factor class. Statistical methods have
already been used to provide estimates of SOC content to a depth of 100 cm in large-
scale databases, such as the maps on soil-water holding capacities from Reynolds, et al.,
1999.
For the development of a PTF to estimate subsoil SOC content from the topsoil the
factors influencing the relationship and the characteristics of the relationship depending
on the factors will have to be determined. For this purpose three databases with
measurements on soil profiles across Europe and one national profile database have
been investigated. The main parameters influencing the change of SOC content with
depth were taken from the literature. The study then evaluated the potential of the
parameters to formulate a function relating topsoil to subsoil SOC content at any depth
within the subsoil up to 100 cm.
1
Distribution of Organic Carbon in Soil Profile Data
2

Distribution of Organic Carbon in Soil Profile Data
2 VERTICAL DISTRIBUTION OF SOC
According to Batjes, 1996 the amount of OC located in the upper 30 cm of the global
soil stratum amounts to almost 50% of the soil organic carbon in the layer 0-100 cm.
When using the upper 200 cm as reference 29% (684–724 Pg C) of SOC is located in
the upper 30 cm, 33% (778-824 Pg C) in the layer of 30–100 cm and 38% (914-908 Pg
C) in the layer of 100–200 cm (Batjes, 1996). Jobbagy & Jackson, 2000 gave as
estimates of the vertical distribution of soil organic carbon 64% (1,502 Pg C) for 0-
100 cm, 21% (491 Pg C) for the depth layer 100-200 cm and 15% (351 Pg C) for the
layer 200-300 cm.
A summary of estimates of SOC in the literature is given in Table 1.
Table 1: Global Soil Organic Carbon Estimates by Depth
Depth Layer
0-30 30-
100 100-
200 200-
300 0-100 0-200 0-300
Source C-
Type
cm cm cm cm cm cm cm
SC
2157–
2293
Batjes, 1996
SOC 684-
724
778-
824
914-
908
1462–
1548
2376-
2456
IPCC, 2001 SC
2011-
2221
Carter & Scholes,
2000
Total
SC
stock
1567
Kasting, 1998 Global
SC
1580
SC 4156 FAO, 2001
SOC 1500 2456
Jobbagy & Jackson,
2000
SOC 491 351 1502 1993 2344
Post et al, 1982 1395
SC: Soil Carbon (organic and/or inorganic not necessarily specified)
SOC Soil Organic Carbon
The figures given in the literature and presented in the table refer to “soil carbon” and
“soil organic carbon”. Although the two sources of carbon in the soil are not equivalent
it is not always evident that they are distinguished. Some of the figures given for SC
very likely refer to only carbon in organic material and do not include other forms of
soil carbon.
3
Distribution of Organic Carbon in Soil Profile Data
2.1 Vertical Distribution of SOC in Topsoil and
Subsoil
Studies of SOC frequently concentrate on the upper 30 cm of soil, in which organic
material is concentrated and where processes of C mineralization and immobilization
are more active. However, the large quantity of SOC stored in the subsoil layer is
ignored when limiting estimates of total SOC pools to the upper layer.
The vertical distribution of SOC in mineral soils is a general decrease of OC content
with depth. The decrease is non-linear and frequently modelled as an exponential
function (Hilinski, 2001). According to the global soils database held at ISRIC in
Wageningen, The Netherlands, for most mineral soils about the same amount of carbon
is held in the 30-100 cm layer as in the 0-30 cm layer. Smith et al. (2000) fitted a
quadratic equation to data from 22 soils from the global soils database of Batjes (1996)
to derive this estimate.
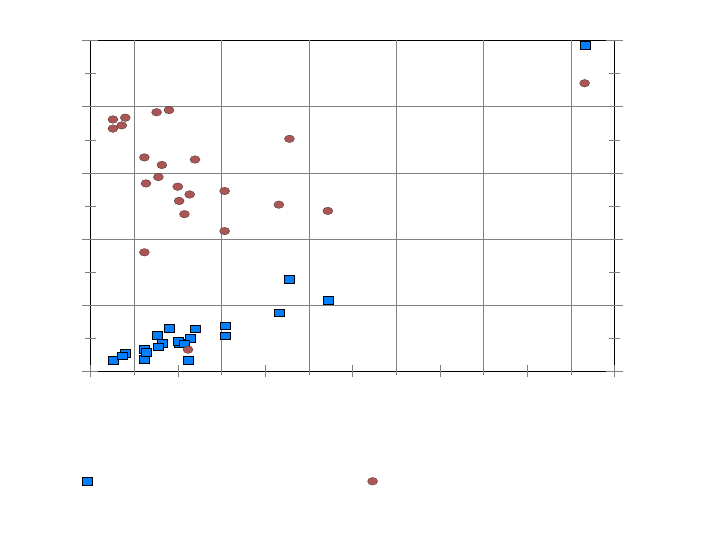
A graphical representation of the values given by Batjes (1996) is shown in Figure 1.
0
10
20
30
40
50
SOC Density 30-100cm (kg m-2)
20
30
40
50
60
70
Rel. SOC Density Subsoil:Topsoil (%)
0 5 10 15 20 25 30
SOC Density (kg m-2)
SOC Density Rel. SOC Density Distribution
Figure 1: Relationship between Soil Organic Carbon Quantity in the 0-30 cm Topsoil
Layer and the 30-100 cm Subsoil Layer (based on figures from: Batjes,
1996)
4
Distribution of Organic Carbon in Soil Profile Data
From the OC data aggregated by FAO soil classes the mean OC stock of the 30-100 cm
subsoil layer was 50% of the amount of the 0-100 cm layer. For individual soil classes
the fraction varies from 23% for Podzoluvisols to 64% for Histosols.
The data indicates an approximately linear relationship with a slope coefficient of 1
between the SOC quantity for the topsoil and the subsoil layers for mineral soil. For
Histosoils the amount of SOC in the subsoil layer considerably outweighs the amount in
the topsoil. The relationship in relative terms of the SOC quantity in the subsoil layer
better illustrates the differences in topsoil to subsoil SOC quantity between mineral soils
and Histosoils. It also shows that Podzoluvisols and Regosols tend to have more OC in
the topsoil than in the subsoil. Those findings are not surprising when considering the
definition of the various soil classes in the FAO74 classification scheme.
5
Distribution of Organic Carbon in Soil Profile Data
2.2 Factors Influencing SOC Vertical
Distribution
Based on published results there appear to be distinct differences in the distribution of
SOC between the topsoil and the subsoil section depending on land use. The first 20 cm
of the soil were found to contain between 33% (shrubland) and 50% (forest), with grass
land in between with 42%, of the SOC relative to the layer of 0-100 cm (Jobbagy &
Jackson, 2000). Globally, the concentration of the amount of SOC in the layer 0-20 cm
ranged form 29% in cold and arid regions under shrubland to 57% for cold and humid
forests.
At a global scale not only the amount of OC but also the specific characteristics of the
exponential relationship of OC with depth in the profile were found to vary strongly
with vegetation type (Jobbagy & Jackson, 2000). The variations are attributed to the
vertical distribution of roots and to a lesser degree to climate and clay content. The
decrease with depth is most pronounced under shrubs, followed by grassland and least
prominent under forest. For forests (Arrouays & Pelissier, 1994) and grassland
(Omonode & Vyn, 2006) a continuous function can be applied for the most part, while
for arable land a sudden change in SOC can occur at the depth of the ploughed layer
limiting the use of a function.
Climatic conditions seem to be the dominant factor determining SOC for the upper soil
layer while for deeper soils clay content becomes increasingly influential. On a global
scale SOC increases with precipitation and decreases with temperature (Post et al,
1982). For a sample of soils under forest in Finland the vertical distribution of SOC
depends on soil fertility to support forest vegetation (Lisky & Westman, 1995). For the
depth layer 50-100 cm the amount of SOC was found to vary from 7.7% to 22% relative
to the layer of 0-100 cm. In a study of two mineral soils under forest in Germany the
relative amount of soil organic matter in the subsoil layer was found to range from 45%
to 75% of the total SOC for the whole profile (Rumpel et al, 2002).
The major conditions influencing SOC independently of climatic conditions are:
• Land use / cover
Shrubland and arable land have the lowest rate of decrease of SOC with depth,
forests the most pronounced with grassland in between.
• SOC content
Soils high in SOC show less of a decrease in OC with depth than soils low in
OC.
• Soil depth
In shallow soils SOC decreases more rapidly with depth than in deeper soils.
• Clay content
For deep soils clay content is more closely related to SOC than for shallow soils.
Findings from other studies suggest that SOC decreases with depth in mineral soils,
while it may increase with depth for organic soils.
6

Distribution of Organic Carbon in Soil Profile Data
3 ANALYSIS OF SOIL PROFILE DATASETS
The general assumption for the relationship describing SOC content and depth below
the soil surface can be expressed in form of a linear function with a logarithmic
transformation of soil depth and/or SOC content, as given by:
(
)
(
)
bdfmSOCf
+
×
=
where
f(SOC) logarithmic transformation of SOC (or none)
d depth of soil section from surface
The slope coefficient m and constant b of the function may depend on the factors
influencing the character of changes in SOC content with depth, as expressed by
(
)
CDSOCLCfbm ,,,,
=
where
LC Land cover
SOC mean OC content of soil section
D depth of soil
C clay content of soil
For the analysis two segments of the soil profile were distinguished:
1. topsoil layer from 0-30 cm
2. subsoil layer from 30-100 cm
The depth range of the topsoil layer is defined by the separation of topsoil from subsoil
in the typological database of the SGDBE. The lower limit of 100 cm for the subsoil
layer was chosen because it allows more direct comparisons with other dataset, such as
ISRIC-WISE or NRCS, but also because measured data at lower depth becomes scare.
The soil profile databases used in the study were:
• SPADE/M: Soil Profile Analytical Database for Europe / Measured Data of
the Soil Geographic Soil Database of Eurasia
• FF Level I and Level II: Forest Focus data from Soil Condition Survey from
systematic and intensive monitoring sites
• ISRIC-WISE: International Soil Reference and Information Centre – World
inventory of Soil Emission Potentials
• UK Soil Database for CO2 Inventory
7
Distribution of Organic Carbon in Soil Profile Data
It was intended to include the HYPRES database (Hydraulic Properties of European
Soils), but the database available to the study did not allow a proper evaluation of the
profile data..
The limits of pedological horizons or layers of fixed height in a profile, as used by the
FF Soil condition Survey, generally do not coincide with the depth ranges of the topsoil
and subsoil. Hence, the soil parameters assigned to a layer have to be derived by
approximation from the profile data. Estimates of SOC and clay content for reporting
the layers were computed by a weighted linear interpolation using the relative coverage
of a depth segment by a horizon as weighting factors.
8
Distribution of Organic Carbon in Soil Profile Data
3.1 Soil Profile Analytical Database of Europe /
Measured Data (SPADE/M)
The SPADE/M database contains the results of measurements taken for pedological
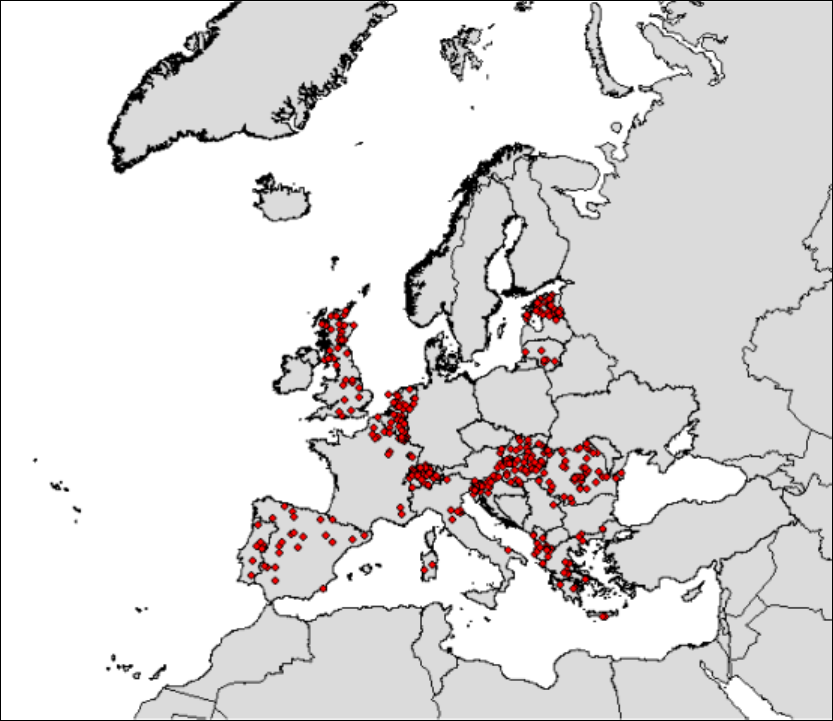
horizons of 496 profiles in Europe (Hiederer & Jones, 2006). The spatial coverage of
measured profiles shows local concentrations and larger regions not covered by data, as
shown in Figure 2.
Figure 2: Spatial Distribution of SPADE/M Profiles
In the preparation of the PTR database of the SGDBE the profiles were intended to
support the definition and the refinement of PTRs used to extend the range of
parameters of the SGDBE. An effort was also undertaken to link the profiles to soil
typological units, but this task was not completed at the time. The use of the data in
multi-parameter or spatial analysis is hampered by the amount of missing entries in the
9
Distribution of Organic Carbon in Soil Profile Data
description of the profiles and horizons. Information on profile depth and soil type is
available for all profiles, although for 16 profiles the soil type is not specific.
Geographic coordinates are given for 408 profiles, land use is identified for 399
profiles, SOC content is recorded for 398 and clay content for 393 profiles. With 139
different soil types a validation of attributing soil attributes based on soil name, as used
by PTRs, is rather limited. There are 8 soil types with 10 or more profiles for one soil
type (Lc: 10, Od: 10, CMe: 11, Jeg: 12, Lgs: 13, Be: 18, Bd: 21, Lo: 34), while for 96
soil types the frequency of profile data is 3 or less. Even with the very broadly defined
vegetation classes the dataset lacks a broad basis to support identifying or confirming
conditions of the PTR when discriminating soil characteristics by type at more than a
general level. In the assessment of SOC content with depth the conditions affecting the
relationship were therefore evaluated in separation.
3.1.1 SOC Content in Profile Horizons
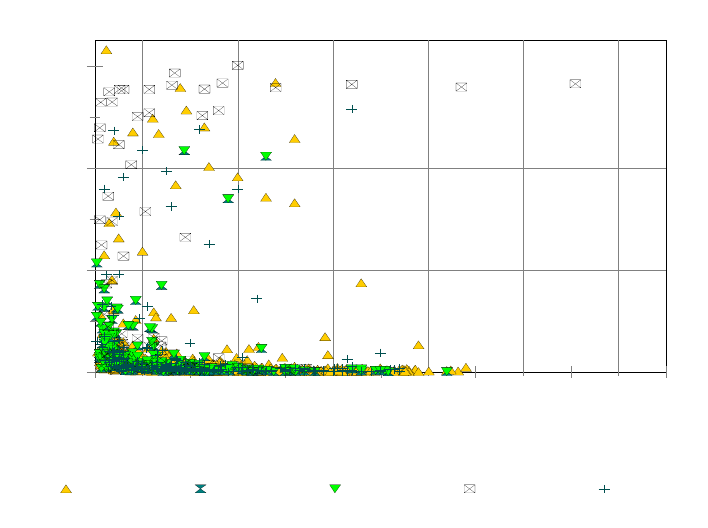
The distribution of SOC content for the central depth of a sample horizon is depicted in
Figure 3.
0
20
40
60
Mean SOC for Plot (%)
0 50 100 150 200 250 300
Central Horizon Depth (cm)
Arable Forest Grassland Shrub Not specifie
d
Figure 3: Horizon Depth vs. Soil Organic Carbon (SPADE/M)
The graph indicates the absence of a simple relationship for the decrease with depth in
the profiles of the dataset. While a large majority of horizons show a decrease in
occurrence with sampling depth, the distribution also suggests a different behaviour for
10

Distribution of Organic Carbon in Soil Profile Data
horizons with high SOC as compared to those with a low SOC content. The inversion
point is around a 20% SOC content. Below this value SOC generally decreases with
depth, while it shows a tendency to increase above this value. The value coincides with
the definition of Histosols in the FAO classification system
(http://www.fao.org/AG/AGL/agll/prosoil/histo.htm). The soil organic matter (SOM)
content of 30% used as one criterion to define Histosols represents approximately 18%
organic carbon (conversion factor of 1.72, Buckman & Brady, 1960). The 18% SOC
content threshold was subsequently used when processing SPADE/M profile data,
because the changes of SOC content with depth appear to differ significantly around
this value of SOC content.
The SPADE/M dataset contains plots with a SOC content >18% mainly on arable land
and areas covered by shrub vegetation. On arable land the highest values of SOC
content in the sampled horizons are reported for depths less than 100 cm. For plots
under shrub the number of horizons with SOC content of approximately >30% increases
with depth. In the interpretation of the distribution one should consider that the database
contains only 6 horizons with data for SOC content >18% and a depth of the central
horizon of more than 100 cm.
In the subsequent analysis profiles with data for less than 3 horizons within the depth
range of 0-30 cm or 30-100 cm were excluded. Omitted were further profiles with
abrupt and significant changes in SOC throughout the profile. Such changes are
generally caused by organic horizons overlying mineral subsoil or vice versa. Profiles of
this type would have confounded the results of changes in SOC content with depth.
Abrupt changes in SOC content were identified by a standard deviation (SD) of 10 or
more in the soil profile. The value was found to separate cases where organic and
mineral horizons were mixed in the profiles dataset and coincides with the theoretical
maximum for the SD of a mineral soil profile.
Conversely, included were also profiles with an incomplete description of the horizons.
Of the 496 samples 218 samples fully describe profiles to a depth of 100 cm or more.
However, only two profiles with a mean SOC content of >18% to a depth of 100 cm
comply with this condition. Partially described profiles where therefore included in the
analysis. The total number of samples was then 340 profiles with data to a depth of
100 cm or deeper (340 for the topmost 30 cm) and 9 profiles with a mean SOC content
>18%. While increasing the number of profiles available for analysis the addition of
incompletely described profiles potentially introduces uncertainties when computing the
mean SOC content for the layer depth. However, the objective of the study was to
analyse changes in SOC content with depth and the absence of a complete description
of the soil profile was considered less detrimental to the task than a decrease in the
number of profiles available for the analysis.
11
Distribution of Organic Carbon in Soil Profile Data
3.1.2 SOC Content and Depth Transformation
The values shown in Figure 3 only depict the distribution of the horizons, not
necessarily the relationship between soil depth and SOC content, since one horizon’s
characteristics are not independent from other horizons of the same plot.
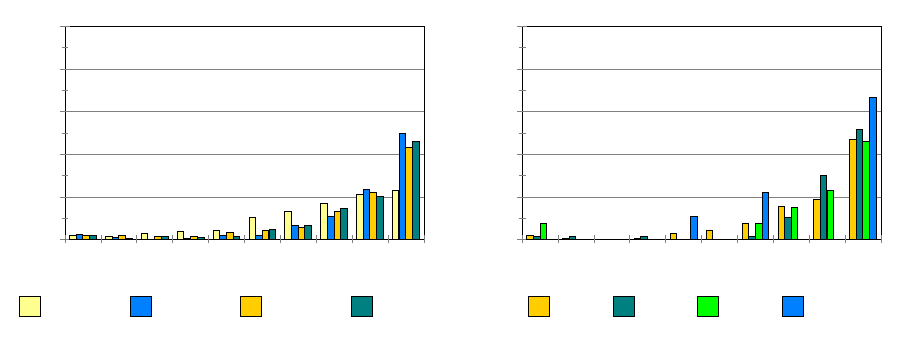
Evaluated were the 4 possible combination of a logarithmic transformation of mean
SOC content and depth. For depth the central value of the horizon was used. The
frequency distribution of the coefficient of determination (r2) for profiles with a
coverage by horizons of >=75% to a depth of 100 cm is shown in Figure 4.
0
20
40
60
80
100
Relative Frequency
0.1 0.2 0.3 0.4 0.5 0.6 0.7 0.8 0.9 1
Coefficient of Determination
No transformation ln(Depth) ln(OC) ln(Depth) + ln(O
C
20
40
60
80
100
Relative Frequency
0.1 0.2 0.3 0.4 0.5 0.6 0.7 0.8 0.9 1
Coeff. Determination ln(Depth)
Arable (142) Forest (56) Grass (26) Shrub (9)
a) Transformation Options b) Land Use Classes for Depth Transformation
Figure 4: Frequency Distribution of Combinations of Logarithmic SOC and Central
Horizon Depth Transformation and Transformation of Depth by Land
Use (SPADE/M)
The results indicate that the change in SOC content with soil depths is better modelled
when using a logarithmic transformation of soil depth and/or SOC content than when
using non-transformed parameters. There is no noteworthy difference in the correlation
of any of the relationships using a transformed depth or SOC content parameter. The
ranking changes slightly for the relationships of the transformed parameters when
setting stricter limits on the completeness of coverage of the profile, but a simple linear
relationship does not model the situation to the same degree.
While the findings indicate that a non-linear relationship between SOC content and
depth can be defined for more than 90% of the profiles in the database (r2>0.5) the
direction of the change is not indicated by the coefficient of determination, nor whether
the relationship can be defined by one set of parameters or depends on other factors.
The results only indicate that the relationship can be modelled by a linear function with
logarithmically transformed parameters for individual profiles. Furthermore, the
12
Distribution of Organic Carbon in Soil Profile Data
seemingly high number of close correlations is at least in part a consequence of the
restricted number of observations, i.e. horizons by plot.
Also shown in the graph is the relative frequency of the coefficient of determination for
the transformation of the depth parameter by the main land use classes. Notable is the
distribution of the correlation fit for profiles under shrub. It should be noted that the
distribution is based on only 9 profiles, which is considered insufficient to provide a
consistent portrayal of the situation. The occurrence of low coefficients of determination
for profiles under grass is also caused by a single profile where the SOC content in the
subsoil changes from 34% to 4.6%.
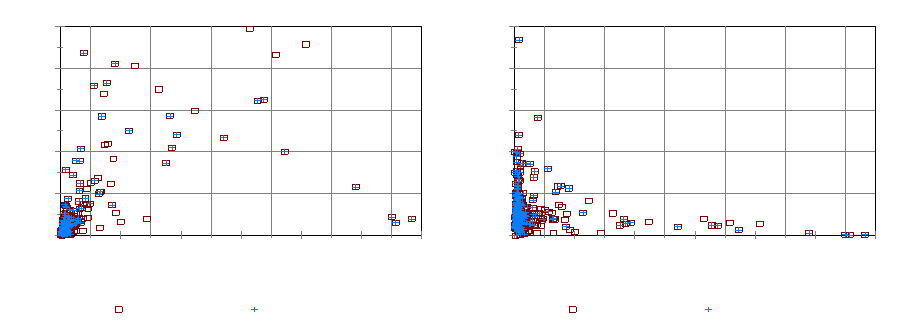
Indicators of the dispersion of the SOC content within a profile are the standard
deviation (SD) and the coefficient of variation (CV) of the SOC content horizon data.
The relationships are presented in Figure 5.
0
5
10
15
20
25
SD of SOC Content
0 10 20 30 40 50 60
Profile SOC Content (%)
Min. Profile Depth 15cm Min. Profile Depth 100cm
0
2
4
6
8
10
CV of SOC Content
0 10 20 30 40 50 60
Profile SOC Content (%)
Min. Profile Depth 15cm Min. Profile Depth 100cm
a) SOC Content vs. SD b) SOC Content vs. CV
Figure 5: Relationship between Standard Deviation (SD) and Coefficient of Variation
(CV) and Profile SOC Content with Varying Cover of Profile Depth
(SPADE/M)
The relationship between the mean SOC content of the profile and the SD of the SOC
contents of the horizons does not reveal a particular general trend. When including
profiles with a minimum depth of 15cm in the analysis the dispersion of the SOC
content values within a profile is highest for profiles with a mean SOC content of about
35%. In case only profiles with a minimum depth of 100 cm are included in the analysis
the main dispersion is more prevalent in mineral soils with a decrease in SD towards
higher mean SOC contents. One may conclude from those observations that deeper
profiles are more homogeneous than shallower profiles with increasing mean SOC
content of the profile. The affinity is not a consequence of a larger number of values
sampled for deeper profiles when the sampling is based on pedological horizons, as in
the case of SPEADE/M data.
13

Distribution of Organic Carbon in Soil Profile Data
For the relationship of the mean SOC content and the CV the larger relative spread of
values within a profile for lower mean SOC contents than for profiles with higher
contents is illustrated in the graph. There are no profiles in the dataset with a CV of >=1
for a mean SOC content of 12% and one for deeper soils of >=100 cm with a CV >0.5.
The larger variations for profiles with a mean SOC content close to 0 have to be
interpreted with the increasing sensitivity of the indicator to small changes. The
decrease at the higher end is controlled by the limit in the SOC content to approx. 60%.
The data suggests that deeper soils tend to be either clearly mineral or organic, but not
transitional. This results in a reduction in the number of profiles with a depth of 100 cm
or more in the range of mean SOC contents between 10-35% from 37 to 4. A
comparable effect would be achieved by limiting the SD to 10. As a consequence, when
concentrating the analysis on profiles without abrupt changes in SOC content between
horizons, the data are split into two distinct groups of mineral and organic soils and peat
with diverse characteristics of the dispersion of SOC content within the profile by the
mean SOC content.
3.1.3 Influence of Land Cover
In the SPADE/M dataset 17 classes of land cover information are defined for 397 plots.
Those land cover classes were translated into the 4 classes of vegetation identified to
influence the change of SOC content with depth on a global scale (Jobbagy & Jackson,
2000). These vegetation classes closely resemble the classes of land use employed in
the pedo-tranfer rule (PTR) for SOC content in the 0-30 cm topsoil of the Soil
Geographic Database of Eurasia (SGDBE).
The distribution of profiles according to the land cover classes for the soil segment 0-
100 cm is as shown in Table 2.
Table 2: Distribution of Soil Profiles by Land Cover Class under Two Treatments
for Soil Segment 0-100 cm
Land Cover Treatment Conditions Change
Profile Cover:
>30%
SD: no limit
Profile Cover:
>75%
SD: <10
%
Arable 169 (58.3%) 137 (64.0%) -18.9
Forest 69 (23.8%) 50 (23.4%) -27.5
Grassland 41 (14.1%) 24 (11.2%) -41.5
Shrub 11 (3.8%) 3 (1.4%) -72.7
TOTAL 290 214 -26.2
14
Distribution of Organic Carbon in Soil Profile Data
The treatment applied to the data affects not just the number of profiles, but also the
distribution of the profiles for the land cover classes in different ways. Overall the
number of profiles is lowered by approx. one quarter by requiring a data coverage to a
depth of >=75cm and limiting profiles to those with a SD of the samples <10. Least
affected by the condition are profiles on arable land, while most affected are those under
shrub. The factor reducing the number of profiles is not so much caused by limiting the
SD of the SOC content within a profile, but by the condition that the profile data has to
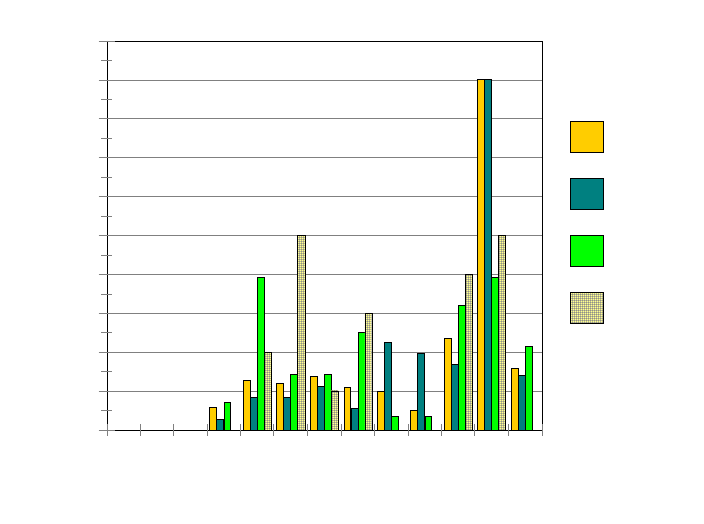
cover a depth of >75cm. The correlation of land cover type and soil profile depth is
illustrated in Figure 6.
0
5
10
15
20
25
30
35
40
45
50
Relative Frequency
0 10 20 30 40 50 60 70 80 90 100 150 200
Profile Depth (cm)
Arable (202)
Forest (71)
Grassland (56)
Shrub (20)
Figure 6: Frequency Distribution of Land Cover Types by Profile Depth (SPADE/M)
The graph indicates a prevalence of arable and forest land to occur on soils with a depth
of more than 100 cm. By contrast, grassland and shrub can more regularly be found on
shallower soils. The presence of those land cover types in the pool of profiles is
therefore more strongly reduced by the processing conditions than for other land cover
types.
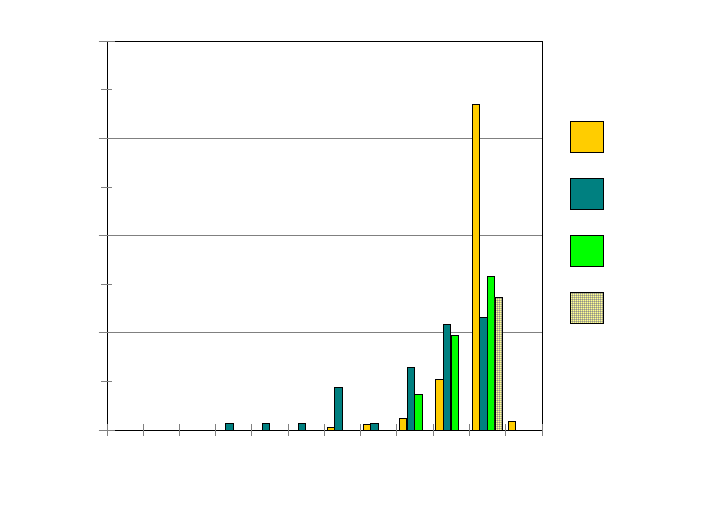
The relative frequency of slope coefficients m less than 1 for the relationship of mean
SOC content and depth by land cover type is presented in Figure 7.
15
Distribution of Organic Carbon in Soil Profile Data
0
20
40
60
80
Relative Frequency
-10 -9 -8 -7 -6 -5 -4 -3 -2 -1 01
Slope Coefficent m
Arable (137)
Forest (50)
Grassland (24)
Shrub (3)
Figure 7: Frequency Distribution of Relative Occurrence of Slope Coefficient m by
Land Cover Type (SPADE/M)
The number of profiles within each category differs from the total number of profiles
due to data requirements for computing the slope coefficient (min. 3 horizons in
profile). The frequency distribution of slope coefficients indicates for profiles on arable
land a prevalence of values between -1 and 0. For profiles in forests slope coefficients
below -1 and to -4 are more frequent than for other vegetation types. Profiles under
grassland follow the tendency found for those in forests, but to a lesser degree. Not
shown are slope coefficients >1. Only 6 profiles fall into this range and not much
information on a relationship of the slope coefficient and land cover type could be
gained from plotting the data.
It could be argued that some land cover types favour the development of OM in the soil,
and thus SOC content, more than others and that as a consequence different coefficients
for SOC content with depth can be defined based on the type of land cover. This is a
circuitous argument, because the land cover type is not necessarily independent from
the SOC content in the profile. When certain land cover types favour the development
of higher SOC content or are favoured to be associated with such soils, a correlation
between the type of vegetation and the rate of change in SOC may still be observed,
although this is not a dependency, but could just as well be a result of a land
management decision. The dataset clearly indicates a relationship of SOC content with
depths as a function of the mean SOC content in the profile, regardless of the land cover
type. A differentiation of the relationship by land cover type is restricted to the topsoil
layer.
16
Distribution of Organic Carbon in Soil Profile Data
3.1.4 Influence of Mean SOC Content in Soil Layers
For horizon information to be used to describe changes in OC content with depth some
conditions had to be set:
• A section must be covered with sample data to at least 75%. Thus, excluded
from the analysis are data from horizons, where the lower limit does not exceed
75cm. For horizons starting above the lower depth limit but reaching to deeper
levels, the soil attribute is assigned to the central horizon depth. The central
depth is used even when the value is lower than the lower depth range of the soil
section. This approach was found preferable to limiting the depth to a fixed
value and assigning a soil attribute to the lower depth limit when the central
horizon depth was actually below that position. Using a threshold of 75% for
data coverage allows including horizon information, which may still pertain to a
soil segment, such as measuring to a depth of 80 cm for the soil section 0-
100 cm.
• To compute the slope and constant for a depth segment it should be covered by
at least 3 points. The function can be fully defined by two points, but this was
found to give at times spurious results.
• A limit of 10 for the standard deviation of SOC contents of the horizons
included in estimating properties of a soil layer is applied to avoid including in
the analysis profiles with discontinuities.
• The lower end of a horizon is set to 300 cm where no specific value is given to
include the 112 plots with a deep but unspecified lower horizon in the analysis.
Further conditions restricting the use of the profiles may apply depending on the
particular aspect investigated and are generally self-evident, e.g. including only plots
with a land cover type in the analysis of the influence of land cover on SOC content.
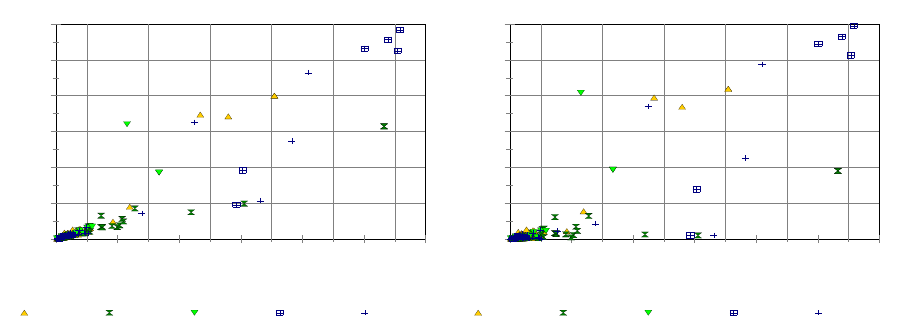
As a first step the relationship of the mean SOC content of the 0-30 cm topsoil
(SOCTOP) and the 30 – 100 cm subsoil (SOCSUB) was determined as well as to the
combined topsoil and subsoil segment (SOC0-100).
The results are graphically depicted in Figure 8.
17
Distribution of Organic Carbon in Soil Profile Data
0
10
20
30
40
50
60
Mean Profile SOC 0-100cm (%)
0 10 20 30 40 50 60
Mean Profile SOC 0-30 cm (%)
Arable Forest Grassland Shrub Not specified
0
10
20
30
40
50
60
Mean Profile SOC 30-100cm (%)
0 10 20 30 40 50 60
Mean Profile SOC 0-30 cm (%)
Arable Forest Grassland Shrub Not specified
a) Topsoil vs Profile SOC Content b) Topsoil vs. Subsoil SOC Content
Figure 8: Relationship between Mean SOC Content of Topsoil and Subsoil and
Combined Soil Segment (SPADE/M)
As could be expected from the analysis of the change in SOC content with depth, the
relationship differs for soils with a mean SOC content of less than approximately 15-
20% for the soil segment 0-100 cm from those with a higher mean SOC content. For a
linear regression the x-coefficient for the relationship of the mean SOC content in the
topsoil versus the soil segment 0-100 cm was found to be:
(r
minmin
1000 542.0 TOP
SOCSOC ×=
−
2: 0.87, 268 dF)
y-offset set to 0: (r
org
TOP
org SOCSOC ×=
−034.1
1000
2: 0.69, 8 dF)
y-offset calculated: (r
7.10799.0
1000 +×=
−
org
TOP
org SOCSOC 2: 0.76, 7 dF)
For a linear regression of the topsoil versus the subsoil mean SOC content the
parameters found were:
(r
minmin 323.0 TOPSUB SOCSOC ×= 2: 0.52, 260 dF)
For organic soils in the profile data it was found to be:
y-offset set to 0: (r
org
TOP
org
SUB SOCSOC ×= 830.0 2: 0.33, 16 dF)
y-offset calculated: (r
8.4948.0 −×= org
TOP
org
SUB SOCSOC 2: 0.34, 15 dF)
The results support the previous proposition that there is a marked difference in the
relationship of mean SOC contents between mineral and organic soils. For a regression
with a y-offset forced to 0 the difference on the x-coefficient for mineral and organic
18

Distribution of Organic Carbon in Soil Profile Data
soil or peat is significant at a 95% confidence level. The regression parameters
separated by land cover type are given in Table 3.
Table 3: Parameters of Linear Regression between SOC Content of Topsoil, Soil
Segment 0-100 cm and Subsoil (SPADE/M)
Regression Analysis
Land Use Type
Slope
Coeff. Coeff.
Determi-
nation
Lower
Limit
(95%)
Upper
Limit
(95%)
TOP vs. 0-100
Arable <18% OC 0.615 0.88 0.590 0.639
Forest <18% OC 0.497 0.85 0.459 0.536
Grass < 18% OC 0.545 0.92 0.508 0.582
Non-Classified 0.498 0.90 0.467 0.528
TOP vs. SUB
Arable <18% OC 0.4384 0.62 0.408 0.476
Forest <18% OC 0.277 0.49 0.222 0.331
Grass < 18% OC 0.343 0.73 0.290 0.396
Non-Classified 0.274 0.61 0.234 0.315
It should be noted that the seemingly linear relation of mean SOC content between the
two layer depths does not imply a linear change of SOC with depth. It does, however,
indicate the potential of estimating the mean SOC content in the 0-100 cm soil segment
by the mean SOC content in the first 30 cm. The variations in the x-coefficient for
various depths in the profile down to 100 cm can be estimated from the correlation
between the slope of the relationship of SOC content and depth with the mean SOC
content of a profile.
The results of the analysis of comparing the mean topsoil SOC content to the soil
segment 0-100 cm is subject to restrictions imposed by including the topsoil data in the
dependent variable. Subsequently, when comparing the mean topsoil SOC content to the
subsoil the relationship becomes less well defined. One reason is that the analysis is
based on all profiles regardless on the soil type. Therefore, included are also profiles,
where the soil type indicates a clear distinction in the SOC content between the horizons
of a profile. The profiles where an organic topsoil (>18% SOC content) is aligned to a
mineral subsoil (<12% SOC content) are classified as Podzols. Of the 21 profiles
classified as Podzols 8 show an organic layer, which extends at time no more than 2cm.
The inverse condition, i.e. a mineral horizon over an organic horizon, is not present in
the profiles in the dataset.
19
Distribution of Organic Carbon in Soil Profile Data
When restricting the variation in SOC content between profile horizons to a SD of 10
the regression coefficient for all profiles regardless of the mean SOC content and a y-
offset of 0 is 0.956, with a coefficient of determination (r2) of 0.90. The high value for
the coefficient of determination is somewhat misleading, since the few profile data for
organic soils and peat control the x-coefficient of the regression and the fit although a
significant difference in the x-coefficient depending on soil type has been established.
Consequently, given the diverse characteristics of the SOC content with depth between
mineral and organic soils it seems to be improper to combine the profile data of mineral
and organic soils into a single population and to determine the relationship between the
topsoil and subsoil SOC content by using a linear regression. Instead, for the analysis of
SOC content and depth mineral soils should be treated separately from organic soils and
peat. While there is a clear distinction in the relationship for profiles with a mean SOC
content <12% and >20%, the situation for soils with mean SOC contents in-between is
not evident from the data.
The evaluation of the slope coefficient of the relationship between SOC content and
depth and the mean SOC content of the soil segment is based on a linear function with a
logarithmic transformation of depth and no transformation for SOC content. For each
profile i it can be formulated for a depth d as:
(
)
iidi bdmSOC +×= ln
,
Using any other combination of transforming SOC content and/or depth resulted in
comparable performance describing SOC content and depth in individual profiles, but
no relationship could be found between the coefficients and the mean SOC content of
either topsoil or subsoil.
The relationship between the coefficients and the mean SOC content of a given soil
segment S can be formulated as:
SSSi bSOCmm
+
×
=
The relationship between the y-offset, when used, and the mean SOC content of a given
soil segment is formulated accordingly.
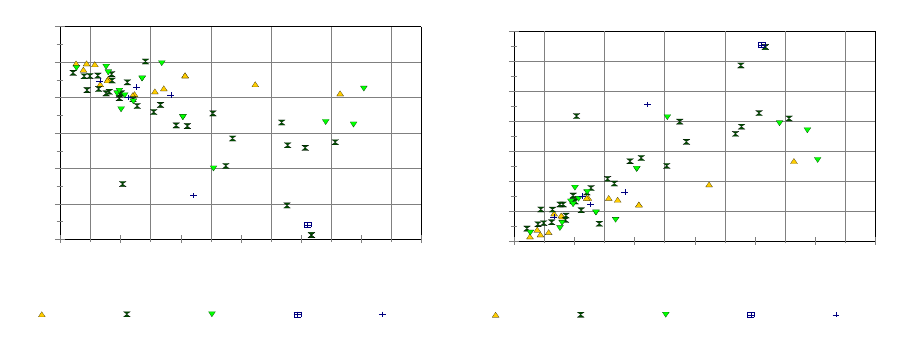
A graphical presentation of the relationship between the mean SOC content of the
topsoil and the regression parameters is given in Figure 9.
20
Distribution of Organic Carbon in Soil Profile Data
-10
-8
-6
-4
-2
0
2
Slope Coefficient m
0 2 4 6 8 10 12
Mean Profile SOC 0-30 cm (%)
Arable Forest Grassland Shrub Not specifie
d
0
5
10
15
20
25
30
35
Constant b
0 2 4 6 8 10 12
Mean Profile SOC 0-30 cm (%)
Arable Forest Grassland Shrub Not specifie
d
a) Topsoil SOC Content vs. Coefficient b) Topsoil SOC Content vs. Constant
Figure 9: Relationship between Mean SOC Content and Model Slope Coefficient and
Constant for Soil Section 0-30 cm by Land Cover Type (SPADE/M)
The range of SOC content values covered by the analysis is unavoidably restricted to
mineral soils, because in the dataset organic soils and peat have less than 3 horizons for
that depth. From the graph a distinctly different relationship between SOC content and
depth for soils on arable land and forest can be perceived. In soils under forest SOC
content decreases at a much more rapid rate than on arable land (difference in x-
coefficient significant at 95% confidence level).
The regression parameters for soils on arable land and under forest are:
623.0147.0 −×−= TOP
arable
TOP SOCm (r2: 0.30, 12 dF)
532.0674.0 −×−= TOP
forest
TOP SOCm (r2: 0.57, 29 dF)
Soils under grassland occupy an intermediate condition and with the variability in
values are not sufficiently distinct from either. For soils under shrub only one profile is
available and thus no comments on a correlation of SOC content and depth in relation to
land cover type can be pronounced.
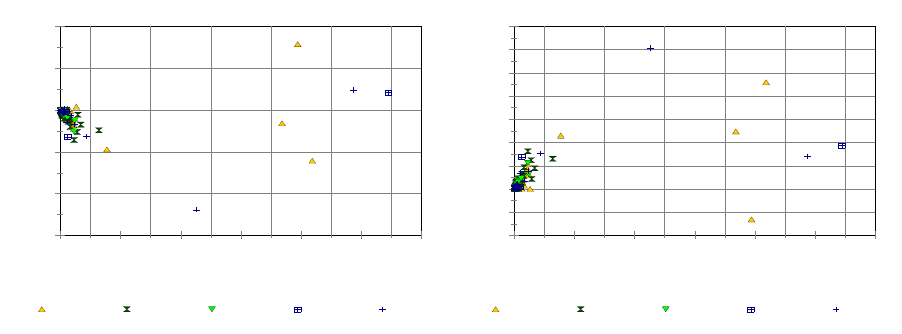
For the subsoil segment the coefficient of the correlation between SOC content and
depth is shown in Figure 10.
21
Distribution of Organic Carbon in Soil Profile Data
-30
-20
-10
0
10
20
Slope Coefficient m
0 10 20 30 40 50 60
Mean Profile SOC 30-100 cm (%)
Arable Forest Grassland Shrub Not specifie
d
-40
-20
0
20
40
60
80
100
120
140
Constant b
0 10 20 30 40 50 60
Mean Profile SOC 30-100 cm (%)
Arable Forest Grassland Shrub Not specifie
d
a) Subsoil SOCC Content vs. Coefficient b) Subsoil SOC Content vs. Constant
Figure 10: Relationship between Mean SOC Content and Model Slope Coefficient
and Constant for Soil Section 30-100 cm by Land Cover Type
(SPADE/M)
The relationship between the x-coefficient of the correlation of SOC content and depth
for soil on arable land and under forest observed for the topsoil is also discernable for
the subsoil section. With data for 18 profiles under grassland a correlation could also be
defined for this land cover type. The regression x-coefficients for soils with a mean
SOC content <18% in the soil segment by land cover type are:
147.0153.1 +×−= SUB
arable
SUB SOCm (CI95: -1.297 to -1.008, r2: 0.71, 103 dF)
317.0998.0 −×−= SUB
forest
SUB SOCm (CI95:-1.291 to -0.706, r2: 0.55, 39 dF)
198.0655.1 +×−= SUB
grass
SUB SOCm (CI95: -2.139 to -1.171, r2: 0.77, 16 dF)
010.0168.1 +×−= SUB
all
SUB SOCm (CI95: -1.298 to -1.038, r2: 0.62, 189 dF)
In the profile data the x-coefficient of SOC content and depth for grassland appears
distinct from those of other land cover types. The difference is significant at a 90%
confidence level, but not at 95%. For the 6 profiles of organic soils and peat no specific
relationship with land cover can be differentiated, regardless of whether the profile with
a mean SOC content of 22% was included or not.
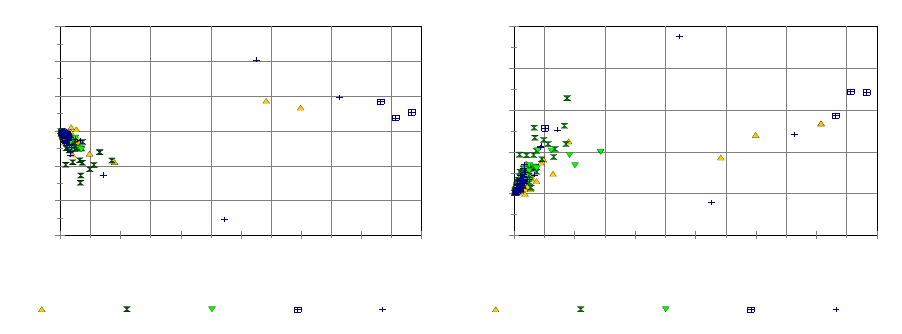
The relationship between the average SOC content to a depth of 100 cm and the slope
and constant for the model function using all profiles with a coverage of >=75% of the
soil section with data are given in Figure 11.
22
Distribution of Organic Carbon in Soil Profile Data
-15
-10
-5
0
5
10
15
Slope Coefficient m
0 10 20 30 40 50 60
Mean Profile SOC 0-100 cm (%)
Arable Forest Grassland Shrub Not specifie
d
-20
0
20
40
60
80
Constant b
0 10 20 30 40 50 60
Mean Profile SOC 0-100 cm (%)
Arable Forest Grassland Shrub Not specifie
d
a) Profile SOC Content vs. Coefficient b) Profile SOC Content vs. Constant
Figure 11: Relationship between Mean SOC Content and Model Slope Coefficient
and Constant for Soil Section 0-100 cm by Land Cover Type
(SPADE/M)
For the 21 profiles the distribution across the four land cover classes is as follows:
Arable: 139, Forest: 50, Grassland: 24, Shrub: 6 and for non specified land cover 52.
For the complete segment the differentiation in the change in SOC content with depth
between profiles on arable land and under forest of the topsoil is blurred by the
indistinct relationship within the subsoil layer. For profiles with high values for
SOC0-100 the dataset contains suitable data only for profiles under arable land (2) and
shrub (3).
The variables describing a linear relationship between the SOC content and depth with
the mean SOC content of the soil segment covering the soil section 0-100 cm are
defined separately for mineral and organic soils as:
139.0515.0 100018 −×−= −< SOCmarable
SOC (CI95: -0.591 to -0.439, r2: 0.57, 135 dF)
844.0676.0 100018 −×−= −< SOCm forest
SOC (CI95:-0.882 to -0.470, r2: 0.48, 48 dF)
270.0680.0 100018 −×−= −< SOCmgrass
SOC (CI95: -0.909 to -0.451, r2: 0.63, 22 dF)
189.0699.0 100018 −×−= −< SOCmall
SOC (CI95: -0.778 to -0.620, r2: 0.54, 261 dF)
7.12180.0 100018 +×−= −≥ SOCmall
SOC (CI95: -0.398 to +0.038, r2: 0.47, 5 dF)
When using the complete soil segment of 0-100 cm no significant differences in the
slope coefficient of the relationship between SOC content and depth can be identified
for any specific land cover type. A significant difference exists for the coefficient of
profiles on arable land from the combined profiles.
23
Distribution of Organic Carbon in Soil Profile Data
For soils with a SOC content of >18% only 7 profiles could be included in the analysis.
Although the mean profile SOC content and the slope coefficient of the correlation
between SOC content and depth shows a coefficient of determination of 0.47 there may
not be a correlation at all at a 95% confidence level. To better evaluate the issue data
from more profiles are needed.
Noticeable in the subsoil section is one profile with a mean SOC100 content of 27.3%.
The profile is fully described by horizons and shows a continuous decrease in SOC with
depth from 38.3% (0-30 cm) to 14.4% (70-100 cm). There is no abrupt change indicated
by the standard deviation for the profile (SD = 8.9). For the profile no information on
soil type or land cover is available. This profile was not included when computing the
effect of mean SOC content on the slope coefficient and constant but left in the graph to
illustrate that there are situations outside the general conditions.
When associating the mean SOC content of the topsoil section to the slope coefficient
of the relation between SOC content and depth for the subsoil section the situation
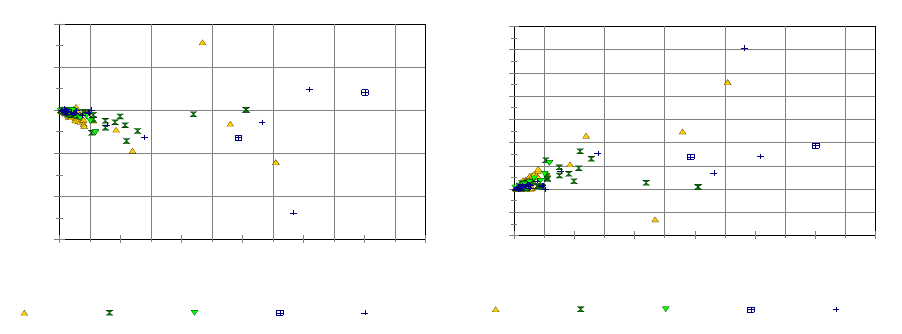
illustrated in Figure 12 was found.
-30
-20
-10
0
10
20
Slope Coefficient m 30-100cm
0 10 20 30 40 50 60
Mean Profile SOC 0-30 cm (%)
Arable Forest Grassland Shrub Not specified
-40
-20
0
20
40
60
80
100
120
140
Constant b for 100cm
0 10 20 30 40 50 60
Mean Profiel SOC 0-30 cm (%)
Arable Forest Grassland Shrub Not specifie
d
a) Topsoil SOC Content vs. Subsoil Coefficient b) Topsoil SOC Content vs. Subsoil Constant
Figure 12: Relationship between Mean SOC Content for Topsoil and Model Slope
Coefficient and Constant for Subsoil by Land Cover Type (SPADE/M)
The results of the regression analysis of the topsoil mean SOC content with the slope
coefficient of the change on SOC content in the subsoil were:
a) for SOC30 ≤ 18%
349.0661.0
18 +×−=
<SUB
arable
SOC SOCm (CI95: -0.731 to -0.591, r2: 0.78, 101 dF)
297.0461.0
18 +×−=
<SUB
forest
SOC SOCm (CI95:-0.514 to -0.318, r2: 0.67, 37 dF)
149.0380.0
18 +×−=
<SUB
grass
SOC SOCm (CI95: -0.514 to -0.246, r2: 0.71, 15 dF)
173.0463.0
18 +×−=
<SUB
all
SOC SOCm (CI95: -0.510 to -0.417, r2: 0.69, 185 dF)
24
Distribution of Organic Carbon in Soil Profile Data
b) for SOC30 > 18%
9.4222.0
18 +×−=
≥SUB
all
SOC SOCm (CI95: -1.220 to 0.777, r2: 0.03, 8 dF)
The result of the regression analysis displays some differentiation in the slope
coefficient between land cover types. The decrease in the slope coefficient of the
relationship between SOC content and depth in the subsoil with an increase in the mean
SOC content in the topsoil is more pronounced for soils on arable land and under grass
than for soils under forest. The differences for forest soils are not enough to reject the
hypothesis that there is no difference at the 95% confidence level, but are at a
confidence level of 90%.
The analysis of the conditions found in the topsoil and subsoil of the profiles suggests
that changes in SOC content occur for soils under forest mainly in the topmost 30 cm.
For grassland the changes in the subsoil are more pronounced than for soils under
forests or on arable land. The description of the relationship of SOC content and depth
by a first order polynomial, albeit with a transformation of one axis, does not allow
representing the differences in the behaviour found between the topsoil and the subsoil
when describing the relationship for the complete soil segment from 0-100 cm. Given
the nature of the differences they are compensated for when integrating all profile
horizons. To better describe the relationship of SOC content with depth a higher-order
polynomial could be convenient. Yet, with a limited number of horizons describing the
changes in SOC content with depth only a simplistic function can be used.
The slope coefficient of the function decreases significantly with a decrease in the
average SOC content and shows a tendency to increase for soils with a SOC content
above 30%. Therefore, the two situations encountered are treated separately for soils
with a mean SOC content above or below 18%:
a) for SOC30 ≤ 18%
minmin 464.0 TOPSUB SOCm ×−= ,
minmin 173.0 TOPSUB SOCb ×=
Since the regression was calculated with 0 as y-offset the SOC content at any depth
in the subsoil section relative to the mean SOC content of the topsoil section can be
estimated by:
()
minmin
min 173.0)ln(464.0 TOPTOP
SUB SOCdSOCdSOC ×+××−=⇒
b) for SOC30 > 18% the relationship can only be approximated by using the slope
coefficient of the complete soil section from 0-100 cm related to the topsoil SOC
content:
704.3012.0
1000 +×+=
−
org
TOP
org SOCm ,
390.5858.0
1000 −×=
−
org
TOP
org SOCb
25
Distribution of Organic Carbon in Soil Profile Data
The profiles for organic soils and peat are not sufficiently comprehensive to establish a
correlation between SOC content and depth for those soils with any confidence. The
findings suggest that under the circumstances it would be preferable to use a constant
slope coefficient independent of SOC content of the topsoil. The function for estimating
subsoil SOC content at a given depth from the topsoil SOC content is then:
()
390.5858.0)ln(704.3 −×+×=⇒ org
TOP
org
SUB SOCddSOC
The separation of the soils in mineral and organic and peat leaves some uncertainty as to
the changes in SOC content with depth for soils with a mean SOC content of 12 to 25%.
3.1.5 Influence of Depth of Soil Stratum
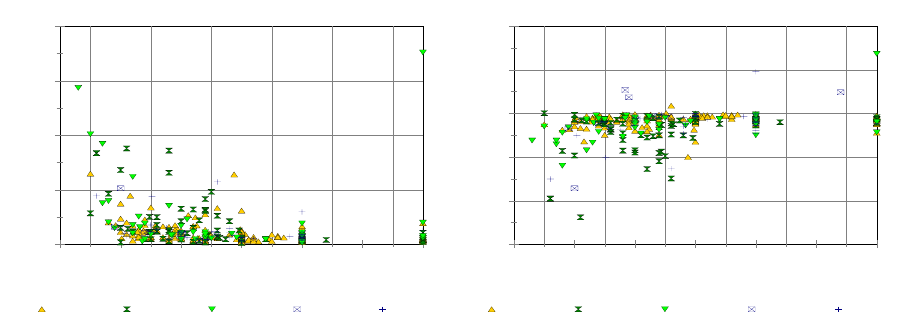
The relationship between the profile mean SOC content and the depth of the soil
stratum for mineral soils and the slope coefficient for all profiles are presented in Figure
13.
0
5
10
15
20
Mean SOC Content (%)
0 50 100 150 200 250 300
Profile Depth (cm)
Arable Forest Grassland Shrub Not specifie
d
-15
-10
-5
0
5
10
Slope Coefficient m
0 50 100 150 200 250 300
Profile Depth (cm)
Arable Forest Grassland Shrub Not Specifi
e
a) Profile Depth vs. SOC Content b) Profile Depth vs. Slope Coefficient
Figure 13: Mean SOC Content for Profile and Change in Model Slope Coefficient
with Depth of Profile (SPADE/M)
For mineral soils the profile data show a tendency towards higher mean SOC content
values and shallower profiles. This trend would appear to be prevalent for soils in
forests and under grassland. When restricting the profiles to those with a standard
deviation of <10 for the horizon SOC content the trend is no longer discernable. One
may conclude from the observation that in the dataset forest and grassland are found
more frequently on soils with higher variations of SOC in the profile than arable land
26
Distribution of Organic Carbon in Soil Profile Data
and on shallower soils. This could be attributed to land management practices of
establishing land uses according to soil characteristics rather than a dependency of SOC
content on land cover type and depth. With the very limited number of organic soils (7)
no relationship between SOC content and profile depth could be identified.
A general relationship between the model slope coefficient and profile depth could not
be substantiated. As it is the case of the relationship between profile depth and mean
SOC content there would appear to be a decrease in the slope coefficient of the
relationship of SOC content and depth up to a profile depth of 150 cm. No such trend
was apparent for any other vegetation type.
When restricting the analysis to the soil segment 0-100 cm and a SD of <10 the data do
not provide sufficient evidence to define a relationship between SOC content and profile
depth, neither for mineral nor for organic soils. Such a relationship seems to be more
prevalent for mineral soils under grassland than for the other land cover types, but
becomes only relevant when analysing subsoil properties at depths lower than 100 cm.
3.1.6 Influence of Clay Content
It has been found that the SOC content is influenced by the amount of clay in the soil, in
particular at lower depths and for deeper soils. A comparison in the subsoil segment
between the clay and SOC content for profiles with an increasing clay content with
depth in the subsoil and those with a decrease is given in Figure 14.
0
1
2
3
4
5
SOC Content 30-100cm
0 20 40 60 80
Increasing Clay Content 30-100 (%)
Arable Forest Grassland Shrub Not specifie
d
0
2
4
6
8
SOC Content 30-100cm
0 10 20 30 40 50 60 70
Decreasing Clay Content 30-100 (%)
Arable Forest Grassland Shrub Not Specifi
e
a) Increasing Subsoil Clay Content vs. SOC b) Decreasing Subsoil Clay Content vs. SOC
Figure 14: Relationship Between Increasing and Decreasing Clay and SOC
Content in Profile Subsoil Section
The graphs plot data from the 187 subsoil profiles, of which 88 show an increase in clay
content with depth and 99 profiles show a decrease. For the subsoil the SOC content
27
Distribution of Organic Carbon in Soil Profile Data
shows a weak tendency to increase with clay content for profiles where the clay content
increases. The tendency seems to be most prevalent for profiles taken on arable land,
whereas for profiles taken under forests or grassland no particular relationship could be
found. While the data point towards a relationship between an increase in subsoil clay
content and SOC content in the subsoil when the clay content exceeds 50%, the
coefficient of determination for the general relationship is only 0.33.
A relationship between the clay content in the subsoil and SOC content for profiles with
a decrease in clay content could not be substantiated by the profile data. Rather it would
appear that for the profiles taken in forests SOC content decreases with clay content.
However, the data do no provide sufficient evidence that such a trend exists.
Not investigated in any detail could be the additional influence of profile depth on the
relationship due to the limited number of data. The dataset contains 12 profiles with a
lower end of the profile of <100 cm and where the clay content increases in the subsoil
section (9 for profiles with a decrease in clay content). Even when analysing the data to
a depth of 300 cm no particular influence of the profile depth on the relationship of clay
on the SOC content in the subsoil was found.
The lack of identifying any relation of clay content with the coefficient characterizing
the change in SOC content with depth does not as such corroborate the absence of a
relationship between the parameters. It only implies that no reliable relationship can be
established based on the available data. There may well be such a relationship for a
specific soil type. To identify any relationships for specific soils and land cover types
data form more profiles would be needed.
3.1.7 SOC Content by Major Soil Category
The mean SOC content in the topsoil and subsoil sections by FAO85 Level I soil
category are given in Table 4.
28

Distribution of Organic Carbon in Soil Profile Data
Table 4: SOC Content by Soil Category (SPADE/M)
Soil FAO85 Arable Forest Grass Shrub ALL
Topsoil
Subsoil
No. of
Profiles
Topsoil
Subsoil
No. of
Profiles
Topsoil
Subsoil
No. of
Profiles
Topsoil
Subsoil
No. of
Profiles
Topsoil
Subsoil
No. of
Profiles
Acrisol 2.2 0.4 2 2.2 0.4 2
Cambisol 1.6 0.6 16 4.2 0.9 11 2.3 0.5 6 2.6 0.7 49
Chernozem 1.8 1.2 8 1.8 1.2 8
Podzoluvisol 1.8 0.4 4 1.9 0.4 2 1.8 0.4 6
Rendzina 1.5 0.5 1 1.8 0.4 1 1.6 0.5 2
Gleysol 1.3 0.8 3 5.1 2.4 1 2.5 1.2 8
Phaeozem 2.4 1.2 15 4.6 1.8 2 2.7 1.3 17
Fluvisol 1.4 0.9 10 2.4 0.7 1 1.4 0.8 16
Kastanozem 4.7 3.0 3 4.7 3.0 3
Luvisol 1.1 0.3 28 2.0 0.4 5 1.9 0.9 5 1.5 0.7 1 1.5 0.4 51
Greyzem 3.1 0.4 1 3.1 0.4 1
Histosol 20.3 27.5 3 11.6 40.8 1 49.1 47.1 5 35.0 38.9 12
Podzol 1.7 0.7 6 14.3 4.4 6 1.8 0.4 1 29.3 1.2 1 9.6 1.9 18
Arenosol 0.4 0.2 3 1.4 0.3 5 0.8 0.3 12
Regosol 0.8 0.2 1 0.8 0.2 2
Solonetz 2.1 1.0 2 1.8 0.9 3
Andosol 10.4 5.0 3 11.3 4.8 4
Vertisol 1.5 0.9 9 0.6 0.3 1 1.4 0.9 11
Planosol 0.4 0.2 1 2.1 0.6 1 1.2 0.4 2
Xerosol 0.9 0.4 1 1.3 0.9 1 1.1 0.6 2
Solonchak 1.0 0.8 2 1.2 0.4 1 0.9 0.5 5
All 2.1 1.5 116 5.1 1.5 37 3.1 3.1 1830.9 26.5 9 4.3 2.8 234
bold: defined by 10 or more profiles
The table provides the mean topsoil and subsoil SOC content for 21 soil classes by main
land use type. When including profiles without land use information the total number of
profiles is 234. The number of profiles assigned to a soil category varies considerably
between the categories, but also between land uses. By far the most profiles are
available for Luvisol (51) and Cambisol (49). For all other soil categories less than 20
profiles could be analysed for topsoil and subsoil SOC content. Most soil classes are
found for arable land (18), followed by forest (10), grass (8) and shrub (5).
The variability of the mean topsoil and subsoil SOC contents between land uses for a
given soil class and the low number of observed data available for most combinations
makes specifying any general trends rather uncertain. The mean SOC contents for shrub
areas, where one profile extensively shifts the whole ratio, illustrate this. Given the
29
Distribution of Organic Carbon in Soil Profile Data
variability between land uses the selective geographic positioning of the profiles may
further introduce bias into estimating a ratio between topsoil and subsoil SOC content.
The mean of all profiles indicates that the subsoil SOC content is 65% of the topsoil
SOC content. However, when using only mineral soil layers the ratio drops to 35%
while parity is achieved for soils with organic layers. Very similar results are obtained
when selecting profiles based on the soil category, i.e. when separating Histosols from
other soil types (33% without Histosols, 111% for Histosols alone). Soils with
potentially distinct differences in SOC content between the topsoil and the subsoil, such
as Podzols, show more divergent ratios and should be treated separately.
30

Distribution of Organic Carbon in Soil Profile Data
3.2 Forest Monitoring Soil Survey Data
A rarely used source of information on soils from ground sampling is available from the
long-term monitoring programme of air pollution effects on forests. The monitoring
activity and the network of plots is implemented for Member States of the European
Union under Council Regulation (EEC) No 3528/86 and Regulations (EEC) No 1696/87
and (EC) No 1091/94. "Regulation (EC) No. 2152/2003 of the European Parliament
and of the Council of 17 November 2003 concerning monitoring of forests and
environmental interactions in the Community (Forest Focus)”1. Forest Focus continues
from the previous regulations as a Community scheme for harmonized, broad-based,
comprehensive and long-term monitoring of European forest ecosystems. It is linked to
one of the six International Cooperative Programmes (ICPs) concerned with the
Assessment and Monitoring of Air Pollution Effects on Forests (ICP Forests), which
acts under the Working Group on Effects of the “Convention on Long-range
Transboundary Air Pollution” (CLRTAP) of the programme for the environment of the
“United Nations Economic Commission for Europe“ (UNECE). The monitoring activity
collects data at two distinct levels serving different needs:
• systematic network of observation points (Level I);
• network of observation plots for intensive and continuous monitoring (Level II).
Data sampled at the plots are reported independently and stored using comparable data
models, but different tables in the Forest Focus Monitoring Database at the JRC.
3.2.1 Soil Condition Survey Data
The soil parameters to be assessed and the methods to be used for collected data at
Level I and Level II plots are defined in Sub-Manual III of the ICP Forests Manual
(UN/ECE, 2006)2. Particularities of the sampling specifications are:
1. Organic and Mineral Layer
The forest soil condition survey distinguishes between an upper organic layer and an
underlying mineral soil layer. The organic layer is defined based on the FAO
definition (FAO, 1990a, Guidelines for soil description, 3rd (revised) edition). The
organic layer is further divided into horizons of litter, fermentation horizon and/or
humus. The litter horizon includes not yet decomposed dead plant material. Other
soil sampling surveys use a different approach by removing any not decomposed
organic material from the sample, e.g. when sampling on arable land. Those
differences in the sampling method of organic material can introduce variations
when the Forest Focus data are compared to those collected from other surveys.
1 OJ L 324, 11.12.2003, p. 1-8
2 http://www.icp-forests.org/pdf/Chapt_3a_2006(1).pdf
31
Distribution of Organic Carbon in Soil Profile Data
2. Differentiation within Organic Layer
The organic material is mainly reported as a single layer, although for 16 plots in the
Level II data more than 2 organic layers are reported. For all plots with multiple
organic layers the information is insufficient to define the change in SOC content
with depth according to the selection conditions. As a consequence of having a
single value of OC for the organic layer, the character of the changes of OC with
depth is generally not well defined for the upper section of the soil.
3. Sampling within Layers of Fixed Thickness
The purpose of the soil assessed at the sites of the sample plots was not to fully
describe the soil profiles but to provide an appreciation of the soil conditions present
at a plot. This purpose of the data collection impacts on the nature and completeness
of the data recorded in the datasets. On Forest Focus plots soil parameters are
sampled within layers of a fixed depth. The Sub-Manual for soil sampling stipulates
for the mineral layer depths of 0-10 cm, 10-20 cm, 20-40 cm and 40-80 cm. The
depth of the soil layer is not recorded, although in few cases data from depths below
80 cm were included in the profile data. As a consequence the soil properties for the
lowest layer are assigned to the mean layer depth of 60 cm. In order to allow any
analysis of the subsoil layer the minimum data coverage of the subsoil layer was set
to 75%.
4. Organic Carbon and Bulk Density
For the organic layer the OC content (g kg-1) and the dry weight of the layer (kg m-2)
are recorded in the database, but not the layer thickness. It is thus straightforward to
compute OC quantities for the organic layers, although not bulk density or SOC
density (no figure to compute volume). For the mineral layers the OC content is
recorded together with bulk density (kg m-3). Measurements of bulk density are
mandatory only for the 0-10 cm layer and OC for the 0-10 cm and the 10-20 cm
layer. Assessing the parameters for other layers is optional.
3.2.2 Pre-Processing Data
The distinctiveness of the sampling approach for Forest Focus soil data from a standard
description of a soil profile by pedological horizons requires specific care to be taken
when comparing data between surveys. Level II data contains significantly more data on
the subsoil section and is used to exemplify the conditions found when preparing the
data for comparison with information provided by a survey based on identifying
pedological profile.
Treatment of Organic Layer in Depth Analysis
Since the relationship between SOC content and depths is non-linear and also dependent
on the total amount of SOC in the soil section the presence of an organic layer in soil
section will influence the character of the relationship even when restricting the analysis
to the mineral layer. This influence has been further evaluated.
32
Distribution of Organic Carbon in Soil Profile Data
a) Identify Organic Layer
Before the organic layer can be processed it has to be identified. Separating the
organic form the mineral layer in the data is not quite as evident as it may at first
seem. The most obvious choice is to filter any O or H layers. However, this
leads to some inconsistencies with the FAO definition for organic soil material,
which defines the material as organic for OC contents between 12 and 20%,
depending on clay content and the status of water saturation. (FAO,
http://www.fao.org/docrep/W8594E/w8594e0b.htm#organic%20soil%20materia
l).
In the Level II dataset 75 layers are defined as mineral with an OC content of
>12% and 24 with an OC content exceeding 20%, with a maximum of 41%. At
least the layers with a mean OC content of >20% should have been classified as
organic layers. For the layers with a mean OC content of >12% but <20% the
character of the soil cannot be determined without adequate information on the
clay content and water saturation. Conversely, there are 130 layers defined as
organic with an OC content <20% and 57 layers with an OC <12%, the lowest
with 2.1% OC content. While it may be argued that organic layers other than
those defined as O or H layers can be recorded for a plot, any layer with an OC
contents of <12% should be classified as mineral. With 14% of Level II profiles
containing non-compliant organic and mineral layers including these profiles in
the evaluation of the relationship of SOC content and depth would introduce
inconsistencies into the results.
b) Estimation of Height of Organic Layer
Without information on the height of the organic layer in the data the position of
the mineral layers within the profile cannot be determined accurately and
therefore had to be estimated. Such information is not recorded in the dataset
and in the absence of data on bulk density cannot be computed from the
available data.
An approximation of the height of the organic layer can be found by using a
representative figure for bulk density. In the Level II data set values of bulk
density are given for 40 organic layers (O and H) of 18 plots. The average value
for those layers is 0.18 g cm-3. Of the 40 layers 4 have OC contents below 20%.
For one plot with 3 organic layers with varying OC content identical values of
0.42 g cm-3 were reported, while all other layers had values of <0.2 g cm-3.
Those plot values were disregarded and the mean bulk density of the remaining
organic layers was 0.13 g cm-3. This value was used to estimate the height of the
organic layers.
In the absence of adequate information on clay content and water status the
layers cannot be re-classified according to the FAO definition; neither can the
OC values be adjusted. With the height of the organic layer estimated by a fixed
value for bulk density applied should be a limit to the profiles, where the OC
content values are below the corresponding value used to estimate bulk density.
Otherwise the height of the organic layer would be largely overestimated and the
33
Distribution of Organic Carbon in Soil Profile Data
position of the mineral layers in the soil section would shift to deeper levels and
obscure any trend in the changes of OC content with depth. The minimum OC
content of the organic layers to include the profile in the analysis was therefore
set to 20%. Any data on saturated organic layers (H) with depth information
attached were also included in the analysis. When a layer did not conform to the
conditions the whole profile was excluded from the analysis rather than only the
layer. No restrictions of limiting the OC content were applied to the mineral
layers, for which a depth was assigned.
c) Effect of Treatment of Organic Layer Height
The consequences of including the OC content of the organic layer(s) and
shifting the mineral layers on the relationship between OC content and depth in
the profile was investigated using the following approaches to treat the layer
data:
1. Use only mineral layer information (M layers) for SOC content and depth.
2. Shift mineral layers by estimated depth of O and H layer, but use only SOC
content from mineral layers.
3. Shift mineral layers by estimated depth of O and H layer and including O
and H layers when computing mean OC content.
Varied was further the effect of treating the uppermost section of the soil by
eliminating a fixed depth of 5cm. The value of 5cm was chosen because it was
quoted in the database as the nominal depth for the organic layer and is the
smallest height of a mineral layer. A value of 2.5cm was included to allow some
measure of appraising where changes in the topmost section occur.
Consistency of the SOC content changes with depth in the profiles is provided
by limiting the standard deviation of the SOC content in the pedological
horizons or sampling layers. Because the variation within the profile can be
expected to vary significantly depending on the treatment of the organic layer in
the profile various thresholds of the standard deviation were include in the
analysis.
The outcome of the treatment applied to define the profile structure was
evaluated based on two indicators:
• the number of profiles compliant with the conditions and
• the coefficient of a linear regression by pairing the mean profile SOC content
with the slope coefficient m of the function relating SOC content to depth,
referred to as the x-coefficient of the SOC depth slope.
The latter indicator is used because the change in SOC content with depth is
strongly correlated to the mean SOC content in a profile and because the mean
SOC content varies substantially with the treatment of the organic layer in the
profile. As a consequence, any significant effects of the treatment of the organic
layer and variations of the processing parameters on the indicator implies that
the relationship between SOC content and depth depends on the choice of the
34
Distribution of Organic Carbon in Soil Profile Data
treatment and thresholds. This seemingly obvious deduction signifies that the
unavoidable treatment of the organic layer data may very much restrict
comparing the results obtained form the Forest Focus Soil Condition database
with those sampled by other soil surveys.
The outcome of the various options of treating the organic layer on the number
of profiles and the coefficient of the SOC depth slope are given in Table 5.
35

Distribution of Organic Carbon in Soil Profile Data
Table 5: Effect of Treating Organic Layer on Number of Profiles and x-Coefficient
of the SOC Depth Slope
Use Height and
OC Content of
O/H Layer(s)
Use Height
of O/H
Layer(s)
Start of
Profile
from Top
Limit for Std.
Dev. of Profile
OC Content
No. of Profiles
Compliant with
Conditions
Regression on
Coeff. of OC
Slope Coeff.
N N
0 100 576* -0.566
20 576* -0.566
12 576* -0.544
6 564 -0.474
2.5 100 575* -0.546
20 575* -0.546
12 575* -0.526
6 564 -0.462
5.0 100 575* -0.480
20 575* -0.480
12 575* -0.480
6 573 -0.441
N Y
0.1 100 374 -0.664
20 374 -0.664
12 373 -0.589
6 364 -0.507
2.5 100 374 -0.671
20 374 -0.671
12 372 -0.671
6 364 -0.511
5.0 100 371 -0.682
20 371 -0.682
12 369 -0.602
6 362 -0.542
Y Y
0 100 387 -0.825
20 374 -0.973
12 110 -0.444
6 11 -0.369
2.5 100 387 -0.986
20 376 -1.224
12 244 -0.824
6 170 -0.364
5.0 100 383 -1.038
20 375 -1.289
12 303 -0.815
6 258 -0.450
* 1 profile removed from comparison due to anomalous arrangement of layers within profile.
36
Distribution of Organic Carbon in Soil Profile Data
The table shows a significant difference in the number of profiles found to comply with
the conditions set and the relationship between the slope coefficient of change in SOC
with depth and the SOC content in the soil section.
The main results of the analysis are:
1. Use only mineral layer information (M layers) for OC content and depth
When the information of the organic layers is not used the largest number of
profiles passes the pre-processing conditions set. The number of profiles varies
very little over the range of standard deviations limits. Notable is a general
decrease in the coefficient of the SOC depth slope when lowering the topmost
depth level of information. This behaviour can be expected in the presence of a
non-linear relationship between SOC content and depth.
2. Shift mineral layers by estimated depth of O and H layer, but use only OC
content from mineral layers
When taking the height of the organic layer into account to estimate the start of
the mineral layers below the surface the number of profiles is considerably less
than when ignoring the organic layers. The main reason is that this particular
approach to pre-processing excludes all profiles where the presence of an
organic layer is indicated, but no information on the layer weight is provided in
the data. The number of profiles remains quite stable regardless of the
restrictions set on the start of the layer or the variation of SOC content values
within the profile. Contrary to the trend found when ignoring the organic layer
information the coefficient of the regression further decreases when lowering the
depth of the topmost layer. In the presence of an organic layer on top of mineral
layers lowering the surface actually raises the top of the mineral layer when the
height of the organic layer is more than the height of the slice removed from the
section. As a consequence, the coefficient of the SOC content to depth
relationship increases when the data contains a non-linear relationship between
SOC content and depth.
3. Shift mineral layers by estimated depth of O and H layer and including O
and H layers when computing mean OC content
When including the estimated height and SOC content of the organic layers in
the combination results in a markedly more complex effect on the number of
profiles covered and the coefficient of the OC depth. For a better assessment of
the interactions the more detailed constraint were used for pre-processing
conditions. The results are graphically presented in Figure 15.
37
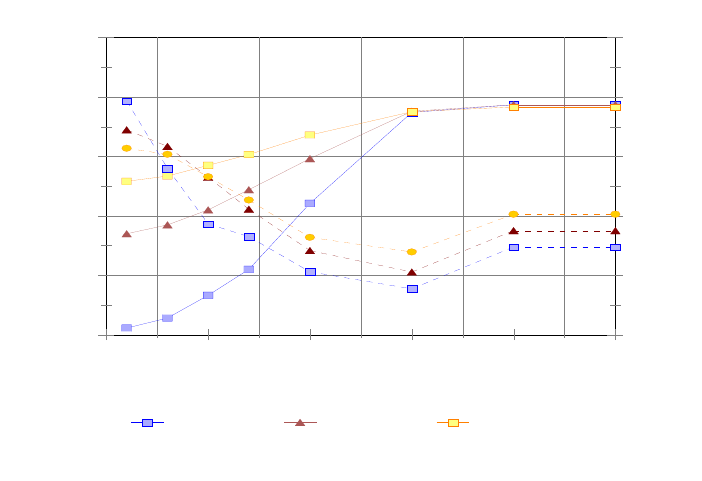
Distribution of Organic Carbon in Soil Profile Data
0
100
200
300
400
500
No. of Plots
-5
-4
-3
-2
-1
0
Regression x-coeff. on OC Depth Slope
5 10 15 20 25 30
Limit on Std. Dev. for OC in Profile
Include O layer Ignore top 2.5 cm Ignore top 5.0 cm
Figure 15: Effect of Various Limits of the Std. Dev. on Profile Number and x-
Coefficient of the SOC Content vs. Depth Slope Factor when Including
Organic Layers (Level II)
For the three topmost sections excluded from the soil profile (0, 2.5 and 5.0 cm)
the number of compliant profiles converges at a SD of approx. 20% to just over
380. As could be expected the number of profiles remaining in the data increases
considerably when larger portions of the topmost soil section are removed from
the profile.
The regression coefficient of the SOC depth slope decreases up to this value to a
local minimum. For the standard deviation of the SOC content values >8 the
regression coefficient of the OC depth slope remains higher for a lower start of
the section within the profile. The rather exceptional behaviour when limiting
the standard deviation to <8 was attributed to the low number of conform
profiles (11).
Neither development exhibits any sudden jumps which could indicate particular
breaks in the composition of profiles with respect to SOC content. The absence
of common sudden changes indicates a lack of clustering of the profile
composition, which would be more difficult to observe when sampling soil
properties by depth layer instead of pedological horizons.
The distribution of the slope coefficient and constant for the logarithmic transformation
of soil depth for changes in mean SOC content for the plot profiles is given in Figure
16.
38
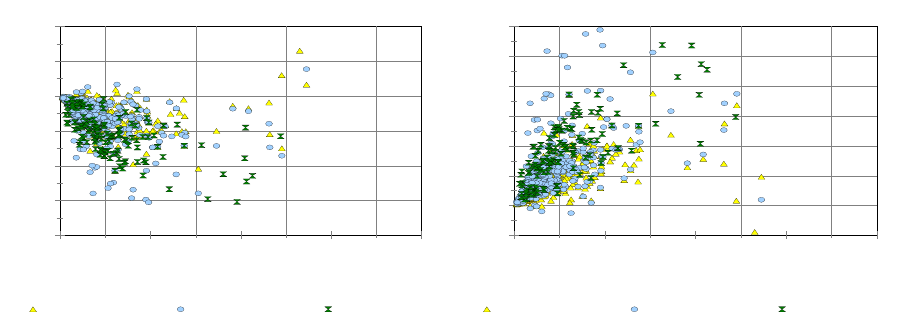
Distribution of Organic Carbon in Soil Profile Data
-40
-30
-20
-10
0
10
20
Slope Coefficient m
0 5 10 15 20
Mean SOC for 100 cm (%)
No depth shift Shift M layers Includes O&H in Mean S
O
-10
0
10
20
30
40
50
60
Constant b
0 5 10 15 20
Mean SOC for 100 cm (%)
No depth shift Shift M layer Includes O&H in Mean S
O
a) Profile SOC Content vs. Coefficient b) Profile SOC Content vs. Constant
Figure 16: Change in Model Slope Coefficient and Constant with Mean SOC for
Complete Soil Section 0-100 cm (Level II)
In the graph the parameters of the linear correlation on the three methods of treating the
organic layer are presented. Without taking the organic surface layer into account the
general trend of a decreasing slope coefficient with depth changes to an increase in the
coefficient for a mean SOC content of approximately 8%. The trends are more
accentuated when including the depth of the organic layer, but no the SOC content of
the layer. The inversion of the trend in the regression parameters is no discernable when
including the depth of the organic layers and the estimated SOC content.
The method of treating the organic layer as a single stratum without further
differentiation leads to large variations in SOC content between the organic and the
mineral layers. This subsequently excludes profiles with a higher SOC content from the
data set used for analysis and precludes an evaluation of the behaviour of SOC content
for organic soils. The change in the trend is still notable when removing the limit on
layer variation on the data set used.
The findings confirm that the height of the organic layer should be accounted for when
evaluating the relationship between SOC content and depth in the soil. Not including
the organic layer information reduces the sensitivity of the relationship between SOC
content and depth and can lead to spurious results. Conversely, fully using the organic
layer information strongly reduces the number of profiles when applying a limit to the
variability of SOC content in the profile. This circumstance is particularly prevalent for
soil profiles in forests where the presence of a thin organic layer over mineral soils is
considerably more widespread than e.g. for profiles taken on arable land. Sampling the
organic layer separately and reporting it regardless of the thickness of the layer, at times
<1cm, only amplifies the effect. Removing the organic layer when it is below a fixed
height increases the number of profiles for a given limit on SOC variability. However,
removing the information on the organic component even only partially from the
analysis directly affects the slope parameter of the relationship of SOC content with
depth. Therefore, this treatment would not appear to be a suitable option when the data
39
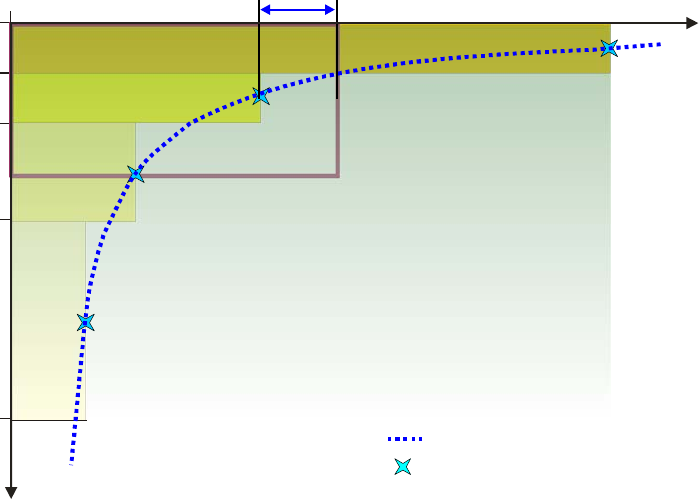
Distribution of Organic Carbon in Soil Profile Data
are processed with the intention of comparing the results with those obtained from other
soil profile datasets.
A possible solution to the problem is to only include the organic layer information in the
calculation of the standard deviation of the soil profile until the thickness of the layer
indicates the presence of a histic or folic horizon, i.e. when the organic layer thickness is
10 cm or more from the soil surface (FAO, 1998). This approach has been taken to use
the Forest Focus Soil Condition data for Level I and Level II plots.
Organic layers with a lower thickness are merged with the underlying layer until the
thickness of the combined layer exceeds 10 cm. Soil properties for the merged layer are
the mean of the individual layers weighted by the portion of the layer thicknesses.
3.2.3 Layer Sampling vs. Pedological Horizons
When evaluating the change in SOC content with depth the sampling method applied
can be of significant consequence when comparing the results obtained. The reasons for
a possible divergence in the coefficients of change can be mainly attributed to the non-
linear change in SOC content with depth and using the central point of a layer as the
depth to which the mean SOC content of a layer is assigned. The situation is
exemplified in Figure 17.
Horizon mid-point
Regression
Δ OC
Layer Depth
Layer OC
Layer
Horizon 4
Horizon 3
Horizon 2
Horizon 1
d
OC
Depth
OC Content
Soil Surface
Figure 17: Sampling Soil Properties by Fixed Layers vs. Pedological Horizons
40

Distribution of Organic Carbon in Soil Profile Data
The figure shows several pedological horizons of a soil profile covered by a single
depth layer. Proportions of SOC content and depth are drawn to scale. For each horizon
and the layer the central depth is indicated. Also indicated is the modelled non-linear
decrease in SOC content with depth as defined by the SOC contents of the horizons and
their central depths. The SOC content of the layer is the SOC content of the horizons
weighted by the thickness of the horizon within the layer calculated as:
∑
=
×=
n
i
i
H
i
HL pOCOC
1
where
OCL: organic carbon content of layer L
OCH: organic carbon content of horizon H
pH: portion of horizon H within layer L
i: horizon within layer
When the decrease in SOC with depths is non-linear the mean SOC content of the layer
at the central layer depth deviates from the SOC content at that position within the
pedological soil profile. Under the condition shown that the layer integrates several
pedological horizons the SOC content at the central depth to the layer overestimates the
equivalent SOC content at that depth in the profile. The difference in the SOC content
(ΔSOC) between the layer and the profile at the depth of the central layer depends on
the actual characteristic of the change of SOC content in the profile. To define the
change in SOC content with depth for a soil profile the SOC content of the layer should
therefore not be assigned to the central depth, but a reduced depth.
For the linear relationship between SOC content and depth using a logarithmic
transformation of the depth parameter the difference in depth Δd can be approximated
by:
b
mOC
L
L
edd
−
−=Δ
where
m: slope coefficient of relationship SOC content and depth
b: constant of relationship SOC content and depth
dL: central depth of layer L
While the computation of Δd is not demanding the validity of the underlying
assumptions very much determines how reasonable it would be to adjust the depth to
which the mean SOC content of a layer is assigned. Under-sampling the pedological
horizons invariably leads to a levelling of the change in SOC content with depth. Over-
sampling a horizon shifts the weight of the layer data in the regression analysis to
misrepresent the relationship. Without ancillary information on the change in SOC
41
Distribution of Organic Carbon in Soil Profile Data
content with depth the difference in the representative depth of the layer in the profile
cannot be reliably determined.
To better understand the effect of sampling layers of fixed depth as compared to
samples taken in pedological horizons the fixed layer sampling was simulated using the
pedological horizon data of the SPADE/M profiles.
There are some practical limitations to the simulation:
• For once, the SOC content of the layers completely within the upper horizon
remains fixed to the SOC content of the horizon. As a result some plots have
identical SOC values for all simulated layers of the layer 0-30 cm. For those
plots no meaningful relationship of changes in SOC with depth can be
determined although a sufficient number of layers are generated by the
interpolation methods to allow computing such changes.
• When the layer depth integrated several horizons of the topsoil the computation
of a rate of change with depth flattens the relationship.
• When layers are spaced too closely in a profile with horizons of variable depth
the repetition of values can introduce an element of bias in the relationship of
SOC content with depth.
Interpolating SOC content for layers from pedological horizons precludes some
knowledge of the change in SOC content with depth. It is not applicable for corrections
of SOC contents, which is a measured property, only to adjust the corresponding depth
to one equivalent to a horizon sample.
The number of layers and their depth intervals were chosen according to the data
sources used:
a) 4 layers FF: 0-10, 10-20, 20-40, 40-80
b) 5 layers FF: 0-5, 5-10, 10-20, 20-40, 40-80
c) 5 layers 0-10, 10-20, 20-30, 30-60, 60-100
d) 6 layers 0-5, 5-10, 10-20, 20-30, 30-60, 60-100
e) 8 layers 0-10, 10-20, 20-30, 30-40, 40-50, 50-60, 60-80, 80-100
f) 9 layers 0-5, 5-10, 10-20, 20-30, 30-40, 40-50, 50-60, 60-80, 80-100.
For sampling 4 or 5 layers the depth intervals of the layers were aligned to the sample
intervals specified for assessing soil conditions under Forest Focus long-term
monitoring for effects of atmospheric pollution on the forest environment. There are
two options for assessment of the mineral layer from 0 – 10 cm:
• using a single layer and
• dividing it into two units of 5 cm thickness.
42
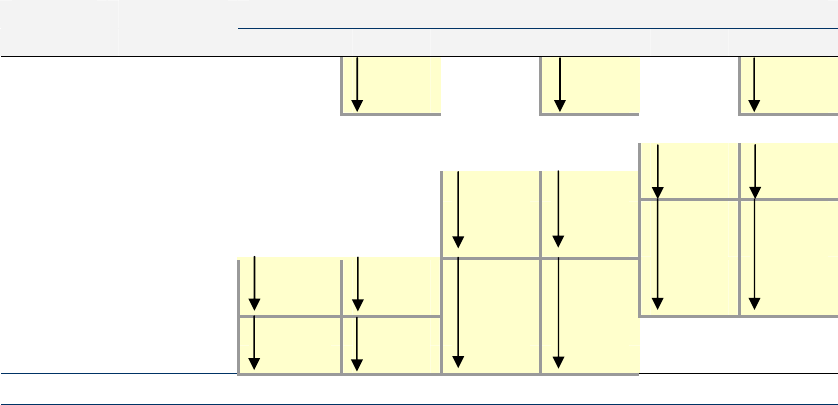
Distribution of Organic Carbon in Soil Profile Data
The subsoil section is treated as either two layers (30 - 60 cm, 60 - 100 cm) or further
subdivided into 5 layers (30 - 40 cm, 40 - 50 cm, 50 - 60 cm, 60 - 80 cm, 80 - 100 cm)
to appreciate the effect of reporting for the subsoil.
To evaluate the representation of the layers for pedological horizons the frequency
distribution of a central depth of a horizon for the layers was determined for 339
profiles included in the evaluation. The results are shown in Table 6.
Table 6: Distribution of Central Depths of Horizons and Layers in SPADE/M
Depth Frequency Layers
cm 9 8 6 5 5FF 4FF
0-5 73 73 73 73
5-10 120 120 193 120 193 120 193
10-20 220 220 220 220 220 220 220
20-30 129 129 129 129 129
30-40 172 172 172 301 301
40-50 128 128 128
50-60 137 137 137 437 437
60-70 98
70-80 97 195 195 460 460
80-90 76
90-100 70 146 146 341 341
TOTAL 1320
Layers 3729 3051 2712 2034 1695 1695 1356
In the database the 339 profiles are defined by a total of 1,320 horizons. To arrive at a
number of layers equal to or larger than the number of horizons the soil stratum needs to
be subdivided into at least 4 layers, i.e. there are on average approx. 4 horizons defining
a profile. A larger number of layers indicates some over-sampling of the profile, but
does not exclude that horizon data are averaged.
Results from the combination of the various options of treating the profile data are
shown in Table 7. The table presents the slope coefficients of the regression between the
pedological horizons and the depth layers for the mean OC content of the section 0 -
100 cm and the slope coefficient of the relationship of changes in OC content with
depth.
43

Distribution of Organic Carbon in Soil Profile Data
Table 7: Effect of Layer Sampling at Various Intensities on Mean SOC Content
and on Relationship of SOC Content with Depth
LAYERS
Topsoil sections 4 3 4 3 3 2
Subsoil sections 5 5 2 2 2 2
Mean SOC content
Coefficient 1.0021 1.0021 1.0048 1.0048 1.0042 1.0042
r20.9989 0.9989 0.9998 0.9998 0.9924 0.9924
Coefficient of changes in SOC content with depth
Coefficient 0.7012 0.8052 0.6737 0.7860 0.6487 0.7615
r20.9302 0.9443 0.9078 0.9274 0.8602 0.8808
The various options for simulating layers do not significantly affect the mean SOC
content of the soil section. However, the slope coefficients characterizing the
relationship between SOC content and depth are strongly affected and generally lower
for the layer data than for the horizon data. The differences in slope coefficients tend to
decrease with an increase in the number of subsoil layers. Conversely, it appears that the
subdivision of the topmost 10 cm into two layers rather decreases the slope coefficient
of the regression function, but that it does not affect the strength of the relationship to
the same degree.
For the mineral soils in the data set used the coefficient describing the relationship
between SOC content and depth would differ by a factor of up to 0.65 when comparing
results obtained from layers of fixed depth as opposed to pedological sampling methods.
The results of the simulation also suggest that dividing the subsoil stratum into two
layers may not provide sufficient detailed to describe the changes in SOC content with
depth. Defining two layers describing the uppermost 10 cm instead of one does not
improve the coherence of the slope coefficient between the two methods. One
explanation is that since only 21.5% of the profiles in the dataset define a distinct
horizon above a depth of 5cm the subdivision simply duplicates the SOC content value
for two different depths.
In conclusion the sampling method of not differentiating the organic layer and sampling
in fixed layers with what amounts to just one sample in the subsoil section very much
limits the use of the forest soil dataset to the analysis of the distribution of the SOC
content in the profile of mineral soil.
44
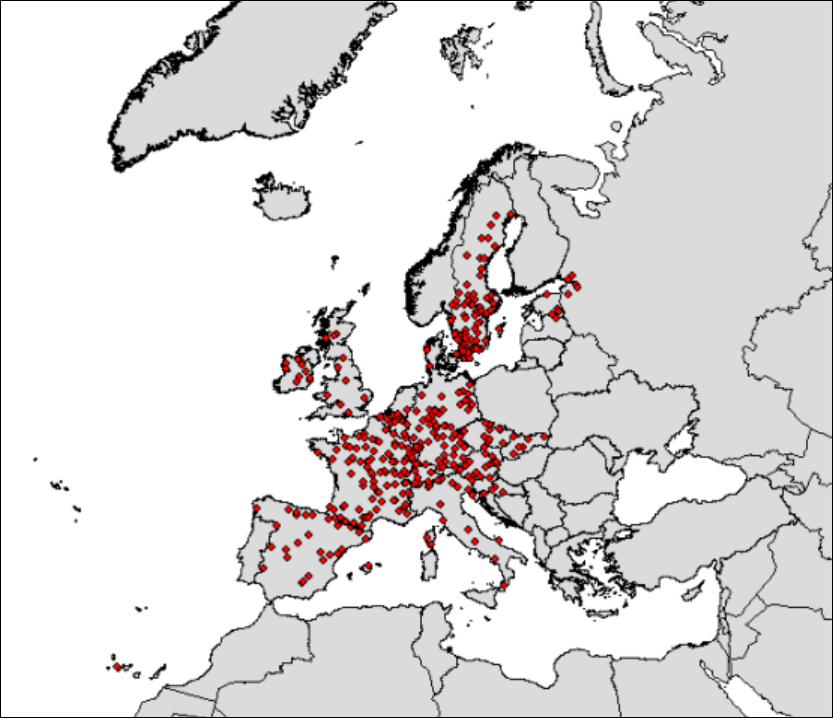
Distribution of Organic Carbon in Soil Profile Data
3.2.4 Intensive Monitoring - Level II
The Forest Focus Level II Soil Condition database contains the geographic coordinates
for 826 plots from 26 countries. Data on ground samples were taken at 741 plots
between 1990 and 2004. For 127 plots the sampling was repeated once, while at 11
plots data from 3 sampling surveys are recorded in the database. For repeated surveys
the specifications of the Sub-Manual allow for subsequent surveys to limit the number
of mineral layers assessed to just two (0-10 cm, 10-20 cm). Collecting data for other
layers has been left an optional activity and corresponding data not always found in the
database.
From the nominal number of plots of 826 data from 391 plots could be used for further
analysis for the relationship between SOC content with depth. The spatial distribution of
those Level II plots is given in Figure 18.
Figure 18: Distribution of Profiles of Forest Focus Level II Soil Profiles with Subsoil
Data
45
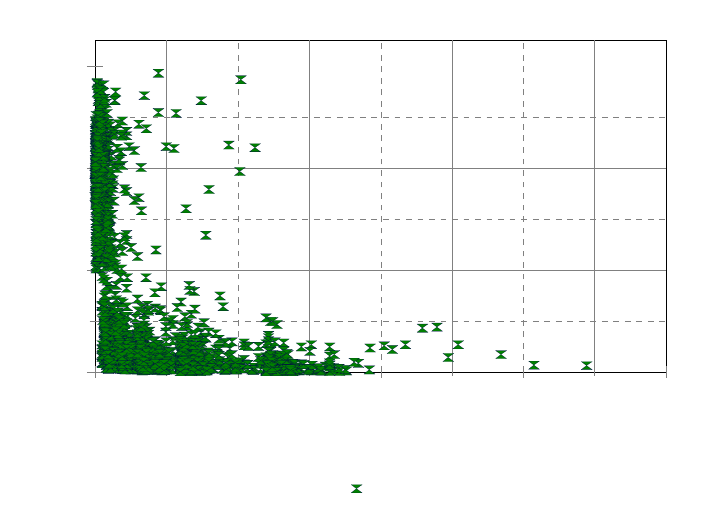
Distribution of Organic Carbon in Soil Profile Data
One of the main factors reducing the amount of useable plots is the lack of
measurements recorded in the database, both for depth layers and parameters. Of the
865 profile data sets for plots with an organic layer (repeated samples included) 330 do
not record the organic layer weight. For those data sets the height of the organic layer
cannot be computed and therefore the starting depth of the mineral layer cannot be
estimated when including the organic layer to position the measurements in the profile.
For 174 plots the mineral layers specified did not contain information on SOC content
for one or more of the layers. There are also cases of data duplication to record a profile.
This situation can occur because data were collected or computed for optional layers
from mandatory layers. For example, layers M05 (0-5cm) and M51 (5-10 cm) were
supplemented by information of the M01 (0-10 cm) layer. The situation is made more
complex when the information for the larger layer does not match the data of the finer
layers.
Limiting the SD in the profiles to 10 would have reduced the number of plots suitable
for evaluating the relationship of SOC content and depth to just 127. Instead, any
organic layer at the top of the profile was merged with a layer at a lower position until
the combined layer was >=10 cm in height. This drastically reduced the large variation
within the profile frequently caused by an organic layer of very limited thickness.
3.2.4.1 SOC Content on Level II Plots
The distribution of the SOC content with depth of the central layer for 2,856 layers is
presented in Figure 19.
0
20
40
60
Mean SOC for Layer (%)
0 50 100 150 200
Central Layer Depth (cm)
Forest
Figure 19: Horizon Depth vs. Soil Organic Carbon for Forest Focus Level II Layers
46
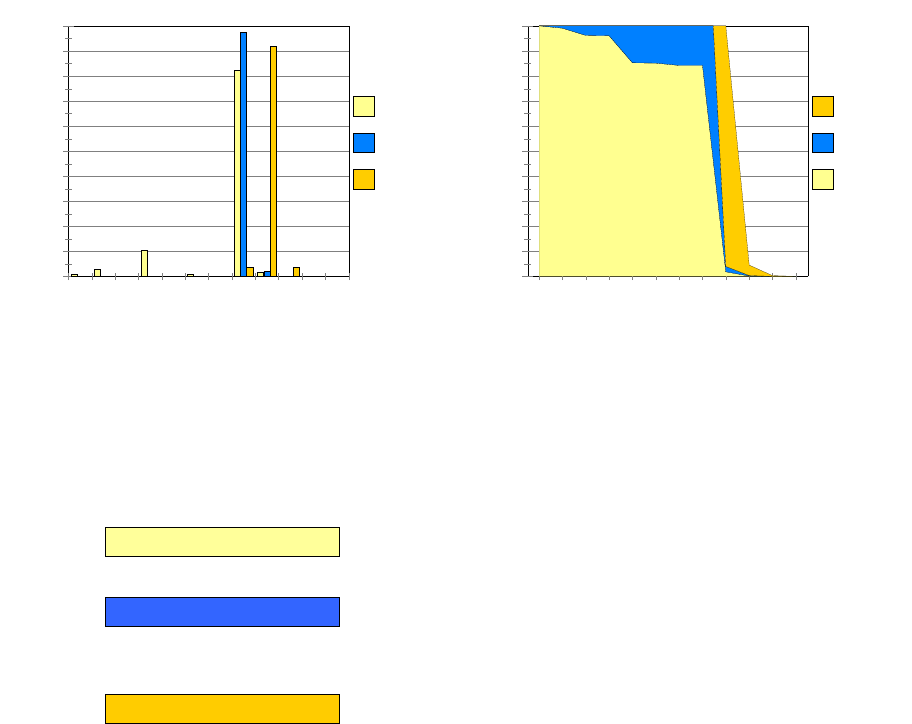
Distribution of Organic Carbon in Soil Profile Data
Similar to the distribution of SOC content with the profile horizons of the SPADE/M
data the graph indicates two different behaviours of the content of SOC with layer depth
near a SOC content of 20%. Values for depths lower than 80 cm are shown in the graph,
because the depth of the mineral layers is given as the estimated depth from the surface,
allowing for the height of the organic layer.
The relative frequency of the lowest depth reported for the FF Level II profiles is
presented in Figure 20.
0
10
20
30
40
50
60
70
80
90
100
Relative Frequency (%)
10 20 30 40 50 60 70 80 90 100 150 200
Profile Depth (cm)
All Profiles
Min. 3 Mineral Layers
Merged Org. Layers
0
10
20
30
40
50
60
70
80
90
100
Relative Occurence (%)
10 20 30 40 50 60 70 80 90 100 150 200
Profile Depth (cm)
Merged Org. Layers
Min. 3 Mineral Layers
All Profiles
a) Profile Depth vs. Relative Frequency b) Profile Depth vs. Accumulated Relative Frequency
Figure 20: Frequency Distribution of Profile Depth and Relative Depth Cover
The graph shows the relative distribution of the end of the lowest layer for:
• All Profiles
all profiles in the dataset, for which a layer depth was reported;
• Min. 3 Mineral Layers
for profiles for which a regression of SOC content vs. depth could be computed
for mineral layers, i.e. with a minimum of 3 mineral layers in the profile and
• Merged Org. Layer
for profiles where the organic layer was merged until a layer thickness of 10 cm
was attained.
The clustering of the end of the lowest layer to be defined by the specifications for
sampling (80 cm) is evident irrespective of the treatment of the organic layer. There are
some profiles with a lower end below 80 cm, but for which less than 3 layers are
recorded and which are therefore excluded form subsequent analysis. The introduction
of the organic layers shifts the lower end of the mineral layers mainly to a depth of 80-
90 cm.
47
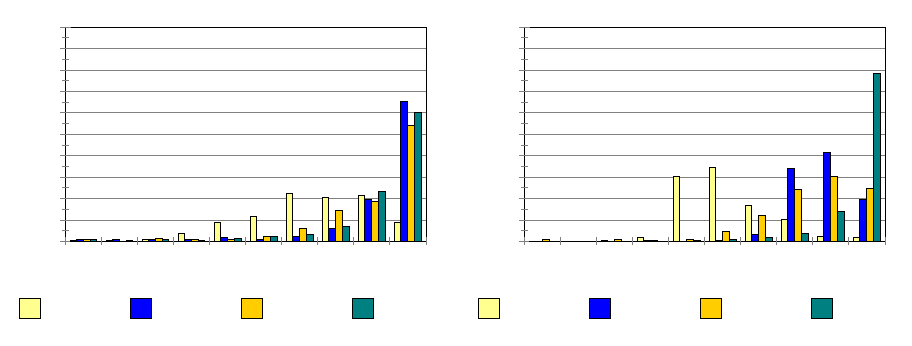
Distribution of Organic Carbon in Soil Profile Data
3.2.4.2 SOC Content and Depth Transformation
The frequency distribution of the coefficient of determination as obtained from 4
combinations of transforming SOC content and/or depth is presented in Figure 21.
0
10
20
30
40
50
60
70
80
90
100
Relative Frequency
0.1 0.2 0.3 0.4 0.5 0.6 0.7 0.8 0.9 1
Regression Coeff. of Determination
No transformation ln(Depth) ln(OC) ln(Depth) + ln(O
C
0
10
20
30
40
50
60
70
80
90
100
Relative Frequency
0.1 0.2 0.3 0.4 0.5 0.6 0.7 0.8 0.9 1
Regression Coeff. of Determination
No transformation ln(Depth) ln(OC) ln(Depth) + ln(O
C
a) Mineral Layers, SD<100 b) Merged Organic Layer, SD<10
Figure 21: Frequency Distribution of Regression Coefficient of Determination for
Logarithmic Transformation of SOC Content and Central Layer Depth
for Mineral Layers and for Merged Organic Layers (Forest Focus
Level II)
Used in the evaluation of the transformations were only profiles with mineral soils and
profiles where the organic layers were merged with mineral layers. No regression
analysis could be performed on profiles with only organic layers. The distribution of the
fit between SOC content and depth for the mineral layers of 594 Level II profiles (no
limit on SD) is comparable to the results obtained from the SPADE/M profiles. The best
fit for each profile was achieved when transforming at least one axis. The
transformation leads to approx. 60% of the profiles having an r2 value of >0.9.
The distribution of coefficients of determinations differs considerably when including
the organic layer in the profile section evaluated. Presented in the graph is the
distribution for 386 profiles with the merged organic layers to a depth of 10 cm, but the
distribution when using separate organic layer data are comparable. The treatment
resulting in the highest number of r2 values >0.9 occurs when both, depth and SOC
content, are transformed. Any other treatment of SOC content and depth results in a
considerably lower score for the correlation coefficient.
The difference in the results depending on the treatment option applied and whether or
not including the organic layer data could not be confirmed by data from profiles of the
SPADE/M and ISRIC-WISE datasets. The variability could be explained by the practice
of generally reporting a distinct organic layer in the Soil Condition dataset as compared
48
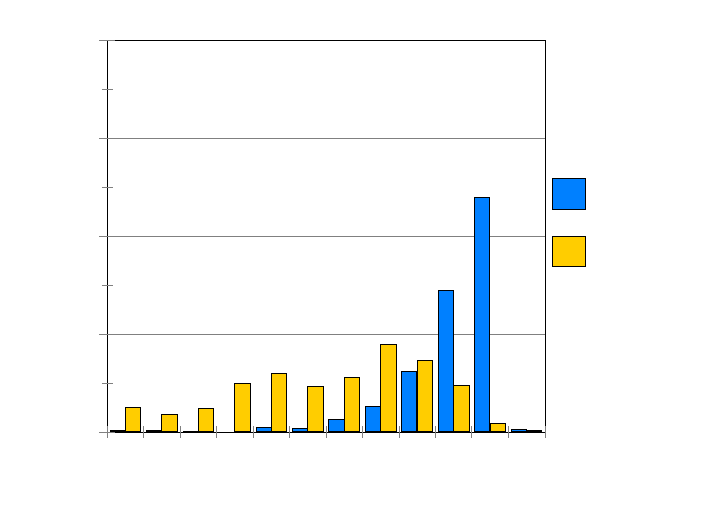
Distribution of Organic Carbon in Soil Profile Data
to profiles sampled following alternative methods. This leads to an abrupt change in the
SOC content within the profile by an order of magnitude rather than a progression with
depth. As a consequence, the differences in the correlation between transformations of
depth and/or SOC content decrease when setting a limit on the variability of the SOC
content in the profile. However, this also drastically reduces the number of profiles
available for analysis. The effect is not completely attributable to the sampling method
on FF plots. By nature, the structure of soil profiles under forest differs as compared to
for example profiles taken on agricultural land. Soils under forest frequently are covered
by an organic layer with a distinctly higher OC content than the underlying soil layer,
which is mostly absent on arable land.
3.2.4.3 Influence of Mean SOC Content in Profile
The treatment of the data extensively changes the characteristics of the development of
SOC content with depth. The relative frequency distribution of the slope coefficients m
obtained from the regression of the two parameters when not considering the organic
layers and when merging the organic layers to a thickness of 10 cm are presented in
Figure 22.
0
20
40
60
80
Relative Frequency
-10 -9 -8 -7 -6 -5 -4 -3 -2 -1 01
Slope Coefficent m
Min. 3 Mineral Layers
Merged org. Layers
Figure 22: Frequency Distribution of Relative Occurrence of Slope Coefficient m
(Level II)
The mineral layers alone show a relatively constant decrease in SOC content with depth
where approx. 50% of the profiles fall into the category of 0 to -1 for the slope
coefficient. Including the organic layers the most frequent occurrence of slope
49
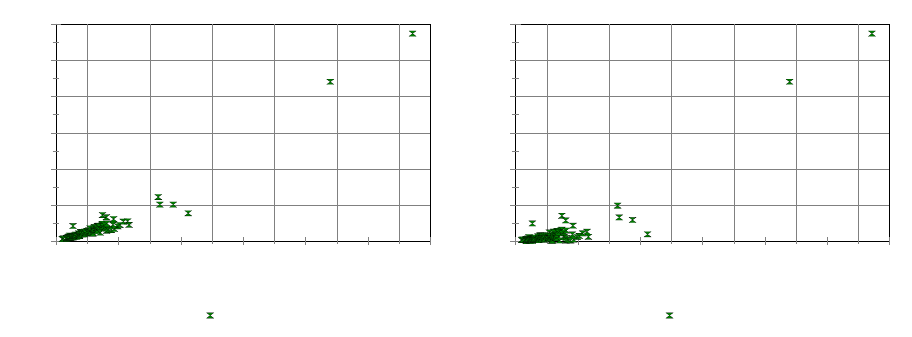
Distribution of Organic Carbon in Soil Profile Data
coefficients to the category are shifted to the range of -3 to -4. The organic layers also
generate a fundamentally different distribution of the coefficient with a much larger
spread of the coefficients.
When relating the mean SOC content in the topsoil to the SOC content of the subsoil
and to the soil segment from 0-100 cm the situation presented in Figure 23 was found.
0
10
20
30
40
50
60
Mean Profile SOC 0-100cm (%)
0 10 20 30 40 50 60
Mean Profile SOC 0-30 cm (%)
Forest Level II
0
10
20
30
40
50
60
Mean Profile SOC 30-100cm (%)
0 10 20 30 40 50 60
Mean Profile SOC 0-30 cm (%)
Forest Level II
a) Topsoil vs. 0-100 cm SOC Content b) Topsoil vs. Subsoil SOC Content
Figure 23: Relationship Between Mean SOC Content in Topsoil and Soil Segment
0-100 cm and Subsoil (Level II)
The relationship between the topsoil SOC content and the segment covering the upper
100 cm of a profile shows a principally linear trend for mineral soils. This trend is much
less evident when comparing the SOC content of the topsoil with the subsoil. The lack
of a distinct relationship can be explained by the presence of the organic layers in the
topsoil, whose effect does not reach the subsoil segment and therefore leads to a less
well defined relationship. Using only the mineral layer information very much increases
the relationship between topsoil and subsoil SOC content.
The dataset contains only 4 profiles for organic soils and 2 for peat. The geographic
clustering of the organic soils makes it unsuitable for defining a meaningful relationship
in SOC content between the topsoil and subsoil. The relationship for the mineral soils as
described by a linear regression was found as being:
minmin
100_0 509.0 TOP
SOCSOC ×= (r2: 0.77, 123 dF)
minmin 237.0 TOPSUB SOCSOC ×= (r2: 0.25, 123 dF)
For the range of SOC content values the mean SOC content to a depth of 100 cm is
approximately half the value of the mean SOC for the topmost 30 cm. The coefficient is
50
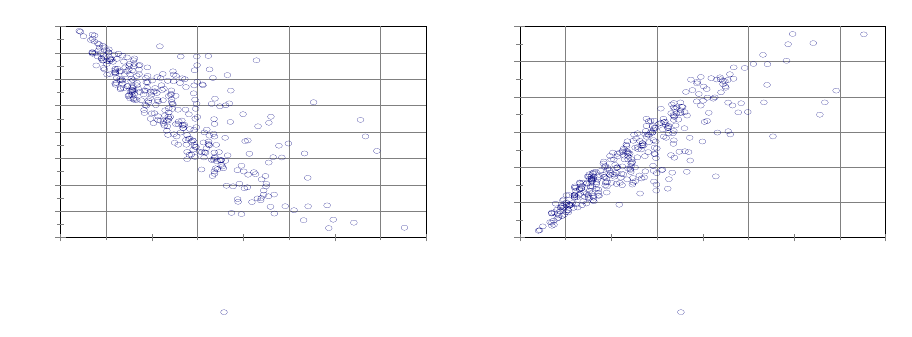
Distribution of Organic Carbon in Soil Profile Data
comparable to the value for the relationship determined for the SPADE/M data (0.52).
Using only data from plots under forest the coefficient for the SPADE/M data is 0.47.
Relating the mean SOC content in the 30 cm topsoil to the subsoil results in a
coefficient of 0.24. This value compares to a coefficient of 0.27 found for the
SPADE/M profiles when relating topsoil to subsoil SOC content. In the interpretation of
the results it should be considered that the Level II data only cover the soil to a depth of
approx. 80 cm and that according to the general trend the SOC content would slightly
decrease to a depth of 100 cm. Both datasets indicate that for forest soils the SOC
content in the subsoil is approx. 25% of the SOC content in the topsoil for mineral soils.
This contrast quite strongly with the coefficients found for soils under arable land use.
The change in the slope of the relationship between SOC content and depth for the
topsoil is given in Figure 24.
-16
-14
-12
-10
-8
-6
-4
-2
0
Slope Coefficient m
0 5 10 15 20
Mean Profile SOC 0-30 cm (%)
SD < 10
0
10
20
30
40
50
60
Constant b
0 5 10 15 20
Mean Profile SOC 0-30 cm (%)
SD < 10#
a) Topsoil SOC Content vs. Coefficient b) Topsoil SOC Content vs. Constant
Figure 24: Relationship between Mean SOC Content and Model Slope Coefficient
and Constant for Topsoil Applying SD Threshold of 10 (Level II)
For the topsoil the relationship between SOC content and depth is quite distinctly
defined for SOC content values up to approximately 12%. For situations with higher
topsoil SOC contents the relationship is not quite as evident. The number of plots falling
into this category is small (5), which makes it difficult to deduct any conclusive
relationship between SOC content in the topsoil and depth specific to profiles with the
higher SOC content.
To be consistent with the analysis of SPADE/M data a value of 18% for the SOC
content was used to separate profiles in the regression analysis. For plots with less than
<18% SOC content in the topsoil the slope and offset values of the relationship
characterizing SOC content and depth are:
TOP
SOCm ×−= 977.0
min (r2: 0.66, 347 dF)
51
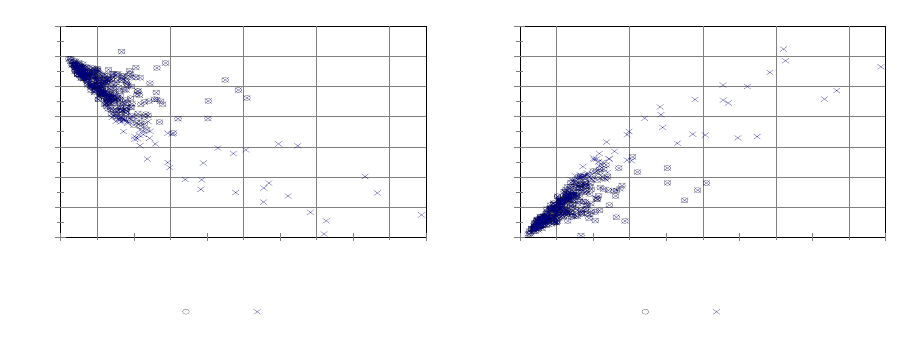
Distribution of Organic Carbon in Soil Profile Data
TOP
SOCb ×= 553.3
min (r2: 0.80, 347 dF)
()
minmin
min 553.3)ln(977.0 TOPTOP
TOP SOCdSOCdSOC ×+××−=⇒
The y-offset for the regressions was set to 0 since it is assumed that a soil without SOC
in the upper layer would also not have any OC at more profound layers.
The relationship between SOC content of the profile segment of 0-100 cm and the
regression parameters for SOC content vs. depth is presented in Figure 25.
-30
-25
-20
-15
-10
-5
0
5
Slope Coefficient m
0 5 10 15 20 25
Mean Profile SOC 0-100 cm (%)
SD < 10 SD < 100
0
20
40
60
80
100
120
140
Constant b
0 5 10 15 20 25
Mean Profile SOC 0-100 cm (%)
SD < 10 SD < 100
a) 0-100 cm SOC Content vs. Coefficient b) 0-100 cm SOC Content vs. Constant
Figure 25: Relationship between Mean SOC Content and Model Slope Coefficient
and Constant for Soil Section 0-100 cm Applying SD Threshold of 10
and 100 (Level II)
The relationship shows a well-defined lower edge of the slope coefficient and an
increase in variation with SOC content above approx. 10%. The regression parameters
are:
1000
min 428.1 −
×−= SOCm (r2: 0.20, 333 dF)
1000
min 855.5 −
×= SOCb (r2: 0.38, 333 dF)
()
min
1000
min
1000
min
1000 855.5)ln(428.1 −−
−×+××−=⇒ SOCdSOCdSOC
When releasing the condition on the SD from 10 to 100 the coefficient does not change
significantly (-1.477), but the coefficient of determination increases from 0.20 to 0.63
(0.38 to 0.74 for the constant).
52
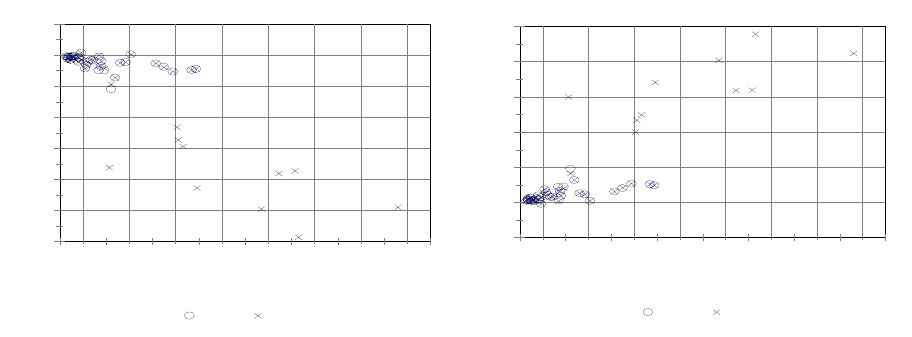
Distribution of Organic Carbon in Soil Profile Data
The relationship between SOC content and the regression parameters for SOC content
vs. depth for the subsoil is presented in Figure 26.
-60
-50
-40
-30
-20
-10
0
10
Slope Coefficient m
0 2 4 6 8 10 12 14 16
Mean Profile SOC 30-100 cm (%)
SD <10 SD <100
-50
0
50
100
150
200
250
Constant b
0 2 4 6 8 10 12 14 16
Mean Profile SOC 30-100 cm (%)
SD <10 SD <100
a) Subsoil SOC Content vs. Coefficient b) Subsoil SOC Content vs. Constant
Figure 26: Relationship between Mean SOC Content and Model Slope Coefficient
and Constant for Subsoil Applying SD Threshold of 10 and 100
(Level II)
The figure shows that limiting the SD of the profiles SOC content to 10 results in a
max. mean SOC content of approx. 6%. For subsoil layers with a higher SOC content
the SD threshold has to be enlarged to 20 or more (see Table 5). Even when increasing
the SD threshold to 100 only 1 profile with a potentially organic subsoil (>12% SOC
content) could be included in the analysis dataset.
The effect of the SD threshold for the variability of SOC contents on the number of
profiles included in the regression limits the number of profiles to 34. As a result of the
variation in the data the change in the parameters of the regression between SOC
content and depth has a higher degree of uncertainty attached than results from the
analysis of the topsoil or the soil segment to 100 cm.
A linear regression of the profiles with variations in SOC content limited to SD<10
provides the following parameters:
SUB
SOCm ×−= 108.1
min (r2: 0.14, 33 dF)
SUB
SOCb ×= 523.5
min (r2: 0.27, 33 dF)
()
minmin
min 523.5)ln(108.1 SUBSUB
SUB SOCdSOCdSOC ×+××−=⇒
In a comparative run of the analysis the threshold criterion set for the number of profiles
used to compute the regression parameters for each profile was relaxed to 2. It was
53
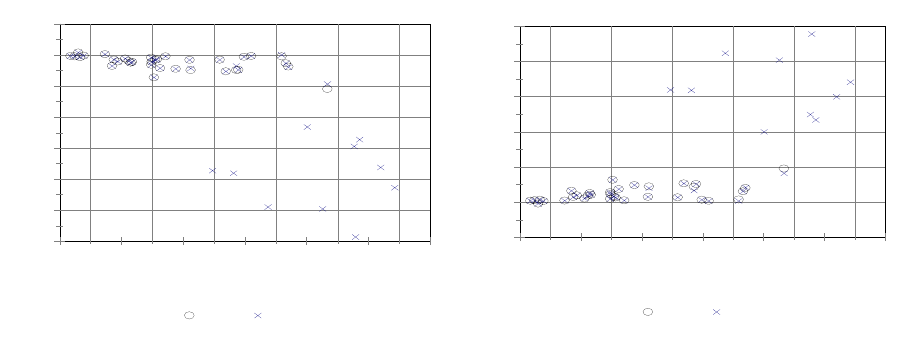
Distribution of Organic Carbon in Soil Profile Data
found that this condition increased the number of profiles to 382, but did not improve
the fit of the data.
Widening the condition on the SD from 10 to 100 increased the number of profiles to
44. A linear regression of profiles with a threshold of SD<100 gave the following
parameters:
SUB
SOCm ×−= 814.3
min (r2: 0.69, 43 dF)
SUB
SOCb ×= 151.16
min (r2: 0.72, 43 dF)
()
minmin
min 151.16)ln(814.3 SUBSUB
SUB SOCdSOCdSOC ×+××−=⇒
The significantly lower coefficient was caused by including profiles with a SOC content
of 8 to 15% and with comparatively with low values for the slope coefficients. Soil
profiles in this part of the spectrum of SOC content values were previously not
included.
For the estimation of the subsoil SOC content at any depth between 30-100 cm the slope
and constant parameters of the relationship of SOC content and depth for the topsoil
would be used. The correlation between the two soil sections is shown in Figure 27.
-60
-50
-40
-30
-20
-10
0
10
Slope Coefficient m 30-100cm
0 10 20 30 40 50 60
Mean Profile SOC 0-30 cm (%)
SD <10 SD <100
-50
0
50
100
150
200
250
Constant b 30-100cm
0 10 20 30 40 50 60
Mean Profiel SOC 0-30 cm (%)
SD <10 SD <100
a) Topsoil SOC vs. Subsoil Coefficient b) Topsoil SOC vs .Subsoil Constant
Figure 27: Relationship between Mean SOC Content for Topsoil and Model Slope
Coefficient and Constant for Subsoil Applying SD Threshold of 10 and
100 (Level II)
Because of the restricted number of profiles describing the subsoil adequately the
correlation between both segments is based on just 34 profiles when limiting the SD of
the SOC content values to 10. The regression parameters provide the following values
for coefficient and constant:
54
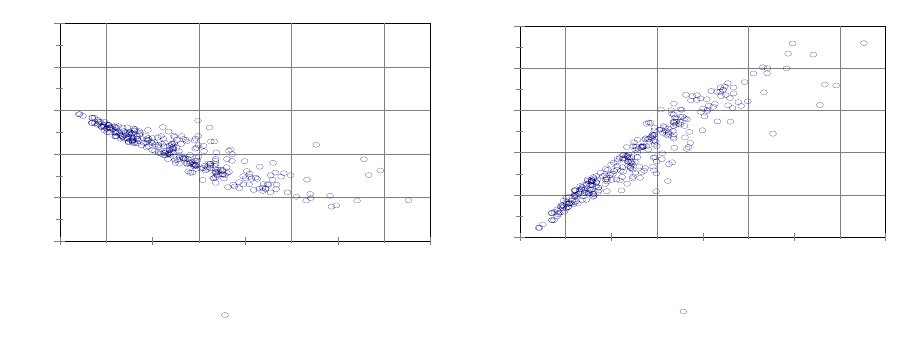
Distribution of Organic Carbon in Soil Profile Data
minmin 016.1 TOPSUB SOCm ×−= (r2: 0.23, 33 dF)
minmin 628.0 TOPSUB SOCb ×= (r2: 0.26, 33 dF)
()
minmin
min 628.0)ln(016.1 TOPTOP
SUB SOCdSOCdSOC ×+××−=⇒
When setting a threshold of 100 for the SD of the SOC content layer data the following
relationship is given:
minmin 546.0 TOPSUB SOCm ×−= (r2: 0.42, 43 dF)
minmin 307.2 TOPSUB SOCb ×= (r2: 0.43, 43 dF)
()
minmin
min 307.2)ln(546.0 TOPTOP
SUB SOCdSOCdSOC ×+××−=⇒
The regression parameters for the more restrictive variations in SOC content are mainly
comparable to those of relating the subsoil SOC content to the slope and constant for
SOC content vs. depth of the subsoil (see Figure 26). They are, however, quite different
from the relationship found when widening the limit on the SD for the variations in the
SOC content and from the relationship found for SPADE/M data. The relationship of
the latter is more comparable to the Level II profiles when not limiting the profiles by
the SD of the SOC content.
A comparison of the mean SOC content in the topsoil and the slope and constant of the
relationship between SOC content and depth for the soil section of 0-100 cm is
presented in Figure 28.
-15
-10
-5
0
5
10
Slope Coefficient m 0-100cm
0 5 10 15 20
Mean Profile SOC 0-30 cm (%)
SD < 10
0
10
20
30
40
50
Constant b for 0-100cm
0 5 10 15 20
Mean Profiel SOC 0-30 cm (%)
SD < 10
a) Topsoil SOC vs. 0-100 cm Coefficient b) Topsoil SOC vs .0-100 cm Constant
Figure 28: Relationship between Mean SOC Content for Topsoil and Model Slope
Coefficient and Constant for Soil Section 0-100 cm (Level II)
55
Distribution of Organic Carbon in Soil Profile Data
The relationship appears to be very well defined and supported by the 303 profiles in
the data. The parameters derived from a linear regression are:
minmin
1000 715.0 TOP
SOCm ×−=
− (r2: 0.76, 302 dF)
minmin
1000 898.2 TOP
SOCb ×=
− (r2: 0.88, 302 dF)
()
minmin
min
1000 898.2)ln(715.0 TOPTOP SOCdSOCdSOC ×+××−=⇒ −
Those values differ to some extent from the corresponding relationship found in the
SPADE/M data for soils in forests (coefficient slope: -0.49, constant slope: 2.27). By
including the topsoil in both, the independent and the dependent variable, the values
attained by the coefficient of determination overestimate the goodness of the fit. Still,
this relationship could be more usefully employed than the correlation between the
mean SOC content of the topsoil and the regression parameters between SOC content
and depth of the subsoil.
3.2.4.4 Influence of Depth of Soil
The depth of the soil layer to an impermeable layer or rock is not extractable from the
Soil Condition database to describe the profile. The sampling specifications only cover
a layer to a depth of 80 cm. In case soil properties are sampled to a depth less than the
layer maximum it is not evident from the data whether the soil does not reach to lower
depth or a different division of layer depth has been applied. To provide an overview of
layers the frequency distribution of the end of the profile data is presented in Figure 29.
56
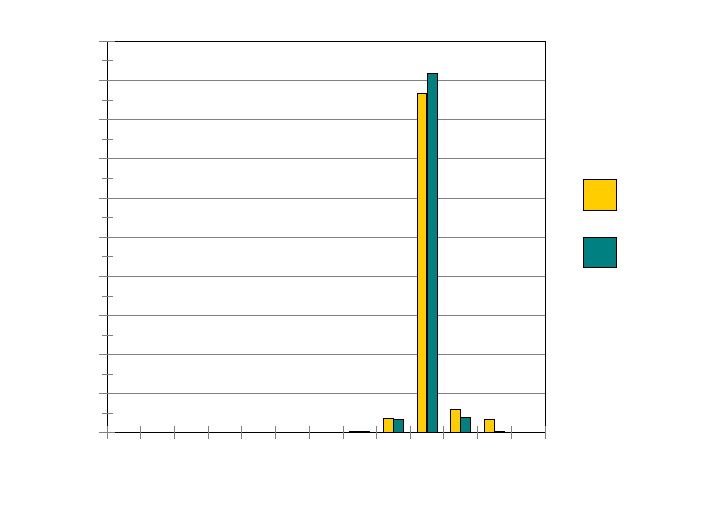
Distribution of Organic Carbon in Soil Profile Data
10
20
30
40
50
60
70
80
90
100
Relative Frequency
0 10 20 30 40 50 60 70 80 90 100 150 200
Profile Depth (cm)
No SD Limit
SD < 10
Figure 29: Relative Frequency Distribution of End of Deepest Layer
Distinguished in the options for processing the data were
1. no limit for the SD and
2. a limit of SD<10.
Despite the stipulations in the Sub-Manual on the sampling procedure approx. 85% of
the profiles in the corresponding Level II dataset cover the soil to a depth of 80-90 cm.
Changes in the value of the coefficient of the function describing the progression in
SOC content with profile depth are graphically presented in Figure 30.
57
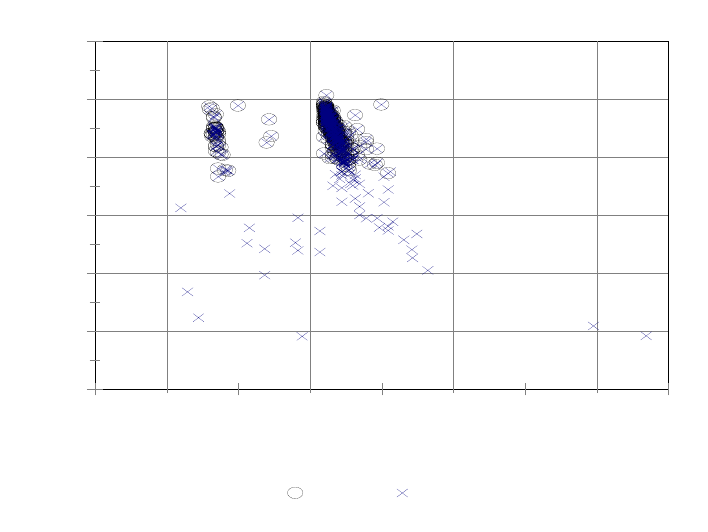
Distribution of Organic Carbon in Soil Profile Data
-50
-40
-30
-20
-10
0
10
Slope Coefficient m
0 50 100 150 200
Profile Depth (cm)
SD <10 SD <100
Figure 30: Change in Model Slope Coefficient with Depth of Profile Applying SD
Threshold of 10 and 100 (Level II)
By limiting the reporting depth of the soil layers for the Level II plots the prescribed
sampling procedure very much restricts any attempts of evaluating changes in the
character of the function relating SOC content to depth. Some of the plot data indicate a
tendency for a decrease in the slope coefficient with depth, but this reason based on the
distribution of the plots in the graph is rather tenuous. In the interpretation of the results
it should be kept in mind that the depth of the profile for the Level II plots is also
determined by the height attributed to the organic layer. The higher the organic layer the
higher will also be the mean SOC content for the plot. With the strong negative
relationship between SOC content and the coefficient a comparable trend can be
introduced into the data simply by the method of preparing the profile information.
With these restrictions on the data no statement on the relationship between the depth of
the soil and the development of the parameters used to mathematically describe the
changes in SOC content with depth can be pronounced.
3.2.4.5 Influence of Clay Content
A value of the clay content in the subsoil section is recorded for 166 profiles. Yet, the
assessment of the relationship between clay and SOC content in the subsoil layer from
30-100 cm is limited by the definition of a single layer ranging from 40 to 80 cm for
sampling soil properties and the limited number of observations of the clay content
recorded in the dataset. For the analysis of the change of clay content with depth 3
58
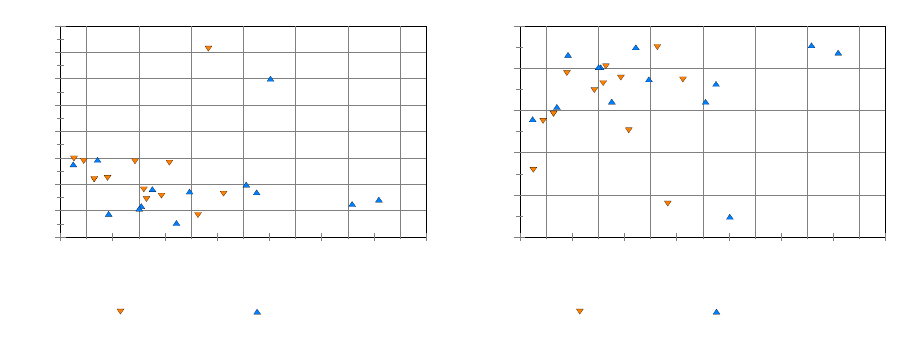
Distribution of Organic Carbon in Soil Profile Data
values within the subsoil section are needed, which restricts the number of profiles to
33. Of those just 4 are common with the analysis of changes of SOC in the subsoil. The
assessment of the influence of the clay content on SOC content was therefore extended
to cover the complete soil section 0-100 cm. In the definition of the parameters for the
profiles a threshold of 100 for the SD was applied. This allowed at least to compare
changes for those profiles. The relationship is graphically presented in Figure 31.
0
2
4
6
8
10
12
14
16
SOC Content 00-100cm
0 10 20 30 40 50 60 70
Clay Content 0-100 (%)
Decreasing Clay Content Increasing Clay Content
-25
-20
-15
-10
-5
0
Slope Coefficient m OC
0 10 20 30 40 50 60 70
Clay Content 0-100 (%)
Decreasing Clay Content Increasing Clay Content
a) 0-100 Clay vs. 0-100 cm SOC Content b) 0-100 Clay vs. 0-100 cm SOC Content
Figure 31: Relationship between Clay and SOC Content and the Slope Coefficient for
Soil Section 0-100 cm by Decreasing and Increasing Clay Content with
Depth (Level II)
For mineral soils the profiles with sufficient data to compute the change in clay content
with depth indicate a decrease in SOC content with increasing clay content. This
tendency is independent of the distribution of the clay content within the profile. The
slope coefficient for the relationship of SOC content and depth shows a tendency to
increase with increasing clay content of the soil from 0-100 cm. Also here the trend
seems to be independent from the change in clay content with depth. For organic soil no
tendency can be pronounced since only 2 profiles of organic soils have sufficient data.
One should caution against an over-interpretation of the relationship based on the
goodness of the fit provided by the regression analysis. The pairs compared are not from
independent measurements. When evaluating the change in SOC content to a depth of
100 cm the upper 30 cm are part of this stratum. By limiting the variability of the profile
data used in the analysis the continuity of change in the profile is maintained, but so is
the auto-correlation of the data. Moreover, when using the relationships identified in the
data the function should be applied only to those areas, which correspond to the
conditions the data represent. This implies that for soils with significant changes in SOC
content to a depth of 100 cm, other than going below or above a mean SOC content of
18%, are not accounted for.
59

Distribution of Organic Carbon in Soil Profile Data
3.2.4.6 SOC Content by Major Soil Category
The mean SOC contents of the Forest Focus Level II profiles for topsoil (0-30 cm) and
the subsoil (30-100 cm) by FAO 90 soil category are given in Table 8.
Table 8: SOC Content by Soil Category (Forest Focus Level II)
Soil FAO90 Soil Organic Carbon
Content No. of Profiles
Topsoil Subsoil
% %
Arenosols 17.1 1.5 4
Calcisols 3.0 0.9 1
Cambisols 13.9 1.4 8
Fluvisols 3.9 0.6 1
Gleysols 2.4 0.6 1
Planosols 23.0 0.6 2
Podzols 19.0 2.7 6
All 15.2 1.6 23
The table contains data form 23 profiles, which cover 7 soil categories. For those
profiles the mean subsoil SOC content is 10.5% of the topsoil SOC content. When
interpreting this figure the particular limitations in sampling Forest Focus soil data need
to be considered. The SOC content of the topsoil is largely liable to cover higher values
than the soil categories of the profiles suggest. The lack of differentiation in the organic
layer and in particular the lack of data on the height of the layer very much limit the
comparability of the Forest Focus soil data with data from other soil profile surveys.
3.2.5 Systematic Monitoring Plots - Level I
The Level I soil database of Forest Focus contains information on 5,144 plots. For an
analysis of soil properties in the subsoil segment the number of plots is largely reduced
due to a lack of suitable data.
• For 335 plots a single layer is recorded and for 791 the properties of 2 layers are
included. Those 1,126 plots could not be used in the analysis of the relationship
between SOC content and layer depth because the description of changes in
SOC content with depth needs at least 3 depth values.
60
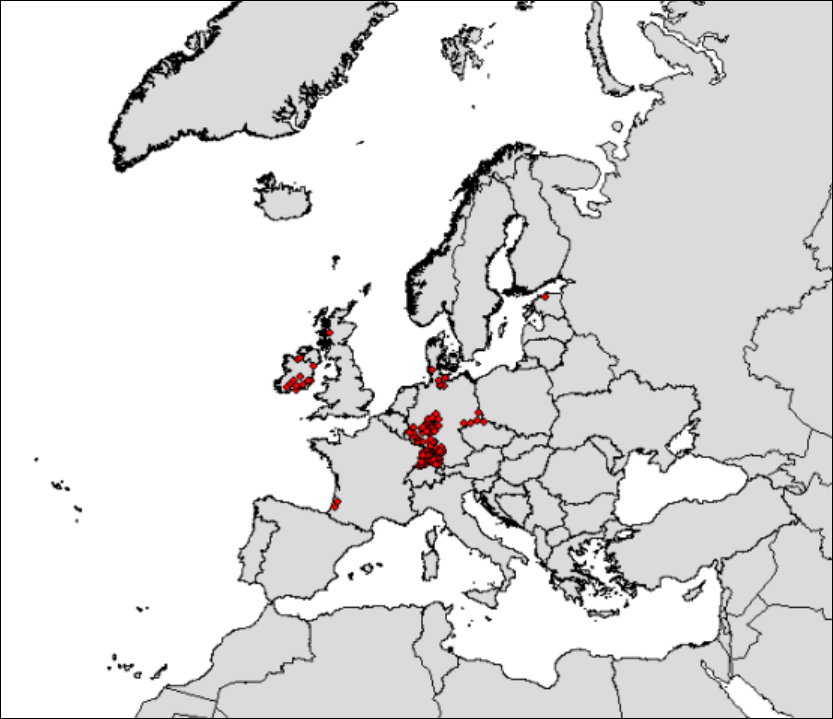
Distribution of Organic Carbon in Soil Profile Data
• Level I data mainly describe the topsoil layer to a depth of 20 cm. As a
consequence a further reduction in the number of suitable profiles is caused by a
lack of data for mineral layers below a depth of 30 cm.
For the analysis of changes in SOC to a depth of 100 cm a description of the SOC
content to the lower limit should be recorded in the database than specified by the Sub-
Manual. Because the deepest mineral layer specified in the Forest Focus field guide for
sampling soil profiles was 40-80 cm for a profile to be included in the analysis the
minimum coverage of the soil section 0-100 cm was set to 75%. In the database only
113 plots record soil properties with adequate coverage. The spatial distribution of those
Level I profiles is depicted in Figure 32.
Figure 32: Distribution of Profiles of Level I Soil Profiles with Subsoil Data
Data to a depth of 100 cm are available for just 47 plots. The lack of information on soil
properties for the subsoil very much limits the use of the database for the purpose of the
investigation. Irregularities in the description of the depth layers were noted in 240
cases. They were almost exclusively caused by missing layers in the profile. Other
61
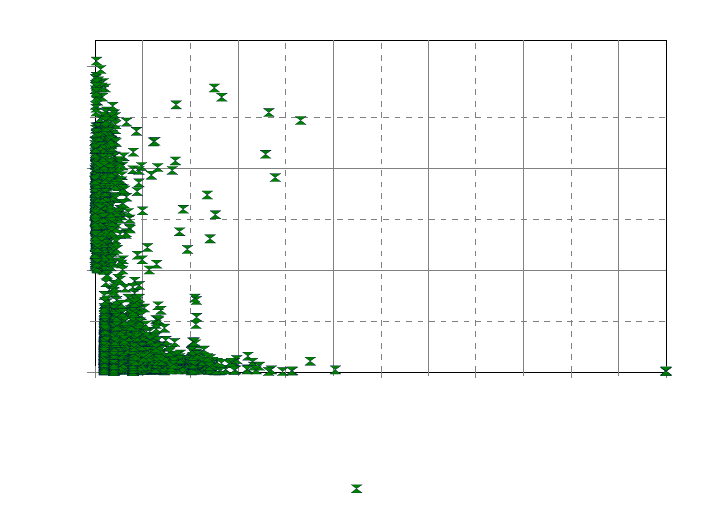
Distribution of Organic Carbon in Soil Profile Data
inconsistencies were the duplicate coverage of depth layers (22 cases). While the
nominal year of the survey is 1995 the dates given for the analysis of the data range
from 1985 (97 cases) to 1998 (1 case).
3.2.5.1 SOC Content in Layers
The distribution of SOC content with layer depth in the dataset is given in Figure 33.
0
20
40
60
Mean SOC for Layer (%)
0 50 100 150 200 250 300
Central Layer Depth (cm)
Forest
Figure 33: Horizon Depth vs. Soil Organic Carbon for Forest Focus Level I Layers
The distribution of the 13,723 layers used in the graph shows the general decrease in
SOC content with increasing depth for mean SOC content values below approximately
20%. For layers sampled with a SOC content above 20% a second peak of an increasing
layer depth centres around 40% of SOC content.
The soil data sampled on Forest Focus Level I plots mainly covers the topmost 20 cm.
Data from lower depths are only included for a small number of plots (see Figure 32).
The relative frequency of the lowest depth for which data are reported in the dataset is
given in Figure 34.
62
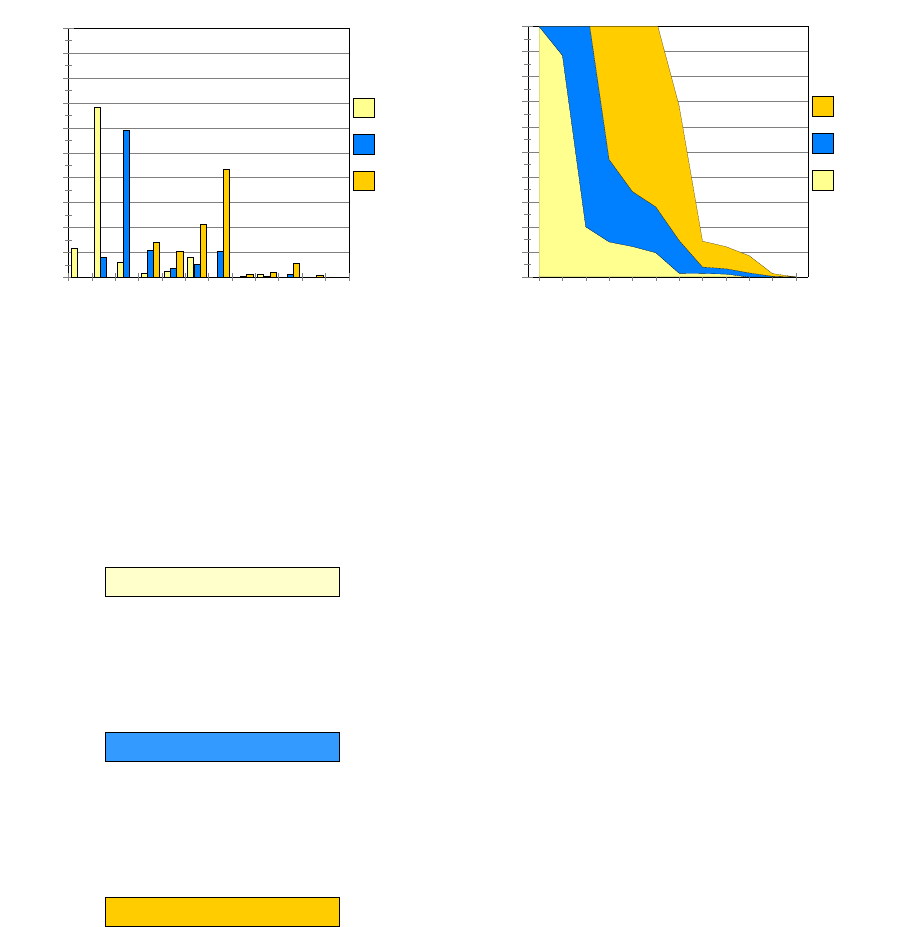
Distribution of Organic Carbon in Soil Profile Data
0
10
20
30
40
50
60
70
80
90
100
Relative Frequency (%)
10 20 30 40 50 60 70 80 90 100 150 200
Profile Depth (cm)
All Profiles
Min. 3 Mineral Layers
Merged Org. Layers
0
10
20
30
40
50
60
70
80
90
100
Relative Occurence (%)
10 20 30 40 50 60 70 80 90 100 150 200
Profile Depth (cm)
Merged Org. Layers
Min. 3 Mineral Layers
All Profiles
a) Relative Frequency by Depth b) Accumulated Relative Frequency
Figure 34: Frequency Distribution of Profile Depth and Relative Depth Cover
For the presentation of the frequency of the depth, to which data for a soil profile is
reported, three different treatments of the data were distinguished:
• All profiles
Data were grouped into the frequency bins as they were recorded in the dataset.
Because, with few exceptions, the layer depth is recorded only for mineral layers
this treatment can be interpreted as indicating the depth to which data for the
mineral layer are reported within a profile.
• Min. 3 mineral layers
This treatment shows the distribution of the depth to which data for the mineral
layers are reported for the profiles with data for at least 3 mineral layers. The
availability of data for at least 3 layers is a requirement of the regression analysis
of SOC continent changes with depth.
• Merged org. layer
Shown is the frequency of the occurrence of the lowest layer within a profile
when including an estimate of the height of the organic layer in the profile and
merging any organic layers until a height of 10 cm was attained. As a further
processing condition the SD of the layer SOC contents of a profile was limited
to 10.
Overall, the number of profiles which can be used to evaluate the change in SOC
content with depth trends is only a portion of the number of profiles in the dataset. The
graph clearly shows that for 80% of the profiles in the dataset the information on the
mineral layer is limited to a depth of 20 cm. When restricting the profiles to those with
at least three mineral layers 80% of the observations are reported to a depth of less than
40 cm. By including in the profile an estimated height of the organic layer approx. 45%
of the profiles then cover the soil to a depth of 80 cm. The treatment of the layer data
63
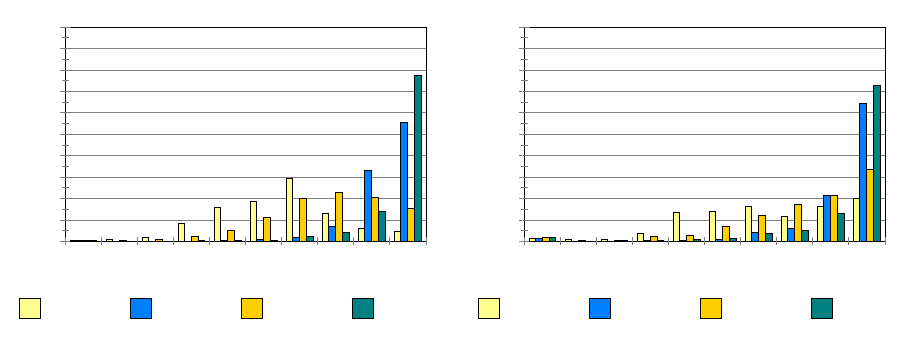
Distribution of Organic Carbon in Soil Profile Data
also affects the number of profiles compliant with the criteria set for the analysis. While
4,770 profiles contain SOC content data for one or more mineral layers 3,123 contain
data on 3 or more mineral layers. The third option of treating the profile further reduces
the number of data plots to 748 profiles.
3.2.5.2 SOC Content and Depth Transformation
The influence of the logarithmic transformation of depth and / or SOC content on the
slope and constant parameters of the linear regression between SOC content and depth
for FF Level I profiles is presented in Figure 35.
0
10
20
30
40
50
60
70
80
90
100
Relative Frequency
0.1 0.2 0.3 0.4 0.5 0.6 0.7 0.8 0.9 1
Correlation Coeff. r2
No transformation ln(Depth) ln(OC) ln(Depth) + ln(O
C
0
10
20
30
40
50
60
70
80
90
100
Relative Frequency
0.1 0.2 0.3 0.4 0.5 0.6 0.7 0.8 0.9 1
Correlation Coeff. r2
No transformation ln(Depth) ln(OC) ln(Depth) + ln(O
C
a) Mineral Layers, SD<100 b) Merged Organic Layer, SD<10
Figure 35: Frequency Distribution of Regression Coefficient for Logarithmic
Transformation of SOC Content and Central Layer Depth for all
Layers and for Merged Organic Layers (Forest Focus Level I)
Based on the distribution of the coefficient of determination (r2) the best fit for
individual profiles is achieved when transforming both axes, i.e. depth and SOC
content, followed by a transformation of only SOC content. The tendency is less
prevalent when limiting the analysis to profiles with a SD <10 for the layer SOC
content. For the occurrence of values of >0.8 for the r2 the performance of the single
axis transformation is practically equal to the transformation of both axes.
3.2.5.3 Influence of Mean SOC Content in Profile
The treatment options of the organic layer not only shift the mineral layers in the soil
profile but also affect the parameters of the relationship between SOC content and
depth, in particular when including the SOC content of the organic layer in the
computations. The distribution of the relative frequency of the regression coefficients
64
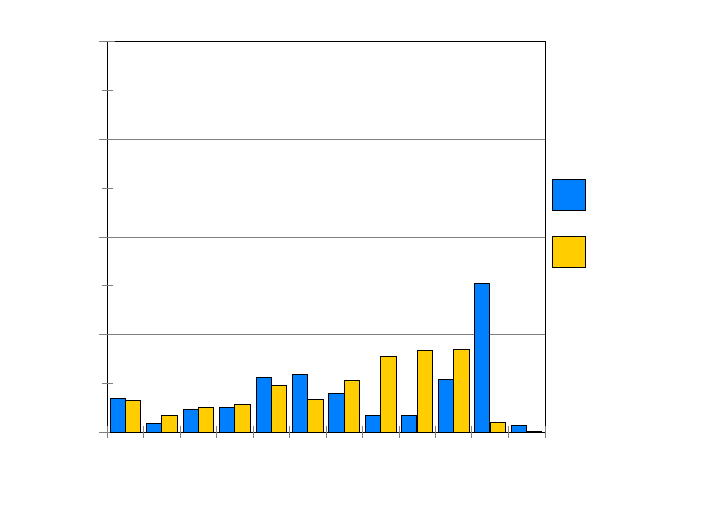
Distribution of Organic Carbon in Soil Profile Data
and constants for the mineral fraction of profiles with at least 3 mineral layers and when
estimating a height for the organic layer and merging layers to a minimum height of
10 cm is presented in Figure 36.
0
20
40
60
80
Relative Frequency
-10 -9 -8 -7 -6 -5 -4 -3 -2 -1 01
Slope Coefficent m
Min. 3 Mineral Layers
Merged org. Layers
Figure 36: Frequency Distribution of Relative Occurrence of Regression Slope
Coefficient m (Forest Focus Level I)
The graph illustrates the shift of slope coefficients to lower values when including the
information on the organic layers in the regression analysis of SOC content and depth.
For profiles with 3 or more mineral layers approx. 1/3 of the profiles have slope
coefficients between -1 and 0, while the occurrence of lower values for the slope
coefficients is more evenly distributed between the two treatments. The general trend is
comparable to data from the Level II profiles, although there is a marked difference in
the distribution of lower slope coefficient for profiles with 3 or more mineral layers. For
Level II profiles there is hardly a profile with a slope coefficient below -6 whereas there
is still a notable number of profiles with coefficients as low as -10 for Level I profiles.
Since there is less variability between profiles in the SOC content at lower levels than
closer to the surface. One reason for the difference could be the rather incomplete
description of soil profiles for Level I plots, where frequently information on SOC
content in the lower parts is absent.
The relationship between the mean SCO content in the topsoil and the soil segment to a
depth of 100 cm is presented in Figure 37 (for merged organic horizons).
65
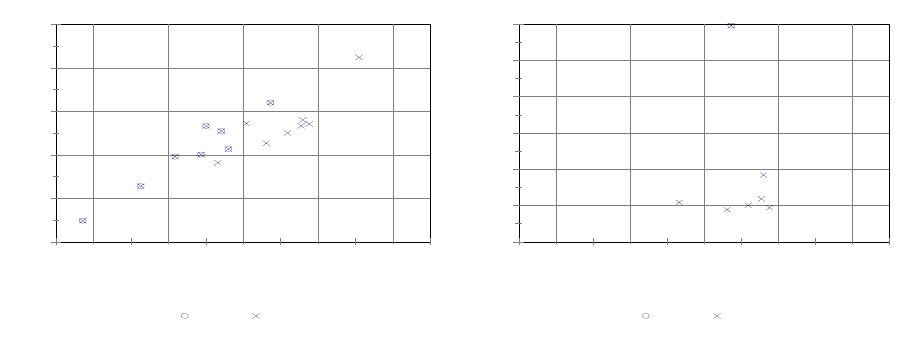
Distribution of Organic Carbon in Soil Profile Data
2
4
6
8
10
Mean Profile SOC 0-100cm (%)
5 10 15 20 25
Mean Profile SOC 0-30 cm (%)
SD < 10 SD > 100
0.5
1
1.5
2
2.5
3
Mean Profile SOC 30-100cm (%)
5 10 15 20 25
Mean Profile SOC 0-30 cm (%)
SD < 10 SD < 100
a) Topsoil vs. 0-100 cm SOC Content b) Topsoil vs. Subsoil SOC Content
Figure 37: Relationship between Mean SOC Content in Topsoil and Soil Segment 0-
100 cm and Subsoil (Level I)
The values of the mean SOC content for the profile segments were computed by
including merged organic layers to a minimum height of 10 cm. The number of suitable
profiles was just 8 when restricting the SD < 10. The number rose to 16 when removing
the restriction (SD < 100). When comparing mean SOC contents between the topsoil
and the subsoil the number of suitable profiles was just 1 for a SD threshold of 10 and 7
when using a threshold of 100. The remaining profiles were all in a narrow range of
SOC contents in the topsoil (11-17%). This small number of profiles and the narrow
range of mean SOC contents covered precludes obtaining any reasonable results from a
regression analysis of the mean SOC content between topsoil and subsoil.
A linear regression between the mean SOC contents of the topsoil and the soil segment
0-100 cm gave the following parameters:
minmin
100_0 380.0 TOP
SOCSOC ×= (r2: 0.76, 15 dF)
For the 8 profiles of positively mineral soils (<12%) the slope coefficient was found to
be 0.426. Both values are noticeably below the slope coefficient found for Level II
profiles (0.509). While the slope coefficients of the regressions between the mean SOC
contents of the topsoil with the soil segment 0-100 cm do probably not differ for
mineral soils and all soils (95% confidence level) the observed difference between
Level I and Level II profile data is significant (95% confidence level). To some degree
the lower slope coefficient in the Level I data is caused by including profiles with a SD
>= 10 in the analysis, which show a tendency for a lower slope coefficient, although not
significantly so. Another hypothesis is that the soil types of the profiles included in the
analysis influences the relationship. Approx. 50% of the Level I profiles are classified
as Cambisoil, mainly humic or gleyic. In the Level II data those soils show a slightly
66
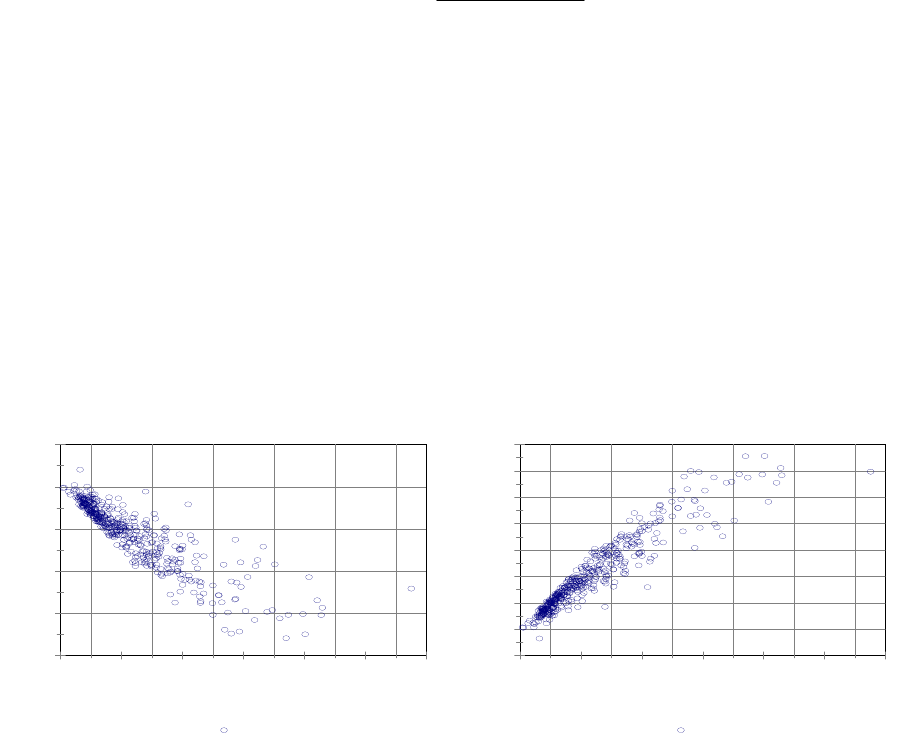
Distribution of Organic Carbon in Soil Profile Data
lower-than-average slope coefficient. However, there is insufficient evidence to
substantiate any of the hypotheses.
In the absence of sufficient data to define the relationship between the mean SOC
content in the topsoil and the subsoil the slope coefficient can be estimated from the
relationship between the topsoil and the profile segment 0-100 cm by:
7.0
3.0
100_0 −
=TOPx
TOPxSUB
m
m
where
mTOPx0_100: regression slope coefficient of topsoil vs. 0-100 cm segment
mTOPxSUB: regression slope coefficient of topsoil vs. subsoil B
For the 16 Level I profiles this would amount to a subsoil SOC content of approx. 16%
of the topsoil SOC content. This contrasts with a value of 24% of the subsoil SOC
content as compared to the topsoil SOC content for Level II profiles.
The relationship between the mean SOC content in the topsoil and the slope coefficient
obtained from the regression between the SOC content and depth is presented in Figure
38.
-20
-15
-10
-5
0
5
Slope Coefficient m
0 5 10 15 20 25 30
Mean Profile SOC 0-30 cm (%)
SD < 10
-10
0
10
20
30
40
50
60
70
Constant b
0 5 10 15 20 25 30
Mean Profile SOC 0-30 cm (%)
SD < 10#
a) Topsoil SOC Content vs. Coefficient b) Topsoil SOC Content vs. Constant
Figure 38: Relationship between Mean SOC Content and Model Slope Coefficient
and Constant for Topsoil applying SD Threshold of 10 (Level I)
For the linear regression used the development of the coefficient and the constant show
a decrease in the relationship for profiles up to a mean topsoil SOC content of approx.
15% or more. This tendency is comparable to the situation found for profiles of the
Level II and SPADE/M datasets.
For profiles with a SOC content of <18% the parameters of a linear relationship are:
67
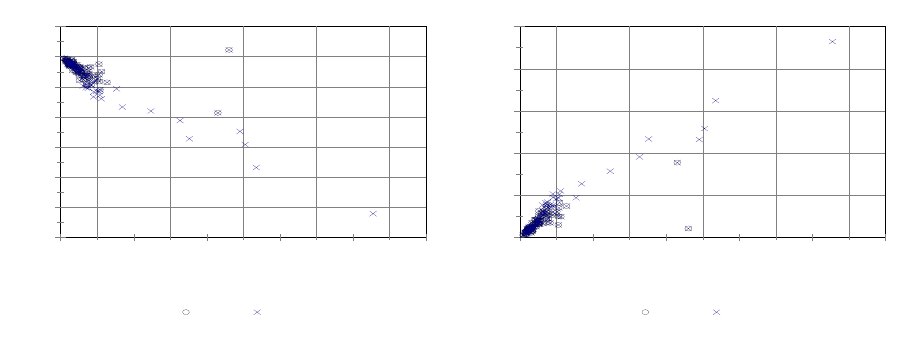
Distribution of Organic Carbon in Soil Profile Data
TOP
SOCm ×−= 931.0
min (r2: 0.76, 428 dF)
TOP
SOCb ×= 408.3
min (r2: 0.87, 428 dF)
()
minmin
min 408.3)ln(931.0 TOPTOP
TOP SOCdSOCdSOC ×+××−=⇒
The values for the coefficient and constant are comparable to those found for Level II
data and any differences are not significant at a 95% confidence level.
The change in the parameters of the linear relationship of SOC content and depth for the
profile segment 0-100 cm is graphically presented in Figure 39.
-60
-50
-40
-30
-20
-10
0
10
Slope Coefficient m
0 10 20 30 40 50
Mean Profile SOC 0-100 cm (%)
SD < 10 SD < 100
0
50
100
150
200
250
Constant b
0 10 20 30 40 50
Mean Profile SOC 0-100 cm (%)
SD < 10 SD < 100
a) 0-100 cm SOC Content vs. Coefficient b) 0-100 cm SOC Content vs. Constant
Figure 39: Relationship between Mean SOC Content and Model Slope Coefficient
and Constant for Soil Section 0-100 cm applying SD Threshold of 10
and 100 (Level I)
Restricting the analysis to profiles with a SD of the layer SOC content <10 limits the
analysis to profiles with a mean SOC content of less than 6%. By increasing the
threshold to 100, basically removing the criterion, profiles with a mean SOC content up
to 43% could be included. For one profile of a terric Histosol the SOC content
increased with depth. This situation was not found atypical for a Histosol, and was also
observed in SPADE/M profiles, although more generally for profiles with higher SOC
contents.
For soils with a mean SOC content of <18% the following relationship was established:
TOP
SOCm ×−= 654.1
min (r2: 0.80, 106 dF)
TOP
SOCb ×= 044.7
min (r2: 0.85, 106 dF)
68
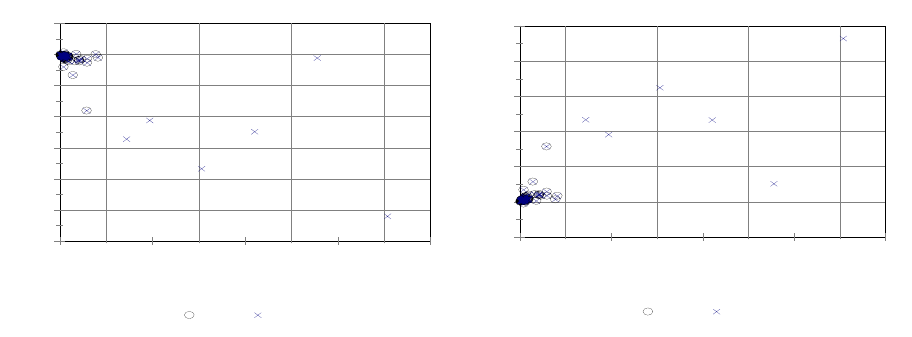
Distribution of Organic Carbon in Soil Profile Data
()
minmin
min
1000 044.7)ln(654.1 TOPTOP SOCdSOCdSOC ×+××−=⇒ −
The slope coefficient is lower for Level I profiles than for those of the Level II dataset,
but still comparable. Both differ significantly from the coefficient found for the
SPADE/M profiles, where a value of -0.676 was determined for soils under forest.
The relation ship between the mean SOC content in the subsoil and the parameters of
the linear function used to describe the change in SOC with depth using a threshold for
the SD of 10 and 100 are presented in Figure 40.
-60
-50
-40
-30
-20
-10
0
10
Slope Coefficient m
0 10 20 30 40
Mean Profile SOC 30-100 cm (%)
SD <10 SD <100
-50
0
50
100
150
200
250
Constant b
0 10 20 30 40
Mean Profile SOC 30-100 cm (%)
SD <10 SD <100
a) Subsoil SOC Content vs. Coefficient b) Subsoil SOC Content vs. Constant
Figure 40: Relationship between Mean SOC Content and Model Slope Coefficient
and Constant for Subsoil applying SD Threshold of 10 and 100
(Level I)
When restricting the SD to 10 only profiles with a mean SOC content in the subsoil of
<5% are included in the analysis. For those profiles the slope and constant hardly
change with the mean SOC content of the subsoil. The parameters are:
SUB
SOCm ×−= 161.1
min (r2: 0.16, 88 dF)
SUB
SOCb ×= 874.5
min (r2: 0.23, 88 dF)
()
minmin
min 874.5)ln(161.1 SUBSUB
SUB SOCdSOCdSOC ×+××−=⇒
The regression coefficient of the 89 profiles is largely determined by just 2 profiles with
a marked decrease in the slope of the SOC content : depth relationship while the
remaining 87 profiles did not show a discernable trend.
69
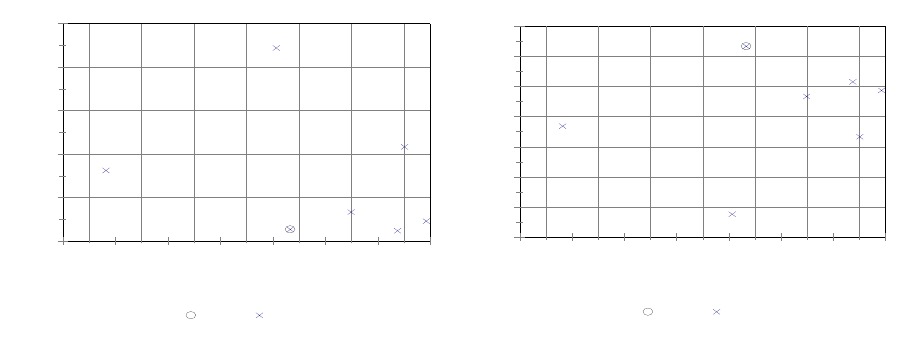
Distribution of Organic Carbon in Soil Profile Data
For an analysis without effective limit on the variation of SOC content (SD < 100) 6
additional profiles were included with a mean SOC content ranging from 7% to 35%.
Those additional profiles do not exhibit any relationship between the slope and constant
of the SOC content vs. depth data and the mean SOC content of the subsoil.
For completeness the regression parameters were also computed for profiles with a SD
threshold of < 100 which were as follows:
SUB
SOCm ×−= 178.1
min (r2: 0.61, 94 dF)
SUB
SOCb ×= 495.5
min (r2: 0.67, 94 dF)
()
minmin
min 495.5)ln(178.1 SUBSUB
SUB SOCdSOCdSOC ×+××−=⇒
The parameters are comparable to those of the profiles with a limit in the SD of <10. As
has been demonstrated before a marked difference in the changes of SOC content may
exist between mineral and organic soils, which suggests processing them separately
when extrapolating SOC content from the topsoil to the subsoil. Hence, the parameters
for the integrated profile data given above should be treated with caution.
When relating the mean SOC content of the topsoil to the slope and constant from the
relationship of the profile SOC content vs. depth only 1 suitable profile could be found.
Removing the limit on the variation of the SOC content within a profile resulted in 7
profiles. The resulting situation is presented in Figure 41.
-1.5
-1
-0.5
0
0.5
1
Slope Coefficient m 30-100cm
10 11 12 13 14 15 16 17
Mean Profile SOC 0-30 cm (%)
SD <10 SD <100
-4
-2
0
2
4
6
8
10
Constant b 30-100cm
10 11 12 13 14 15 16 17
Mean Profiel SOC 0-30 cm (%)
SD <10 SD <100
a) Topsoil SOC Content vs. Subsoil Coefficient b) Topsoil SOC Content vs. Subsoil Constant
Figure 41: Relationship between Mean SOC Content for Topsoil and Model Slope
Coefficient and Constant for Soil Section 0-100 cm applying SD
Threshold of 10 and 100 (Level I)
70
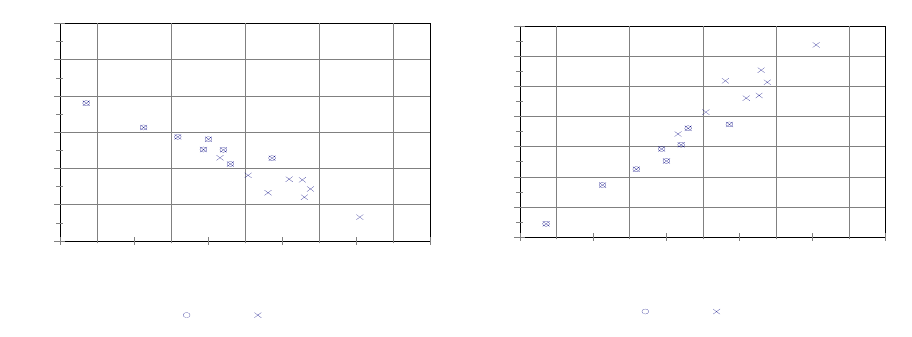
Distribution of Organic Carbon in Soil Profile Data
The number of profiles with sufficient data to analyse changes in SCO content with
depth and the limited distribution of the SOC contents precludes computing meaningful
regression parameters for profiles.
Relating the mean SOC content of the topsoil to the coefficient and constant from the
relationship of the profile SOC content vs. the soil segment 0-100 cm resulted in 8
profiles for a SD threshold of < 10 and 16 for a threshold of < 100. The relationship is
graphically presented in Figure 42.
-20
-15
-10
-5
0
5
10
Slope Coefficient m 0-100cm
0 5 10 15 20 25
Mean Profile SOC 0-30 cm (%)
SD < 10 SD < 100
0
10
20
30
40
50
60
70
Constant b for 0-100cm
0 5 10 15 20 25
Mean Profiel SOC 0-30 cm (%)
SD < 10 SD < 100
a) Topsoil SOC Content vs. 0-100 cm Coefficient b) Topsoil SOC Content vs. 0-100 cm Constant
Figure 42: Relationship between Mean SOC Content for Topsoil and Model Slope
Coefficient and Constant for Subsoil applying SD Threshold of 10 and
100 (Level I)
There would not appear to be a significant difference in the relationship found between
profiles with a variation in SOC content limited to SD<10 and those without such a
limit. Also, the one profile with an organic topsoil did not reveal a relationship any
different from the one found for mineral topsoil profiles.
The regression parameters for the linear relationship for profiles with a SD threshold of
< 100 are:
TOP
SOCm ×−=
−762.0
min
1000 (r2: 0.88, 14 dF)
TOP
SOCb ×= 043.3
min (r2: 0.93, 14 dF)
()
minmin
min
1000 043.3)ln(762.0 TOPTOP SOCdSOCdSOC ×+××−=⇒ −
The relationship would seem highly significant for the profiles used in the analysis. In
the interpretation of the results one should consider that the data are auto-correlated and
that only 1 profile with a mean SOC content of 5% is included. The assessment of the
relationship of topsoil and subsoil indicates mean SOC content and the slope coefficient
of profile SOC content vs. depth were found to be largely unrelated in the data analysed.
71
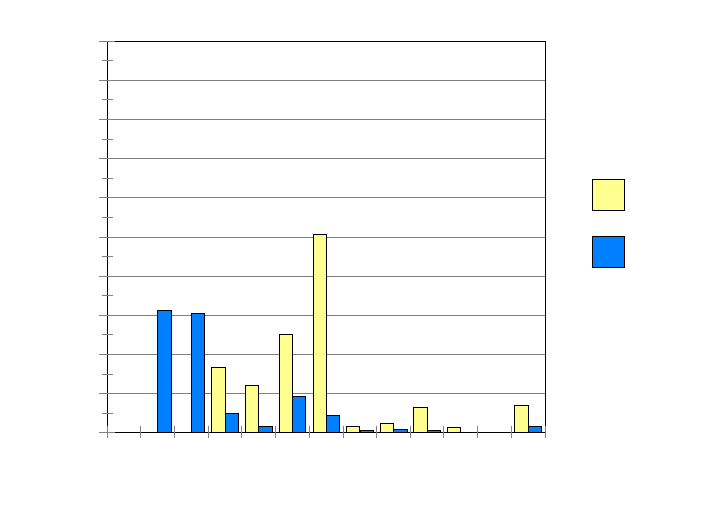
Distribution of Organic Carbon in Soil Profile Data
As a consequence, the values provided by the regression analysis for the coefficient of
correlation underestimate the proportion of variability in when applied more generally
across the whole range of SOC contents of mineral soils.
3.2.5.4 Influence of Depth of Soil
The guide to sampling soil condition data at Level I plots and Level II plots only detail
the layers at which the conditions should be assessed. Not specified are noting the depth
of the organic layer, describing the whole soil profile or indicate the depth to rock, the
presence of an impermeable layer or obstacles to the development of roots. With respect
to evaluating the effect of the depth of the soil layer on the development of SOC content
with depth the information provided by the data is very much restricted.
The relative frequency of the lowest depth to which profile data are recorded in the
Level I dataset is graphically presented in Figure 43.
0
10
20
30
40
50
60
70
80
90
100
Relative Frequency (%)
10 20 30 40 50 60 70 80 90 100 150 200
Profile Depth (cm)
SD < 10
SD < 100
Figure 43: Relative Frequency Distribution of End of Deepest Layer in Profile
(Level I)
The distribution shows that most Level I profiles report soil conditions to a depth of
30 cm (SD < 100), provided the height of the organic layer is included. When restricting
the profiles to those with a SD < 10 for the variation in the layer SOC content of a
profile approx. 50% of the profiles with sufficient data for a regression analysis contain
data to a depth of 70 cm, at the cost of the number of total number of profiles available
for analysis. The distribution of profile data depth differs from the situation depicted in
72
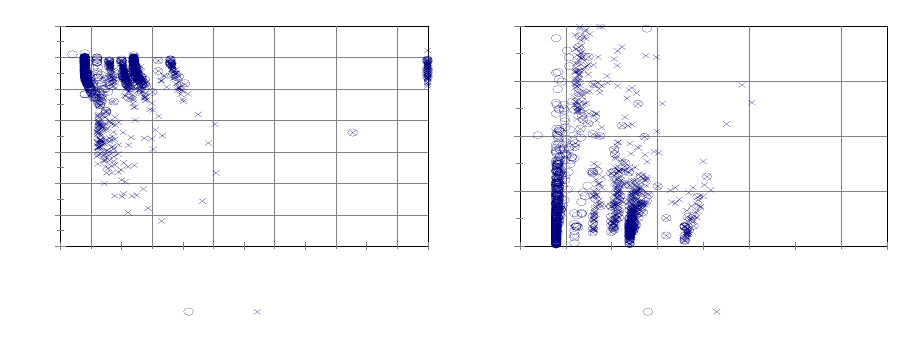
Distribution of Organic Carbon in Soil Profile Data
Figure 34 in particular for profiles without restriction on the variation in the layer SOC
content because for the regression analysis a minimum of 3 layers are specified. By
merging thin layers to a single layer with a thickness of at least 10 cm the number of
layers in a profile available for analysis is reduced, which results in the change in the
distribution of profile depths.
Subsequent to the specifications for sampling soil profile data the relationship between
parameters of the SOC content vs. depth regression and the depth of the soil cannot be
described in detail. From the data it is not evident whether the deepest layer recorded
can be taken as an indicator for the soil depth. Rather, in most cases it can be assumed
that the lowest extent of the deepest layer reported for a profile does not represent the
depth of the soil. Nonetheless, the relationship between the lowest extent of the last
layer of a profile was plotted against the slope coefficient of the relationship between
the profile layer SOC content and depth. The result is presented in Figure 44.
-60
-50
-40
-30
-20
-10
0
10
Slope Coefficient m
0 50 100 150 200 250 300
Profile Depth (cm)
SD <10 SD <100
0
5
10
15
20
Mean SOC Content (%)
0 50 100 150 200
Profile Depth (cm)
SD <10 SD <100
a) Profile Depth vs. Coefficient b) Profile Depth vs. Constant
Figure 44: Change in Model Slope Coefficient with Depth of Profile applying SD
Threshold of 10 and 100 (Level I)
The relationship between the depth of the profile and the slope coefficient of the
function describing the changes in SOC content with depth indicate a decrease in the
coefficient with increasing profile depth. The trend is very much influenced by the
treatment of including the organic layer in the profile. The difference in SOC content
between the organic and the mineral layer lowers the slope coefficient for the
relationship between SOC content and depth. This tendency is pronounced with an
increased thickness of the organic layer, which in turn also leads to a lower limit of the
profile. From the data a particular relationship between soil depth and the progression of
SCO content with depth cannot be pronounced.
73

Distribution of Organic Carbon in Soil Profile Data
3.2.5.5 Influence of Clay Content
In contrast to Level II the Level I data set does not contain information on measured
clay content. As stated by the sampling specifications soil texture for Level I plots is
recorded according to the USDA-FAO classification scheme for soil texture (coarse,
medium, medium fine, fine and very fine). Yet, the information recorded in the data set
uses 5 classes for soil texture. The FAO classification scheme distinguishes 12 classes
for texture, which are not found in the dataset. No values could be found in the data set
for the estimates of clay content (in %) stipulated in the sampling specifications. It
should be noted that the only specifications available were those starting with 2002. The
specifications on which the sampling of the Level I data set are based could not be
retrieved and may be presumed to differ in those respects from latter versions. As a
consequence, the influence of clay content on the distribution of SOC in the soil profile
could not be evaluated for Level I profiles.
3.2.5.6 SOC Content by Major Soil Category
A summary of topsoil and subsoil mean SOC contents for Forest Focus Level I profiles
aggregated by FAO90 level 1 soil classes is given in Table 9.
Table 9: SOC Content by Soil Category (Forest Focus Level I)
Forest FAO90 Soil
Topsoil Subsoil No. of Profiles
Anthrosols 16.9 0.5 1
Cambisols 14.6 0.7 3
Gleysols 15.5 0.5 1
Podzols 1432 1.7 2
All 14.9 0.9 7
The results are shown for reasons of completeness of the analysis with the findings from
the other datasets used in the study. There are only 7 profiles for which a meaningful
SOC content for both soil layers could be determined in the dataset. The profiles are
assigned to 4 soil classes according to the FAO980 classification scheme. For these
profiles the SOC content of the subsoil averages on 6.2% of the SOC content of the
topsoil. As with Forest Focus Level II data the considerable difference is largely
attributable to the practice specified for sampling and reporting the organic layer and
influenced by the method applied to establish a profile for the plot data.
74
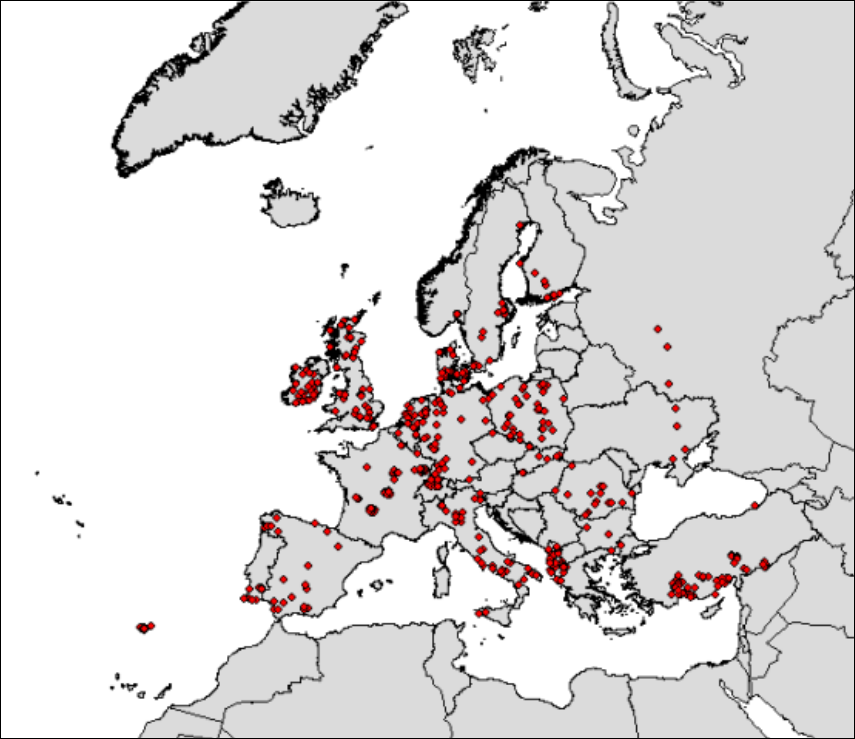
Distribution of Organic Carbon in Soil Profile Data
3.3 ISRIC-WISE
The World Inventory of Soil Emission Potentials (WISE) soil database version 1.1 of
the International Soil Reference and Information Centre (ISRIC) contains 4,382 profiles
with global coverage (Batjes, 2002). In the area of interest 551 soil profiles of the
database are situated. Their spatial distribution is illustrated in Figure 45.
Figure 45: Distribution of Profiles Used from ISRIC-WISE Database
For 539 profiles data for SOC content are recorded in the database. One profile (ES015)
contained a value of 96.11% for the SOC content in horizons 2. This value is obviously
erroneous and the profile was removed from the data set used for analysis. The dates of
sampling of the profiles indicate a sampling period from 1957 to 1995. For 88 profiles
the information on the date is insufficient for identifying the sampling date. The soil
75
Distribution of Organic Carbon in Soil Profile Data
classification used in the evaluation stated as FAO90 and not directly comparable to the
SPADE/M information, where soils are classified according to the FAO85 scheme.
The profiles of the ISRIC-WISE data set belong to 83 different soil classes. Of those, 23
classes are assigned to one profile while for 36 soil types the frequency of occurring less
than 3. For 20 soil classes the frequency of occurrence is 10 or more profiles. The most
common soil classes are Dystric Cambisol (34 profiles, 6.2%), Eutric Cambisol (31
profiles, 5.6%) and Haplic Luvisol (31 profiles, 5.6%).
The land use information is coded according to a classification using 3 levels of detail.
The table field contains codes for 42 classes with a mixture of levels of the coding
scheme. The land use information was reclassified to the 4 classes used in the
evaluation. In most cases the re-coding was straightforward. Only the assignment of the
FAO/ISRIC classes to the evaluation class “shrub” was ineffective. The class could be
unambiguously assigned to just 2 codes (AT3: Non-irrigated shrub cultivation; AT4:
Irrigated shrub cultivation). In 13 cases where a correspondence could not be
established the profile land use was set to the class “Other / Not classified”.
3.3.1 SOC in Plot Horizons
The data set uses the start of the mineral soil layer as the origin for recording horizon
depth. The height of any organic surface horizon overlying the mineral layer is recorded
with a negative entry for horizon depth. To be compatible with other data sets used in
the evaluation the topmost profile, organic or mineral, is set to represent the profile
surface, i.e. a depth of 0. For profiles with organic surface layers (negative depth) the
depths figures were adjusted to record the topmost profile horizon starting at 0 cm.
The distribution of the mean SOC content of 2,228 profile horizons by the central depth
of the horizon is presented in Figure 3.
76
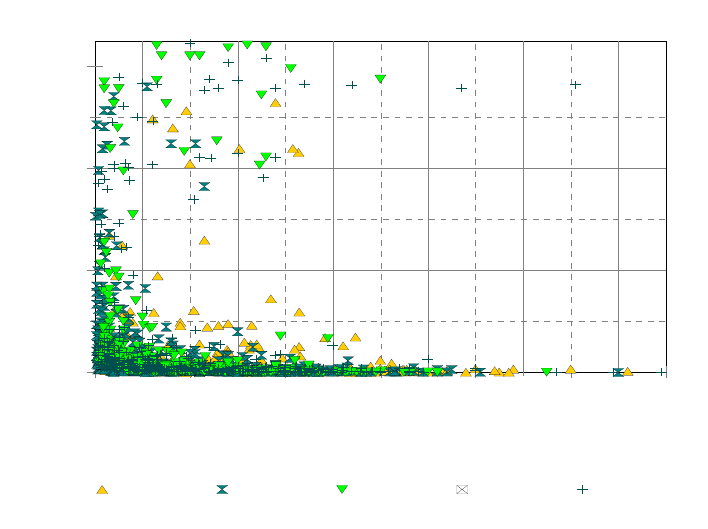
Distribution of Organic Carbon in Soil Profile Data
20
40
60
Mean SOC for Horizon (%)
50 100 150 200 250 300
Central Horizon Depth (cm)
Arable Forest Grassland Shrub Other / NC
Figure 46: Horizon Depth vs. Soil Organic Carbon (ISRIC-WISE)
The distribution of the horizon SOC content shows the familiar distinction between
mineral and organic horizons:
• For horizons with a SOC content below approx. 20% the SOC content generally
decreases with depth.
• For horizons with a SOC content above approx. 20% the SOC content shows a
tendency to increase with depth.
The graph also indicates that for deeper organic soils grassland and arable land uses are
prevalent while the profiles under forest are on shallower soils.
3.3.2 SOC Content and Depth Transformation
The relationship between SOC content and depth for each profile was analysed for the 4
options of transforming the variables. For the soil section 0-100 cm, a minimum
coverage of 75% of the section and a limit on the SD<10 of the SOC content the
distribution of the coefficient of determination (r2) was established for each profile. The
result together with the relative distribution of the transformed depth parameter is
presented in Figure 47.
77
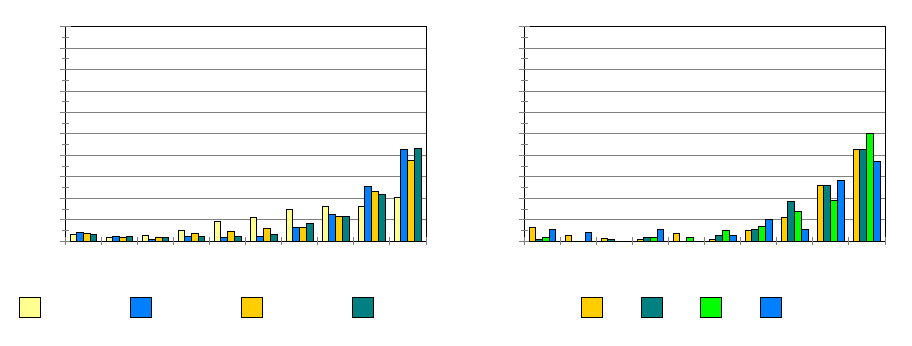
Distribution of Organic Carbon in Soil Profile Data
0
10
20
30
40
50
60
70
80
90
100
Relative Frequency
0.1 0.2 0.3 0.4 0.5 0.6 0.7 0.8 0.9 1
Coefficient of Determination
No transformation ln(Depth) ln(OC) ln(Depth) + ln(O
C
0
10
20
30
40
50
60
70
80
90
100
Relative Frequency
0.1 0.2 0.3 0.4 0.5 0.6 0.7 0.8 0.9 1
Coefficient of Determination
Arable Forest Grass Other
a) Transformation Options b) Land Use Classes for Transformed Depth
Figure 47: Frequency Distribution of Combinations of Logarithmic SOC and Central
Horizon Depth Transformation and Transformation of Depth by Land
Use (ISRIC-WISE)
For 40% of the profiles a value >0.9 is obtained for the coefficient of determination
when logarithmically transforming the depth variable or both variables. The logarithmic
transformation of just the SOC content variable puts 39% of the profiles in this range.
For the depth transformation 50% of the soil profiles under grass show a r2 value of
>0.9. The lowest score was found for profiles assigned to “other” land uses with 37%
are in this range when describing the change in SOC content with depth.
The frequency distribution of the lowest horizon reported for a profile as well as the
accumulated distribution are presented in Figure 48.
78
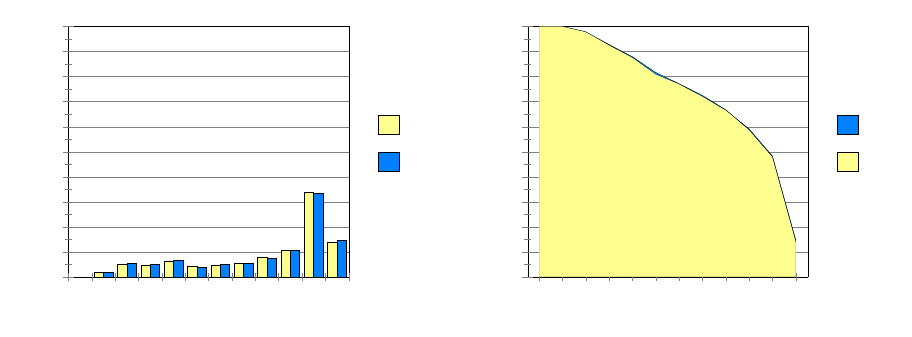
Distribution of Organic Carbon in Soil Profile Data
0
10
20
30
40
50
60
70
80
90
100
Relative Frequency (%)
10 20 30 40 50 60 70 80 90 100 150 200
Profile Depth (cm)
SD < 100
SD < 10
0
10
20
30
40
50
60
70
80
90
100
Relative Occurence (%)
10 20 30 40 50 60 70 80 90 100 150 200
Profile Depth (cm)
SD < 10
SD < 100
a) Lowest Horizon by SD of SOC Content b) Accumulated Relative Frequency
Figure 48: Relative Occurrence of Profile Depth (ISRIC-WISE)
The graph shows a clear peak in the distribution for profile depths ranging between
from 100 – 150 cm. Approx. one third of all profiles report horizon data to that depth.
The accumulated distribution indicates that nearly 50% of all profiles reach to a depth of
150 cm. The graph distinguishes between profiles with a limit of the SD < 10 and all
profiles. The relative frequency distribution did not show any significant difference in
the occurrence of profile depth between the profiles with a limited variability in SOC
content and those without restriction.
The variability in the SOC content between the horizons forming a profile for the soil
section 0-100 cm can be expressed by the SD or the Coefficient of Variation (CV), the
latter for a normalization by the mean SOC content. The relationships plotted against
the mean profile SOC content are presented in Figure 49.
The distribution of the SD shows a sharp increase with the profile SOC content for soils
with a mean SOC content of approx. 15-20%. For organic soils the SD generally
decreases with SOC content. This development for organic soils is influenced by the
presence of an upper limit to SOC content. The relative variation in SOC content is
highest for profiles with a low SOC content. It decreases to <1 for profiles with a mean
SOC content of 12%. In the distribution of the variation the ISRIC-WISE data set is
very comparable to the results obtained for the SPADE/M profiles.
79
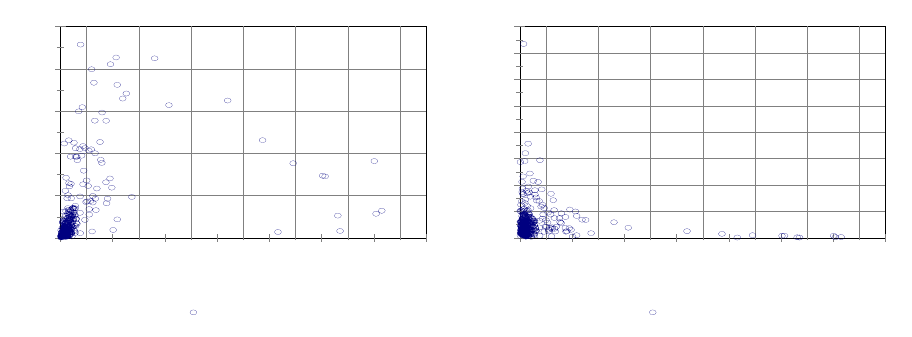
Distribution of Organic Carbon in Soil Profile Data
0
5
10
15
20
25
SD of Horizon SOC Content
0 10 20 30 40 50 60 70
Mean Profile SOC 0-100 cm (%)
Min. Profile Depth 5cm
0
2
4
6
8
10
12
14
16
CV of Horizon SOC Content
0 10 20 30 40 50 60 70
Mean Profile SOC 0-100 cm (%)
Min. Profile Depth 5cm
a) 0-100 cm SOC Content vs. SD b) 0-100 cm SOC Content vs. CV
Figure 49: Relationship between Standard Deviation (SD) and Coefficient of
Variation (CV) and Profile SOC Content with Varying Cover of Profile
Depth (ISRIC-WISE)
3.3.3 Influence of Land Cover
The relationship between land cover type and variability of the profile was investigated
by varying the data cover of the soil segment 0-100 cm from including the topsoil
section to 75% of the total profile section. For the topsoil no limit on the variability of
the SOC content was set, which is consistent with objective of providing an estimate for
the subsoil SOC content from topsoil information. The limit on the variability of SOC
content for the whole segment 0-100 cm reduces the presence of profiles with mixed
mineral and organic horizons in the sample. Mixed profiles have discontinuous
developments of SOC content with depth and could be identified by the assigned soil
type. The results of the analysis on changes in the number of profiles when using 30%
and 75% coverage of the 0-100 cm segment with data on horizons in a profile and SOC
content variability are given in Table 10.
80

Distribution of Organic Carbon in Soil Profile Data
Table 10: Distribution of Soil Profiles by Land Cover Class under Two Treatments
for Soil Segment 0-100 cm
Land Cover Treatment Conditions Change
Cover: >30%
SD: no limit Cover: >75%
SD: <10 %
Arable 160 (35.7%) 141 (39.5%) -11.9
Forest 131 (29.2%) 96 (26.9%) -26.7
Grassland 74 (16.5%) 55 (15.4%) -25.7
Shrub 0 (0.0%) 0 (0.0%) -
Other / NC 83 (18.5) 65 (18.2) -21.7
TOTAL 448 357 -20.3
Of the 551 profiles used 448 completely cover the topsoil. Approx. 1/3 of the profiles
are located on arable land, 30% under forest and 1/6 on grassland. The distribution of
more homogenous profiles to a depth of at least 75cm mainly affects those under forest
and on grassland with a reduction of approx. 25%. Profiles on arable land would appear
to be deeper and less variable in within-profile SOC content than profiles sampled on
other land use types.
The distribution of the depths by land cover type for 537 profiles is presented in Figure
50.
81
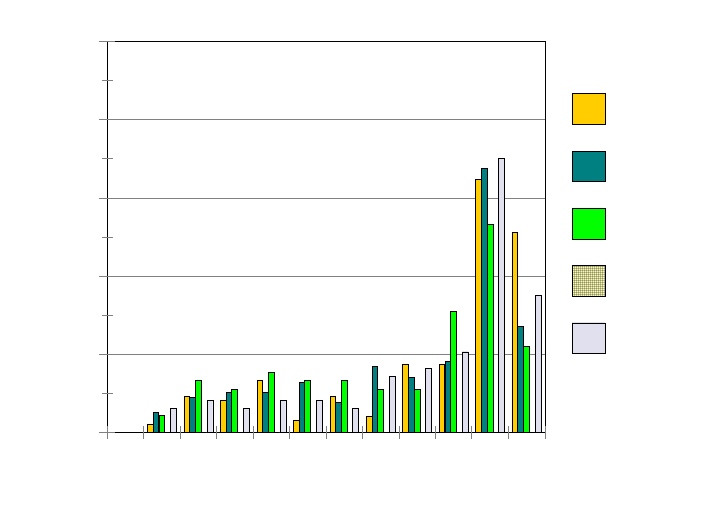
Distribution of Organic Carbon in Soil Profile Data
0
10
20
30
40
50
Relative Frequency (%)
10 20 30 40 50 60 70 80 90 100 150 200
Profile Depth (cm)
Arable (195)
Forest (154)
Grassland (90)
Shrub (1)
Other / NC (97)
Figure 50: Frequency Distribution of Land Cover Types by Profile Depth (ISRIC-
WISE)
The graph shows the previously mentioned prevalence of profiles on arable land for
deeper soils. In particular, for soils with a depth > 200 cm arable land use dominates. By
contrast, profiles from grassland tend to be more widespread on shallower soils and is
the most widely found land use for profiles with a depth below 80 cm.
The occurrence by land use type of the regression coefficient derived from the
relationship between SOC content and depth for the soil segment 0-100 cm was
computed to evaluate the distribution of the coefficient. The resulting relative frequency
aggregated by bins is depicted in Figure 51.
82
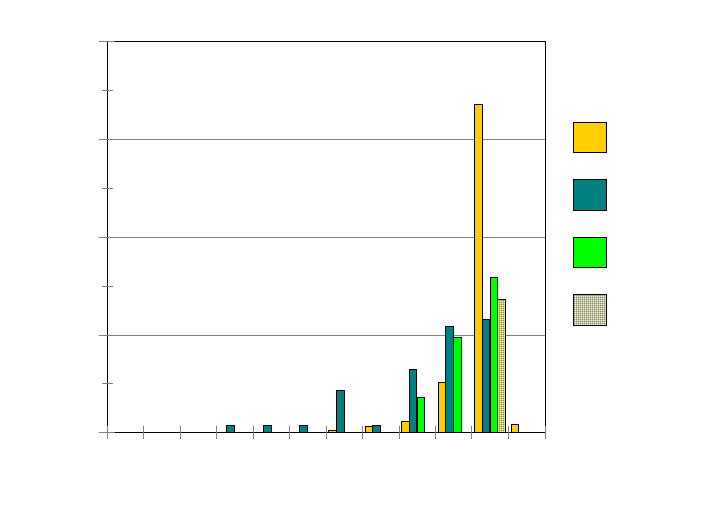
Distribution of Organic Carbon in Soil Profile Data
0
20
40
60
80
Relative Frequency
-10 -9 -8 -7 -6 -5 -4 -3 -2 -1 01
Slope Coefficent m
Arable (137)
Forest (50)
Grassland (24)
Shrub (3)
Figure 51: Frequency Distribution of Relative Occurrence of Slope Coefficient m by
Land Cover Type (ISRIC-WISE)
The graph shows a predominance of arable soils for a gradual decrease of SOC content
with horizon depth. This tendency is reflected by the finding that over 65% of all
profiles have a slope coefficient between -1 and 0. For profiles under forest the decline
in SOC content with depth tends to be steeper, while the change for profiles on
grassland takes an intermediate position.
3.3.4 Influence of Mean SOC Content in Soil Section
The mean SOC content in the topsoil was compared to corresponding values in the
complete segment 0-100 cm and just the subsoil. The data pairs for the profiles are
presented in Figure 52.
83
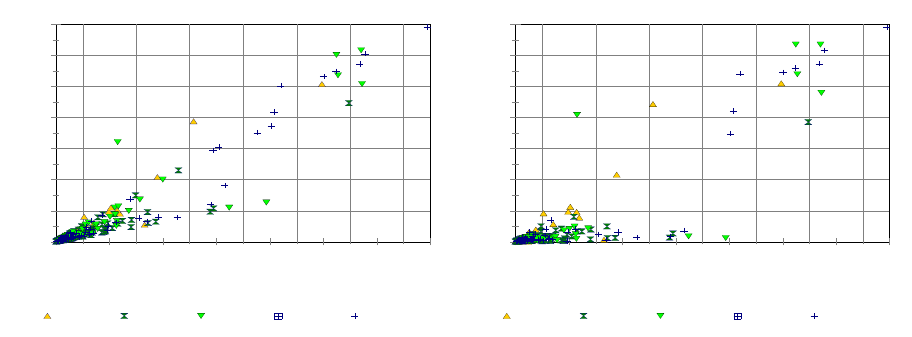
Distribution of Organic Carbon in Soil Profile Data
0
10
20
30
40
50
60
70
Mean Profile SOC 0-100cm (%)
0 10 20 30 40 50 60 70
Mean Profile SOC 0-30 cm (%)
Arable Forest Grassland Shrub Other / NC
0
10
20
30
40
50
60
70
Mean Profile SOC 30-100cm (%)
0 10 20 30 40 50 60 70
Mean Profile SOC 0-30 cm (%)
Arable Forest Grassland Shrub Other / NC
a) Topsoil vs. 0-100 cm SOC Content b) Topsoil vs. Subsoil SOC Content
Figure 52: Relationship between Mean SOC Content of Topsoil and Subsoil and
Combined Soil Segment (ISRIC-WISE)
The relationship between the mean SOC content of the topsoil and the segment 0-
100 cm indicates divergent trends for SOC contents above approx. 15%. The profiles on
the lower data belong to the soil types Gleyic Podzol (PZg) and Dystric Gleysol (GLd)
on grassland and non-specific land use types. These soil types indicate the presence of a
discontinuity in soil horizon properties or the presence of an organic horizon overlaying
mineral soil. As a consequence, there is very limited or no relationship in SOC content
between the topsoil and the subsoil. This situation can be observed when plotting the
mean SOC content of the topsoil against the subsoil. For profiles with a topsoil SOC
content of above approx. 12% the subsoil SOC content remains practically unchanged.
For the 11 profiles of the Gleyic Podzol 10 profiles show a very distinct decrease in
SOC content between the topsoil and the subsoil. None of these profiles are on arable
land. For the 15 profiles classified as Dystric Gleysol only the 2 profiles with a mean
SOC content of 20% in the topsoil show a comparable development. This situation
indicates a more complex relationship between topsoil and subsoil SOC content for the
Dystric Gleysol then for the Gleyic Podzol.
The parameters for a linear relationship between the SOC content in the topsoil and the
soil segment 0-100 cm was found to be:
(r
TOP
SOCSOC ×=
−887.0
1000
2: 0.90, 534 dF)
No PZg profiles: (r
TOP
SOCSOC ×=
−923.0
1000
2: 0.92, 523 dF)
Limiting the profiles to mineral soils (SOC content < 18) the relationships were found
to be:
(r
minmin
1000 658.0 TOP
SOCSOC ×=
−
2: 0.65, 504 dF)
84
Distribution of Organic Carbon in Soil Profile Data
No PZg profiles: (r
minmin
1000 685.0 TOP
SOCSOC ×=
−
2: 0.67, 498 dF)
For organic soils (SOC content >=18%) the relationships were:
(r
0.13219.1
1000 −×=
−
org
TOP
org SOCSOC 2: 0.78, 28 dF)
No PZg profiles: (r
7.9173.1 10001000 −×= −−
orgorg SOCSOC 2: 0.80, 23 dF)
For the entirety of profiles the relationship between the topsoil and the soil segment 0-
100 cm SOC content is close to 1 when not including profiles from Gleyic Podzol. This
would indicate that there is practically no change in the SOC content from the topsoil to
the subsoil. In a simplistic approximation this would connote that more than twice the
amount of SOC is stored in the subsoil than in the topsoil.
When separating the profiles into mineral and organic a more complex relationship was
found. For profiles with a SOC content of <18% in the topsoil the SOC content of the
soil segment 0-100 cm is approx. 2/3 of the topsoil value. Based on the number of
profiles the deviating trend for Gleyic Podzol does not significantly change the
relationship.
For organic soils a notably different relationship emerges. There appears to be a general
increase in SOC content with depths. Those increases concern profiles on arable land,
but also forest and grassland on peat. All profiles where the mean SOC content for the
segment 0-100 cm qualifies them as organic are classified as Histosols (Hs), either
terric (HSf) or fibric (HSf). The profile data for Histosols also demonstrates that one
should not rely merely on the soil class in the assignment of mineral or organic soil
types in a dataset. One of the profiles classified as Histosols had a mean SOC content of
3% for the segment 0-100 cm while another had a mean SOC content of 3.1% for the
subsoil, which is inconsistent with the definition of the soil class. Despite the non-
conform classifications the latter was included in the analysis of the regression analysis
for organic soils, because the topsoil SOC content was > 18% (19.2%).
In the assessment of the regression the y-offset was computed for organic soils rather
than set to 0 as for mineral soils. Even when forcing the y-offset to 0 the slope
coefficient of 0.96 remains significantly different from the coefficient found for mineral
soil profiles. Thus, based on the results of the regression analysis, the change in SOC
content with depth is very likely to be different between mineral and organic soils.
However, in the interpretation of the results it should be considered that the slope
coefficient of the SOC content relationship for organic soils is very much influenced by
just 2 profiles, one on grassland and one on arable land.
Relating the SOC content of the topsoil to the subsoil demonstrates the difference in the
change in SOC content with the amount of SOC in the soil. Without the duplication of
the topsoil in the supposedly independent data set the divergent relationships are more
apparent. There is practically no relationship between the topsoil and subsoil SOC
content for the Gleyic Podzol in the profile data.
The regression analysis of the relationship between topsoil and subsoil SOC content
produced the following results:
85
Distribution of Organic Carbon in Soil Profile Data
(r
TOPSUB SOCSOC ×= 809.0 2: 0.76, 472 dF)
No PZg profiles: (r
TOPSUB SOCSOC ×= 885.0 2: 0.83, 461 dF)
Limiting the profiles to mineral soils (SOC content < 18%) the relationships were found
to be:
(r
minmin 355.0 TOPSUB SOCSOC ×= 2: 0.19, 447 dF)
No PZg profiles: (r
minmin 391.0 TOPSUB SOCSOC ×= 2: 0.22, 441 dF)
For organic soils (SOC content >=18%) the relationships were:
(r
0.27461.1 −×= org
TOP
org
SUB SOCSOC 2: 0.70, 23 dF)
No PZg profiles: (r
8.11215.1 −×= org
SUB
org
SUB SOCSOC 2: 0.66, 17 dF)
For mineral soils the relationship in SOC content between topsoil and subsoil hardly
exists. The mean SOC content for the topsoil of all profiles with a topsoil SOC content
of <18% is 2.8%. By contrast, The mean SOC content for the subsoil of all profiles with
a topsoil SOC content of <18% is 1.0%. Hence, while there is a pronounced decrease in
SOC content from the topsoil to the subsoil this is not immediately evident from the
regression analysis. The change in SOC content with depth is more prevalent for soils
with a mean SOC content of >18% in the topsoil.
For mineral soils the regression coefficient relating SOC content of the topsoil to the
soil segment 0-100 cm and the subsoil was computed for the major land use types. The
results are given in Table 11.
86

Distribution of Organic Carbon in Soil Profile Data
Table 11: Parameters of Linear Regression between SOC Content of Topsoil and
Soil Segment 0-100 cm and Subsoil (ISRIC-WISE)
Regression Analysis Slope
Coeff. Coefficient of
Determination
r2
Lower
Limit
(95%)
Upper
Limit
(95%)
TOP vs. 0-100
Arable <18 0.729 0.78 0.690 0.769
Forest <18 0.576 0.77 0.541 0.611
Grass < 18* 0.707 0.87 0.663 0.750
Other / NC 0.662 0.79 0.606 0.717
TOP vs. SUB
Arable <18 0.573 0.53 0.513 0.634
Forest <18 0.247 0.43 0.215 0.280
Grass < 18* 0.246 0.49 0.211 0.282
Other / NC 0.322 0.31 0.259 0.384
* Profile No. 2836 (soil type HSs) not included.
The results of the regression analysis show a general decrease in the variability of the
data for individual land use types as compared to the results obtained from all profiles.
This could be taken as an indication for a distinct relationship between the topsoil and
subsoil SOC contents of one or more land use types.
When comparing the relationship between the topsoil and the soil segment 0-100 cm the
mean SOC content profiles under forest show a correlation coefficient which is
distinctly different from those found for other land use types. However, when
comparing the relationship between the topsoil and the subsoil mean SOC content
profiles on arable land a distinctly different development emerges, while the
relationship for profiles under forest and on grassland are quite similar.
The influence of the level of SOC on the relationship between topsoil and subsoil SOC
content was evaluated by assessing the rate of change in SOC content with depth. The
results of plotting the mean SOC content in the topsoil versus the coefficient and
constant derived from the regression of SOC content with depth are presented in Figure
53.
87
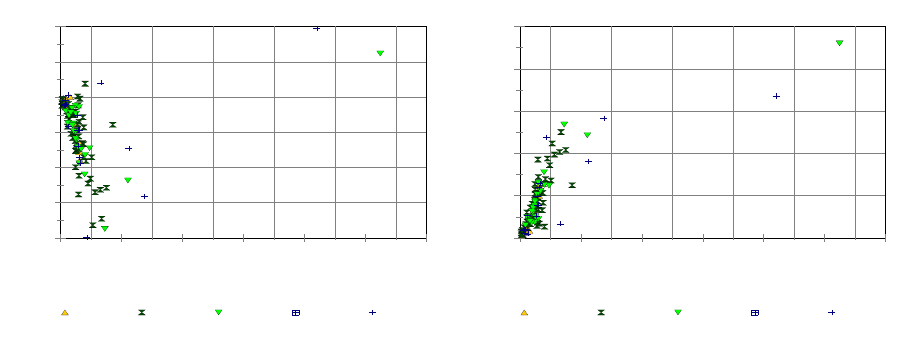
Distribution of Organic Carbon in Soil Profile Data
-8
-6
-4
-2
0
2
4
Slope Coefficient m
0 10 20 30 40 50 60
Mean Profile SOC 0-30 cm (%)
Arable Forest Grassland Shrub Other / NC
0
10
20
30
40
50
Constant b
0 10 20 30 40 50 60
Mean Profile SOC 0-30 cm (%)
Arable Forest Grassland Shrub Other / NC
a) Topsoil SOC Content vs. Coefficient b) Topsoil SOC Content vs. Constant
Figure 53: Relationship between Mean SOC Content and Model Slope Coefficient
and Constant for Topsoil by Land Cover Type (ISRIC-WISE)
The graph indicates a decrease in the regression coefficient with increasing SOC content
in the topsoil. From this general trend 2 profiles with mineral soils deviated by showing
an increase in SOC content with depth and 4 profiles show a comparable rate in the
SOC content : depth coefficient, but with a distinct offset. Further investigation of the
data of these profiles could not shed any light as to the reasons for the off-set from the
general trend for those profiles.
The regression analysis of the mean topsoil SOC content with coefficients and constants
obtained from relating the horizon topsoil SOC content to the central horizon depth
gave the following parameters for mineral profiles:
TOPTOP SOCm ×−= 630.0 (r2: 0.35, 106 dF)
TOP
arable
TOP SOCm ×−= 760.0 (r2: 0.73, 13 dF)
TOP
forest
TOP SOCm ×−= 735.0 (r2: 0.42, 55 dF)
TOP
grassland
TOP SOCm ×−= 678.0 (r2: 0.54, 21 dF)
The 2 profiles in the data set with organic profiles were not further analyzed. They were
found to significantly differ in their characteristics from the distribution of SOC content
in mineral soils, and it was not expected that the characteristics of the relationship could
be defined from just 2 profiles.
For the relationship between the mean SOC content in the subsoil and the coefficients
and constants from the regression of subsoil SOC content and depth the data pairs are
presented in Figure 54.
88
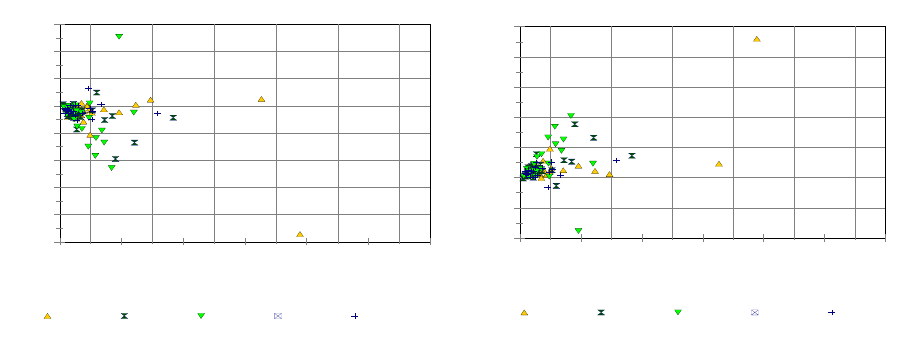
Distribution of Organic Carbon in Soil Profile Data
-10
-8
-6
-4
-2
0
2
4
6
Slope Coefficient m
0 2 4 6 8 10 12
Mean Profile SOC 30-100 cm (%)
Arable Forest Grassland Shrub Other / NC
-20
-10
0
10
20
30
40
50
Constant b
0 2 4 6 8 10 12
Mean Profile SOC 30-100 cm (%)
Arable Forest Grassland Shrub Other / NC
a) Subsoil SOC Content vs. Coefficient b) Subsoil SOC Content vs. Constant
Figure 54: Relationship between Mean SOC Content and Model Slope Coefficient
and Constant for Subsoil by Land Cover Type (ISRIC-WISE)
The relationship of the subsoil SOC content with the regression coefficients and
constants of the SOC content changes with depth indicates a less defined change for the
subsoil than for the topsoil. In contrast to the topsoil data the subsoil dataset only
contains results for profiles with a mean SOC content <8%. Almost 20% of the subsoil
profiles show no change in SOC content with depth or even a slight increase. One
profile classified as a Eutric Flivisol shows a marked increase in subsoil SOC content
with depth. The magnitude of the increased was caused by a relatively low SOC content
of a horizon stretching from 18-45 cm and a subsequent increase for deeper horizons.
The profile data does not provide an explanation for the uncharacteristic behaviour of
the SOC content development in the profile. Because the trend displayed by the profile
was found to be anomalous the data were not included in the regression analysis. The
results of the change in regression coefficient relating SOC content to depth in the
subsoil are:
SUBSUB SOCm ×−= 646.0 (r2: 0.25, 126 dF)
SUB
arable
SUB SOCm ×−= 074.0 (r2: -0.68, 41 dF)
SUB
forest
SUB SOCm ×−= 686.0 (r2: 0.21, 36 dF)
SUB
grassland
SUB SOCm ×−= 410.1 (r2: 0.32, 24 dF)
The changes in the regression coefficient are notably different between the land use
types. For profiles on arable land an increase in the regression coefficient of SOC
content vs. depth dominates in the subsoil. For profiles on grassland the decrease in the
slope coefficient persists also in the subsoil. To a lesser degree this decrease is also
notable for profiles under forest.
89
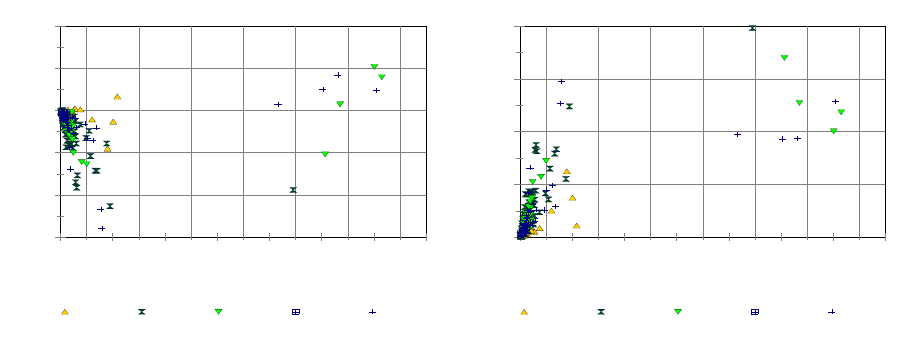
Distribution of Organic Carbon in Soil Profile Data
The results of relating the mean SOC content in the soil segment 0-100 cm and the
coefficients and constants from the regression of SOC content and depth for the
segment are presented in Figure 55.
-15
-10
-5
5
10
Slope Coefficient m
10 20 30 40 50 60 70
Mean Profile SOC 0-100 cm (%)
Arable Forest Grassland Shrub Other / NC
20
40
60
80
Constant b
10 20 30 40 50 60 70
Mean Profile SOC 0-100 cm (%)
Arable Forest Grassland Shrub Other / NC
a) 0-100 cm SOC Content vs. Coefficient b) 0-100 cm SOC Content vs. Constant
Figure 55: Relationship between Mean SOC Content and Model Slope Coefficient
and Constant for Soil Section 0-100 cm by Land Cover Type (ISRIC-
WISE)
The graph shows the distinctly different relationship between the change in the
regression coefficient between mineral and organic soils. A regression analysis between
the mean SOC content of the segment 0-100 cm and the coefficient of the relationship
between SOC content and depth provided the following results:
10001000 850.0 −− ×−= SOCm (r2: 0.46, 346 dF)
10001000 347.0 −− ×−= SOCmarable (r2: -0.13, 139 dF)
10001000 040.1 −− ×−= SOCm forest (r2: 0.51, 94 dF)
10001000 179.1 −− ×−= SOCmgrassland (r2: 0.71, 50 dF)
The general tendency of a distinctly different relationship for profiles on arable land as
compared to those under forest or on grassland found for the subsoil, but not the topsoil,
is also present in the structure of the soil segment 0-100 cm. This indicates that changes
in SOC content with depth are more comparable for soils under forest and grassland
than either with development of soils on arable land.
In order to estimate the SOC content at a certain depth in the subsoil the mean SOC
content in the topsoil is associated with the regression parameters describing the
90
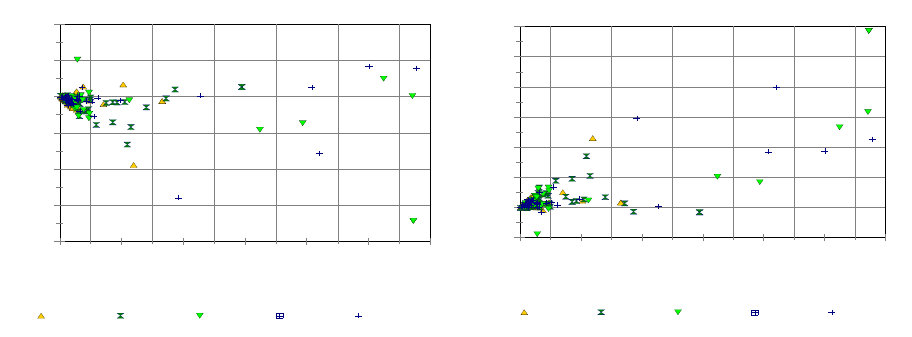
Distribution of Organic Carbon in Soil Profile Data
relationship between SOC content and depth in the subsoil. The available data pairs
from the profiles are presented in Figure 56.
-20
-15
-10
-5
0
5
10
Slope Coefficient m 30-100cm
0 10 20 30 40 50 60
Mean Profile SOC 0-30 cm (%)
Arable Forest Grasslsand Shrub Other / NC
-20
0
20
40
60
80
100
120
Constant b 30-100cm
0 10 20 30 40 50 60
Mean Profiel SOC 0-30 cm (%)
Arable Forest Grassland Shrub Other / NC
a) Topsoil SOC Content vs. Subsoil Coefficient b) Topsoil SOC Content vs. Subsoil Constant
Figure 56: Relationship between Mean SOC Content for Topsoil and Model Slope
Coefficient and Constant for Subsoil by Land Cover Type (ISRIC-
WISE)
Following the low level of correlation between the topsoil and the subsoil mean SOC
content the relationship between the mean SOC content of the topsoil and the slope
coefficient of the SOC content vs. depth association in the subsoil was as expected
rather weak. The development of SOC content with depth for one profile on grassland
(No. 1695) was found to be outside the common trend, with a strong increase in SOC
content with depth for an organic soil. Because of the particularity of the profile it was
excluded from the formulation of parameters representing a general relationship. The
regression analysis of data from profiles with a mean SOC content < 18% in the topsoil
resulted in slope and constants of:
TOPSUB SOCm ×−= 208.0 (r2: 0.14, 238 dF)
SUB
arable
SUB SOCm ×−= 232.0 (r2: -0.10, 111 dF)
SUB
forest
SUB SOCm ×−= 202.0 (r2: 0.24, 54 dF)
SUB
grassland
SUB SOCm ×−= 218.0 (r2: -0.02, 50 dF)
Those findings lead to the following general formulation of the relationship between
topsoil mean SOC content and the regression coefficient of the relationship between
SOC content and depth for the subsoil:
()
minmin
min 157.1)ln(208.0 TOPTOP
SUB SOCdSOCdSOC ×+××−=⇒
91

Distribution of Organic Carbon in Soil Profile Data
or profiles with higher SOC content a tendency for the slope coefficient to increase is
ggested by the data. However, for data from one plot with peat on grassland (No.
F
su
1698) displays a notable rate of SOC content decreasing with subsoil depth. The profile
horizon data do not indicate any particular inconsistency in the values reported. With
the few profiles for organic soils this single profile very much dominates the results of a
regression analysis. While accepting the profile data as real and useful when
appreciating the variation in soil conditions including the profile in the formulation of
general trends was considered unsupportive. Excluding the profile data from the
analysis results in a slight increase (m = +0.07) in the regression coefficient of SOC
content vs. depth with increasing SOC content in the subsoil for organic soils and peat.
For profiles of individual land use types and for the collection of all profiles available
for the analysis the correlation between the mean SOC content of the topsoil and the
subsoil slope coefficient of the change of the SOC content with depth in the subsoil thus
determined the level of dependability is rather low. Alternatively, the relationship can
also be approximated from the correlation between the mean SOC content of the topsoil
and the soil segment 0-100 cm. The computation was developed from the following
approach:
()
(
)
SUBSUB
SUB bdmdSOC +×= ln
he general function for the subsoil coefficient can be related to the mean SOC
ontent of the subsoil by a linear function as:
an approximation the mean SOC content of the subsoil can be linked to the
ean SOC content of the topsoil and the soil segment 0-100 cm by
T
c
SUSUB SOCnm ×= min
1
min
B
In
m
proportionally weighing the sections:
7.0
3.0
1000
SUB
SOCSOC
SOC ×−
=−TOP
he mean SOC content of the segment 0-100 cm is correlated to the mean
psoil SOC content by:
1000 TOP−
y substitution the slope coefficient for the SOC content at a given depth in the
bsoil estimated from the mean topsoil SOC content becomes:
T
to
minminmin SOCnSOC ×=
2
B
su
min
min
2
min
1
minminmin
2
min
1
min 3.0
3.0 TOPTOP
SUB
n
n
SOCSOCn
nm ×
−
×=
×−×
×= 7.07.0 TOP
SOC
92
Distribution of Organic Carbon in Soil Profile Data
Correspondingly, the function constant for the subsoil can be estimated from
psoil and segment 0-100 cm data. For mineral soils the relationship between
soil SOC content and the coefficient defining changes in SOC content
For organic soils the subsoil slope coefficient varies considerably between
the 7 profiles in the data subset. Instead of using the method detailed above for
rom
an
The function for the subsoil SOC content at a given depth d is then
to
the top
with depth in the subsoil thus becomes:
()
minmin
min 410.1)ln(232.0 TOPTOP
SUB SOCSOCddSOC ×+××−=⇒
org
n1
organic soils the coefficient was estimated f 14 profiles available for
characterizing the relationship of the topsoil me SOC content and the subsoil
slope coefficient. The corresponding values were averaged by soil type to
achieve a more compact data set for the analysis. Subsoil slope coefficient and
constant were estimated by:
orgorg
TOP
orgorg
SUB cSOCnm 11 +×= and orgorg
TOP
orgorg
SUB cSOCnb 22 +×=
:
()
()
(
)
orgorg
TOP
orgorgorg
TOP
org
org
SUB cSOCndcSOCndSOC 2211 ln +×+×+×=
Using the values derived from the analysis the subsoil SOC content could be
stimated based on the mean topsoil SOC content as:
e
()
()
(
)
2.5898.0ln4.2075.0 +×+×−×= org
TOP
org
TOP
org
SUB SOCdSOCdSOC
Care should be applied in the interpretation of the function parameters. The function
sults in a slight increase in SOC content with depth for topsoil SOC contents > 20%.
his trend corresponds to the correlation of topsoil to segment 0-100 cm mean SOC
d
re
T
content. Nonetheless, the function parameters are based on the data from just 9 profiles
with organic topsoil and subsoil. When applying the SOC content threshold only to the
topsoil data from 5 additional profiles are included, all of which indicate a change from
an organic topsoil horizon to a mineral subsoil. Yet, the function is not applicable to
those profiles. Under conditions where the subsoil SOC content is to be estimated the
knowledge of a mineral subsoil can only be derived from the soil type and this
information should be taken into account in addition to the mean topsoil SOC content.
It should further be considered that while the method is mathematically apt and may be
considered an alternative to the regression analysis in cases where subsoil data are
scarce it does in no way improve the reliability of the relationship between topsoil an
subsoil SOC content.
93
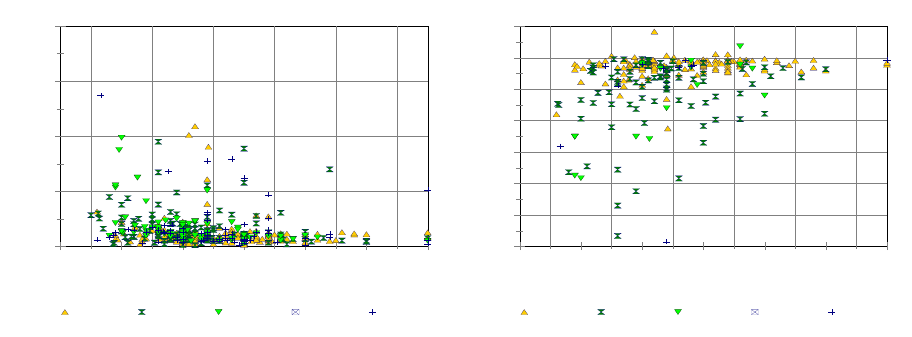
Distribution of Organic Carbon in Soil Profile Data
3.3.5 Influence of Depth of Soil
The amount of OC in a soil segment may be affected by the depth of the soil above the
lation between mean SOC content
he soil stratum the lowest horizon
depth of a profile is used as a substitute. To evaluate the relationship the profile depth is
rock layer. Profile depth would influence the corre
and depth. In the absence of data on the depth of t
related to the mean SOC content of the soil segment 0-100 cm and the slope coefficient
of the SOC content vs. depth correlation. The results for the collection of all profiles are
presented in Figure 57.
0
5
10
15
-12
-10
-8
-6
-4
-2
0
20 2
Mean SOC Content 0-100 (%)
0 50 100 150 200 250 300
Profile Depth (cm)
Arable Forest Grassland Shrub Other / NC
Slope Coefficient 0-100 m
0 50 100 150 200 250 300
Profile Depth (cm)
Arable Forest Grassland Shrub Other / NC
a) Profile Depth vs. 0-100 cm SOC Content b) Profile Depth vs. 0-100 cm Coefficient
Figure 57: Maximum Profile Depths vs. Mean SOC Content for Soil Segment 0-
100 cm and Change in Model Slope Coefficient with Depth of Profile
ISRI
The data indica
coefficient with the depth of the soil stra may hide more consistent
correlations for individual soil types. With the total number of 449 profile pairs
vailable for the evaluation data for 13 soil types were included with data from 10 or
( C-WISE)
te a decrease in the variability of the mean SOC content and slope
tum. The graph
a
more profiles. For those soil types the relationship between soil depth and the mean
SOC content and the slope coefficient of the SOC content : depth correlation of the soil
segment 0-100 cm were assessed individually.
94
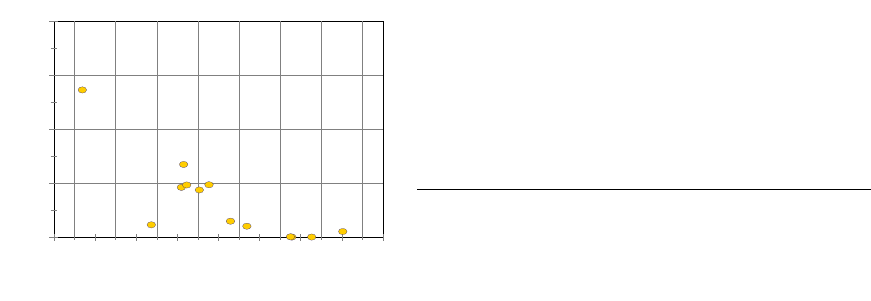
Distribution of Organic Carbon in Soil Profile Data
0
0.25
0.5
0.75
1
Coefficient of Determination
-1.5 -1.25 -1 -0.75 -0.5 -0.25 0 0.25 0.5
Coeff. Soil Depth vs. SOC Content
CMc
CMd
CMe
CMv
FLc
FLe
GLd
LVh
LVj
LVx
PZg
PZh VRk
Figure 58: Regressions Coefficient of
Linear Function between Soil Depth
and Mean SOC Content for Soil
Segment 0-100 cm vs. Coefficient of
Determination of Correlation
(ISRIC-WISE)
Table 12: Parameters of Linear Regression
between Soil Depth and Mean SOC Content for
Soil Segment 0-100 cm vs. Coefficient of
Determination of Correlation (ISRIC-WISE)
Soil No. of
Profiles Slope
Coeff Coeff.
of
Deter.
Coeff.
Min
(95%)
Coeff.
Max.
(95%)
CMc 10 0.723 0.23 -1.799 0.352
CMd 33 1.325 0.68 -1.655 -0.994
CMe 21 0.325 0.05 -1.055 0.437
CMv 10 0.690 0.24 -1.685 0.304
FLc 16 0.052 0.00 -0.980 0.877
FLe 18 0.425 0.07 -1.216 0.366
GLd 12 0.906 0.06 -3.486 1.673
LVh 26 0.709 0.34 -1.127 -0.291
LVj 13 0.614 0.22 -1.381 0.154
LVx 19 0.555 0.24 -1.056 -0.055
PZg 10 0.069 0.00 -1.992 2.130
PZh 23 0.060 0.00 -0.629 0.509
VRk 16 0.258 0.03 -0.628 1.144
As the graph illustrates the regression coefficient is negative for 11 out of the 13
profiles analyzed. The graph also shows the generally low level of predictability of the
SOC content from soil depth and indicates a low level of significance that the slope
coefficient will be different from 0. It simply indicates that the lower the regression
coefficient of the relationship between the coefficient of the SOC content-to-depth
function and the SOC content the less likely it is that no relationship exists.
The lower and upper values of the regression coefficient of the correlation between the
soil depth and the mean segment SOC content, both transformed by a natural logarithm,
for the 13 soil types are given in Table 12. At a confidence level of 95% only the profiles
of Dystric Cambisol (CMd) and Chromic Luvisol (LVx) could be considered to provide
sufficient evidence for predicting SOC content from soil depth.
The evaluation of the influence of soil depth on the mean SOC content in a soil segment
suggested that there may be a decrease in mean SOC content in the soil segment 0-
100 cm for some soil types more than for others. The correlations is probably non-
linear, although with the data available it was not possible to establish a definite
relationship and its characteristics. The impact of soil depth on the distribution of OC in
the profile seems to be more expressed when the soil stratum is deeper than 100 cm
which suggest that even when estimating the distribution of OC from the topsoil
information on soil depth beyond 100 cm could be of use.
95
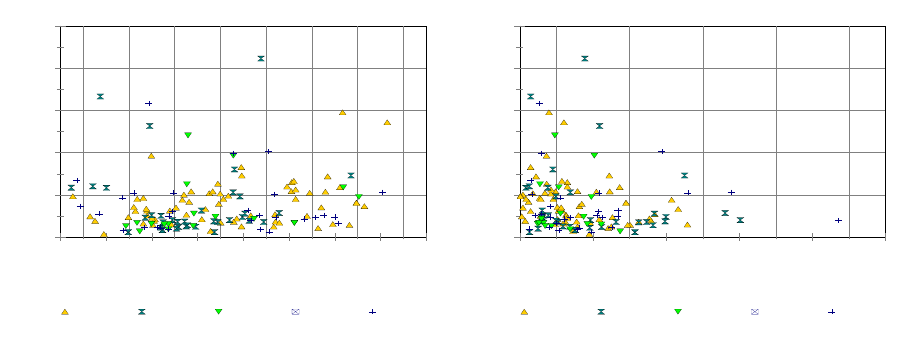
Distribution of Organic Carbon in Soil Profile Data
3.3.6 Influence of Clay Content
An increase in clay content in deeper parts of the soil is linked to an increase in SOC
content in those parts. This relationship should be separated from an increase on SOC
quantity with clay content in deeper soils, because with an increase in clay content also
the bulk density increases.
For the collection of profiles with an increase in clay content with depth the relationship
between the mean SOC the clay content and the mean subsoil SOC content and the
slope coefficient of the subsoil SOC content vs. depth function are presented in Figure
59.
1
2
3
4
5
SOC Content 30-100cm (%)
10 20 30 40 50 60 70 80
Clay Content 0-100 (%)
Arable Forest Grassland Shrub Other / NC
0
1
2
3
4
5
SOC Content 30-100cm (%)
0 0.2 0.4 0.6 0.8 1
Coeff. Clay Content vs. Depth
Arable Forest Grassland Shrub Other / NC
a) 0-100 cm Clay vs. Subsoil SOC Content b) Profile Depth vs. 0-100 cm Coefficient
Figure 59: Relationship between Clay Content and Subsoil SOC Content and the
Coefficient of the Relationship Clay Content vs. Depth and the Subsoil
SOC Content for Profiles with an Increase in Clay Content with Depth
(ISRIC-WISE)
The graphs distinguish in the data from the 148 profiles between land use types.
Alternatively, profiles could be grouped by soil type, but the number of profiles of a
particular soil type was commonly low and reached 10 profiles only for one soil type
(LVh, Halplic Luvisol). For those profiles the SOC content in the subsoil actually
decreases with increasing clay content.
While no particular correlation or trend could be identified between clay content and
SOC content in the subsoil for profiles where the clay content increases with depth the
data show a strong decrease in the variability of the subsoil SOC content with
increasing coefficient for the change in clay content with depth.
For profiles with a decrease in clay content with depth the relationships are not quite
inversed. There is no discernable relationship between clay content and SOC content in
the profiles. There is further no notable change in the variability of the subsoil SOC
96
Distribution of Organic Carbon in Soil Profile Data
content and the coefficient of the change in clay content with depth for those profiles.
Contrary to profiles with an increase in clay content with depth for profiles with a
decrease in clay content with depth the mean SOC content in the subsoil seems to
increase with a higher mean clay content in the profile. This suggests that the influence
of the clay content in the subsoil on OC depends on the distribution of clay within the
profile.
The findings suggest that the relationship between SOC and clay content are more
complex and governed by factors other than just the clay content in the subsoil. For
some soil types opposing trends were found in the relationship depending on whether
clay content increases with depth or decreases. For a more comprehensive analysis the
number of profiles for a given soil type would have to be substantially larger than what
was available from the data set.
3.3.7 SOC Content by Major Soil Category
The mean SOC content in the topsoil and subsoil sections by FAO90 Level 1 soil
category are given in Table 13.
From the dataset covering Europe the topsoil and subsoil SOC contents of 471 profiles
could be compared for 25 main soil categories. The most frequently encountered soil
categories are Cambisols (96 profiles), Luvisols (84 profiles), Fluvisols (41 profiles),
Podzols (40 profiles) and Gleysols (38 profiles). There would appear to be a notable
preference of some soil categories to be associated with specific land uses. For example,
Vertisols are mainly covered by arable land use (85%), while Podzols are predominantly
found under forest cover in the profiles of the dataset.
Overall, the subsoil SOC content amounts to 55% of the SOC content of the topsoil.
The averaged value varies markedly with land use: for arable profiles it is 73%, for
forest 27% and for grassland 61%. The relative portion SOC content in the subsoil is
36% when both soil layers are of mineral type. For organic topsoils and subsoils the
portion increases to 105%, i.e. an increase in SOC content in the subsoil layer over the
topsoil. All aggregated figures are weighted by the number of profiles in the survey, not
the distribution of the soils across Europe. The figures should therefore not be
interpreted as being universally representative values but rather be taken as a guidance
for various soil types.
97

Distribution of Organic Carbon in Soil Profile Data
Table 13: SOC Content by Soil Category (ISRIC-WISE)
SOIL
FAO90 ARABLE FOREST GRASS OTHER /
NC ALL
Topsoil
Subsoil
No. of
Profiles
Topsoil
Subsoil
No. of
Profiles
Topsoil
Subsoil
No. of
Profiles
Topsoil
Subsoil
No. of
Profiles
Topsoil
Subsoil
No. of
Profiles
Acrisols 1.3 0.2 1 4.3 0.5 1 2.8 0.4 2
Alisols 1.7 0.8 2 1.6 0.2 2 1.5 0.6 1 1.6 0.5 5
Andosols 8.1 7.2 4 8.9 4.5 7 6.2 2.4 3 8.1 4.8 14
Arenosols 0.5 0.2 1 0.4 0.2 1 1.3 0.2 1 0.7 0.2 3
Anthrosols 2.1 1.6 2 2.1 1.6 2
Chernozems 2.0 0.9 13 2.7 0.4 2 2.6 1.6 4 2.2 1.0 19
Calcisols 0.9 0.4 4 7.3 1.4 1 0.7 0.5 7 1.3 0.5 12
Cambisols 1.6 0.7 34 2.8 0.7 34 3.3 0.9 19 1.9 0.5 9 2.4 0.7 96
Fluvisols 1.6 1.2 21 2.2 0.9 5 2.3 0.7 10 3.0 2.0 5 2.0 1.2 41
Gleysols 3.3 0.5 9 4.1 0.7 5 7.6 1.1 13 5.1 0.6 11 5.4 0.8 38
Gypsisols 1.3 0.5 1 1.3 0.5 1
Histosols 31.5 38.9 3 54.8 38.5 1 46.3 53.9 5 40.2 40.6 8 41.3 44.1 17
Kastanozems 1.2 0.7 5 1.7 0.8 1 1.3 0.7 6
Leptosols 1.5 0.9 2 10.6 3.0 3 8.1 2.8 2 7.3 2.3 7
Luvisols 0.9 0.5 34 1.9 0.5 32 1.7 0.4 9 1.6 0.6 9 1.5 0.5 84
Lixisols 2.5 0.6 1 2.5 0.6 1
Podzoluvisols 1.0 0.3 2 2.8 0.2 1 1.9 0.1 2 1.4 0.2 1 1.7 0.2 6
Phaeozems 2.6 1.6 17 2.1 0.7 6 2.0 1.1 2 1.6 0.7 3 2.3 1.3 28
Planosols 2.4 0.4 8 3.6 0.7 3 2.7 0.5 11
Plinthosols 0.7 0.1 1 0.7 0.1 1
Podzols 2.9 0.6 2
9.6 0.9 21 10.4 1.4 7 12.7 1.8 10 10.2 1.2 40
Regosols 0.5 0.2 5 0.3 0.1 1 0.5 0.2 6
Solonchaks 0.5 0.7 1 0.8 0.3 2 0.7 0.4 3
Solonetz 1.2 0.5 2 1.2 0.5 2
Vertisols 1.4 1.1 22 1.0 0.3 1 1.2 0.9 3 1.4 1.1 26
All 2.3 1.7 176 4.4 1.2 134 7.2 4.4 76 7.3 4.7 85 4.6 2.5 471
bold: defined by 10 or more profiles
98
Distribution of Organic Carbon in Soil Profile Data
3.4 UK Soil Database for CO2 Inventory
The national soil database used to model soil carbon fluxes and land use for the national
carbon dioxide inventory for the UK (Thomson et al., 2008; Bradley et al., 2005) was
made available for evaluation proposes by the Centre for Ecology and Hydrology,
Edinburgh..
The soil properties were stored in an aggregated form of two depth layer:
• layer 0 – 30 cm (topsoil);
• layer 30 – 100 cm (subsoil).
The data for the sections are based on soil profile properties. The soil properties for each
of the layers are organic carbon (content and quantity), sand, silt and clay content and
bulk density. The soil data are provided separately for the following land use types:
• “Arable”: cultivated land (mainly arable and ley (short term) grassland);
• “Grass”: managed permanent grassland;
• “Forest”: woodland (deciduous and coniferous trees);
• “Semi”: semi-natural vegetation and grassland that receives no management.
No specific land use class was defined for urban areas. For continuous urban areas the
SOC content was set to 0t C ha-1 and for suburban areas a value of 0.5 of the SOC
content of the same soil series under pasture (land use type “Grass”) was used. To
model soil carbon fluxed under different land uses the soil database had to cover the
multitude of possible combinations of soil type under land cover with information on
topsoil and subsoil. Where there was no information available from measured profiles
estimates values were entered from suitable measured data based on expert judgement
or as in the case of SOC content , derived from a conversion table with grassland set as
the reference. Mostly this would have come from similar soil series sampled in the same
geographic area. The coverage of soil data by measured profiles greatly varies between
England & Wales, Northern Ireland and Scotland. As most measured data in Northern
Ireland was from a narrow range of soil series under pasture there was much more
substitution form other sources, often with profile data from England & Wales. As a
consequence, the ratio of topsoil to subsoil OC content contains an element of data
redundancy because in cases where only a few suitable soil cores were available the
ratio of parameter values between the topsoil and the subsoil for this soil series would
appear in several places in the database for similar series (Milne, 2009). No information
on which parameters were derived from measured profiles and which were from actual
measurements was available to separate the data in the analysis.
The data are stored in form of a single table, including all land use types, depth sections
and soil properties. Separate tables are provided for England & Wales, Northern Ireland
99
Distribution of Organic Carbon in Soil Profile Data
and Scotland. For this study the tabulated data were transferred to a normalized data
model without modifying the data values and processed using a database management
system instead.
Due to the aggregation of data according to soil categories geographic coordinates were
not available, which would have allowed mapping the soil property data at a specific
location. Information on how to integrate without ambiguity the data of the
classification schemes used in the three regions could not be established and hence the
tables were treated separately.
The number of soil types in the tables varies depending on the region:
• England & Wales: 433; 410 soil series names + 23 descriptive names
• Northern Ireland: 476 series codes; 1 named “ALL”
• Scotland: 540 sequential codes; no soil series names
Not all records contain data on every soil properties for each of the land use types. This
can be a characteristic of the soil type, e.g. no texture data for peat, although in other
cases the absence of data is not immediately obvious.
To reduce the influence of data redundancy data which were unmistakably calculated
from other soil properties were excluded from the analysis. For some cases calculated
values were apparent in the spreadsheet tables by formulas which were entered in the
table fields. The spreadsheet for England & Wales contained 18,419 data entries, of
which 2,563 were evidently calculated from other data by a standard equation
(spreadsheet formula in field). As a consequence, no topsoil data are available for the
land use “Wood” for England & Wales, because such data were calculated largely from
data of the land use “Semi” by applying a constant factor. For England & Wales the
SOC content of “Wood” profiles was calculated by applying a factor of 1.8 to the SOC
content value of the “Semi” land use. In other cases the link between data fields was
less evident. For Northern Ireland identical values for SOC content were found for
“Wood” and “Semi” for most soil categories. Since soil profiles for Northern Ireland
were taken almost exclusively on grassland most values of SOC content for forests and
semi-natural are surrogate data. The SOC content for those profiles is computed as
1.33*SOC content of permanent grassland (DEFRA, 2003), but the spreadsheet did not
contain live formulas linking the fields. Subsequently, those data entries were included
in the analysis.
A illustration of the records with data for organic carbon content for topsoil and subsoil
after removing data calculated by formulas in the three spreadsheet tables is presented
in Figure 60.
100
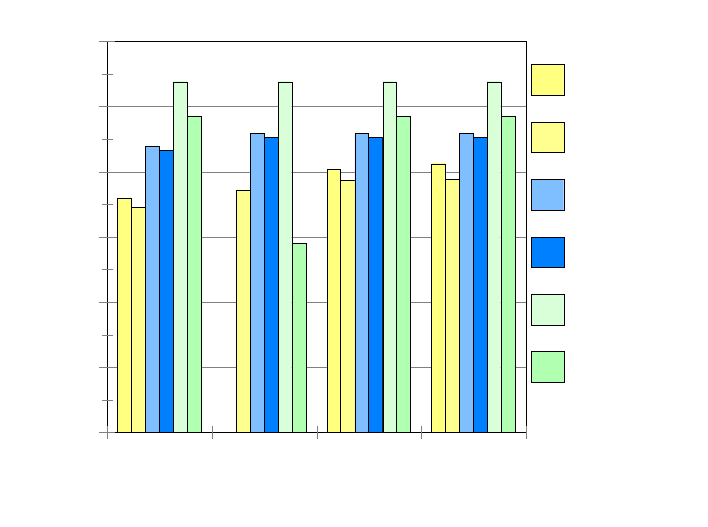
Distribution of Organic Carbon in Soil Profile Data
0
100
200
300
400
500
600
Soils with OC Content Data
ARABLE FOREST GRASS SEMI
Land Cover / Land Use
0-30cmEngland & Wales
30-100cm England & Wale
s
0-30cm N-Ireland
30-100cm N-Ireland
0-30cm Scotland
30-100cm Scotland
Figure 60: Table Records with Data for Soil Organic Carbon Content by Land cover
Type and Region (UK)
The graph shows that the number of records with data for SOC content varies between
land use types for England & Wales, while it remains quite stable in the data for
Northern Ireland and Scotland. All regions show more data for the topsoil layer than for
the subsoil with the biggest difference found for the Scottish data. The amount of data
with values for SOC content vary significantly for forest in the subsoil for Scotland
from 486 for other land cover types to 291.
The lack of formulas in the spreadsheets files or the amount of field entries does not as
such signify that data from independent observations are recorded. One indicator for
independence of observations is a high degree of unique entries for a combination of
parameters. An overview over the number of soil classes with data for SOC content by
land use type and unique combinations of SOC, clay, silt, sand content and bulk density
is presented in Table 14.
101

Distribution of Organic Carbon in Soil Profile Data
Table 14: Soil Class Data in Tables
Soil Classes with Data for SOC Content Region Soil
Category Arable Forest Grass Semi Total All Unique*
359 0** 404 412 1175
England
& Wales 433 346 372 387 388 1493
2668 2022
439 459 459 459 1816
Northern
Ireland
476
433 453 453 453 1792
3608 787
538 538 538 538 2152
Scotland 540 486 291 486 486 1749
3901 2791
* Unique combination of SOC, clay, silt, sand content and bulk density
** Does not include any data calculated by formula in spreadsheet data
The table shows by region and land use type the number of soil categories with data for
SOC content. It also indicates the total number of data for SOC content for the topsoil
and subsoil of all land use types. The total number of soil categories ranges from 433
for England & Wales to 540 for Scotland. The distribution of data between land cover
types is generally stable for data for Northern Ireland and Scotland, but more variable
for England & Wales. Noticeable is the absence of measured data for soils under forest
for England & Wales. All data recorded in the tables were found to be the result of
applying a conversion factor from data for other land uses.
The ratio of all data over unique combinations is 0.76 for England & Wales, 0.72 for
Scotland and 0.22 for Northern Ireland. While some repetition of soil properties
between land cover types and depth layer could be expected the degree of data
duplication for Northern Ireland is unusual. Some combinations are repeated up to 60
times in the data. In particular for organic soils there is relatively little differentiation
between land cover types and soil layer. For soils with a lower SOC content no
differentiation is recorded, predominantly for soils under forest and semi-natural land.
3.4.1 SOC Data in Profile Layers
The database does not contain the measurements taken for pedological horizons of the
profiles but the weighted means of a soil property distributed within the fixed-depth
topsoil and subsoil layers (DEFRA, 2003). Therefore, the distribution of SOC content
by depth can only cover the distribution of the mean SOC content of the various soil
categories for either of the two soil sections. The relative frequency distribution by land
use type and region is given in Figure 61.
102
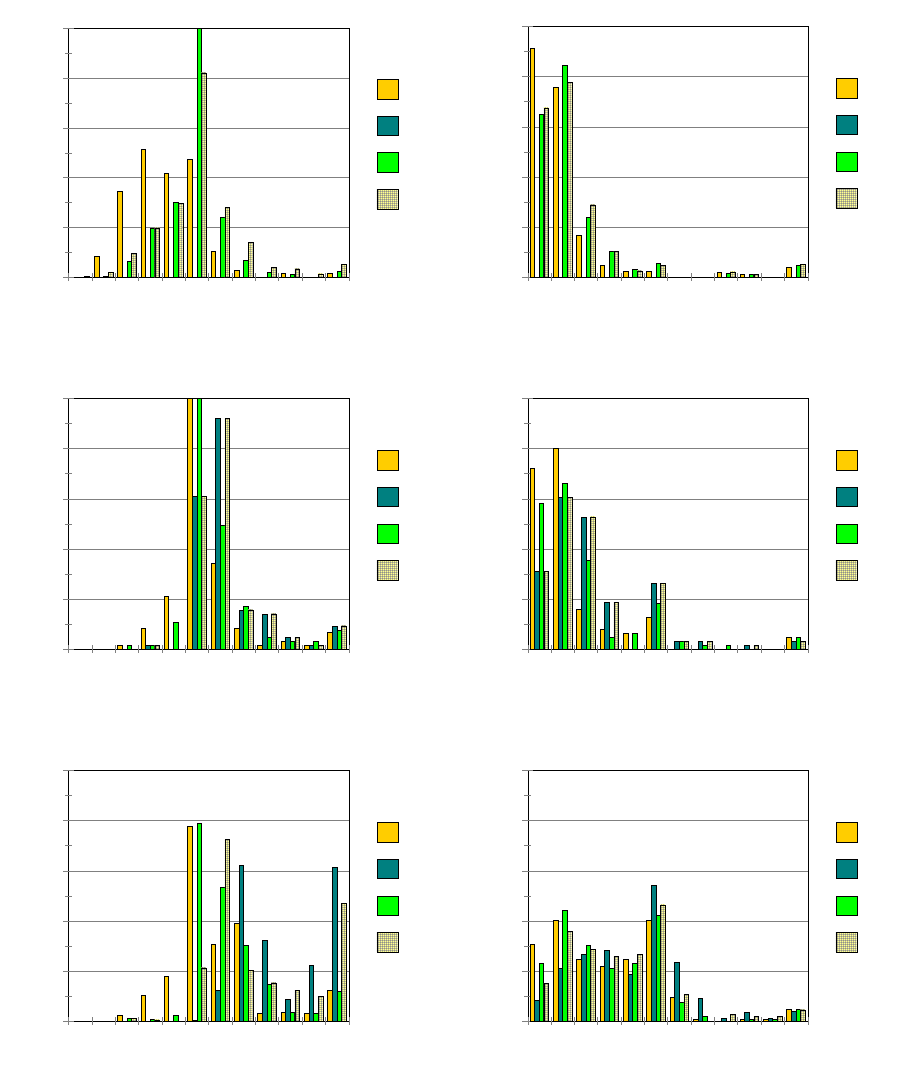
Distribution of Organic Carbon in Soil Profile Data
0
10
20
30
40
50
Relative Frequency (%)
0.5
1.0
1.5
2.0
2.5
5.0
10.0
15.0
20.0
25.0
30.0
>30
0-30cm OC Content (%)
Arable
Forest
Grassland
Semi
0
10
20
30
40
50
Relative Frequency (%)
0.5
1.0
1.5
2.0
2.5
5.0
10.0
15.0
20.0
25.0
30.0
>30
30-100cm OC Content (%)
Arable
Forest
Grassland
Semi
Topsoil England & Wales Subsoil
0
10
20
30
40
50
Relative Frequency (%)
0.5
1.0
1.5
2.0
2.5
5.0
10.0
15.0
20.0
25.0
30.0
>30
0-30cm OC Content (%)
Arable
Forest
Grassland
Semi
0
10
20
30
40
50
Relative Frequency (%)
0.5
1.0
1.5
2.0
2.5
5.0
10.0
15.0
20.0
25.0
30.0
>30
30-100cm OC Content (%)
Arable
Forest
Grassland
Semi
Topsoil Northern Ireland Subsoil
0
10
20
30
40
50
Relative Frequency (%)
0.5
1.0
1.5
2.0
2.5
5.0
10.0
15.0
20.0
25.0
30.0
>30
0-30cm OC Content (%)
Arable
Forest
Grassland
Semi
0
10
20
30
40
50
Relative Frequency (%)
0.5
1.0
1.5
2.0
2.5
5.0
10.0
15.0
20.0
25.0
30.0
>30
30-100cm OC Content (%)
Arable
Forest
Grassland
Semi
Topsoil Scotland Subsoil
Figure 61: Relative Frequency of Mean SOC Content for Topsoil and Subsoil by
Land Cover Type and Region
103
Distribution of Organic Carbon in Soil Profile Data
The graphs show a generally lower SOC content in the subsoil than the topsoil for the
soil series. There are notable differences in the distribution of SOC content between the
regions. For England & Wales the arable land is predominantly found on soils with
lower SOC content in both, topsoil and subsoil. Grassland is mainly concentrated on
soils with medium topsoil SOC content, while semi-natural areas tend to be located on
soils with medium to high SOC content in the topsoil, but lower contents in the subsoil.
Soils in Northern Ireland show less variation in the topsoil SOC content than those of
England & Wales. Arable land is concentrated on soils with a topsoil SOC content of
approx. 5-10%, as are areas of grassland. By contrast, subsoil SOC contents are more
variable in the soil data of Northern Ireland than for England & Wales. Forests and
semi-natural areas, having the same soil properties, are prominent on soils with higher
topsoil and subsoil SOC content.
The soils of Scotland show less of a distinction between the relative occurrence of
arable land and grassland by SOC content. Forests dominate land use on soils with a
topsoil SOC content between 10-30%. Land cover types up to subsoil SOC contents of
approx. 10% are relatively evenly distributed with a preference for soils with a low SOC
content to be used as arable land.
3.4.2 SOC Content and Depth Coefficient
With just two mean values for the topsoil and subsoil the characteristics of the
distribution of SOC content with depth cannot be established. Instead, a coefficient
based on the ratio of the subsoil over the topsoil mean SOC content can be used as a
general indicator. Analogous to a linear function the relationship can be expressed as
SOCSU = m * SOCTOP. This coefficient was computed for the four land cover classes
and separately for the regional datasets. The results are graphically presented in Figure
62.
The graphs depict on the left-hand side the relative frequency of the subsoil to topsoil
coefficient by values merged into bins ranging from 0 to 1 (1: subsoil has the same SOC
content as topsoil). The right-hand side depicts the raw ration values (not rounded, but
computed to 16 digits) and their relative frequency of occurrence.
104
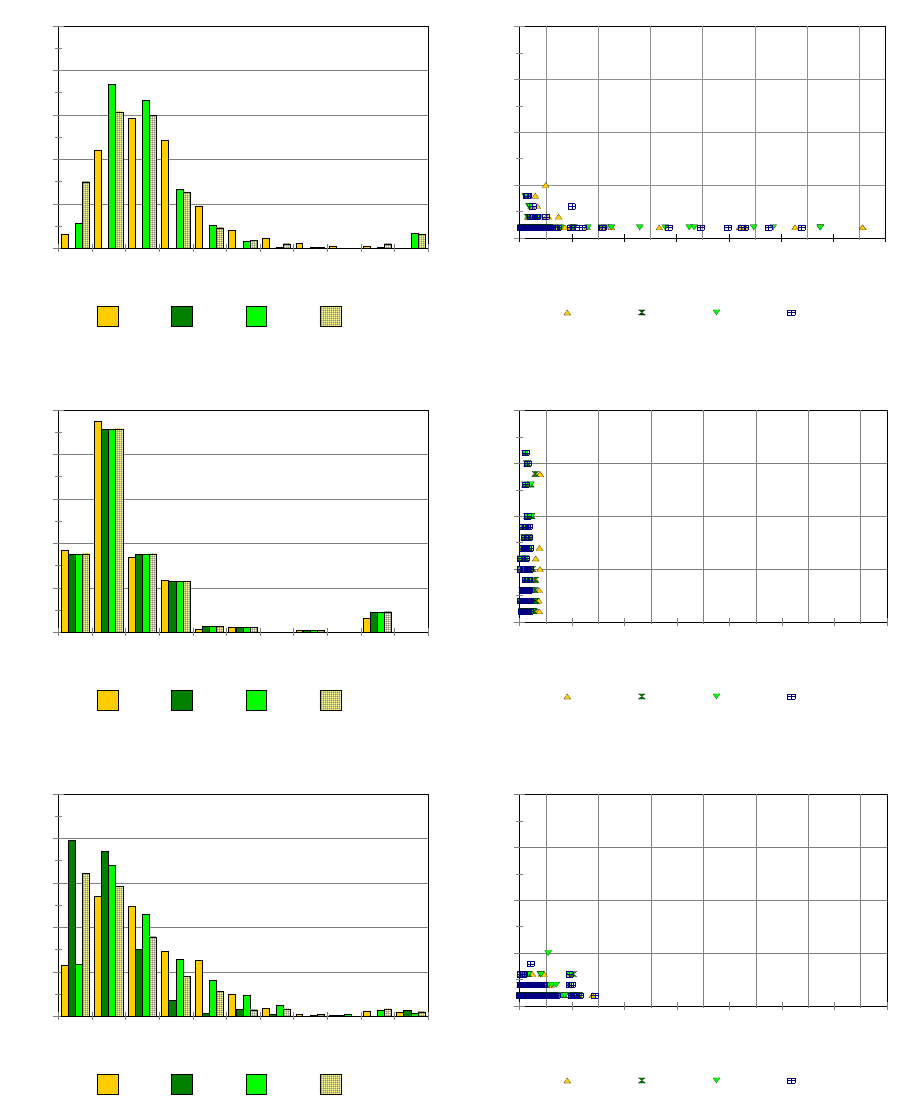
Distribution of Organic Carbon in Soil Profile Data
0
10
20
30
40
50
Relative Frequency
<0.1
0.10
0.20
0.30
0.40
0.50
0.60
0.70
0.80
0.90
1.00
Quotient 30-100cm / 0-30cm
Arable Forest Grassland Semi
0
5
10
15
20
Relative Frequency
0 1 2 3 4 5 6 7
Quotient 30-100cm / 0-30cm
Arable Forest Grassland Semi
Merged into bins England & Wales Raw values
0
10
20
30
40
50
Relative Frequency
<0.1
0.10
0.20
0.30
0.40
0.50
0.60
0.70
0.80
0.90
1.00
Quotient 30-100cm / 0-30cm
Arable Forest Grassland Semi
0
5
10
15
20
Relative Frequency
0 1 2 3 4 5 6 7
Quotient 30-100cm / 0-30cm
Arable Forest Grassland Semi
Merged into bins Northern Ireland Raw values
0
10
20
30
40
50
Relative Frequency
<0.1
0.10
0.20
0.30
0.40
0.50
0.60
0.70
0.80
0.90
1.00
Quotient 30-100cm / 0-30cm
Arable Forest Grassland Semi
0
5
10
15
20
Relative Frequency
0 1 2 3 4 5 6 7
Quotient 30-100cm / 0-30cm
Arable Forest Grassland Semi
Merged into bins Scotland Raw values
Figure 62: Coefficient of Subsoil over Topsoil SOC Content
105
Distribution of Organic Carbon in Soil Profile Data
For the relative frequency distribution merged into bins the graph suggests some
similarity in the behaviour of the SOC content data for mineral soils of England &
Wales and Scotland, and a remarkably different distribution of the data reported for
Northern Ireland. For the raw values of the coefficients all datasets demonstrate distinct
characteristics in the distribution of the values. The data for England & Wales have a
low repeat rate of ratio values and a comparatively small value range. In the
interpretation of the frequency value the removal of the major part of forest data should
be considered, although the range of the ratio values would not have changed from
applying a fixed conversion factor for SOC content. The span of values is narrower for
the dataset for Northern Ireland than for England & Wales, while the occurrence of
identical ratio values is comparatively elevated. The data for Scotland show an
intermediate range of values and a frequency of the occurrence of individual coefficient
values comparable to the data from England & Wales. Notable here is the high
occurrence of profiles with a very low quotient for profiles under forest and semi-
natural vegetation.
3.4.3 Influence of Land Cover
From the data for England & Wales and Scotland presented in Figure 62 one may infer
that soils under arable land differ less in SOC content between the topsoil and subsoil
than those under other land use types, in particular grassland. On soils with a substantial
difference in SOC content between topsoil and subsoil (coefficient < 1) the dominant
land use is forest and semi-natural. The relative occurrence of the non-merged
coefficients displays the largely different distribution of SOC content between the
topsoil and the subsoil for the datasets from the three regions. A relatively high repeat
frequency of the same ration values are shown for data from Northern Ireland. The
repeat frequency of ratio values is generally below 10 for England & Wales and
Scotland. The Scottish data is characterized by a large range of low SOC content topsoil
associated with high SOC content in the subsoil.
The distribution of the coefficient computed from the mean SOC content for topsoil and
subsoil by land use and separated by mineral or organic topsoil is given in Table 15.
106

Distribution of Organic Carbon in Soil Profile Data
Table 15: Distribution of Mean SOC Content Ratio by Land Cover
Land
Cover England & Wales Northern Ireland Scotland
Mineral
Topsoil Organic
Topsoil Mineral
Topsoil Organic
Topsoil Mineral
Topsoil Organic
Topsoil
Arable 4.18 17.14 7.61 4.43 5.21 18.52
Forest 7.32 9.61 9.53 11.28
Grassland 5.10 13.76 7.44 9.11 5.44 12.00
Semi 5.47 20.38 7.32 9.61 5.67 20.51
ALL 4.92 18.80 7.43 9.01 5.73 11.67
A low level of distinction between land use and soil category for the dataset for
Northern Ireland is evident, also when separating the SOC content coefficient into
mineral and organic topsoils. The compactness in the data for Northern Ireland contrasts
with the discrimination of coefficients for land use and topsoil category apparent in the
datasets for England & Wales and Scotland. Despite the differences in the profiles for
these regions the distribution of the coefficient by land use is unexpectedly similar. This
correspondence is not present when comparing the mean coefficient of all land use
types, because the forest data for England & Wales are excluded. The otherwise
divergent characteristics of the data from England & Wales and Scotland may be taken
to indicate that the coefficients found could be used to estimate the subsoil SOC content
from the topsoil value. One should caution against such a supposition, not least because
the coefficients presented in the table are means computed from the distribution of soil
types and do not necessarily follow the distribution of land use in the regions.
3.4.4 Influence of Mean SOC Content in Soil Layer
The degree to which the SOC content of the subsoil layer may be estimated from the
SOC content in the topsoil can be evaluated from a comparison of the values reported
for the two soil sections. The relationships are graphically presented in Figure 63.
107
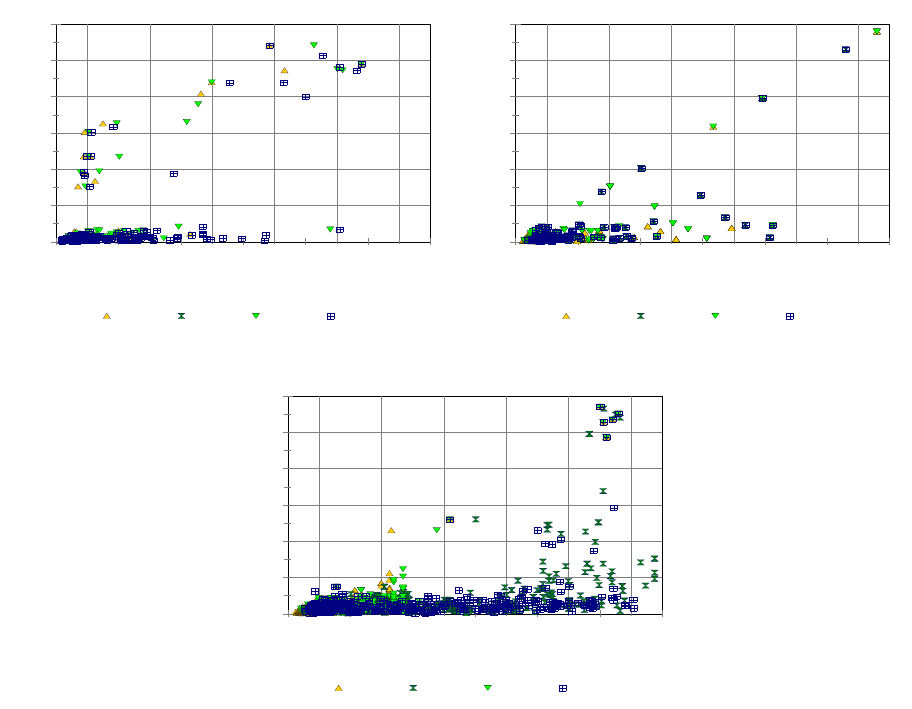
Distribution of Organic Carbon in Soil Profile Data
0
10
20
30
40
50
60
Mean Profile SOC 30-100cm (%)
0 10 20 30 40 50 60
Mean Profile SOC 0-30 cm (%)
Arable Forest Grassland Semi
0
10
20
30
40
50
60
Mean Profile SOC 30-100cm (%)
0 10 20 30 40 50 60
Mean Profile SOC 0-30 cm (%)
Arable Forest Grassland Semi
England & Wales Northern Ireland
0
10
20
30
40
50
60
Mean Profile SOC 30-100cm (%)
0 10 20 30 40 50 60
Mean Profile SOC 0-30 cm (%)
Arable Forest Grassland Semi
Scotland
Figure 63: Relationship between Mean SOC Content of Topsoil and Subsoil (UK)
The relationships between topsoil and subsoil SOC content illustrated in the graph show
distinctly different situations in the data between the regions:
• England & Wales
The data of England & Wales does not indicate a general relationship between
the SOC content of the topsoil to the subsoil for topsoils with a SOC content <
6%. Conversely, for soils with an organic subsoil the SOC content of the subsoil
increases with increasing topsoil SOC content. The data for the subsoil SOC
content present a complete gap without records between 4.1 and 15.3%. No
comparable gap exists for topsoil SOC contents and it is not apparent what
causes this absence of coverage. Besides, other soil profile data contain subsoil
SOC contents in this range, such as the SPADE/M or the ISRIC/WISE datasets.
108
Distribution of Organic Carbon in Soil Profile Data
• Northern Ireland
A trend comparable to the one for England & Wales is found for the data for
Northern Ireland. However, the constant slope coefficient for an organic subsoil
indicates that for some soils a fixed relationship of 1:1 was defined in the data
between the topsoil and subsoil SOC content. For all 57 cases of a soil with a
subsoil SOC content >13% the ratio is 1.0. There are other clusters of regularly
occurring ratio values, such as 96 cases of 6.89, 72 cases of 2.56, 64 cases of
8.95, or 40 cases of 4.43. The number of cases with a relatively high frequency
of occurrence have in common that the frequency of occurrence is divisible by 4.
This may indicate that a constant factor was applied to relate topsoil to subsoil
SOC content rather indiscriminately of the land use type.
• Scotland
The SOC content coefficients for Scotland differ notably from the results
obtained for the other two regions in particular for organic soils. There would
appear to be a relationship in SOC content between the topsoil and the subsoil
SOC content for soils with an organic subsoil. Where peat occurs in the topsoil
(SOC content >30%) no relationship with the subsoil SOC content could be
identified. Although not evident from the graph also the Scottish data contains
some ratio values of topsoil to subsoil SOC content with a high occurrence.
There were 76 cases of 4.74%, 68 cases of 2.62% and 58 cases of 4.27%. No
factual reason could be found explaining the similarity in the behaviour.
For reasons of comparability with other datasets the mean SOC content of the soil
segment 0-100 cm was estimated from the topsoil and subsoil data (weighted mean).
The parameters for a linear relationship between the SOC content in the topsoil and the
soil segment 0-100 cm for the data of England & Wales was found to be:
(r
TOP
SOCSOC ×=
−773.0
1000
2: 0.68, 1,120 dF)
Despite a coefficient of determination of 0.68 it should be noted that integrating all soils
into a single pool is not supported by the data. There is a distinctly different relationship
in SOC content of the topsoil to the subsoil between mineral and organic soils in the
dataset. This is visually apparent when comparing the topsoil to the subsoil SOC
content (see Figure 63).
The data indicate that the SOC content of the subsoil allows estimating the topsoil SOC
content to a larger degree than in the opposite direction, with regional differences. This
association may provide a reasonable correlation between the topsoil and subsoil SOC
content, but a low level of dependence of the subsoil SOC content from the topsoil.
In the regression analysis a distinction was made not only between mineral and organic
soils, but also between the topsoil and the subsoil. Limiting the profiles to mineral soils
in the topsoil the relationships for the data for England & Wales were found to be:
109
Distribution of Organic Carbon in Soil Profile Data
a) topsoil SOC content < 12%
(r
12min 399.0 <
×= TOP
TOPSUB SOCSOC 2: 0.07, 1,052 dF)
b) subsoil SOC content < 12%
(r
12min 131.0 <
×= SUB
TOPSUB SOCSOC 2: -0.23, 1,078 dF)*
c) topsoil and subsoil SOC content < 12%
(r
12min 205.0 <+
×= SUBTOP
TOPSUB SOCSOC 2: 0.13, 1,031 dF)
For largely organic soil sections the relationships were:
a) topsoil SOC content > 12%
(r
6.15280.1 12 −×= >TOP
TOP
org
SUB SOCSOC 2: 0.56, 66 dF)
b) subsoil SOC content > 12%
(r
7.19684.0 12 +×= >SUB
TOP
org
SUB SOCSOC 2: 0.80, 40 dF)
c) topsoil and subsoil SOC content > 12%
(r
6.26507.0 12 +×= >+SUBTOP
TOP
org
SUB SOCSOC 2: 0.43, 19 dF)
* Adjusted coefficient of determination quoted for y-intercept=0, which can be negative.
The distribution of the SOC content between topsoil and subsoil and results from the
regression analysis suggest that deriving the SOC content of the subsoil from the topsoil
alone would lead to unreliable estimates. When limiting the topsoil to mineral soils
subsoils with organic material are included in the data and influence the relationship.
Even when limiting topsoil and subsoil to mineral material the topsoil SOC content
could not adequately explain the variation in the subsoil.
For soils with an organic subsoil the situation is different when profiles with mineral
topsoils are also removed. For those soils the SOC content in the subsoil generally
increases with the topsoil SOC content. There remains some distinction for soils with a
topsoil SOC content either side of approx. 15% SOC content.
A detailed evaluation of the relationship between topsoil and subsoil SOC content for
data from Northern Ireland was not performed. The extent of the pre-defined
relationships in particular for organic soils could only find the factors used to associate
the two soil sections (m = 1.0).
For the Scottish data the absence of a mineral topsoil over an organic subsoil in the
dataset was notable. Such profiles were reported for England & Wales and Northern
Ireland. Instead, the soil data for Scotland contain a substantial number of profiles with
organic or peat in the topsoil over a mineral subsoil. This group of soils is hardly
present in the data for England & Wales or for Northern Ireland.
110
Distribution of Organic Carbon in Soil Profile Data
For the mainly mineral soil components in the topsoil of the Scottish data the regression
parameters were computed as:
a) topsoil SOC content < 12%
(r
12min 234.0 <
×= TOP
TOPSUB SOCSOC 2: 0.12, 1,095 dF)
b) subsoil SOC content < 12%
(r
12min 114.0 <
×= SUB
TOPSUB SOCSOC 2: 0.03, 1,886 dF)
c) topsoil and subsoil SOC content < 12%
(r
12min 234.0 <+
×= SUBTOP
TOPSUB SOCSOC 2: 0.12, 1,095 dF)
For largely organic soils the parameters were:
a) topsoil SOC content > 12%
(r
8.3355.0 12 −×= >TOP
TOP
org
SUB SOCSOC 2: 0.23, 842 dF)
b) subsoil SOC content > 12%
(r
2.2820.0 12 −×= >SUB
TOP
org
SUB SOCSOC 2: 0.21, 57 dF)
c) topsoil and subsoil SOC content > 12%
(r
2.2820.0 12 −×= >+SUBTOP
TOP
org
SUB SOCSOC 2: 0.21, 57 dF)
One result of the analysis is that in the profiles of the Scottish data the topsoil is always
organic when the subsoil is organic. Other than this only the absence of a clear
relationship could be pronounced.
A summary of the regression parameters for the regional datasets and separated by land
use is given in Table 11.
111

Distribution of Organic Carbon in Soil Profile Data
Table 16: Parameters of Linear Regression between SOC Content of Topsoil and
Subsoil for Mineral Soils(UK)
Regression Analysis Slope
Coeff. Coeff.
Determination
r2*
Lower
Limit
(95%)
Upper
Limit
(95%)
England & Wales
Arable 0.515 0.09 0.399 0.631
Forest
Grass 0.398 0.10 0.318 0.478
Semi 0.342 0.05 0.259 0.425
Northern Ireland
Arable 0.146 -0.23 0.135 0.157
Forest 0.182 -0.01 0.169 0.194
Grass 0.178 0.07 0.164 0.193
Semi 0.182 -0.01 0.169 0.194
Scotland
Arable 0.252 0.28 0.236 0.268
Forest 0.181 -0.16 0.159 0.204
Grass 0.258 0.15 0.240 0.275
Semi 0.231 -0.06 0.211 0.251
* Adjusted r2 quoted, which can be negative.
The coefficient of correlation between topsoil and subsoil SOC content did not reveal
any tangible evidence of a relationship between the two soil sections. This lack of a
connection is not caused by a small number of outlying points but by a general
dispersion of the data.
Results of analysing the correlation between SOC content and depth in the SPADE/M
and ISCRIC-WISE profile datasets have shown a tendency for a more pronounced
decrease in SOC content with higher topsoil SOC content for a mineral subsoil. This
development was investigated using the UK soil dataset based on the relationship
between the topsoil SOC content and the ration of topsoil to subsoil SOC content. The
results are graphically presented in Figure 64.
112
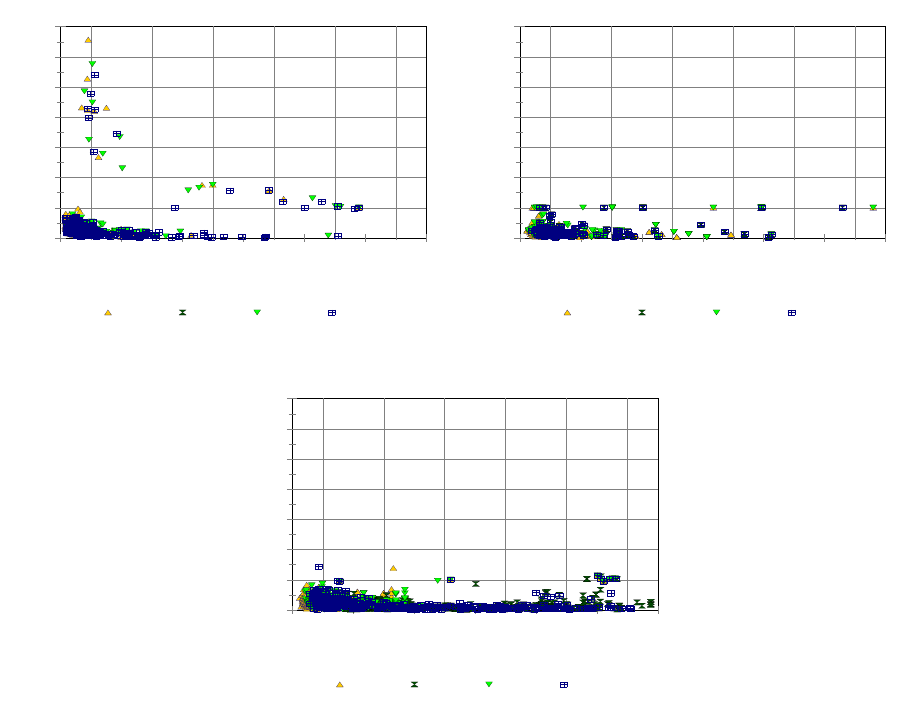
Distribution of Organic Carbon in Soil Profile Data
0
1
2
3
4
5
6
7
Quotient 30-100cm / 0-30cm
0 10 20 30 40 50 60
Mean Profile SOC 0-30 cm (%)
Arable Forest Grassland Semi
0
1
2
3
4
5
6
7
Quotient 30-100cm / 0-30cm
0 10 20 30 40 50 60
Mean Profile SOC 0-30 cm (%)
Arable Forest Grassland Semi
England & Wales Northern Ireland
0
1
2
3
4
5
6
7
Quotient 30-100cm / 0-30cm
0 10 20 30 40 50 60
Mean Profile SOC 0-30 cm (%)
Arable Forest Grassland Semi
Scotland
Figure 64: Relationship between Mean SOC Content and Coefficient for SOC
Content (UK)
From the graph no relationship between the topsoil SOC content and the coefficient of
the SOC content between layers could be deducted. Distinguishing between mineral and
organic soil sections did not provide any additional information on an association linked
to a particular land use type. The graph shows that for peat in England & Wales and
Northern Ireland a comparatively uniform distribution of SOC content between the
topsoil and the subsoil is recorded for the various soil types. For the soils in Scotland
the presence of peat in the topsoil by itself does not allow formulating any assumption
on the subsoil SOC content.
3.4.5 Influence of Depth of Soil
Changes in SOC content with depth can only be evaluated based on the mean values
assigned to the topsoil and subsoil with fixed and uniform depth limits. The dataset
113
Distribution of Organic Carbon in Soil Profile Data
available for the study did not contain information on typical profile depths for any soil
type, although this parameter is specified in the accompanying document (DEFRA,
2003). It was therefore not possible to evaluate a relationship between the soil depth
and the topsoil SOC content.
3.4.6 Influence Clay Content
An increase in clay content in deeper parts of the soil is linked to an increase in SOC
content with depth. For the UK data the clay content in the soil segment 0-100 cm was
estimated and compared to the subsoil SOC content. Furthermore, the change in clay
content between the topsoil and the subsoil was related to the subsoil SOC content. The
resulting data pairs are presented in Figure 65.
The relationships shown in the graph do not indicate any particular association between
an increase in the presence of clay in the subsoil and the SOC content. The variation of
the subsoil SOC content peaks around a coefficient of 1 and decreases with distance
from a uniform SOC content between topsoil and subsoil layers. This behaviour is most
notable in the graph for the soil data form Scotland, but also prevalent in the data from
England & Wales and Northern Ireland.
114
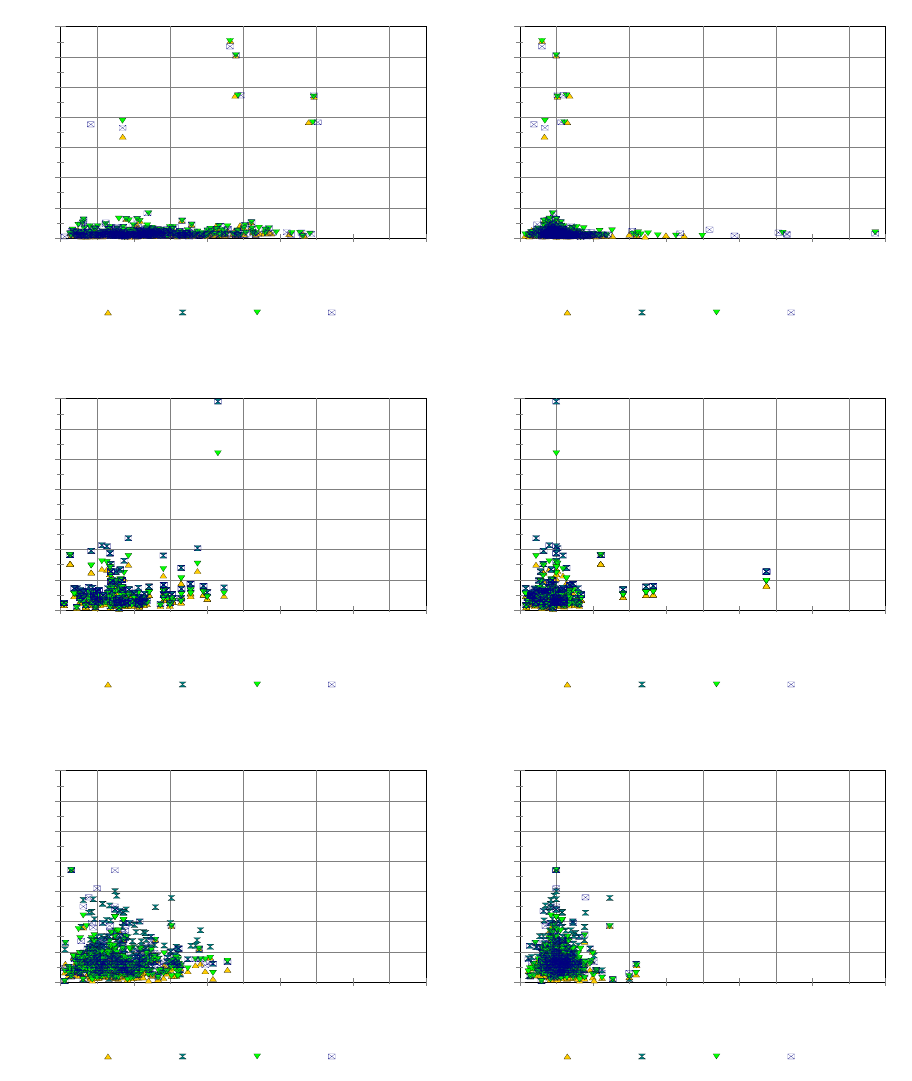
Distribution of Organic Carbon in Soil Profile Data
0
5
10
15
20
25
30
35
SOC Content 30-100cm (%)
0 20 40 60 80 100
Clay Content 0-100 (%)
Arable Forest Grassland Semi
0
5
10
15
20
25
30
35
SOC Content 30-100cm (%)
0 2 4 6 8 10
Clay Quotient 30-100cm / 0-30cm
Arable Forest Grassland Semi
England & Wales
0
2
4
6
8
10
12
14
SOC Content 30-100cm (%)
0 20 40 60 80 100
Clay Content 0-100 (%)
Arable Forest Grassland Semi
0
2
4
6
8
10
12
14
SOC Content 30-100cm (%)
0 2 4 6 8 10
Clay Quotient 30-100cm / 0-30cm
Arable Forest Grassland Semi
Northern Ireland
0
2
4
6
8
10
12
14
SOC Content 30-100cm (%)
0 20 40 60 80 100
Clay Content 0-100 (%)
Arable Forest Grassland Shrub
0
2
4
6
8
10
12
14
SOC Content 30-100cm (%)
0 2 4 6 8 10
Clay Quotient 30-100cm / 0-30cm
Arable Forest Grassland Shrub
Scotland
Figure 65: Relationship between Clay Content and Subsoil SOC Content and the
Ratio of Topsoil to Subsoil Clay Content (UK)
115
Distribution of Organic Carbon in Soil Profile Data
116

Distribution of Organic Carbon in Soil Profile Data
4 SUMMARY AND CONCLUSIONS
The study investigated the vertical distribution of OC in sampled soil data from several
independent databases with large-scale coverage. The vertical distribution of soil
characteristic was assessed on the ground using different methods of delineating profile
sections to which the data relate. Data from the SPADE/M and ISRIC-WISE datasets
characterize the profiles as pedological horizons, thus describing sections with more or
less homogeneous characteristics, while the data from the Forest Focus survey and the
UK CO2 Inventory use layers of fixed depth, which should describe the topsoil or
subsoil layers used in this study more readily. The Forest Focus data posed a particular
problem to the analysis by reporting the organic layer data without sufficient detail on
the distribution of SOC content within the layer or the layer depth. A summary of the
factors found to influence the function parameters when modelling the distribution of
SOC content in the subsoil from the topsoil and any general conclusions which could be
drawn from the evaluation are given below.
• Profile Sampling Method
The rate of change of SOC content with depth was found to depend on the
method used to sample the profile:
o Profile Sampling by Pedological Horizons
Arranging the profiles by soil category the mean SOC contents in the
topsoil and the subsoil for the surveys sampling pedological horizons are
presented in Figure 66.
The mean SOC contents for the SPADE/M profiles use the FAO85
classification while the ISRIC-WISE profiles are described following the
classification scheme of FAO 90, which may explain some divergence
between the data. For soils with mineral profiles the SOC content in the
subsoil is approx. 33% of the SOC content of the topsoil. By contrast, for
organic soils the SOC content in the subsoil is approx. 10% higher in the
subsoil than the topsoil.
For the study area the mean SOC contents and the relative value of the
subsoil SOC content with respect to the topsoil value are more variable
than the values given for SOC quantities at the global scale (see Figure
1). In the data used the relative SOC content in the subsoil ranges
between 15 to 80% of the SOC content in the topsoil. For the major soil
categories the variation is not related to the topsoil SOC content, as
indicated by the figures from Batjes, 1996 on SOC quantity. This
disparity could be due to the distribution of bulk density in the profile
and the general decrease of bulk density with increasing g SOC content.
117
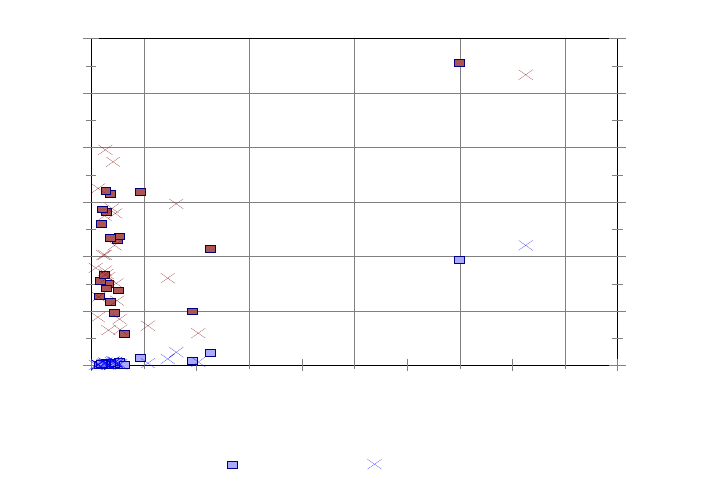
Distribution of Organic Carbon in Soil Profile Data
0
20
40
60
80
100
120
Mean SOC 30-100cm (%)
0
20
40
60
80
100
120
Relative SOC in 30-100cm (%)
0 10 20 30 40 50
Mean SOC 0-30cm (%)
SPADE/M ISRIC-WISE
computing rates of change of SOC content with depth, although some
Figure 66: Relationship between Soil Organic Carbon Content in the 0-30 cm Topsoil
Layer and the 30-100 cm Subsoil Layer for SPADE/M and ISRIC-
WISE Major Soil Types
o Profile Sampling by Layers of Fixed Depth
The relationship between the mean SOC content in the topsoil and
subsoil of profiles from Forest Focus Level I and Level II data are
presented in Figure 67.
Data from the ISRIC-WISE database for profiles under forest are added
to the graph for reasons of facilitating comparability of the results. The
Forest Focus data show distinctly lower values for the subsoil SOC
content relative to the topsoil SOC content than the ISRIC-WISE
profiles, which use the same soil classification scheme. This
circumstance is attributed to the ambiguity with which the organic layer
is sampled and recorded in the Forest Focus Soil Condition survey. The
method of reporting the characteristics of organic layers was found to be
a major shortcoming to the use of the data: For mineral soils the height
of the organic layer severely restricted a description of the OC content
with depth while organic soils are described by too few layers. The
number of informative profiles was further reduced by limiting the
sampling to the upper 20 to 30 cm. This restriction in the survey data
almost completely excluded Level I from the analysis. A method of
estimating the height of the organic layer by using a function relating
SOC to bulk density was applied and tested. This method allowed
118
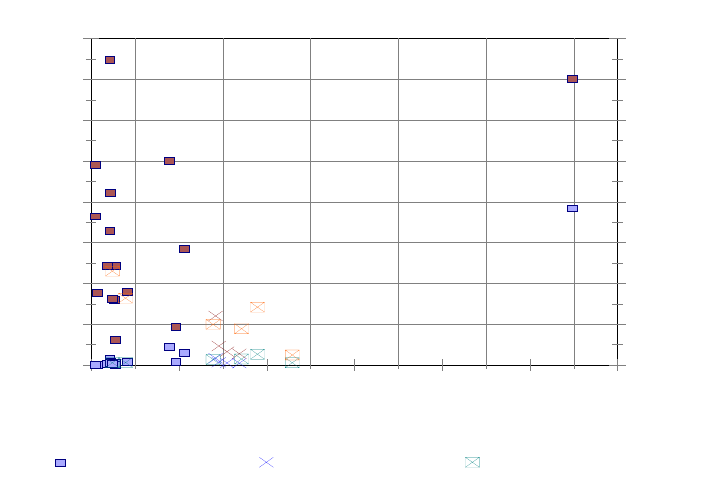
Distribution of Organic Carbon in Soil Profile Data
uncertainty remains with respect to the sampling method of the organic
layer.
0
10
20
30
40
50
60
70
80
Mean SOC 30-100cm (%)
0
10
20
30
40
50
60
70
80
Relative SOC in 30-100cm (%)
0 10 20 30 40 50 60
Mean SOC 0-30cm (%)
ISRIC-WISE (Forest) FF-L1 FF-L2
Figure 67: Relationship between Soil Organic Carbon Content in the 0-30 cm Topsoil
L
• Mineral vs. Organic Soil
of the SOC content within a profile showed that
tent with depth could be described by a
Layer and the 30-100 cm Subsoil Layer for Forest Focus Level I and
evel II and ISRIC-WISE Forest Profiles by Major FAO90 Soil Types
The analysis of the distribution
the subsoil SOC content is unrelated to the topsoil SOC content for profiles with
a change from mineral to organic soil. For profiles of either mineral or organic
soils the change in SOC content with depth could be modelled by a function
with a logarithmic transformation of the depth or the SOC content parameter.
When transforming only the depth parameter a relationship between the
coefficient describing the change in SOC content with depth and the SOC
content in the upper 30 cm of the soil profile was found. A transformation of
both depth and SOC content was found to describe the change in SOC content
with depth of individual profiles with as much consistency as the transformation
of the single factor, but the resulting function parameters were found to be
unrelated to the topsoil SOC content.
While the rate of change of OC con
linear function using a logarithmic transformation of depth the direction of the
change was found to depend on the SOC content. In mineral soils the SOC
119
Distribution of Organic Carbon in Soil Profile Data
content generally decreases with depth, whereas in organic soils it increases with
depth. The actual rate of change was found to differ significantly with land use /
cover.
• Influence of Land Use / Cover
nges in SOC content with depth by land
o Arable Land
and the subsoil SOC content is approx. 70% of the topsoil
o Forest
s under forest a tendency for a more rapid decrease in SOC
o Grassland
l change in SOC content with depth under grassland is
o Shrub
s under shrub and other land uses the subsoil SOC content is on
• Depth of Soil Stratum
n the coefficient of the change in SOC content with
Distinct associations between the cha
use were obscured by the prevalence of some land uses to occur on specific soil
types. The pedological horizon data (SPADE/M and ISRIC-WISE) suggest that
the coefficient of the change on SOC content with depth is largely determined
by variations in the topsoil rather than the subsoil SOC content, where less
variability in SOC content seems to exist. For mineral soils on arable land the
coefficient characterizing the decreasing SOC content is lower than for soils
under forest or grassland.
Under arable l
SOC content for mineral soils.
For soil
content from the topsoil to the subsoil was found, an effect which is
mainly due to an organic upper layer. On average the subsoil SOC
content under forest is approx. 25-30% of the topsoil SOC content.
The genera
comparable to the one found for soils under forest, but with a larger
variability in the topsoil SOC content between the SPADE/M and the
ISRIC-WISE data than for soils under forest.
For soil
average 33% of the topsoil SOC content for mineral soils.
An influence of soil depth o
depth has been observed when the profile SOC content was aggregated. The
trend of a decrease in the rate of change of SOC content with deeper soils is
rather the consequence of a decrease in the variability of the SOC content for
deeper soils than an indicator of a relationship of the coefficient of the change in
SOC content with depth with the subsoil SOC content for individual profiles.
120
Distribution of Organic Carbon in Soil Profile Data
• Clay Content in Subsoil
The impact of the subsoil clay content on the coefficient describing the rate of
change in SOC content with depth in aggregated data is a result of a decrease in
the variability of the coefficient with clay content. When evaluating individual
samples a strong decrease in the variability of the subsoil SOC content was
found when the coefficient of change in clay content with depth increases. The
SOC content seems to increase with clay content in the subsoil on soils where
the clay content decreases with depth, but no relationship was found for soils
where the clay content increase with depth.
The study found that the subsoil SOC content could be estimated from the topsoil SOC
content by a function with a logarithmic transformation for the depth parameter. The
applicability of such a function depends on
1. identifying soils with an abrupt change between mineral and organic horizons,
2. separating mineral from organic soils and
3. the availability of suitable land use / cover data.
Soils with abrupt changes in SOC content can be identified by the FAO class in the
SGDBE. In the absence of a relationship of the SOC content between the mineral and
organic horizons within a soil profile generalized values obtained from soils with a
gradual change could be used. The depth at which the change in soil type occurs should
be available to adjust the SOC content to the fixed depth of the topsoil and subsoil
layers. For mineral soils with a more gradual change in SOC content with depth the
subsoil SOC content in the 30-100 cm layer is approx. 27% of the topsoil SOC content
under forest, 70% for arable land, 60% for grassland and 65% for all other areas. These
values are only guides and have to be adjusted by the actual depth of the soil stratum.
For organic soils and peat the SOC content generally increases with depth. The topsoil
SOC content is loosely correlated with the subsoil SOC content but as a general rule the
subsoil tends towards a SOC content of >30% on any organic soil.
No discernible relationship was found between the topsoil SOC content and the depth of
the soil segment to an impermeable layer or rock for any land cover / use type. Such a
relationship could be assumed based on a different water regime in deeper soils.
However, investigating the relationship further requires analysing the data also by soil
type, for which an insufficient number of samples was available in the data sets.
Similarly, a widely applicable relationship between the clay content in the subsoil and
SOC content could not be ascertained. The relationship seems to be affected by the
change in clay content with depth. For the task of estimating the subsoil SOC content
from the topsoil the depth of the soil stratum and the clay content the study did not
uncover a serviceable function.
The study found few soils and pedological horizons with SOC content ranging between
6-20%. It was considered unlikely that the procedure for sampling soil data was biased
against positioning sites on these soils in all databases and found more likely that the
SOC content tends to be wither below 6% or above 18%. This lack of a transitional
121
Distribution of Organic Carbon in Soil Profile Data
phase raises the question how SOC content reacts to changes in environmental
conditions. A main factor determining SOC content is the soil water content, which was
not taken into account in this study. Under the assumption of a steady-state between
SOC content and environmental conditions, as used by IPCC (2003), the lack the
absence of a transitional phase could indicate rather rapid changes in SOC content once
a critical condition has been reached.
To improve the understanding of the interdependence between land use / cover, soil
type and their combined effect on the distribution of SOC content with depth more data
from samples data needs to be evaluated. In the assessment of the results changes in
environmental conditions will have to be taken into account when data are analyzed
which were collected at different dates.
122
Distribution of Organic Carbon in Soil Profile Data
Acknowledgement
This study has been performed of a long-term visit to the Centre for Ecology and
Hydrology, Edinburgh in support to the project “Review of Existing Information on the
Interrelations between Soil and Climate Change” (ClimSoil) of the European
Commission, Contract number 070307/2007/486157/SER/B1. I would like to thank all
staff at CEH, Edinburgh for providing this opportunity, the time spent presenting their
organization and research despite their own demanding work loads, the support received
to come to grips with a different IT infrastructure. Not least I would like to express my
deep felt appreciation for the patience shown to me to on how best to adjust to daily
challenges, such as the peculiarities of the Scottish weather and cuisine.
123

Distribution of Organic Carbon in Soil Profile Data
References
Arrouays, D. and P. Pelissier (1994) Changes in Carbon Storage in temperate humic
loamy soils after forest clearing and continuous corn cropping in France. Plant
and Soil 160 (2). pp. 215-223.
Batjes, N.H. (2002) A homogenized soil profile data set for global and regional
environmental research (WISE, V. 1.1). International Soil Reference and
Information Centre, Wageningen, The Netherlands. Available on
http://www.isric.org.
Batjes, N.H. (1996) Total carbon and nitrogen in the soils of the world. European
Journal of Soil Science 47 (2), pp. 151–163 doi:10.1111/j.1365-
2389.1996.tb01386.x.
Batjes, N.H. (2005) ISRIC-WISE global data set of derived soil properties on a 0.5 by
0.5 degree grid – Version 3.0. Report 2005/08, World Soil Information,
Wageningen.
http://www.isric.org/isric/webdocs/Docs/ISRIC_Report_2005_08.pdf (last
accessed: June, 2008).
Bradley, R.I, R. Milne, J. Bell, J, A. Lilly, C. Jordan and A. Higgins (2005), The
derivation and use of a UK database for modelling soil carbon fluxes and land
use for the national carbon dioxide inventory. Soil Use and Management 21,
pp363-369.
Buckman, H.O. and Brady, N.C. (1960). The nature and properties of soils. Macmillian,
New York, 565pp.
DEFRA (2003) UK soil database for modelling soil carbon fluxes and land use for the
national carbon dioxide inventory – Final Report. Department for
Environment, Food and Rural Affairs, Area 301, Cromwell House, Dean
Stanley Street, London, SW1P 3JH. Project Code SP0511. 18pp. Electronic
version from: resreports@defra.gsi.gov.uk
FAO (1998) World reference base for soil resources, World Soil Resources Report 84,
Food and Agriculture Organization of the United Nations, Rome).
FAO (2001) Soil carbon sequestration for improved land management. Food and
Agriculture Organization of the United Nations, Rome.
Hiederer, R., R.J.A. Jones and J. Daroussin (2006) Soil Profile Analytical Database for
Europe (SPADE): Reconstruction and Validation of the Measured Data
(SPADE/M). Geografisk Tidsskrift, Danish Journal of Geography 106(1). p.
71-85.
Hilinski, T.E. (2001) Century 5: Implementation of Exponential Depth Distribution of
Organic Carbon in the CENTURY Model. Department of Soil and Crop
Sciences, Colorado State University.
124

Distribution of Organic Carbon in Soil Profile Data
http://www.nrel.colostate.edu/projects/century5/reference/html/Century/exp-c-
distrib.htm (last accessed: June, 2008)
IPCC (2001) Climate Change 2001: The Scientific Basis. Contribution of Working
Group I to the Third Assessment Report of the Intergovernmental Panel on
Climate Change, J.T. Houghton,Y. Ding, D.J. Griggs,M. Noguer, P.J. van der
Linden, X. Dai, K. Maskell and C.A. Johnson, Eds., Cambridge University
Press, Cambridge, 881 pp.
IPCC (2003) Good Practice Guidance for Land Use, Land-Use Change and Forestry.
Institute for Global Environmental Strategies (IGES) for the IPCC.
http://www.ipcc-nggip.iges.or.jp/public/gpglulucf/gpglulucf_contents.html
Jobbagy E.G and R.B. Jackson (2000) The Vertical Distribution of Soil Organic Carbon
and Its Relation to Climate and Vegetation. Ecological Applications, Vol. 10, No. 2, pp.
423-436.
Kasting, J.F. (1998) The Carbon Cycle, Climate, and The Long-Term Effects Of Fossil
Fuel Burning. Consequences Vol. 4, No. 1.
http://gcrio.org/CONSEQUENCES/vol4no1/carbcycle.html (last accessed:
June, 2008).
Liski, J. and C.J. Westman (1995) Density of organic carbon in soil at coniferous forests
sites in southern Finland. Biogeochemistry 29, pp. 183-197.
Milne, R. and D.C. Mobbs (2006) UK Emissions by Sources and Removals by Sinks
due to Land Use, Land Use Change and Forestry Activities. Annual report for
DEFRA Contract EPG1/1/160, CEH, Edinburgh.
Milne, R. (2009) Personal communication. Centre for Ecology and Hydrology,
Edinburgh, UK.
Omonode, R.A. and T.J. Vyn (2006) Vertical distribution of soil organic carbon
and nitrogen under warm-season native grasses relative to croplands in
west-central Indiana, USA. Agriculture, Ecosystems and Environment
117 (2006) pp. 159–170.
Pignard, G., J-L. Dupouey, D. Arrouays, D. Loustau (2000) Carbon stocks estimates for
French forests. Biotechnol. Agron. Soc. Environ. 2000 4 (4), pp. 285–289.
Post, W. M., W. R. Emanuel, P. J. Zinke, and A. G. Stangenberger (1982) Soil carbon
pools and world life zones. Nature 298. pp.156–159.
Reynolds, C.A., T. J. Jackson, and W.J. Rawls (1999) Estimating Available Water
Content by Linking the FAO Soil Map of the World with Global Soil Profile
Databases and Pedo-transfer Functions. Proceedings of the AGU 1999 Spring
Conference, Boston, MA. May31-June 4, 1999.
http://www.ngdc.noaa.gov/ecosys/cdroms/reynolds/reynolds/reynolds.htm#tr
Rumple, C., I. Kögel-Knabner and F. Bruhn (2002) Vertical distribution, age and
chemical composition of organic carbon in two forest soils of different
pedogenesis. Organic Geochemistry (33). pp. 1131-1142.
125

Distribution of Organic Carbon in Soil Profile Data
Thomson, A. M., ;D.C. Mobbs, R. Milne, U. Skiba, A. Clark, P.E. Levy, S.K. Jones,
M.F. Billett, M. Van Oijen, M.; N. Ostle, B. Foereid, W.S. Fung, P. Smith,
R.W. Matthews, E. Mackie, P. Bellamy, M. Rivas-Casado, J. Grace, A.
Higgins, C. Jordan, R.W. Tomlinson (2008) Inventory and projections of UK
emissions by sources and removals by sinks due to land use, land use change
and forestry. Annual Report July 2008. Edinburgh, UK, CEH/DEFRA, 250pp.
http://www.edinburgh.ceh.ac.uk/ukcarbon/docs/2008/Defra_Report_2008.pdf
UN/ECE (ed.) (2006) Manual on methods and criteria for harmonized sampling,
assessment, monitoring and analysis of the effects of air pollution on forests -
Sampling and Analysis of Soil. UN Economic Commission for Europe,
Convention on Long-Range Transboundary Air Pollution, International Co-
operative Programme on Assessment and Monitoring of Air Pollution Effects
on Forests. Palais des Nations, CH - 1211 Geneva 10, Switzerland. V. 6/2006,
25pp. http://www.icp-forests.org/pdf/Chapt_3a_2006(1).pdf (last accessed:
November, .2008)
USDA (2008) National Soil Characterization Data. Soil Survey Laboratory, National
Soil Survey Center, Soil Conservation Service, Lincoln, Nebraska, USA.
http://soils.usda.gov/survey/nscd/description.html (last accessed: June,
2008)
126
Distribution of Organic Carbon in Soil Profile Data
European Commission
EUR 23980 EN – Joint Research Centre – Institute for Environment and Sustainability
Title: Distribution of Organic Carbon in Soil Profile Data
Author(s): R. Hiederer
Luxembourg: Office for Official Publications of the European Communities
2009 – 126 pp. – 21.0 x 29.7 cm
EUR – Scientific and Technical Research series – ISSN 1018-5593
ISBN 978-92-79-13352-7
DOI 10.2788/33102
Abstract
While the major portion of organic carbon in the soil is concentrated in the upper 30 cm
soil profile data show that significant quantities of OC can also be found at lower depths
even in mineral soils. The subsoil layer of 30-100 cm layer is estimated to contain as
much organic carbon as the topsoil layer (Batjes, 1996; FAO, 2001; Jobbagy & Jackson,
2000).
For the topsoil layer soil organic carbon content has previously been estimated at pan-
European scale for the topsoil layer (Jones et al., 2005). In this study the possibility of
advancing the existing methodology to allow estimating organic carbon in the subsoil
layer to 100 cm was therefore investigated. Rather then developing a pedo-transfer rule
for subsoil organic carbon content it was investigated whether the rule-based system
could be substituted by a function linking the subsoil organic carbon content to the
portion found in the topsoil. In the analysis the foremost factors influencing the change
of organic carbon within a profile have been evaluated. To develop the function and the
influence of the factors influencing the distribution of organic carbon within the profiles
data from several databases were subjected to a statistical analysis.
The findings indicate that the organic carbon content of the subsoil layer varies to a
much lesser degree that of the topsoil layer. The evaluation of the influence of land
cover suggests that under forest the subsoil stratum amounts to approx. 25% of the
topsoil value while for arable land the decline of organic carbon content with depth is
shallower with approx. 55%, with soils under grassland and shrub land ranging in
between. A marked difference in the distribution of organic carbon between the topsoil
and the subsoil layer from profiles with mineral soils to those form organic soils was
observed. For organic soils the organic carbon content generally increases with depth, in
particular under arable land.
Distribution of Organic Carbon in Soil Profile Data

Distribution of Organic Carbon in Soil Profile Data
How to obtain EU publications
Our priced publications are available from EU Bookshop (http://bookshop.europa.eu),
where you can place an order with the sales agent of your choice.
The Publications Office has a worldwide network of sales agents. You can obtain their
contact details by sending a fax to (352) 29 29-42758.

Distribution of Organic Carbon in Soil Profile Data
The mission of the JRC is to provide customer-driven scientific and technical support
for the conception, development, implementation and monitoring of EU policies. As a
service of the European Commission, the JRC functions as a reference centre o
f
science and technology for the Union. Close to the policy-making process, it serves
the common interest of the Member States, while being independent of special
interests, whether private or national.
LB-NA-23980-EN-C
