VS259601 Economic Reporter Vol11No2
User Manual: VS259601
Open the PDF directly: View PDF ![]() .
.
Page Count: 16

SOUTHEASTERN LOUISIANA UNIVERSITY
Economic Reporter
Promoting Economic Development in Southeast Louisiana
Summer 2015 Vol. 11 · No. 2
NATIONAL
U.S. Economy
STATE
Louisiana Economy
REGIONAL
Employment
Retail Sales
Building Permits
Trends in the
Northshore Housing
Market by Parish
LOCAL
Livingston
St. Helena
St. Tammany
Tangipahoa
Washington
SOUTHEASTERN
Gnarly Barley:
Southeastern
Alumni Brew a
Successful Local
Business
CONTACT US
Southeastern Louisiana
University
Business Research Ctr.
1514 Martens Drive
Hammond, LA 70401
Phone: (985) 549-3199
Fax: (985) 549-2127
brc@southeastern.edu
U.S. Economy
NATIONAL
Dr. A. M. M. Jamal
Professor of Marketing and Supply Chain Management
Southeastern Louisiana University
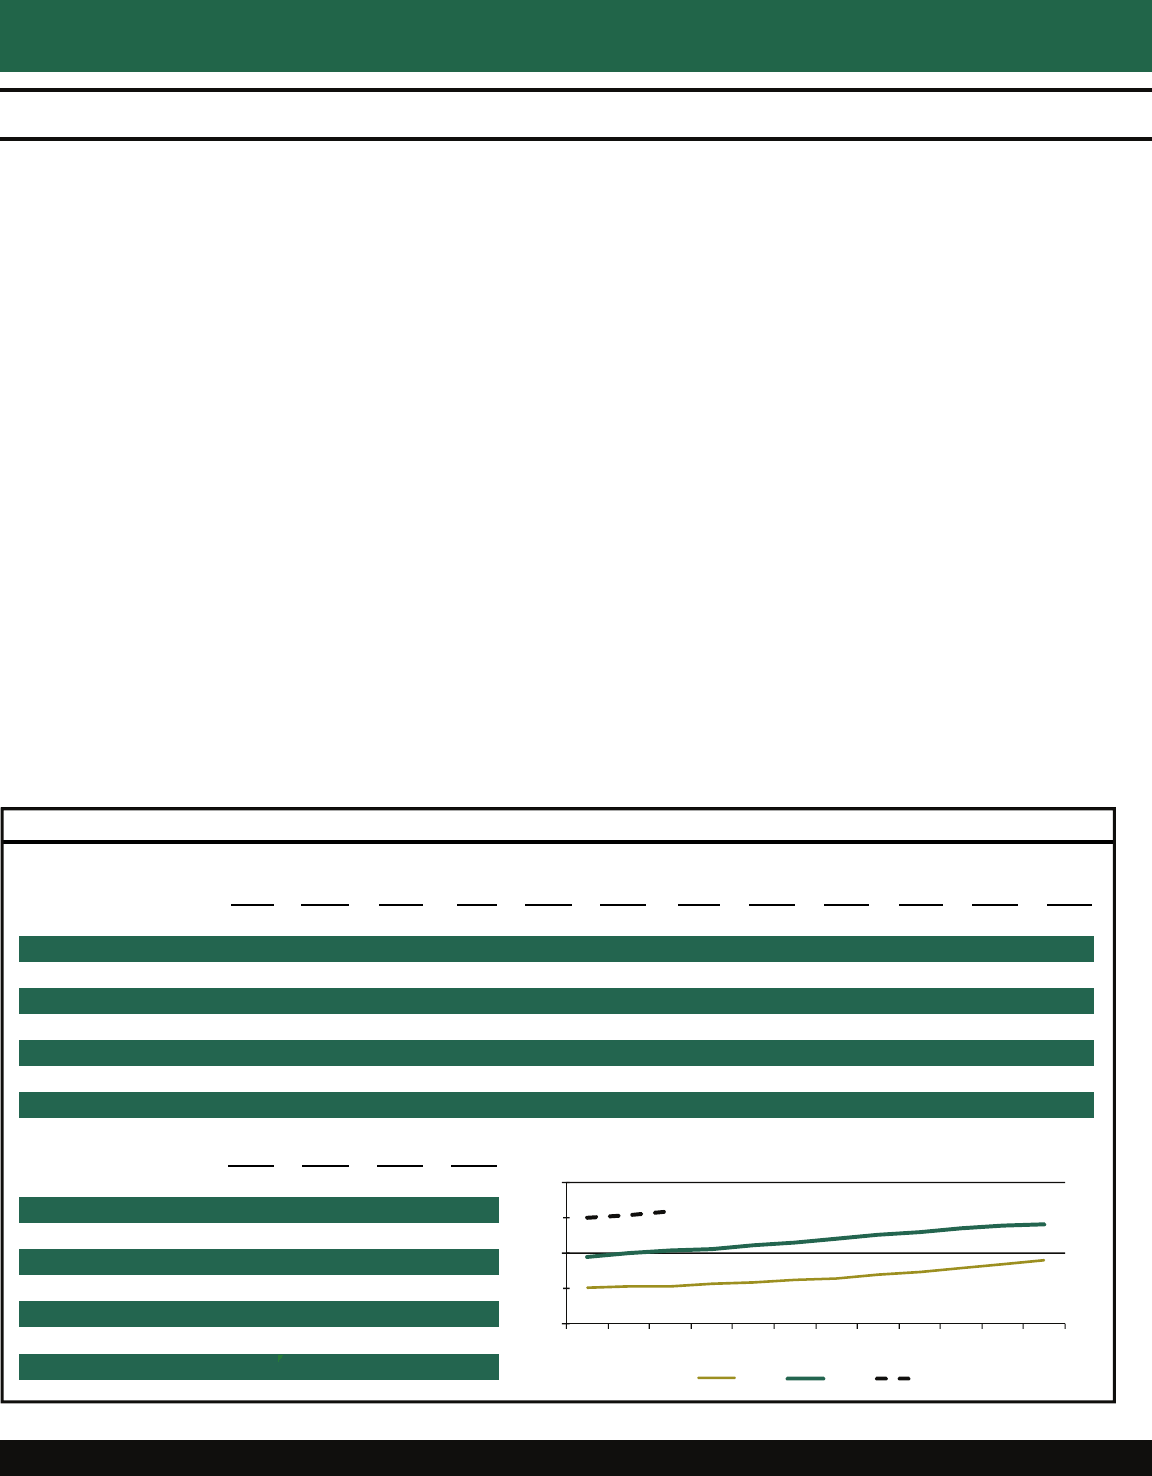
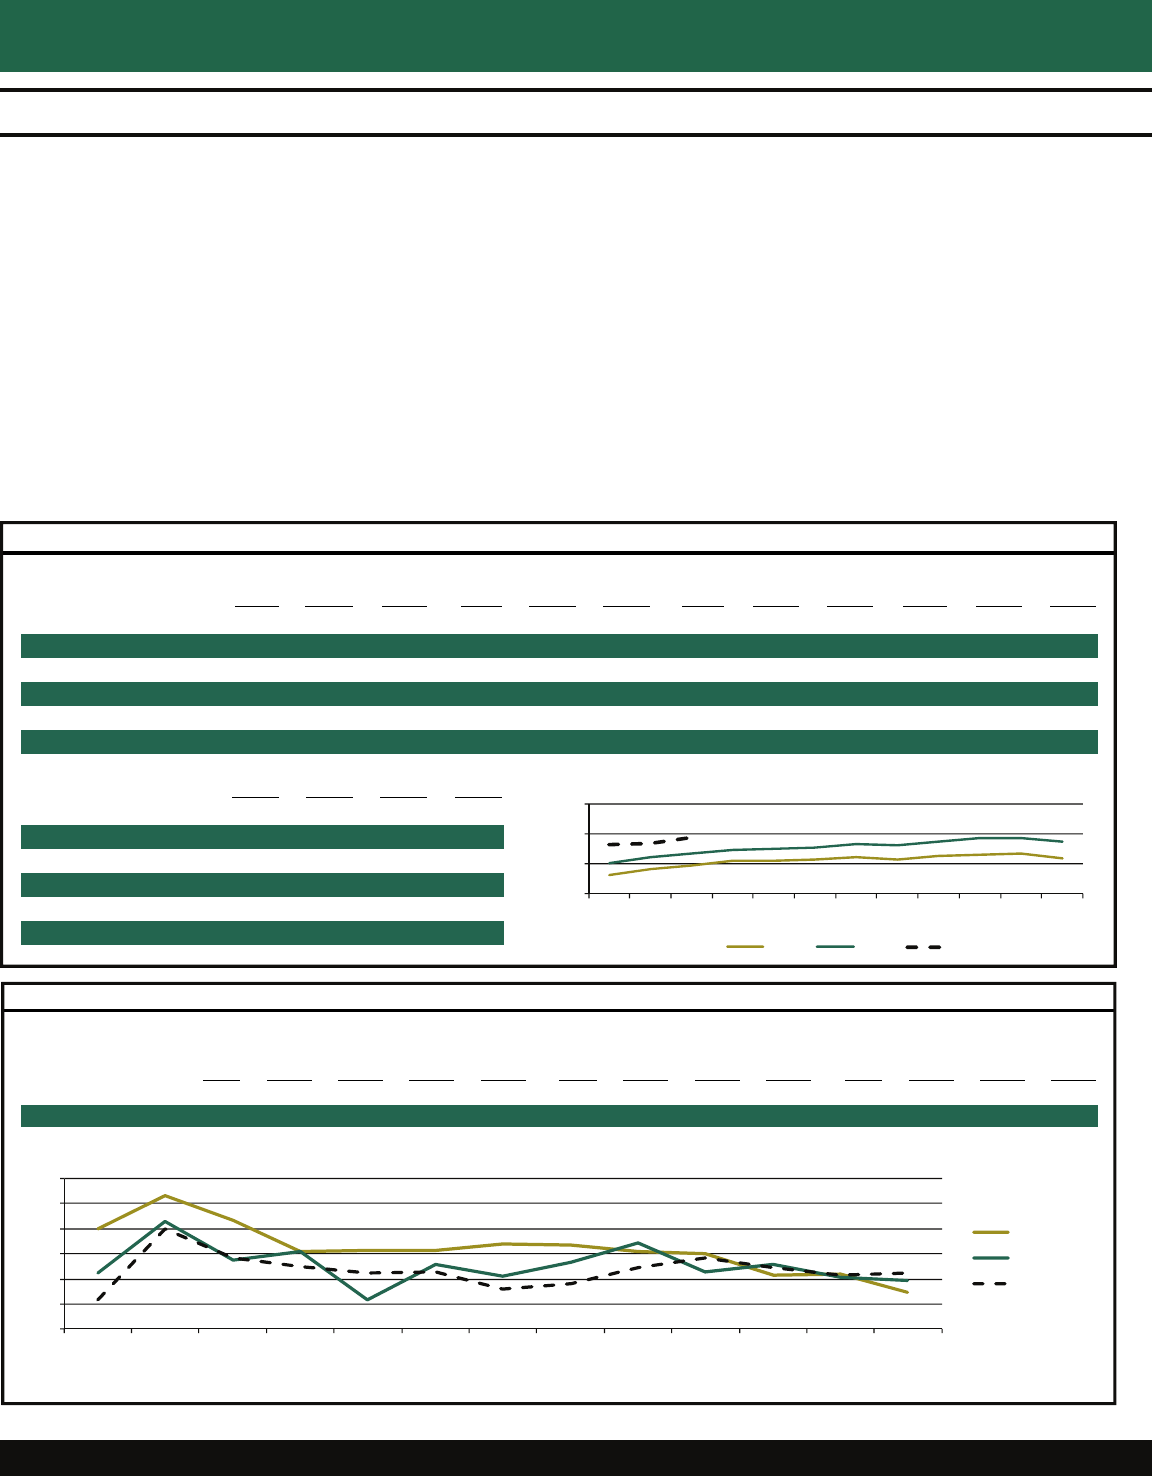
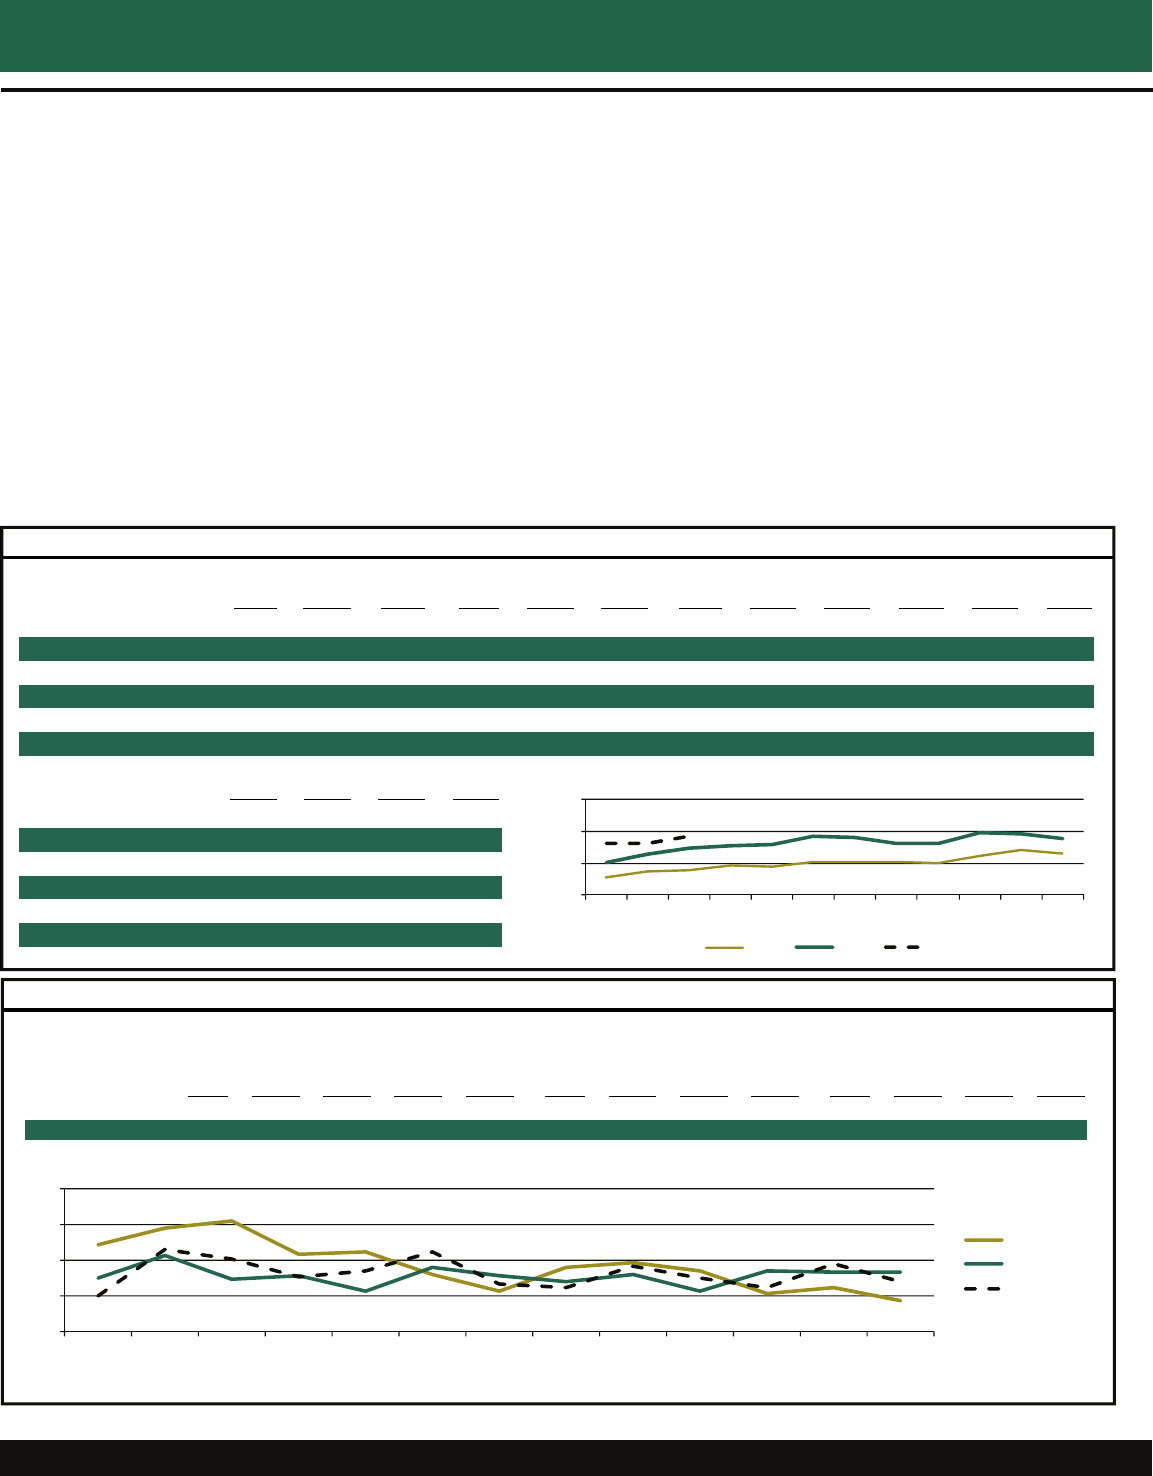
U. S. real gross domestic product
declined at a 0.2 percent annual rate
during the first quarter of 2015 and was
2.9 percent higher than in the first
quarter of 2014.
Total civilian employment for the first
quarter of 2015 rose 2.0 percent
compared to the corresponding period of
the previous year while the workforce
rose 0.8 percent. This helped the
unemployment rate to drop from 6.6
percent to 5.6 percent.
A survey of professional economists
by the Federal Reserve Bank of
Philadelphia projects the U.S.
economy to grow 2.4, 2.8, 2.8, and
2.5 percent in 2015, 2016, 2017, and
2018, respectively. An alternative set
of forecasts by Wells Fargo Bank
indicates gains of 1.9 percent and 2.9
percent for 2015 and 2016.
U.S. housing starts totaled 2.93
million in 1Q2015, up from 2.80
million in 1Q2014, an increase of 4.7
percent.
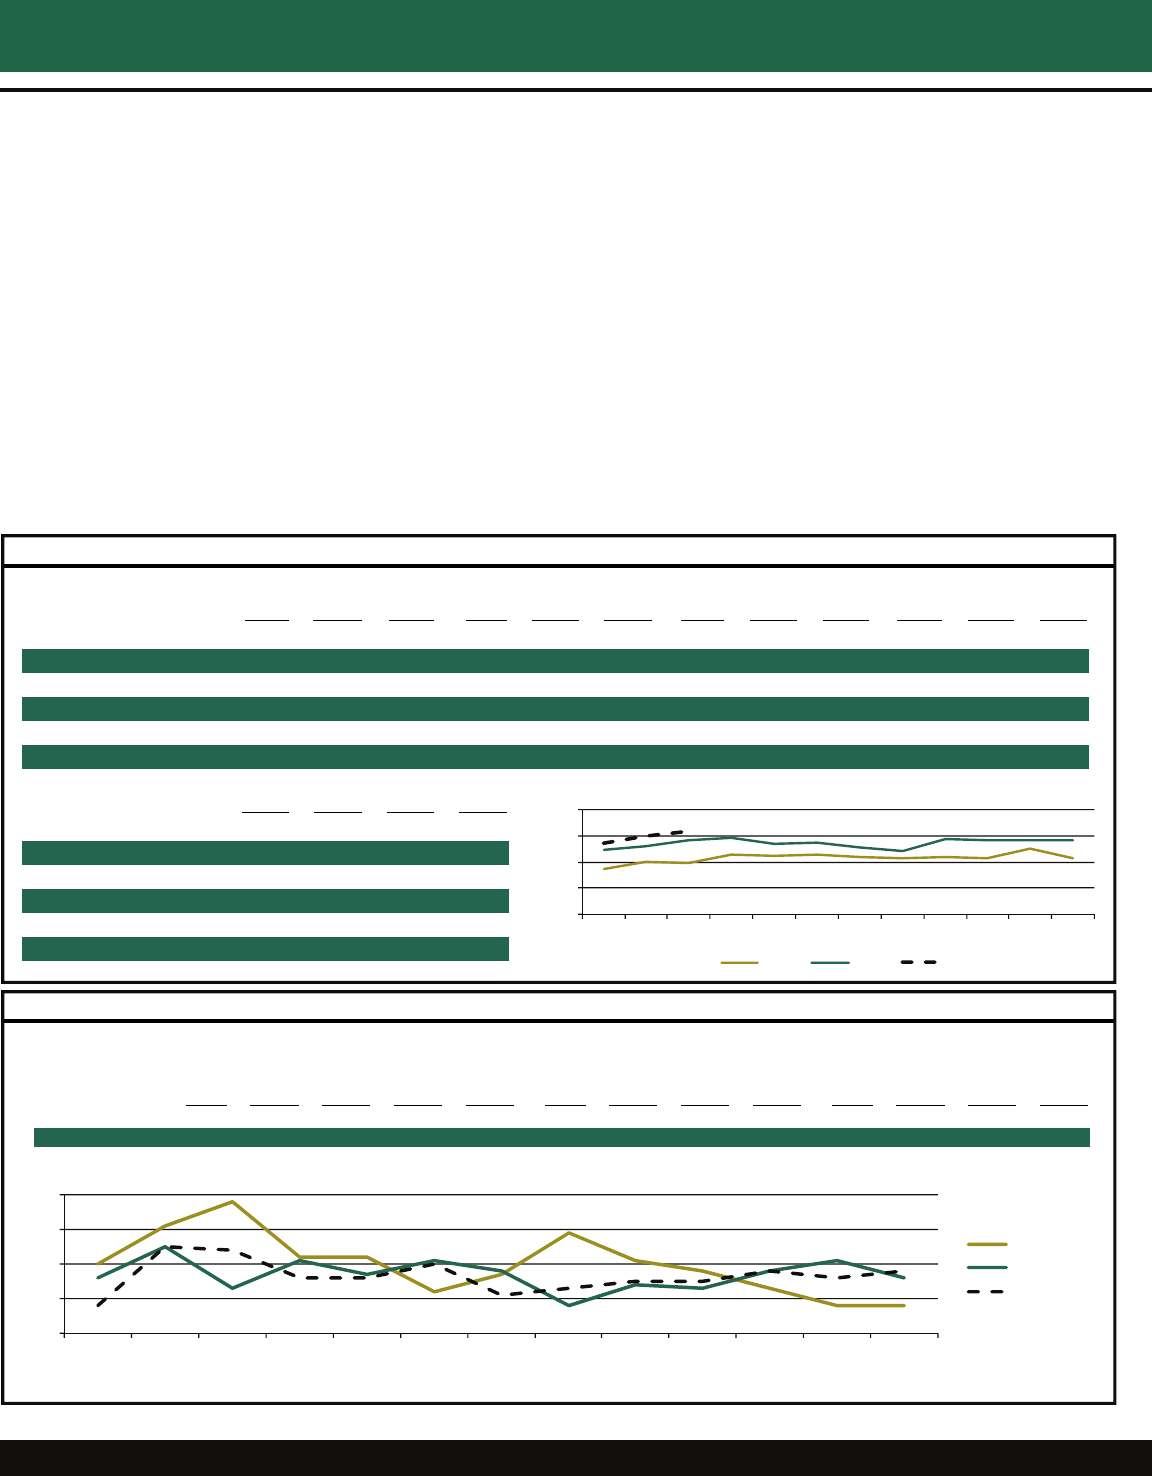
EMPLOYMENT (Seasonally Adjusted)
UNITED STATES (Numbers in Thousands)
Apr 14 May 14 Jun 14 Jul 14 Aug 14 Sep 14 Oct 14 Nov 14 Dec 14 Jan 15 Feb 15 Mar 15
Labor Force 155,420 155,629 155,700 156,048 156,018 155,845 156,243 156,402 156,129 157,180 157,002 156,906
% Change vs Prior Year 0.0% 0.0% 0.0% 0.3% 0.3% 0.2% 1.1% 0.7% 0.7% 1.1% 0.8% 0.5%
Total Employment 145,724 145,868 146,247 146,401 146,451 146,607 147,260 147,331 147,442 148,201 148,297 148,331
% Change vs Prior Year 1.4% 1.4% 1.5% 1.5% 1.5% 1.6% 2.7% 2.0% 1.9% 2.1% 2.1% 1.7%
Total Nonfarm Emp. 138,385 138,621 138,907 139,156 139,369 139,619 139,840 140,263 140,592 140,793 141,059 141,144
% Change vs Prior Year 1.8% 1.8% 1.9% 2.0% 2.0% 2.0% 2.0% 2.1% 2.3% 2.3% 2.3% 2.2%
Unemployment Rate 6.2% 6.3% 6.1% 6.2% 6.1% 5.9% 5.7% 5.8% 5.6% 5.7% 5.5% 5.5%
% Change vs Prior Year -1.3% -1.2% -1.5% -1.1% -1.1% -1.3% -1.5% -1.2% -1.1% -0.9% -1.1% -1.2%
2QT-14 3QT-14 4QT-14 1QT-15
Labor Force 155,583 155,970 156,258 157,029
% Change vs Prior Year 0.0% 0.3% 0.8% 0.8%
Total Employment 145,946 146,486 147,344 148,276
% Change vs Prior Year 1.5% 1.5% 2.2% 2.0%
Total Nonfarm Emp. 138,638 139,381 140,232 140,999
% Change vs Prior Year 1.9% 2.0% 2.1% 2.3%
Unemployment Rate 6.2% 6.1% 5.7% 5.6%
% Change vs Prior Year -1.3% -1.2% -1.3% -1.1%
Source: U.S. Bureau of Labor Statistics
140,000
145,000
150,000
155,000
Jan Feb Mar Apr May Jun Jul Aug Sep Oct Nov Dec
Total Employment (000s)
2013 2014 2015
Economic Reporter
Southeastern Louisiana University 2
STATE
Louisiana Economy
Dr. A. M. M. Jamal
Professor of Marketing and Supply Chain Management
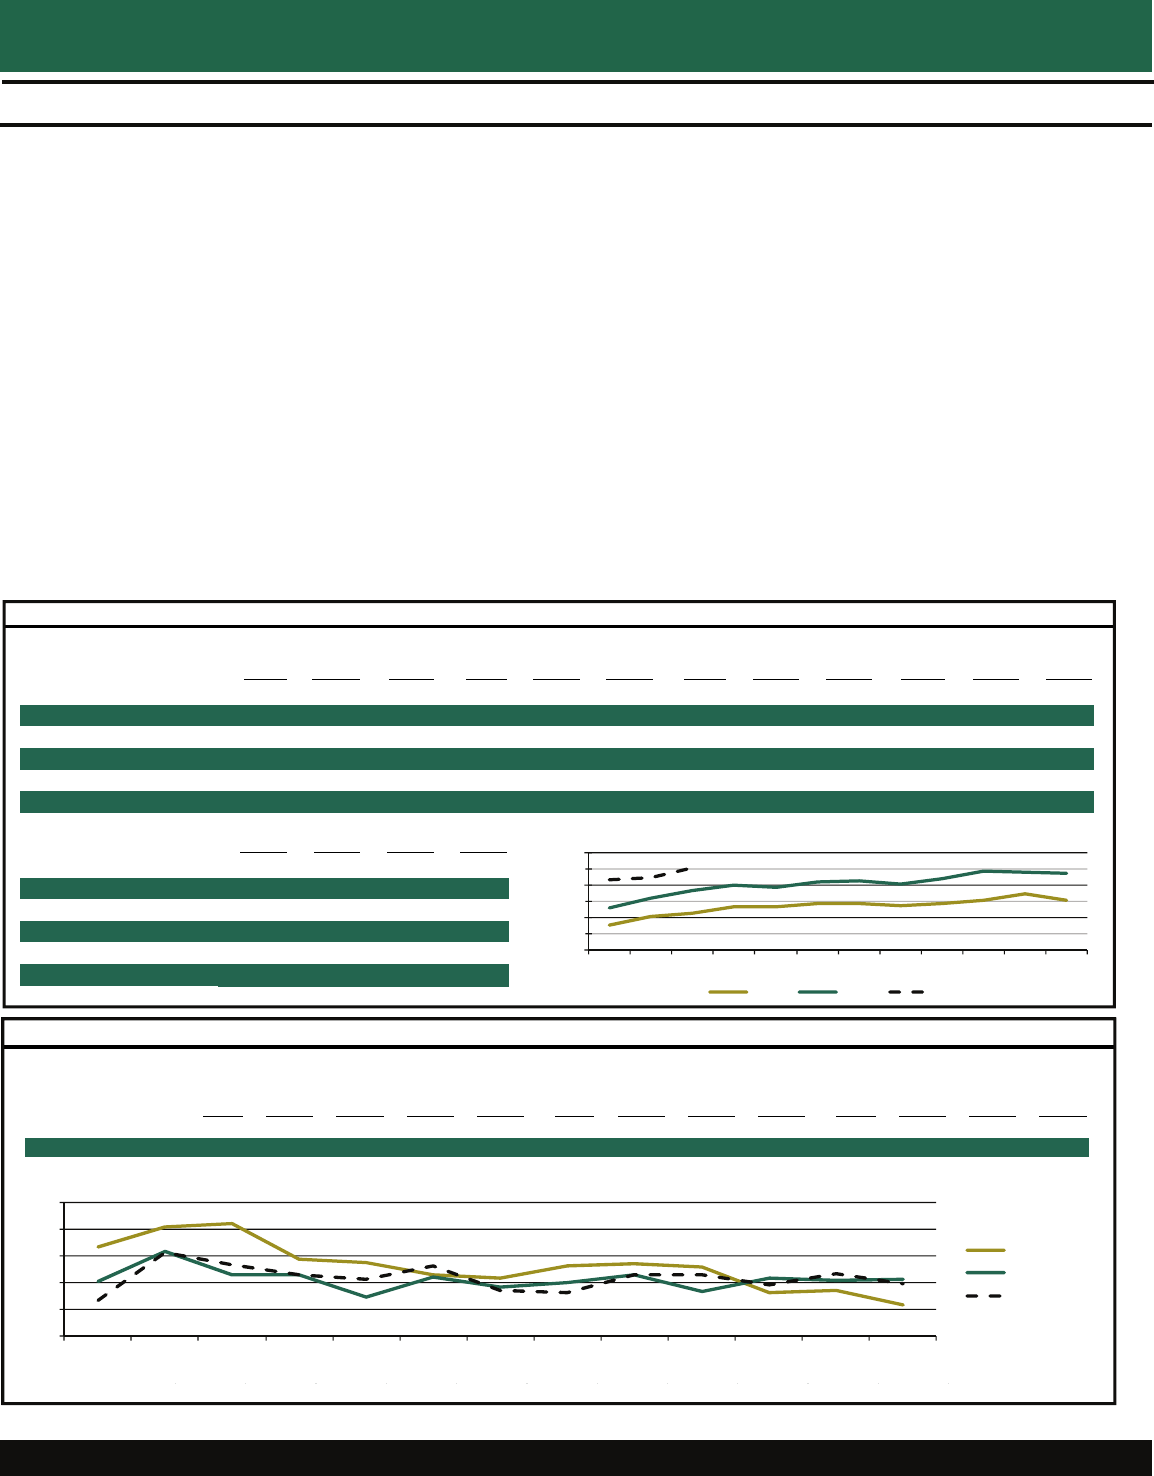
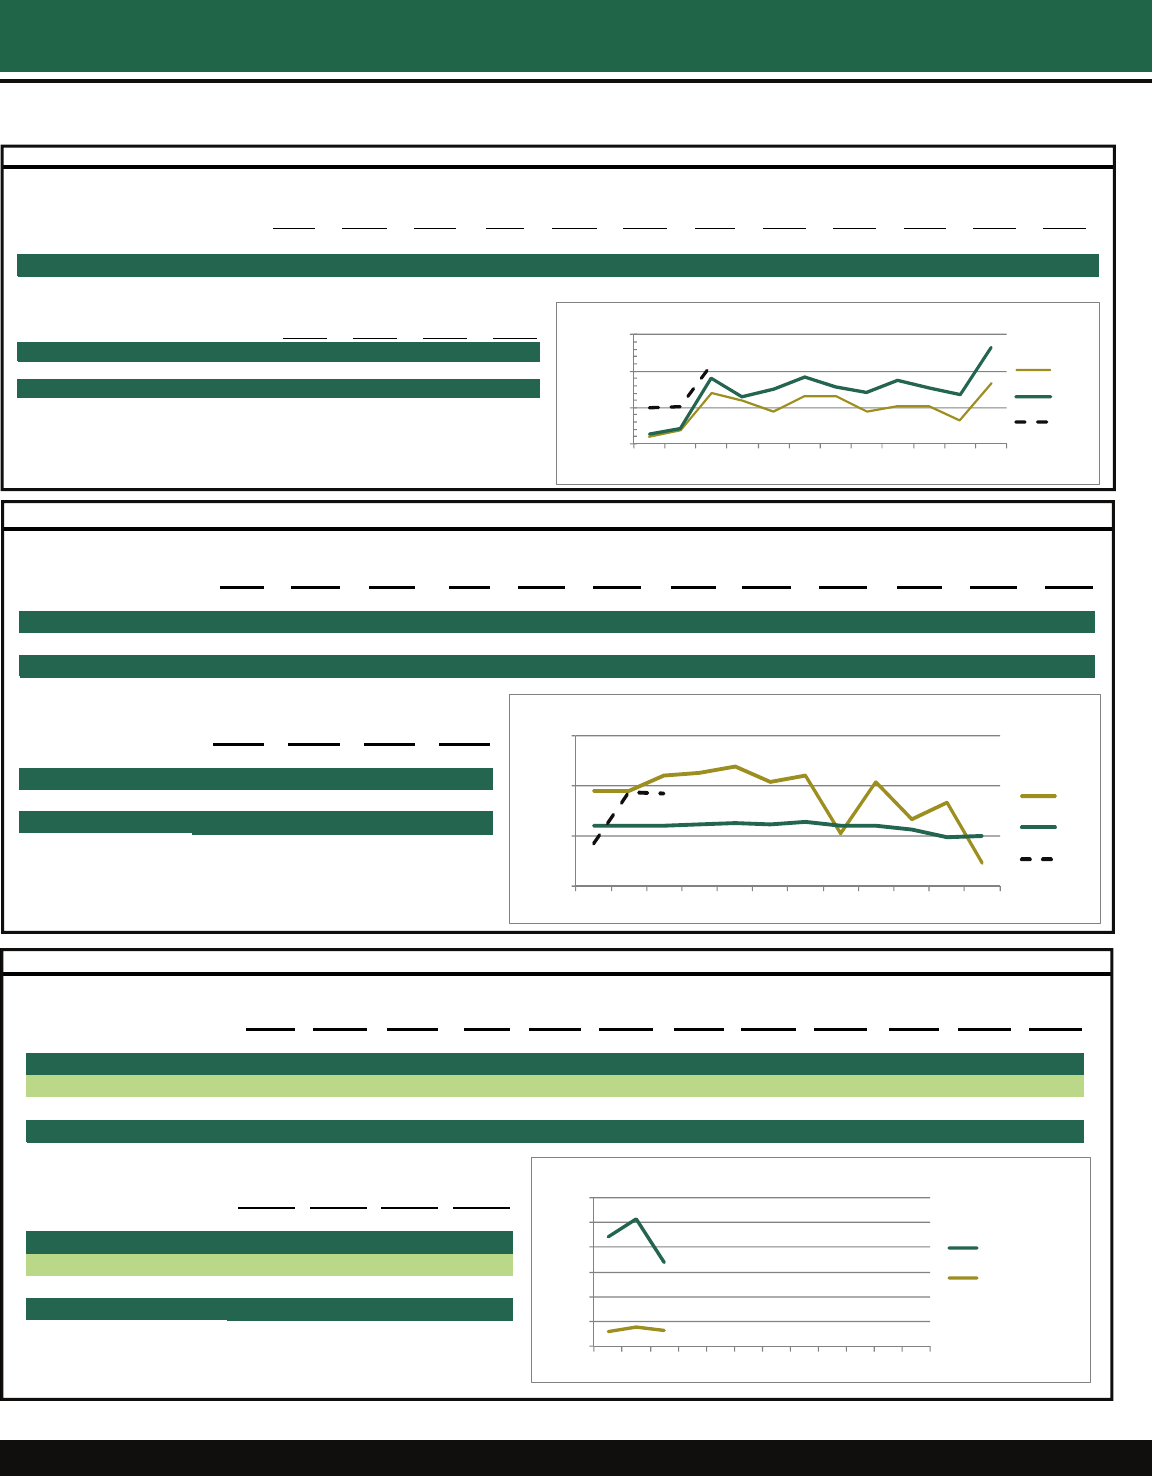
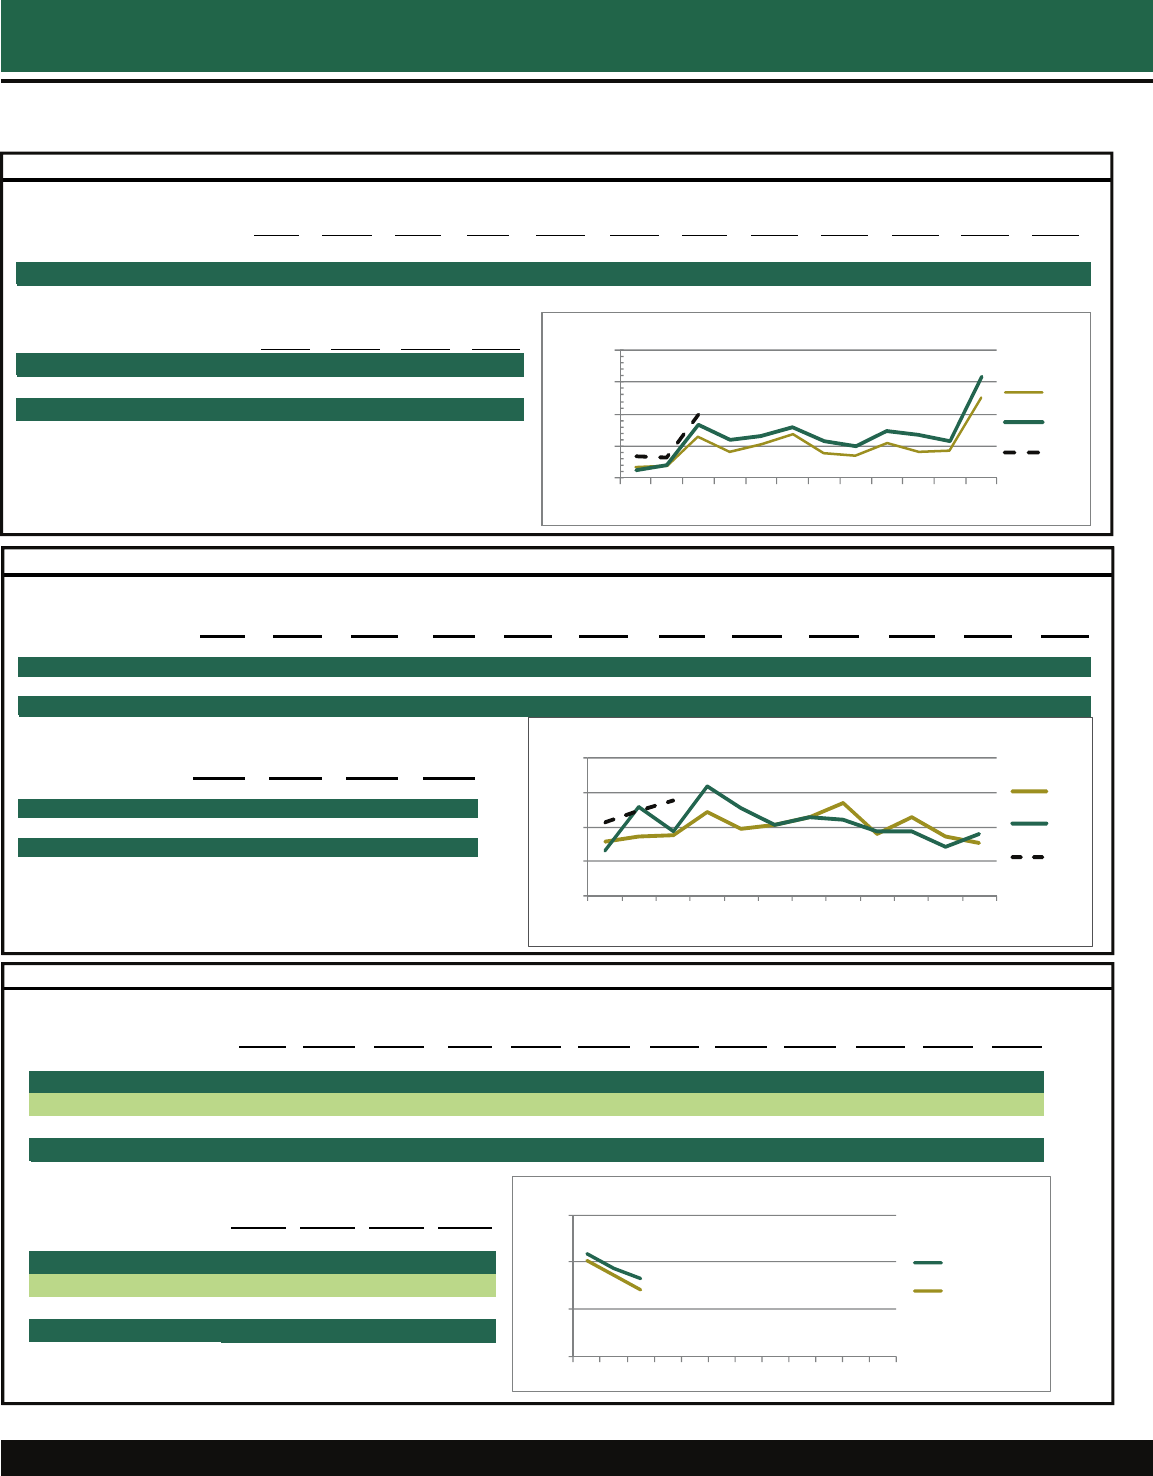
Total state employment for the first quarter of
2015 rose 0.8 percent from the previous quarter
and was 2.7 percent higher than for the first
quarter of 2014.
The unemployment rate for the first quarter of
2015 was 6.8 percent, compared to 5.5 percent in
1Q2014. The state unemployment rate was above
the 5.6 percent national rate primarily because
the Louisiana labor force grew faster than
employment.
Sales tax collections for the first quarter of 2015
fell 12.4 percent compared to the prior quarter,
but were 3.5 percent higher than for the first
quarter of 2014. (On a year-over-year basis, the
increase is a continuation of the trend observed
during recent quarters.)
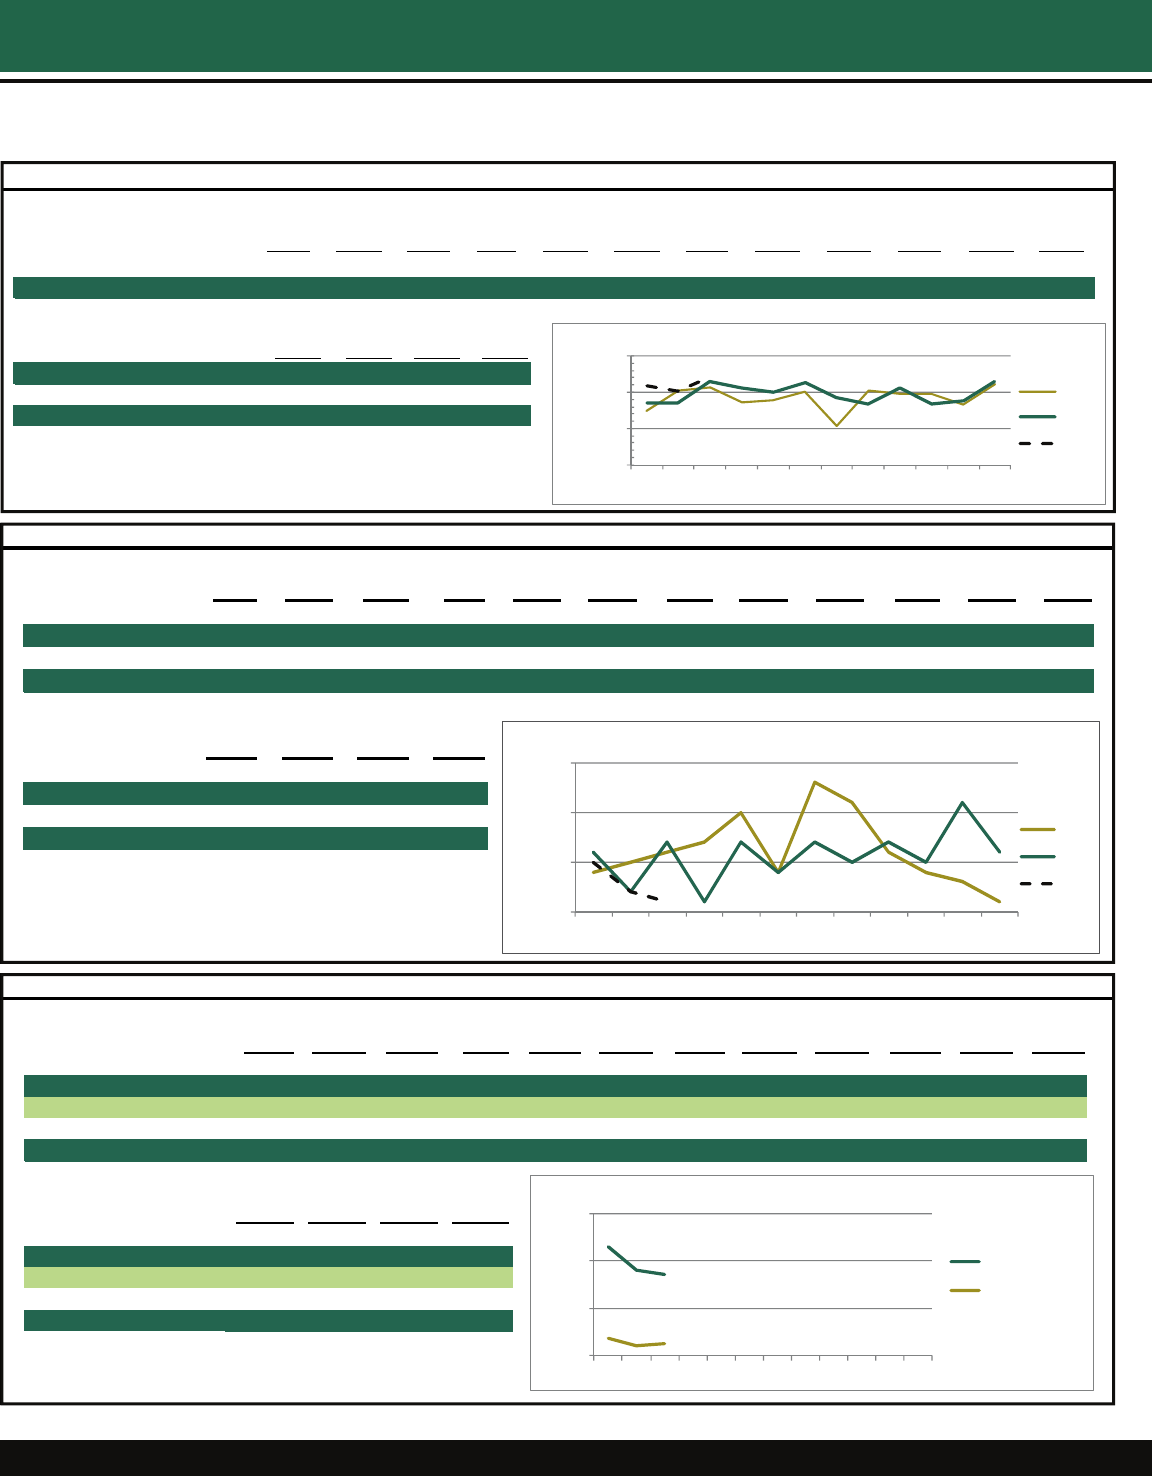
EMPLOYMENT (Seasonally Adjusted)
LOUISIANA (Numbers in Thousands)
Apr 14 May 14 Jun 14 Jul 14 Aug 14 Sep 14 Oct 14 Nov 14 Dec 14 Jan 15 Feb 15 Mar 15
Labor Force 2,127 2,137 2,148 2,159 2,171 2,181 2,189 2,196 2,201 2,203 2,202 2,205
% Change vs Prior Year 1.2% 1.7% 2.2% 2.7% 3.2% 3.6% 4.0% 4.2% 4.4% 4.4% 4.1% 4.0%
Total Employment 2,007 2,011 2,015 2,020 2,026 2,031 2,035 2,038 2,041 2,050 2,054 2,060
% Change vs Prior Year 2.6% 2.6% 2.7% 2.8% 2.9% 2.9% 2.8% 2.7% 2.5% 2.7% 2.7% 2.8%
Total Nonfarm Emp. 1,972 1,978 1,981 1,982 1,985 1,988 1,992 1,994 1,997 1,989 1,987 1,984
% Change vs Prior Year 1.2% 1.5% 1.4% 1.5% 1.5% 1.5% 1.5% 1.4% 1.8% 1.3% 1.0% 0.7%
Unemployment Rate 5.7% 5.9% 6.2% 6.4% 6.7% 6.9% 7.0% 7.2% 7.2% 7.0% 6.7% 6.6%
% Change vs Prior Year -1.2% -0.9% -0.5% -0.1% 0.3% 0.7% 1.1% 1.4% 1.7% 1.5% 1.3% 1.1%
2QT-14 3QT-14 4QT-14 1QT-15
Labor Force 2,137 2,170 2,195 2,204
% Change vs Prior Year 1.7% 3.2% 4.2% 4.2%
Total Employment 2,011 2,026 2,038 2,054
% Change vs Prior Year 2.6% 2.8% 2.7% 2.7%
Total Nonfarm Emp. 1,977 1,985 1,994 1,987
% Change vs Prior Year 1.3% 1.5% 1.6% 1.0%
Unemployment Rate 5.9% 6.7% 7.1% 6.8%
% Change vs Prior Year -0.9% 0.3% -0.9% 1.3%
Source: Louisiana Department of Labor, Labor Market Statistics
1700
1800
1900
2000
2100
Jan Feb Mar Apr May Jun Jul Aug Sep Oct Nov Dec
Total Employment
20 05 20 06 20 07
1,900
2,000
2,100
Jan Feb Mar Apr May Jun Jul Aug Sep Oct Nov Dec
Total Employment (000s)
2013 2014 2015
Seasonally-adjusted state personal income in-
creased 0.8 percent ($1.5 billion) in the first
quarter of 2015, ranking 35th in the nation.
Net earnings were up $543 million, dividends,
interest and rents increased $181 million, and
personal transfer receipts increased by $822 mil-
lion.
Industries contributing the most quarter-over-
quarter growth in earnings from 4Q2014 to
1Q2015 were ““Health Care and Social Assis-
tance” (+$177 million), “Professional, Scientific,
& Technical Services” (+$161 million), and
“Farm” (+ $133 million).
Earnings from “Mining” (which includes oil and
gas) declined by $357 million from 4Q2014 to
1Q2015.
REGIONAL
Northshore Employment
Dr. A. M. M. Jamal
Professor of Marketing and Supply Chain Management
Southeastern Louisiana University
Southeastern Louisiana University 3
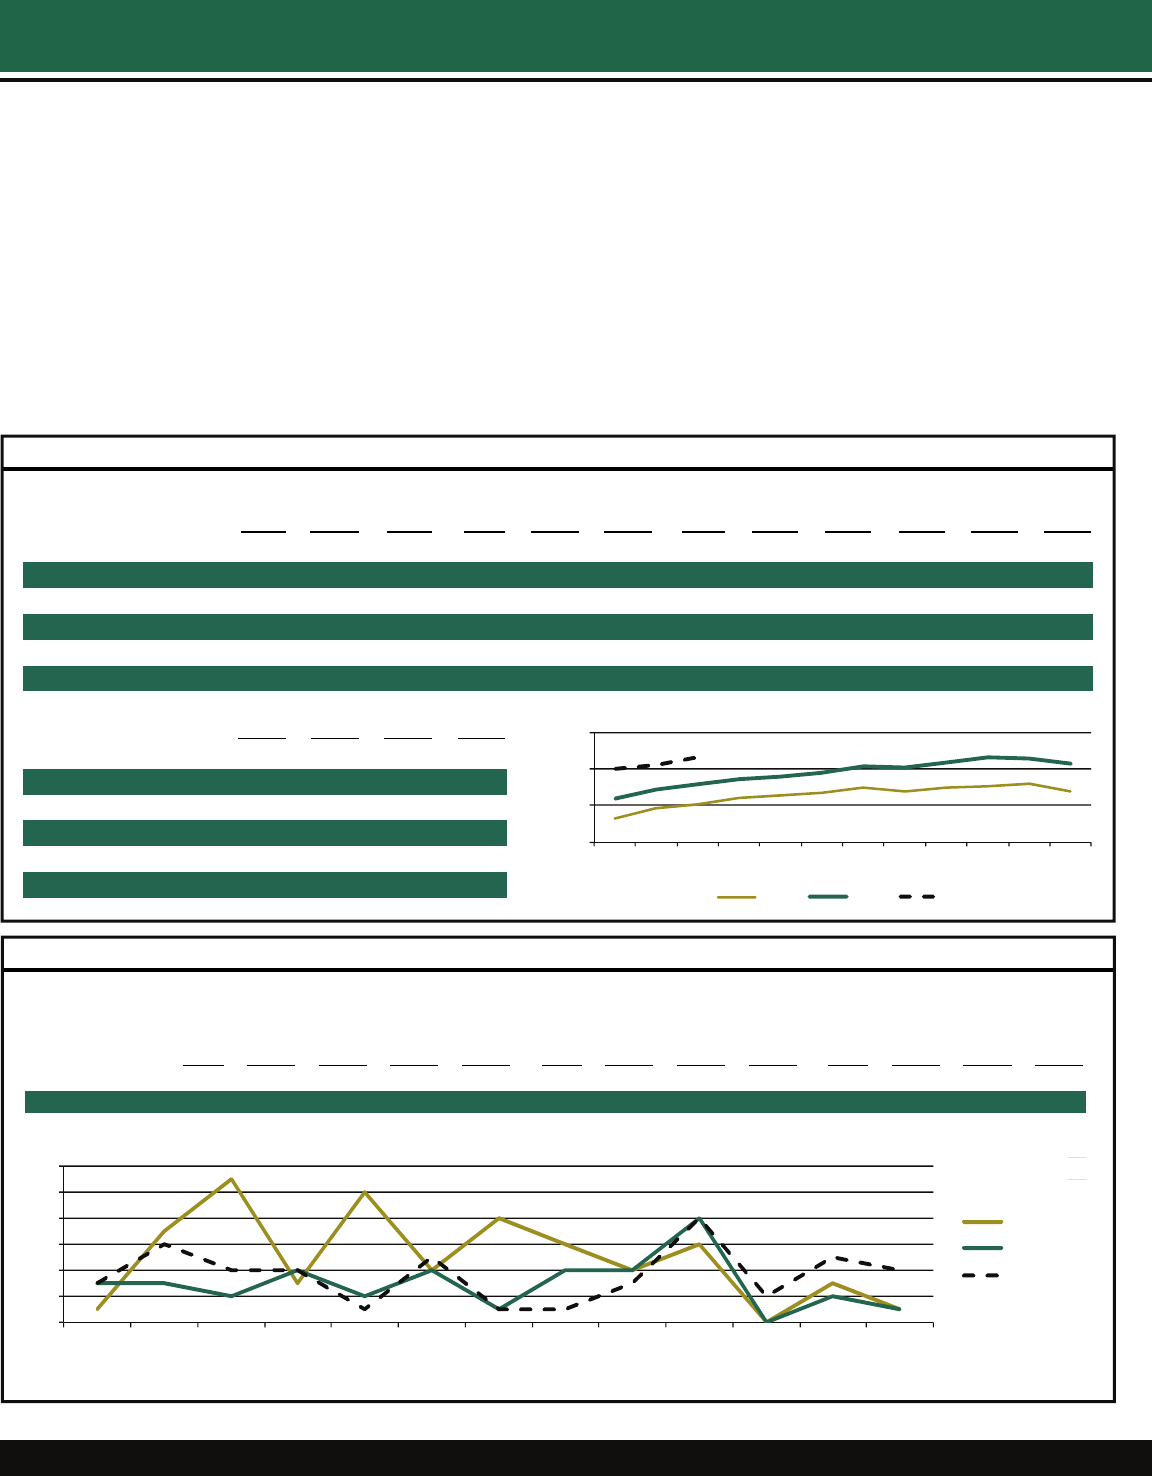
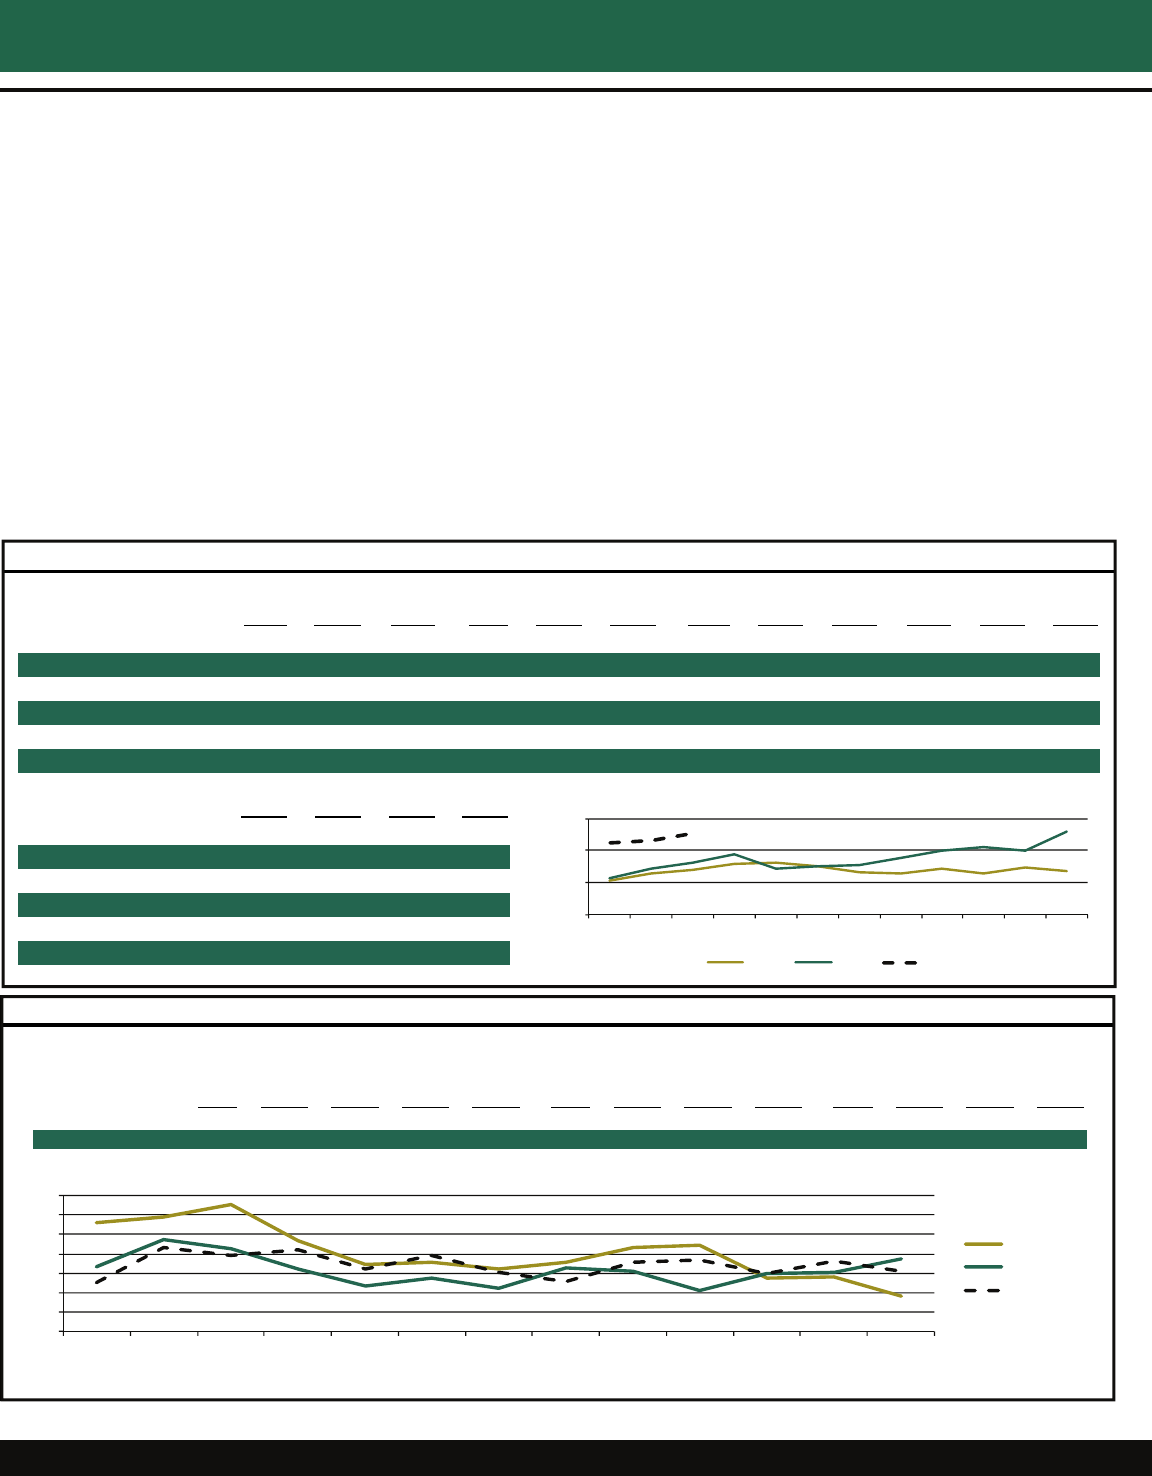
Total employment in the Northshore Region
(Livingston, St. Helena, St. Tammany,
Tangipahoa, and Washington parishes) was 0.4
percent lower in 1Q2015 compared to the
previous quarter, but rose 3.1 percent (+7,358
jobs) compared to the first quarter of 2014.
The total civilian work force in 1Q2015 was 0.5
percent lower than the previous quarter but 4.0
percent higher than in the first quarter of 2014.
The unemployment rate for the first quarter of
2015 was 6.2 percent, compared to 6.4 percent in
the previous quarter and 5.4 percent during the
first quarter of 2014.
(Note: All regional and parish employment
analyses are based on unadjusted employment
data. Seasonally-adjusted data are not available
at the parish level.)
Economic Reporter
EMPLOYMENT (Not seasonally ad
j
usted)
NORTHSHORE REGION
Apr 14 May 14 Jun 14 Jul 14 Aug 14 Sep 14 Oct 14 Nov 14 Dec 14 Jan 15 Feb 15 Mar 15
Labor Force 252,452 253,833 257,996 259,161 258,622 259,055 261,379 260,630 259,601 259,119 257,766 261,040
% Change vs Prior Year 1.5% 1.5% 1.5% 2.8% 3.2% 3.8% 4.5% 4.2% 5.1% 4.8% 3.7% 3.6%
Total Employment 239,986 239,361 240,953 241,294 240,494 242,063 244,569 244,082 243,798 241,705 242,520 245,264
% Change vs Prior Year 2.8% 2.6% 2.8% 3.0% 2.9% 3.2% 3.9% 2.8% 3.6% 3.7% 2.8% 2.9%
Unemployment Rate 4.9% 5.7% 6.6% 6.9% 7.0% 6.6% 6.4% 6.5% 6.3% 6.7% 5.9% 6.0%
% Change vs Prior Year -1.2% -1.0% -1.2% -0.2% 0.3% 0.5% 0.6% 1.3% 1.4% 1.0% 0.9% 0.6%
2QT-14 3QT-14 4QT-14 1QT-15
Labor Force 254,760 258,946 260,537 259,308
% Change vs Prior Year 1.5% 3.2% 4.6% 4.0%
Total Employment 240,100 241,284 244,150 243,163
% Change vs Prior Year 2.7% 3.0% 3.4% 3.1%
Unemployment Rate 5.8% 6.8% 6.4% 6.2%
% Change vs Prior Year -1.1% 0.2% 1.1% 0.8%
Source: Labor Market Statistics, Local Area Unemployment Statistics Program
220, 000
230, 000
240, 000
250, 000
123456789101112
Total Employment
2013 2014 2015
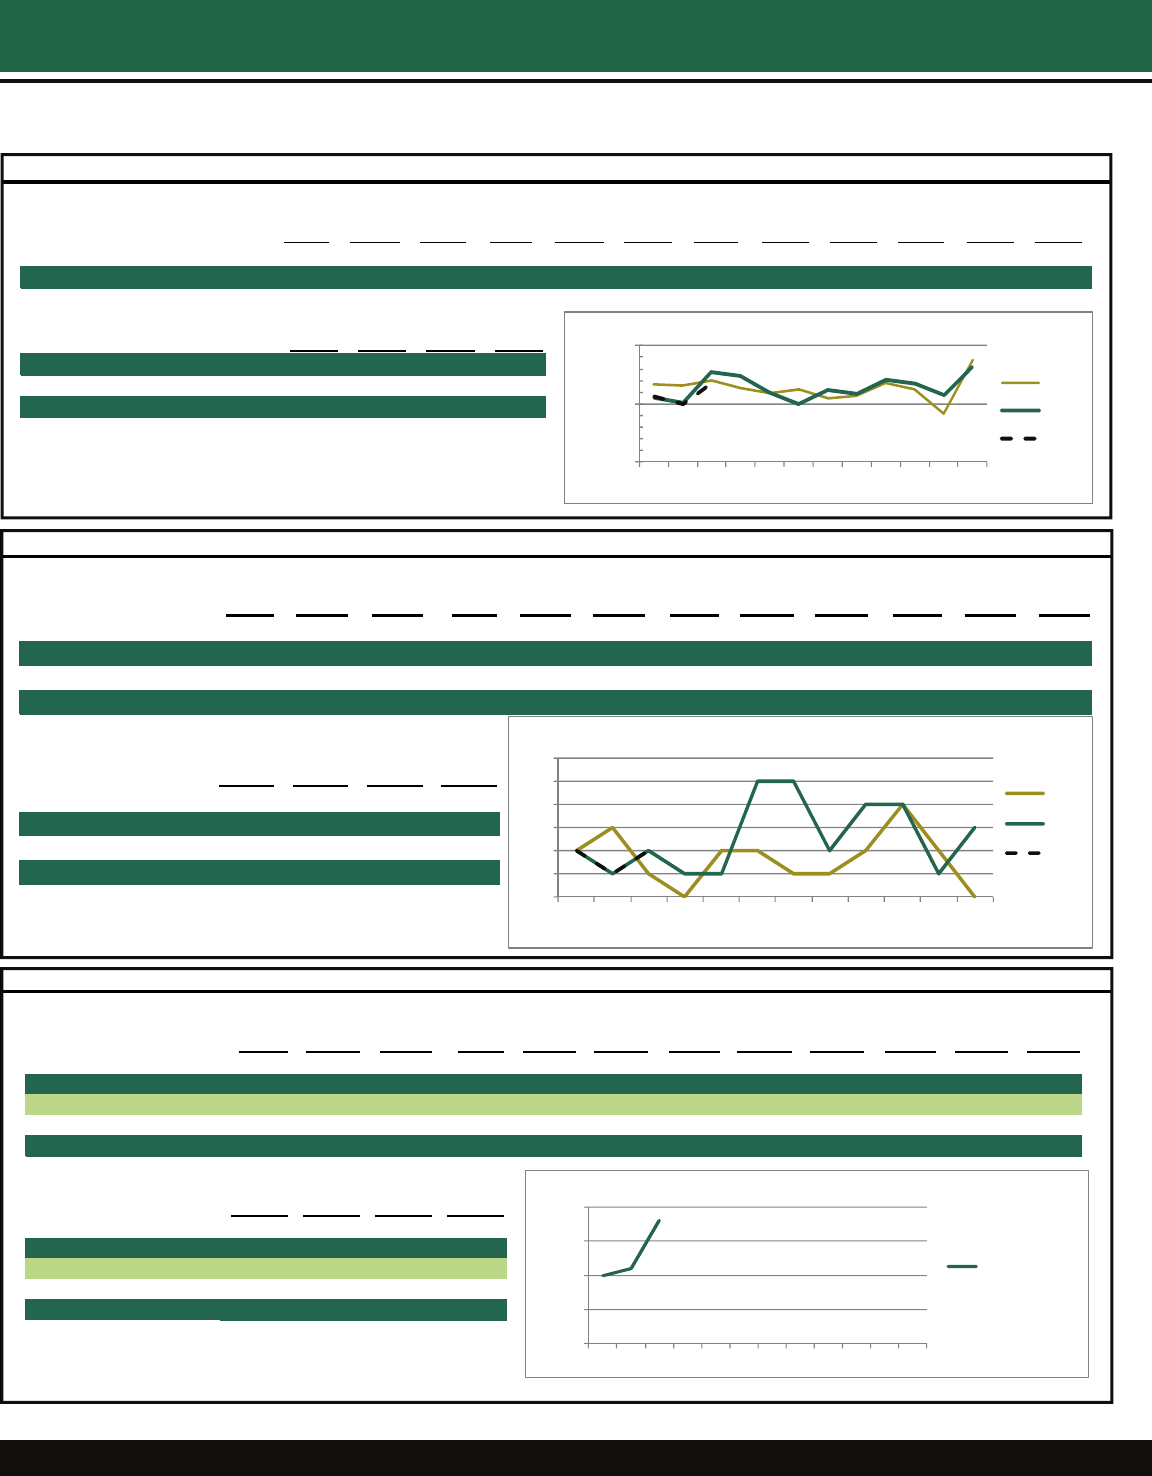
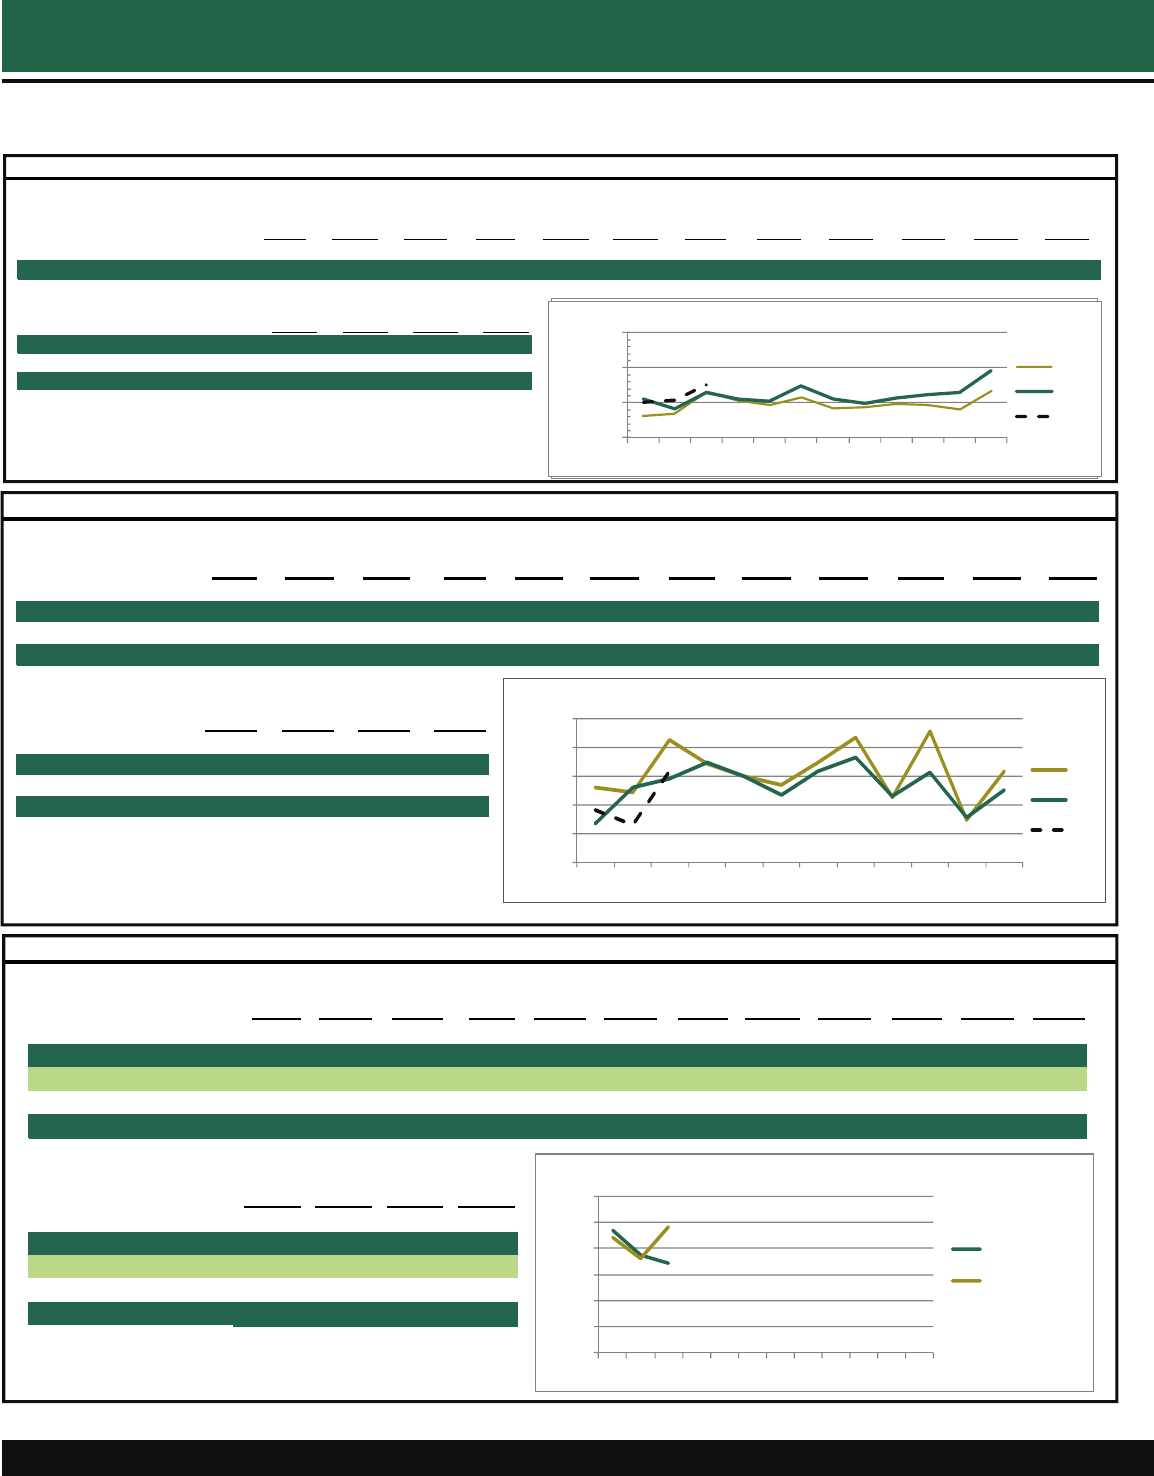
WEEKLY UNEMPLOYMENT INSURANCE (UI) CLAIMS
Northshore Region
Week 12345678910111213
Date 1/3/15 1/10/15 1/17/15 1/24/15 1/31/15 2/7/15 2/14/15 2/21/15 2/28/15 3/7/15 3/14/15 3/21/15 3/28/15
Initial UI Claims 135 314 266 232 213 262 172 165 230 230 192 233 199
Weeks Claimed 1,837 1,889 1,916 1,878 1,844 1,828 1,837 1,810 1,804 1,831 1,730 1,780 1,771
Source: Labor Market Statistics, Local Area Une mployment Statistics Program
0
200
400
600
800
1,000
1,200
1,400
27 28 29 30 31 32 33 34 35 36 37 38 39
Week
Weekly Initial Unemployment Insurance Claims
2012
2013
2014
0
100
200
300
400
500
12345678910111213
Week
Weekly Initial Unemployment Insurance Claims
2013
2014
2015
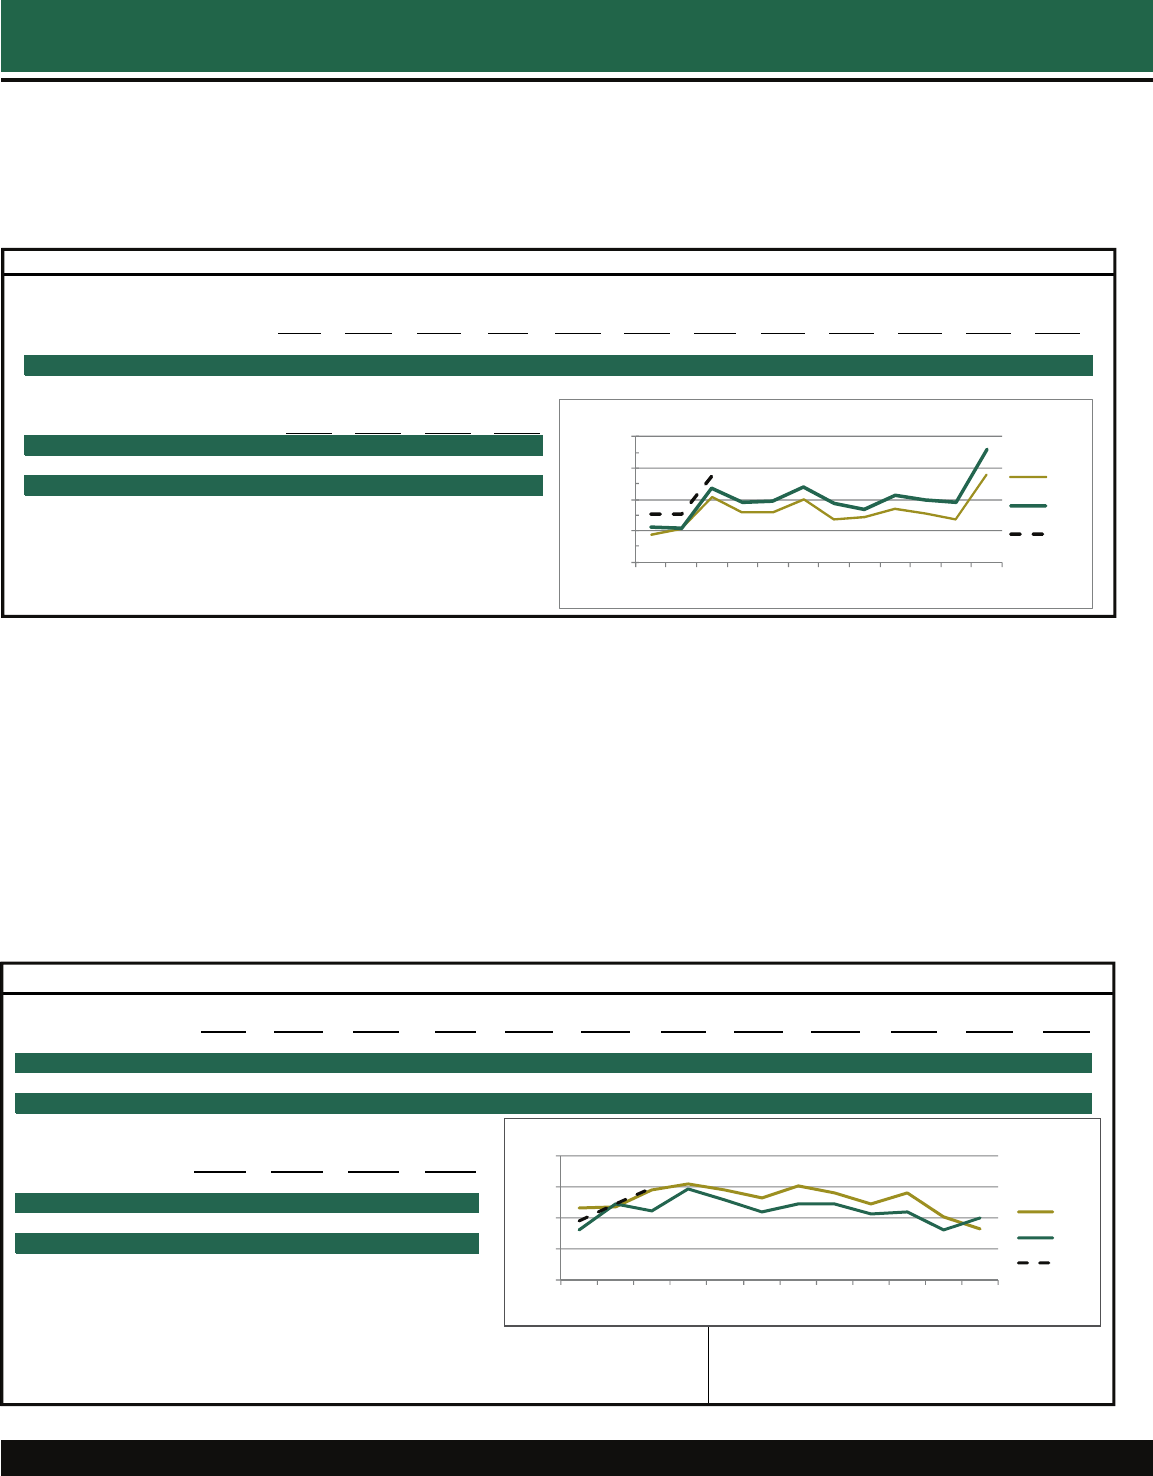
Estimated Retail Sales in the Northshore Region
The 1Q2015 value of retail sales for the region fell
7.7 percent from the previous quarter but was 6.0
percent higher than for the first quarter of 2014.
All the parishes in the Northshore region except
St. Helena saw year-over-year gains in sales
compared to the first quarter of 2014.
Residential Building Permits in the Northshore Region
Building permits for residential units in the
Northshore region for 1Q2015 rose 26.0 percent
over the prior quarter and were 16.9 percent
higher than in the first quarter of 2014, reflecting
an encouraging outlook for construction in the
region overall.
On a year-over-year basis, Livingston and St.
Tammany parishes showed strong increases in
the number of permits issued, Tangipahoa and
Washington reported declines, and St. Helena was
unchanged.
It should be noted that the number of units in
unincorporated St. Tammany Parish and all of
Washington Parish are based on data (or
estimates) provided by the U.S. Census Bureau.
Southeastern Louisiana University 4
Economic Reporter
ESTIMATED RETAIL SALES
NORTHSHORE REGION
Apr 14 May 14 Jun 14 Jul 14 Aug 14 Sep 14 Oct 14 Nov 14 Dec 14 Jan 15 Feb 15 Mar 15
Estimated Retail Sales (mil.) $690.79 $695.31 $740.38 $686.65 $667.66 $713.92 $699.59 $690.91 $861.73 $654.39 $651.13 $772.45
% Change vs Prior Month -6.3% 0.7% 6.5% -7.3% -2.8% 6.9% -2.0% -1.2% 24.7% -24.1% -0.5% 18.6%
% Change vs. Prior Year 5.0% 5.5% 5.9% 8.2% 3.7% 6.5% 6.8% 8.7% 10.6% 6.7% 6.9% 4.8%
2QT-14 3QT-14 4QT-14 1QT-15
Quarterly Avg. Sales (mil.) $708.83 $689.41 $750.74 $692.66
% Change vs. Prior Quarter 8.5% -2.7% 8.9% -7.7%
% Change vs Prior Year 5.5% 6.1% 8.8% 6.0%
Sources: Livingston Parish School Board - Sales and Use Tax Division
St. Helena Parish Sheriff's Office
St. Tammany Parish Sales and Use Tax Department
Tangipahoa Parish School Board - Sales and Use Tax Division
Washington Parish Sheriff's Office - Sales and Use Tax Department
$500
$600
$700
$800
$900
Jan Feb Mar Apr May Jun Jul Aug Sep Oct Nov Dec
Millions
EstimatedRetailSales
2013
2014
2015
RESIDENTIAL BUILDING PERMITS
NORTHSHORE REGION
Apr 14 May 14 Jun 14 Jul 14 Aug 14 Sep 14 Oct 14 Nov 14 Dec 14 Jan 15 Feb 15 Mar 15
Total Permits 292 252 220 242 230 211 218 160 195 191 245 295
% Change vs Prior Year -2.0% -9.7% -14.7% -18.0% -18.1% -9.4% -13.1% -17.1% 30.9% 18.6% 1.2% 33.5%
Total Units 292 259 220 244 245 211 220 162 199 191 245 296
% Change vs Prior Year -5.5% -10.4% -17.0% -19.5% -12.8% -13.9% -21.1% -19.8% 22.1% 18.6% 0.4% 33.9%
2QT-14 3QT-14 4QT-14 1QT-15
Total Permits 764 683 573 731
% Change vs Prior Year -8.5% -15.6% -3.4% 17.1%
Total Units 771 700 581 732
% Change vs Prior Year -10.7% -15.6% -9.8% 16.9%
Sources: Livingston Parish -- Livingston Parish Permit Office, Town of Albany,
City of Denham Springs, Tow n of Livingston,
Tow n of Walker, http://censtats.census.gov
St. Helena Parish -- St. Helena Parish Permit Office and Tangipahoa Parish -- Tangipahoa Parish Permit Office, City of Hammond,
http://censtats.census.gov (estimates w ith imputation) City of Ponchatoula, http://censtats.census.gov
St. Tammany Paris h -- St. Tammany Paris h Permit Of f ice, Tow n of Abita Springs, V illage of Folsom, Tow n of Washington Parish -- http://censtats.census.gov
Madisonville, City of Mandeville, Tow n of Pearl River, City of Slidell, http://censtats .census.gov
0
100
200
300
400
Jan Feb Mar Apr May Jun Jul Aug Sep Oct Nov Dec
ResidentialBuildingPermits:NumberofUnits
2012
2013
2014
0
100
200
300
400
Jan Feb Mar Apr May Jun Jul Aug Sep Oct Nov Dec
ResidentialBuildingPermits:NumberofUnits
2013
2014
2015
Southeastern Louisiana University 5
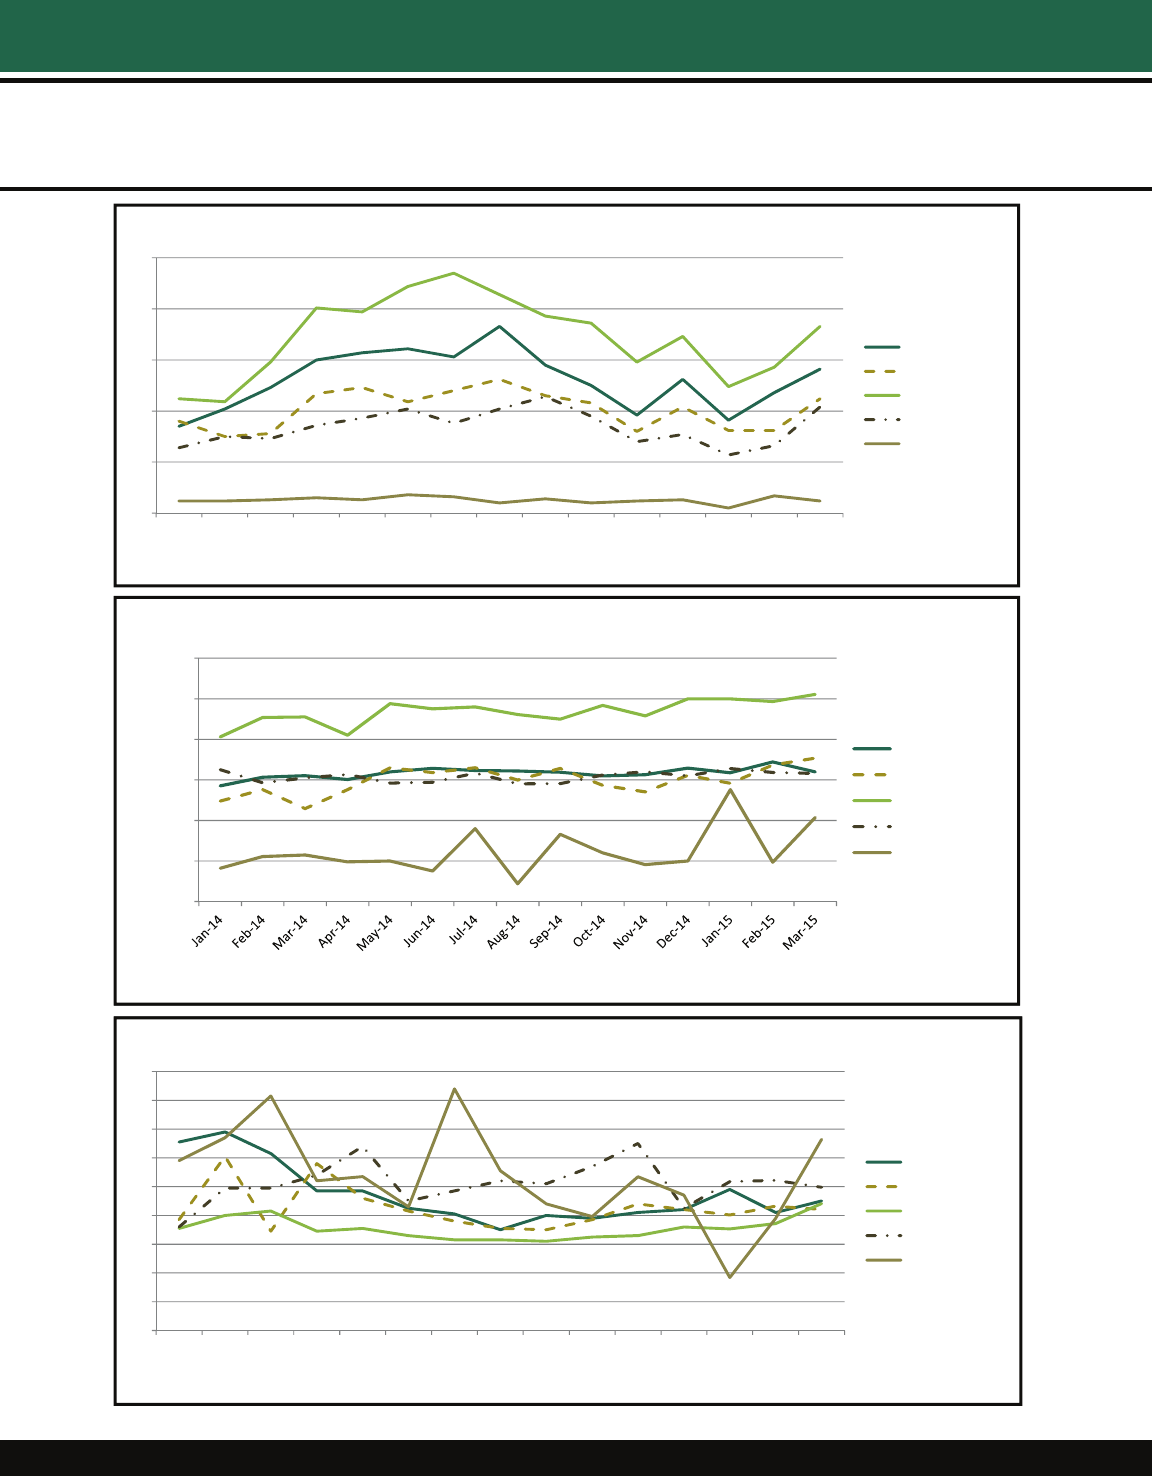
Trends in the Northshore Housing Market by Parish
Herb Holloway
Research Economist
Economic Reporter
0
50
100
150
200
250
Jan‐14 Feb‐14 Mar‐14 Apr‐14 May‐14 Jun‐14 Jul‐14 Aug‐14 Sep‐14 Oct‐14 Nov‐14 Dec‐14 Jan‐15 Feb‐15 Mar‐15
NumberofHomesSoldbyMonthbyParish:Jan2014‐ Mar2015
Livingston
EastSt.Tammany
WestSt.Tammany
Tangipahoa
Washington
Sources: LivingstonParishdatacourtesyofGreaterBatonRougeAreaRealtors(GBRAR)
OtherparishesbasedoninformationfromtheGulfSouthRealEstateInformationNetwork,Inc.fortheperiod01/2014through03/2015.
$‐
$50,000
$100,000
$150,000
$200,000
$250,000
$300,000
MedianSellingPricesbyMonthbyParish:Jan2014‐ Mar2015
Livingston
EastSt.Tammany
WestSt.Tammany
Tangipahoa
Washington
Sources: LivingstonParishdatacourtesyofGreaterBatonRougeAreaRealtors(GBRAR)
OtherparishesbasedoninformationfromtheGulfSouthRealEstateInformationNetwork,Inc.fortheperiod01/2014through03/2015.
0
20
40
60
80
100
120
140
160
180
Jan‐14 Feb‐14 Mar‐14 Apr‐14 May‐14 Jun‐14 Jul‐14 Aug‐14 Sep‐14 Oct‐14 Nov‐14 Dec‐14 Jan‐15 Feb‐15 Mar‐15
AverageDaysonMarketbyMonthbyParish:Jan2014‐ Mar2015
Livingston
EastSt.Tammany
WestSt.Tammany
Tangipahoa
Washington
Sources: LivingstonParishdatacourtesyofGreaterBatonRougeAreaRealtors(GBRAR)
OtherparishesbasedoninformationfromtheGulfSouthRealEstateInformationNetwork,Inc.fortheperiod01/2014through03/2015.
Livingston Parish
Livingston Parish employment in 1Q2015 fell 0.7
percent from the prior quarter but grew 4.3 per-
cent compared to the first quarter of 2014.
The unemployment rate of 5.4 percent was lower
than the 5.7 percent in the prior quarter but high-
er than the 4.8 percent of 1Q2014.
The value of taxable sales rose 9.7 percent com-
pared to the first quarter of 2014, a larger in-
crease than the 6.0 percent average for the re-
Southeastern Louisiana University 6
LOCAL
gion. The number of building permits for residen-
tial units rose 47.4 percent from the previous
quarter and was 26.1 percent higher than the first
quarter of 2014, based on data provided by local
officials and the U.S. Census Bureau.
Livingston Parish residents purchased 1,299 new
cars and light trucks in 1Q2015, including 132
from dealers within Livingston Parish. Parish
dealers also sold 70 new vehicles to residents of
other parishes within Louisiana.
Economic Reporter
EMPLOYMENT
LIVINGSTON PARISH
Apr 14 May 14 Jun 14 Jul 14 Aug 14 Sep 14 Oct 14 Nov 14 Dec 14 Jan 15 Feb 15 Mar 15
Labor Force 65,133 66,019 66,864 67,514 67,420 67,797 68,420 68,365 67,355 67,090 66,941 67,910
% Change vs Prior Year 1.7% 2.5% 2.4% 3.5% 4.3% 4.6% 5.3% 5.4% 5.6% 5.7% 4.7% 4.7%
Total Employment 62,281 62,596 62,786 63,278 63,128 63,794 64,391 64,365 63,647 63,131 63,503 64,337
% Change vs Prior Year 3.0% 3.6% 3.4% 3.6% 3.9% 4.1% 4.6% 4.2% 4.5% 4.9% 4.0% 4.2%
Unemployment Rate 4.4% 5.2% 6.1% 6.3% 6.4% 5.9% 5.9% 5.9% 5.5% 5.9% 5.1% 5.3%
% Change vs Prior Year -1.3% -1.0% -1.0% -0.1% 0.3% 0.5% 0.6% 1.1% 1.1% 0.7% 0.7% 0.4%
2QT-14 3QT-14 4QT-14 1QT-15
Labor Force 66,005 67,577 68,047 67,314
% Change vs Prior Year 2.2% 4.2% 5.5% 5.0%
Total Employment 62,554 63,400 64,134 63,657
% Change vs Prior Year 3.3% 3.9% 4.4% 4.3%
Unemployment Rate 5.2% 6.2% 5.7% 5.4%
% Change vs Prior Year -1.1% 0.2% 0.9% 0.6%
Source: Labor Market Statistics, Local Area Unemployment Statistics Program
55,000
60,000
65,000
70,000
123456789101112
Total Employment
2013 2014 2015
WEEKLY UNEMPLOYMENT INSURANCE (UI) CLAIMS
LIVINGSTON
PARISH
Week
12345678910111213
Date
1/3/15 1/10/15 1/17/15 1/24/15 1/31/15 2/7/15 2/14/15 2/21/15 2/28/15 3/7/15 3/14/15 3/21/15 3/28/15
Initial UI Claims 23 80 57 50 45 46 32 36 49 57 49 43 45
Weeks Claimed 353 367 381 367 364 362 356 348 342 351 348 364 351
Source: Labor Market Statistics, Local Area Unemployment Statistics Program
0
20
40
60
80
100
120
12345678910111213
Week
Weekly Initial Unemployment Insurance Claims
2013
2014
2015
Southeastern Louisiana University 7
Livingston Parish—continued
Economic Reporter
ESTIMATED RETAIL SALES
LIVINGSTON PARISH
Apr 14 May 14 Jun 14 Jul 14 Aug 14 Sep 14 Oct 14 Nov 14 Dec 14 Jan 15 Feb 15 Mar 15
Estimated Retail Sales (mil.) $126.10 $130.14 $136.68 $131.23 $128.57 $134.81 $130.47 $127.07 $152.82 $120.08 $120.33 $143.12
% Change vs Prior Month -7.2% 3.2% 5.0% -4.0% -2.0% 4.9% -3.2% -2.6% 20.3% -21.4% 0.2% 18.9%
% Change vs. Prior Year 1.8% 10.4% 8.5% 4.2% 9.3% 11.8% 7.9% 12.5% 14.4% 14.1% 10.9% 5.3%
2QT-14 3QT-14 4QT-14 1QT-15
Quarterly Avg. Sales (mil.) $130.97 $131.54 $136.79 $127.85
% Change vs. Prior Quarter 12.4% 0.4% 4.0% -6.5%
% Change vs Prior Year 6.9% 8.4% 11.7% 9.7%
Source: Livingston Parish School Board - Sales and Use Tax Division
$100
$120
$140
$160
Jan Feb Mar Apr May Jun Jul Aug Sep Oct Nov Dec
Millions
EstimatedRetailSales
2013
2014
2015
New Light Vehicle Purchases & Sales
LIVINGSTON PARISH
Apr 14 May 14 Jun 14 Jul 14 Aug 14 Sep 14 Oct 14 Nov 14 Dec 14 Jan 15 Feb 15 Mar 15
New Car/Truck Purchases 444 516 339
% Change vs Prior Year n/a n/a n/a
Purch a se s w ith i n Pa r i sh 39 54 39
New Car/Truck Sales* 61 79 62
% Change vs Prior Year n/a n/a n/a
2QT-14 3QT-14 4QT-14 1QT-15
New Car/Truck Purchases 1,299
% Change vs Prior Year n/a
Purch a se s w ith i n Pa r i sh 132
New Car/Truck Sales* 202
% Change vs Prior Year n/a
Source: Louisiana Dept. of Public Safety (compiled by Dominion Cross-Sell)
* = Includes only new vehicle sales within Louisiana
0
100
200
300
400
500
600
Jan Feb Mar Apr May Jun Jul Aug Sep Oct Nov Dec
Car/TruckPurchases&Sales:NumberofUnits
2015Purchases
2015Sales
RESIDENT IAL BUILDING PERMITS
LIVINGSTON PARISH
Apr 14 May 14 Jun 14 Jul 14 Aug 14 Sep 14 Oct 14 Nov 14 Dec 14 Jan 15 Feb 15 Mar 15
Total Permits 61 63 61 64 60 60 56 48 50 42 93 92
% Change vs Prior Year -40.2% -42.2% -36.5% -37.3% 13.2% -34.1% -15.2% -35.1% 117.4% -30.0% 55.0% 53.3%
Total Units 61 63 61 64 60 60 56 48 50 42 93 92
% Change vs Prior Year -46.0% -47.1% -40.8% -41.8% 13.2% -41.7% -15.2% -42.2% 117.4% -30.0% 55.0% 53.3%
2QT-14 3QT-14 4QT-14 1QT-15
Total Permits 185 184 154 227
% Change vs Prior Year -39.7% -25.2% -5.5% 26.1%
Total Units 185 184 154 227
% Change vs Prior Year -44.8% -30.8% -10.5% 26.1%
Sources: Tow n of Albany, City of Denham Springs, Tow n of Livingston,
Livingston Parish Permit Office, http://censtats.census.gov
(Note: City of Walker permits estimated for 3Q2014)
0
50
100
150
Jan Feb Mar Apr May Jun Jul Aug Sep Oct Nov Dec
ResidentialBuildingPermits:NumberofUnits
2013
2014
2015
St. Helena Parish
Employment in St. Helena Parish in the first
quarter of 2015 rose 4.4 percent (+183 jobs)
compared to the same quarter of the previous
year. The labor force grew 5.3 percent, causing
the unemployment rate to rise to 9.7 percent
from the 9.0 percent of a year ago.
The value of taxable sales fell 5.5 percent com-
pared to the first quarter of 2014, in contrast to
Southeastern Louisiana University 8
the 6.0 percent average increase for the region.
Building permits for residential units fell 37.5 per-
cent from the previous quarter but were un-
changed compared to 1Q2014.
Residents of St. Helena Parish purchased 39 new
cars and light trucks in the first quarter of 2015.
Economic Reporter
EMPLOYMENT
ST. HELENA PARISH
Apr 14 May 14 Jun 14 Jul 14 Aug 14 Sep 14 Oct 14 Nov 14 Dec 14 Jan 15 Feb 15 Mar 15
Labor Force 4,548 4,624 4,758 4,818 4,795 4,808 4,792 4,786 4,780 4,746 4,712 4,775
% Change vs Prior Year -7.9% -8.2% -10.4% -9.7% -8.8% -7.5% -6.2% -5.5% -5.2% 6.0% 4.7% -4.8%
Total Employment 4,180 4,200 4,222 4,270 4,256 4,299 4,326 4,324 4,284 4,248 4,274 4,326
% Change vs Prior Year 3.1% 3.3% 3.4% 3.6% 3.9% 4.2% 4.6% 4.3% 4.6% 5.0% 4.0% 4.4%
Unemployment Rate 8.1% 9.2% 11.3% 11.4% 11.2% 10.6% 9.7% 9.7% 10.4% 10.5% 9.3% 9.4%
% Change vs Prior Year -2.6% -2.0% -2.1% -1.4% -0.9% -0.7% -0.6% 0.3% 1.0% 0.9% 0.6% 0.6%
2QT-14 3QT-14 4QT-14 1QT-15
Labor Force 4,643 4,807 4,786 4,744
% Change vs Prior Year 0.7% 2.7% 4.8% 5.3%
Total Employment 4,201 4,275 4,311 4,283
% Change vs Prior Year 3.3% 3.9% 4.5% 4.4%
Unemployment Rate 9.5% 11.1% 9.9% 9.7%
% Change vs Prior Year -2.2% -1.0% 0.3% 0.7%
Source: Labor Market Statistics, Local Area Unemployment Statistics Program
3,750
4,000
4,250
4,500
Jan Feb Mar Apr May Jun Jul Aug Sep Oct Nov Dec
Total Employment
2013 2014 2015
WEEKLY UNEMPLOYMENT INSURANCE (UI) CLAIMS
ST. HELENA PARISH
Week
12345678910111213
Date
1/3/15 1/10/15 1/17/15 1/24/15 1/31/15 2/7/15 2/14/15 2/21/15 2/28/15 3/7/15 3/14/15 3/21/15 3/28/15
Initial UI Claims 3644151138254
Weeks Claimed 29303033353537353036343630
Source: Labor Market Statistics, Local Are a Unemployment Statistics Program
0
5
10
15
20
14 15 16 17 18 19 20 21 22 23 24 25 26
Week
Weekly Initial Unemployment Insurance Claims
2012
2013
2014
0
2
4
6
8
10
12
40 41 42 43 44 45 46 47 48 49 50 51 52
Week
Weekly Initial Unemployment Insurance Claims
2012
2013
2014
0
2
4
6
8
10
12
12345678910111213
Week
Weekly Initial Unemployment Insurance Claims
2013
2014
2015
Southeastern Louisiana University 9
St. Helena Parish—continued
Economic Reporter
ESTIMATED RETAIL SALES
ST. HELENA PARISH
Apr 14 May 14 Jun 14 Jul 14 Aug 14 Sep 14 Oct 14 Nov 14 Dec 14 Jan 15 Feb 15 Mar 15
Estimated Retail Sales (mil.) $7.37 $5.97 $4.90 $6.12 $5.88 $7.01 $6.76 $5.68 $8.20 $5.66 $4.90 $6.74
% Change vs Prior Month -4.7% -19.1% -17.9% 24.9% -3.9% 19.2% -3.6% -16.0% 44.5% -31.0% -13.5% 37.6%
% Change vs. Prior Year 15.8% 0.6% -21.1% 12.7% 4.0% 3.1% 8.3% 36.2% -6.9% 2.9% -3.3% -12.9%
2QT-14 3QT-14 4QT-14 1QT-15
Quarterly Avg. Sales (mil.) $6.08 $6.34 $6.88 $5.76
% Change vs. Prior Quarter -0.3% 4.3% 8.5% -16.2%
% Change vs Prior Year -1.5% 6.3% 7.4% -5.5%
Source: St. Helena Parish Sheriff's Office
$0
$5
$10
Jan Feb Mar Apr May Jun Jul Aug Sep Oct Nov Dec
Millions
EstimatedRetailSales
2013
2014
2015
RESIDENT IAL BUILDING PERMIT S
ST. HELENA PARISH
Apr 14 May 14 Jun 14 Jul 14 Aug 14 Sep 14 Oct 14 Nov 14 Dec 14 Jan 15 Feb 15 Mar 15
Total Permits 1 1 5 5 2 4 4 1 3 2 1 2
% Change vs Prior Year 0.0% -50.0% 150.0% 400.0% 100.0% 100.0% 0.0% -50.0% 0.0% 0.0% 0.0% 0.0%
Total Units 1 1 5 5 2 4 4 1 3 2 1 2
% Change vs Prior Year 0.0% -50.0% 150.0% 400.0% 100.0% 100.0% 0.0% -50.0% 0.0% 0.0% 0.0% 0.0%
2QT-14 3QT-14 4QT-14 1QT-15
Total Permits 7 11 8 5
% Change vs Prior Year 75.0% 175.0% 33.3% 0.0%
Total Units 7 11 8 5
% Change vs Prior Year 75.0% 175.0% 33.3% 0.0%
Sources: 2008-2010 - http://censtats.census.gov (estimates w ith imputation)
2011-2015 - St. Helena Parish Police Jury: Building Permit Department
0
1
2
3
4
5
6
Jan Feb Mar Apr May Jun Jul Aug Sep Oct Nov Dec
ResidentialBuildingPermits:NumberofUnits
2013
2014
2015
New Light Vehicle Purchases & Sales
ST. HELENA PARISH
Apr 1 4 May 14 Jun 14 Jul 14 Aug 14 Sep 14 Oct 14 Nov 14 Dec 14 Jan 15 Feb 15 Mar 15
New Car/Truck Purchases 10 11 18
% Change vs Prior Year n/a n/a n/a
P urcha se s w i thi n P a ri sh 000
New Car/Truck Sales* 000
% Change vs Prior Year n/a n/a n/a
2QT-14 3QT-14 4QT-14 1QT-15
New Car/Truck Purchases 39
% Change vs Prior Year n/a
P urcha se s w i thi n P a ri sh 0
New Car/Truck Sales* 0
% Change vs Prior Year n/a
Source: Louisiana Dept. of Public Safety (compiled by Dominion Cross-Sell)
* = Includes only new vehicle sales within Louisiana
0
5
10
15
20
Jan Feb Mar Apr May Jun Jul Aug Sep Oct Nov Dec
Car/TruckPurchases:NumberofUnits
2015Purchases
St. Tammany Parish
Total employment in St. Tammany Parish in the
first quarter of 2015 increased 2.1 percent com-
pared to 1Q2014, somewhat below the average
gain for the region (3.1 percent).
The labor force increased by 3.1 percent and the
unemployment rate rose to 5.7 percent from
4.8 percent in 1Q2014.
The value of taxable retail sales in 1Q2015 rose
4.9 percent compared to the first quarter of
2014, short of the 6.0 percent average gain for
the region.
Southeastern Louisiana University 10
Building permits for residential units rose 44.5
percent over the previous quarter and 27.3 per-
cent compared to the first quarter of 2014, re-
flecting a very optimistic outlook for construction
activities in the parish.
St. Tammany Parish residents purchased 2,862
new cars and light trucks in 1Q2015. St. Tamma-
ny Parish dealers sold a total of 2,592 new cars
and light trucks within Louisiana — 1,686 to par-
ish residents and 906 to residents of other parish-
es. Data was not available for out-of-state sales.
Economic Reporter
EMPLOYMENT
ST. TAMMANY PARISH
Apr 14 May 14 Jun 14 Jul 14 Aug 14 Sep 14 Oct 14 Nov 14 Dec 14 Jan 15 Feb 15 Mar 15
Labor Force 112,844 114,120 116,347 116,563 115,851 115,295 117,022 116,705 115,413 115,237 114,387 115,795
% Change vs Prior Year 1.9% 2.5% 2.7% 3.6% 3.5% 3.8% 4.4% 3.7% 3.6% 4.1% 2.7% 2.6%
Total Employment 107,808 108,013 109,177 109,087 108,144 108,109 109,794 109,544 108,860 108,142 108,148 109,330
% Change vs Prior Year 3.1% 3.5% 3.7% 3.6% 2.9% 2.9% 3.5% 2.2% 2.1% 2.9% 1.7% 1.9%
Unemployment Rate 4.5% 5.4% 6.2% 6.4% 6.7% 6.2% 6.2% 6.1% 5.7% 6.2% 5.5% 5.6%
% Change vs Prior Year -1.1% -0.9% -0.9% 0.0% 0.6% 0.8% 0.8% 1.4% 1.4% 1.1% 0.9% 0.7%
2QT-14 3QT-14 4QT-14 1QT-15
Labor Force 114,437 115,903 116,380 115,140
% Change vs Prior Year 2.4% 3.6% 3.9% 3.1%
Total Employment 108,333 108,447 109,399 108,540
% Change vs Prior Year 3.4% 3.1% 2.6% 2.1%
Unemployment Rate 5.3% 6.4% 6.0% 5.7%
% Change vs Prior Year -1.0% 0.5% 1.2% 0.9%
Source: Labor Market Statistics, Local Area Une mployment Statistics Program
100,000
105,000
110,000
115,000
Jan Feb Mar Apr May Jun Jul Aug Sep Oct Nov Dec
Total Employment
2013 2014 2015
WEEKLY UNEMPLOYMENT INSURANCE (UI) CLAIMS
ST. TAMMANY PARISH
Week 12345678910111213
Date 1/3/15 1/10/15 1/17/15 1/24/15 1/31/15 2/7/15 2/14/15 2/21/15 2/28/15 3/7/15 3/14/15 3/21/15 3/28/15
Initial UI Claims 50 116 102 78 86 112 67 63 92 76 63 96 70
Weeks Claimed 648 682 680 672 676 678 700 703 699 712 655 669 677
Source: Labor Market Statistics, Local Area Unemployment Statistics Program
0
20
40
60
80
100
120
140
40 41 42 43 44 45 46 47 48 49 50 51 52
Week
Weekly Initial Unemployment Insurance Claims
2012
2013
2014
0
50
100
150
200
12345678910111213
Week
Weekly Initial Unemployment Insurance Claims
2013
2014
2015
Southeastern Louisiana University 11
St. Tammany Parish—continued
Economic Reporter
ESTIMATED RETAIL SALES
ST. TAMMANY PARISH
Apr 14 May 14 Jun 14 Jul 14 Aug 14 Sep 14 Oct 14 Nov 14 Dec 14 Jan 15 Feb 15 Mar 15
Estimated Retail Sales (mil.) $359.33 $366.16 $379.57 $357.56 $350.30 $373.10 $367.61 $357.93 $459.13 $334.55 $331.54 $399.22
% Change vs Prior Month -6.1% 1.9% 3.7% -5.8% -2.0% 6.5% -1.5% -2.6% 28.3% -27.1% -0.9% 20.4%
% Change vs. Prior Year 5.5% 3.9% 2.7% 5.5% 4.3% 4.9% 7.6% 4.1% 8.0% 6.9% 3.5% 4.3%
2QT-14 3QT-14 4QT-14 1QT-15
Quarterly Avg. Sales (mil.) $368.35 $360.32 $394.89 $355.10
% Change vs. Prior Quarter 8.8% -2.2% 9.6% -10.1%
% Change vs Prior Year 4.0% 4.9% 6.7% 4.9%
Source: St. Tammany Sales and Use Tax Department
$250
$350
$450
$550
Jan Feb Mar Apr May Jun Jul Aug Sep Oct Nov Dec
Millions
EstimatedRetailSales
2012
2013
2014
$300
$350
$400
$450
$500
Jan Feb Mar Apr May Jun Jul Aug Sep Oct Nov Dec
Millions
EstimatedRetailSales
2013
2014
2015
RESIDENT IAL BUILDING PERMITS
ST. TAMMANY PARISH
Apr 14 May 14 Jun 14 Jul 14 Aug 14 Sep 14 Oct 14 Nov 14 Dec 14 Jan 15 Feb 15 Mar 15
Total Permits 160 128 103 114 109 94 93 71 90 106 123 139
% Change vs Prior Year 32.2% 30.6% 1.0% 0.0% -19.3% 5.6% -18.4% -16.5% 18.4% 60.6% -4.7% 47.9%
Total Units 160 128 103 114 110 94 93 71 90 106 123 138
% Change vs Prior Year 32.2% 30.6% 1.0% 0.0% -18.5% 5.6% -18.4% -16.5% 18.4% 60.6% -4.7% 46.8%
2QT-14 3QT-14 4QT-14 1QT-15
Total Permits 391 317 254 368
% Change vs Prior Year 21.8% -6.2% -7.6% 27.3%
Total Units 391 318 254 367
% Change vs Prior Year 21.8% -5.9% -7.6% 27.0%
Sources: St. Tammany Parish Permit Office, Town of Abita Springs, Village of
Folsom, Tow n of Madisonville, City of Mandev ille, Tow n of Pearl River,
C ity of Slidell, http://censtats.census.gov (some data estimated)
0
50
100
150
200
Jan Feb Mar Apr May Jun Jul Aug Sep Oct Nov Dec
ResidentialBuildingPermits:NumberofUnits
2013
2014
2015
New Light Vehicle Purchases & Sales
ST. TAMMANY PARISH
Apr 14 May 14 Jun 14 Jul 14 Au g 14 Sep 14 Oct 14 Nov 14 Dec 14 Jan 15 Feb 15 Mar 15
New Car/Truck Purchases 1,093 938 831
% Change vs Prior Year n/a n/a n/a
Purchases within Parish 659 555 472
New Car/Truck Sa les* 1,019 863 710
% Change vs Prior Year n/a n/a n/a
2QT-14 3QT-14 4QT-14 1QT-15
New Car/Truck Purchases 2,862
% Change vs Prior Year n/a
Purchases within Parish 1,686
New Car/Truck Sales* 2,592
% Change vs Prior Year n/a
Source: Louisiana Dept. of Public Safety (compiled by Dominion Cross-Sell)
* = Includes only new vehicle sales w ithin Louisiana
0
500
1,000
1,500
Jan Feb Mar Apr May Jun Jul Aug Sep Oct Nov Dec
Car/TruckPurchases&Sales:NumberofUnits
2015Purchases
2015Sales
Tangipahoa Parish
Total employment in Tangipahoa Parish in the first
quarter of 2015 grew 3.9 percent compared to the
first quarter of 2014. The workforce rose 4.9 per-
cent, causing the unemployment rate to rise to
7.4 percent from the 6.6 percent of a year ago.
The value of taxable sales rose 4.0 percent com-
pared to the first quarter of the previous year,
which was below the 6.0 percent average for the
region.
Permitted residential units fell 12.6 percent from
the previous quarter and were 8.8 percent lower
Southeastern Louisiana University 12
compared to the first quarter of 2014, reflecting a
moderately depressed outlook for residential con-
struction activities.
Tangipahoa Parish residents purchased 1,183 new
cars and light trucks in the first quarter of 2015,
including 616 from dealers within the parish and
567 from outside dealers.
Tangipahoa Parish dealers also sold 672 vehicles
to residents of other Louisiana parishes, for total
in-state sales of 1,288 vehicles.
Economic Reporter
EMPLOYMENT
TANGIPAHOA PARISH
Apr 14 May 14 Jun 14 Jul 14 Aug 14 Sep 14 Oct 14 Nov 14 Dec 14 Jan 15 Feb 15 Mar 15
Labor Force 52,940 52,104 52,718 53,066 53,553 53,791 53,869 53,927 55,326 54,855 54,436 55,035
% Change vs Prior Year 0.4% -1.9% -2.0% 0.2% 1.7% 2.2% 3.5% 3.7% 7.2% 5.6% 4.6% 4.4%
Total Employment 49,760 48,851 49,024 49,078 49,549 49,991 50,225 49,987 51,146 50,440 50,593 51,069
% Change vs Prior Year 1.2% -0.7% 0.0% 0.9% 2.1% 2.3% 3.4% 2.1% 5.1% 4.5% 3.6% 3.7%
Unemployment Rate 6.0% 6.2% 7.0% 7.5% 7.5% 7.1% 6.8% 7.3% 7.6% 8.0% 7.1% 7.2%
% Change vs Prior Year -0.8% -1.1% -1.9% -0.6% -0.4% 0.0% 0.1% 1.4% 1.9% 1.0% 0.9% 0.7%
2QT-14 3QT-14 4QT-14 1QT-15
Labor Force 52,587 53,470 54,374 54,775
% Change vs Prior Year -1.2% 1.4% 4.8% 4.9%
Total Employment 49,212 49,539 50,453 50,701
% Change vs Prior Year 0.2% 1.7% 3.5% 3.9%
Unemployment Rate 6.4% 7.4% 7.2% 7.4%
% Change vs Prior Year -1.3% -0.3% 1.1% 0.8%
Source: Labor Market Statistics, Local Are a Unemployment Statistics Program
46,000
48,000
50,000
52,000
Jan Feb Mar Apr May Jun Jul Aug Sep Oct Nov Dec
Total Employment
2013 2014 2015
WEEKLY UNEMPLOYMENT INSURANCE (UI) CLAIMS
TANGIPAHOA PARISH
Week
12345678910111213
Date
1/3/15 1/10/15 1/17/15 1/24/15 1/31/15 2/7/15 2/14/15 2/21/15 2/28/15 3/7/15 3/14/15 3/21/15 3/28/15
Initial UI Claims 51 87 79 84 65 79 61 52 71 74 60 73 62
Weeks Claimed 650 652 663 634 617 591 587 566 573 576 554 564 570
Source: La bor Marke t Statistics, Local Are a Une mployment Statistics Program
0
20
40
60
80
100
120
140
40 41 42 43 44 45 46 47 48 49 50 51 52
Week
Weekly Initial Unemployment Insurance Claims
2012
2013
2014
0
20
40
60
80
100
120
140
12345678910111213
Week
Weekly Initial Unemployment Insurance Claims
2013
2014
2015
Southeastern Louisiana University 13
Tangipahoa Parish—continued
Economic Reporter
RESIDENT IAL BUILDING PERMIT S
TANGIPAHOA PARISH
Apr 14 May 14 Jun 14 Jul 14 Aug 14 Sep 14 Oct 14 Nov 14 Dec 14 Jan 15 Feb 15 Mar 15
Total Permits 69 53 47 61 58 46 60 29 46 36 26 61
% Change vs Prior Year 1.5% -11.7% -13.0% -24.6% -37.9% 2.2% -4.8% 0.0% -6.1% 33.3% -48.0% 5.2%
Total Units 69 60 47 63 73 46 62 31 50 36 26 63
% Change vs Prior Year 1.5% 0.0% -13.0% -21.7% -21.8% 2.2% -31.9% 6.9% -20.6% 33.3% -50.0% 8.6%
2QT-14 3QT-14 4QT-14 1QT-15
Total Permits 169 165 135 123
% Change vs Prior Year -7.1% -17.9% -4.3% -8.9%
Total Units 176 182 143 125
% Change vs Prior Year -3.3% -9.5% -21.9% -8.8%
Source: Tangipahoa Parish Permit Office, City of Hammond Permit Office,
City of Ponchatoula Permit Office
(Note: City of Hammond permits for 1Q2015 estimated by BRC)
0
20
40
60
80
100
Jan Feb Mar Apr May Jun Jul Aug Sep Oct Nov Dec
ResidentialBuildingPermits:NumberofUnits
2013
2014
2015
New Light Vehicle Purchases & Sales
TANGIPAHOA PARISH
Apr 1 4 May 14 Jun 14 Jul 14 Aug 14 Sep 14 Oct 14 Nov 14 Dec 14 Jan 15 Feb 15 Mar 15
New Car/Truck Purchases 468 373 342
% Change vs Prior Year n/a n/a n/a
Purcha se s w ithi n Pa ri sh 250 181 185
New Car/Truck Sales* 444 361 483
% Change vs Prior Year n/a n/a n/a
2QT-14 3QT-14 4QT-14 1QT-15
New Car/Truck Purchases 1,183
% Change vs Prior Year n/a
Purcha se s w ithi n Pa ri sh 616
New Car/Truck Sales* 1,288
% Change vs Prior Year n/a
Source: Louisiana Dept. of Public Safety (compiled by Dominion Cross-Sell)
* = Includes only new vehicle sales w ithin Louisiana
0
100
200
300
400
500
600
Jan Feb Mar Apr May Jun Jul Aug Sep Oct Nov Dec
Car/TruckPurchases&Sales:NumberofUnits
2015Purchases
2015Sales
ESTIMATED RETAIL SALES
TANGIPAHOA PARISH
Apr 14 May 14 Jun 14 Jul 14 Aug 14 Sep 14 Oct 14 Nov 14 Dec 14 Jan 15 Feb 15 Mar 15
Estimated Retail Sales (mil.) $155.68 $152.82 $173.88 $154.64 $149.15 $156.59 $161.26 $164.98 $195.44 $150.85 $153.53 $175.35
% Change vs Prior Month -5.4% -1.8% 13.8% -11.1% -3.5% 5.0% 3.0% 2.3% 18.5% -22.8% 1.8% 14.2%
% Change vs. Prior Year 1.9% 3.7% 10.5% 8.4% 4.0% 5.3% 9.5% 16.9% 16.8% -3.0% 8.9% 6.5%
2QT-14 3QT-14 4QT-14 1QT-15
Quarterly Avg. Sales (mil.) $160.79 $153.46 $173.90 $159.91
% Change vs. Prior Quarter 4.6% -4.6% 13.3% -8.0%
% Change vs Prior Year 5.4% 5.9% 14.5% 4.0%
Source: Sales Tax Division of the Tangipahoa Parish School System
$100
$150
$200
$250
Jan Feb Mar Apr May Jun Jul Aug Sep Oct Nov Dec
Millions
EstimatedRetailSales
2012
2013
2014
$100
$150
$200
$250
Jan Feb Mar Apr May Jun Jul Aug Sep Oct Nov Dec
Millions
EstimatedRetailSales
2013
2014
2015
Washington Parish
Total employment in Washington Parish in the
first quarter of 2015 rose 2.2 percent compared
to the first quarter of the previous year. The labor
force rose 3.4 percent, leading to an increase in
the unemployment rate to 7.8 percent from the
6.7 percent of 1Q2014.
The value of taxable sales in 1Q2015 was 15.5
percent higher than in the first quarter of the pre-
vious year, far surpassing the 6.0 percent average
gains for the region.
Southeastern Louisiana University 14
Residential building permits fell 63.6 percent from
the prior quarter and were 46.7 percent lower
compared to the first quarter of 2014, projecting
a significant slowing of residential construction
activity for the parish.
Washington Parish residents purchased 291 new
cars and light trucks in the first quarter of 2015 —
31 from dealers within Washington Parish and 260
from outside the parish.
Washington Parish dealers sold 10 additional vehi-
cles to residents of other Louisiana parishes.
Economic Reporter
EMPLOYMENT
WASHINGTON PARISH
Apr 14 May 14 Jun 14 Jul 14 Aug 14 Sep 14 Oct 14 Nov 14 Dec 14 Jan 15 Feb 15 Mar 15
Labor Force 16,987 16,966 17,309 17,200 17,003 17,364 17,276 17,309 17,223 17,191 17,290 17,525
% Change vs Prior Year 2.3% 1.7% 1.5% 2.4% 2.4% 5.0% 5.2% 4.0% 6.5% 3.5% 3.6% 3.3%
Total Employment 15,957 15,701 15,744 15,581 15,417 15,870 15,833 15,862 15,861 15,744 16,002 16,202
% Change vs Prior Year 4.3% 3.1% 2.9% 2.5% 1.8% 4.4% 4.6% 2.3% 4.8% 1.8% 2.5% 2.4%
Unemployment Rate 6.1% 7.5% 9.0% 9.4% 9.3% 8.6% 8.4% 8.4% 7.9% 8.4% 7.4% 7.5%
% Change vs Prior Year -1.8% -1.3% -1.3% -0.1% 0.6% 0.5% 0.5% 1.5% 1.5% 1.5% 1.0% 0.8%
2QT-14 3QT-14 4QT-14 1QT-15
Labor Force 17,087 17,189 17,269 17,335
% Change vs Prior Year 1.8% 3.2% 5.2% 3.4%
Total Employment 15,801 15,623 15,852 15,983
% Change vs Prior Year 3.5% 2.9% 3.9% 2.2%
Unemployment Rate 7.5% 9.1% 8.2% 7.8%
% Change vs Prior Year -1.5% 0.3% 1.2% 1.1%
Source: Labor Market Statistics, Local Area Unemployment Statistics Program
13,000
14,000
15,000
16,000
17,000
Jan Feb Mar Apr May Jun Jul Aug Sep Oct Nov Dec
Total Employment
2013 2014 2015
WEEKLY UNEMPLOYMENT INSURANCE (UI) CLAIMS
WASHINGTON PARISH
Week
12345678910111213
Date
1/3/15 1/10/15 1/17/15 1/24/15 1/31/15 2/7/15 2/14/15 2/21/15 2/28/15 3/7/15 3/14/15 3/21/15 3/28/15
Initial UI Claims 8252416162011131515181618
Weeks Claimed 157 158 162 172 152 162 157 158 160 156 139 147 143
Source: Labor Market Statistics, Local Area Unemployment Statistics Program
0
5
10
15
20
25
30
35
40 41 42 43 44 45 46 47 48 49 50 51 52
Week
Weekly Initial Unemployment Insurance Claims
2012
2013
2014
0
10
20
30
40
12345678910111213
Week
Weekly Initial Unemployment Insurance Claims
2013
2014
2015
Southeastern Louisiana University 15
Washington Parish—continued
Economic Reporter
ESTIMATED RETAIL SALES
WASHINGTON PARISH
Apr 14 May 14 Jun 14 Jul 14 Aug 14 Sep 14 Oct 14 Nov 14 Dec 14 Jan 15 Feb 15 Mar 15
Estimated Retail Sales (mil.) $42.31 $40.22 $45.35 $37.11 $33.76 $42.42 $33.50 $35.25 $46.14 $43.25 $40.83 $48.01
% Change vs Prior Month -8.2% -4.9% 12.8% -18.2% -9.0% 25.7% -21.0% 5.2% 30.9% -6.3% -5.6% 17.6%
% Change vs. Prior Year 23.6% 12.8% 12.8% 72.0% -17.4% 9.2% -13.8% 5.5% 3.6% 26.4% 19.8% 4.2%
2QT-14 3QT-14 4QT-14 1QT-15
Quarterly Avg. Sales (mil.) $42.63 $37.76 $38.30 $44.03
% Change vs. Prior Quarter 11.8% -11.4% 1.4% 15.0%
% Change vs Prior Year 16.1% 11.9% -1.6% 15.5%
Source: Washington Parish Sheriff's Office - Sales and Use Tax Department.
Note: November and December 2014 sales tax collections combined in data submitted by WPSO,
so retail sales for these tw o months w ere estimated by BRC.
$0
$20
$40
$60
Jan Feb Mar Apr May Jun Jul Aug Sep Oct Nov Dec
Millions
EstimatedRetailSales
2013
2014
2015
RESIDENTIAL BUILDING PERMITS
WASHINGTON PARISH
Apr 14 May 14 Jun 14 Jul 14 Aug 14 Sep 14 Oct 14 Nov 14 Dec 14 Jan 15 Feb 15 Mar 15
Total Permits 1 7 4 7 5 7 5 11 6 5 2 1
% Change vs Prior Year -85.7% -30.0% 0.0% -46.2% -54.5% 16.7% 25.0% 266.7% 500.0% -16.7% 0.0% -85.7%
Total Units 1 7 4 7 5 7 5 11 6 5 2 1
% Change vs Prior Year -85.7% -30.0% 0.0% -46.2% -54.5% 16.7% 25.0% 266.7% 500.0% -16.7% 0.0% -85.7%
2QT-14 3QT-14 4QT-14 1QT-15
Total Permits 12 19 22 8
% Change vs Prior Year -42.9% -36.7% 175.0% -46.7%
Total Units 12 19 22 8
% Change vs Prior Year -42.9% -36.7% 175.0% -46.7%
Sources: Washington Parish Permit Office and
http://censtats.census.gov
0
5
10
15
Jan Feb Mar Apr May Jun Jul Aug Sep Oct Nov Dec
ResidentialBuildingPermits:NumberofUnits
2013
2014
2015
New Light Vehicle Purchases & Sales
WASHINGTON PARISH
Apr 1 4 May 14 Jun 14 Jul 14 Aug 14 Sep 14 Oct 14 Nov 14 Dec 14 Jan 15 Feb 15 Mar 15
New Car/Truck Purchases 115 90 86
% Change vs Prior Year n/a n/a n/a
Purcha se s w i thi n P a ri sh 1489
New Car/Truck Sales* 18 10 13
% Change vs Prior Year n/a n/a n/a
2QT-14 3QT-14 4QT-14 1QT-15
New Car/Truck Purchases 291
% Change vs Prior Year n/a
Purcha se s w i thi n P a ri sh 31
New Car/Truck Sales* 41
% Change vs Prior Year n/a
Source: Louisiana Dept. of Public Safety (compiled by Dominion Cross-Sell)
* = Includes only new vehicle sales within Louisiana
0
50
100
150
Jan Feb Mar Apr May Jun Jul Aug Sep Oct Nov Dec
Car/TruckPurchases&Sales:NumberofUnits
2015Purchases
2015Sales

Our Special Thanks
This edition of the Economic Reporter would not exist without
valuable contributions from:
Southeastern Louisiana University: Dr. A.M.M. Jamal
(College of Business), Rene Abadie (Public Information Office)
Livingston Parish School Board Sales and Use Tax
Division
St. Helena Parish Sheriff’s Office
St. Tammany Parish Permit Office and Sheriff’s Office
Sales and Use Tax Department
Tangipahoa Parish Permit Office and School Board Sales
and Use Tax Department
Washington Parish Building and Planning Department
and Sheriff’s Office Sales and Use Tax Department
Building permit offices of the following municipalities:
Town of Abita Springs Town of Madisonville
Village of Albany City of Mandeville
City of Denham Springs Town of Pearl River
Village of Folsom City of Ponchatoula
City of Hammond City of Slidell
Town of Livingston Town of Walker
This publication is jointly produced by the following
Southeastern Louisiana University departments:
Business Research Center
Office of Economic & Business Development
Southeast Louisiana Business Center
College of Business
Zac and Cari Caramonta opened Gnarly Barley Brewing Company in the heart of Hammond in the spring of
2014 and have experienced growth that has surprised even them. Their success, though, is not the result of
luck, but of years of planning.
After much research, planning and recipe creating, Zac did his first full brew in their kitchen – and it was a
success.
Soon thereafter Zac designed and built a larger scale brewing system and moved from the kitchen to the
garage. In 2011, the couple made the jump into the business world, forming an LLC and getting ready to
produce beer to sell.
After working festivals and brewing small quantities, the couple knew the time was right to move to the next
level.
Releasing their first beers in May 2014, growth in the past months has been far beyond expectations. Gnarly
Barley currently produces three main beers: Catahoula Common, Radical Rye P.A. and Korova Milk Porter.
Each beer is an original recipe created by Zac, and all three have received acclaim both locally or regionally.
Gnarly Barley beers have won awards in the region and have been listed on every regional top beer list and
ranking since opening last year.
As of June 2015, Gnarly Barley was offered in nearly 300 bars and restaurants from Lafayette to Slidell. Zac
and Cari see strong growth for some time based on current sales trends and the feedback they are receiving.
Read the full “Gnarly Barley: Home Grown Brew” story and more in the current edition of Southeastern Mag-
azine. - (Article courtesy of Southeastern’s Public Information Office.)
SOUTHEASTERN
Gnarly Barley
Southeastern alumni brew a successful local business
Economic Reporter
