Ellipse APM 5.0 User Guide 5.1
User Manual:
Open the PDF directly: View PDF ![]() .
.
Page Count: 62
- Introduction
- Main Dashboard Summary
- Summary Dashboard
- Spatial View Dashboard
- Assets Page
- Asset Details Summary
- Asset Details | Transformers | General
- Asset Details | Transformers | DGA
- Asset Details | Transformers | Duval Triangles
- Asset Details | Transformers | Standard Oil Test
- Asset Details | Transformers | Bushing
- Assets Details | Circuit Breaker | General
- Issues Dashboard
- Glossary
- Appendix A: Maintenance Priority Score Calculations
- Appendix B: Generic Replacement Score Calculations
- Index

—
ABB AbilityTM Ellipse Asset Performance
Management
Ellipse APM User Guide
Release 5.x
AHCDDB-0006-1804-03
© Copyright 2018 ABB
All Rights Reserved
Confidential and Proprietary
November 7, 2018
Legal Disclaimer
The product described in this documentation may be connected to, and/or communicate information and data via, a
network interface, which should be connected to a secure network. It is your sole responsibility to ensure a secure
connection to the network and to establish and maintain appropriate measures (such as but not limited to the installation
of firewalls, application of authentication measures, encryption of data, installation of antivirus programs, etc.) to protect
the product, the network, your systems, and the interface against any kind of security breach, unauthorized access,
interference, intrusion, leakage, damage, or corruption or theft of data. We are not liable for damages or losses related to
any such security breach, unauthorized access, interference, intrusion, leakage, damage, or corruption or theft of data.

Table of Contents
Introduction 1
Overview 1
Ellipse APM Key Benefits 1
Ellipse APM Supported Assets 1
How Ellipse APM Works 1
Additional Resources 2
Selection Pane Options 2
Main Dashboard Summary 4
Asset Risk 5
Spatial View 6
Issues 8
Key Risk Changes 9
Most Important Issues 9
Analytics 10
Assets by Type and Organization 11
Summary Dashboard 12
Spatial View Dashboard 14
Assets Page 17
Asset Report 20
Asset Details Summary 22
Name Plate Detail 22
Risk Matrix 22
Risk Trend 23
Extended Asset Details Page 23
Parameters 24
Messages 25
Replacement Score 26
Analytics 27
Action Plan 27
Creating a New Issue 29
Ellipse APM and EAM Work Request Status Mapping 30
Ellipse APM and EAM Work Order Status Mapping 31
More About Issues 31
Table of Contents
Ellipse Asset Performance Management iii AHCDDB-0006-1804-03

Notifications 31
Asset Details | Transformers | General 34
Asset Details | Transformers | DGA 35
Asset Details | Transformers | Duval Triangles 37
Fault Codes 38
Using the Duval Triangle Method 38
Duval Triangle Type 1 39
Duval Triangle Type 4 39
Duval Triangle Type 5 39
Asset Details | Transformers | Standard Oil Test 41
Interfacial Tension 41
Power Factor 41
Moisture 42
Dielectric Strength 42
Acid Number 42
Inhibitor Content 43
Using the Standard Oil Test 43
Asset Details | Transformers | Bushing 44
Assets Details | Circuit Breaker | General 46
ABB Circuit Breaker Model - Issues and Error Messages 47
Issues Dashboard 48
Issues Sorting Order 50
Glossary 51
Appendix A: Maintenance Priority Score Calculations 54
Maintenance Priority Score Ranking 54
Appendix B: Generic Replacement Score Calculations 56
Index 58
Table of Contents
Ellipse Asset Performance Management iv AHCDDB-0006-1804-03

Introduction
Overview
Ellipse APM transforms real-time and historical asset data into strategic insights on the health of your mission
critical assets. The solution can be delivered as a service via the Azure cloud (SaaS) or perpetually licensed for
an on-premise installation.
Ellipse APM Key Benefits
nConsolidates data on assets and their health across the enterprise and makes them available to key
stakeholders on a dynamic and timely basis.
nAsset performance models capture and systematize subject matter expert know-how.
nProvides visibility to potential failures to support operational and maintenance decision making
nEvaluates which assets can be extended beyond their expected life and which need to be replaced.
nFocuses limited maintenance resources on the assets that need help (critical and poor health) and
provides justification to defer maintenance on healthy assets.
Ellipse APM Supported Assets
Ellipse APM contains out of the box models for the following asset types:
nOil filled Transformers
nHV Circuit Breakers
nStation Batteries and chargers
nTransmission Lines
nCapacitor Banks
nCCVTs (Capacitance Coupled Voltage Transformers)
nUnderground Cables
How Ellipse APM Works
Ellipse APM provides predictive analytics for asset performance.
nCollects - A unified view of all asset data in a proven analytics platform.
nPredicts - Algorithms codify experience to predict and prioritize risk.
nInforms - Industry standard KPIs and expert decision support.
nActs - Holistic asset performance management.
The Ellipse APM Reporting Module includes:
Ellipse Asset Performance Management 1 AHCDDB-0006-1804-03

nMain Dashboard
nAssets
nAsset Details
nIssues
Access Ellipse APM at:
https://ahc.enterprisesoftware.abb
Additional Resources
nOn-Premise Installation
See On-Premise Installation Guide
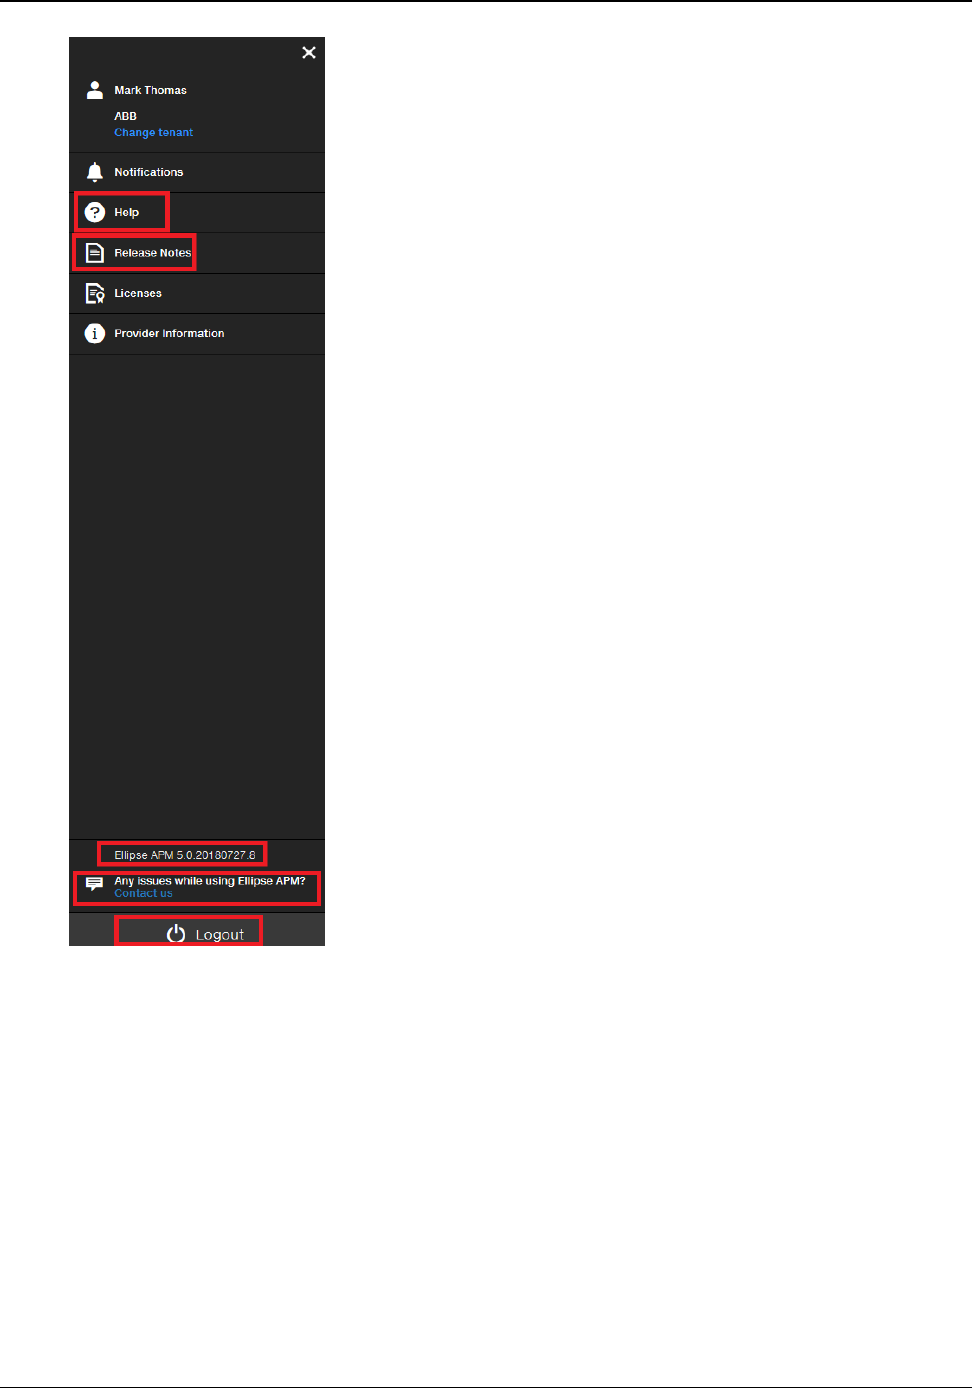
Selection Pane Options
Click on the triple bar icon to open the Selection Pane.
nThe User Guide in printable form is available through Help menu option on the Selection Pane.
nA compilation of Release Notes is available through the Release Notes menu option on the Selection
Pane.
nProduct version is available on the Selection Pane.
nA support contact link is available on the Selection Pane.
nLogout resides on the Selection Pane.
Ellipse Asset Performance Management 2 AHCDDB-0006-1804-03
Ellipse Asset Performance Management 3 AHCDDB-0006-1804-03

Main Dashboard Summary
Navigate to the Main Dashboard
To navigate to the Main Dashboard, from anywhere within APM, click ABB Ellipse APM.
Individual widget-style components on the home page provide the user with a high level perspective of Asset
Risk across the fleet with drill-downs into details.
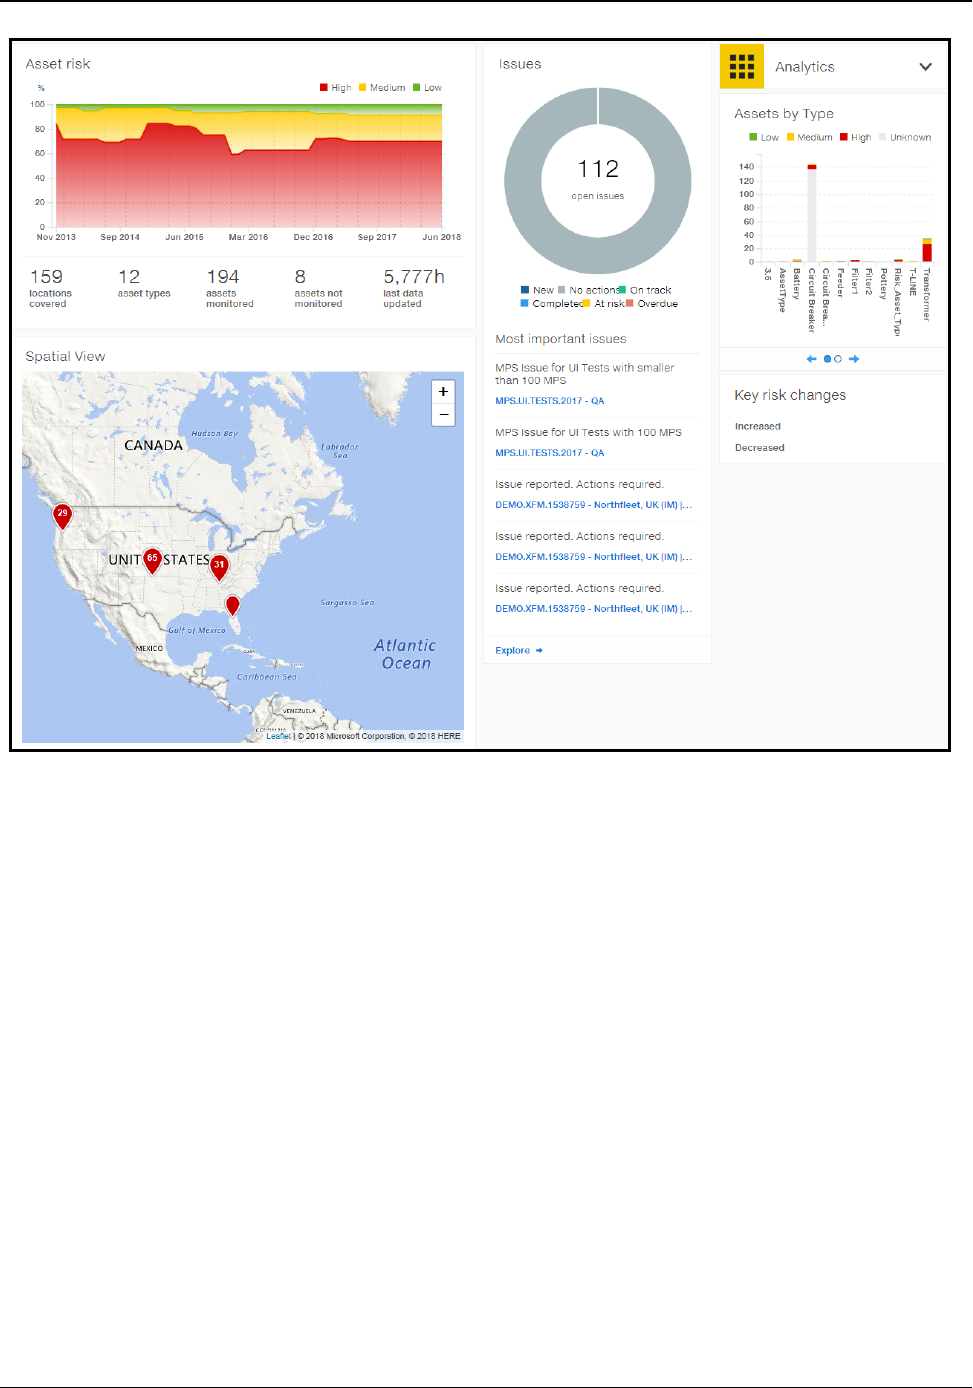
Dashboard
The Dashboard shows summary level risk information for the entire fleet of assets. Drill from the home page to
Ellipse APM features including asset details, issues associated and predefined standard visualizations.
nThe Asset Risk graph displays the share of assets by risk level over time.
nA widget displays the number of Open Issues by status along a list of the most important issues based
on maintenance priority.
nASpatial View displays asset along with risk levels by location (substation).
nA widget displays Assets by Organization and Assets by Type.
nUnder the Analytics drop-down arrow, users can add additional reports leveraging PowerBI (SaaS only),
other analytics tools, or access predefined standard visualizations.
nKey Risk Changes shows most significantly improved or degraded assets in the past 30 days.
Ellipse Asset Performance Management 4 AHCDDB-0006-1804-03
Asset Risk
Asset Risk shows the distribution of assets by risk status (color) over time and further shows counts for
locations covered, asset types, assets monitored, assets not monitored and last data updated.
Ellipse Asset Performance Management 5 AHCDDB-0006-1804-03
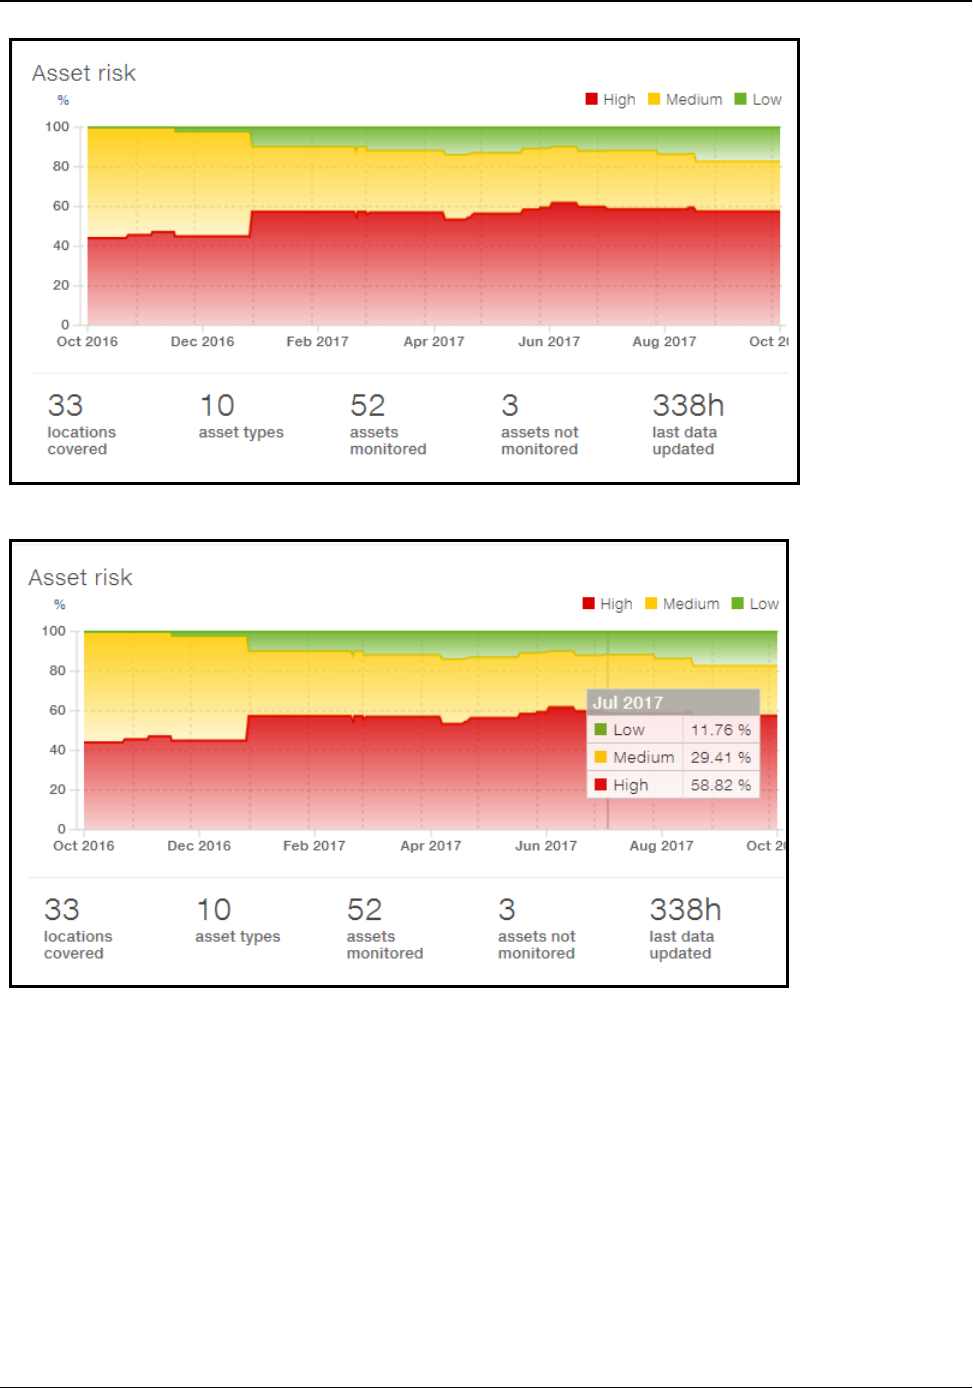
nUse the cursor to slide a line across the graph to display more detail on Asset Risks across time.
Asset Risk Chart can show up to five years of data points history (one per month) calculated to the end of each
month. In case of a lack of historical data, the chart scales to fit the same size on the user interface.
Spatial View
Spatial view shows the geographical distribution of asset locations (substations) including details related to
asset risk. The color of the dot is based on the worst asset risk for the location.
Ellipse Asset Performance Management 6 AHCDDB-0006-1804-03
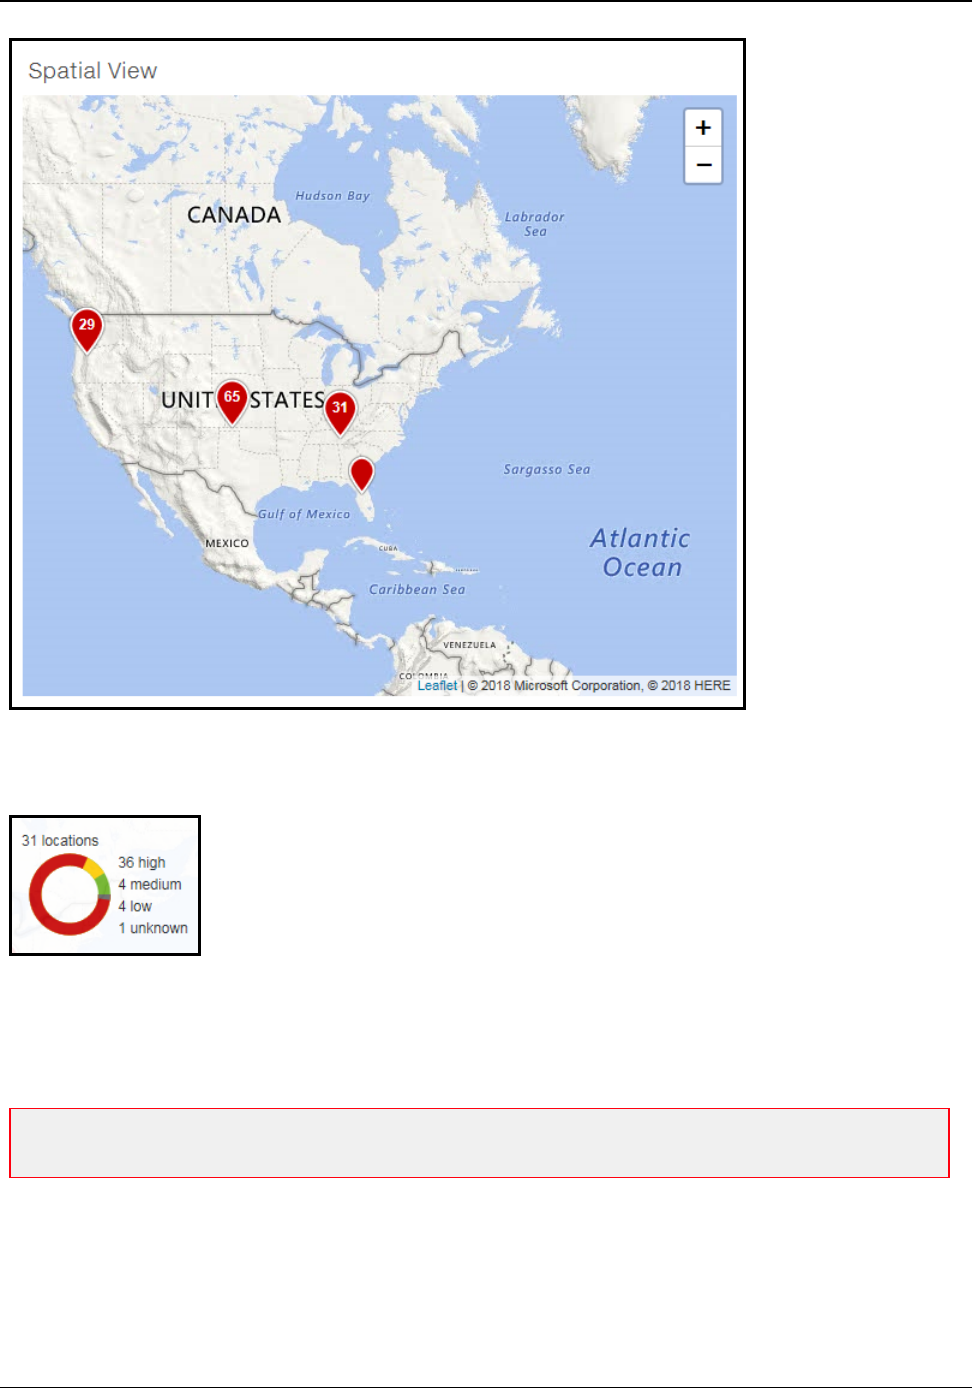
By hovering over a data point on the map, a tool tip-style pop-up displays how many assets are located within
the selected location for each of the risk classes. A drill-down feature opens a report with more details for the
selected, single location.
A drill-down feature on the Spatial View opens a Location Summary report with more details for the selected,
single location.
Note: •Location Summary is available only on the spatial view widget on the main Dashboard on the cloud
version.
Ellipse Asset Performance Management 7 AHCDDB-0006-1804-03
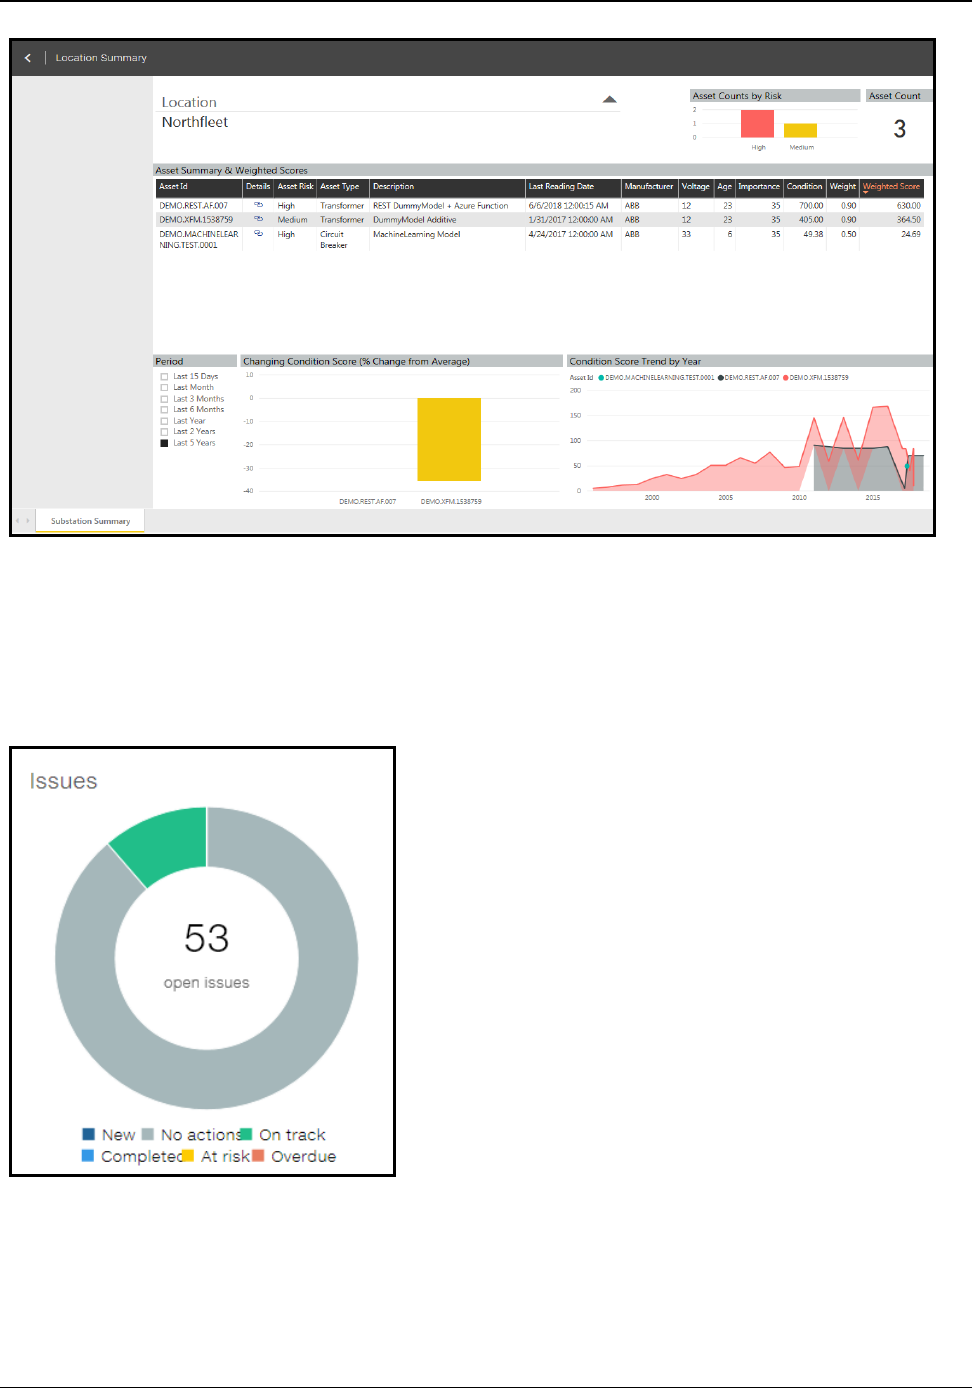
Issues
Issues displays a count of identified asset risk issues by resolution status. This resolution status is based on
the status of work orders and work requests associated with the issue. Click on any donut chart section to drill
down and see the issues corresponding to the count.
The Issues widget further lists the most important issues related to asset risks based on calculated
maintenance priorities.
Issues displays a color coded legend delineating issues including:
Ellipse Asset Performance Management 8 AHCDDB-0006-1804-03
nNew - New issue identified in the past 7 days and not yet evaluated by users.
nNo actions - There is no work-order or work-request attached or if the work-request is cancelled or
closed.
nOn track - All work-orders attached to the issue have not exceeded Schedule Date yet (time buffer >24h
) or the Schedule Date is not specified yet. This state also refers to cases when there is a work-request
In Requested and In Progress status without Schedule Date specified.
nAt risk - At least one of the planned actions draws on to the Scheduled Date ( 0 < time buffer =< 24h),
then the issue points on At risk state.
nOverdue - At least one of the planned actions exceeded the fixed Schedule Date of the work-order.
nCompleted - All actions are closed.
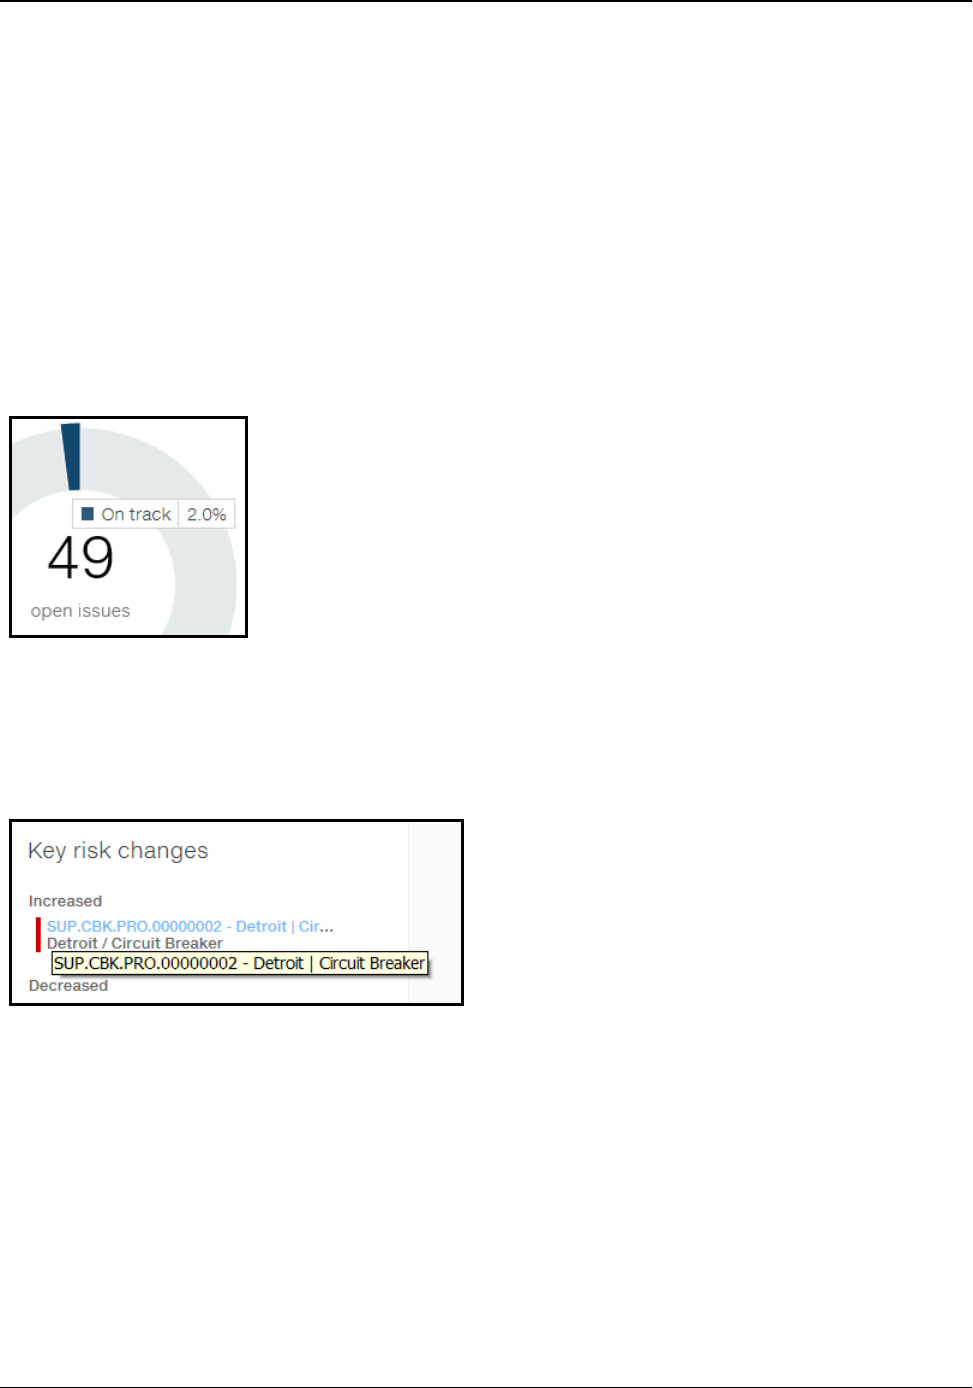
By hovering over a data point on the chart, a tool tip-style pop-up displays the percentage of issues that are
located within the selected color coded legend. The number inside (i.e., 49) refers to all open issues.
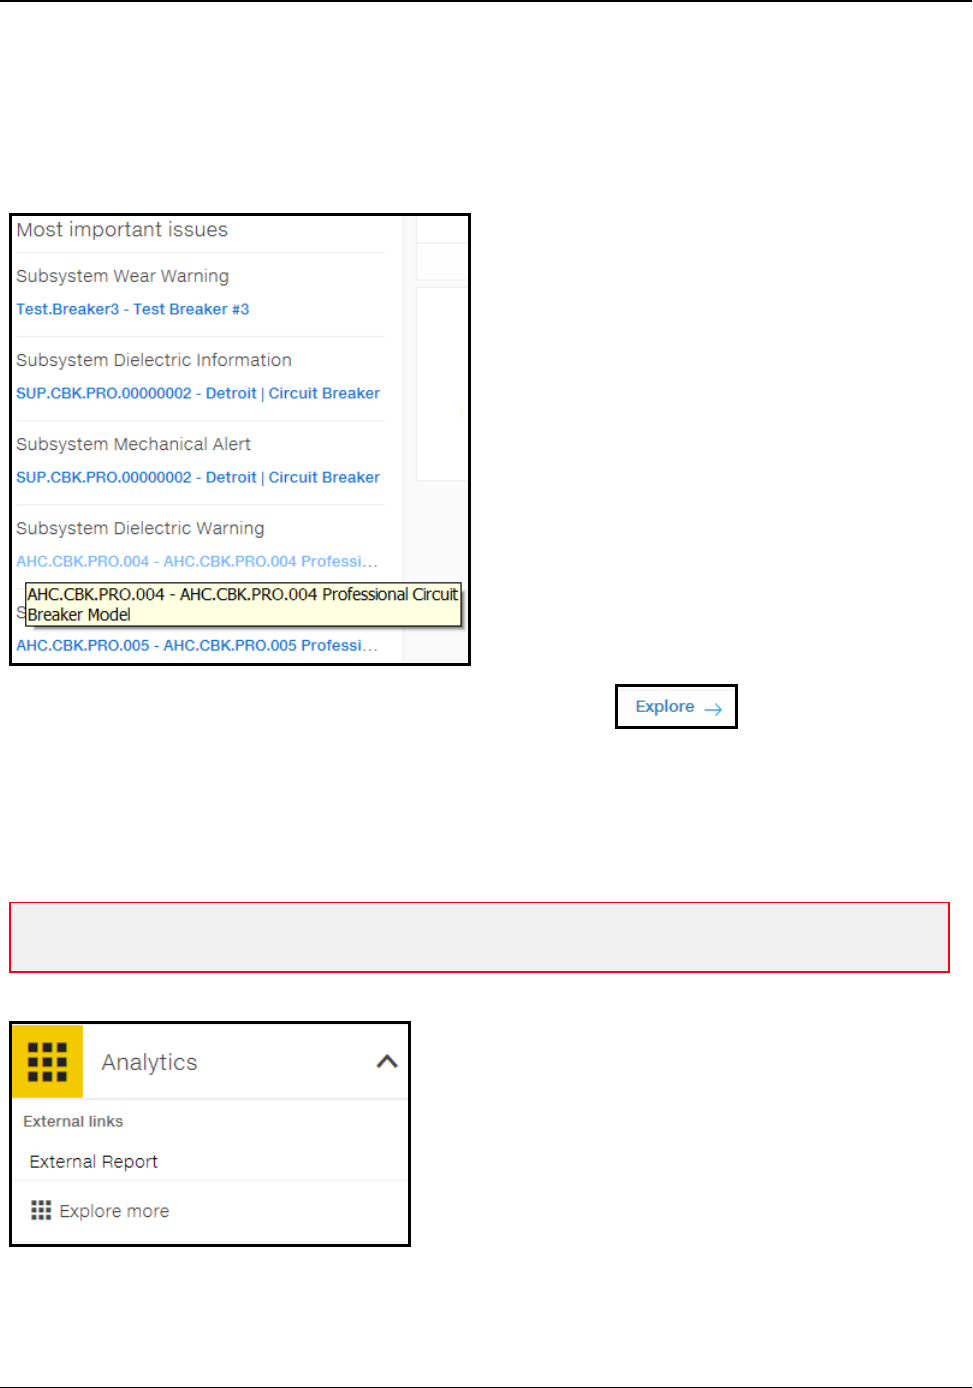
Key Risk Changes
Key Risk Changes show assets with the most significant absolute condition improvement or the most
significant condition degradation over the past 30 days. Click on the asset ID to navigate to the asset details.
Most Important Issues
Most Important Issues displays the five most significant risks or issues identified in Ellipse APM, based on the
maintenance priority calculated by the application for each issue. The asset ID in blue is a link to the asset
details page for each listed entry on the Most Important Issues list.
The Issues widget has sort rules. Issues are displayed in following order:
Ellipse Asset Performance Management 9 AHCDDB-0006-1804-03
nIssues with New status indicated are at the top.
nIssues with Maintenance Priority Score are descending.
nWhen two or more issues have the same MPS, Asset Risk takes precedence.
nSort rules on Issues widget are the same sort rules on Issues page.
A direct link to Issues page to view all risks/issues is available through button.
Analytics
Analytics provides access to additional reports and visualizations. Administrative users can edit this menu and
add or change reports in this list. To navigate to these additional, customer-specific report, and other reports and
visualizations, click on the down arrow next to Analytics.
Note: This list can include custom embedded PowerBI content (cloud only). The list can further include
hyperlinks to external content.
Ellipse Asset Performance Management 10 AHCDDB-0006-1804-03
Note: The Explore more option directs users to their workspaces: https://app.powerbi.com (separate
PowerBI license required).
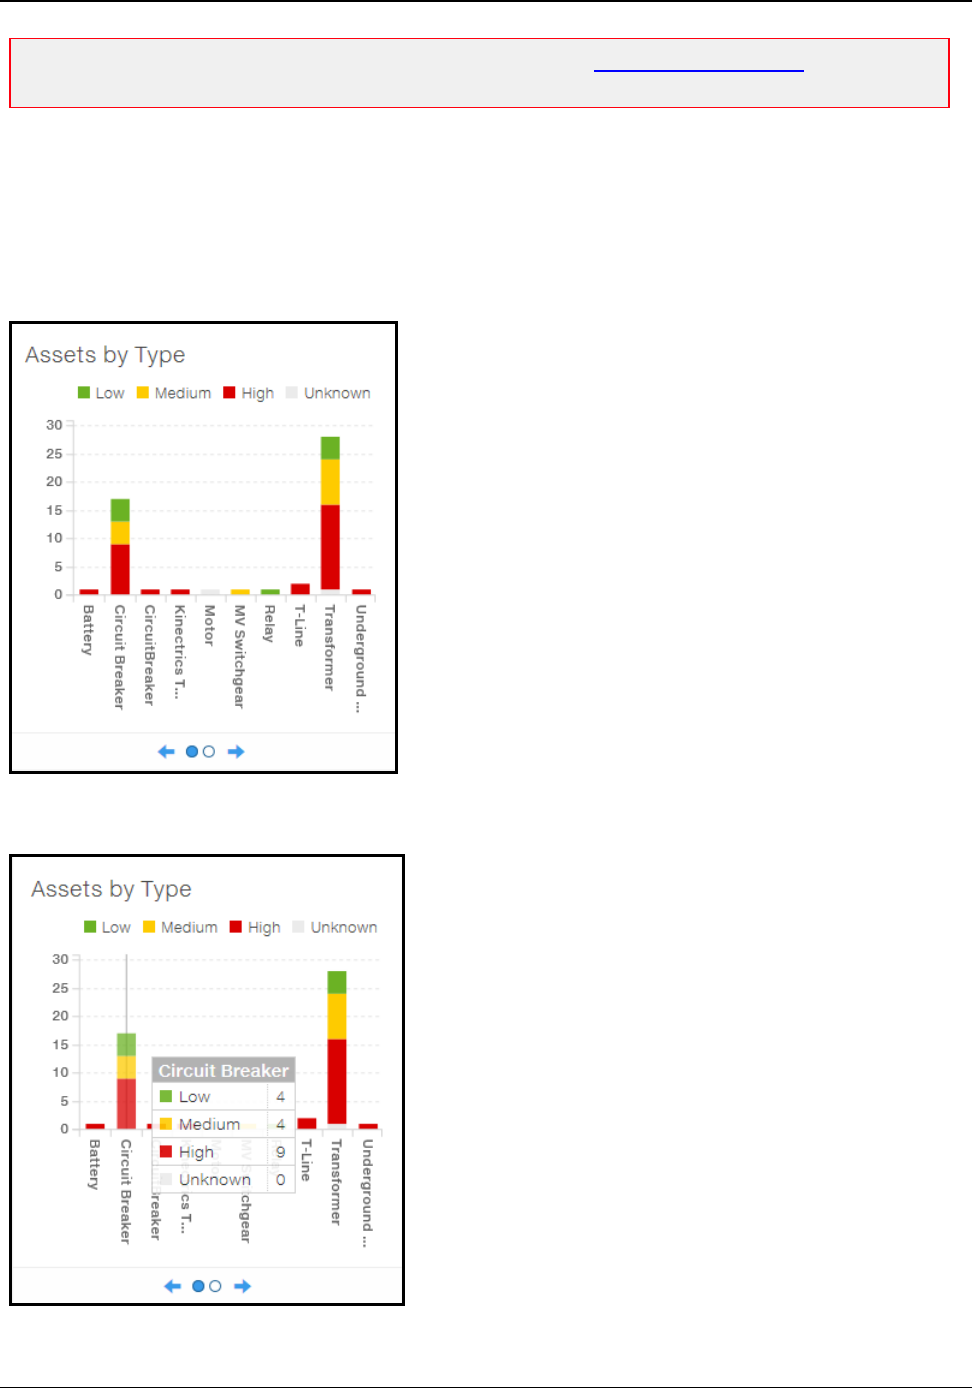
Assets by Type and Organization
Assets by Type and Organization provides a clear and consistent overviews the risk distribution across the
asset types and organizations or operating companies.
By hovering the cursor over any bar, a tool tip-style pop-up displays how many Low, Medium, High, and
Unknown assets are located within the selected organization or by asset type.
Ellipse Asset Performance Management 11 AHCDDB-0006-1804-03

A drill-down feature on any bar opens an Assets page with the assets narrowed down to a list selected from this
widget
Independently the Assets Page is also accessible through the Assets menu button. Use the navigation tool to
toggle between Assets by Type and Assets by Organization.
Summary Dashboard
The following provides you with navigation to the Summary Dashboard, a high-level overview, and then
discusses each component at a high level.
Navigate to the Summary Dashboard
To navigate to the Summary Dashboard from anywhere within APM, click Dashboard and then Summary.
Ellipse Asset Performance Management 12 AHCDDB-0006-1804-03
Individual widget-style components on the Summary page provide the user with a high level perspective of
Asset Risk across the fleet with drill-downs into details.
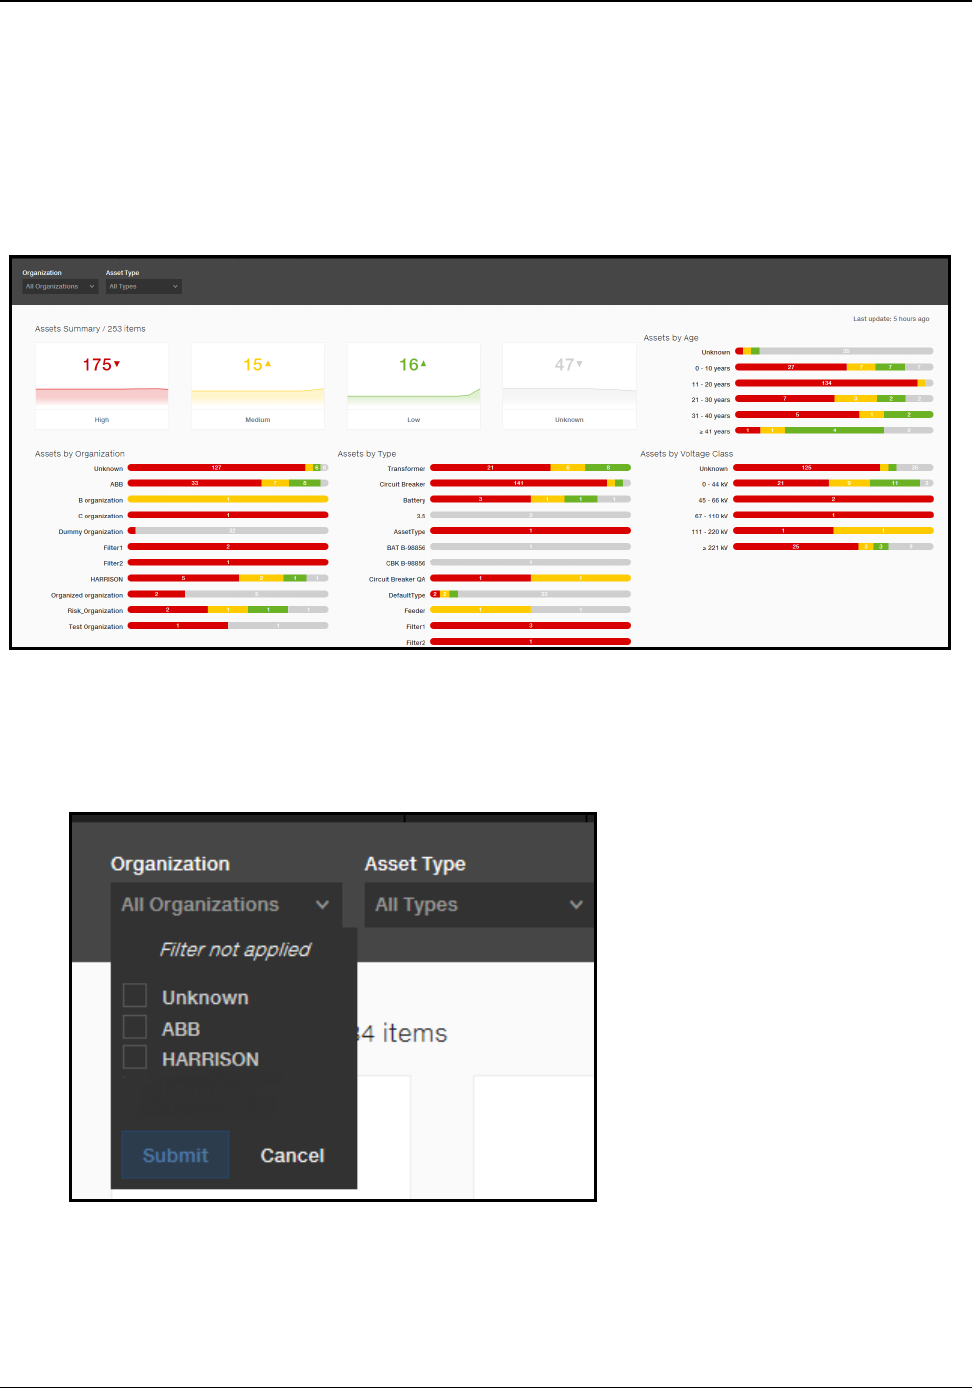
Summary Dashboard
The Summary Dashboard shows summary level risk information indicating the current status for the entire
fleet of assets.
nA filtering panel implementation narrows searches by Organization and Asset Type.
Ellipse Asset Performance Management 13 AHCDDB-0006-1804-03
nThe Asset Summary risk graphs display color coded risk levels which are derived from an intersection
of asset condition and importance.
Unknown is used when the application does not have information.
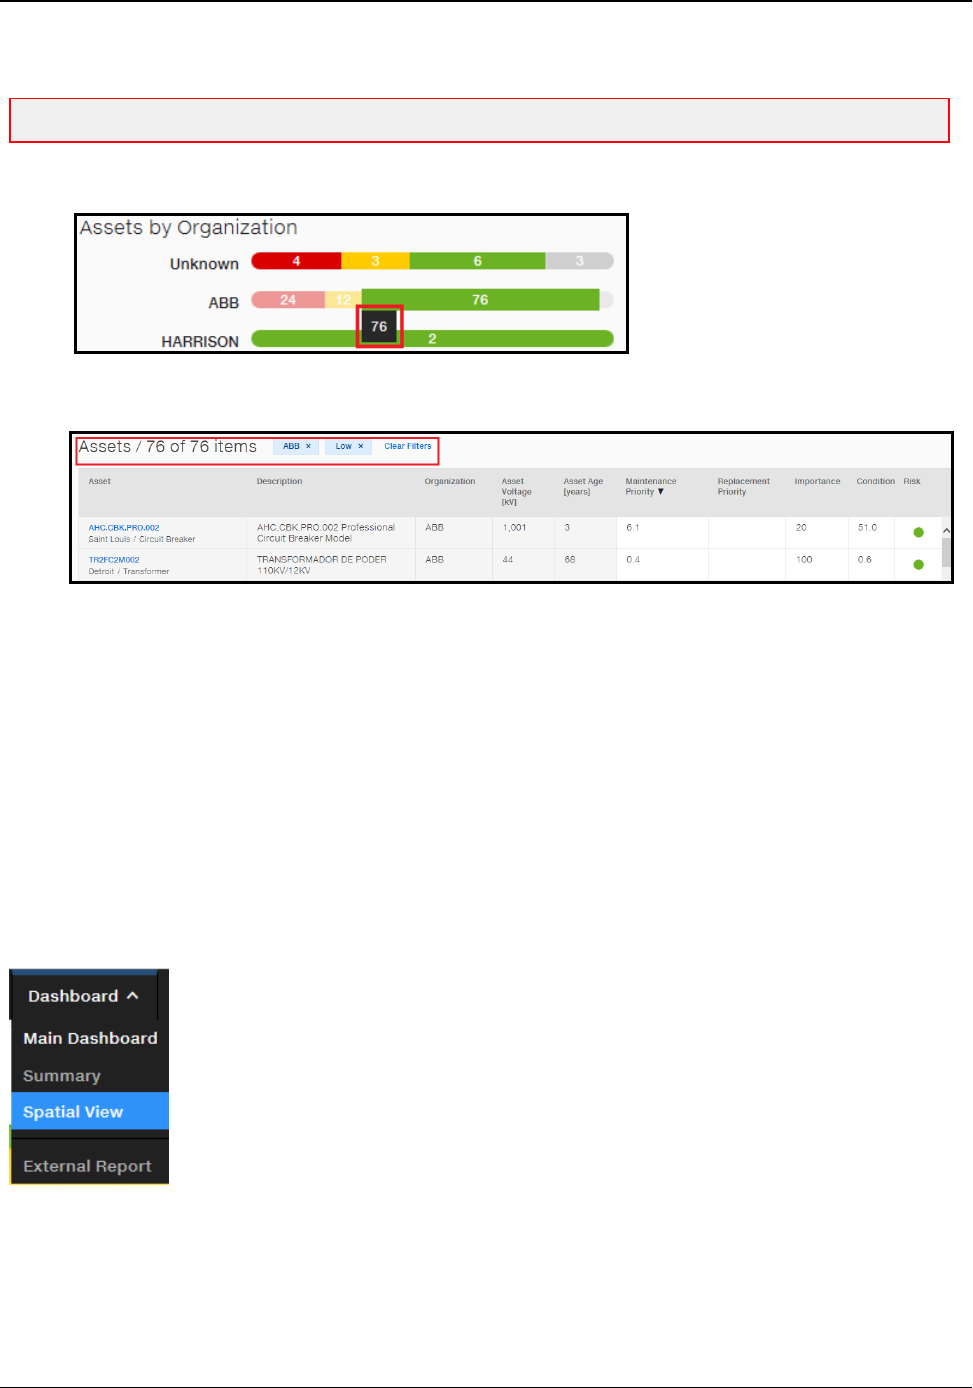
nBar chart widgets display Assets by Organization,Assets by Type,Assets by Age,Assets by
Voltage Class
nYou are redirected to the assets page by clicking on each bar which keeps the filters passed (e.g.
Organization, Medium risk assets).
nYou can drill down from the Risk counter on Assets Summary to the pre-filtered Assets Page.
Spatial View Dashboard
The following provides you with navigation to the Spatial View Dashboard, a high-level overview, and then
discusses each component at a high level.
Navigate to the Spatial View Dashboard
To navigate to the Spatial View Dashboard from anywhere within APM, click Dashboard and then Spatial
View.
Spatial View Dashboard
The Spatial View displays asset locations along with risk levels by location. The Spatial View shows the
geographical distribution of asset locations including details related to asset health.
Ellipse Asset Performance Management 14 AHCDDB-0006-1804-03
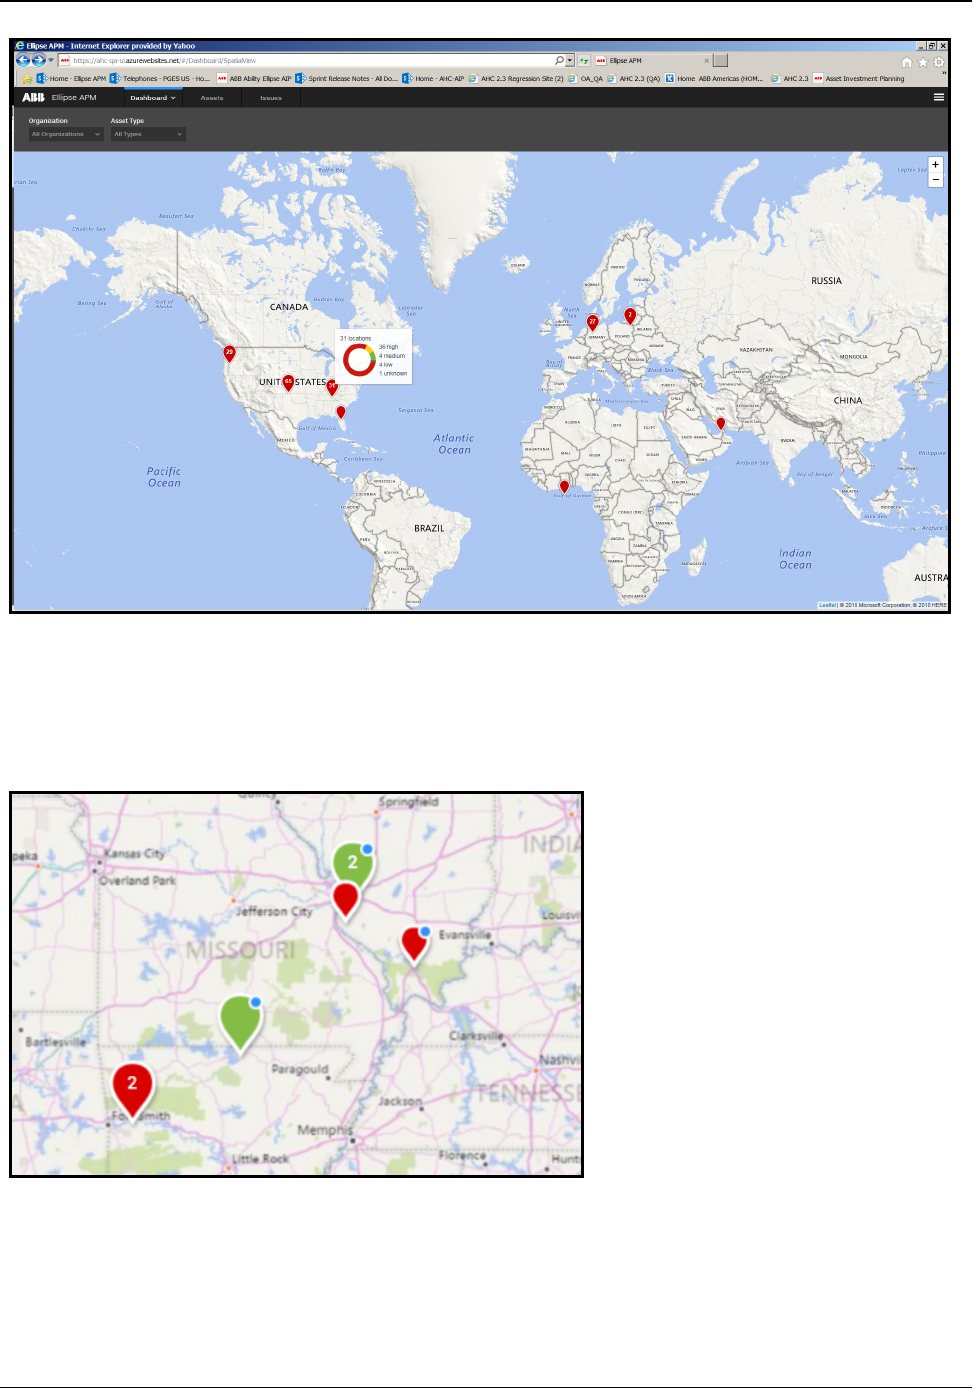
The color of the dot is based on the worst asset risk status for the location. Tool tips on the Spatial View
Dashboard provide the user with a high level perspective of Asset Risk across the fleet with drill-downs into
asset details.
The small blue dots indicate a change to any asset in the substation from the previous work week business day.
nIf any asset in the substation changes color, the indicator will be there even if the substation summary
does not change.
Ellipse Asset Performance Management 15 AHCDDB-0006-1804-03
nIf a substation is "blinking" today because of a change that happened overnight, this substation does not
continue to blink tomorrow.
nChange indication remains for one business day, typically 24 hours, but 72 hours between Friday and
Monday. Check and validation occurs every hour, no matter if any user drilled on the localization.
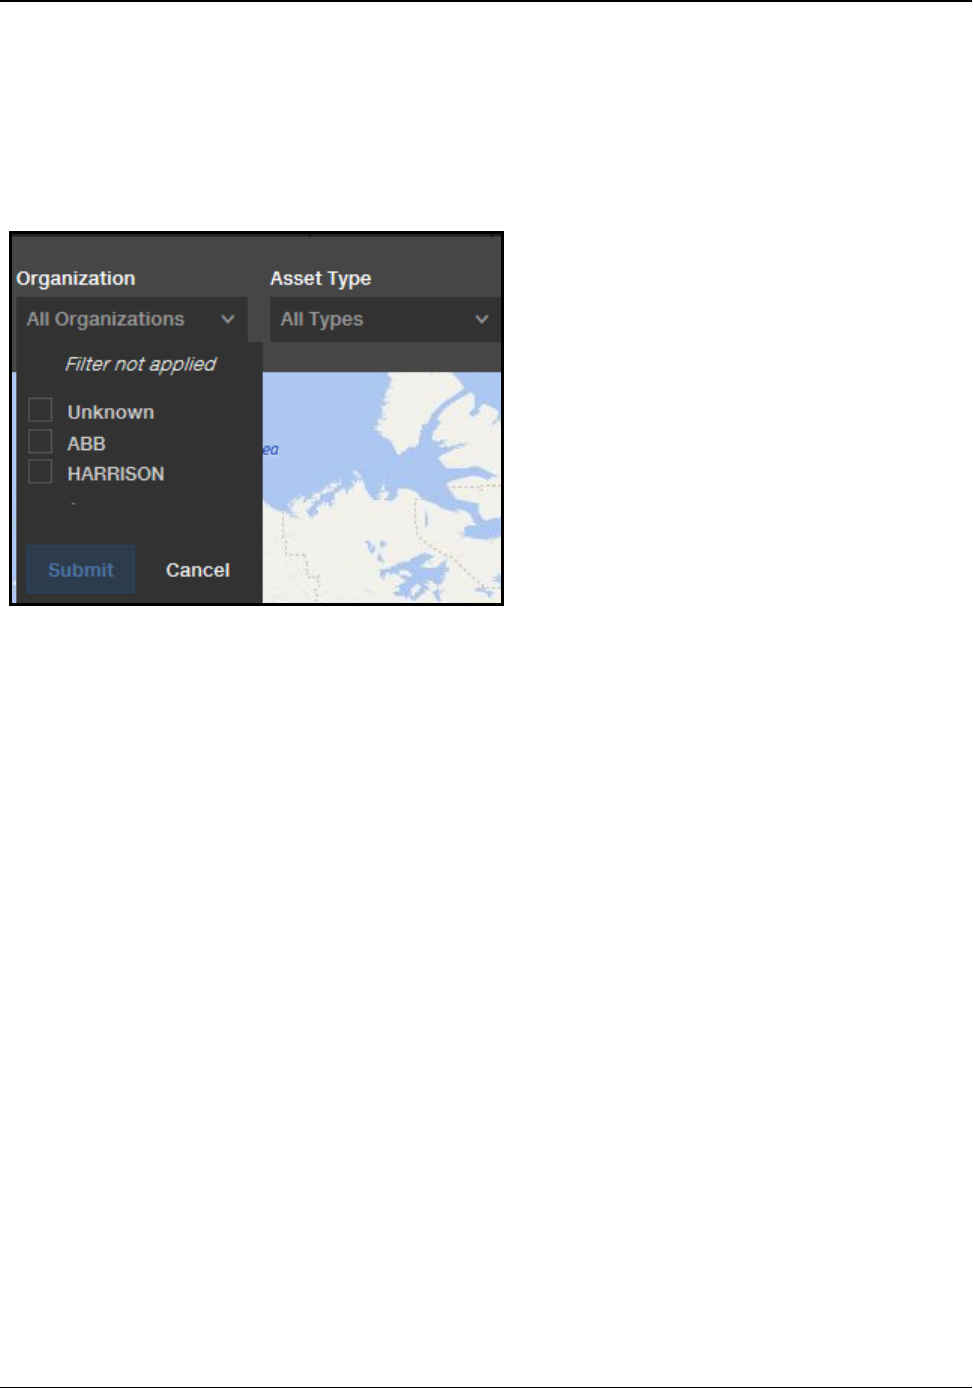
A filtering panel implementation narrows searches by Organization and Asset Type.
Ellipse Asset Performance Management 16 AHCDDB-0006-1804-03
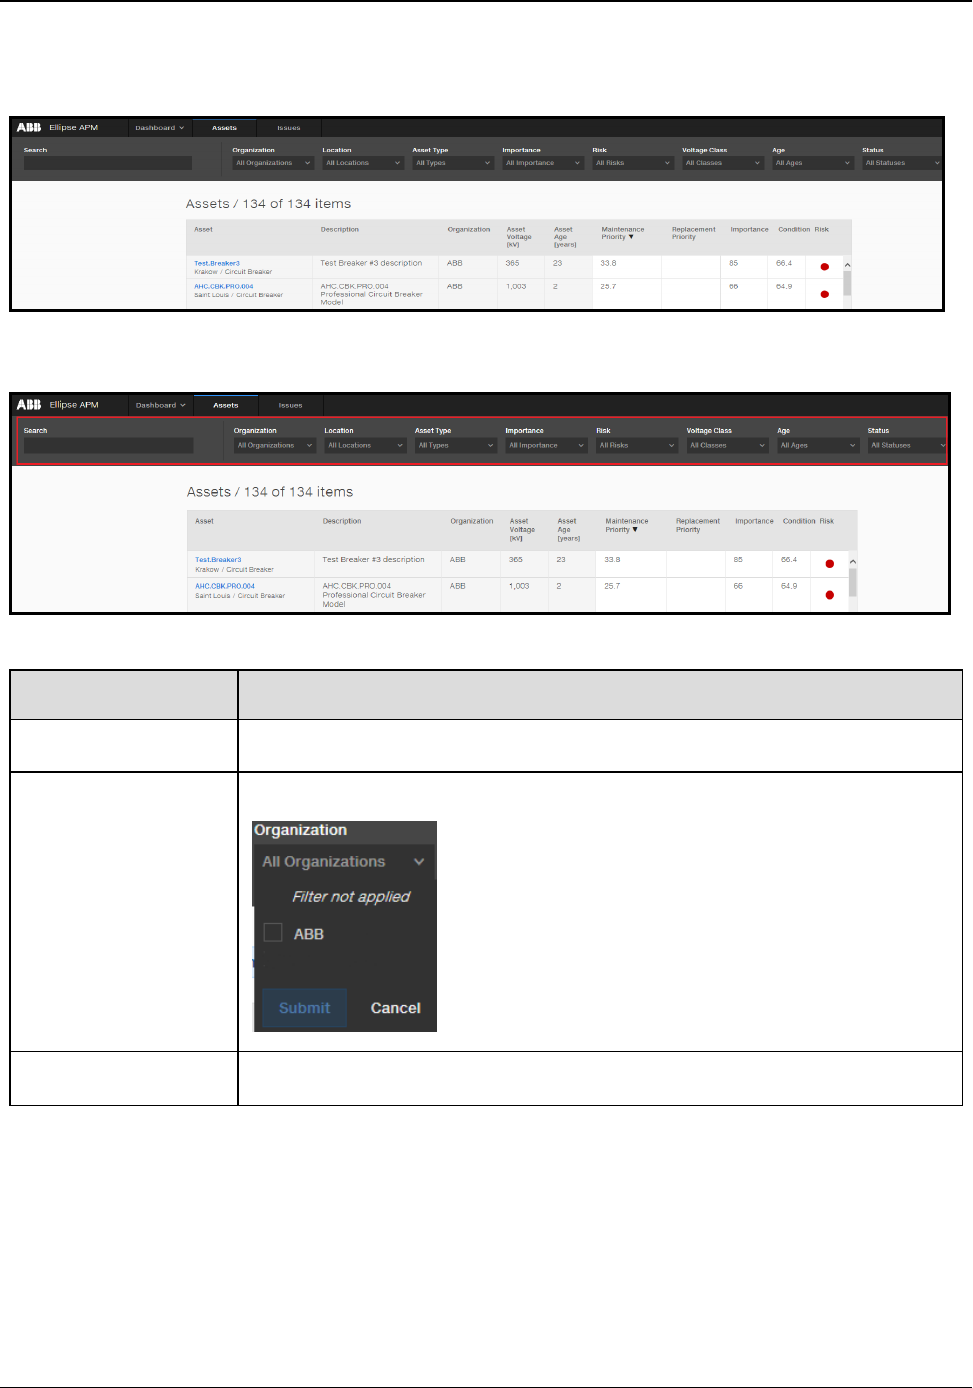
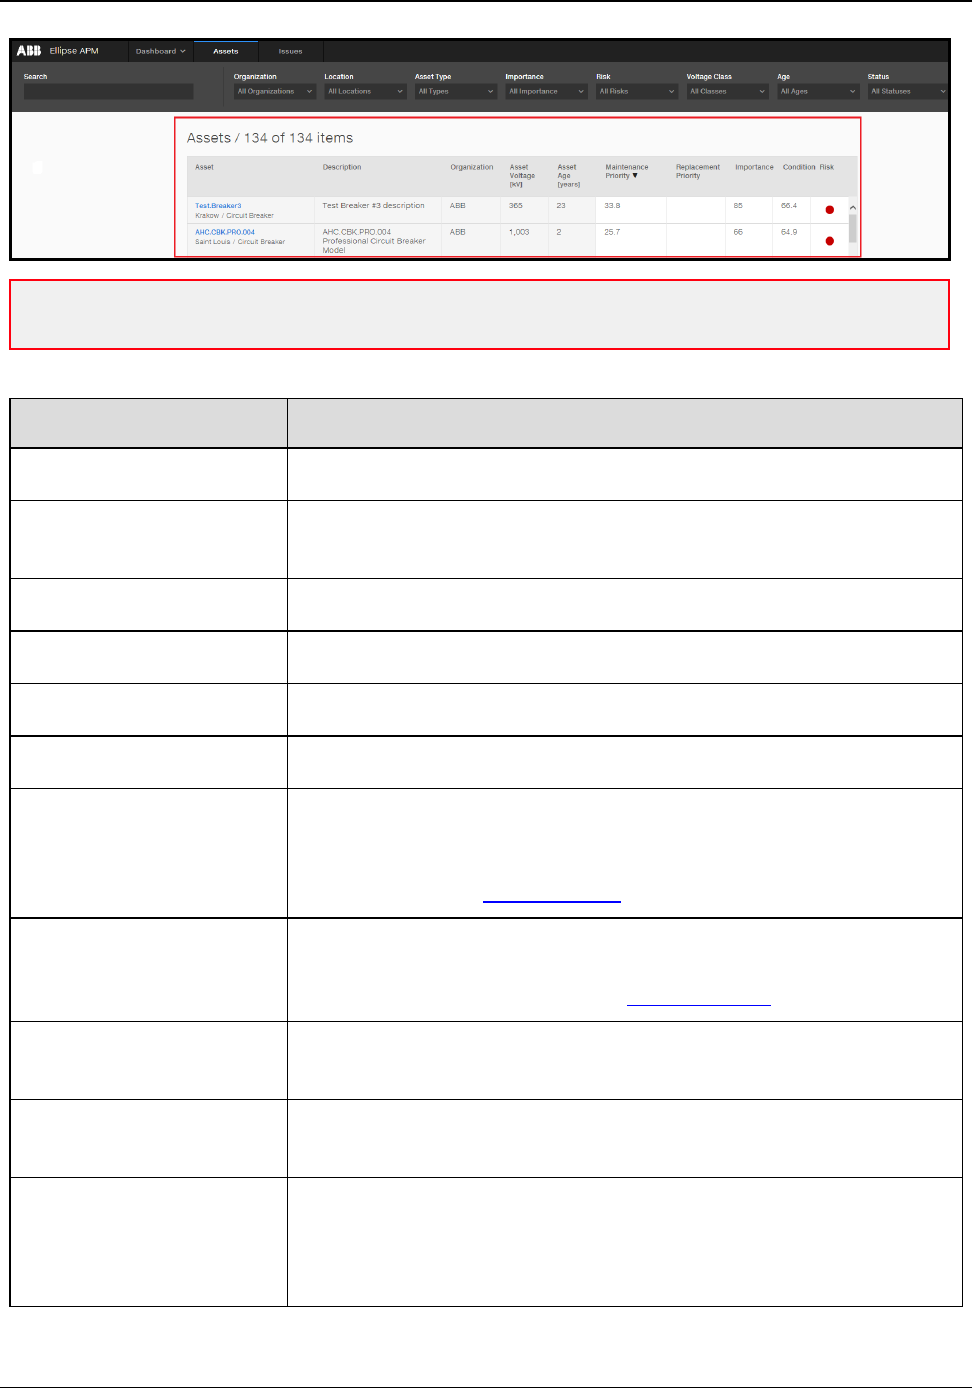
Assets Page
The search panel is divided into selected, predefined attributes as well as free text search box. You can easily
select multiple conditions to determine filtering criteria for all assets.
Query Categories Description
Search Box This accepts typed-in text in order to look up, for example, an asset type.
Organization This is name of the organization filtered by assets.
Location This is the name of the location (e.g., substation) where the asset resides.
Ellipse Asset Performance Management 17 AHCDDB-0006-1804-03
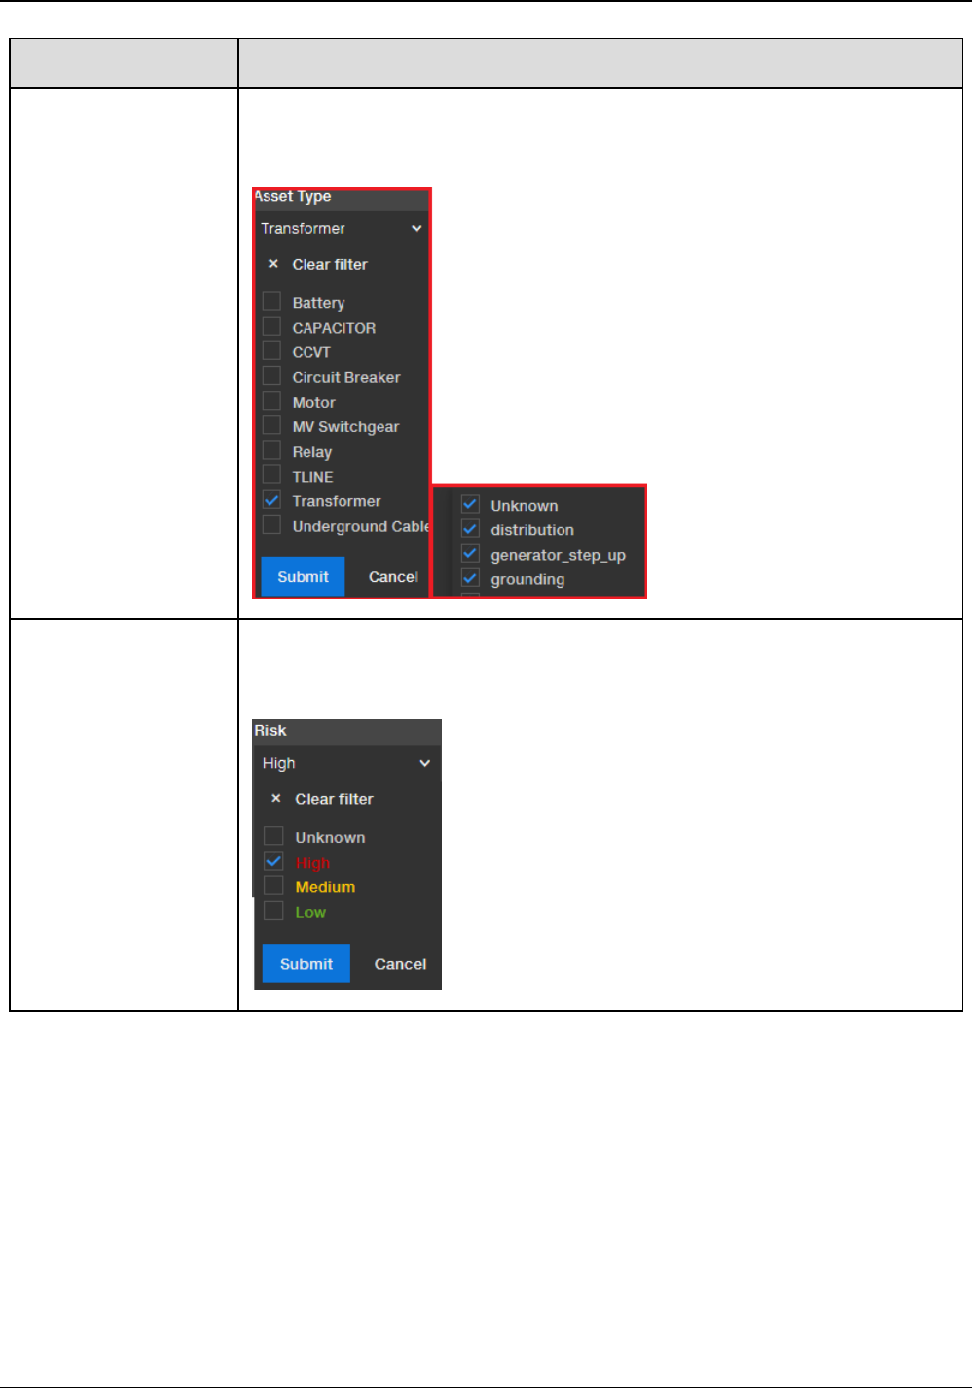
Query Categories Description
Asset Type This breaks down the type of equipment to identify ( e.g. transformer, circuit
breaker, etc). Second level of filtering options are available for Asset type -Asset
sub-type.
Risk Level This is the Risk of Failure and is designated by the colors of a "stoplight" to let
you know those assets that are either OK (green), might need to be looked at
(yellow), or requires attention (red).
Ellipse Asset Performance Management 18 AHCDDB-0006-1804-03
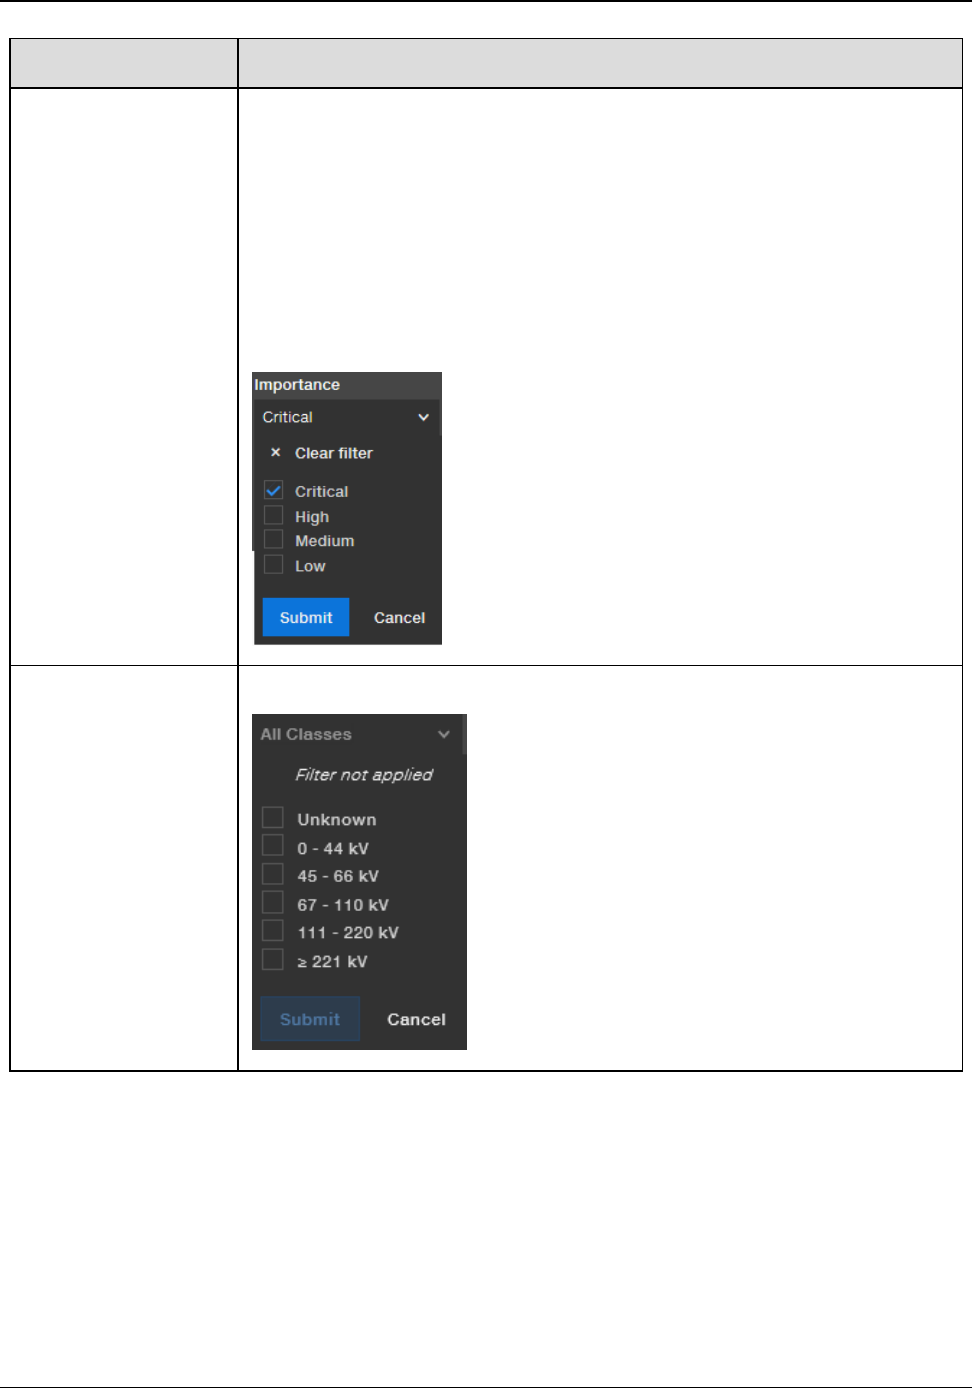
Query Categories Description
Importance A Unit Importance is a rating including Critical, High, Medium, and Low:
nLow (>0 and <= 25%)
nMedium (>25 and <=50%)
nHigh (>50 and <= 75%)
nCritical (>75 and <= 100%)
A Unit Importance number is assigned to each asset. The value range is from one
to 100. A distribution asset that services one customer might have a unit
importance of two (2), whereas an asset that services a hospital might have a unit
importance of 95.
Voltage The grid shows the actual voltage.
Ellipse Asset Performance Management 19 AHCDDB-0006-1804-03
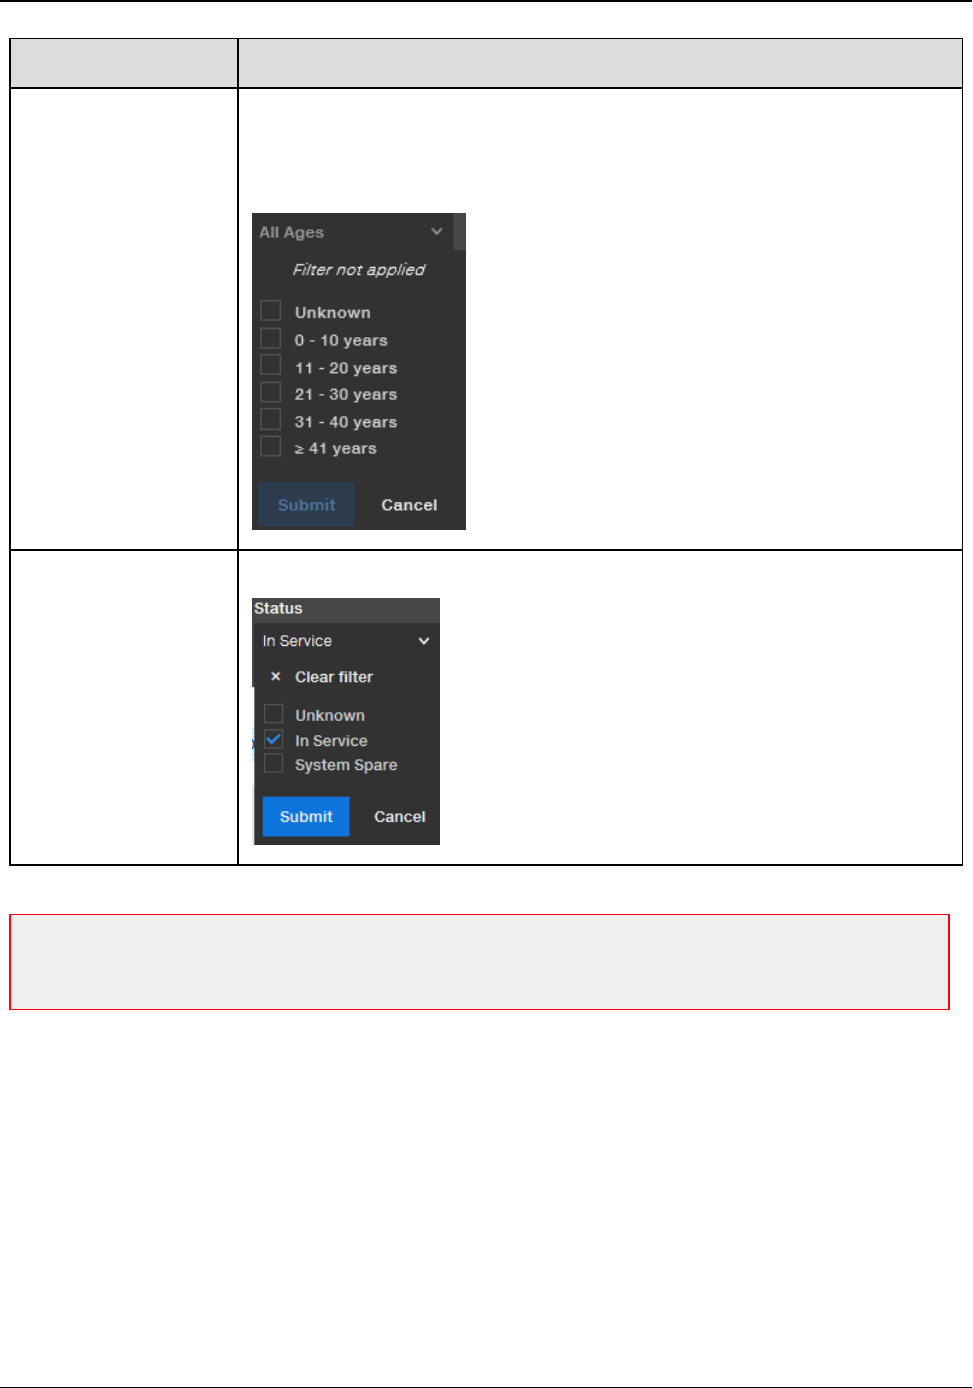
Query Categories Description
Age Numeric age of the asset. Age is calculated as a difference between a current
date and Manufactured Date. In case of unknown Manufacturer Date, Install Date
is taken for the calculation. In case of an unknown Manufactured Date and Install
Date, Asset Age is recognized as Unknown.
Status This the status of the asset (e.g., in service, spare, etc.).
Note: Common search panels available through other Ellipse APM pages allow an easy way to narrow
down the number of visible entries by specific categories. Column headers are clickable to adjust the sort
order of the results.
Asset Report
The Asset Report displays the results of a query performed on the Asset Query search panel. The Asset Report
supports sort functionality for fleet assets in Ellipse APM. Asset ID is a hyperlink which redirects the user to the
Asset Details page.
Ellipse Asset Performance Management 20 AHCDDB-0006-1804-03
Note: You can easily drill down to the assets details page through a hyperlink by clicking on any available
asset column available.
The Asset Report displays the following columns:
Report Categories Description
Asset A link to the Asset Details page resides in this field.
Description This describes the type of asset and pertinent information about that par-
ticular asset that can be used to identity it.
Organization This is name of the organization where the asset resides.
Location This is name of the location where the asset resides.
Voltage The grid shows the actual voltage.
Asset Age [years] Numeric age of the asset.
Maintenance Priority The highest maintenance priority score of open issues/risks against the
asset. The score that helps prioritize maintenance activities. The algorithm
is based primarily on model-returned data or defaults if no specific data is
provided by a model. See Appendix A.
Replacement Priority Ellipse APM assigns an asset a Replacement Score which is calculated by
an algorithm. The calculation is derived from a number of parameters which
are weighted to determined the score. See Appendix B.
Importance A Unit Importance number is assigned to each asset. The value range is
from one to 100. A higher number indicates a more important asset.
Condition This is a value assigned to the likelihood of failure in order to provide a
numerical value that will help determine the health of that asset.
Risk This is the Risk of Failure and is designated by the colors of a "stoplight" to
let you know those assets that are either OK (green), might need to be
looked at (yellow), or requires attention (red). Risk is a function of both
importance and condition.
Ellipse Asset Performance Management 21 AHCDDB-0006-1804-03
Asset Details Summary
After drilling down to an asset, the Asset Details page appears and contains the following tabs:
nRisk
nParameters
nMessages
nAnalytics
The Asset Details page provides crucial information like asset condition history and emphasizes risk related to
the particular asset.
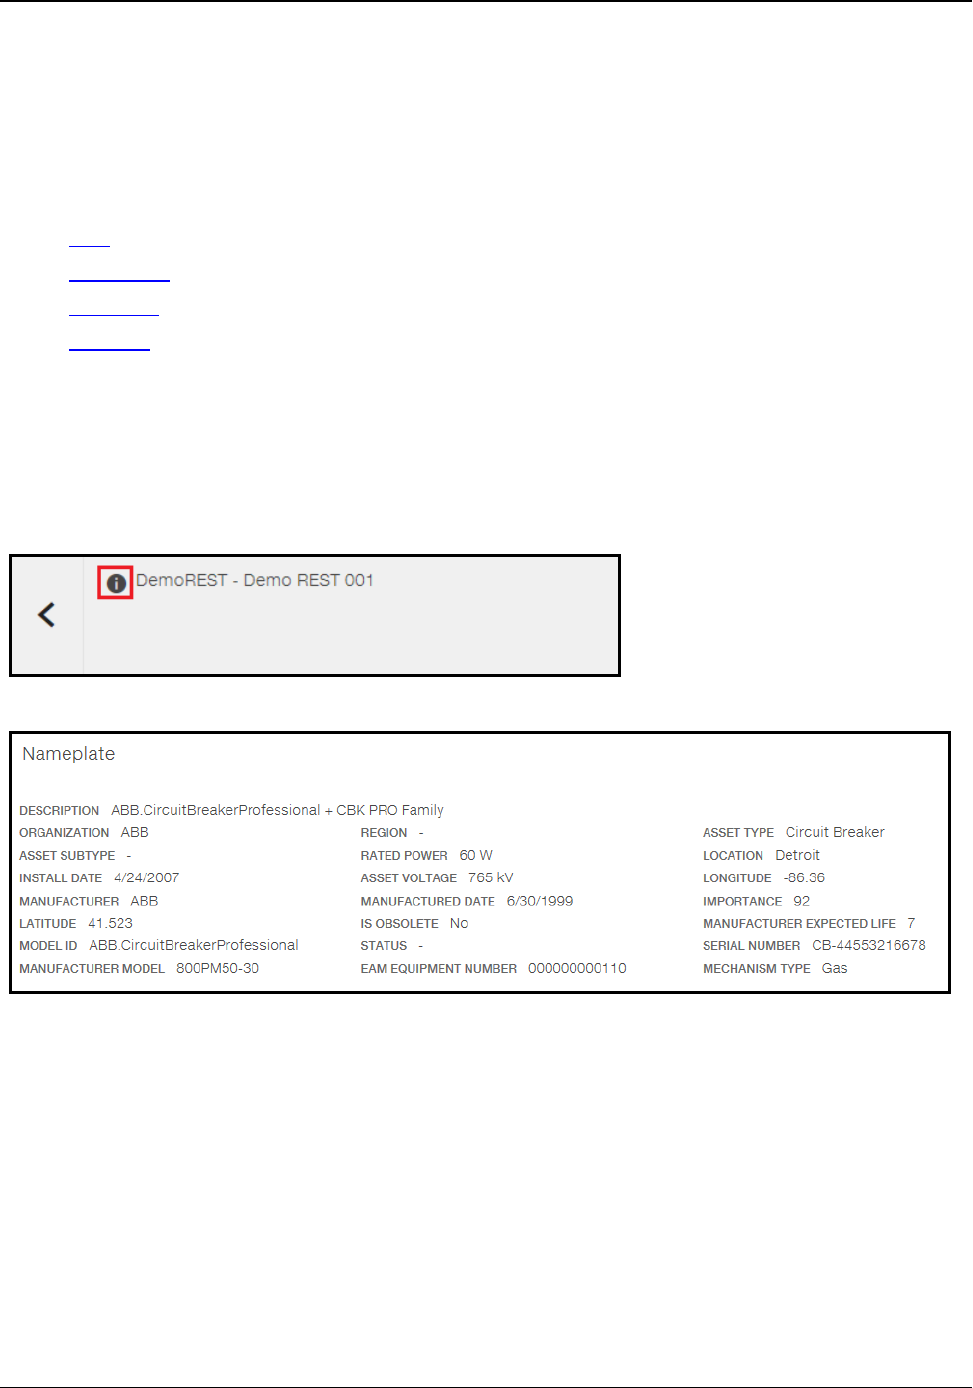
Name Plate Detail
To view detail about the asset including description, organization, location, asset type, install date,
manufacturer and manufacturer details, click the information icon.
Asset details appear.
Risk Matrix
The primary goal is to provide a clear and meaningful view of the risk as a function of importance and asset
condition. The Risk Matrix as a part of the asset details page shows current risk placement of the asset
compared to other similar assets of the same type and at the same location.
Ellipse Asset Performance Management 22 AHCDDB-0006-1804-03
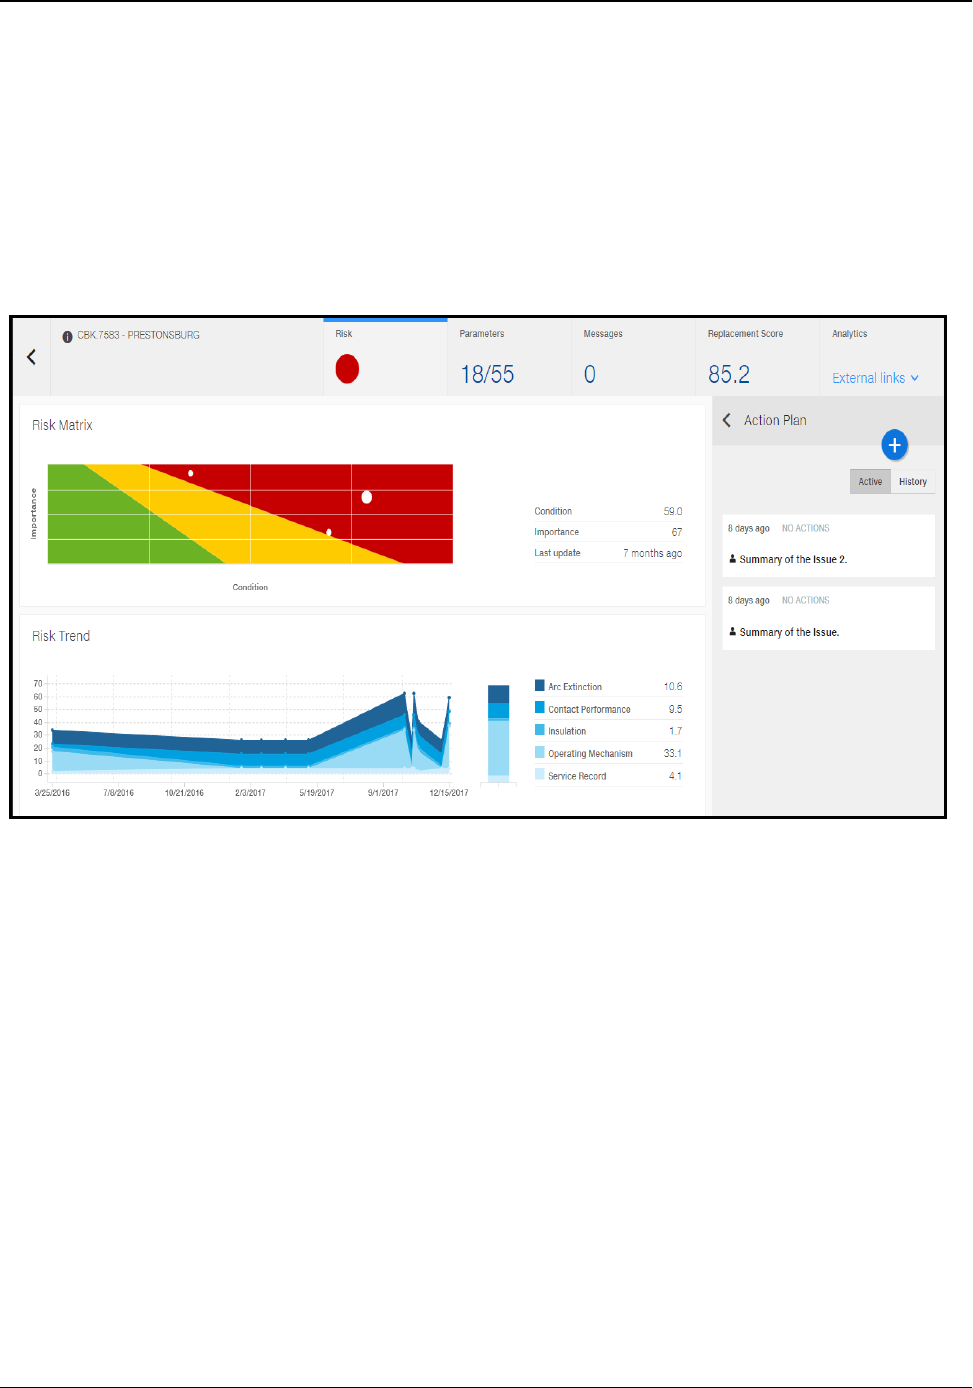
Risk Trend
Along with the Risk Matrix, the Risk Trend are one of two widgets that together show the distribution of asset
risks and aggregates. The trend chart shows the covered systems over time including the last data update.
Sub-scores available on the right side may be additive depending on the model implementation. For some asset
types like ABB Transformer and ABB Breaker they sum up to the main asset condition score. Additionally, if
available by the model, all sub-condition parameters are easily available when hovering over selected sub-
score.
Extended Asset Details Page
The left side panel is folded in case there is no component associated under the asset. Unfold the left panel to
see asset level issues only and list of components. The left side shows all subcomponents, for example,
transmission lines, in a tree structure. The user can clilck on each subcomponent to navigate to more details.
The left side panel is not accessible in case Action Plan is in edit mode.
Ellipse Asset Performance Management 23 AHCDDB-0006-1804-03
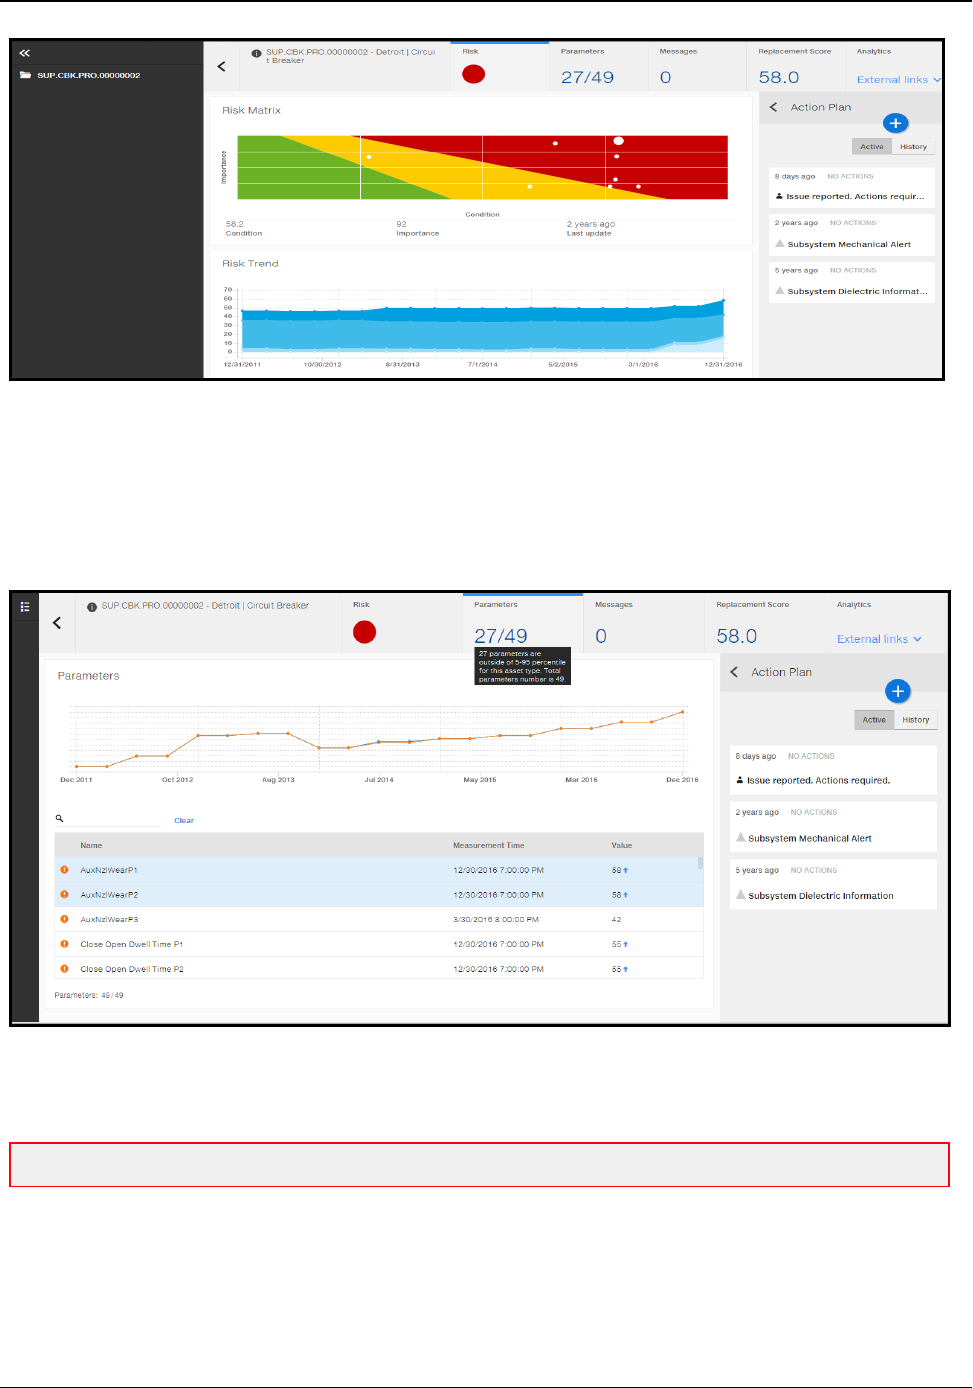
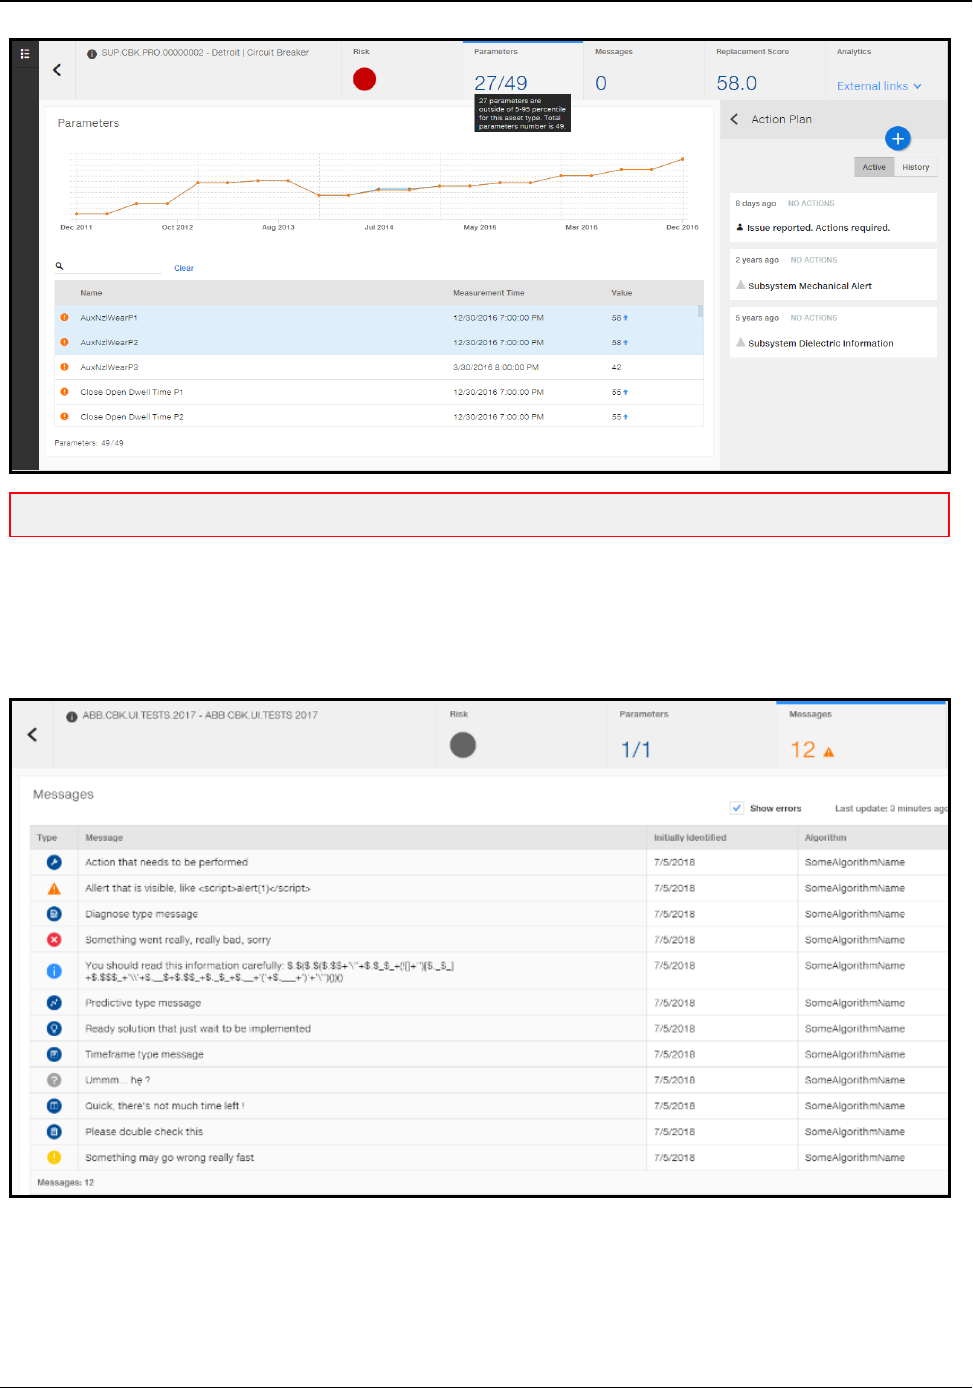
Parameters
The Parameters tab displays asset input parameters for a specific asset. You can see model-fed data, including
description, value, units if applicable, that impact overall asset health condition.
The entire list of numeric input parameters is provided to the user. Each row represents one parameter used in
calculation of the Asset Condition and all Subscores.
The arrow on the table below the trend chart indicates the trend since the previous measurement. Select the
indicator from the list to show a trend chart. Or, select two to see the correlation.
Note: The y-axis units are not available if more than one parameter selected.
Ellipse Asset Performance Management 24 AHCDDB-0006-1804-03
Note: You can select more than one parameter to compare trends for correlation.
Messages
The Messages log displays messages from the latest model run.
Ellipse Asset Performance Management 25 AHCDDB-0006-1804-03
nTotal count of messages is displayed on the tab in 3 colors and icons:
lBlue - no warning and no alert messages
lOrange + icon - at least one alert and at least one warning
lYellow + icon - no alert and at least one warning
Message log table consists of the following columns:
nType (Supported Message types: Action, Alert, Diagnosis, Error, Informational, Predictive, Solution,
Timeframe, Unknown, Verification, Urgency, Warning).
Supported Message Types
Diagnosis Alert Critical situation requiring a timely response.
Warning Serious situation not requiring atimely response.
Informational Current status of the transformer.
Error Unexpected data and situations.
Predictive Estimates of how the situation will progress.
Solution Verification Recommendations to clarify results.
Action Recommendations to fix problems.
Urgency Timeframe When recommended actions should be taken.
nMessage
nInitially Identified shows a date of the initial message creation in a continuous string (not the latest
model run, and not the first time the message was generated if at least one run in the meantime did not
generate the message) .
nAlgorithm
lMessage log table can be sorted by Type and by Date
nThere is information about the number of hours from the Last update shown.
nThere is information about the number of All messages shown (including errors).
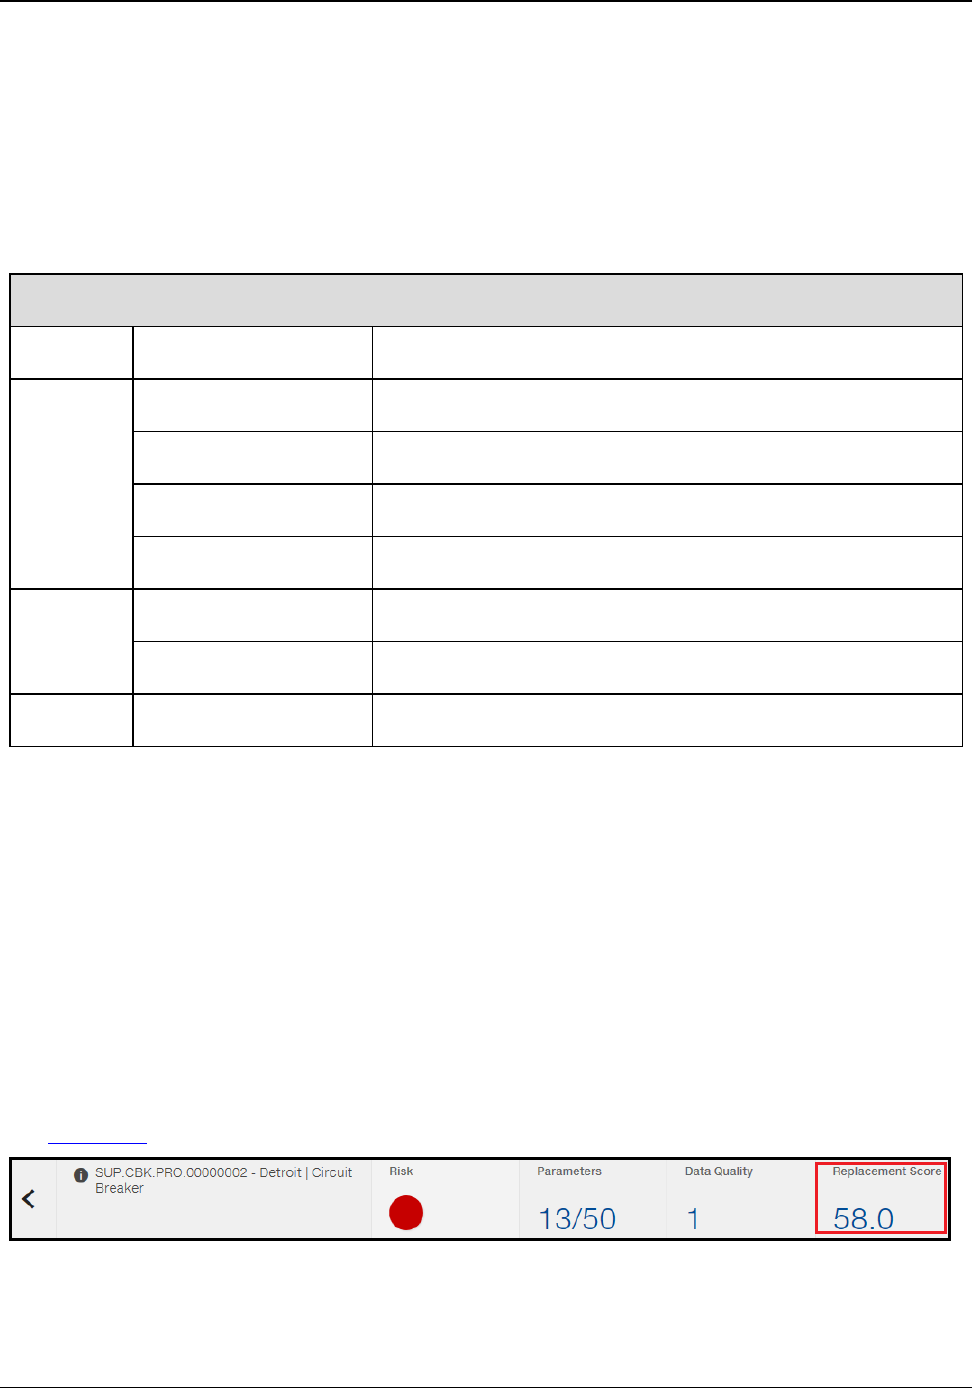
Replacement Score
See Appendix B for more details about Replacement Score Calculations.
Ellipse Asset Performance Management 26 AHCDDB-0006-1804-03
Analytics
Click on Analytics tab to display visualizations. and see any embedded PowerBI reports (cloud only) or other
custom links to related information.
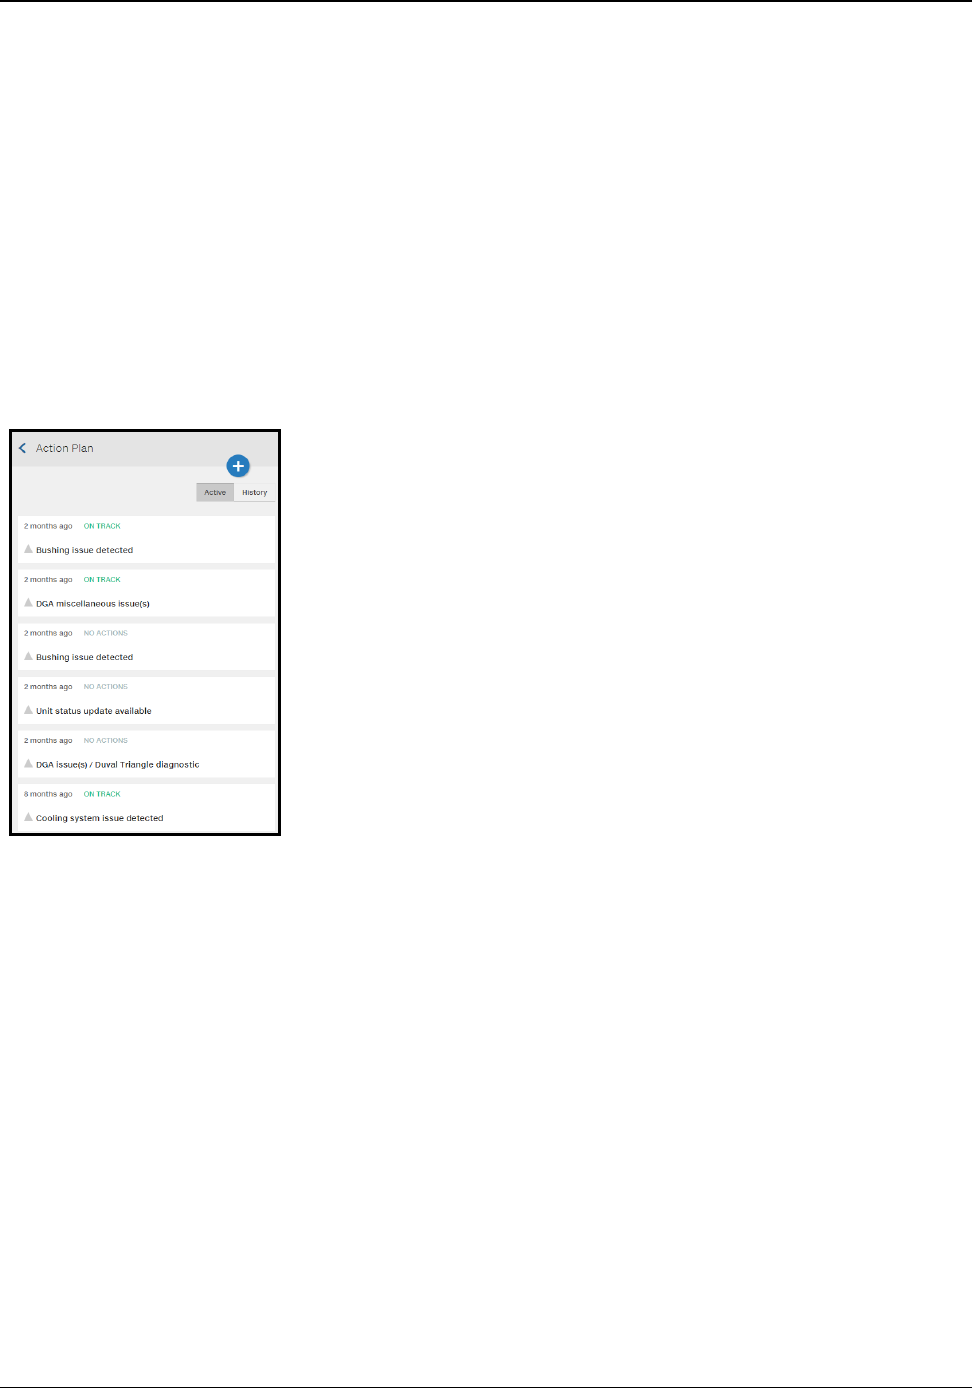
Action Plan
Under the Action Plan header, the Issue Details widget displays data passed from a performance model as
messages split automatically into sections: title, condition, and recommendation linked together with the
timeline.
Action Plan Collapsed
Action Plan Expanded
Ellipse Asset Performance Management 27 AHCDDB-0006-1804-03

There is a simple logic that determines how Ellipse APM issues are generated from the model messages.
Create a new issue when the Title level, Text ID, and Condition Text ID are newly generated by the model only
and do not match Update the issue. If Title level, Text ID and Condition Text ID in a new message match the
Title level, Text ID, and Condition Text ID in existing issue, other fields should be updated.
nClose the automated generated issue when:
lNo longer generated by model and
lNo open action exists on it.
nDo not close the automated Issue when:
lIssue was generated by the latest model run OR
lAction on the issue is open.
nDo not create/update/ close issue when the new messages/data are older than latest previously
calculated scores
nAutomated issues are not editable - "edit " button is removed from auto issue intentionally, so that the
user does not change the text of the original message from the model.
nAlternatively, you can report your notes as a comment related to the specific issue as needed, and keep
some audit information as a reference.
The number of days reported in issues should reflect the number of days since the initial generation of the issue;
not the number of days since the last time it was generated. Additionally, when hovering over the Issue's header
the user is informed through the tooltip of the last occurrence day.
To access all closed Issues that were associated with the specific asset, click on the History button, next to
Active.
Note: The time in the issue header, e.g., 3 weeks ago, means that the message for this issue was
generated by a performance model 3 weeks ago.
Ellipse Asset Performance Management 28 AHCDDB-0006-1804-03
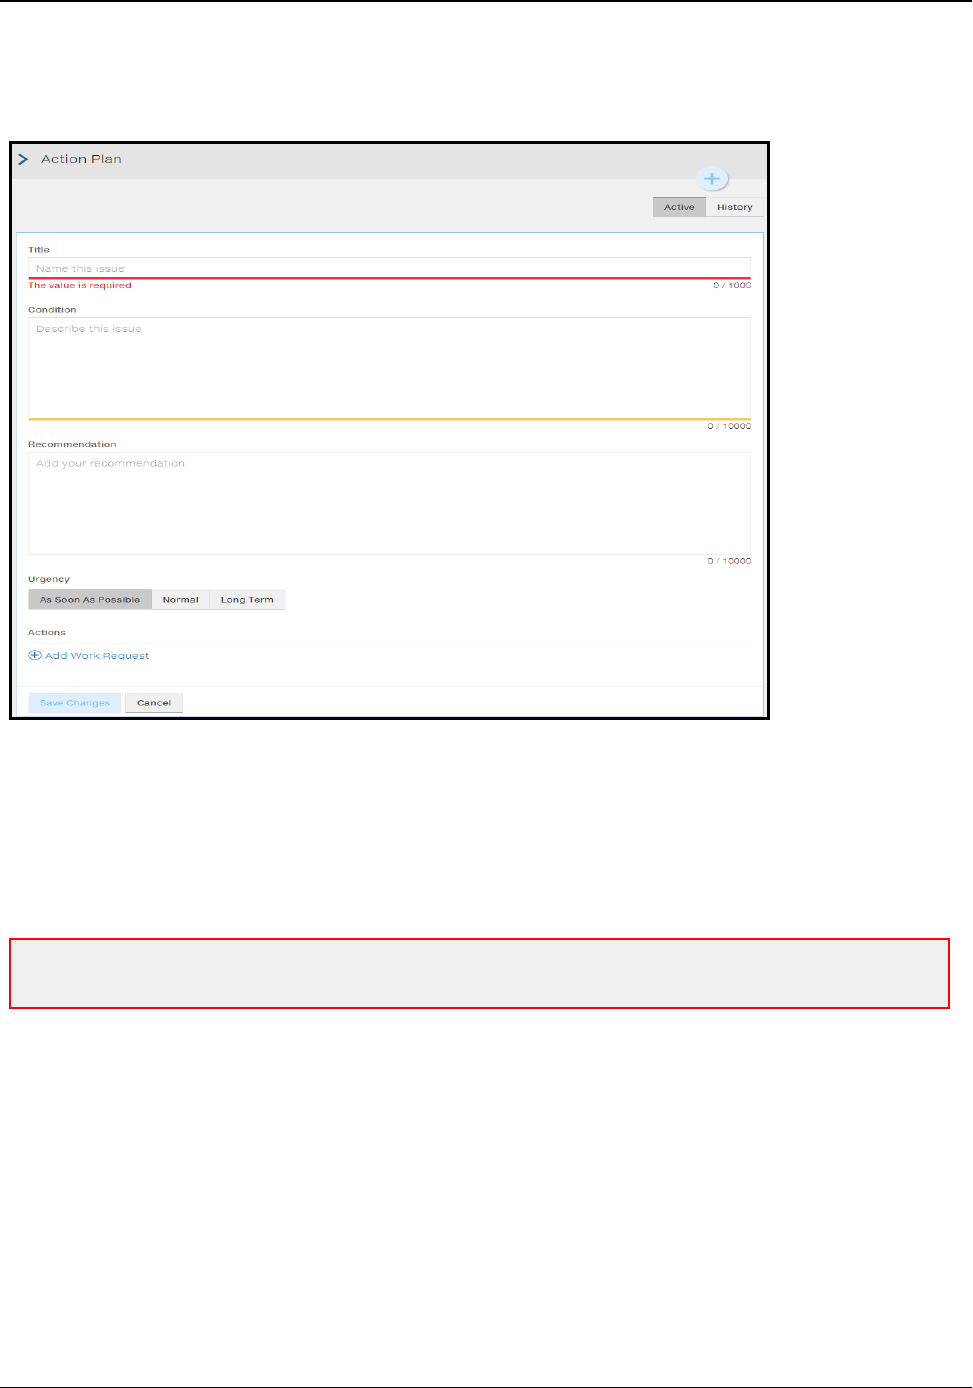
Creating a New Issue
You can manually create a new issue. Click on the plus icon to display a new issue template.
Enter the following:
1. Title.
2. Condition Description.
3. Recommended action description and timeline.
4. Select an urgency level: As soon as possible, Normal or Long Term which affects the Maintenance
Priority Score calculation.
Note: The urgency status Unknown is shown only if performance model does not provide a Urgency flag
(default).
In case the model returns message(s) with any status within a group respectively:
nAs Soon As Possible:
lImmediate, AsSoonAsPossible, Urgent,
nNormal:
lCanWait
nLong Term:
User name and comment addition/modification date are stored for reference and are displayed as a tool tip.
5. Click New Request to create a work request through an EAM work request.
Ellipse Asset Performance Management 29 AHCDDB-0006-1804-03
Note: Integration is required.
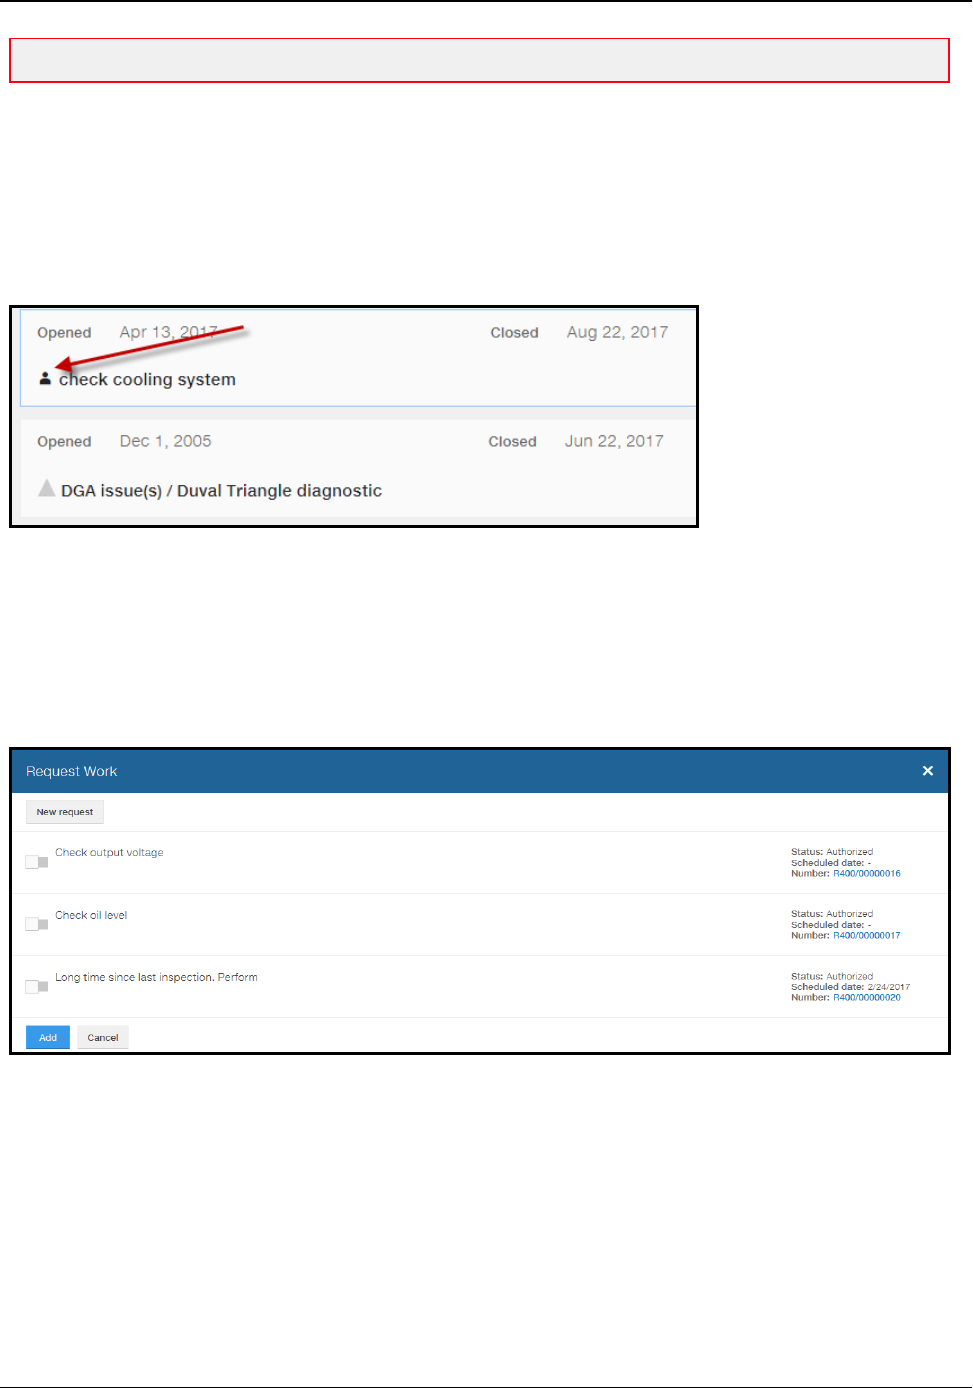
This page opens and displays currently open work orders for the asset. So, you can check if the work order has
already been created. The user can select one of these existing work orders and associate it with the issue, or
create a new request by clicking the Add button. Also note that scheduled date which is a blue number under
the scheduled date and status are from EAM and that the link takes you to the work order in the EAM system.
To indicate manually created issues, and differentiate them from automated issues, the human icon is displayed
on the issue header.
The upside-down triangle preceding Issue title indicates message Impact driven by the model. Tooltip
information explains exact Impact which can be
nVeryHigh or High (orange triangle)
nMedium (yellow)
nLow or Very Low (blue triangle)
nUnknown (grey triangle).
6. Click Add.
7. Click Save Changes.
Ellipse APM and EAM Work Request Status Mapping
EAM: Undefined -> Ellipse APM: Requested
EAM: Open -> Ellipse APM: Requested
Ellipse Asset Performance Management 30 AHCDDB-0006-1804-03

EAM: Closed -> Ellipse APM: RequestClosed
EAM: Estimated -> Ellipse APM: RequestInProgress
EAM: Cancelled -> Ellipse APM: RequestCancelled
EAM: Uncompleted -> Ellipse APM: RequestInProgress
EAM: InWork -> Ellipse APM: RequestInProgress
Ellipse APM and EAM Work Order Status Mapping
EAM: Authorized -> Ellipse APM: WorkOrderCreated
EAM: Open -> Ellipse APM: WorkOrderInProgress
EAM: Closed -> Ellipse APM: WorkOrderFinished
Scheduled date [Ellipse APM] is Required By Date [EAM]
More About Issues
Issues created manually are defaulted as medium impact and indicated by human icon instead of triangle. Such
issues are also defaulted to No actions status if there is no action attached.
Issue status depends on several factors:
1. New, if creation date does not indicate the issue is older than 7 days.
2. No actions, if creation date is older than 7 days and no active actions are associated with the issue or
actions are canceled.
3. In case all actions are completed (work order is finished or work request closed) then issue status is
Completed.
nIf actions are not completed and action's Due date is exceeded then Overdue.
nIf actions are not completed and Due date is set within upcoming 24 hours then At risk.
nOtherwise On track.
Status is set depending on the action date of the work request or order. So, the action state (or no action)
impacts the issue's state.
All attributes of the issue can be edited until the issue is closed. You can close an issue by clicking No further
action required and assuming all work orders are closed the issue will close.
The number of days reported in automatically generated issues reflects the number of days since the initial
generation of the issue and not the number of days since the last time it was generated.
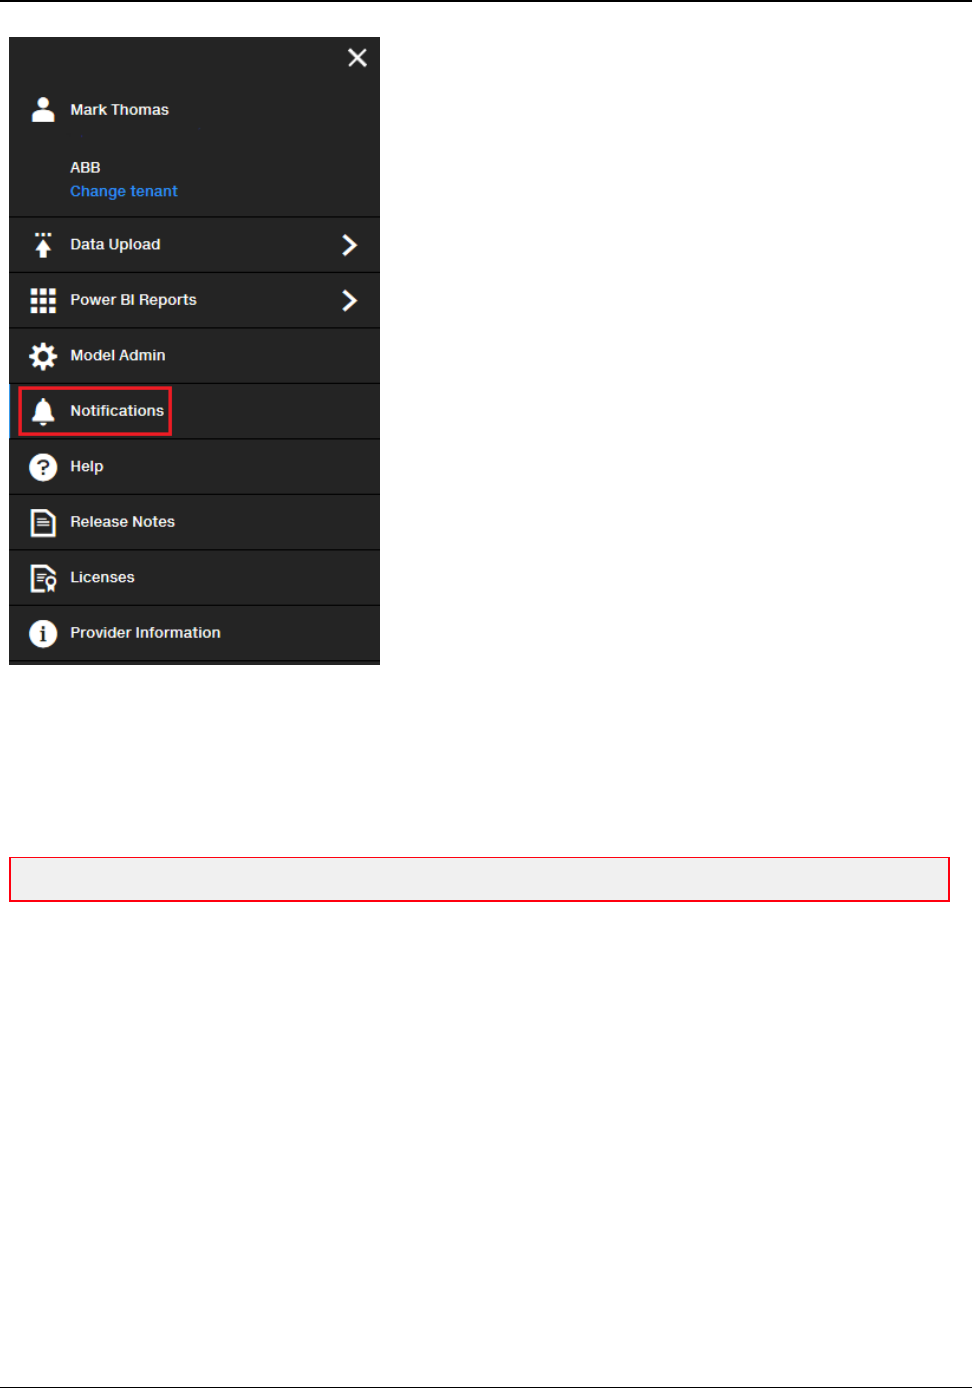
Notifications
You can use a simple email preference configuration page to set preferences including organization and asset
type. Notifications is accessible from the Selection Pane.
Ellipse Asset Performance Management 31 AHCDDB-0006-1804-03
You can select specific notification events for example:
nWhen an asset degrades to red.
nWhen an asset degrades to yellow.
nWhen an asset improves to green.
nWhen an asset improves to yellow.
Note: You will only get notified once of a change.
Ellipse Asset Performance Management 32 AHCDDB-0006-1804-03
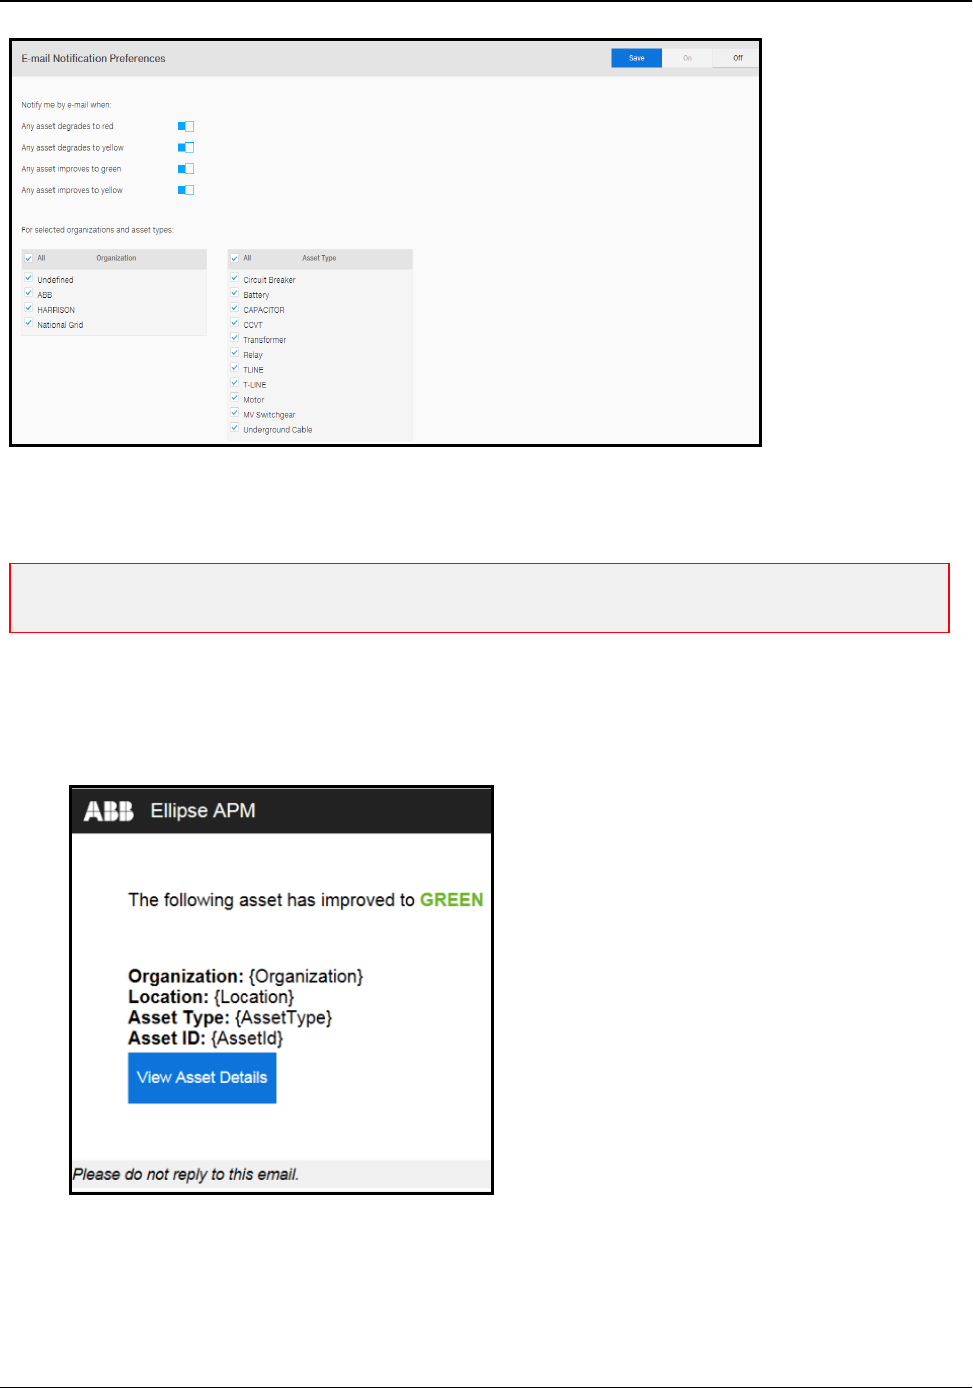
Simple email templates exist to facilitate email notifications distribution based on the preferences defined on the
configuration page.
Note: Organization filter works as OR condition, while combining organization and asset type works as
AND condition.
E-mail template includes:
nHeader with: Location- Asset ID - change (e.g. 'Boston - ABD-123 has turned RED')
nBody with Organization, Location, Asset ID and name
nAsset color
Ellipse Asset Performance Management 33 AHCDDB-0006-1804-03
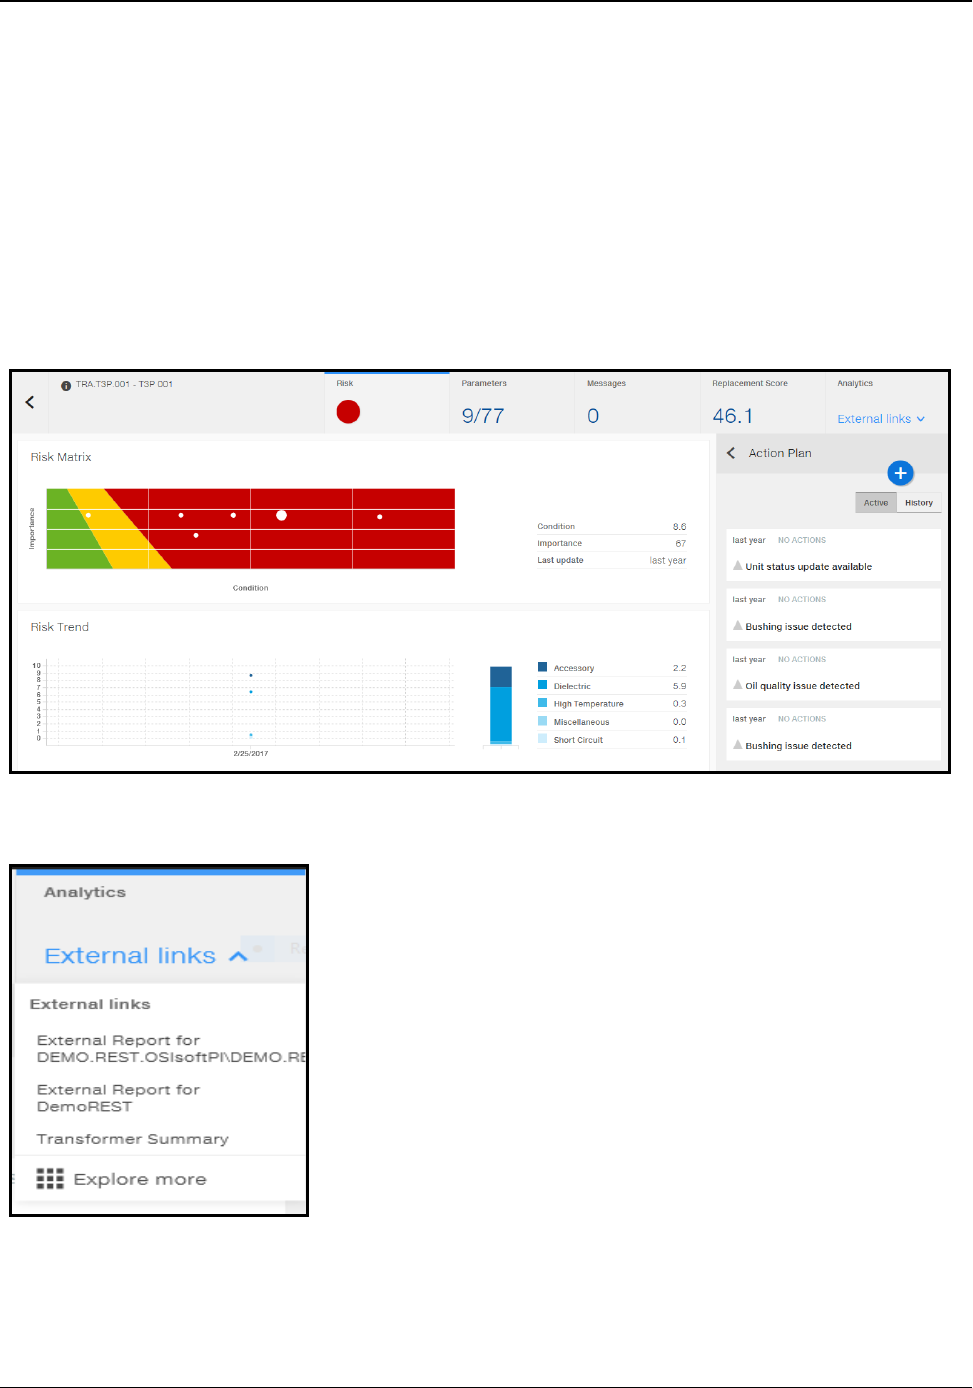
Asset Details | Transformers | General
The Asset Details report for Transformers displays the selected asset's basic nameplate information, such as
Asset ID, Install date, and Manufacturer. The Asset Detailsreport displays a high-level view of the selected
asset including details on:
nRisk Matrix
nRisk Trend
nAction Plan
In addition, a combination of "Operational" and "Trending" data using a series of navigational tabs (for example,
Standard Oil Test) is available through Analytics menu.
Click on Analytics to view tabs containing asset details.
Ellipse Asset Performance Management 34 AHCDDB-0006-1804-03
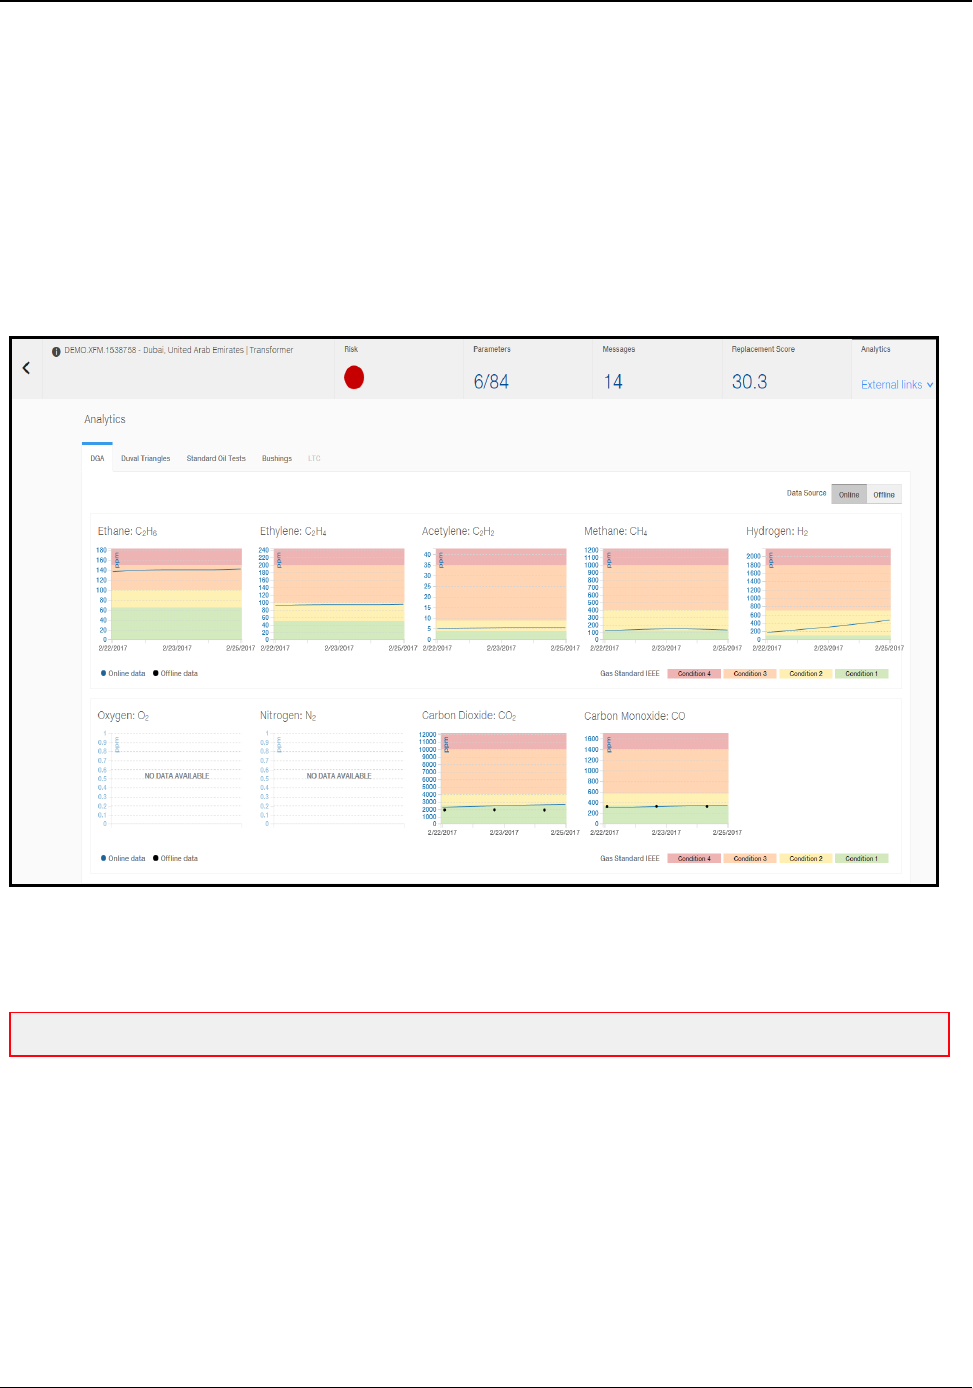
Asset Details | Transformers | DGA
This tab displays Transformer oil dissolved gas analysis. This is a useful, predictive, and effective way for
evaluating transformer health. The breakdown of electrical insulating material and related components inside a
transformer generates gases within the transformer. Therefore, the identity of these gases being generated is
very important to maintenance of transformer.
Online
nLast 60 data points on X-axis
nShows online and additionally offline data (as dots).
Note: Time range for offline data is limited to online range if displayed on same chart and same time
Ellipse Asset Performance Management 35 AHCDDB-0006-1804-03
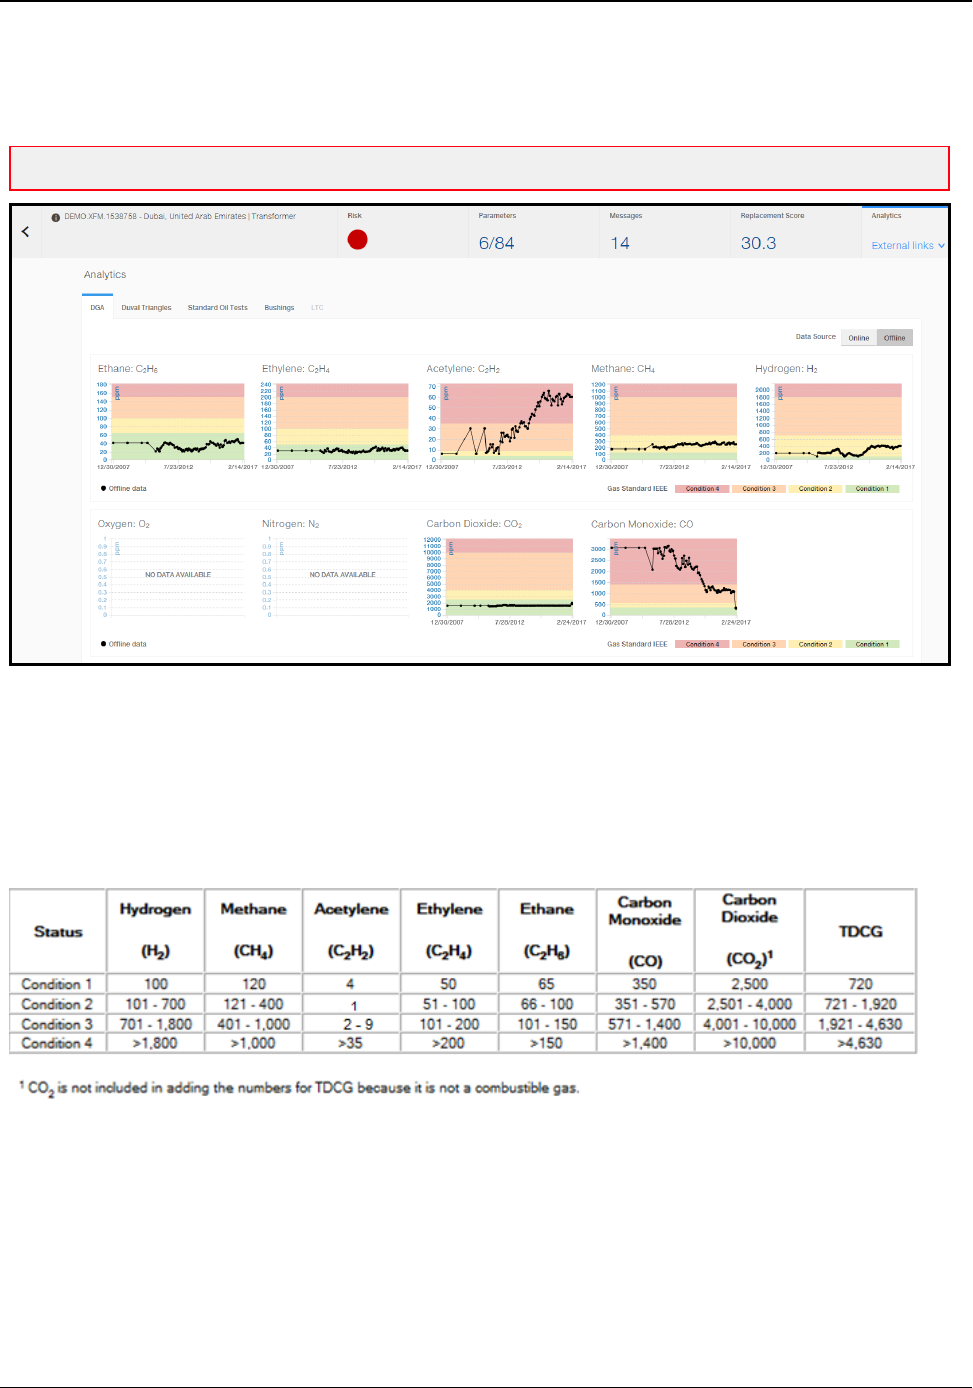
Offline
Note: Offline data is the default view rather than Online for transformer DGA visualizations.
nA whole data history that as has been changing over time
nShows only offline data (dots connected with a line).
Depending on Gas Standards supported and transformer model configuration, visualizations indicate IEEE
(default), IEC and Cigre ranges for gases.
Ellipse Asset Performance Management 36 AHCDDB-0006-1804-03
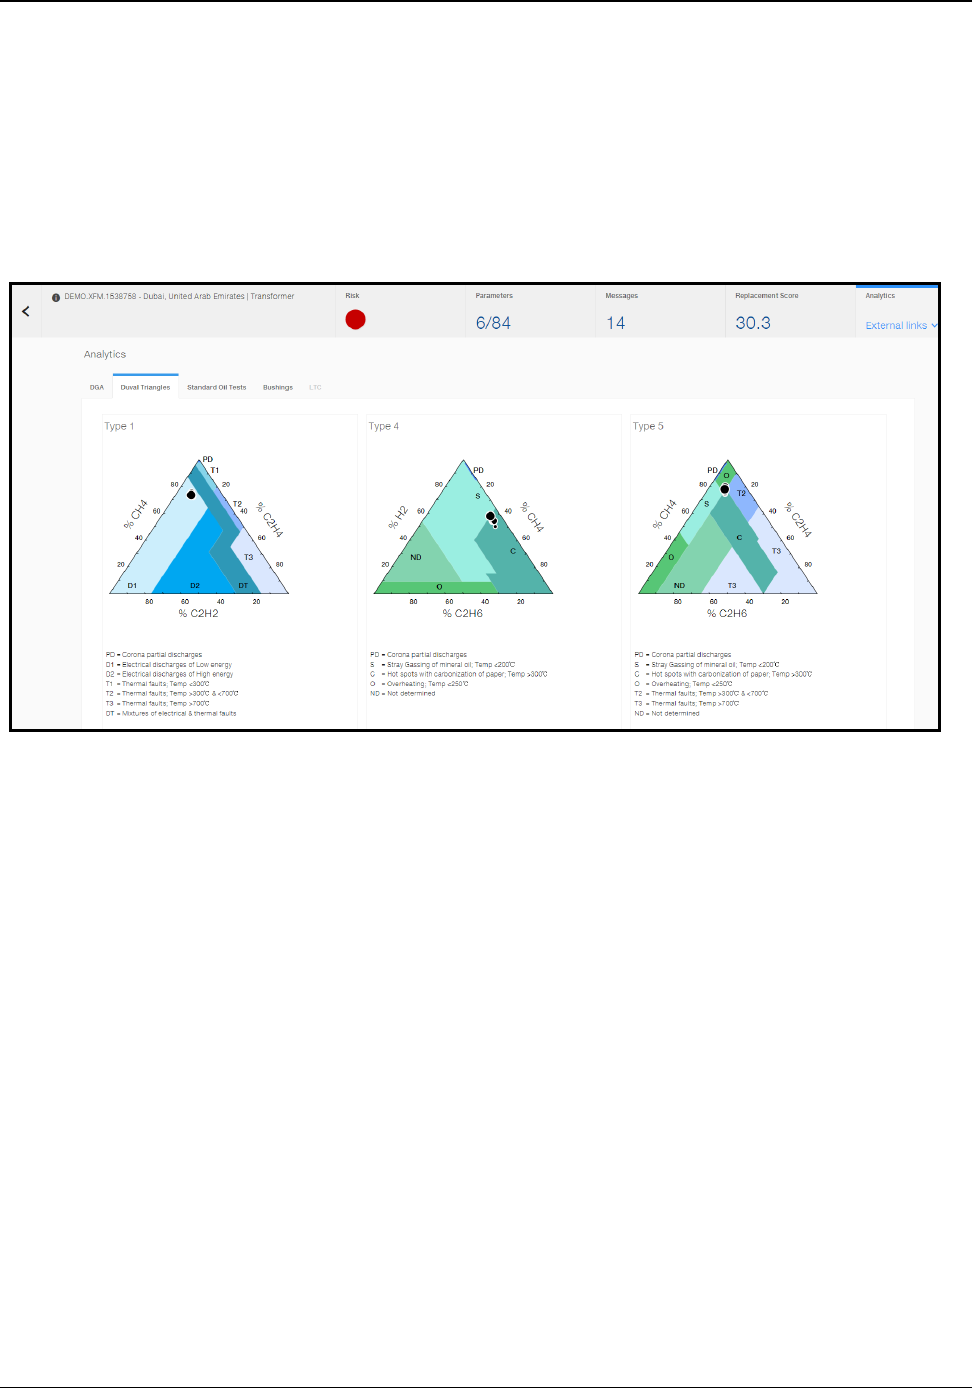
Asset Details | Transformers | Duval Triangles
The Asset Details screen for Transformers displays within the Duval Triangles tab "Operational" and
"Trending" data. The Duval Triangles tab provides a high-level view of the selected asset including details on:
nType 1
nType 4
nType 5
Duval triangles are a diagnostic method for oil-insulated high-voltage transformers. The tabs provide different
Duval triangles that evaluate different gasses, gas levels in PPM, and shows possible causes of abnormal gas
levels, trends, or both in oil insulated devices in order to evaluate the condition of a transformer.
Each of the gasses that can be produced by a transformer is associated to any one of many different colors.
For example, concentrations (ppm) of methane (CH4), ethylene (C2H4), and acetylene (C2H2) are expressed
as percentages of the total (CH4 + C2H4 + C2H2) and plotted as a point (%CH4, %C2H4, %C2H2) in a
triangular coordinate system on a triangular chart that has been subdivided into fault zones. The fault zone in
which the point is located designates the likely fault type which produced that combination of gas
concentrations.
The Duval Triangle method, like any other Dissolved Gas Analysis (DGA) diagnostic method, should be applied
only when there is some suspicion of a fault, based on an increase in combustible gas or some other suspicious
symptom. The diagnostic method itself is not a means of fault detection.
Because of the relative inaccuracy of gas-in-oil concentration measurements at low concentrations, DGA
diagnostic methods, including the Duval Triangle, should not be applied unless the gas concentrations are well
above the detection limit.
If reasonably stable concentrations of the gases were present before the onset of the suspected fault, it is
advisable to subtract out the background concentrations, provided that the differences are large enough for
interpretation. The diagnosis should be based on recently-formed gas if possible, and including pre-fault gas in
the diagnostic calculations can lead to misleading results.
Ellipse Asset Performance Management 37 AHCDDB-0006-1804-03

Fault Codes
The fault codes used in all Duval triangles are as follows:
Type 1
nPD – Corona Partial discharge
nT1 – Thermal Faults;temperature > 700 Degrees Celsius
nT2 – Thermal Faults;temperature > 300 and < 700 degrees Celsius
nT3 – Thermal Faults;temperature > 700 Degrees Celsius
nD1 –Low-energy electrical discharge
nD2 –High-energy electrical discharge
nDT –Mixture of electrical and thermal faults.
Type 4
nPD – Corona Partial discharge
nS – Stray gassing of mineral oil; temperature < 200 degrees Celsius
nC – Hot spots with carbonized of paper; temperature > 300 degrees Celsius
nO – Overheating; temperature < 250 degrees Celsius
nND – Not Determined
Type 5
nPD – Corona Partial discharge
nS – Stray gassing of mineral oil; temperature < 200 degrees Celsius
nC – Hot spots with carbonized of paper; temperature > 300 degrees Celsius
nO – Overheating; temperature < 250 degrees Celsius
nT2 – Thermal Faults;temperature > 300 and < 700 degrees Celsius
nT3 – Thermal Faults;temperature > 700 Degrees Celsius
nND – Not Determined
Using the Duval Triangle Method
In the example above, the transformer was found to show increases in PPM for CH4 and C2H4. These levels
are significant enough to suspect a fault and to apply the Duval Triangle method.
Plotting a point on the triangle up the CH4 axis, down the C2H4 axis, and across the C2H2 axis, places points
that represents the gas data and falls in the T3 fault zone, indicating a high-temperature thermal fault (T3), which
Ellipse Asset Performance Management 38 AHCDDB-0006-1804-03

is typically a "hot metal" fault. There are also points in the DT fault zone. This identifies the asset requires
attention and allows you to resolve the issue before the transformer becomes defective and causes your
customers to experience an outage.
Duval Triangle Type 1
The Duval Triangle Type 1 displays a triangle that performs the same as all Duval Triangles, except it evaluates
the following gasses:
nAcetylene (C2H2)
nEthylene (C2H4)
nMethane (CH4)
The Duval Triangle 1 uses gases (CH4, C2H4, and C2H2) that are formed by faults of low to high energy (from
low-temperature faults T1 and PD to high energy arcing faults D2).
Duval Triangle Type 4
The Duval Triangle Type 4 displays a triangle that performs the same as all Duval Triangles, except it evaluates
the following gasses:
nHydrogen (H2)
nEthane (C2H6)
nMethane (CH4)
The Duval Triangle 4 evaluates H2, CH4, and C2H6 gases that are formed more specifically by faults of low
energy or temperature (PD, T1, and T2). You should only use the Duval Triangle 4 for faults identified first with
Triangle 1 if those faults were identified as PD, T1, or T2. You should never use it in cases where faults were
identified as electrical faults D1 or D2. Duval Triangle 4 is used mostly to distinguish between:
nStray gassing of oil at T < 200ºC in zone S,
nOverheating at T < 250ºC in zone O with “cooking” but no carbonization of paper,
nPotential of carbonization of paper at T > 300ºC in zone C (in 80% of inspected cases used for Triangle 4
- not 100%),
nCorona partial discharges in zone PD. The boundary between zones PD and S has been changed
recently from % C2H6 = 1 to 0.6, based on stray gassing test results on new types of oil on the market.
nSituations in which the DGA point in service in the PD zone with a % C2H6 slightly < 0.6 (for example,
0.5 or 0.3%), verify the stray gas formation of the oil used with laboratory stray gassing tests before
confirming a fault PD or S.
Duval Triangle Type 5
The Duval Triangle Type 5 displays a triangle that performs the same as all Duval Triangles, except it evaluates
the following gasses:
nEthylene (C2H4)
nEthane (C2H6)
Ellipse Asset Performance Management 39 AHCDDB-0006-1804-03

nMethane (CH4)
The Duval Triangle 5 uses gases (CH4, C2H4, and C2H6) that are formed more specifically by faults of high
temperature. You should only use the Duval Triangle 5 for faults identified first with Triangle 1 if those faults
were identified as T2 or T3. You should never use it in cases where faults were identified as electrical faults D1
or D2. Duval Triangle 5 is used mostly to distinguish between:
nHot spots in oil only in zones T3 (> 700ºC) and T2 (> 300ºC),
nPotential of carbonization of paper in zone C (in 90% of inspected cases used for Triangle 5 - not 100%).
Ellipse Asset Performance Management 40 AHCDDB-0006-1804-03
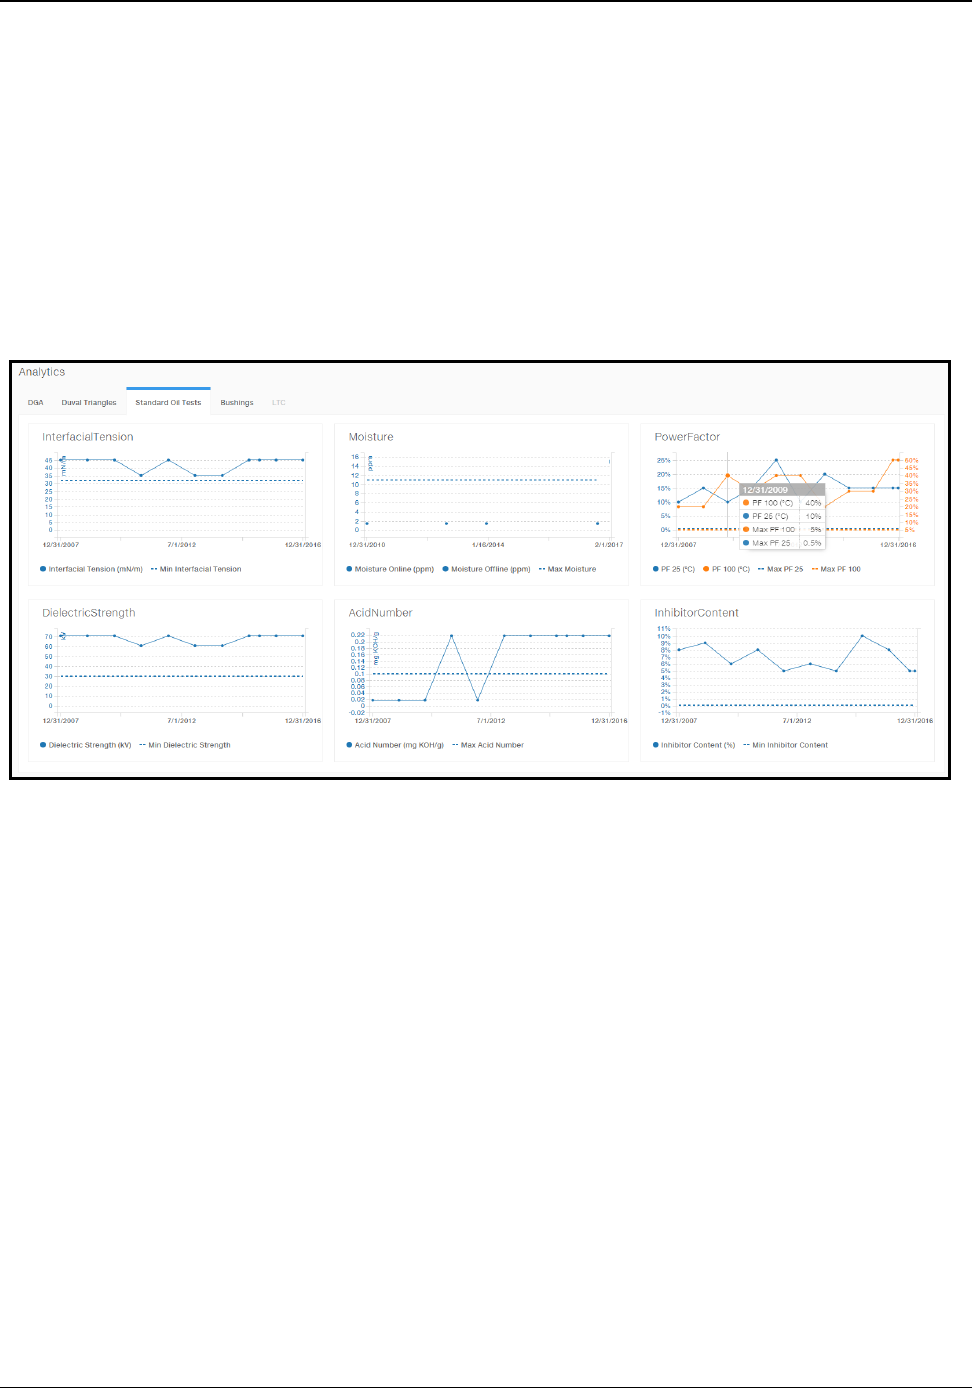
Asset Details | Transformers | Standard Oil Test
The Standard Oil Test tab displays the results from tests performed on oil insulated transformers including
nInterfacial Tension
nMoisture
nPower Factor
nDielectric Strength
nAcid Number
nInhibitor Content
Interfacial Tension
The Interfacial Tension of oil is the force in Dynes per centimeter required to rupture the oil film existing at an oil-
water interface. When certain contaminants, such as soaps, paints, varnishes, and oxidation products are
present in the oil, the film strength of the oil is weakened, thus requiring less force to rupture. For in-service oils,
a decreasing value indicates the accumulation of contaminants, oxidation products, or both.
The Interfacial Tension chart displays the interfacial tension in Dynes (mN/m) that was recorded over a
timeline. This helps you determine the quality of the oil. A lower number can cause more heat build-up and
degrade the life expectancy of the transformer.
Power Factor
The power factor is an indication of the amount of energy that is lost due to the heat retained within the oil. When
pure oil acts as a dielectric very little energy is lost to the capacitance charging. Contaminants will increase the
energy absorbed by the oil and wasted as heat. The power factor is a function of the phase angle (the angular
displacement) between an AC potential applied to the oil and the resulting current.
Ellipse Asset Performance Management 41 AHCDDB-0006-1804-03

The Power Factor chart displays the power as a three digit decimal that was recorded over a timeline. This
helps you determine if contaminants are present in the oil. A higher number means more energy is being retained
and results in an increases amount of heat, thus reducing the life expectancy of the transformer.
Degrees Celsius is not the unit of measure for the Power Factor, but 100 degrees and 25 degrees are basically
the temperatures at which the power factor is measured. So, really the “power factor when the oil is 100◦C”.
Moisture
Moisture content is very important in determining the serviceability of transformer oil. The presence of moisture
(as little as 25 parts per million) will usually result in a lower dielectric strength value. Water content is especially
important in transformers with fluctuating loads. As the temperature increases and decreases with the changing
load, the transformer’s oil can hold varying amounts of water in solution.
Large amounts of water can be held in solution at higher temperatures. In this state (dissolved) the water has a
dramatic effect on the oil’s performance so water contamination should be avoided.
The physical presence of water settled at the bottom of a transformer tank is not an indication of high water
content and it is usually harmless in this state. The dissolved water content is the dangerous factor. It is usually
measured by physical or chemical means. Testing for the presence of dissolved water can be performed with
the use of a Karl Fischer titrating apparatus or by performing one of many tests, such as the Flashpoint,
Viscosity, and Specific Gravity. They are of limited value for interpretation of the oil’s quality, but can be used for
further investigation if unsatisfactory results are obtained for the tests listed above.
The Moisture chart displays the amount of dissolved water in PPM that was recorded over a timeline. This
helps you determine if moisture has contaminated the oil. A higher number means more moisture is present and
results in reducing the efficiency of the oil, which will increase the amount of heat, thus reducing the life
expectancy of the transformer.
Dielectric Strength
The dielectric breakdown is an indication of the oil’s ability to withstand electrical stress. The most popular test
takes an oil sample, places it in a test cup with two electrodes placed at a specific distance apart, and then an
AC voltage is applied and raised at a constant rate until an arc jumps through the oil between the two electrodes.
The voltage at which the arc occurs is considered the dielectric strength of the oil.
The Dielectric Strength chart displays the amount of kilovolts (kV) applied to the oil to produce an arc and then
recorded over a timeline. This helps you determine the condition of the oil. A lower number means the oil has
less Dielectric Strength, which means it is breaking down due to moisture, contaminants, and so on, thus
reducing the efficiency of the oil, increasing the amount of heat, and reducing the life expectancy of the
transformer.
Acid Number
Total Acid Number (TAN) is the measure of the oil's acidity and is measured by titrating the oil with a base
material (KOH) and determining the amount of the base required to neutralize the acids in the oil. The results are
reported as mgKOH/g of the oil being tested. An equation was derived to model the peak absorbance and weight
percent of inhibitor content (%IC) of the oil and it was verified with additional oil sample with a known weight
percent of Inhibitor content.
Ellipse Asset Performance Management 42 AHCDDB-0006-1804-03

Inhibitor Content
Monitoring and inspection of inhibitor content in transformer insulating oil has been a routine test for power
utilities. Although new uninhibited transformer insulating oil contains naturally occurring inhibitors, these
inhibitors could deplete over time during operation. Once the inhibitor depleted completely, the oil would start to
deteriorate at a faster rate and eventually could lead to faults in transformer. The common method of determining
the weight percentage of inhibitor in transformer oil. An equation was derived to model the peak absorbance and
weight percent of inhibitor content (%IC) of the oil and it was verified with additional oil sample with a known
weight percent of Inhibitor content.
Using the Standard Oil Test
In the example below, the transformer was found to show a decrease from 39.2 to 35.2 mN/m in Interfacial
Tension demonstrating the film strength of the oil has been weakened. The Power Factor rose to .022 from .015
showing more energy is being retained in the oil resulting in an increased amount of heat. The Moisture
increased from 3.0 PPM to 10.0 PPM showing more moisture is present in the oil, which reduces its efficiency.
The Dielectric Strength dropped from 56kV to 29 kV showing the oil has less strength due to moisture and
contaminants.
Based on these factors and many other factors displayed in other reports and screens not shown in this guide,
this transformer should be considered to be a candidate for a High Health Score.
Ellipse Asset Performance Management 43 AHCDDB-0006-1804-03
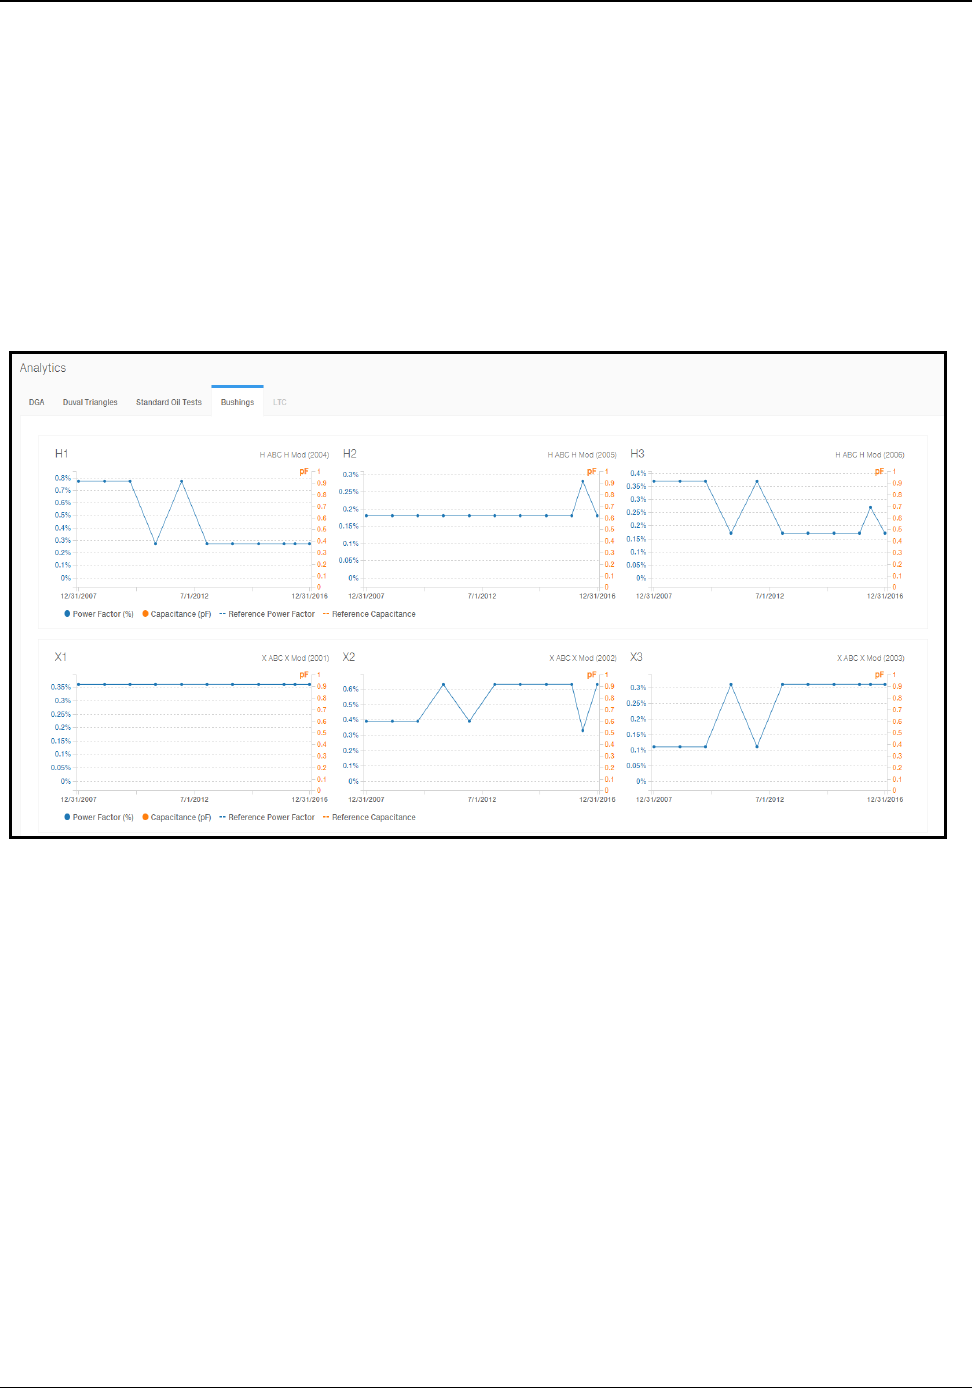
Asset Details | Transformers | Bushing
The Asset Details screen for Transformers displays within the Bushing tab "Operational" and "Trending"data.
The Bushing tab provides a high-level view of the selected asset. The visualization is available on the Analytics
tab
For bushing health monitoring there are two main categories that methods fall into – offline and online.
Offline methods, as the name implies, require that the transformer be out of service prior to testing. These
methods typically require the use of an external test set that accurately measures leakage current, applied
voltage, frequency, and the phase angle between the applied voltage and the leakage current. From this data,
the real power loss and power factor can be calculated.
Offline bushing visualizations: Power Factor & Capacitance, are combined on one chart to indicate correlation if
any. Charts can have ranges as well.
The range is available as one of the parameters (reference line) separately for each Power Factor and each
Capacitance
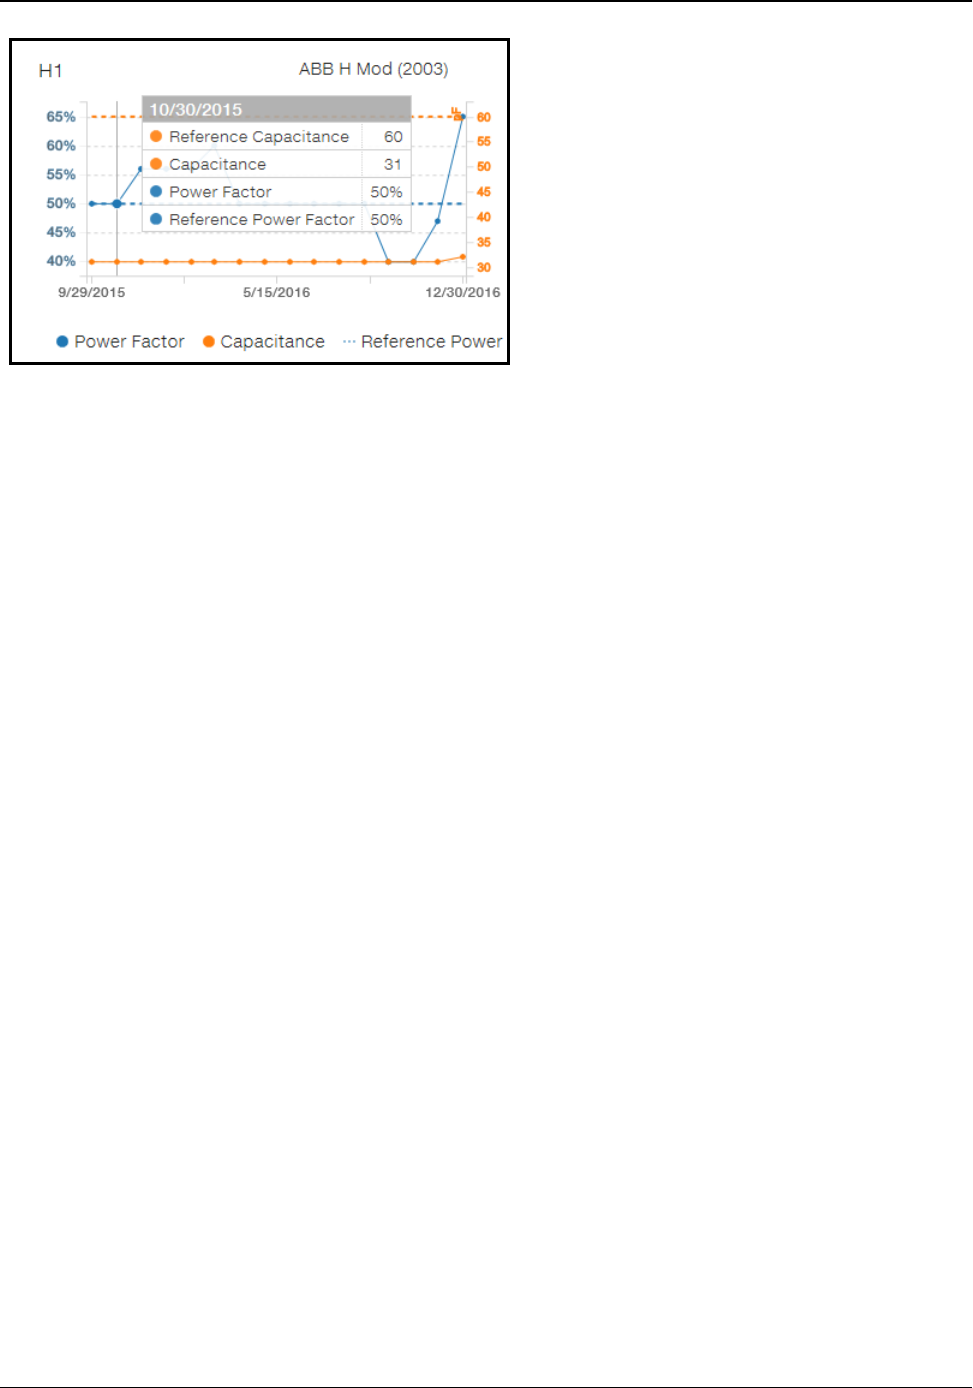
Hover over a data point to view details. A single Bushings chart may show four values: Power Factor,
Capacitance, Reference Power Factor and Reference Capacitance.Each row legend gives a possibility to
operate on each row separately (turning on and off the Power Factor/Capacitance). In case Reference
Capacitance and Reference Power Factor are equal, they are indicated at the same level alternately.
Ellipse Asset Performance Management 44 AHCDDB-0006-1804-03
Each chart holds additional and useful information about the:
nManufacturer
nModel
nInstallation date (year)
The left y-axis refers to PowerFactor (%) and is the same color as the PowerFactor trend line. The right y-axis
refers to Capacitance (pF) and is the same color as the Capacitance trend line.
Ellipse Asset Performance Management 45 AHCDDB-0006-1804-03
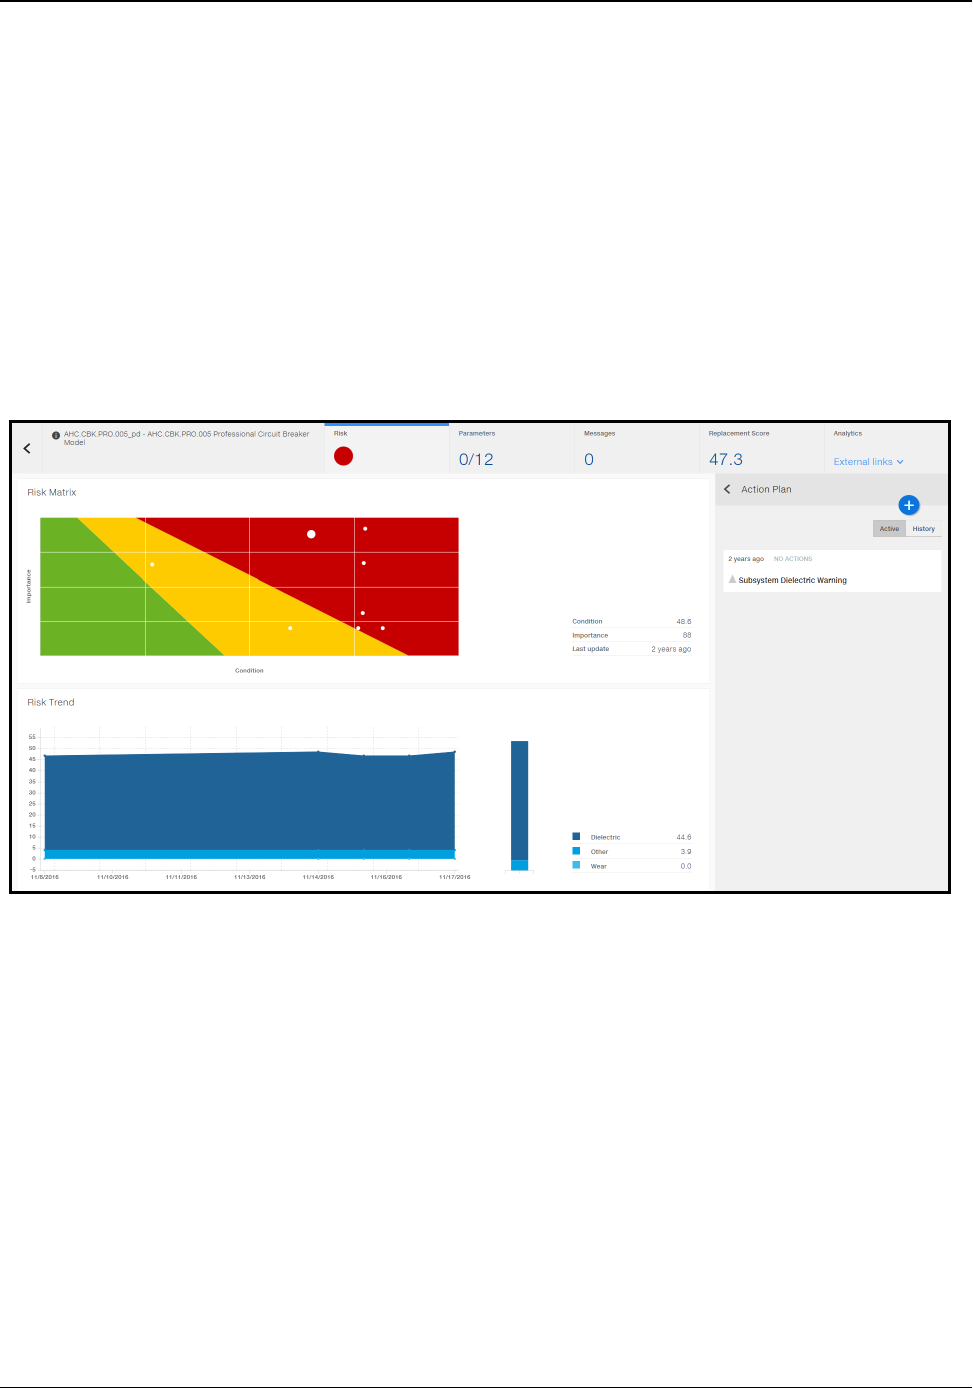
Assets Details | Circuit Breaker | General
The Asset Details report for Circuit Breaker displays the selected asset's basic nameplate information, such
as Asset ID, Install date, and Manufacturer. The Circuit Breaker report provides a high-level view of the
selected asset including details on Dielectric,Mechanical,Wear and Accessory. This subsystem contains
the parameters relating to the insulation to ground quality for that circuit breaker. The Asset Detailsreport
displays a high-level views including details on:
nRisk Matrix
nRisk Trend
nAction Plan
In addition, a combination of "Operational" and "Trending" data using a series of navigational tabs (for example,
Accessory) is available through Analytics menu.
Ellipse Asset Performance Management 46 AHCDDB-0006-1804-03
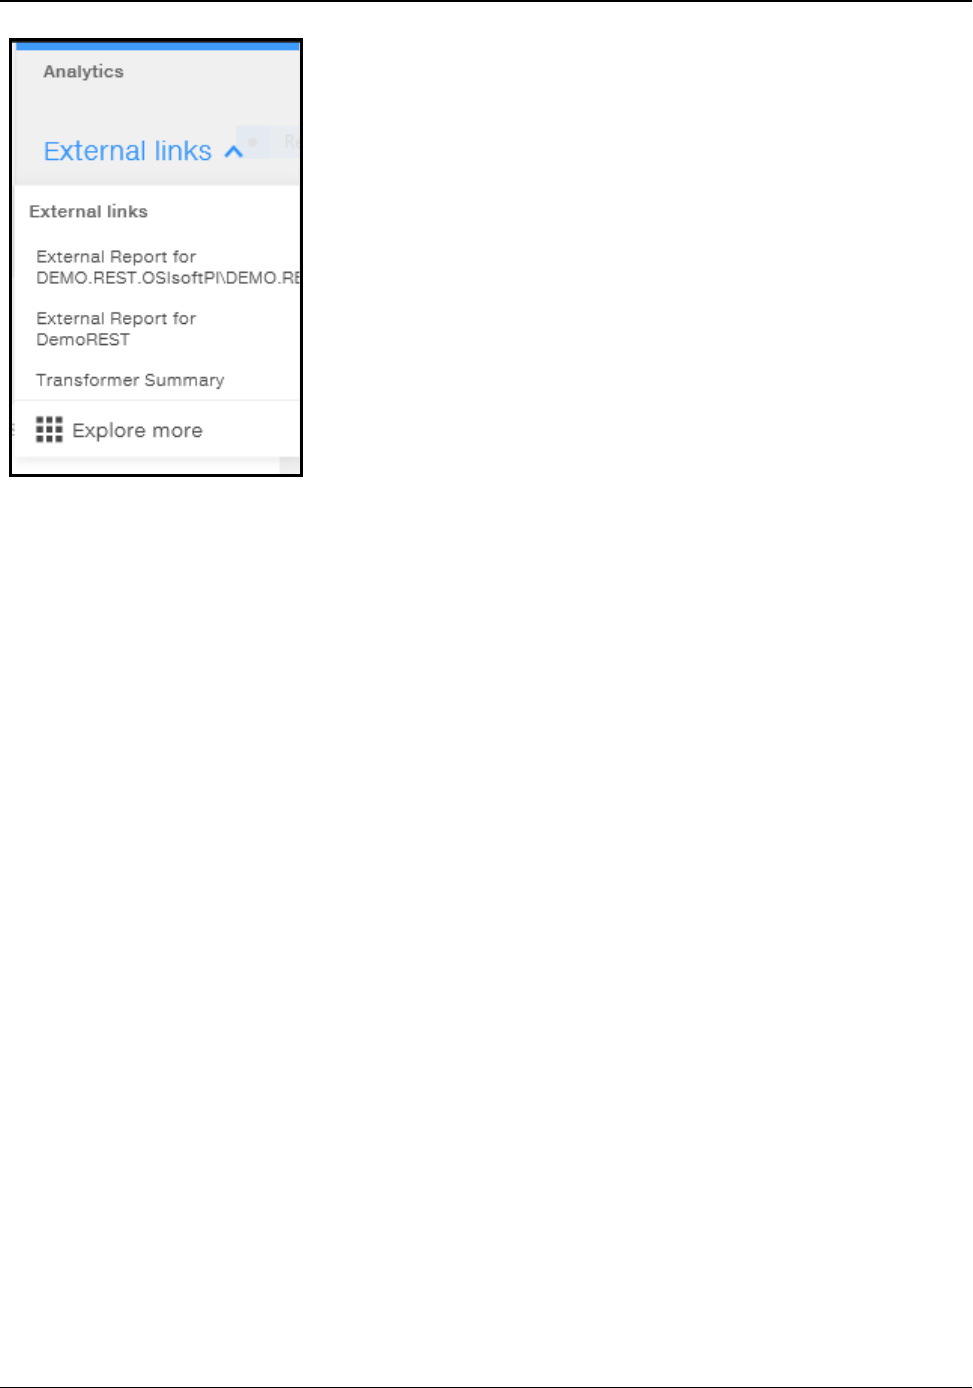
ABB Circuit Breaker Model - Issues and Error Messages
Issues and Error Messages output from the ABB Circuit Breaker model.
nAdditional error messages: In addition to error messages for full model run failures, APM displays error
messages related to input data quality.
nIssues are split: Instead of merging recommendations into a single issue per sub-system, each
recommendation is represented as a separate issue in the action plan. This change facilitates translation
of issues into different languages (besides supported language i.e.,English, Chinese, Spanish, and
Portuguese). Moreover, this change allows for more descriptive issue titles and less cluttering in the
issue details.
Ellipse Asset Performance Management 47 AHCDDB-0006-1804-03
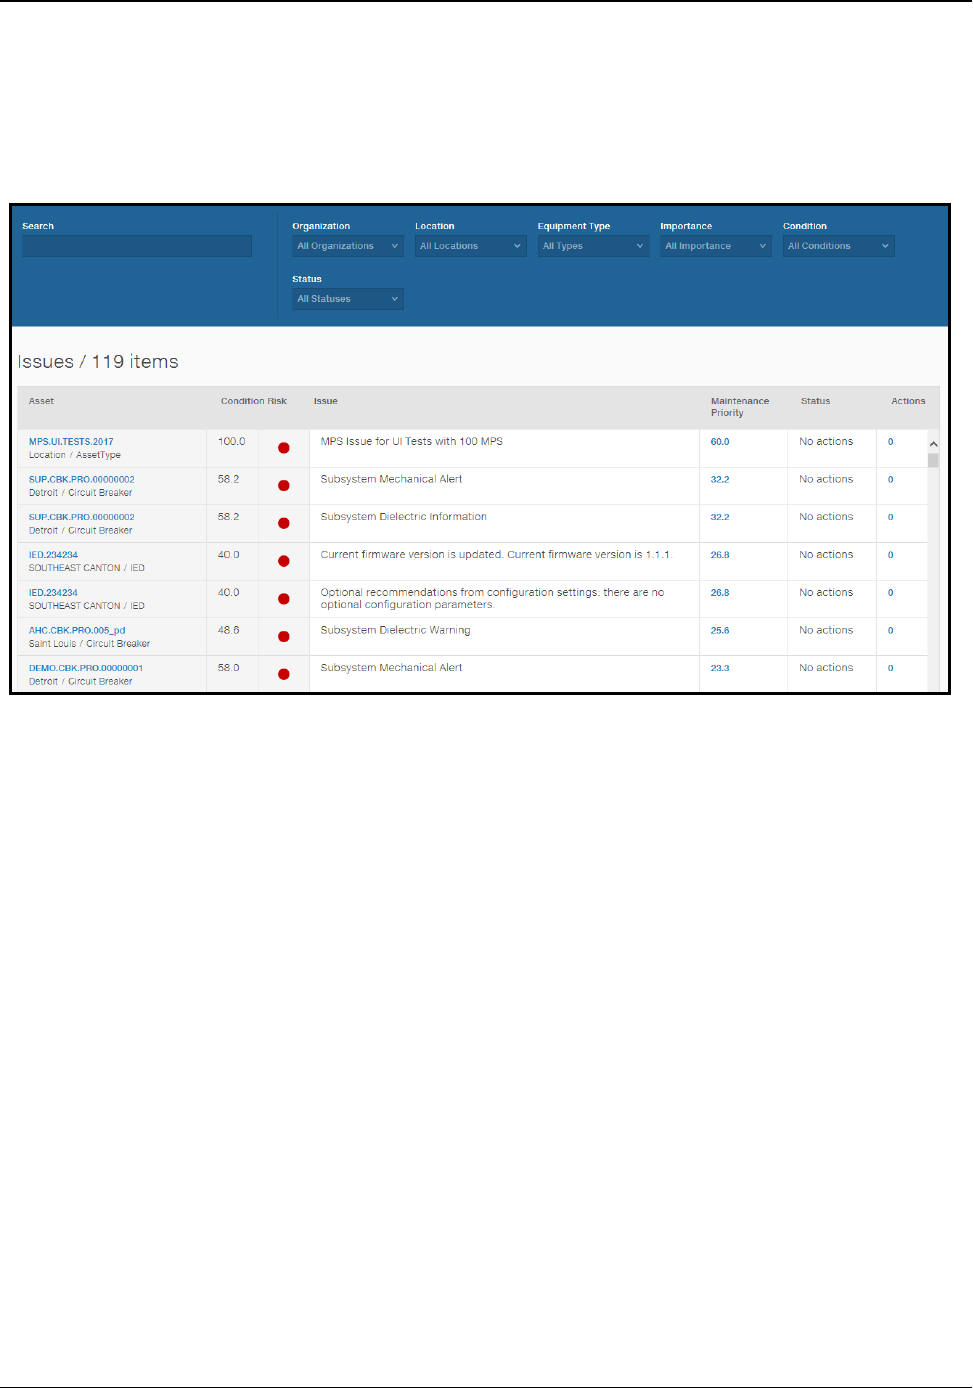
Issues Dashboard
The Issues page is a list of all open Issues identified on the fleet's assets. This list includes the actions
associated with existing issues and Maintenance Priority Score calculated for each individually according to
internal application logic.
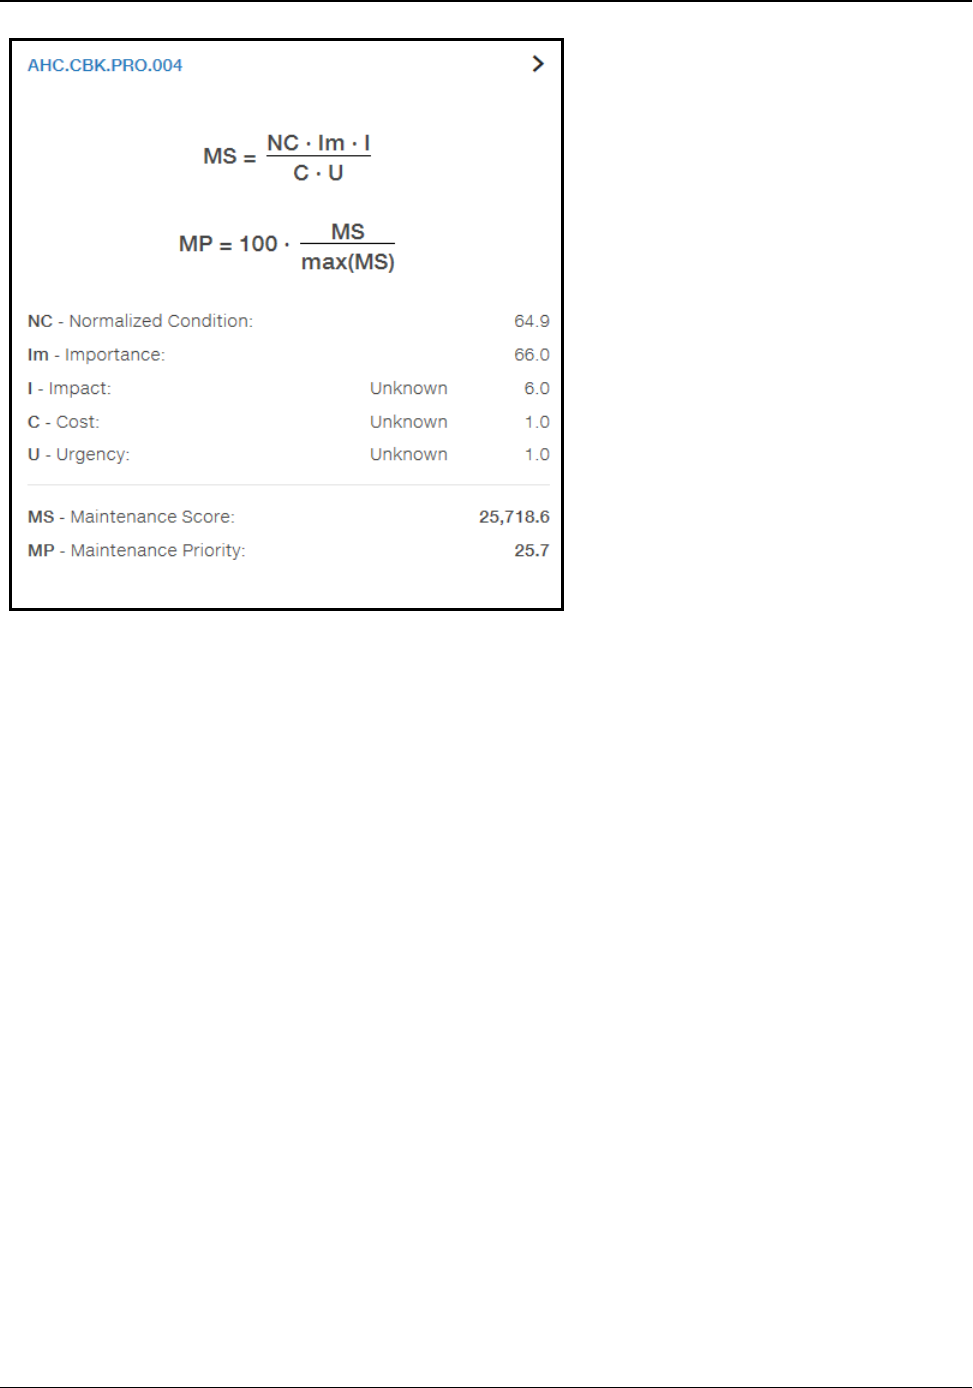
Click on Maintenance Priority to see maintenance priority details. This pop-out shows the Maintenance
Priority and Maintenance Score calculations and results for each.
Ellipse Asset Performance Management 48 AHCDDB-0006-1804-03
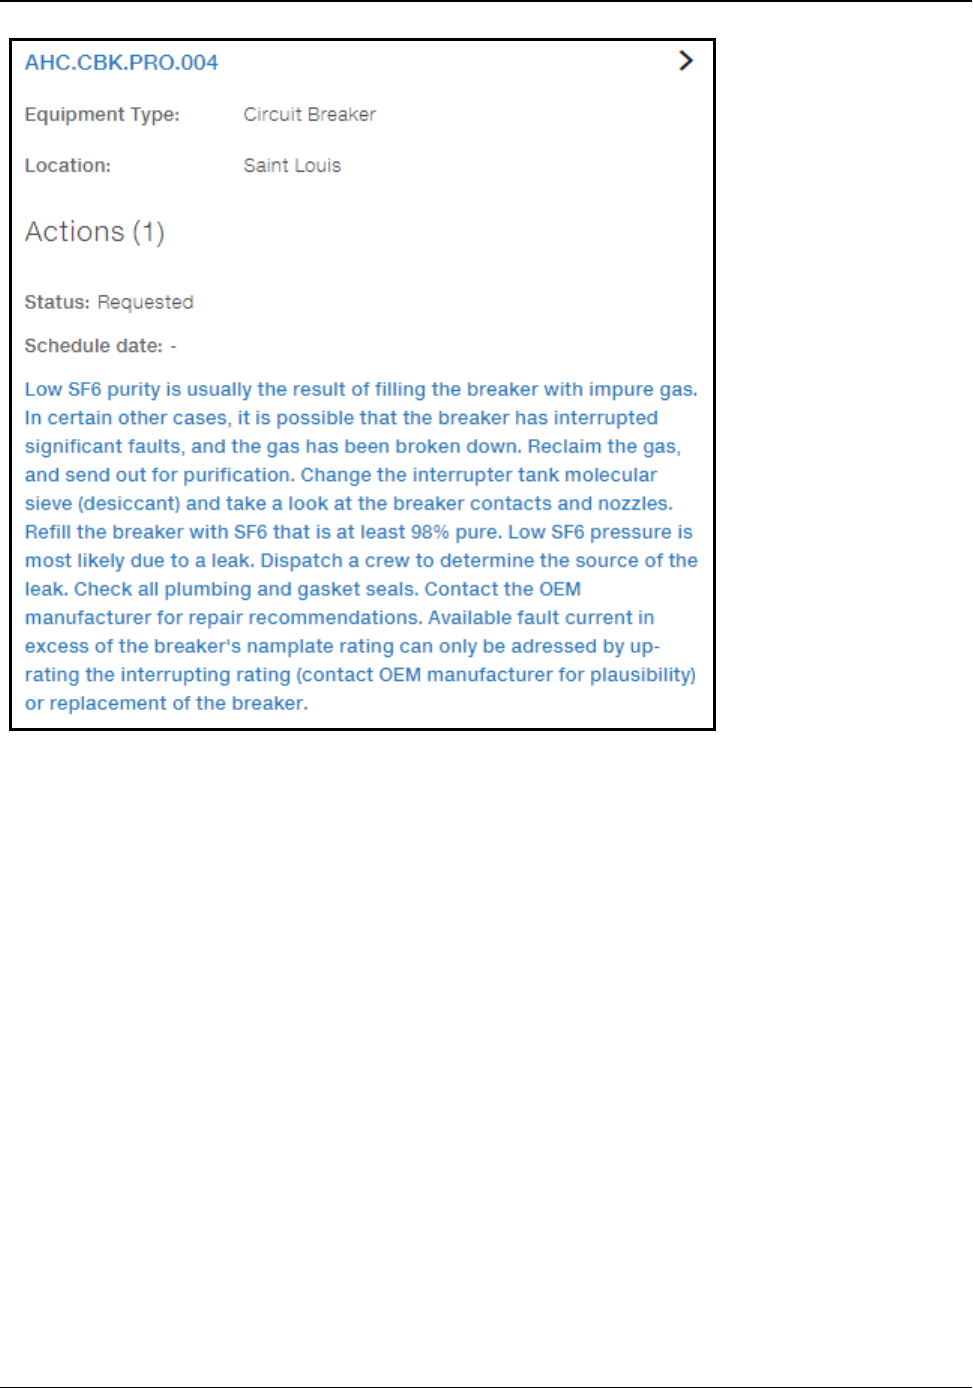
Click on the Action count to see action details. This pop-out will show the list of actions, and for each action:
action number, status, schedule date. The action number is hyperlinked to open the action in the source tool
(typically the Enterprise Asset Management system).
Ellipse Asset Performance Management 49 AHCDDB-0006-1804-03
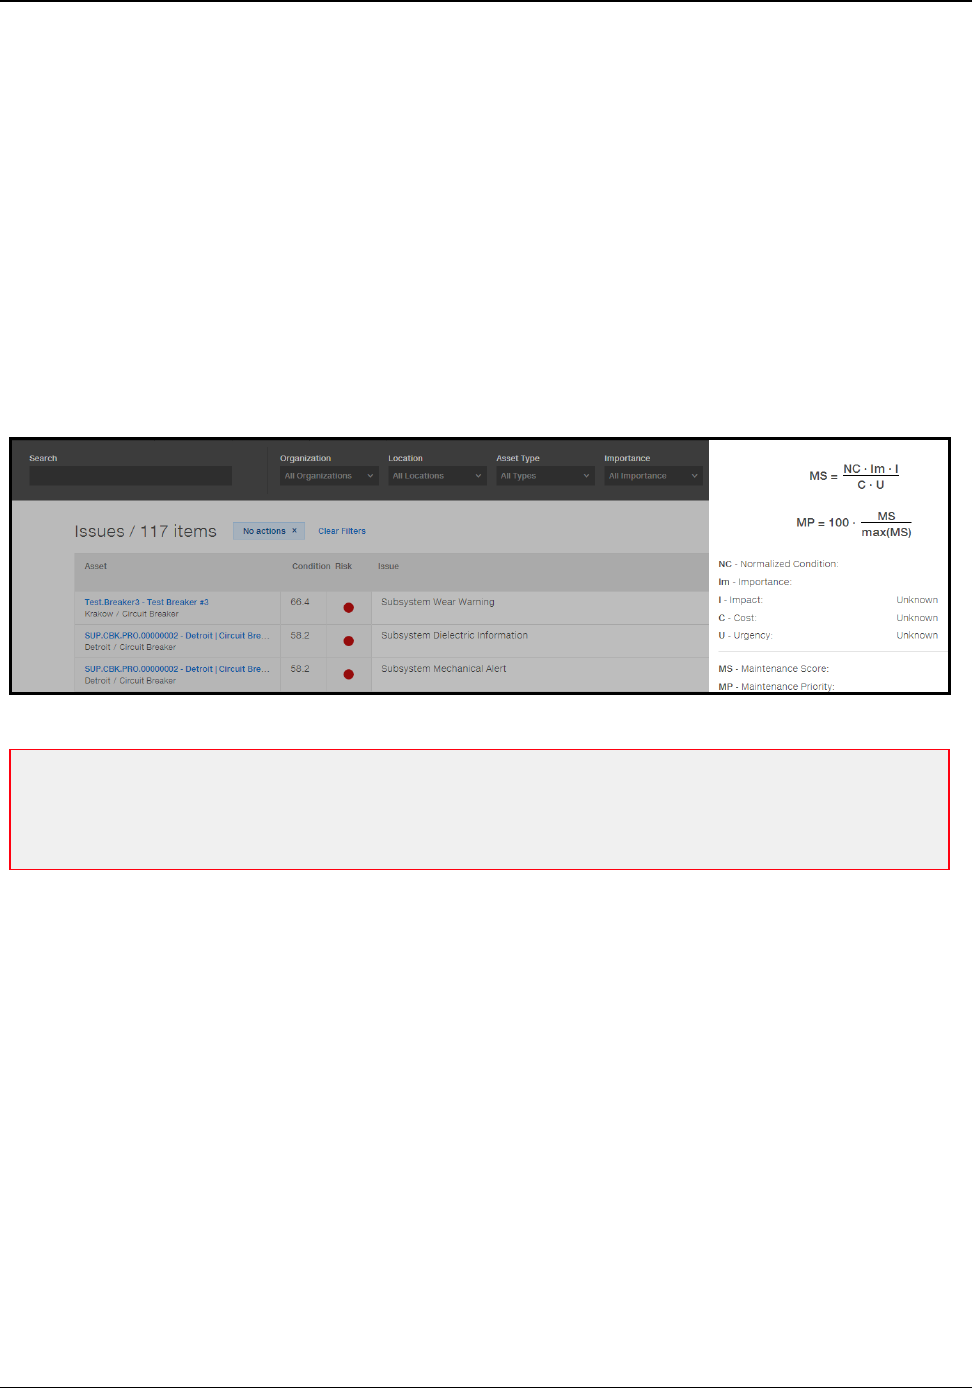
Issues Sorting Order
Issues are sorted and displayed in following order:
nIssues with New statuses are displayed at the top of the list.
nMaintenance Priority is displayed in descending order.
nWhen there are two or more issues with the same Maintenance Priority, Health score takes precedence,
and the sort is descending.
nSort rules on Issues widget is exactly the same as on Issues page (watchlist).
Ellipse Asset Performance Management 50 AHCDDB-0006-1804-03

Glossary
This glossary contains terminology for Ellipse APM.
A
Asset Condition
This is a value assigned to the likelihood of Failure in order to provide you with a numerical value that will
help you determine the health of that asset.
Asset Risk
Shows the intersection of asset count in percentages and date with a color coded graph displaying
counts for locations covered, asset types, assets monitored, assets not monitored and last data
updated.
Azure
Microsoft Azure is a collection of integrated cloud services that developers and IT professionals use to
build, deploy, and manage applications through our global network of datacenters.
C
CCVTs
Capacitance Coupled Voltage Transformers
I
Issues
Displays a count of identified asset risk issues by resolution status.
Ellipse Asset Performance Management 51 AHCDDB-0006-1804-03

M
Maintenance Priority
A score that helps prioritizing maintenance activities. The algorithm is based primarily on model-returned
data or defaults if no specific data is provided by a model.
Most Important Issues
List displays up to six assets with most significant absolute changes in the health score over the past
week.
O
Open Issues
A card displays the number of Open Issues along with a watch list of the most important issues.
P
Parameters Tab
Displays asset input parameters for a specific asset. You can see model-fed data, including description,
value, units if applicable, that impact overall asset health.
R
Replacement Priority
Ellipse APM assigns an asset a Replacement Score which is calculated by an algorithm. The
calculation is derived from a number of parameters which are weighted to determined the score. The
parameters are different for each asset type.
Ellipse Asset Performance Management 52 AHCDDB-0006-1804-03

Risk
This is the Risk of Failure and is designated by the colors of a "stoplight" to let you know those assets
that are either OK (green), might need to be looked at (yellow), or requires attention (red).
S
Scatter Plot
A report displaying Assets by Condition and Importance
Spatial View
Shows the geographical distribution of fleet assets (locations) including details related to asset health.
Ellipse Asset Performance Management 53 AHCDDB-0006-1804-03
Appendix A: Maintenance Priority Score Calculations
Maintenance Priority Calculations:
nNormalized Condition: (100 * Condition / NormalizationScoreFactor)
lNormalizationScoreFactor - value store in model configuration (can be changed by admin user
through API for morel configuration, JSON).
nLimited ranges for i(impact), c(cost), u(urgency) as a [1..10]
l[1..10] range; this value can be changed by admin user through API for model configuration,
JSON.
nCalculation process is simplified to the equation: MPS = (MS(i) * 100) / 100000 [assuming that maximum
possible MS(i) would be 100000 as max(MS(i))] for entire calculation.
nImportance (not normalized because it is always between 1..100 for each asset).
Note: We cannot use a maintenance priority that works across asset types unless we have a correction
factor. The reason for that is an asset type that is generally less important in a network would see the same
‘normalized importance’ values as an asset type that is generally more important. This would skew the
maintenance priority results in favor of the less important assets.
Maintenance Priority Score Ranking
The following is a list of Maintenance Priority Score (MPS) Ranking:
nthe higher MPS the higher ranking
nissues with same MPS have the same ranking
nissues with no MPS have the lowest ranking
nranking sample:
lan issue with MPS=3 rank 1
lan issue with MPS=2 rank 2
lan issue with MPS=1 rank 3
Ellipse Asset Performance Management 54 AHCDDB-0006-1804-03

lan issue with MPS=1 rank 3
lan issue with MPS=1 rank 3
lan issue with MPS=0 rank 6
lan issue with MPS=null rank 7
nDENSE_RANK computes the rank of a row in an ordered group of rows and returns the rank as a
number. The ranks are consecutive integers beginning with 1. The largest rank value is the number of
unique values returned by the query. Rank values are not skipped in the event of ties. Rows with equal
values for the ranking criteria receive the same rank. This function is useful for top-N and bottom-N
reporting.
Ellipse Asset Performance Management 55 AHCDDB-0006-1804-03

Appendix B: Generic Replacement Score Calculations
nAll Kinectrics models and ABB Circuit Breaker models return normalized scores and those scores are
used for the replacement score algorithm.
nOn the other hand, ABB Transformer scores are not normalized. So the replacement score uses non-
normalized condition score, as originally returned by the model (0..4).
nThe REST model may return normalized or non-normalized scores, depending on design and individual
preferences/requirements.
1. The calculation of the Replacement Score is the sum of the following sub-scores:
nAge Score
nFinancial Score
nHealth Score
nObsolescence Score
2. Only Replacement Score, which is the main score for the asset is stored in database and so this value is
shown to the user. Subscore values are not stored in the database..
nRaw Scores are determined using the following formulas:
nRaw Age Score =
a. 100 if age is greater m+3s;
b. 80 if m+2s < age<= m+3s;
c. 60 if m+s < age<= m+2s;
d. 40 if m < age<= m+s;
e. 20 if m-s < age<= m;
f. 0 otherwise
Where age = Current Date – In-Service Date in Years; m is the mean age of the asset population and s is
the standard deviation of the age of the asset population. In-Service Date is held as Install Date on the
nameplate.
m - means average age for assets of the same family according to asset types
s - standard deviation of assets age or same same family according to asset types
nRaw Importance Score = Asset Importance
nRaw Financial Score =
a. 0 if age is 0
b. 100 if age is equal to Asset Life Age (this will be different for different types of assets)
c. Age*(100/Asset Life Age (mfg expected life))
Ellipse Asset Performance Management 56 AHCDDB-0006-1804-03

Age is calculated as (Current Date – Manufactured Date) in years
Note: Replacement Score algorithm (Age calculation) is done based on Manufactured Date (Install Date
when the Manufacturer Date is not available and current date if both Manufactured Date and Install date are
not defined).
Asset Life Age means Ellipse APM Manufacturer Expected Life, and 'Age' is calculated as 'age' for Age Score
(Current Date - Install Date)
nRaw Health Score = Total Condition Score
nObsolescence Score = 0 or 100 depending on a customer provided obsolete indicator not attribute but
IsObsolete field is used , taken from the asset's nameplate.
a. Set to 0 if asset is not obsolete.
b. Set to 100 if asset is obsolete.
4. Each Weighted Score is set using the following calculation
Weighted Score = Raw Score * Customer Assigned Weight / Total of all Customer Assigned Weights
For example, if given the following weights:
Age Score = 50
Criticality Score = 100
Financial Score = 100
Health Score = 100
Obsolescence Score = 0
Then if the Raw Age Score is 60, the Weighted Age Score would get calculated as:
Weighted Age Score = 60 * 50 / 350 which comes out to 8.57 (rounded)
Ellipse Asset Performance Management 57 AHCDDB-0006-1804-03

Index
Index
A
Action Plan 27
Analytics 10, 27
Asset Details 22
Asset Risk 5
Assets by Type and Organization 11
C
Creating a New Issue 29
D
Dashboard 4
G
Generic Replacement Score Calculations 56
I
Issues 8, 48
Issues Sorting Order 50
K
Key Risk Changes 9
M
Main Dashboard Summary 4
Maintenance Priority Calaculations 54
Messages 25
Most Important Issues 9
N
Name Plate Detail 22
P
Parameters 24
R
Replacement Score 26
Risk Matrix 22
Risk Trend 23
S
Spatial View 6
Spatial View Dashboard 14
Summary Dashboard 13
Ellipse Asset Performance Management 58 AHCDDB-0006-1804-03
