Using The Forest Change Assessment Viewer From Eastern Environmental Threat Center FCAV Users Guide
User Manual:
Open the PDF directly: View PDF ![]() .
.
Page Count: 35
1. Map Navigation
2. Obtaining Data Layer Information
3. Basemap Types
4. Choosing ‘Themes’ of Data Layers
5. Viewing the most recent Forest Change
6. Sharing views with Colleagues
7. The “Graph NDVI” Control
Quick Start Guide
Data Layers Used to Vet Disturbances
Investigative Protocol
Access to Web Map Services
Tips and Hints
Frequently Asked Questions
Points of Contact
Phenology-related Internet Websites
Appendices: Other Phenology Data Sets
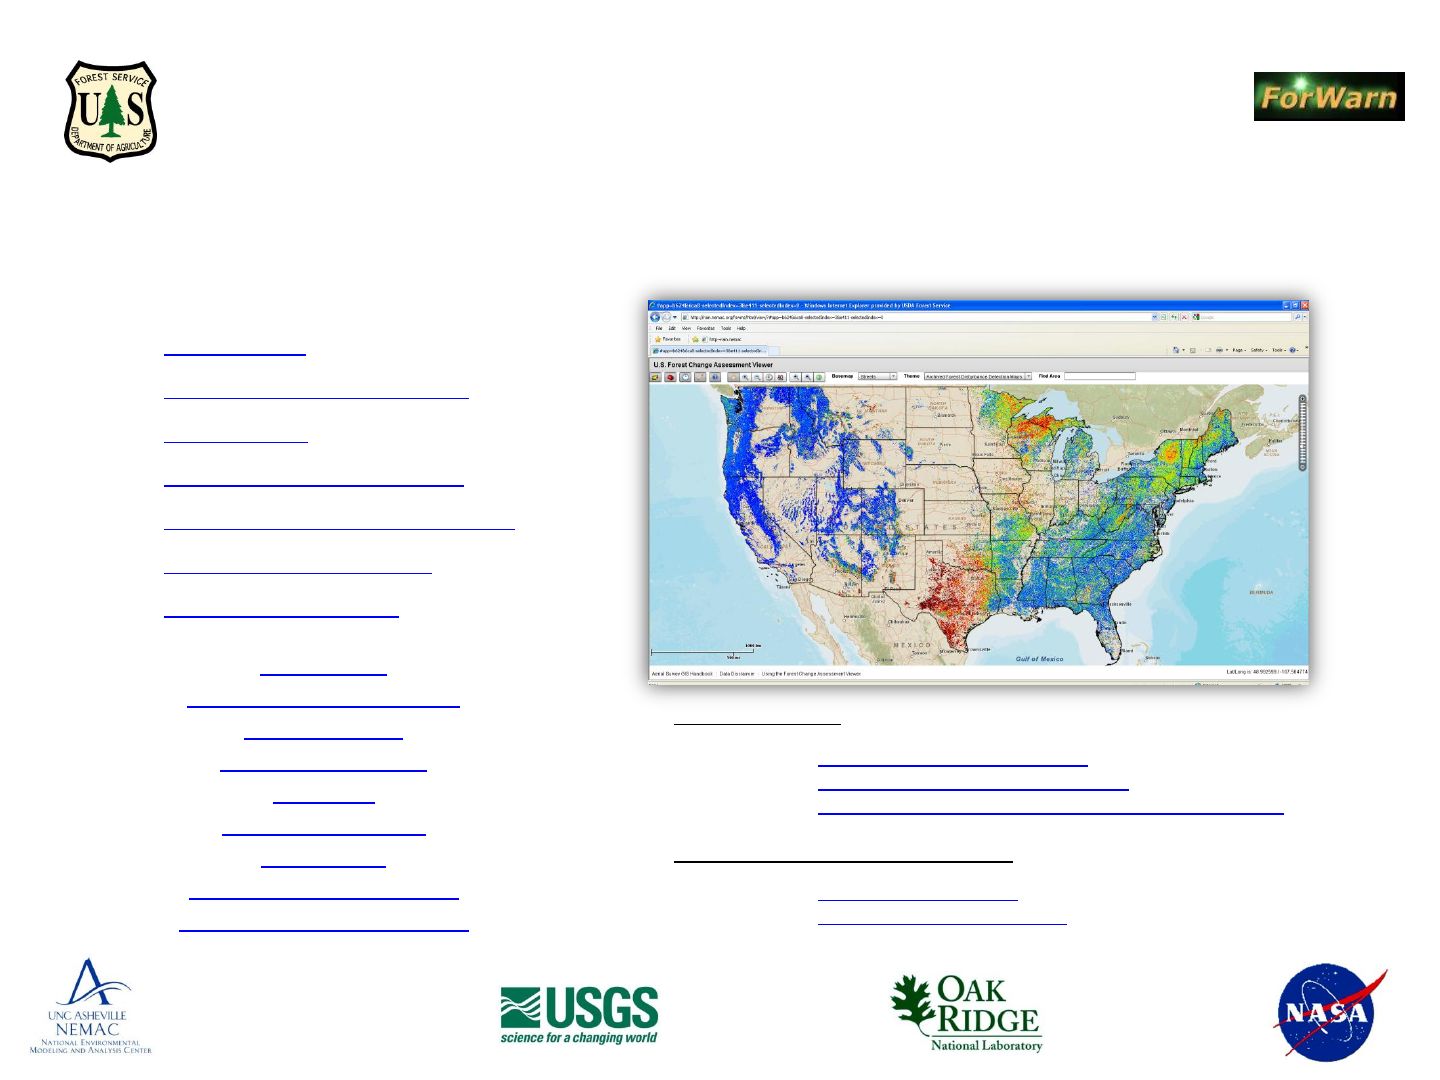
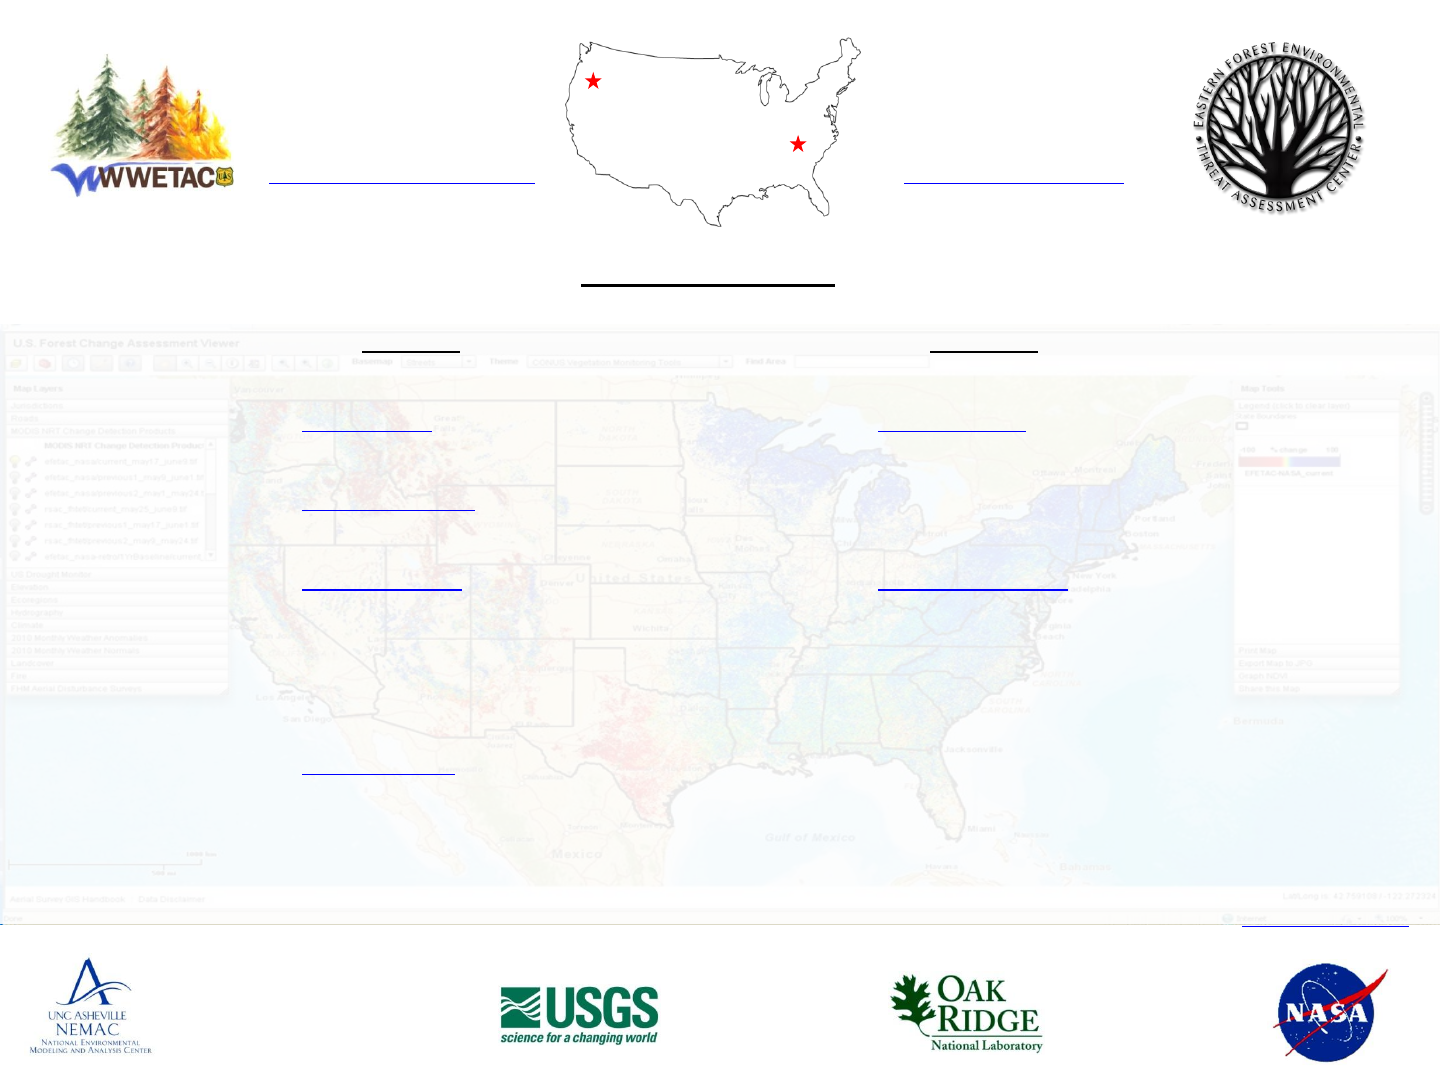
Using the Forest Change Assessment Viewer
from the Forest Services’ Eastern Forest Environmental Threat Assessment Center (EFETAC)
and the Western Wildland Environmental Threat Assessment Center (WWETAC)
A Users Guide for map navigation, data layers and interpretation
(click heading to jump to section)
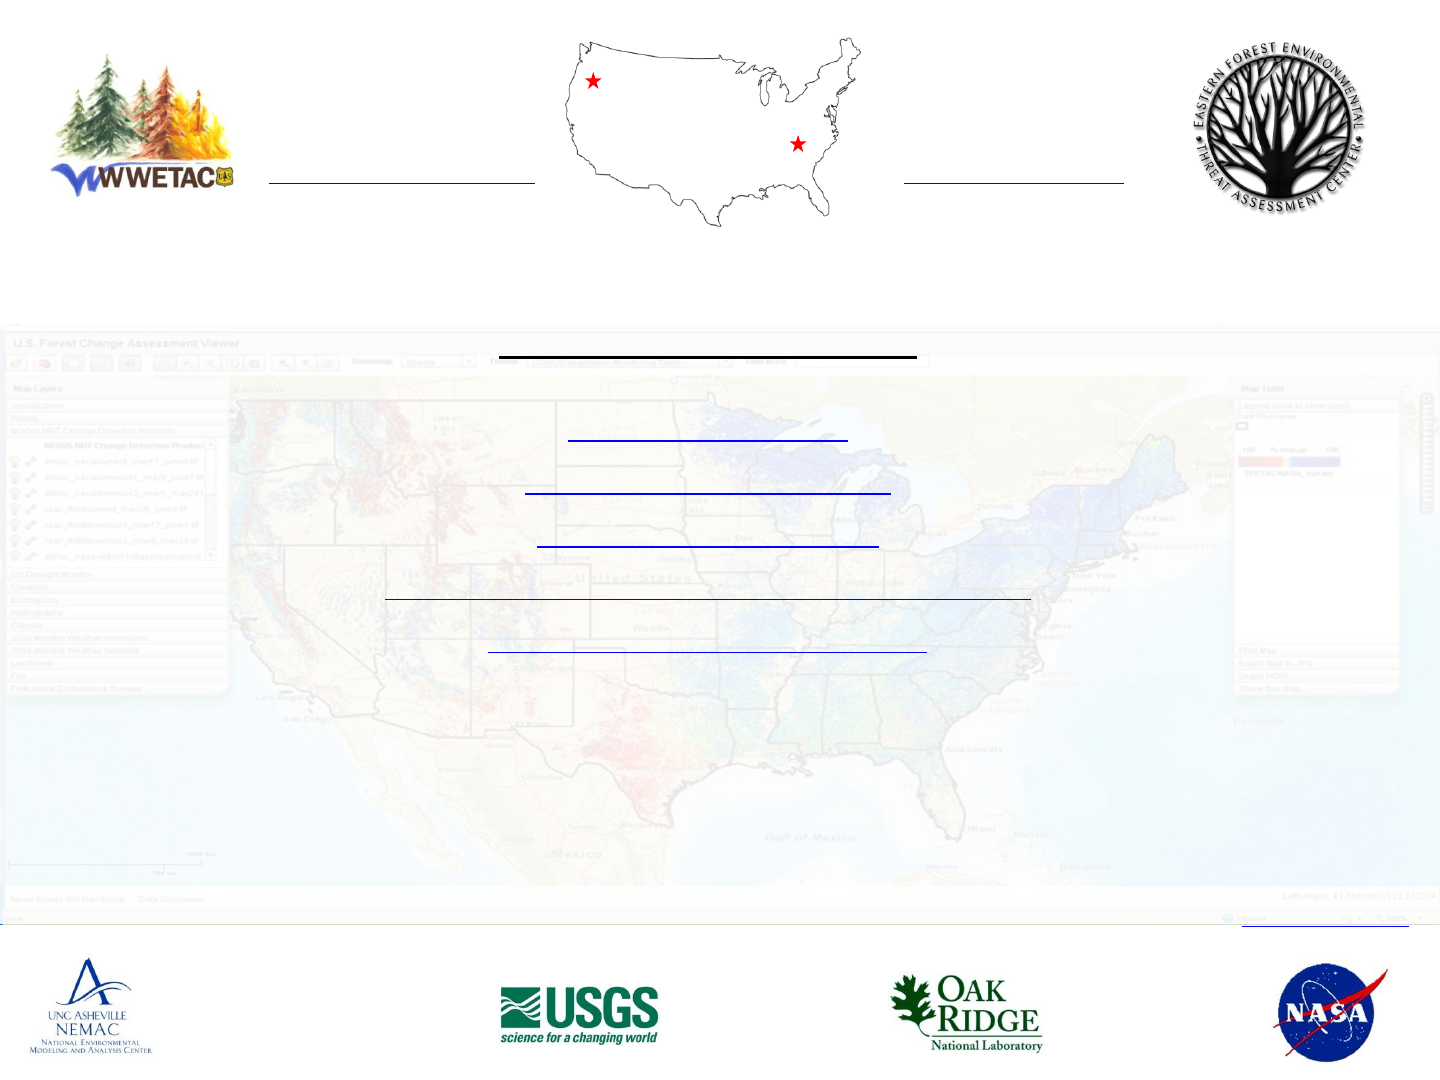
ForWarn Quick Links
Website: http://forwarn.forestthreats.org/
Viewer: http://forwarn.forestthreats.org/fcav/
Help Videos: http://forwarn.forestthreats.org/support/video-resources
Forest Service Threat Assessment Centers
Eastern: http://forestthreats.org/
Western: http://www.fs.fed.us/wwetac/
Document Version 02/15/12
National Environmental Modeling and
Analysis Center (NEMAC)
University of North Carolina - Asheville
NASA
Stennis Space
Center, Mississippi
- Partners -
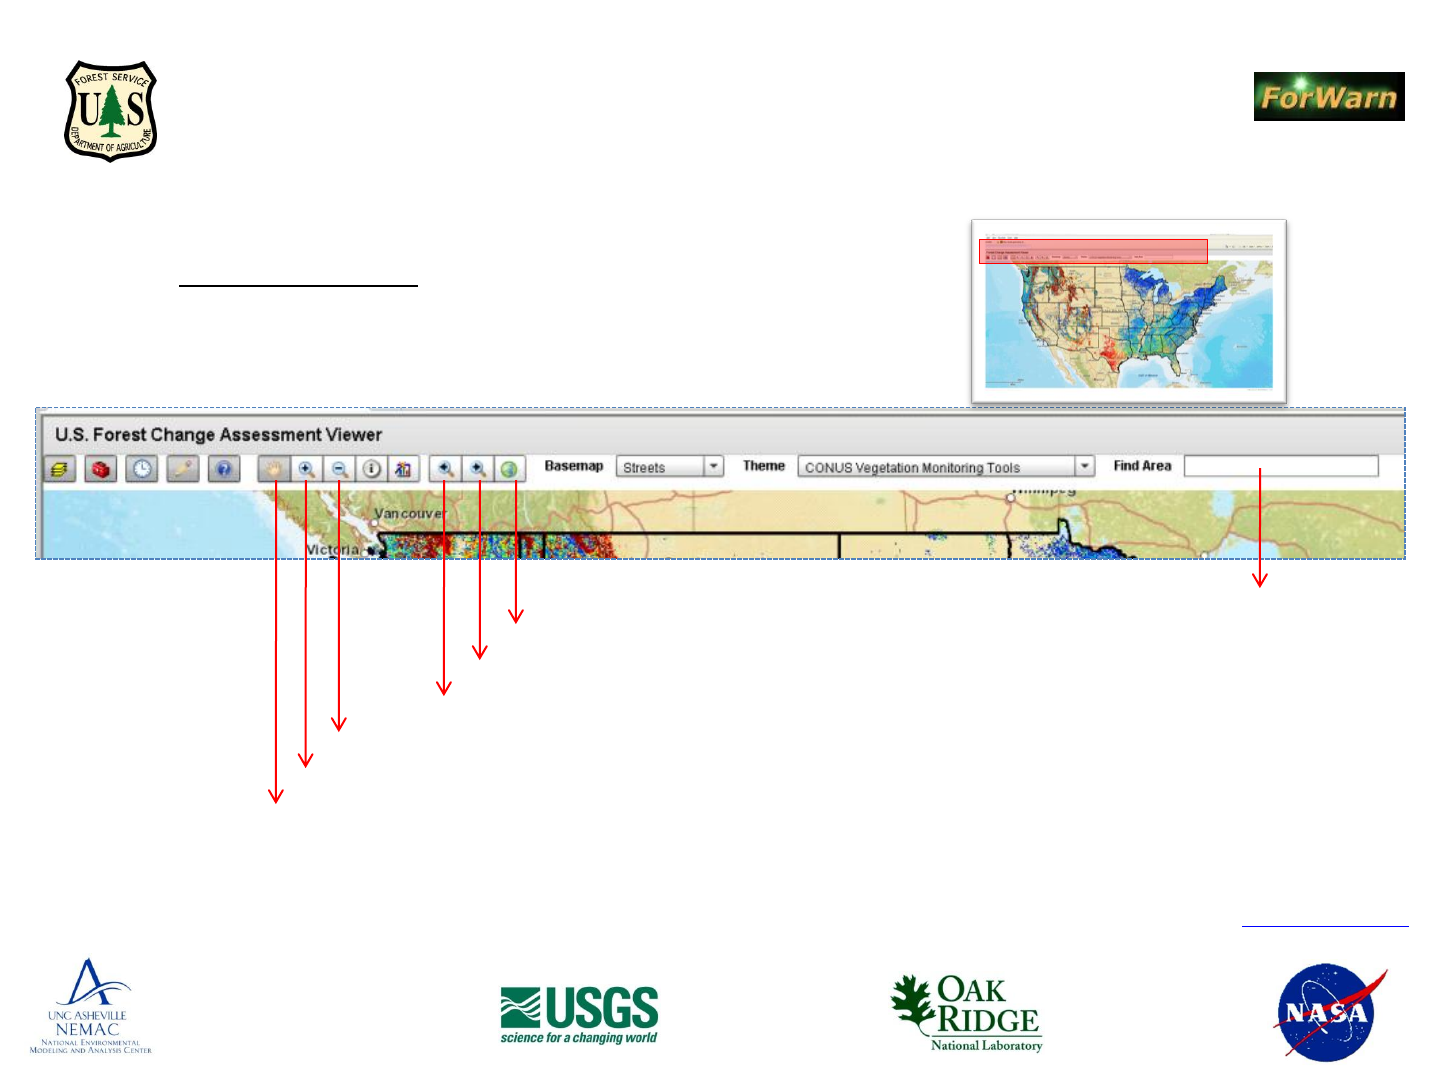
Basic Navigation: Moving around the map
“Pan” around the image by clicking and dragging the image
“Zoom-in” control, drag a box over the area of interest to zoom-in
“Zoom-out” control, drag a box over the area of interest to zoom-out
“Previous Extent,” click to jump back you your previous viewing area
“Next Extent,” click to jump ahead to a viewing area previously visited
“Full Extent,” resets the view to the conterminous United States (CONUS)
Type in a U.S. county by name to zoom-to
Portion of Viewer detailed is shown in red
Using the Forest Change Assessment Viewer
from the Forest Services’ Eastern Forest Environmental Threat Assessment Center (EFETAC)
and the Western Wildland Environmental Threat Assessment Center (WWETAC)
Back to Contents page
National Environmental Modeling and
Analysis Center (NEMAC)
University of North Carolina - Asheville
NASA
Stennis Space
Center, Mississippi
- Partners -
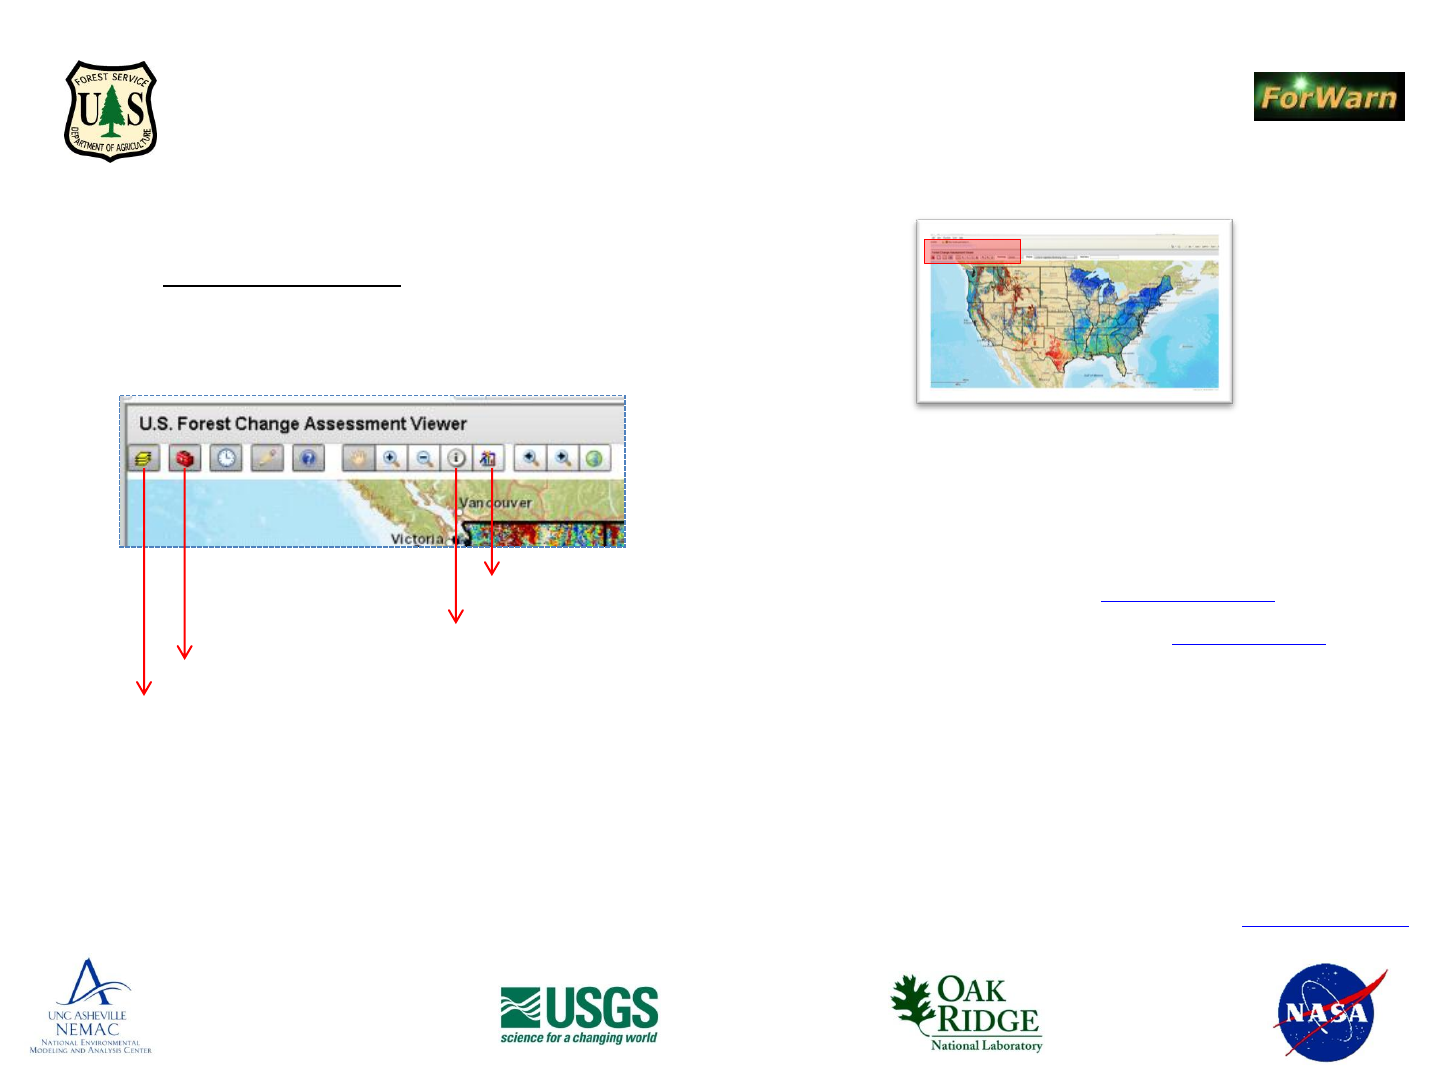
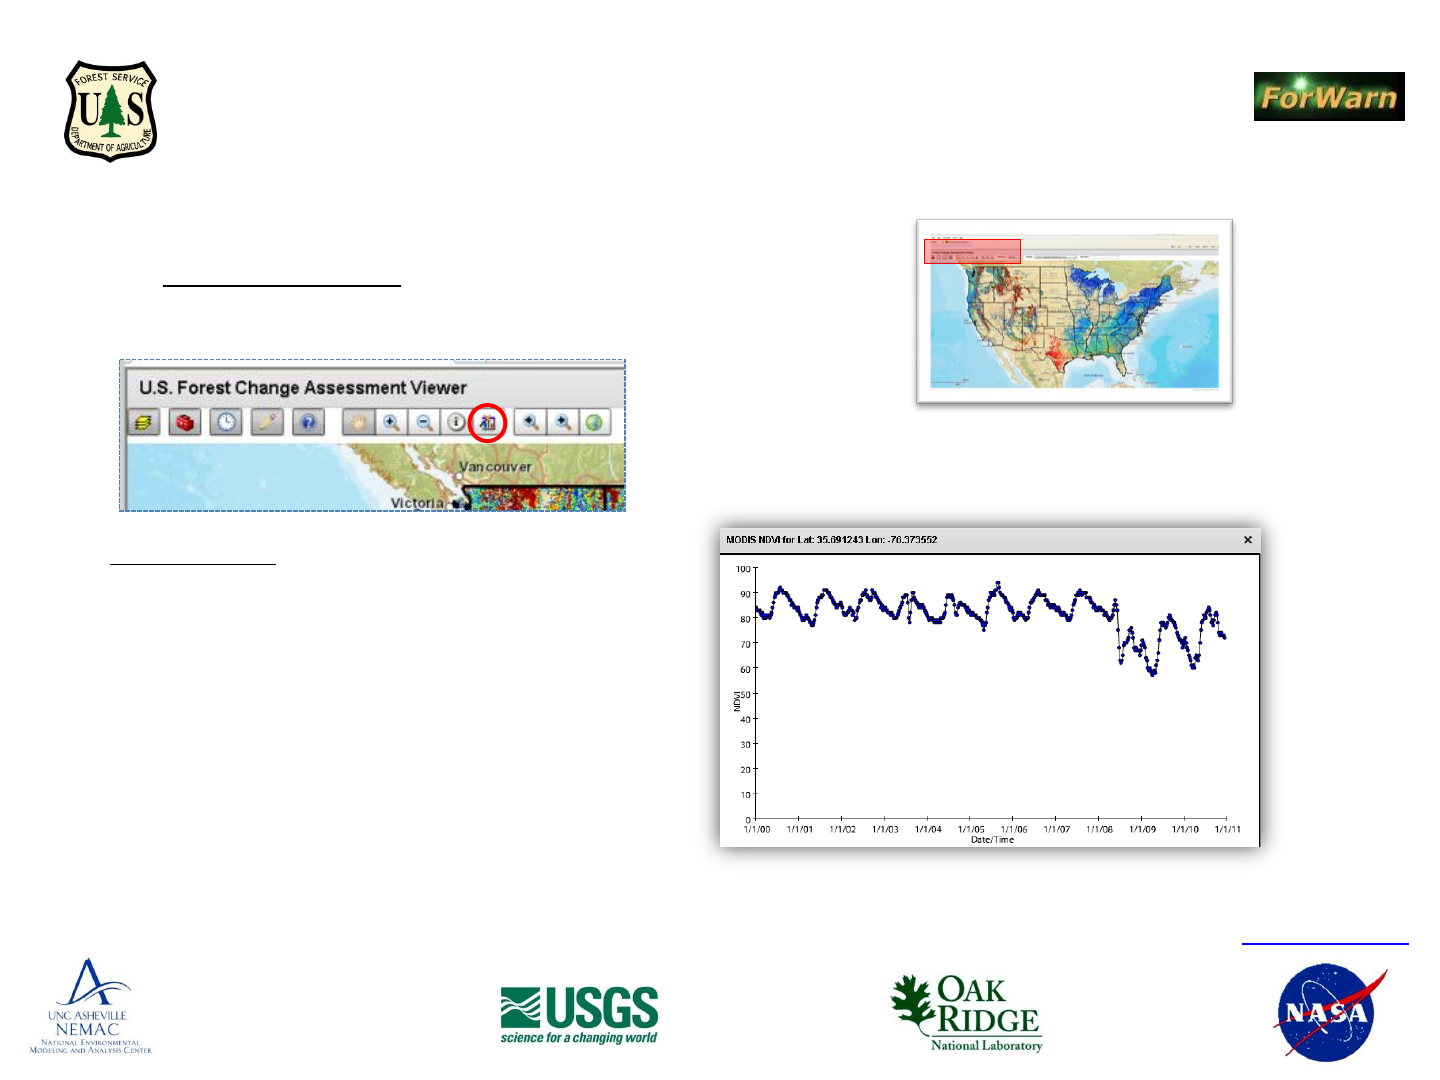
Basic Navigation: Obtaining Information
Portion of Viewer detailed is shown in red
Toggles on and off the ‘Table of Contents’
Toggles on and off the ‘Map Tools’ box
“Identify” control, displays database information for layers that are clicked ‘on’ (to remove highlight)
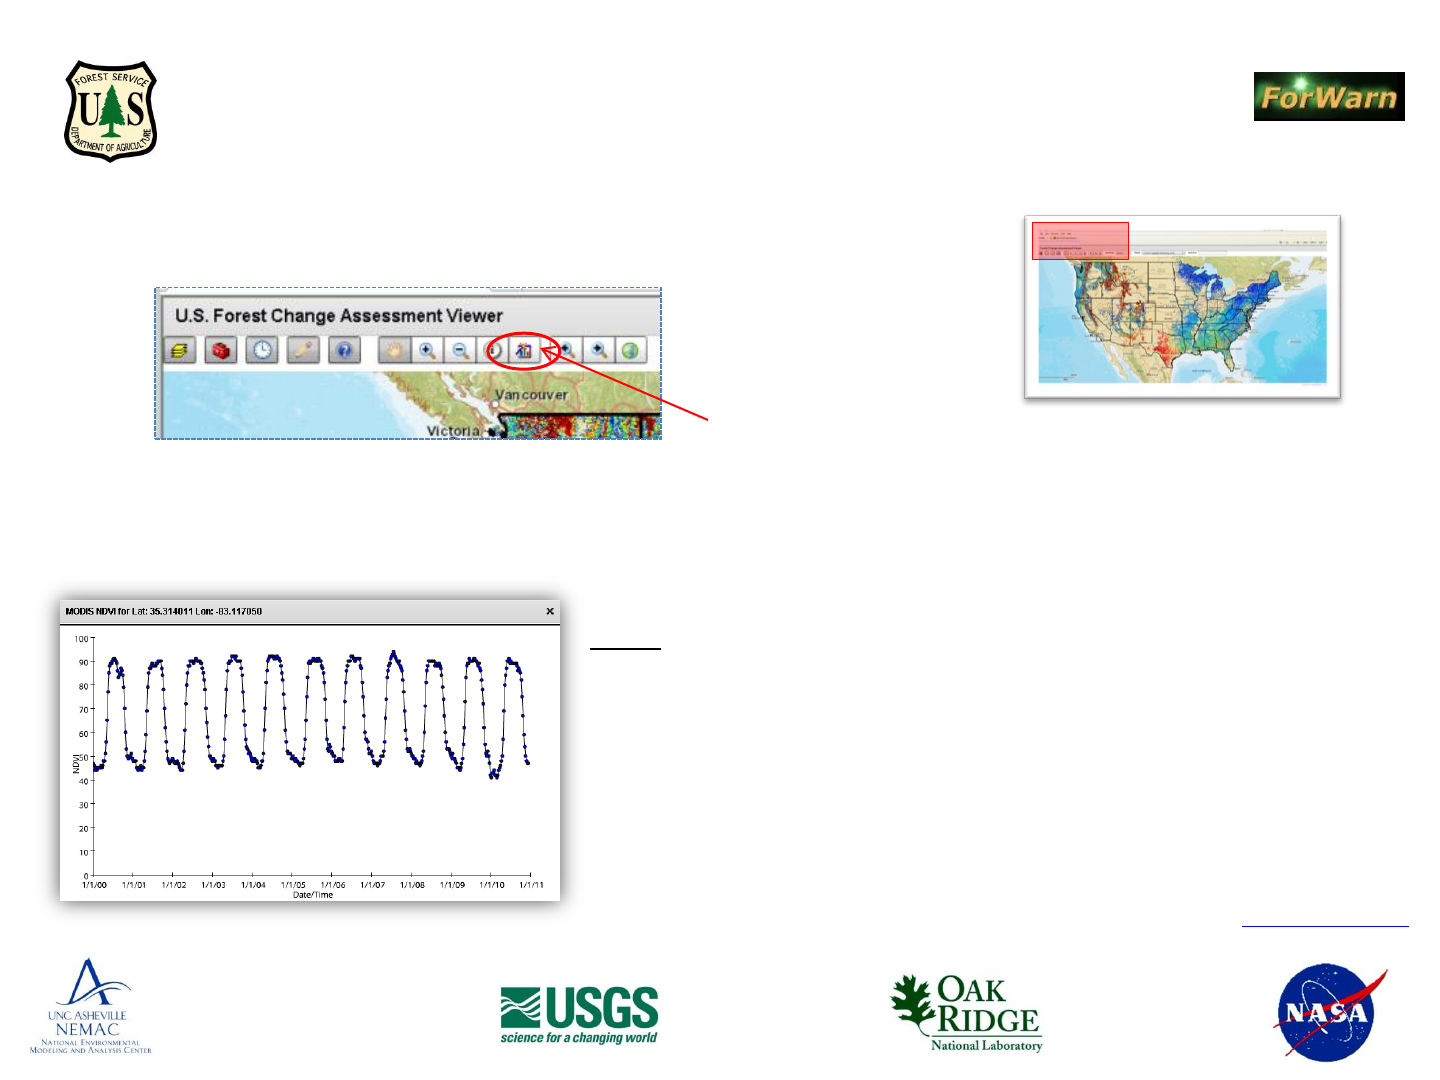
“Graph NDVI” shows a locations’ change in NDVI value through time (use and interpretation)
Using the Forest Change Assessment Viewer
from the Forest Services’ Eastern Forest Environmental Threat Assessment Center (EFETAC)
and the Western Wildland Environmental Threat Assessment Center (WWETAC)
Back to Contents page
National Environmental Modeling and
Analysis Center (NEMAC)
University of North Carolina - Asheville
NASA
Stennis Space
Center, Mississippi
- Partners -
Basic Navigation: Obtaining Information
Portion of Viewer detailed is shown in red
Using the Forest Change Assessment Viewer
from the Forest Services’ Eastern Forest Environmental Threat Assessment Center (EFETAC)
and the Western Wildland Environmental Threat Assessment Center (WWETAC)
Back to Contents page
National Environmental Modeling and
Analysis Center (NEMAC)
University of North Carolina - Asheville
NASA
Stennis Space
Center, Mississippi
- Partners -
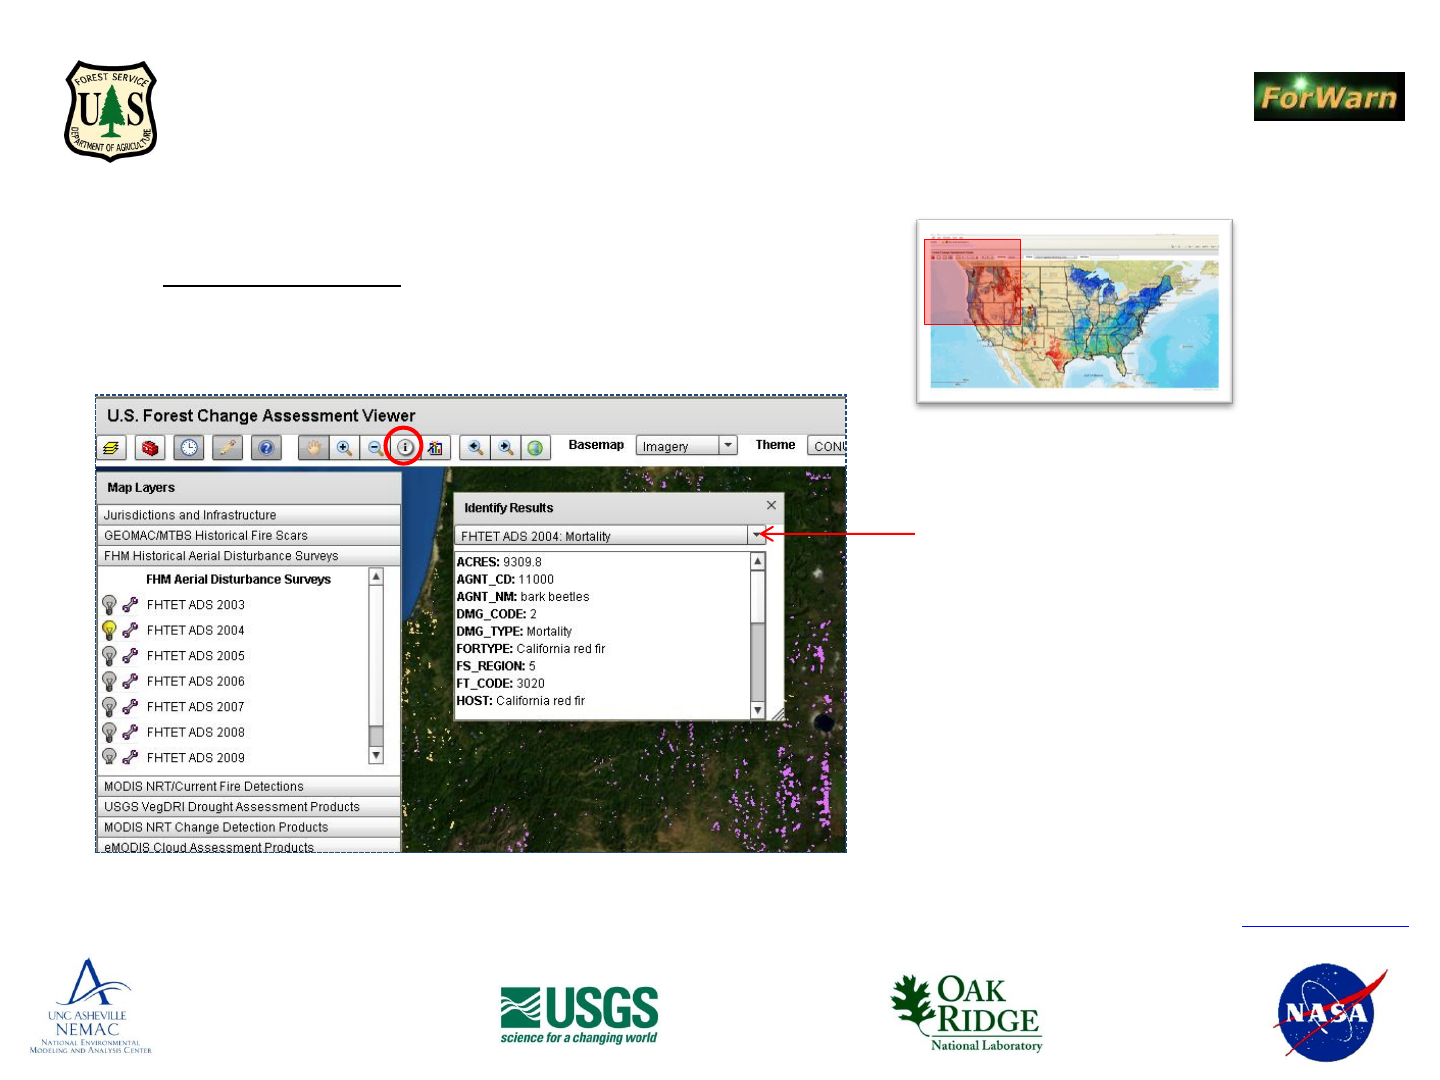
Using the Identify feature
Choose the “Identify” icon and click
any active data layer feature visible
in the viewer.
If more than one data layer is active,
use the dropdown in the “Identify
Results" window to change which
active layer’s feature information is
displayed
To unselect a highlighted feature,
turn off the active data layer in the
Table of Contents and click outside
any of the features displayed in the
viewer. To close the Identify Results
window, click the ‘x’ in the upper
right corner of the results window
Note: before performing an Identify
operation, turn off the data layer
“Political Boundaries and Roads /
State Boundaries”
Basic Navigation: Obtaining Information
Portion of Viewer detailed is shown in red
“Graph NDVI” shows a locations’ change in NDVI value over an
11-years history, measured every 8-days
Using the Forest Change Assessment Viewer
from the Forest Services’ Eastern Forest Environmental Threat Assessment Center (EFETAC)
and the Western Wildland Environmental Threat Assessment Center (WWETAC)
Large scale best use:
•zoom into your area of interest and choose the imagery basemap
•make active one of the forest change images and apply a
transparency so you can see through to the aerial photography
underneath (use the ‘wrench’ icon next to the layers ‘light bulb’
• use the transparent pixels of the forest change image as a guide
to select a specific pixels’ land cover composition for which the
NDVI history will be returned
• by using the transparent forest change images’ pixels as a
template, one can photo-interpret a pixels land cover composition
before selection to better understand the character of that pixels’
NDVI history
• different land covers, land uses and mixed pixel compositions
create unique phenological signatures
Using the Graph NDVI feature
Back to Contents page
National Environmental Modeling and
Analysis Center (NEMAC)
University of North Carolina - Asheville
NASA
Stennis Space
Center, Mississippi
- Partners -
The “Graph NDVI” database covers the entire U.S. and is not
restricted to the forest mask, as are the forest change images
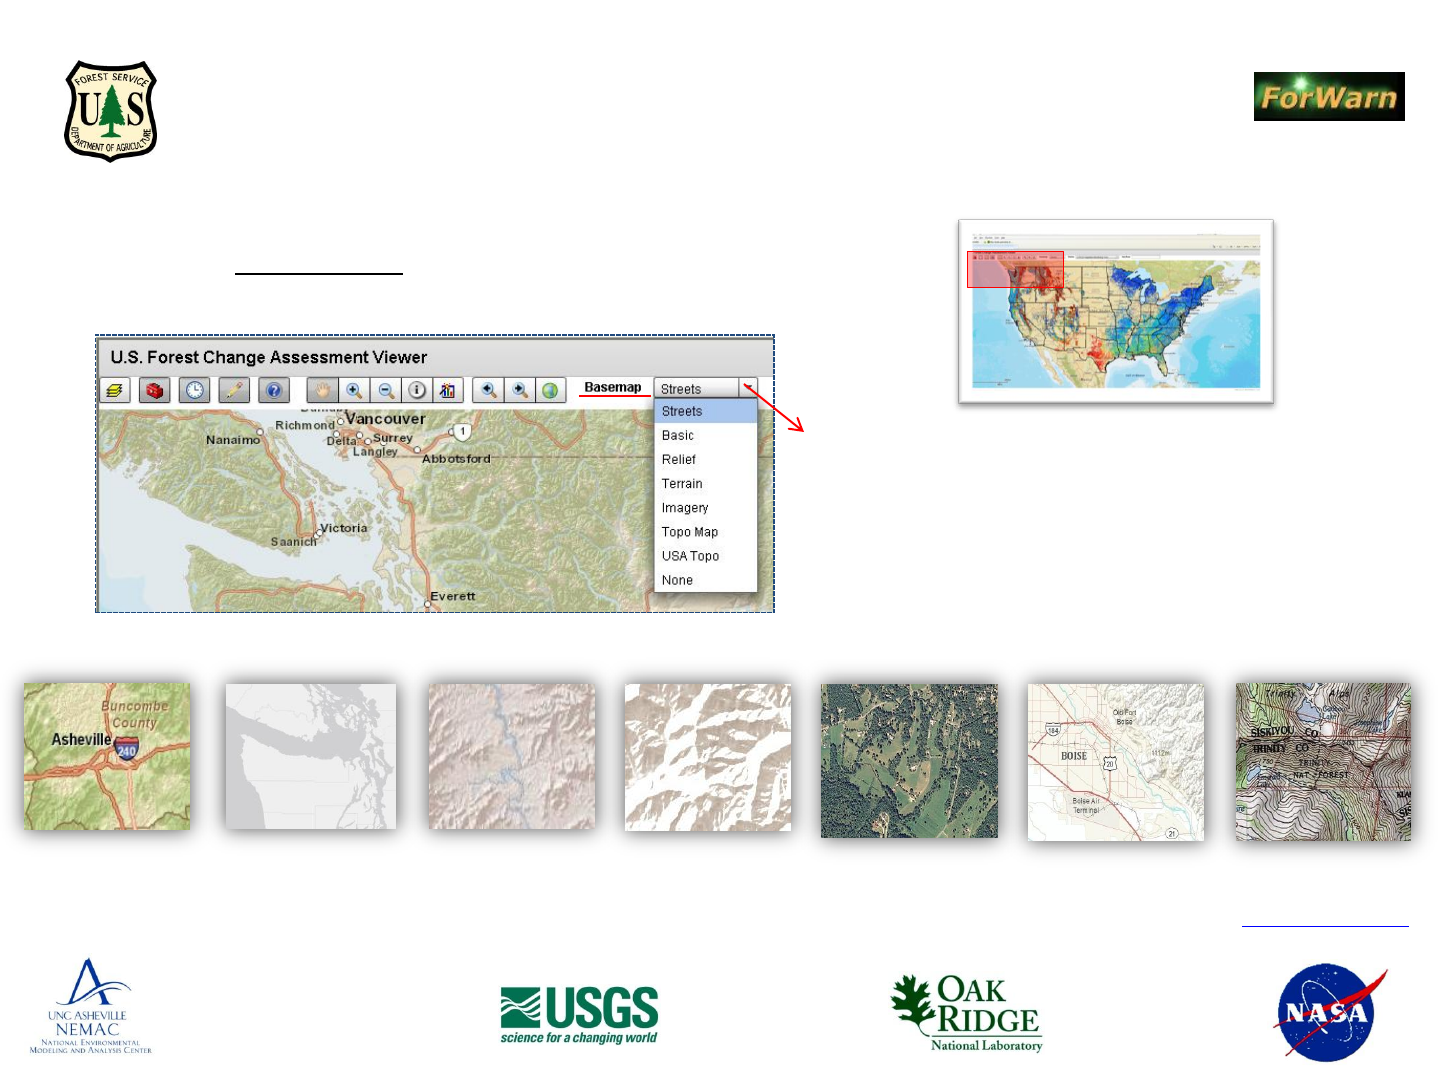
Data Layers: Choosing a Basemap
Click the “Basemap” dropdown to choose among the types below
…this may become more important when viewing forest disturbance
image products later, keep the default “Streets” to begin with
Portion of Viewer detailed is shown in red
Notes – all basemap layers exhibit increased detail when zoomed
(*) USGS quads 1:24k, 1:100k and 1:250k
Using the Forest Change Assessment Viewer
from the Forest Services’ Eastern Forest Environmental Threat Assessment Center (EFETAC)
and the Western Wildland Environmental Threat Assessment Center (WWETAC)
Streets Relief Terrain Imagery Topo Map USA Topo* Basic
Back to Contents page
National Environmental Modeling and
Analysis Center (NEMAC)
University of North Carolina - Asheville
NASA
Stennis Space
Center, Mississippi
- Partners -
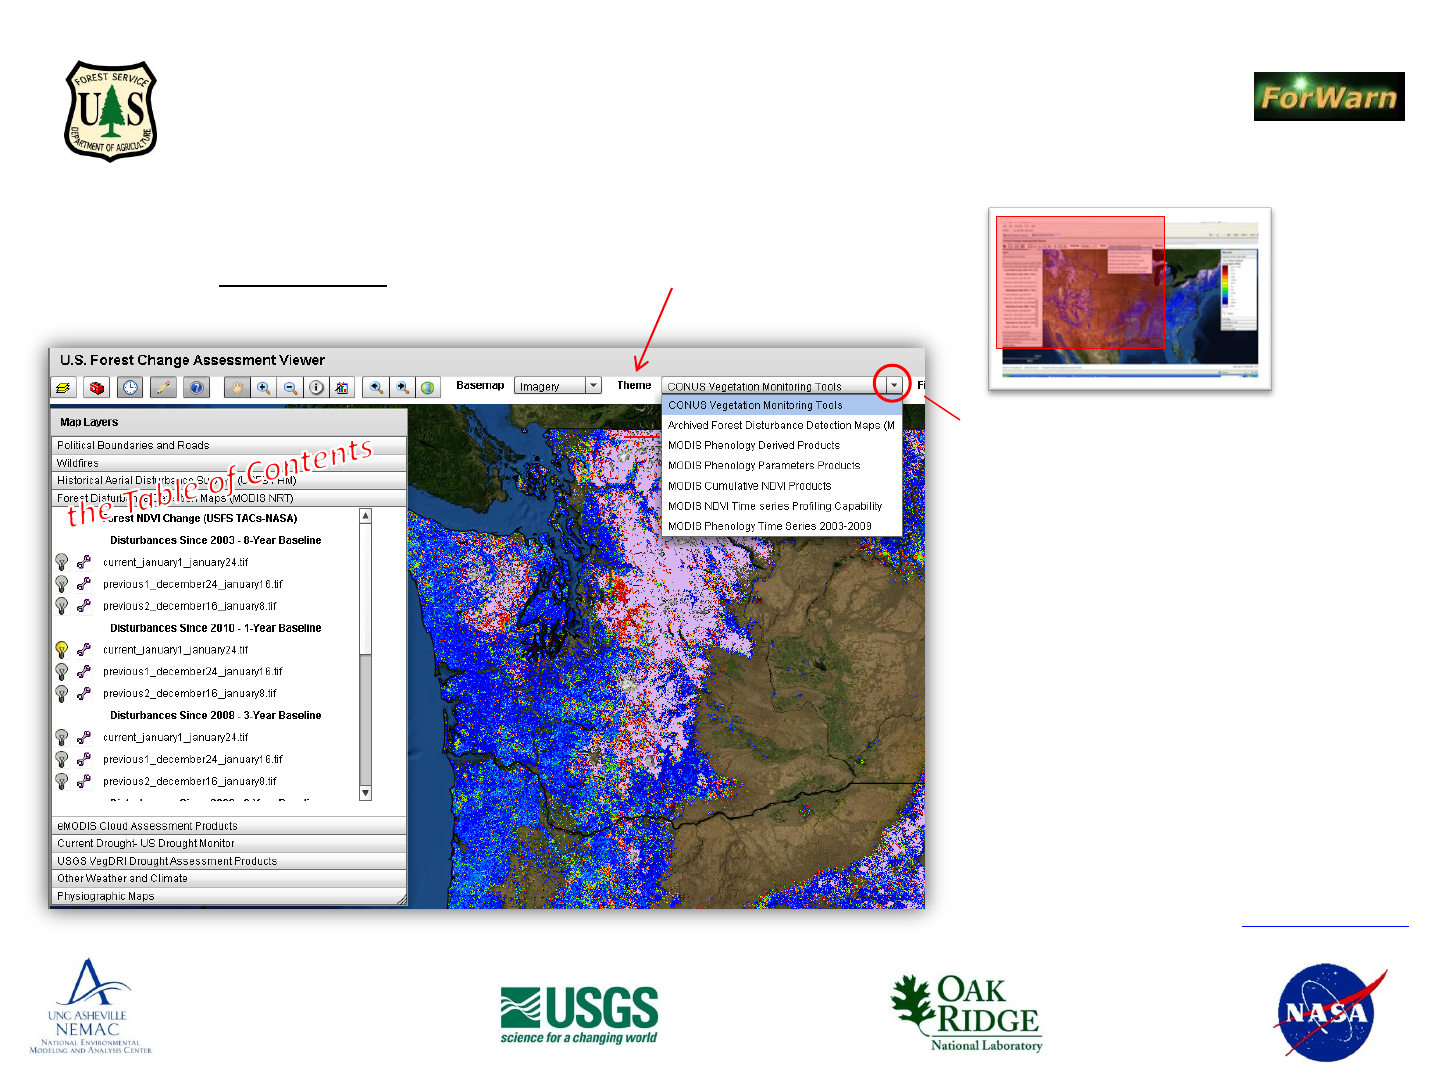
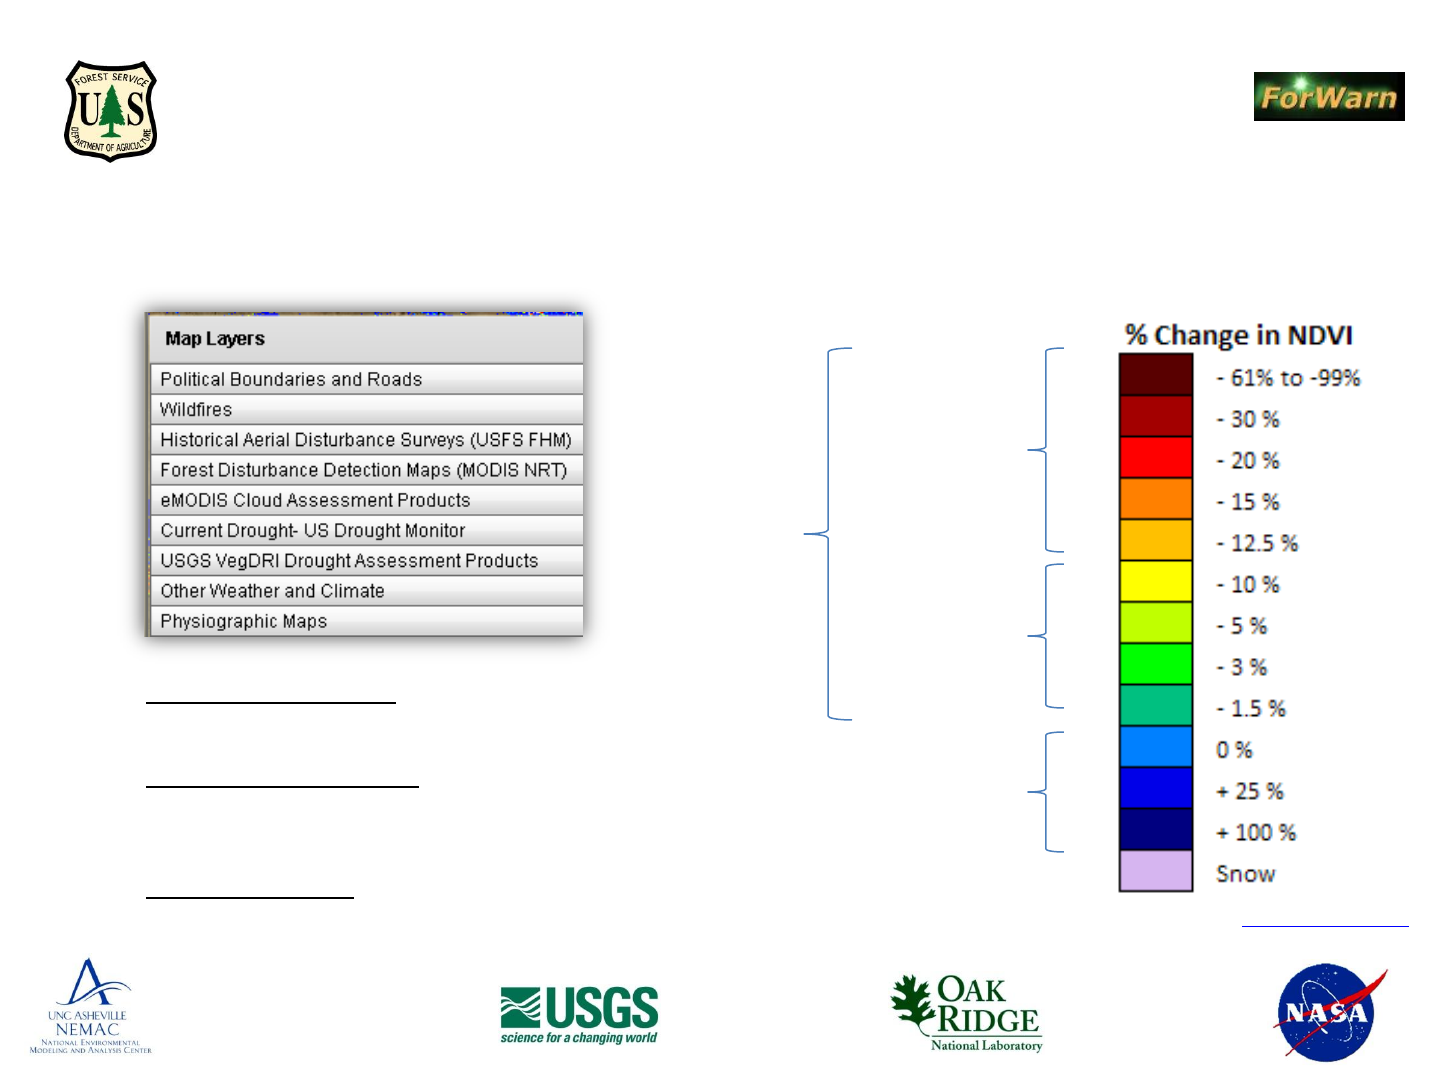
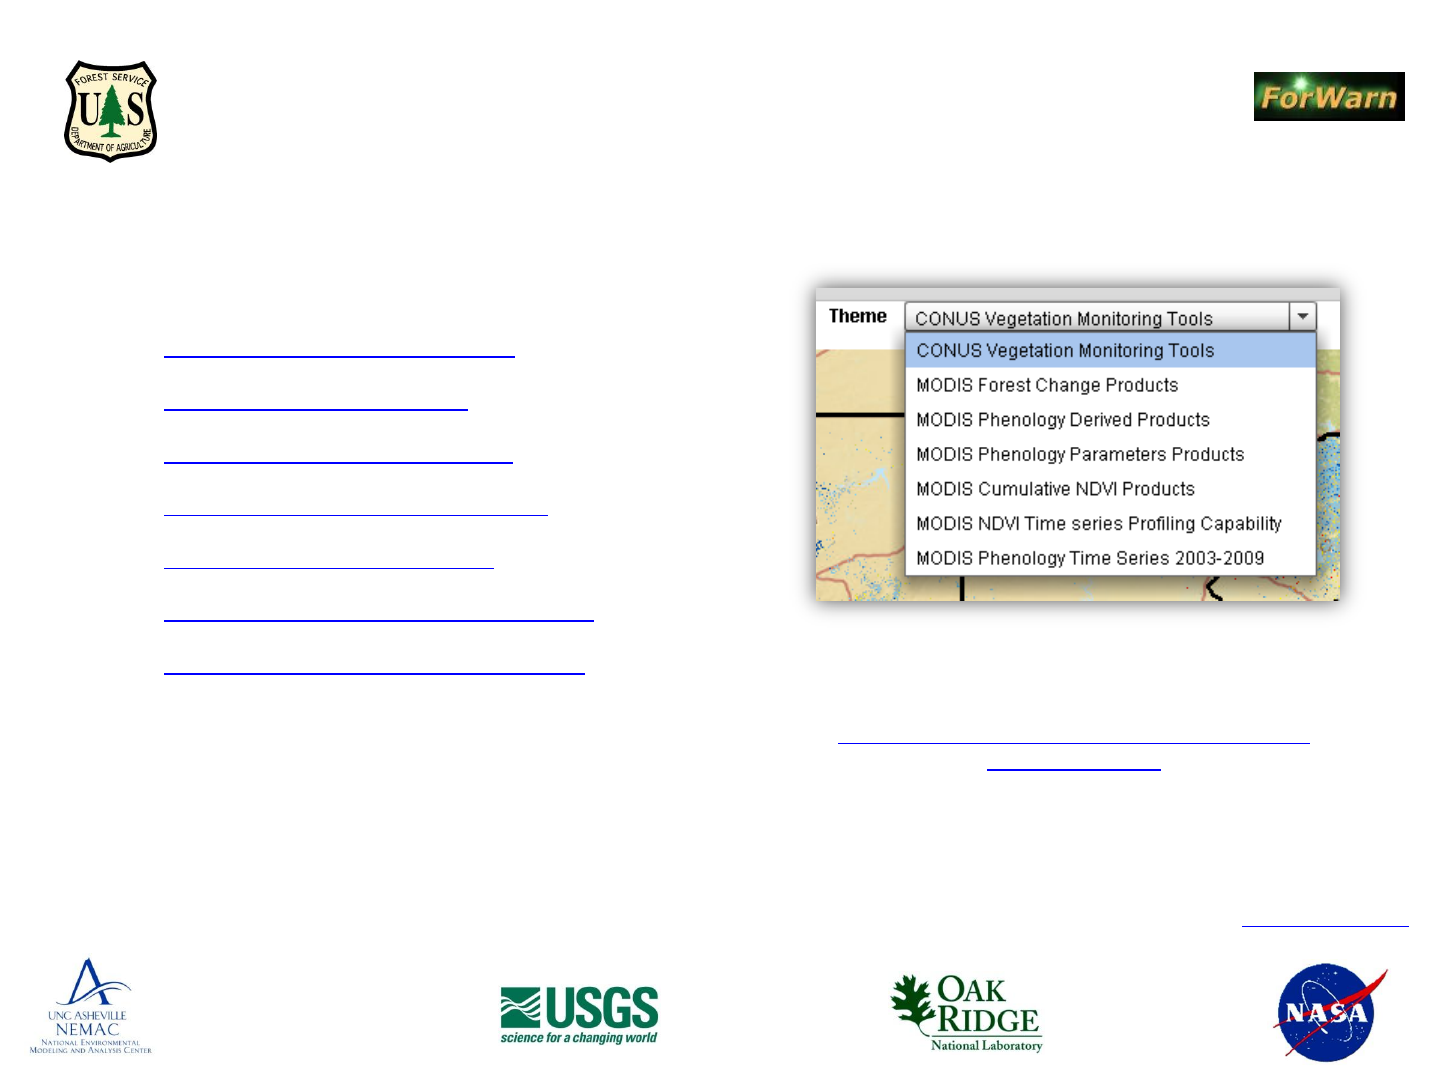
Data Layers: Choosing a Data Theme
• The “Theme” dropdown adds
specific data layers to the Table of
Contents, only one “Theme” can
chosen at a time
• Beginning users should leave the
theme choice set to the default
“CONUS Vegetation Monitoring
Tools”
• More detail will follow regarding
the other thematic collections, the
specific data layers that are added to
the Table of Contents and to which
purpose(s) the other themes and
data layers are appropriate
Portion of Viewer detailed is shown in red
Using the Forest Change Assessment Viewer
from the Forest Services’ Eastern Forest Environmental Threat Assessment Center (EFETAC)
and the Western Wildland Environmental Threat Assessment Center (WWETAC)
Back to Contents page
National Environmental Modeling and
Analysis Center (NEMAC)
University of North Carolina - Asheville
NASA
Stennis Space
Center, Mississippi
- Partners -
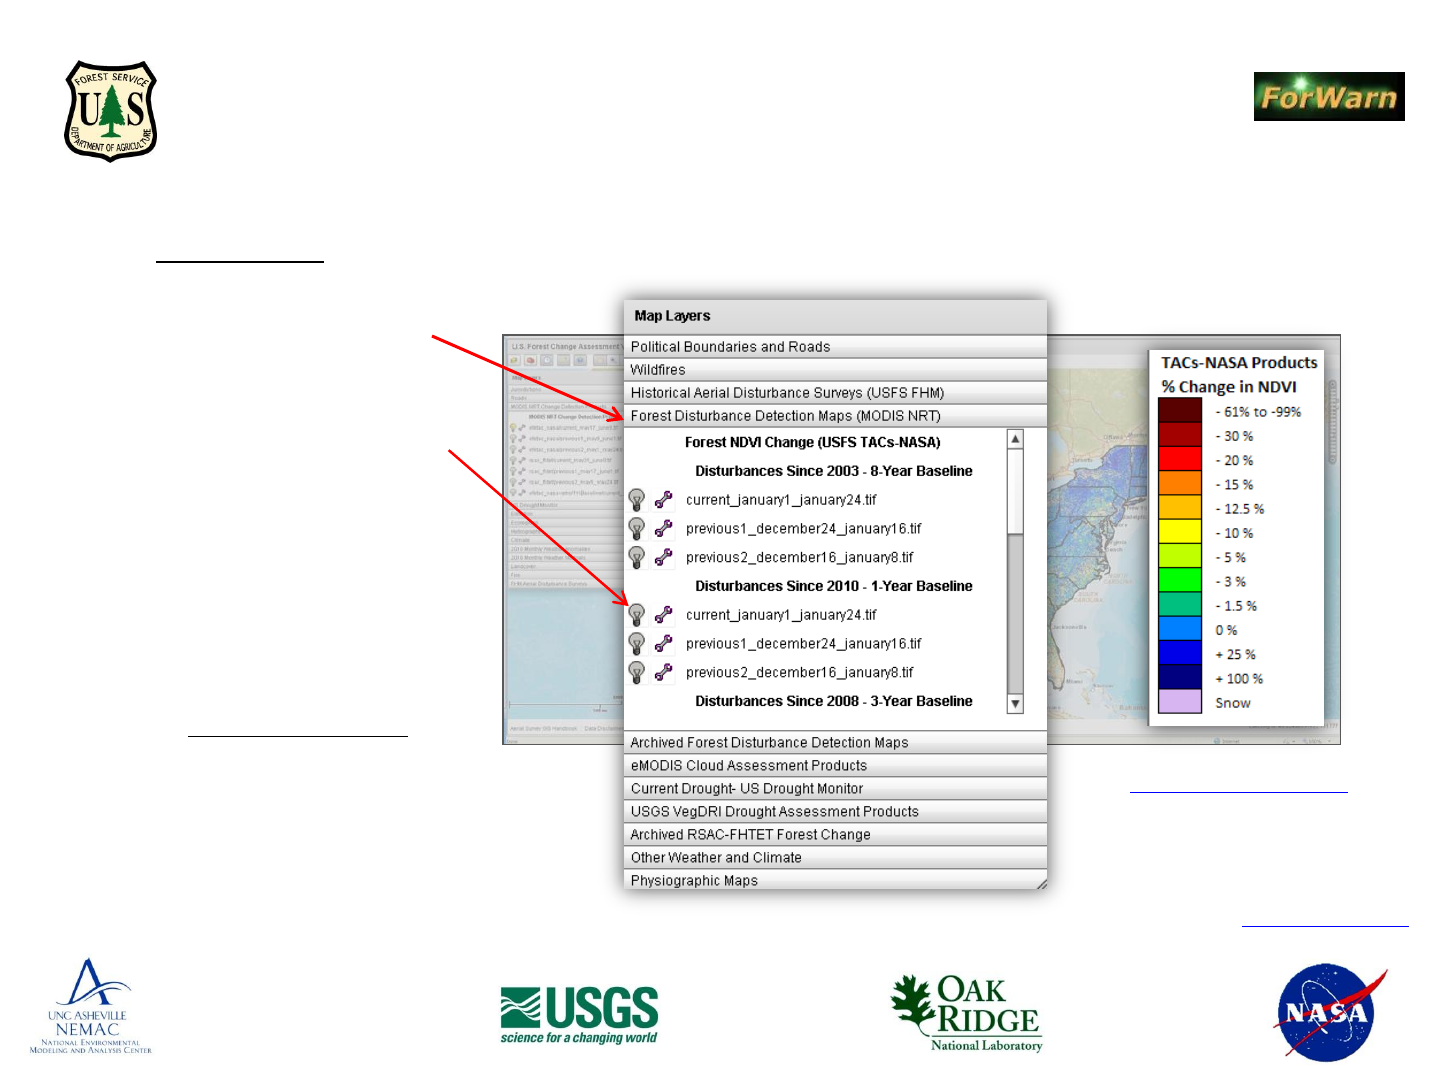
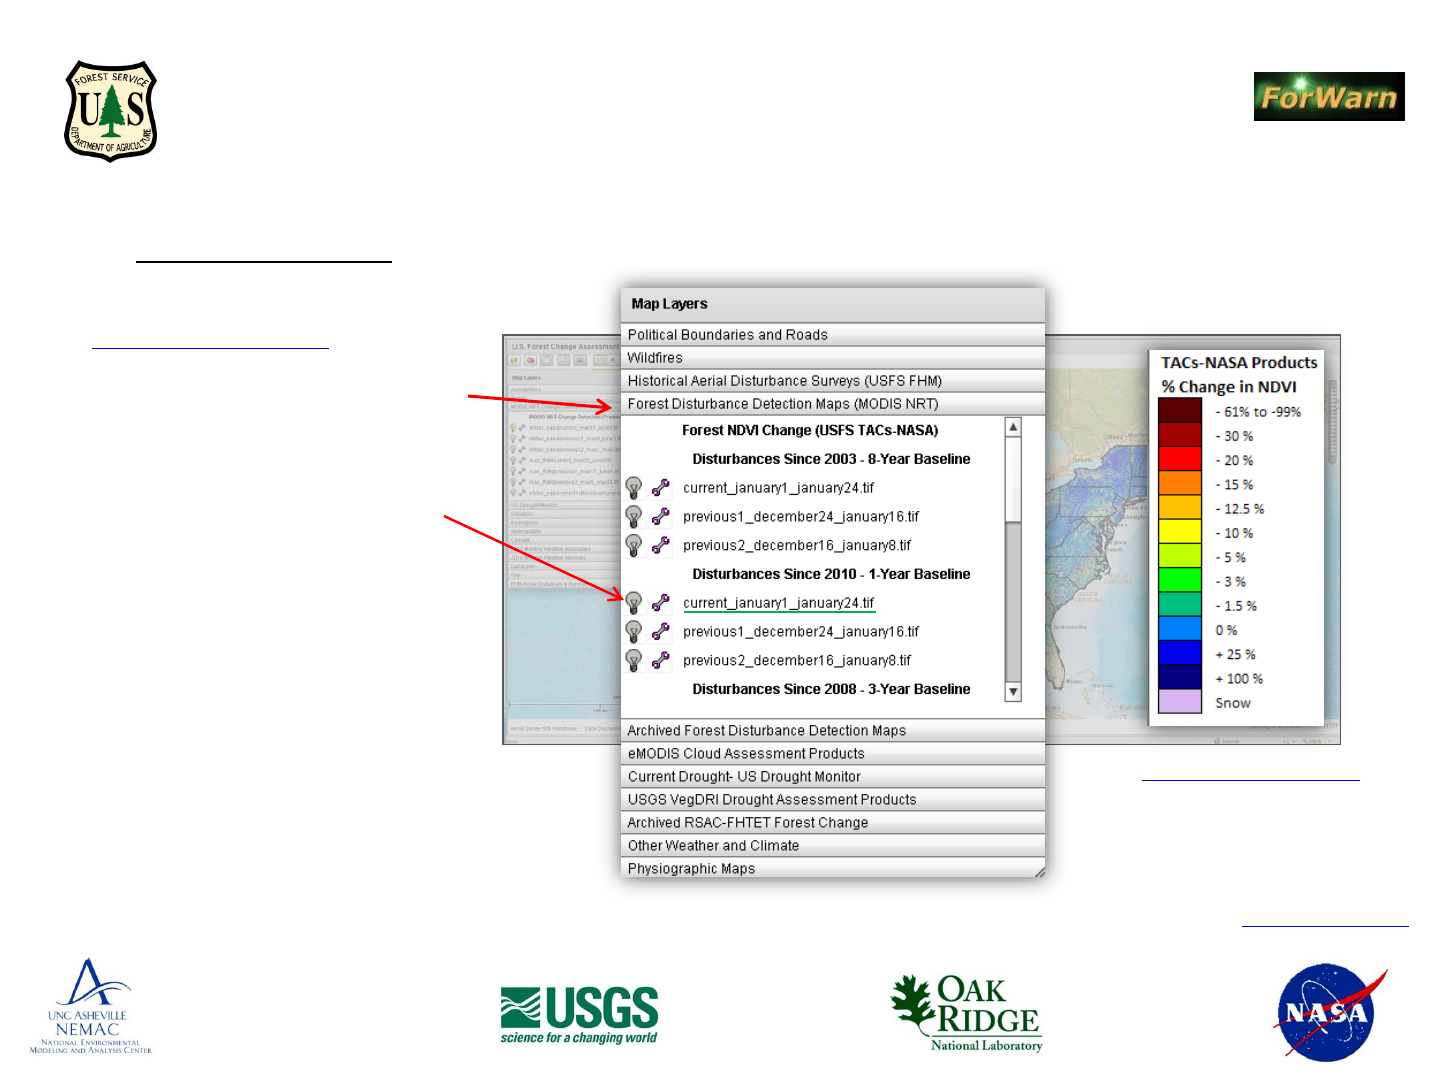
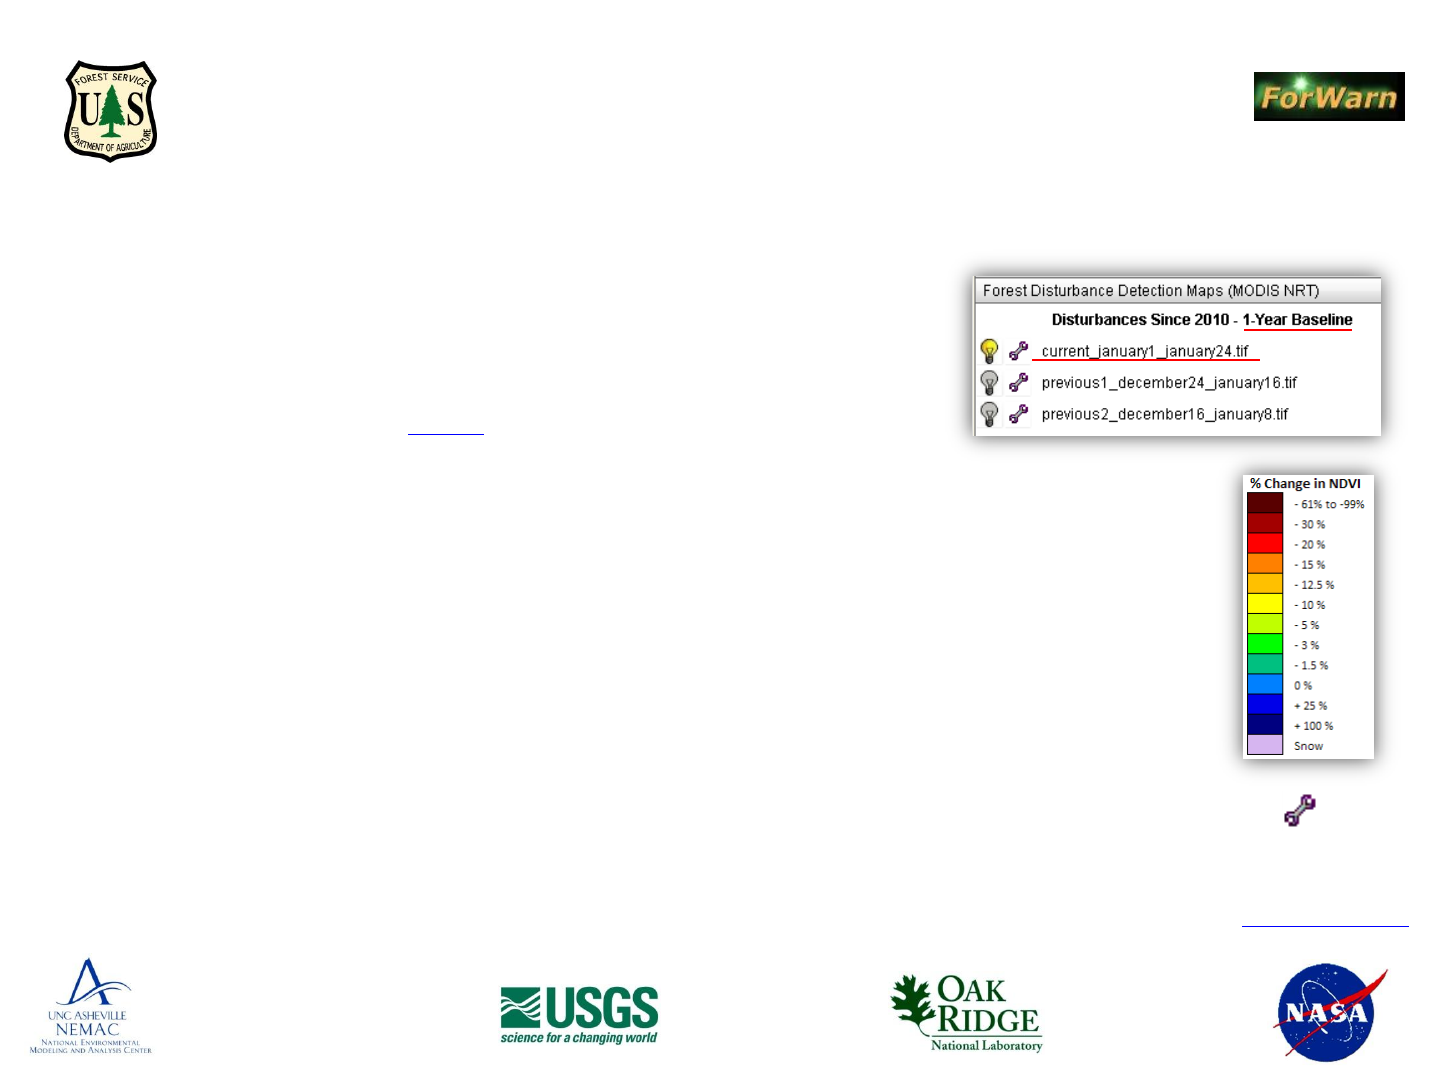
Data Layers: Viewing the most recent 1-year baseline forest change product
1. In the Table of Contents window,
click on the tab heading “Forest
Disturbance Detection Maps” to
expand and view the data layers
(NRT – near real time)
2. Click the ‘light bulb’ to the left of
the top data layer, this turns-on the
most recent baseline-specific forest
change image
3. Use the ‘wrench’ icon adjust the
transparency of any layer to better
view the basemap, or other layers
4. The top three layers are the (3)
most current eight-day, percent
NDVI forest change products from
EFETAC (using the 8-yr baseline)
5. Uses: toggle the three most recent
products to view a time-based
progression of NDVI decline, or
disturbance (shades of yellow to
red), or NDVI increase, or “green-
up” (shades of green to blue)
Table of Contents
window expanded
What do the colors mean?
Using the Forest Change Assessment Viewer
from the Forest Services’ Eastern Forest Environmental Threat Assessment Center (EFETAC)
and the Western Wildland Environmental Threat Assessment Center (WWETAC)
Back to Contents page
National Environmental Modeling and
Analysis Center (NEMAC)
University of North Carolina - Asheville
NASA
Stennis Space
Center, Mississippi
- Partners -
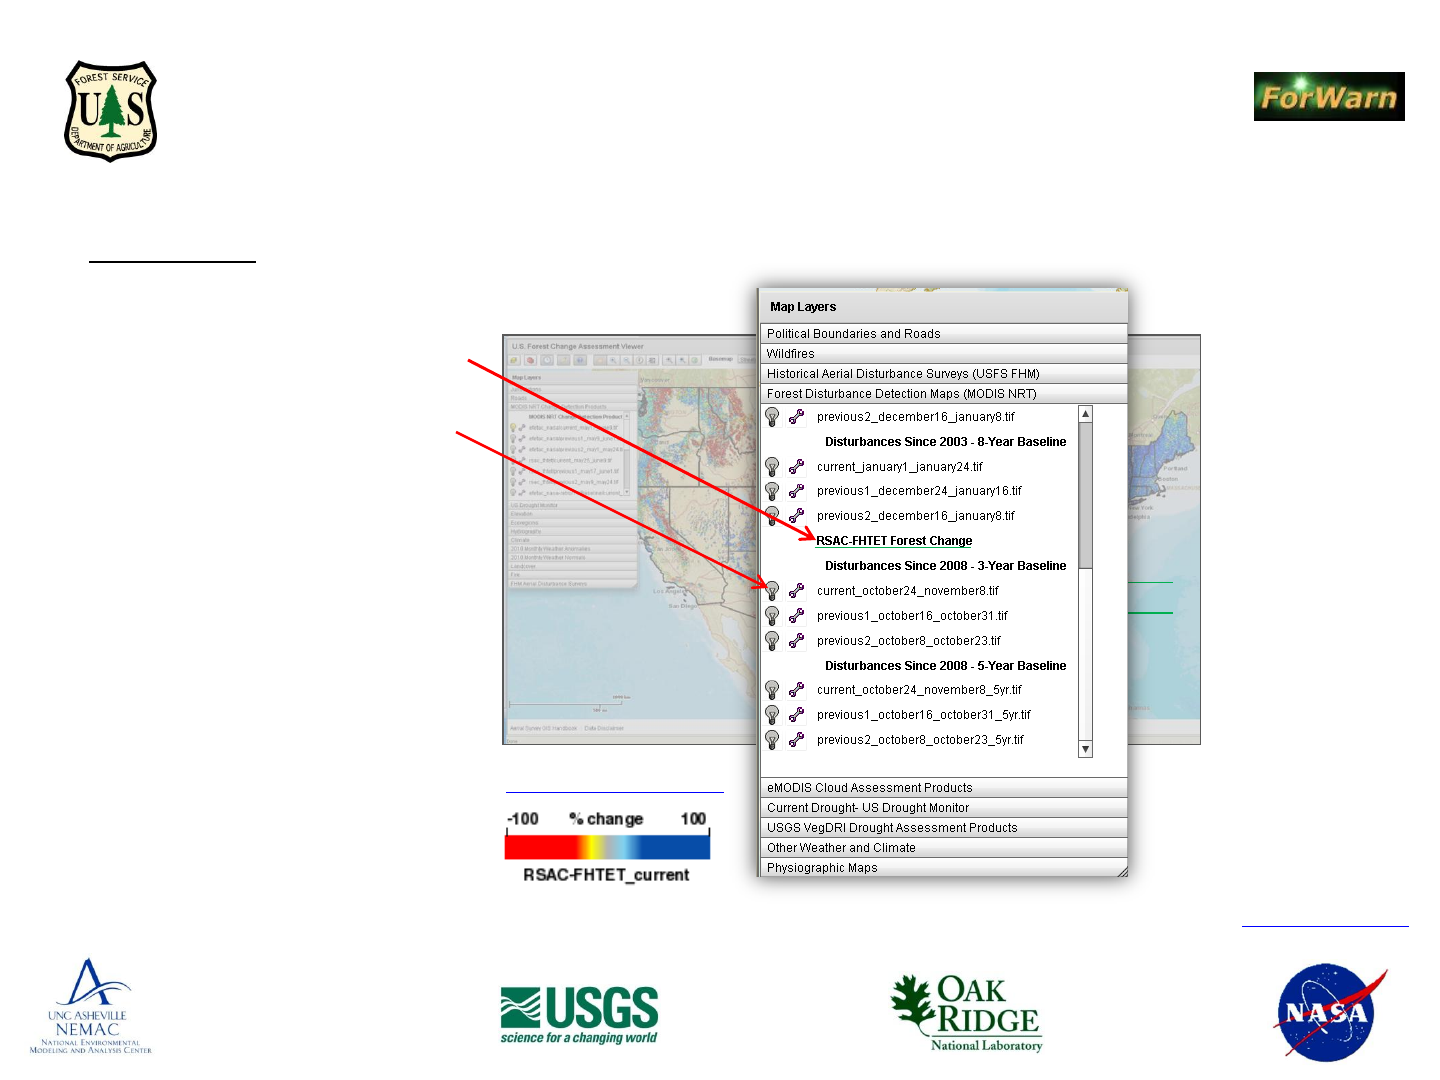
Data Layers: Forest Change image products from the RSAC (Remote Sensing Application Center, USDAFS)*
1. In the Table of Contents window, click
on the tab heading “Forest
Disturbance Detection Maps” to
expand and view the data layers (NRT
– near real time)
2. Scroll down and click the ‘light bulb’ to
the left of the top “RSAC” data layer,
this turns-on the most recent forest
change detection image from the RSAC
Forest Health Technology Enterprise
Team of the USDA Forest Service (*)
3. Uses: toggle the three most recent
RSAC image products to view a time-
based progression of a percent NDVI
change based on average NDVI values
(*) Different methodologies are employed by
EFETAC and RSAC to produce forest change
image products: EFETAC uses a 24-day
compositing window and maximum NDVI
values when computing percent NDVI change;
RSAC uses a 16-day compositing window and
computes percent NDVI change based on
average NDVI values
What do the colors mean?
Using the Forest Change Assessment Viewer
from the Forest Services’ Eastern Forest Environmental Threat Assessment Center (EFETAC)
and the Western Wildland Environmental Threat Assessment Center (WWETAC)
RSAC products are based on
a 3- and 5-year baseline and
composed via a 16-day
compositing period to obtain
a cloud-free CONUS mosaic
Back to Contents page
National Environmental Modeling and
Analysis Center (NEMAC)
University of North Carolina - Asheville
NASA
Stennis Space
Center, Mississippi
- Partners -
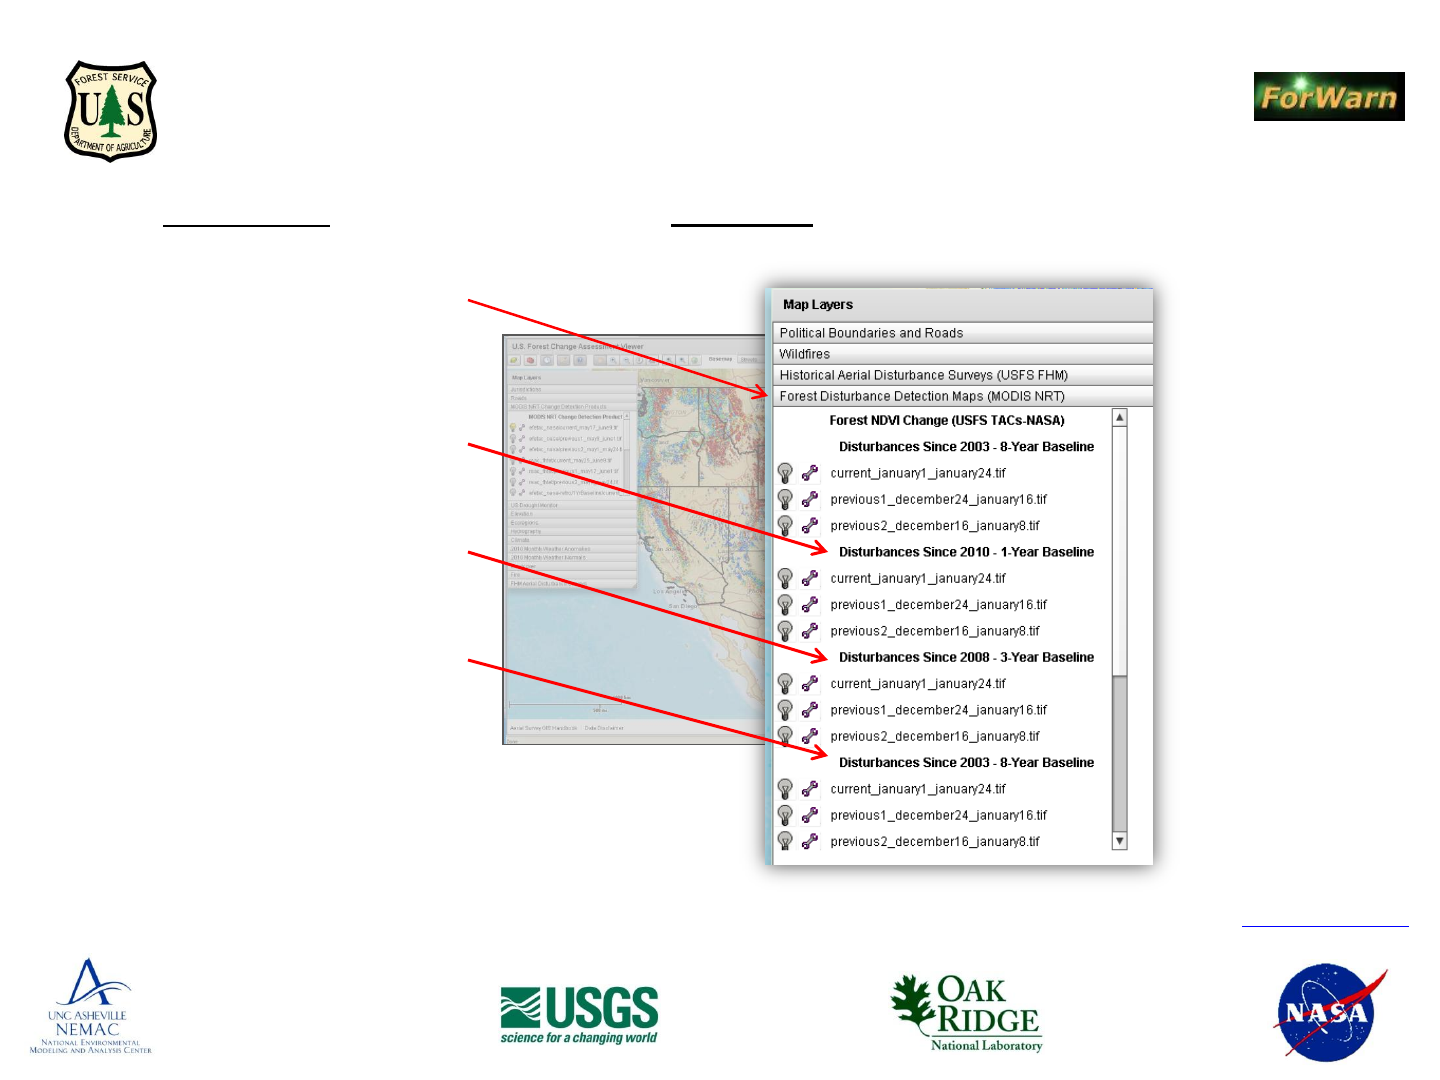
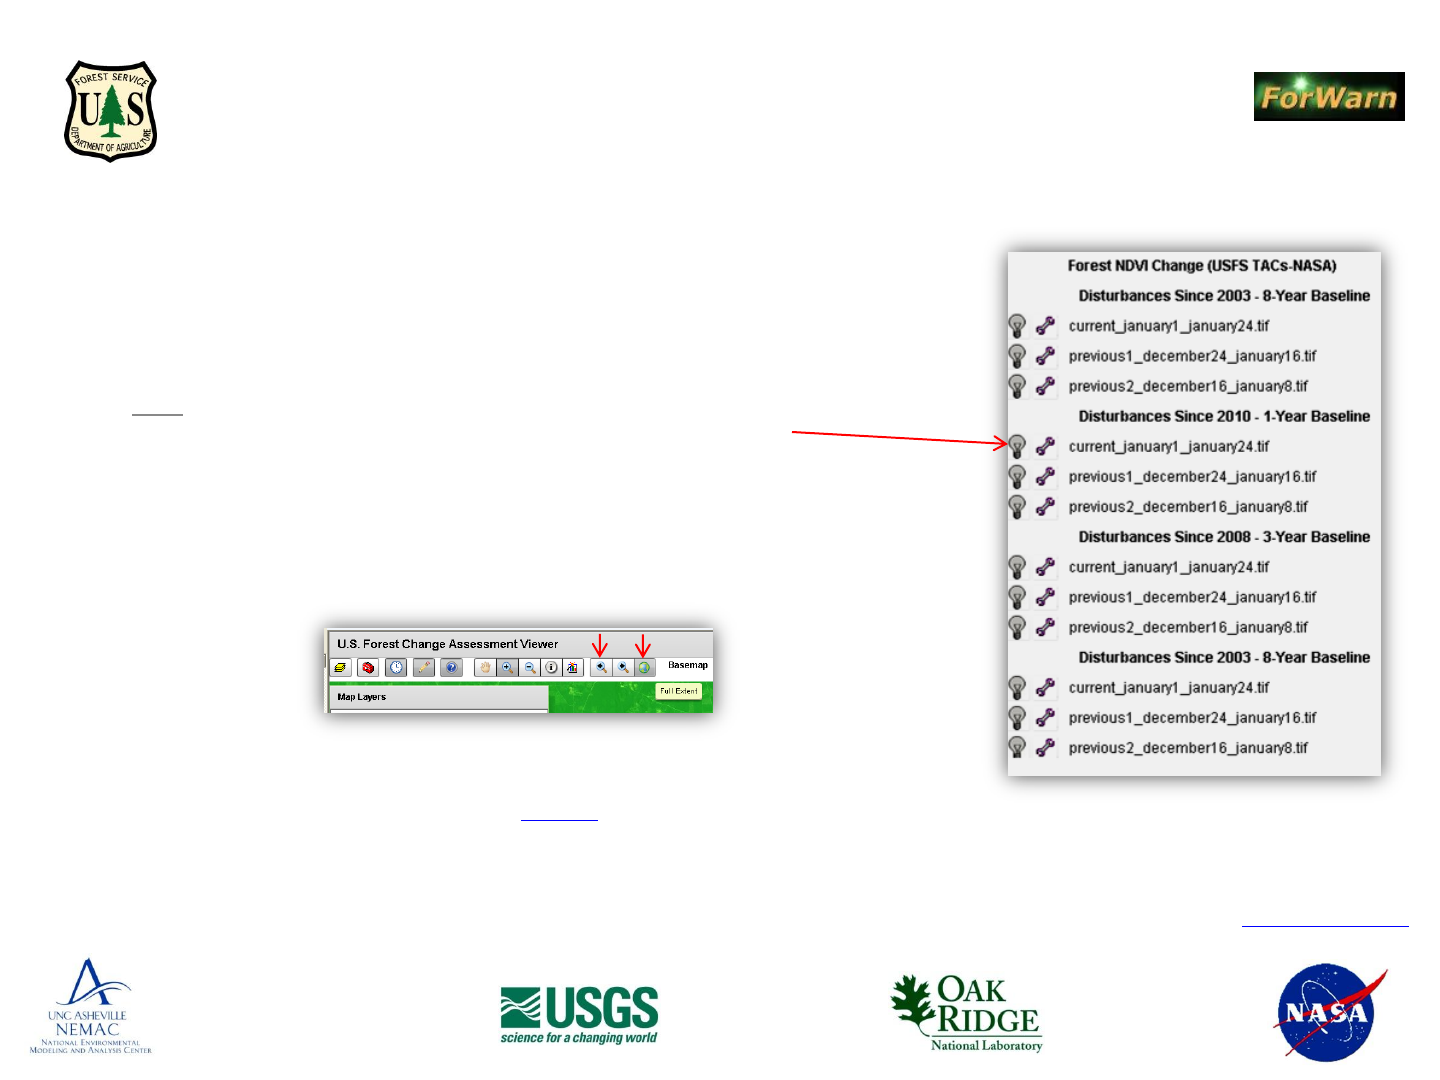
Data Layers: The (3) most recent “BASELINE” forest change image products
The different baseline time periods are used to create (3) separate, ‘percent NDVI change’ products, change compared to the previous 1-, 3- or 8-year time periods
1. In the Table of Contents window, click on the tab
heading “Forest Disturbance Detection Maps,”
this expands the tab and presents the data layers
(NRT – near real time)
2. The “Baseline” products are identified by three
time periods, a 1-year, 3-year and an “All-year,”
or 9-year baseline
3. The 1-year baseline image presents the percent of
NDVI change for the specific 8-day product
compared to the maximum NDVI value of for
same date (and 24-day window) for the previous
year (2010)
4. The 3-year baseline image presents the percent of
NDVI change for the specific 8-day product
compared to the maximum NDVI value of for
same date (and 24-day window) for the previous
3-years (2007-2010)
5. The 8-year baseline image presents the percent of
NDVI change for the specific 8-day product
compared to the maximum NDVI value of for
same date (and 24-day window) for the previous
8-years (2003-2010) (duplication in TOC required)
6. The top three layers are the (3) most recent eight-
day forest change products from EFETAC based on
the 8-year baseline
7. Uses: toggle three products of the same baseline
period to view a time-based progression percent
NDVI change (NDVI decline = forest disturbance,
shades of yellow to red, or NDVI increase = forest
recovery , or “green-up,” shades of blue to green
Table of Contents
window expanded
Using the Forest Change Assessment Viewer
from the Forest Services’ Eastern Forest Environmental Threat Assessment Center (EFETAC)
and the Western Wildland Environmental Threat Assessment Center (WWETAC)
Expect to see greater ‘percent NDVI change’ in the 3-, and 8-yr baseline products than
seen in the 1-yr baseline forest change product. Back to Contents page
National Environmental Modeling and
Analysis Center (NEMAC)
University of North Carolina - Asheville
NASA
Stennis Space
Center, Mississippi
- Partners -
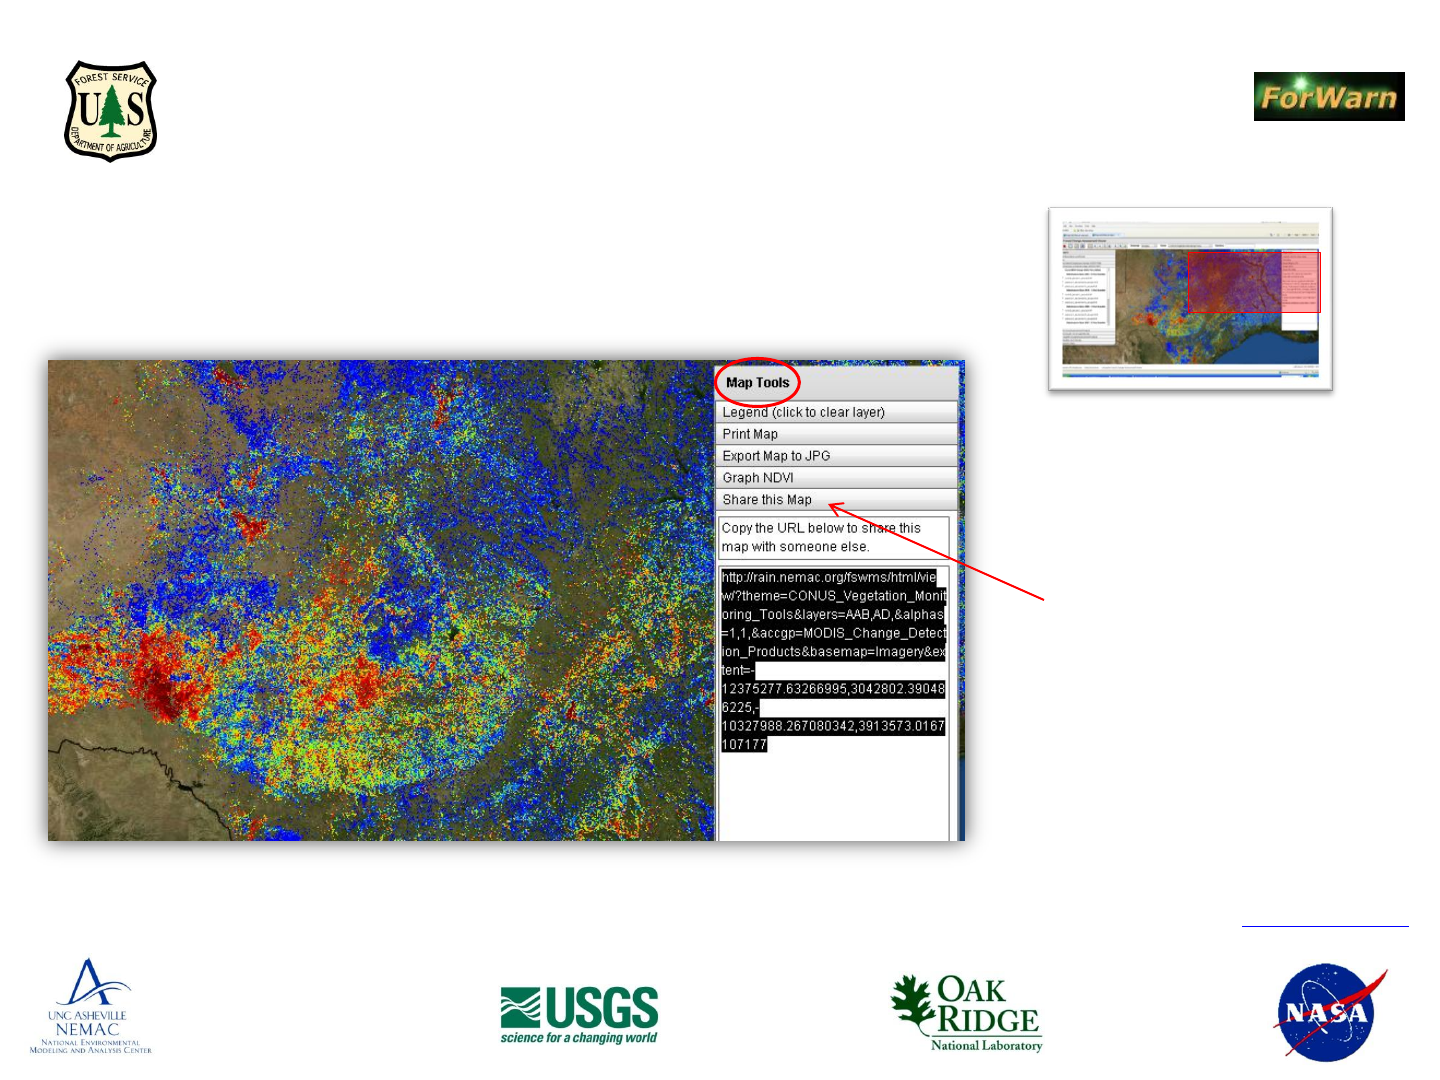
Share Disturbance Events with Colleagues
• The “Map Tools” box in the
upper right portion of the Viewer
offers the capability to send a
URL of a view via your email
client to a colleague.
• Click the “Share this Map” tab,
then highlight and copy the URL,
and paste the link into your email
program. Your colleague can
open the Viewer to the same
extent and data layers you were
using to explore a disturbance
event.
Portion of Viewer detailed is shown in red
Using the Forest Change Assessment Viewer
from the Forest Services’ Eastern Forest Environmental Threat Assessment Center (EFETAC)
and the Western Wildland Environmental Threat Assessment Center (WWETAC)
• Printing, graphing NDVI history and the ability to save a JPEG of the view is also available from the Map Tools tabs.
Back to Contents page
National Environmental Modeling and
Analysis Center (NEMAC)
University of North Carolina - Asheville
NASA
Stennis Space
Center, Mississippi
- Partners -
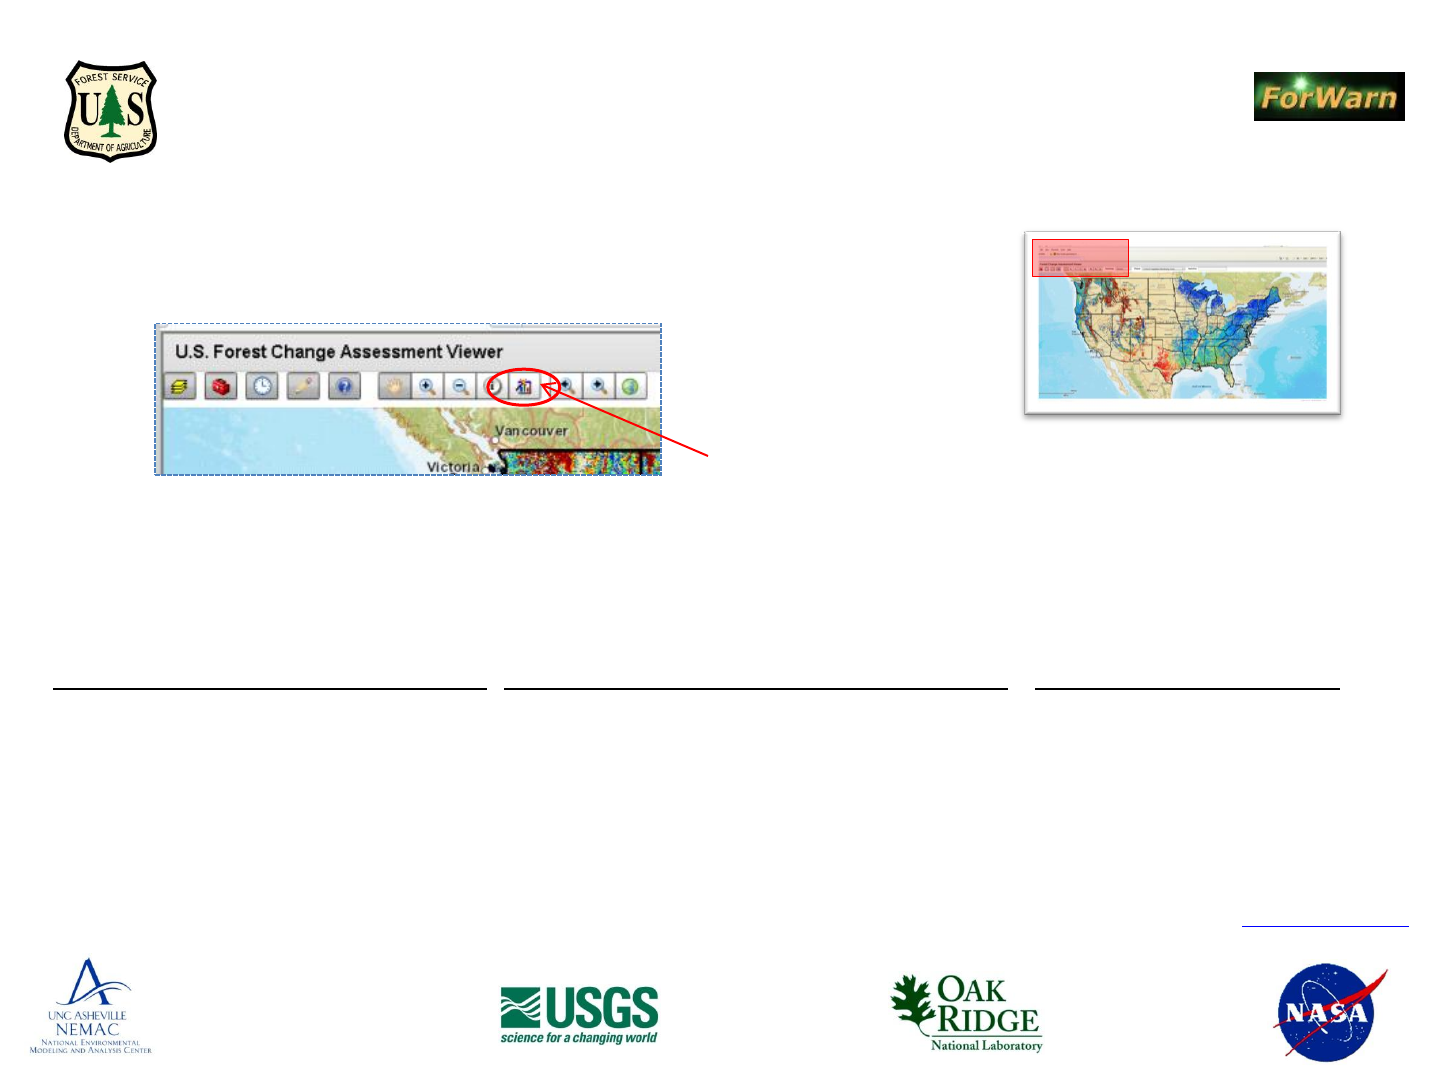
What is the “Graph NDVI” Tool (pg 1 of 4)
Use of this tool allows one to observe an 11-year NDVI history of a single MODIS pixel (231 meter square area), anywhere in the conterminous
U.S. (CONUS). NDVI values are presented in x and y graph format. NDVI values are plotted along the y-axis, and the 11-year time scale, with
measurements recorded every 8-days, are plotted along the x-axis. Changes in NDVI values fluctuate and relate primarily to changes to
vegetative condition and vigor, but also can noticeably change due to natural disturbance events and anthropogenic modifications.
Using the Forest Change Assessment Viewer
from the Forest Services’ Eastern Forest Environmental Threat Assessment Center (EFETAC)
and the Western Wildland Environmental Threat Assessment Center (WWETAC)
Portion of Viewer detailed is shown in red
The “Graph NDVI” tool presents a graph of NDVI values for a specific location
over the period of 11-years, with measurements recorded every 8-days
Natural disturbances causing a decline in NDVI value
Tornados and hurricane events
Wind, hail and ice storm damage
Drought and flood conditions
Insect and disease outbreaks
Fall season brown-up
Snow pack extent
Wildfire events
Human-Induced disturbances causing a decline in NDVI value
Forest fragmentation, conversion and urban sprawl
Forest clear-cutting and stand thinning
Mining, oil and natural gas activities
Non-native plant species invasions
Climate variability and change
Prescribed fire
Arson wildfire
Events that can increase NDVI values
Vegetative recovery from disturbance
Non-native plant species invasions
Precipitation events in arid locales
Forest canopy closure
Forest plantings
Spring leaf-out
Back to Contents page
National Environmental Modeling and
Analysis Center (NEMAC)
University of North Carolina - Asheville
NASA
Stennis Space
Center, Mississippi
- Partners -
Use of the “Graph NDVI” Tool (pg 2 of 4)
• To CLOSE the multi-graph window, click the ‘x’ in the upper right corner of the graph window
Optional
Expanding the axes spreads-out the data measurements and provides more detail:
• to spread-out the Date/Time axis, place the mouse cursor inside graph window and on the x-axis,
press and hold SHIFT, and move cursor left and right to expand and contract the timescale axis,
release the SHIFT key and ‘drag’ the Date/Time axis left and right to see more detail
• to spread-out the NDVI axis, place the mouse cursor inside graph window and on the y-axis, press
and hold SHIFT, and move cursor up and down to expand and contract the NDVI axis, release the
SHIFT key and ‘drag’ the NDVI axis up and down to see more detail
• whether expanding or contracting an axis, remember to place your cursor
on the axis to affect
Using the Forest Change Assessment Viewer
from the Forest Services’ Eastern Forest Environmental Threat Assessment Center (EFETAC)
and the Western Wildland Environmental Threat Assessment Center (WWETAC)
Portion of Viewer detailed is shown in red
The “Graph NDVI” tool presents a graph of NDVI values for a specific location
over the period of 11-years, with measurements recorded every 8-days
To operate the “Graph NDVI” tool, first, zoom to your area of interest, then select the icon displayed in the Viewers top left banner. Perform
a single click of the mouse on your area of interest and a separate window will open with a graph of the NDVI values for that specific location.
Try using the ‘imagery’ basemap to guide your selection of a point to graph with the Multi-graph tool.
Back to Contents page
National Environmental Modeling and
Analysis Center (NEMAC)
University of North Carolina - Asheville
NASA
Stennis Space
Center, Mississippi
- Partners -
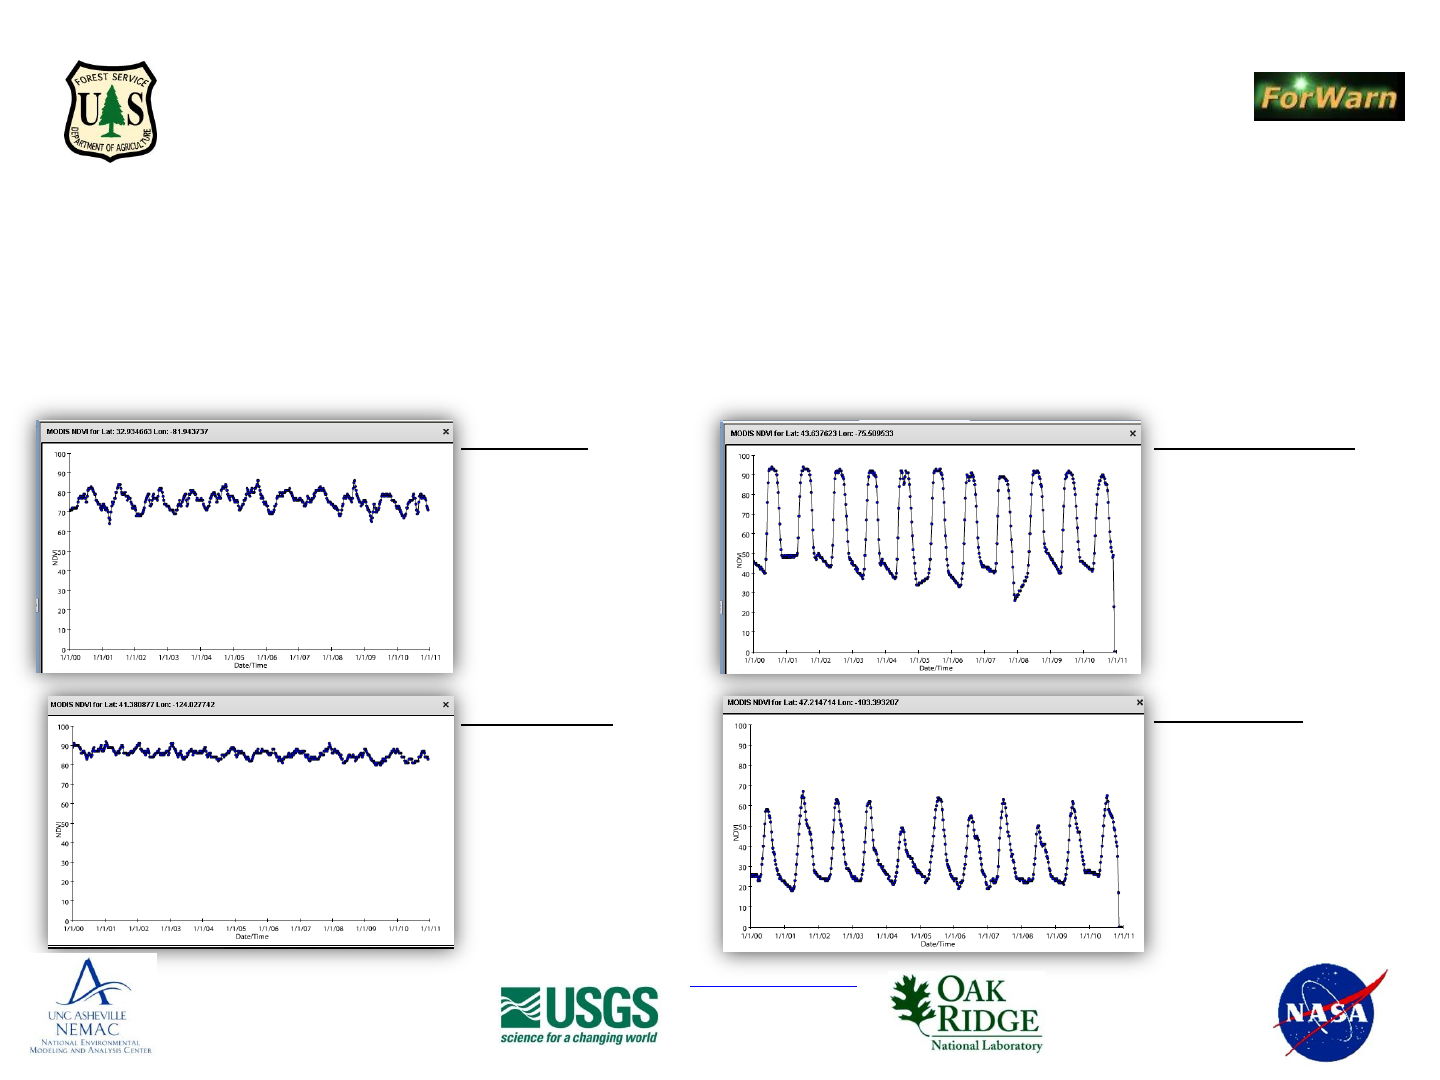
Interpreting NDVI Pheno-signatures, The Basics (pg 3 of 4)
An entire course of study can be devoted this topic alone. Be aware of the following NDVI-curve response characteristics when interpreting the
NDVI signature that the multi-graph produces: the data range and amplitude of NDVI values, the duration of change that NDVI values experience
across time, the modality, or period, of reoccurring NDVI values of similar character, the type of land cover or land use that was selected, the
phenological character of increase and/or decrease in NDVI value over time and denote the date that abrupt changes in NDVI values occur. Here
are a few typical NDVI response curves from basic vegetative land covers:
Back to Contents page
Using the Forest Change Assessment Viewer
from the Forest Services’ Eastern Forest Environmental Threat Assessment Center (EFETAC)
and the Western Wildland Environmental Threat Assessment Center (WWETAC)
Pine Plantation
(Pinus sp., GA)
• relatively high average-NDVI
values
• amplitude relatively narrow
• annual NDVI value increase
and decrease due to
photosynthetic response to
annual phenology
Mixed Hardwood Forest
(Adirondack Park, NY)
• high maximum-NDVI values
• data range relatively high
• NDVI increase and decrease
due to annual phenology
• NDVI-minimum variability
may be due to snow events
masking the shrub layer
Coastal Redwoods
(Sequoia sempervirens, CA)
• relatively high and constant
NDVI values
• amplitude of change very
narrow
• slight phenological variation
across time
Prairie Grasslands
(National Grasslands, ND)
• relatively low average-NDVI
values and range large
• sharp NDVI increase and
decrease due to annual
phenology
• variability in yearly maximums
due to variations in seasonal
precipitation
National Environmental Modeling and
Analysis Center (NEMAC)
University of North Carolina - Asheville
NASA
Stennis Space
Center, Mississippi
- Partners -
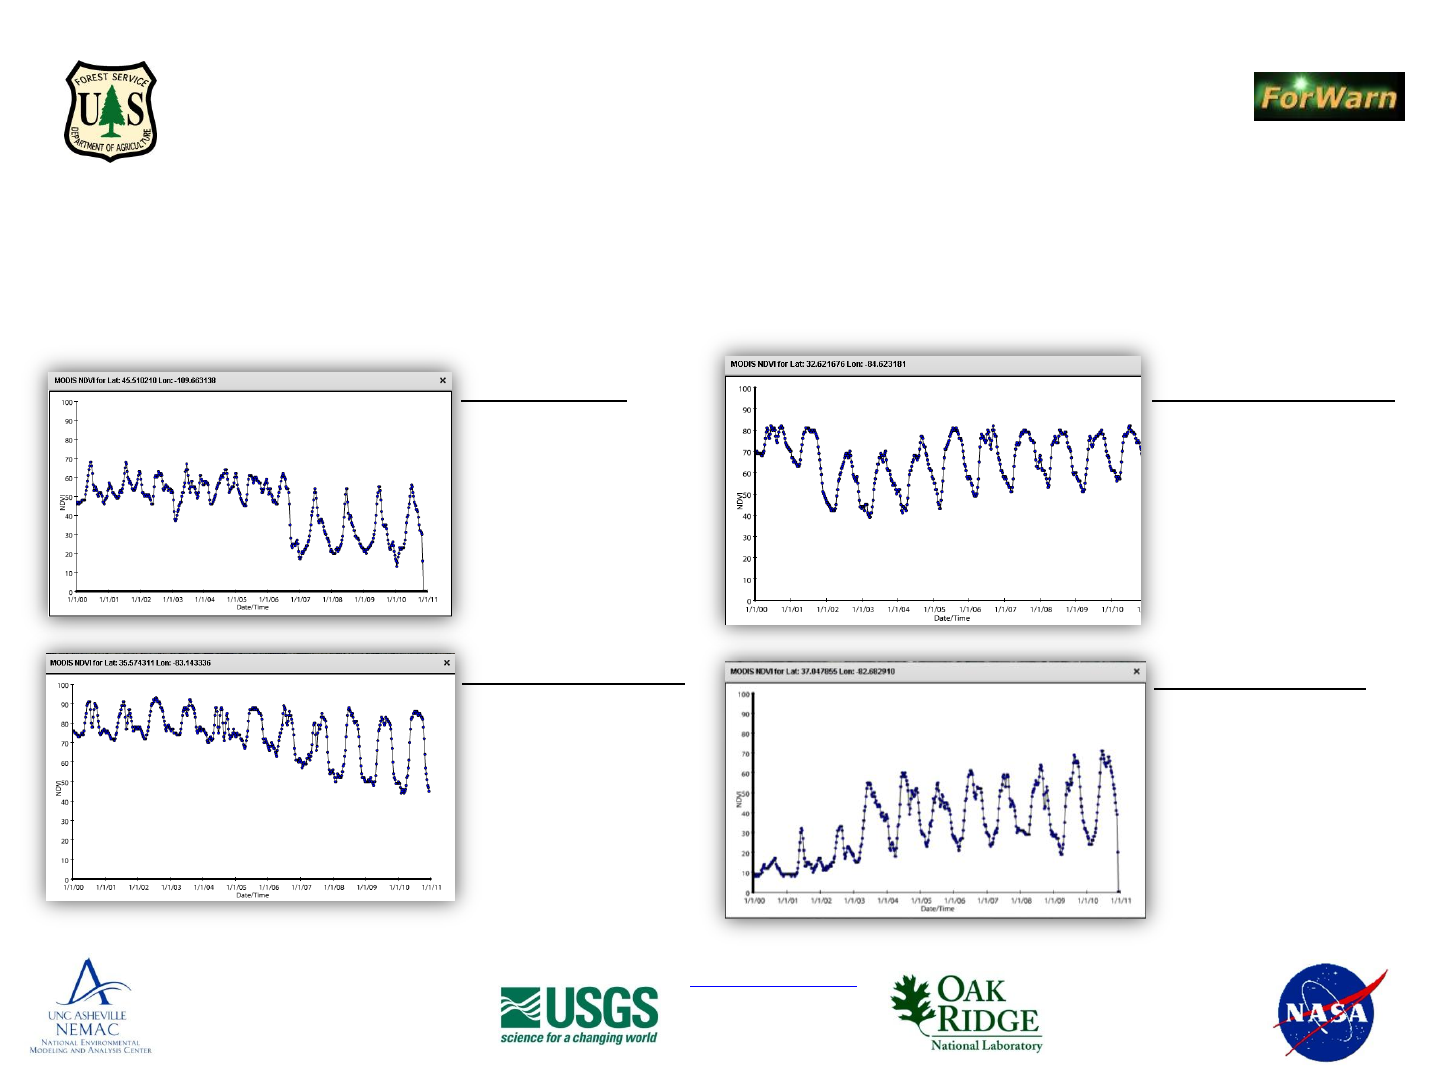
Abnormal, or unexpected changes in NDVI values can be explained. Here are some typical examples of changes in vegetative vigor that is observed in
the NDVI curve produced by the Multi-graph tool:
Using the Forest Change Assessment Viewer
from the Forest Services’ Eastern Forest Environmental Threat Assessment Center (EFETAC)
and the Western Wildland Environmental Threat Assessment Center (WWETAC)
Interpreting NDVI Pheno-signatures, Advanced (pg 4 of 4)
2006 Derby Wildfire
(southern Montana)
•Pre-fire, dominated by low
density Ponderosa Pine
•Post-fire, tree killing event
led to grass dominated
landscape
• observe greater peakedness
and lower winter minimums
Timber Harvest and Recovery
(central Georgia)
• drop in NDVI due to plantation
clear-cut in 2001
• crown closure of the pine
plantation reduces the amplitude
of the annual phenological signal
• note the trend in increased
minimum NDVI values over time
Non-native Invasive Specie
(Hemlock Wooly Adelgid, TN)
• declining Hemlock
composition causes a drop in
the winter minimum
• defoliation began during the
2005 growing season
• this tool can be used to
monitor the rate of decline
for this area and for new sites
Strip-Mining Reclamation
(western Virginia)
• NDVI increase due to the mined
area being replanted
• has not achieved maximum
greenness of original forest cover
• this tool can provide insights
into the ability of reclaimed land
to recover its productivity within
a specified time frame
Back to Contents page
National Environmental Modeling and
Analysis Center (NEMAC)
University of North Carolina - Asheville
NASA
Stennis Space
Center, Mississippi
- Partners -
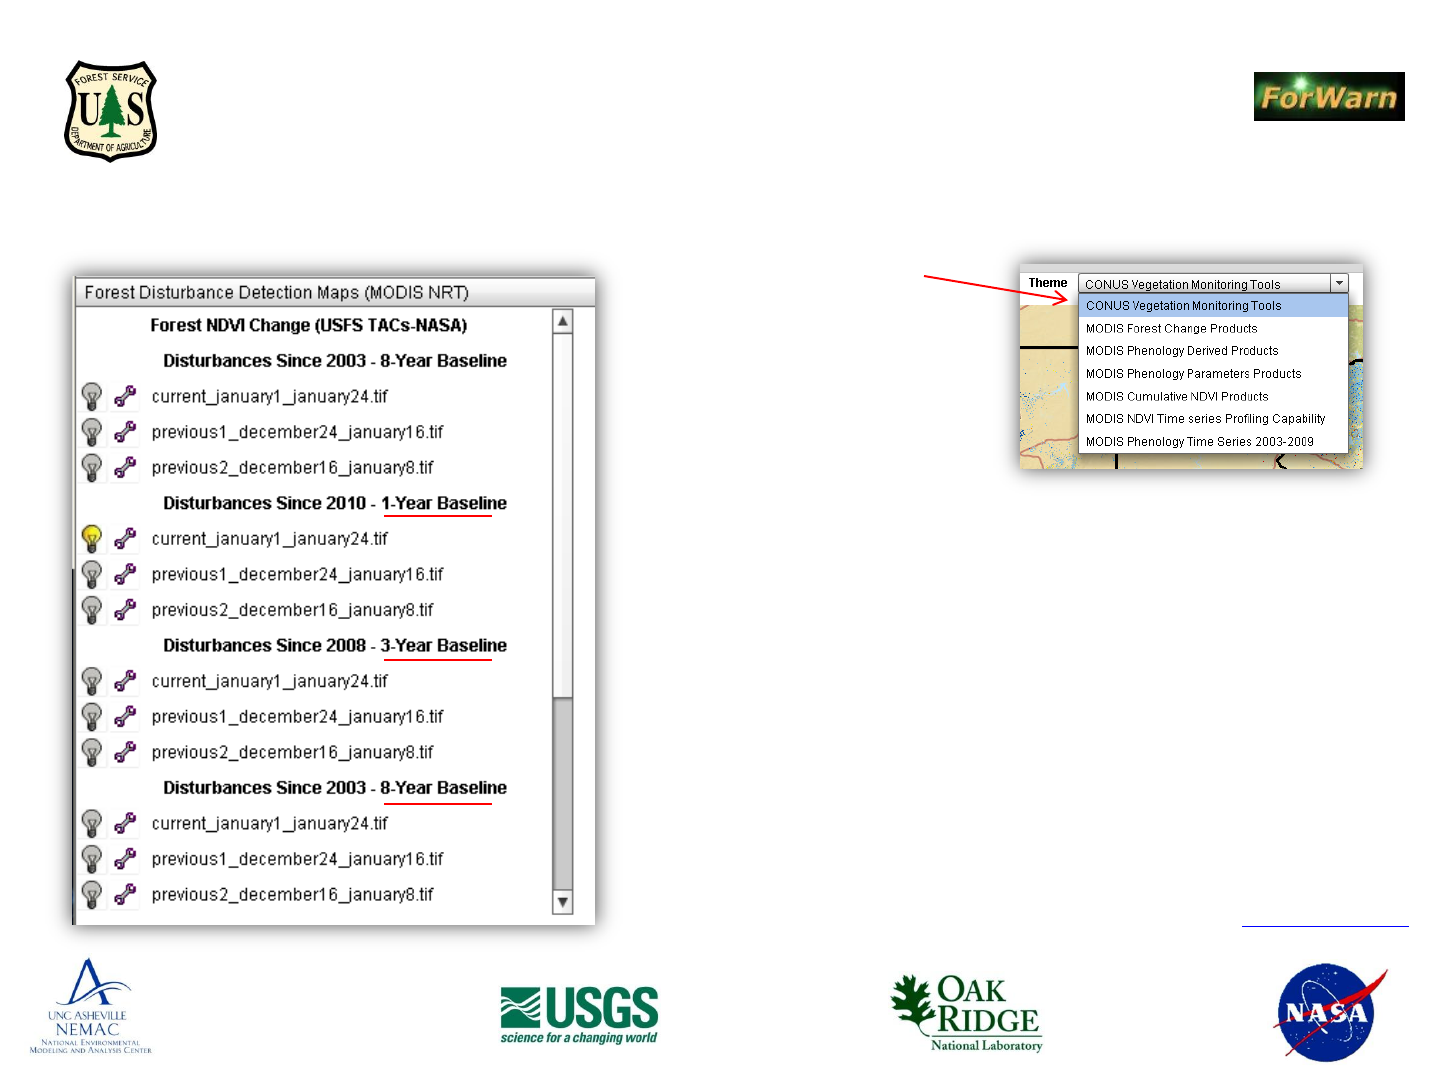
Quick Start Guide
1. Open this URL in a web browser
http://forwarn.forestthreats.org
2. In the Table of Contents window, click on
the tab heading “Forest Disturbance
Detection Maps” to expand and view the
data layers (NRT – near real time)
3. Determine which baseline you are
interested in, and click the ‘light bulb’
next to an image in either the 1, 3 or 8-
year baseline groupings. The first (top)
change image listed is the most recent in
the group (most recent 1-yr baseline
indicated by arrow)
4. Use the map controls to zoom and pan,
or type the name of a county in the “Find
Area” box in the top-right area of the
FCAV viewer window
5. Use the ‘wrench’ icon to adjust the
transparency of any layer to better view
the basemap , or other layers
Table of Contents
window expanded
What do the colors mean?
Using the Forest Change Assessment Viewer
from the Forest Services’ Eastern Forest Environmental Threat Assessment Center (EFETAC)
and the Western Wildland Environmental Threat Assessment Center (WWETAC)
Back to Contents page
National Environmental Modeling and
Analysis Center (NEMAC)
University of North Carolina - Asheville
NASA
Stennis Space
Center, Mississippi
- Partners -
Using the Forest Change Assessment Viewer
from the Forest Services’ Eastern Forest Environmental Threat Assessment Center (EFETAC)
and the Western Wildland Environmental Threat Assessment Center (WWETAC)
These data Layers can be used to determine the cause of NDVI change
Back to Contents page
National Environmental Modeling and
Analysis Center (NEMAC)
University of North Carolina - Asheville
NASA
Stennis Space
Center, Mississippi
- Partners -
Platform
Data Item
Primary
Secondary
Location
ForWarn FCAV
1, 3 and/or 8-yr baseline images
x
http://forwarn.forestthreats.org
Aerial Disturbance Surveys (ADS)
x
http://forwarn.forestthreats.org
ADS Pest Proximity
x
http://forwarn.forestthreats.org
Cloud TCC 24-day CONUS
x
http://forwarn.forestthreats.org
Drought Monitor (NOAA)
x
http://forwarn.forestthreats.org
VegDri Products (USGS)
x
http://forwarn.forestthreats.org
ESRI Imagery Basemap
x
http://forwarn.forestthreats.org
ESRI Topo (situation)
x
http://forwarn.forestthreats.org
Historical Fire Scars
x
http://forwarn.forestthreats.org
MODIS Hotspots layer (2)
x
http://forwarn.forestthreats.org
“Graph NDVI” Tool
x
http://forwarn.forestthreats.org
RSAC Change Products
x
http://forwarn.forestthreats.org
Desktop GIS
Landsat TM 5/7 (most recent)
x
http://glovis.usgs.gov/
RSAC Image Server (newer NAIP)
x
http://fsweb.rsac.fs.fed.us (FS-only)
WMS 1, 3 and 8-yr baselines
x
fswms.nemac.org/ewswcs? (denote version 1.0.0)
Protected Areas Database (PADUS)
x
http://gapanalysis.usgs.gov/data/padus-data/
Web Browser
Active Fire Maps (sat. imagery)
x
http://activefiremaps.fs.fed.us/imagery.php
Active Fire Maps (occurrence)
x
http://activefiremaps.fs.fed.us/
InciWeb (active events and maps)
x
http://www.inciweb.org/
RAWS Weather Station Data
x
http://www.raws.dri.edu/
News Articles (recent via Google)
x
https://www.google.com/
National Forest 'Alerts & Notices'
x
go to specific NF home web pages

Using the Forest Change Assessment Viewer
from the Forest Services’ Eastern Forest Environmental Threat Assessment Center (EFETAC)
and the Western Wildland Environmental Threat Assessment Center (WWETAC)
Investigative Protocol: Determine the cause of NDVI departure
Back to Contents page
National Environmental Modeling and
Analysis Center (NEMAC)
University of North Carolina - Asheville
NASA
Stennis Space
Center, Mississippi
- Partners -
1. View the ‘current’ forest change images and zoom into areas of moderate to high NDVI decline, view the imagery basemap to determine land cover and land use in location of departure
2. Use the three most recent change images of one of the baseline groups and toggle through the forest change images, observe disturbance progression, extent, speed, pattern, NDVI
change percent and seasonality
3. If appears rapidly in one change image, look for graphic patterns in the percent change NDVI colors to indicate possible sensor, snow or cloud anomalies, if not, go to 4.
a. Reference same date MODIS Cloud product and look for cloud contamination in the area of disturbance in the forest change image, if clouds present, stop here
b. If necessary, check availability of recent Landsat imagery (GloVis), download and image interpret, if not sensor anomaly, snow or cloud-related effects, go to 4.
4. Progresses ‘naturally’ and not due to sensor anomalies, snow, snowpack fringe, clouds or cloud-removal image processing:
a. Display imagery basemap and see if decline appears spatially related to ‘edge-of-forest-mask’ or ‘edge-of-snowpack’ region
1. Regarding ‘edge-of-forest’ mask, if yes, check NOAA Drought Monitor and USGS VegDri products “days since precip 7 and 30-day,” etc.
2. Regarding ‘edge of snowpack,’ if yes, check MODIS Cloud product dated the same as the forest change image used and image interpret condition
3. If not drought related or snowpack related ‘mixed pixel edge’ go to 4b or 5
b. Desktop GIS display of recent NAIP from your state (if Forest Service personnel, display aerials from the RSAC Image Server in desktop GIS)
1. Observe if disturbance visible, if yes interpret cause of percent NDVI change
c. If not explained with newer NAIP, go to 5
5. High, moderate and low percent NDVI decline
a. Natural disturbances
1. Insect and/or disease activity, check annual Aerial Disturbance Survey (ADS) polygons and ADS Pest Proximity layer (for a short list of possible disturbance agents)
2. Fire scar, confirm with MODIS Hotspots and other fire related data layers outside of the FCAV
3. Extreme weather, use NOAA Drought Monitor and USGS VegDri products (also Google the area for local news stories)
a. Possible causes, tornado, hail, wind, hurricane, drought, flood, snow, check via Google news stories and NWS severe weather announcements
4. Normal or premature fall season brown-down, check RAWS data (freeze/frost), download and enhance Landsat image dated to closely match the date of the forest
change image
b. Anthropogenic disturbances
1. Silvicultural Management (clearcut, thinning, salvage logging, etc.), observe “Graph NDVI” for the specific MODIS pixel(s) if in date range of Graph NDVI dataset, and
download and image interpret recent Landsat product
2. Prescribed fire, check with MODIS Hotspot and fire related layers inside, and outside the FCAV
3. Development related, acquire recent Landsat and image interpret, apply image enhancement techniques and different band combinations
6. If NDVI decline is undetermined or to confirm a suspected cause, obtain newest Landsat image via GLOVIS, create 453 RGB FCC (for seasonality issues a 321 RGB TCC), display on desktop
GIS with the latest 1-yr FCAV change image, image interpret and ascribed potential cause, collaborate with colleagues through the FCAV “Share this Map” URL feature
7. Return to the FCAV in a week to view next most recent forest change product and assess the disturbances’ condition and progression from previous forest change images
8. If necessary, contact a public land manager in the area to inquire and question (use PADUS on the desktop if necessary, or Google for point of contact information)
The FCAV contains ancillary data layers that can be used to identify variables that can help explain change in expected NDVI values.
Using the Forest Change Assessment Viewer
from the Forest Services’ Eastern Forest Environmental Threat Assessment Center (EFETAC)
and the Western Wildland Environmental Threat Assessment Center (WWETAC)
Determining the cause of NDVI change
Drought Severity,
insect and disease
outbreaks, all other
Wild and prescribed
fire, clear cutting,
extreme weather
events
Precipitation events,
reforestation,
vegetative recovery,
seasonal green-up,
canopy closure,
pheno-state normal in
baseline comparison
Seasonal brown-up,
thinning, early
disturbance
detection zone
Desktop-based information, such as State specific
current NAIP, current Landsat download via
GLOVIS, local datasets
Web-based searches and sites, such as use of
Google to search the area/county/state for local
news and current information, federal wildfire
websites
FCAV Multigraph NDVI, when viewing the 3-year
and 8-year baseline forest change products
Wildfire
Insects “& Dis.
Clouds
Drought/
Flood
Back to Contents page
National Environmental Modeling and
Analysis Center (NEMAC)
University of North Carolina - Asheville
NASA
Stennis Space
Center, Mississippi
- Partners -

Web Map Service (WMS) and Web Coverage Services (WCS)
WMS
• To view MODIS Forest Change Detection Products on a desktop GIS via
a Web Map Service (WMS) connection, use the URL below to view the
WMS services available for the ForWarn system :
http://wms.forwarn.forestthreats.org
• Using the ForWarn WMS connection will allow desktop users to
integrate and view their own local data layers for comparison and
analysis. The spatial extent and severity of forested areas undergoing
change can be viewed and quantified
• Use the ForWarn WMS connection to screen digitize polygons of forest
disturbance and levels of severity, or vegetative recovery and re-growth
• On the above website, copy the URL up to the “* GetCapabilities +” text
and paste in ArcGIS “Add WMS Server” properties dialog box, demote
Version 1.3.0
Using the Forest Change Assessment Viewer
from the Forest Services’ Eastern Forest Environmental Threat Assessment Center (EFETAC)
and the Western Wildland Environmental Threat Assessment Center (WWETAC)
WCS
• Coming soon, the web coverage service is in development
A Web Map Service (WMS) is a standard protocol for serving geo-referenced map images over the internet to a user GIS. With regards to the
ForWarn products served by the FCAV, the Web Coverage Service (WCS) allows users to download the forest change raster files directly to the users
local hard drive where additional geospatial processing can be performed.
Back to Contents page
National Environmental Modeling and
Analysis Center (NEMAC)
University of North Carolina - Asheville
NASA
Stennis Space
Center, Mississippi
- Partners -
Individual WMS Content
/ews (3) 1, 3 and 8-year baseline products, Web Mercator
/ewswgs84 (3) 1, 3 and 8-year baseline products, native WGS84
/ewswcs in development
/ews1year 1-year baseline products, 2-years history every 8-days
/ews3year 3-year baseline products, 2-years history every 8-days
/ewstruecolor MODIS true color composites, Cloud Products
/vlayers multi-year ADS and MTBS; pest proximity
/derivatives National Phenology Datasets
/modisndvi 16-day NDVI images (old, once used for Graph NDVI tool)
/parameters Phenological parameters datasets
/integrals “area under the curve” datasets
/rlayers monthly precipitation “percent of normal”; forest types and
forest groups
/wlayers TRMM weather; cumulative fire detections and current large
fire incidents

Tips and Hints
•If a URL hangs up during load, try changing the backdrop
•The "imagery" basemap works very well to locate general disturbances,
since it has dark colors
•To see if a potential disturbance is drought related, try turning on the
Drought Monitor Data Layer
•To see if a potential disturbance is wildfire related, open the “Wildfires”
tab in the table of contents to view current and historical wildfire
information
•To see if a potential disturbance is insect or disease related, try turning
on the sketchmapper polygons from past years under the table of
contents tab labeled “Historical Aerial Disturbance Surveys.” If there has
been insect or disease activity nearby in the past, it is likely to have
happened again
• Use the FCAV to zoom you your specific area of interest and apply your
desired data layers and layer transparencies, perform a “share URL”
operation and save the link to your desktop or as a favorite in your
browser regularly monitor potential disturbances quickly
•The 1-year Baseline product can present less ’noise’ when interpreting
the severity of a forest disturbance
•Use the MODIS NRT WMS connection to screen digitize polygons of
forest disturbance severity or vegetative recovery and re-growth
•To view a past disturbance to a forested area, access the Archived
imagery and choose imagery before and after the incident:
- to view previous 8-day imagery, change the “Theme” to “MODIS Forest
Change Products,” in the Table of Contents open the tab named “Archived NRT
EFETAC-NASA,” scroll to dated pre- and post-incident to view the extent of forest
change, or disturbance
•The FCAV provides an extraordinary mechanism for mapping fuel-
producing events and fuel moisture. Blow-downs, ice storms and beetle
kill areas can be targeted for fuels management (Norman, EFETAC)
Using the Forest Change Assessment Viewer
from the Forest Services’ Eastern Forest Environmental Threat Assessment Center (EFETAC)
and the Western Wildland Environmental Threat Assessment Center (WWETAC)
Back to Contents page
National Environmental Modeling and
Analysis Center (NEMAC)
University of North Carolina - Asheville
NASA
Stennis Space
Center, Mississippi
- Partners -
Frequently Asked Questions (pg 1 of 3)
What is the best image to display to see if there is any forest disturbance in my area of interest?
The most recent forest disturbance image is located in the Table of Contents, under the tab named
“Forest Disturbance Detection Maps.” Click this tab and look at the top of the listing in either of the
baseline groupings for the most recently-dated forest disturbance image (try using the 1-yr baseline)
For descriptions of the “Baseline” products, click here (MODIS = Moderate Resolution Imaging Spectrometer,
231 meter spatial resolution; NRT = Near-Real-Time)
What do the colors mean?
Generally, the colors relate to forest productivity as compared to a previous baseline (8-year: the default, 3-year or 1-year baseline).
Shades of blue-to-green denote a healthy forest condition and similar in development to previous year (s). Shades of red-to-yellow denote
a forest condition where the greenness at that time period differs greatly-to-moderately when compared to the forest productivity, or
greenness values of the previous year(s).
Specifically, the colors denote the percent change difference when comparing the current images NDVI (Normalized Difference Vegetation
Index) value with the maximum NDVI pixel value over the past 8-, 3- or 1-year baseline NDVI image set. NDVI values are calculated via a
band ratio of red to infrared (of the electromagnetic spectrum) and range from +1.0 to -1.0 in value.
Baseline products: Located under the same tab named “Forest Disturbance Detection Maps,” the first three forest change images (the
three most recent) are a result of comparing the observed “greenness” for that date range with the maximum “greenness” observed over
the past 8-years (2003-2010). Try looking at the “current” 1-year baseline for the most recent date to display the forest change image for
the current period compared to ONLY last year (be sure to unclick the most recent 8-year baseline image to see the 1-year baseline image).
The forest disturbance image is covering up the basemap and I can’t see where I am viewing?
Located in the Table of Contents beside each data layer is a “wrench”-looking icon, clicking this icon will open a control that one can use to
apply a transparency for any data layer. Set the slider at a position where you can see both the basemap and the colors of the forest
disturbance image.
The transparency tool
is located in the Table of Contents
Using the Forest Change Assessment Viewer
from the Forest Services’ Eastern Forest Environmental Threat Assessment Center (EFETAC)
and the Western Wildland Environmental Threat Assessment Center (WWETAC)
Back to Contents page
National Environmental Modeling and
Analysis Center (NEMAC)
University of North Carolina - Asheville
NASA
Stennis Space
Center, Mississippi
- Partners -
What are the “Baseline” products?
The (3) forest change image products are based on the difference between the current NDVI value compared to
three separate historical periods of time, specifically a 1-, 3- and 8-year timeframes. Located under the tab
named “Forest Disturbance Detection Maps,” the three forest change images in each baseline group are the
three most recent, and depict the percent change by comparing the observed “greenness” for that date range
with the maximum “greenness” observed over the 1-,3-, or 8-years baseline time periods. Try looking at the
“current” 1-year baseline to display a forest change image for the current period compared to ONLY last year (be
sure to turn off the most recent 8-year baseline image to see the 1-year baseline image).
How do I remove the highlight color after an “Identify” operation is performed ?
•Turn off any active layer and click anywhere on the screen with the identify tool.
•Turn off the “States” layer under the “Jurisdictions” tab in the table of contents.
•As a last resort, click “1”, the Full Extent icon, click an area outside of CONUS, then click “2”, the Previous Extent
button to zoom back to the area that you were viewing:
What is the quickest way to see if a forest disturbance is taking place in my area?
Reference the “Quick Start Guide” of this help document (click here).
What if the Table of Contents is empty? Clear your computers internet cache by pressing F5.
Frequently Asked Questions (pg 2 of 3)
Using the Forest Change Assessment Viewer
from the Forest Services’ Eastern Forest Environmental Threat Assessment Center (EFETAC)
and the Western Wildland Environmental Threat Assessment Center (WWETAC)
2 1
Back to Contents page
National Environmental Modeling and
Analysis Center (NEMAC)
University of North Carolina - Asheville
NASA
Stennis Space
Center, Mississippi
- Partners -

How do I find older Products? - choose second thematic collection, “Archived Forest Disturbance Maps,” and select Map Layers tab of same name
How do I look at a time series? - choose second thematic collection, “Archived Forest Disturbance Maps,” and select Map Layers tab of same name
If I see a disturbance, how do I determine the cause? - view these sections in the Users Guide “Data Layers Used to Vet Disturbances,” and “Investigative Protocol”
How do I share maps? - see Users Guide Section 6
What should I do if I find a forest disturbance in my area? – first determine if the cause of NDVI decline is due to cloud contamination or a sensor or image
processing anomaly by using the MODIS Cloud Products located in either the default thematic data collection or the second collection, the “Archived Forest Disturbance
Maps.” If not, then check to see if the changed areas are primarily located on the margin of the forest mask, or snow pack margin. Does the forest change image pixels
contain a high grass component (use the imagery basemap in the Viewer, or load into your desktop GIS and use your states’ recent NAIP imagery to view the most up to
date aerial photography, or download a recent Landsat image via GloVis). If still undetermined, use the Viewers weather and climate layers to see if possibly related to
drought. Perform a Google search for any recent news items. Call a land manager in the areas to inquire of any forest disturbances. Use the “Share URL” feature of the
FCAV and collaborate with other resource professionals, or contact the Eastern, or Western Threat Centers to assist with the analysis.
Why can’t I find my area using the Find Area search feature? – this feature operates only on county names, try typing in an established U.S. county name?
List of Acronyms:
ADS – Aerial Detection Survey (USDAFS) eMODIS – expedited Moderate-Resolution Imaging Spectroradiometer (USGS)
FHM – Forest Health Monitoring (USDAFS) FHP – Forest Health Protection (USDAFS)
FHTET – Forest Health Technology Enterprise Team (USDAFS) FIA – Forest Inventory and Analysis (USDAFS)
FWS LCC – US Fish and Wildlife Landscape Conservation Cooperative GEOMAC – Geospatial Multi-Agency Coordination Group
MODIS – Moderate-Resolution Imaging Spectroradiometer (USGS) MTBS – Monitoring Trends in Burn Severity
NEON – National Ecological Observatory Network NOAA – National Oceanic and Atmospheric Administration
NRT – Rear-Real-Time NWS – National Weather Service (NOAA)
RSAC – Remote Sensing Application Center (USDAFS) SRTM – Shuttle Radar Topography Mission (NASA)
TRMM – Tropical Rainfall Measuring Mission (NASA)
Frequently Asked Questions (pg 3 of 3)
Using the Forest Change Assessment Viewer
from the Forest Services’ Eastern Forest Environmental Threat Assessment Center (EFETAC)
and the Western Wildland Environmental Threat Assessment Center (WWETAC)
Back to Contents page
National Environmental Modeling and
Analysis Center (NEMAC)
University of North Carolina - Asheville
NASA
Stennis Space
Center, Mississippi
- Partners -
Points of Contact
Back to Contents page
National Environmental Modeling and
Analysis Center (NEMAC)
University of North Carolina - Asheville
NASA
Stennis Space
Center, Mississippi
- Partners -
Eastern US Western US
Team Leads: Danny C. Lee, EFETAC Director Nancy Grulke, WWETAC Director
dclee@fs.fed.us, 828.257.4854 ngrulke@fs.fed.us, 541-416-6583
Principle William (Bill) W. Hargrove, Research Ecologist
Investigator: whargrove@fs.fed.us, 865.235.4753
Technical Bill Christie, Biological Scientist (GIS/RS) Sean Schroder, Remote Sensing Research
Assistance: wchristie@fs.fed.us, 828.257.4370 swschroeder@fs.fed.us, 541.383.6602
Mailing Eastern Forest Environmental Threat Assessment Center Western Wildland Environmental Threat Assessment Center
Address: USDA Forest Service, Southern Research Station USDA Forest Service
200 W.T. Weaver Blvd., Asheville, NC 28804 3160 NE Third St., Prineville, OR 97754
Outreach: Perdita Spriggs, Communications Director
pspriggs@fs.fed.us, 828-230-3292
USDA Forest Service, Forestry Sciences Laboratory
P.O. Box 12254, Research Triangle Park, NC 27709
Western Wildland
Environmental Threat
Assessment Center
http://www.fs.fed.us/wwetac
Eastern Forest
Environmental Threat
Assessment Center
http://forestthreats.org/
Phenology-related Websites
National Phenology Network
USGS-Remote Sensing and Phenology
Measuring Vegetation (NDVI & EVI)
The USDA/FS “ForWarn” Forest Change Assessment Viewer (FCAV)
Phenology - Wikipedia, the free encyclopedia
Back to Contents page
National Environmental Modeling and
Analysis Center (NEMAC)
University of North Carolina - Asheville
- Partners -
NASA
Stennis Space
Center, Mississippi
Western Wildland
Environmental Threat
Assessment Center
http://www.fs.fed.us/wwetac
Eastern Forest
Environmental Threat
Assessment Center
http://forestthreats.org/
Appendices: Theme-based Data Layers
1. CONUS Vegetation Monitoring Tools (default, %NDVI change)
2. MODIS Forest Change Products (archived time series)
3. MODIS Phenology Derived Products (ecologically higher order)
4. MODIS Phenology Parameters Products (threshold timing)
5. MODIS Cumulative NDVI Products (accumulating total NDVI)
6. MODIS NDVI Time Series Profiling Capability (8-day NDVI maps)
7. MODIS Phenology Time Series 2003 – 2009 (multiple)
(click heading to jump to section)
Using the Forest Change Assessment Viewer
from the Forest Services’ Eastern Forest Environmental Threat Assessment Center (EFETAC)
and the Western Wildland Environmental Threat Assessment Center (WWETAC)
Back to Contents page
National Environmental Modeling and
Analysis Center (NEMAC)
University of North Carolina - Asheville
NASA
Stennis Space
Center, Mississippi
- Partners -
For a description of these products, go to:
http://forwarn.forestthreats.org/advanced/national-
phenology-data-set
Appendix 1: CONUS Vegetation Monitoring Tools (Thematic Group Data Layers)
The (3) most recent forest change
image products for each of the three
separate baselines are available, look
for a new forest change image for
each of the baselines every 8-days
from the FCAV.
The 8-year baseline group is repeated
at the top of the listing and near the
bottom of the listing is required by the
application
In preparing the current MODIS forest change images, a new NDVI image is
compared to one of three baselines to establish percent change. As of 06/2011,
change products are created via looking at the maximum NDVI value for a pixel
against the longest baseline, specifically, the 2003 – 2008 baseline. Future plans are
to create the (3) most recent forest change products based on each baseline length,
namely, the current NDVI value compared to the maximum NDVI value during
baseline 2001 – 2010, during baseline 2005-2010, and during baseline 2010.
Using the Forest Change Assessment Viewer
from the Forest Services’ Eastern Forest Environmental Threat Assessment Center (EFETAC)
and the Western Wildland Environmental Threat Assessment Center (WWETAC)
Back to Contents page
National Environmental Modeling and
Analysis Center (NEMAC)
University of North Carolina - Asheville
NASA
Stennis Space
Center, Mississippi
- Partners -
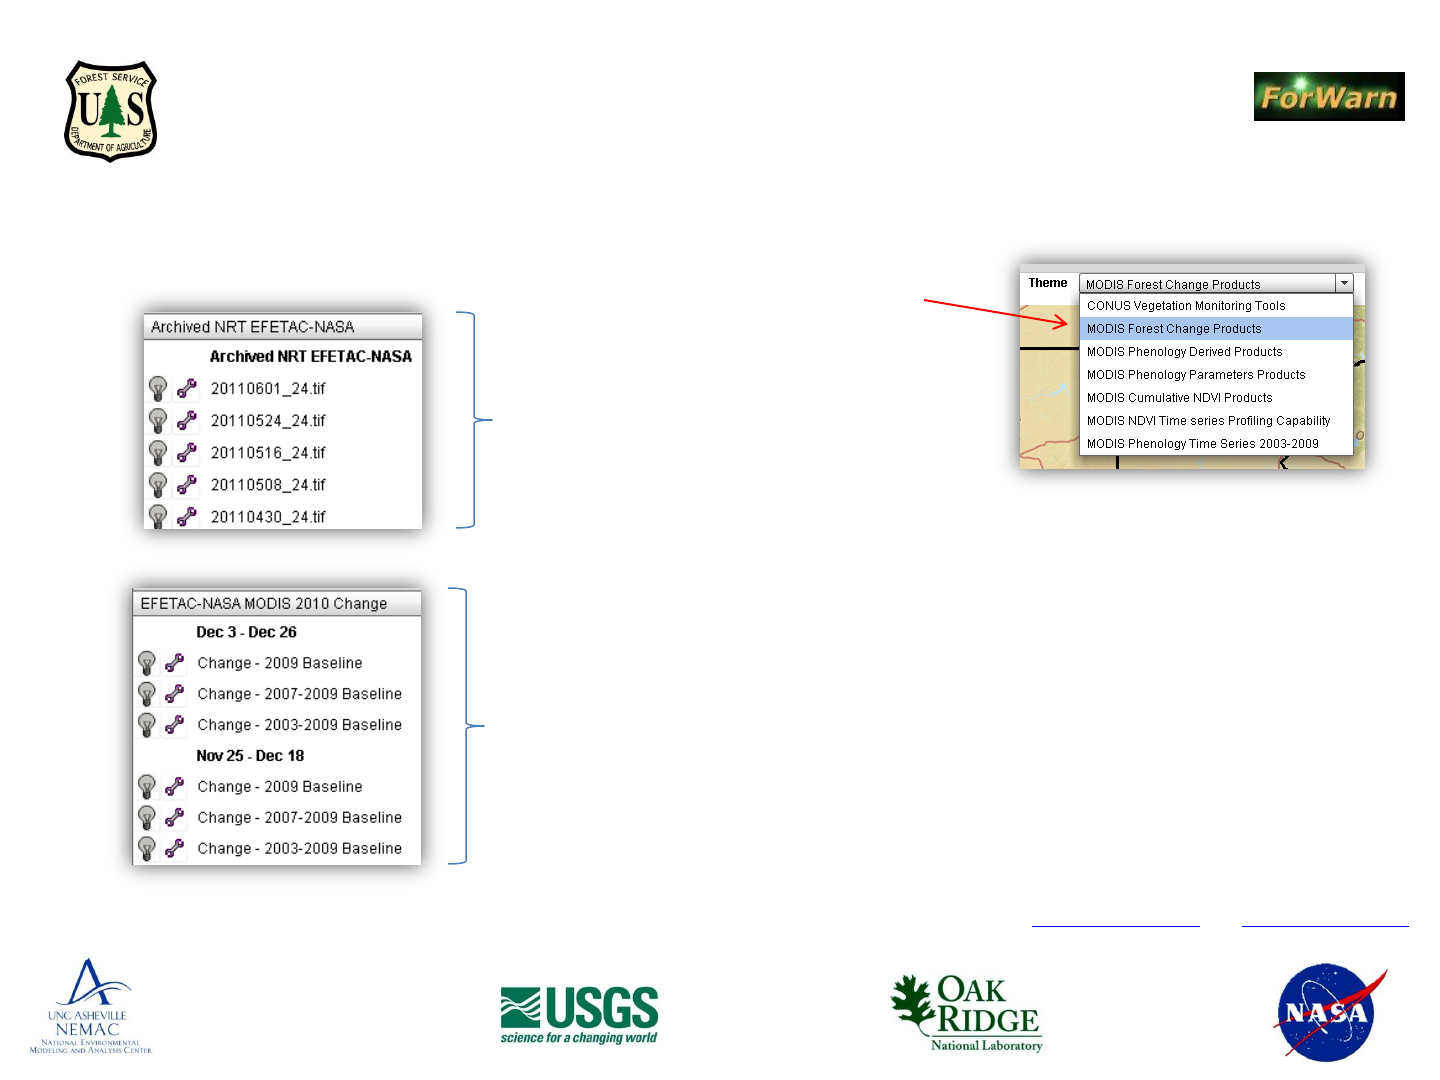
Appendix 2: MODIS Forest Change Products (Thematic Group Data Layers )
Individual 8-day images of forest change produced
throughout the year from EFETAC. Look for a
similar archive in the Table of Contents that
presents forest change products from USDAFS
Remote Sensing Application Center (RSAC)
Composite forest change images given the current 3-
baseline time periods from EFETAC. Look for a similar
data layer set in the Table of Contents that presents
forest change products from USDAFS Remote Sensing
Application Center (RSAC) for 2010.
Using the Forest Change Assessment Viewer
from the Forest Services’ Eastern Forest Environmental Threat Assessment Center (EFETAC)
and the Western Wildland Environmental Threat Assessment Center (WWETAC)
Back to Appendicle list
Back to Contents page
National Environmental Modeling and
Analysis Center (NEMAC)
University of North Carolina - Asheville
NASA
Stennis Space
Center, Mississippi
- Partners -
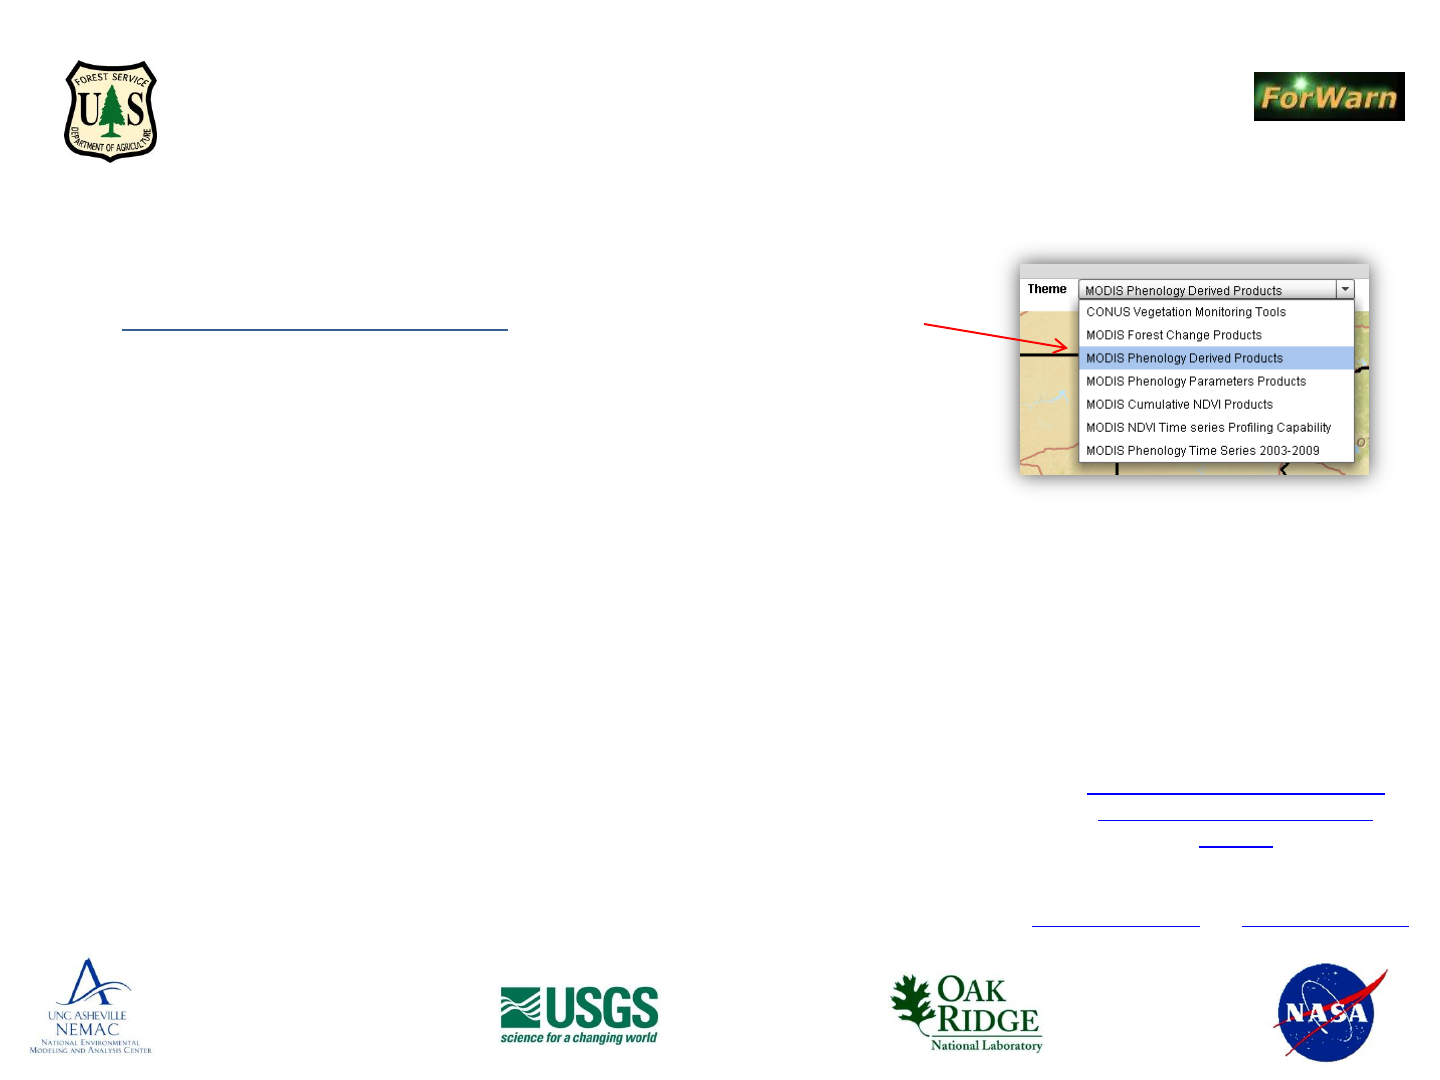
Appendix 3: MODIS Phenology Derived Products (Thematic Group Data Layers )
Examples of Derived Products
• Season durations (pheno-periods, number of days)
• Rates (speed and intensity of development)
• Ratios (show which season makes up the greater proportion of the year)
• Variance (shows the degree of variability in duration of spring, fall, and growing season)
• Mean X (time of year at greatest NDVI) and Y (greatest NDVI value).
• Standard Deviations and Means (from normal and mean max and min NDVI)
Using the Forest Change Assessment Viewer
from the Forest Services’ Eastern Forest Environmental Threat Assessment Center (EFETAC)
and the Western Wildland Environmental Threat Assessment Center (WWETAC)
Back to Appendicle list
Back to Contents page
National Environmental Modeling and
Analysis Center (NEMAC)
University of North Carolina - Asheville
NASA
Stennis Space
Center, Mississippi
- Partners -
For a description of these
products, go to:
http://forwarn.forestthreats.org/
advanced/national-phenology-
data-set
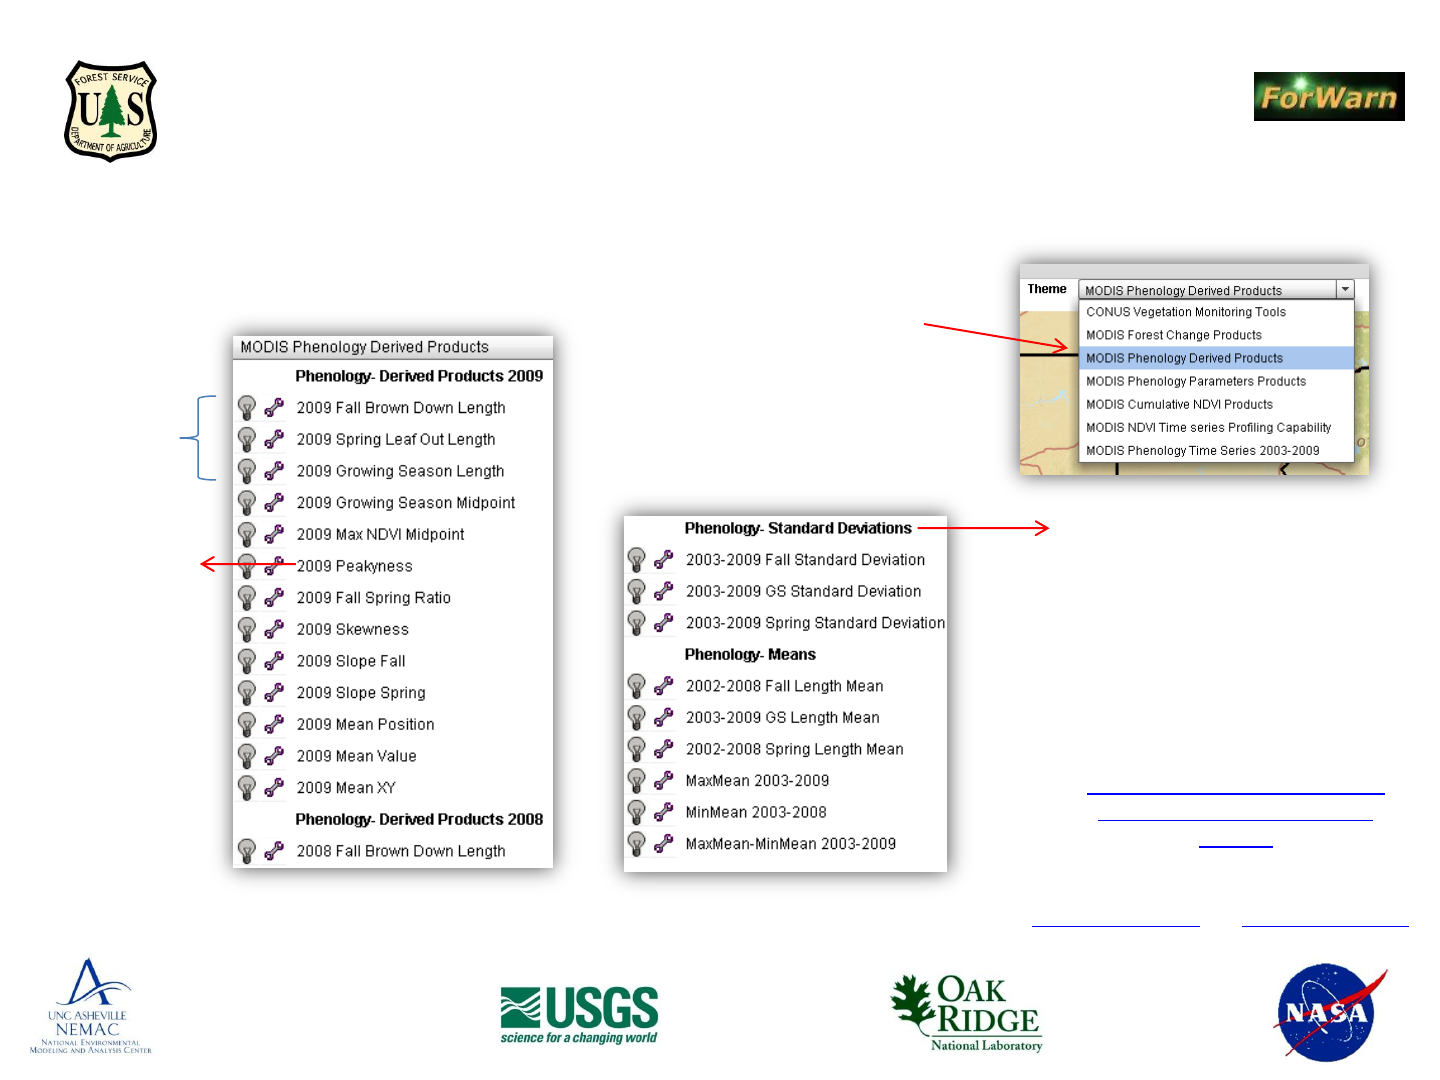
Appendix 3: MODIS Phenology Derived Products (continued)
2003 – 2009 Phenology-based image products
2003 – 2009 Phenology Standard
Deviations and Means
listing repeats for next year…
For a description of these
products, go to:
http://forwarn.forestthreats.org/
advanced/national-phenology-
data-set
Contrasts
vegetation that
keeps a small
amount of leaf area
over a long period
of time versus
vegetation that
explosively
produces a large
amount of leaf
area, but only holds
it for a short time
Shows places that are particularly
predictable versus places that are
particularly unpredictable
(GS – Growing Season)
Using the Forest Change Assessment Viewer
from the Forest Services’ Eastern Forest Environmental Threat Assessment Center (EFETAC)
and the Western Wildland Environmental Threat Assessment Center (WWETAC)
Pheno-periods
(length in days)
Back to Appendicle list
Back to Contents page
National Environmental Modeling and
Analysis Center (NEMAC)
University of North Carolina - Asheville
NASA
Stennis Space
Center, Mississippi
- Partners -
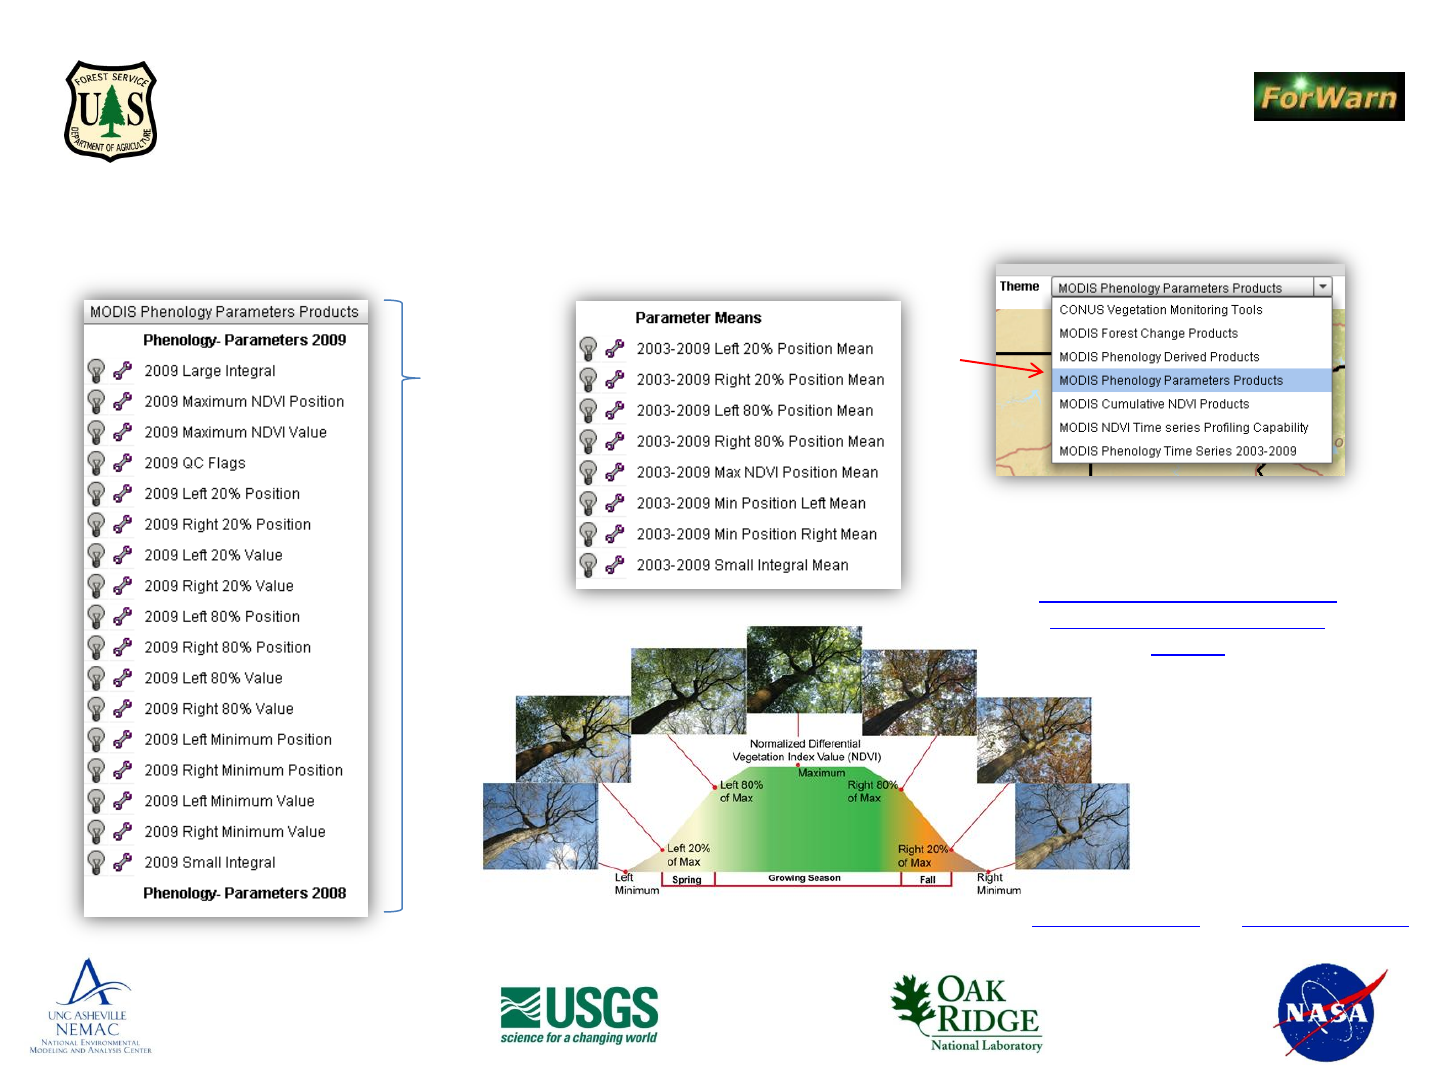
Appendix 4: MODIS Phenology Parameter Products (Thematic Group Data Layers )
2003 – 2009 Phenology parameter products
Phenology Parameter Means
listing continues…
The Phenological Curve
(red dots indicate measurement points)
Phenological
Parameters
do not
represent the
percentage of
the year, but
rather the
percentage of
the maximum
NDVI values
over the
course of the
year
Using the Forest Change Assessment Viewer
from the Forest Services’ Eastern Forest Environmental Threat Assessment Center (EFETAC)
and the Western Wildland Environmental Threat Assessment Center (WWETAC)
Back to Appendicle list
Back to Contents page
National Environmental Modeling and
Analysis Center (NEMAC)
University of North Carolina - Asheville
NASA
Stennis Space
Center, Mississippi
- Partners -
For a description of these
products, go to:
http://forwarn.forestthreats.org/
advanced/national-phenology-
data-set
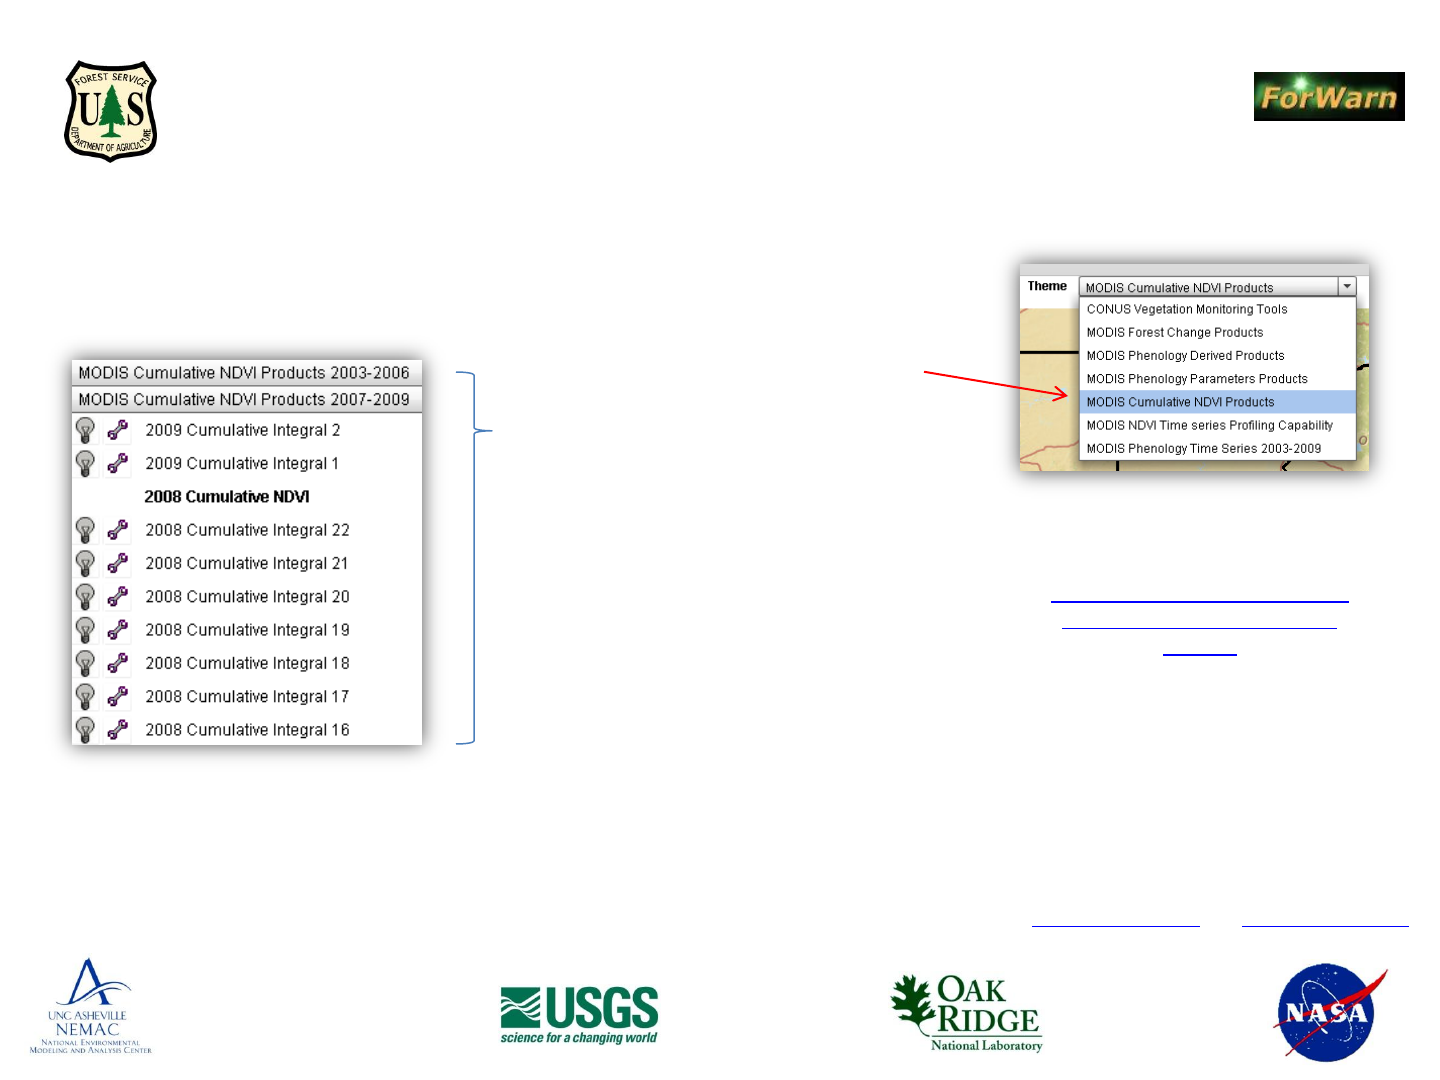
Appendix 5: MODIS Cumulative NDVI Products (Thematic Group Data Layers )
2003 – 2009 Cumulative NDVI products
The MODIS satellite takes a complete picture of
the continental United States every day, although
cloud cover, smoke, and other interference often
blocks the view of the landscape. To get a
complete picture, a 16-day composite is made by
taking the highest value for each pixel recorded
over the 16-day period. For the Cumulative
Phenology data set, the NDVI values in each
successive 16-day interval are then summed to
form an accumulating total, starting over at the
beginning of each year. The first national 16-day
interval map, or Interval #1, is usually excluded
from products because it covers the December-
January transition from one year to the next.
Therefore, there are usually 22 intervals that make
up one year (#2–23).
Using the Forest Change Assessment Viewer
from the Forest Services’ Eastern Forest Environmental Threat Assessment Center (EFETAC)
and the Western Wildland Environmental Threat Assessment Center (WWETAC)
Treating yearly NDVI in a cumulative way causes
differences to become more pronounced
throughout the year (Hargrove, EFETAC).
Back to Appendicle list
Back to Contents page
National Environmental Modeling and
Analysis Center (NEMAC)
University of North Carolina - Asheville
NASA
Stennis Space
Center, Mississippi
- Partners -
For a description of these
products, go to:
http://forwarn.forestthreats.org/
advanced/national-phenology-
data-set
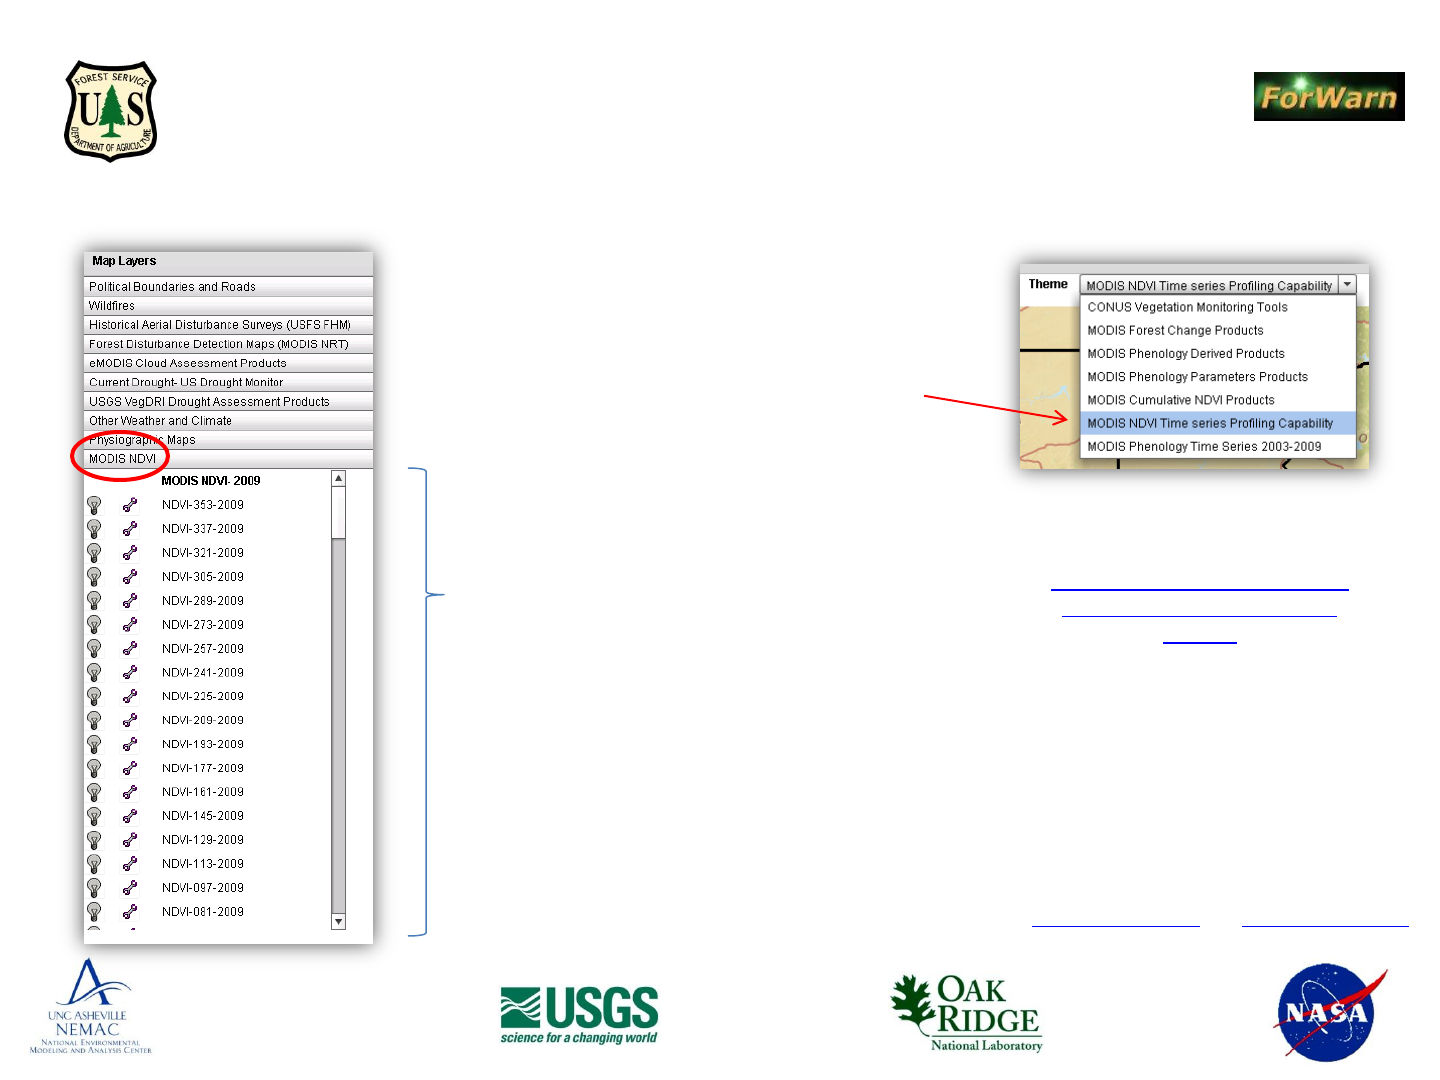
Appendix 6: MODIS NDVI Time Series Profiling Capability (Thematic Group Data Layers )
2003 – 2009 NDVI Time Series Products
(DOY – Day of Year)
The DOY products can tell one what day in the
year a threshold is attained
Using the Forest Change Assessment Viewer
from the Forest Services’ Eastern Forest Environmental Threat Assessment Center (EFETAC)
and the Western Wildland Environmental Threat Assessment Center (WWETAC)
Back to Appendicle list
Back to Contents page
National Environmental Modeling and
Analysis Center (NEMAC)
University of North Carolina - Asheville
NASA
Stennis Space
Center, Mississippi
- Partners -
For a description of these
products, go to:
http://forwarn.forestthreats.org/
advanced/national-phenology-
data-set
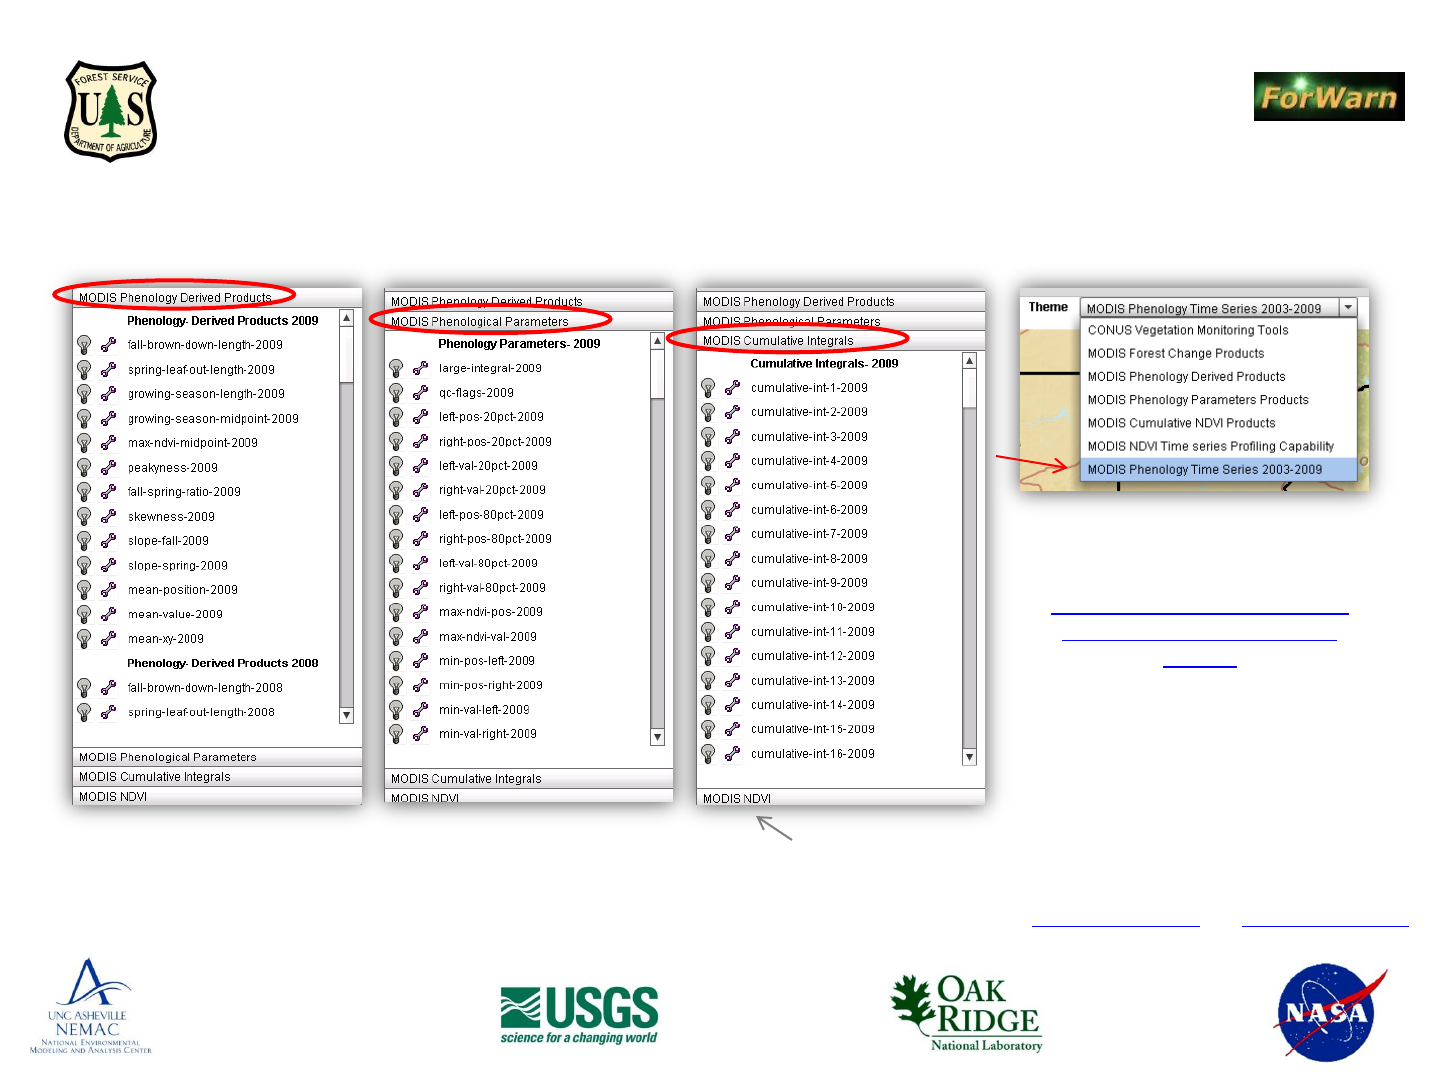
Appendix 7: MODIS Phenology Time Series 2003 - 2009 (Thematic Group Data Layers )
Using the Forest Change Assessment Viewer
from the Forest Services’ Eastern Forest Environmental Threat Assessment Center (EFETAC)
and the Western Wildland Environmental Threat Assessment Center (WWETAC)
Back to Appendicle list
Back to Contents page
National Environmental Modeling and
Analysis Center (NEMAC)
University of North Carolina - Asheville
NASA
Stennis Space
Center, Mississippi
- Partners -
For a description of these
products, go to:
http://forwarn.forestthreats.org/
advanced/national-phenology-
data-set
Replicated here from previous collection
