FUNda MENTALs Topic 8
User Manual: FUNdaMENTALs-Topic-8 Fundamentals Of Design
Open the PDF directly: View PDF ![]() .
.
Page Count: 66

1/1/2008© 2008 Alexander Slocu
m
8-0
FUNdaMENTALSofDesign
Topic 8
Structures

Structures
Take a close look at a bridge or a building as it is
being built and compare what you see to the structure of
a large crane, automobile, or machine tool. What com-
monalities and differences do you observe? Many struc-
tures meet their functional requirements by taking
advantage of fundamental principles such as the Parallel
Axis Theorem which motivates designers to increase
strength or stiffness by placing the mass away from the
neutral axis. In fact, in order to become good at design-
ing structures, or anything for that matter, you have to
become good at observing structures!1
The design process for a structure is just like the
design process for an entire machine: Functional
requirements must be defined, and then Design Parame-
ters are envisioned. Analysis provides insight to what
might be the most efficient design, but history (refer-
ences) often plays an important role in catalyzing ideas.
There will always be risks associated with structures as
in general it is desired that they be as light as possible, at
least for airplanes and robots. And where there are
risks, there must be countermeasures, such as adding a
diagonal brace or increasing the stiffness of a plate by
making it into a laminate.
In fact, one of the greatest risks in the design of
structures is that the desire for cost savings will lead to a
structure that is strong but not stiff. A common example
is the floor of a house, which is strong, but it bounces
and things rattle when you walk across it. Another
example is plastic lawn furniture which can be strong
but feels wobbly. In machines, this “lawn furniture
effect” means that the structure is too compliant and
when loads are placed on it, it bends and sags. This can
cause bearings and other components to become loaded
in ways in which they were not intended.
Accordingly, this chapter will focus on designing
structures to meet functional requirements. Included
will be consideration for how structures are manufac-
tured and the implications for design.
1. As part of this book’s continuing pursuit of personal happiness, if you are interested in someone, but
not sure how to ask them out, invite them to go look at structures with you! There are few spectator sports
as exciting as looking at the details of bridge construction, crane booms, or the erection of steel structures!
1/1/2008© 2008 Alexander Slocu
m
8-1
Topic 8
Structures
Topics
• Beginnings
•FUNdaMENTAL Principles
• Materials
• Visualization
• Layout
• Stability
• Loadings
• Stiffness
• Strength
• Trusses
• Laminates
& Composites
Bryan Ruddy’s most amazing Lazy-
Tongs structure (2001)
Robert Panas' 2005 2.007 machine

Beginnings
The design process starts with development of a strategy and ends
with components as outlined by FRDPARRC tables (see Chapter 1). Just as
the design process RepeatsRepeatsRepeatsRepeats, so it is with structures:
Everything has a structure:
• The overall system
• The modules
• The components
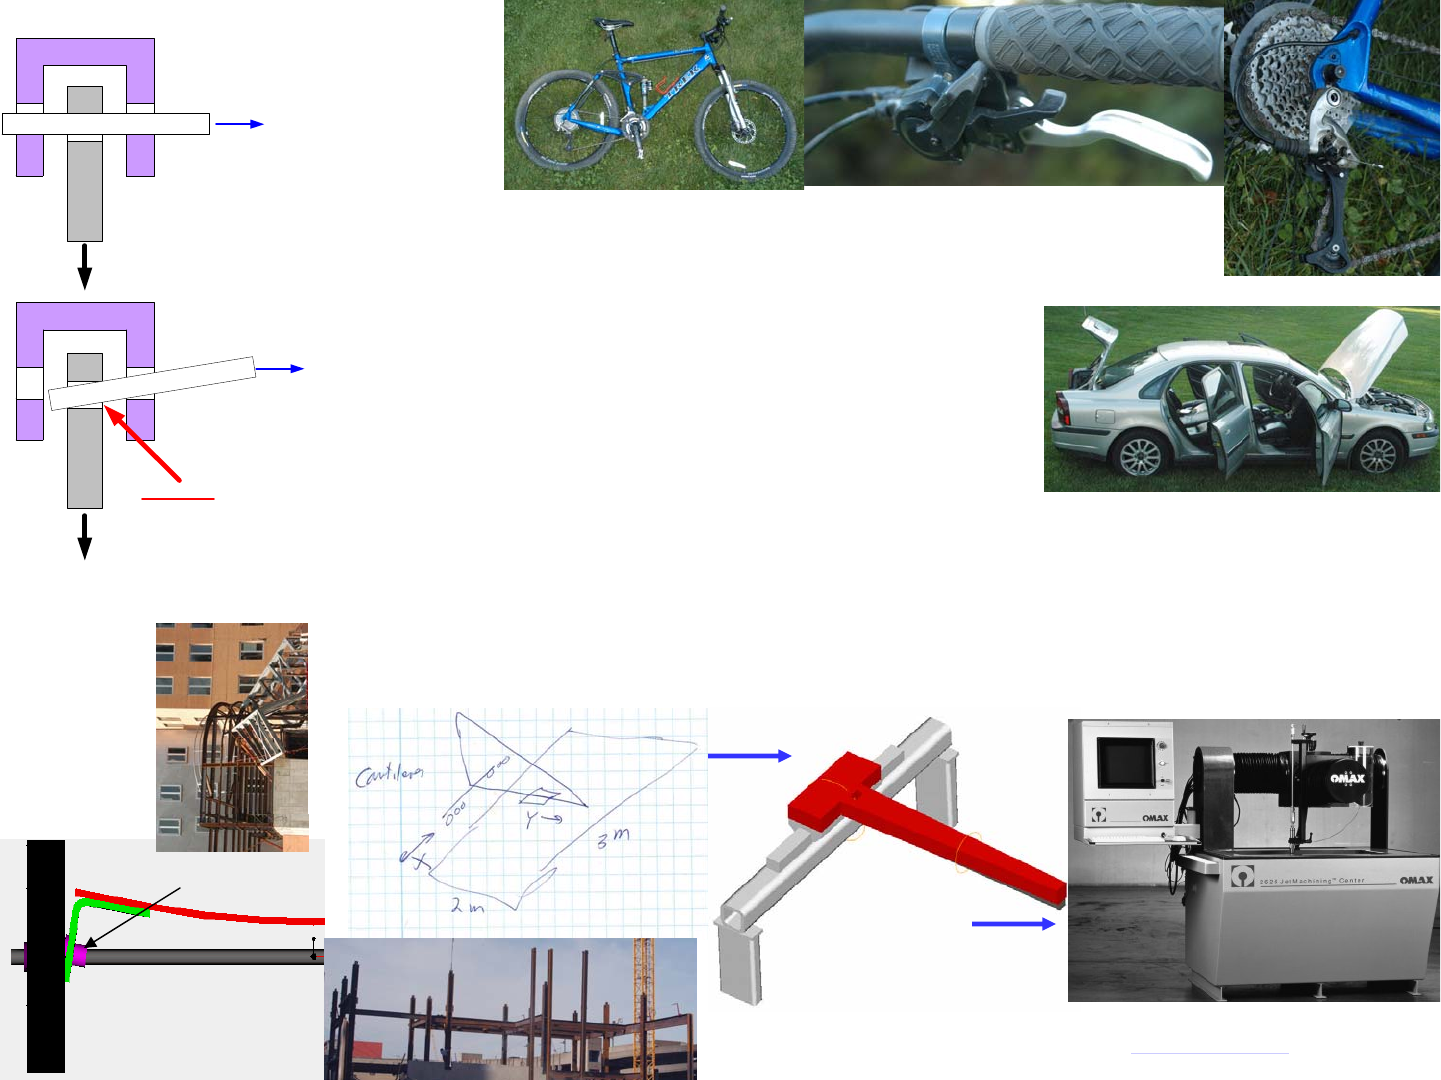
In order to train your mind to synthesize structures, start by observing
the world around you. Look at your bicycle and try to see how the frame
achieves its primary function of supporting your weight, while also providing
support and mounting points for other components. Open a car’s doors, hood,
and trunk, and identify the major structural features that support the overall car,
while also providing mounting points for other components. How is the engine
mounted? What are the implications for safety? Car designers realized that
given a velocity V, the acceleration to slow down in a distance x is
If the structure between the bumper and the passenger could be made
to crumple upon impact, the passenger compartment would have time to slow
down and hence subject the driver to lower acceleration and less force. These
types of first-order calculations associated with the functional requirements,
such as keeping the passenger safe, are a vital part of creating a structure.
The philosophical aspect of analysis is perhaps even more important,
for it is a catalyst to creative thought. If you perfectly develop the detailed
design of a poor structural concept, then the result will be a detailed piece of
junk. Selecting the best initial concept, such as one where the center of stiff-
ness and mass are coincident, sets you up to do the detailed design on a great
concept, and you can have a great machine. Hence before proceeding further,
review the following list of FUNdaMENTAL principles that were discussed in
detail in Chapter 3. Can you see images in your mind that illustrate each of
these principles? How many of the following do you really recall and under-
stand?
• Occam’s Razor: KISS & MISS
• Newton & Conservation
• Saint-Venant’s Principle
• Abbe’s Principle
• Maxwell’s Reciprocity
• Self-Principles
• Stability
• Superposition
• Golden Rectangle
• Parallel Axis Theorem
• Accuracy, Repeatability, Resolution
• Sensitive Directions
• Reference Features
• Structural Loop
• Free Body Diagram
• Centers of Action
• Exact Constraint Design
• Elastic Averaged Design
• Stick Figures
Being able to associate images with fundamental principles can
enable you to recall them to form foundations or starting points for your new
design. Similarly, whenever you see a structure, scan through the fundamental
principles and store an image of what you have seen with the appropriate prin-
ciple. Store both good and bad images, because there are a lot of poorly
designed products that make it to the marketplace. This can happen because a
big company pushed a product through on the basis of its name, or the product
has new and unique features that make people want it, but it was just poorly
executed (and waiting for a competitor to fix and take market share!).
On the basis of your initial sketch of your best concept, cycle through
the fundamental principles and make sure you are not violating any. If you are,
do appropriate analysis to see if the design might still be OK. Remember, prin-
ciples are guidelines and with appropriate deterministic analysis, they can be
applied appropriately and creatively.
2
2
1222
v
vat x a v ax a
t
x
==⇒=⇒=
1/1/2008© 2008 Alexander Slocu
m
8-2
Beginnings
• People have always sought to create ever larger, more complex structures
– A structure might be able to hold its own weight, but then how much of a load could it carry?
• Bridges represent the greatest structural challenges:
– Whenever a longer bridge was needed, adding more material also increased the weight…
• http://www.bizave.com/portland/bridges/Bridge-Gallery1.html
http://www.discovery.com/stories/technology/buildings/brdg_explore.html#photo
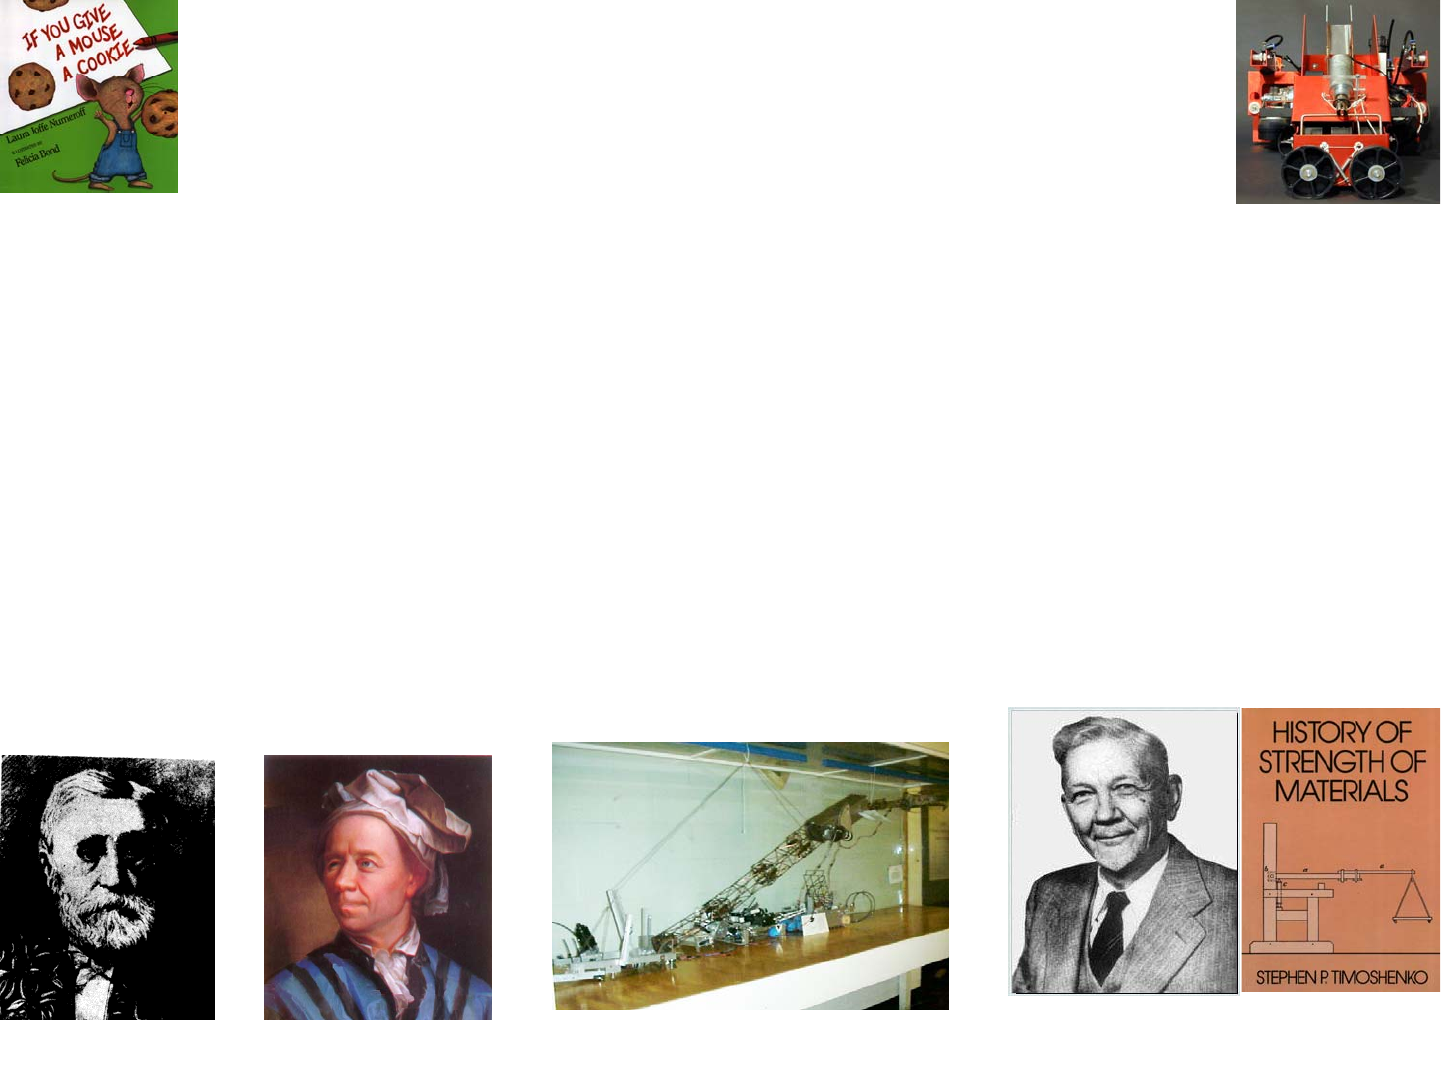
• The great mathematicians of the 18th century set their minds to the task of developing
mathematical formulas for predicting the strength of structures
– See Stephen Timoshenko, History of Strength of Materials
• History often repeats itself (Patterns!)
– Your machine has limited size & weight, yet you want your machine to reach out to the world
John McBean’s longest 2.007 truss ever!
Rony Kubat’s most professional
2.007 machine EVER!
Barré de Saint-Venant
1797-1886
Stephen Prokofyevich Timoshenko
(1878-1972)
http://smitu.cef.spbstu.ru/timoshenko_en.htm
Leonhard Euler
1707-1783
FUNdaMENTAL Principles
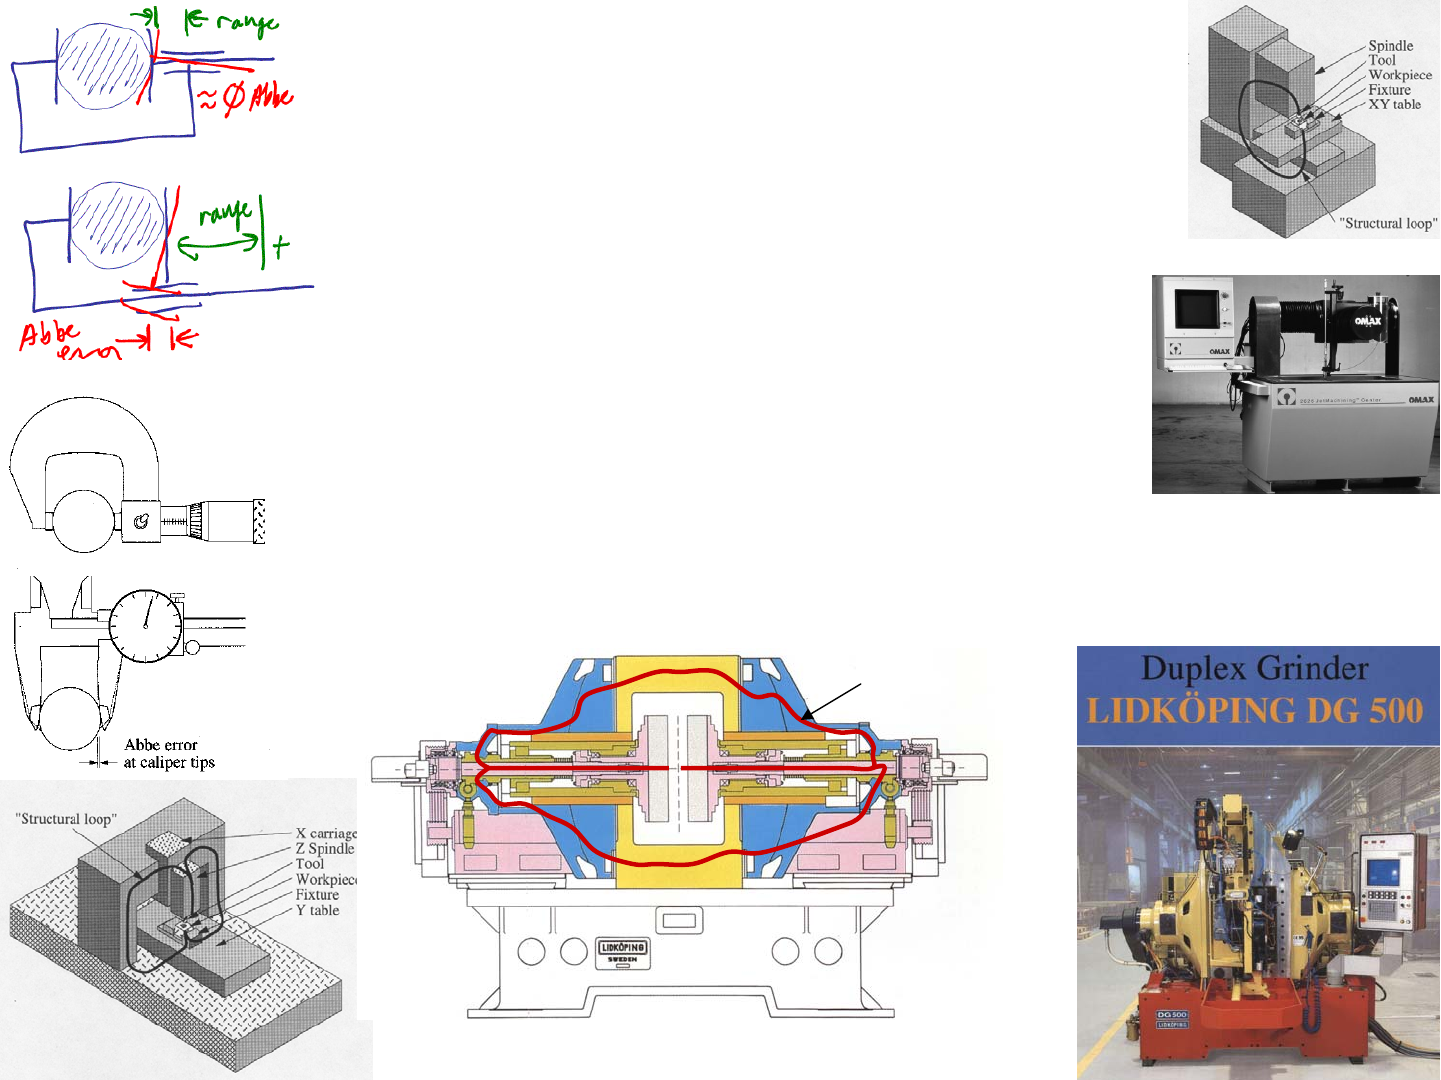
The process of creating a machine’s structure starts with drawing a
stick figure of the machine’s structural loop. Principle problems are typically
encountered due to Abbe or sine-error effects, and then appropriate changes in
geometry can be implemented, or the stiffness can be increased by proper
selection of components or bracing. Creating the structure requires the
designer to be acutely aware of the rest of the machine’s components while
always keeping in mind the fundamental principles which were discussed in
detail in Topic 3. In quick review:
•Occam’s Razor: This is what layout is all about, keeping things simple to
start and adding detail as the design develops.
•Newton and Conservation: Action and reaction, free-body-diagrams,
work in = work out... The basics come first before the details!
•Saint-Venant’s Principle: When an object is to be controlled, sketch it
being held at points several characteristic dimensions apart.
•Golden Rectangle: Don’t know what size it should be? Start with a ratio
of about 1.6:1.
•Abbe’s Principle: Small angular deflections are amplified by distance to
create large linear displacements (which can be good or bad).
•Maxwell & Reciprocity: Uncomfortable with a design? Try inverting it,
or turning it on its side.
•Self-Principles: Use an object’s geometry or other property to prevent a
problem, like using a tapered plug to withstand pressure, or preventing
overextension of a spring with the use of a hard-stop or a string in parallel.
•Stability: Stable, neutrally stable, and unstable effects can help or hurt.
Triggers, for example, can be made neutrally stable and fast. Vibration
can induce instability to get objects to come out of a bin... Beware of
buckling of torsion and compression members!
•Symmetry: Try a design that is symmetric, and then impose Reciprocity to
consider a design that is not symmetric...
•Parallel Axis Theorem: Add mass away from the neutral axis to increase
strength and stiffness.
•Accuracy, Repeatability, Resolution: Make your machine repeatable
first, then tune for accuracy if you have fine enough resolution: Tell the
same story each time, the correct story, and with enough detail so people
can understand it.
•Sensitive Directions & Reference Features: Why pay for performance in
a direction that is not needed? Establish reference planes (datums) from
which you measure critical parameters.
•Structural Loops: Draw a line through the path that forces follow, and
seek to minimize its length. If the path length and shape changes signifi-
cantly as the machine moves, then the machine will have limited accuracy
and may have limited repeatability. Of particular note is the double disk
grinding machine which uses the symmetry of a closed loop to minimize
Abbe or sine error effects!
•Free Body Diagrams & Superposition: To analyze a complex object,
separate it into its parts and label the forces and moments on each part that
are imposed by other parts.
•Preload: Loose fits between objects mean you cannot predict where one
object will be with respect to the other. Apply loads between the objects
as part of manufacturing and assembly to take out the slack in the system.
•Centers of Action: If forces are applied through the centers of mass, stiff-
ness and friction, there will be no moments and hence minimal Abbe and
sine errors.
•Exact Constraint Design: The number of points at which a body is held/
supported should be equal to the number of degrees of freedom that are to
be restrained.
•Elastically Averaged Design: Hold/support a body with ten times (or
more) more compliant points than there are degrees of freedom to be
restrained, such that the errors in the compliant support points will average
out.
•Stick Figures: Initially sketch an idea using simple stick figures, which
also denote where major coordinate systems are located in the design .
The coordinate system are to be used for modelling individual modules
(e.g., for creating an error budget to predict a machine’s repeatability &
accuracy).
Think about your design concept and cycle through all these funda-
mental principles to see how they relate to your design. Remember, they are
principles, not laws, and hence they should serve as catalysts and guidelines. If
you want to not abide by one, make sure you have done the appropriate analy-
sis or experiment to validate your hypothesis.
1/1/2008© 2008 Alexander Slocu
m
8-3
FUNdaMENTAL Principles
• When the first sketch of the structure is made:
– Arrows indicating forces, moments, and power should also be sketched
– The path of how these forces and moments flow from the point of action to the
point of reaction, shows the structural loop
• A sketch of the structural loop is a great visual design aid
– A closed structural loop indicates high stability and the likely
use of symmetry to achieve a robust design
– An open structural loop is not bad, it means “proceed carefully”
– Remember Aesop’s fables & “The Oak Tree and the Reeds”
• Example: automobiles to disk drives to semiconductors, exist because of
double-disk grinders’ ability to create parallel flat surfaces:
Structural Loop

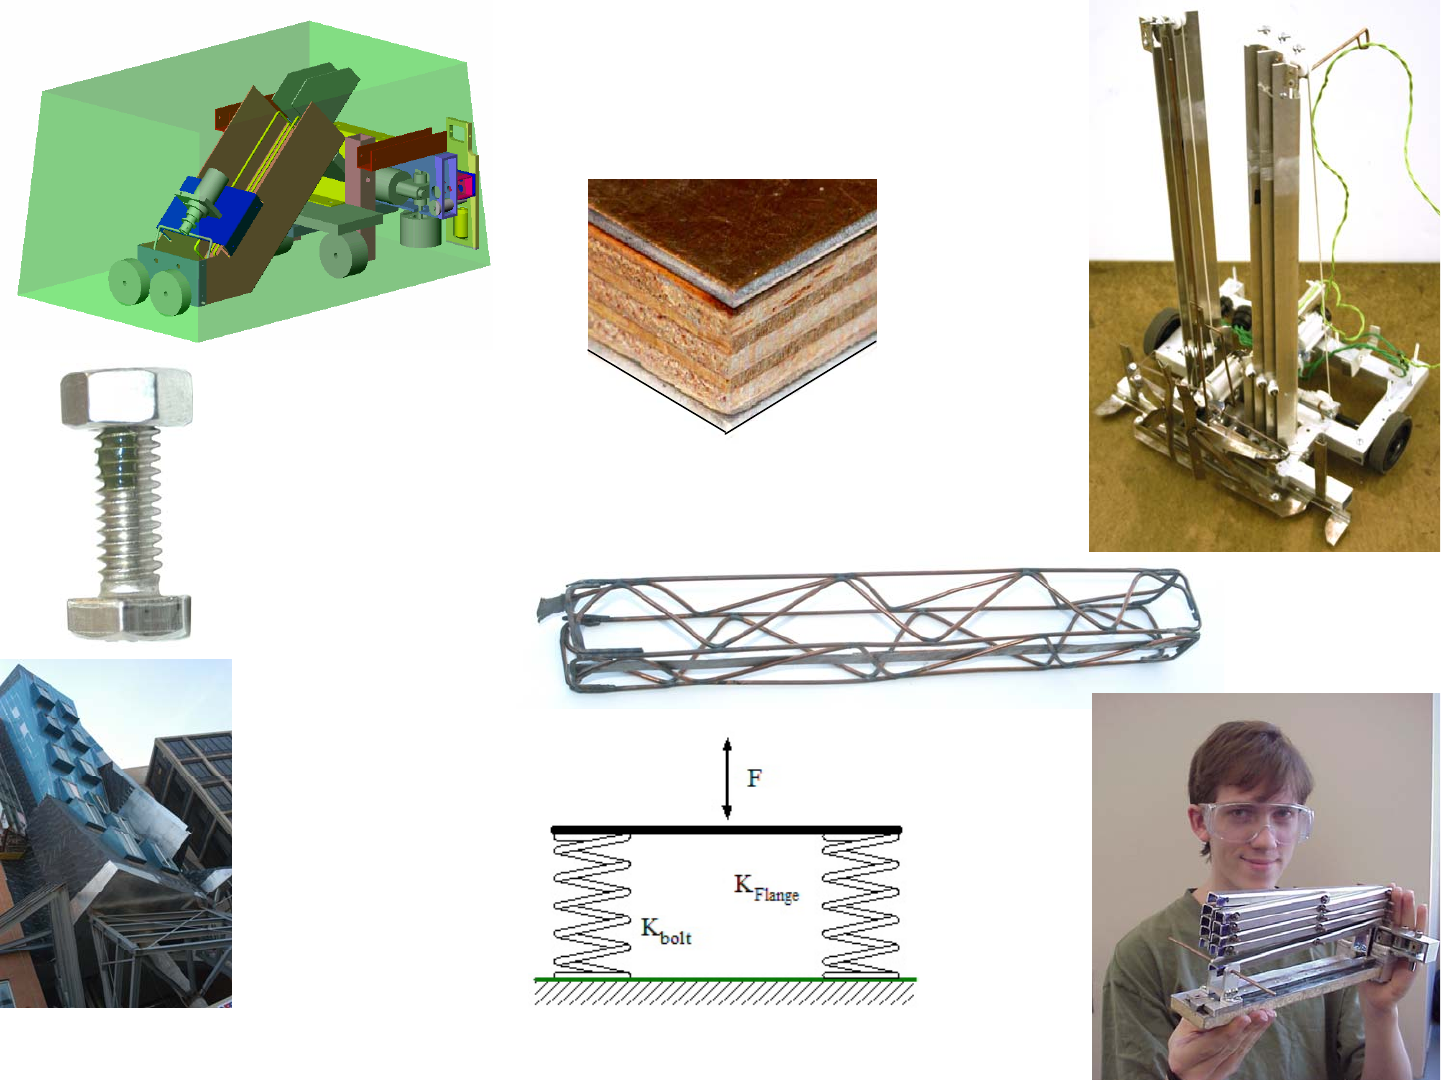
Materials
A structure is only as good as the materials and manufacturing pro-
cesses used. Different materials often motivate the use of different types of
manufacturing methods, which affects the design of the structure. For exam-
ple, if the functional requirements of the structure include high stiffness, so
deformations will not affect component alignment and function, a high modu-
lus of elasticity material can be desirable. A metal shape with a large cross-
sectional moment of inertia might be best. However, an additional functional
requirement, such as to provide a large planer surface on which components
can be mounted, could make creating the structure just from metal very chal-
lenging if the weight were to be kept reasonable. In this case, a ribbed or lam-
inated structure might be best. The decision as to what is best will often be cost
driven. Different applications have different costs. For automobiles, save a
kilogram and save $1. For airplanes, save a kilogram and save $100. For
spacecraft, save a kilogram and save $10,000!
Materials generally fall into three classes: structural, aesthetic, and
hybrid. Structural materials must withstand loads. Aesthetic materials act as
coverings that look and/or feel good, but do not have to withstand significant
loads. Hybrids must look and feel good and also perform a structural function.
For example, the windows on your car have been shaped to look good, but they
also have to reduce drag and withstand wind forces and minor impacts. Struc-
tural materials can be further divided into those which are rigid and those
which are compliant or resilient. Both must have long life under load, but their
degree of stiffness helps them to meet the intended functional requirements.
Hooke’s law defines a linear isotropic material’s behavior:
Hooke’s law relates the strain, which is the ratio of the deformation to
the length of the component (or the stress divided by the modulus of elasticity),
to the stress, which is the ratio of the force to the area. An important issue is
that when stress is applied to an object in the X-direction, for example, there is
deformation in the X-direction and the Y and Z directions as well (squeeze a
soft object to see this effect). This poisson effect, and hence the term Poisson’s
ratio
ν
, is a critical effect for bearings where tightening of bolts can cause
bulging of features which then cause overloading of the bearings! In addition,
Hooke’s law also includes a term for the thermal expansion of the material: the
product of the coefficient of thermal expansion α or CTE, and the change in
temperature ΔT. Hooke’s law also relates the torsional strain to the applied
torque and the shear modulus. The shear modulus and the modulus of elastic-
ity are also related by the poisson ratio ν.
The ductility of a material, which is a measure of the resistance to
fracture, is the elongation which is the amount (%) that a material deforms
before it fails. The fracture toughness is a measure of how easily cracks can
grow in the material. The brittle-to-ductile transition temperature is the tem-
perature where a marked increase in toughness occurs. In general, body-cen-
tered-cubic materials (e.g., ferritic steels) are susceptible to cold-temperature
embrittlement. Face-centered-cubic materials (e.g., aluminum and austenitic
stainless steels) typically do not suffer this loss of ductility.
The ultimate strength is the stress at which the material breaks. The
yield strength is the stress at which the material can be subjected to with suffer-
ing from permanent deformation. The fatigue strength or endurance limit is
the stress to which the material can be subjected for many cycles without fail-
ing. The tensile, flexural (bending), and compressive strengths are generally
the same for a metal. Brittle materials, such as glasses, ceramics, and concrete,
are much stronger in compression than in tension, because the smallest crack in
tension in a brittle material will grow rapidly. Plastics, rubbers, and woods
also have different tensile, flexural, and compressive strengths, but when just
their strength is quoted, the default is the lowest and hence limiting value.
Feel the stiffness of each of the materials in your kit. Perform
inclined plane coefficient of friction tests between all your kit materials and
between the kit materials and the contest table surfaces. What would work best
for what functional requirements?
()
()
()
()
21
XYZ
X
YXZ
Y
ZYZ
Z
XY XZ YZ
XY XZ YZ
T
E
T
E
T
E
E
G
GGG
η
σσσ
α
ε
η
σσσ
α
ε
η
σσσ
α
ε
ν
τττ
γ
γγ
−+
=+Δ
−+
=+Δ
−+
=+Δ
====
+
1/1/2008© 2008 Alexander Slocu
m
8-4
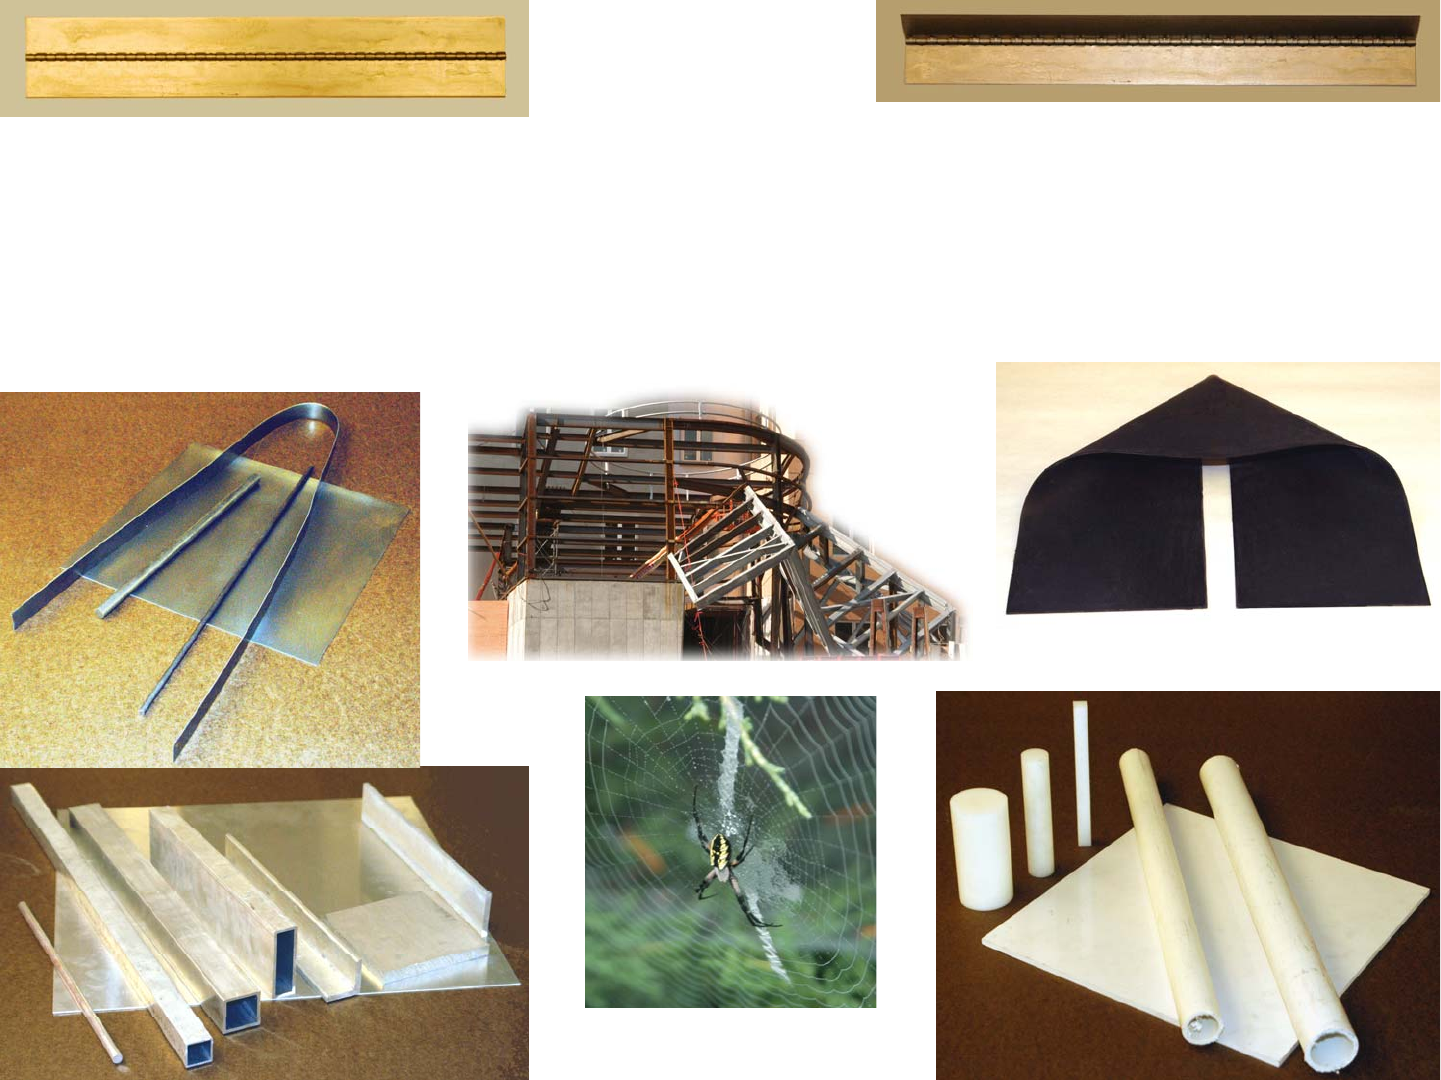
Materials
• Materials make the machine just as sure as any creative design, and are often selected based
on strength, stiffness, manufacturability, and wear and corrosion resistance
– Metals have very high strength-to-weight ratios and are easily machined formed, and joined
– Wood has high directional strength/weight and is easily joined
– Plastics can have good structural and low friction & wear-resistant properties and are easily
molded, formed, machined
Mild steel shapes in the 2.007 kit
Aluminum shapes in the 2.007 kit
Plastic shapes in the 2.007 kit
It’s a bird! It’s a plane! NO, look, it’s a
sheet of rubber from the 2.007 kit

Materials: Wear, Strength & Stiffness1
A material's strength is determined by a complex interaction of metal-
lurgical properties, whereas wear resistance is a function of the type and distri-
bution of particles on the surface of the part. For example, 7075-T6 aluminum
has a yield strength of 462 MPa (67 ksi), almost twice that of A36 structural
steel, yet in a wear test with the two rubbing against each other, the steel would
win. In fact, friction and wear properties of materials are highly dependant on
which two materials are paired together, and the type of lubricant between
them. In general, dissimilar materials work best. For example, nylon on steel
is better than nylon on nylon, and aluminum on aluminum is perhaps the worst!
Often, wear-resistant materials have a hard carbide, nitride, or oxide layer on
their surfaces. Hardened steels, ceramics, and thickly anodized aluminum all
have good wear properties. Other materials, such as brass, cast iron, and most
plastics, wear well when used in conjunction with a hard material because of
the former's inherent ability to act as a bearing (its lubricity).
Table 1 broadly compares various materials typically found in a robot
design contest kit of materials. The web can of course provide much more
detail, including various manufacturing methods. For example, the table
shows that nylon can be welded (using ultrasonic welders), but not typically in
a shop for a robot design course. All metals, with the exception of beryllium,
have the interesting property that their specific moduli of elasticity, their mod-
ulus of elasticity divided by their density, are equal. Plastics, rubbers, and
woods vary widely. Most materials exhibit some degree of ductility, where
before they break, they start showing signs of yielding: Upon load release, but
before the structure breaks, the structure will suffer some permanent deforma-
tion. In general, the stronger a material, the less it yields, and hence the less of
a warning one has before it fails catastrophically.
The Brinell B hardness and the Rockwell C hardness (denoted by
HRC and then the number) can be approximately related to the tensile strength
of plain carbon and low-alloy steels by:2
A common way to predict when failure will occur is to find an equiv-
alent maximum shear or tensile stress in the part. Brittle materials have low
ductility (e.g., ceramics) and usually fail when their maximum tensile or com-
pressive stress is exceeded. Materials with higher ductility (e.g., most metals)
usually fail when their maximum shear stress is exceeded. A complex state of
stress can be equated to an equivalent stress using the Mises yield criterion:
Do you have components which may be subjected to high stresses?
Try and predict the Mises stress and determine if the component will yield.
Remember the stress concentration discussion from Chapter 5!
1. For a concise, yet expanded discussion, see A. Slocum Precision Machine Design, Society of Manu-
facturing Engineers, Dearborn, MI, pp. 330-340
Table 1: Materials (C = cut, M = machine, W= weld, F = form, B = bond)
Yield strength
(MPa) Modulus of
Elasticity (GPa) Density (g/cm3)Manufacturability
Mild steel 250 208 7.9 C,M,W,F,B
High strength
Aluminum 275 69 2.7 C,M,W,F,B
White Pine wood 8 9 0.37 C,F,B
Birch 12 14 .66 M,B
Nylon (no fill) 40 2.7 1.14 C,M,W,F,B
Nylon (30% glass
filled) 80 9.3 1.39 C,M,W,F,B
ABS (extruded) 20 2.0 1.05 C,M,W,F,B
2. F. McClintock and A. Argon, Mechanical Behavior of Materials, Addison-Wesley Publishing Co.,
Reading, MA, 1966, p. 448.
2
1590
3.45 3.45 122
MPa MPa
B
H
RC
σσ
⎛⎞
≈≈
⎜⎟
−
⎝⎠
()()()
22 2
222
max metals
333
2
2
XY YZ ZX
yield XY XZ YZ
yield
σσ σσ σσ
σ
τττ
σ
τ
−+−+−
=+++
≈
1/1/2008© 2008 Alexander Slocu
m
8-5
Materials: Wear, Strength & Stiffness
•Axial, torsion, and bending loads can be applied to structures and components
– An equivalent stress needs to be determined and compared to the material’s yield stress
• Yielding in a component’s material can mean the component has failed, as will the machine,
or it can be used to form a component during manufacturing
– Elastic instability (buckling) can affect shafts and columns in compression or torsion
– Know your limits! (See pages 5-20 to 5-23!)
σyield
σultimate
Stress
(force/area)
Strain
(elongation/length)
εyield
εplastic
deformation
εdeformation
εelastic
springback
Mild steel (1018)
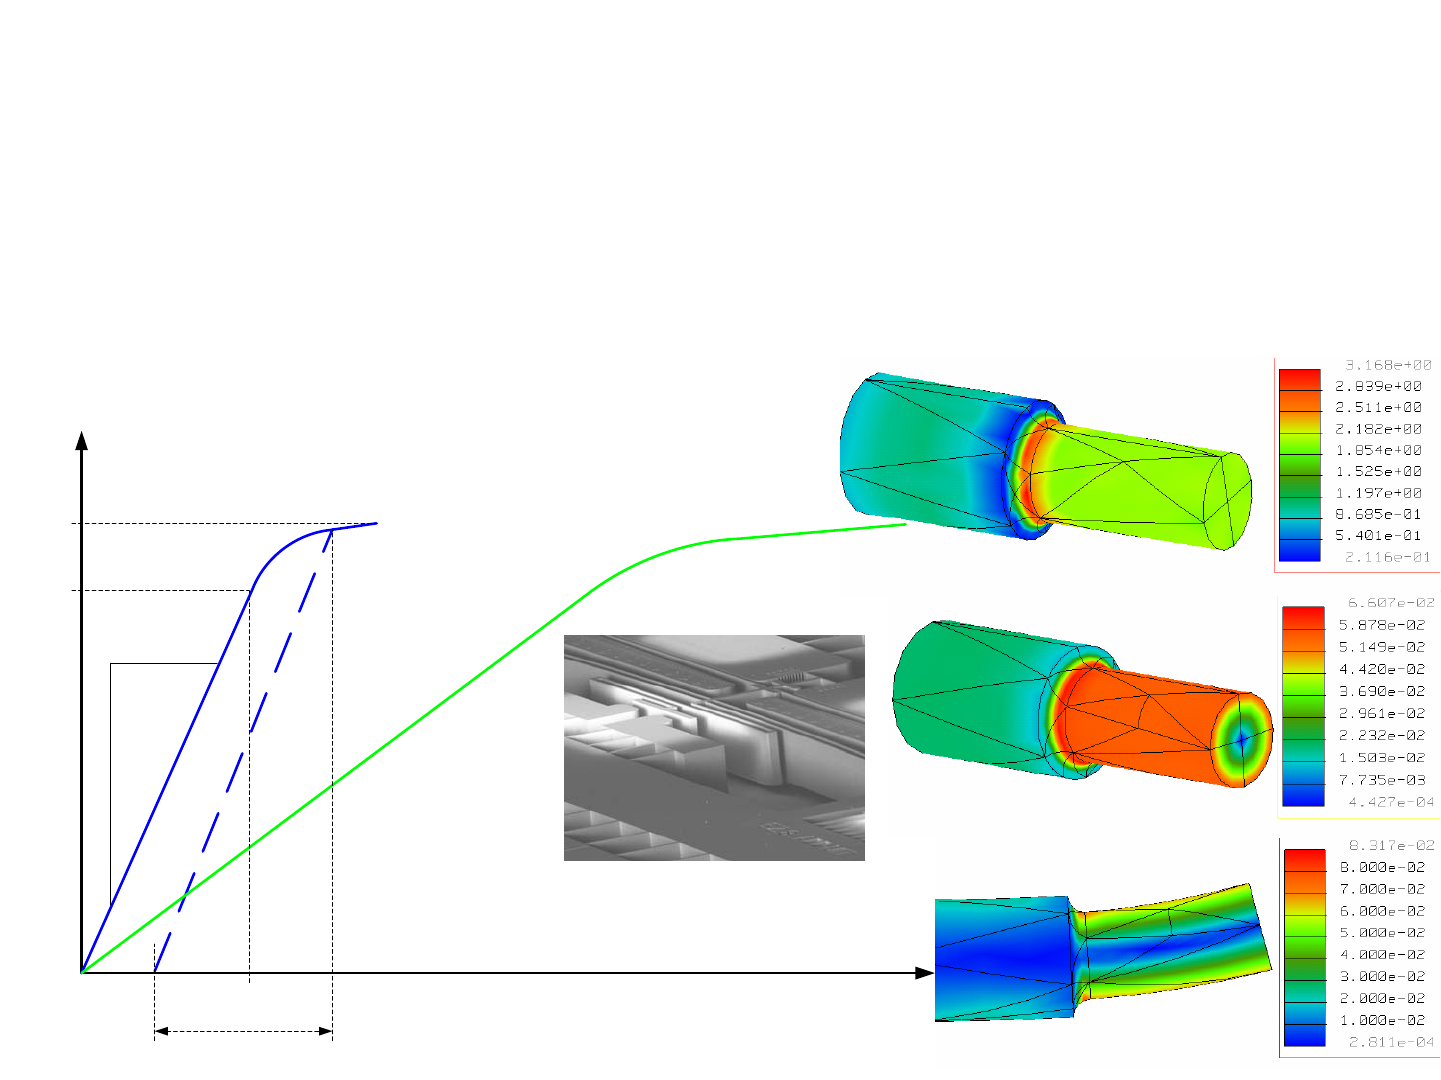
6061-T6 Aluminum
E = slope
Silicon MEMS relay structure
from Jian Li’s Ph.D. thesis
Visualization
A very powerful design technique for creating the structural frame-
work for your machine is the ability to play the movie of your machine or its
modules working even though the machine does not yet physically exist and the
design is still in the concept phase. With your mind you should be able to
imagine each component as it moves, and envision all the undesirable motions
that might also occur. The structure must accommodate all these motions.
Once again, a bicycle makes a great practice device. Imagine riding
your bike and squeezing the brakes. In your mind, see your hand displace the
end of the brake handle so it pivots about a pin. See the other end of the brake
handle move less, but hence with more force. See the cable being pulled by the
brake lever. See the cable being pulled within the protective guidance sheath.
Follow the brake cable along the frame, taking note of its attachment points
and how motion of the handlebars does not cause the cable to shorten (else
when you would turn, you would skid). See the cable connected to the linkage
that holds the brake pads. As the cable pulls on the linkage, you should be able
to see how it evenly displaces each brake pad to provide equal force to each
side of the wheel. Your wheel is bent? See how the brake linkage floats about
a central pivot point so even pressure is still applied to both sides of the wheel.
Now there is a hill coming up, and you have to change gears. Push
the gear selection lever. How does it cause the derailleur cable tension to
change? Is it a simple lever, or is it a ratchet where clicking one lever increases
the gear ratio, and clicking another lever decreases the gear ratio. This allows
your hand to remain firmly on the handlebar, so you could be shifting while
riding a rugged mountain road. Can you see the detail of how this shifter
works? In the early stages of a design, do you even need to know such detail
for a module? Would it not be safe to assume that such a nifty shifting device
could be developed by a dedicated focused effort. This might entail some risk,
but a reasonable countermeasure would be to assume that you could always
use a standard shifting technology to meet the shipping date.
Continuing, follow the cable to the derailleur. The force from the
cable needs to pull the derailleur so it pulls laterally on the chain so as to guide
the chain off of one sprocket and onto another. What is the optimum angle for
the derailleur pivot axis? Does it matter at this point? Do you have the time to
optimize it now, or can you just leave an attachment point on the bicycle frame
such that the derailleur can be bolted in place when it is optimized?
This is why being able to play the movie in your head is so valuable,
for it serves as a last-minute check of your FRDPARRC table before you put
details to the structure. It allows you to imagine your machine in action: It
allows you to see if the design parameters are indeed capable of satisfying the
functional requirements. As you play the movie, you are likely to discover
details that you overlooked in the initial lofty conceptual design phase. You
are also likely to discover impossibilities and very high risk FRs and DPs; on
the other hand, you are also likely to visualize viable countermeasures.
As the number of functional requirements increases, your ability to
visualize the entire machine will become more and more challenged. This is
why having a FRDPARRC table is so important. It allows you to visualize one
module at a time, and then after having visualized all the modules individually,
you are more likely to be able to visualize the entire machine.
In addition to visualizing the overall kinematics of the machine, you
can imagine fine details, such as when a trigger pin is pulled, will it jamb? In
your mind, zoom in on the cross section of the mechanisms, and imagine the
parts as they can rattle in the bearings that support them because of clearance.
Slowly pull the trigger pin out. How will the forces be balanced? Will the pin
suddenly rotate as it is no longer supported on both ends? Will this cause it to
jamb in the hole in structure or in the component being triggered?
Furthermore, you can also visualize the effect of deformations on
machine performance. One by one, imagine that each machine component
where made of soft rubber, and visualize how it deforms under the loads
imposed by the machine. This can help identify regions where extra design
care must be used in the detail design phase.
You cannot be asked to turn in the movie that you have created in
your head, but after playing the movie and carefully reviewing it, are there any
design changes to be made? Visualize the machine sizing box for the contest.
Now visualize all the motions your machine makes and the modules. Now try
to visualize at least one overall structure that can achieve the functional
requirements for your machine.
1/1/2008© 2008 Alexander Slocu
m
8-6
Visualization
www.omax.com
F
F
Trigger
F
F
Trigger
Jammed!
Ouch!
•Develop your ability to imagine a structure deforming as loads are applied
– Sequentially imagine that each element of the design is a piece
of rubber, while other elements are steel
• Apply forces to the system and see how it deforms
– Does the deformation cause problems?
– How can structure be changed to minimize deformations?
•Play the movie in your mind
•Bracing elements with triangles (plate-type gussets or beam-type trusses) are the most
efficient method for strengthening a structure
•Creating CAD or paper and pushpin models is an effective way to visualize a structure
– Even if you are planning on using finite element analysis, a simple model can help you later
determine if the results are meaningful!
Layout: Introduction
Developing a strategy involves numerous rough sketches of stick fig-
ures and motion-indicating arrows. Concept development involves one-step
finer resolution, but the sketches are still generally sketchy. However, once the
final concept is selected and it is time to divide the machine up into modules, it
is time for the layout. Layout occurs after you have completed the first-order
design calculations to determine concept feasibility. Remember, analysis will
continue during layout and especially during the detailed engineering phase
which follows layout.
Layout is thus the design phase where the design engineer has sorted
through numerous strategy and concept options, done preliminary calculations
and/or experiments, and has a good picture in their head of what the design
should look like including ideas for modules. The challenge is now to transfer
thoughts into reality. Since all the machine’s modules are attached to the over-
all machine structure, it is logical to start the development of the structure with
a layout sketch for the machine to ensure that the structure will be designed
with the attachment points and spaces needed for all the modules.
A layout sketch is thus a sketch that clearly shows the likely size of
the modules and their relation to each other, with enough detail to show the
overall design of each module. Later for each module, a more detailed layout
sketch is also completed. For example, the layout sketch of a machine should
show that an arm is articulating or extending (rotary or prismatic joints). It
should also show the anticipated location of the drive motor and the type of
connection to the arm. However, not so much detail should be shown that the
designer feels constrained by too many preconceived details before the
detailed engineering is completed.
A layout sketch often starts with the allowable outer boundary of the
machine. Adding the general anticipated shape, size, and location of modules
enables you to sketch different concepts for the machine’s structure (frame).
You may also want to sketch the location of the “tool” and the “work” (e.g.,
gripper and hockey pucks) as they are moved by the machine. Then you can
place the modules and sketch the frame. You can then perform the appropriate
analysis needed to size components. With your visualization skills, you can
“see” how the machine will perform and check for any failure risks that may
occur due to interferences between modules or structural deflections that could
cause elements to jamb and fail. You could also start with a design sketch for
the frame, and then add the modules, modifying the frame as you go. Which
starting method is best? You should be able to see if a machine is to be struc-
ture dominated, like a crane, or module dominated, like a car, and then proceed
accordingly. When to move from a hand sketch to a solid model depends on
the skill and comfort level of the designer, but it ultimately should happen.
How can you ensure that you have just enough detail, but not too
much? Use your FRDPARRC tables from Strategy, to Concept, to Modules,
to understand what functions the structure must perform. Remember, the
FRDPARRC tables provide a means to organize your thoughts with words and
simple sketches that described your ideas. FRDPARRC tables are roadmaps to
help create a first-order sketch of the machine. They make sure there are some
features on the layout sketch that are associated with each of the design param-
eters you have identified for your “best design”.
Too much detail in the layout phase is a waste of time, because after
the layout phase comes the detailed engineering phase, and this almost always
leads to changes in the modules, their relation to each other, and in the overall
machine. Design is an iterative process, and any design process must itself be
flexible and minimally burdensome to the creative design engineer. How can
you develop your layout skills? Like anything else, practice, practice, practice.
It never stops, it just keeps getting better!
In order to develop your layout skills, start with something simple,
like your bicycle. Draw the major components, the wheels, the gears, the
derailleur, the pedals, the brakes, the handlebars, the seat. Next draw simple
lines to connect these components. Did you draw the lines along the lines of a
conventional frame? What other collections of lines might also achieve the
same function but with a different topology? Layout is a great catalyst for
thinking of configurations you might not have thought of before.
Next, layout a simple 2WD car upon which your robot might be built.
How would a 4WD car look? How about a car with two large drive wheels in
the middle, and then swivel casters at the front and back? Is there a risk of
hang-up in the middle? What might be a countermeasure? With these three
base-platforms, see how you would add your modules, such as an arm or a
bulldozer, or maybe another bother-bot.
1/1/2008© 2008 Alexander Slocu
m
8-7
Layout:
Introduction
Will Delhagen & Alex Jacobs in
MIT’s 2001 2.007 contest Tiltilator!
•Layout is used to initially define relative placement of elements and the supporting structure:
–The Layout is the first embodiment of the design intent and defines boundaries on the structure
–You can create several simple stick-figure layout sketches of different concepts
–Use appropriate analysis (e.g., 1st order error budget) guided by the layouts to help select the best!
•A Layout Drawing is the graphical interpretation of the FRDPARRC table’s Design Parameters:
– As a design progresses from Strategy, to Concept, to Modules, to Components, the layout is the
first step towards creating the details
•A sketch & notes can suffice for an initial layout, & serve as a road map for creating a solid model
•A solid model can serve as a layout, as long as one takes care to not add a lot of detail:
– Use datum planes and curves referenced to a global coordinate system
– Beware of referencing features to other features which may later be moved or deleted

Layout: Sketches
Since most machines must have an overall structure to which modules
are attached, a skeleton or frame may be the first module whose layout is
sketched, or as mentioned previously, the modules can be sketched in their rel-
ative positions, and then the structure can be added. As an example, consider
the layout sketch for Alex Sprunt’s wall-crawler. It shows sketches of the
modules as they are initially envisioned, and their relative locations in order to
enable them to execute their function: The machine crawls along the wall of
1998’s Ballcano contest to position the machine. The grey “tongue” then
extends to form a trough to channel the balls towards the scoring bin. With the
modules sketched in the desired position, the structure can then be sketched to
which the modules will be attached. For this design, how might you start with
a sketch of the structure and then attach the modules? Which method do you
think would enable/help you to better develop the modules?
When there are strict physical size limits, it is helpful to sketch them
and then sketch within those boundaries. Once simple “stick figure” lines are
drawn within the boundary to show the intended structural loop (see page 3-
24), arrows should be added to show applied forces, moments, and motions of
the “tool” and the “work” (e.g., a lifting bucket and the balls). Next, in order to
evolve the stick-figure that merely connects the modules into a layout sketch
for the structure, FUNdaMENTAL principles can be applied (see Chapter 3).
For example, remember to form triangles to brace structures and achieve a
high-degree of stiffness; and apply the parallel axis theorem. Do not just add
thickness without carefully thinking! This will result in a first-order estimate
of what the structural detail might look like. Appropriate analysis can be
applied to initially size members and determine feasibility. With each step,
more and more detail is added. With each step, the risks can be assessed and
countermeasures taken if the design appears to becoming too complex or the
risk of success too great.
In order to take the next step, which would be creation of the solid
model, the layout either has to be neat and accurately show relative sizes of
elements, or it has to be labeled with intended dimensions. The Tiltilator con-
test table evolved from an early sketch and the PREP process as shown in the
first sketch at the top of the page. From this tangle was extracted the layout
sketch, which shows notes and dimensions necessary for the design engineer to
then develop the solid model of the system. Note that once the solid model
was developed, 3D and 2D views were easily created which were helpful in the
development of contest machine layouts.
It is important to be able to visualize the environment in which your
machine must function. This can be aided by making photocopies of a layout
sketch of the environment which will allow you to sketch and compare differ-
ent layouts of your machine. You can then literally wallpaper (temporarily)
these around your working or living space, so that while doing other things,
you can be subliminally analyzing and evolving your design.1
Sketch the layout of the contest table and as you do so, try to envision
yourself as a machine driving around on it. What are the regions which might
cause you to get stuck? Are you still happy with your concept? Now is the
time to change it before launching into your machine’s layout phase.
Gather your most recent FRDPARRC tables for your strategy, con-
cept, and modules, and decide if you want to start with the structure. If so, then
sketch in modules. If you want to start with the modules, lay them out, and
then sketch in lines that join the modules. With good guesstimates of the
forces on the modules, add thickness to the lines of the structure, such that it
will then have sufficient stiffness or strength. Add notes and major dimensions
to the layout drawing to enable you to create the solid model of the machine.
Remember, solid models will be made of parts and subassemblies that will
then be brought together to create a full solid model of the machine.
If you run into problems with making things fit and have to change
your design, update your FRDPARRC tables accordingly; however, minimize
busy paperwork. Your goal at this stage is to iterate and converge rapidly, yet
maintain enough documentation to enable others (or yourself at a later date) to
follow your thought process.
1. Another social opportunity: ask that potentially special someone if they would like to help you
wallpaper your room... and then while they are helping hang sketches, you can ask them what they think of
your design!
1/1/2008© 2008 Alexander Slocu
m
8-8
Layout: Sketches
1) Early concept
development
(used in PREP)
2) Layout sketch
(used to create
simple 2D CAD
drawing or solid
model)
3) Solid model
(and generated
end view)
Alex Sprunt’s Wall-Crawler
•Use Motion diagrams and stick figures to help define and select
your concept as initial starting points for your layout
– Design is like a flexible anagram
• You are allowed not only to rearrange things
– You are allowed to add or subtract things!
• Use your knowledge of the FRs and DPs and of fundamental
principles to catalyze the creation of the layout
– E.g., the red-line-strategy machine grabs the pendulum with
a flexible arm and then goes to the end of the beam
• What kinds of structures can enable a machine to do this?
•In order to define the structure, you will also have to sketch
some basic ideas for the mechanism

Layout: FRDPARRC
To help review the design process and hardwire it into your neurons,
close your eyes and review the various topics discussed on the last three pages.
Now scan through your FRDPARRC sheets to make sure you have a clear view
of what you want to accomplish. Systematically go through your design, as
documented by the FRPARRC sheets, and apply Maudslay’s maxims:1
• Get a clear notion of what you desire to accomplish, then you will proba-
bly get it
• Keep a sharp look-out upon your materials: get rid of every pound of
material you can do without. Put yourself to the question, ‘What business
has it there?’
• Avoid complexities and make everything as simple as possible
• Remember the get-ability of parts
Now, crank up the stereo and prepare to sketch your layout drawing:
A good song to play would be from the Rolling Stones:2
• “You can’t always get what you want.
• But if you try sometimes well you might find
• You get what you need”
Now use your FRDPARRC sheets to guide creation of a layout sketch
for the machine. Make sure to keep copies of the FRDPARRC sheets in front
of you as you sketch (you can tape them up around your work area like wallpa-
per!):
Sketch the overall functional requirements of the machine by the
actions it is to take. Since you probably already have earlier sketches of the
stick figure with arrows indicating motions and forces, you are basically
already done with this step. Keep a copy of this sketch in front of you as you
begin the layout sketch for the actual machine configuration.
Using the stick figure for your machine as a skeleton, foundation, or
platform for your machine, sketch objects for each design parameter with just
enough detail to indicate the type of mechanism you intend to develop in detail
(later on). You should have done preliminary design calculations in the con-
cept feasibility stage, but you may find that more analysis is now required as
you begin to put actual geometric bounds on the design. If you need guidance
on what a module might look like or how much space it might take up, look at
other machines from the past as references.
The layout phase is also the last-chance to consider different risks that
your machine will encounter. How confident are you of the physics of opera-
tion of the module whose boundaries you are sketching? As you are sketching
its boundaries, you will have to be thinking about its detail. If you find your
mind a blank as to what detail may actually go into the box you are sketching
to define the module, then you should label it as being a very (perhaps the
most) critical module. You should be able to say to yourself “I am not sure how
I will do this, but I can envision several different ways...” in order to make the
risk manageable.
Finally, as you are sketching and making note of the level of risk for
each module, you can also be thinking of countermeasures ranging from “I can
just delete the module and if needed add a simple weight to maintain machine
balance” to “If this module does not work, in the same space I can replace it
with a simple dindlewidget to achieve some effect”.
The layout phase will often leave you with more questions than when
you started. This is good, because it has served its purpose of helping to define
the detail that will be required in order to create solid models of your machine.
From the solid models you can make the manufacturing drawings, from which
you can then make the parts and the machine.
Before you complete the layout sketches for your machine, make sure
you have scanned through the rest of this book to activate your neurons with
design images that can be useful when you start the layout sketches for your
own machine.
1. Review them if needed on page 1-4.
2. Mick Jagger & Keith Richards 1969http://lyrics.all-lyrics.net/r/rollingstones/letitbleed.txt
1/1/2008© 2008 Alexander Slocu
m
8-9
Layout: FRDPARRC
• Use a FRDPARRC table to guide creation of initial layout sketches
• Example: For the MIT & the Pendulum contest, create layouts for
Concepts for Start pendulum swinging and collect balls and pucks Strategy
????
1)Botherbot
2)Pendulum clamp
3)Cover goal
Block
opponent
????
1)Vehicle knocks
pendulum as it
drives by
2)Fixed-to-ground
spinning actuator
Actuate
pendulum
from ground
1)Gather 2 or 3
objects
2)Gather 2 or 3
objects
1)Not enough
time to make
multiple trips
2)Gather bin
is too large
Physics text
and past
contests.
Farm
equipment
websites
1)Time/Motion
study, Friction/slip,
Linkage design
2)Friction, slip,
linkage design
1)Pick up and score
one at a time
2)Harvest lots and
dump loads
Gather pucks
and balls and
deposit in
goal
Counter-
measures
RiskReferencesAnalysisPossible Design
Parameters
(Modules FR’s)
Functional
Requirements
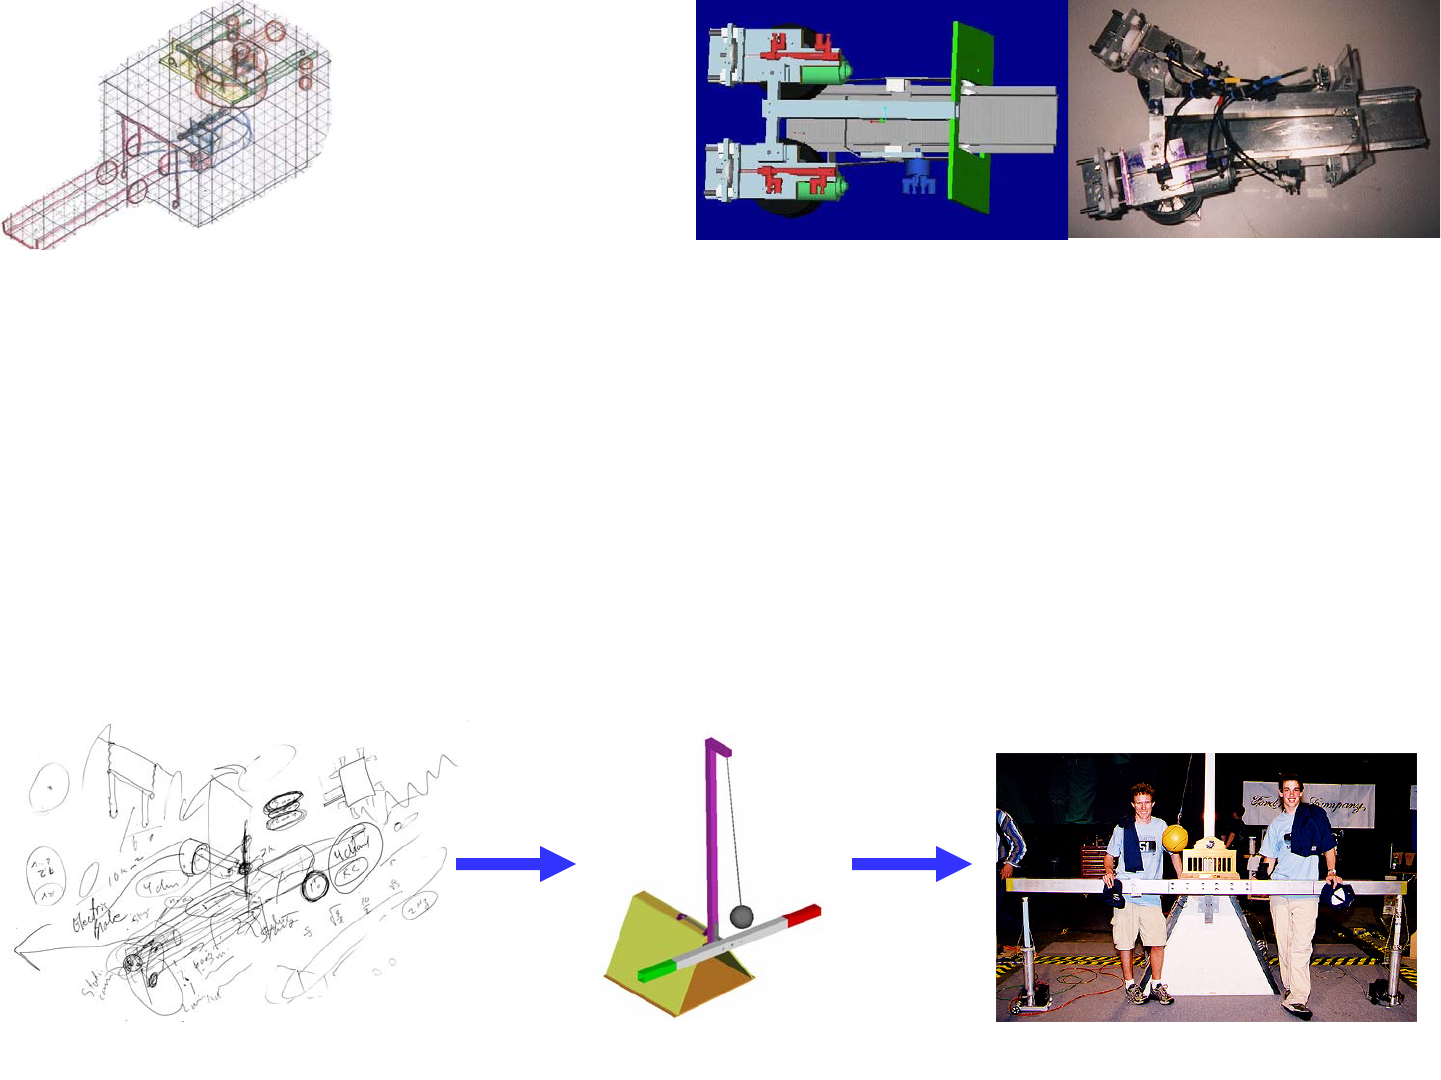
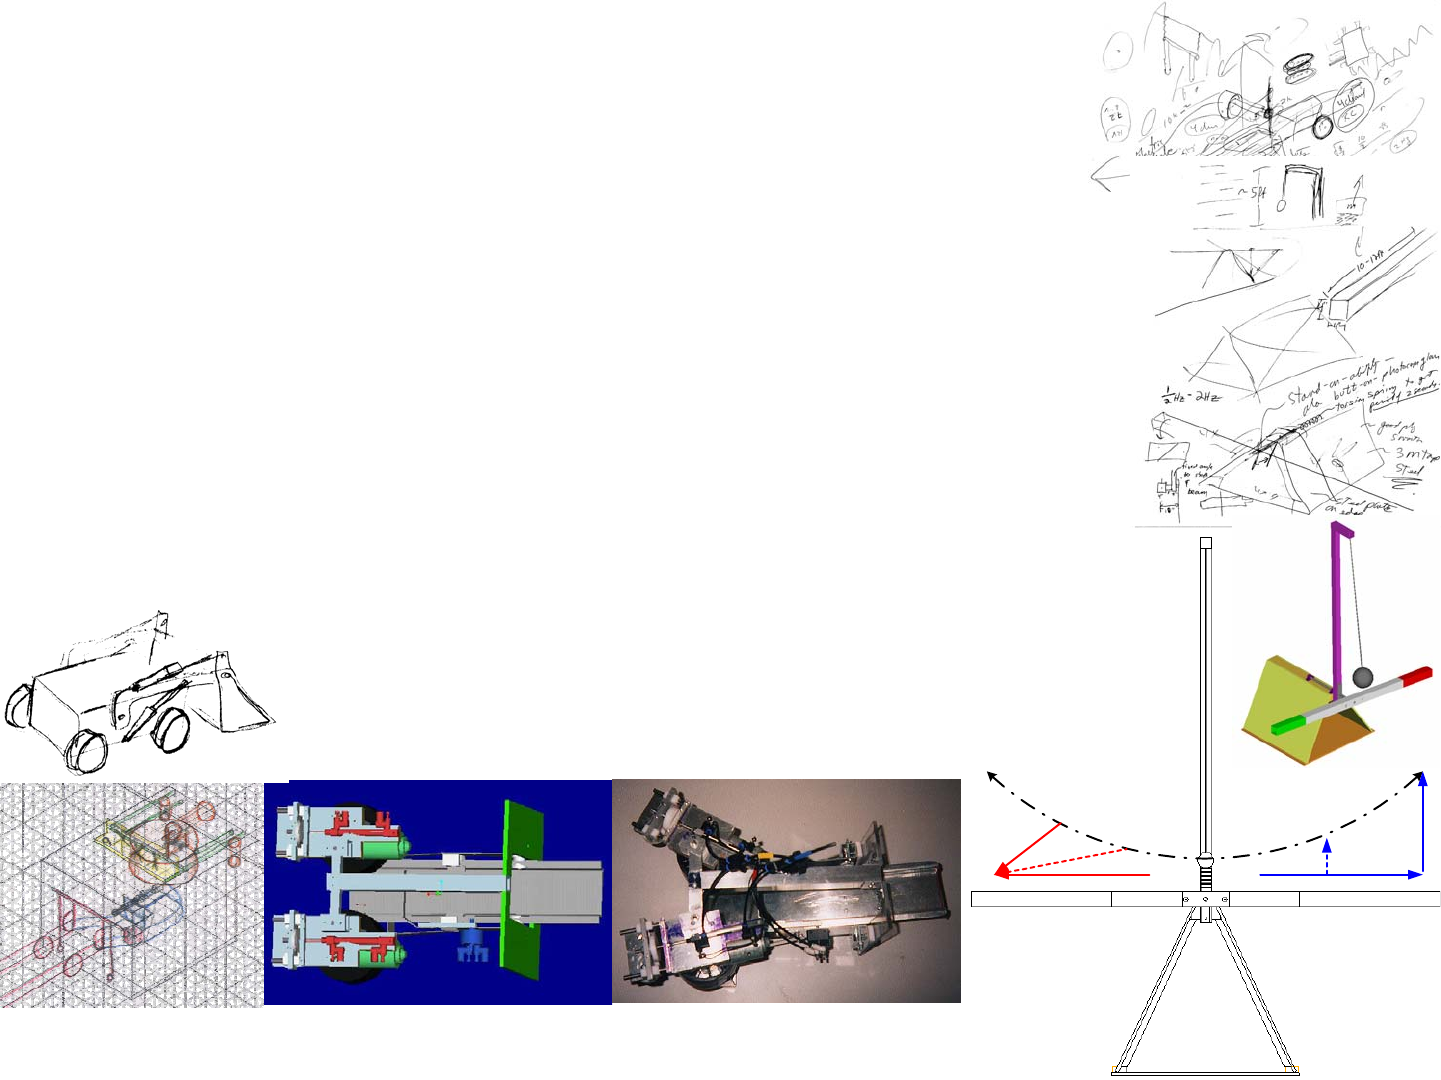
Layout: “GeekPlow” Example
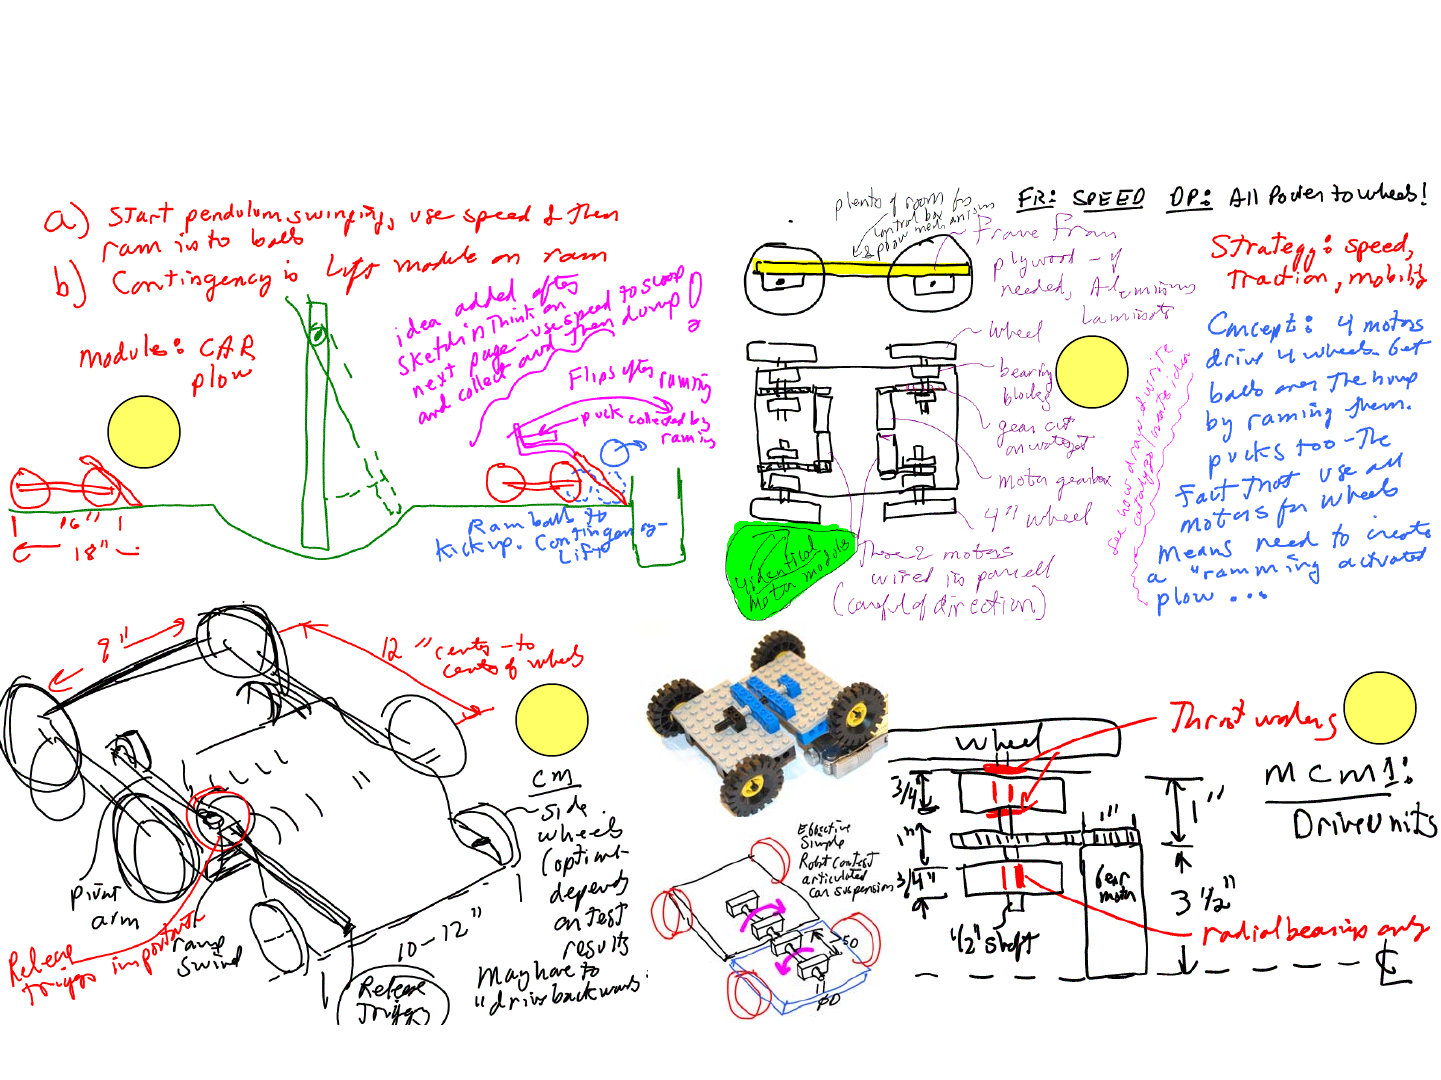
Let us explore how layout sketches can evolve. Sketch (1) is a simple
side-view layout sketch for the Start pendulum swinging and collect balls and
pucks strategy. Sketch (2) shows a layout sketch for a car concept, which
evolved in parallel with playing with the spreadsheet on Page 7-17. Two
motors would have enough power, but wheel slippage could occur, so 4 wheel-
drive was chosen. Past experience showed connecting the front and back
wheels on each side of the vehicle is difficult to do simply, and thus to ensure
high efficiency and minimal complexity of the car, four motors would be used.
However, they can be wired in two sets of two, so two control channels would
still be left. With four motors driving, there should be no shortage of power,
and enough vehicle speed could be obtained to enable the car to ram the balls
and send them flying over the lip of the table into the scoring bin. In addition,
the ramp could perhaps ram the puck stacks and make them fall onto the upper
part of the ramp, and then they could fall into the scoring bin.
Sketch (3) is a layout of the gearmotor/wheel most-critical-module.
Note that as sketched in (2) two sets, mirror images, would have to be made. Is
this bad? Should 4 identical units be made instead? What is the level of gran-
ularity of the elements in these modules? Fine granularity means that most of
the elements are identical, only the baseplate onto which the units were assem-
bled would be mirror images.
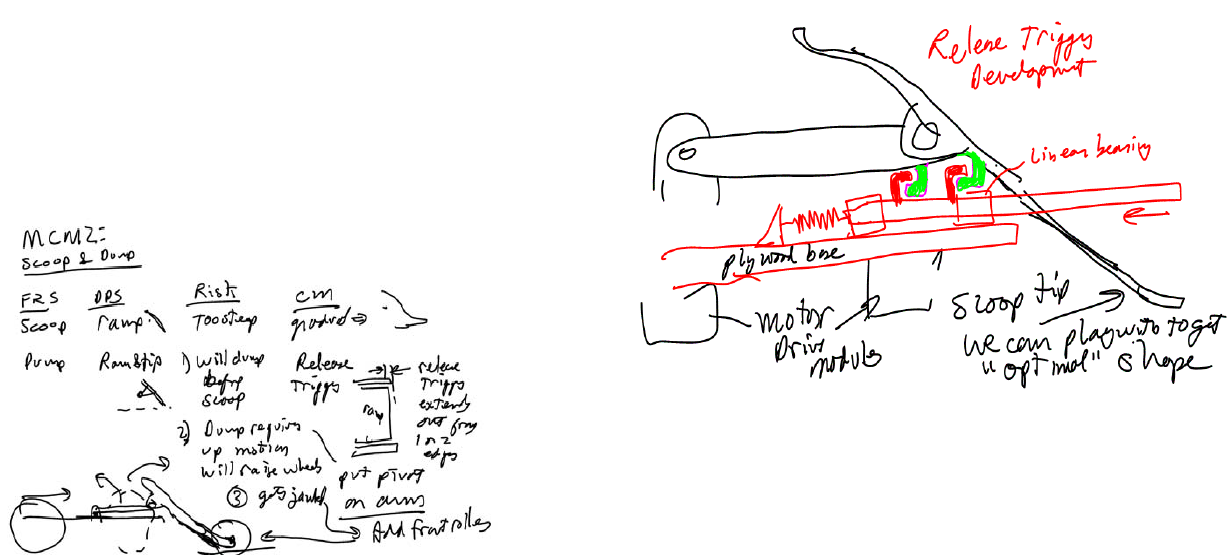
What is the next most important module? Probably the plow because
it could be just a simple static plow, a default countermeasure, or perhaps a
more sophisticated unit as sketched. Making note of the FRDPARRC chart
entries and then sketching a correlated element helps the idea to evolve: Words
trigger images, and the images highlight risks...and henceforth catalyzes inven-
tion. From this coarse layout sketch evolves more detail, where the next step
would be to use solid modelling to further explore the geometry, or in some
cases, analysis comes first. Before final commitment, a bench level experi-
ment or bench-level prototype of this mechanism can be built and tested.
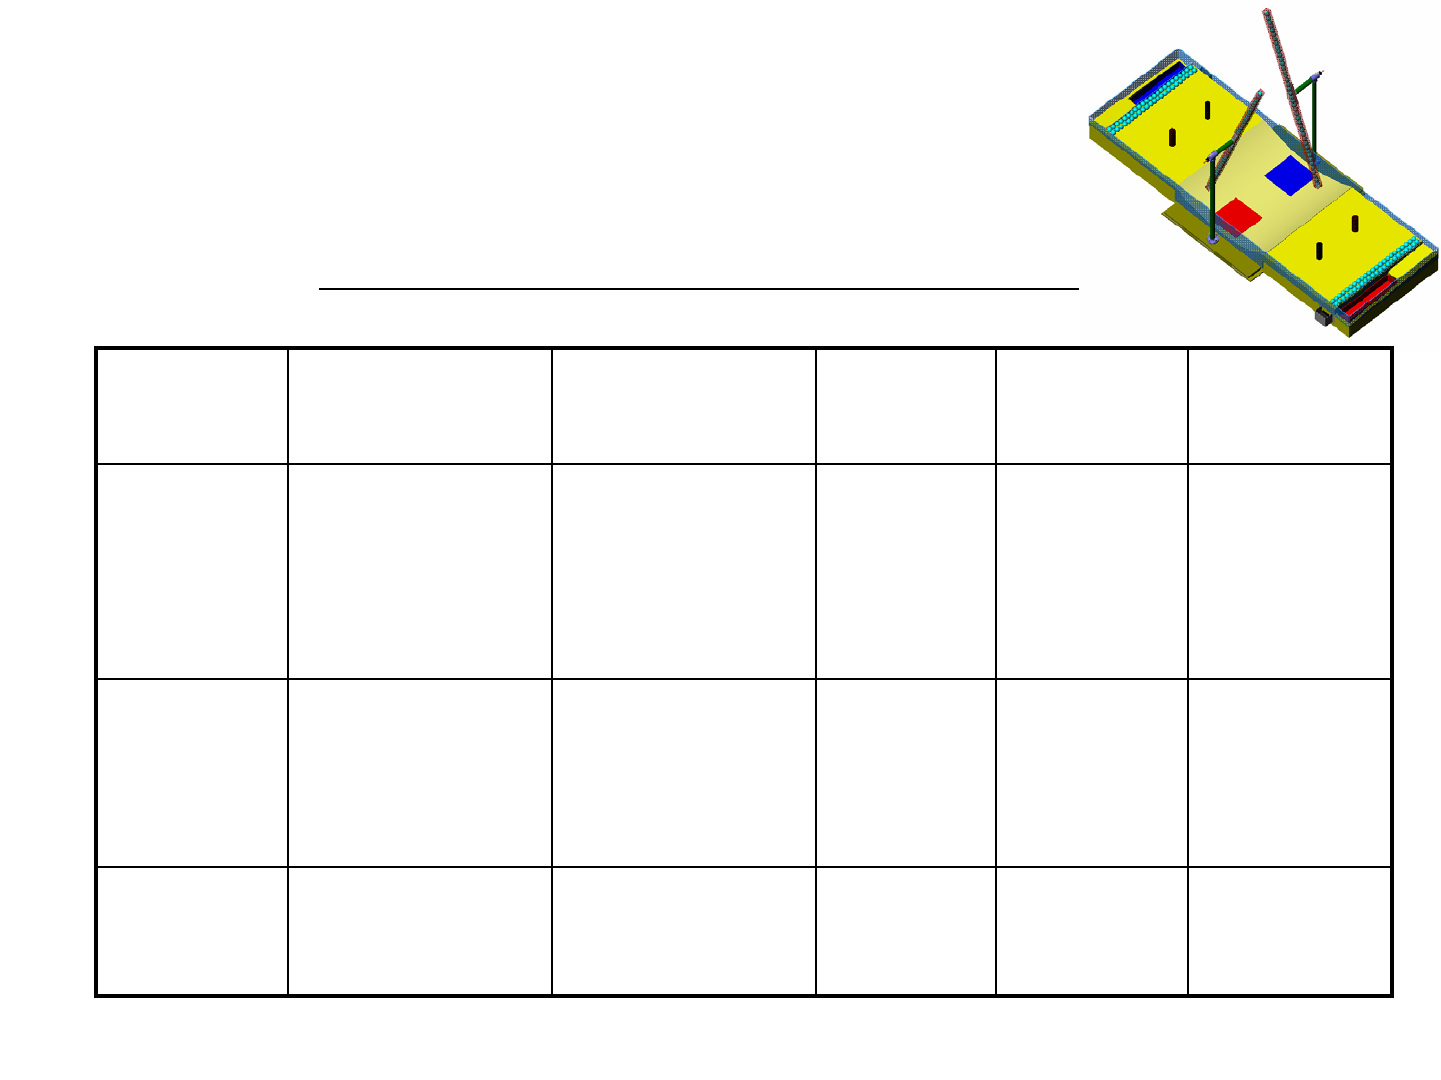
The result is a two-stage ramp/plow system shown in the sketch
below. The rear link pivots and prevents the plow from raising the front of the
vehicle as it collides with a rigid object. However, to prevent premature dump-
ing, a trigger is used which must first impact the wall...
Sketch (4) brings it all together to show how countermeasures/design
solutions evolved with risk identification: Just the way environmental pres-
sures can cause a species to evolve, potential risks cause a design to evolve.
This is the essence of the iterative process that is design.
Have you created a similar set of evolutionary sketches for your
machine yet? Now would be a good time to start!
1/1/2008© 2008 Alexander Slocu
m
8-10
Layout: “GeekPlow” Example
• Appropriate detail for layout sketches and Peer Review Evaluation Process (PREP) of a
machine (sketched with a Tablet PC) created according to the previous FRDPARRC table:
12
43
Layout: Analysis & Bench Level Experiments
An initial layout drawing can be as simple as a stick figure, or a stick
figure with some guesstimates of component and structure size. Since they can
be created quickly, they can be used in the initial concept selection process if
they are coupled with appropriate analysis. In fact, the process can be:
1. Create initial layout sketches of most viable concepts initially selected
from a first-round application of weighted concept selection charts (see
page 2-25). Often a more detailed sketch model is also created to help the
designer visualize the system (see Page 2-7).
2. Apply the appropriate level of initial analysis or experimentation to
determine feasibility. For example, a First Order Structural Analysis
should be conducted to ensure that the proposed frame is stiff or strong
enough to handle the anticipated loads. A First Order Error Analysis is
used to identify the sensitive directions and estimate the dominant Abbe or
sine errors. If these errors are about 1/4 or less of the total allowable inac-
curacy (error) in the system, the design probably could be engineered suc-
cessfully in the detail phase. A First Order Power Budget is critical to the
motor and energy storage system selection process.
3. Sketch the final concept to the next level of detail by initially sizing struc-
tural members and bearings using strength or stiffness criteria according to
the type of machine you are designing. Where accuracy is required, create
a detailed error budget (see Topic 12).
4. Create and check the power budget to ensure there is enough power and
energy to accomplish the desired task. This also allows you to determine
the load power rate, and then you can initially select a motor whose power
rate is at least 4 times the load power rate. Then you can compute the opti-
mal power transmission ratio and determine the size of the motor and
gearbox and then complete the layout drawing (see Topic 7, page 7-26).
There will be times when the cost (time) to do analysis is too high.
Sometimes a simple analytical model can be used for a first order estimate of
performance, and then a Bench-Level Experiment (see page 2-8) is designed
and conducted for less cost than it would take to perform a more rigorous anal-
ysis. However, a BLE does not allow you to play “what if?” games with the
variables, unless the experiment was designed as such to test many parameters.
When creating robots for design contests, after first order calculations
are done, a BLE is often the most appropriate analysis tool. As an example,
consider the structural platform for the GeekPlow car sketched earlier which
will be very stiff, and thus nominally, only three wheels at a time will ever
touch the ground. Will this make the vehicle difficult to steer? Will this pro-
vide enough traction? What are the options and their complexity? An analyti-
cal determination of these questions would be very costly in this application.
On the other hand, a sketch model could easily be built and tested. If the risks
were determined to be significant, they could be mitigated without too much
effort in the layout stage. If one waits until after the car was built and tested,
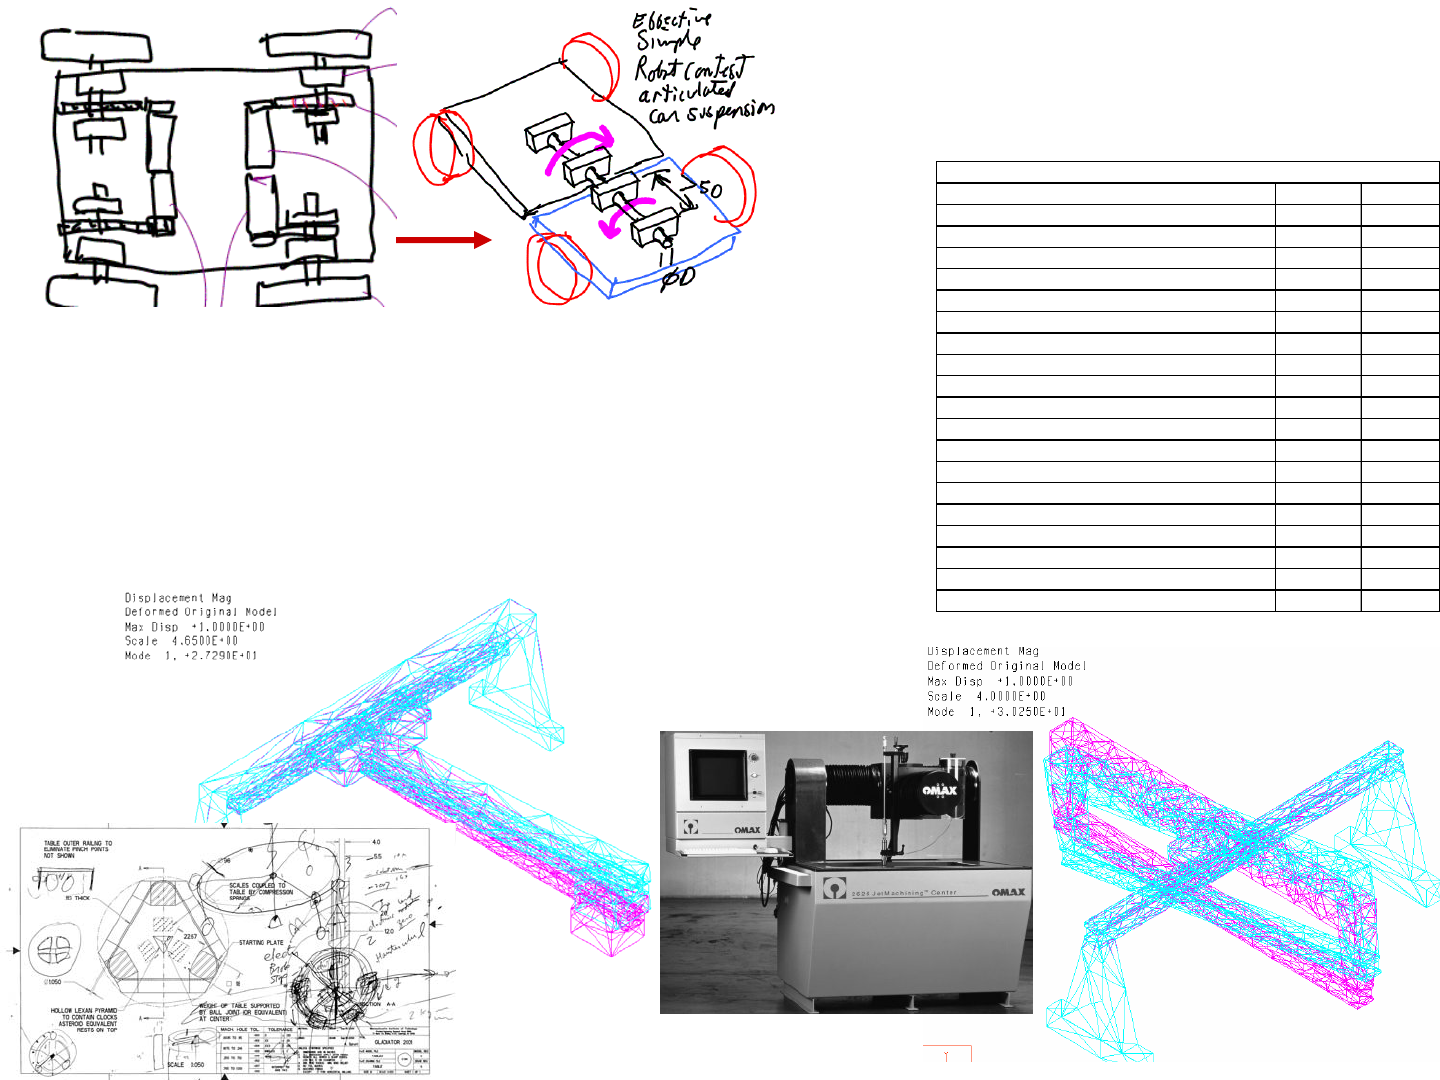
and then the design is found to have problems, one would be in serious trouble.
Two countermeasures that can be considered are: add a suspension to at least
two of the wheel modules (see page 5-16), or add an articulation between the
front and rear halves of the vehicle. The sketch shows how the same bearing
blocks and shafts that are intended to be used for the wheels can also be used to
make the rotary motion joint between the front and rear halves of the car.
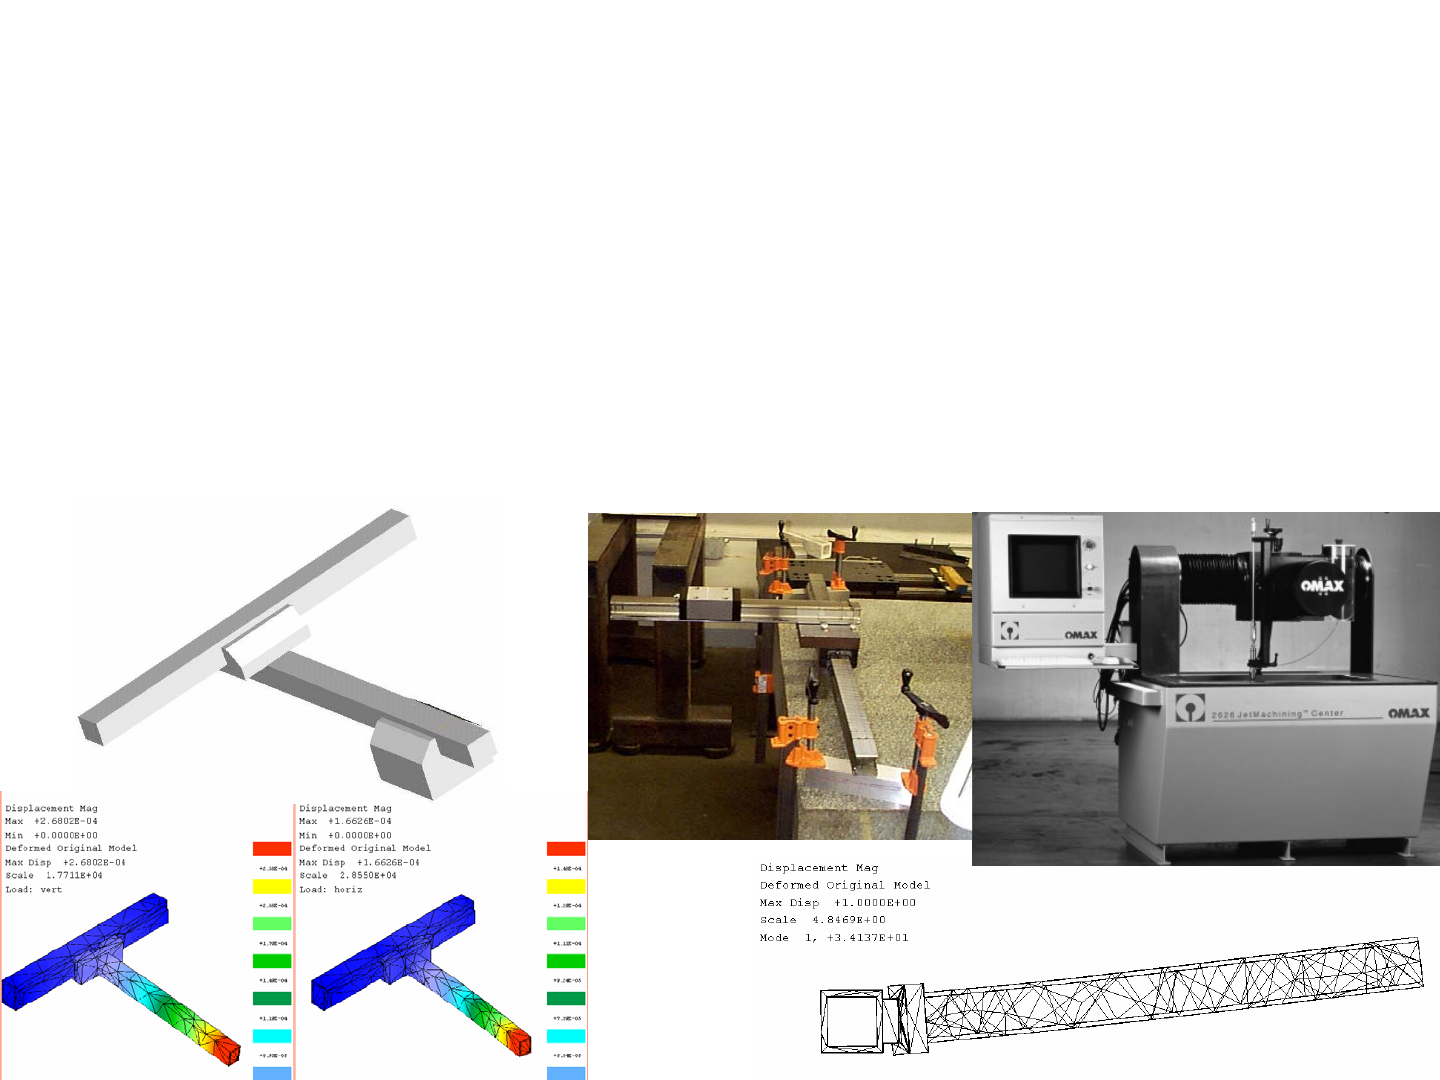
Consider the finite element analysis (FEA) results for the waterjet cut-
ter main axes shown, where the concept was to use a single large linear bearing
for each of the machine’s axes. Since the machine is small compared to its big
brothers, which used two bearing rails per axes, preliminary analysis indicated
one bearing rail per axis should be fine. The FEA with some first-order joint
property assumptions then showed that the machine had great promise in terms
of its structural resonance being high enough to allow it to be controlled with
good accuracy. However, because it was difficult to create accurate FEA mod-
els of structural joints, before committing to the expense of a prototype
machine, a simple BLE of the bearings and structure were conducted. The
experiment showed that the design could work, but it also illustrated the diffi-
culty in obtaining the components, and this led to a slightly modified approach,
but the general concept remained the same.
Although analytical or philosophical insight is the motivation for a
new concept, unless you have the experience, or the analysis to justify every
major design decision, you will need to do experiments. Hence when creating
a layout for a machine, never be shy about verifying a model or answering a
question of determinism. Remember, simple formulas, spreadsheets, and
Bench Level Experiments and Prototypes are powerful tools. What first order
analysis and bench level experiments are you planning?!
1/1/2008© 2008 Alexander Slocu
m
8-11
Layout: Analysis & Bench Level Experiments
• Since layout involves creating the overall skeleton or supporting structure, it also is a
first chance to define the overall structural performance
– The key is to understand how the structural loop behaves
• Sequentially imagine each component is made of a soft material…visualize…
• Estimate deflections, stresses, and vibration modes
– Perform first order calculations to size members and components
• If the machine is complex, Finite Element Analysis (FEA) may also be used
• If analysis is too costly (e.g., time to do), consider a Bench Level Experiment
?
Layout: Evolution & Comparison
Every design changes as it evolves from the initial stick-figure con-
cept sketch to the more detailed layout drawing. At every step of the way the
FRDPARRC charts should motivate analysis and comparison. The comparison
process itself highlights which attributes of which designs are best. The design
engineer should then determine if these best attributes can help the “best”
design to evolve to include them.
For example, is the GeekPlow design the best design for winning the
Schwing! (MIT & the pendulum) contest? What if you develop this idea and
learn that an opponent is developing a fast machine to race across the table and
plant a screw-jack that cranks down on the bin, which is what Martin Jonikas
did to win. In a robot design course, and often so in life, you should keep on
track to produce a well-designed reliable machine that works in the manner in
which it was engineered. AND THEN you should think about a blocking
(marketing, sales & service) strategy to deploy... Then, practice, practice,
practice, so when the contest time comes, you can drive so fast and so well,
that you can confound any opponent and still win. In fact, Martin won every
round easily, but in the final round, his opponent almost successfully blocked
him with a “normal” machine!
How different is this from real life? Should you not abandon what
you were doing and rush to copy? NO, because you will always be behind who
you are copying and will not do as good a job. It is far better to release a robust
reliable product with many good attributes. This allows you to establish mar-
ket presence and a reputation for reliability (if you are a student, this then
means you can earn a good grade and have a well-engineered and built
machine for your portfolio when you go job hunting!). Then you will have
time to evolve your design. For example, if you develop the fast car and a rea-
sonable plow, do you have time for a bothering module, or maybe your new
jack scoring module?
Since layout drawings are by definition simple and fast, when you
have two seemingly equally viable concepts, you can use layout sketches and
preliminary analysis to help decide which design is best. In fact, it is probably
true that ALL designs evolve beginning from the time they are first sketched;
however, this can only occur if you make sure to leave your ego in a box at
home. With an open mind you will often come to a design review with a nice
drawing of the machine or your part of it all laid out nicely. If it is the concept
selection phase, a weighted concept selection chart (see page 2-27) can be used
to help select the “best” design. However, other concepts will usually have
some better attributes, and then the layout sketch of the “best” design can be
quickly modified. For example, the GeekPlow car body can have a line drawn
through it and bearing blocks and a shaft added to enable its main frame to
twist and hence ensure that all four wheels are always in contact with the
ground. This will increase traction and steering control.
Best designs that are chosen purely on the basis of qualitative selec-
tion charts and committee deliberations are gambling with the future of the
project. Final concept selection decisions MUST be supported by physics,
either via analysis or Bench-Level-Experiments!
Returning to the waterjet machining center design example, two more
FEA results are shown. Previously, the FEA results showed static deflections.
This time wireframe images are used to show the animated motion output from
FEA dynamic simulations. This lets the engineer see how the structure will
behave dynamically, and where bending vibrations will occur. Often, dynamic
deflections that occur at resonant frequencies are not in the same location or
direction as the static deflections. This is particularly true for higher-order
modes of vibration.
Consider a simply supported beam loaded at its center. The static
deflection causes the beam to bend in a simple curved-shape that can be
described by a radius of curvature, and this is also the first mode of vibration.
However, the second mode of vibration causes the beam to bend into a side-
ways “S” shape. Higher modes add more nodes. In more complex structures,
these nodes can occur in undesirable places in the system. A classic example is
when engine vibration in a car causes a body panel somewhere else on the
vehicle to rattle and drive the driver crazy... Advanced analysis can be a part of
the layout process for complex machines.
Review your design selection charts and make sure that a good
attribute has not been overlooked that might be added without too much pain.
Is there some BLE or analysis that still needs to be done, which if the results
are surprising might cause you to take appropriate countermeasures?
1/1/2008© 2008 Alexander Slocu
m
8-12
• There are often two or more possible design paths
– Use analysis, manufacturability, & robustness design reviews
• The overall structure must be defined before module
development can commence in earnest
– Make the design amenable to evolution as detail later emerges
• Use weighted design comparison charts
Comparison between one large or two small bearings
LWH55 (T2 preload)
Moment (kgf-m) 42
Deflection (rad, minutes) 0.000582 2
Moment stiffness (kgf-m/rad) 71,463
distance to load (m) 0.12
Load (kgf) 100
resulting moment (kgf-m) 12
resulting deflection (rad) 0.000168
resulting deflection (microns) 20.2
equivelent stiffness (N/micron, lbs/inch) 49 286,086
rated moment load capacity (kgf-m) 431
equivelent load capacity at outside edge (kgf) 3,592
Lwhd15 (T2 preload)
Force (kgf) 200
deflection (microns) 10
Lateral stiffness 20
distance between bearing rails 0.2
stiffness (kgf-m/rad) 800,000
rated load at edge of table (2 trucks) (kgf) 1900
Layout: Evolution &
Comparison
Layout: Solid Models
Layout sketches can be considered as the time when you are still free
to think wild and crazy and randomly; after all, pieces of paper with sketched
pencil lines can be turned over and a new page started with almost no effort.
Solid models, on the other hand, generally take more effort and designers are
less likely to discard them. This potentially starts them climbing up the cost
curve with less and less increase in performance. This is where many design
engineers get into trouble: They create a quick solid model for the purposes of
laying out a design, and because they anticipate having to redo it anyway, they
do not take as much care as they should in defining their design intent. BUT
they then end up with a concept they solid modeled which has poorly defined
design intent. Sadly, they rarely take the time to properly create the model.
Design intent is the overall philosophy that will govern the design.
For example, the design intent of a machine tool is to make accurate parts;
therefore, the machine itself must be extremely accurate. It must be designed
and manufactured with respect to certain reference planes and features that are
not to be messed with. The design intent sets the tone for how features will be
referenced. For example, all features should be referenced to datum planes, so
that any feature ideally should be deletable without causing the model to crash.
Problems can occur when a solid model is used to layout a design and
care is not taken to dimension features with respect to unchanging, or very well
solidified and monitored global references. During layout, if the design engi-
neer is not thinking to the future, features may be dimensioned or referenced to
other features in order to rapidly create the model. However, some features
will likely be deleted as the design evolves, with the result that the model can
crash. Creating a robust solid model means following a robust process.
Another way to build a robust solid model layout is to build up com-
ponents from simple shapes. For example, a shaft with many features should
not be created in the layout phase by drawing the entire complex cross section
and then revolving it. What if some of the features are not needed? One can-
not simple set the dimensions to zero because most modelers set a minimum
feature size. In addition, it would clutter the model with extra dimensions. It is
far better to create a basic cylinder, and add features as individual cuts as the
design progresses. If each cut is referenced to a datum, then any one cut can be
easily deleted.
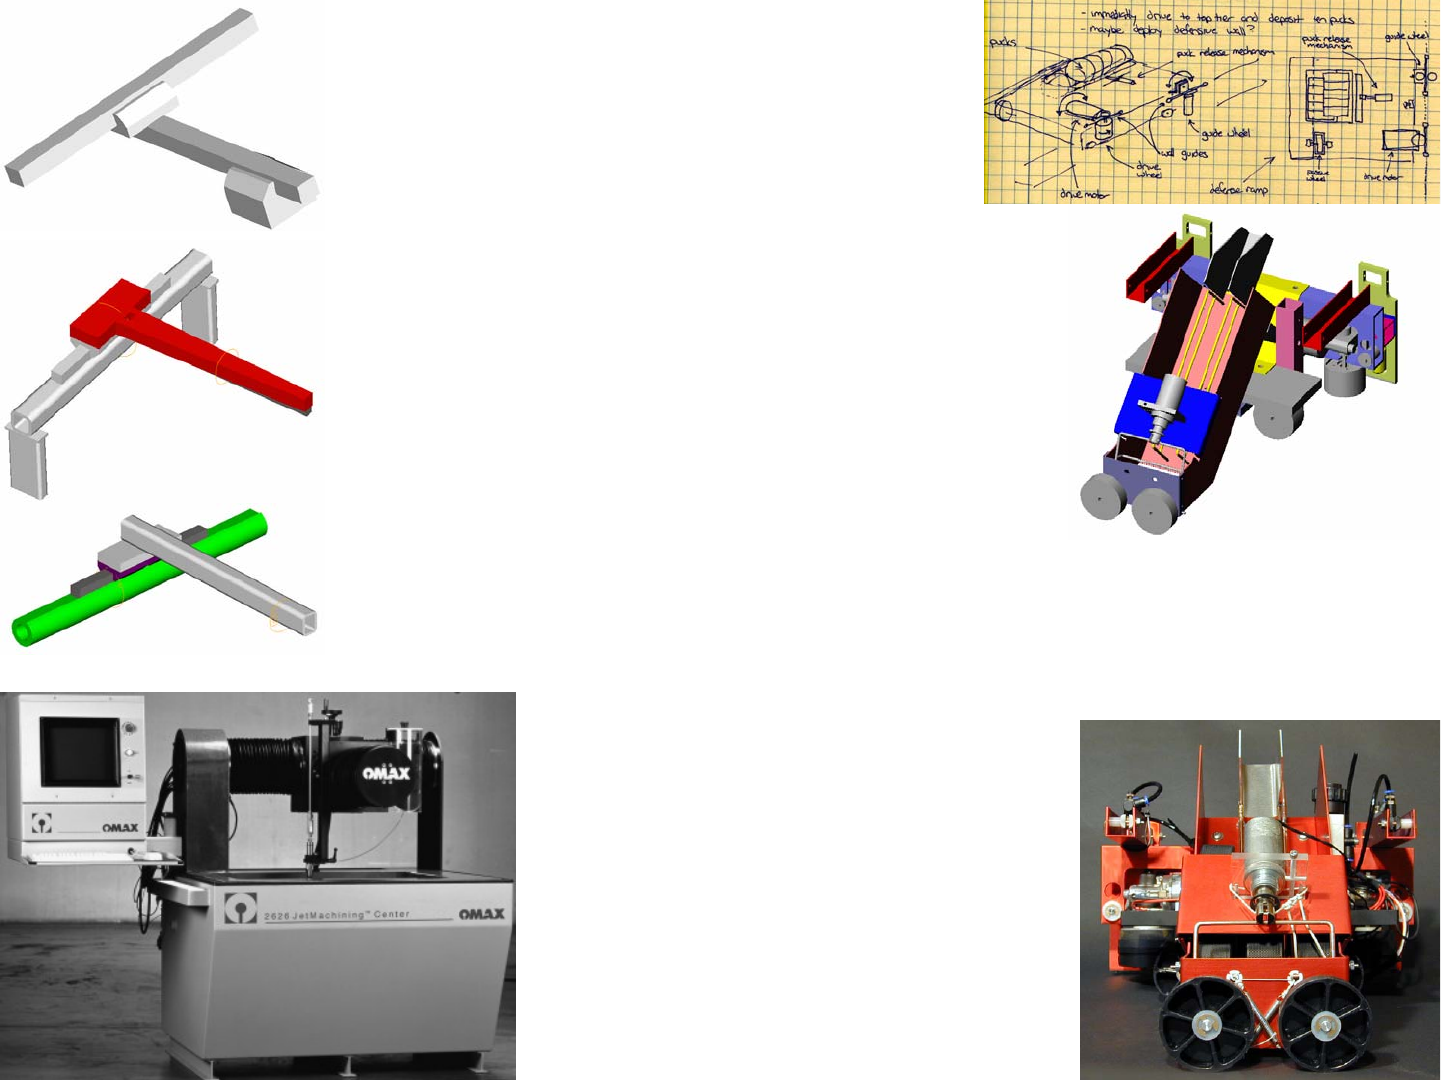
The sequence of solid model layout drawings for the waterjet cutter
shows how layout solid models can be effectively used to test different ways
the concept of using a single bearing rail can be realized in order to create a
low cost small-size abrasive waterjet machining center (the OMAX 2626).
In fact, there are two general approaches for creating a solid model
that can be used during layout, and that will also have a greater likelihood of
being able to be used later for the detailed design phase. The first approach is
to define potential modules essentially as blocks, or very coarse structures.
These “boxes” or coarse structures have reference points or features which
define where they will connect to other modules or to the structure. Each mod-
ule can then be developed in detail, but it must be able to “fit in the box”. As
long as the reference features are maintained with respect to the boxes, than
what goes in the boxes can evolve with relative freedom.
The second approach is to create a skeleton structure from reference
lines, arcs, and planes, which is essentially a stick figure that depicts the mini-
mum point-to-point geometry of the machine. Reference points on the skele-
ton structure are where modules would be attached. Structural members of
size determined by appropriate analysis are then assembled to the skeleton
structure as they are developed. Since elements are assembled to the skeleton
structure, any single element can be deleted without causing the model to
crash. When the design is finalized, relations between dimensions and features
of individual parts can then be created.
Rony Kubat’s solid model is shown along with the final machine he
built for the MechEverest competition. Rony finished in the top 4, and his
robot was the best engineered and the best detailed. His attention to detail,
including sending out his aluminum parts to be anodized, was amazing, and the
parts were made from drawings generated by the solid modeler. Note how he
created a model of the sizing box and checked to see that the solid model of his
machine would fit inside the solid model of the sizing box.
Use your hand-sketched layout to create a solid model based layout
drawing for your machine. Which of the two above methods do you prefer?
Your model should help you verify that the space you have allocated for each
module is sufficient, and that you can create a sufficiently strong and stiff
structure to meet your design’s functional requirements.
1/1/2008© 2008 Alexander Slocu
m
8-13
Layout: Solid Models
Rony Kubat’s rough sketch, solid model and
machine. Rony’s solid model fit in a solid
model size-constraint box as did his real
machine in the real box. It performed as
modeled and very nearly won the 2.007
MechEverest contest as it scored a perfect 50
points EVERY time…
• In order to create an appropriate level-of-
detail solid model layout drawing:
– Use the FRDPARRC tables from Strategy, to
Concept, to Modules, to Components to
understand what functions the structure must
perform
• The chicken-and-egg issue is that no
detail yet exists, only sketches and
spreadsheets
– Most machines must have an
overall structure, a skeleton or
frame, to which modules are
attached
» Creating the skeleton or frame is
the critical first step in catalyzing
the generation of detail for all the
modules
» Details are added as the design
progresses

Stability
In the context of a robot for a design contest, there are several forms
of structural stability to be considered. Elastic stability is the ability of a struc-
ture to bear a load and then elastically return to its unloaded shape; however, if
the load increases beyond a certain point, the structure may suddenly undergo a
rapid increase in deflection that quickly leads to material failure. Although
there are cases where buckling can occur without exceeding the material yield
strength (see page 4-26)1. In machines, common static loadings include axial
and torsion loads, both of which can reach a point where the structure suddenly
buckles. On the other hand, Dynamic stability is the ability of a structure to
not become so excited by a periodic force that it shakes itself apart. When the
frequency, or an integer multiple thereof, of an applied dynamic force is equal
to a natural frequency of a structure, the loading self-reinforces and it can
cause the structure or component to become overloaded and fail. Only with
good damping, energy lost per cycle, can this effect be prevented. Dynamic
stability is discussed in greater detail on page 5-26
Axial Loading: Take a long thin rod and place it lengthwise between
your hands and push on it. There comes a time when it suddenly bends side-
ways a lot. If you grip the ends and then try to compress it till it buckles, the
required load is greater. How the ends of a structural member are attached has
a huge effect on the load the member can bear without buckling. This was dis-
cussed in detail on page 5-26. When designing trusses, as discussed later in
this chapter, buckling of the compression members in a truss is of paramount
importance, and indeed is one of the dominant truss failure modes.
Torsional loading: When a long shaft is subject to static torsional
loads and then suddenly as the torque increases past a critical point, it deflects
sideways. The criteria for this was given on page 7-22 in the context of a shaft
used as a torsional spring. However, if the torque is further increased, perma-
nent yielding may occur.
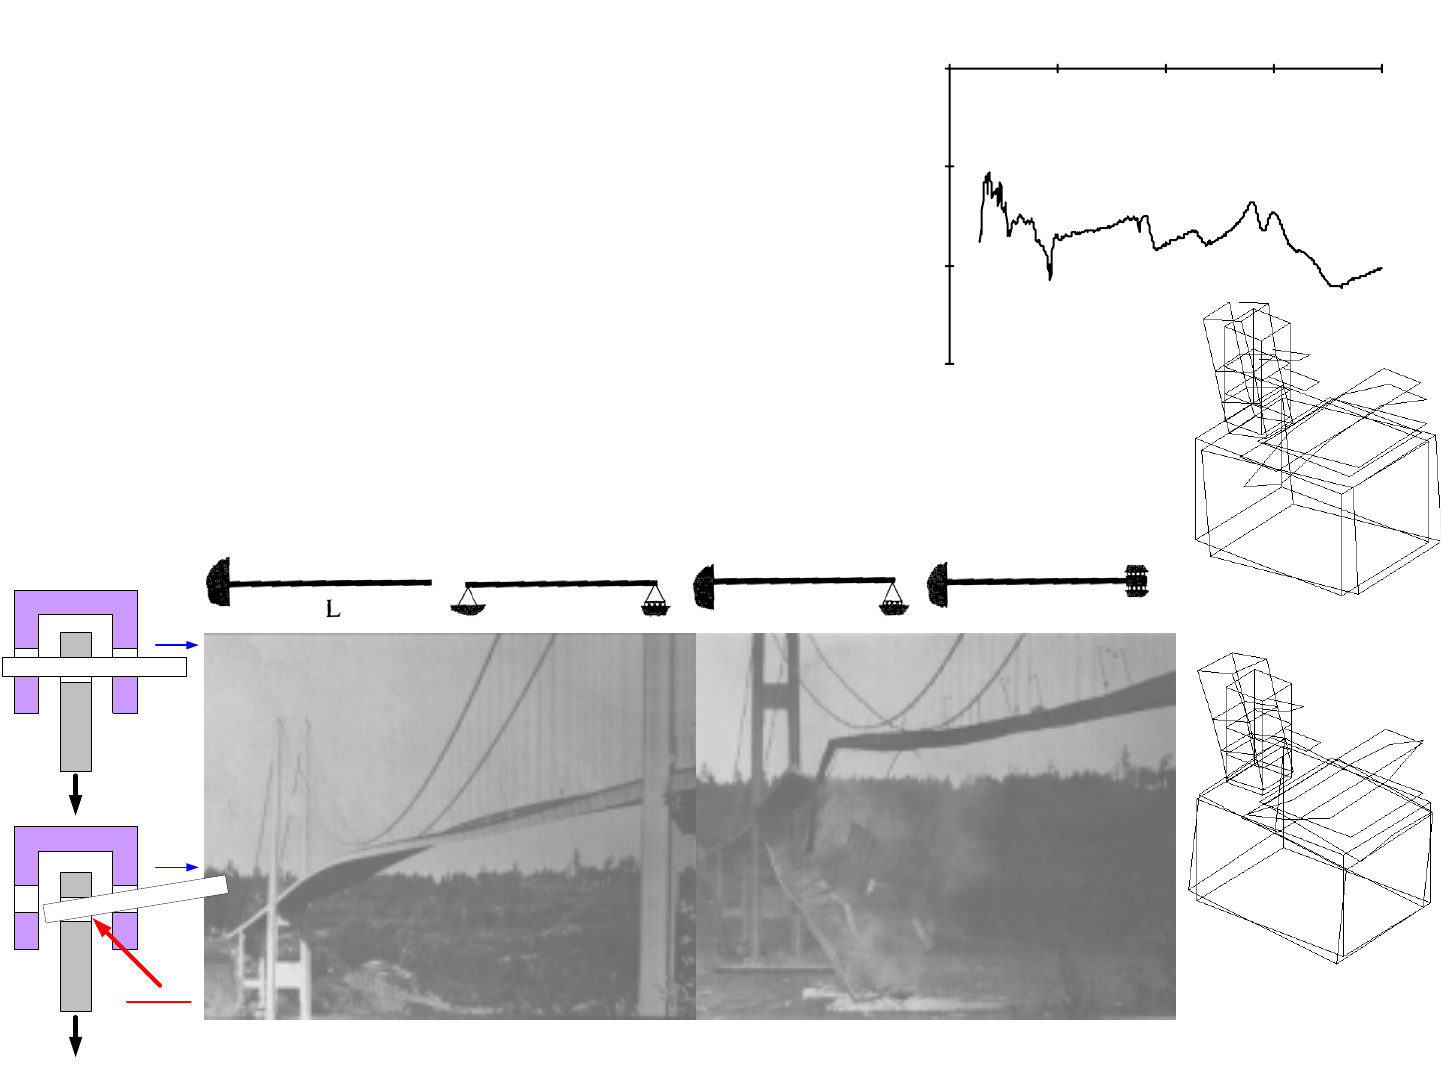
The pictures show an extreme case of what can happen if loads are
dynamically applied to the structure at one of its natural frequencies: The infa-
mous Tacoma Narrows bridge was designed with closed sections for aesthetics
and a “modern look”. However, this allowed the wind in the gorge to shed vor-
tices off of the structure which then excited it until it crashed into the gorge.
Every structure has an infinite number of natural frequencies which
will cause vibration when excited. When you push on an object and let go, it
vibrates back and forth, just like plucking a guitar string. If you give the struc-
ture a push at the maximum deflection point each time, so the frequency of
pushing is equal to the frequency of vibration, the vibrations will get bigger
and bigger. The dynamic deflection caused by a force acting on the structure at
its natural frequency, divided by the deflection that would occur if the force
was applied statically, is called the dynamic amplification factor, or the quality
factor Q of the structure. Damping, caused by many different factors but dom-
inantly in machines by friction between joints, limits the Q of most structures.
Still, it is not uncommon for a machine structure to have a Q of 20. This does
not mean that during use the structure will become dynamically unstable and
destroy itself; however, the increased deflections can cause increased loads (F
= kx) which cause other components, such as bearings, to become overloaded
and their life can thus be reduced.
The plot of response of a point on the spindle of a small grinding
machine shows many such resonances. Each of these resonance corresponds
to a particular mode of vibration, which means a certain part of the structure is
being excited at its natural frequency. Finite element analysis is very useful at
identifying the modes of vibrations, which members are deflecting most at
which frequency. However, FEA is not good at predicting the amount of
damping and hence Q is typically found using experimental modal analysis.
Entire journals and conferences are dedicated to this most excellent of engi-
neering pursuits.
In addition to load-induced stability issues, there are simple geometric
stability issues. A simple example is that of tipping of a car on a slope, or of a
car as it drives up an incline. What would happen if a car attempting to jump
from a ramp where to slam on the brakes just after it left the ramp? Why
should the driver instead rev the engine to increase the wheel speed? What is
being conserved and how does it affect motion of the car?
Identify instability risks to which your machine might be susceptible!
1. See for example Brenner M.P., Lang J. H., Li J., Qiu, J., Slocum A. H., "Optimal, design of a
bistable switch", PNAS, August 19, 2003, Vol. 100, No. 17, 9663-9667.
1/1/2008© 2008 Alexander Slocu
m
8-14
Stability
• Static Stability:
– For robot contest machines, tipping-over stability is often a
prime Functional Requirement that drives the shape of the
overall structure and where the modules will be located with
respect to each other
• Dynamic stability and Buckling (see page 5-23!):
– Are structural resonances excited that can lead to instability
and degradation of components or the process?
– Do axial compression forces cause the component to buckle?
• Positive uses (apply reciprocity!)
– Pile drivers, ultrasonic machining, triggers…
http://www.eng.iastate.edu/explorer/Bridge/collapse.htm
0.001
0.01
0.1
1.0 50 100 150 200
Drive point displacement (micrometers/Newton)
Hz
1
2345678
Mode 7:
Table
bending
Mode 8:
Column
bending
Experimental modal
analysis of a small surface
grinder (performed by Eric
Marsh when he was Prof.
Slocum’s Ph.D. student)
F
F
Jammed!
Stability: Driving Over Obstacles
Many a robot has been frustrated by trying to climb over a simple
obstacle, so doing the analysis before the robot is built can save a lot of grief.
As shown in the diagram, the first condition for driving over an obstacle is that
both front wheels have made contact with the obstacle and that have just left
the ground. Note that the diagram lumps the two rear wheels together as a set,
and the two front wheels together, so if each wheel is driven by its own motor,
twice the motor torque should be entered in the spreadsheet
driving_over_step.xls.
Assuming the generic case of a four wheel drive vehicle, the
unknowns are FTr, FNr, FTf, FNf. and μ. The equilibrium equations include the
sum of the forces in the X and Y directions, and the sum of the moments about
the contact point with the obstacle. In addition, the tangential forces equal the
product of the minimum coefficient of friction μ and the normal forces. To
assess the appropriateness of Front Wheel Drive (FWD), Rear Wheel Drive
(RWD), or All Wheel Drive (AWD), the parameter γ is defined such that for
FWD γf = 1 and γr = 0, for RWD γf = 0 and γr = 1, and for AWD γf = 1 and γr =
1. Then the equilibrium condition requires the coefficient of friction be greater
than a minimum value in order for the machine to drive over a step:
Note the expression for μ requires the limit to be taken if γr or γf is
zero and then a conditional IF statement used. Or as noted in the spreadsheet
Driving_over_step.xls, 1x10⁻⁶ can be added to each of γr and γf so the full for-
mula can be used in the spreadsheet. The tractive effort FT to be provided by
each of the rear and front wheel sets is just the product of the minimum coeffi-
cient of friction and the normal forces FNr and FNf respectively.
Why is it so hard to climb over an obstacle when it seems like an
automobile drives so easily over a curb? It turns out that if you position both
front wheels against a curb and try to drive over it, you can have considerable
difficulty. If, however, you place one wheel against the curb so the other three
are on flat ground acting to push the one wheel up...so only one wheel at a time
is being forced up the curb, then you can easily drive up the curb. Note that
this is only possible if the car has a suspension (see page 5-17). As a first order
estimate, if the diameter of the wheel is small compared to the distance
between the wheels (use Saint-Venant), and the curb height is small compared
to the wheel diameter (guess who?), then in the previous equation set, the sum
of the forces in the X direction only has half of the front normal force acting to
resist motion, while the other equilibrium equations remain the same; hence:
Pulling the rear wheel over a step (speed bump, the machine is still
horizontal as it engages the bump) is easier than pushing, so if we solve for the
pushing case, conservatively, it is possible to pull over a step. Similarly, if the
machine has climbed onto a platform and then needs to drag the rear wheels
up, if it is a 4WD, no problem. What if it is a RWD?
Play with the spreadsheet Driving_over_step.xls and use the results to
help develop your design and driving strategy!
()
()
()
()
()
2
22
2
cos sin
0cossin
0cossin
0sin sin
Let: sin sin cos
4
2
XNrNfNf
rf
YNr Nf Nf
f
Nr w cg
cg w cg
rf rf
rf
rf
Nr Nf
w
hRh
Rh
RR
FFFF
mg
FF F F
MRmgR
FL L
ARB S C
LLL
CA B AB
CSAB
AS
mgA
FRS
L
θθ
μμ θ θ
γγ
θμ θ
γ
θθ
θ
θθ
γγ γγ
γγ
μγγ
−
−
==
== + −
== − + +
== + + +
−
=+ =− = =
−++ +
+
≥
=+
∑
∑
∑
()
()
wf
mgB
FRS C S
L
μγ
=++
()
()
()
()
2
22
0cossin2
2
2
XNrNfNf
rf
rf rf
rf
rf
Nr Nf
wwf
FFFF
CA B AB
CS
AB
AS
mgA mgB
FF
RS RS C S
LL
μμ θ θ
γγ
γγ γγ
γγ
μγγ
μγ
== + −
−++ +
+
≥
==
+++
∑
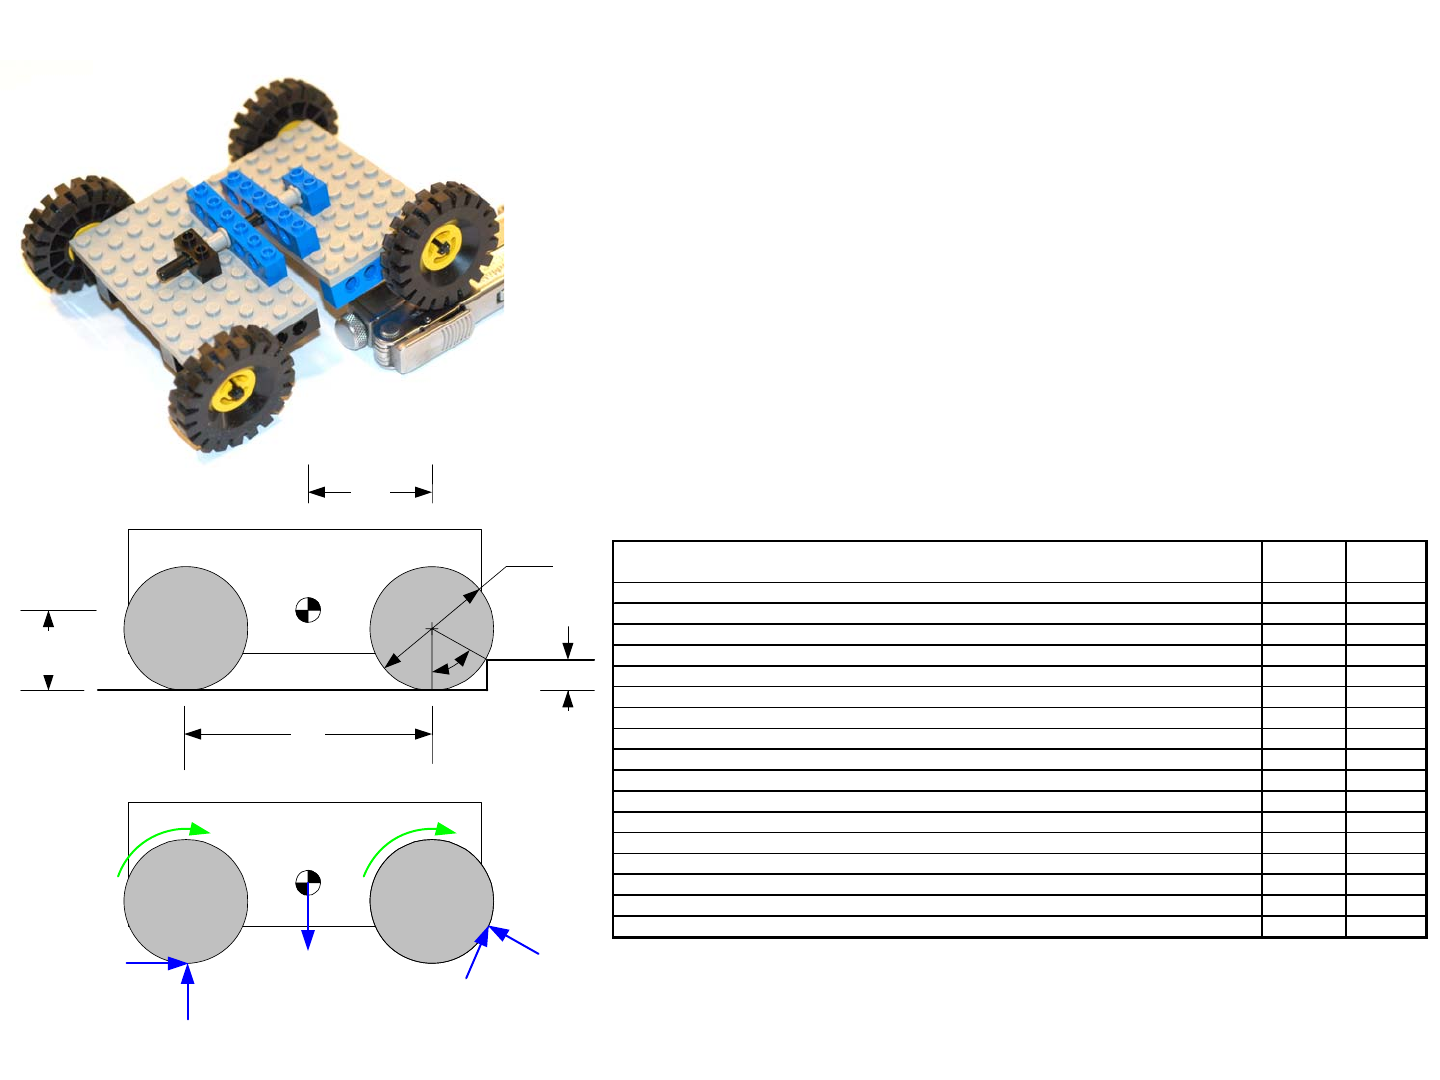
1/1/2008© 2008 Alexander Slocu
m
8-15
Stability: Obstacles
• Two wheel drive vehicles: The rear wheels have to push hard
enough to make the front wheels climb the obstacle
• Four wheel drive vehicles: The rear wheels also provide the
normal force needed for the front wheels to apply a tractive
effort to help climb over the obstacle
• What do the free-body diagrams show about “pushing”
verses “pulling” the wheels over a bump?
– Is it better to try and climb a bump straight-on (both front
wheels engage it at the same time) or one wheel at a time?
• Experiment with the spreadsheet Driving_over_step.xls
h
D
L
w
L
cg
h
cg
θ
F
Tr
F
Tf
F
Nr
F
Nf
Γ
Fw
Γ
Rw
mg
Option 1: Nice and easy slow drive over the step 2 wheels
contact 1 wheel
contact
Normal force between a rear wheel and the ground, FNr/2 (N) 13.9 13.9
Minimum required coefficient of friction, mumin2, mumin1 0.43 0.24
Normal force between a front wheel and the step FNf/2 (N) 11.2 13.3
Total motor tractive effort, gm (N) 16.0 16
Total motor limited tractive force from from both rear wheels, Frwmax (N) 8.0 8
Total motor limited tractive force from from both front wheels, Ffwmax (N) 8.0 8
Total friction limited tractive effort, gmu (N) 15.1 16.3
Total friction limited tractive force from from both rear wheels before slip, Frwmumax (N) 8.4 8.4
Total friction limited tractive force from from both rear wheels before slip, Ffwmumax (N) 6.7 8.0
Total minimum tractive effort required, gmin (N) 21.7 13.22
Total tractive effort required by both rear wheels, FTr (N) 12.06 6.77
Total tractive effort required by both front wheels, FTf (N) 9.66 6.45
Step Climable?
Can the machine climb over the step? no yes
Option 2: Ramming speed!
Ideal forward velocity required to get over the step, v (mm/s) 626
Δ
potential energy on top of step, DPE (N-m) 0.98

Stability: Slopes & Balance
In addition to deformations of a structure, there is the issue of bal-
ance: Will the structure nominally remain in its desired position, or is there a
point where the applied loads cause the structure to stop functioning. This may
occur by causing the machine to lose traction, or in the more extreme case, the
machine may tip over.
Assuming the generic case of a four wheel drive vehicle, the
unknowns are FTr, FNr, FTf, FNf. and μ. The equilibrium equations are the sum
of the forces in the X and Y directions, and the sum of the moments about the
contact point with the obstacle. In addition, the tangential forces equal the
product of the minimum coefficient of friction μ and the normal forces. To
assess the appropriateness of Front Wheel Drive (FWD), Rear Wheel Drive
(RWD), or All Wheel Drive (AWD), once again the parameter γ is defined such
that for FWD γf = 1 and γr = 0, for RWD γf = 0 and γr = 1, and for AWD γf = 1
and γr = 1. Then the equilibrium condition requires the coefficient of friction
be greater than a minimum value in order for the machine to drive up a slope;
Whether the machine can drive up the slope with front wheel, rear
wheel, or four wheel drive can be determined by playing with the parameters γ
and compare the coefficient that is required to that you have between your
machine’s wheels and the surface of the slope. The spreadsheet
Driving_up_slope.xls allows you to experiment.
What about tipping over? Your intuition or experience should tell you
that the machine’s center of gravity should be low to the ground and as close to
the uphill side of the machine as possible. Conditionally, when the normal
force on the front wheels becomes zero, the gravity vector just passes through
the rear wheel contact point. This causes the force FNf to become zero. Setting
the equation for FNf equal to zero shows tipping occurs when:
What is the best location for the center of mass if there are functional
requirements of being able to scale obstacles and drive up steep hills? Is four
wheel drive always the best option? A low center of mass in the middle of a
4WD vehicle will produce the best design. So if you have a 4WD truck that
you want to make functional for off-roading, get big tires to give the truck
clearance beneath the differential housing and the ground. DO NOT jack up
the suspension any more than is needed to give clearance between the tires and
the wheel-wells. It may look cool but the chances of your ever needing clear-
ance between the ground and the center of the truck are far less than your
chances of rolling the vehicle!
What about driving across a slope? When will your machine tip
over? Why must heavy equipment (even riding lawnmowers) be very careful
driving across slopes. The machine may seem stable but hit one small bump...
Does the use of a suspension affect your decision as to where to place
the center of mass, or whether or not you should have a 4WD, FWD, or RWD
vehicle? What about steering, which will steer better given you probably are
going to use skid-steering (where the wheels on one side are driven forward
while the wheels on the other side are driven backward)?
()
()
()
()
()
()
0sin
0cos
0cossin
cos sin
cos sin
sin
sin cos cos
Xf
rNr Nf
YNrNf
Nr w cg mg
cg mg
Nr
w
wcg mg
Nf
w
w
cg w
mg
rf f
F
Fmg
F
mg
FFF
Mmg
h
FL L
mg h
L
FL
mg h
LL
FL
L
hLL
μγ
μθ
γ
θ
θθ
θθ
θθ
θ
μ
θ
θθ
γγ γ
== + −
== + −
== − +
+
=
−−
=
≥−++
∑
∑
∑
1
tan wcg
mg
L
L
h
θ
−⎛⎞
−
=⎜⎟
⎜⎟
⎝⎠
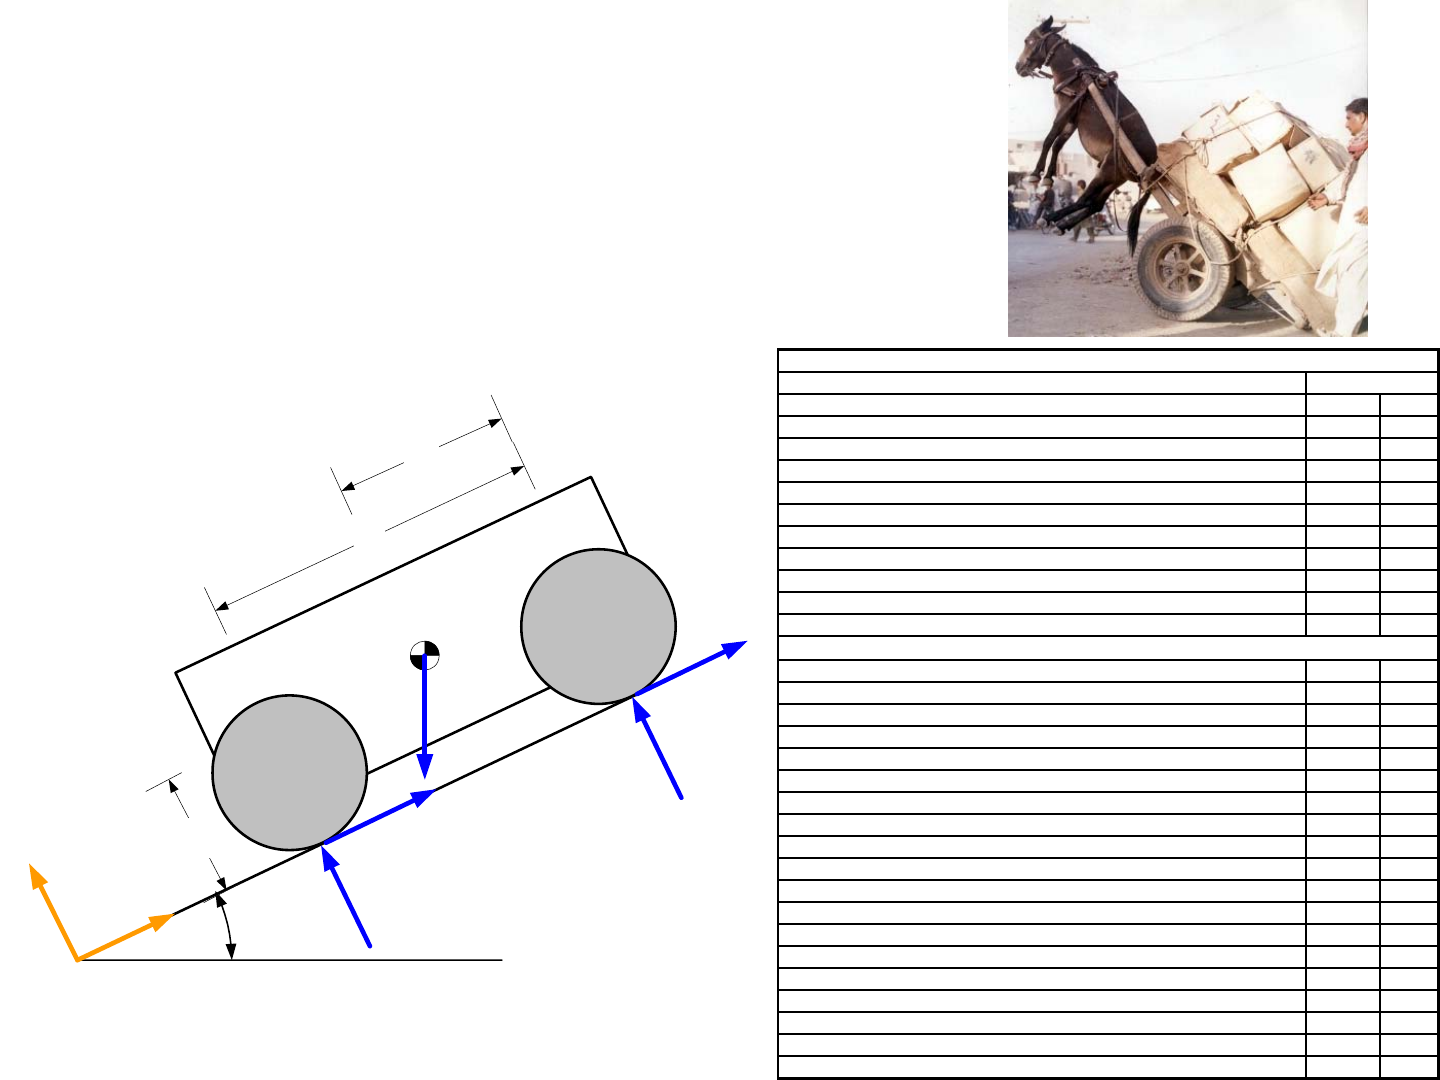
1/1/2008© 2008 Alexander Slocu
m
8-16
Stability: Slopes & Balance
• Can the machine drive up the hill?
– What is better for climbing hills, FWD or RWD?
– Do you really need AWD?
• When will the machine tip over?
– What happens when the force vector due to gravity just passes
through the rear wheels ground contact points?
θ
Lw
Lcg
X
Y
mg
FTr
FTf
FNr
FNf
hmg
Funny image found on www, photographer not
credited, would like to, email slocum@mit.edu
System
Rear wheels' diameter, Drw (mm) 100
Front wheels' diameter, Dfw (mm) 100
Distance between wheels, Lw (mm) 250
Distance center of front wheel to center of gravity, Lcg (mm) 125
Height of center of mass about plane, hmg (mm) 50
Slope angle, theta (deg, rad) 20.00 0.35
Machine mass, m (kg) 4
Machine weight, mg (N) 39.2
Maximum drive torque applied to both rear wheels, grw (N-mm) 400
Maximum drive torque applied to both front wheels, gfw (N-mm) 400
Coefficient of friction, mu 0.5
Enter 1 for rear wheel drive or AWD,
γ
r
1
Enter 1 for front wheel drive or AWD,
γ
f1
Nice and easy slow drive up the ramp (no acceleration)
Normal force between both rear wheels and ground, FNr (N) 21.1
Normal force between both front wheels and step FNf (N) 15.7
Maximum rear wheel tractive force from drive torque, Frwmax (N) 8
Maximum rear wheel force from drive torque, Ffwmax (N) 8
Maximum rear wheel tractive force before slip, Frwmumax (N) 10.5
Maximum front wheel tractive force before slip, Ffwmumax (N) 7.9
Total tractive force generated by both rear wheels, FTr (N) 8.00
Total tractive effort required by both front wheels, FTf (N) 7.87
Total tractive effort of the machine, FTm (N) 15.87
Force from gravity acting along the incline, Fg (N) 13.41
Can the machine climb up the ramp? yes
Tip-over angle (deg, rad) 68.2 1.19
Required minimum friction coefficients:
Front wheel drive only required coefficient of friction 0.85
Rear wheel drive only required coefficient of friction 0.64
All wheel drive required coefficient of friction 0.36
for FWD
γ
f
= 1 and
γ
r
= 0, for RWD
γ
f
= 0 and
γ
r
= 1, and for AWD
γ
f
= 1 and
γ
r
= 1
Driving_up_slope.xls
Values

Loadings: Axial, Bending, Torsion, & Shear
As shown, there are four basic types of loading, and in combination,
they essentially create all the different types of loads to which a structure can
be subjected. As discussed on page 3-23, superposition allows us to consider
the effects of one load type at a time, and then the combinatorial effect of all
the stresses created by all the loads can be assessed using the von Mises equiv-
alent stress criteria. Different types of materials fail in different ways, but for
ductile metals, those most often used in machines such as robots, the von
Mises equivalent stress can be equated to the tensile yield stress for a material
in order to determine when it will fail.1
Novice engineers most often overlook boundary conditions, or make
incorrect loading assumptions. When is a structure anchored so there is a
defined angle to another structure? When does it act as if it is pinned, or free
to rotate at the point of attachment? Often reality lies somewhere in-between,
and an engineer may want to err on the conservative side for initial estimations,
and then use finite element analysis in the detailed design phase. As an exam-
ple, consider a structure where two beams project out of a wall at right angles
as shown. If the top beam merely rests on the lower beam, then no moments
are transmitted to the lower beam, and the applied force F is shared by both
beams. There are five basic steps to analyzing structures:
• Draw the free-body diagram of the system, and clearly label the forces,
moments, and displacements.
• Identify the knowns and unknowns of the problem.
• Write down the boundary conditions (geometric compatibility).
• Write down the force and moment equilibrium equations.
• Write down the constitutive relations (e.g., how deflection relates to force
and geometry).
The number of unknown variables should equal the number of equa-
tions obtained from the compatibility, equilibrium, and constitutive relations.
For the example of the two beams at right angles to each other:
Assume the beams are the same length L and diameter D, then by
symmetry, the force will be evenly distributed between them (F1= F2 = F/2)
and M1 = M2. The ratio of the fixed ends deflection to the free-ends deflection
is 3.6:1. If, for example, the thickness of the beam varies with position along
the beam, one often starts with the basic differential equations of beam bend-
ing. Nonlinear effects, such as a bending beam encountering a curved surface,
can also be included as a boundary conditions. The differential equations can
then be solved numerically using a program such as MATLAB2. If one just
relies on finite element analysis to analyze a system one has drawn on the solid
modeler, then one loses massive potential for using analysis to drive creative
solutions. For example, having the general form of the equations an using
optimization routines, can lead to shaped beams with far superior properties
than could be imagined by an FEA-limited engineer3.
What are your boundary conditions?!
1. Fracture which occurs when high stresses either initiate a crack, or when stresses applied to a defect
in the structure start a crack tip growing. The finite element analysis figures show how stresses increase
around sharp geometric features, so imagine what happens when a very sharp crack exists. Crack tips,
however, can be blunted by other defects, inclusions (alloying elements) or geometric features (holes).
Other factors such as cold temperatures can embrittle certain metals, such as many ferritic alloys, while
austenitic metals, such as aluminum and some stainless steels, are not subject to temperature embrittle-
ment. The study of how fractures occur is called fracture mechanics, and it is by the skill of those in this
field that planes keep flying!
2. See for example Li, J, Brenner, M., Lang, J., Slocum, A. "DRIE Etched Electrostatic Curved-Elec-
trode Zipping Actuators", JMEMS
3. Brenner M.P., Lang J. H., Li J., Qiu, J., Slocum A. H., "Optimal design of a bistable switch", PNAS,
August 19, 2003, Vol. 100, No. 17, 9663-9667.
12 1 2
121212
12 1 2
21
32 3 2
11 11 2 2 2 2
12
11 11 2 2 2 2
22
11 11 2 2 2 2
12
11 11 2 2 2
unknowns: , , , , , , , , ,
compatability:
constitutive:
32 3 2
22
FFMM
FL ML FL M L
EI EI EI EI
FL ML FL M L
EI EI EI E
φφ
δδθθ
φφ
δδ θ θ
δδ
θθ
===
=+ = +
=+ = +
()
2
21 12
12
12
12
12
21
equilibrium:
PP
I
E
ML ML G
GG
II
F
FF
φφ
ν
===
+
+=
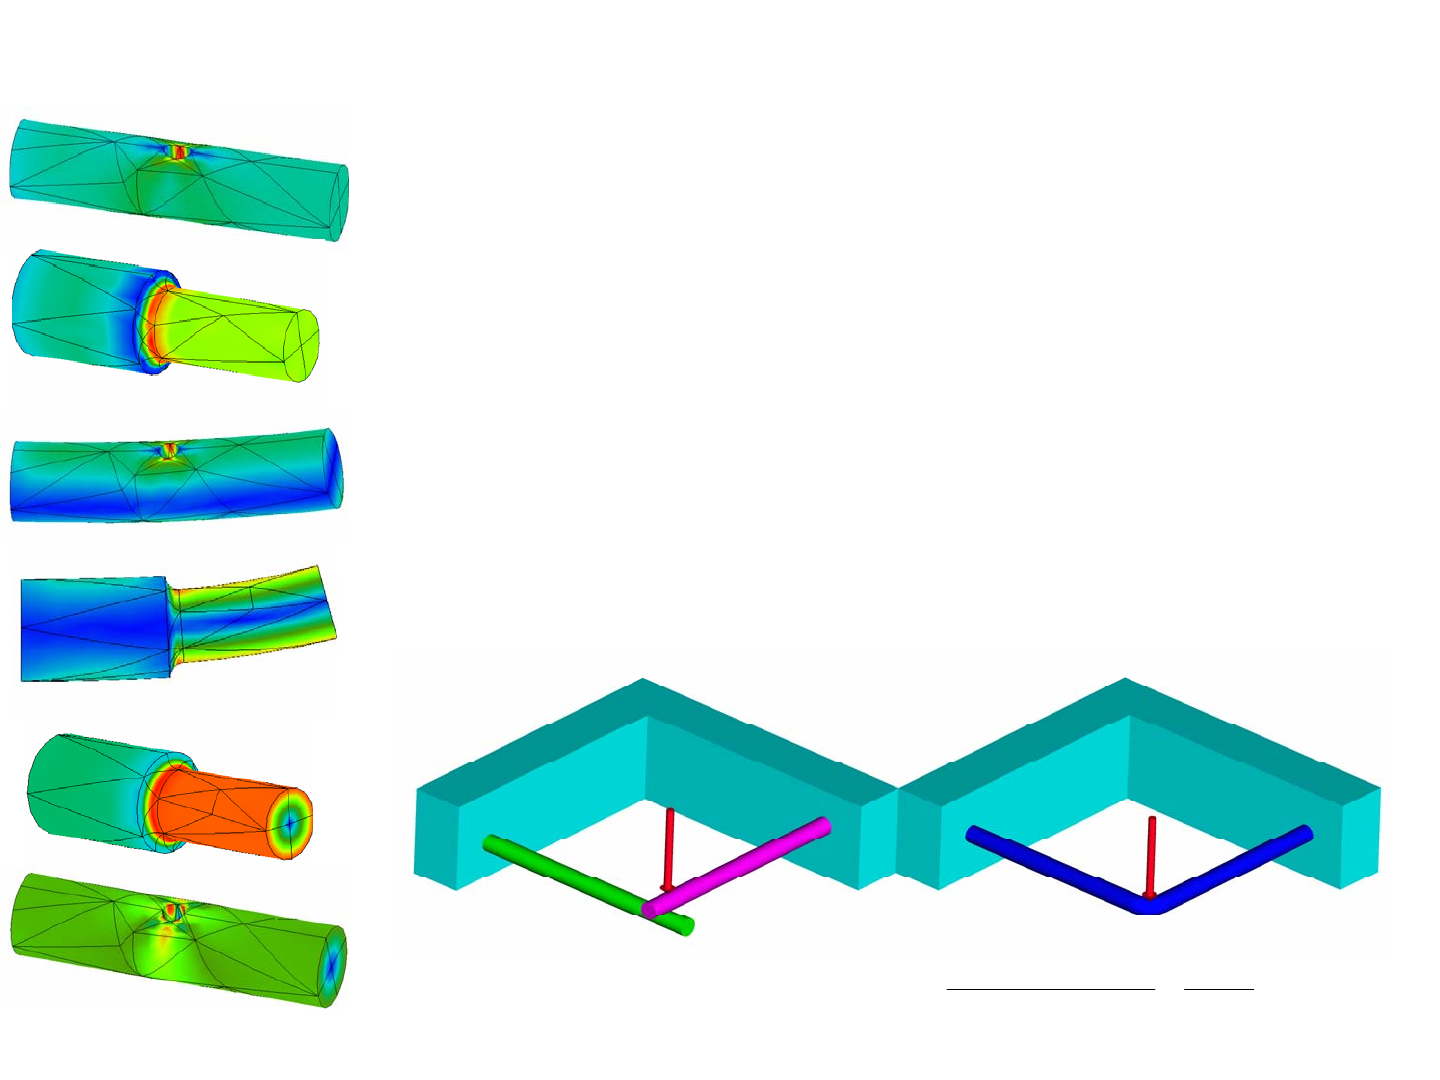
1/1/2008© 2008 Alexander Slocu
m
8-17
• There are four basic types of loads:
–Axial tension or compression: the applied force directly acts on the
material to cause tension or compression
–Bending: an applied force acts via a lever to bend a beam, causing
tension on one side and compression on the other side of the structure
–Torsion: a torque (e.g., twisting or two equal and opposite forces applied
about a point) causes twist of the structure
–Shear: two equal and opposite essentially collinear forces act
perpendicular to a structure
• Structures that fail in torsion are actually also failing in shear
• Glue joints in laminates, subjected to bending, actually fail in shear
• Boundary conditions are critical!
Loadings: Axial, Bending, Torsion, & Shear
ends of beams joined
one beam resting on the other
34
For equal diameter and length beams: 4
ν
δ
ν
δ
+
=
Ends free
Ends rigidly connected
F2
F1
FF

Loadings: Structural Cross-Sections
The shape of a structural cross-section has a huge effect on its
strength and stiffness. As shown, the formulas can be quite complex, but they
are easily encoded in a spreadsheet to enable a design engineer to play “what-
if” scenarios. This represents a basic starting set used by most design engi-
neers. As a design engineer’s focus and experience grows, other structural sec-
tions unique to their application can be added.1
The spreadsheets Section_Round_Rectangle.xls, Section_angle.xls,
Section_channel.xls, and Section_I.xls are provided for the reader to experi-
ment with different cross-sections. In general, if torsional stiffness or strength
is desired, then a closed section, preferably circular, should be used. If maxi-
mum bending strength is to be obtained, then an I-beam or rectangular tube is
best. It is a simple exercise for the reader to create spreadsheets for the generic
open and closed sections shown. Furthermore, these spreadsheets present just
the starting point, and the reader can customize them to include calculations for
different bending or torsional boundary conditions.
In creating the spreadsheets for various sections, the formula assume
that the inscribed circle diameter D is known, but this is not typically given by
the manufacturer of structural shapes. A good geometry refresher is to calcu-
late the diameter of the inscribed circle in the corners of angles, channels, and
I-beams. As with any problem, start with a sketch, add known dimensions and
boundary conditions, and label the unknowns. As shown in the small figure,
this quickly leads to an equation based on the Pythagorean theorem: The diam-
eter is then found using the quadratic formula:
Finite element analysis is a great tool, but until the structure is
designed, you need analytical and practical intuition of how shapes’ geometry
affects strength and stiffness. For example, use the spreadsheet
round_rectangle_strength.xls to conduct a design study: what to use, a round
or square tube for a waterjet cutter’s main structural axes?2 If we pick a con-
stant size, and vary the wall thickness to maintain constant area (weight):
Whereas if we are constrained by size, such as by a maximum bellows
size, what is the biggest section that will fit inside a given circular bellows
diameter:
On the other hand, if the wall thickness is made the same and the size
of the steel tube selected to once again obtain the same cross sectional area:
Is it surprising that in many cases, a round beam is actually better than
a square beam? What if an I-beam were used? It all really depends on the
functional requirements of the system. Many a design opportunity was missed
because of reliance on old or inappropriate generalizations!
1. The formula for the effective torsional moment of inertia were developed from equations given in R.
Roark and W. Young Formulas for Stress and Strain, Fifth Edition, Mcgraw-Hill Book Company, NY, pp
290-296. Additional formulas for various bending and torsional beam end constraints can also be found. A
slightly more advanced topic, not covered here, but easy to investigate, is the shear center of a non-sym-
metric section. For example, if a channel section is loaded with the force normal to its flange, the strong
direction, it will also twist unless the load is applied through the shear center. See page 194 of Roark. No
design engineer should be without a Roark!
()()()
() ()
()
222
22
22
let 2
222
62 2 2 0
DDDD
Rdr br r
Rrdb rbd
bd
Rr
+= =+− +− +
+−−− + +++ + =
2. This question confronted the author when he created the design concept for the OMAX 2652 Abra-
sive Waterjet Machining Center. See www.omax.com
Tube Size (mm) Wall thickness Area I
b
endin
g
Itorsio
n
Round 100 10 2827 2898119 5796238
Square 100 7.65 2826 4044369 6025209
ratio 1.00 1.31 1.00 0.72 0.96
Tube Size (mm) Wall thickness Area I
b
endin
g
Itorsio
n
Round 100 10 2827 2898119 5796238
Square 70.7 12.05 2827 1689839 2432178
ratio 1.41 0.83 1.00 1.72 2.38
Tube Size (mm) W all thickness Area Ibending Itorsion
Round 100 10 2827 2898119 5796238
Square 80.7 10 2827 2400573 3530185
ratio 1.24 1.00 1.00 1.21 1.64
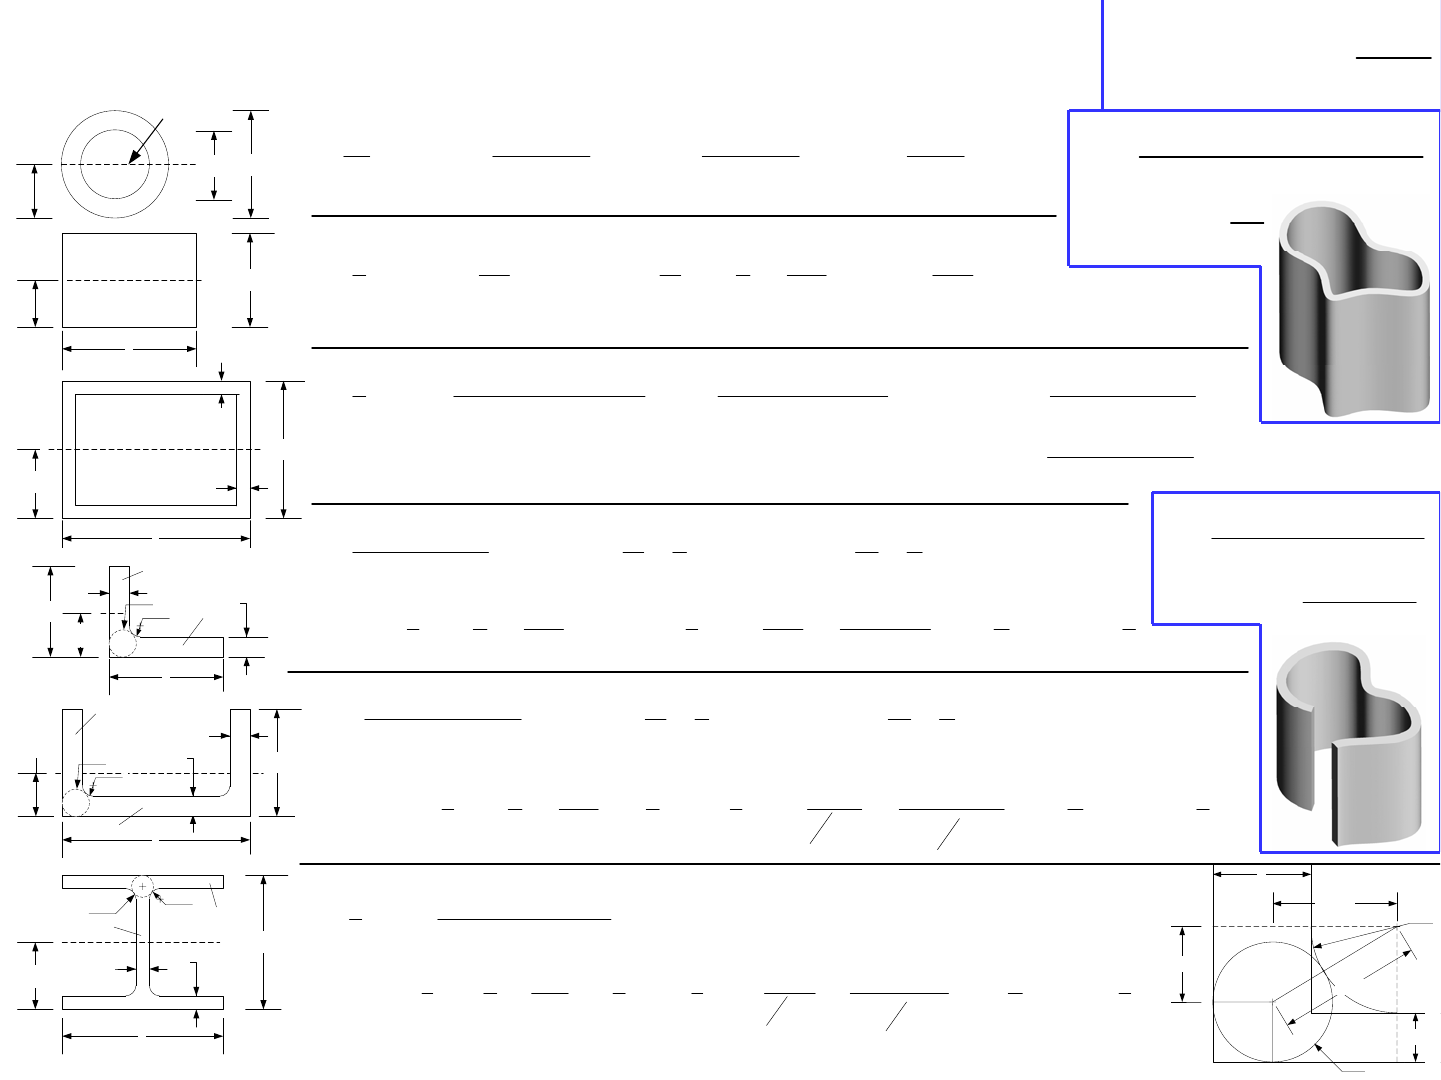
1/1/2008© 2008 Alexander Slocu
m
8-18
b
d
r
Ø D
d+r-D/2
b+r-D/2
D/2+r
D/2
Loadings: Structural Cross-Sections torsional stiffness
P
G
I
KL
=
(
)
(
)
44 44
max
264 322
oI oI
o o
bending torsion
NA torsion
DD DD
DD
yII I
ππ
τ
−−
Γ
== = =
34
3max
43
4
torsion with a = b
16 4.8
3.36 1
212 312
2.25
bending torsion
NA
ba b
bb
a
yb
II aaa
b
I
τ
⎡⎤
⎛⎞
Γ
== =−− =
⎢⎥
⎜⎟
⎝⎠
⎣⎦
=
()() ()() ()()
() ()()
322
3
max short side
22
3
torsion with a = b and uniform thickness t max long side
22 2
212 2
2
ba abba
bending torsion
NA baab b b a
ab a
aa b a b
bbtt tttt
yII
ab a b
tttt t t t
tb t
Iab
tt t
τ
τ
−− − − − Γ
== = =
+−− − −
Γ
=− = −−
2
mean of areas enclosed by boaundaries thickness
length of median boundary
average shear stress
4
2
pt
A
IP
tA
τ
=
Γ
=
()
3
length of median boundary thickness
average shear stress 2
2
3
31.8
pt
P
I
Pt
t
P
τ
=
Γ+
=
()
()
()
()
() ()
22
22 22
44
3
34
4
4
12 2 12 2
2
11
0.21 1 0.105 1 0.07 0.076
312 3 192
bending
NA NA NA
torsion
bcb
ad a d
ad
ab d c b
yyy
I
ab d c b
bddr
bb
acbd
b
I D
acbbb
acb
⎡⎤⎡ ⎤
+− ⎛⎞ ⎛⎞
==+−+−+−
⎢⎥⎢ ⎥
⎜⎟ ⎜⎟
+− ⎝⎠ ⎝⎠
⎢⎥⎢ ⎥
⎣⎦⎣ ⎦
⎡⎤
⎛⎞
⎡⎤
⎛⎞ ⎛⎞
⎢⎥
⎜⎟
=− − +− − − + +
⎢⎥
⎜⎟ ⎜⎟
⎜⎟
−
⎢⎥
⎝⎠
−
⎝⎠
⎣⎦ ⎝⎠
⎣⎦
(
)
()
()
()
()
22
22 22
3
44
34
4
4
2
222
12 2 12 2
22 2
11
2 0.21 1 0.105 1
31223 192
22
bending
NA NA NA
torsion
bcb
ad a d
ad
ab d c b
yyy
I
ab d c b
bc d d
bb
abd
b
I D
c
ab
abcb
⎡⎤⎡ ⎤
+− ⎛⎞ ⎛⎞
==+−+−+−
⎢⎥⎢ ⎥
⎜⎟ ⎜⎟
+− ⎝⎠ ⎝⎠
⎢⎥⎢ ⎥
⎣⎦⎣ ⎦
⎡⎤
⎛⎞
⎡⎤
⎢⎥
⎛⎞ ⎜⎟
⎛⎞
=−−+−− − +
⎢⎥
⎜⎟ ⎢⎥
⎜⎟ ⎜⎟
⎝⎠ −
⎝⎠
⎣⎦
⎢⎥
−
⎜⎟
⎝⎠
⎣⎦
0.07 0.076 r
b
⎧ ⎫
⎪ ⎪
⎛⎞⎪ ⎪
+
⎨ ⎬
⎜⎟
⎝⎠
⎪ ⎪
⎪ ⎪
⎩ ⎭
Ignore r in Ibending
calculations)
Ignore r in Ibending
calculations)
()()
()
3
3
3
44
34
4
4
22
212
11
2 0.21 1 0.105 1 0.15 0.10
31223 192
22
bending
NA
torsion
aadcb
cc
yI
bc d dr
bb
abd
b
I D
c
abb
abcb
−− −
==
⎧ ⎫
⎡⎤
⎛⎞
⎪ ⎪
⎡⎤
⎢⎥
⎛⎞ ⎜⎟
⎛⎞ ⎛ ⎞
⎪ ⎪
=−−+−− − + +
⎨ ⎬
⎢⎥
⎜⎟ ⎢⎥
⎜⎟ ⎜ ⎟
⎜⎟
⎝⎠ ⎝ ⎠
−
⎝⎠
⎣⎦
⎪ ⎪
⎢⎥
−
⎜⎟
⎝⎠
⎪ ⎪
⎣⎦
⎩ ⎭
Be thankful for spreadsheets!
c
a
Do
ta
tb
b
Di
Neutral axis
b
d
c
a
a
c
yNA
yNA
yNA
yNA
db
b
a
yNA
ad
bØ D
r
Ø D
r
r
flange
web
web
flange
Ø D
leg
leg
yNA
Stiffness (1/Compliance)
When designing a structure for accuracy, achieving high stiffness is
typically of primary importance. When designing for ergonomics, stiffness
may have to be high or low depending on the design’s functional requirements.
Hence understanding the philosophy behind achieving the desired stiffness is
of greatest importance. It is therefore so important to once again review the
FUNdaMENTAL principles of Topic 3, and in particular, Saint-Venant’s prin-
ciple and the principle of Structural Loops. Also beware Maudslay’s maxim
from page 1-4: Keep a sharp look-out upon your materials: get rid of every
pound of material you can do without. Put yourself to the question, ‘What
business has it there?
For example, it is a straightforward calculation to determine the
deflection and stiffness of a uniform cantilever beam to be used as a spring.
Adding taper complicates the calculation (see page 7-24); however, the taper
angle employs Maudslay’s Maxim to get rid of material that is not being
strained as much as the material at the base of the cantilever. When the beam is
tapered, it is lighter, and more compliant.
As discussed on the next page, there are a number of simple cases for
which closed-form solutions exist to predict deflections of beams under vari-
ous loading conditions. However, there are two real-world issues that must be
considered when applying these formulas: machine elements & joints, and
boundary conditions. Occam and Maudslay would implore us to make all ele-
ments of a design have a similar effect on total system stiffness, lest one ele-
ment be over or under-designed. Therefore, during the initial concept stage
before the bearings or joints are designed in detail, but while the structure is
being laid out, one can assume that each will contribute equally to the net sys-
tem compliance (remember, compliance is 1/stiffness!). Hence with regard to
initial layout calculations, the structure itself should be 2-3 times stiffer than
the net desired system stiffness. 2 or 3, that is the question! If there are few
joints, use 2. If there are a lot of joints, use 3. This is where experience must
be established with practice!
Boundary conditions can also be vexing, because an object is rarely
truly clamped or simply supported. If you cannot tell, then reality is probably
somewhere in-between, and you can model the system as having a stiffness
that is the average of the simply supported and clamped conditions. Then in the
detailed design phase, finite element analysis comes to the rescue. Shown are
the colored outputs from finite element analysis of various structures and
assemblies designed by the author. Each of these designs were first created
using first order analysis techniques such as have been discussed. This
allowed for the initial feasibility determination and then sizing of the elements.
Next solid models were created with all the detailed nuances such as rounded
corners and bearings and joints. Then the solid model assembly was used by
the FEA program.
The solid models and FEA results show a silicon microcantilever for
electrical contacts, a 4-bar linkage made from flexing elements, and the Z-axis
portion of a robot for use in a semiconductor testing device. The former illus-
trate designs where large compliance is required so the components essentially
behave like spring-guided stages. The latter illustrates the desire to minimize
compliance, because if the structure deforms too much under load, then the
robot would not be able to achieve its desired accuracy. What would a design
engineer do if given the space constraints, the risk of too-large deflections was
too great? As a countermeasure, one could use low-friction rolling element
bearings to make sure the deflections were repeatable. The force could also
determined using load sensors, or measurement of the current in the motor that
drives the Z-axis ballscrew. Software-based error compensation could then be
used to correct for deflections caused by the force.
With regard to machines for design contests and low-cost machines, a
simple piece of sheet-metal makes a very poor frame if its deflection causes
clearances between machine elements to close and bind. High compliance
might be acceptable for plastic lawn furniture, but not for durable machinery!
Do a stiffness review of your machine by imagining each element in
the structure is made of soft rubber. How does its deflection ripple through the
machine? Do deflections cause Abbe (sine) errors that can cause machine ele-
ments to jamb, or gear teeth to skip? Formulate a plan to determine deflec-
tions, assess the risks, and develop countermeasures. Can you add diagonal
braces or ribs? Can you increase clearances?
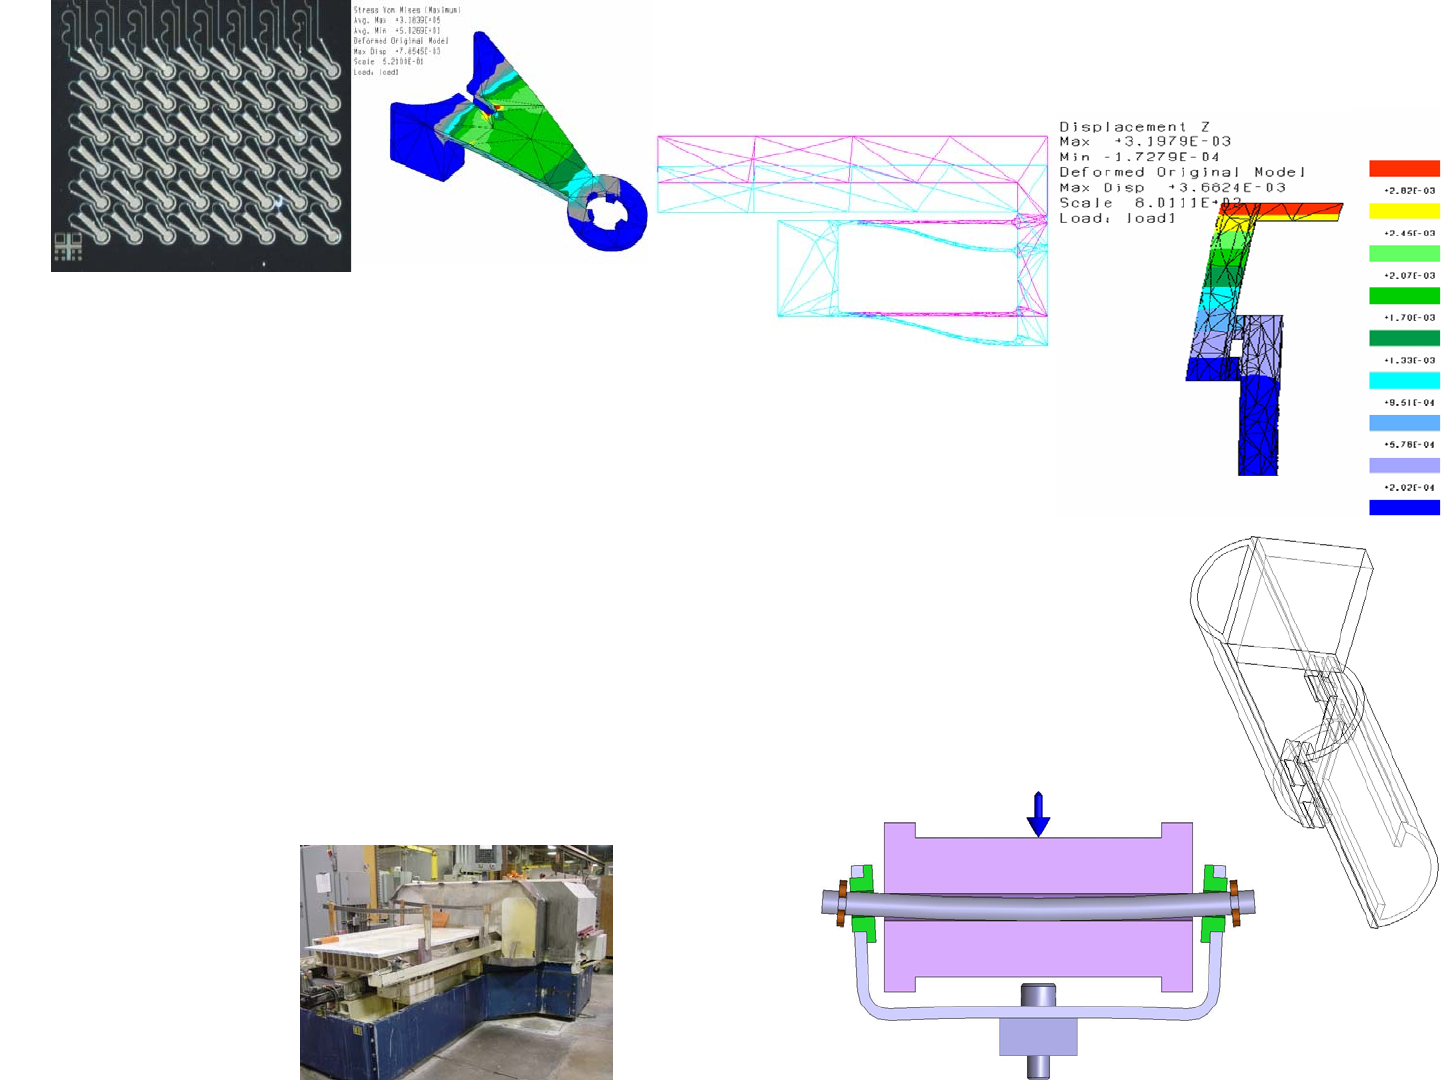
1/1/2008© 2008 Alexander Slocu
m
8-19
Stiffness (1/Compliance)
• All structures deform under load
– Will the deformations create translational and angular displacements that
will cause other elements to become overloaded or interfere and then fail?
• Make the deflection 3-5x LESS than critical clearances (Saint-Venant)
• Where are forces transmitted between members with respect to their
neutral axes?
– Position interface contact points at neutral axis planes!
• System compliance = sum of structural and element compliances
– Machine elements (e.g., bearings) and joints should have a stiffness on the
order of the structure itself
– During early design stage, before bearings and joints are designed,
assume net stiffness will thus be structural stiffness/3
1 mm long silicon microspring electrical
contacts. See US Patent 6,497,581
Width-tapered silicon springs

Stiffness: First-Order Analysis
It is important to be able to rapidly evaluate different design concepts,
which often requires first order analysis of a structure. Shown are some very
common beam mounting and loading conditions, and the resulting maximum
bending moments and deflections. Of course there are many other conditions,
including for plates and curved members that also have closed-form solutions.
A practising design engineer should keep a copy of R. Roark and W. Young
Formulas for Stress and Strain, (Mcgraw-Hill Book Company, NY,) on their
desk for easy reference!
For these most common mountings shown, spreadsheets are provided
for beams of uniform cross section: Beam_Cantilever.xls,
Beam_Simply_Supported.xls, Beam_Fixed_Simply _Supported.xls, and
Beam_Fixed_fixed.xls. These spreadsheets allow for the input of point, distrib-
uted, and moment loads. For the distributed load, wa is the magnitude of the
distributed load at one end, and wL is the magnitude at the other end; hence a
triangular load profile can be input. The reaction forces at the boundaries are
RA and RB, and the reaction moments are MA and MB. The slopes and deflec-
tions at the boundaries are
θ
A,
θ
B and
δ
A,
δ
B respectively. In combination, the
moment, slope, and deflection are given at any point along the beams. To
obtain different loading profiles, superposition can be used. Numerical and
graphical outputs are provided as shown.
The equations shown are impossibly complex with respect to spotting
trends. However, consider the simplified special cases for a force or a moment
applied to the end of a cantilevered beam shown on the bottom of the page. As
a design engineer trained to recognize patterns, what do you notice about the
deflection and slope relations for a cantilever beam loaded by a force F or a
moment M? Dr. William Plummer at Polaroid had a need for a fixture to adjust
the pitch and roll of a lens in a calibration fixture without creating any transla-
tional displacement. A fancy company tried to sell then a stacked cradle sys-
tem for tens of thousands of dollars. Dr. William Plummer remembered his
fundamentals of beam bending and used reciprocity to make an Abbe error
cancel a displacement error! This exemplifies that although computer aided
design tools may be useful for rapidly evaluating a design concept, they do not
usually provide creative insight as does the knowledge of fundamentals.
Review the structure of your machine. How would you use superpo-
sition of basic mountings to model the primary elements? What are the biggest
unknowns, boundary conditions or applied loads? How can you make reason-
able conservative assumptions? How can you test them? (build and try!)
Beam
Length, L (mm) 100
Length increment, Linc (mm) 1
Modulus of elasticity, E (N/mm^2) 200000
Moment of inertia, I (mm^4) 450
Distance farthest fiber to nuetral axis, cc (mm) 3
Loading
Point load, F (N) 100
Location of point load, af (mm) 50
Distributed load amplitude, wa, (N/mm) 0
Distributed load amplitude, wL, (N/mm) 0
Starting point of load, aw (mm) 50
Moment load, M (N-mm) 0
Location of moment load, am (mm) 50
Maximum deflection (microns) -5.8
Maximum slope (radians) -0.174
Reactions at beam ends
RA, Ra (N) 50.000
RB, Rb (N) 50.000
MA, Ma (N) -1250.000
MB, Mb (N-mm) -1250.000
Enters numbers in BOLD, Results in RED
By Alex Slocum, last modified 12/28/03 by Alex Slocum
To determine deflection of a beam
Beam_Fixed_Fixed.xls
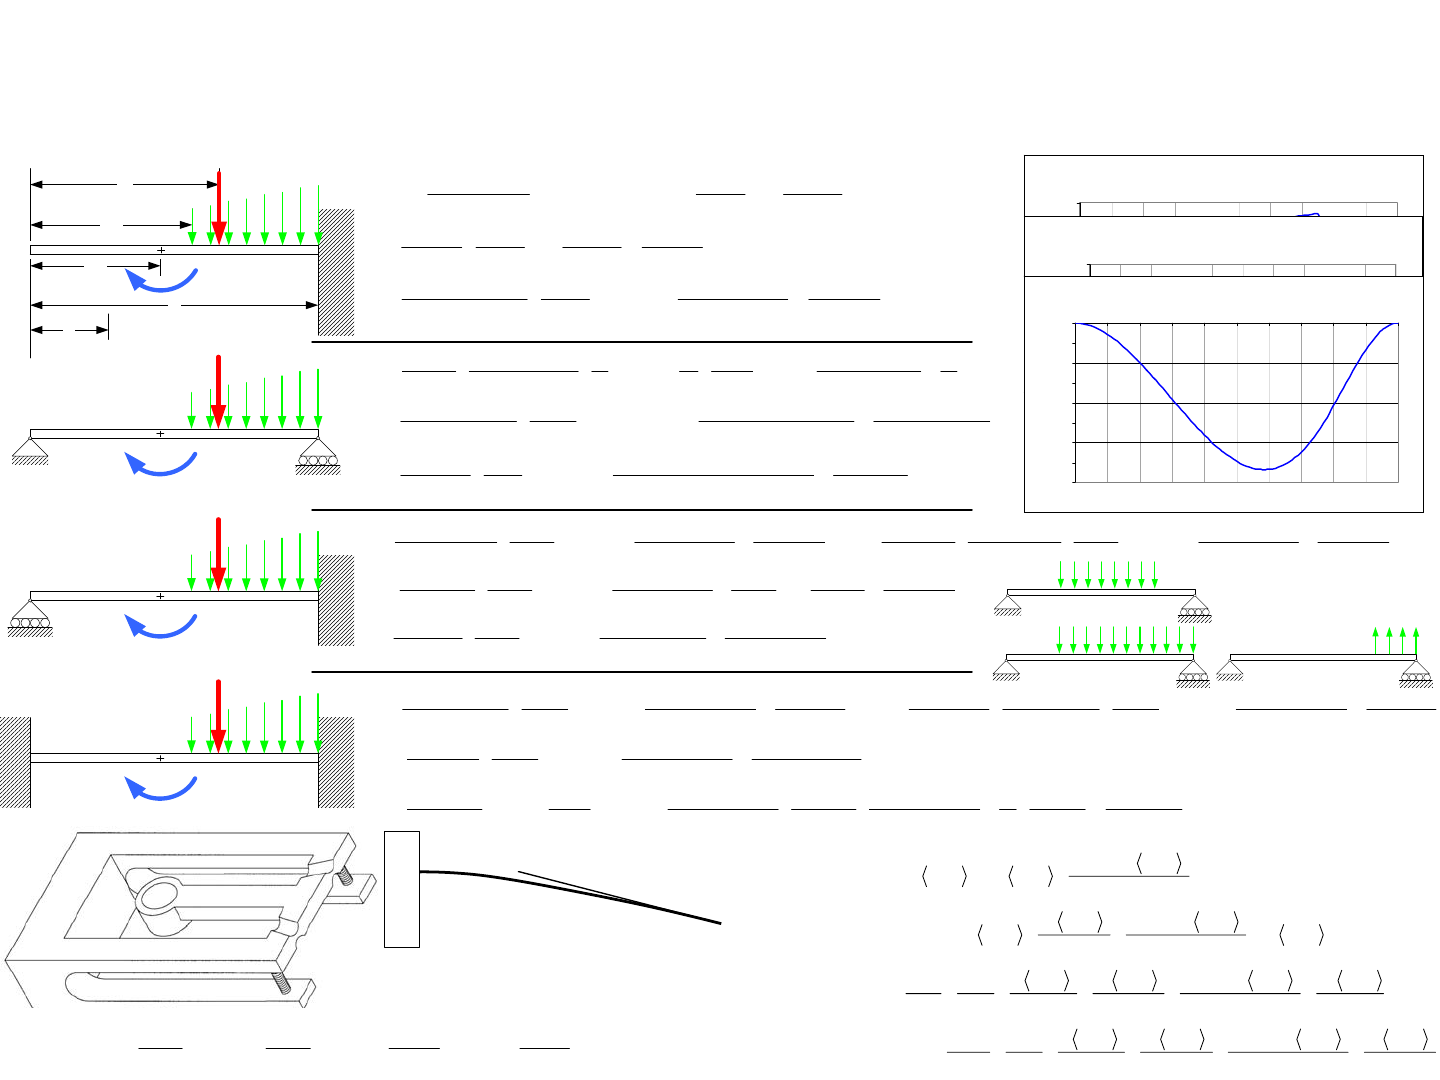
1/1/2008© 2008 Alexander Slocu
m
8-20
Stress
-12.0
-10.0
-8.0
-6.0
-4.0
-2.0
0.0
2.0
4.0
6.0
0 102030405060708090100
Distance from left end of beam (mm)
Stress (Pa)
Slope
-0.150
-0.100
-0.050
0.000
0.050
0.100
0.150
0.200
0 102030405060708090100
Distance from left end of beam (mm)
Slope (milli radians)
Stiffness: First-Order Analysis
• Complex systems can often be modeled by superimposing simple models
Abbe errors exist, but reciprocity says they
might be usable… Do you see a pattern?
322
322
FFMM
L
LLL
E
IEIEIEI
δαδ α
=== =
()() ()
() ()
()() ()()
()
()()
()()
()
2
23
3
3 2
32 2
223
26 4
23 4
3
624 5 2
La La
BB
a
La
Aa
La
Aa
La La
ww ww
F
FL a M
w
RM
FL a L a M L a
ww
w
EI EI EI
Fa M
La La
aa
LL L
ww
La
w
EI EI EI
θ
δ
⎡⎤
+− − −
=+ =− −− + +
⎢⎥
⎢⎥
⎣⎦
⎡⎤
−− − −
=+ + −
⎢⎥
⎢⎥
⎣⎦
−−+ −
⎡⎤
−−+
=−+++
⎢⎥
⎢⎥
⎣⎦
()()( ) () ()( )
()( )()
()
()
()()
() ()
()()
()
2
222 2
2
2
2
2
222
22
2
2
22
623
663
2732
2
624 15 6
9
83
1
624 15
La La
A B La
La
Aa
La
Ba
FL a L a L a L a
wwM Fa ww M
ww
RR
LLLL LL
aL M aL
FaLa La La ww L a a
L
aL
wa
L
EIL EIL EIL
Fa L a aL
awwLa
Lwa
L
EIL EIL
θ
θ
⎡⎤
−−+ − −+
=+ − =+ +− +
⎢⎥
⎢⎥
⎣⎦
⎡⎤
−+− −+
−− − −
=−+−+ −
⎢⎥
⎢⎥
⎣⎦
⎡
−−−++
⎢
=+ +
−
⎣
()
2
23
6
Ma
L
EIL
⎤−
⎥+
⎢⎥
⎦
()( )()()
()()
(
)
(
)
()()()()
()()
(
)
()
()()
()()
() ()
23 3
222 2
2 2
33 33 3 3
32
2 2
2
22
3 3
24 4
3
3 3
28 5 2 2 28 5 2
4
3
28 5 2 3
La La La
A Ba a
La La
Baa
MFa M
FL a L a L a L a L a L a L a
aLa a
L L
ww ww ww
La La
w w
R R
LL L L L L
Fa M
La La La
a
Lww ww
La
ww
MLL
−− −
⎡⎤ ⎡⎤
−+− − + +−− − +
= + ++ − = + − ++ +
⎢⎥ ⎢⎥
⎢⎥ ⎢⎥
⎣⎦ ⎣⎦
−− ⎡⎤⎡⎤
−−+−−
=+ ++ −++
⎢⎥⎢⎥
⎢⎥⎢⎥
⎣⎦⎣⎦
()
()()()
()()
()( )
2
2
23
3
2
23 3
3
448 5 4
La
Aa
aL
L
FaLa La L a MLa aL
ww
La
w
EIL EIL EIL
θ
−
⎡⎤
−− − − + − −
=− ++ +
⎢⎥
⎢⎥
⎣⎦
()( )()()
()() () ()()()()()
()() ()
()()()
()()
()
()
23 3
2
33 3 3 3 3
23 2
2
22 2
22
2
232632 326
210 2210
43
23
3
12 5
La La La
A B
a a
La
Aa
B
FL a L a L a L a MaL a F L a L a L a L a MaL a
ww a ww ww
La La
w w
R R
LL L L L L
MaL
Fa L a L a L a a
L
ww
La
w
MLL L
FLa
aL
ML
⎡⎤ ⎡⎤
−
+− −+ − − +−− −+ −
=+++ − =+−++ +
⎢⎥ ⎢⎥
⎢⎥ ⎢⎥
⎣⎦ ⎣⎦
−+
⎡⎤
−− − − +
=− ++ −
⎢⎥
⎢⎥
⎣⎦
−−
=+−
()
()
()
()()
()()() ()()
2 2
32 3 23 32
21063026
La a La La
a
a
La La La La MaaL
ww w ww ww
w
aLa
w
L L
⎧ ⎫
⎡⎤
−−++−+−−
⎪ ⎪
++ − − − − +
⎢⎥
⎨ ⎬
⎢⎥
⎪ ⎪
⎣⎦
⎩ ⎭
()
()
()
()
()
()
2
0
23
0
23 4
2
23
Transverse shear 2
Moment 26
Slope 22 6 24
Displacement 26
La
Aa
aLa
AA
aLa
AA
A
AA
AA
xa
ww
V Fxa xa
w
RLa
xa xa
www
MxFxa Mxa
MR La
Fx a x a x a Mx a
www
xx
MR
EI EI EI EI EI L a EI
F
xx
MR
xEI EI
θθ
δθ
δ
−−
=− −− −− −
−−−
=+− −− − + −
−
−−−−−
=+ + − − − +
−
=++−
+
()
()
34 52
624120 2
aLa
x
axa xaMxa
www
EI EI EI L a EI
−−−−−
−− +
−
Deflection
-4.0
-3.5
-3.0
-2.5
-2.0
-1.5
-1.0
-0.5
0.0
0 102030405060708090100
Distance from left end of beam (mm)
Deflection (mcrons)
+
=
am
aw
L
x
AB
af
w
a
M
Fw
L
To see the plots in full,
see the spreadsheets!
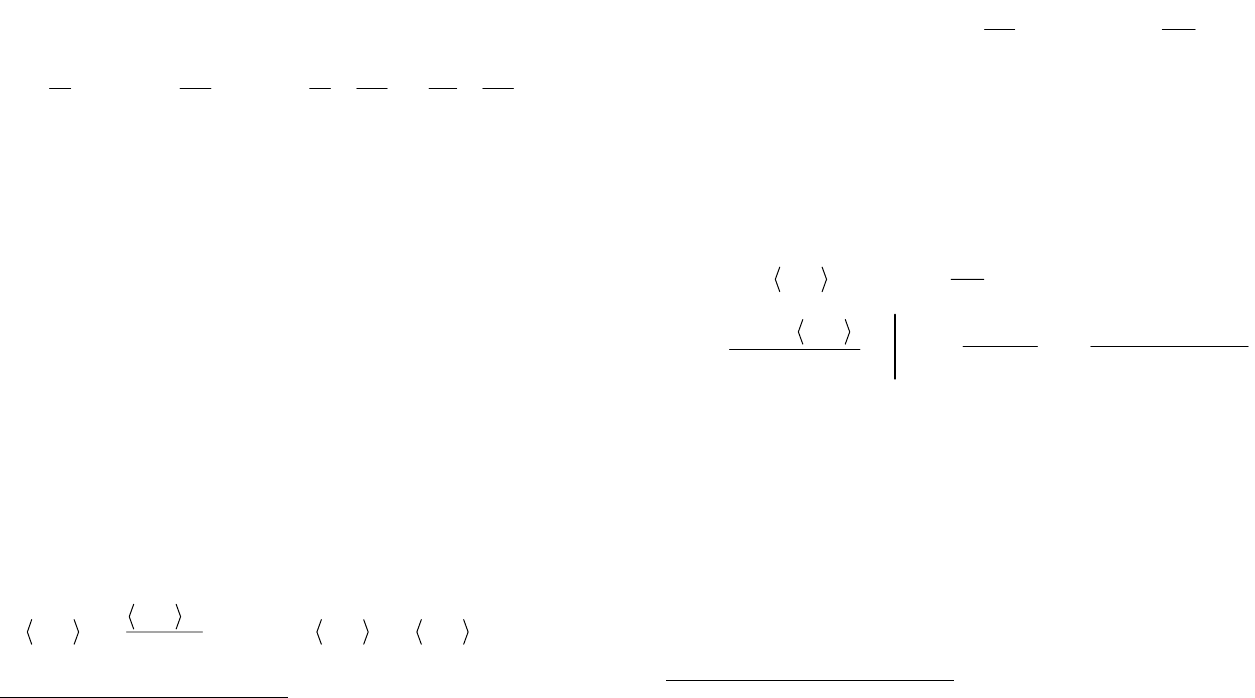
Stiffness: Analytical Methods
Most design engineers can make do with equations from a handbook
or by modifying pre-made spreadsheets such as those provided with this book.
Sometimes, however, more powerful analytical tools are needed to help syn-
thesize or optimize a new design. Finite element analysis is a powerful tool,
but often does provide the insight afforded by fundamental analysis unless you
take the time to set up a parametric design study. For example, the equations
shown on the previous page were developed from the general differential equa-
tion of the elastic curve formed by a bending beam:
The moment M is typically a function of position x along the beam.
An important task, therefore, is to find the expression for the moment M as a
function of the loading parameters, such as point forces and distributed loads,
and their point of application along the beam. The load intensity function q
allows for the creation of an expression where loads are applied at different
points. The solution of the differential equations depends primarily on the
boundary conditions. In addition, starting from this basic form allows for the
use of an expression for the moment of inertia I as a function of position x, as is
the case with a tapered beam. In addition, the displacement y can have bound-
ary conditions imposed, such as a beam coming into contact with surface.1
In order to formulate the load intensity function q, singularity func-
tions allow loads to be “turned on” at a desired point. The figure shows how
this is done for different loading conditions. For example, the unit step func-
tion is given by <x - a>0 where the use of the angle brackets < > is defined as:
If x < a, <x - a>0 = 0. If x > a, then <x - a>0 = 1. The integration law is:
In the mid 19th century, Alberto Castigliano was a student at the Poly-
technic University in Turin Italy, and he developed an energy-based method for
determining the deflection of elastic structures.2 A small change in applied
load Q results in a small change in the displacement
Δ
. Since work (energy) is
the product of force and displacement, the change in energy can be obtained by
calculating the change in area on a force-displacement graph. As dQ is made
infinitesimally small:
The table shows various loadings, associated variables, and expres-
sions for elastic energy and displacement. If it is desired to know the displace-
ment of a point on a beam different than where the force is applied, a virtual
force Q is applied at the point of interest, and the expression for the moment is
determined with all applied loads. For a cantilever beam with a force F applied
a distance a from the end, the bending displacement at the end is found from:
Here, a virtual force Q is applied and carried through to the integra-
tion, then set to zero, the integrand simplified, and then the integral completed.
The singularity function is <x - a> = 0 for x < a, so the integral is evaluated
from a to L. For displacement at the point of load application, “Q” = F. See
the curved beam example. For complex loadings, the integral is done in parts.
Energy methods make it simple to include the deflection contribution
of shear, which is usually neglected in beams. Why? The advanced methods
shown here can either be a refresher to the reader who has seen them before,
but perhaps not used them, or as a catalyst to the design engineer.
1. This creates a hardening spring effect. See Brenner, M., Lang, J., Li, J., Slocum, A., "Optimum
Design of an Electrostatic Zipper Actuator", Nanotech 2004, Boston
() ()
2222
2222
' '' '' ' '' ''
dy y d y y
dddd
EI M EI V EI q
dx d dx
xdxdxdx
y EIy M EIy V EIy q
θ
θ
=⇒ = ⇒ = =
=⇒= ⇒ = =
1
1
00
1
n
xx
n
nn
xa
xadx n xadx xa n
n
+
+
−∞ −∞
−
−= ≥ −=− <
+
∫∫
2. “When a body is elastically deflected by any combination of loads, the deflection at any point and in
any direction is equal to the partial derivative of the strain energy, computed with all loads acting, with
respect to a load, real or virtual, located at the point of interest and acting in the direction of interest.”
'dU dU
dU dU dQ dQ dM
θ
==Δ ⇒Δ= ⇒=
()
()
()
3
32
00
23
6
L
L
a
Q
dM
MQxFxa x
dQ
Fa
Fx a
Qx F x a a
LL
xdx
xdx EI EI
EI =
=+ − =
−+
−
+−
Δ= = =
∫
∫
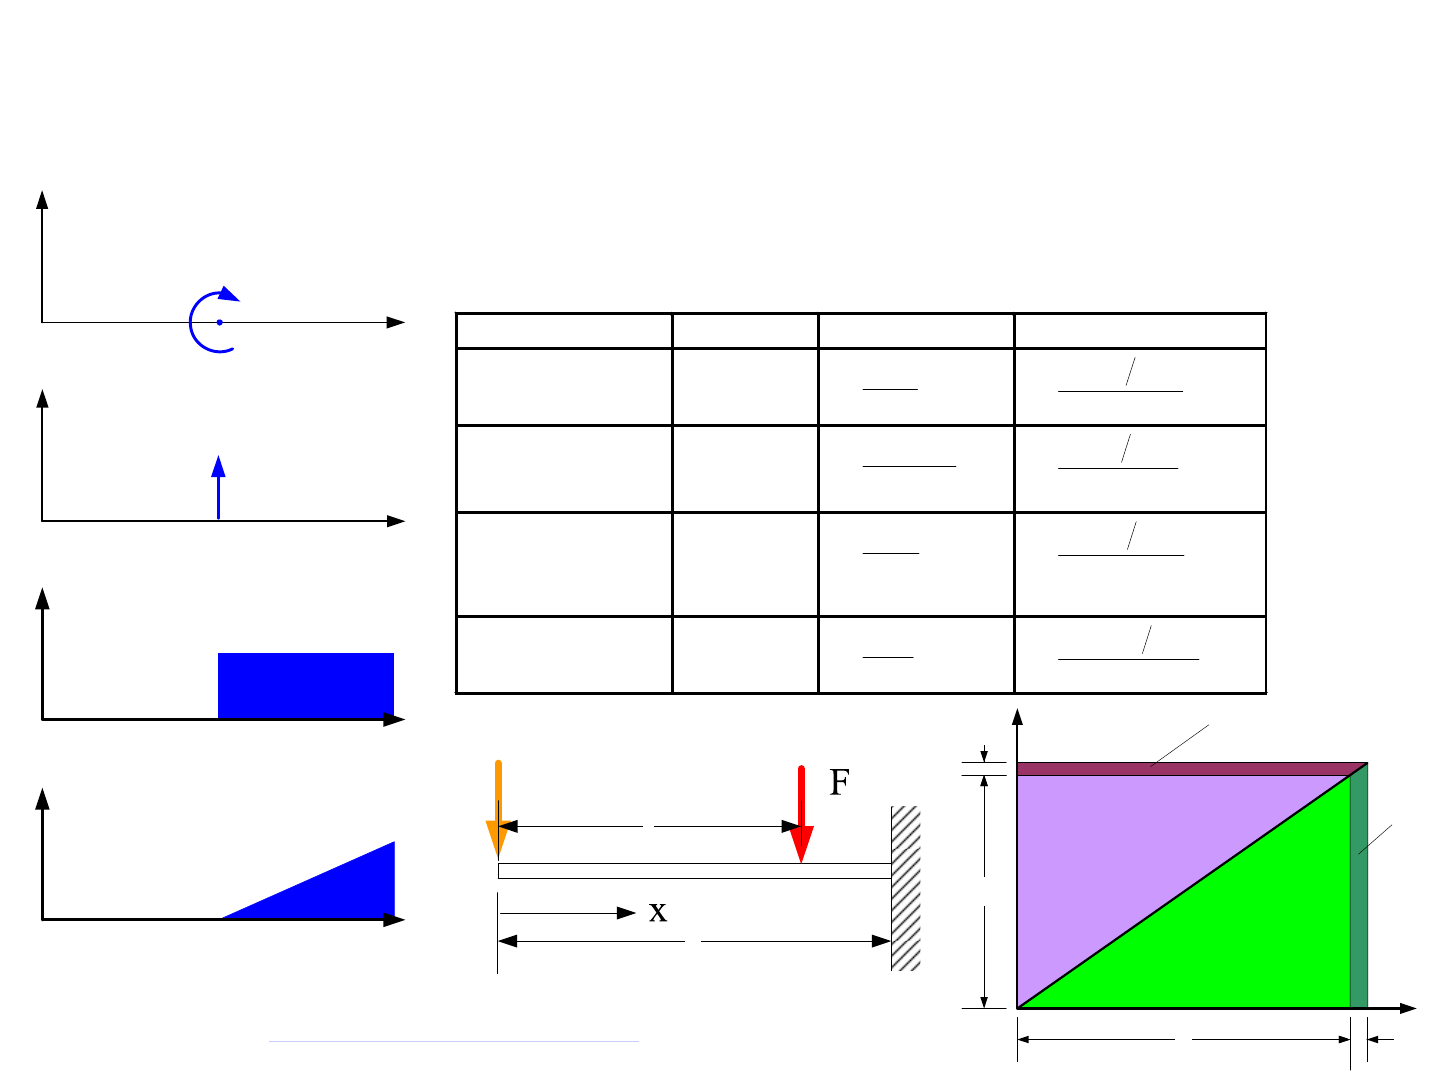
1/1/2008© 2008 Alexander Slocu
m
8-21
Stiffness: Analytical Methods
• For closed form analysis, singularity functions enable loads to be
“turned on” at specific locations
– Create expressions for the moment M(x) as a function of position
–M(x) is used in moment-curvature & energy method calculations
x0
q = M<x - a>
-2
x = a
M
(N-m)
x0
q = F<x - a>
-1
x = a
F
(N)
x0
q = w<x - a>
0
x = a
w
(N/m)
x0
q = w<x - a>
1
x = a
w
(N/m/m)
Q
dQ
ΔdΔ
dU'
dU
complementary
elastic energy U'
elastic energy U
A most useful website is http://www.integrals.com/index.en.cgi
ds is the distance along the beam (e.g., ds = dx for
straight beams, ds = Rdq for curved beam). For
determining the slope, differentiate not with respect to a
force Q, but an applied moment M(which may also be a
virtual applied moment at the point of interest)
Loading Variables Energy Deflection
Axial P, E , A
2
02
LPds
E
A
∫
(
)
0
LPQFds
E
A
∂∂
∫
Torsion Γ, G, Ipolar
2
02polar
L
Ids
G
Γ
∫
(
)
0polar
LQ
Ids
G
∂Γ ∂
Γ
∫
Transverse Shear
(approximate for non-
rectangular sections,
else ½ =>
3
/
5
)
V, G, A
2
02
LVds
GA
∫
(
)
0
LVQVds
GA
∂∂
∫
Bending M, E, I
2
02
LMds
E
I
∫
(
)
0
LMMQ
ds
E
I
∂∂
∫
L
Q (virtual force at
point of interest)
a
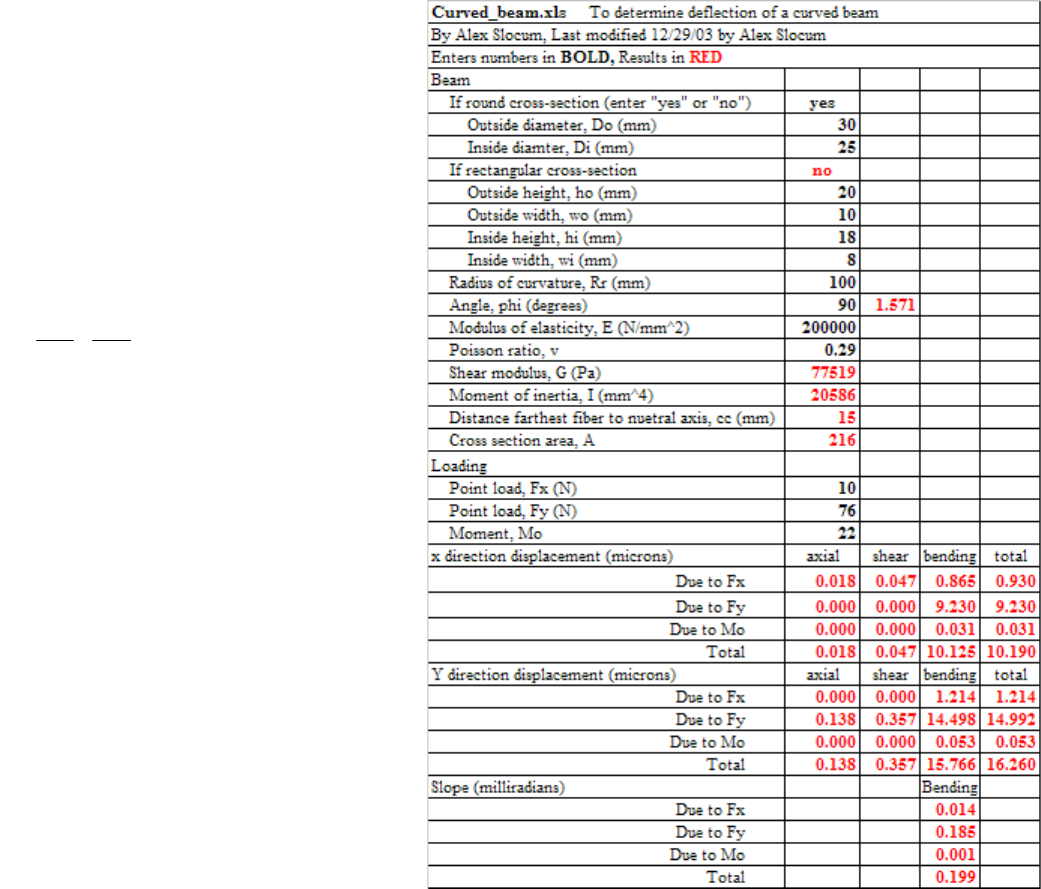
Stiffness: Energy Methods Examples
Energy methods are particularly useful if the goal is to determine the
deflection at one point in a structure. If it is desired to know the shape of the
deflected structure, then integration of the moment curvature relation or finite
element analysis should be used. Energy methods are also very useful to deter-
mine the relative importance of shear and bending contributions, particularly
as “beams” become short and beam bending assumptions are no longer clear,
as is the case with gear teeth.
To illustrate this, consider a simple cantilever beam loaded at its end
by a force F. The vertical deflection of a cantilever beam is given by the well-
know expression FL3/3EI, which is obtained from the moment curvature rela-
tion or energy methods. Energy methods yield a second shear term also:
Finite element analysis programs will take shear into account. The
graph shows the ratios. The results converge when the length/thickness is
about 3-5. Below this level, it is clear that shear deformations are very impor-
tant. This is further illustration of Saint-Venant’s principle! The 5% error at
long lengths is due to FEA effects such as too coarse a mesh (beware, and if
this happens, use a finer mesh!). Large deflections also have to be considered
in both theory and FEA.
The spreadsheet Curved_beam.xls further illustrates the relative con-
tributions of axial, shear, and bending deformations from different load direc-
tions as applied to a curved beam shown in the figure. The equations may
seem nasty, but with energy methods they are easily derived and then encapsu-
lated into the spreadsheet.
It is important for design engineers to collect information and analysis
tools pertaining to the type of design work they most often do. In addition, it is
important to check the results of analysis tools against other methods to vali-
date their accuracy! What analysis tools do you find most useful for the design
of your contest machines?
36
35
F
FL
L
EI GA
δ
=+
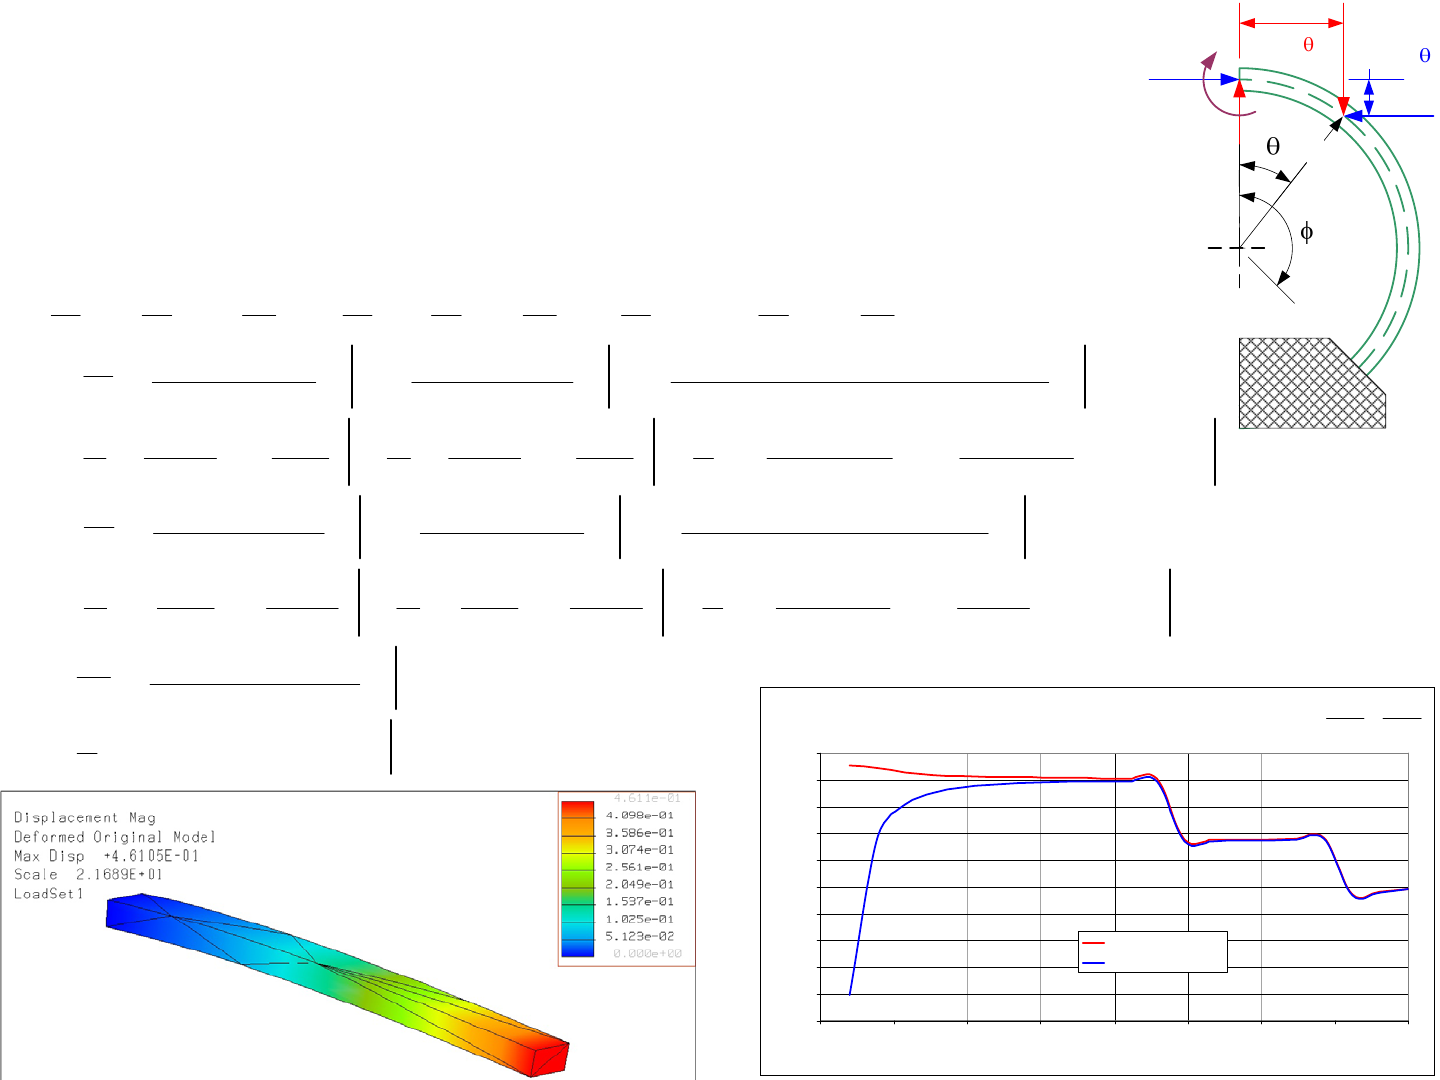
1/1/2008© 2008 Alexander Slocu
m
8-22
Cantilever Beam Bending: FEA vs Theory
0.86
0.88
0.90
0.92
0.94
0.96
0.98
1.00
1.02
1.04
1.06
0.0 5.0 10.0 15.0 20.0 25.0 30.0 35.0 40.0
Beam length/height
deflection ratio
Theory total/FEA
Theory bending/FEA
Stiffness: Energy Methods Examples
• Energy methods can be used to determine the deflections in a curved beam
– They can also be used to calculate the relative contributions of axial, shear, and
bending; E.g., for a curved beam:
(
)
()
2
0axial she
cos sin sin cos 1 cos sin
cos sin 0 sin cos 0 1 cos sin 1
sin cos
cos
xy xy x y o
xy o xy o x y o
x
x
PVMRRdsRd
FF FF F F M
PP P VVV M M M
RR
FF M FFM F F M
UFF
xy Rd
FEA
φ
θθ θ θ θ θ θ
θθ θθ θ θ
θθθ
δθ
=− =+ =−+ + =
∂∂ ∂ ∂∂ ∂ ∂ ∂ ∂
==−= == = =− = =
∂∂ ∂ ∂∂∂ ∂ ∂ ∂
∂−
== +
∂∫
() ()()
2
222
00
ar bending
22
3
axial shear bending
cos sin 1 cos sin 1 cos 1 cos
sin
2 sin 2 1 2 sin 2 1 1 6 8s
cos cos
42 42
o
xx x x
R
FF FR FR M
xy x y
Rd Rd
GA EI
RR F
FF FF R
yy
EA GA EI
φφ
θθθ θ θθ θ
θθ
φφ φ φφ φ φ
δ
+−+−+−
+
⎡⎤⎡⎤
⎛⎞ ⎛⎞
+− −− −
⎛⎞ ⎛⎞
=++
−+
⎢⎥⎢⎥
⎜⎟ ⎜⎟
⎜⎟ ⎜⎟
⎝⎠ ⎝⎠
⎝⎠ ⎝⎠
⎣⎦⎣⎦
∫∫
()
()
22
3
22 2
22
000
axial shear bending
2
axial
in sin 2 1 2cos cos sin
42
cos sin sin 1 cos sin
sin cos sin
cos sin
1cos
o
y
o
y
y
y
FMR
R
UR
FF FF FR FRM
xy xy x y
Rd Rd Rd
FEA GA EI
RFx
EA
φφφ
φφ φφ φφ
θθ θ θ θ θ θ θ
θθ
δθθ θ
φ
δ
⎡⎤
⎛⎞
+−+
⎛⎞
++−
⎢⎥
⎜⎟
⎜⎟
⎝⎠
⎝⎠
⎣⎦
∂++−++
−
== + +
∂
−
=−
∫∫∫
()
()
2 2 2
33
shear bending
0bending
ben
2 sin 2 1 2 sin 2 1 1 2cos 2 sin 2
cos cos 1cos
24 24 2 4
1cos sin
yy o
xy
xyo
o
RFF
FFF MR
RR
x
GA EI
URR
FFM
Rd
MEI
φ
φφ φ φφ φφ φφ φ
θθ
θθ
θ
⎡⎤⎡⎤⎡ ⎤
⎛⎞ ⎛⎞ ⎛ ⎞
−−+ −+−
⎛⎞ ⎛⎞ ⎛⎞
++
++ ++−
⎢⎥⎢⎥⎢ ⎥
⎜⎟ ⎜⎟ ⎜ ⎟
⎜⎟ ⎜⎟ ⎜⎟
⎝⎠ ⎝⎠ ⎝⎠
⎝⎠ ⎝⎠ ⎝ ⎠
⎣⎦⎣⎦⎣ ⎦
∂−+ +
==
∂
=
∫
()()
22
ding
1sin 1 cos o
xy
R
FF
M
RR
EI
φφ φ φ
⎡⎤
−+ −+
⎣⎦
36
35
F
FL
L
EI GA
δ
=+
See Beam_curved.xls
Fx
Fy
Mo
R
Rsin R(1-cos )

Stiffness: Finite Element Analysis
Finite Element Analysis is a powerful tool that essentially divides a
complex structure up into many small elements, where for each the stresses
and deformations can be solved for using known equations of elasticity.
Because the boundaries of each element in contact with another element must
have equal and opposite forces and equal deflections, a large array of equations
can be generated and solved by computer to determine the forces and deflec-
tions on all the elements. A critical issue is the constraints on the exterior ele-
ments that are meant to model the connection of the part to the world. For
example, a cantilever beam has all the faces of elements at one end constrained
to not have any deflections. But what about a simply supported beam?
There are some types of elements, plates and shells that are two
dimensional yet are assigned a thickness. These 2D elements can have an edge
constrained to be simply supported (no linear displacement) or supported so
there is no linear or angular displacement. Most design engineers creating new
designs use a solid modelling system, and the solid modeler is often linked
directly to an FEA program. Herein lies the challenge, because some (not all)
FEA programs take a solid model and break it up into solid elements, where
their solid elements can only be constrained along a surface which causes a
moment constraint (no linear or angular translations) to always be imposed.
The moment constraint does not always capture the intent of the designer and
can cause a structure’s stiffness to be greatly over predicted. Fortuneatly, as
shown, some FEA programs do allow a solid’s edge to be displacement but not
rotation constrained.
If an FEA program does not allow the edge of a solid to be simply
cpontrained, thin solid flexural elements can be added as shown. The table
shows the size of a uniformly loaded beam modeled and the deflections pre-
dicted by theory and by FEA with several different boundary conditions. Note
the Saint-Venant effect: the flexure should be an order of magnitude thinner
than the beam it supports, and the flexure length should be an order of magni-
tude greater than its thickness. The same type of constraint issue is addressed
for bolted joint connections on page Page 9-12. As with any tool, FEAcan be a
great asset and time saver, but used improperly, a design engineer might think
they have a great design, and then when its built and too late and too expensive
to change things, the design is found to not meet specifications. Attention to
details and really understanding the FUNdaMENTALS is soooo important!
There are many other FEA tricks that can be done to enable you to
rapidly and simply use a solid model created for design and part detailing to
then be easily used in FEA. For example, for bearings see page 10-23. The
key is to always just think FUNdaMENTALLY what is physically happening
and then adjust/add features and properties accordingly.
Review the solid model for your machine and isolate critical elements
such as a module that uses gears. How will gear tooth separation forces under
maximum torque transmission cause deflections? Are these deflections less
than 1/5th of the gear tooth height? How can you use theoretical predictions or
FEA to model the system and make this determination? It is important to be
able to do the detailed analysis of a critical module and document your process,
the results, and any changes that the results lead you to make. This type of
design study will be what you will typically be called upon to do in your pro-
fessional life. If you become a manager, you will want to require your engi-
neers to do this type of study, but unless you do it several times yourself first,
you will not really be able to intelligently review what you want your engi-
neers to do. Having this type of study in your portfolio for job interviews is
also a powerful salary and position responsibility enhancing catalyst!
Total uniform load, W (N) 100
Length, L (mm) 200
Width, b (mm) 20
Thickness, t (mm) 10
Modulus, E 200028
I (mm^4) 1667
simply supported fixed-fixed
Theory 0.03125 0.00625
FEA (with thin flexure support) 0.03096 0.00635
FEA (PRO/Mechanica with edge
constraint applied to solid) 0.03162 0.00634
Flexure length/thickness FEA deflection
20 0.03096
10 0.02890
5 0.02062
deflection at center (mm)
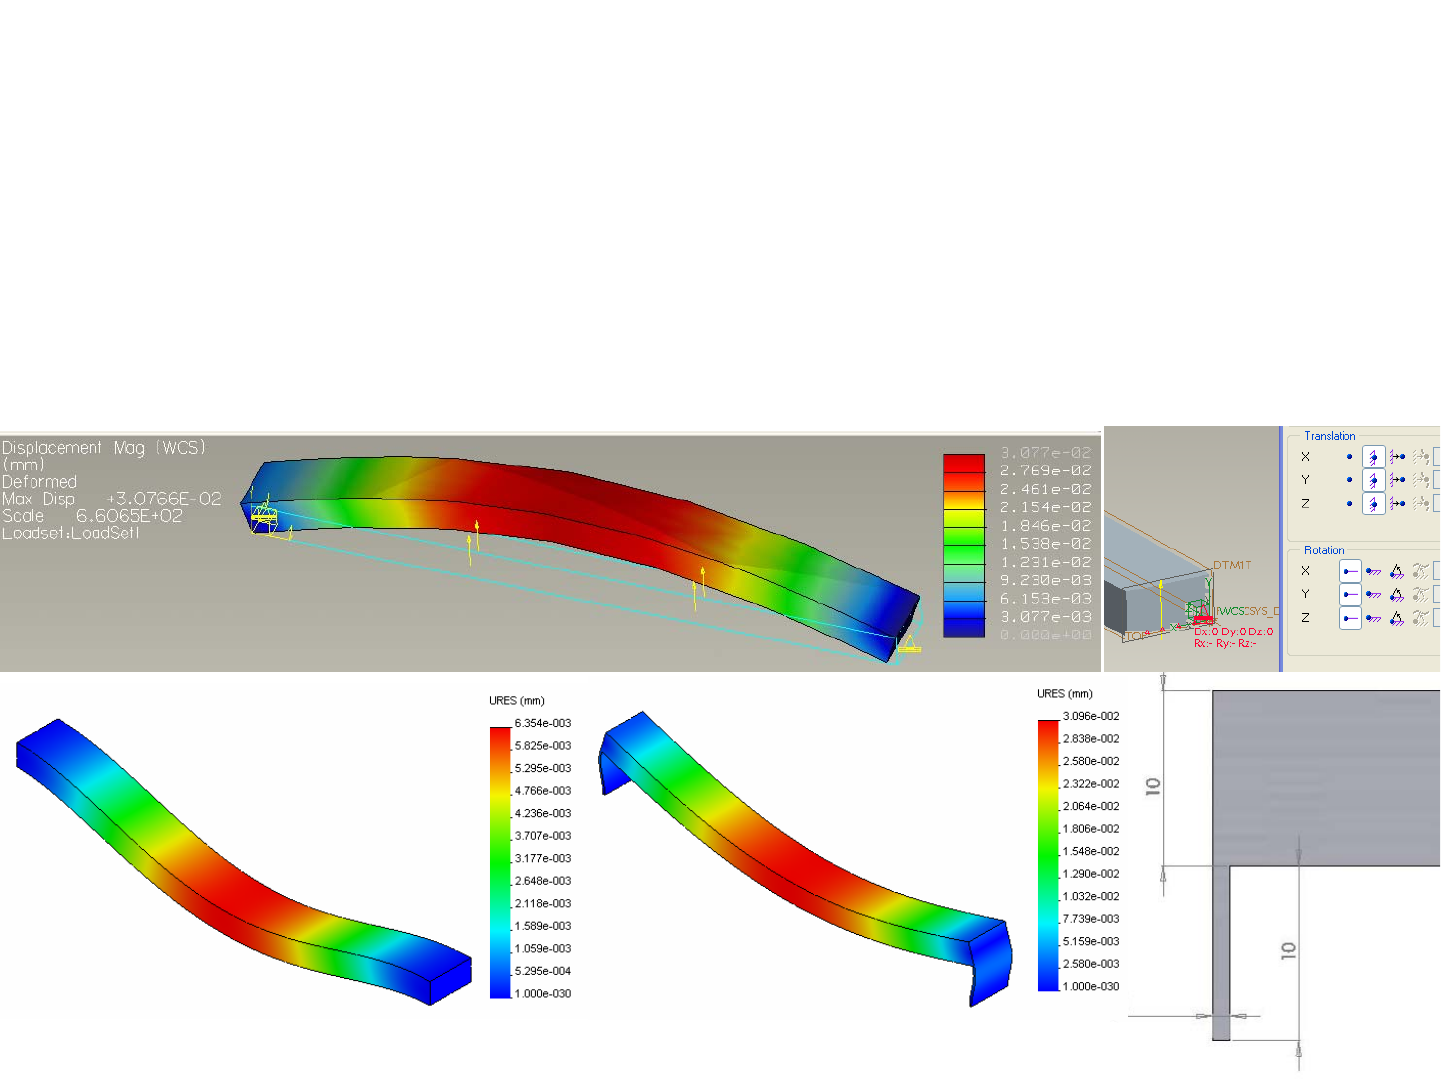
1/1/2008© 2008 Alexander Slocu
m
8-23
Stiffness: Finite Element Analysis
• Solid models that directly feed into FEA programs must be used carefully
– Some FEA programs allow the user to select an edge as a simply supported constraint
(moments not constrained).\
– Some FEA programs import solid models as solid elements that can only be constrained at their
faces, not along an edge, and hence zero slope is enforced
• To model a simply supported connection, create a long thin solid element
» A flexural bearing support: use Saint-Venant where the length is 20x the thickness
Stiffness: Plates
The most important plate analysis parameter is the plate constant D
which is a function of the material’s modulus of elasticity E, the poisson ration
ν
, and the plate thickness t:
As with beams, the stiffness, both displacement and slope, will be
proportional to the thickness cubed of the plate, and the stresses will be propor-
tional to the thickness squared. Furthermore, as with all applications of simple
elastic deflection theory, it is assumed that the thickness is small compared to
the length of a beam or the diameter of a plate. How much is “less”? Saint -
Venant says “less” is a factor of about 5.
The manner in which the edge of the plate is restrained also has a
huge effect on stiffness. A plate with a simply supported boundary, one that
does not support a moment may be 4-5 times more compliant than a plate
whose boundary is fixed. However, making a boundary itself stiff enough to
actually create a fixed boundary support is difficult. One essentially has to
invoke Saint-Venant and make the thickness of the supporting structure 3-5
times that of the plate. In reality, this is done using orthogonal plates whose
thickness may also be stiffened with orthogonal plates. The use of raised fea-
tures on plates is also a common method for stiffening plates without greatly
increasing the weight. Similarly, the edge of a plate can be folded over to help
increase its stiffness.
Faced with a plate problem, it may be tempting to reach for a hand-
book to look up an equation, much the way engineers often do for bending
beams. However, there are innumerable complex plate equations, and the con-
stants to be evaluated can cause one to lose site of the insights that might other-
wise be gained. In addition, because plates are large surfaces that are likely to
have other things attached to them, finite element analysis is often the primary
analysis tool. Still, for basic configurations, simple closed-form equations
exist and can provide important insight into the behavior of a plate. This helps
with the creation of initial concepts that can then be analyzed with finite ele-
ment analysis.
Some of the simpler and more common and useful configurations are
shown, along with the equations used to create the spreadsheets
Plate_Circular_Central.xls, Plate_Circular_Uniform.xls and
Plate_Rectangular.xls. The plots of deflection as a function of radius illustrate
the Abbe error risks faced by designers who anchor precision components to
plates: The slope angle on the deflected plate can cause displacements that can
cause components to bind.
There are several countermeasures to the risk of plate deflection-
induced slope angles causing component binding. The first is the brute force
method of increasing the plate thickness. Because the stiffness increases with
the cube of the thickness, this is actually not such a brute-force method, and
often the problem can thus be easily addressed if the design engineer thinks of
the risk before the machine is built! In particular, as discussed on page 8-29,
laminates can be particularly effective. For design contests, metal plates
bonded to either side of a foam or wood core can create a very stiff plate.
The second countermeasure involves mounting the components so
their interfaces to other components can accommodate displacement, caused
by sine errors (slope x distance) and misalignment (slope). A classic example
is in an automobile where the driveshaft must transmit power from the preci-
sion mechanism of the transmission to the precision mechanism of the differ-
ential. Torque must be transmitted, but accommodations must be made for
angular misalignments and axial displacements as the car frame deforms under
load. To accommodate these motions, each end of the drive shaft has a two-
angular-degree-of-freedom joint, such as a universal joint. In addition, a spline
allows one part of the drive shaft to slide in and out of the other, so its length
can change, which still maintains torque transferring ability. See page 5-27 for
a quick refresher on how such a coupling can easily be manufactured.
What kinds of plates do you have in your machine? What are the
risks of plate deformation on machine performance? Is there an appropriate
analysis that can be performed with simple spreadsheets? Or is it less costly
(time is money) to make a simple model and load it? Perhaps the most difficult
task is estimating the loads to which the plate will be subjected.
()
3
2
12 1
Et
D
ν
=−
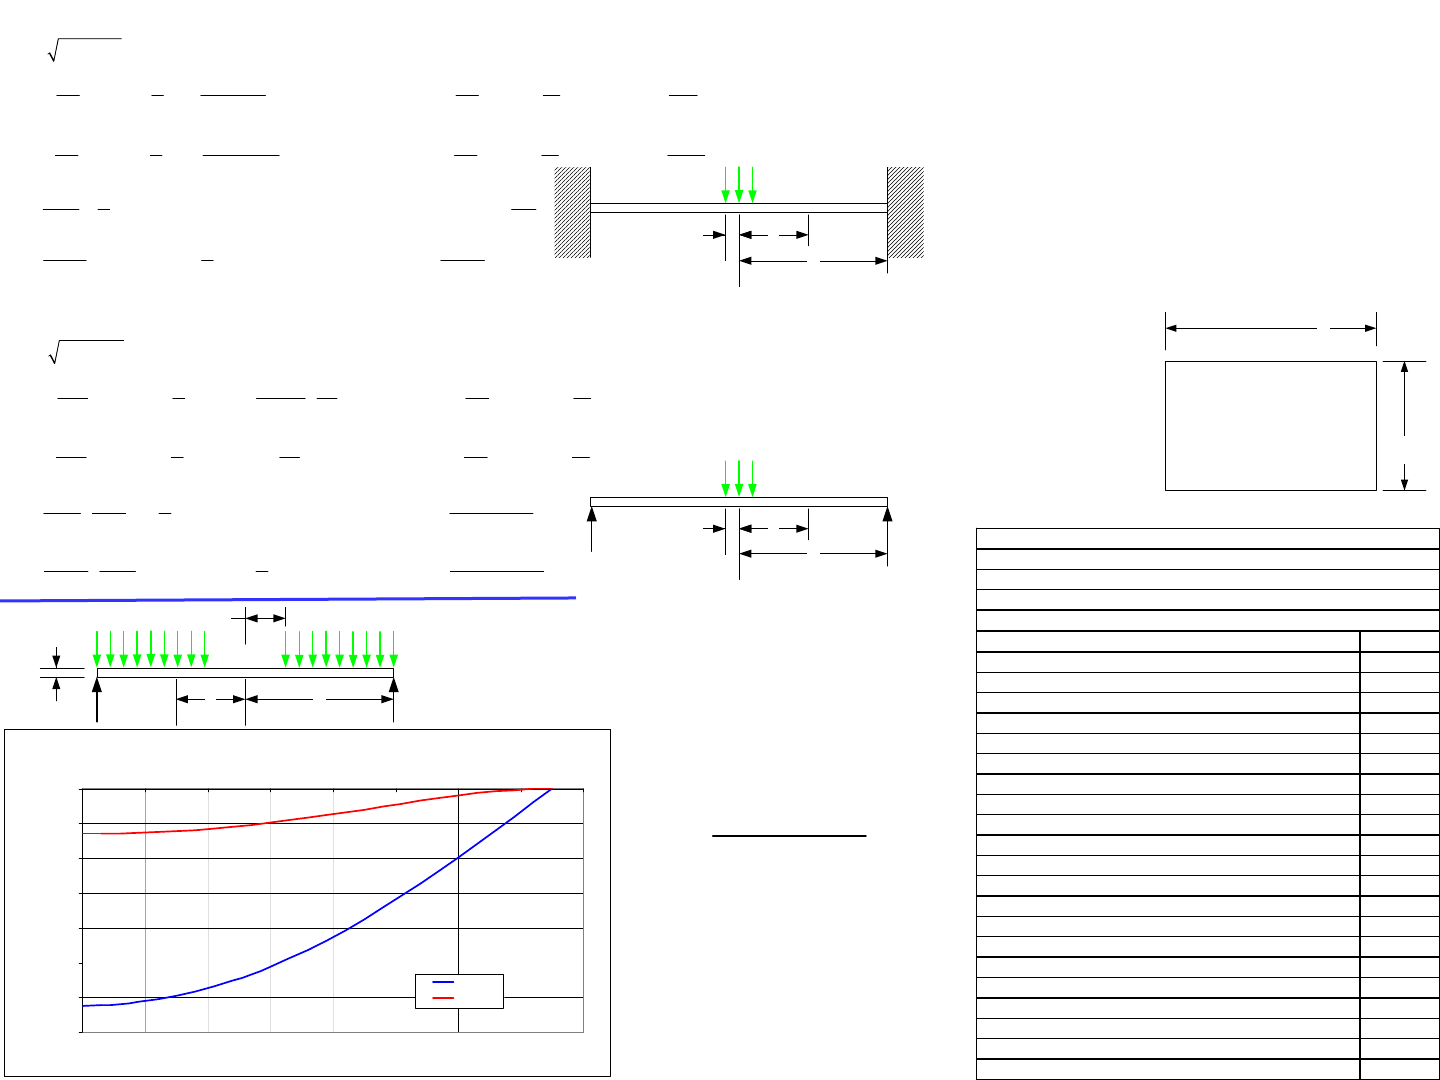
1/1/2008© 2008 Alexander Slocu
m
8-24
Stiffness: Plates
• A few simple loading cases give
insight into the nature of stresses
& deformations in plates
•Check out the many different
spreadsheets!
()
3
2
12 1
Et
D
ν
=−
() () ()
() () ()
2
'2
22'2
max @ r = 0
22'
'2
max @ r = 0
2'
1.6 0.675 if 0.5
41 ln 1 41 ln 1
16 4
41 ln 1 4 41 ln 1
16 4
1ln
41
oo o
o
r r
o
o
t t
o
tt
t
rr r
Wa Wa
arr
MM
rarr
Wa Wa
r
MM
rrr
Wr
D
νν ν
ππ
νν ν
ππ
θπν
=+− <
⎡⎤
⎛⎞
⎡
⎤
−
=++− =++
⎢⎥
⎜⎟
⎢
⎥
⎣
⎦
⎝⎠
⎣⎦
⎡⎤
⎡
⎤
⎛⎞
=++−− =++
⎢⎥
⎜⎟
⎢
⎥
⎝⎠
⎣
⎦
⎣⎦
=+
+
()
()
()
()
max @ r = a
2
222 max @ r = 0
41
3
32ln
16 1 16 1
aWa
rD
W
Wa a
arr
Dr D
θπν
ν
ν
δδ
πν πν
⎛⎞ =
⎜⎟ +
⎝⎠
−+
−+
⎛⎞
=−− =
⎜⎟
++
⎝⎠
() () ()
() () ()
2
'2
'2
max @ r = 0 min @ r = a
2'
'2
max @ r = 0 min @ r = a
2'
1.6 0.675 if 0.5
1
1ln1 1ln
44 4 4
1
1ln 1ln
44 4 4
4
oo o
o
rrr
o
o
ttt
o
tt
t
rr r
Wa Wa W
r
MMM
rrr
Wa Wa W
r
MMM
rrr
Wr
D
ν
νν
π
ππ
νν
ν
νν ν
π
ππ
θπ
=+− <
⎡⎤
−−
=+−+ =+ =
⎢⎥
⎢⎥
⎣⎦
⎡⎤
−−
=+−+ =+ =
⎢⎥
⎢⎥
⎣⎦
=max @ r = 0.368a
2
22max @ r = 0
ln 0.0293
12ln
16 16
aWa
rD
Wa W
a
ar
Dr D
θ
δδ
ππ
=
⎛⎞
−−
⎛⎞
=−+ =
⎜⎟
⎜⎟
⎝⎠
⎝⎠
Circular plates with support around
entire outer boundary
a
r
o
W=qπr
o2
r
o
<< a
r
a
r
o
W=qπr
o2
r
o
<< a
r
Uniformly_loaded_circular_plate.xls
-3.500
-3.000
-2.500
-2.000
-1.500
-1.000
-0.500
0.000
0 1020304050607080
Radius (mm) (0 = center)
Deflection (mm
)
d (mm)
d (mm)
Circular plates with support
(simply supported or fixed)
around entire outer boundary
ar
r
o
t
a
b
simply supported = S
S
S
S
Plate
length a (mm) 300
width, b (mm) 200
thickness, t (mm) 1.5
Modulus of elasticity, E (N/mm^2) 68947.6
Poisson ratio, v 0.3
Total area 60000
a/b, aob 1.50
Loading
uniform loading pressure over entire plate, q (N/mm^2) 0.00017
total load applied to the plate, W (N) 10
uniform over small concentric circle of ro, qo (N/mm^2) 10
load application radius, ro (mm) 2
total load applied to center of plate, Wo (N) 126
Simply supported outer boundary:
Distributed load:
Center displacement, dc (mm) -0.096
Bending stress at center (N/mm^2) 1
Reaction load at center of long side (N/mm) 0
Centrally applied concentrated load:
Center displacement, fdc (mm) -3.621
Bending stress at center (N/mm^2) 190
Enters numbers in BOLD, Results in RED
From Roark & Young, Formulas for Stress and Strain, 5th eddition, pa
g
To determine deflection of a rectangular plate
Plate_Rectangular.xls
By Alex Slocum, Last modified 1/1/04 by Alex Slocum
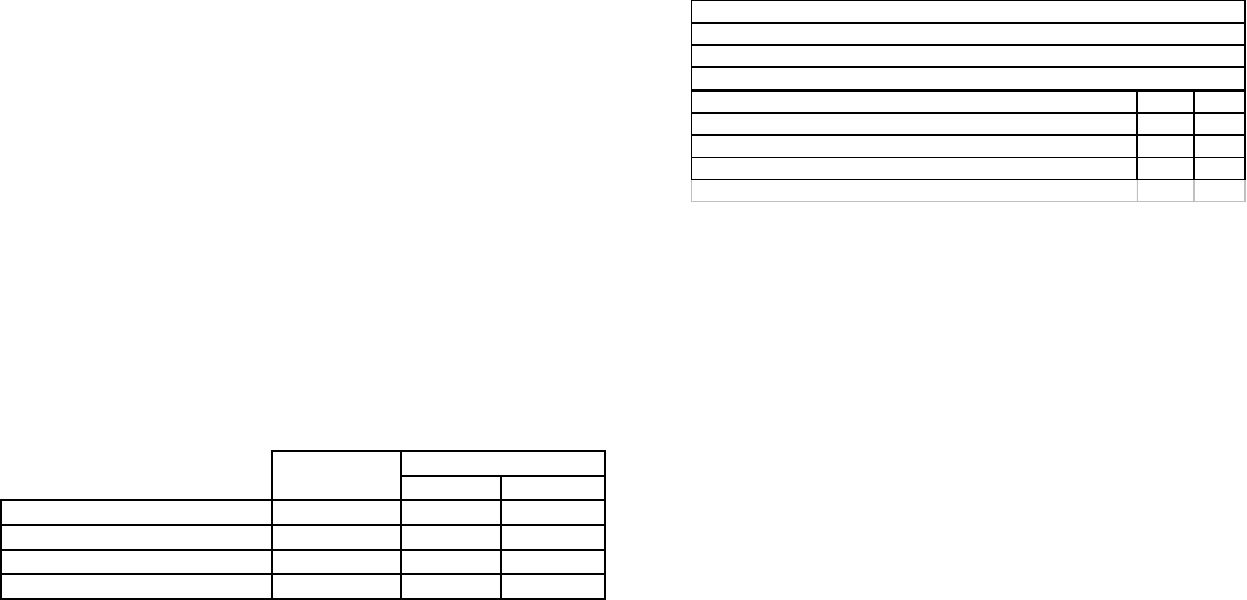
Stiffness: Plates Examples
Engineering estimation is an important skill to develop. This includes
being able to use as simple a model as possible to obtain an initial estimate for
initial concept evaluation. For example, is a single aluminum plate stiff
enough for a robot base? Assume we have an aluminum plate that serves as
the main chassis. The plate supports the wheels and the bearings located at its
corners. The dimensions of the plate, with the outer wheel support bearings’
centers at the plate corners, are 200 mm x 300 mm x 1.5 mm, and it is uni-
formly loaded with 10 N. Can the wheels of a 2WD car with a solid axle
essentially be mounted at the corners and all the rest of the robot built on top?
Is this a good design? Why or why not for many reasons?
Is this really a plate and do we need plate theory? Is there a simple
model we can use, or do we have to resort to finite element analysis? Can we
model the system as a beam? The latter would be the simplest and fastest
option. Spreadsheets Plate_Rectangular.xls and Beam_Simply_supported.xls
were used along with finite element analysis. The images show the FEA
results which only give the deflections. To estimate the slope at a point, one
can locally make a linear approximation. 2/3rds of the center deflection
divided by 1/3rd of the length makes a reasonable approximation:
Note that the center deflections reported for the simply supported
beam model assumed first that a 300 mm beam is simply supported, and that
the beam has a width of 200 mm, and hence the distributed loading is 0.033 N/
mm. For the second case of the slope along the 200 mm edge, a 200 mm long
beam is assumed with a distributed loading of 0.05 N/mm. In which direction
is the slope most important, along the 200 or 300 mm length of the plate? The
axis of motion of the vehicle should be along the 300 mm direction. Why?
The load was assumed to be only 10 N distributed over the entire plate. What
might be the real load, and what might be dynamic effects? Plan for about 50
N, and then there would be about 2 mrad of angular error on the 200 mm side.
Bearing_shaft_allowable_misalign.xls shows that the thin aluminum sheet
should actually be OK in this case:
What is learned from this exercise? The simply supported beam
model provides a good conservative estimate, when compared to the baseline
“accurate” four-corners-supported FEA model. It should also be seen that ini-
tial design calculations can be quickly done to greatly reduce risk. If the calcu-
lations had indicated there might be a problem, then it would have been easy to
fix using a countermeasure. For example, the edges of the sheet metal can be
folded to create a “pan” that makes the structure act more like a simply sup-
ported plate. In this case, the simply supported plate theory would be a very
good simple model for the system. However, without the corners connected,
the edges can still flare outward. Note the proper FEA constraints of points
near the holes made to support wheel-shaft bearings: PNT0: XYZ, PNT1:YZ,
PNT2&3: Z. Why are they constrained like this instead of just constraining all
the degrees of freedom (XYZ) at each of the points? Why are there triangular
cutouts in the sheet metal? Is it better to try and fold the corners over so they
can be riveted, or to just make 4 angle brackets which then rivet the corners
together? How much stiffer is this latter fixed-corner design?
3D folded sheet metal structures can be easily created in a solid mod-
eling program, and then unbent flat so the parts can easily be cut, for example
by an OMAX Abrasive Waterjet Machining CenterTM. This can save a lot of
time, but it requires analysis, design, and manufacturing to be done with care
and balance.
How would you design and analyze a manufacturable folded sheet
metal structure to form the basis of your machine structure? Turn on your solid
modeling program and give it a try!
300mm side 200 mm side
Simply supported beam theory 0.906, 0.179 9.66 2.87
Simply supported edges theory 0.096 0.64 0.96
Simply supported edges FEA model 0.043 0.29 0.43
Four corners supported FEA model 0.945, .030 6.30 0.30
Slope (mrad) at corner
Center deflection
(mm)
Bearing length, L (mm) 5
Bearing inner diameter, d (mm) 6
Shaft diameter, Ds (mm) 5.9
Allowable small misalignment angle, α (milli radians, degrees) 19.5 1.120
bearing_shaft_allowable_misalign.xls
To determine bearing clearance when shaft is angled
By Alex Slocum, Last modified 1/4/2004 by Alex Slocum
Enters numbers in BOLD, Results in RED
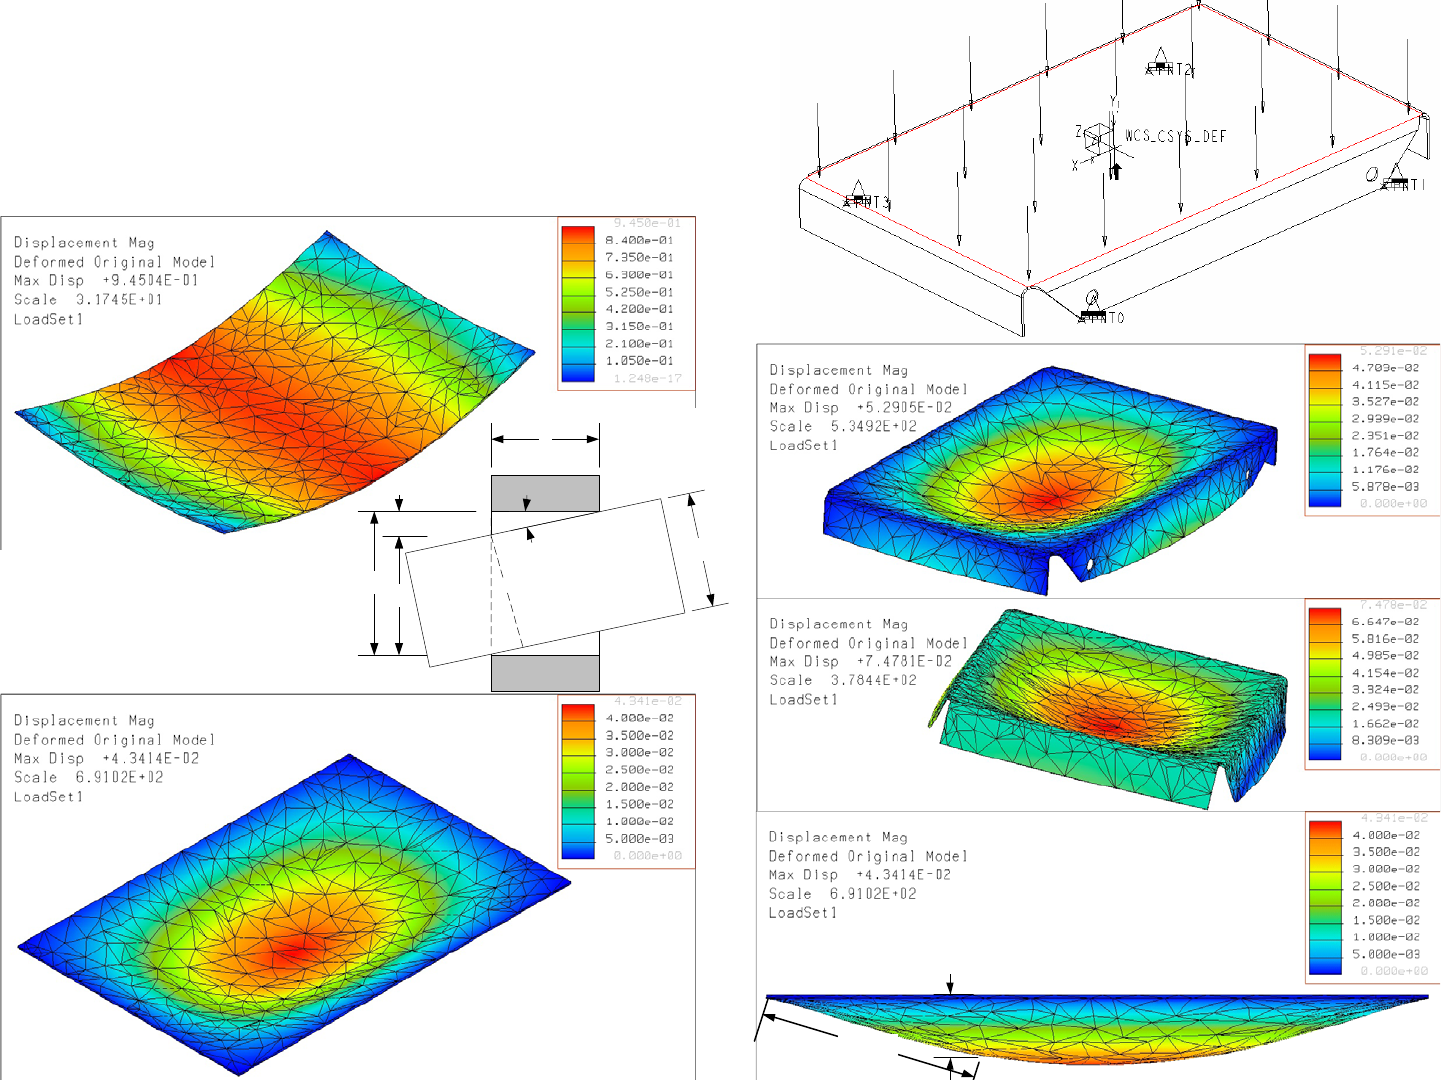
1/1/2008© 2008 Alexander Slocu
m
8-25
Stiffness: Plate Examples
• Al plate 200 x 300 x 1.5mm
uniformly loaded with 10N
100 mm
.03 mm
L
d
D
δ
D' α
α
Fixed-corners (L brackets
would have to be added)
Free-corners: 1 mrad
slope on flange ends results
Shaft misaligned in bearing
from slope in plate
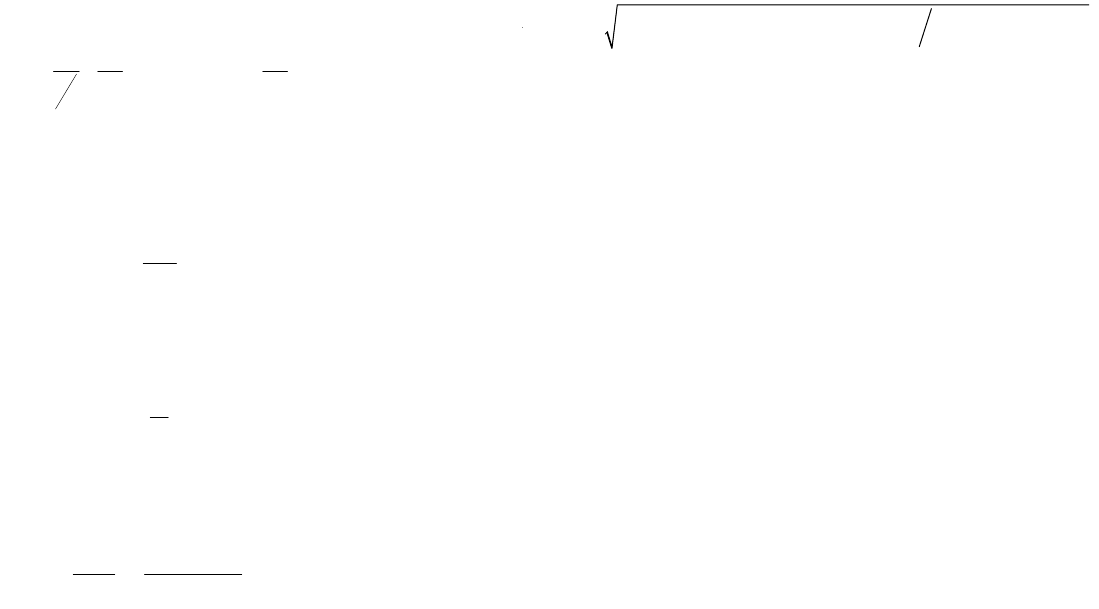
Strength
Many machines are designed for stiffness to ensure that their machine
elements maintain proper clearances, and when designing for stiffness,
strength is often not an issue. However, many designs are strength-based; they
are not as much concerned with deflection as they are with not breaking! The
nice thing is that the analysis process is much the same, because in both cases,
the bending moment must be determined. Page 8-18 showed the properties of
various cross sections and the bending moments for several different common
mountings of beams. The stress in a bending beam is then just a function of the
bending moment:
The stress in plates is also dependent on the moment, but the moment
in a plate is defined as the moment per unit length, and hence has units of
force. The stress in a plate is then given by
Tensile or compression stresses from uniaxial tension or compressive
force F is simply a function of the minimum cross sectional area A:
For simple circular sections of outer diameter Do and inner diameter
Di, the torsional stress created by a torque Γ on the shaft is:
Multiple loads are often applied to a structure. For linear elastic
materials, which is most often the case in the design of products and machines,
the fundamental principle of Superposition can be applied. This means that the
stresses from many different load states can be individually assessed, and then
combined. The stresses along a common axis simply add. The sums of
stresses along and about different axes can be combined into a total state of
equivalent stress, which can then be compared to the yield stress for the mate-
rial, using the von Mises equivalent stress criteria. The von Mises criteria
combines axial stresses (bending, tension, compression) with shear stresses
(shear, torsion). The product of the von Mises stress and various loading fac-
tors should then be less than the yield strength of the material:
•K
SF is the Safety Factor associated with uncertainty in what are the magni-
tudes of the actual loads on the system. A typical value is KSF = 2. If the
uncertainty is higher, the loads need to be better understood.
•K
LF is the Load Factor associated with the level of severity of service.
When the structure is subject to severe dynamic impact, KLF may be as
high as 3; however, this should only be used for initial feasibility studies.
Any structure subject to large impacts will require careful simulation
before building, e.g., with finite element analysis. Else KLF = 1.
•K
EF is the Environmental Factor associated with the harshness of the envi-
ronment. If the environment is hot, humid, or corrosive, even though an
appropriate material must be used, an additional factor may be added to
guard against uncertainty. It may also be as high as 3. Else KEF = 1.
• KSCF is the Stress Concentration Factor which is a very real and predict-
able effect associated with sharp corners and other features. It can be as
high as 3, but with good design is typically less than 2 (see page 8-27).
How stressed are you and your machine at this point? For a robot
design contest, the safety factor might be 2, the stress concentration 1.5, and
other factors 1. The smallest part that breaks can doom a machine to fail. One
gear tooth failing can bring a bulldozer to a halt or down a plane or helicopter.
Follow each load path through your machine’s structural loop and evaluate the
risk and the effect of each element if it fails.
max
()
M
My Mc
yI
I
I
y
σσ
== =
2
6
M
t
σ
=
F
A
σ
=
()
22
16 o
polar oi
rD
IDD
τπ
ΓΓ
=⇒ −
()
()
()
()
22
2222
SF LF EF SCF
23 3 3
2
tensile
s
x y x z y z xy xz yz
s
k
kkkkk
σ
σ
σσσσσ τττ
≥−+−+−+++
=×××
()
()
()
()
22
2222
SF LF EF SCF
23 3 3
yeild s x y x z y z xy xz yz
s
k
kkkkk
σ
σσ σσ σσ τ τ τ
≥−+−+−+++
=×××
1/1/2008© 2008 Alexander Slocu
m
8-26
Strength
•Stress=Moment*distance of farthest fiber from Neutral axis/Moment of Inertia:
– Stress ratio = Applied stress / Maximum allowable stress
•The parallel axis theorem can be used to evaluate any cross section’s inertia:
– Most important: The parallel axis theorem tells us that a section stiffens with the
square of the distance from the neutral axis!
• E.g., when designing a laminate (1/16” AL sheet separated by wood core),
double the core thickness and quadruple the panel stiffness!
•Torsional shear stress=Torque*radius/polar moment of inertia
•Stresses caused by multiple loads can be combined into an equivalent stress by
the von Mises equivalent stress formula:
I
Mc
=
σ
Ten 80 lb bags of concrete
Funny image found on www, photographer not
credited, would like to, email slocum@mit.edu
()
()
()
22
2
222
333
2
xy xz yz
x
yxzyz
equivalent
σσ σσ σσ
τ
ττ
σ
−+−+−
=+++
c
a
D
o
t
a
t
b
b
D
i
Neutral axis
b
d
c
a
a
c
y
NA
y
NA
y
NA
y
NA
db
b
a
y
NA
ad
b
Ø D
r
Ø D
r
r
flange
web
web
flange
Ø D
leg
leg
OK, what’s the ratio of the
stress ratio in the bar to the
stress ratio in the knees?

Strength: 1st Order Analysis
As described in detail in Topic 1, The MIT and the Pendulum was a
contest where each contestant had a 2.5 m long 75 mm square plastic tube with
3 mm wall thickness. The tube was filled with street-hockey-balls and sup-
ported by a pivot through its center. Some students wanted to be able to clamp
onto the tube and use a drive wheel to drive up the tube to engage the support
shaft and start the pendulum rotating. How hard could they preload the drive
wheel without breaking the tube? If they broke the tube, they would lose in a
BIG way! The students were advised to do appropriate analysis, because trial
and error could result in breaking the tube and failing the course!
With modern solid modeling and finite element analysis programs, it
seems to be a straightforward task to model an existing system and apply a
load to determine its effects on the system. In this case, how long of a beam
segment should be included in the model? One could include the entire beam,
and although this adds a few seconds of processor time for this simple case, in
more complex systems, it could add minutes or more. When FEA is used for
design studies, where a design parameter is varied over a wide range so the
design program can then plot the effect of the varying parameter on the desired
factor, these minutes rapidly add up.
Saint-Venant comes to the rescue once again. In this case, the charac-
teristic dimension is the width of the beam, so the segment modeled should be
3-5 times as long as the width. The FEA results show that after about 3 times
the width on either side of the force, the model has fully converged:
What if the load were applied over a fixed length instead of at a point?
In that case, the length of the beam should extend 3 characteristic dimensions
on either side of the limits of the load.
The FEA model used here also took advantage of symmetry. Only
one-quarter of the beam was modeled, and the faces along the cuts were con-
strained to only deform normal to the beam surface which they intersected.
Could a one-eighth model have been used in this case? (Yes, but the full length
was kept here for better visualization, as was the full-section model).
Is there a simple beam model that could have been used? A simply
supported beam model would have a beam of length equal to the width of the
beam section, and length equal to? A point load is applied to the real structure,
but a simply supported beam model assumes the force is applied across the
entire width of a beam. Can Saint-Venant help? It would appear that the beam
length should be about 5 times the width in order for the maximum predicted
deflection to be on the order of the actual deflection. However, the predicted
stress is far from the actual stress. Here is a case where it is inappropriate to
apply a simple model because it results in far too conservative a result.
This type of analysis is called boundary analysis, where upper and
lower limits (bounds) or extremes are considered. What critical high-stress sit-
uations might exist in your machine and how might you model upper and
lower bounds? If there is risk and uncertainty, should you not invest the time
in a finite element model, or a real physical model that you can test? A Bench-
Level-Experiment, real or virtual, now can prevent much agony later.
Beam Width Von Mises Stress Deflection
(mm) (N/mm^2) (mm)
75 28 2.0
150 29 1.5
225 27 1.4
300 29 1.4
375 26 1.4
450 25 1.4
By Finite Element Analysis
Beam Width Von Mises Stress Deflection
(mm) (N/mm^2) (mm)
75 1.7 16.7
150 0.9 8.3
225 0.6 5.6
300 0.4 4.2
375 0.3 3.3
450 0.3 2.8
By Simply Supported Beam Model
1/1/2008© 2008 Alexander Slocu
m
8-27
H
H
Strength: 1st Order Analysis
• Square tube with point loads
(from wheels) on two opposite
sides
Model plane of symmetry
Yes, yes, yes, for all you FEA avocados out there, only a 1/8 models with
zero slope constraints at the planes of symmetry is actually needed

Strength: Life, Fatigue and Stress Concentration
To give structures long life, they must be designed not according to
just the yield strength of the material, but to the endurance strength of the
material. On page 8-5 the yield and tensile (ultimate) stress levels for a mate-
rial were defined for one loading cycle. But how many times can the stress be
applied, removed, and then reapplied before the structure fatigues? The endur-
ance limit is how many stress cycles can be applied before failure, and it
depends on the type of material used. Materials referred to as Type 1 materials
herein, such as ferrous alloys, have an endurance limit where if the stress is
kept below this limit, life will be “infinite”. Materials referred to as Type 2
materials herein, such as aluminum alloys, have no endurance limit, which
means that even if only 1% of the ultimate tensile stress is applied, with
enough cycles, eventually, they will fail. Materials such as plastics (or metals
at high temperatures) will creep when subject to continual high stress.
To conservatively design a structure from Type 1 materials to have
“infinite life”, the equivalent alternating stress, calculated for example using
the von Mises criteria including the stress factors, (see page 8-25) should be
less than one-half the ultimate tensile stress for the material:
Will this lead to a too conservative design? This is where attention to
detail and knowledge of statistics and the environment in which the machine is
used become the cornerstones of engineering design. Anyone can design given
infinite resources, but only the best can design with less! Structures typically
also have a continuous or mean applied stress in addition to cyclic (alternating)
stresses. The Goodman diagram is a means to determine the relative allowable
mean and alternating stress levels. For a typical Type 1 material, the allowable
mean Smx and alternating stresses Sax are related in terms of the ultimate
strength and the endurance limit by:
When most people see a crack in something, they know from experi-
ence that the object has been weakened. It is not just that the crack has reduced
the cross-section, the crack seems to amplify stresses and make the object
break more easily. But how sharp must the crack be to create this effect? This
is the heart of the matter with stress concentration factors. Stress concentra-
tions can cause high local stresses and small fatigue cracks. These cracks have
very sharp tips, far sharper than the manufactured feature that gave rise to their
formation. As a result, the cracks start to grow, and failure can soon thereafter
occur. The study of how cracks form and grow is called fracture mechanics,
and it is a critical engineering function in many industries: Every company
wants to reduce costs, and reducing structural weight typically also reduces
cost. However, too much weight reduction can lead to too small sections
which then fatigue and fail. Reciprocity tells us that putting notches into struc-
tures to create breakaway points can also sometimes be a good idea!
Fatigue is a common form of failure in rotating shafts because they
are subjected to very high cycles and they often have minimal fillets (rounded
corners). The latter is often due to space constraints and creating generous
radii often means removing a lot of material in manufacturing.
There are many references that provide formulas for stress concentra-
tions.1 The figures, from pages 5-23 to 5-25 show how FEA can highlight
regions of high stress, but they also show that the stress concentration factor is
typically about 2 for modestly radiused feature interfaces. This may seem like
a modest number, but this depends on the type of loading. For a beam where
the strength is proportional to the height squared, increasing the radius of cur-
vature at the interface by a factor of 2 could reduce the stress concentration
from 2 to 1.5; hence the height of the beam could drop by (2/1.5)1/2 = 1.15.
Over the length of a long beam, this can result in significant material savings.
A machine for a robot design contest may not seem like it would be
subject to high cycle fatigue, but high loads, small parts, and stress concentra-
tions can cause low-cycle fatigue failures. Do you have plastics subject to high
stress that may creep? Systematically trace all loads through the structural
loops and evaluate their magnitude and number of cycles. Where are the high-
risk areas, and what are your countermeasures or plans to reduce the risk?
()
()
()
()
22
2222
SF LF EF SCF
23 3 3
2
tensile
s
x y x z y z xy xz yz
s
k
kkkkk
σ
σ
σσσσσ τττ
≥−+−+−+++
=×××
en
ax mx en
u
S
SSS
S
−
=+
1. See for example, Roark & Young Formulas for Stress and Strain, 5th edition, pages 590-603
1/1/2008© 2008 Alexander Slocu
m
8-28
Strength: Life, Fatigue and Stress Concentration
• Fatigue: To obtain “infinite” life (endurance limit) in a steel structure
• Applied stress should be less than ½ yield stress
• Aluminum has no endurance limit: Infinite life requires zero stress
• Continuous (preload) and alternating stresses can be applied, so use preload to:
– Minimize the ratio of alternating stress to constant stress
– Never let the stress alternate between positive and negative
• Stress concentration:
– Stresses must flow around features, and the
sharper the feature, the more severe the turn
• This causes a kink, and the stress rises
Alternating stress: S
a
Mean tensile stress: S
m
Goodman line
Ultimate tensile
strength: S
u
Endurance limit stress: S
en
S
ax
S
mx
N: number of cycles to failure
S: stress
S
en
Type 1
Type 2

Trusses
Often one needs a large area or length spanned, but with minimal
weight and cost. Wide flange beams, such as I-beams shown on page 8-18 are
often used because they place most of the beam’s mass far away from the neu-
tral axis where it does the most good. However, when even greater strength-to-
weight ratios are needed, design engineers often turn to trusses. A truss is
essentially a beam where all the extra material has been removed (remember
Maudslay!). Since it would be costly to remove lots of material in most cases,
trusses are often made from individual elements, such as tubes, that are fas-
tened together with bracing elements. This gives a truss its characteristic zig-
zag shape. Trusses are often welded together; however, many large bridge
trusses are still manufactured from bolted-together members.1
There are many websites that feature truss-design programs, many of
which are free. Check them out! However, is there a way to rapidly determine
if a truss is appropriate for an application? The Parallel Axis Theorem comes
to the rescue. A truss typically has two members in the top chord and two in
the bottom chord. Where extreme efficiency is required, only one element is
used for the top (tensile) chord and two are used for the bottom chord to better
resist buckling (see Pages 8-14 and 5-23). The triangular shape can still have
sufficient lateral and torsional stiffness. When creating formulas for quick esti-
mation of truss strength, all one needs is the cross-sectional area of the chord.
When considering buckling of the chords, the cross-section detail, a tube for
example, must be known. For a simple 4-chord truss of height H, chord cross
sectional area A, and chord moment of inertia IA through the A’s neutral axes:
For a 3-chord truss, the upper chord may not always have the same
area as the lower chord members, and the neutral axis location with respect to
the bottom chord (distance c) must first be found:
In these equations, I/c can be used with the bending moment to obtain
a reasonable estimate of the stress in the top and bottom chords. Given the
stress and the chord cross sectional area, the tensile force in the top chord and
the compressive force in the bottom chord can be determined. A buckling
analysis can then be done. Very conservatively, the buckling analysis can
assume simply supported boundary conditions for the chord segment. Of
course there is a truss design spreadsheet Truss.xls that the reader may want to
try! However, these equations are not very good at predicting displacement of
a truss. FEA or energy methods can be used for determining displacements.
The purpose of the braces is to transfer stresses between the top and
bottom chords, while reducing the free-span of any chord in compression to
minimize the chance of buckling. It is relatively straightforward to create a
free-body diagram for each member and solve for the forces in each member.
One could then ideally optimize the brace design. However, this can only be
done if the members are assumed to be pinned at their ends, and since the
members are generally long and thin, this is not a bad assumption. Since there
are so many web-based truss design programs available, it is rare that an engi-
neer will need to do this analysis. For very large trusses, finite element analy-
sis tools come to the rescue.
Each side of a truss is called a bent, and the bents are then assembled
to form the truss. Note the fabricated elements shown in the figures, and how
the braces have been made from a continuous piece of metal that has been bent
into a zig-zag shape prior to being spot welded to the chords. Many large
trusses for buildings are manufactured in a similar fashion, where angle sec-
tions are then welded to either side of the zig-zag braces.
Take a look around at trusses in cranes, bridges, and buildings.
Notice the many different types of bracing. Where might you use a truss in
your machine? Experiment with Truss.xls to play “what if” scenarios.
1. Bolted connections have a lingering advantage over welded connections: It is difficult for a crack to
form that can run through a bolted joint.
2
22
44 2
2
AA I
H
I
AAAAH
IIHH
c
⎛⎞
⎛⎞
=+ =+≈ =
⎜⎟
⎜⎟
⎜⎟
⎝⎠
⎝⎠
() ()
22
22
2
22
2
U
NA UL
LU U L U L
NA NA NA NA
H
A
yAA
IH H
yy yy
IIAAAA
=+
=++ − + ≈ − +
1/1/2008© 2008 Alexander Slocu
m
8-29
Trusses
• Trusses can carry huge loads while being very light weight
– Saint-Venant & trusses
• Web member (braces) spacing is typically on the order of the truss height
• Greater spacing leads to greater deflections and greater chance of chord buckling
– Fundamentally, the farther away from the neutral axis you can add area, the better
squared you will be!
– Trusses are easily fabricated from spot-welded steel welding rod!
∑
∑
=
=
=N
iii
N
ii
ii
NA AE
y
AE
y
1
1
NA
H
AH/2
W
2
NA zz zNA
Ay
II −
=+
H
A
L
y
NA
A
U
W
NA

Laminates & Composites
A laminate is a structure comprised of thin strong layers of material
bonded to a lighter material whose primary purpose is to separate the stronger
layers and thereby make use of the parallel axis theorem to achieve high
strength and light weight. A composite is a material formed from high-strength
members, generally small fibers, bonded together with an adhesive matrix.
Often, composite layers are bonded to a soft core, as is done with snowboards!
One of the principle calculations needed for the design of laminates
or composites is that of the overall effective moment of inertia, the bending
stress, and the shear stress. The tensile/compressive stress profile in a beam
regardless of its shape is linear, from the maximum tensile (+) stress to the
maximum compressive (-) stress. In addition, there are shear stresses through
the section of the beam, and it turns out that the profile is parabolic, with zero
shear at the top and bottom of the beam. The derivation of the shear stress in a
symmetrical beam is the subject of many a strength of materials textbook, and
in summary, it is determined from the shear force (dM/dx), the moment of iner-
tia Izz with respect to the beam cross section, and the first moment of the area
of interest about the neutral axis:
For a simple cantilevered rectangular beam of height h and width b,
the shear stress at a distance y from the neutral axis is given by:
A parabolic distribution shows the shear stress is zero at y = +/-h/2
and a maximum at y = 0, where it is simply 3V/2bh. When two sheets of high
strength material of thickness t are bonded to a low-strength core, whose main
purpose is to separate the high strength sheets, the shear stress of interest is at
the bond layer. Neglecting the core, a reasonable assumption, and assuming
the sheet thickness is much less than the core thickness, the shear stress at the
bond layer is found from:
When determining the equivalent state of stress in an I-beam, note
that the maximum bending stress is at the flange outer surface and the maxi-
mum shear stress is at the center of the web; thus do NOT use both stresses in
the Von-Mises criteria.
What about plywood? The plys are strong in one direction, and weak
in the orthogonal direction. By stacking the plys up orthogonal to each other,
one acts as a core to the other and a strong and nearly isotropic structure is
obtained from normally anisotropic plys. The above theory still applies for
shear stresses, and additional stiffness and strength properties of a laminate can
be estimated from:
These expressions are for estimation purposes only. They are proba-
bly good enough for most robot design contests; however, for a production
device, finite element analysis should be used. Laminate.xls allows you to
experiment with the stiffness of a piece of plywood by itself, with metal on one
side, or with metal on two sides. Compare this with two sheets of metal
bonded to a foam core.
Is plywood good enough for your vehicle base, or would a layer of
metal not only add stiffness, but aid in manufacturability? It is easier to pre-
cisely locate a hole in metal than in wood.
22
1
zz yx
AA
z
z
VQ
dA Q dA
yy
Ib
I
τ
== =
∫∫
2
1
zz yx
AA
z
z
VQ
dA Q ydA
y
Ib
I
τ
== =
∫∫
()
2
23
2
2
3
4
222 8 12
34
2
zz
xy
zz
hyhb
y
hh
Qyybb
I
Vy
h
VQ
bbh
I
τ
⎛⎞
−−
⎛⎞
⎜⎟
=+−= =
⎜⎟
⎜⎟
⎝⎠
⎝⎠
−
==
()
()
(
)
()
()
()
3
3
bond layer
22
212 2
2
zz
xy
bht
hbht h t
t
Qh bt I
Vh t
bh h t
τ
−− −
=− = ≈
−
≈−
()
2
laminate
laminate
estimate for calculating stress in a particular layer
modulus for the layer of interest
IE
ii
iii
ii
NA i NA
ii
yEA
yyy
I
EI E A
E
EA
EI
∑
==+−
∑
∑
≈
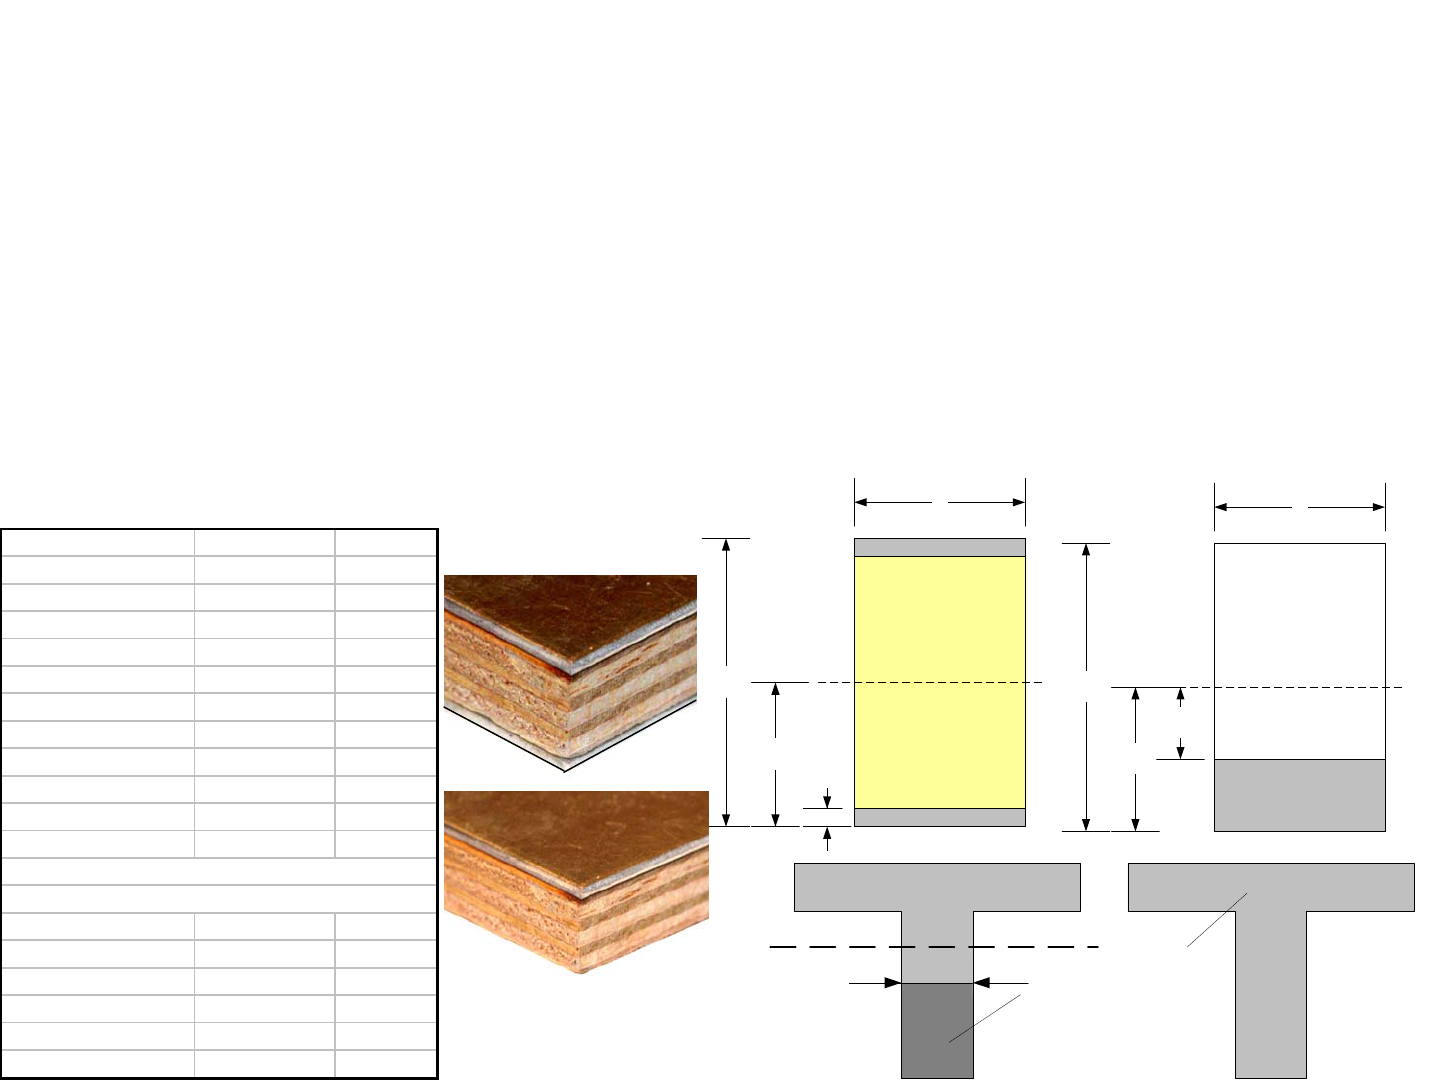
1/1/2008© 2008 Alexander Slocu
m
8-30
Laminates & Composites
• Laminates are made of stress-carrying elements bonded to a core (see Laminate.xls)
– They have tensile/compressive carrying members on the outside (chords), and a shear carrying
member (core) on the inside
• Metal chords with a wood core can give nearly the strength of an I beam
• The shear stresses in the adhesive and core materials must be carefully considered
• Composites use a matrix, typically a polymer such as epoxy, to bond together structural
fibers, cloth…
– Thin composite members are then often laminated to a core…
Simple Plate
t0.0625 thickness
w1width
L10 length
E1.00E+07 modulus
maxstress 20000
I 2.03E-05
A 6.25E-02
Ioc 6.51E-04
Fmax 1.30
deflection 2.13
Sandwhich beam (2 plates with wood core)
Assume I and E of wood core are ignored
tcore 0.5
Icore 0.0099
Ioccore 0.0318
Fmaxcore 63.5
deflection 0.21
NA A
A1
b
NA
h
h/2
y
b
NA
h
h/2 t
b
Drill holes in plywood to
reduce weight of laminate core
Solid plywood
Topic 8 Study Questions
Which suggested answers are correct (there may be more than one, or none)?
Can you suggest additional and/or better answers?
1. When the first sketch of the structure is made, arrows indicating forces,
moments, and flow of power should also be sketched:
True
False
2. Arrows which indicate the path of force flow from the point of action to
the point of reaction, which shows the structural loop:
True
False
3. A closed structural loop indicates high stability and the likely use of
symmetry to achieve a robust design:
True
False
4. An open structural loop is not bad, it means “proceed carefully”:
True
False
5. Wiring, hoses, and cable carriers can all be added by manufacturing
personnel because drawing them is never accurate and assembly people
know best:
True
False
6. Planning for placement of wiring, hoses, cable carriers, guards, and
sensors, is often best done during the concept development phase of a
machine:
True
False
7. Materials make the machine just as sure as any creative design, and are
often selected based on strength, stiffness, manufacturability, and wear
and corrosion resistance:
True
False
8. Metals have very high strength-to-weight ratios and are easily machined
formed, and joined:
True
False
9. Wood has high directional strength/weight and is easily joined:
True
False
10. Plastics can have good structural and low friction & wear-resistant
properties and are easily molded, formed, machined:
True
False
11. Axial, torsion, and bending loads can be applied to structures and
components, so an equivalent stress needs to be determined and compared
to the material’s yield stress:
True
False
12. A good process for designing a robust structure is to sequentially imagine
that each element of the design is a piece of rubber, while other elements
are steel and then apply forces to the system and see how it deforms:
True
False
13. Bracing elements with triangles (plate-type gussets or beam-type trusses)
are the most efficient method for strengthening a structure:
True
False
14. Layout is used to initially define relative placement of elements and the
supporting structure and is the first embodiment of the design intent and
defines boundaries on the structure:
True
False
15. A Layout Drawing is the graphical interpretation of the FRDPARRC
table’s Design Parameters:
True
False
16. A sketch & notes can suffice for an initial layout, & serve as a road map
for creating a solid model
True
False
17. A solid model can serve as a layout, as long as one takes care to not add a
lot of detail
True
False
18. Motion diagrams and stick figures to help define and select your concept
as initial starting points for your layout:
True
False
19. A layout can help the designer understand how the structural loop behaves
by enabling the designer to:
Sequentially imagine each component is made of a soft material
and visualize deformations
Estimate deflections, stresses, and vibration modes by
performing first order calculations to size members and
components
If the machine is complex, Finite Element Analysis (FEA) may
also be used
If analysis is too costly (e.g., time to do), do a Bench Level
Experiment
Use trial and error to arrive at a workable solution
Way oversize all the elements to be sure the design will work
20. In order to create an appropriate level-of-detail solid model layout
drawing use FRDPARRC tables (from Strategy, to Concept, to Modules,
to Components) to understand what functions the structure must perform
and then start the design of the structure:
Start with a hand sketch that captures the ideas swirling about in
your brain
Label principle design parameters (elements) that meet the
design intent
Identify the structural loop and understand its critical points
Use first order analysis to initially size members
Create minimal detail solid model components and assemble
them using reference planes where possible to maximize the
robustness of the model
21. For two wheel drive vehicles, the rear wheels have to push hard enough to
make the front wheels climb the obstacle:
True
False
22. For four wheel drive vehicles, the rear wheels also provide the normal
force needed for the front wheels to apply a tractive effort to help climb
over the obstacle:
True
False
23. Rather than using brute force, it is generally better to climb an obstacle
one wheel at a time
True
False
24. Because there are always obstacles, it is a good idea to design in a
suspension into a vehicle so it can conform to the terrain:
True
False
25. When will a machine driving up a hill tip over?
The force vector due to gravity just passes through the rear
wheels ground contact points
The slope angle is equal to the angle of the vector between the
rear wheels contact point with the ground and the center of mass
26. Axial tension or compression is the applied force directly acts on the
material to cause tension or compression
True

False
27. Bending is an applied force acts via a lever to bend a beam, causing
tension on one side and compression on the other side of the structure
True
False
28. Torsion is a torque (e.g., twisting or two equal and opposite forces applied
about a point) causes twist of the structure
True
False
29. Shear is two equal and opposite essentially colinear forces act
perpendicular to a structure
True
False
30. All structures deform under load so:
Make sure that the deformations which create translational and
angular displacements do not cause other elements to become
overloaded or interfere and then fail
Make deflections 3-5x LESS than critical clearances (Saint-
Venant)
Try to make forces between members transmitted without
causing twisting
Position interface contact points at neutral axis planes
31. System compliance = sum of structural and element compliances, so:
Machine elements (e.g., bearings) and joints should have a
stiffness on the order of the structure itself
During the early design stage, before bearings and joints are
designed, assume net stiffness will thus be structural stiffness/3
Use steel whenever possible
32. Complex systems can often be modeled by superimposing simple models
True
False
33. Stress=Moment*distance of farthest fiber from Neutral axis/Moment of
Inertia:
True
False
34. Torsional shear stress=Torque*radius/polar moment of inertia
True
False
35. Stresses caused by multiple loads can be combined into an equivalent
stress by the von Mises equivalent stress formula:
36. Fatigue: To obtain “infinite” life (endurance limit) in a steel structure
Applied stress should be less than ½ yield stress
Aluminum has no endurance limit: Infinite life requires zero
stress
Steel should be used whenever possible
37. Continuous (preload) and alternating stresses can be applied, so use
preload to:
Minimize the ratio of alternating stress to constant stress
Never let the stress alternate between positive and negative
Keep the continuous stress at ½ yield stress
38. Stress concentration results in corners:
Stresses must flow around features,
The sharper the feature, the more severe the turn
Aluminum structures are less subject to stress concentration
because aluminum is softer than steel
39. A structure can be made much stiffer by using heat treated alloy metals:
True
False
40. Heat treated alloy metals often have a significantly greater modulus of
elasticity than non heat treated alloy metals:
True
()
()
()
22
2
222
333
2
xy xz yz
xyxzyz
equivalent
σσ σσ σσ τττ
σ
−+−+−
=+++
()
()
()
22
2
222
333
3
xy xz yz
xyxzyz
equivalent
σσ σσ σσ τττ
σ
−+−+−
=+++
False
41. Trusses can carry huge loads while being very light weight, and Saint-
Venant’s principle can be used to initially layout a truss:
Web member (braces) spacing is typically on the order of the
truss height
Greater spacing leads to greater deflections and greater chance of
chord buckling
Strength increases the farther away from the neutral axis you can
add chord area
The ratio of chord mass to brace mass should be 3-5
42. The neutral axis theorem can be used to initially size a square cross section
truss of height h, width b, and each of four chords having a cross sectional
area of A , where the effective second moment of the area of the truss to
model it as a beam can be estimated by:
I = 4*A*(h/2)^2
I=4*A*b*h^3/12
43. Laminates have tensile/compressive carrying members on the outside
(chords), and a shear carrying member (core) on the inside
True
False
44. Metal chords with a wood core can give nearly the strength of an I beam
True
False
45. The shear stresses in a laminate’s adhesive and core materials must be
carefully considered
True
False
46. Cast iron is always the best choice for a machine tool structure if it can be
obtained in time:
True
False
47. Welded steel structures are always the most economical for short-turn-
around-delivery:
True
False
48. Polymer concrete is always the best choice for high volume small-to-mid-
size machine structures:
True
False
49. Structures made from polymer concrete always have the highest damping:
True
False
50. Structures made from welded steel always vibrate excessively:
True
False
51. Machine structures should be selected on the basis of cost,
manufacturability of the entire system, structural performance (including
thermal and dynamic), and delivery time:
True
False
52. Thermal expansion errors of a structure are typically the most difficult to
control and often one of the greatest sources of error in a machine:
True
False
53. Temperature control of a machine can be achieved by:
Putting the machine in a temperature controlled room
Insulating the exterior of the machine and isolating heat sources
Preventing infrared light from reaching the machine by hanging
PVC curtains between the machine and light sources in the room
Circulating temperature controlled fluid through the machine
54. Heat can often be prevented from being transferred to the machine from
chips generated by the cutting process by using a flood of coolant to wash
the chips away:
True
False
55. Heat is best prevented from getting into a machine from the process by:
Isolating the machine from the process as much as possible
Using sheet metal shields to prevent radiant, convective, and
conductive heat transfer
Using gutters, which do not contact the structure to collect
coolant and process generated debris
Using low coefficient of thermal expansion materials
56. An actuator attached to a system at its center of stiffness will minimally
cause angular motion errors and thus result in a more robust design:
True
False
57. Thermal error can be very difficult to characterize because of the many
indifferent ways heat can be transferred, and long time constants:
True
False
58. The best strategy for dealing with thermal error is to minimize and isolate
heat sources:
True
False
59. Insulating structural members can help reduce thermal errors:
True
False
60. Since sensors do not generate appreciable heat, there is no need to insulate
sensor support structures to help reduce thermal expansion errors:
True
False
61. Infrared heat can be prevented from being transmitted from lights to
sensitive machines by shielding the machine from direct light sources
using clear PVC plastic curtains:
True
False
