The Deutsche Bank Guide To Exchange Rate Determination FX Broker DB
User Manual:
Open the PDF directly: View PDF ![]() .
.
Page Count: 160 [warning: Documents this large are best viewed by clicking the View PDF Link!]
DB Guide to Exchange-Rate Determination
May 2002 Deutsche Bank @
Deutsche Bank Foreign Exchange Research 1
Deutsche Bank@
May 2002
FX Research
Global Markets Research
Michael R. Rosenberg
Head of Global FX Research
David Folkerts-Landau
Managing Director, Head of
Global Markets Research
Exchange-Rate Determination
in the Short, Medium, & Long Run
The Deutsche Bank
Guide to
Exchange-Rate
Determination
A Survey of
Exchange-Rate
Forecasting Models and
Strategies
Bandwagon Effect/
Trend-Following Behavior
Real
Interest-Rate
Differentials
Purchasing Power Parity
Capital
Flows
Fiscal
Policy Portfolio-Balance
Considerations
Current
Account
Trends
Relative
Economic
Growth
Monetary
Policy
Investor Positioning
FX Options Market
Positioning
Risk Appetite
Investor Sentiment
Net Foreign Assets
Productivity Trends
Savings/Investment
Balance Trends
Persistent Trend in
Terms-of-Trade
Exchange Rate

DB Guide to Exchange-Rate Determination May 2002
Deutsche Bank @
2Deutsche Bank Foreign Exchange Research
Introduction .................................................................................................... 4
Exchange Rate Determination in the Short Run ........................................ 7
Currency Forecasting Using Technical Analysis .........................................11
Sentiment and Positioning Indicators ....................................................... 21
Currency Options Market ......................................................................... 22
Order Flow and the Determination of Exchange Rates ........................... 24
Investor Positioning and the Trend in Exchange Rates ............................. 27
Risk Appetite Shifts and Currency Trends................................................. 28
Exchange Rate Determination in the Long Run ....................................... 31
Purchasing Power Parity ........................................................................... 33
The Macroeconomic-Balance Approach to Long-Run
Exchange-Rate Determination ............................................................ 42
The Real Long-Run Equilibrium Exchange Rate ....................................... 43
Productivity Trends and Exchange Rates .................................................. 46
Terms of Trade and Exchange Rates......................................................... 50
Net International Investment and the Equilibrium Exchange Rate........... 51
Long-Term Cycles in Exchange Rates....................................................... 53
Overshooting Exchange Rates ................................................................. 60
Exchange Rate Determination in the Medium Run.................................. 63
International Parity Conditions.................................................................. 65
Real Interest-Rate Differential Model ....................................................... 67
Forward-Rate Bias Strategy...................................................................... 72
Current-Account Imbalances and the Determination of
Exchange Rates................................................................................... 77
Capital Flows and Exchange Rates........................................................... 86
Mundell-Fleming Model ........................................................................... 96
Monetary Approach ................................................................................ 104
Portfolio-Balance Approach ..................................................................... 108
Fiscal Policy .............................................................................................115
Economic Growth....................................................................................119
Central-Bank Intervention ....................................................................... 124
Anticipating Currency Crises in Emerging Markets ............................... 129
References................................................................................................... 155
Table of Contents
Datastream International, Inc. is the source of the majority of data
used in the charts and tables in this publication. Other sources are
noted individually.
Market sentiment data is by permission of Consensus, Inc.,
Con-
sensus, National Futures and Financial Weekly,
(1) (800) 383-1441 or (1) (816) 373-3700
www.consensus-inc.com
Sources:
May 5, 2002

DB Guide to Exchange-Rate Determination
May 2002 Deutsche Bank @
Deutsche Bank Foreign Exchange Research 3
"If you think writing about the fortunes of the stock
market is tricky, try getting your arms around cur-
rencies."
Bill Gross
PIMCO
Investment Outlook, January 2002
"Having endeavored to forecast exchange rates
for more than half a century, I have understand-
ably developed significant humility about my abil-
ity in this area...."
Alan Greenspan
Remarks Before the Euro 50 Roundtable
Washington D.C., November 30, 2001
Deutsche Bank Guide to Exchange-Rate Determination
"Explaining the yen, dollar and euro exchange rates
is still a very difficult task, even ex-post."
Kenneth Rogoff
Economic Counselor and Director of Research,
International Monetary Fund

DB Guide to Exchange-Rate Determination May 2002
Deutsche Bank @
4Deutsche Bank Foreign Exchange Research
Getting the exchange rate right is a critical objective of all
international investors. Unfortunately, getting the exchange
rate right on a reasonably consistent basis is far from easy.
As anyone involved in the business of currency forecast-
ing can attest, it can be a humbling experience.
Currency forecasts can go awry for a variety of reasons.
For instance, if one's expectation of the direction in which
fundamental-based forces are heading is flawed, so will
be one's forecast of a currency's future path. Even if one's
interpretation of the underlying fundamental forces were
correct, currency forecasts might still go awry if short-term
technical forces carried exchange rates far from their fun-
damental equilibrium path.
Scores of empirical studies have found that fundamental-
based models tend to perform poorly in terms of explain-
ing exchange-rate trends, particularly over short-term peri-
ods. However, fundamental-based models tend to work
better over medium and especially longer-run horizons.
Unfortunately, most fund managers, whose performances
are evaluated over relatively short time spans these days,
are often not willing to risk significant sums of capital on
the basis of longer-term, fundamental-based projections.
That is why many market participants have recently turned
their attention away from longer-run fundamental-based
forecasting approaches in favor of shorter-term forecast-
ing tools such as technical-based trend-following trading
rules. In addition, there has recently been significant inter-
est in flow, sentiment, and positioning indicators to deter-
mine the exposure of market participants to the individual
currencies. Such indicators are often used as contrarian
indicators to determine whether a currency is significantly
overbought or oversold, and thus ripe for a correction.
Given the wide variety of forecasting approaches, we
thought it would be useful to put together a guidebook
that summarized each of those approaches in an easy-to-
read format. Our intention was to create a user-friendly
format where the written text was purposely kept to a
minimum and where the charts and tables—about 400 in
all—would tell the story.
This guidebook recognizes that the tools required for short-
term investors differ significantly from those needed for
medium and long-term currency managers. Hence, the
guidebook devotes separate chapters to the determina-
tion of exchange rates over short, medium, and long-term
horizons.
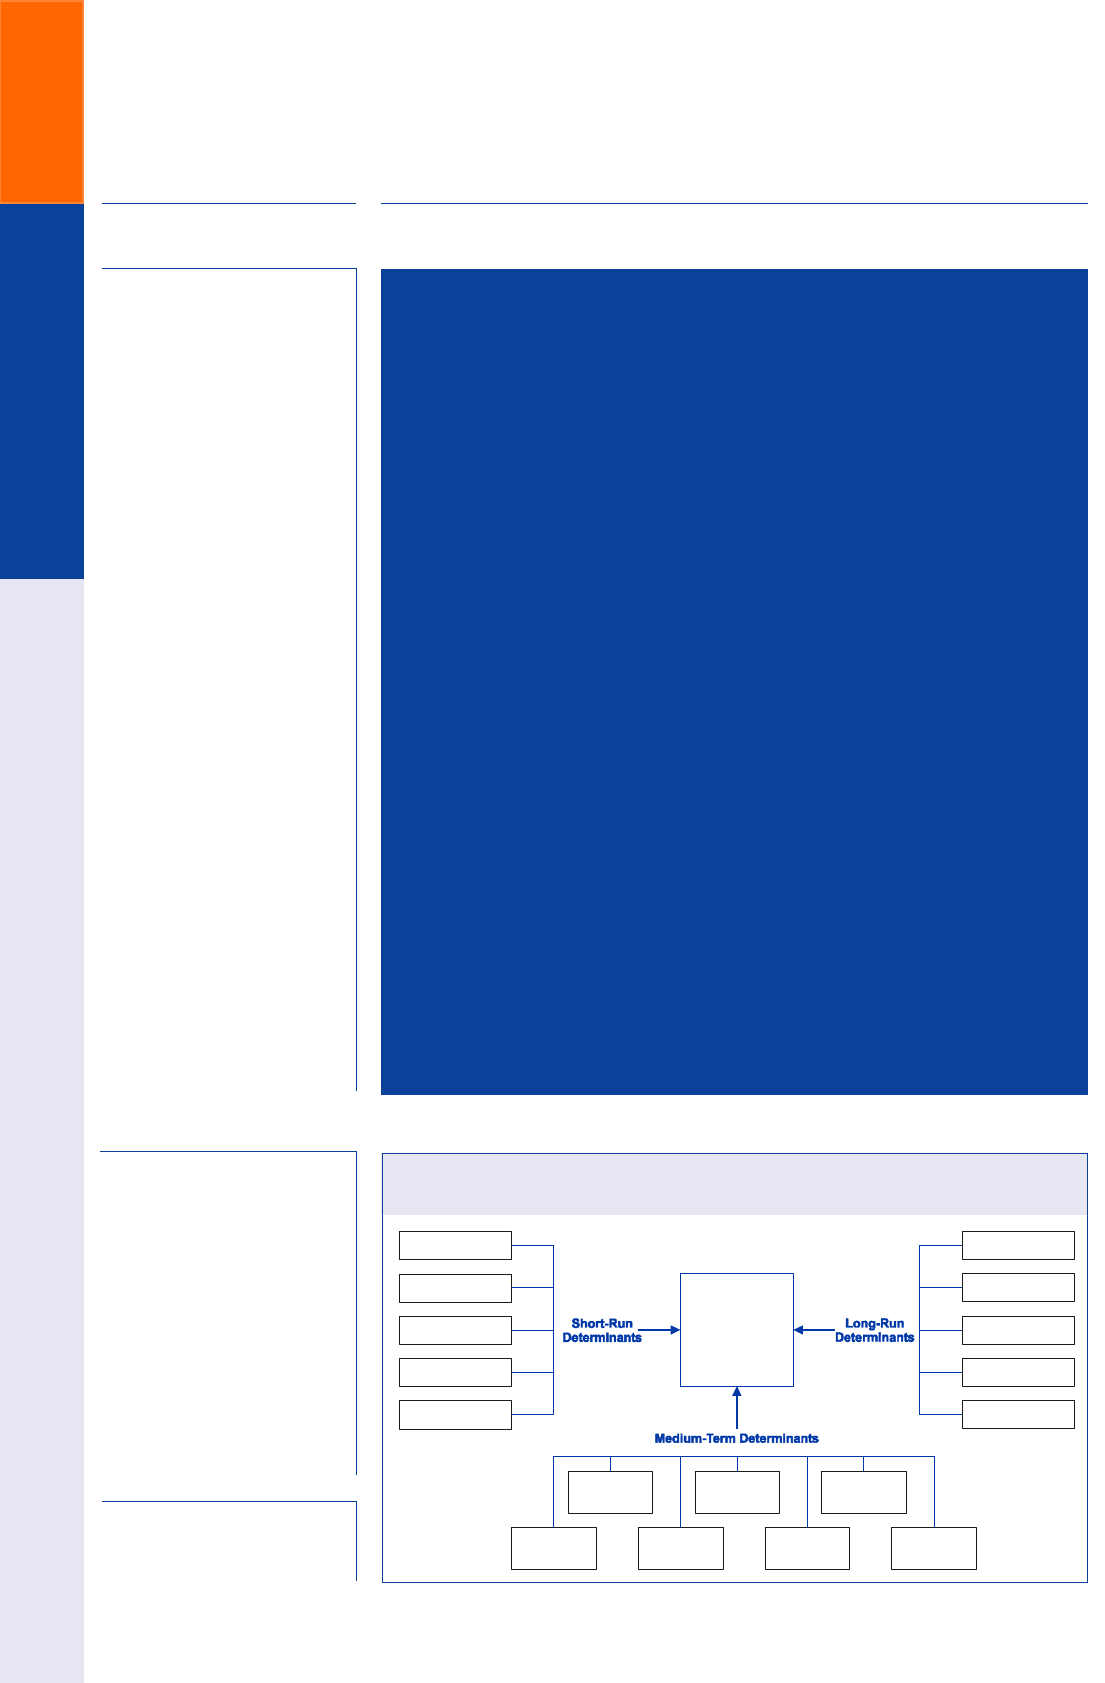
The adjacent schematic diagram provides a convenient il-
lustration of the layout of this guidebook and highlights
the myriad of channels through which fundamental and
technical forces jointly affect exchange rates. Some of those
channels will tend to exert a more profound impact on ex-
change rates in the short run, while others will tend have a
more profound impact in the medium or long run. We ex-
plore each of those channels in the chapters that follow.
In the chapter entitled "Exchange Rate Determination in
the Short Run," we investigate the potential risks and re-
wards of using a variety of short-run forecasting tools in
formulating short-term FX strategies. These include mov-
ing-average trend-following trading rules, sentiment and
positioning surveys, FX dealer customer-flow data, infor-
mation embedded in currency option prices, and risk ap-
petite indices.
We find that moving-average trading rules would have gen-
erated significant risk-adjusted excess returns over rela-
tively long periods for most major currency pairs, although
losing trades tend to occur far more frequently than win-
ning trades, in many cases by a factor of 3 to 1. The high
frequency of losing trades suggests that moving-average
trading rules can be risky over short periods and that an
investor would need considerable risk capital on hand to
absorb such losses to stay in the game until exchange rates
eventually become more highly trended.
The evidence on flow, sentiment, and positioning surveys
suggests that these indicators should be viewed more as
contemporaneous rather than as leading indicators of ex-
change-rate movements. We argue that such indicators can
be useful as confirmation indicators in conjunction with
traditional trend-following trading rules in formulating short-
term FX strategies.
In the chapter entitled "Exchange Rate Determination in
the Long Run," we explore the fundamental forces that
give rise to long-term cycles in exchange rates. The chap-
ter begins by noting that deviations from estimated PPP
values have tended to be large and persistent, suggesting
that fundamental forces other than relative national infla-
tion rates have played a key role in driving the long-term
path that exchange rates have taken. We investigate a va-
riety of fundamental variables that have had some suc-
cess in explaining the long-term path that currencies have
taken, including relative productivity growth, persistent
trends in a country's terms of trade, long-term trends in
net foreign asset and liability positions, and long-term
trends in national savings and investment.
Introduction

DB Guide to Exchange-Rate Determination
May 2002 Deutsche Bank @
Deutsche Bank Foreign Exchange Research 5
In the chapter entitled "Exchange Rate Determination in
the Medium Run," we investigate a wide range of cyclical
forces that have caused currencies either to rise or fall on
a medium-term basis relative to their long-run equilibrium
path. In many cases, these medium-term deviations from
the long-run equilibrium path have been quite sizeable and
persistent. We find that medium-term trends are influenced
by a variety of macroeconomic indicators such as the trend
in real interest-rate differentials, current and capital-account
balances, relative monetary and fiscal policies, relative eco-
nomic growth, and portfolio-balance considerations.
Finally, in the chapter entitled "Anticipating Currency Cri-
ses in Emerging Markets," we set out to identify those
economic and financial variables that have had success in
correctly predicting whether an emerging-market currency
might be vulnerable to a speculative attack, and whether it
is possible to construct an early-warning system that can
successfully pinpoint when a speculative attack might oc-
cur. Empirical research finds that crises-prone currencies
typically display a number of classic symptoms that warn
of an impending attack. Those symptoms include exces-
sive real appreciation of the emerging-market currency,
weak domestic economic growth, rising unemployment,
an adverse terms of trade shock, deteriorating current-ac-
count balances, excessive domestic credit expansion, bank-
ing-system difficulties, unsustainably large government
budget deficits, overly expansionary monetary policies, a
high ratio of M2 money supply to reserves, foreign-ex-
change reserve losses, falling asset prices, and/or a huge
build-up in short-term liabilities by either the private or public
sector.
The overall conclusion one draws from a variety of empiri-
cal studies is that the success of early-warning systems in
terms of generating correct out-of-sample projections is
mixed. While most early-warning models can point to a
significant number of correctly predicted crises, those
same models also have a tendency to generate a sizable
number of false alarms and missed crises.
Perhaps all that one can say after reviewing all the differ-
ent approaches to exchange-rate determination is that no
single approach has a monopoly on being right all of the
time. Some strategy systems such as moving-average trad-
ing rules and forward-rate bias strategies appear to have a
long-run track record of success, but one needs to be mind-
ful that there were a number of periods in the past when
significant losses were incurred from following these strat-
egies. Likewise, some key fundamental variables may have
closely tracked the trend in exchange rates in the past, but
there is no guarantee that they will continue to do so in
the future. If divergent trends begin to set in, fund manag-
ers must decide whether to disregard the trend in those
key fundamental variables or not.
Although many fund managers might prefer to follow a
rigid rule or trading system for formulating FX strategies,
one should not sell short a judgment-based approach to
currency investment management. In the end, successful
FX management is based as much on "art" as it is on "sci-
ence."
Bandwagon Effect/
Trend-Following Behavior
Real
Interest-Rate
Differentials
Purchasing Power Parity
Capital
Flows
Fiscal
Policy Portfolio-Balance
Considerations
Current
Account
Trends
Relative
Economic
Growth
Monetary
Policy
Investor Positioning
FX Options Market
Positioning
Risk Appetite
Investor Sentiment
Net Foreign Assets
Productivity Trends
Savings/Investment
Balance Trends
Exchange-Rate Determination
in the Short, Medium, and Long Run
Persistent Trend in
Terms-of-Trade
Exchange Rate

DB Guide to Exchange-Rate Determination May 2002
Deutsche Bank @
6Deutsche Bank Foreign Exchange Research

DB Guide to Exchange-Rate Determination
May 2002 Deutsche Bank @
Deutsche Bank Foreign Exchange Research 7
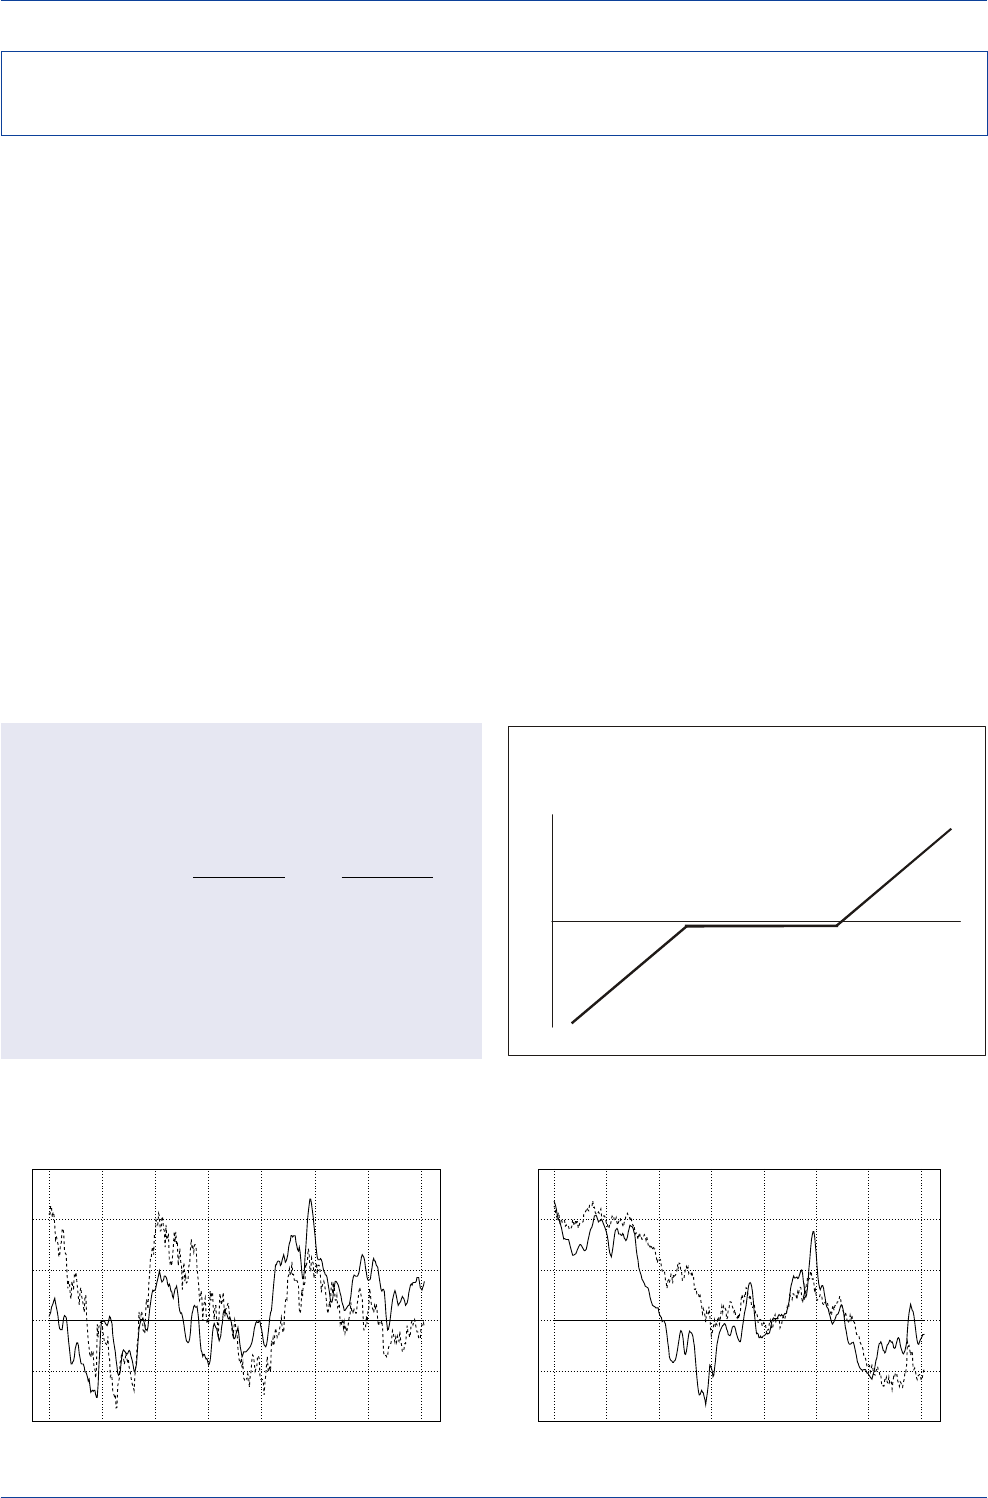
A Stylized Model of Exchange-Rate Overshooting
at the End of a Long-Term Uptrend
Currency’s
Value
Time
Economic Fundamentals
Exchange-Rate Determination
in the Short Run

DB Guide to Exchange-Rate Determination May 2002
Deutsche Bank @
8Deutsche Bank Foreign Exchange Research
Economists have come up with a wide range of theories
to explain how exchange rates are determined. The over-
whelming body of evidence from scores of empirical stud-
ies indicates that fundamental-based models, while use-
ful in explaining long-term trends, have not met much suc-
cess in explaining short-term exchange-rate trends. Indeed,
the evidence suggests that for short-term horizons, a ran-
dom walk characterizes exchange-rate movements better
than most conventional fundamental-based exchange rate
models.
One of the reasons why researchers have not been able
to unearth any significant relationship between changes
in macroeconomic variables and changes in exchange rates
over short periods is that exchange rates often exhibit much
greater variability than do macroeconomic time series in
the short run. The often chaotic behavior of exchange rates
is capable of generating so much noise that it may ob-
scure any discernable relationship between macroeco-
nomic time series and the short-term movement of ex-
change rates.
Bandwagon effects are also capable of causing exchange
rates to wander away from fundamental equilibrium val-
ues in the short run. Survey studies find that FX market
participants tend to have extrapolative expectations over
short-term horizons and mean-reverting or regressive ex-
pectations over longer horizons. If investors have extrapo-
lative expectations over short horizons, they may tend to
accentuate and perpetuate exchange-rate movements in
the short run far beyond the path justified by fundamen-
tals alone. Indeed, if a significant number of investors en-
gaged in extrapolative/trend-following trading strategies,
exchange rates might tend to overshoot on both the up-
side and downside, which could further obscure the rela-
tionship between macroeconomic fundamentals and the
short-term movement of exchange rates.
Because exchange rates can and often do deviate signifi-
cantly from any semblance of fair value in the short run,
investors have looked for alternative forecasting tools to
help them formulate currency investment strategies over
short-term horizons. Short-run forecasting tools that have
attracted interest in recent years include technical-based
trend-following trading rules, sentiment and positioning sur-
veys, FX dealers' customer order flow data, information
embedded in currency option prices, and risk appetite in-
dices.
Investors who concentrate their energies on such tools
presume that the market exhibits a tendency to tip its hand
ahead of time as to which direction it intends to take ex-
change rates in the future. While technical models have
been found to be profitable in the past, most of the other
short-term indicators are relatively new to the FX arena
and thus only a limited time series is available to test their
predictive power. What evidence we do have, however,
suggests that in most cases, these indicators are more
useful as contemporaneous rather than as leading indica-
tors of exchange-rate movements. Nevertheless, they may
prove useful as confirmation indicators that can be used in
conjunction with traditional technical-based trend-follow-
ing trading rules in formulating short-term investment strat-
egies.
Short-Run Forecasting Tools
Short-Run Forecasting Tools: A Checklist
Up
Short-Term Trend
Down
Moving-Average Crossover Trading Rule
Market Sentiment
Speculative Positioning
Order Flow
Option Market Sentiment
Risk Appetite Indices
Neutral Over-
sold
Over-
bought
Momentum
(Consensus Inc. Index of Bullish Opinion)
(Net IMM Contracts)
(DB Customer Order Flow Database)
(Risk Reversals)
Forecasting Tool
DB Guide to Exchange-Rate Determination
May 2002 Deutsche Bank @
Deutsche Bank Foreign Exchange Research 9
FX market participants typically fall into one of two camps:
(1) Shorter-run technically oriented traders or
(2) Longer-run fundamental-based investors.
Shorter-run technically oriented traders do not base their
investment decisions on fundamental considerations.
Rather, they rely on trend-following trading rules to deter-
mine their position taking: they buy when the currency is
rising, and they sell when the currency is falling. In con-
trast, longer-run fundamental-based investors base their
investment decisions largely on valuation considerations.
If a currency is believed to be mispriced relative to its fair
value, fundamental-based investors would buy those cur-
rencies that are believed to be undervalued and would
sell those currencies that are believed to be overvalued.
Knowing precisely what exchange-rate level represents a
currency's true equilibrium or fair value is not an easy task.
Different exchange-rate models can and often do yield quite
different estimates of a currency's long-run equilibrium
value. In most cases, the marketplace will have only a rough
idea of where a currency's long-run equilibrium value lies.
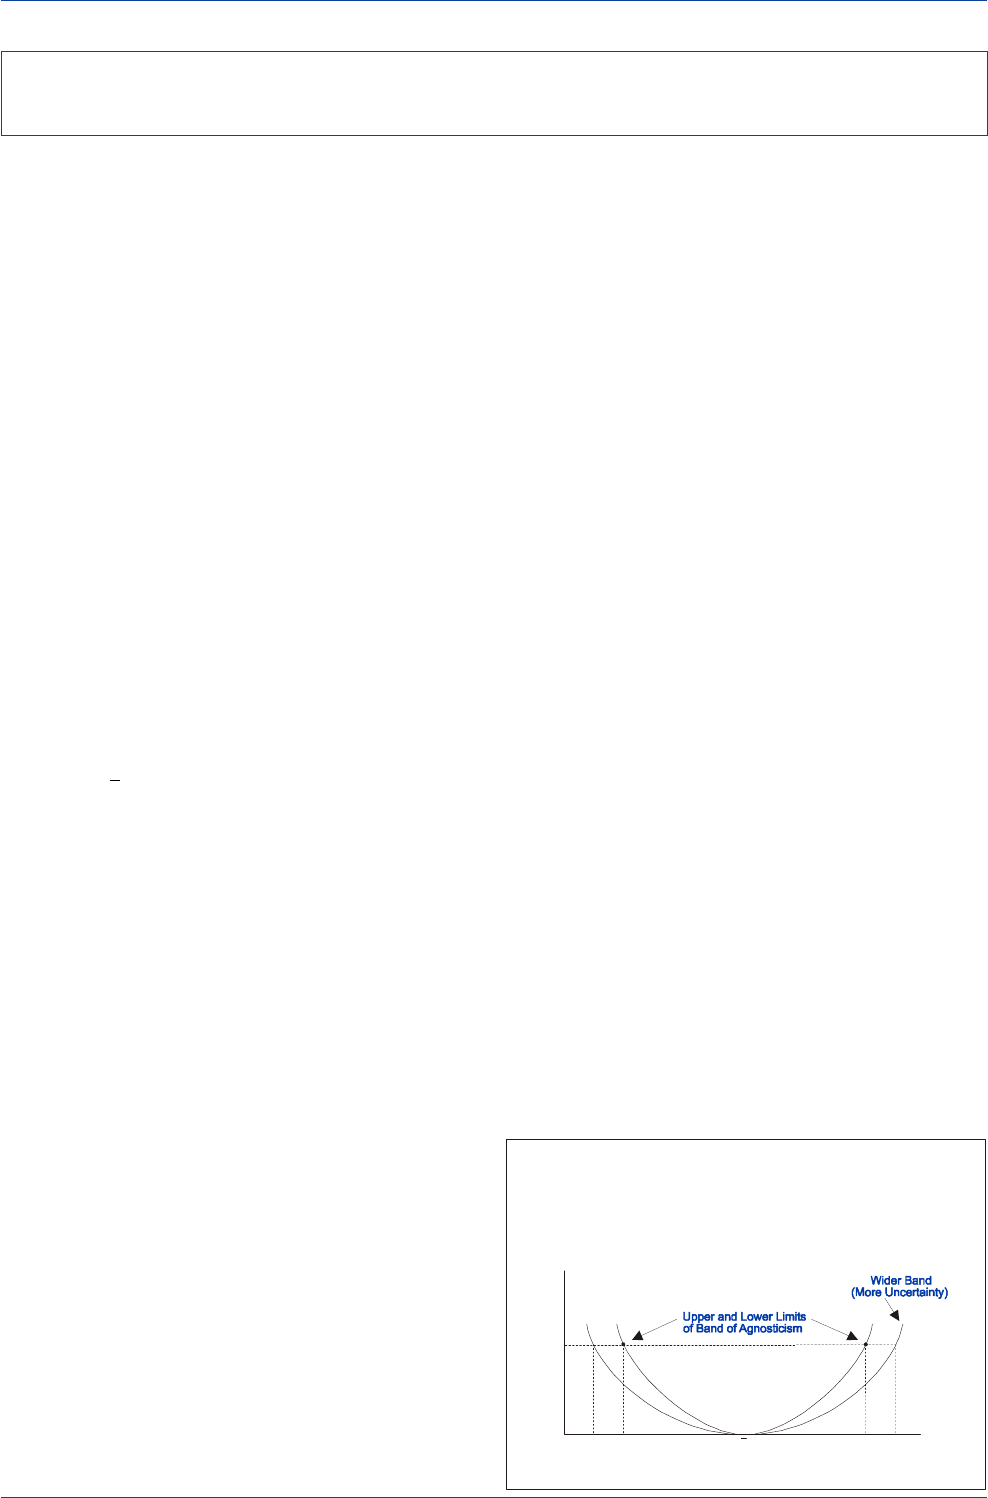
Because of this, fundamental-based investors will not set
their sights on an imprecise point estimate of fair value,
but rather on an equilibrium range or band. Within this
equilibrium range or band, fundamental-based investors
will presume that the true but unknown equilibrium ex-
change rate, q, lies somewhere between an upper bound,
qU, and a lower bound, qL.
The qU-qL band has been referred to as the "band of agnos-
ticism" in academic writings (see DeGrauwe, 1996). When
exchange rates trade inside the qU-qL band, fundamental-
based investors tend to be agnostic in terms of their cur-
rency positioning, accepting the fact that the actual ex-
change rate is probably trading close to its fair value. Ex-
change-rate movements within the qU-qL band are viewed
as noise and therefore not worthy of serious investment
consideration. Fundamental-based investors would thus
not feel compelled to take on either aggressive long or
short currency positions when exchange rates are trading
inside the band. Instead, they would more likely adopt a
neutral stance toward currency positioning.
When exchange rates fluctuate inside the band of agnosti-
cism, trading tends to be dominated by short-term techni-
cally oriented traders since fundamental-based investors
will refrain from joining the fray until the actual exchange
rate moves outside of the band. When the actual exchange
rate moves outside the qU-qL equilibrium range, fundamen-
tal-based investors will tend to shed their agnosticism and
become more willing to take on aggressive long positions
if the actual exchange rate falls below qL and aggressive
short positions if the actual exchange rate rises above qU.
In times of greater market uncertainty, however, the band
of agnosticism is likely to widen since investor confidence
regarding estimates of fair value is likely to be less strongly
held than in tranquil environments. In such cases, techni-
cally oriented traders would tend to dominate trading ac-
tivity over even wider ranges (q'U-qL'>qU- qL). That, in turn,
would likely lead to even greater FX volatility in the short
run.
One of the key problems for fundamental-based investors
is that even if the exchange rate moved outside of the
band of agnosticism, there is no guarantee that it would
move back inside the band anytime soon. Indeed, funda-
mental-based investors run the risk that an overvalued
currency might get even more overvalued if the exchange
rate moved deeper into overvalued territory, and vice versa.
Since large financial resources are likely to be needed for
investors to position themselves against an overshooting
exchange rate, one has to wonder how many fund manag-
ers would be willing to risk their clients' capital on the
basis of long-run valuation considerations, particularly if
clients evaluate their fund manager’s investment perfor-
mance over a relatively short time span. If fund managers
view it as simply too risky to take on long or short cur-
rency positions on the basis of long-run valuation consid-
erations, then there might be several occasions when ex-
change rates could wander far from any semblance of fair
value, and yet very few investors would be willing to risk
their clients' capital to bring the exchange rate back into
line with fair value.
Why FX Market Participants Focus Their Energies on Short-Run Rather
Than Long-Run Strategies
The "Band of Agnosticism"
Index of Investor Willingness to
Make Currency Bets Based on
"Fundamentals"
Real Exchange Rate
q’
L
q
L
Analyzing the Behavior of Fundamental-Based Investors When
Expectations of Real Long-Run Equilibrium Exchange Rates Are Loosely Held
q
U
q’
U
Source: Adapted from DeGrauwe (1996)
q

DB Guide to Exchange-Rate Determination May 2002
Deutsche Bank @
10 Deutsche Bank Foreign Exchange Research
When FX dealers were asked recently what role funda-
mental factors played in the determination of exchange
rates, 97% of the respondents felt that fundamentals
played no role on an intra-day basis. However, over me-
dium and longer-term horizons, FX dealers felt that funda-
mental forces did play an important role, with 57.4% of
the respondents believing that exchange rates reflect fun-
damental value on a medium-term (within six months)
basis, and 87% believing exchange rates reflect fundamen-
tal value on a long-term (over six months) basis.
When asked to rank the most important determinants of
exchange rates on an intra-day basis, FX dealers indicated
that bandwagon effects, speculative forces, and over-re-
action to news were the principal driving forces in the very
short run. On a medium-term basis, economic fundamen-
tals and technical trading increase in importance from the
dealer community's perspective, but FX dealers also con-
tinued to assign importance to speculative forces as a key
determinant of medium-term trends in exchange rates. For
longer horizons, FX dealers believed that economic funda-
mentals were the dominant factor driving exchange rates.
However, a not insignificant number (11.3%) believed that
technical trading was important even in the long run.
The FX dealer survey also asked dealers whether they
thought that exchange rates were more predictable on an
intra-day basis or on a medium-term (up to six months) or
long-term (beyond six months) basis. FX dealers were
asked to assign a rating of 1 if there was no predictability,
a rating of 5 if there was a high predictability and a rating
of 2, 3, or 4 if there was low, medium, or better than aver-
age predictability, respectively. Since FX dealers tend to
trade on an intra-day basis, one might have thought that
they would assign a high rating to exchange-rate predict-
ability on an intra-day basis. This was not the case. Indeed,
62% of the dealer respondents gave ratings of 1 or 2, to
the predictability of exchange rates in the short run, while
only 11% gave ratings of 4 or 5.
For medium and longer time horizons, the confidence in
exchange-rate predictability increases, with 30.4% of deal-
ers assigning a ranking of 4 or 5 on a medium-term basis
and 35.1% assigning a ranking of 4 or 5 on a longer-term
basis. The question that we need to ask ourselves is: if FX
dealers are more confident in predicting exchange rates
on a medium/long-term basis rather than on an intra-day
basis, why then do traders concentrate their energies on
very short-run trading? The answer might be that traders
are in a better position to evaluate and manage FX risk on
a short-term basis, which overrides their greater confidence
in medium/long-term exchange-rate predictability.
FX Dealers’ Perception of the Role of Fundamentals
in Explaining Exchange-Rate Movements
FX Dealer Survey Question—Do You Believe Exchange-Rate
Movements Reflect Changes in Fundamental Value on an:
Intraday Medium-Run Long-Run
Basis Basis Basis
(up to 6 months) (beyond 6 months)
Yes 3% 57.8% 87%
No 97% 42.2% 12%
No Opinion 0% 0.0% 1%
Source: Yin-Wong Cheung, Menzie D. Chinn, and Ian W. Marsh,
“How Do UK-Based Foreign Exchange Dealers Think Their Market Operates?”,
NBER Working Paper 7524, February 2000.
FX Dealers’ Perception of the Most Important Factor
That Explains Exchange-Rate Movements
FX Dealer Survey Question—Select the Single Most Important
Factor that Determines Exchange Rate Movements on an:
Intraday Medium-Run Long-Run
Basis Basis Basis
(up to 6 months) (beyond 6 months)
Bandwagon Effects 29.3% 9.5% 1.0%
Over-reaction to News 32.8% 0.7% 0.0%
Speculative Forces 25.3% 30.7% 3.1%
Economic Fundamentals 0.6% 31.4% 82.5%
Technical Trading 10.3% 26.3% 11.3%
Other 1.7% 1.5% 2.1%
Source: Yin-Wong Cheung, Menzie D. Chinn, and Ian W. Marsh,
“How Do UK-Based Foreign Exchange Dealers Think Their Market Operates?”,
NBER Working Paper 7524, February 2000.
FX Dealers’ Perception of the Predictability of
Exchange-Rate Movements
FX Dealer Survey Question—On a Scale of 1 to 5, Indicate If You
Believe the Market Trend Is Predictable on an:
Intraday Medium-Run Long-Run
Basis Basis Basis
(up to 6 months) (beyond 6 months)
1 (Least Predictable) 21.6% 5.9% 17.2%
2 40.3% 20.7% 16.4%
3 26.9% 43.0% 30.6%
4 9.0% 18.5% 20.9%
5 (Most Predictable) 2.2% 11.9% 14.2%
Source: Yin-Wong Cheung, Menzie D. Chinn, and Ian W. Marsh,
“How Do UK-Based Foreign Exchange Dealers Think Their Market Operates?”,
NBER Working Paper 7524, February 2000.
How FX Dealers View the Determination of Exchange Rates in the Short Run
DB Guide to Exchange-Rate Determination
May 2002 Deutsche Bank @
Deutsche Bank Foreign Exchange Research 11
Technical models generate exchange-rate forecasts by
extrapolating past sequences of exchange-rate movements
into the future. For example, if a currency begins to edge
higher and rises above some critical value, a technical
model will typically issue a recommendation to go long
that currency, the presumption being that the newly formed
trend will continue to carry the currency higher in the fu-
ture. Similarly, a sell signal would be issued if the currency
began to edge lower and fell below some critical value.
Trend-following trading rules will be profitable as long as
the ensuing trend does indeed move in the same direc-
tion as the preceding trend, which would be the case if
exchange rates moved in broad, well-defined cycles. But
that is not to say that exchange rates must always move in
large swings for trend-following trading rules to be profit-
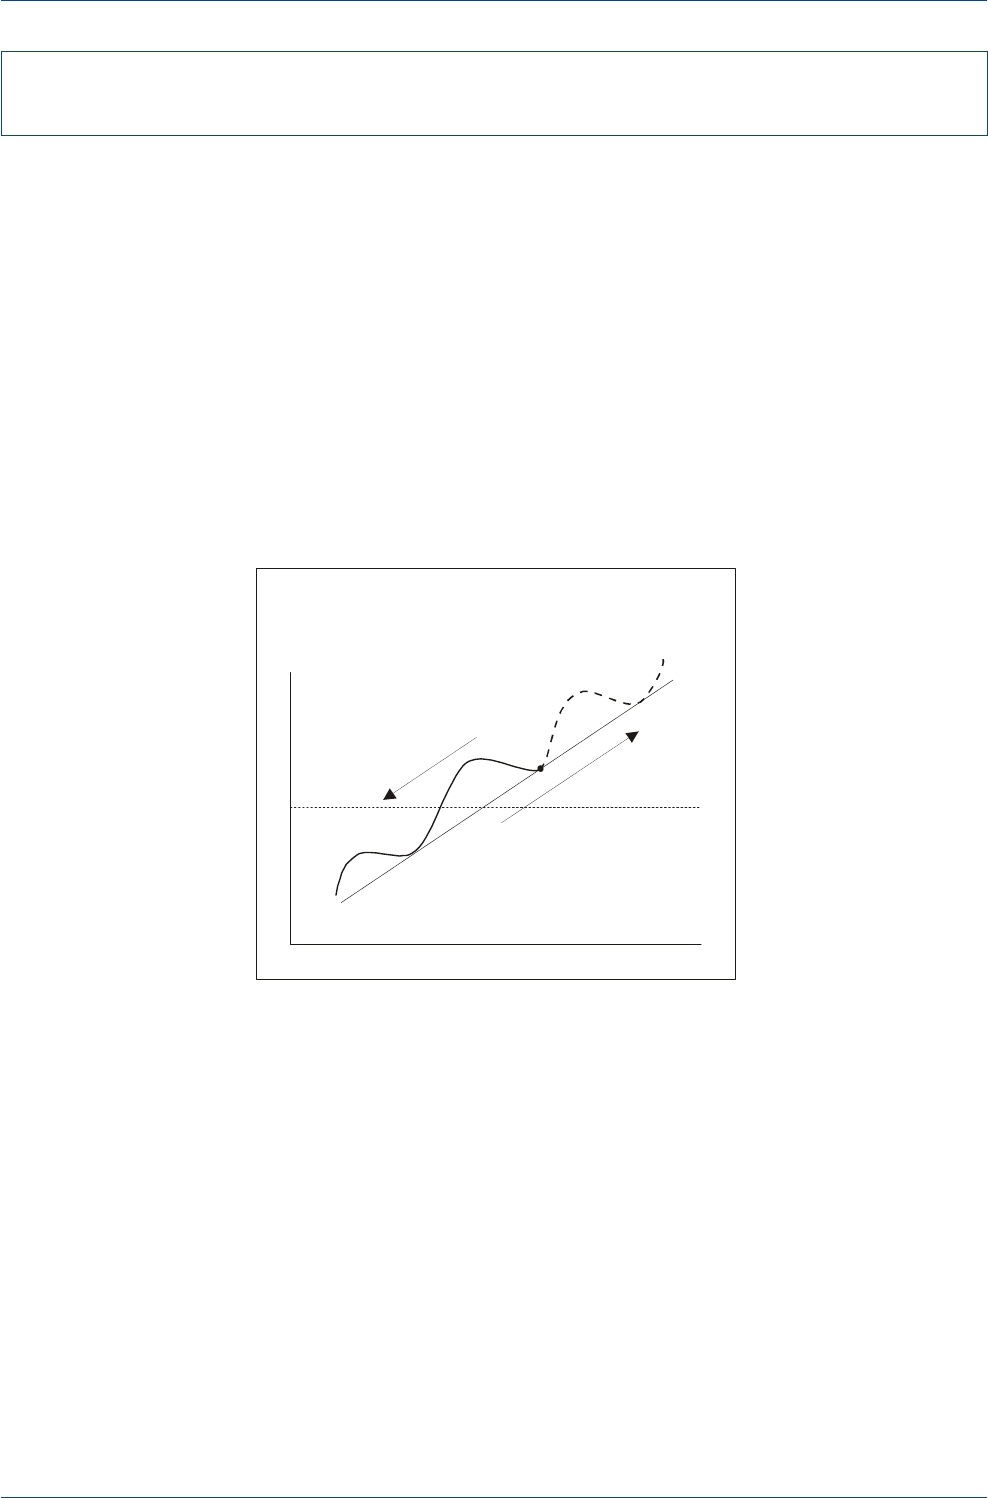
Technical Analysis:
The Advantage of Trading
With and Not Against the Trend
Exchange Rate
Time
Long-Run Equilibrium
Exchange Rate
Technical Analysis:
Even though a currency overshoots its
long-run equilibrium level, a technician
will recommend maintaining long positions
as long as the trend in the exchange
rate is up.
Fundamental Analysis:
May prematurely recommend
selling a currency that has
overshot its long-run
equilibrium level.
Trendline
Market Price
Today’s
Spot
Rate
able. What matters for long-term profitability is that large
exchange-rate upswings and downswings must occur on
a frequent enough basis to overcome those occasions
when currency movements are not highly trended.
Fundamental-based models tend to focus on whether a
currency lies above or below its long-run equilibrium or
"fair" value. Technical models, on the other hand, are not
interested in whether a currency lies above or below its
fair value. Rather, technical models are only interested in
whether the trend in the exchange rate is upward or down-
ward. As long as a confirmed uptrend (or downtrend) is in
place, a recommended long (short) position will be main-
tained even if the prevailing trend carries the exchange
rate well above (below) its long-run fair value.
Currency Forecasting Using Technical Analysis—
The Advantage of Trading with and Not Against the Trend
Source: Rosenberg (1996)
DB Guide to Exchange-Rate Determination May 2002
Deutsche Bank @
12 Deutsche Bank Foreign Exchange Research
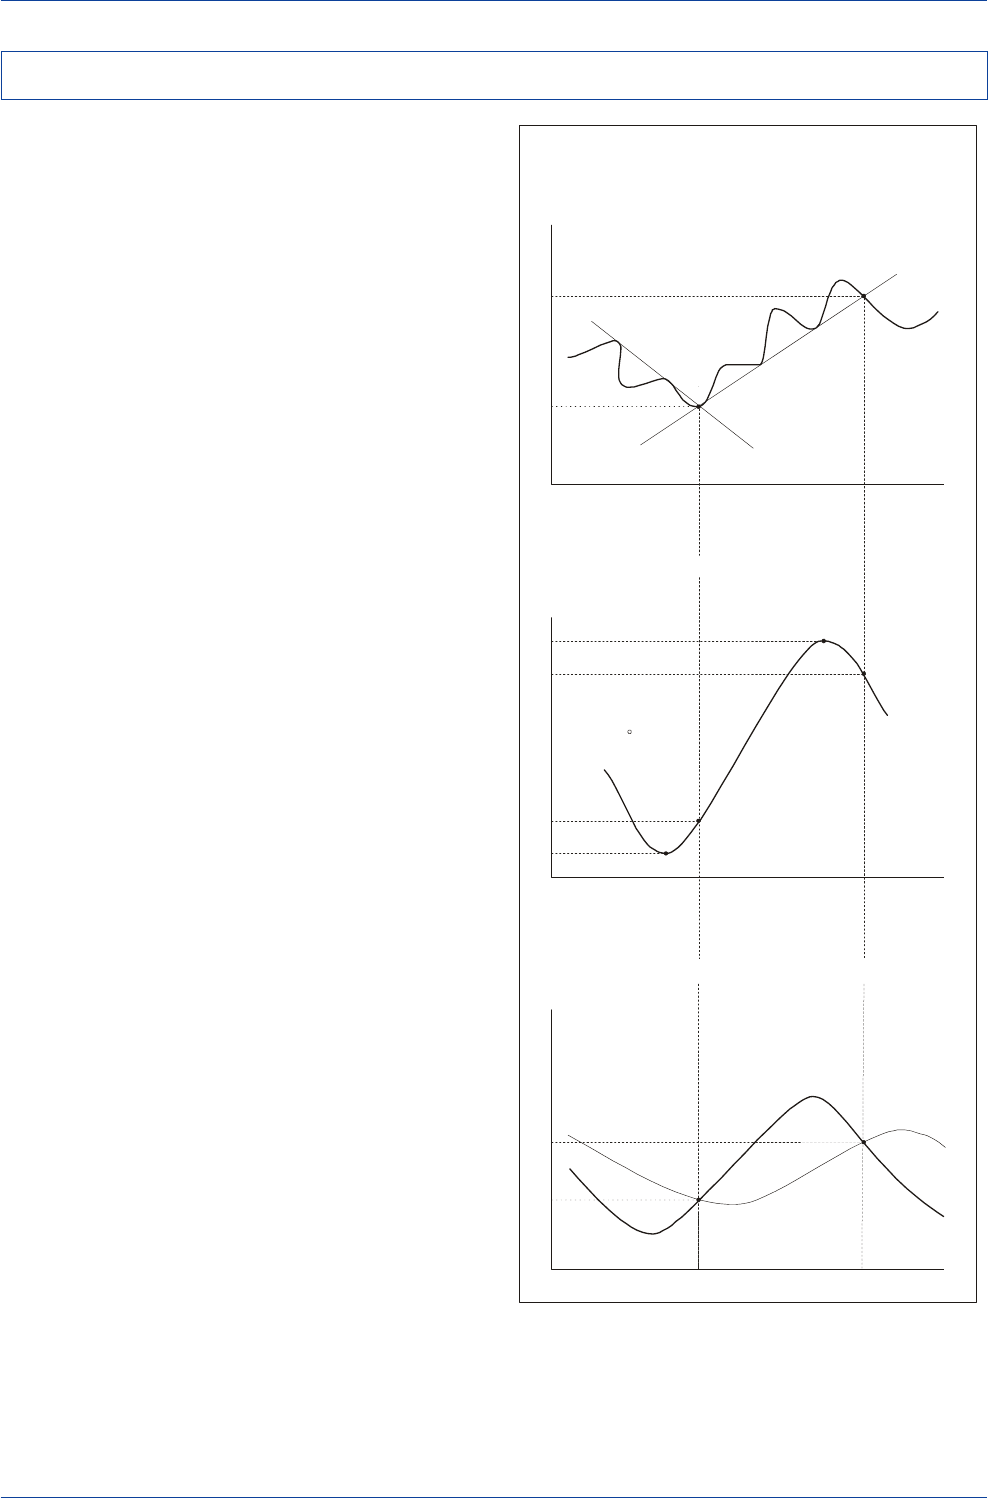
Identification and Confirmation of a Valid Uptrend/Downtrend
Exchange Rate
Time
Trendline
Market Price
Peak
2
Exchange Rate
Time
Peak
1
Peak
3
Trough
2
Trough
1
Trough
3
Trendline
Peak
2
Peak
3
Trough
2
Trough
1
Trough
3
Peak
1
Market Price
Identification and Confirmation
of a Market Reversal
Exchange Rate
Time
Trendline
Market Price
Head-and-Shoulders Reversal Pattern
Exchange Rate
Time
Neckline
Market Price
Head
Left Shoulder
Right Shoulder
Trend-following trading rules come in many forms. But what
all trend-following trading rules have in common is that
they seek to identify the direction in which the
broad
trend
in exchange rates is heading. One can visualize the trend
in exchange rates as a series of primary and secondary
waves. The primary wave refers to the large, broad moves
in exchange rates that carry the underlying trend in cur-
rency values either upward or downward. The secondary
waves refer to the temporary corrections or partial
retracements of the primary trend that typically take place
over the course of longer-run exchange-rate cycles. What
trend-following trading rules attempt to do is to identify
the direction in which the primary waves are heading.
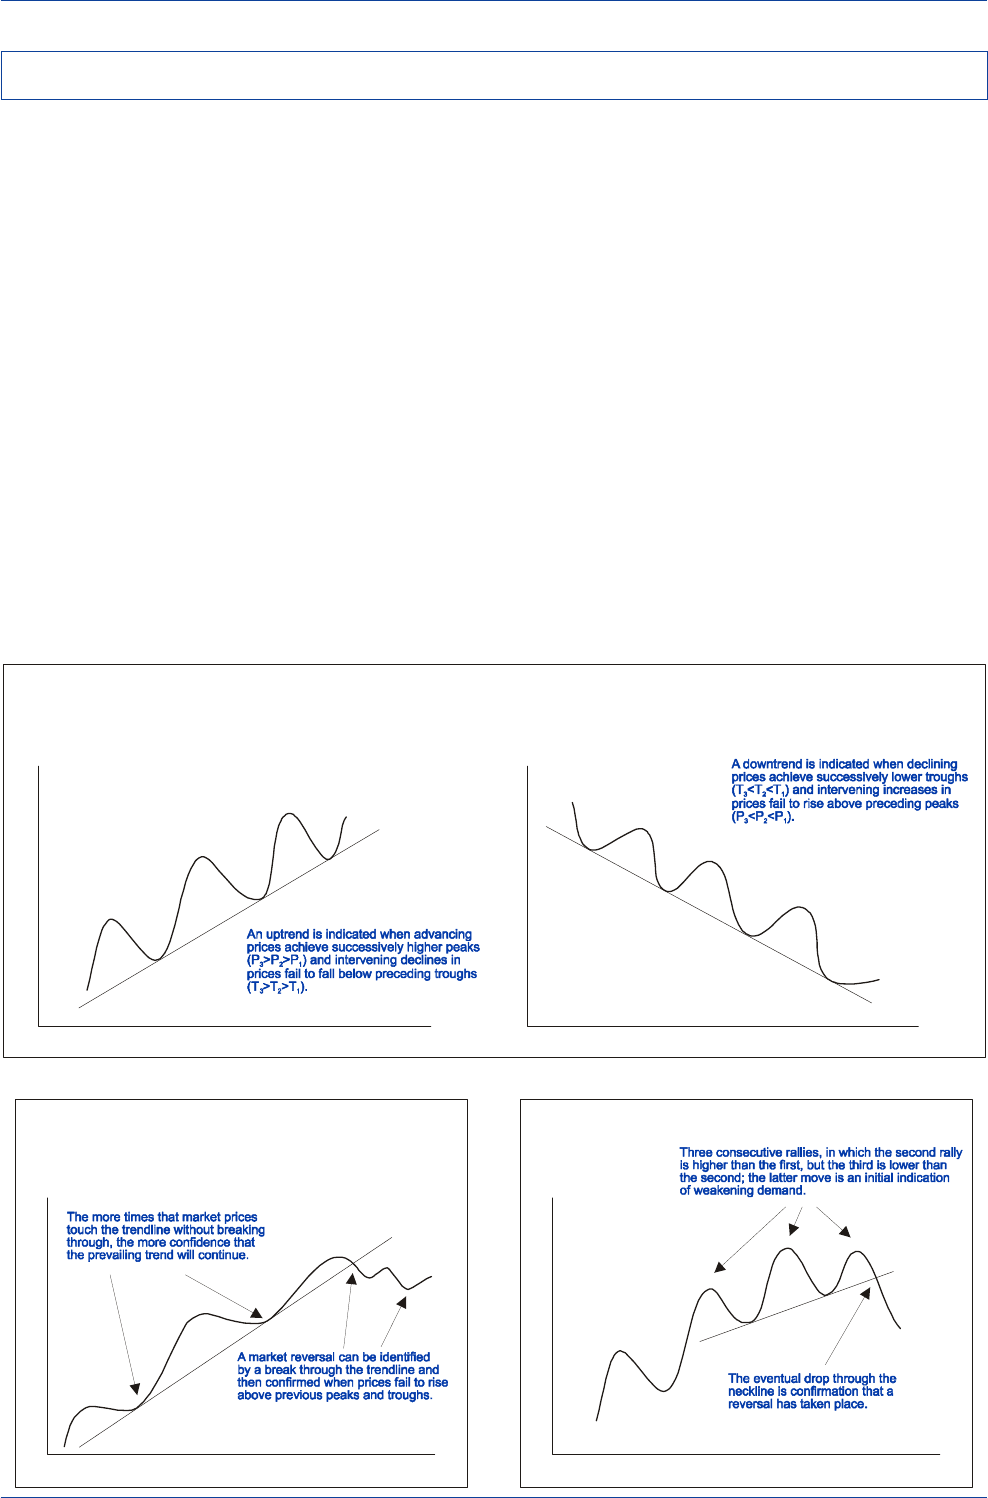
In a rising market, each rally and partial retracement will
be higher than its predecessor. As long as advancing prices
achieve successively higher peaks and troughs, they indi-
cate that buying pressure is overcoming selling pressure.
In such a case, the uptrend will be presumed to be intact,
until a reversal is signaled. The opposite would be the case
in a declining market.
Markets reverse in many different ways, but all reversals
have one thing in common—all reversals of valid uptrends
(downtrends) must be preceded by the failure of market
prices to achieve successively higher peaks and troughs
(lower troughs and peaks). In the case of a reversal of a
previous valid uptrend, when the wavelike series of rising
peaks and troughs is broken, it indicates that selling pres-
sure is finally beginning to overcome buying pressure.
One of the most recognizable reversal patterns is the head-
and-shoulders pattern. A head-and-shoulders pattern is
essentially a series of three successive rallies with the
second stronger than the first, and the third weaker than
the second. Because the third rally fails to carry as far as
the second, the string of successively higher peaks is bro-
ken. This is an initial indication of weak demand, and the
eventual drop in market prices to levels below the preced-
ing trough (or neckline) is confirmation that a reversal is
taking place. A recent Federal Reserve Bank of New York
study (Osler and Chang, 1995) found that head-and-shoul-
ders patterns have been successful in anticipating rever-
sals in trend for the yen and Deutschemark.
The Identification of FX Market Trends and Reversals
Source: Rosenberg (1996)
Source: Rosenberg (1996) Source: Rosenberg (1996)
DB Guide to Exchange-Rate Determination
May 2002 Deutsche Bank @
Deutsche Bank Foreign Exchange Research 13
A wide variety of trend-following trading rules abounds,
but by and large they all share the basic property of ex-
trapolation. A chartist who monitors the behavior of mar-
ket prices on a bar chart with a ruler and pencil will as-
sume that an uptrend is intact as long as advancing prices
achieve successively higher peaks and intervening declines
fail to fall below preceding troughs.
More sophisticated extrapolation techniques can be de-
signed with the assistance of a computer. One popular
computer-based technical model is the filter rule, which
issues a buy recommendation if an exchange rate rises by
x%
above its most recent trough, and issues a sell recom-
mendation if the exchange rate falls by
x%
below its most
recent peak. Another popular computer-based technical
model is the moving-average crossover model. By con-
structing longer-run moving averages of daily exchange-
rate movements, one can more easily isolate the primary
trend from short-run noise. If the short-run moving aver-
age of the exchange rate rises above its long-run moving
average, it is an indication that buying pressure is over-
coming selling pressure, and vice versa.
In each case, predictions of the likely future path that ex-
change rates might take are being generated by the ex-
trapolation of the prevailing trend in exchange rates into
the future. Essentially, it really doesn't matter which trend-
following rule you use. Since a trend is a trend, all trend-
following trading rules should roughly generate the same
directional forecast.
Because all of these models generate forecasts by extrapo-
lating the recent past trend of exchange rates into the fu-
ture, buy or sell signals will be issued only after a currency
has already started rising or falling. Although this means
that trend-following trading rules will not capture the very
top and bottom of market moves, they may nevertheless
be profitable if the ensuing exchange-rate movements per-
sist long enough and carry far enough to generate signifi-
cant excess returns.
Filter-Rule Strategy
DM/US$
Time
B
S
P
T
x%
x%
Moving-Average Crossover Strategy
DM/US$
Time
B
S
SRMA
LRMA
All Trend-Following Trading Rules Share
the Same Property: Extrapolation
DM/US$
Time
B
S
Down Trendline
Up Trendline
Trendline Penetration
Trend-Following Trading Rules and the Principle of Extrapolation
Source: Rosenberg (1996)
DB Guide to Exchange-Rate Determination May 2002
Deutsche Bank @
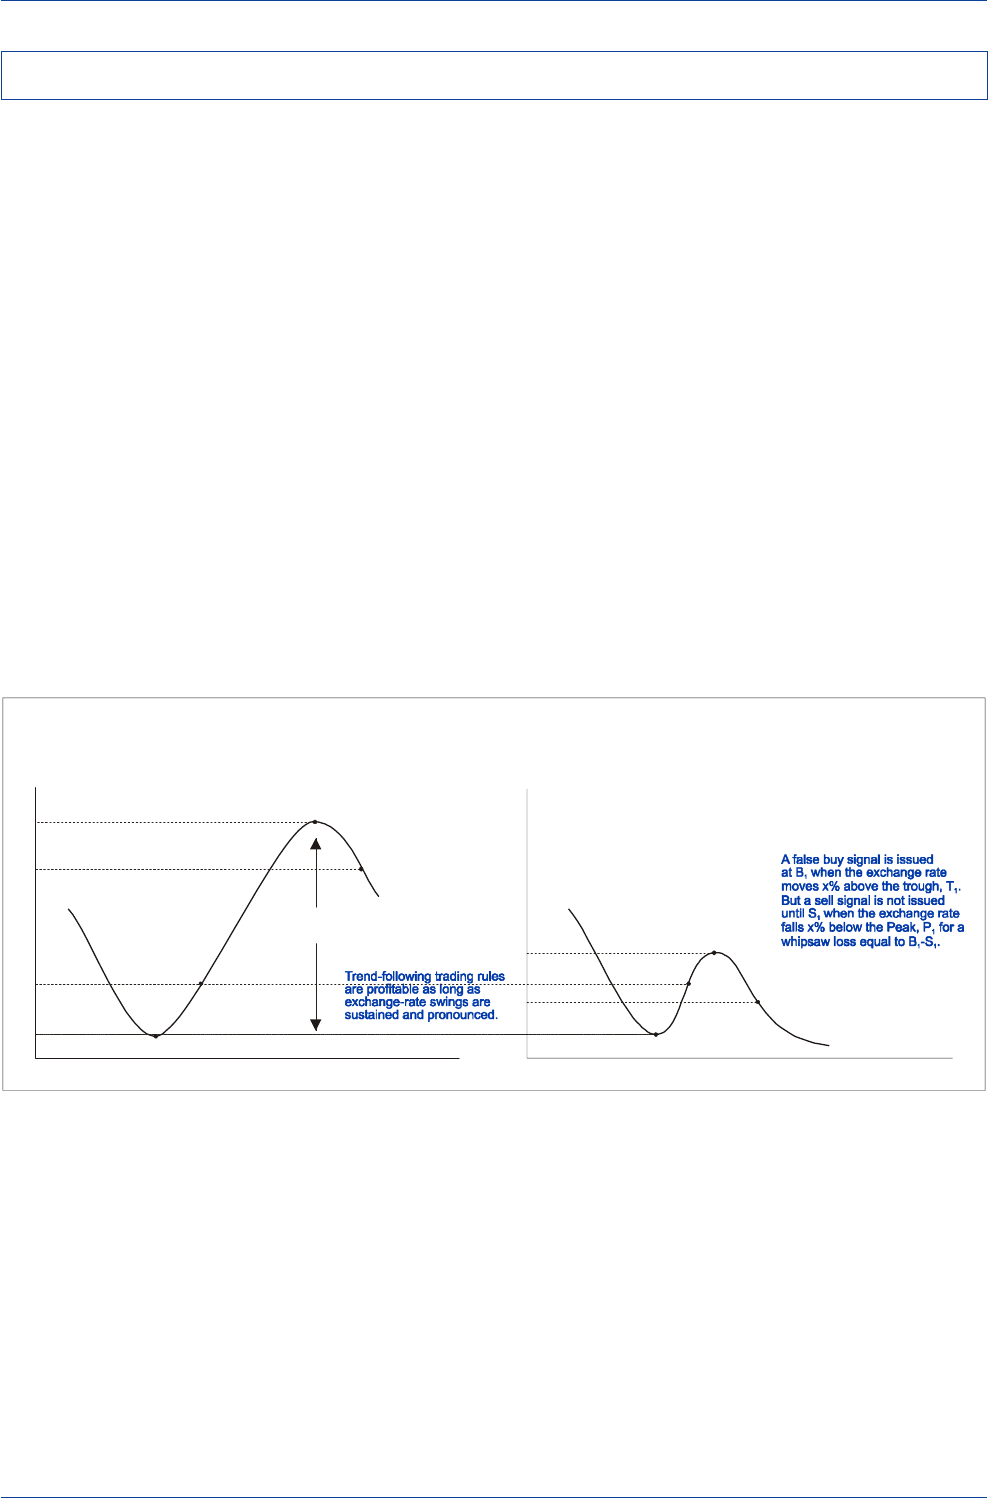
14 Deutsche Bank Foreign Exchange Research
Investors Who Follow a Trend-Following Trading Rule
May Be Vulnerable to Whipsaws Caused by False Signals
DM/US$
Time
B
S
P
T
x%
x%
DM/US$
B
1
S
1
P
1
T
1
An Example of a False Signal
and a Whipsaw Loss
Time
1
Market-Swing
Requirement
Market-Swing Requirement
of Profitable Trend-Following Trading Rules
When exchange-rate swings are sustained and pro-
nounced, the profitability of most technical trading rules
will not be seriously undermined if the trading rule tends
to be a bit late in drawing attention to a shift in market
direction. Unfortunately, this market-swing requirement
could prove in many cases to be a tall order. In markets
that exhibit little overall price variation or are not highly
trended, an investor who adheres to a trend-following trad-
ing rule will find his portfolio vulnerable to potential whip-
saw losses caused by frequent false signals.
Consider the two exchange rate series depicted below.
The series on the left illustrates the working of a profitable
x%
filter rule trading strategy. A recommendation to buy
dollars is issued at point
B
when the DM/US$ exchange
rate rises
x%
from its recent trough at point
T
. The ensuing
market action then carries the DM/US$ exchange rate to a
peak at point
P
, but a recommendation to sell dollars is
issued only at point
S
, when the exchange rate has fallen
x%
from its peak level. An investor who rigidly adhered to
this
x%
filter rule trading strategy would have bought dol-
lars at
B
and sold dollars at
S
, with the spread between
S
and
B
representing the profit margin per dollar invested.
The series on the right illustrates how losses can be in-
curred using a filter rule trading strategy. The series on the
right behaves in a similar fashion as the series on the left,
except for the fact that the dollar's upswing is less pro-
nounced following the recommendation to buy dollars at
point
B
1. That is, the swing in the DM/US$ exchange rate
from
B
1 to
P
1 falls short of the swing from
B
to
P
in the
chart on the left. At
P
1, the dollar's upward momentum is
shown to lose steam far earlier than was the case in the
series on the left. Indeed, the DM/US$ actually begins to
lose ground soon after its initial rise and a sell signal is
eventually issued at point
S
1. Since the selling price (
S
1)
lies below the purchase price (
B
1), a loss is incurred with
the spread between
S
1 and
B
1 representing the margin of
loss per dollar invested. Hence, the buy recommendation
at
B
1 proved to be a false buy signal, with the investor
whipsawed in the process.
Potential Pitfalls from Following Technical Trading Rules
Source: Rosenberg (1996)

DB Guide to Exchange-Rate Determination
May 2002 Deutsche Bank @
Deutsche Bank Foreign Exchange Research 15
Studies on the long-run profitability of technical-based trad-
ing rules often find that simple moving-average rules would
have generated significant excess returns over relatively
long periods for most major currency pairs. We simulated
more than 2500 sets of moving-average crossover trading
rules for seven currencies versus the U.S. dollar—the Deut-
schemark, Japanese yen, Swiss franc, British pound, and
the dollar-bloc currencies—over the 1986-2002 period, and
unearthed the optimal moving-average trading rules listed
in the table below. The criterion used to choose the opti-
mal trading rule in each case was to identify the rule that
yielded the highest Sharpe ratio (after adjusting for trans-
action costs) for the entire 16-year period.
For each exchange rate, there were a number of moving-
average crossover trading rules that yielded similar attrac-
tive Sharpe ratios, and we list the top 10 trading rules for
each exchange rate. In each case, there was always one
rule that eked out the highest Sharpe ratio and those are
shown in the column on the left. (For example, the best
performing trading rule for the Deutschemark/U.S. dollar
exchange rate was a 1-day/32-day moving-average cross-
over trading rule, which yielded an average annual total
return of 5.01% with a Sharpe ratio of 0.45.) The moving-
average crossover trading rules are ranked for each ex-
change rate and are listed from left to right in the table
below.
The 10 Best Moving-Average Crossover Trading Rules for 1986-2002
(Average Annual Total Returns and Sharpe Ratios for January 1986-April 2002 )
US$ Exchange Rate #1 #2 #3 #4 #5 #6 #7 #8 #9 #10
DEM Mov. Avg. Days 1/32 1/33 1/31 1/28 1/30 1/29 1/34 1/20 1/35 1/19
Total Return (%) 5.01 4.89 4.38 4.20 3.96 3.88 3.98 3.58 3.43 3.13
Std. Dev. (%) 11.06 11.06 11.06 11.06 11.06 11.06 11.06 11.06 11.06 11.06
Sharpe Ratio 0.45 0.44 0.40 0.38 0.36 0.35 0.36 0.32 0.31 0.28
JPY Mov. Avg. Days 8/59 8/60 7/61 8/61 7/60 9/60 9/62 9/61 8/62 8/63
Total Return (%) 9.19 9.16 8.83 8.86 8.76 8.79 8.63 8.63 8.53 8.49
Std. Dev. (%) 11.75 11.75 11.75 11.75 11.75 11.75 11.75 11.75 11.75 11.75
Sharpe Ratio 0.78 0.78 0.75 0.75 0.75 0.75 0.73 0.73 0.73 0.72
GBP Mov. Avg. Days 1/19 1/18 1/20 1/21 1/22 1/16 1/24 1/15 1/17 1/23
Total Return (%) 5.80 5.45 5.36 5.32 5.28 5.20 4.91 4.82 4.80 4.49
Std. Dev. (%) 9.46 9.47 9.46 9.46 9.46 9.47 9.45 9.47 9.47 9.45
Sharpe Ratio 0.61 0.58 0.57 0.56 0.56 0.55 0.52 0.51 0.51 0.48
CHF Mov. Avg. Days 1/57 1/59 1/58 1/56 1/60 1/55 1/69 1/54 1/61 1/65
Total Return (%) 8.63 8.44 8.40 8.40 7.87 7.79 7.50 7.24 7.21 6.84
Std. Dev. (%) 11.65 11.64 11.66 11.65 11.63 11.66 11.63 11.66 11.63 11.64
Sharpe Ratio 0.74 0.72 0.72 0.72 0.68 0.67 0.65 0.62 0.62 0.59
CAD Mov. Avg. Days 14/199 14/200 14/197 13/197 14/198 13/198 15/195 15/193 15/194 14/196
Total Return (%) 1.88 1.88 1.86 1.83 1.82 1.81 1.75 1.66 1.64 1.59
Std. Dev. (%) 4.81 4.81 4.81 4.81 4.81 4.81 4.81 4.81 4.81 4.81
Sharpe Ratio 0.39 0.39 0.39 0.38 0.38 0.38 0.36 0.34 0.34 0.33
AUD Mov. Avg. Days 13/39 13/38 13/40 1/16 13/42 13/41 14/43 13/37 13/43 13/45
Total Return (%) 3.53 3.44 3.41 2.99 2.73 2.54 2.45 2.44 2.37 2.34
Std. Dev. (%) 10.30 10.31 10.28 10.29 10.28 10.28 10.28 10.31 10.28 10.28
Sharpe Ratio 0.34 0.33 0.33 0.29 0.27 0.25 0.24 0.24 0.23 0.23
NZD Mov. Avg. Days 10/17 11/15 10/18 10/15 11/17 14/196 10/16 11/20 11/16 11/14
Total Return (%) 5.20 4.99 5.10 4.76 4.67 4.28 4.28 4.41 3.85 3.38
Std. Dev. (%) 10.79 10.80 10.78 10.80 10.79 10.14 10.80 10.78 10.80 10.81
Sharpe Ratio 0.48 0.46 0.47 0.44 0.43 0.42 0.40 0.41 0.36 0.31
Note: A Sharpe Ratio measures the amount of return on an investment (less the return of a risk-free asset) per unit of risk, which is proxied by its standard deviation.
Datastream is the source of the underlying exchange-rate data.
Empirical Evidence on the Profitability of Moving-Average Trading Rules
DB Guide to Exchange-Rate Determination May 2002
Deutsche Bank @
16 Deutsche Bank Foreign Exchange Research
Given the Sharpe ratios shown in the table on the preced-
ing page, one might wonder why more investors do not
rely on trend-following trading rules more regularly. One
reason is that investors might have a fairly high Sharpe
ratio threshold for committing capital to any particular trad-
ing strategy. For instance, many investors might not em-
brace a trading strategy rule unless it generated a Sharpe
ratio of at least 0.50. And in some cases, an even higher
Sharpe ratio might be required for an investor to add sig-
nificant risk capital to a particular trading rule. If that were
the case, only the yen and Swiss franc would qualify as
currencies worthy of trading from a technical perspective.
While the estimated Sharpe ratios may have been high on
average for the 1986-2002 period, one should note that
the Sharpe ratios were highly volatile when viewed on a
one-year rolling basis. As the charts below show, there
were periods when risk-adjusted return performances were
high and other periods when risk-adjusted return perfor-
mances were downright poor. This was clearly the case
for several key exchange rates in 2001, with one-year roll-
ing Sharpe ratios falling into negative territory for the Deut-
schemark, British pound, and Swiss franc.
Except for the yen and the dollar-bloc currencies, total re-
turn performances were not that impressive in 2001. In
most cases, currencies were largely range-bound versus
the U.S. dollar in 2001 and therefore generated a consider-
able number of false signals that yielded small but fre-
quent losses. On the other hand, the yen’s downtrend—
particularly in late 2001—was clearly evident and exploit-
able by following a moving-average crossover trading rule.
Deutschemark Moving-Average Crossover
Trading Rule Risk-Adjusted Performance
(1993-2002)
-3
-2
-1
0
1
2
3
1993 1994 1995 1996 1997 1998 1999 2000 2001 2002
(One-Year Rolling Sharpe Ratio)
Japanese Yen Moving-Average Crossover
Trading Rule Risk-Adjusted Performance
(1993-2002)
-2
-1
0
1
2
3
1993 1994 1995 1996 1997 1998 1999 2000 2001 2002
(One-Year Rolling Sharpe Ratio)
British Pound Moving-Average Crossover
Trading Rule Risk-Adjusted Performance
(1993-2002)
-3
-2
-1
0
1
2
3
1993 1994 1995 1996 1997 1998 1999 2000 2001 2002
(One-Year Rolling Sharpe Ratio)
Swiss Franc Moving-Average Crossover
Trading Rule Risk-Adjusted Performance
(1993-2002)
-2
-1
0
1
2
3
1993 1994 1995 1996 1997 1998 1999 2000 2001 2002
(One-Year Rolling Sharpe Ratio)

DB Guide to Exchange-Rate Determination
May 2002 Deutsche Bank @
Deutsche Bank Foreign Exchange Research 17
Most academic studies as well as our own work docu-
ment the fact that moving-average trading rules have
tended to generate attractive risk-adjusted returns over the
long run. What is not often pointed out in these studies is
the frequency with which winning and losing positions tend
to occur. As the table below illustrates, moving-average
trading rules have tended to generate far more losing than
winning trades on average. For example, in the case of
the Deutschemark, Swiss franc, cable, and the A$, roughly
75% of the recommended trades generated by optimized
moving-average trading rules end up as losing trades. Only
25% of the trades proved to be winning ones. In the case
of the C$ and NZ$, roughly two-thirds of the recommended
trades resulted in losses. Only in the case of the yen was
the win/loss ratio close to 50%.
From a longer-run perspective, having a trading rule that
generates such frequent losing trades does not pose a
serious problem if the losing positions are cut quickly—so
only a small loss is taken—and profits are allowed to ride
on the less frequent correctly predicted winning trades.
Indeed, this is often what is found to be the case. As shown
in the table below, the average profit on the less frequent
winning trades has tended to exceed the average loss on
the more frequent losing trades by a fairly hefty margin.
This margin of difference has been sufficient to allow mov-
ing-average trading rules to be profitable in the long run.
Frequency of Winning and Losing Trades Generated by Moving-Average
Trading Rules
Profit and Losses from Optimal Moving-Average Trading Rules
(Risk-Return Analysis & Winning versus Losing Trades of Selected Currencies versus the U.S. Dollar)
(January 1986-April 2002)
DEM JPY GBP CAD AUD NZD CHF
Optimal Moving-Average Trading Rule
Number of Days (SRMA/LRMA) 1/32 8/59 1/19 14/199 1/16 10/17 1/57
Average Annual Return 5.0% 9.2% 5.8% 1.9% 3.5% 5.2% 8.6%
Standard Deviation of Returns 11.1% 11.8% 9.5% 4.8% 10.3% 10.8% 11.7%
Sharpe Ratio 0.45 0.78 0.61 0.40 0.34 0.48 0.74
Total Recommended Trades 342 81 452 35 218 165 217
Winning Trades 91 37 126 13 61 58 57
Winning Trade Percentage 27% 46% 28% 37% 28% 35% 26%
Losing Trades 251 44 326 22 157 107 160
Losing Trade Percentage 73% 54% 72% 63% 72% 65% 74%
Average Profit on Winning Trades 2.97% 5.92% 2.27% 3.69% 2.03% 2.11% 4.63%
Average Profit on Losing Trades -0.77% -1.72% -0.62% -1.03% -0.63% -0.84% -0.84%
Ratio of Profits/Losses 3.86 3.44 3.66 3.58 3.22 2.51 5.51
Note: A Sharpe Ratio measures the amount of return on an investment (less the return of a risk-free asset) per unit of risk,
which is proxied by its standard deviation.
Datastream is the source of the underlying exchange-rate data.
DB Guide to Exchange-Rate Determination May 2002
Deutsche Bank @
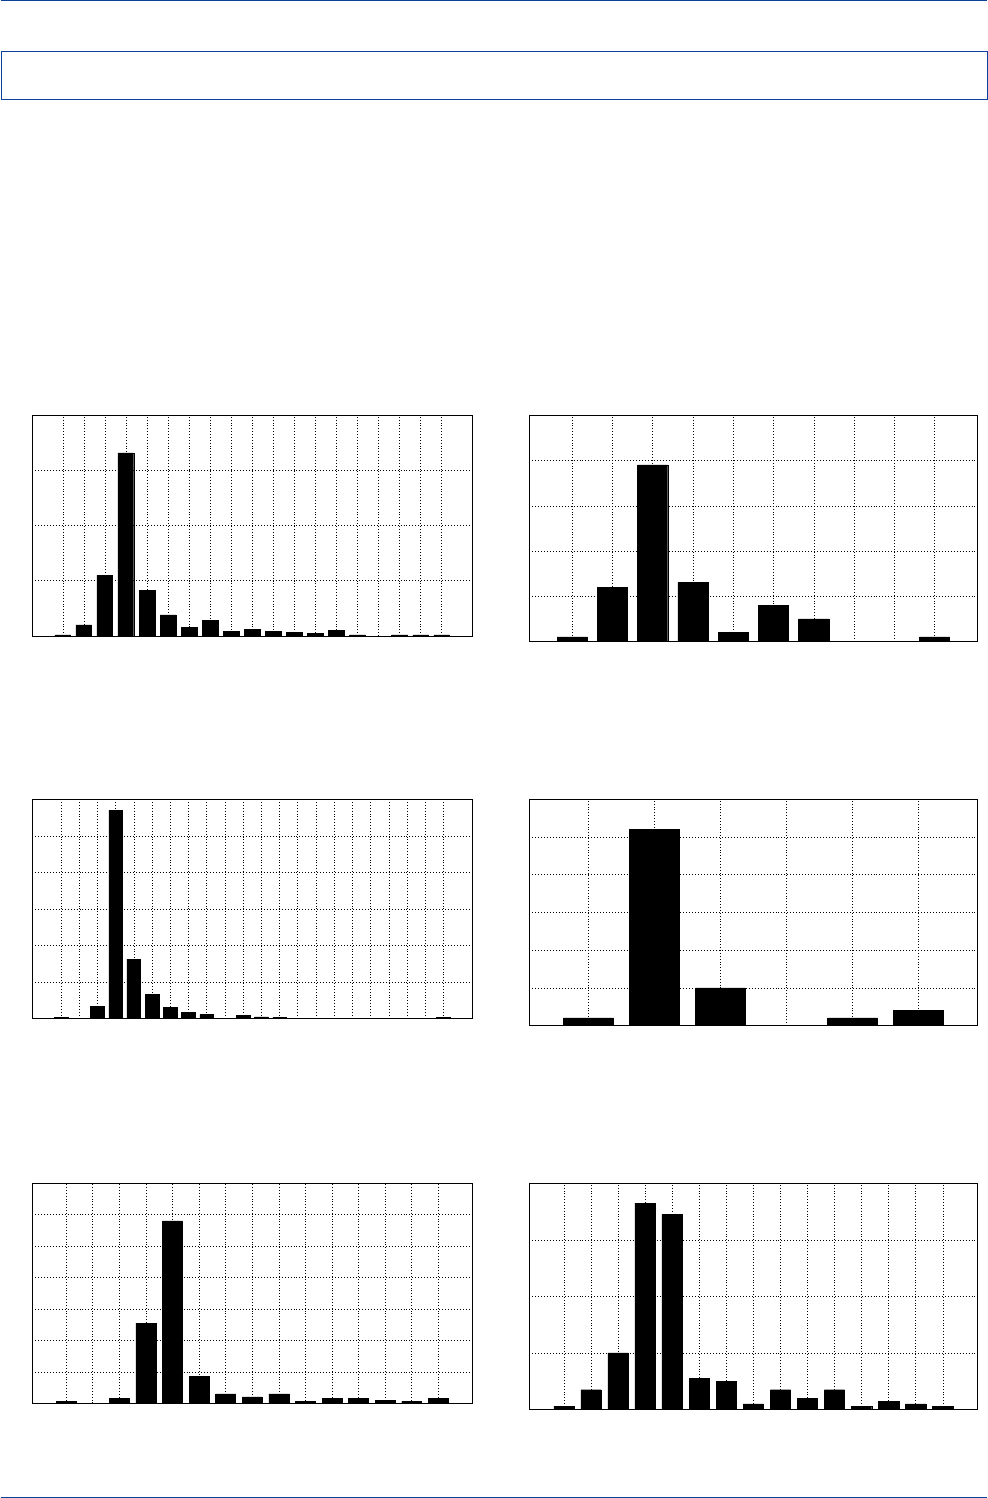
18 Deutsche Bank Foreign Exchange Research
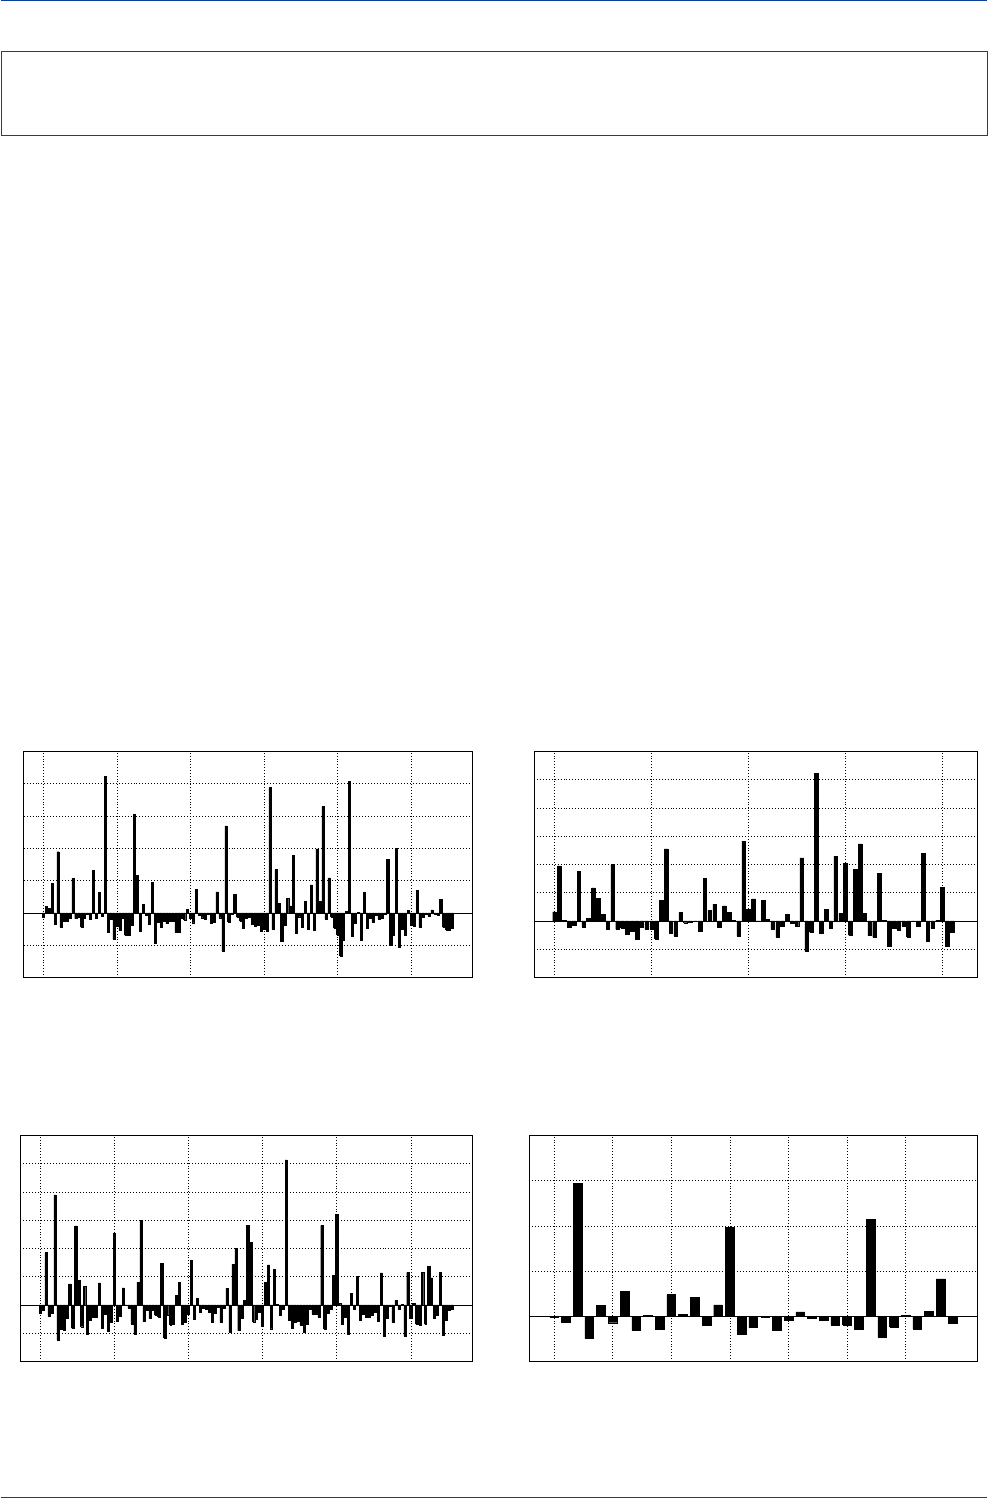
The charts below reveal the distribution of returns that each
of our optimal moving-average crossover trading rules has
generated over the past 16 years. As shown, the over-
whelming majority of recommended trades resulted in ei-
ther small gains or small losses. However, note that the
distribution of returns is skewed heavily to the right in most
cases. This indicates that large positive returns do occur
from time to time; it is just that the frequency of big win-
ning trades tends to be quite low. These highly skewed
return distributions raise the question whether conventional
measures of risk such as standard deviation, Sharpe ra-
tios, and information ratios accurately convey the asym-
metric risks facing technically oriented investors, particu-
larly over short horizons.
Distribution of Returns from Moving-Average Trading Rules
Distribution of Returns of DEM Trades
(Generated by Moving-Average Crossover Strategy)
(1986-2002)
0
50
100
150
200
-2.9
-2.0
-1.1
-0.20.71.6 2.5 3.4 4.35.26.1 7.0 7.9 8.89.7
10.6
11.5
12.4
13.1
Frequency
Return(%)
Distribution of Returns of JPY Trades
(Generated by Moving-Average Crossover Strategy)
(1986-2002)
0
10
20
30
40
50
-5.4 -2.1 1.3 4.6 8.0 11.4 14.7 18.1 21.4 24.5
Frequency
Return(%)
Distribution of Returns of GBP Trades
(Generated by Moving-Average Crossover Strategy)
(1986-2002)
0
50
100
150
200
250
300
-4.1
-2.8
-1.4
-0.1
1.2
2.5
3.8
5.2
6.5
7.8
9.1
10.4
11.8
13.1
14.4
15.7
17.0
18.3
19.7
21.0
22.3
23.6
Frequency
Return(%)
Distribution of Returns of CAD Trades
(Generated by Moving-Average Crossover Strategy)
(1986-2002)
0
5
10
15
20
25
30
-2.46 0.81 4.07 7.34 10.6 13.6
Frequency
Return(%)
Distribution of Returns of AUD Trades
(Generated by Moving-Average Crossover Strategy)
(1986-2002)
0
20
40
60
80
-2.4 -1.7 -1.0 -0.4 0.3 1.0 1.7 2.3 3.0 3.7 4.4 5.1 5.7 6.4 6.8
Frequency
Return(%)
Distribution of Returns of CHF Trades
(Generated by Moving-Average Crossover Strategy)
(1986-2002)
0
20
40
60
80
100
120
140
-5.73
-4.13
-2.52
-0.91 0.69 2.3 3.9 5.51 7.12 8.72
10.33
11.93
13.54
15.15 16.2
Frequency
Return(%)
Source: Datastream
Source: Datastream
Source: Datastream
Source: Datastream
Source: Datastream
Source: Datastream
DB Guide to Exchange-Rate Determination
May 2002 Deutsche Bank @
Deutsche Bank Foreign Exchange Research 19
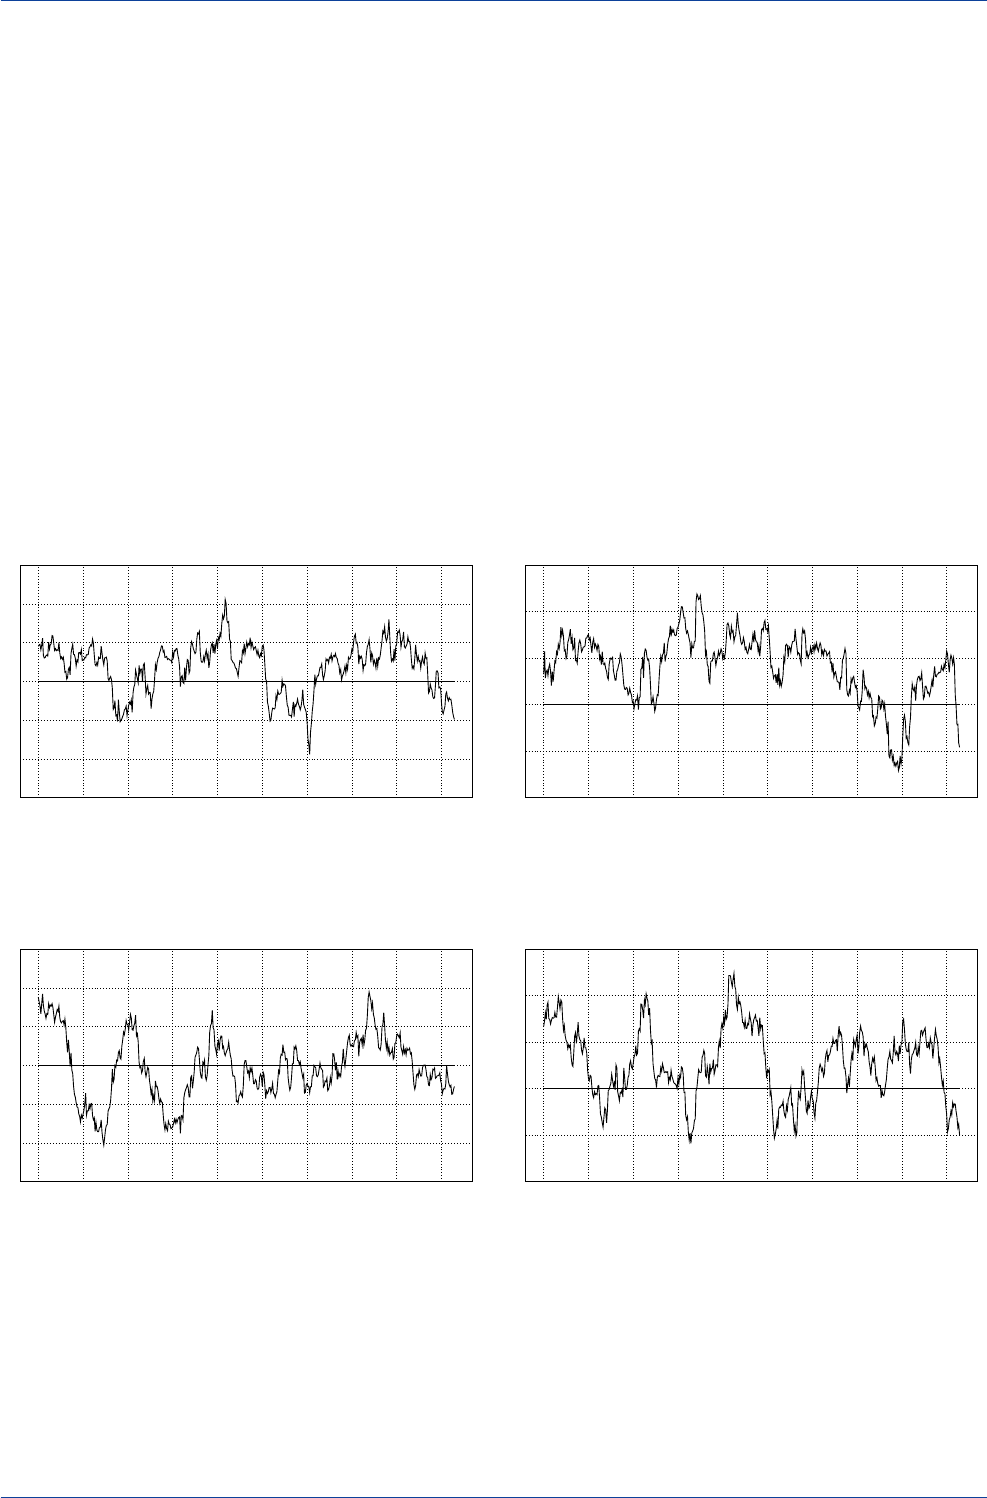
The charts below provide a different way of looking at the
short-term risks facing technically oriented investors in the
FX arena. These charts show the actual gains and losses
on the recommended trades that our optimal moving-av-
erage trading rules have generated in recent years. What
these charts reveal is that there were often frequent runs
of successive losing trades that had to be absorbed be-
fore a sizeable winning trade was generated. While posi-
tive returns were generated in most cases for the entire
sample period, clearly there were uncomfortably lengthy
intervals when frequent losses were incurred.
Our analysis raises several interesting issues. First, should
technical-based moving-average trading rules be viewed
as short-term forecasting tools or instead would it be bet-
ter to view such trading rules as long-term forecasting
tools? The results here suggest that technical-based mov-
ing-average trading rules work best in the long run, not in
the short run. Indeed, the odds that a moving-average trad-
ing rule recommendation will generate a profit appear to
be no better than 25%-35% in most cases in the short
run. Second, it is possible that since the frequency of los-
ing trades is so large, this might actually dissuade inves-
tors from using technical models in formulating currency
investment strategies. If investors shy away from using
technical models because of the high frequency of short-
term losses, this might explain why excess returns in the
long run from technical-based models are not completely
arbitraged away.
In order to successfully trade currencies using a technical-
based moving-average trading rule, an investor needs to
have staying power—considerable risk capital on hand to
absorb possible frequent short-term trading losses—and
patience. There might be other technical tools that could
be used to cut down on the number of frequent losses on
short-term trading positions, but one needs to be mindful
of the fact that attempts to add "filters" or other types of
technical bells and whistles to limit the frequency of false
signals might hinder the upside potential of correctly pre-
dicted winning trades.
Should Moving-Average Trading Rules Be Viewed as Short or Long-Run
Forecasting Tools?
Profit and Losses on Individual DEM Trades
(Generated by Moving-Average Crossover Strategy)
(Most Recent 140 Trades)
-4
-2
0
2
4
6
8
10
12-27-95 04-21-97 03-27-98 01-14-99 11-08-2000 10-02-2001
Returns(%)
Trade Dates
Profit and Losses on Individual JPY Trades
(Generated by Moving-Average Crossover Strategy)
(1986-2002)
-10
-5
0
5
10
15
20
25
30
01-01-87 12-27-89 02-02-94 01-23-98 03-07-2002
Returns(%)
Trade Dates
Profit and Losses on Individual GBP Trades
(Generated by Moving-Average Crossover Strategy)
(Most Recent 140 Trades)
-2
-1
0
1
2
3
4
5
6
06-12-97 06-01-98 01-27-99 01-03-2000 01-12-2001 09-24-2001
Returns(%)
Trade Dates
Profit and Losses on Individual CAD Trades
(Generaged by Moving-Average Crossover Strategy)
(1986-2002)
-5
0
5
10
15
20
11-03-86 06-23-89 11-02-90 09-16-94 04-25-96 01-14-97 08-06-99
Returns(%)
Trade Dates
Datastream is the source of the
underlying exchange-rate data.
Datastream is the source of the
underlying exchange-rate data.
Datastream is the source of the
underlying exchange-rate data.
Datastream is the source of the
underlying exchange-rate data.
DB Guide to Exchange-Rate Determination May 2002
Deutsche Bank @
20 Deutsche Bank Foreign Exchange Research
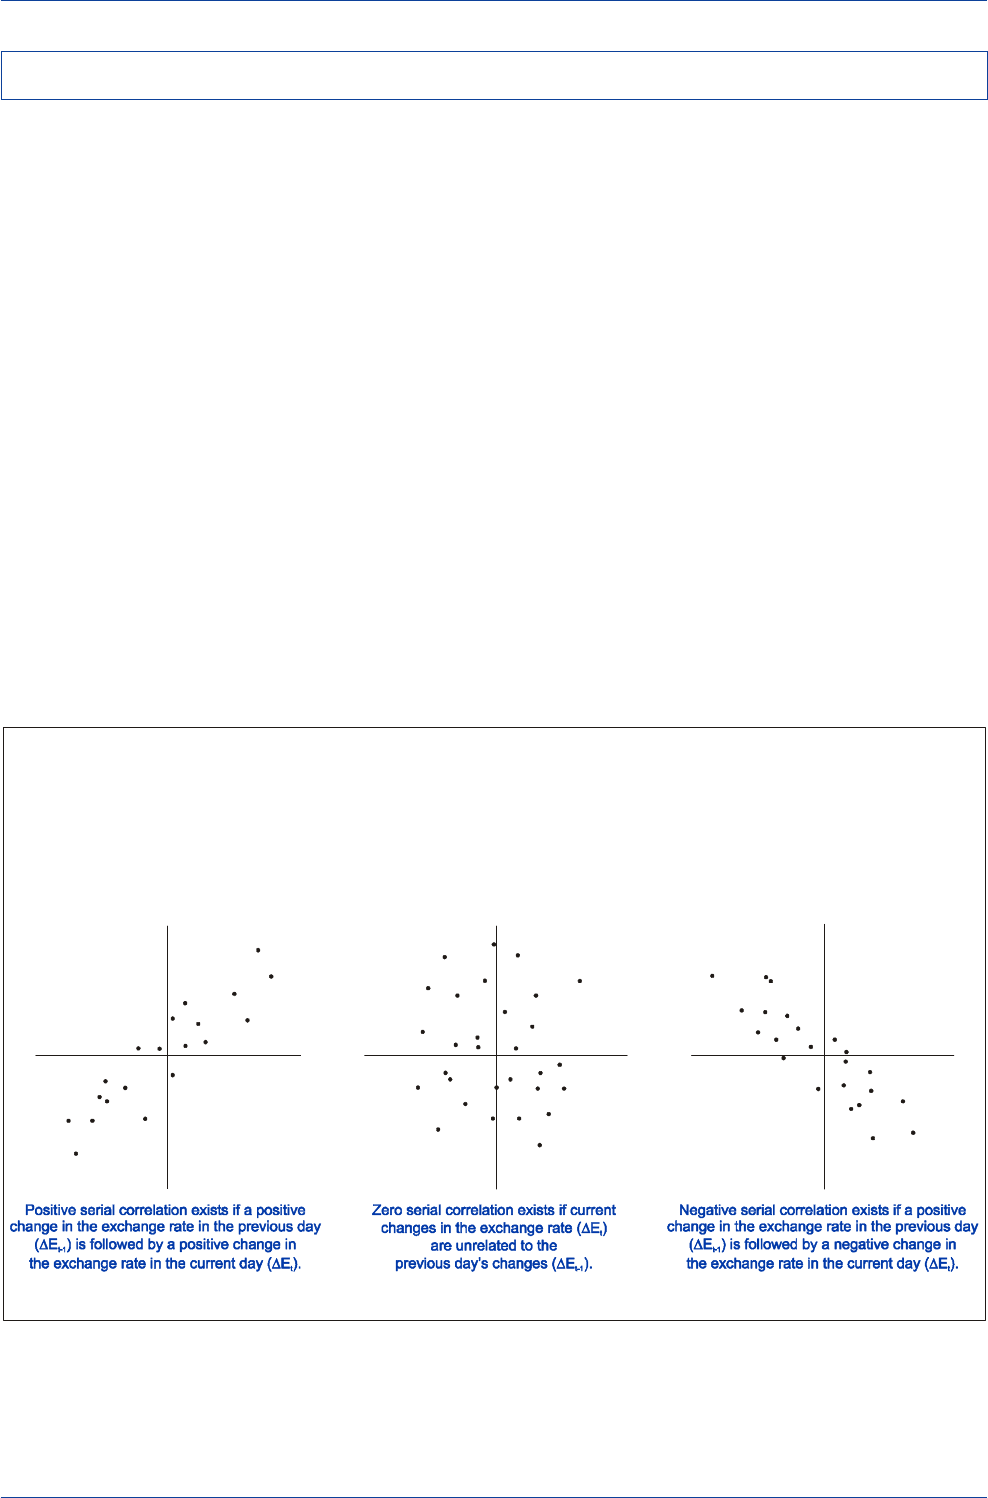
Most academic studies have concluded that exchange-rate
movements closely approximate a random walk process.
A random walk (serial correlation) test seeks to investi-
gate whether there exists a positive, negative, or zero lin-
ear relationship between today’s change in the exchange
rate and yesterday’s change in the exchange rate. Evidence
of a positive linear relationship would indicate the exist-
ence of trend persistence since a positive change in a
currency's value yesterday would tend to be followed by a
positive change today.
Estimated serial correlation coefficients could vary between
+1, 0, and -1 depending on whether there exists a strong
positive relationship, no relationship, or a strong negative
relationship between successive exchange-rate changes.
The weight of evidence generally supports the view that
for most currencies, the estimated serial correlation coef-
ficients are often quite small and in many cases statisti-
cally insignificant from zero.
Although researchers often find support for the view that
exchange-rate movements tend to fluctuate randomly on
a daily basis, they also find evidence that exchange-rate
changes are positively serially correlated when viewed on
a monthly basis. Thus, although exchange rates may fluc-
tuate randomly over very short time spans (i.e., daily), they
tend to rise and fall on a trend basis on a medium/long-
term (i.e., monthly) basis. If so, this would imply that trend-
following trading rules could be devised to profit from these
medium/long-term trends that exchange rates follow.
One of the problems with serial correlation tests is that
they seek only to determine whether a stable "linear" rela-
tionship exists between successive exchange-rate move-
ments. Although it might be the case that successive ex-
change-rate changes are linearly independent, they might
nevertheless exhibit significant positive nonlinear depen-
dence, which traditional serial correlation tests would not
detect. This might explain why researchers have found that
exchange rates follow a random walk, yet at the same time
have found that trend-following technical trading rules have
been profitable. It may be the case that there does exist
some form of serial dependency in successive exchange-
rate movements; it's just that this serial dependence is
not linear. If there exists some form of nonlinear depen-
dence in successive exchange-rate movements, it would
appear that trend-following trading rules are capturing this
form of serial dependence.
Random Walk Tests and the Profitability of Technical Trading Rules
(a)
Positive Serial Correlation
Serial Correlation Tests:
Examining Whether a Stable Linear Relationship Exists between
Current and Previous Changes in an Exchange Rate
(b)
Zero Serial Correlation (c)
Negative Serial Correlation
∆
E
t
∆
E
t
∆
E
t
∆
E
t-1
∆
E
t-1
∆
E
t-1
Source: Adapted from Fogler (1978)
DB Guide to Exchange-Rate Determination
May 2002 Deutsche Bank @
Deutsche Bank Foreign Exchange Research 21
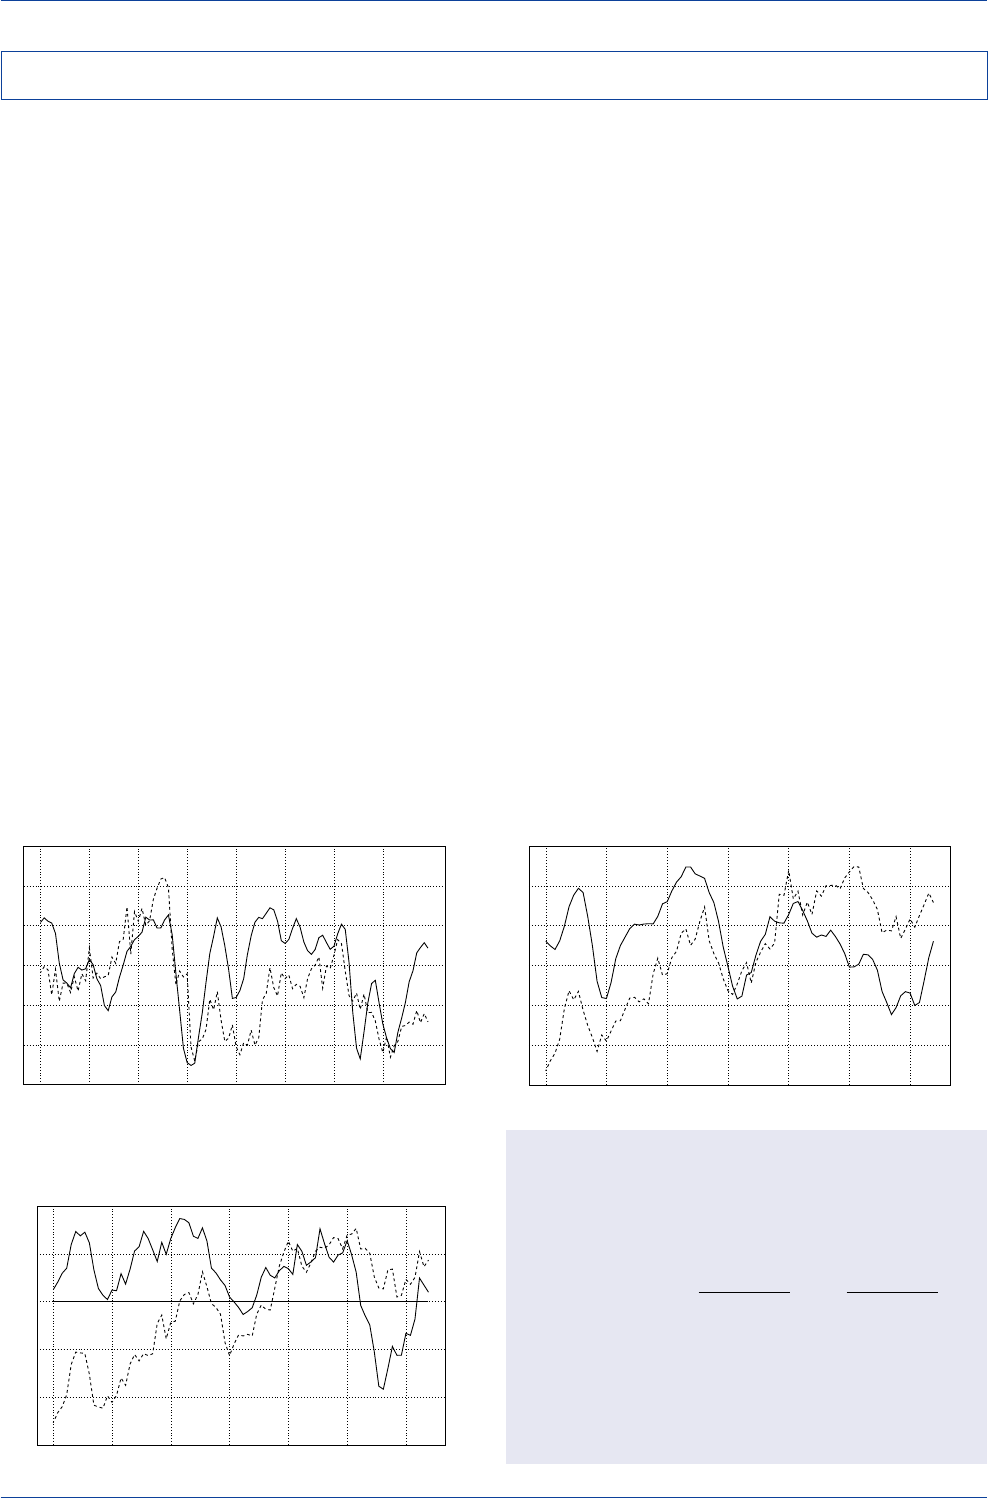
Fund managers have turned to sentiment and positioning
surveys in recent years as forecasting tools. In most cases,
exchange rates move in the same direction that sentiment
and positioning surveys are moving in the short run. For
example, when sentiment toward the dollar becomes in-
creasingly bullish—as reported in the weekly Consensus
Inc. Survey of Bullish Market Opinion—the dollar tends to
rise. Similarly, when long U.S. dollar speculative positions
are undertaken on the IMM (money-market futures ex-
change), the dollar tends to rise as well.
What does the empirical evidence say about the success
of sentiment/positioning surveys in predicting exchange-
rate movements? Our analysis, listed in the table below,
finds that changes in sentiment and positioning surveys
are statistically significant, for the most part, in explaining
contemporaneous changes in exchange rates, but that
lagged values of sentiment and positioning survey data
are statistically insignificant in predicting current changes
in exchange rates. This suggests that sentiment/position-
ing survey data cannot be relied upon as forecasting tools.
What does the empirical evidence say about the useful-
ness of sentiment/positioning survey data as contrarian
indicators? The trends in market sentiment and specula-
tive positioning could be viewed as potential overbought
or oversold indicators if the rise or fall in each of those
series appeared stretched relative to historical norms.
Unfortunately, the empirical evidence suggests that there
is no statistically significant relationship between over-
stretched sentiment and positioning surveys and subse-
quent changes in exchange rates. Based on these find-
ings, it could prove risky to adopt a contrarian position sim-
ply because investors' FX exposures appeared to be at
extreme levels. History is replete with examples where
over-stretched markets have stayed over-stretched for a
considerable time. Perhaps all that one can say is that if
one or more of those indicators moved into significantly
overbought or oversold territory, then the
odds
of a rever-
sal would have increased, but that it would not be pos-
sible to issue a definitive signal that an imminent reversal
was at hand.
Although trends in sentiment and positioning surveys may
not help us in forecasting future movements in exchange
rates, they may nevertheless be useful as trend confirma-
tion indicators. Because of the strong positive contempo-
raneous correlation between the sentiment and position-
ing data, on the one hand, and the trend in exchange rates
on the other, sentiment and positioning data could be used
in conjunction with a moving-average model to confirm
whether an exchange-rate uptrend or downtrend is intact.
Market Sentiment and the U.S. Dollar
(Consensus Inc. Index of Bullish Opinion)
(1998-1999)
90
92
94
96
98
100
102
30
40
50
60
70
80
90
Jan-98 Apr-98 Jul-98 Oct-98 Jan-99 Apr-99 Jul-99 Oct-99
US$ Index----
A
nalysts Bullish on the US$(4-Week Avg.)(%)____
Sources: Datastream;
Based on Consenus Inc. Index of Bullish Market Opinion
Market Sentiment and the U.S. Dollar
(Consensus Inc. Index of Bullish Opinion)
(April 2000-November 2001)
94
96
98
100
102
104
106
108
30
40
50
60
70
80
90
Apr-00 Jul-00 Oct-00 Jan-01 Apr-01 Jul-01 Oct-01
US$ Index----
A
nalysts Bullish on the US$(4-Week Avg.)(%)____
Based on Consenus Inc. Index of Bullish Market Opinion
By permission of Consensus, Inc., (1) (816) 373-3700,
Consensus, National Futures and Financial Weekly,
www.consensus-inc.com
Speculative Positioning and the U.S. Dollar
(IMM Derived Net Non-Commercial FX Positions)
(April 2000-November 2001)
94
96
98
100
102
104
106
108
-150
-100
-50
0
50
100
Apr-00 Jul-00 Oct-00 Jan-01 Apr-01 Jul-01 Oct-01
US$ Index----
S
um of Net Contracts vs. USD(000s)____
Assessing the Statistical Significance of
Sentiment/Positioning/Flow Variables as
Explanatory Variables of Exchange-Rate Movements
(January 15, 1999-November 2, 2001 Weekly Data)
Lagged
Contemporaneous One Period
Consensus Inc. Bullish Market Opinion (US$)
Regression Coefficient 0.12 0.09
(t-Statistic) (3.90) * (1.15)
IMM Net Non-Commercial FX Positions (US$)
Regression Coefficient 0.23 0.01
(t-Statistic) (5.65) * (0.24)
*Indicates a statistically significant value at the 95% confidence level.
By permission of Consensus Inc.
Are Sentiment and Positioning Indicators Useful in Predicting FX Movements?
Source: IMM, Datastream
DB Guide to Exchange-Rate Determination May 2002
Deutsche Bank @
22 Deutsche Bank Foreign Exchange Research
Investors often try to infer the market's expectation of fu-
ture interest-rate movements by examining interest-rate
futures contracts for various maturities or by examining
the implied future path in interest rates embedded in yield-
curve slopes. Similarly, investors often try to infer the
market's expectation of future exchange-rate movements
by examining the level of domestic/foreign interest-rate
spreads, or the implied path of long-dated forward ex-
change rates.
Information on future interest-rate and exchange-rate move-
ments can also be gleaned from the options market.
Whereas interest-rate futures, yield-curve slopes, and yield
spreads provide point estimates regarding expected fu-
ture values, the options market provides a different piece
of information—the market's expectation of the probabil-
ity distribution of future interest rates and exchange rates.
For example, in the FX market, data on implied volatility
for a range of maturities and strike prices are readily avail-
able. Implied volatility provides us with a measure of the
marketplace's uncertainty regarding future exchange-rate
movements. If implied volatility is rising, it "implies" greater
uncertainty about future exchange-rate movements, and
vice versa.
One could construct a forward implied volatility curve to
glean expected future volatility movements by stringing
together implied volatilities for a range of maturities with
the same strike price. If the forward implied volatility curve
were steeply upward sloping, the market would be pricing
in the expectation of a future jump in currency volatility. If
the forward implied volatility curve were flat, the market-
place would be pricing in no change in the level of cur-
rency volatility in the future.
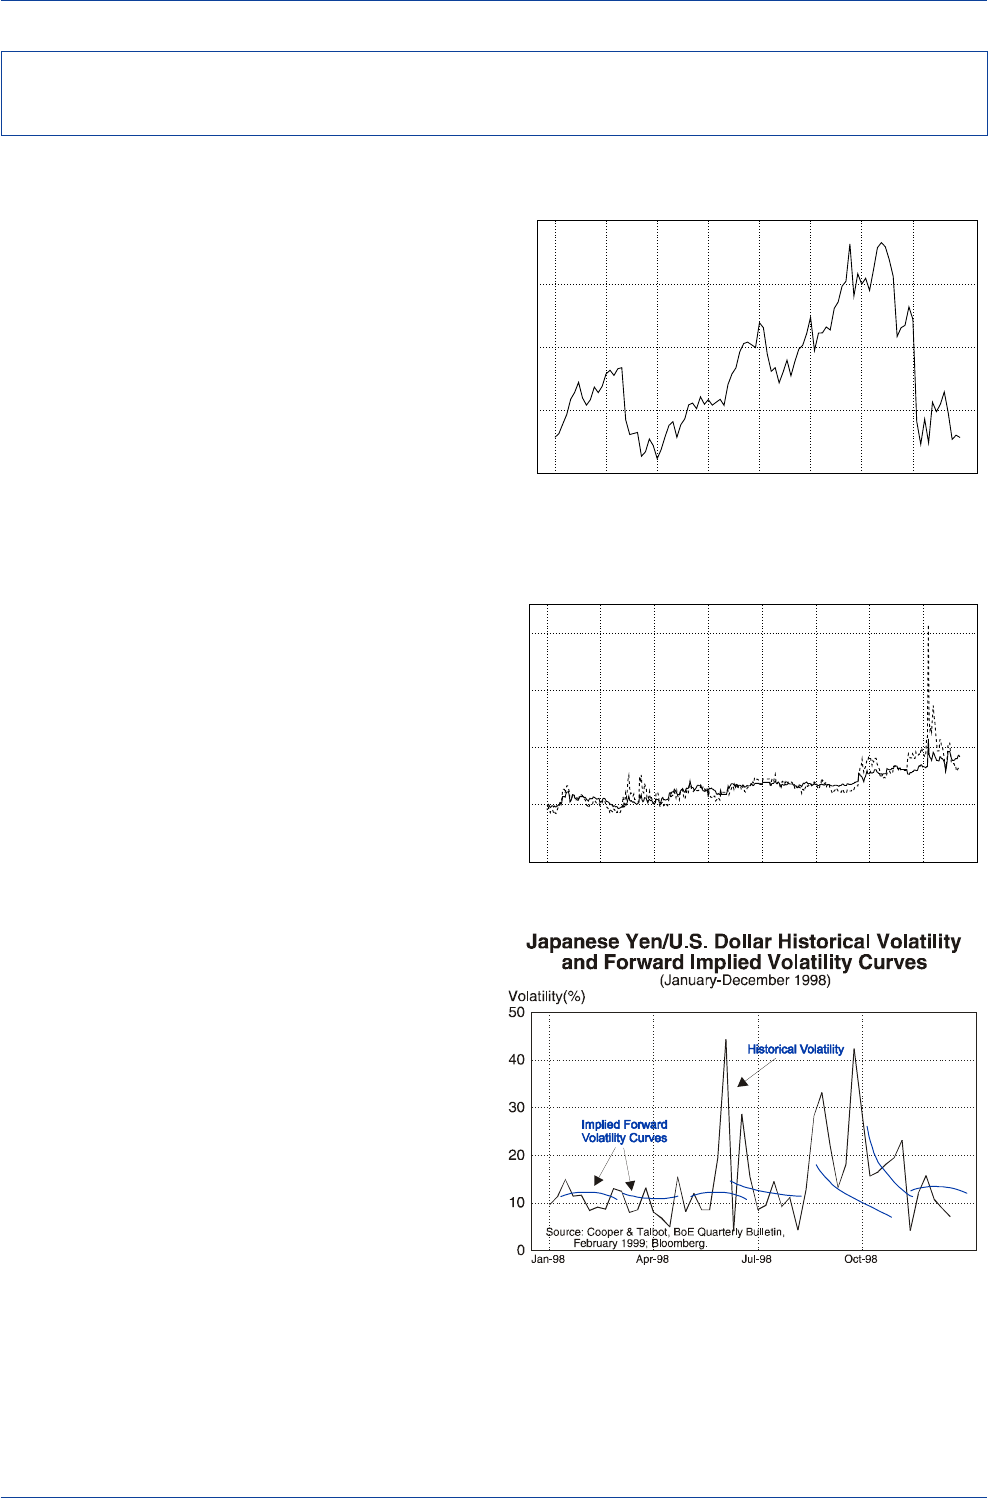
Does the forward implied volatility curve accurately antici-
pate future jumps in exchange-rate volatility? Because vola-
tility jumps often occur suddenly and without warning, it
is highly unlikely that the forward implied volatility curve
would be able to consistently forecast future jumps in the
exchange rate. Indeed, the Bank of England examined
whether implied forward volatility curves anticipated the
unwinding of the infamous yen carry (long dollar/short yen)
trade in October 1998, and concluded that "Forward vola-
tility curves…. did not expect the increase in volatilities
(that occurred) in October 1998. Although (historical) vola-
tility had increased throughout the summer, the forward
volatility curve suggested that it would fall back towards
previous levels." Indeed, in mid-September 1998, histori-
cal volatility was running around 22%-26% and forward
volatility curves were expecting implied volatilities to ease
toward 14% in the October-November 1998 period. Instead,
historical volatility soared to over 40% in early October
when the yen carry trade was suddenly unwound.
Can One Extract Information from the Currency Options Market
to Predict Future Exchange-Rate Movements?
Japanese Yen/U.S. Dollar Exchange Rate
(1997-1998)
110
120
130
140
150
Jan-97 Apr-97 Jul-97 Oct-97 Jan-98 Apr-98 Jul-98 Oct-98
Yen/US$
Japanese Yen/U.S. Dollar Implied Volatility
(1997-1998)
0
10
20
30
40
Jan-97 Apr-97 Jul-97 Oct-97 Jan-98 Apr-98 Jul-98 Oct-98
1-Month Volatility----(%) 12-Month Volatility____
Source: Datastream
Source: DRI
DB Guide to Exchange-Rate Determination
May 2002 Deutsche Bank @
Deutsche Bank Foreign Exchange Research 23
Assessing the Statistical Significance of
Sentiment/Positioning/Flow Variables as
Explanatory Variables of Exchange-Rate Movements
(January 15, 1999-November 2, 2001 Weekly Data)
Lagged
Contemporaneous One Period
Option Market Sentiment (Euro Risk Reversals)
Regression Coefficient -0.02 0.03
(t-Statistic) (-0.90) (1.23)
Option Market Sentiment (Yen Risk Reversals)
Regression Coefficient 0.11 0.04
(t-Statistic) (3.06) * (1.19)
*Indicates a statistically significant value at the 95% confidence level.
Source: Datastream; DB
Euro Risk Reversals & US$/Euro Exchange Rate
Euro Calls(+)/Puts(-) Trading at Premium vs. USD
0.82
0.84
0.86
0.88
0.90
0.92
0.94
0.96
0.98
-1.0
-0.5
0.0
0.5
1.0
1.5
Jul-00 Oct-00 Jan-01 Apr-01 Jul-01 Oct-01 Jan-02 Apr-02
US$/Euro----
C
alls(+)/Puts(-) Trading at Premium____
Yen Risk Reversals & Yen/US$ Exchange Rate
Yen Calls(+)/Puts(-) Trading at Premium vs. USD
(140)
(135)
(130)
(125)
(120)
(115)
(110)
(105)
(100)
-2.0
-1.0
0.0
1.0
2.0
3.0
Jul-00 Oct-00 Jan-01 Apr-01 Jul-01 Oct-01 Jan-02 Apr-02
Yen/US$(reverse scale)----
C
alls(+)/Puts(-) Trading at Premium____
FX traders often use risk reversals to glean information on
whether the market might be attaching a higher probabil-
ity to a large currency appreciation than to a large currency
depreciation, or vice versa. A risk reversal is a currency
option position that consists of the purchase of an out-of-
the-money (25
delta
) call and the simultaneous sale of an
out-of-the-money (25
delta
) put, both in equal amounts and
both with the same expiration date. Risk reversals are
quoted in terms of the implied volatility spread between
the 25
delta
call and 25
delta
put. For example, if the im-
plied volatility on the call were 2% larger than the implied
volatility on the put, the risk reversal would be quoted at
+2.0%. If the implied volatility on the put were 2% greater
than the implied volatility on the call, the risk reversal would
be quoted at -2%.
A risk reversal quoted at +2% would indicate that the
market was attaching a higher probability to a large cur-
rency appreciation than to a large currency depreciation.
This would indicate that the market was willing to pay more
to insure against the risk that the currency will rise sharply
than it was willing to pay to insure against the risk that the
currency will fall sharply.
The key issue for traders and investors is whether the level
or trend in currency risk reversals can be used to correctly
anticipate future exchange-rate movements. The evidence
indicates a high contemporaneous correlation between the
trend in risk reversals and the trend in exchange rates, but
no statistically significant relationship exists between
lagged risk reversal data and future exchange-rate move-
ments. Therefore, risk reversals are capable of confirming
an exchange rate’s trend, but not predicting it.
Nor is there evidence that overly stretched risk reversal
measures can function as a consistently reliable contrary
indicator. Indeed, the Bank of England's study on the un-
winding of the yen carry trade in the fall of 1998 found that
dollar/yen risk reversals failed to provide an early warning
of the dramatic unwinding of long dollar/short yen posi-
tions that was about to occur.
Inferring Information about Future Exchange-Rate Movements
from Currency Risk Reversals
Yen/US$
Profit
Payoff Schedule of 25 Delta
Risk Reversal at Maturity
(-)
(+)
0
Source: Datastream; DB Source: Datastream; DB

DB Guide to Exchange-Rate Determination May 2002
Deutsche Bank @
24 Deutsche Bank Foreign Exchange Research
In recent years, there has been increased interest on the
part of investors and academicians in FX-dealer customer-
flow data. One of the characteristics that distinguishes the
FX market from the world equity market is that the FX
market has considerably less transparency. Equity-market
disclosure requirements mandate that all trades are in-
stantly posted. Thus, volume and price data are instantly
available to all parties. Not so in the FX market. No such
disclosure requirements exist, which means that order-flow
information is not immediately available to all parties.
Indeed, large FX dealers are in a unique position in that
they are able to observe large trades that could move the
market before other parties are aware of such trades. A
recent survey of FX dealers indicated that most traders
believe that large FX dealers have a comparative advan-
tage over smaller dealers because they have a large cus-
tomer base that gives them privileged information about
customer orders.
One could envisage a marketplace where there exists both
private and publicly available information. Publicly available
information consists largely of macroeconomic-related
data, which is available to all market participants at the
same time. However, there may be microeconomic-related
information that is important for exchange rates, but is not
publicly available. Examples of microeconomic-related in-
formation are shifts in risk appetite, liquidity needs, hedg-
ing demands, and institutional portfolio rebalancings. Such
microeconomic-related FX flows give rise to buy or sell
orders that influence the short-term trend in exchange
rates, just as investor responses to macroeconomic-related
information do. Large FX dealers can use the information
gleaned from the change in their customer order flow to
drive their own short-run strategies, which can then add to
the upward or downward pressure on the exchange rate's
value.
Viewing the impact of order flow in this manner, it is evi-
dent that order flow serves as a proximate determinant
and not as the ultimate determinant of short-term ex-
change-rate movements. The ultimate determinant of ex-
change rates is the joint interplay of macroeconomic and
microeconomic information underlying the change in or-
der flow.
Given the potential impact that order flow can have on
exchange rates in the short run, a large FX dealer's order
book can provide valuable information to both traders and
investors who wish to keep abreast of underlying private
investor shifts in portfolio behavior, whether those shifts
are of a macro or micro-economic nature.
Information
Not Publicly
Available
Portfolio
Shifts Order
Flow
Change
in
Exchange Rate
The Effect of Information on Order Flow
and Exchange Rates
Publicly
Available
Information
Reasons for Competitive Advantage
of Large FX Players
(Based on an FX Dealer Survey)
Survey Response (%)
Large Customer Base 33.3
Better Information 22.9
Deal in Large Volumes 14.8
Ability to Affect Exchange Rate 9.4
Offer New FX Products 6.2
Access to Global Trading Network 4.7
Experienced Trades 4.2
Lower Costs 2.9
Smaller Counterparty Risk 0.5
Other 1.0
Source: Cheung and Chinn, “Traders, Market Microstructures and
Exchange Rate Dynamics”, unpublished paper.
FX Dealer Order Flow and the Determination of Exchange Rates

DB Guide to Exchange-Rate Determination
May 2002 Deutsche Bank @
Deutsche Bank Foreign Exchange Research 25
How FX Dealers and Fund Managers View the Importance of
Flow Analysis Relative to Fundamental and Technical Analysis
According to a recent survey of professional FX dealers
and fund managers, both FX dealers and fund managers
treat the analysis of foreign-exchange flows as a distinct
form of analysis, independent from more traditional fun-
damental and technical approaches. A recent survey by
Gehrig and Menkhoff (2002) indicates that FX market par-
ticipants in general attach the greatest weight to technical
analysis (40.2%), followed by fundamental analysis
(36.3%), and finally by flow analysis (23.5%). Among the
participants surveyed, FX dealers were the ones who as-
signed the most weight to flow analysis, with 26.2% of
them viewing it as their most important source of informa-
tion. By comparison, only 16.8% of fund managers re-
garded flow analysis as their most important source of
information, with 46.2% considering fundamental analy-
sis as their most important source.
FX market participants generally regard the analysis of FX
flows as more useful for short-term rather than long-term
forecasting. As shown in the pie chart on the bottom right,
25.4% of all respondents believe that flow analysis pro-
vides valuable information only on an intra-day basis. An-
other 37.3% believe that the information provided by flow
analysis can be useful up to a few days. Combined, 62.7%
of all respondents believe that flow analysis should be lim-
ited to forecasting horizons up to only a few days. In terms
of the longer-run usefulness of flow analysis for currency
forecasting, 21.9% of FX respondents believe that flow
analysis can be useful for several weeks, while only a
modest 15.4% believe that flow analysis can be useful for
up to several months into the future.
Survey of All FX Market Participants
The Importance of Fundamental, Technical & Flow
Analysis in Currency Investment Decision
Fundamental Analysis--36.3%
Technical Analysis--40.2%
Flow Analysis--23.5%
Survey of Fund Managers
The Importance of Fundamental, Technical and
Flow Analysis in Currency Investment Decision
Fundamental Analysis--46.2%
Technical Analysis--37.0%
Flow Analysis--16.8%
Survey of FX Dealers
The Importance of Fundamental, Technical & Flow
Analysis in Currency Investment Decision
Fundamental Analysis--32.4%
Technical Analysis--41.4%
Flow Analysis--26.2%
The Usefulness of Flow Analysis
at Different Forecasting Horizons
(Survey of All FX Participants)
Intraday--25.4%
A Few Days--37.3%
A Few Weeks--21.9%
More than 2 Months--15.4%
Source: Gehrig and Menkhoff (2002) Source: Gehrig and Menkhoff (2002)
Source: Gehrig and Menkhoff (2002) Source: Gehrig and Menkhoff (2002)
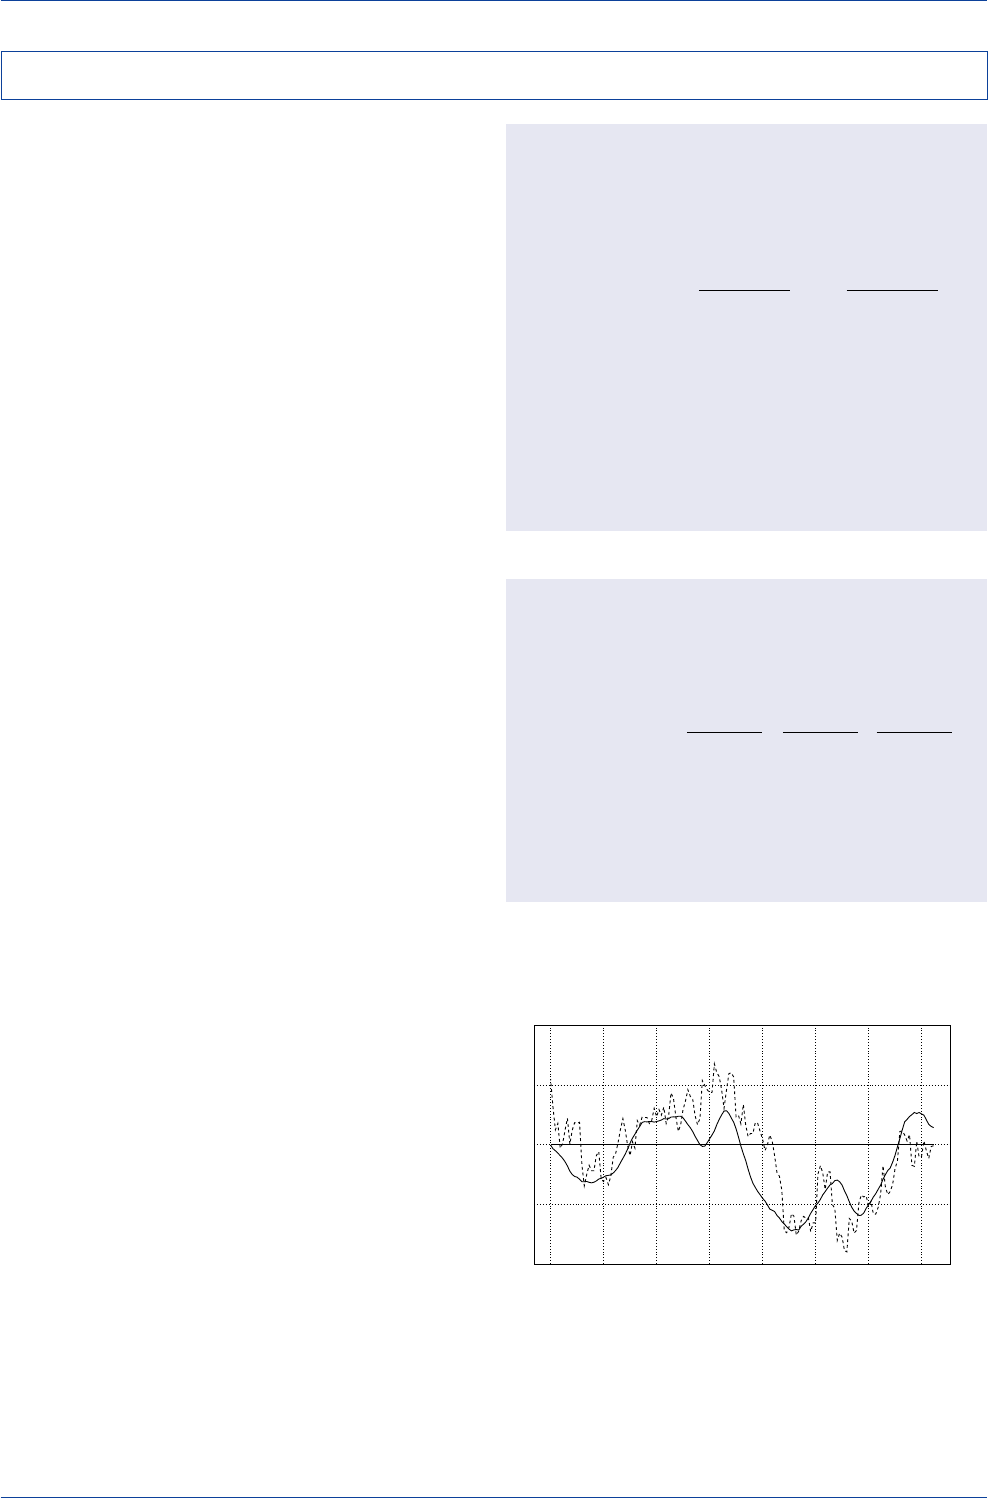
DB Guide to Exchange-Rate Determination May 2002
Deutsche Bank @
26 Deutsche Bank Foreign Exchange Research
Like positioning and sentiment data, the empirical evidence
suggests that FX customer order flow has a contempora-
neous—rather than a predictive—relationship with ex-
change-rate movements. The chart below indicates that
cumulative trends in order flow and the trend in the dollar
closely parallel one another on a contemporaneous basis.
(Note that since both exchange rates and customer flow
data can fluctuate erratically on a daily basis, we have
smoothed out the erratic daily fluctuations in these time
series to discern whether a strong positive correlation ex-
ists between order flow and exchange rates.)
There is no evidence, however, of a statistically significant
relationship between lagged order flow and future ex-
change-rate movements. This finding is supported by vari-
ous academic studies that have investigated the impor-
tance of order flow on exchange rates.
Such findings should not come as a surprise. After all, if
there are more dollar buyers than dollar sellers on a sus-
tained basis in the FX market, both cumulative net dollar
purchases and the dollar's value should rise in a parallel
fashion. One should expect dollar purchases in the cur-
rent period to drive the dollar higher now, not at some
point in the future.
Empirical work on customer order flow's impact on ex-
change rates indicates that certain customers' FX orders
may exert a greater impact on exchange rates than other
customers' FX orders. Research by Fan and Lyons (1999)
indicates that real-money accounts (i.e., unleveraged fund
managers) played a more important role in driving the euro
than did corporate or hedge fund players. In the case of
the yen, hedge funds and corporates played a relatively
more important role.
Assessing the Statistical Significance of
Sentiment/Positioning/Flow Variables as
Explanatory Variables of Exchange-Rate Movements
(January 15, 1999-November 2, 2001 Weekly Data)
Lagged
Contemporaneous One Period
Market Positioning in the US$ (DB Flow Data)
Regression Coefficient 0.69 -0.40
(t-Statistic) (1.97) * (-1.13)
Market Positioning in the Euro (DB Flow Data)
Regression Coefficient 0.066 0.057
(t-Statistic) (2.88) * (1.82)
Market Positioning in the Yen (DB Flow Data)
Regression Coefficient 0.187 -0.024
(t-Statistic) (1.75) (-0.22)
*Indicates a statistically significant value at the 95% confidence level.
The Impact of Real Money, Hedge Fund, and Corpo-
rate Customer Order Flows on Exchange Rates
(January 1993-June 1999, Monthly Data)
Real Money Leveraged Non-Financial
(Unhedged) (Hedged) Corporate
Flow Flow Flow
Euro (R2 = 0.27)
Regression Coefficient 1.5 0.6 -0.2
(t-Statistic) (4.6) (1.6) (-0.5)
Yen (R2 = 0.34)
Regression Coefficient 1.1 1.8 -2.3
(t-Statistic) (1.9) (4.9) (-3.5)
*Source: Richard K. Lyons,
The Microstructure Approach to Exchange Rates
, 2001.
Market Positioning and the U.S. Dollar
(DB Flow Momentum Indicator, Moving Average)
(April-November 2001)
102
103
104
105
106
107
108
-10
-5
0
5
10
Apr-01 May-01 Jun-01 Jul-01 Aug-01 Sep-01 Oct-01 Nov-01
US$ Index----Net USD Buying/Selling(index)___
Source: DB, Datastream
Customer Order Flow and Exchange Rates—Empirical Evidence
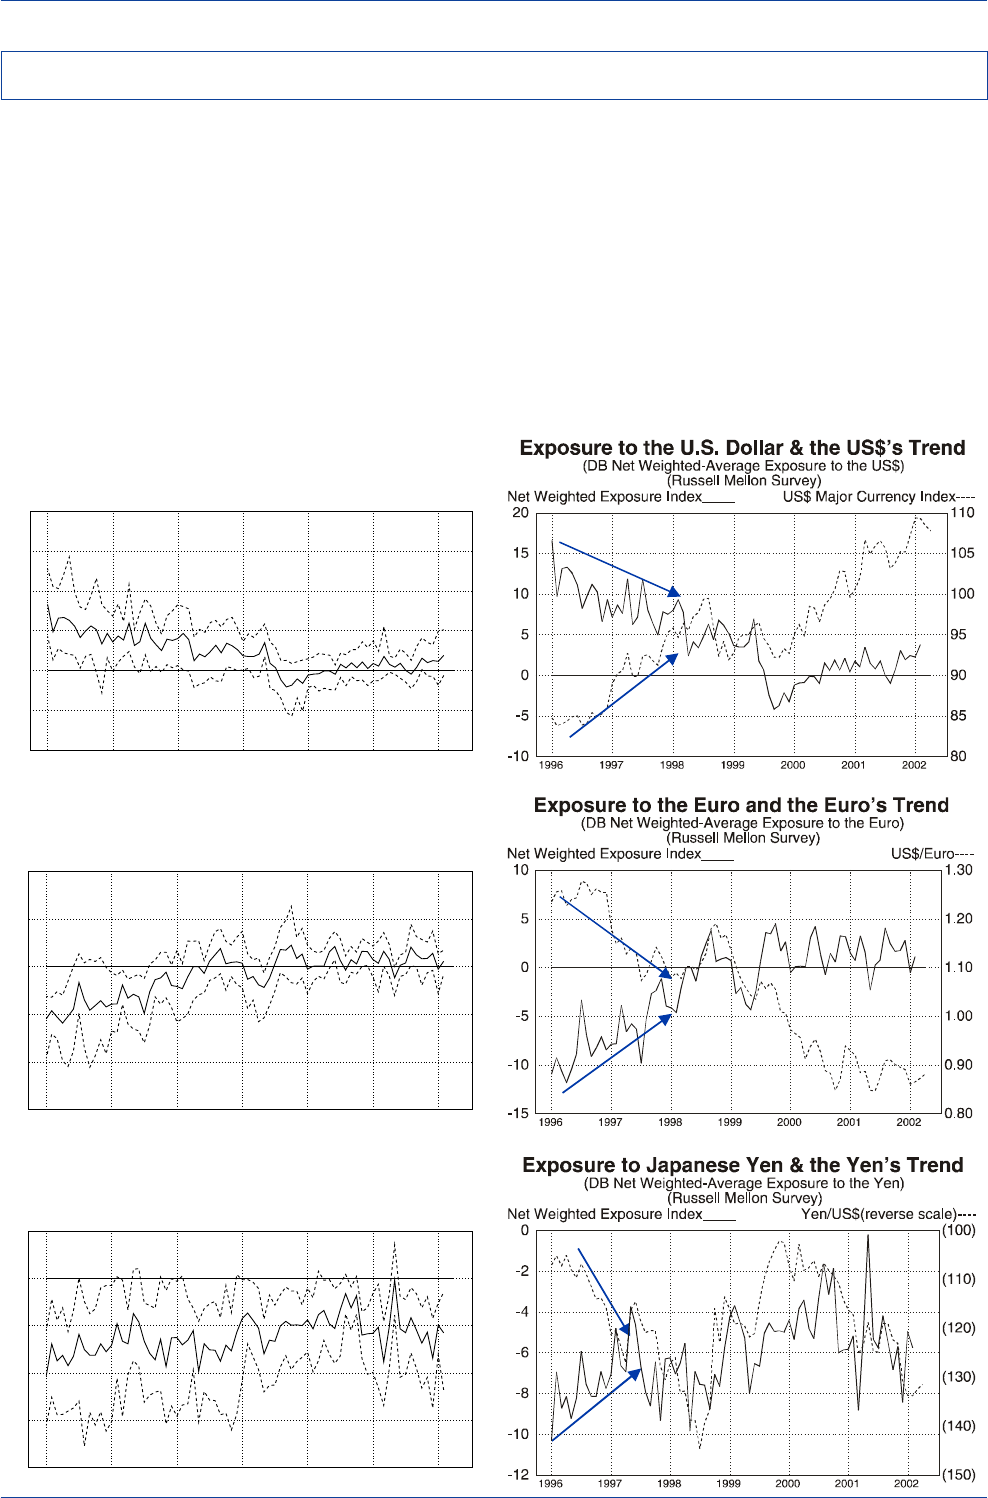
DB Guide to Exchange-Rate Determination
May 2002 Deutsche Bank @
Deutsche Bank Foreign Exchange Research 27
Surveys of global fund-manager positioning are another
tool that FX market participants have turned to in recent
years for short-term exchange-rate forecasting. The monthly
Russell-Mellon survey summarizes the portfolio positions
of 28 global fixed-income managers in selected curren-
cies and bond markets, with attention normally focused
on the 25th, median, and 75th percentile exposures. The
trends in investor exposure to the dollar, euro, and yen for
the 1996-2001 period are shown in the charts on the left.
In an attempt to better detect underlying trends in currency
positioning, we have calculated a net weighted-average
exposure index for investor allocations to the dollar, euro,
and yen in the Russell-Mellon survey. We make the heroic
assumption that the range of all reported currency expo-
sures can be defined by a normal distribution, and that the
25th, median, and 75th percentile exposure fit comfortably
inside this normal distribution. We then calculate a net
weighted-average exposure for each currency, which is
plotted against each of the respective currencies in the
diagrams on the right. These charts suggest that the use-
fulness of fund-manager positioning in predicting exchange-
rate movements may be tenuous at best.
Investor Positioning and the Trend in Exchange Rates
Source: Russell Mellon, Datastream
Source: Russell Mellon, Datastream
Source: Russell Mellon, Datastream
Investor Exposure to the U.S. Dollar
(DB Net Weighted-Average Exposure to the US$)
(Russell-Mellon Survey)
-20
-10
0
10
20
30
40
1996 1997 1998 1999 2000 2001 2002
25 and 75 Percentiles----
Net Weighted Exposure Index____
Source: Russell Mellon
Investor Exposure to the Euro
(DB Net Weighted-Average Exposure to the Euro)
(Russell-Mellon Survey)
-30
-20
-10
0
10
20
1996 1997 1998 1999 2000 2001 2002
25 and 75 Percentiles----
Net Weighted Exposure Index____
Source: Russell Mellon
Investor Exposure to the Japanese Yen
(DB Net Weighted-Average Exposure to the Yen)
(Russell-Mellon Survey)
-20
-15
-10
-5
0
5
1996 1997 1998 1999 2000 2001 2002
25 and 75 Percentiles----
Net Weighted Exposure Index____
Source: Russell Mellon
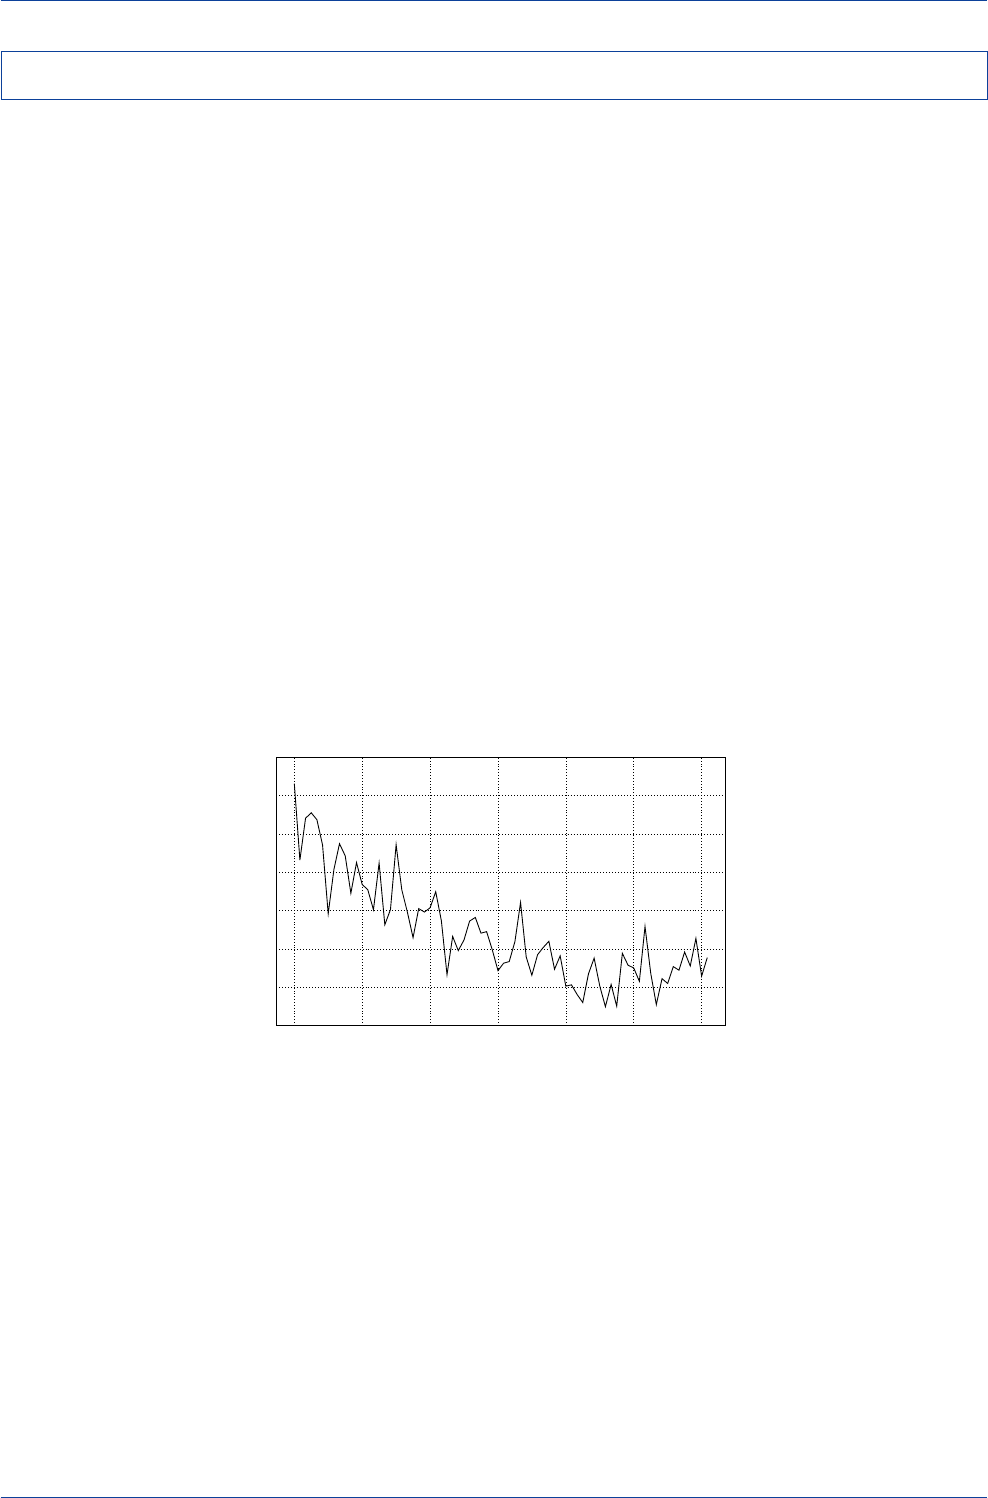
DB Guide to Exchange-Rate Determination May 2002
Deutsche Bank @
28 Deutsche Bank Foreign Exchange Research
Surveys of investor positioning can also be used to gauge
investors' appetite to take on currency risk. We have con-
structed a composite currency exposure index using the
net weighted-average exposures of the Russell Mellon sur-
vey. The Deutsche Bank Currency Exposure Index is a
simple average of the absolute value of the net weighted-
average overweight/underweight exposures that global
fund managers maintain toward the dollar, euro, and yen.
A high index value indicates that overall investor position-
ing is aggressive, while a low index value indicates that
overall investor positioning is not aggressive.
The Deutsche Bank Currency Exposure Index reveals that
investors willingly took on aggressive currency exposures
in 1996-97, with overweight/underweight positions aver-
aging 6-10 percentage points above or below their bench-
mark weights. Over the 1997-2002 period, however, the
appetite to take on greater currency exposures appears to
have fallen sharply. At present, the average overweight/
underweight currency exposure that investors are main-
taining relative to their benchmark index amounts to just
two or three percentage points relative to market norms
as investors have chosen to position their portfolio closer
to their benchmarks.
What accounts for this drop-off in investors' currency-risk
appetite? We believe that investors have been caught in a
bind in terms of weighting the conflicting forces of valua-
tion and trend. For instance, investors may have felt com-
pelled to underweight the dollar and overweight the euro,
given the dollar's huge overvaluation and the euro’s huge
undervaluation. But trend-following models have been ar-
guing that investors should take the opposite position.
Given this conflict between valuation and trend, investors
have opted to take on neutral currency exposures and have
been unwilling to shift from this stance for the past few
years. Perhaps investors are waiting for a more definitive
sign that the dollar's long-term appreciating trend has con-
vincingly reversed.
Deutsche Bank Currency-Exposure Index
0
2
4
6
8
10
12
14
1996 1997 1998 1999 2000 2001 2002
(Composite Exposure Index)
Source: Based on the Russell Mellon Survey
Currency Exposure and the Decline in Investor Appetite for FX Risk
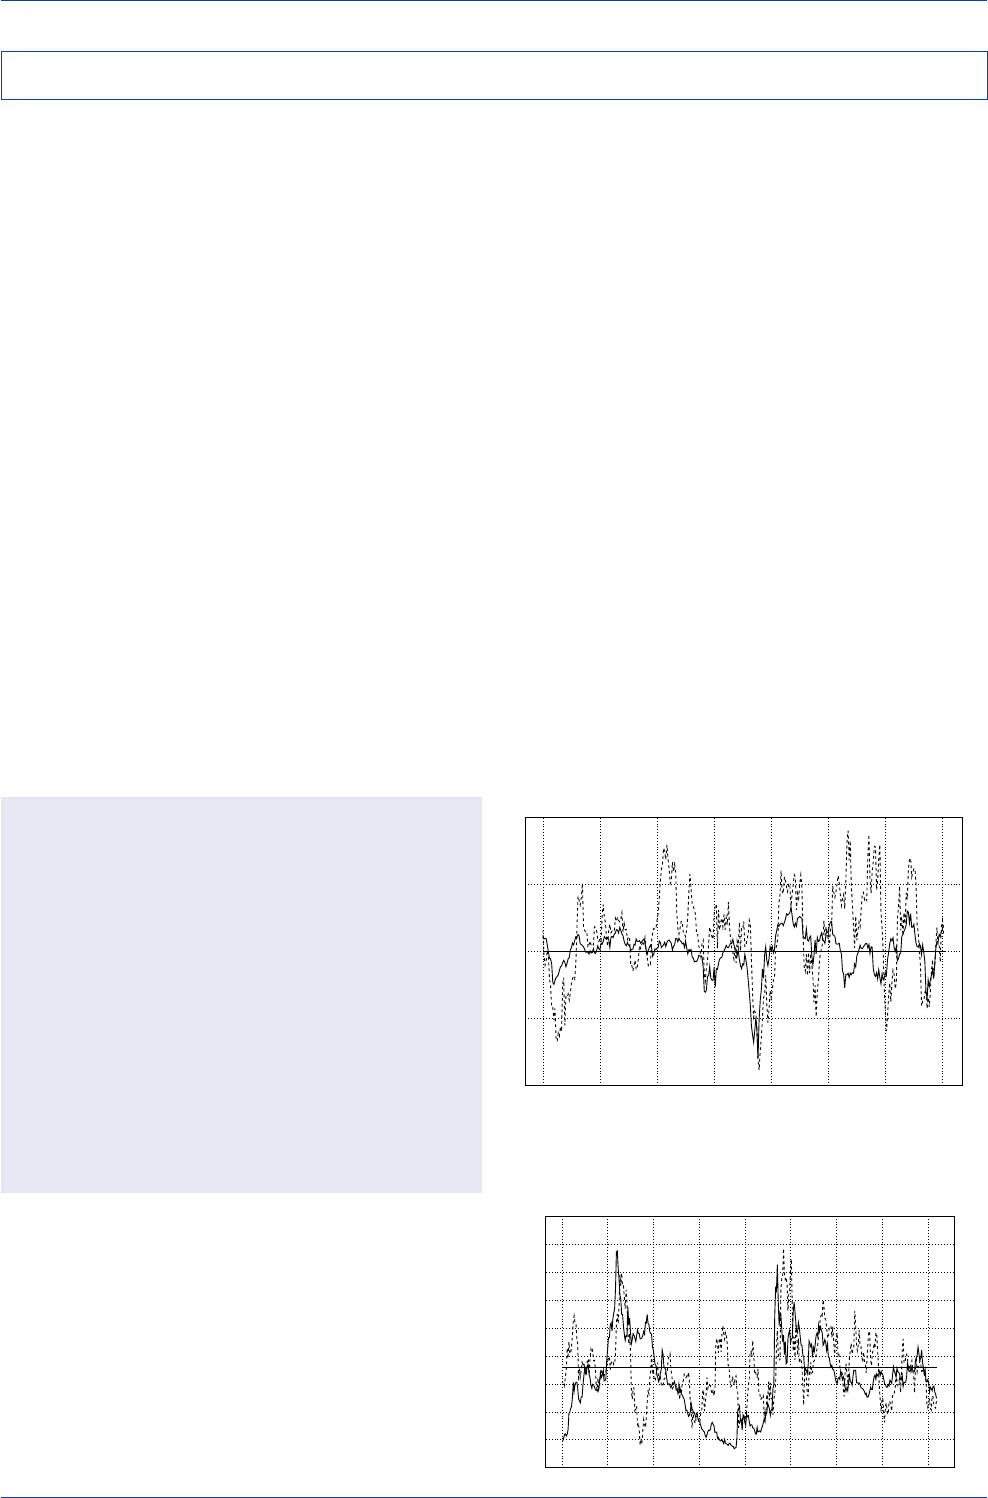
DB Guide to Exchange-Rate Determination
May 2002 Deutsche Bank @
Deutsche Bank Foreign Exchange Research 29
Currency values can be affected by shifts in investors' over-
all appetite to take on risky positions. At any point in time,
investors' overall appetite for risk could lean in favor of
either risk taking or risk aversion. During periods of high
investor confidence, investors tend to increase their expo-
sure to risky assets. During periods of heightened risk aver-
sion, however, investors tend to reduce their exposure to
risky assets. They may close out positions in foreign in-
vestments and return to home base, or they may cut sig-
nificant overweight or underweight exposures relative to
their benchmarks, particularly if such exposures are lever-
aged.
It has been suggested that certain currencies may be more
vulnerable than others during risk-averse periods. For ex-
ample, countries that run large current-account deficits
might see their currencies weaken if foreign capital were
to exit during a period of heightened risk aversion. Like-
wise, high-yield currencies could be vulnerable if inves-
tors sought to unwind risky long high-yield/short low-yield
carry trades in a risk-averse environment.
How does one measure investors' overall appetite for risk?
A number of approaches exist, but by and large they all
seek to capture increases in volatility, wider credit spreads,
trends in commodity prices, and/or shifts in yield curves.
We have constructed the Deutsche Bank Risk Appetite
Index using the components shown in the table below.
There appears to be a strong contemporaneous relation-
ship between the change in the dollar's value and the
change in Deutsche Bank's Risk Appetite Index. As with
the other sentiment/positioning/flow measures, no lead-
ing or predictive relationship is evident, which is to be ex-
pected. After all, when investors’ appetite for risk falls sud-
denly and sharply, it should affect all markets at the same
time. Implied volatility should jump upward, credit spreads
should spike higher, the yield curve should immediately
and perhaps dramatically alter its slope, and currency val-
ues should change at roughly the same time.
This contemporaneous relationship between exchange
rates and risk aversion is evident in the way the Japanese
yen/U.S. dollar exchange rate and the EMBI/U.S. Treasury
yield spread (which is considered to be a measure of
emerging-market risk) have behaved during recent peri-
ods of heightened risk aversion. In the past seven years,
there have been two occasions when the dollar has
tumbled by 20% or more over a very short time span—
January-April 1995 and August-October 1998. In both in-
stances, the EMBI spread exploded to the upside. During
both periods, the EMBI spread and the yen were respond-
ing to heightened risk aversion on a global basis as inves-
tors sought to withdraw from leveraged carry trades that
had suddenly become highly vulnerable.
DB Risk Appetite Index and the U.S. Dollar
-8
-6
-4
-2
0
2
4
6
8
-4
-2
0
2
4
1995 1996 1997 1998 1999 2000 2001 2002
US$ Index(Deviation from Trend)----DB Risk Appetite Index____
Components of the DB Risk Appetite Index
Component Reason for Inclusion
G3 Implied Three-Month FX Volatility Captures FX market uncertainty and risk.
(average of USD/JPY, EUR/JPY
and EUR/USD volatility)
VIX Index Captures uncertainty and risk in the U.S.
(CBOE OEX Volatility Index, and, therefore, global equity markets.
expected volatility
in the S&P100 index)
U.S. High Yield Bond Spread An indicator of risk in U.S. credit markets.
JP EMBI+ Composite Index An indicator of emerging-market volatility,
uncertainty, and risk.
Journal of Commerce Metals Index Proxy for global-growth risks on the
assumption that risk appetites will be
higher during periods of stronger growth.
G3 Yield Curve Proxy for global growth risks, liquidity, and
(10-year bonds less cash rates) safe-haven flows into government bonds.
Construction of the RAI: The DB RAI index is a simple average of the deviation in
each of the above indicators from their trend (standardised). In this way, the index
overcomes problems associated with, for example, the structural widening in credit
spreads in recent years. Periods spent in Risk Taking or Risk Aversion territory have
been determined from the Risk Appetite Index using a standard MACD technique,
designed to pick up shifts in the trend in the RAI.
Source: DB, Datastream
Risk Appetite Shifts and Currency Trends
Emerging-Market Credit Risk & the U.S. Dollar
(1994-1998)
-20
-10
0
10
20
30
200
400
600
800
1000
1200
1400
1600
1800
2000
1994 1995 1996 1997 1998 1999 2000 2001 2002
Yen/US$(3-mo. % chg.)----EMBI Yield Spread(bps.)____
Source: Bloomberg, Datastream
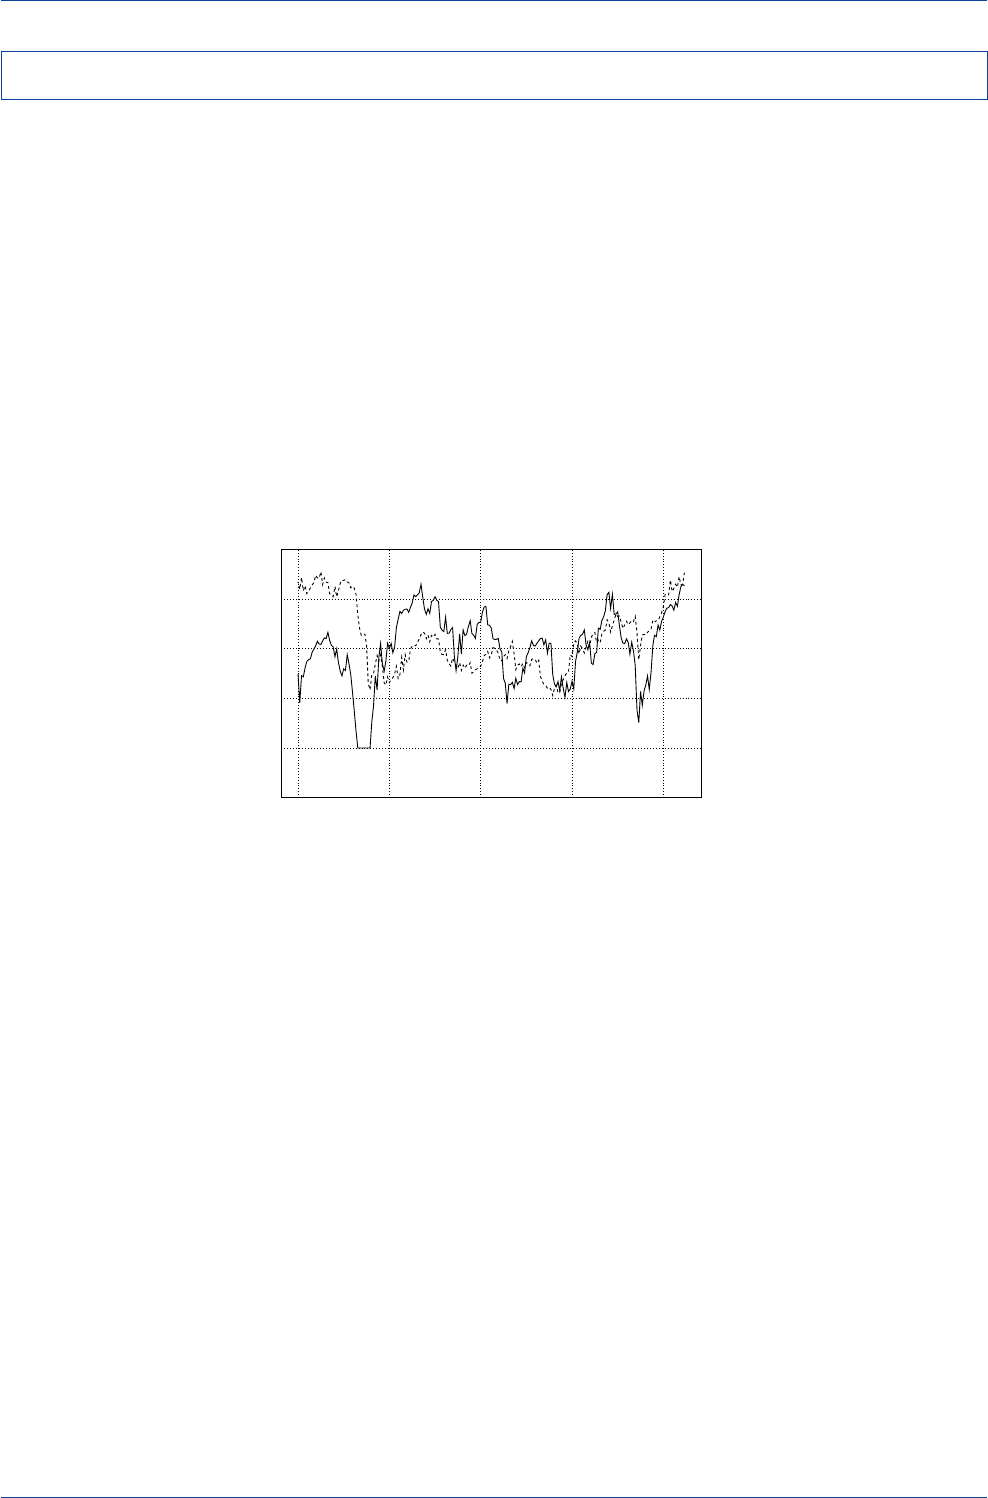
DB Guide to Exchange-Rate Determination May 2002
Deutsche Bank @
30 Deutsche Bank Foreign Exchange Research
Researchers have found that carry trades (long positions
in high-yield currencies funded by short positions in low-
yield currencies) work best in benign risk-appetite envi-
ronments. That is, when investors have a strong appetite
to take on risk, they are more apt to engage in riskier strat-
egies such as carry trades, and if their level of confidence
is high, they may engage in such trades in a leveraged
manner. In contrast, during periods of high risk aversion,
investors are more likely to cut risky positions, particularly
positions that might be highly leveraged. Thus, if the incli-
nation to take on carry trades tends to move positively
with investors’ appetite to take on risk, we would expect
to find a close relationship between the profitability of carry
trades and the trend in risk appetite indicators.
Indeed, as the chart below reveals, the rolling returns from
being long the three highest yielding currencies in the in-
dustrial world and being short the three lowest yielding
currencies in the industrial world closely tracks the trend
in the Deutsche Bank Risk Appetite index. Given this tight
fit, fund managers who undertake carry trades on a fre-
quent basis might find it useful to initiate carry trades when
the risk appetite index is trading upward, and to cut such
positions when the risk appetite index is trending down-
ward.
Risk Appetite and the Profitability of Carry Trades
Deutsche Bank Risk Appetite Index
and the Profitability of Carry Trades
-10
-5
0
5
10
15
20
-15
-10
-5
0
5
10
1998 1999 2000 2001 2002
Fwd.-Bias Strategy Return(%)----DB RAI(index)____

DB Guide to Exchange-Rate Determination
May 2002 Deutsche Bank @
Deutsche Bank Foreign Exchange Research 31
Exchange-Rate Determination in the
Long Run
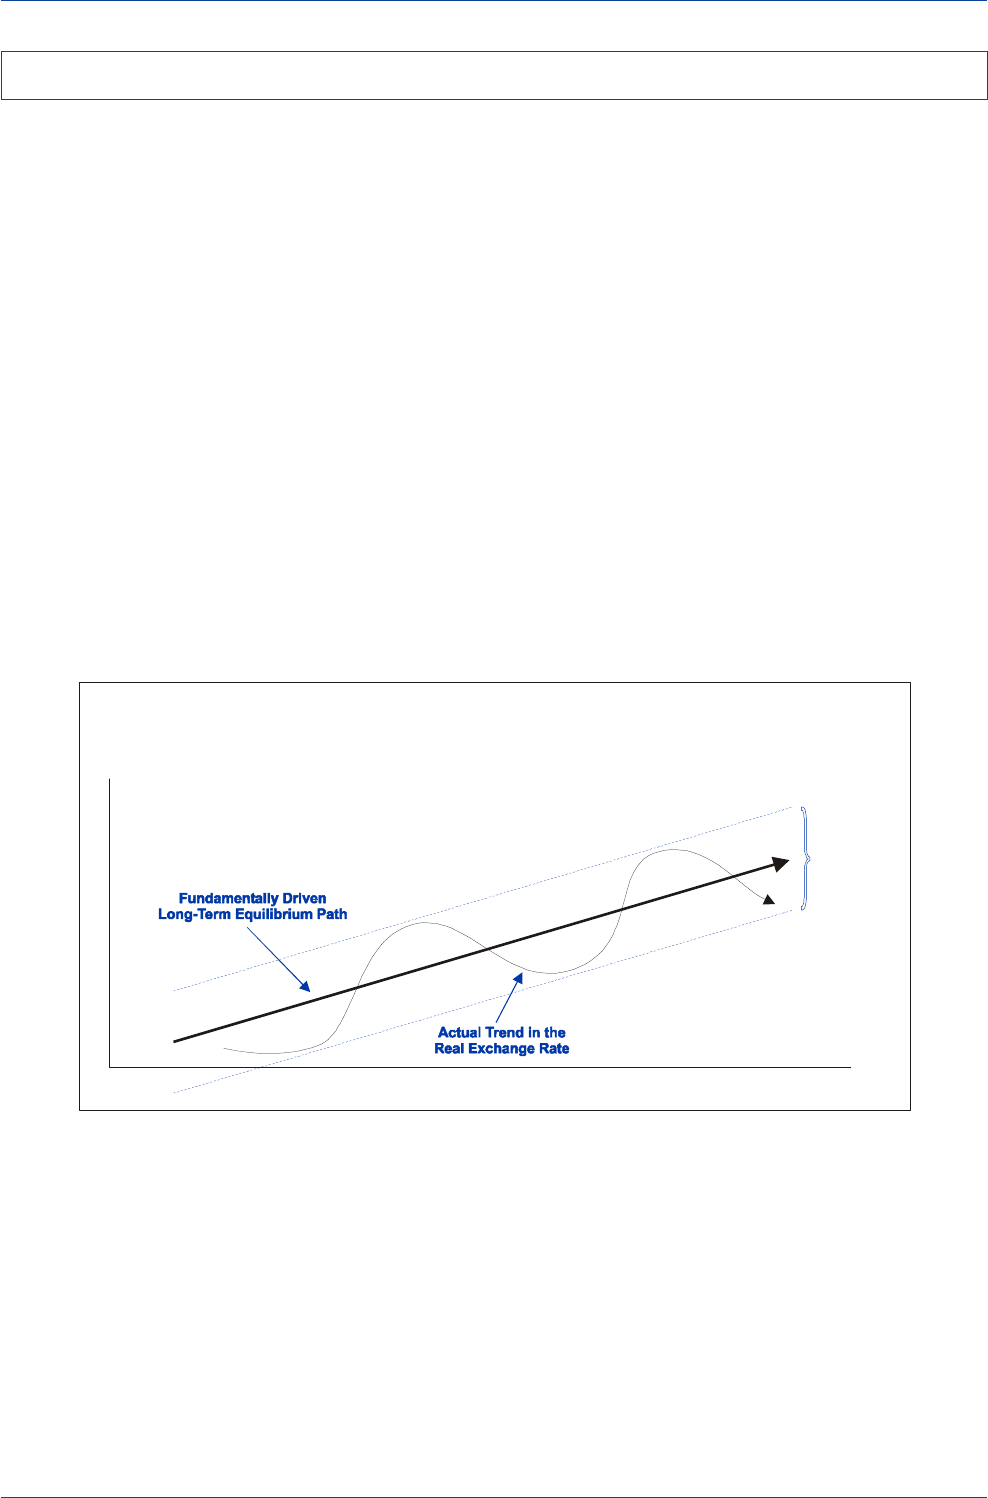
DB Guide to Exchange-Rate Determination May 2002
Deutsche Bank @
32 Deutsche Bank Foreign Exchange Research
In the long run, a currency’s value should gravitate toward
its real long-run equilibrium value. If we were able to esti-
mate which exchange-rate level represented long-run fair
value, we would be able to identify the likely path that an
exchange rate should take on a long-term basis. Unfortu-
nately, there is no uniform agreement among economists
on what exchange-rate level represents a currency's true
long-run equilibrium level. The purchasing power parity
(PPP) approach to assessing long-run fair value probably
has the widest following among economists and strate-
gists, but it is also widely recognized that the PPP approach
has serious limitations. That is because historically, the
deviations from estimated PPP values have been both large
and persistent, which suggests that fundamental forces
other than relative national inflation rates have been play-
ing an important role in driving the long-term path of ex-
change rates.
The failure of PPP to hold over medium-term and, in some
cases, long-term horizons has led economists to consider
alternative approaches to assess long-term value in the
FX markets. For instance, the IMF favors the macroeco-
nomic-balance approach to long-term exchange-rate deter-
mination, in which the long-run equilibrium exchange rate
is defined as the rate that would equalize a country's sav-
ings-investment balance with its underlying current-account
balance. According to this approach, if there is a shift in a
country's national savings, investment, or underlying cur-
rent account, then the real long-run equilibrium exchange
rate should adjust accordingly. This approach is quite simi-
lar to the Fundamental Equilibrium Exchange Rate (FEER)
approach pioneered by John Williamson.
More recently, economists have sought to identify the long-
run equilibrium paths of currencies with econometric mod-
els, relating key economic variables to long-term trends in
exchange rates. These studies have found that long-term
trends in relative productivity growth, sectoral-productiv-
ity differentials, persistent trends in a country’s terms of
trade, the net external investment position of a country as
a percentage of its GDP, and trends in national savings and
investment have had some success in explaining the long-
term path of exchange rates.
A Stylized Model of the
Long-Term Trend in a Currency’s Value
Real Exchange Rate
Time
Long-Run
Equilibrium
Path
Exchange-Rate Determination in the Long Run
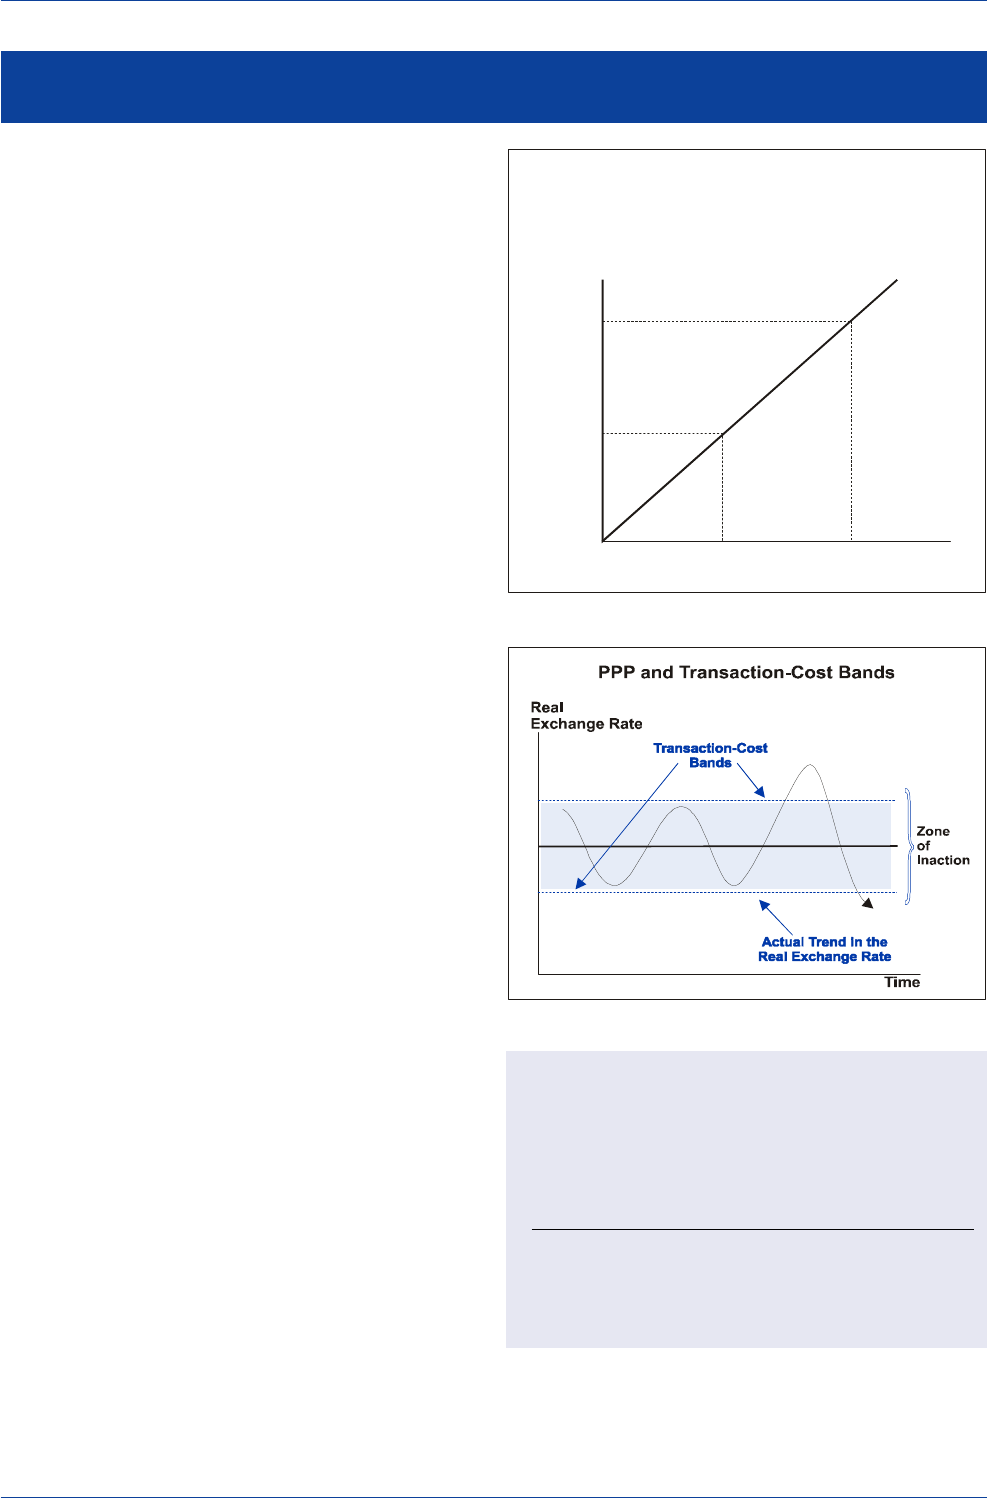
DB Guide to Exchange-Rate Determination
May 2002 Deutsche Bank @
Deutsche Bank Foreign Exchange Research 33
The purchasing power parity (PPP) approach to exchange-
rate determination contends that the long-run equilibrium
value of a currency is completely determined by the ratio
of domestic prices relative to foreign prices. PPP is built
on the notion of arbitrage across all tradable goods and
services. Arbitrage ensures that the prices of similar goods
in two countries will be equalized, when expressed in ei-
ther local or foreign currency terms. For example, if the
U.S. and Euroland produced a similar basket of goods, ar-
bitrage should ensure that the prices of those goods would
be the same in both regions. If the price of the U.S. basket
suddenly rose relative to the price of the Euroland basket,
the dollar would need to fall to offset the relative price
change in order to keep the prices of the two baskets equal-
ized.
The evidence on PPP suggests that there are often signifi-
cant and persistent departures from PPP in the short and
medium run. One key reason is that arbitrage in tradable
goods might be limited by transaction costs, tariffs, and
entry and exit barriers. If such barriers to arbitrage were
significant, a large "zone of inaction" might exist whereby
firms would be unwilling to arbitrage traded-goods prices,
and thus significant departures from PPP would exist over
a certain range of exchange-rate movements. Real ex-
change rates would fluctuate randomly inside this zone of
inaction, but if the real exchange rate moved outside of
the transaction bands, arbitrage would finally become prof-
itable enough to bring the real exchange rate back inside
the zone of inaction.
According to a recent survey, U.K.-based foreign-exchange
dealers believe that PPP can be a useful tool for long-run
currency forecasting, but view it as a poor forecasting tool
for the short and medium term. But even for long-run fore-
casting, there does not appear to be overwhelming sup-
port for PPP. According to the survey, only 44.3% believed
that PPP could be useful in predicting exchange-rate move-
ments beyond six months, while 34.9% believed it was
not useful, and 20.8% had no opinion. Survey of U.K.-Based FX Dealers
on the Validity of PPP as a Forecasting Tool
Question: Do you think PPP can be used to predict
exchange-rate movements?
Intraday Medium Run Long Run
(within 6 Months) (over 6 months)
Yes 4.8 16.4 44.3
No 87.4 67.3 34.9
No Opinion 7.8 16.3 20.8
Source: Cheung, Chinn and Marsh, NBER Working Paper 7524, Feb. 2000.
Purchasing Power Parity
Exchange Rate Changes Are Posited to Reflect
Changes in Relative Prices
Relative Price Level
(P /P )
GUS
1.0
DM2000/
US2000
Exchange Rate
(DM/US$)
2.0
DM2000/
US1000
PPP
45 degrees
Purchasing Power Parity
Source: Rosenberg (1996)
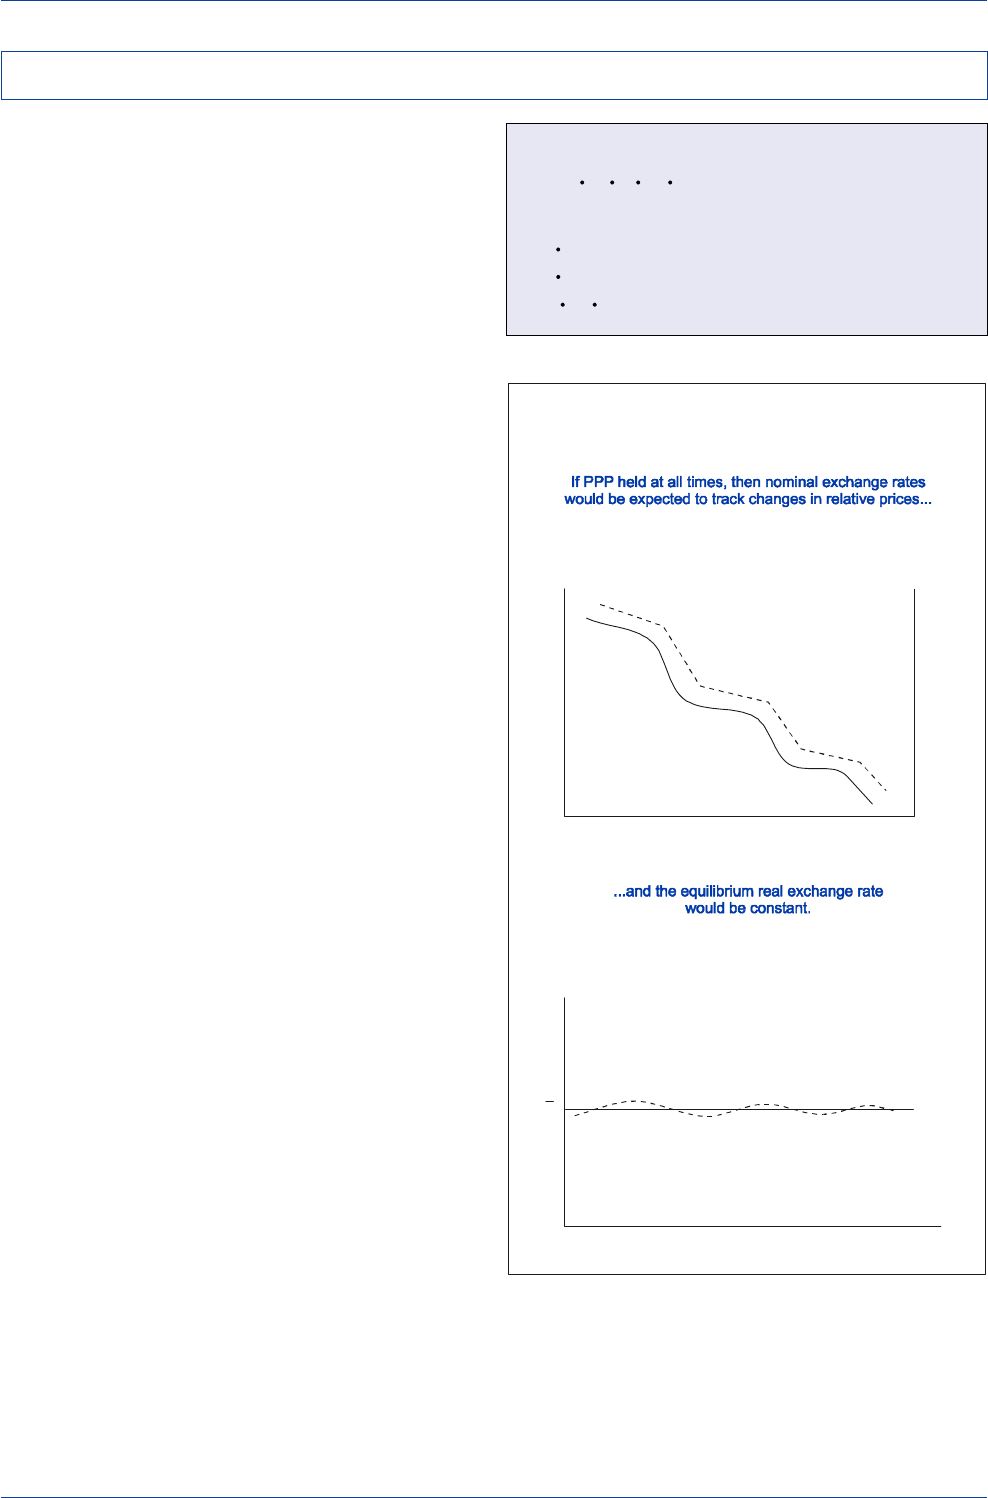
DB Guide to Exchange-Rate Determination May 2002
Deutsche Bank @
34 Deutsche Bank Foreign Exchange Research
According to the relative version of PPP, the exchange rate
over time will move to offset differences in national infla-
tion rates. If, for example, the U.S. inflation rate averaged
5% higher than the Euroland inflation rate, the dollar would
need to fall by 5% per annum versus the euro to offset the
gap in relative inflation rates. Thus, if PPP held at all times,
we should expect the nominal exchange-rate path to par-
allel the inflation-differential path.
A country's real exchange rate can be defined as the nomi-
nal exchange rate adjusted for changes in relative inflation
rates. The dollar's real value would be unchanged if the
dollar's nominal value moved exactly in line with changes
in U.S./foreign inflation differentials. Thus, if the U.S. in-
flated at a rate of 5% per annum above the Euroland infla-
tion rate, and the dollar fell by 5% per annum versus the
euro at the same time, the dollar's real value versus the
euro would be unchanged over time. Indeed, if PPP holds
over time, then the real exchange rate would be constant
over time as well.
Many analysts use the trend in real exchange rates as a
gauge to assess a country’s long-run competitiveness. If a
country inflated at a rapid rate relative to its trading part-
ners, and its currency failed to decline in tandem, the
currency's real value would, as a consequence, rise. The
rise in the real exchange rate could be viewed as a mea-
sure of the loss in that country's competitiveness versus
its trading partners. If, instead, the nominal exchange rate
declined to exactly offset the difference in relative infla-
tion rates, then the real exchange rate would have been
constant and there would have been no change in trade
competitiveness.
Real Exchange Rate Determination
q = e - (p* - p)
where:
q = change in the real exchange rate
e = change in the nominal exchange rate
(p* - p) = change in relative price levels
Purchasing Power Parity and the Real Exchange Rate
Relative Price Levels and
Nominal and Real Exchange Rates
Relative Price
Level
(P /P )
EUS
(P /P )
EUS
Time
e
$
U.S. Dollar’s
Value
(e )
$
Time
Real
Exchange Rate
(q)
qq
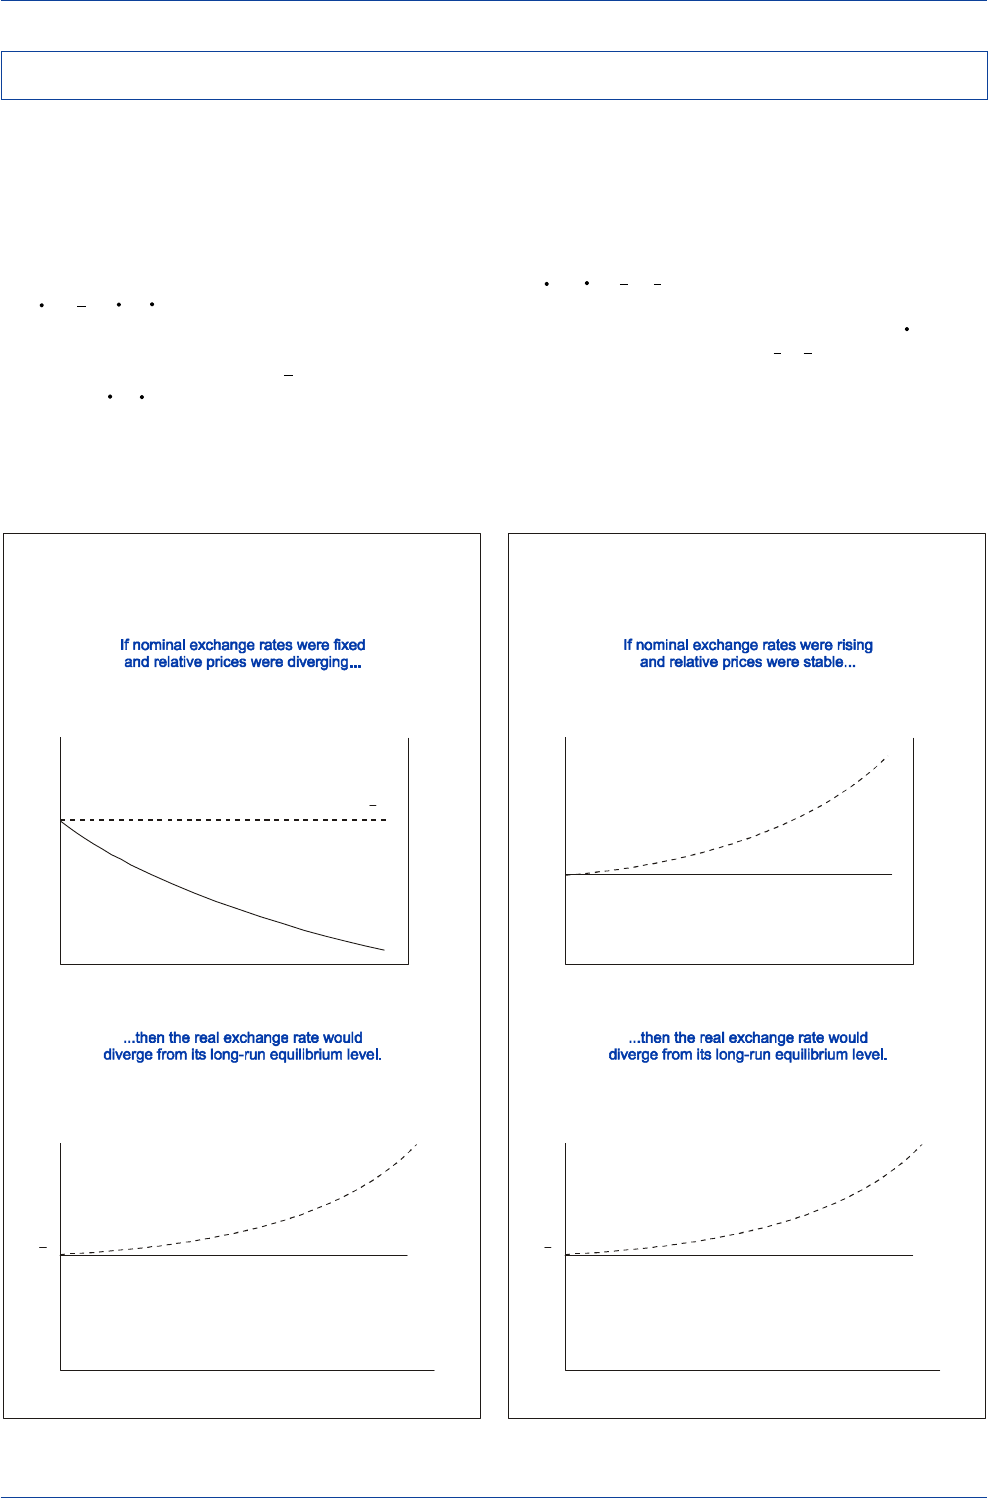
DB Guide to Exchange-Rate Determination
May 2002 Deutsche Bank @
Deutsche Bank Foreign Exchange Research 35
PPP misalignments occur when nominal exchange rates
fail to move in line with relative inflation rates. Consider
what would happen if the U.S. inflation rate averaged 5%
per annum faster than Euroland’s inflation rate but the U.S.
dollar/euro exchange rate was fixed. By preventing a de-
cline in the dollar's nominal value that would offset the
relatively higher U.S. inflation rate, the dollar's real value
q$ = e$ - (pE - pUS)
would be pushed steadily higher as the gap between the
fixed nominal value for the dollar, e$, and a falling inflation
differential, (pE - pUS), steadily widened. The more the U.S.
inflates relative to Euroland, with no offsetting dollar de-
preciation, the less competitive the U.S. would be.
PPP misalignments can also occur if the nominal exchange
rate rises or falls by large amounts relative to modestly
changing or unchanging inflation differentials. For example,
if the U.S. and Euroland inflated at similar rates, but the
dollar's nominal value nevertheless soared versus the euro,
then the dollar's real value
q$ = e$ - (pE - pUS)
would rise as the gap between a rising dollar, e$, and an
unchanged inflation differential, (pE - pUS), steadily widened.
The consequences of a steadily rising real value for the
dollar would be a long-run decline in U.S. competitiveness.
Real Appreciations and Exchange-Rate Misalignments
The Response of Real Exchange Rates
to Changes in Relative Prices
When Nominal Exchange Rates are Fixed
Relative Price
Level
(P - /P )
E- US
(p /p )
EUS
Time
e
$
U.S Dollar’s
Nominal Value
(e )
$
Time
Real
Exchange Rate
(q )
$
q
$
q
$
The Response of Real Exchange Rates
to Changes in Nominal Exchange Rates
When Relative Prices Levels are Stable
Relative Price
Level
(P -/P )
EUS
(p /p )
EUS
Time
e
$
U.S. Dollar’s
Nominal Value
(e )
$
Time
Real
Exchange Rate
(q )
$
q
$
q
$
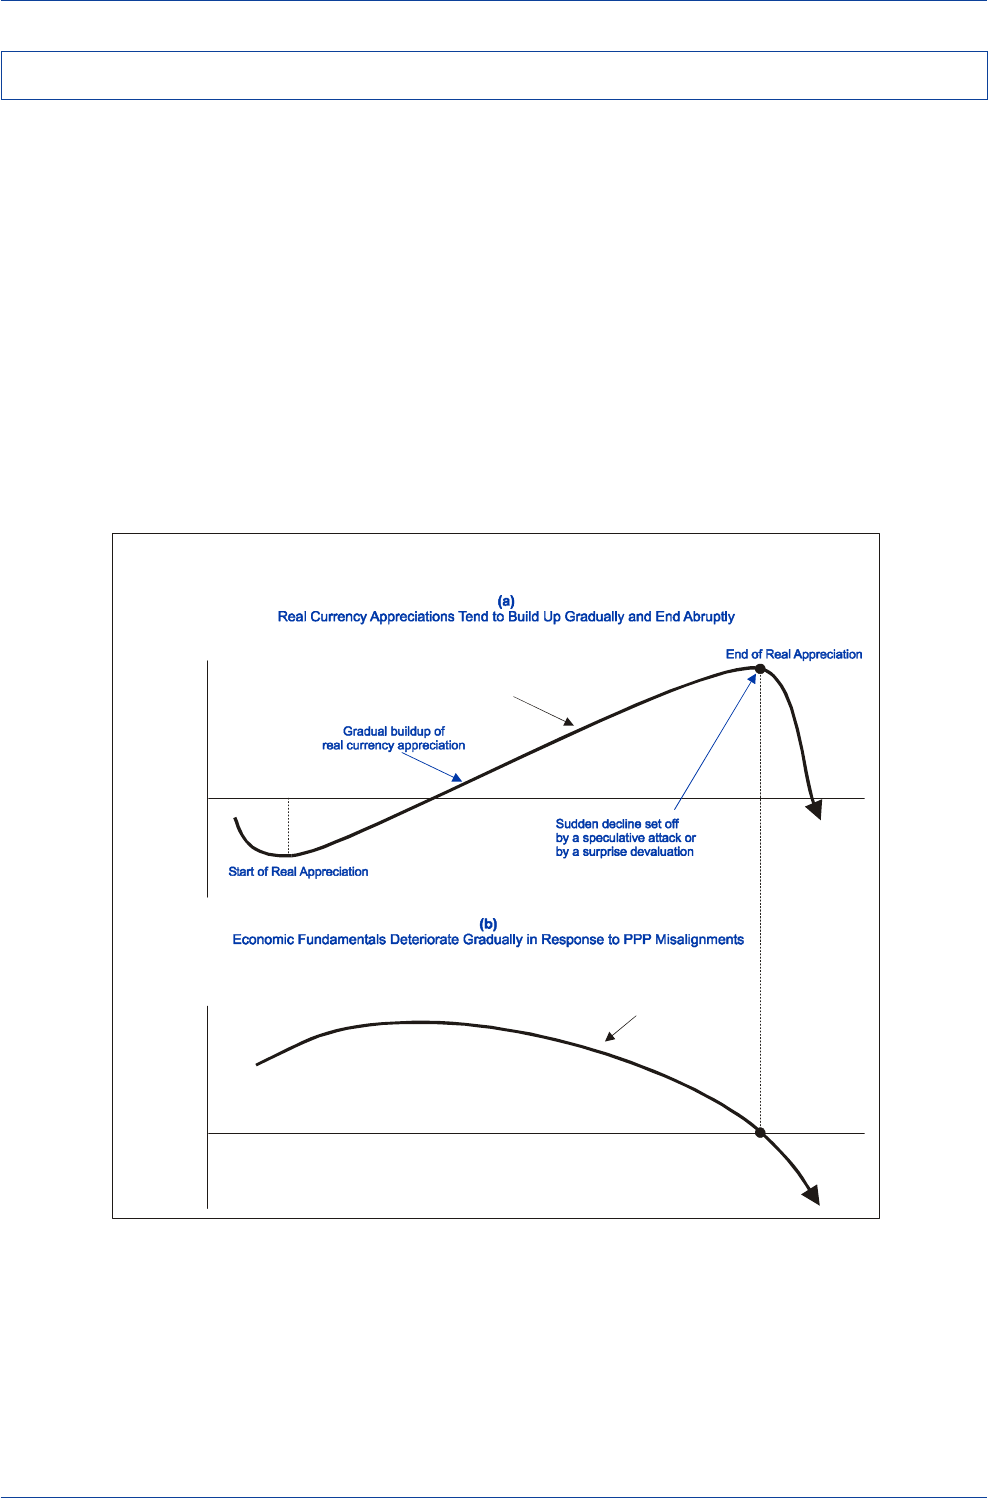
DB Guide to Exchange-Rate Determination May 2002
Deutsche Bank @
36 Deutsche Bank Foreign Exchange Research
Evidence for both developed and developing countries
suggests that PPP misalignments tend to build up gradu-
ally over time. A key reason why this pattern tends to re-
cur so often is that in the early years of an overly appreci-
ated currency, firms and households find a way to adjust,
and this, at least temporarily, works to temper the harsh
effects of real currency appreciation on the domestic
economy. For example, firms may try to maintain market
share by cutting their profit margins, while households may
attempt to maintain their spending by running down their
savings. Because of these and other adjustments, real
growth might not show any visible signs of weakness and
the current-account balance might not deteriorate signifi-
cantly in the early years of a misaligned exchange rate.
Since an overly appreciated currency is not likely to give
rise initially to a deteriorating trend in domestic economic
activity or in the current-account balance, it is highly un-
likely that the market will feel compelled to wage an attack
on the overvalued currency in the early years of real ap-
preciation. The larger a PPP misalignment grows and the
longer it lasts, however, the greater the likelihood that it
will eventually lead to a visible deterioration in economic
fundamentals. Only when economic fundamentals dete-
riorate beyond a certain threshold level (point
A
in the dia-
gram below) will market participants become emboldened
to wage an attack on the misaligned currency and push it
back toward its real long-run equilibrium level.
PPP Misalignments and Their Eventual Corrections
PPP
Time
% Overvalued
(0)
% Undervalued
(+)
(-)
Weighted-Average Trend
in Fundamentals
Time
Real Exchange Rate
Economic Fundamentals
A
PPP Cycle of Exchange-Rate Misalignment and Correction
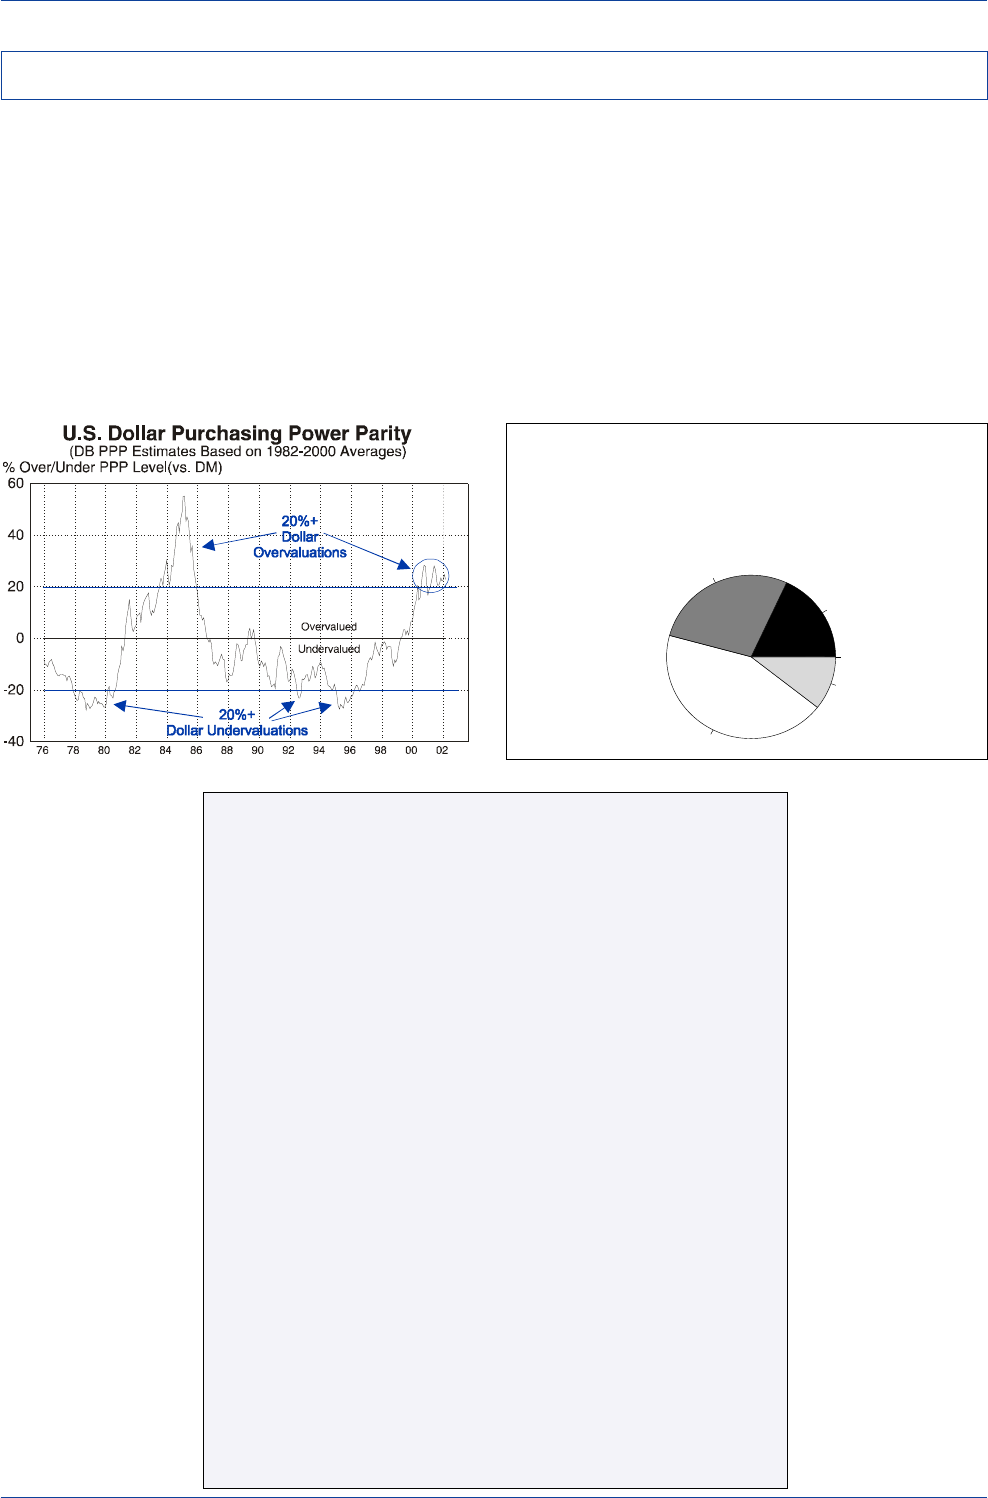
DB Guide to Exchange-Rate Determination
May 2002 Deutsche Bank @
Deutsche Bank Foreign Exchange Research 37
Historically, PPP misalignments exceeding +/- 20% have
been rare and short-lived in the industrial world. When-
ever the DM/US$ exchange rate has risen or fallen by more
than 20% relative to its PPP equilibrium level, the result-
ing misalignment has proven to be transitory.
For the past two years, the dollar has been overvalued by
25%-30%, which is the largest PPP misalignment that the
dollar has experienced since the 1984-85 dollar bubble.
This suggests that the dollar has been in an upside over-
shoot, and since exchange rate misalignments of this size
tend not to be sustainable, one should expect that the
DM/US$ exchange rate will eventually move back inside
its +/- 20% PPP band.
There are signs that the overvalued dollar has been taking
its toll on U.S. competitiveness since 2000. A recent sur-
vey conducted by the Federal Reserve Bank of Philadel-
phia suggests that over 45% of U.S. firms have been nega-
tively affected in some manner by the dollar's overvalua-
tion in the past two years. Further evidence can be found
in the rising chorus of complaints by U.S. industry, as re-
flected in the letter, reprinted below, from leading manu-
facturing associations to the U.S. Treasury Secretary.
The Honorable Paul O’Neill
Secretary of the Treasury
Washington DC 20220
June 4, 2001
Dear Mr. Secretary:
We are writing to tell you that at current levels the exchange value of the dollar is having a strong
negative impact on manufacturing exports, production, and employment. A growing number of American
factory workers are now being laid off principally because the dollar is pricing our products out of
markets – both at home and abroad. Small firms are being affected as well as large ones. As you
balance your responsibilities for international monetary stability and domestic economic growth, we
ask that you take into account the growing burden an overvalued dollar is imposing on U.S. manufacturing.
Since early 1997 the dollar has appreciated by 27 percent. Industries such as aircraft, automobiles and
parts, paper and forest products, machine tools, medical equipment, steel, and other capital goods –
as well as consumer goods producers — are being affected very significantly. No amount of cost
cutting can offset a nearly 30 percent dollar markup.
The total effect on the U.S. economy is staggering. These output losses are particularly serious at this
time, as they coincide with a general economic slowdown. The economic fundamentals have changed
dramatically in the last six months. Production and profitability are down, and manufacturing employment
has fallen by more than a half million jobs since mid-2000. Yet, in the face of slowing economic growth,
declining interest rates, and rising manufacturing unemployment, the dollar has remained high.
In our view, a clarification of Treasury policy is in order, to be certain that it is not seen as endorsing an
ever stronger dollar irrespective of the economic fundamentals. We urge the Treasury to make it clear
that the value of the dollar should be consistent with economic reality and market conditions. This
policy should be buttressed by a commitment to further reductions in interest rates and to cooperating
in exchange markets as appropriate. Moreover, it is vital that the Treasury not condone currency
manipulation by trading partners seeking to make their exports more competitive.
Mr. Secretary, 18 million workers and their families depend directly on the continued strength and
competitiveness of American manufacturing. Many more Americans rely on stockholdings in our
companies for their retirement income. We would like to meet with you to describe more fully the
effects the value of the dollar is having on us. We hope you will be able to accommodate our request.
Respectfully,
Jerry J. Jasinowski, President John W. Douglass, President and CEO
Aerospace Industries Association National Association of Manufacturers
W. Henson Moore, President and CEO Don Carlson, President
American Forest and Paper Association AMT – The Association for Manufacturing Technology
Stephen Collins, President Christopher M. Bates, President & CEO
Automotive Trade Policy Council Motor Equipment Manufacturers Association
The Effect of the Dollar’s Rise on U.S. Business
(Philadelphia Fed Survey)
Question: "Which of the following best
characterizes the effect of the rise in the
value of the dollar on your business?"
Substantial Negative--18.1%
Some Negative Effect--27.7%
No Effect--43.6%
Some Positive Effect--10.6%
Substanial Positive--0.0%
PPP Case Study: Dollar Overvaluation in 2001-02
Source: Datastream
Source: Federal Reserve
Bank of Philadelphia
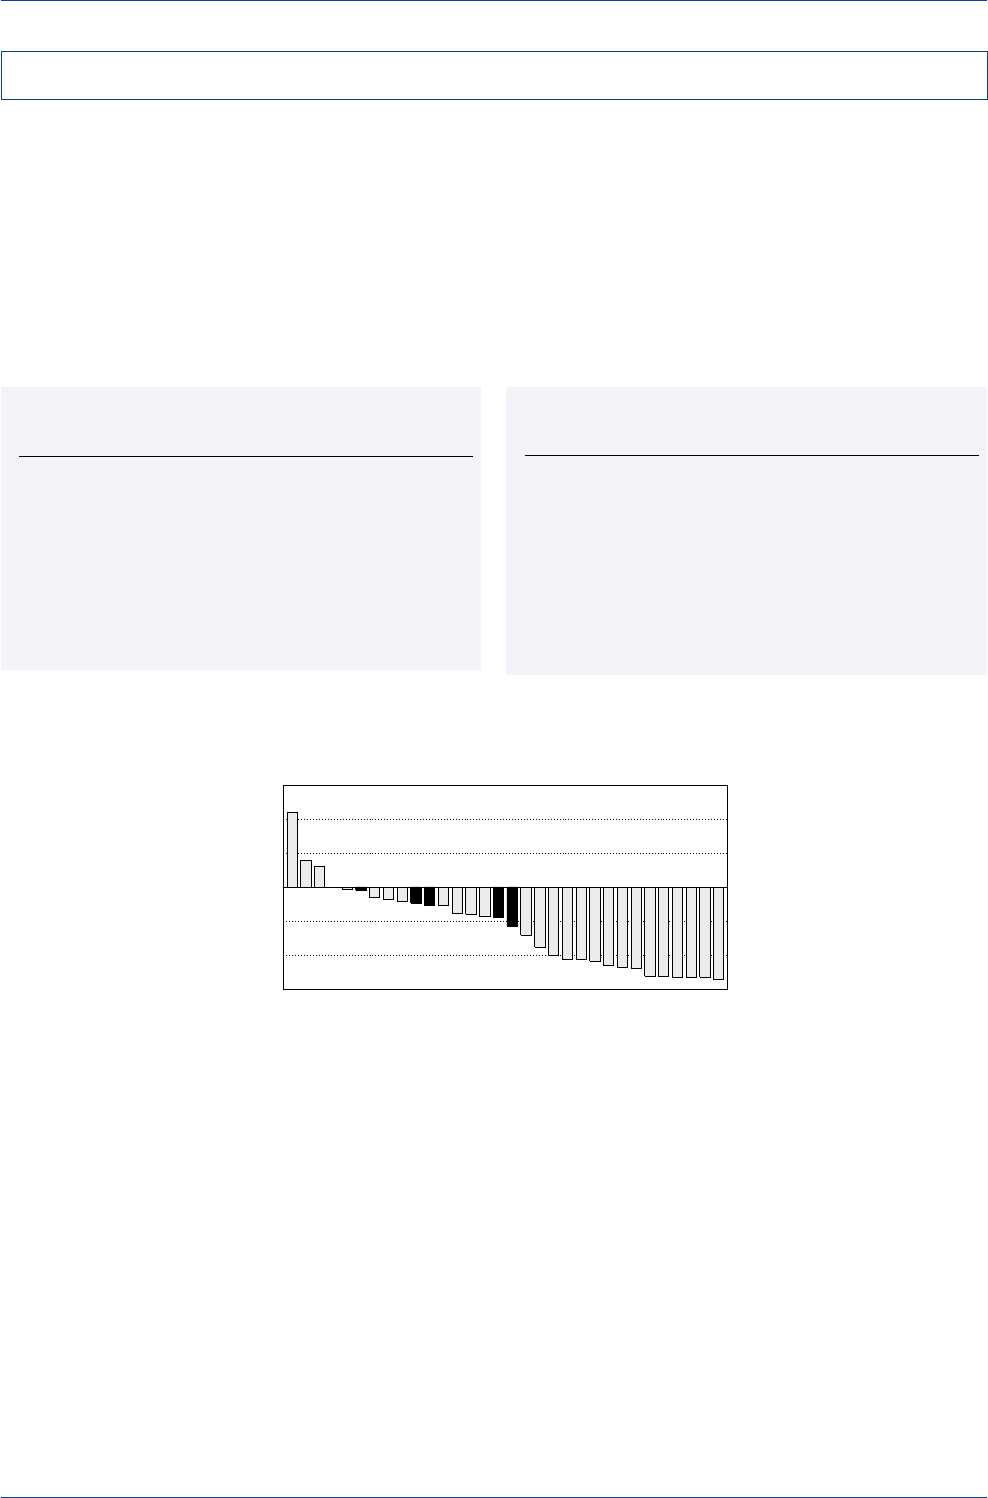
DB Guide to Exchange-Rate Determination May 2002
Deutsche Bank @
38 Deutsche Bank Foreign Exchange Research
Different approaches to calculating PPP are likely to yield
different estimates of the dollar's PPP fair value. We favor
a long-run averaging approach that allows us to circum-
vent the "base period" problem, in which PPP estimates
can be distorted upward or downward if a particular year is
chosen as the base period. We currently find the dollar to
be significantly overvalued—by over 20% versus the
euro—using either relative consumer or producer price
inflation rates to generate long-run average PPP estimates.
The Economist Magazine's Big Mac Index currently esti-
mates that the dollar is only 10% overvalued versus the
euro. The price of a McDonald's Big Mac hamburger in
Germany and France is roughly equal to the price of the
Big Mac in the U.S., but in Italy and Spain, Big Macs are
20% cheaper than in the U.S.
March 15, 2002 PPP % Over/
Currency (vs. US$) Spot Rate Estimate Under-Valued
Swedish Krona 10.32 7.02 -47.0
Canadian Dollar 1.59 1.24 -27.7
Australian Dollar 0.53 0.72 -27.5
N.Z. Dollar 0.44 0.60 -27.2
Euro 0.88 1.18 -25.4
Norwegian Krone 8.78 7.11 -23.5
Deutsche Mark 2.21 1.80 -22.9
Danish Krone 8.41 7.07 -18.9
Swiss Franc 1.66 1.45 -14.5
Japanese Yen 129.06 117.32 -10.0
British Pound 1.43 1.55 -8.0
US$ Index 117.18 96.32 21.7
CPI-Based Purchasing Power Parity (PPP) Estimates March 15, 2002 PPP % Over/
Currency (vs. US$) Spot Rate Estimate Under-Valued
Swedish Krona 10.32 7.73 -33.4
Euro 0.88 1.14 -22.7
Australian Dollar 0.53 0.67 -22.1
Swiss Franc 1.66 1.38 -20.0
Deutsche Mark 2.21 1.85 -19.8
N.Z. Dollar 0.44 0.52 -15.9
Norwegian Krone 8.78 7.75 -13.3
Danish Krone 8.41 7.46 -12.8
Canadian Dollar 1.59 1.43 -11.2
Japanese Yen 129.06 117.36 -10.0
British Pound 1.43 1.46 -2.6
US$ Index 117.18 104.22 12.4
PPI-Based Purchasing Power Parity (PPP) Estimates
Big Mac PPP Estimates
(Economist Magazine’s Big Mac Index)
-60
-40
-20
0
20
40
60
Switz.
Denmark
Britain
U.S.
Argentina
France
Japan
Mexico
Sweden
Germany
Euro area
S. Korea
Canada
Taiwan
Chile
Spain
Italy
Singapore
Brazil
Australia
Poland
N.Z.
Czech Rep.
Hong Kong
Indonesia
Hungary
Russia
Thailand
China
S. Africa
Malaysia
Philippines
%
Over(+) Under(-) Valued
U.S. Dollar PPP Estimates in 2002
Source: www.economist.com
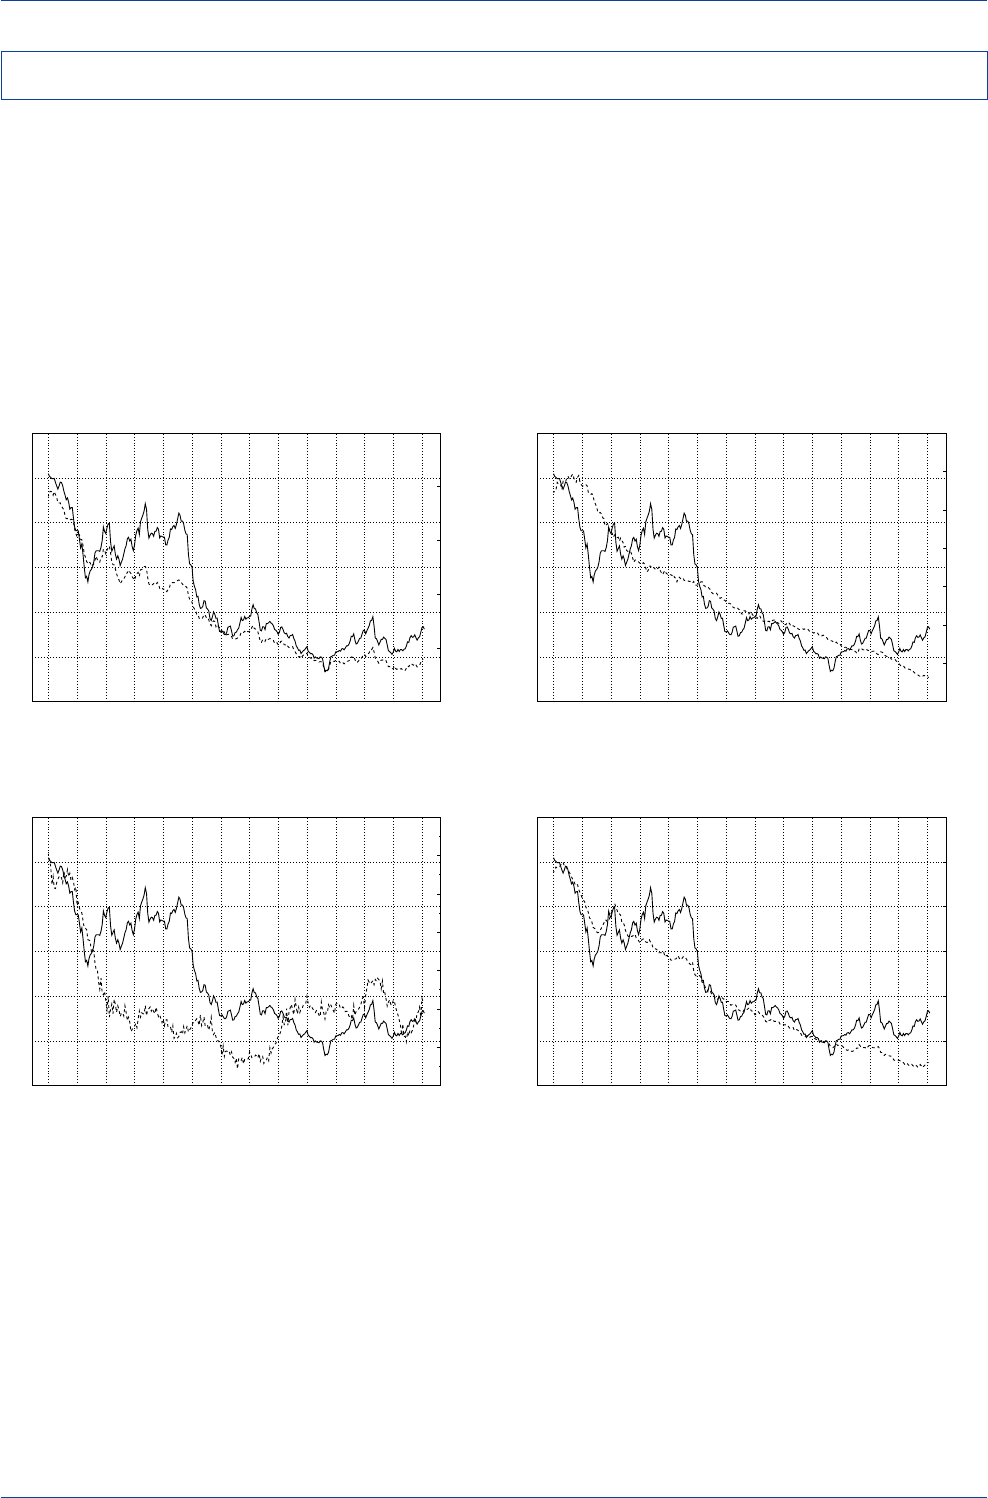
DB Guide to Exchange-Rate Determination
May 2002 Deutsche Bank @
Deutsche Bank Foreign Exchange Research 39
PPP estimates are often better guides to medium/long-
run exchange-rate movements when traded-goods price
indices are used to derive PPP estimates rather than when
non-tradable goods price indices are used. For example,
the yen tends to move much more in line with the trend in
Japanese/U.S. relative export prices than it does with the
trend in relative consumer prices.
Since PPP operates on the principle of arbitrage, interna-
tional trade should ensure that tradable goods prices in
different countries are broadly similar when measured in a
single national currency.
The Yen and Relative Unit Labor Costs
0.80
0.90
1.00
1.10
1.20
1.30
1.40
1.50
50
100
150
200
250
300
350
76 78 80 82 84 86 88 90 92 94 96 98 00 02
Japan/U.S. ULCs----
Y
en/US$____
The Yen and Relative Producer Prices
0.60
0.80
1.00
1.20
1.40
1.60
1.80
50
100
150
200
250
300
350
76 78 80 82 84 86 88 90 92 94 96 98 00 02
Japan/U.S. Wholesale Prices----
Y
en/US$____
The Yen and Relative Consumer Prices
0.50
0.60
0.70
0.80
0.90
1.00
1.10
1.20
50
100
150
200
250
300
350
76 78 80 82 84 86 88 90 92 94 96 98 00 02
Japan/U.S. Consumer Prices----
Y
en/US$____
The Yen and Relative Export Prices
0.20
0.40
0.60
0.80
1.00
1.20
50
100
150
200
250
300
350
76 78 80 82 84 86 88 90 92 94 96 98 00 02
Japan/U.S. Export Prices----
Y
en/US$____
Purchasing Power Parity and the Yen
Source: Datastream Source: Datastream
Source: Datastream Source: Datastream
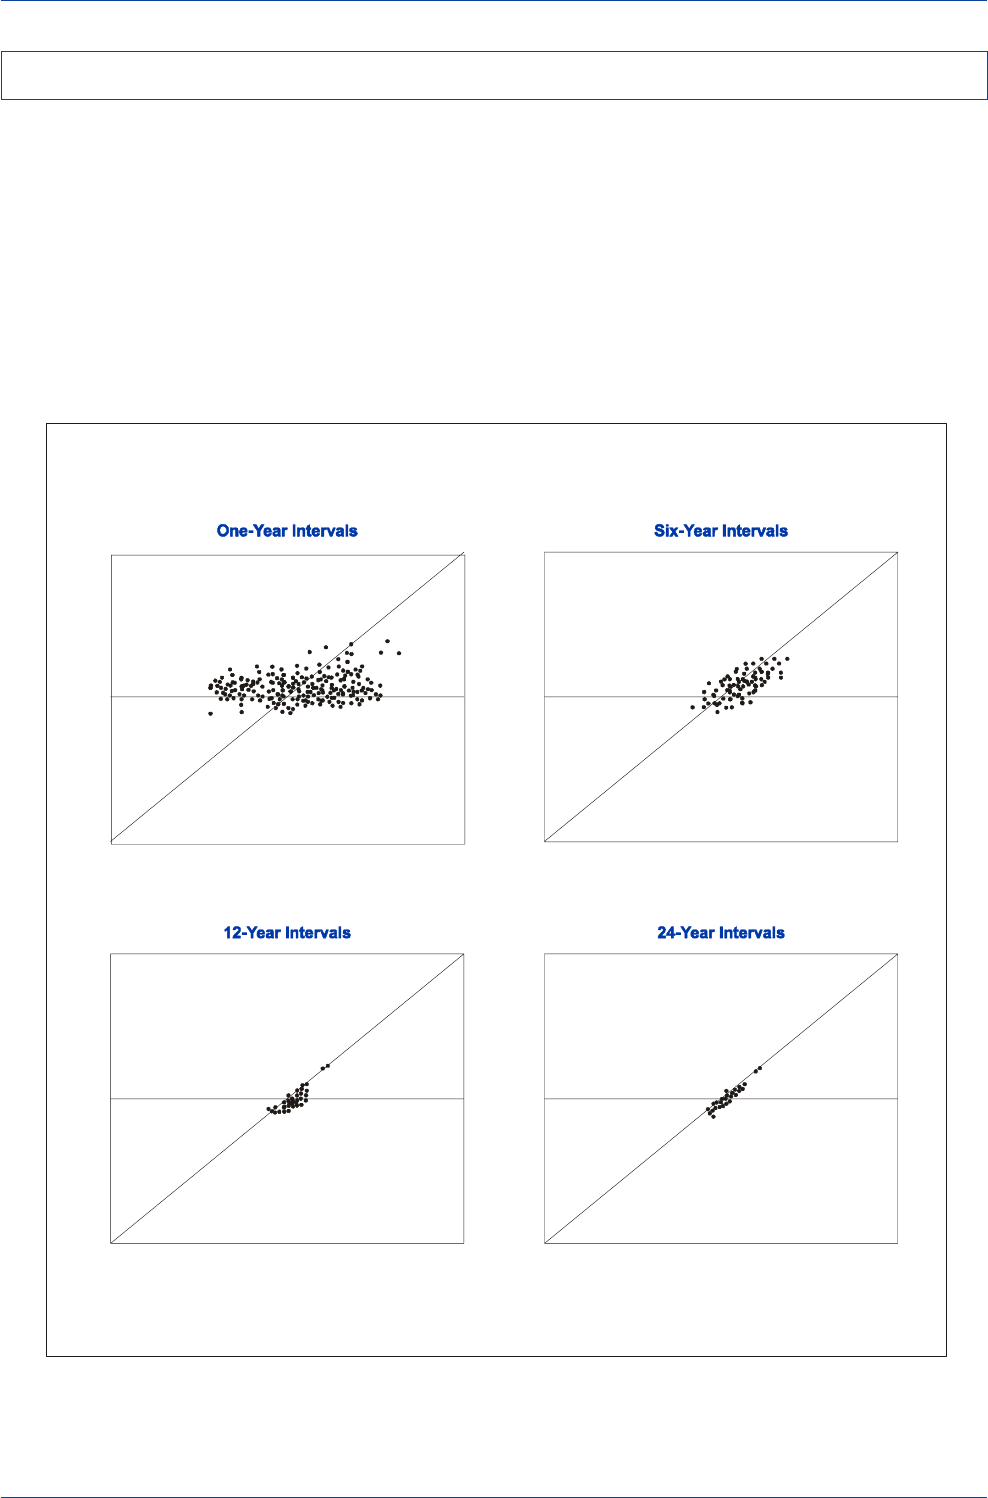
DB Guide to Exchange-Rate Determination May 2002
Deutsche Bank @
40 Deutsche Bank Foreign Exchange Research
There exists a huge volume of empirical work on whether
or not PPP represents a valid tool for forecasting purposes.
The weight of evidence suggests that although there are
often significant and persistent departures from PPP in both
the short and medium term, exchange rates do exhibit a
tendency to gravitate toward their PPP values in the long
run.
The consensus among academic researchers is that the
speed of convergence to PPP is quite slow—PPP devia-
tions appear to dampen at a rate of roughly 15% per year.
Empirical Evidence on PPP
This places the half-life of PPP deviations at around 4½
years for exchange rates in industrial nations. In other
words, for any given deviation of an exchange rate from its
estimated PPP value, roughly half of that deviation should
be removed in 4½ years' time. As the charts below show,
there is no positive relationship between changes in ex-
change rates and changes in relative inflation rates on a
one-year basis. However, as the time horizon is length-
ened, to six years and beyond, a strong positive relation-
ship becomes apparent.
The Impact of Relative Inflation Rates on Exchange Rates
Over Different Time Horizons
Adapted from Peter Isard, Hamid Faruqee, G. Russell Kincaid, and Marin Fetherston,
“Methodology for Current Account and Exchange Rate Assessments”,
IMF Occasional Paper 209, 2001.
50
40
30
20
10
0
-10
-20
-30
-40
-50 -50 -40 -30 -20 -10 0 10 20 30 40 50
50
40
30
20
10
0
-10
-20
-30
-40
-50 -50 -40 -30 -20 -10 0 10 20 30 40 50
50
40
30
20
10
0
-10
-20
-30
-40
-50 -50 -40 -30 -20 -10 0 10 20 30 40 50
50
40
30
20
10
0
-10
-20
-30
-40
-50 -50 -40 -30 -20 -10 0 10 20 30 40 50
% Change in Exchange Rate % Change in Exchange Rate
% Change in Exchange Rate % Change in Exchange Rate
% Change in
Relative Inflation
% Change in
Relative Inflation % Change in
Relative Inflation
% Change in
Relative Inflation
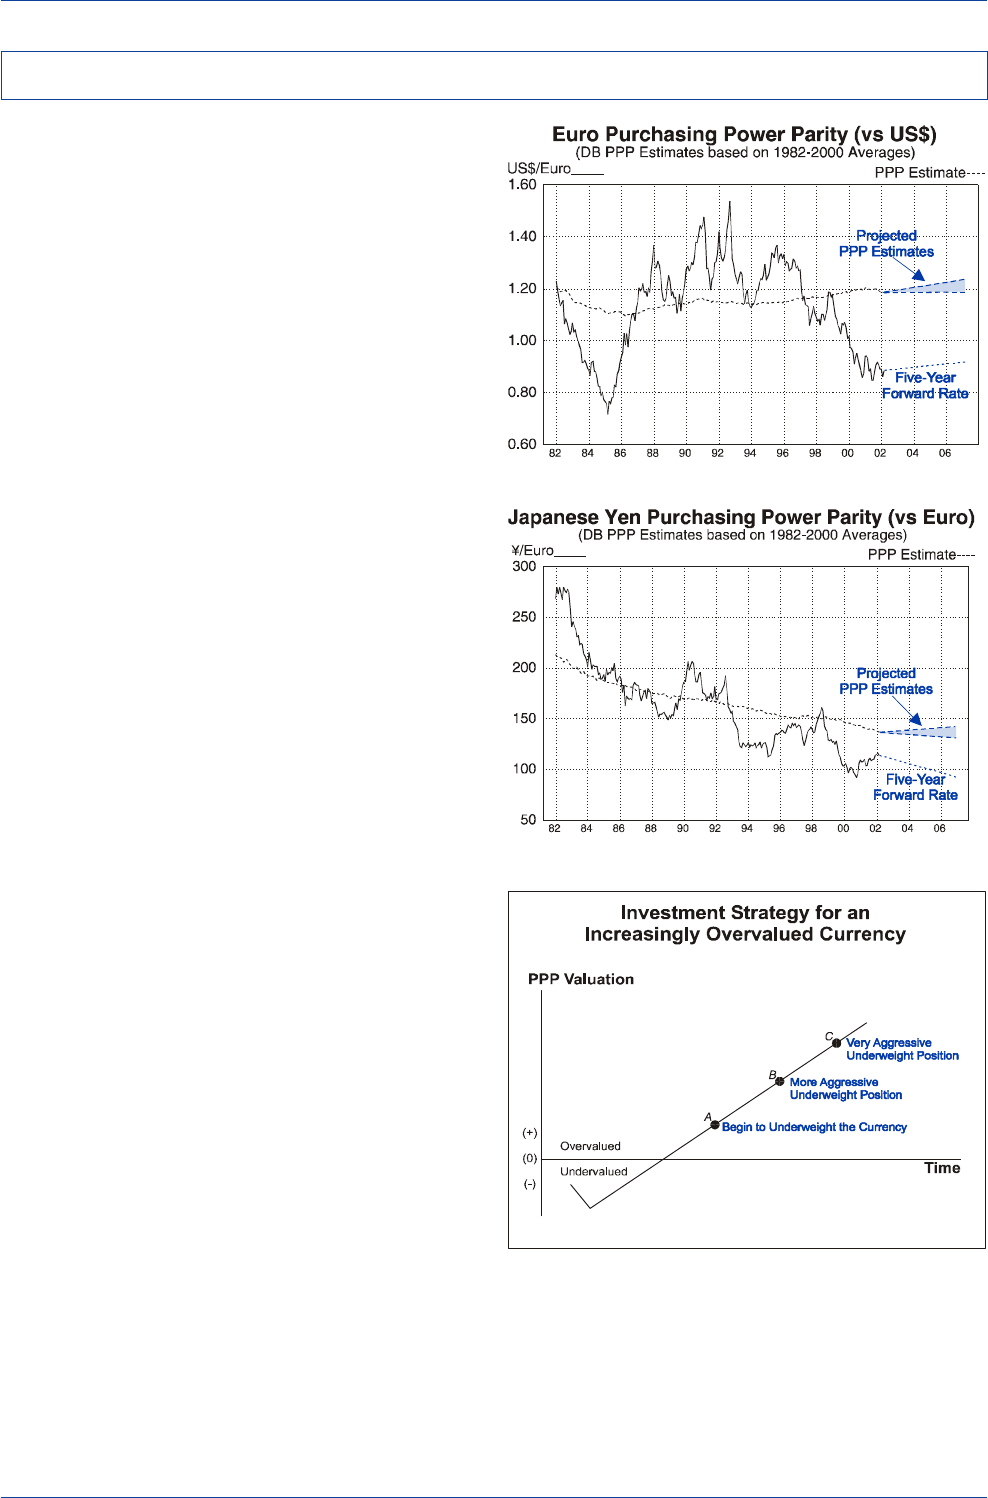
DB Guide to Exchange-Rate Determination
May 2002 Deutsche Bank @
Deutsche Bank Foreign Exchange Research 41
PPP and Investment Strategy
Source: Datastream, Bloomberg
Source: Datastream, Bloomberg
Since many empirical studies find that exchange rates ex-
hibit a tendency to gravitate toward their PPP levels in the
long run, long-term investors and issuers would stand to
benefit by positioning themselves for an eventual correc-
tion of a large PPP misalignment. If investors could count
on a rapid return to PPP, they could purchase undervalued
currencies in the hope that the undervaluation would soon
be corrected via an appreciation of the currency. Similarly,
they would look to sell overvalued currencies.
For instance, the euro's gross PPP undervaluations ver-
sus both the dollar and the yen do not appear to be sus-
tainable, given the long-run track record of these two
crossrates. Yet long-dated euro/dollar and euro/yen forward
exchange rates are not anticipating a significant correction
in the euro’s PPP misalignment over the next five years.
With conventional PPP analysis arguing for a long-term ap-
preciation of the euro versus both the dollar and the yen,
this would seem to present an opportunity for investors
and issuers to exploit the divergent trends in PPP and long-
dated forward rates.
Because the deviations from PPP can be large and persis-
tent over short and medium-term horizons, it can be dan-
gerous to pursue strategies that are based solely on an
expected rapid return of exchange rates to their estimated
PPP values. The major risk to such strategies is that the
deviations from PPP may widen further instead of narrow-
ing. Investors who embrace a PPP approach to investment
strategy would have to have substantial risk capital on hand
to absorb losses that could be incurred if the departures
from PPP proved to be sizable and persistent.
One way to manage FX risk using a PPP approach to in-
vestment strategy would be to gradually take on long po-
sitions in undervalued currencies (or short positions in over-
valued currencies) as misalignments build. Modest posi-
tions would be undertaken when the misalignments were
small, and if the deviations from PPP grow and persist,
more aggressive positions could then be undertaken.
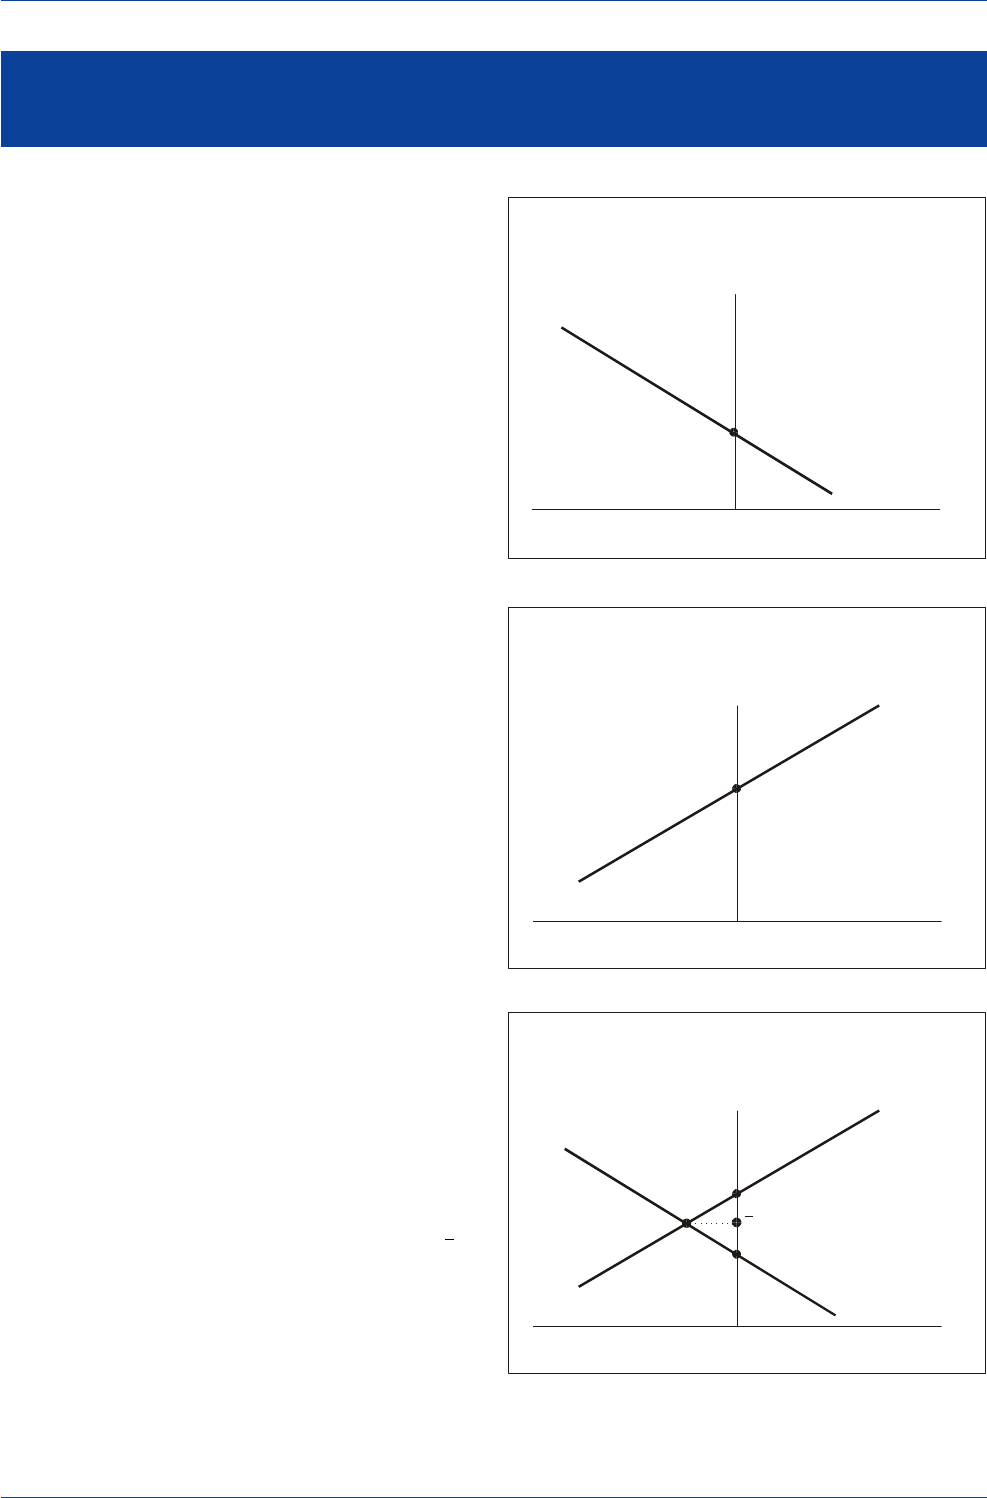
DB Guide to Exchange-Rate Determination May 2002
Deutsche Bank @
42 Deutsche Bank Foreign Exchange Research
According to the macroeconomic-balance approach to long-
run exchange-rate determination, a currency's real long-
run equilibrium value is defined as that rate that equalizes
a country's savings-investment balance with its underly-
ing current-account balance. The IMF uses the macroeco-
nomic-balance approach to derive quantitative estimates
of long-run fair value for all industrial-country currencies.
The IMF's approach is a three-step procedure.
1. The IMF estimates a trade-equation model to calcu-
late a country's underlying current-account position.
2. The IMF then estimates a national income model to
determine the normal or sustainable savings-invest-
ment imbalance that would prevail over the medium
run if that country were operating at its full-employ-
ment potential.
3. Finally, the IMF estimates the equilibrium exchange
rate that would equate the underlying current-account
imbalance with the sustainable savings-investment
gap.
A country's underlying current-account balance tends to
move inversely with the real exchange rate. That is, a
country's current account would tend to improve as the
currency's real value moved lower and its tradable goods
became more competitive. Hence, the underlying current-
account balance, CAB, is shown to be negatively related
to the real exchange rate in the top diagram.
A country's savings-investment gap typically moves posi-
tively with the real exchange rate. Although the overall level
of national savings does not typically respond to changes
in the exchange rate, investment spending tends to move
inversely with changes in the real exchange rate. This is
because a rising real exchange rate lowers profitability,
which in turn discourages investment spending. Thus, as
the real exchange rate rises, investment spending should
fall, and the gap between savings and investment should
therefore rise. Hence, the savings-investment, S-I, gap is
shown in the middle diagram to move positively with the
real exchange rate.
A currency's real long-run equilibrium value is determined
at the point where a country's savings-investment imbal-
ance just matches its underlying current-account imbal-
ance. The equilibrium exchange rate is shown to be q0 in
the bottom diagram where the S-I and CAB schedules in-
tersect at point
E
.
The Macroeconomic-Balance Approach
to Long-Run Exchange-Rate Determination
The Underlying Current-Account Balance
and the Real Exchange Rate
Current Account Balance
Real Exchange Rate
(-) (0) (+)
q
1
CAB
The Savings-Investment Schedule
and the Real Exchange Rate
Savings-Investment
Real Exchange Rate
(-) (0) (+)
S-I
q
2
The Equilibrium Real Exchange Rate
Is Determined When the Current-Account Gap
Equals the Savings-Investment Gap
Current-Account Balance,
Savings-Investment
Real Exchange Rate
(-) (0) (+)
q
1
S-I
q
0
q
2
CAB
E
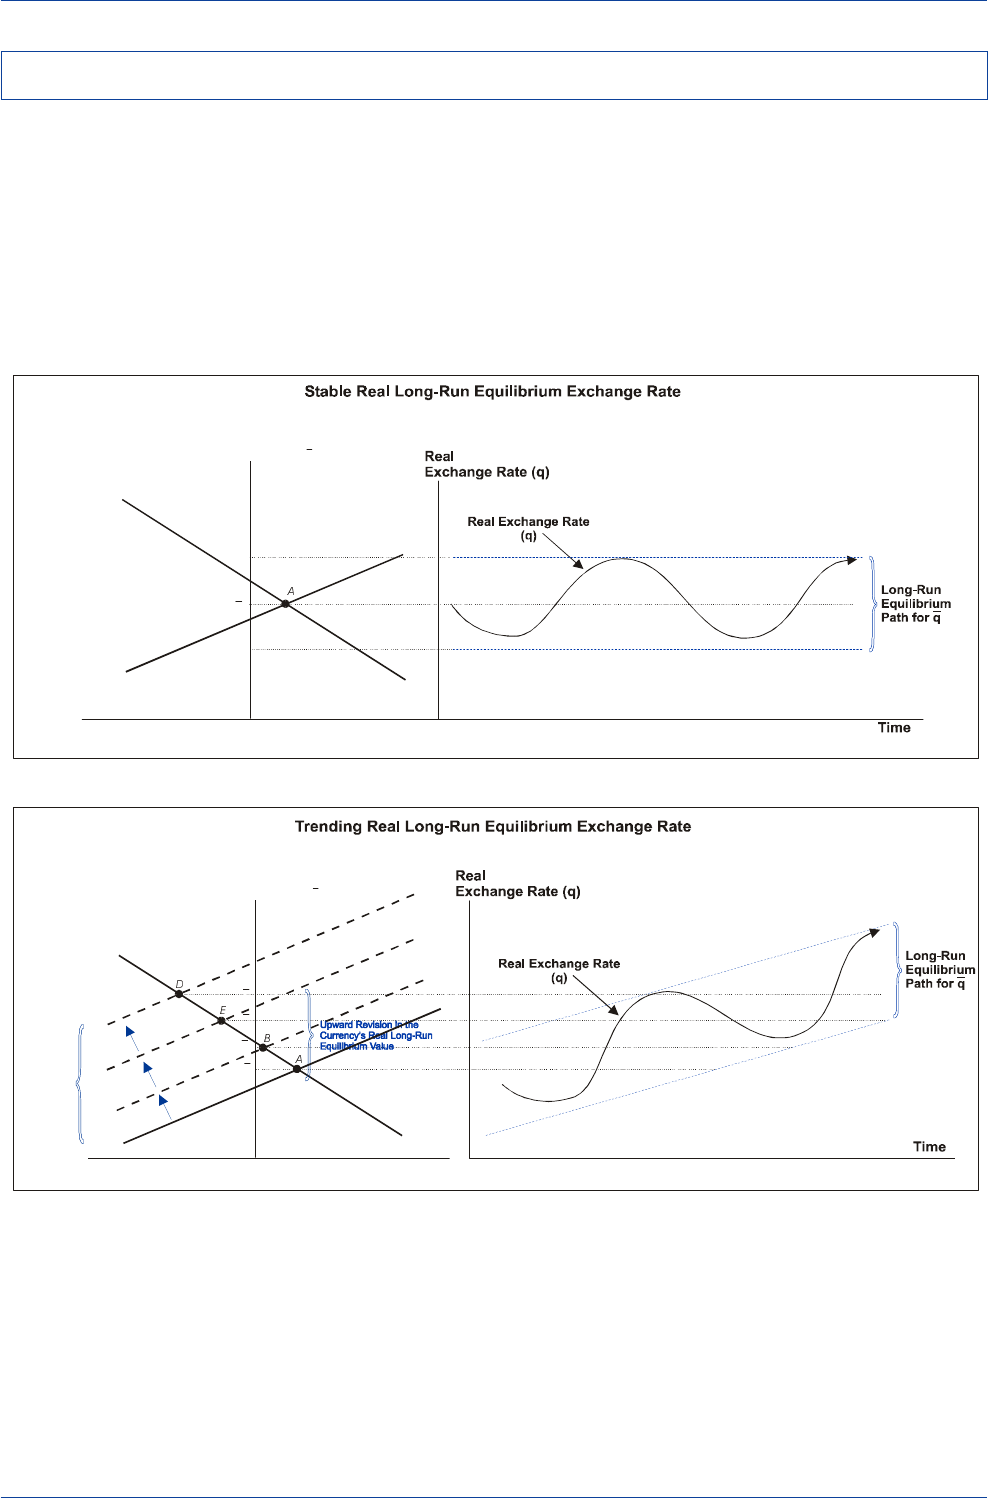
DB Guide to Exchange-Rate Determination
May 2002 Deutsche Bank @
Deutsche Bank Foreign Exchange Research 43
If a currency's real long-run equilibrium value is determined
by the interaction of savings, investment, and external-
balance considerations, its value would be constant over
time only if there were no structural changes on the sav-
ings, investment, or external-balance fronts over the rel-
evant time period. (This is illustrated in the top diagram.)
When structural changes on those three fronts occur, how-
ever, the real long-run equilibrium exchange rate will ei-
ther rise or fall in response to those changes. A structural
rise in investment, a sustained move toward fiscal stimu-
lus, or a persistent decline in private savings should give
rise to a trend increase in the real long-run equilibrium ex-
change rate over time, as shown in the bottom diagram.
The opposite would give rise to a trend decline in the real
long-run equilibrium exchange rate.
Equilibrium Exchange Rate—Constant or Variable?
Investment-Spending
Schedule Stable Over Time
Savings minus Investment,
Current-Account Surplus
Equilibrium Real
Exchange Rate (q)
CAB
1
q
1
(0)
S-I
1
Current-Account Deficit
Structural
Shifts in
Investment
Spending
Savings minus Investment,
Current-Account Surplus
Equilibrium Real
Exchange Rate (q)
S-I
2
CAB
1
q
2
q
1
(0)
S-I
1
Current-Account Deficit
S-I
3
S-I
4
q
3
q
4
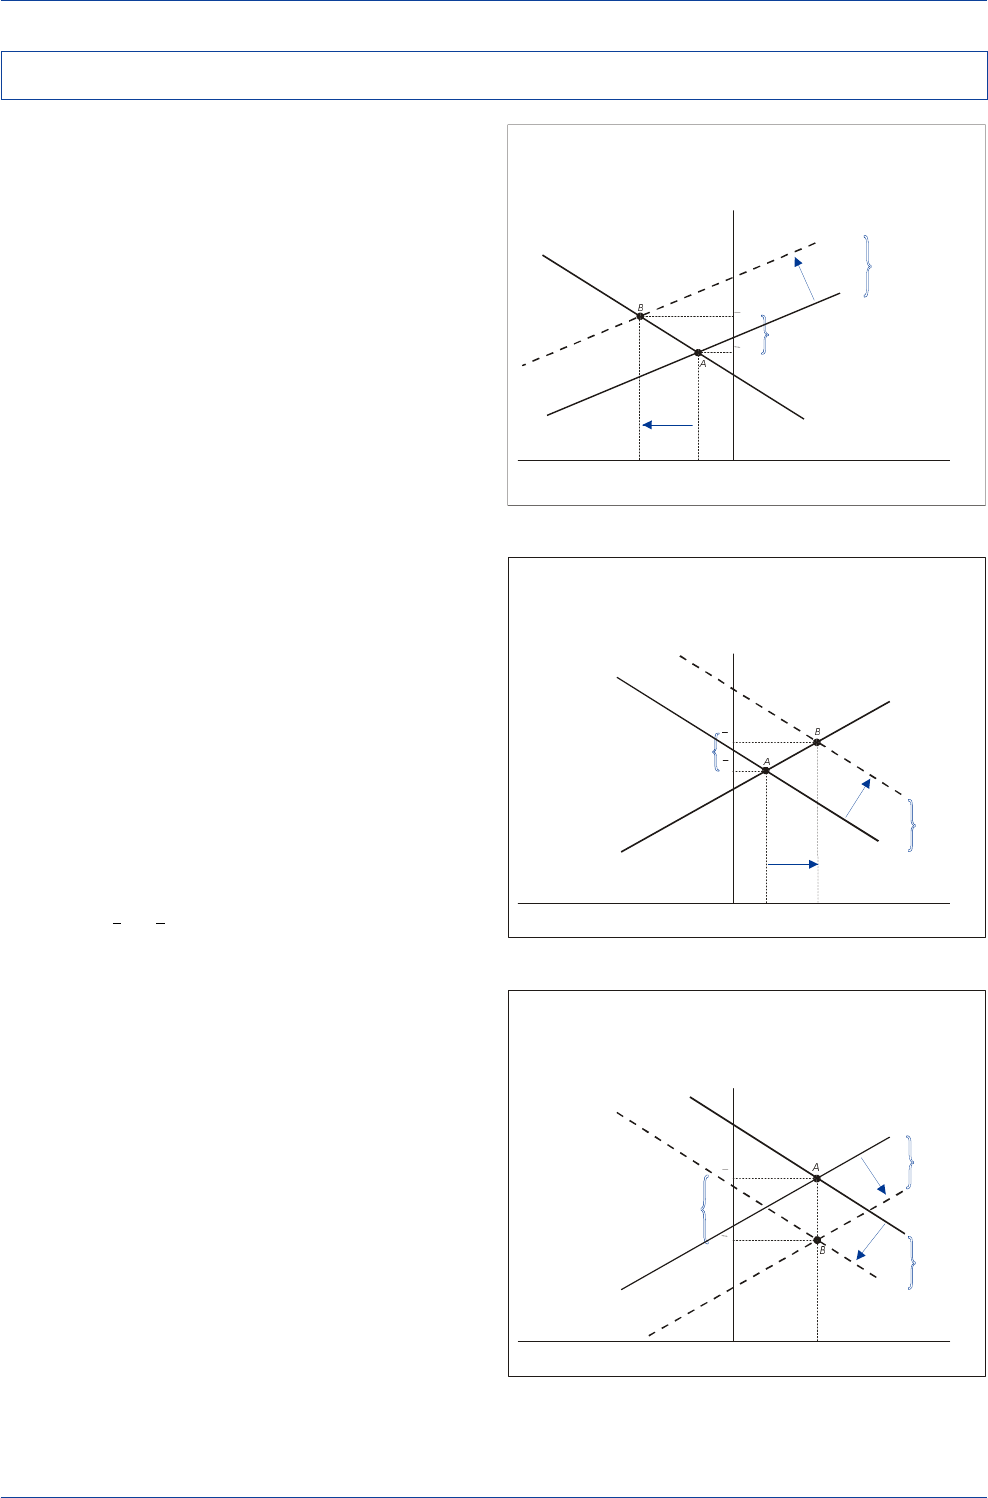
DB Guide to Exchange-Rate Determination May 2002
Deutsche Bank @
44 Deutsche Bank Foreign Exchange Research
Structural changes on a country's
internal-balance
front can
exert a powerful influence on the trend in exchange rates
over time. When a country enjoys a major investment
boom, such as the U.S. experienced in the second half of
the 1990s, it will give rise to an upward shift in the S-I
schedule and to a rise in the equilibrium exchange rate
over time. Similarly, a major move toward fiscal stimulus,
as the U.S. experienced in the first half of the 1980s, would
shift the S-I curve upward and push the currency's real
long-run equilibrium value higher, as shown in the top dia-
gram.
Structural changes on a country's
external-balance
front
can also exert a powerful influence on the trend in exchange
rates over time. Productivity changes and technological
innovations in a country's traded-goods sector can give
rise to a sustained improvement in a country's current-
account balance and thereby contribute to a trend rise in
the real exchange rate over time, as shown in the middle
diagram. Japan's large and persistent current-account sur-
pluses played a key role in driving the yen's real value higher
in the 1980s and early 1990s.
During certain periods, structural changes might be occur-
ring on both the internal and external-balance fronts at the
same time. The net impact of those changes will deter-
mine whether the exchange rate will rise or fall. For ex-
ample, in the case of Japan in 2000-01, both internal and
external-balance forces were working jointly to lower the
yen's real long-run equilibrium value. Japan's fiscal stance
was tightening, investment spending was declining, and,
at the same time, Japan's current-account surplus was
undergoing a structural deterioration as competition from
Asia intensified. As illustrated in the bottom diagram, those
forces combined to cause the yen’s equilibrium value to
decline from q1 to q2.
A Shift in Investment Behavior
Can Give Rise to an Upward Revision
in a Currency’s Long-Run Equilibrium Value
Savings minus Investment,
Current-Account Balance
Real Exchange Rate
Structural
Increase in
Investment
Spending
S-I
2
CAB
1
Upward Revision in the
Currency’s Real Long-Run
Equilibrium Value
q
2
q
1
(0)(-) (+)
S-I
1
A Structural Improvement in Competitiveness Can Give
Rise to an Improvement in the Current-Account Balance
and in a Currency’s Real Long-Run Equilibrium Value
Savings minus Investment,
Current-Account Balance
Real Exchange Rate
Structural
Improvement
in Current
Account
CAB
1
Upward Revision in the
Currency’s Real Long-Run
Equilibrium Value
q
2
q
1
(0)(-) (+)
S-I
1
CAB
2
The Combination of a Structural Decrease in Investment
and a Deterioration in the Current-Account Balance
Will Give Rise to a Downward Revision in
a Currency’s Real Long-Run Equilibrium Value
Savings minus Investment,
Current-Account Balance
Real Exchange Rate
Structural
Deterioration
in Current
Account
CAB
1
Downward Revision in the
Currency’s Real Long-Run
Equilibrium Value
q
2
q
1
(0)(-) (+)
S-I
1
CAB
2
Structural
Decrease in
Investment or
Gov’t Spending
S-I
2
Changes in Real Long-Run Equilibrium Exchange Rates

DB Guide to Exchange-Rate Determination
May 2002 Deutsche Bank @
Deutsche Bank Foreign Exchange Research 45
The problem for currency forecasters and investment strat-
egists is how to precisely quantify what exchange rate level
truly represents a currency's real long-run equilibrium level.
Estimates of the equilibrium exchange rate are often sen-
sitive to the assumptions that a macro-econometric mod-
eler might make. Indeed, it is quite possible that a wide
range of equilibrium exchange-rate estimates are plausible,
with each estimate dependent on the underlying assump-
tions made.
Estimates of the dollar's equilibrium value by the Institute
for International Economics show the dollar to be signifi-
cantly overvalued versus the yen and euro by 25%-30%.
A recent report by the OECD surveyed a broad range of
econometric studies that constructed estimates for the
euro's long-run equilibrium value. Although the estimates
vary widely, they tend to center around the US$/€ 1.10-
1.20 range, suggesting that the euro is significantly under-
valued versus the U.S. dollar.
Selected Estimates of the Euro's
Medium/Long-Run "Equilibrium" Value Equilibrium
Key Explanatory Exchange Rate
Study Variables/Model Estimate
(US$/€)
Wren-Lewis & Driver (1998) FEER Model 1.19-1.45
Borowski and Couharde (2000) FEER Model 1.23-1.31
Alberola et al. (1999) Ratio of Nontraded/Traded Goods Prices, 1.26
Net Foreign Assets
Chinn and Alquist (2000) M1, GDP, Short-Term Interest Rates, CPI, 1.19-1.28
Ratio of Nontraded/Traded Goods Prices
Lorenzen and Thygessen (2000) Net Foreign Assets, R&D Spending, 1.17-1.24
Demographics,
Ratio of Nontraded/Traded Goods Prices
Duval (2001) Consumption, Multi-Factor Productivity, 1.15
Real Long-Term Yield Spread,
Ratio of Nontraded/Traded Goods Prices
Clostermann and Schnatz (2000) Real Long-Term Yield Spread, Oil Price, 1.13
Government Spending,
Ratio of Nontraded/Traded Goods Prices
Teiletche (2000) Productivity, Government Spending, 1.09
Real Long-Term Yield Spread, M1,
Industrial Production
OECD GDP PPP 1.09
Gern et al. Short-Term Real Interest-Rate Differential 1.03
Schulmeister PPP for Tradeables 0.87
Deutsche Bank PPP (Long-Run Average) 1.20
Source: OECD Working Paper Number 298, June 2001 (for other than Deutsche Bank).
Equilibrium Exchange Rate Estimates
Fundamental Equilibrium Exchange Rate Estimates
(Estimates of U.S. Dollar FEERs for 2000)
Euro Japanese Yen
Range 1.135-1.387 77.3-94.5
Midpoint 1.26 86.0
Source: Simon Wren-Lewis and Rebecca Driver,
Exchange Rates for the Year 2000
, Institute for International Economics, 1998.
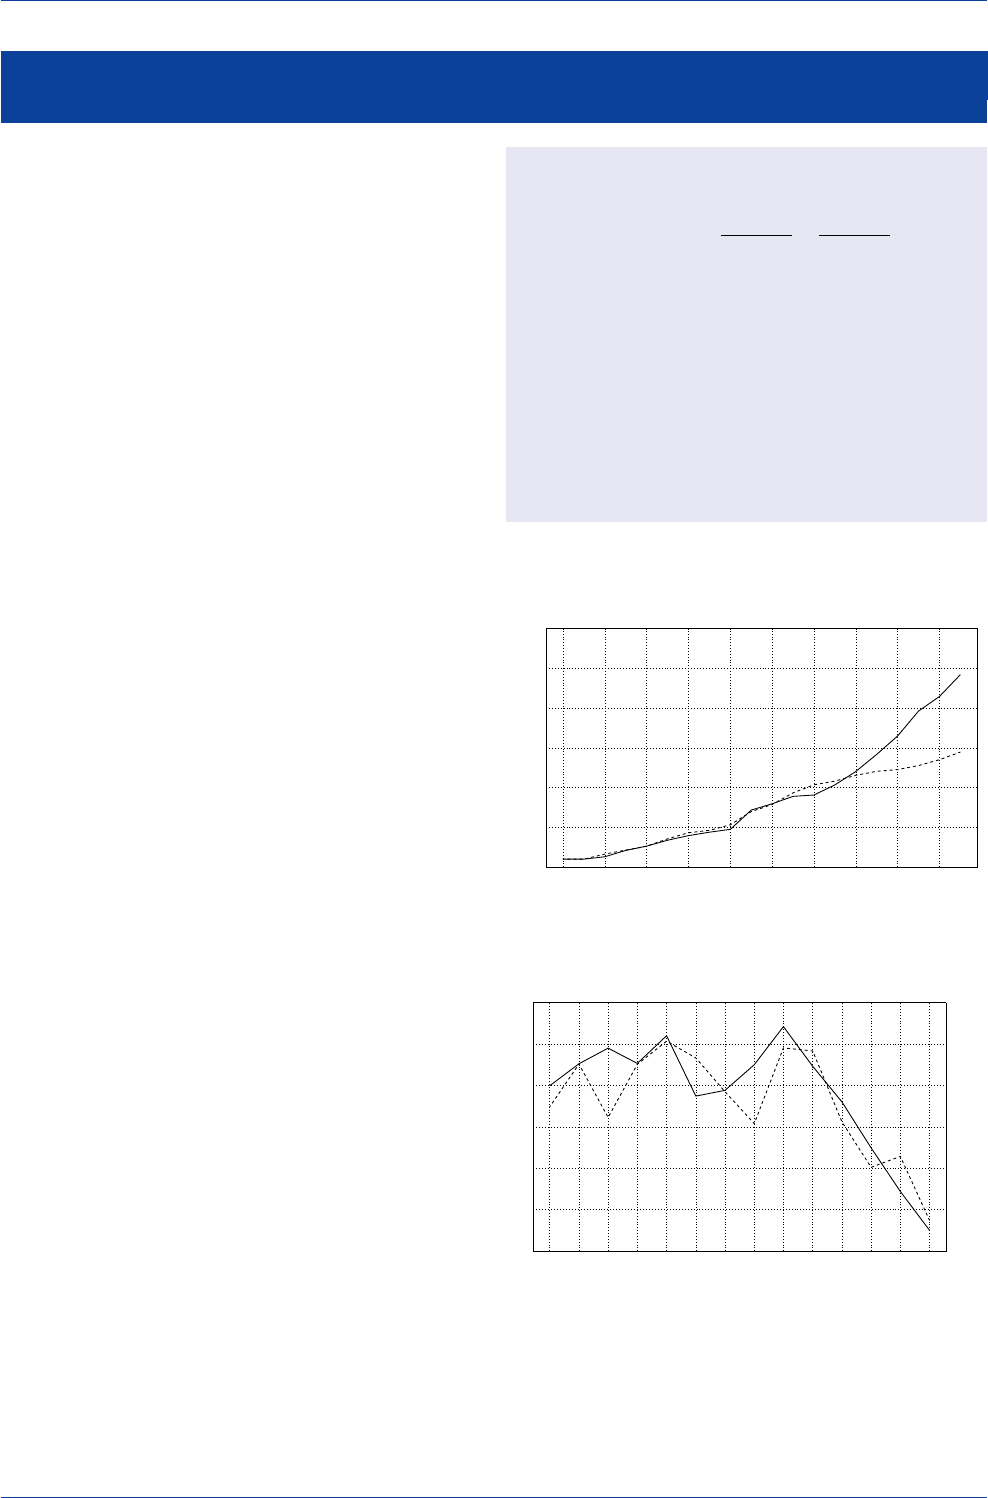
DB Guide to Exchange-Rate Determination May 2002
Deutsche Bank @
46 Deutsche Bank Foreign Exchange Research
Many economists cite the rise in U.S. productivity growth
relative to productivity growth overseas beginning in the
second half of the 1990s as one of the key variables that
drove the dollar sharply higher versus most major curren-
cies. Clearly, the gains in productivity were a uniquely U.S.
phenomenon. A recent Federal Reserve Board Study found
that multifactor productivity growth in the U.S. surged in
the second half of the 1990s, while it decelerated in Japan
and was broadly unchanged in Euroland.
Fed Chairman Alan Greenspan has been a strong advo-
cate of the thesis that the dollar’s seven-year uptrend was
productivity-related. According to Mr. Greenspan, "The evi-
dent strengthened demand for the dollar, relative to the
euro, has reflected a market expectation that productivity
growth in the United States is likely to be greater than in
continental Europe in the years ahead."
The importance of relative productivity growth as a key
determinant of the dollar's value versus the euro can be
gleaned from the accompanying charts. U.S. and Euroland
labor productivity growth did not differ by much in the 1980s
and early 1990s. But beginning in 1995, U.S. productivity
growth surged relative to the trend in Euroland. Indeed,
the trend in long-term Euroland/U.S. relative productivity
growth appears to explain a large portion of the 1995-2000
slide in the euro's value versus the U.S. dollar.
U.S. and Euroland Productivity
(Derived from OECD Calculations of
Unit Labor Costs and Compensation Growth Rates)
0
500
1000
1500
2000
2500
3000
1983 1985 1987 1989 1991 1993 1995 1997 1999 2001
Euroland----
(Index) U.S.____
Source: OECD Economic Outlook
Productivity Growth Rates
(Percentage Changes in Multifactor Productivity)
1990-95 1996-99
(%) (%)
U.S. 0.79 1.47
Canada 0.26 0.27
France 0.89 1.12
Germany 1.02 1.07
Italy 1.32 -0.14
Japan 1.31 0.85
U.K. 1.21 0.95
Australia 1.15 2.11
Denmark 2.37 0.31
Norway 2.48 1.13
Switzerland -0.57 0.84
Source: Gust, C. and Marquez, J., “Productivity Developments Abroad”,
Federal Reserve Bulletin
, October 2000.
U.S./Euroland Productivity Ratio
and the U.S. Dollar/Euro Exchange Rate
0.90
1.00
1.10
1.20
1.30
1.40
0.6
0.7
0.8
0.9
1.0
1.1
1.2
87 88 89 90 91 92 93 94 95 96 97 98 99 00
US$/Euro----Euroland/US Productivity(ratio)____
Source: OECD Economic Outlook
Productivity Trends and Exchange Rates
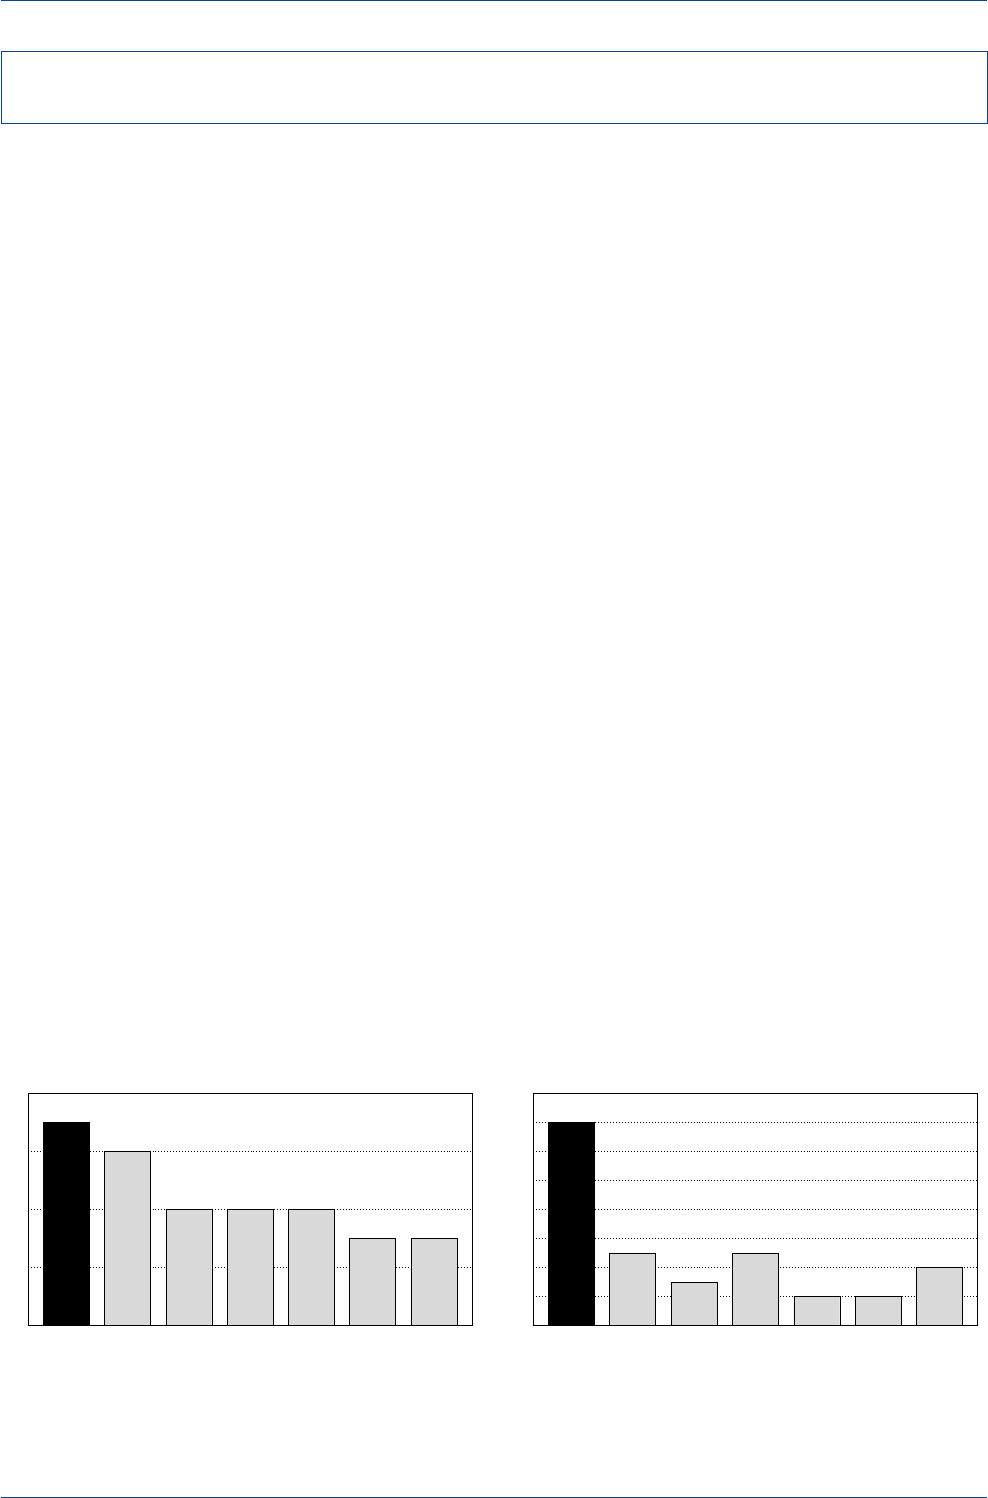
DB Guide to Exchange-Rate Determination
May 2002 Deutsche Bank @
Deutsche Bank Foreign Exchange Research 47
There has been a great deal of debate among economists
over what contributed to the recent stellar gains in U.S.
productivity and whether those gains will prove sustain-
able in the long term. A number of researchers believe
that the absolute gains in U.S. productivity were largely an
information technology (IT) phenomenon, and since the IT
boom was largely a U.S. story, the relative gains in U.S.
productivity could be explained by IT as well. Many of those
same researchers believe that the recent gains in U.S. la-
bor productivity will prove sustainable in the long run, which
would be dollar positive. On the other side of the argu-
ment, some researchers are not convinced that the U.S.
enjoyed a productivity miracle, contending instead that
favorable cyclical factors might have exaggerated the rise
in reported productivity. If that were the case, then U.S.
productivity growth would be expected to fall back to its
long-term trend.
A recent Conference Board report demonstrates that the
relatively robust U.S. productivity gains were due not only
to the comparative advantage of IT firms in the U.S., but
also to the ability of U.S. non-IT firms to use the new infor-
mation technologies developed by the IT sector to boost
their overall productivity. This was made possible by U.S.
firms' willingness to invest in these new technologies. In
contrast, non-IT firms in Euroland and Japan were slow to
invest in new technologies, even though such technolo-
gies were as available to them as they were to non-IT firms
in the U.S. The net result is that productivity gains in the
non-IT sector of the U.S. were several times greater than
the productivity gains by comparable firms in Euroland and
Japan.
According to the Conference Board report, the failure of
Euroland firms to embrace the new technologies "can be
traced to insufficient liberalization and impediments to
market evolution." The report adds that Euroland "barriers
to change…are widespread….and opportunities are still
restricted in many information and communications tech-
nology-using industries, such as transportation, communi-
cation and banking." The report emphasized that Euroland
"regulatory rigidities inhibit reallocations of labor and capi-
tal to their most productive uses, reducing the benefits to
be obtained from investment in new technologies."
The Conference Board holds out the hope that "new com-
petitive rules in communications, banking reforms, and
even the adoption of the single currency" may make it pos-
sible for Euroland to experience stronger productivity gains
in the future, which would be positive for the euro. On a
negative note, however, the report argues that "recent com-
pilations of economic and administrative regulations sug-
gest that Europe and Japan still have some way to go be-
fore they will be able to fully exploit the new computer and
information technologies. Failure to move forward on regu-
latory liberalization and the reduction of impediments to
market evolution would perpetuate the present under-in-
vestment in information and communications technology."
The report then wryly concludes that "realizing the poten-
tial growth effects from information and communications
technology is not automatic."
One implication of the Conference Board report is that U.S.
firms may enjoy stronger productivity gains than their coun-
terparts in Euroland and Japan for a while longer. This sug-
gests that until Euroland begins to close the productivity
gap with the U.S. on a sustained basis, the euro will con-
tinue to encounter difficulty in making significant headway
versus the dollar.
Contribution of IT-Producing Industries to
Labor Productivity Growth in G-7 Countries
(1995-1999)
0.30.3
0.40.40.4
0.6
0.7
0.0
0.2
0.4
0.6
0.8
U.S. U.K. Japan Germany France Italy Canada
Percentage Contribution(%)
Source: Conference Board
Contribution of IT-Using Industries to
Labor Productivity Growth in G-7 Countries
(1995-1999)
0.4
0.20.2
0.5
0.3
0.5
1.4
0.0
0.2
0.4
0.6
0.8
1.0
1.2
1.4
1.6
U.S. U.K. Japan Germany France Italy Canada
Percentage Contribution(%)
Source: Conference Board
U.S. Productivity Growth Surge and the Dollar—A Medium or
Long-Term Phenomenon?
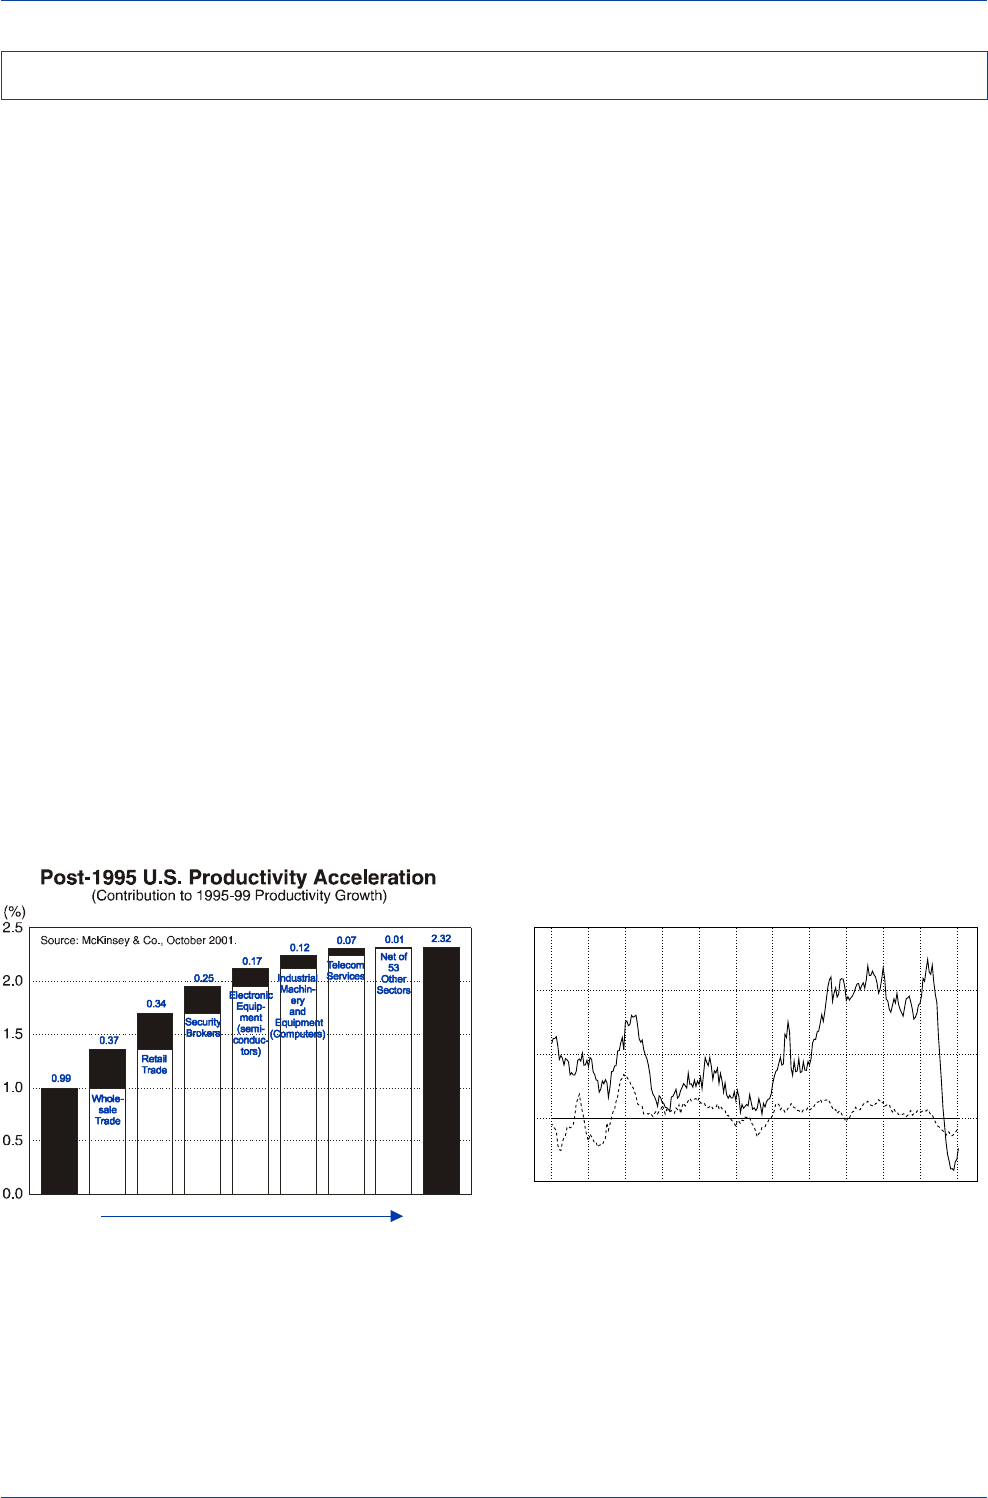
DB Guide to Exchange-Rate Determination May 2002
Deutsche Bank @
48 Deutsche Bank Foreign Exchange Research
A new study by McKinsey & Company, Inc. ("U.S. Produc-
tivity Growth: 1995-2000") sheds additional light on the
sources of the U.S. productivity surge. The McKinsey study
contends that U.S. productivity increased in the 1995-2000
period for both cyclical and structural reasons. The study
finds that U.S. labor-productivity growth rose from an aver-
age 1.4% per annum over the 1987-95 period to an aver-
age 2.5% per annum over the 1995-2000 period, with only
about one-half of the incremental gains projected to be
long-lasting.
The McKinsey study projects that U.S. labor productivity
growth will ease a bit toward an average 2.0% per annum
pace over the next five years as the influence of shorter-
run cyclical factors washes out. While this would repre-
sent a slowdown from the 1995-2000 pace, it would nev-
ertheless exceed the pace of productivity growth in 1987-
95.
A 0.5% per annum increase in labor-productivity growth
might not seem like a lot, but if such a gain were sus-
tained over a 10-year period, it could contribute up to $1.2
trillion in additional surpluses on the U.S. Federal govern-
ment budget balance. It could also cut the cost of a 50-
year fix to Social Security in half.
The McKinsey study finds that the gain in U.S. labor pro-
ductivity over the 1995-2000 period was more than just an
IT story. The study contends that regulatory changes, strong
competition, better management, and favorable cyclical
factors all played a positive role in boosting U.S. productiv-
ity. Interestingly, the study finds that of the 59 sectors of
the U.S. economy that were investigated, only six sectors,
representing 28% of the economy, contributed to the 1995-
2000 productivity gains. The six sectors that made sub-
stantial contributions to U.S. productivity growth were: 1)
wholesale trade, 2) retail trade, 3) security and commod-
ity brokers, 4) electronic equipment/semiconductor firms,
5) industrial equipment/computer firms, and 6) telecom
services. The other 53 sectors, representing 72% of the
economy, made either small positive or negative contribu-
tions that effectively washed each other out for a net-zero
contribution to the U.S. economy's total productivity gains.
Of concern to both the U.S. economy and the dollar is the
fact that 72% of the overall U.S. economy did not partici-
pate in the productivity gains registered in the past five
years. The dollar rose strongly because the gains regis-
tered by the other 28% were so powerful that they were
able to boost the overall U.S. economy's productivity
growth far above the pace of productivity growth in
Euroland and elsewhere. For those sectors that enjoyed
strong productivity gains, the dollar's rise has not dented
their overall competitiveness, as the positive effects of a
relative rise in productivity have effectively offset the nega-
tive effects of a rising dollar. But the other 72% that did
not participate in the productivity surge have been left to
compete in world markets with an overvalued exchange
rate without an offsetting gain in productivity. That is why
a large number of U.S. firms have begun to complain that
the dollar's strength is negatively affecting their long-run
competitiveness.
1987-95
Productivity
Growth
1995-99
Productivity
Growth
(By Sector)
U.S High- & Low-Tech Industrial Production
(Year-over-Year Percentage Changes)
-20
0
20
40
60
1980 1982 1984 1986 1988 1990 1992 1994 1996 1998 2000 2002
Total excluding High-Tech----
(%) Computers/Communications/Semiconductors____
U.S. Productivity Gains and the Dollar—Is the Dollar Now Fairly or Over-Valued?
Source: Datastream
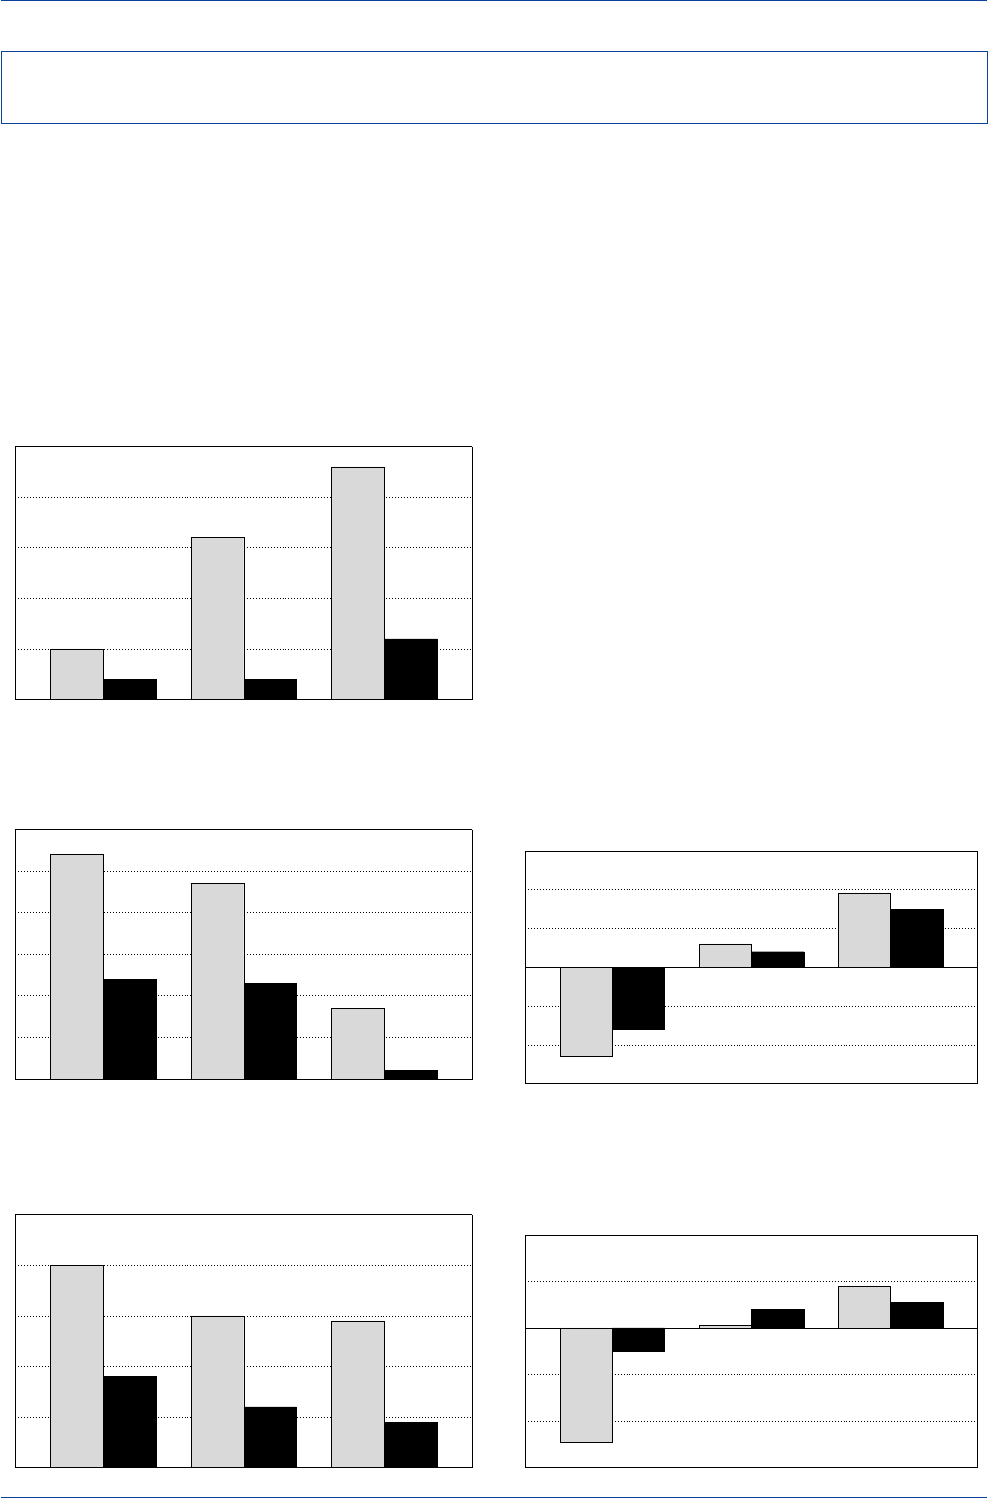
DB Guide to Exchange-Rate Determination
May 2002 Deutsche Bank @
Deutsche Bank Foreign Exchange Research 49
Productivity gains will tend to exert a greater impact on
exchange rates if those productivity gains are concentrated
in the traded-goods sector of an economy. A recent Fed-
eral Reserve Bank of New York study ("To What Extent Does
Productivity Drive the Dollar?",
Current Issues in Econom-
ics and Finance
, Volume 7, Number 8, August 2001) finds
that most of the gains in U.S. productivity in the 1990s
were concentrated in the U.S. traded-goods sector.
Looking at sectoral productivity gaps (the difference be-
tween traded-goods productivity and non-traded-goods pro-
ductivity) in the U.S., Japan, and Euroland, one finds that
the U.S. sectoral productivity gap has risen in the past 30
years as the gap between U.S. traded and non-traded pro-
ductivity growth has widened. In contrast, the sectoral pro-
ductivity gap has fallen in Japan and has been steady in
Euroland. The New York Fed's findings reveal that relative
sectoral productivity gaps explain more than two-thirds of
the movement in the yen and euro in the past decade.
U.S. Productivity Growth by Sector
(1970-1999)
1.2
0.40.4
4.6
3.2
1.0
0
1
2
3
4
5
1970-80 1980-90 1990-99
Nontraded Sector(dark)
(%) Traded Sector(light)
Source: OECD; Federal Reserve Bank of New York,
August 2001
Japan Productivity Growth by Sector
(1970-1999)
0.2
2.3
2.4
1.7
4.7
5.4
0
1
2
3
4
5
6
1970-80 1980-90 1990-99
Nontraded Sector(dark)
(%) Traded Sector(light)
Source: OECD; Federal Reserve Bank of New York,
August 2001
Euroland Productivity Growth by Sector
(1970-1999)
0.9
1.2
1.8
2.9
3.0
4.0
0
1
2
3
4
5
1970-80 1980-90 1990-99
Nontraded Sector(dark)
(%) Traded Sector(light)
Source: OECD; Federal Reserve Bank of New York,
August 2001
U.S. Productivity and Changes in the
U.S./Euro Real Exchange Rate
(1970-1999)
1.1
0.8
-1.0
1.8
0.1
-4.9
-6
-4
-2
0
2
4
1970-80 1980-90 1990-99
HBS Productivity Measure(dark)
(%) Real Exchange Rate Chg.(light)
Note: Harrod, Balassa, Samuelson Productivity.
Source: OECD; Federal Reserve Bank of New York,
August 2001.
U.S. Productivity and Changes in the
U.S./Japan Real Exchange Rate
(1970-1999)
1.5
0.4
-1.6
1.9
0.6
-2.3
-3
-2
-1
0
1
2
3
1970-80 1980-90 1990-99
HBS Productivity Measure(dark)
(%) Real Exchange Rate Chg.(light)
Note: Harrod, Balassa, Samuelson Productivity.
Source: OECD; Federal Reserve Bank of New York,
August 2001.
Productivity Growth in the Traded-Goods Sector and the Determination of
Exchange Rates
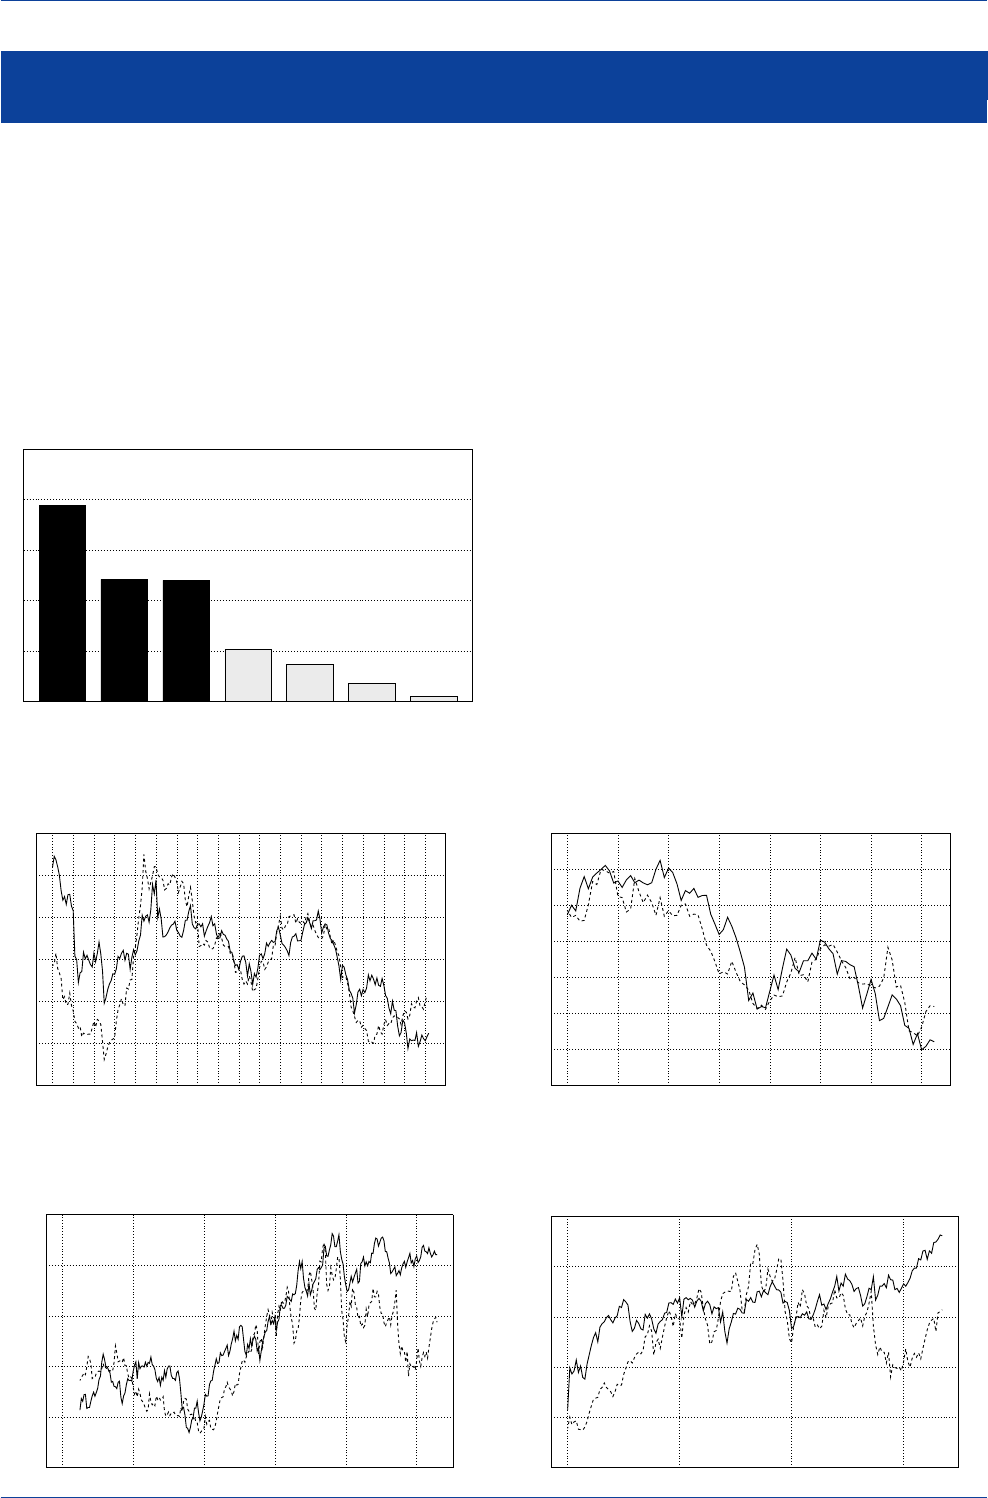
DB Guide to Exchange-Rate Determination May 2002
Deutsche Bank @
50 Deutsche Bank Foreign Exchange Research
The Norwegian Krone and the Price of Oil
(since January 1999)
5
10
15
20
25
30
35
40
(4.80)
(4.60)
(4.40)
(4.20)
(4.00)
(3.80)
1999 2000 2001 2002
Brent Oil(US$/bbl.)----Nkr/DM(reverse scale)____
Changes in a country's terms of trade can, at times, exert
a strong influence on the direction that exchange rates
take. For instance, in commodity-oriented industrial econo-
mies such as Australia, New Zealand, and Canada, where
commodity exports make up a large part of GDP (relative
to the rather small shares in the G3 economies), one finds
a strong positive relationship between the trend in relevant
commodity-price indices and the trend in the A$, NZ$, and
C$, respectively.
In the case of the euro, the price of oil has been found to
be an important explanatory variable, with higher oil prices
contributing to a weaker euro, and vice versa. A recent
Bank of Canada study found that a similar relationship held
between energy prices and the C$, with higher energy
prices bearish for the C$ and lower energy prices bullish
for the C$.
A recent study by the central bank of Norway (Norges Bank)
finds that there is a non-linear relationship between oil
prices and the Norwegian krone. A change in oil prices
tends to have a larger impact on the krone's value when
the price of oil is below $14 a barrel or above $20 a barrel.
When oil prices fluctuate inside the $14-$20 range, the
impact of oil price changes on the krone's value is found
to be insignificant.
The Australian Dollar and Commodity Prices
Reserve Bank of Australia Commodity Price Index
70
80
90
100
110
120
0.40
0.50
0.60
0.70
0.80
0.90
1.00
84 85 86 87 88 89 90 91 92 93 94 95 96 97 98 99 00 01 02
RBA Commodity Price Index(US$-Terms)----US$/A$____
The Euro and the Price of Oil
(since April 1997)
5
10
15
20
25
30
35
40
(1.30)
(1.20)
(1.10)
(1.00)
(0.90)
(0.80)
1997 1998 1999 2000 2001 2002
Brent Oil(US$/bbl.)----US$/Euro(reverse scale)____
The Canadian Dollar and Commodity Prices
Bank of Canada Commodity (excl. Energy) Index
80
90
100
110
120
130
140
(1.65)
(1.60)
(1.55)
(1.50)
(1.45)
(1.40)
(1.35)
(1.30)
1995 1996 1997 1998 1999 2000 2001 2002
BoC Non-Energy Commod. Price Index----C$/US$(reverse scale)____
Commodity Exports as a Percentage of GDP
(for Selected Industrial Countries)
0.5
1.8
3.7
5.2
12.0
12.1
19.4
0
5
10
15
20
25
N.Z. Canada Australia UK Germany U.S. Japan
(%)
Source: Datastream Source: Datastream
Source: Datastream Source: Datastream
Source: OECD
Terms of Trade Changes and Exchange Rates
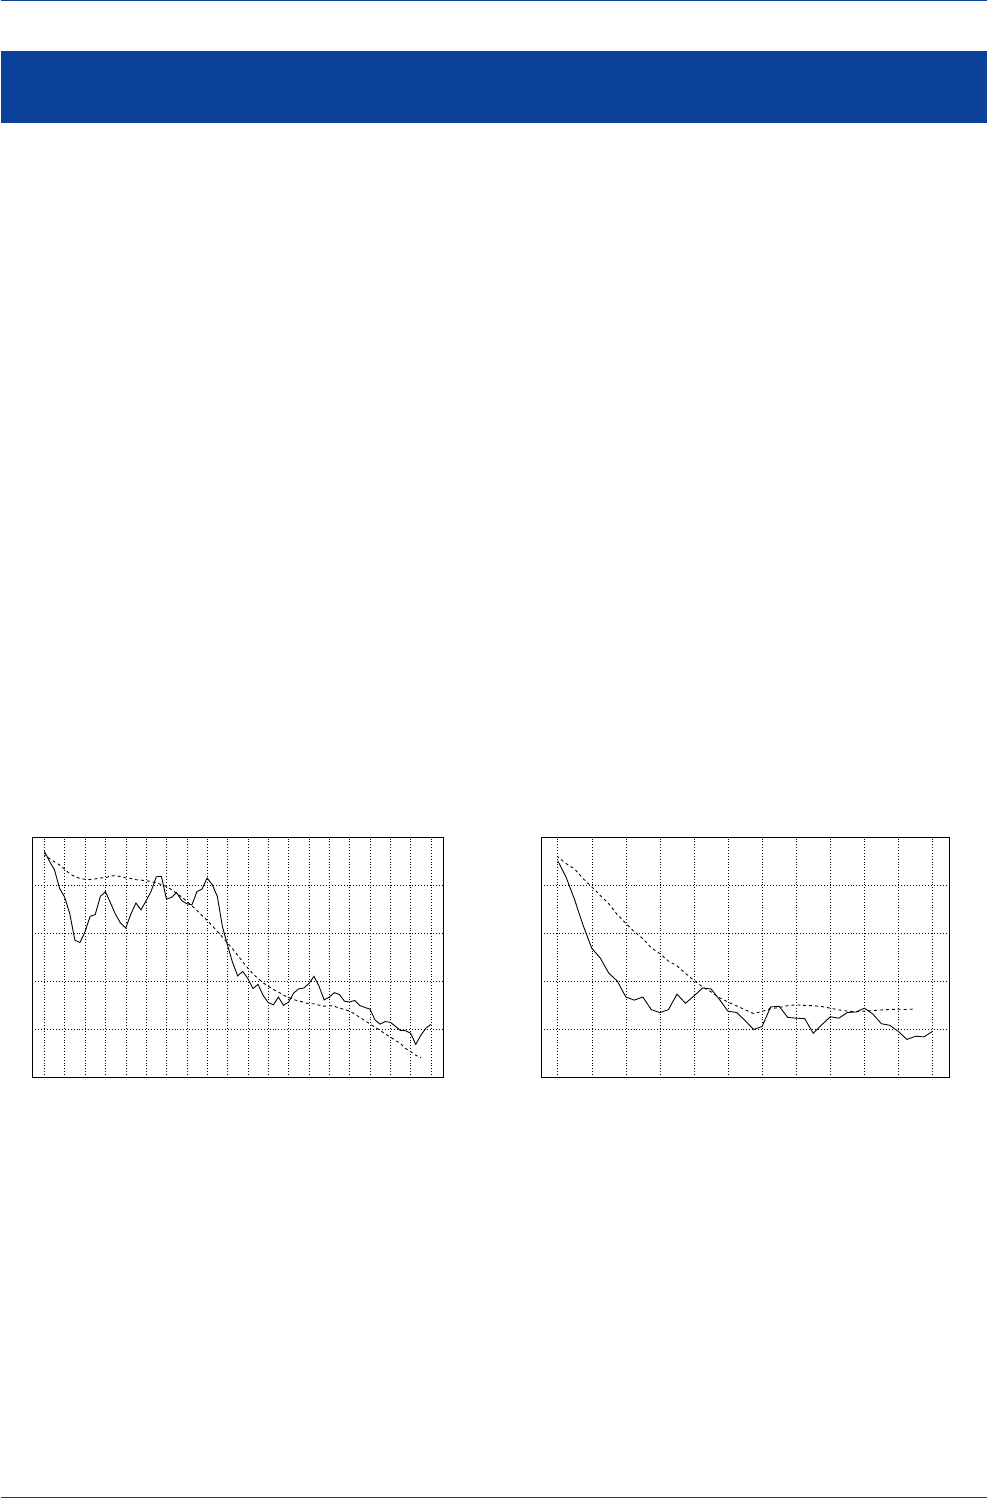
DB Guide to Exchange-Rate Determination
May 2002 Deutsche Bank @
Deutsche Bank Foreign Exchange Research 51
Several researchers have noted that there exists a posi-
tive long-run relationship between a country's net interna-
tional investment position as a percentage of GDP and its
real effective exchange rate. There are several reasons why
this relationship tends to hold.
First, exchange rates typically do not adjust to equilibrate
the current-account balance in each and every period. The
reason for this is that a deficit country may be able to at-
tract sufficient capital inflows to finance its deficit for a
considerable time. Indeed, if those inflows are consider-
able, the deficit country's currency might, in fact, rise even
as the current-account deficit widens—witness the U.S.
in 1981-85 and again in 1995-2002.
If a country's current-account deficit rises persistently over
time, however, there is likely to come a point when it can
no longer be easily financed. When that point is reached, a
currency's real value could then come under considerable
downward pressure. Hence, although the exchange rate
and the current-account imbalance may not appear to be
positively related on a monthly or quarterly basis, cumula-
tive trends in current-account imbalances and exchange
rates tend to be more closely aligned.
A second reason for the positive relationship between the
trend in net international investment positions and the trend
in real exchange rates is the effect of the transfer of wealth
implied by external-account imbalances. The cumulative
trend in current-account imbalances gives rise to shifts in
the residence of wealth from deficit to surplus countries,
and such wealth transfers give rise to portfolio adjustments
that put upward pressure on surplus-country currencies
and downward pressure on deficit-country currencies over
time.
Given that most investors prefer to keep the bulk of their
wealth in domestic and not foreign-currency assets—the
so-called home-country bias—investors in surplus coun-
tries will find themselves accumulating more foreign-cur-
rency assets than they desire relative to their domestic
holdings. Over time, surplus country investors will attempt
to rebalance their portfolios in favor of domestic-currency
assets. As they do, the surplus country's currency will tend
to rise relative to the deficit country's currency. The Japa-
nese yen and the Deutschemark—to a lesser degree—
underwent long-term appreciations from the 1980s until
the mid-1990s as their cumulative current-account sur-
pluses rose.
The Japanese Yen and the U.S./Japan
Cumulative Current-Account/GDP Differential
(50)
(40)
(30)
(20)
(10)
0
10
20
50
100
150
200
250
300
77 78 79 80 81 82 83 84 85 86 87 88 89 90 91 92 93 94 95 96
Cum. Curr.-Acct. as % of GDP Diff.---- (%)
¥
/US$____
The Deutschemark and the U.S./German
Cumulative Current-Account/GDP Differential
(50)
(40)
(30)
(20)
(10)
0
1.00
1.50
2.00
2.50
3.00
3.50
85 86 87 88 89 90 91 92 93 94 95 96
Cum. Curr.-Acct. as % of GDP Diff.---- (%)DM/US$____
Source: Datastream Source: Datastream
Net International Investment and the Equilibrium Exchange Rate
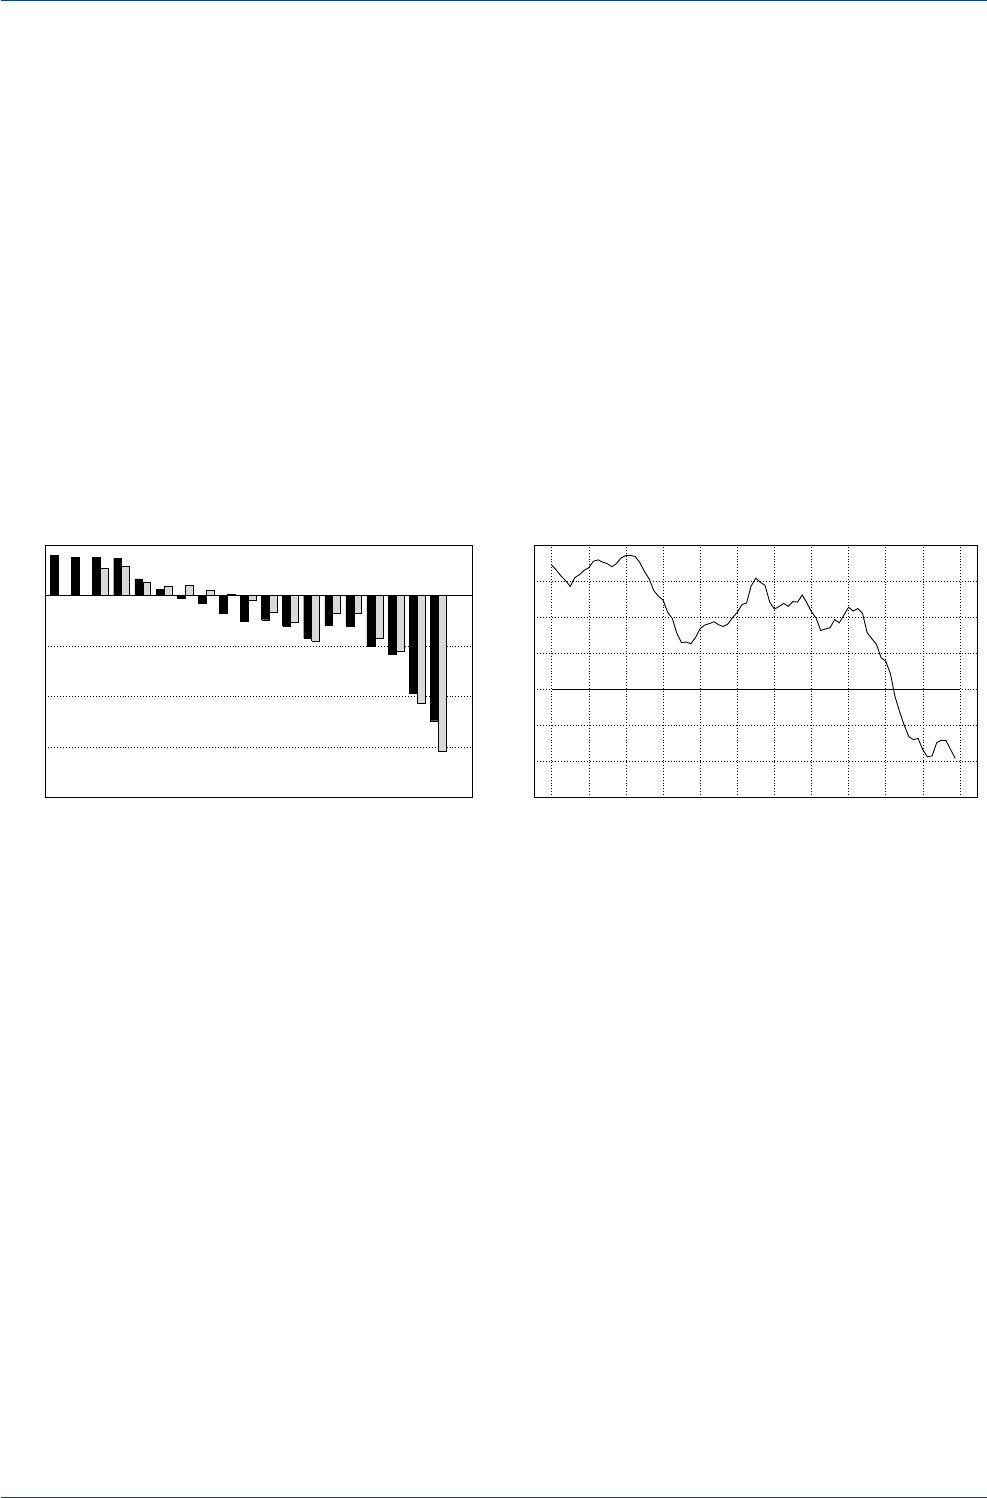
DB Guide to Exchange-Rate Determination May 2002
Deutsche Bank @
52 Deutsche Bank Foreign Exchange Research
A final reason why the trends in net international invest-
ment positions and real exchange rates are positively re-
lated is that heavily indebted nations need to service their
net external debts, and that can only be done if the debtor
country runs a trade surplus to generate the income to
service those debts. In order for the debtor country to run
a trade surplus consistently over time, the real exchange
rate of a debtor country would need to decline. Similarly, a
country with a large cumulative current-account surplus
would need to see its currency's real value rise over time
to insure that the surplus and the associated net foreign
asset position did not continue rising to unsustainably high
levels.
Although the U.S. has seen its net international investment
position deteriorate sharply in the past decade, the dollar
has nevertheless remained extraordinarily resilient. One
explanation is that, although U.S. external liabilities exceed
U.S. external assets by a wide margin, the U.S. has tended
to earn a higher return on its external assets than it has
paid out on its external liabilities. The result has been that
net investment income flows, until recently, posted a mod-
est surplus. While U.S. net investment income flows have
recently swung into a modest deficit position, the deficit
does not appear to be sizeable enough at this stage to
seriously damage the dollar's long-run prospects.
U.S. Balance on Investment Income
(Four-Quarter Moving Sum)
-30
-20
-10
0
10
20
30
40
1980 1982 1984 1986 1988 1990 1992 1994 1996 1998 2000 2002
(US$ bn.)
U.S. Net Investment Position
(at Current Cost and Market Value)
-2000
-1500
-1000
-500
0
500
80 81 82 83 84 85 86 87 88 89 90 91 92 93 94 95 96 97 98 99
Market Value(light)
(US$ bn.) Current Cost(dark)
Source: Datastream Source: Datastream
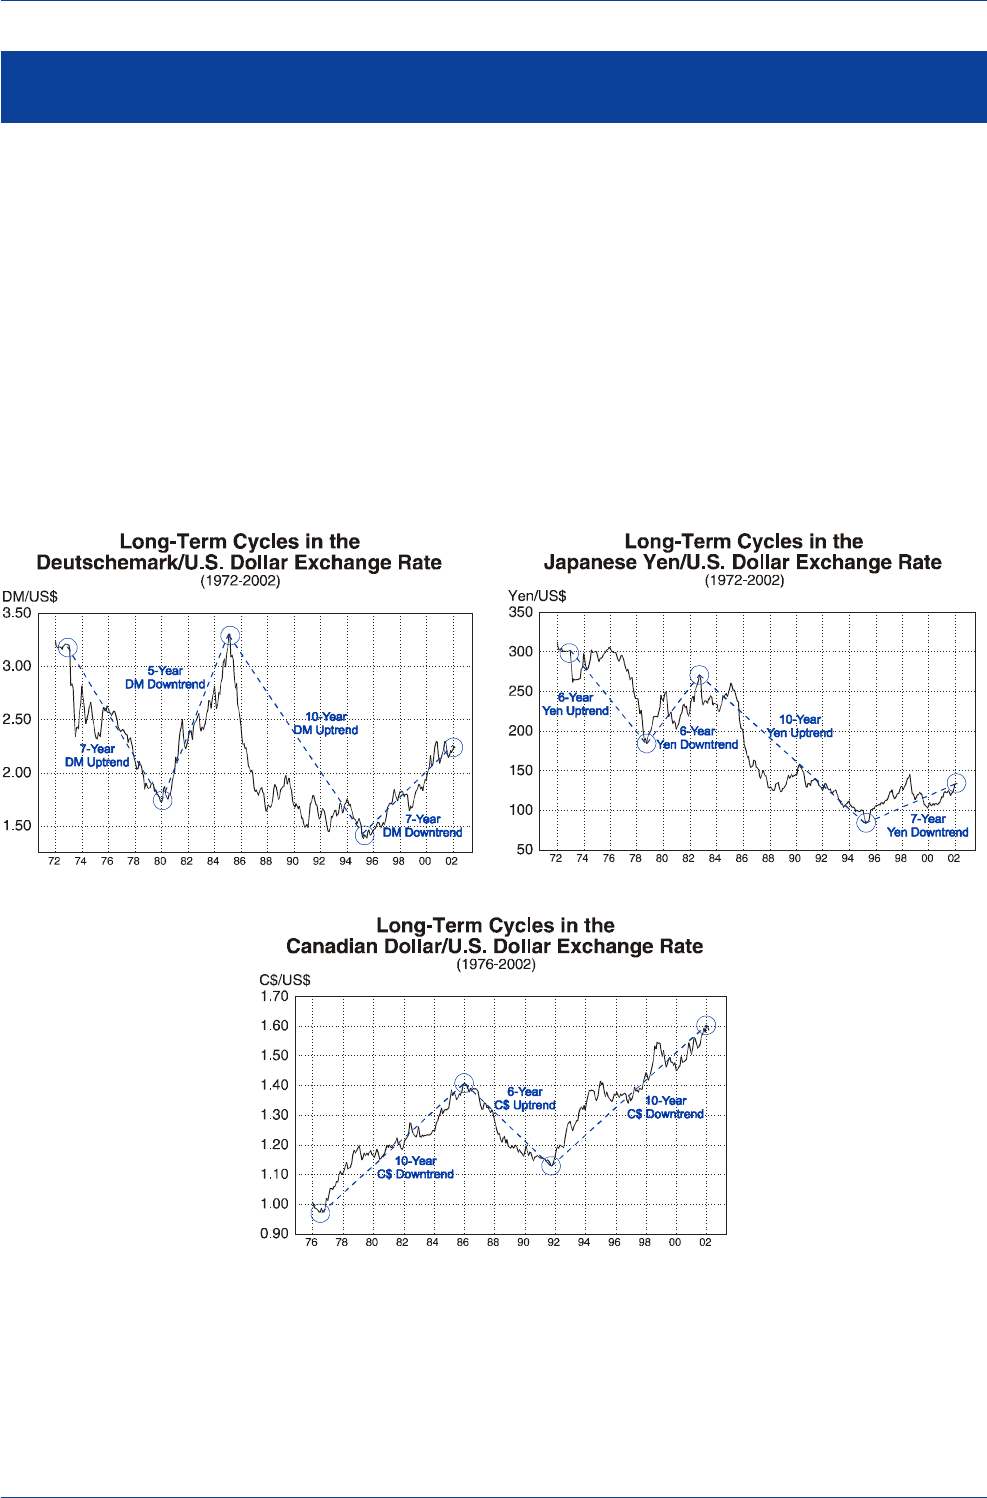
DB Guide to Exchange-Rate Determination
May 2002 Deutsche Bank @
Deutsche Bank Foreign Exchange Research 53
The dollar has exhibited a tendency to both rise and fall
over long-term cycles, with each of the dollar cycles since
the floating of exchange rates in 1973 sharing a number of
common features.
First, the magnitude of the dollar's exchange-rate move-
ments in each cycle has generally been large, often far
exceeding the forecasts of portfolio managers, market pun-
dits and forward-exchange rates.
Second, the period of each dollar cycle has tended to be
long, often surpassing by a wide margin the typical length
of U.S. and foreign business cycles. That would suggest
that cyclical factors alone cannot account for the tendency
of the dollar to move in large and protracted swings.
Third, at the end of each major cycle, there has been a
tendency for the dollar to overshoot its long-run equilib-
rium level, often in a climactic fashion.
Finally, when the dollar has overshot its fair value at the
end of a long cycle, the deviation in the dollar's value from
its estimated PPP value has often given rise to serious
imbalances on either the internal or external-balance fronts
in the U.S., Europe, or Japan. When those imbalances
reached a critical level, it often set market forces in motion
to bring the overshoot to an end, and to plant the seeds
for a 180-degree shift in the dollar's long-term trend.
Long-Term Cycles in Exchange Rates
Source: Datastream
Source: Datastream
Source: Datastream
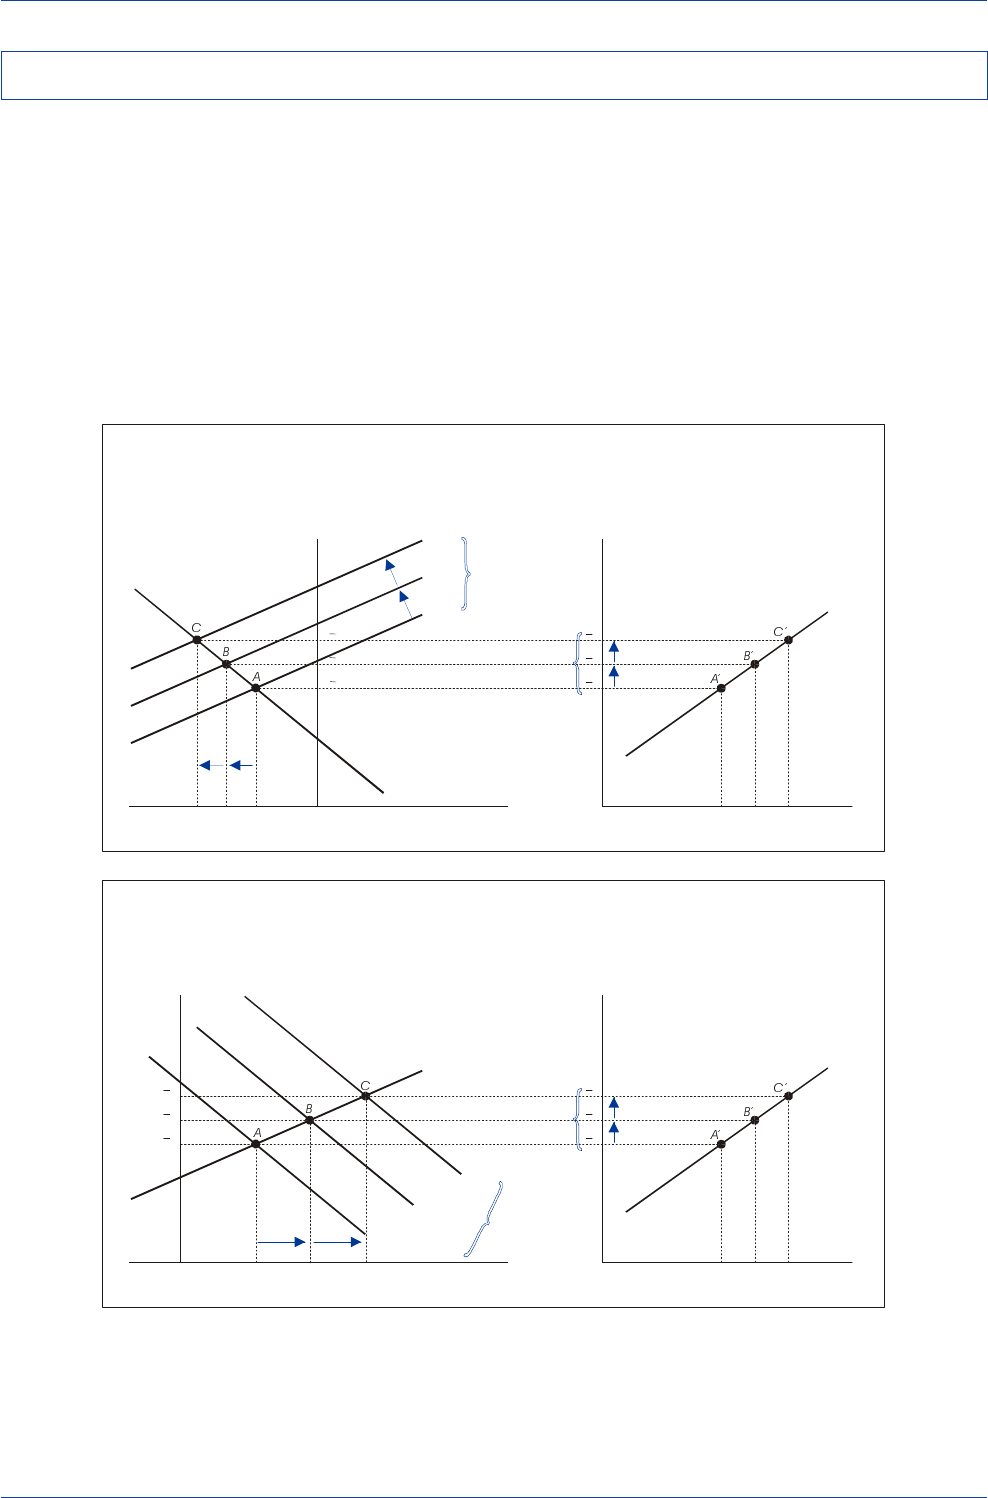
DB Guide to Exchange-Rate Determination May 2002
Deutsche Bank @
54 Deutsche Bank Foreign Exchange Research
Structural changes on a country's internal or external-bal-
ance front are largely responsible for the long-term cycles
in exchange rates that we have witnessed. For instance,
the U.S. investment boom of the second half of the 1990s
and the structural rise in U.S. productivity during that pe-
riod are largely responsible for the dollar's persistent rise
over the 1995-2002 period. As illustrated in the first dia-
gram below, the U.S. savings-investment schedule, S-I,
gradually shifted upward and to the left, giving rise to a
persistent uptrend in the dollar's real long-run equilibrium
value over time. Likewise, the persistent rise in Japan's
current-account surplus in the 1980s and early 1990s played
a key role in lifting the yen's equilibrium value over time,
as illustrated in the second diagram.
In both the dollar's and the yen's case, the upward revi-
sions in the real long-run equilibrium exchange rates ap-
pear to have taken place gradually, and not instantaneously
as several theories would have suggested. This would ex-
plain why the up and down cycles in exchange rates en-
dure for years at a time.
Factors Contributing To Long-Term Cycles
The Positive Effects over Time of Structural Increases in Investment
on a Currency’s Long-Run Equilibrium Value
Savings minus Investment,
Current-Account Balance
Real Exchange Rate
Persistent
Structural
Increases in
Investment
Spending
S-I
2
CAB
1
Upward Revision in
the Currency’s Real
Long-Run Equilibrium
Value over Time
q
2
q
1
(0)(-) (+)
S-I
1
S-I
3
q
3
Time
Real Exchange Rate
q
2
q
1
q
3
t
1
t
2
t
3
The Positive Effects over Time of Structural Increases in a Current-Account Surplus
on a Currency’s Long-Run Equilibrium Value
Savings minus Investment,
Current-Account Balance
Real Exchange Rate
Persistent
Structural
Increases in
Current-Account
Balance
CAB
2
CAB
1
Upward Revision in
the Currency’s Real
Long-Run Equilibrium
Value over Time
q
2
q
1
(0)(-) (+)
S-I
1
CAB
3
q
3
Time
Real Exchange Rate
q
2
q
1
q
3
t
1
t
2
t
3
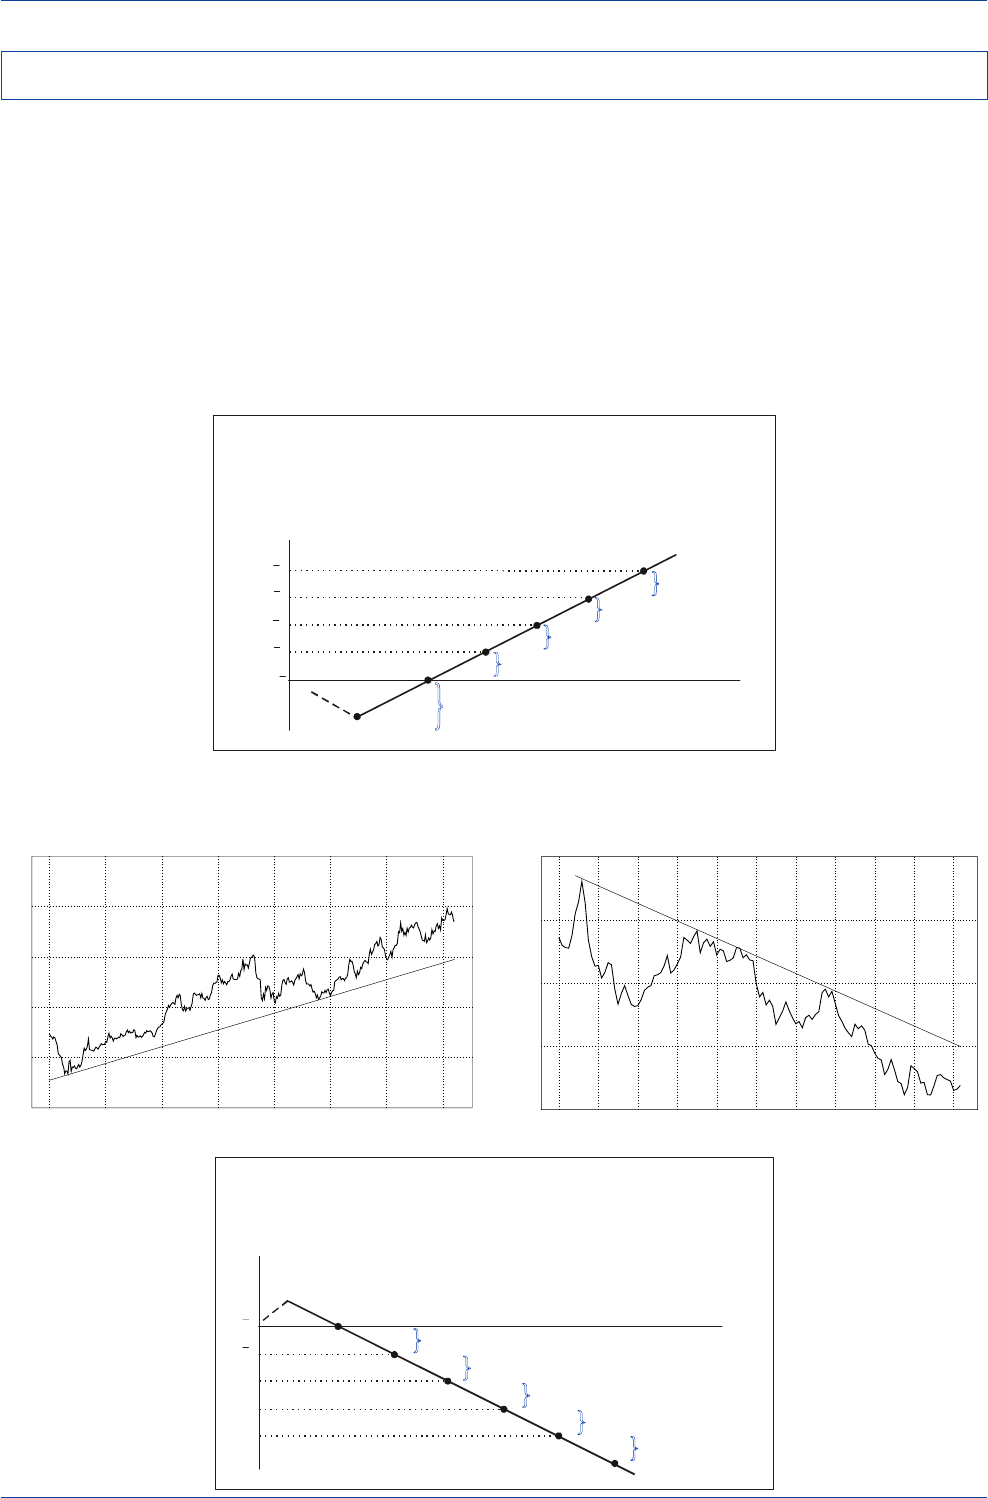
DB Guide to Exchange-Rate Determination
May 2002 Deutsche Bank @
Deutsche Bank Foreign Exchange Research 55
Most long-term exchange-rate cycles are not driven by a
single shock to the internal or external-balance schedules,
but rather by a series of separate, yet related shocks that
reinforce one another in driving an exchange rate higher or
lower over time. For instance, the dollar's long-term uptrend
between April 1995 and November 2000 reflected a com-
bination of favorable factors including: (1) "New Economy"
forces that helped propel U.S. investment spending and
productivity growth higher, (2) a structural shift in capital
flows from emerging markets and Euroland to the U.S., (3)
higher oil prices, and (4) relatively tight U.S. monetary and
credit conditions up until 2001.
In the case of the euro, its long-term decline since the
early 1990s also reflected a multitude of problems includ-
ing: (1) pervasive structural rigidities in European labor and
product markets, (2) an adverse fiscal/monetary policy mix
in Euroland, (3) higher oil prices, (4) an adverse structural
shift in Euroland capital flows, and (5) excessive pessimism
regarding the potential problems associated with the launch
of the new euro notes and coins in early 2002.
U.S. Dollar Major Currency Index
(1995-2002)
70
80
90
100
110
120
1995 1996 1997 1998 1999 2000 2001 2002
(Index)
U.S. Dollar/Euro Exchange Rate
(and the Euro’s Downtrend since September 1992)
0.80
1.00
1.20
1.40
1.60
1992 1993 1994 1995 1996 1997 1998 1999 2000 2001 2002
US$/Euro
Long-Term Cycles in Exchange Rates: The Dollar and Euro in the 1990s
Source: Datastream Source: Datastream
The Dollar’s Long-Term Uptrend
A Stylized Diagram of the Fundamental Forces that Have Contributed to
Increases in the Dollar’s Real Long-Run Equilibrium Value
A
B
C
E
US$ Real
Exchange Rate
Correction
of Initial
Undervaluation
U.S. Investment Boom
Time
q
1
PPP=q
0
F
q
2
Higher Oil Prices
Structural Shift in Portfolio Flows
Tighter Fed Policy
q
4
q
3
D
The Euro’s Secular Decline
A Stylized Diagram of the Fundamental Forces
That Have Contributed to the Euro’s Long-Term Slide
A
B
C
D
The Euro’s
Value
Purchasing Power Parity
Euroland’s Adverse Policy Mix
Time
q
D
E
q
C
Higher Oil Prices
Euroland’s Structural Rigidities
Adverse Structural Shift
in Capital Flows
q
B
q
E
q
A
F
Euro’s Confidence Crisis/
Excessive Pessimism
q
F
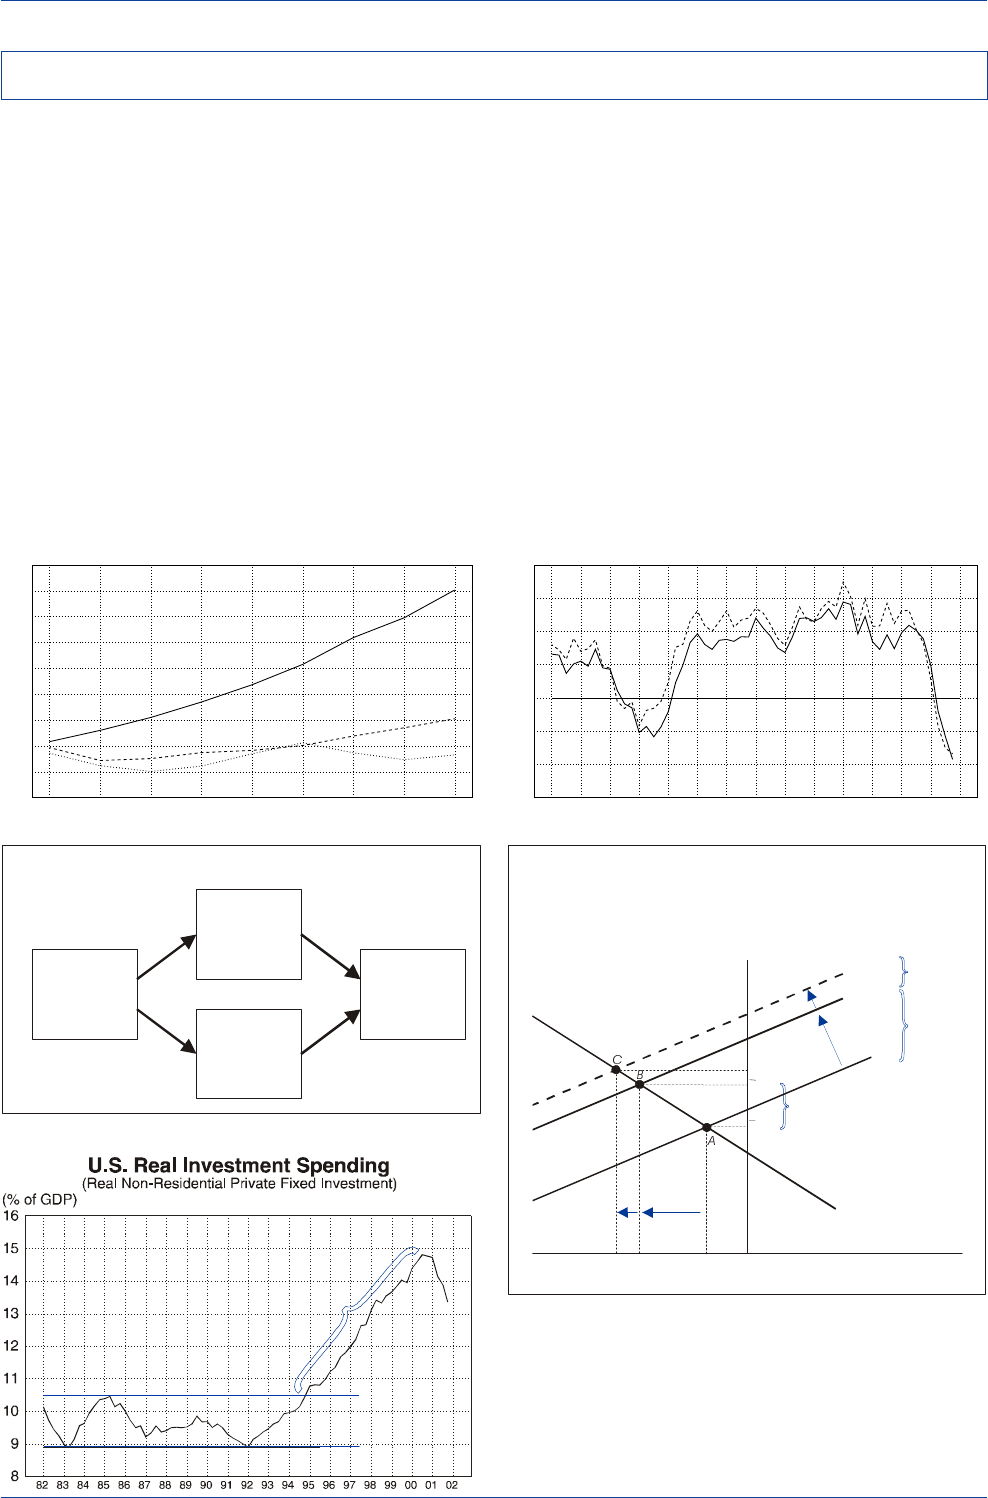
DB Guide to Exchange-Rate Determination May 2002
Deutsche Bank @
56 Deutsche Bank Foreign Exchange Research
U.S. Nonresidential Fixed Investment and
Equipment & Software Investment
(Year-over-Year Percentage Changes)
-15
-10
-5
0
5
10
15
20
88 89 90 91 92 93 94 95 96 97 98 99 00 01 02
Equipment & Software----
(%) Fixed Investment____
Source: Datastream
The dollar's rising trend versus most major currencies over
the 1995-2002 period had, for the most part, strong funda-
mental underpinnings. The U.S. economy underwent a
major investment boom over this period, particularly when
compared with the weak investment performance in Eu-
rope and Japan. A large portion of the U.S. boom was con-
centrated in the information technology (IT) arena where
U.S. industry held a dominant, global position. The IT-led
investment boom, in turn, contributed to a surge in U.S.
productivity growth relative to productivity growth else-
where. Since exchange-rate trends are often strongly in-
fluenced by relative productivity trends, the relative surge
in U.S. productivity growth had the effect of raising the
dollar's equilibrium value.
In addition to the rise in productive investment that oc-
curred during the 1995-2000 period, there was probably
also a considerable amount of excess investment during
the height of the IT bubble period, particularly in the
Internet, telecom, and PC areas. This excess investment
spending, which is shown in the diagram below as left-
ward shifts in the savings-investment schedule to S-I3, is
now in the process of being unwound. Indeed, the S-I curve
now appears to be shifting back down to perhaps S-I2, sug-
gesting that the dollar's equilibrium value should be shift-
ing downward as well. At the time of this writing, how-
ever, the dollar's actual value does not appear to have fallen
nearly as much as the apparent decline in its equilibrium
value.
Real Gross Non-Residential Fixed Capital
Formation in the U.S., Euroland, and Japan
(1992-2000)
-40
-20
0
20
40
60
80
100
120
140
1992 1993 1994 1995 1996 1997 1998 1999 2000
Europe---- Japan....
(Cumulative % Change) U.S.____
The 1990s U.S. Investment Boom and the Dollar
Increase in
Capital Inflow
(equal to the gap
between
U.S. domestic
investment
and savings)
The Increase in Investment Spending and the Dollar
Increase in
U.S.
Investment
Spending
Real
Appreciation
of the
U.S. Dollar
Increase in
Future U.S.
Productivity
Growth
The Increase in U.S. Investment Spending
Has Given Rise to an Upward Revision
in the Dollar’s Long-Run Equilibrium Value
Savings minus Investment,
Current-Account Balance
Real Exchange Rate
Structural
Increase in
Investment
Spending
S-I
2
CAB
1
Upward Revision in the
Currency’s Real Long-Run
Equilibrium Value
q
2
q
1
(0)(-) (+)
S-I
1
Excess
Investment
Spending
S-I
3
q
3
“New Economy” Phenomenon
or
Excessive Investment?
Source: Datastream
Source: Datastream
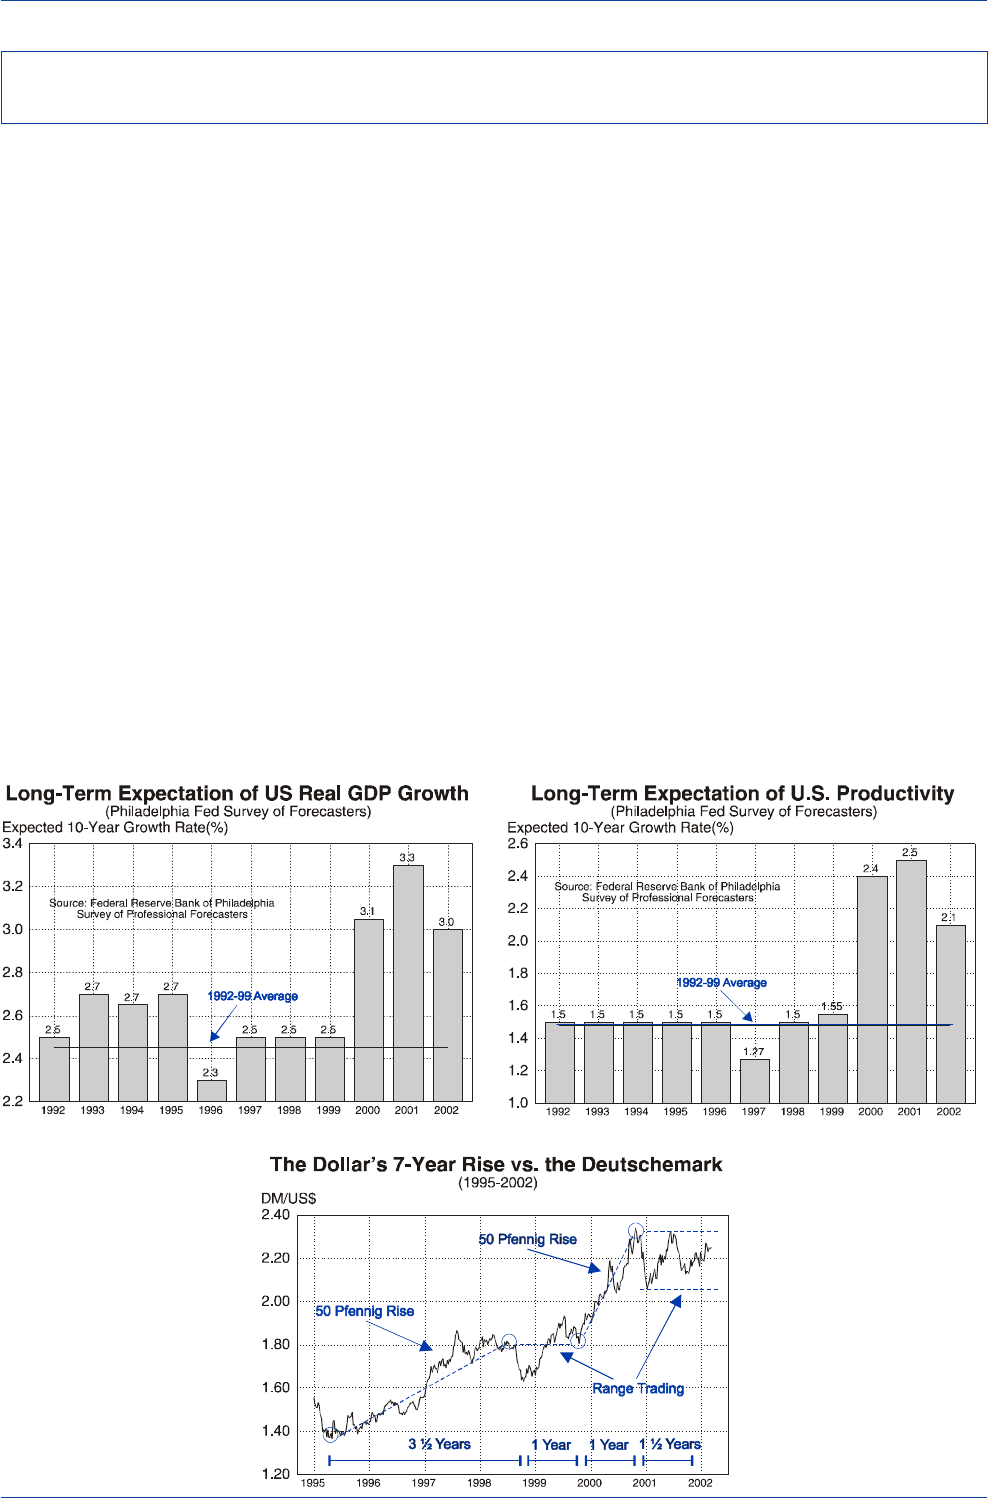
DB Guide to Exchange-Rate Determination
May 2002 Deutsche Bank @
Deutsche Bank Foreign Exchange Research 57
The Dollar’s Dramatic Rise in 1999-2000 May Have Been Driven by a Sudden
Upward Revision in the Dollar’s Real Long-Run Equilibrium Level
Source: Datastream
The dollar’s dramatic surge between the fall of 1999 and
the fall of 2000 may have been propelled by an upward revi-
sion in the market's expectations regarding the U.S.
economy's long-run growth prospects and a subsequent
upward revision in the dollar's real long-run equilibrium value.
The U.S. economy had been growing faster than the
Euroland economy for much of the 1990s, but it wasn't
until late in the decade that observers began to take no-
tice that "something special" was taking place that was
distancing the U.S. from the rest of the world. As the ac-
companying charts show, in annual surveys from 1992-99,
professional economists had been projecting a relatively
bland long-term U.S. economic outlook, with real GDP
growth expected to average 2.5% per annum and produc-
tivity expected to rise by a modest 1.5% per annum over
each ensuing 10-year period.
Normally, one would think that shifts in expectations re-
garding the U.S. long-term growth outlook would take place
gradually over a number of years. But in 1999, expecta-
tions seemed to change overnight. In the 2000 and 2001
surveys, professional economists’ long-term projections
were pushed up sharply. Economists were now forecast-
ing long-term U.S. real GDP growth of 3.3% and U.S. pro-
ductivity growth of 2.5% per annum.
It was as if economists suddenly embraced the notion that
the U.S. was now enjoying a productivity miracle, brought
about by the "New Economy" phenomenon, and that the
gains in productivity would be permanent. Quite likely, a
literature search would show a quantum leap in the num-
ber of academic articles that appeared with the term "New
Economy" in the title beginning in 1999. (For a discussion
of the New Economy's impact on the FX market, see
Liesbeth Van de Craen and Peter Vanden Haute,
The New
Economy and the Foreign Exchange Market
.)
Assuming the marketplace embraced the same long-term
views of the U.S. economy as those held by professional
forecasters, it is not hard to explain why the dollar rose 50
pfennigs versus the Deutschemark between autumn 1999
and autumn 2000. We believe that the suddenly improved
long-term growth outlook for the U.S. economy compelled
market participants to revise up sharply their notion of the
dollar's real long-run equilibrium value. Indeed, the dollar's
rise from the autumn of 1999 to the autumn of 2000, which
followed the upward revision in the U.S. long-term growth
outlook, roughly matched, in terms of magnitude, the rise
that occurred in the prior 4½ years.
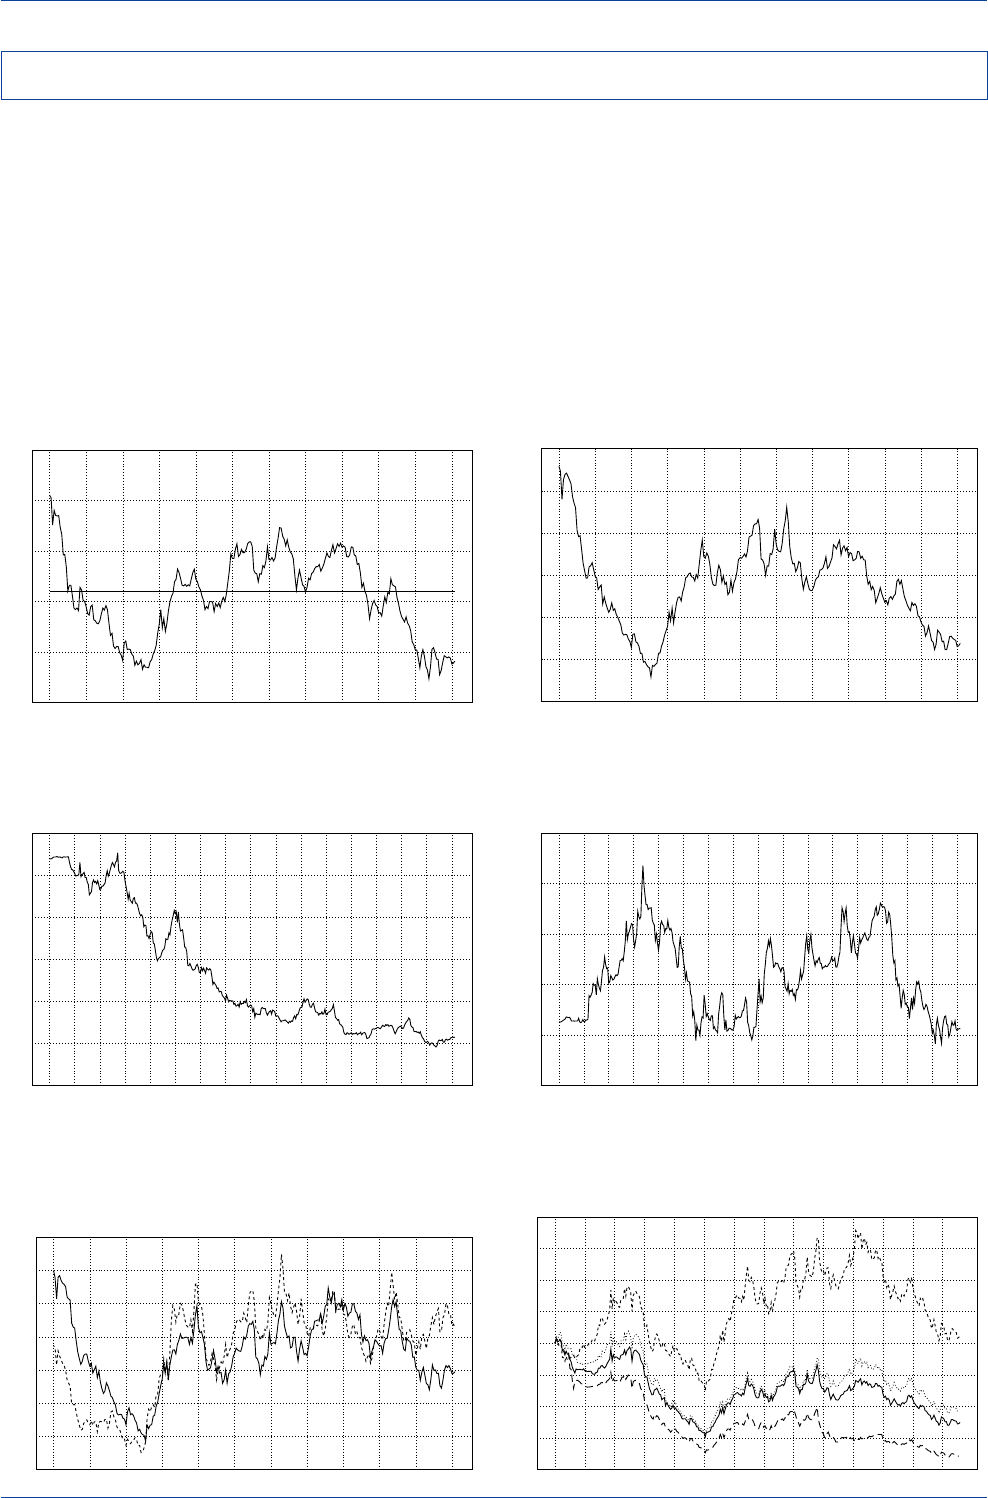
DB Guide to Exchange-Rate Determination May 2002
Deutsche Bank @
58 Deutsche Bank Foreign Exchange Research
The "synthetic" euro's real trade-weighted value had been
declining on a trend basis for much of the decade heading
into its 1999 launch date. Yet many pundits expected that
the new single currency would be strong, believing that
the euro would embrace all of the hard-currency attributes
of the Deutschemark and would discard all the soft-cur-
rency attributes of its depreciation-prone ERM members.
This did not happen. By 2001, the euro was trading close
to its 20-year low versus the yen and British pound, and—
except for the 1985 dollar bubble—the euro was trading
close to a record low versus the U.S. dollar.
Perhaps those pundits failed to recognize that the euro's
long-term behavior, being a weighted average of all EMU
member currencies, resembled that of a soft and not a
hard currency. In fact, its persistent decline versus a wide
range of currencies suggests that negative fundamental
developments intrinsic to Euroland probably played a large
role in the euro's long-term slide.
US$/Euro Exchange Rate
(1980-2002)
0.60
0.80
1.00
1.20
1.40
1.60
1.80
1980 1982 1984 1986 1988 1990 1992 1994 1996 1998 2000 2002
US$/Euro
Synthetic Euro Real Trade-Weighted Index
(1980-2002)
70
80
90
100
110
120
1980 1982 1984 1986 1988 1990 1992 1994 1996 1998 2000 2002
Bank of England Index
Average
Canadian Dollar/Euro and
Australian Dollar/Euro Exchange Rates
(1980-2002)
0.80
1.00
1.20
1.40
1.60
1.80
2.00
2.20
1980 1982 1984 1986 1988 1990 1992 1994 1996 1998 2000 2002
A$/Euro----
C
$/Euro____
The Euro Relative to the Euroland Currencies
(European Currencies versus the U.S. Dollar)
20
40
60
80
100
120
140
160
180
75 77 79 81 83 85 87 89 91 93 95 97 99 01
France.... Italy/Spain__ __
(Index) Euro____ DM----
British Pound/Euro Exchange Rate
(1970-2002)
0.50
0.60
0.70
0.80
0.90
1.00
70 72 74 76 78 80 82 84 86 88 90 92 94 96 98 00 02
£/Euro
Japanese Yen/Euro Exchange Rate
(1970-2002)
0
100
200
300
400
500
600
70 72 74 76 78 80 82 84 86 88 90 92 94 96 98 00 02
¥
/Euro
The Euro's Long-Term Struggle
Source: Datastream
Source: Datastream Source: Datastream
Source: Datastream
Source: DatastreamSource: Datastream
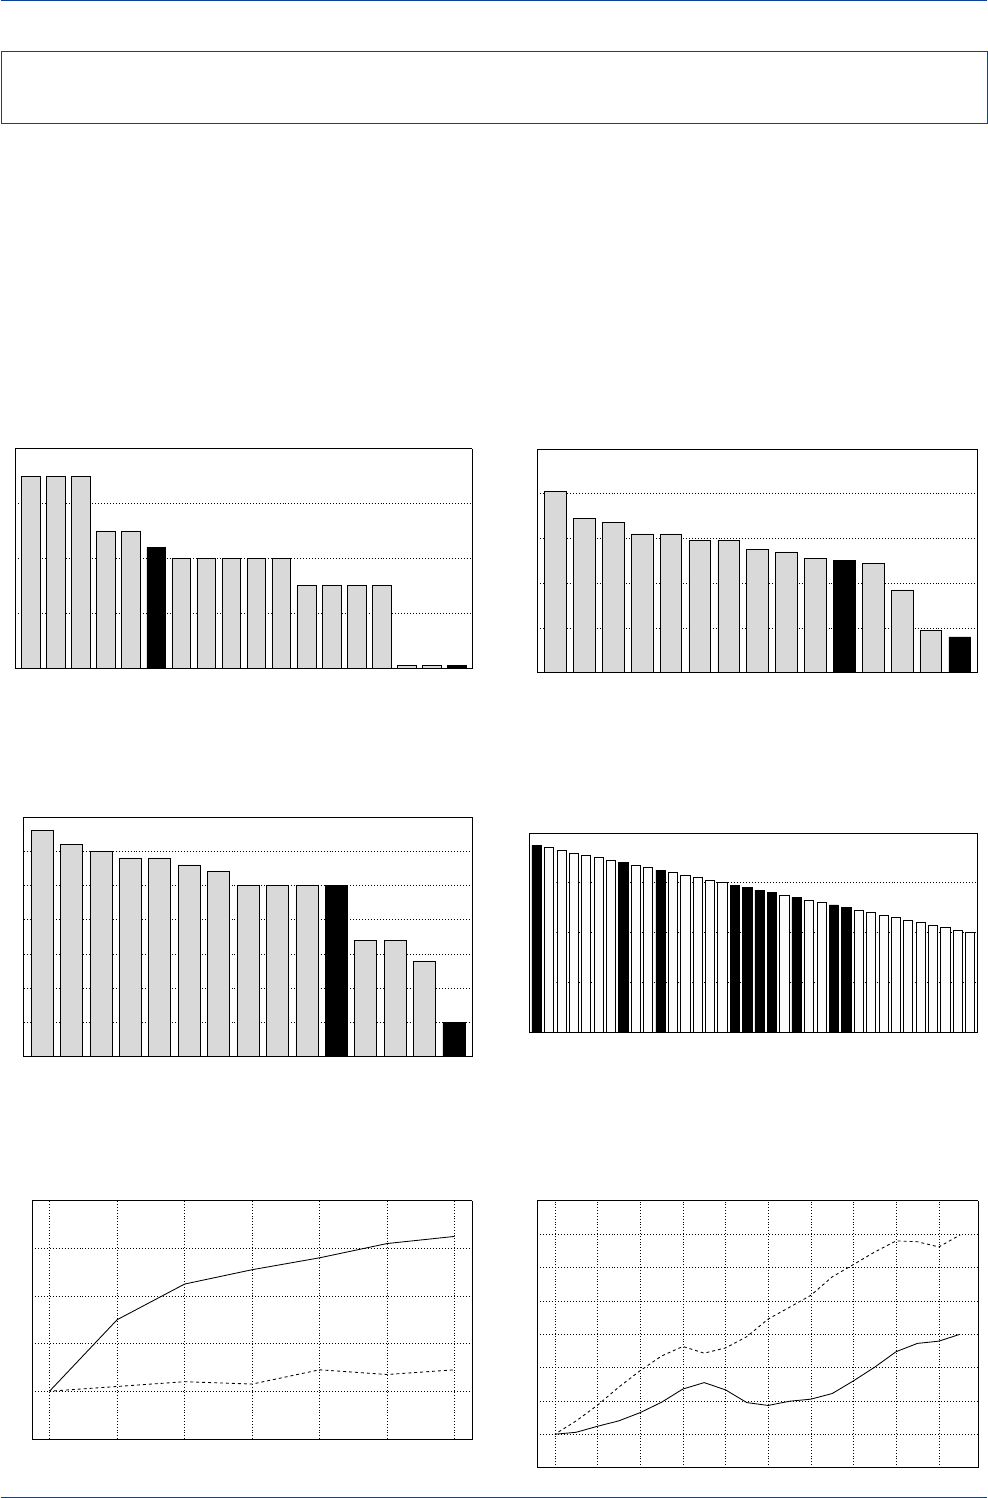
DB Guide to Exchange-Rate Determination
May 2002 Deutsche Bank @
Deutsche Bank Foreign Exchange Research 59
Structural rigidities in Europe's labor and product markets
undoubtedly have adversely affected Europe's long-term
growth potential and thus probably contributed to a down-
ward revision in the market's assessment of the euro's
real long-run equilibrium value as well. Structural rigidities
in Europe's labor market include: job protection legisla-
tion, working time regulations, overly generous early re-
tirement schemes, unemployment insurance and welfare
benefits, and barriers to hiring skilled labor from abroad.
On the product front, structural rigidities include the slug-
gishness of firms to adopt a culture of risk taking, the high
cost of telecommunications, and the unwillingness of many
European governments to allow market forces to operate
unfettered. The charts below show that European labor
markets are far more regulated than the U.S., European
unemployment benefits are far more generous, while Eu-
ropean taxes and real labor costs are higher than they are
in the U.S. as well.
Strictness of Labor Market Regulation
(Most to Least Strict)
0
2
4
6
8
G
reece
Italy
Spain
France
Sweden
EMU-11
Germany
Ireland
Finland
Portugal
Norway
Austria
Belgium
Netherlands
Switz.
Denmark
U.K.
U.S.
A
ggregate Index
Source: OECD
Overall Taxes as a Percentage of Earnings
30
35
40
45
50
55
60
65
D
enmark
Belgium
Sweden
France
Germany
Norway Italy
Finland
Ireland
Netherlands
EMU-11
Portugal
Spain U.K. U.S.
(%)
Source: OECD
Unemployment Benefit Generosity
(Most to Least Generous)
16
19
37
49
50.1
51
54
55
5959
6262
67
69
81
0
20
40
60
80
100
Denmark
Netherlands
Sweden
Norway
Switz.
Belgium
Finland
France
Germany U.K.
EMU-11
Spain
Ireland Italy U.S.
A
ggregate Index
Source: OECD
Europe’s Real Labor Costs & Total Employment
80
100
120
140
160
180
1970 1975 1980 1985 1990 1995 1998
Total Employment----
(1970 = 100) Real Labor Costs____
Source: OECD
2001 Global Competitiveness
(based on World Economic Forum Rankings)
0
20
40
60
80
Finland
U.S.
Canada
Singapore
Australia
Norway
Taiwan
Netherlands
Sweden
N.Z.
Ireland
U.K.
Hong Kong
Denmark
Switz.
Iceland
Germany
Austria
Belgium
France
Japan
Spain
Korea
Israel
Portugal
Italy
Chile
Hungary
Estonia
Malaysia
Slovenia
Mauritius
Thailand
South Africa
Costa Rica
Greece
Rankings(Most to Least Competitive)
Source: World Economic Forum
(Top-36 Countries)
European and U.S. Total Employment
95
100
105
110
115
120
125
130
135
84 86 88 90 92 94 96 98 00 02e
U.S.----
(1984=100) Europe____
Source: OECD Economic Outlook
Euroland's Structural Rigidities and the Euro's Real Long-Run
Equilibrium Value
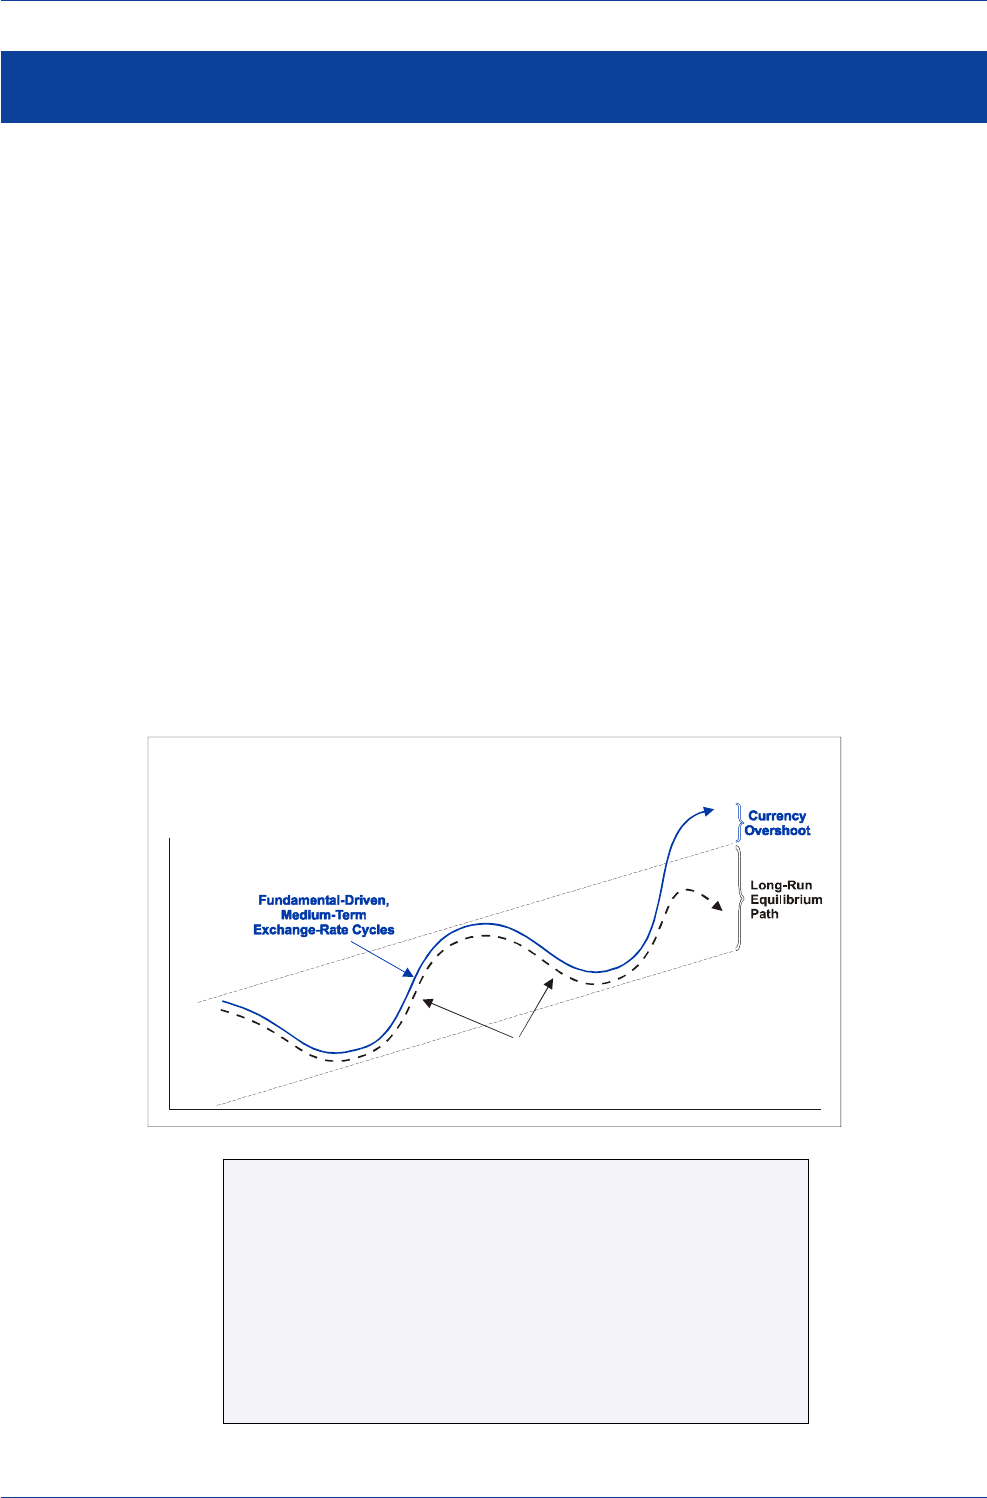
DB Guide to Exchange-Rate Determination May 2002
Deutsche Bank @
60 Deutsche Bank Foreign Exchange Research
Since the beginning of floating exchange rates, there have
been a number of occasions when exchange rates have
significantly overshot their long-run equilibrium path, ei-
ther on the upside or the downside. We define an exchange-
rate overshoot episode as one in which an exchange rate
deviates by more than +/- 20% from its long-run purchas-
ing power parity path and/or where there exists a signifi-
cant divergence between the actual trend in exchange rates
and some long-term, key determinant—such as the trend
in real interest-rate differentials in the case of the Deut-
schemark, or the trend in relative monetary-base growth
rates in the case of the Japanese yen.
For the most part, long-term cycles have strong fundamen-
tal underpinnings. That is, we can find a strong positive
relationship between the long-term trend in exchange rates
and the long-term trend in some key fundamental indica-
tor. What we find interesting, however, is that at the end
of a typical long-term dollar cycle there has been a ten-
dency for the dollar's value to overshoot its long-run fun-
damentally driven equilibrium path by rather large amounts.
A simple model can be designed to explain why exchange
rates tend to overshoot. The model assumes that inves-
tors' expectations of exchange rates are driven by both
fundamental and technical considerations. Mathematically,
we can say that exchange rate expectations, eet, in time
period
t
are driven by fundamental forces, fundt, and by
the past pattern of exchange-rate movements, et-1.
It is further assumed that the market will assign weights
to the relative importance that it attaches to the current
trend in fundamental forces,
w
, and to the past pattern of
exchange-rate movements, 1-
w
. Those weights are as-
sumed to vary over time, with the market assigning more
weight to fundamentals and less weight to technicals, and
vice versa, as fundamental and technical forces vary in
terms of influencing the path that currencies take. Ex-
change-rate expectations can therefore be expressed as:
eet =
w
(fundt) + (1-
w
)et-1
A Stylized Model of Exchange-Rate Overshooting
at the End of a Long-Term Uptrend
Currency’s
Value
Time
Economic Fundamentals
Exchange Rate Expectations can be expressed as:
e
et = w (fundt) + (1-w )et-1
where:
eet= exchange-rate expectations
fundt= fundamental forces
et-1 = past pattern of exchange-rate movements
w = market-assigned weight to the importance of the current
trend in fundamental forces
1-w = market-assigned weight to the importance of the past pattern
of exchange-rate movements
Overshooting Exchange Rates
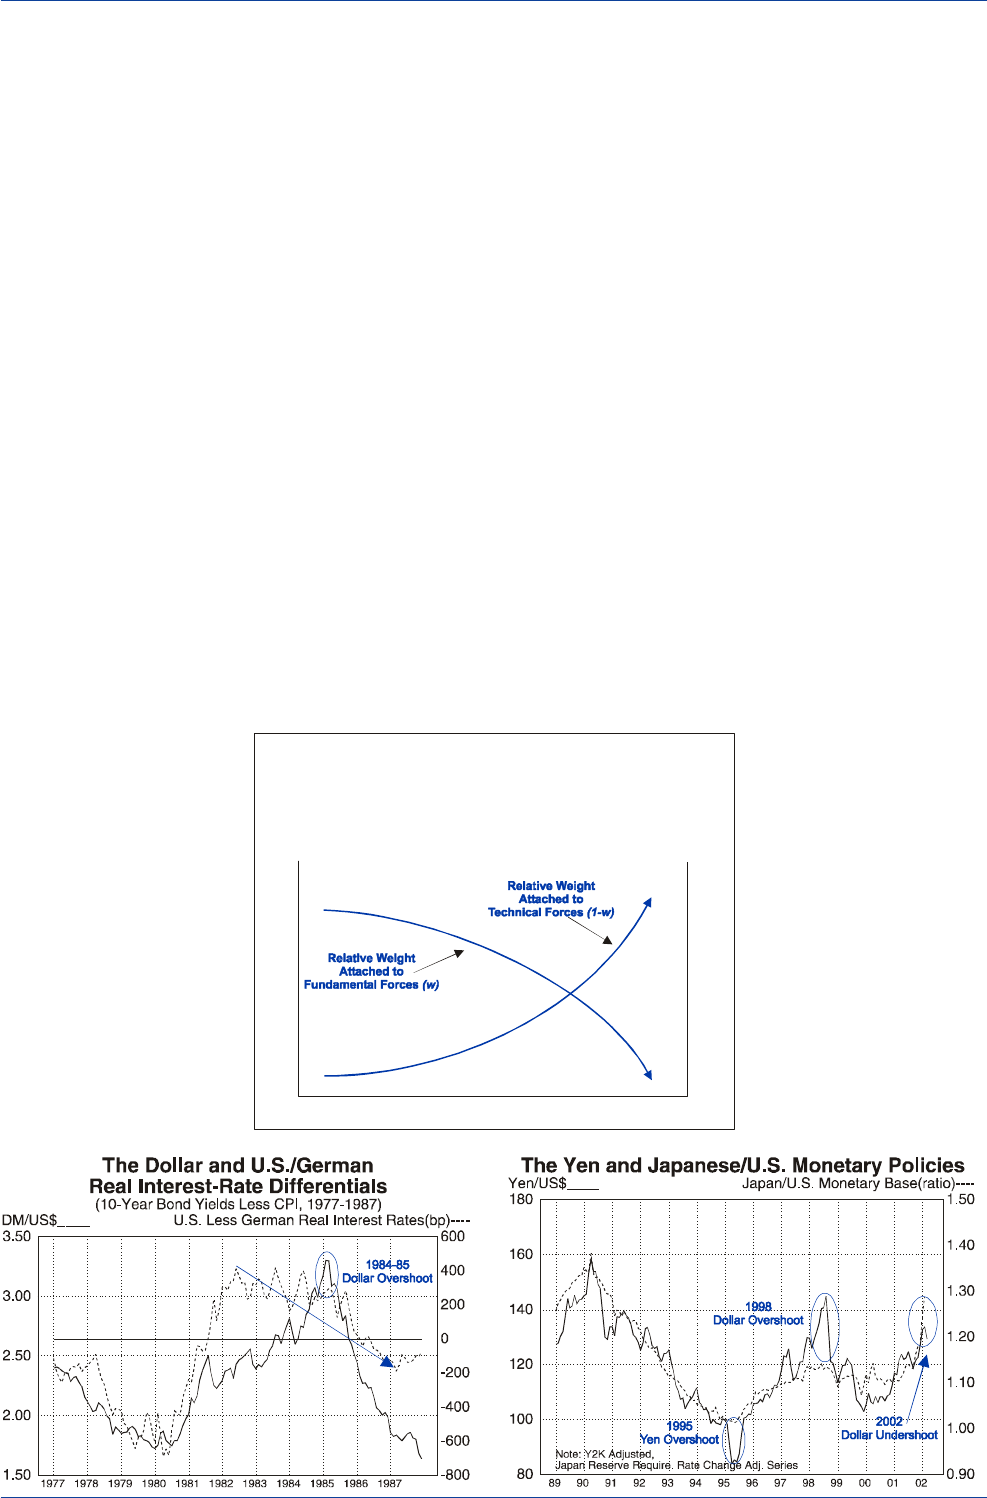
DB Guide to Exchange-Rate Determination
May 2002 Deutsche Bank @
Deutsche Bank Foreign Exchange Research 61
Typically, in the early and middle stages of an extended
exchange-rate cycle, the market tends to attach greater
weight to the trend in economic fundamentals (i.e.,
w
rises). This is because the trend in exchange rates and the
trend in key fundamental variables parallel each other quite
closely. In the latter stages of an extended exchange-rate
cycle, however, there often occurs some disconnect be-
tween the trend in the exchange rate and the trend in key
fundamental variables.
What causes this disconnect to occur is the tendency of
the market at the end of a long cycle to assign less weight
to fundamental forces and more weight to the prevailing
trend in exchange rates (i.e., 1-
w
rises). For instance, after
a long cycle of currency appreciation, the market gets ac-
customed to being long the appreciating currency and
tends to shrug off any adverse underlying fundamental
developments as being just a temporary phenomenon.
Hence, the market will begin to attach less weight to the
deteriorating trend in fundamentals (i.e.,
w
will gradually
fall) and more weight to the past favorable trend in the
exchange rate (i.e., 1-
w
will gradually rise).
By attaching greater weight to expectations that the pre-
vailing trend will remain strong and less weight to the de-
terioration of fundamental forces, the trend in exchange
rates and the trend in fundamentals becomes discon-
nected. Eventually, a point will be reached when the mar-
ket finally recognizes that the deterioration in fundamen-
tals is a permanent, and not just a temporary phenom-
enon. At that point, market expectations will shift, result-
ing in greater weight being assigned to deteriorating fun-
damental forces and less weight to the prospect that the
exchange-rate overshoot will persist. It is at this stage that
the unwinding of long speculative positions gives rise to a
rapid, and at times violent, correction of the exchange-rate
overshoot.
There have been several extraordinary episodes of major
currency overshooting since the beginning of floating ex-
change rates—the Deutschemark in the mid-1980s, the
yen in 1995 and 1998, and the dollar in general in 2000-02.
In the case of the Deutschemark, there was a significant
disconnect between the trend in U.S./German real long-
term interest-rate differentials and the DM/US$ exchange
rate towards the end of the dollar's remarkable run up-
ward during its bubble period. There was simply no way to
explain the dollar's surge in 1984-85 on the basis of real
yield spreads, and this overshoot in the dollar's value was
eventually corrected in 1985-87.
In the case of the yen, there was a similar disconnect be-
tween the trend in U.S. and Japanese relative monetary-
base growth and the trend in the yen's value versus the
dollar in 1995 and again in 1998. The dollar overshot to the
downside in 1995 and overshot to the upside in 1998, and
in both cases the overshoots were subsequently corrected.
Source: Datastream
Source: Datastream
The Market Attaches Less Weight
to Fundamental Forces During
an Exchange-Rate Overshooting Period
Market-Assigned
Weight
(w)
Time
Market-Assigned
Weight
(1-w)
Beginning of
Exchange-Rate Cycle Overshooting
Period
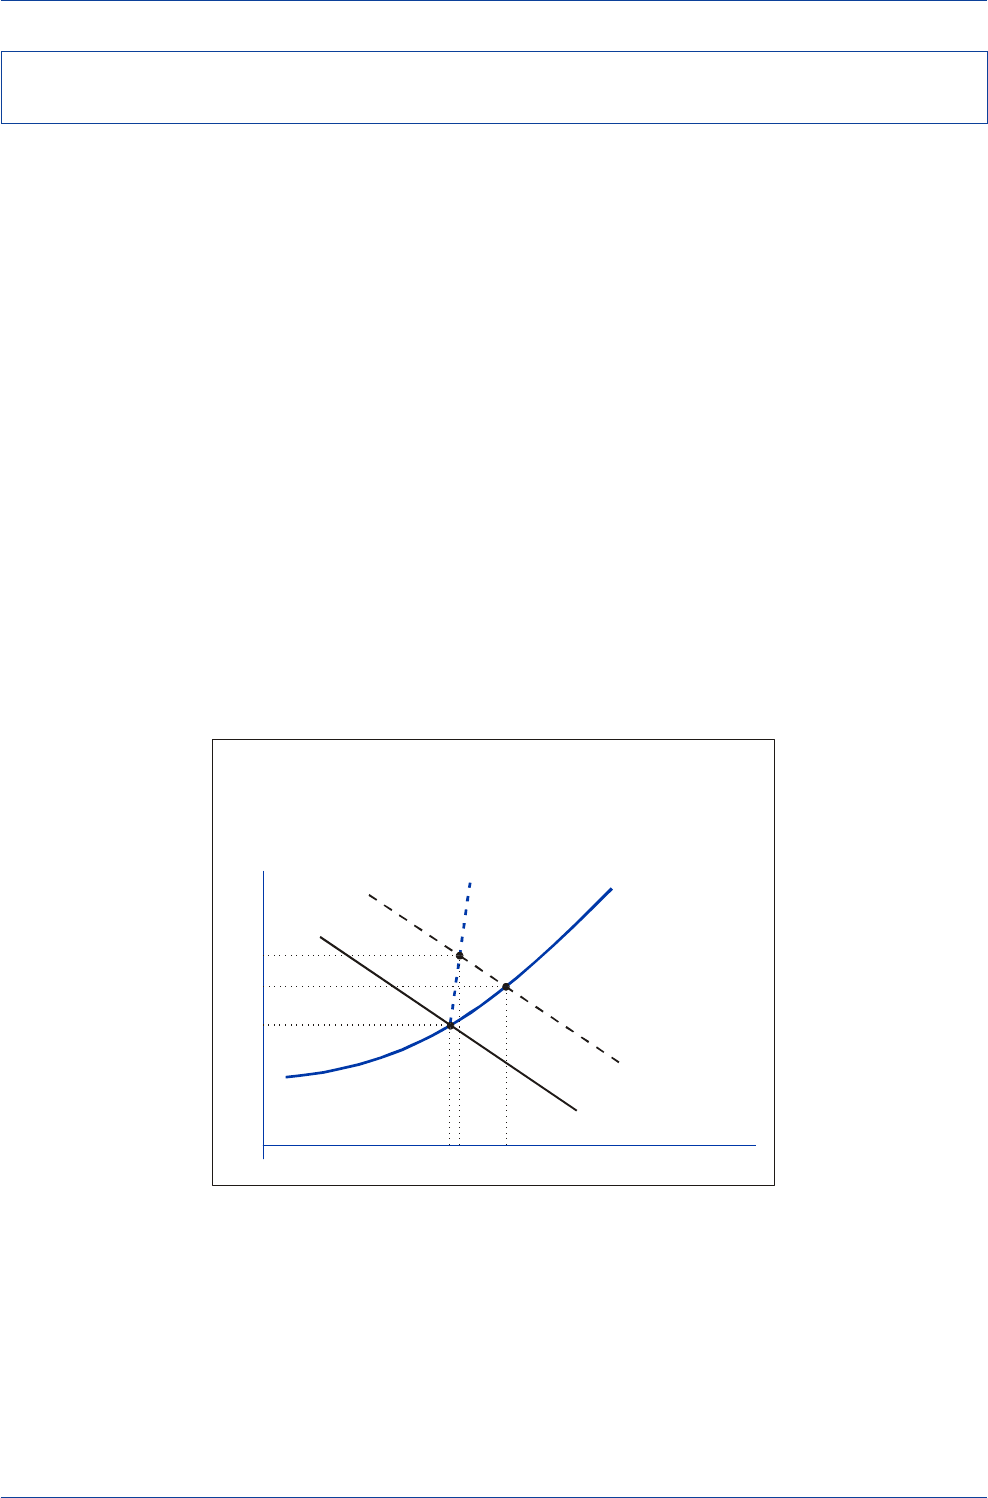
DB Guide to Exchange-Rate Determination May 2002
Deutsche Bank @
62 Deutsche Bank Foreign Exchange Research
It is widely recognized that financial markets need stabiliz-
ing speculators to ensure that financial market prices do
not wander too far from fair value. By buying at price lev-
els that are perceived to be low and selling at price levels
that are perceived to be high, speculators will ensure that
asset prices do not become too stretched relative to fair
value. If there is a fairly elastic supply of speculative capi-
tal in the foreign-exchange market, a significant increase
in commercial demand for dollars (perhaps generated by a
foreign acquisition of a U.S. firm) need not give rise to a
dramatic rise in the dollar's value. Instead, the increased
commercial demand for dollars may give rise to only a
modest increase in the dollar's value from e0 to e1 as shown
in the diagram below.
However, consider a situation where there is an absence
or a shortage of stabilizing speculative capital. This might
occur if hedge funds, investors, and foreign-exchange trad-
ers are unwilling or unable to commit relatively large sums
of capital for speculative purposes. In such a case, the
supply of speculative capital in the foreign-exchange mar-
ket would appear to be relatively inelastic. In that environ-
ment, it may only take a modest increase in the commer-
cial demand for dollars to push the dollar's value sharply
higher from e0 to e2. In other words, when there is a short-
age of stabilizing speculative capital, exchange rates are
likely to be more volatile and prone to overshooting, even
amid modest changes in the commercial demand for dol-
lars.
Such behavior might explain why the dollar has remained
significantly overvalued against a wide range of curren-
cies in the past few years. With many investors, hedge
funds, and foreign-exchange traders unwilling or unable to
risk sufficient capital to bet against the dollar, there simply
has not been enough speculative capital in the market to
reverse the dollar's overshoot.
The tendency of speculative capital to dry up when mar-
ket prices move far out of line with fair value is not unique
to the foreign-exchange market. Indeed, most speculative
bubbles, particularly at their peaks, are not fed by exces-
sive speculation, but instead are driven by an absence of
stabilizing speculation. When an absence of stabilizing
speculative capital causes exchange rates to overshoot
their long-run equilibrium value, central banks often inter-
vene and take on the role of a stabilizing speculator.
How a Shortage of Stabilizing Speculative Capital Can Give Rise to
Exchange-Rate Overshooting
An Absence of Currency Speculation
Can Lead to Greater Exchange-Rate Volatility
and Exchange-Rate Overshooting
Quantity of Dollars
Exchange Rate
C
Commercial Demand for Dollars
2
Commercial Demand for Dollars
1
Inelastic Speculative
Supply of Dollars
B
A
Elastic Speculative
Supply of Dollars
e
2
e
1
e
0
Q
C
Q
B
Q
A

DB Guide to Exchange-Rate Determination
May 2002 Deutsche Bank @
Deutsche Bank Foreign Exchange Research 63
Exchange-Rate Determination
in the Medium Term
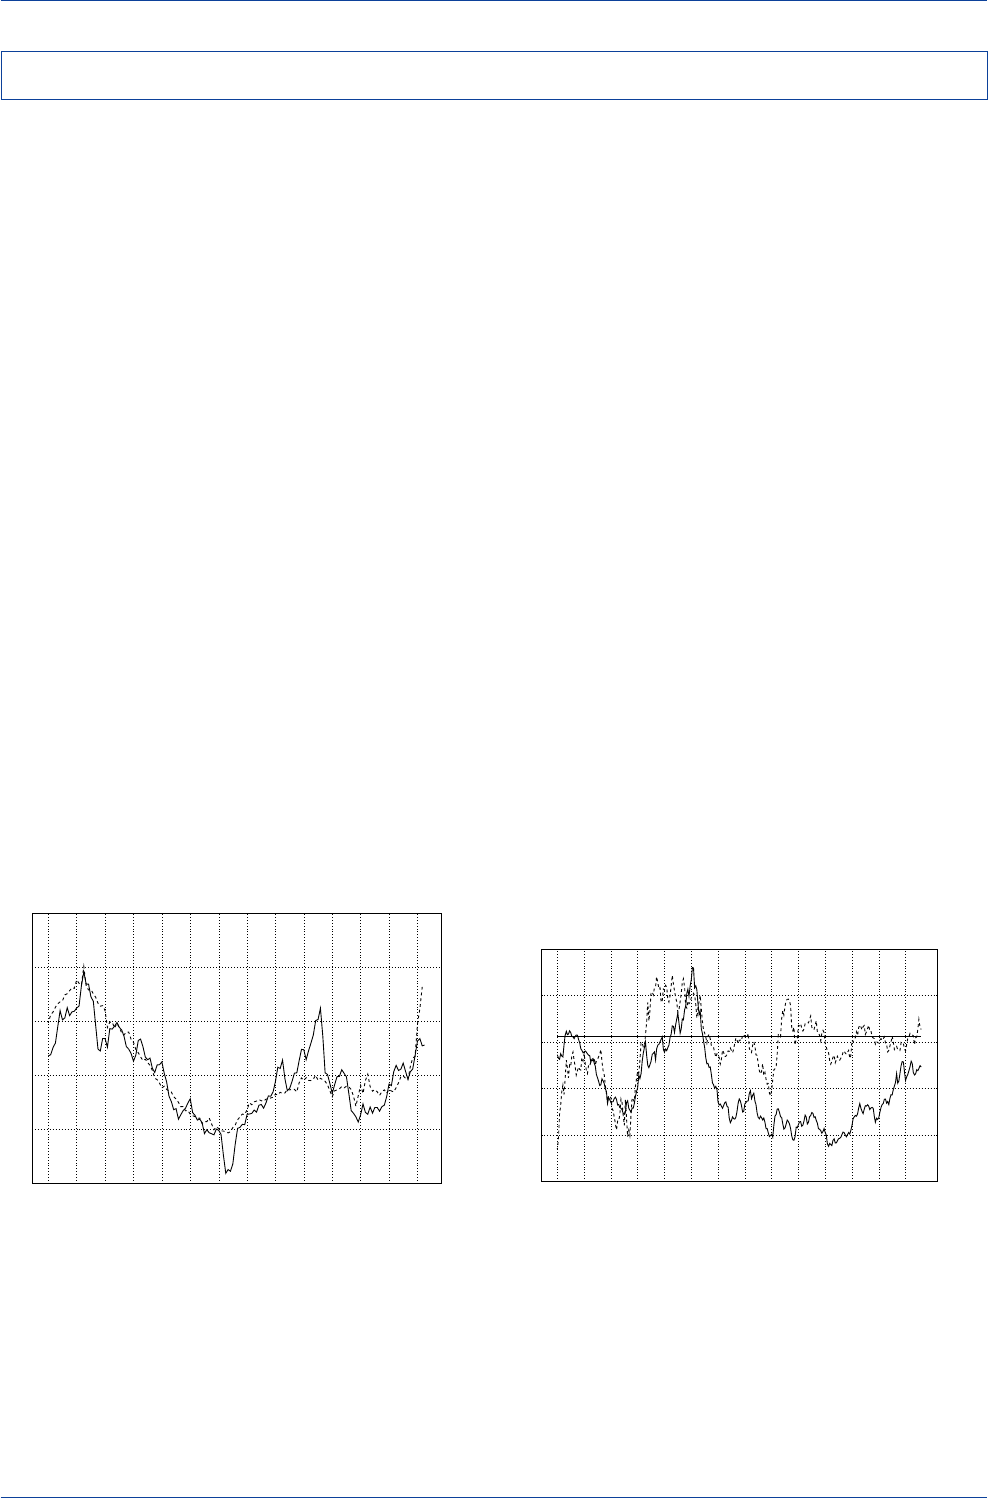
DB Guide to Exchange-Rate Determination May 2002
Deutsche Bank @
64 Deutsche Bank Foreign Exchange Research
Exchange rates are simultaneously determined by long-
term structural, medium-term cyclical, and short-term
speculative forces. Since long-term structural forces often
change at a glacial pace, they are likely to exert a greater
influence on a currency's long-run equilibrium path than
on a currency's short or medium-term path. A variety of
structural forces operate jointly to influence a currency's
long-run equilibrium path. These include the long-term trend
in national inflation rates, relative productivity growth, long-
term trends in net foreign asset and liability positions, per-
sistent trends in a country's terms of trade, and long-term
trends in national savings and investment.
Medium-term cyclical forces often cause a currency to ei-
ther rise or fall relative to its long-run equilibrium path. In
many cases the medium-term deviations from the long-
run equilibrium path can be quite sizeable, and in some
instances they can be quite persistent. In the long run,
these medium-term cyclical forces tend to wash out, and
once they do, there is a tendency for the exchange rate to
return to its long-run equilibrium path.
Nevertheless, in the interim, fund managers must find a
way to adjust their portfolios to account for these devia-
tions from long-run equilibrium levels or else risk serious
underperformance over medium-term horizons. Since in-
vestment performance is often evaluated over relatively
short time spans today, it is important for fund managers
to channel their energies towards getting the direction that
exchange rates take over short and medium-term horizons
right.
Medium-term trends in exchange rates tend to be influ-
enced by the direction of macroeconomic variables. The
key medium-term determinants of exchange rates include
trends in real interest-rate differentials, current and capital
account trends, relative monetary and fiscal policies, rela-
tive economic growth, and portfolio-balance considerations.
The success that these variables have had in explaining
the medium-term trends that exchange rates have taken
in the past is at best mixed. In many cases, one can find
evidence of a strong correlation between one or more of
these variables and the trend in exchange rates over sev-
eral cycles. But something often happens to break this
tight cyclical linkage. When it does, the subsequent use-
fulness of that variable as an explanatory variable becomes
seriously undermined.
Overall, we find that shifts in fiscal and monetary policies
play the most important role in driving a currency's value
on a medium-term basis, with many of the major exchange-
rate cycles in the 1990s attributable to shifts in fiscal/mon-
etary policy mixes of individual countries. We find that the
trend in the ratio of Japan's monetary base to the U.S.
monetary base has done the best job of explaining the
Japanese yen/U.S. dollar exchange rate's medium-term cy-
clical path over the past 12 years. In the case of the Deut-
schemark (and now the euro), the trend in the U.S./Ger-
man real long-term yield spread has done the best job of
explaining the medium-term cyclical paths that the Deut-
schemark/U.S. dollar exchange rate has taken over the past
25 years.
The Yen and Japanese/U.S. Monetary Policies
0.90
1.00
1.10
1.20
1.30
1.40
1.50
80
100
120
140
160
180
89 90 91 92 93 94 95 96 97 98 99 00 01 02
Japan/U.S. Monetary Base(ratio)----
Y
en/US$____
Note: Y2K Adjusted,
Japan Reserve Require. Rate Change Adj. Series
Exchange-Rate Determination in the Medium Term
DM/US$ Exchange Rate and U.S./German
Real Interest-Rate Differentials
(10-Year Bond Yields Less CPI)
-1000
-800
-600
-400
-200
0
200
400
600
1.00
1.50
2.00
2.50
3.00
3.50
75 77 79 81 83 85 87 89 91 93 95 97 99 01
U.S. Less German Real Interest Rates(bp)----DM/US$____
Source: Datastream
Source: Datastream

DB Guide to Exchange-Rate Determination
May 2002 Deutsche Bank @
Deutsche Bank Foreign Exchange Research 65
International parity conditions are financial arbitrage con-
ditions that would exist in an ideal world. The key interna-
tional parity conditions are (1) purchasing power parity, (2)
covered interest-rate parity, (3) uncovered interest-rate
parity, (4) the Fisher effect, which focuses on inflation as
the key determinant of nominal interest rates, and (5) the
forward exchange rate as an unbiased predictor of the fu-
ture spot rate. Parity conditions show how inflation differ-
entials, interest-rate differentials, forward exchange rates,
and expected changes in exchange rates are linked inter-
nationally. Parity conditions tell us that high (low) inflation
countries should see their currencies depreciate (appreci-
ate) over time, and that forward exchange rates should
function as unbiased predictors of future spot rates. These
international parity conditions form the building blocks of
many of the major macro models of exchange-rate deter-
mination.
Empirical evidence indicates that most of the key interna-
tional parity conditions rarely hold in either the short or
medium term. There are often significant departures from
purchasing power parity, interest-rate differentials often
fail to explain future exchange-rate changes, and the for-
ward exchange rate has been found to be a poor predic-
tor of the future spot exchange rate. Why study interna-
tional parity conditions if they fail to hold? Actually, if inter-
national parity conditions held at all times, there would
be no profitable arbitrage opportunities available for inter-
national investors to exploit by moving capital from one
market to another. It is only when international parity con-
ditions fail to hold that profit opportunities from cross-
border investments become available.
Ex Ante
Purchasing Power Parity
According to
ex ante
purchasing power parity (PPP), the expected
change in the spot exchange rate should equal the difference in
expected national inflation rates.
Ex ante
PPP tells us that a high-
inflation country should see its currency depreciate and that a
low-inflation country should see its currency appreciate over time.
Covered Interest-Rate Parity
According to the covered interest-rate parity condition, an invest-
ment in a foreign-currency deposit completely hedged against
exchange-rate risk should yield exactly the same return as a com-
parable domestic-currency deposit. Since a hedged foreign-cur-
rency investment will have the same risk characteristics as a do-
mestic-currency investment, we should expect the yield on the
domestic investment, iD, to equal the foreign interest rate, iF, less
the forward discount, FD. Indeed, arbitrage should insure that
this would always be the case. The empirical evidence in support
of covered interest-rate parity is quite robust.
Uncovered Interest-Rate Parity
According to the uncovered interest-rate parity (UIP) condition,
the expected return on an uncovered foreign-currency investment
should equal the expected return on a comparable domestic-cur-
rency investment. The expected return on a domestic-currency
investment, iD, is known with certainty, while the expected return
on an uncovered foreign-currency investment, iF- ee, is not known
with certainty because the actual change in the exchange rate, e,
may turn out to be different from the expected change in the
exchange rate, ee. The UIP condition implies that investors do not
need to be compensated—in the form of a risk premium—for
taking on the risk that their expectations may prove to be wrong.
In the absence of a risk premium, the yield spread between for-
eign and domestic currency deposits, iF - iD, should adjust to equal
the expected change in the exchange rate, ee. The empirical evi-
dence is not highly supportive of UIP in either the short or me-
dium run.
e = p - p
eee
FD
Expected Change
in Exchange Rate
Foreign-Domestic
Expected
Inflation
Differential
=
i - i = FD
FD
Foreign-Domestic
Interest-Rate
Differential
Forward
Discount
=
e = i - i
e
FD
Foreign-Domestic
Interest-Rate
Differential
Expected
Change in
Exchange Rate
=
International Parity Conditions—
The Building Blocks of Macro Exchange-Rate Modeling
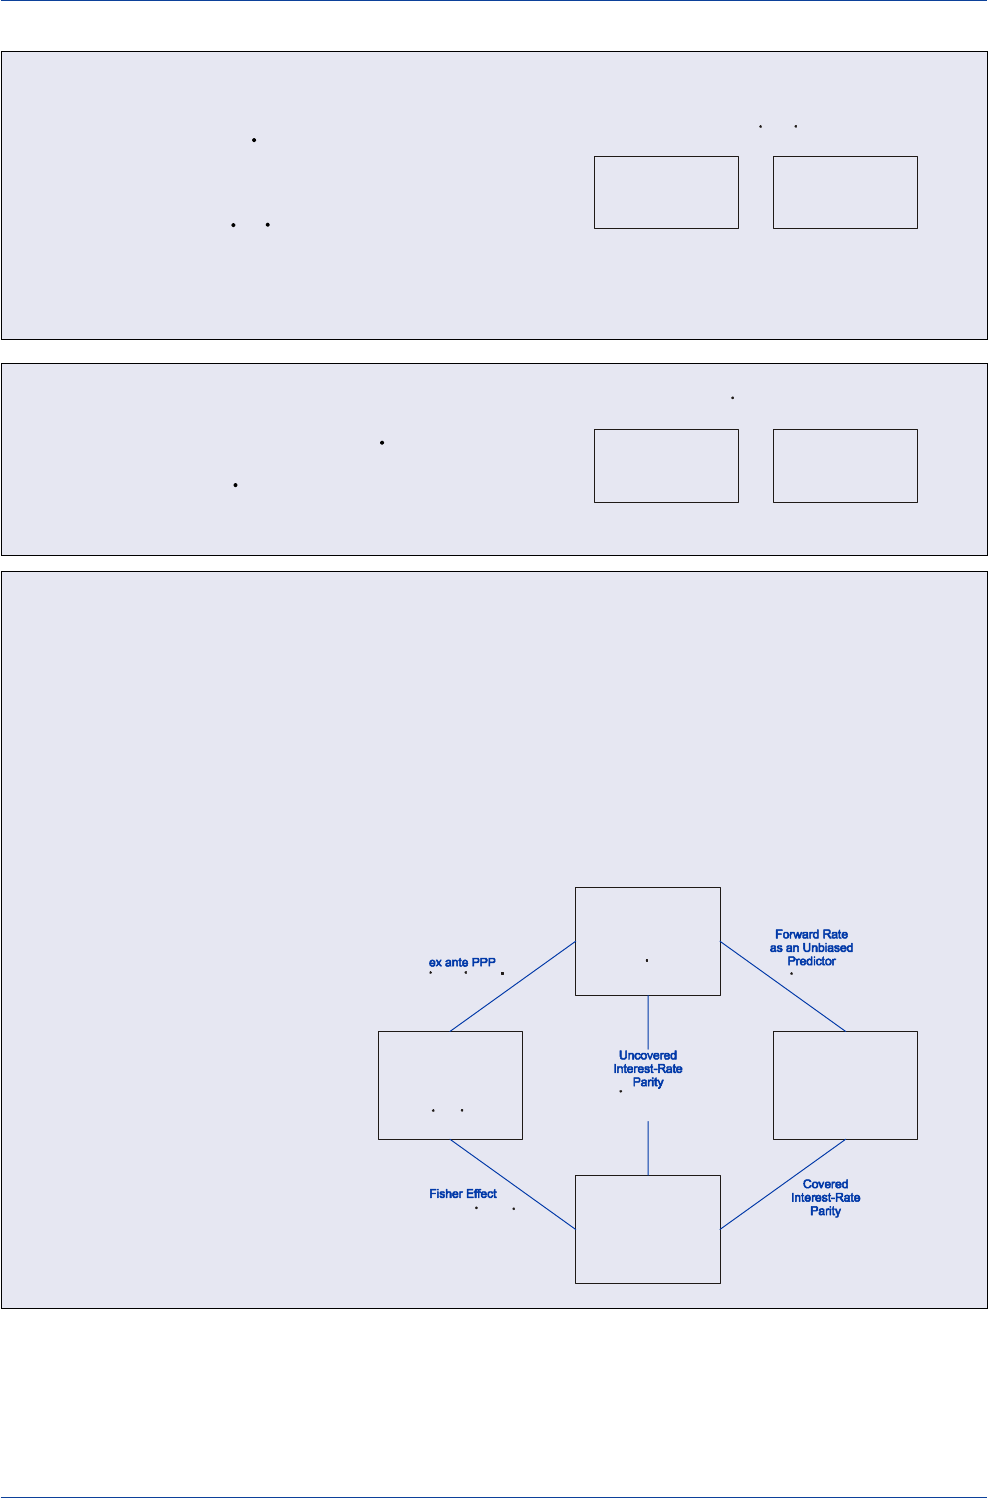
DB Guide to Exchange-Rate Determination May 2002
Deutsche Bank @
66 Deutsche Bank Foreign Exchange Research
Fisher Effect
According to the Fisher effect, the nominal interest rate, i,
in a given country will equal the real interest rate, r, plus
the expected inflation rate, pe. If the real interest rate in
the foreign country is equal to the domestic real interest
rate, rF = rD, then the yield spread between two countries,
iF - iD, should equal the expected inflation differential be-
tween the two countries, pFe - pDe. Empirical evidence sug-
gests that real interest rates often differ among countries.
Thus, nominal yield spreads will not necessarily reflect dif-
ferences in national inflation rates.
Forward Rate as an Unbiased Predictor of the
Future Spot Rate
If covered interest-rate parity holds such that iF- iD=FD, and
uncovered interest-rate parity holds such that ee= iF- iD, then
the forward discount, FD, will equal the expected change
in the spot exchange rate, ee. Empirical evidence suggests,
however, that the forward exchange rate is a poor and bi-
ased predictor of the future spot exchange rate.
International Parity Conditions—
How Spot Exchange Rates, Forward Exchange Rates,
and Interest Rates Are Linked Internationally
If all of the key international parity conditions held at all
times, the expected change in the spot exchange rate
would equal (1) the forward discount, (2) the interest-rate
differential, and (3) the expected inflation differential. These
conditions will hold only in an ideal world. Empirical stud-
ies actually reject most of the parity conditions (covered
interest-rate parity being the exception). There are often
large and persistent deviations from PPP and UIP, and the
forward exchange rate has been found to be both a poor
and a biased predictor of the future spot rate. When these
parity conditions fail to hold, profitable investment oppor-
tunities become available.
e = FD
e
Forward
Discount
Expected
Change in
Exchange Rate
=
i - i = p - p
FD F D
ee
Foreign-Domestic
Interest-Rate
Differential
=
Foreign-Domestic
Expected
Inflation
Differential
Expected
Change in
Exchange Rate
e
e
Foreign-Domestic
Expected
Inflation
Differential
p - p
FD
ee
Foreign-Domestic
Interest-Rate
Differential
i - i
FD
Forward
Discount
FD
e = p - p
eee
FD
i - i = FD
FD
e = i - i
e
FD
i - i = p - p
FD F D
ee
e = FD
e

DB Guide to Exchange-Rate Determination
May 2002 Deutsche Bank @
Deutsche Bank Foreign Exchange Research 67
Derivation of the Real Interest-Rate Differential Model
of Exchange-Rate Determination
(1) ee$ = iF - iUS Uncovered Interest-Rate Parity
(2) ee$ = qe$ - (peF - peUS)Ex Ante Purchasing Power Parity
(3) qe$ = (iF - peF ) - (iUS - peUS)(2) minus (1)
(4) qe$ = rF - rUS Real Interest-Rate Parity
(5) qe$ = q$ - q$Long-Run Exchange-Rate Adjustment
(6) q$ - q$ = rF - rUS Combine (4) and (5)
(7) q$ = q$ + (rUS - rF)RID Model
(8) q$ = q$ + (rUS - rF) - (φUS - φF)Extended RID Model
International capital flows have become increasingly mo-
bile in the past 20 years as barriers to cross-border move-
ments of capital have been gradually lifted in most mar-
kets. As cross-border capital flows have risen in importance,
interest-rate differentials have come to play a more impor-
tant role in the determination of exchange rates. Indeed,
empirical evidence has shown that relative current-account
trends have become less important in explaining exchange-
rate movements in the past two decades, while interest-
rate differentials have become more important.
To analyze the role that interest-rate differentials play in
the determination of exchange rates, many international
economists use the real interest-rate differential (RID)
model as their principal analytical tool. The RID model is a
formal model that links the trend in real exchange rates to
the trend in real interest-rate differentials.
The RID model is fairly simple to derive. If it is assumed
that both uncovered interest-rate parity (equation 1) and
ex ante purchasing power parity (equation 2) hold in the
long run, then the expected long-run change in the dollar's
real value will equal the real long-term yield spread (equa-
tions 3 and 4). If it is assumed that the expected change in
the dollar’s real value in the long run equals the difference
between the dollar’s actual real value and its long-run equi-
librium level (equation 5), it can then be shown in equation
7 that the dollar's actual real value, q$, can be expressed
as a function of two key variables—the dollar's real long-
run equilibrium value, q$, and the real long-term interest-
rate differential, rUS-rF. According to this model, the dollar's
real value would rise if there were an upward revision in
the market's assessment of the dollar's real long-run equi-
librium value and/or if there were a rise in the U.S./foreign
real long-term interest-rate differential.
The RID model can be extended to incorporate shifts in
risk premiums on U.S., φUS, and foreign assets, φF. The ex-
tended model is shown in equation 8, where a rise in the
risk premium on U.S. assets tends to exert downward pres-
sure on the dollar’s value, while a rise in the risk premium
on foreign assets tends to exert upward pressure on the
dollar’s value.
The Real Interest-Rate Differential Model
of Exchange-Rate Determination
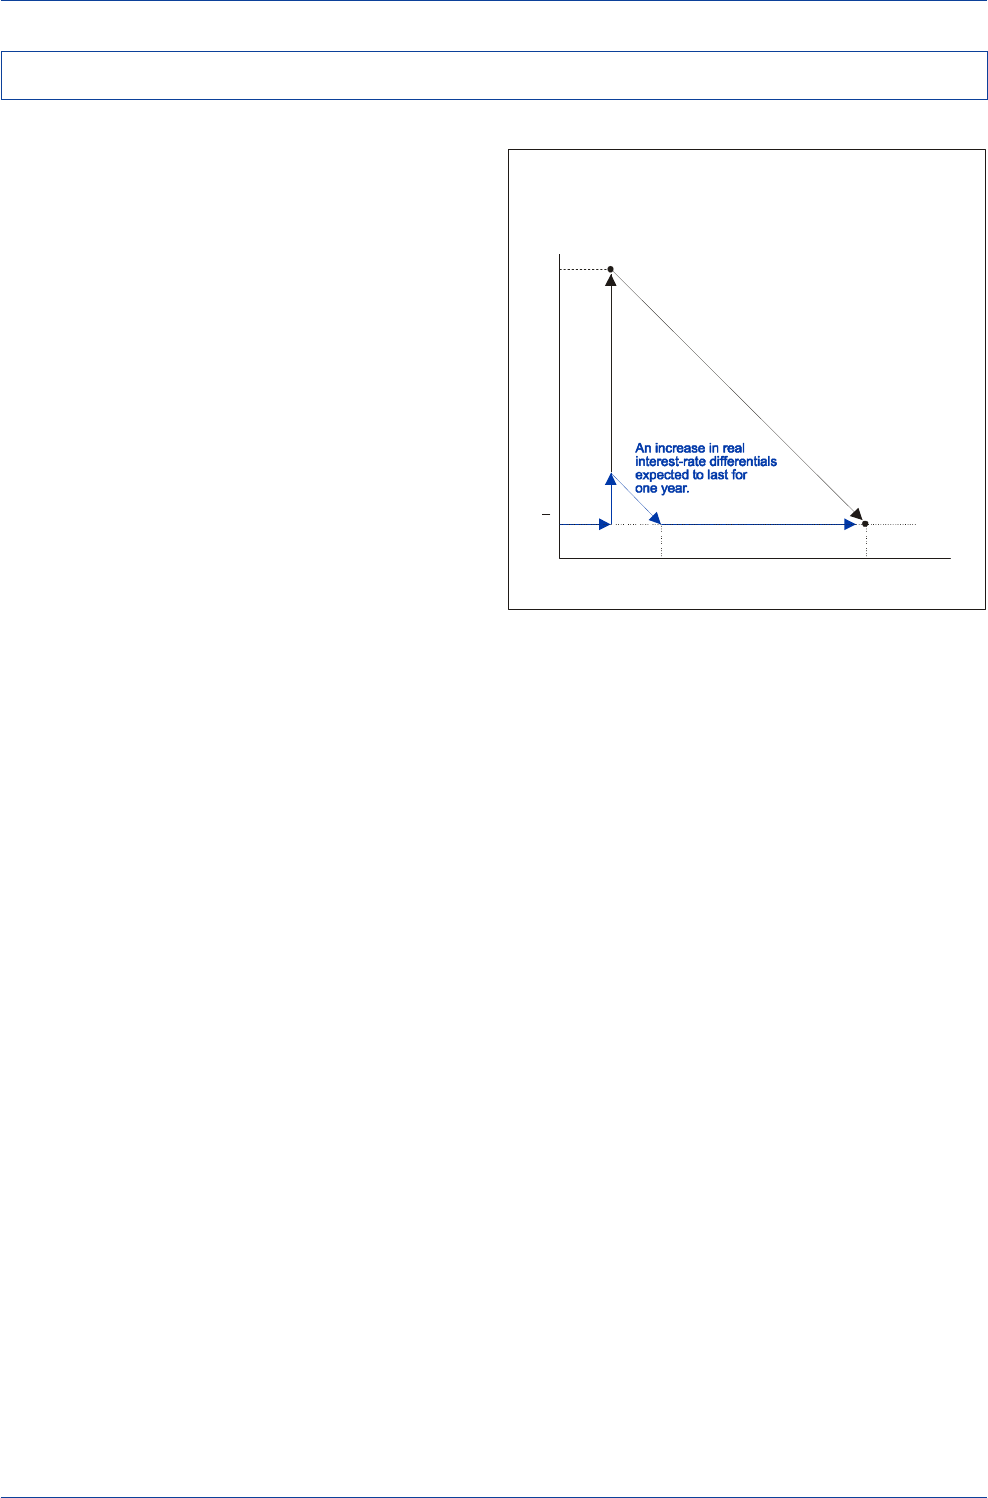
DB Guide to Exchange-Rate Determination May 2002
Deutsche Bank @
68 Deutsche Bank Foreign Exchange Research
Empirical studies have found that the trend in real long-
term yield spreads does a better job of explaining exchange-
rate movements than the trend in nominal short-term yield
spreads. There are two reasons for this. First, real yields—
rather than nominal yields—better reflect structural shifts
in savings and investment and the easing/tightening moves
by central banks. Second, changes in long-term interest
rates are likely to have a more profound impact on exchange
rates than changes in short-term rates because changes
in short-term rates can be and often are transitory, while
changes in long-term rates tend to be sustained. Taking
both of these factors together, the historical evidence sup-
ports a stronger linkage between exchange rates and real
long-term yield spreads than between exchange rates and
nominal short-term yield spreads.
The accompanying diagram shows that the magnitude of
an exchange-rate response to a given change in real inter-
est-rate spreads is far greater when real long-term yield
spreads change (from q0 to q5) than when real short-term
yield spreads change (from q0 to q1). That is because ex-
change rates tend to respond more vigorously to changes
in real interest-rate spreads that are expected to persist.
The diagram also suggests that large changes in exchange
rates may result from fairly modest changes in real long-
term interest-rate differentials. The diagram illustrates as
well that in the long run, the response of an exchange rate
to a change in real yield spreads will only be transitory.
In theory, the rise in the real exchange rate in response to
the change in real yield spreads should be instantaneous,
followed by a gradual decline in the real exchange rate back
to its long-run equilibrium value as real yield spreads re-
turn to their normal levels. In practice, both the change in
real yield spreads and the change in exchange rates tend
to be much more gradual than the diagram depicts. It is
this more gradual response that gives rise to the tight
graphical relationship that one finds when comparing the
trend in the dollar's value with the trend in U.S./foreign
real long-term yield spreads.
Real Exchange-Rate Response to a Rise in Real
Short- and Long-Term Interest-Rate Differentials
U.S. Dollar’s Real Value
Time
q
2
Source: Adapted from Clark . (1994).
et al
q
1
t
0
t
1
t
2
t
3
t
4
t
5
q= q
0
q
3
q
4
q
5
An increase in real
interest-rate differentials
expected to last for
five years.
The Real Interest-Rate Differential Model—Theory
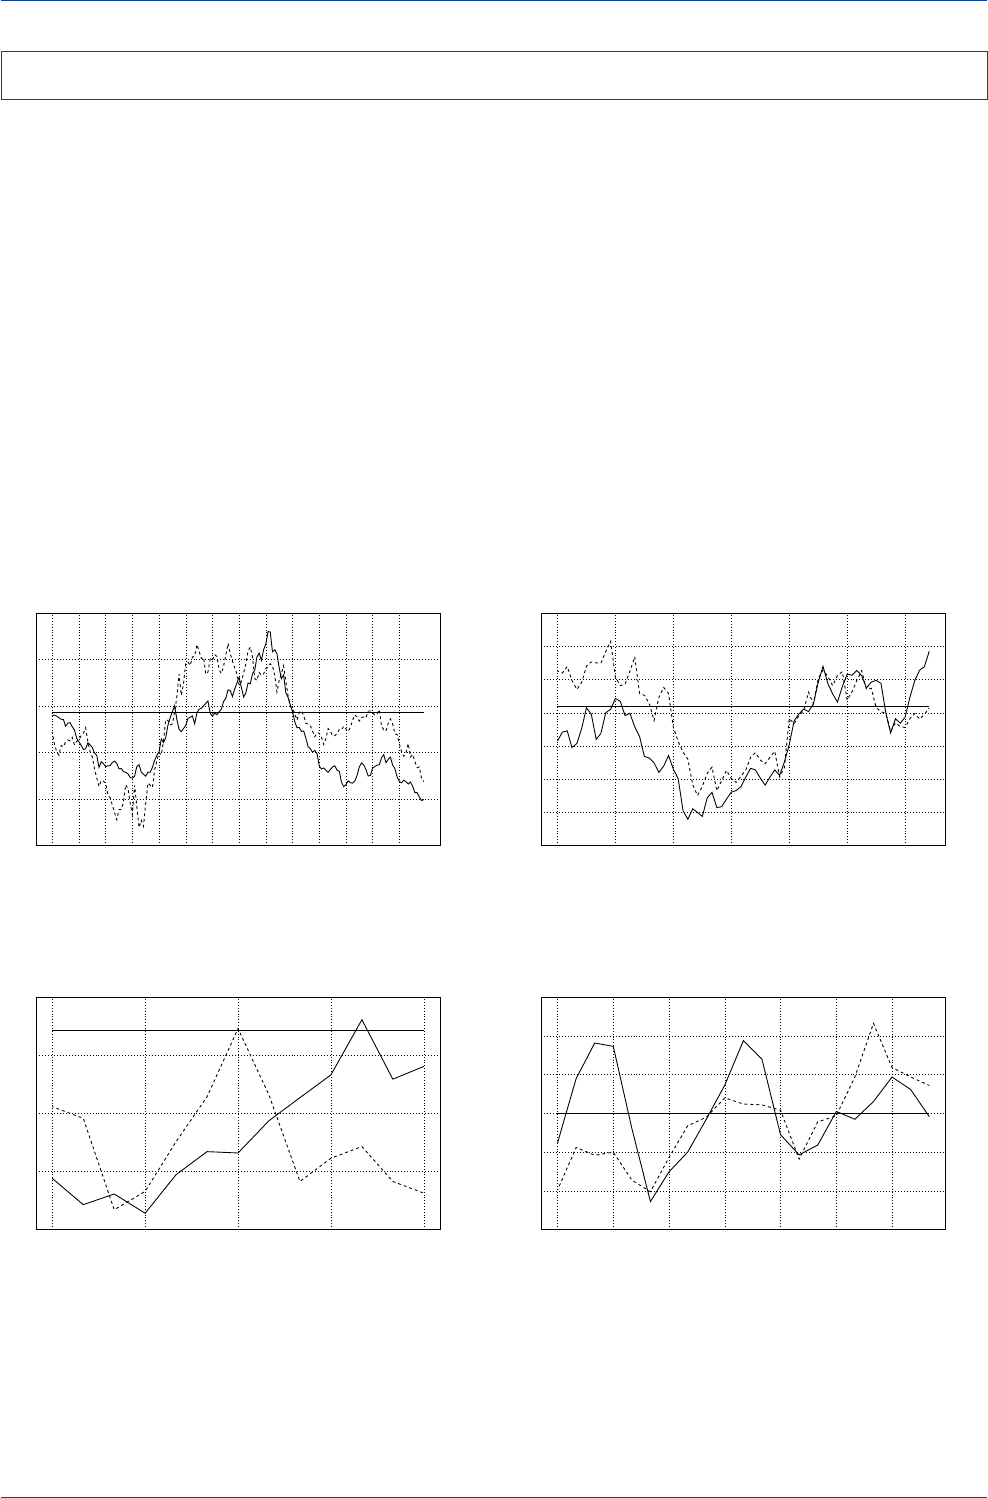
DB Guide to Exchange-Rate Determination
May 2002 Deutsche Bank @
Deutsche Bank Foreign Exchange Research 69
The trend in real long-term interest-rate differentials has
played a pivotal role in driving the dollar's value versus the
Deutschemark in the past few decades (as shown below
in the charts of the various periods).
The decline of the dollar in the late 1970s, the rise of the
dollar in the first half of the 1980s, and the dollar's decline
after 1985 can be attributed to changes in U.S./German
real long-term yield spreads.
Over the 1993-98 period, an adverse shift in real yield
spreads led to the dollar's decline in 1994-95, while the
dollar's rise in 1995-98 can be attributed to a shift in the
U.S./German real yield spread that was favorable to the
dollar.
In the 1999-2000 period, the relationship broke down when
the trend in Deutschemark (now the euro) completely di-
verged from the trend in the U.S./German (now the U.S./
European) real long-term yield spread. Although real yield
spreads moved against the U.S., the dollar nevertheless
surged against the euro, with the dollar’s gains likely at-
tributable to a rise in the dollar’s real long-run equilibrium
level.
We believe that the breakdown in the real yield spread/
exchange rate linkage in 1999-2000 will prove to be only a
temporary phenomenon. The indications are now that the
real-interest-rate-spread/exchange-rate linkage has been re-
established in 2001-02.
The Real Interest-Rate Differential Model—Evidence
DM/US$ Exchange Rate and U.S./German
Real Interest-Rate Differentials
(10-Year Bond Yields Less CPI, 1977-1990)
-800
-600
-400
-200
0
200
400
600
1.00
1.50
2.00
2.50
3.00
3.50
77 78 79 80 81 82 83 84 85 86 87 88 89 90
U.S. Less German Real Interest Rates(bp)----DM/US$____
DM/US$ Exchange Rate and U.S./German
Real Interest-Rate Differentials
(10-Year Bond Yields Less CPI, 1993-June 1999)
-300
-200
-100
0
100
200
1.30
1.40
1.50
1.60
1.70
1.80
1.90
2.00
1993 1994 1995 1996 1997 1998 1999
U.S. Less German Real Interest Rates(bp)----DM/US$____
DM/US$ Exchange Rate and U.S./German
Real Interest-Rate Differentials
(10-Year Bond Yields Less CPI, July 1999-2000)
-120
-100
-80
-60
-40
-20
0
20
1.80
1.90
2.00
2.10
2.20
Jul-99 Oct-99 Jan-00 Apr-00 Jul-00
U.S. Less German Real Interest Rates(bp)----DM/US$____
DM/US$ Exchange Rate and U.S./German
Real Interest-Rate Differentials
(10-Year Bond Yields Less CPI, Aug. 2000-2002)
-150
-100
-50
0
50
100
150
2.05
2.10
2.15
2.20
2.25
2.30
2.35
Aug-00 Nov-00 Feb-01 May-01 Aug-01 Nov-01 Feb-02
U.S. Less German Real Interest Rates(bp)----DM/US$____
Source: Datastream Source: Datastream
Source: Datastream Source: Datastream
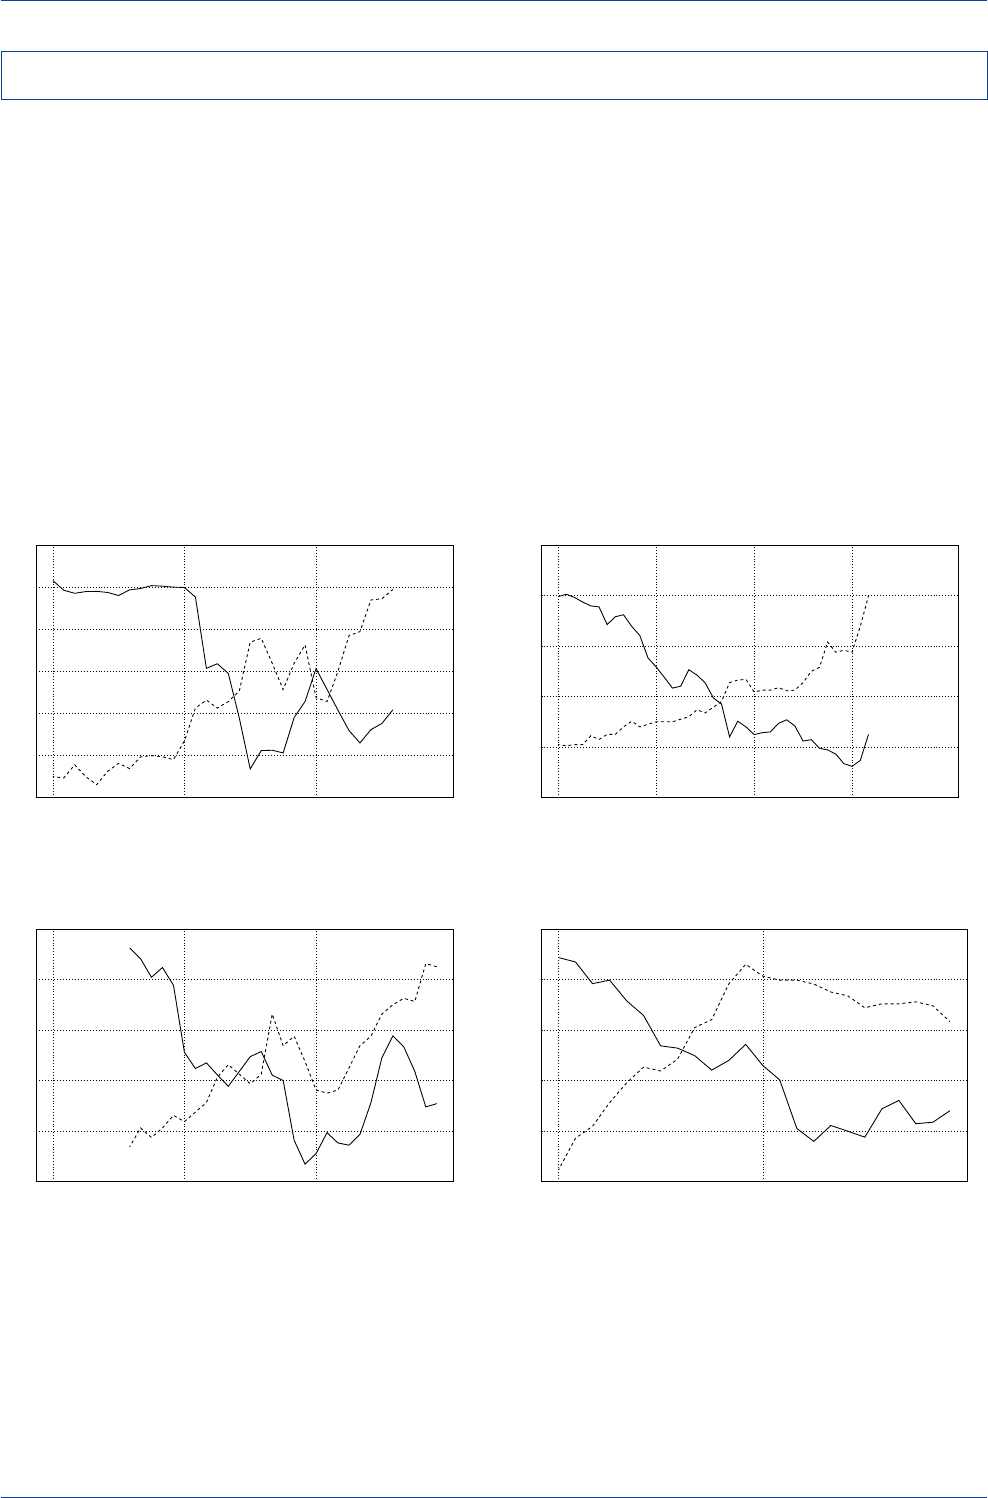
DB Guide to Exchange-Rate Determination May 2002
Deutsche Bank @
70 Deutsche Bank Foreign Exchange Research
To many FX market participants, 2001 was a highly un-
usual year. The Federal Reserve cut short-term interest
rates from 6.5% to 1.75% and U.S./foreign short-term yield
spreads narrowed dramatically, yet the dollar remained
remarkably resilient. This has led some observers to ques-
tion whether the old rules for FX forecasting still apply.
Indeed, some observers have tried to redefine the linkage
between interest rates and exchange rates by arguing that
lower interest rates may, in fact, be positive for a currency
if they raise expectations of future economic growth in
both absolute and relative terms.
From an historical vantage point, 2001 does not appear to
be that unusual. Indeed, 2001 is not the first time that
nominal U.S. short-term interest rates and the dollar's value
have moved in opposite directions. Consider the Fed tight-
ening episodes of 1972-74, 1977-80, 1986-88, and 1994-
95. In all of those cases, the dollar actually fell, and in most
cases, quite sharply.
Nominal Short-Term Yields and the Dollar’s Value
The Dollar & U.S. Short-Term Interest Rates
(January 1972-August 1974)
4
6
8
10
12
14
16
2.20
2.40
2.60
2.80
3.00
3.20
3.40
1972 1973 1974
3-Month Euro-$ Rate(%)----DM/US$____
The Dollar & U.S. Short-Term Interest Rates
(January 1977-March 1980)
0
5
10
15
20
25
1.60
1.80
2.00
2.20
2.40
2.60
1977 1978 1979 1980
3-Month Euro-$ Rate(%)----DM/US$____
The Dollar & U.S. Short-Term Interest Rates
(August 1986-December 1988)
5
6
7
8
9
10
1.60
1.70
1.80
1.90
2.00
2.10
1986 1987 1988
3-Month Euro-$ Rate(%)----DM/US$____
The Dollar & U.S. Short-Term Interest Rates
(1994-1995)
3
4
5
6
7
1.30
1.40
1.50
1.60
1.70
1.80
1994 1995
3-Month Euro-$ Rate(%)----DM/US$____
Source: Datastream Source: Datastream
Source: Datastream Source: Datastream
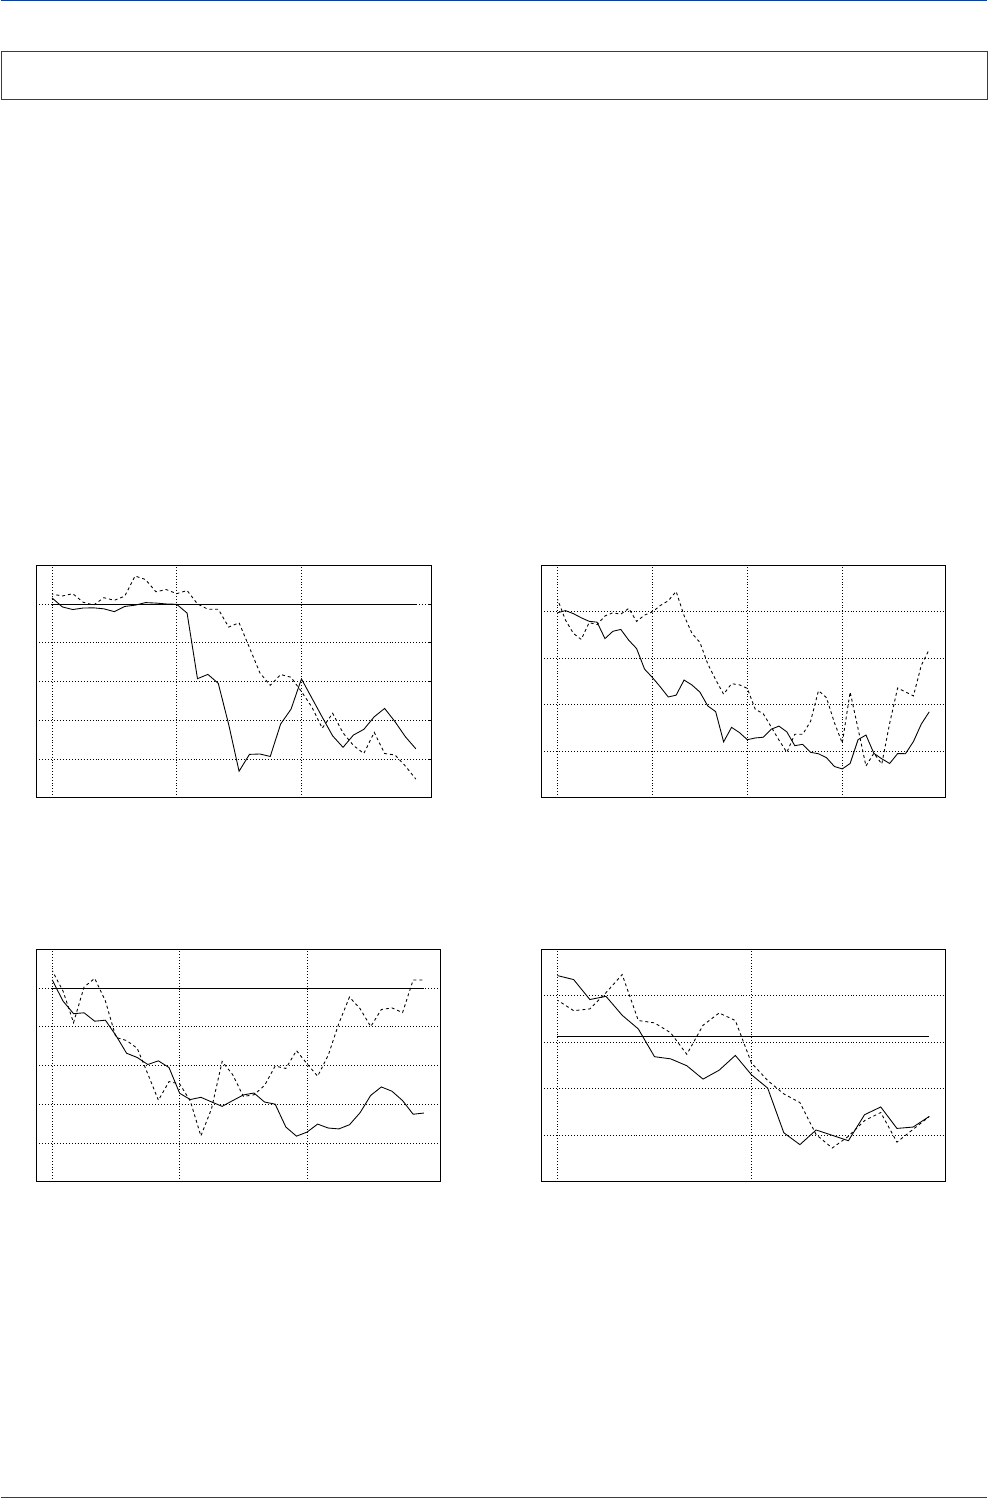
DB Guide to Exchange-Rate Determination
May 2002 Deutsche Bank @
Deutsche Bank Foreign Exchange Research 71
The seemingly anomalous relationship between nominal
short-term interest rates and the dollar’s value that occurred
in 1972-74, 1977-80, 1986-88, and 1994-95 can be explained
by the trend that real long-term interest-rate differentials
took in all four episodes. In all of those cycles, real long-
term yield spreads moved in favor of Germany, which sup-
ported the case for a weaker, not a stronger, dollar.
In 2001, the same thing happened, except in reverse. Even
though nominal short-term yield spreads moved in Europe's
favor, real long-term yield spreads actually moved mod-
estly in favor of the dollar.
The conclusion one should draw from this historical analy-
sis is that the level and trend in nominal short-term yield
spreads may not be the best guide for explaining medium-
term exchange-rate movements. Rather, it is the level and
trend in real long-term yield spreads that do the best job in
terms of explaining medium-term exchange-rate move-
ments.
Real Long-Term Yield Spreads and the Dollar’s Value
The Dollar and U.S./German
Real Interest-Rate Differentials
(10-Year Bond Yields Less CPI, 1972-1974)
-1000
-800
-600
-400
-200
0
200
2.20
2.40
2.60
2.80
3.00
3.20
3.40
1972 1973 1974
U.S. Less German Real Interest Rates(bp)----DM/US$____
The Dollar and U.S./German
Real Interest-Rate Differentials
(10-Year Bond Yields Less CPI, 1977-1980)
-800
-600
-400
-200
0
1.60
1.80
2.00
2.20
2.40
2.60
1977 1978 1979 1980
U.S. Less German Real Interest Rates(bp)----DM/US$____
The Dollar and U.S./German
Real Interest-Rate Differentials
(10-Year Bond Yields Less CPI, 1986-1988)
-250
-200
-150
-100
-50
0
50
1.40
1.60
1.80
2.00
2.20
2.40
2.60
1986 1987 1988
U.S. Less German Real Interest Rates(bp)----DM/US$____
The Dollar and U.S./German
Real Interest-Rate Differentials
(10-Year Bond Yields Less CPI, 1994-1995)
-250
-200
-150
-100
-50
0
50
100
150
1.30
1.40
1.50
1.60
1.70
1.80
1994 1995
U.S. Less German Real Interest Rates(bp)----DM/US$____
Source: Datastream Source: Datastream
Source: Datastream Source: Datastream

DB Guide to Exchange-Rate Determination May 2002
Deutsche Bank @
72 Deutsche Bank Foreign Exchange Research
Numerous academic papers have investigated empirically
whether the forward exchange rate has served as a reli-
able unbiased predictor of the future spot exchange rate.
The forward-rate predictor hypothesis is usually tested by
regressing the change in the exchange rate, et+k, on the
forward discount, FDt,k:
et+k = a + ß (FDt,k)
If the forward exchange rate were an unbiased predictor
of the future spot rate, estimates of the regression coeffi-
cient, beta (ß), would be equal to 1.0. If ß = 1.0, then et+k
would be expected to equal FDt,k, on average, over time.
Interestingly, the academic evidence strongly rejects the
hypothesis that the forward exchange rate is an unbiased
predictor of the future spot exchange rate, with estimates
of ß that are often significantly less than one. Indeed, ß
has often been found to be less than zero. In a survey of
75 published papers on the forward rate predictor hypoth-
esis, the average estimate of ß was found to be - 0.88.
This startling finding has the following implication for cur-
rency investment strategies. Currencies that trade at a for-
ward discount, on average, weaken less than the amount
implied by the forward discount. If anything, there has been
a tendency for such currencies to appreciate, not depreci-
ate, over time. This means that the forward discount has
been a biased predictor of future changes in the spot ex-
change rate. Hence, the term "forward discount bias." The
opposite applies for currencies that trade at a forward pre-
mium. From a strategy standpoint, if these findings on past
performance were to remain valid in the future, investors
would stand to benefit by over-weighting currencies that
trade at a forward discount and under-weighting curren-
cies that trade at a forward premium.
Various interpretations have been offered to explain these
anomalous findings. One view holds that currencies that
trade at a forward discount are more risky than those that
trade at a forward premium. Hence, investors demand a
higher risk premium to buy and hold such currencies, and
the excess return earned by investing in such currencies
merely represents the reward for accepting higher risk.
Another view holds that the market simply makes repeated
expectational errors, and that investors could exploit this
by trading against the implicit views expressed in the for-
ward exchange market.
Although excess returns could have been earned in the
past by investors who sought to exploit the "bias" in the
forward discount, the risk/return tradeoff is not always at-
tractive for such strategies. Monthly returns can be and
often are quite volatile for single-currency trades. In fact,
single-currency trading strategies have not been attractive
enough to justify risking large sums to trade the bias. (A
single-currency strategy consists of buying, or going long,
only the highest yielding currency, i.e., the currency with
the largest forward discount, and funding it by borrowing
(or going short) only the lowest yielding currency, i.e., the
currency with the largest forward premium.)
Risk-adjusted excess returns from following diversified
multi-currency approaches to exploit the bias, however,
have been more impressive. Adopting a diversified strat-
egy of going long the three highest-yielding currencies in
the industrial world and funding that position by going short
the three lowest-yielding currencies has yielded estimated
Sharpe ratios averaging 0.7-0.8 for dollar, euro, and yen-
based investors. That is nearly double the Sharpe ratios
generated by buying and holding the shares of the S&P
500 index. This basket approach to trading the forward dis-
count bias is the bedrock of Deutsche Bank's Forward-
Rate Bias trading system.
Forward-Rate Bias
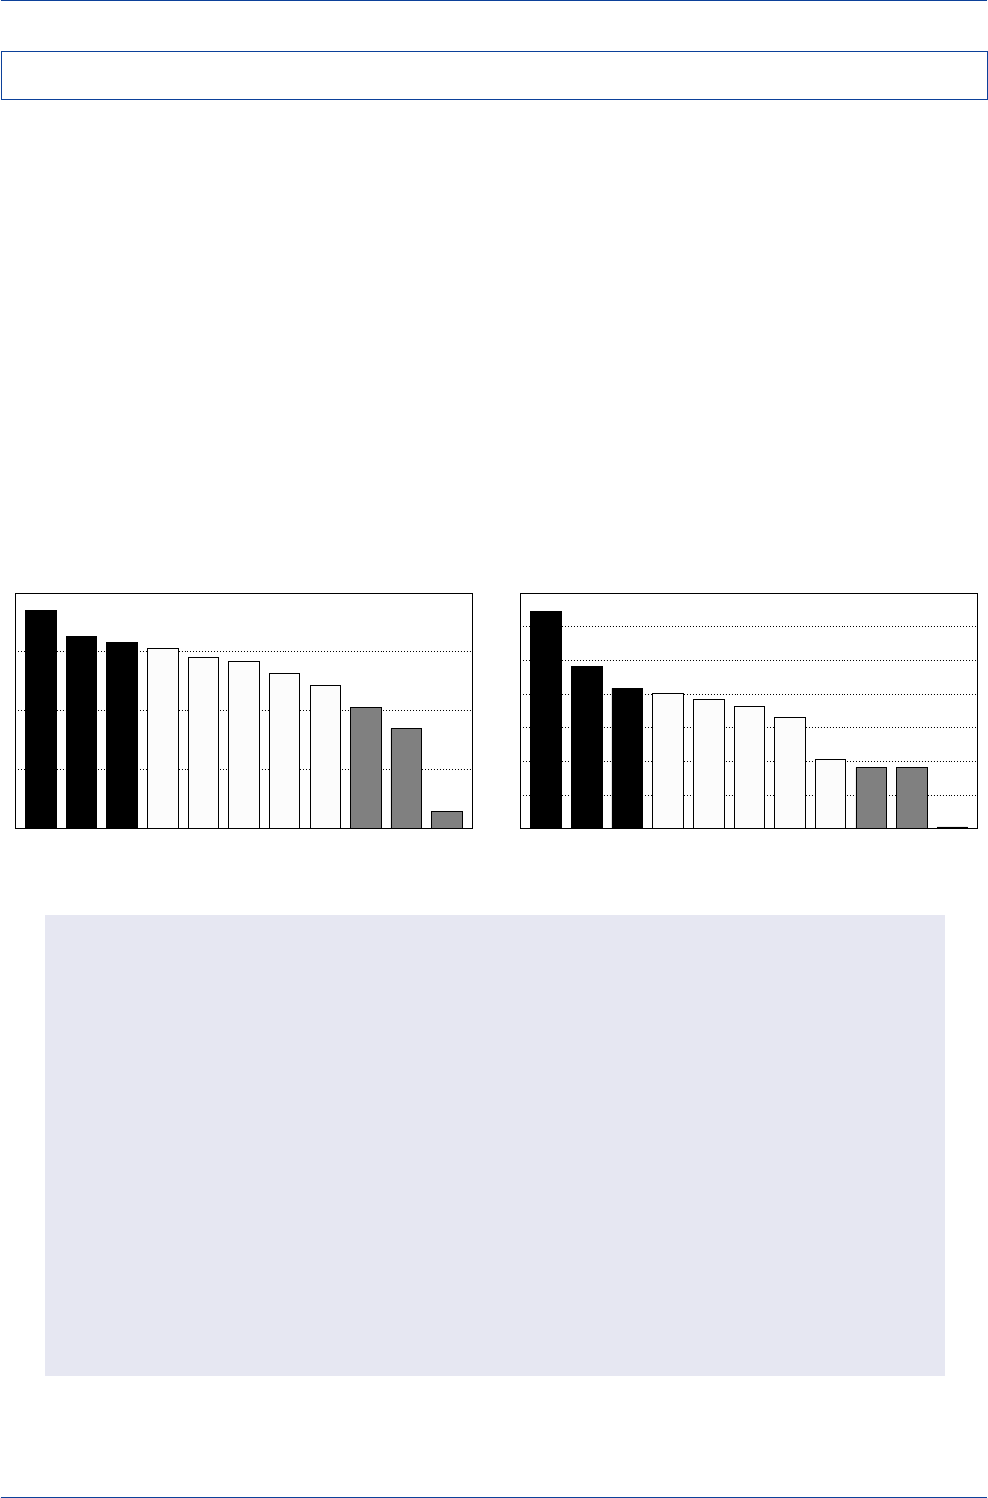
DB Guide to Exchange-Rate Determination
May 2002 Deutsche Bank @
Deutsche Bank Foreign Exchange Research 73
Our favorite approach to trading the forward-rate bias is to
adopt a diversified strategy to exploit the fact that curren-
cies trading at a forward discount tend to outperform those
currencies trading at a forward premium. The 11 curren-
cies that we include in our trading system are the U.S.
dollar, euro, Japanese yen, Swiss franc, British pound,
Canadian dollar, Australian dollar, New Zealand dollar, Dan-
ish krone, Norwegian krone, and Swedish krona. Our in-
vestment approach is straightforward: we recommend
going long the three highest-yielding currencies in the in-
dustrial world and going short the three lowest-yielding
currencies in the industrial world. Net long/short positions
are put on at the beginning of each month and then closed
at the end of each month. This process is repeated each
month over time.
The table below shows how our monthly recommenda-
tions for long and short currency positions for the 11 in-
dustrial country currencies can vary over time. At the be-
ginning of 2001, a high-yield/low-yield currency investment
strategy would have favored being long the Norwegian
krone, New Zealand dollar, and U.S. dollar, and being short
the Swedish krona, Swiss franc, and Japanese yen. By
the end of 2001, with U.S. yields having fallen below those
in most other markets, this strategy shifted in favor of be-
ing long the Norwegian krone, New Zealand dollar, and
Australian dollar, and short the Swiss franc, U.S. dollar, and
Japanese yen.
Recommended Long and Short Positions versus the U.S. Dollar
from Adhering to Long High-Yielders/Short Low-Yielders Currency-Investment Strategy
(January 2001-April 2002)
Month AUD CAD DKK EUR JPY NZD NOK SEK CHF GBP USD
Jan-01 ----short long long short short - long
Feb-01 ----short long long short short long -
Mar-01----short long long short short long -
Apr-01----short long long short short long -
May-01----short long long short short long -
Jun-01 ----short long long - short long short
Jul-01 ----short long long - short long short
Aug-01 ----short long long - short long short
Sep-01 ----short long long - short long short
Oct-01 ----short long long - short long short
Nov-01 long ---short long long - short - short
Dec-01 long ---short long long - short - short
Jan-02 long ---short long long - short - short
Feb-02 long ---short long long - short - short
Mar-02 long ---short long long - short - short
Apr-02 long ---short long long - short - short
May-02----short long long long short - short
Note: Datastream is the source of the underlying data.
Trading the Bias
Three-Month Nominal Interest Rates
(as of December 31, 2000)
0.6
3.4
4.1
4.9
5.3
5.7
5.8
6.1
6.3
6.5
7.4
0
2
4
6
8
Norway N.Z. U.S. Aust. U.K.Canada
Denmark Euro
Sweden
Switzerland Japan
(%) 3-Month Euro-Deposit Rates
Three-Month Nominal Interest Rates
(as of December 31, 2001)
0.1
1.81.8
2.1
3.3
3.6
3.8
4.0
4.2
4.8
6.5
0
1
2
3
4
5
6
7
Norway N.Z. Aust. U.K.
Sweden
Denmark EuroCanada
Switzerland U.S. Japan
(%) 3-Month Euro-Deposit Rates
Source: Datastream Source: Datastream
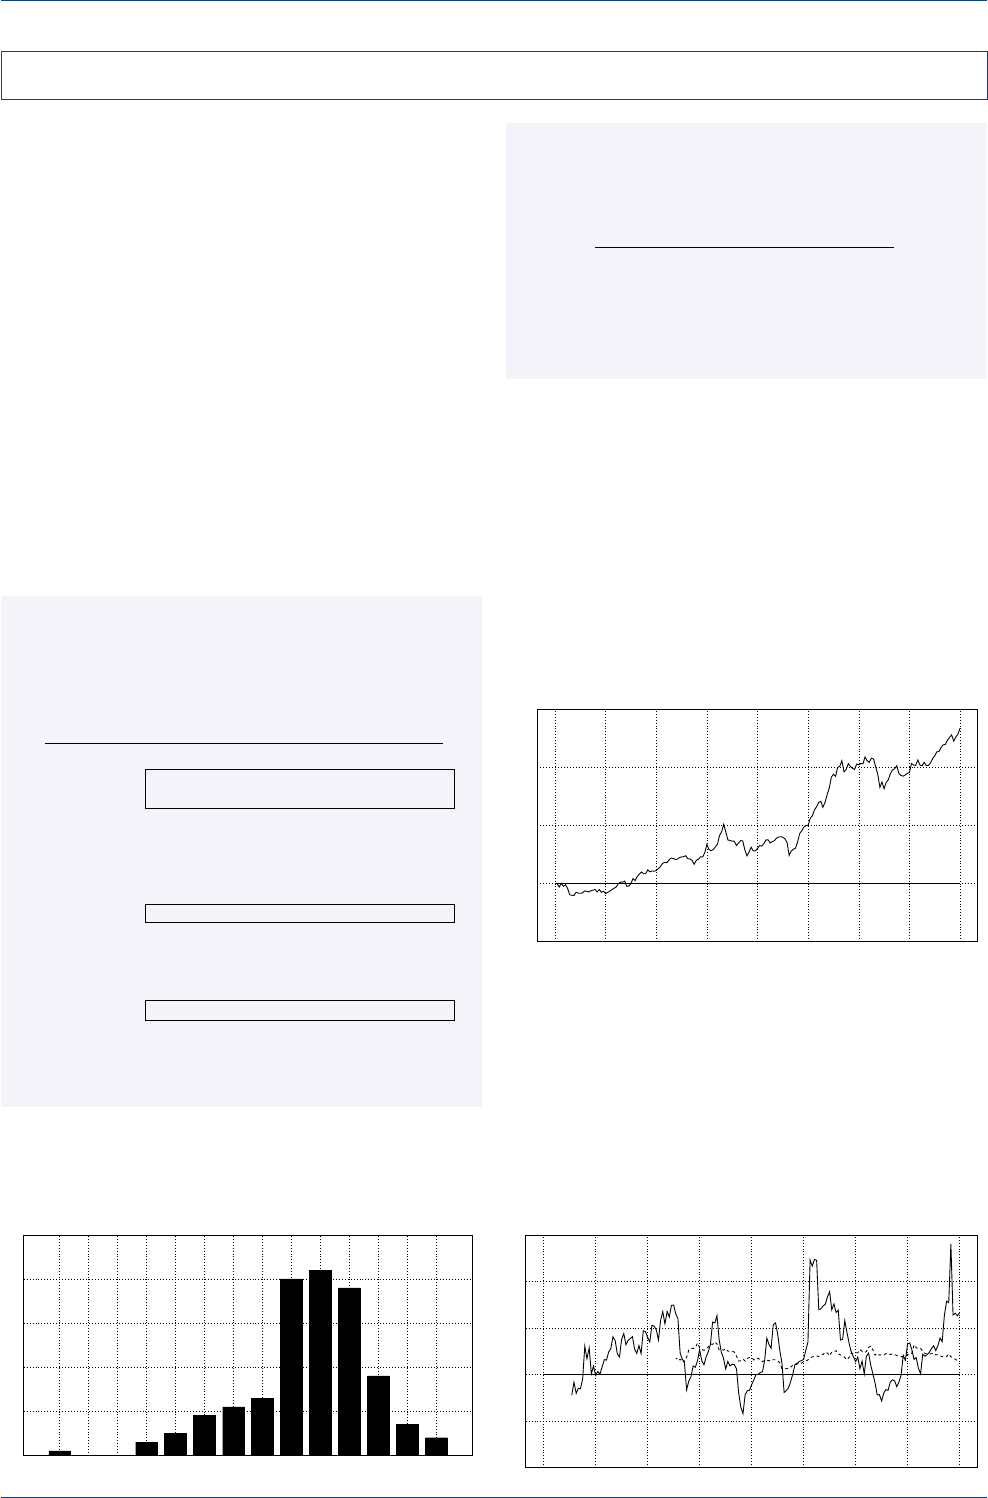
DB Guide to Exchange-Rate Determination May 2002
Deutsche Bank @
74 Deutsche Bank Foreign Exchange Research
Our analysis of the risks and returns that would have been
generated for a dollar-based investor following our diversi-
fied forward-rate bias strategy indicates that relatively at-
tractive risk-adjusted returns could have been earned in
the past 16 years. Over the 1986-2001 period, the average
annual excess return from following the forward-rate bias
strategy was around 5.6%, with an annualized standard
deviation of 7.8% and a Sharpe ratio of 0.73. This Sharpe
ratio compares favorably with the annualized Sharpe ratio
on a buy-and-hold S&P 500 equity strategy of 0.3-0.4.
At the end of January 2001, the cumulative excess return
since 1986 on the forward-rate bias strategy stood at 233%.
The distribution of monthly returns indicates that the re-
turns are skewed toward positive levels, suggesting posi-
tive investment returns were available from following this
strategy over the 1986-2001 period. High values for rolling
Sharpe ratios lend additional support to the long-run at-
tractiveness of this strategy.
Risk/Reward Structure
of Forward Discount Bias Strategy
(Going Long All High-Yield Currencies and Short All Low-Yield
Currencies Relative to the U.S. Dollar)
(January 1986-April 2002)
Annual Excess Return 5.6%
Standard Deviation 7.8%
Sharpe Ratio 0.73
Note: Datastream is the source of the underlying data.
Cumulative Excess Returns of US$-Based
Forward-Rate Bias Strategy
(1986-2002)
50
100
150
200
250
1986 1988 1990 1992 1994 1996 1998 2000 2002
(Index, 1986=100)
Distribution of Monthly Excess Returns
of US$-Based Forward Rate Bias Strategy
(1986-2002)
0
10
20
30
40
50
-8.2 -7.1 -6.0 -5.0 -3.9 -2.8 -1.8 -0.7 0.3 1.4 2.5 3.5 4.6 5.0
Frequency
Monthly Excess Return(%)
Sharpe Ratios of US$-Based
Forward Rate Bias Strategy
(1986-2002)
-4
-2
0
2
4
6
1986 1988 1990 1992 1994 1996 1998 2000 2002
Five-Year Rolling Sharpe Ratio----
One-Year Rolling Sharpe Ratio____
Forward-Rate Bias Strategy Long-Run Track Record for US$-Based Investors
Annual Excess Percentage Returns
Generated by the DB Forward-Rate Bias Strategy
From the Perspective of U.S. Dollar, Euro, and Yen-Based Investors
(1986-2001)
------ Investors’ Base Currency ------
Year US$ Euro Yen
(%) (%) (%)
1986 -8.4 -7.2 -7.3
1987 -0.6 -0.1 0.1
1988 8.4 8.9 8.9
1989 6.6 7.1 7.2
1990 9.0 8.9 9.3
1991 8.5 7.6 8.2
1992 5.4 4.1 5.1
1993 -4.7 -5.4 -4.5
1994 5.4 5.3 5.5
1995 8.5 9.5 10.4
1996 24.2 24.6 24.7
1997 5.2 5.7 5.8
1998 -10.7 -10.2 -9.2
1999 4.4 4.8 4.7
2000 3.2 3.3 3.5
2001 9.5 9.6 9.8
Note: Datastream is the source of the underlying data.
Source: Datastream
Source: Datastream
Source: Datastream
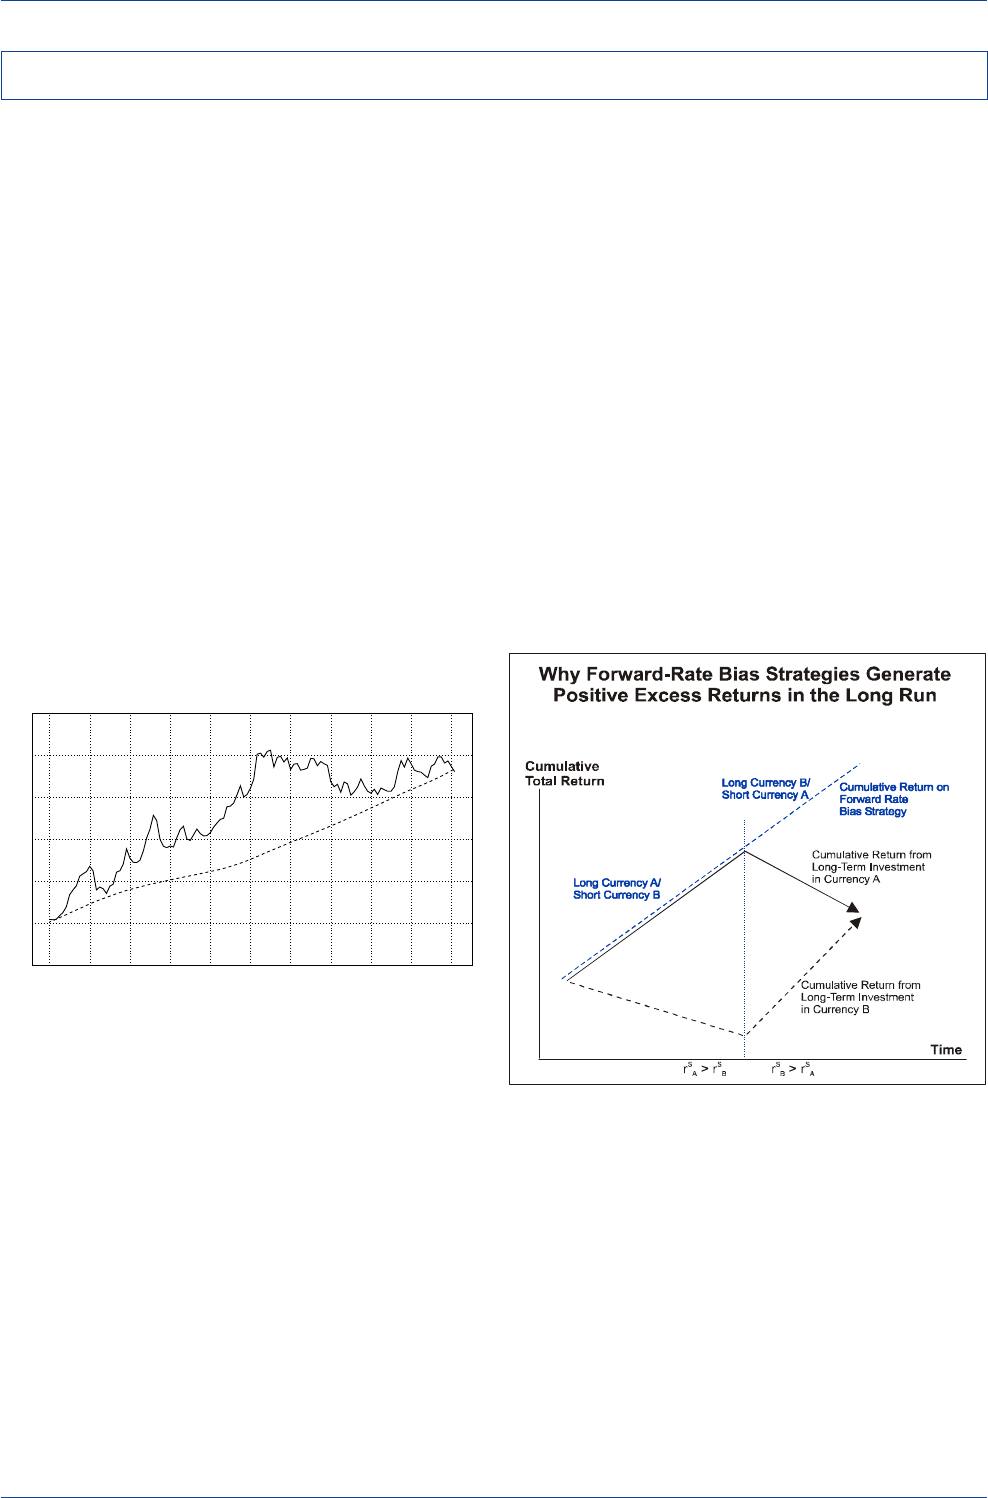
DB Guide to Exchange-Rate Determination
May 2002 Deutsche Bank @
Deutsche Bank Foreign Exchange Research 75
Empirical evidence indicates that in the very long run, the
cumulative returns on dollar-denominated and foreign-cur-
rency-denominated short-term fixed-income instruments
are broadly the same. That is, high-yield markets have seen
their currencies weaken over time, while low-yield mar-
kets have seen their currencies strengthen over time.
Indeed, consider the economic consequences if the cu-
mulative returns on a persistently high-yielding market
exceeded the cumulative returns on a persistently low-
yielding market. One market could consistently outperform
another market only if (1) its real yields were consistently
higher, which would dampen that country's long-run growth
prospects, or (2) its currency became progressively more
overvalued on a PPP basis, which would dampen the
country's long-run trade competitiveness. Eventually, a de-
terioration in growth and/or competitiveness would give
rise to corrective moves on the interest-rate and/or ex-
change-rate fronts that would erase the cumulative excess
returns. As shown below, the cumulative returns of U.S.
and foreign money-market instruments in U.S. dollar terms
were virtually the same for the 1990-1999 period.
How, then, do forward-rate bias strategies generate such
attractive risk-adjusted excess returns? The answer is that
in the industrialized world, individual markets often trade
places with other markets in terms of which market has
the highest or lowest yield. When currency
A
's yield rises
above currency
B
's yield, the widening of the
A-B
yield
spread will likely contribute to a rise in currency
A
's value.
When currency
A
's yield begins to fall relative to currency
B
's yield, downward pressure on currency
A
is likely to
materialize. The forward-rate bias strategy would gener-
ate excess returns if an investor went long currency
A
when
its yields rose above currency
B
's, and would also gener-
ate excess returns if that investor went short currency
A
when its yields fell below currency
B
's, as long as the ex-
change rate moved in sympathy with the
A-B
yield spread.
Thus, the forward-rate strategy could generate significant
excess returns, even though the cumulative returns on
currencies
A
and
B
might be the same in the long run.
World Money-Market Performance
(in US$ terms)
80
100
120
140
160
180
200
1990 1991 1992 1993 1994 1995 1996 1997 1998 1999 2000
U.S.----
(Index) Non-US____
Source: Salomon Bothers Money Market Indices
Forward-Rate Bias—The Economic Rationale
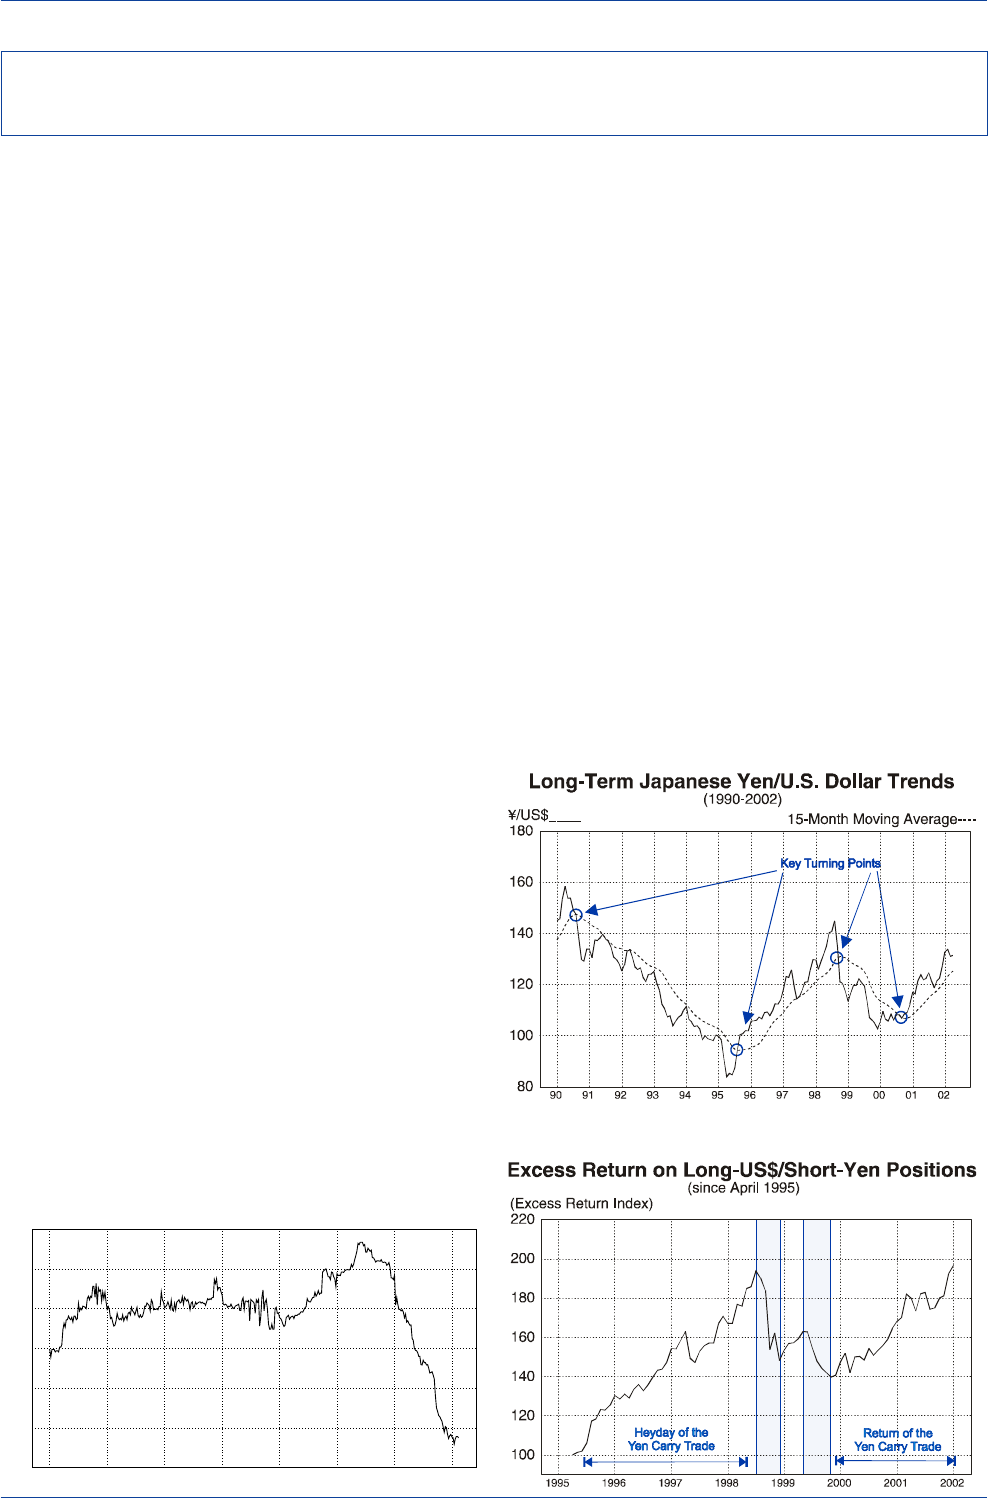
DB Guide to Exchange-Rate Determination May 2002
Deutsche Bank @
76 Deutsche Bank Foreign Exchange Research
The monetary, fiscal, external, and financial-sector shocks
that hit Japan in 1995-98 were all largely yen-negative. As
the yen steadily weakened, investors became increasingly
confident that the yen's path was essentially a one-way
street, which encouraged fund managers to take on ag-
gressive long-dollar/short-yen positions. As the yen weak-
ened on a trend basis for 3½ straight years, consistently
remaining above its 60-week moving average, and with
the U.S./Japan short-term yield spread averaging around
500 basis points, the "Yen Carry Trade" (borrowing in yen
to invest in dollar-denominated securities) became enor-
mously popular.
The yen carry trade generated large and persistent excess
returns over the April 1995-August 1998 period. While it is
difficult to quantify precisely how large the outstanding
positions were at their peak, BIS data on foreign-exchange
market turnover suggest that the yen carry trades were
probably quite sizable, given that the yen's share of total
foreign-exchange turnover rose substantially between 1995
and 1998. As the BIS notes, "Between 1995 and 1998, the
value of transactions involving the Japanese currency (at
constant exchange rates) had grown at twice the rate of
those involving the U.S. dollar or the Deutschemark, and
60% faster than global market turnover."
Excessive optimism or pessimism can often carry an ex-
change rate to extreme levels, and such was the case for
the yen. The popularity of the yen carry trade had pushed
the dollar into substantial overbought territory versus the
yen by the summer of 1998.
Undervalued and oversold, the yen was, in retrospect, ripe
for a corrective move upward. Although Japan's fundamen-
tal backdrop had not improved much, the existence of large
highly leveraged positions in the yen carry trade by the
speculative community raised the risk that a sudden un-
winding of those positions could drive the yen's value up
sharply. When the Russian debt crisis hit in the summer of
1998, investors around the world felt compelled to unwind
all highly leveraged fixed-income and currency positions,
including the yen carry trade.
U.S./Japanese Short-Term Interest-Rate Spread
(Three-Month Euro-Deposit Rates)
(1995-2002)
100
200
300
400
500
600
700
1995 1996 1997 1998 1999 2000 2001 2002
(Basis Points)
During the ensuing melee, the yen carry trade became a
victim of the global deleveraging process. The dollar fell by
9% versus the yen between August 31 and September 7,
1998, and then fell an additional 12% October 6-8 as highly
leveraged long-dollar/short-yen positions were aggressively
unwound. From a peak of ¥/US$ 147 on August 11, 1998,
the dollar had fallen by 34 big figures in just two months to
a low of ¥/US$ 113 on October 16, 1998.
Huge losses were incurred during the dollar sell-off of 1998,
which highlights the risks of taking on leveraged positions
in carry trades. However, from a long-run perspective, the
cumulative excess returns on the yen-carry strategy have
been fairly attractive, despite those losses. Indeed, there
have been only two periods (the shaded areas in the chart
below) when the long-dollar/short-yen carry trade has suf-
fered brief, albeit large, short-run losses since April 1995.
Note that the cumulative excess returns from following
this strategy have now surpassed those recorded just be-
fore the unwinding of the yen carry trade in 1998.
Forward-Rate Bias Strategy Opportunities and Pitfalls—
The Case of the Yen Carry Trade
Source: Datastream
Source: Datastream
Source: Datastream
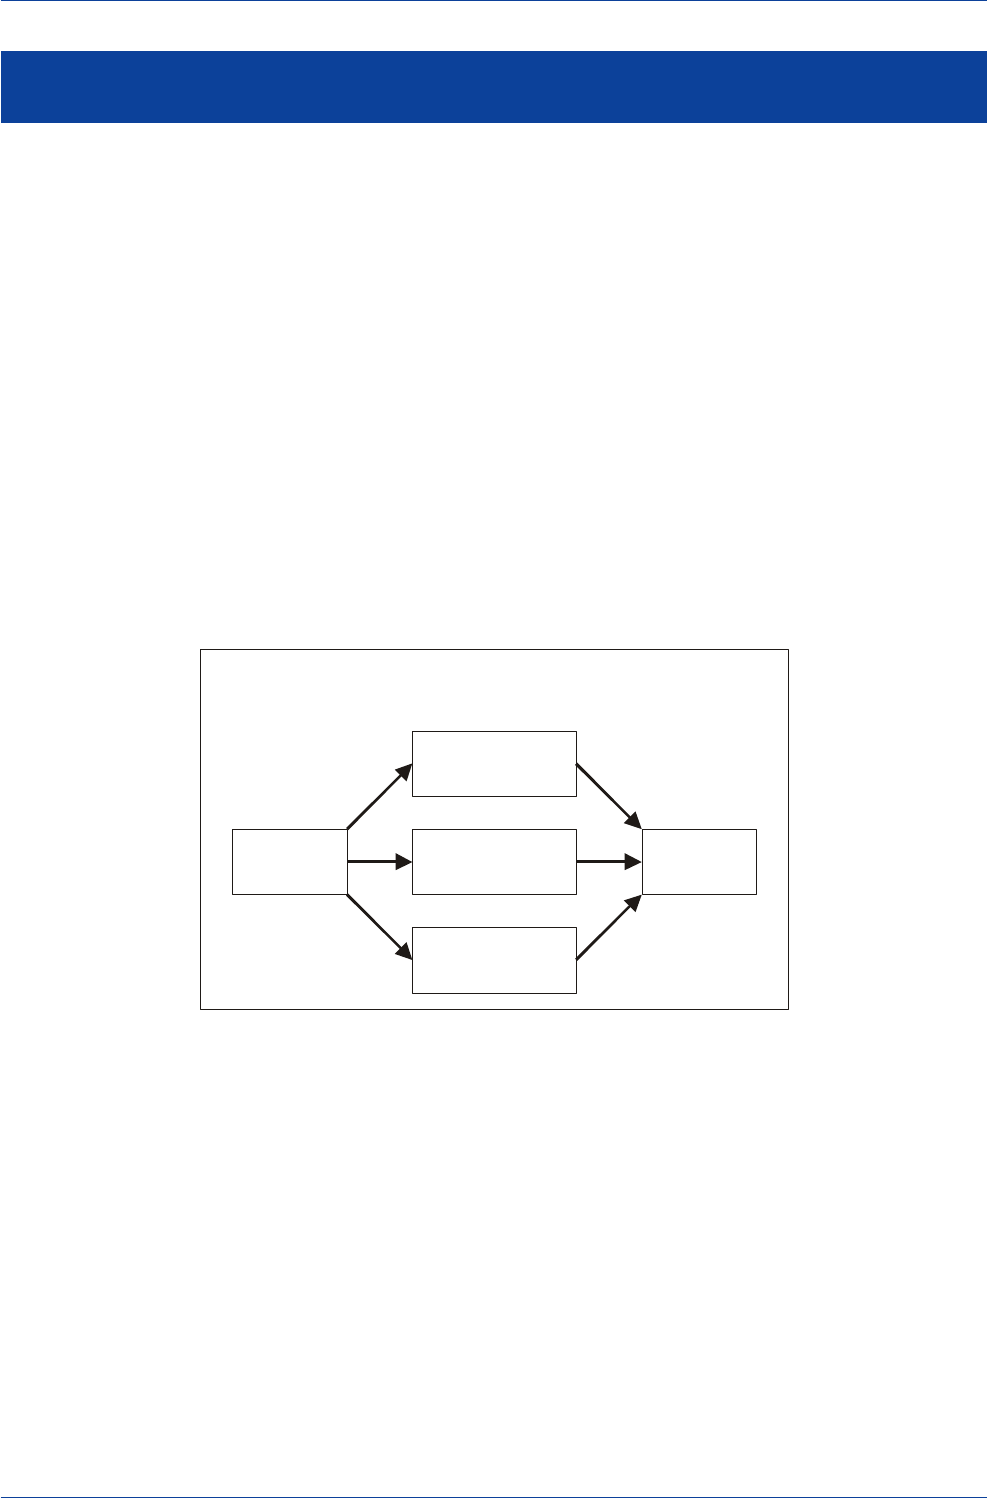
DB Guide to Exchange-Rate Determination
May 2002 Deutsche Bank @
Deutsche Bank Foreign Exchange Research 77
Conventional wisdom holds that countries that run persis-
tent current-account surpluses will see their currencies
appreciate over time, while countries that run persistent
current-account deficits will see their currencies depreci-
ate over time.
Current-account imbalances can affect exchange rates
through a variety of channels. First, the existence of major
external imbalances can influence the flow supply of and
demand for individual currencies and thereby directly in-
fluence the paths that exchange rates take.
Second, major current-account imbalances can shift the
residence of financial wealth among deficit and surplus
nations, decreasing it in the former and raising it in the
latter. Such shifts in the residence of financial wealth could
then lead to a shift in global asset preferences, which, in
turn, could influence the paths that exchange rates take.
Third, there is a general notion that there exists some limit
on the ability of countries to run sizeable and persistent
current-account deficits, because such deficits could lead
to an unending rise in debt owed by deficit countries to
foreign investors. If foreign investors view the rise in ex-
ternal debt as unsustainable, they would reason that at
some point, a major depreciation of the deficit country's
currency might be required to ensure that the current-ac-
count deficit narrowed and that the external debt stabi-
lized at a level deemed sustainable.
In such a manner, the existence of a large current-account
imbalance will tend to alter the market's notion of what
level of the exchange rate constitutes a currency's real long-
run equilibrium value, with ever-larger deficits and external
debt levels giving rise to steady, downward revisions in
market expectations of the real long-run equilibrium ex-
change rate.
Current Account Imbalances and Exchange Rates—
The Channels of Influence
Flow
Supply and Demand
for Foreign Exchange
Exchange
Rate
Transfer of Wealth
from Deficit
to Surplus Countries
External
Debt
Sustainability
Current
Account
Imbalance
Current-Account Imbalances and the Determination of Exchange Rates
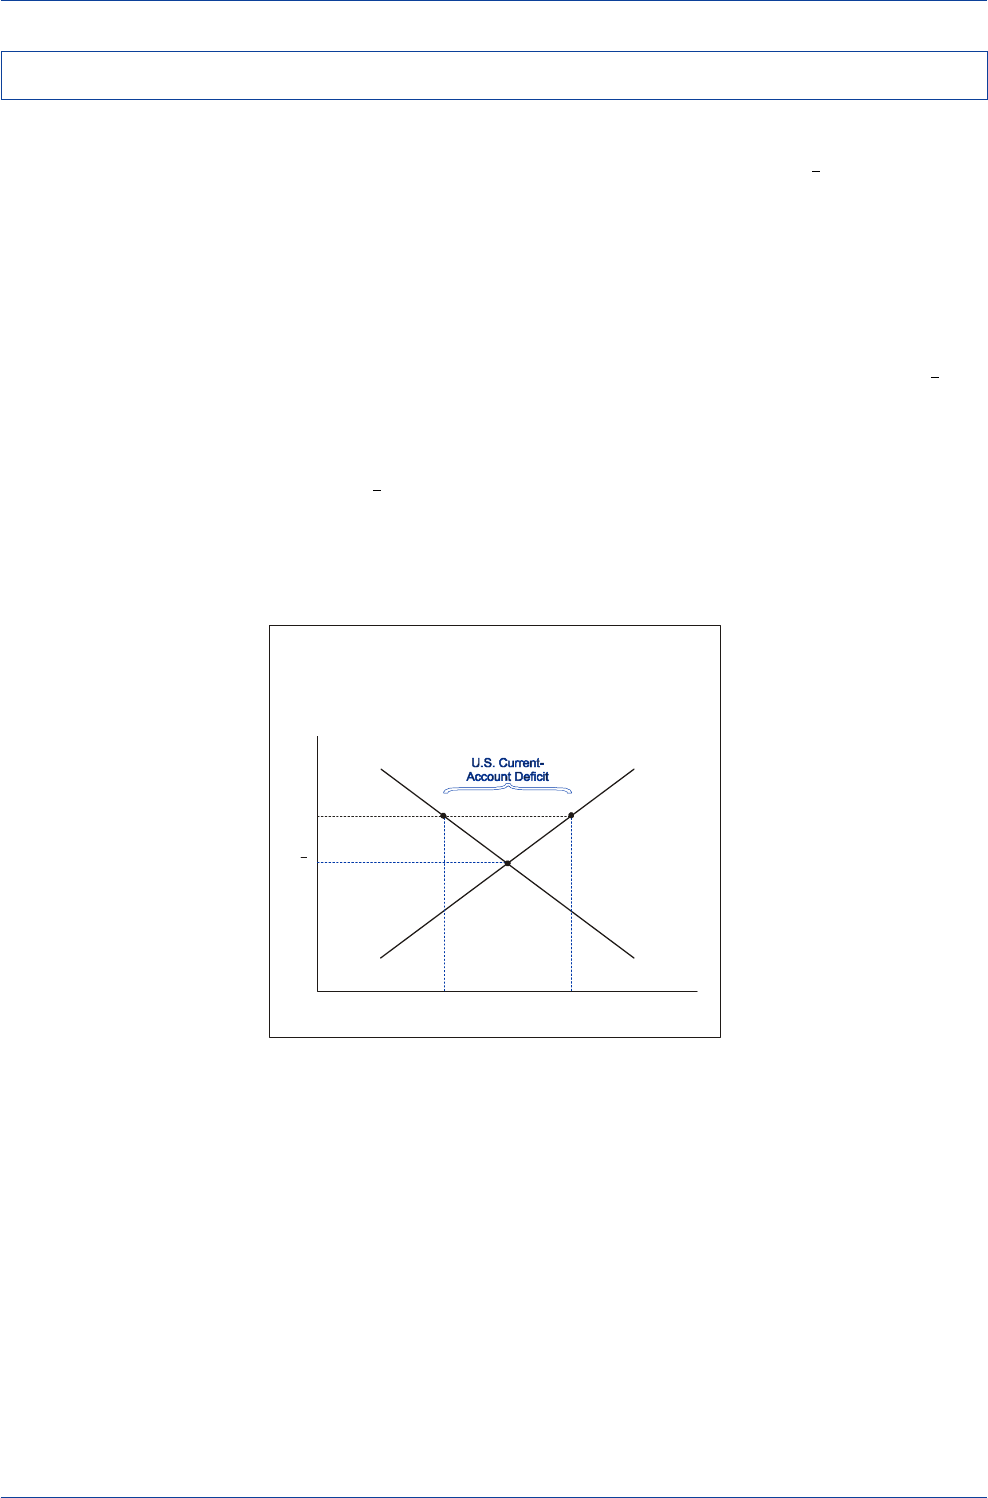
DB Guide to Exchange-Rate Determination May 2002
Deutsche Bank @
78 Deutsche Bank Foreign Exchange Research
Most market participants view U.S. current-account trends
as important for the dollar because such trends directly
influence the flow supply of and demand for dollars in the
foreign-exchange market. Using the traditional balance-of-
payments flow model of exchange-rate determination, we
can describe how current-account flows determine the
supply of and demand for dollars.
Let's assume that the flow demand for dollars, D$, is gen-
erated by foreign demand for U.S. goods and services,
while the flow supply of dollars, S$, is generated by U.S.
demand for foreign goods and services. If current-account
flows determine the supply of and demand for dollars, then
it should be the case that when the U.S. current-account
balance is in equilibrium, the supply of and demand for
dollars will be in equilibrium as well. In terms of the dia-
gram below, the dollar's equilibrium value, q0, would be
determined by the intersection of the supply, S$, and de-
mand, D$, curves for dollars.
Balance-of-Trade Flow Model
of Exchange-Rate Determination
Dollar’s Value
Quantity of
Dollars
D
$
S
$
q
0
AB
q
1
Q
A
Q
B
C
If, however, the U.S. were running a current-account defi-
cit, perhaps because the value of the dollar was too high
at q1 relative to its equilibrium value, q0, then the supply of
dollars, S$, on the foreign-exchange market would exceed
the demand for dollars, D$. The excess supply of dollars,
which is the foreign-exchange market counterpart of the
U.S. current-account deficit, is represented as the gap be-
tween points
A
and
B
. The dollar's value at q1 would clearly
not be sustainable since the excess supply of dollars,
AB
,
on the foreign-exchange market would exert continual
downward pressure on the dollar's value. Once the dollar's
value falls toward its long-run equilibrium value, q0, the
supply of dollars would be brought back into line with the
demand for dollars, and the U.S. current account would be
brought back into balance at point
C
.
Balance of Payments Flow Model of Exchange-Rate Determination
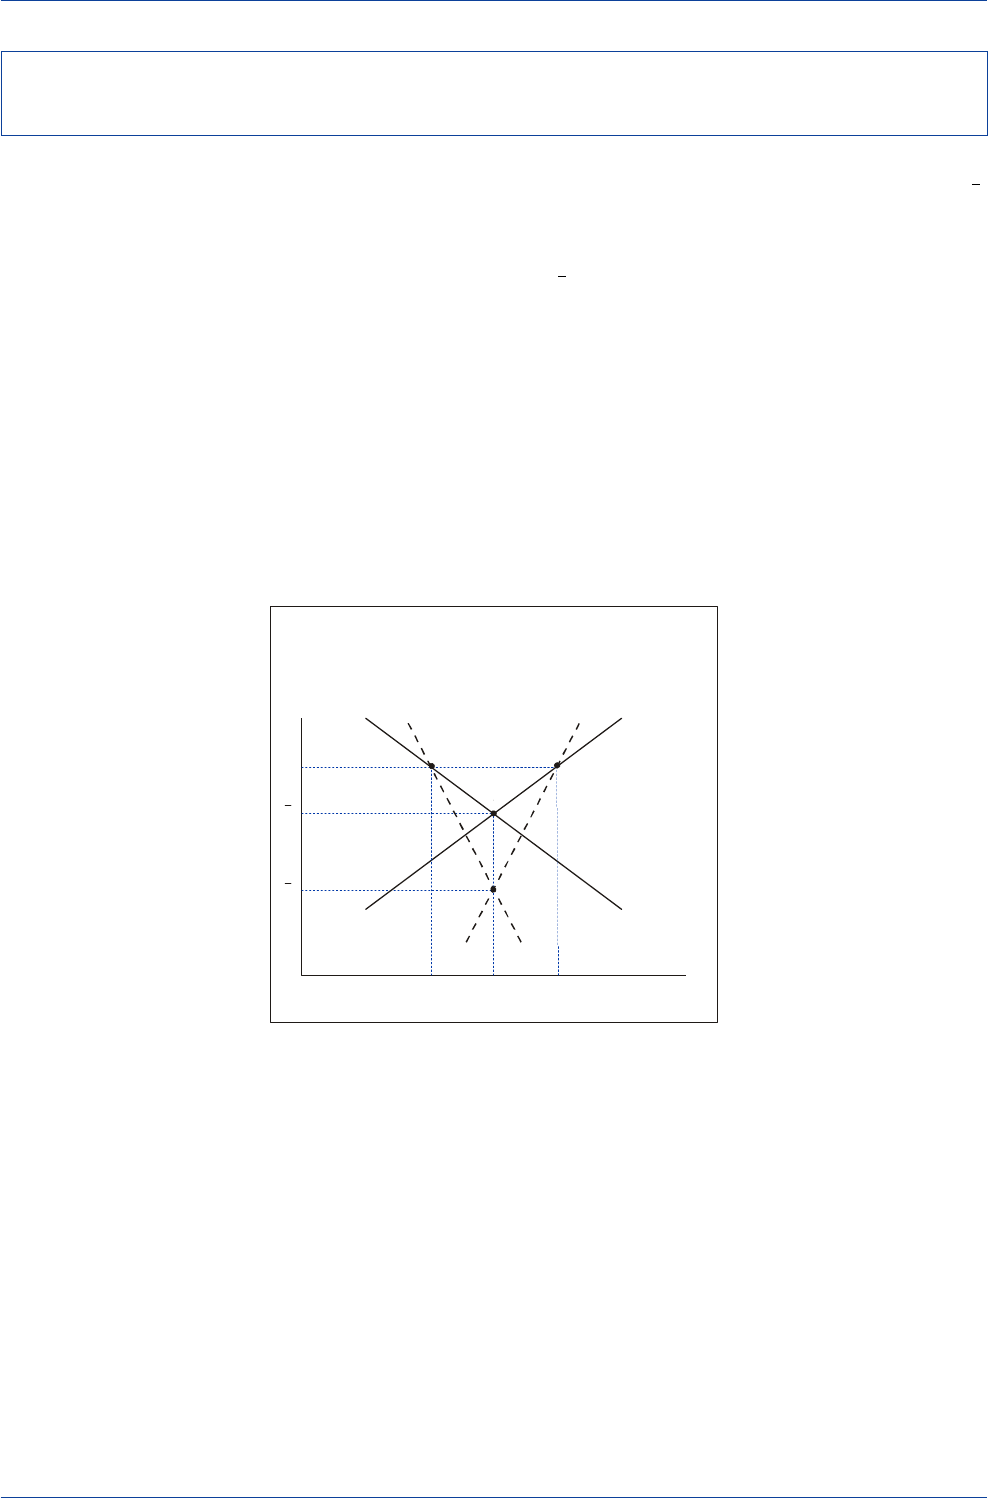
DB Guide to Exchange-Rate Determination
May 2002 Deutsche Bank @
Deutsche Bank Foreign Exchange Research 79
The traditional balance-of-payments flow model posits that
exchange rates will adjust until all current-account imbal-
ances are corrected and current-account equilibrium is re-
stored. How much exchange rates must adjust to restore
current-account equilibrium depends on the elasticities of
the supply and demand curves for foreign exchange.
In the accompanying diagram, we plot two sets of supply
and demand curves for dollars—one set that is highly elas-
tic (Se$ and De$, respectively) and another set that is highly
inelastic (Si$ and Di$, respectively). Initially, it is assumed
that the U.S. is running a current-account deficit equal to
AB
at the prevailing exchange rate, q1. The exchange-rate
change necessary to correct the U.S. current-account im-
balance will differ depending on whether the prevailing
supply and demand curves for dollars are highly elastic or
inelastic.
Elasticities of Supply and Demand
for Dollars and
Exchange-Rate Determination
Exchange Rate
Quantity of
Dollars
D
e
$
AB
Q
A
Q
E
Q
B
q
1
S
e
$
S
i
$
D
i
$
C
C´
q
0
q
2
If the supply and demand curves for dollars were highly
elastic, only a modest decline in the dollar's value to q0
would be required to restore equilibrium to the U.S. cur-
rent account. If, instead, the supply and demand curves
for dollars were highly inelastic, a large decline in the dol-
lar to q2 would be required to restore equilibrium to the
U.S. current account.
U.S. export and import price elasticities are estimated to
be quite small, perhaps averaging only around -1.0 for ex-
ports and -0.3 for imports. Based on these rather low elas-
ticities, it would likely require a rather large depreciation of
the dollar to restore a sizeable U.S. current-account deficit
to a more sustainable level. Thus, the inelastic supply and
demand curves shown below may be a more realistic pic-
ture of the potentially large dollar adjustment that might
be required to restore equilibrium to the U.S. current-ac-
count balance.
Trade Elasticities and the Exchange-Rate/Trade-Balance
Adjustment Process
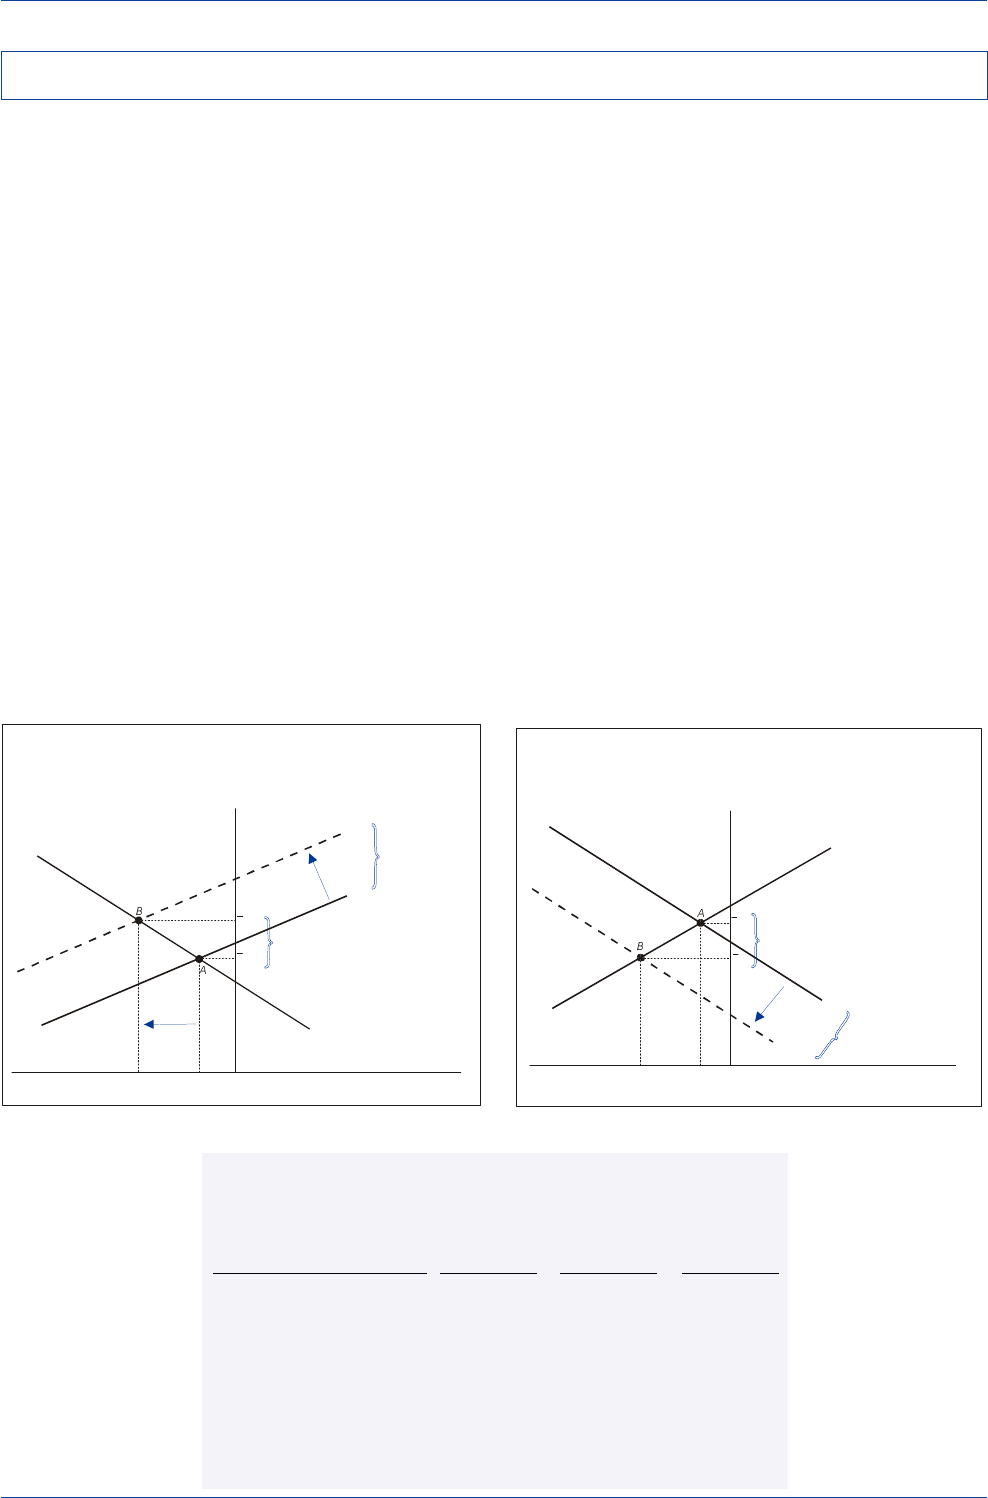
DB Guide to Exchange-Rate Determination May 2002
Deutsche Bank @
80 Deutsche Bank Foreign Exchange Research
The dramatic appreciation of the dollar over the 1995-2001
period despite a record deterioration of the U.S. current
account is clear evidence that a current-account deficit need
not be bearish for a currency. Indeed, the same thing hap-
pened in the first half of the 1980s when the dollar soared,
yet the current-account deficit steadily widened.
Current-account imbalances are typically driven by struc-
tural changes in international competitiveness, changes in
the terms of trade, and long-term shifts in national sav-
ings-investment (S-I) balances. Consider the impact on
exchange rates and the current account if a country under-
went a major investment boom or undertook a long-term
policy of fiscal expansion. In both cases, the S-I schedule
would shift upward to the left. The increase in investment
relative to national savings would result in a wider current-
account deficit and, at the same time, put upward pres-
sure on the real exchange rate. That is pretty much what
happened to the U.S. savings-investment balance, the cur-
rent-account balance, and the dollar in both the 1980-85
and 1995-2001 episodes. Hence, when the source of the
deterioration in the current-account balance is a rise in in-
vestment relative to national savings, there is a high likeli-
hood that the currency will strengthen over time, not
weaken.
Current-Account/Exchange-Rate Linkages
and the Impact of Economic and Financial Disturbances
Economic Current Exchange
Conditions Account Rate Linkage
Expansionary Monetary Policy Deterioration Depreciation Positive
Restrictive Monetary Policy Improvement Appreciation Positive
Expansionary Fiscal Policy Deterioration Appreciation Negative
Restrictive Fiscal Policy Improvement Depreciation Negative
Exogenous Increase Improvement Appreciation Positive
in Domestic Supply
Exogenous Increase Improvement Appreciation Positive
in Foreign Demand
U.S. Savings-Investment Balance
and the Dollar
Savings minus Investment,
Current-Account Balance
U.S. Dollar
Real Exchange Rate
“New Economy”
Increase in
Investment
Spending
S-I
2
CAB
1
“New Economy”
Upward Revision in the
Dollar’s Real Long-Run
Equilibrium Value
q
2
q
1
(0)(-) (+)
S-I
1
If the deterioration in a country's current-account balance
were instead due to a long-run deterioration in that
country's competitiveness, the CAB schedule would shift
downward to the left relative to an unchanged S-I sched-
ule. In such a case, the deterioration of the current ac-
count would coincide with a long-term slide in the domes-
tic currency’s real long-run equilibrium value.
The message from all this is that certain economic distur-
bances may cause exchange rates and the current-account
balance to move in the same direction while other distur-
bances may cause exchange rates and the current account
to diverge. Consider the current-account/exchange-rate link-
age that arises in response to fiscal and monetary policy
changes. A country that pursues a highly expansionary
monetary policy will likely see its current account deterio-
rate and its currency weaken at the same time. The ques-
tion is whether the weakening of the currency is due to
the easier monetary policy or the current-account deterio-
ration or possibly both. In the case of a highly expansion-
ary fiscal policy, the trend in the current account and the
trend in the exchange rate may diverge as the current ac-
count deteriorates while the currency appreciates.
Are Current-Account Deficits Necessarily Bearish for Exchange Rates?
U.S. Current-Account Deficit and the Dollar
Savings minus Investment,
Current-Account Balance
U.S. Dollar
Real Exchange Rate
S-I
CAB
2
CAB
1
Downward Revision in the
Dollar’s Real Long-Run
Equilibrium Value
Long-Run Deterioration in
U.S. Trade Competitiveness
q
1
q
2
(0)(-) (+)
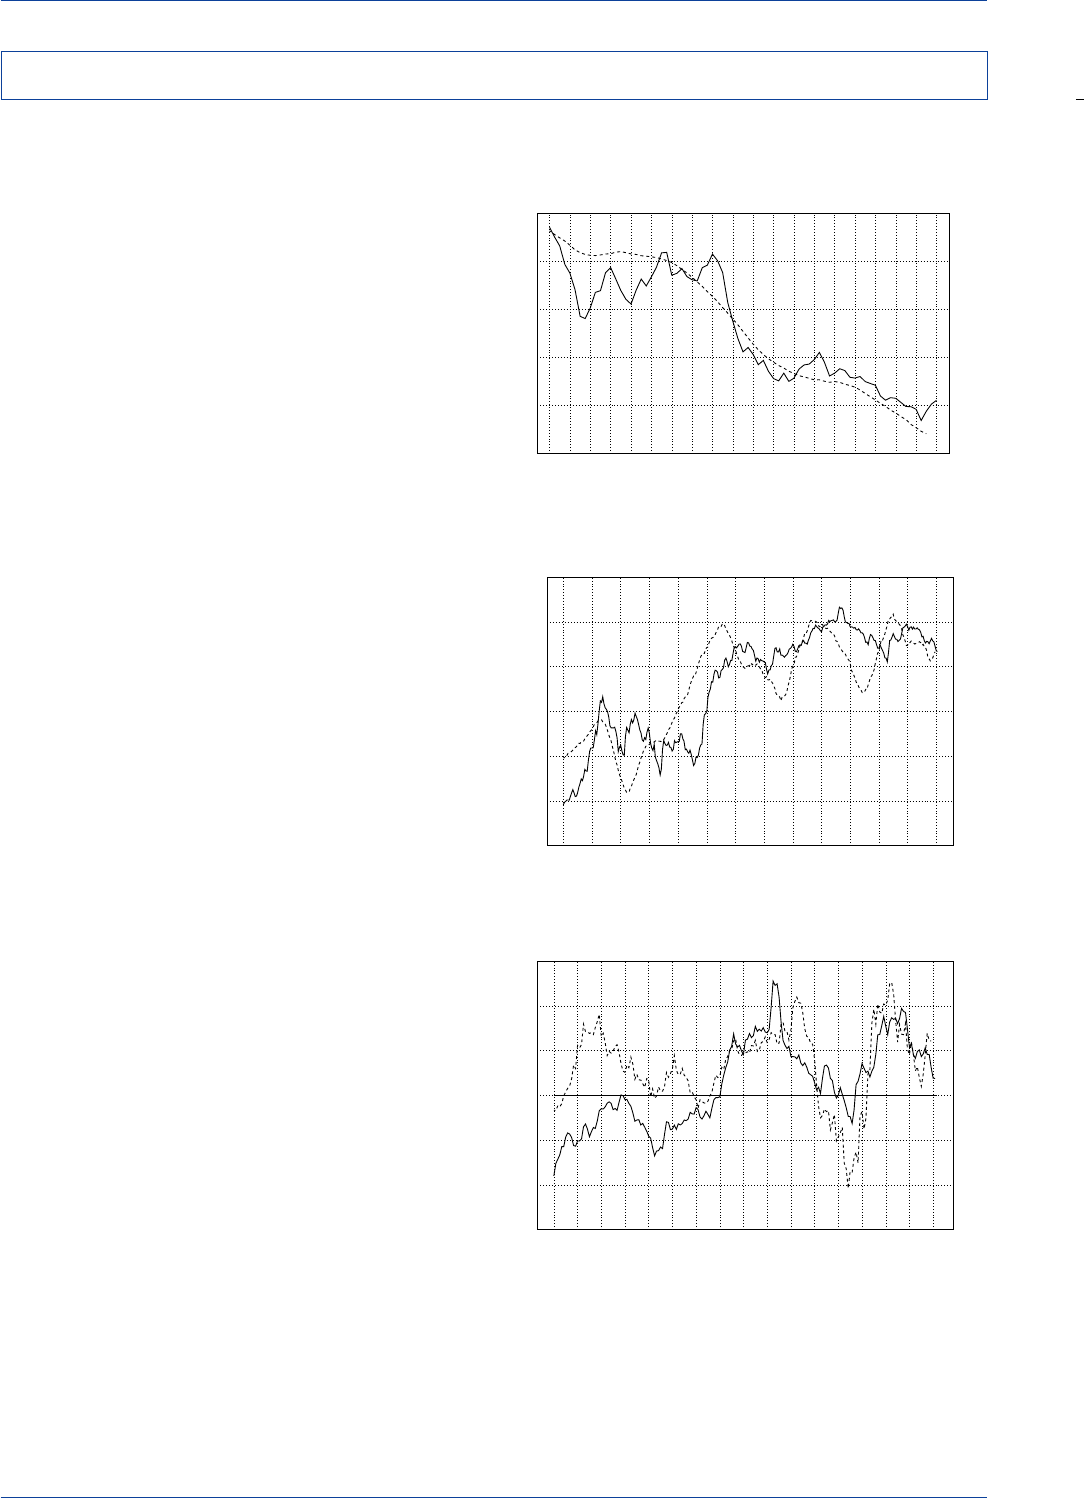
DB Guide to Exchange-Rate Determination
May 2002 Deutsche Bank @
Deutsche Bank Foreign Exchange Research 81
Japan's tendency to run large and persistent current-ac-
count surpluses over time largely explains why the yen's
trade-weighted value has risen on a secular basis. From a
simple flow supply-and-demand perspective, one would
expect larger and larger surpluses to give rise to succes-
sive increases in the demand for yen over time. Indeed,
the rising trend in Japan's current-account surplus has
moved in sympathy with the rising trend in the yen's value
in the past 30 years.
Related to this is the fact that Japan's cumulative current-
account surpluses have allowed Japanese investors to
acquire a rising claim on U.S. assets. To induce Japanese
investors to acquire and hold onto those rising dollar claims,
either U.S. interest rates needed to rise relative to those in
Japan, or the dollar needed to fall versus the yen to make
dollar assets appear cheaper to Japanese investors, or
some combination of the two was required. The evidence
indicates the dollar bore the brunt of this adjustment. The
accompanying chart shows that the yen’s long-term trend
moved sympathetically with the ratio of Japan's interna-
tional investment position relative to the U.S. international
investment position, as a percentage of their respective
GDPs.
In addition to the long-term financial pressure on yen ema-
nating from Japan's persistent current-account surpluses,
Professor Ronald I. McKinnon of Stanford University makes
the case that commercial tensions between the U.S. and
Japan, including intermittent threats of an outright trade
war, may have played an important role in driving the yen's
real value higher over time. According to McKinnon, the
U.S.—concerned about Japan's large and rising bilateral
trade surplus and frustrated by the inability of U.S. firms to
penetrate Japan's relatively closed markets—pursued a
policy of coupling protectionist threats with demands, im-
plicit or explicit, for yen appreciation. With the yen the fo-
cus of both U.S. trade and exchange-rate policies, the Japa-
nese authorities had to either tolerate an ever-rising yen or
accept the wrath of American protectionists.
Repeated attempts to talk the dollar down versus the yen
created, according to McKinnon, a syndrome of an ever-
rising yen that had a pervasive influence on investor ex-
pectations in Japan. Concerned about possible large losses
on their dollar-based investments, brought about by re-
peated attempts by U.S. officials to talk the dollar down,
Japanese investors became increasingly reluctant to hold
too large a proportion of their total portfolio in foreign as-
sets. This meant that Japanese funds would effectively be
bottled up inside Japan, with no safe-passageway for
Japan's current-account surpluses to exit through. This
contributed to an ever-rising basic balance of payments
surplus in Japan (the current account plus the long-term
capital account). As shown in the accompanying chart, the
tendency of Japan's basic balance of payments to regis-
ter a persistent surplus over time played a key role in driv-
ing the yen higher over time.
The Japanese Yen and the U.S./Japan
Cumulative Current-Account/GDP Differential
(50)
(40)
(30)
(20)
(10)
0
10
20
50
100
150
200
250
300
77 78 79 80 81 82 83 84 85 86 87 88 89 90 91 92 93 94 95 96
Cum. Curr.-Acct. as % of GDP Diff.---- (%)
¥
/US$____
The Yen and Japan’s Current-Account Balance
-10
-5
0
5
10
15
20
(350)
(300)
(250)
(200)
(150)
(100)
(50)
76 78 80 82 84 86 88 90 92 94 96 98 00 02
Current Acc’t(¥ tr.)----
Y
en/US$(reverse scale)____
The Yen and Japan’s Basic Balance
-10
-5
0
5
10
60
80
100
120
140
160
180
86 87 88 89 90 91 92 93 94 95 96 97 98 99 00 01 02
Basic Balance(12-mo. moving sum)(¥ tr.)----
Y
en Index____
Japan’s Current-Account Balance and the Yen
Source: Datastream
Source: Datastream
Source: Datastream
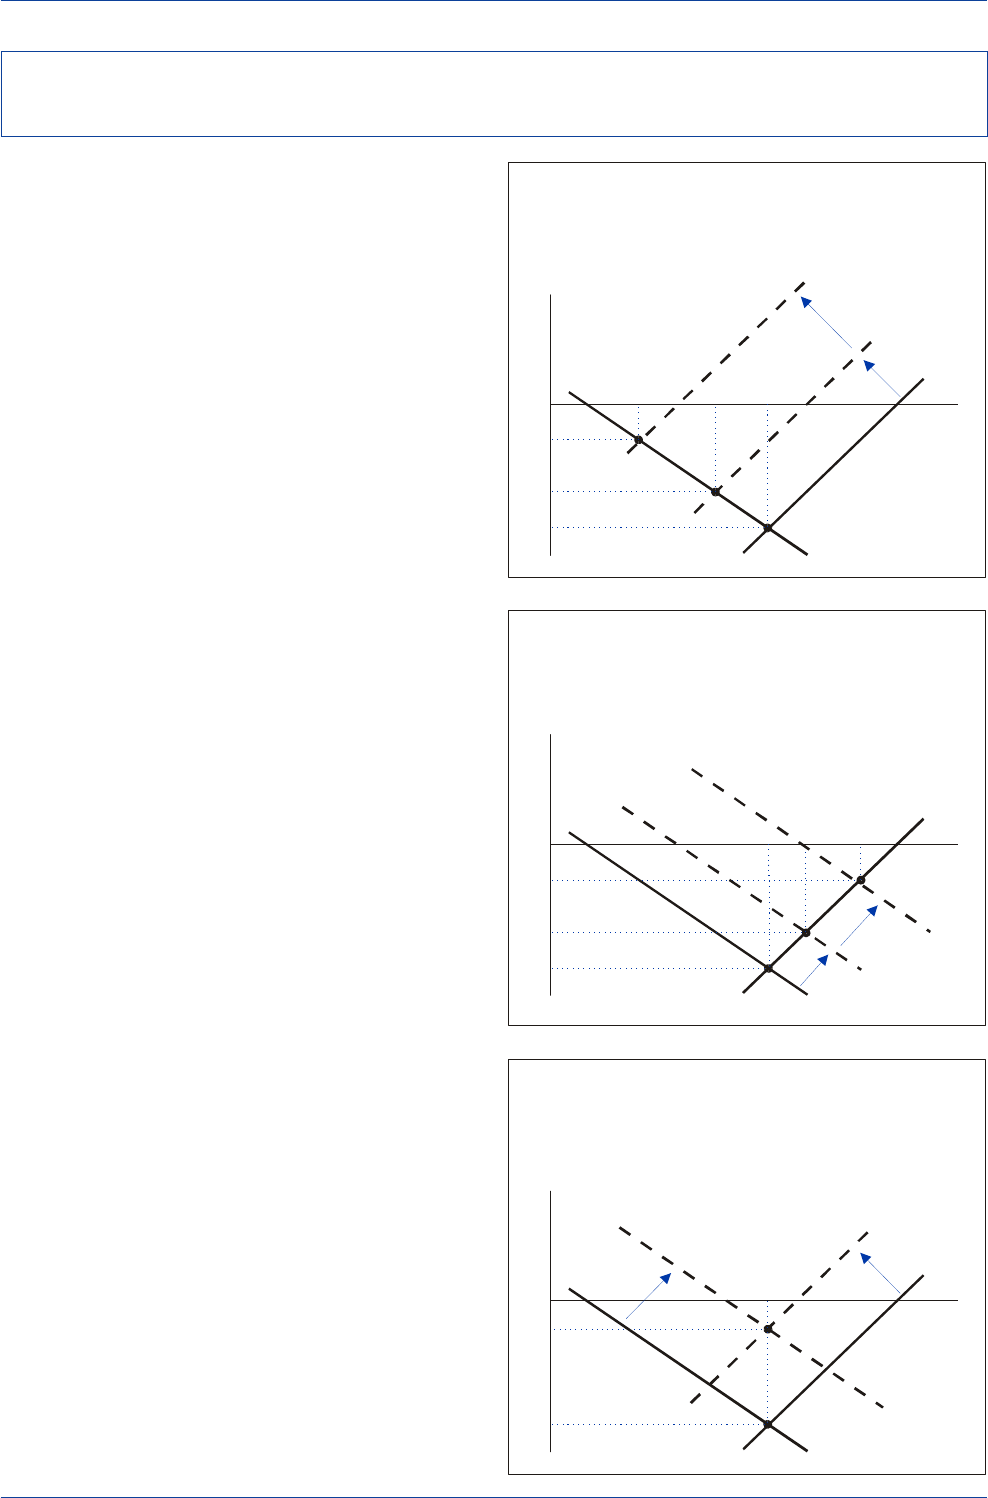
DB Guide to Exchange-Rate Determination May 2002
Deutsche Bank @
82 Deutsche Bank Foreign Exchange Research
There are essentially three ways that the U.S. can narrow
its large current-account deficit. First, the U.S. could pur-
sue policies that encourage domestic savings and/or dis-
courage domestic investment, perhaps via a tighter fiscal
and/or tighter monetary policy. Such policies would con-
tribute to a leftward shift of the savings-investment (S-I)
schedule in the diagram on the right. As illustrated, U.S.
domestic demand would need to be pared back, perhaps
significantly, to restore sustainable balance to the U.S. ex-
ternal account.
A second way to eliminate the unsustainable portion of
the U.S. current-account deficit would be to engineer a
major depreciation of the dollar to improve U.S. competi-
tiveness, and thereby boost net exports. A major dollar
depreciation would shift the export-import (Ex-Im) sched-
ule to the right to Ex-Im1 and would to narrow the deficit
from point
A’
to a more sustainable level such as point
B’
.
An even larger dollar depreciation would be needed to shift
the export-import curve to Ex-Im2 to narrow the deficit to
point
C’
.
The problem with this strategy is that it might create other
problems for U.S. policymakers, and in all likelihood, might
fail completely. That is because if the U.S. economy were
already operating at its full employment level of output Y'F,
then a dollar depreciation that shifts the export-import curve
to the right would drive the level of U.S. output past its full
employment potential. Since this would be highly inflation-
ary, the Federal Reserve would need to tighten monetary
policy, perhaps significantly. But if the Federal Reserve
were forced to push U.S. interest rates up sharply, that
would attract capital inflows to the U.S., which would then
strengthen the dollar, thereby offsetting, perhaps com-
pletely, the initial depreciation of the dollar.
A third way to eliminate the unsustainable portion of the
U.S. current-account deficit would be to combine belt-tight-
ening and dollar-depreciation initiatives. A modest belt-tight-
ening move on the fiscal and monetary policy front could
shift the S-I curve to the left to S-I3, while a modest dollar
depreciation could work to shift the export-import curve to
the right to Ex-Im3. The combination of these two policy
actions would leave the equilibrium level of output un-
changed while narrowing the U.S. current-account deficit
to a sustainable level.
Correcting the U.S. Current-Account Deficit—
Belt Tightening vs. Dollar Depreciation
Correcting the U.S. Current-Account Imbalance
via a Weakening of the Dollar
Output
Saving-Investment,
Exports-Imports
C
B’
C’
S-I
0
Ex-Im
2
Ex-Im
1
A’
B
A
Y’
F
Y’’ Y’’’
Ex-Im
0
0
Correcting the U.S. Current-Account Imbalance
via Tighter Fiscal/Monetary Policies
plus a Weakening of the Dollar
Output
Saving-Investment,
Exports-Imports
C
C’
S-I
3
S-I
0
Ex-Im
3
A’
A
Y’
F
Ex-Im
0
0
Correcting the U.S. Current-Account Imbalance
via Tighter Fiscal and Monetary Policies
Output
Saving-Investment,
Exports-Imports
C
B’
C’
S-I
0
S-I
2
S-I
1
Ex-Im
0
A’
B
A
Y’
F
Y’’Y’’’
0
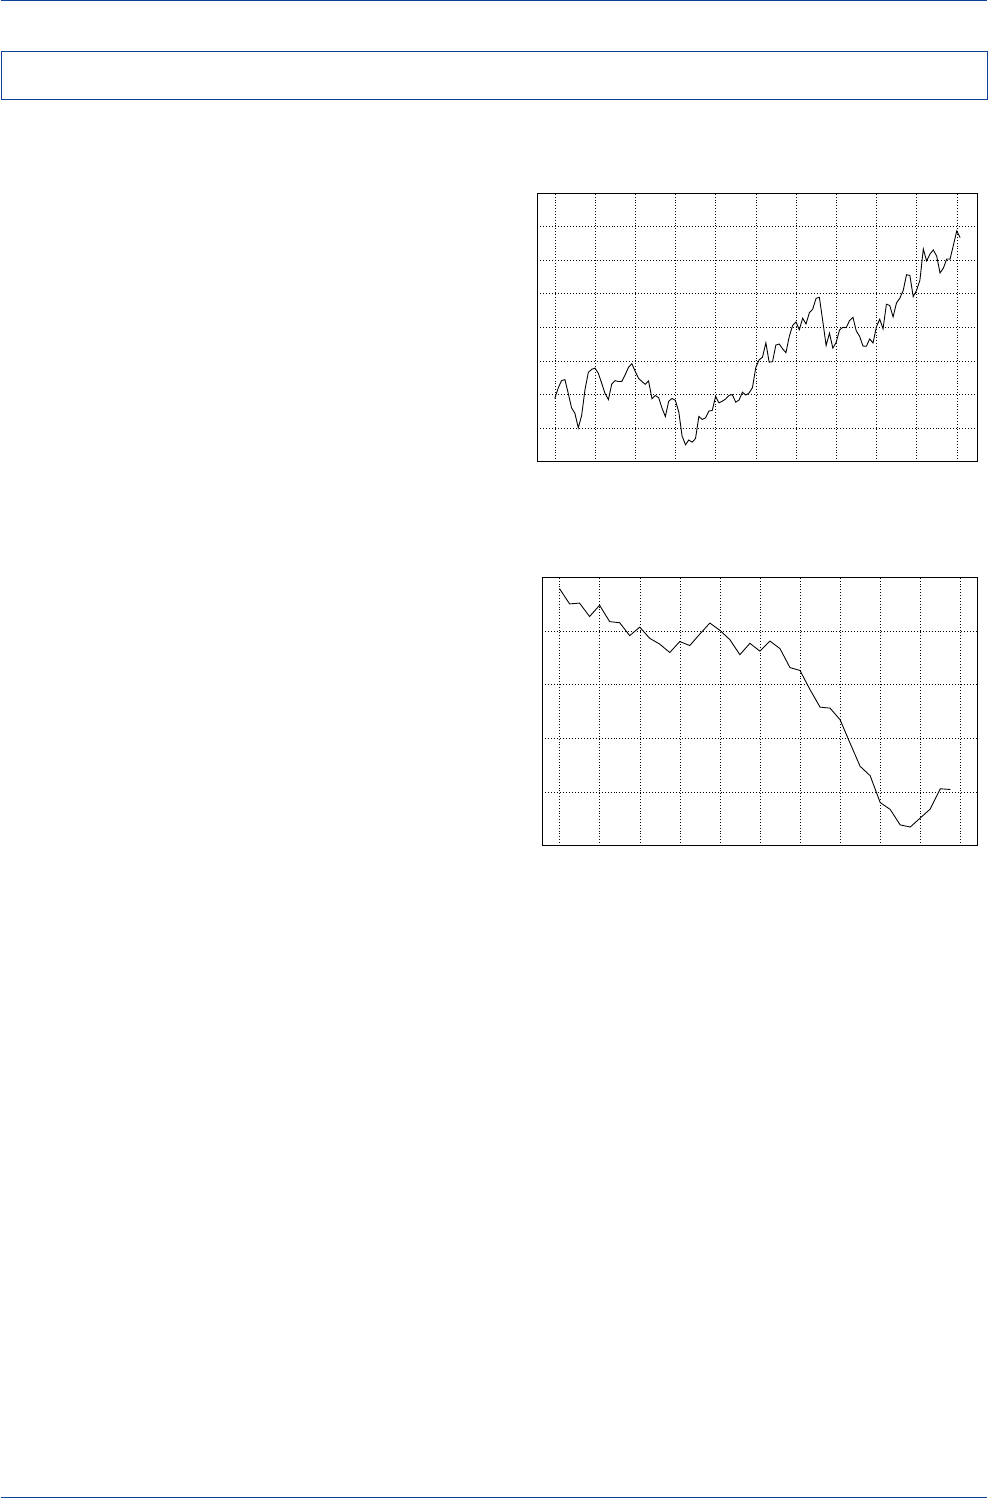
DB Guide to Exchange-Rate Determination
May 2002 Deutsche Bank @
Deutsche Bank Foreign Exchange Research 83
Many pundits have argued that the record deterioration of
the U.S. current-account deficit will inevitably lead to a hard
landing for the dollar. So far it has not.
One possible explanation for the dollar’s resiliency is that
the current-account deterioration might be an
equilibrium
and not a
disequilibrium
phenomenon. If one views U.S.
economic developments from a "New Economy" perspec-
tive, the revolutionary changes in information technology
may have raised both the speed limit on sustainable U.S.
GDP growth and the sustainable U.S. current-account defi-
cit.
With the return on capital on new technology investments
highly attractive, foreign investors have been more than
willing to finance a larger-than-normal gap between U.S.
savings and investment. As a result, the inflow of foreign
capital into the U.S. has exceeded the typical flow of capi-
tal that found its way to the U.S. in the past. Since, by
definition, a country's current-account deficit equals its
capital-account surplus, which also equals its savings-in-
vestment gap, it would appear that the information tech-
nology revolution in the U.S. simultaneously raised both
the speed limit on sustainable U.S. growth and the size of
the sustainable current-account deficit that the U.S. can
safely run without triggering a dollar crisis. In fact, the in-
formation technology revolution, which is presently domi-
nated by U.S. firms, may have lifted the dollar's real long-
run equilibrium level as well.
While it might be true that the size of the sustainable cur-
rent-account deficit has risen, there nevertheless must exist
some threshold level for the U.S. current-account deficit
that would trigger a decline in the dollar’s value. The key
questions for investors then are: (1) what might the new
higher threshold level be, and (2) how soon will it be be-
fore the U.S. current-account deficit crosses that thresh-
old and begins to take its toll on the dollar?
U.S. Dollar Index
75
80
85
90
95
100
105
110
115
1992 1993 1994 1995 1996 1997 1998 1999 2000 2001 2002
US$ Major Currency Index
U.S. Current-Account Balance
-500
-400
-300
-200
-100
0
1992 1993 1994 1995 1996 1997 1998 1999 2000 2001 2002
(US$ bn.) Annualized
U.S. Current-Account Deficit and the Dollar
Source: Datastream
Source: Datastream

DB Guide to Exchange-Rate Determination May 2002
Deutsche Bank @
84 Deutsche Bank Foreign Exchange Research
Based on an analysis of 17 episodes in industrial countries
over the 1980-95 period, Catherine L. Mann (1999) found
that current-account deficits reaching 4.2% of GDP tended
to set forces in motion—including corrective currency ad-
justments—for a reversal of the current-account shortfall.
The U.S. current-account deficit as a percentage of GDP is
presently at 4.1%. If the U.S. economy recovers strongly
over the course of 2002, the U.S. current-account deficit
could widen to as much as 5% of GDP, well above the
4.2% average threshold.
Another study (Caroline L. Freund, 2000) examined a larger
sample of industrial country current-account adjustment
episodes and found that the median current-account defi-
cit/GDP ratio that triggered corrective adjustments in the
current account was around 4.9%. Those results are re-
ported in the table below.
As shown by the median current-account adjustment pro-
cess, an industrial-country deficit of 4.9% of GDP has, in
the past, led to a 19% real depreciation of the deficit
country's currency over a three-year period, with the de-
cline beginning one year prior to the peak in the current-
account deficit and ending about three years after the peak.
In conjunction with a slowdown in domestic demand, the
decline of the currency has typically helped bring about an
83% decline in the current-account imbalance. If the U.S.
conforms to the median episode, and the U.S. current-ac-
count deficit/GDP ratio rises to 5% by year-end 2002, then
the corrective downward adjustment in the dollar's value
(which typically occurs one year prior to the peak in the
deficit) should have started in early 2002.
Estimating the Threshold Level for the U.S. Current-Account Deficit
That Would Trigger a Decline in the Dollar’s Value
Current-Account Adjustment and Real Exchange-Rate Depreciation
(in 25 Episodes of Large Current-Account Adjustments, 1980-1995)
Relative to Peak Deficit Year (t0),
Current Account/GDP Ratio Three-Year Real the Year in which
at Peak 3 Years after Peak Percentage Exchange-Rate Exchange-Rate Depreciation
Date (t0) (t
3) Change Depreciation Began Ended Duration
Australia (1989) -6.2% -3.7% 40% 21% 1 5 4
Austria (1980) -4.9% 0.4% 108% 19% -1 2 3
Belgium (1981) -4.2% -0.1% 98% 51% -3 4 7
Canada (1981) -4.2% -0.4% 91% ----
Canada (1993) -3.9% 0.6% 114% 19% -1 3 4
Denmark (1986) -5.3% -1.0% 81% ----
Finland (1991) -5.5% 1.3% 124% 30% -1 2 3
France (1982) -2.2% 0.0% 100% 15% -1 3 4
Greece (1985) -8.1% -1.5% 82% 21% -2 2 4
Hong Kong (1980) -5.0% 0.6% 111% ----
Ireland (1981) -13.6% -5.6% 59% 41% -2 1 3
Israel (1982) -8.7% 4.8% 155% 14% 2 6 4
Italy (1981) -2.6% -0.8% 70% 12% -1 1 2
Italy (1992) -2.5% 2.3% 194% 28% 0 4 4
Korea (1980) -8.5% -1.8% 78% ----
New Zealand (1984) -13.6% -8.0% 41% 11% -1 1 2
Norway (1986) -6.0% 0.2% 104% 5% -3 1 4
Portugal (1981) -16.8% -2.8% 83% 8% 1 3 2
Singapore (1980) -13.3% -3.5% 74% ----
Spain (1981) -2.9% 1.1% 139% 36% -1 3 4
Spain (1981) -3.8% -1.4% 62% 17% 1 4 3
Sweden (1980) -3.5% -0.8% 77% 20% 1 4 3
Sweden (1992) -3.6% 2.1% 160% 21% 1 4 3
United Kingdom (1989) -4.4% -1.8% 60% 15% 3 5 2
United States (1987) -3.7% -1.7% 56% 34% -1 2 3
Median -4.9% -0.8% 83% 19% -1 3 3
Source: Caroline L. Freund, “Current Account Adjustment in Industrial Countries", Federal Reserve Board, International Finance Discussion Paper, No. 692, December 2000.

DB Guide to Exchange-Rate Determination
May 2002 Deutsche Bank @
Deutsche Bank Foreign Exchange Research 85
After the experiences of the early 1980s and the late 1990s,
when the dollar soared despite the significant widening of
the U.S. current-account deficit, one could make the case
that the U.S. current-account deficit might be overrated as
a key determinant of the dollar. In fact, one could question
whether the measurement problems associated with cur-
rent-account data makes them a reliable measure of U.S.
trade competitiveness.
The reported current-account data omit the contribution
that U.S. foreign affiliates make to the aggregate sales by
U.S. firms in international markets. When allowance is
made for the role played by U.S. foreign affiliates, one finds
that U.S. firms' penetration of foreign markets actually ex-
ceeds the penetration of foreign firms in the U.S. market.
The U.S. Commerce Department reports that worldwide
sales by U.S. companies to foreign residents (which in-
clude U.S. exports plus total sales by U.S. companies' for-
eign affiliates to non-residents) amounted to $3.17 trillion
in 1998 (latest data available), while total sales by foreign
companies to U.S. residents (which include U.S. imports
plus total sales by foreign firms' U.S. affiliates to U.S. resi-
dents) amounted to $2.81 trillion in the same period. That
means that worldwide sales by U.S. companies to foreign
residents exceeded the sales of foreign firms to U.S. resi-
dents by $363 billion. Breaking the data down, the Com-
merce Department notes that of the $3.17 trillion in U.S.
firms' worldwide sales, $930 billion represented U.S. ex-
ports of goods and services, while $2.24 trillion repre-
sented the sales by U.S. firms' foreign affiliates. Of the
$2.81 trillion in foreign companies' sales to U.S. residents,
$1.1 trillion represented U.S. imports of foreign goods and
services, while $1.7 trillion represented the sales by for-
eign firms' U.S. affiliates.
What is clear from the data is that although U.S. imports
($1.1 trillion) exceeded U.S. exports ($930 billion), leaving
a wide U.S. trade deficit of $167 billion, the sales of U.S.
firms' foreign affiliates ($2.24 trillion) far exceeded the sales
of foreign firms' U.S. affiliates ($1.71 trillion), leaving a U.S.
surplus on foreign affiliate operations of $530 billion.
Overall, despite the fact that the U.S. runs a large trade
deficit, U.S. firms have had greater success in terms of
penetrating foreign markets than foreign firms have had in
penetrating the U.S. market. The data show that, at the
margin, U.S. firms tend to accommodate foreign demand
through their overseas affiliates (71% of worldwide sales)
rather than through outright exports from the U.S. (only
29% of worldwide sales). In contrast, foreign firms, at the
margin, tend to rely more on exports to the U.S. (39% of
their U.S. sales) and a bit less on their U.S.-based affiliates
(61% of their U.S. sales) to accommodate demand in the
U.S. market.
What does this all imply for the U.S. current-account
deficit's impact on the dollar? Does the dollar need to de-
cline in order to balance U.S. exports and imports? Does
the dollar have to be penalized because U.S. firms tend to
accommodate foreign demand more through their over-
seas affiliates than via direct exports, particularly given the
fact that U.S. firms do a better job in the aggregate than
their foreign counterparts in terms of penetrating the
other's market? Or should the dollar be rewarded to re-
flect the global reach and strength that U.S. firms exhibit
in the market?
Worldwide Sales by U.S. Companies versus
Foreign Companies’ Sales to the U.S.
(Latest Data, 1998)
(US$ Billions)
Worldwide Sales Sales by Foreign
by U.S. Firms Firms to the U.S. Difference
Total $3,173 $2,810 +$363
Sales by
Foreign Affiliates $2,240 (71%) $1,710 (61%) +$530
Exports $933 (29%) $1,100 (39%) -$167
Source: U.S. Commerce Department
Is the U.S. Current-Account Balance a Reliable Measure of
U.S. Trade Competitiveness?
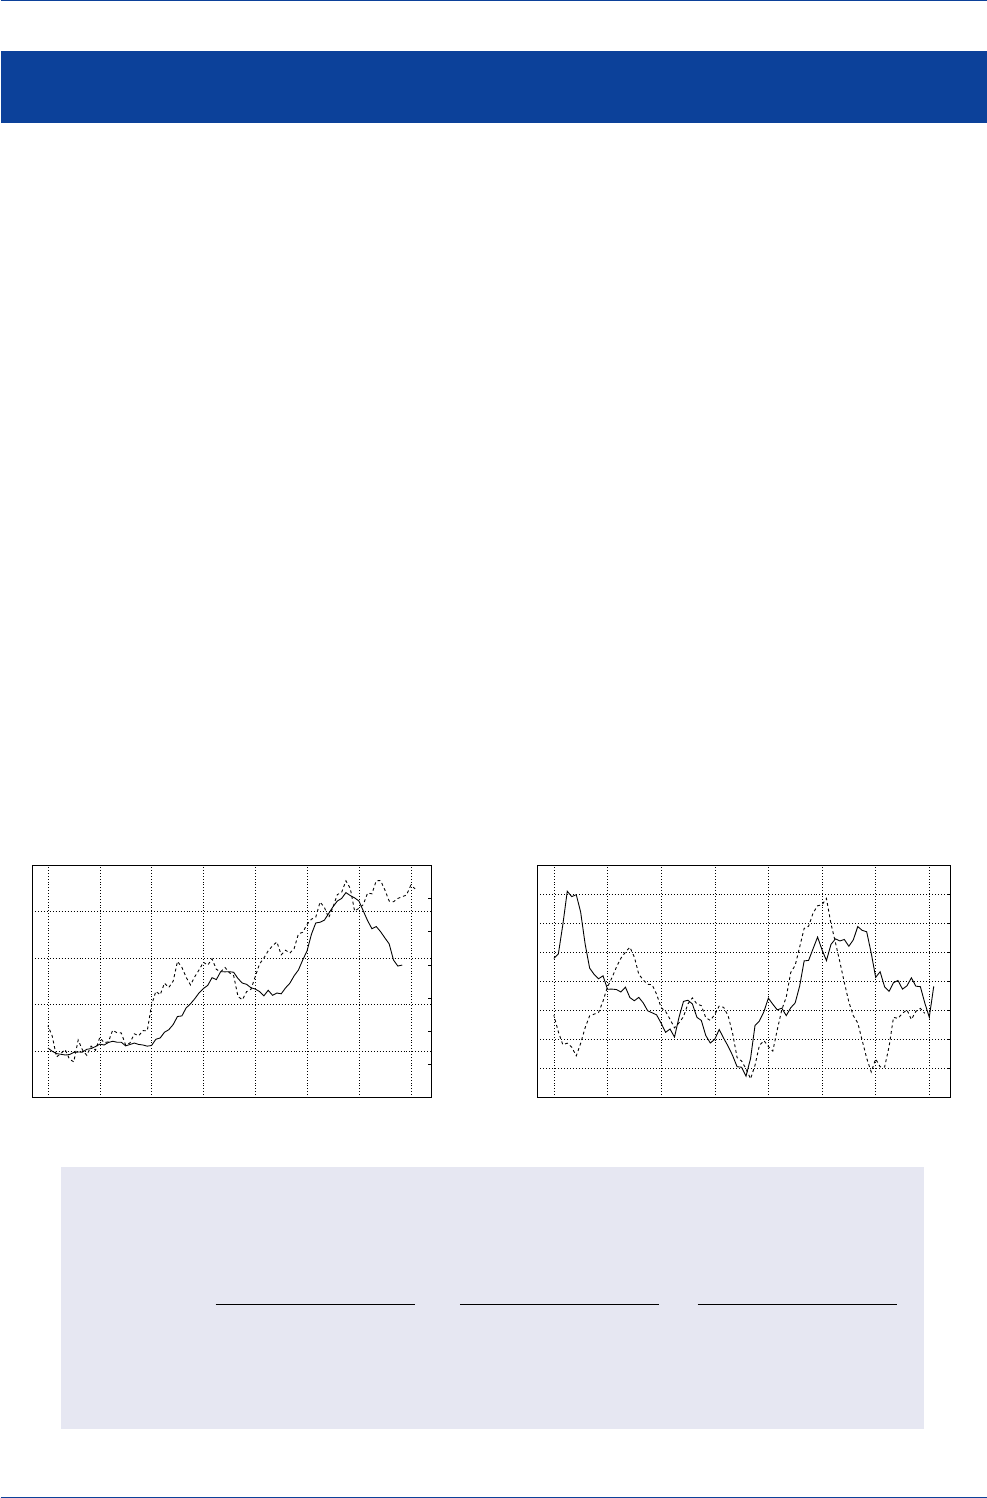
DB Guide to Exchange-Rate Determination May 2002
Deutsche Bank @
86 Deutsche Bank Foreign Exchange Research
Greater financial integration of the world's capital markets
and the increased freedom of capital to flow across na-
tional borders have increased the importance of financial
flows in the determination of exchange rates. The rise in
the dollar's value in recent years was largely driven by
strong increases in the demand for U.S. assets by over-
seas investors. For example, Euroland investors had been
structurally underweight equities for a long time, but be-
ginning in the late 1990s they started to shift their portfo-
lio allocations away from bonds and toward equities. Within
their rising equity holdings, European investors also made
the decision to increase the percentage allocated to U.S.
equities and reduce the percentage allocated to Euroland
equities. Overall, there was a marked rise in European in-
vestors' demand for U.S. equities in 1999-2001 that helped
lift the dollar versus the euro.
Foreign demand for Japanese equities has also played a
role in influencing the medium-term direction of the yen.
The yen's weakness over the 1995-98 period coincided
with declining foreign demand for Japanese equities, and
the yen's subsequent rebound in late 1998 and in 1999
coincided with a rise in foreign demand for Japanese equi-
ties. The drop-off in foreign demand for Japanese equities
in 2000-01 coincided with a sharp decline in the yen's value.
Foreign direct investment (FDI) and portfolio capital flows
were highly positive for the dollar and negative for the euro
in the past few years. As shown in the table below,
Euroland's overall balance of payments was in huge defi-
cit—because of sizable FDI and portfolio outflows from
Euroland—which is in stark contrast to the U.S. and Japa-
nese overall balance of payments surpluses.
Although the U.S. has seen its current-account deficit
double between 1998 ($217 billion) and 2000 ($435 bil-
lion), the U.S. over the same period was the recipient of
massive FDI and portfolio inflows, which exceeded the size
of the U.S. current-account deficit. As a result, the U.S.
overall balance of payments swung from a deficit of $43
billion in 1998 to a surplus of $52 billion in 2000.
In contrast, Euroland saw its current account swing from
a surplus to a deficit position, while FDI and portfolio flows
recorded large outflows as well. As a result, Euroland ran
overall balance of payments deficits averaging $173-$183
billion per annum in 1998-2000, which weighed heavily on
the euro during this period.
European Investor Demand for U.S. Equities
and the U.S. Dollar/Euro Exchange Rate
(12-Month Moving Sum of Net Equity Purchases)
(1.50)
(1.40)
(1.30)
(1.20)
(1.10)
(1.00)
(0.90)
(0.80)
-50
0
50
100
150
200
1995 1996 1997 1998 1999 2000 2001 2002
US$/Euro(reverse scale)----European Net Purchases(US$ bn.)____
The Japanese Yen and
Foreign Investor Demand for Japanese Equities
(12-Month Moving Sum of Net Equity Purchases)
-20
0
20
40
60
80
100
120
140
100
110
120
130
140
150
160
170
180
1995 1996 1997 1998 1999 2000 2001 2002
Foreign Net Purchases(US$ bn.)----Yen Effective Rate____
U.S., Euroland, and Japanese Balance of Payments
(1998-2000)
(US$ Billions)
Current Account FDI and Portfolio Flows Overall Balance of Payments
1998 1999 2000 1998 1999 2000 1998 1999 2000
U.S. -217 -331 -435 174 338 487 -43 7 52
Euroland 35 -7 -32 -218 -166 -144 -183 -173 -176
Japan 120 109 118 -63 -36 -60 57 73 58
Source: DatastreamSource: Datastream
Capital Flows and Exchange Rates

DB Guide to Exchange-Rate Determination
May 2002 Deutsche Bank @
Deutsche Bank Foreign Exchange Research 87
Despite all of the attention that capital flows receive in the
FX market, there has not been much rigorous empirical
testing to determine whether these flows have a statisti-
cally significant and quantitatively important impact on
exchange rates, at least until lately. The International Mon-
etary Fund recently published a report examining the im-
pact that capital flows have had on the euro and the yen in
the past decade. The IMF examined the trend in capital
flows and other relevant indicators to determine whether
they had statistically significant and quantitatively impor-
tant effects on exchange rates. The IMF's findings (based
on an analysis of exchange rates over the 1988-2000 pe-
riod) can be summarized as follows:
(1) "There is evidence that equity flows matter for the euro-
dollar rate, but not for the yen-dollar rate."
(2)Relative expected current and future growth rates de-
rived from Consensus Economic Forecasts are cor-
rectly signed and statistically significant in explaining
the euro, but not the yen.
(3)Relative equity returns are not statistically significant
in explaining either the euro or the yen.
(4)Bilateral current-account trends vis-à-vis the U.S. are
not statistically significant in explaining either the
euro's or the yen's trend. However, the IMF notes that
when multilateral, and not bilateral, current-account
positions were investigated, there was some evidence
of a positive effect of current-account trends on ex-
change rates.
(5)"There is little evidence that merger and acquisition
flows are important for exchange-rate determination.
The coefficients on net foreign direct-investment (FDI)
flows are correctly signed, but statistically insignifi-
cant for both the euro and yen." These results are con-
sistent with the view that "the majority of cross-bor-
der merger and acquisition flows are financed through
share-swaps that have no immediate impact on the
demand for currencies."
(6)"Net bond flows appear to have no significant effect
on the euro- or yen-dollar rate."
(7) "The movements of the euro-dollar and yen-dollar ex-
change rates are significantly correlated with the long-
term interest-rate differential, but not their short-term
equivalent." The IMF did note, however, that in the case
of the euro, the explanatory power of the long-term
spread is weaker than that for equity flows.
IMF Analysis of Factors That Explain Movements
in the Euro and the Yen versus the U.S. Dollar
(1988-2000)
Euro Yen
Coefficient Coefficient
Current Account & Capital Flows
Current Account Insignificant Insignificant
Capital Account
Net Bond Flows Insignificant Incorrect Sign
Net Equities Flows Significant Insignificant
Foreign Direct Investment Insignificant Insignificant
Traditional Underlying Factors
Long-Term Interest Differential Significant Significant
(Marginally)
Short-Term Interest Differential Insignificant Insignificant
Relative Current Growth Insignificant Insignificant
Alternative Underlying Factors
Relative Stock Returns Insignificant Insignificant
Relative Expected Growth Significant Insignificant
Note: Coefficients of regression of change in the logarithm of the U.S. dollar exchange
rate on a constant and the contemporaneous value of the explanatory variable using
quarterly data since 1988. Significant denotes that the variable was both statistically
significant and had the correct sign. All other variables were not statistically significant.
Source: Robin J. Brooks, Hali Edison, Manmohan S. Kumar, Torsten M. Slok,
"Exchange Rates and Capital Flows", International Monetary Fund,
Research
Department Series, Working Paper,
No. 01/190, May 2000, available on the IMF's
Web site (www.imf.org).
The IMF concluded that its findings were "supportive of
the new conventional wisdom that net equity flows are
important for the euro-dollar exchange rate, although long-
term interest-rate differentials also appear to matter. For
the yen, however, there is little evidence that net equity
flows have been an important determinant of the bilateral
exchange rate with the U.S. dollar." The IMF noted that the
importance of equity flows for the euro might stem from
the fact that European investors might have been diversi-
fying their portfolios away from intra-European investments
to U.S. equity investments. The IMF warned that if such
portfolio adjustments are not yet complete, then the euro
could remain weak for some time until European portfo-
lios are completely rebalanced.
Capital Flows and Exchange Rates: Empirical Evidence

DB Guide to Exchange-Rate Determination May 2002
Deutsche Bank @
88 Deutsche Bank Foreign Exchange Research
Correlation Between Equity Market Trends
and Exchange Rates
(Daily, Weekly, Monthly, and Quarterly Data)
(January 1983-May 2000)
Equity Market/ Correlation Coefficient
Exchange Rate Daily Weekly Monthly Quarterly
Dow Jones/
US$ Index 0.03 0.04 0.04 0.11
Dow Jones-Nikkei/
Yen/US$ 0.04* 0.07* 0.08 0.11
Dow Jones-DAX/
DM/US$ 0.17** -0.15** -0.25** -0.22**
* Statistically significant at 5% level
** Statistically significant at 1% level
Source: BIS Quarterly Review, August 2000
Correlation Between International Portfolio
Equity Flows and Exchange Rates
(Monthly Data)
(January 1983-May 2000)
Equity Market Flows/
Exchange Rate Correlation Coefficient
U.S.-Japan Equity Flows/
Yen/US$ 0.04
U.S.-European Flows/
DM/US$ 0.05
Japan-European Flows/
Yen/DM -0.26
Source: BIS Quarterly Review, August 2000
Given the surge in the U.S. equity market in the second
half of the 1990s, many observers have naturally associ-
ated the rise in the dollar's value over this period with the
increase in U.S. equity values. Appearances, however, can
be deceiving. As the Bank of International Settlements
reports in its August 2000
BIS Quarterly Review
, "There is
little evidence of a robust significant correlation between
stock market indices and the major exchange rates." The
BIS finds that the "correlation coefficient for the Dow Jones
index and the nominal effective dollar rate is positive but
very small and not statistically significant."
The BIS also reports that "a similar result holds for the co-
movement of the return on the Dow Jones relative to the
Nikkei and the percentage change of the bilateral yen/dol-
lar rate." What was particularly surprising regarding the BIS
findings was that "the correlation between the return on
the Dow Jones relative to Germany's DAX equity index
and movements in the Deutschemark/U.S. dollar exchange
rate was negative and statistically significant." In other
words, when the U.S. equity market has risen relative to
the German equity market, the dollar has tended to fall,
not rise in value versus the Deutschemark, as conventional
reasoning would have suggested.
Not only did the BIS find a weak relationship between eq-
uity indices and exchange-rate movements, it also found a
weak relationship between international portfolio equity
flows and the trend in exchange rates. The correlation be-
tween U.S./Japan equity flows and the Japanese yen/U.S.
dollar exchange rate was close to zero, as was the correla-
tion between U.S./European equity flows and the Deut-
schemark/U.S. dollar exchange rate. Contrary to conven-
tional wisdom, the BIS found that the yen tended to
strengthen versus the Deutschemark when equity flows
moved in favor of Europe, although the reported correla-
tion coefficient was not statistically significant.
Given the historically weak relationship between equity-
market trends and exchange rates, why has the foreign-
exchange market become so fixated on equity-market de-
velopments? One reason may be that in the late 1990s
the correlation between the Dow Jones Industrial Aver-
age and the dollar was in fact highly positively correlated
(even though the long-run correlation between the Dow
Jones index and the dollar has averaged close to zero).
The high correlation in the late 1990s may have led market
observers to believe that this trend would continue into
the future. This proved not to be the case over the 2000-01
period, however, as the correlation between the Dow Jones
index and the dollar plummeted.
Correlation of U.S. Equity Prices & the Dollar
(Rolling Six-Mo. Correlation of Log Differences
of Daily Dow Jones Ind. & US$ Trade Wgt Indices)
-0.3
-0.2
-0.1
0.0
0.1
0.2
0.3
0.4
0.5
1993 1994 1995 1996 1997 1998 1999 2000 2001 2002
Correlation Coefficient (Month-end Values)
Equity-Market Trends and the Dollar
Source: Datastream
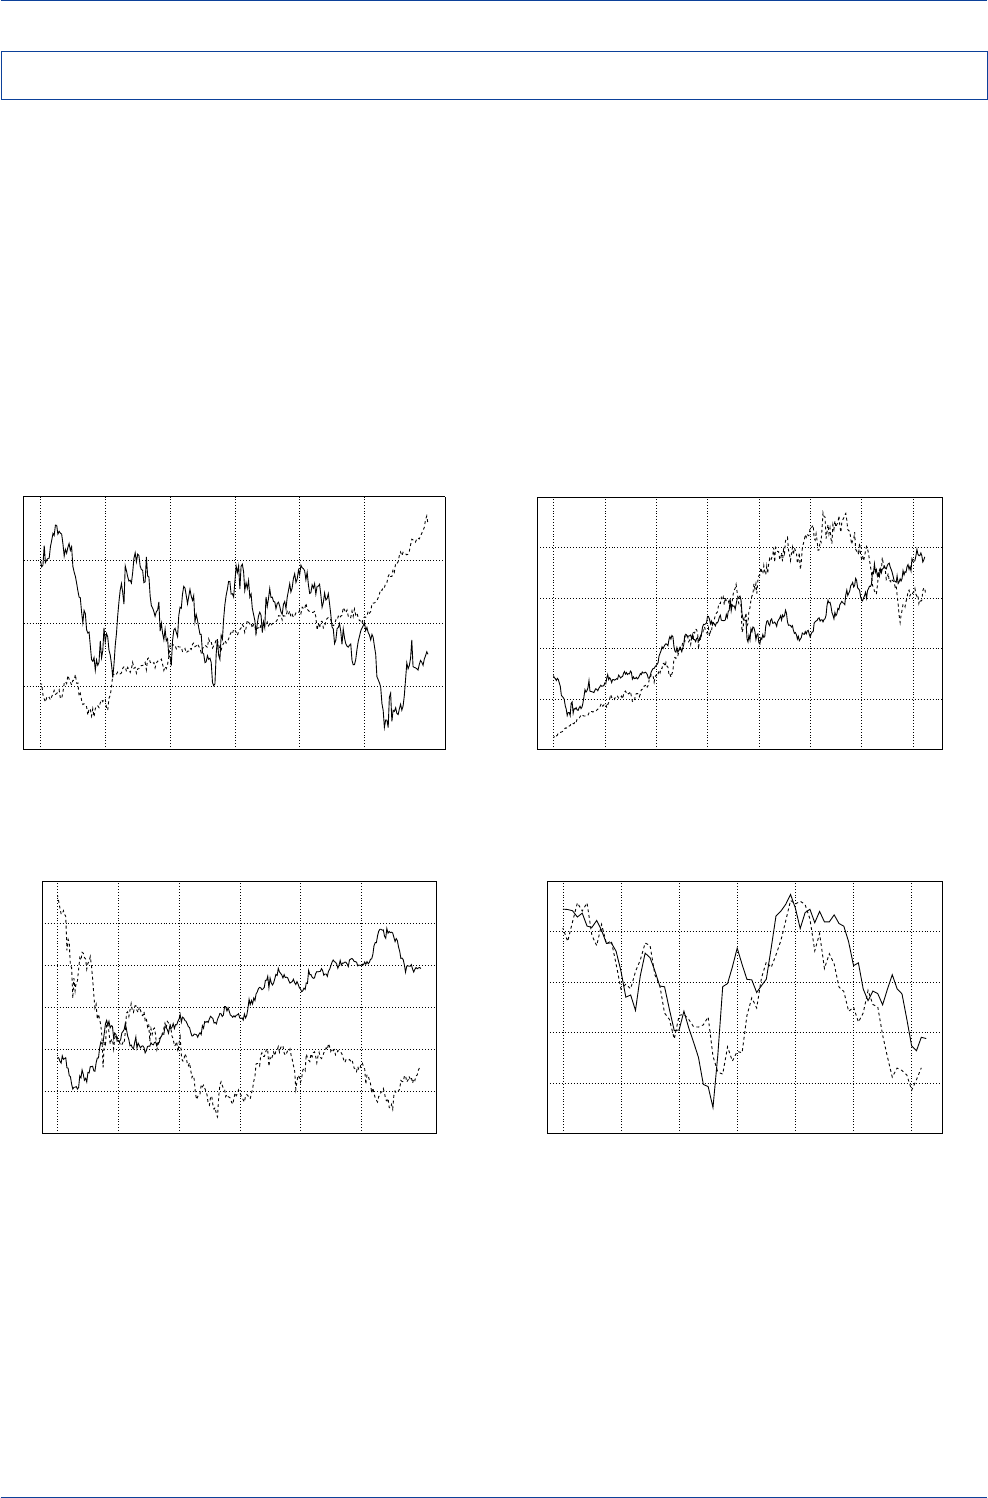
DB Guide to Exchange-Rate Determination
May 2002 Deutsche Bank @
Deutsche Bank Foreign Exchange Research 89
Although exchange rates and equity markets will move in
sync from time to time, the relationship between equity-
market trends and exchange rates is not stable. For in-
stance, between 1990 and 1995, the U.S. dollar fell de-
spite a strongly performing U.S. equity market, while the
Japanese yen soared despite a weakly performing equity
market. In both cases the correlation between local eq-
uity-market performances and the local currency's value
was negative. In contrast, between 1995 and 2001, the
correlation between local equity-market performances and
the local currency's value turned highly positive. The U.S.
dollar soared in tandem with a rising U.S. equity market,
at least up until late 1999, while the yen weakened in tan-
dem with a trend decline in the Japanese equity market.
Such instability makes it difficult to form judgments on pos-
sible future currency moves based solely on expected eq-
uity-market performances.
The Dollar and U.S. Equity Prices
(1990-1995)
250
300
350
400
450
500
550
600
650
75
80
85
90
95
1990 1991 1992 1993 1994 1995
S&P 500 Index----US$ Index____
The Yen and Japanese Equity Prices
(1990-1995)
1000
1500
2000
2500
3000
(180)
(160)
(140)
(120)
(100)
(80)
(60)
1990 1991 1992 1993 1994 1995
TOPIX Index----
Y
en/US$(reverse scale)____
The Yen and Japanese Equity Prices
(1996-2002)
800
1000
1200
1400
1600
1800
(150)
(140)
(130)
(120)
(110)
(100)
1996 1997 1998 1999 2000 2001 2002
TOPIX Index----
Y
en/US$(reverse scale)____
The Dollar and U.S. Equity Prices
(1995-2002)
400
600
800
1000
1200
1400
1600
70
80
90
100
110
120
1995 1996 1997 1998 1999 2000 2001 2002
S&P 500 Index----US$ Index____
Source: Datastream Source: Datastream
Source: Datastream Source: Datastream
Equity-Market Trends and Exchange Rates—An Unstable Relationship
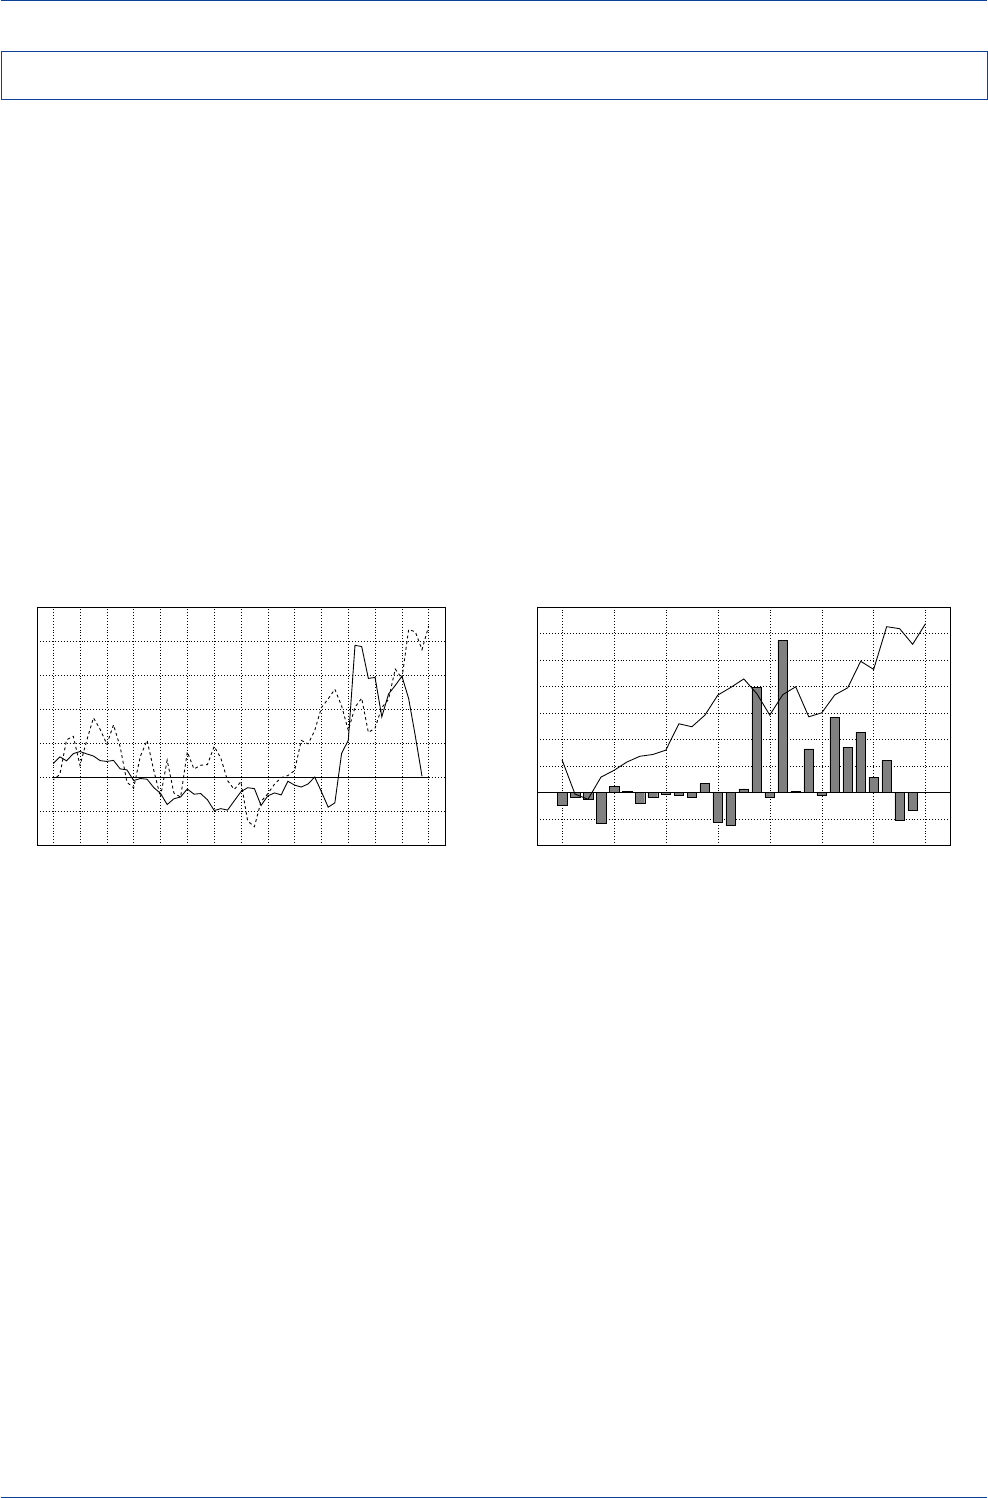
DB Guide to Exchange-Rate Determination May 2002
Deutsche Bank @
90 Deutsche Bank Foreign Exchange Research
The market's recent fixation with foreign direct investment
flows as an explanatory variable in projecting future ex-
change-rate movements is a phenomenon that derives
largely from recent large acquisitions of U.S. firms by Eu-
ropean corporates and the surge in the dollar that appeared
to accompany those acquisitions. But the relationship be-
tween FDI flows and the dollar is not robust over time.
If one plots the trend in the U.S. dollar trade-weighted in-
dex against the smoothed trend (four-quarter moving sum)
in U.S. net FDI over the 1988-2000 period, a careful read-
ing of that plot would reveal that U.S. net FDI flows were
actually negative from 1991 to mid-1998, yet the dollar was
strong during a considerable portion of that time. Mean-
while, quarterly data reveal that net FDI flows were quite
large in the fourth quarter of 1998, yet the dollar fell during
that period.
Since then, FDI flows have been quite volatile—large in
one quarter and then modest in the following quarter. The
trend in the dollar has clearly not moved in sympathy with
this quarterly pattern in net FDI flows during the past two
years. Indeed, the correlation between quarterly net FDI
flows and the dollar's value since 1981 is a low 0.05.
U.S. Annual Net FDI and the Dollar
(Net Foreign Direct Investment, 4-Qtr. Mov. Sum)
(1988-2002)
75
80
85
90
95
100
105
110
-100
-50
0
50
100
150
200
250
88 89 90 91 92 93 94 95 96 97 98 99 00 01 02
US$ Index----
A
nnual Net FDI(US$ bn.)____
U.S. Quarterly Net FDI and the Dollar
(Net Foreign Direct Investment)
(1995-2002)
70
80
90
100
110
-40
-20
0
20
40
60
80
100
120
140
1995 1996 1997 1998 1999 2000 2001 2002
US$ Index(line)Quarterly Net FDI(US$ bn.)(bars)
Foreign Direct Investment Flows and Exchange Rates
Source: Datastream Source: Datastream
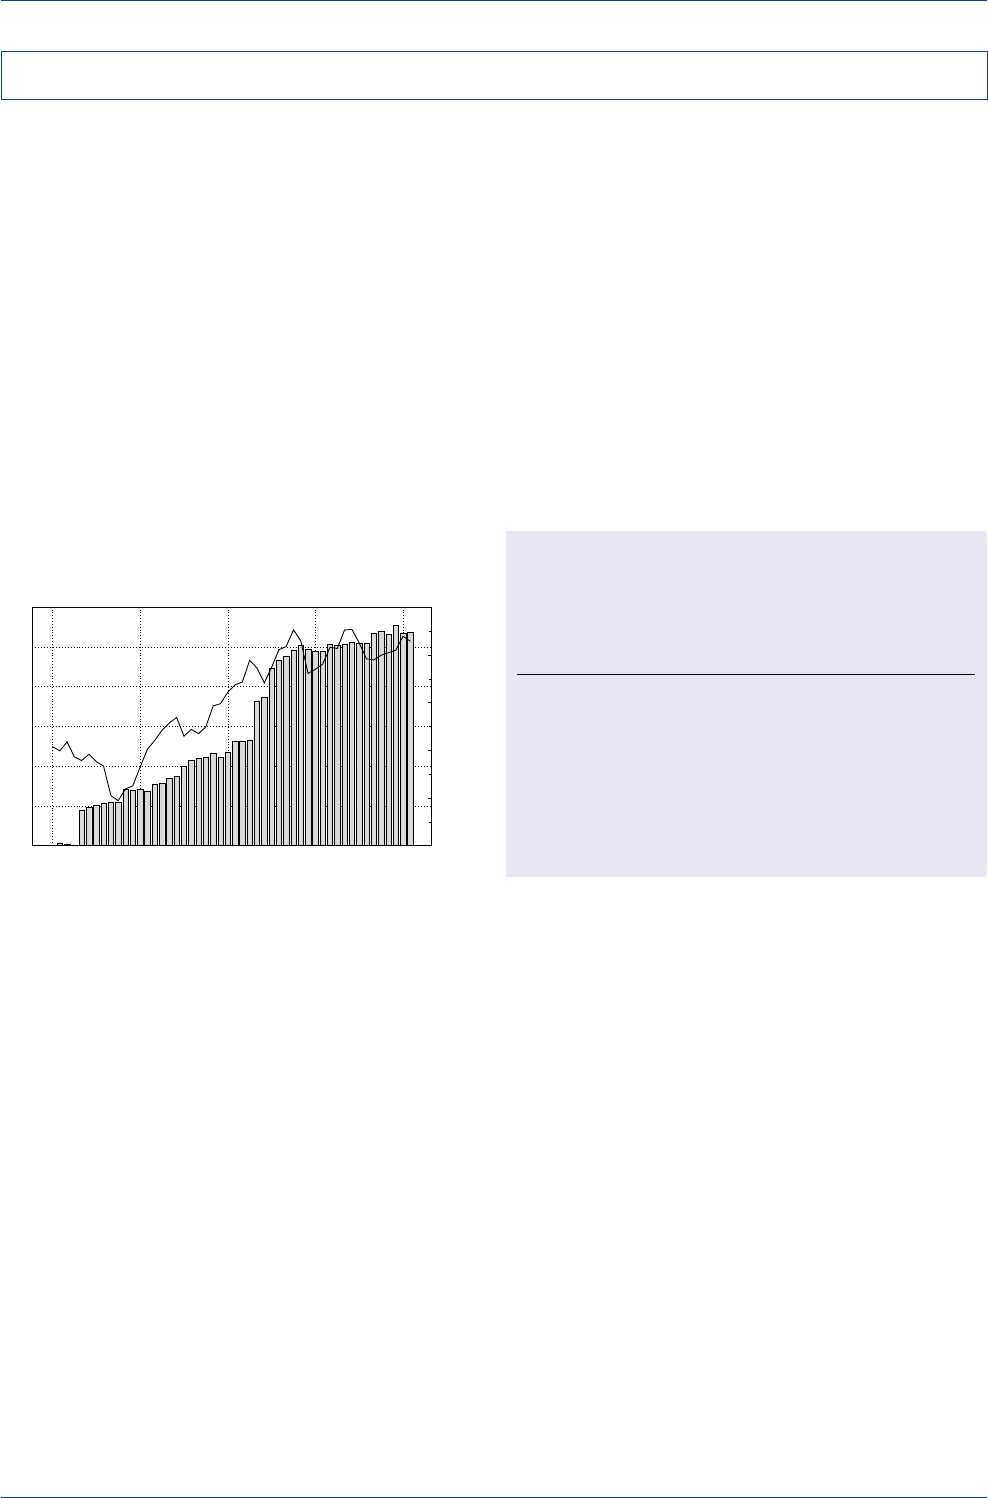
DB Guide to Exchange-Rate Determination
May 2002 Deutsche Bank @
Deutsche Bank Foreign Exchange Research 91
A recent BIS study entitled "The Impact of Transatlantic
M&A Activity on the Dollar/Euro Exchange Rate" finds that
over the 1999-2000 period, M&A announcements of Eu-
ropean firms' acquisitions of U.S. firms had a statistically
significant impact on the dollar's value versus the euro,
and that the size of this impact was independent of how
the deal was financed. Interestingly, M&A deals involving
U.S. firms' acquisitions of Euroland firms were found not
to have a statistically significant impact on the dollar's value
versus the euro.
This asymmetric response suggests that the influence of
M&A deals on the dollar's value over the 1999-2001 pe-
riod may have less to do with the FX flows, if any, gener-
ated by such deals, and more to do with the way the mar-
ket perceived the underlying rationale for those deals. That
is, the market may have perceived the steady acquisition
of U.S. firms by Euroland firms as a sign that Euroland
firms had greater confidence in the long-run growth pros-
pects of the U.S. relative to Euroland. The fact that the
pace of transatlantic activity slowed sharply in 2001, yet
the dollar remained remarkably resilient, suggests that the
linkage between M&A activity and the dollar may be less
robust when viewed over longer time horizons.
Estimates of the Effect of M&A Flows
on the U.S. Dollar/Euro Exchange Rate
(January 1999-September 2001)
Coefficient
(t-Statistic)
Current and Lagged M&A Flows into Euroland +0.346
(1.55)
Current and Lagged M&A Flows into U.S. -0.481*
(-2.52)
Note: * denotes that the variable was statistically significant and had the correct sign.
Source: Ingo Fender and Gabriele Galati, “The Impact of Transatlantic M&A Activity
on the Dollar/Euro Exchange Rate”,
BIS Quarterly Review
, December 2001.
Merger & Acquisition Flows and the Dollar
(Cumulative Net Flow from Euroland to the U.S.)
(1998-2002)
(1.30)
(1.20)
(1.10)
(1.00)
(0.90)
(0.80)
0
50
100
150
200
250
300
1998 1999 2000 2001 2002
US$/Euro(reverse scale)(line)M&A Flows(US$ bn.)(bars)
Merger and Acquisition Flows and the Dollar—1999-2001
Source: Bloomberg, Datastream
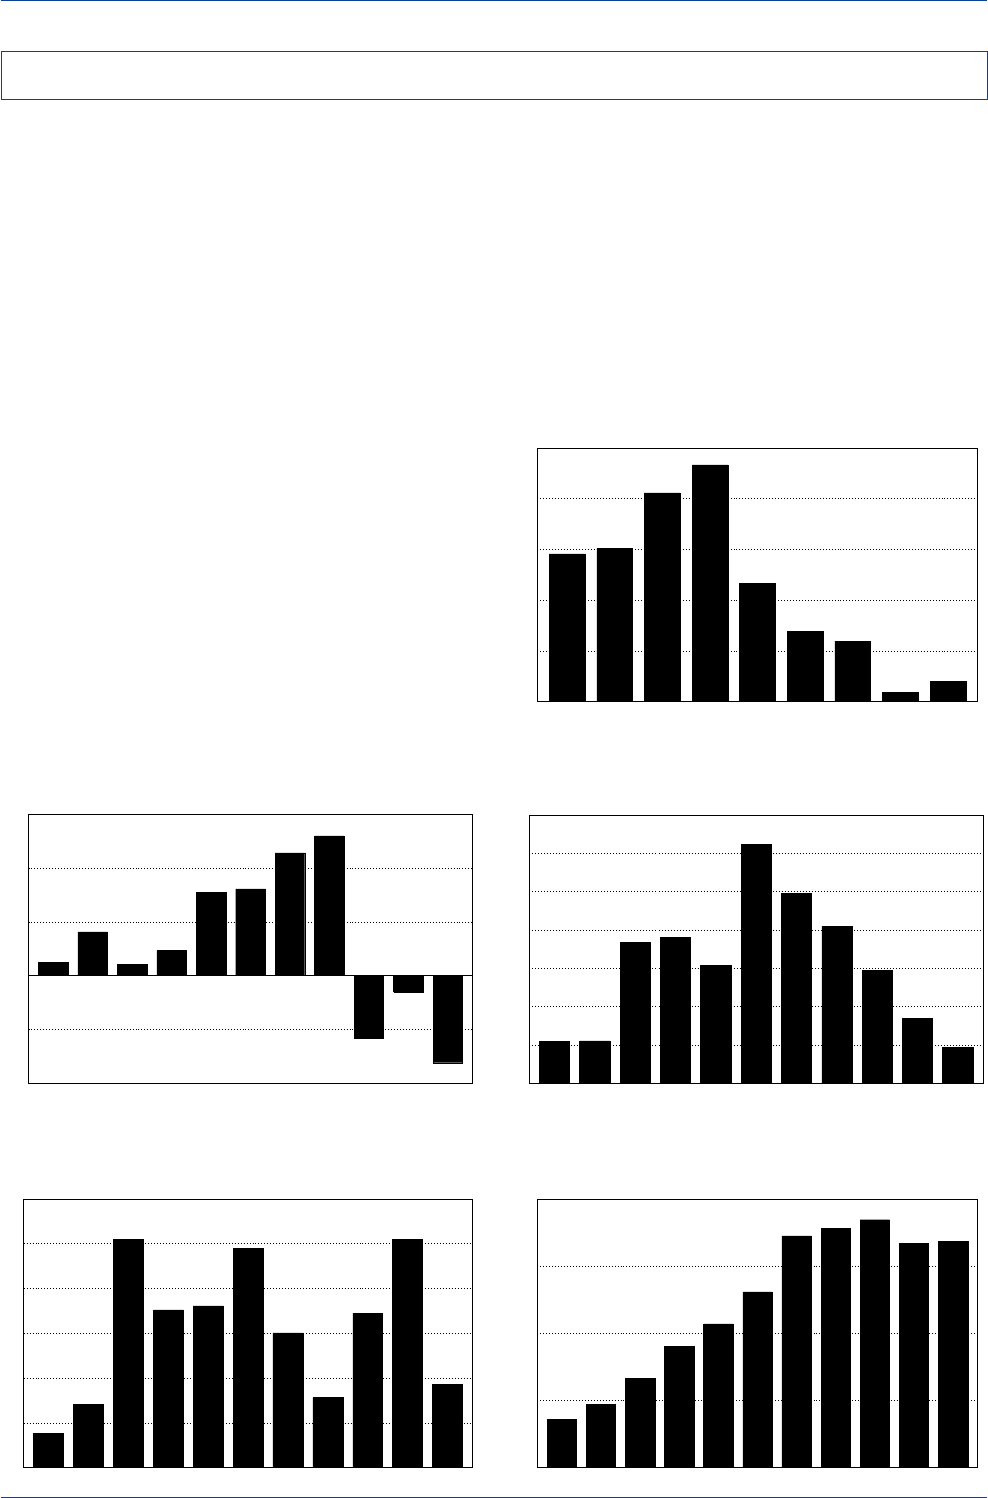
DB Guide to Exchange-Rate Determination May 2002
Deutsche Bank @
92 Deutsche Bank Foreign Exchange Research
It is widely recognized that part of the dollar's strengthen-
ing trend in recent years can be explained by the dramatic
surge in foreign direct investment and portfolio flows into
the U.S. from overseas markets. Many assume that this
surge in capital inflows reflected a newfound optimism in
the health and vigor of the U.S. economy and financial
markets. While this is undoubtedly true, it may also be the
case that a significant portion of the capital flow that has
found its way to the U.S. simply reflected capital flight from
other parts of the world, notably emerging markets.
The evidence suggests that a series of crises in emerging
markets—from Asia to Russia to Brazil to Turkey to Argen-
tina—persuaded investors to exit from emerging-market
investments and look for more stable returns in the indus-
trialized markets. Given the U.S. dollar's dominant posi-
tion as a global medium of exchange and store of value,
the U.S. naturally benefited from that capital flight. Net
private capital flows into emerging markets peaked at $233
billion in 1996, just prior to the Asian financial crisis of 1997.
Since then, private capital flows to emerging markets have
plummeted, with the 2000 inflow amounting to only $9.0
billion.
As the charts below indicate, net FDI flows into emerging
markets did not change much over the 1997-2001 period.
Net FDI inflows remained stable, averaging around $170
billion per annum. Where there was a striking change in
the path of capital flows was in the bond financing and
bank lending areas. Bank lending plummeted from an in-
flow of $51.9 billion in 1998 to an outflow of $32.3 billion in
2001. Bond financing flows fell from a high of $62.3 billion
in 1996 to a mere $9.5 billion in 2001.
The Impact of Emerging-Market Capital Flight on the Dollar—1997-2001
Capital Flows into Emerging Markets
(Net Private Capital Flows)
20.1
8.9
59.6
69.6
116.8
233.2
205.7
151.3
145.6
0
50
100
150
200
250
1993 1994 1995 1996 1997 1998 1999 2000 2001e
(US$ bn.)
Source: IMF World Economic Outlook,
December 2001
Bond Flows into Emerging Markets
9.5
16.9
29.5
40.9
49.6
62.3
30.7
38.1
36.7
11.1
11.0
0
10
20
30
40
50
60
70
1991 1992 1993 1994 1995 1996 1997 1998 1999 2000 2001e
(US$ bn.)
Source: World Bank
Equity Flows into Emerging Markets
18.5
50.9
34.5
15.6
30.1
48.9
36.1
35.2
51.0
14.1
7.6
0
10
20
30
40
50
60
1991 1992 1993 1994 1995 1996 1997 1998 1999 2000 2001e
(US$ bn.)
Source: World Bank
FDI Flows into Emerging Markets
168.2
166.7
184.4
178.3
172.5
130.8
106.8
90.0
66.6
47.1
35.7
0
50
100
150
200
1991 1992 1993 1994 1995 1996 1997 1998 1999 2000 2001e
(US$ bn.)
Source: World Bank
Banking Flows into Emerging Markets
-32.3
-6.1
-23.3
51.9
45.6
32.2
30.9
9.3
4.1
16.3
5.0
-40
-20
0
20
40
60
1991 1992 1993 1994 1995 1996 1997 1998 1999 2000 2001e
(US$ bn.)
Source: World Bank
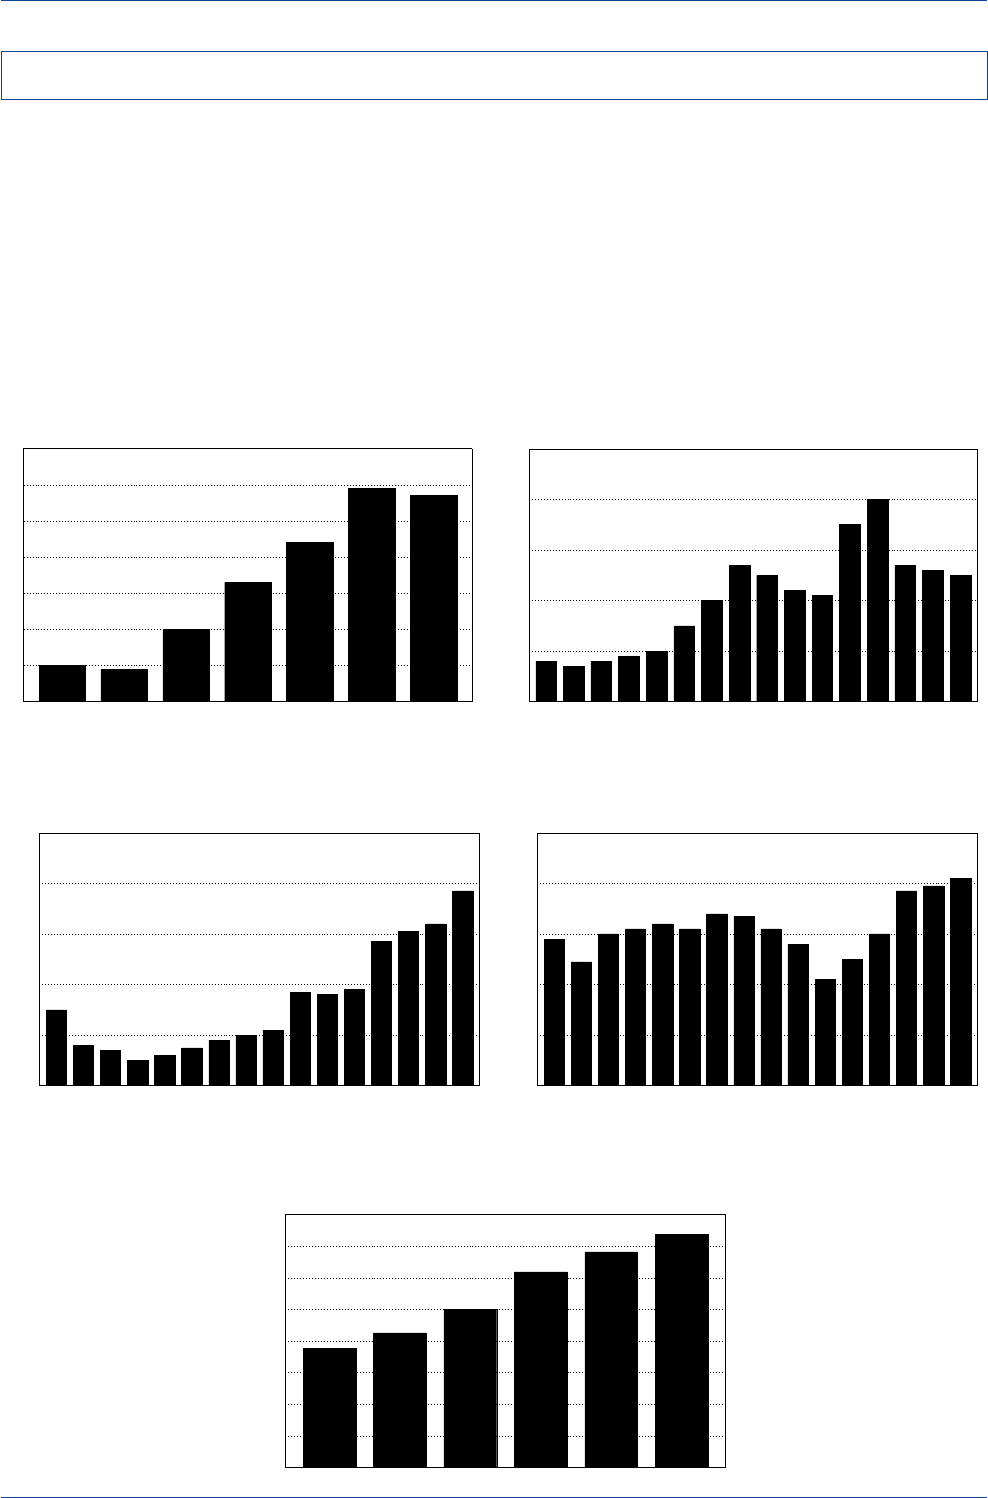
DB Guide to Exchange-Rate Determination
May 2002 Deutsche Bank @
Deutsche Bank Foreign Exchange Research 93
The 1997-2001 episode did not mark the first time that
capital flight from emerging markets has played an impor-
tant role in contributing to a major rise in the dollar's value.
A similar development occurred in the first half of the 1980s
when the dollar underwent a dramatic upside overshoot
that could not be adequately explained by U.S., European,
or Japanese economic fundamentals.
One reason the dollar might have overshot its equilibrium
level in 1982-85 was that the U.S. had become a major
recipient of massive capital flight from Latin America fol-
lowing the onset of the Latin American debt crisis in 1982.
Evidence on Latin American capital flight and dollarization
ratios indicates that a large and sustained increase in the
demand for dollars by Latin American residents occurred
at that time.
Argentina’s Dollarization Ratio
(1979-1985)
0
10
20
30
40
50
60
70
1979 1980 1981 1982 1983 1984 1985
(%)
Source: IMF
Mexico’s Dollarization Ratio
(1970-1985)
0
10
20
30
40
50
70 71 72 73 74 75 76 77 78 79 80 81 82 83 84 85
(%)
Peru’s Dollarization Ratio
(1970-1985)
0
20
40
60
80
100
70 71 72 73 74 75 76 77 78 79 80 81 82 83 84 85
(%)
Source: IMF
Uruguay’s Dollarization Ratio
(1970-1985)
0
20
40
60
80
100
70 71 72 73 74 75 76 77 78 79 80 81 82 83 84 85
(%)
Source: IMF
The Latin American Debt Crisis and the Surge of the Dollar—1982-85
Capital Flight from Developing Countries
(1980-1985)
147.5
136.4
123.8
99.9
85.2
75.4
0
20
40
60
80
100
120
140
160
1980 1981 1982 1983 1984 1985
(US$ bn.)
Source: Liliana Rojas Suarez,
"Risk & Capital Flight in Developing Countries",
IMF, 1991.
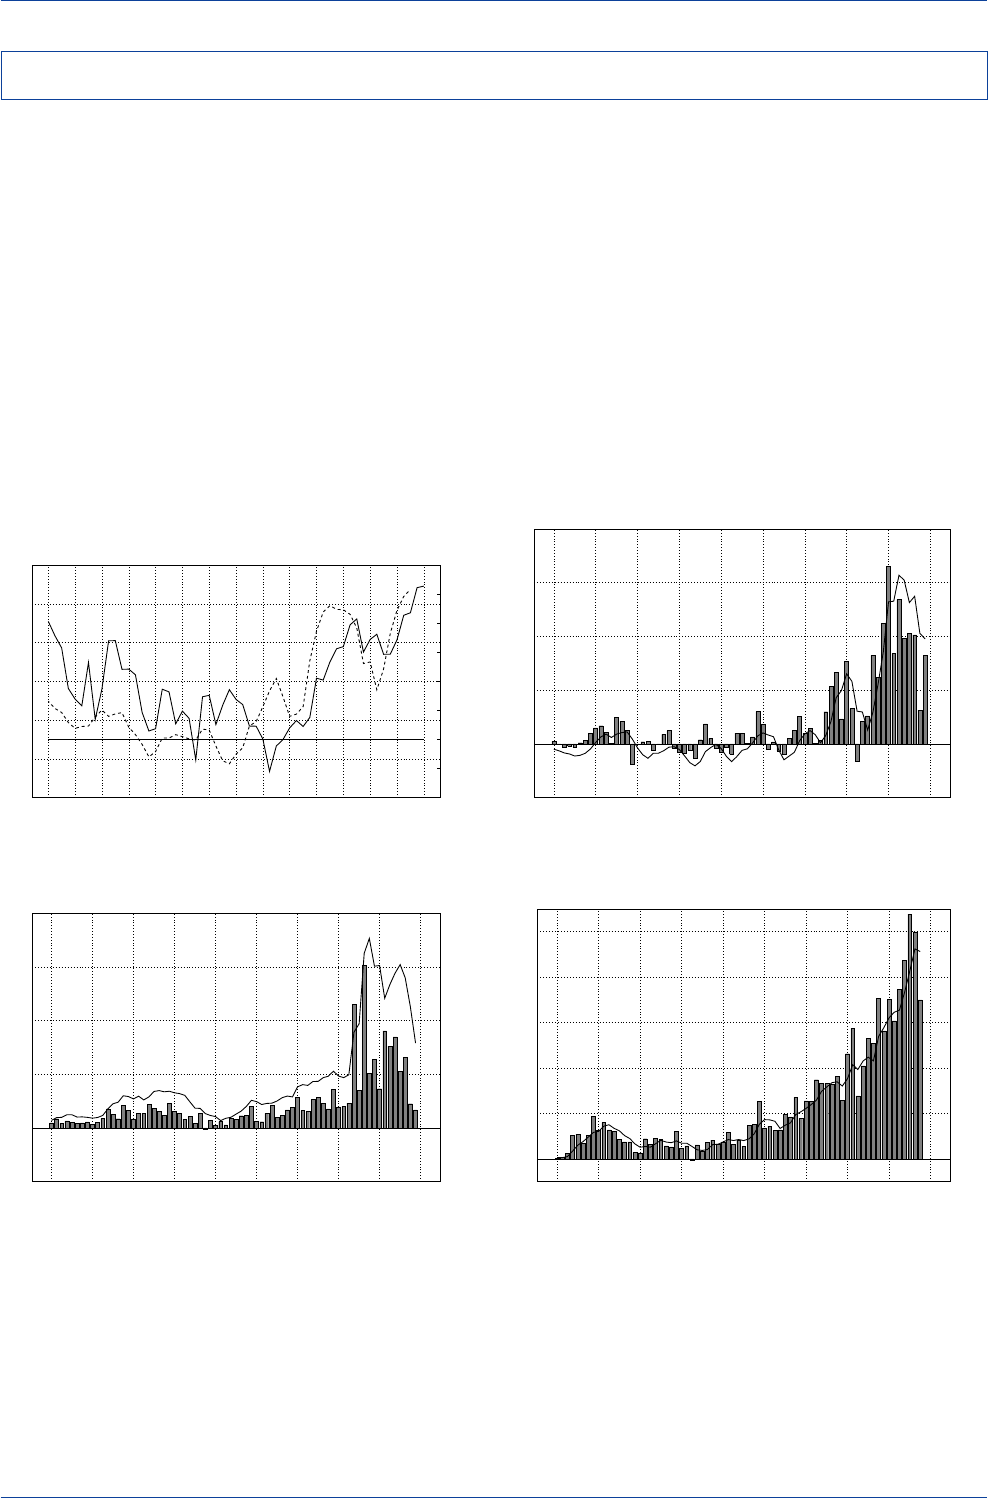
DB Guide to Exchange-Rate Determination May 2002
Deutsche Bank @
94 Deutsche Bank Foreign Exchange Research
The U.S. was the beneficiary of a structural shift in capital
inflows in the 1995-2001 period, both from the emerging
markets and from Europe. The rise in capital flows from
emerging markets to the U.S. began with the flight of capi-
tal from Asia following the Asian financial crisis in 1997.
Capital flows to emerging markets dried up as well in 1998
following the Russian/LTCM crisis and have yet to recover.
It is assumed that most of those flows found their way to
the U.S.
The inflows from Europe came in the form of surges in
foreign direct investment into the U.S., stepped-up foreign
purchases of U.S. equities by Euroland investors, and huge
increases in European purchases of U.S. corporate bonds.
Foreign direct investment and equity flows slowed dra-
matically in 2001, but this was more than offset by a major
surge in foreign purchases of U.S. corporate bonds. These
inflows helped drive the dollar steadily higher over the 1995-
2001 period despite a record deterioration of the U.S. cur-
rent-account deficit.
Net Foreign Direct Investment in the U.S.
-100
0
100
200
300
400
-50
0
50
100
150
200
1984 1986 1988 1990 1992 1994 1996 1998 2000 2002
Annual(line)(US$ bn.) Quarterly(bars)
Net Foreign Purchases of U.S. Corporate Bonds
0
100
200
300
400
0
20
40
60
80
100
1984 1986 1988 1990 1992 1994 1996 1998 2000 2002
Annual(line)(US$ bn.) Quarterly(bars)
Net Foreign Purchases of U.S. Stocks
-50
0
50
100
150
200
250
-20
0
20
40
60
80
1984 1986 1988 1990 1992 1994 1996 1998 2000 2002
Annual(line)(US$ bn.) Quarterly(bars)
The U.S. Dollar and
Net Portfolio Investment into the U.S.
(12-Month Moving Sum of Net Portfolio Invesment)
-100
-50
0
50
100
150
200
250
300
75
80
85
90
95
100
105
87 88 89 90 91 92 93 94 95 96 97 98 99 00 01
Net Portfolio Investment(US$ bn.)----US$ Major Currency Index____
Financing the U.S. Current-Account Deficit
Source: Datastream
Source: Datastream
Source: Datastream
Source: Datastream
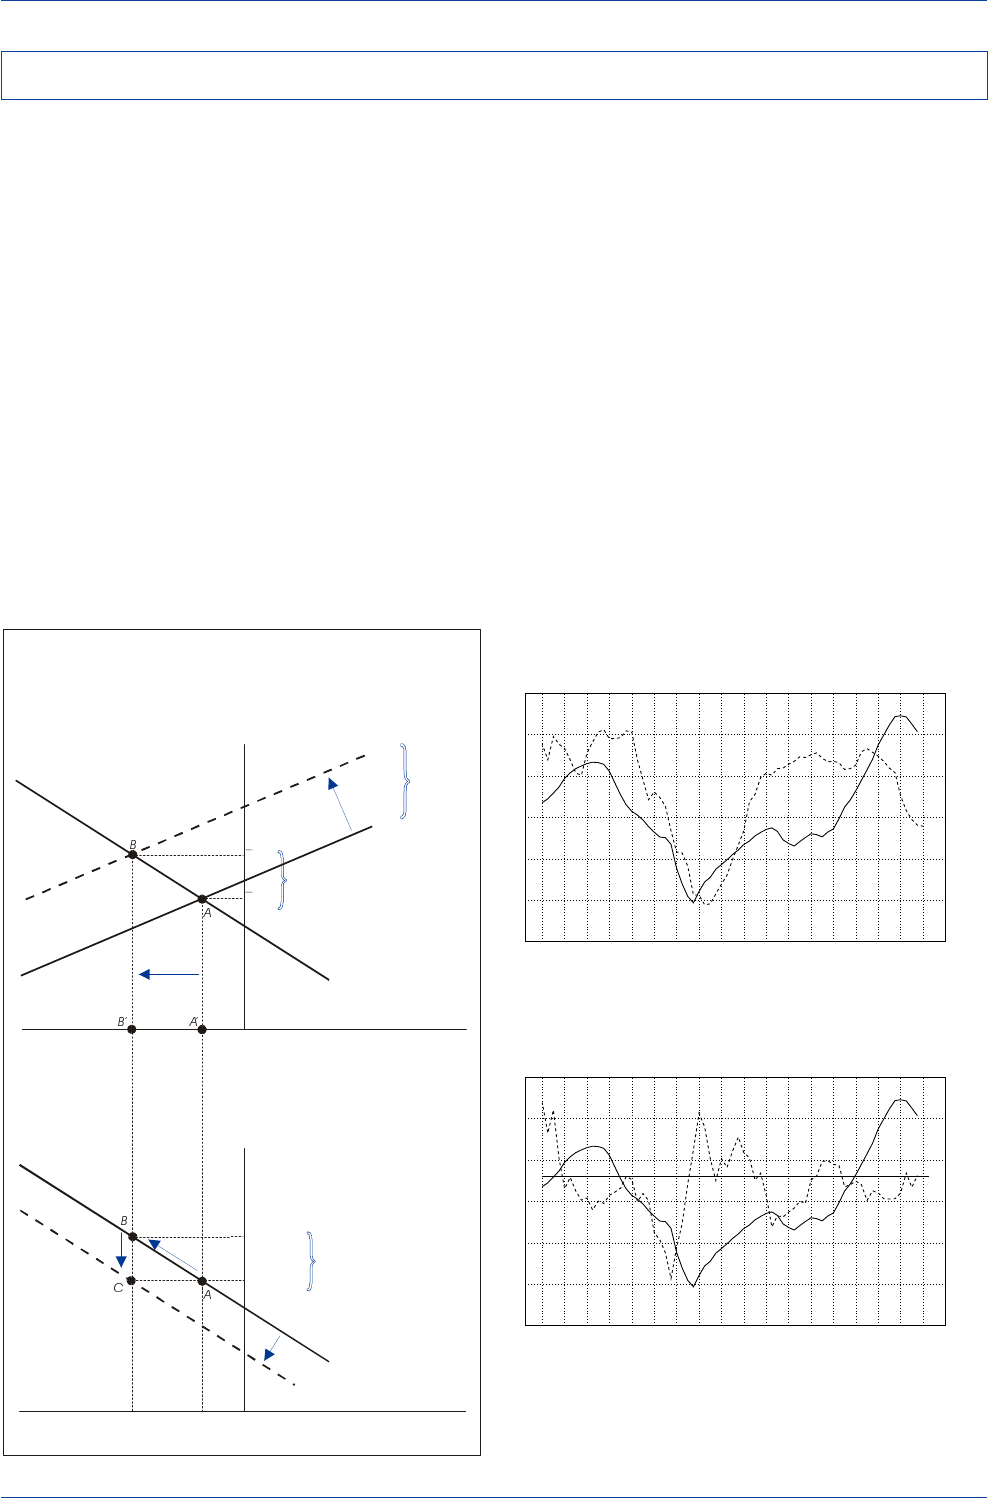
DB Guide to Exchange-Rate Determination
May 2002 Deutsche Bank @
Deutsche Bank Foreign Exchange Research 95
Under normal conditions, U.S. interest rates would have
been required to rise relative to foreign interest rates in
order to attract greater capital inflows to finance the steady
widening of the U.S. current-account deficit. As shown in
Figure (a) in the diagram below, the equilibrium value for
the dollar is shown to be determined at the point where
the U.S. savings-investment schedule (S-I) and the U.S.
current-account balance schedule (CAB) intersect. As
shown in Figure (b), the U.S./foreign interest-rate spread
required to finance the current-account deficit and attract
the necessary capital flows is (rUS -rF)1.
An increase in U.S. investment, such as the one experi-
enced by the U.S. during the 1990s, would have shifted
the S-I schedule to the left, which under normal circum-
stances would have required a relative rise in U.S. interest
rates in order to induce foreign investors to finance the
wider U.S. current-account deficit. Higher U.S. interest rates
would, in turn, have led to wider U.S./foreign yield spreads,
from (rUS -rF)1 to (rUS -rF)2.
It was truly remarkable during the 1995-2001 period of dollar
appreciation that the U.S. was able to finance a record de-
terioration in its current-account deficit without having to
push U.S. interest rates higher relative to interest rates
overseas.
How did the U.S. accomplish this? The U.S. was the ben-
eficiary of a major structural shift in capital flows to the
U.S. (shown in Figure (b) as a shift of the capital flow sched-
ule from
U.S. Capital Flows
1 to
U.S. Capital Flows
2) that
was independent of any change in U.S./foreign yield
spreads. Indeed, the capital flight from the emerging mar-
kets and the inflow of capital from Euroland actually al-
lowed nominal and real yield spreads to narrow during the
dollar's run-up in 1999-2001. Hence, the normally reliable,
positive correlation between trends in U.S./foreign yield
spreads and trends in the dollar’s value was broken in 1999-
2000. At the same time, the correlation between the trend
in U.S./foreign yield spreads and the U.S. current-account
deficit was broken as well.
U.S. Current-Account Deficit and the
U.S./German Short-Term Interest-Rate Spread
-800
-600
-400
-200
0
200
400
600
-1
0
1
2
3
4
5
85 86 87 88 89 90 91 92 93 94 95 96 97 98 99 00 01 02
U.S.-German 3-Mo. Rates(bp)----
C
urr’t Acc’t Deficit/GDP(%)____
How a Surge in U.S. Investment Spending
Typically Affects the Dollar
and U.S./Foreign Real Yield Spreads
Savings minus Investment,
Current-Account Surplus
U.S. Dollar
Real Exchange Rate
Surge in
Investment
Spending
S-I
2
CAB
1
Upward Revision in the
Dollar’s Real Long-Run
Equilibrium Value
q
2
q
1
(0)
S-I
1
U.S. Capital Outflows
U.S./Foreign
Real Yield Spreads
U.S. Capital Flows
1
Typical Rise in
U.S. Real Interest Rates
Necessary to Attract
Additional Capital Inflows
(from point to ).
AB
(r - r )
US F 2
(0)
U.S. Capital Inflows
(r - r )
US F 1
U.S. Capital Flows
2
(b)
(a)
Current-Account Deficit
But the 1995-2000 Structural
Shift in Capital Inflows (from
US Capital Flow to US Capital Flow )
Allowed Real Interest-Rate Spreads
to Remain at (r -r ) .
12
US F 1
The U.S. Current-Account Deficit and U.S./Foreign Yield Spreads
U.S. Current-Account Deficit and the
U.S./German Real Long-Term Yield Spread
-600
-400
-200
0
200
400
-1
0
1
2
3
4
5
85 86 87 88 89 90 91 92 93 94 95 96 97 98 99 00 01 02
U.S.-German Real 10-Year Yield(bp)----
C
urr’t Acc’t Def./GDP(%)____
Source: Datastream
Source: Datastream
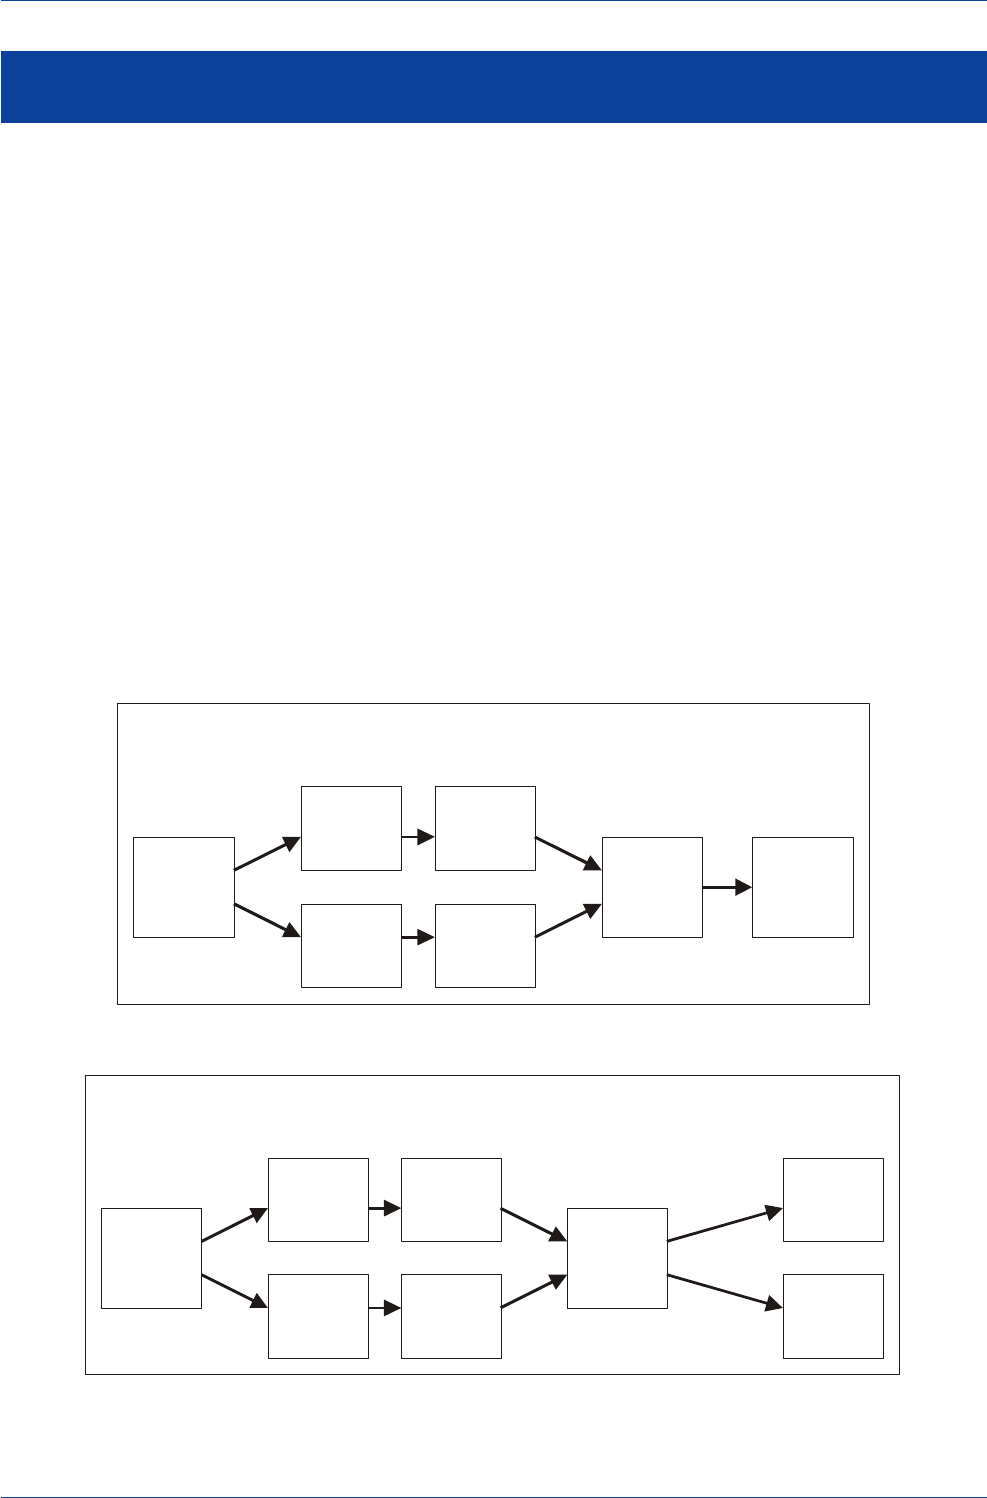
DB Guide to Exchange-Rate Determination May 2002
Deutsche Bank @
96 Deutsche Bank Foreign Exchange Research
Our understanding of the impact that monetary and fiscal
policy changes have on exchange rates owes much to the
pioneering work of Robert A. Mundell and J. Marcus
Fleming. The Mundell-Fleming (MF) model has become
the textbook standard that most students today use to
study the role of monetary and fiscal policy in an open
economy.
In the MF model, the degree of capital mobility plays a
pivotal role in determining the exchange rate's response
to a change in fiscal or monetary policy. For example, an
expansionary monetary policy will lead to a depreciation
of the domestic currency in large part because the induced
decline in domestic interest rates will generate an outflow
of capital that puts downward pressure on the domestic
currency. The more sensitive capital flows are to changes
in interest rates, the greater will be the outflow of capital
in response to the interest-rate decline. Hence, the more
mobile capital is, the more the currency will depreciate in
response to a monetary expansion.
Fiscal policy's impact on the exchange rate is a bit am-
biguous. If capital is highly mobile, an expansionary fiscal
policy will likely give rise to an appreciation of the domes-
tic currency. If capital is relatively immobile, then an ex-
pansionary fiscal policy could lead to a decline in the do-
mestic currency's value. This is because an expansionary
fiscal policy typically results in a rise in domestic interest
rates and an increase in economic activity. The rise in do-
mestic interest rates should attract an inflow of capital from
abroad, which should be positive for the domestic currency,
but at the same time, the consequent rise in domestic
economic activity will contribute to the deterioration of the
trade account, which should be negative for the domestic
currency.
Whether the exchange rate rises or falls in response to a
fiscal expansion will depend on how sensitive capital flows
are to changes in interest rates. If capital flows are highly
mobile, the induced inflow of capital from abroad should
dominate the deterioration in trade, and thus the domes-
tic currency will tend to appreciate in value. If capital flows
are relatively immobile, the opposite will be the case.
The Mundell-Fleming Model of Exchange-Rate Determination
Source: Rosenberg (1996)
Source: Rosenberg (1996)
The Mundell-Fleming Model Transmission Mechanism
Overall
Balance of
Payments
Deficit
Domestic
Expansionary
Monetary
Policy
Decrease in
Domestic
Interest Rates
Increase in
Domestic
Economic
Activity
Deterioration
of
Trade
Balance
Capital
Outflow
Depreciation
of
Domestic
Currency
How Changes in Monetary Policy Affect Exchange Rates
The Mundell-Fleming Model Transmission Mechanism
Overall
Balance of
Payments
(?)
Domestic
Expansionary
Fiscal
Policy
Increase in
Domestic
Interest Rates
Increase in
Domestic
Economic
Activity
Deterioration
of
Trade
Balance
Capital
Inflow
Depreciation
of
Domestic
Currency
How Changes in Fiscal Policy Affect Exchange Rates
Appreciation
of
Domestic
Currency
Trade-Balance
Deterioration
Dominates
Capital Inflow
Capital Inflow
Dominates
Deterioration of
Trade Balance
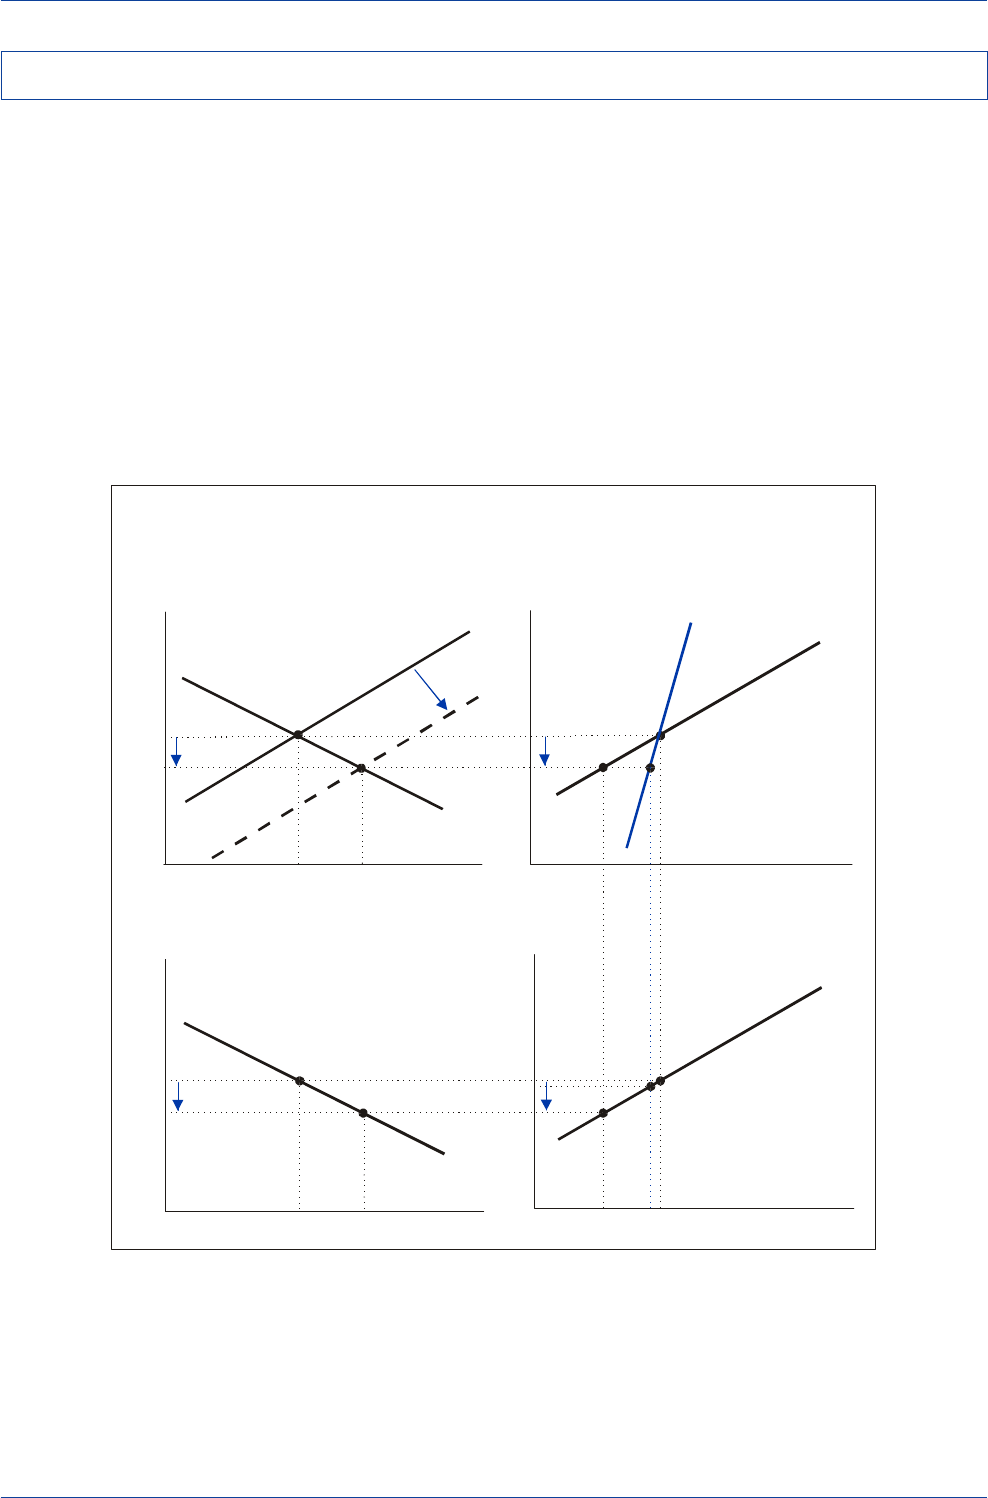
DB Guide to Exchange-Rate Determination
May 2002 Deutsche Bank @
Deutsche Bank Foreign Exchange Research 97
In the MF model, an expansionary domestic monetary
policy will exert downward pressure on a domestic
currency's value while a restrictive domestic monetary
policy will exert upward pressure on a domestic currency's
value. The more mobile is capital, the greater will be the
exchange-rate response.
In an IS-LM context, an expansionary domestic monetary
policy will shift the LM (liquidity) curve downward and to
the right to LM1, resulting in a decline in domestic interest
rates and a rise in domestic demand. The decline in do-
mestic interest rates will cause capital to flow abroad, while
the rise in domestic demand will cause the trade balance
to deteriorate. The combined deterioration of the trade and
capital accounts will lead to a deterioration of the overall
balance of payments and, in the process, exert downward
pressure on the domestic currency.
Under conditions of low capital mobility, the interest-rate-
induced outflow of capital should be modest (from K0 to
K1). A modest capital outflow in turn should result in a
modest decline in the domestic currency's value (from E0
to E1). Under conditions of high capital mobility, the inter-
est-rate-induced outflow of capital should be large (from
K0 to K2), and the resultant decline in the domestic
currency's value (from E0 to E2) should be large as well.
Monetary Policy's Impact on Exchange Rates in the MF Model
The Effect of an Easing in Monetary Policy on an Exchange Rate
under Conditions of Low and High Capital Mobility
Output
Interest Rate
IS
1
LM
1
B
A
LM
0
Y
0
Capital Inflow
Interest Rate
B’
A
K
2
i
0
i
1
Y
1
Low Capital
Mobility
High Capital
Mobility
K
1
K
0
B
i
0
i
1
Trade Deficit
Exchange Rate
B
A
Im -Ex
00
Capital Inflow
Exchange Rate
B’ A
K
2
E
0
E
2
K
1
K
0
B
E
0
E
2
Im -Ex
11
E
1
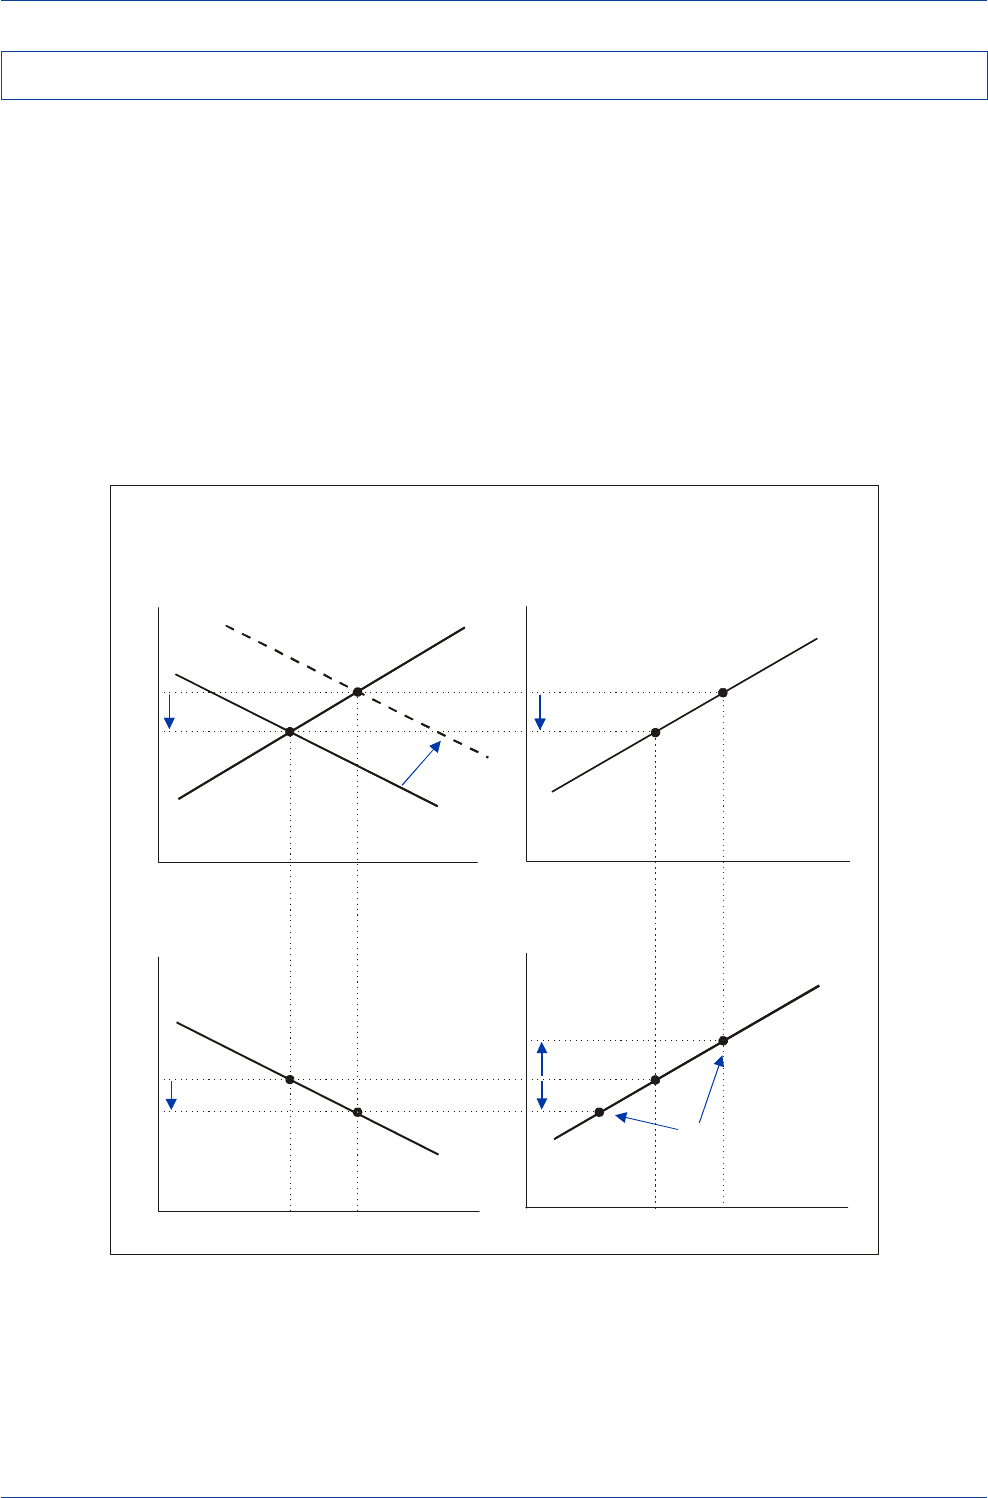
DB Guide to Exchange-Rate Determination May 2002
Deutsche Bank @
98 Deutsche Bank Foreign Exchange Research
The impact of fiscal policy on exchange rates is somewhat
ambiguous in the MF model. In an IS-LM context, an ex-
pansionary fiscal policy will give rise to a rightward shift of
the IS (investment-savings) curve to IS1, resulting in a rise
in domestic interest rates from i0 to i1 and a rise in domes-
tic demand from Y0 to Y1. The rise in domestic interest rates
will attract an inflow of capital from abroad, which should
drive the domestic currency’s value higher (from E0 to E2)
while the rise in domestic demand should cause the trade
balance to deteriorate, which should cause the domestic
currency to weaken (from E0 to E1). The equilibrium ex-
change rate could thus be either E1 or E2 following a fiscal
expansion, i.e., the resulting change is ambiguous.
Under conditions of high capital mobility, the induced in-
flow of capital should dominate the deterioration in trade,
and thus the currency should strengthen significantly. If
capital mobility is not that high, then the exchange-rate
response will be more muted. Under certain conditions
when capital mobility is extremely low, the deterioration
in trade may dominate and the domestic currency could
weaken.
Fiscal Policy's Impact on Exchange Rates in the MF Model
The Effect of an Expansionary Fiscal Policy on an Exchange Rate
under Conditions of High Capital Mobility
Output
Interest Rate
IS
1
IS
1
B
A
LM
0
Y
0
Capital Inflow
Interest Rate
A
i
0
i
1
Y
1
High Capital
Mobility
K
1
K
0
B
i
0
i
1
Trade Deficit
Exchange Rate
B
A
Im -Ex
00
Capital Inflow
Exchange Rate
B
A
E
0
E
1
K
1
K
0
B
E
0
E
1
Im -Ex
11
Ambiguous
E
2
The Effect of an Expansionary Fiscal Policy on an Exchange Rate
under Conditions of High Capital Mobility
Output
Interest Rate
IS
0
IS
1
B
A
LM
0
Y
0
Capital Inflow
Interest Rate
A
i
0
i
1
Y
1
High Capital
Mobility
K
1
K
0
B
i
0
i
1
Trade Deficit
Im -Ex
00
Capital Inflow
Exchange Rate
B
A
K
1
K
0
B
E
0
E
1
Im -Ex
11
Ambiguous
E
2
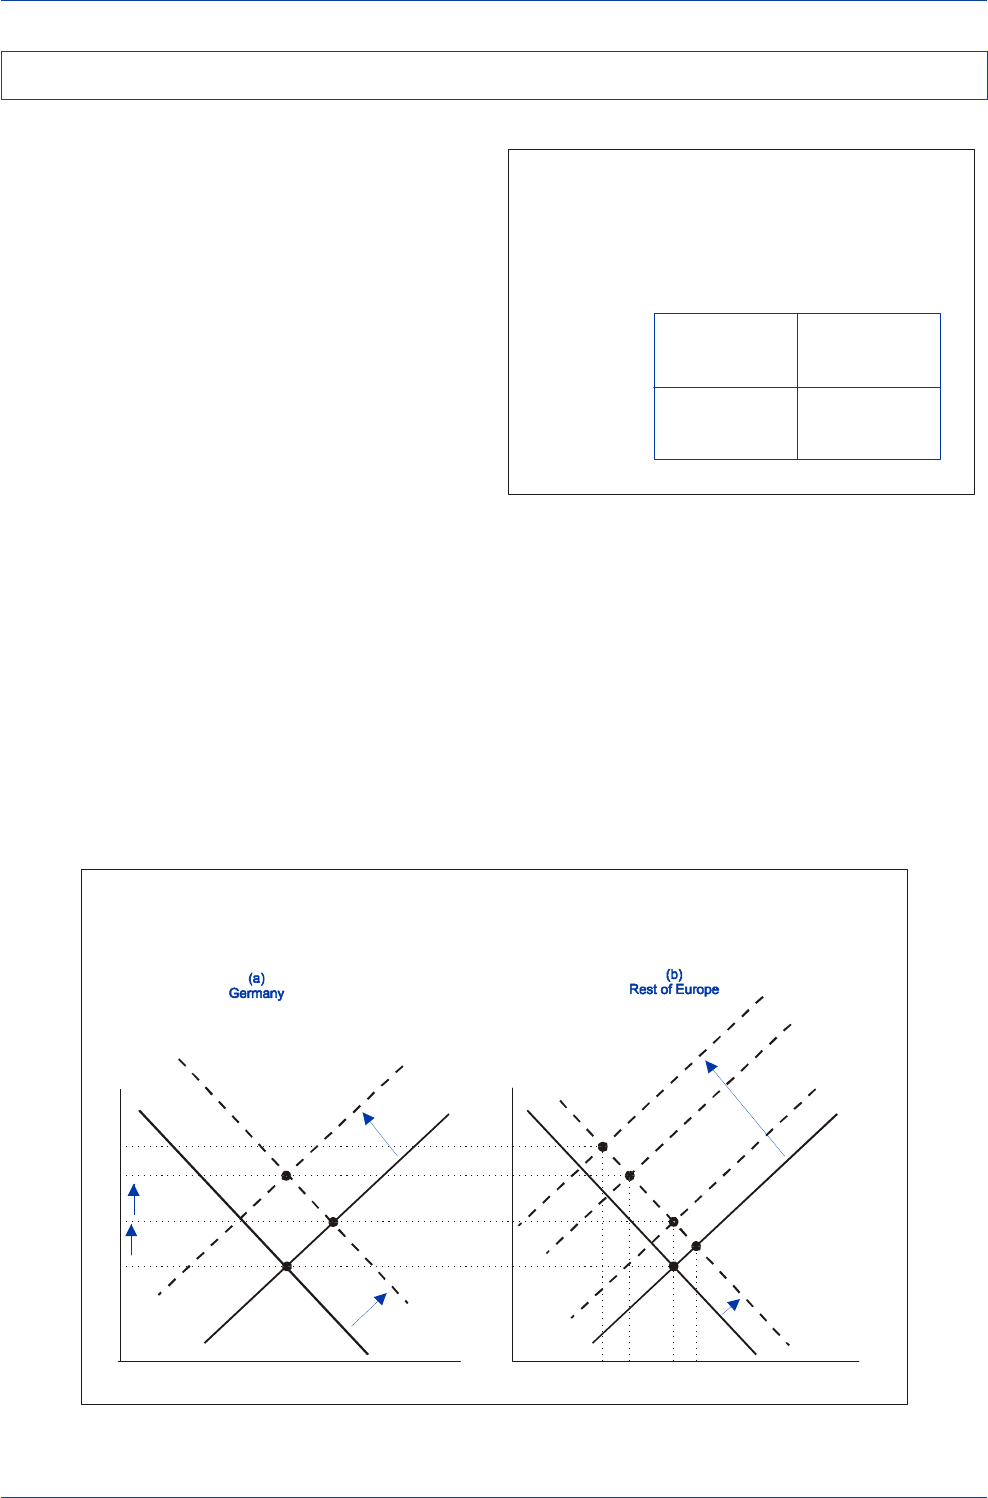
DB Guide to Exchange-Rate Determination
May 2002 Deutsche Bank @
Deutsche Bank Foreign Exchange Research 99
The specific mix of monetary and fiscal policies that a coun-
try pursues can have a profound impact on exchange rates.
In a world of high capital mobility, an expansionary do-
mestic fiscal policy will give rise to an appreciation of the
domestic currency's value. Similarly, a tight domestic mon-
etary policy will give rise to an appreciation of the domes-
tic currency's value when capital flows are highly mobile.
Thus, the combination of an expansionary fiscal and a re-
strictive monetary policy should be extremely bullish for a
currency when capital mobility is high. Conversely, the
combination of a restrictive fiscal policy and an expansion-
ary monetary policy should be extremely bearish for a cur-
rency. When monetary and fiscal policies are both expan-
sive or restrictive at the same time, the impact on exchange
rates is ambiguous.
The classic example of how an expansive fiscal/tight mon-
etary policy mix contributed to a sharp rise in a currency's
value is the case of the U.S. in the first half of the 1980s,
when President Reagan's expansive fiscal policy collided
with Fed Chairman Paul Volcker's tight monetary policy.
That policy mix helped drive U.S. real interest rates and
the dollar’s value to extraordinarily lofty levels.
Another classic episode in which a dramatic shift in the
policy mix caused equally dramatic changes in exchange
rates was the case of Germany in 1990-92. During that
period, the German government pursued a highly expan-
sionary fiscal policy to help facilitate German unification.
At the same time, the Bundesbank pursued an extraordi-
narily tight monetary policy to combat the inflationary pres-
The Monetary/Fiscal Policy Mix
and the Determination of Exchange Rates
Expansionary
Monetary
Policy
Restrictive
Monetary
Policy
Expansionary
Fiscal
Policy
Restrictive
Fiscal
Policy
Ambiguous
Ambiguous
Domestic
Currency
Appreciates
Domestic
Currency
Depreciates
The 1992 ERM Crisis—
The Effect of Germany’s Fiscal/Monetary Policy Mix
on European Interest Rates
Output
G
Interest Rate
IS
1
LM
1
B
A
LM
0
Y= Y
02
Output
ROE
Interest Rate
B’
A’
i
0
i
1
Y
1
B’’
Y
0
Y
1
Y
2
Y
3
C’
D’
C
IS
0
i
2
i
3
i
0
i
1
i
2
i
3
IS
1
IS
0
LM
1
LM
0
LM
2
LM
3
sures associated with unification. The combined expan-
sive fiscal/tight monetary policy mix drove interest rates
sharply higher in Germany, and those higher interest rates
were then transmitted to the rest of Europe via the ERM
pegged exchange-rate regime. Those higher interest rates
led to a marked slowdown in European growth and to a
marked rise in European unemployment. Recognizing that
this deterioration in the European economic climate was
unsustainable, currency speculators waged an attack on
the ERM regime and eventually toppled it. European cen-
tral banks could no longer keep interest rates high enough
to defend the ERM pegs and at the same time encourage
a rebound in economic activity.
Fiscal/Monetary Policy Mix and the Determination of Exchange Rates
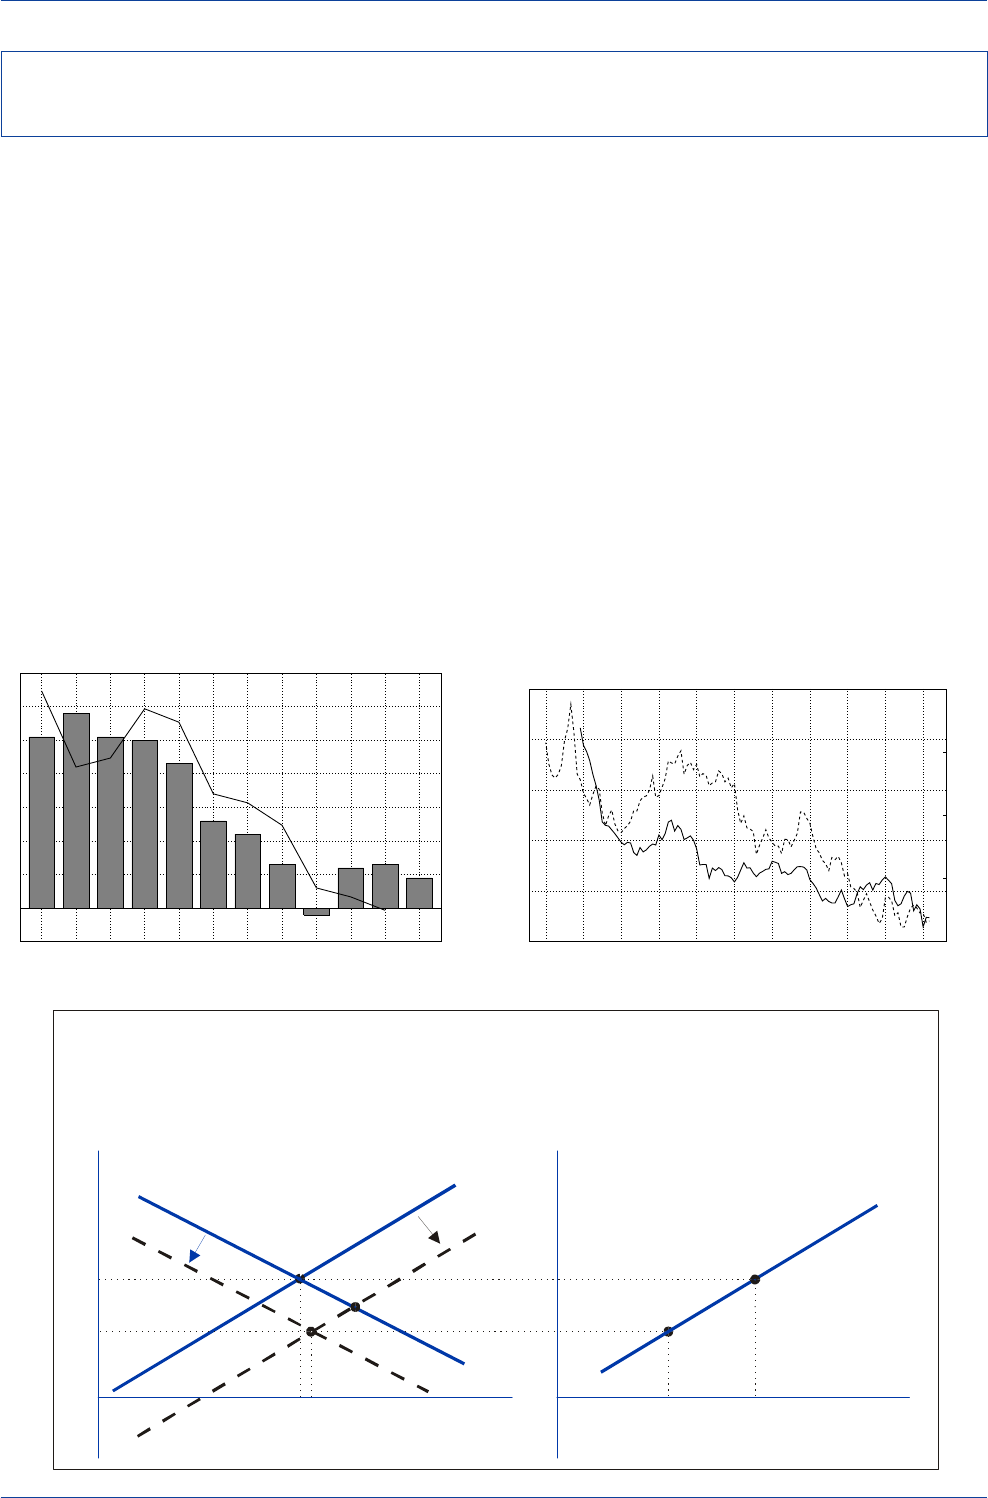
DB Guide to Exchange-Rate Determination May 2002
Deutsche Bank @
100 Deutsche Bank Foreign Exchange Research
The (synthetic) euro's decline in the past nine years pro-
vides an example of how an adverse fiscal/monetary policy
mix can have a negative impact on a currency’s value. In
the run-up to European Monetary Union (EMU), Europe's
overall fiscal stance leaned toward significant restraint as
most governments in Europe steadily trimmed their struc-
tural budget deficits to satisfy the EMU admission criteria
on budget deficits and debt levels set out in the Maastricht
Treaty. All else being equal, fiscal restraint would have been
negative for the euro.
To counteract the negative economic consequences of
Europe's relatively restrictive fiscal policy stances, most
European central banks felt compelled to pursue relatively
easy monetary-policy stances. Real short-term interest
rates in Europe were pushed steadily lower in the 1990s.
All else being equal, the pursuit of a relatively easy mon-
etary policy should have exerted downward pressure on
the euro's value.
A tight fiscal or an easy monetary policy alone would have
been enough to depress the euro's value in the 1990s.
But the combination of the two proved to be deadly. As
illustrated in the IS-LM diagram below, the pursuit of an
easy monetary policy in Europe resulted in a rightward
shift in Europe's LM schedule from LM0 to LM1, while the
pursuit of a tight fiscal policy in Europe resulted in a left-
ward shift in Europe's IS schedule from IS0 to IS1. The inter-
section of the newly shifted IS1 and LM1 curves at point
C
indicates that Europe's policy mix drove European real in-
terest rates lower, and those lower real rates then contrib-
uted to a decline in the euro's value from point
A’
to point
C’
.
Euroland Real Short-Term Rates & the Euro
(Three-Month Euro Deposit Rate less CPI)
0.80
1.00
1.20
1.40
1.60
0
2
4
6
8
10
1992 1993 1994 1995 1996 1997 1998 1999 2000 2001 2002
US$/Euro----Euroland Real 3-Mo. Rate(%)____
Euroland’s Budget Deficit and the Euro
0.80
0.90
1.00
1.10
1.20
1.30
1.40
-1
0
1
2
3
4
5
6
7
1992 1993 1994 1995 1996 1997 1998 1999 2000 2001 2002 2003
US$/Euro(line)Budget Deficit/GDP(%)(bars)
Source: OECD Economic Outlook
The Effect of Europe’s Fiscal/Monetary Policy Mix on the Euro
Output
Real Interest Rate
C
IS
1
IS
0
LM
1
B
A
LM
0
Y
1
Y
0
Euro’s Value
Real Interest Rate
C’
A’
E
0
E
1
r
0
r
1
r
01
r
1
(a) (b)
Euroland's Fiscal/Monetary Policy Mix in the 1990s and the Long-Term
Decline in the Euro's Value
Source: Datastream
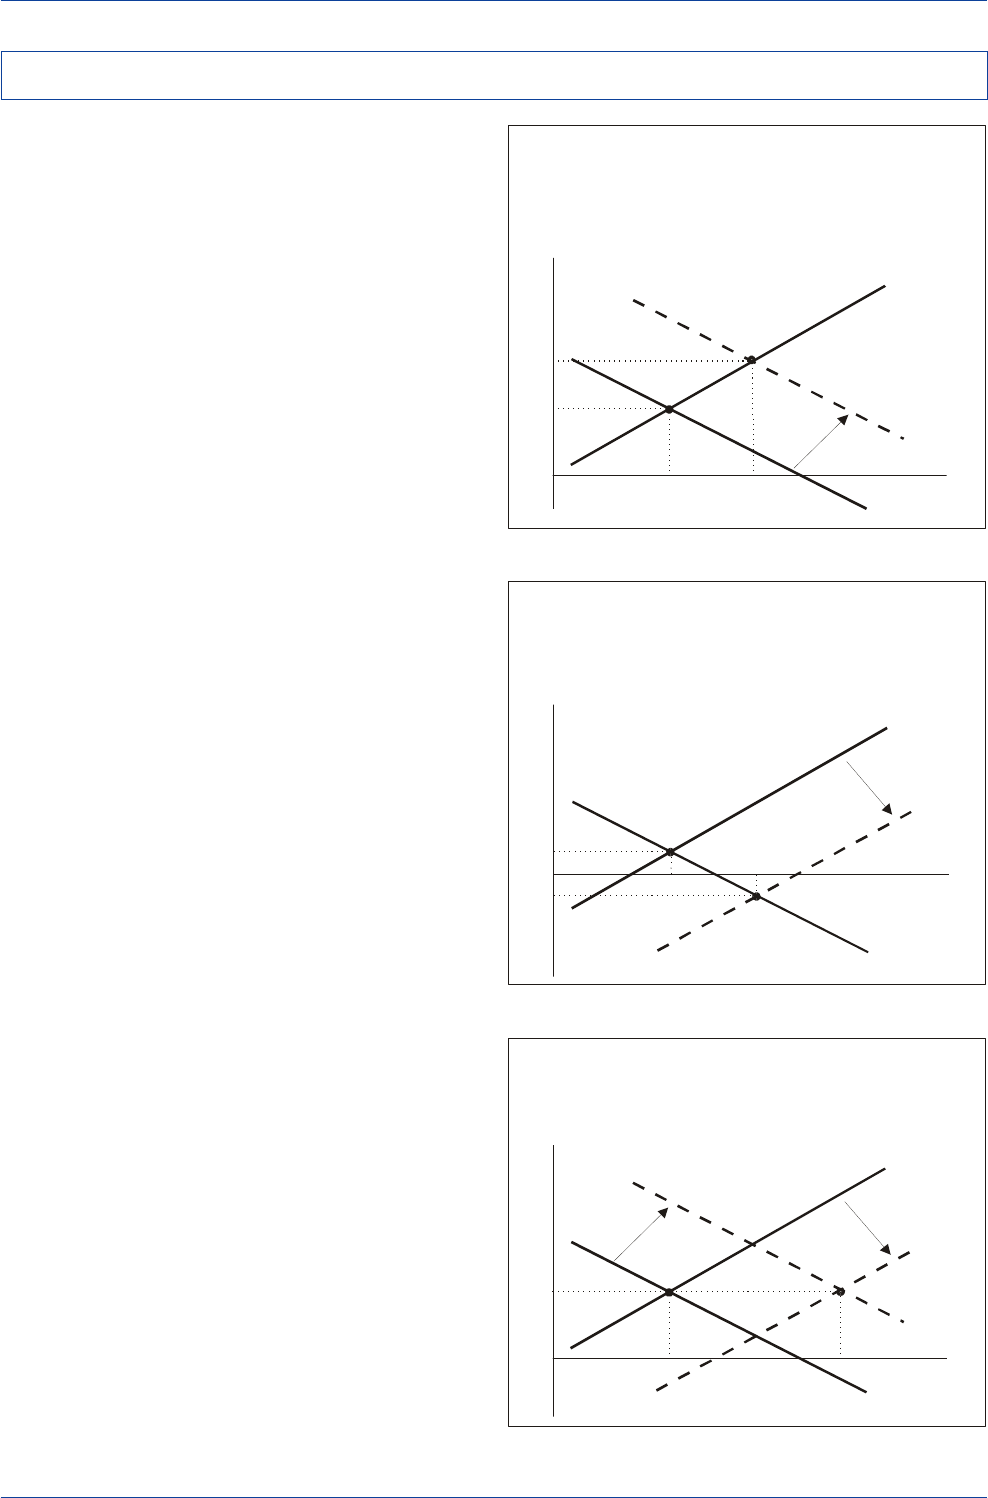
DB Guide to Exchange-Rate Determination
May 2002 Deutsche Bank @
Deutsche Bank Foreign Exchange Research 101
The Japanese yen’s response to changing monetary/fiscal
policy conditions during 1999-2001 provides another ex-
ample of the influence of policy mixes on exchange rates.
In 1998-99, a number of prominent economists offered
policy prescriptions to help Japan out of its decade-long
economic slump. Adam Posen, of the Institute for Interna-
tional Economics in Washington, D.C. wrote a book en-
titled
Restoring Japan's Economic Growth
(1998), in which
he recommended that the Japanese government should
undertake a major fiscal stimulus initiative to reverse the
decline in Japanese economic activity. Posen argued that
Japan's fiscal stance had been too austere in the 1990s,
particularly after the 1997 hike in Japan's consumption tax.
Therefore, massive fiscal stimulus was needed to offset
the contractionary forces underway in Japan. In an IS-LM
context, Posen's solution amounted to shifting the IS curve
as far to the right as possible.
Paul Krugman of Princeton University offered a different
policy prescription. Krugman (1998) argued that Japan had
fallen into a liquidity trap and stressed that the Japanese
economy needed a negative real interest rate to restore
economic growth. Since nominal interest rates were al-
ready near zero and could not move into negative territory,
Krugman asserted that Japan needed to generate expec-
tations of higher inflation to drive real interest rates into
negative territory. That could be accomplished only if the
Bank of Japan made a credible commitment to expand
the rate of growth of the money supply now and in the
future. In an IS-LM context, Krugman's solution amounted
to shifting the LM curve downward and to the right, so
that it intersected the IS curve in negative real interest-
rate territory.
A combination of fiscal and monetary stimulus probably
would have been the most desirable policy, allowing
Japan's real growth to expand by more than would have
been possible with either fiscal or monetary stimulus alone.
In addition, the impact of such a policy mix would have
been broadly neutral for the yen. An expansive fiscal policy
stance would have been yen supportive, while an expan-
sive monetary policy stance would have been yen nega-
tive, leaving the yen's value largely unchanged.
Posen’s Solution for Resolving
Japan’s Economic Problems
A Massive Fiscal Stimulus
Output
Real Interest Rate
IS
2
B
A
LM
1
Y
1
Y
2
r
1
r
2
IS
1
IS
2
Easy Monetary Policy and Negative Real Interest Rates
Output
Real Interest Rate
IS
1
LM
2
B
A
LM
1
Y
1
Y
2
Krugman’s Solution for Resolving
Japan’s Economic Problems
r
1
r
2
Japan’s Monetary/Fiscal Policy Mix Debate and the Yen’s Value in 1999-2000
Output
Real Interest Rate
IS
2
IS
1
LM
2
B
A
Preferable 1999 Japanese
Fiscal/Monetary Policy Mix
LM
1
Y
1
A Combination of Fiscal and Monetary Stimulus
Y
3
r
1
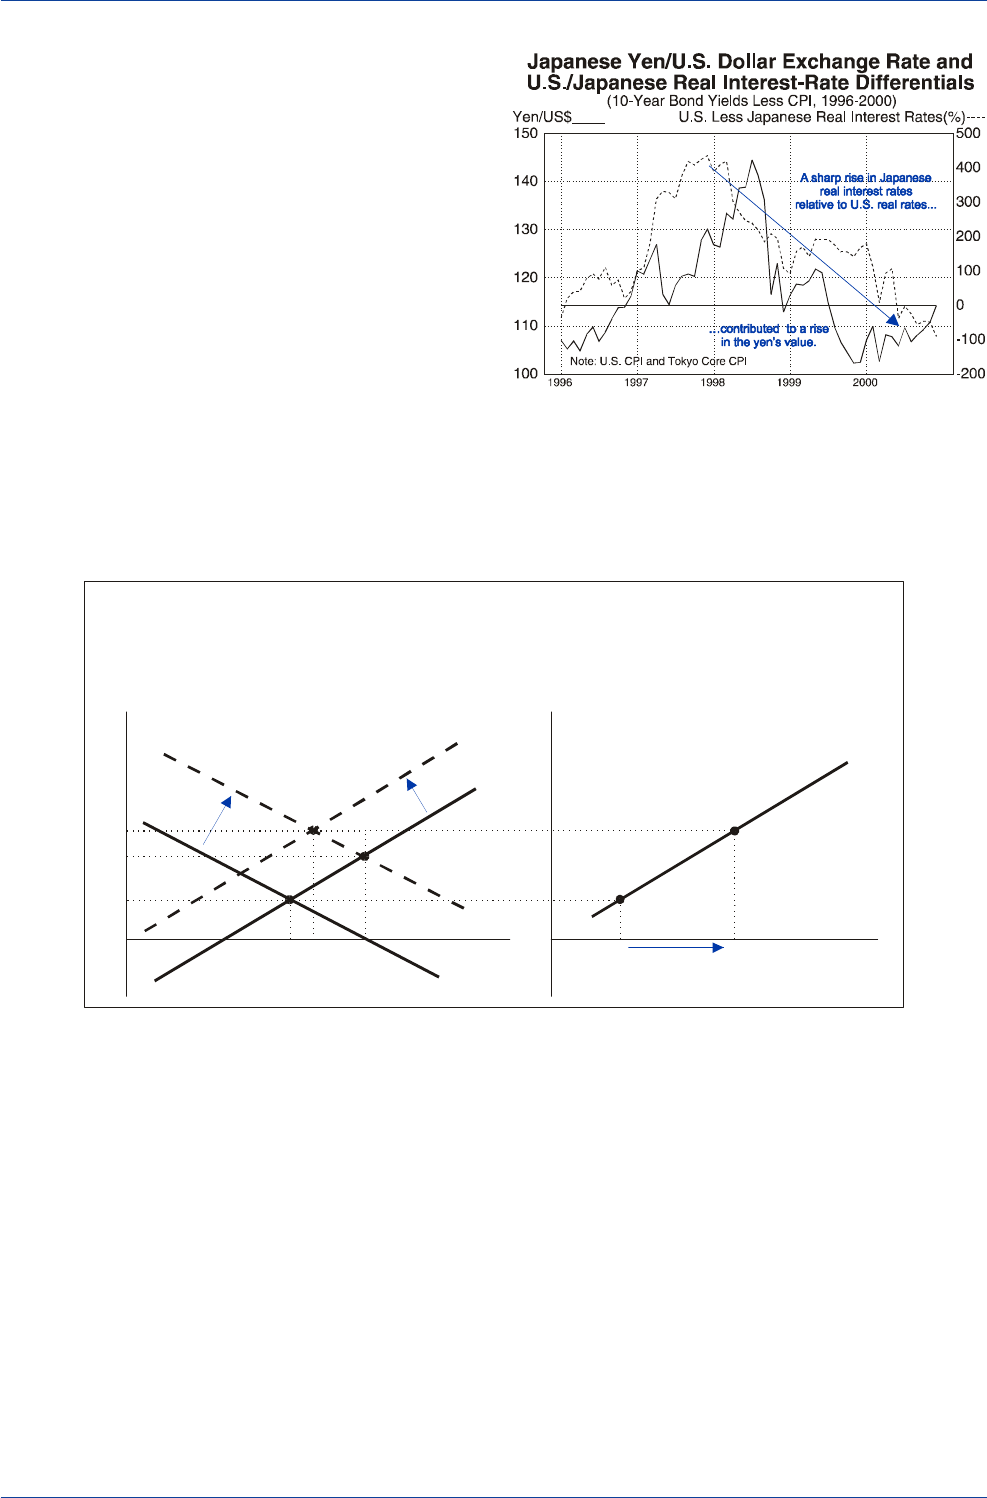
DB Guide to Exchange-Rate Determination May 2002
Deutsche Bank @
102 Deutsche Bank Foreign Exchange Research
In the end, the Japanese authorities chose to follow the
policy recommendations suggested by Posen and engi-
neered a powerful fiscal stimulus over the 1998-99 period.
The Bank of Japan did not adopt an aggressive policy of
monetary easing, as recommended by Krugman, but rather
leaned toward restraint over much of the 1999-2000 pe-
riod. So instead of Japan's LM curve shifting to the right, it
appears that the LM curve shifted to the left in 1999 and
remained there in 2000.
The result of this expansive fiscal/tight monetary policy
mix was that Japan's LM curve shifted leftward while its
IS curve shifted rightward, which had the effect of driving
real interest rates higher instead of lower. As shown in the
IS-LM diagram, the increase in output associated with this
policy mix is normally quite modest (shown as a rise from
Y1 to Y4), while the rise in real interest rates tends to be
large. There was indeed a very sharp increase in real inter-
est rates in Japan relative to U.S. real rates in 1999-2000,
which contributed to a rise in the yen's value over that
period.
The Effect of Japan’s 1999
Expansive Fiscal/Restrictive Monetary Policy Mix
on the Yen
Output
Real Interest Rate
C
IS
2
IS
1
LM
2
B
A
LM
1
Y
1
Y
4
Y
2
Yen’s Value
Real Interest Rate
C
A
E
1
E
2
r
1
r
2
r
1
r
3
r
3
Source: Datastream
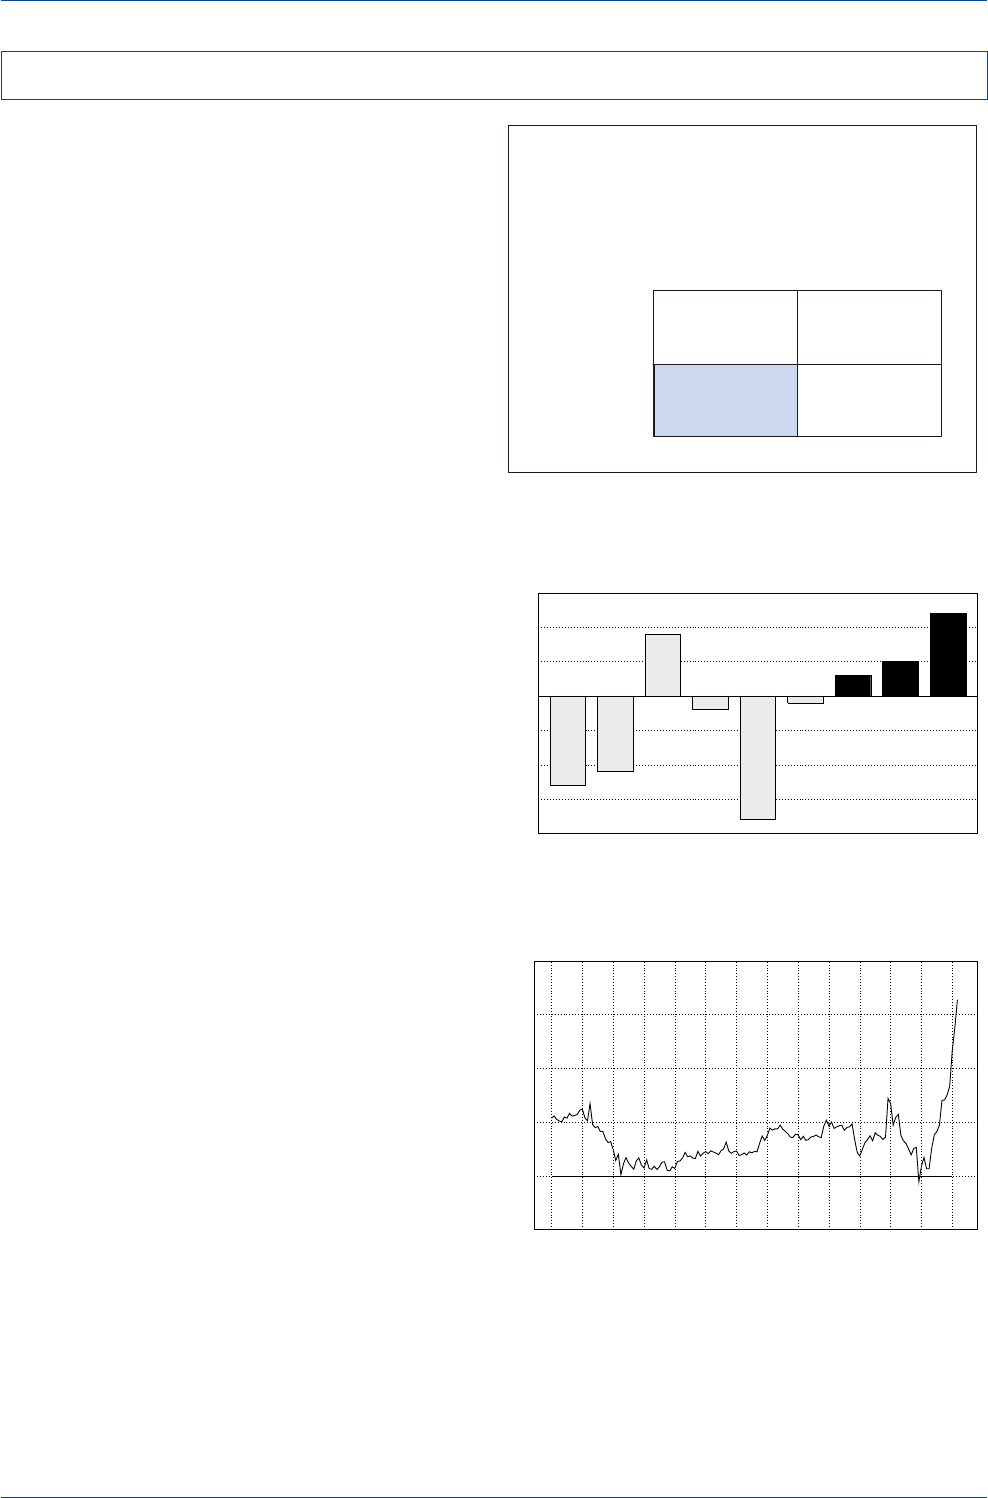
DB Guide to Exchange-Rate Determination
May 2002 Deutsche Bank @
Deutsche Bank Foreign Exchange Research 103
The 1999-2000 period of yen strength ended when Japan's
fiscal/monetary policy mix swung back in the direction of
significant fiscal restraint and aggressive monetary ease
in 2001-2002. Such a policy mix is normally bearish for a
currency, but this policy mix was especially bearish for the
yen, given the magnitude of the policy changes that were
implemented.
On the fiscal-policy front, Japan's structural budget deficit
as a percentage of GDP (the actual budget deficit as a
percentage of GDP adjusted for cyclical developments) is
expected to contract by a combined 1.7 percentage points
in 2002-03, according to IMF estimates. This would repre-
sent a greater tightening in Japan's fiscal stance than the
tightening that occurred in 1997, which was widely cred-
ited with pushing the Japanese economy into a recession
in 1997-98.
Given that Japan is presently saddled with huge budget
deficits, a large outstanding stock of government debt, and
adverse demographics that are expected to wipe out the
social security system's surpluses, the Japanese govern-
ment will need to pursue relatively restrictive policies, not
just in 2002, but for several years to come while it puts its
fiscal house in order. Such a policy stance should exert
downward pressure on the yen, not just in 2002, but for
many years to come.
Japan's monetary-policy stance is adding to this down-
ward pressure on the yen's value. Japan's monetary policy
became highly reflationary in late 2001 as economic con-
cerns began to mount. The Bank of Japan started adding
liquidity at an extremely rapid clip, with the level of BoJ
current-account deposits being targeted at the upper end
of a ¥10-¥15 trillion target range. This infusion of liquidity
boosted monetary-base growth to more than a 30% year-
over-year rate by early 2002, its highest pace in the past
three decades. This surge in Japanese monetary-base
growth relative to U.S. monetary-base growth contributed
to the yen's weakening trend.
Monetary/Fiscal Policy Mix and the
Determination of Exchange Rates
Expansionary
Monetary
Policy
Restrictive
Monetary
Policy
Expansionary
Fiscal
Policy
Restrictive
Fiscal
Policy
Ambiguous
Ambiguous
Domestic
Currency
Appreciates
Domestic
Currency
Depreciates
Japan’s Fiscal Policy Trends
(Changes in Structural Budget Balance as % GDP)
-2.0
-1.5
-1.0
-0.5
0.0
0.5
1.0
1.5
1995 1996 1997 1998 1999 2000 2001 2002 2003
(Percentage Point Change)
Contractionary Fiscal Policy
Expansionary Fiscal Policy
Bank of Japan Monetary-Base Growth
-10
0
10
20
30
40
89 90 91 92 93 94 95 96 97 98 99 00 01 02
(Year-over-Year % Change)
Japan’s Monetary/Fiscal Policy Mix in 2001-02 and the Value of the Yen
Source: Datastream
Source: OECD, IMF Estimates
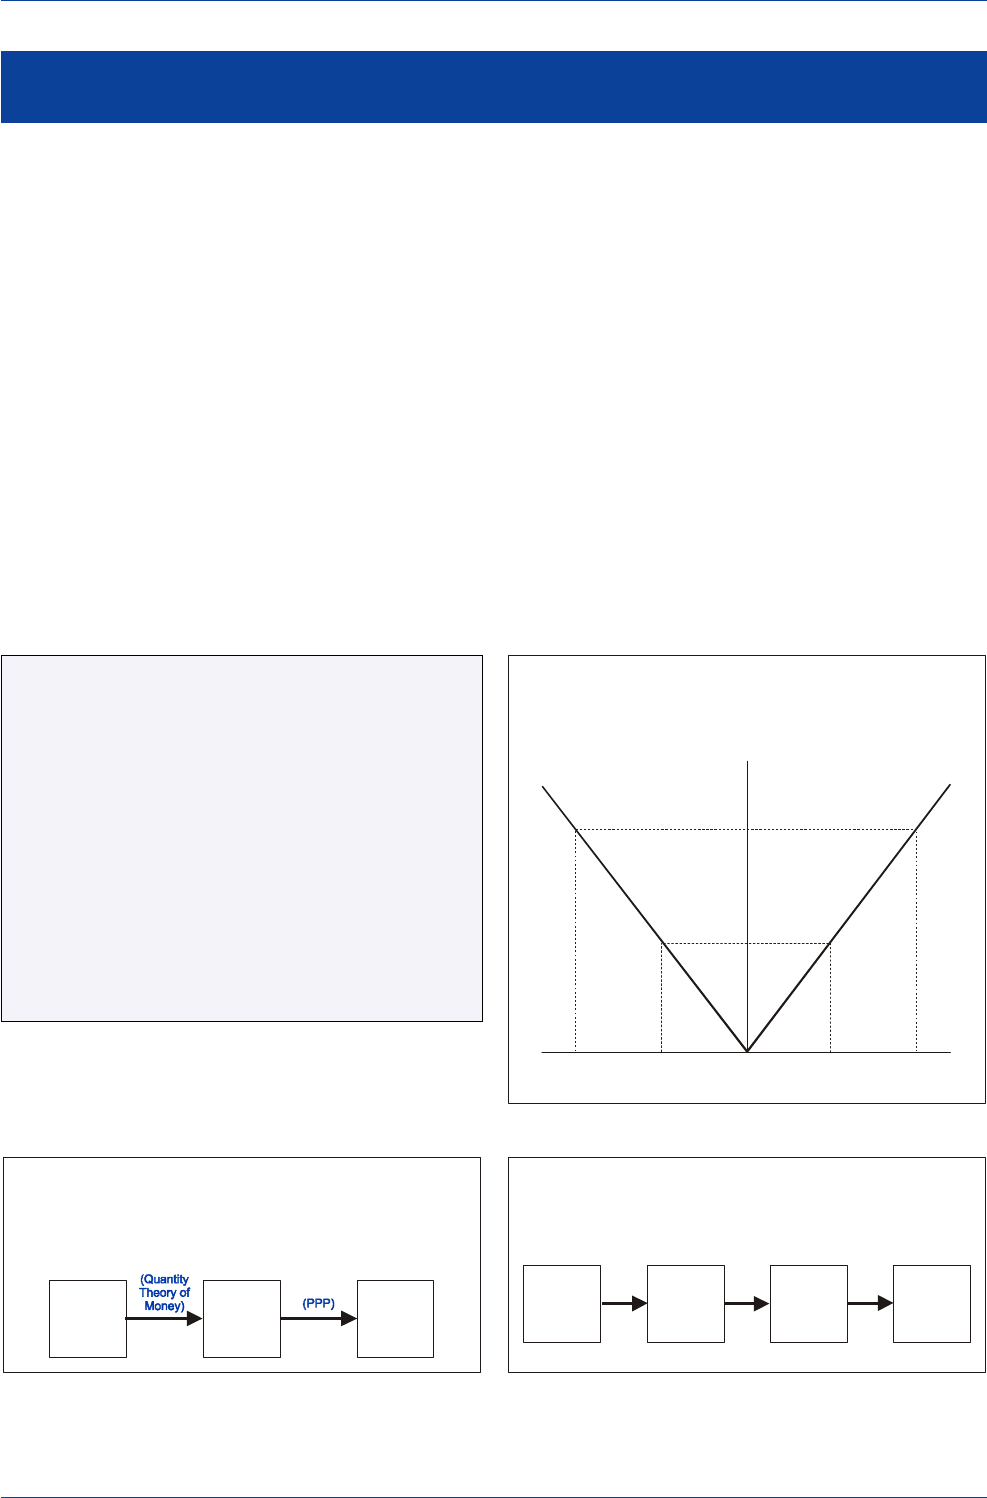
DB Guide to Exchange-Rate Determination May 2002
Deutsche Bank @
104 Deutsche Bank Foreign Exchange Research
Historically, changes in monetary policy have had a pro-
found impact on exchange rates. In the case of the dollar,
relatively easy monetary policies pursued by the U.S. dur-
ing the Carter Administration contributed to a sharp de-
cline of the dollar in 1977-78. The dramatic tightening in
U.S. monetary policy by the Volcker-led Federal Reserve in
the early 1980s helped drive the dollar dramatically higher
between 1981 and 1985. In the case of the yen, a rela-
tively tight monetary policy by the Bank of Japan in the
early 1990s contributed to a major strengthening of the
yen during that period. Then beginning in 1995 and con-
tinuing until 1998, the Bank of Japan pursued an extraordi-
nary easy monetary policy that contributed to a weaker
yen. More recently, the Bank of Japan has been engaging
in a very dramatic easing in monetary policy and the yen
has fallen commensurately. Finally, in the case of many
emerging-market currencies, overly easy monetary poli-
cies have often been the catalyst for currency-crisis epi-
sodes.
The monetary approach asserts that changes in the sup-
ply of and demand for money are the primary determi-
nants of exchange-rate movements. Although the mon-
etary approach is widely regarded as an incomplete theory
of exchange-rate determination because it ignores other
important explanatory variables, it nevertheless correctly
warns that the pursuit of overly expansionary monetary
policies will exert downward pressure on a currency's
value, and vice versa.
The monetary model of exchange-rate determination can
be derived from a basic model of the demand for money.
If it is assumed that purchasing power parity (PPP) holds
at all times, the equilibrium exchange rate can be shown
to be completely determined by trends in relative money-
supply growth, relative GDP growth, and relative interest-
rate differentials. According to the monetary model, a rela-
tive increase in domestic monetary growth, a relative de-
crease in domestic GDP growth, and a relative rise in do-
mestic interest rates will exert downward pressure on a
domestic currency's value.
Derivation of the Flexible-Price Monetary Model
of Exchange-Rate Determination
(1) mS = mD = m = p + b1y - b2i Money supply and demand
as a function of prices,
output, and interest rates
(2) p = m - b1y + b2i Price-level determination
(3) e$ = (pF - pUS) Purchasing power parity
assumption
(4) e$ = (mF-mUS) - b1(yF-yUS) + b2(iF-iUS)
Flexible-price monetary model
of the exchange rate
Source: Rosenberg (1996) Source: Rosenberg (1996)
Source: Rosenberg (1996)
How Real Economic Forces Influence Exchange Rates
in the Flexible-Price Monetary Model
of Exchange-Rate Determination
Change in
Real
Economic
Activity
Change in
Price
Level
Change in
Exchange
Rate
Change in
Real
Money
Demand
The Monetary Approach to Exchange-Rate Determination
The Direct Effect of Money-Supply Changes
on Exchange Rates
in the Flexible-Price Monetary Model
of Exchange-Rate Determination
Change in
Money
Supply
Change in
Price
Level
Change in
Exchange
Rate
The Impact of Money-Supply Changes
on Price Levels and Exchange Rates
Domestic Price Level
m
0
e
0
m
1
p
1
Foreign Currency’s
Value
Domestic
Money Supply
p
0
e
1
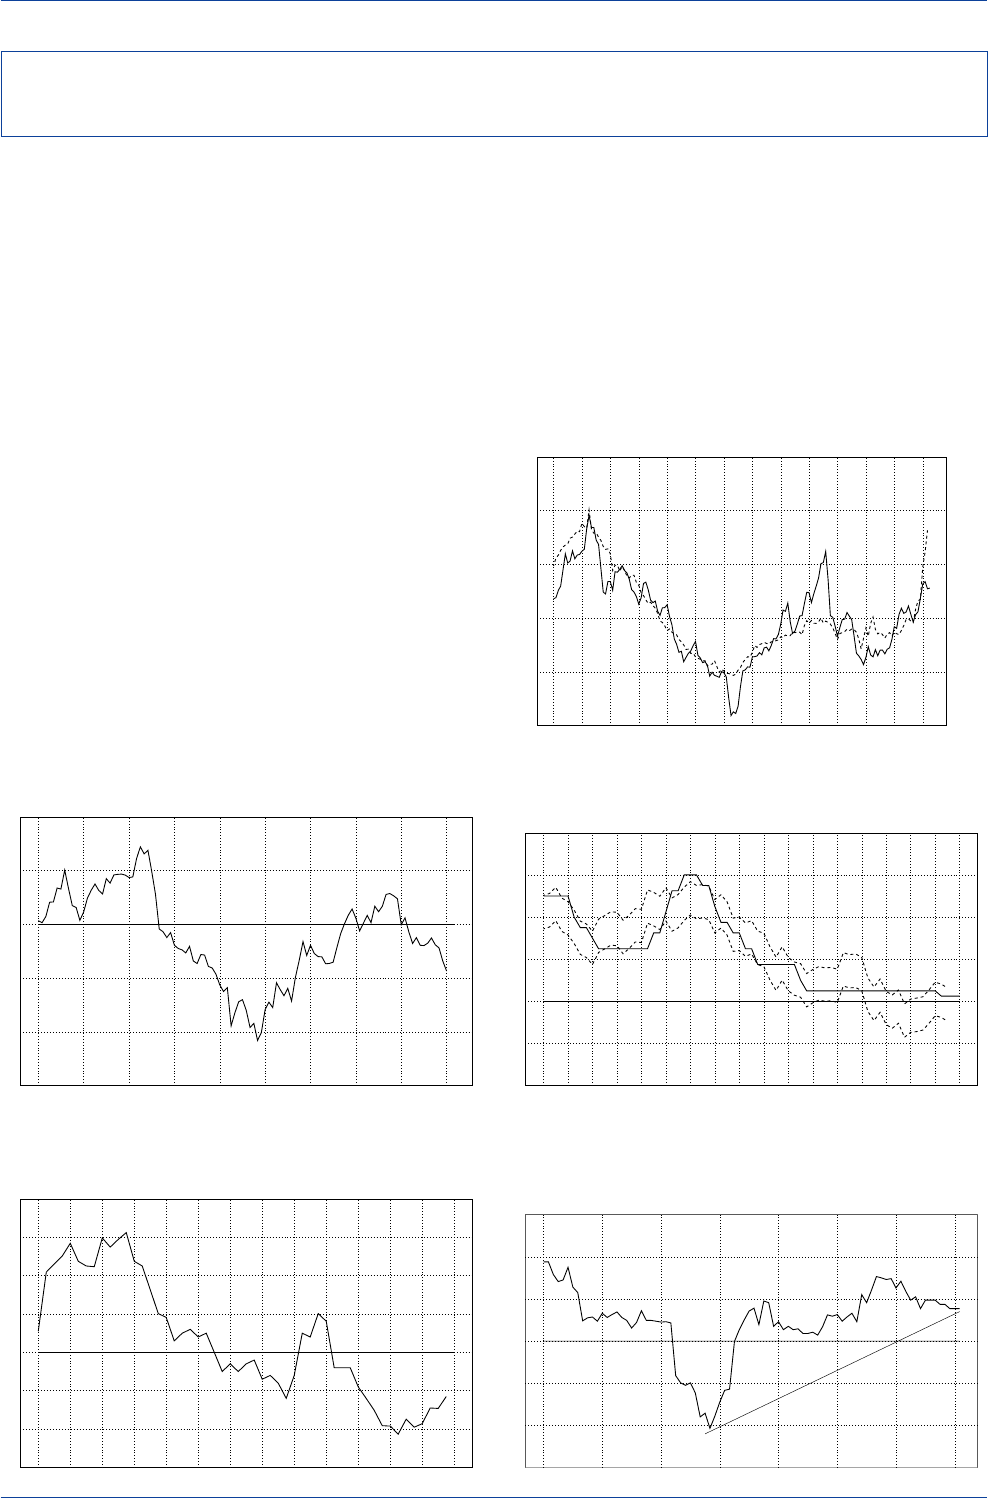
DB Guide to Exchange-Rate Determination
May 2002 Deutsche Bank @
Deutsche Bank Foreign Exchange Research 105
While the monetary model has not been highly success-
ful, broadly speaking, in explaining exchange-rate trends,
it nevertheless has done a fairly good job of explaining the
yen's medium-term cycles over the past 12 years. Since
1989, the yen has tended to strengthen on a trend basis
when Japanese monetary-base growth has decreased
relative to the U.S., and vice versa.
For example, monetary conditions in Japan were quite lax
in 1988-89 and this helped foster a weakening of the yen
during that period. Over the 1990-95 period, Bank of Ja-
pan policy was especially tight compared to a rather loose
Federal Reserve. That relatively tight BoJ stance helped
contribute to a stronger yen in 1990-95. The BoJ then turned
easy again over the 1995-98 period and the yen weak-
ened in tandem. BoJ policy then turned restrictive in 1998-
2000 and the yen strengthened in response. Beginning in
2001 and carrying over into 2002, BoJ policy has turned
easy again, and the yen has weakened accordingly. All in
all, the yen’s medium-term cycles of the past dozen years
were largely determined by the path that the Japan/U.S.
monetary-base ratio took.
Some observers might find it difficult to accept that BoJ
policy was too tight in 1998-2000 when Japanese short-
The Yen and Japanese/U.S. Monetary Policies
0.90
1.00
1.10
1.20
1.30
1.40
1.50
80
100
120
140
160
180
89 90 91 92 93 94 95 96 97 98 99 00 01 02
Japan/U.S. Monetary Base(ratio)----
Y
en/US$____
Note: Y2K Adjusted,
Japan Reserve Require. Rate Change Adj. Series
Japan’s Monetary Conditions Index
-6
-4
-2
0
2
4
1993 1994 1995 1996 1997 1998 1999 2000 2001 2002
(%)
Restrictive
Accommodative
Japan’s Monetary Policy Function
(Taylor Rule)
-4
-2
0
2
4
6
8
85 86 87 88 89 90 91 92 93 94 95 96 97 98 99 00 01 02
Model Estimates(+/-1 Std. Error Band)----
(%) Discount Rate____
Source: Datastream Source: Datastream
Source: Datastream
The Monetary Model’s Track Record—
Japanese Monetary Policy and the Yen
term interest rates were hovering around zero. We would
argue, however, that nominal interest rates were a mis-
leading guide as to how tight the Bank of Japan truly was.
In fact, Deutsche Bank's monetary conditions index for
Japan shows a shift from an accommodative policy stance
to a restrictive policy in 1998-2000, and our Taylor Rule
model suggests that negative nominal rates would have
been more appropriate than the zero interest-rate policy
that the BoJ has been maintaining up until now.
Japan’s GDP Implicit Price Deflator
-3
-2
-1
0
1
2
3
4
89 90 91 92 93 94 95 96 97 98 99 00 01 02
Y
ear-over-Year % Change
Japan’s Real Short-Term Interest Rate
(Three-Month Euro-¥ Rate less Core Inflation)
-3
-2
-1
0
1
2
3
1995 1996 1997 1998 1999 2000 2001 2002
%
Source: Datastream Source: Datastream
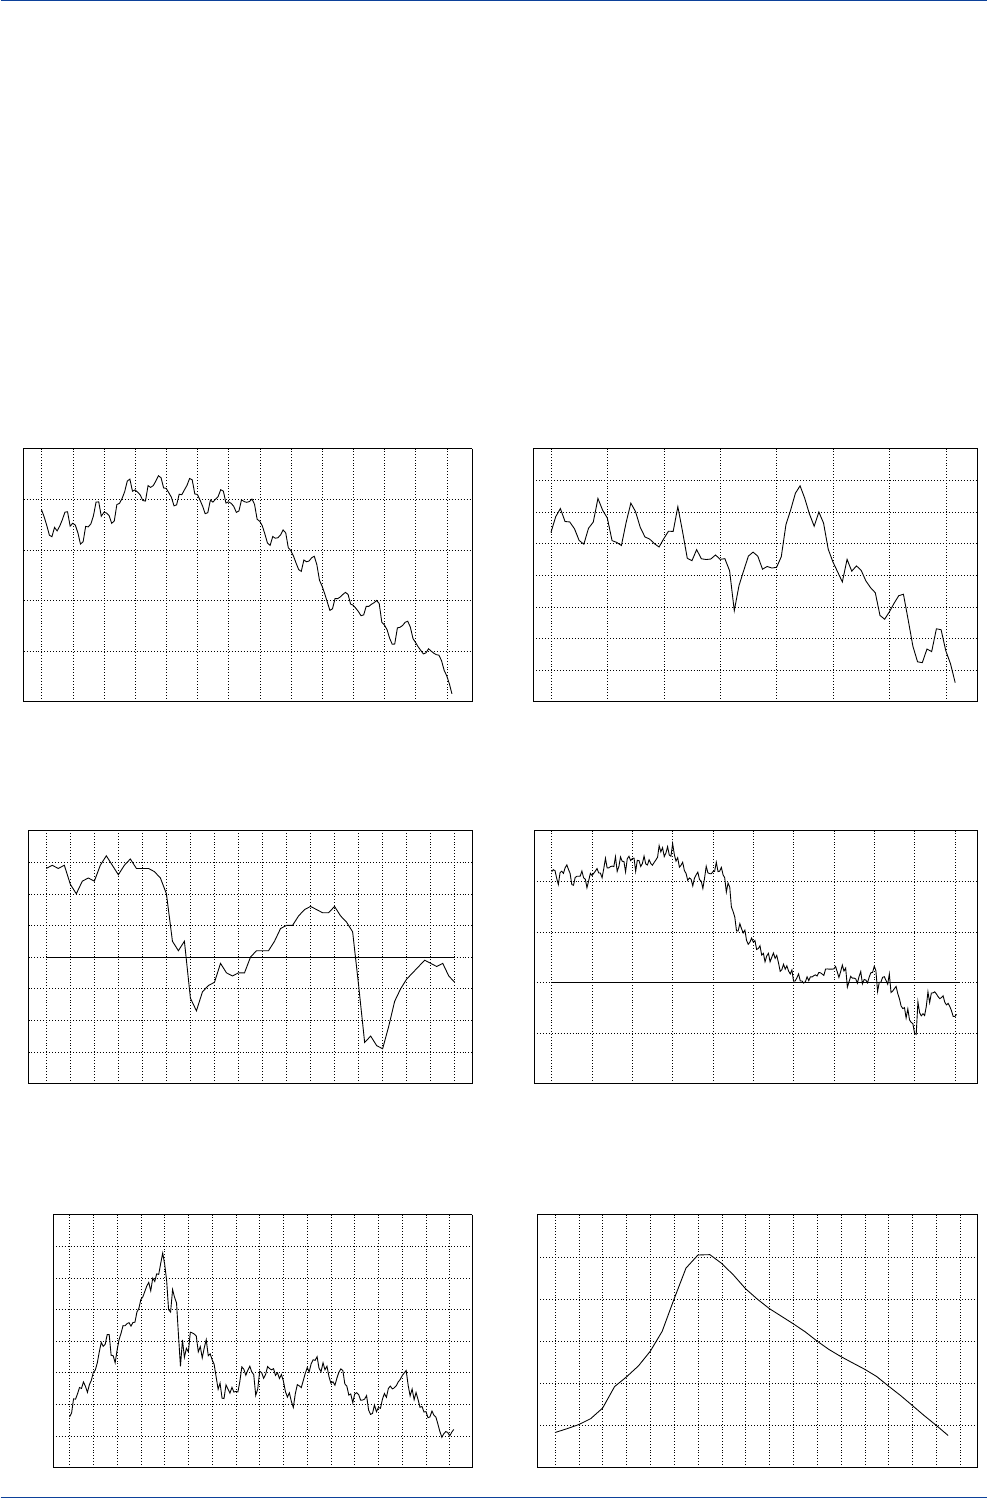
DB Guide to Exchange-Rate Determination May 2002
Deutsche Bank @
106 Deutsche Bank Foreign Exchange Research
A variety of other indicators were also suggesting that BoJ
policy was actually quite tight over the 1998-2000 period.
For example, if one accepts the monetarist proposition that
"inflation is always and everywhere a monetary phenom-
enon", then it must also be true that deflation is always
and everywhere a monetary phenomenon. If so, the exist-
ence of outright deflation in Japan would be evidence that
BoJ policy had been too tight. Indeed, Japan's GDP defla-
tor had been declining for nearly four years and had fallen
to -2%, a near record pace of outright deflation.
Another indicator suggesting that BoJ policy was too tight
in 1998-2000 was the rising trend in real short-term inter-
est rates. With Japan's GDP deflator falling and nominal
short-term interest rates stable at around zero percent, this
had the effect of driving Japan's real short-term interest
rates higher on a trend basis. A declining money multiplier
and weak broad money-supply growth were also indica-
tive of an overly tight monetary-policy stance. The tighten-
ing of credit conditions in Japan in 1998-2000, including
the decline in Japanese bank lending, the decline in Japa-
nese banks' willingness to lend, and the steady erosion in
equity prices and land values, were still more signs of fi-
nancial restraint.
Japan’s Money Multiplier
(Broad Liquidity/Monetary Base)
20
22
24
26
28
30
89 90 91 92 93 94 95 96 97 98 99 00 01 02
Money Multiplier(6-mo. mov. avg.)
Japan’s Broad Liquidity Money-Supply Growth
(1995-2002)
1.0
1.5
2.0
2.5
3.0
3.5
4.0
4.5
5.0
1995 1996 1997 1998 1999 2000 2001 2002
(Year-over-Year % Change)
Japanese Bank Lending
(1982-2002)
-10
-5
0
5
10
15
1982 1984 1986 1988 1990 1992 1994 1996 1998 2000 2002
(Year-over-Year % Change)
Japan’s Equity Market
(1986-2002)
5,000
10,000
15,000
20,000
25,000
30,000
35,000
40,000
45,000
86 87 88 89 90 91 92 93 94 95 96 97 98 99 00 01 02
Nikkei Price Index
Japanese Land Prices
(Nationwide Index)
60
70
80
90
100
110
120
85 86 87 88 89 90 91 92 93 94 95 96 97 98 99 00 01 02
(Index)
Japanese Banks’ Willingness to Lend
(Tankan Survey)
-40
-30
-20
-10
0
10
20
30
40
85 86 87 88 89 90 91 92 93 94 95 96 97 98 99 00 01 02
(Diffusion Index)
Source: Datastream Source: Datastream
Source: Datastream Source: Datastream
Source: Datastream Source: Datastream
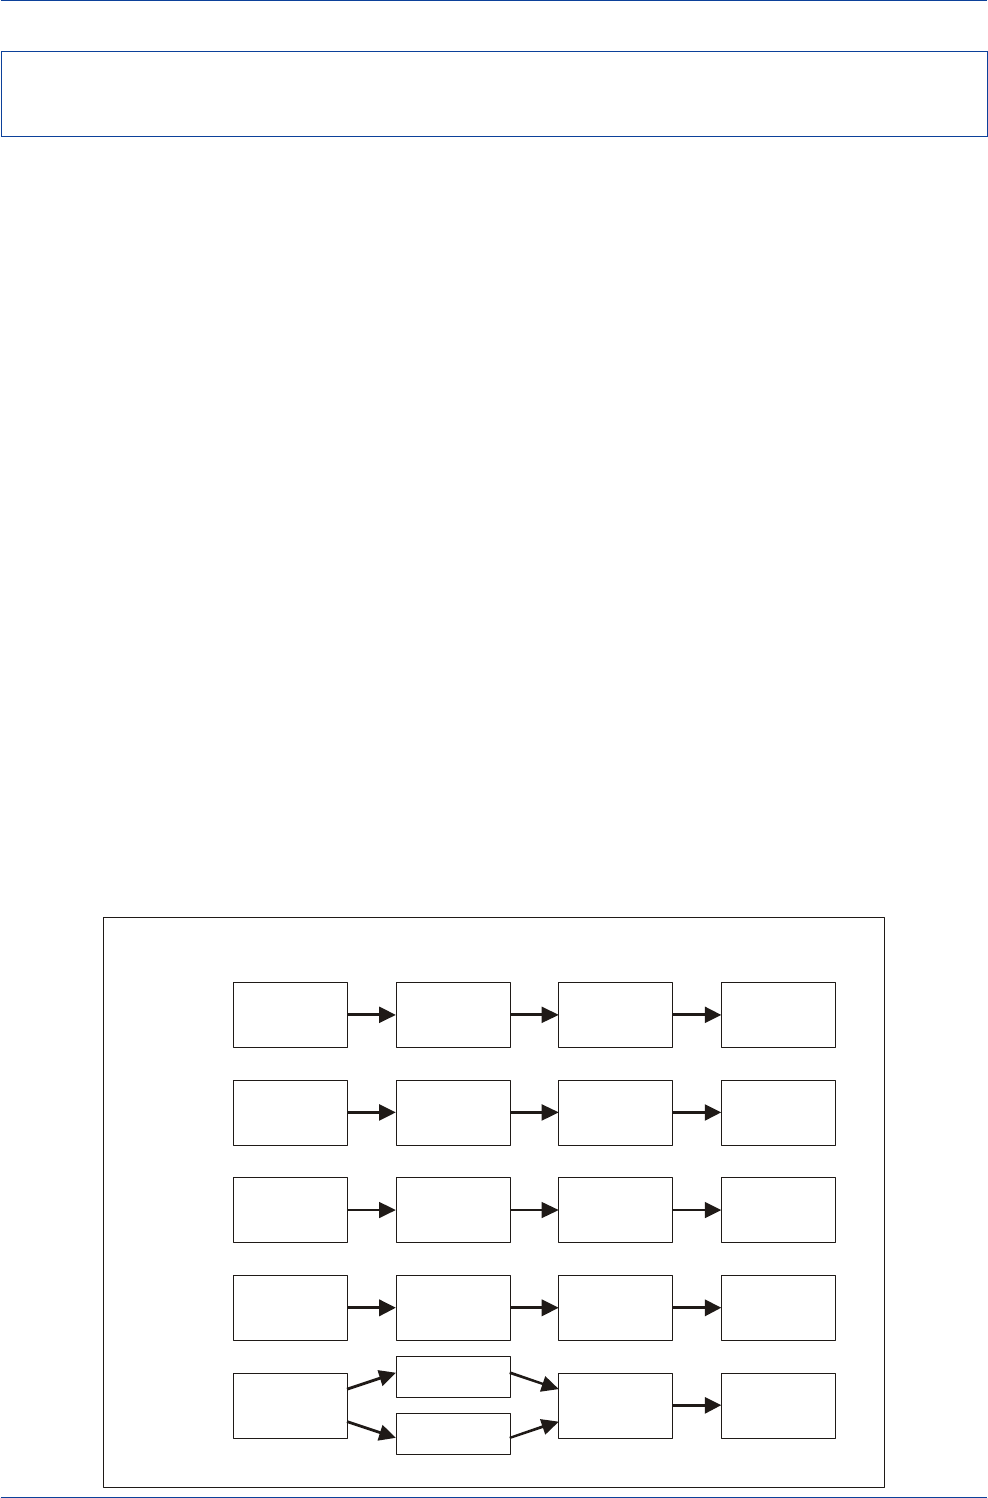
DB Guide to Exchange-Rate Determination
May 2002 Deutsche Bank @
Deutsche Bank Foreign Exchange Research 107
Monetary policy typically affects economic activity through
a variety of channels: (1) an interest-rate channel, (2) a bank-
lending or credit channel, (3) an exchange-rate channel, (4)
an inflation-expectations channel, and (5) a wealth-effect
channel. Under normal circumstances, an easier monetary
policy will lead to lower short-term interest rates, and as
lower short rates are transmitted to lower rates across the
entire yield curve, investment spending will tend to rise.
If, however, nominal short-term interest rates are already
at zero, as has been the case in Japan, an easier policy
stance will not be able to drive short-term interest rates
any lower, thereby rendering the interest-rate channel in-
effective.
The bank-lending channel in Japan has also been rendered
ineffective as the Bank of Japan's attempt to ease policy
has been blunted by the financial problems besetting the
banking industry. Indeed, since Japanese bank lending has
outright contracted in the past four years, this channel has
been effectively closed. And if bank share prices are any
indication of what is in store, the banking system's prob-
lems are not likely to go away anytime soon.
The exchange-rate channel has also failed to operate prop-
erly in Japan. Normally an easy monetary policy gives rise
to a depreciation of the exchange rate and that, in turn,
contributes to a rise in net exports and therefore economic
activity. Up until recently, the yen was fairly strong, sug-
gesting that monetary policy in Japan had been tight in
the first place. Given the yen’s firmness in 1999-2000, it is
obvious that this channel did not function properly during
that period. However, the yen’s weakness in 2001-02 may
render this channel more effective in the future.
When nominal short-term interest rates are zero, monetary
policy can still be effective if the money supply is expanded
at a sufficiently rapid rate so as to raise the expected infla-
tion rate. A higher expected inflation rate will then lower
the
real
short-term interest rate, even if
nominal
rates are
zero. In theory, those lower real interest rates should stimu-
late investment spending as outlined in the conventional
interest-rate channel. Many outside observers have rec-
ommended that the Bank of Japan engineer a quantitative
easing in policy and adopt a positive inflation target. But
Japan's deflationary pressures remain intact, thereby ren-
dering the inflation-expectations channel inoperative over
the last decade.
Finally, the wealth-effect channel in Japan has not been
operative for some time now. Normally, an easier mon-
etary policy can be transmitted to the domestic economy
through rising equity prices and real estate values, which
then increases net wealth and, in turn, helps boost con-
sumption. But with the Tokyo stock market and real estate
values down significantly on a trend basis, there has been
a trend decline in net financial wealth over time. Indeed,
the inability of equity and real estate prices in Japan to
rally raises questions whether monetary policy has been
truly easy even when interest rates are near zero.
With the traditional channels of monetary policy not func-
tioning properly, the Bank of Japan's policy actions have
not been as accommodative as would have been the case
under normal conditions. The end result of all this is that
the Bank of Japan has been too tight, perhaps inadvert-
ently, and this gave rise to a stronger-than-desired Japa-
nese yen.
Why Monetary and Credit Conditions in Japan Became Too Tight in the
Past Decade
The Channels of Monetary Policy
How Monetary Policy Changes Are Transmitted to Economic Activity
Expansionary
Monetary
Policy
Stimulate
Investment
Spending
Lower
Nominal
Interest Rates
Stimulate
Investment
Spending
Increase in
Economic
Activity
Increase in
Bank
Loans
Exchange
Rate
Depreciation
Stimulate
Net
Exports
Expansionary
Monetary
Policy
Expansionary
Monetary
Policy
Expansionary
Monetary
Policy
Expansionary
Monetary
Policy
Increase in
Economic
Activity
Increase in
Economic
Activity
Increase in
Economic
Activity
Increase in
Economic
Activity
Rise in
Inflation
Expectations
Rise in
Equity Prices
Rise in Land &
Housing Prices
Lower
Real
Interest Rates
Rise in
Value of
Financial Wealth
Interest Rate
Channel
Bank Lending
Channel
Exchange Rate
Channel
Inflation
Expectations
Channel
Wealth Effect
Channel
Adapted from Frederick Mishkin, “The Channels of Monetary Transmission: Lessons for Monetary Policy”,
NBER Working Paper, No. 5464, February 1996.
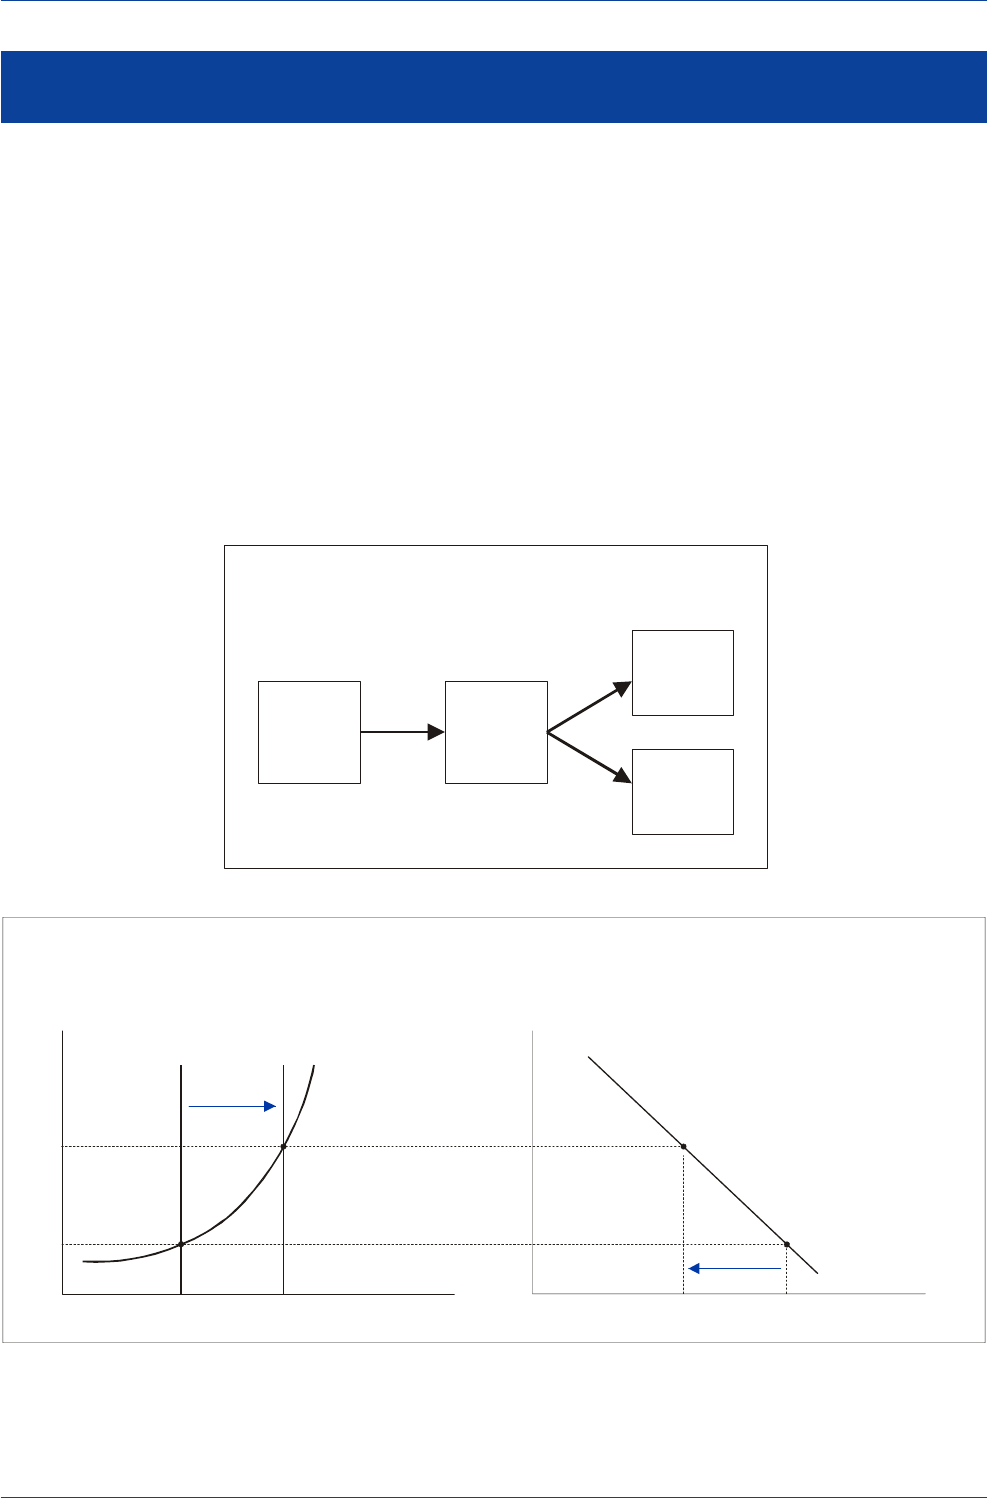
DB Guide to Exchange-Rate Determination May 2002
Deutsche Bank @
108 Deutsche Bank Foreign Exchange Research
The portfolio-balance model posits that exchange rates are
determined by the supply of and demand for all financial
assets. The monetary model is actually a subset of the
broader portfolio-balance model in that the monetary model
narrowly focuses on the supply of and demand for money
as the key determinant of exchange-rate movements. The
portfolio-balance model broadens the menu of assets that
can determine the path that exchange rates take. In addi-
tion to relative changes in money supply and demand, the
portfolio-balance model focuses on relative changes in bond
supply and demand (domestic as well as foreign) as key
determinants of exchange-rate movements.
In the portfolio-balance model, global investors are as-
sumed to hold a diversified portfolio of domestic and for-
eign bonds. Their desired allocation to domestic and for-
eign bonds is assumed to vary in response to changes in
expected return and risk considerations. In the portfolio-
balance framework, a steady increase in the supply of do-
mestic bonds outstanding, generated by a continued wid-
ening of the government budget deficit, will be willingly
held only if asset holders are compensated in the form of
a higher expected return or risk premium. The higher risk
premium could come in the form of higher domestic inter-
est rates or an immediate decline in the domestic
currency's value, or some combination of the two. The
major insight one draws from this is that in the long run,
governments that run large budget deficits on a sustained
basis will eventually see their currencies decline in value.
Portfolio-Balance Model
Transmission Mechanism
Increase in
Supply of
Government
Debt
Outstanding
Increase
in
Risk
Premium
Increase in
Domestic
Interest
Rates
Decline in
Domestic
Currency’s
Value
The Supply and Demand for Domestic Bonds and the Risk Premium
Risk Premium
Supply of
Domestic Bonds e
1
Domestic
Currency’s Value
Ø
1
Ø
0
Ø
1
Ø
0
e
0
Risk Premium
B
S
B
S
1
B
D
Portfolio-Balance Model of Exchange-Rate Determination
Source: Rosenberg (1996)
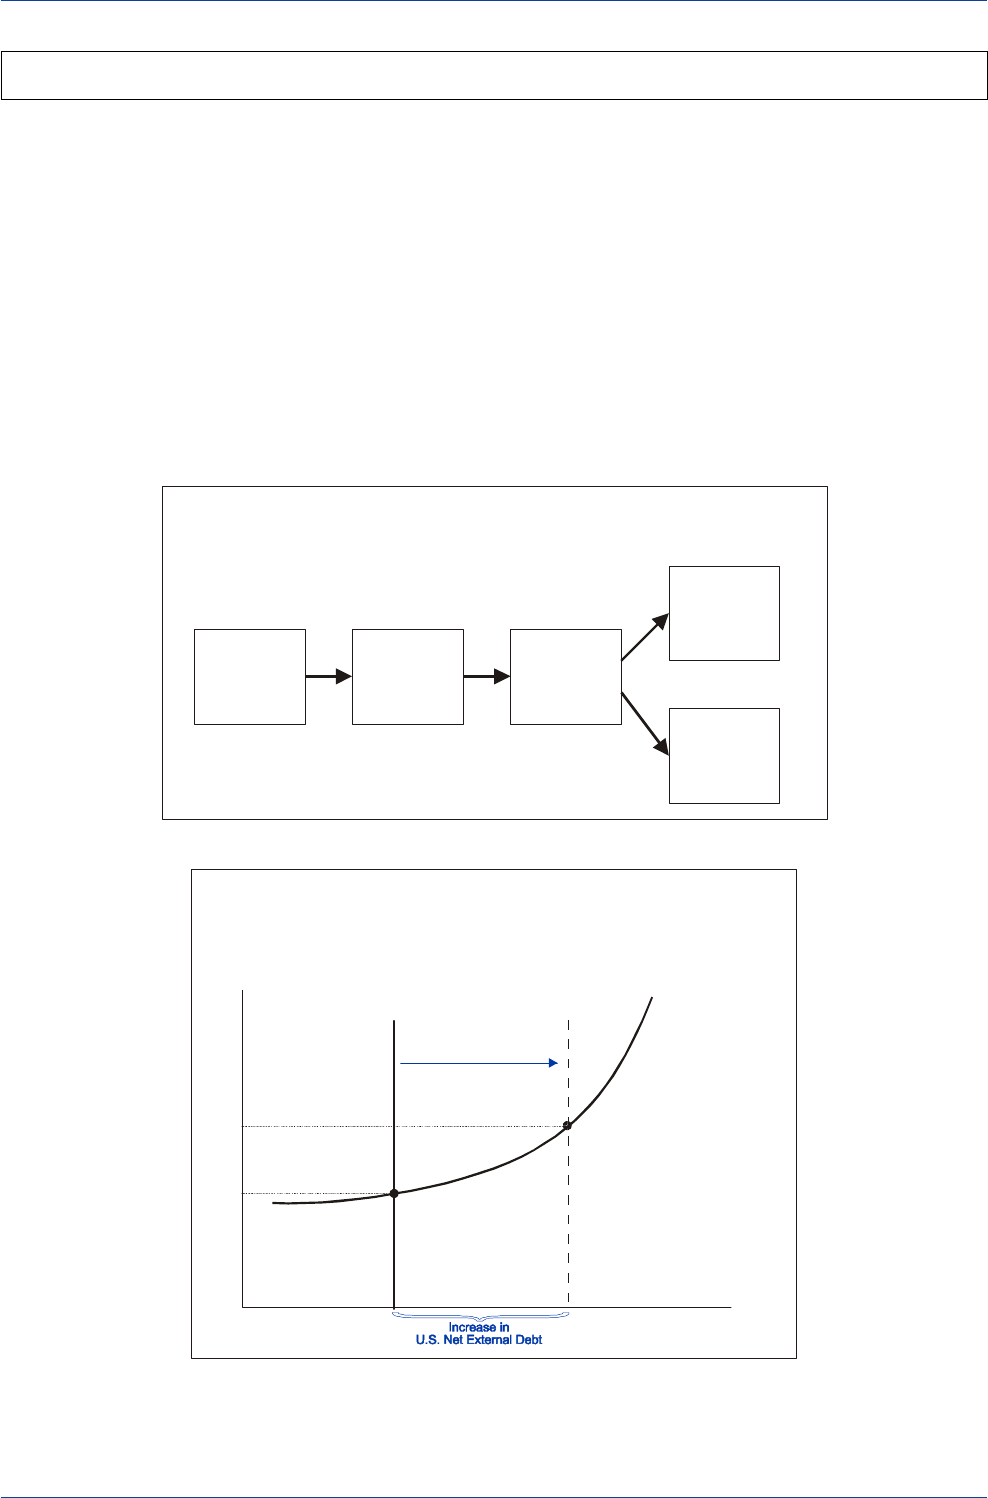
DB Guide to Exchange-Rate Determination
May 2002 Deutsche Bank @
Deutsche Bank Foreign Exchange Research 109
According to the portfolio-balance model, a rising net ex-
ternal debt burden will, in the long run, have negative con-
sequences for domestic interest rates and/or the domes-
tic currency's value. That is because, in the long run, for-
eign investors will demand a higher risk premium to buy
and hold increasing claims on the debtor country's assets.
That higher risk premium could come in the form of wider
domestic/foreign interest-rate spreads and/or a weaker do-
mestic currency. If the external debt becomes particularly
burdensome, the domestic currency may have to weaken
sharply, thereby allowing foreign investors to buy the debtor
country's assets at fire-sale prices.
The diagram below illustrates what normally happens when
a country undergoes a rapid deterioration in its net exter-
nal debt position. The risk premium on a debtor country's
assets, Ø1, is determined at point
A
, where the outstand-
ing stock of external debt, DS1, is willingly held by foreign
investors. If the outstanding stock of debt rises to DS2, for-
eign investors will demand a higher risk premium, Ø2, to
buy and hold that debt (at point
B
). The result would be a
widening in domestic/foreign yield spreads and/or a weak-
ening of the domestic currency.
Rising Net External Debt and the
Risk Premium on U.S. Dollar-Denominated Assets
(A Stylized Diagram of the 1997-2002 Period)
Risk Premium
on U.S. Assets
U.S. Net External Debt
DS
1
Ø
2
Ø
1
A
B
U.S. Net External Debt
DD
1
Foreign Demand
for
US$-Denominated
Assets
DS
2
External Debt, Portfolio Balance & Exchange-Rate Determination—Theory
Cumulative
Current-Account
Deficits
Rising
Net External
Debt Ratio
Increase in
Domestic
Interest
Rates
Decline in
Domestic
Currency’s
Value
Current-Account Imbalances and Exchange Rates—
The Channels of Influence
Increase
in
Risk Premium
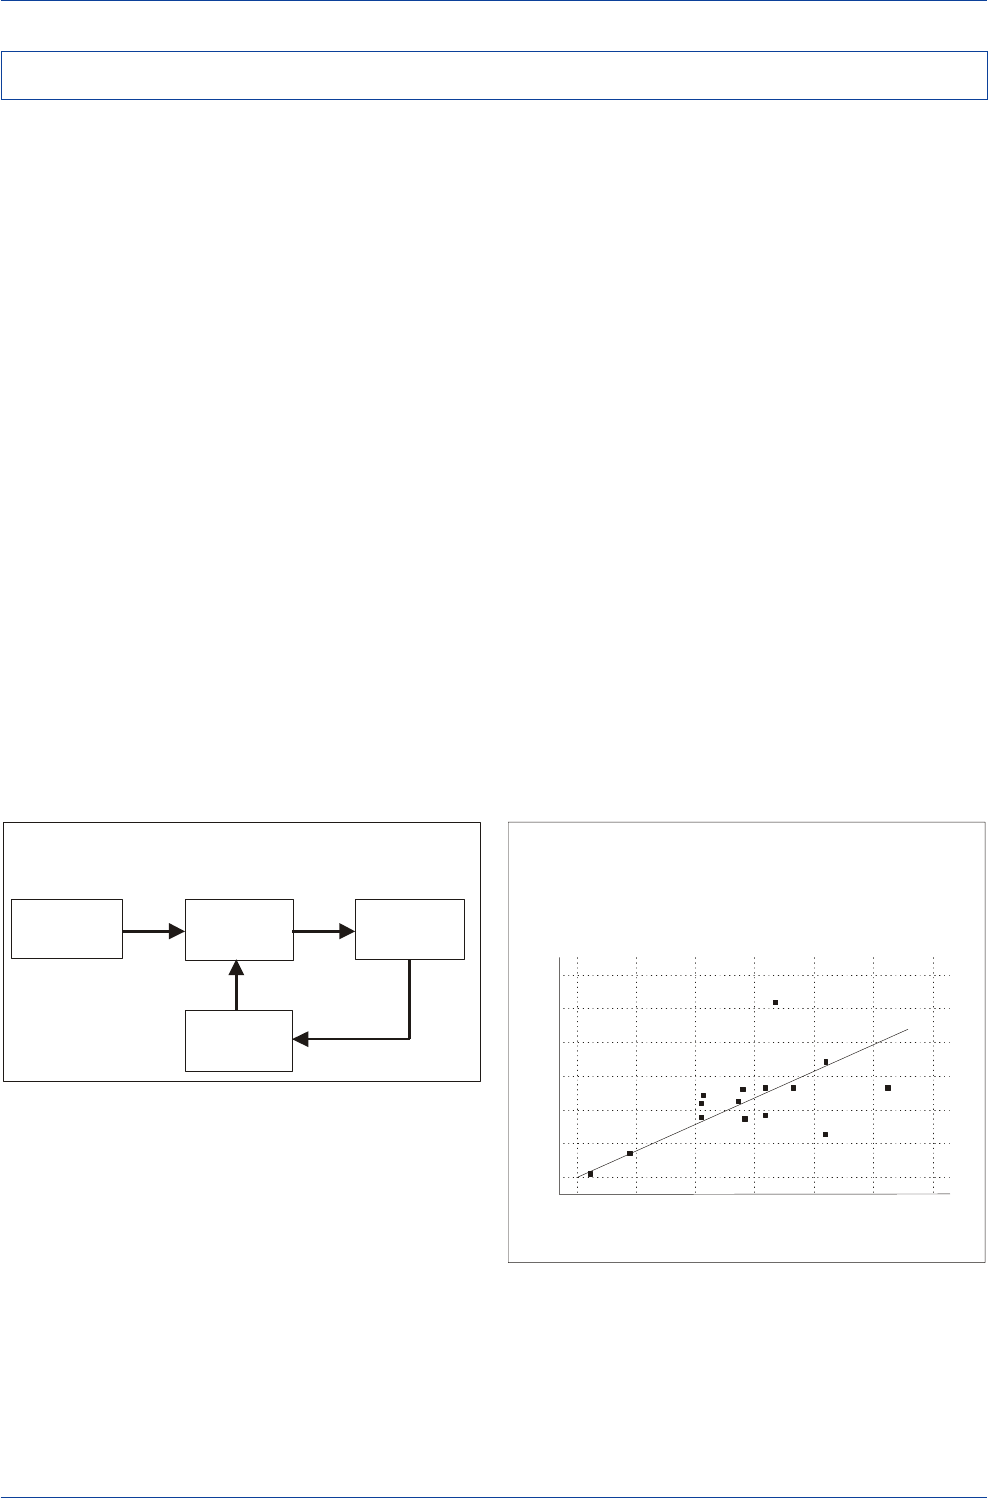
DB Guide to Exchange-Rate Determination May 2002
Deutsche Bank @
110 Deutsche Bank Foreign Exchange Research
Just how long can a country run large and persistent cur-
rent-account deficits (or surpluses) before there is a re-
quired adjustment in the exchange rate to correct the grow-
ing external imbalance? There must be some limit on the
ability of a country to run sizable and persistent current-
account deficits, because the financing of such deficits
would lead to an unending rise in debt owed by deficit
countries to foreign investors. Since that debt must be
serviced, there is a risk that a deficit country could fall into
a "debt trap" with rising debts adding to debt-service obli-
gations, which then worsen the current-account deficit.
Once entrenched in a debt trap, the deteriorating current-
account trend adds to the rising external debt, which mag-
nifies the debt-service burden further, and so on.
The trend in the outstanding external debt as a percent-
age of GDP would rise without limit, unless this was off-
set by a rising trade surplus as a percentage of GDP. In the
absence of an improving trade position, the market would
be faced with the task of adding more and more risky debt
of the deficit country to its portfolios. At some point, the
market would probably demand a higher risk premium to
induce it to buy and hold onto that rising debt. Eventually,
there may come a time when the market perceives the
debt of the deficit country as so risky that it refuses to add
any more of that debt to its portfolios.
Debt-Trap Dynamics
Trade
Deficit Current-Account
Deficit External Debt
Outstanding
Debt
Service
Real Currency Appreciation vs.
the Change in Net Foreign Assets/GDP Ratio
(in Selected OECD Countries, 1986-90 vs. 1981-85)
Rate of Real
Currency Appreciation
Change in Net Foreign Assets/GDP Ratio
40%
30%
20%
10%
0%
-10%
-20%
-0.15 -0.05-0.10 0.0 0.05 0.10 0.15
Australia
U.S.
U.K. Finland
Sweden
Netherlands
Canada
Denmark
Italy France Spain
Belgium
Germany
Japan
Norway
Source: Obstfeld and Rogoff (1994).
Thus, although it may be difficult to quantify precisely, there
will clearly be a limit on just how long a country can run
large and persistent current-account deficits (or surpluses).
It is unlikely that an efficient forward-looking market would
be willing to finance an unending string of current-account
deficits until the deficit country became hopelessly en-
gulfed in a debt trap. Rather, an efficient forward-looking
market would look far into the future, and if it judged the
future path of the net external debt/GDP ratio to be unsus-
tainable, then the exchange rate would adjust sooner to
ensure that the trade balance would improve by a suffi-
cient amount to offset the rising debt-service burden and
thus stabilize the net foreign debt/GDP ratio at a level that
was deemed sustainable.
Using the sustainability criterion to determine a currency's
real long-run equilibrium level, the equilibrium real exchange
rate could be defined as that rate that will ensure a stable
net external debt/GDP ratio in the long run. One would
then expect to find a positive (negative) relationship be-
tween a currency's real value and the trend in the net ex-
ternal asset (liability) position of that country, and long-run
equilibrium would be attained only when the net invest-
ment position stabilized. Obtsfeld and Rogoff (1994) pro-
vide evidence suggesting that there has been a significant
positive relationship between an increase in a country's
net foreign asset position as a percentage of GDP and the
trend in its real effective exchange rate for 15 OECD coun-
tries.
Debt Trap Dynamics and the Equilibrium Exchange Rate
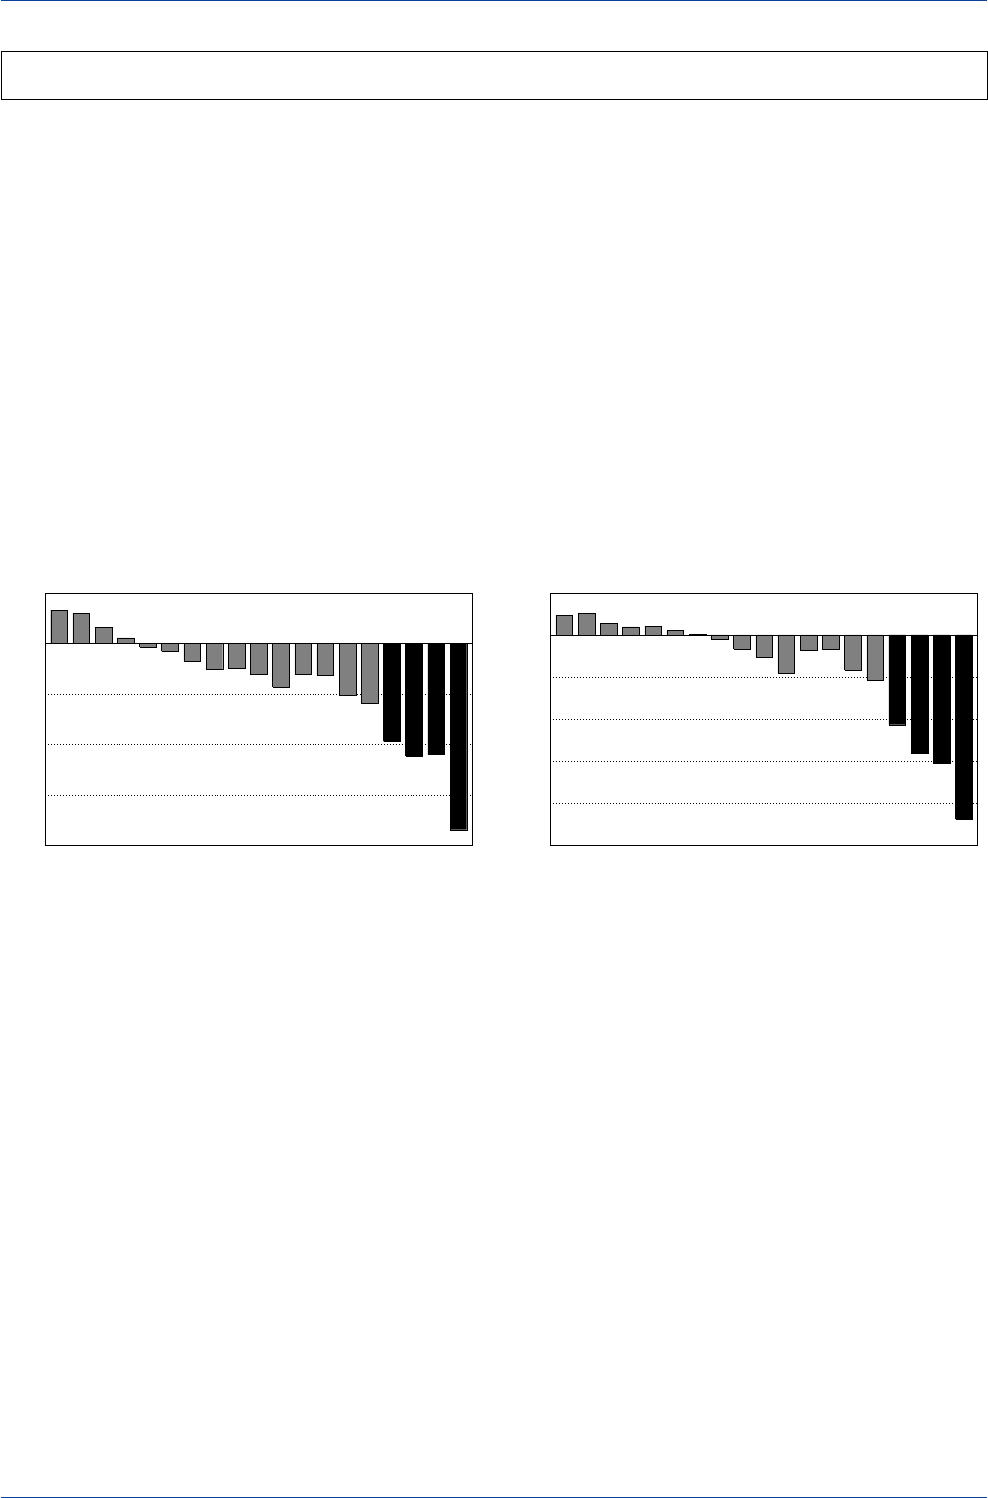
DB Guide to Exchange-Rate Determination
May 2002 Deutsche Bank @
Deutsche Bank Foreign Exchange Research 111
The U.S. suffered a mammoth deterioration in its net ex-
ternal debt position in 2000, according to the latest annual
estimates by the U.S. Commerce Department. The U.S.
net external debt, which is the difference between the level
of foreign-owned assets in the U.S. and the level of U.S.-
owned assets abroad, soared in 2000 to $1.84 trillion, from
$1.1 trillion the previous year on a current cost basis. On a
market value basis, U.S. net external debt soared from
$1.52 trillion in 1999 to $2.19 trillion in 2000.
Note that the U.S. net external debt did not change much
over the 1997-99 period despite a record deterioration in
the U.S. current-account deficit. The reason for this was
that favorable valuation factors on U.S.-owned assets
abroad offset increases in foreign holdings of U.S. assets.
Unfortunately, negative valuation adjustments in 2000,
coupled with record increases in foreign holdings of U.S.
assets, contributed to a near-50% rise in the U.S. debt
burden, the worst annual deterioration on record.
The portfolio-balance model would have predicted that the
dollar should have fallen and U.S./foreign yield spreads
should have widened in response to the deterioration in
the U.S. net external debt position. This did not happen.
Instead, U.S./foreign yield spreads actually narrowed, not
widened, while the dollar's value soared, not weakened
as the portfolio-balance model would have predicted. This
would suggest, if anything, that the risk premium on dol-
lar-denominated investments must have fallen, not risen
in recent years.
U.S. Net Investment Position
(at Current Cost)
-2000
-1500
-1000
-500
0
500
82 83 84 85 86 87 88 89 90 91 92 93 94 95 96 97 98 99 00
(US$ bn.)
U.S. Net Investment Position
(at Market Value)
-2500
-2000
-1500
-1000
-500
0
500
82 83 84 85 86 87 88 89 90 91 92 93 94 95 96 97 98 99 00
(US$ bn.)
U.S. External Debt Problem & the Dollar—Theory vs. Practice
Source: Datastream Source: Datastream
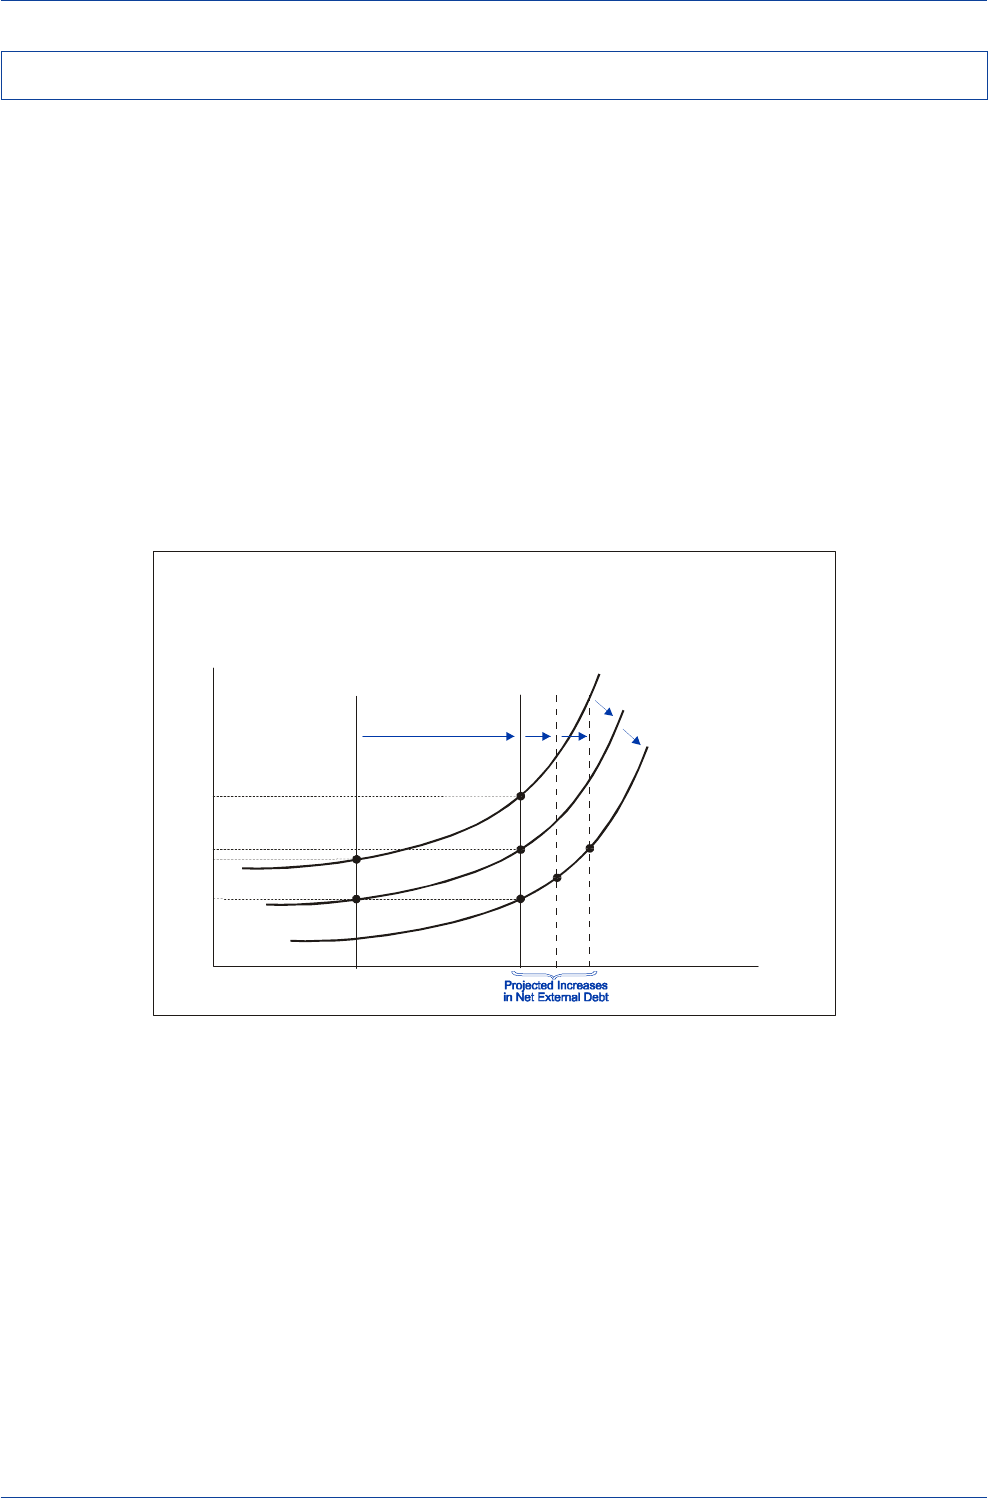
DB Guide to Exchange-Rate Determination May 2002
Deutsche Bank @
112 Deutsche Bank Foreign Exchange Research
Perhaps the diagram below better characterizes the recent
trend in the U.S. risk premium. In this diagram, let's as-
sume that the U.S. net external debt position during 1997-
99 stood at
U.S. Net External Debt
1997-99. Since the U.S. net
external debt position did not change much in 1997-99,
we assume that the outstanding stock of foreign-held U.S.
debt remained fixed at that level. Given the prevailing
For-
eign Demand for U.S. Assets
1 that existed in 1997, the U.S.
risk premium is assumed to have initially stood at Ø1 in
1997.
Between 1997 and 1999, foreign demand for U.S. assets
began to rise. This rise was attributable to increased Euro-
pean investor demand for U.S. equities and bonds, record
FDI flows in the U.S., and capital flight from emerging mar-
kets to the U.S. as investors looked for a refuge from the
Asian and Russian financial crises. This increased demand
for U.S. assets is shown as a rightward shift in the Foreign
Demand for U.S. Assets schedule to
Foreign Demand for
U.S. Assets
2. That shift in overseas demand helped drive
the risk premium on dollar-denominated assets down from
Ø1 to Ø3 (or from point
A
to point
C).
As the U.S. net external debt soared from
U.S. Net Exter-
nal Debt
1997-99 to
U.S. Net External Debt
2000 in 2000, one
might have expected the risk premium on dollar denomi-
nated assets to have risen to perhaps Ø4 (or point
D
), but
that was not the case. With U.S./foreign yield spreads con-
tinuing to narrow and the dollar remaining firm, the risk
premium on dollar-denominated assets must have fallen
further in 2000. This implies that although the U.S. net ex-
ternal debt position rose in 2000, the demand for U.S. as-
sets by foreign investors must have risen commensurately,
say to
Foreign Demand for U.S. Assets
3.
Recent Trends in the Risk Premium on US$-Denominated Assets
Rising Net External Debt and the
Risk Premium on U.S. Dollar-Denominated Assets
(A Stylized Diagram of the 1997-2001 Period)
Risk Premium
U.S. Net External Debt
U.S.
Net External
Debt
1997-99
Ø
2
Ø
1
Ø
3
A
B
C
D
EF
U.S.
Net External
Debt
2000
Foreign Demand for
US$-Denominated Assets
1
Foreign Demand for
US$-Denominated Assets
2
Foreign Demand for
US$-Denominated Assets
3
Ø
4
G
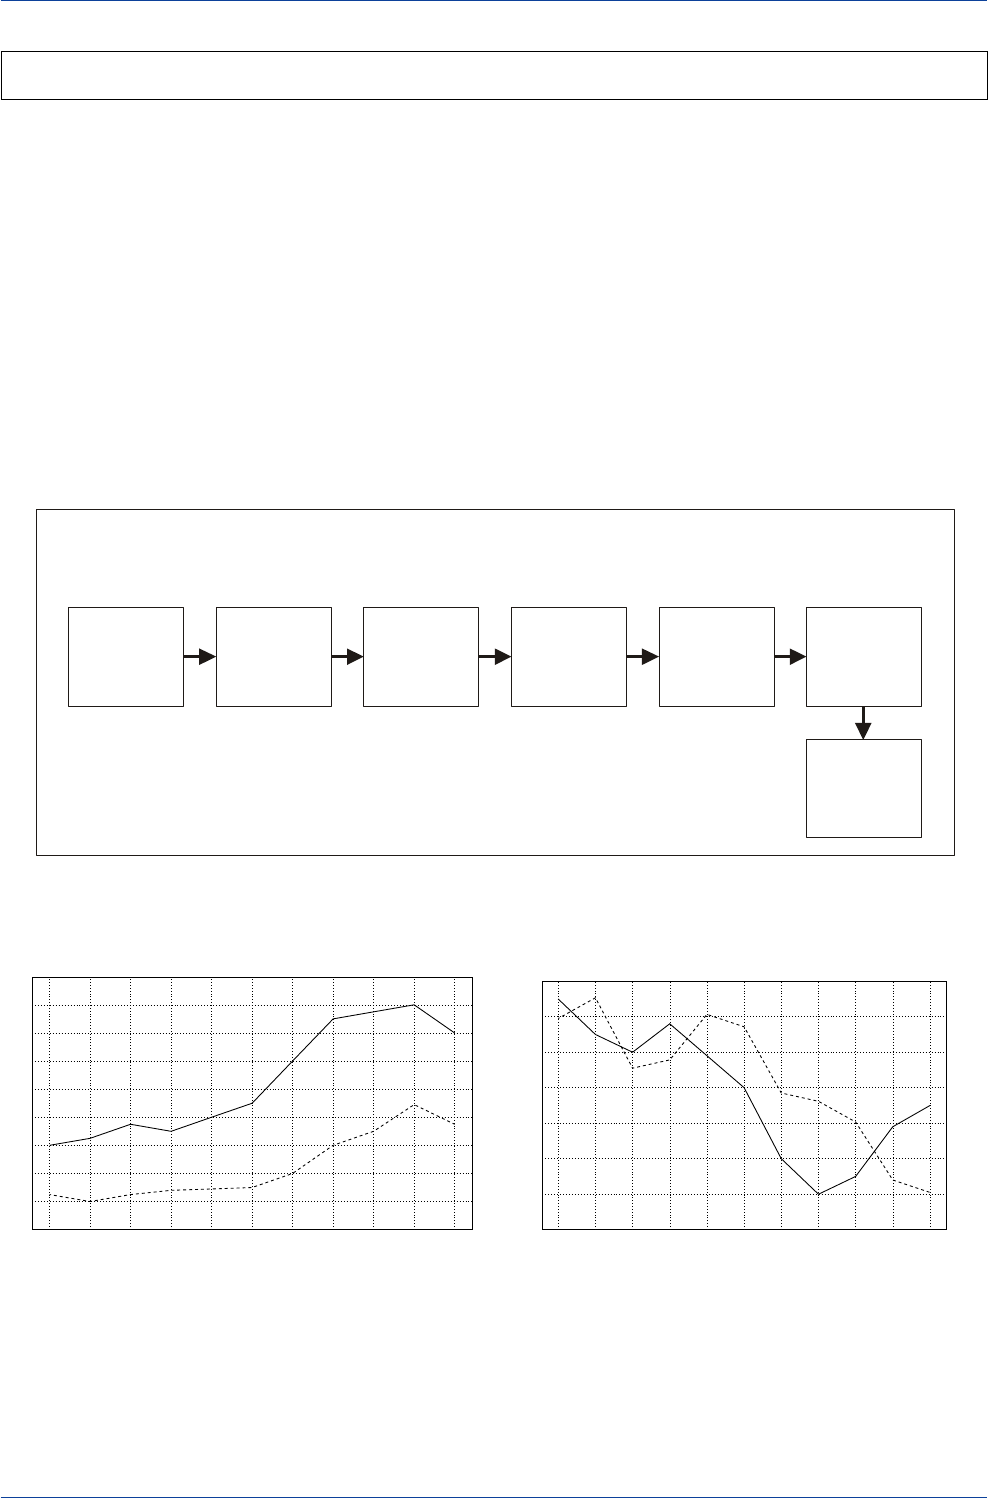
DB Guide to Exchange-Rate Determination
May 2002 Deutsche Bank @
Deutsche Bank Foreign Exchange Research 113
Relative
Increase in
U.S. Equity
Market
Capitalization
Ratio
Relative
Increase
in
U.S. Wealth
Relative
Rise in
U.S.
Aggregate
Demand
Relative
Rise in
U.S. Real
Interest Rate
How a Relative Rise in the U.S. Equity Market’s Capitalization Ratio
Would Help Raise the Dollar’s Value
Relative
Rise in U.S.
Household
Propensity
to Consume
Capital
Inflow
into U.S.
Rise in
U.S. Dollar’s
Value
Analysts attribute the rise in the dollar's value versus the
euro in the second half of the 1990s to a wide range of
factors including strong productivity gains in the U.S., struc-
tural shifts in portfolio flows from Euroland to the U.S., in-
creased M&A flows from Euroland to the U.S., structural
rigidities in Euroland, "New Economy" forces in the U.S.,
relative economic growth rates, policy mixes, and euro-
changeover risk. The portfolio-balance model offers an ad-
ditional explanation—the increase in wealth generated by
the U.S. equity-market rally in the second half of the 1990s
and its impact on U.S. domestic demand.
While it is true that both the U.S. and Euroland equity mar-
kets rallied strongly in the second half of the 1990s, U.S.
equity-market capitalization as a percentage of GDP rose
by a larger amount than the comparable capitalization ra-
tio in Euroland. According to the IMF, U.S. market capitali-
zation rose from about 80% of GDP in 1994 to 160% in
1999, while the comparable capitalization ratio in Euroland
rose from 30% of GDP to 90% of GDP. Thus, the capitali-
zation ratio in the U.S. rose a full 100%, while Euroland's
capitalization rose just 60%. Since U.S. households have
a higher propensity to consume out of equity wealth than
do their Euroland counterparts, the greater increase in U.S.
wealth relative to Euroland had a larger impact on the rise
in U.S. demand relative to Euroland demand in the second
half of the 1990s.
Shifts in Equity Market Capitalization Ratios & the Trend in Exchange Rates
Euroland & U.S. Equity-Market Capitalization
(as a Percentage of GDP)
0
20
40
60
80
100
120
140
160
180
1991 1992 1993 1994 1995 1996 1997 1998 1999 2000 2001
Euroland----
(%) U.S.____
Adapted from Guy Meredith,
"Why Has the Euro Been So Weak?", IMF
Source: FIBV
Euroland-U.S. Equity-Market Capitalization
Differential and the Euro
0.80
0.90
1.00
1.10
1.20
1.30
1.40
-100
-90
-80
-70
-60
-50
-40
-30
1991 1992 1993 1994 1995 1996 1997 1998 1999 2000 2001
US$/Euro----(%) Euroland-U.S. Capitalization Ratios___
Adapted from Guy Meredith,
"Why Has the Euro Been So Weak?", IMF
Source: FIBV
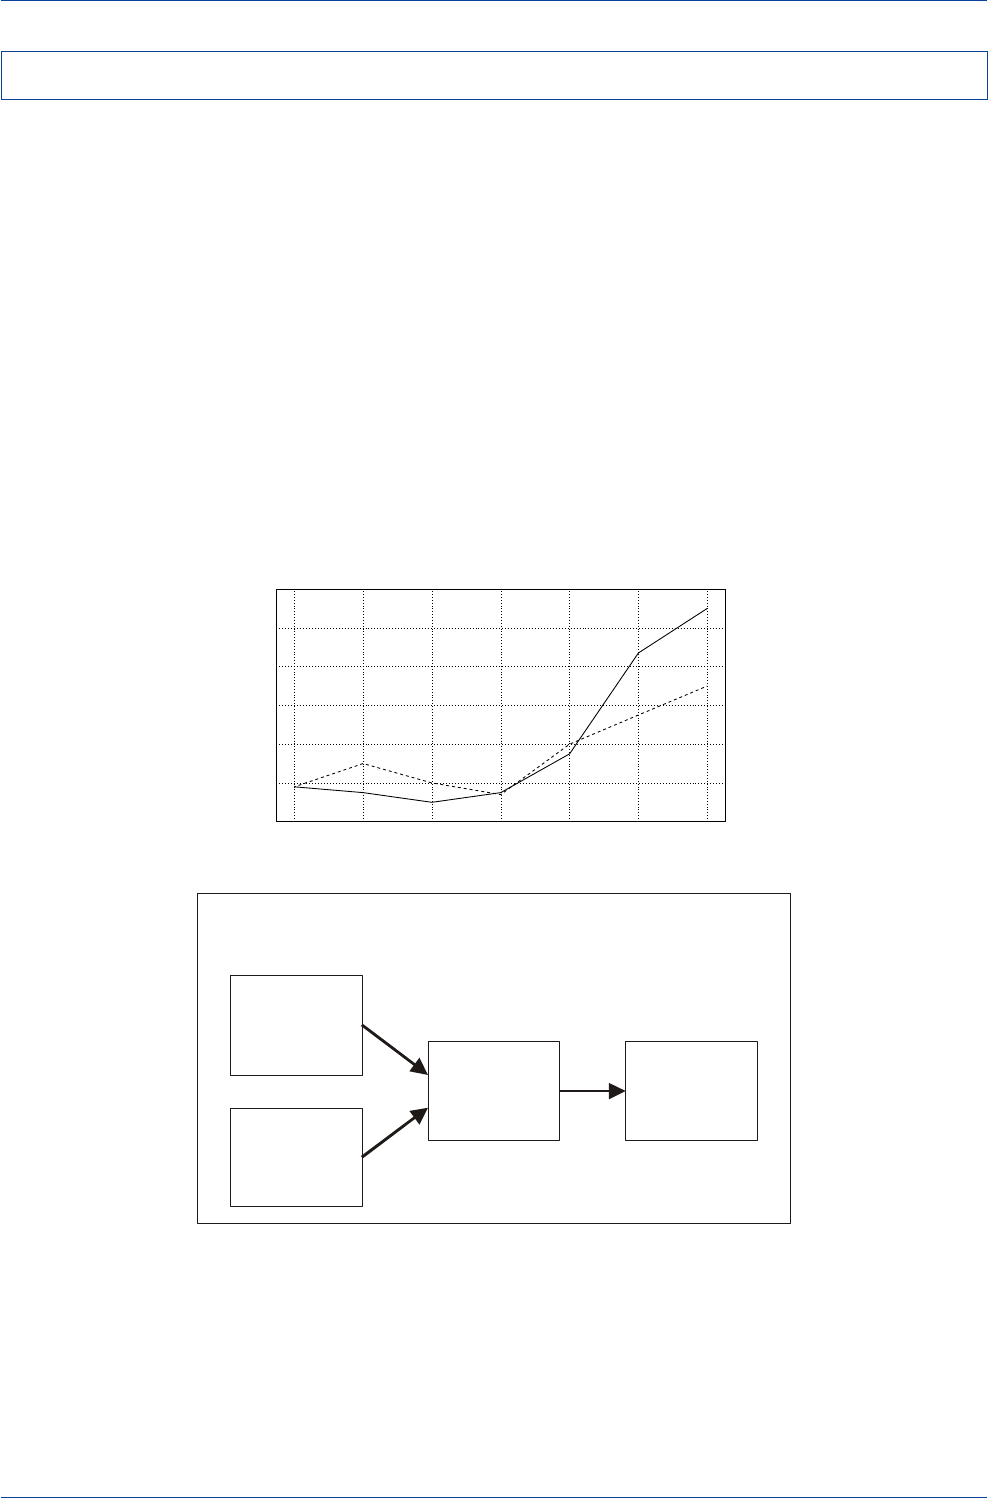
DB Guide to Exchange-Rate Determination May 2002
Deutsche Bank @
114 Deutsche Bank Foreign Exchange Research
At the outset of the euro's launch, EMU optimists pre-
dicted that global investors and central banks would at-
tempt to build their holdings of euro assets at the expense
of their dollar holdings. It was widely felt that such portfo-
lio shifts would be extremely bullish for the euro.
What was not considered by EMU optimists was the pos-
sibility that issuers might also find the euro as an attrac-
tive vehicle in which to fund their operations. If the issu-
ance of euro-denominated debt exceeded the demand for
that debt, then the euro would weaken, not strengthen.
That is pretty much what happened to the euro over the
1999-2001 period. Issuance of euro-denominated debt by
non-residents soared between 1999 and 2001, both in
absolute terms and as a share of all foreign-currency de-
nominated debt. As shown in the accompanying chart, the
share of international debt denominated in euros rose from
17% prior to the euro's launch to around 27% in 2000.
Most of that increase in debt was purchased by Euroland
residents, as little was purchased by international inves-
tors.
Overall, the increased issuance of euro-denominated debt,
the increased demand for foreign equities by euro-area resi-
dents, and the stepped-up acquisition of U.S. firms by Eu-
ropean firms resulted in a large flow of capital out of
Euroland, which acted to depress the euro's value over
the 1999-01 period.
Euro-Denominated Debt Issuance and the Value of the Euro
Increased
Investment in
Non-Euro Assets
by Euroland
Residents
How Euro-Area Portfolio Shifts Might Have
Contributed to a Trend Decline in the Euro’s Value
Capital
Outflow
from
Euroland
Decline in
Euro’s
Value
Increase in
Euro-Denominated
Borrowing
by Non-Residents
Euro-Denominated Share of
International Debt Issues
(Percentage of Total Issues in All Currencies)
16
18
20
22
24
26
28
1994 1995 1996 1997 1998 1999 2000
Current Currency Values----
(%) Constant Currency Values____
Adapted from Guy Meredith,
"Why Has the Euro Been So Weak?", IMF
Source: Detkon and Hartmann (2000)
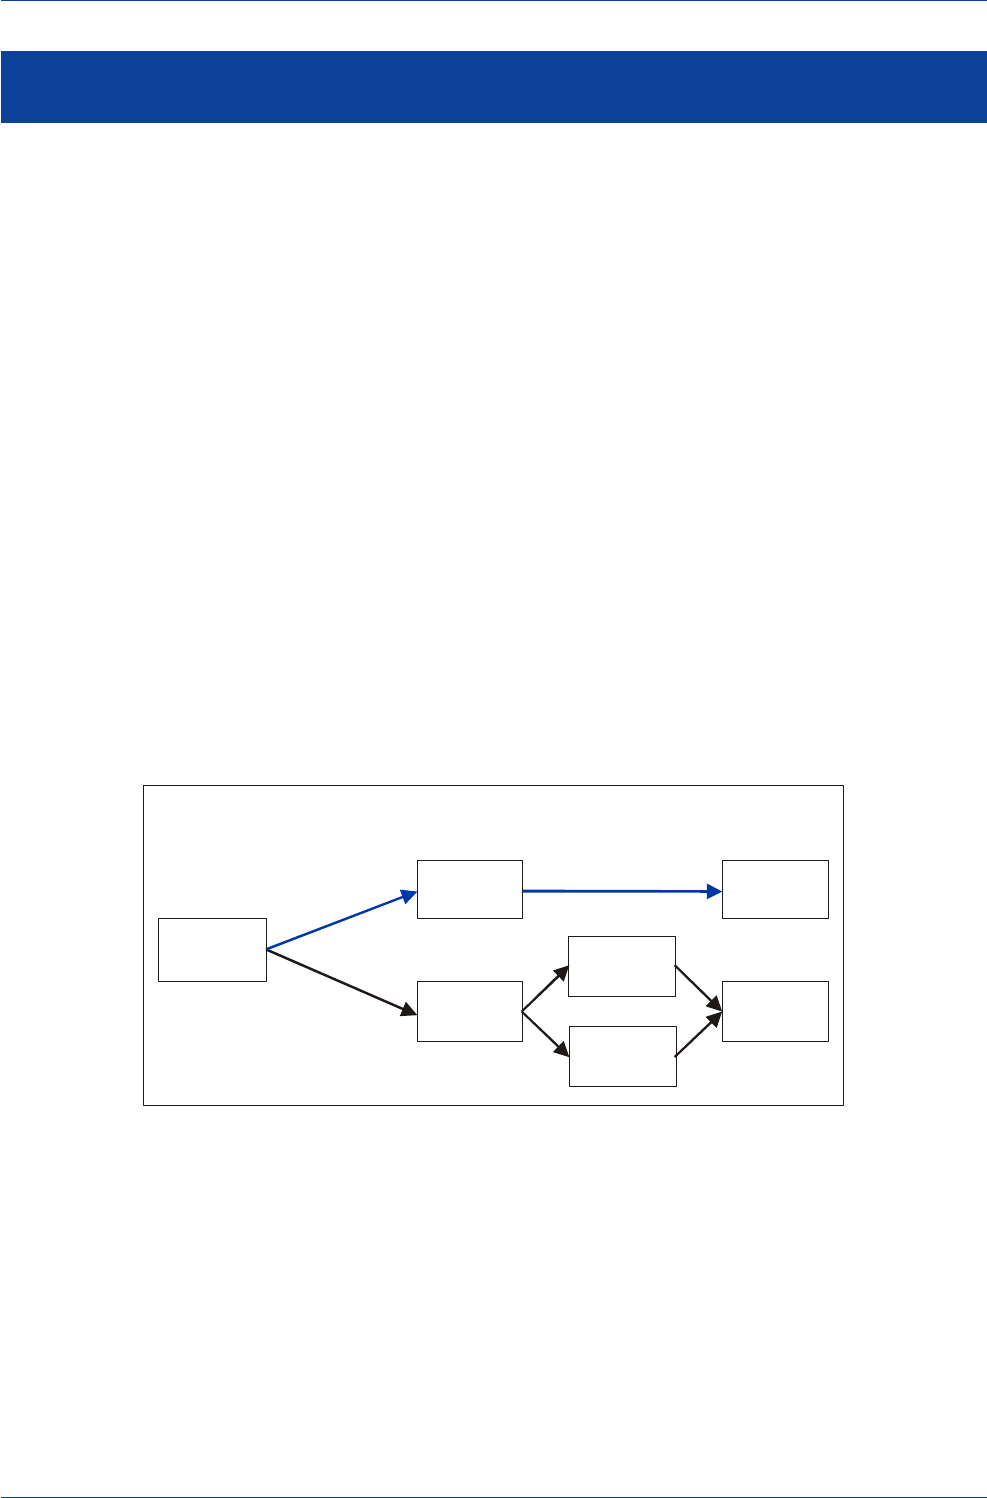
DB Guide to Exchange-Rate Determination
May 2002 Deutsche Bank @
Deutsche Bank Foreign Exchange Research 115
There is no universal agreement among economists on
the role that fiscal policy plays in the determination of ex-
change rates. The reason for disagreement is that fiscal
impulses are transmitted to exchange rates through a vari-
ety of channels, some of which generate positive influ-
ences on a currency's value, while others generate nega-
tive influences.
For example, in the Mundell-Fleming model, an expansion-
ary fiscal policy typically gives rise to higher domestic in-
terest rates and an increase in domestic economic activ-
ity. The rise in domestic interest rates will induce a capital
inflow that should contribute to a rise in the domestic
currency's value, but the consequent rise in domestic eco-
nomic activity will also contribute to a deterioration of the
trade account, which should put downward pressure on
the domestic currency's value. How sensitive capital move-
ments are to the rise in domestic interest rates will deter-
mine whether the induced capital inflow will dominate the
deterioration of the trade balance or vice versa.
In the portfolio-balance model, a steady string of rising bud-
get deficits will result in a rising stock of government debt
outstanding. If risk-averse investors balk at buying and
holding an ever-rising stock of government debt, then in-
vestors would need to be induced to buy and hold that
debt through higher domestic interest rates, an immedi-
ate decline in the domestic currency's value, or some com-
bination of the two.
Perhaps one could combine the Mundell-Fleming and port-
folio-balance models into a single integrated framework
by asserting that a stimulative fiscal policy is likely to be
positive for a currency in the short run, but negative in the
long run. After the currency’s initial appreciation during the
period when the stimulative fiscal policy is put into place,
budget deficits will rise and total debt outstanding will grow.
As the government's debt obligation rises, the market will
begin to wonder how that debt will be financed, and if the
mountain of debt is sizable, the market may believe that
pressure will eventually be brought to bear on the central
bank to monetize the debt. That clearly would lead to a
rapid reversal of the initial currency appreciation.
Alternatively, the market may believe that the government's
fiscal stance will eventually have to shift toward signifi-
cant restraint to restore longer-run balance to its fiscal po-
sition. A reversal of the fiscal stance that initially drove the
currency higher would, by definition, set forces in motion
for a reversal of the initial currency appreciation.
The Short- and Long-Run Response of Exchange Rates
to Changes in Fiscal Policy
Expansive
Fiscal
Policy
Increase in Real
Interest-Rate
Differential
Currency
Appreciates
Government
Debt
Buildup
Currency
Depreciates
Short-Run Response
Long-Run Response
Central Bank
Monetizes
Debt
Fiscal Stance
Turns
Restrictive
Fiscal Policy and Exchange Rates
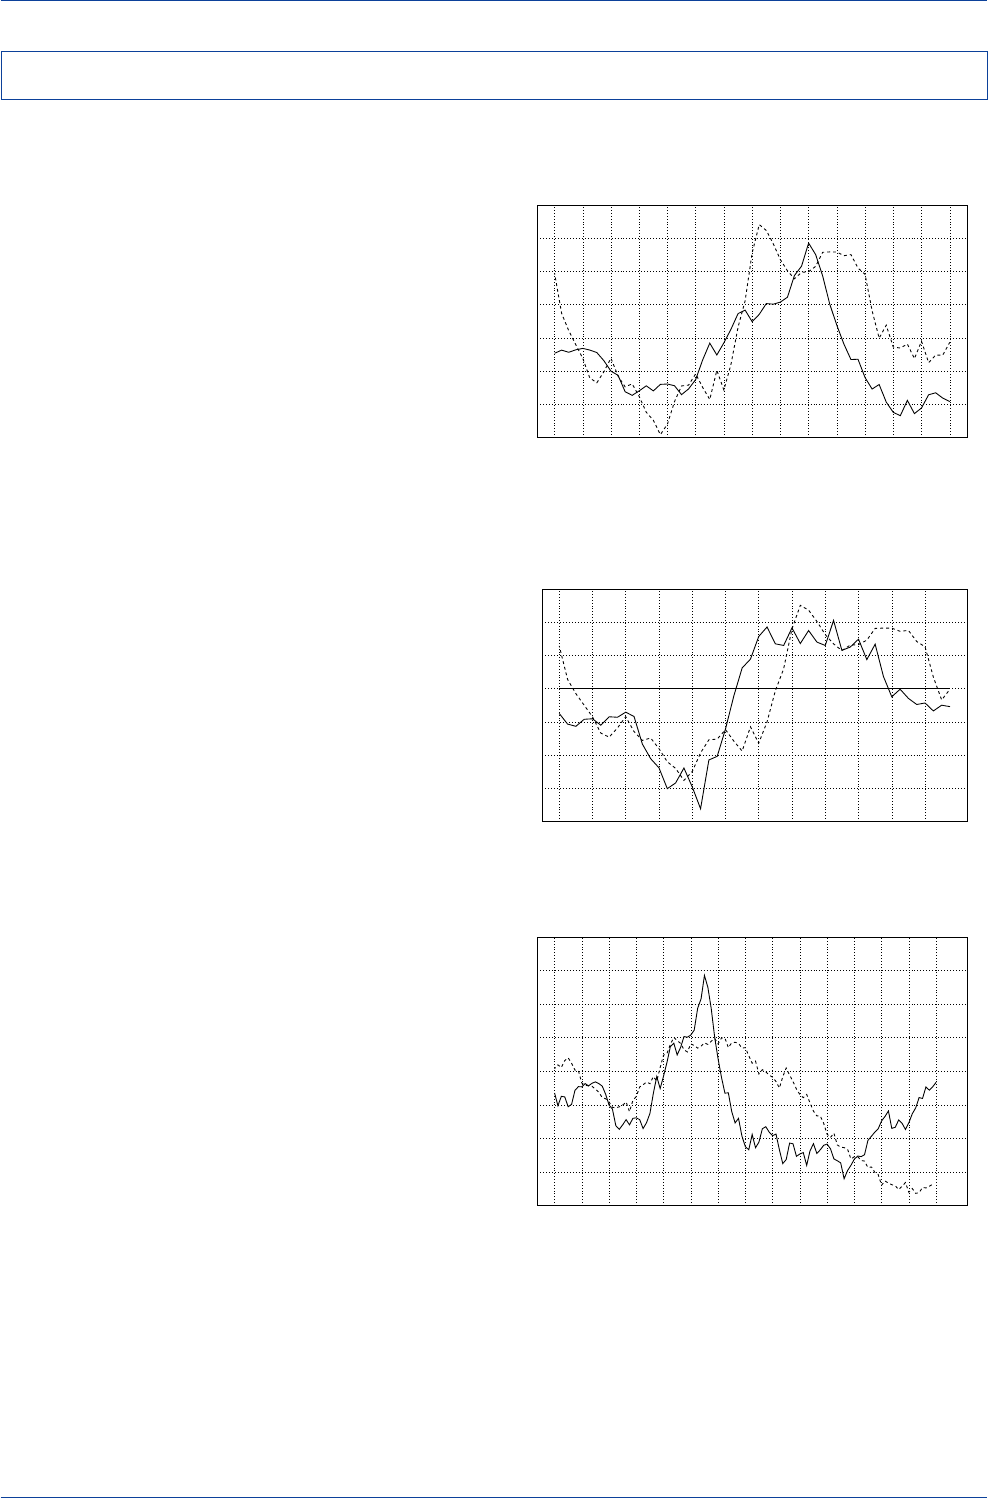
DB Guide to Exchange-Rate Determination May 2002
Deutsche Bank @
116 Deutsche Bank Foreign Exchange Research
U.S./German Real Interest-Rate Differentials
and the U.S. Federal Budget Deficit
(1977-1987)
0
1
2
3
4
5
6
-800
-600
-400
-200
0
200
400
600
76 77 78 79 80 81 82 83 84 85 86 87
Budget Deficit as a % of GDP----U.S.-German Real 10-Yr.(bp)____
The U.S. Dollar and U.S. Defense Spending
3
4
5
6
7
8
70
80
90
100
110
120
130
140
150
74 76 78 80 82 84 86 88 90 92 94 96 98 00 02
Defense Spending(% of GDP)----US$ Index____
One of the best examples of how a stimulative fiscal policy
can have a favorable impact on a currency is U.S. Presi-
dent Reagan's Economic Recovery and Tax Act of 1981.
The dollar rose sharply following the passage of the act as
it contributed to both a rise in the dollar's real long-run
equilibrium level and a significant rise in U.S./foreign real
interest-rate differentials.
The U.S. 1981 tax bill included cuts in marginal tax rates
for individuals and investment tax credits and accelerated
depreciation allowances for corporations to help spur busi-
ness investment. From an exchange-rate determination
standpoint, the business-oriented tax cuts helped boost
the dollar's real long-run equilibrium value because they
made U.S. industry more competitive. But the dollar got
its real boost when U.S. government spending soared at
the same time that taxes were cut. That pushed the U.S.
budget deficit as a percentage of GDP from 1.6% up to a
high of 6.1% in just four years in the early 1980s. Along
with an extremely tight monetary policy during the early
1980s, this helped drive U.S./European real yield spreads
up sharply, thereby sending the dollar up sharply as well.
Until the last decade, trends in U.S. military spending as a
percentage of GDP were highly positively correlated with
trends in the dollar's value. Higher military spending was
generally dollar supportive, while lower military spending
was generally dollar bearish. Academic research posited
that when U.S. military spending rose, it was likely due to
increased uncertainty in the global political landscape, with
the dollar benefiting from its role as a safe-haven currency
during troubled times. However, the close relationship
between military spending and the dollar appears to have
broken down in recent years.
The U.S. Dollar and the
U.S. Federal Budget Deficit
(1976-1990)
1
2
3
4
5
6
80
90
100
110
120
130
140
150
76 77 78 79 80 81 82 83 84 85 86 87 88 89 90
Deficit as a % of GDP----US$ Index____
U.S. Fiscal Policy and the Dollar
Source: Datastream
Source: Datastream
Source: Datastream
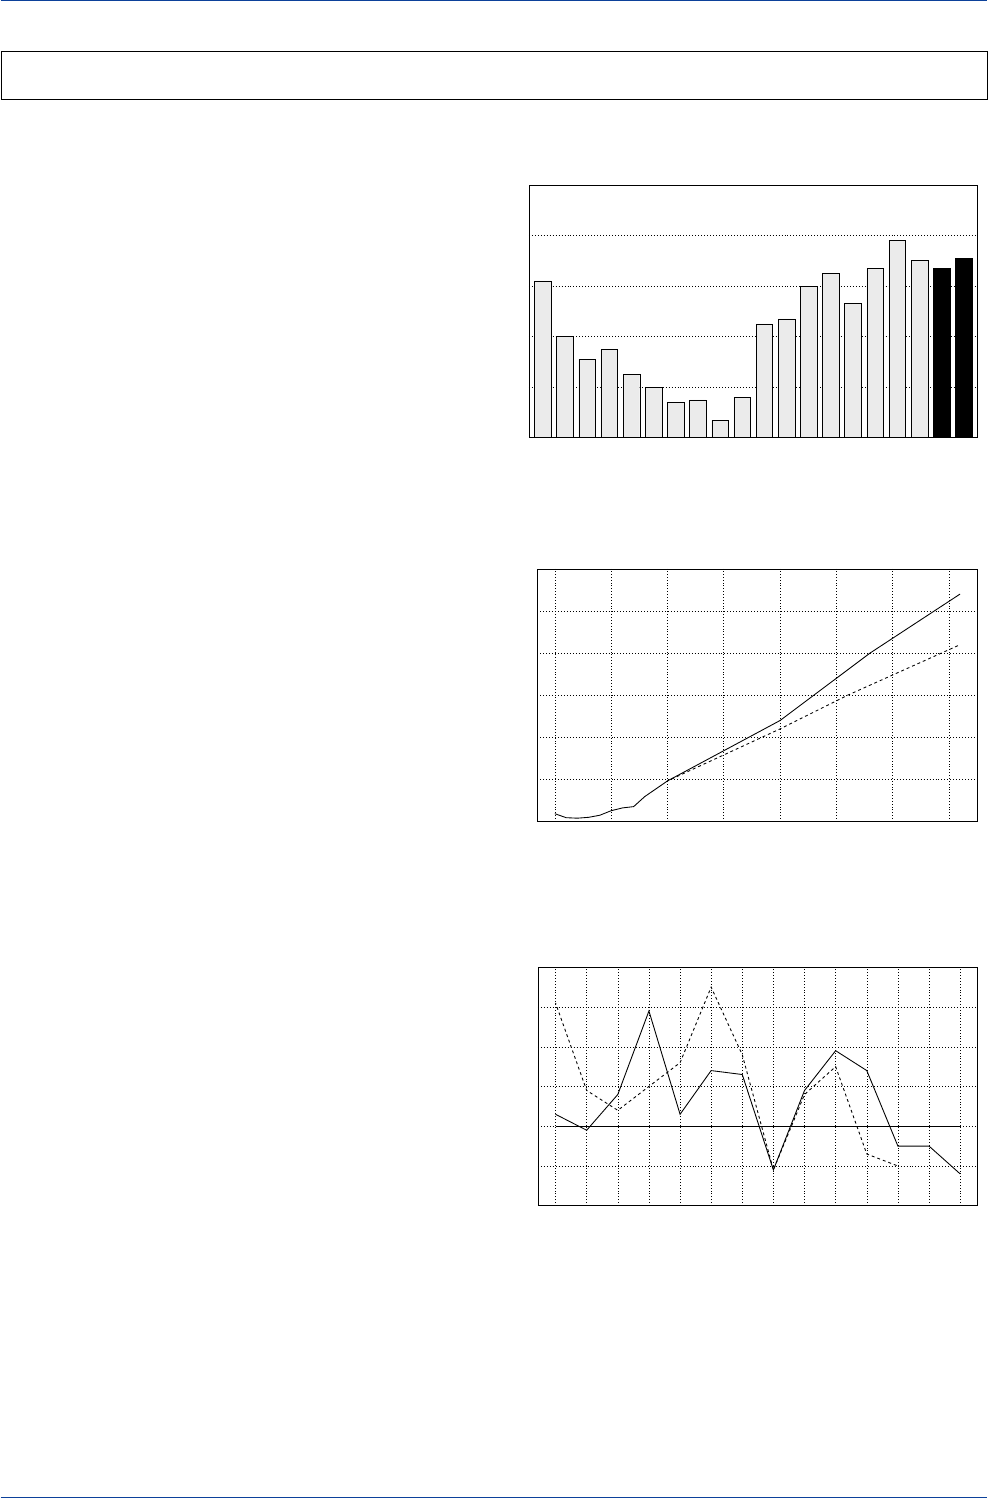
DB Guide to Exchange-Rate Determination
May 2002 Deutsche Bank @
Deutsche Bank Foreign Exchange Research 117
Japan’s Budget Deficit
(Excluding Social Security)
7.1
6.7
7.0
7.8
6.7
5.3
6.5
6.0
4.7
4.5
1.6
0.7
1.5
1.4
2.0
2.5
3.5
3.1
4.0
6.2
0
2
4
6
8
10
83 84 85 86 87 88 89 90 91 92 93 94 95 96 97 98 99 00 01 02
(% of GDP)
Source: OECD Economic Outlook,
2001-02 OECD Projections
Japan’s Mounting Debt Problem
(Assuming Unchanged Fiscal Policies)
0
50
100
150
200
250
300
1990 1995 2000 2005 2010 2015 2020 2025
Assuming 3.5% Real Interest Rate____ 1.5%----
Net Debt(% of GDP)
Source: OECD Economic Outlook,
June 1999
Japan’s Fiscal Stance and GDP Growth
(Annual Percentage Change in Japan’s Structural
Balance as a Percent of GDP)
-2.0
-1.0
0.0
1.0
2.0
3.0
4.0
91 92 93 94 95 96 97 98 99 00 01e 02e 03e 04e
GDP Growth(%)----
Fiscal Stance(Led One Year)(%)____
Expansionary
Restictive
Japan's fiscal deficit—at both the central and local author-
ity level—has been swelling in recent years, partly because
of past stimulus efforts and partly because government
revenue growth has been weak during Japan's decade-
long slump. Japan already has the industrial world's larg-
est government debt outstanding as a percentage of GDP,
and that debt burden seems certain to mount in future
years, according to OECD projections. Even those debt
projections probably understate Japan's true debt burden
by a sizeable amount, given Japan's seriously under-funded
social security and public pension systems, as well as other
off-balance-sheet liabilities that the government will be
obliged to underwrite.
The path for Japanese debt is clearly not sustainable. In
the long run, the Japanese government will have to do
what every other government in the industrial world has
had to do when faced with a similar set of circumstances.
That is, the Japanese government will have to engineer a
multi-year plan of fiscal consolidation—either by raising
taxes and/or by curtailing government spending—to bring
the budget deficit/GDP ratio down to sustainable levels.
Changes in Japan's fiscal stance have historically had a
marked impact on Japan's GDP growth rate, with stimula-
tive policies boosting GDP growth higher and restrictive
policies dragging GDP growth lower. Therefore, as Japan's
fiscal stance is tightened, pressure will come to bear on
the BoJ to turn more accommodative to sustain economic
growth.
As a result of these anticipated policy changes, Japan's
fiscal/monetary policy mix appears destined to shift toward
a stance of significant fiscal restraint and considerable
monetary ease. Hence, Japan's policy mix should there-
fore be highly yen negative. Indeed, since such a policy
mix will need to be put in place for a number of years, the
yen appears destined to weaken on a long-term basis.
Japan’s Fiscal Policy Mix and the Yen
Source: OECD Economic Outlook
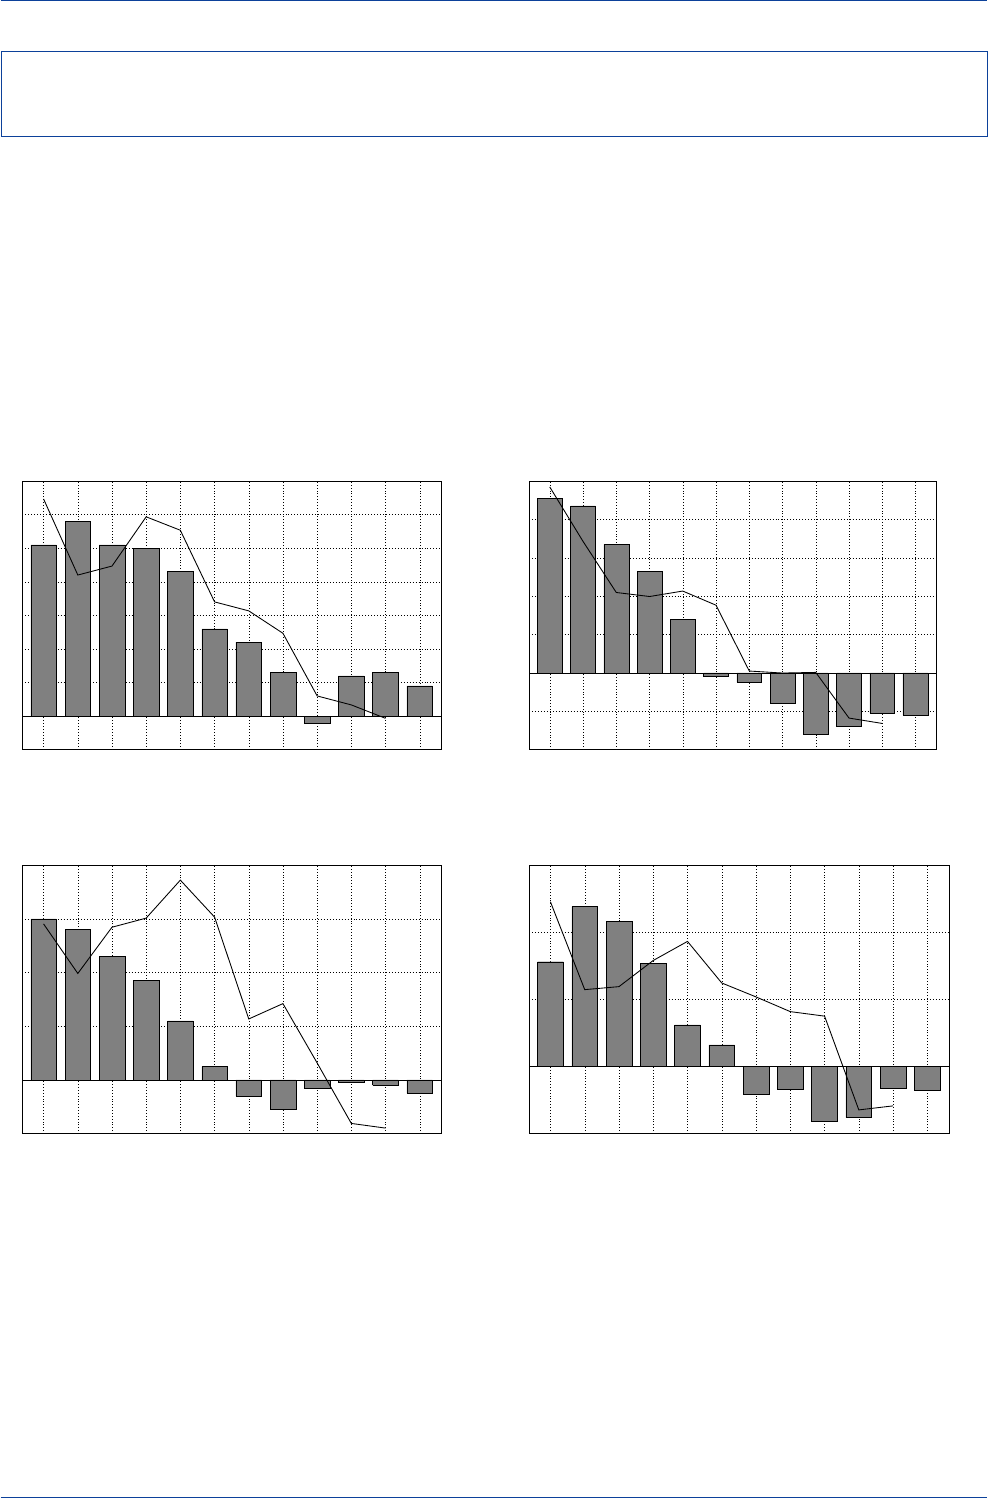
DB Guide to Exchange-Rate Determination May 2002
Deutsche Bank @
118 Deutsche Bank Foreign Exchange Research
Euroland’s Budget Deficit and the Euro
0.80
0.90
1.00
1.10
1.20
1.30
1.40
-1
0
1
2
3
4
5
6
7
1992 1993 1994 1995 1996 1997 1998 1999 2000 2001 2002 2003
US$/Euro(line)Budget Deficit/GDP(%)(bars)
Source: OECD Economic Outlook
Canada’s Budget Deficit and the C$
(1.60)
(1.50)
(1.40)
(1.30)
(1.20)
-4
-2
0
2
4
6
8
10
1992 1993 1994 1995 1996 1997 1998 1999 2000 2001 2002 2003
C$/US$(reverse scale)(line)Budget Deficit/GDP(%)(bars)
Source: OECD Economic Outlook
Australia’s Budget Deficit and the A$
0.50
0.55
0.60
0.65
0.70
0.75
0.80
-2
0
2
4
6
8
1992 1993 1994 1995 1996 1997 1998 1999 2000 2001 2002 2003
US$/A$(line)Budget Deficit/GDP(%)(bars)
Source: OECD Economic Outlook
Sweden’s Budget Deficit and the Krona
(11)
(10)
(9)
(8)
(7)
(6)
(5)
-5
0
5
10
15
1992 1993 1994 1995 1996 1997 1998 1999 2000 2001 2002 2003
Skr/US$(reverse scale)(line)Budget Deficit/GDP(%)(bars)
Source: OECD Economic Outlook
A number of currencies—notably the Canadian dollar, euro,
Australian dollar, and Swedish krona—weakened on a trend
basis over the past 10 years as their respective govern-
ments engineered major fiscal consolidations to rein in
excessively wide budget deficits.
In all cases, pressure was brought to bear on the respec-
tive central banks to pursue highly accommodative mon-
etary policies during those extended periods of fiscal con-
solidations. Therefore, the policy mix in each of those cases
exerted significant downward pressure on the respective
currencies.
The Experience of Other Countries with Restrictive Fiscal Policies
in the Past 10 Years
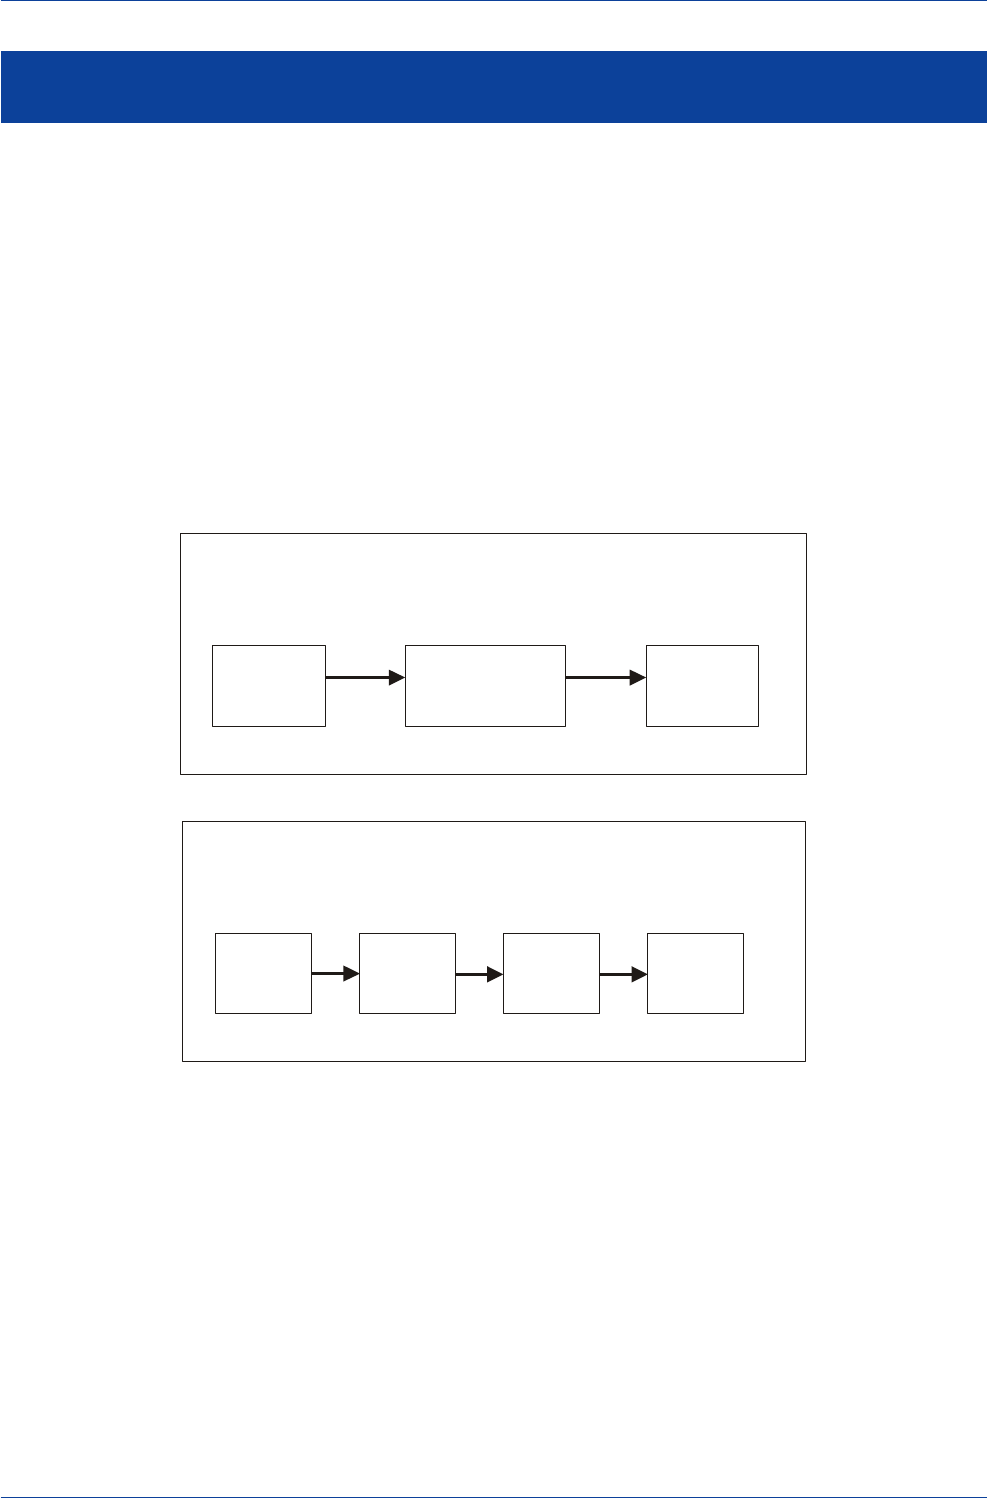
DB Guide to Exchange-Rate Determination
May 2002 Deutsche Bank @
Deutsche Bank Foreign Exchange Research 119
Is a strongly growing domestic economy bullish or bear-
ish for a currency? According to the monetary model of
exchange-rate determination, an increase in domestic eco-
nomic activity will give rise to an increase in the demand
for domestic money, and the increased demand for money
(everything else being equal) should then lead to an ap-
preciation of the domestic currency. In contrast, in the
Mundell-Fleming and Balance of Payments Flow models,
an increase in domestic economic activity will give rise to
an increase in import demand, which should cause the
trade balance to deteriorate. The deterioration of the trade
balance should then exert downward pressure on the do-
mestic currency.
One could combine the conclusions drawn from these two
models by arguing that in the short/medium run, a strongly
growing domestic economy should be bullish for a domes-
tic currency because increases in economic activity are
often associated with attractive investment opportunities
that should attract significant inflows of capital from abroad.
But in the long run, the balance of payments may place a
constraint on how rapidly a domestic economy can grow
relative to growth overseas. If strong domestic demand
gives rise to a significant deterioration of the trade bal-
ance that is deemed unsustainable, then either domestic
demand will have to be restrained or the domestic
currency's real value will have to fall to bring the trade/
current-account imbalance back to sustainable levels.
How Changes in Economic Activity Influence Exchange Rates
in the Balance of Payments Flow (Mundell-Fleming) Model
of Exchange-Rate Determination
Increase in
Domestic
Economic
Activity
Deterioration
of
Trade
Balance
Decrease in
Domestic
Currency’s
Value
Deterioration
in Balance
of Payments
How Changes in Economic Activity Influence Exchange Rates
in the Monetary Model
of Exchange-Rate Determination
Increase in
Domestic
Economic
Activity
Increase in
Demand
for Money
Increase in
Domestic
Currency’s
Value
Economic Growth and Exchange Rates
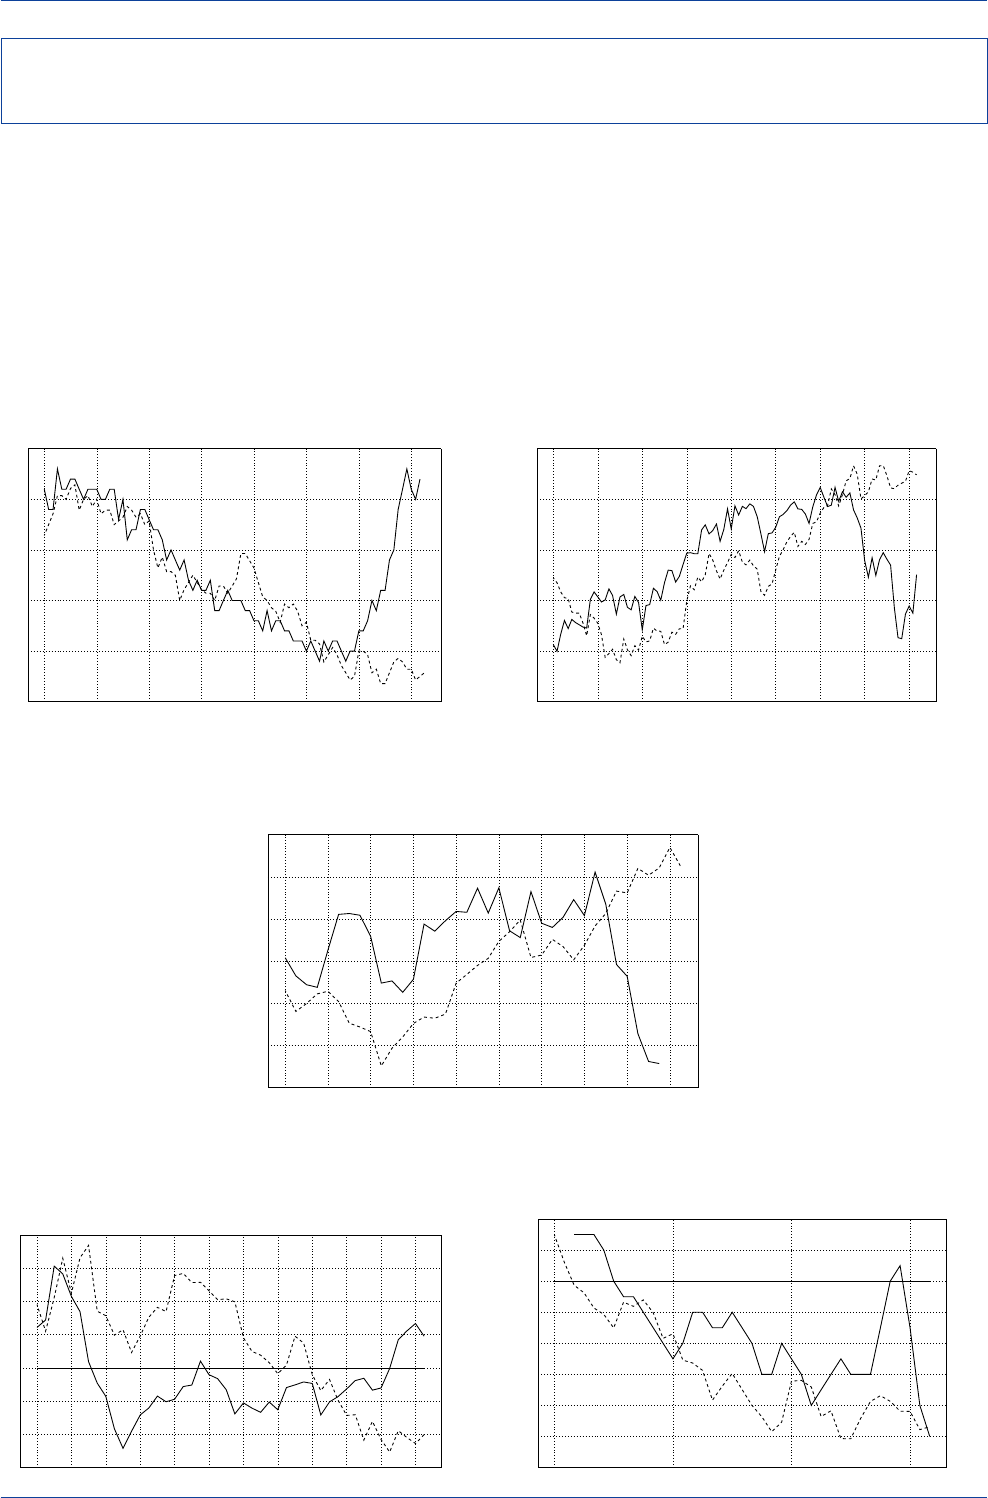
DB Guide to Exchange-Rate Determination May 2002
Deutsche Bank @
120 Deutsche Bank Foreign Exchange Research
Trends in economic activity have been a key determinant
of exchange-rate trends in recent years. In the case of the
dollar, the trends in the U.S. unemployment rate and U.S.
consumer confidence were, until recently, highly correlated
with the trend in the dollar. However, in both cases, there
was a disconnect between those economic indicators and
the dollar in 2001.
The trend in the euro has also been found to be highly
correlated with the difference in U.S./Euroland
expected
GDP growth rates since the euro's inception in 1999.
Expectations of U.S./European GDP Growth
and the Euro
0.80
0.90
1.00
1.10
1.20
-1.2
-1.0
-0.8
-0.6
-0.4
-0.2
0.0
0.2
0.4
1999 2000 2001 2002
US$/Euro----German-U.S. GDP Expectations(%)____
Source: Consensus Economics Inc.;
Forecasts of U.S. and German GDP growth
for the following year (three-month average)
Euroland/U.S. Real GDP Growth Differentials
and the Euro
(Year-over-Year Percent Changes in Real GDP)
0.80
0.90
1.00
1.10
1.20
1.30
1.40
1.50
-6
-4
-2
0
2
4
6
8
91 92 93 94 95 96 97 98 99 00 01 02
US$/Euro----(%) EMU-US GDP Diff.(led 2 qtr.)____
U.S. GDP Growth and the Dollar
(1993-2002)
75
80
85
90
95
100
105
110
0
1
2
3
4
5
6
1993 1994 1995 1996 1997 1998 1999 2000 2001 2002
US$ Major Currency Index----Real GDP(y-o-y % chg.)____
U.S. Consumer Sentiment and the Dollar
(Conference Board Consumer Confidence Index)
(1.50)
(1.40)
(1.30)
(1.20)
(1.10)
(1.00)
(0.90)
(0.80)
60
80
100
120
140
160
1994 1995 1996 1997 1998 1999 2000 2001 2002
US$/Euro(reverse scale)----Consumer Confidence Index____
U.S. Unemployment and the Dollar
(1995-2002)
0.80
0.90
1.00
1.10
1.20
1.30
1.40
1.50
3.5
4.0
4.5
5.0
5.5
6.0
1995 1996 1997 1998 1999 2000 2001 2002
US$/Euro----U.S. Unemployment Rate(%)____
How Changes in Economic Activity Have Influenced Recent Trends in
Exchange Rates
Source: Datastream
Source: DatastreamSource: Datastream
Source: Datastream
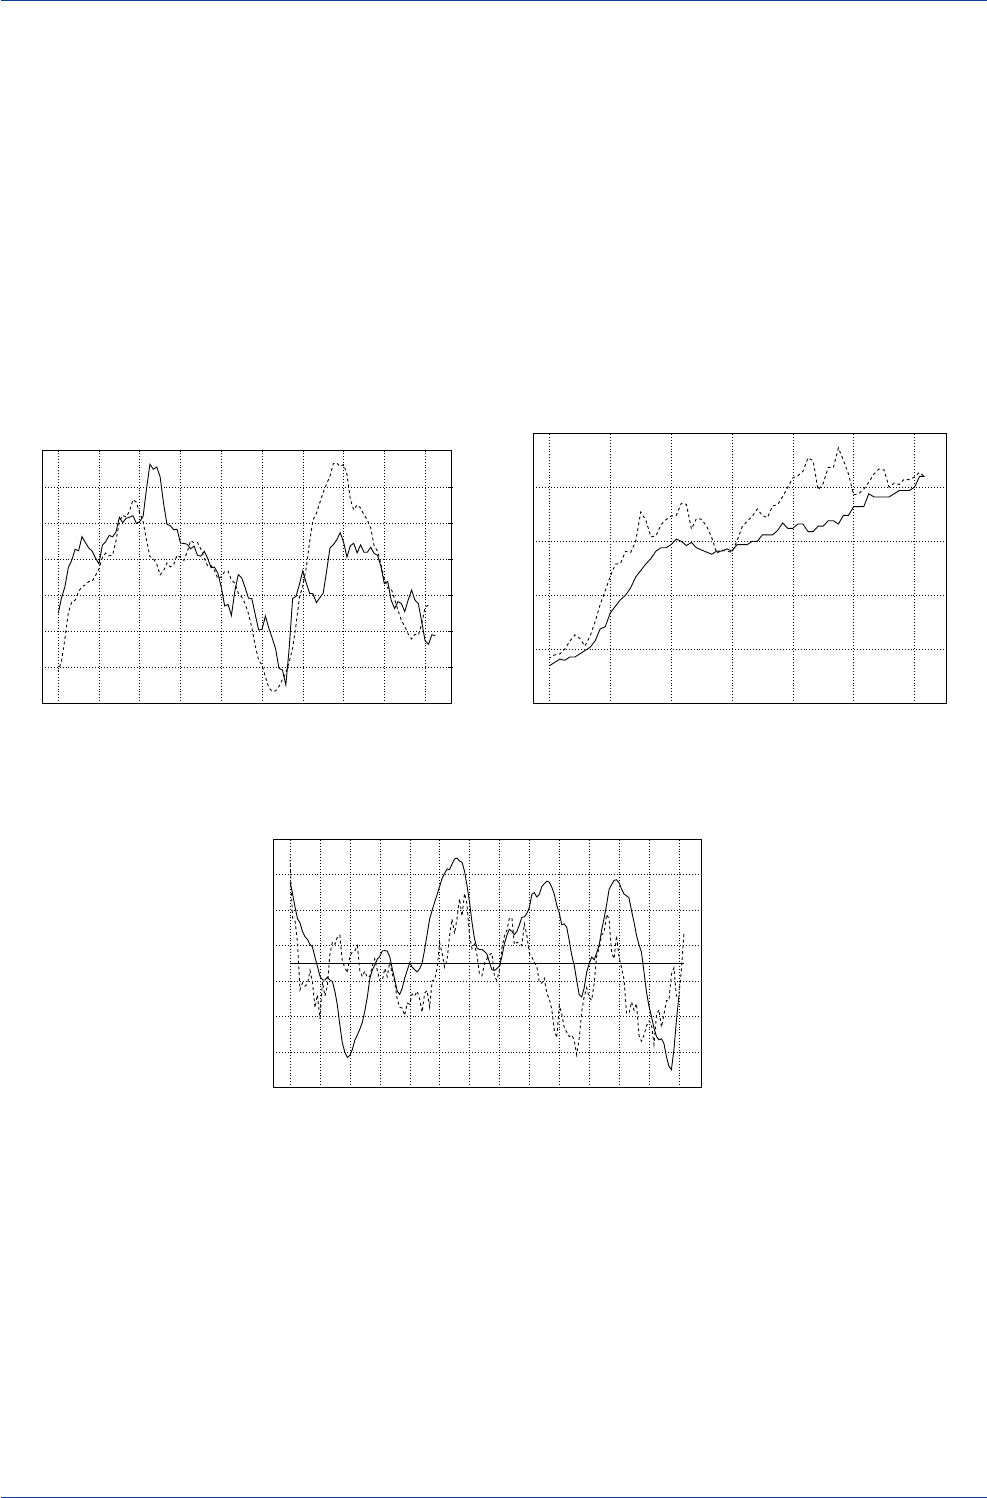
DB Guide to Exchange-Rate Determination
May 2002 Deutsche Bank @
Deutsche Bank Foreign Exchange Research 121
The Yen & Japan’s Leading Economic Indicator
(OECD Composite Leading Indicator for Japan)
(6)
(4)
(2)
0
2
4
6
8
(150)
(140)
(130)
(120)
(110)
(100)
(90)
(80)
1993 1994 1995 1996 1997 1998 1999 2000 2001 2002
Leading Indicator(%)----
Y
en/US$(reverse scale)____
U.K./German Unemployment and the Pound
2.00
2.20
2.40
2.60
2.80
3.00
3.20
3.40
1.0
1.5
2.0
2.5
3.0
3.5
1996 1997 1998 1999 2000 2001 2002
DM/£----
G
erman/U.K. Unemployment Rate(ratio)____
Trends in Global Economic Growth
and the Australian Dollar
-30
-20
-10
0
10
20
30
-6
-4
-2
0
2
4
6
8
89 90 91 92 93 94 95 96 97 98 99 00 01 02
US$/A$(y-o-y %)----
O
ECD Leading Economic Indicator(y-o-y %)____
Other currencies have also exhibited a tendency to move
in tandem with relative economic performances. For in-
stance, there has been a close relationship in recent years
between the yen and the OECD's leading indicator of Japa-
nese economic activity, with weaker Japanese growth
prospects negative for the yen and vice versa. In the case
of the British pound, the ratio of German/U.K. unemploy-
ment rates has served as a good guide to sterling's pros-
pects. All things being equal, a decline (rise) in the U.K.
unemployment rate relative to the German unemployment
rate has been bullish (bearish) for sterling.
Finally, in the case of Australia, the A$'s fortunes have of-
ten been tied to global economic prospects, with strong
global growth positive for the A$ and vice versa. Evidently,
strong global growth boosts the world's demand for com-
modities, which is positive for Australia's trade balance,
and thus the A$.
Source: Datastream Source: Datastream
Source: Datastream

DB Guide to Exchange-Rate Determination May 2002
Deutsche Bank @
122 Deutsche Bank Foreign Exchange Research
It is not too difficult to unearth the reasons for the dollar's
rising trend over the past six years. The U.S. grew two to
three times faster than either the German or Japanese
economies, with 'New Economy' forces in the U.S. widely
credited for the relative strength of the U.S. economy, and
thus the dollar.
According to the ‘New Economy’ view, the surge in U.S.
investment spending and the consequent rise in U.S. pro-
ductivity helped push U.S. growth significantly above the
pace of overseas growth, which, in turn, raised the dollar's
real long-run equilibrium value versus the euro. This view
appears to be shared by many economists. However, what
is open to dispute is: (1) by how much did the dollar's real
long-run equilibrium value actually rise, and (2) did the
dollar's rise in 2000-01 push it above its new long-run equi-
librium level?
(Note that the German economy did not fare much better
than Japan over the past 10 years. Given that the 1990s
have often been characterized as Japan's lost decade, they
could just as easily have been characterized as Germany's
lost decade as well.)
Structural Rigidities, Long-Term Growth, and Long-Term Trends
in Exchange Rates
U.S., German, and Japanese Real GDP Growth
Annual Percentage Growth Rates
(1993-2002) 1993-2002
1993 1994 1995 1996 1997 1998 1999 2000 2001p2002pAverage
U.S. 2.7 4.0 2.7 3.6 4.4 4.3 4.1 4.1 1.2 2.3 3.3
Germany -1.1 2.3 1.7 0.8 1.4 2.0 1.8 3.0 0.6 0.9 1.2
Japan 0.5 1.1 1.5 3.6 1.8 -1.0 0.7 2.2 -0.4 -1.0 0.9
Source: IMF

DB Guide to Exchange-Rate Determination
May 2002 Deutsche Bank @
Deutsche Bank Foreign Exchange Research 123
How Germany and Japan Rank in Independent Surveys of Global Competitiveness
Babson College A. T. Kearney
World Institute Japan Center Global Foreign PriceWaterhouse
Economic Management for Economic Entrepreneurship Direct Investment Coopers
Rank Forum Development Research Monitor Confidence Index Opacity Index
1U.S. U.S. U.S. Brazil U.S. Singapore
2 Singapore Singapore Singapore Korea China U.S.
3 Luxembourg Finland Netherlands U.S. Brazil Chile
4 Netherlands Netherlands Finland Australia U.K. U.K.
5 Ireland Switzerland Hong Kong Norway Mexico Hong Kong
6 Finland Luxembourg Norway Canada Germany Mexico
7 Canada Ireland Sweden Argentina India Italy
8 Hong Kong Germany Australia India Italy Hungary
9 U.K. Sweden U.K. Italy Spain Israel
10 Switzerland Iceland Switzerland U.K. France Uruguay
11 Taiwan Canada Canada Germany Poland Greece
12 Australia Denmark Germany Denmark Canada Peru
13 Sweden Australia N.Z. Spain Singapore Egypt
14 Denmark Hong Kong Belgium Israel Thailand Lithuania
15 Germany U.K. Denmark Finland Australia South Africa
16 Norway Norway Japan Sweden Czech Rep. Japan
17 Belgium Japan Iceland Belgium S.Korea Colombia
18 Austria Austria Ireland France Netherlands Argentina
19 Israel France Taiwan Singapore Taiwan Taiwan
20 N.Z. Belgium Austria Japan Japan Brazil
21 Japan N.Z. France Ireland Hungary Pakistan
Euroland and Japan’s Competitiveness Rankings
World Economic Forum Rankings
(1996-2001)
Country 2001 2000 1999 1998 1997 1996
Finland 1 6 11 15 19 16
U.S. 212334
Canada 375548
Netherlands 84971217
Ireland 11 5 10 11 16 26
U.K. 12984715
Germany171525242522
Austria 18 18 20 20 27 19
Belgium 19 17 24 27 31 25
France 20 22 23 22 23 23
Japan 21 21 14 12 14 13
Spain 22 27 26 25 26 32
Portugal 25 23 27 26 30 34
Italy 26 30 35 41 39 41
Luxembourg NA 3 7 10 11 5
Source: World Economic Forum, www.weforum.org
The persistent underperformance of the German and
Euroland economies has, according to the BIS, given rise
to an asymmetry in the response of global investors to
favorable and unfavorable data releases out of Euroland.
When Euroland data releases are disappointing, the mar-
ket tends to react negatively and the euro declines in value.
However, when Euroland data releases are favorable, the
investment community has been reluctant to reward the
euro by driving it higher. Evidently, investors have become
accustomed to longer-term disappointing data out of
Euroland, and therefore treat favorable data releases as
transitory events and unfavorable data releases as more
permanent events. Given the market's asymmetric behav-
ior, the euro has tended to trade with a sustained down-
ward bias.
Market participants often place the blame for Euroland’s
and Japan's sluggish growth on structural rigidities that
inhibit their long-term economic potential. As shown in the
table below, the major European economies and particu-
larly Japan fare poorly in various independent surveys of
global competitiveness, entrepreneurship, attracting for-
eign direct investment, and opacity/transparency. The fact
that Europe's and Japan's poor standing is consistent
across a wide range of independent surveys suggests that
structural rigidities could act as a major drag not only on
Europe's and Japan's long-term growth prospects, but on
the euro's and yen's value as well.
Indicators of Global Competitiveness & Long-Term Value in FX Markets

DB Guide to Exchange-Rate Determination May 2002
Deutsche Bank @
124 Deutsche Bank Foreign Exchange Research
The argument most often made to justify official interven-
tion in the FX markets is that the exchange rate is simply
too important a price to be left to the market. Intervention
advocates contend that financial markets cannot be trusted
to get the exchange rate "right". They argue that interven-
tion is necessary to keep exchange rates broadly in line
with their long-run fundamental equilibrium value. Thus,
the case for intervention relies largely on the belief that
the authorities can do a better job than the market in terms
of driving exchange rates towards their long-run equilib-
rium value. This assumes that government officials have
better information and greater knowledge than the mar-
ket, which, of course, is highly debatable.
No precise rules govern the conduct of FX intervention,
but the IMF has established guidelines to prevent one
country from unfairly manipulating its exchange rate to gain
an unfair advantage over others.
Numerous empirical studies have been conducted to as-
sess whether intervention operations have a statistically
significant and quantitatively important impact on exchange
rates. In most studies, the results have been negative. In
those cases where a statistically significant relationship
between intervention and exchange rates has been found,
it has generally been the case that the impact was not
quantitatively important, i.e., the effect of the intervention
effort was neither sizable nor lasting. The major reason for
such findings is that intervention operations are typically
small relative to the volume of foreign exchange that
changes hands on a daily basis in the FX markets. Daily
intervention efforts typically average in the hundreds of
millions or perhaps only several billion. This contrasts with
average daily FX turnover of $1.2 trillion. While episodes of
successful intervention can be found, no systematic rela-
tionship exists between official intervention efforts and the
trend in exchange rates.
Why FX Intervention Advocates Believe
That the Market Cannot Be Trusted
to Get the Exchange Rate "Right"
• FX market may fail to use "all" existing information.
• FX market may be dominated by noise (trend-fol-
lowing) traders.
• Excessive speculation.
• Excessive risk aversion (shortage of speculation).
• FX market may be using a defective model of ex-
change-rate determination.
• Market perceptions of the future may be flawed or
inappropriately skewed.
• FX market may be pre-occupied with extraneous
information.
• FX market may be subject to persistent mood
swings, shifting from excessive optimism to exces-
sive pessimism, and then back.
Acceptable Forms of FX Intervention
That Help Foster Orderly Market Conditions
• Simple smoothing operations to limit erratic short-
run fluctuation in exchange rates.
• Counter excessive speculation or market overreac-
tion to news.
• Trend-breaking operation to put an end to an unde-
sirable uptrend or downtrend in a currency's value.
• Counter excessive risk aversion.
• Intervention to target a currency's value to some
specific level or range.
• Intervention to prevent large and persistent
misalignments.
Central Bank Intervention
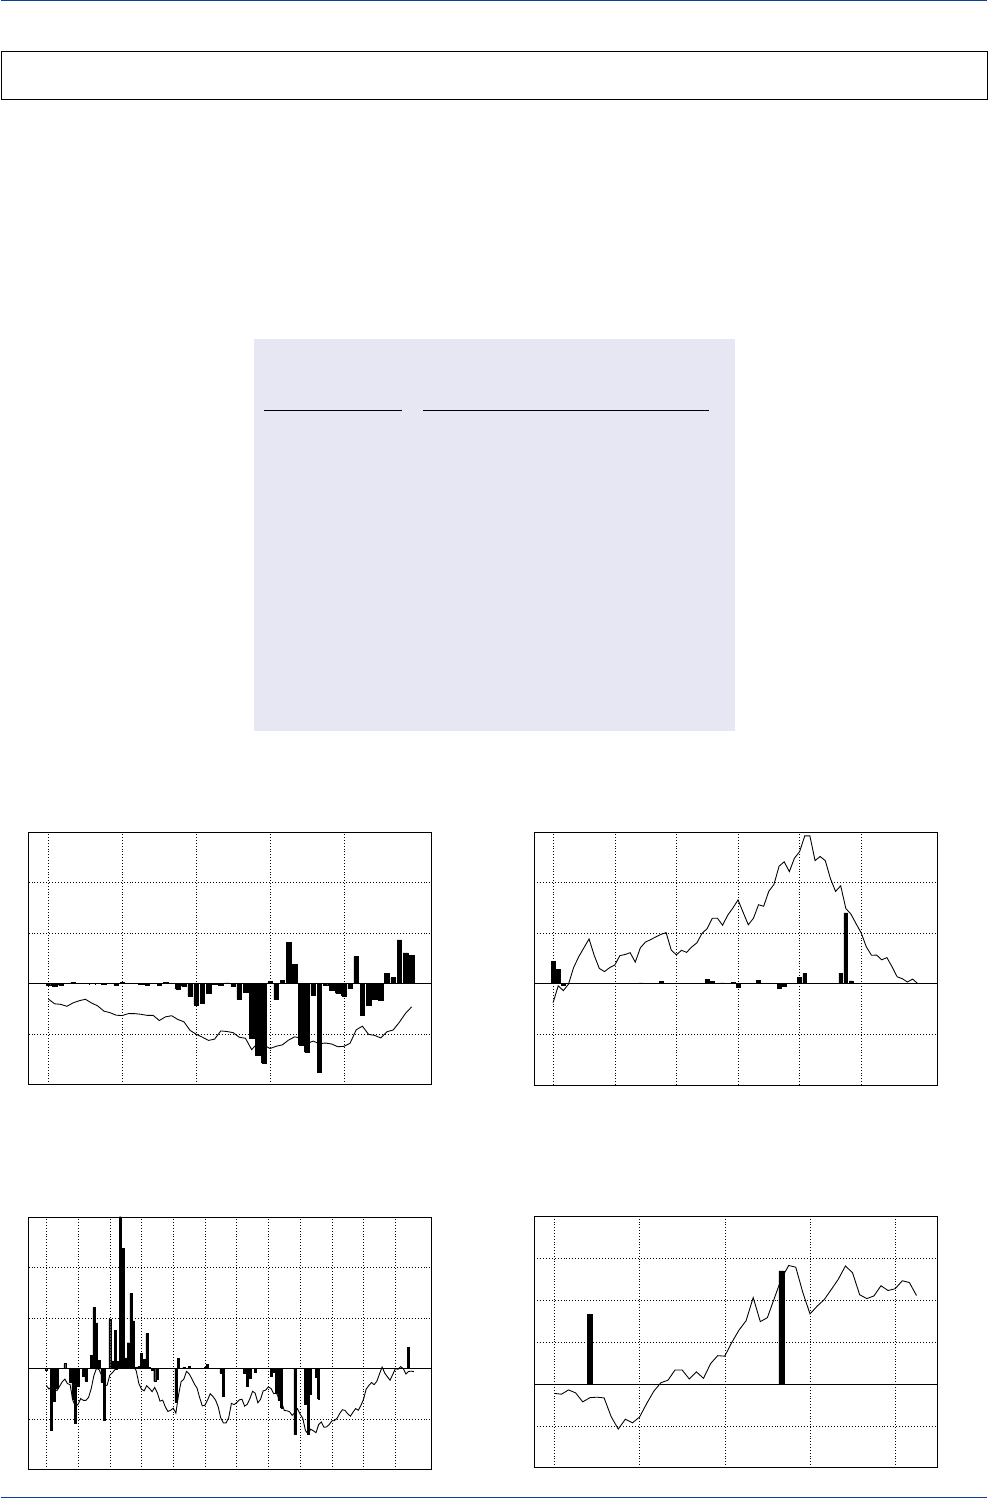
DB Guide to Exchange-Rate Determination
May 2002 Deutsche Bank @
Deutsche Bank Foreign Exchange Research 125
Dollar Over/Undervaluations & U.S. Intervention
(DM/US$ PPP Estimates, 1998-2002)
-1000
-500
0
500
1000
1500
2000
-20
-10
0
10
20
30
40
1998 1999 2000 2001 2002
Intervention(US$ mn.)(bars)
%
Over/Under PPP Level(DM/US$)(line)
Dollar Overvalued -- Sell Dollars
Dollar Undervalued -- Buy Dollars
U.S. intervention policy has been highly changeable over
the past 30 years. Official attitude toward the dollar has
swung from benign neglect, to active encouragement of
a weaker dollar, to active intervention to stop the dollar
from falling, and most recently to acknowledge that a
strong dollar is in the U.S. national interest.
Intervention was most pronounced in the late 1970s, the
late 1980s, and in 1994-95. Since 1995, the Fed has inter-
vened on only two occasions—in mid-1998 (to guide the
dollar lower versus the yen) and in the fall of 2000 (to guide
the dollar lower versus the euro).
Dollar Over/Undervaluations & U.S. Intervention
(1976-1980)
-4000
-2000
0
2000
4000
6000
-40
-20
0
20
40
60
1976 1977 1978 1979 1980
Intervention(US$ mn.)(bars)
%
Over/Under PPP Level(DM/US$)(line)
Dollar Overvalued--Sell Dollars
Dollar Undervalued--Buy Dollars
Dollar Over/Undervaluations & U.S. Intervention
(1981-1986)
-4000
-2000
0
2000
4000
6000
-40
-20
0
20
40
60
1981 1982 1983 1984 1985 1986
Intervention(US$ mn.)(bars)
%
Over/Under PPP Level(DM/US$)(line)
Dollar Overvalued--Sell Dollars
Dollar Undervalued--Buy Dollars
Dollar Over/Undervaluations & U.S. Intervention
(1987-1998)
-4000
-2000
0
2000
4000
6000
-40
-20
0
20
40
60
87 88 89 90 91 92 93 94 95 96 97 98
Intervention(US$ mn.)(bars)
%
Over/Under PPP Level(DM/US$)(line)
Dollar Overvalued--Sell Dollars
Dollar Undervalued--Buy Dollars
Changeability of U.S. Exchange-Rate Policy
Administration/Period Policy
Nixon 1969-71 Benign neglect.
1971-73 Cut dollar loose from gold.
Devaluated dollar.
Carter 1977-78 Encouraged decline of dollar.
1978-80 Major intervention to arrest dollar’s decline.
Reagan/ 1981-84 Benign neglect/laissez-faire attitude toward
Bush dollar’s rise.
1985-86 Encouraged decline of dollar (Plaza Accord).
1987-92 Promoted dollar stability (Louvre Accord).
Clinton 1993-96 Encouraged decline of dollar.
1997-00 Strong-dollar policy.
Bush 2001- Strong-dollar policy.
U.S. Intervention Policy
Source: Federal Reserve Bank, Datastream Source: Federal Reserve Bank, Datastream
Source: Federal Reserve Bank, Datastream Source: Federal Reserve Bank, Datastream
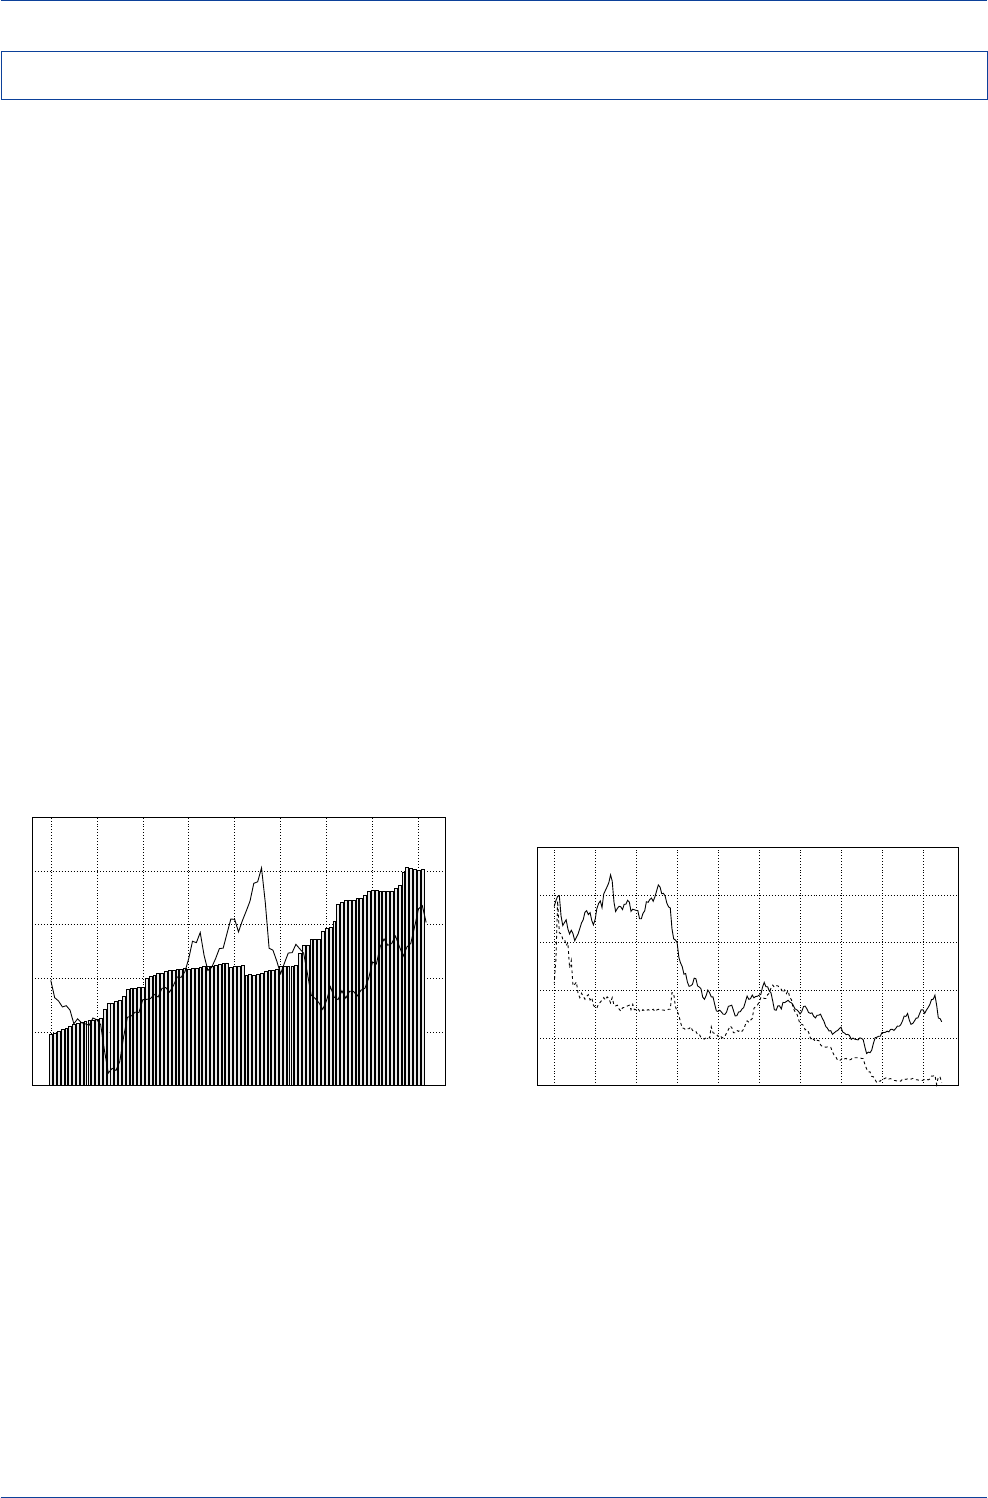
DB Guide to Exchange-Rate Determination May 2002
Deutsche Bank @
126 Deutsche Bank Foreign Exchange Research
In Japan, the Ministry of Finance has the responsibility for
determining the country's intervention policy, while the
Bank of Japan carries out that policy in the FX market.
Japanese authorities have consistently pursued a policy
of "leaning against the wind" in the conduct of intervention
operations. Whenever the yen has risen sharply against
the dollar, the BoJ has bought dollars and sold yen to mod-
erate the yen's rise. When the yen has fallen sharply in
value versus the dollar, the BoJ has sold dollars and pur-
chased yen to moderate the yen's decline. As a result,
there has been a close parallel movement between the
yen's value and the BoJ's holdings of foreign-exchange
reserve, with reserves rising whenever the yen has risen,
and vice versa.
Some analysts have found that the BoJ has tended to in-
tervene more aggressively when the yen has risen sharply
than when the yen has fallen sharply. That is, BoJ inter-
vention policy tends to be asymmetric, with greater em-
phasis placed on moderating yen strength than on tem-
pering yen weakness.
BoJ intervention was particularly aggressive in 1995 when
the yen soared to an all-time high of ¥/US$ 79.75. The BoJ's
FX reserves soared by nearly $75 billion between mid-1995
and mid-1996 to encourage an outright decline in the yen's
Japan’s Foreign Exchange Reserves & the Yen
80
100
120
140
160
0
100
200
300
400
500
1994 1995 1996 1997 1998 1999 2000 2001 2002
Yen/US$(line)Reserves(US$(bn.)(bars)
BoJ/MoF Intervention Policy
The Yen & Japanese Short-Term Interest Rates
(Three-Month Euro-Deposit Rates)
(1980-1998)
0
5
10
15
20
50
100
150
200
250
300
1980 1982 1984 1986 1988 1990 1992 1994 1996 1998
3-mo. Rate(%)----Yen/US$____
Source: Datastream
Source: Datastream
value. At the same time, short-term rates were guided
lower from 1.75% in April 1995 to 0.50% in September
1995 to help encourage a decline in the yen's value.
The BoJ was also aggressive in 2001 as it attempted to
guide the yen lower. Indeed, in September 2001 alone,
the BoJ intervened to the tune of around $25 billion, and
the entire intervention effort was nonsterilized, i.e., its dollar
purchases were directly added to Japan's monetary base.
The intervention effort succeeded in driving the yen lower,
in part, because it forced investors with long yen/short
dollar exposures to unwind their positions and, in part,
because the monetary effects were quite substantial, as
Japan's monetary-base growth soared on a year-over-year
basis from 9.0% to 14.2% during that month.
The BoJ has frequently geared the overall thrust of its do-
mestic monetary policy actions with an eye toward mod-
erating movements in the yen's value. The BoJ has often
cut short-term interest rates to dissuade investors from
purchasing yen assets when the yen was rising sharply in
value, and vice versa. This would explain why Japanese
interest rates and the yen often move inversely, with the
yen rising at the same time that interest rates are falling,
and vice versa.
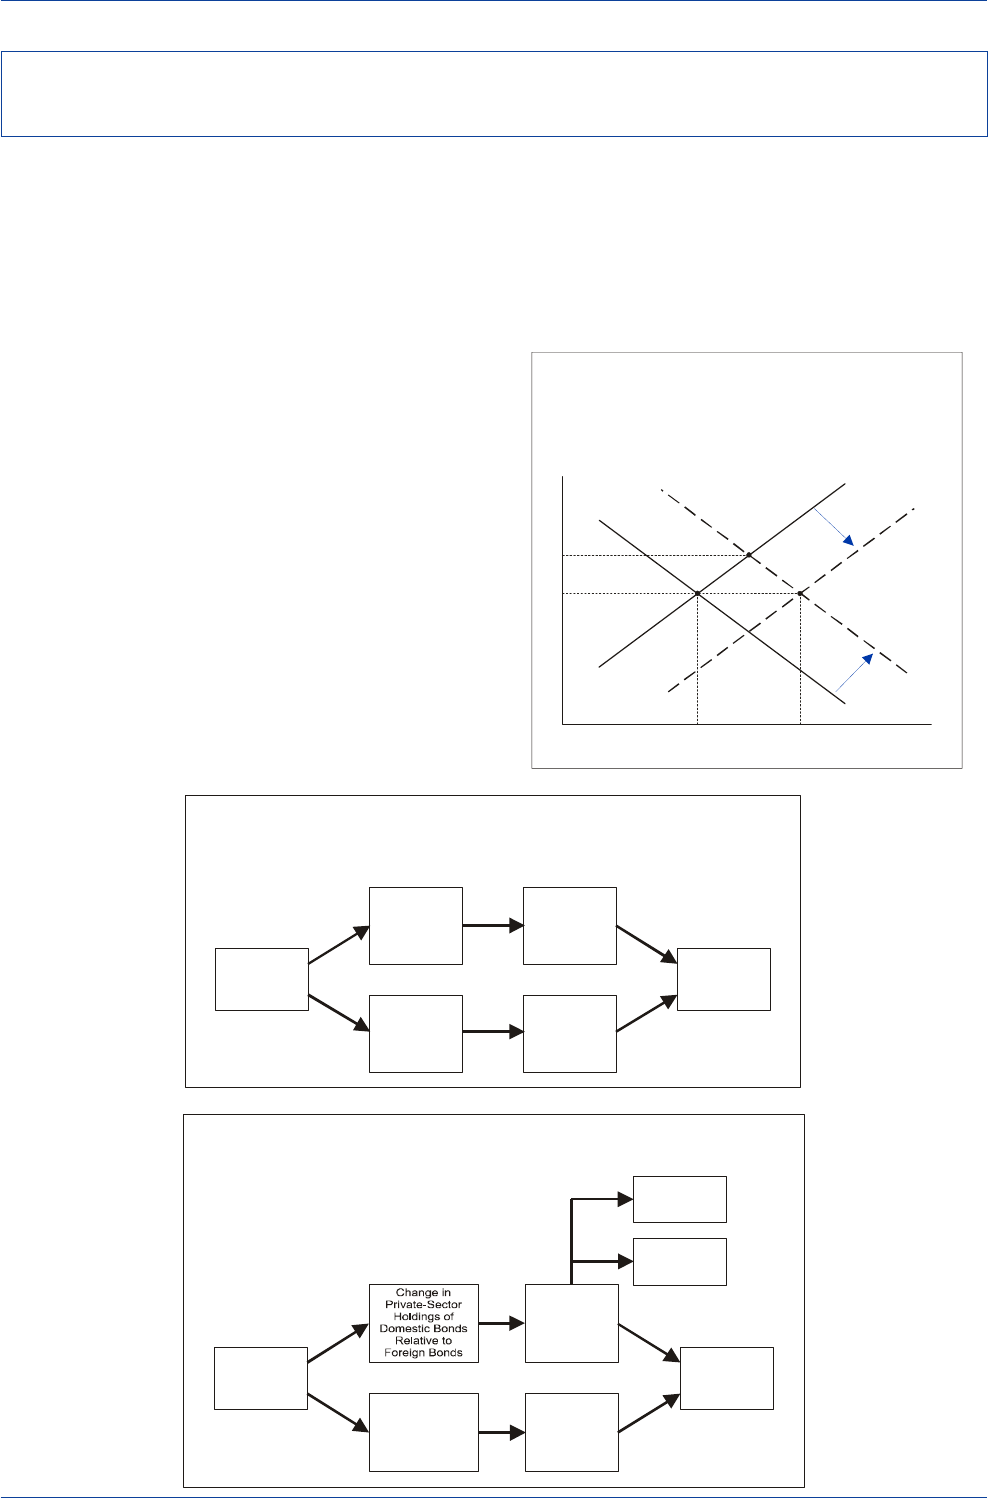
DB Guide to Exchange-Rate Determination
May 2002 Deutsche Bank @
Deutsche Bank Foreign Exchange Research 127
Economists have identified three
direct
channels through
which central bank intervention might have an immediate
impact on exchange rates.
First, intervention that alters the flow supply of foreign
exchange relative to the demand for foreign exchange can
directly affect the short-term trend in exchange rates. In-
tervention operating through that channel can be effective
only if the volume of intervention is sizable relative to the
daily turnover in the foreign-exchange market.
Second, nonsterilized intervention that alters the supply
of money relative to the private sector's demand for money
can directly affect the medium-term trend in exchange
rates. Intervention operating through this monetary chan-
nel can be effective only if the volume of intervention is
sizable relative to the outstanding stock of domestic money
holdings.
Third, sterilized intervention that alters the supply of do-
mestic bonds relative to the supply of foreign bonds in
private portfolios can also have a direct impact on the
medium-term trend in exchange rates. Intervention oper-
ating through that channel can be effective only if the vol-
ume of intervention is sizable relative to the stock of pub-
licly traded domestic and foreign bonds held in private
portfolios.
Unfortunately, the weight of evidence suggests that the
volume of intervention is often quite small relative to the
daily turnover of foreign-exchange activity, the stock of
money held by the private sector, and the stock of publicly
traded domestic and foreign bonds in private portfolios.
Thus, most studies conclude that the direct effect of inter-
vention on exchange rates is either statistically insignifi-
cant or quantitatively unimportant.
Central-Bank Intervention’s Role
in Regulating the Flow
Supply of and Demand for Foreign Exchange
Exchange Rate
Quantity of Foreign Exchange
S
D
E
2
E
0
D’
q
1
q
0
S’
E
1
The Portfolio-Balance Channel Transmission Mechanism
(The Impact of Sterilized Intervention on Exchange Rates
Change in
Exchange
Rate
Expectations
of Future
Monetary
Growth
Sterilized
Intervention
Change in
Risk
Premium
Change in
Expected
Future
Exchange
Rate
Change in
Domestic
Interest Rate
Change in
Foreign
Interest Rate
Direct Central Bank Intervention Channels—
The Balance of Payments Flow, Monetary, & Portfolio-Balance Channels
The Monetary Channel Transmission Mechanism
(The Impact of Nonsterilized Intervention on Exchange Rates
Change in
Monetary
Base
Change in
Exchange
Rate
Expectations
of Future
Monetary
Growth
Nonsterilized
Intervention
Multiple
Expansion of
Domestic
Money Supply
Change in
Expected
Future
Exchange Rate
via
Monetary
Channel
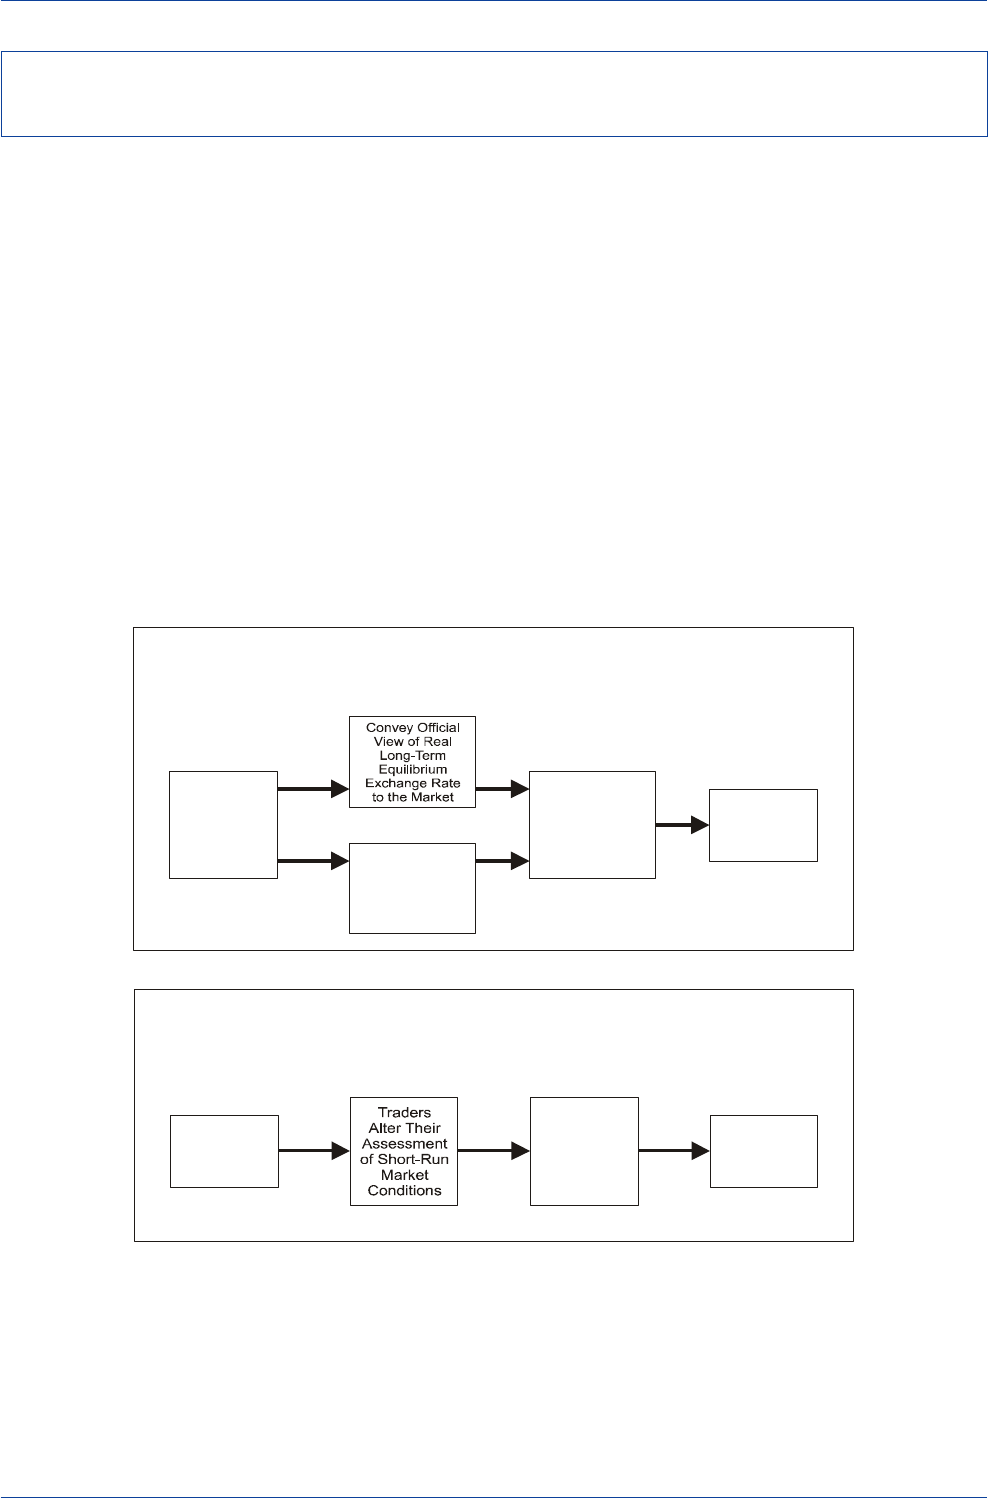
DB Guide to Exchange-Rate Determination May 2002
Deutsche Bank @
128 Deutsche Bank Foreign Exchange Research
Economists have also identified a number of
indirect
chan-
nels through which intervention can alter investors' expec-
tations and positioning and, in so doing, help push cur-
rency values in the direction desired by monetary officials.
First, a central bank may use intervention as a signal of its
monetary-policy intentions. To the extent that expectations
of monetary growth are altered, intervention could have
an immediate impact on exchange rates.
Second, a central bank may use intervention as a signal to
the market that an exchange rate is deviating too far from
its long-run equilibrium value. To the extent that interven-
tion helps anchor market expectations to the true long-run
equilibrium exchange rate, it can have a stabilizing influ-
ence.
Central Bank Intervention—
Signaling Channel Transmission Mechanism
Change in
Exchange
Rate
Convey Official
Intention of
Future
Monetary-Policy
Actions
to the Market
Central Bank
Intervention
Revision
of Market
Expectations
of Future
Exchange
Rate
Market
Efficiency
Channel
Superior
Information
Channel
Third, a central bank may want to take advantage of the
element of surprise and intervene when exchange rates
have overshot their equilibrium level and the market is
heavily overbought or oversold. If trend-followers dominate
foreign exchange activity and drive exchange rates far from
their true long-run equilibrium values, a surprise round of
intervention, appropriately timed, could force traders with
vulnerable long or short positions to unwind their positions.
Such actions could serve to break the prevailing trend and
possibly lead to a trend reversal if trend-followers could be
persuaded to jump in and help reinforce the new trend in
exchange rates.
As was the case above, the evidence in support of inter-
vention operations working through one of these indirect
channels is mixed. There have clearly been selected epi-
sodes of successful intervention operations, but most stud-
ies conclude that central banks cannot unduly influence
exchange rates on a sustained basis.
Central Bank Intervention—
Noise-Trading Channel Transmission Mechanism
Change in
Exchange
Rate
Central Bank
Intervention
Traders
Adjust Their
Short-Run
Currency
Positions
Indirect Central Bank Intervention Channels—
Signaling and Noise-Trading Channels

DB Guide to Exchange-Rate Determination
May 2002 Deutsche Bank @
Deutsche Bank Foreign Exchange Research 129
Anticipating Currency Crises in
Emerging Markets
Note: This section draws, in part, from Michael Rosenberg’s “Currency Crises in Emerging Markets”, Merrill Lynch, 1998.
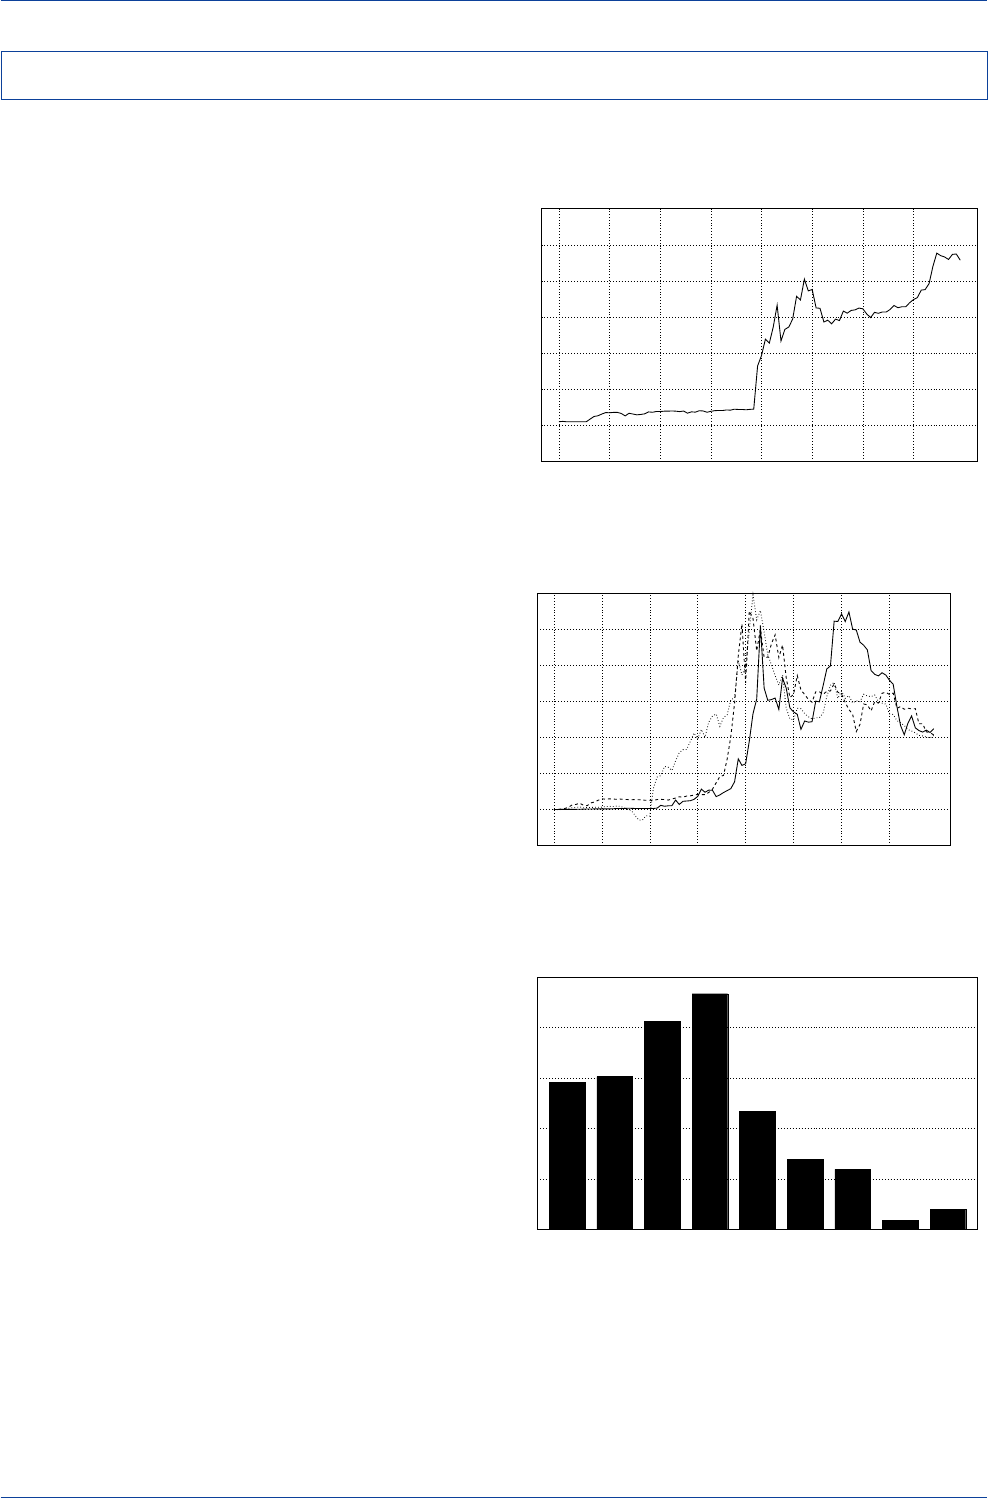
DB Guide to Exchange-Rate Determination May 2002
Deutsche Bank @
130 Deutsche Bank Foreign Exchange Research
The first half of the 1990s witnessed a strong and grow-
ing interest on the part of global fund managers in emerg-
ing-market investments. But a series of financial crises
during the second half of the decade significantly reduced
global fund managers' appetite for such investments. In-
deed, net private capital flows into developing countries
swung from an inflow of $233.2 billion in 1996 to a mere
$8.9 billion in 2000, according to IMF estimates, as over-
seas investors shied away from emerging-market invest-
ments following the Mexican peso crisis of 1994-95, the
Asian currency crisis of 1997, and the Russian crisis of
1998.
While the potential rewards from investing in emerging
markets can be quite attractive, these crisis episodes high-
light that the risks can be quite great as well. From a stra-
tegic standpoint, the issue is whether these currency cri-
ses could have been adequately anticipated ahead of time
to allow investors to hedge or unwind their emerging-mar-
ket currency exposures before the collapse in currency
values actually took place.
Views on the underlying causes of currency crises differ
greatly. One school of thought contends that currency cri-
ses tend to be precipitated by deteriorating economic fun-
damentals. If so, and the trend in those economic funda-
mentals weakens steadily and predictably, then it should
be possible to construct an early-warning system to an-
ticipate when a currency might be vulnerable to a specu-
lative attack.
An alternative school of thought argues that while evidence
of deteriorating economic fundamentals might explain a
relatively large number of currency collapses, there might
also be cases where economies with relatively sound fun-
damentals could see their currencies come under attack
because of a sudden adverse shift in market sentiment or
mood swing that is totally unrelated to economic funda-
mentals. If attacks can occur out-of-the-blue when eco-
nomic fundamentals are not offering any warning of an
impending attack, then there may simply be no way for
fundamental-based models to predict the onset of currency
crises.
Currency Crises in Emerging Markets—Introduction
Capital Flows into Emerging Markets
(Net Private Capital Flows)
20.1
8.9
59.6
69.6
116.8
233.2
205.7
151.3
145.6
0
50
100
150
200
250
1993 1994 1995 1996 1997 1998 1999 2000 2001e
(US$ bn.)
Source: IMF World Economic Outlook,
December 2001
Mexican Peso/U.S. Dollar Exchange Rate
(1994-1995)
2.00
3.00
4.00
5.00
6.00
7.00
8.00
9.00
Jan-94 Apr-94 Jul-94 Oct-94 Jan-95 Apr-95 Jul-95 Oct-95
Peso/US$
Asian Currencies & the 1997-98 Currency Crisis
(Currency Indices, January 1997=100)
80
100
120
140
160
180
200
220
0
100
200
300
400
500
600
700
Jan-97 Apr-97 Jul-97 Oct-97 Jan-98 Apr-98 Jul-98 Oct-98
Korean Won---- Thai Baht....Indonesian Rupiah____
Source: Datastream
Source: Datastream
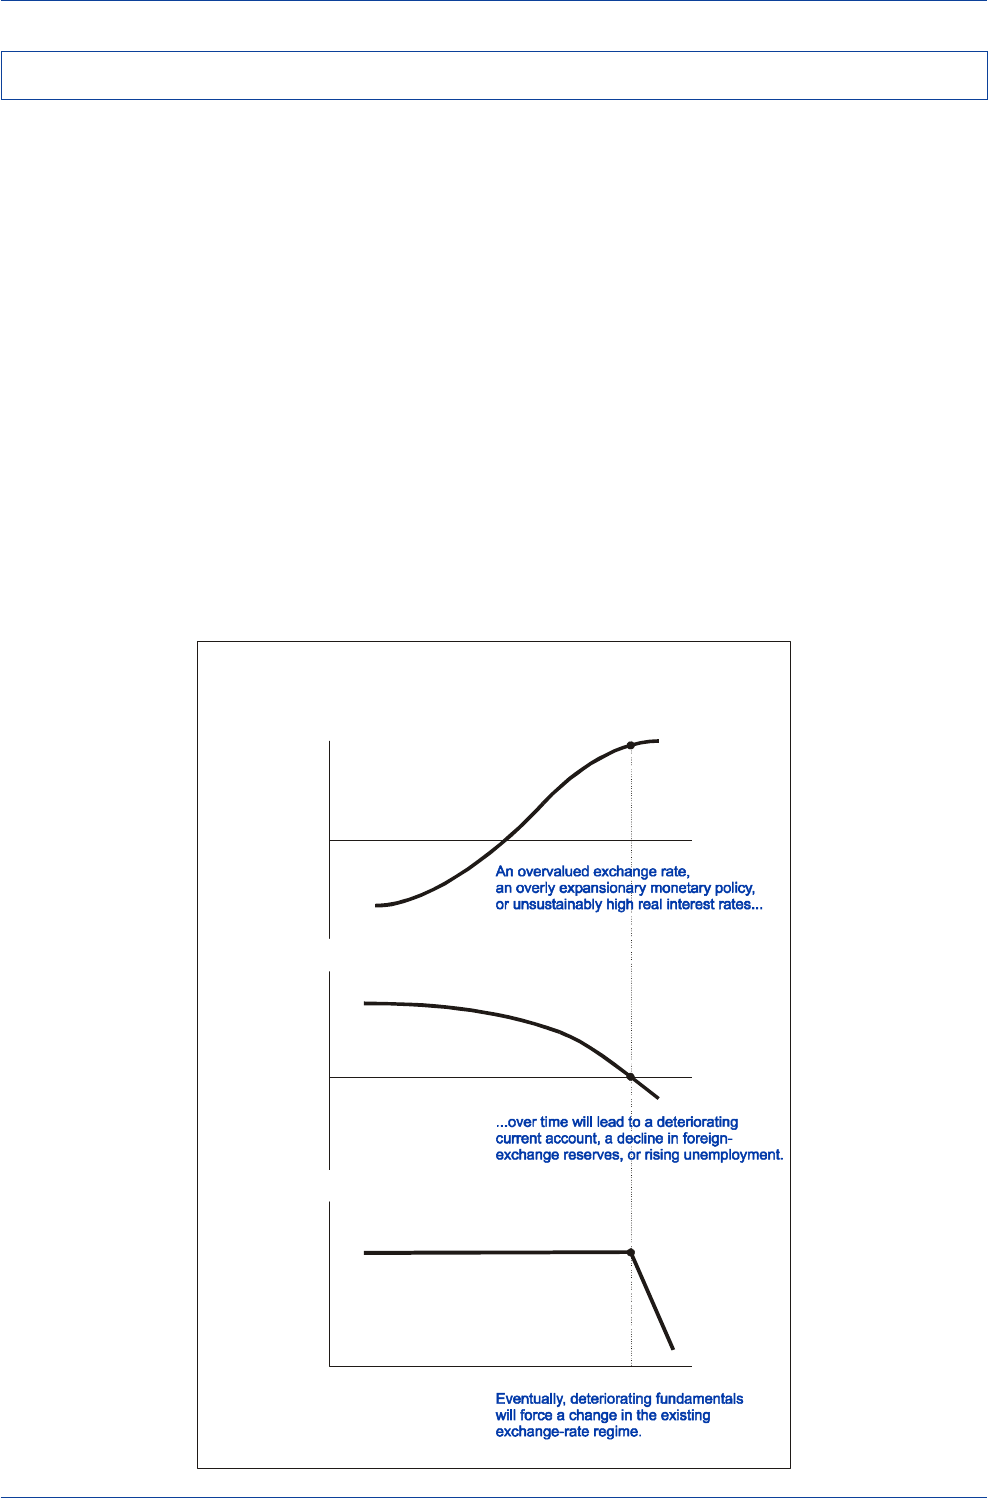
DB Guide to Exchange-Rate Determination
May 2002 Deutsche Bank @
Deutsche Bank Foreign Exchange Research 131
Crisis-prone currencies typically display a number of clas-
sic symptoms that warn of an impending speculative at-
tack. These symptoms include:
• Excessive real appreciation of the emerging-market
currency.
• Weak domestic economic growth.
• Rising unemployment.
• A deteriorating current-account balance.
• Excessive domestic credit expansion.
• Banking-system difficulties.
• Unsustainably large government budget deficits.
• Overly expansionary monetary policies.
• A high ratio of M2 money supply to reserves.
• Foreign-exchange reserve losses.
• Falling asset prices.
• A huge buildup in short-term liabilities by either the
private or public sector.
While not all of these symptoms are present in each and
every currency crisis, most crises display a number of these
symptoms, enough to at least warn of the possibility of an
impending speculative attack.
Typically, analysts will look for evidence of deteriorating
fundamentals to determine whether an emerging-market
currency might be vulnerable to a speculative attack. One
can visualize that there exist critical threshold levels for
economic vulnerability indicators where, if economic fun-
damentals deteriorate beyond those threshold levels, an
attack on the currency will inevitably be waged.
The seeds of an inevitable currency collapse are planted
when a policy shift or an economic or financial shock gives
rise to a serious deterioration in one or more key economic
variables. Once economic fundamentals deteriorate be-
yond critical threshold levels (point
A
in the middle dia-
gram), a currency will naturally collapse under its own
weight.
Deteriorating Economic Fundamentals and the Onset of Currency Crises
Deteriorating Economic Fundamentals
and the Onset of Currency Crises
Economic
Fundamentals
A
Time
Policy
Variable
or
Financial
Shock
Time
Time
Nominal
Exchange
Rate
0
A’’
0
(+)
(-)
(b)
(a)
(c)
Source: Rosenberg (1998)
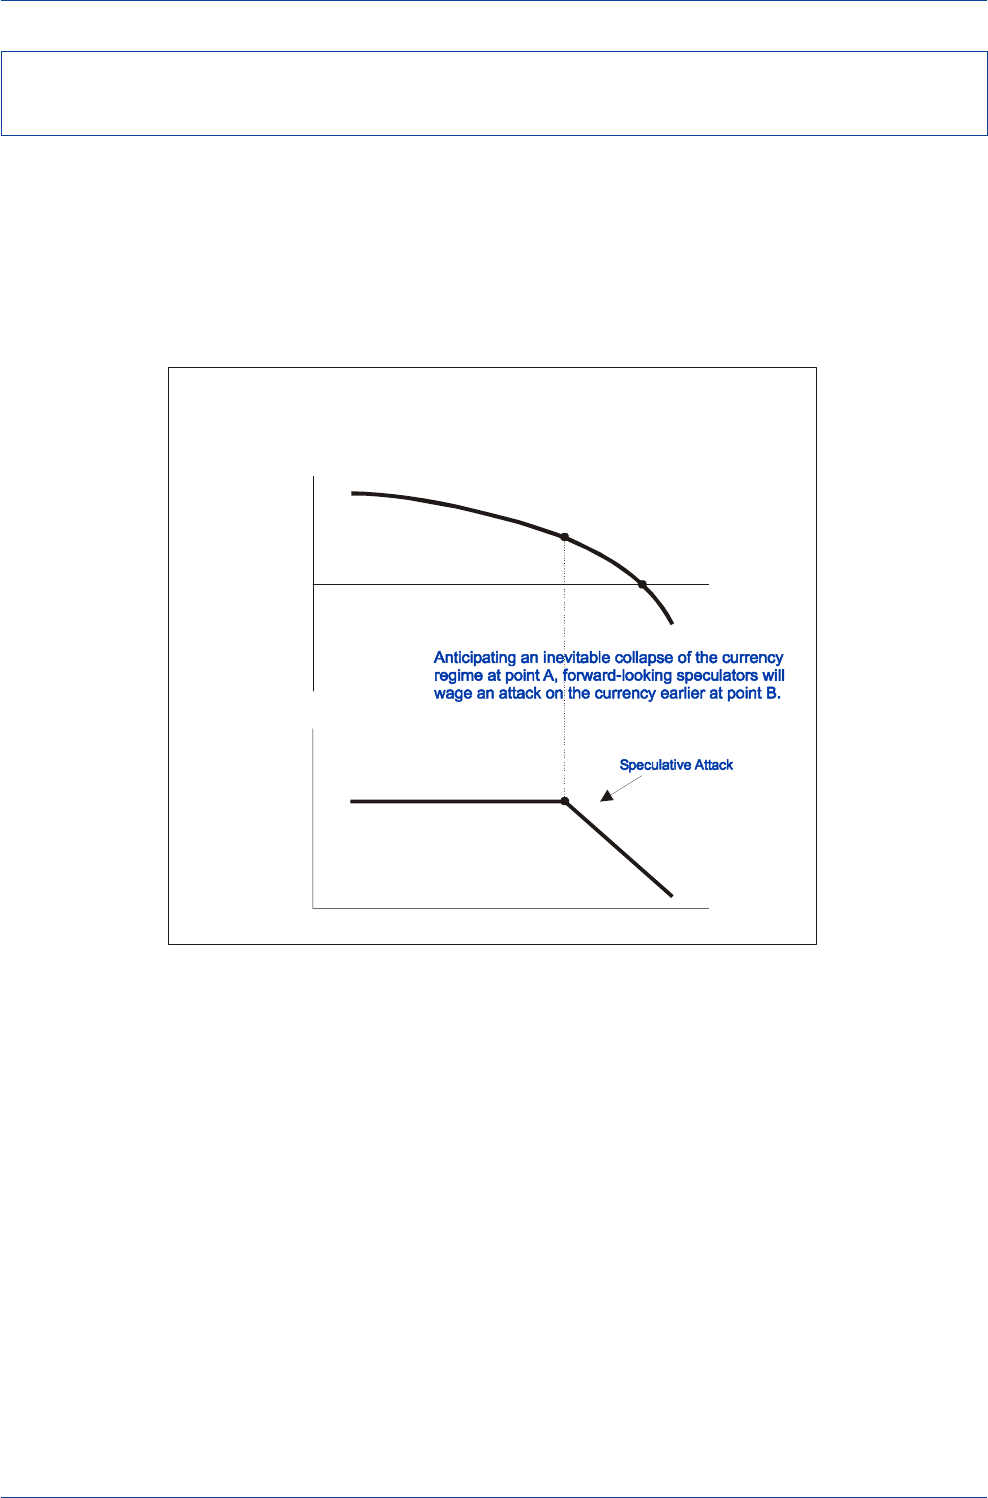
DB Guide to Exchange-Rate Determination May 2002
Deutsche Bank @
132 Deutsche Bank Foreign Exchange Research
Since speculators, investors, and borrowers tend to be
forward looking, they will recognize before the fact that a
steady deterioration in economic fundamentals will lead
to an inevitable currency collapse. By looking ahead and
reasoning backward, speculators, investors, and borrow-
ers will not wait for point
A
to be reached to capitalize on
or to hedge against a possible currency collapse. Instead,
forward-looking market participants will begin to sell the
vulnerable currency well ahead of the inevitable collapse
at point
A
. By doing so, heavy selling pressure will occur
well before point
A
is reached. Such selling might trigger a
currency collapse in the vicinity of point
B
.
Forward-Looking Speculators Bring Forward
the Day of Reckoning
Economic
Fundamentals
B
B’
Time
A
Nominal
Exchan
g
e
Rate
Time
Forward-Looking Investors May Wage an Attack Before Fundamentals
Deteriorate Beyond Threshold Levels
Source: Rosenberg (1998)
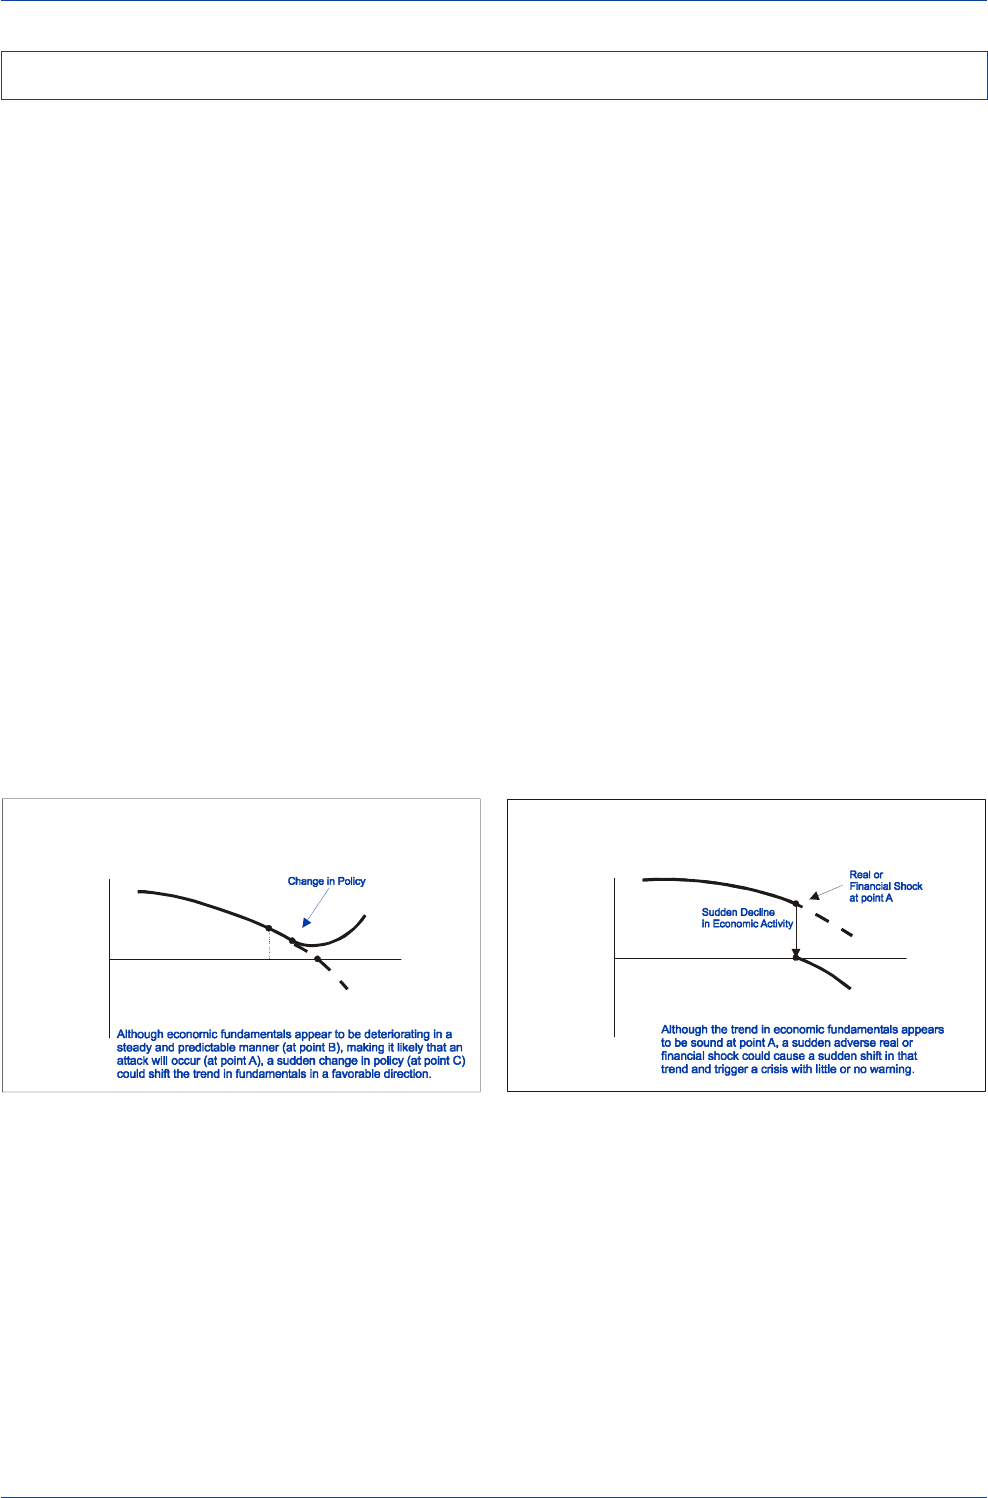
DB Guide to Exchange-Rate Determination
May 2002 Deutsche Bank @
Deutsche Bank Foreign Exchange Research 133
In a world where there is complete certainty regarding the
future path that economic fundamentals will take, it should
be possible to pinpoint exactly when a speculative attack
might occur. However, in a world where there is less than
complete certainty, it might not be possible for a leading-
indicator model to correctly anticipate the onset of all cur-
rency crises.
Consider the case where economic fundamentals do not
deteriorate in a steady and predictable manner. Assume
that the trend in economic fundamentals is gradually weak-
ening, but there comes a point (such as point
C
in the
diagram below) where a sudden, unexpected improvement
in one or more key fundamental indicators permanently
alters the long-term trend in economic fundamentals in a
favorable direction. The danger here is that prior to point
C
being reached, an early detection system might have pre-
maturely warned of an inevitable currency collapse at point
B
when no such warning was truly called for.
In contrast to situations where leading-indicator models
might falsely warn of an attack that does not in fact occur,
there might be situations where leading-indicator models
fail to correctly warn market participants of an actual at-
tack. Consider a situation where the trend in economic
fundamentals appears to be sound and displays no sign of
serious deterioration right up until the time of a specula-
tive attack. Just prior to the point of attack, the trend in
economic fundamentals is shown to suddenly deteriorate
in the diagram below, perhaps because of an adverse
terms-of-trade shock, a sudden collapse of a large corpo-
ration or bank that undermines business confidence, or
because of contagion effects stemming from financial cri-
ses in neighboring markets. The deterioration in the funda-
mental backdrop and the attack on the now vulnerable,
but previously sound, currency occur virtually simulta-
neously with little or no warning.
One additional problem that model builders face is that
not all leading indicators of currency crises point in the
same direction at the same time. In many instances, we
may find that certain economic indicators deteriorate
steadily and predictably and therefore warn of an impend-
ing crisis, while other indicators may exhibit no sign of
deterioration and therefore suggest no need for a correc-
tive exchange-rate adjustment.
The simple fact is that when a country's economic funda-
mentals point in different directions, there is likely to be
considerable uncertainty whether the general trend in a
broad grouping of fundamental indicators argues for an
inevitable currency collapse or not. And when there is a
high level of uncertainty, it is difficult to generate signifi-
cant confidence in a mechanical, fundamental-based model
that purportedly predicts the onset of currency crises.
Uncertainty and the Timing of Speculative Attacks
A Sudden Deterioration in Economic Fundamentals
Could Trigger a Speculative Attack with Little Advance Warning
Economic
Fundamentals
A
A’
Time
Source: Rosenberg (1998) Source: Rosenberg (1998)
Uncertainty about the Future Course of Economic Fundamentals
Makes It Difficult to Pinpoint When an Attack Might Occur
Economic
Fundamentals
B
C
Time
A
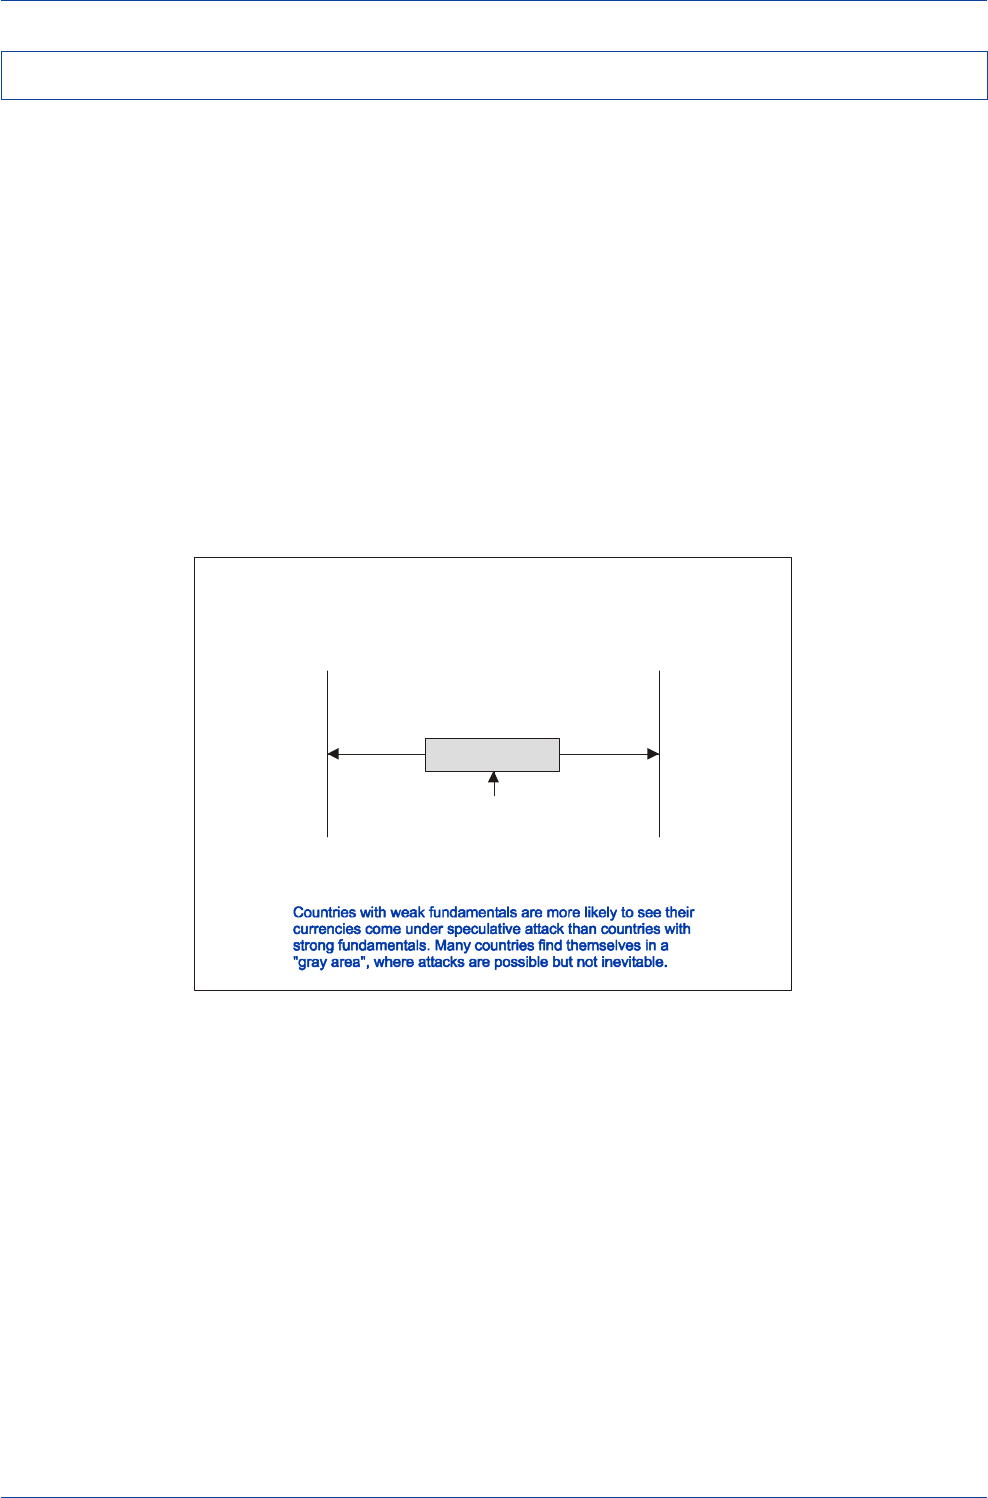
DB Guide to Exchange-Rate Determination May 2002
Deutsche Bank @
134 Deutsche Bank Foreign Exchange Research
A number of economists have tried to make the case that
an exchange-rate regime might not have a unique equilib-
rium, but instead might face multiple equilibria. The dia-
gram below illustrates the possible range of equilibrium
settings that might exist for a particular exchange rate. At
the right end of the fundamental economic spectrum, a
unique equilibrium exists since countries with strong fun-
damentals are unlikely to see their currencies come under
speculative attack. At the left end of the fundamental eco-
nomic spectrum, a unique equilibrium also exists since
countries with weak fundamentals are highly likely to see
their currencies come under speculative attack. In the
middle, a so-called "gray area" exists where exchange-rate
crises may or may not occur.
It is in this gray area where multiple equilibria may exist—
economic fundamentals are either not strong enough that
a speculative attack can be completely avoided or not weak
enough that a crisis is an inevitable outcome. Operating in
the gray area, speculative attacks are possible but not in-
evitable. Exchange rates may be stable in the gray area for
a while, but they can easily be pushed over the edge by a
sudden adverse shift in market sentiment or mood swing.
Should a currency operating in the gray area come under
speculative attack, domestic economic fundamentals could
deteriorate unexpectedly if business confidence suddenly
sours or if foreign-currency debt burdens suddenly rise. If
the fundamental economic deterioration is truly serious,
the currency could be pushed out of the gray area toward
the "weak fundamentals" area where attacks are inevitable.
By so doing, the initial attack, which occurred when the
currency was still in the gray area, would prove to have
been a self-fulfilling prophecy.
Multiple Equilibria and Self-Fulfilling Expectations
Multiple Equilibria and the
Probability of Exchange-Rate Crises
Weak Fundamentals
No AttackAttack Inevitable
"Gray Area"
(Vulnerable to Attack but Not Inevitable)
Strong Fundamentals
Probability of Attack on Currency
Source: Rosenberg (1998)
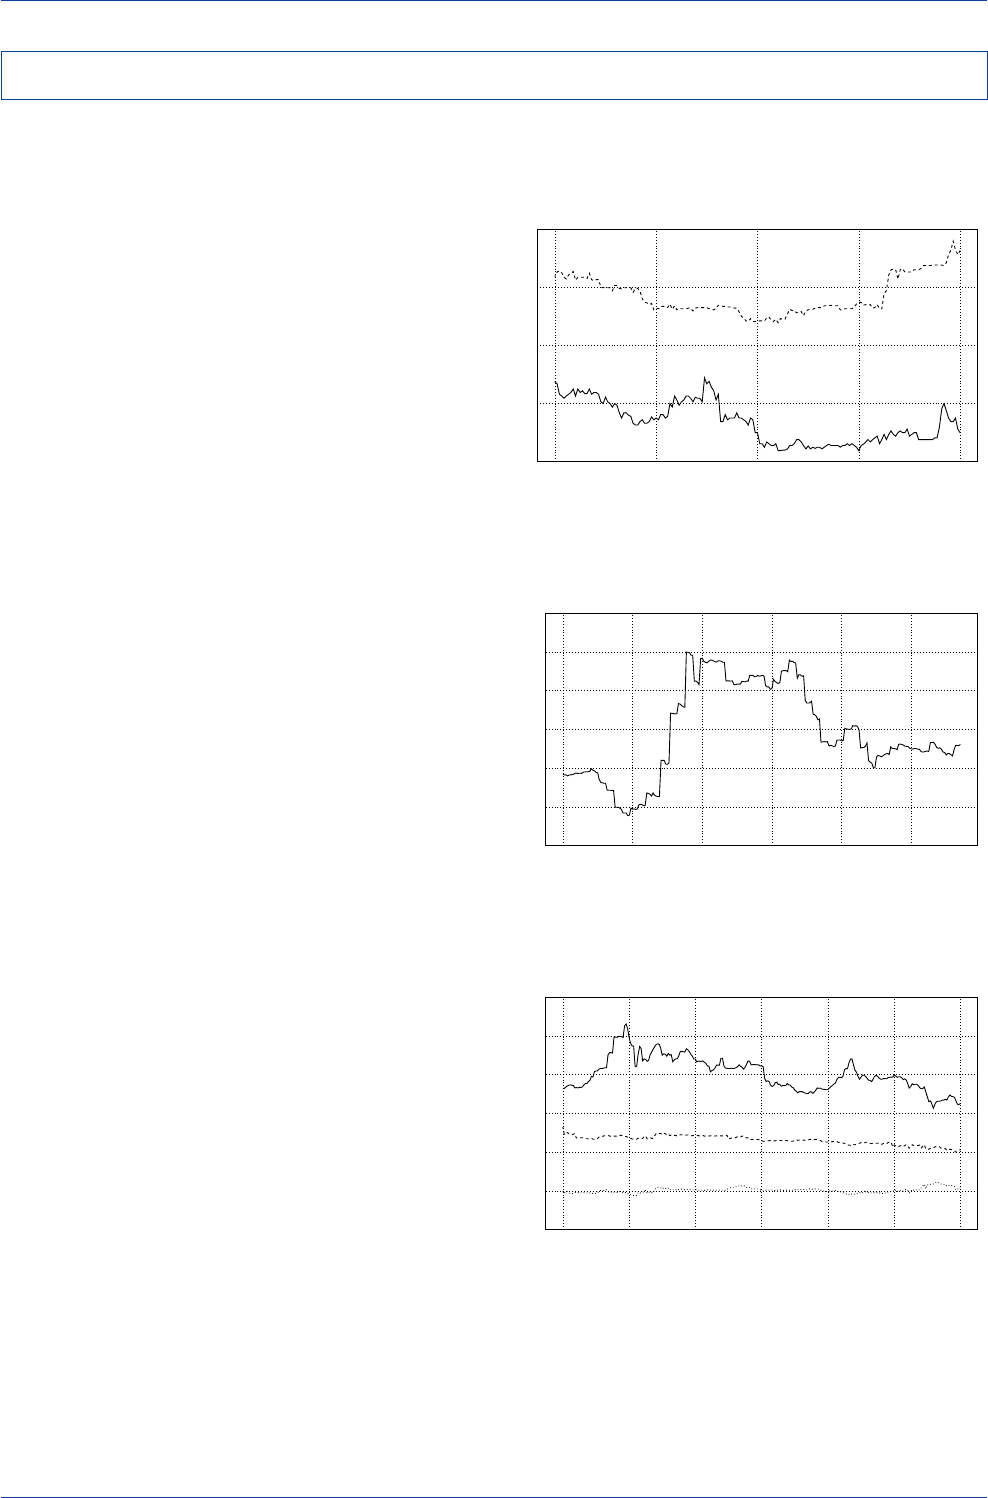
DB Guide to Exchange-Rate Determination
May 2002 Deutsche Bank @
Deutsche Bank Foreign Exchange Research 135
If market participants were truly forward looking, interest-
rate differentials would tend to widen as an impending
currency crisis drew nearer and investors demanded a
higher return or risk premium to cover the expected cur-
rency loss on their investment. However, a careful reading
of the history of speculative attacks, particularly the crises
of the 1990s, suggests that this has not been the case.
For example, interest-rate differentials failed to widen
measurably in anticipation of the ERM currency crisis of
1992-93, the Mexican peso crisis of 1994-95 or the Asian
currency crisis of 1997-98. Not only did interest-rate differ-
entials fail to widen, but the consensus forecasts of pri-
vate economists, the risk assessments by credit rating
agencies, and the economic outlook reports of the IMF
and the World Bank also failed to provide adequate warn-
ing of the impending currency crises. Even in those cases
where doomsayers might have correctly anticipated the
onset of an impending currency crisis, the eventual ex-
change-rate collapse often exceeded the direst projections
of doom and gloom analysts.
If anything, the evidence seems to be more consistent
with the view that market participants are more often than
not taken by surprise when an attack occurs. Indeed, in-
vestors and borrowers often tend to be leaning the wrong
way in terms of their portfolio positioning at the time of an
attack. Once an attack is waged, investors and borrowers
are immediately forced to reposition their portfolios to avoid
excessive currency losses, and such portfolio reposition-
ing works to intensify selling pressure on the currency
under attack. It is this massive liquidation of vulnerable
positions that is largely responsible for the seemingly ex-
cessive exchange-rate moves that typically occur during
speculative attacks.
Can the Marketplace Adequately Anticipate the Onset of Currency Crises?
Mexican/U.S. Short-Term Yield Spread
Prior to the 1994 Mexican Peso Crisis
(91-Day Cetes less U.S. T-Bill Rate)
400
600
800
1000
1200
1400
1600
03-Jan-94 04-Mar-94 05-May-94 06-Jul-94 06-Sep-94 07-Nov-94
(Basis Points)
Asian/U.S. Short-Term Yield Spreads
Prior to the 1997 Asian Currency Crisis
(Local 3-Month Rates less U.S. T-Bill Rate)
0
200
400
600
800
1000
1200
01-Jul-96 30-Aug-96 31-Oct-96 01-Jan-97 04-Mar-97 05-May-97 04-Jul-97
Thailand---- Malaysia....
(Basis Points) Korea____
European/German Short-Term Yield Spreads
Prior to the 1992 ERM Crisis
(3-Month Euro-Rates less Euro-DM)
0
100
200
300
400
01-Jan-92 03-Mar-92 04-May-92 03-Jul-92 03-Sep-92
Spain----
(Basis Points) U.K.____
Source: Datastream
Source: Datastream
Source: Datastream
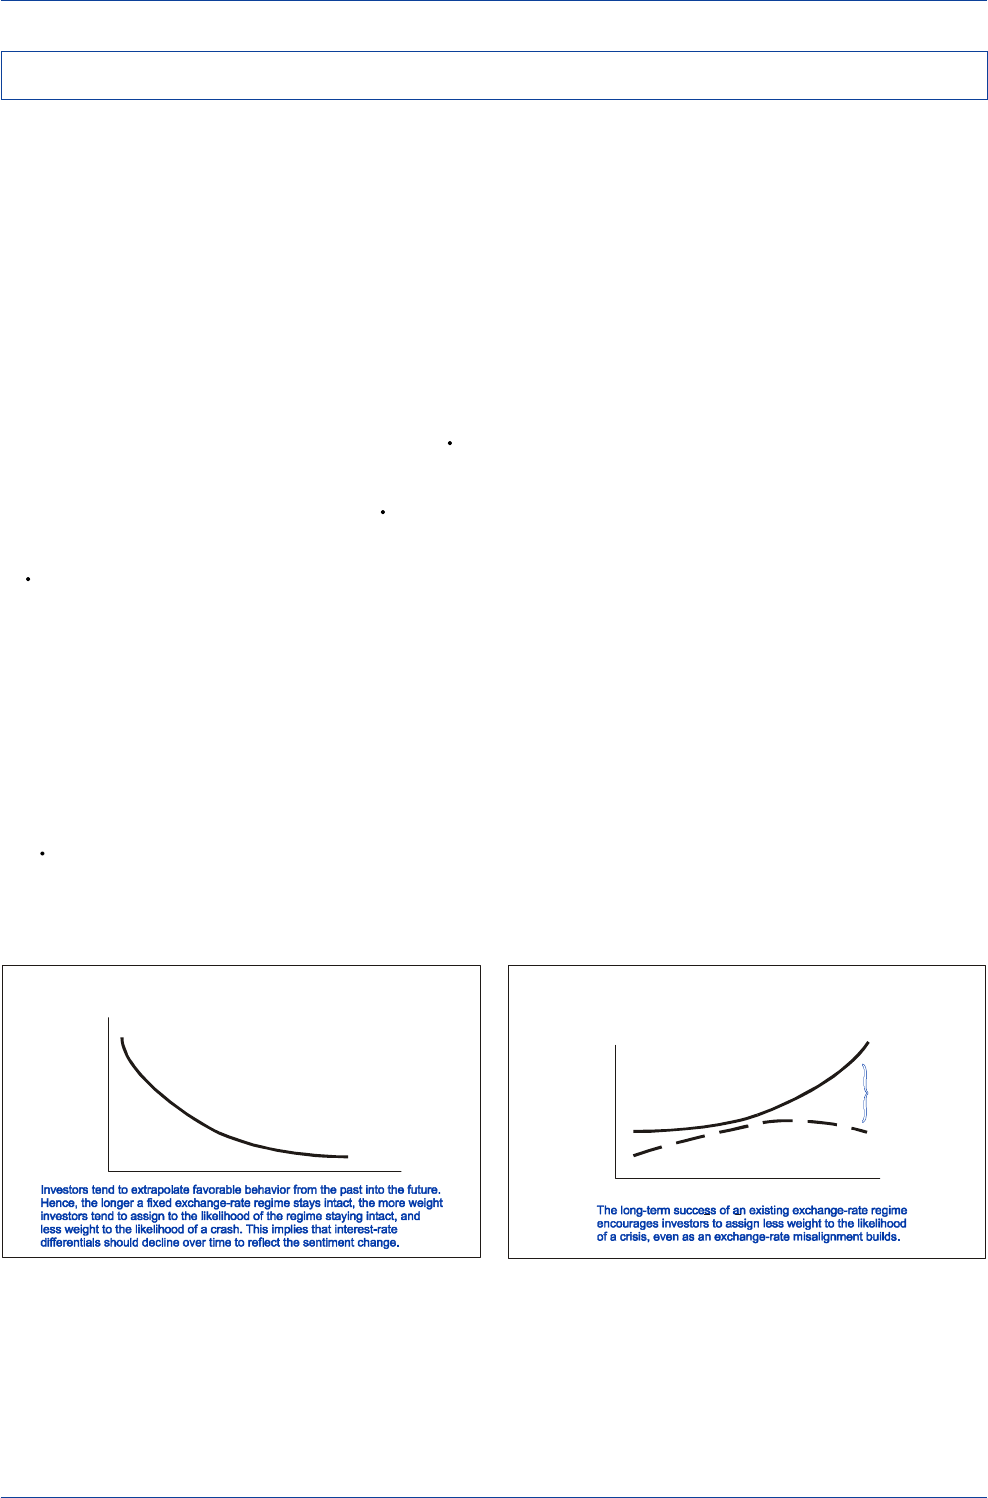
DB Guide to Exchange-Rate Determination May 2002
Deutsche Bank @
136 Deutsche Bank Foreign Exchange Research
Why does the market fail to adequately anticipate the on-
set of currency crises? To answer this question one needs
to develop a model of investor and borrower behavior that
explains why market participants might assign decreasing
weight to the probability of a currency collapse at a time
when the actual probability of a currency collapse is rising.
A variant of the model developed by Frankel and Froot
(1990) may help explain this phenomenon.
The Frankel-Froot model can be applied to the case of an
emerging-market economy that is maintaining a fixed ex-
change rate and where there may be some question
whether the fixed exchange-rate regime will prove to be
sustainable. Let's assume that investors’ expectations re-
garding the outlook for an emerging-market currency (eeEM)
that is pegged to the U.S. dollar are determined as a
weighted-average of two possible outcomes: (1) the fixed
exchange-rate regime continues to survive (eeEM=0), and
(2) the fixed exchange-rate regime comes under attack,
where the currency is expected to collapse at a rate equal
to eeEM= k (
k
being the expected percentage rate collapse
of the emerging-market currency). Investors are assumed
to assign a certain probability, w, to the existing exchange-
rate regime staying intact and another probability, 1-w, to
the regime collapsing. Let's assume that the interest-rate
differential between the emerging-market country and the
U.S., iEM - iUS, equals the market's "average" expected change
in the emerging-market exchange rate. Mathematically, the
average change in the expected exchange rate can be ex-
pressed as the weighted-average probability of the two
possible exchange-rate outcomes:
eeEM= iEM - iUS = w(0) + (1 - w)k
Investors are assumed to vary the weights,
w
and 1-
w
,
that they attach to the two possible exchange-rate out-
comes depending on how successful the authorities are
in preserving a stable, fixed exchange-rate regime. The
longer the fixed exchange-rate regime survives, the more
confident investors will be that the regime will continue to
survive in the future. In other words, investors are prone
to extrapolate favorable past behavior into the future much
like chartists do.
Hence, the longer a fixed exchange-rate regime survives,
the more weight investors will assign to the likelihood of
no exchange-rate change in the future (i.e.,
w
will rise) and
less weight to the likelihood of a currency collapse (i.e., 1-
w
will decline). As
w
rises and 1-
w
declines, the interest-
rate differential, iEM - iUS, will tend to decline over time. This
implies that the market will assign less weight to the pos-
sibility of a future currency collapse over time.
Thus, the long-term success of an existing exchange-rate
regime might in and of itself encourage investors to as-
sign less weight to the likelihood of a crisis even if the
existing regime is enjoying unwarranted excess credibil-
ity. As the exchange-rate misalignment builds, the market
"expectation" of a possible currency collapse could diverge
sharply from the actual risk of such a collapse.
The Longer a Fixed Exchange-Rate Regime Stays Intact,
the Less Weight Investors Assign to the Likelihood of a Crash
Market-Assigned
Weight to the
Likelihood of a
Currency Crash
Time
The Market’s Assessment of the Risk of an Imminent
Currency Crisis Might Differ Greatly from the True Risk
Probability of a
Currency Crisis
Exchange-Rate
Misalignment
True Probability
of a Crisis
Market’s Assessment of the
Risk of a Currency Crisis
Widening Gap
Between
Perception & Reality
Exchange-Rate Expectations and the Anticipation of Currency Crises
Source: Rosenberg (1998)Source: Rosenberg (1998)
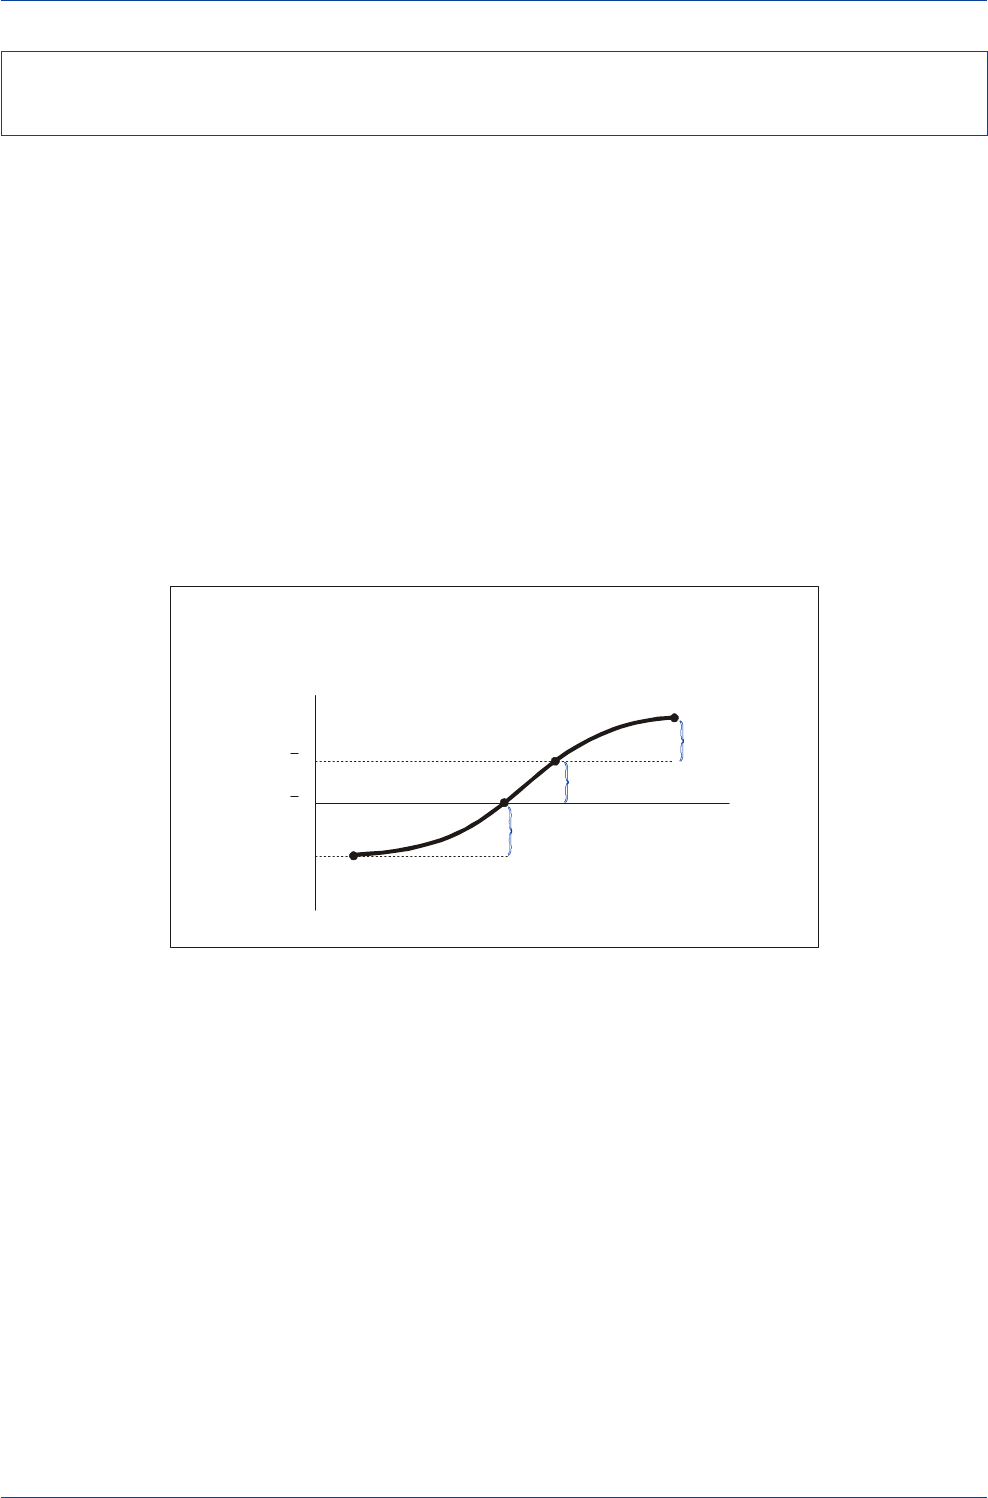
DB Guide to Exchange-Rate Determination
May 2002 Deutsche Bank @
Deutsche Bank Foreign Exchange Research 137
Currencies that undergo large and persistent real appre-
ciations are often vulnerable to a speculative attack. In-
deed, empirical studies find that overly appreciated real
exchange rates are the best single leading indicator of cur-
rency crises in emerging markets. How do real apprecia-
tions get started? This question can be answered with the
assistance of a simple stylized diagram of the equilibrium
and disequilibrium forces that contribute to large and per-
sistent real exchange-rate appreciations over time.
The Typical Path to a Currency Crisis—Persistent Real Appreciation,
Overvaluation, and Collapse
We break the typical causes of a sustained real exchange-
rate appreciation episode into four phases:
1. The correction of a currency's initial undervaluation
(from point
A
to point
B
),
2. A rise in the real long-run equilibrium exchange rate
(from point
B
to point
C,
with the combined rise in the
real exchange rate from point
A
to point
C
considered
an equilibrium phenomenon),
3. Inflation inertia that contributes to a cumulative rise in
inflation that is not offset by a change in the nominal
exchange rate, and
4. A surge in capital inflows that drives the nominal ex-
change rate, and thus the real exchange rate, higher
(from point
C
to point
D
, with the rise in the real ex-
change rate from point
C
to point
D
considered to be
a disequilibrium phenomenon).
Typical Causes of Real Exchange-Rate Appreciation
Real
Exchange Rate
Time
q
0
Rise in Real Long-Run
Equilibrium Exchange Rate
q
1
Inflation Inertia and
Excessive Surge
in Capital Inflows
Correction of
Initial Undervaluation
q
A
B
C
D
Source: Rosenberg (1998)
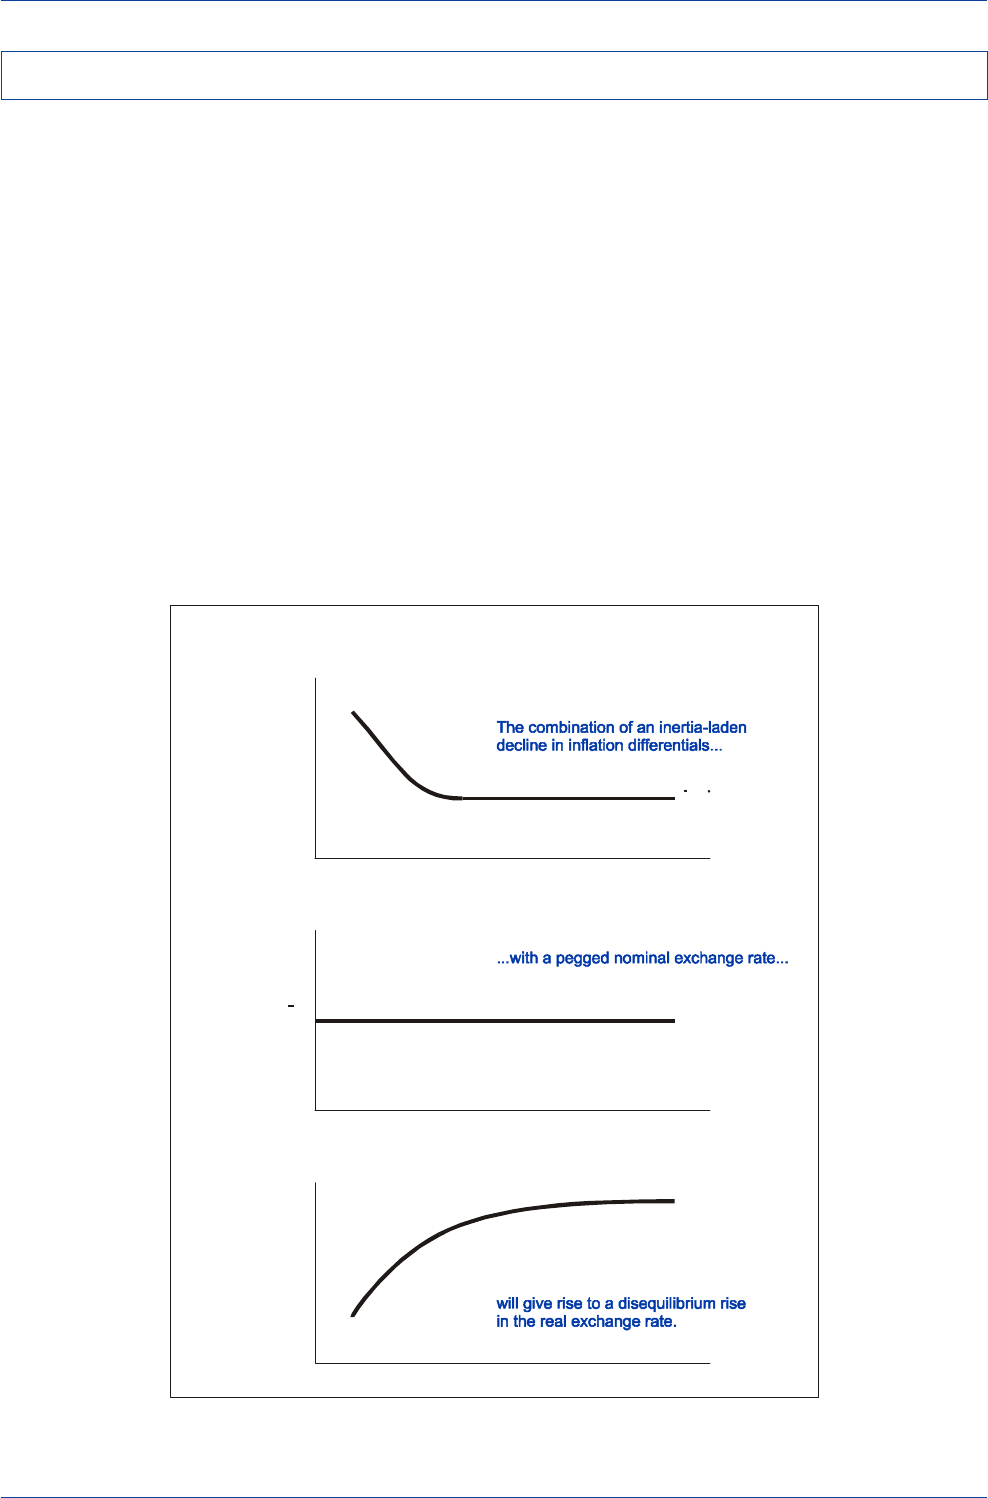
DB Guide to Exchange-Rate Determination May 2002
Deutsche Bank @
138 Deutsche Bank Foreign Exchange Research
Exchange-Rate Targeting, Inflation Inertia, and Currency Overvaluation
One of the primary factors responsible for disequilibrium
increases in the real exchange rate has been inappropriate
exchange-rate policies. For instance, not allowing the nomi-
nal exchange rate to depreciate to offset a persistently high
underlying inflation rate can lead to a disequilibrium rise in
the real exchange rate. An overvalued exchange rate will
threaten the competitiveness of an emerging-market coun-
try, and make its currency vulnerable to a speculative at-
tack.
Many emerging-market countries use the nominal ex-
change rate as an anchor to help bring their inflation rates
down to those prevailing in the rest of the world. The in-
tent is to buy credibility with a hard-currency posture. By
pegging the nominal exchange rate or limiting its flexibil-
ity, the authorities are compelled to adjust their monetary
policies to satisfy their nominal exchange-rate objective.
As a result, they are restricted from pursuing overly ex-
pansionary policies for purely domestic reasons.
In theory, a rigid nominal exchange-rate peg should allow
an emerging-market nation to bring its inflation rate down
rapidly to match the inflation performance of hard-currency
industrial countries. In practice, however, this seldom hap-
pens. Instead, backward-looking expectations, particularly
if the emerging-market country has a long history of failed
stabilization efforts, and structural impediments—such as
wage-indexation programs—work to prevent prices and
wages from falling rapidly into line with those in the indus-
trial world.
Combining an inertia-laden decline in emerging-market/in-
dustrial-country inflation differentials with a pegged nomi-
nal exchange rate, will give rise to a disequilibrium increase
in the real exchange rate. Policy decisions that permit a
buildup in the cumulative inflation gap without an offset-
ting depreciation of the nominal exchange rate are a recipe
for a currency crisis.
Inflation Inertia and Real Exchange-Rate Appreciation
Nominal
Exchange
Rate
Time
Inflation
Differential
Time
Time
Real
Exchange
Rate
q
EM
e
0
e
EM
p-p
EM US
Source: Rosenberg (1998)
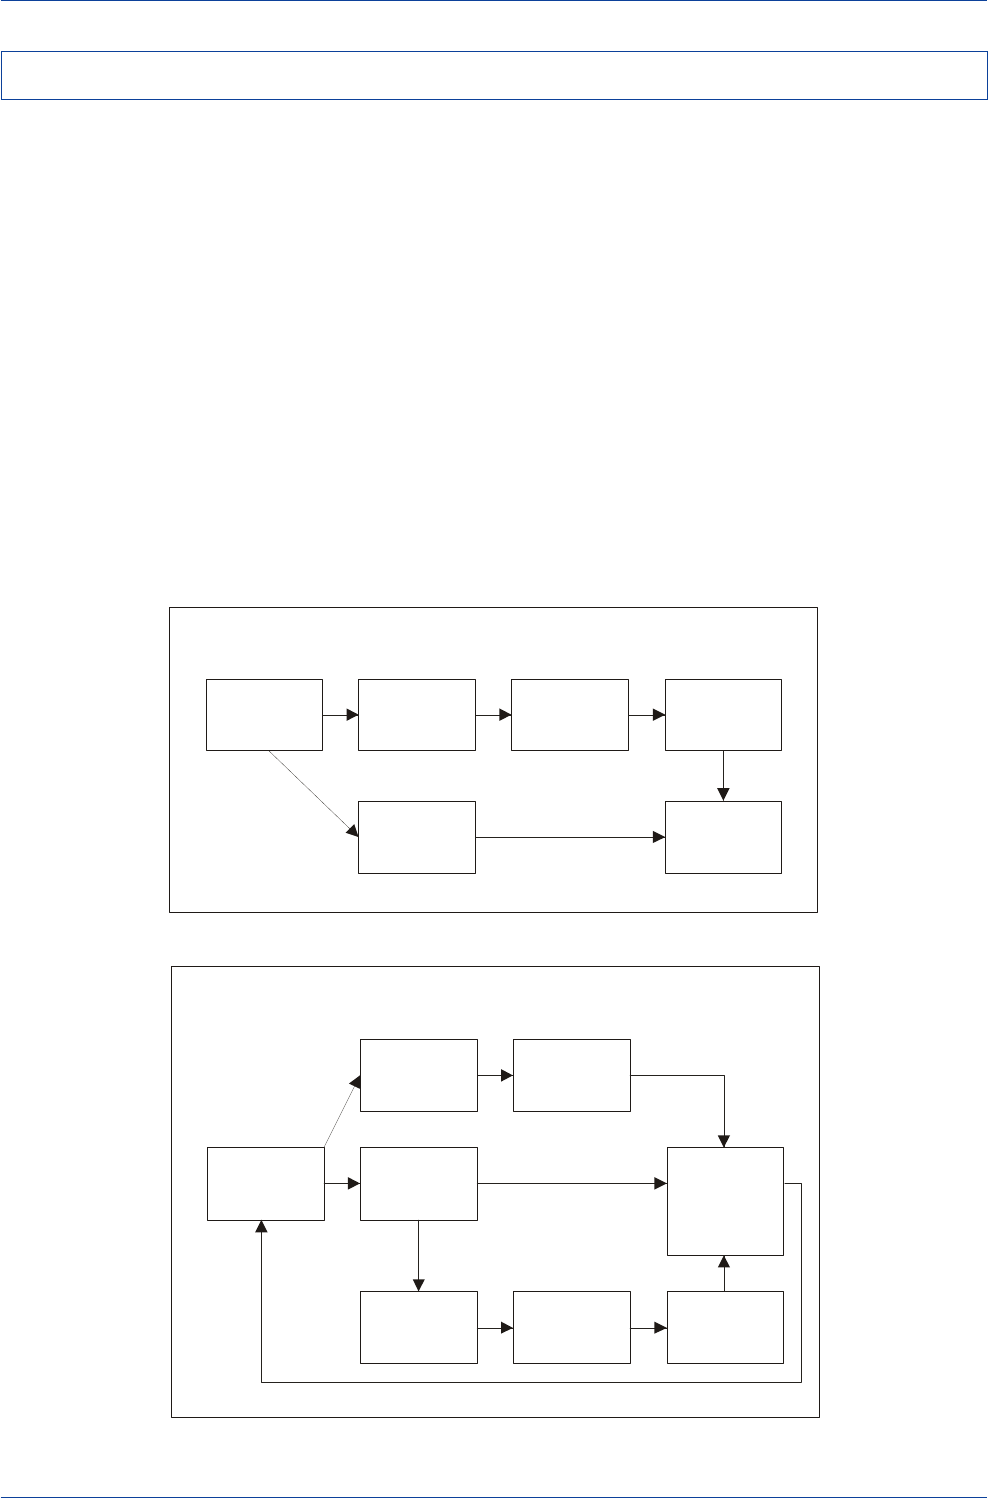
DB Guide to Exchange-Rate Determination
May 2002 Deutsche Bank @
Deutsche Bank Foreign Exchange Research 139
Surges in Capital Inflows and Real Appreciation
Surges in capital inflows have also been an important
source of real appreciation for many emerging-market cur-
rencies. Surges in capital inflows affect the real exchange
rate via two channels. First, where there is scope for nomi-
nal exchange-rate flexibility, a surge in private capital in-
flows will directly drive the value of the nominal exchange
rate higher and, in the process, drive the real exchange
rate higher in tandem. Second, a surge in capital inflows
can indirectly drive the real exchange rate higher if the
authorities intervene to stabilize the nominal exchange rate
and the resulting increase in the central bank's foreign-
exchange reserves fuels a major increase in the domestic
money supply (assuming the intervention move is not com-
pletely sterilized). An increase in domestic money-supply
growth will then tend to fuel a rise in domestic demand
and in the process drive domestic inflation higher. A rise in
domestic inflation without an offsetting depreciation of the
domestic currency will then drive the real exchange rate
higher. Hence, both directly and indirectly, a sustained
surge in capital inflows is likely to drive the real exchange
rate higher in emerging markets.
In many episodes of significant real appreciation in emerg-
ing markets, excessive optimism on the part of interna-
tional investors and domestic borrowers has led to exces-
sive surges in capital inflows that have caused real ex-
change rates to overshoot their long-run equilibrium levels
by a wide margin. At times, a speculative bubble in the
real exchange rate might form, making the emerging-mar-
ket currency vulnerable to a possible collapse in the event
of a speculative attack. When a currency moves along a
bubble path, its rise into deeply overvalued territory is
clearly not sustainable in the long run, but positive feed-
back trading and bandwagon effects are capable of sus-
taining an exchange-rate overshoot for short and medium-
term periods.
Capital Inflows and the Real Exchange Rate
Surge in
Capital
Inflow
Increase in
Foreign-Exchange
Reserves
Increase
in
Money Supply
Increase
in
Inflation
Nominal
Exchange-Rate
Appreciation
Real
Exchange-Rate
Appreciation
Positive Feedback Trading and
Excessive Surges in Capital Inflows
Surge in
Capital
Inflow
Real
Appreciation Excess
Returns
Increase
in
Foreign-Exchange
Reserves
Expectation
of
Additional
Above-Average
Returns
Increase
in
Money Supply
Increase
in
Economic
Activity
Lower
Budget
Deficit
Source: Rosenberg (1998)
Source: Rosenberg (1998)
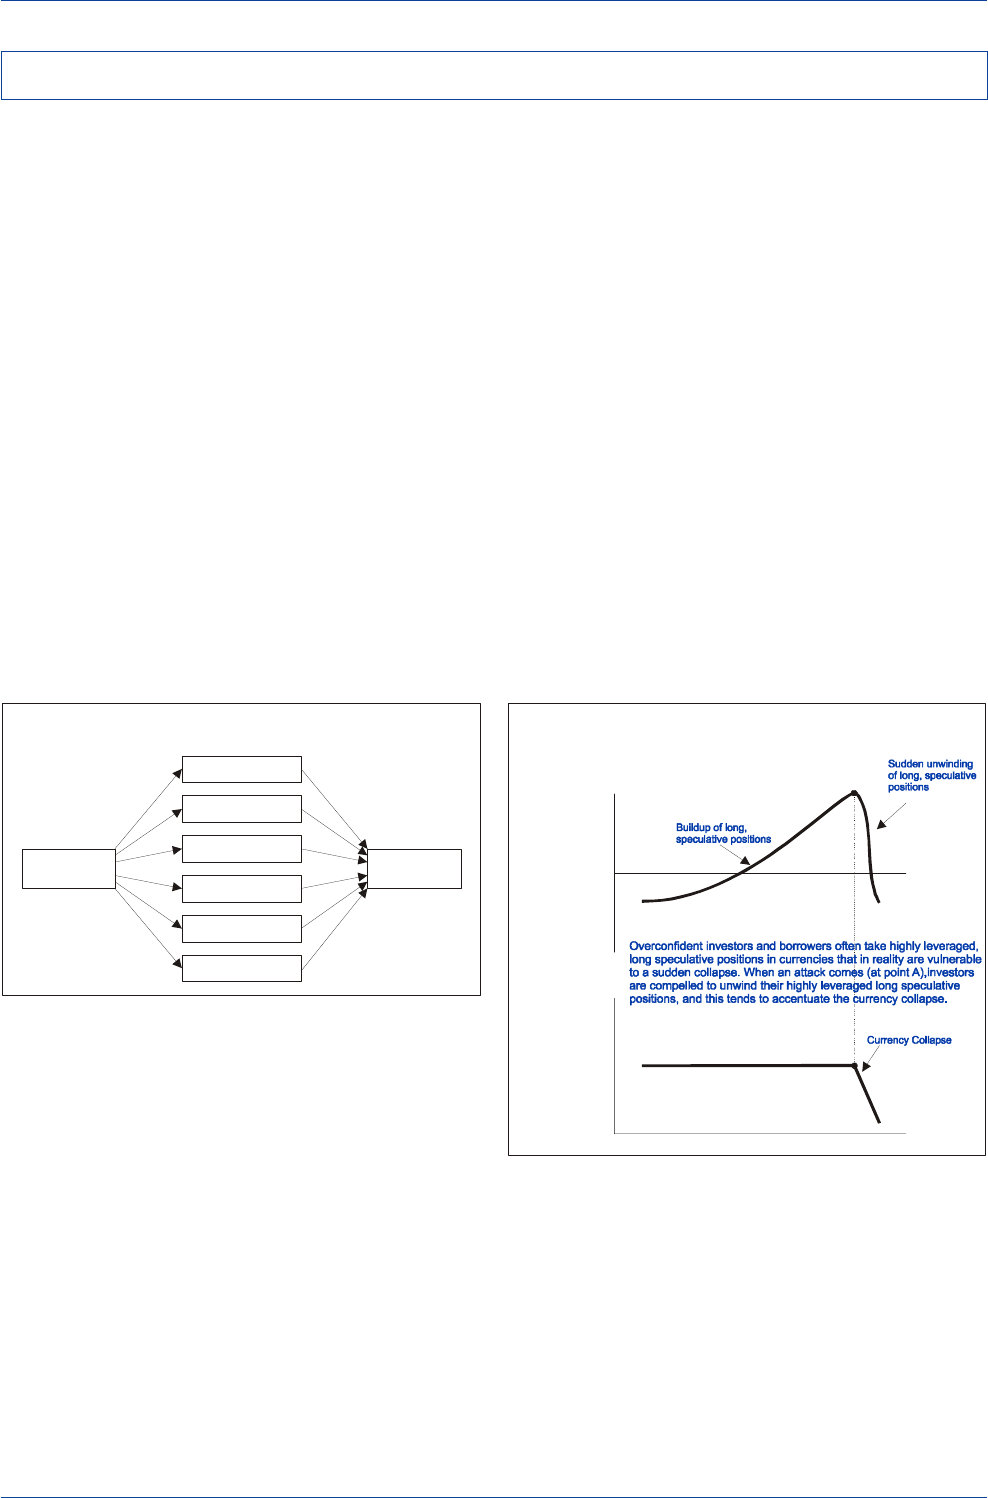
DB Guide to Exchange-Rate Determination May 2002
Deutsche Bank @
140 Deutsche Bank Foreign Exchange Research
Capital Flows, Excessive Leverage, and Crisis Vulnerability
An excessive surge in capital inflows can plant the seeds
of a currency crisis by contributing to: (1) an unwarranted
real appreciation of the emerging-market currency, (2) a
huge build-up in external indebtedness, (3) a financial as-
set or property-market bubble, (4) a consumption binge
that contributes to an explosive growth in domestic credit
and/or the current-account deficit, or (5) over-investment
in risky projects and questionable activities.
It is no accident that the ERM, Mexican, and Asian cur-
rency crises were all preceded by a surge in capital in-
flows. In each case, the surge in capital inflows led to a
buildup of huge, highly leveraged, long speculative posi-
tions by local as well as international investors in the cur-
rencies that eventually came under heavy attack. For ex-
ample, in the run-up to the ERM crisis, investors, believing
that European yield convergence would occur as European
Monetary Union (EMU) approached, took on highly lever-
aged long positions in the high-yielding European curren-
cies and short positions in the lower-yielding Deutsche-
mark. Likewise, in the run-up to the Mexican peso crisis,
investors and banks were highly leveraged and made ex-
tensive use of derivative products in taking on speculative
long peso/short dollar positions. And in the run-up to the
Asian currency crisis, it was Asian firms and banks that
were highly leveraged as they took on a huge volume of
short-term dollar-denominated debt to fund local activities.
The seemingly excessive currency collapses (at least rela-
tive to underlying economic fundamentals) that followed
in each of those episodes simply reflected the sudden
unwinding of those leveraged positions at the time of each
attack.
When investors assign a smaller and smaller probability to
an imminent currency collapse, they often tend to become
overconfident that no attack will occur, and thus appear
willing to take on highly leveraged, long speculative posi-
tions in currencies that are in reality vulnerable to a sud-
den collapse. What actually triggers a collapse is less im-
portant than the fact that at the time of an attack investors
tend to be leaning, perhaps heavily, the wrong way in terms
of their portfolio positioning. When the attack comes, fear
takes over, as highly leveraged investors need to unwind
their vulnerable long positions. It is the unwinding of those
long positions that causes exchange rates to depreciate
violently at the time of an attack.
Excessive Surges in Capital Inflows
Often Plant the Seeds of Future Currency Crises
Excessive Surge
in
Capital Inflow
Real
Appreciation
Increase in
External Indebtedness
Current-Account
Deficit
Excessive Growth
in Domestic Credit
Equity and/or
Property Bubble Currency
Crisis
Over-investment
in Risky Projects
Source: Rosenberg (1998)
Source: Rosenberg (1998)
Investors and Borrowers Are Often Caught Leaning the Wrong Way
at the Time of an Exchange-Rate Collapse
Net Long Positions
in Emerging-Market
Currency
A’
Time
A
Nominal
Exchange
Rate
Time
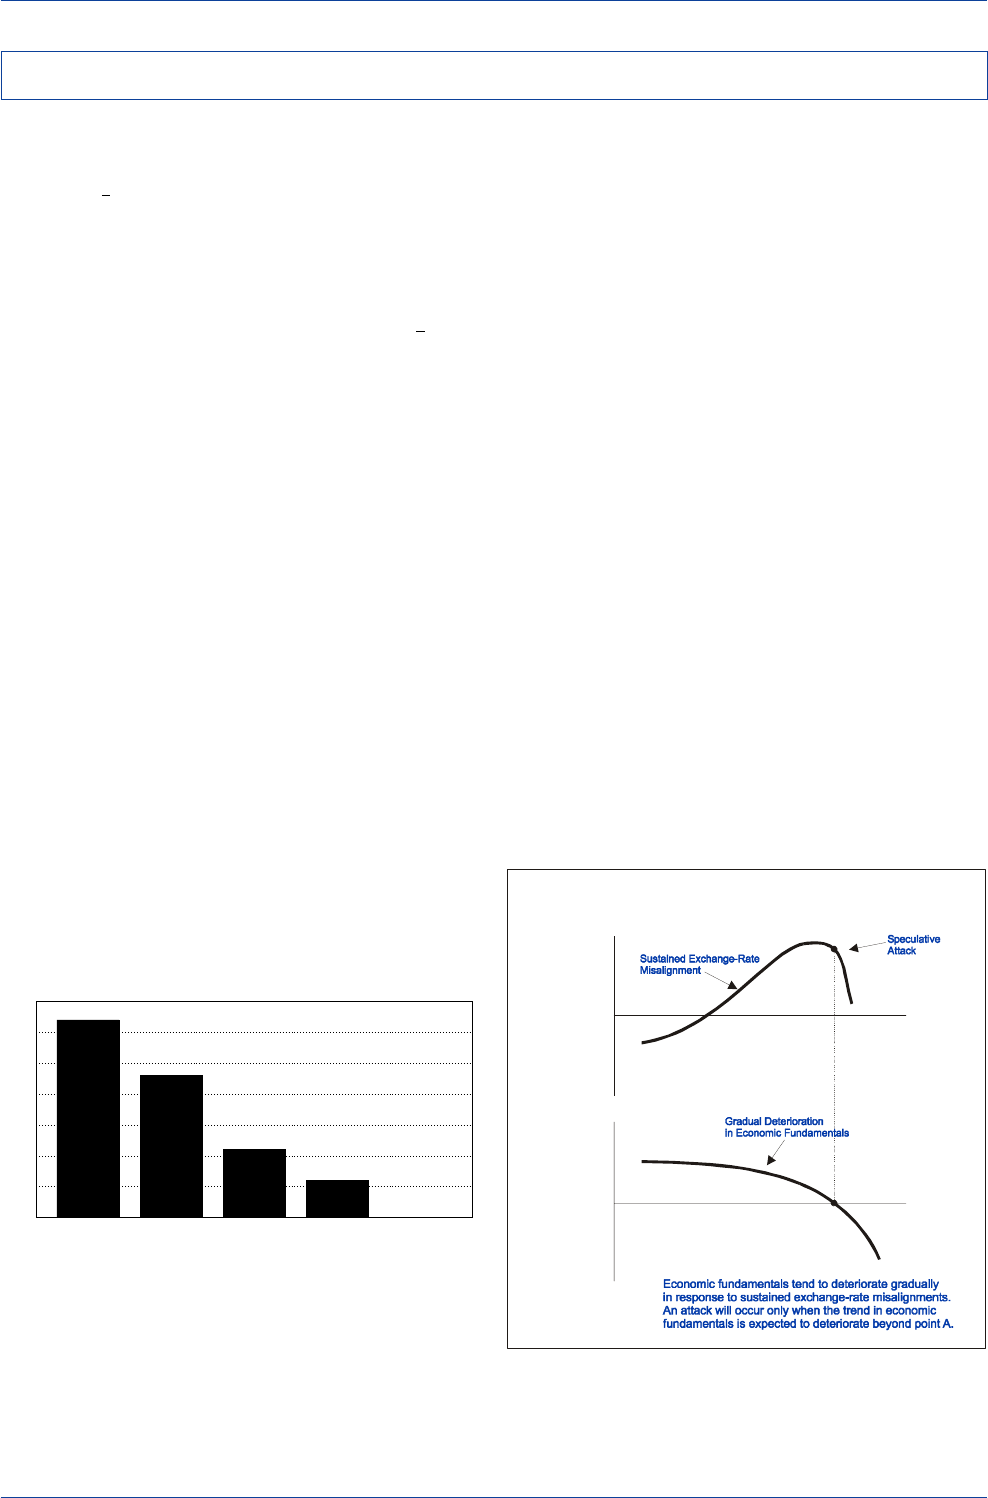
DB Guide to Exchange-Rate Determination
May 2002 Deutsche Bank @
Deutsche Bank Foreign Exchange Research 141
Real Exchange-Rate Misalignment and Collapse
A currency that undergoes significant real appreciation will
be vulnerable to a speculative attack only if the actual real
exchange rate (q) rises relative to its real long-run equilib-
rium value (q). In such cases, the resulting overvaluation
of the real exchange rate relative to its long-run equilib-
rium level should be viewed as a "disequilibrium" rise in
the real exchange rate that would call for an eventual cor-
rection of the misaligned exchange rate.
Since the real long-run equilibrium exchange rate, q, is not
directly observable, it will never be known for sure whether
a rise in the actual real exchange rate, q, is an "equilibrium"
or a "disequilibrium" phenomenon. This will be especially
true for small and medium-sized real appreciations. How-
ever, for large and sustained real appreciations, the odds
of a persistent rise in q being a purely equilibrium phe-
nomenon are likely to be small. Instead, large and persis-
tent real appreciations are more likely to be disequilibrium
phenomena in need of correction. Indeed, in a recent ex-
haustive study of real appreciation episodes in 93 coun-
tries over the 1960-94 period, Goldfajn and Valdes (1996)
found that virtually all currencies that underwent real ap-
preciations exceeding 35% from trough to peak eventu-
ally collapsed either through a speculative attack or a sur-
prise devaluation.
Views on what real exchange-rate level constitutes a
currency's real long-run equilibrium value often differ among
market participants. Hence, views on the magnitude of
the prevailing real exchange-rate misalignment will differ
as well. Given such high levels of uncertainty, the market
will generally presume that a sustained increase in the
real exchange rate is an equilibrium phenomenon unless
convinced otherwise. Hence real exchange-rate
misalignments are unlikely to be corrected until there are
visible signs of fundamental economic deterioration.
In a typical real appreciation/misalignment episode, real
appreciation tends to proceed gradually. As the exchange-
rate misalignment builds, there will probably be no correc-
tive adjustment early on, since economic fundamentals
likely will display little sign of significant deterioration. But
as the real exchange-rate misalignment grows and persists,
the trend in economic fundamentals will gradually begin
to deteriorate. When the deterioration in fundamentals
reaches a point that convinces speculators that remedial
action is called for, then and only then will they attack the
overly appreciated currency.
Evidence presented by Goldfajn and Valdes (1996) suggests
that real appreciations tend to build up gradually and then
end abruptly. They find that there is a large asymmetry
between the average duration of real appreciation episodes
and the time that it takes to unwind the appreciation of
the real exchange rate. Goldfajn and Valdes estimate that
the average duration of real appreciation episodes is about
twice as long as the time that it takes to unwind the real
appreciation.
Real Exchange-Rate Misalignments Tend to
Build Up Gradually and End Abruptly
Economic
Fundamentals
A’
Time
A
Real
Exchange
Rate
Time
Source: Rosenberg (1998)
Probability That a Real Appreciation Episode
Will Come to an End without a
Speculative Attack or Surprise Devaluation
0.00
0.06
0.11
0.23
0.32
0.00
0.05
0.10
0.15
0.20
0.25
0.30
0.35
15 20 25 30 35
Probability
Source: Goldfajn and Valdes (1996).
Real Currency Appreciation(%)
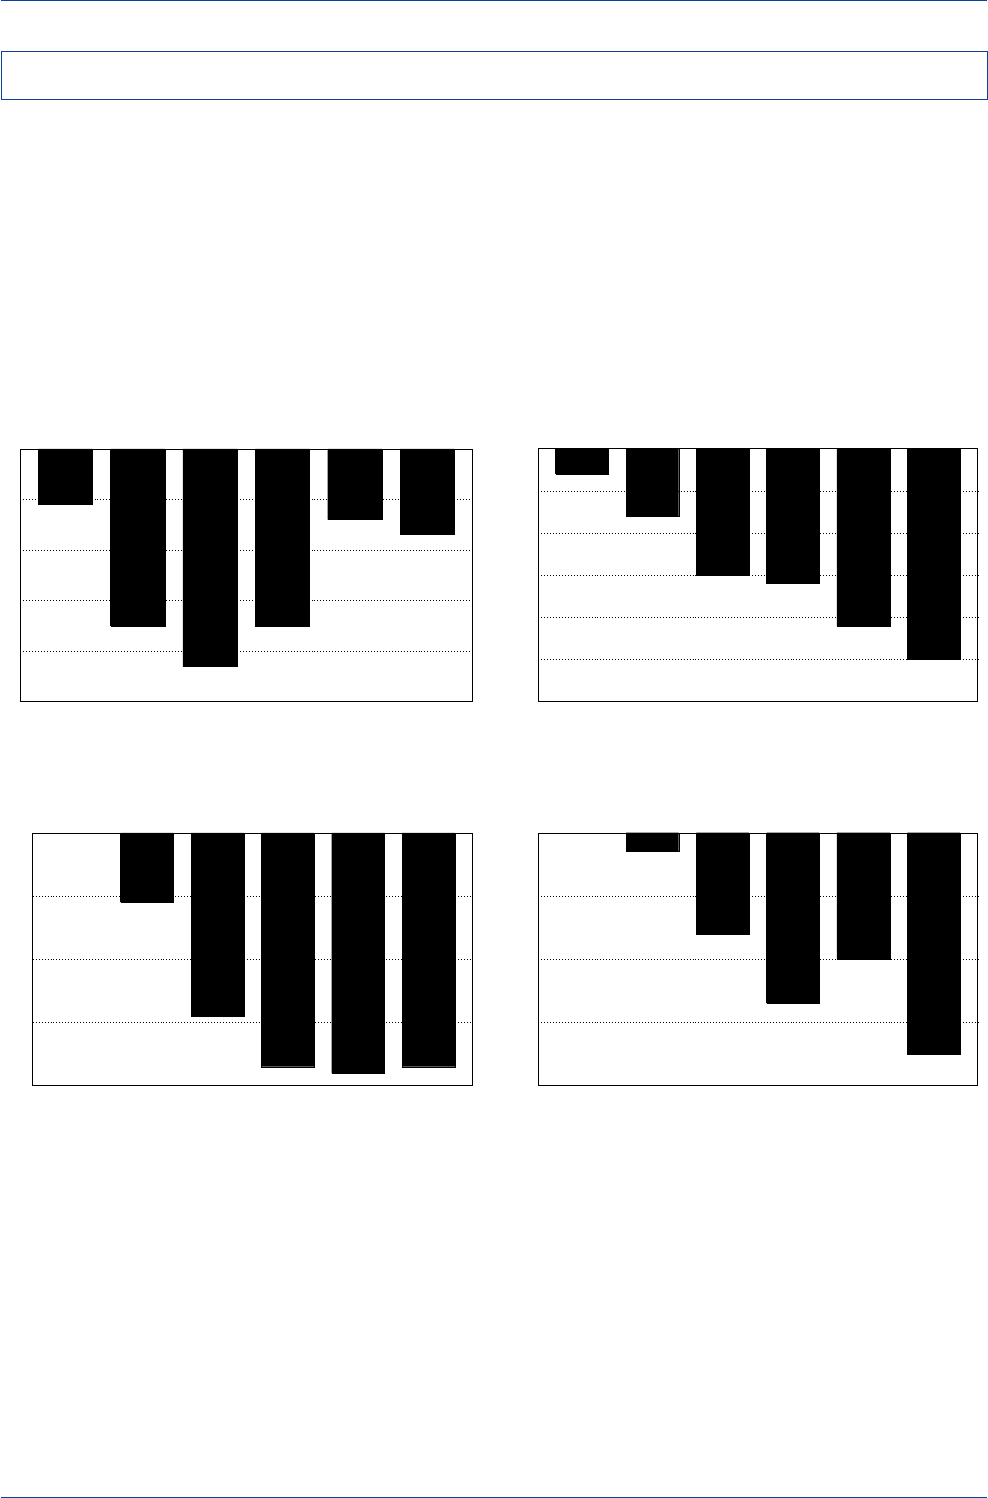
DB Guide to Exchange-Rate Determination May 2002
Deutsche Bank @
142 Deutsche Bank Foreign Exchange Research
Current-Account Imbalances and Currency Crises
Countries that run large and persistent current-account
deficits are likely to see their currencies become vulner-
able to a speculative attack. That appeared to be the case
for European countries prior to the ERM crises of the early
1990s.
When a country is running a large and persistent current-
account deficit, it must attract continual capital inflows to
finance the deficit. Over time, this will give rise to a large
and growing external debt. If this external debt burden
becomes inordinately large, it might raise questions about
the solvency of the indebted nation. If the market sus-
pects that the indebted nation does not have the ability to
generate sufficient trade surpluses in the future to repay
its debt, they might reason that exchange rates will need
to be adjusted downward to boost the competitiveness of
the indebted nation.
Italy’s Current-Account Balance
(1987-1992)
-2.5
-2.1
-1.6
-1.5
-0.8
-0.3
-3.0
-2.5
-2.0
-1.5
-1.0
-0.5
0.0
1987 1988 1989 1990 1991 1992
(% of GDP)
Source: OECD Economic Outlook, June 1998.
U.K. Current-Account Balance
(1987-1992)
-1.7
-1.4
-3.5
-4.3
-3.5
-1.1
-5
-4
-3
-2
-1
0
1987 1988 1989 1990 1991 1992
(% of GDP)
Source: OECD Economic Outlook, June 1998
Spain’s Current-Account Balance
(1987-1992)
-3.7
-3.8
-3.7
-2.9
-1.1
0.0
-4.0
-3.0
-2.0
-1.0
0.0
1987 1988 1989 1990 1991 1992
(% of GDP)
Source: OECD Economic Outlook,
June 1998
Sweden’s Current-Account Balance
(1987-1992)
-3.5
-2.0
-2.7
-1.6
-0.3
0.0
-4.0
-3.0
-2.0
-1.0
0.0
1987 1988 1989 1990 1991 1992
(% of GDP)
Source: OECD Economic Outlook, June 1998.
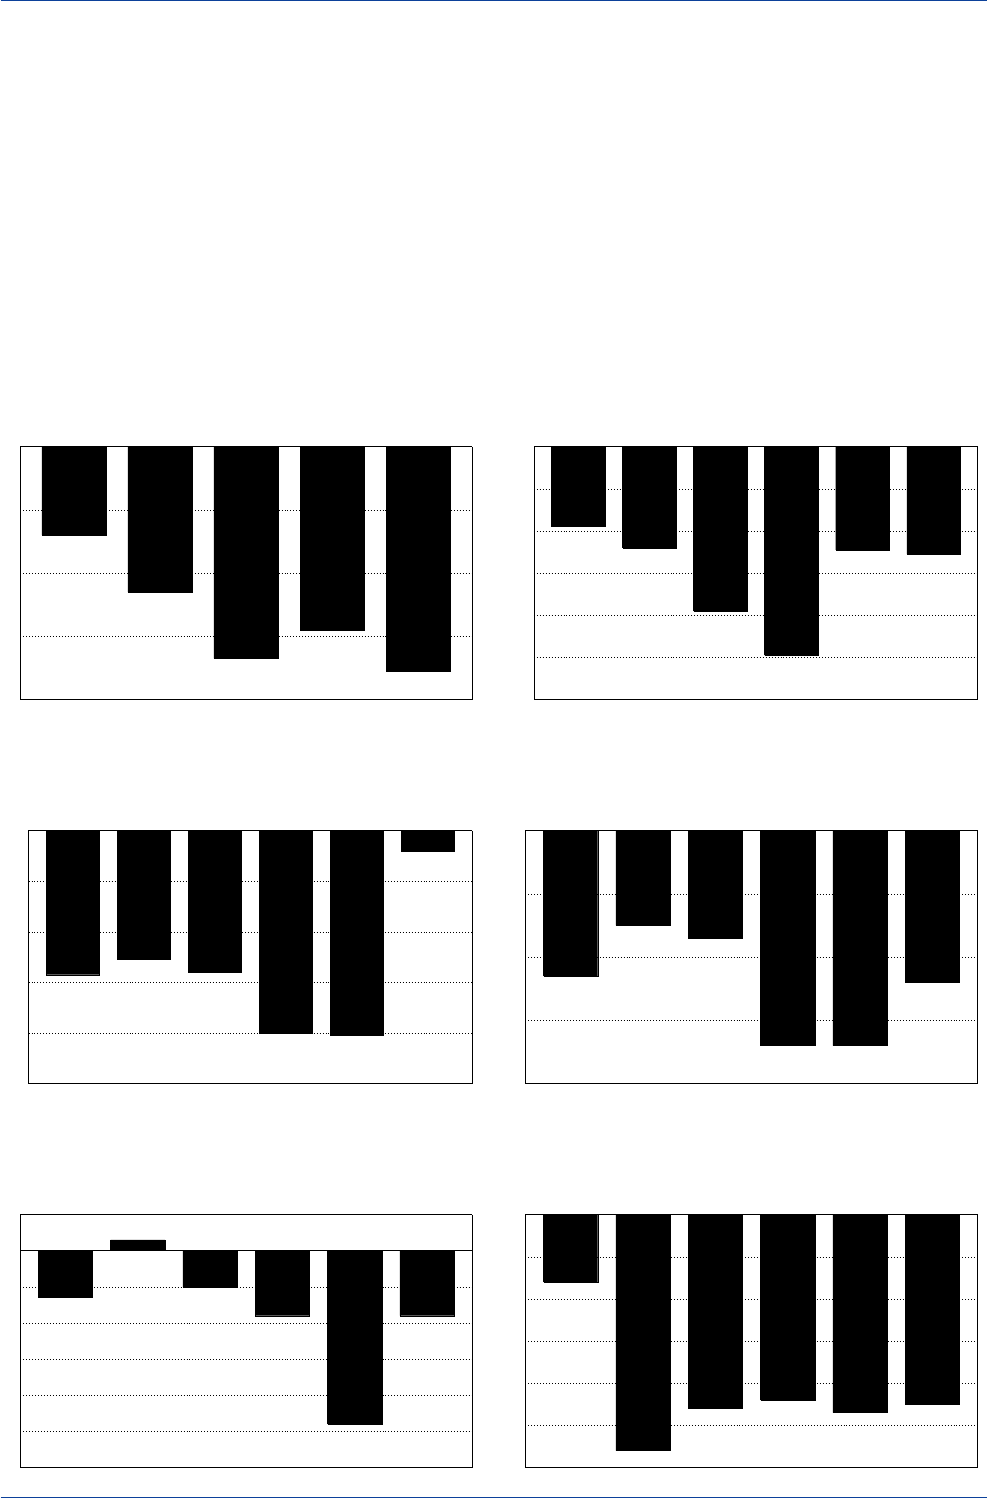
DB Guide to Exchange-Rate Determination
May 2002 Deutsche Bank @
Deutsche Bank Foreign Exchange Research 143
While current-account imbalances may have played an
important role in triggering the Mexican peso and Asian
currency crises in the 1990s, most international econo-
mists would argue that the violent character of those cur-
rency-crisis episodes could be explained only by financial-
sector weaknesses, and not by external-balance consider-
ations.
What does the empirical evidence suggest about the role
of current-account imbalances in triggering currency cri-
ses in emerging markets? Frankel and Rose (1996) exam-
ined the fundamental forces that triggered currency
crashes in over 100 emerging-market countries over the
1971-92 period, and found that current-account imbalances
were not statistically significant in predicting currency
crashes. Sachs, Tornell, and Velasco (1996) found that cur-
rent-account imbalances were not helpful in determining
which currencies were vulnerable to contagion effects fol-
lowing the Mexican peso collapse in 1994-95. However,
Goldstein et al. (2000) and the IMF (1998) found that cur-
rent-account deficit/GDP ratios have, on average, been sig-
nificantly larger in periods leading up to a crisis than dur-
ing tranquil periods. The latter results suggest that current-
account imbalances may have some predictive power in
anticipating currency crises.
Mexico’s Current-Account Balance
(1990-1994)
-7.1
-5.8
-6.7
-4.6
-2.8
-8
-6
-4
-2
0
1990 1991 1992 1993 1994
(% of GDP)
Source: OECD Economic Outlook, June 1998.
Malaysia’s Current-Account Balance
(1992-1997)
-5.1
-4.9
-9.9
-7.8
-4.8
-3.8
-12
-10
-8
-6
-4
-2
0
1992 1993 1994 1995 1996 1997
(% of GDP)
Source: National government data.
Thailand’s Current-Account Balance
(1992-1997)
-0.8
-8.1
-8.0
-5.6
-5.1
-5.7
-10
-8
-6
-4
-2
0
1992 1993 1994 1995 1996 1997
(% of GDP)
Source: National government data.
Indonesia’s Current-Account Balance
(1992-1997)
-2.4
-3.4-3.4
-1.7
-1.5
-2.3
-4
-3
-2
-1
0
1992 1993 1994 1995 1996 1997
(% of GDP)
Source: National government data.
Korea’s Current-Account Balance
(1992-1997)
-1.8
-4.8
-1.8
-1.0
0.3
-1.3
-6
-5
-4
-3
-2
-1
0
1
1992 1993 1994 1995 1996 1997
(% of GDP)
Source: OECD Economic Outlook, June 1998.
Philippine’s Current-Account Balance
(1992-1997)
-4.5
-4.7
-4.4
-4.6
-5.6
-1.6
-6
-5
-4
-3
-2
-1
0
1992 1993 1994 1995 1996 1997
(% of GDP)
Source: National government data.
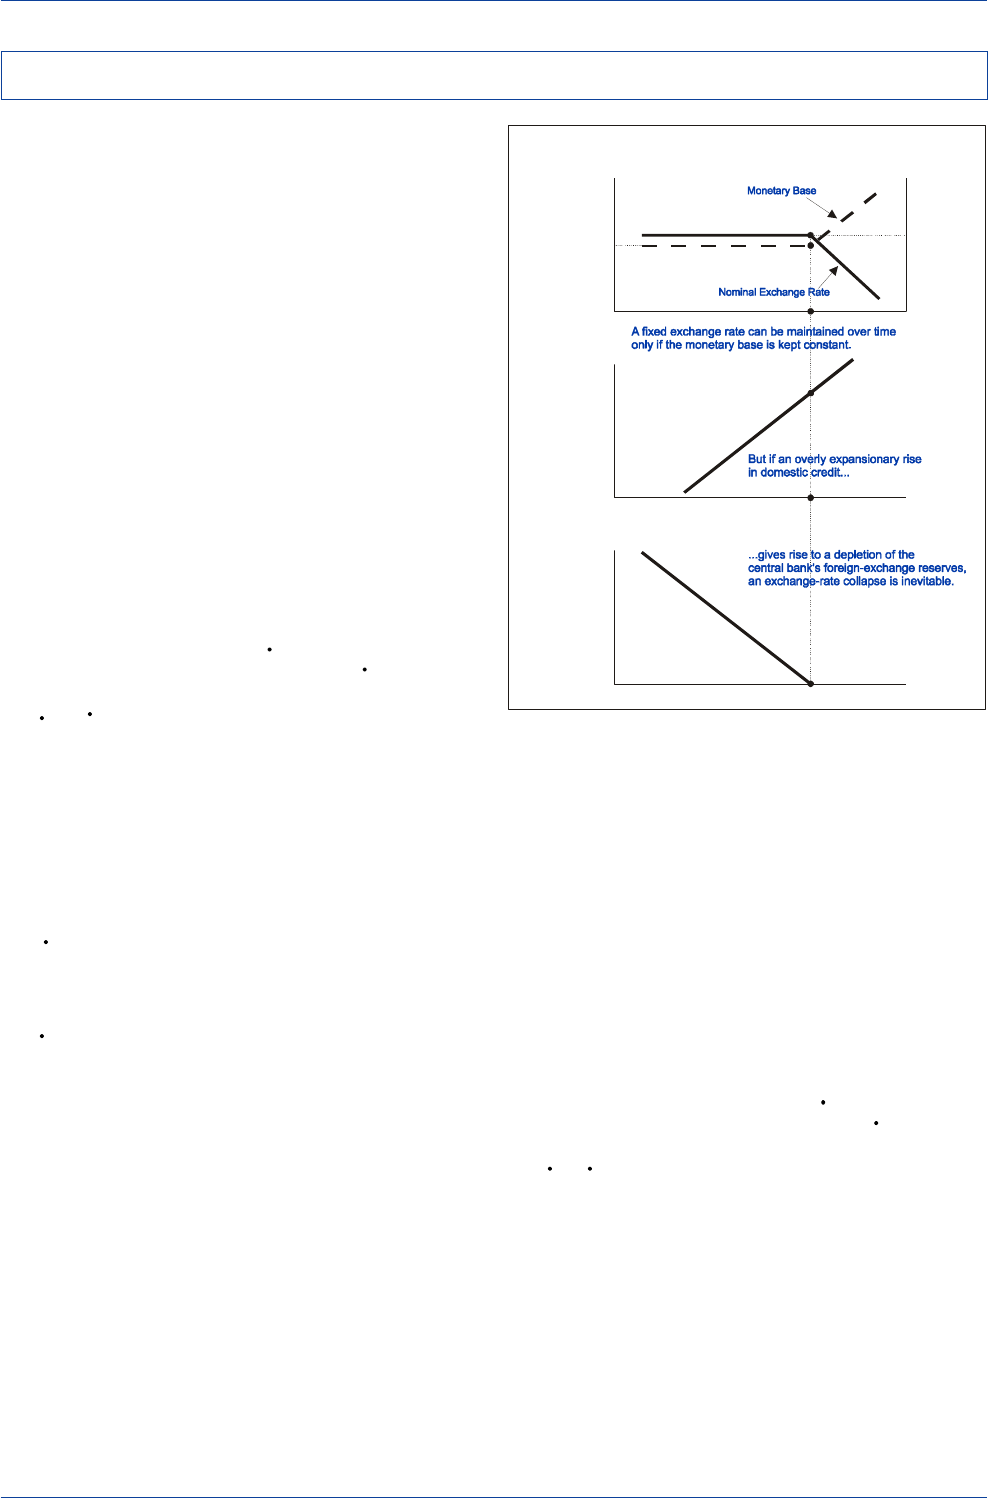
DB Guide to Exchange-Rate Determination May 2002
Deutsche Bank @
144 Deutsche Bank Foreign Exchange Research
Overly Expansionary Monetary Policy and Currency Crises
Countries that pursue overly expansionary monetary poli-
cies are likely to see their currencies become vulnerable
to a speculative attack. History is replete with examples in
which domestic credit creation by a central bank in excess
of money demand has planted the seeds of a speculative
attack.
If a central bank wished to peg its currency to a hard cur-
rency, it would need to pursue monetary policies consis-
tent with that exchange-rate objective. An overly expan-
sionary monetary policy would be inconsistent with the
maintenance of stable nominal exchange rates in the long
run. Examples of inconsistent policies would be situations
in which a central bank felt compelled to monetize a large
and persistent budget deficit or had to inject massive sums
of liquidity to prop up an ailing banking system. In both
cases, such policy stances would inevitably lead to a col-
lapse of a pegged exchange-rate regime.
We can illustrate the inherent inconsistency between the
pursuit of a stable nominal exchange rate, on the one hand,
and an excessively expansionary monetary policy, on the
other, with a simple model. We start by assuming that
changes in a currency's value, e, are inversely related to
changes in that country's monetary base, M:
e = - M (1)
That is, an expansion of the monetary base will lead to an
equiproportionate decline in a currency's value, while a
contraction of the monetary base will lead to an
equiproportionate rise in a currency's value. In this simpli-
fied model, a fixed exchange rate can be maintained over
time only if the monetary base is kept constant over time.
That is, if:
M = 0 (2)
then, from (1) above
e = 0 (3)
A country's monetary base consists of domestic credit
issued by the central bank, D, and the central bank's hold-
ings of foreign-exchange reserves, R:
M = D + R (4)
If a central bank attempted to monetize a large budget
deficit by expanding domestic credit, D, that would lead to
a corresponding rise in the monetary base, M, unless the
central bank’s holdings of reserves, R, were run down by
an amount equal to the rise in D. If the central bank's hold-
ings of foreign-exchange reserves, R, were run down by
an amount equal to the increase in domestic credit, D, the
monetary base would be held constant and the nominal
exchange rate would remain fixed.
Since a central bank's holdings of foreign-exchange re-
serves are finite, there is a limit to how much a central
bank can continuously run down its reserves to offset a
continuous expansion of domestic credit. At the point
where the central bank's holdings of foreign-exchange re-
serves approach zero (shown as t1 in the diagram above),
an exchange-rate peg would collapse on its own accord
because at that point the monetary base would begin to
expand at the same rate as domestic credit was expand-
ing. That is, if
R = 0 (5)
then changes in the monetary base, M, would be entirely
determined by changes in domestic credit, D:
M = D (6)
With both D and M rising at the same rate, the rise in M
would no longer be consistent with the maintenance of a
stable exchange rate. Once M starts to expand, the ex-
change rate would begin to decline at the same rate that
M is rising. In practice, if forward-looking investors saw
that the central bank’s FX reserves were falling to danger-
ously low levels, they would, in all likelihood, wage an at-
tack on the vulnerable currency prior to point t1 being
reached.
Overly Expansionary Monetary Policies, Reserve Loss,
and the Inevitability of an Exchange-Rate Collapse
Time
Monetary
Base
Time
Time
Foreign-
Exchange
Reserves
e
Domestic
Credit
Nominal
Exchange
Rate
M
t
1
t
1
t
1
D
R
M
0
e
0
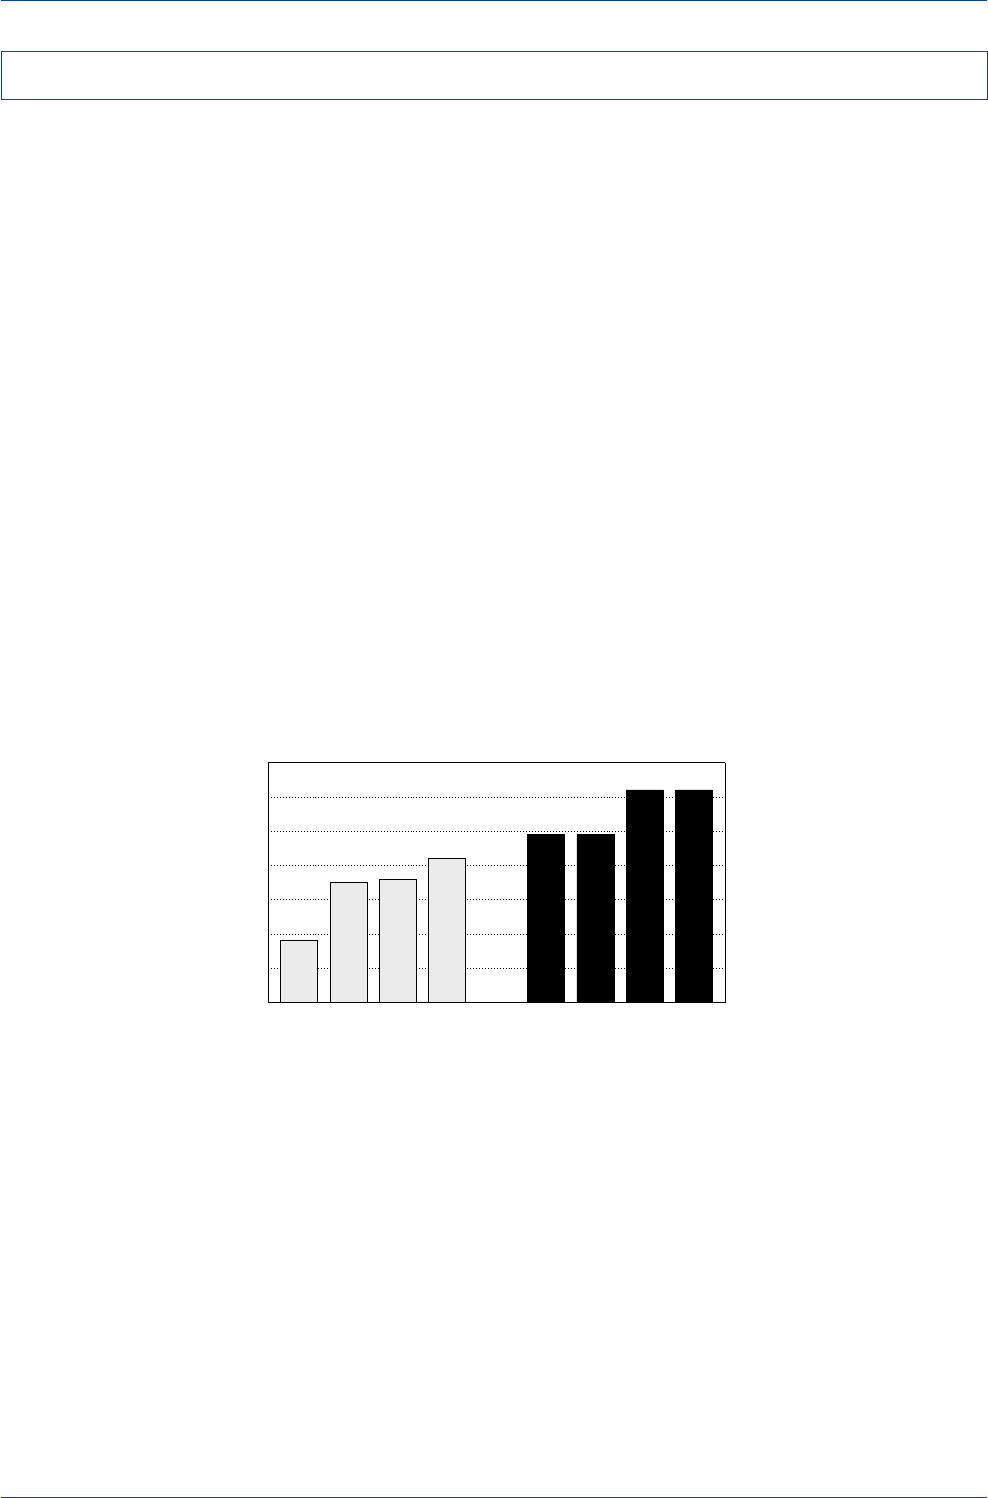
DB Guide to Exchange-Rate Determination
May 2002 Deutsche Bank @
Deutsche Bank Foreign Exchange Research 145
M2/FX Reserve Ratio as a Leading Indicator of Currency Crises
The ratio of M2 money supply to the central bank's hold-
ings of foreign-exchange reserves has been found to be a
reliable leading indicator of currency crises in emerging
markets in a number of recent empirical studies. Kaminsky,
Lizondo, and Reinhart (1998) found that large increases in
a country's M2/reserve ratio tended to precede currency
crises in a majority of cases studied. In addition, Sachs,
Tornell, and Velasco (1996) found that countries with rela-
tively high M2/reserve ratios tended to be more vulner-
able to the contagion effects associated with the Mexican
peso crisis (the so-called Tequila effect) than those coun-
tries with relatively low M2/reserve ratios. Furthermore,
Goldstein and Hawkins (1998) found that Asian countries
had considerably higher M2/reserve ratios than their Latin
American counterparts in mid-1997, just prior to the Asian
financial crisis. This made the Asian currencies more vul-
nerable to a speculative attack. Finally, the International
Monetary Fund (IMF), in its May 1998 World Economic
Outlook report, noted that the M2/reserve ratio displayed
a "remarkable pattern around the time of a crisis". Accord-
ing to the IMF, the M2/reserve ratio tended to rise sharply
in the 24 months leading up to a crisis and then to plum-
met sharply once a crisis got underway.
What makes the M2/reserve ratio attractive as a leading
indicator is that it captures the extent to which a central
bank has sufficient foreign-exchange reserves on hand to
absorb a run by deposit holders out of local-currency de-
posits into foreign currency. If the M2/reserve ratio is rela-
tively high, it would suggest that a central bank may not
have sufficient resources to directly satisfy all of the de-
mands of deposit holders if everyone attempted to move
out of domestic-currency deposits at the same time. With-
out sufficient reserve backing, the emerging-market cur-
rency would be vulnerable to an attack. In contrast, if an
emerging-market country had a relatively low M2/reserve
ratio, that would imply that the central bank had sufficient
reserves to back the domestic-currency liabilities of the
banking system. As the IMF notes, the M2/reserve ratio
"can be viewed as an indicator of investor confidence in
the domestic financial system."
Latin American vs. Asian M2/Reserve Ratios
(Just Prior to the 1997 Asian Currency Crisis)
6.26.2
4.94.9
4.2
3.6
3.5
1.8
0
1
2
3
4
5
6
7
Chile BrazilArgentina Mexico
Philippines ThailandIndonesia Korea
Mid-1997 M2 Money Supply/FX Reserves(ratio)
Source: IMF
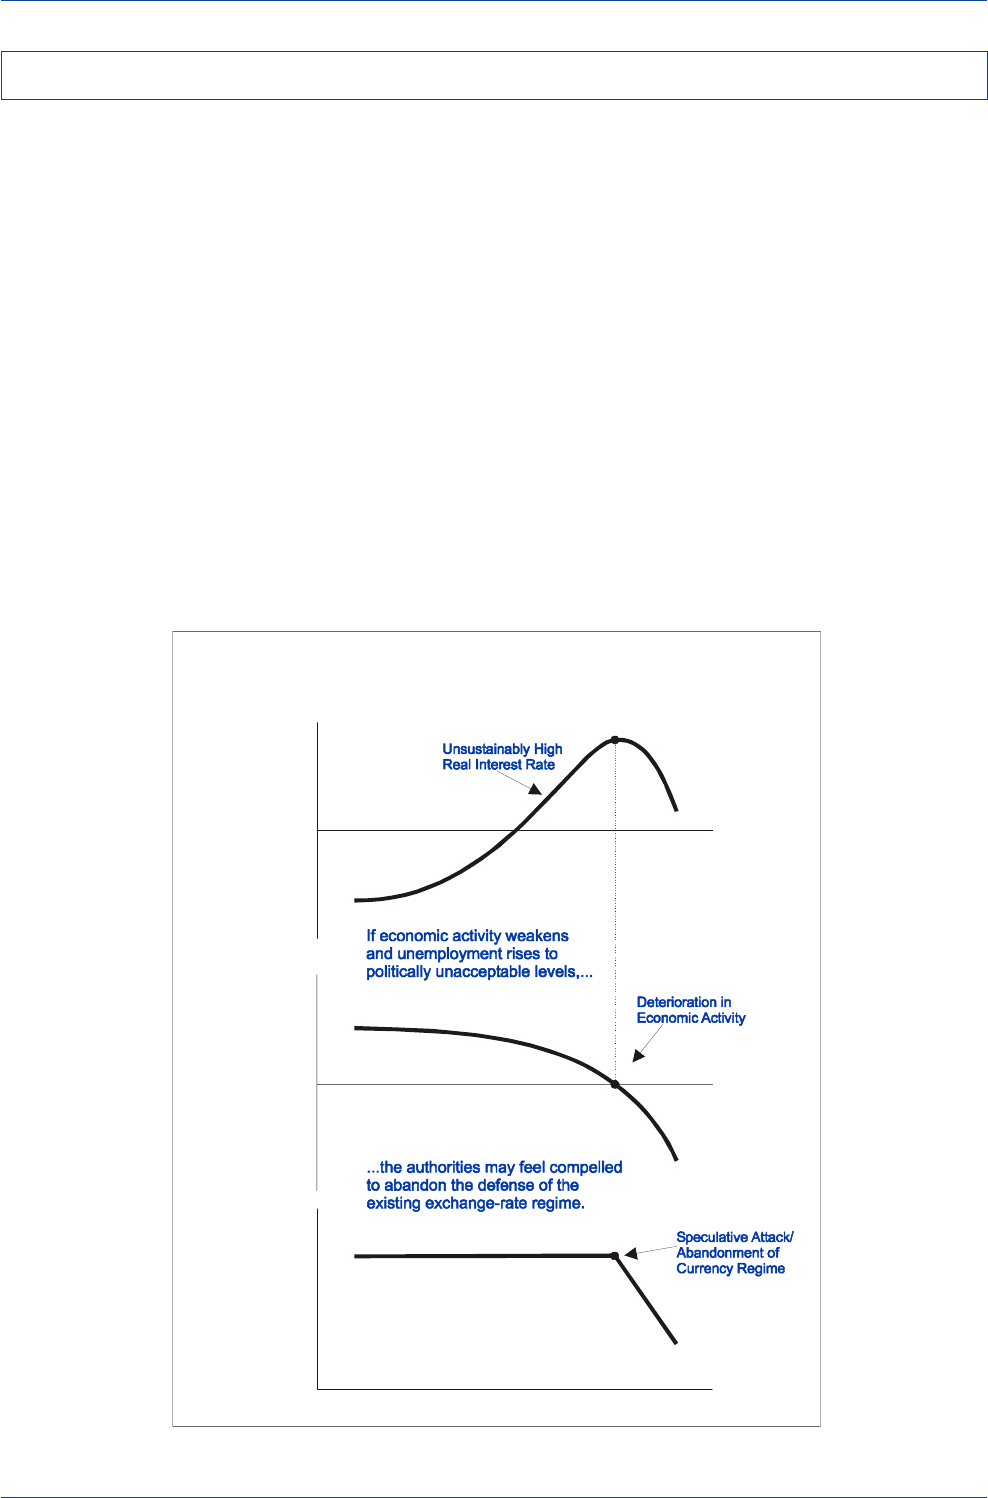
DB Guide to Exchange-Rate Determination May 2002
Deutsche Bank @
146 Deutsche Bank Foreign Exchange Research
High Unemployment as a Leading Indicator of Currency Crises
A deterioration in the domestic economic situation can also
act as an early-warning sign of a currency crisis. For in-
stance, substantial increases in unemployment rates to
unacceptably high levels appeared to be a key factor in
precipitating the collapse of two major fixed exchange-rate
regimes in the 20th century—the collapse of the Gold Stan-
dard in the 1930s and the collapse of the ERM in 1992-93.
If a country's unemployment rate rises to levels that are
deemed to be politically unacceptable, the monetary au-
thorities may face a major policy dilemma: interest rates
may need to be lowered to stimulate growth and alleviate
the unemployment problem but, at the same time, inter-
est rates may need to be raised to defend a potentially
vulnerable exchange rate.
Recognizing that policymakers may face a growing di-
lemma in an environment of weak domestic demand,
speculators will reason that the authorities' commitment
to defend the exchange rate may gradually wane as the
unemployment rate marches steadily higher. As the cred-
ibility of an exchange-rate commitment wanes, higher in-
terest rates may be needed to persuade skeptical inves-
tors that the existing exchange-rate regime is still viable.
Unfortunately, since higher interest rates will act to slow
domestic demand and aggravate the unemployment prob-
lem, attempts to boost credibility through higher interest
rates may actually backfire and undermine the credibility
of the exchange-rate peg even further.
Since forward-looking market participants will recognize
that a high and rising unemployment rate will erode the
credibility of an existing exchange-rate regime, they are
likely to test policymakers' resolve and wage an attack
before the authorities voluntarily abandon their exchange-
rate commitment. In fact, if policymakers are put to the
test by a speculative attack, they may abandon their de-
fense of the existing exchange-rate regime because an
interest-rate defense likely will prove to be too costly.
Source: Rosenberg (1998)
Unsustainably High Real Interest Rates Can Give Rise to
Weaker Economic Activity and Rising Unemployment,
Thereby Making a Currency Vulnerable to a Speculative Attack
Economic
Activity
A’
Time
A
Real
Interest
Rate
Time
Time
Nominal
Exchan
g
e
Rate
e
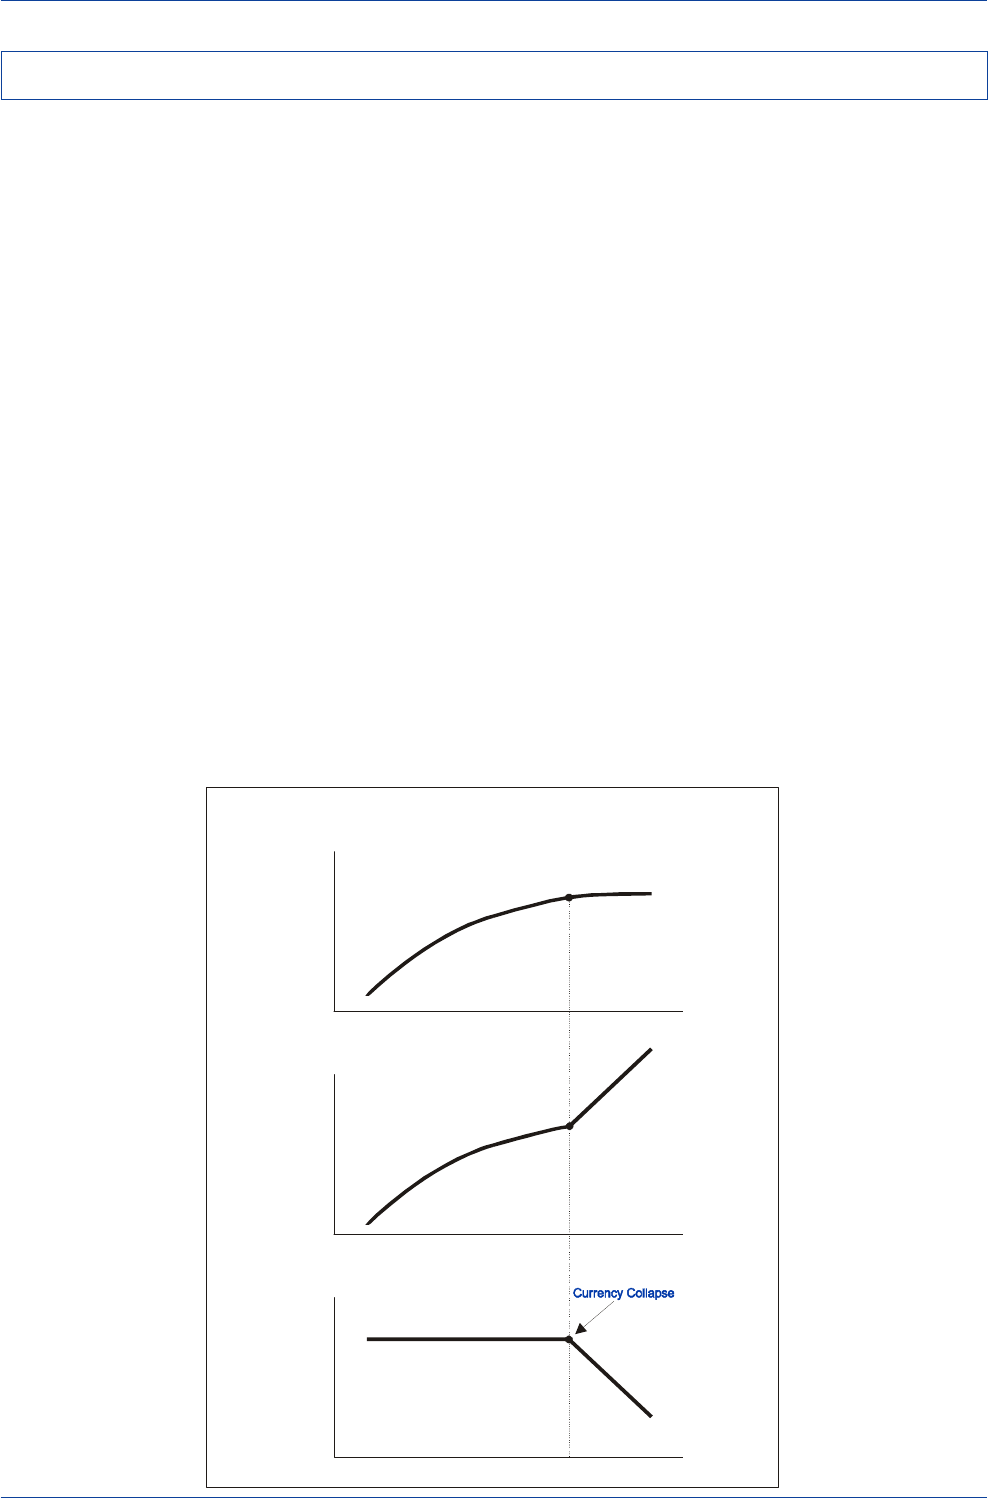
DB Guide to Exchange-Rate Determination
May 2002 Deutsche Bank @
Deutsche Bank Foreign Exchange Research 147
Debt Crises and Currency Crises
When an emerging-market country's government or pri-
vate sector amasses a large volume of short-term debt, it
places its currency in a vulnerable position where a self-
fulfilling panic can lead to a sudden and massive specula-
tive attack. For example, a country that issues a lot of short-
term local-currency debt could run into problems if, for
whatever reason, domestic and foreign creditors refuse to
roll over the existing stock of debt.
In such a case, the local monetary authorities might feel
compelled to push domestic short-term interest rates up
sharply to induce the investment community to buy and
hold the large stock of short-term debt. Unfortunately, high
and rising short-term interest rates can place the highly
indebted public or private sectors of an emerging market
in a vulnerable position directly—by increasing the cost of
servicing the large stock of local-currency debt—or indi-
rectly—by leading to a slowdown in domestic economic
activity, which acts to reduce public and private sectors'
revenue intake and thereby makes it even more difficult to
service the debt.
A rising local-currency debt-service burden poses three
major risks for an emerging-market currency. First, it might
raise questions about long-term solvency, which could
spark a sudden panic withdrawal of funds by local and for-
eign creditors. Second, it might raise fears that the local
authorities will attempt to reduce the real value of the debt
burden by inflating. Third, a large local-currency debt-ser-
vice burden could constrain the local authorities from pur-
suing a tight monetary policy that might be necessary to
defend their currency from speculative attack. All of these
risk factors highlight the fact that currency vulnerability is
likely to rise when local-currency debt-service burdens are
large and growing.
Currency vulnerability is also likely to be high when an
emerging-market economy amasses a large volume of
short-term foreign-currency debt. Indeed, short-term for-
eign-currency debt has the potential to impose a greater
burden on an emerging-market country than local-currency
debt because the local authorities cannot reduce the real
burden of a foreign-currency debt obligation by inflating.
In addition, given that the local-currency value of a foreign-
currency debt obligation is sensitive to changes in the ex-
change rate, currency depreciation could be extremely
costly, since that would directly raise the local-currency
value of the foreign-currency debt. Crisis-prone currencies
are therefore likely to be in an especially vulnerable state
when short-term foreign-currency debt obligations are high
and rising.
A large buildup in short-term foreign-currency debt, by it-
self, will not precipitate a currency crisis if foreign credi-
tors are willing to extend new loans and roll over any exist-
ing loans. However, if for whatever reason fear strikes in
The Local-Currency Value of Short-Term Foreign-Currency Debt
Tends to Soar Following a Major Currency Collapse
Time
US$ Value
of Dollar-
Denominated
Debt
Time
Time
Nominal
Exchange
Rate
e
Local-Currency
Value
of Dollar-
Denominated
Debt
Source: Rosenberg (1998)
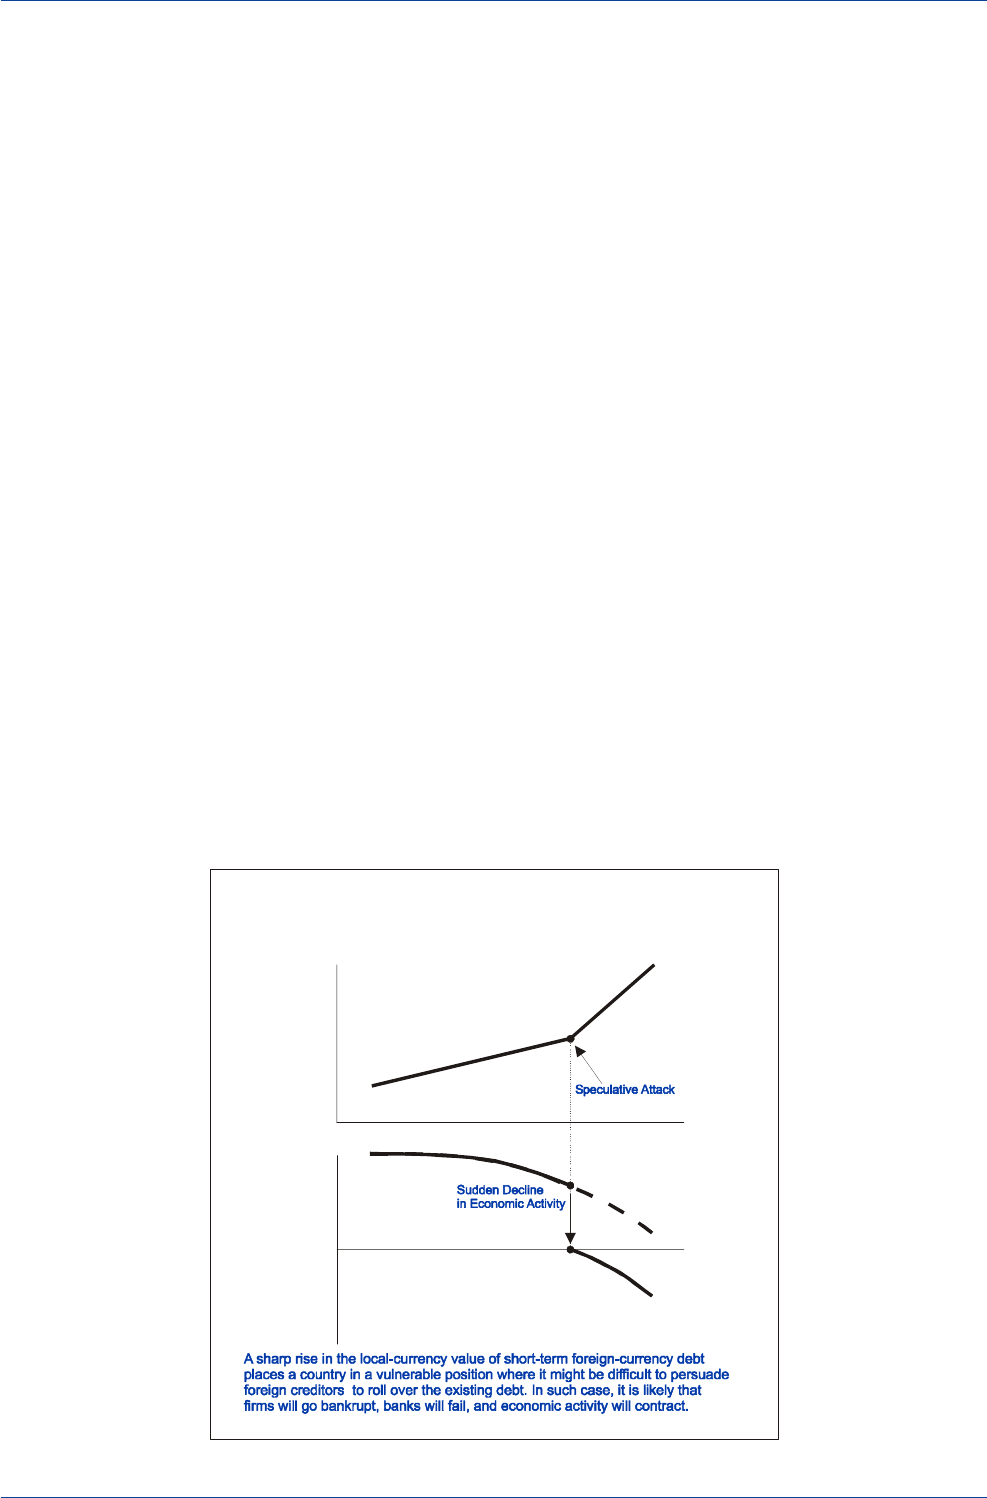
DB Guide to Exchange-Rate Determination May 2002
Deutsche Bank @
148 Deutsche Bank Foreign Exchange Research
the hearts of foreign creditors, and foreign funds are with-
held, the emerging-market currency could come under
heavy downward pressure. If so, the local-currency value
of the short-term foreign-currency debt could soar, possi-
bly throwing otherwise viable local entities into insolvency.
The importance of short-term foreign-currency debt as a
measure of financial vulnerability is highlighted by the fact
that debt crises played an important role in the currency
crises in both Mexico and Asia. Indeed, the buildup of a
large volume of short-term foreign-currency debt by the
public sector in Mexico and the private sector in Asia is
widely credited with planting the seeds of the Mexican
peso and Asian currency crises. In both situations, the lo-
cal-currency value of the foreign-currency debt soared as
the peso and Asian currencies came under heavy down-
ward pressure.
The local-currency value of foreign-currency debt is highly
sensitive to changes in the exchange rate. A sudden sharp
depreciation of an emerging-market currency will instantly
raise the local-currency value of all short-term foreign-cur-
rency-denominated debt, and by so doing, will dramati-
cally increase the burden of servicing that debt. As indebt-
edness soared in Mexico and Asia, default risk rose sharply
and, as a result, overseas private capital was no longer
forthcoming. With no funds forthcoming, the trend in eco-
nomic fundamentals deteriorated suddenly and markedly.
The stylized diagram below demonstrates that a sharp rise
in the local-currency value of short-term foreign-currency
debt places a nation's economy in a vulnerable position if
soaring debt burdens make it difficult for local firms to ser-
vice their debts. Note that right up until the time of a specu-
lative currency attack, a highly indebted nation may not
show any visible signs of economic weakness. Once an
attack takes place and the local-currency value of short-
term foreign-currency debt soars, the trend in economic
fundamentals is shown to suddenly deteriorate as firms
go bankrupt, banks fail, and the government's fiscal bal-
ance deteriorates.
A country's economic vulnerability might not reveal itself
prior to a debt-induced attack, and there may be few signs
suggesting that an attack is imminent. An emerging-mar-
ket economy might successfully leverage off of relatively
cheap short-term foreign-currency debt and post an im-
pressive growth performance for a long while without trig-
gering a crisis, much as Asia did in the decade leading up
to the crisis in 1997. In fact, Asia's solid growth performance
might have deluded the majority of market participants into
believing that Asia's underlying fundamentals were sound
when, in fact, they were all the time vulnerable if the value
of the Asian currencies, for whatever reason, suddenly
declined.
This has important implications for modeling currency cri-
ses in emerging markets. Signs of fundamental economic
deterioration may not be visible going into a crisis. While
evidence of deteriorating fundamentals may be useful in
predicting certain currency crises, there may be few reli-
able guideposts available to predict when a debt-driven
currency crisis might occur. A large foreign-currency debt
burden may be a sign of currency vulnerability in the long
run, but there may simply be no way of knowing before-
hand when an attack might actually be waged.
A Sharp Increase in the Local-Currency Value of
Short-Term Foreign-Currency Debt Could Lead
to a Sudden Deline in Economic Activity
Economic
Fundamentals
A’
A’’
Time
A
Local-Currency
Value of Dollar-
Denominated
Debt
Time
Source: Rosenberg (1998)

DB Guide to Exchange-Rate Determination
May 2002 Deutsche Bank @
Deutsche Bank Foreign Exchange Research 149
Banking Crises and Currency Crises
Many countries that have faced serious currency crises in
recent years have also experienced severe banking crises
at the same time. This is no mere coincidence. Recent
empirical work conducted by Kaminsky and Reinhart (1997)
finds that banking crises are a good leading indicator of
currency crises. According to Kaminsky and Reinhart, more
than 50% of all banking crises in the past 25 years have
been followed by a currency crisis within three years, while
about 25% of all banking crises were followed by a cur-
rency crisis within one year. The fact that banking crises
tend to lead currency crises does not imply that banking
crises are the primary cause of currency crises. What the
evidence does suggest is that a common set of funda-
mental economic factors determines whether a banking
system and a currency might both be vulnerable to a cri-
sis. When the trend in economic fundamentals is inexora-
bly deteriorating, banking systems have tended to experi-
ence greater stress early on, followed by the currency
market.
Not all currency crises are preceded by a banking crisis.
However, when banking crises are present, they do tend
to aggravate and accentuate the crisis on the currency front.
This is true of both developed and developing countries.
Banking system problems in Scandinavia in the early 1990s
and in Japan in the second half of the 1990s accentuated
their exchange-rate depreciations during those periods.
Banking crises in Mexico and Asia are widely credited with
accentuating the slide of the Mexican peso and Asian cur-
rencies during their crisis periods in the 1990s.
In a typical banking/currency crisis, the seeds of a banking
crisis are often planted when an emerging-market country
takes steps to liberalize its financial markets. When finan-
cial liberalization is accompanied by other economic re-
forms, capital inflows from abroad often increase substan-
tially. This surge in capital inflow is then intermediated by
the banking sector to the rest of the emerging-market
economy via a lending boom. The lending boom typically
gives rise to an asset-price bubble in the equity and/or prop-
erty market and often encourages over-investment or over-
consumption. Given that emerging-market banks on aver-
age are less regulated and not as adequately supervised
as their counterparts in the industrial world, they are more
likely to engage in questionable and risky lending activi-
ties.
The excesses in a typical banking crisis are ultimately un-
wound when the asset-price bubble bursts and bankrupt-
cies climb. As bankruptcies climb, this gives rise to an in-
crease in nonperforming loans on emerging-market banks'
books. If nonperforming loans are large relative to the ag-
gregate loan portfolio, banks may become technically in-
solvent, which in turn may prompt a run on the banking
system. In a panic phase, depositors are prone to flee both
weak and healthy banks, thereby placing a strain on the
entire banking system.
A banking crisis is likely to lead to a significant downturn
in economic activity. As economic activity weakens, there
will be great pressure on the monetary authorities to take
corrective action to stimulate monetary policy. If the reso-
lution of a banking crisis requires a costly fiscal bailout,
the monetary authorities may be called upon to monetize
part or all of any increase in deficit financing. Hence, a
banking crisis may indirectly set off a currency crisis by
requiring the monetary authorities to pursue an excessively
expansionary monetary policy.
Excessive Surges in Capital Inflows
Often Plant the Seeds of a Future Banking Crisis
Surge in
Capital
Inflow
Asset
Price
Bubble
Increase in
Questionable
and Risky
Loans
Bank
Lending
Boom
Bubble
Bursts
Increase in
Non-
performing
Loans
Over-
consumption
and
Over-
investment
Banking
Crisis
Banking Crises Often Lead Currency Crises
Banking
Crisis
Decline in
Economic
Activity
Dramatically
Easier
Monetary
Policy
Costly
Fiscal
Bailout
Decline in
Central
Bank’s
Holdings
of
Foreign-
Exchange
Reserves
Decline in
Credibility
of Existing
Exchange-
Rate
Regime
Capital
Flight
Currency
Crisis
Source: Rosenberg (1998) Source: Rosenberg (1998)
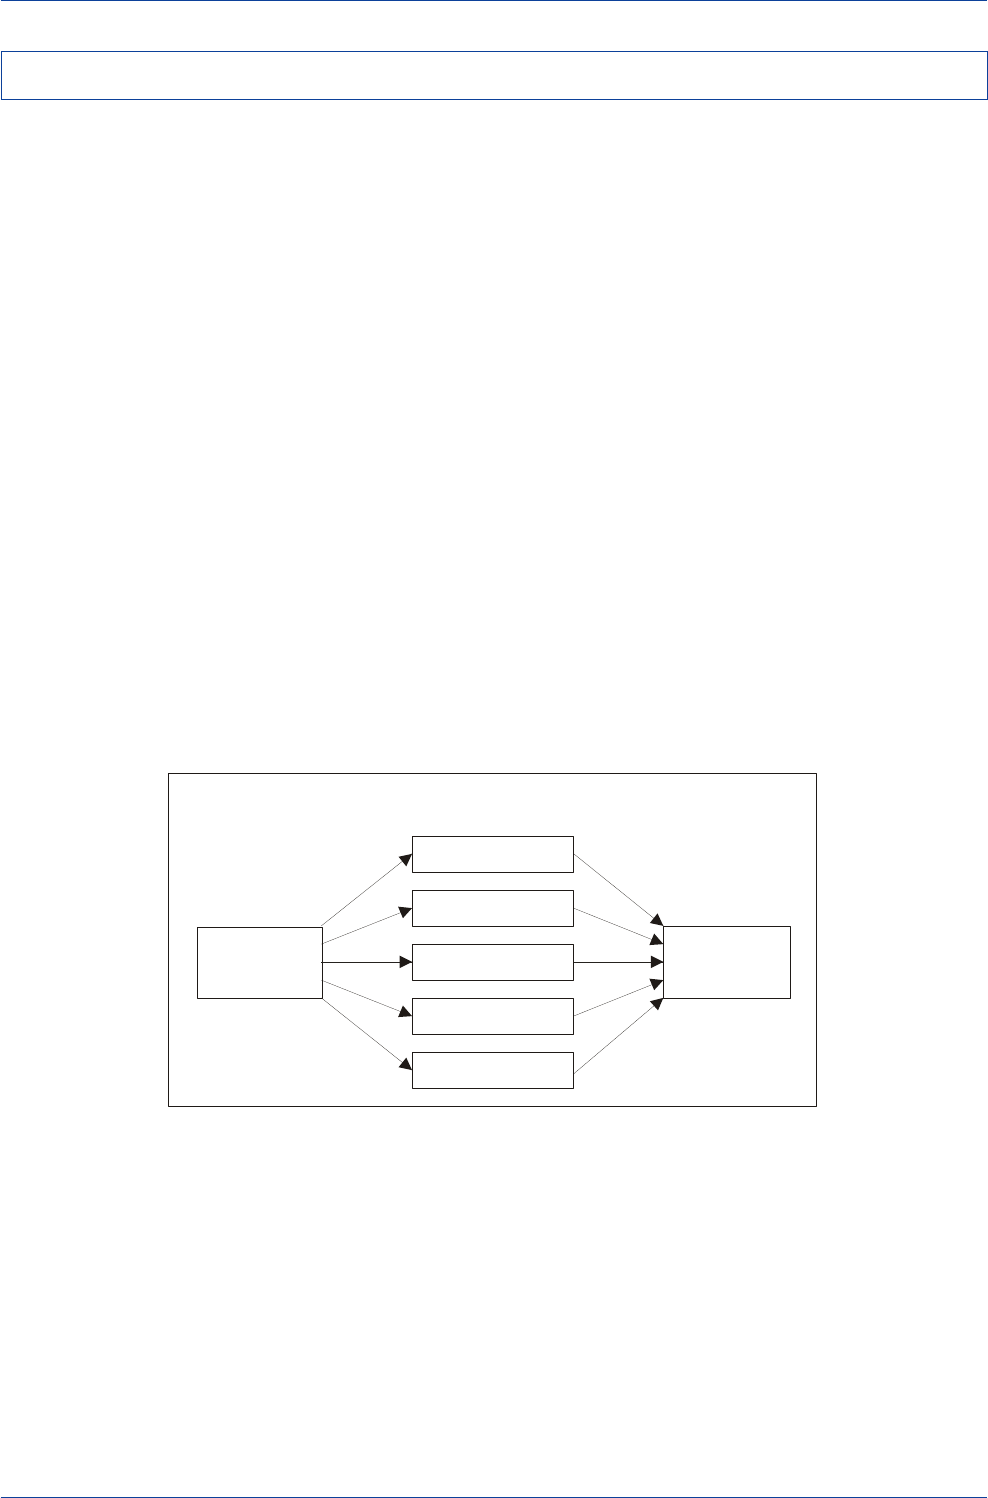
DB Guide to Exchange-Rate Determination May 2002
Deutsche Bank @
150 Deutsche Bank Foreign Exchange Research
Contagion—How Currency Crises Spread from One Market to Another
Each of the major currency crises of the 1990s has had an
element of contagion that saw speculative pressures
spread rapidly from one currency to another. For example,
in the ERM crisis of 1992-93, the collapse of the Italian lira
spread rapidly to the U.K., Spain, and Scandinavia, and then,
after a one-year respite, spread to France and Belgium.
During the Mexican peso crisis of 1994-95, speculative
pressures spread rapidly to a number of markets, with Ar-
gentina the most adversely affected. In the case of the
Asian currency crisis of 1997-98, the collapse of the Thai
baht spread both north and east to affect most countries
in the region.
While economists agree that currency crises often con-
tain a powerful contagion element, there is disagreement
as to the underlying causes of contagion. There are actu-
ally several channels through which contagion effects can
cause speculative attacks to spread from one currency to
another. First, strong bilateral or third-party trade links can
be an important source of contagion. For example, if the
currency of country A declines and this adversely affects
the competitiveness of country B, this might raise the vul-
nerability of country B's currency to speculative attack.
Second, similar macroeconomic performances might lie
behind contagious speculative attacks. If country A's cur-
rency came under attack because of poor current-account
balance or economic growth prospects, this might lead
investors to believe that country B, which might have similar
weak macroeconomic prospects, could also see its cur-
rency come under attack.
Third, financial linkages in the form of common lenders/
creditors, market liquidity, and investor risk appetite can
be important sources of contagion. For example, asset-
allocation shifts by global investors might play a role in the
spillover of currency crises from one country to another.
Global fund managers with exposure to the emerging
markets often diversify their investments among several
emerging markets. If one of the currencies in a fund
manager's emerging-market portfolio were to come un-
der heavy speculative attack, the fund manager—con-
cerned about the possibility of fund withdrawals by indi-
vidual investors—might decide to build up cash positions
and to reduce the fund’s overall exposure to the entire
basket of emerging-market currencies in his portfolio. If
other fund manager portfolios are rebalanced in a similar
fashion, this may place downward pressure on a large num-
ber of emerging-market currencies.
The Channels of Contagion
Crisis
in
Country “A”
Bilateral
Trade Linkages
Level of
Market Liquidity
Common
Lender
Trade with a
Common Third Party
Crisis
in
Country “B”
Global Reduction in
Appetite for Risk
Source: Rosenberg (1998)

DB Guide to Exchange-Rate Determination
May 2002 Deutsche Bank @
Deutsche Bank Foreign Exchange Research 151
Fourth, a general decline in global investors' appetite for
risk might generate contagion among emerging-market
currencies if investors reduce their exposure to all risky
assets. This typically occurs during times of global finan-
cial or economic stress.
Finally, if policymakers in an individual emerging market
abandon the defense of a pegged exchange rate because
the cost of defending the exchange rate against attack
proves to be too great, then this action might contain infor-
mation on the ability and willingness of policymakers in
other countries to withstand the pressures of speculative
attacks.
According to a recent IMF analysis of emerging-market
contagion effects, trade linkages probably played a small
role in the spread of currency crises from one country to
another in the 1990s. In contrast, financial linkages appear
to have played a larger role, particularly through changes
in investor risk appetite and the existence of common lend-
ers.
Contagion and Its Causes
(Contagion Effects after the Mexican, Thailand, and Russian Financial Crises)
Bilateral Trade Trade with Level of
with Initially a Common Market Global
Affected Third Common Reduction in
Country 1Party 2Lender 3Liquidity 4Appetite for Risk 5
Mexico (December 1994)
Argentina — Low Yes, little exposure Low Moderate decline in risk appetite in January 1995.
Brazil — Low Yes, little exposure High
Thailand (July 1997)
Hong Kong SAR — Low No High Modest decline in risk appetite in May 1997, but not sustained.
Indonesia — Low Yes, moderate exposure Low
Malaysia Low High Yes, moderate exposure Moderate
Philippines Low Moderate No Low
South Korea — Moderate Yes, high exposure Moderate
Russia (August 1998)
Brazil — — No High Marked decline in risk appetite in August and September.
Hong Kong SAR — — No High
Mexico — — No Moderate/High
Sources: IMF World Economic Outlook (December 2001); Kaminsky and Reinhart (2000); Kumar and Persaud (2001); and Glick, and Rose, 1999.
1 Exposure through bilateral trade is measured by the share of the country’s total exports destined to the initial crisis country.
2 Trade with a common third party in the same commodities is measured as the percentage of total exports competing with the top exports of initial crisis country.
3 For a discussion of how Bank of International Settlements data can be used to identify common bank lender clusters, see Kaminsky and Reinhart (2000).
For bonds, see J.P. Morgan’s EMBI+ weights.
4 Market liquidity is roughly proxied by the country’s representation (its share) in the global mutual funds’ emerging market portfolio.
High, moderate, and low classifications are comparisons with respect to other emerging markets.
5 For a description of the methodology used to estimate risk appetite, see Kumar and Persaud (2001).

DB Guide to Exchange-Rate Determination May 2002
Deutsche Bank @
152 Deutsche Bank Foreign Exchange Research
Devising an Early-Warning System to Anticipate Currency Crises
Since currency crises tend to be triggered in countries with
a number of economic problems, not just one problem, an
ideal early-warning system should be broad-based, incor-
porating a wide range of symptoms that crisis-prone cur-
rencies might exhibit prior to a speculative attack. For in-
stance, a typical crisis-prone currency might exhibit a num-
ber of symptoms such as an overly appreciated real ex-
change rate, a major terms-of-trade shock, a deteriorating
current account, weak economic activity and rising unem-
ployment, an overly expansionary fiscal policy, an overly
expansionary monetary policy, an excessive increase in
bank lending, declining foreign-exchange reserves at the
central bank, a high ratio of M2 money supply to central
bank reserves, falling equity and property prices, a sharp
increase in nonperforming loans on bank books, and/or a
sharp increase in short-term debt incurred by the domes-
tic private or public sector.
Kaminsky and Reinhart (1998) argue that an ideal early-
warning system should focus on the behavior of a group
of indicators, and not on the behavior of a single indicator
to predict the onset of currency crises. They found that
currency crises in Latin America and Asia over the 1970-
95 period were preceded by a multitude of economic and
financial problems, not just one. Examining the behavior
of 15 macroeconomic indicators prior to the onset of the
currency crises in Latin America, Kaminsky and Reinhart
found that in 44% of the crisis episodes, 80%-100% of
the indicators were flashing a warning signal prior to each
crisis episode. In another 39% of the crisis episodes, 60%-
80% of the indicators were flashing prior to each attack.
Similar results were found for currency crisis episodes in
Asia and elsewhere.
The table below provides an extensive list of indicators
that can help detect whether potentially vulnerable cur-
rencies have become "symptomatic" in terms of display-
ing signs that a currency crisis might be imminent. Con-
sidering the broad range of symptoms that a potentially
vulnerable currency might exhibit, a rule of thumb might
be that the probability of an imminent currency crisis would
be considered to be high if a relatively large number of
indicators started flashing. An absence of flashing indica-
tors would suggest that the probability of an imminent cri-
sis was low.
Indicators of Currency Crisis Vulnerability
Symptoms Indicators
Real Exchange Rate Overvaluation Behavior of real exchange rate relative to trend,
exports, imports, trade balance.
Terms of Trade Shock Price of exports, price of imports, commodity prices.
Current Account Imbalance Real exchange rate, savings, investment.
Weak Economic Activity/ Real GDP, output gap, unemployment rate,
Rising Unemployment real interest rate.
Overly Expansionary Fiscal Policy Government spending, budget deficit,
volume of credit extended to public sector.
Overly Expansionary Monetary Policy Domestic credit expansion, reserves,
money-supply growth, money multiplier.
High Ratio of M2 to Reserves M2, international reserves.
Banking Crises Equity and property prices, non-performing loans,
lending/deposit rate spread, bank share prices.
Debt Crises Total debt, domestic debt, foreign-currency debt,
short-term/total debt.
Contagion Foreign growth, foreign interest rates, crises elsewhere.
Performance of Leading Indicators
Prior to Currency Crises
Percentage of Indicators Showing
Anomalous Behavior Prior to Crisis
Quintiles Latin America Asia Others
80%-100% 44% 28% 32%
60%-79% 39% 42% 39%
40%-59% 8% 28% 18%
20%-39% 8% 0% 11%
less than 20% 0% 0% 0%
100% 100% 100%
Source: Kaminsky and Reinhart (1998)

DB Guide to Exchange-Rate Determination
May 2002 Deutsche Bank @
Deutsche Bank Foreign Exchange Research 153
Kaminsky, Lizondo, and Reinhart (1998) examined the be-
havior of 16 macroeconomic and financial indicators around
the time of a currency crisis for 76 currency-crisis episodes
in 15 developing and five industrial countries over the 1970-
95 period. They established a ranking for each indicator in
terms of the largest number of good signals issued, the
fewest number of false signals issued, and the average
lead time between the point in time when a signal was
first issued and the onset of a crisis.
How Well Do Leading Indicators Perform in Anticipating the Onset of
Currency Crises?
The real exchange rate was rated the best indicator, both
in terms of issuing the highest percentage of good signals
and the fewest false signals. Other indicators that per-
formed well in terms of issuing a large number of good
signals with few false signals included banking crises, the
ratio of M2 to reserves, the trend in equity prices, exports
and output. All of the indicators studied provided a warn-
ing window of 1- 1½ years, with banking crises providing
the longest lead time.
Leading Indicators of Currency Crises
Ranked by Highest Percentage of Good Signals Issued
Actual Good Signals/
Indicator Possible Good Signals
Real Exchange Rate 25
International Reserves 22
M2/Reserves 21
M2 Multiplier 20
Banking Crisis 19
Terms of Trade 19
Exports 1
Stock Prices 1
Output 16
Excess M1 Balances 16
Bank Deposits 16
Real Interest Rate 15
Domestic Credit/GDP 14
Lending Rate/Deposit Rate 13
Real Interest-Rate Differential 11
Imports 9
Source: Kaminsky, Lizondo, and Reinhart (1998).
Leading Indicators of Currency Crises
Ranked by Lowest Percentage of Bad Signals Issued
Actual Bad Signals/
Indicator Possible Bad Signals
Real Exchange Rate 5
Banking Crisis 6
Exports 7
Stock Prices 8
Output 8
Excess M1 Balances 8
Domestic Credit/GDP 9
M2/Reserves 10
Real Interest Rate 11
Real Interest-Rate Differential 11
Imports 11
International Reserves 12
M2 Multiplier 12
Terms of Trade 15
Bank Deposits 19
Lending Rate/Deposit Rate 22
Source: Kaminsky, Lizondo, and Reinhart (1998).
Leading Indicators of Currency Crises
Ranked by Longest Lead Time between
Date of Signal and the Onset of a Crisis
Indicator Months of Lead Time
Banking Crisis 19
Real Exchange Rate 17
Real Interest Rate 17
Imports 16
M2 Multiplier 16
Output 16
Bank Deposits 15
Excess M1 Balances 15
Exports 15
Terms of Trade 15
International Reserves 15
Stock Prices 14
Real Interest Rate 14
M2/Reserves 13
Lending Rate/Deposit Rate 13
Domestic Credit/GDP 12
Source: Kaminsky, Lizondo, and Reinhart (1998).
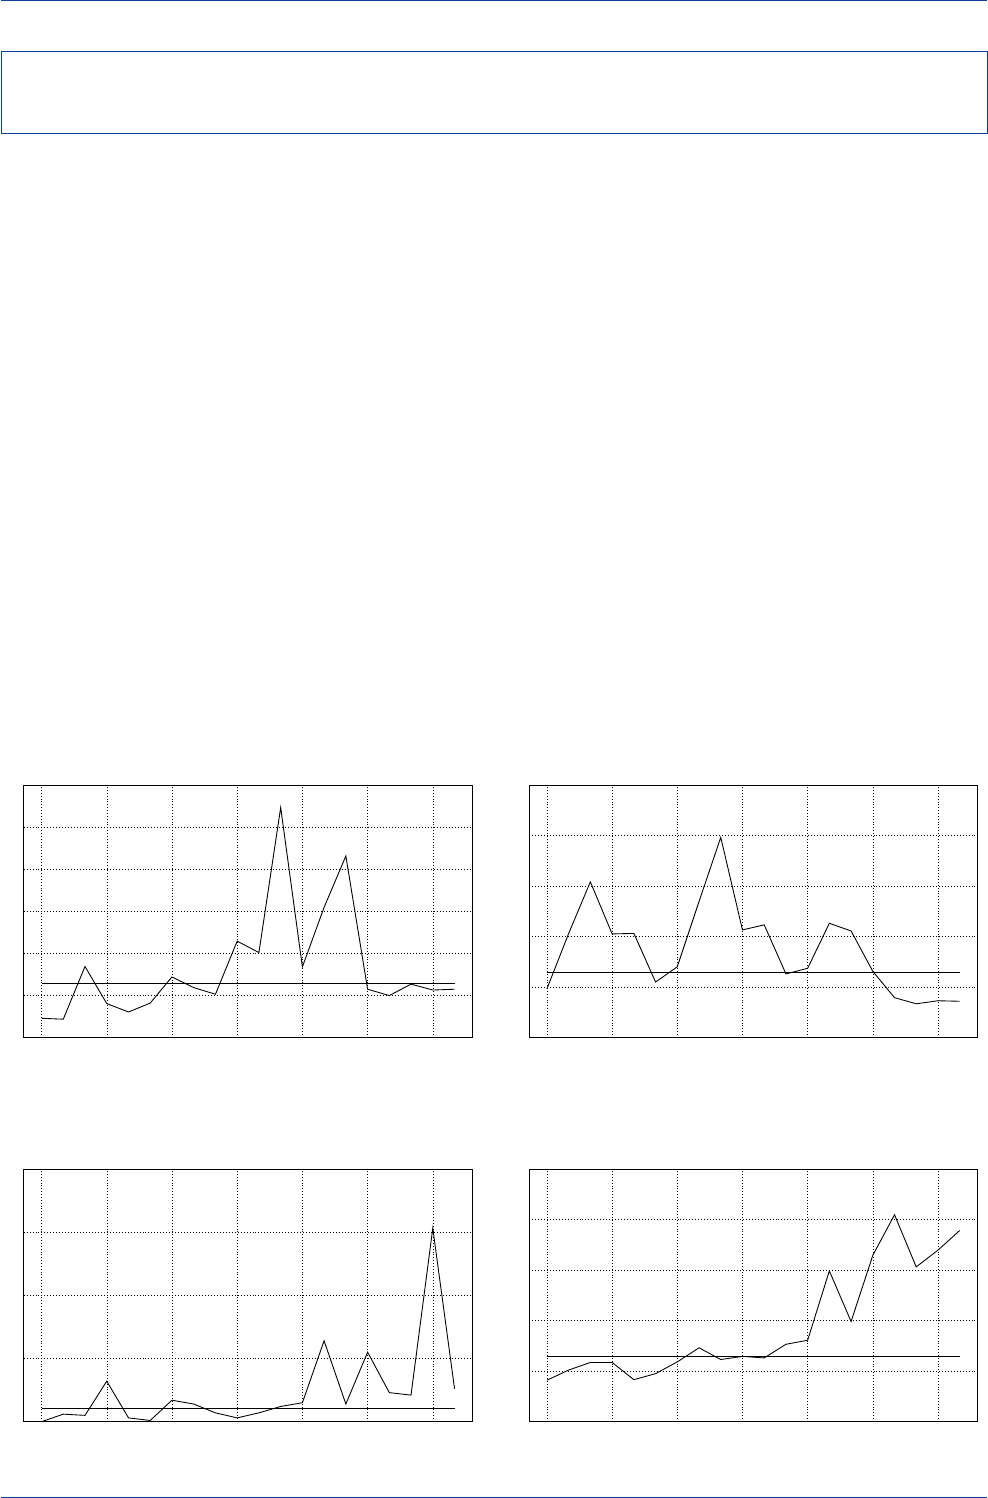
DB Guide to Exchange-Rate Determination May 2002
Deutsche Bank @
154 Deutsche Bank Foreign Exchange Research
The Deutsche Bank Alarm Clock (DBAC) is an economet-
ric model that estimates the probabilities of exchange-rate
and local interest-rate events. The model's recommenda-
tions are published every month in the
Deutsche Bank
Alarm Clock Monthly
.
DBAC simultaneously estimates exchange-rate and inter-
est-rate events over the course of the next 30 days, auto-
matically measuring the extent that interest-rate pressures
affect the exchange rate and vice versa. The model covers
the period starting in 1985, and includes macroeconomic
fundamentals and financial vulnerability indicators for 19
emerging markets in a pooled sample to produce the esti-
mates.
On the currency side, DBAC reports estimated probabili-
ties of an exchange-rate devaluation of 5% or more, 10%
or more, 15% or more, 20% or more, and 25% or more.
On the interest-rate side, DBAC reports the probability of
a 500 basis point increase in interest rates. These prob-
abilities are then compared to what is termed the “action
trigger”, which indicates when a given probability estimate
is signaling a potential crisis.
The action triggers were derived from the maximization of
in-sample return over cost of funds for a specific invest-
ment strategy. The choice of the action trigger is depen-
dent on one's risk preference or investment strategy, and
therefore different preferences or investment rules may
imply different action triggers. However, for two typical
strategies—long/short and long/out positions in all of the
countries included in the sample—the optimal action trig-
gers turn out to be about the same.
In the following charts, whenever the probability line
crosses above the trigger level, the model recommends
taking defensive action; when the probability line is below
the trigger level, the exchange rate is not expected to move
sharply enough to warrant defensive action.
Deutsche Bank Alarm Clock Model for Emerging-Market Currency and
Interest-Rate Risk
Brazilian Real Devaluation Probability
(Probability of 5% Exchange-Rate Devaluation)
0
10
20
30
40
50
60
Sep-00 Dec-00 Mar-01 Jun-01 Sep-01 Dec-01 Mar-02
Probability(%)
DBAC Trigger Level
Indonesian Rupiah Devaluation Probability
(Probability of 5% Exchange-Rate Devaluation)
0
10
20
30
40
50
Sep-00 Dec-00 Mar-01 Jun-01 Sep-01 Dec-01 Mar-02
Probability(%)
DBAC Trigger Level
Venezuelan Bolivar Devaluation Probability
(Probability of 15% Exchange-Rate Devaluation)
0
5
10
15
20
Sep-00 Dec-00 Mar-01 Jun-01 Sep-01 Dec-01 Mar-02
Probability(%)
DBAC Trigger Level
South African Rand Devaluation Probability
(Probability of 5% Exchange-Rate Devaluation)
0
10
20
30
40
50
Sep-00 Dec-00 Mar-01 Jun-01 Sep-01 Dec-01 Mar-02
Probability(%)
DBAC Trigger Level
Source: Deutsche Bank Alarm Clock
Source: Deutsche Bank Alarm Clock
Source: Deutsche Bank Alarm ClockSource: Deutsche Bank Alarm Clock

DB Guide to Exchange-Rate Determination
May 2002 Deutsche Bank @
Deutsche Bank Foreign Exchange Research 155
References
Aziz, Jahangir, Francesco Caramazza and Ranil Salgado
(2000), "Currency Crises: In Search of Common Elements",
IMF World Economic Outlook Supporting Studies
, 2000,
pp. 86-128.
Bank For International Settlements (1999), "The Yen Carry
Trade and Recent Foreign Exchange Market Volatility",
BIS
Quarterly Review
, March 1999, pp. 33-37.
Berg, Andrew, Eduardo Borensztein, Gian Maria Milesi-
Ferretti and Catherine Pattilo (1999),
Anticipating Balance
of Payment Crises: The Role of Early Warning Systems
,
IMF Occasional Paper No. 186, Washington, D.C.
Bernard, Henri J. and Gabriele E.B. Galati (2000), "The Co-
Movement of US Stock Markets and the Dollar",
BIS Quar-
terly Review
, August 2000, pp. 31-34.
Bernhardsen, Tom and Oistein Roisland (2000), "Factors
That Influence the Krone Exchange Rate",
Norges Bank
Economic Bulletin
, Fourth Quarter 2000.
Bilson, John F.O. (1984), "Purchasing Power Parity as a Trad-
ing Strategy",
Journal of Finance
, Vol. 39, No.3, pp. 715-
25.
Brooks, Robin, Hali Edison, Manmohan S. Kumar and
Torsten Slok (2001), "Exchange Rates and Capital Flows",
IMF Working Paper
, WP/01/190.
Cheung, Yin-Wong, Menzie D. Chinn and Ian W. Marsh
(2000), "How Do UK-Based Foreign Exchange Dealers Think
Their Market Operates",
NBER Working Paper
, No.7524,
February 2000.
Chinn, Menzie D. and Ron Alquist (2000), "Tracking the
Euro's Progress",
International Finance
, Vol. 3, No. 3, No-
vember 2000, pp. 357-373.
Clostermann, Jorg and Bernd Schnatz (2000), "The Deter-
minants of the Euro-Dollar Exchange Rate: Synthetic Fun-
damentals and a Non-Existing Currency",
Deutsche
Bundesbank Discussion Paper
, 2/00.
Cooper, Neil and James Talbot (1999), "The Yen/Dollar Ex-
change Rate in 1998: Views From Options Markets",
Bank
of England Quarterly Bulletin
, February 1999, pp. 68-77.
Copeland, Laurence S. (2000),
Exchange Rates and Inter-
national Finance
, Third Edition, Pearson Education Limited,
Essex.
DeGrauwe, Paul (1996),
International Money: Postwar
Trends and Theories
, 2nd Edition, Oxford University Press,
Oxford.
Dominguez, Kathryn M. and Jeffrey Frankel (1993),
Does
Foreign Exchange Intervention Work?
, Institute For Inter-
national Economics, Washington, D.C.
Dornbusch, Rudiger (1976), "Expectations and Exchange
Rates Dynamics",
Journal of Political Economy
, Vol. 84, pp.
1161-76.
Dunis, Christian and Pierre Lequeux (2001), "The Informa-
tion Content of Risk Reversals",
Derivatives Use, Trading
and Regulation
, Vol. 7, Number 2, pp.98-117.
European Central Bank (2002), "Economic Fundamentals
and the Exchange Rate of the Euro",
ECB Monthly Bulle-
tin
, January 2002.
Fender, Ingo and Gabriele Galati (2001), "The Impact of
Transatlantic M&A Activity on the Dollar/Euro Exchange
Rate",
BIS Quarterly Review
, December 2001, pp. 58-68.
Fleming, J. Marcus (1962), "Domestic Financial Policies
Under Fixed and Floating Exchange Rates",
IMF Staff Pa-
pers
, Vol.9, November 1962, pp. 369-79.
Frankel, Jeffrey (1979), "On the Mark: A Theory of Floating
Exchange Rates Based on Real Interest Rate Differentials",
American Economic Review
, Vol. 69, September 1979, pp.
610-22.
Frankel, Jeffrey and Kenneth Froot (1990), "Chartists, Fun-
damentalists and the Demand For Dollars", in
Policy Is-
sues in Interdependent Economics
, edited by T. Courakis
and M. Taylor, Clarendon Press, Oxford.
Frankel, Jeffrey A. and Andrew K. Rose (1996), "Currency
Crashes in Emerging Markets: Empirical Indicators",
NBER
Working Paper
, No. 5437.

DB Guide to Exchange-Rate Determination May 2002
Deutsche Bank @
156 Deutsche Bank Foreign Exchange Research
Froot, Kenneth A. and Richard H. Thaler (1990), "Anoma-
lies: Foreign Exchange",
Journal of Economic Perspectives
,
Vol.4, No.3, Summer 1990, pp. 179-192.
Gehrig, Thomas and Lukas Menkhoff (2002), "The Use of
Flow Analysis in Foreign Exchange,"
CEPR Discussion Pa-
per Series
, No. 3221.
Goldfajn, Ilan and Rodrigo O. Valdes (1996), "The Aftermath
of Appreciations",
NBER Working Paper
, No. 5650.
Goldstein, Morris, Graciela L. Kaminisky and Carmen M.
Reinhart (2000),
Assessing Financial Vulnerability: An Early
Warning System For Emerging Markets
, Institute For In-
ternational Economics, Washington, D.C.
Goldstein, Morris, and John Hawkins (1998), "The Origin
of the Asian Financial Turmoil",
Reserve Bank of Australia,
Research Discussion Paper
, No. 9805.
Gruen, David (2001), "Some Possible Long-Term Trends in
the Australian Dollar",
Reserve Bank of Australia Bulletin
,
December 2001, pp.30-41.
Gust, Christopher and Jaime Marquez (2000), "Productiv-
ity Developments Abroad",
Federal Reserve Bulletin
, Oc-
tober 2000, pp. 665-681.
Hallwood, C. Paul and Ronald MacDonald (2000),
Interna-
tional Money and Finance
, 3rd Edition, Blackwell Publish-
ers, Malden, Massachusetts.
IMF,
World Economic Outlook Reports
, May 1998, Decem-
ber 2001.
Isard, Peter and Hamid Faruqee, editors (1998), “Exchange
Rate Assessment: Extensions of the Macroeconomic Bal-
ance Approach”,
IMF Occasional Paper
, No. 167.
Isard, Peter, Hamid Faruqee, G. Russell Kincaid and Mar-
tin Fetherston (2001), “Methodology For Current Account
and Exchange Rate Assessments”, I
MF Occasional Paper
,
No. 209.
Kaminsky, Graciela L. and Carmen M. Reinhart (1997), "The
Twin Crises: The Causes of Banking and Balance of Pay-
ments Problems",
University of Maryland Working Paper
,
No. 37.
Kaminsky, Graciela L. and Carmen M. Reinhart (1998), "Fi-
nancial Crises in Asia and Latin America: Then and Now",
mimeo.
Kaminsky, Graciela L., Saul Lizondo and Carmen M.
Reinhart (1998), "Leading Indicators of Currency Crises",
IMF Staff Papers
, Vol. 45, No. 1, March 1998, pp. 1-48.
Koen, Vincent, Laurence Boone, Alain de Serres and Nicola
Fuchs (2001), "Tracking the Euro",
OECD Economic Depart-
ment Working Paper
, No. 298.
Kritzman, Mark P. (1998), "The Forward Rate Bias",
AIMR
Conference Proceedings, Currency Risk in Investment
Portfolios
, Charlottesville, VA.
Krugman, Paul (1998), "It's Baaack: Japan's Slump and the
Return of the Liquidity Trap",
Brookings Papers on Economic
Activity
, 1998, Vol. 2.
Laidler, David and Shay Aba (2002), "Productivity and the
Dollar: Commodities and the Exchange Rate Connection",
C.D.
Howe Institute Commentary
, No. 158, February 2002.
Lyons, Richard K. (2000), "Multiple Currency Investment
Strategies To Take Advantage of the Forward Discount Bias",
class project for International Finance 285 course, (http://
haas.berkeley.edu/~Lyons/285.html).
Lyons, Richard K. (2001),
The Microstructure Approach to
Exchange Rates
, MIT Press, Cambridge, Mass.
MacDonald, Ronald and J. Nagayasu (2000), "The Long-
Run Relationship Between Real Exchange Rates and Real
Interest Rate Differentials: A Panel Study",
IMF Staff Pa-
pers
, Vol. 47, No. 1, pp. 116-128.
MacDonald, Ronald and Jerome L. Stein (1999),
Equilib-
rium Exchange Rates
, Kluwer Academic Publishers,
Dordrecht, Netherlands.
MacDonald, Ronald and Philip Swagel (2000), "Business
Cycle Influences on Exchange Rates: Survey and Evidence",
IMF World Economic Outlook Supporting Studies
, 2000,
pp.129-160.
Mann, Catherine L. (1999),
Is the US Trade Deficit Sustain-
able?
, Institute For International Economics, Washington,
D.C.

DB Guide to Exchange-Rate Determination
May 2002 Deutsche Bank @
Deutsche Bank Foreign Exchange Research 157
Mark, Nelson C. (2001),
International Macroeconomics and
Finance: Theory and Econometric Methods
, Blackwell Pub-
lishers, Malden, Mass.
McGuckin, Robert H. and Bart Van Ark (2001),
Making the
Most of the Information Age: Productivity and Structural
Reform in the New Economy
, The Conference Board, Inc.,
New York.
McKinsey Global Institute (2001),
US Productivity Growth
,
1995-2000, McKinsey and Co., Washington D.C.
McKinnon, Ronald I. (1979),
Money in International Ex-
change: The Convertible Currency System
, Oxford Univer-
sity Press, New York.
McKinnon, Ronald I. And Kenichi Ohno (1997),
Dollar and
Yen: Resolving Economic Conflict Between The United
States and Japan
, MIT Press, Cambridge, Mass.
Meredith, Guy (2001), "Why Has the Euro Been So Weak?"
IMF Working Paper
, WP/01/155.
Meese, Richard and Kenneth Roguff (1983), "Empirical
Exchange Rate Models of the Seventies: Do They Fit Out
of Sample",
Journal of International Economics
, Vol. 14,
No. 1, pp. 3-24.
Mundell, Robert A. (1963), "Capital Mobility and Stabiliza-
tion Policy Under Fixed and Flexible Exchange Rates",
Ca-
nadian Journal of Economics and Political Science
, Vol. 29,
November 1963, pp. 475-85.
Neely, Christopher J. (1997), "Technical Analysis in the For-
eign Exchange Market: A Layman's Guide",
Federal Re-
serve Bank of St. Louis Review
, September/October 1997,
pp. 23-38.
Obstfeld, Maurice and Kenneth Rogoff (1994), "The
Intertemporal Approach to the Current Account",
NBER
Working Paper
, No. 4893.
Osler, Carol and P.N. Kevin Chang (1995), "Head and Shoul-
ders: Not Just A Flaky Pattern",
Federal Reserve Bank of
New York Staff Reports
, No. 4.
Pilbeam, Keith (1998),
International Finance
, 2nd Edition,
Macmillan Press LTD, London.
Posen, Adam S. (1998),
Restoring Japan's Economic
Growth
, Institute For International Economics, Washing-
ton, D.C.
Rogoff, Kenneth (1996), "The Purchasing Power Parity
Puzzle", J
ournal of Economic Literature
, Vol. XXXIV, June
1996, pp. 647-668.
Rosenberg, Michael R. (1998),
Currency Crises in Emerg-
ing Markets: A Guide To Speculative Attack Models and
Early Warning Systems
, Merrill Lynch Research Report.
Rosenberg, Michael R. (1996),
Currency Forecasting: A
Guide To Fundamental and Technical Models of Exchange
Rate Determination
, Richard D. Irwin Co., Chicago, IL.
Sachs, Jeffrey, Aaron Tornell and Andres Velasco (1996),
"Financial Crises in Emerging-markets: The Lessons From
1995",
Brookings Papers on Economic Activity
, 1996, No.
1, pp. 147-215.
Sarno, Lucio and Mark P. Taylor (2001), "Official Interven-
tion in the Foreign Exchange Market: Is It Effective and, If
So, How Does It Work?",
Journal of Economic Literature
,
Vol. XXXIV, No. 3, September 2001, pp. 839-868.
Tille, Cedric, et al. (2001), "To What Extent Does Productiv-
ity Drive the Dollar",
Federal Reserve Bank of New York
Current Issues in Economics and Finance
, Vol. 7, No. 8,
August 2001.
Williamson, John, editor (1994),
Estimating Equilibrium
Exchange Rates
, Institute For International Economics,
Washington, D.C.

DB Guide to Exchange-Rate Determination May 2002
Deutsche Bank @
158 Deutsche Bank Foreign Exchange Research

FX Weekly 7 December 2001
Deutsche Bank @
14 Deutsche Bank Foreign Exchange Research

Global Markets Research
David Folkerts-Landau
Managing Director, Global Head of Research Tel: +44 20 754 55502
Stuart Parkinson, Chief Operating Officer Tel: +44 20 754 57303
Peter Garber, Global Strategist Tel: +1 212 469 5466
Credit Derivatives Research and Strategy
John F. Tierney, Global Head Tel: +1 212 469 6795
Credit Research
Simon Adamson, Co-head, European High Grade Credit Research Tel: +44 20 754 58715
David Bitterman, Co-head, US High Yield Credit Research Tel: +1 212 469 2599
Nuj Chiaranussati, Head of Asian Credit Research Tel: +65 6423 5930
Anja King, Co-head, European High Grade Credit Research Tel: +44 20 754 59260
Helen Rodriguez, Head, European High Yield Research Tel: +44 20 754 53824
Andrew W. Van Houten, Co-head, US High Yield Credit Research Tel: +1 212 469 2777
Economic Research
Ciaran Barr, Chief Economist UK Tel: +44 20 754 52088
Ulrich Beckmann, Co-head, European Economics Tel: +49 69 910 31729
Marco Annunziata, Chief Economist, Emerging Europe Tel: +44 20 754 55506
Ivan Colhoun, Chief Economist, Australia Tel: +61 2 9258 1667
Peter Hooper, Chief US Economist Tel: +1 212 469 7352
Atsushi Mizuno, Chief Economist, Japan Tel: +81 3 5156 6316
Carlo Monticelli, Co-head, European Economics Tel: +44 20 754 72884
Michael Spencer, Chief Economist, Asia Tel: +852 2203 8305
Emerging Markets Research
Jose Luis Daza, Head of Emerging Markets Strategy Tel: +1 212 469 8985
Leonardo Leiderman, Head of Emerging Markets Economics Tel: +1 212 469 5894
Fixed Income and Relative Value Research
Jamil Baz, Global Head Tel +44 20 754 54017
Foreign Exchange Research
Michael Rosenberg, Global Head Tel +1 212 469 4776
Indices
Fergus Lynch, Head of Index Development Tel: +44 20 754 58765
Quantitative Flow Research
Robin Lumsdaine, Head/Global Econometric Strategist Tel: +44 20 754 54858
Securitization Research
Karen Weaver, Global Head Tel: +1 212 469 3125
Main Offices
London
Winchester House
1 Great Winchester Street
London EC2N 2DB
United Kingdom
Tel: +44 20 7545 8000
Frankfurt
Grosse Gallusstrasse 10-14
60311 Frankfurt
Germany
Tel: +49 69 9100-0
New York
31 West 52nd Street
New York, NY 10019
United States of America
Tel: +1 212 469 5000
Hong Kong
55/F, Cheung Kong Center
2 Queen’s Road, Central
Hong Kong
Tel: +852 2203 8888
Sydney
Grosvenor Place
Level 18,225 George Street
Sydney NSW 2000
Australia
Tel: +61 2 9258 1661
Singapore
5 Temasek Boulevard
#08-01 Suntec Tower Five
Singapore 038985
Tel: +65 6224 4677
Tokyo
Sanno Park Tower
2-11-1, Nagatacho,
Chiyoda-ku, Tokyo 100-6171
Japan
Tel: +81 3 5156 6000
"210 %"
+(
Publication Address:
Deutsche Bank AG London
Winchester House
1 Great Winchester Street
London EC2N 2DB
Internet:
http://research.gm.db.com
Ask your usual contact for a
username and password.
The information and opinions in this report were prepared by Deutsche Bank AG or one of its affiliates (collectively “Deutsche
Bank”). This report is based upon information available to the public. The information herein is believed by Deutsche Bank to be
reliable and has been obtained from sources believed to be reliable, but Deutsche Bank makes no representation as to the
accuracy or completeness of such information. Deutsche Bank may be market makers or specialists in, act as advisers or lenders
to, have positions in and effect transactions in securities of companies mentioned herein and also may provide, may have
provided, or may seek to provide investment banking services for those companies. In addition, Deutsche Bank or its respective
officers, directors and employees hold or may hold long or short positions in the securities, options thereon or other related
financial products of companies discussed herein. Opinions, estimates and projections in this report constitute the current
judgement of the author as of the date of this report. They do not necessarily reflect the opinions of Deutsche Bank and are
subject to change without notice. Deutsche Bank has no obligation to update, modify or amend this report or to otherwise notify
a reader thereof in the event that any matter stated herein, or any opinion, projection, forecast or estimate set forth herein,
changes or subsequently becomes inaccurate or misleading. Prices and availability of financial instruments also are subject to
change without notice. This report is provided for informational purposes only. It is not to be construed as an offer to buy or sell
or a solicitation of an offer to buy or sell any financial instruments or to participate in any particular trading strategy in any
jurisdiction in which such an offer or solicitation would violate applicable laws or regulations. The financial instruments discussed
in this report may not be suitable for all investors and investors must make their own investment decisions using their own
independent advisors as they believe necessary and based upon their specific financial situations and investment objectives. If a
financial instrument is denominated in a currency other than an investor’s currency, a change in exchange rates may adversely
affect the price or value of, or the income derived from, the financial instrument, and such investor effectively assumes currency
risk. In addition, income from an investment may fluctuate and the price or value of financial instruments described in this report,
either directly or indirectly, may rise or fall. Furthermore, past performance is not necessarily indicative of future results, and
should not therefore form the basis of a decision whether or not to invest in any securities issued by any company mentioned
herein. Unless governing law permits otherwise, all transactions should be executed through the Deutsche Bank entity in the
investor’s home jurisdiction. In the U.S. this report is approved and/or distributed by Deutsche Bank Securities Inc., a member of
the NYSE, the NASD and SIPC. In the United Kingdom this report is approved and/or communicated by Deutsche Bank AG
London. In jurisdictions other than the U.S. and the U.K. this report is distributed by the Deutsche Bank affiliate in the investor’s
jurisdiction, and interested parties are advised to contact the Deutsche Bank office with which they currently deal. Additional
information relative to securities, other financial products or issuers discussed in this report is available upon request. No part of
this material may be copied or duplicated in any form or by any means, or redistributed, without Deutsche Bank’s prior written
consent. Copyright• 2002 Deutsche Bank AG
Subscribers to research via
email receive their
electronic publication on
average 1-2 working days
earlier than the printed
version.
If you would like to receive
this or any other product
via email please contact
your usual Deutsche Bank
representative.
Global Markets Global Markets Global Markets
