Kenmore Ultra Wash 665 Installation Manual G 2180 G2180 90024 Spectra Ebook
User Manual: G 2180
Open the PDF directly: View PDF ![]() .
.

A
Agilent ChemStation
for LC 3D Systems
Understanding Your
Spectra Module

Understanding Your ChemStation Spectra Module
Notices
© Agilent Technologies, Inc. 1994-2007,
2008
No part of this manual may be reproduced in
any form or by any means (including elec-
tronic storage and retrieval or translation
into a foreign language) without prior agree-
ment and written consent from Agilent
Technologies, Inc. as governed by United
States and international copyright laws.
Microsoft ® is a U.S. registered trademark
of Microsoft Corporation.
Manual Part Number
G2180-90024
Edition
06/08
Printed in Germany
Agilent Technologies
Hewlett-Packard-Strasse 8
76337 Waldbronn, Germany
Software Revision
This guide is valid for B.04.xx revisions of
the Agilent ChemStation for LC 3D Systems
software, where xx refers to minor revisions
of the software that do not affect the techni-
cal accuracy of this guide.
Warranty
The material contained in this docu-
ment is provided “as is,” and is sub-
ject to being changed, without notice,
in future editions. Further, to the max-
imum extent permitted by applicable
law, Agilent disclaims all warranties,
either express or implied, with regard
to this manual and any information
contained herein, including but not
limited to the implied warranties of
merchantability and fitness for a par-
ticular purpose. Agilent shall not be
liable for errors or for incidental or
consequential damages in connec-
tion with the furnishing, use, or per-
formance of this document or of any
information contained herein. Should
Agilent and the user have a separate
written agreement with warranty
terms covering the material in this
document that conflict with these
terms, the warranty terms in the sep-
arate agreement shall control.
Technology Licenses
The hardware and/or software described in
this document are furnished under a license
and may be used or copied only in accor-
dance with the terms of such license.
Restricted Rights Legend
If software is for use in the performance of a
U.S. Government prime contract or subcon-
tract, Software is delivered and licensed as
“Commercial computer software” as
defined in DFAR 252.227-7014 (June 1995),
or as a “commercial item” as defined in FAR
2.101(a) or as “Restricted computer soft-
ware” as defined in FAR 52.227-19 (June
1987) or any equivalent agency regulation or
contract clause. Use, duplication or disclo-
sure of Software is subject to Agilent Tech-
nologies’ standard commercial license
terms, and non-DOD Departments and
Agencies of the U.S. Government will
receive no greater than Restricted Rights as
defined in FAR 52.227-19(c)(1-2) (June
1987). U.S. Government users will receive
no greater than Limited Rights as defined in
FAR 52.227-14 (June 1987) or DFAR
252.227-7015 (b)(2) (November 1995), as
applicable in any technical data.
Safety Notices
CAUTION
A CAUTION notice denotes a haz-
ard. It calls attention to an operat-
ing procedure, practice, or the like
that, if not correctly performed or
adhered to, could result in damage
to the product or loss of important
data. Do not proceed beyond a
CAUTION notice until the indicated
conditions are fully understood and
met.
WARNING
A WARNING notice denotes a
hazard. It calls attention to an
operating procedure, practice, or
the like that, if not correctly per-
formed or adhered to, could result
in personal injury or death. Do not
proceed beyond a WARNING
notice until the indicated condi-
tions are fully understood and
met.
Understanding Your ChemStation Spectra Module 3
In This Guide…
This handbook describes the concepts behind the spectra module of the
Agilent ChemStation revision B.04.0x. It complements the information in the
Understanding Your ChemStation manual with the special spectra concepts
applicable to the Agilent ChemStation for LC 3D, CE systems, and the
UV-visible part of the Agilent ChemStation for LC-MSD.
For details of installation and configuration of your spectra module with an
Agilent ChemStation for LC 2D system, see the Installing Your ChemStation
manual.
1 Understanding Spectral Analysis
This chapter covers the following:
• What is spectral analysis?
• Determining the optimum detection wavelength.
• Spectral report styles.
2 Spectral Libraries
Traditional data systems quantify the detected compounds by correlations
based on retention times. This can lead to erroneous identification, if:
• compounds other than the calibrated ones appear in the specified
retention time window,
• more than one peak appears in the specified retention time window, or
• the compound is retained on the column longer than the specified window
because of solvent flow rate changes or, more commonly, changing column
characteristics.
One way to avoid such errors is to use peak qualifiers as described in the
Understanding your Agilent ChemStation manual.
With a diode array detector such errors can be avoided, since UV-visible
spectra can be used to confirm a peak’s identity. Standard spectra are
acquired from a reference sample under well-defined chromatographic
conditions and stored in a database (spectral library). You can compare peak
spectra of an unknown sample with those stored in one or more libraries.
Spectra can be overlaid for visual comparison and the similarity of standard
and sample spectra can be calculated.
4 Understanding Your ChemStation Spectra Module
The ChemStation can automate this process for all peaks within a
chromatogram and for all chromatograms within a sequence. In addition to
such peak confirmation, the software can perform a peak purity check, using
the settings in the Purity Preferences dialog box.
These qualitative results can be combined with quantitative results into a
single report. This report contains all the information an analyst needs for
each peak from a run such as:
•compound name,
• amount,
• retention time,
• identity match factor, and
•purity match factor.
This chapter describes the concepts of a spectra library search. For
information on how to perform library searches refer to the online help
system and the integrated tutorial.
3 Evaluating Peak Purity
This chapter describes peak-purity evaluation for B.04.0x revisions of the
software.
Understanding Your ChemStation Spectra Module 5
Contents
1 Understanding Spectral Analysis 7
What is Spectral Analysis? 8
Determining the Optimum Detection Wavelength 10
Spectral Report Styles 12
2 Spectral Libraries 13
Search Modes 14
Report Description 17
Purity Marker 17
Library Match Marker 17
Compound Name Marker 18
Amount Marker 18
3 Evaluating Peak Purity 19
Checking Peak Purity 20
What is a Peak Purity Check? 20
The Match Factor 21
Background Correction by Selecting a Reference Spectrum 22
Peak-Purity Techniques 24
Peak Purity Display 25
Spectra Window 25
Spectral Normalization 26
Purity Window 27
Spectral Similarity Curves 28
Threshold Curve 29
Using Specific Target Spectra 31
6 Understanding Your ChemStation Spectra Module
Contents
Purity Calculation and Display 32
Classifying a Peak as Pure or Impure 33
Peak Purity Information 34
Advanced Peak Purity Options 36
Using Peak Purity Analysis 38
Spectra Acquisition 38
Setting Options for Peak Purity 39
Mass Spectral Peak Purity 41
Mass Spectral Purity Calculations 42
Mass Spectral Purity Display 43
Index 45

8 Understanding Your ChemStation Spectra Module
1 Understanding Spectral Analysis
What is Spectral Analysis?
What is Spectral Analysis?
Spectral analysis allows you to process spectral data acquired from the
UV-visible diode-array detector or the fluorescence detector.
The analysis of spectral data adds a third dimension to your analytical data
when using it with chromatographic data (see Figure 1).
UV-Visible Diode-Array Detector
The UV-visible diode-array detector allows you to continuously acquire
spectra in the UV-visible region of the spectrum; because the diode-array
detector acquires all wavelengths simultaneously, there is no loss of sensitivity
during spectral acquisition.
Figure 1 Spectral Information
Absorbance axis
Time axis
Chromatogram
Wavelength axis
Spectrum
Understanding Your ChemStation Spectra Module 9
Understanding Spectral Analysis 1
What is Spectral Analysis?
Fluorescence Detector
The fluorescence detector allows you to collect spectral data in three different
modes:
•you can set a fixed excitation wavelength and collect emission spectra
•you can set a fixed emission wavelength and collect excitation spectra
•you can acquire a fluorescence scan, in which both excitation wavelength
and emission wavelength are varied to give a three-dimensional
characterization of the sample.
Excitation and emission spectra can be acquired during chromatography, but
because the fluorescence detector is a scanning detector, the more
wavelengths that are acquired (the wider the scan range) the lower the
sensitivity of the analysis. The three-dimensional fluorescence scan must be
acquired either in stopped flow mode or off-line, since it requires a constant
concentration of sample in the cell throughout the analysis.
Spectral Processing
You can process your spectral data in many ways. For example, you can:
•extract chromatographic signals from spectral data to determine the
optimum detection wavelength for each peak,
•do spectral library searches to obtain a qualitative identification,
•calculate ratios of chromatographic signals to determine peak purity, and
•do peak-purity checks to discover (hidden) impurities.
10 Understanding Your ChemStation Spectra Module
1 Understanding Spectral Analysis
Determining the Optimum Detection Wavelength
Determining the Optimum Detection Wavelength
After you have developed suitable conditions for peak separation, the next
step in method development is to determine the optimum detection
wavelength for each peak.
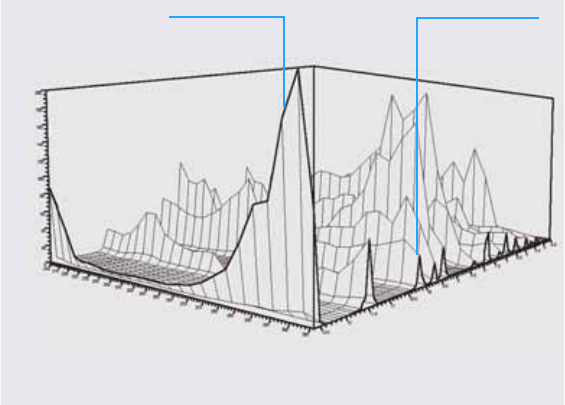
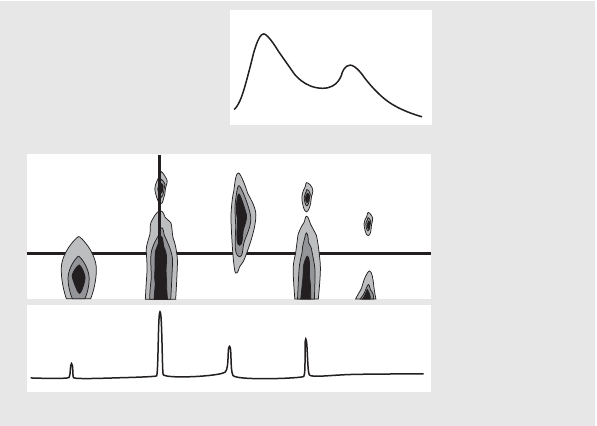
One technique is to present the peak intensity (absorbance or luminescence),
wavelength and time as a contour map called an isoabsorbance plot. This
technique plots the spectral information as a series of isoabsorptive,
concentric lines in the wavelength and time plane. This allows for all spectral
information to be presented and inspected simultaneously. See the center
display in Figure 2.
Figure 2 Isoabsorbance Plot
λ
Time
Absorbance
Wavelength [nm]
Absorbance
Understanding Your ChemStation Spectra Module 11
Understanding Spectral Analysis 1
Determining the Optimum Detection Wavelength
This technique is useful in method development to find the optimum detection
wavelength for each separated peak. The wavelength corresponds to the
horizontal cursor position in the isoabsorbance plot. When moving the cursor
along the wavelength axis, the chromatogram is reconstructed in the lower
window, see Figure 2 on page 10.
To find the optimum detection wavelength for a peak it is necessary to do the
following:
•Select Quick View from the Cursor field and move the horizontal cursor in
the center display until the absorbance of the peak of interest is as high as
possible, and there is a good chromatographic separation in the lower
display.
•Select Signal from the Cursor field and optimize the bandwidth to increase
the signal-to-noise ratio to obtain the optimum wavelength for detection.
The selected signal and bandwidth may be transferred to the signal window
in the data analysis view by clicking the Copy button. The signal and
bandwidth can then be used to test the integration, identification, and
quantification processes.
Wavelength optimization with the fluorescence detector generally requires
two runs:
•Set up an excitation wavelength in the low UV range (230 to 250 nm) and
collect emission spectra. For each peak in the chromatogram, determine the
optimum emission wavelength using the isoabsorbance plot.
•Prepare a timetable to set the optimum emission wavelength for each peak
as it elutes, and collect the excitation spectra.
Fluorescence Spectrum
The three-dimensional isoabsorbance plot is used to display spectra obtained
from fluorescence scans only. In this case, the spectral information is plotted
on the excitation wavelength/emission wavelength plane. There is no time
axis, since the fluorescence scan is acquired either in stopped-flow mode or off
line. From the isoabsorbance plot, you can extract excitation or emission
spectra at any wavelength; the excitation spectra are shown above the
isoabsorbance plot (vertical cursor), the emission spectra are shown below the
isoabsorbance plot (horizontal cursor).
12 Understanding Your ChemStation Spectra Module
1 Understanding Spectral Analysis
Spectral Report Styles
Spectral Report Styles
The following report styles are available with the spectral module:
•Library Search
produces a calibrated report including library search results. Peak
numbers, retention times, library search match factors, amounts, and
compound names are printed according to the parameters specified in the
Automated Library Search dialog box. For more information see “Report
Description” on page 17.
•Short + Spectrum
comprises instrument conditions, chromatogram, quantitative results, and
peak purity information.
•Detail + Spectrum
comprises header, instrument conditions, chromatogram, quantitative
results, calibration curves, and peak purity information. The header is
stored in a file called RPTHEAD.TXT in the method directory. You can
change the header using a text editor to include a method specific text.
•Performance + Lib. Search
combines the Performance and Library Search styles.
Peak Purity Information
Peak purity information refers to the evaluation of spectra across the peaks
resulting in purity plots for each compound. These plots comprise overlaid
and normalized spectra, and single and overlaid signals. The purity plots can
also include the threshold and similarity curves, depending on the Purity
Preferences settings for the method.
The numeric calculations include the purity factor, a measure of the similarity
in the spectra shape. For more information on peak purity refer to Chapter 3,
“Evaluating Peak Purity”.

14 Understanding Your ChemStation Spectra Module
2 Spectral Libraries
Search Modes
Search Modes
In a spectral library search one of three search modes may be used. A spectral
library and a calibration table are prerequisites for all three modes. You can
add a peak purity check as an option.
•Identify by spectral library search.
This mode is the most general search mode. The ChemStation uses the
chromatogram as basis for the library search. It compares the peak spectra
of all peaks found by the integrator and characterized by their retention
times, with spectra of up to four specified libraries. To speed up the process
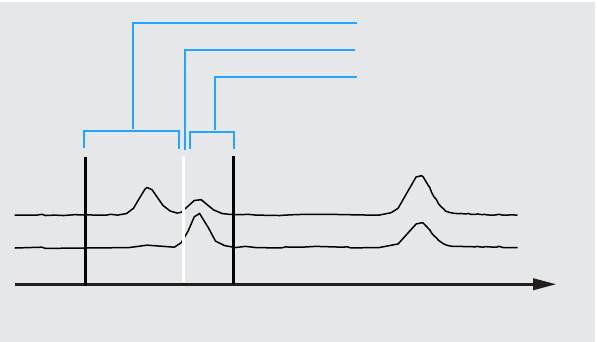
or to increase reliability, you can narrow down the search to spectra that
fall within a certain retention time window using the Library Search
Template see Figure 3.
The name of the compound with the best match is assigned to the peak. You
can specify how good this match must be with your own threshold value. If
a match factor is found, which is better than the threshold, the peak is
Figure 3 Retention Time Window
Left window
Expected retention time
Right window
Time [min]
Understanding Your ChemStation Spectra Module 15
Spectral Libraries 2
Search Modes
reported as being identified. The ChemStation then refers to the calibration
table for an identically named entry. If such an entry is found, the data is
used to calculate and report the amount.
If no matching name is found in the calibration table, the peak’s identity is
given, however, since the method is not calibrated for the compound, an
amount is not calculated.
This mode is recommended when searching for unknown compounds in an
analysis. It is most efficient if the number of compounds in the
chromatogram is low compared to the number of entries in the library.
•Target compound analysis using a calibration table.
This search mode is only for compounds for which the method is calibrated.
The ChemStations compares the peaks spectra only for calibrated
compounds with spectra of up to four specified libraries. Peaks are only
reported as identified if confirmed by spectral comparison. The compound
names defined in the calibration table must be identical to the compound
names defined in the library.
A target window for retention times can be specified as part of the search
method. Only peaks with retention times that fit into the target window are
used in the identification process. The best match is reported as being
identified only when the match exceeds the threshold that you have set.
This mode is recommended for searching specific calibrated compounds in
the chromatogram. It is preferable to the first search mode if the
chromatogram contains many compounds but only a few, the ones of
interest, are calibrated.
•Target compound analysis using a spectral library.
This search mode is for all library entries, not only those that are also
contained in the calibration table. The ChemStation uses the spectra library
as basis. It compares all library spectra with peak spectra from the
chromatogram and attempts to identify all peaks found by the integrator
which fall into the retention time window specified for the library entries
and in the library search template. Only the peaks for which the retention
time fits into the target window are used in the identification process.
When a match is found that exceeds the threshold you have set, the peak is
reported as identified. Quantification proceeds based on the name of that
compound in the calibration table. If the compound exists both in the
16 Understanding Your ChemStation Spectra Module
2 Spectral Libraries
Search Modes
library and in the calibration table, it is reported as calibrated and
identified. If the compound is not included in the calibration table, it is
reported as uncalibrated.
This mode is recommended when you have set up libraries containing
specific groups of compounds. For example, you may have one library
containing water-soluble vitamins and another library containing
fat-soluble vitamins. You can then search the chromatogram for these
particular compounds. If the chromatogram contains many compounds and
the library contains only a few compounds, this mode is preferable to the
first search mode.
•Peak Purity Check
The peak purity check is optional. We recommend using the peak purity
check before a library search, since a match is only as reliable as the quality
of the separation. The ChemStation compares the consistency of the spectra
in different sections of each peak. It calculates and reports a purity factor.
Purity can be defined by a threshold, below which questionable results are
tagged with an x in the report. For more information on peak purity refer to
Chapter 3, “Evaluating Peak Purity”.
Understanding Your ChemStation Spectra Module 17
Spectral Libraries 2
Report Description
Report Description
A typical report generated by a spectral library search includes:
•chromatogram/electropherogram annotated with retention/migration
times,
•header with information on file names and search parameters,
•description of the detector’s signal and two analysis tables,
•retention times of the peaks found in the analysis,
•retention times of library match candidates,
•retention times recorded in the calibration table, and
•compound amounts and their purity factor (if selected), together with:
library entry number,
library match factor, and
compound name.
In different columns of the library search report, certain markers are used to
denote compound purity, compound matching, and compound naming.
These markers can be interpreted as described in the next steps.
Purity Marker
For impure compounds the spectra at the upslope and downslope of the peak
are normally different and therefore both are used for the library search.
u: Compound impure and spectrum at the upslope was used for identification.
d: Compound impure and spectrum at downslope was used for identification.
Library Match Marker
x: Match factor below the given match threshold.
18 Understanding Your ChemStation Spectra Module
2 Spectral Libraries
Report Description
Compound Name Marker
?: Compound identified with match factor below the given match threshold.
??: Compound identified with a name already allocated to another compound
with a better match. For this specific compound, a better match with a unique
name could not be found.
Amount Marker
+: Individual amount high — amount limit set in Compound Details is exceeded.
-: Individual amount low — amount limit set in Compound Details is exceeded.
Peaks that do not match any entries in the calibration table are listed in a
separate table labeled Uncalibrated Compounds.

19
Agilent ChemStation for LC 3D Systems
Understanding Your Spectra Module
Agilent Technologies
3
Evaluating Peak Purity
Checking Peak Purity 20
What is a Peak Purity Check? 20
The Match Factor 21
Background Correction by Selecting a Reference Spectrum 22
Peak-Purity Techniques 24
Peak Purity Display 25
Spectra Window 25
Spectral Normalization 26
Purity Window 27
Spectral Similarity Curves 28
Threshold Curve 29
Using Specific Target Spectra 31
Purity Calculation and Display 32
Classifying a Peak as Pure or Impure 33
Peak Purity Information 34
Advanced Peak Purity Options 36
Using Peak Purity Analysis 38
Spectra Acquisition 38
Setting Options for Peak Purity 39
Mass Spectral Peak Purity 41
Mass Spectral Purity Calculations 42
Mass Spectral Purity Display 43
This section describes the various methods that you can use to evaluate the
purity of a peak.

20 Understanding Your ChemStation Spectra Module
3 Evaluating Peak Purity
Checking Peak Purity
Checking Peak Purity
An important question in any chromatographic analysis is whether the peak
comprises one or more components. In quality control, impurities hidden
behind the peak of interest can falsify results. In research analysis, a hidden
and undetected component might lead to a loss of essential information of
value to research work.
What is a Peak Purity Check?
A peak purity check assesses whether a peak is pure or contains impurities.
This assessment is based on the comparison of spectra recorded during the
elution of the peak. Five spectra per peak are used to assess purity: two
spectra on each of the up and down slopes and one at the top (top, or apex
spectrum). The five spectra are averaged and compared with all spectra
recorded in the peak.
If the peak spectra are not identical with the average spectrum, the peak
theoretically contains a spectral impurity. The spectral impurity can be caused
by one or more components, non-baseline separated peaks, or by background
absorption.
The Spectra window contains the peak spectra that comprise the comparison
(average) spectra drawn in a normalized and overlaid mode. The Purity
window contains the signals with superimposed purity information. The
purity factor is a measure of the similarity in the shape of the spectra.
Peak impurity can be detected even if there is a background absorption in the
system, which can be corrected. Usually the background absorption does not
disturb the quantification of the peak, since it also influences the height of the
NOTE If the spectra are identical, the peak can still contain impurities. This can be the case if the
spectral absorption is small compared to the main compound, or if the impurity and the
main compound have the same or almost the same spectra, with similar elution times.
Understanding Your ChemStation Spectra Module 21
Evaluating Peak Purity 3
Checking Peak Purity
peak start and end which is removed by baseline correction. The background
absorptions can change by using different solvents or solvent composition in
one analysis.
The Match Factor
Peak impurity detection by a visual spectral comparison is time-consuming
and is not suitable for automated operations. Several statistical techniques are
available for automated comparison of spectra. One technique is a
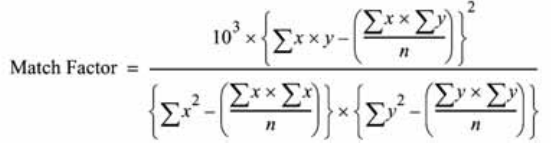
mathematical comparison between two spectra. It calculates a match factor
representing the degree of similarity between the spectra.
The comparison of two spectra gives the match factor, which is defined as:
The values x and y are measured absorbances in the first and second spectrum
respectively, at the same wavelength; n is the number of data points and Σ the
sum of the data. At the extremes, a match factor of 0 indicates no match and
1000 indicates identical spectra. Generally, values above 990 indicate that the
spectra are similar. Values between 900 and 990 indicate there is some
similarity, but the result should be interpreted with care. All values below 900
indicate the spectra are different.
The match factor is influenced by a number of parameters, which are
determined by the sample and the separation method. They include compound
specificity, spectral absorption of matrix compounds, and spectral noise level,
as well as background absorption and spectral shifts caused by solvent or
different instruments (different wavelength calibrations).
Smoothing Spectra
The reliability of a purity check is limited when the spectral noise is of the
same order as the spectrum. Smoothing spectra works in the following way.

22 Understanding Your ChemStation Spectra Module
3 Evaluating Peak Purity
Checking Peak Purity
1For a defined number of data points, for example 5, also referred to as the
filter, a cubic regression is used to determine a new data point.
2The filter then moves one point further, taking the last 4 of the already used
data points and an additional point and the process is repeated.
By using the smoothing algorithm, statistical noise can be reduced, which
makes the identification of the smoothed spectrum more reliable.
Splining Spectra
If you have acquired spectra with low resolution, you can use splining to make
your spectrum look more like a curved line rather than a polygon. This is done
by calculating additional data points between the original data points of your
spectrum using trigonometric functions. When splining spectra, the original
data points are preserved.
Logarithmic Spectra
Logarithmic spectra compress the absorbance scale. They may be useful where
the absorbances cover a very wide range.
Derivative Spectra
Derivative spectra reveal more specific details than original spectra when
comparing different compounds. Small differences in the spectra are much
more obvious and easier to identify visually. However, the noise is increased,
which limits the use of derivative spectra.
Background Correction by Selecting a Reference Spectrum
Various types of correction are available to extract peak spectra from the data
file for background corrections:
NOTE The smoothing algorithm can also change the profile of a spectrum, depending on the
length of the filter, i.e. the number of data points used in the smoothing algorithm at one
time. It is recommended that you smooth all spectra with the same filter before making
comparisons.
Understanding Your ChemStation Spectra Module 23
Evaluating Peak Purity 3
Checking Peak Purity
Manual Reference Selection
When one reference spectrum is selected, the selected spectrum at the
specified time is taken from the data file and subtracted from each peak
spectrum. This correction cannot be used for a changing background
absorption.
When two baseline spectra are selected, a linear interpolation is made
between the two spectra. A reconstructed reference spectrum based on the
linear interpolation is subtracted from each peak spectrum. This correction
can be used to compensate for a slow changing background absorption.
Automatic Reference Selection
In automatic reference selection, the selected reference spectra depend on the
storage mode of the spectra in the data file.
All Spectra: The integrated peak start and end spectra of the selected peak are
taken as the reference spectra, and linearly interpolated as for manual
reference selection with two reference spectra.
Peak-controlled Spectra: The nearest baseline spectrum is taken as the
reference spectrum and subtracted as for manual reference selection with one
reference spectrum.
24 Understanding Your ChemStation Spectra Module
3 Evaluating Peak Purity
Checking Peak Purity
Peak-Purity Techniques
Peak purity techniques can only be used with peaks that have a baseline
separation. If peaks are not baseline-separated, then the peak purity is more
complicated because each peak contains the neighboring peaks as an impurity.
Peak purity may be determined interactively on a peak-by-peak basis for all
the peaks from a certain data file, or automatically at the end of each analysis
as part of the method when using a spectral report style, for example
detail+spectrum.
You can optimize peak purity processing for accuracy or performance by
setting options relating to:
•wavelength range used for the purity determination,
•reference spectra,
•purity threshold,
•spectral processing, including logarithmic, smoothing and splining factors,
and derivative order,
•purity components, calculated and displayed (these include the spectra,
spectral differences, the signals, similarity and threshold curves).
The techniques that you can use to judge a peak’s purity, which are described
in the following sections, include:
•spectral normalization
comparison of normalized spectra from different peak sections,
•similarity curve
comparison of an average or selected spectrum with all other spectra taken
as the peak eluted.
Understanding Your ChemStation Spectra Module 25
Evaluating Peak Purity 3
Peak Purity Display
Peak Purity Display
Spectra Window
The spectra window shows the five spectra that are used to calculate the
average spectrum that is used in the purity calculation. You can use the
Agilent ChemStation’s graphical manipulations to examine the peak spectra in
more detail.
26 Understanding Your ChemStation Spectra Module
3 Evaluating Peak Purity
Peak Purity Display
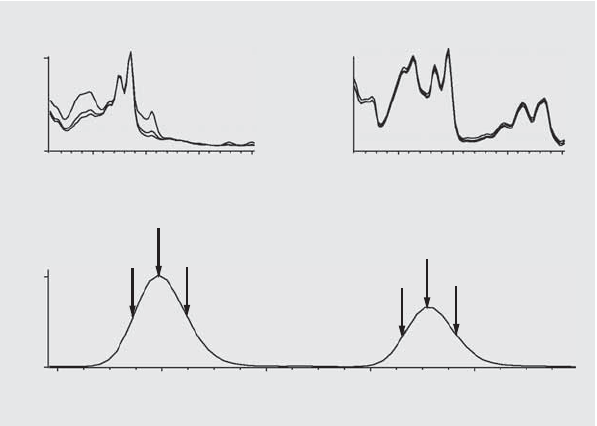
Spectral Normalization
A common peak purity technique involves normalizing and comparing spectra
taken across the peak. Normalization compensates for the changing
concentration of the component passing through the detector cell as the peak
eluted. This function is available as part of the Agilent ChemStation’s spectral
display facilities.
Spectra are acquired, for example, at the upslope, the apex, and at the
downslope of the peak. The spectra are normalized and overlaid for graphical
presentation. This technique is very good for interactive data evaluation and
can also be adapted for automated routine analysis.
Alternatively, if a numeric factor is preferred, upslope and downslope spectra
can be mathematically compared and purity factors can be printed for each
peak together with retention time.
Figure 4 shows an example in which spectra have been acquired at the
upslope, the apex and the downslope of the peaks, and normalized. Both the
visual comparison and the purity factor calculated by the software clearly
show the difference between the pure and impure peaks.
Figure 4 Peak-Purity Check by Overlaying Spectra
100
0
50
0
200 400 200 400
7,6 7,8 8,0 8,2 8,4
Understanding Your ChemStation Spectra Module 27
Evaluating Peak Purity 3
Peak Purity Display
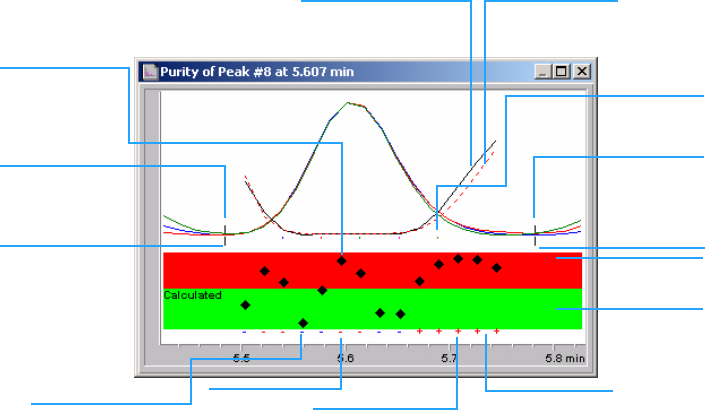
Purity Window
The contents of the Purity window depend on the purity parameters selected.
The default display is the Purity Ratio, which shows the signals with
superimposed similarity and threshold curves (see Figure 5). The green and
red bands below the display show the user-defined purity threshold. The
calculated purity value for each spectrum in the peak is shown as a black dot;
if the black dot lies within the green band, the purity of the spectrum lies
within your acceptable purity definition.
Figure 5 Purity Window
similarity value
of each recorded
spectrum
similarity curve threshold curve
selected
peak spectra
peak end
reference
spectrum
exceeds
threshold
within
threshold
+ used for purity
calculation
RED: exceeds threshold
- not used for
calculation
Blue: within
reference
spectrum
peak start
28 Understanding Your ChemStation Spectra Module
3 Evaluating Peak Purity
Peak Purity Display
Spectral Similarity Curves
Spectral similarity curves are shown in the Purity window of the Spectra
display (see Figure on page 41).
If details are not clear in the display, you can zoom in by holding down the left
button while moving the mouse. An area is drawn on the screen as you move
the mouse to show the zoom area. To revert to the original display, double
click the left mouse button.
Spectral Similarity Curves give the most detailed information about a peak's
purity or impurity. All spectra from a peak are compared with one or more
spectra, by default an average spectrum. The degree of match or spectral
similarity is plotted over time during elution. An ideal profile for a pure peak
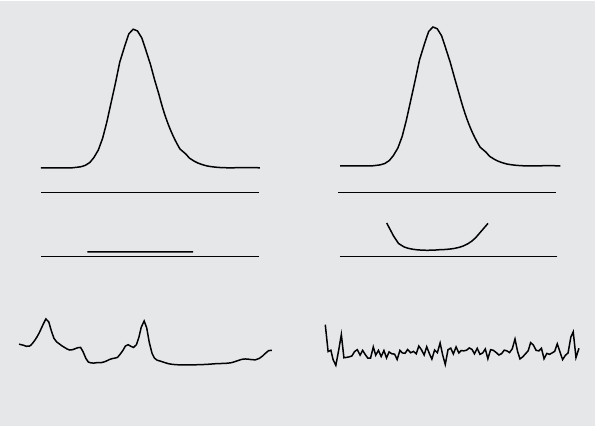
is a flat line at 1000, as shown in Figure 6 (a).
At the beginning and end of each peak, where the signal-to-noise ratio
decreases, the contribution of spectral background noise to the peak’s spectra
becomes significant. The contribution of noise to the similarity curve is shown
in Figure 6 (b).
Figure 6 Similarity Curves for a Pure Peak With and Without Noise Plotted in Relation
to Ideal Similarity Factor (1000) and User-Defined Threshold (980)
b) Peak without impurity but with noise
Similarity curveSimilarity curve
Noise, 0.1 mAUPeak spectrum, 20 mAU
a) Peak without impurity and noise
Understanding Your ChemStation Spectra Module 29
Evaluating Peak Purity 3
Peak Purity Display
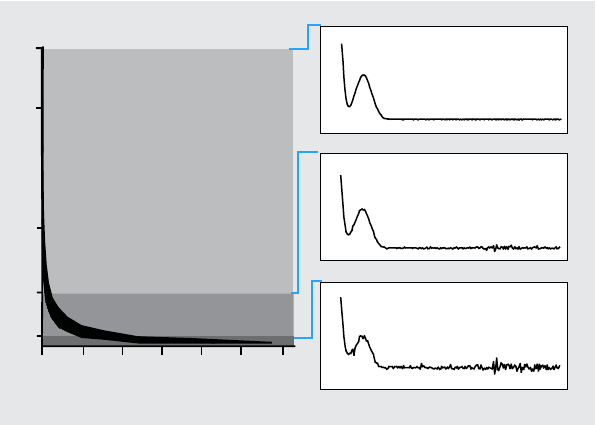
Threshold Curve
The threshold curve shows the effect of noise on a given similarity curve. The
effect increases rapidly toward the start and end of a peak. In essence, a
threshold curve is a similarity curve of a pure peak with a background noise
component.
The influence of noise can be seen in Figure 7. The similarity factor decreases
with a decreasing signal-to-noise ratio or constant noise level with decreasing
absorbance range.
Figure 7 Similarity Factor as a Function of the Noise Level
Spectral impurity
within noise level
Spectral impurity
exceeds noise
Decreasing similarity
Absorbance range [mAU]
25
20
10
5
1000 990 980 970 960 950 940
25 mAU
5 mAU
1 mAU
1
30 Understanding Your ChemStation Spectra Module
3 Evaluating Peak Purity
Peak Purity Display
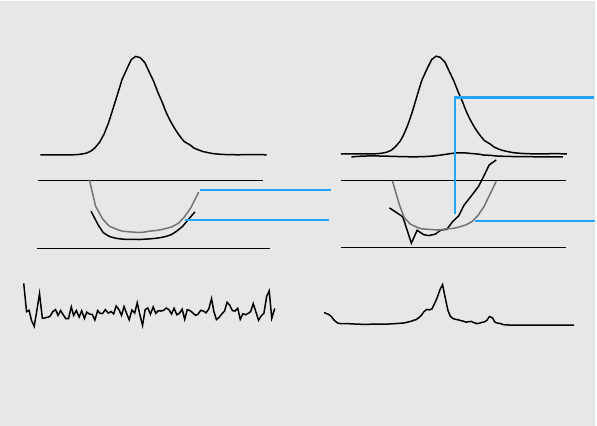
Figure 8 (a) shows both the similarity curve and the threshold curve for a pure
peak with noise, Figure 8 (b) for an impure peak.
The noise threshold is determined automatically, based on the standard
deviation of pure noise spectra at a specified time, by default 14 spectra at the
beginning of the run (i.e. at 0 minutes).
The threshold curve, represented by the broken line, gives the range for which
spectral impurity lies within the noise limit. Above this threshold, spectral
impurity exceeds the spectral background noise and the similarity curve
intersects the threshold curve, indicating an impurity (provided the reference
and noise parameters have been sensibly chosen).
Figure 8 Effect of Impurity and Noise on Similarity and Threshold Curves
Threshold curve
Threshold curve
Similarity curve
Similarity curve
5% impurity
Noise 0.1 mAU Impurity spectrum 1 mAU
(a) Peak without impurity but with noise (b) Peak with impurity and noise
Understanding Your ChemStation Spectra Module 31
Evaluating Peak Purity 3
Peak Purity Display
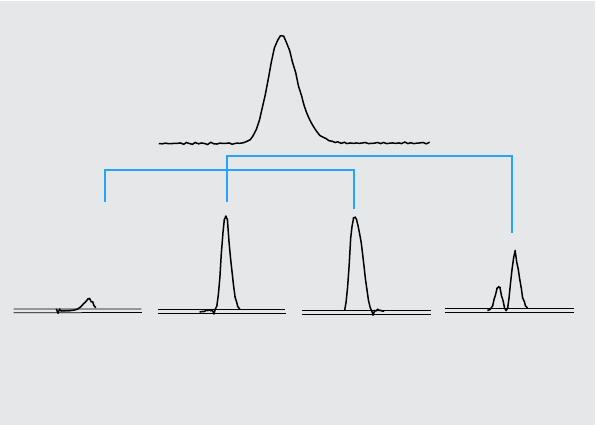
Using Specific Target Spectra
The Agilent ChemStation permits calculations of the purity factor and
similarity curves relative to different target spectra, as shown in Figure 9. As a
general rule, the default comparison with the average spectrum provides the
most valuable information for most unknown impurities. The flexibility of
being able to select a specific target spectrum is valuable in cases where the
analyst must assume where the impurity is, or needs to improve the sensitivity
of the purity evaluation. An example may help to show how this principle can
be applied: if the impurity is assumed to be in the tail of the peak, selecting the
tail or apex spectrum to be compared with all other spectra will provide the
most significant information in this case.
Figure 9 gives the ratio curve for the front, apex, tail, and average spectrum of
a peak which contains an impurity after the response maximum (apex).
The front spectrum gives a small spectral impurity at the end of the peak. The
deviation in this first ratio curve is small since the front spectrum absorbed
little (giving a rather high threshold curve).
Figure 9 The Ratio Curves for Different Target Spectra from the Same Peak
Peak with 2%
Ratio of front
spectrum to all
other spectra
Ratio of apex
spectrum to all
other spectra
Ratio of tail
spectrum to all
other spectra
Ratio of average
spectrum to all
other spectra
1
0
32 Understanding Your ChemStation Spectra Module
3 Evaluating Peak Purity
Peak Purity Display
The apex spectrum gives a low impurity in the front of the peak (the apex
spectrum contains only a very small amount of the impurity) and high
impurity at the tail.
The tail spectrum (with a high level of impurity) gives a spectral impurity at
the front of the peak.
The average spectrum (a mean of the five selected peak spectra) indicates
spectral impurity in the total peak. This average spectrum contains the
spectral contribution of the impurity. In this case, the average contains more
contribution from the impurity than the apex spectrum, showing a higher
spectral impurity at the elution or migration front, and lower impurity at the
tail, compared with the ratio curve of the apex spectrum.
The profile of the similarity, threshold and ratio curves depends on the
position, level, and spectral differences of the impurity and, as such, no
general statements can be made on the shape. Expect the profile to differ from
situation to situation.
Purity Calculation and Display
The purity factor is not an absolute measure of the peak purity. It is a function
of the parameters used in the calculations, especially the purity threshold.
Therefore, the results need to be interpreted together with the threshold set.
For pure peaks, comparable results are generated for different parameter
settings. For impure peaks, a worst case analysis is done. Only data points that
refer to an impurity, for example spectra that lie below the threshold, are
considered in the calculation, therefore a change in the threshold value can
drastically influence the purity factor for an impure peak. See below for more
details on these calculations. For a detailed description of the Agilent
ChemStation similarity curves, see “Spectral Similarity Curves” on page 28.
All Spectra
1All reference-corrected spectra recorded for the peak that are above the
user-defined threshold are used for the calculation of the purity and
threshold curves; five of these spectra are displayed in the Spectra window.
2The match factors are calculated between each spectrum and the average of
the five spectra displayed in the Spectra window; they are plotted as single
points in the Purity display.

Understanding Your ChemStation Spectra Module 33
Evaluating Peak Purity 3
Peak Purity Display
For the User-defined threshold, the similarity curve is superimposed on the
Purity plot.
For the Calculated threshold, the threshold value is calculated for each
spectrum; the purity values of the spectra are defined as a ratio between the
threshold value and the similarity value which give a straight line. This
gives a better indication of the pure and impure data points. The similarity
and threshold curves are superimposed on the purity plot.
Peak-Controlled Spectra
1All reference-corrected spectra recorded for the peak that are above the
user-defined threshold are used in the calculation and displayed in the
Spectra window.
2The match factors are calculated between each spectrum displayed in the
Spectra window and the average of these spectra; they are plotted as single
points in the Purity display.
3The purity value is calculated as the mean value of all the calculated match
factors.
Classifying a Peak as Pure or Impure
The calculated purity level is used to generate the purity statement displayed
on the screen. If the purity factor is within the threshold value, (set manually,
or calculated from the threshold curve), the peak is classed as pure. If the
purity factor exceeds the threshold value, the peak is classed as impure.
NOTE The detected impurity is a spectral impurity which does not necessarily mean a compound
impurity. Spectral impurities can be caused by changes in solvent composition (gradients)
or can occur in peaks that are not baseline separated.
34 Understanding Your ChemStation Spectra Module
3 Evaluating Peak Purity
Peak Purity Display
Peak Purity Information
Purity Factor
The purity factor gives a numerical value for the purity of the peak.
•If the peak has been classified as pure, the purity factor is the mean value of
all spectra that are within the threshold.
•If the peak has been classified as impure, the purity factor is the mean value
of all spectra that exceed the threshold.
In either case, the number of spectra used for the calculation of the purity
factor, and the basis for the calculation are specified.
Threshold
For a calculated threshold, this is the mean value of all those spectra used in
the calculation of the purity factor. For a user-defined threshold, this is the
value you set in the Purity Options.
Peak Spectra
Peak Spectra shows details of the five spectra selected for the purity
calculations. You can also display
•Difference spectra
Spectra calculated as the difference between the averaged spectrum and the
individual selected spectra. Pure peaks show only noise in the difference
spectra.
•Compared spectrum
The average spectrum used for the purity calculations.
•All recorded spectra
All spectra recorded across the peak.
•Reference spectra
The spectrum or spectra used for background correction.

Understanding Your ChemStation Spectra Module 35
Evaluating Peak Purity 3
Peak Purity Display
Purity and Noise Calculations
The information about the Purity Calculation shows the number of recorded
spectra and the number of those within the threshold or exceeding the
threshold that have been used to calculate the purity factor.
The information about the Noise Calculation shows the spectra that have been
used to calculate the noise threshold, and the results of the calculation. You
can show the noise spectra as well as a graph of the noise statistics. You can
also change the parameters for the noise calculation.
Purity Curve
The Purity Curve information shows the results of the comparison of each
spectrum in the peak with the average spectrum. The values in the Difference
column represent the arithmetical difference between the values in the Purity
column and those in the Threshold column. The Difference value is used to
determine which spectra are used in the calculation of the Purity factor and
Threshold value for the peak.
More Purity Curves
The information for More Purity Curves shows the results of purity
calculations using Front, Apex and Tail spectra in addition to that of the
average spectrum (see “Using Specific Target Spectra” on page 31). You can
choose to show the similarity curves of any or all of these calculations. You
can also change the parameters of the purity calculation, and the way that the
results are displayed.
NOTE Changing the parameters for the calculation of background noise can have a major effect
on the results of the purity calculation. Ensure that you understand the information given in
“Advanced Peak Purity Options” on page 36 before making any changes.
NOTE Changing the parameters for the calculation of purity can have a major effect on the purity
results. Ensure that you understand the information given in “Advanced Peak Purity
Options” on page 36 before making any changes.
36 Understanding Your ChemStation Spectra Module
3 Evaluating Peak Purity
Peak Purity Display
Advanced Peak Purity Options
Changes made in the Advanced Peak Purity Options can have a major effect on
the purity results. We recommend that you do not make changes unless you
understand the effect that your changes will have on the results.
Purity Calculation
The purity calculation by default uses the average of five spectra across the
peak (see “What is a Peak Purity Check?” on page 20), but you can also use
other spectra as the basis of the calculation:
All peak spectra uses each of the five selected spectra to produce five sets of
results that are displayed in the same window.
Apex spectrum, Front spectrum and Tail spectrum use specific spectra that
may allow you to improve the sensitivity of the purity analysis (see “Using
Specific Target Spectra” on page 31).
Front & Tail spectrum shows the two sets of results produced using the Front
and Tail spectra as the basis of the purity calculation.
The default display of peak purity is the Purity Ratio, as shown in Figure 5 on
page 27, but you can also display the purity results as similarity and threshold
curves.
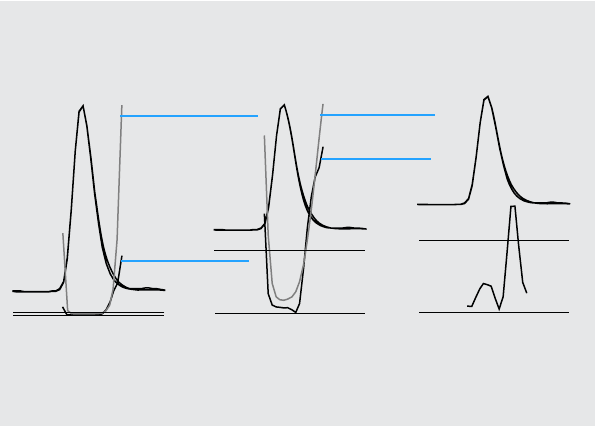
The Agilent ChemStation provides three modes to display the similarity and
threshold curves:
1Without any transformation, see Figure 10 on page 37 (a);
2As the natural logarithm, ln, see Figure 10 on page 37 (b), with the
advantage of more detail for the peak apex in the lower part of the graphic;
3As a ratio: , see Figure 10 on page 37 (c).ratio 1000 similarity–
1000 threshold–
-----------------------------------------=
Understanding Your ChemStation Spectra Module 37
Evaluating Peak Purity 3
Peak Purity Display
For a spectrally pure peak, the ratio values are below 1, and for spectrally
impure peaks, the values are above 1. The advantage of the ratio mode is that
only one line is displayed, leading to easier interpretation.
Noise Threshold
By default, the noise threshold is determined automatically, using the
standard deviation of 14 pure noise spectra at the beginning of a run (0
minutes). You can change the time and number of the spectra from which the
standard deviation of noise will be calculated, or you can enter a fixed value
for the standard deviation (default value 0.1). Best accuracy is achieved when
the standard deviation is calculated from a specified number of scans.
Figure 10 Threshold and Similarity Curves,
(a) as Calculated,
(b) ln (Threshold) and ln (Similarity), and
(c) as a Ratio
(a) As calculated (b) As natural logarithm (c) As ratio
Threshold curve
Similarity curve
ln (threshold)
ln (similarity)
995
1000
995
1000
1
0
38 Understanding Your ChemStation Spectra Module
3 Evaluating Peak Purity
Using Peak Purity Analysis
Using Peak Purity Analysis
This section includes practical hints on acquiring data suitable for peak purity
analysis and setting the peak purity options.
Spectra Acquisition
Peak purity testing is based on comparison of spectra across a peak. Make
sure that enough spectra are available for comparison and that the quality of
the spectra is high. Make sure the detector is well maintained, the lamp
intensity is strong, and that you choose the appropriate flow cell and slit. In
general, you should optimize for sensitivity rather than resolution, since even
small shifts in the spectra are expressed over broader wavelength ranges, and
resolution is generally not so important.
Use the store All spectra to collect spectra continuously. Newer detectors
support the All in Peak mode which collects spectra continuously when a peak
is detected and in addition stores about 20 spectra at the start of the run for
use in determining baseline noise for the purity analysis.
Set the peak width on the diode array detector screen to the width of the
narrowest peak of interest in the run.
Make sure your sample concentration is appropriate for the linear operation
range of the detector. If a component is too concentrated, the detector will
operate outside its linear range at the wavelengths of highest absorbance
while remaining linear at other wavelengths. This will cause the shape of the
spectra to change with concentration, and the component will be reported as
possibly impure. If the component concentration is too low, the signal-to-
noise ratios for the spectra will be poor and the sensitivity of the purity
analysis will be reduced. The most accurate and sensitive purity analysis is for
peaks between about 250 and 800 mAU in height.
Use the default settings for checking peak purity. If a possible impurity is
detected, you can take a more critical look at the results to confirm the
impurity and characterize it further.
Understanding Your ChemStation Spectra Module 39
Evaluating Peak Purity 3
Using Peak Purity Analysis
Setting Options for Peak Purity
Select the following settings in the appropriate tabs of the Spectral Options
dialog box.
Wavelength Range
Use this setting to control the portion of the wavelength range used for the
purity analysis. You can set a low limit for example to exclude wavelengths
where absorbance of the mobile phase causes excessive noise. You can set a
high limit to exclude higher wavelengths where the compound of interest does
not absorb.
Spectra Processing
Use spectral processing to perform mathematical calculations to transform,
smooth or spline spectra. In practice, anything that enhances small differences
in the spectra (derivatives) also enhances the noise, while anything that
reduces the noise (smoothing) decreases the sensitivity for small spectral
changes.
Absorbance Threshold
The absorbance threshold sets lowest intensity of spectrum that can be
included in the analysis. Normally, the threshold is set to 1 – 2 mAU to ensure
that the spectra at the edges of the peak are included in the purity check.
Reference Spectrum
Reference spectra are baseline spectra used to correct the background
absorbance. We recommend that you always use a reference spectrum. The
recommended setting is Automatic. With this mode, a spectrum is taken from
the baseline near the start and end of integration. A linear extrapolation of
these two spectra is used to correct each spectra across the peak. As this is a
two-point reference, it can compensate for detector drift and for changes in
mobile phase composition using gradients. The other reference modes are
available for backwards compatibility with previous software and so that
some purity information can be obtained even if only a few spectra were
collected.
40 Understanding Your ChemStation Spectra Module
3 Evaluating Peak Purity
Using Peak Purity Analysis
If two peaks are not completely baseline-separated, automatic selection of
reference spectra using Automatic reference selection might lead to a
reference spectrum being selected from the valley between the two peaks. An
unresolved peak cannot be pure. In this case the purity test can be used to
look for other hidden components. Use Manual reference selection to select
reference spectra from before and after the group of peaks.
Purity Threshold
If your data was collected by acquiring peak-controlled spectra, you need to
enter a value for the purity threshold. Generally, the default value of 990 will
give acceptable results.
If your data was collected by acquiring All spectra or All in peak, the best
results will be produced by allowing the Agilent ChemStation to calculate a
threshold for each spectrum based on its individual signal-to-noise ratio.
Alternatively, you can set a fixed threshold for all scans in the peak, although
this is not recommended. If you do wish to use a fixed threshold, use a much
higher value than for peak-controlled spectra, e.g. between 995 and 998.
Understanding Your ChemStation Spectra Module 41
Evaluating Peak Purity 3
Mass Spectral Peak Purity
Mass Spectral Peak Purity
In LC/MS, the abundances of the ion(s) that characterize a compound
maximize at a particular retention time, when the concentration of that
component in the MSD is at a maximum. Depending on the chromatography
conditions and the scan cycle time, the retention times of closely-eluting peaks
may be very close together, and multiple components may appear as a single
peak or as a peak with distortions (e.g. shoulders) in the total ion
chromatogram (TIC). By examining the retention times at which individual
ions maximize, it may be possible to group together clusters of ions that
maximize at the same retention time; these ions are all then assumed to belong
to the same component. If more than one cluster of ions maximize at different
retention times under the same chromatographic peak envelope, the peak can
be said to be impure, and the individual clusters of ions can be determined.
In this analysis, several assumptions are made:
•The components of a multi component mixture can be separated either by
their mass spectra or their retention times. Either each component of the
mixture has a distinctive mass spectrum with unique m/z values, or the
components are sufficiently well separated to allow multiple maxima to be
determined.
•The signal-to-noise ratio is high enough to allow real maxima to be
identified unambiguously.
•The ion retention times that are used as the basis for calculating the
component retention times are precise and representative.
With only a rare exception, electrospray ionization (ESI) produces only
molecular ions unless ion source collision-induced dissociation (CID) is used
to produce fragments. This means that if two distinct, singly charged ions are
found in a series of spectra (even if they co-elute) it is possible to identify and
quantitate those ions. Care should be taken when doing this since cation and
anion adducts can generate ions besides the expected [M+H]+ or [M-H]- ions.
Atmospheric pressure chemical ionization (APCI) also produces molecular
ions but thermal fragments are more common in APCI than electrospray.
In addition, a mass spectrum contains isotope information that can be used to
help with identification and purity assessment.
42 Understanding Your ChemStation Spectra Module
3 Evaluating Peak Purity
Mass Spectral Peak Purity
The peak purity algorithm will only identify an impure peak if there are
spectral and time differences. Manual interpretation can go beyond that limit.
Unlike UV data, MS data can be used to quantitate impure peaks as long as the
“compounds” have different ions. Peak Purity generally requires scan data,
not SIM data, to be useful.
Mass Spectral Purity Calculations
A range of the TIC covering the integrated area of the peak is searched using a
selected set of m/z values, and the maximum abundance for each m/z value is
determined. For each maximum found, an interpolated retention time (scan
number) is calculated using a parabolic fit. The retention times of the largest
maxima are grouped into clusters, which are then identified with the
components that are present in the range. Information about how many
components, the retention time (scan number) of each component and the
largest m/z values in the cluster are reported.
The selected set of m/z values is obtained by examining the scans at 25%, 50%
and 75% of the integrated peak time range, using all m/z values that have an
abundance greater than 1% of the maximum abundance in the scan (base
peak). For each selected m/z value, the average abundance of the first and last
scans in the time range is used for background correction before the clusters
are determined.
Each m/z value in the set is examined in every scan in the time range, and the
maximum abundance is stored along with the abundances on either side of the
maximum. Only one maximum per m/z value is stored. Each stored maximum
is verified by checking that it does not occur in the first or last scan, and does
not have zero abundance on either side.
After an interpolated scan number has been calculated for the m/z value and
the background correction has been made, a table is produced containing m/z
values, abundance and interpolated scan numbers, ordered by interpolated
scan number.
Clusters are determined by examining the largest abundances in the list in
order of increasing scan number. Once a cluster has been registered, the
average interpolated scan number of the m/z values in the cluster is
calculated; if the next point under consideration is more than half a scan away
from the average, a new cluster is started.
Understanding Your ChemStation Spectra Module 43
Evaluating Peak Purity 3
Mass Spectral Peak Purity
The number of clusters found is reported as the number of components; the
average interpolated scan number is the reported scan number; and the m/z
values with the two largest abundances in the cluster are reported as the ions.
An integrated peak that contains more than one cluster is reported as impure.
Mass Spectral Purity Display
Ions for Peak Window
The Ions for Peak window shows the two m/z values with the largest
abundances in each cluster. Single component peaks show two ions
maximizing at the same retention time; multi-component peaks show pairs of
ions maximizing at the same retention time. Each pair of ions indicates a
component in the impure peak. You can use the Agilent ChemStation’s
graphical manipulations to examine the ions in more detail.
MS Peak Purity Results Window
The MS Peak Purity Results window contains the tabular results of the peak
purity analysis. Each line in the table contains the information for one
component: average interpolated scan number and the two most abundant
ions.
44 Understanding Your ChemStation Spectra Module
3 Evaluating Peak Purity
Mass Spectral Peak Purity
Understanding Your ChemStation Spectra Module 45
Index
A
apex spectrum,32
automated spectral library search
overview,3
peak purity,16
search modes,14
standard search,14
target compound analysis,15
average spectrum,32
B
background
absorptions,20
background correction,22
baseline
correction,23
C
compare
spectra,26
COMPARE command,21
compound name marker,18
contour
lines,10
map,10
D
derivative spectra,22
determining
optimum wavelength,10
F
fluorescence spectrum,11
front spectrum,31
H
hints,38
I
impurity,20
isoabsorbance plot,10
L
library match marker,17
linear range,38
logarithmic spectra,22
M
mass spectral peak purity,41
match factor,21
N
normalize
spectra,26
O
optimum wavelength,10
P
peak
impurity,20
purity,20
peak purity
mass spectral,41
spectral similarity curves,28
threshold curve,29, 36
using specific target spectra,31
what is?,20
peak signals window,28
purity
peak,20
purity calculations
mass spectral,42
threshold curve,29, 33
purity display
mass spectral,43
R
reference spectrum,39
background correction,22
report
library search,12
peak purity,12
spectral,12
S
smooth spectra,21
spectra
derivative,22
logarithmic,22
normalize,26
smooth,21
spectra acquisition,38
spectral analysis
what is?,8
spectral operations
compare,26
normalize,26
spectral similarity curves,28
spectrum
correction,23
reference,39
spectrum, fluorescence,11

© Agilent Technologies 1994, 1995-2003, 2004,
2006, 2007, 2008
Printed in Germany
06/08
*G2180-90024*
*G2180-90024*
G2180-90024
www.agilent.com
Agilent Technologies
In This Book
This handbook describes the
concepts behind the spectra
module of the Agilent
ChemStation revision
B.04.0x. It complements the
information in the
Understanding Your
ChemStation manual with
the special spectra concepts
applicable to the Agilent
ChemStation for LC 3D and
CE systems and the
UV-visible part of the Agilent
ChemStation for LC-MSD.
For details of installation and
configuration of your spectra
module with an Agilent
ChemStation for LC 2D
system, see the Installing
Your ChemStation manual.
