GC3 Manual
User Manual:
Open the PDF directly: View PDF ![]() .
.
Page Count: 37

Golden Cheetah User Manual
Mark Liversedge
This manual is for Golden Cheetah, version 3.0.
Copyright c
2013 Mark Liversedge
i
Table of Contents
1 WELCOME TO GOLDENCHEETAH . . . . . . 1
1.1 About this latest version, V3.0 ........................... 1
1.2 Open Source ............................................ 3
1.3 Bit of Past and Present .................................. 4
1.4 Future Plans ............................................ 5
2 QUICK START GUIDE ................... 6
2.1 Downloading and Installing .............................. 6
2.2 Running for the first time ................................ 6
2.3 Downloading a ride from device .......................... 8
2.4 Importing data from file ................................. 9
3 GETTING AROUND GOLDENCHEETAH
........................................ 10
3.1 The Menu Bar ......................................... 11
3.2 The Toolbar and Scope bar ............................. 15
3.3 Views & Sidebar ....................................... 17
3.4 Searching and Filtering ................................. 17
3.5 Adding and adjusting charts ............................ 18
3.6 Going fullscreen ........................................ 18
3.7 The Metric database ................................... 18
4 IMPORTING EXPORTING
DOWNLOADING AND CREATING DATA
........................................ 19
4.1 Download from device .................................. 19
4.2 Import from file ........................................ 19
4.3 Manual activity ........................................ 19
4.4 Exporting data......................................... 19
4.5 Uploading and Downloading from the Cloud.............. 19
5 THE ANALYSIS VIEW .................. 20
5.1 About Activities and Intervals........................... 20
5.2 Sidebar actions and context menus ...................... 20
5.3 Editing and adjusting data.............................. 20
6 ANALYSIS VIEW CHARTS .............. 21
7 THE HOME VIEW....................... 22
7.1 About Date Ranges, Seasons and Events ................. 22
ii
8 PERFORMANCE TRACKING CHARTS . . 23
9 THE DIARY VIEW ...................... 24
9.1 Purpose ............................................... 24
9.2 Summarising for Day / Week / Month ................... 24
9.3 Longer term purpose (planning) ......................... 24
10 THE TRAIN VIEW ..................... 25
10.1 About Devices, Workouts and Video .................... 25
10.2 Sidebar actions and context menus ..................... 25
10.3 Working with the Workout Library ..................... 25
10.4 Setting up and starting a workout ...................... 25
11 TRAINING VIEW CHARTS ............ 26
12 CONFIGURING ........................ 27
12.1 General .............................................. 27
12.2 Athlete ............................................... 27
12.3 Passwords ............................................ 27
12.4 Appearance........................................... 27
12.5 Data Fields ........................................... 27
12.6 Metrics ............................................... 27
12.7 Train Devices ......................................... 27
A - Supported Devices, Formats & Services. . . . 28
B - Metrics Reference ........................ 29
B - Data Filtering Reference.................. 30
C - Glossary & Resources .................... 31
D - OS Specifics (Directories, Drivers and
Permissions) ............................ 32
Index ....................................... 33
Chapter 1: WELCOME TO GOLDENCHEETAH 1
1 WELCOME TO GOLDENCHEETAH
GoldenCheetah is an open source program for cyclists.
In fact, it is primarily a program for cyclists with a power meter. It provides functions to
download, import, edit, upload and analyse rides containing power data.
It can be used to analyse bike rides that do not contain power, perhaps containing speed,
cadence or GPS data. It can be used to analyse other kinds of workouts, perhaps run or
swim activities. It can be used purely as a log or journal for any activity.
GoldenCheetah is primarily an open source program for cyclists that own a power meter.
In addition to the post-workout analysis it can also be used as a desktop application to
record and monitor workouts on a cycle trainer. It captures telemetry from ANT+sensors
and can also work directly with Bike trainers that provide the right kind of interface.
In this manual we will be explaining how to use and configure the functions within Gold-
enCheetah. We will be describing it from the perspective of a bike rider. In all cases we will
be describing how the functions within GoldenCheetah work, and how to configure them.
This is not a manual on how to train with power. We would urge you to read other books for
that kind of information and would recommend ‘Racing and Training with a Power Meter’
by Dr Andrew Coggan and Hunter Allan.
1.1 About this latest version, V3.0
This manual has been written as a companion to the latest release of GoldenCheetah, v3.0.
Released in Spring 2013, it represented an overhaul of the code and was a major update.
If you are new to GoldenCheetah then all the functions it provides will be new to you, but
for existing users, version 3.0 had introduced;
500+bug fixes and minor enhancements
It fixed 46 serious issues and over 400 bugs in over 1,500 different commits. GoldenCheetah
is now over 120,000 lines of code. In addition to addressing stability issues it also addressed
a number of performance related issues. Whilst the new metric functionality and database
means that a modern PC is recommended, the code is still efficient enough to run on a
netbook.
Redesigned UI and UX
One of the most immediate changes you will notice with v3.0 are the major changes to the
user experience and user interface. From the initial help screens for new users through to the
redesigned preferences pane for advanced users, it is more complete and more professional.
Chapter 1: WELCOME TO GOLDENCHEETAH 2
There are 4 views available with specific and detailed sidebars for performance tracking
(home), short term tracking (diary) as well as the well known analysis and training views
from earlier releases.
It now allows you to view charts tabbed and tiled, you can resize and move charts around
and customise them using roll-over controls. The activity list is fully configurable and can
be configured to show any number of columns.
Support for the latest bike computers
It supports direct download features for the Cyclops Joule and Joule GPS as well as the
latest SRM Powercontrol 6 and 7. We also added support for the O-sync Macro and Macro
X.
Support for more telemetry
Alongside the support for the latest bike computers it also added the ability to track and
plot new data series, including; Headwind, LR Balance, Temperature and Slope.
Export and Batch Export as well as lots of new file formats
It will now export and batch export your data to a wide variety of file formats include TCX,
PWX, JSON and XML as well as FITLOG and GPX.
It also supports reading files from SportTracks, GPX, Tacx CAF and the SLF/SMF file
formats. We have also added legacy WKO+file format support (CP 1.0 and 1.1) as well as
import of Wattbike TXT exports.
Support for a wide selection of internet services
It can upload and download data from; Withings, Zeo, Strava, TrainingPeaks, Training
Stage Buch, RideWithGPS as well as Internet based calendars (calDAV) such as Google
Calendar.
Realtime training significantly enhanced
Support has been added for native ANT+removing the need for quarqd. Video Playback is
built in using VLC/QTKit. It now has a media library to organise and reference any video
content you may have from Tacx Ergvideos through Sufferfest.
It supports Virtual Power for popular devices from KK, LeMond and many other trainers.
We have added support for the amazing new Wahoo Fitness Kickr trainer as well as the old
Tacx Fortius.
It also introduces new ways to ride on the trainer including; Streetview, SpinScan (on
Computrainer) and an enhanced Workout Plot that plots telemetry against the workout as
you ride.
Chapter 1: WELCOME TO GOLDENCHEETAH 3
It also includes Computrainer calibration, a workout wizard and download from ErgDB as
well as Multi-device Support allowing you to ride with with your ANT+powermeter on
your Computrainer, Kickr or Fortius.
Advanced search and data filtering
It introduces free text search across all activities and a data filter (using the same search
box) to filter activities with specific properties. Some examples of using the filter might be
finding all rides with a TSS >300 or perhaps those with an IF >0.9 and a duration of >1hr.
The search and filter functions can be applied to the charts – which means that you can
plot a PMC only where sport is "Bike"or perhaps power distribution but only where the
workout code is FTPTEST.
Lots of new charts
It provides a new HR to Power analysis chart as well as a more utilitarian 2d scatter plot.
It will also use Bing as map provider for the Map chart.
The histogram and CP curve plots will now plot data for a date range rather than for a
specific ride and it will also now plot a mean max curve for HR, Power, Speed, Cadence,
xPower, VAM and NP.
New metrics, including TrainingPeaks’ TSS and NP
The TrainingPeaks metrics have been added to both the analysis functions as well as the
training functions (e.g. track TSS as you ride the trainer).
There are now over 100 different metrics and measures you can work with including things
like; Pace, Maximums, Gradient, VAM, wpk, time in HR Zones and many, many more.
1.2 Open Source
GoldenCheetah is an open source program. This means the source code is freely available
to download and compile. You can add new features and fix bugs. All we ask is that you
then share your work back to the main project.
This is how GoldenCheetah has developed since it was first created in 2006. Over 50
different people have contributed new features and fixes in the 7 years since then.
Mailing list
As you would expect there is an active community of users and developers, you can join the
discussion and contribute. The main GoldenCheetah website is www.goldencheetah.org
and the main mailing list is hosted on Google Groups and is called golden-cheetah-users.
Chapter 1: WELCOME TO GOLDENCHEETAH 4
Reporting bugs and requesting new features
The code is hosted in a repository at GitHub. Github is an internet service hosting open
source and commercial code repositories for thousands of projects. In addition to hosting
projects GitHub also provides an issue tracker.
The issue tracker URL is: github.com/GoldenCheetah/GoldenCheetah/issues.
We use the GitHub issue tracker to manage all bug reports and feature requests. If you are
looking for a new feature or have experienced a problem using the software then you should
consider raising it on the issue tracker.
As a non-developer one of the most valuable contributions you can make to the project is
to provide accurate and informative bug reports. This makes it easier for the developers to
fix the code and in turn makes the software better for everyone.
1.3 Bit of Past and Present
In early 2006 a Cat 1 racer called Sean Rhea bought a Powertap. Back then power meters
were not very common. They certainly weren’t very open. The software options were very
limited. But Sean was a bit of a geek.
He set about reverse engineering the protocol the Powertap used to communicate with the
PC and he developed a couple of command line utilities in the C programming language;
‘ptdl’ and ‘ptunpk’. These utilities downloaded data from a Powertap via its serial interface
saving to ‘raw’ files on disk, and then read that raw file and formatted the output for
inputting into GNU plot.
But it soon became clear that using the command line was not at all user friendly. A GUI
was going to be required. And so, in late 2006 Sean set about writing a GUI version using
the QT framework and moving to the C++ language (because he needed to learn QT for his
new job).
This early version had the main charts you see today, indeed a lot of that early code is still
present. It could plot the ride, histograms and the CP curve that it is famous for.
From 2007 with Sean leading many new people became involved and new features were
introduced; support for SRM using the libsrm project written by Rainer Clasen. Support
for Linux, Windows, Metrics, File Formats, Power Zones and a large number of new charts
including a Performance Manager written by Eric Murray. Google Map written by Greg
Lonnon.
During this time the project moved from a ‘hack’ project to a fully fledged open source de-
velopment project and saw Jamie Kimberley, Robert Carlsen and Justin Knotzke assist Sean
in managing development with the introduction of a bugs database and more formalised
releases for Linux, Mac and Windows.
In Summer 2009 a lot of the current developers joined the project, notably Damien Grauser
who added much needed support for interval analysis and Mark Liversedge who contributed
WKO+file support and the 3d plot. Over the next 12 months v2.0 was developed intro-
ducing the training View (with Justin Knotzke) as well as the editor and tools, metadata
and long term plotting charts.
Chapter 1: WELCOME TO GOLDENCHEETAH 5
At the tail end of 2010 Sean handed leadership of the project to Mark. Sean was no longer
racing and most develpoment was now being delivered by others anyway. So in January
2011 Mark merged a number of features that were being developed in private into the main
repository and thus V3 development began.
In Spring 2013, after 3 years of development version 3 was released, along with this user
guide.
Version 3 is a landmark release and provides a platform for future development - the modular
views and configurable layouts means it will be very easy to introduce new functionality
and concepts without needing to adjust the underlying code. In short, v3 provides a future
platform.
1.4 Future Plans
Version 3.1 is already being planned and the high priority features include;
•Planning functions centred around the concept of an interactive performance manager
chart where you set target events and physical adaptations or performance targets with
a progression of daily stress and long term stress.
•Interval Analysis and Comparison across separate rides, to compare efforts and track
and rank performance in intervals or ‘segments’ of rides and routes.
•Season by Season progression to compare and rank performance development in cycles
and seasons across the long term charts, but also the critical power and distribution
charts.
•Separation of the training view into a separate program ‘OpenTrainer’ to enable more
advanced graphical displays including video with overlay and animations.
Version 3.1, hopefully, will not take so long to come to fruition and is currently targetted
for Spring 2014.
Chapter 2: QUICK START GUIDE 6
2 QUICK START GUIDE
For those of you that are new to GoldenCheetah this section gets you up and running with
the software and using its basic features. For those of you with experience of GoldenCheetah
from previous releases, you might like to skip this chapter.
2.1 Downloading and Installing
There are four ways to get GoldenCheetah onto your PC and available for use:
•Download a Stable release build - We maintain a stable release binary for download and
installation on the GoldenCheetah website, at www.goldencheetah.org/download.
•Download a Development build - We also provide regular build updated of the very
latest code on the GoldenCheetah development build website, at www.stand2surf.net.
•Build from Source - Since we provide the source code for the program you can get the
source from GitHub and build your own. But unless you plan on contributing to the
project this is probably a pointless exercise. You could just use the pre-built binaries
described above.
•Apt-get install - If you are running a Linux distro you can get the GoldenCheetah
binary and dependencies installed via apt-get. It is worth noting that at the time of
writing the V3 build has not yet been packaged.
Once you have the binary installed you can go ahead and run it, it doesn’t need any
configuration before you start.
2.2 Running for the first time
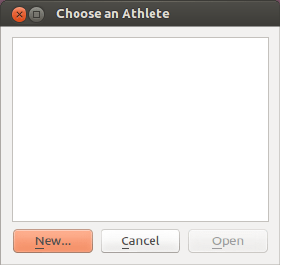
When you run GoldenCheetah for the very first time it will prompt you with the Athlete
selection dialog box. In GoldenCheetah we allow you to create as many athletes as you
like. This may sound like it is only useful for coaches, but in fact you may want to set up
a scratch athlete to play and learn.
Either way in this first run you will not have an athlete created, and will see a blank dialog,
asking you to select or create an athlete to work with:
Figure 1: Initial Dialog
Chapter 2: QUICK START GUIDE 7
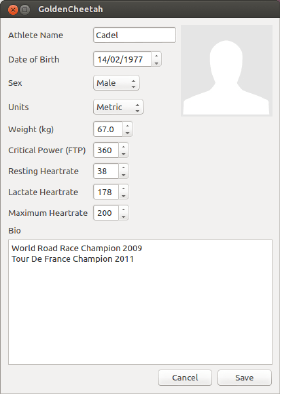
At this point you should go ahead and click ‘New...’. This will open another dialog window
to create a new athlete and set some basic data.
Figure 2: New Athlete Dialog
Whilst it is possible to configure these values in preferences or within an individual activity
you should go ahead and set up as much of the data as accurately as possible. These values
are used as defaults in many metric calculations.
If you click on the blank athlete icon on the right it is possible to set an image for the
athlete too. This isn’t used anywhere at present, but that may change in the future.
The LTHR value is the HR at which the onset of blood lactate accumulates, whilst the CP
value is the maximum theoretical watts you can hold for an hour. It is very similar to your
FTP (if that is a term you understand).
Once you’re happy with the settings click save and you will then be able to select your new
athlete in that initial dialog (except of course there is now an athlete listed). Go ahead and
open that athlete and you wil be greeted with GoldenCheetah, but a splash page.
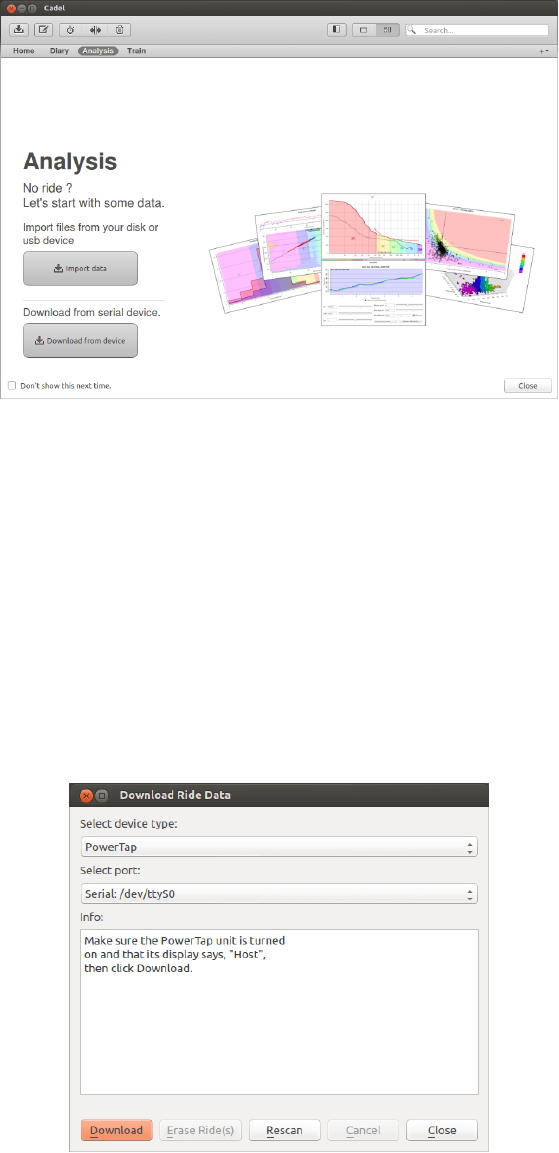
Chapter 2: QUICK START GUIDE 8
Figure 3: Analysis view splash screen
This page is shown because there is no data associated with this athlete. We need to go
ahead and download some data from your bike computer or import some data from disk or
USB.
2.3 Downloading a ride from device
If you use a Powertap, SRM, Joule, Joule GPS or Macro-X device you will be able to
download from it directly. Please make sure the device is conected and plugged in correctly.
For example, if you are downloading from a Powertap please make sure the computer is
firmly connected and displays ‘HOST’ on its screen.
Figure 4: Download Dialog
To start the download go ahead and click the download from device button. This will open
up the download dialog. Select the right kind of device and serial port before clicking on
the ‘Download’ button. If no serial port is listed, or the port is not correct you can click on
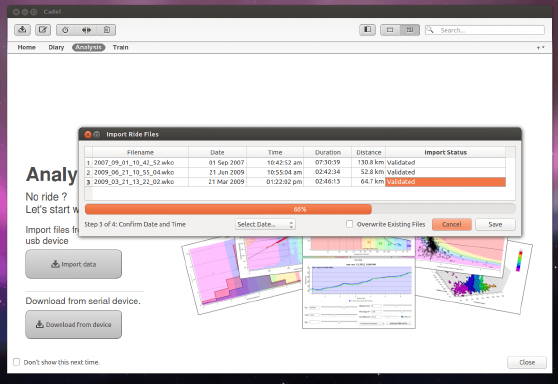
Chapter 2: QUICK START GUIDE 9
the ‘Rescan’ button to look again for your device. This is sometimes required if you click
on ‘Download’ before the device is connected.
Any ride files will then be downloaded and imported into GoldenCheetah and the splash
screen will disappear to reveal the Analysis view of GoldenCheetah. Congratulations - you
can now start using GoldenCheetah to analyse and track your performance.
2.4 Importing data from file
To import files into GoldenCheetah you have a couple of options. You can drag and drop
them from a file explorer or from the desktop into the main GoldenCheetah window, or you
can select them via the import files button on the splash screen. Once you have done either
the import activity wizard will appear to process the selected files.
Figure 5: Import Activity Wizard
You will notice that the files are opened first to ensure you have the required permissions to
read them before being validated. Once validated the dialog will prompt you to edit any of
the dates (some file formats do not include date information). Once you have set the dates
(if needed) you can click on save to complete the import and save the files to disk.
The splash screen will now disapper and reveal the main GoldenCheetah analysis view and
you can now start analysing and tracking your performance.
Chapter 3: GETTING AROUND GOLDENCHEETAH 10
3 GETTING AROUND GOLDENCHEETAH
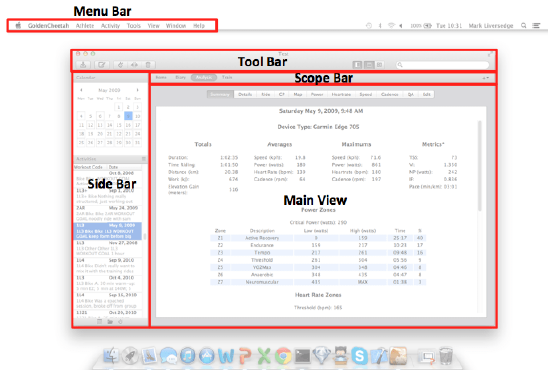
Figure 6: Main window elements
Regardless of whether you are training with your bike trainer, reviewing recent activities in
the diary or tracking long term performance in the home view, the GoldenCheetah layout
is always the same.
Looking at the figure above you will see the following components;
•Menu Bar - this contains all the menu options for GoldenCheetah. The screenshot
shown is from the Mac OSX version, but the menu bar is similar in modern Linux
distributions. On Windows the menu bar will be seen within the main window rather
than at the top of the screen.
•Tool Bar - the toolbar contains buttons to get quick access to functions that also
available within the menu bar. We place them in the toolbar because they are used
very commonly, and it is handy to be able to get at them quickly and easily.
In V3 the toolbar is biased towards functions used during analysis, but this may change
as we get more feedback from users about what they use most commonly in the other
views.
•Scope Bar - the scope bar is used to select the view. Each view offers different func-
tionality as their names suggest. Additionally there is a ‘+’ menu to the right of the
scope bar for adding charts to the view selected.
•Side Bar - the side bar contains selections and lists that are most appropriate for what
the user is currently doing. It changes as different views are selected in the scope bar.
•Main View - selected via the scope bar the main view shows the charts and windows
relevant to the view in question. Analysis View contains analysis functions and so on.
Note that the view can be shown in a tabbed style or a scrolling set of tiles.
The only time the main window looks different to that shown above is when running for
the first time or when no data is available. In this case a ‘splash’ screen is shown to assist
new users in importing data or setting up devices etc.
Chapter 3: GETTING AROUND GOLDENCHEETAH 11
3.1 The Menu Bar
The GoldenCheetah menu bar is no different to any other application. The only slight confu-
sion is the location of the preferences pane across platform. On Windows and Linux the pref-
erences pane can be found as Tools->Options whilst on a Mac it is found as GoldenCheetah-
>Preferences.
NOTE: Each menu is now explained in the section below, but depending upon the options
installed when the program was built you may not see all the menu options listed. If you
installed a stable build from the GoldenCheetah website it will have all available options
compiled in this is not the case for Development builds.
The Athlete menu
The Athlete menu is largely about opening and closing new windows. Since in GoldenChee-
tah we open a new window to work with a specific athlete (you cannot switch athlete in the
main window, you need to open another window). As a result this menu is rather trivial:
•New... - Opens the new athlete dialog we saw in the quick start guide and then proceeds
to open a
•Open... - Opens the choose athlete dialog in order that you select an athlete to open
in a new window.
•Close - Closes the current athlete window.
NOTE: When you restart GoldenCheetah it will always open the athlete you last opened,
so if you open up an athlete and close to go back to a previous window the last Athlete that
was opened will be displayed, rather than the last one you closed. You can specify which
athlete to open on the command line e.g. $ ./GoldenCheetah "Mark Liversedge".
The Activity menu
In GoldenCheetah we refer to a ride file or any file that contains data related to an exercise
you have completed as an ‘Activity’ this is because simply referring to it as a ‘ride’ wouldn’t
be valid if, for example, it was a run!
Additionally, a prescribed activity plan (e.g. 2x20 mins at L4) we refer to as a ‘workout’.
This may be confusing to users that come to us from TrainingPeaks WKO+where a workout
refers to a past activity. We refer to future activities as planned activities and past activities
as just activities.
So, this menu contains functions for working with activities – past exercises that have been
recorded and imported into GoldenCheetah.
•Download from device... - Also available from the tool bar this function opens the dialog
to download data directly from a device. We support SRM Powercontrol, Powertap
LYC, Joule and Macro-X devices.
•Import from file... - This option will open a file selecton box to select one or more files
to import. Once selected the files will be processed by the import wizard. You can also
import files by just dragging and dropping them on the analysis view.
Chapter 3: GETTING AROUND GOLDENCHEETAH 12
NOTE: If you try and drag and drop on the training view we will try and import videos
and workouts (not activities).
•Manual activity entry... - This will open up a dialog box to create a manual entry.
There is also a button on the toolbar that does this. A manual activity gives you
the opportunity to estimate time, distance, stress and other metrics for an activity
that wasn’t record (for example on a gym bike). See Section 4.1 [Importing Exporting
Downloading and Creating Data], page 19.
•Export... - Will open a dialog box to export the currently selected activity. You can
select the directory to export to and the file format to write the export as. This is
particularly useful if you want to send your data to a coach who requires data in a
format his software understands.
For example; PWX files can be read by WKO+and Garmin TCX files can be read by
almost all sports software.
NOTE: Whilst we offer FITLOG format for SportsTracks we would not recommend it,
since the fidelity of the file format is very suspect.
•Batch export... - This opens the batch export dialog, it provides the ability to select
the output directory and format to export to as well as select the activities you wish
to export. Since this functions is typically used to export data for import into another
program there is a select all option too.
•Export Metrics as CSV... - Although the metric database is a sqlite file it can be
useful to export all the metrics as a comma separated variable format to work with in
a spreadsheet. This function will export all columns and rows to a CSV file of your
choice.
•Upload to TrainingPeaks - This will upload the currently selected ride to Training-
Peaks.com. There are no options since the account and password need to be defined
in the preferences pane before you start.
•Download from TrainingPeaks... - This will open the download dialog for Training-
Peaks.com. It allows you to select the specific activities you want to download and will
match the available activities to any existing activities by examining their date and
time.
•Upload to Strava... - This opens the upload to strava dialog to allow you to select
which data series you want included.
•Download from Strava... - Download from Strava requires a Strava activity ID. Once
you provide this the activity will be downloaded and imported into your activity library.
Note that there is no option to select activities from a list since Strava do not support
this (data lock-in).
•Upload to RideWithGPS... - This will upload the currently selected ride to RideWith-
GPS.com. There are no options required.
•Upload to Trainingstagebuch... - This will upload the currently selected ride to Train-
ingStageBuch.com. The user id and password need to be configured in the preferences
pane in order for this to work.
•Save activity - We do not automatically save changes to activities, if you want to update
the activity you must save it. The metrics for the activity will only be updated when
it is saved.
Chapter 3: GETTING AROUND GOLDENCHEETAH 13
•Delete activity... - Permanently deletes the ride from the ride library. There is no undo
so use with caution. It will prompt to confirm you really mean it.
•Split activity... - Will open the split activity wizard, this wizard will allow you to find
breaks in an activity and split it into separate activities. This is of particular use when
you forget to stop recording and end up with multiple activites downloaded as a single
activity.
The Tools menu
The Tools menu contains a selection of ‘handy’ utilities, its a bit of a catch all for functions
that are either related to manipulating activities or don’t really fit in anywhere else.
•Options... - Only on Linux and Windows this opens the preferences pane. Note that
the preferences pane is an application in its own right and will remain open even when
you have closed the main windows. You can also have multiple preferences panes open
at once we recommend you do not do this.
•Critical Power Estimator... - Opens a dialog to estimate your CP based upon a short
and long power best or result from a specific test. We recommend using 3 minutes and
20 minutes since that aligns with the algorithm used (Monod/Scherer).
•Air Density (Rho) Estimator... - Opens a tool for estimating Air Density based upon
temperature and air pressure. This is useful when working with Aerolab.
•Get Withings Data... - Downloads all measures for you Withings weight scale, but the
user id and public key need to be configured in the passwords section of the preferences
pane.
•Get Zeo Data... - Downloads sleep data for your Zeo sleep monitor. You will need to
have configured the user id and pasword in the preferences pane.
•Create a new workout... - Opens the workout wizard for creating a training view
workout. This will create a ‘.erg’ or ‘.crs’ workout.
•Download workouts from ErgDB... - Opens a dialog to select and download training
view workouts from the internet ErgDB website.
•Import workouts or videos... - Opens a file dialog to select and import a workout or
video into the training view library.
•Scan disk for videos and workouts... - Opens a dialog to scan directoris for workouts
and videos and import into the training view library.
•Upload Activity to Calendar - Will create a calendar entry to any CalDAV based calen-
dar service. You will need to configure the URL, user and password in the preferences
pane before using this.
•Refresh Calendar - Will read any entries from your CalDAV internet calendar to display
on the calendar view.
•Find intervals... - Opens a dialog to find intervals in the current activity. This menu
option is here since it has always been on the tools menu. It should really be moved to
the Activity menu.
•Adjust Torque Values... - An editor tool for adjusting the torque data series. This is
useful when using a Powertap without calibrating.
Chapter 3: GETTING AROUND GOLDENCHEETAH 14
•Fix GPS Errors... - An editor tool for extrapolating and adjusting GPS values, this is
useful when your GPS device lost its satellite connection or after importing from other
software and the data contains invalide values.
•Fix Gaps In Recording... - GoldenCheetah expects all data series samples to have
timestamps separated by a consistent recording interval (e.g. every 1 second). This
tool dialog allows you to extrapolate values where there are gaps in recording. In future
releases we may remove the need for the data series to have regular timestamps.
•Fix HR Spikes... - Find and smooth out spikes in HR, usually caused by loss of
conection or iterference from overhead power lines.
•Fix Power Spikes... - Find and smooth out spikes in Power, usually caused by reed
switch being double triggered or recording interference.
The View menu
The View menu provides a menu access to the view configuration, showing and hiding UI
elements as well as switching fullscreen and adding charts to the layout.
•Toggle Full Screen - As the name suggests toggles between normal and full screen. On
Linux and Mac this is also available from the F11 key (and you can use the ESC key
to leave full screen mode too). On Mac Lion we use the standard toolbar button for
switching between normal and full screen mode.
•Show Left Sidebar - Toggles the display of the sidebar.The button on the toolbar also
does the same. You can also drag and close the sidebar by hand.
•Show Toolbar - Toggles showing or hiding the tool bar.
•Tabbed View - Toggles tabbed or tiled mode for the current view.
•Analysis - Switch to the Analysis view.
•Home - Switch to the Home view.
•Train - Switch to the Training view.
•Diary - Switch to the Diary view.
•Add Chart - Opens a submenu to select a chart to add. When selected an add chart
dialog will be open showing the chart and allowing you to adjust the chart settings
before it is added to the current view.
•Reset Layout - Will reset the current view layout to the application default. This is
useful if you spoil your setup, or want to fall back to the current application default.
Note that the application default will change and improve over time.
The Window menu
Simply lists the current windows you have open and allows you to select the window to
raise and make the current window focus.
Chapter 3: GETTING AROUND GOLDENCHEETAH 15
3.2 The Toolbar and Scope bar
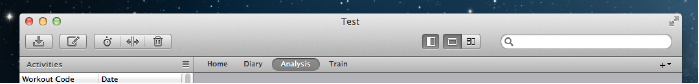
Figure 7: Tool Bar and Scope Bar
Working from left to right in the toolbar, there are a number of buttons to download and
import activities that are mostly relevant to the analysis view; and lastly a search box;
•Download Activity - Will open a dialog to download an activity from a supported
device (including Powertap Cervo, SRM Powercontrol, O-Synce Macro, Saris Joule).
•Compose Manual Activity - Will open a dialog to manually enter an activity, for
example when you worked out at a gym and could not record the data.
•Find Intervals - Will open a dialog to find peak and best intervals in an activity.
•Split Activity - Will open a dialog to split an activity into separate activities. This is
useful when you have an activity that spans mutiple days.
•Delete Activity - Deletes the currently selected activity. Will prompt the user to
confirm before doing so.
Then to the right of the toolbar there are a trio of buttons to control the way the main
window is laid out;
•Show/Hide Sidebar - Will toggle the visibility of the sidebar, if it is hidden it will how
it. If it is shown it will hide it.
•Tabbed Mode - Switch the main view into tabbed mode. See Views and the Sidebar
below.
•Tiled Mode - Switch the main view into tiled mode. See Views and the Siidebat below.
Lastly to the right of the toolbar there is a search/filter box;
•Mac OSX only Search box - On a Mac the search box is limited to text search only,
this may change as it means one cannot use it to filter the activity list with a data
filter.
•Windows/Linux Search/Filter box - On Windows and Linux the search box can be
toggled between a search box and filter box by clicking on the search or filter icon
inside the box (and to the left hand side). See searching and filtering below for more
details.
Beneath the toolbar is the scope bar, this is a selector to choose from one of four views in
main view – essentially its a selector for choosing what you want to do with GoldenCheetah,
it offers four views;
•Home - The home view is for long term tracking and allows you to work with charts
that plot and analyse metrics. It is intended to be used to reviewing progress and
identify what is and is not working (or perhaps historically, what has worked and what
hasn’t).
In this view the scope is generally limited to the date range or season selected in the
associated sidebar – the currently selected ride is not relevant in this view.
Chapter 3: GETTING AROUND GOLDENCHEETAH 16
•Diary - The diary view is for tracking recent rides - looking at the data in terms of the
last day, week or month. As planning functions arrive in v3.1 this view will become
more funcitonally rich, but for now it is more or less a configurable version of the old
Weekly Chart.
In this view the scope is limited to the day, week or month of the currently selected
activity. As you select different activities the date range changes to reflect this.
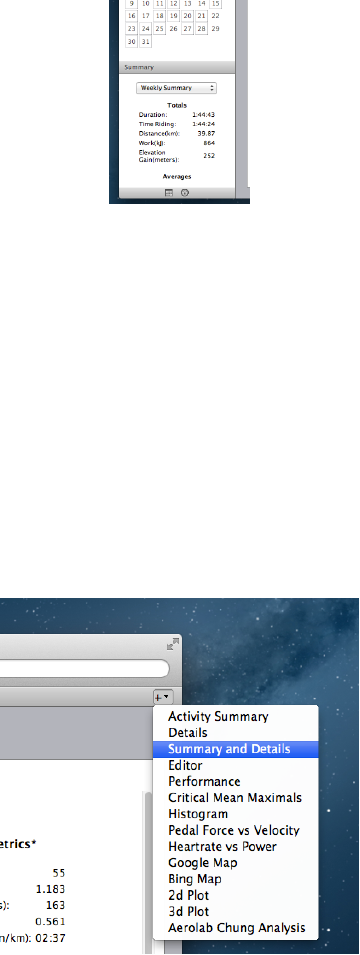
To select the summarisation level (day, week or month) the summary sidebar contains
a drop down selector. See Figure 8 below.
Figure 8: Summary level selector
•Analysis - The analysis view is where you review and analyse individual activities. As
well as using the numerous analysis charts you can also edit and adjust the telemetry
data within the activities and add your own narratives and texts. The narrative fields
are configurable to your tastes, see ‘Metadata’ in chapter 4.
In this view the scope is limited to the currently selected activity in the sidebar.
To the right of the scope bar is a ‘+’ menu button;
•Add Chart (‘+’) Menu - The charts on each view can be configured and added or
deleted. The ‘+’ menu to the right of the scope bar lists all the charts that are available
for the currently selected view, see Figure 9 below. Selecting a chart from this menu
will open the add chart dialog, which is described below in the secion Adding and
adjusting charts.
Figure 9: The ‘+’ Add Chart Menu
Chapter 3: GETTING AROUND GOLDENCHEETAH 17
NOTE: Only the windows that are relevant for the current view will be listed. You
cannot, for example, add a long term metric chart to the analysis view, or a performance
chart (all plot) to the diary view.
3.3 Views & Sidebar
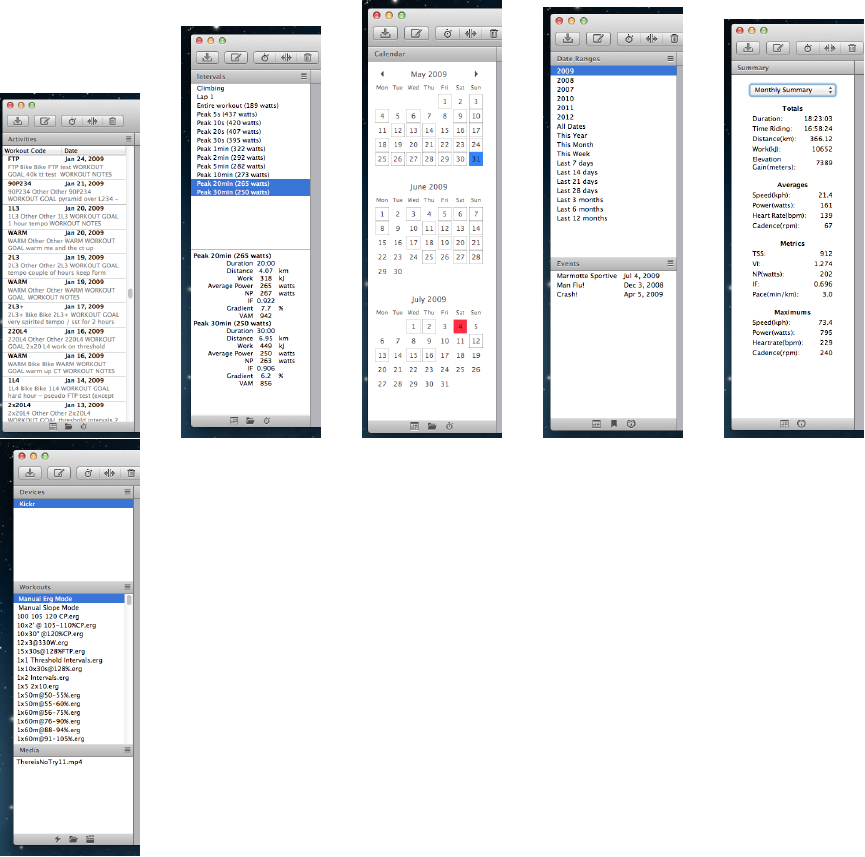
Figure 10: Sidebars
scopebar, sidebar, tab/tiled, add chart menu
Chapter 3: GETTING AROUND GOLDENCHEETAH 18
3.4 Searching and Filtering
free text search and basics of data filtering
3.5 Adding and adjusting charts
the dialog, title, settings, finding them again
3.6 Going fullscreen
key sequences, hiding and showing the toolbar screensaver?
3.7 The Metric database
why, what, where, refreshing, exporting
Chapter 4: IMPORTING EXPORTING DOWNLOADING AND CREATING DATA 19
4 IMPORTING EXPORTING DOWNLOADING
AND CREATING DATA
4.1 Download from device
download dialog, basics for each device (plugging in etc)
4.2 Import from file
selecting a file, the import wizard
4.3 Manual activity
the manual activity dialog and refer to details screen for more "indepth"(need a better
word) stuff
4.4 Exporting data
i A single ride ii Multiple rides
4.5 Uploading and Downloading from the Cloud
i TrainingPeaks ii Strava iii TrainingStage Buch iv RideWithGPS
Chapter 5: THE ANALYSIS VIEW 20
5 THE ANALYSIS VIEW
5.1 About Activities and Intervals
5.2 Sidebar actions and context menus
o activities o intervals
5.3 Editing and adjusting data
o using the editor i basics ii anomalies iii find o advanced editor functions i the ‘fix’ tools ii
copying, cutting and pasting
Chapter 6: ANALYSIS VIEW CHARTS 21
6 ANALYSIS VIEW CHARTS
i Activity Summary ii Details iii Summary and Details iv Editor v Performance vi Critical
Mean Maximals vii Histogram viii Pedal Force vs Velocity ix Heartrate vs Power x Google
Map xi Bing Map xii 2d Plot xiii 3d Plot xiv Aerolab Chung Analysis
Chapter 7: THE HOME VIEW 22
7 THE HOME VIEW
7.1 About Date Ranges, Seasons and Events
Chapter 8: PERFORMANCE TRACKING CHARTS 23
8 PERFORMANCE TRACKING CHARTS
i Long Term Metrics - indepth howto incl. setting up a PMC++ ii Performance Manager iii
Collection TreeMap iv Critical Mean Maximal v Distribution
Chapter 9: THE DIARY VIEW 24
9 THE DIARY VIEW
9.1 Purpose
9.2 Summarising for Day / Week / Month
9.3 Longer term purpose (planning)
Chapter 10: THE TRAIN VIEW 25
10 THE TRAIN VIEW
10.1 About Devices, Workouts and Video
10.2 Sidebar actions and context menus
o devices o workouts o media
10.3 Working with the Workout Library
- Creating a new Workout - Getting Workouts from ErgDB
10.4 Setting up and starting a workout
- Using CT handlebar controller - controlling workout from mouse +keyboard
Chapter 11: TRAINING VIEW CHARTS 26
11 TRAINING VIEW CHARTS
i Telemetry ii Workout iii Realtime iv Pedal Stroke v Map vi StreetView vii Video Player
Chapter 12: CONFIGURING 27
12 CONFIGURING
Intro and explain opening the Preferences Pane
12.1 General
12.2 Athlete
i About ii Power Zones iii HR Zones
12.3 Passwords
i General ii Withings iii Zeo iv Google Calendar (calDAV)
12.4 Appearance
12.5 Data Fields
i Fields ii Notes Keywords iii Processing
12.6 Metrics
12.7 Train Devices
i Using Multiple Devices ii Adding a device
A - Supported Devices, Formats & Services 28
A - Supported Devices, Formats & Services
B - Metrics Reference 29
B - Metrics Reference
B - Data Filtering Reference 30
B - Data Filtering Reference
C - Glossary & Resources 31
C - Glossary & Resources
D - OS Specifics (Directories, Drivers and Permissions) 32
D - OS Specifics (Directories, Drivers and
Permissions)
Index 33
Index
(Index is nonexistent)
