National Information Display Laboratory Plasma Panel Get TRDoc?Location=U2&doc=Get TRDoc
User Manual: Plasma Display Panel
Open the PDF directly: View PDF ![]() .
.
Page Count: 48
- Tel: (609) 951-0150
- Fax: (609) 734-2313
- NIDL IEC Monitor Certification Report
- Section I INTRODUCTION
- I.1 The Pioneer PDP-502MX Plasma Display Panel
- Additional Information Supplied by Manufacturer
- *These values have individually adjusted high and low levels. Once adjusted, color balance settings can be set into one of two color memories for each type of input. All of these adjustments can be done via a wireless remote or RS-232C control.
- I.2. Initial Monitor Set Up
- I.3. Equipment
- Section II PHOTOMETRIC MEASUREMENTS
- II.1. Dynamic range and Screen Reflectance
- II.2. Maximum Luminance (Lmax)
- II.3. Luminance (Lmax) and Color Uniformity
- II.4. Halation
- II.5. Color Temperature
- II.6. Bit Depth
- II.8. Luminance Step Response
- II.9. Addressability
- II.10. Pixel Aspect Ratio
- II.11. Screen Size (Viewable Active Image)
- II.12. Contrast Modulation and RAR
- II.13. Pixel Density
- II.14. Moiré
- II.15. Straightness
- II.16. Refresh Rate
- II.17. Extinction Ratio
- II.18. Linearity
- II.19. Jitter/Swim/Drift
- II.20. Warm-up Period
NIDL
NIDL evaluated the thin, large screen, flat panel Pioneer 50 inch plasma display
panel (PDP) to determine its usefulness to the display of images that are of
interest to imagery analysts and GI specialists. As NIDL’s ratings show, the
Pioneer PDP-502MX is not going to be useful as the primary imagery analysis
display on an IEC workstation. It fails many of the IEC requirements so we rate
it “F” for IEC workstation monoscopic and stereo applications. Rather, its
usefulness comes from its large, 50 inch diagonal size and its high pixel count
for a PDP, up to 1280 x 768 pixels in the 16:9 and 1024 x 768 pixels in the 4:3
format, that could make it appropriate for group conference discussions. The
Pioneer PDP-502MX has a relatively good gray scale capability; it can display
245 of 256 differences in input levels for a 7.94 bit depth. Its linearity surpasses
that we have measured for CRT monitors, and comes about because of its
precisely formed pixel structure. This pixel structure, like in LCD monitors, can
have several non-operating pixels. It has a very high (exceeds 60% over the
entire screen) and a very uniform 1-pixel-on/1-pixel-off contrast modulation for
both the horizontal and vertical directions. The PDP can have a maximum
luminance up to 40 fL for a small patch of white, and a minimum luminance of
0.2 fL. For full screen white, its luminance is 18 fL, limited by internal circuitry
to minimize panel heat generation and its luminance is more uniform than a
CRT monitor. The reflectivity and viewing angle are about the same as for a
CRT monitor. It has a capability to do stereo imaging at 43 Hz per eye, which is
on the borderline of visible flicker, and its dynamic range in stereo is good. The
extinction ratio is poor, and is probably limited by the long persistence of the
green phosphor. Most who have seen the Pioneer PDP-502MX would love to
have one, at least for football games. The price is about $18,000.
Evaluation of the
Pioneer PDP-502MX
4 x 3 Aspect Ratio, 50 inch Diagonal
Color Plasma Display Panel
National Information Display Laboratory
P. O. Box 8619
Princeton, NJ 08543-8619
Tel: (609) 951-0150
Fax: (609) 734-2313
e-mail: nidl@nidl.org
Publication No. 730081200-116
December 30, 2000
NOTICE:
The National Information Display Laboratory (NIDL) at the Sarnoff Corporation prepared this report. Neither the
NIDL nor any person acting on their behalf:
A. Makes any warranty or representation, expressed or implied, with respect to the use of any information contained
in this report, or that the use of any information, apparatus, method, or process disclosed in this report is free from
infringement of any third party rights; or
B. Makes any endorsement of any of the products reported on herein; or
C. Assumes any liabilities with respect to the use of, or for damages resulting from the use of, any information,
apparatus, method, or process disclosed in this report.
Report Documentation Page
Report Date
30 Dec 2000 Report Type
N/A Dates Covered (from... to)
-
Title and Subtitle
Evaluation of the Pioneer PDP-502MX 4 x 3 Aspect Ratio,
50 Inch Diagonal Color Plasma Display Panel
Contract Number
Grant Number
Program Element Number
Author(s) Project Number
Task Number
Work Unit Number
Performing Organization Name(s) and Address(es)
National Information Display Laboratory P.O. Box 8619
Princeton, NJ 08543-8619
Performing Organization Report Number
Sponsoring/Monitoring Agency Name(s) and
Address(es) Sponsor/Monitor’s Acronym(s)
Sponsor/Monitor’s Report Number(s)
Distribution/Availability Statement
Approved for public release, distribution unlimited
Supplementary Notes
Per conversation with Ronald Enstrom this document is public release, The original document contains color
images.
Abstract
Subject Terms
Report Classification
unclassified Classification of this page
unclassified
Classification of Abstract
unclassified Limitation of Abstract
UU
Number of Pages
44

Pioneer PDP-502MX 50 inch Color Plasma Display Panel -i-
Use or disclosure of data on this sheet is subject to the restrictions on the cover and title of this report.
CONTENTS
NIDL IEC Monitor Certification Report............................................................. ii
Evaluation Datasheet............................................................................................ iii
Section I INTRODUCTION .................................................................................1
I.1 The Pioneer PDP-502MX Plasma Display Panel............................................2
Additional Information Supplied by Manufacturer ........................................3
I.2. Initial Monitor Set Up.....................................................................................4
I.3. Equipment .......................................................................................................4
Section II PHOTOMETRIC MEASUREMENTS..............................................5
II.1. Dynamic range and Screen Reflectance ......................................................5
II.2. Maximum Luminance (Lmax) .....................................................................7
II.3. Luminance (Lmax) and Color Uniformity...................................................9
II.4. Halation ..................................................................................................... 11
II.5. Color Temperature .................................................................................... 13
II.6. Bit Depth ................................................................................................... 14
II.8. Luminance Step Response ........................................................................ 18
II.9. Addressability ........................................................................................... 21
II.10. Pixel Aspect Ratio..................................................................................... 22
II.11. Screen Size (Viewable Active Image) ...................................................... 23
II.12. Contrast Modulation and RAR ................................................................. 24
II.13. Pixel Density ............................................................................................. 27
II.14. Moiré ......................................................................................................... 28
II.15. Straightness ............................................................................................... 29
II.16. Refresh Rate .............................................................................................. 32
II.17. Extinction Ratio ........................................................................................ 33
II.18. Linearity .................................................................................................... 36
II.19. Jitter/Swim/Drift ....................................................................................... 39
II.20. Warm-up Period ........................................................................................ 41

ii- NIDL
Use or disclosure of data on this sheet is subject to the restrictions on the cover and title of this report.
NIDL IEC Monitor Certification Report
The Pioneer PDP-502MX Plasma Display Panel
FINAL GRADES
Monoscopic Mode: F
Stereoscopic Mode: F
A = Substantially exceeds IEC Requirements; B = Meets IEC Requirements; C = Nearly
meets IEC Requirements; F = Fails to meet IEC Requirements in a substantial way.
NIDL evaluated the thin, large screen, flat panel Pioneer 50 inch plasma display panel (PDP) to
determine its usefulness to the display of images that are of interest to imagery analysts and GI
specialists. As NIDL’s ratings show, the Pioneer PDP-502MX is not going to be useful as the
primary imagery analysis display on an IEC workstation. It fails many of the IEC requirements so
we rate it “F” for IEC workstation monoscopic and stereo applications. Rather, its usefulness
comes from its large, 50 inch diagonal size and its high pixel count for a PDP, up to 1280 x 768
pixels in the 16:9 and 1024 x 768 pixels in the 4:3 format, that could make it appropriate for
group conference discussions. The Pioneer PDP-502MX has a relatively good gray scale
capability; it can display 245 of 256 differences in input levels for a 7.94 bit depth. Its linearity
surpasses that we have measured for CRT monitors, and comes about because of its precisely
formed pixel structure. This pixel structure, like in LCD monitors, can have several non-
operating pixels. It has a very high (exceeds 60% over the entire screen) and a very uniform 1-
pixel-on/1-pixel-off contrast modulation for both the horizontal and vertical directions. The PDP
can have a maximum luminance up to 40 fL for a small patch of white, and a minimum
luminance of 0.2 fL. For full screen white, its luminance is 18 fL, limited by internal circuitry to
minimize panel heat generation and its luminance is more uniform than a CRT monitor. The
reflectivity and the viewing angle are about the same as for a CRT monitor. It has a capability to
do stereo imaging at 43 Hz per eye, which is on the borderline of visible flicker, and its dynamic
range in stereo is good. The extinction ratio is poor, and is probably limited by the long
persistence of the green phosphor. Most who have seen the Pioneer PDP-502MX would love to
have one, at least for football games. The price is about $18,000.

Pioneer PDP-502MX 50 inch Color Plasma Display Panel -iii-
Use or disclosure of data on this sheet is subject to the restrictions on the cover and title of this report.
Evaluation Datasheet
Pioneer PDP-502MX Plasma Display Panel Monitor
Mode IEC Requirement Measured Performance Compliance
MONOSCOPIC
Addressability 1024 x 1024 min. 1024 x 768 * Fail
Dynamic Range 24.7dB 19.2 dB Fail
Luminance (Lmin) 0.1 fL ± 4% min. 0.210 fL Fail
Luminance (Lmax) 30 fL, min 17.6 fL, full screen
40.1 fL 20% of screen size
Fail
Uniformity (Lmax) 20% max. 4.4% Pass
Halation 3.5% max. 6.62% ± 0.3 Fail
Color Temp 6500 to 9300 K 6513 Pass
Reflectance Not specified 5.14% N/A
Bit Depth 8-bit± 5 counts 7.94 effective bits Fail
Step Response No visible ringing Smearing Fail
Uniformity (Chromaticity) 0.010 delta u'v' max.
± 0.005 delta u’v’
0.006 delta u'v' Pass
Pixel Aspect Ratio Square
H = V± 6%
21.58 H x 20.32 V (mils)
H = V+ 6.2%
Fail
Screen Size, viewable diagonal 17.5 to 24 inches
± 2 mm
42 inches as tested
50 inches maximum
Fail
Cm, Zone A, 7.6" 25% min. 63% Pass
Cm, Zone A, 20.7” 25% min. 62% Pass
Cm, Zone B 20% min. 62% Pass
Pixel Density 72 ppi min. 30 H x 32 V ppi Fail
Moiré, phosphor-to-pixel spacing 1.0 max 1.0 Pass
Straightness 0.5% max
± 0.05 mm
0.05% Pass
Linearity 1.0% max
± 0.05 mm
0.04% Pass
Jitter 2 ± 2 mils max. 0.74 mils Pass
Swim, Drift 5 ± 2 mils max. 0.65 mils Pass
Warm-up time, Lmin to +/- 50% 30 mins. Max
± 0.5 minute
<1.0 mins. Pass
Warm-up time, Lmin to +/- 10% 60 mins. Max
± 0.5 minute
<1.0 min. Pass
Refresh 72 ±1 Hz min.
60 ±1 Hz absolute min.
Set to 75Hz Pass
STEREOSCOPIC
Addressability 1024 x 1024 min. 1024 x 768 interlaced
1024 x 384 per eye
Fail
Lmin 0.1 fL 0.21 fL Fail
Lmax 6 fL min ± 4% 2.26 fL Fail
Dynamic range 17.7 dB min 20.3 dB Pass
Uniformity (Chromaticity) 0.02 delta u'v' max
± 0.005 delta u’v’
0.007 delta u'v' Pass
Refresh rate 60 Hz per eye, min 43 Hz per eye Fail
Extinction Ratio 15:1 min 1.6:1 Fail
* As tested in 4:3 mode. Native addressability is 1280 x 768 pixels in 16:9 mode.

Pioneer PDP-502MX 50 inch Color Plasma Display Panel -1-
Use or disclosure of data on this sheet is subject to the restrictions on the cover and title of this report.
Section I INTRODUCTION
The National Information Display Laboratory (NIDL) was established in 1990 to bring together
technology providers - commercial and academic leaders in advanced display hardware, softcopy
information processing tools, and information collaboration and communications techniques -
with government users. The Sarnoff Corporation in Princeton, New Jersey, a world research
leader in high-definition digital TV, advanced displays, computing and electronics, hosts the
NIDL.
The present study evaluates a production unit of the Pioneer PDP-502MX Plasma Display Panel.
This report is intended for both technical users, such as system integrators, monitor designers,
and monitor evaluators, and non-technical users, such as image analysts, software developers, or
other users unfamiliar with detailed monitor technology.
The IEC requirements, procedures and calibrations used in the measurements are detailed in the
following:
• NIDL Publication No. 0201099-091, Request for Evaluation Monitors for the National
Imagery & Mapping Agency (NIMA) Integrated Exploitation Capability (IEC), August 25,
1999.
Two companion documents that describe how the measurements are made are available from the
NIDL and the Defense Technology Information Center at http://www.dtic.mil:
• NIDL Publication No. 171795-036 Display Monitor Measurement Methods under
Discussion by EIA (Electronic Industries Association) Committee JT-20 Part 1:
Monochrome CRT Monitor Performance Draft Version 2.0. (ADA353605)
• NIDL Publication No. 171795-037 Display Monitor Measurement Methods under
Discussion by EIA (Electronic Industries Association) Committee JT-20 Part 2: Color CRT
Monitor Performance Draft Version 2.0. (ADA341357)
Other procedures are found in a recently approved standard available from the Video Electronics
Standards Association (VESA) at http://www.vesa.org:
• VESA Flat Panel Display Measurements Standard, Version 1.0, May 15, 1998.
The IEC workstation provides the capability to display image and other geospatial data on either
monochrome or color monitors, or a combination of both. Either of these monitors may be
required to support stereoscopic viewing. Selection and configuration of these monitors will be
made in accordance with mission needs for each site. NIMA users will select from monitors
included on the NIMA-approved Certified Monitor List compiled by the NIDL. The color and
monochrome, monoscopic and stereoscopic, monitor requirements are listed in the Evaluation
Datasheet.

-2- NIDL
Use or disclosure of data on this sheet is subject to the restrictions on the cover and title of this report.
I.1 The Pioneer PDP-502MX Plasma Display Panel
Pioneer’s Specifications
According to Pioneer, the specifications for the Pioneer PDP-502MX Plasma Display Panel are:
TYPE PDP 256 gray scale, 16.7 million colors
Pixels 1280 (Horizontal.) x 768 (Vertical.)
Pixel Pitch 0.858mm (Hor/RGB trio) x 0.808mm (Ver)
Display Area 50" diagonal viewable area
Aspect Ratio 4:3 and 16:9
Viewing Angle < 160 degrees horizontal, < 160 degrees vertical
VIDEO INPUT Standards Composite, Y/C & S-Video, RGBHV, Analog RGB
3.58 NTSC, PAL, SECAM, 4.43 NTSC, SDTV,
HDTV, VESA DDC 1/2B
Compatibility PC, Mac®, 640 x 400 up to 1600 x 1280
Frequency Fhorizontal is 24.8-91.1kHz, Fvertical is 56-85Hz,
and 35.5 and 46.4 kHz, 43Hz interlace
AUDIO Speakers Two 12-watt (optional on sides, adds 11 lbs. 14 oz.)
Amplifier 2W+2W Stereo
CONNECTORS Video BNC, Mini DIN 4 pin, Mini D-sub 15 pin, BNC
(x5)
Audio 2 pin jacks for audio in, Stereo mini jack for audio
in, stereo mini jack for audio out
Controls RS-232C D-sub, 9-pin, In/Out Mini-DIN, 6 pin;
In/Out Monaural mini-jack (x2)
POWER Input 100-120VAC 50/60Hz
Consumption 470W, Standby: 0.6 W
USER CONTROLS Side Panel Standby/On, Input, Menu, Set, Size, Display
Remote Standby/On, Input, Menu, Adjust, Set, Size, Muting,
Volume, Display
Picture Mode Contrast, Bright, Color, Tint, Sharp, R Level, G
Level, B Level
Screen Mode H-Position, V-Position, V-Size, Clock Frequency,
Clock Phase
DIMENSIONS External 1218mm (W) x 714mm (H) x 98mm (D)
(47 31/32" x 28 1/8" x 3 7/8")
WEIGHT Net
With Stand
40.3Kg. (88.77 lbs.)
41.0Kg. (90.44 lbs.)
OPERATING
RANGE Temperature
Pressure
Humidity
0 to 40° C, (32 to 104° F)
0.8 to 1.1 atmospheres
20% to 80%
PRICE US $19,995
Pioneer PDP-502MX 50 inch Color Plasma Display Panel -3-
Use or disclosure of data on this sheet is subject to the restrictions on the cover and title of this report.
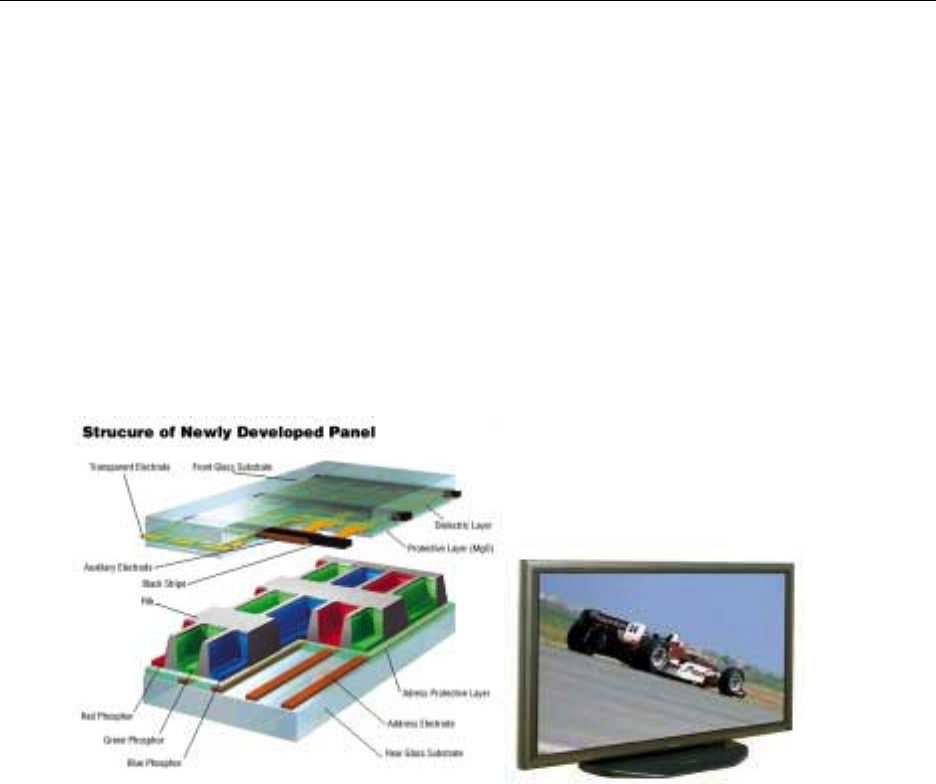
Additional Information Supplied by Manufacturer
• Pioneer PDP-502MX Flat Screen Plasma Display Panel (PDP). Large-screen PDP
units boast ultra-slim dimensions, are surprisingly light in weight and deliver superb
picture quality -- a combination of features that open up a host of opportunities in the
visual presentation field, especially in the current HDTV/DVD era. Pioneer's next-
generation PDP technology has established itself as a core element in all kinds of public
display and visual communications systems. The PDP-502MX with its further improved
picture quality and durability represents a major triumph for Pioneer, which has continued
to lead the industry in developing and mass producing PDPs.
• Newly Developed Panel Pushes the Previous Limits of Illumination Efficiency. New
True Matrix imaging technology makes on-screen images brighter than ever. Pioneer’s
newly developed Encased Cell Structure ensures superior illumination efficiency by
increasing phosphor surface area and eliminating light leakage from the neighboring above
and below cells, thereby improving clarity in the vertical direction. In addition, this
arrangement increases the amount of light produced resulting in brighter on-screen images.
• Black Stripes Greatly Improve Contrast, especially in Bright Locations. The new
black stripes on the panel's non-luminous front section reduce the amount of external light
reflected off the screen surface to effectively double the on-screen image contrast when the
display is used in bright locations. Thanks to this innovation, viewers can enjoy sharp
pictures, even under bright ambient lighting conditions, with no reduction in black
contrast.
• Improved Blue Phosphor Makes On-Screen Whites Even Whiter. Pioneer’s new
plasma display achieves more brilliant white reproduction thanks to the employment of an
improved blue phosphor that features an improved illumination efficiency balance. The
color temperature can be set by changing the color balance controls. * Our new phosphor
development brings enhanced white reproduction and sharper contrast to every image.
*These values have individually adjusted high and low levels. Once adjusted, color balance
settings can be set into one of two color memories for each type of input. All of these
adjustments can be done via a wireless remote or RS-232C control.

-4- NIDL
Use or disclosure of data on this sheet is subject to the restrictions on the cover and title of this report.
I.2. Initial Monitor Set Up
Reference: Request for Evaluation Monitors, NIDL Pub. 0201099-091, Section 5, p 5.
All measurements will be made with the display commanded through a laboratory grade
programmable test pattern generator. The system will be operated in at least a 24 bit mode (as
opposed to a lesser or pseudo-color mode) for color and at least 8 bits for monochrome. As a first
step, refresh rate should be measured and verified to be at least 72 Hz. The screen should then be
commanded to full addressability and Lmin set to 0.1 fL. Lmax should be measured at screen
center with color temperature between D65 and D93 allowable and any operator adjustment of
gain allowable. If a value >35fL is not achieved (>30 fL for color), addressability should be
lowered. For a nominal 1600 by 1200 addressability, addressability should be lowered to 1280 by
1024 or to 1024 by 1024. For a nominal 2048 by 2560 addressability, addressabilities of 1200 x
1600 and 1024 x 1024 can be evaluated if the desired Lmax is not achieved at full addressability.
I.3. Equipment
Reference: Monochrome CRT Monitor Performance, Draft Version 2.0 Section 2.0, page 3.
The procedures described in this report should be carried out in a darkened environment such
that the stray luminance diffusely reflected by the screen in the absence of electron-beam
excitation is less than 0.003 cd/m2 (1mfL).
Instruments used in these measurements included:
• Quantum Data 8701 400 MHz programmable test pattern signal generator
• Quantum Data 903 250 MHz programmable test pattern signal generator
• Photo Research SpectraScan PR-650 spectroradiometer
• Photo Research SpectraScan PR-704 spectroradiometer
• Minolta LS-100 Photometer
• Minolta CA-100 Colorimeter
• Graseby S370 Illuminance Meter
• Microvision SuperSpot 100 Display Characterization System which included OM-1 optic
module (Two Dimensional photodiode linear array device, projected element size at
screen set to 1.3 mils with photopic filter) and Spotseeker 4-Axis Positioner
Microvision SuperSpot 220 with LCD Goniometer
Stereoscopic-mode measurements were attempted using the following commercially-available
stereo products:
• StereoGraphics CE-3 CrystalEyes 3 eyewear and the ENT infrared emitter.

Pioneer PDP-502MX 50 inch Color Plasma Display Panel -5-
Use or disclosure of data on this sheet is subject to the restrictions on the cover and title of this report.
Section II PHOTOMETRIC MEASUREMENTS
II.1. Dynamic range and Screen Reflectance
References: Request for Evaluation Monitors, NIDL Pub. 0201099-091, Section 5.6, p 6.
VESA Flat Panel Display Measurements Standard, Version 1.0, May 15, 199,
Section 308-1.
Full screen white-to-black dynamic range in a dark room in 1024 x 768 format is 19.2 dB limited
by the inability to reduce Lmin below 0.21 fL and the inability to increase Lmax beyond 17.6 fL.
Objective: Measure the photometric output (luminance vs. input command level) at Lmax
and Lmin in both dark room and illuminated ambient conditions.
Equipment: Photometer, Integrating Hemisphere Light Source or equivalent
Procedure: Luminance at center of screen is measured for input counts of 0 and Max Count.
Test targets are full screen (flat fields) where full screen is defined addressability.
Set Lmin to 0.1 fL. For color monitors, set color temperature between D65 to D93.
Measure Lmax.
This procedure applies when intended ambient light level measured at the display
is 2fc or less. For conditions of higher ambient light level, Lmin and Lmax should
be measured at some nominal intended ambient light level (e.g., 18-20 fc for
normal office lighting with no shielding). This requires use of a remote spot
photometer following procedures outlined in reference 2, paragraph 308-2. This
will at best be only an approximation since specular reflections will not be
captured. A Lmin > 0.1 fL may be required to meet grayscale visibility
requirements.
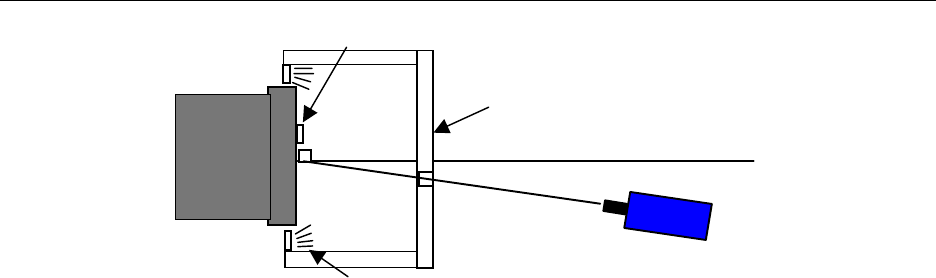
According to the VESA directed hemispherical reflectance (DHR) measurement
method, total combined reflections due to specular, haze and diffuse components
of reflection arising from uniform diffuse illumination are simultaneously
quantified as a fraction of the reflectance of a perfect white diffuse reflector using
the set up depicted in figure II.1-1. Total reflectance was calculated from
measured luminances reflected by the screen (display turned off) when uniformly
illuminated by an integrating hemisphere simulated using a polystyrene icebox.
Luminance is measured using a spot photometer with 1° measurement field and an
illuminance sensor as depicted in Figure II.1-1. The measured values and
calculated reflectances are given in Table II.1-1.
Data: Define dynamic range by: DR=10log(Lmax/Lmin)
-6- NIDL
Use or disclosure of data on this sheet is subject to the restrictions on the cover and title of this report.
Monitor
under
test
0°
8°
Photometer
White polystyrene box
- Top View -
Illuminance sensor
Halogen lamps, total four,
(1 each corner)
Figure II.1-1. Test setup according to VESA FPDM procedures for measuring
total reflectance of screen.
Table II.1-1. Directed Hemispherical Reflectance of Faceplate
VESA ambient contrast illuminance source (polystyrene box)
Ambient Illuminance 20.0 fc
Reflected Luminance 1.03 fL
Faceplate Reflectance 5.14 %
Ambient dynamic ranges of full screen white-to-black given in Table II.1-2 were computed for
various levels of diffuse ambient lighting using the measured value for DHR and the darkroom
dynamic range measurements. Full screen white-to-black dynamic range is 19.2 dB in a dark
room (the absolute threshold for IEC is 22 dB) and drops further when viewed in diffuse ambient
illumination.
Table II.1-2.Dynamic Range in Dark and Illuminated Rooms
Effect of ambient lighting on dynamic range is calculated by multiplying the measured
display faceplate reflectivity times the ambient illumination measured at the screen in foot candles added to the
minimum screen luminance, Lmin, where Lmin = 0.21 fL.
Ambient Illumination Dynamic Range
0 fc (Dark Room) 19.2 dB
1 fc 18.3 dB
2 fc 17.5 dB
3 fc 16.9 dB
4 fc 16.3 dB
5 fc 15.8 dB
6 fc 15.4 dB
7 fc 15.0 dB
8 fc 14.6 dB
9 fc 14.3 dB
10 fc 14.0 dB

Pioneer PDP-502MX 50 inch Color Plasma Display Panel -7-
Use or disclosure of data on this sheet is subject to the restrictions on the cover and title of this report.
II.2. Maximum Luminance (Lmax)
References: Request for Evaluation Monitors, NIDL Pub. 0201099-091, Section 5.2, p 6.
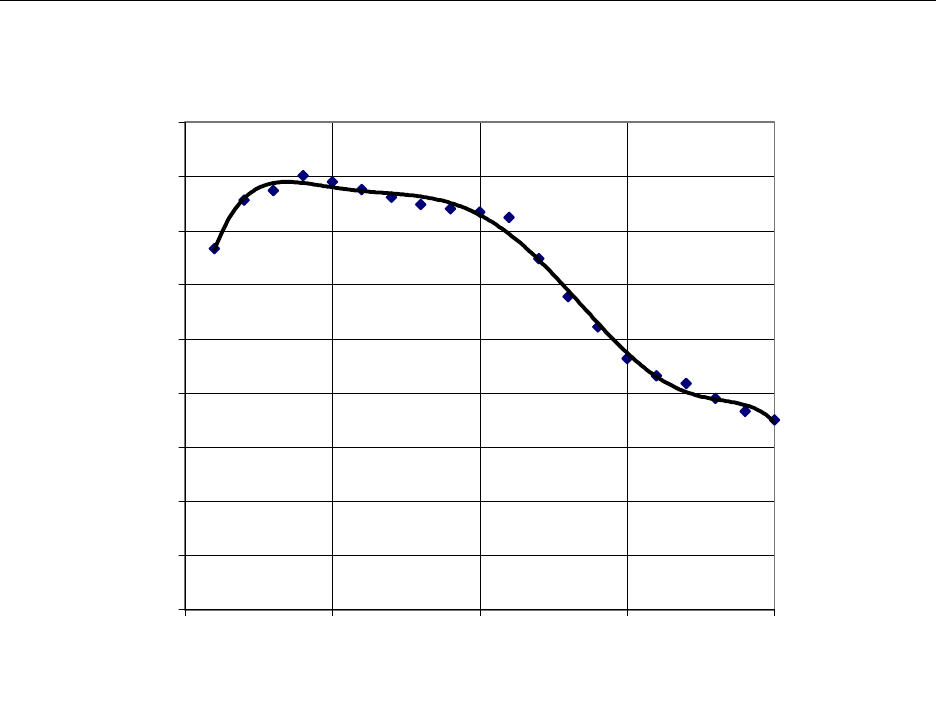
The highest luminance for full screen at Lmax was 17.6 fL measured at screen center in 1024 x
768 format. The luminance of smaller white targets was much greater than full screen
luminance. Luminances as high as 40.1 fL were measured for small white patches that were
reduced to only 20% of the image area.
Objective: Measure the maximum output display luminance.
Equipment: Photometer
Procedure: See dynamic range. Use the value of Lmax defined for the Dynamic Range
measurement.
Data: The maximum output display luminance, Lmax, and associated CIE x, y
chromaticity coordinates (CIE 1976) were measured using a hand-held
colorimeter (Minolta CA-100). The correlated color temperature (CCT)
computed from the measured CIE x, y chromaticity coordinates was within range
specified by IEC (6500K and 9300K).
Table II.2-1. Maximum Luminance and Color of Full Screen White
Color and luminance (in fL) for Full screen at 100% Lmax taken at screen center.
Format CCT CIE x CIE y Luminance
1024 x 768 6513 0.312 0.333 17.6
-8- NIDL
Use or disclosure of data on this sheet is subject to the restrictions on the cover and title of this report.
Luminance Loading
0
5
10
15
20
25
30
35
40
45
0% 25% 50% 75% 100%
White Target Size (in Percentage of Total Image Area)
Luminance (fL)
Figure II.2-1. The luminance of white varies inversely with the target size. The IEC
luminance requirement is for full screen.
Pioneer PDP-502MX 50 inch Color Plasma Display Panel -9-
Use or disclosure of data on this sheet is subject to the restrictions on the cover and title of this report.
II.3. Luminance (Lmax) and Color Uniformity
Reference: Monochrome CRT Monitor Performance, Draft Version 2.0, Section 4.4, p. 28.
Maximum luminance (Lmax) varied by up to 4.4% across the screen. Chromaticity variations
were less than 0.006 delta u'v' units.
Objective: Measure the variability of luminance and chromaticity coordinates of the white
point at 100% Lmax only and as a function of spatial position. Variability of
luminance impacts the total number of discriminable gray steps.
Equipment: • Video generator
• Photometer
• Spectroradiometer or Colorimeter
Test Pattern: Full screen flat field with visible edges at Lmin as shown in Figure II.3-1.
Center
Minor
Major
12
6
2D
10D
3
9
4D
8D
10% V
10% H
H
V
Full Screen Flat Field test pattern. Nine screen test locations.
Figure II.3-1 Figure II.3-2
Procedure: Investigate the temporal variation of luminance and the white point as a function
of intensity by displaying a full flat field shown in Figure II.3-1 for video input
count levels corresponding Lmax. Measure the luminance and C.I.E. color
coordinates at center screen.
Investigate the temporal variation of luminance and the white point as a function
of spatial position by repeating these measurements at each of the locations
depicted in Figure II.3-2. Define color uniformity in terms of u´v´.
Data: Tabulate the luminance and 1931 C.I.E. chromaticity coordinates (x, y) or
correlated color temperature of the white point at each of the nine locations
depicted in Figure II.3-2. Additionally, note the location of any additional points
that are measured along with the corresponding luminance values.
-10- NIDL
Use or disclosure of data on this sheet is subject to the restrictions on the cover and title of this report.
Table II.3-1.Spatial Uniformity of Luminance and Color
Color and luminance (in fL) for Full screen taken at nine screen positions.
1024 x 768
POSITION CCT CIE x CIE y L, fL
center 6513 0.312 0.333 17.6
2 6420 0.314 0.331 18.2
3 6413 0.314 0.332 17.8
4 6273 0.317 0.329 18.1
6 6460 0.313 0.333 18.1
8 6338 0.316 0.327 17.8
9 6535 0.312 0.330 17.5
10 6338 0.316 0.327 17.4
12 6407 0.314 0.333 18.1
12 2
3
468
9
10
CENTER Key to clock
positions used
in the tables
1024 x 768
/HIW &HQWHU 5LJKW
7RS &HQWHU %RWWRP
/HIW &HQWHU 5LJKW
7RS &HQWHU %RW W RP
Fig.II.3-3. Spatial Uniformity of Luminance and Chromaticity.
(Delta u'v' of 0.004 is just visible.)
01
u
c
(Ö
c
>
id
+;
0)
-o
Pioneer PDP-502MX 50 inch Color Plasma Display Panel -11-
Use or disclosure of data on this sheet is subject to the restrictions on the cover and title of this report.
II.4. Halation
Reference: Monochrome CRT Monitor Performance, Draft Version 2.0 Section 4.6, page 48.
Halation was 6.62 % +/- 0.5% on a small black patch surrounded by a large full white area.
Objective: Measure the contribution of halation to contrast degradation. Halation is a
phenomenon in which the luminance of a given region of the screen is increased
by contributions from surrounding areas caused by light scattering within the
phosphor layer and internal reflections inside the glass faceplate. The
mechanisms that give rise to halation, and its detailed non-monotonic dependence
on the distance along the screen between the source of illumination and the region
being measured have been described by E. B. Gindele and S.L. Shaffer. The
measurements specified below determine the percentage of light that is piped into
the dark areas as a function of the extent of the surrounding light areas.
Equipment: • Photometer
• Video generator
Test Pattern:
0.01% screen area
11-pixel square
(L )
Surround
(L )
white
black
Figure II.4-1 Test pattern for measuring halation.
Procedure: Note: The halation measurements require changing the setting of the
BRIGHTNESS control and will perturb the values of Lmax and Lmin that are
established during the initial monitor set-up. The halation measurements should
therefore be made either first, before the monitor setup, or last, after all other
photometric measurements have been completed.
Determine halation by measuring the luminance of a small square displayed at
Lblack (essentially zero) and at Lwhite when surrounded by a much larger square
displayed at Lwhite (approximately 75% Lmax).
Establish Lblack by setting the display to cutoff. To set the display to cut-off,
display a flat field using video input count level zero, and use a photometer to
monitor the luminance at center screen. Vary the BRIGHTNESS control until the
CRT beam is visually cut off, and confirm that the corresponding luminance
(Lstray) is essentially equal to zero. Fine tune the BRIGHTNESS control such that

-12- NIDL
Use or disclosure of data on this sheet is subject to the restrictions on the cover and title of this report.
CRT beam is just on the verge of being cut off. These measurements should be
made with a photometer that is sensitive at low light levels (below Lmin of the
display). Make no further adjustments or changes to the BRIGHTNESS control
or the photometer measurement field.
Next, decrease the video-input level to display a measured full-screen luminance
of 75% Lmax measured at screen center. Record this luminance (Lwhite).
The test target used in the halation measurements is a black (Lblack) square patch
of width equal to 0.01% of the area of addressable screen, the interior square as
shown in Figure II.4-1. The interior square patch is enclosed in a white (Lwhite)
background encompassing the remaining area of the image. The exterior surround
will be displayed at 75% Lmax using the input count level for Lwhite as determined
above. The interior square will be displayed at input digital count level zero.
Care must be taken during the luminance measurement to ensure that the
photometer's measurement field is less than one-half the size of the interior square
and is accurately positioned not to extend beyond the boundary of the interior
square. The photometer should be checked for light scattering or lens flare effects
which allow light from the surround to enter the photosensor. A black card with
aperture equal to the measurement field (one-half the size of the interior black
square) may be used to shield the photometer from the white exterior square while
making measurements in the interior black square.
Analysis: Compute the percent halation for each test target configuration. Percent halation
is defined as:
% Halation = Lblack / (Lwhite - Lblack) x 100
Where, Lblack= measured luminance of interior square
displayed at Lblack using input count level zero,
Lwhite= measured luminance of interior square
displayed at Lwhite using input count level
determined to produce a full screen luminance
of 75% Lmax .
Data: Table II.4-1 contains measured values of Lblack, Lwhite and percentage halation.
Table II.4-1 Halation for 1024 x 768 Addressability
Reported Values Range for 4% uncertainty
Lblack 0.89 fL ± 4% 0.85 fL to 0.92 fL
Lwhite 13.43 fL ± 4% 12.88 fL to 13.98 fL
Halation 6.62% ± 0.5% 6.10 % to 7.18%

Pioneer PDP-502MX 50 inch Color Plasma Display Panel -13-
Use or disclosure of data on this sheet is subject to the restrictions on the cover and title of this report.
II.5. Color Temperature
Reference: Monochrome CRT Monitor Performance, Draft Version 2.0 Section 5.4, page 22.
The CCT of the measured white point lies within the boundaries accepted by IEC.
Objective: Insure measured screen white of a color monitor has a correlated color
temperature (CCT) between 6500K and 9300K.
Equipment: Colorimeter
Procedure: Command screen to Lmax. Measure u’v’ chromaticity coordinates (CIE 1976).
Data: Coordinates of screen white should be within 0.01 ∆u’v’ of the corresponding CIE
daylight, which is defined as follows: If the measured screen white has a CCT
between 6500 and 9300 K, the corresponding daylight has the same CCT as the
screen white. If the measured CCT is greater than 9300 K, the corresponding
daylight is D93. If the measured CCT is less than 6500 K, the corresponding
daylight is D65. The following equations were used to compute ∆u’v’ values
listed in table II.5.1:
1. Compute the correlated color temperature (CCT) associated with (x,y) by the
VESA/McCamy formula: CCT = 437 n^3 + 3601 n^2 + 6831 n + 5517,
where n = (x-0.3320)/(0.1858 - y). [This is on p. 227 of the FPDM standard]
2. If CCT < 6500, replace CCT by 6500. If CCT > 9300, replace CCT by 9300.
4. Use formulas 5(3.3.4) and 6(3.3.4) in Wyszecki and Stiles (pp.145-146 second
edition) to compute the point (xd,yd) associated with CCT.
• First, define u = 1000/CCT.
• If CCT < 7000, then xd = -4.6070 u^3 + 2.9678 u^2 + 0.09911 u +
• 0.244063.
• If CCT > 7000, then xd = -2.0064 u^3 + 1.9018 u^2 + 0.24748 u +
• 0.237040.
• In either case, yd = -3.000 xd^2 + 2.870 xd -0.275.
5. Convert (x,y) and (xd,yd) to u'v' coordinates:
• (u',v') = (4x,9y)/(3 + 12y - 2x)
• (u'd,v'd) = (4xd,9yd)/(3 + 12yd - 2xd)
6. Evaluate delta-u'v' between (u,v) and (ud,vd):
• delta-u'v' = sqrt[(u' - u'd)^2 + (v' - v'd)^2].
7. If delta-u'v' is greater than 0.01, display fails the test. Otherwise it passes the
test.
-14- NIDL
Use or disclosure of data on this sheet is subject to the restrictions on the cover and title of this report.
Correlated Color Temperature
0.43
0.44
0.45
0.46
0.47
0.48
0.17 0.18 0.19 0.20 0.21 0.22
u'
v'
9300 Limit
6500 Limit
1024 x 767
Error bars denote delta u'v' = 0.010
Figure II.5-1 The CCT of the measured white point is within the boundaries required by IEC.
Table II.5-1 Delta u’v’ Distances between measured white points and
CIE coordinate values from D65 to D93.
1024 x 768
CIE x 0.312
CIE y 0.333
CIE u' 0.196
CIE v' 0.470
CCT 6513
delta u'v' 0.003
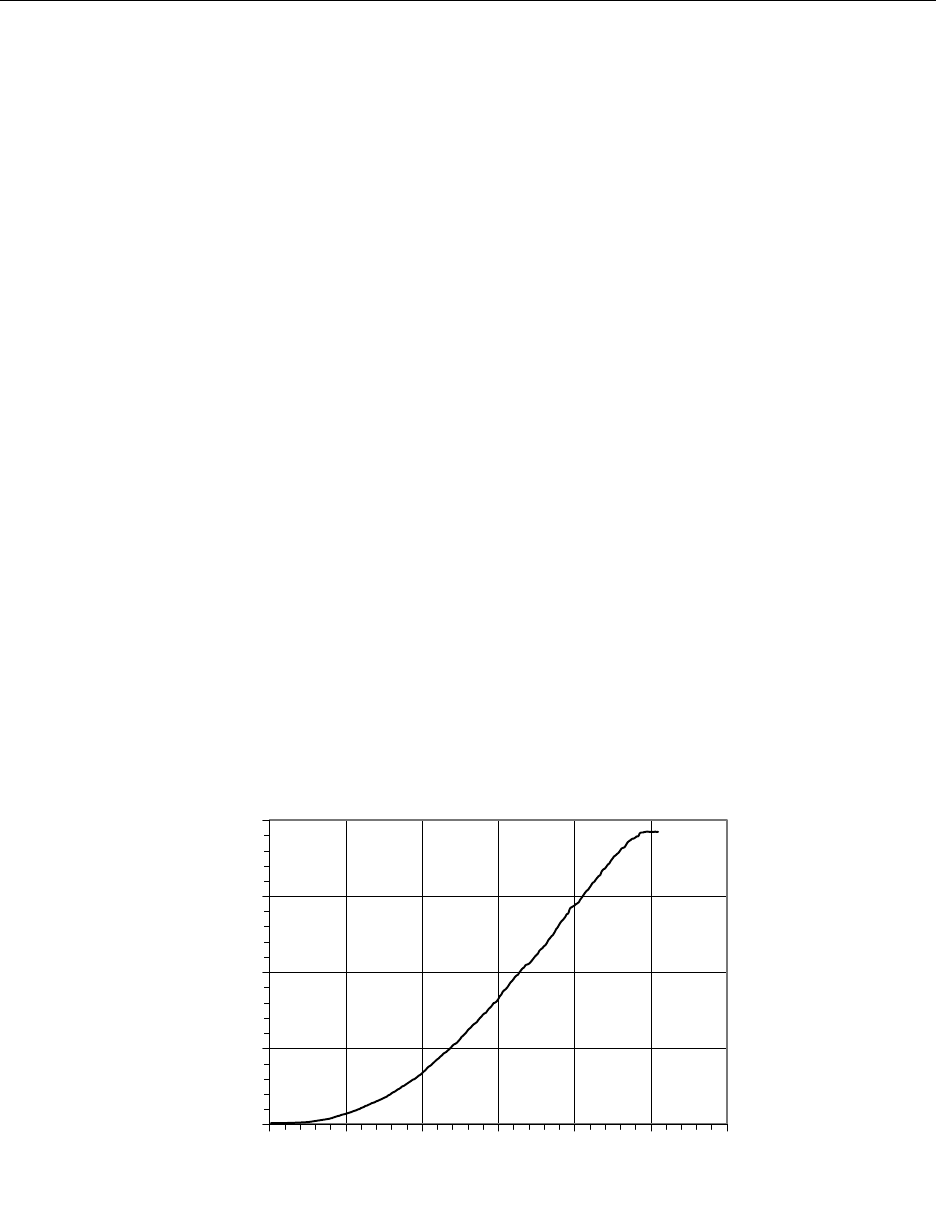
II.6. Bit Depth
Reference: Request for Evaluation Monitors, NIDL Pub. 0201099-091, Section 5.6, p 6.
Positive increases in luminance were measured for 245 of the 256 input levels for 7.94 effective
bits of gray scale. 223 of 256 input levels differed by at least 1 JND of luminance. Black level
clipping was observed for levels 000 through 003. White level saturation was observed for levels
245 through 255.
Objective: Measure the number of bits of data that can be displayed as a function of the DAC
and display software.
Equipment: Photometer
Pioneer PDP-502MX 50 inch Color Plasma Display Panel -15-
Use or disclosure of data on this sheet is subject to the restrictions on the cover and title of this report.
Test targets: Targets are n four inch patches with command levels of all commandable levels;
e.g., 256 for 8 bit display. Background is commanded to 0.5* ((0.7 *P)+0.3*n)
where P = patch command level, n = number of command levels.
Procedure: Measure patch center for all patches with Lmin and Lmax as defined previously.
Count number of monotonically increasing luminance levels. Use the
NEMA/DICOM model to define discriminable luminance differences. For color
displays, measure white values.
Data: Define bit depth by log 2 (number of discrete luminance levels)
The number of bits of data that can be displayed as a function of the input signal
voltage level were verified through measurements of the luminance of white test
targets displayed using a Quantum Data 8701 test pattern generator and a Minolta
CA-100 colorimeter. Targets are n four-inch patches with command levels of all
commandable levels; e.g., 256 for 8 bit display. Background is commanded to
0.5* ((0.7 *P)+0.3*n) where P = patch command level, n = number of command
levels. The NEMA/DICOM model was used to define discriminable luminance
differences in JNDs.
Figure II.6-1 shows the System Tonal Transfer curve at center screen as a function
of input counts. The data for each of the 256 levels are listed in Tables II.6-1 and
II.6-2.
System Tonal Transfer Curve
0
10
20
30
40
0 50 100 150 200 250 300
Input Level of Target, 0 to 255 counts
Luminance, fL
Figure II.6-1. System Tonal Transfer at center screen as a function of input counts.

-16- NIDL
Use or disclosure of data on this sheet is subject to the restrictions on the cover and title of this report.
Table II.6-1. System Tonal Transfer at center screen as a function of input counts.
Target levels 000 to 127.
Background Target L, fL Diff, fL Diff, JND Background Target L, fL Diff, fL Diff, JND
38 0 0.154 0.000 0 61 64 2.463 0.047 2
39 1 0.154 0.000 0 61 65 2.592 0.129 4
39 2 0.154 0.000 0 62 66 2.646 0.054 2
39 3 0.154 0.000 0 62 67 2.784 0.138 4
40 4 0.155 0.001 0 62 68 2.836 0.052 2
40 5 0.156 0.001 0 63 69 2.912 0.076 2
41 6 0.156 0.000 0 63 70 3.044 0.132 4
41 7 0.157 0.001 0 63 71 3.097 0.053 2
41 8 0.158 0.001 1 64 72 3.196 0.099 2
42 9 0.160 0.002 0 64 73 3.275 0.079 3
42 10 0.162 0.002 0 64 74 3.364 0.089 2
42 11 0.168 0.006 2 65 75 3.488 0.124 3
43 12 0.180 0.012 2 65 76 3.569 0.081 3
43 13 0.186 0.006 1 65 77 3.666 0.097 2
43 14 0.189 0.003 1 66 78 3.813 0.147 4
44 15 0.193 0.004 0 66 79 3.928 0.115 3
44 16 0.201 0.008 2 66 80 4.074 0.146 3
44 17 0.208 0.007 1 67 81 4.192 0.118 3
45 18 0.216 0.008 1 67 82 4.302 0.110 2
45 19 0.224 0.008 2 67 83 4.419 0.117 3
45 20 0.231 0.007 1 68 84 4.585 0.166 4
46 21 0.243 0.012 2 68 85 4.676 0.091 1
46 22 0.252 0.009 1 69 86 4.797 0.121 3
46 23 0.258 0.006 1 69 87 4.976 0.179 4
47 24 0.274 0.016 2 69 88 5.055 0.079 1
47 25 0.299 0.025 4 70 89 5.186 0.131 3
48 26 0.319 0.020 3 70 90 5.338 0.152 3
48 27 0.342 0.023 3 70 91 5.456 0.118 2
48 28 0.388 0.046 5 71 92 5.595 0.139 3
49 29 0.413 0.025 3 71 93 5.747 0.152 2
49 30 0.439 0.026 3 71 94 5.864 0.117 2
49 31 0.469 0.030 3 72 95 5.936 0.072 2
50 32 0.501 0.032 4 72 96 6.091 0.155 2
50 33 0.527 0.026 2 72 97 6.258 0.167 3
50 34 0.555 0.028 3 73 98 6.414 0.156 3
51 35 0.603 0.048 4 73 99 6.546 0.132 2
51 36 0.627 0.024 2 73 100 6.692 0.146 2
51 37 0.653 0.026 3 74 101 6.926 0.234 4
52 38 0.689 0.036 3 74 102 7.081 0.155 2
52 39 0.735 0.046 3 74 103 7.288 0.207 4
52 40 0.779 0.044 4 75 104 7.526 0.238 3
53 41 0.836 0.057 4 75 105 7.672 0.146 2
53 42 0.904 0.068 5 76 106 7.776 0.104 2
53 43 0.972 0.068 4 76 107 7.982 0.206 3
54 44 1.046 0.074 5 76 108 8.172 0.190 2
54 45 1.091 0.045 3 77 109 8.382 0.210 3
55 46 1.151 0.060 3 77 110 8.546 0.164 2
55 47 1.223 0.072 4 77 111 8.684 0.138 2
55 48 1.296 0.073 4 78 112 8.892 0.208 3
56 49 1.341 0.045 3 78 113 9.048 0.156 2
56 50 1.398 0.057 3 78 114 9.274 0.226 2
56 51 1.464 0.066 3 79 115 9.393 0.119 2
57 52 1.519 0.055 3 79 116 9.524 0.131 1
57 53 1.587 0.068 3 79 117 9.712 0.188 3
57 54 1.657 0.070 3 80 118 9.894 0.182 2
58 55 1.723 0.066 3 80 119 10.100 0.206 2
58 56 1.794 0.071 3 80 120 10.320 0.220 3
58 57 1.877 0.083 4 81 121 10.510 0.190 2
59 58 1.965 0.088 3 81 122 10.620 0.110 1
59 59 2.022 0.057 3 81 123 10.740 0.120 1
59 60 2.156 0.134 5 82 124 10.960 0.220 3
60 61 2.211 0.055 2 82 125 11.220 0.260 3
60 62 2.297 0.086 3 83 126 11.480 0.260 2
60 63 2.416 0.119 4 83 127 11.640 0.160 2

Pioneer PDP-502MX 50 inch Color Plasma Display Panel -17-
Use or disclosure of data on this sheet is subject to the restrictions on the cover and title of this report.
Table II.6-2. System Tonal Transfer at center screen as a function of input counts
Target levels 128 to 255.
Background Target L, fL Diff, fL Diff, JND Background Target L, fL Diff, fL Diff, JND
83 128 11.860 0.220 2 106 192 26.80 0.23 1
84 129 12.070 0.210 2 106 193 27.04 0.24 1
84 130 12.360 0.290 3 106 194 27.28 0.24 1
84 131 12.550 0.190 2 107 195 27.64 0.36 2
85 132 12.710 0.160 1 107 196 27.76 0.12 1
85 133 12.980 0.270 3 107 197 28.34 0.58 2
85 134 13.180 0.200 2 108 198 28.54 0.20 1
86 135 13.280 0.100 1 108 199 28.66 0.12 1
86 136 13.450 0.170 1 108 200 28.76 0.10 0
86 137 13.720 0.270 3 109 201 28.96 0.20 1
87 138 13.960 0.240 2 109 202 29.08 0.12 1
87 139 14.160 0.200 1 109 203 29.24 0.16 1
87 140 14.440 0.280 3 110 204 29.58 0.34 1
88 141 14.580 0.140 1 110 205 29.87 0.29 1
88 142 14.690 0.110 1 111 206 30.16 0.29 2
88 143 14.960 0.270 2 111 207 30.42 0.26 1
89 144 15.220 0.260 2 111 208 30.72 0.30 1
89 145 15.420 0.200 2 112 209 30.86 0.14 1
90 146 15.620 0.200 2 112 210 31.16 0.30 1
90 147 15.940 0.320 2 112 211 31.44 0.28 1
90 148 16.010 0.070 1 113 212 31.76 0.32 2
91 149 16.150 0.140 1 113 213 31.88 0.12 0
91 150 16.460 0.310 2 113 214 32.16 0.28 1
91 151 16.870 0.410 3 114 215 32.43 0.27 1
92 152 17.030 0.160 1 114 216 32.66 0.23 1
92 153 17.460 0.430 3 114 217 32.78 0.12 1
92 154 17.660 0.200 2 115 218 33.27 0.49 2
93 155 17.760 0.100 1 115 219 33.56 0.29 1
93 156 18.020 0.260 1 115 220 33.62 0.06 0
93 157 18.320 0.300 3 116 221 33.86 0.24 1
94 158 18.620 0.300 2 116 222 34.18 0.32 2
94 159 18.860 0.240 1 116 223 34.32 0.14 0
94 160 19.060 0.200 2 117 224 34.68 0.36 2
95 161 19.360 0.300 2 117 225 34.94 0.26 1
95 162 19.560 0.200 1 118 226 35.23 0.29 1
95 163 19.670 0.110 1 118 227 35.37 0.14 0
96 164 19.980 0.310 2 118 228 35.58 0.21 1
96 165 20.280 0.300 1 119 229 35.72 0.14 1
97 166 20.520 0.240 2 119 230 36.02 0.30 1
97 167 20.630 0.110 1 119 231 36.30 0.28 1
97 168 20.970 0.340 2 120 232 36.36 0.06 0
98 169 21.040 0.070 0 120 233 36.45 0.09 0
98 170 21.080 0.040 0 120 234 36.77 0.32 2
98 171 21.280 0.200 2 121 235 37.09 0.32 1
99 172 21.490 0.210 1 121 236 37.30 0.21 1
99 173 21.780 0.290 2 121 237 37.42 0.12 0
99 174 22.050 0.270 1 122 238 37.56 0.14 1
100 175 22.240 0.190 1 122 239 37.60 0.04 0
100 176 22.460 0.220 2 122 240 37.72 0.12 0
100 177 22.840 0.380 2 123 241 37.88 0.16 1
101 178 23.020 0.180 1 123 242 37.90 0.02 0
101 179 23.160 0.140 1 123 243 38.32 0.42 1
101 180 23.440 0.280 1 124 244 38.40 0.08 1
102 181 23.560 0.120 1 124 245 38.40 0.00 0
102 182 23.870 0.310 2 125 246 38.44 0.04 0
102 183 24.240 0.370 2 125 247 38.50 0.06 0
103 184 24.460 0.220 1 125 248 38.52 0.02 0
103 185 24.740 0.280 1 126 249 38.47 -0.05 0
104 186 24.920 0.180 1 126 250 38.48 0.01 0
104 187 25.220 0.300 2 126 251 38.47 -0.01 0
104 188 25.680 0.460 2 127 252 38.44 -0.03 0
105 189 25.880 0.200 1 127 253 38.51 0.07 0
105 190 26.260 0.380 2 127 254 38.44 -0.07 0
105 191 26.570 0.310 2 128 255 38.47 0.03 0
-18- NIDL
Use or disclosure of data on this sheet is subject to the restrictions on the cover and title of this report.
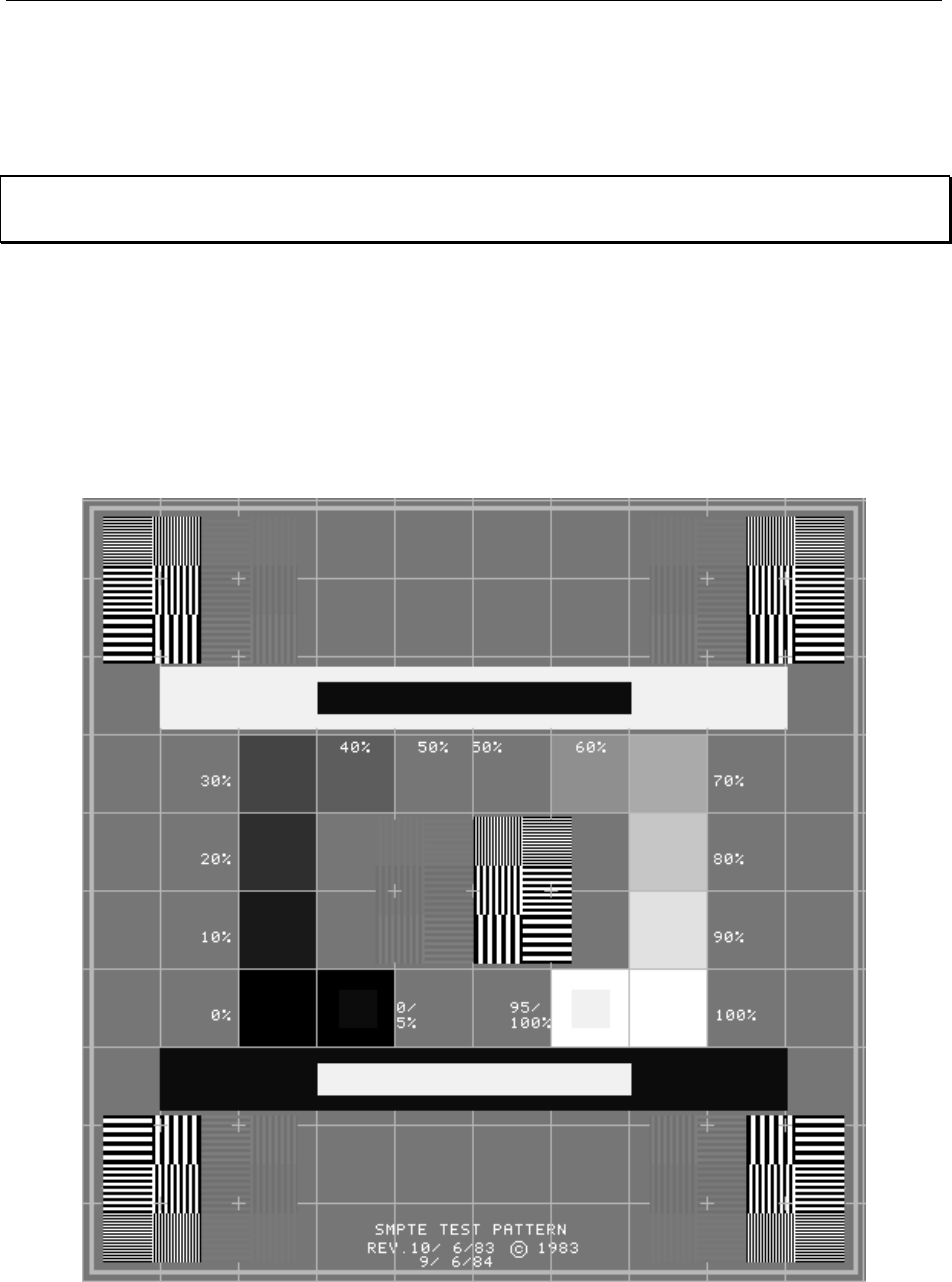
II.8. Luminance Step Response
Reference: Request for Evaluation Monitors, NIDL Pub. 0201099-091, Section 5.8, p 7.
Video artifacts in the form of smearing were observed. Abrupt luminance variations of 1% were
measured.
Objective: Determine the presence of artifacts caused by undershoot or overshoot.
Equipment: Test targets, SMPTE Test Pattern RP-133-1991, 2-D CCD array
Procedure: Display a center box 15% of screen size at input count levels corresponding to
25%, 50%, 75%, and 100% of Lmax with a surround of count level 0. Repeat
using SMPTE Test pattern
Figure II.8-1. SMPTE Test Pattern.

Pioneer PDP-502MX 50 inch Color Plasma Display Panel -19-
Use or disclosure of data on this sheet is subject to the restrictions on the cover and title of this report.
Data: Define pass by absence of noticeable ringing, undershoot, overshoot, or streaking.
The test pattern shown in Figure II.8-1 was used in the visual evaluation of the
monitor. This test pattern is defined in SMPTE Recommended Practice RP-133-
1986 published by the Society of Motion Picture and Television Engineers
(SMPTE) for medical imaging applications. Referring to the large white-in-black
and black-in-white horizontal bars contained in the test pattern, RP133-1986,
paragraph 2.7 states “ These areas of maximum contrast facilitate detection of
mid-band streaking (poor low-frequency response), video amplifier ringing or
overshoot, deflection interference, and halo.” Video artifacts in the form of
smearing were observed in the Pioneer PDP-502MX Plasma Display Panel.
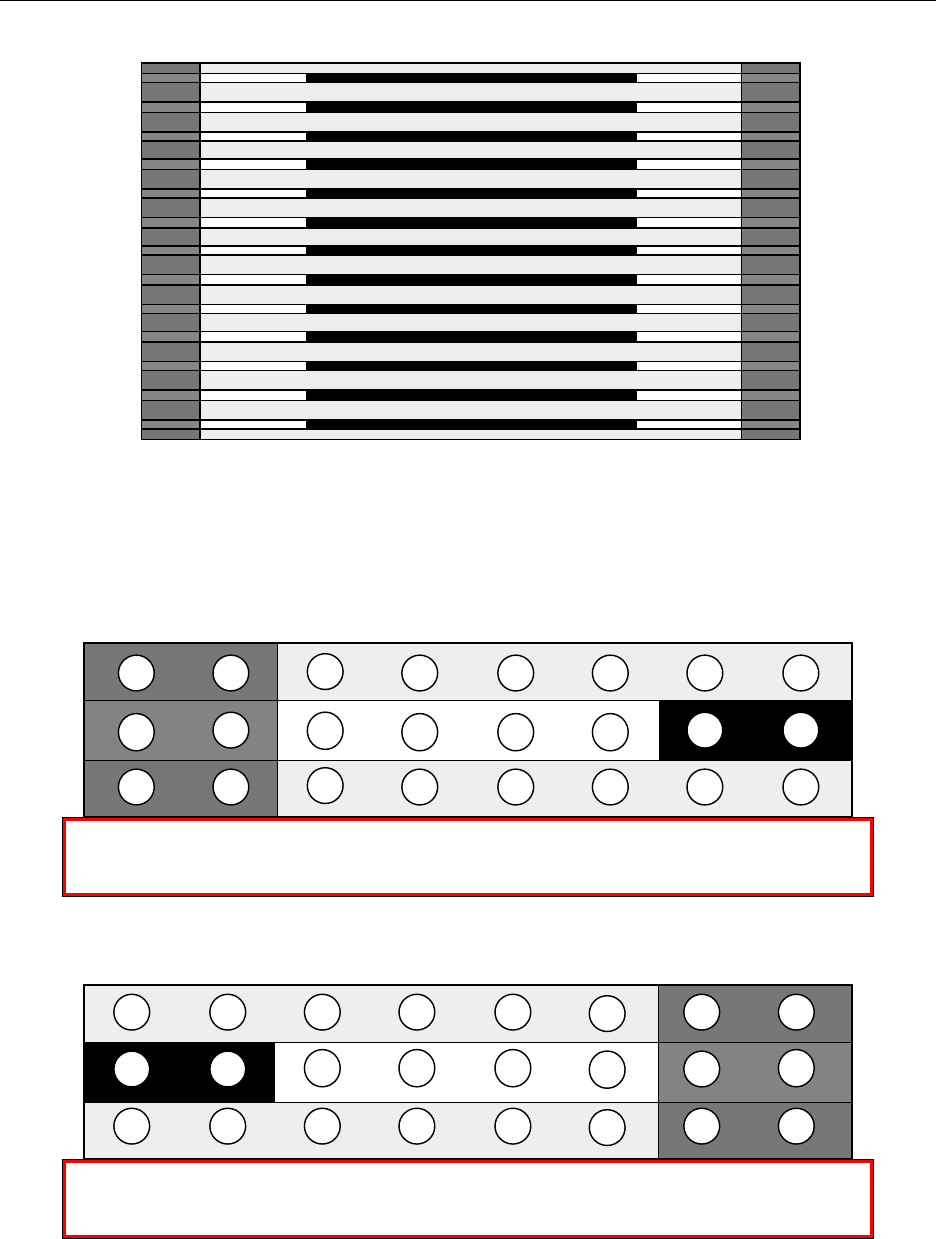
Another test pattern available on the Quantum Data 8701 400 MHz programmable
test pattern generator was displayed to further examine and quantify video
artifacts. The test pattern consists of black horizontal bars each 12 pixels in
height (approximately 3/8 inch) extending across the central portion of the screen
as shown in Figure II.8-2. Each black bar is surrounded by white. The black bar
displayed within a white surround introduces abrupt variations in video duty
cycle and challenges the display’s ability to regulate luminance over a range of
loading conditions. Nonuniformities on luminance of the white surround occurred
depending on the presence of the black bar. For example, luminance of the white
surround measured to the left and right of the black bar is approximately 1%
greater compared to the luminance above and below the black bar. This small
luminance difference appears as a discontinuity in the white surround and easily
visible.
Table II.8-1. Luminance Non-Uniformity of White with Black Bar
Left Side Luminance of White Right Side Luminance of White
Above black bar 20.34 fL Above black bar 20.79 fL
To the left of black bar 20.50 fL To the right of black bar 21.03 fL
Below black bar 20.30 fL Below black bar 20.82 fL
Nonuniformity 0.87% Nonuniformity 1.06%
-20- NIDL
Use or disclosure of data on this sheet is subject to the restrictions on the cover and title of this report.
Figure II.8-2. Quantum Data “bar BLACK” Test Target
Table II.8-2. Quantum Data “bar BLACK” Test Target Measured Luminance in fL.
3
11
19
4
12
20
5
13
21
6
14
22
2
10
18
7
15
23
1
9
17
8
16
24
3.288 3.352 20.18 20.49 20.58 20.1 19.78 19.99
3.361 3.432 20.19 20.83 20.54 20.42 1.589 1.552
3.367 3.373 20.13 20.56 20.44 20.07 20.1 20.13
Left side white-to-black leading transition of black bar.
3
11
19
4
12
20
5
13
21
6
14
22
2
10
18
7
15
23
1
9
17
8
16
24
20.03 20.29 20.49 20.75 20.82 21.11 3.569 3.5
1.503 1.558 20.42 21.1 21.2 21.39 3.606 3.513
20.26 20.37 20.85 20.74 20.94 20.75 3.159 3.484
Right side black-to-white trailing transition of black bar.
Pioneer PDP-502MX 50 inch Color Plasma Display Panel -21-
Use or disclosure of data on this sheet is subject to the restrictions on the cover and title of this report.
II.9. Addressability
Reference: Monochrome CRT Monitor Performance, Draft Version 2.0, Section 6.1, page 67.
This monitor properly displayed all but 3 stuck pixels when operated in the native format of 1024
x 768 pixels (H x V).
Objective: Define the number of addressable pixels in the horizontal and vertical dimension;
confirm that stated number of pixels is displayed.
Equipment: Programmable video signal generator.
Test pattern with pixels lit on first and last addressable rows and columns and on
two diagonal lines beginning at upper left and lower right; H and V grille patterns
1-pixel-on/1-pixel-off.
Procedure: The number of addressed pixels were programmed into the Quantum Data 8701
test pattern generator for 75 Hz for monoscopic mode and 120 Hz maximum
addressable for stereoscopic mode, where possible. All perimeter lines were
confirmed to be visible, with no irregular jaggies on diagonals and, for
monochrome monitors, no strongly visible moiré on grilles.
Data: If tests passed, number of pixels in horizontal and vertical dimension. If test fails,
addressability unknown.
Table II.9-1 Addressabilities Tested
Monoscopic Mode Stereo Mode*
1024 x 768 x 75 Hz
Non-Interlaced
1024 x 768 x 85 Hz Interlaced
(43 Hz per eye)
* Manufacturer states 91.1 kHz maximum scan rate, thus, 120 Hz vertical scan
rate is not achievable in stereo mode. Manufacturer states a maximum vertical
refresh rate of 85 Hz.
-22- NIDL
Use or disclosure of data on this sheet is subject to the restrictions on the cover and title of this report.
824
741
409
400
448
474
768
0
1024
0
Figure II.9-1. Inoperative Stuck Pixels (at given x,y coordinates)
II.10. Pixel Aspect Ratio
Reference: Request for Evaluation Monitors, NIDL Pub. 0201099-091, Section 5.10, p 8.
Pixel aspect ratio is within 6.21%.
Objective: Characterize aspect ratio of pixels.
Equipment: Test target, measuring tape with at least 1/16th inch increments
Procedure: Display box of 400 x 400 pixels at input count corresponding to 50% Lmax and
background of 0. Measure horizontal and vertical dimension.
Alternatively, divide number of addressable pixels by the total image size to
obtain nominal pixel spacings in horizontal and vertical directions.
Data: Define pass if H= V± 6% for pixel density <100 ppi and ± 10% for pixel density >
100 ppi.
Monoscopic Mode
Addressability (H x V) 1024 x 768
H x V Image Size (inches) 34.535 x 24.387
H x V Pixel Spacing (mils) 21.58 x 20.32
H x V Pixel Aspect Ratio H = V + 6.21%

Pioneer PDP-502MX 50 inch Color Plasma Display Panel -23-
Use or disclosure of data on this sheet is subject to the restrictions on the cover and title of this report.
II.11. Screen Size (Viewable Active Image)
Reference: VESA Flat Panel Display Measurements Standard, Version 1.0, May 15, 1998,
Section 501-1.
Image size as tested in monoscopic mode (1024 x 768) was 42.278 inches in diagonal with an
aspect ratio of 4:3. Maximum viewable image size is 50 inches in diagonal and 16:9 aspect
ratio.
Objective: Measure beam position on the LCD display to quantify width and height of active
image size visible by the user (excludes any overscanned portion of an image).
Equipment: • Video generator
• Spatially calibrated CCD or photodiode array optic module
• Calibrated X-Y translation stage
Test Pattern: Use the three-line grille patterns in Figure II.11-1 for vertical and horizontal lines
each 1-pixel wide. Lines in test pattern are displayed at 100% Lmax must be
positioned along the top, bottom, and side edges of the addressable screen, as well
as along both the vertical and horizontal centerlines (major and minor axes).
1-pixel-wide lines displayed at 100% Lmax
Figure II.11-1 Three-line grille test patterns.
Procedure: Use diode optic module to locate center of line profiles in conjunction with
calibrated X-Y translation to measure screen x,y coordinates of lines at the ends of
the major and minor axes.
Data: Compute the image width defined as the average length of the horizontal lines
along the top, bottom and major axis of the screen. Similarly, compute the image
height defined as the average length of the vertical lines along the left side, right
side, and minor axis of the screen. Compute the diagonal screen size as the
square-root of the sum of the squares of the width and height.
-24- NIDL
Use or disclosure of data on this sheet is subject to the restrictions on the cover and title of this report.
Table II.11-1. Image Size as tested.
Monoscopic Modes
Addressability (H x V) 1024 x 768
H x V Image Size (inches) 34.535 x 24.387
Diagonal Image Size (inches) 42.278
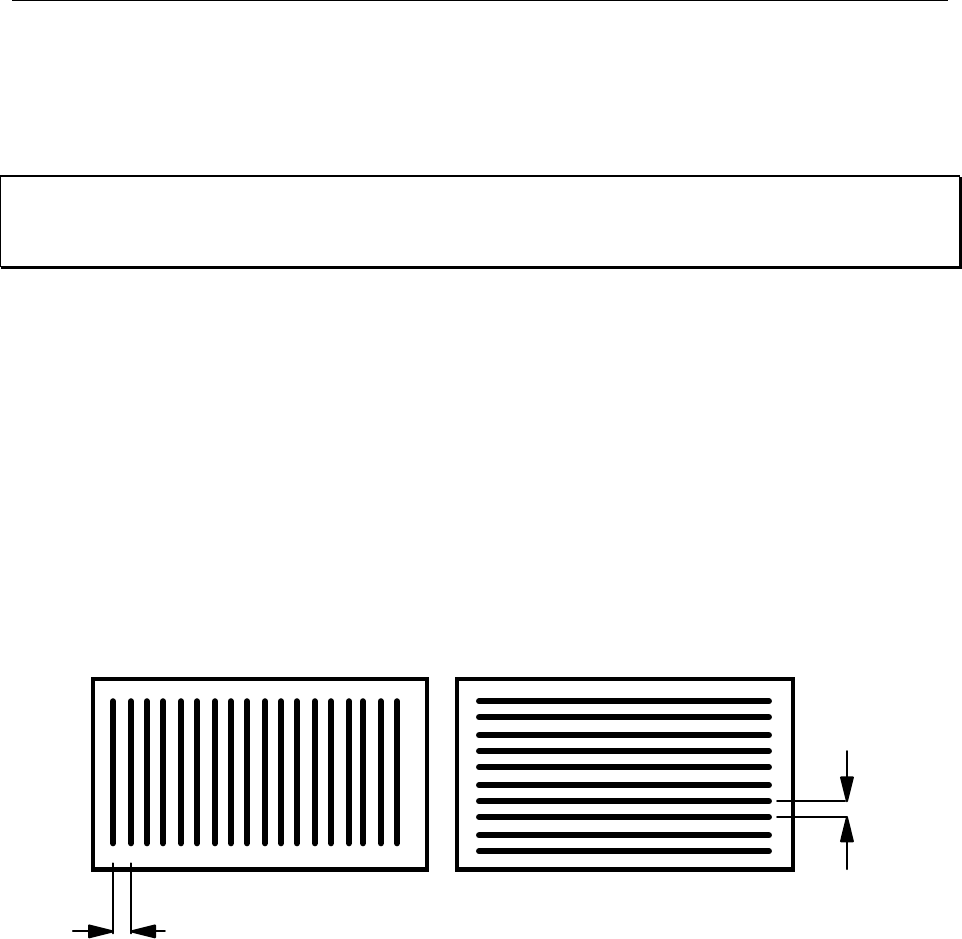
II.12. Contrast Modulation and RAR
Reference: Monochrome CRT Monitor Performance, Draft Version 2.0, Section 5.2, page 57.
Contrast modulation (Cm) for 1-on/1-off grille patterns displayed at 50% Lmax exceeded Cm =
63% in Zone A of diameter 7.6 inches, and exceeded 62% for Zone A diameter of 20.7 inches
(40% of image area). CM exceeded 62% for zone B. The Resolution-Addressability-Ratio (RAR)
was 1.47 x 0.91 (H x V) based on measured linewidths.
Objective: Quantify contrast modulation as a function of screen position.
Equipment: • Video generator
• Spatially calibrated CCD or photodiode array optic module
• Photometer with linearized response
Procedure: The maximum video modulation frequency for each format 1024 x 768 was
examined using horizontal and vertical grille test patterns consisting of alternating
lines with 1 pixel on, 1 pixel off. Contrast modulation was measured in both
horizontal and vertical directions at screen center and at eight peripheral screen
positions. The measurements should be along the horizontal and vertical axes and
along the diagonal from these axes. Use edge measurements no more than 10% of
screen size in from border of active screen. The input signal level was set so that
1-line-on/1-line-off horizontal grille patterns produced a screen area-luminance of
25% of maximum level, Lmax.
Zone A is defined as a 24 degree subtended circle from a viewing distance of 18
inches (7.6 inch circle). Zone B is the remainder of the display. Use edge
measurements no more than 10% of screen size in from border of active screen
area to define Cm for Zone B (remaining area outside center circle). Determine
Cm at eight points on circumference of circle by interpolating between center and
display edge measurements to define Cm for Zone A. If measurements exceed the
threshold, do not make any more measurements. If one or more measurements fail
the threshold, make eight additional measurements at the edge (but wholly within)
the defined circle.
Data: Values of vertical and horizontal Cm for Zone A and Zone B are given in Table
II.12-1. The contrast modulation, Cm, is reported (the defining equation is given
below) for the 1-on/1-off grille patterns. The modulation is equal to or greater
than 63% in Zone A, and is equal to or greater than 62% in Zone B.
Pioneer PDP-502MX 50 inch Color Plasma Display Panel -25-
Use or disclosure of data on this sheet is subject to the restrictions on the cover and title of this report.
Lpeak - Lvalley
Cm =
Lpeak + Lvalley
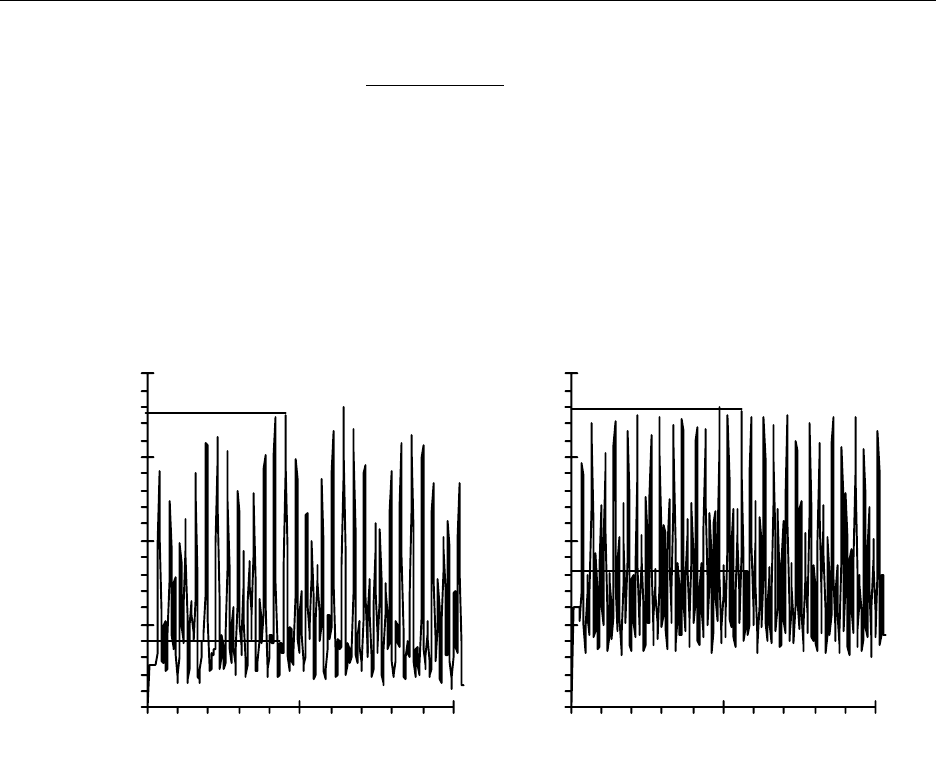
The sample contrast modulations shown in Figure II.12-1 for two different color
CRTs are not fully realized because of the presence of moiré caused by aliasing
between the image and the shadow mask. Because contrast modulation values are
calculated for the maximum peak and minimum valley luminance levels as
indicated in the sample data shown, they do not include the degrading effects of
aliasing.
0
30
60
90
120
0 250 500
0
50
100
150
200
0 250 500
Monitor A Monitor B
105 - 24 179 - 821
Cm = -- = 63% Cm = -- = 37%
105 + 24 179 + 821
Figure II.12-1. Contrast modulation for sample luminance profiles (1 pixel at input
level corresponding to 50% Lmax, 1 pixel at level 0 = Lmin) for monitors exhibiting
moiré due to aliasing.
-26- NIDL
Use or disclosure of data on this sheet is subject to the restrictions on the cover and title of this report.
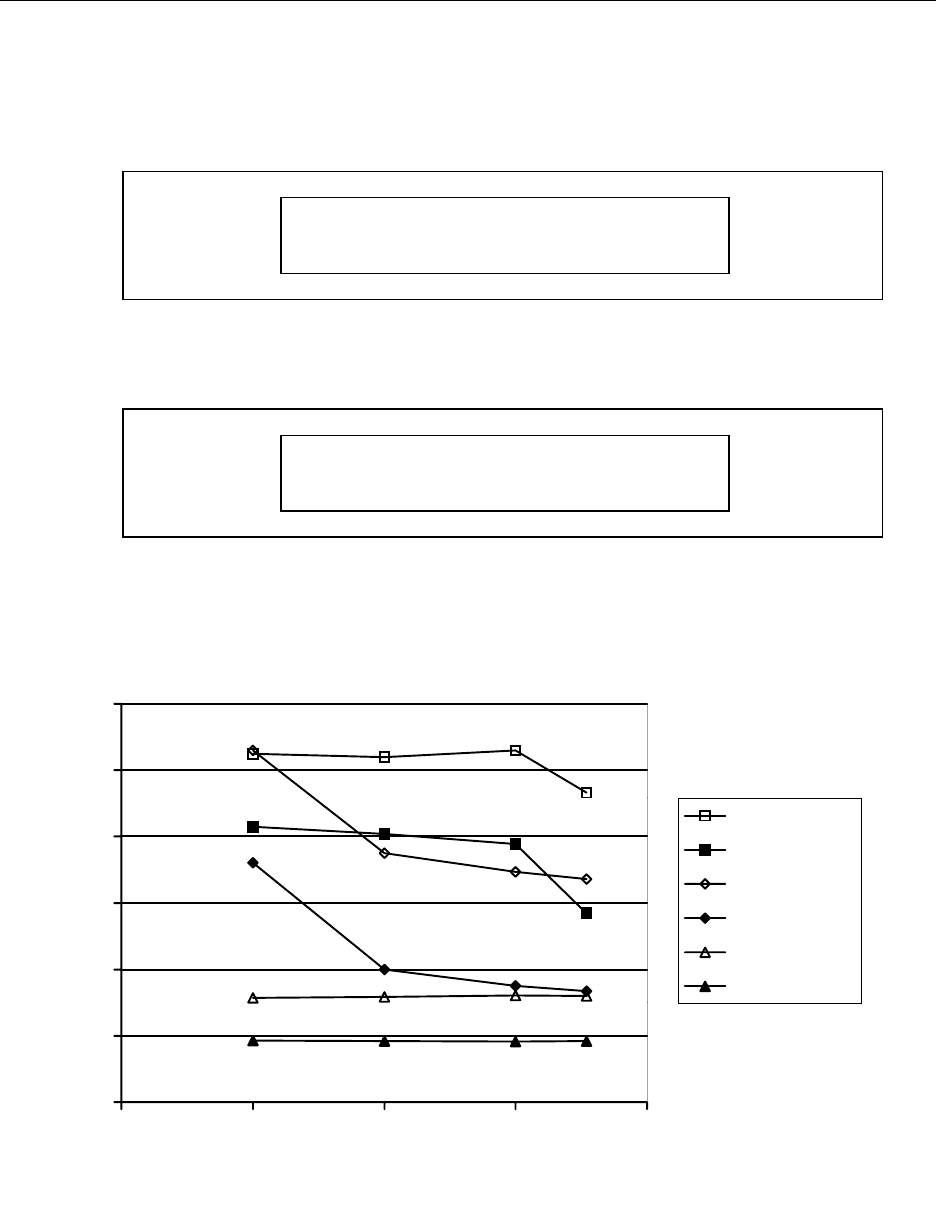
Table II.12-1. Contrast Modulation
Corrected for lens flare and Zone Interpolation
Zone A = 7.6-inch diameter circle for 24-degree subtended circle at 18-inches viewing distance
Left Minor Right
H-grille V-grille H-grille V-grille H-grille V-grille H-grille V-grille H-grille V-grille
Top 78% 65% 79% 63% 79% 62%
76% 63% 77% 63% 77% 63%
Major 76% 64% 76% 63% 76% 63% 76% 63% 77% 63%
76% 64% 77% 63% 77% 63%
Bottom 78% 66% 78% 62% 79% 62%
Zone A = 20.7-inch diameter circle for 40% area
Left Minor Right
H-grille V-grille H-grille V-grille H-grille V-grille H-grille V-grille H-grille V-grille
Top 78% 65% 79% 63% 79% 62%
77% 64% 79% 63% 78% 63%
Major 76% 64% 76% 64% 76% 63% 77% 63% 77% 63%
77% 65% 78% 62% 78% 63%
Bottom 78% 66% 78% 62% 79% 62%
Line Width
0
20
40
60
80
100
120
0 5 10 15 20
Luminance
Line Width (mils)
V Line 5%
H Line 5%
V Line 10%
H Line 10%
V Line 50%
H Line 50%
Figure II.12-2. Linewidth at 50% intensity level measured at screen center is used to compute
the Resolution-Addressability-Ratio (RAR) by dividing by the measured pixel spacing of 21.58 H
x 20.32 V mils. Thus, RAR averaged over the luminance range is 1.47 H x 0.91 V.
Pioneer PDP-502MX 50 inch Color Plasma Display Panel -27-
Use or disclosure of data on this sheet is subject to the restrictions on the cover and title of this report.
II.13. Pixel Density
Reference: Request for Evaluation Monitors, NIDL Pub. 0201099-091, Section 5.13, p 9.
Pixel density was 30 H x 32 V pixels per inch (ppi) as measured for a 400-pixel target.
Objective: Characterize density of image pixels
Equipment: Measuring tape with at least 1/16 inch increments
Procedure: Measure H&V dimension of active image window and divide by vertical and
horizontal addressability
Data: Define horizontal and vertical pixel density in terms of pixels per inch
Table II.13-1. Pixel-Density
Monoscopic Mode
H x V Addressability, Pixels 1024 x 768
H x V 400-Pixel Target Size, Inches 13.470 x 12.684
H x V Pixel Density, ppi 30 x 32

-28- NIDL
Use or disclosure of data on this sheet is subject to the restrictions on the cover and title of this report.
II.14. Moiré
Reference: Request for Evaluation Monitors, NIDL Pub. 0201099-091, Section 5.14, p 9.
The Pioneer PDP-502MX Plasma Display Panel shows no moiré when operated using a one-to-
one pixel mapping between input signal and the native addressable pixels. As tested in 1024 x
768 mode, only 80% of the available 1280 x 768 total pixels were addressed leaving the side
edges of the screen dark.
Objective: Determine lack of moiré.
Equipment Loupe with scale graduated in 0.001 inch or equivalent
Procedure Measure phosphor pitch in vertical and horizontal dimension at screen center. For
aperture grille screens, vertical pitch will be 0. Define pixel size by 1/pixel
density.
Data: Define value of phosphor: pixel spacing. Value <1 passes, but <0.6 preferred.
Table II.14-1. Phosphor-to-Pixel-Spacing Ratios
Monoscopic Mode
Addressability 1024 x 768
Phosphor Trio Spacing (H x V) 21.8 x 20.5 mils
Pixel Spacing (H x V) 21.8 x 20.5 mils
Phosphor-to-Pixel-Spacing 1.0

Pioneer PDP-502MX 50 inch Color Plasma Display Panel -29-
Use or disclosure of data on this sheet is subject to the restrictions on the cover and title of this report.
II.15. Straightness
Reference: Monochrome CRT Monitor Performance, Draft Version 2.0, Section 6.1 Waviness,
page 67.
Deviation from straightness did not exceed 0.05% of the total image height or width.
Note: Because this plasma panel is a fixed pixel display, the straightness measurement serves
more as a test of the measurement equipment.
Objective: Measure beam position on the CRT display to quantify effects of waviness which
causes nonlinearities within small areas of the display distorting nominally
straight features in images, characters, and symbols.
Equipment: • Video generator
• Spatially calibrated CCD or photodiode array optic module
• Calibrated X-Y translation stage
Test Pattern: Use the three-line grille patterns in Figure II.15-1 for vertical and horizontal lines
each 1-pixel wide. Lines in test pattern are displayed at 100% Lmax must be
positioned along the top, bottom, and side edges of the addressable screen, as well
as along both the vertical and horizontal centerlines (major and minor axes).
1-pixel-wide lines displayed at 100% Lmax
Figure II.15-1 Three-line grille test patterns.
-30- NIDL
Use or disclosure of data on this sheet is subject to the restrictions on the cover and title of this report.
A
C
D
5% of total width
Total width of addressable screen
Center screen
(x=0, y=0)
B
-x +x
+y
-y
E
F
G
H
Figure II.15-2 Measurement locations for waviness along horizontal lines. Points
A, B, C, D are extreme corner points of addressable screen. Points E, F, G, H are the
endpoints of the axes.
Procedure: Use diode optic module to locate center of line profiles in conjunction with
calibrated X-Y translation to measure screen x,y coordinates along the length of a
nominally straight line. Measure x,y coordinates at 5% addressable screen
intervals along the line. Position vertical lines in video to land at each of three (3)
horizontal screen locations for determining waviness in the horizontal direction.
Similarly, position horizontal lines in video to land at each of three (3) vertical
screen locations for determining waviness in the vertical direction.
Data: Tabulate x,y positions at 5% addressable screen increments along nominally
straight lines at top and bottom, major and minor axes, and left and right sides of
the screen as shown in Table II.15-I. Figure II.15-3 shows the results in graphical
form.
Pioneer PDP-502MX 50 inch Color Plasma Display Panel -31-
Use or disclosure of data on this sheet is subject to the restrictions on the cover and title of this report.
Table II.15-1. Straightness
Tabulated x,y positions at 5% addressable screen increments
along nominally straight lines.
Top Bottom Major Minor Left Side Right Side
xyxyxyxyxy xy
-17281 12231 -17296 -12153 -17295 13 6 12217 -17283 12232 17267 12230
-14400 12227 -14400 -12156 -14400 10 6 10800 -17285 10800 17265 10800
-12800 12224 -12800 -12159 -12800 7 5 9600 -17285 9600 17265 9600
-11200 12221 -11200 -12161 -11200 4 5 8400 -17285 8400 17264 8400
-9600 12218 -9600 -12164 -9600 1 4 7200 -17287 7200 17264 7200
-8000 12218 -8000 -12165 -8000 0 2 6000 -17290 6000 17262 6000
-6400 12217 -6400 -12165 -6400 0 0 4800 -17294 4800 17258 4800
-4800 12216 -4800 -12166 -4800 -1 -4 3600 -17298 3600 17256 3600
-3200 12215 -3200 -12166 -3200 0 -6 2400 -17298 2400 17256 2400
-1600 12215 -1600 -12166 -1600 0 -5 1200 -17296 1200 17258 1200
0 12215 0 -12166 0 0 -1 0 -17294 0 17260 0
1600 12216 1600 -12166 1600 0 -1 -1200 -17294 -1200 17261 -1200
3200 12217 3200 -12165 3200 1 0 -2400 -17294 -2400 17261 -2400
4800 12218 4800 -12164 4800 1 0 -3600 -17294 -3600 17261 -3600
6400 12219 6400 -12163 6400 2 -1 -4800 -17295 -4800 17261 -4800
8000 12220 8000 -12161 8000 4 -2 -6000 -17296 -6000 17260 -6000
9600 12222 9600 -12160 9600 6 -3 -7200 -17297 -7200 17260 -7200
11200 12224 11200 -12158 11200 8 -1 -8400 -17296 -8400 17262 -8400
12800 12226 12800 -12156 12800 9 0 -9600 -17294 -9600 17265 -9600
14400 12227 14400 -12156 14400 10 1 -10800 -17294 -10800 17265 -10800
17268 12230 17204 -12153 17261 12 0 -12170 -17295 -12156 17264 -12157
1024 x 768
Figure II.15-3 Waviness of Pioneer PDP-502MX Plasma Display Panel in 1024 x 768 mode.
Departures from straight lines are exaggerated on a 10X scale. Error bars are +/- 0.5% of total
screen size.
-32- NIDL
Use or disclosure of data on this sheet is subject to the restrictions on the cover and title of this report.
II.16. Refresh Rate
Reference: Request for Evaluation Monitors, NIDL Pub. 0201099-091, Section 5.16, p 9.
Vertical refresh rate for 1024 x 768 format was set to 75 Hz for monoscopic mode, and limited to
43 Hz per eye for stereo mode. The PDP panel cannot achieve the necessary 120 Hz refresh rate
required to achieve 60 Hz per eye for stereo.
Objective: Define vertical and horizontal refresh rates.
Equipment: Programmable video signal generator.
Procedure: The refresh rates were programmed into the Quantum Data 8701 test pattern
generator for 72 Hz minimum for monoscopic mode and 120 Hz minimum for
stereoscopic mode, where achievable.
Data: Report refresh rates in Hz.
Table II.16-1 Refresh Rates as Tested
Monoscopic Mode Stereo Mode
Addressability 1024 x 768 1024 x 768 Interlaced
1024 x 384 per eye
Vertical Scan 75 Hz 43 Hz per eye *
Horizontal Scan 63.98 kHz 91.1 kHz
* Manufacturer states 91.1 kHz maximum scan rate, thus, 120 Hz vertical scan rate is not
achievable in stereo mode. Manufacturer states a maximum vertical refresh rate of 85 Hz.

Pioneer PDP-502MX 50 inch Color Plasma Display Panel -33-
Use or disclosure of data on this sheet is subject to the restrictions on the cover and title of this report.
II.17. Extinction Ratio
Reference: Request for Evaluation Monitors, NIDL Pub. 0201099-091, Section 5.17, p10.
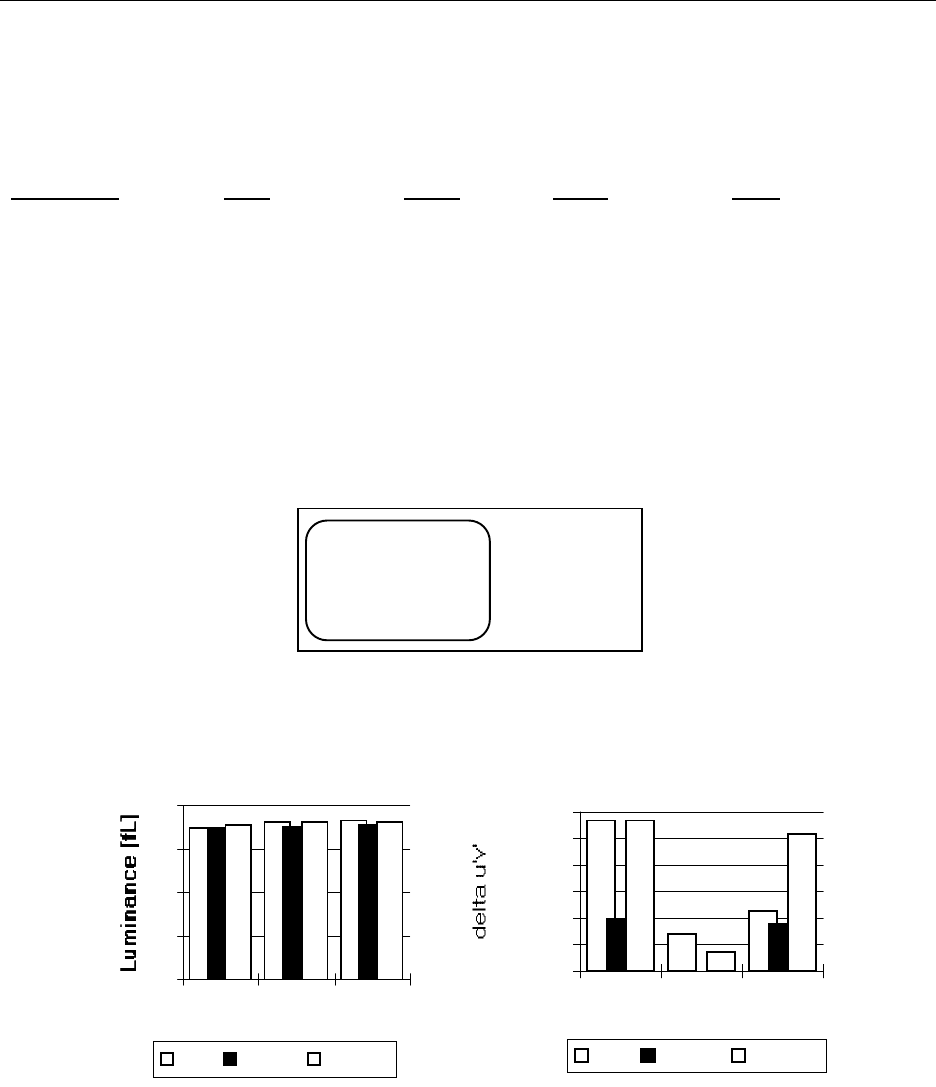
Stereo extinction ratio averaged 1.6 to 1 (1.5 left, 1.6 right) at screen center. Luminance of
white varied by up to 8.0% across the screen. Chromaticity variations of white were less than
0.007 delta u'v' units. Dynamic Range is 20.3 dB with 2.26 fL Lmax measured through the stereo
viewing system.
Objective: Measure stereo extinction ratio
Equipment: Two “stereo” pairs with full addressability. One pair has left center at command
level of 255 (or Cmax) and right center at 0. The other pair has right center at
command level of 255 (or Cmax) and left center at 0.
Stereoscopic-mode measurements were made using commercially available
wireless CrystalEyes active LC shutter glasses from StereoGraphics Corporation.
Procedure: If possible, calibrate monitor to 0.1 fL Lmin and 35 fL Lmax (no ambient).
Measure ratio of Lmax to Lmin on both left and right side images through the
stereo system.
Data: Extinction ratio (left) = L (left,on, white/black)/left,off, black/white)
L(left,on, white/black) ~ trans(left,on)*trans(stereo)*L(max)*Duty(left)
+ trans(left,off)*trans (stereo)*L(min)*Duty (right)
Use left,off/right,on to perform this measurement
Extinction ratio (right) = L (right,on,white/black)/right,off, black/white)
L(right,on, white/black) ~ trans(right,on)*trans(stereo)*L(max)*Duty(right)
+ trans(right,off)*trans (stereo)*L(min)*Duty (left)
Use left,on/right,off to perform this measurement
Stereo extinction ratio is average of left and right ratios defined above.
Table II.17-1. Luminance and Chromaticity of White (Stereoscopic Mode)
Lmin, Average Left, Right, center 0.021 fL
Lmax, Average Left, Right, center 2.26 fL
Dynamic Range, center 20.3 dB
Uniformity, Luminance 8.0 %
Uniformity, Chromaticity 0.007 u'v'
-34- NIDL
Use or disclosure of data on this sheet is subject to the restrictions on the cover and title of this report.
0
0.2
0.4
0.6
0.8
1
Left Center Right
Luminance [fL]
Top Center Bottom
Left Eye, Black/White
0
0.5
1
1.5
2
Left Center Right
Luminance [fL]
Top Center Bottom
Right Eye, Black/White
Fig.II.17-1. Spatial Uniformity of luminance in stereo mode when displaying black to the left
eye while displaying white to the right eye.
0
0.5
1
1.5
2
Left Center Right
Luminance [fL]
Top Center Bottom
Left Eye, White/Black
0
0.2
0.4
0.6
0.8
1
Left Center Right
Luminance [fL]
Top Center Bottom
Right Eye, White/Black
Fig.II.17-2. Spatial Uniformity of luminance in stereo mode when displaying white to the left
eye while displaying black to the right eye.
Pioneer PDP-502MX 50 inch Color Plasma Display Panel -35-
Use or disclosure of data on this sheet is subject to the restrictions on the cover and title of this report.
Left Eye
0.0
0.5
1.0
1.5
2.0
Left Center Right
Extinction ratio
Top Center Bottom
Right Eye
0.0
0.5
1.0
1.5
2.0
Left Center Right
Extinction Ratio
Top Center Bottom
Fig.II.17-3. Spatial Uniformity of extinction ratio in stereo mode.
/HIW &HQWHU 5LJKW
7RS &HQWHU %RWWRP
/HIW &HQWHU 5LJKW
7RS &HQWHU %RWWRP
Fig.II.17-4 Spatial uniformity of chromaticity of white in stereo mode.
-36- NIDL
Use or disclosure of data on this sheet is subject to the restrictions on the cover and title of this report.
II.18. Linearity
Reference: Monochrome CRT Monitor Performance, Draft Version 2.0, Section 6.2, page 73.
The maximum nonlinearity of the displayed pixels was measured to be 0.04% of full screen.
Note: Because this plasma panel is a fixed pixel display, the linearity measurement serves more
as a test of the measurement equipment.
Objective: Measure the relation between the actual position of a pixel on the screen and the
commanded position to quantify effects of raster nonlinearity. Nonlinearity of
scan degrades the preservation of scale in images across the display.
Equipment: • Video generator
• Spatially calibrated CCD or photodiode array optic module
• Calibrated X-Y translation stage
Test Pattern: Use grille patterns of single-pixel horizontal lines and single-pixel vertical lines
displayed at 100% Lmax. Lines are equally spaced in addressable pixels.
Spacing must be constant and equal to approximately 5% screen width and
height to the nearest addressable pixel as shown in Figure II.18-1.
5% screen
height
5% screen
width 1-pixel wide lines
V-grille H-grille
Figure II.18-1. Grille patterns for measuring linearity
Procedure: The linearity of the raster scan is determined by measuring the positions of lines
on the screen. Vertical lines are measured for the horizontal scan, and horizontal
lines for the vertical scan. Lines are commanded to 100% Lmax and are equally
spaced in the time domain by pixel indexing on the video test pattern. Use optic
module to locate center of line profiles in conjunction with x,y-translation stage
to measure screen x,y coordinates of points where video pattern vertical lines
intersect horizontal centerline of screen and where horizontal lines intersect
vertical centerline of the CRT screen as shown in Figure II.18-2.
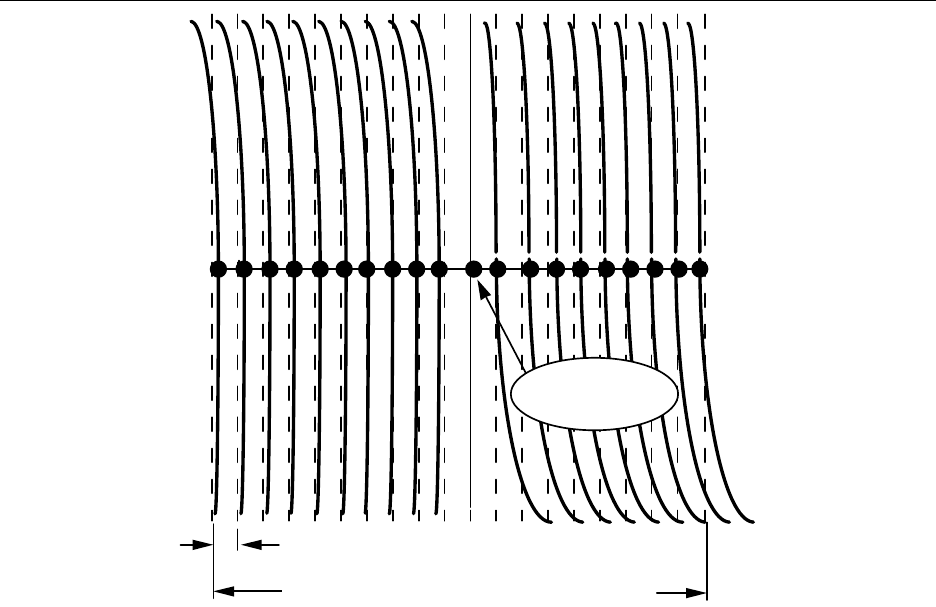
Pioneer PDP-502MX 50 inch Color Plasma Display Panel -37-
Use or disclosure of data on this sheet is subject to the restrictions on the cover and title of this report.
5% of total addressable width
Total width of addressable screen
Center screen
(x=0, y=0)
Figure II.18-2. Measurement locations for horizontal linearity along the major axis of the
display. Equal pixel spacings between vertical lines in the grille pattern are indicated by the
dotted lines. The number of pixels per space is nominally equivalent to 5% of the addressable
screen size.
Data: Tabulate x, y positions of equally spaced lines (nominally 5% addressable screen
apart) along major (horizontal centerline) and minor (vertical centerline) axes of
the raster. If both scans were truly linear, the differences in the positions of
adjacent lines would be a constant. The departures of these differences from
constancy impact the absolute position of each pixel on the screen and are, then,
the nonlinearity. The degree of nonlinearity may be different between left and
right and between top and bottom. The maximum horizontal and vertical
nonlinearities (referred to full screen size) are listed in table II.18-1. The
complete measured data are listed in table II.18-2 and shown graphically in
Figures II.18-3.
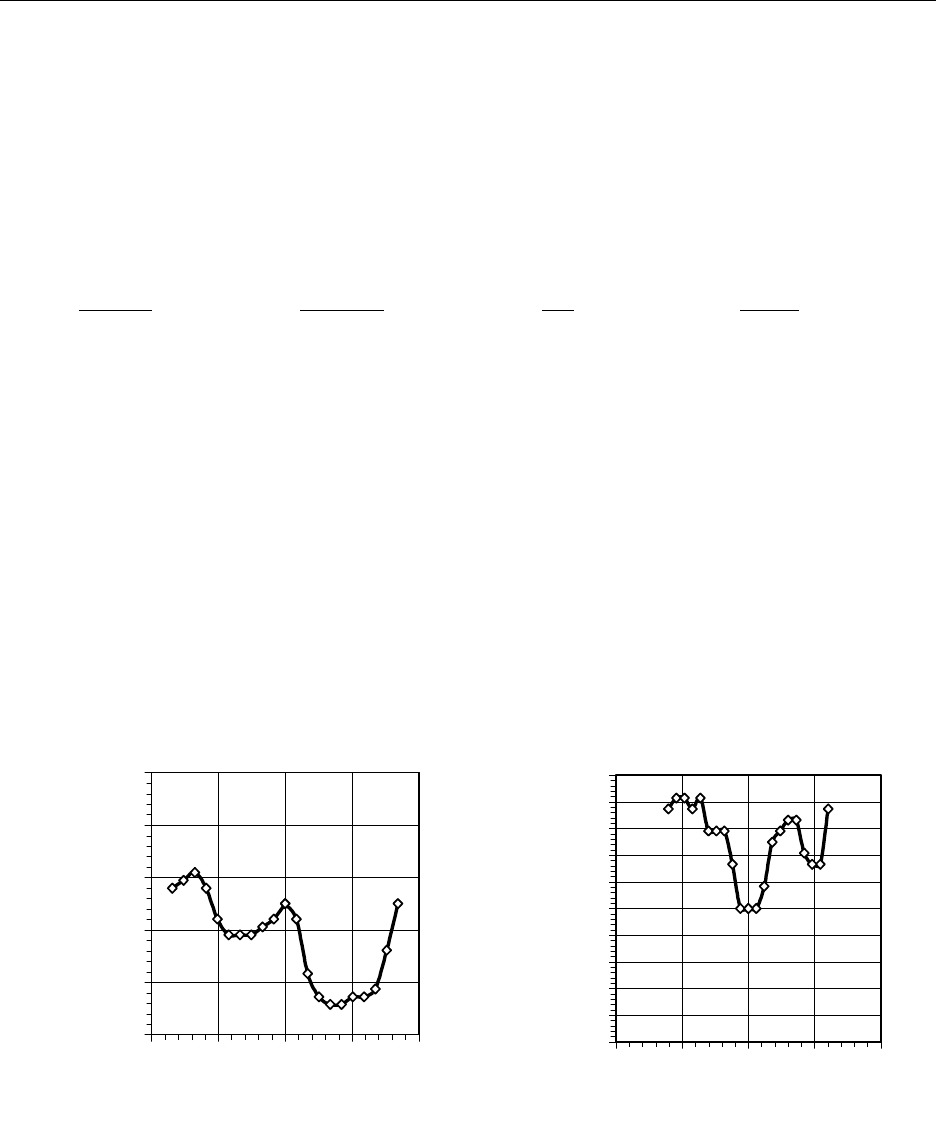
-38- NIDL
Use or disclosure of data on this sheet is subject to the restrictions on the cover and title of this report.
Table II.18-1. Maximum Horizontal and Vertical Nonlinearities
Format Left Side Right Side Top Bottom
1024 x 768 0.01% 0.04% 0.04% 0.04%
Table II.18-2. Horizontal and Vertical Nonlinearities Data
Vertical Lines
x-Position (mils) Horizontal lines
y-Position (mils)
Left Side Right Side Top Bottom
-16888 16890 12089 -12071
-15198 15195 10876 -10862
-13508 13501 9668 -9654
-11821 11811 8461 -8447
-10136 10122 7256 -7238
-8449 8432 6048 -6033
-6760 6743 4839 -4825
-5071 5055 3630 -3617
-3381 3369 2418 -2412
-1691 1687 1208 -1208
0000
Horizontal Pixel position accuracy
relative to center
-0.05%
-0.03%
-0.01%
0.01%
0.03%
0.05%
-20 -10 0 10 20
Pixel Position from center (inches)
Deviation in percentage of
Screen
Vertical pixel position accuracy
relative to center
-0.05%
-0.04%
-0.03%
-0.02%
-0.01%
0.00%
0.01%
0.02%
0.03%
0.04%
0.05%
-20 -10 0 10 20
Pixel Position from center (inches)
Deviation in percentage of
Screen
Figure. II.18-3 Horizontal and Vertical Linearity Characteristics.
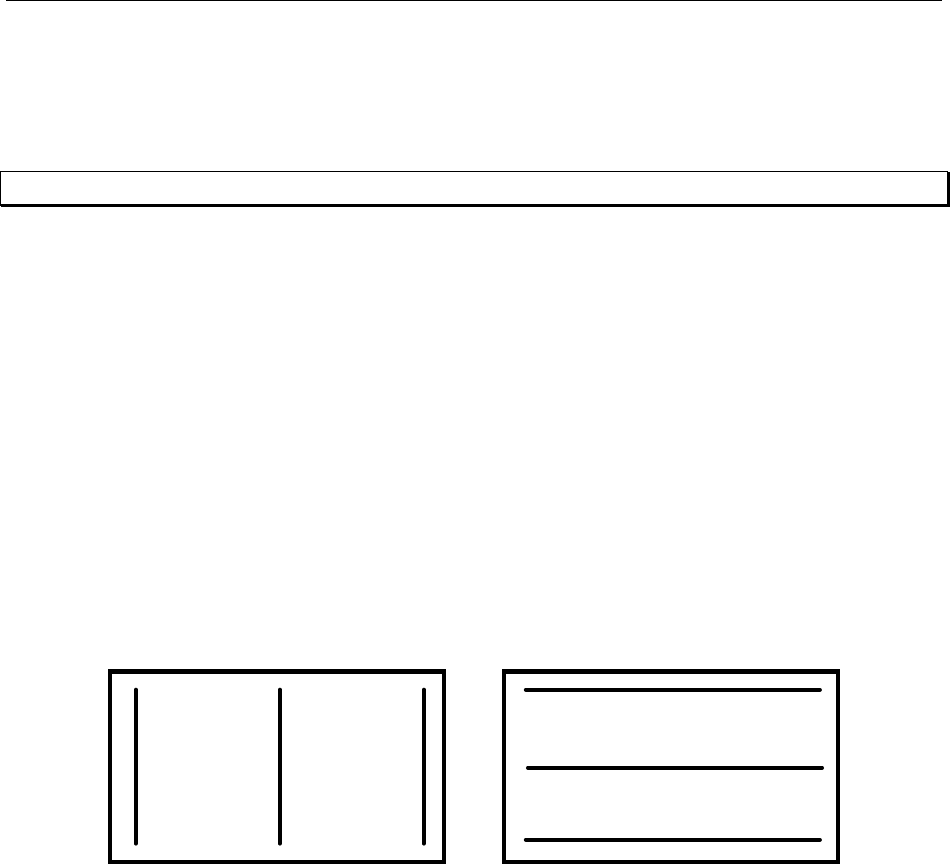
Pioneer PDP-502MX 50 inch Color Plasma Display Panel -39-
Use or disclosure of data on this sheet is subject to the restrictions on the cover and title of this report.
II.19. Jitter/Swim/Drift
Reference: Monochrome CRT Monitor Performance, Draft Version 2.0 Section 6.4, p80.
Maximum jitter and swim/drift was 0.74 mils and 0.65 mils, respectively.
Objective: Measure amplitude and frequency of variations in beam spot position of the CRT
display. Quantify the effects of perceptible time varying raster distortions: jitter,
swim, and drift. The perceptibility of changes in the position of an image depends
upon the amplitude and frequency of the motions, which can be caused by
imprecise control electronics or external magnetic fields.
Equipment: • Video generator
• Spatially calibrated CCD or photodiode array optic module
• Calibrated X-Y translation stage
Test Pattern: Use the three-line grille patterns in Figure II.19-1 for vertical and horizontal
lines each 1-pixel wide. Lines in test pattern must be positioned along the top,
bottom, and side edges of the addressable screen, as well as along both the
vertical and horizontal centerlines (major and minor axes).
V-grille for measuring horizontal motion, H-grille for measuring vertical motion
1-pixel wide lines
Three-line grille test patterns.
Figure II.19-1
Procedure: With the monitor set up for intended scanning rates, measure vertical and
horizontal line jitter (0.01 to 2 seconds), swim (2 to 60 seconds) and drift (over
60 seconds) over a 2.5 minute duration as displayed using grille video test
patterns. Generate a histogram of raster variance with time. The measurement
interval must be equal to a single field period.
Optionally, for multi-sync monitors measure jitter over the specified range of
scanning rates. Some monitors running vertical scan rates other than AC line
frequency may exhibit increased jitter.

-40- NIDL
Use or disclosure of data on this sheet is subject to the restrictions on the cover and title of this report.
Measure and report instrumentation motion by viewing Ronchi ruling or
illuminated razor edge mounted to the top of the display. It may be necessary to
mount both the optics and the monitor on a vibration-damped surface to reduce
vibrations.
Data: Tabulate motion as a function of time in x-direction at top-left corner screen
location. Repeat for variance in y-direction. Tabulate maximum motions (in mils)
with display input count level corresponding to Lmax for jitter (0.01 to 2 seconds),
swim (2 to 60 seconds) and drift (over 60 seconds) over a 2.5 minute duration.
The data are presented in Table II.19-1. Both the monitor and the Microvision
equipment sit on a vibration-damped aluminum-slab measurement bench. The
motion of the test bench was a factor of 10 times smaller than the CRT raster
motion.
Table II.19-1. Jitter/Swim/Drift
Time scales: Jitter 2 sec., Swim 10 sec., and Drift 60 sec.
1024 x 768 x 75hz
H-lines V-lines
10D corner Max Motions
Jitter 0.874 1.75
Swim 0.893 1.78
Drift 0.901 1.78
Black
Tape
Max
Motions
Jitter 0.538 1.01
Swim 0.587 1.13
Drift 0.587 1.15
Less Tape Motion maximum
s
Jitter 0.34 0.74 0.74
Swim 0.31 0.65 0.65
Drift 0.31 0.63 0.63
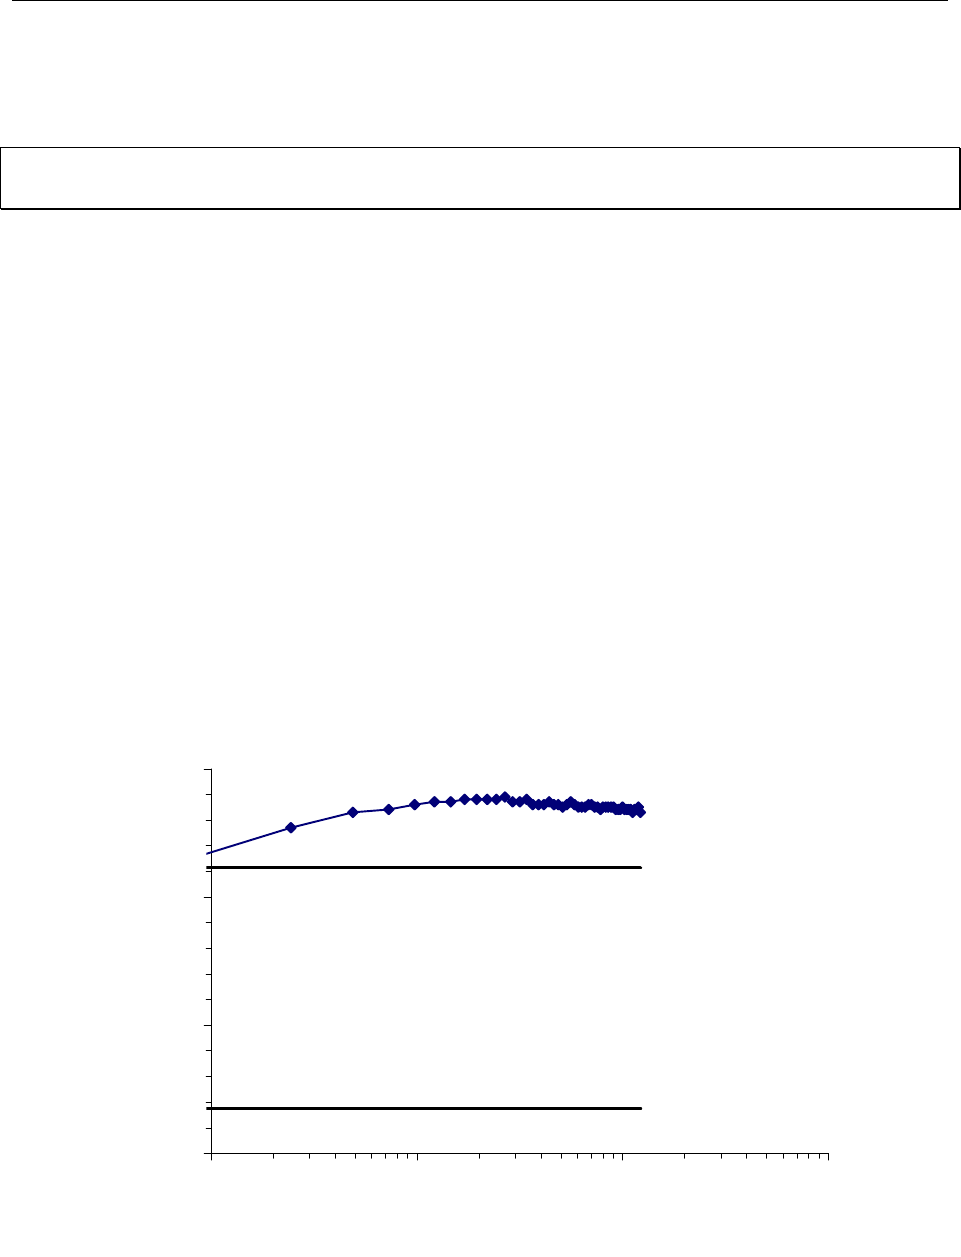
Pioneer PDP-502MX 50 inch Color Plasma Display Panel -41-
Use or disclosure of data on this sheet is subject to the restrictions on the cover and title of this report.
II.20. Warm-up Period
Reference: Request for Evaluation Monitors, NIDL Pub. 0201099-091, Section 5.20, p. 10.
Less than a minute warm-up was necessary for luminance to be stable to within 10% of Lmin =
0.234 fL
Objective: Define warm-up period
Equipment: Photometer, test target (full screen 0 count)
Procedure: Turn monitor off for three-hour period. Turn monitor on and measure center of
screen luminance (Lmin as defined in Dynamic range measurement) at 1-minute
intervals for first five minutes and five-minute intervals thereafter. Discontinue
when three successive measurements are ± 10% of Lmin.
Data: Pass if Lmin within ± 50% in 30 minutes and ±10% in 60 minutes.
The luminance of the screen (commanded to the minimum input level, 0 for
Lmin) was monitored for 120 minutes after a cold start. Measurements were
taken every minute. Figure II.20-1 shows the data for 1024 x 768 format in
graphical form. The luminance remains very stable after 53 minutes.
Lmin Warm Up Characteristic
0.1
0.15
0.2
0.25
1 10 100 1000
Time after power ON, minutes
Lumiance, fL
Less than 1 minute to -50% final Lmin
Less than 1 minute to -10% final Lmin
Figure II.20.1. Luminance (fL) as a function of time (in minutes) from a cold start with an input
count of 0. (Note suppressed zero on luminance scale).
