NOC Administrator's Guid Ground Work Monitor And Ganglia Integration System Administrator Guide 5.0.0
User Manual:
Open the PDF directly: View PDF ![]() .
.
Page Count: 32
- 1 Overview
- 2 Installation
- 3 Detailed Description
- 4 Administration
- Appendix A: Revision History
GroundWork Monitor
Ganglia Integration Module
System Administrator Guide
Revision 5.0.0
February 28, 2011
Prepared by: GroundWork Open Source, Inc.
139 Townsend Street, Suite 500
San Francisco, CA 94107

GroundWork Ganglia Integration Module Administrator’s Guide
Contents
1 Overview...................................................................................................................................................................3
2 Installation ...............................................................................................................................................................4
2.1 GroundWork Monitor..........................................................................................................................................4
2.2 Fresh Installation of the Ganglia Integration Module.........................................................................................4
2.3 Upgrading from a Previous Release of the Ganglia Integration Module...........................................................6
3 Detailed Description................................................................................................................................................8
3.1 Check Ganglia and Nagios................................................................................................................................8
3.2 Performance Considerations...........................................................................................................................11
3.3 ganglia Database.............................................................................................................................................12
3.3.1 cluster Table...........................................................................................................................................12
3.3.2 clusterhost Table....................................................................................................................................12
3.3.3 host Table...............................................................................................................................................13
3.3.4 hostinstance Table.................................................................................................................................13
3.3.5 location Table.........................................................................................................................................13
3.3.6 metric Table............................................................................................................................................14
3.3.7 metricinstance Table..............................................................................................................................14
3.3.8 metricvalue Table...................................................................................................................................14
3.4 Ganglia Web Interface.....................................................................................................................................15
3.4.1 Threshold Configuration........................................................................................................................15
3.4.2 Access to Ganglia Web Servers............................................................................................................15
3.5 Auto-Import.......................................................................................................................................................16
4 Administration.......................................................................................................................................................17
4.1 Ganglia-Related Configuration.........................................................................................................................17
4.1.1 Check Ganglia Configuration.................................................................................................................17
4.1.2 Ganglia Threshold Administration Configuration...................................................................................20
4.1.3 Ganglia Web Server Viewing Configuration..........................................................................................21
4.1.4 Ganglia Portal Access Permissions.......................................................................................................21
4.2 Ganglia Database Administration....................................................................................................................22
4.2.1 Defining Thresholds...............................................................................................................................22
4.2.2 Validating the Configuration...................................................................................................................27
4.2.3 Finding and Deleting Hosts....................................................................................................................27
4.3 Auto-Import Configuration................................................................................................................................29
Appendix A: Revision History.................................................................................................................................32
Version 5.0.0 of 2011-02-28 16:07:30 Page 2 of 32

GroundWork Ganglia Integration Module Administrator’s Guide
1 Overview
This document describes the system administrator tasks required to install and administer the software which
integrates GroundWork Monitor with Ganglia, referred to as the Ganglia Integration Module. This software allows
information gathered by the Ganglia monitoring system to be processed by a GroundWork Monitor system.
Ganglia is an agent-based, cluster-oriented monitoring system. It is useful for large installations with many similar
hosts. It is efficient and scalable, and can collect and graph many different metrics. Ganglia, however, does not
include threshold values for these metrics, or notifications when these thresholds are violated. Nor does it include
reporting. These functions are part of GroundWork Monitor, via the Nagios® monitoring system and GroundWork's
user interfaces and databases. This integration module brings these projects together by allowing GroundWork
Monitor operator views, dashboards, reports, notifications, and configuration tools to be applied to Ganglia data.
The Ganglia Integration Module has the following features.
●A “collector” gathers information for each host running the Ganglia gmond agent, and relays that information to
a GroundWork Monitor host. For each monitored host, selected metrics are compared against warning and
critical thresholds. If the thresholds are exceeded for a configured duration, a service alert is generated.
●A web interface called the Ganglia Configuration Administration tool is provided. This interface allows the
administrator to:
●Define Ganglia metrics to monitor (i.e., select a subset of the metrics that Ganglia is collecting, for
purposes of watching for extreme values).
●Define warning, critical, and duration thresholds for the watched metrics.
●Assign watched-metric thresholds globally (to all Ganglia clusters), to specific Ganglia clusters, or to
specific hosts.
●View the current metric state of certain metrics monitored by the Ganglia interface, for particular hosts.
●Conveniently access the web pages provided by Ganglia itself.
●An import script that automatically defines the Ganglia hosts to the GroundWork Monitor system is also
included. The Monarch Nagios configuration database is updated by the import script, and Monarch
procedures are called to automatically commit the changes to Nagios.
The integration module package consists of the following main components:
●Check Ganglia daemon, check_ganglia.pl. This module reads a set of Ganglia gmetad and/or gmond
XML streams and extracts the metrics for each host. It compares these metrics to the defined watched-metric
thresholds to determine if a metric is in violation of its associated thresholds. It then sends passive service
check results to the Nagios command pipe. The daemon also updates the ganglia database.
●ganglia MySQL database. This database contains:
●The default, per-cluster, and per-host watched-metric thresholds.
●The current metric measurements for each host.
●Ganglia configuration administration CGI programs, presented as portal applications within GroundWork
Monitor Enterprise Edition. The standard security mechanisms available to similar portal applications (e.g.,
limiting access to only certain Roles) are also available for these portal pages.
●Auto-import script. This script, autoimport.pl, queries the ganglia MySQL database for hosts reported by
the check ganglia daemon. It then queries the monarch database for hosts defined in Nagios, and finds
Ganglia hosts that are not in Nagios, which it adds to the monarch database. It applies a default ganglia
profile to such new hosts, and optionally commits the changes to Nagios.
The detailed design of the system is described below.
Version 5.0.0 of 2011-02-28 16:07:30 Page 3 of 32

GroundWork Ganglia Integration Module Administrator’s Guide
2 Installation
The following software prerequisites are required to install the Ganglia Integration Module.
●GroundWork Monitor Enterprise Edition version 6.4.0.
●Ganglia Version 3.0.x or 3.1.X monitoring your infrastructure. Note: it is not necessary to install gmond or
gmetad on the GroundWork server, but if you do not, you must ensure that the GroundWork server can
access the XML feed on at least one gmond or gmetad instance.
The Ganglia Integration Module is supplied as a set of RPM packages:
●groundwork-ganglia-integration
●groundwork-autoimport
Multiple RPMs are used to provide appropriate granularity for upgrades as this software and the base product both
evolve. Currently, RPMs are provided for Red Hat Enterprise Linux 5 32-bit and Red Hat Enterprise Linux 5 64-bit
platforms.
Certain customer-specific extensions may be supplied to those customers as separate RPMs:
●groundwork-ganglia-customername
●groundwork-autoimport-customername
The check_ganglia.pl script which is at the heart of this software runs continually under control of the
GroundWork Monitor gwservices service. To enable us to automatically install all the software in its intended
locations without having it disrupt system operation before it is properly configured, the daemon script looks for the
enable_processing setting in its configuration file. If the option is turned off, as it is in the default installed
configuration file, the script will just emit a log message saying that processing is not enabled, and it will then sleep
for a very long time.
To install, you will need to perform the following steps:
●Set up GroundWork Monitor Enterprise Edition.
●Set up Ganglia, and in particular make sure you understand where the gmond and/or gmetad XML feeds are
accessible.
●Install the required Ganglia Integration RPM.
●Optionally install the Autoimport RPM.
●Configure and start the software.
The rest of this chapter contains basic instructions for performing these steps.
2.1 GroundWork Monitor
Install GroundWork Monitor according to the standard product installation procedures.
2.2 Fresh Installation of the Ganglia Integration Module
All the Ganglia Integration RPMs get installed on your top-level GroundWork Monitor system, which is where the
check_ganglia.pl script will run.
Note: Installation of the RPMs will restart both of the apache and gwservices components of GroundWork Monitor.
This will disrupt existing, running sessions where users are accessing GroundWork Monitor. Thus, you may wish
to wait until a convenient period of low use to perform these steps.
Install the RPMs for your platform. Here we specify them as individual rpm commands, but you may combine them
on a single rpm command if you wish. The groundwork-ganglia-customername and/or groundwork-
autoimport-customername RPMs will only be installed at particular customer sites.
rpm -Uvh groundwork-ganglia-integration-release-build.platform.rpm
rpm -Uvh groundwork-ganglia-customername-release-build.platform.rpm
rpm -Uvh groundwork-autoimport-release-build.platform.rpm
rpm -Uvh groundwork-autoimport-customername-release-build.platform.rpm
where platform is i386 for a 32-bit platform, x86_64 for a 64-bit platform, or noarch for either platform.
Version 5.0.0 of 2011-02-28 16:07:30 Page 4 of 32

GroundWork Ganglia Integration Module Administrator’s Guide
Once the software is installed, take the following steps:
●Create the ganglia database. This is a destructive operation (it will wipe out any previous database named
ganglia). Creating the database is not done automatically during RPM installation because we cannot
assume where you want to have this database reside.
mysql options < /usr/local/groundwork/core/databases/ganglia_db_create.sql
where the options are whatever you need to access the proper MySQL instance, such as:
mysql -h host -u root -p < ganglia_db_create.sql
Note: If you don't have a password for the MySQL root account (definitely not a recommended setup!), just
type Return at the password prompt.
●Set up the /usr/local/groundwork/config/check_ganglia.conf config file. In particular:
●Check that the GANGLIA_GMOND_PORT and GANGLIA_GMETAD_PORT definitions match the port numbers
in use at your site.
●Define the hosts and ports at which Ganglia XML streams should be accessed to obtain metric data
(<ganglia_hosts> section).
●List the names of the particular Ganglia clusters you wish to monitor (ganglia_cluster lines).
●Adjust the database-access parameters to fit your local site (dBHost through dBPass).
●Set enable_processing = yes (this parameter appears at the top of the file) once all the other setup in
this file is ready.
●Set up the /usr/local/groundwork/config/GangliaConfigAdmin.conf config file. In particular,
adjust the database-access parameters to fit your local site (DatabaseHost through DatabasePass).
●Set up the /usr/local/groundwork/config/GangliaWebServers.conf config file. In particular,
define the hosts and URLs at which your Ganglia Web Server pages are available for viewing
(<ganglia_web_servers> section).
●Set up the /usr/local/groundwork/config/autoimport.conf config file. In particular:
●Check the commit_changes value to make sure it will reflect your local usage of auto-import.
●Check the process_wg_hostgroups value to make sure it reflects your local usage. Almost all
customers will set this to no.
●Check the custom_hostgroup_package and custom_hostgroup_package_options values to
make sure they reflect your local usage. Most customers will set the custom_hostgroup_package to
an empty string; this option must be set properly even if process_wg_hostgroups is set to no.
●Adjust the database-access parameters to fit your local site (ganglia_database through
ganglia_dbpwd, and possibly cacti_database through cacti_dbpwd).
●Check the process_cacti_hosts value to make sure it reflects your local usage.
●Set up a cron job for auto-import, perhaps.
●Kill the check_ganglia.pl daemon so it restarts (under control of gwservices) using the modified
configuration file. Finding the right process to kill is a bit complicated because of the manner in which Perl is
installed in GroundWork Monitor. You can either restart all of gwservices:
service groundwork restart gwservices
or target just the check_ganglia.pl daemon. This command will do the trick (or complain with a usage
message if the daemon is not running):
kill `ps -w -w --no-headers -C .perl.bin -o pid,args | fgrep check_ganglia.pl | awk '{print $1}'`
Note that all of the configuration files above (check_ganglia.conf, GangliaConfigAdmin.conf,
GangliaWebServers.conf, and autoimport.conf) have definite controlled ownership (nagios:nagios)
and permissions (600). These settings are not optional; the configuration files are checked for access rights each
time the associated program runs, and each program will not run if access to the configuration file is not restricted.
At this point, all of the components are installed and ready to begin collecting data and monitoring your
infrastructure. Please read the main body of this document to learn how to get the database populated with your
Version 5.0.0 of 2011-02-28 16:07:30 Page 5 of 32

GroundWork Ganglia Integration Module Administrator’s Guide
Ganglia-monitored hosts, import them into GroundWork Monitor, set up the thresholds on the metrics, and start
getting results.
You may also want to modify the default access controls set up for the Ganglia Integration Module's UI pages. See
Section 4.1.4, Ganglia Portal Access Permissions, on page 21 for details.
2.3 Upgrading from a Previous Release of the Ganglia Integration Module
Read through this entire section before beginning. Some steps must be taken manually on the old system to
capture configuration data there and transfer it to the new system.
The ganglia database schema and the configuration files for this release are compatible with those from the
Ganglia Integration Module version 4.X.X releases. The basic upgrade strategy, therefore, is to save your old
database and configuration files, then run the Fresh Installation procedure in the previous section, putting back
your old database and configuration files as needed. The following caveats apply:
●You may create the ganglia database as noted under Fresh Installation, but you will then replace its content
with that of the old database, to restore the metric thresholds you previously configured.
●To back up your old database, run a copy of mysqldump that knows where your ganglia database is
located. For instance, on a GroundWork Monitor 5.1.3 system with the database on the same machine, the
command would be:
/usr/bin/mysqldump -u root -p ganglia > /tmp/gangla-db.dump
●To restore the database dump on the upgraded system, after moving it to the /tmp directory on your
GWMEE 6.4 system, use the following commands:
cd /usr/local/groundwork/mysql/bin
./mysql -h host -u root -p ganglia < /tmp/ganglia-db.dump
●The gangliaconfig.conf file from the previous release is no longer used.
●Ownership of the check_cacti.conf and GangliaConfigAdmin.conf files has changed. Keep the
setup established by the new release for the ownership (nagios:nagios) and permissions (600) on these
files.
●The /usr/local/groundwork/etc/check_ganglia.conf file in the previous releases has been moved.
Its new location is listed above, in the Fresh Installation section.
●Certain parameters in the check_ganglia.conf file may no longer be relevant in the upgraded environment.
In particular:
●custom_metrics_package should be set to "" if you will no longer be using a customer-specific
package (groundwork-ganglia-customername RPM) to process metric data.
●Database-access parameters are likely to have changed, if only because you most probably will be
running the ganglia database on new hardware in conjunction with an upgrade to the GWMEE 6.4
release.
●The /usr/local/groundwork/etc/GangliaConfigAdmin.conf file in the previous releases has been
moved. Its new location is listed above, in the Fresh Installation section.
●Certain parameters in the GangliaConfigAdmin.conf file may have changed in the upgraded environment.
In particular:
●Database-access parameters are likely to have changed, if only because you most probably will be
running the ganglia database on new hardware in conjunction with an upgrade to the GWMEE 6.4
release.
●The GangliaWebServers.conf file is new with the Ganglia Integration Module 5.0.0 release, and must be
configured from scratch.
Version 5.0.0 of 2011-02-28 16:07:30 Page 6 of 32

GroundWork Ganglia Integration Module Administrator’s Guide
●Certain parameters in the autoimport.conf file may have changed in the upgraded environment. In
particular:
●The standard logfile path has changed. It is now:
# Where to put all the log messages from autoimport processing.
logfile = "/usr/local/groundwork/nagios/var/log/autoimport.log"
(Note that the RPM installation will create a symlink to this path in the /usr/local/groundwork/logs/
directory, for convenient access.)
●Logging now pays more attention to the configured debug level. For this reason, you probably want to set
the debug_level to 5 (log statistical data) to capture operational statistics in the log file.
●Database-access parameters are likely to have changed, if only because you most probably will be
running the ganglia and cacti databases on new hardware in conjunction with an upgrade to the
GWMEE 6.4 release.
Version 5.0.0 of 2011-02-28 16:07:30 Page 7 of 32
GroundWork Ganglia Integration Module Administrator’s Guide
3 Detailed Description
The operation of the Ganglia Integration Module is described in the following sections.
3.1 Check Ganglia and Nagios
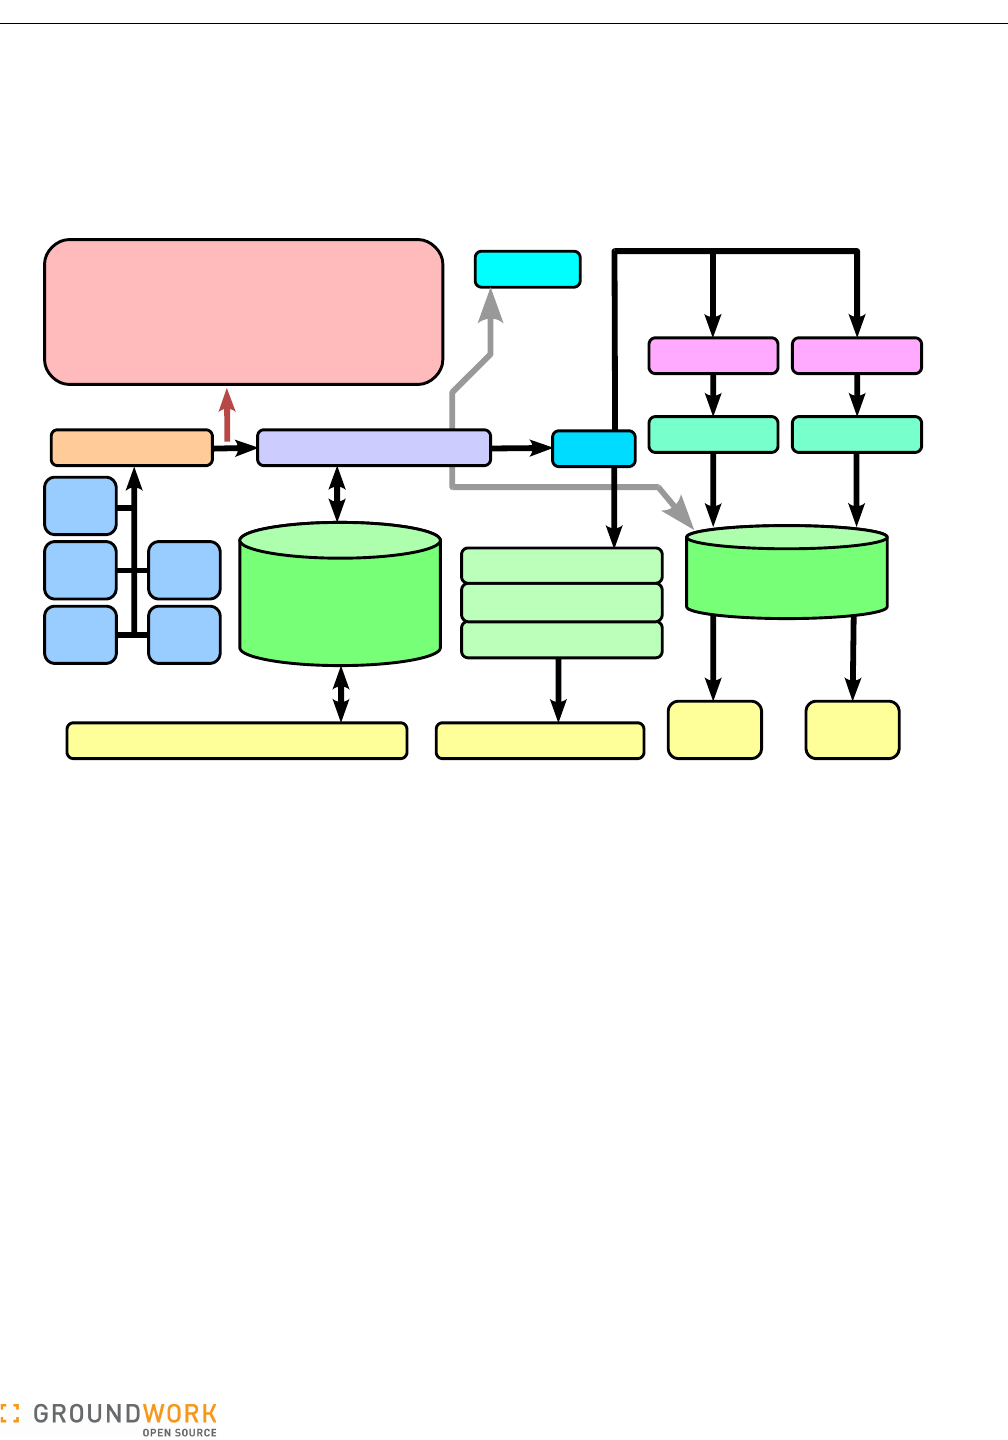
The following diagram illustrates the system operation.
Ganglia data for an entire grid or cluster can be queried from the gmond or gmetad agents. The agents output
their data in a standard XML stream format, documented in the Ganglia manuals. You can inspect this stream by
entering the command “telnet <ganglia host> <port #>” where <ganglia host> is the host name or IP address of the
host executing the Ganglia gmond or gmetad agent and <port #> is the TCP port where gmond or gmetad is
configured to attach. Typically, this is 8649 for a host running gmond and 8651 for a host running gmetad.
The check_ganglia daemon reads this XML stream to find the metrics for each host. The XML stream describes
the cluster-host-metric hierarchy. Be aware that the XML data envelopes do differ between the gmond and gmetad
streams. The check_ganglia daemon is capable of interpreting both. In general, if you are running gmetad, you
will use that XML data stream.
The check_ganglia daemon is implemented as the check_ganglia.pl script. This is not a Nagios plugin,
despite its resident directory and the similar-looking filename. It is not launched as an active check by the Nagios
scheduler. Instead, it runs under the supervise director program, which will restart programs under its control.
The supervise program is itself run as part of the GroundWork Monitor gwservices component.
The check_ganglia daemon polls every 5 minutes by default, maintaining the current status states and metric
values in memory. When it starts, check_ganglia.pl first reads the last state and metric values from the
ganglia MySQL database. This initial read of the data allows the daemon to detect state transitions even on the
first polling cycle. At the beginning of each polling cycle, the thresholds are read anew from the ganglia
database, to pick up any recent changes. After each poll, the daemon compares the last values with the thresholds
and sets the state of each metric to either OK, WARNING, or CRITICAL. It then sends these results to Nagios by
writing to the Nagios command pipe, located in /usr/local/groundwork/nagios/var/nagios.cmd, or
wherever the configuration file specifies. check_ganglia.pl then updates the ganglia database with the latest
state and metric values.
The check_ganglia.pl script prints operational statistics in its log file at the end of each polling cycle. The log
file can be most easily found through the /usr/local/groundwork/logs/check_ganglia.log symlink.
Version 5.0.0 of 2011-02-28 16:07:30 Page 8 of 32
cluster
host
gmetad / gmond
Ganglia configuration administration
node metrics (XML)
node
metric
data
passive service
check results
<Cluster Name=A>
<Host Name=Host1>
<Metric Name=cpu Value=20% />
<Metric Name=disk Value=500MB />
</Host>
<Host Name=Host2>
<Metric Name=cpu Value=20% />
host ganglia service
Nagios
ganglia database
* current metric state
* thresholds
* host configurations
host ganglia service
host ganglia service
cluster
host
cluster
host
cluster
host
cluster
host
status.log nagios.log
status feeder event feeder
Status
Viewer
Event
Console
GWCollageDB
* current node states
status
data
log
messages
event
data
host/service
status data
Nagios
event log
messages
host/service
status info
Nagios user interface
out-of-band alerts service
status
service
status
node, CPU
utilization
RRD files
check_ganglia daemon

GroundWork Ganglia Integration Module Administrator’s Guide
check_ganglia.pl provides for several types of alerting options — value duration, special metrics, and custom
metrics.
●To ensure alerts are generated only for consistent problems rather than transient ones, a duration threshold
can be specified for each metric. A metric must have exceeded its Warning or Critical threshold continuously
(insofar as the periodic check_ganglia polling cycles can see) for more than the Duration threshold in order for
that state to be set.
For example, if a critical CPU threshold is set for 95% and the duration threshold is 1 hour, the first time the
CPU measurement is greater than 95% will NOT set the state to CRITICAL. Each successive poll for the next
1 hour must show the CPU usage greater than 95% before it is set to CRITICAL. A metric is reset to an OK
state when a single poll measurement is less than the configured state-recognition threshold.
●Derived metrics are those metrics that do not originate from Ganglia, but are calculated using multiple Ganglia
metrics. This feature enables alert thresholds for certain types of conditions to be set more easily.
An example of one such derived metric is swap_free_percent. An out-of-the-box Ganglia install gathers
metrics for swap_total and swap_free, but not for swap_free_percent. It is not uncommon for clusters
and compute grids to contain systems that have varying swap configurations. A derived metric like
swap_free_percent could prove useful when applying universal thresholds to all machines or to subsets of
machines on the grid. Clearly, setting thresholds on a per host basis using the standard Ganglia metrics is
tedious in this case. The check_ganglia daemon makes this process considerably less painful by actually
computing, storing, and alerting on these derived metrics.
As currently written and included in this module, check_ganglia supports four derived metrics:
●mem_cached_percent
●mem_free_percent
●swap_free_percent
●time_since_last_update
This set can be expanded further by the administrator, though all derived metrics must be directly coded into
the check_ganglia.pl script. If you do decide to create more special metrics, please contribute your
modifications back to GroundWork for folding into future releases.
●Boottime metric. When check_ganglia notices that a monitored machine's Ganglia boottime metric has
changed since the last time the machine's state was checked, a temporary WARNING service state will be
generated starting with that polling cycle of that host. The duration of this pulsed state is configured at a global
level to reflect site preferences. This state will appear in the Console messages so the operators are able to
sense when machines get rebooted even if they are otherwise in an OK state when each state-data polling
cycle occurs. The pulse duration allows such conditions to be noticed even when operators are distracted or
out of the room for some period.
●Custom metrics. Some customers have specialized needs beyond those which can be handled by the metrics
listed above. Certain internal interfaces have been designed to enable call-outs to a external Perl module
which can contain arbitrary extensions. Typically, an external module like this is used to adapt to the peculiar
environment at the customer site in a manner which is not appropriate for a general product to support. The
APIs for these module calls are not currently documented.
Processing of derived, boottime, and custom metrics is controlled via options in the check_ganglia.conf
configuration file rather than through the threshold-configuration GUI.
Version 5.0.0 of 2011-02-28 16:07:30 Page 9 of 32
GroundWork Ganglia Integration Module Administrator’s Guide
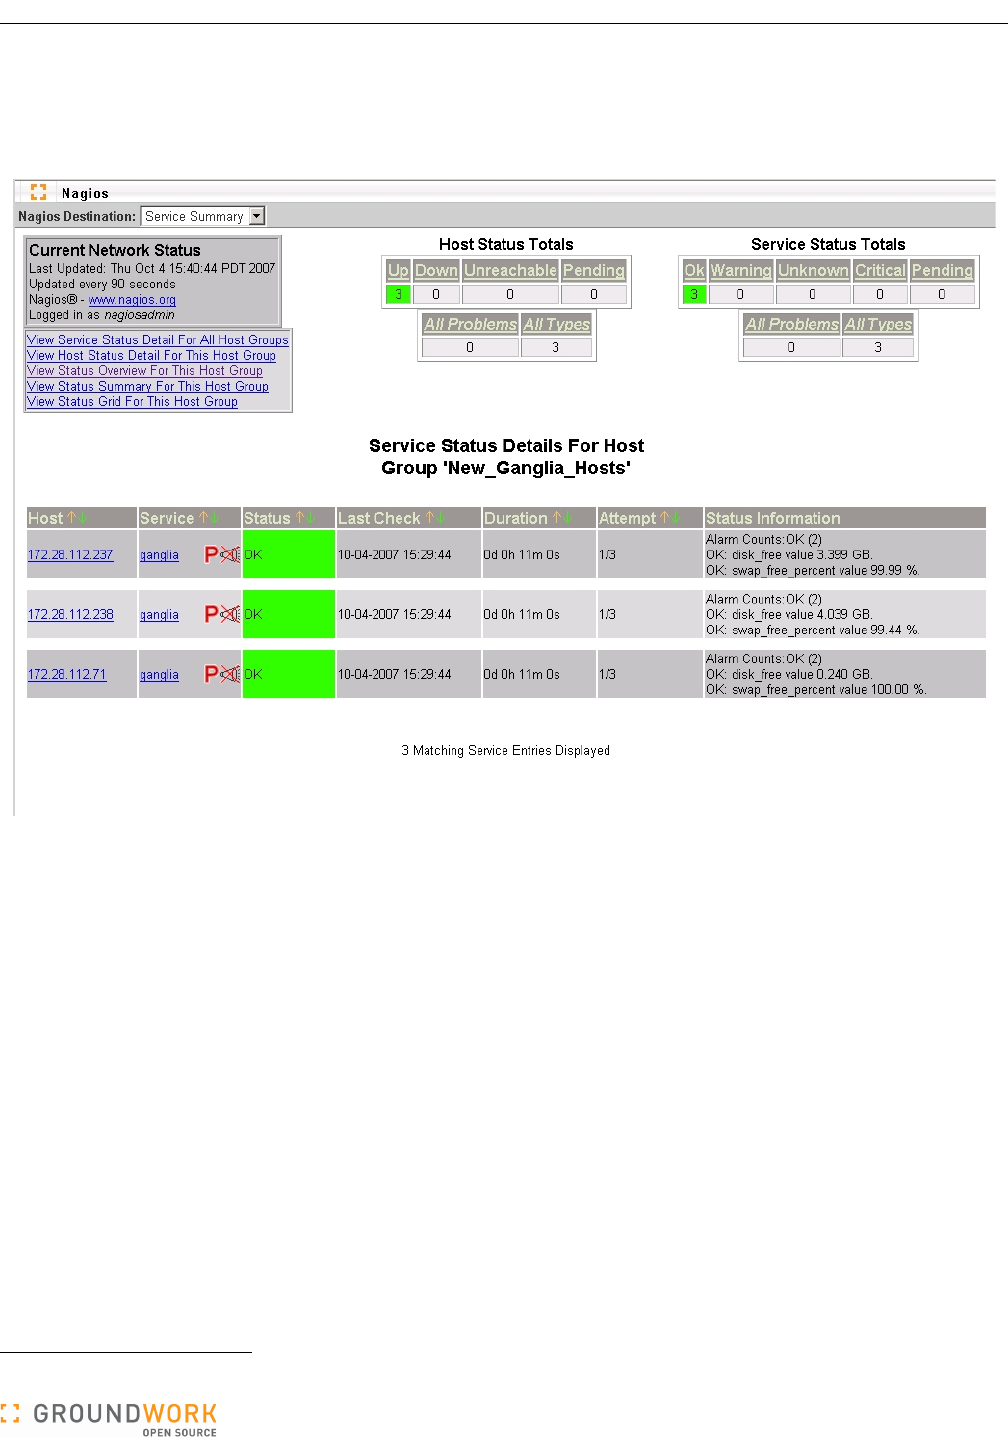
There are also several options for defining how Nagios integrates with check_ganglia. The Nagios system may be
set up to have a single service that represents all Ganglia-related metrics for that host, or a separate service for
each metric.1 These options are described below.
The Nagios service detail screen for a single service, named, for example, “ganglia”, would look like this:
In this case, if any metric comprising the “ganglia” service for a host goes into the WARNING or CRITICAL state,
the service will go into that state. If there are multiple metrics in alert, the state of the service is set to the highest
severity. The service text will show the metrics that are in the WARNING or CRITICAL state with the last
measurements. The consolidate_metrics_service_output_detail option in the
check_ganglia.conf configuration file controls the level of detail that is displayed in the service output text.
In the above example, a low level of detail is shown — if OK, no metric measurements are shown and if non-OK,
only the non-OK metrics and measurements are shown. If the high detail setting is chosen, the state and last value
for every metric is shown. A standard, non-GroundWork Nagios configuration will only show 64 characters on the
service output text. On a GroundWork Monitor implementation of Nagios, this field has been expanded to 2048
characters to accommodate this option.
The second option is to define a separate service for each metric. In this case, each Ganglia metric is defined as a
service under the host, for example, “ganglia_cpu_wio”, “ganglia_cpu_sys”, “ganglia_load_1”, etc. The
check_ganglia.pl script will send separate passive service results to Nagios for each metric in this case.
When choosing whether to consolidate, or to “roll” or “unroll” the Ganglia service checks in Nagios, note that there
is a significant performance impact with unrolling the ganglia checks into multiple Nagios service checks. The next
section details this further. Rolling all Ganglia checks into a single Nagios service check allows for simpler
configuration and navigation, especially for large data centers. In contrast, using multiple service checks provides
for greater granularity during alerting and reporting.
1 The separate-service model is not supported in the current release of the Ganglia Integration Module (GWMON-5461).
Version 5.0.0 of 2011-02-28 16:07:30 Page 10 of 32

GroundWork Ganglia Integration Module Administrator’s Guide
3.2 Performance Considerations
A number of factors influence the performance of the system. The primary driver is the number of Ganglia hosts
that need to be monitored by the Nagios system. A corollary to this is the total number of services that the Nagios
system needs to support. In testing various configurations, GroundWork has noticed the following potential
bottlenecks in Nagios.
1. A large number of services will cause Nagios to take a long time to verify or commit. GroundWork has
observed this when the number of services is greater than 20,000.2
2. The Nagios command pipe, nagios.cmd, can only read and buffer a limited number of passive service check
results at one time. If the internal buffer becomes full and Nagios stops reading the pipe, check_ganglia will
delay while writing to this pipe. This can be partially remedied by setting a non-default value for the “External
command buffer slots” option in Page 2 of the “Configuration → Control → Nagios main configuration” settings.
The default value built into Nagios is 4096; a value of 16000 is more suitable for a very large site.
3. Historically, there are other issues with the Nagios handling of a large volume of passive service checks that
are outside the scope of this document; customers with a support contract can contact GroundWork for details
and a workaround.
4. Nagios can only process a limited number of state changes at any one time. State transitions from OK to
CRITICAL appear to be especially problematic. Nagios 3.x will not process any other host or service checks
when it is verifying a host alert.3 Depending on the host check command, the number of retries, and the retry
interval, this can significantly delay Nagios updates when the number of down hosts is large.
Care must be taken so that passive check result messages do not overload the Nagios command pipe, causing a
condition where the number of queued messages keeps increasing. In this case, Nagios may fall behind and never
catch up. check_ganglia has several features that attempt to avoid this condition. The intent of these features is to
minimize the number of service check results that are sent from check_ganglia to the Nagios command pipe for
each poll, and to optimize the writing of results that do get sent to the command pipe.
1. Passive service checks can be sent on every poll or only when a state has changed. This behavior is
controlled by a pair of options in the config file:
send_updates_even_when_state_is_persistent
suppress_most_updates_for_persistent_non_okay_states
If the first of these options is disabled, either the state is OK or the second option is enabled, and the state has
not changed, a passive service check will not be sent. The maximum_service_non_update_time
parameter can be set so a service can be guaranteed an update within a defined time interval, even when the
first and second options are set as described. This allows a periodic passive check to be submitted into
Nagios even when the underlying state has not changed. Setting this latter option to less than the Nagios
freshness check thresholds will ensure that results are submitted in time to avoid a false positive alarm, and still
limit the latency to detect an error condition that prevents the host or service from sending data to Nagios.
2. As stated in the previous section, you can consolidate the metrics into a single service or have a separate
service for each metric. Using multiple metrics increases the overall services count and has a tendency to add
additional delay into the Nagios verify and startup operations. In addition, multiple metrics also cause more
passive results to be written to the Nagios command pipe and thus cause more service state changes to be
processed.
3. If the send_after_each_service option is set to “yes”, the daemon will write the passive service check
results after each service state is processed. If it is set to “no”, it will write all service results at one time. We
have found that the write time to the Nagios command pipe is minimized if this is set to “no”.
4. A throttle parameter called throttle_state_change_threshold can be set to limit the number of state
changes that are sent to Nagios at any one time. If this threshold is reached, check_ganglia will break the
current batch of state change messages into smaller batches, insert each batch into the Nagios command pipe,
wait the number of seconds specified in the throttle_state_change_threshold_wait parameter, and
then transmit the next batch. This continues until all messages have been sent.
2 A variety of performance improvements in the GroundWork and Nagios processing of Commit operations have been made since this original
observation. Testing with a current release of the product is in order.
3 That was true for Nagios 2. We need to verify the claim for Nagios 3.
Version 5.0.0 of 2011-02-28 16:07:30 Page 11 of 32

GroundWork Ganglia Integration Module Administrator’s Guide
5. The send_to_foundation option can be set to send the service check results directly to the Foundation
database, avoiding Nagios altogether. Foundation can process state changes more quickly than Nagios, so
this can be an option if the operator is using only the GroundWork-specific user interface components (Status
Viewer and Event Console). Of course, this will render the Nagios web pages and notification engine unusable
for Ganglia service checks, as they will be out of sync with the service checks data stream. Special setup for
Nagios would be needed in this case so that Nagios would not feel starved for input on these services.
All of these options and several other operating parameters are documented in the check_ganglia.conf
configuration file installed by the RPM. The initial settings in this file represent a good starting point and should be
checked and adjusted as needed. Before you change values in this file, you may wish to first make a backup copy,
to make it easy to refer to the original settings.
3.3 ganglia Database
The ganglia database contains the following tables:
●cluster – clusters monitored.
●clusterhost – relates clusters to hosts. Populated by configuration, and used for host thresholds.
●host – hosts monitored.
●hostinstance – relates hosts to clusters. Populated by check_ganglia. Has all the hosts Ganglia knows
about.
●location – locations reference. Used only in limited ways — reserved for future use.
●metric – holds abstract metric definitions and default thresholds, to be copied as initial values when these
metrics are applied during configuration to specific clusters or hosts.
●metricinstance – last metric state and value reported by check_ganglia.
●metricvalue – stores the actual metric thresholds to be applied, whether they are at the global default level,
the cluster level, or the host level.
The metricvalue table should have been named metricthreshold, to better reflect its actual content. This
situation will be corrected in a future update to this package.
Each table's field structure is described below, along with basic data about its indexes.
3.3.1 cluster Table
+-------------+------------------+------+-----+---------+----------------+
| Field | Type | Null | Key | Default | Extra |
+-------------+------------------+------+-----+---------+----------------+
| ClusterID | int(11) unsigned | NO | PRI | NULL | auto_increment |
| Name | text | NO | | | |
| Description | text | YES | | NULL | |
| Regex | tinyint(1) | YES | | NULL | |
+-------------+------------------+------+-----+---------+----------------+
+---------+------------+----------+--------------+-------------+-----------+
| Table | Non_unique | Key_name | Seq_in_index | Column_name | Collation |
+---------+------------+----------+--------------+-------------+-----------+
| cluster | 0 | PRIMARY | 1 | ClusterID | A |
+---------+------------+----------+--------------+-------------+-----------+
3.3.2 clusterhost Table
+---------------+------------------+------+-----+---------+----------------+
| Field | Type | Null | Key | Default | Extra |
+---------------+------------------+------+-----+---------+----------------+
| ClusterHostID | int(11) unsigned | NO | PRI | NULL | auto_increment |
| ClusterID | int(11) unsigned | NO | MUL | | |
| HostID | int(11) unsigned | NO | MUL | | |
+---------------+------------------+------+-----+---------+----------------+
Version 5.0.0 of 2011-02-28 16:07:30 Page 12 of 32

GroundWork Ganglia Integration Module Administrator’s Guide
+-------------+------------+-----------------------+--------------+---------------+-----------+
| Table | Non_unique | Key_name | Seq_in_index | Column_name | Collation |
+-------------+------------+-----------------------+--------------+---------------+-----------+
| clusterhost | 0 | PRIMARY | 1 | ClusterHostID | A |
| clusterhost | 1 | ClusterHost_ClusterFK | 1 | ClusterID | A |
| clusterhost | 1 | ClusterHost_HostFK | 1 | HostID | A |
+-------------+------------+-----------------------+--------------+---------------+-----------+
3.3.3 host Table
+-------------+------------------+------+-----+---------+----------------+
| Field | Type | Null | Key | Default | Extra |
+-------------+------------------+------+-----+---------+----------------+
| HostID | int(11) unsigned | NO | PRI | NULL | auto_increment |
| Name | text | NO | | | |
| IPAddress | varchar(45) | YES | | NULL | |
| Description | text | YES | | NULL | |
| Regex | tinyint(1) | YES | | NULL | |
+-------------+------------------+------+-----+---------+----------------+
+-------+------------+----------+--------------+-------------+-----------+
| Table | Non_unique | Key_name | Seq_in_index | Column_name | Collation |
+-------+------------+----------+--------------+-------------+-----------+
| host | 0 | PRIMARY | 1 | HostID | A |
+-------+------------+----------+--------------+-------------+-----------+
3.3.4 hostinstance Table
+----------------+------------------+------+-----+---------+----------------+
| Field | Type | Null | Key | Default | Extra |
+----------------+------------------+------+-----+---------+----------------+
| HostInstanceID | int(11) unsigned | NO | PRI | NULL | auto_increment |
| ClusterID | int(11) unsigned | NO | MUL | | |
| HostID | int(11) unsigned | NO | MUL | | |
| LocationID | int(11) unsigned | NO | MUL | | |
+----------------+------------------+------+-----+---------+----------------+
+--------------+------------+-------------------------+--------------+----------------+-----------+
| Table | Non_unique | Key_name | Seq_in_index | Column_name | Collation |
+--------------+------------+-------------------------+--------------+----------------+-----------+
| hostinstance | 0 | PRIMARY | 1 | HostInstanceID | A |
| hostinstance | 1 | HostInstance_ClusterFK | 1 | ClusterID | A |
| hostinstance | 1 | HostInstance_HostFK | 1 | HostID | A |
| hostinstance | 1 | HostInstance_LocationFK | 1 | LocationID | A |
+--------------+------------+-------------------------+--------------+----------------+-----------+
3.3.5 location Table
+-------------+------------------+------+-----+---------+----------------+
| Field | Type | Null | Key | Default | Extra |
+-------------+------------------+------+-----+---------+----------------+
| LocationID | int(11) unsigned | NO | PRI | NULL | auto_increment |
| Name | text | NO | | | |
| Description | text | YES | | NULL | |
| Regex | tinyint(1) | YES | | NULL | |
+-------------+------------------+------+-----+---------+----------------+
+----------+------------+----------+--------------+-------------+-----------+
| Table | Non_unique | Key_name | Seq_in_index | Column_name | Collation |
+----------+------------+----------+--------------+-------------+-----------+
| location | 0 | PRIMARY | 1 | LocationID | A |
+----------+------------+----------+--------------+-------------+-----------+
Version 5.0.0 of 2011-02-28 16:07:30 Page 13 of 32

GroundWork Ganglia Integration Module Administrator’s Guide
3.3.6 metric Table
+-------------+------------------+------+-----+---------+----------------+
| Field | Type | Null | Key | Default | Extra |
+-------------+------------------+------+-----+---------+----------------+
| MetricID | int(11) unsigned | NO | PRI | NULL | auto_increment |
| Name | text | NO | | | |
| Description | text | YES | | NULL | |
| Units | varchar(45) | YES | | NULL | |
| Critical | decimal(64,10) | YES | | NULL | |
| Warning | decimal(64,10) | YES | | NULL | |
| Duration | decimal(64,10) | YES | | NULL | |
+-------------+------------------+------+-----+---------+----------------+
+--------+------------+----------+--------------+-------------+-----------+
| Table | Non_unique | Key_name | Seq_in_index | Column_name | Collation |
+--------+------------+----------+--------------+-------------+-----------+
| metric | 0 | PRIMARY | 1 | MetricID | A |
+--------+------------+----------+--------------+-------------+-----------+
3.3.7 metricinstance Table
+---------------------+------------------+------+-----+---------+----------------+
| Field | Type | Null | Key | Default | Extra |
+---------------------+------------------+------+-----+---------+----------------+
| MetricInstanceID | int(11) unsigned | NO | PRI | NULL | auto_increment |
| HostInstanceID | int(11) unsigned | NO | MUL | | |
| MetricID | int(11) unsigned | NO | MUL | | |
| Description | text | YES | | NULL | |
| LastState | text | YES | | NULL | |
| LastUpdateTime | int(11) unsigned | NO | | | |
| LastStateChangeTime | int(11) unsigned | NO | | | |
| LastValue | text | YES | | NULL | |
+---------------------+------------------+------+-----+---------+----------------+
+----------------+------------+-------------------------------+--------------+------------------+-----------+
| Table | Non_unique | Key_name | Seq_in_index | Column_name | Collation |
+----------------+------------+-------------------------------+--------------+------------------+-----------+
| metricinstance | 0 | PRIMARY | 1 | MetricInstanceID | A |
| metricinstance | 1 | MetricInstance_HostInstanceFK | 1 | HostInstanceID | A |
| metricinstance | 1 | MetricInstance_MetricFK | 1 | MetricID | A |
+----------------+------------+-------------------------------+--------------+------------------+-----------+
3.3.8 metricvalue Table
+---------------+------------------+------+-----+---------+----------------+
| Field | Type | Null | Key | Default | Extra |
+---------------+------------------+------+-----+---------+----------------+
| MetricValueID | int(11) unsigned | NO | PRI | NULL | auto_increment |
| ClusterID | int(11) unsigned | NO | MUL | | |
| HostID | int(11) unsigned | NO | MUL | | |
| LocationID | int(11) unsigned | NO | MUL | | |
| MetricID | int(11) unsigned | NO | MUL | | |
| Description | text | YES | | NULL | |
| Critical | decimal(64,10) | YES | | NULL | |
| Warning | decimal(64,10) | YES | | NULL | |
| Duration | decimal(64,10) | YES | | NULL | |
+---------------+------------------+------+-----+---------+----------------+
+-------------+------------+------------------------+--------------+---------------+-----------+
| Table | Non_unique | Key_name | Seq_in_index | Column_name | Collation |
+-------------+------------+------------------------+--------------+---------------+-----------+
| metricvalue | 0 | PRIMARY | 1 | MetricValueID | A |
| metricvalue | 1 | MetricValue_ClusterFK | 1 | ClusterID | A |
| metricvalue | 1 | MetricValue_HostFK | 1 | HostID | A |
| metricvalue | 1 | MetricValue_LocationFK | 1 | LocationID | A |
| metricvalue | 1 | MetricValue_MetricFK | 1 | MetricID | A |
+-------------+------------+------------------------+--------------+---------------+-----------+
Version 5.0.0 of 2011-02-28 16:07:30 Page 14 of 32

GroundWork Ganglia Integration Module Administrator’s Guide
3.4 Ganglia Web Interface
The Ganglia web interface consists of two parts.
3.4.1 Threshold Configuration
Configuration of thresholds within the ganglia database is controlled by the GangliaConfigAdmin.cgi CGI
Perl script. Settings for this script are defined in the GangliaConfigAdmin.conf file. The following functions
are available in this interface.
●Define the Ganglia metrics to be monitored, by adding the metric names to the database. Each configured
name must exactly match the corresponding Ganglia metric name.
●Define the clusters to be monitored, by adding the cluster names to the database. This setup should match the
set of ganglia_cluster definitions you specify separately in the check_ganglia.conf file.
●Define hosts to be monitored. Hosts are automatically added to the ganglia database by check_ganglia.
This allows you to modify a host’s settings by selecting from a list of existing hosts. check_ganglia will also put
the host’s configuration information in the host description field.
●Define the Warning, Critical, and Duration thresholds for each metric.
●You must define metric thresholds for the “Default” cluster. These are global, default settings which will
apply if there are no other settings defined at the cluster or host level.
●You may define metric thresholds for a specific cluster. These settings will override the default cluster
settings. These settings are overridden by host metric thresholds, if they exist.
●You may define metric thresholds for a specific host. These settings will override the default or specific
cluster settings.
●Be sure to specify threshold values that make sense for the metric. In some cases, you may want the
metric value to normally be above a certain level, and to alert you when it falls below the thresholds you
specify. In this case, simply set the Warning threshold higher than the Critical threshold, and this setup will
properly analyze the state.
●You may also delete clusters, hosts, or metrics from the ganglia database.4 Note that this will not affect
Monarch or Nagios, until and unless autoimport.pl is run.
3.4.2 Access to Ganglia Web Servers
The Ganglia Integration Module provides a simple way to access the web interface provided by Ganglia itself,
without exiting the GroundWork Monitor environment. The Ganglia Views tab presents a list of Ganglia web
servers, whose hostnames and access URLs are configured in the GangliaWebServers.conf file. The
GangliaWebServers.cgi script uses this configuration data to present a screen with links to the Ganglia
servers; web pages from those servers are presented in a frame beneath these links.
4 Inasmuch as hosts known to Ganglia will be automatically added back to the ganglia database when check_ganglia runs, it only makes
sense to delete hosts after you have either removed them from service or when you stop monitoring the cluster in which they reside. Note
that other Ganglia nodes in the cluster will hang on to knowledge about a host for some time after it has gone missing (see, for example, the
host_dmax and cleanup_threshold parameters in gmond.conf files).
Version 5.0.0 of 2011-02-28 16:07:30 Page 15 of 32
GroundWork Ganglia Integration Module Administrator’s Guide
3.5 Auto-Import
The majority of Ganglia implementations are large. One of the big advantages of Ganglia is its ability to monitor a
large infrastructure. Integrating it with Nagios has therefore traditionally been difficult, because of the extremely
tedious process of creating all those host and service definitions. One of the great things about GroundWork
Monitor, though, is that we can import host definitions and automatically assign service profiles. The auto-import
script does that, both for Ganglia and for Cacti, though of course here we are dealing only with Ganglia. You can
run the auto-import script as a regularly scheduled (cron) job on the GroundWork server, or as needed, manually.
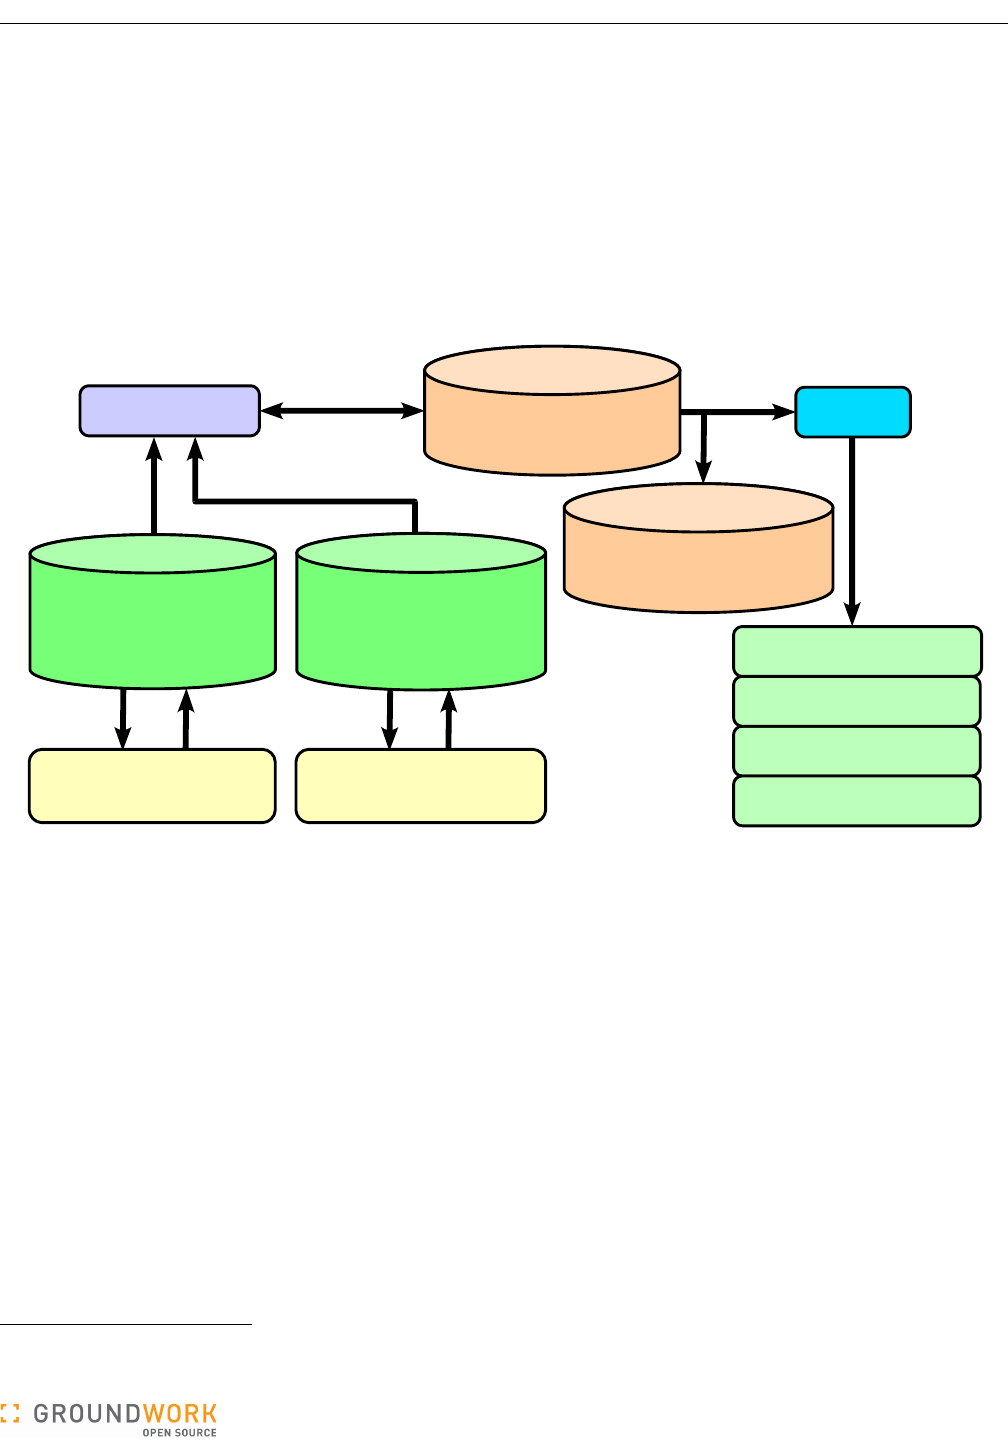
The auto-import process is shown in the following diagram.
The auto-import script optionally reads the ganglia database to find the current hosts that are in the Ganglia XML
stream, and optionally reads the cacti database to find the current hosts known to Cacti. It also queries the
monarch database to determine the hosts currently defined in the Nagios system. For hosts in Ganglia but not in
Nagios, the script will add the new host to Monarch using the hostname and IP address determined from the
Ganglia XML, and matching that stored in the ganglia database. A default host profile must be specified in the
autoimport.conf configuration file. This host profile, which defines the services to be applied to a host, is then
applied to each imported host. This host profile must be pre-defined in Monarch. You can easily create this profile
via the Monarch GUI. Note that the default host profile must have a one-to-one correspondence with the type of
service checks set in the check_ganglia configuration — a single service check for all Ganglia metrics, or a
separate service check definition for each metric. The auto-import script will also assign the host to a default
“New_Ganglia_Hosts” hostgroup.5 This host group must also be pre-defined.
If a host known to Ganglia is to be deleted from Nagios with Monarch, it must also be deleted from the ganglia
database using the Ganglia Threshold Configuration web interface. If not, the host will be added back to Monarch
the next time auto-import executes.
If a host is in Monarch, but is no longer in the Ganglia database, the host is assigned to a “deleted hosts” host
group.6 Collecting all such hosts together in one place this way allows you to manually delete hosts more easily by
reviewing the hosts in this host group.
5 The name of this hostgroup is configurable in the autoimport.conf file.
6 The standard name of this hostgroup is _DELETED_HOSTS, but it is likewise configurable.
Version 5.0.0 of 2011-02-28 16:07:30 Page 16 of 32
reconciles monarch, ganglia, and cacti databases;
updates monarch database; syncs with GWCollageDB;
adds Ganglia hosts with ganglia service;
adds Cacti hosts with a Cacti profile
service
status
tracking
creates Nagios
configuration files and
re-loads Nagios
(commits changes)
Auto-Import
host ganglia service
Nagios
host ganglia service
host ganglia service
host ganglia service
monarch database
* Nagios configuration
display control display control
ganglia database
* current metric state
* thresholds
* host configurations
Ganglia configuration
administration
Cacti configuration
administration
cacti database
* current metric state
* thresholds
* host configurations
GWCollageDB database
* Grid configuration

GroundWork Ganglia Integration Module Administrator’s Guide
4 Administration
The administration tasks for the Ganglia Integration Module are described in this section.
4.1 Ganglia-Related Configuration
4.1.1 Check Ganglia Configuration
The following parameters control the options in the check_ganglia.pl script. These are found in the
check_ganglia.conf file, and represent a common starting point. To configure the check_ganglia.pl
script, simply edit this file in /usr/local/groundwork/config/, and restart gwservices.
# Configuration file for the check_ganglia.pl script.
#######################################################
#
# General Program Execution Options
#
#######################################################
# Process Ganglia XML streams? If not, just sleep forever.
# This option is turned off (the value "no", but without quotes) in the default
# configuration file simply so the script can be safely installed before it is
# locally configured. To get the software to run, it must be turned on here
# (the value "yes", but without quotes) once the rest of the setup is correct
# for your site.
enable_processing = no
# Auto-flush the logging output.
# no = normal processing, for efficiency
# yes = autoflush the log output on every single write, for debugging mysterious failures
autoflush_log_output = no
# Global Debug Level Flag; No debug = 0, Statistics = 5, Normal debug = 6,
# Detail debug = 7 (gmond XML and metric attribute parsing)
# More precisely, specify one of the following numbers:
# NONE = 0; turn off all debug info
# FATAL = 1; the application is about to die
# ERROR = 2; the application has found a serious problem, but will attempt to recover
# WARNING = 3; the application has found an anomaly, but will try to handle it
# NOTICE = 4; the application wants to inform you of a significant event
# STATS = 5; the application wants to log statistical data for later analysis
# INFO = 6; the application wants to log a potentially interesting event
# DEBUG = 7; the application wants to log detailed debugging data
debug_level = 5
# Send to Nagios?
# [yes/no]
send_to_nagios = yes
# Send updates to the database and Nagios even when the state does not change?
# (If not, update in any case on the next iteration after maximum_service_non_update_time.)
# [yes/no]
send_updates_even_when_state_is_persistent = no
# Avoid sending updates to the database and Nagios when the state is not changing?
# (Even if so, send them in any case on the next iteration after maximum_service_non_update_time.)
# [yes/no]
suppress_most_updates_for_persistent_non_okay_states = yes
# Absolute pathname of the Nagios command pipe.
nagios_cmd_pipe = "/usr/local/groundwork/nagios/var/spool/nagios.cmd"
# Consolidate metric results?
# no = send individual metric results
# yes = send all metric results as a single service
consolidate_metrics = yes
Version 5.0.0 of 2011-02-28 16:07:30 Page 17 of 32

GroundWork Ganglia Integration Module Administrator’s Guide
# Service name used for consolidated metrics.
consolidate_metrics_service_name = "ganglia"
# Detail for metric service output.
# [yes/no]; yes = show more detail, no = low detail
consolidate_metrics_service_output_detail = yes
# How to group writes of service results to Nagios.
# no = send all results in a single write
# yes = send to Nagios after each service result
send_after_each_service = no
# How to select the part of a hostname to report out, if the host is not an IP address.
# This pattern must include exactly one part enclosed in parentheses.
# If you don't want any hostname stripping, set this pattern to "".
# For example, to strip the full domain, and only use an unqualified name, use:
# short_hostname_pattern = "(\S+?)\."
short_hostname_pattern = ""
# What external package to call to process custom metrics.
# Set to an empty string if you have no such external package.
# If you don't know what these are, set this to "".
custom_metrics_package = ""
# Output a warning if the host has rebooted since the last reporting cycle?
output_reboot_warning = yes
# Set to the number of seconds to continue to report a reboot warning, if $output_reboot_warning is set.
# Anything shorter than the value for cycle_time (below) is effectively equal to zero.
# Simple arithmetic (e.g., 5*60) is allowed in this expression.
output_reboot_warning_duration = 10*60
# Output the mem_free_percent calculated metric?
output_mem_free_percent = no
# Output the mem_cached_percent calculated metric?
output_mem_cached_percent = no
# Output the swap_free_percent calculated metric?
output_swap_free_percent = yes
# Output the time since Ganglia received an update for each host?
output_time_since_last_update = yes
#######################################################
#
# Performance Throttling Parameters
#
#######################################################
# Time interval for each ganglia poll, in seconds.
# Standard period is 5 minutes.
# Simple arithmetic (e.g., 5*60) is allowed in this expression.
cycle_time = 5*60
# Maximum time interval in seconds between service checks sent to Nagios.
# That is, we will always send a service check result to Nagios on the next
# iteration after this time period has elapsed.
# Simple arithmetic (e.g., 15*60) is allowed in this expression.
maximum_service_non_update_time = 10*60
# Maximum number of state changes that will be sent for each write to Nagios.
# If the number of outstanding state changes is greater than this, check_ganglia
# will wait for throttle_state_change_threshold_wait seconds before sending the
# remaining messages.
throttle_state_change_threshold = 500
Version 5.0.0 of 2011-02-28 16:07:30 Page 18 of 32

GroundWork Ganglia Integration Module Administrator’s Guide
# When throttle_state_change_threshold is exceeded, time in seconds to wait
# before sending the remaining state change message buffer.
# Simple arithmetic (e.g., 2*60) is allowed in this expression.
throttle_state_change_threshold_wait = 6
# The number of slots to pre-allocate for queueing Nagios service messages
# before they are sent to the command pipe. This number should be a little
# more than the total number of hosts in your grid.
initial_bulk_messages_size = 15000
# The number of slots to pre-allocate for queueing metric-instance update rows before
# they are sent to the database. This number should be a little more than the total
# number of metrics you expect to process in each cycle. Bear in mind that you will
# typically have configured at least several metrics to be thresholded per host.
initial_metric_values_size = 100000
# The maximum number of metric value rows you want to have updated in one database
# statement. For efficient updates, it should be at least several thousand.
max_bulk_update_rows = 5000
# The maximum time in seconds to wait for any single write to the output command pipe
# to complete.
max_command_pipe_wait_time = 3*60
# The maximum size in bytes for any single write operation to the output command pipe.
# The value chosen here must be no larger than PIPE_BUF (getconf -a | fgrep PIPE_BUF)
# on your platform, unless you have an absolute guarantee that no other process will
# ever write to the command pipe.
max_command_pipe_write_size = 4096
# Send a check_ganglia service check result at the end of each polling cycle?
# [yes/no]
send_check_ganglia_service_check = yes
#######################################################
#
# Ganglia Parameters
#
#######################################################
# Where to talk to the Ganglia gmond to fetch node-state data.
# Default gmond port is 8649.
GANGLIA_GMOND_PORT = 8649
# Where to talk to the Ganglia gmetad to fetch node-state data.
# Default gmetad port is 8651.
GANGLIA_GMETAD_PORT = 8651
# List of Ganglia gmond or gmetad hosts to query.
# For convenience, to disable a given entry you need only comment out
# its port definition, not the entire <host ...></host> block.
# You may also refer to symbols defined above, like $GANGLIA_GMOND_PORT,
# to document your choices.
<ganglia_hosts>
<host localhost>
port = $GANGLIA_GMOND_PORT
</host>
<host mygmetadhost>
# port = $GANGLIA_GMETAD_PORT
</host>
<host 192.168.1.99>
# port = 8648
</host>
</ganglia_hosts>
Version 5.0.0 of 2011-02-28 16:07:30 Page 19 of 32

GroundWork Ganglia Integration Module Administrator’s Guide
# Clusters to monitor.
# Define as many as you need, on separate lines; enclose each value in "double quotes".
# If you define some ganglia_cluster values here, only the clusters listed will be monitored.
# If you don't define any ganglia_cluster values, then all clusters will be monitored.
# Examples:
# ganglia_cluster = "GroundWork Cluster 002"
# ganglia_cluster = "GroundWork Compute Farm"
ganglia_cluster = "GroundWork Cluster 001"
# Ganglia thresholds database connection parameters.
dBHost = "localhost"
dBName = "ganglia"
dBUser = "root"
dBPass = "mysql"
#######################################################
#
# Foundation Options (used if send_to_foundation=yes)
#
#######################################################
# Send host/service status updates to Foundation?
# [yes/no]
send_to_foundation = no
# This monitoring server name; used as update content (message source).
this_server = "localhost"
# Where to connect to Foundation to send the updates.
# Usual foundation_port is 4913.
foundation_host = "localhost"
foundation_port = 4913
4.1.2 Ganglia Threshold Administration Configuration
The following parameters control the options in the GangliaConfigAdmin.cgi script. These are found in the
GangliaConfigAdmin.conf file. You will need to adjust the database-access parameters in this file to match
your local site. To configure this user interface, simply edit this file in /usr/local/groundwork/config/.
# Configuration file for the GangliaConfigAdmin.cgi script.
#######################################################
#
# General Program Execution Options
#
#######################################################
# Global Debug Level Flag.
# 0 = no debug output
# 1 = Normal debug output
debug_level = 0
# The max number of hosts to process in one DELETE statement. (This just puts a limit on
# a single statement; repeated statements will still be used to process longer lists.)
max_delete_hosts = 1000
# Ganglia thresholds database connection parameters.
DatabaseHost = "localhost"
DatabaseName = "ganglia"
DatabaseUser = "root"
DatabasePass = "mysql"
Version 5.0.0 of 2011-02-28 16:07:30 Page 20 of 32

GroundWork Ganglia Integration Module Administrator’s Guide
4.1.3 Ganglia Web Server Viewing Configuration
The following parameters control the options in the GangliaWebServers.cgi script. These are found in the
GangliaWebServers.conf file. You will need to adjust the set of Ganglia web server hosts and their respective
URLs to specify the ones you want to make available through the GroundWork Monitor UI. To configure this user
interface, simply edit this file in /usr/local/groundwork/config/.
# Configuration file for the GangliaWebServers.cgi script.
#######################################################
#
# General Program Execution Options
#
#######################################################
# Global Debug Level Flag.
# 0 = no debug output
# 1 = Normal debug output
debug_level = 0
# List of Ganglia web servers to allow access to.
# For convenience, to disable a given entry you need only comment out
# its url definition, not the entire <host ...></host> block.
<ganglia_web_servers>
<host work>
url = "http://work/ganglia/"
</host>
<host geco-15-4>
url = "http://geco-15-4/ganglia/"
</host>
<host mygmetadhost>
# url = "http://mygmetadhost/ganglia/"
</host>
<host 192.168.1.99>
# url = "http://192.168.1.99/ganglia/"
</host>
</ganglia_web_servers>
4.1.4 Ganglia Portal Access Permissions
The GroundWork 6.4.0 environment uses the JBoss authentication/authorization facilities for controlling access to
the elements within the top-level Ganglia tab within GroundWork Monitor, just as it does for other facilities within the
base product. By default, a fresh installation allows access only to users with the GWAdmin role. However, it may
be helpful to allow operators (who are not GroundWork Monitor administrators) access to the Ganglia → Ganglia
Views page, for quick access to the data the Ganglia web servers can present, while still preventing them from
accessing the Ganglia → Ganglia Thresholds page.
The Ganglia Integration Module makes the following objects accessible to an administrator under the
Administration tab, for modifying access permissions as needed in the local environment.
●Portal Management → Portal Objects → groundwork-monitor → ganglia-integration
●Portal Management → Portal Objects → groundwork-monitor → ganglia-integration → ganglia-thresholds
●Portal Management → Portal Objects → groundwork-monitor → ganglia-integration → ganglia-views
The following additional objects are provided by the Ganglia Integration Module. Do not change the settings on
these objects without first consulting with GroundWork Support.
●Portal Management → Portlet Instances → GWGangliaThresholdsInstance
●Portal Management → Portlet Instances → GWGangliaViewsInstance
●Portal Management → Portlet Definitions → Ganglia Metric Threshold Configuration Portlet
●Portal Management → Portlet Definitions → Ganglia Web Server Views Portlet
The steps needed to modify any of these objects are beyond the scope of this document. For details, see the
PORTAL ADMINISTRATION section of the Bookshelf within GroundWork Monitor.
Version 5.0.0 of 2011-02-28 16:07:30 Page 21 of 32

GroundWork Ganglia Integration Module Administrator’s Guide
4.2 Ganglia Database Administration
4.2.1 Defining Thresholds
To set up monitoring of Ganglia metrics via thresholds, you will need to:
1. define them, and
2. apply them to the clusters, hosts, and metrics that Ganglia is now collecting for you.
The minimal steps required are:
1. Add a metric name for each metric you want to monitor. If special (derived, boot time, or custom) metrics are
defined and enabled, you have to add them as well if you want them to be monitored.
2. Select the Default cluster, which contains the global default threshold settings.
3. Add the metric names you want to monitor to the Default cluster, and define the Warning, Critical, and Duration
thresholds for them.
You can also create more specific thresholds which apply to individual clusters and hosts.
1. Add specific clusters.
a. Select the cluster, and add the metrics for which you want to override the Default cluster settings for this
specific cluster.
b. Define the Warning, Critical, and Duration thresholds for each cluster-level override of the global settings.
2. Optionally, add or select specific hosts.
a. Select the cluster in which this host is defined (i.e., set the Threshold Cluster for the host) and update the
host.
b. Add the metrics for which you want to override the Default and specific-cluster settings.
c. Define the Warning, Critical, and Duration thresholds for each host-level override of the global and cluster-
level settings.
Some things to remember:
●The metric names have to match those from Ganglia exactly. It's a good idea to have the Ganglia web
interface up while you work on the thresholds, so you can see the precise format of the metrics and define the
thresholds in ways that make sense.7 Accessing GroundWork Monitor through several windows in the same
browser is supported in current GWMEE releases. So if you want, you can access the Ganglia Web Server
pages through the Ganglia → Ganglia Views screen.
●Warning thresholds and critical thresholds can be high or low, so make sure you see the metric values and
alert on them properly. If the warning threshold is less than or equal to the critical threshold, you will get an
alarm when the value rises. If the warning threshold is greater than the critical threshold, you will get an alarm
when the value falls.
●The units of measure are important for thresholds. For example, the disk_free metric is in gigabytes by default.
If you want an alarm when you have 500 megabytes left, set the threshold to 0.5.
●Duration thresholds are specified in seconds.
The remainder of this section walks through setting up thresholds on a few metrics to get you started. There is also
help in the form of tool tips and a help page, but It's probably a good idea to read this section first and make sure
you understand how to set up thresholds before just diving in. Once you are familiar with the tasks involved, the
tool tips will serve to remind you of what to do and how to use the more advanced features.
7 Accessing GroundWork Monitor through several windows in the same browser is supported in current GWMEE releases. So if you want, you
can access the Ganglia Web Server pages through the Ganglia → Ganglia Views screen.
Version 5.0.0 of 2011-02-28 16:07:30 Page 22 of 32
GroundWork Ganglia Integration Module Administrator’s Guide
The initial screen of the Ganglia threshold-configuration web interface is shown below.
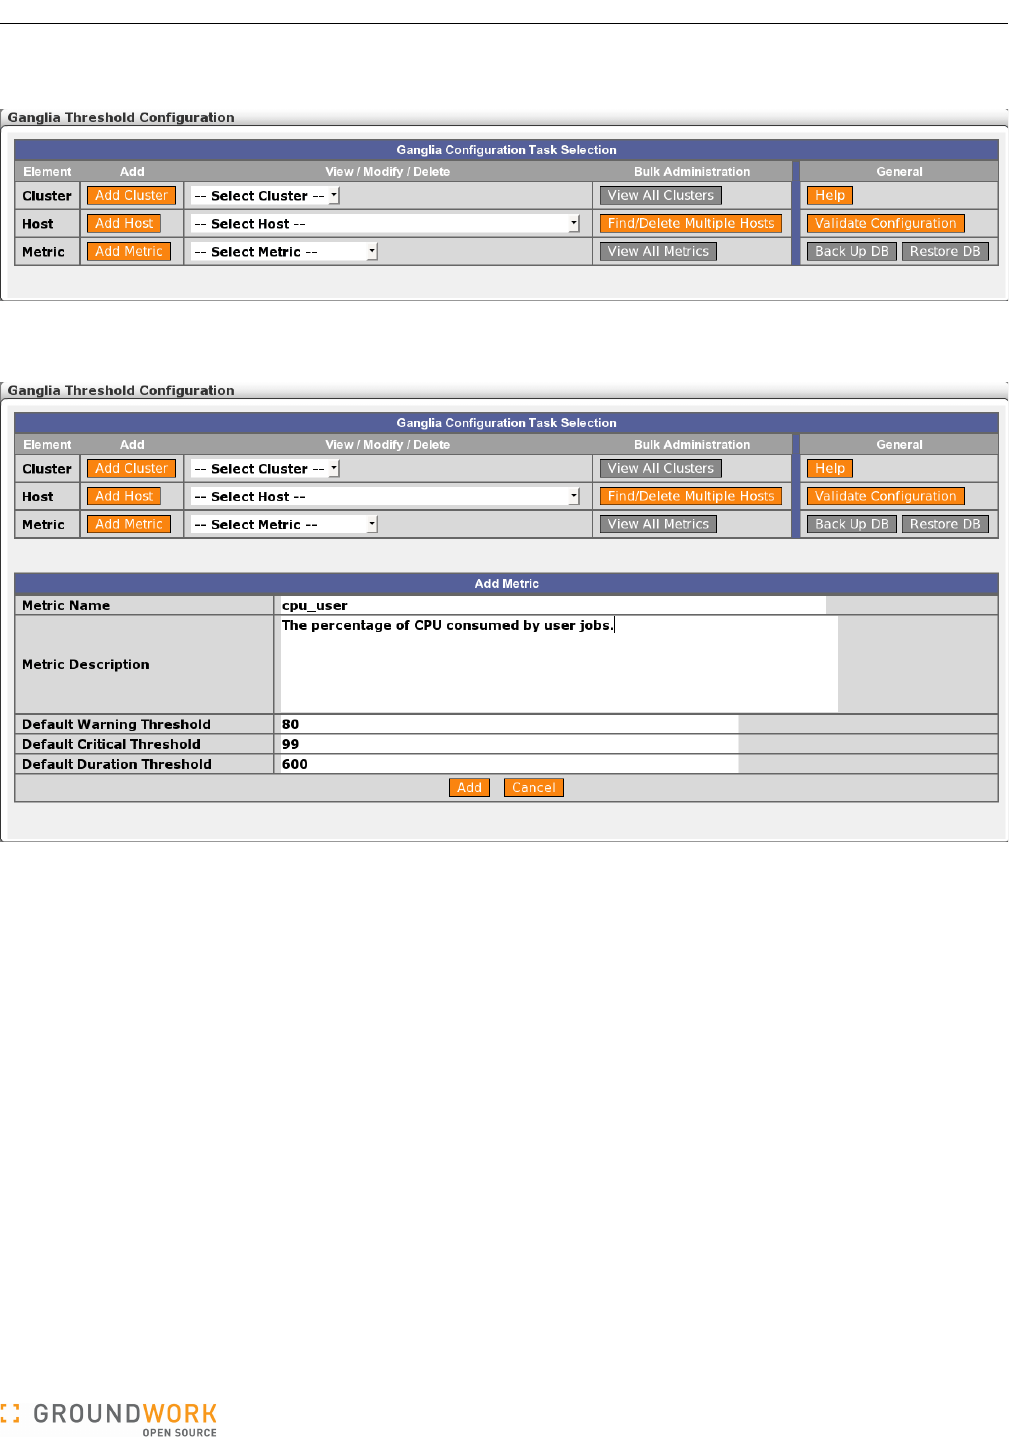
Your first task is to set up metrics. To define a new metric, select the “Add Metric” button. This will present the
following screen.
Enter the metric name, exactly as defined in Ganglia. The example here is cpu_user, a common metric. A free text
field is available for the metric description. Also define the default Warning, Critical, and Duration threshold values
that will be filled in when this metric is applied to a cluster or host, and click the Add button. After a metric is added,
it will appear in the metric drop-down lists.
Once you have at least one metric, it can be applied to a cluster or host. You will probably want to set up several
metrics before you proceed to this step.
Version 5.0.0 of 2011-02-28 16:07:30 Page 23 of 32
GroundWork Ganglia Integration Module Administrator’s Guide
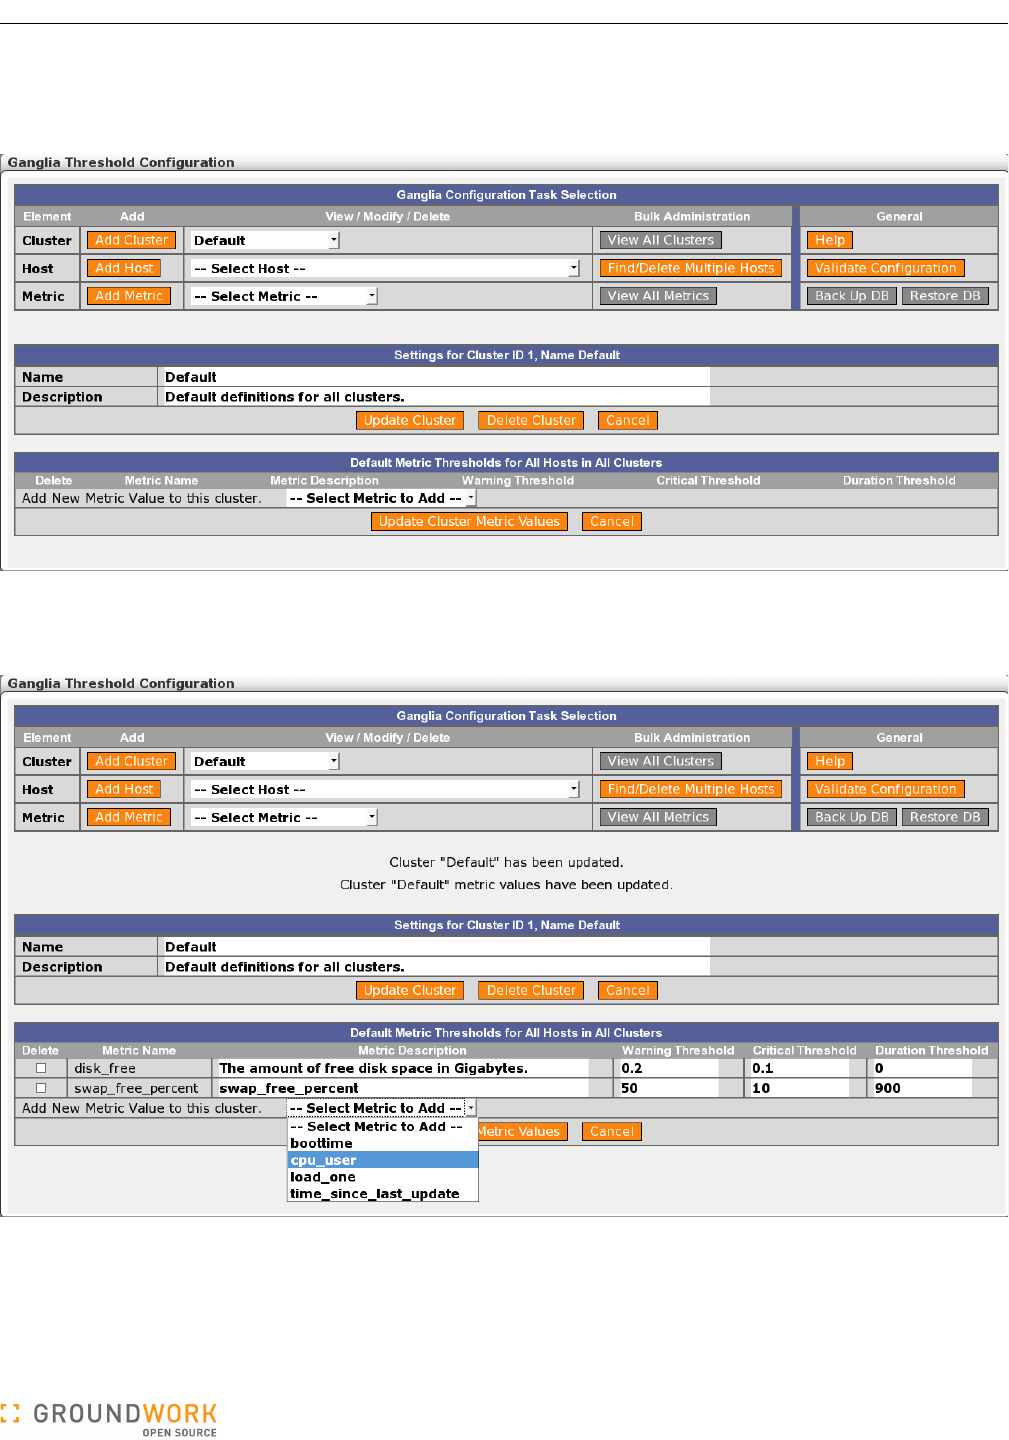
First, the metric must be applied to the “Default” cluster so that a global default threshold exists for any host. To do
this, select the “Default” cluster from the cluster drop down list under View/Modify/Delete. The following page is
presented:
By selecting a metric from the “Add New Metric Value to this cluster” drop down, one of the metrics you have
defined will be added to the list. If desired, update the metric description, or the Warning, Critical, or Duration
thresholds. Continue until all the metrics you wish to monitor are defined and applied to the Default cluster.
To delete metrics from a cluster, select their Delete checkboxes, then click the “Update Cluster Metric Values”
button.
You can also delete definitions for this entire cluster by clicking the “Delete Cluster” button. DO NOT DO THIS for
the Default cluster!
Version 5.0.0 of 2011-02-28 16:07:30 Page 24 of 32
GroundWork Ganglia Integration Module Administrator’s Guide
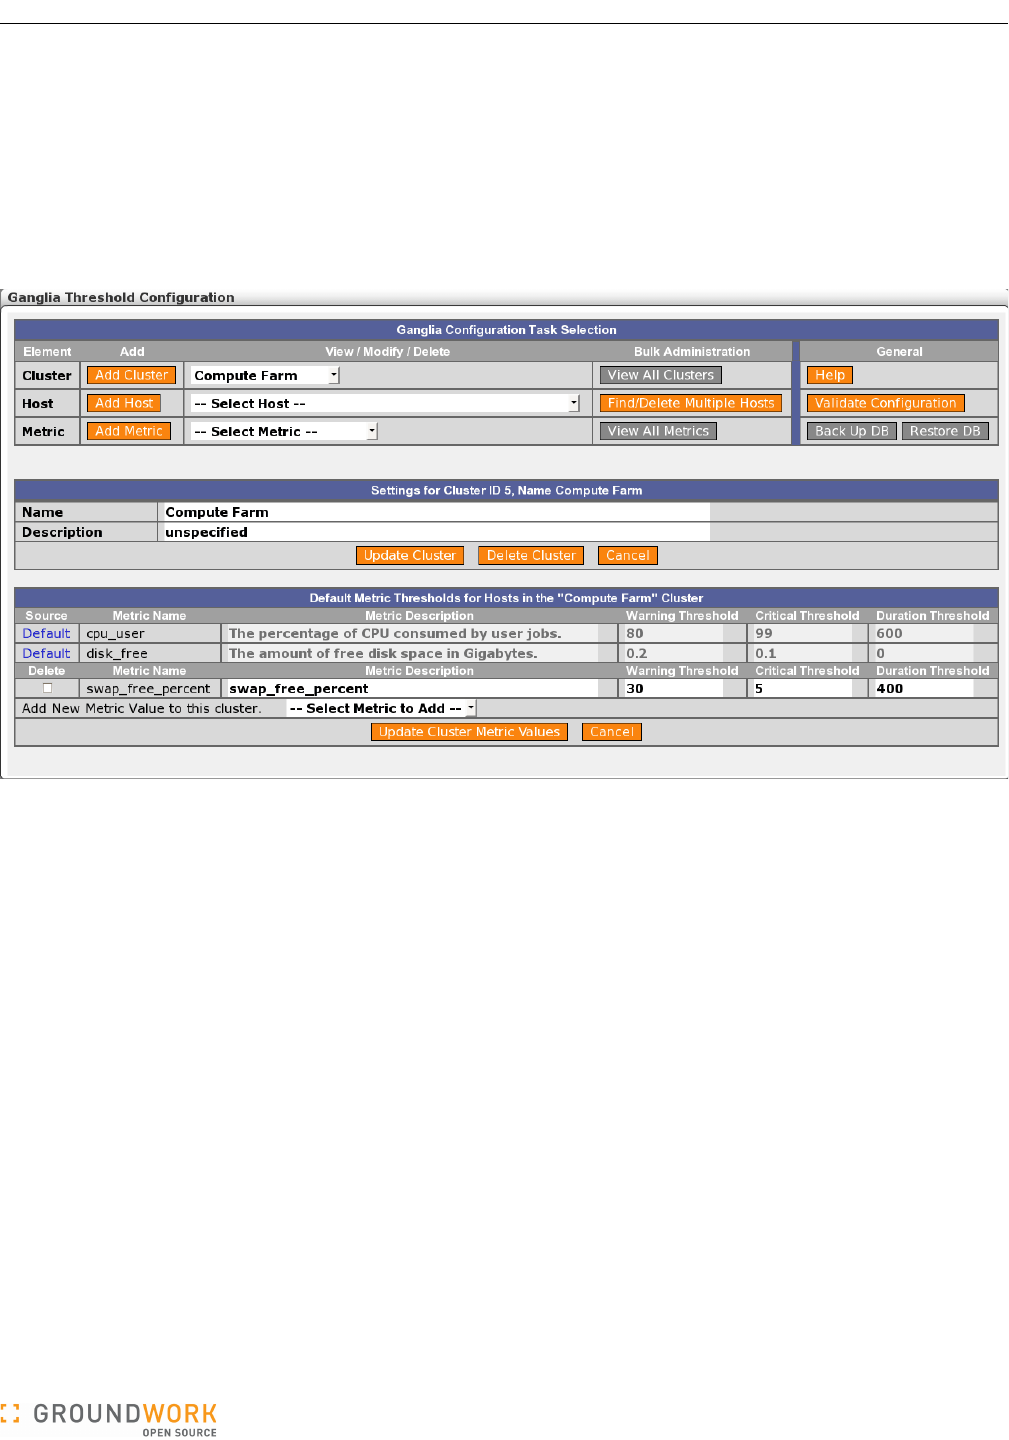
After defining the Default cluster, you may click the “Add Cluster” button to define a new cluster, then repeat this
process to define metric thresholds for that cluster. Note that if you don’t define a metric for this cluster, it will still
be monitored using the thresholds defined and applied to the Default cluster. Those global settings are shown as
read-only copies above the per-cluster metric thresholds, as shown in the figure below. This gives you a complete
picture of all the thresholds that will be applied to hosts in the cluster, all in one screen. The Source field is a link to
the screen where these default settings are established, so these global values can be quickly accessed and
adjusted if needed. Only define metric thresholds in a specific cluster if you want to override the settings in the
Default cluster. If you do define per-cluster thresholds for some metrics, the display of the corresponding Default
cluster thresholds for those metrics will be suppressed, as they will no longer apply to this particular cluster.
Generally speaking, you will want to stop at this stage and not go further to define per-host metric thresholds.
That's because treating hosts in a grid as individual objects adds complexity to the setup and extra administrative
burden to maintain it. Uniformity of monitoring across groups of similar hosts makes the configuration much easier
to understand. However, if you do have hosts with particular characteristics that should be monitored in a special
way, you can proceed to the next step and set up metric thresholds at the host level.
Version 5.0.0 of 2011-02-28 16:07:30 Page 25 of 32
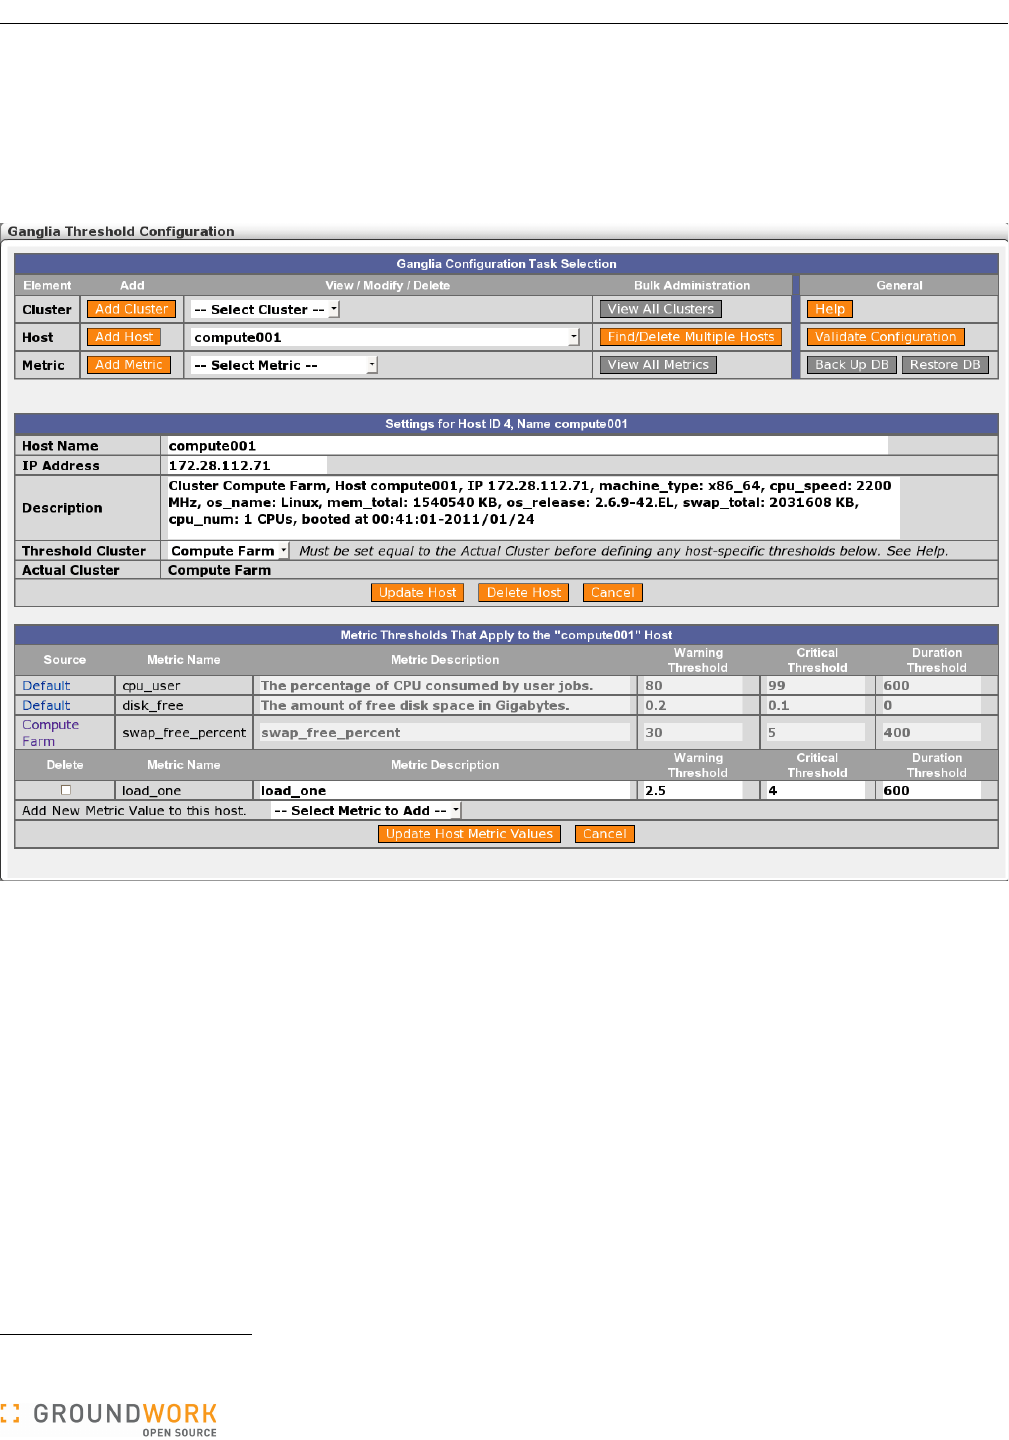
GroundWork Ganglia Integration Module Administrator’s Guide
You may manually define hosts to the ganglia database by selecting “Add Host”, but note that hosts are
automatically added to the database by check_ganglia. It is much easier to allow check_ganglia to execute at least
once, then select the existing host from the “Modify Host Metric Values” drop-down list and modify its metric
settings. You can also use the Find/Delete Multiple Hosts function to generate a list, from which you can click the
host name link to reach the particular host's screen. When you select an existing host with one of these methods,
the following page appears.
To define per-host metric thresholds, first select the Cluster that this host belongs to in the “Threshold Cluster” field,
and click the “Update Host” button to add the host to that cluster in the database. This step is necessary since the
database is not populated with this information by check_ganglia.8
As on the cluster page, you may add metrics and thresholds to this host. These values will override any thresholds
for the same metrics specified at the cluster level, as well as the Default-cluster thresholds for those metrics if no
cluster-level thresholds are defined. Note that if you don’t define a metric for this host, it will still be monitored if it is
defined in the Default cluster or this specific cluster. Only define metrics for a host if you want to override the
setting in the specific cluster or the Default cluster. The screen for this host shows all the thresholds that apply to
this host if the corresponding metrics are sensed by Ganglia, with the source of each threshold clearly identified.
Once you have your thresholds defined, you will begin to receive passive service check results for the services on
these hosts in Nagios. You next need to define these hosts and services in Nagios so that you can set up the
displays and notifications. The easiest way to do this is with the Auto-Import function, described in a later section.
8 Well, it kind of is, but in a different place. That's where the Actual Cluster displayed in the screen comes from. This distinction and the extra
manual step involved will be reviewed in a future release.
Version 5.0.0 of 2011-02-28 16:07:30 Page 26 of 32
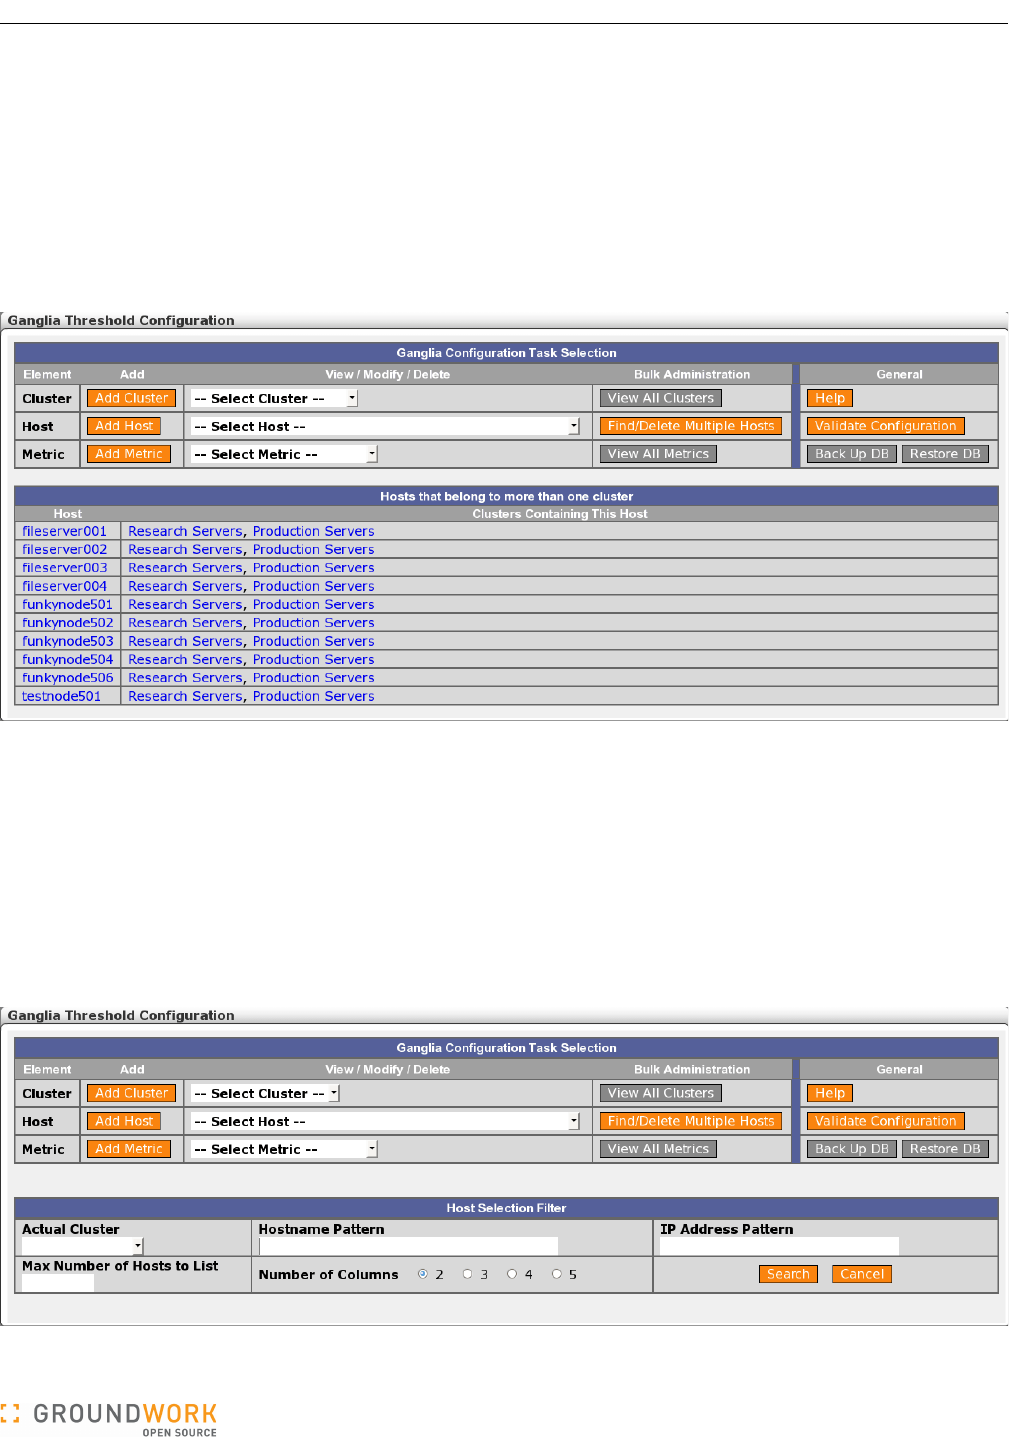
GroundWork Ganglia Integration Module Administrator’s Guide
4.2.2 Validating the Configuration
Certain combinations of settings make little sense, but can be hard to spot when the user interface is presenting
only a small portion of the setup in any single screen. To help with this, the threshold configuration UI provides an
automated mechanism for digging out certain types of misconfiguration and making them very evident. This facility
can be accessed via the “Validate Configuration” button in the top section of the screen.
In the present release, validation runs just one type of sanity check, namely, looking for hosts that belong to more
than one cluster, according to the ganglia database. This could cause confusion as to what cluster-level metric
thresholds should be applied, so it is a situation to be avoided. If any such hosts are found, they are listed on-
screen:
The host and cluster names are links to the respective pages for those hosts and clusters within the threshold
configuration UI, so you can jump immediately to those areas to investigate and make adjustments.
4.2.3 Finding and Deleting Hosts
The threshold configuration tool is designed to make bulk administration of metric thresholds easy. But another
aspect of bulk administration comes into play at other times — namely, when you need to find certain hosts, or
delete groups of hosts. This is important, for instance, when you take a complete cluster permanently out of
service.
Identifying individual hosts or groups of similar hosts can be done via the “Find/Delete Multiple Hosts” capability,
accessed via a button in the top section of the screen. It brings up a search template:
Version 5.0.0 of 2011-02-28 16:07:30 Page 27 of 32
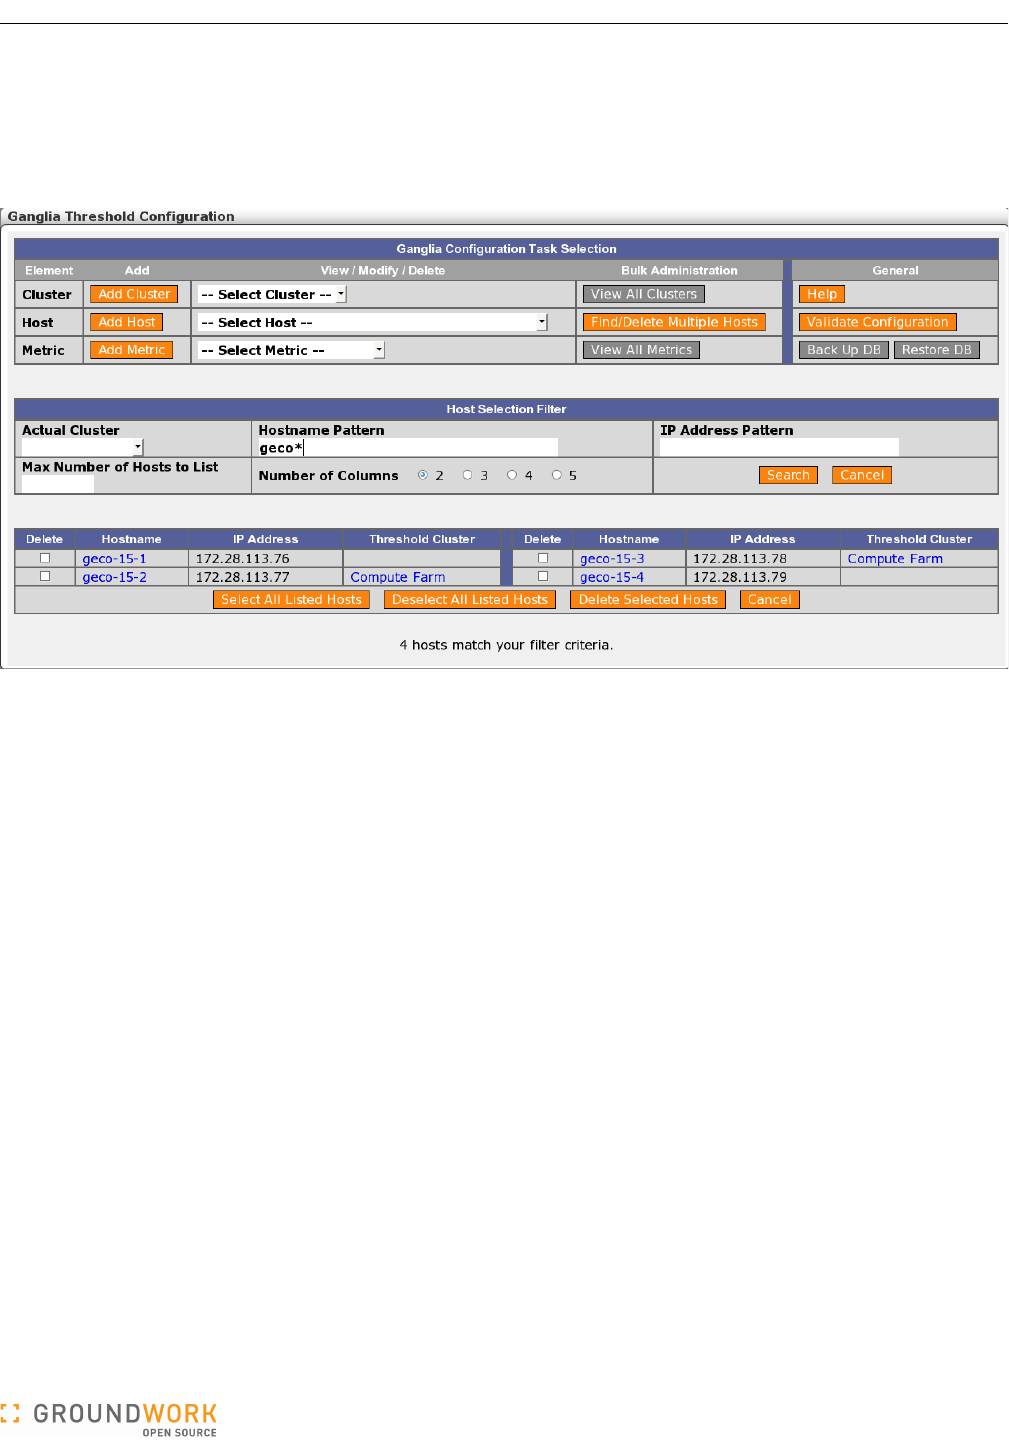
GroundWork Ganglia Integration Module Administrator’s Guide
You can specify a number of criteria to search on, either singly or in combination. If you wave the mouse pointer
over the respective heading for each search criterion, a pop-up tooltip will appear that describes acceptable values.
(The tooltip will remain steady for you to read its content until either some other tooltip appears, or you click
somewhere in the screen to dismiss it.)
The search results look like this:
Here we see four hosts that matched our specified hostname pattern. Each of their names is a link to the
respective host page within the threshold configuration tool. We also see that two of these hosts (geco-15-2 and
geco-15-3) have a Threshold Cluster set, which is a strong indication that host-level metric thresholds are set for
these hosts. These cluster names are also links to the respective cluster pages.
Once you have identified an interesting group of hosts this way, you can easily select some or all of them and
delete them in bulk from the ganglia database. This is a maintenance step you would typically need to take
before running auto-import, so the synchronization of the Monarch and Nagios views of the infrastructure with the
Ganglia view will properly reflect the permanent removal of these hosts from your data center.
Version 5.0.0 of 2011-02-28 16:07:30 Page 28 of 32

GroundWork Ganglia Integration Module Administrator’s Guide
4.3 Auto-Import Configuration
There are several parameters that control the options in the auto-import script. These are found in the
autoimport.conf file, stored in the /usr/local/groundwork/config directory. To configure auto-import,
simply edit this file. If the import runs under cron, you may wish to kick it off once by hand to ensure the results are
what you expect, and that you did not make a mistake editing the file that would prevent the import from functioning.
If you are running the import manually, then you will do this anyway.
As always, be sure to make a backup of your Monarch database before running any kind of bulk update such as
this import script. If it fails for any reason, you should take care not to lose any data.
Here is a listing of the initial configuration file. You should review this file and modify it to meet your needs, and set
up the required services, profiles, and host groups in the Monarch GUI. Then simply run the script from the
command line:
/usr/local/groundwork/nagios/libexec/autoimport.pl
Look in the configured logfile (see below) to see whether any errors occurred, and to examine the operational
statistics for each run.
If the script ran without errors, and you did not enable the commit_changes option, just open the Monarch
(Configuration) GUI, review and adjust the imported hosts, and commit the changes. It's probably a good idea not
to enable that option the first time you run the import, just so you can be sure of the results before you go live with
the new setup.
You may also want to know which hosts are not being monitored by Ganglia, either because they are being
monitored some other way, by Nagios, perhaps, or because they have dropped out of the Ganglia data stream. By
default, these hosts will be placed in a new host group you created called _DELETED_HOSTS. Do not worry, the
autoimport script will not actually delete the hosts it moves there. That is up to you to do on review.
Once you are done importing your hosts and committing your changes, you will be monitoring with Ganglia
thresholds under Nagios in GroundWork Monitor. Congratulations!
# Configuration file for the autoimport.pl script.
#######################################################
#
# General Program Execution Options
#
#######################################################
# Global Debug Level (controls the output of messages in the logfile)
# NONE = 0; turn off all debug info
# FATAL = 1; the application is about to die
# ERROR = 2; the application has found a serious problem, but will attempt to recover
# WARNING = 3; the application has found an anomaly, but will try to handle it
# NOTICE = 4; the application wants to inform you of a significant event
# STATS = 5; the application wants to log statistical data for later analysis
# INFO = 6; the application wants to log a potentially interesting event
# DEBUG = 7; the application wants to log detailed debugging data
debug_level = 5
# Where to put all the log messages from autoimport processing.
logfile = "/usr/local/groundwork/nagios/var/log/autoimport.log"
# Whether or not to commit a new configuration to Nagios.
# Changes will be committed to the Monarch database regardless.
# [yes/no]
commit_changes = yes
# When defining a monarch host, use the host name instead of the IP address?
# [yes/no]
define_monarch_host_using_dns = yes
# Whether to process WesternGeco-style hostgroups.
# [yes/no]
process_wg_hostgroups = yes
Version 5.0.0 of 2011-02-28 16:07:30 Page 29 of 32

GroundWork Ganglia Integration Module Administrator’s Guide
# Whether to use hostgroup_program to classify hosts according to their function.
# If "no", use custom_hostgroup_package instead.
# Used only if process_wg_hostgroups = yes.
# [yes/no]
use_hostgroup_program = no
# A program to classify hosts into hostgroups according to their function.
# Used only if process_wg_hostgroups = yes and use_hostgroup_program = yes.
# The value specified can include initial options beyond just the program name;
# the hostname to be classified will be appended to this full command string.
hostgroup_program = "/usr/local/groundwork/jobs/westerngeco/bin/hosttype -c"
# What Perl package to call to classify hosts into hostgroups according to their function.
# Used only if process_wg_hostgroups = yes and use_hostgroup_program = no.
# For efficiency, the use of a package, if available, is preferred over an external program.
# Set this to an empty string if you have no such package.
custom_hostgroup_package = "WesternGecoHostgroupName"
# What options to initialize the custom_hostgroup_package with.
custom_hostgroup_package_options = "-c"
# Where to find the Nagios log file.
nagioslogfile = "/usr/local/groundwork/nagios/var/nagios.log"
# Ganglia service name to search for in Nagios log file. Hosts with this service will be matched.
ganglia_svc_name = "ganglia"
# Cacti service name to search for in Nagios log file. Hosts with this service will be matched.
cacti_svc_name = "cacti"
# Assign deleted hosts to the deleted_hostgroup specified below?
# [yes/no]
assign_deleted_hosts_to_hostgroup = yes
# The name of the hostgroup to which deleted hosts will be assigned.
# This hostgroup must already exist in the Monarch database.
deleted_hostgroup = "_DELETED_HOSTS"
# Assign new hosts to the single fixed new hostgroup for the type of node discovered,
# as specified below (new_ganglia_hosts_hostgroup or new_cacti_hosts_hostgroup)?
# [yes/no]
assign_new_hosts_to_hostgroup = no
# Names of hostgroups for newly discovered hosts.
# Used only if assign_new_hosts_to_hostgroup = yes.
new_ganglia_hosts_hostgroup = "New_Ganglia_Hosts"
new_cacti_hosts_hostgroup = "New_Cacti_Hosts"
# For newly discovered Ganglia hosts, assign host profiles named by the Ganglia clusters
# in which the hosts reside? "yes" is only possible if get_ganglia_host_from_ganglia_db
# (below) is "yes".
# If "no", just use the single fixed default_host_profile_ganglia specified below.
# If "yes", the default_host_profile_ganglia host profile will still be used if we find
# no host profile named after a given Ganglia cluster.
# [yes/no]
assign_host_profiles_by_ganglia_clusters = yes
# Note: For newly discovered Cacti hosts, assuming you only use Cacti for network devices,
# using a single host profile (default_host_profile_cacti, specified below) makes sense.
# Within Cacti, you don't have something akin to "Host Groups", though you do have a 'tree'
# structure defined in the database for navigating the devices. If we did want to allow
# alternate host profiles for Cacti devices, then the name of the branch of the tree the
# device is attached to would be the logical candidate. We leave that sort of thing for
# possible future development.
Version 5.0.0 of 2011-02-28 16:07:30 Page 30 of 32

GroundWork Ganglia Integration Module Administrator’s Guide
# Default Monarch host and service profiles to be applied to newly discovered hosts.
default_host_profile_ganglia = "ganglia_host"
default_service_profile_ganglia = "Ganglia Hosts"
default_service_profile_ganglia_id = ""
default_host_profile_cacti = "cacti_host"
default_service_profile_cacti = "Cacti Hosts"
default_service_profile_cacti_id = ""
# Process ganglia hosts?
# [yes/no]
process_ganglia_hosts = yes
# Read the Nagios log to pick up the list of Ganglia hosts from service check messages?
# [yes/no]
get_ganglia_host_from_nagios_log = no
# Get the list of ganglia hosts from the Ganglia database?
# Only effective if get_ganglia_host_from_nagios_log = no.
# [yes/no]
get_ganglia_host_from_ganglia_db = yes
# How to access the Ganglia database.
ganglia_database = "ganglia"
ganglia_host = "localhost"
ganglia_dbuser = "root"
ganglia_dbpwd = "mysql"
# Process cacti hosts?
# [yes/no]
process_cacti_hosts = no
# How to access the Cacti database.
cacti_database = "cacti"
cacti_host = "localhost"
cacti_dbuser = "cacti"
cacti_dbpwd = "cactipasswd"
# How to access the Monarch database.
monarch_user_acct = "super_user"
Version 5.0.0 of 2011-02-28 16:07:30 Page 31 of 32
GroundWork Ganglia Integration Module Administrator’s Guide
Appendix A: Revision History
This manual is expected to be a living document. Future versions may include detail and experience which is not
available during the initial development.
The following versions of this document have been issued to date.
Version Date Description of Changes
2.0 October 3, 2007 First public release.
3.0 --- Interim internal release.
4.0.5 February 6, 2008 Draft-in-progress of changes to reflect repackaging as RPMs.
5.0.0 February 28, 2011 Revised to reflect installation and running in the GroundWork Monitor Enterprise Edition 6.4 environment. Also
edited operational instructions for clarity and to describe new functionality.
Version 5.0.0 of 2011-02-28 16:07:30 Page 32 of 32
