Credit Card Fraud Detection XGBOOST Guide
User Manual:
Open the PDF directly: View PDF ![]() .
.
Page Count: 14
Credit Card Fraud Detection - XGBOOST ∗
Javier Ng EY
The datasets contains transactions made by credit cards in September 2013 by european cardhold-
ers. This dataset presents transactions that occurred in two days, where we have 492 frauds out
of 284,807 transactions. The dataset is highly unbalanced, the positive class (frauds) account for
0.172% of all transactions.
Keywords: xgboost, machine learning, R
Overview
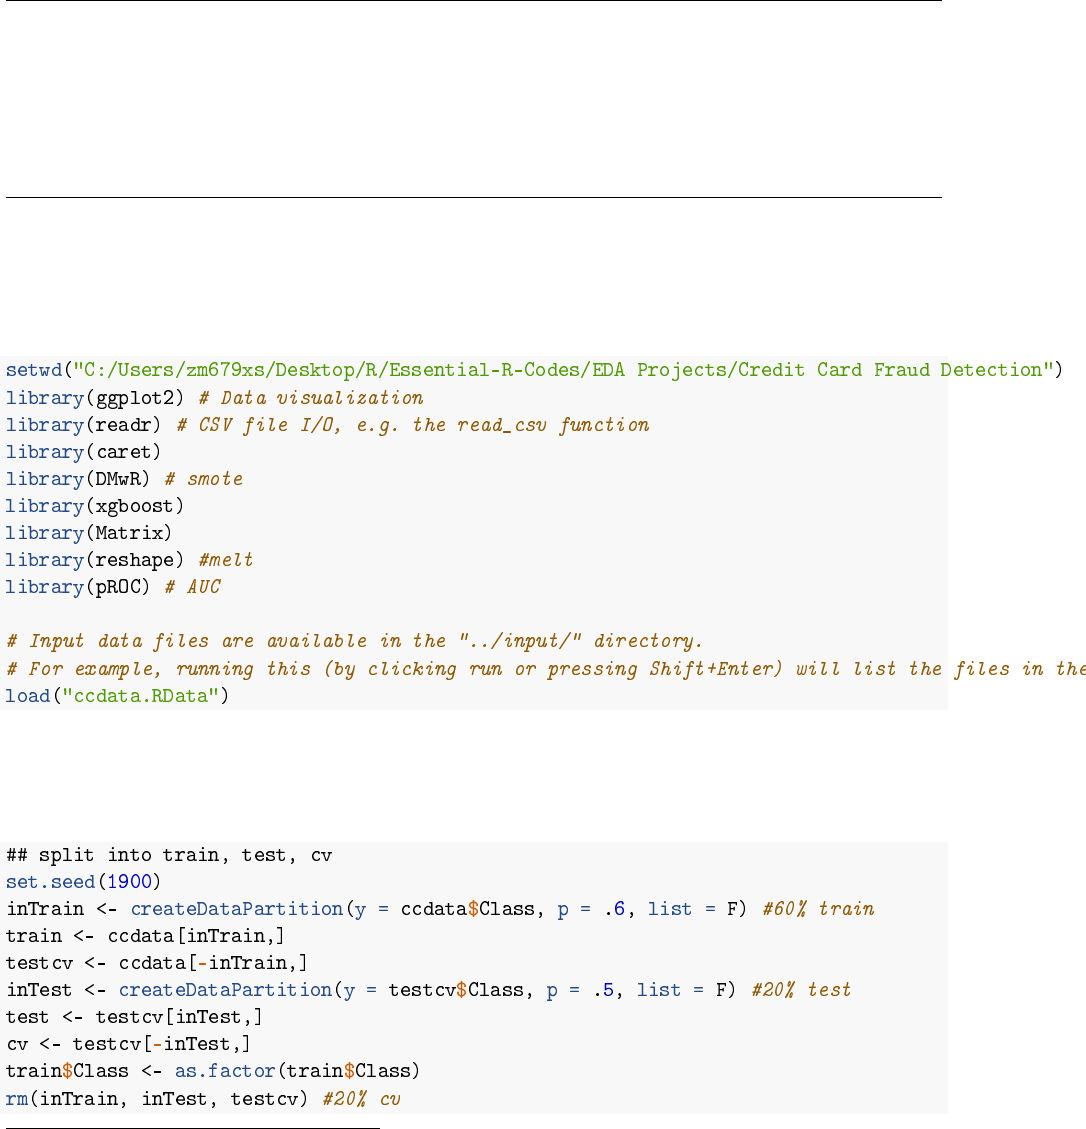
Loading of Libraries
Split Data
Split data into train, test and cv using caret.
∗PDF is available on EY FDA shared drive. Current version: March 11, 2019; Corresponding author:javier.ng@sg.
ey.com.
1
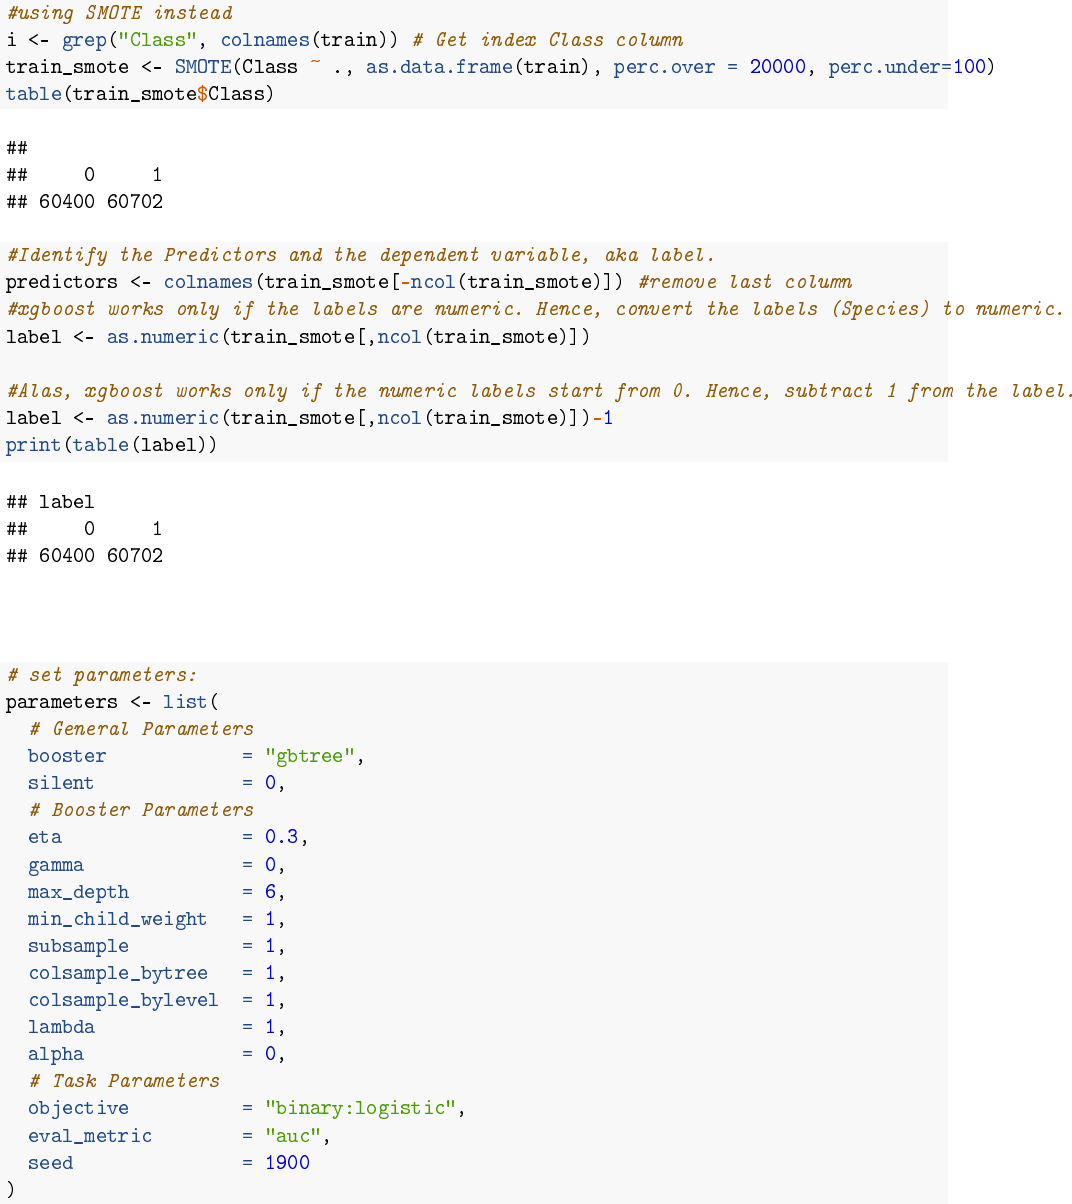
Imbalance Dataset
Using SMOTE to make the dataset more balanced.
Setting Parameters for XGBoost
2
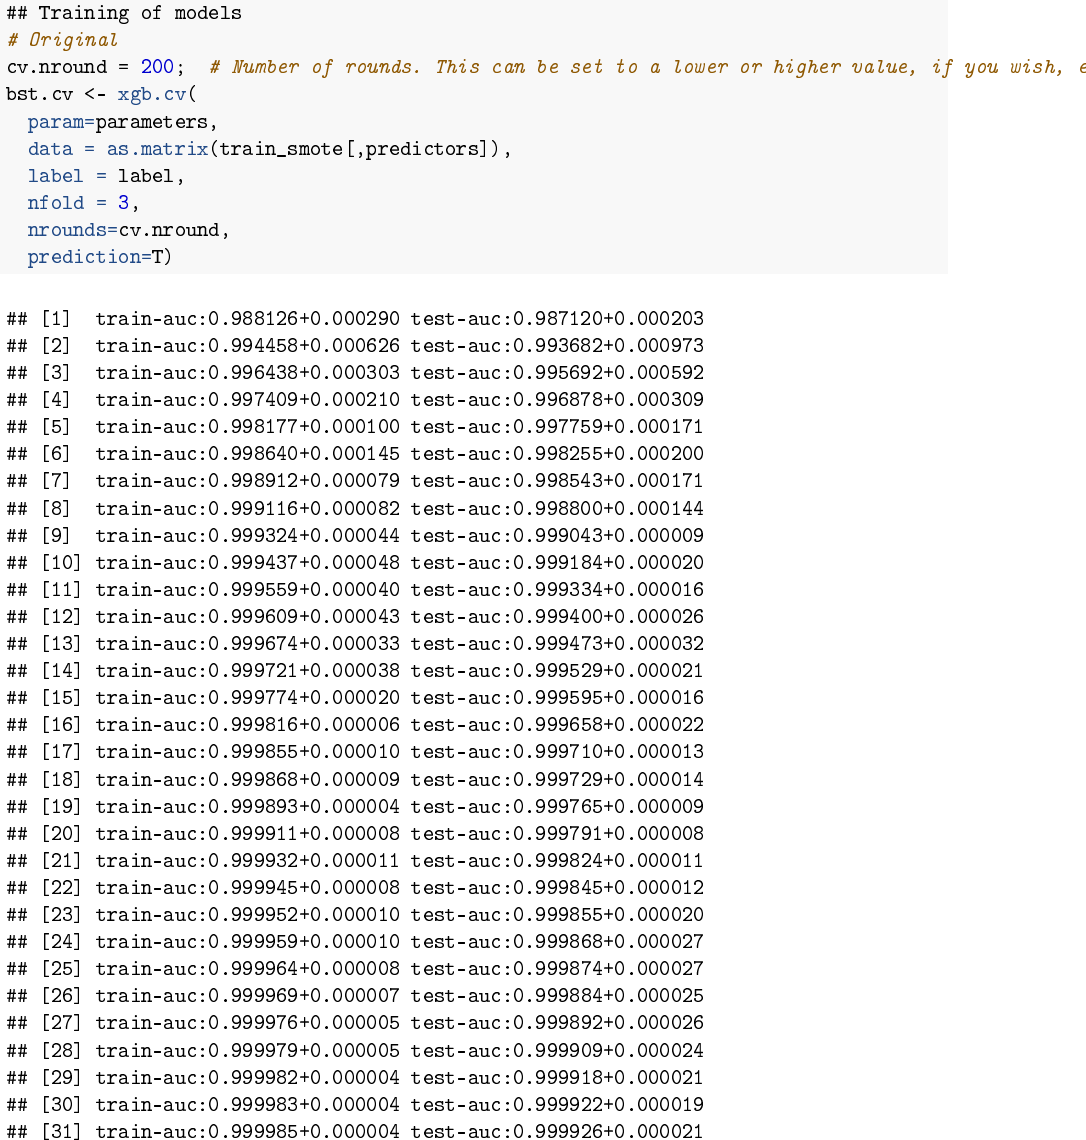
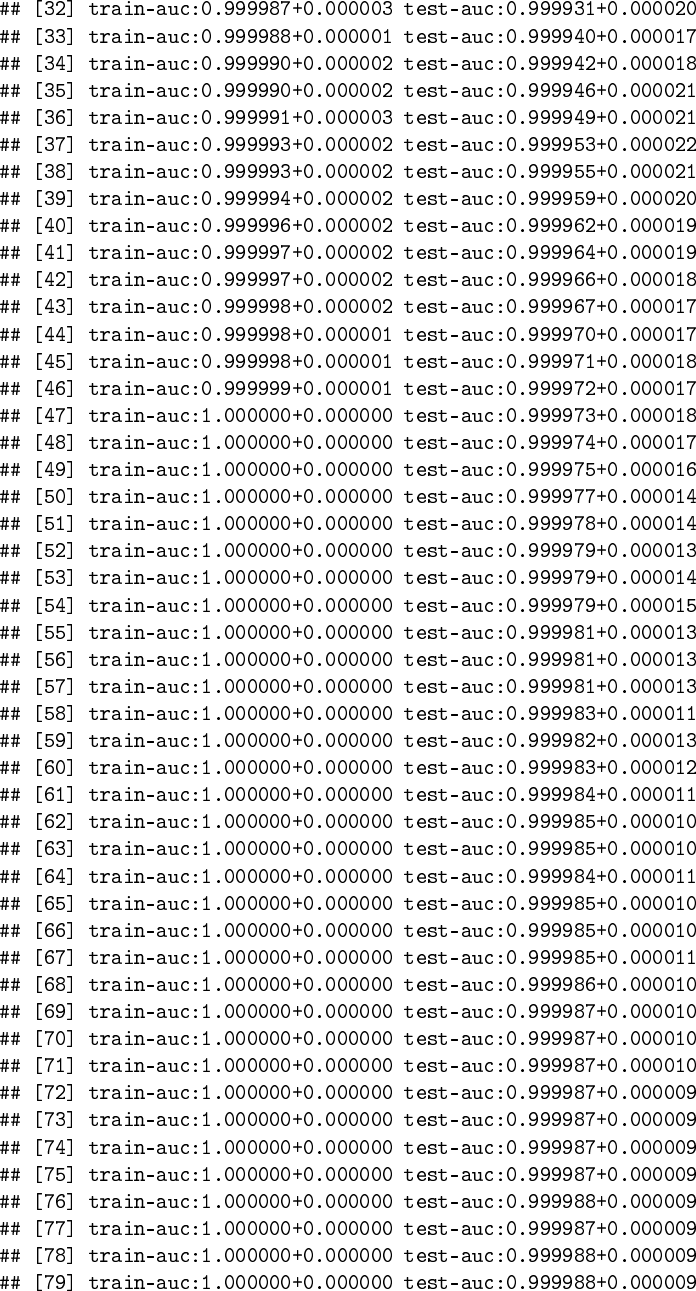
Train Model
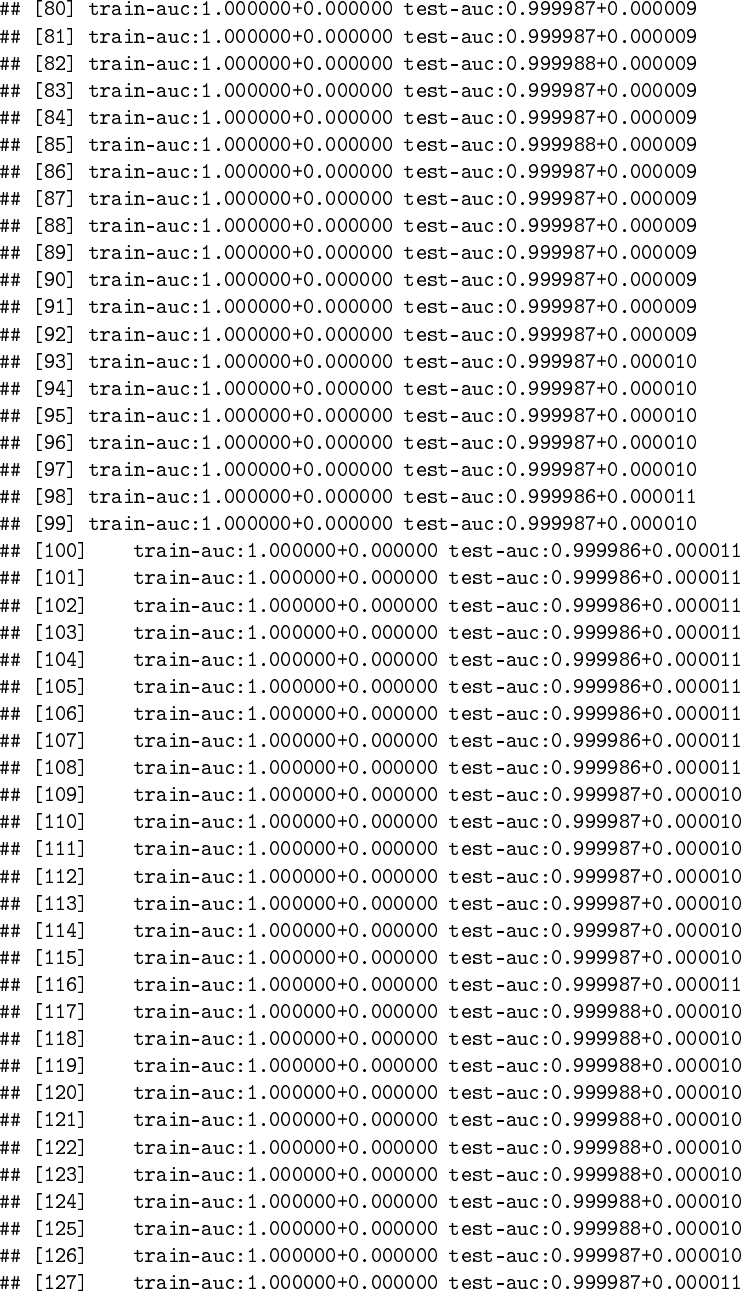
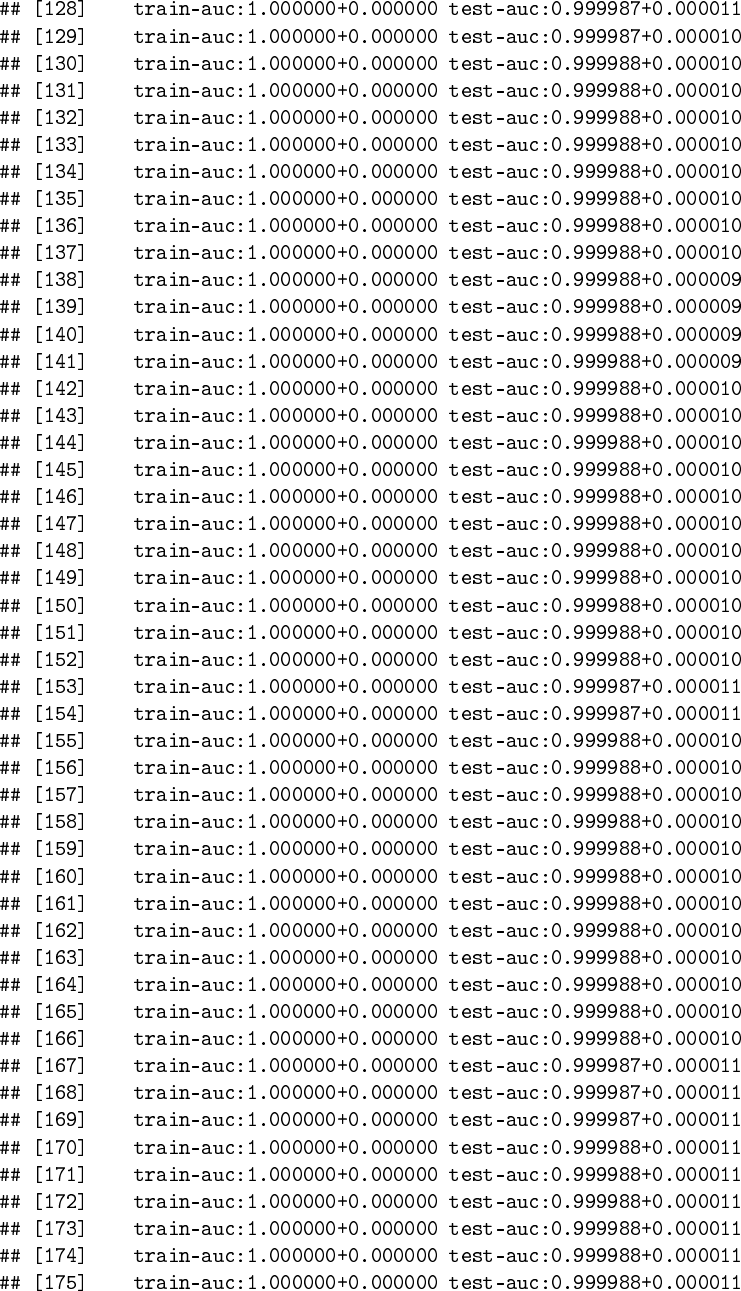
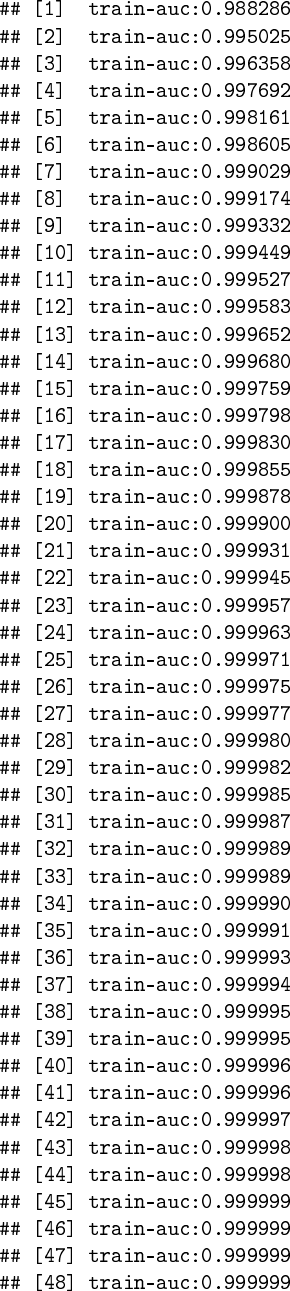
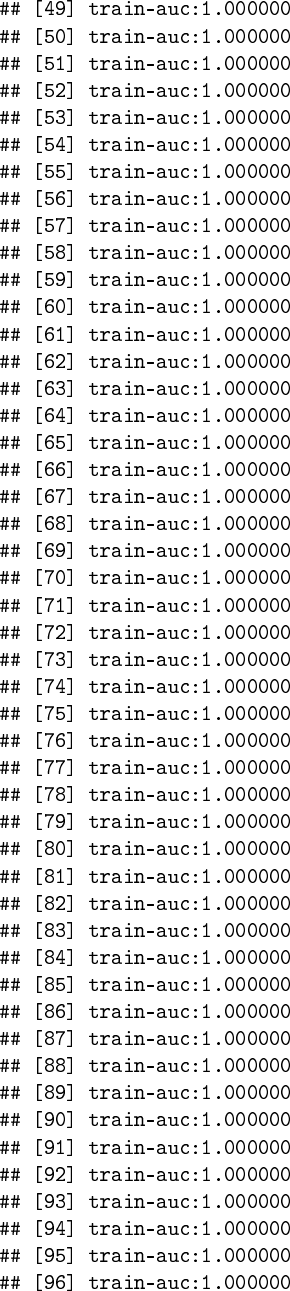
Train the model with the parameters set above and nrounds = 25 (increasing nrounds does not
improve the model anymore). Plots show increasing train and cv AUC in the beginning and
stagnating at later rounds as expected.
3
4
5
6
Predict
Predict with dataset and set threshold of 0.5
7
8
9
10
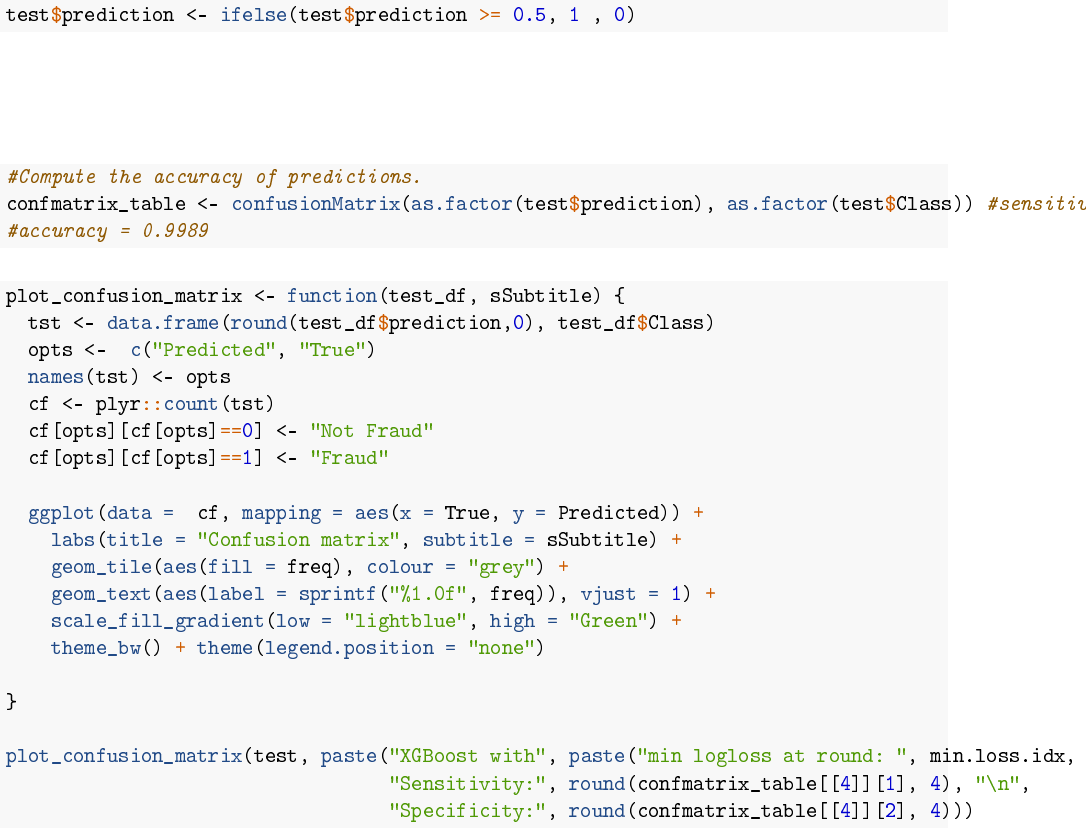
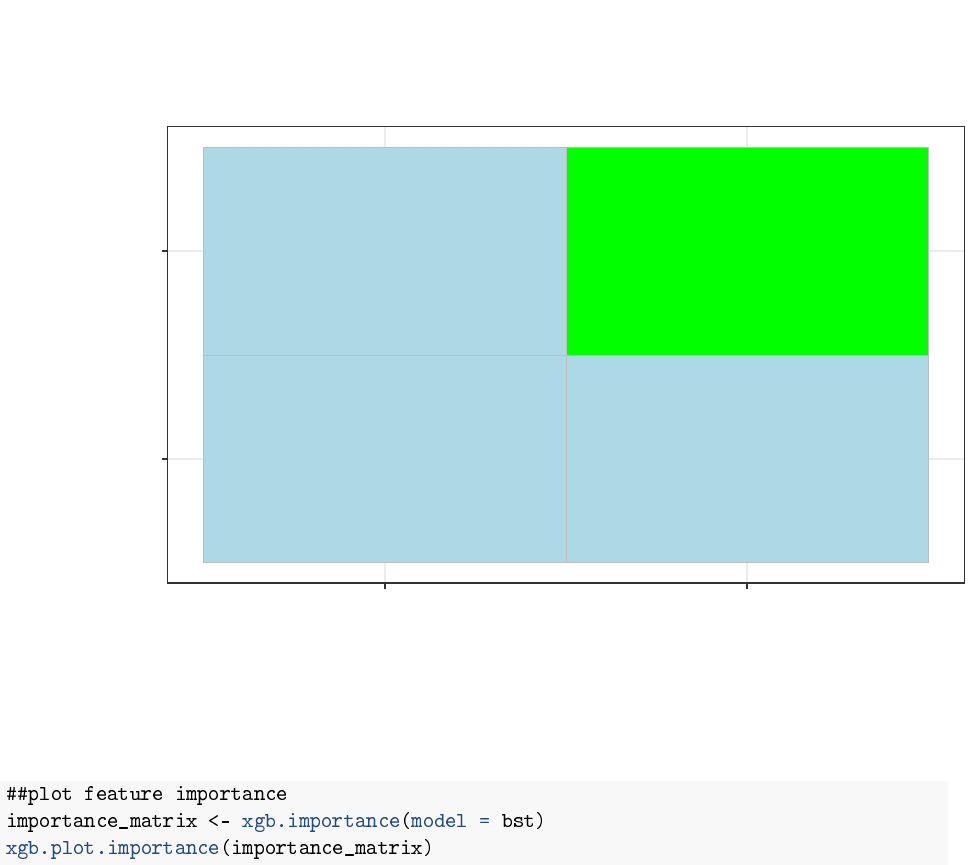
Confusion Matrix
Sensitivity (TPR) = 0.9991 Specificity (TNR) = 0.9135 Accuracy = 0.9989
11
568039
5495
Fraud
Not Fraud
Fraud Not Fraud
True
Predicted
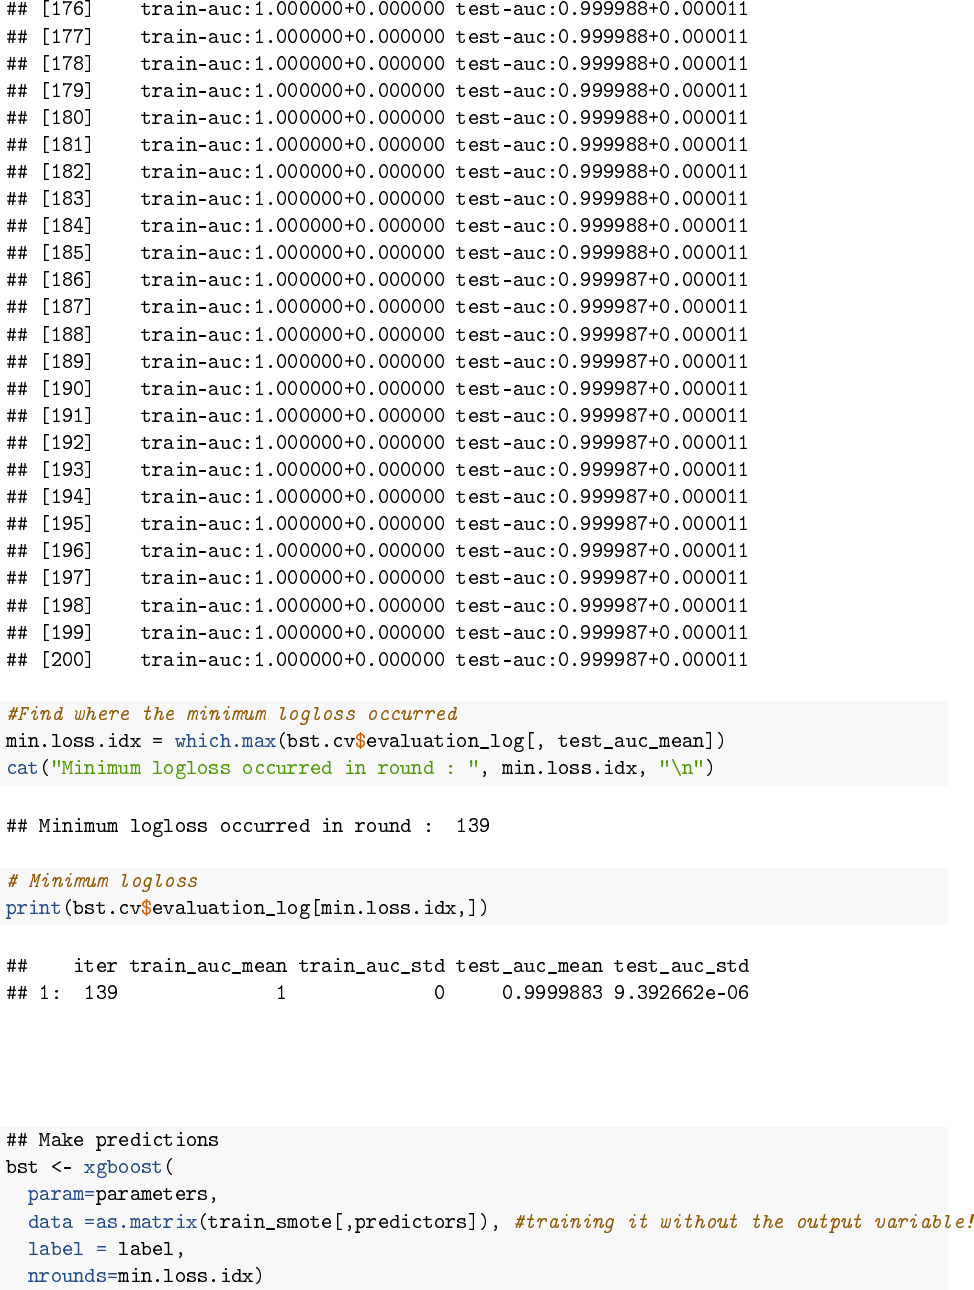
XGBoost with min logloss at round: 139
Sensitivity: 0.9991
Specificity: 0.9135
Confusion matrix
Importance Matrix
Identify features that are most important
12
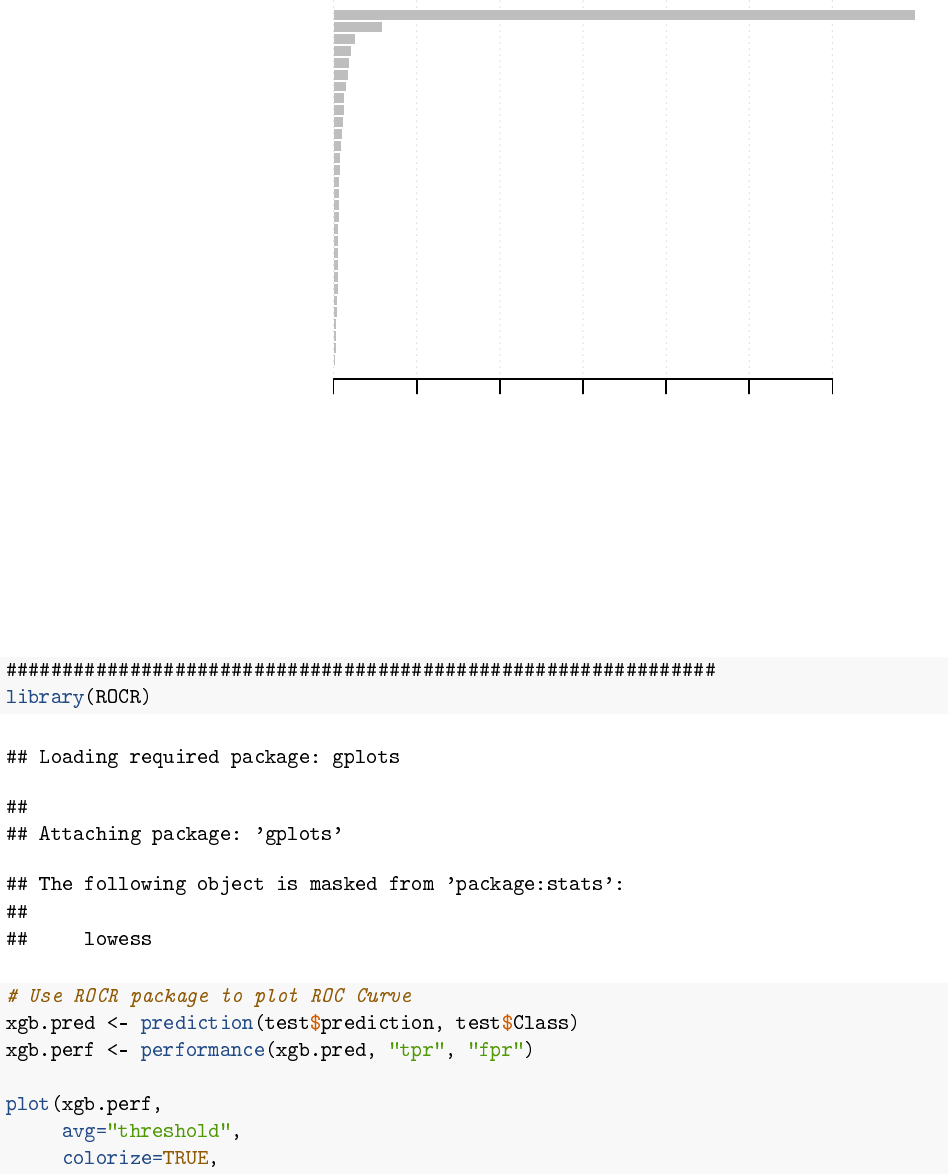
V28
V16
V27
V22
V24
V6
V25
V5
V9
V21
V20
V15
V2
V19
V23
Time
V18
V13
V7
Amount
V17
V3
V26
V1
V12
V10
V11
V8
V4
V14
0.0 0.1 0.2 0.3 0.4 0.5 0.60.0 0.1 0.2 0.3 0.4 0.5 0.6
ROC Curve
AUC = 0.956
13
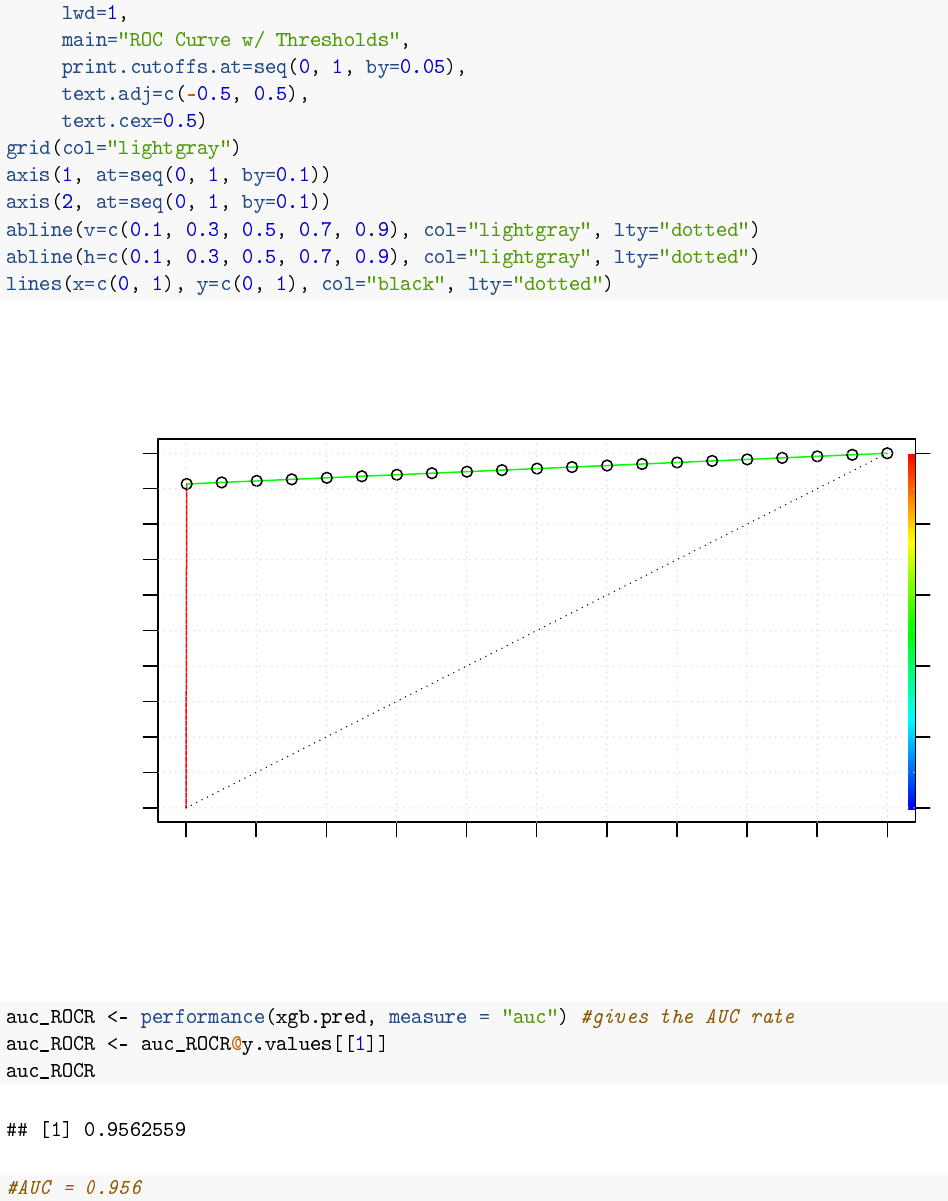
ROC Curve w/ Thresholds
Average false positive rate
Average true positive rate
0.0 0.2 0.4 0.6 0.8 1.0
0.0 0.2 0.4 0.6 0.8 1.0
0 0.4 0.8 1.2 1.6 2
0
0.05
0.1
0.15
0.2
0.25
0.3
0.35
0.4
0.45
0.5
0.55
0.6
0.65
0.7
0.75
0.8
0.85
0.9
0.95
1
0.0 0.1 0.2 0.3 0.4 0.5 0.6 0.7 0.8 0.9 1.0
0.0 0.2 0.4 0.6 0.8 1.0
14
