Guide To DHS Statistics 7
Guide_to_DHS_Statistics_DHS-7
User Manual:
Open the PDF directly: View PDF ![]() .
.
Page Count: 645 [warning: Documents this large are best viewed by clicking the View PDF Link!]
- Foreword
- Acknowledgements
- 1) Introduction and Description of DHS Datasets
- Purpose of the Guide
- Description of The Demographic and Health Surveys Program
- Organization of DHS Data
- Analyzing DHS Data
- Sample Design, Stratification and Sampling Weights
- Households
- De Facto and De Jure Populations
- Age of Children
- All Women Factors
- Median Calculations
- Matching and Merging Datasets
- Background characteristics
- Data Suppression and Parenthesizing
- Indicator Guidelines
- International Indicator Guides and Resources
- 2) Population and Housing
- Household Drinking Water
- Percent distribution of households and de jure population by source of drinking water
- Percent distribution of households and de jure population by time to obtain drinking water
- Percentage of households and de jure population using methods to treat drinking water and percentage using an appropriate treatment method
- Percent distribution of households and de jure population using piped water or water from a tube well or borehole by availability of water
- Type of Sanitation Facility
- Household Characteristics
- Cooking Fuel
- Smoking in Home
- Household Possessions
- Wealth Quintiles
- Handwashing
- Household Population by Age, Sex, and Residence
- Household Composition
- Children’s Living Arrangements and Orphanhood
- Birth Registration
- Educational Attainment of Household Members
- School Attendance Ratios
- Household Drinking Water
- 3) Respondents’ Characteristics
- Background Characteristics of Respondents
- Educational Attainment of Women and Men
- Literacy
- Exposure to Mass Media
- Internet Usage
- Employment and Occupation
- Percent distribution of women and men by employment status
- Percent distribution of women and men age 15-49 employed in the 12 months preceding the survey by occupation
- Percent distribution of women employed by type of earnings, type of employer, and continuity of employment, according to type of employment
- Health Insurance Coverage
- Tobacco Use
- Percentage of women and men who smoke various tobacco products
- Percent distribution of men by smoking frequency
- Average number of cigarettes smoked per day
- Percentage of women and men age who currently use smokeless tobacco, according to type of tobacco product, and percentage who use any type of tobacco
- 4) Marriage and Sexual Activity
- Current Marital Status
- Number of Co-Wives and Number of Wives
- Age at First Marriage
- Age at First Sexual Intercourse
- 5) Fertility
- Notes and Considerations
- Current Fertility
- Completed Fertility
- Children Ever Born and Living
- Birth Intervals
- Postpartum Exposure: Amenorrhea, Abstinence, and Insusceptibility
- Menopause
- Age at First Birth
- Teenage Pregnancy and Motherhood
- 6) Fertility Preferences
- 7) Family Planning
- Knowledge of Contraceptive Methods
- Ever Use of Contraceptive Methods
- Current Use of Contraceptive Methods
- Knowledge of the Fertile Period
- Age at Sterilization
- Use of Social Marketing Brand Pill and Condom
- Informed Choice
- Contraceptive Discontinuation
- Need and Demand for Family Planning
- Decision making about Family Planning
- Future Use of Contraception
- Exposure to Family Planning Messages
- Contact of Nonusers with Family Planning Providers
- 8) Infant and Child Mortality
- Notes and Considerations
- Early Childhood Mortality
- Methodology of DHS Mortality Rates Estimation
- Neonatal Mortality Rate (NNMR), Post-Neonatal Mortality Rate (PNMR), Infant Mortality Rate (IMR), Child Mortality Rate (CMR) (Ages 1-4), Under-five Mortality Rate (U5MR)
- Perinatal Mortality
- High-Risk Fertility Behavior
- 9) Reproductive Health
- Antenatal Care
- Percent distribution of antenatal care by type of provider, and percentage of antenatal care from a skilled provider
- Percent distribution of number of antenatal care visits, and of timing of first antenatal visit
- Median number of months pregnant at time of first antenatal care visit
- Percentage of women receiving components of antenatal care
- Tetanus Toxoid Injections
- Place of Delivery
- Percent distribution of live births by place of delivery, and the percentage of live births delivered in a health facility
- Percent distribution of live births by person providing assistance during delivery, and the percentage assisted by a skilled provider
- Definition
- Calculation
- Handling of Missing Values
- Notes and Considerations
- References
- World Health Organization, 2018. Definition of skilled health personnel providing care during childbirth: the 2018 joint statement by WHO, UNFPA, UNICEF, ICM, ICN, FIGO and IPA. World Health Organization.http://www.who.int/reproductivehealth/publicati...
- Resources
- Percentage of live births delivered by caesarean section, the percentage that was planned before the onset of labor pains, and that was decided after the onset of labor pains
- Percent distribution by duration of stay in the health facility following the most recent live birth by type of delivery
- Definition
- Calculation
- Handling of Missing Values
- Notes and Considerations
- References
- Campbell, O.M., L. Cegolon, D. Macleod, and L. Benova. 2016. “Length of stay after childbirth in 92 countries and associated factors in 30 low-and middle-income countries: compilation of reported data and a cross-sectional analysis from nationally rep...
- Resources
- Postnatal Care
- Percent distribution of timing of first postnatal check for the mother, and percentage who received a postnatal check during the first 2 days
- Percent distribution of type of provider for the first postnatal check for the mother
- Percent distribution of timing of first postnatal check for the newborn, and percentage receiving a postnatal check during the first 2 days
- Percent distribution of type of provider for the first postnatal check for the newborn
- Percentage of newborns receiving selected function of postnatal care
- Problems in Accessing Health Care
- Antenatal Care
- 10) Child Health
- Child Size and Weight at Birth
- Vaccination
- Percentage of children age 12-23 months and children age 24-35 months who received specific vaccines at any time before the survey according to vaccination card, according to mother’s report, according to either vaccination card or mother’s report, an...
- Percentage of children who ever had a vaccination card and who had a vaccination card seen
- Prevalence and Treatment of Symptoms of Acute Respiratory Infection (ARI)
- Percentage of children under age 5 with symptoms of ARI, and among children under age 5 with symptoms of ARI, the percentage for whom advice or treatment was sought and for whom advice or treatment was sought the same or next day.
- Percentage of children under age 5 with symptoms of ARI for whom advice or treatment was sought from specific sources, and among those for whom advice or treatment was sought, percentage for whom advice or treatment was sought from specific sources
- Prevalence and Treatment of Fever
- Prevalence and Treatment of Diarrhea
- Feeding Practices during Diarrhea
- Oral Rehydration Therapy, Zinc, and Other Treatments for Diarrhea
- Source of Advice or Treatment for Children with Diarrhea
- Knowledge of ORS packets
- Disposal of children’s stool
- 11) Nutrition of Children and Adults
- References
- Initial Breastfeeding
- Breastfeeding and Complementary Feeding
- Percent distribution of children exclusively breastfeeding, or breastfeeding and consuming plain water only, non-milk liquids, consuming other milk, and consuming complementary foods
- Percentage of children exclusively breastfed, predominantly breastfed, age-appropriately breastfed, and introduced to solid, semi-solid, or soft foods
- Percentage of children currently breastfeeding, continuing breastfeeding at 1 year and at 2 years
- Percentage of children using a bottle with a nipple
- Median and mean durations of breastfeeding among children born in the past three years for any breastfeeding, exclusive breastfeeding, predominant breastfeeding
- Foods and Liquids Consumed by Children
- Minimum Dietary Diversity, Minimum Meal Frequency and Minimum Acceptable Diet
- Iodization of Household Salt
- Micronutrient Intake among Children
- Therapeutic and Supplemental Foods
- Micronutrient Intake among Women
- Anemia Status
- Nutritional Status
- 12) Malaria
- Changes over Time
- References
- Resources
- Household Possession of Mosquito Nets
- Source of Mosquito Nets
- Access to an Insecticide-Treated Net (ITN)
- Use of Mosquito Nets by Persons in the Household
- Use of Existing ITNs
- Use of Mosquito Nets by Children
- Use of Mosquito Nets by Pregnant Women
- Use of Intermittent Preventive Treatment (IPTp) by Women during Pregnancy
- Prevalence, Diagnosis, and Prompt Treatment of Children with Fever
- Percentage of children with fever in the 2 weeks preceding the survey; and among children with fever, percentage for whom advice or treatment was sought, percentage for whom advice or treatment was sought the same or next day following the onset of fe...
- Percentage of children under age 5 with fever in the 2 weeks preceding the survey for whom advice or treatment was sought from specific sources; and among children under age 5 with fever in the 2 weeks preceding the survey for whom advice or treatment...
- Type of Antimalarial Drugs Used
- Coverage of Testing for Anemia and Malaria in Children
- Hemoglobin <8.0 g/dl in Children
- Prevalence of Malaria in Children
- 13) HIV-AIDS Related Knowledge, Attitudes, and Behaviors
- Knowledge of HIV or AIDS
- Knowledge of HIV Prevention Methods
- Comprehensive Knowledge about HIV (Total and Youth)
- Knowledge of Prevention of Mother-to-Child Transmission
- Discriminatory Attitudes towards People Living with HIV
- Multiple Sexual Partners, Higher-Risk Sexual Partners, and Condom Use
- Payment for Sexual Intercourse and Condom Use
- Coverage of Prior HIV Testing
- Pregnant Women Counseled and Tested for HIV
- Male Circumcision
- Prevalence of Sexually Transmitted Infections (STIs) and STI Symptoms
- Care-Seeking Behavior for Sexually Transmitted Infections (STI)
- Age at First Sexual Intercourse among Young People
- Premarital Sexual Intercourse among Young People
- Recent HIV Tests among Young People
- Self-Testing for HIV
- 14) HIV Prevalence
- 15) Women’s Empowerment
- Employment and Cash Earnings
- Control over Women’s Cash Earnings
- Control over Men’s Cash Earnings
- Ownership of Assets
- Ownership of Title or Deed for House or Land
- Ownership and Use of Bank Accounts and Mobile Phones
- Participation in Decision Making
- Attitude towards Wife Beating
- Attitudes towards Negotiating Safer Sexual Relations with Husband
- Ability to Negotiate Sexual Relations with Husband
- Indicators of Women’s Empowerment
- 16) Adult and Maternal Mortality
- Adult Mortality Rates
- Maternal Mortality and Pregnancy-related Mortality
- Age-specific pregnancy-related and maternal mortality rates, and total pregnancy-related and maternal mortality rate
- Percentage of female deaths that are pregnancy-related deaths and maternal deaths
- Pregnancy-related mortality ratio and maternal mortality ratio
- Lifetime risk of pregnancy-related death and maternal death
- Completeness of Information on Siblings
- Sibship Size and Sex Ratio of Siblings
- 17) Domestic Violence
- References
- Experience of Physical Violence
- Persons Committing Physical Violence
- Experience of Sexual Violence
- Persons Committing Sexual Violence
- Age at First Experience of Sexual Violence
- Experience of Physical or Sexual Violence by Anyone: Different Combinations
- Experience of Physical Violence during Pregnancy
- Marital Control
- Spousal Physical Violence
- Spousal Sexual Violence
- Spousal Emotional Violence
- Combinations of Types of Spousal Violence: Ever Experienced
- Combinations of Types of Spousal Violence: 12 months preceding the Survey
- Types of Spousal Violence
- Experience of spousal violence by duration of marriage
- Injuries to Women due to Spousal Violence
- Initiation of Spousal Violence by Women
- Help Seeking to Stop the Violence
- Sources for Help to Stop the Violence

Guide to DHS Statistics
DHS-7
The Demographic and Health Surveys Program

Guide to DHS Statistics ii August 2018
This publication was developed with support provided by the United States Agency for International
Development (USAID) through The Demographic and Health Surveys Program (#AID-OAA-C-13-00095).
The views expressed are those of the authors and do not necessarily reflect the views of USAID or the
United States government.
The DHS Program assists countries worldwide in the collection and use of data to monitor and evaluate
population, health, and nutrition programs. Information on The DHS Program may be obtained from ICF,
530 Gaither Road, Suite 500, Rockville MD, 20850, USA; telephone: 301-407-6500; fax: 301-407-6501; e-
mail: info@DHSprogram.com; website: www.DHSprogram.com.
Recommended citation:
Croft, Trevor N., Aileen M. J. Marshall, Courtney K. Allen, et al. 2018. Guide to DHS Statistics. Rockville,
Maryland, USA: ICF.

Guide to DHS Statistics iii August 2018
Table of Contents
Foreword .........................................................................................................................................xviii
Acknowledgements .......................................................................................................................... xix
Introduction and Description of DHS Datasets ........................................................................... 1.1
Purpose of the Guide
Description of The Demographic and Health Surveys Program
The DHS Program ............................................................................................................................... 1.1
Model Questionnaires ....................................................................................................................... 1.3
Questionnaire Modules ..................................................................................................................... 1.5
Other Basic Documentation ............................................................................................................... 1.6
Reports and Data ............................................................................................................................... 1.7
Data Archiving .................................................................................................................................... 1.8
Model Datasets .................................................................................................................................. 1.9
DHS Website .................................................................................................................................... 1.10
Other Tools and Resources .............................................................................................................. 1.10
Organization of DHS Data
Structure of DHS Data ...................................................................................................................... 1.13
Recode Files ..................................................................................................................................... 1.15
Recode File Naming ......................................................................................................................... 1.18
Recode Variable Naming .................................................................................................................. 1.19
Not Applicable and Missing Values and Other Special Codes ......................................................... 1.21
Construction of Variables ................................................................................................................. 1.23
Analyzing DHS Data
Sample Design, Stratification and Sampling Weights ...................................................................... 1.29
Households ...................................................................................................................................... 1.36
De Facto and De Jure Populations ................................................................................................... 1.36
Age of Children ................................................................................................................................. 1.37
All Women Factors ........................................................................................................................... 1.40
Median Calculations ......................................................................................................................... 1.44
Matching and Merging Datasets ...................................................................................................... 1.48
Background characteristics .............................................................................................................. 1.58
Data Suppression and Parenthesizing .............................................................................................. 1.65
Indicator Guidelines
Indicator Pages ................................................................................................................................. 1.66
Example Indicator Page .................................................................................................................... 1.68
Using Indicator Pages ....................................................................................................................... 1.69
International Indicator Guides and Resources
Population and Housing ............................................................................................................... 2.1
Household Drinking Water
Guide to DHS Statistics iv August 2018
Percent distribution of households and de jure population by source of drinking water ................ 2.2
Percent distribution of households and de jure population by time to obtain drinking water ........ 2.6
Percentage of households and de jure population using methods to treat drinking water and
percentage using an appropriate treatment method........................................................................ 2.8
Percent distribution of households and de jure population using piped water or water from a tube
well or borehole by availability of water ......................................................................................... 2.10
Type of Sanitation Facility
Percent distribution of households and de jure population by type of sanitation facility, by
improved and unimproved sanitation ............................................................................................. 2.12
Percent distribution of households and de jure population with a toilet/latrine facility by location of
facility ............................................................................................................................................... 2.15
Household Characteristics
Percent distribution of households and de jure population by housing characteristics ................. 2.17
Cooking Fuel
Percent distribution of households and de jure population by type of cooking fuel, percentage using
solid fuel for cooking, and percentage using clean fuel for cooking ............................................... 2.19
Smoking in Home
Percent distribution by frequency of smoking in the home ............................................................ 2.21
Household Possessions
Percentage of households possessing various household effects, means of transport, ownership of
agricultural land, and ownership of livestock/farm animals ........................................................... 2.23
Wealth Quintiles
Percent distribution of the de jure population by wealth quintiles and the Gini coefficient .......... 2.25
Handwashing
Percentage of households in which a place used for handwashing was observed, and among those
households, percent distribution by the availability of water, soap, and other cleansing agents .. 2.30
Household Population by Age, Sex, and Residence
Percent distribution of the de facto household population by different age groupings, according to
sex and residence. ............................................................................................................................ 2.32
Household Composition
Percent distribution of households by sex of head of household and by household size, mean size of
households, and percentage of households with orphans and foster children under age 18 ........ 2.34
Children’s Living Arrangements and Orphanhood
Percent distribution of de jure children, children not living with a biological parent, and children
with one or both parents dead ........................................................................................................ 2.37
Birth Registration
Percentage of de jure children whose births are registered with civil authorities ......................... 2.39
Educational Attainment of Household Members
Percent distribution of the de facto female and male household population age 6 and over by
highest level of schooling attended or completed .......................................................................... 2.41
Median years of education completed ............................................................................................ 2.43

Guide to DHS Statistics v August 2018
School Attendance Ratios
Net attendance ratios (NAR) and gross attendance ratios (GAR) for the de facto household
population by sex and level of schooling, and the Gender Parity Index (GPI) ................................. 2.45
Respondents’ Characteristics ...................................................................................................... 3.1
Background Characteristics of Respondents
Percent distribution of women and men by background characteristics .......................................... 3.2
Educational Attainment of Women and Men
Percent distribution of women and men by highest level of schooling attended or completed ...... 3.3
Median years of education completed .............................................................................................. 3.5
Literacy
Percent distribution of women and men by level of schooling attended and level of literacy, and
percentage literate ............................................................................................................................ 3.7
Exposure to Mass Media
Percentage of women and men exposed to specific media on a weekly basis ................................. 3.9
Internet Usage
Percentage of women and men who have ever used the internet, percentage who have used the
internet in the past 12 months, and among women and men who have used the internet in the past
12 months, percent distribution by frequency of internet use in the past month ......................... 3.11
Employment and Occupation
Percent distribution of women and men by employment status .................................................... 3.13
Percent distribution of women and men age 15-49 employed in the 12 months preceding the
survey by occupation ....................................................................................................................... 3.15
Percent distribution of women employed by type of earnings, type of employer, and continuity of
employment, according to type of employment ............................................................................. 3.17
Health Insurance Coverage
Percentage of women and men with specific types of health insurance coverage, and percentage
with any health insurance ................................................................................................................ 3.19
Tobacco Use
Percentage of women and men who smoke various tobacco products ......................................... 3.21
Percent distribution of men by smoking frequency ........................................................................ 3.23
Average number of cigarettes smoked per day ............................................................................... 3.24
Percentage of women and men age who currently use smokeless tobacco, according to type of
tobacco product, and percentage who use any type of tobacco .................................................... 3.26
Marriage and Sexual Activity ....................................................................................................... 4.1
Current Marital Status
Percent distribution by current marital status .................................................................................. 4.2
Number of Co-Wives and Number of Wives
Percent distribution of currently married women by number of co-wives ....................................... 4.4
Percent distribution of currently married men by number of wives ................................................. 4.6

Guide to DHS Statistics vi August 2018
Age at First Marriage
Percentage first married by specific exact ages ................................................................................. 4.8
Median age at first marriage ........................................................................................................... 4.10
Age at First Sexual Intercourse
Percentage who had first sexual intercourse by specific exact ages ............................................... 4.13
Median age at first sexual intercourse ............................................................................................ 4.15
Fertility .......................................................................................................................................... 5.1
Current Fertility
Age-Specific Fertility Rate (ASFR) ....................................................................................................... 5.2
Age-Specific Fertility Rate (ASFR) 10-14 ............................................................................................ 5.7
Trends in Age-Specific Fertility Rates ............................................................................................... 5.12
Total Fertility Rate (TFR) .................................................................................................................. 5.14
General Fertility Rate (GFR) ............................................................................................................. 5.15
Crude Birth Rate (CBR) ..................................................................................................................... 5.17
Percentage currently pregnant ........................................................................................................ 5.19
Completed Fertility
Mean number of children ever born to women age 40-49 ............................................................. 5.20
Children Ever Born and Living
Percent distribution by number of children ever born .................................................................... 5.21
Mean number of children ever born and mean number of living children ..................................... 5.22
Birth Intervals
Percent distribution by months since preceding birth .................................................................... 5.24
Median number of months since preceding birth ........................................................................... 5.26
Postpartum Exposure: Amenorrhea, Abstinence, and Insusceptibility
Percentage of births for which mothers are: a) postpartum amenorrheic, b) abstaining from sexual
intercourse and c) insusceptible to pregnancy, by number of months since birth ......................... 5.28
Median and Mean Durations of Postpartum Amenorrhea, Abstinence, and Insusceptibility ........ 5.30
Menopause
Percentage of women who are menopausal ................................................................................... 5.35
Age at First Birth
Percentage of women who gave birth by specific exact ages ......................................................... 5.37
Median age at first birth .................................................................................................................. 5.39
Teenage Pregnancy and Motherhood
Percentages of teenage girls who are mothers, pregnant with their first child, and have begun
childbearing...................................................................................................................................... 5.41
Fertility Preferences ..................................................................................................................... 6.1
Fertility Preferences
Percent distribution by desire for children ........................................................................................ 6.2
Desire to Limit Childbearing

Guide to DHS Statistics vii August 2018
Percentage who want no more children ........................................................................................... 6.4
Ideal Number of Children
Percent distribution by ideal number of children .............................................................................. 6.6
Mean ideal number of children ......................................................................................................... 6.8
Fertility Planning
Fertility planning status ................................................................................................................... 6.10
Wanted Fertility
Wanted Fertility Rates ..................................................................................................................... 6.12
Family Planning ............................................................................................................................ 7.1
Knowledge of Contraceptive Methods
Percentage who know of any method, any modern method, any traditional method and specific
methods; mean number of methods known ..................................................................................... 7.2
Ever Use of Contraceptive Methods
Percentages who ever used any method, any modern method, any traditional method and specific
methods ............................................................................................................................................. 7.7
Current Use of Contraceptive Methods
Percentage of women who currently use any method, any modern method, any traditional method
and specific methods ....................................................................................................................... 7.11
Knowledge of the Fertile Period
Percent distribution of women, by knowledge of the fertile period during the ovulatory cycle .... 7.16
Percentage of women with correct knowledge of the fertile period during the ovulatory cycle ... 7.18
Age at Sterilization
Percentage distribution of women sterilized in specific age groups ............................................... 7.19
Median Age at Sterilization .............................................................................................................. 7.20
Source of Contraception
Percent distribution of current users of modern methods, by most recent source of method...... 7.22
Use of Social Marketing Brand Pill and Condom
Percentage of women currently using oral contraceptives or condoms who use a specific socially
marketed brand ............................................................................................................................... 7.24
Informed Choice
Percentage of current users of selected contraceptive methods who were informed about side
effects or problems of the method used, what to do if they experienced side effects or problems,
and who were informed of other methods of contraception that could be used .......................... 7.26
Contraceptive Discontinuation
First-year contraceptive discontinuation rates ................................................................................ 7.28
Percent distribution of discontinued episodes of contraceptive use in the 5 years preceding the
survey by reason
for discontinuation ............................................................................................... 7.35
Need and Demand for Family Planning

Guide to DHS Statistics viii August 2018
Percentage of women with a) unmet need for family planning, b) met need for family planning, c)
total demand for family planning by whether for spacing, limiting, and total, and the percentage of
the demand for family planning that is satisfied ............................................................................. 7.38
Decision making about Family Planning
Percent distribution of currently married women who are current users of family planning by who
makes the decision to use family planning, and percent distribution of currently married women
who are not currently using family planning by who makes the decision not to use family planning
......................................................................................................................................................... 7.45
Future Use of Contraception
Percent distribution of currently married women who are not using a contraceptive method, by
intention to use in the future. ......................................................................................................... 7.47
Exposure to Family Planning Messages
Percentages of all women and men who heard or saw a family planning message on the radio,
television, in a newspaper or magazine, or on a mobile phone in the past few months or in none of
the four media sources. ................................................................................................................... 7.49
Contact of Nonusers with Family Planning Providers
Percentages of women who are not using contraception who were visited by a fieldworker who
discussed family planning, who visited a health facility and discussed family planning, who visited a
health facility but did not discuss family planning and who did not discuss family planning with a
fieldworker or at a health facility during the 12 months preceding the survey. ............................. 7.51
Infant and Child Mortality............................................................................................................ 8.1
Early Childhood Mortality
Methodology of DHS Mortality Rates Estimation ............................................................................... 8.2
Neonatal Mortality Rate (NNMR), Post-Neonatal Mortality Rate (PNMR), Infant Mortality Rate (IMR),
Child Mortality Rate (CMR) (Ages 1-4), Under-five Mortality Rate (U5MR) ........................................ 8.5
Perinatal Mortality
Perinatal mortality rate .................................................................................................................... 8.11
High-Risk Fertility Behavior
Risk ratio of children in high-risk fertility behavior categories ......................................................... 8.14
Percentage of births in high-risk fertility behavior categories ......................................................... 8.17
Percentage of currently married women in high-risk fertility behavior categories ......................... 8.19
Reproductive Health .................................................................................................................... 9.1
Antenatal Care
Percent distribution of antenatal care by type of provider, and percentage of antenatal care from a
skilled provider ................................................................................................................................... 9.2
Percent distribution of number of antenatal care visits, and of timing of first antenatal visit ......... 9.5
Median number of months pregnant at time of first antenatal care visit ........................................ 9.8
Percentage of women receiving components of antenatal care ....................................................... 9.9
Tetanus Toxoid Injections

Guide to DHS Statistics ix August 2018
Percentage of women receiving two or more tetanus toxoid injections during pregnancy, and
percentage whose most recent live birth was protected against neonatal tetanus ....................... 9.11
Place of Delivery
Percent distribution of live births by place of delivery, and the percentage of live births delivered in
a health facility ................................................................................................................................. 9.14
Assistance during Delivery
Percent distribution of live births by person providing assistance during delivery, and the
percentage assisted by a skilled provider ........................................................................................ 9.16
Caesarean Section
Percentage of live births delivered by caesarean section, the percentage that was planned before
the onset of labor pains, and that was decided after the onset of labor pains............................... 9.19
Duration of Stay in Health Facility after Birth
Percent distribution by duration of stay in the health facility following the most recent live birth by
type of delivery ................................................................................................................................ 9.21
Postnatal Care
Percent distribution of timing of first postnatal check for the mother, and percentage who received
a postnatal check during the first 2 days ......................................................................................... 9.23
Percent distribution of type of provider for the first postnatal check for the mother.................... 9.26
Percent distribution of timing of first postnatal check for the newborn, and percentage receiving a
postnatal check during the first 2 days ............................................................................................ 9.29
Percent distribution of type of provider for the first postnatal check for the newborn ................. 9.32
Percentage of newborns receiving selected function of postnatal care ......................................... 9.35
Problems in Accessing Health Care
Percentage of women who reported serious problems in accessing health care for themselves, by
type of problem ............................................................................................................................... 9.37
Child Health ............................................................................................................................. 10.1
Child Size and Weight at Birth
Percent distribution of live births by birth size and birth weight .................................................... 10.2
Vaccination
Percentage of children age 12-23 months and children age 24-35 months who received specific
vaccines at any time before the survey according to vaccination card, according to mother’s report,
according to either vaccination card or mother’s report, and percentage who received specific
vaccines by appropriate age ............................................................................................................ 10.4
Percentage of children who ever had a vaccination card and who had a vaccination card seen . 10.11
Prevalence and Treatment of Symptoms of Acute Respiratory Infection (ARI)
Percentage of children under age 5 with symptoms of ARI, and among children under age 5 with
symptoms of ARI, the percentage for whom advice or treatment was sought and for whom advice
or treatment was sought the same or next day. ........................................................................... 10.13
Percentage of children under age 5 with symptoms of ARI for whom advice or treatment was
sought from specific sources, and among those for whom advice or treatment was sought,
percentage for whom advice or treatment was sought from specific sources ............................. 10.16

Guide to DHS Statistics x August 2018
Prevalence and Treatment of Fever
Percentage of children under age 5 with fever, percentage with fever for whom advice or treatment
was sought, for whom advice or treatment was sought the same or next day, and who took
antibiotic drugs .............................................................................................................................. 10.19
Prevalence and Treatment of Diarrhea
Percentage of children under age 5 with diarrhea, and percentage for whom advice or treatment
was sought ..................................................................................................................................... 10.22
Feeding Practices during Diarrhea
Percent distribution of children under age 5 with diarrhea by amount of liquids given, and by
amount of foods given ................................................................................................................... 10.25
Oral Rehydration Therapy, Zinc, and Other Treatments for Diarrhea
Among children under age 5 who had diarrhea in the 2 weeks preceding the survey, percentage
given fluid from an ORS packet or pre-packaged ORS fluid, recommended homemade fluids (RHF),
ORS or RHF, zinc, ORS and zinc, ORS or increased fluids, oral rehydration therapy (ORT), continued
feeding and ORT, and other treatments; and percentage given no treatment ............................ 10.27
Source of Advice or Treatment for Children with Diarrhea
Percentage of children under age 5 with diarrhea for whom advice or treatment was sought from
specific sources, among children with diarrhea for whom advice or treatment was sought,
percentage sought from specific sources, and among children with diarrhea who received ORS, the
percentage for whom advice or treatment was sought from specific sources ............................. 10.30
Knowledge of ORS packets
Percentage of mothers who know about ORS packets or ORS pre-packaged liquids ................... 10.32
Disposal of children’s stool
Percent distribution of youngest children under age 2 living with the mother, by the manner of
disposal of child’s last fecal matter, and the percentage of children whose stools are disposed of
appropriately .................................................................................................................................. 10.33
Nutrition of Children and Adults ............................................................................................ 11.1
Initial Breastfeeding
Percentage of children ever breastfed, who started breastfeeding within one hour of birth, who
started breastfeeding within one day of birth, and who received a prelacteal feed ...................... 11.3
Breastfeeding and Complementary Feeding
Percent distribution of children exclusively breastfeeding, or breastfeeding and consuming plain
water only, non-milk liquids, consuming other milk, and consuming complementary foods ........ 11.5
Percentage of children exclusively breastfed, predominantly breastfed, age-appropriately
breastfed, and introduced to solid, semi-solid, or soft foods ........................................................ 11.10
Percentage of children currently breastfeeding, continuing breastfeeding at 1 year and at 2 years
....................................................................................................................................................... 11.13
Percentage of children using a bottle with a nipple ...................................................................... 11.15
Median and mean durations of breastfeeding among children born in the past three years for any
breastfeeding, exclusive breastfeeding, predominant breastfeeding ........................................... 11.16
Foods and Liquids Consumed by Children

Guide to DHS Statistics xi August 2018
Percentage of breastfeeding and non-breastfeeding children consuming specific foods ............ 11.22
Minimum Dietary Diversity, Minimum Meal Frequency and Minimum Acceptable Diet
Percentage of children fed the minimum dietary diversity, the minimum meal frequency, and the
minimum acceptable diet .............................................................................................................. 11.25
Iodization of Household Salt
Percentage of households with salt tested for iodine content, with salt but salt not tested, with no
salt, and among households tested percentage with iodized salt................................................. 11.29
Micronutrient Intake among Children
Percentage of children who consumed foods rich in vitamin A, who consumed foods rich in iron,
who were given multiple micronutrient powder, who were given iron supplements, who received
vitamin A supplements, who received deworming medication, or who live in household with tested
iodized salt ..................................................................................................................................... 11.31
Therapeutic and Supplemental Foods
Percentage of children who received Plumpy’Nut or who received Plumpy’Doz ......................... 11.35
Micronutrient Intake among Women
Percent distribution of women with a birth in last five years, by number of days they took iron
tablets or syrup during pregnancy of last birth, percentage who took deworming medication, and
percentage who live in a household with tested iodized salt........................................................ 11.37
Anemia Status
Percentage of children with anemia .............................................................................................. 11.39
Percentage of women with anemia ............................................................................................... 11.42
Percentage of men with anemia .................................................................................................... 11.46
Nutritional Status
Percentage of children stunted, wasted, and underweight, and mean z-scores for stunting, wasting
and underweight. ........................................................................................................................... 11.49
Percentage of women by nutritional status .................................................................................. 11.54
Percentage of men by nutritional status ....................................................................................... 11.57
Malaria ..................................................................................................................................... 12.1
Household Possession of Mosquito Nets
Percentage of households with at least one mosquito net, with at least one insecticide-treated net
(ITN), average number of mosquito nets, average number of ITNs, percentage of households with
at least one mosquito net for every two persons who stayed in the household last night, and
percentage of households with at least one ITN for every two persons who stayed in the household
last night ........................................................................................................................................... 12.3
Source of Mosquito Nets
Percent distribution of mosquito nets by source of net .................................................................. 12.6
Access to an Insecticide-Treated Net (ITN)
Percent distribution of the household population by number of ITNs the household owns .......... 12.8
Percentage of the population with access to an ITN ..................................................................... 12.10
Use of Mosquito Nets by Persons in the Household

Guide to DHS Statistics xii August 2018
Percentage of the household population who slept the night before the survey under a mosquito
net, under an insecticide-treated net (ITN), and among the population in households with at least
one ITN, the percentage who slept under an ITN the night before the survey ............................. 12.13
Use of Existing ITNs
Percentage of insecticide-treated nets (ITNs) used the night before the survey .......................... 12.15
Use of Mosquito Nets by Children
Percentage of children under age 5 who slept the night before the survey under a mosquito net,
under an insecticide treated net (ITN), and among children under age 5 in households with at least
one ITN, the percentage who slept under an ITN the night before the survey ............................. 12.17
Use of Mosquito Nets by Pregnant Women
Percentage of pregnant women who slept the night before the survey under a mosquito net, who
slept the night before the survey under an insecticide-treated net (ITN), and among pregnant
women age 15-49 in households with at least one ITN, the percentage who slept under an ITN the
night before the survey .................................................................................................................. 12.19
Use of Intermittent Preventive Treatment (IPTp) by Women during Pregnancy
Percentage of women who, during the pregnancy that resulted in the last live birth, received one or
more doses of SP/Fansidar, received two or more doses of SP/Fansidar, and who received three or
more doses of SP/Fansidar ............................................................................................................ 12.22
Prevalence, Diagnosis, and Prompt Treatment of Children with Fever
Percentage of children with fever in the 2 weeks preceding the survey; and among children with
fever, percentage for whom advice or treatment was sought, percentage for whom advice or
treatment was sought the same or next day following the onset of fever, and percentage who had
blood taken from a finger or heel for testing ................................................................................ 12.24
Percentage of children under age 5 with fever in the 2 weeks preceding the survey for whom advice
or treatment was sought from specific sources; and among children under age 5 with fever in the 2
weeks preceding the survey for whom advice or treatment was sought, the percentage for whom
advice or treatment was sought from specific sources ................................................................. 12.27
Type of Antimalarial Drugs Used
Among children with fever in the 2 weeks preceding the survey who took any antimalarial
medication, percentage who took specific antimalarial drugs ...................................................... 12.30
Coverage of Testing for Anemia and Malaria in Children
Percentage of eligible children who were tested for anemia and for malaria .............................. 12.33
Hemoglobin <8.0 g/dl in Children
Percentage of children with hemoglobin lower than 8.0 g/dl ....................................................... 12.35
Prevalence of Malaria in Children
Percentage of children classified in two tests as having malaria .................................................. 12.38
HIV-AIDS Related Knowledge, Attitudes, and Behaviors ...................................................... 13.1
Knowledge of HIV or AIDS
Percentage of women and men who have heard of HIV or AIDS .................................................... 13.2
Knowledge of HIV Prevention Methods
Guide to DHS Statistics xiii August 2018
Percentage of women and men who know that people can reduce the risk of getting HIV by use of
condoms and having just one uninfected faithful partner .............................................................. 13.4
Comprehensive Knowledge about HIV (Total and Youth)
Percentage of women and men who know that a healthy looking person can have HIV and reject
local misconceptions about transmission or prevention of HIV ...................................................... 13.6
Percentage of women and men with comprehensive knowledge about HIV, percentage of young
women and young men with comprehensive knowledge about HIV .............................................. 13.9
Knowledge of Prevention of Mother-to-Child Transmission
Percentage of women and men who know that HIV can be transmitted from mother to child during
pregnancy, during delivery, by breastfeeding, and in all 3 ways; Percentage of women and men who
know that the risk of mother-to-child transmission can be reduced by the mother taking special
drugs .............................................................................................................................................. 13.12
Discriminatory Attitudes towards People Living with HIV
Percentage who have discriminatory attitudes towards people living with HIV among women and
men who have heard of HIV or AIDS ............................................................................................. 13.14
Multiple Sexual Partners, Higher-Risk Sexual Partners, and Condom Use
Percentage of all women and men and of young women and men who had multiple sexual
partners, higher-risk sexual partners, condom use with multiple partners, and condom use at last
high-risk sex ................................................................................................................................... 13.16
Mean number of sexual partners .................................................................................................. 13.19
Payment for Sexual Intercourse and Condom Use
Percentage of men who ever paid for sexual intercourse, percentage who paid for sexual
intercourse in the past 12 months, and percentage reporting using a condom at last paid sexual
intercourse ..................................................................................................................................... 13.20
Coverage of Prior HIV Testing
Percentage of women and men who know where to get an HIV test, percent distribution by prior
HIV testing status and whether they received the result of their last test, percentage ever tested for
HIV, percentage who have been tested for HIV in the past 12 months and received the results of
the last test .................................................................................................................................... 13.22
Pregnant Women Counseled and Tested for HIV
Percentage of women who received counseling on HIV during antenatal care; percentage tested for
HIV during antenatal care according to whether they received their test results and post-test
counseling; percentage who received counseling on HIV and an HIV test during antenatal care and
received the test result; and percentage who received an HIV test during antenatal care or labor,
according to whether they received the test result ...................................................................... 13.25
Male Circumcision
Percentage of men circumcised, and percent distribution of men according to circumcision status
and circumcision provider .............................................................................................................. 13.27
Prevalence of Sexually Transmitted Infections (STIs) and STI Symptoms
Percentage of women and men who had an STI in the past 12 months, had an abnormal genital
discharge in the past 12 months, had a genital sore or ulcer in the past 12 months, had an STI or
symptoms of an STI in the past 12 months .................................................................................... 13.29

Guide to DHS Statistics xiv August 2018
Care-Seeking Behavior for Sexually Transmitted Infections (STI)
Among women and men who reported an STI or symptoms of an STI in the past 12 months, the
percentage who sought advice or treatment ................................................................................ 13.31
Age at First Sexual Intercourse among Young People
Percentage of young women and men who had sexual intercourse before age 15 or age 18 ..... 13.34
Premarital Sexual Intercourse among Young People
Percentage of never-married young women and men who have never had sexual intercourse . 13.36
Recent HIV Tests among Young People
Among young women and men age 15-24 who have had sexual intercourse in the past 12 months,
percentage who have been tested for HIV in the past 12 months and received the results ........ 13.38
Self-Testing for HIV
Percentage of women and men who have ever heard of HIV self-test kits and percentage who have
ever used a self-test kit .................................................................................................................. 13.40
HIV Prevalence ........................................................................................................................ 14.1
Coverage of HIV Testing
Percent distribution of women and men eligible for HIV testing .................................................... 14.2
HIV Prevalence
Among women and men interviewed and tested, percentage HIV positive ................................... 14.5
Prior HIV Testing
Percent distribution of women and men who tested HIV positive and who tested HIV negative
according to HIV testing status prior to the survey ......................................................................... 14.8
HIV Prevalence by Male Circumcision
Among men who were tested for HIV, percentage HIV positive by circumcision status .............. 14.10
HIV Prevalence among Couples
Percent distribution of couples living in the same household by HIV status ................................ 14.12
Women’s Empowerment ....................................................................................................... 15.1
Employment and Cash Earnings
Percentage of currently married women and men employed in the past 12 months, and percent
distribution of currently married women and men employed in the past 12 months by type of
earnings ............................................................................................................................................ 15.2
Control over Women’s Cash Earnings
Percent distribution of currently married women who received cash earnings for employment in
the 12 months preceding the survey by person who decides how wife’s cash earnings are used, and
percent distribution by whether she earned more or less than her husband ................................ 15.4
Control over Men’s Cash Earnings
Percent distribution of currently married men who receive cash earnings by person who decides
how husband’s cash earnings are used, and percent distribution of currently married women whose
husbands receive cash earnings, by person who decides how husband’s cash earnings are used 15.6

Guide to DHS Statistics xv August 2018
Ownership of Assets
Percent distribution of women and men by ownership of housing and land ................................. 15.8
Ownership of Title or Deed for House or Land
Percent distribution of women (or men) who own a house or own land by whether the house or
land owned has a title or deed, and whether or not the woman/man's name appears on the title or
deed ............................................................................................................................................... 15.10
Ownership and Use of Bank Accounts and Mobile Phones
Percentage of women and men who use an account in a bank or other financial institution and
percentage who own a mobile phone, and among women and men who own a mobile phone,
percentage who use it for financial transactions ........................................................................... 15.12
Participation in Decision Making
Percent distribution of currently married women and men by person who usually makes decisions
about various issues ....................................................................................................................... 15.14
Percentage of currently married women and men who usually make specific decisions either alone
or jointly with their husband/wife ................................................................................................. 15.16
Attitude towards Wife Beating
Percentage of all women and men who agree that a husband is justified in hitting or beating his
wife for specific reasons ................................................................................................................ 15.18
Attitudes towards Negotiating Safer Sexual Relations with Husband
Percentage of women and men who believe that a woman is justified in refusing to have sexual
intercourse with her husband if she knows that he has sexual intercourse with other women, and
percentage who believe that a woman is justified in asking that they use a condom if she knows
that her husband has a sexually transmitted infection (STI) ......................................................... 15.20
Ability to Negotiate Sexual Relations with Husband
Percentage of currently married women who can say no to their husband if they do not want to
have sexual intercourse, and percentage who can ask their husband to use a condom .............. 15.22
Indicators of Women’s Empowerment
Percentage of currently married women who participate in all decision making, and percentage
who disagree with all of the reasons justifying wife-beating ........................................................ 15.24
Adult and Maternal Mortality ................................................................................................ 16.1
Adult Mortality Rates
Age-specific adult mortality rates, and age 15-49 mortality rate .................................................... 16.2
Probability of dying between the ages of 15 and 50 for women and men ..................................... 16.8
Maternal Mortality and Pregnancy-related Mortality
Age-specific pregnancy-related and maternal mortality rates, and total pregnancy-related and
maternal mortality rate ................................................................................................................. 16.14
Percentage of female deaths that are pregnancy-related deaths and maternal deaths .............. 16.21
Pregnancy-related mortality ratio and maternal mortality ratio .................................................. 16.25
Lifetime risk of pregnancy-related death and maternal death ...................................................... 16.31
Completeness of Information on Siblings

Guide to DHS Statistics xvi August 2018
Completeness of data on survival status of sisters and brothers, age of living siblings and age at
death and years since death of dead siblings. ............................................................................... 16.33
Sibship Size and Sex Ratio of Siblings
Mean sibship size and sex ratio of siblings at birth ....................................................................... 16.35
Domestic Violence .................................................................................................................. 17.1
Experience of Physical Violence
Percentage of women who have experienced physical violence, and who have experienced physical
violence in the past 12 months ........................................................................................................ 17.3
Persons Committing Physical Violence
Among women who have experienced physical violence since age 15, percentage who report
specific persons who committed the violence ................................................................................ 17.6
Experience of Sexual Violence
Percentage of women who have ever experienced sexual violence, and who experienced sexual
violence in the 12 months preceding the survey ............................................................................. 17.9
Persons Committing Sexual Violence
Among women who have experienced sexual violence, percentage who report specific persons who
committed the violence ................................................................................................................. 17.12
Age at First Experience of Sexual Violence
Percentage of women who have experienced sexual violence by exact ages .............................. 17.15
Experience of Physical or Sexual Violence by Anyone: Different Combinations
Percentage of women who have experienced physical violence only, sexual violence only, physical
and sexual violence, and experienced physical or sexual violence ............................................... 17.17
Experience of Physical Violence during Pregnancy
Percentage of women who have experienced violence during pregnancy ................................... 17.20
Marital Control
Percentage of ever-married women whose husbands/partners demonstrated types of controlling
behaviors ........................................................................................................................................ 17.22
Spousal Physical Violence
Percentage of ever-married women who have experienced spousal physical violence ever or in the
12 months preceding the survey by their current or most recent husbands/partners................. 17.25
Spousal Sexual Violence
Percentage of ever-married women who have experienced spousal sexual violence ever or in the 12
months preceding the survey ........................................................................................................ 17.27
Spousal Emotional Violence
Percentage of ever-married women who have experienced spousal emotional violence ever or in
the 12 months preceding the survey ............................................................................................. 17.29
Combinations of Types of Spousal Violence: Ever Experienced
Percentage of ever-married women who have ever experienced physical violence and sexual
violence, physical violence and sexual violence and emotional violence, physical violence or sexual
Guide to DHS Statistics xvii August 2018
violence, physical violence or sexual violence or emotional violence by their current or most recent
husbands/partners ......................................................................................................................... 17.31
Combinations of Types of Spousal Violence: 12 months preceding the Survey
Percentage of ever-married women who have experienced physical violence and sexual violence,
physical violence and sexual violence and emotional violence, physical violence or sexual violence,
physical violence or sexual violence or emotional violence by their current or most recent
husbands/partners in the 12 months preceding the survey ......................................................... 17.33
Types of Spousal Violence
Percentage of ever-married women who have experienced emotional violence, physical violence,
sexual violence, physical violence and sexual violence, physical violence and sexual violence and
emotional violence, physical violence or sexual violence, physical violence or sexual violence or
emotional violence by any husband or partner in the 12 months preceding the survey ............. 17.35
Experience of spousal violence by duration of marriage
Among married women married only once, the percentage who first experienced spousal physical
or sexual violence by specific exact years since marriage ............................................................. 17.38
Injuries to Women due to Spousal Violence
Among ever-married women who have experienced violence committed by their current or most
recent husband/partner, the percentage who have been injured as a result of the violence...... 17.40
Initiation of Spousal Violence by Women
Percentage of ever-married women who have committed physical violence against their current or
most recent husband/partner when he was not already beating or physically hurting her, ever and
in the past 12 months .................................................................................................................... 17.42
Help Seeking to Stop the Violence
Percent distribution of women who have experienced physical or sexual violence by help-seeking
behavior ......................................................................................................................................... 17.44
Sources for Help to Stop the Violence
Percentage of women age who have experienced physical or sexual violence and sought help by
sources from which they sought help ............................................................................................ 17.46
Guide to DHS Statistics xviii August 2018
Foreword
DHS surveys collect a wealth of information on a wide range of topics from a representative sample of
the population in the countries that participate in The DHS Program. For each country, the information
collected is processed, tabulated, and presented in a report that describes the living conditions and the
demographic and health situation in the country. Before producing the tables, many steps are necessary
to ensure that the data properly reflect the situation they intend to describe. This involves editing the
data for consistency, imputation of key dates of events, weighting the sample results, considering such
factors as the sample design and response rates, calculating the wealth index, and constructing accurate
summary variables.
Many of the procedures involved are straightforward and are familiar to demographic analysts.
However, other procedures need special attention and have been developed on the basis of experience
accumulated over many years regarding the preferred way of calculating certain indicators, what to
guard against, and what not to forget.
This Guide to DHS Statistics is meant to be a tool for all data users. It can be an aid for those who are just
starting out in data analysis, a tool for checking procedures for those whose skills are more advanced,
and a reference document for all who deal with data generated by The DHS Program surveys. Even
those who do not analyze data using a statistical software package can benefit from a deeper
understanding of the definitions of these indicators and a closer examination of the numerators and
denominators.
I hope that this valuable tool will significantly increase the capacity of many researchers to do their own
tabulations and analyses. I trust that it will help make data users aware of the precautions to take and
the procedures that need to be followed to ensure that indicators are calculated correctly. It should also
ensure that the strengths and limitations of certain data and indicators are clear to all users.
Sunita Kishor
Project Director
Guide to DHS Statistics xix August 2018
Acknowledgements
The original Guide to DHS Statistics was written in 2003 and revised in 2006 by Shea Rutstein and
Guillermo Rojas. This version of the Guide to DHS Statistics written in 2018 is not just an update, but a
complete revision of the guide and focuses on the indicators produced as part of the tabulations for a
standard DHS-7 survey.
This version of the guide was prepared by Trevor Croft with substantial support from Aileen Marshall
and Courtney Allen. Many DHS Program staff contributed to the writing or reviewing of particular
chapters or topics including Fred Arnold, Shireen Assaf, Sarah Balian, Yodit Bekele, Jean de Dieu
Bizimana, Clara Burgert, Debbie Collison, Joy Fishel, Julia Fleuret, Lia Florey, Jose Miguel Guzman, Sara
Head, Richard Joseph, Sunita Kishor, Annē Linn, Joanna Lowell, Lindsay Mallick, Claudia Marchena,
Fidele Mutima, Erica Nybro, Ladys Ortiz Parra, Tom Pullum, Keith Purvis, Christian Reed, Kia Reinis, Luis
Alejandro Rey, Guillermo Rojas, Gulnara Semenov, Amadou Sow, Sarah Staveteig, Cameron Taylor,
Albert Themme, Wenjuan Wang, Ann Way, Rebecca Winter, Mianmian Yu, Sally Zweimueller.
Chapters of the Guide were also reviewed by Patrick Gerland, Philipp Ueffing, Joseph Cummins, Anaka
Aivar, and Nehar Agarwal. Robert Bozsa provided support for the development of the web version.
Many thanks to everyone who contributed to this Guide to DHS Statistics for their valuable input.

Guide to DHS Statistics 1.1 August 2018
Introduction and Description of DHS Datasets
Purpose of the Guide
This guide has two main purposes:
To explain how statistics produced in Demographic and Health Surveys (DHS) reports are
defined and calculated and serve as a reference document for researchers.
To provide an overview of the structure and use of DHS datasets.
The first version of this document (Rutstein and Rojas, 2003 [updated 2006]) had been prepared in
response to feedback received from DHS data users on the need for a detailed guide to assist them in
understanding DHS data sets and reproducing the statistics in DHS reports. This version updates the
earlier versions to capture new variable definitions and the expanding array of data.
The first chapter of the guide deals with general topics including DHS data file structure, recode files and
variable naming, sampling design, sampling weights and sample stratification, century month codes and
other created variables, matching and merging datasets, adjustment factors employed in surveys in
which only ever-married women are interviewed, and background variables used in tabulations.
The remaining chapters deal with the definitions of individual statistics presented in DHS reports by
chapter.
Description of The Demographic and Health Surveys Program
The DHS Program
The DHS Program was established by the United States Agency for International Development (USAID) in
1984. Originally designed as a follow-up to the World Fertility Survey (WFS) and the Contraceptive
Prevalence Survey (CPS) projects, it has provided technical assistance to more than 350 surveys in over
90 countries, advancing global understanding of health and population trends in developing countries.
The DHS Program has been implemented in overlapping five-year phases:
DHS-I 1984 - 1990
DHS-II 1989 - 1993
DHS-III 1992 - 1998
DHS-IV 1997 - 2003 (MEASURE DHS)
DHS-V 2003 - 2008 (MEASURE DHS+)
DHS-VI 2008 - 2013 (MEASURE DHS Phase III)
DHS-7 2013 - 2018
The DHS Program has been implemented by the same team since its inception although the name of the
organization has changed through acquisitions. It was first awarded in 1984 to Westinghouse Health
Systems, which subsequently evolved into part of Macro Systems, ORC Macro, Macro International and
is now part of ICF. The DHS Program is implemented by ICF and its partners Path, Avenir Health, Johns
Hopkins Center for Communication Programs, Vysnova, Blue Raster, Kimetrica, and Encompass.
Guide to DHS Statistics 1.2 August 2018
The main objective of The DHS Program is to improve the collection, analysis, and dissemination of
population, health, and nutrition data and to facilitate use of these data for planning, policy-making and
program management, resulting in:
Improved tools, methods, partnerships, and technical guidance to collect quality population,
health, and nutrition data.
Increased in-country individual and institutional capacity for identification of data needs and for
survey design, management, and data collection to meet those needs.
Improved availability of DHS Program survey data and information.
Advanced availability and synthesis of DHS Program survey data.
Improved facilitation of DHS Program data use among stakeholders worldwide.
Many countries have conducted multiple surveys to establish trend data that enable them to gauge
progress in their programs. Countries that participate in The DHS Program are primarily countries that
receive USAID assistance; however, several non-USAID supported countries have participated with
funding from other donors such as UNICEF, UNFPA, the World Bank, and national governments. The
Demographic and Health Survey was the original survey tool developed by The DHS Program in 1984.
More than 300 DHS surveys in over 90 countries have been conducted since the program’s inception.
The DHS Program has evolved over the years to incorporate several other survey types:
The DHS Program created the AIDS Indicator Survey (AIS) in 2003 to respond to the need for global
monitoring of the HIV/AIDS epidemic. The AIS is a household based survey focusing on HIV and AIDS
knowledge, attitudes, behavior, and prevalence. Demand for the AIS was not as high as had been
anticipated, largely because the DHS was also designed to collect the same HIV data as a subset of the
larger DHS and most countries requested a DHS rather than an AIS. Eleven AIS surveys were conducted
in 2003-2015.
In 2006, The DHS Program began implementing the Malaria Indicator Survey (MIS), also a household
based survey, designed to collect data focused on internationally accepted malaria indicators. More
than 30 MIS have been conducted since 2006. Though a DHS collects the same malaria indicators as an
MIS, differences between the two surveys include the collection of malaria parasitemia and data
collection during malaria high transmission season during an MIS, whereas a DHS typically collects data
during the dry season.
Finally, the Service Provision Assessment (SPA) survey is a health facility assessment that provides a
comprehensive overview of a country’s health service delivery. It meets the need for monitoring health
system strengthening in developing countries.
This Guide will focus on DHS surveys and the statistics produced in the reports; note that most DHS
survey reports include all the statistics that are presented in the more narrowly focused AIS and MIS
reports.
Guide to DHS Statistics 1.3 August 2018
Model Questionnaires
One of the key aims of The DHS Program is to collect data that are comparable across countries. To
achieve this, standard model questionnaires have been developed. These model questionnaires—which
have been reviewed and modified in each of the seven phases of The DHS program—form the basis for
the questionnaires that are implemented in each country. Typically, a country is asked to adopt the
model questionnaire in its entirety, but can add questions of particular interest. However, questions in
the model may be deleted when they are irrelevant in a particular country.
DHS surveys are designed to collect data on marriage, fertility, mortality, family planning, reproductive
health, child health, nutrition, and HIV/AIDS. Due to the subject matter of the survey, women of
reproductive age (15–49) are the focus of the survey. Women eligible for an individual interview are
identified through the households selected in the sample. Consequently, all DHS surveys utilize a
minimum of two questionnaires—a Household Questionnaire and a Woman’s Questionnaire.
The Household Questionnaire is used to list all the usual members and visitors in the selected
households. The respondent for the Household Questionnaire is any knowledgeable person age 15 or
older living in the household. Some basic information is collected on the characteristics of each person
listed, including his/her age, sex, education, and relationship to the head of the household. The main
purpose of the Household Questionnaire is to provide the mechanism for identifying women eligible for
individual interview and children under five who are to be weighed, measured, and tested for anemia. In
addition, information is collected about the dwelling itself, such as the source of water, type of
sanitation facilities, materials used to construct the house, ownership of various consumer goods, and
use of iodized salt.
The Biomarker Questionnaire, introduced as part of DHS-7, collects biomarker data for eligible
household members. These include anthropometric measurements (height and weight), tests for the
hemoglobin level in blood for anemia, samples for HIV testing, malaria testing and other lab based
biomarkers. Previously, in DHS-IV to DHS-VI, the biomarker questionnaire was part of the Household
Questionnaire.
The Woman’s Questionnaire forms the central part of the DHS questionnaires and covers all of the key
topics of the survey. The Woman’s Questionnaire surveys women of reproductive age (15-49). The
Woman’s Questionnaire, along with other questionnaires, has undergone changes in every phase of
DHS. In DHS-I through DHS-IV, questionnaires for women distinguished between countries with high and
low contraceptive prevalence rates. The DHS Model “A” Woman’s Questionnaire was for use in the high
contraceptive prevalence countries, while the DHS Model “B” Woman’s Questionnaire was for use in
countries with relatively low contraceptive use. The main difference between these questionnaires was
that the “A” core collected considerably more information on family planning than the “B” core. In DHS-
V and later, these have been combined into a single Woman’s Questionnaire.
The DHS-7 Woman’s Questionnaire includes the following standard sections:
1) Background characteristics (age, education, religion, etc.)
2) Reproduction
3) Contraception
4) Pregnancy and postnatal care
5) Immunization

Guide to DHS Statistics 1.4 August 2018
6) Child health and nutrition
7) Marriage and sexual activity
8) Fertility preferences
9) Husband’s background and woman’s work
10) HIV/AIDS
11) Other health issues
The Man’s Questionnaire is similar but shorter than the Woman’s Questionnaire and is used to collect
data on background characteristics, reproduction and fertility preferences, contraception, employment
and gender roles, HIV/AIDS, and other health issues. The respondent to the Man’s questionnaire is men
of reproductive age (typically 15 to 49, 54, or 59).
In 2015, The DHS Program introduced the Fieldworker Questionnaire to collect data on the background
characteristics of interviewers, supervisors, field editors and health technicians. Data from the
fieldworker questionnaire permit users to include characteristics of the fieldworkers as well as the
survey respondents in their analysis.
See https://www.dhsprogram.com/What-We-Do/Survey-Types/DHS-Questionnaires.cfm for more
information on the DHS questionnaires.
The model questionnaires for all seven phases of DHS can be found at:
DHS-7 https://www.dhsprogram.com/publications/publication-DHSQ7-DHS-Questionnaires-and-Manuals.cfm
DHS-VI https://www.dhsprogram.com/publications/publication-DHSQ6-DHS-Questionnaires-and-Manuals.cfm
DHS-V https://www.dhsprogram.com/publications/publication-DHSQ5-DHS-Questionnaires-and-Manuals.cfm
DHS-IV https://www.dhsprogram.com/publications/publication-DHSQ4-DHS-Questionnaires-and-Manuals.cfm
DHS-III https://www.dhsprogram.com/publications/publication-DHSQ3-DHS-Questionnaires-and-Manuals.cfm
DHS-II https://www.dhsprogram.com/publications/publication-DHSQ2-DHS-Questionnaires-and-Manuals.cfm
DHS-I https://www.dhsprogram.com/publications/publication-DHSQ1-DHS-Questionnaires-and-Manuals.cfm

Guide to DHS Statistics 1.5 August 2018
Questionnaire Modules
Some countries have a need for special information not contained in the model questionnaires. To
accommodate this need and to achieve some level of comparability across countries that apply them,
optional questionnaire modules have been developed on a series of topics. The modules currently
available in the DHS-7 phase are:
Accident and Injury
Adult and Maternal mortality
Disability
Domestic Violence
Female Genital Cutting
Fistula
Male Child Circumcision
Newborn Care
Non-communicable Diseases
Out-of-pocket Health Expenditures
The modules can be found at https://www.dhsprogram.com/publications/publication-DHSQM-DHS-
Questionnaires-and-Manuals.cfm and are available in English and French.
Various other modules have been used in previous phases of DHS, but are no longer maintained as
supported modules, including:
Children’s education
Consanguinity
HIV/AIDS
Malaria
Pill-taking behavior
Sterilization experience
Verbal autopsy
Women’s status
Some of these modules have been incorporated into the standard DHS questionnaire, including much of
the HIV/AIDS, Malaria, and Women’s Status modules. Earlier versions of some of these modules can be
found at https://www.dhsprogram.com/publications/publication-DHSQMP-DHS-Questionnaires-and-
Manuals.cfm.
DHS surveys are also sometimes requested to include UNICEF Multiple Indicator Cluster Surveys (MICS)
modules, such as:
Child Discipline
Child Labor
Early Childhood Development
These modules can be found as part of the MICS tools at http://mics.unicef.org/tools.

Guide to DHS Statistics 1.6 August 2018
Other Basic Documentation
To achieve comparable information across countries, it is necessary to ensure that the questionnaires
and the survey procedures followed in each country are similar. Therefore, The DHS Program has
developed a set of basic documentation to go with the model questionnaires. The basic documentation
consists of the following manuals, most of which are available in English and French:
The DHS Interviewer’s Manual provides a detailed explanation of the survey questions and tips on
conducting interviews.
The DHS Supervisor’s and Editor’s Manual explains the roles of the supervisor in leading the field teams,
and for editors, how to check completed questionnaires.
Training Field Staff for DHS Surveys is designed for survey managers to provide tips on how to organize
and conduct training for field staff. It describes techniques of mock interviewing, demonstration
interviews in front of the class, field practice, and sample tests for trainees.
The DHS Sampling Manual presents the DHS approach to issues like optimum sampling frames, sample
domains, stages, and sample selection. The Household Listing portion of the sampling manual describes
how to locate selected sample points, how to draw a sketch map, and how to list the households and
structures.
The DHS Tabulation Plan for Key Indicators Report describe the key tabulations in the Key Indicators
Report.
The Tabulation Plan for DHS Final Report details the tabulations that will be produced with the survey
data for each chapter of the report. This manual also aids data processing staff in determining the exact
tabulations that are required for the survey reports. The Guide to DHS Statistics should be used in
conjunction with the Tabulation Plan and describes the statistics presented in each tabulation.
The Biomarker Field Manual is designed to be used, in combination with classroom instruction and
practical experience, to teach fieldworkers how to collect biomarkers for a DHS, MIS or AIS.
The DHS User’s Guide for Questionnaires in Excel is guide to using the Excel versions of the DHS
questionnaires in adapting them to individual surveys.
Incorporating Geographic Information into Demographic and Health Surveys: A Field Guide to GPS Data
Collection is designed to be a start-to-finish guide to Global Positioning System (GPS) data collection in
DHS, MIS, and AIS. This guide provides background information on GPS, how the technology works, how
GPS data are collected, and how they are used in the context of a DHS.
DHS Survey Organization Manual is intended as an aid to host country survey staff, donors, and others,
and explains the standard approach to implementing a DHS.
The basic documentation for The DHS Program can be found at
https://www.dhsprogram.com/publications/Publication-Search.cfm?type=35.

Guide to DHS Statistics 1.7 August 2018
Reports and Data
The survey results for each participating country are published initially in a Key Indicators Report (KIR -
formerly known as a preliminary report), followed by a more detailed Final Report and a summary type
Key Findings report. The latter two reports are widely distributed and constitute primary outputs of the
project. Results are also presented through fact sheets and other dissemination materials.
Further dissemination of survey data is achieved through the publication of analytical and other reports.
Of particular relevance for program and policy purposes are the Comparative Report series. These
descriptive reports provide information across survey countries and can contribute greatly to the policy
debate through the exhaustive view they provide on a particular situation in a large number of
countries. Analytical Studies are also published and provide rigorous analysis of survey data,
emphasizing policy and program-relevant themes and research questions. Further Analysis reports
provide results emanating from research that is typically based in and on a single DHS country.
Methodological reports cover issues relating to the collection and analysis of DHS data, particularly
focusing on new types of data.
DHS data are also shared through a number of tools, including the STATcompiler, Mobile app, API,
Spatial Data Repository (see Other Tools and Resources). However, the major output of the surveys is
the micro-level datasets distributed through the DHS Data Archive.

Guide to DHS Statistics 1.8 August 2018
Data Archiving
The DHS Program believes that widespread access to survey data by responsible researchers has
enormous advantages for the countries concerned and the international community in general.
Therefore, The DHS Program policy is to release survey data to the public when the main survey report
is published, generally within 12 months after the end of fieldwork.
DHS Archive
DHS maintains a data archive of all survey datasets collected over the more than 30 years of The DHS
Program. Datasets are available at https://www.dhsprogram.com/data/available-datasets.cfm. Users log
in or register for access to datasets at https://dhsprogram.com/data/dataset_admin/login_main.cfm.
Once registered and access permission has been provided, users may download the datasets from the
required countries. The DHS Program has developed a set of tutorial videos on YouTube on dataset
registration, modifying dataset requests, dataset names, dataset types, downloading datasets,
downloading multiple datasets, and an introduction to DHS datasets (these are just a few of the DHS
tutorial videos on YouTube).
The reformatting of each dataset into standard recode files facilitates use of DHS data. These files
standardize the variable names and coding categories across countries and construct many of the
commonly used variables such as marital status or age in five-year groups. Because DHS surveys collect
an enormous amount of information on different subjects for the household, household members,
women age 15–49, children under age five, and men age 15–59, these standard recode files are a
particular advantage for cross-country analysis. The DHS recode datasets are described in more detail in
Organization of DHS Data.
IPUMS-DHS
IPUMS-DHS is designed to facilitate further analysis of DHS data. It provides an interface to select and
download a customized set of variables across a number of surveys or countries in a single dataset.
IPUMS-DHS contains thousands of consistently coded variables on the health and well-being of women,
children, and births, and on all household members, for 24 African countries and 4 Asian countries.
IPUMS-DHS datasets do differ from datasets available directly through The DHS Program website. The
IUPMS-DHS datasets are created from the original recode datasets. Either dataset can be used to
reproduce the results published in the DHS survey reports, but the variable names and the coding
schemes within the datasets are different. While the original datasets use a naming system of letters
and digits for the variables (e.g. v705), the IPUMS-DHS datasets use short names for the variables (e.g.
currwork). Additionally, the coding of each variable is different. The IPUMS-DHS datasets have
harmonized coding schemes across the phases of DHS with more detailed coding schemes incorporating
survey-specific codes consistently over time.
The indicator definitions in the Guide to DHS Statistics refer to the variable names and coding from the
DHS standard recode datasets available through https://www.dhsprogram.com/.

Guide to DHS Statistics 1.9 August 2018
Model Datasets
The DHS Program has created model datasets so users can become familiar with datasets without
having to register for access. These datasets have been created strictly for practice and do not represent
any country's actual data. Model datasets are based on the DHS 6 Questionnaire and Recode. They can
be downloaded from the Download Model Datasets page on the website.

Guide to DHS Statistics 1.10 August 2018
DHS Website
The DHS Program website provides access to survey documentation, survey reports, analytical studies,
datasets and much more. Resources include:
Core documentation: questionnaires, manuals, and methodology
Microdata and Indicator data: Datasets, support for dataset use, and links to online data tools
Publications, including survey reports, and dissemination materials
Further analysis reports: analytical reports, comparative reports and methodological reports
Journal articles database: a database of peer-reviewed journal articles that feature DHS data
Indicator information: Topical pages provide an in-depth look at key topics including SDGs
Other Tools and Resources
STATcompiler allows users to make custom tables, charts, and maps with DHS indicator-level data. The
STATcompiler contains over 1,000 indicators for all DHS countries. It is designed to explore trends and
cross-country comparisons. The tool is available in English and French.
API: The DHS Program Application Programming Interface (API) provides software developers access to
aggregated indicator data from The DHS Program. The API can be used to create various applications to
help analyze, visualize, explore and disseminate data on population, health, HIV, and nutrition from
more than 90 countries.
Mobile app: The DHS Program mobile application provides up-to-date indicator data through tables,
charts, and maps, as well as basic survey information and links to publications. It is available for free for
Apple and Android devices. Search “DHS Program” in your app store.
The DHS Program User Forum is an online community designed to foster conversation and data use
support between DHS data users. Users can search the forum for answers to frequently asked questions
on technical or analytical topics, post new questions, or respond to queries from other users. The DHS
Program staff moderate the forum and often provide answers to questions.
Spatial Data Repository: The DHS Program Spatial Data Repository (SDR) provides geographically-linked
health and demographic data from The DHS Program and the U.S. Census Bureau for mapping in a
geographic information system (GIS).
Boundaries: Explore how DHS region boundaries have changed over time and download survey
boundary data.
Modeled surfaces: Modeled surfaces are produced using standardized geostatistical methods,
publically available DHS data, and a standardized set of covariates across countries. Each map
package contains a mean estimate surface, an uncertainty surface, and corresponding
information on the model creation process and validation.
Covariates: Datasets containing key covariate data for DHS Program survey clusters from
external geospatial covariate datasets covering agriculture, climate, environment, health,
infrastructure, and population variables.
Blog: The DHS Program blog highlights new tools, explores complex data topics, and keeps followers
abreast of changes to the questionnaire and other developments

Guide to DHS Statistics 1.11 August 2018
eLearning courses: The DHS Program has partnered with K4Health to develop 3 elearning courses on
the Global Health eLearning Center:
Demographic and Health Surveys: Data Use
Data Visualization: an Introduction
Social Media for Health and Development
YouTube: The DHS Program’s YouTube channel is the home of tutorial videos, Key Findings videos, and
interviews with topical experts. Of particular relevance to dataset users are the following:
Intro to The DHS Program (7 min)
How to Read Tables
o English (7 min)
o French (10 min total)
o Also available in Portuguese, Spanish, Arabic
Sampling and Weighting (Part I and Part II) (30 min total)
De Jure and De Facto (5 min)
Using DHS Datasets for Analysis: 9 videos (32 min total)
Matching DHS Final Report Tables: Parts I-IV (19 min total)
STATcompiler Tutorial
o Parts 1-3 (English) (<15 min)
o Parts 1-3 (French) (<15 min)
DHS Program digital resources (4 min)
GIS Playlist: 4 videos (32 min total)
Top 10 STATcompiler features (3 min)
How to subscribe to forums & topics DHS Program User Forum (6 min)
Topical Videos
Family Planning:
Contraceptive Prevalence Rate: Indicator Snapshot (4 min)
Contraceptive Calendar Tutorial Part I & Part II (15 min total)
Demand satisfied by modern methods: Indicator Snapshot (8 min)
Malaria:
ITN Access: Indicator Snapshot (English or French) (6-9 min)
Maternal Mortality Ratio (MMR) and Pregnancy-related Mortality Ratio (PRMR):
MMR versus PRMR 3 video playlist:
o MMR Indicator Snapshot (8 min) (English)
o Differences between MMR and PRMR (9 min) (English)
o Interpreting trends in PRMR (14 min) (English)
Announcements and updates about new surveys, data, and resources are made on the DHS website,
through email alerts (register on the website), and through social media channels:
Twitter @dhsprogram
Facebook facebook.com/dhsprogram
LinkedIn linkedin.com/company/dhs-program

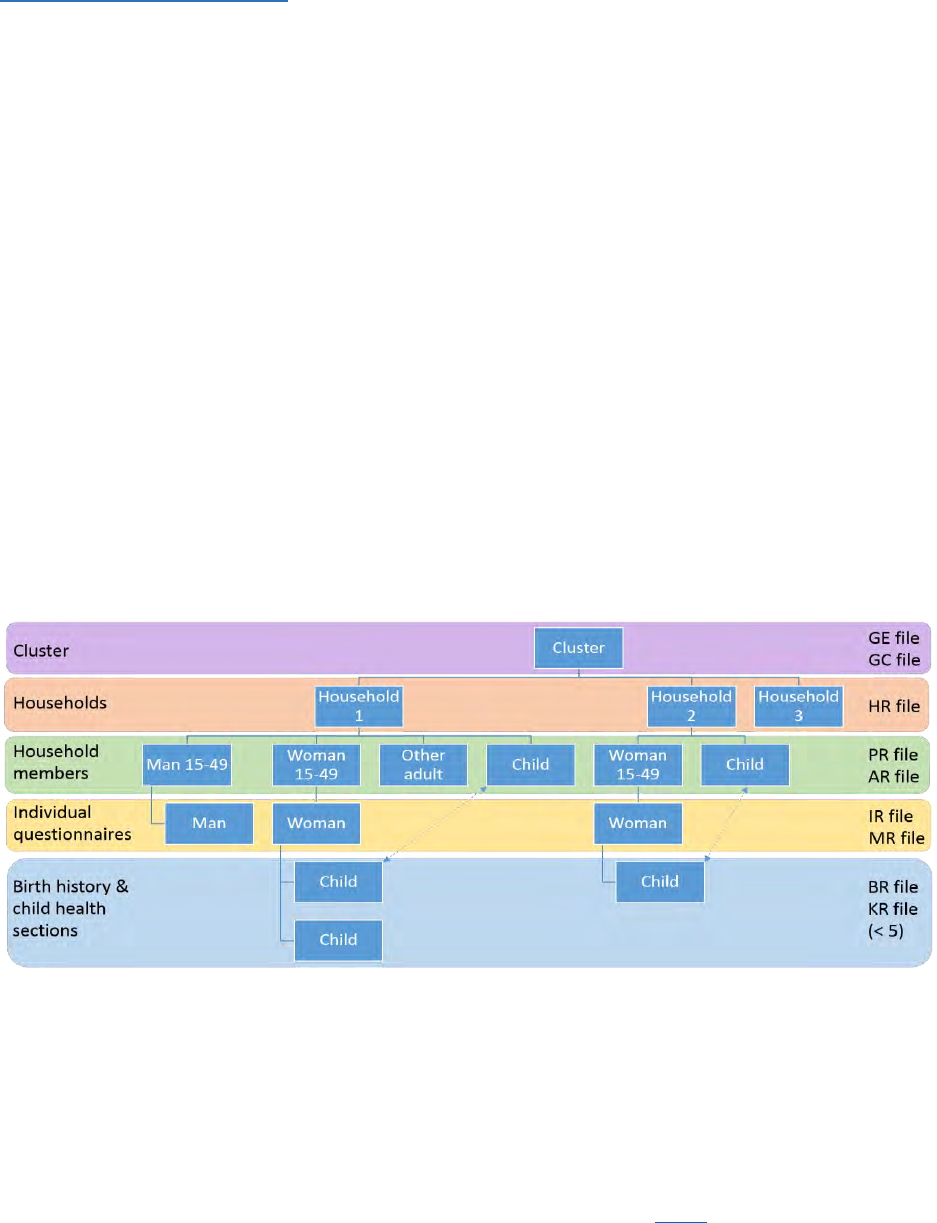
Guide to DHS Statistics 1.13 August 2018
Organization of DHS Data
Structure of DHS Data
DHS surveys collect data through four main questionnaires. The Household Questionnaire collects data
on the characteristics of the household and list all household members. The household roster within this
questionnaire captures key characteristics of each household member and is used to select women and
men eligible for individual interviews. The Biomarker Questionnaire collects information for each eligible
household member on anthropometric measurements and levels of hemoglobin, and records
information about samples for biomarker testing. Eligible household members are typically children
under age 5, and women and men age 15-49.
Women and men age 15-49 (age range varies for men) are interviewed using the Woman’s
Questionnaire and Man’s Questionnaire respectively. The Woman’s Questionnaire, in addition to
questions about the woman, contains a birth history that is used to list all children (alive or dead) that
the respondent has given birth to, with the child’s sex, date of birth, age, and survival status. The birth
history is then the basis for selecting children under certain ages for the maternal health, immunization,
child health, and nutrition sections of the questionnaire.
The data from a DHS survey naturally forms a hierarchy of households within a cluster, household
members within each household, interviewed women and men as a subset of household members, and
children of each interviewed woman, as shown in the example figure below.
Within this hierarchy, data may be collected about the same person in more than one questionnaire. For
example, data about women may be collected in the Household Questionnaire, and also in the Woman’s
Questionnaire. Similarly for men, some basic characteristics are collected in the Household
Questionnaire and in the Man’s Questionnaire. Additionally, data on children may be collected in the
Household Questionnaire and in the birth history within a Woman’s Questionnaire – these data can be
linked in analysis.
The DHS Program uses a software package, CSPro, to process its surveys. CSPro is developed by the US
Bureau of the Census, ICF, and SerPro SA with funding from USAID. CSPro is specifically designed to

Guide to DHS Statistics 1.14 August 2018
meet the data processing needs of complex surveys such as DHS, and one of its key features is its ability
to handle hierarchical files. CSPro is used in The DHS Program in all steps of data processing with no
need for another package or computer language. All steps, from entering/capturing the data to the
production of statistics and tables published in DHS final reports, are performed with CSPro. In addition,
CSPro provides a mechanism to export data to the statistical packages Stata, SPSS, SAS and R.
The example above shows that, while a single questionnaire is always completed for each household in
the DHS sample, the number of Woman’s Questionnaires or Man’s Questionnaires that will be
completed depends on the number of eligible women or men listed in the Household Questionnaire. In
other words, for each Household Questionnaire there may be zero or several Woman’s or Man’s
Questionnaires.
The hierarchical data file produced in CSPro has a two-level structure reflecting the relationship
between the questionnaires; the Household Questionnaire and Biomarker Questionnaire are at level 1
and the Woman’s and Man’s Questionnaires are at level 2. Within each CSPro level, there can be one or
more different types of records each containing many variables. For example, records in the household
level in a typical DHS file can be single (e.g. household characteristics) or multiple (e.g. household
member’s roster). Thus, using the same file, it is possible to work with different units of analysis
(households, household members, women, men and children). This makes the analysis of variables
across different units very convenient.
The hierarchical structure defined by CSPro has several advantages and disadvantages. Among the
advantages, the following can be highlighted:
All the data are stored in just one ASCII file. Virtually all packages can read ASCII files.
Since all the data are stored in the same file, it is easy to maintain the integrity of the data in
terms of data structure related to levels and records.
The data file mirrors the paper questionnaire. Each section in the questionnaire can be defined
as a record in the data file and only the information that is needed is present in the file.
The major disadvantage is that only CSPro easily handles hierarchical data. Most analysis software does
not support hierarchical data, or at least not simply, so The DHS Program produces a set of exported
datasets from the CSPro versions of the DHS recode files with different units of analysis that are
convenient for use in statistical software such as Stata, SPSS, SAS and R.
In the exported files, there is one record for each case. All variables in each case are placed
subsequently on the same record. The multiple or repeating records from the hierarchical file are placed
one after the other on the record, with the maximum number of occurrences of each section
represented in the data file. For example, if a data file collects information on the age of a woman’s
children, up to a maximum of 20 children, then there will be 20 records represented in the data file
whether or not a woman had the maximum number of children. Each variable in a repeating section is
placed immediately after the preceding variable of the same occurrence, such that all variables for
occurrence 1 precede all variables for occurrence 2 of a section.
For more information, see the YouTube tutorial video Introduction to DHS Data Structure.

Guide to DHS Statistics 1.15 August 2018
Recode Files
There are four main questionnaires in DHS surveys: A Household Questionnaire, a Biomarker
Questionnaire, a Woman’s Questionnaire, and a Man’s Questionnaire. There are also several
standardized modules for countries with interest in extra topics. These modules are applied as part of
the Household, Biomarker, Woman’s, or Man’s Questionnaires.
Since the very beginning of DHS, a recode file has been a standard part of the survey process. Primarily
the recode file was developed to define a standardized file that would facilitate cross-country analysis.
Initially it was also to compare data with the World Fertility Surveys (WFS) to study trends. In DHS-I the
recode file was defined only for the Woman’s Questionnaire, as the Household Questionnaire was
originally just used for the selection of women for interview. Additionally, the use of a Man’s
Questionnaire was not part of the original design, and only a few men’s surveys took place in DHS-I. The
recode file proved to be very useful and as a result, since DHS-II, a recode file was introduced for the
Household and Man’s Questionnaires.
DHS questionnaires have changed extensively since the first phase. For this reason, there is a different
recode definition for each DHS phase. However, if a variable is present in one or more phases, that
variable has the same meaning in each phase in which it is present. If a question is dropped from one
phase to another, the name of the variable used for that question is not reusable. The variable will not
be present in the recode of the phase where it was dropped. If a new question is added to the core
questionnaire, a new variable will be added to the recode definition.
See https://www.dhsprogram.com/data/Data-Variables-and-Definitions.cfm for a discussion of the
benefits of the recode files.
Recode files are created using a hierarchical model in CSPro and later exported to files compatible with
Stata, SPSS, SAS and R for use by analysts. The DHS Recode Manual provides a description of the
contents of the recode file, including a brief description of each variable and the applicable base for the
variable. The DHS Recode Map provides a simple codebook for the standard DHS recode. The DHS
Recode Manual and Map for all phases of DHS can be found at
https://www.dhsprogram.com/publications/publication-dhsg4-dhs-questionnaires-and-manuals.cfm.
The DHS Program recode files are exported into several dataset types. Below is a description of the
dataset types referred to in the Guide to DHS Statistics, together with the unit of analysis (or case) for
each dataset:
HR: Household Recode
Unit of analysis: Households
Includes household characteristics, the household roster, and biomarkers rosters as repeating sets of
variables. This dataset is used for calculation of household level indicators such as water and sanitation
(see Chapter2).
PR: Household members (or Persons) Recode
Unit of analysis: Household member
Includes characteristics of household members including age, sex, marital status, education, as well as
biomarker measurement information. The dataset includes both de facto and de jure household

Guide to DHS Statistics 1.16 August 2018
members. It also includes the characteristics of the households where the individual lives or was visiting.
This dataset is used for analysis of education of household members (Chapter 2) and of anthropometry
and anemia in children under age 5 (Chapter 11).
IR: Individual (Women’s) Recode
Unit of analysis: De facto woman interviewed
Contains all the data collected in the Woman’s Questionnaire for de facto women plus some variables
from the Household Questionnaire. Up to 20 births in the birth history (see also BR file), and up to 6
children under age 5 (see also KR file), for whom pregnancy and postnatal care as well as immunization,
health and nutrition data were collected, can be found as repeated variables in this file. This dataset is
used for most woman-level analysis including marriage and sexual activity (Chapter 4), fertility and
fertility preferences (Chapters 5 and 6), family planning (Chapter 7), anthropometry and anemia in
women (Chapter 11), malaria prevention for women (Chapter 12), HIV/AIDS (Chapters 13 and 14),
women’s empowerment (Chapter 15), adult and maternal mortality (Chapter 16), and domestic violence
(Chapter 17).
BR: Births Recode
Unit of analysis: Birth
Contains the full birth history of all women interviewed, including information on pregnancy and
postnatal care as well as immunization, health and nutrition data for children born in the last 5 years.
Data for the mother of each of these children are also included. This dataset is used for fertility (Chapter
5) and mortality (Chapter 8) analysis.
KR: Kids Recode
Unit of analysis: Child under age 5 born to a woman interviewed
Contains the information related to the child's pregnancy and postnatal care and immunization, health
and nutrition data. The data for the mother of each of these children is also included. This dataset is
used to look at child health indicators such as immunization coverage, vitamin A supplementation,
recent occurrences of diarrhea, fever, and cough for young children and treatment of childhood diseases
(Chapter 10), nutrition of young children (Chapter 11), and malaria prevention and treatment (Chapter
12).
MR: Men’s Recode
Unit of analysis: De facto man interviewed
Contains all data collected in the Man’s Questionnaire de facto men plus some variables from the
Household Questionnaire. This dataset is used for most man-level analysis including marriage and sexual
activity (Chapter 4), fertility preferences (Chapters 6), and HIV/AIDS (Chapters 13 and 14).
CR: Couples Recode
Unit of analysis: Married woman and man
Contains data for married or living together women and men who both declared that they are married
(living together) to each other and with completed individual interviews. This dataset is the result of
linking the IR and MR files, based on whom they both declared as partners. In polygynous societies a
man’s data may be linked to more than one woman’s data. This dataset is used for analysis of couples,
principally related to HIV (Chapters 13 and 14).

Guide to DHS Statistics 1.17 August 2018
AR: HIV testing Recode
Unit of analysis: Person tested for HIV
Contains the result of lab testing for HIV from blood samples provided by women and men, together
with a separate weight variable for use when analyzing HIV test results. This dataset is used for analysis
of HIV prevalence (Chapter 14).
The DHS Program has also prepared two geographic datasets that data analysts can use with DHS data:
GE: Geographic Data
Unit of analysis: Cluster
The geographic datasets (also known as GPS data) contain a single record per cluster in which the survey
was conducted and provide the latitude, longitude and elevation for the survey cluster, for use in
Geographic Information Systems (GIS). Questions concerning the geographic data are addressed on the
Geographic Data forum within the DHS User Forum.
GC: Geospatial Covariates
Unit of analysis: Cluster
The geospatial covariate datasets link survey cluster locations to ancillary data, known as covariates,
that contain data on topics including agriculture, environment, health, infrastructure, and population
factors. This allows individuals with limited GIS experience to conduct geospatial statistical analysis
without having to manually source and link these covariates to cluster locations. These covariates are
extracted from freely available global datasets. See the Spatial Data Repository’s Covariates webpage
and Methodology webpage for more information.
In addition to the contextual variables that can be included in analysis from the geospatial covariates,
interviewers can also have an effect on the responses to certain survey questions. To permit analysis of
interviewer effects on survey responses analysts can also use the characteristics of the fieldworkers.
FW: Fieldworker’s Dataset
Unit of analysis: Fieldworker
Contains the basic characteristics of each fieldworker who participated in the survey, including their age,
sex, marital status, level of education, region of residence, languages, and prior experience with DHS or
other surveys. Data from the fieldworker’s dataset may be linked to the survey responses using the
interviewer, supervisor, field editor, or biomarker specialists IDs.
Additional dataset types also exist, and when using older datasets, two of these are of particular
relevance:
WI: Wealth Index
Unit of analysis: Household
Contains the wealth score and quintiles for surveys prior to the late 1990’s. Wealth Index analysis was
introduced to The DHS Program around the end of the 1990's. When the decision was made to include
the wealth index as part of DHS, standard variables were added to the recode definition for both the
household and individual datasets (hv270 and hv271 for households; v190 and v191 for women; and

Guide to DHS Statistics 1.18 August 2018
mv190 and mv191 for men). For surveys conducted prior to the change in the recode file definition a file
was created containing the score and the quintile variables. Wealth index files were created for all DHS
surveys except surveys carried out as part of DHS-I. This dataset can be linked to any of the datasets
described above.
HW: Height and Weight
Unit of analysis: Children under age 5
In 2006 new child growth standards were introduced by WHO. Prior to this time, The DHS Program used
the NCHS/CDC/WHO reference. After the adoption of the new WHO standards, standard recode
variables hv70 to hv73 and hw70 to hw73 were added to the recode definition to store the z-scores
based on the new WHO child growth definition. All files using the DHS-V, DHS-VI or DHS-7 recode
structure have these variables. For surveys prior to DHS-V, a file was created containing the z-scores
based on the new standard. In early DHS phases only children of interviewed women were measured.
Starting with DHS-III onwards all children under five listed in households interviewed have been
measured. This dataset can be linked to the household members (PR), the children under five (KR) or the
births (BR) datasets described above if height and weight was taken for children in the households. The
file can only be linked to the children under five (KR) or birth (BR) dataset when only children of
interviewed women were measured for early DHS phases.
Additional information about datasets can be found in The DHS Program YouTube video on DHS Dataset
Types in 60 Seconds and on The DHS Program at https://www.dhsprogram.com/data/Dataset-
Types.cfm.
Recode File Naming
Survey datasets are distributed as compressed .zip files. Each zip file contains a dataset and related
documentation files. The naming of the zip files and their contents follows the DHS file naming
convention: CCDDVVFF[DS].ZIP
Code Description:
CC: Country Code
DD: Dataset Type. See File types above.
VV: Dataset Version. First character - DHS Phase, second character - Release version.
FF: File Format. DT - Stata, SV - SPSS, SD - SAS, FL - Flat, no file format – Hierarchical.
DS: Data Structure. SPA only: SR - SPA Recode, SP - SPA Raw.
For example, UGIR7ADT.ZIP contains the Stata version of the Individual Women’s Recode dataset for the
Uganda 2016 DHS conducted as part of DHS-7.
The DHS file naming convention is described in detail at https://www.dhsprogram.com/data/File-Types-
and-Names.cfm.
The list of datasets available for each survey can be found on The DHS Program website at
https://www.dhsprogram.com/data/available-datasets.cfm, or through The DHS Program API using the
datasets call, e.g. https://api.dhsprogram.com/rest/dhs/datasets?f=html&perpage=1000. The API call
can be filtered by country, survey, survey type, file format, or dataset type (file type). See
https://api.dhsprogram.com/#/api-datasets.cfm for more information on using the API datasets call.
Guide to DHS Statistics 1.19 August 2018
Recode Variable Naming
Variables in the recode file begin with one or two letters followed by one to four (typically three) digits
and in some cases followed by a letter. Following is a list describing the general variable name
conventions.
Household Recode (HR) and Household Member Recode (PR)
hv0xx Basic characteristics of the household interview (hhid,hv000-hv046)
hv8xx Time of household interview and date of biomarker visit (hv801-hv807a)
hv1xx Characteristics of household members (hvidx,hv101-hv140)
hv2xx Characteristics of the household (hv201-hv271a)
haxx Anthropometry, anemia and biomarkers for women (ha0-ha70)
hbxx Anthropometry, anemia and biomarkers for men (hb0-hb70)
hcxx Anthropometry, anemia and biomarkers for children (hc0-hc73)
hmlxx Mosquito net characteristics and use (hmlidx,hml3-hml11,hml21-hml23,hmla-hmle)
Mosquito net use by household members (hml12-20), and malaria test results (hml30-hml36)
shxxx Survey-specific household or household member characteristics
Women’s Individual Recode (IR), Births Recode (BR), and Children Under age 5 Recode (KR)
v0xx Basic characteristics of the women’s interview (caseid,v000-v046)
v1xx Woman’s characteristics (v101-v191a)
bxx Birth history (bidx,bord,b1-b20)
v2xx Reproduction (v201-v244)
v3xx Contraception (v301-v3a09b)
mxx Maternal health, pregnancy, postnatal care and breastfeeding (midx,m1-m78j)
v4xx Anthropometry and anemia of interviewed women, breastfeeding, and feeding of youngest
child living with mother (v401-v482c)
hxx Immunization and child health (hidx,h0-h80g)
hwxx Anthropometry for children of interviewed women (hwidx,hw1-hw73)
v5xx Marriage and sexual exposure
v6xx Fertility preferences
v7xx Husband’s characteristics, women’s work, women’s empowerment (v701-v746)
HIV/AIDS knowledge, attitudes and practices, and sexually transmitted infections (v750-v791a)
v8xx Interview characteristics (v801-v815c)
HIV related practices, sexual activity (v820-v858)
vcal Reproductive/contraceptive calendar
mmxx Adult and maternal mortality (optional)
mlxx Malaria-related child health (idxml,ml0-ml25a)
dxxx Domestic violence (d005,d101-d130c)
gxxx Female genital cutting (g100-g119,gidx,g121-124)
sxxx Women’s survey-specific
Men’s Recode (MR)
mv0xx Basic characteristics of the men’s interview (mcaseid,mv000-mv046)
mv8xx Interview characteristics (mv801-mv803)
mv1xx Man’s characteristics (mv101-mv191a)
mv2xx Reproduction (mv201-mv252)
Guide to DHS Statistics 1.20 August 2018
mv3xx Contraception (mv301-mv3b25b)
mv4xx Smoking, tuberculosis and other adult health issues (mv463a-mv484l)
mv5xx Marriage and sexual exposure (mv501-mv541)
mv6xx Fertility preferences (mv602-mv634d)
mv7xx Employment (mv714-mv747b)
HIV/AIDS knowledge, attitudes and practices, and sexually transmitted infections (mv750-
mv793b,mv820-mv858)
mgxxx Female genital cutting (mg100-mg119)
smxx Men’s survey-specific
HIV Testing Data (AR)
hivxx HIV test results
Recode variable names are used consistently across DHS, AIS and MIS to facilitate analysis of all surveys
types.

Guide to DHS Statistics 1.21 August 2018
Not Applicable and Missing Values and Other Special Codes
In DHS datasets there are several special values that have particular codes. Two of them are very
important – not applicable and missing. The DHS Program treats these two differently although some
software treat them as the same.
“Not applicable” is defined as when a question is not supposed to be asked due to the flow of
the questionnaire. For example question 227 in the Woman’s Questionnaire “How many
months pregnant are you?” is not applicable if the answer to the preceding question 226 “Are
you pregnant now?” is No or Unsure. Question 227 would be left blank in the questionnaire in
this case.
“Missing” is defined as a variable that should have a response, but because of interview error
the question was not asked. For example, question 227 “How many months pregnant are you?”
should be answered if a woman responded Yes to question 226 “Are you pregnant now?” If the
interviewer incorrectly left the question blank then a code is required to recognize that. The
general rule for DHS data processing is that answers should not be made up, and so a “missing
value” will be assigned. The data will be kept as missing in the data file and no imputation for
this kind of question will be done. Missing values in general are codes 9, 99, 999, 9999, etc.
depending on the number of digits used for the variable.
There are important differences in how “not applicable” and “missing” are handled in each of the
statistical software:
In Stata, in most datasets both not applicable and missing values have been converted to Stata’s
missing value (.). In some datasets though the codes remain as 9, 99, 999 or 9999.
In SPSS, not applicable values are converted to system missing, while the missing values are
converted to user missing.
In SAS, as in Stata, both not applicable and missing values have been converted to SAS’ missing
value (.)
The distinction between “not applicable” and “missing” can be important for matching results from DHS
reports. In general the denominators for most indicators in DHS reports exclude the “not applicable”
cases, but include the “missing” cases. Careful attention to the selection of the denominator and then
ensuring that “missing” values are correctly treated is important for ensuring that results match those
published in DHS survey reports.
There are some important background variables where the “missing” code is not accepted, including:
Geographical variables such as type of place of residence (urban/rural) (hv025, v025, mv025,
v102, mv102), regions (hv024, v024, v101, mv101), and any other variable whose value can be
established by the sample design
Level of education for women and men in the individual questionnaire (v106, mv106)
Current use of contraception for women (v312)
Current marital status of women and men (v501, mv501)
Variables related to the woman’s birth history (v201 to v210, b0, b4, b5, b9).
Note though that in earliest phases of DHS it is possible that some of these variables may have “missing”
values.
Guide to DHS Statistics 1.22 August 2018
In addition to “not applicable” and “missing” values there are often other special values recorded in the
datasets. Codes 8, 98, 998, 9998 are assigned to “don’t know” responses. These codes are normally pre-
coded in the questionnaires, and are consistently used throughout the recode file.
Another special code used for data editing purposes is code “Inconsistent.” This code is generally used in
the secondary editing of data, when a value or code is not plausible, but it is impossible to determine
the correct code. For example, dates for vaccinations recorded as having occurred before the birth of
the child. The value is not missing, but is not possible. The secondary editing team is instructed to first
check for clues that could lead to correcting the problem, but if that is not possible, to establish which
piece of information is wrong (day, month, or year) and assign the code for “Inconsistent” to that item.
Inconsistent codes are 7, 97, 997, 9997 depending on the variable number of digits.
Other special responses may be coded 96 (996, 9996), 95 (995, 9995), 94 (994, 9994), etc. For example,
in variable v226 (Time since last period (comp) (months)) code 996 means “Never menstruated”, code
995 means “Before last birth”, and code 994 means “In menopause”. As another example, variable v525
(age at first sex) has codes 99 “Missing”, 98 “Don’t know”, 97 “Inconsistent”, 96 “At first union”, and 0
“Not had sex”.
All of these special codes should be taken into account when analyzing DHS datasets. For example, if
they are not excluded to calculate the mean age at first sex, eventually the mean will be inflated by ages
96, 97, 98, and 99. Even code 0 would need to be excluded as it would incorrectly deflate the mean age
at first sex.
In general, The DHS Program uses a conservative approach to the calculation of indicators including
missing and special values in denominators of most percentages (but not means and medians) and
excluding them from the numerators or showing them as separate categories in percent distributions.

Guide to DHS Statistics 1.23 August 2018
Construction of Variables
DHS Recode files are created through a complex recoding application, converting the raw data as
collected in the questionnaires into a standardized recode format for use in analysis. In this process
there are a number of different types of variables constructed. For most variables this is a one-to-one
conversion, possibly recoding categories (e.g. converting No = 2 in the questionnaire to No = 0 in the
recode variable), while for others the creation is more complex. The creation of some types of variables
is described below.
Multiple Response Variables
In multiple response questions, the question is asked and the respondent spontaneously begins
providing answers. The answers are not read, but the interviewer has to classify the response according
to the options available for the question. The interviewer keeps probing for other responses until the
respondent says that she has no more answers. Question 409 of the Woman’s Questionnaire is a typical
example of this type of question:
At the time of data capture, all responses are stored in just one field. However, dealing with
combinations of alphabetic codes presents a challenge for analysis purposes, so each response for this
type of question is translated into codes 0 = No, 1 = Yes, 9 = Missing, in separate variables in the recode
files:
m2a Prenatal care: Doctor
m2b Prenatal care: Nurse/Midwife
m2c Prenatal care: Auxiliary Midwife
m2d Prenatal care: CS Health Specialist
m2e Prenatal care: CS Health Specialist
m2f Prenatal care: CS Health Specialist
m2g Prenatal care: Traditional Birth Attendant
m2h Prenatal care: Village Health Worker
m2i Prenatal care: CS Other Person
m2j Prenatal care: CS Other Person
m2k Prenatal care: Other Response (uncoded)
m2l Prenatal care: CS Other
m2m Prenatal care: CS Other
m2n Prenatal care: No One
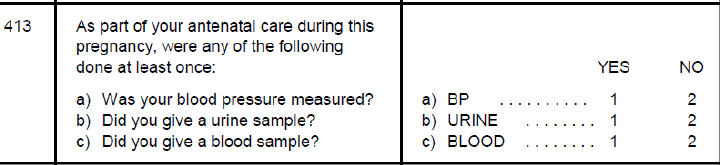
Guide to DHS Statistics 1.24 August 2018
(variables in italics are used for survey-specific categories)
In creating these variables there are several conditions taken into consideration with this type of
variable:
If the question was missing, all applicable variables will be assigned the code “missing”.
If a response category does not exist for a particular survey, the variable will be left blank “not
applicable”.
There are provisions for survey-specific (CS = country-specific) responses that are not part of the
standard model questionnaires. For example, some countries include additional categories of
health professionals.
Multipart Questions
In multipart questions the response for the separate parts of the question are usually stored in separate
variables in the recode files. For example, question 413 in the Woman’s Questionnaire is as follows:
Each part of the question is treated as a separate variable in the recode file:
m42c During pregnancy: blood pressure taken
m42d During pregnancy: urine sample taken
m42e During pregnancy: blood sample taken
Each variable is coded 0 = No, 1 = Yes, 9 = Missing.
Date Variables
Certain date variables in DHS surveys receive special treatment. As dates are central to the calculation
of fertility and mortality rates and the selection of cases for inclusion in other analyses, there is a need
for fully specified dates (month and year) for key events. These events are:
Date of birth of the respondent
Date of first marriage or union
Dates of birth of each child
Date started using current method of contraception
Date current pregnancy started
Date of interview
Note that date of interview is always fully specified and can have no special values.
However, the respondent may not know the exact date of an event, the date (or part of it) may have
been left blank by the interviewer, or the date may have been inconsistent with other information. For
all of these situations the month and/or year part of the date variables may have either the missing
value code or one of the other special codes. As fully specified dates are required for analysis The DHS

Guide to DHS Statistics 1.25 August 2018
Program uses a process of date editing and imputation to impute exact dates (to the month and year)
for each of these dates.
The DHS Program date editing and imputation uses a multi-step process:
1) Construct logical ranges using the information reported for the date.
2) Apply isolated constraints to narrow the ranges
3) Apply neighboring constraints to further narrow the ranges
4) Ensure sufficient gap between events, further narrowing ranges
5) Random imputation within final ranges.
The result of these steps is the production of imputed dates for the key dates:
Date of birth of the respondent (month: v009, year: v010, CMC: v011, flag: v014)
Date of first marriage or union (month: v507, year: v508, CMC: v509, flag: v510)
Dates of birth of each child (month: b1, year: b2, CMC: b3, flag: b10)
Date started using current method of contraception (month: v315, year: v316, CMC: v317, flag:
v318)
Date current pregnancy started (duration of current pregnancy: v214, flag: v223)
Date of interview (month: v006, year: v007, CMC: v008)
Flag variables indicate the information originally provided as input to the imputation process for the
date. Note that although date of current pregnancy started is imputed, the variable included in the
recode file is just the duration of pregnancy, calculated by subtracting the imputed date current
pregnancy started from date of interview.
Each of these steps is described in more detail in DHS Data Editing and Imputation (Croft, 1991)
https://www.dhsprogram.com/publications/publication-DHSG3-DHS-Questionnaires-and-Manuals.cfm.
For simplicity of calculation dates of key events are presented both as month and year and in terms of
Century Month Codes.
Century Month Code
Century month codes (CMC) are calculated by taking the difference between the year of an event and
1900, multiplying by 12, and adding the month of the event:
CMC = (Year – 1900) * 12 + Month
January 1900 is CMC, February 1900 is CMC 2, January 1901 is CMC 13, and December 1999 is CMC
1200. For example, the CMC for August 2018 is:
CMC = (2018 - 1900) * 12 + 8 = 1424
In other words, 1424 months have elapsed between January 1900 and August 2018, inclusive.
Based on CMC it is possible to calculate the month and year using the following formulas:
Year = int( ( CMC - 1 )/12 ) + 1900 [int(x) is the integer part of x]
Month = CMC - ( ( Year - 1900 ) * 12 )

Guide to DHS Statistics 1.26 August 2018
The year 1900 was chosen as the reference date because all of the DHS relevant events occurred during
the twentieth or twenty-first centuries. Century Month Codes was also used in the World Fertility
Surveys (https://wfs.dhsprogram.com/) that were the precursor to The DHS Program, and all dates in
those surveys (conducted from 1976 to 1984) were in the 20th century, hence the name.
Century month codes are particularly important to check consistency of dates, to calculate intervals
between events, and in the imputation of dates when the information for an event is missing or partially
complete. The main DHS events with their corresponding recode variable names are given above.
Example:
Let us see the events for a married, sterilized respondent with three births and with event dates that
occurred as shown in the following figure. If a horizontal line is drawn from the woman’s date of birth to
the date of interview, all the events can be depicted in the line.
Variables
v011
v509
b3_1
b3_2
b3_3
v317
v008
Dates
04/1992
10/2011
07/2013
10/2014
11/2016
04/2017
08/2018
CMC
1108
1342
1363
1378
1403
1408
1424
Event
Date of birth
Date of
marriage
Date of birth
of first child
Date of birth
of second
child
Date of birth
of third child
Date of
sterilization
Date of
interview
DHS uses century month codes extensively during the process of editing and imputing data. The
advantages of the approach include the following:
When checking for consistency, use of the century month codes makes it easy to check not only
that the events occurred in chronological order, but also that there should be a minimum
interval between them. For example b3_2 - b3_1 should be greater or equal to 9 months (the
expected duration of a pregnancy).
For imputation purposes, if information were missing between two events, the random
imputation would be quite reasonable. For example, if date of birth for the second child is
unknown, that birth should have occurred between the first birth plus nine months, and nine
months before the third birth. The lower and upper limits for a random number generator are
plausible, e.g.:
random (b3_1 + 9, b3_3 - 9) = random (1372, 1394)
The use of CMC in analysis facilitates the calculation of intervals or ages at different events. Throughout
The DHS Program analysis programs, instructions such as those shown below are very common:
Respondent’s age = int( (v008 - v011)/12 ) (1424 - 1108)/12 = 26 years
Age at first birth = int( (b3_1 - v011)/12 ) (1363 - 1108)/12 = 21 years
Age at sterilization = int( (v317 - v011)/12 ) (1408 - 1108)/12 = 25 years
Age of last child in months = v008 - b3_3 1424 - 1403 = 11 months
Interval between birth 1 and 2 = b3_2 - b3_1 1378 - 1363 = 15 months
Months since sterilization = v008 - v317 1424 - 1408 = 16 months
Guide to DHS Statistics 1.27 August 2018
DHS recommends that analysts use the century month code variables when dealing with intervals or
ages at different events.
The Century Month Code works well for most DHS analyses, but there are three countries that use non-
western calendars. To date these countries are:
• Ethiopia: The Ethiopian calendar is 7-8 years behind the Gregorian (Western) calendar, and the
Ethiopian year starts around September 11th or 12th of each year (exact day varies). 1st July
2017 is 24 Sane (the 10th month) 2009 in the Ethiopian calendar. The Ethiopian calendar
consists of 12 months of 30 days, plus one month of 5 days (or 6 days in a leap year). The
century month codes in the dataset are all based on the Ethiopian calendar, but “squeezing” the
13th month into a 12 month calendar. The reference date for surveys in Ethiopia is 1 Mäskäräm
1900 in the Ethiopian Calendar, which is September 12, 1907 in the Gregorian calendar. To
approximately adjust dates to the Gregorian calendar add 92 months to the CMC.
• Nepal: The Nepali calendar is 56-57 years ahead of the Gregorian (Western) calendar, and the
Nepali year starts around mid-April of each year (exact day varies). 1st July 2017 is 17 Ashad (the
3rd month) 2074 in the Nepali calendar. The Nepali calendar is made up of 12 months of
between 28 and 32 days, and the number of days in a month can vary from year to year. The
century month codes in the dataset are all based on the Nepali calendar. The reference date for
surveys in Nepal is 1 Baisakh 1900 in the Nepali Calendar, which is April 16, 1843 in the
Gregorian calendar, for all surveys in Nepal except for the Nepal DHS 1996, in which the
reference date was 1 Baisakh 2000 in the Nepali Calendar, which is April 14, 1943 in the
Gregorian calendar. To approximately adjust dates to the Gregorian calendar subtract 681
months from the CMC, or, in the case of Nepal DHS 1996, add 519 months.
• Afghanistan: The Afghan calendar is 621-622 years behind the Gregorian (Western) calendar,
and the Afghan year starts around March 20th or 21st of each year (exact day varies). 1st July
2017 is 10 Saratan (the 4th month) 1396 in the Afghan calendar. The Afghan calendar is made up
of 12 months, the first 6 of which have 31 days, the next 5 months have 30 days, and the last
month has 29 or 30 days in a leap year. The century month codes in the dataset are all based on
the Afghan calendar with 1300 as the base year, rather than 1900. The reference date of surveys
in Afghanistan is 1 Hamal 1300, which is March 21, 1921 in the Gregorian calendar. To
approximately adjust dates to the Gregorian calendar add 255 months to the CMC.
All calculations with CMCs in these surveys work as they do for any other survey. The exception is any
analysis requiring specific years, in which case adjustments must be made to the calculated CMC as
described above. It should be noted, however, that these are approximate adjustments as the calendars
start in the middle of months and dates of events to the day would be required to calculate exact
adjustments.
Century Day Code
In DHS-7, The DHS Program introduced the collection of day of birth of children in the birth history in
addition to the month and year of birth. Adding day of birth permits calculating the age of children
more accurately. Calculating age in months using just month and year of birth and month and year of
interview meant that age in months could be off by one month in approximately half of all cases. For
many analyses this difference was small and had little effect, but for some analyses this difference could

Guide to DHS Statistics 1.28 August 2018
be more meaningful. With the introduction of day of birth, and the need to calculate age of children
more accurately, The DHS Program introduced the Century Day Code (CDC). The Century Day Code is the
number of days from the beginning of 1900. January 1, 1900 is CDC 1, January 2, 1900 is CDC 2,
December 31, 1999 is CDC 36525, and August 1, 2018 is CDC 43313. The Century Day Code is not simple
to calculate manually, but it is the same system used in Excel for calculations between dates. To find the
CDC for a date using Excel, enter the date into a field (say A1), and then, in another field (say B1) enter
=VALUE(A1). Similarly, to get the date from a CDC value in Excel, use the day(), month() and year()
functions in Excel (or simply convert the Numeric cell to a Date type cell).
The Century Day Codes are used with the date of birth of children and the date of interview and permit
the calculation of age of children accurate to the day (see Age of Children). For some dates of birth of
children, the exact date may not be fully specified at the time of data collection. For these dates an
imputation process is followed, building on the imputation process for date variables described above,
and resulting in the imputation of a century day code for all children in the woman’s birth history.

Guide to DHS Statistics 1.29 August 2018
Analyzing DHS Data
It is important that analysts be familiar with certain key aspects of DHS data to be able to calculate
accurately the indicators described in further chapters. The following sections describe some of the key
elements to pay attention to in analyzing DHS data.
Sample Design, Stratification and Sampling Weights
DHS sample designs are usually two-stage probability samples drawn from an existing sample frame,
generally the most recent census frame. A probability sample is defined as one in which the units are
selected randomly with known and nonzero probabilities. A sampling frame is a complete list of all
sampling units that entirely covers the target population.
Stratification is the process by which the sampling frame is divided into subgroups or strata that are as
homogeneous as possible using certain criteria. Within each stratum, the sample is designed and
selected independently. The principal objective of stratification is to reduce sampling errors. In a
stratified sample, the sampling errors depend on the population variance existing within the strata but
not between the strata. Typically, DHS samples are stratified by geographic region and by urban/rural
areas within each region.
Within each stratum, the sample design specifies an allocation of households to be selected. Most DHS
surveys use a fixed take of households per cluster of about 25-30 households, determining the number
of clusters to be selected. In the first stage of selection, the primary sampling units (PSUs) are selected
with probability proportional to size (PPS) within each stratum. The PSUs are typically census
enumeration areas (EAS). The PSU forms the survey cluster. In the second stage, a complete household
listing is conducted in each of the selected clusters. Following the listing of the households a fixed
number of households is selected by equal probability systematic sampling in the selected cluster.
The overall selection probability for each household in the sample is the probability of selecting the
cluster multiplied by the probability of selecting the household within the cluster. The overall
probability of selection of a household will differ from cluster to cluster. See Appendix A of the DHS
Survey Reports for most surveys for the details specific to that survey.
DHS dataset users should be aware that, in most cases, the data must be weighted. This is because the
overall probability of selection of each household is not a constant. The following describes how DHS
weights are constructed and when they should be used.
Sampling weights
Sampling weights are adjustment factors applied to each case in tabulations to adjust for differences in
probability of selection and interview between cases in a sample, due to either design or happenstance.
In DHS surveys, in most surveys the sample is selected with unequal probability to expand the number
of cases available (and hence reduce sample variability) for certain areas or subgroups for which
statistics are needed. In this case, weights need to be applied when tabulations are made of statistics to
produce the proper representation. When weights are calculated because of sample design, corrections
for differential response rates are also made.
Guide to DHS Statistics 1.30 August 2018
There are four main sampling weights in DHS surveys: household weights, household weights for the
men’s subsample, individual weights for women, and individual weights for men:
The household weight (hv005) for a particular household is the inverse of its household
selection probability multiplied by the inverse of the household response rate in the stratum.
The household weight for the men’s subsample (hv028) for a particular household is the inverse
of its household selection probability for the subsample multiplied by the inverse of the
household response rate for the subsample in the stratum.
The individual weight for women (v005) is the household weight (hv005) multiplied by the
inverse of the individual response rate for women in the stratum.
The individual weight for men (mv005) is the household weight for the men’s subsample
(hv028) multiplied by the inverse of the individual response rate for men in the stratum.
There may be additional sampling weights for sample subsets, such as anthropometry, biomarkers, HIV
testing, etc. There is only a need for the additional sample weights if there is a differential probability in
selecting the subsamples. For example, if one in five households is selected in the whole sample for
doing biomarkers, then an additional sample weight is not necessary. However, if one in five households
in urban areas and one in two households in rural areas are selected, then an additional sample weight
is necessary when estimating national levels or for any group that includes cases from both urban and
rural areas. Notwithstanding the foregoing, the DHS has customarily included both household weights
and individual weights for the subsample for the men’s surveys, normalizing the weights for the number
of households in the subset for the men’s surveys, and to the number of men’s individual interviews
even when no differential sub-selection has been used.
Response rate groups are groups of cases for which response rates are calculated. In DHS surveys,
households and individuals are grouped into sample strata and response rates are calculated for each
stratum.
Household Response Rate
Coverage: All households. Excluded are dwellings without a household (no household lives in the
dwelling, address is not a dwelling, or the dwelling is destroyed).
Numerator: Number of households with a completed household interview (hv015 = 1).
Denominator: Number of households with a completed household interview, households that live in the
dwelling but no competent respondent was at home, households with permanently postponed or
refused interviews, and households for which the dwelling was not found (hv015 in 1, 2, 4, 5, 8).
The household response rate for the men’s subsample is calculated in the same way, but restricting
numerator and denominator to household selected for the men’s subsample.
Women’s Individual Response Rate
Coverage: Women eligible for interview, usually women age 15-49 who stayed in the household the
night before the survey. In ever-married samples, women are eligible for interview only if they have ever
been married or lived in a consensual union. In some surveys, the age range of eligibility has differed,
e.g., ever-married women age 12-49.
Guide to DHS Statistics 1.31 August 2018
Numerator: Number of eligible women with a completed individual interview (v015 = 1).
Denominator: Number of eligible women with a completed individual interview, eligible women not
interviewed because they were not at home, eligible women with permanently postponed or refused
interviews, eligible women with partially completed interviews, eligible women for whom an interview
could not be completed due to incapacitation or other reasons (v015 in 1:9).
Men’s Individual Response Rates
Coverage: Men eligible for interview, usually men age 15-49, 15-54, or 15-59 who stayed in the
household the night before the survey. In ever-married samples, men are eligible for interview only if
they have ever been married or lived in a consensual union. The age range of eligibility varies from
survey to survey.
Numerator: Number of eligible men with a completed individual interview (mv015 = 1).
Denominator: Number of eligible men with a completed individual interview, eligible men not
interviewed because they were not at home, eligible men with permanently postponed or refused
interviews, eligible men with partially completed interviews, eligible men for whom an interview could
not be completed due to incapacitation or other reasons (mv015 in 1:9).
Normalization of weights
Sample design weights are produced by the DHS sampler using the sample selection probabilities of
each household and the response rates for households and for individuals. The initial design weights are
then normalized by dividing each weight by the average of the initial weights (equal to the sum of the
initial weight divided by the sum of the number of cases) so that the sum of the normalized weights
equals the sum of the cases over the entire sample. The normalization is done separately for each
weight.
Application of sampling weights
Sample weights are calculated to six decimals but are presented in the standard recode files without the
decimal point. They need to be divided by 1,000,000 before use to approximate the number of cases.
Sampling weights can be applied in two main ways:
1) A simple application of weights when all that is needed are indicator estimates.
2) As part of complex sample parameters when standard errors, confidence intervals or
significance testing is required for the indicator.
The methods of applying the weights varies across the various statistical software.
Example 1: Simple weighting
The below examples for Stata, SPSS and R produce simple weighted estimates of current use of modern
methods. Note that any standard error or confidence interval given by the below commands assume a
simple random sample and do not take into account the complex sample used in DHS surveys.

Guide to DHS Statistics 1.32 August 2018
Stata
* Open the model dataset
use "ZZIR62FL.DTA", clear
* Percentage currently using a modern method
gen modern_use = (v313 == 3)
* Create weight variable
gen wt = v005/1000000
* Tabulate indicator by region
mean modern_use [iw=wt], over(v024)
Mean estimation Number of obs = 8,348
_subpop_1: v024 = region 1
_subpop_2: v024 = region 2
_subpop_3: v024 = region 3
_subpop_4: v024 = region 4
--------------------------------------------------------------
Over | Mean Std. Err. [95% Conf. Interval]
-------------+------------------------------------------------
modern_use |
_subpop_1 | .1724828 .007062 .1586395 .1863262
_subpop_2 | .2148514 .0102385 .1947815 .2349213
_subpop_3 | .3124085 .0096652 .2934622 .3313547
_subpop_4 | .1928716 .0099471 .1733729 .2123704
--------------------------------------------------------------
SPSS
* Open the model dataset.
get file = "ZZIR62FL.SAV".
* Percentage currently using a modern method.
compute modern_use = (v313 = 3).
* Create weight variable.
compute wt = v005/1000000.
weight by wt.
* Tabulate indicator by region.
means tables=modern_use by v024 /cells mean count.
Report
modern_use
V024 Region
Mean
N
1 Region 1
.1725
2863
2 Region 2
.2149
1610
3 Region 3
.3124
2300
4 Region 4
.1929
1574
Total
.2231
8348

Guide to DHS Statistics 1.33 August 2018
R
# load libraries
library(foreign)
library(plyr)
# Open the model dataset
dta <- read.dta("ZZIR62FL.dta", convert.factors = FALSE)
# Percentage currently using a modern method
dta$modern_use <- ifelse(dta$v313==3,1,0)
# Create weight variable
dta$wt <- dta$v005/1000000
# Tabulate indicator by region
ddply(dta,~v024,summarise,mean=weighted.mean(modern_use, wt))
v024 mean
1 1 0.1724828
2 2 0.2148514
3 3 0.3124085
4 4 0.1928716
Complex sample designs
However when standard errors, confidence intervals or significance testing is required, then it is
important to take into account the complex sample design. For the complex sample design, it is
necessary to know three pieces of information – the primary sampling unit or cluster variable, the
stratification variable, and the weight variable.
The primary sampling unit variable is typically v021 (or hv021 or mv021). If this variable does not
contain the PSU number then, in all but a few surveys, the cluster number (v001 or hv001 or mv001) can
be used. In most surveys there is a one-to-one correspondence between the cluster number and the
PSU number, but in a small number of surveys, for example some of the surveys in Egypt, the PSU and
cluster number do not match one-to-one – see Appendix A in the DHS survey reports for details of the
sampling design.
The stratification variable is typically v023 (or hv023 or mv023), however the stratification variables
have not been consistently defined in many surveys and may need to be created. It is best to check the
sample design in Appendix A of the DHS survey reports to verify the stratification used in the design of
the sample. In many surveys, the stratification is based on urban and rural areas in each region (v024 x
v025).
The weight variable is v005 (or hv005 or mv005) divided by 1,000,000.
To apply the complex sample design parameters in estimating indicators each of the statistical software
use a different set of commands applying the sample design and producing the indicator estimates:
Stata: svyset and svy: commands
SPSS: csplan, csdescriptives and cstabulate commands
R: survey package, including svydesign and other svy functions.

Guide to DHS Statistics 1.34 August 2018
Example 2: Complex sample design weighting
The below examples for Stata, SPSS, and R, continuing on from example 1, demonstrate the use of the
complex sample designs for estimates of current use of modern methods, together with standard errors
and confidence intervals.
Stata
* define strata
gen stratum = v023
* alternative strata based on region and urban/rural
* egen stratum = group(v024 v025)
* complex sample design parameters
svyset v021 [pw=wt], strata(stratum)
svy: mean modern_use, over(v024)
Survey: Mean estimation
Number of strata = 8 Number of obs = 8,348
Number of PSUs = 217 Population size = 8,347.9996
Design df = 209
_subpop_1: v024 = region 1
_subpop_2: v024 = region 2
_subpop_3: v024 = region 3
_subpop_4: v024 = region 4
--------------------------------------------------------------
| Linearized
Over | Mean Std. Err. [95% Conf. Interval]
-------------+------------------------------------------------
modern_use |
_subpop_1 | .1724828 .0154383 .1420481 .2029175
_subpop_2 | .2148514 .0140044 .1872434 .2424594
_subpop_3 | .3124085 .0357686 .2418951 .3829219
_subpop_4 | .1928716 .0139509 .1653691 .2203742
--------------------------------------------------------------
SPSS
* Define strata.
compute stratum = v023.
* alternative strata based on region and urban/rural.
* compute stratum = v024 * 2 + v025.
* Complex sample design parameters.
csplan analysis
/plan file='C:\Temp\DHS_IR.csplan'
/planvars analysisweight=wt
/design strata=stratum CLUSTER=v021
/estimator type=wr.
* Complex Samples Descriptives.
csdescriptives
/plan file='C:\Temp\DHS_IR.csplan'
/summary variables=modern_use
/subpop table=v024 display=layered
/mean
/statistics se cin
/missing scope=analysis classmissing=exclude.

Guide to DHS Statistics 1.35 August 2018
Univariate Statistics
V024 Region
Estimate
Standard Error
95% Confidence Interval
Lower
Upper
1 Region 1
Mean
modern_use
.1725
.01544
.1420
.2029
2 Region 2
Mean
modern_use
.2149
.01400
.1872
.2425
3 Region 3
Mean
modern_use
.3124
.03577
.2419
.3829
4 Region 4
Mean
modern_use
.1929
.01395
.1654
.2204
R
library(survey)
# Complex sample design parameters
DHSdesign<-svydesign(id=dta$v021, strata=dta$v023, weights=dta$wt, data=dta)
# tabulate indicator by region
svyby(~modern_use, ~v024, DHSdesign, svymean, vartype=c("se","ci"))
v024 modern_use se ci_l ci_u
1 1 0.1724828 0.01543828 0.1422244 0.2027413
2 2 0.2148514 0.01400441 0.1874033 0.2422995
3 3 0.3124085 0.03576857 0.2423034 0.3825136
4 4 0.1928716 0.01395092 0.1655283 0.2202149
Notes and Considerations
The sum of the sample weights only equals the number of cases for the entire sample and not for
subgroups such as urban and rural areas.
Sample weights are inversely proportional to the probability of selection and are used to correct for the
under- or over-sampling of different strata during sample selection. If weights are not used, all
calculations will be biased toward the levels and relationships in the over-sampled strata. Comparisons
of regression coefficients, as well as rates, percentage, means, etc. coming from different surveys are
only valid if weights have been used to correct for the sample designs of the different surveys.
An option to use sample weights is included in virtually all procedures in all statistical packages. Weights
tend to increase the size of standard errors and confidence intervals, but not by large amounts.
Recommendations against the use of weights for estimating relationships, such as regression and
correlation coefficients, in prior versions of the Guide to DHS statistics are no longer DHS policy.
For more information on DHS sample design, stratification and sample weights, see the DHS Sampling
and Household Listing Manual (https://www.dhsprogram.com/publications/publication-DHSM4-DHS-
Questionnaires-and-Manuals.cfm). See also the DHS YouTube videos:
Part I: Introduction to DHS Sampling Procedures
Part II: Introduction to Principles of DHS Sampling Weights
Part III: Demonstration of How to Weight DHS Data in Stata
Part IV: Demonstration of How to Weight DHS Data in SPSS and SAS

Guide to DHS Statistics 1.36 August 2018
Households
Households are the primary unit selected for interview in DHS surveys. The definition of a household is
a person or group of related or unrelated persons who live together in the same dwelling unit(s), who
acknowledge one adult male or female as the head of the household, who share the same housekeeping
arrangements and who are considered a single unit.
Each country has its own definition of a household, which may vary slightly from this definition, but
generally the definition is very similar.
De Facto and De Jure Populations
When listing household members in the roster of a DHS Household Questionnaire, the household
respondent is asked “Please give me the names of the persons who usually live in your household and
guests of the household who stayed here last night, starting with the head of the household.” For each
person listed the respondent is asked “Does (NAME) usually live here?” and “Did (NAME) stay here last
night?” For most people listed, the answer to both questions will be yes. However, there are some
people for whom the respondent says yes, they usually live in the household, but no, they did not stay in
the household the previous night. Conversely, there may be some guests who do not usually live in the
household, but stayed in the household the previous night.
The group of people that usually live in the surveyed households are known as the de jure population (or
usual residents) and the group of people that stayed in the household the previous night are known as
the de facto population. Typically, more than 90 percent of the persons listed in the household roster
are both de jure and de facto household members.
Theoretically a person could be a de jure member in one household and a de facto member in another
household, and could potentially be included more than once in the survey. To avoid this potential
double counting of people it is important to ensure that either a de facto population or a de jure
population is selected for all analysis of the data. Either one is a valid population. DHS selects generally
selects a de facto sample as the response rate is usually higher for the de facto population as they
stayed in the household the previous night and are less likely to be away. The DHS individual women’s
recode (IR file) and men’s recode (MR file) only contain de facto women and men respectively.
In the household members recode (PR file), all persons listed in the household roster are included in the
file and the choice of population for reporting may differ depending on the indicator. For example, for
anthropometric measures, anemia testing, and HIV testing, The DHS Program selects the de facto
population as the persons must be measured and tested and the response rate is typically higher for this
group. However, for indicators that are about the household, such as the water and sanitation
indicators, and where the person may not be interviewed themselves, The DHS Program reports based
on the de jure population as the person usually lives in the household and uses the water and sanitation
facilities, whereas the water and sanitation facilities used by any guest in the household may be quite
different in their own household compared to the surveyed household.
For all indicators based on the household members (PR file), either the de jure population (hv102 = 1) or
the de facto population (hv103 = 1) is selected. See the YouTube video on De Jure and De Facto for
more information.

Guide to DHS Statistics 1.37 August 2018
Age of Children
The age of children is used frequently in selecting the children to be included in the denominators and
numerators of many of the indicators described in the following chapters. In DHS-7, The DHS Program
changed the way in which the age of children is calculated to provide a more accurate estimate of their
age. Day of birth was added for all births in the birth history in DHS-7 questionnaires. Adding day of birth
permits the calculation of ages of children in days, and allows for the more accurate calculation of age in
months (https://www.dhsprogram.com/data/calculating-the-age-of-children.cfm).
Due to the addition of the age in days, The DHS Program also introduced the Century Day Code (CDC) –
the number of days since January 1, 1900. Several variables related to the century day codes have been
added, and as well as several new age related variables:
v008a: CDC date of individual interview, similar to the century month code variable v008.
b17: Imputed day of birth for children of the respondent (similar to the imputed month and
year of birth in b1 and b2).
b18: CDC date of birth of children of the respondent.
b19: Age of child, or months since birth for children who have died, in completed months,
computed as:
b19 = int( (v008a - b18) / 30.4375)
hv008a: CDC date of household interview
hv807a: CDC date of biomarker data collection
hml16a: Age of child in months for children. Used for reporting malaria testing for children
hc1a: Age of child in days for children included in the biomarker questionnaire
hc20: CDC date of biomarker data collection for children. If date of measurement is included
for individual children the variable may be different than hv807a, for example when
retaking child’s measurements
hc32a: CDC date of birth of children included in the biomarker questionnaire
hw1a: Age of child in days for children included for anthropometry in the biomarker
questionnaire
Changes have also been made to the method of calculating several existing variables:
b8: Age of child in years – now calculated based on b19, instead of v008 - b3
b11, b12: Previous and succeeding birth interval. Previous birth interval was previously calculated
as b3(i) - b3(i+1), but is now calculated as int( (b18(i) - b18(i+1)) / 30.4375 ), and a
similar change is made for the succeeding birth interval
v208: Births in the five years preceding the survey
v209: Births in the 12 months preceding the survey
v222: Interval between last birth and date of interview in months
v238: Births in the three years preceding the survey
v337: Months of use of current contraceptive method
hc1: Age of child in months for children for whom anthropometric measures were taken,
computed as follows:
hc1 = int( (hv807a - hc32a) / 30.4375 )
hw1: Age of child in months for children of respondents for whom anthropometric measures
were taken. hw1 is set equal to hc1. Take note that hc1 and hw1 are calculated with
reference to the date of biomarker data collection, and this can occasionally differ from

Guide to DHS Statistics 1.38 August 2018
the date of individual interview, and so, on rare occasions hw1 and b19 may differ
slightly.
hml16: Age of child in months for children included in the malaria bed net roster
Additionally, anywhere that a restriction based on the age of the child or the number of months since a
birth, e.g. selecting all children born in the last five years, the condition has been changed to refer to
b19 instead of v008 - b3.
In surveys that introduced the day of birth of the child, changes have been made in the analysis of the
data in two main ways:
1) The restrictions on the denominator for tables now all use the age variables based on the
calculation to the day, rather than to the month. In most cases this means changing selections
such as
if (v008 - b3 < 60)
to
if (b19 < 60)
If the original restriction is applied, the analysis will exclude a small number of cases that are
included with the newer calculation. On average, this will add approximately half a month’s
worth of additional births or children into the analysis.
2) All background age group variables used in analysis are now based on the revised ages.
Previously on average, because the calculation method only considered month and year and not
day of birth, the age group of 0 months would have roughly half the number of cases of age
group 1 month, or other older single month age groups. With the new method, age group 0
months will have a roughly similar number of cases as other single month age groups.
These changes affect virtually all tables related to children, particularly to children under the age of five.
Fertility rate and childhood mortality rate tables are not currently changed as these tables exclude the
month of interview from calculations and effectively use complete months in the calculations.
For analysts it is recommended that they change their selection criteria in analysis from using v008 - b3
< xx to b19 < xx. It is possible to generalize the logic changes to creating b19 using the old approach if it
does not exist in the dataset, or to use b19 if it does exist. Below are examples for use in Stata and SPSS:
Stata
capture confirm variable b19
if _rc { // b19 does not exist, so create equivalent for old calculation method
gen b19 = v008 - b3
label variable b19 "Age of child in months or months since birth"
}
else {
capture assert b19 == .
if _rc == 0 { // b19 exists, but is empty
replace b19 = v008 - b3
}
}
tab yyy zzz [iw=wt] if b19 < xx

Guide to DHS Statistics 1.39 August 2018
SPSS
* check if pre- DHS-7 recode file.
if (char.index("123456789", char.substr(v000,3,1)) < 7) b19 = v008-b3.
variable label b19 "Age of child in months or months since birth".
* if not, check if b19 is empty.
if (sysmis(b19)) b19 = v008-b3.
compute filter_$=(b19 < xx).
filter by filter_$.
crosstab tables=yyy by zzz.
This approach will use b19 if it exists in the dataset, but otherwise create its equivalent using the old age
calculation method, and allow the production of analyses that are consistent with the tabulations in the
DHS reports.
Guide to DHS Statistics 1.40 August 2018
All Women Factors
Definition
Factors for adjusting ever-married samples to estimate statistics based on all women.
Coverage:
Population base: All de facto women (PR file).
Time period: Current status at time of survey.
All women factors are specific for individual years of age and specific for the particular subgroup to be
estimated (e.g., there are two sets of factors by type of area: one for urban areas and one for rural
areas).
Numerator: Number of all de facto women age 15-49 (hv103 = 1 & hv104 = 2 & hv105 in 15:49), by
single years of age (hv105) and background characteristics.
Denominator: Number of de facto ever-married women age 15-49 (hv103 = 1 & hv104 = 2 & hv105 in
15:49 & hv115 in 1:9), by single years of age (hv105) and background characteristics.
Variables: PR file.
hv103
Slept last night
hv104
Sex of household member
hv105
Age of household members
hv115
Current marital status
hv005
Household sample weight
Calculation
Numerator: From the household survey, tabulation by single year of age and by subgroup of the number
of women 15–49 years of age of any marital status who slept in the household the night before the
interview.
Denominator: From the household survey, tabulation by single year of age and by subgroup of the
number of women age 15–49 years who slept in the household the night before the interview who have
ever been married.
Tabulations use the household sampling weights (hv005).
All women factors are numerator divided by denominator. Factors are multiplied by 100 in the recode
file.
Example:
The following table shows an example of the number of women age 15-49 for all women, ever-married
women and
the resulting all women factors according to place of residence (urban/rural) and total. The

Guide to DHS Statistics 1.41 August 2018
distribution
w
as obtained from the household schedule for de facto women (women who stayed in
the
household the night before the survey). The data are weighted using the household weights.
Age
All Women
Ever-Married Women
All Women Factors x 100
Urban
Rural
Total
Urban
Rural
Total
Urban
Rural
Total
15
50.70
413.65
464.35
0.00
43.55
43.55
884
950
1066
16
48.18
466.25
514.44
0.00
127.09
127.09
884
367
404
17
41.07
381.55
422.61
15.84
254.55
270.40
884
150
156
18
42.16
380.85
423.01
20.01
301.43
321.44
211
126
132
19
58.19
377.12
435.31
35.83
318.74
354.57
162
118
123
20
57.33
387.45
444.78
40.69
351.82
392.51
141
110
113
21
53.13
293.66
346.78
41.45
263.32
304.77
128
112
114
22
50.88
318.50
369.38
37.06
305.28
342.34
137
104
108
23
35.92
383.58
419.51
28.06
359.32
387.38
128
107
108
48
17.46
175.20
192.66
17.46
172.85
190.31
100
101
101
49
14.18
152.22
166.40
13.51
152.22
165.73
105
100
100
The “all women factors” are calculated by dividing the total number of women by the number of ever-
married women for each characteristic (urban/rural and total) within each single age. The factor for
women 15 years old living in rural areas is 9.5 or an ever-married woman age 15 living in a rural area
represents 9.5
women of the total women population in that area for that survey. This value is calculated
by dividing 413.65 by 43.55.
It is important to note that there are no ever-married women for ages 15 and 16 in the urban areas. To
calculate the factors for those ages, the total number of women needs to be accumulated until an age
where ever-married women are found (age 17 in this case). The result of this accumulation is then
divided
by the number ever-married women found.
(50.70 + 48.18 + 41.07)/15.84 = 139.95/15.84 = 8.84
The same factor is applied to women ages 15, 16, and 17 because 15.84 ever-married women represent
the 139.95 accumulated women for those age groups.
Handling of Missing Values
Women with missing or unknown age are excluded from both the numerator and the denominator.
Women with unknown or missing marital status are considered never-married.
Notes and Considerations
Women in consensual unions and women separated from consensual unions are considered as ever-
married.
If there are no or very few women ever-married for a single age for the subgroup, then neighboring ages
are combined to calculate the all women factor, using the same value for each of the single ages.
Guide to DHS Statistics 1.42 August 2018
The all women factors for ever-married samples are the inverse of the proportions ever-married at the
time of the survey.
The all women factors are used because of the selection process used in the design of the sample.
Therefore, it is only appropriate to use internally generated factors and not to use information external
to the survey. For each subgroup to be estimated, the same factor is applied to each woman irrespective
of the time period to be estimated since it is based on sample selection.
In surveys using samples of ever-married women and ever-married men, the same methodology is used
to calculate all men factors.
Although the factors are calculated at the household level, they are normally used at the women’s level
(or men’s levels for ever-married men’s surveys). To do that, each woman is assigned a factor for each
characteristic for which the factors are calculated. The links to assign the factors are age and the
characteristic. In the example above an ever-married woman 18 years old, living in an urban area, would
be assigned the
factors 1.32 for the total (awfactt = 132) and 2.11 for place of residence (awfactu = 211).
When establishing the values for the
characteristics to be used as links, they must be taken from the
household members data (PR file) and not from the woman’s
data. The reason is that there may be
differences from the data reported in the Household Questionnaire compared with
the data recorded in
the Woman’s Questionnaire. A different person than the respondent to the Woman’s Questionnaire may
report age and education of the woman in the Household Questionnaire. However, when factors are
calculated they need to use the household variables (because not all women have an individual
interview).
Another important issue is that factors can only be calculated for characteristics present in the
Household Questionnaire. For example, factors for media exposure or knowledge of HIV/AIDS cannot be
calculated
because they are collected at the women’s level.
The appropriate all women factor to use in analysis is that of the woman’s reported single year of age
from the household survey at the time of the survey for the subgroup to be tabulated. Fortunately the
DHS individual recode files already includes the all women factors. DHS individual women’s recode files
(IR files) include five standard variables containing all women factors:
awfactt All women factor for total population
awfactu All women factor for place of residence (urban/rural)
awfactr All women factor for region (according to the country’s regions)
awfacte All women factor for education (none, primary, secondary, higher)
awfactw All women factor for wealth index (lowest, second, middle, fourth, highest)
Surveys may also include additional all women factors for other background characteristics, particularly
when survey specific educational groupings are used.
These variables are five-digit variables with two implicit decimals, so they must be divided by 100 before
applying.
Any table that is based on total population for ever-married samples should use these factors.
All tables
based on all women (fertility rates, age at first union, age at first sex, etc.) must use all women
factors.
If the background variable to be used is not one of the standard or country-specific all women
factors
they have to be created as described above.

Guide to DHS Statistics 1.43 August 2018
Application of All Women Factors
In tabulations, all women factors are treated as adjustments to the respondent sampling weight variable
for each woman, multiplying the weight variable for the woman by her appropriate all women factor to
inflate the number of cases from the number of ever-married women to the number of all women. In
many cases though it is not as simple as multiplying the sampling weight by the all women factor. For
example, to calculate the percentage married before age 15 of all women from an ever-married sample,
simply applying the all women factor to the weight variable would be to assume that the same
proportion of never-married women were married before age 15 as ever-married women, and this is
clearly impossible. Rather we know that no never-married women aged 15 and older were married
before age 15. In terms of the calculation, this means that the all women factor must be applied to the
denominator only, and not to the numerator.
Similarly, to calculate the mean number of children ever born for all women from an ever-married
sample, the assumption is made that never married women have had no children. Thus it is not
necessary to increase the numerator (the number of children ever born) as there are no children to add,
but it is necessary to inflate the denominator to include all women.
In practice, using statistical software, it is typically not possible to use simple percentages or means
when using all women factors, but rather to calculate ratios of variables. Below are examples of
calculating the mean number of children ever born in Stata and SPSS:
Stata
* Mean number of children ever born for ever-married women.
gen wt = v005/1000000
mean v201 [iw=wt]
* Mean number of children ever born for all women.
gen awf = awfactt/100
ratio v201 / awf [iw=wt]
SPSS
* Mean number of children ever born for ever-married women.
compute wt = v005/1000000.
weight by wt.
means tables=v201 /cells mean count.
* Mean number of children ever born for all women.
compute awf = awfactt/100.
weight by v005.
ratio statistics v201 with awf /print=wgtmean.
Note that in SPSS the ratio statistics command does not permit non-integer weights so v005 is used as
the weight directly without dividing by 1,000,000.
Guide to DHS Statistics 1.44 August 2018
Median Calculations
There are four different types of median calculations in DHS statistics, and results vary according to the
type of variable being analyzed. The calculations for the first three types of medians are calculated in a
similar manner and vary basically in the final result. Medians using the current status data are calculated
using a different methodology. To illustrate the approach used in calculating the first three types of
medians, consider the following table, which will be used in examples below:
Variable
Percentage
Cumulative
Percentage
…
…
19
21
9
28
22
7
35
23
8
43
24
9
52
25
6
58
26
5
63
…
…
…
Medians for Completed Time Periods
These are medians for variables such as intervals between events or ages calculated at different events.
Medians for this type of variable take into consideration that ages are given in completed years. The
median for completed time periods is calculated as:
median = mi + (0.5 - p i) / (p i+1 - p i) + 1
where i is the age category immediately prior to reaching 50%, mi is the number of completed years for
that category, p i is the cumulative proportion at the age category immediately prior to reaching 50%,
and p i+1 is the cumulative proportion at the age category immediately after reaching 50%.
A respondent who is currently 21 years old could be somewhere between 23 years and 0 days old and
23 years and 364 days old. The addition of 1 in the calculation is because the cumulative percentage for
a particular category is the percentage up to the end of the category. For example, the cumulative
percentage for age 23 is the cumulative percentage by age 24.
Example
If the variable above in question is age at an event in completed years, the median would be calculated
for a completed period. In this case the interpolation will take place between ages 23 and 24. The result
of the interpolation is 23 + (50 - 43)/(52 - 43) + 1 = 24.8. The one year has to be added as, according to
the completed year definition of age, the cumulative percentage of 43 percent occurred before reaching
24 years and the cumulative value of 52 percent occurred before reaching 25 years of age.
Examples of these types of medians are age at first sexual intercourse, age at first union, age at first
birth, age at sterilization, median number of months since preceding birth, and median number of
months pregnant at time of first antenatal care visit.
Guide to DHS Statistics 1.45 August 2018
Medians for Continuous Variables
These are medians for variables such as children’s weight at birth or any other type of measurement in
the continuous scale. The median for continuous variables is calculated as:
median = mi + (0.5 - p i) / (p i+1 - p i)
where i is the entry immediately prior to reaching 50%, mi is the value for that entry, p i is the
cumulative proportion at the value immediately prior to reaching 50%, and p i+1 is the cumulative
proportion at the value immediately after reaching 50%.
Example
If the variable in the table above was continuous, for example, time to collect water (for purposes of
simplicity, time is truncated to the minute). The interpolation would also take place between 23 and 24
minutes, and no adjustment is needed. The median time to collect water would then be 23.8 minutes.
The standard DHS-7 tabulation plan currently includes no examples of medians for continuous variables,
although median time to collect water, or median birth weight are examples of this type of median that
could be calculated using DHS data.
Medians for Discrete Variables
These types of medians apply to variables such as number of children, number of antenatal care visits,
or in general any discrete variable where the only possible values are integers. For example, a
respondent can only have one, two, or any integer number of children. It is not possible to have 2.3
children.
If the variable is discrete, the median would be obtained at 24 when 50 percent or more was reached.
However, it is also possible to present an interpolated median for discrete variables, and in this case the
same formula is used as for continuous variables. Examples of these medians in the Guide to DHS
Statistics include median years of education in Chapters 2 and 3.
Medians using Current Status Data
These types of medians are calculated for variables where 100 or close to 100 percent of the population
have a characteristic at the beginning of an event and the percentages diminish as time passes by. For
example, 100 percent of children do not know how to walk at birth. As time progresses, some children
begin to walk, and there is an age (in months) where 50 percent or more of the children learn to walk.
Current status data are used in DHS to calculate the median duration of breastfeeding, post-partum
amenorrhea, post-partum abstinence, and post-partum insusceptibility. Looking at how the median
duration of breastfeeding is
calculated (the same principle applies for amenorrhea, abstinence and
insusceptibility), information is first obtained on the
proportion of children currently being breastfed (for
breastfeeding, according to the children’s age in
months). For purposes of providing some stability to the
proportions, the birth data are grouped into two-month intervals. Before calculating the proportions, the
distribution is smoothed by a moving average of
three groups.
To smooth the distribution by a three-group moving average, sum the previous, current, and following
value of the distribution and divide it by 3. For example, the smoothed total children for the age group
2–3 comes from: (137.6 + 183.0 + 193.4)/3 = 171.3. The first (0–1) and last (34–35) age groups cannot be

Guide to DHS Statistics 1.46 August 2018
smoothed, so they remain with the original values. The number of children currently being breastfed is
also shown unsmoothed and smoothed. With the distributions smoothed, the percentages of children in
each group are calculated:
Age
Total
children
Children
breastfed
Total
children
smoothed
Children
breastfed
smoothed
Percentage
breastfed
0-1
137.6
152.0
137.6
152.0
90.5
2-3
183.0
192.3
171.3
186.7
91.8
4-5
193.4
215.9
186.1
206.7
90.0
6-7
181.8
211.8
181.5
210.6
86.2
8-9
169.4
204.2
173.5
206.2
84.2
10-11
169.4
202.6
162.4
199.0
81.6
12-13
148.5
190.2
164.2
203.4
80.7
14-15
174.6
217.3
148.9
203.9
73.0
16-17
123.6
204.1
132.5
206.4
64.2
18-19
99.3
197.7
92.1
177.4
51.9
20-21
53.5
130.5
62.3
144.5
43.1
22-23
34.0
105.3
42.2
148.2
28.5
24-25
39.2
208.9
31.4
186.5
16.8
26-27
21.0
245.4
24.7
213.9
11.6
28-29
14.0
187.5
13.9
202.5
6.9
30-31
6.7
174.6
9.4
159.8
5.9
32-33
7.5
117.4
7.0
149.5
4.7
34-35
6.7
156.4
6.7
156.4
4.3
The first age (duration) for which the proportion falls below 50 percent will be used for the calculation
of the median by linear interpolation between the midpoint of that age group and the next youngest
midpoint age. The median in this example falls between the age groups 18–19 and 20–21. Between
these two age groups is when the transition from more than 50 percent (51.9%) to less than 50 percent
(43.1%) of children still being breastfed occurred. The interpolation is then done between the midpoints
for the age groups. In DHS-7, the midpoint of the 18-19 month age group is the average of the lower
and upper limits of the age group (18.0+20.0)/2 = 19.0. Similarly for age group 20-21 the midpoint is
21.0. Note that in DHS-VI and earlier phases the midpoints would have been 18.5 and 20.5 respectively
due to the different calculation of age (the age distribution would also be different though). This is
because, prior to DHS-7, age of children was calculated in months only, and the month of interview was
on average only half a month, and consequently all following month groups had a midpoint half a month
less.
It should be noted that, in DHS-VI and earlier, the midpoint for the first age group is calculated in a
somewhat different manner. On average, there were only about half as many children born in the
month of the interview than in any other regular month. A reasonable age for children born in the
month of interview was 0.25, assuming that interviews are uniformly distributed. Thus, the age average
Guide to DHS Statistics 1.47 August 2018
for kids born 0 to 1 months was calculated as (0.5 * 0.25 + 1)/1.5 = 0.75. In DHS-7, the midpoint for the
first age group is simply (0.0 + 2.0)/2 = 1.0.
The median is calculated using the following formula:
median = mi + (mi+1 - mi) . (p i - 0.5) / (p i - p i+1)
median = 19.0 + (21.0 – 19.0) . (51.9 – 50.0) / (51.9 – 43.1)
median = 19.4
Details of the calculation of these medians are provided with each indicator in the chapters that follow.

Guide to DHS Statistics 1.48 August 2018
Matching and Merging Datasets
The DHS Program distributes separate datasets for households (HR), household members (PR), women’s
(IR), births (BR), children under five (KR), men’s (MR), and
couples (CR) files. Care has been taken to
include all variables deemed important for each of these files. For example, variables for household
characteristics are
included in the women, men, and children’s files. However, there are instances when
researchers need to
merge or combine different files to obtain the variables that meet their analysis
requirements. This section
discusses the variables and mechanisms that can be used to accomplish that
task.
ID Variables
One of the advantages of processing complex surveys with a software capable of handling hierarchical
files is that it allows tight control of the case identifiers. The DHS Program makes considerable effort to
ensure that files can be matched
seamlessly whenever a relationship is possible. To properly manipulate
the files it is necessary to know
the variables that identify cases in each file. The following table shows
those variables:
Type
File
ID Variable
Cluster
Number
Household
Number
Household Line
Number
Other IDs
HR
Household
hhid
hv001
hv002
PR
Household
members
hhid
hv001
hv002
hvidx
Mother: hv112
Father: hv114
IR
Women
caseid
v001
v002
v003
Husband: v034
MR
Men
mcaseid
mv001
mv002
mv003
Wives: mv034_i
BR
Births
caseid, bidx
v001
v002
Mother: v003
Child: b16
Birth: bidx
KR
Children
caseid, bidx
v001
v002
Mother: v003
Child: b16
Birth: bidx
CR
Couples
caseid
v001
v002
Wife: v003
Husband: mv003
AR
HIV test
hivclust
hivnum
hivline
GE
Geographic
dhsid
dhsclust
GC
Geospatial
covariates
dhsid
dhsclust
HW
Height &
weight
hwhhid, hwline /
hwcaseid, hwline
hwline
WI
Wealth
index
whhid
hhid
caseid
The ID variables hhid, caseid, and mcaseid are alphabetic variables that uniquely identify households,
women and men respectively. These variables are a concatenation of the cluster number and household
number for the household file, and cluster, household number, and line number for women, men, and
couples. The variable hhid is a 12 character string with the cluster and household number right-aligned
in the string. The variables caseid and mcaseid are 15 character strings with the cluster, household and
Guide to DHS Statistics 1.49 August 2018
line number right-aligned in the string. The first 12 characters of variables caseid and mcaseid match
with hhid, and are followed by 3 characters for the line number. In the concatenated variables numbers
are converted to strings with leading blanks for each part of the ID.
Example
File
ID
Variable
Width
Value
Cluster
Number
Household
Number
Line
Number
Household
hhid
12
"......17..23"
17
23
Women
caseid
15
"......17..23..2"
17
23
2
Men
mcaseid
15
"......17..23..1"
17
23
1
Note: A dot (.) is used above to represent a blank in the ID values.
The layout of the hhid and caseid strings will vary depending on the number of digits used for the cluster
and household number in the survey. In addition, some surveys also include a dwelling number in the
hhid and caseid string between the cluster and household number.
In the case of children, variable caseid is the same as that of their mother plus a consecutive number to
differentiate among children in reverse chronological order. The ID for couples is that of the woman
(caseid - as opposed to mcaseid for the man) because in polygynous countries a man can be the partner
for more than one woman.
Type of Relationship
When merging data files it is important to know the type of relationship that exists between the files to
be merged as well as the type of output file desired (unit of analysis). There are two main types of
relationships: The first is that of many entities related to one entity (m:1) and the second is that of one
entity related to just one other entity (1:1). A third possibility is a many to many relationship, but that is
not generally used in analyzing DHS data.
An example of many to one relationships can be found between women or men and households. There
may exist zero or several Woman’s or Man’s Questionnaires for each household (see Structure of DHS
Data), and there is just one household that will match each woman or man.
An example of one to one relationships can be found between children of interviewed women in the KR
file and the children’s records as household members in the PR file. There will be at most one record in
the PR file for a child in the KR file, but there could be no record in the PR file if the child has died or the
child does not live in the household. [Note – however, that when merging PR data for a child to the KR
data, it may be necessary to define the relationship as many to one (m:1) as the household line number
will be not applicable (missing in Stata, system missing in SPSS) for any child who has died or lives
elsewhere and is not listed in the household schedule, and these may appear as duplicate IDs.]
In some surveys, the couple’s relationship between a woman and man may be considered a one to one
relationship, but in many surveys there are polygynous unions and so the relationship is usually a many
to one (m:1) relationship between women and men.
Guide to DHS Statistics 1.50 August 2018
Merging files
All statistical packages, including Stata, SPSS, SAS and R, have commands that allow merging of files, but
regardless of the software the following steps are necessary:
Determine the common identifiers (identification variables)
Determine the base (primary) file. The base file essentially establishes the unit of analysis
Determine the variables to merge from the secondary file to the primary file
Ensure both data files are sorted by the identification variables
Finally, use the right commands for the software to merge the files
Normally, when the relationship is that of many to one (m:1), the base file is the one with the many
entities. For example, if merging data from households and women, the base file should be the women’s
file because this will assign to every woman the characteristics of her household. If the match is done
the other way around, in some software, once the program matches the first woman it will not look for
another woman or it will give an error for finding duplicate cases. In the case of matching women and
children, the base file should be the children’s file, and the mothers’ characteristics are assigned to
children.
In DHS surveys, Man’s Questionnaires are often applied to a subsample of households. This means that
not all currently married women have a match with a Man’s Questionnaire. In this case, the base file
should the Man’s Questionnaire and the resulting file (unit of analysis) will be the Couples file.
If the relationship is that of one to one (1:1), the base file is normally the one with the smaller number
of cases.
Merging can be performed using either the ID variables (hhid, caseid, mcaseid) or using the cluster
number (hv001, v001, mv001), household number (hv002, v002, mv002), and household line number
(hvidx, v003, mv003, or other line number variables). Most matches will work using either set of
information in most cases, but there are some issues with some surveys:
The ID variables are left-aligned in a few surveys, rather than right aligned, complicating
converting caseid to hhid. This can be corrected by right aligning the variable:
Stata:
replace hhid = substr(" ",1,12-length(hhid)) ///
+ substr(hhid,1,length(hhid))
SPSS:
compute hhid = concat(char.substr(" ",1,12-char.length(hhid)),
char.substr(hhid,1,char.length(hhid))).
In some surveys hhid has a different length than 12 or caseid or mcaseid has a different length
than 15. These can usually be corrected to the right length, but care should be taken to ensure
that no data are lost from the IDs in the process.
The combination of cluster, household and line number is not unique in some surveys. For these
surveys, typically there is also a dwelling number which must be used, and the household
number is the number within the dwelling. For these surveys it is necessary to include the
dwelling number in the set of variables used for matching. The dwelling number will usually be

Guide to DHS Statistics 1.51 August 2018
a survey-specific variable starting with “sh”, “s”, or “sm” for household, women’s and men’s
files.
Examples
The following is a list of common combinations of datasets that may be merged together:
Unit of analysis
(Base or Primary
file)
Matched with
(Secondary file)
Relation-
ship
Needed to merge in
Household
members (PR)
Household (HR)
m:1
Mostly not needed – household variables
already included in PR file, however
needed for merging net roster for ITN
access indicators.
Children in
household
members file (PR)
(Example 2 below)
Parent in household
members file (PR)
m:1
Parent’s characteristics
Children in
household
members file (PR)
Mother in women’s
file (IR)
m:1
Mother’s characteristics
Children in
household
members file (PR)
Child in children’s file
(KR or BR)
1:1
Child’s characteristics
Children in
household
members file (PR)
Height/weight file
(HW) (for surveys pre
2007)
1:1
Child’s anthropometry
Women (IR)
Household (HR)
m:1
Household characteristics
Men (MR)
Household (HR)
m:1
Household characteristics
Children of
interviewed
women (KR or BR)
(Example 1 below)
Household (HR)
m:1
Household characteristics
Women (IR)
Woman in household
members file (PR)
1:1
Woman’s biomarkers or other
characteristics of woman
Men (MR)
Man in household
members file (PR)
1:1
Man’s biomarkers or other characteristics
of man
Children of
interviewed
women (KR or BR)
Child in household
members file (PR)
1:1
Child’s biomarkers or other characteristics
of child
Women or Men
(IR/MR)
HIV test (AR)
1:1
HIV test results
Women (IR)
Partner in men’s file
(MR)
m:1
Not needed – use the Couple’s (CR) file
Children of
interviewed
women (KR or BR)
Woman (IR)
m:1
Not needed – woman’s variables already
included in KR or BR file

Guide to DHS Statistics 1.52 August 2018
Children of
interviewed
women (KR or BR)
Mother in household
members file (PR)
m:1
Mother’s biomarkers or other
characteristics of mother
Children of
interviewed
women (KR or BR)
Height/weight file
(HW) (for surveys pre
2007)
1:1
Child’s anthropometry
Household
members (PR)
Mosquito nets (HR)
m:1
Characteristics of mosquito nets
All (HR, PR, IR, KR,
BR, MR, CR)
Wealth index files
(WI) (for early
surveys)
m:1
Wealth index
All (HR, PR, IR, KR,
BR, MR, CR)
Geographic (GE)
m:1
GPS coordinates
All (HR, PR, IR, KR,
BR, MR, CR)
Geospatial covariates
(GC)
m:1
Geospatial covariates
A few of these types of merges are not typically needed as the variables of interest are already included
in the base file.
Most merges can be done in a number of ways, but typically follow the approach of:
1. Opening the secondary file, and extracting just the variables that need to be merged together
with the ID variables for matching, sorting the data on the ID, and saving into a temporary file.
This may include renaming ID variables or variables to be merged to facilitate the merge.
2. Opening the primary file, ensuring that the same ID variables are available, sorting on the IDs.
3. Merging as a many to one (m:1) or one to one (1:1) match on the ID variables.
Below are a few examples in Stata and SPSS of typically merges from the list above.
Example 1:
This example merges household characteristics from the household (HR) file to the children under five
(KR) file. This is a relatively simple merge based on the household ID using either hhid or the
combination of cluster number and household number. When using the household ID (hhid) it is
necessary to construct this from the caseid variable in the KR file for matching. Alternatively, using the
cluster number and household number, the variables in the household file are renamed to permit
matching. Either approach to matching should produce the same results.
Stata
* Example of matching and merging household characteristics to children under five
* open secondary file, e.g. household file, selecting just the variables needed
use hhid hv001 hv002 hv201 hv205 using "ZZHR62FL.dta", clear
* rename, generate or clone variables to be used for matching
rename hv001 v001
rename hv002 v002
* sort according to the ID variables
sort hhid
* or, sort v001 v002

Guide to DHS Statistics 1.53 August 2018
* save temporary file of just the variables to merge in
tempfile secondary
save "`secondary'", replace
* open primary file
* e.g. Children's file
use "ZZKR62FL.dta", clear
* creating matching variables
gen hhid = substr(caseid,1,12)
* or use v001 and v002 below
* sort according to the ID variables needed for matching
sort hhid
* or, sort v001 v002
* now merge the data from the secondary file to the primary file
* keep(master match) keeps all entries from the KR file
merge m:1 hhid using "`secondary'", keep(master match) keepusing(hv201 hv205)
* or, merge m:1 v001 v002 using "`secondary'", keep(master match) keepusing(hv201
hv205)
* check the merge - should all be matched
tab _merge
SPSS
* Example of matching and merging household characteristics to children under five.
* open secondary file, e.g. household file, selecting just the variables needed.
get file = "ZZHR62FL.sav"
/keep hhid hv001 hv002 hv201 hv205.
* note that if width of hhid is 36 not 12, close the file and set unicode off.
* rename or compute variables to be used for matching.
rename variables (hv001 = v001) (hv002 = v002).
* sort according to the ID variables.
sort cases by hhid.
* or, sort cases by v001 v002.
* name the working dataset.
dataset name secondary.
* open primary file.
* e.g. Children's file.
get file = "ZZKR62FL.sav".
* creating matching variables.
string hhid (a12).
compute hhid = char.substr(caseid,1,12).
* or use v001 and v002 below.
* sort according to the ID variables needed for matching.
sort cases by hhid.
* or, sort cases by v001 v002.
* now merge the data from the secondary file to the primary file.
match files /file = * /table = secondary /by hhid.
* or, match files /file = * /table = secondary /by v001 v002.
* close the secondary file.

Guide to DHS Statistics 1.54 August 2018
dataset close secondary.
* check the merge - should all be matched.
frequencies variables=hv201.
Note for SPSS users: If the string variables for hhid or caseid are three times the expected size (expected
size: 12 for hhid and 15 for caseid), the file was opened in Unicode mode. Close the file, set unicode off,
and retry.
Example 2:
This example merges mother’s characteristics from the household members (PR) file to the children’s
records in the household members (PR) file. This example looks complicated in that both the base file
and the secondary file are the same file, but is relatively simple. It requires creating a simple file of the
selected characteristics, with the ID variables, and then matching that file to the PR file based on the
correct IDs. A person ID variable (pid) is created for use in matching and is based on the household
member line number in the secondary file, and on the mother’s line number in the primary file. This will
match only for the children whose mother is also listed in the household members file.
Stata
* Example merging mother's characteristics into household members data (PR)
* open secondary file (household member's - PR)
* for mother's characteristics, e.g. age and level of education
use hhid hvidx hv105 hv106 using "ZZPR62FL.dta", clear
* rename person ID for matching on, and mother's age and education vars
rename hvidx pid
rename hv105 mother_age
rename hv106 mother_educ
label variable mother_age "Mother's age"
label variable mother_educ "Mother's education"
* sort file by IDs
sort hhid pid
* save temporary data file
tempfile secondary
save "`secondary'", replace
* open primary file - also PR file
use "ZZPR62FL.dta", clear
* generate person ID for matching on - based on mother's ID
gen pid = hv112
* sort file by IDs
sort hhid pid
* merge mother's characteristics into PR file
merge m:1 hhid pid using "`secondary'", keep(master match)
* check the merge - data only available for children under 18
tab _merge if hv105 < 18,m
* majority of children have mothers also in HH, but many don't
SPSS
* Example merging mother's characteristics into household members data (PR).
* open secondary file (household member's - PR)
* for mother's characteristics, e.g. age and level of education.

Guide to DHS Statistics 1.55 August 2018
get file = "ZZPR62FL.sav"
/keep hhid hvidx hv105 hv106.
* rename person ID for matching on, and mother's age and education vars.
rename variables (hvidx = pid) (hv105 = mother_age) (hv106 = mother_educ).
variable labels mother_age "Mother's age".
variable labels mother_educ "Mother's education".
* sort file by IDs.
sort cases by hhid pid.
* name the working dataset.
dataset name secondary.
* open primary file - also PR file.
get file = "ZZPR62FL.sav".
* generate person ID for matching on - based on mother's ID.
compute pid = hv112.
* sort file by IDs.
sort cases by hhid pid.
* merge mother's characteristics into PR file.
match files /file = * /table = secondary /by hhid pid.
* close the secondary file.
dataset close secondary.
* check the merge - data only available for children under 18.
compute merge_var = (sysmis(mother_age)).
value labels merge_var 0 "Matched" 1 "No match".
compute filter_$ = (hv105 < 18).
filter by filter_$.
frequencies variables=merge_var.
* majority of children have mothers also in HH, but many don't.
This approach can also be used to match women’s characteristics from the IR file to the children’s
characteristics in the PR file. The only differences are in creating the temporary file, based on the IR file
data. It requires constructing hhid from caseid as in the prior example (or using the cluster and
household number) and creating pid from the woman’s line number (v003).
Example 3:
This example merges children’s characteristics from the household members (PR) file to the children
under five (KR) file. In this example, rather than creating the matching variables in the secondary file,
they are created in the base file. In Stata, because b16 will be missing for dead children or children
living elsewhere, the merge must be treated as many to one (m:1), even though the cases actually
merging will be one to one. This is because the IDs must be unique for a 1:1 match, but as more than
one case within a household may be missing for b16, they are not unique. The KR file could be subset to
only include children listed in the household before the merge, and then a 1:1 match can be used.
Stata
* Example merging children's characteristics from PR into children under five data
(KR)
* open secondary file (household member's - PR)
* for children's characteristics, e.g. birth registration
use hhid hvidx hv140 using "ZZPR62FL.dta", clear
* sort file by IDs
sort hhid hvidx

Guide to DHS Statistics 1.56 August 2018
* save temporary data file
tempfile secondary
save "`secondary'", replace
* open primary file - KR file
use "ZZKR62FL.dta", clear
* generate household and person ID for matching on
gen hhid = substr(caseid,1,12)
gen hvidx = b16
* sort file by IDs
sort hhid hvidx
* merge mother's characteristics into PR file
merge m:1 hhid hvidx using "`secondary'", keep(master match)
* check the merge
tab b16 _merge,m
* majority of children in KR file are also in PR file, but not all
SPSS
* Example merging children's characteristics from PR into children under five data
(KR).
* open secondary file (household member's - PR)
* for children's characteristics, e.g. birth registration.
get file = "ZZPR62FL.sav"
/keep hhid hvidx hv140.
* sort file by IDs.
sort cases by hhid hvidx.
* name the working dataset.
dataset name secondary.
* open primary file - KR file.
get file = "ZZKR62FL.sav".
* generate household ID and person ID for matching on.
string hhid (a12).
compute hhid = char.substr(caseid,1,12).
compute hvidx = b16.
* sort file by IDs.
sort cases by hhid hvidx.
* merge children's characteristics into KR file.
match files /file = * /table = secondary /by hhid hvidx.
* close the secondary file.
dataset close secondary.
* check the merge.
compute merge_var = (sysmis(hv140)).
value labels merge_var 0 "Matched" 1 "No match".
frequencies variables=merge_var.
* majority of children in KR file are also in PR file, but not all.
Example 4:
This example merges HIV test results from the AR file to the women’s data (IR) file. In this example, the
hhid and caseid variables do not exist in the AR file, so the merge will be based on the cluster,
household, and line number variables. The relationship between the cases is a 1:1 match, and the
women’s data will be the base file.

Guide to DHS Statistics 1.57 August 2018
Stata
* Example merging HIV test results from AR into women's data (IR)
* open secondary file (HIV test results - AR)
use using "ZZAR61FL.dta", clear
* rename matching variables to the same as in the IR file
rename hivclust v001
rename hivnumb v002
rename hivline v003
* sort file by IDs
sort v001 v002 v003
* save temporary data file
tempfile secondary
save "`secondary'", replace
* open primary file - IR file
use "ZZIR62FL.dta", clear
* sort file by IDs
sort v001 v002 v003
* merge HIV test results into IR file
merge 1:1 v001 v002 v003 using "`secondary'", keep(master match)
* check the merge
tab _merge,m
* women were tested in roughly half the sample, and some refused testing
* need to merge in PR file data to check this though.
SPSS
cd "C:\Users\21180\OneDrive - ICF\Data\DHS_model".
* Example merging HIV test results from AR into women's data (IR).
* open secondary file (HIV test results - AR).
get file = "ZZAR61FL.sav".
* rename matching variables to the same as in the IR file.
rename variables (hivclust = v001) (hivnumb = v002) (hivline = v003).
* sort file by IDs.
sort cases by v001 v002 v003.
* name the working dataset.
dataset name secondary.
* open primary file - IR file.
get file = "ZZIR62FL.sav".
* sort file by IDs.
sort cases by v001 v002 v003.
* merge HIV test results into IR file.
match files /file = * /table = secondary /by v001 v002 v003.
* close the secondary file.
dataset close secondary.
* check the merge.
compute merge_var = (sysmis(hiv03)).
value labels merge_var 0 "Matched" 1 "No match".
frequencies variables=merge_var.
* women were tested in roughly half the sample, and some refused testing
* need to merge in PR file data to check this though.
Guide to DHS Statistics 1.58 August 2018
Background characteristics
In most DHS report tabulations, results are presented by background characteristics. These
characteristics fall in to groups according to the unit of analysis to which they apply. These units include
the cluster, household, household member, individual woman respondent, individual man respondent,
birth or child. Characteristics from higher levels may also be used in tabulations at lower levels. For
example, cluster level characteristics such as region and type of place of residence are used at all levels,
and individual women’s characteristics such as level of education may be used when reporting on their
children.
The main background characteristics are described here briefly for each of these units:
Cluster
Region of residence
Region of residence (hv024, v024, v101, mv024) is defined for every cluster or enumeration area as part
of the sample design for the survey. Region of residence is typically the first administrative level within
the country, or a grouping of the first administrative level.
Type of place of residence
Type of place of residence (hv025, v025, v102, mv025) is the designation of the cluster or enumeration
area as an urban area or a rural area. As for region of residence, type of place of residence is established
for the cluster as part of the sample design for the survey, and cannot vary within cluster.
The definition of a cluster as urban or rural is made according to the definition used in each country. The
traditional distinction between urban and rural areas within a country has been based on the
assumption that urban areas, no matter how they are defined, provide a different way of life and usually
a higher standard of living than rural areas. In many developed countries this distinction has become
blurred, and the principal difference between urban and rural areas in terms of living standards tends to
be the degree of population concentration or density (UNSD, 2017). UNSD recommends that the
classification of a cluster as urban or rural is made first and foremost on a measure of population
density. However, other criteria may also be considered in the designation of the cluster, including the
percentage of the population involved in agriculture, the availability of electricity or piped water, and
the ease of access to healthcare, schools, or transportation, among others. There is no one standard
definition of urban and rural, and the definition used is necessarily country specific and may change over
time.
Household
Wealth Quintile
The wealth index (hv270, v190, mv190) is a composite measure of a household's cumulative living
standard. The wealth index is calculated using data on a household’s ownership of selected assets.
Information on the wealth index is based on data collected in the Household Questionnaire. This
questionnaire includes questions concerning the household’s ownership of a number of consumer items
such as a television and car; dwelling characteristics such as flooring material; type of drinking water
source; toilet facilities; and other characteristics that related to wealth status.

Guide to DHS Statistics 1.59 August 2018
Each household asset for which information is collected is assigned a weight or factor score generated
through principal components analysis. The resulting asset scores are standardized in relation to a
standard normal distribution with a mean of zero and a standard deviation of one.
Each household is assigned a standardized score for each asset, where the score differs depending on
whether or not the household owned that asset. These scores are summed by household, and
individuals are ranked according to the total score of the household in which they reside. The sample is
then divided into population quintiles -- five groups with the same number of individuals in each to
create the break points that define wealth quintiles as: Lowest, Second, Middle, Fourth, and Highest.
The asset index is developed on the basis of data from the entire country sample and used in most
tabulations presented, based on separate scores prepared for rural and urban households, and
combined together to produce a single asset index for all households.
Wealth quintiles are expressed in terms of quintiles of individuals in the population, rather than
quintiles of individuals at risk for any one health or population indicator.
See https://www.dhsprogram.com/topics/wealth-index/Index.cfm for more information on the wealth
index, and particularly:
DHS Comparative Reports No. 6, The DHS Wealth Index (Rutstein and Johnson, 2004)
https://www.dhsprogram.com/publications/publication-cr6-comparative-reports.cfm for the
original approach to the creation of the wealth index, and
DHS Working Papers No. 60, The DHS wealth index: Approaches for rural and urban areas
(Rutstein, 2008) https://www.dhsprogram.com/publications/publication-WP60-Working-
Papers.cfm for the revised approach.
Source of drinking water
The main source of drinking water (hv201) for members of the household is classified as improved and
unimproved sources, following the WHO/UNICEF Joint Monitoring Programme (JMP) on Water and
Sanitation guidelines. The JMP provided an updated methodology for this classification in 2018 and this
will be implemented in DHS surveys by the end of 2018 (WHO/UNICEF, 2018). Typically, this is used as a
characteristic related to prevalence of diarrhea.
Type of Toilet facility
The type of toilet facility (hv205) members of the household usually use is classified into groups for
improved sanitation, unimproved sanitation: shared facility, unimproved sanitation: unimproved facility,
and open defecation, following the WHO/UNICEF Joint Monitoring Programme (JMP) on Water and
Sanitation guidelines. As for source of drinking water, the updated JMP methodology will be
implemented in DHS surveys by the end of 2018 (WHO/UNICEF, 2018). Typically, this is used as a
characteristic related to prevalence of diarrhea.
Cooking fuel
The main type of cooking fuel (hv226) used by the household is used as a characteristic related to
prevalence of symptoms of acute respiratory infections (ARI).
Guide to DHS Statistics 1.60 August 2018
Household member
Sex
Sex of each household member (hv104) is collected in the Household Questionnaire with the question:
“Is (NAME) male or female?”. The DHS Program does not collect data for any other categories as they
represent too small a proportion of the population to affect survey statistics in a meaningful way.
Respondents are permitted to refuse to answer, and their responses will be excluded from any sex-
specific results.
Age
Age of each household member (hv105) is asked in the Household Questionnaire with the question
“How old is (NAME)?”. Age is recorded in completed years, with children under one year recorded as 0
years old. Ages above 95 are recorded in a category of 95 or more.
Education
Education is generally reported as the highest level of education attended (not necessarily completed)
(hv106 or hv109) in categories of no education, primary, secondary, higher than secondary. The
classification of education used in the tabulations may vary from country to country. The education
system in each country also varies and the number of years of education in each level will vary.
Characteristics of parents
Characteristics of parents of children under age 18 may be used including education level, survival status
(alive or dead), and residence status (lives with child or does not live with child) of the mother or father.
Additionally, interview status (interviewed, not interviewed but in household, not in household),
nutritional status (thin, normal, or overweight or obese), and smoking status (smokes cigarettes or
tobacco, or does not smoke) of the mother are commonly used characteristics. Constructing variables
for characteristics of parents requires matching and merging data (see Matching and Merging Datasets).
Individual Woman
Age
Rather than relying on the age reported by the respondent to the Household Questionnaire, individual
women are asked their date of birth and age as part of their interview. Age (v012) is recorded in
completed years, and is typically reported in 5-year groups (v013).
Education
Level of education of the respondent (v106), as for age, interviewed women are asked for the highest
level of school they attended, and the highest grade they completed at that level. Education is generally
reported as the highest level of education attended (not necessarily completed) in categories of no
education, primary, secondary, higher than secondary. In some surveys, primary education may be
broken down into primary incomplete and primary complete and similarly secondary education may be
broken down into secondary incomplete and secondary complete (v149).
Marital Status
Respondents are asked “Are you currently married or living together with a man as if married?” and if
the answer is no, not in union, they are asked “Have you ever been married or lived together with a man
Guide to DHS Statistics 1.61 August 2018
as if married?” Women that respond yes to the latter question are asked “What is your marital status
now: widowed, divorced, or separated?” Marital status is typically reported in 3 groups as a background
characteristic: Never married or in union, currently married or in union, or divorced, separated or
widowed (v502). The term “currently married” is used in DHS reports as a shorthand for currently
married or in union. In some tables, particularly those related to HIV the never-married category is
further disaggregated into those who ever had sex or never had sex.
Marital duration
Marital duration (v512) is the number of years since first marriage calculated from the date of interview
minus the date of first marriage, grouped into 5–year groups (v513). Women who are not currently
married or in union are excluded. Currently married women who have been married two or more times
are presented in a separate group.
Number of living children
The total number of children the individual woman respondent has given birth to, including any current
pregnancy (v219, v220).
Maternity status/Currently pregnant
For maternity status, whether the respondent is pregnant (v213), breastfeeding (v404) or neither. For
currently pregnant, whether the respondent was currently pregnant at the time of the interview.
Employment status
Whether the respondent is currently employed (v714) (having worked in the past 7 days, including
women who did not work in the past 7 days but who are regularly employed and were absent from work
for leave, illness, vacation, or any other such reason), worked in the past 12 months (but not currently)
(v731), or not employed in the past 12 months. Employment in the past 12 months may also be broken
down into those paid cash and those not paid cash (v741).
Religion
Survey specific classification of the religious group to which the respondent associates himself or herself
(v130).
Ethnic group
Survey specific classification of the ethnic group to which the respondent belongs (v131).
Other individual characteristics
A number of other background characteristics are also used in various tabulations, particularly in
tabulations related to HIV indicators, including knowledge of condom source, type of union, times slept
away from home in past 12 months, time away in past 12 months, ANC for last birth in past 3 years.
Birth
Survival status
Whether or not the child is still alive at the time of the interview (b5).
Guide to DHS Statistics 1.62 August 2018
Birth order
Birth order (bord) or parity is the order number of the births from first to last. Twins are given the same
birth order, but the birth order of a child born after twins will be the total number of births preceding
plus one. For example, if a second birth resulted in twins the birth order will be 2 for both twins, and a
birth following the twins will be birth order 4.
Sex of preceding birth
The sex of the child born prior to the child of interest (b4(i+1) where i+1 is the following entry in the
birth history as the birth history is in reverse chronological order). Not applicable for first-order births.
Survival of preceding birth
The survival status of the child born prior to the child of interest (b5(i+1) where i+1 is the following entry
in the birth history as the birth history is in reverse chronological order). Not applicable for first-order
births.
Previous birth interval
The difference calculated in months between the date of birth of the child of interest and the date of
birth of the preceding child, typically presented in years (b11). Not applicable for first-order births.
Previous pregnancy interval
The difference calculated in months between the start of the pregnancy of interest and the date of birth
or termination of the preceding pregnancy. Presented as <15 months, 15-26 months, 27-38 months, and
39+ months which correspond to birth intervals of <24 months, 24-35 months, 36-47 months, and 48+
months. First pregnancies are presented separated.
Birth size
Size of the child at birth (m18) is classified as small or very small, and average or larger, and is based on
the mother’s report of the relative size of the child at birth.
Mother’s age at birth
The age of the mother at the time of the birth is calculated by subtracting the date of birth of the
individual woman respondent from the date of birth of the child ( int((b3 - v011)/12) ). Mother’s age at
birth is typically presented in 5-year or 10-year groups.
Child
Sex
Sex of child (b4) as reported in the birth history (or, for anthropometry and anemia, sex reported in the
household schedule if the child was not reported in a birth history of an individual woman respondent).
Age
Age of child (b19) is calculated from the reported date of birth and/or age of the child from the birth
history. Incomplete dates of birth are imputed and an age calculated for the child if necessary. For
anthropometry and anemia indicators, age may be computed from the date of birth reported in the
biomarker questionnaire if the child was not listed in the birth history of an individual woman

Guide to DHS Statistics 1.63 August 2018
respondent. Typically presented in 12-month, 6-month or smaller age groups, depending on the
indicator. See also Age of Children.
Antenatal care visits
Antenatal care visits (m14) are presented in groups of none, 1-3, 4+.
Place of delivery
Place of delivery (m15) is categorized into health facility, respondents’ or other home, or elsewhere. In
some surveys, health facility may be broken down into public and private facilities.
Assistance at delivery
Whether the delivery of a birth was assisted by a health professional, someone else, or no one (m3a –
m3n).
Breastfeeding status
Whether the child was currently breastfeeding at the time of the survey (m4).
Individual Man
Age
Age for men (mv012) is collected in the same way as for women and is usually reported in 5-year groups
(mv013). The age range for men may vary and could go up to 54, 59, or even 64 in some surveys.
Education
Education for men (mv106) is collected and presented in the same way as for women.
Marital Status
Marital status for men (mv502) is collected and presented in the same way as for women.
Number of living children
Number of living children (mv218) is the total number of children that the man has fathered and may
include children born to more than one wife or partner.
Male Circumcision
Whether the man has been circumcised or not (mv483). In some surveys the type of circumcision
(mv483b) – traditional or medical – may also be presented.
Other units of analysis
Other units of analysis are represented in DHS Program tabulations and may have particular
characteristics associated with them, for example:
Mosquito nets – Type of mosquito net (insecticide treated net or not) (hml7).
Episodes of contraceptive use – Reasons for discontinuation (vcal_2).

Guide to DHS Statistics 1.64 August 2018
References for Background Characteristics
UNSD. 2017. Principles and Recommendations for Population and Housing Censuses, Rev.3
https://www.un.org/development/desa/capacity-development/tools/tool/principles-and-
recommendations-for-population-and-housing-censuses-rev-3/
World Health Organization (WHO) and the United Nations Children’s Fund (UNICEF). 2017. Progress on
drinking water, sanitation and hygiene: 2017 update and SDG baselines. Licence: CC BY-NC-SA 3.0 IGO.
https://www.unicef.org/publications/index_96611.html
WHO and UNICEF. 2018. JMP Methodology: 2017 Update & SDG Baselines
http://www.unwater.org/publication_tag/jmp/
Rutstein, S.O. and K. Johnson. 2004. The DHS wealth index. DHS Comparative Reports No. 6. Calverton,
Maryland, USA: ORC Macro. https://www.dhsprogram.com/publications/publication-cr6-comparative-
reports.cfm
Rutstein, S.O. 2008. The DHS wealth index: Approaches for rural and urban areas. DHS Working Papers
No. 60. Calverton, Maryland, USA: Macro International.
https://www.dhsprogram.com/publications/publication-WP60-Working-Papers.cfm
Guide to DHS Statistics 1.65 August 2018
Data Suppression and Parenthesizing
The DHS Program uses a set of guidelines for the minimum number of cases that are required to present
an indicator. The minimum number of cases for a statistic is based on the unweighted number of cases.
For most statistics, parentheses are used if based on 25 to 49 unweighted cases and an asterisk if based
on fewer than 25 cases.
For fertility rates, including the TFR, parentheses are used if based on 125 to 249 person-years of
exposure, and not shown if fewer than 125 person-years of exposure.
For mortality rates, parentheses are used if based on 250 to 499 children exposed in any of the
component rates, and an asterisk if based on fewer than 250 children.
For contraceptive discontinuation rates, rates based on 125 to 249 exposed women in the first month
are shown in parentheses. Rates based on fewer than 125 exposed women are not shown.
Medians from smoothed data are shown in parentheses when the denominator of the smoothed
percentage for the group preceding the first group which falls below 50 percent plus the number of
cases in the adjacent categories that are used for smoothing that group is based on 25 to 49 cases. If this
denominator is less than 25 cases then the median is not shown.

Guide to DHS Statistics 1.66 August 2018
Indicator Guidelines
Indicator Pages
The below description provides a summary of the contents of the indicator pages that follow in this
guide. Each indicator page provides a description of the indicators, the population group and time
period they represent, how the indicators are calculated, including the definition of numerators and
denominators and the datasets and variables used, how missing and “don’t know” responses are
handled, any changes over time, and useful references and resources.
① Brief subject title for the indicators
② Title of the indicators in a single statement
③ Definition
Provides a more detailed definition of the indicators, listing each indicator separately.
④ Coverage: Summarizes the population covered by the indicators and the time period to which
the indicators apply:
⑤ Population base: The population group to which the indicators apply (e.g. households,
household members, women, men, births, children, etc.), and the datasets to use for
this population (e.g. HR, PR, IR, MR, BR, KR, etc.)
⑥ Time period: The period preceding the survey to which the indicators apply.
⑦ Numerator(s): Number of the population meeting the criteria for inclusion in the numerator(s)
of the indicators. Criteria for selection for the numerator(s) are given based on the variables in
the recode file. Unless noted, the criteria for the numerator(s) are a subset of those selected for
the denominator(s) below, and the selection criteria for the denominator(s) is not usually
repeated in the numerator(s).
⑧ Denominator(s): Number of the population meeting the criteria for inclusion in the denominator
of the indicators. Criteria for selection for the denominator are given based on the variables in
the recode file. If no criteria is specified, the denominator is formed of all cases in the dataset.
⑨ Variables: Dataset(s) used to produce the indicators and the list of variables needed to calculate
the indicators. If indicators are to be disaggregated, the background variables to use are not
included in this list.
v???
Variables needed for the indicator
?005
Sample weight variable
⑩ Calculation
Explanation of the calculation of the indicators, typically based on the numerator(s) and
denominator(s) defined above. For most indicators that are simple percentages this is
numerator divided by denominator multiplied by 100. For more complicated indicators a
detailed description of the calculation method is provided.

Guide to DHS Statistics 1.67 August 2018
⑪ Handling of Missing Values
Explanation of how missing values and “Don’t know” responses are handled for the indicators.
⑫ Changes over Time
Brief description of the ways in which the indicators have changed over time between different
phases of The DHS Program.
⑬ References
List of key references to international indicator guidelines further describing the indicators or
cross-national analyses using the indicators.
⑭ Resources
A list of resources relevant to the indicators, including links to DHS videos and webpages.
⑮ DHS-7 Tabulation plan: Table number reference to the DHS-7 Tabulation Plan, found at
https://www.dhsprogram.com/publications/publication-DHSM6-DHS-Questionnaires-and-
Manuals.cfm
⑯ API Indicator IDs: IDs for use with the DHS Application Programming Interface (API) described at
https://api.dhsprogram.com/#/index.html. The full list of API Indicator IDs can be found at
http://api.dhsprogram.com/rest/dhs/indicators?f=html
API link – link to present national indicator data for surveys from the API in a browser.
STATcompiler link – link to national indicator data in STATcompiler.

Guide to DHS Statistics 1.68 August 2018
Example Indicator Page
① Knowledge of HIV or AIDS
② Percentage of women and men who have heard of HIV or AIDS
③ Definition
Percentage of women and men age 15-49 who have heard of HIV or AIDS.
④ Coverage:
⑤ Population base: Women and men age 15-49 (IR file, MR file).
⑥ Time period: Current status at time of survey.
⑦ Numerator: Number of women (or men) age 15-49 who answer “yes”, that they have heard of HIV or AIDS (women:
v751 = 1; men: mv751 = 1).
⑧ Denominator: Number of women (or men) age 15-49.
⑨ Variables: IR file, MR file.
v751
Ever heard of HIV or AIDS (women)
v005
Woman’s individual sample weight
mv751
Ever heard of HIV or AIDS (men)
mv005
Man’s individual sample weight
⑩ Calculation
The numerator divided by the denominator, expressed as a percentage.
⑪ Handling of Missing Values
Missing values are assumed to reflect a lack of knowledge about HIV or AIDS and are therefore not included in the
numerator.
⑫ Changes over Time
Previous DHS questionnaires asked if women and men had “ever heard of an illness called AIDS”. Due to improved
knowledge about HIV/AIDS and the decrease in AIDS cases as treatment is more common, some respondents may be
more familiar with the term “HIV” than “AIDS”. The purpose of the question is to assess basic knowledge of either
HIV or AIDS.
⑬ References
⑭ Resources
⑮ DHS-7 Tabulation plan: Table 13.0
⑯ API Indicator IDs: HA_KAID_W_HRD, HA_KAID_M_HRD
(API link, STATcompiler link)

Guide to DHS Statistics 1.69 August 2018
Using Indicator Pages
Example code
The indicator pages can be used as a guide in constructing code in statistical software for tabulating
indicators. Below are examples in Stata and SPSS for producing indicators based on the information in
the indicator pages. Most indicators are simple percentages computed as the proportion meeting some
numerator condition that is a subset of cases meeting the denominator condition. The below code
provides a generic example of code, applied to the indicator page example above. The code below
provides examples of simple tabulations that do not take into account the complex sample design, as
well as examples that take into account the complex sample design and produce confidence intervals
and standard errors for the indicators.
Stata
* open dataset, using type of dataset from variables list, e.g. IR file in this case
use "ZZIR62FL.dta", clear
* select denominator
* gen denom = ( denominator criteria )
* or denom = 1 if all cases are selected
gen denom = 1
* select numerator, based on subset of denominator
* gen numer = ( numerator criteria ) if (denom == 1)
gen numer = (v751 == 1) if (denom == 1)
* Label numerator variable
label variable numer "Knows of HIV/AIDS"
label define YesNo 1 "Yes" 0 "No"
label values numer YesNo
format numer denom %1.0f
* set up weight
* gen wt = weightvar / 1000000
gen wt = v005/1000000
* simple tabulation
tab numer [iw=wt] if (denom == 1)
* or by background characteristic, e.g. by region
tab v024 numer [iw=wt] if (denom == 1), row
* or for complex samples use svyset and svy: tab
* first set up strata variable - can vary from survey to survey
* example using v023, but may be a combination of v024 and v025
gen strat = v023
* or egen strat = group(v024 v025)
* set up svyset command
svyset v021 [pw=wt], strata(strat)
* tabulate using svy: tab
svy: tab numer if (denom == 1), ci se
* or by background characteristic
svy: tab v024 numer if (denom == 1), row ci se

Guide to DHS Statistics 1.70 August 2018
SPSS
* open dataset, using type of dataset from variables list, e.g. IR file in this case.
get file = "ZZIR62FL.SAV".
* select denominator
* compute denom = ( denominator criteria ).
* or denom = 1 if all cases are selected.
compute denom = 1.
* select numerator, based on subset of denominator.
* if (denom = 1) numer = ( numerator criteria ).
if (denom = 1) numer = (v751 = 1).
* Label numerator variable.
variable labels numer "Knows of HIV/AIDS".
value labels numer 1 "Yes" 0 "No".
formats numer denom (f1.0).
* set up weight.
* compute wt = weightvar/1000000.
compute wt = v005/1000000.
weight by wt.
* filter for selected cases.
filter by denom.
* simple tabulation.
frequencies variables=numer.
* or by background characteristic, e.g. by region.
crosstabs tables=v024 by numer /count=asis /cells=row.
* or for complex samples use csplan and csdescriptives.
* first set up strata variable - can vary from survey to survey.
* example using v023, but may be a combination of v024 and v025.
compute strat = v023.
* or compute strat = v024*2 + v025.
* turn off weight to avoid warning message, as weight comes from csplan.
weight off.
* set up csplan command.
csplan analysis /plan file='DHS.csaplan'
/planvars analysisweight=wt
/srsestimator type=wor
/design strata=strat cluster=v021
/estimator type=wr.
* tabulate using csdescriptives.
csdescriptives /plan file='DHS.csaplan'
/summary variables = numer
/mean
/statistics se cin.
* or by background characteristic.
csdescriptives /plan file='DHS.csaplan'
/summary variables = numer
/subpop table=v024
/mean
/statistics se cin.

Guide to DHS Statistics 1.71 August 2018
Numerator and denominator conditions
The indicator pages provide generic logic for the definitions of the numerators and denominators that is
not specific to any particular software and needs to be translated to the software to be used for
analysis. Below is a brief explanation of the generic code used and how to implement it in Stata or SPSS.
Generic code
Stata code
SPSS code
var = n
var == n
var = n or var EQ n
var ≠ n
var != n
var <> n or var NE n
var ≠ a,b
var != a & var != b
var <> a AND var <> b
var in a,b,c
var == a | var == b | var == c
or
inlist(var,a,b,c)
var = a OR var = b OR var = c
or
any(var,a,b,c)
var in x:y
var >= x & var <= y
or
inrange(var,x,y)
var >= x AND var <= y
or
range(var,x,y)
var in a,b,c,x:y
var == a | var == b | var == c |
(var >= x & var <= y)
or
inlist(var,a,b,c) |
inrange(var,x,y)
var = a OR var = b OR var = c
OR (var >= x AND var <= y)
or
any(var,a,b,c) OR
range(var,x,y)
x <= var <= y
var >= x & var <= y
or
inrange(var,x,y)
var >= x AND var <= y
or
range(var,x,y)
x < var < y
var > x & var < y
var > x AND var < y
condx & condy
e.g.
vara = x & varb
= y
condx & condy
e.g.
vara == x & varb == y
condx & condy or
condx AND condy
e.g.
vara = x & varb = y
or
vara = x AND varb = y
condx or condy
e.g.
vara = x or varb
= y
condx | condy
e.g.
vara == x | varb == y
condx | condy or
condx OR condy
e.g.
vara = x | varb = y
or
vara = x OR varb = y
any of vara – x
= 1
vara = 1 | varb = 1 | varc = 1 |
... varx = 1
vara = 1 | varb = 1 | varc =
1 | ... varx = 1

Guide to DHS Statistics 1.72 August 2018
International Indicator Guides and Resources
Bloom, S.S. 2008. Violence Against Women and Girls: A Compendium of Monitoring and Evaluation
Indicators. https://www.measureevaluation.org/resources/tools/gender/violence-against-women-and-
girls-compendium-of-indicators
Every Woman Every Child. 2016. Indicator and monitoring framework for the global strategy for
women’s, children’s and adolescents’ health (2016-2030)
http://www.who.int/life-course/publications/indicator-monitoring-framework-publication/en/
Goodman, R.A., 1989. “Current trends: CDC criteria for anemia in children and child bearing-aged
women.” MMWR Morb Mortality Wkly Rep, 38, pp.400-404.
https://www.cdc.gov/mmwr/preview/mmwrhtml/00001405.htm
Joint United Nations Programme on HIV/AIDS (UNAIDS). 2018. Global AIDS Monitoring 2018, Indicators
for monitoring the 2016 United Nations Political Declaration on Ending AIDS.
http://www.unaids.org/en/resources/documents/2018/Global-AIDS-Monitoring
Marks, J. S., W.H. Dietz, B.R. Holloway, and A.G. Dean. 1998. "Recommendations to prevent and control
iron deficiency in the United States." Morbidity and Mortality Weekly Report Series. Atlanta, GA:
CDC.https://www.cdc.gov/mmwr/preview/mmwrhtml/00051880.htm
MICS6 Indicators and Definitions. http://mics.unicef.org/tools
Roll Back Malaria Monitoring and Evaluation Reference Group Survey and Indicator Task Force. 2013.
Household Survey Indicators for Malaria Control
https://data.unicef.org/resources/household-survey-indicators-for-malaria-control-2013-edition/
Summary List of Indicators for Family Planning.
https://www.measureevaluation.org/prh/rh_indicators/indicator-summary
Sustainable Development Goal Indicators in DHS Surveys.
https://dhsprogram.com/topics/sdgs/index.cfm
Sustainable Development Goals. https://sustainabledevelopment.un.org/
Tabulation Plan for DHS Final Reports. https://dhsprogram.com/publications/publication-dhsm6-dhs-
questionnaires-and-manuals.cfm
UNICEF. 2012. Pneumonia and diarrhea: Tackling the deadliest diseases for the world’s poorest children
https://www.unicef.org/publications/index_65491.html
UNICEF. 2018. Immunization summary. https://data.unicef.org/topic/child-health/immunization/
WHO and Department of Reproductive Health and Research. 1997. The Sisterhood Method of Estimating
Maternal Mortality. http://www.who.int/reproductivehealth/publications/monitoring/RHT_97_28/en/

Guide to DHS Statistics 1.73 August 2018
WHO and UNICEF. 2013. GAPPD: ending preventable child deaths from pneumonia and diarrhoea by
2025. http://www.who.int/woman_child_accountability/news/gappd_2013/en/
WHO Child Growth Standards. http://www.who.int/childgrowth/standards/en/
WHO Department of Gender, Women and Health. 2001. Putting Women First: Ethical and Safety
Recommendations for Research on Domestic Violence Against Women
http://www.who.int/gender-equity-rights/knowledge/who_fch_gwh_01.1/en/
WHO vaccine-preventable diseases: monitoring system. 2018 global summary
http://apps.who.int/immunization_monitoring/globalsummary/schedules
WHO. 2005. WHO Multi-country Study on Women’s Health and Domestic Violence against Women.
http://www.who.int/reproductivehealth/publications/violence/24159358X/en/
WHO. 2007. Indicators for assessing infant and young child feeding practices.
Part I Definitions: http://www.who.int/nutrition/publications/infantfeeding/9789241596664/en/
Part II Measurement: http://www.who.int/nutrition/publications/infantfeeding/9789241599290/en/
Part III Country Profiles: http://www.who.int/nutrition/publications/infantfeeding/9789241599757/en/
WHO. 2011. Haemoglobin concentrations for the diagnosis of anaemia and assessment of severity.
http://www.who.int/vmnis/indicators/haemoglobin/en/
WHO. 2015. The Global Prevalence of Anaemia in 2011. Geneva: World Health Organization;
http://www.who.int/nutrition/publications/micronutrients/global_prevalence_anaemia_2011/en/
WHO. 2016. Guidelines on HIV self-testing and partner notification. http://www.who.int/hiv/pub/self-
testing/hiv-self-testing-guidelines/en/
WHO. 2017. Global Nutrition Monitoring Framework: operational guidance for tracking progress in
meeting targets for 2025. Geneva: World Health Organization
http://www.who.int/nutrition/publications/operational-guidance-GNMF-indicators/en/
WHO. 2018. Global reference list of 100 core health indicators. Geneva: World Health Organization.
http://www.who.int/healthinfo/indicators/2015/en/

Guide to DHS Statistics 2.1 August 2018
Population and Housing
The focus of this chapter is to describe the environment in which women, children and men live. This
description shows housing facilities (sources of water supply, sanitation facilities, dwelling
characteristics and household possessions), household arrangements (headship, size), and general
characteristics of the population such as age-sex structure, literacy and education. A distinction is made
between urban and rural settings where many of these indicators usually differ.
Besides providing the background for better understanding of many social and demographic
phenomena discussed in the following chapters, this general description is useful for assessing the level
of economic and social development of the population.

Guide to DHS Statistics 2.2 August 2018
Household Drinking Water
Percent distribution of households and de jure population by source of drinking water
Definition
Percent distribution of households and de jure population by source of drinking water.
Coverage:
Population base:
a) Households (HR file)
b) De jure household population (HR file or PR file)
Time period: Current status at time of survey
Numerators:
1) Number of households or de jure population by source of drinking water (hv201)
2) Number of households or de jure population by improved or unimproved drinking water source:
Improved: hv201 in 11:14,21,31,41,51 or (hv201 = 71 & hv202 in 11:14,21,31,41,51,71)
Unimproved: hv201 in 32,42,43,61,62 or (hv201 = 71 & hv202 not in 11:14,21,31,41,51,71)
Other source: hv201 = 96
Denominators:
a) Number of households
b) Number of de jure population (hv012 – see Calculation)
Variables: HR file.
hv012
Number of de jure members (if using HR file)
hv102
Usual resident (if using PR file)
hv201
Source of drinking water
hv202
Source of non-drinking water
hv005
Household sample weight
Calculation
Percent distribution of de jure population by source of drinking water can be calculated using the HR file
and simply weighting the data by the sample weight (hv005/1000000) multiplied by the number of de
jure household members (hv012). Alternatively the PR file can be used, selecting the de jure members
(hv102 = 1) and weighting just by the sample weight (hv005/1000000).
Numerators divided by denominator multiplied by 100.
Handling of Missing Values
Households and de jure population with missing information are included as separate categories.
Guide to DHS Statistics 2.3 August 2018
Notes and Considerations
Drinking water source classifications improved, unimproved, and other are based on those defined by
the WHO/UNICEF Joint Monitoring Programme (JMP) for Water Supply and Sanitation during the MDG
monitoring period. Households using bottled water for drinking are classified as improved or
unimproved based on the water used for cooking and handwashing.
The standard recode for hv201 includes the following categories of unimproved and improved water
sources:
Unimproved categories
32 unprotected well
42 unprotected spring
43 surface water (river/dam/lake/pond/stream/canal/irrigation channel)
61 tanker truck
62 cart with small tank
71 bottled water (if hv202 not in 11:14,21,31,41,51,71)
96 other
Improved
11 piped into dwelling
12 piped to yard/plot
13 public tap/standpipe
14 piped to neighbor
21 tube well or borehole
31 protected well
41 protected spring
51 rainwater
71 bottled water (if hv202 in 11:14,21,31,41,51,71)
Note that in the process of creating the new SDG indicators, in 2017, the JMP changed the definition of
improved sources of drinking water (see Changes over Time).
Percent distribution adds up to 100 percent.
Changes over Time
The improved source category “Piped to neighbor” was introduced in the standard DHS-7 household
questionnaire.
In earlier phases of DHS, if a spring or well was not specified as protected, it was considered
unimproved.
During the MDG monitoring period, the JMP considered the following to be improved drinking water
sources: piped water, public taps/standpipes, boreholes or tubewells, protected dug wells, protected
springs, rainwater, and bottled water (if an improved water source was used for cooking and
handwashing).

Guide to DHS Statistics 2.4 August 2018
In 2017, the JMP expanded the definition of improved sources to also include packaged or delivered
water. As of August 2018, this change has not been implemented in DHS surveys, but is expected to be
made before the end of 2018. When implemented, it will change the categorization of tanker truck or
cart with small tank (both delivered water) to improved sources and would also include all bottled water
as an improved source irrespective of the source of water for cooking and handwashing (hv201 in
11:14,21,31,41,51,61,62,71).
In DHS-VI, the question on the source of water for cooking and handwashing was not included in the
questionnaire, and bottled water was considered an improved source.
References
World Health Organization (WHO) and the United Nations Children’s Fund (UNICEF). 2017. Progress on
drinking water, sanitation and hygiene: 2017 update and SDG baselines. Licence: CC BY-NC-SA 3.0 IGO.
http://www.who.int/water_sanitation_health/publications/jmp-2017/en/
World Health Organization (WHO) and the United Nations Children’s Fund (UNICEF). 2018. JMP
Methodology: 2017 Update & SDG Baselines
https://www.ircwash.org/resources/jmp-methodology-2017-update-sdg-baselines
World Health Organization. 2018. Global reference list of 100 core health indicators. Geneva: World
Health Organization. http://www.who.int/healthinfo/indicators/2018/en/
Resources
DHS-7 Tabulation plan: Table 2.1
API Indicator IDs:
Households:
Improved sources:
WS_SRCE_H_IMP, WS_SRCE_H_PIP, WS_SRCE_H_PYD, WS_SRCE_H_TAP, WS_SRCE_H_PNB,
WS_SRCE_H_POY, WS_SRCE_H_TUB, WS_SRCE_H_PWU, WS_SRCE_H_PWL, WS_SRCE_H_PSU,
WS_SRCE_H_PSG, WS_SRCE_H_RNW, WS_SRCE_H_BOT, WS_SRCE_H_FLT
(API link, STATcompiler link)
Unimproved sources:
WS_SRCE_H_NIM, WS_SRCE_H_UWU, WS_SRCE_H_UWL, WS_SRCE_H_USU, WS_SRCE_H_USG,
WS_SRCE_H_TNK, WS_SRCE_H_CRT, WS_SRCE_H_VND, WS_SRCE_H_SCH, WS_SRCE_H_BTU,
WS_SRCE_H_SRF, WS_SRCE_H_OTH
(API link, STATcompiler link)
De jure population:
Improved sources:
WS_SRCE_P_IMP, WS_SRCE_P_PIP, WS_SRCE_P_PYD, WS_SRCE_P_TAP, WS_SRCE_P_PNB,
WS_SRCE_P_POY, WS_SRCE_P_TUB, WS_SRCE_P_PWU, WS_SRCE_P_PWL, WS_SRCE_P_PSU,
WS_SRCE_P_PSG, WS_SRCE_P_RNW, WS_SRCE_P_BOT, WS_SRCE_P_FLT
(API link, STATcompiler link)
Unimproved sources:
WS_SRCE_P_NIM, WS_SRCE_P_UWU, WS_SRCE_P_UWL, WS_SRCE_P_USU, WS_SRCE_P_USG,
WS_SRCE_P_TNK, WS_SRCE_P_CRT, WS_SRCE_P_VND, WS_SRCE_P_SCH, WS_SRCE_P_BTU,
WS_SRCE_P_SRF, WS_SRCE_P_OTH

Guide to DHS Statistics 2.6 August 2018
Percent distribution of households and de jure population by time to obtain drinking water
Definition
Percent distribution of households and de jure population by round trip time to obtain drinking water.
Coverage:
Population base:
a) Households (HR file)
b) De jure household population (HR file or PR file)
Time period: Current status at time of survey
Numerators: Number of households or de jure population by round trip time to obtain drinking water:
1) Water on premises (hv204 = 996)
2) Less than 30 minutes (hv204 in 0:29)
3) 30 minutes or longer (hv204 in 30:900)
Denominators:
a) Number of households
b) Number of de jure population (hv012 – see Calculation)
Variables: HR file.
hv012
Number of de jure members (if using HR file)
hv102
Usual member (if using PR file)
hv204
Time to get to water source (minutes)
hv005
Household sample weight
Calculation
Percent distribution of de jure population by time to source of drinking water can be calculated using
the HR file and simply weighting the data by the sample weight (hv005/1000000) multiplied by the
number of de jure household members (hv012). Alternatively the PR file can be used, selecting the de
jure members (hv102 = 1) and weighting just by the sample weight (hv005/1000000).
Numerators divided by denominator multiplied by 100.
Handling of Missing Values
Households and population with missing information are included as separate categories.
Notes and Considerations
The time to obtain drinking water is the sum of minutes it takes to go to the water source, the time
spent waiting to obtain water, the time collecting the water and the time to return from the water
source. The classifications for the time to obtain water are: water on the premises, less than 30 minutes,
and 30 minutes or longer. The classification piped into dwelling/yard/plot includes piped to a neighbor.

Guide to DHS Statistics 2.7 August 2018
Percent distribution adds up to 100 percent.
Changes over Time
As part of the SDG period, the JMP has introduced criteria for safely managed, basic, and limited
drinking water service that require information on the time required to obtain the drinking water. The
classifications for the time to obtain water are: water on the premises (including water with a collection
time of zero minutes), a collection time of 30 minutes or less, and a collection time of more than 30
minutes. As of August 2018, this change has not been implemented in DHS surveys, but is expected to
be made before the end of 2018.
References
World Health Organization (WHO) and the United Nations Children’s Fund (UNICEF). 2017. Progress on
drinking water, sanitation and hygiene: 2017 update and SDG baselines. Licence: CC BY-NC-SA 3.0 IGO.
http://www.who.int/water_sanitation_health/publications/jmp-2017/en/
World Health Organization (WHO) and the United Nations Children’s Fund (UNICEF). 2018. JMP
Methodology: 2017 Update & SDG Baselines
https://www.ircwash.org/resources/jmp-methodology-2017-update-sdg-baselines
Resources
DHS-7 Tabulation plan: Table 2.1
API Indicator IDs:
Households:
WS_TIME_H_ONP, WS_TIME_H_L30, WS_TIME_H_30P, WS_TIME_H_DKM
(API link, STATcompiler link)
De jure population:
WS_TIME_P_ONP, WS_TIME_P_L30, WS_TIME_P_30P, WS_TIME_P_DKM
(API link, STATcompiler link)
Guide to DHS Statistics 2.8 August 2018
Percentage of households and de jure population using methods to treat drinking water
and percentage using an appropriate treatment method
Definition
Percentages of households and de jure population that are using one or more methods to treat drinking
water and percentages that are using an appropriate treatment method.
Coverage:
Population base:
a) Households (HR file)
b) De jure household population (HR file or PR file)
Time period: Current status at time of survey
Numerators:
Number of households or de jure population by water treatment prior to drinking category:
1) Boil (hv237a = 1)
2) Add bleach or chlorine (hv237b = 1)
3) Strain through cloth (hv237c = 1)
4) Ceramic, sand or other filter (hv237d = 1)
5) Solar disinfection (hv237e = 1)
6) Let it stand and settle (hv237f = 1)
7) Other (hv237g = 1 or hv237h = 1 or hv237j = 1 or hv237k = 1 or hv237x = 1)
8) No treatment (hv237 = 0)
Number of households or de jure population using:
9) An appropriate treatment method (hv237a = 1 or hv237b = 1 or hv237d = 1 or hv237e = 1)
Denominators:
a) Number of households
b) Number of de jure population (hv012 – see Calculation)
Variables: HR file.
hv012
Number of de jure members (if using HR file)
hv102
Usual resident (if using PR file)
hv237
Anything done to water to make safe to drink
hv237a
Water usually treated by: boil
hv237b
Water usually treated by: add bleach/chlorine
hv237c
Water usually treated by: strain through a cloth
hv237d
Water usually treated by: use water filter
hv237e
Water usually treated by: solar disinfection
hv237f
Water usually treated by: let it stand and settle
hv237g
Water usually treated by: CS
hv237h
Water usually treated by: CS
hv237j
Water usually treated by: CS
hv237k
Water usually treated by: CS
hv237x
Water usually treated by: other

Guide to DHS Statistics 2.9 August 2018
hv005
Household sample weight
Calculation
Percentage of de jure population using methods to treat water can be calculated using the HR file and
simply weighting the data by the sample weight (hv005/1000000) multiplied by the number of de jure
household members (hv012). Alternatively the PR file can be used, selecting the de jure members
(hv102 = 1) and weighting just by the sample weight (hv005/1000000).
Numerators divided by denominator multiplied by 100.
Handling of Missing Values
Households and population with missing information are included as separate categories.
Notes and Considerations
Respondents may report multiple treatment methods so the sum of treatment may exceed 100.
Appropriate water treatment methods are: boil, add bleach or chlorine, ceramic, sand or other filter,
and solar disinfection.
References
World Health Organization (WHO) and the United Nations Children’s Fund (UNICEF). 2017. Progress on
drinking water, sanitation and hygiene: 2017 update and SDG baselines. Licence: CC BY-NC-SA 3.0 IGO.
http://www.who.int/water_sanitation_health/publications/jmp-2017/en/
World Health Organization (WHO) and the United Nations Children’s Fund (UNICEF). 2018. JMP
Methodology: 2017 Update & SDG Baselines
https://www.ircwash.org/resources/jmp-methodology-2017-update-sdg-baselines
Resources
DHS-7 Tabulation plan: Table 2.1
API Indicator IDs:
Households:
WS_WTRT_H_BOL, WS_WTRT_H_BLC, WS_WTRT_H_STN, WS_WTRT_H_CER, WS_WTRT_H_SOL
WS_WTRT_H_OTH, WS_WTRT_H_NTR, WS_WTRT_H_DKM, WS_WTRT_H_APP
(API link, STATcompiler link)
De jure population:
WS_WTRT_P_BOL, WS_WTRT_P_BLC, WS_WTRT_P_STN, WS_WTRT_P_CER, WS_WTRT_P_SOL,
WS_WTRT_P_OTH, WS_WTRT_P_NTR, WS_WTRT_P_DKM, WS_WTRT_P_APP
(API link, STATcompiler link)
Guide to DHS Statistics 2.10 August 2018
Percent distribution of households and de jure population using piped water or water from
a tube well or borehole by availability of water
Definition
Percent distribution of households and de jure population using piped water or water from a tube well
or borehole by availability of water in the 2 weeks preceding the survey.
Coverage:
Population base:
a) Households (HR file)
b) De jure household population (HR file or PR file)
Time period: 2 weeks before the survey
Numerators: Number of households or de jure population using piped water or water from a tube well
or borehole by availability of water in the 2 weeks preceding the survey:
1) Not available for at least one day (hv201a = 1)
2) Available with no interruption of at least one day (hv201a = 0)
3) Don’t know/missing (hv201a = 8,9)
Denominators:
a) Number of households
b) Number of de jure population (hv012 – see Calculation)
Variables: HR file.
hv012
Number of de jure members (if using HR file)
hv102
Usual resident (if using PR file)
hv201a
Water not available for at least a day last two weeks
hv005
Household sample weight
Calculation
Percent distribution of de jure population by availability of water can be calculated using the HR file and
simply weighting the data by the sample weight (hv005/1000000) multiplied by the number of de jure
household members (hv012). Alternatively the PR file can be used, selecting the de jure members
(hv102 = 1) and weighting just by the sample weight (hv005/1000000).
Numerators divided by denominator multiplied by 100.
Handling of Missing Values
Households and population with missing information are included as separate categories.

Guide to DHS Statistics 2.11 August 2018
Notes and Considerations
These statistics are restricted to households/populations using piped or tube well/borehole water as a
source for drinking water, plus households/populations using bottled water for drinking and piped or
tube well/borehole water for cooking and handwashing.
Percent distribution adds up to 100 percent.
Changes over Time
Information pertaining to the availability of water was introduced in DHS-7.
References
World Health Organization (WHO) and the United Nations Children’s Fund (UNICEF). 2017. Progress on
drinking water, sanitation and hygiene: 2017 update and SDG baselines. Licence: CC BY-NC-SA 3.0 IGO.
http://www.who.int/water_sanitation_health/publications/jmp-2017/en/
World Health Organization (WHO) and the United Nations Children’s Fund (UNICEF). 2018. JMP
Methodology: 2017 Update & SDG Baselines
https://www.ircwash.org/resources/jmp-methodology-2017-update-sdg-baselines
Resources
DHS-7 Tabulation plan: Table 2.2

Guide to DHS Statistics 2.12 August 2018
Type of Sanitation Facility
Percent distribution of households and de jure population by type of sanitation facility, by
improved and unimproved sanitation
Definition
1) Percent distribution of households and de jure population by type of sanitation facility
2) Percent distribution of households and de jure population by improved and unimproved
sanitation.
Coverage:
Population base:
a) Households (HR file)
b) De jure household population (HR file or PR file)
Time period: Current status at time of survey
Numerators:
1) Number of households or de jure population by type of sanitation facility (hv205)
2) Number of households or de jure population by improved and unimproved sanitation:
Improved sanitation (hv205 in 11,12,13,21,22,41 & hv225 = 0)
Unimproved sanitation:
Shared facility (hv205 in 11,12,13,21,22,41 & hv225 = 1)
Unimproved facility (hv205 in 14,15,23,42,43,96)
Open defecation (no facility/bush/field) (hv205 = 31)
Denominators:
a) Number of households
b) Number of de jure population (hv012 – see Calculation)
Variables: HR file.
hv012
Number of de jure members (if using HR file)
hv102
Usual resident (if using PR file)
hv205
Type of toilet facility
hv225
Share toilet with other households
hv005
Household sample weight
Calculation
Percent distribution of de jure population by type of sanitation facility can be calculated using the HR file
and simply weighting the data by the sample weight (hv005/1000000) multiplied by the number of de
jure household members (hv012). Alternatively the PR file can be used, selecting the de jure members
(hv102 = 1) and weighting just by the sample weight (hv005/1000000).
Numerators divided by denominator multiplied by 100.
Guide to DHS Statistics 2.13 August 2018
Handling of Missing Values
Households and population with missing information are included as separate categories.
Notes and Considerations
Sanitation classifications improved or unimproved are based on those defined by the WHO/UNICEF Joint
Monitoring Programme (JMP) for Water Supply and Sanitation during the MDG monitoring period. By
definition, an improved facility cannot be shared. The category unimproved sanitation is composed of
shared facilities, unimproved facilities, and open defecation.
The standard recode for hv205 includes the following categories of unimproved and improved
sanitation:
Unimproved categories
14 flush - to somewhere else
15 flush - don't know where
23 pit latrine - without slab / open pit
31 no facility/bush/field
42 bucket toilet
43 hanging toilet/latrine
96 other
Improved (if not shared)
11 flush - to piped sewer system
12 flush - to septic tank
13 flush - to pit latrine
16 flush - unspecified
21 pit latrine - ventilated improved pit (vip)
22 pit latrine - with slab
41 composting toilet
Note that in the process of defining the SDG indicators on water and sanitation, in 2017, the JMP
changed the definition of improved sanitation (see Changes over Time).
Percent distribution adds up to 100 percent.
Changes over Time
During the MDG monitoring period, the JMP considered the following to be improved sanitation: non-
shared facilities that flush/pour flush to piped sewer system, septic tank, or pit latrine; ventilated
improved pit latrine, pit latrine with a slab, and composting toilet. In 2017, the JMP changed the
definition of improved sanitation to also include shared facilities and made explicit that facilities that
flush/pour flush to an unknown location are considered improved. As of August 2018, these changes
have not been implemented in DHS surveys, but are expected to be made before the end of 2018. When
implemented, whether or not a facility is shared will no longer be used to distinguish improved facilities
from unimproved, and facilities that flush to an unknown location will be categorized as improved.
However, facilities that flush to known location but not to a sewer system, septic tank, or pit latrine (i.e.,
those that flush to “somewhere else”) will continue to be classified as unimproved.

Guide to DHS Statistics 2.14 August 2018
References
World Health Organization (WHO) and the United Nations Children’s Fund (UNICEF). 2017. Progress on
drinking water, sanitation and hygiene: 2017 update and SDG baselines. Licence: CC BY-NC-SA 3.0 IGO.
http://www.who.int/water_sanitation_health/publications/jmp-2017/en/
World Health Organization (WHO) and the United Nations Children’s Fund (UNICEF). 2018. JMP
Methodology: 2017 Update & SDG Baselines
https://www.ircwash.org/resources/jmp-methodology-2017-update-sdg-baselines
World Health Organization. 2018. Global reference list of 100 core health indicators. Geneva: World
Health Organization. http://www.who.int/healthinfo/indicators/2018/en/
Resources
DHS-7 Tabulation plan: Table 2.3
API Indicator IDs:
Households
Improved sanitation:
WS_TLET_H_IMP, WS_TLET_H_FSW, WS_TLET_H_FSP, WS_TLET_H_FPT, WS_TLET_H_VIP,
WS_TLET_H_PSL, WS_TLET_H_COM, WS_TLET_H_IMO
(API link, STATcompiler link)
Shared facility:
WS_TLET_H_SHR, WS_TLET_H_SSW, WS_TLET_H_SSP, WS_TLET_H_SPT, WS_TLET_H_SVP,
WS_TLET_H_SSL, WS_TLET_H_SCM, WS_TLET_H_SHO
(API link, STATcompiler link)
Unimproved facility:
WS_TLET_H_NIM, WS_TLET_H_NFL, WS_TLET_H_NPT, WS_TLET_H_NBK, WS_TLET_H_NHG,
WS_TLET_H_NWT, WS_TLET_H_NFC, WS_TLET_H_OTH, WS_TLET_H_DKM
(API link, STATcompiler link)
De jure population
Improved sanitation:
WS_TLET_P_IMP, WS_TLET_P_FSW, WS_TLET_P_FSP, WS_TLET_P_FPT, WS_TLET_P_VIP,
WS_TLET_P_PSL, WS_TLET_P_COM, WS_TLET_P_IMO
(API link, STATcompiler link)
Shared facility:
WS_TLET_P_SHR, WS_TLET_P_SSW, WS_TLET_P_SSP, WS_TLET_P_SPT, WS_TLET_P_SVP,
WS_TLET_P_SSL, WS_TLET_P_SCM, WS_TLET_P_SHO
(API link, STATcompiler link)
Unimproved facility:
WS_TLET_P_NIM, WS_TLET_P_NFL, WS_TLET_P_NPT, WS_TLET_P_NBK, WS_TLET_P_NHG,
WS_TLET_P_NWT, WS_TLET_P_NFC, WS_TLET_P_OTH, WS_TLET_P_DKM
(API link, STATcompiler link)
WHO 100 Core Health Indicators: Population using safely managed sanitation services
MICS6 Indicator WS.9: Use of basic sanitation services
Guide to DHS Statistics 2.15 August 2018
Percent distribution of households and de jure population with a toilet/latrine facility by
location of facility
Definition
Percent distribution of households and de jure population with a toilet/latrine facility by location of
facility.
Coverage:
Population base:
a) Households (HR file)
b) De jure household population (HR file or PR file)
Time period: Current status at time of survey
Numerators: Number of households or de jure population with a toilet/latrine facility by location of
facility
Denominators:
a) Number of households with a toilet/latrine facility
b) Number of de jure population in households with a toilet/latrine facility (hv012 – see
Calculation)
Variables: HR file.
hv012
Number of de jure members (if using HR file)
hv102
Usual resident (if using PR file)
hv205
Type of toilet facility
hv238a
Location of toilet facility
hv005
Household sample weight
Calculation
Percent distribution of de jure population by location of facility can be calculated using the HR file and
simply weighting the data by the sample weight (hv005/1000000) multiplied by the number of de jure
household members (hv012). Alternatively the PR file can be used, selecting the de jure members
(hv102 = 1) and weighting just by the sample weight (hv005/1000000).
Numerators divided by denominator multiplied by 100.
Handling of Missing Values
Households and population with missing information are included as separate categories.
Notes and Considerations
Percent distribution adds up to 100 percent.

Guide to DHS Statistics 2.16 August 2018
Changes over Time
Information on the location of the facility was introduced in DHS-7.
References
World Health Organization (WHO) and the United Nations Children’s Fund (UNICEF). 2017. Progress on
drinking water, sanitation and hygiene: 2017 update and SDG baselines. Licence: CC BY-NC-SA 3.0 IGO.
http://www.who.int/water_sanitation_health/publications/jmp-2017/en/
World Health Organization (WHO) and the United Nations Children’s Fund (UNICEF). 2018. JMP
Methodology: 2017 Update & SDG Baselines
https://www.ircwash.org/resources/jmp-methodology-2017-update-sdg-baselines
Resources
DHS-7 Tabulation plan: Table 2.3

Guide to DHS Statistics 2.17 August 2018
Household Characteristics
Percent distribution of households and de jure population by housing characteristics
Definition
Percent distribution of households and de jure population by housing characteristics.
Coverage:
Population base:
a) Households (HR file)
b) De jure household population (HR file or PR file)
Time period: Current status at time of survey
Numerators: Number of households and de jure population by housing characteristic:
1) Electricity (hv206)
2) Flooring material (hv213)
3) Rooms used for sleeping (hv216)
4) Place for cooking (hv241, hv226 = 95 [No food cooked in household])
Denominators:
a) Number of households
b) Number of de jure population (hv012 – see Calculation)
Variables: HR file.
hv012
Number of de jure members (if using HR file)
hv102
Usual resident (if using PR file)
hv206
Has electricity
hv213
Main floor material
hv216
Number of rooms used for sleeping
hv226
Cooking fuel
hv241
Food cooked in the house/separate building/outdoors
hv005
Household sample weight
Calculation
Percent distribution of de jure population by housing characteristics can be calculated using the HR file
and simply weighting the data by the sample weight (hv005/1000000) multiplied by the number of de
jure household members (hv012). Alternatively the PR file can be used, selecting the de jure members
(hv102 = 1) and weighting just by the sample weight (hv005/1000000).
Numerators divided by denominator multiplied by 100.
Handling of Missing Values
Households and population with missing information are included as separate categories.

Guide to DHS Statistics 2.18 August 2018
Notes and Considerations
Percent distribution adds up to 100 percent.
Resources
DHS-7 Tabulation plan: Table 2.4
API Indicator IDs:
Electricity:
HC_ELEC_H_ELC, HC_ELEC_H_NEL, HC_ELEC_H_DKM
(API link, STATcompiler link)
Flooring:
HC_FLRM_H_NAT, HC_FLRM_H_ETH, HC_FLRM_H_DNG, HC_FLRM_H_RUD, HC_FLRM_H_WDP,
HC_FLRM_H_PLM, HC_FLRM_H_OTR, HC_FLRM_H_FIN, HC_FLRM_H_PQT, HC_FLRM_H_VIN,
HC_FLRM_H_CER, HC_FLRM_H_CEM, HC_FLRM_H_CPT, HC_FLRM_H_OTH, HC_FLRM_H_DKM
(API link, STATcompiler link)
Rooms for sleeping:
HC_RMSL_H_1RM, HC_RMSL_H_2RM, HC_RMSL_H_3RM, HC_RMSL_H_DKM
(API link, STATcompiler link)
Place for cooking:
HC_CKPL_H_HSE, HC_CKPL_H_SEP, HC_CKPL_H_OUT, HC_CKPL_H_NFD, HC_CKPL_H_DKM,
HC_CKPL_W_OTH
(API link, STATcompiler link)
SDG indicator 7.1.1: Proportion of population with access to electricity
MICS6 Indicator SR.1: Percentage of household members with access to electricity

Guide to DHS Statistics 2.19 August 2018
Cooking Fuel
Percent distribution of households and de jure population by type of cooking fuel,
percentage using solid fuel for cooking, and percentage using clean fuel for cooking
Definition
1) Percent distribution of households and de jure population by type of cooking fuel.
2) Percentage of households and de jure population using solid fuel for cooking.
3) Percentage of households and de jure population using clean fuel for cooking.
Coverage:
Population base:
a) Households (HR file)
b) De jure household population (HR file or PR file)
Time period: Current status at time of survey
Numerators:
1) Number of households and de jure population by type of cooking fuel (hv226)
2) Number of households and de jure population using solid fuel for cooking (hv226 in 6:11)
3) Number of households and de jure population using clean fuel for cooking (hv226 in 1:4)
Denominators:
a) Number of households.
b) Number of de jure population (hv012 – see Calculation)
Variables: HR file.
hv012
Number of de jure members (if using HR file)
hv102
Usual resident (if using PR file)
hv226
Type of cooking fuel
hv005
Household sample weight
Calculation
Percent distribution of de jure population by type of cooking fuel can be calculated using the HR file and
simply weighting the data by the sample weight (hv005/1000000) multiplied by the number of de jure
household members (hv012). Alternatively the PR file can be used instead, selecting the de jure
members (hv102 = 1) and weighting just by the sample weight (hv005/1000000).
Numerators divided by denominator multiplied by 100.
Handling of Missing Values
Households and population with missing information are included as separate categories.

Guide to DHS Statistics 2.20 August 2018
Notes and Considerations
Solid fuels include coal/lignite, charcoal, wood, straw/shrub/grass, agricultural crops, and animal dung.
Clean fuels include electricity, liquefied petroleum gas (LPG), natural gas, and biogas.
Percent distribution adds up to 100 percent.
References
Bonjour, S., H. Adair-Rohani, J. Wolf, N.G. Bruce, S. Mehta, A. Prüss-Ustün, M. Lahiff, E.A. Rehfuess, V.
Mishra, and K.R. Smith. 2013. “Solid fuel use for household cooking: country and regional estimates for
1980–2010.” Environmental health perspectives, 121(7):784. https://ehp.niehs.nih.gov/1205987/
WHO. 2006. Fuel for life: household energy and health.
http://www.who.int/indoorair/publications/fuelforlife/en/
World Health Organization. 2018. Global reference list of 100 core health indicators. Geneva: World
Health Organization. http://www.who.int/healthinfo/indicators/2018/en/
Resources
DHS-7 Tabulation plan: Table 2.4
API Indicator IDs:
HC_CKFL_H_ELC, HC_CKFL_H_LPG, HC_CKFL_H_KER, HC_CKFL_H_COL, HC_CKFL_H_CHR,
HC_CKFL_H_WOD, HC_CKFL_H_STR, HC_CKFL_H_AGR, HC_CKFL_H_DNG, HC_CKFL_H_GAS,
HC_CKFL_H_OTH, HC_CKFL_H_NFD, HC_CKFL_H_DKM, HC_CKFL_H_SLD
(API link, STATcompiler link)
SDG Indicator 7.1.2: Proportion of population with primary reliance on clean fuels and technology
WHO 100 Core Health Indicators: Population with primary reliance on clean fuels and technology
MICS6 Indicator TC.15: Primary reliance on clean fuels and technologies for cooking

Guide to DHS Statistics 2.21 August 2018
Smoking in Home
Percent distribution by frequency of smoking in the home
Definition
Percent distribution by frequency of smoking in the home, according to residence.
Coverage:
Population base:
a) Households (HR file)
b) De jure household population (HR file or PR file)
Time period: Current status at time of survey
Numerators: Number of households and de jure population by frequency of smoking in the home
(hv252)
Denominators:
a) Number of households
b) Number of de jure population (hv012 – see Calculation)
Variables: HR file.
hv012
Number of de jure members (if using HR file)
hv102
Usual resident (if using PR file)
hv252
Frequency household members smoke inside the house
hv005
Household sample weight
Calculation
Percent distribution of de jure population by type of cooking fuel can be calculated using the HR file and
simply weighting the data by the sample weight (hv005/1000000) multiplied by the number of de jure
household members (hv012). Alternatively the PR file can be used instead, selecting the de jure
members (hv102 = 1) and weighting just by the sample weight (hv005/1000000).
Numerators divided by denominator multiplied by 100.
Handling of Missing Values
Households and population with missing information are included as separate categories.
Notes and Considerations
Percent distribution adds up to 100 percent.

Guide to DHS Statistics 2.22 August 2018
Changes over Time
Collection of information on the frequency of smoking in the home began in DHS-VI.
Resources
DHS-7 Tabulation plan: Table 2.4
API Indicator IDs:
HC_SMKH_H_DLY, HC_SMKH_H_WLY, HC_SMKH_H_MLY, HC_SMKH_H_LES, HC_SMKH_H_NEV, HC_SMKH_H_DKM
(API link, STATcompiler link)

Guide to DHS Statistics 2.23 August 2018
Household Possessions
Percentage of households possessing various household effects, means of transport,
ownership of agricultural land, and ownership of livestock/farm animals
Definition
1) Percentage of households possessing various household effects.
2) Percentage of households possessing various means of transport.
3) Percentage of households owning agricultural land.
4) Percentage of households owning livestock or farm animals.
Coverage:
Population base: Households (HR file)
Time period: Current status at time of survey
Numerators:
1) Number of households possessing various household effects:
a. Radio (hv207 = 1)
b. Television (hv208 = 1)
c. Mobile phone (hv243a = 1)
d. Non-mobile telephone (hv221 = 1)
e. Computer (hv243e = 1)
f. Refrigerator (hv209 = 1)
2) Number of households possessing various means of transport:
a. Bicycle (hv210 = 1)
b. Animal drawn cart (hv243c = 1)
c. Motorcycle/scooter (hv211 = 1)
d. Car/truck (hv212 = 1)
e. Boat with a motor (hv243d = 1)
3) Number of households owning agricultural land (hv244 = 1)
4) Number of households owning livestock or farm animals (hv246 = 1)
Denominator: Number of households
Variables: HR file.
hv207
Has radio
hv208
Has television
hv209
Has refrigerator
hv210
Has bicycle
hv211
Has motorcycle/scooter
hv212
Has car/truck
hv221
Has telephone (land-line)
hv243a
Has mobile telephone
hv243c
Has animal-drawn cart
hv243d
Has boat with a motor

Guide to DHS Statistics 2.24 August 2018
hv243e
Has a computer
hv244
Owns land usable for agriculture
hv246
Owns livestock, herds or farm animals
hv005
Household sample weight
Calculation
Numerators divided by denominator multiplied by 100.
Handling of Missing Values
Households with missing information are excluded from the numerator but included in the
denominator.
Notes and Considerations
Farm animals include cows, bulls, other cattle, horses, donkey, mules, goats, sheep, and chickens or
other poultry. Surveys may also include additional animals such as rabbits, pigs, camels, or other
animals.
Resources
DHS-7 Tabulation plan: Table 2.5
API Indicator IDs:
HC_HEFF_H_RDO, HC_HEFF_H_TLV, HC_HEFF_H_MPH, HC_HEFF_H_NPH, HC_HEFF_H_FRG,
HC_TRNS_H_BIK, HC_TRNS_H_CRT, HC_TRNS_H_SCT, HC_TRNS_H_CAR, HC_TRNS_H_BTM,
HC_AGON_H_LND, HC_AGON_H_ANM
(API link, STATcompiler link)
MICS6 Indicator SR.4: Households with a radio
MICS6 Indicator SR.5: Households with a television
MICS6 Indicator SR.6: Households with a telephone (fixed line or mobile phone)
MICS6 Indicator SR.7: Households with a computer

Guide to DHS Statistics 2.25 August 2018
Wealth Quintiles
Percent distribution of the de jure population by wealth quintiles and the Gini coefficient
Definition
Percent distribution of the de jure population by wealth quintiles and the Gini coefficient.
Coverage:
Population base: De jure population (HR file)
Time period: Current status at time of survey
Numerators:
1) Number of de jure population in each quintile (hv270)
2) Gini coefficient of wealth index (hv271 – see Calculation)
Denominators: Number of de jure population (hv012)
Variables: HR file.
hv012
Number of de jure members
hv270
Wealth index combined
hv271
Wealth index factor score combined
hv005
Household sample weight
Calculation
For the percent distribution, numerators divided by denominator multiplied by 100.
For the Gini coefficient, the Notes and Considerations below provide a description of the Gini
coefficient.
The calculation of the Gini coefficient can be performed in a number of ways. For simplicity and
practicality, The DHS Program calculates the Gini coefficient with the Brown Formula shown below:
G: Gini coefficient
Xk: cumulative proportion of the population variable, for k = 1,...,n, with X0 = 0, Xn = 1
Yk: cumulative proportion of the wealth variable, for k = 1,...,n, with Y0 = 0, Yn = 1
and n = 100 in the DHS implementation.
To implement this, the following steps are used for each background characteristic:
Guide to DHS Statistics 2.26 August 2018
1) Calculate the minimum (min) and maximum (max) wealth index score for the characteristic
(national, urban/rural, or region). Note that min and max can be negative for specific
characteristics, but at the national level min should be negative and max should be positive.
2) Calculate the wealth group as k = ( ( hv271 - min ) / ( (max - min) / (n - 1) ) + 1. This will result in
groups 1 to 100.
3) Tally the population for this group k (popk = popk + sample weight (hv005/1000000) * number of
de jure household members (hv012)).
4) Tally the relative wealth score for this group (wealthk = wealthk + sample weight
(hv005/1000000) * difference of the wealth index score and the minimum wealth index score
for the background characteristic (hv271 - min)).
5) Calculate cumulative population groups by accumulating the populations in each group
(cum.popk = cum.popk-1 + popk, where cum.pop0 = 0 and k = 1 to 100).
6) Calculate cumulative wealth groups by accumulating the relative wealth in each group
(cum.wealthk = cum.wealthk-1 + wealthk, where cum.wealth0 = 0 and k = 1 to 100).
7) Convert cumulative populations into cumulative proportions of population (prop.popk =
cum.popk / cum.pop100, where k = 1 to 100 and cum.pop100 is the total population for the
characteristic as calculated in step 5, and prop.pop100 will thus be 1, and prop.pop0 = 0).
8) Convert cumulative wealth into cumulative proportions of wealth (prop.wealthk = cum.wealthk /
cum.wealth100, where k = 1 to 100 cum.wealth100 is the total relative wealth for the characteristic
as calculated in step 6, and prop.wealth100 will thus be 1, and prop.wealth0 = 0).
9) Apply the formula given above to calculate the Gini coefficient:
(G = abs(1 - sum ( (prop.popk - prop.popk-1) * (prop.wealthk - prop.wealthk-1) ) where k = 1 to
100)).
Handling of Missing Values
There are no missing data for the wealth index factor score.
Notes and Considerations
In addition to standard background characteristics, most of the results in the survey reports are shown
by wealth quintiles, an indicator of the economic status of households. Although surveys under The DHS
Program do not collect data on consumption or income, they do collect detailed information on dwelling
and household characteristics and access to a variety of consumer goods and services, and assets, which
together are used as a measure of economic status. The wealth index is a measure that has been used in
many DHS and other country-level surveys to indicate inequalities in household characteristics, in the
use of health and other services, and in health outcomes. The resulting wealth index is an indicator of
the level of wealth that is consistent with expenditure and income measures. The wealth index is
constructed using household asset data via principal components analysis.
In its current form, which takes better account of urban-rural differences in the scores and indicators of
wealth, the wealth index is created in three steps. In the first step, a subset of indicators common to
both urban and rural areas is used to create wealth scores for households in both areas. Categorical
variables to be used are transformed into separate dichotomous (0-1) indicators, as are groupings of
certain discrete variables such as numbers of different types of animals. These variables and those that
are continuous are then analyzed using principal components analysis to produce a common factor
score for each household. In a second step, separate factor scores are produced for households in urban
Guide to DHS Statistics 2.27 August 2018
and in rural areas using area-specific indicators. The third step combines the separate area-specific
factor scores to produce a nationally applicable combined wealth index by adjusting the area-specific
score through regression on the common factor scores. This three-step procedure permits greater
adaptability of the wealth index in both urban and rural areas. The resulting combined wealth index has
a mean of zero and a standard deviation of one, and once it is obtained, national-level wealth quintiles
are obtained by assigning the household score to each de jure household member, ranking each person
in the population by their score and then dividing the ranking into five equal parts, from quintile one
(lowest-poorest) to quintile five (highest-wealthiest), each having approximately 20% of the population.
DHS-7 standard Table 2.6 shows the distribution across the five wealth quintiles of the population of
urban and rural areas and in each region. These distributions indicate the degree to which wealth is
evenly (or unevenly) distributed by geographic areas. The distribution of households by quintiles is not
exactly 20 percent due to the fact that members of the households, not households, were divided into
quintiles.
Also included in DHS-7 standard Table 2.6 is the Gini coefficient, which indicates the level of
concentration of wealth, 0 being an equal distribution and 1 a totally unequal distribution. In other
words, if every person in the country owned the same amount of wealth, the Gini coefficient would be
0. If one person in the country owned all of the wealth, then the Gini coefficient would be 1. In a country
with a Gini coefficient of 0.2, wealth is fairly evenly distributed across the population. On the other
hand, in a country with a Gini coefficient of 0.8, the top 10 percent of wealthiest people own much more
wealth than the lowest 10 percent. A Gini coefficient that increases over time in a country indicates that
wealth is becoming more concentrated, and disparities between the richest and poorest are increasing.
The Gini coefficient is calculated as a ratio of the areas on the Lorenz curve diagram (see figure below). If
the area between the line of perfect equality and Lorenz curve is A, and the area underneath the Lorenz
curve is B, then the Gini coefficient is A/(A+B). This ratio is expressed as a percentage or as the
numerical equivalent of that percentage, which is always a number between 0 and 1. As wealth
becomes more concentrated, the Lorenz curve moves down and to the right, area A increases as a
proportion of A+B, and the Gini coefficient gets higher (closer to 1).
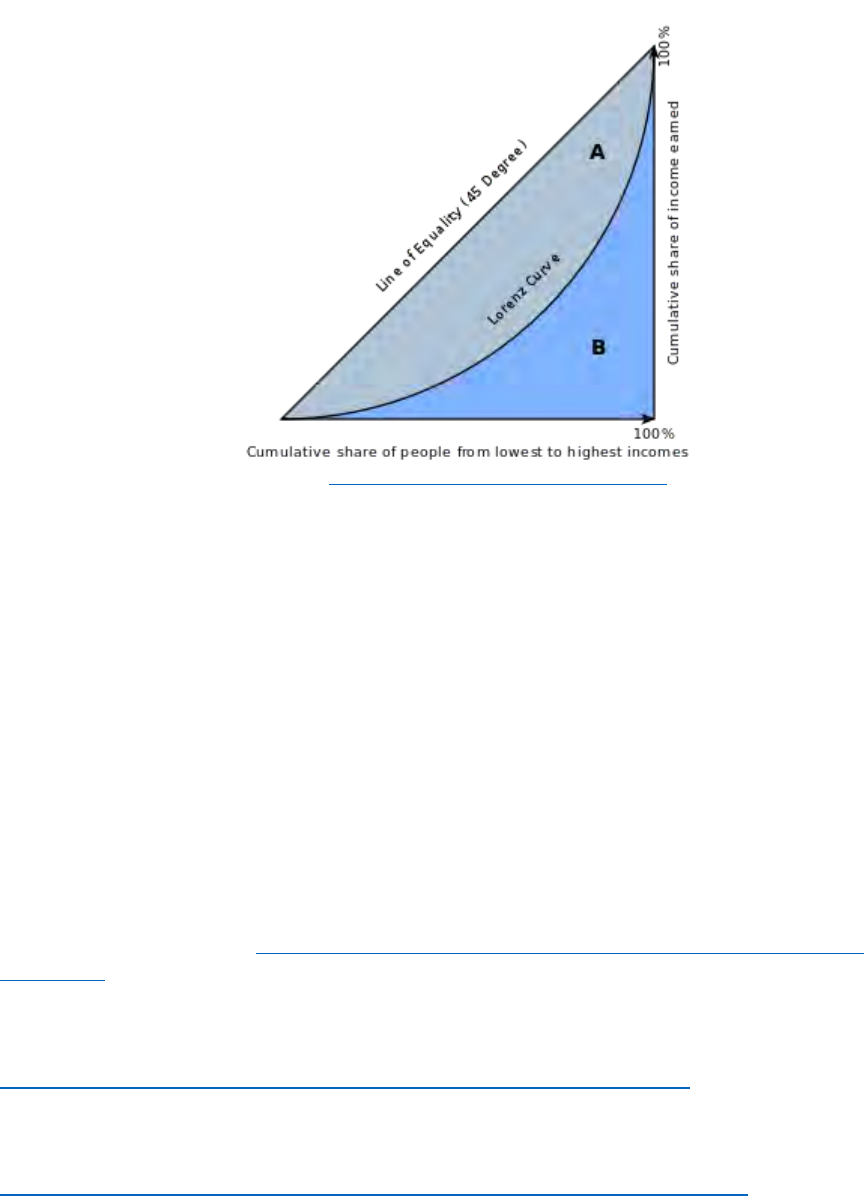
Guide to DHS Statistics 2.28 August 2018
Source: https://en.wikipedia.org/wiki/Gini_coefficient
Because of its nature, smaller areas are more likely to have lower values of the Gini coefficient because
they are more likely to be homogeneous than are larger areas. Thus the value of the coefficient in each
region is often lower than the value of the nation as a whole.
Changes over Time
The method of calculating the wealth quintiles has gone through several iterations. Initially the national
wealth index score was calculated directly using a single principal components analysis (Rutstein and
Johnson, 2004). In 2008 the calculation method was changed to produce separate urban and rural
wealth scores and then use a regression equation to map these to a combined national wealth index
score (Rutstein, 2008).
References
Rutstein, S.O. and K. Johnson. 2004. The DHS wealth index. DHS Comparative Reports No. 6. Calverton,
Maryland, USA: ORC Macro. https://dhsprogram.com/publications/publication-cr6-comparative-
reports.cfm
Rutstein, S.O. 2008. The DHS wealth index: Approaches for rural and urban areas. DHS Working Papers
No. 60. Calverton, Maryland, USA: Macro International.
https://dhsprogram.com/publications/publication-wp60-working-papers.cfm
Rutstein, S. O. and S. Staveteig. 2014. Making the Demographic and Health Surveys Wealth Index
comparable. DHS Methodological Reports No. 9. Rockville, Maryland, USA: ICF International.
https://dhsprogram.com/publications/publication-mr9-methodological-reports.cfm


Guide to DHS Statistics 2.30 August 2018
Handwashing
Percentage of households in which a place used for handwashing was observed, and
among those households, percent distribution by the availability of water, soap, and other
cleansing agents
Definition
1) Percentage of households where a place used for handwashing was observed, and by whether
its location is fixed or mobile.
2) Among households where a place for handwashing was observed, percent distribution by
availability of water, soap, and other cleansing agents.
Coverage:
Population base: Households (HR file)
Time period: Current status at time of survey
Numerators:
1) Number of households where a place for handwashing was observed:
a. Fixed (hv230a = 1)
b. Mobile (hv230a = 2)
c. Total (hv230a in 1,2)
2) Number of households where a place for handwashing was observed (hv230a in 1,2) with:
a. Soap and water (hv230b = 1 & hv232 = 1)
b. Water and cleansing agent other than soap only (hv230b = 1 & hv232 ≠ 1 & hv232b = 1)
c. Water only (hv230b = 1 & hv232 ≠ 1 & hv232b ≠ 1 & hv232y = 1)
d. Soap but no water (hv230b ≠ 1 & hv232 = 1)
e. Cleansing agent other than soap (hv230b ≠ 1 & hv232 ≠ 1 & hv232b = 1)
f. No water, no soap, no other cleansing agent (hv230b ≠ 1 & hv232 ≠ 1 & hv232b ≠ 1 &
hv232y = 1)
Denominators:
1) Number of households
2) Number of households in which a place for handwashing was observed (hv230a in 1,2)
Variables: HR file.
hv230a
Place where household members wash their hands
hv230b
Presence of water at hand washing place
hv232
Items present: Soap or detergent
hv232b
Items present: Ash, mud, sand
hv232y
Items present: None
hv005
Household sample weight

Guide to DHS Statistics 2.31 August 2018
Calculation
Numerator divided by denominator multiplied by 100.
Handling of Missing Values
Households with missing information on a place for washing or on availability of water, soap, or other
cleansing agent are assumed not to have those characteristics.
Notes and Considerations
Percent distribution adds up to 100 percent.
Changes over Time
Questions on handwashing were introduced in DHS-VI, with a single coding category used to indicate a
place handwashing was “Observed”. In DHS-7, an additional coding category was added to indicate the
type of place for handwashing that was observed. The two categories are “Observed, fixed place” and
“Observed, mobile”.
As part of the SDG period, the JMP has introduced criteria for basic and limited handwashing facilities
that take into consideration the availability of soap and/or water. In the context of the SDGs, the
presence of cleansing agents other than soap (e.g. ash, mud, or sand) are not taken into consideration.
As of August 2018, this change has not been implemented in DHS surveys, but is expected to be made
before the end of 2018.
References
World Health Organization (WHO) and the United Nations Children’s Fund (UNICEF). 2017. Progress on
drinking water, sanitation and hygiene: 2017 update and SDG baselines. Licence: CC BY-NC-SA 3.0 IGO.
http://www.who.int/water_sanitation_health/publications/jmp-2017/en/
World Health Organization (WHO) and the United Nations Children’s Fund (UNICEF). 2018. JMP
Methodology: 2017 Update & SDG Baselines
https://www.ircwash.org/resources/jmp-methodology-2017-update-sdg-baselines
Resources
DHS-7 Tabulation plan: Table 2.7
API Indicator IDs:
WS_HNDW_H_OBS, WS_HNDW_H_SPW, WS_HNDW_H_WCL, WS_HNDW_H_WTO, WS_HNDW_H_SPO,
WS_HNDW_H_CLO, WS_HNDW_H_NON, WS_HNDW_H_DKM
(API link, STATcompiler link)
MICS6 Indicator WS.7: Handwashing facility with water and soap

Guide to DHS Statistics 2.32 August 2018
Household Population by Age, Sex, and Residence
Percent distribution of the de facto household population by different age groupings,
according to sex and residence.
Definition
Percent distribution of the de facto household population by:
1) Five-year age groups
2) Dependency age groups (0-14, 15-64, 65+)
3) Child and adult population (0-17, 18+)
Percentage of the de facto household population:
4) That are adolescents (age 10-19)
According to sex and residence.
Coverage:
Population base: De facto household population (PR file)
Time period: Current status at time of survey
Numerator: Number of de facto persons (hv103 = 1) by age groupings:
1) Five-year age groups: 0-4, 5-9, …, 75-79, 80+ ( int(hv105/5) )
2) Dependency age groups: 0-14, 15-64, 65+ (hv105 in 0:14, hv105 in 15:64, hv105 in 65:97)
3) Child and adult population: 0-17, 18+ (hv105 in 0:17, hv105 in 18:97)
4) Adolescents: 10-19 (hv105 in 10:19)
Denominators: Number of de facto persons (hv103 = 1)
Variables: PR file.
hv103
Slept last night
hv105
Age of household members
hv005
Household sample weight
Calculation
Numerator divided by denominator multiplied by 100.
Handling of Missing Values
Persons with “Don’t know” responses or missing information for age are included as separate categories
in the percent distributions. Persons with missing information on sex are excluded from the sex specific
disaggregations but included in the total for both sexes.
Notes and Considerations
Percent distributions add up to 100 percent.

Guide to DHS Statistics 2.33 August 2018
Changes over Time
Inclusion of dependency age groups, child and adult populations, and adolescents in the standard
tabulation were introduced in DHS-7.
Resources
DHS-7 Tabulation plan: Table 2.8
API Indicator IDs:
Five-year groups:
HC_AGEG_P_004, HC_AGEG_P_059, HC_AGEG_P_104, HC_AGEG_P_159, HC_AGEG_P_204,
HC_AGEG_P_259, HC_AGEG_P_304, HC_AGEG_P_359, HC_AGEG_P_404, HC_AGEG_P_459,
HC_AGEG_P_504, HC_AGEG_P_559, HC_AGEG_P_604, HC_AGEG_P_659, HC_AGEG_P_704,
HC_AGEG_P_759, HC_AGEG_P_80P, HC_AGEG_P_DKM
(API link, STATcompiler link)
Age groupings:
HC_AGEG_P_014, HC_AGEG_P_154, HC_AGEG_P_65P,
HC_AGEG_P_017, HC_AGEG_P_18P, HC_AGEG_P_109
(API link, STATcompiler link)

Guide to DHS Statistics 2.34 August 2018
Household Composition
Percent distribution of households by sex of head of household and by household size,
mean size of households, and percentage of households with orphans and foster children
under age 18
Definition
1) Percent distribution of households by sex of head of household.
2) Percent distribution of households by household size.
3) Mean size of households.
4) Percentage of households with orphans and foster children under age 18.
Coverage:
Population base: Households (HR file & PR file)
Time period: Current status at time of survey
Numerators:
1) Number of households by sex of head of household (hv219)
2) Number of households by number of usual members (hv012)
3) Number of usual household members (hv012)
4) Number of households with
a) Double orphans under age 18 (sum of d_orphan > 0)
b) Single orphans under age 18 (sum of s_orphan > 0)
c) Foster children under age 18 (sum of foster_child > 0)
d) Orphans and/or foster children under age 18 (sum of d_orphan + sum of s_orphan + sum of
foster_child > 0)
See Calculation below for construction of the working variables above.
Denominator: Number of households
Variables: HR file, PR file.
hv012
Number of de jure members
hv102
Usual resident
hv105
Age of household members
hv111
Mother alive
hv112
Mother’s line number
hv113
Father alive
hv114
Father’s line number
hv219
Sex of head of household
hv005
Household sample weight
Calculation
Percent distributions: Numerators divided by denominator multiplied by 100.
Guide to DHS Statistics 2.35 August 2018
Mean: Numerator divided by denominator.
Percentage of households with orphans or foster children: Using the PR file, create binary (0/1) variables
for de jure children under age 18 (hv105 in 0:17 & hv102 = 1) who are:
a. Double orphans under age 18: Both parents are no longer alive (d_orphan = (hv111 = 0 & hv113
= 0))
b. Single orphans under age 18: Only one parent is no longer alive (s_orphan = ( (hv111 = 0 &
hv113 ≠ 0) or (hv111 ≠ 0 & hv113 = 0 ) ) ).
c. Foster children under age 18: Whose parents are both either not listed in the household roster
or are not usual members of the household. This will require merging the mother’s and the
father’s residency status (hv102) from a copy of the PR file, based on the mother and father’s
line numbers (hv112 or hv114) into the PR file, and then checking the residency status of the
mother and the father, if they are listed in the household roster (foster_child = ( (hv112 in 0,99
or hv102(mother) <> 1) & (hv114 in 0,99 or hv102(father) <> 1) ) ).
d. Orphans and/or foster children under age 18 (any of d_orphan, s_orphan, and foster_child
above).
After constructing these variables, aggregate counts of these variables at the household level (collapse
in Stata, aggregate in SPSS), and then merge the aggregated variables into the HR file. Finally, the
numerators for each group of orphans and foster children are:
a. Double orphans under age 18 (sum of d_orphan > 0)
b. Single orphans under age 18 (sum of s_orphan > 0)
c. Foster children under age 18 (sum of foster_child > 0)
d. Orphans and/or foster children under age 18 (sum of d_orphan + sum of s_orphan + sum of
foster_child > 0).
And the final indicators are numerators divided by denominator multiplied by 100.
Handling of Missing Values
Households and population with missing information are included as separate categories.
Notes and Considerations
Foster children are those under age 18 living in households with neither their mother nor their father
present, and the mother and/or the father are alive.
In some circumstances a small number of households will report zero usual members and the only
persons listed in the household roster are de facto residents who stayed in the household the night
before the survey. This may happen with households occupied at time of listing but not by the time of
the interview, or with vacation homes that are only used on an occasional basis.
Percent distributions add up to 100 percent.
Resources
DHS-7 Tabulation plan: Table 2.9

Guide to DHS Statistics 2.36 August 2018
API Indicator IDs:
HC_HHHD_H_MAL, HC_HHHD_H_FEM, HC_MEMB_H_0MM, HC_MEMB_H_1MM, HC_MEMB_H_2MM,
HC_MEMB_H_3MM, HC_MEMB_H_4MM, HC_MEMB_H_5MM, HC_MEMB_H_6MM, HC_MEMB_H_7MM,
HC_MEMB_H_8MM, HC_MEMB_H_9MM, HC_MEMB_H_MNM, HC_ORPH_H_DBL, HC_ORPH_H_SNG,
HC_ORPH_H_FOS, HC_ORPH_H_FOR
(API link, STATcompiler link)

Guide to DHS Statistics 2.37 August 2018
Children’s Living Arrangements and Orphanhood
Percent distribution of de jure children, children not living with a biological parent, and
children with one or both parents dead
Definition
1) Percent distribution of de jure children under age 18 by living arrangements.
2) Percentage of de jure children under age 18 not living with a biological parent.
3) Percentage of de jure children under age 18 with one or both parents dead.
Coverage:
Population base: De jure children under age 18 (PR file)
Time period: Current status at time of survey
Numerators:
1) Number of children under age 18 by living arrangement and survival status of parents:
a. Living with both parents (with_mother & with_father)
b. Living with mother (with_mother), but not with father:
i. father alive (father_alive & not with_father)
ii. father dead (not father_alive)
c. Living with father (with_father), but not with mother:
i. mother alive (mother_alive & not with_mother)
ii. mother dead (not mother_alive)
d. Not living with either parent (not with_mother & not with_father):
i. both alive (mother_alive & father_alive)
ii. only mother alive (mother_alive & not father_alive)
iii. only father alive (not mother_alive & father_alive)
iv. both dead (not mother_alive & not father_alive)
2) Number of children under age 18 not living with a biological parent (group d above)
3) Number of children under age 18 with both parents dead (hv111 = 0 and hv113 = 0)
See Calculation below for construction of the working variables above.
Denominator: Number of de jure children under age 18 (hv102 = 1 and hv105 < 18)
Variables: PR file.
hv102
Usual resident
hv104
Sex of household member
hv105
Age of household members
hv111
Mother alive
hv112
Mother's line number
hv113
Father alive
hv114
Father's line number
Calculation

Guide to DHS Statistics 2.38 August 2018
To construct the working variables needed for these indicators, first merge hv102 for the mother from a
copy of the PR file into the main PR file based on the mother’s line number (hv112) if the mother is
listed in the household roster. Similarly merge hv102 for the father from a copy of the PR file into the
main PR file based on the father’s line number (hv114) if the father is listed in the household roster.
Then the following working variables needed in the calculation of the living arrangements indicators can
be constructed:
mother_alive = ( hv111 = 1 )
with_mother = ( hv112 in 1:hv009 & hv102(mother) = 1 )
father_alive = ( hv113 = 1 )
with_father = ( hv114 in 1:hv009 & hv102(father) = 1 )
The indicators are calculated as numerators divided by denominator multiplied by 100.
Handling of Missing Values
Children with missing information are included in a separate category in the percent distribution.
Notes and Considerations
Percent distribution adds up to 100 percent.
References
Mishra, V. and S. Bignami-Van Assche. 2008. Orphans and vulnerable children in high HIV-prevalence
countries in sub-Saharan Africa. DHS Analytical Studies No. 15. Calverton, Maryland, USA: Macro
International. https://dhsprogram.com/publications/publication-AS15-Analytical-Studies.cfm
Rutstein, S. O. 2008. Finding the missing maternal and paternal orphans. Calverton, Maryland, USA:
Macro International. https://dhsprogram.com/publications/publication-od53-other-documents.cfm
Resources
DHS-7 Tabulation plan: Table 2.10
API Indicator IDs:
HC_LVAR_C_BTH, HC_LVAR_C_MFA, HC_LVAR_C_MFD, HC_LVAR_C_FMA, HC_LVAR_C_FMD,
HC_LVAR_C_NBA, HC_LVAR_C_NMA, HC_LVAR_C_NFA, HC_LVAR_C_NBD, HC_LVAR_C_NMS,
HC_LVAR_C_NBP, HC_LVAR_C_P1D
(API link, STATcompiler link)
MICS6 Indicator SR.18: Children’s living arrangements
MICS6 Indicator SR.19: Prevalence of children with one or both children dead

Guide to DHS Statistics 2.39 August 2018
Birth Registration
Percentage of de jure children whose births are registered with civil authorities
Definition
1) Percentage of de jure children under age 5 whose births are registered with civil authorities and
who had a birth certificate.
2) Percentage of de jure children under age 5 whose births are registered with civil authorities and
who did not have a birth certificate.
3) Percentage of de jure children under age 5 whose births are registered with civil authorities.
Coverage:
Population base: De jure children under age 5 (PR file)
Time period: 5 years preceding the survey
Numerators:
1) Number of de jure children under age 5 whose births are registered and who had a birth
certificate (hv140 = 1)
2) Number of de jure children under age 5 whose births are registered and who did not have a
birth certificate (hv140 = 2)
3) Number of de jure children under age 5 whose births are registered (hv140 in 1,2)
Denominator: Number of de jure children under age 5 (hv102 = 1 & hv105 in 0:4)
Variables: PR file.
hv102
Usual resident
hv105
Age of household members
hv140
Member has a birth certificate
hv005
Household sample weight
Calculation
Numerator divided by denominator multiplied by 100.
Handling of Missing Values
Children with missing information on birth registration are excluded from the numerators, but included
in the denominator.
References
Stone, L.F., A. Olgiati, and S. Duryea, 2006. The Under-Registration of Births in Latin America. Inter-
American Development Bank.

Guide to DHS Statistics 2.40 August 2018
Resources
DHS-7 Tabulation plan: Table 2.11
API Indicator IDs: CP_BREG_C_CRT, CP_BREG_C_NCT, CP_BREG_C_REG
(API link, STATcompiler link)
SDG indicator 16.9.1: Proportion of children under 5 years of age whose births have been registered
with a civil authority, by age
WHO 100 Core Health Indicators: Birth registration
MICS6 Indicator PR.1: Birth registration

Guide to DHS Statistics 2.41 August 2018
Educational Attainment of Household Members
Percent distribution of the de facto female and male household population age 6 and over
by highest level of schooling attended or completed
Definition
Percent distribution of the de facto female and male household population age 6 and over by highest
level of schooling attended or completed.
Coverage:
Population base: De facto female and male household members age 6 and over (PR file)
Time period: Current status at time of survey
Numerator: Number of de facto females or males age 6 and over distributed by level of schooling
attended or completed (hv109, hv103 = 1 & hv105 in 6:99)
Denominator: Number of de facto females or males age 6 and over (hv103 = 1 & hv105 in 6:99)
Variables: PR file.
hv103
Slept last night
hv104
Sex of household member
hv105
Age of household members
hv109
Educational attainment
hv005
Household sample weight
Calculation
Numerator divided by the denominator multiplied by 100.
Handling of Missing Values
Missing data and “Don’t know” responses are grouped into a separate category in the percent
distribution.
Notes and Considerations
Years of education considered for completion of each level of education vary from country to country,
and may change over time within country. Education levels are also country-specific. Respondents are
asked the highest level of schooling attended and the highest grade completed at that level.
Resources
DHS-7 Tabulation plan: Tables 2.12.1 and 2.12.2

Guide to DHS Statistics 2.42 August 2018
API Indicator IDs:
Women:
ED_EDAT_W_NED, ED_EDAT_W_SPR, ED_EDAT_W_CPR, ED_EDAT_W_SSC, ED_EDAT_W_CSC,
ED_EDAT_W_HGH, ED_EDAT_W_DKM, ED_EDAT_W_PRI, ED_EDAT_W_SEC
(API link, STATcompiler link)
Men:
ED_EDAT_M_NED, ED_EDAT_M_SPR, ED_EDAT_M_CPR, ED_EDAT_M_SSC, ED_EDAT_M_CSC,
ED_EDAT_M_HGH, ED_EDAT_M_DKM, ED_EDAT_M_PRI, ED_EDAT_M_SEC
(API link, STATcompiler link)
Guide to DHS Statistics 2.43 August 2018
Median years of education completed
Definition
Median years of education for the de facto female and male household population age 6 and over.
Coverage:
Population base: De facto female and male household members age 6 and over (PR file)
Time period: Current status at time of survey
Numerator: Number of de facto females or males age 6 who attended or completed any school
according to the number of years completed (hv108 if hv103 = 1 & hv105 in 6:99 & hv108 in 0:96)
Denominator: Number of de facto females or males age 6 and over (hv103 = 1 & hv105 in 6:99 & hv108
in 0:96)
Variables: PR file.
hv103
Slept last night
hv104
Sex of household member
hv105
Age of household members
hv108
Education completed in single years
hv005
Household sample weight
Calculation
Medians are calculated from cumulated single-year percent distributions (see Numerator and
Denominator above) of completed years of schooling. The median is linearly interpolated between the
years of completed schooling that occur before and after a cumulative 50 percent:
median = mi + (0.5 - p i) / (p i+1 - p i)
Example
The table below shows the cumulative (weighted) percentage of women age 15-19 by completed years
of schooling. We look for two successive cumulative percentages that bracket 50%. We find that 41.6%
of women age 15-19 have completed 6 years of schooling and 54.6% completed 7 years of schooling.
We find the median by interpolating between the two numbers of completed years.

Guide to DHS Statistics 2.44 August 2018
Completed
years of
education
Frequency
Percentage of
de facto
females age
15-19
Cumulative
percentage of
de facto
females age
15-19
0
375
18.6
18.6
1
8
0.4
19.0
2
17
0.8
19.8
3
40
2.0
21.8
4
67
3.3
25.2
5
115
5.7
30.9
6
217
10.8
41.6
7
262
13.0
54.6
8
357
17.7
72.3
9
226
11.2
83.5
10
172
8.5
92.0
11
93
4.6
96.6
12
66
3.3
99.9
13
2
0.1
100.0
median = 6 + (50.0 - 41.6) / (54.6 - 41.6)
median = 6.6
Handling of Missing Values
Missing data and “Don’t know” responses for the highest level of education attended or the highest
grade completed are excluded from the median calculation.
References
Filmer, D., and L. Pritchett. 1999. "The effect of household wealth on educational attainment: evidence
from 35 countries." Population and development review 25(1): 85-120.
Resources
DHS-7 Tabulation plan: Table 2.12.2
API Indicator IDs: ED_EDUC_W_MYR, ED_EDUC_M_MYR
(API link, STATcompiler link)

Guide to DHS Statistics 2.45 August 2018
School Attendance Ratios
Net attendance ratios (NAR) and gross attendance ratios (GAR) for the de facto household
population by sex and level of schooling, and the Gender Parity Index (GPI)
Definition
Primary school net attendance ratio (NAR) for:
1) De facto male household population.
2) De facto female household population.
3) De facto household population of both sexes.
Secondary school net attendance ratio (NAR) for:
4) De facto male household population.
5) De facto female household population.
6) De facto household population of both sexes.
Primary school gross attendance ratio (GAR) for:
7) De facto male household population.
8) De facto female household population.
9) De facto household population of both sexes.
Secondary school gross attendance ratio (GAR) for:
10) De facto male household population.
11) De facto female household population.
12) De facto household population of both sexes.
Gender parity indices for:
13) Net attendance ratio for primary school.
14) Net attendance ratio for secondary school.
15) Gross attendance ratio for primary school.
16) Gross attendance ratio for secondary school.
Coverage:
Population base: De facto household population age 5-24 years
Time period: Current status at time of survey
Numerators:
Primary school NAR:
1) Number of de facto male population attending primary school
(hv103 = 1 & hv104 = 1 & age_schl in A:B & hv122 = 1)
2) Number of de facto female population attending primary school
(hv103 = 1 & hv104 = 2 & age_schl in A:B & hv122 = 1)
3) Number of de facto total of both sexes population attending primary school
(hv103 = 1 & age_schl in A:B & hv122 = 1)
Guide to DHS Statistics 2.46 August 2018
Secondary school NAR:
4) Number of de facto male population attending secondary school
(hv103 = 1 & hv104 = 1 & age_schl in C:D & hv122 = 2)
5) Number of de facto female population attending secondary school
(hv103 = 1 & hv104 = 2 & age_schl in C:D & hv122 = 2)
6) Number of de facto total population of both sexes attending secondary school
(hv103 = 1 & age_schl in C:D & hv122 = 2)
Primary school GAR:
7) Number of de facto male population attending primary school
(hv103 = 1 & hv104 = 1 & hv122 = 1)
8) Number of de facto female population attending primary school
(hv103 = 1 & hv104 = 2 & hv122 = 1)
9) Number of de facto total of both sexes population attending primary school
(hv103 = 1 & hv122 = 1)
Secondary school GAR:
10) Number of de facto male population attending secondary school
(hv103 = 1 & hv104 = 1 & hv122 = 2)
11) Number of de facto female population attending secondary school
(hv103 = 1 & hv104 = 2 & hv122 = 2)
12) Number of de facto total population of both sexes attending secondary school
(hv103 = 1 & hv122 = 2)
Denominators:
Primary school:
1) Number of de facto primary school age male population
2) Number of de facto primary school age female population
3) Number of de facto primary school age total population of both sexes
Secondary school:
4) Number of de facto secondary school age male population
5) Number of de facto secondary school age female population
6) Number of de facto secondary school age total population of both sexes
Denominators for 7-12 are the same as denominators 1-6, respectively
See Calculation for the method used to calculate primary school age and secondary school age
population (age_schl in A:B or C:D).
Variables: PR file.
hv008
Date of interview (CMC)
hv103
Slept last night
hv104
Sex of household member
hv105
Age of household members
hv122
Educational level during current school year
hv005
Household sample weight
Guide to DHS Statistics 2.47 August 2018
Calculation
To calculate the primary school age and secondary school age population, first the standard age groups
for primary and secondary school in the particular country are established, for example, as 6-11 and 12-
17 respectively. Sources for establishing the age range include the national Ministry of Education and
the UNESCO Institute for Statistics database. Additionally, the month of the start of the academic year
(m_acadyr) is also established. As the survey may take place at any point in the academic year and a
child’s age may have changed since the start of the academic year, the age of the person at the start of
the academic year is estimated. To do this, first the century month code of the start of the academic
year is calculated as:
cmc_acadyr = ((hv007-1900)*12+m_acadyr) if m_acadyr >= hv006
cmc_acadyr = ((hv007-1-1900)*12+m_acadyr) if m_acadyr < hv006
To calculate the age at the start of the school year a century month code of date of birth (cmcdob) is
needed for all persons age 5-24 using one of two approaches is used:
1) Merge the birth history data for b3 from the BR file onto the PR file using cluster
(hv001/v001), household (hv002/v002), and line number in the household roster
(hvidx/b16). If the person is listed in the birth history of any women (BR file), the
century month code (CMC) of the date of birth of the person (b3) is used as cmcdob.
2) If the CMC date of birth of the person is not known, a century month code for the date
of birth is randomly imputed using a uniform distribution between the possible bounds
of the date of birth, calculated as the CMC date of interview minus 12 times the age in
years as a maximum and 11 months earlier as a minimum:
max_cmcdob = hv008 - hv105*12
min_cmcdob = max_cmcdob - 11
cmcdob = random(min_cmcdob, max_cmcdob).
The age at the start of the academic year is then calculated by subtracting the CMC date of birth from
the CMC date of start of academic year as:
age_schl = int( (cmc_acadyr - cmcdob) / 12).
The age at the start of the academic year (age_schl) is then used to determine the primary and
secondary school age populations used in the numerators for the NARs and the denominators for both
the NARs and the GARs.
The NARs and GARs are then calculated by dividing the numerators by the denominators and multiplying
by 100.
The Gender Parity Indices are calculated by dividing the NAR or GAR for females by the corresponding
NAR or GAR for males.
Handling of Missing Values
Population with missing information for age are assumed to be outside the age range of 5-24.
Population with missing information for sex are excluded from the sex-specific numerators and
denominators, but included in the total (both sexes) numerators and denominators. Population with

Guide to DHS Statistics 2.48 August 2018
missing information or “Don’t know” responses for level of education are excluded from the
numerators.
Notes and Considerations
NAR for primary school is the percentage of the primary-school age (A-B years) population that is
attending primary school. The NAR for secondary school is the percentage of the secondary-school age
(C-D years) population that is attending secondary school. By definition, the NAR cannot exceed 100.0.
The GAR for primary school is the total number of primary school students, expressed as a percentage of
the official primary-school-age population. The GAR for secondary school is the total number of
secondary school students, expressed as a percentage of the official secondary-school-age population. If
there are significant numbers of overage and underage students at a given level of schooling, the GAR
can exceed 100.0.
The Gender Parity Index for primary school is the ratio of the primary school NAR (GAR) for females to
the NAR (GAR) for males. The Gender Parity Index for secondary school is the ratio of the secondary
school NAR (GAR) for females to the NAR (GAR) for males.
References
Langsten, R. 2017. "School fee abolition and changes in education indicators." International Journal of
Educational Development 53: 163-175.
UNESCO Institute for Statistics database (http://data.uis.unesco.org/Index.aspx?DataSetCode=edulit_ds)
Resources
DHS-7 Tabulation plan: Table 2.13
API Indicator IDs:
ED_NARP_M_MAL, ED_NARP_W_FEM, ED_NARP_B_BTH, ED_NARP_B_GPI,
ED_GARP_M_MAL, ED_GARP_W_FEM, ED_GARP_B_BTH, ED_GARP_B_GPI,
ED_NARS_M_MAL, ED_NARS_W_FEM, ED_NARS_B_BTH, ED_NARS_B_GPI,
ED_GARS_M_MAL, ED_GARS_W_FEM, ED_GARS_B_BTH, ED_GARS_B_GPI
(API link, STATcompiler link)
MICS6 Indicator LN.5a: Net attendance ratio: Among primary school age
MICS6 Indicator LN.5b: Net attendance ratio: Among lower secondary school age
MICS6 Indicator LN.5c: Net attendance ratio: Among upper secondary school age
MICS6 Indicator LN.11a: Education Parity Indices (Gender)

Guide to DHS Statistics 3.1 August 2018
Respondents’ Characteristics
This chapter provides a description of the situation of respondents of reproductive age in the country.
This information is useful for understanding the context of the reproductive and health status of women
and men. Percent distributions of various demographic and socioeconomic characteristics are shown for
the full sample. The main background characteristics that will be used in subsequent chapters on
reproduction and health are age at the time of the survey, marital status, broad education levels,
urban/rural residence, region, and the wealth quintile to which respondents belong. In addition,
information is provided on employment and work status, literacy, exposure to mass media, and internet
usage.
This chapter also covers some adult health issues including health insurance coverage and tobacco use.

Guide to DHS Statistics 3.2 August 2018
Background Characteristics of Respondents
Percent distribution of women and men by background characteristics
Definition
Percent distribution of women and men age 15-49 by background characteristics.
Coverage:
Population base: Women and men age 15-49 (IR file, MR file)
Time period: Current status at time of survey
Numerators: Number of women (or men) age 15-49 by background characteristics
Denominator: Number of women (or men) age 15-49
Variables: IR file, MR file.
v005
Women's sample weight
mv005
Men's sample weight
Calculation
Numerators divided by the denominator, multiplied by 100.
Handling of Missing Values
Missing values or “Don’t know” responses are shown separately in the percent distributions.
Notes and Considerations
This indicator provides a summary of the background characteristics of women and men in the
population and in the survey. Data are typically presented weighted but with the unweighted survey
denominator also shown. Standard background characteristics include age, marital status, residence,
subnational region, education, wealth quintile.
Percent distributions for each background characteristic add up to 100 percent.
Resources
DHS-7 Tabulation plan: Table 3.1
API Indicator IDs: SV_BACK_W_PCW, SV_BACK_M_PCM
(API link, STATcompiler link)

Guide to DHS Statistics 3.3 August 2018
Educational Attainment of Women and Men
Percent distribution of women and men by highest level of schooling attended or
completed
Definition
Percent distribution of women and men age 15-49 by highest level of schooling attended or completed.
Coverage:
Population base: Women and men age 15-49 (IR file, MR file)
Time period: Current status at time of survey
Numerators: Number of women (or men) age 15-49 by highest level of schooling attended or completed
(women: v149; men: mv149)
Denominator: Number of women (or men) age 15-49
Variables: IR file, MR file.
v149
Educational attainment (women)
v005
Women's sample weight
mv149
Educational attainment (men)
mv005
Men's sample weight
Calculation
Numerator divided by the denominator multiplied by 100.
Handling of Missing Values
Missing data and “Don’t know” responses are grouped into a separate category in the percent
distribution.
Notes and Considerations
Years of education considered for completion of each level of education vary from country to country,
and may change over time within country. Education levels are also country-specific. Respondents are
asked the highest level of schooling attended and the highest grade completed at that level.
References
Gardner, Robert. 1998. Education. DHS Comparative Studies No. 29. Calverton, Maryland: Macro
International Inc. https://www.dhsprogram.com/publications/publication-CS29-Comparative-
Reports.cfm

Guide to DHS Statistics 3.4 August 2018
Resources
DHS-7 Tabulation plan: Tables 3.2.1 and 3.2.2
API Indicator IDs:
Women:
ED_EDUC_W_NED, ED_EDUC_W_SPR, ED_EDUC_W_CPR, ED_EDUC_W_SSC, ED_EDUC_W_CSC,
ED_EDUC_W_HGH, ED_EDUC_W_DKM, ED_EDUC_W_PRI, ED_EDUC_W_SEH
(API link, STATcompiler link)
Men:
ED_EDUC_M_NED, ED_EDUC_M_SPR, ED_EDUC_M_CPR ED_EDUC_M_SSC, ED_EDUC_M_CSC,
ED_EDUC_M_HGH, ED_EDUC_M_DKM, ED_EDUC_M_PRI, ED_EDUC_M_SEH
(API link, STATcompiler link)
Guide to DHS Statistics 3.5 August 2018
Median years of education completed
Definition
Median years of education for women and men age 15-49.
Coverage:
Population base: Women and men age 15-49 (IR file, MR file)
Time period: Current status at time of survey
Numerators: Number of years of women (or men) age 15-49 by median years completed (women: v133;
men: mv133)
Denominator: Number of women (or men) age 15-49
Variables: IR file, MR file.
v133
Education in single years (women)
v005
Women's sample weight
mv133
Education in single years (men)
mv005
Men's sample weight
Calculation
Medians are calculated from cumulated single-year percent distributions (see Numerator and
Denominator above) of completed years of schooling. The median is linearly interpolated between the
years of completed schooling that occur before and after a cumulative 50 percent (see example below).
median = mi + (0.5 - p i) / (p i+1 - p i)
Example
The table below shows the cumulative (weighted) percentage of women age 15-49 by completed years
of schooling. We look for two successive cumulative percentages that bracket 50%. We find that 44% of
women age 15-49 have completed 5 years of schooling and 54% completed 6 years of schooling. We
find the median by interpolating between the two numbers of completed years.

Guide to DHS Statistics 3.6 August 2018
Completed
years of
education
Frequency
Percent of
women age
15-49
Cumulative
percent of
women age
15-49
0
3205
13.1
13.1
1
631
2.6
15.6
2
1160
4.7
20.3
3
1696
6.9
27.3
4
1867
7.6
34.9
5
2234
9.1
44.0
6
2495
10.2
54.1
7
2905
11.8
65.9
8
2511
10.2
76.2
9
1273
5.2
81.3
10
1502
6.1
87.5
11
748
3.1
90.5
median = 5 + (50.0 - 44.0) / (54.1 - 44.0)
median = 5.6
Handling of Missing Values
Missing data and “Don’t know” responses for the highest level of education attended or the highest
grade completed are excluded from the median calculation.
References
Oya, C., and J. Sender. "Divorced, separated, and widowed women workers in rural Mozambique."
Feminist Economics 15, no. 2 (2009): 1-31.
Resources
DHS-7 Tabulation plan: Tables 3.2.1 and 3.2.2
API Indicator IDs: ED_EDUC_W_MYR, ED_EDUC_M_MYR
(API link, STATcompiler link)

Guide to DHS Statistics 3.7 August 2018
Literacy
Percent distribution of women and men by level of schooling attended and level of literacy,
and percentage literate
Definition
1. Percent distribution of women and men age 15-49 by level of schooling attended and level of
literacy.
2. Percentage of women and men age 15-49 who are literate.
Coverage:
Population base: Women (or men) age 15-49 (IR file, MR file)
Time period: Current status at time of survey
Numerators:
1) Number of women (or men) age 15-49 by level of schooling attended and level of literacy:
a) Higher than secondary education (women: v106 = 3; men: mv106)
No schooling, primary or secondary schooling and:
b) Can read a whole sentence (women: v155 = 2; men: mv155 = 2)
c) Can read part of a sentence (women: v155 = 1; men: mv155 = 1)
d) Cannot read at all (women: v155 = 0; men: mv155 = 0)
e) No card with required language (women: v155 = 4; men: mv155 = 4)
f) Blind or visually impaired (women: v155 = 5; men: mv155 = 5)
2) Number of women (or men) age 15-49 literate (women: v106 = 3 or v155 in 1,2; men: mv106 = 3
or mv155 in 1,2)
Denominator: Number of women (or men) age 15-49
Variables: IR file, MR file.
v106
Highest educational level (women)
v155
Literacy (women)
v005
Women's sample weight
mv106
Highest educational level (men)
mv155
Literacy (men)
mv005
Men's sample weight
Calculation
Numerator divided by denominator multiplied by 100.
Handling of Missing Values
Missing values on level of education or ability to read a sentence are presented in a separate category in
the percent distribution.

Guide to DHS Statistics 3.8 August 2018
Notes and Considerations
Literate here is defined as women and men who attended schooling higher than the secondary level or
who can read a whole sentence or part of a sentence.
Categories for percent distribution are mutually exclusive and exhaustive. Percent distribution adds up
to 100 percent. The question on the ability of the respondent to read a sentence are not asked to
women and men with higher than secondary education.
Changes over Time
In DHS-VI and earlier surveys the question on the ability of the respondent to read a sentence was not
asked to women and men with secondary education or higher than secondary. Thus estimates from
earlier surveys may over estimate literacy relative to DHS-7 surveys. Care should be taken in
interpreting trends.
References
Gardner, R. 1998. Education. DHS Comparative Studies No. 29. Calverton, Maryland: Macro International
Inc. https://www.dhsprogram.com/publications/publication-CS29-Comparative-Reports.cfm
Resources
DHS-7 Tabulation plan: Tables 3.3.1 and 3.3.2
API Indicator IDs:
Women:
ED_LITR_W_SCH, ED_LITR_W_RDW, ED_LITR_W_RDP, ED_LITR_W_NRD, ED_LITR_W_NCD,
ED_LITR_W_BLD, ED_LITR_W_MIS, ED_LITR_W_LIT
(API link, STATcompiler link)
Men:
ED_LITR_M_SCH, ED_LITR_M_RDW, ED_LITR_M_RDP, ED_LITR_M_NRD, ED_LITR_M_NCD,
ED_LITR_M_BLD, ED_LITR_M_MIS, ED_LITR_M_LIT
(API link, STATcompiler link)
MICS6 Indicator SR.2: Literacy rate (age 15-24 years)
Note that this indicator is limited to 15-24 years, and assumes that women or men with secondary
education are literate, while the DHS indicator does not make that assumption.

Guide to DHS Statistics 3.9 August 2018
Exposure to Mass Media
Percentage of women and men exposed to specific media on a weekly basis
Definition
Percentage of women and men age 15-49 who are exposed to specific media on a weekly basis.
Coverage:
Population base: Women and men age 15-49 (IR file, MR file)
Time period: Current status at time of survey
Numerator: Number of women (or men) age 15-49 who are exposed to specific media on a weekly basis:
1) Reads a newspaper at least once a week (women: v157 in 2,3; men: mv157 in 2,3)
2) Watches television at least once a week (women: v159 in 2,3; men: mv159 in 2,3)
3) Listens to radio at least once a week (women: v158 in 2,3; men: mv158 in 2,3)
4) Accesses all three media at least once a week (women: v157 in 2,3 & v158 in 2,3 & v159 in 2,3;
men: mv157 in 2,3 & mv158 in 2,3 & mv159 in 2,3)
5) Accesses none of the three media at least once a week (women: v157 ≠ 2,3 & v158 ≠ 2,3 & v159
≠ 2,3; men: mv157 ≠ 2,3 & mv158 ≠ 2,3 & mv159 ≠ 2,3)
Denominator: Number of women (or men) age 15-49
Variables: IR file, MR file.
v157
Frequency of reading newspaper or magazine (women)
v158
Frequency of listening to radio (women)
v159
Frequency of watching television (women)
v005
Women's sample weight
mv157
Frequency of reading newspaper or magazine (men)
mv158
Frequency of listening to radio (men)
mv159
Frequency of watching television (men)
mv005
Men's sample weight
Calculation
Numerator divided by denominator multiplied by 100.
Handling of Missing Values
Missing values are excluded from the numerators, but included in the denominator.
References
Westoff, Charles F. and Akinrinola Bankole. 1997. Mass Media and Reproductive Behavior in Africa. DHS
Analytical Reports No. 2. Calverton, Maryland, USA: Macro International

Guide to DHS Statistics 3.10 August 2018
https://dhsprogram.com/publications/publication-ar2-analytical-studies.cfm
Resources
DHS-7 Tabulation plan: Tables 3.4.1 and 3.4.2
API Indicator IDs:
Women: ED_MDIA_W_NWS, ED_MDIA_W_TLV, ED_MDIA_W_RDO, ED_MDIA_W_3MD, ED_MDIA_W_N3M
(API link, STATcompiler link)
Men: ED_MDIA_M_NWS, ED_MDIA_M_TLV, ED_MDIA_M_RDO, ED_MDIA_M_3MD, ED_MDIA_M_N3M
(API link, STATcompiler link)
MICS6 Indicator SR.3: Exposure to mass media

Guide to DHS Statistics 3.11 August 2018
Internet Usage
Percentage of women and men who have ever used the internet, percentage who have
used the internet in the past 12 months, and among women and men who have used the
internet in the past 12 months, percent distribution by frequency of internet use in the
past month
Definition
1) Percentage of women and men age 15-49 who have ever used the internet.
2) Percentage of women and men age 15-49 who have used the internet in the past 12 months.
3) Among women and men age 15-49 who have used the internet in the past 12 months, percent
distribution by frequency of internet use in the past month.
Coverage:
Population base: Women and men age 15-49 (IR file, MR file)
Time periods: Lifetime of respondent, 12 months preceding the survey, and month preceding
the interview
Numerators:
1) Number of women (or men) age 15-49 who have ever used the internet (women: v171a in 1:3;
men: mv171a in 1:3)
2) Number of women age (or men) 15-49 who have used the internet in the past 12 months
(women: v171a = 1; men: mv171a = 1)
3) Among women (or men) age 15-49 who have used the internet in the past 12 months, number
of women by frequency of internet use in the month preceding the survey:
a) Almost every day (women: v171b = 3; men: mv171b = 3)
b) At least once a week (women: v171b = 2; men: mv171b = 2)
c) Less than once a week (women: v171b = 1; men: mv171b = 1)
d) Not in the past month (women: v171b = 0; men: mv171b = 0)
Denominator: Number of women (or men) age 15-49
Variables: IR file, MR file.
v171a
Use of internet (women)
v171b
Frequency of using internet last month (women)
v005
Women's sample weight
mv171a
Use of internet (men)
mv171b
Frequency of using internet last month (men)
mv005
Men's sample weight
Calculation
Numerator divided by denominator multiplied by 100.
Guide to DHS Statistics 3.12 August 2018
Handling of Missing Values
Missing data and “Don’t know” responses for use of the internet and when are treated as not having
used the internet and not in the preceding 12 months. Missing data and “Don’t know” responses on
frequency of use in the month preceding the survey are presented in a separate category in the percent
distribution.
Notes and Considerations
This indicator may be used to report on SDG Indicator 17.8.1: Proportion of individuals using the
Internet. Note that this indicator is not available for all ages and that the time period used is 12 months
preceding the interview, not 3 months.
Percent distribution adds up to 100 percent.
Changes over Time
DHS-VI and earlier surveys did not collect data on internet use.
Resources
DHS-7 Tabulation plan: Tables 3.5.1 and 3.5.2
SDG Indicator 17.8.1: Proportion of individuals using the Internet
MICS6 Indicator SR.12a: Use of Internet
Note that this indicator is not available for all ages and that the time period used in DHS is 12 months
preceding the interview, not 3 months.

Guide to DHS Statistics 3.13 August 2018
Employment and Occupation
Percent distribution of women and men by employment status
Definition
Percent distribution of women and men age 15-49 by whether currently employed, employed in the 12
months preceding the survey but not currently, or not employed in the 12 months preceding the survey.
Coverage:
Population base: Women and men age 15-49 (IR file, MR file)
Time period: 12 months preceding the survey
Numerator: Number of women (or men) age 15-49 by employment status:
1) Currently employed (women: v731 in 2,3; men: mv731 in 2,3)
2) Employed in the 12 months preceding the survey but not currently (women v731 = 1; men:
mv731 = 1)
3) Not employed in the 12 months preceding the survey (women v731 = 0; men: mv731 = 0)
4) Employment status missing or unknown (women v731 in 8,9; men: mv731 in 8,9)
Denominator: Number of women (or men) age 15-49
Variables: IR file, MR file.
v731
Respondent worked in last 12 months (women)
v005
Women's sample weight
mv731
Respondent worked in last 12 months (men)
mv005
Men's sample weight
Calculation
Numerator divided by the denominator multiplied by 100.
Handling of Missing Values
Missing data and “Don’t know” responses are reported in a separate category in the percent
distribution.
Notes and Considerations
“Currently employed” is defined as having done work in the past 7 days. Includes persons who did not
work in the past 7 days but who are regularly employed and were absent from work for leave, illness,
vacation, or any other such reason.
Percent distribution adds up to 100 percent.

Guide to DHS Statistics 3.14 August 2018
Resources
DHS-7 Tabulation plan: Tables 3.6.1 and 3.6.2
API Indicator IDs:
Women: EM_EMPL_W_EMC, EM_EMPL_W_ENC, EM_EMPL_W_N12, EM_EMPL_W_DKM
(API link, STATcompiler link)
Men: EM_EMPL_M_EMC, EM_EMPL_M_ENC, EM_EMPL_M_N12, EM_EMPL_M_DKM
(API link, STATcompiler link)
Guide to DHS Statistics 3.15 August 2018
Percent distribution of women and men age 15-49 employed in the 12 months preceding
the survey by occupation
Definition
Percent distribution of women and men age 15-49 employed in the 12 months preceding the survey by
occupation.
Coverage:
Population base: Women and men age 15-49 employed (IR file, MR file)
Time period: 12 months preceding the survey
Numerator: Number of women (or men) age 15-49 in the 12 months preceding the survey employed by
occupation group:
1) Professional, technical or managerial (women: v717 = 1; men: mv717 = 1)
2) Clerical (women: v717 = 2; men: mv717 = 2)
3) Sales and services (women: v717 in 3,7; men: mv717 in 3,7)
4) Skilled manual (women: v717 = 8; men: mv717 = 8)
5) Unskilled manual (women: v717 = 9; men: mv717 = 9)
6) Domestic service (women: v717 = 6; men: mv717 = 6)
7) Agriculture (women: v717 in 4,5; men: mv717 in 4,5)
8) Missing or don’t know (women: v717 in 96:99; men: mv717 in 96:99)
Denominator: Number of women (or men) age 15-49 employed (women: v731 in 1:3; men: mv731 in
1:3)
Variables: IR file, MR file.
v731
Respondent worked in last 12 months (women)
v005
Women's sample weight
mv731
Respondent worked in last 12 months (men)
mv005
Men's sample weight
Calculation
Numerator divided by the denominator multiplied by 100.
Handling of Missing Values
Missing or “Don’t know” responses for whether employed in the 12 months preceding the survey are
excluded from the numerators and denominator. Missing or “Don’t know” responses for occupation are
included in a separate category in the percent distribution.
Notes and Considerations
Coding of occupations in most surveys follows a coding scheme based on the ILO International Standard
Classification of Occupations (ISCO), however the exact coding scheme used can be survey specific.

Guide to DHS Statistics 3.16 August 2018
Changes over Time
In some prior surveys the domestic service category may have been grouped with the sales and services
category.
References
ILO. 2008. International Standard Classification of Occupations (ISCO)
http://www.ilo.org/public/english/bureau/stat/isco/isco08/
Resources
DHS-7 Tabulation plan: Tables 3.7.1 and 3.7.2
API Indicator IDs:
Women:
EM_OCCP_W_PRO, EM_OCCP_W_CLR, EM_OCCP_W_SAL, EM_OCCP_W_MNS, EM_OCCP_W_MNU,
EM_OCCP_W_DOM, EM_OCCP_W_AGR, EM_OCCP_W_OTH, EM_OCCP_W_DKM
(API link, STATcompiler link)
Men:
EM_OCCP_M_PRO, EM_OCCP_M_CLR, EM_OCCP_M_SAL, EM_OCCP_M_MNS, EM_OCCP_M_MNU,
EM_OCCP_M_DOM, EM_OCCP_M_AGR, EM_OCCP_M_OTH, EM_OCCP_M_DKM
(API link, STATcompiler link)
Guide to DHS Statistics 3.17 August 2018
Percent distribution of women employed by type of earnings, type of employer, and
continuity of employment, according to type of employment
Definition
Percent distribution of women age 15-49 employed in the 12 months preceding the survey by:
1) Type of earnings.
2) Type of employer.
3) Continuity of employment.
According to type of employment (agricultural or nonagricultural).
Coverage:
Population base: Women age 15-49 employed (IR file)
Time period: 12 months preceding the survey
Numerators:
1) Number of women age 15-49 employed in the 12 months preceding the survey by type of
earnings: Cash only, cash and in-kind, in-kind only, not paid, missing (v741 = 1/2/3/0/9)
2) Number of women age 15-49 employed in the 12 months preceding the survey by type of
employer: Employed by family member, employed by non-family member, self-employed,
missing (v719 = 1/2/3/9)
3) Number of women age 15-49 employed in the 12 months preceding the survey by continuity of
employment: All year, seasonal, occasional, missing (v732 = 1/2/3/9)
By agricultural or nonagricultural work (agricultural: v717 in 4,5)
Denominator: Number of women age 15-49 employed (v731 in 1:3)
Variables: IR file.
v717
Respondent's occupation (grouped)
v719
Respondent works for family, others, self
v731
Respondent worked in last 12 months
v732
Respondent employed all year/seasonal
v741
Type of earnings from respondent's work
v005
Women's sample weight
Calculation
Numerator divided by denominator multiplied by 100.
Handling of Missing Values
Missing values or “Don’t know” responses are presented in separate categories in each percent
distribution.
Notes and Considerations

Guide to DHS Statistics 3.18 August 2018
Percent distributions add up to 100 percent.
Resources
DHS-7 Tabulation plan: Table 3.8
API Indicator IDs:
EM_EMPT_W_CSH, EM_EMPT_W_CAK, EM_EMPT_W_KND, EM_EMPT_W_NPD, EM_EMPT_W_CMS,
EM_EMPT_W_FAM, EM_EMPT_W_NFM, EM_EMPT_W_SEM, EM_EMPT_W_EMS, EM_EMPT_W_AYR,
EM_EMPT_W_SES, EM_EMPT_W_OCC, EM_EMPT_W_TMS
(API link, STATcompiler link)

Guide to DHS Statistics 3.19 August 2018
Health Insurance Coverage
Percentage of women and men with specific types of health insurance coverage, and
percentage with any health insurance
Definition
1) Percentage of women and men age 15-49 with specific types of health insurance coverage.
2) Percentage of women and men age 15-49 with any health insurance.
Coverage:
Population base: Women and men age 15-49 (IR file, MR file)
Time period: Current status at time of survey
Numerators:
1) Number of women (or men) age 15-49 with specific types of health insurance coverage:
a) Social security (women: v481c = 1; men: mv481c = 1)
b) Other employer-based insurance (women: v481b = 1; men: mv481b = 1)
c) Mutual Health Organization or community-based insurance (women: v481a = 1; men:
mv481a = 1)
d) Privately purchased commercial insurance (women: v481d = 1; men: mv481d = 1)
e) Other (women: any of v481e – h, x = 1; men: any of mv481e – h, x = 1)
f) None (none of the above)
2) Number of women (or men) age 15-49 with any health insurance (any of v481a – h, x = 1; men:
any of mv481a – h, x = 1)
Denominator: Number of women (or men) age 15-49
Variables: IR file, MR file.
v481a
Health insurance type: mutual/community organization (women)
v481b
Health insurance type: provided by employer (women)
v481c
Health insurance type: social security (women)
v481d
Health insurance type: private/commercially purchased (women)
v481e
Health insurance type: CS (women)
v481f
Health insurance type: CS (women)
v481g
Health insurance type: CS (women)
v481h
Health insurance type: CS (women)
v481x
Health insurance type: other (women)
v005
Women's sample weight
mv481a
Health insurance type: mutual/community organization (men)
mv481b
Health insurance type: provided by employer (men)
mv481c
Health insurance type: social security (men)
mv481d
Health insurance type: private/commercially purchased (men)
mv481e
Health insurance type: CS (men)
mv481f
Health insurance type: CS (men)
mv481g
Health insurance type: CS (men)
mv481h
Health insurance type: CS (men)

Guide to DHS Statistics 3.20 August 2018
mv481x
Health insurance type: other (men)
mv005
Women's sample weight
Calculation
Numerators divided by denominator multiplied by 100.
Handling of Missing Values
Missing values and “don’t know” responses are excluded from the numerators, but included in the
deonimnator.
Notes and Considerations
Types of health insurance available vary from country to country and may change over time.
Changes over Time
DHS-VI and earlier surveys did not report the percentage of women or men age 15-49 with any health
insurance.
References
Wang, W., G. Temsah, and L Mallick. 2014. Health Insurance Coverage and Its Impact on Maternal
Health Care Utilization in Low- and Middle-Income Countries. DHS Analytical Studies No. 45. Rockville,
Maryland, USA: ICF International. https://dhsprogram.com/publications/publication-as45-analytical-
studies.cfm
Resources
DHS-7 Tabulation plan: Tables 3.9.1 and 3.9.2
API Indicator IDs:
Women:
AH_HINS_W_SOS, AH_HINS_W_EBI, AH_HINS_W_MUT, AH_HINS_W_PRV, AH_HINS_W_OTH,
AH_HINS_W_NON
(API link, STATcompiler link)
Men:
AH_HINS_M_SOS, AH_HINS_M_EBI, AH_HINS_M_MUT, AH_HINS_M_PRV, AH_HINS_M_OTH,
AH_HINS_M_NON
(API link, STATcompiler link)
MICS6 Indicator EQ.2a: Health insurance coverage

Guide to DHS Statistics 3.21 August 2018
Tobacco Use
Percentage of women and men who smoke various tobacco products
Definition
Percentage of women and men age 15-49 who smoke various tobacco products:
1) Cigarettes
2) Other types of tobacco
3) Any type of tobacco
Coverage:
Population base: Women and men age 15-49 (IR file, MR file)
Time period: Current status at time of survey
Numerators: Number of women (or men) age 15-49 who smoke various tobacco products:
1) Cigarettes (women: v463aa in 1,2 or v463e = 1; men: any of mv464a – c in 1:888 or any of
mv484a – c in 1:888)
2) Other types of tobacco (women: v463b = 1 or v463f = 1 or v463g = 1; men: any of mv464d – g in
1:888 or any of mv484d - g in 1:888)
3) Any type of tobacco (women: v463aa in 1,2 or v463b = 1 or v463e = 1 or v463f = 1 or v463g = 1;
men: any of mv464a - g in 1:888 or mv484a – g in 1:888)
Denominator: Number of women (or men) age 15-49.
Variables: IR file, MR file.
v463aa
Frequency smokes cigarettes (women)
v463b
Smokes pipe full of tobacco (women)
v463e
Smokes kreteks (women)
v463f
Smokes cigars, cheroots or cigarillos (women)
v463g
Smokes water pipe (women)
v005
Women's sample weight
mv463aa
Frequency currently smokes tobacco (men)
mv464a
On average respondent smokes daily: manufactured cigarettes (men)
mv464b
On average respondent smokes daily: hand rolled cigarettes (men)
mv464c
On average respondent smokes daily: kreteks (men)
mv464d
On average respondent smokes daily: pipes full of tobacco (men)
mv464e
On average respondent smokes daily: cigars, cheroots, cigarillos (men)
mv464f
On average respondent smokes daily: water pipe sessions (men)
mv464g
On average respondent smokes daily: others (men)
mv484a
On average respondent smokes weekly: manufactured cigarettes (men)
mv484b
On average respondent smokes weekly: hand rolled cigarettes (men)
mv484c
On average respondent smokes weekly: kreteks (men)
mv484d
On average respondent smokes weekly: pipes full of tobacco (men)
mv484e
On average respondent smokes weekly: cigars, cheroots, cigarillos (men)
mv484f
On average respondent smokes weekly: water pipe sessions (men)
mv484g
On average respondent smokes weekly: others (men)

Guide to DHS Statistics 3.22 August 2018
mv005
Men's sample weight
Calculation
Numerator divided by the denominator multiplied by 100.
Handling of Missing Values
Missing data on whether smoked each type of tobacco are assumed to be non-use of the type of
tobacco and are excluded from the numerator, but included in the denominator.
Notes and Considerations
Smoking cigarettes includes smoking manufactured cigarettes, hand-rolled cigarettes and kreteks.
Changes over Time
DHS-VI and earlier surveys asked less detailed questions about current smoking status, forms of tobacco
smoked, and daily/weekly frequency of smoking tobacco.
DHS-VI and earlier surveys also reported smoking tobacco in pipes separately from other tobacco, which
included smokeless tobacco.
References
Ansara, D.L., F. Arnold, S. Kishor, J. Hsia, and R. Kaufmann. 2013. Tobacco Use by Men and Women in 49
Countries with Demographic and Health Surveys. DHS Comparative Reports No. 31. Calverton, Maryland,
USA: ICF International. https://dhsprogram.com/publications/publication-cr31-comparative-reports.cfm
Global Adult Tobacco Survey Collaborative Group. 2011. Tobacco Questions for Surveys: A Subset of Key
Questions from the Global Adult Tobacco Survey (GATS), 2nd Edition. Atlanta, GA: Centers for Disease
Control and Prevention. http://www.who.int/tobacco/surveillance/tqs/en/
Resources
DHS-7 Tabulation plan: Tables 3.10.1 and 3.10.2
API Indicator IDs:
Women: AH_TOBC_W_CIG, AH_TOBC_W_PIP, AH_TOBC_W_OTH, AH_TOBC_W_NON
(API link, STATcompiler link)
Men: AH_TOBC_M_CIG, AH_TOBC_M_PIP, AH_TOBC_M_OTH, AH_TOBC_M_NON
(API link, STATcompiler link)

Guide to DHS Statistics 3.23 August 2018
Percent distribution of men by smoking frequency
Definition
Percent distribution of men age 15-49 by smoking frequency:
1) Daily smoker.
2) Occasional smoker.
3) Non-smoker.
Coverage:
Population base: Men age 15-49 (MR file)
Time period: Current status at time of survey
Numerators: Number of men age 15-49 who smoke various tobacco products:
1) Daily smoker (mv464aa = 1)
2) Occasional smoker (mv464aa = 2)
3) Non-smoker (mv464aa = 0)
Denominator: Number of men age 15-49
Variables: IR file, MR file.
mv463aa
Frequency currently smokes tobacco (men)
mv005
Men's sample weight
Calculation
Numerator divided by the denominator multiplied by 100.
Handling of Missing Values
Missing data for the frequency of smoking is presented in a separate category in the percent
distribution.
References
Global Adult Tobacco Survey Collaborative Group. 2011. Tobacco Questions for Surveys: A Subset of Key
Questions from the Global Adult Tobacco Survey (GATS), 2nd Edition. Atlanta, GA: Centers for Disease
Control and Prevention. http://www.who.int/tobacco/surveillance/tqs/en/
Resources
DHS-7 Tabulation plan: Table 3.10.2
Guide to DHS Statistics 3.24 August 2018
Average number of cigarettes smoked per day
Definition
Among men age 15-49 who smoke cigarettes daily, percent distribution by average number of cigarettes
smoked per day.
Coverage:
Population base: Men age 15-49 (MR file)
Time period: Current status at time of survey
Numerator: Number of men age 15-49 who smoke cigarettes daily (<5, 5-9, 10-14, 15-24, 25+) (mv484a
+ mv484b + mv484c – see calculation)
Denominator: Number of men age 15-49 who smoke cigarettes daily (mv484a + mv484b + mv484c > 0 –
see calculation)
Variables: MR file.
mv463aa
Frequency smokes cigarettes
mv464a
On average respondent smokes daily: manufactured cigarettes
mv464b
On average respondent smokes daily: hand rolled cigarettes
mv464c
On average respondent smokes daily: kreteks
mv005
Men's sample weight
Calculation
Numerators: The total number of cigarettes smoked daily is calculated by adding mv484a + mv484b +
mv484c, treating any special codes such as 888 (not every day) as zero cigarettes. The total number of
cigarettes is then grouped into the categories (<5, 5-9, 10-14, 15-24, 25+).
Denominator: Men are counted in the denominator if the total number of cigarettes smoked daily
calculated above is greater than zero.
Numerator divided by denominator multiplied by 100.
Handling of Missing Values
Missing data on the number of cigarettes of each type is treated as zero cigarettes of that type.
Changes over Time
DHS-VI and earlier surveys asked men who had said that they currently smoked cigarettes the number of
cigarettes they had smoked in the past 24 hours and reported that response, instead of the average
number of cigarettes smoked per day.

Guide to DHS Statistics 3.25 August 2018
References
Global Adult Tobacco Survey Collaborative Group. 2011. Tobacco Questions for Surveys: A Subset of Key
Questions from the Global Adult Tobacco Survey (GATS), 2nd Edition. Atlanta, GA: Centers for Disease
Control and Prevention. http://www.who.int/tobacco/surveillance/tqs/en/
Resources
DHS-7 Tabulation plan: 3.11
Guide to DHS Statistics 3.26 August 2018
Percentage of women and men age who currently use smokeless tobacco, according to
type of tobacco product, and percentage who use any type of tobacco
Definition
Percentage of women and men age 15-49 who currently use smokeless tobacco, according to type of
smokeless tobacco product, and percentage who use any type of tobacco.
Coverage:
Population base: Women and men age 15-49 (IR file, MR file)
Time period: Current status at time of survey
Numerators:
1) Number of women (or men) age 15-49 who currently use smokeless tobacco, according to type
of tobacco product:
a) Snuff, by mouth (women: v463h = 1; men: mv464h in 1:888 or mv484h in 1:888)
b) Snuff, by nose (women: v463d = 1; men: mv464i in 1:888 or mv484i in 1:888)
c) Chewing tobacco (women: v463c = 1; men: mv464j in 1:888 or mv484j in 1:888)
d) Betel quid with tobacco (women: v463i = 1; men: mv464k in 1:888 or mv484k in 1:888)
e) Other type of smokeless tobacco (women: other smokeless tobacco in v463 series = 1;
men: mv464l in 1:888 or mv484l in 1:888)
f) Any type of smokeless tobacco (women: any of v463h, d, c, I, or other = 1; men: any of
m44h – l = 1 or any of mv484h – l = 1)
2) Number of women (or men) age 15-49 who use any type of tobacco (women: v463aa in 1,2 or
v463ab in 1,2; men: mv463aa in 1,2 or mv463ab in 1,2)
Denominator: All women (or men) age 15-49
Variables: IR file, MR file.
v463aa
Frequency smokes cigarettes (women)
v463ab
Frequency currently uses other type of tobacco (women)
v463c
Chews tobacco (women)
v463d
Snuff by nose (women)
v463h
Snuff by mouth (women)
v463i
Chews betel quid with tobacco (women)
v005
Women's sample weight
mv463aa
Frequency currently smokes tobacco (men)
mv463ab
Frequency currently uses smokeless tobacco (men)
mv464h
On average respondent uses daily: snuff by mouth (men)
mv464i
On average respondent uses daily: snuff by nose (men)
mv464j
On average respondent uses daily: chewing tobacco (men)
mv464k
On average respondent uses daily: betel quid with tobacco (men)
mv464l
On average respondent uses daily: any other (men)
mv484h
On average respondent uses weekly: snuff by mouth (men)
mv484i
On average respondent uses weekly: snuff by nose (men)
mv484j
On average respondent uses weekly: chewing tobacco (men)
mv484k
On average respondent uses weekly: betel quid with tobacco (men)

Guide to DHS Statistics 3.27 August 2018
mv484l
On average respondent uses weekly: any other (men)
mv005
Men's sample weight
Calculation
Numerator divided by the denominator multiplied by 100.
Handling of Missing Values
Missing data on use of types of smokeless tobacco are treated as non-use of that type of tobacco and
are excluded from the numerators.
Notes and Considerations
The indicators include women and men who use smokeless tobacco daily or occasionally (less than
daily).
The indicator for use of any type of tobacco includes all types of smokeless tobacco listed above plus
cigarettes, kreteks, pipes, cigars, cheroots, cigarillos, water pipes, and any other types of tobacco use
included in the survey.
Changes over Time
DHS-VI and earlier surveys asked less detailed questions about current use of smokeless tobacco, forms
of smokeless tobacco smoked, and daily/weekly frequency of consumption of smokeless tobacco.
DHS-VI and earlier surveys did not separately report smokeless tobacco.
References
Ansara, D.L., F. Arnold, S. Kishor, J. Hsia, and R. Kaufmann. 2013. Tobacco Use by Men and Women in 49
Countries with Demographic and Health Surveys. DHS Comparative Reports No. 31. Calverton, Maryland,
USA: ICF International. https://dhsprogram.com/publications/publication-cr31-comparative-reports.cfm
Global Adult Tobacco Survey Collaborative Group. 2011. Tobacco Questions for Surveys: A Subset of Key
Questions from the Global Adult Tobacco Survey (GATS), 2nd Edition. Atlanta, GA: Centers for Disease
Control and Prevention. http://www.who.int/tobacco/surveillance/tqs/en/
Resources
DHS-7 Tabulation plan: Table 3.12

Guide to DHS Statistics 4.1 August 2018
Marriage and Sexual Activity
This chapter addresses current marital status, age at first marriage, and age at sexual initiation. Marriage
is a primary indication of the exposure of women to the risk of pregnancy and, therefore, is important
for the understanding of fertility. Populations in which age at marriage is low tend to be populations
with early childbearing and high fertility. For this reason, there is an interest in trends in age at marriage.
The chapter also includes information on age at first sexual intercourse, which in some countries is a
more direct measure of the beginning of exposure to pregnancy and the level of exposure.

Guide to DHS Statistics 4.2 August 2018
Current Marital Status
Percent distribution by current marital status
Definition
Percentage of women and men according to current status of marriage or cohabitation.
Coverage:
Population base: Women and men age 15-49 (IR file, MR file)
Time period: Current status at time of survey
Numerators: Number of women (or men) who are currently:
0) Never married nor lived in a consensual union (women: v501 = 0; men: mv501 = 0)
1) Legally or formally married (women: v501 = 1; men: mv501 = 1)
2) Not legally or formally married but living with a man/woman in a consensual union (women:
v501 = 2; men: mv501 = 2)
3) Widowed from a marriage or consensual union and not remarried or not in a consensual union
(women: v501 = 3; men: mv501 = 3)
4) Divorced from a legal or formal marriage and not remarried or in a consensual union (women:
v501 = 4; men: mv501 = 4)
5) Separated from a marriage or consensual union (women: v501 = 5; men: mv501 = 5)
6) Married or living in a union (women: v501 = 1,2; men: mv501 = 1,2)
Denominator: Number of women age 15-49 or number of men (age range varies by survey)
Variables: IR file, MR file.
v501
Current marital status (women)
v005
Woman’s individual sample weight
mv501
Current marital status (men)
mv005
Man’s individual sample weight
awfactt
All woman factor (only needed with ever-married samples)
Calculation
Numerators are divided by the denominator and multiplied by 100. In ever-married
samples, the
denominator is adjusted by the all woman factors.
Handling of Missing Values
Not applicable—Marital status is not allowed to have missing values.
Notes and Considerations
Percentages add up to 100 percent.

Guide to DHS Statistics 4.3 August 2018
The definition of a consensual union may vary between countries. No proof of marital status is requested
during interview;
categorization is done by the respondent.
The percent of women or men currently in union is obtained as a sum of legal and consensual unions
(categories 1 and 2 above).
References
Wang, W., S. Staveteig, R. Winter, and C. Allen. 2017. Women’s Marital Status, Contraceptive Use, and
Unmet Need in Sub-Saharan Africa, Latin America, and the Caribbean. DHS Comparative Reports No. 44.
Rockville, Maryland, USA: ICF
https://dhsprogram.com/publications/publication-CR44-Comparative-Reports.cfm
Resources
DHS-7 Tabulation plan: Table 4.1
API Indicator IDs:
Women:
MA_MSTA_W_NMA, MA_MSTA_W_MAR, MA_MSTA_W_LTG, MA_MSTA_W_WID, MA_MSTA_W_DIV,
MA_MSTA_W_SEP, MA_MSTA_W_UNI
Men:
MA_MSTA_M_NMA, MA_MSTA_M_MAR, MA_MSTA_M_LTG, MA_MSTA_M_WID, MA_MSTA_M_DIV,
MA_MSTA_M_SEP, MA_MSTA_M_UNI
(API link, STATcompiler link)
MICS6 Indicator PR.5: Young people age 15-19 years currently married or in union

Guide to DHS Statistics 4.4 August 2018
Number of Co-Wives and Number of Wives
Percent distribution of currently married women by number of co-wives
Definition
1) Percentage of currently married women (women who are either legally or formally married or
who are living in a consensual union), by the number of other wives that her partner has.
2) Percentage of currently married women (women who are either legally or formally married or
who are living in a consensual union) with one or more co-wives.
Coverage:
Population base: Currently married women (v502 = 1) (IR file)
Time period: Current status at time of survey
Numerators:
1) Number of currently married women (v502 = 1), by number of other wives (v505) of her current
partner
2) Number of currently married women, with one or more co-wives (v502 = 1 and v505 > 0)
Denominator: Number of currently married women (v502 = 1)
Variables: IR file.
v502
Currently/formerly/never married
v505
Number of co-wives
v005
Woman’s individual sample weight
awfactt
All woman factor (only needed with ever-married samples)
Calculation
For each number of co-wives, numerators are divided by the denominator and multiplied by 100. In ever-
married
samples, the denominator is adjusted by the all woman factors.
Handling of Missing Values
If number of co-wives is unknown by respondent or missing, respondent is excluded from numerator
and may be presented in the table as a separate column for unknown or missing number of co-wives.
Notes and Considerations
Percentages add up to 100 percent.
Questions on number of co-wives are normally only asked in countries where polygyny is
practiced, primarily in sub-Saharan Africa.
References

Guide to DHS Statistics 4.5 August 2018
Smith-Greenaway, E., and J. Trinitapoli. 2014. "Polygynous contexts, family structure, and infant
mortality in sub-Saharan Africa." Demography 51(2): 341-366.
https://link.springer.com/article/10.1007%2Fs13524-013-0262-9
Resources
DHS-7 Tabulation plan: Table 4.2.1
API Indicator IDs: MA_CWIV_W_0WV, MA_CWIV_W_1WV, MA_CWIV_W_2PW
(API link, STATcompiler link)
MICS6 Indicator PR6: Polygyny

Guide to DHS Statistics 4.6 August 2018
Percent distribution of currently married men by number of wives
Definition
Percentage of men who are either legally or formally married or who are living in a consensual union,
by
the number of wives.
Coverage:
Population base: Currently married men (mv502 = 1) (MR file)
Time period: Current status at time of survey
Numerator: Number of currently married men (mv502 = 1), by number of wives (mv505)
Denominator: Number of currently married men (mv502 = 1)
Variables: MR file.
mv502
Currently/formerly/never married
mv505
Number of wives
mv005
Man’s individual sample weight
amfactt
All man factor (only needed with ever-married samples)
Calculation
For each number of wives, numerators are divided by the denominator and multiplied by 100. In ever-
married
samples, the denominator is adjusted by the all man factors.
Handling of Missing Values
If number of wives is unknown by respondent or missing, respondent is excluded from the numerator
and may be presented in the table as a separate column for unknown or missing number of wives.
Notes and Considerations
Percentages add up to 100 percent.
Questions on number of wives are normally only asked in countries where polygyny is practiced, primarily
in sub-Saharan Africa.
References
Reniers, G., and S. Watkins. 2010. "Polygyny and the spread of HIV in Sub Saharan Africa: a case of
benign concurrency." AIDS (London, England) 24(2): 299.
https://journals.lww.com/aidsonline/fulltext/2010/01030/Polygyny_and_the_spread_of_HIV_in_sub_S
aharan.16.aspx
Resources


Guide to DHS Statistics 4.8 August 2018
Age at First Marriage
Percentage first married by specific exact ages
Definition
1) Percentage of women and men who were first married or lived with a spouse or consensual
partner by specific exact ages.
2) Percentage of women and men never married.
Coverage:
Population base: Women and men of all marital statuses (IR file, MR file)
Time period: Lifetime of the respondent
Numerators:
1) Number of women (or men) whose first marriage or consensual union occurred before
they attained the specified age group (15, 18, 20, 22, 25) (women: v511 < specified age;
men: mv511 < specified age)
2) Number of women (or men) who have never married or lived in union (women: v502 = 0;
men: mv502 = 0)
Denominator: Number of women age 15-49 or number of men (age range varies by survey),
including those who have never been married or in a
consensual union. This denominator may
need to be restricted (see Notes and Considerations below)
Variables: IR file, MR file.
v502
Currently/formerly/never married (women)
v511
Age at first marriage or union (women)
v005
Woman’s individual sample weight
awfactt
All woman factor (only needed with ever-married samples)
mv502
Currently/formerly/never married (men)
mv511
Age at first marriage or union (men)
mv005
Man’s individual sample weight
amfactt
All man factor (only needed with ever-married samples)
Calculation
Age at first marriage or first union (women: v511; men: mv511): Difference between date when a
woman (or man) began living with first spouse or consensual partner and date of birth of woman (or
man) in completed single years.
Numerators: Number of women (or men) married by specific exact ages (15, 18, 20, 22, 25) includes
women (or men) first in a marriage or consensual union before earlier specific ages, e.g. the number
of women (or men) who married before age 18 includes those who married before age 15. Women (or
men) who have never married
nor lived in a consensual union are included in a separate category.
Denominator: Number of women (or men) of all marital statuses. In ever-married samples, the
denominator
is adjusted by the all woman (or man) factors. Denominator for cohort must exclude

Guide to DHS Statistics 4.9 August 2018
women who have not yet reached the oldest age of the specific age category (see Notes and
Considerations below).
Numerators are divided by the overall denominator and multiplied by
100.
Handling of Missing Values
Not applicable—birth dates of women and men and ages at first marriage were imputed if missing.
Notes and Considerations
Percentages are not calculated for the age-at-first-marriage categories by cohorts of women or men
where the
youngest member of the cohort has not yet completed the oldest age of the category. For
example,
percentages for the cohort of women or men 15-19 at the time of the survey will not be
calculated for age categories
18, 20, 22, and 25 because some women (or men) who have never been
married are still below those ages and
could still marry or start to live in a consensual union before
reaching those age categories.
References
Koski, A., S. Clark, and A. Nandi. 2017. "Has Child Marriage Declined in sub‐Saharan Africa? An Analysis
of Trends in 31 Countries." Population and Development Review 43(1): 7-29.
https://onlinelibrary.wiley.com/doi/full/10.1111/padr.12035
Walker, J. 2012. "Early marriage in Africa–Trends, harmful effects and interventions." African journal of
reproductive health 16(2): 231-240.
Resources
DHS-7 Tabulation plan: Table 4.3
API Indicator IDs:
Women:
MA_MBAG_W_B15, MA_MBAG_W_B18, MA_MBAG_W_B20, MA_MBAG_W_B22, MA_MBAG_W_B25, MA_MBAG_W_NMA
Men:
MA_MBAG_M_B15, MA_MBAG_M_B18, MA_MBAG_M_B20, MA_MBAG_M_B22, MA_MBAG_M_B25, MA_MBAG_M_NMA
(API link, STATcompiler link)
SDG Indicator 5.3.1: Proportion of women aged 20-24 years who were married or in a union before age
15 and before age 18
WHO 100 Core Health Indicators: Early marriage
MICS6 Indicator PR.4a: Child marriage – before age 15
MICS6 Indicator PR.4b: Child marriage – before age 18

Guide to DHS Statistics 4.10 August 2018
Median age at first marriage
Definition
Median age in years when women and men first lived with spouse or consensual partner.
Coverage:
Population base: Women and men of all marital statuses (IR file, MR file)
Time period: Lifetime of the respondent
Median: Median for completed time periods
Variables: IR file, MR file.
v502
Currently/formerly/never married (women)
v511
Age at first marriage or union (women)
v005
Woman’s individual sample weight
awfactt
All woman factor (only needed with ever-married samples)
mv502
Currently/formerly/never married (men)
mv511
Age at first marriage or union (men)
mv005
Man’s individual sample weight
amfactt
All man factor (only needed with ever-married samples)
Calculation
Medians are calculated from cumulated single-year percent distributions (see Numerator and
Denominator below) of age at first marriage
or consensual union (see Age at First Marriage indicator
defined above). Median is linearly interpolated between the single-year percent distributions that occur
at the ages before and after 50 percent of the women (or men) had married for the first time or begun
living in a consensual union. (See Median Calculations in Chapter 1).
Numerators: Number of women (or men) who were legally or formally married or started living in a
consensual union at single year of age categories. Women (or men) who have never
been married or
lived in a consensual union (women: v502 = 0; men: mv502 = 0) are included in a separate category at
the tail of the distribution. In ever-married samples, the all woman (or man) factor is tallied in the
category of women (or men) who have never been married or lived in a consensual union.
Denominator: Number of women (or men) of all marital statuses. Numerators are divided by the
overall denominator and multiplied by 100 to obtain percentages. In ever-married samples, the
denominator
is adjusted by the all woman (or man) factors.
Handling of Missing Values
Not applicable—Dates of birth and age at first marriage or consensual union were imputed if missing.
Notes and Considerations
Age at first marriage (women: v511; men: v511) is the difference between the respondent’s birth date
and date they began living with first spouse or partner and is truncated to years. This age is taken as
including up to next completed year of age. For example, the cumulated percentage for women or men
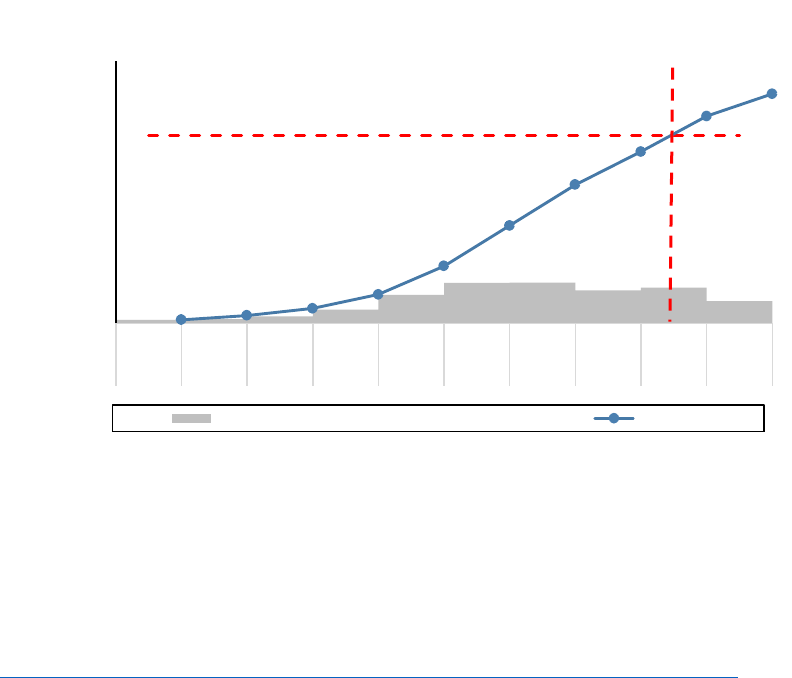
Guide to DHS Statistics 4.11 August 2018
with a difference of 19 years (between birth date and date began living with spouse) actually includes all
women or men below 20 years of age at first marriage.
Since the median is based on all women or men, including those who have never been married or lived
in a consensual union, there may not be a median for younger cohorts of women or men (since fewer
than 50 percent of the cohort may have been married or lived in a consensual union). Medians are
omitted for women or men whose current age interval includes or precedes the median age at first sex.
Example
For example, the figure below shows the cumulative (weighted) percentage of women age 20-49 who
were first married at specific ages. We look for two successive cumulative percentages that bracket 50%.
We find that 46% of women age 20-49 were first married at 17 (by 18th birthday) and 55% at age 18 (by
19th birthday). Because we know that cumulatively, 50% of women age 20-49 must occur between the
18th birthday and the 19th birthday, we know the median age is 18. To be more precise we interpolate
between 18.0 and 19.0. The interpolation between these two points reveals a median of 18.5 or the age
at which 50% of women age 20-49 experienced their first union or cohabitation is 18.5.
Mathematically, this is equivalent to calculating an interpolated median between the completed ages 17
and 18, and adding one to the result.
References
MacQuarrie, K. L.D., L. Mallick, and C. Allen. 2017. Sexual and Reproductive Health in Early and Later
Adolescence: DHS Data on Youth Age 10-19. DHS Comparative Reports No. 45. Rockville, Maryland, USA:
ICF. https://dhsprogram.com/publications/publication-CR45-Comparative-Reports.cfm
50%
1% 2% 4% 8%
15%
26%
37%
46%
55%
61%
0%
10%
20%
30%
40%
50%
60%
70%
10.0-10.9 11.0-11.9 12.0-12.9 13.0-13.9 14.0-14.9 15.0-15.9 16.0-16.9 17.0-17.9 18.0-18.9 19.0-19.9
Age at first marriage
Age at first marriage among women age 20-49,
DHS Model Dataset
Percent of women age 20-49 married at each age Cumulative
Median = 18.5


Guide to DHS Statistics 4.13 August 2018
Age at First Sexual Intercourse
Percentage who had first sexual intercourse by specific exact ages
Definition
1) Percentage of women and men who first had sexual intercourse before attaining the specific
exact ages.
2) Percentage of women and men who never had sexual intercourse.
Coverage:
Population base: Women and men of all marital statuses (IR file, MR file)
Time period: Lifetime of the respondent
Numerators:
1) Number of women (or men who had their first sexual intercourse before they attained the
specific age (women: v531 < specific age; men: mv531 < specific age)
2) Number of women (or men) who never had sexual intercourse (women: v531 = 0; men: mv531 =
0)
Denominator: Number of women (or men), including those who never had sexual intercourse. All
interviewed women between ages 15 and 49 years or interviewed men (age range varies by survey).
Variables: IR file, MR file.
v531
Age at first sexual intercourse (imputed) (women)
v005
Woman’s individual sample weight
awfactt
All woman factor (only needed with ever-married samples)
mv531
Age at first sexual intercourse (imputed) (men)
mv005
Man’s individual sample weight
amfactt
All man factor (only needed with ever-married samples)
Calculation
Age at first sexual intercourse: Reported by woman or man as age in completed years or when they first
had sex. This age is imputed for those who reported the age at first sex was the same as their age at first
union.
Numerators: Number of women (or men) who first had sexual intercourse below the specific
exact ages (15, 18, 20, 22, 25) includes women (or men) who first had sexual intercourse before
earlier specific ages, e.g. the number of women (or men) who first had sexual intercourse before
age 18 includes those who had sexual intercourse before age 15. Women (or men) who have
never had sexual intercourse are included in a separate category.
Denominator: Number of women (or men) of all marital statuses. Numerators for each specified age
are divided by the overall denominator and multiplied by 100. In ever-married samples, denominators
are adjusted by the all woman (or man) factors. This denominator may need to be restricted (see
Notes and Considerations below).

Guide to DHS Statistics 4.14 August 2018
Handling of Missing Values
Women or men with unknown and missing ages at first sexual intercourse are excluded from the
numerators, but included in the denominator. Women or men whose imputed age at sex is inconsistent
(women: v531=97; men: v531=97) are excluded from the numerators, but included in the denominator.
Notes and Considerations
When presenting this indicator by age groups, percentages for the specified age at first sexual
intercourse are not calculated for those groups of age where the youngest member of the age group has
not yet reached that specified age. For example, percentages for women 20–24 at the time of the survey
will not be calculated for the specified age 22, or 25 because the cohort is truncated and some women
or men who have never had intercourse are still below those ages and could still have their first
intercourse within the age group categories.
In many ever-married samples, age at first sexual intercourse was not asked. In the other ever-married
surveys, never-married women or men are assumed not to have had sexual intercourse, and their all
women or men factor is tallied in the category for never had sexual intercourse.
Changes over time
Some rounds of DHS included a category 96 for age at first union (women: v525=96; men: mv525=96)
for when the woman or man began living with their spouse or consensual partner. In the DHS standard
recode variable v531 (or mv531 for men) (age at first sex (imputed)) this response has been converted
to the age at first union in completed years.
Resources
DHS-7 Tabulation plan: Table 4.5
API Indicator IDs:
Women:
SX_SBAG_W_B15, SX_SBAG_W_B18, SX_SBAG_W_B20, SX_SBAG_W_B22, SX_SBAG_W_B25, SX_SBAG_W_NSX
Men:
SX_SBAG_M_B15, SX_SBAG_M_B18, SX_SBAG_M_B20, SX_SBAG_M_B22, SX_SBAG_M_B25, SX_SBAG_M_NSX
(API link, STATcompiler link)

Guide to DHS Statistics 4.15 August 2018
Median age at first sexual intercourse
Definition
Median age in years at first sexual intercourse.
Coverage:
Population base: Women and men of all marital statuses. (IR file, MR file)
Time period: Lifetime of the respondent
Median: Median for completed time periods
Calculation
Medians are calculated from cumulated single-year percent distributions (see Numerator and
Denominator below) of age at first sexual intercourse (see Age at First Sexual Intercourse above).
Median is linearly interpolated between the single-year percent distributions that occur at the ages
before and after 50 percent of the women (or men) had sexual intercourse for the first time. (See
Median Calculations in Chapter 1).
Numerators: Number of women (or men) within single year of age categories of age at first sexual
intercourse (women: v531; men: mv531). Women (or men) who have never had sexual intercourse
are included in a separate category at the tail of the distribution. In ever-married samples, the all
woman (or man) factor is tallied in the category of women (or men) who have never been married or
lived in a consensual union.
Denominator: Number of women (or men) of all marital statuses. Numerators are divided by the
overall denominator and multiplied by 100 to obtain percentages. In ever-married samples the
denominator
is adjusted by the all woman (or man) factors.
Variables: IR file, MR file.
v531
Age at first sexual intercourse (imputed) (women)
v005
Woman’s individual sample weight
awfactt
All woman factor (only needed with ever-married samples)
mv531
Age at first sexual intercourse (imputed) (men)
mv005
Man’s individual sample weight
amfactt
All man factor (only needed with ever-married samples)
Handling of Missing Values
Women and men with unknown and missing ages at first sexual intercourse are excluded from both the
denominator and the numerators. Women and men with inconsistent ages at first sexual intercourse
(women: v531=97; men: mv531=97) or who did not know their age at first sex (women: v531=98; men:
mv531=98) are excluded from the numerator, but included in the denominator.
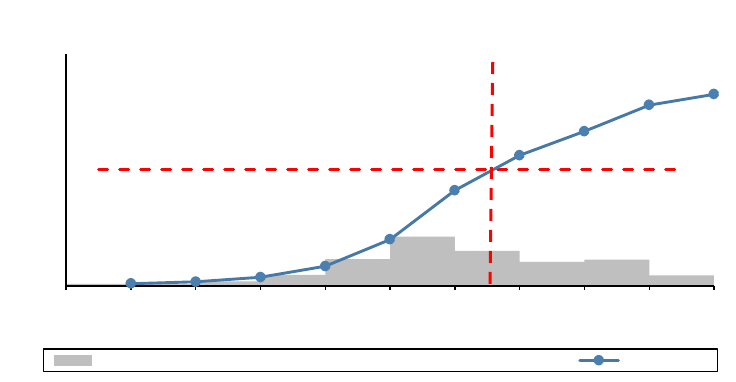
Guide to DHS Statistics 4.16 August 2018
Notes and Considerations
The reported age at first sexual intercourse is in completed years (e.g., women reporting 19 years of age
at first sexual intercourse actually includes all women who had their first sexual intercourse under 20
years of age).
Since the median is based on all women or men, including those who never had sexual intercourse,
there may not be a median for younger cohorts of women or men (since fewer than 50 percent of the
cohort may have had sexual intercourse). Medians are omitted for women or men whose current age
interval includes or precedes the median age at first sex.
In most of the ever-married DHS surveys, age at first sexual intercourse was not asked. In the ever-
married surveys that included questions on age at first sexual intercourse, never-married women or
men are assumed not to have had sexual intercourse.
Changes over time
Some rounds of DHS included a category 96 for age at first union (women: v525=96; men: mv525=96)
for when the woman or man began living with her/his first spouse or consensual partner. In the DHS
standard recode variables v531/mv531 (age at first sex (imputed)) this response has been converted to
the age at first union in completed years.
Example
For example, the figure below shows the cumulative (weighted) percentage of women age 20-49 who
reported having first had sex at specific ages. We look for two successive cumulative percentages that
bracket 50%. We find that 41% of women age 20-49 had experienced their sexual debut at 15 (by 16th
birthday) and 56% at age 16 (by 17th birthday). Because we know that cumulatively, 50% of women age
20-49 had sex between the 16th birthday and the 17th birthday, we know the median age is 16. To be
more precise we interpolate between 16.0 and 17.0. The interpolation between these two points
reveals a median of 16.6 or the age at which 50% of women age 20-49 experienced first sex is 16.6.
50%
1% 2% 4% 8%
20%
41%
56%
67%
78% 82%
10 12 14 16 18 20
0%
20%
40%
60%
80%
100%
10.0-10.9 11.0-11.9 12.0-12.9 13.0-13.9 14.0-14.9 15.0-15.9 16.0-16.9 17.0-17.9 18.0-18.9 19.0-19.9
Age at first sex
Age at first sex among women age 20-49,
DHS Model Dataset
Percent of women age 20-49 who had first sex at each age Cumulative
Median = 16.6

Guide to DHS Statistics 4.17 August 2018
Mathematically, this is equivalent to calculating an interpolated median between the completed ages 17
and 18, and adding one to the result.
References
MacQuarrie, K. L.D., L. Mallick, and C. Allen. 2017. Sexual and Reproductive Health in Early and Later
Adolescence: DHS Data on Youth Age 10-19. DHS Comparative Reports No. 45. Rockville, Maryland, USA:
ICF. https://dhsprogram.com/publications/publication-CR45-Comparative-Reports.cfm
Resources
DHS-7 Tabulation plan: Tables 4.5, 4.6
API Indicator IDs: SX_AAFS_W_M2A, SX_AAFS_W_M2B, SX_AAFS_M_M2A, SX_AAFS_M_M2B
(API link, STATcompiler link)

Guide to DHS Statistics 5.1 August 2018
Fertility
In DHS surveys, information is collected on current, past, and cumulative fertility. Drawing on the birth
history information collected in the survey, the chapter begins with a description of current fertility. This
is followed by a description of differentials in fertility by background characteristics. Then, attention is
focused on trends in fertility, which permits an examination of changes in age-specific fertility rates by
time periods going back 20 years from the time of the survey.
The chapter also presents information on the cumulative fertility of female respondents in terms of the
mean number of children ever born and the mean number of surviving children to women classified by
five-year age groups.
The chapter also presents information on birth intervals for births in the five years preceding the survey,
age at first birth for five-year age groups of women and information on teenage pregnancy and
motherhood by single year of age for youngest survey respondents, i.e., women age 15-19. These data
are important because they indicate the beginning of a woman’s reproductive life.
Notes and Considerations
Birth History
The indicators related to current fertility are calculated from the DHS birth history:
A full birth history is a complete list of all children the woman has ever given birth to including
their date of birth, sex, survival status, age (if alive), and age at death (if died). This is the form of
birth history found in the majority of DHS surveys. Birth histories include all live births, including
children who later died, but omit stillbirths, miscarriages or abortions. Birth histories are
collected in chronological order from first to last.
A truncated birth history is a list of all births since a particular date, typically for the five years
preceding the survey. Truncated birth histories are used in many of the Malaria Indicator
Surveys and are collected in reverse chronological order. Truncated birth histories may
demonstrate different characteristics than a full birth history as births in the particular time
period may be omitted, transferred out of the time period, transferred into the time period.
A pregnancy history is a complete list of all pregnancies the woman has ever had, including all
live births, stillbirths, miscarriages and abortions. Pregnancy histories have been used in surveys
in countries of the Commonwealth of Independent States, as well as Nepal, Philippines,
Vietnam, and in some special surveys such as the Afghanistan Mortality Survey, and the Ghana
Maternal Health Surveys. In surveys using pregnancy histories, the birth history is extracted
from the full pregnancy history and is found in the b* series variables. The full pregnancy history
is also available in the recode files for these surveys, typically in an s2* series of variables.

Guide to DHS Statistics 5.2 August 2018
Current Fertility
Age-Specific Fertility Rate (ASFR)
Definition
Age-Specific Fertility Fate (ASFR): Based on Age-Period Rates.
Coverage:
Population base: All women age 15-49 years in seven five-year age groups (15-19, 20-24, 25-29,
30-34, 35-39, 40-44, 45-49 years)
Time period: Three years preceding the survey
Numerator: Number of births that occurred in a period (typically the 1-36 months before the survey) to
women in the age group at the time of the birth (v008 - b3 in 1:36) (BR file)
Denominator: Number of women-years of exposure in the same period (1-36 months before the survey)
of women in the age group (IR file)
Variables: BR file, IR file.
b3
CMC date of birth of child
v011
CMC date of birth of respondent
v008
CMC date of interview
v005
Woman’s individual sample weight
awfactt
All woman factor (only needed with ever-married samples)
Calculation
The age-specific fertility rate is calculated as the quotient of the numerator divided by the denominator
for each age group, multiplied by 1000. The result is an average rate over the 36-month period,
expressed as an annual rate per 1000 women.
Numerator: Births are tabulated according to period of birth and the age of mother at the time of the
birth:
Period of birth: The period of birth is calculated as the difference in months between the date of
interview and the date of birth, both in century-month code format (CMC). Births are included in
the tabulation if they occur 1-36 months before the survey (v008 - b3 in 1:36).
Age of mother at the time of the birth: The difference in months between the date of birth of
the child and the date of birth of the mother both in CMC. The difference is then divided by 60
and truncated to whole numbers to form the age groups (agegroup = int( (b3 - v011) /60) ). Note
that age group 15-19 is classified as age group 3 here, not age group 1. Births are tabulated by
age group.
Denominator: Women-years of exposure are calculated as the sum of the number of months exposed in
the five-year age group during the time period divided by 12. A woman can contribute exposure to
Guide to DHS Statistics 5.3 August 2018
several age groups in the period, depending on the length of the period. For periods exceeding five
years a woman can contribute to more than two age groups. For a period of three years or five years a
woman will contribute to no more than two five-year age groups during the 36- or 59-month period.
The description below assumes a period of 1-36 months preceding the survey, and that a woman
contributes to at most two age groups, described here as the higher age group and the lower age group:
Higher age group: A woman’s age at the end of the period determines the higher age group. The
higher age group is calculated by subtracting the women’s date of birth from the date of
interview minus one (in CMC), dividing the difference by 60 and truncating to a whole number
(agegroup = int( (v008-1-v011)/60 ). The -1 is to ignore the month of interview and use just the
36 months prior to but not including the month of interview.
The number of months spent in the higher age group is the difference in months between her
age at the end of the period of exposure (date of interview less one month) and the lower age
limit of the age group plus one month (exposure = v008 - 1 - v011 - agegroup*60 + 1). As the -1
and the +1 cancel out this can be simplified to (exposure = v008 - v011 - agegroup*60). If the
number of months in the age group exceeds 36 then the exposure is truncated to 36 for the
period (exposure = 36 if exposure > 36). If the number of months in the age group is less than
the duration of the time period (36 months), then the woman contributes exposure to both the
higher age group and the next lower age group (agegroup-1).
Lower age group: The contribution to the lower age group is 36 less the number of months of
exposure in the higher age group. If the number of months in the higher age group is greater
than the duration of the time period (i.e., >36 months), then the exposure in the higher group is
the duration of the period (36 months) and the exposure in the lower age group is zero.
Tabulation: Each woman is tallied twice, once according to her higher age group accumulating
the exposure she contributes to that group and once in the lower age group accumulating lower
age group exposure. For ever-married samples, the exposure is adjusted to represent all women
by multiplying the exposure by the woman’s “all-woman factor” (awfactt), which is derived from
the proportion of women ever-married from the persons data file (PR file). See the section on all
women factors for details on their calculation. The total exposure in each age group is then the
sum of the exposure in each age group from the first and second tallying.
Examples
Example 1: A woman interviewed in December 2017, born in May 1986. Her CMC date of
interview is 12*(2017 - 1900) + 12 = 1416. The CMC of the date of the end of the period of
exposure is 1416 - 1 = 1415. Her CMC date of birth is 12*(1986 - 1900) + 5 = 1037. Her age in
months at the end of the period is 1415 - 1037 = 378. The age group at the end of the period is
378/60 = 6.3, truncated to 6. This represent age group 30-34 years (30 = 6*5 years interval). The
number of months in this age group is 378 - 6*60 + 1 = 19 months. Since this is less than the
total number of months during the period (36 months), she contributed 19 months to age group
30-34 during the period and 36 - 19 = 17 months to the age group 25-29 during the period.
Example 2: A woman interviewed in December 2017, born in March 1983. Her CMC date of
interview is 12*(2017 - 1900) + 12 = 1416. The date of the end of the period of exposure is 1416
- 1 = 1415. Her CMC date of birth is 12*(1983 - 1900) + 3 = 999. Her age in months at the end of
Guide to DHS Statistics 5.4 August 2018
the period is 1415 - 999 = 416. The age group at the end of the period is 416/60 = 6.93,
truncated to 6. This represent age group 30-34 years (30 = 6*5 years interval). The number of
months in this age group is 416 - 6*60 + 1 = 57 months. Since the number of months in this age
group is greater than 36 months, she contributed 36 months of exposure to age group 30-34
during the period and no exposure to the next lower age group during the period.
Handling of Missing Values
The total number of children to which a woman has given birth is recorded obligatorily by the
interviewer; no unknown numbers of children are allowed. There are three values involved in the
calculation of ASFR, interview date, birth date of woman and birth dates of children. The interview date
is always known from fieldwork dates. If missing or unknown, the birth dates of interviewed women and
her children are imputed before formation of the standard recode file. See Date Variables in Chapter 1.
Notes and Considerations
The Age-Specific Fertility Rate (ASFR) is also known as the Age-Period Fertility Rate. The ASFR is typically
calculated for the three years that precede the date of the survey and is presented as an annual rate.
The ASFR for women in the age group 15-19 is also known as the Adolescent Birth Rate (ABR).
Births to women at ages less than 15 years or more than 49 years at the time of the birth are not
included in the calculation of these ASFRs, however births to girls age 10-14 at the time of birth are
included in the calculation of the ASFR 10-14.
Births in the month of interview are excluded. This exclusion is because this month does not represent a
full month but is censored by the date of interview.
A three-year (36 month) time period is taken for calculating current AFSR. This period is a compromise
between the need for recency and reduction of sampling variation. This time period was selected during
the World Fertility Survey, when sample sizes were on average about 5,000 women. For comparability
over time and across surveys, this period has been maintained by The DHS Program.
No adjustment is made for truncation by age. Women who are at most 49 years at the time of interview
were 48 years the year before and 47 years two years before. The reason no adjustment is made is that
the tiny probability of women age 48 and 49 years of age giving birth in the three years preceding the
survey outweighs the complication of adjusting by single years of age.
In line with general DHS policy, no adjustment is made for possible omission or date misreporting of the
dates of birth of children or misreporting of the date of birth of the woman.
For ever-married samples, it is assumed that never-married women have not had any births. Only the
denominator of the rates is adjusted to estimate the number of all women exposed in the age group.

Guide to DHS Statistics 5.5 August 2018
References
Croft, T. 1991. “Date Editing and Imputation”. In Demographic and Health Surveys World Conference
Proceedings, II: 1337-1356, Columbia, Maryland: IRD/ORC Macro.
https://dhsprogram.com/publications/publication-DHSG3-DHS-Questionnaires-and-Manuals.cfm
Moultrie, T.A. 2013. Direct estimation of fertility from survey data containing birth histories. In
Moultrie, T.A., R. E. Dorrington, A. G. Hill, K. Hill, I. M. Timæus and B. Zaba (eds). Tools for Demographic
Estimation. Paris: International Union for the Scientific Study of Population.
http://demographicestimation.iussp.org/content/direct-estimation-fertility-survey-data-containing-
birth-histories
Pullum, T, S. Assaf, and S. Staveteig. 2017. Comparisons of DHS Estimates of Fertility and Mortality with
Other Estimates. DHS Methodological Reports No. 21. Rockville, Maryland, USA: ICF.
https://www.dhsprogram.com/publications/publication-MR21-Methodological-Reports.cfm
Pullum, T. W. 2004. “Natality: Measures based on censuses and surveys.” Chapter 16 of The Methods
and Materials of Demography, 2nd edition, edited by D.A. Swanson and J. Siegel, 407-428, San Diego,
California: Academic Press.
https://demographybook.weebly.com/uploads/2/7/2/5/27251849/david_a._swanson_jacob_s._siegel_t
he_methods_and_materials_of_demography_second_edition__2004.pdf
Pullum, T. W. and S. Becker. 2014. Evidence of omission and displacement in DHS birth histories. DHS
Methodological Reports No. 11. Rockville, Maryland, USA: ICF International.
https://www.dhsprogram.com/publications/publication-MR11-Methodological-Reports.cfm
Schoumaker, B. 2011. "Omissions of births in DHS birth histories in sub-Saharan Africa: Measurement
and determinants". Paper presented at Population Association of America, Washington D.C., March 31 -
April 2, 2011. http://paa2013.princeton.edu/papers/132148
Schoumaker, B. 2013. “A Stata module for computing fertility rates and TFRs from birth histories: tfr2.”
Demographic Research 28:1093–1144. http://doi.org/10.4054/DemRes.2013.28.38
Schoumaker, B. 2014. Quality and Consistency of DHS Fertility Estimates, 1990 to 2012. DHS
Methodological Reports No. 12. Rockville, Maryland, USA: ICF International.
https://www.dhsprogram.com/publications/publication-MR12-Methodological-Reports.cfm
Resources
R package DHS.rates: Calculate Key DHS Indicators: https://CRAN.R-project.org/package=DHS.rates
DHS-7 Tabulation plan: Table 5.1
API Indicator IDs:
FE_FRTR_W_A15, FE_FRTR_W_A20, FE_FRTR_W_A25, FE_FRTR_W_A30,
FE_FRTR_W_A35, FE_FRTR_W_A40, FE_FRTR_W_A45
(API link, STATcompiler link)
Guide to DHS Statistics 5.6 August 2018
SDG Indicator 3.7.2: Adolescent birth rate (15-19)
WHO 100 Core Health Indicators: Adolescent birth rate (15-19)
MICS6 Indicator TM.1: Adolescent birth rate (ASFR 15-19)
Guide to DHS Statistics 5.7 August 2018
Age-Specific Fertility Rate (ASFR) 10-14
Definition
Age-Specific Fertility Rate (ASFR) for age group 10-14: Based on Age-Period Rates.
Coverage:
Population base: All girls age 10-14 years
Time period: Three years preceding the survey
Numerator: Number of births that occurred in a period (typically the 1-36 months or 1-60 months before
the survey) to girls in the age group 10-14 at the time of the birth (v008 - b3 in 1:36 [or 60]) (BR file)
Denominator: Number of years of exposure in the same period of girls in the age group 10-14 (IR file)
The rate is the quotient of the numerator divided by the denominator multiplied by 1000.
Variables: BR file, IR file.
b3
CMC date of birth of child
v011
CMC date of birth of respondent
v008
CMC date of interview
v005
Woman’s individual sample weight
awfactt
All women factor (only needed with ever-married samples)
Calculation
The ASFR 10-14 is calculated as the quotient of the numerator divided by the denominator for each age
group, multiplied by 1000. The result is an average rate over the 36- or 59-month period, expressed as
an annual rate per 1000 women. The age-specific fertility rate for age group 10-14 is calculated in a
similar manner to the ASFRs for age groups between 15 and 49, but with adjustments to both
numerator and denominator to avoid biases as girls age 10-14 are not typically interviewed in DHS
surveys, and the ASFR 10-14 is based on retrospective data for women age 15-19.
Numerator: Births are tabulated according to period of birth and the age of mother at the time of the
birth, and are adjusted for truncation of reports:
Period of birth: The period of birth is calculated as the difference in months between the date of
interview and the date of birth, both in century-month code format (CMC). Births are included in
the tabulation if they occur 1-36 months before the survey (v008 - b3 in 1:36 [or 60]).
Age of mother at the time of the birth: The difference in months between the date of birth of
the child and the date of birth of the mother both in CMC. The difference is then divided by 12
and truncated to whole numbers to form single year age groups (singleage = int( (b3 - v011) /12
). Births are tabulated by single year age group for ages 10-14. Note that the use of single year
age groups is different than the five-year age groups used for ASFRs for ages 15 to 49.
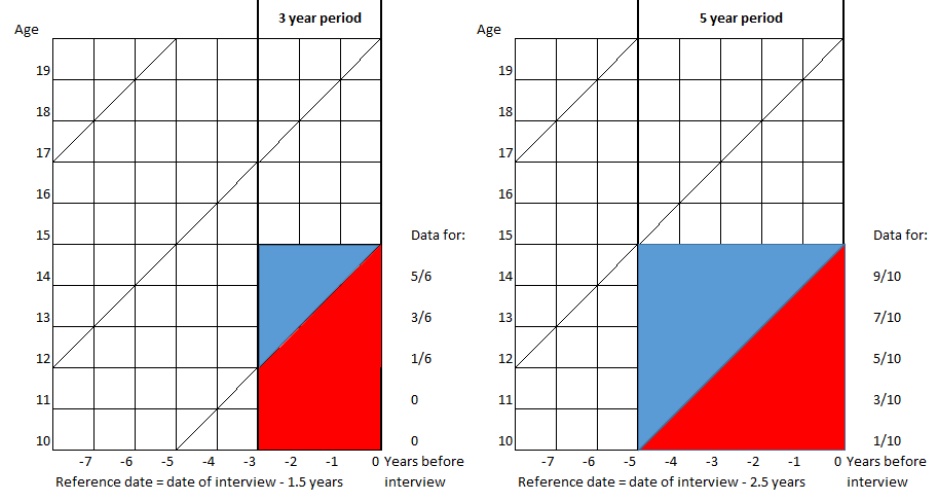
Guide to DHS Statistics 5.8 August 2018
Adjustment of number of births due to truncation of reports: Figure 5.1 below shows the
reports available for the calculation of ASFR 10-14 (in blue) and the data not available due to
truncation (in red) for both a three-year period and a five-year period immediately preceding
the survey. For a three-year (36-month) period, for age 14 data are reported for 5/6 of the
births and exposure, for age 13 for 3/6, and for age 12 for 1/6. For ages 11 and 10 no data are
reported. The births for ages 12-14 are thus adjusted by the inverse of these proportions – 6/5
for age 14, 6/3 for age 13, and 6/1 for age 12. For ages 11 and 10, the assumption is that there
are no births in these age groups (in total over more than 200 DHS surveys there were 9 births
reported at age 11 and 1 birth at age 10 in the five years preceding the survey). For a five-year
(60-month) period similar adjustments of 10/9, 10/7, 10/5, 10/3, 10/1 are made for ages 14, 13,
12, 11, and 10 respectively. After adjusting the births, the total births in each single age is
summed to produce an aggregate for the age group 10-14.
Figure 5.1
Denominator: Women-years of exposure are calculated as the sum of the number of months exposed in
each single-year age group for ages 10-14 during the time period, adjusted for truncation of reports (see
below), divided by 12. A woman can contribute exposure to several single year ages in the period,
depending on the length of the period, and may contribute to x+1 single year ages for a period covering
x years.
Oldest age: A woman’s age at the end of the period determines the oldest age. The oldest age is
calculated by subtracting the women’s date of birth from the date of interview minus one (in
CMC), dividing the difference by 12 and truncating to a whole number (singleage = int( (v008-1-
v011)/12 ). The -1 is to ignore the month of interview and use just the 36 (or 60) months prior to
but not including the month of interview.
The number of months spent in the oldest age is the difference in months between her age in
months at the end of the period of exposure (date of interview less one month) and the lower
Guide to DHS Statistics 5.9 August 2018
age limit in months of the age group plus one month (exposure = v008 - 1 - v011 - singleage*12
+ 1). As the -1 and the +1 cancel out this can be simplified to (exposure = v008 - v011 -
singleage*12). The remaining exposure (to be covered by other ages) is 36 or 60 minus the
exposure.
Other ages: Starting one year before the oldest age, the contribution of exposure to other ages
is the minimum of either 12 months or the remaining exposure in months. After tallying the
exposure for a single year age, the remaining exposure is reduced by the amount contributed,
the single year age is reduced by one year and the tallying repeated for the next lower age until
the remaining exposure is 0 or the age is outside of 10-14.
Tabulation: Each woman is tallied once per single year age for each age she was exposed for in
the period, accumulating the exposure she contributes to that age. For ever-married samples,
the exposure is adjusted to represent all women by multiplying the exposure by the woman’s
“all-woman factor” (awfactt), which is derived from the proportion of women ever-married from
the persons data file (PR file). See the section on all women factors for details on their
calculation. The total exposure in the age group 10-14 is then the sum of the exposure in each
single age adjusted for truncation of reports (see below).
Adjustment of years of exposure due to truncation of reports: As for the births, similar
adjustments are made for the exposure. For a 36-month period the exposure for ages 12-14 are
thus adjusted by the inverse of these proportions – 6/5 for age 14, 6/3 for age 13, and 6/1 for
age 12. After adjusting the exposure, the total exposure in each single age is summed to
produce an aggregate for the age group 12-14. As no exposure is collected for ages 11 and 10,
the assumption is that the exposure per single year age for ages 10 and 11 is the same as the
average for ages 12-14, and so the exposure is multiplied by 5/3 to produce an estimate of
exposure for ages 10-14. For a 60-month period similar adjustments of 10/9, 10/7, 10/5, 10/3,
10/1 are made to the single year exposure for ages 14, 13, 12, 11, and 10 respectively before
summing the total exposure for ages 10-14.
Examples
Example 1: A woman interviewed in December 2017, born in September 2002. Her CMC date of
interview is 12*(2017 - 1900) + 12 = 1416. The date of the end of the period of exposure is 1416
- 1 = 1415. Her CMC date of birth is 12*(2002 - 1900) + 9 = 1233. Her age in months at the end of
the period is 1415 - 1233 = 182. The single age group at the end of the period is 182/12 = 15.17,
truncated to 15. The number of months in this age group is 182 - 15*12 + 1 = 3 months. For the
oldest age group (15) she would contribute 3 months, however, age 15 is outside the age group
range of 10-14, so no tallying is done for this age group. The remaining exposure in the 36-
month period would be 36 – 3 = 33 months. For the next age younger group (14) she
contributes the minimum of the remaining exposure (33 months) or 12 months, so thus
contributes 12 months and the remaining exposure becomes 21 months. For age 13 she again
contributes 12 months, and the remaining exposure becomes 9 months. For age 12 she
contributes just the remaining exposure (9 months) to this age in the period.

Guide to DHS Statistics 5.10 August 2018
Summary of exposure for example 1:
Age
Exposure
Remaining exposure
Tallying
15
3
33
No tallying as too old
14
12
21
12 months at age 14
13
12
9
12 months at age 13
12
9
0
9 months at age 12
Example of adjustments for births and exposure for three-year period:
Age
Births
Exposure
Adjustment
Births adjusted
Exposure adjusted
12
1
450
6/1
6
2700
13
8
1500
6/3
16
3000
14
20
2500
6/5
24
3000
Sum for 12-14
46
8700
Sum for 10-14
5/3 for exposure only
46
14500
ASFR 10-14
Births/Exposure
.003
Handling of Missing Values
The total number of children to which a woman has given birth is recorded obligatorily by the
interviewer; no unknown numbers of children are allowed. There are three values involved in the
calculation of ASFR, interview date, birth date of woman and birth dates of children. The interview date
is always known from fieldwork dates. If missing or unknown, the birth dates of interviewed women and
her children are imputed before formation of the standard recode file. See Date Variables in Chapter 1.
Notes and Considerations
The ASFR 10-14 is typically calculated for the three years that precede the date of the survey, and is
presented as an annual rate.
Births to women while age 15 or higher are not included in the calculation of the ASFR 10-14;, however,
births to girls age 10-14 at the time of birth are included in the calculation of the ASFR 10-14.
Births in the month of interview are excluded. This exclusion is because this month does not represent a
full month but is censored by the date of interview.
In line with general DHS policy, no adjustment is made for possible omission or date misreporting of the
dates of birth of children or misreporting of the date of birth of the woman.
For ever-married samples, it is assumed that never-married women have not had any births. Only the
denominator of the rates is adjusted to estimate the number of all women exposed in the age group.

Guide to DHS Statistics 5.11 August 2018
References
MacQuarrie, K. L.D., L. Mallick, and C. Allen. 2017. Sexual and Reproductive Health in Early and Later
Adolescence: DHS Data on Youth Age 10-19. DHS Comparative Reports No. 45. Rockville, Maryland, USA:
ICF. https://dhsprogram.com/publications/publication-cr45-comparative-reports.cfm
Pullum, T., and T. Croft. 2018. Methods to Estimate Under-15 Fertility
Using Demographic and Health Surveys Data. DHS Methodological Report No. 23. Rockville, Maryland,
USA: ICF. https://www.dhsprogram.com/publications/publication-MR23-Methodological-Reports.cfm
Way, A. 2014. Youth data collection in DHS surveys: An overview. DHS Occasional Papers No. 9. Rockville,
Maryland, USA: ICF International. https://www.dhsprogram.com/publications/publication-OP9-
Occasional-Papers.cfm
Resources
DHS-7 Tabulation plan: Table 5.1
API Indicator ID: FE_FRTR_W_A10
(API link, STATcompiler link)
SDG Indicator 3.7.2: Adolescent birth rate (10-14)
WHO 100 Core Health Indicators: Adolescent birth rate (10-14)
Guide to DHS Statistics 5.12 August 2018
Trends in Age-Specific Fertility Rates
Definition
Age-Specific Fertility Rate (ASFR) for five-year periods preceding the survey: Based on Age-Period Rates.
Coverage:
Population base: All women age 15-49
Time period: Five-year (or four-year) periods preceding the survey
Calculation
The calculation of ASFRs for trends is the same as the calculation of current ASFRs, except that they are
calculated for either five-year periods preceding the survey (1-60, 61-120, 121-180 and 181-240 months
before the interview date) or four-year periods (1-48, 49-96, 97-144, 145-192, and 193-240 months
before the interview date).
Handling of Missing Values
See Handling of Missing Values for Age-Specific Fertility Rate (ASFR).
Notes and Considerations
Since the time periods are five years or less in duration, the calculation of women-years of exposure is
the same as that for current age-specific fertility rates with the total duration within each period per
woman of 60 (or 48) months for five-year (or four-year) periods, respectively.
For five-year time periods, the following ASFRs will be truncated:
Period
Age Group
0-4 years
45-49
5-9
40-44
10-14
35-39
15-19
30-34
For four-year time periods, the following ASFRs will be truncated:
Period
Age Group
0-3 years
45-49
4-7
40-44, 45-49
8-11
35-39, 40-44
12-15
35-39
16-19
30-34, 35-39
The four-year period is used where birth displacement at five years of age is thought to be important.


Guide to DHS Statistics 5.14 August 2018
Total Fertility Rate (TFR)
Definition
The total fertility rate (TFR) is an age-period fertility rate for a synthetic cohort of women. It measures
the average number of births a group of women would have by the time they reach age 50 if they were
to give birth at the current age-specific fertility rates. The TFR is expressed as the average number of
births per woman. Unless otherwise specified, the TFR is for all women.
Coverage:
Population base: All women age 15-49
Time period: Three years preceding the survey, excluding the month of interview (1-36 months
before the survey)
Calculation
The TFR is the sum of the Age-Specific Fertility Rate (ASFR) for all women multiplied by five. The ASFRs
are those for the seven five-year age groups from 15-19 to 45-49.
Handling of Missing Values
See Handling of Missing Values for Age-Specific Fertility Rate (ASFR).
Notes and Considerations
The TFR for women age 15-44 is sometimes presented in DHS reports as a variant. It uses the ASFRs
from the 6 five-year age groups from 15-19 to 40-44.
The TFR is presented only for women age 15-49 and does not include the ASFR for girls age 10-14, which
is generally negligible.
References
See References for Age-Specific Fertility Rate (ASFR).
Resources
DHS-7 Tabulation plan: Tables 5.1 and 5.2
API Indicator ID: FE_FRTR_W_TFR
(API link, STATcompiler link)
WHO 100 Core Health Indicators: Total fertility rate
Guide to DHS Statistics 5.15 August 2018
General Fertility Rate (GFR)
Definition
The general fertility rate (GFR) is the average number of children currently being born to women of
reproductive age in the period, typically 1-36 months preceding the survey, expressed per 1,000 women
age 15-44.
Coverage:
Population base: All women 15-44 years of age during the period
Time period: Three years preceding the survey excluding the month of interview (1-36 months)
Numerator: Total number of births in the period (v008 - b3 in 1:36) (BR file)
Denominator: Total number of women-years of exposure during period (IR file)
Variables: BR file, IR file.
b3
CMC date of birth of child
v011
CMC date of birth of respondent
v008
CMC date of interview
v005
Woman’s individual sample weight
awfactt
All women factor (only needed with ever-married samples)
Calculation
Numerator: The total of all births in the period to all women age 15-49, irrespective of their age at the
time of birth (v008 - b3 in 1:36).
Denominator: The sum of the women-years of exposure over the five-year age groups from 15-19 to 40-
44 tabulated as for the age-specific fertility rates.
GFR is quotient of the numerator divided by the denominator, multiplied by 1000.
Handling of Missing Values
See Handling of Missing Values for Age-Specific Fertility Rate (ASFR).
Notes and Considerations
All births in the period are counted including births to women age 45-49 and births to women before
they reached age 15. The exposure is limited to women age 15-44 and does not count the exposure for
women age 45-49 in the denominator. In the literature the denominator for the general fertility rate is
women of reproductive age and this is sometimes based on women age 15-44 and other times women
age 15-49. The DHS Program uses a denominator based on women age 15-44 as was used in the World
Fertility Survey.

Guide to DHS Statistics 5.16 August 2018
For ever-married samples, all women factors are applied in the tabulation of the denominators, as for
the age-specific fertility rates.
References
See References for Age-Specific Fertility Rate (ASFR).
Resources
DHS-7 Tabulation plan: Table 5.1
API Indicator ID: FE_FRTR_W_GFR
(API link, STATcompiler link)
Guide to DHS Statistics 5.17 August 2018
Crude Birth Rate (CBR)
Definition
The crude birth rate (CBR) is the annual average number of births per thousand of the whole population.
Coverage:
Population base: All women age 15-49
Time period: Three years preceding the survey, excluding the month of interview (1-36 months)
Numerator: Total number of births in the three years preceding the survey (v008 - b3 in 1:36) (BR file)
Denominator: Total number of person-years of exposure during the three years preceding the survey (PR
file)
Calculation
The crude birth rate is calculated by summing the product of the current age-specific fertility rates and
the proportion of women in the specific age group out of the total de facto population based on the
household members (PR) file:
∑ ( ASFR i * (Womenih / Populationtot) )
See Age-Specific Fertility Rate (ASFR) for the calculation of the ASFRs.
For the proportion of women in the specific age group out of the total de facto population:
Numerator: From the household members (PR) file, the number of women who slept in the
household the night before the interview tabulated by five-year age group (according to age
reported in the household schedule) for groups 15-19 to 45-49 .
Denominator: From the household survey, the total number of people of both sexes and all ages
who slept in the household the night before the interview.
Variables: PR file.
hv103
Stayed in the household the previous night (de facto)
hv104
Sex of household member
hv105
Age of household member
hv005
Household sample weight
Handling of Missing Values
Sex of household member is always assigned. It may be possible that in early DHS surveys sex had
missing values. In that case the household member was included in the denominator, but not the
numerator.
Women with unknown age are assumed to be outside the 15-49 year range; thus they are not tabulated
for numerators. People of either sex with unknown age are included in the denominators.

Guide to DHS Statistics 5.18 August 2018
Notes and Considerations
Nominally the calculation of the crude birth rate is just the number of births in the period based on the
BR file divided by the total de facto population based on the PR file, however, because there is some
level of non-response to the women’s questionnaire the number of births would be an underestimate
relative to the population, and thus would bias downwards the crude birth rate. To avoid this problem,
the calculation instead takes each of the age-specific fertility rates (ASFRs) for women age 15-19 to age
45-49, each of which has women as the denominator, and multiplies each of the ASFRs by the
proportion of women in the age group compared to the total de facto population, and sums these
products, as follows:
CBR = ∑ (Births / Populationtot)
= ∑ (Births i / Womeniw) * (Womenih / Populationtot) )
= ∑ ( ASFR i * (Womenih / Populationtot) )
where i is the age group from 15-19 to 45-49, Womeniw is the number of women-years of exposure in
age group i from the women’s questionnaire data (IR file), and Womenih is the count of women in age
group i from the household population (PR file).
Assumptions: Due to the lack of birth dates for the household population, the proportion of women in
each age group at the time of the survey is assumed to be the same as the proportion at the midpoint of
the time period.
References
See References for Age-Specific Fertility Rate (ASFR).
Resources
DHS-7 Tabulation plan: Table 5.1
API Indicator ID: FE_FRTR_W_CBR
(API link, STATcompiler link)

Guide to DHS Statistics 5.19 August 2018
Percentage currently pregnant
Definition
Proportion of all women 15-49 years of age who report themselves as pregnant at the time of interview
expressed as a percentage.
Coverage:
Population base: All women 15-49 years of age (IR file)
Time period: Current status at time of survey
Numerator: Number of women age 15-49 who report themselves pregnant at the time of interview
(v213 = 1)
Denominator: Number of women age 15-49
Variables: IR file.
v213
Currently pregnant
v005
Woman’s individual sample weight
awfactt
All women factor (only needed with ever-married samples)
Calculation
Numerator divided by denominator, multiplied by 100. In ever-married samples, the denominator is
adjusted by the all woman factor.
Handling of Missing Values
Women with missing and “don’t know” responses are considered not pregnant. Women who do not
know or are unsure whether they are pregnant or women with missing data on whether pregnant are
excluded from the numerator but are included in the denominator.
Notes and Considerations
The percentage of women currently pregnant is underreported because women who are in their early
stage of pregnancy may not yet know if they are pregnant and because some women may not want to
declare that they are pregnant. In ever-married samples, never-married women are assumed not to be
pregnant.
Resources
DHS-7 Tabulation plan: Table 5.2
API Indicator ID: FE_FRTY_W_PRG
(API link, STATcompiler link)

Guide to DHS Statistics 5.20 August 2018
Completed Fertility
Mean number of children ever born to women age 40-49
Definition
Arithmetic average number of all children, both surviving and dead, born to women age 40-49.
Coverage:
Population base: All women age 40-49 (IR file)
Time period: Current status at time of surve
Numerator: Number of all children ever born (v201) to women age 40-49 (v012 in 40:49)
Denominator: Number of women age 40-49 in the sample (v012 in 40:49). In ever-married samples,
tabulation of all women age 40-49 requires using all women factors.
Variables: IR file.
v201
Number of children ever born
v012
Age in single years
v005
Woman’s individual sample weight
awfactt
All women factor (only needed with ever-married samples)
Calculation
Numerator divided by denominator multiplied by 100. In ever-married samples, the denominator is
adjusted by the all woman factor.
Handling of Missing Values
Not applicable—Number of children ever born is not allowed to have missing values.
Notes and Considerations
The mean number of children ever born to women age 40-49 provides an estimate of completed fertility
that can be compared with current total fertility to indicate fertility change. In ever-married samples,
never-married women are assumed to have never given birth.
Resources
DHS-7 Tabulation plan: Table 5.2
API Indicator ID: FE_FRTY_W_MNC
(API link, STATcompiler link)

Guide to DHS Statistics 5.21 August 2018
Children Ever Born and Living
Percent distribution by number of children ever born
Definition
Percentage of women with specified number of children ever born.
Coverage:
Population base: All women age 15-49; Currently married women age 15-49, including women
formally married or living in a consensual union (v502 = 1) (IR file)
Time period: Current status at time of survey
Numerator: Number of women age 15-49 who in their lives have given birth to the specified number of
children (v201)
Denominator: Number of women age 15-49 in the sample. In ever-married samples, tabulation of all women
requires using all women factors
Variables: IR file.
v201
Number of children ever born
v502
Currently/formerly/never in union
v005
Woman’s individual sample weight
awfactt
All women factor (only needed with ever-married samples)
Calculation
For each specified number of children, numerator divided by the denominator multiplied by 100. In
ever-married samples, the denominator is adjusted by the all woman factor.
Handling of Missing Values
Not applicable—Number of children and marital status are not allowed to have missing values.
Notes and Considerations
Percentages add up to 100 percent.
Resources
DHS-7 Tabulation plan: Table 5.4
API Indicator IDs:
FE_CEBA_W_CH0, FE_CEBA_W_CH1, FE_CEBA_W_CH2, FE_CEBA_W_CH3, FE_CEBA_W_CH4,
FE_CEBA_W_CH5, FE_CEBA_W_CH6, FE_CEBA_W_CH7, FE_CEBA_W_CH8, FE_CEBA_W_CH9,
FE_CEBA_W_C10
(API link, STATcompiler link)
Guide to DHS Statistics 5.22 August 2018
Mean number of children ever born and mean number of living children
Definition
Arithmetic average number of all children, both surviving and dead, and living children to all women in
the sample.
Coverage:
Population base: All women age 15-49; Currently married women age 15-49, including women
formally married or living in a consensual union (v502 = 1) (IR file)
Time period: Current status at time of survey
Numerators:
1) Mean number of children ever born: Sum of number of children surviving and dead at the time
of the survey who were given birth by women in the sample (v201)
2) Mean number of living children: Sum of number of children alive at the time of the survey who
were given birth by women in the sample (v218)
Denominator: Number of women in sample.
Variables: IR file.
v201
Number of children ever born
v218
Number of living children
v502
Currently/formerly/never in union
v005
Woman’s individual sample weight
awfactt
All women factor (only needed with ever-married samples)
Calculation
Numerator divided by denominator. In ever-married samples, the denominator is adjusted by the all
woman factor.
Handling of Missing Values
Not applicable—Number of children and marital status of women and children’s survival status are not
allowed to have missing values.
Notes and Considerations
Expressed to two decimal places. The mean number of children ever born and mean number of living
children can be used to understand fertility change over time.
The mean number of children ever born and mean number of living children by age group can also be
used as inputs for indirect estimation of infant and under five mortality rates. The DHS Program
produces direct estimates of infant and under five mortality rates (see Early Childhood Mortality Rates)
rather than indirect estimates but presents these indicators to facilitate other data users’ analyses.

Guide to DHS Statistics 5.23 August 2018
References
Bongaarts, J. and Casterline, J. 2013. “Fertility transition: is sub‐Saharan Africa different?.” Population
and development review, 38:153-168. https://onlinelibrary.wiley.com/doi/pdf/10.1111/j.1728-
4457.2013.00557.x
Garenne, M.M. 2008. Fertility Changes in Sub-Saharan Africa. DHS Comparative Reports No. 18.
Calverton, Maryland, USA: Macro International Inc. https://dhsprogram.com/publications/publication-
cr18-comparative-reports.cfm
Resources
DHS-7 Tabulation plan: Table 5.4
API Indicator IDs: FE_CEBA_W_MNC, FE_CEBA_W_MNL
(API link, STATcompiler link)

Guide to DHS Statistics 5.24 August 2018
Birth Intervals
Percent distribution by months since preceding birth
Definition
Percentage of births in the five years preceding the survey by specified grouped number of months since
the preceding birth.
Coverage:
Population base: All second- and higher-order births in the time period (BR file or KR file)
Time period: Five years preceding the survey (0-59 months)
Numerator: Number of births whose interval with the preceding birth (b11) is within the specified group
Denominator: Total number of births
Variables: BR file or KR file.
bord
Birth order
b0
Twin
b11
Preceding birth interval
b19
Months since birth of child (DHS-7)
v005
Woman’s individual sample weight
Calculation
Covered births: Children both surviving and dead who have a difference between the date of interview
and their birth date of 0-59 months (see notes), excluding first-born children and their twins, i.e.
excluding birth_order = 1, where birth_order is calculated as follows:
birth_order = bord
if (b0 > 1) birth_order = bord - b0 + 1
Preceding birth interval: (b11) Difference between birth date of child and birth date of preceding child
grouped into the groups 7-17, 18-23, 24-35, 36-47, 48-59, and 60+ months. For children of multiple
births, the birth date of the preceding child is the number of months since the end of the preceding
pregnancy that ended in a live birth.
Numerators for each birth interval category are divided by the same denominator and multiplied by 100
to obtain percentages.
Handling of Missing Values
Not applicable—Birth dates of children are imputed if missing; therefore birth dates do not have missing
values.

Guide to DHS Statistics 5.25 August 2018
Notes and Considerations
Percentages add up to 100 percent.
First-order births (and their twins) are excluded from both numerators and denominators.
Births in the month of interview are included and births 60 months before the interview are excluded.
Changes over Time
The calculation of months since birth has changed in DHS-7 compared to prior rounds of DHS. In DHS-7
recode files b19 provides months since birth for both living and dead children calculated from the date
of birth in days. In prior rounds of The DHS Program, months since birth were calculated based on the
date of birth in months as v008-b3. The selection for births in the five years preceding the survey is
based on b19 < 60 or, in datasets without b19, v008-b3 < 60.
Similarly, the calculation of the length of the preceding birth interval (b11) also changed in DHS-7, and is
now calculated as the difference in the century day code (CDC) for the date of birth (b18) for the index
child and the preceding child, in days, divided by 30.4375 to convert to months. In prior rounds of The
DHS Program, the preceding birth interval was just the difference in the CMC date of birth of the index
child and the preceding child. Overall the preceding birth interval will be a month shorter in roughly half
of the cases using the DHS-7 calculation rather than the prior method.
For more information on the changes in the calculation of age of children, months since birth, and the
preceding birth interval, see Age of Children in Chapter 1.
Resources
DHS-7 Tabulation plan: Table 5.5
API Indicator IDs:
FE_BINT_C_I07, FE_BINT_C_I18, FE_BINT_C_I24, FE_BINT_C_I36, FE_BINT_C_I48, FE_BINT_C_I60
(API link, STATcompiler link)
Guide to DHS Statistics 5.26 August 2018
Median number of months since preceding birth
Definition
Median number of months since the preceding birth for births in the five years preceding the survey.
Coverage:
Population base: All second- and higher-order births in the time period (BR file or KR file)
Time period: Five years (0-59 months) preceding the survey (b19 < 60)
Median: Interpolated retrospective median
Variables: BR file or KR file.
bord
Birth order
b0
Twin
b11
Preceding birth interval
b19
Months since birth of child (DHS-7)
v005
Woman’s individual sample weight
Calculation
Numerators: Preceding birth interval (b11) in single months. The preceding birth interval is the
difference between birth date of child and birth date of preceding child in months. For children of
multiple births, the birth date of the preceding child is the number of months since the end of the
preceding pregnancy that ended in a live birth.
Denominator: Children both surviving and dead who were born 0-59 months prior to the interview (b19
< 60 – see Changes over Time), excluding first-born children and their twins (see Percent distribution by
months since preceding birth).
Numerators for each single month category are divided by the same denominator and multiplied by 100
to obtain percentages.
Median is calculated from single month percent distributions of durations of preceding birth intervals.
Median is linearly interpolated between the duration month values by which 50 percent or more of the
preceding intervals were closed by a birth.
Example: If the cumulative distribution up to and including the category 21 months is 49.3% and up to
and including 22 months is 50.7% then the median is 21 + ((50.0 - 49.3) / (50.7 - 49.3)) +1 = 22.5
months. The +1 is an adjustment as the category 21 months is not exactly 21 months but up to, but not
including, 22 months (see Notes and Considerations).
Handling of Missing Values
Not applicable—Birth dates of children are imputed if missing; therefore, birth dates do not have
missing values.

Guide to DHS Statistics 5.27 August 2018
Notes and Considerations
First-order births (and their twins) are excluded from calculation.
Births in the month of interview are included and births 60 or more months before the interview are
excluded.
Since the difference in the index child’s and previous child’s birth dates are truncated to completed
months, the difference between them is taken as including up to the next completed month (cumulated
percentage for a birth interval with a difference of 21 months actually includes all preceding birth
intervals below 22 months). Therefore, an adjustment is made to the interpolated median by increasing
the interpolated value by one month as shown in the example above.
Changes over Time
See Changes over Time for Percent distribution by months since preceding birth.
Resources
DHS-7 Tabulation plan: Table 5.5
API Indicator ID: FE_BINT_C_MED
(API link, STATcompiler link)

Guide to DHS Statistics 5.28 August 2018
Postpartum Exposure: Amenorrhea, Abstinence, and Insusceptibility
Percentage of births for which mothers are: a) postpartum amenorrheic, b) abstaining
from sexual intercourse and c) insusceptible to pregnancy, by number of months since
birth
Definition
1) Percentage of births in the 3 years preceding the survey for which the mothers are postpartum
amenorrheic.
2) Percentage of births in the 3 years preceding the survey for which the mothers are postpartum
abstaining from sexual intercourse.
3) Percentage of births in the 3 years preceding the survey for which the mothers are insusceptible
to pregnancy.
Coverage:
Population base: All births within the time period preceding the survey (KR file)
Time period: Current status at the time of the survey (interview date) for births within the three
years (0-35 months) preceding the survey
Numerators:
1) Number of births at specified times before the survey for which the mother is postpartum
amenorrheic (i.e., her menstrual period has not resumed since the birth) (m6 = 96)
2) Number of births at specified times before the survey for which the mother is postpartum
abstaining (i.e., mother has not resumed sexual intercourse since the birth) (m8 = 96)
3) Number of births at specified times before the survey for which the mother is either postpartum
amenorrheic or abstaining (m6 = 96 or m8 = 96)
Denominator: Number of births at specified times in the three years preceding the survey (b19 < 36)
Variables: KR file.
b0
Twin
b3
CMC date of birth
b19
Months since birth
m6
Duration of amenorrhea (96 = still amenorrheic)
m8
Duration of abstinence (96 = still abstaining)
v005
Woman’s individual sample weight
Calculation
Numerators:
Number of last births where the mother is amenorrheic since the birth (m6=96). For last birth,
amenorrhea status is from the mother’s report of her status at the time of the interview. For all other
births, the mother is assumed not to be amenorrheic since the birth.

Guide to DHS Statistics 5.29 August 2018
Number of last births where the mother has abstained from sexual intercourse since the birth (m8=96).
For last birth, abstinence status is from the mother’s report of her status at the time of the interview.
For all other births, the mother is assumed not to have been abstaining since the birth.
Number of last births where the mother is either amenorrheic or has abstained from sexual intercourse
since the birth (m6=96 or m8=96). For last birth, insusceptibility is from the mother’s report of her
amenorrhea and sexual abstinence status at the time of the interview. For all other births, the mother is
assumed not to have been insusceptible since the birth.
Births are grouped by two-month intervals before the survey, as determined by difference in interview
date and birth date (b19).
Denominator: Number of all births in the three years preceding the survey (b19 < 36), including last and
prior births, grouped by two-month intervals before survey ( int( b19/2 ) ), as determined by difference
in interview date and birth date..
Percentages: Numerators are divided by the denominator and multiplied by 100.
Handling of Missing Values
Birth dates were imputed if missing. Dates of interview are not allowed to have missing data.
Women with missing reports of amenorrhea or sexual abstinence are considered to be not amenorrheic
or not abstaining, respectively.
Notes and Considerations
Only the last of multiple births are considered (caseid ≠ caseid[_n-1] or b3 ≠ b3[_n-1]). The other births
are ignored in both numerators and denominator. Births of both living and dead children are included.
Survival status is ignored.
Changes over Time
The calculation of the number of months since the birth has changed in DHS-7 compared to prior rounds
of The DHS Program. This indicator uses the variable b19 (months since birth) calculated using the full
date of birth of the child and the full date of interview, while in earlier rounds of The DHS Program, the
number of months since birth was calculated using the century month code of the date of birth and the
century month code of the date of interview as v008 - b3. See Age of Children in Chapter 1 for more
information. The main effect for this indicator is that the number of months since the birth is roughly
half a month shorter on average than presented in prior rounds of The DHS Program, so care should be
taken when comparing results between surveys.
Resources
DHS-7 Tabulation plan: Table 5.6
API Indicator IDs: FE_PPIS_W_AMN, FE_PPIS_W_ABS, FE_PPIS_W_INS
(API link, STATcompiler link)
Guide to DHS Statistics 5.30 August 2018
Median and Mean Durations of Postpartum Amenorrhea, Abstinence, and Insusceptibility
Definition
1) Median number of months of postpartum amenorrhea.
2) Median number of months of postpartum abstinence.
3) Median number of months of postpartum insusceptibility.
4) Mean number of months of postpartum amenorrhea.
5) Mean number of months of postpartum abstinence.
6) Mean number of months of postpartum insusceptibility.
Coverage:
Population base: All births within the time period (0-35 months) preceding the survey (KR file)
Time period: Current status at the time of survey
Numerators:
1) Number of births at specified times before the survey for which the mother is postpartum
amenorrheic (i.e., her menstrual period has not resumed since the birth) (m6 = 96)
2) Number of births at specified times before the survey for which the mother is postpartum
abstaining (i.e., mother has not resumed sexual intercourse since the birth) (m8 = 96)
3) Number of births at specified times before the survey for which the mother is either postpartum
amenorrheic or abstaining (m6 = 96 or m8 = 96)
Denominator: Number of births at specified times in the three years preceding the survey (b19 < 36)
Variables: KR file.
b0
Twin
b3
CMC date of birth
b19
Months since birth
m6
Duration of amenorrhea (96 = still amenorrheic)
m8
Duration of abstinence (96 = still abstaining)
v005
Woman’s individual sample weight
Calculation
Utilize the numerators and denominators calculated for the Percentage of births for which mothers are:
a) postpartum amenorrheic, b) abstaining from sexual intercourse and c) insusceptible to pregnancy, by
number of months since birth, by time since birth, as given above. Numerators and denominators are
each smoothed by a three-group moving average. For example, the value of the numerator and
denominators for births that occurred 4-5 months before the interview is the average of groups 2-3, 4-5,
and 6-7 months. Groups < 2 months and 34-35 months are not smoothed. Smoothed proportions are
calculated by dividing the smoothed numerator values by the smoothed denominator values of each
two-month group.
Median
Guide to DHS Statistics 5.31 August 2018
Beginning with the lowest time-since-birth group, each group is examined to see whether the
proportion amenorrheic, abstaining, or insusceptible is less than 0.5. Value of median is determined by
linear interpolation of percentage of first group below 0.5 and previous group percentage using the
following formula:
median = mi-1 + (p i-1 - 0.5)/(p i-1 - p i) * (w i)
where pi is the proportion amenorrheic, abstaining, or insusceptible for the first group, where the
proportion is below 0.5, pi-1 is the proportion amenorrheic, abstaining, or insusceptible for the preceding
group, mi-1 is the midpoint value for the preceding group, and wi is the time width of the group taken as
the difference between the midpoint value of the current group and the preceding group.
Prior to DHS-7: In The DHS Program rounds prior to DHS-7, for all groups except the first, the midpoint
values are one-half month above the lower limit. This midpoint value comes about because the time
since birth is calculated as the difference between birth dates and date of interview that are accurate for
month only (day of month is not ascertained), and month 0 effectively contains on average only half a
month’s births.
For example, if the date of interview were April 2018, the interview could have occurred at any time
during the month, from the 1st to the 30th. The same holds true for a birth that occurred in January 2018,
at any time between the 1st and the 31st of the month. Thus, the difference in time between the date of
birth and the date of interview could be between 60 days and 120 days. Assuming a constant
distribution by day of month for interviews and for births, the midpoint is 90 days or three months,
which is the value of the difference in the century-month codes of the dates. The midpoint value for the
group of the difference of 2 months and 3 months together is therefore 2.5.
The first group is special. The value of the previous group is assumed to be 100 percent since all women
are assumed to be amenorrheic and abstaining on the day of birth. Moreover, births that occur in the
month of interview can only come before the date of interview, rather than on any day of the month of
interview. Based on simulations, 0.75 is chosen as the midpoint value for the group < 2 months (i.e., 0-
1). The midpoint of the previous group is 0 (day of interview).
DHS-7: The midpoint values are at the midpoints of the range as the difference between the births dates
and date of interview are accurate to the day, and month 0 now contains a full month of births.
Using the example above, if the date of interview were April 2018, the interview could have occurred at
any time during the month, from the 1st to the 30th. The same holds true for a birth that occurred in
January 2018, at any time between the 1st and the 31st of the month. With the day of interview known,
and the day of birth known, or imputed, it is possible to calculate the exact age of the child to the day
and the age would be between 2.0 months and just less than 4.0 months and would be either 2 month
or 3 months when truncated. Similarly, a child born in February 2018 would either be 1 or 2 months old.
Combining all date combinations together, a child categorized as 2 months old would on average be 2.5
month, and a child categorized as 3 months old would on average be 3.5 months old. The midpoint
value for the group of the difference of 2 months and 3 months together is therefore 3.0.
In DHS-7, the first group is still special, and the value of the previous group is still assumed to be 100
percent since all women are assumed to be amenorrheic and abstaining on the day of birth. However,
because births in the month 0 group now come from births in the month of interview and in the
Guide to DHS Statistics 5.32 August 2018
preceding month, the midpoint of the month 0 group is 0.5 and the month 1 group is 1.5, so for the
group 0-1 months, the midpoint is 1.0.
Example:
DHS-7
Rounds prior to DHS-7
Group
Pi
Midpoint
Width
Group
Pi
Midpoint
Width
<2
0.88
1.0
1.0
<2
0.90
0.75
0.75
2–3
0.67
3.0
2.0
2–3
0.70
2.5
1.75
4–5
0.52
5.0
2.0
4–5
0.55
4.5
2.00
6–7
0.40
7.0
2.0
6–7
0.43
6.5
2.00
Note that the proportions in age each group are not the same between the DHS-7 approach and the
prior approach as the calculation of months since birth has changed in DHS-7 to provide a more accurate
estimate, thus requiring the change in the method of calculating the median.
DHS-7: median duration = 5.0 + (0.52-0.50)/(0.52-0.40)*(7.0-5.0) = 5.33 months
Prior to DHS-7: median duration = 4.5 + (0.55-0.50)/(0.55-0.43)*(6.5-4.5) = 5.33 months
Note also that due to a number of factors including the different calculation of the age groups, and the
application of the three-month moving average, the actual calculations are unlikely to result in exactly
the same estimates (as the example does) from the two approaches, but they should be quite close. In
general, the DHS-7 approach is a more accurate estimate.
Mean
The mean duration is the accumulation over all groups of the proportions amenorrheic, abstaining, or
insusceptible (pi) multiplied by the width of the time-since-birth group (wi).
mean duration = ∑ pi wi
The calculation of the mean is also affected by the change in approach in the calculation of the time-
since-birth groups, which will result in slightly different proportions in each group, and a change in the
width of the first two groups.
Handling of Missing Values
Birth dates were imputed if missing. Dates of interview are not allowed to have missing data.
Women with missing reports of amenorrhea or sexual abstinence are considered to be not amenorrheic
or not abstaining, respectively.
Notes and Considerations
Medians and means are based on current status of mothers of the births. The distributions of the
proportions of births by month of birth of the child are analogous to the lx column of the synthetic life
table. The basic assumption is that there has been no change in the proportions amenorrheic,
Guide to DHS Statistics 5.33 August 2018
abstaining, and insusceptible over time so that proportions that are calculated from births with small
times since birth are the same as those of births that occurred earlier, when those earlier births had
those durations. For the short period of 36 months, this assumption is very likely to be approximately
correct. The proportions are assumed to be 1 at the time of birth and to decrease monotonically with
time since birth. The time at which the proportions decline to 0.5 is taken as the median. The mean is
taken similarly from the lx column of the life table, which in this case is the series of proportions by time
since birth. Because the sum of proportions equals 1, there is no need to divide the sum of the
proportions times the width of the interval.
Because of the relatively small number of births in each month before the interview, the months are
first grouped and then smoothed to reduce random fluctuations due to sampling variance.
Mean
Truncated Mean: Because of the limitation to births that occurred within the three years preceding the
survey, the mean is truncated if there are mothers who are amenorrheic or abstaining longer than three
years after their last birth. It is very unlikely that the proportions are more than negligible after 35
months since birth, except for those women who are not really postpartum amenorrheic or abstaining
(more likely for older women whose postpartum amenorrhea blended into menopause or whose
postpartum sexual abstinence blended into terminal abstinence). Therefore, it is felt that the truncated
mean is very close to the full mean.
The measures are based on all births that occurred within the three years preceding the interview,
including last and other births, surviving or not.
Decisions on Alternatives
Current status medians and means are used instead of measures based on the recall of durations
because of the severe heaping (digit preference) on multiples of 3 and 6 months in the recall data.
In the current calculation of median and mean durations, a woman can contribute more than once if she
had more than one birth in the three years preceding the survey. An alternative calculation would be to
base the medians and means on women rather than births. In this alternative, each woman is
represented only once, which is equivalent to durations based on only the last birth. Estimates of
durations based on last births (open interval durations) are thought to overestimate average durations
of amenorrhea and abstinence since they almost always exceed those based on recall after other births
(closed interval durations).
Changes over Time
As described above under the median calculation the change in the calculation of time since birth
required changes in the calculation of the current status median from the proportions amenorrheic,
abstaining or insusceptible. See Age of Children in Chapter 1 for more information on the change in the
calculation of time since birth.


Guide to DHS Statistics 5.35 August 2018
Menopause
Percentage of women who are menopausal
Definition
Percentage of women age 30-49 who are menopausal.
Coverage:
Population base: All women age 30-49 (v012 in 30:49) (IR file)
Time period: Current status at the time of survey
Numerator: Number of women whose last menstruation occurred six or more months before the survey
(v226 in 6:399) or before the last birth (v226 = 995), who have had a hysterectomy (v226 = survey
specific code), who declare that they are menopausal (v226 = 994), or who never menstruated (v226 =
996). Excludes women who are currently pregnant or have postpartum amenorrhea (v213 = 1 or v405 =
1).
Denominator: All women age 30-49
Variables: IR file.
v012
Age in single years
v213
Currently pregnant
v226
Time since last period in months
v405
Currently amenorrheic
v005
Woman’s individual sample weight
Calculation
Numerator divided by denominator and multiplied by 100.
Handling of Missing Values
Women with inconsistent or missing values and “don’t know” on time since last menstrual period are
not considered menopausal.
Notes and Considerations
Since the purpose of the statistic is to measure biological non-exposure to the risk of pregnancy, which
increases with age, women who had a hysterectomy and who never had a period are included, as well as
those who are truly menopausal. The lack of a period for six months (not postpartum) is taken as a
prime indication of menopause in older women.


Guide to DHS Statistics 5.37 August 2018
Age at First Birth
Percentage of women who gave birth by specific exact ages
Definition
1) Percentages of women age 15-49 who had a first birth by specific exact ages.
2) Percentage of women age 15-49 who have never given birth.
Coverage:
Population base: All women age 15-49 (IR file)
Time period: Current status at time of survey
Numerator:
1) Number of women whose first birth was before specific exact ages (v212 < specific age)
2) Number of women who have never gave birth (v201 = 0)
Denominator: Total number of women including those without a birth
Variables: IR file.
v201
Number of children ever born
v212
Age at first birth
v005
Woman’s individual sample weight
Calculation
Age at first birth (v212) is the difference between the birth date of the first-born child and birth date of
the woman (in CMC format) grouped into categories of age at first birth in years.
Numerators: Number of women who gave birth by specific exact ages (15, 18, 20, 22, 25) includes
women who gave birth before earlier specific ages, e.g. the number of women who gave birth before
age 18 includes those who gave birth before age 15. Number of women with no births (v201 = 0) are
included in a separate category.
Denominator: Number of all women, irrespective of marital status or whether they ever had a birth.
Ever-married sample denominators are adjusted by the all women factors.
Numerators for each exact age category are divided by the overall denominator and multiplied by 100.
Handling of Missing Values
Not applicable—Birth dates of children and women are imputed if missing; therefore, birth dates do not
have missing values.

Guide to DHS Statistics 5.38 August 2018
Notes and Considerations
Percentages are not calculated for the exact ages at first birth categories by cohorts of women where
the youngest member of the cohort has not yet reached the exact age of the category. For example,
percentages for the cohort of women age 20-24 at the time of the survey will not be calculated for exact
age categories 22 and 25 because some women without births are still in or below the exact ages and
could still have first births before the specific age.
Resources
DHS-7 Tabulation plan: Table 5.9
API Indicator IDs:
FE_BBAG_W_A15, FE_BBAG_W_A18, FE_BBAG_W_A20, FE_BBAG_W_A22, FE_BBAG_W_A25, FE_BBAG_W_NEV
(API link, STATcompiler link)
MICS6 Indicator TM.2: Early childbearing
(Percentage of women age 20-24 years who have had a live birth before age 18)
Guide to DHS Statistics 5.39 August 2018
Median age at first birth
Definition
Median age in years at birth of the first child.
Coverage:
Population base: All women age 15-49 (IR file)
Time period: Current status at time of survey
Median: Median for completed time periods
Variables: IR file.
v201
Number of children ever born
v212
Age at first birth
v005
Woman’s individual sample weight
Calculation
Age at first birth: Difference between birth date of first-born child and birth date of woman (in CMC
format), truncated to single years of age (v212).
Numerators: Number of women within single age group categories. Women with no births (v201 = 0) are
included in a separate category at the tail of the distribution.
Denominator: Number of all women, irrespective of marital status or whether they ever had a birth.
Ever-married sample denominators are adjusted by the all women factors.
Numerators for each single age group category are divided by the same denominator and multiplied by
100 to obtain percentages.
Medians are calculated from cumulated single year of age percent distributions of age at first birth.
Median is linearly interpolated between the age values by which 50 percent or more of the women had
a first birth. See Median Calculations in Chapter 1.
Example:
Handling of Missing Values
Not applicable—Birth dates of children are imputed if missing; therefore birth dates do not have missing
values.
Notes and Considerations
Since the difference in mother’s and child’s birth dates are truncated to years, difference between them
is taken as including up to next completed year of age (cumulated percentage for women with a

Guide to DHS Statistics 5.40 August 2018
difference of 19 years actually includes all women below 20 years of age at first birth). Therefore an
adjustment is made to the interpolated median by increasing the interpolated value by one year.
Since the median is based on all women including those without a birth, there may not be a median for
younger cohorts of women (since fewer than 50 percent of the cohort may have had a birth).
Resources
DHS-7 Tabulation plan: Tables 5.9 and 5.10
API Indicator IDs: FE_AAFB_W_M20, FE_AAFB_W_M25
(API link, STATcompiler link)

Guide to DHS Statistics 5.41 August 2018
Teenage Pregnancy and Motherhood
Percentages of teenage girls who are mothers, pregnant with their first child, and have
begun childbearing
Definition
1) Percentage of women age 15-19 who have had a live birth.
2) Percentage of women age 15-19 who are pregnant with their first child.
3) Percentage of women age 15-19 who have begun childbearing.
Coverage:
Population base: All women age 15-19 (v013 = 1) (IR file)
Time period: Current status at time of survey
Numerators:
1) Percentage of women who are mothers: Number of women who have had a birth (v201 > 0)
2) Percentage of women who are pregnant with first child: Number of women who have not had a
birth but are pregnant at the time of interview (v213 = 0 & v213 = 1)
3) Percentage of women who have begun childbearing: Number of women who either have had a
birth or who are pregnant at the time of interview (v201 > 0 or v213 = 1)
Denominator: All women age 15-19 including those without a birth (v013 = 1)
Variables: IR file.
v013
Age in five year groups (1 = 15-19)
v201
Number of children ever born
v213
Currently pregnant
v005
Woman’s individual sample weight
Calculation
Percentage of women who have begun childbearing is the sum of the percentage who are mothers and
the percentage who are pregnant with their first child.
Numerators for percentages are divided by the same denominator and multiplied by 100 to obtain
percentages.
Denominator is the number of women of all marital statuses. Ever-married samples denominators are
adjusted by the all women factors.
Handling of Missing Values
Women who have missing data for current pregnancy or are unsure whether they are pregnant are
considered not pregnant at the time of interview.


Guide to DHS Statistics 6.1 August 2018
Fertility Preferences
This chapter addresses three questions that allow an assessment of the need for contraception. Does
the respondent want more children? If so, how long would she prefer to wait before the next child? If
she could start afresh, how many children in all would she want? Two further issues are examined. To
what extent do unwanted or mistimed pregnancies occur? What effect would the prevention of such
pregnancies have on the fertility rates? Bearing in mind that the underlying rationale of most family
planning programs is to give couples the freedom and ability to bear the number of children they want
and to achieve the spacing of births they prefer, the importance of this chapter is obvious.
Interpretation of data on fertility preferences has always been the subject of controversy. Survey
questions have been criticized on the grounds that answers are misleading because: a) they reflect
unformed, ephemeral views, which are held with weak intensity and little conviction; and b) they do not
take into account the effect of social pressures or the attitudes of other family members, particularly the
husband, who may exert a major influence on reproductive decisions. The first objection has greater
force in non-contracepting societies where the idea of conscious reproductive choice may still be alien;
preference data from these settings should be interpreted with caution. In societies with moderate to
high levels of contraceptive use, greater interpretive weight can be attached to the findings. The second
objection is correct in principle. In practice, however, its importance is doubtful; for instance, the
evidence from surveys in which both husbands and wives are interviewed suggests that there is no
radical difference between the views of the two sexes.
The inclusion of women who are currently pregnant complicates the measurement of views on future
childbearing. For these women, the question on desire for more children is rephrased to refer to desire
for another child after the one that they are expecting. To take into account the way in which the
preference variable is defined for pregnant women, the results are classified by number of living
children, including the current pregnancy as equivalent to a living child.

Guide to DHS Statistics 6.2 August 2018
Fertility Preferences
Percent distribution by desire for children
Definition
Percentage of currently married women and men according to their desire for children in seven
categories:
1) Wants to have a/another child soon
2) Wants to have a/another child later
3) Wants to have a/another child, but undecided when
4) Undecided whether wants a/another child
5) Wants no more children
6) Sterilized
7) Declared infecund
Coverage:
Population base: Currently married women, currently married men (IR file, MR file)
Time period: Current status at time of survey
Numerators: Number of currently married or in union women (v502 = 1) or men (mv502 = 1) who:
1) Want to have a/another child soon, defined as within two years (women: v605 = 1; men: mv605
= 1)
2) Want to have a/another child later, defined as after two or more years (women: v605 = 2; men:
mv605 = 2)
3) Want to have a/another child, but undecided when (women: v605 = 3; men: mv605 = 3)
4) Are undecided whether want another child (women: v605 = 4; men (mv605 = 4)
5) Want no more children (women: v605 = 5; men: mv605 = 5)
6) Are sterilized: woman or partner (women: v605 = 6; men: mv605 = 6)
7) Declared they are infecund or cannot become pregnant (women: v605 = 7; men: mv605 = 7)
Denominator: All currently married or in union women (v502 = 1) or men (mv502 = 1)
Variables: IR file, MR file.
v605
Desire for more children (women)
v502
Currently/formerly/never in union (women)
v005
Woman’s individual sample weight
mv605
Desire for more children (men)
mv502
Currently/formerly/never in union (men)
mv005
Man’s individual sample weight
Calculation
Numerators are divided by the denominator and multiplied by 100.

Guide to DHS Statistics 6.3 August 2018
Handling of Missing Values
Missing information on whether a woman or man wants a/another child, or on the time to wait for
a/another child for those who want a/another child, is excluded from the numerators, but included in
the denominator. Missing data are usually presented in an eighth category to complete the percent
distribution.
Notes and Considerations
Percentages add up to 100 percent.
Desire for children is typically presented by number of living children as desire for children typically
decreases with increasing numbers of living children. The number of living children also includes any
current pregnancy in the count of living children.
Data may also be presented for all women or men rather than currently married women or men. In
most surveys data are only available for women or men who have ever had sexual intercourse and
women or men who have never had sexual intercourse (v525 = 0; mv505 = 0) are categorized separately
as such. In some surveys, particularly ever married samples, the data on desire for more children are
only collected for currently married or in union women or men.
Resources
DHS-7 Tabulation plan: Table 6.1
API Indicator IDs:
Women:
PR_DESC_W_ASN, PR_DESC_W_ALT, PR_DESC_W_AUN, PR_DESC_W_UND, PR_DESC_W_WNM,
PR_DESC_W_STR, PR_DESC_W_INF
Men:
PR_DESC_M_ASN, PR_DESC_M_ALT, PR_DESC_M_AUN, PR_DESC_M_UND, PR_DESC_M_WNM,
PR_DESC_M_STR, PR_DESC_M_INF
(API link, STATcompiler link)

Guide to DHS Statistics 6.4 August 2018
Desire to Limit Childbearing
Percentage who want no more children
Definition
Percentage of currently married or in union women and men who declare that they want no more
children.
Coverage:
Population base: Currently married women, or currently married men (IR file, MR file)
Time period: Current status at time of survey
Numerator: Number of currently married or in union women or men (women: v502 = 1; men: mv502 =
1) who state that they want no more children (women: v605 = 5; men: mv605 = 5) or
women: who are sterilized or whose partner is sterilized (women: v605 = 6)
men: who are sterilized or who state in response to the question about desire for children that
their wife has been sterilized (mv605 = 6)
Denominator: All currently married or in union women or men (women: v502 = 1; men: mv502 = 1)
Variables: IR file, MR file.
v605
Desire for more children (women)
v502
Currently/formerly/never in union (women)
v005
Woman’s individual sample weight
mv605
Desire for more children (men)
mv502
Currently/formerly/never in union (men)
mv005
Man’s individual sample weight
Calculation
Numerators are divided by the denominator and multiplied by 100.
Handling of Missing Values
Missing information on whether a woman or man wants no more children is excluded from the
numerator but included in the denominator.
Notes and Considerations
Desire to limit childbearing is typically presented by number of living children as desire for children
typically decreases with increasing numbers of children. The number of living children presented in DHS
tables also includes any current pregnancy in the count of living children.
Men are not asked about their current use of contraception. Men are asked if they or their partner used
anything to avoid or prevent a pregnancy the last time they had sex. Only if something was used to

Guide to DHS Statistics 6.5 August 2018
avoid pregnancy, the method was recorded. If men or their partner were sterilized at the last time they
had sex, it assumed here that they have no desire for more children. It is possible that some men or
their partners have been sterilized since the last time they had sex, but those men are still asked about
their desire for children.
Resources
DHS-7 Tabulation plan: Tables 6.2.1 and 6.2.2
API Indicator IDs:
Women: PR_DESL_W_WNM
Men: PR_DESL_M_WNM
(API link, STATcompiler link)

Guide to DHS Statistics 6.6 August 2018
Ideal Number of Children
Percent distribution by ideal number of children
Definition
Percentage of women and men who declare, that if they could go back to the time when they did not
have any children and could choose exactly the number of children to have in their whole life, a specific
number of children.
Coverage:
Population base: All women or men (IR file, MR file)
Time period: Current status at time of survey
Numerators: Number of women (or men) who state that their ideal number of children is 0, 1, 2, 3, 4, 5,
6 or more, or give a non-numeric response (v613/mv613 = 0, 1, 2, 3, 4, 5, 6-90, 96-99, respectively)
Denominator: All women age 15-49 or all men (age range varies by survey)
Variables: IR file, MR file.
v613
Desire for more children (women)
v005
Woman’s individual sample weight
mv613
Desire for more children (men)
mv005
Man’s individual sample weight
Calculation
Numerators are divided by the denominator and multiplied by 100.
Handling of Missing Values
Missing information on ideal number of children is considered as a non-numeric response and is
included in that category of numerator and is in the denominator for all categories.
Notes and Considerations
The ideal number of children is defined as the number of children that a woman or man would have if
they could go back to the time when they did not have any children and could choose exactly the
number of children to have in their whole life. The ideal number of children reported has been shown to
be affected by the actual number of living children and so the ideal number of children is typically
presented by number of living children. The number of living children presented in DHS tables also
includes any current pregnancy in the count of living children.
Resources
DHS-7 Tabulation plan: Table 6.3

Guide to DHS Statistics 6.7 August 2018
API Indicator IDs:
Women:
PR_IDLC_W_ID0, PR_IDLC_W_ID1, PR_IDLC_W_ID2, PR_IDLC_W_ID3, PR_IDLC_W_ID4,
PR_IDLC_W_ID5, PR_IDLC_W_ID6, PR_IDLC_W_IDN
Men:
PR_IDLC_M_ID0, PR_IDLC_M_ID1, PR_IDLC_M_ID2, PR_IDLC_M_ID3, PR_IDLC_M_ID4,
PR_IDLC_M_ID5, PR_IDLC_M_ID6, PR_IDLC_M_IDN
(API link, STATcompiler link)
Guide to DHS Statistics 6.8 August 2018
Mean ideal number of children
Definition
Mean ideal number of children for all women and men or for currently married or in union women or
men.
Coverage:
Population base: All women (or men) or currently married or in union women (or men) (IR file,
MR file)
Time period: Current status at time of survey
Numerator: Sum of the ideal number of children for all women (v613) or men (mv613), or for currently
married or in union women (v502 = 1) or men (mv502 = 1) excluding non-numeric responses to the ideal
number of children (women: v613 <= 90; men: mv613 <= 90). For men, this indicator may be restricted
to men age 15-49 (mv012 in 15:49)
Denominator: All women or men, currently married or in union women (v502 = 1) or men (mv502 = 1).
For men, this indicator may be restricted to men age 15-49 (mv012 in 15:49)
Variables: IR file, MR file.
v613
Ideal number of children (women)
v005
Woman’s individual sample weight
mv613
Ideal number of children (men)
mv005
Man’s individual sample weight
mv012
Age in 5-year groups (men)
Calculation
Numerator is divided by the denominator.
Handling of Missing Values
Missing information on ideal number of children is excluded from both the numerator and denominator.
Notes and Considerations
The ideal number of children is defined as the number of children that a woman or man would have if
they could go back to the time when they did not have any children and could choose exactly the
number of children to have in their whole life. The ideal number of children reported has been shown to
be affected by the actual number of living children and so the ideal number of children is typically
presented by number of living children. The number of living children presented in DHS tables also
includes any current pregnancy in the count of living children.
Resources


Guide to DHS Statistics 6.10 August 2018
Fertility Planning
Fertility planning status
Definition
Percent distribution of births to women age 15-49 in the 5 years preceding the survey, including current
pregnancies, by planning status of the birth – wanted then, wanted later or not wanted at all
Coverage:
Population base: Children born in the five years preceding the survey to all women (KR file),
including current pregnancy (IR file)
Time period: Births in the five years preceding the survey, including current pregnancy (v213 =
1)
Numerators: Births in the five years preceding the survey according to planning status of the birth:
wanted then, wanted later or not wanted at all (m10), plus any current pregnancy according to planning
status (v225).
Denominator: Births in the five years preceding the survey, including current pregnancy (v213 = 1).
Variables: KR file, IR file.
m10
Wanted pregnancy when became pregnant
v225
Current pregnancy wanted
v213
Currently pregnant
v005
Woman’s individual sample weight
Calculation
Numerators are divided by the denominator.
Handling of Missing Values
Missing information on the planning status of a birth or the current pregnancy is excluded from the
numerators, but included in the denominator.
Notes and Considerations
The fertility planning status is tabulated by birth order and mother’s age at birth. For the births in the
preceding five years the birth order is the order of births, with twins counting as the same birth order:
order = bord; if b0 > 1 then order = bord - b0 + 1.
For the current pregnancy, the birth order is the order of the next birth (v201 + 1), and the mother’s age
at birth is the age she would be at the time of delivery: agegroup = int( (v008 + 9 - v214 - v011) / 60 ) - 2.


Guide to DHS Statistics 6.12 August 2018
Wanted Fertility
Wanted Fertility Rates
Definition
Age-Specific Wanted Fertility Rate (ASWFR) and Total Wanted Fertility Rate (TWFR): Based on Age-
Period Rates
Coverage:
Population base: All women age 15-49 years in seven five-year age groups (15-19, 20-24, 25-29,
30-34, 35-39, 40-44, 45-49 years)
Time period: Three years preceding the survey
Numerator: Number of wanted births that occurred in a period (typically the 1-36 months before the
survey) to women in the age group at the time of the birth (v008 - b3 in 1:36) (BR file)
Denominator: Number of women-years of exposure in the same period (1-36 months before the survey)
of women in the age group (IR file)
Calculation
The age-specific wanted fertility rates (ASFWRs) is calculated as the quotient of the numerator divided
by the denominator for each age group, multiplied by 1000. The ASWFRs are an average rate over the
36-month period, expressed as an annual rate per 1000 women.
The total wanted fertility rate (TWFR) is the sum of the seven age-specific wanted fertility rates
multiplied by five, and divided by 1000.
Numerator: Births are tabulated according to period of birth, age of mother at the time of the birth, and
wantedness of the birth.
Period of birth: The period of birth is calculated as the difference in months between the date of
interview and the date of birth, both in century month code format (CMC). Births are included in
the tabulation if they occur 1 to 36 months before the survey (v008 - b3 in 1:36).
Age of mother at the time of the birth: The difference in months between the date of birth of
the child and the date of birth of the mother, both in CMC. The difference is then divided by 60
and truncated to whole numbers to form the age groups (agegroup = int( (b3 - v011) /60) ). Note
that age group 15-19 is classified as age group 3 here, not age group 1. Births are tabulated by
age group.
Wantedness: A birth is considered wanted if the number of living children at the time of
conception of the birth is less than the ideal number of children as reported by the respondent.
For the calculation of the time of conception, nine months are subtracted from the date of birth.
A preceding child is considered living at the time of conception if it was born before the date of
conception and a) is living at the time of the survey or b) died at or before the date of
Guide to DHS Statistics 6.13 August 2018
conception (calculations based on century month codes). The date of death of preceding
children who died is calculated by adding the age at death in months to the child’s birth date in
century month code. If a child’s age at death is reported in years, then the child is assumed to
have died at ages 6 months higher than the number of years (30 months for children who died
at 2 years of age, 42 months for children who died at 3 years of age, etc.)
Variables: BR file.
b3
CMC date of birth of child
b5
Child is alive
b6
Age at death
b7
Age at death (imputed)
v613
Ideal number of children
v011
CMC date of birth of respondent
v008
CMC date of interview
v005
Woman’s individual sample weight
Denominator: Women-years of exposure are calculated as the sum of the number of months exposed in
the five-year age group during the time period divided by 12. A woman can contribute exposure to
several age groups in the period, depending on the length of the period. For periods exceeding five
years a woman can contribute to more than two age groups. For a period of three years or five years a
women will contribute to no more than two five-year age groups during the 36- or 59-month period.
The description below assumes a period of 1-36 months preceding the survey, and that a woman
contributes to at most two age groups, described here as the higher age group and the lower age group:
Higher age group: A woman’s age at the end of the period determines the higher age group. The
higher age group is calculated by subtracting the women’s date of birth from the date of
interview minus one (in CMC), dividing the difference by 60 and truncating to a whole number
(agegroup = int( (v008-1-v011)/60 ). The -1 is to ignore the month of interview and use just the
36 months prior to but not including the month of interview.
The number of months spent in the higher age group is the difference in months between her
age at the end of the period of exposure (date of interview less one month) and the lower age
limit of the age group plus one month (exposure = v008-1-v011 - agegroup*60 + 1). As the -1
and the +1 cancel out this can be simplified to (exposure = v008-v011 - agegroup*60). If the
number of months in the age group exceeds 36 then the exposure is truncated to 36 for the
period (exposure = 36 if exposure > 36). If the number of months in the age group is less than
the duration of the time period (36 months), then the woman contributes exposure to both the
higher age group and the next lower age group (agegroup-1).
Lower age group: The contribution to the lower age group is 36 less the number of months of
exposure in the higher age group. If the number of months in the higher age group is greater
than or equal to the duration of the time period (i.e., >=36 months), then the exposure in the
higher group is the duration of the period (36 months) and the exposure in the lower age group
is zero.
Tabulation: Each woman is tallied twice, once according to her higher age group accumulating
the exposure she contributes to that group and once in the lower age group accumulating lower
age group exposure. For samples of ever-married women, the exposure is adjusted to represent
Guide to DHS Statistics 6.14 August 2018
all women by multiplying the exposure by the woman’s “all-woman factor” (awfactt), which is
derived from the proportion of women ever-married from the persons data file (PR file). See the
section on all women factors for details on their calculation. The total exposure in each age
group is then the sum of the exposure in each age group from the first and second tallying.
Variables: IR file.
v011
CMC date of birth of respondent
v008
CMC date of interview
v005
Woman’s individual sample weight
awfactt
All women factor (only needed with ever-married samples)
See the age-specific fertility rates (ASFRs) for examples of the calculation of the denominators.
Handling of Missing Values
The total number of children to which a woman has given birth is recorded obligatorily by the
interviewer; no unknown numbers of children are allowed. There are six values involved in the
calculation of ASWFR: interview date, birth date of woman, birth dates of children, survival of children,
ages at death of dead children, and ideal number of children. The interview date is always known from
fieldwork dates. If missing or unknown, the birth dates of interviewed women and her children are
imputed before the formation of the standard recode file. For dead children with missing age at death,
the age at death in months is imputed in the standard recode dataset, using a hot deck technique based
on birth order. See Date Variables in Chapter 1 and Croft, 1991.
For ideal number of children, non-numeric and “don’t know” responses are considered to be high
numbers, so that all births are considered wanted. Births to women with missing information on ideal
number of children are considered as unwanted.
Notes and Considerations
The calculation of age-specific and total wanted fertility rates is the same as age-specific and total
fertility rates with the addition of the classification of births to wanted or unwanted at the time of
conception.
Births to women younger than 15 years or older than 49 years at the time of the birth are not included.
Births in the month of interview are excluded. This exclusion is because this month does not represent a
full month, but is censored by the date of interview.
A three-year (36 month) time period is taken for calculating current AFSR. This period is a compromise
between the need for recency and reduction of sampling variation. This time period was selected during
the World Fertility Survey, when sample sizes were on average about 5,000 women. For comparability
over time and across surveys, this period has been maintained by The DHS Program.
No adjustment is made for truncation by age. Women who are at most 49 years at the time of interview
were 48 years the year before and 47 years two years before the interview. The reason no adjustment is

Guide to DHS Statistics 6.15 August 2018
made is that the tiny probability of women age 48 and 49 years of age giving birth in the three years
preceding the survey outweighs the complication of adjusting by single years of age.
In line with general DHS policy, no adjustment is made for possible omission or date misreporting of the
dates of birth of children or misreporting of the date of birth of the woman.
For samples of ever-married women, it is assumed that never-married women have not had any births.
Only the denominator of the rates is adjusted to estimate the number of all women.
References
Bankole, Akinrinola and Charles F. Westoff. 1995. Childbearing attitudes and intentions. DHS
Comparative Studies No. 17. Calverton, Maryland, USA: Macro International.
https://dhsprogram.com/publications/publication-CS17-Comparative-Reports.cfm
Bongaarts, John. 1990. The Measurement of Unwanted Fertility. Working Papers, No. 10. New York:
Population Council.
Croft, T. 1991. Date Editing and Imputation. Demographic and Health Surveys World Conference
Proceedings, II: 1337-1356, Columbia, Maryland: IRD/ORC Macro.
https://dhsprogram.com/publications/publication-dhsg3-dhs-questionnaires-and-manuals.cfm
Lightbourne, R.E. 1985. Desired Number of Births and Prospects for Fertility Decline in 40 Countries.
International Family Planning Perspectives 11(2):34-47.
Lightbourne, R. 1987. Reproductive Preferences and Behaviour. In The World Fertility Survey: An
Assessment, ed. John Cleland and Chris Scott, 836-861. London: Oxford University Press.
Measure Evaluation Family Planning and Reproductive Health Indicators Database
https://www.measureevaluation.org/prh/rh_indicators/family-planning/fertility/wanted-total-fertility-
rate
Westoff, Charles F. 1991. Reproductive preferences: a comparative view. DHS Comparative Studies No.
3. Columbia, Maryland, USA: Institute for Resource Development.
https://dhsprogram.com/publications/publication-CS3-Comparative-Reports.cfm
Resources
DHS-7 Tabulation plan: Table 6.6
API Indicator IDs: PR_WTFR_W_WFR
(API link, STATcompiler link)

Guide to DHS Statistics 7.1 August 2018
Family Planning
This chapter begins with an assessment of respondent knowledge of different contraceptive methods
before moving on to a consideration of current practice of family planning methods. For users of rhythm
(periodic abstinence), standard days method, and all women, knowledge of the ovulatory cycle is
examined; while for those relying on sterilization, the timing of method adoption is assessed. Special
attention is focused on source of contraception, informed choice, discontinuation rates and reasons for
discontinuation, unmet need for family planning, and intention to use in the future. The chapter
concludes with tabulations on exposure to media coverage on the topic of family planning and on
contact with family planning providers.

Guide to DHS Statistics 7.2 August 2018
Knowledge of Contraceptive Methods
Percentage who know of any method, any modern method, any traditional method and
specific methods; mean number of methods known
Definition
1) Percentage of women and men who know specific methods
2) Percentage of women and men who know of any method
3) Percentage of women and men who know any modern method
4) Percentage of women and men who know any traditional method
5) Mean number of methods known
Coverage:
Population base:
1) All women (IR file)
2) Currently married women (v502 = 1) (IR file)
3) Sexually active unmarried women: Includes women who are not currently married or in
a consensual union (single, divorced, widowed, and separated) and who had sexual
intercourse within the last 30 days (v502 ≠ 1 & v528 <= 30) (IR file)
4) All men between ages 15 and 49 years (mv012 in 15-49) (MR file)
5) Currently married men (mv502 = 1) (MR file)
6) Sexually active unmarried men: Includes men who are not currently married or in a
consensual union (single, divorced, widowed, and separated) and who had sexual
intercourse within the last 30 days (mv502 ≠ 1 & mv528 <= 30) (MR file)
Time period: Lifetime of woman/man interviewed
Numerators:
1) Specific methods: Number of women/men in the coverage category who say they know (or have
heard) of the specific method, whether through a spontaneous response or after describing the
method
2) Any method: Number of women/men in the coverage category who say they know of at least
one specific method, including self-reported other methods (v304_1 to v304_20 = 1 [or 2])
3) Modern methods: Number of women/men in the coverage category who say they know at least
one of the following methods:
a) Female sterilization (tubal ligation, laparectomy, voluntary surgical contraception for
women) (v304_6 = 1 [or 2])
b) Male sterilization (vasectomy, voluntary surgical contraception for men) (v304_7 = 1 [or
2])
c) The contraceptive pill (oral contraceptives) (v304_1 = 1 [or 2])
d) Interuterine contraceptive device (IUD) (v304_2 = 1 [or 2])
e) Injectables (Depo-Provera) (v304_3 = 1 [or 2])
f) Implants (Norplant) (v304_11 = 1 [or 2])
g) Male condom (prophylactic, rubber) female condom (v304_5 = 1 [or 2])
h) Female condom (v304_14 = 1 [or 2])
Guide to DHS Statistics 7.3 August 2018
i) Diaphragm (v304_4 = 1 [or 2]), contraceptive foam and contraceptive jelly female
condom (v304_15 = 1 [or 2])
j) Lactational amenorrhea method (LAM) (v304_13 = 1 [or 2])
k) Standard days method (SDM) (v304_18 = 1 [or 2])
l) Emergency contraception (double dose of contraceptive pill twice in 24 hours for two
days) and specific dosage “emergency pills” (v304_16 = 1 [or 2])
m) Country-specific modern methods and other modern contraceptive methods
respondent mentioned (including cervical cap, contraceptive sponge, and others)
(v304_17 = 1 [or 2]), but does NOT include abortion, menstrual regulation
4) Traditional methods: Number of women/men in the coverage category who say they know at
least one of the following methods:
a) Periodic abstinence (rhythm, calendar method) (v304_8 = 1 [or 2])
b) Withdrawal (coitus interruptus) (v304_9 = 1 [or 2])
c) Country-specific traditional methods of proven effectiveness, and folk methods
including locally described methods and/or spiritual methods of unproven effectiveness,
such as herbs, amulets, gris-gris, etc. (v304_10 = 1 [or 2])
5) Mean number of methods: Sum of the number of methods known for women/men in the
coverage category.
Denominator: Number of women/men in the coverage categories
Variables: IR file, MR file.
v304_1 to _20
Knows method
v304a_1 to _20
Type of method
v005
Woman’s individual sample weight
mv304_1 to _20
Knows method
mv304a_1 to _20
Type of method
mv005
Man’s individual sample weight
Calculation
Within each coverage category, the numerator divided by the denominator, expressed as a percentage.
For the mean number of methods known, within each coverage category, the numerator (5 above)
divided by the denominator.
Handling of Missing Values
Coverage categorization: Missing value in whether or not currently married is allowed in the data.
Missing value in sexual activity is treated as had sexual relations (non-virgin). Missing value in time since
last intercourse is treated as greater than 30 days, i.e., not sexually active.
Numerators: Treated as does not know method for individual methods and grouped methods.
Denominators: All women/men in coverage category included, even if missing values on all methods.
Guide to DHS Statistics 7.4 August 2018
Notes and Considerations
Breastfeeding, prolonged breastfeeding, prolonged abstinence are NOT considered contraceptive
methods in themselves. The lactational amenorrhea method is based on three criteria: Woman is
amenorrheic since last birth; last birth occurred within six months; woman is exclusively or
predominately breastfeeding. In the DHS description of LAM, the following wording is used: “Up to six
months after childbirth, before the menstrual period has returned, women use a method requiring
frequent breastfeeding day and night.” This description varies from the official LAM criteria by not
including exclusive or predominant breastfeeding (which is based on whether or not the child received
complementary liquids and foods), substituting frequency of breastfeeding (it is not a requirement that
frequent night-time feeding occurs), and by not including the criterion that the woman knows that
another form of contraception is necessary. The DHS description may therefore include women who say
yes even though they had never heard of the term LAM or of programs that instruct in the method, thus
overestimating knowledge and ever use. Note that the exact description of LAM used when probing for
knowledge of LAM has changed from round to round of DHS.
Changes over Time
The list of specific methods and their categorization has changed.
In DHS I and II surveys, modern methods included pill, IUD, injection, vaginal methods, condom, female
sterilization, and male sterilization. The vaginal methods were included in a single group diaphragm,
foam and jelly. Traditional methods included periodic abstinence (of any kind), withdrawal and all
respondent- mentioned other methods.
In DHS III surveys, modern methods included pill, IUD, injection, vaginal methods, condom, female
sterilization, male sterilization, and implants. Traditional methods included periodic abstinence or
rhythm method (of any kind), withdrawal, and lactational amenorrhea. Folk methods included
respondent-mentioned other methods and were categorized separately from traditional methods.
In DHS IV surveys, modern methods included female sterilization, male sterilization, pill, IUD, injection,
implants, diaphragm (separately from other vaginal methods), foam or jelly, male condom and female
condom, LAM, and emergency contraception. Traditional methods included periodic abstinence or
rhythm method (of any kind), and withdrawal. Folk methods included respondent-mentioned other
methods and were categorized separately from traditional methods. Note diaphragm was separated
from the vaginal methods foam or jelly. Also note that LAM was reclassified as a modern method in DHS
IV.
In DHS V surveys, the same list of modern and traditional methods used in DHS IV also applied, but the
description of LAM used in the DHS IV questionnaire was removed, and respondents needed to explicitly
mention LAM. DHS VI surveys also used the same list of methods as DHS V surveys. In DHS-7 surveys,
standard days method was added as a modern method, and the probe for LAM was reinstated with the
current wording.
In early rounds of DHS, traditional and folk methods were tabulated separately, but in later rounds
traditional and folk methods have been grouped together under the heading traditional methods.

Guide to DHS Statistics 7.5 August 2018
In the early rounds of DHS, both spontaneous (v304_x = 1) and probed (v304_x = 2) knowledge of
contraceptive methods was recorded, but in DHS IV surveys and later rounds no differentiation of
knowledge is recorded.
Note that individual surveys may have included different methods in the list of contraceptive methods,
and may have categorized certain methods, such as LAM, differently.
References
Fabic, M.S., and Y Choi. 2013. "Assessing the Quality of Data Regarding Use of the Lactational
Amenorrhea Method.” Studies in Family Planning 44(2):205-21.
https://doi.org/10.1111/j.1728-4465.2013.00353.x
Resources
DHS-7 Tabulation plan: Tables 7.1 and 7.2
API Indicator IDs:
Any method:
FP_KMTA_W_ANY, FP_KMTM_W_ANY, FP_KMTU_W_ANY, FP_KMET_W_ANY
FP_KMTA_M_ANY, FP_KMTM_M_ANY, FP_KMTU_M_ANY, FP_KMET_M_ANY
(API link, STATcompiler link)
Modern method:
FP_KMTA_W_MOD, FP_KMTM_W_MOD, FP_KMTU_W_MOD, FP_KMET_W_MOD
FP_KMTA_M_MOD, FP_KMTM_M_MOD, FP_KMTU_M_MOD, FP_KMET_M_MOD
(API link, STATcompiler link)
Traditional method (including folk method):
FP_KMTA_W_TFK, FP_KMTM_W_TFK, FP_KMTU_W_TFK,
FP_KMTA_M_TFK, FP_KMTM_M_TFK, FP_KMTU_M_TFK
(API link, STATcompiler link)
Traditional method (excluding folk method):
FP_KMTA_W_TRA, FP_KMTM_W_TRA, FP_KMTU_W_TRA,
FP_KMTA_M_TRA, FP_KMTM_M_TRA, FP_KMTU_M_TRA
(API link, STATcompiler link)
Individual methods (women):
FP_KMTA_W_FST, FP_KMTM_W_FST, FP_KMTU_W_FST,
FP_KMTA_W_MST, FP_KMTM_W_MST, FP_KMTU_W_MST,
FP_KMTA_W_PIL, FP_KMTM_W_PIL, FP_KMTU_W_PIL,
FP_KMTA_W_IUD, FP_KMTM_W_IUD, FP_KMTU_W_IUD,
FP_KMTA_W_INJ, FP_KMTM_W_INJ, FP_KMTU_W_INJ,
FP_KMTA_W_DFJ, FP_KMTM_W_DFJ, FP_KMTU_W_DFJ,
FP_KMTA_W_IMP, FP_KMTM_W_IMP, FP_KMTU_W_IMP,
FP_KMTA_W_MCN, FP_KMTM_W_MCN, FP_KMTU_W_MCN,
FP_KMTA_W_FCN, FP_KMTM_W_FCN, FP_KMTU_W_FCN,
FP_KMTA_W_LAM, FP_KMTM_W_LAM, FP_KMTU_W_LAM,
FP_KMTA_W_EMC, FP_KMTM_W_EMC, FP_KMTU_W_EMC,
FP_KMTA_W_DIA, FP_KMTM_W_DIA, FP_KMTU_W_DIA,
FP_KMTA_W_FOM, FP_KMTM_W_FOM, FP_KMTU_W_FOM,
FP_KMTA_W_MPL, FP_KMTM_W_MPL, FP_KMTU_W_MPL,
FP_KMTA_W_STD, FP_KMTM_W_STD, FP_KMTU_W_STD,
FP_KMTA_W_OMD, FP_KMTM_W_OMD, FP_KMTU_W_OMD,
FP_KMTA_W_RHY, FP_KMTM_W_RHY, FP_KMTU_W_RHY,
FP_KMTA_W_WTH, FP_KMTM_W_WTH, FP_KMTU_W_WTH,
Guide to DHS Statistics 7.6 August 2018
FP_KMTA_W_LTA, FP_KMTM_W_LTA, FP_KMTU_W_LTA,
FP_KMTA_W_BRF, FP_KMTM_W_BRF, FP_KMTU_W_BRF,
FP_KMTA_W_OTR, FP_KMTM_W_OTR, FP_KMTU_W_OTR,
FP_KMTA_W_FLK, FP_KMTM_W_FLK, FP_KMTU_W_FLK
Individual methods (men):
FP_KMTA_M_FST, FP_KMTM_M_FST, FP_KMTU_M_FST,
FP_KMTA_M_MST, FP_KMTM_M_MST, FP_KMTU_M_MST,
FP_KMTA_M_PIL, FP_KMTM_M_PIL, FP_KMTU_M_PIL,
FP_KMTA_M_IUD, FP_KMTM_M_IUD, FP_KMTU_M_IUD,
FP_KMTA_M_INJ, FP_KMTM_M_INJ, FP_KMTU_M_INJ,
FP_KMTA_M_DFJ, FP_KMTM_M_DFJ, FP_KMTU_M_DFJ,
FP_KMTA_M_IMP, FP_KMTM_M_IMP, FP_KMTU_M_IMP,
FP_KMTA_M_MCN, FP_KMTM_M_MCN, FP_KMTU_M_MCN,
FP_KMTA_M_FCN, FP_KMTM_M_FCN, FP_KMTU_M_FCN,
FP_KMTA_M_LAM, FP_KMTM_M_LAM, FP_KMTU_M_LAM,
FP_KMTA_M_EMC, FP_KMTM_M_EMC, FP_KMTU_M_EMC,
FP_KMTA_M_DIA, FP_KMTM_M_DIA, FP_KMTU_M_DIA,
FP_KMTA_M_FOM, FP_KMTM_M_FOM, FP_KMTU_M_FOM,
FP_KMTA_M_MPL, FP_KMTM_M_MPL, FP_KMTU_M_MPL,
FP_KMTA_M_STD, FP_KMTM_M_STD, FP_KMTU_M_STD,
FP_KMTA_M_OMD, FP_KMTM_M_OMD, FP_KMTU_M_OMD,
FP_KMTA_M_RHY, FP_KMTM_M_RHY, FP_KMTU_M_RHY,
FP_KMTA_M_WTH, FP_KMTM_M_WTH, FP_KMTU_M_WTH,
FP_KMTA_M_LTA, FP_KMTM_M_LTA, FP_KMTU_M_LTA,
FP_KMTA_M_BRF, FP_KMTM_M_BRF, FP_KMTU_M_BRF,
FP_KMTA_M_OTR, FP_KMTM_M_OTR, FP_KMTU_M_OTR,
FP_KMTA_M_FLK, FP_KMTM_M_FLK, FP_KMTU_M_FLK

Guide to DHS Statistics 7.7 August 2018
Ever Use of Contraceptive Methods
Percentages who ever used any method, any modern method, any traditional method and
specific methods
Definition
1) Percentage of women and men who ever used specific methods
2) Percentage of women and men who ever used any method
3) Percentage of women and men who ever used any modern method
4) Percentage of women and men who ever used any traditional method
Coverage:
Population base:
1) All women (IR file)
2) Currently married women (v502 = 1) (IR file)
3) Sexually active unmarried women: Includes women who are not currently married or in
a consensual union (single, divorced, widowed, and separated) and who had sexual
intercourse within the last 30 days (v502 ≠ 1 & v528 <= 30) (IR file)
4) All men between ages 15 and 49 years (mv012 in 15-49) (MR file)
5) Currently married men (mv502 = 1) (MR file)
6) Sexually active unmarried men: Includes men who are not currently married or in a
consensual union (single, divorced, widowed, and separated) and who had sexual
intercourse within the last 30 days (mv502 ≠ 1 & mv528 <= 30) (MR file)
Time period: Lifetime of woman/man interviewed
Numerators:
1) Specific methods: Number of women/men in the coverage category who have used the method
(women/men who do not know a method are not asked about its use and are assumed not to
have used it)
2) Any method: Number of women/men in the coverage category who say they have used at least
one specific method, including self-reported other methods (v305_1 to v305_20 = 1 [or 2])
3) Modern methods: Number of women/men in the coverage category who say they have used at
least one of the following methods:
a) Female sterilization (tubal ligation, laparectomy, voluntary surgical contraception for
women) (v305_6 = 1 [or 2])
b) Male sterilization (vasectomy, voluntary surgical contraception for men) (v305_7 = 1 [or
2])
c) The contraceptive pill (oral contraceptives) (v305_1 = 1 [or 2])
d) Interuterine contraceptive device (IUD) (v305_2 = 1 [or 2])
e) Injectables (Depo-Provera) (v305_3 = 1 [or 2])
f) Implants (Norplant) (v305_11 = 1 [or 2])
g) Male condom (prophylactic, rubber) female condom (v305_5 = 1 [or 2])
h) Female condom (v305_14 = 1 [or 2])
i) Diaphragm (v305_4 = 1 [or 2]), contraceptive foam and contraceptive jelly female
condom (v305_15 = 1 [or 2])
Guide to DHS Statistics 7.8 August 2018
j) Lactational amenorrhea method (LAM) (v305_13 = 1 [or 2])
k) Standard days method (SDM) (v305_18 = 1 [or 2])
l) Emergency contraception (double dose of contraceptive pill twice in 24 hours for two
days) and specific dosage “emergency pills” (v305_16 = 1 [or 2])
m) Country-specific modern methods and other modern contraceptive methods
respondent mentioned (including cervical cap, contraceptive sponge, and others)
(v305_17 = 1 [or 2]), but does NOT include abortion, menstrual regulation
4) Traditional methods: Number of women/men in the coverage category who say they have used
at least one of the following methods:
n) Periodic abstinence (rhythm, calendar method) (v305_8 = 1 [or 2])
o) Withdrawal (coitus interruptus) (v305_9 = 1 [or 2])
p) Country-specific traditional methods of proven effectiveness, and folk methods
including locally described methods and/or spiritual methods of unproven effectiveness,
such as herbs, amulets, gris-gris, etc. (v305_10 = 1 [or 2])
Denominator: Numbers of women/men in the coverage categories
Variables: IR file, MR file.
v305_1 to _20
Ever used method
v304a_1 to _20
Type of method
v005
Woman’s individual sample weight
mv305_1 to _20
Ever used method
mv304a_1 to _20
Type of method
mv005
Man’s individual sample weight
Calculation
Within each coverage category, the numerator divided by the denominator, expressed as a percentage.
Handling of Missing Values
Coverage categorization: Missing value in whether or not currently married is allowed in the data.
Missing value in sexual activity is treated as had sexual relations (non-virgin). Missing value in time since
last intercourse is treated as greater than 30 days, i.e., not sexually active.
Numerators: Treated as has not used method for individual methods and grouped methods.
Denominators: All women/men in coverage category included, even if missing values on all methods.
Notes and Considerations
See notes and considerations for Knowledge of Contraceptive Methods.
Changes over Time
The list of specific methods and their categorization has changed. See changes over time for Knowledge
of Contraceptive Methods.

Guide to DHS Statistics 7.9 August 2018
Ever use of contraceptive methods is no longer reported in most DHS survey reports since around 2008.
Resources
DHS-7 Tabulation plan: No longer presented in DHS reports.
API Indicator IDs:
Any method:
FP_EVUA_W_ANY, FP_EVUM_W_ANY, FP_EVUU_W_ANY
FP_EVUA_M_ANY, FP_EVUM_M_ANY, FP_EVUU_M_ANY
(API link, STATcompiler link)
Modern method:
FP_EVUA_W_MOD, FP_EVUM_W_MOD, FP_EVUU_W_MOD
FP_EVUA_M_MOD, FP_EVUM_M_MOD, FP_EVUU_M_MOD
(API link, STATcompiler link)
Traditional method (including folk method):
FP_EVUA_W_TFK, FP_EVUM_W_TFK, FP_EVUU_W_TFK
FP_EVUA_M_TFK, FP_EVUM_M_TFK, FP_EVUU_M_TFK
(API link, STATcompiler link)
Traditional method (excluding folk method):
FP_EVUA_W_TRA, FP_EVUM_W_TRA, FP_EVUU_W_TRA
FP_EVUA_M_TRA, FP_EVUM_M_TRA, FP_EVUU_M_TRA
(API link, STATcompiler link)
Individual methods (women):
FP_EVUA_W_FST, FP_EVUM_W_FST, FP_EVUU_W_FST,
FP_EVUA_W_MST, FP_EVUM_W_MST, FP_EVUU_W_MST,
FP_EVUA_W_PIL, FP_EVUM_W_PIL, FP_EVUU_W_PIL,
FP_EVUA_W_IUD, FP_EVUM_W_IUD, FP_EVUU_W_IUD,
FP_EVUA_W_INJ, FP_EVUM_W_INJ, FP_EVUU_W_INJ,
FP_EVUA_W_DFJ, FP_EVUM_W_DFJ, FP_EVUU_W_DFJ,
FP_EVUA_W_IMP, FP_EVUM_W_IMP, FP_EVUU_W_IMP,
FP_EVUA_W_MCN, FP_EVUM_W_MCN, FP_EVUU_W_MCN,
FP_EVUA_W_FCN, FP_EVUM_W_FCN, FP_EVUU_W_FCN,
FP_EVUA_W_LAM, FP_EVUM_W_LAM, FP_EVUU_W_LAM,
FP_EVUA_W_EMC, FP_EVUM_W_EMC, FP_EVUU_W_EMC,
FP_EVUA_W_DIA, FP_EVUM_W_DIA, FP_EVUU_W_DIA,
FP_EVUA_W_FOM, FP_EVUM_W_FOM, FP_EVUU_W_FOM,
FP_EVUA_W_MPL, FP_EVUM_W_MPL, FP_EVUU_W_MPL,
FP_EVUA_W_STD, FP_EVUM_W_STD, FP_EVUU_W_STD,
FP_EVUA_W_OMD, FP_EVUM_W_OMD, FP_EVUU_W_OMD,
FP_EVUA_W_RHY, FP_EVUM_W_RHY, FP_EVUU_W_RHY,
FP_EVUA_W_WTH, FP_EVUM_W_WTH, FP_EVUU_W_WTH,
FP_EVUA_W_LTA, FP_EVUM_W_LTA, FP_EVUU_W_LTA,
FP_EVUA_W_BRF, FP_EVUM_W_BRF, FP_EVUU_W_BRF,
FP_EVUA_W_OTR, FP_EVUM_W_OTR, FP_EVUU_W_OTR,
FP_EVUA_W_FLK, FP_EVUM_W_FLK, FP_EVUU_W_FLK
Individual methods (men):
FP_EVUA_M_FST, FP_EVUM_M_FST, FP_EVUU_M_FST,
FP_EVUA_M_MST, FP_EVUM_M_MST, FP_EVUU_M_MST,
FP_EVUA_M_PIL, FP_EVUM_M_PIL, FP_EVUU_M_PIL,
FP_EVUA_M_IUD, FP_EVUM_M_IUD, FP_EVUU_M_IUD,
FP_EVUA_M_INJ, FP_EVUM_M_INJ, FP_EVUU_M_INJ,
FP_EVUA_M_DFJ, FP_EVUM_M_DFJ, FP_EVUU_M_DFJ,
FP_EVUA_M_IMP, FP_EVUM_M_IMP, FP_EVUU_M_IMP,
FP_EVUA_M_MCN, FP_EVUM_M_MCN, FP_EVUU_M_MCN,
FP_EVUA_M_FCN, FP_EVUM_M_FCN, FP_EVUU_M_FCN,
Guide to DHS Statistics 7.10 August 2018
FP_EVUA_M_LAM, FP_EVUM_M_LAM, FP_EVUU_M_LAM,
FP_EVUA_M_EMC, FP_EVUM_M_EMC, FP_EVUU_M_EMC,
FP_EVUA_M_DIA, FP_EVUM_M_DIA, FP_EVUU_M_DIA,
FP_EVUA_M_FOM, FP_EVUM_M_FOM, FP_EVUU_M_FOM,
FP_EVUA_M_MPL, FP_EVUM_M_MPL, FP_EVUU_M_MPL,
FP_EVUA_M_STD, FP_EVUM_M_STD, FP_EVUU_M_STD,
FP_EVUA_M_OMD, FP_EVUM_M_OMD, FP_EVUU_M_OMD,
FP_EVUA_M_RHY, FP_EVUM_M_RHY, FP_EVUU_M_RHY,
FP_EVUA_M_WTH, FP_EVUM_M_WTH, FP_EVUU_M_WTH,
FP_EVUA_M_LTA, FP_EVUM_M_LTA, FP_EVUU_M_LTA,
FP_EVUA_M_BRF, FP_EVUM_M_BRF, FP_EVUU_M_BRF,
FP_EVUA_M_OTR, FP_EVUM_M_OTR, FP_EVUU_M_OTR,
FP_EVUA_M_FLK, FP_EVUM_M_FLK, FP_EVUU_M_FLK

Guide to DHS Statistics 7.11 August 2018
Current Use of Contraceptive Methods
Percentage of women who currently use any method, any modern method, any traditional
method and specific methods
Definition
1) Percentage of women who currently use specific methods
2) Percentage of women who currently use any method
3) Percentage of women who currently use any modern method
4) Percentage of women who currently use any traditional method
The percentage of currently married women who currently use any method of contraception is called
the contraceptive prevalence rate (CPR).
Coverage:
Population base:
1) All women (IR file)
2) Currently married (v502 = 1) (IR file)
3) Sexually active unmarried women: Includes women who are not currently married or in
a consensual union (single, divorced, widowed, and separated) and who had sexual
intercourse within the last 30 days (v502 ≠ 1 & v528 <= 30) (IR file)
Time period: Current use is defined by the respondent
Numerators:
Within each coverage category:
1) Specific methods: Number of women who say they currently use the specific method (v312 = x),
after being asked whether they or their partner are currently doing something or using any
method to delay or avoid getting pregnant. Women who say they are pregnant are coded as not
currently using any method
2) Any method: Number of women who say they use any method of contraception (v313 ≠ 0)
3) Modern methods: Number of women who say they use one of the following methods: female
sterilization (tubal ligation, laparectomy, voluntary surgical contraception for women), male
sterilization (vasectomy, voluntary surgical contraception for men), the contraceptive pill (oral
contraceptives), interuterine contraceptive device (IUD), injectables (Depo-Provera), implants
(Norplant), female condom, male condom (prophylactic, rubber), diaphragm, contraceptive
foam and contraceptive jelly, lactational amenorrhea method (LAM), standard days method
(SDM), country-specific modern methods and respondent-mentioned other modern
contraceptive methods (including cervical cap, contraceptive sponge, and others), but does NOT
include abortions and menstrual regulation. (v313 = 3)
4) Traditional methods: Number of women who say they currently use one of the following
methods: periodic abstinence (rhythm, calendar method), withdrawal (coitus interruptus) and
country-specific traditional methods of proven effectiveness, folk methods (locally described
methods and spiritual methods of unproven effectiveness, such as herbs, amulets, gris-gris, etc.)
(V313 = 1 or 2). In the later rounds of the DHS program, both traditional methods and folk
methods have been grouped under the heading traditional methods
Guide to DHS Statistics 7.12 August 2018
Denominator: Number of women in each of the coverage categories
Variables: IR file.
v312
Current contraceptive method
v313
Current use by method type
v005
Woman’s individual sample weight
Calculation
Within each coverage category, the numerator divided by the denominator, expressed as a percentage.
Handling of Missing Values
Coverage categorization: Missing value in whether or not currently married is not allowed in the data.
Missing value in sexual activity treated as had sexual relations (non-virgin). Missing value in time since
last intercourse treated as greater than 30 days (not sexually active).
Numerators: Treated as does not use method for individual methods and grouped methods.
Denominators: All women in coverage category included, even if missing values on current use of
methods.
Notes and Considerations
Breastfeeding, prolonged breastfeeding, and prolonged abstinence are NOT contraceptive methods in
themselves. The lactational amenorrhea method is based on three criteria: Woman is amenorrheic since
last birth; last birth occurred within six months; woman is exclusively or predominately breastfeeding. In
the DHS description of LAM only the following is used: “Up to six months after childbirth, before the
menstrual period has not returned, women use a method requiring frequent breastfeeding day and
night.” This description varies from the official LAM criteria by not including exclusive or predominant
breastfeeding (which is based on whether or not the child received complementary liquids and foods),
substituting frequency of breastfeeding (it is not a requirement that frequent night-time feeding occurs)
and by not including the criterion that the woman knows that another form of contraception is
necessary. The DHS description may therefore include women who say yes even though they had never
heard of the term LAM or of programs that instruct in the method, thus overestimating knowledge and
ever use.
Each respondent defines current use of contraception. While some methods such as sterilization, pill,
IUD, injectables, implants, and LAM involve continuous protection, other methods are coital-specific,
requiring use during intercourse, such as condoms, vaginal methods, periodic abstinence, SDM and
withdrawal. Current use for coital-specific methods is a difficult concept since it may mean use at last
intercourse, which could have been a long time before the interview or intention to use at next
intercourse.
Guide to DHS Statistics 7.13 August 2018
The following two groups are included in the current use of contraception tables for all women, but are
excluded from the tables for currently married or in union women and the sexually active unmarried
women:
Unmarried sexually inactive women—includes women who are not currently married or in a
consensual union (single, divorced, widowed and separated) and who had sexual intercourse at
least once in their lives but not within the last 30 days.
Unmarried women who never had sexual intercourse—includes women who are not currently
married or in a consensual union (single, divorced, widowed and separated) and who never had
sexual intercourse.
Changes over Time
The list of specific methods and their categorization has changed.
In DHS I and II surveys, modern methods included pill, IUD, injection, vaginal methods, condom, female
sterilization, and male sterilization. The vaginal methods included in a single group diaphragm, foam and
jelly. Traditional methods included periodic abstinence (of any kind), withdrawal, and all respondent-
mentioned other methods.
In DHS III surveys, modern methods included pill, IUD, injection, vaginal methods, condom, female
sterilization, male sterilization, and implants. Traditional methods included periodic abstinence (of any
kind), withdrawal and lactational amenorrhea. Folk methods included respondent-mentioned other
methods and were categorized separately from traditional methods.
In DHS IV surveys, emergency contraception was added to the list of contraceptive methods in the
contraceptive table but was not included as a separate method for current use (included in “others”).
The DHS IV and following questionnaires allowed for more than one method to be currently used. For
specific methods, the following hierarchy is used to tabulate current use, selecting only the highest
method in the list: female sterilization, male sterilization, intrauterine contraceptive device (IUD),
contraceptive injection, contraceptive implants (Norplant), contraceptive pill, condoms, emergency
contraception, standard day method (SDM), vaginal methods (foam, jelly, suppository), lactational
amenorrhea method (LAM), periodic abstinence, withdrawal, other methods. Note that in DHS IV and
DHS V priority was given to the contraceptive pill before IUD, injectables and implants.
In DHS VI the category for other methods was separated into other modern methods and other
traditional methods. In DHS 7 emergency contraception and standard days method are explicitly listed
in the coding categories for current use of contraception.
In earlier rounds of DHS through DHS V, women who declared that they ever used female sterilization
were directly coded as currently using female sterilization. Following the removal of the questions on
ever use of contraceptive methods in DHS VI this automated coding no longer applies.

Guide to DHS Statistics 7.14 August 2018
References
United Nations, Department of Economic and Social Affairs, Population Division. 2015. Trends in
Contraceptive Use Worldwide 2015 (ST/ESA/SER.A/349).
http://www.un.org/en/development/desa/population/publications/family/contraceptive-infochart-
2015.shtml
Wang, W., S. Staveteig, R. Winter, and C. Allen. 2017. Women's marital status, contraceptive use, and
unmet need in Sub-Saharan Africa, Latin America, and the Caribbean. DHS Comparative Report No. 44.
Rockville, Maryland, USA: ICF. https://dhsprogram.com/publications/publication-CR44-Comparative-
Reports.cfm
Fabic, M.S., and Y. Choi. 2013. "Assessing the Quality of Data Regarding Use of the Lactational
Amenorrhea Method." Studies in Family Planning 44(2):205-21. https://doi.org/10.1111/j.1728-
4465.2013.00353.x
Resources
DHS-7 Tabulation plan: Tables 7.3, 7.4.1, 7.4.2, and 15.14
DHS Family Planning Topics page: https://www.dhsprogram.com/topics/Family-Planning.cfm
DHS Indicator Snapshot: Contraceptive Prevalence: https://www.youtube.com/watch?v=hf9s6wdHqfw
API Indicator IDs:
Any method:
FP_CUSA_W_ANY, FP_CUSM_W_ANY, FP_CUSU_W_ANY
(API link, STATcompiler link)
Modern method:
FP_CUSA_W_MOD, FP_CUSM_W_MOD, FP_CUSU_W_MOD
(API link, STATcompiler link)
Traditional method (including folk method):
FP_CUSA_W_TFK, FP_CUSM_W_TFK, FP_CUSU_W_TFK
(API link, STATcompiler link)
Traditional method (excluding folk method):
FP_CUSA_W_TRA, FP_CUSM_W_TRA, FP_CUSU_W_TRA
(API link, STATcompiler link)
Individual methods (women):
FP_CUSA_W_FST, FP_CUSM_W_FST, FP_CUSU_W_FST,
FP_CUSA_W_MST, FP_CUSM_W_MST, FP_CUSU_W_MST,
FP_CUSA_W_PIL, FP_CUSM_W_PIL, FP_CUSU_W_PIL,
FP_CUSA_W_IUD, FP_CUSM_W_IUD, FP_CUSU_W_IUD,
FP_CUSA_W_INJ, FP_CUSM_W_INJ, FP_CUSU_W_INJ,
FP_CUSA_W_DFJ, FP_CUSM_W_DFJ, FP_CUSU_W_DFJ,
FP_CUSA_W_IMP, FP_CUSM_W_IMP, FP_CUSU_W_IMP,
FP_CUSA_W_MCN, FP_CUSM_W_MCN, FP_CUSU_W_MCN,
FP_CUSA_W_FCN, FP_CUSM_W_FCN, FP_CUSU_W_FCN,
FP_CUSA_W_LAM, FP_CUSM_W_LAM, FP_CUSU_W_LAM,
FP_CUSA_W_EMC, FP_CUSM_W_EMC, FP_CUSU_W_EMC,
FP_CUSA_W_DIA, FP_CUSM_W_DIA, FP_CUSU_W_DIA,
FP_CUSA_W_FOM, FP_CUSM_W_FOM, FP_CUSU_W_FOM,
Guide to DHS Statistics 7.15 August 2018
FP_CUSA_W_MPL, FP_CUSM_W_MPL, FP_CUSU_W_MPL,
FP_CUSA_W_STD, FP_CUSM_W_STD, FP_CUSU_W_STD,
FP_CUSA_W_OMD, FP_CUSM_W_OMD, FP_CUSU_W_OMD,
FP_CUSA_W_RHY, FP_CUSM_W_RHY, FP_CUSU_W_RHY,
FP_CUSA_W_WTH, FP_CUSM_W_WTH, FP_CUSU_W_WTH,
FP_CUSA_W_LTA, FP_CUSM_W_LTA, FP_CUSU_W_LTA,
FP_CUSA_W_BRF, FP_CUSM_W_BRF, FP_CUSU_W_BRF,
FP_CUSA_W_OTR, FP_CUSM_W_OTR, FP_CUSU_W_OTR,
FP_CUSA_W_FLK, FP_CUSM_W_FLK, FP_CUSU_W_FLK,
FP_CUSA_W_TFK, FP_CUSM_W_TFK, FP_CUSU_W_TFK
WHO 100 Core Health Indicators: Contraceptive Prevalence Rate
MICS6 Indicator TM.3: Contraceptive Prevalence Rate

Guide to DHS Statistics 7.16 August 2018
Knowledge of the Fertile Period
Percent distribution of women, by knowledge of the fertile period during the ovulatory
cycle
Definition
Percent distribution of women, by knowledge of the fertile period during the ovulatory cycle.
Coverage:
Population base:
1) All women (IR file)
2) Women who currently use periodic abstinence (rhythm method) (IR file: v312 = 8)
3) Women who currently use the standard days method (SDM) (IR file: v312 = 18)
Time period: Current as defined by the respondent
Numerators: Number of women within each base by category of knowledge of the fertile period:
1) Just before her menstrual period begins (v217 = 4)
2) During her menstrual period (v217 = 1)
3) Right after her menstrual period has ended (v217 = 2)
4) Halfway between two menstrual periods (v217 = 3)
5) Other (v217 = 6)
6) No specific time (v217 = 5)
7) Don't know (v217 = 8)
8) Missing (v217 = 9)
Denominator: Number of women who are in each population base
Variables: IR file.
v217
Knowledge of ovulatory cycle
v312
Current contraceptive method
v005
Woman’s individual sample weight
Calculation
Numerators divided by the denominator, multiplied by 100. Categories add to 100 percent total.
Handling of Missing Values
Women who did not know or have a missing value for knowledge of the fertile period are included as
separate categories in the distribution.

Guide to DHS Statistics 7.17 August 2018
Changes over Time
In prior rounds of DHS, these indicators have been presented for non-current users of periodic
abstinence as well as current users of periodic abstinence. In DHS 7 the population base for users of
standard days method was added.
References
Institute for Reproductive Health. 2013. Fertility Awareness across the Life Course: A comprehensive
literature review. FAM Project. Washington, DC. Institute for Reproductive Health, Georgetown
University. http://irh.org/resource-library/a-comprehensive-literature-review-fertility-awareness-
across-the-life-course/
Resources
DHS-7 Tabulation plan: Table 7.5
API Indicator IDs:
FP_KFTP_W_BEF, FP_KFTP_W_DUR, FP_KFTP_W_AFT, FP_KFTP_W_HLF, FP_KFTP_W_OTH,
FP_KFTP_W_NON, FP_KFTP_W_DKN, FP_KFTP_W_MIS
(API link, STATcompiler link)

Guide to DHS Statistics 7.18 August 2018
Percentage of women with correct knowledge of the fertile period during the ovulatory
cycle
Definition
Percentage of women with correct knowledge of the fertile period during the ovulatory cycle, by age
groups.
Coverage:
Population base: All women in five-year age groups (15-19, 20-24 25-29, 30-34, 35-39, 40-44, 45-
49) (IR file)
Time period: Current status at time of survey.
Numerator: Number of women with correct knowledge of the fertile period (v217 = 3) in each age
category. Correct knowledge of fertile period is defined as “halfway between two menstrual periods”.
Denominator: Number of women in each age group
Variables: IR file.
v217
Knowledge of ovulatory cycle
v005
Woman’s individual sample weight
Calculation
The numerator divided by the denominator, expressed as a percentage, for each age group.
Handling of Missing Values
Women who did not know or have a missing value for knowledge of the fertile period are excluded from
the numerator but included in the denominators.
Resources
DHS-7 Tabulation plan: Table 7.6
API Indicator IDs: FP_KFTP_W_HLF
(API link, STATcompiler link)

Guide to DHS Statistics 7.19 August 2018
Age at Sterilization
Percentage distribution of women sterilized in specific age groups
Definition
Percentage distribution of sterilized women who had contraceptive sterilization in the specified age
groups.
Coverage:
Population base: Women of all marital statuses age 15-49 who have had a contraceptive
sterilization (IR file)
Time period: Current status at the time of the survey
Numerator: Number of women whose contraceptive sterilization occurred in the time they were in the
specified age groups (<25, 25-29, 30-34, 35-39, 40-44, 45-49) (v320)
Denominator: Total number of women who have had contraceptive sterilization (v312 = 6)
Variables: IR file.
v312
Current contraceptive method
v320
Age at sterilization
v005
Woman’s individual sample weight
Calculation
Numerators divided by the same denominator and multiplied by 100 to obtain percentages.
Handling of Missing Values
Women with missing values for age at sterilization are imputed in the data file.
Notes and Considerations
Percentage distribution adds up to 100 percent.
Resources
DHS-7 Tabulation plan: Table 7.7
API Indicator IDs:
FP_ASTR_W_A20, FP_ASTR_W_A25, FP_ASTR_W_A30, FP_ASTR_W_A35, FP_ASTR_W_A40,
FP_ASTR_W_A45
(API link, STATcompiler link)
Guide to DHS Statistics 7.20 August 2018
Median Age at Sterilization
Definition
Median age in years when women had contraceptive sterilization operation.
Coverage:
Population base: Women of all marital statuses age 15-49 who have had a contraceptive
sterilization (v312 = 6) at less than 40 years of age (v320 < 5) (IR file)
Time period: Current status at the time of the survey
Median: Median for completed time periods
Variables: IR file.
v011
Date of birth
v312
Current contraceptive method
v317
Date of start of use of method
v320
Age at sterilization
v005
Woman’s individual sample weight
Calculation
Age at sterilization is the difference between date of sterilization operation and birth date of woman,
truncated to single years of age ( (v317 - v011) / 12 ).
Medians are calculated from cumulated single year of age percent distributions of age at sterilization.
Median is linearly interpolated between the age values by which 50 percent or more of the women had
been sterilized truncate.
Since the difference between the date of sterilization and the respondent’s birth date is truncated to
years, the difference is taken as including up to next completed year of age (the cumulated percentage
for women with a difference of 29 years actually includes all women below 30 years of age at
sterilization). Therefore an adjustment is made to the interpolated median by increasing the
interpolated value by one year. See Median Calculations in Chapter 1.
Handling of Missing Values
Women with missing values for age at sterilization are imputed in the data file. See Date Variables in
Chapter 1.
Notes and Considerations
Women who were sterilized at age 40 years or over are excluded from the calculation of the median to
minimize problems of censoring.

Guide to DHS Statistics 7.21 August 2018
Since the median is based only on women who have been sterilized by the time of the survey, the
median age is not calculated for periods of time of sterilization 10 years and more before the survey
because of censoring (the oldest possible age in the data set would be 39 years at ten years prior and
less for earlier time periods).
Resources
DHS-7 Tabulation plan: Table 7.7
API Indicator IDs: FP_ASTR_W_MED
(API link, STATcompiler link)

Guide to DHS Statistics 7.22 August 2018
Source of Contraception
Percent distribution of current users of modern methods, by most recent source of
method
Definition
Percent distribution of current users of modern methods, by most recent source of method.
Coverage:
Population base: Women of all marital statuses who use a modern method of contraception
except for the lactational amenorrhea method (LAM) (IR file)
Time period: Current status at time of survey
Numerator: Number of women, by declared most recent source of contraception (V326)
Denominator: Number of women who currently use a modern method of contraception, excluding LAM
(v313 = 3 & v312 ≠ 13)
Variables: IR file.
v312
Current contraceptive method
v313
Current use by method type
v326
Last source for current users
v005
Woman’s individual sample weight
Calculation
Numerators divided by the same denominator and multiplied by 100.
Handling of Missing Values
Women who did not know or with missing values for most recent source are included as a separate
category.
Notes and Considerations
Percentages add up to 100 percent.
Modern methods include female sterilization, male sterilization, pill, IUD, injectables, implants, male
condom, female condom, emergency contraception, and SDM.
Resources
DHS-7 Tabulation plan: Table 7.8

Guide to DHS Statistics 7.23 August 2018
API Indicator IDs:
Public sources:
FP_SRCM_W_PUB, FP_SRCM_W_GHS, FP_SRCM_W_GHC, FP_SRCM_W_GFP, FP_SRCM_W_GMB,
FP_SRCM_W_GFW, FP_SRCM_W_GOT
(API link, STATcompiler link)
Private sources:
FP_SRCM_W_PRV, FP_SRCM_W_PHS, FP_SRCM_W_PPH, FP_SRCM_W_PDR, FP_SRCM_W_PMB,
FP_SRCM_W_PFW, FP_SRCM_W_POT
(API link, STATcompiler link)
Other sources:
FP_SRCM_W_OSR, FP_SRCM_W_SHP, FP_SRCM_W_CHH, FP_SRCM_W_FRR, FP_SRCM_W_OTH,
FP_SRCM_W_DKM, FP_SRCM_W_MIS
(API link, STATcompiler link)

Guide to DHS Statistics 7.24 August 2018
Use of Social Marketing Brand Pill and Condom
Percentage of women currently using oral contraceptives or condoms who use a specific
socially marketed brand
Definition
1) Percentage of women age 15-49 currently using oral contraceptives who use a specific socially
marketed brand.
2) Percentage of women age 15-49 currently using condoms who use a specific socially marketed
brand.
Coverage:
Population base: Women age 15-49 who are currently using an oral contraceptive (pills) or
condom (IR file
Time period: Current status at time of survey
Numerators:
1) Number of women age 15-49 who are currently using a socially marketed brand of oral
contraceptive pill (v323 = survey-specific code(s))
2) Number of women who are currently using a socially marketed brand of condoms (v323a =
survey-specific code(s))
Denominators:
1) Number of women who are currently using oral contraceptive (pills) (v312 = 1)
2) Number of women who are currently using condoms (v312 = 5)
Variables: IR file.
v312
Current contraceptive method
v323
Brand of pill used
v323a
Brand of condom used
v005
Woman’s individual sample weight
Calculation
Numerator divided by the denominator multiplied by 100.
Handling of Missing Values
Women who did not know or have a missing value for the brand of oral contraceptive or condom are
excluded from the numerator (assumed not using a social marketing brand) but included in the
denominator.

Guide to DHS Statistics 7.25 August 2018
Notes and Considerations
Social marketing brands of oral contraceptives (pills) or condoms are specific to each country.
Information on the brand of condom is provided by the women, not their partner.
Changes over Time
The social marketing brands are likely to change over time, and the coding of specific brands may
change from survey to survey within a country.
Resources
DHS-7 Tabulation plan: Table 7.9
API Indicator IDs: FP_SOCM_W_PIL, FP_SOCM_W_CON
(API link, STATcompiler link)

Guide to DHS Statistics 7.26 August 2018
Informed Choice
Percentage of current users of selected contraceptive methods who were informed about
side effects or problems of the method used, what to do if they experienced side effects or
problems, and who were informed of other methods of contraception that could be used
Definition
1) Percentage of current users of selected contraceptive methods who were informed about side
effects or problems of the method used.
2) Percentage of current users of selected contraceptive methods who were informed of what to
do if they experienced side effects or problems with the method used.
3) Percentage of current users of selected contraceptive methods who were informed of other
methods of contraception that could be used.
4) Percentage of current users of selected contraceptive methods who were informed of all three
(Method Information Index).
Coverage:
Population base: Women who started the last episode of use of modern contraceptive method
within the 5 years preceding the survey. Only users of female sterilization, pill, IUD, injectables,
and implants are included
Time period: 5 years preceding the survey
Numerator: Number of women who say they were informed at the start of the current episode of use of
the method about:
1) Side effects or problems of the method used (v3a02 = 1 or v3a03 = 1)
2) What to do if they experienced side effects or problems with the method used (v3a04 = 1)
3) Other methods of contraception that could be used (v3a05=1 or v3a06=1)
4) All three ((v3a02 = 1 or v3a03 = 1) & (v3a04 = 1) & (v3a05=1 or v3a06=1))
Denominator: Number of women who started the last episode of use of modern contraceptive method
(female sterilization, pill, IUD, injectables, and implants) within the 5 years preceding the survey (v312 in
1:3,6,11 & v008 - v317 < 60)
Variables: IR file.
v3a02
Told about side effects
v3a03
Told about side effects by health or family planning worker
v3a04
Told how to deal with side effects
v3a05
Told about other family planning methods
v3a06
Told about other family planning methods by health or family planning worker
v3a07
First source for current method
v313
Current use by method type
v317
Current contraceptive method
v005
Woman’s individual sample weight

Guide to DHS Statistics 7.27 August 2018
Calculation
Numerators divided by the denominators and multiplied by 100 to obtain percentages.
Handling of Missing Values
Women who did not know whether they were informed are considered not informed. Women with
missing values on whether they were informed are excluded from the numerators but included in the
denominators.
Notes and Considerations
Informed choice is a necessary part of family planning programs. Family planning providers should
inform all method users of the potential side effects and what they should do if they encounter any of
the effects. This information both assists the user in coping with side effects and decreases unnecessary
discontinuation of temporary methods. Users of temporary methods should also be informed of the
choices they have with respect to other methods. Informed choice should be analyzed by type of
method and type of provider in order to improve policy and program practices.
Changes over Time
In earlier rounds of DHS, an additional indicator was included on whether users were informed that
sterilization is permanent.
Resources
DHS-7 Tabulation plan: Table 7.10
API Indicator IDs: FP_ICHC_W_SID, FP_ICHC_W_WDO, FP_ICHC_W_HFP
(API link, STATcompiler link)

Guide to DHS Statistics 7.28 August 2018
Contraceptive Discontinuation
First-year contraceptive discontinuation rates
Definition
Among women age 15-49 who experienced episode of contraceptive use within the 5 years preceding
the survey, percentage of episodes discontinued within 12 months by reason for discontinuation,
according to specific method.
The discontinuation rates are based on episodes of use of particular methods. An individual woman may
contribute more than one episode to the calculation. The calculation procedure is based on life table
methods.
Coverage:
Population base: Contraceptive use episodes of all interviewed women who used a
contraceptive method in the 5 years preceding the survey (IR file)
Time period: Method use in the 3-62 months preceding the survey
Discontinuation rate: Users who discontinue using a contraceptive method within 12 months of
beginning use during a specific episode of use. Users who switch to another method are considered to
have discontinued the previous method at the time of switching.
Exposure: Duration of use of a specific method within one episode of use. Exposure begins with initial
month of use and ends with discontinuation or with the month of interview if method was still being
used at the time of the interview.
Variables: IR file.
vcal_1
Calendar (method use, non-use and pregnancies)
vcal_2
Calendar (reasons for discontinuation)
v018
Row of month of interview
v019
Length of calendar
v005
Woman’s individual sample weight
Calculation
In the DHS standard recode file, the data for contraceptive discontinuation rates come from the
reproductive calendar (vcal). The reproductive calendar in the questionnaire consists of two or more
columns of boxes, where each box represents a specific calendar month. The reproductive calendar
usually begins with the first month of the fifth calendar year before the date of the start of fieldwork.
For example, if the fieldwork began in July 2018, the calendar would start in January 2013. In the first
column, episodes of use of contraception are indicated by placing a method code in the boxes that
correspond to the calendar months when used. Pregnancies, births, and non-live birth terminations are
also represented in this column by placing the corresponding codes in the appropriate months. Months
with codes “0” are those in which the woman did not use contraception, was not pregnant, did not give

Guide to DHS Statistics 7.29 August 2018
birth, or did not have a fetal loss or stillbirth. In the second column, the reason for contraceptive
discontinuation is noted in the box that corresponds to the last month of use.
In the standard recode file, the reproductive calendar is represented by character strings of fixed length.
Each position within the character string represents a calendar month with the first position in the string
representing the most recent point in time, and the last representing the beginning of the calendar (e.g.
January 2013. Thus the third position from the end may represent March 2013, while the fifth position
from the end represents May 2013. To calculate the durations of the episodes of use, each position is
examined in chronological order (starting at the end of the string and moving towards the beginning) for
a contraceptive code. The first code following a position without that code indicates the start of a new
episode of use. The last position (e.g. January 2013) is ignored in this examination, since a code in that
position may represent an episode of use that began before the calendar start date. The number of
continuous positions with the same contraceptive code indicates the number of months of use in the
episode. An episode ends if the following month does not have the same contraceptive code (a
discontinuation) or corresponds to the month of interview (a censored duration). The episodes are then
tabulated by duration and reasons for ending for each contraceptive method and for all methods
combined. Standard life table calculations are then applied to the terminations to calculate months of
exposure and number of discontinuations by month of episode. The cumulative proportion that
discontinued by 12 months is taken as the 12-month discontinuation rate. See the Contraceptive
Calendar Tutorial at https://www.dhsprogram.com/data/Calendar-Tutorial/index.cfm for a description
of the calendar, how the data are stored and how to analyze the calendar data, and videos on
Completing the Contraceptive Calendar and the Data Structure of the Contraceptive Calendar.
The discontinuation rate is categorized by reason for discontinuation, which is noted in the second
column of the reproductive calendar in the box that corresponds to the month of discontinuation.
Discontinuation, by reason of contraceptive failure, is given if the woman became pregnant while using
contraception. In this case, the box in the first column corresponding to the month following the
termination should include a “P” for pregnancy or a “T” for pregnancy termination (very unlikely to
occur). Discontinuation to switch to another method is determined if the box for the month following
the discontinuation of the specific method contains another contraceptive method. Discontinuation for
switching is also indicated by a code in the second calendar column that indicates that the woman
wanted a more effective method and that the new method began within two months of discontinuation
(i.e., only one month with a ‘0’, indicating no contraceptive use, between episodes of use).
Discontinuation of a method, by reason of desire to become pregnant, is indicated in column 2 by the
appropriate code.
The life table calculated for the contraceptive discontinuation rates is a true multiple decrement table
producing net discontinuation rates. In formulas, the monthly rate of discontinuation,
qij
, where
i
is the
number of months since the start of the episode and
j
is the reason for discontinuation, is calculated by
dividing the number of episodes discontinued in month
i
,
dij
, by the total number of episodes that
reached duration, i.e.:
(and
for “any reasons” combined).
and the cumulative probability of not discontinuing at each month
i
for reason
j
is:

Guide to DHS Statistics 7.30 August 2018
where
any
is “any reasons” combined and
l0j = 1
and
l0,any = 1
.
The cumulative probability of discontinuing by 12 months duration for reason
j
is:
Q12j = 1
Note that this is mathematically equivalent to the cumulative probability of discontinuing by 12 months
duration for any reasons given as:
Example:
Using the DHS-6 Model Datasets, we first sum each month of exposure in the period of interest (3 to 62
months preceding the survey) according to the duration of use of the method in that month. Late
entries will first enter the table at the duration of use when they entered the period of interest. In the
month of discontinuation of the method, the discontinuations are tallied according to the reason for
discontinuation. The “Any reason” column is the sum of the individual reasons for discontinuation. The
“Switched to another method” column is tallied separately from the reasons for discontinuation.
Duration
of use
Method
failure
Desire to
become
pregnant
Other
fertility
related
reasons
Side
effects/
health
concerns
Wanted
more
effective
method
Other
method
related
reasons
Other
reasons
Any
reason
Switched
to another
method
Exposure
1
0.887530
2.329931
0.000000
18.885184
7.936933
1.547109
10.400709
41.987396
3.789610
2,631.94
2
1.041063
1.140181
0.291982
9.595957
0.737800
1.203585
0.809309
14.819877
1.475600
2,534.74
3
6.722316
9.828108
0.399263
59.663155
8.163438
3.252900
3.729920
91.759100
15.687751
2,496.58
4
1.584460
0.000000
1.982117
21.353032
1.219110
7.822816
2.456574
36.418109
5.191382
2,331.74
5
5.999001
1.686366
1.172808
4.998823
3.576653
0.799367
0.809309
19.042327
4.672285
2,205.84
6
6.367820
19.024693
0.000000
43.431689
6.550592
11.890163
8.981334
96.246291
25.541805
2,119.36
7
0.903114
10.711671
0.000000
10.925789
3.527042
0.000000
0.394817
26.462433
5.166854
1,954.98
8
3.610944
4.739678
0.000000
9.301247
0.000000
1.202538
16.878426
35.732833
3.565578
1,883.74
9
0.000000
14.390345
1.092375
28.412269
8.904068
0.257330
11.521093
64.577480
31.959763
1,802.60
10
1.315005
9.698899
1.147836
17.394270
1.827615
0.903114
2.339794
34.626533
9.736157
1,697.47
11
4.868782
7.380097
2.320644
5.824226
1.827615
1.547109
3.353669
27.122142
2.636924
1,613.89
12
2.672211
15.977691
2.616564
12.536034
6.412058
6.683679
13.131727
60.029964
17.138133
1,545.51
We now convert the counts of discontinuations and the months of exposure into monthly rates of
discontinuation (
qij
) by dividing the discontinuation columns by the exposure column, as below:

Guide to DHS Statistics 7.31 August 2018
Duration
of use
Method
failure
Desire to
become
pregnant
Other
fertility
related
reasons
Side
effects/
health
concerns
Wanted
more
effective
method
Other
method
related
reasons
Other
reasons
Any
reason
Switched
to
another
method
1
0.000337
0.000885
0.000000
0.007175
0.003016
0.000588
0.003952
0.015953
0.001440
2
0.000411
0.000450
0.000115
0.003786
0.000291
0.000475
0.000319
0.005847
0.000582
3
0.002693
0.003937
0.000160
0.023898
0.003270
0.001303
0.001494
0.036754
0.006284
4
0.000680
0.000000
0.000850
0.009158
0.000523
0.003355
0.001054
0.015618
0.002226
5
0.002720
0.000765
0.000532
0.002266
0.001621
0.000362
0.000367
0.008633
0.002118
6
0.003005
0.008977
0.000000
0.020493
0.003091
0.005610
0.004238
0.045413
0.012052
7
0.000462
0.005479
0.000000
0.005589
0.001804
0.000000
0.000202
0.013536
0.002643
8
0.001917
0.002516
0.000000
0.004938
0.000000
0.000638
0.008960
0.018969
0.001893
9
0.000000
0.007983
0.000606
0.015762
0.004940
0.000143
0.006391
0.035825
0.017730
10
0.000775
0.005714
0.000676
0.010247
0.001077
0.000532
0.001378
0.020399
0.005736
11
0.003017
0.004573
0.001438
0.003609
0.001132
0.000959
0.002078
0.016805
0.001634
12
0.001729
0.010338
0.001693
0.008111
0.004149
0.004325
0.008497
0.038841
0.011089
Next we convert the monthly discontinuation rates into the cumulative probabilities of not discontinuing
at each month, using the formula , where l0j = 1 and l0,any = 1. To carry out
these calculations, first calculate l1,any, then l2,any, etc. for “any reason”, and then calculate l1j,
l2j, etc. for
each separate reason for discontinuation j.
Duration
of use
Method
failure
Desire to
become
pregnant
Other
fertility
related
reasons
Side
effects/
health
concerns
Wanted
more
effective
method
Other
method
related
reasons
Other
reasons
Any
reason
(li,any)
Switched
to
another
method
0
1.000000
1.000000
1.000000
1.000000
1.000000
1.000000
1.000000
1.000000
1.000000
1
0.999663
0.999115
1.000000
0.992825
0.996984
0.999412
0.996048
0.984047
0.998560
2
0.999259
0.998672
0.999887
0.989099
0.996698
0.998945
0.995734
0.978294
0.997987
3
0.996624
0.994821
0.999730
0.965720
0.993499
0.997670
0.994273
0.942337
0.991840
4
0.995984
0.994821
0.998929
0.957091
0.993006
0.994509
0.993280
0.927620
0.989742
5
0.993461
0.994112
0.998436
0.954988
0.991502
0.994173
0.992939
0.919612
0.987777
6
0.990698
0.985857
0.998436
0.936143
0.988660
0.989013
0.989042
0.877850
0.976694
7
0.990293
0.981047
0.998436
0.931237
0.987076
0.989013
0.988865
0.865967
0.974374
8
0.988633
0.978868
0.998436
0.926961
0.987076
0.988461
0.981106
0.849541
0.972735
9
0.988633
0.972086
0.997921
0.913571
0.982880
0.988339
0.975676
0.819106
0.957673
10
0.987998
0.967406
0.997367
0.905177
0.981998
0.987903
0.974547
0.802397
0.952975
11
0.985578
0.963737
0.996213
0.902282
0.981089
0.987134
0.972880
0.788913
0.951664
12
0.984214
0.955581
0.994878
0.895883
0.977816
0.983723
0.966177
0.758270
0.942916
Finally, the 12 month discontinuation rates are simply 1 minus the rates of continuing at 12 months:

Guide to DHS Statistics 7.32 August 2018
Method
failure
Desire to
become
pregnant
Other
fertility
related
reasons
Side
effects/
health
concerns
Wanted
more
effective
method
Other
method
related
reasons
Other
reasons
Any
reason
Switched
to
another
method
12
0.015786
0.044419
0.005122
0.104117
0.022184
0.016277
0.033823
0.241730
0.057084
Or, as percentages:
12
1.6
4.4
0.5
10.4
2.2
1.6
3.4
24.2
5.7
Handling of Missing Values
Use of contraception is generally not allowed to be missing in any month in the calendar. In the few
surveys where it is missing, these are treated as months of non-use of contraception. Missing and
unknown reasons for discontinuation are treated as “Other” reasons.
Notes and Considerations
The life table calculated is a true multiple decrement table producing net discontinuation rates. The
various reasons for discontinuation are treated as competing risks, and the monthly probabilities of
discontinuation are additive across the reasons for discontinuation. In the DHS tables, only episodes that
began within the calendar period and ended three months before the interview are included. Episodes
that began before the beginning of the calendar are excluded. Episodes that ended in the month of
interview or the two months prior are treated as censored at three months before the interview rather
than terminated afterwards to avoid bias due to unrecognized pregnancies.
For methods that are not followed by another method or a pregnancy, it is assumed that the method
episode started on average in the middle of the first month of use and ended in the middle of the month
after the last noted month of use. If the month following the last noted method indicates a pregnancy or
a different method, then it is assumed that the episode ended on average in the middle of that following
month. Thus, the duration of exposure is taken as the difference between the month of first use and the
month of last use (i.e., equal to the number of months during that episode with a notation for the
method).
It is worth noting that different assumptions can be made to the calculation of the at risk component of
the life table for contraceptive discontinuation. These assumptions are related to the fact that
contraceptive information is usually collected using a calendar that collects information on use in
calendar months, whereas the life table refers to actual months of use. One consequence of this
approach is that censored observations actually contribute a full month of exposure in the last month of
observation included in the analysis rather than half a month of exposure. In many life table analyses
the number at risk is often taken as the number continuing to the month minus half of the censored
observations. For the calculation of discontinuation rates The DHS Program assumes that all
observations are at risk for the full month, rather than excluding half the censored observations.
Methods that have less than 125 months of exposure (unweighted) in the first month of the life table
are not shown because of large sampling variance, and methods that have 125-249 months of exposure
(unweighted) are shown in parentheses to caution the reader that estimates of the discontinuation
rates are based on small sample sizes.

Guide to DHS Statistics 7.33 August 2018
The reasons for discontinuation are exclusive categories, and as the discontinuation rates are net rates
the discontinuation rates by reason sum to the total discontinuation rates for any reason. The
discontinuation rates for switching to another method are calculated separately and are not exclusive of
other reasons.
Changes over Time
The list of specific methods and their categorization has changed.
In DHS I and II surveys, modern methods included pill, IUD, injection, vaginal methods, condom, female
sterilization, and male sterilization. The vaginal methods included in a single group diaphragm, foam,
and jelly. Traditional methods included periodic abstinence (of any kind), withdrawal, and all
respondent- mentioned other methods.
In DHS III surveys, modern methods included pill, IUD, injection, vaginal methods, condom, female
sterilization, male sterilization, and implants. Traditional methods included periodic abstinence (of any
kind), withdrawal, and lactational amenorrhea. Folk methods included respondent-mentioned other
methods and were categorized separately from traditional methods.
In DHS IV surveys, emergency contraception was added to the list of contraceptive methods but is not
included as a separate method for current use (i.e., included in “other”). The questionnaire allowed for
more than one method to be currently used but restricted the calendar to only one code (method) in
each box according to the following hierarchy: female sterilization, male sterilization, contraceptive pill,
intrauterine contraceptive device (IUD), contraceptive injection, contraceptive implants (Norplant),
condoms, diaphragm, form or jelly, lactational amenorrhea method (LAM), periodic abstinence,
withdrawal, and other methods.
In DHS VI surveys, other modern method and other traditional methods were added to the list. Pill was
moved after implants in the methods hierarchy. In DHS-7 surveys, emergency contraception and
standard days method (SDM) are listed as separate methods; diaphragm and foam or jelly are included
in “other modern method”.
References
Ali, M.M., J. Cleland, and I.H. Shah. 2012. Causes and Consequences of Contraceptive Discontinuation:
Evidence from 60 Demographic and Health Surveys. Geneva: World Health Organization.
http://www.who.int/reproductivehealth/publications/family_planning/9789241504058/en/
Bradley, S.E.K., H.M. Schwandt, and S. Khan. 2009. Levels, Trends, and Reasons for Contraceptive
Discontinuation. DHS Analytical Studies No. 20. Calverton, MD: ICF Macro.
https://dhsprogram.com/publications/publication-AS20-Analytical-Studies.cfm
Curtis, S.L. and A. Blanc. 1997. Determinants of Contraceptive Failure, Switching, and Discontinuation: An
Analysis of DHS Contraceptive Histories. DHS Analytical Reports No. 6. Calverton, MD: Macro
International Inc. https://dhsprogram.com/publications/publication-AR6-Analytical-Studies.cfm

Guide to DHS Statistics 7.34 August 2018
Curtis, S.L. and C.R. Hammerslough. 1995. Model further analysis plan: Contraceptive use dynamics. DHS
Further Analysis Reports No. 59. Calverton, Maryland, USA: Macro International.
https://dhsprogram.com/publications/publication-fa59-further-analysis.cfm
Staveteig, S., L. Mallick, and R. Winter. 2015. Uptake and discontinuation of long-acting reversible
contraceptives (LARCs) in low-income countries. DHS Analytical Studies No. 54. Rockville, Maryland, USA:
ICF International. https://dhsprogram.com/publications/publication-as54-analytical-studies.cfm
Polis, C.B., S.E.K. Bradley, A. Bankole, T. Onda, T. Croft, S. Singh. 2016. “Typical-use contraceptive failure
rates in 43 countries with Demographic and Health Survey data: Summary of a detailed report.”
Contraception, Volume 94, Issue 1, 11-17. https://www.contraceptionjournal.org/article/S0010-
7824(16)00103-7/abstract
Polis, C.B., S.E.K. Bradley, A. Bankole, T. Onda, T. Croft, S. Singh. 2016. Contraceptive Failure Rates in the
Developing World: An Analysis of Demographic and Health Survey Data in 43 Countries. New York:
Guttmacher Institute. https://www.guttmacher.org/report/contraceptive-failure-rates-in-developing-
world
Resources
DHS-7 Tabulation plan: Table 7.11
API Indicator IDs: FP_DISR_W_PRG, FP_DISR_W_DES, FP_DISR_W_FRT, FP_DISR_W_SID,
FP_DISR_W_WME, FP_DISR_W_MET, FP_DISR_W_OTH, FP_DISR_W_ANY, FP_DISR_W_SWH
(API link, STATcompiler link)
DHS Contraceptive Calendar Tutorial: https://www.dhsprogram.com/data/Calendar-Tutorial/index.cfm
DHS Contraceptive Calendar Tutorial Video Part 1: Completing the Contraceptive Calendar
https://www.youtube.com/watch?v=_7V6S5ljnZc
DHS Contraceptive Calendar Tutorial Video Part 2: Data Structure of the Contraceptive Calendar
https://www.youtube.com/watch?v=T2pS8IM0jyU
Measure Evaluation. Online Course: Multiple-Decrement Life Tables.
https://www.measureevaluation.org/resources/training/online-courses-and-resources/non-certificate-
courses-and-mini-tutorials/multiple-decrement-life-tables
Guide to DHS Statistics 7.35 August 2018
Percent distribution of discontinued episodes of contraceptive use in the 5 years preceding
the survey by reason
for discontinuation
Definition
Percent distribution of discontinued episodes of contraceptive use in the 5 years preceding the survey,
by reason for discontinuation, according to specific method.
The distributions, by reason for discontinuation, are based on episodes of use of particular methods. An
individual woman may contribute more than one episode to the calculation.
Coverage:
Population base: Episodes of contraceptive use that were discontinued for all interviewed
women who used a contraceptive method in the five years preceding the survey (IR file)
Time period: Episode of use that occurred 3–62 months before the interview
Numerator: Number of episodes of use that were discontinued, by reason for discontinuation, according
to contraceptive method and for all methods together
Denominator: Total number of episodes of use that were discontinued, according to contraceptive
method and for all methods
Variables: IR file.
vcal_1
Calendar (method use, non-use and pregnancies)
vcal_2
Calendar (reasons for discontinuation)
v018
Row of month of interview
v005
Woman’s individual sample weight
Calculation
In the DHS standard recode file, the data for contraceptive discontinuation rates come from the
reproductive calendar. The reproductive calendar in the questionnaire consists of two or more columns
of boxes where each box represents a specific calendar month. The reproductive calendar usually begins
with the first month of the fifth calendar year before the date of the start of fieldwork. For example, if
the fieldwork began in July 2018, the calendar would start in January 2013. In the first column, episodes
of use of contraception are indicated by placing a method code in the boxes that correspond to the
calendar months when used. Pregnancies, births, and non-live birth terminations are also represented in
this column by placing the corresponding codes in the appropriate months. Months with no codes are
those in which the woman did not use contraception, was not pregnant, did not give birth or did not
have a fetal loss or stillbirth. In the second column, the reason for contraceptive discontinuation is noted
in the box that corresponds to the month of discontinuation.
In the standard recode file, the reproductive calendar is represented by character strings of fixed length.
Each position within the character string represents a calendar month with the first position in the string
representing the most recent point in time, and the last representing the beginning of the calendar (e.g.
January 2013. Thus the third position from the end may represent March 2013, while the fifth position

Guide to DHS Statistics 7.36 August 2018
from the end represents May 2013. Each position is examined in chronological order for a contraceptive
code starting in the 59 month before the interview (position = v018 + 59) and moving towards the
beginning. The first code following a month without that code indicates the start of a new episode of
use. Subsequent positions are examined until a different code is found. An episode of use ends if the
following month does not have the same contraceptive code (a discontinuation). The episodes are then
tabulated by reason for discontinuation for each type of contraceptive method and for all methods
combined. The reason for discontinuation is noted in the second column of the reproductive calendar in
the box that corresponds to the month of discontinuation.
See the Contraceptive Calendar Tutorial at https://www.dhsprogram.com/data/Calendar-
Tutorial/index.cfm for a description of the calendar, how the data are stored and how to analyze the
calendar data, and particularly Example 5 - Reasons for discontinuation in the last five years by method
at https://www.dhsprogram.com/data/Calendar-Tutorial/index.cfm#example5.
Handling of Missing Values
Information on use of contraception is not allowed to be missing in any month in the calendar. Missing
reasons for discontinuation are treated as “Other” reasons.
Notes and Considerations
The distribution of reasons for discontinuation is a little different than that obtained in the calculation of
discontinuation rates. In the distribution, all discontinuations in the five years preceding the survey are
included, whereas in the calculation of the discontinuation rates, only those that ended within the first
12 months of use are included. Also, censored episodes are not included in the rate calculations.
Methods that have less than 25 discontinued episodes (unweighted) are not shown because of large
sampling variance.
Changes over Time
The list of specific methods and their categorization has changed.
In DHS I and II surveys, modern methods included pill, IUD, injection, vaginal methods, condom, female
sterilization, and male sterilization. The vaginal methods included in a single group diaphragm, foam,
and jelly. Traditional methods included periodic abstinence (of any kind), withdrawal, and all
respondent- mentioned other methods.
In DHS III surveys, modern methods included pill, IUD, injection, vaginal methods, condom, female
sterilization, male sterilization, and implants. Traditional methods included periodic abstinence (of any
kind), withdrawal, and lactational amenorrhea. Folk methods included respondent-mentioned other
methods and were categorized separately from traditional methods.
In DHS IV surveys, emergency contraception was added to the list of contraceptive methods but is not
included as a separate method for current use (i.e., included in “other”). The questionnaire allowed for
more than one method to be currently used but restricted the calendar to only one code (method) in
each box according to the following hierarchy: female sterilization, male sterilization, contraceptive pill,

Guide to DHS Statistics 7.37 August 2018
intrauterine contraceptive device (IUD), contraceptive injection, contraceptive implants (Norplant),
condoms, diaphragm, form or jelly, lactational amenorrhea method (LAM), periodic abstinence,
withdrawal, and other methods.
In DHS VI surveys, other modern method and other traditional methods were added to the list. Pill was
moved after implants in the methods hierarchy. In DHS-7 surveys, emergency contraception and
standard days method (SDM) are listed as separate methods; diaphragm and foam or jelly are included
in “other modern method”.
References
DHS Contraceptive Calendar Tutorial. Example 5 - Reasons for discontinuation in the last five years by
method. https://www.dhsprogram.com/data/Calendar-Tutorial/index.cfm#example5
Resources
DHS-7 Tabulation plan: Table 7.12
API Indicator IDs:
FP_RDIS_W_PRG, FP_RDIS_W_DES, FP_RDIS_W_DIS, FP_RDIS_W_WME, FP_RDIS_W_SID,
FP_RDIS_W_ACC, FP_RDIS_W_CST, FP_RDIS_W_INC, FP_RDIS_W_FAT, FP_RDIS_W_DIF,
FP_RDIS_W_INF, FP_RDIS_W_SEP, FP_RDIS_W_OTH, FP_RDIS_W_DKN, FP_RDIS_W_MIS
(API link, STATcompiler link)
DHS Contraceptive Calendar Tutorial: https://www.dhsprogram.com/data/Calendar-Tutorial/index.cfm
DHS Contraceptive Calendar Tutorial Video Part 1: Completing the Contraceptive Calendar
https://www.youtube.com/watch?v=_7V6S5ljnZc
DHS Contraceptive Calendar Tutorial Video Part 2: Data Structure of the Contraceptive Calendar
https://www.youtube.com/watch?v=T2pS8IM0jyU

Guide to DHS Statistics 7.38 August 2018
Need and Demand for Family Planning
Percentage of women with a) unmet need for family planning, b) met need for family
planning, c) total demand for family planning by whether for spacing, limiting, and total,
and the percentage of the demand for family planning that is satisfied
Definition
Percentage of currently married women, all women, and sexually active unmarried women with
1) unmet need for family planning,
2) met need for family planning,
3) total demand for family planning
by whether for spacing, limiting, and total,
and
4) Percentage of total demand for family planning that is satisfied
5) Percentage of total demand for family planning that is satisfied by modern methods
Coverage:
Population base:
1) All women (IR file)
2) Currently married (v502 = 1) (IR file)
3) Sexually active unmarried women: Includes women who are not currently married or in
a consensual union (single, divorced, widowed, and separated) and who had sexual
intercourse within the last 30 days (v502 ≠ 1 & v528 <= 30) (IR file)
Time period: Current status at time of survey.
Numerators:
1) Unmet need for contraception: Number of women who are not using a method of contraception
and are:
a) For spacing (v626a = 1):
fecund and say they want to wait two or more years for their next birth;
fecund and are unsure whether they want another child;
fecund, want another child, but are unsure when to have the birth;
pregnant and wanted current pregnancy later; or
postpartum amenorrheic and wanted last birth later
b) For limiting (v626a = 2):
fecund and do not want any more children;
pregnant and did not want current pregnancy; or
postpartum amenorrheic and did not want the last birth
c) Total unmet need: Number of women with an unmet need for family planning for spacing
or limiting (v626a = 1 or v626a = 2)
2) Met need for contraception: Number of women who are using a method of contraception and
are
a) For spacing (v626a = 3):
not considered to be limiting (see below)
Guide to DHS Statistics 7.39 August 2018
b) For limiting (v626a = 4):
want no more children;
are sterilized; or
say they cannot get pregnant when asked about the desire for future children
c) Total met need (v626a = 3 or v626a = 4): Number of women with met need for spacing or
limiting
3) Total demand for contraception: Number of women who have a met need or unmet need:
a) For spacing (v626a = 1 or v626a = 3)
b) For limiting (v626a = 2 or v626a = 4)
c) Total (v626a in 1, 2, 3, 4)
4) Demand satisfied: Number of women who are using any contraceptive method (v626a in 3,4)
5) Demand satisfied by modern methods: Number of women who are using any modern
contraceptive method including female sterilization, male sterilization, pill, IUD, injectables,
implants, male condom, female condom, emergency contraception, vaginal methods, lactational
amenorrhea method, or other modern methods (v313 = 3)
Denominators:
Unmet need, met need, and total demand indicators:
Number of
All women age 15-49
Currently married women (v502 = 1)
Sexually active unmarried women – including women who are not currently married or in a
consensual union (single, divorced, widowed, and separated) and who had sexual intercourse
within the last 30 days (v502 ≠ 1 & v528 in 0:30)
Demand satisfied indicators:
Number of
All women age 15-49
Currently married women (v502 = 1)
Sexually active unmarried women – including women who are not currently married or in a
consensual union (single, divorced, widowed, and separated) and who had sexual intercourse
within the last 30 days (v502 ≠ 1 & v528 in 0:30).
that have either unmet need for family planning or met need for family planning (v626a in 1, 2, 3, 4)
Variables: IR file.
v626a
Unmet need for contraception (Definition 3)
v313
Current use by method type
v502
Currently/formerly/never in union
v528
Time since last sex (in days)
v005
Woman’s individual sample weight
Calculation
Unmet need, met need, and total demand indicators:
Guide to DHS Statistics 7.40 August 2018
Numerator divided by the denominator multiplied by 100.
The calculation of numerators for the met and unmet need indicators first takes into account a woman’s
contraceptive status. Women who are using contraception are considered to have a met need for family
planning.
For women who are not using contraception, the determination of the need for family planning involves
several additional steps. Nonusers are separated into those who are currently married and those who
are not married but who are sexually active. An unmarried woman is considered to be sexually active if
the woman had sexual intercourse within 30 days prior to the survey. Unmarried women who are not
sexually active are considered not to be exposed to the risk of pregnancy and, therefore, have no need
for family planning.
To assign need status to married and sexually active unmarried nonusers, these women are separated
into two groups: (1) those who are pregnant or postpartum amenorrheic and (2) those who are not
pregnant or postpartum amenorrheic. Women are considered to be postpartum amenorrheic if their
period had not returned since their last live birth in the two-year period prior to the survey.
Married and sexually active unmarried nonusers who are not pregnant or postpartum amenorrheic are
further separated into those who are considered fecund and those who are infecund. Women are
classified as infecund if they fall into any of the following categories:
married 5+ years, had no children in the past 5 years and never used contraception;
responded “can’t get pregnant” to question on desire for future children;
responded “menopausal/hysterectomy” on reason for not using contraception;
response to time since last period is > 6 months and not postpartum amenorrheic (0-59
months);
response to time since last period is “menopausal/hysterectomy” or “never menstruated”; or
response to time since last period is “last period was before last birth” and last birth was 5+
years ago.
Infecund women have no need for family planning. Other women who have no need include married or
sexually active unmarried women who are not using contraception and are:
pregnant and wanted the current pregnancy;
postpartum amenorrheic and wanted their last birth; or
fecund and want another child within 2 years.
Married and sexually active unmarried nonusers have unmet need for spacing if they are:
pregnant and wanted the pregnancy later;
postpartum amenorrheic and wanted their last birth later; or
fecund and want the next child in 2+ years, want another child but are undecided on the timing
or are undecided if they want another child.
Married and sexually active unmarried nonusers have an unmet need for limiting if they are:
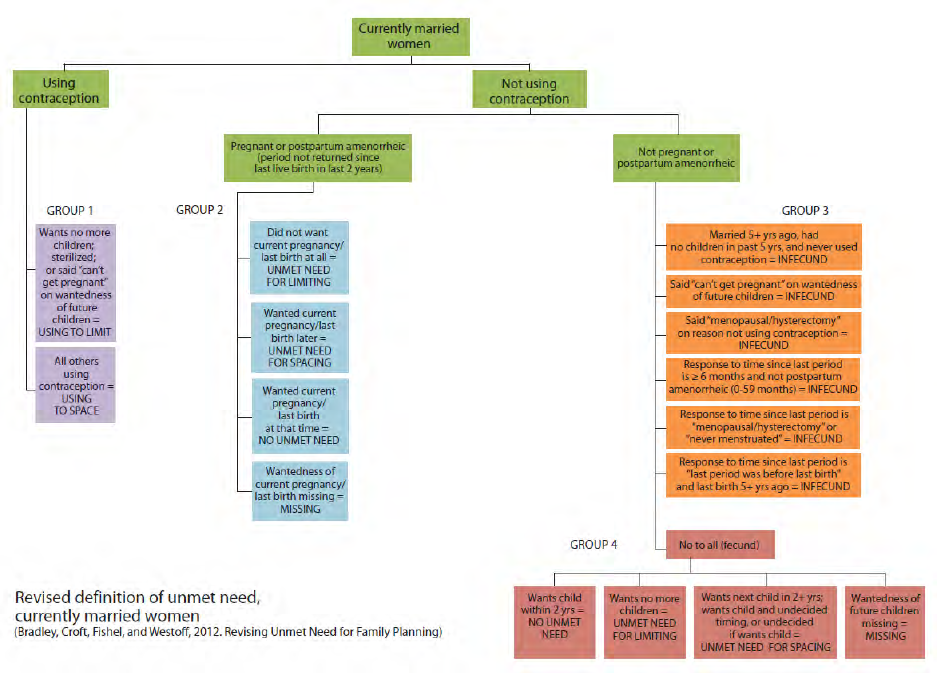
Guide to DHS Statistics 7.41 August 2018
pregnant and did not want the current pregnancy at all;
postpartum amenorrheic and did not want their last birth at all their last birth; or
fecund and want no more children.
The calculation of unmet need for currently married women is summarized in the diagram below:
Demand satisfied indicators:
Numerator divided by the denominator multiplied by 100.
The numerator for the proportion of demand satisfied include the number of women currently using any
contraceptive method while the numerator for the demand satisfied by modern methods include the
number of women using any modern contraceptive method.
The denominators include those women with a met need (those using contraception irrespective
whether the method is a modern method or a traditional method) and those with an unmet need for
family planning.

Guide to DHS Statistics 7.42 August 2018
Notes and Considerations
Details of the calculation of the unmet need variable can be found on the Unmet Need page of the DHS
Program website at https://www.dhsprogram.com/topics/Unmet-Need.cfm, including survey-specific
code in Stata and SPSS for the construction of v626a for surveys that do not have the variable in the
dataset. The results of the change in Definition are also summarized in Revising Unmet Need: In Brief at
https://www.dhsprogram.com/pubs/pdf/OD63/OD63[12June2012_English].pdf
The proportion of demand satisfied by modern methods indicator corresponds to SDG indicator 3.7.1
and UNAIDS indicator 5.2.
Handling of Missing Values
If responses are missing on questions with respect to the wantedness of births or the current pregnancy,
women are assigned a value of missing on the unmet need variable. This represents a change from the
previous practice of assuming that pregnant, postpartum amenorrheic, or fecund nonusers for whom
information on the wantedness of the current pregnancy/last birth was missing had an unmet need for
family planning (Bradley et al. 2012).
Changes over Time
The Definition of unmet need for family planning was simplified during the DHS VI project to improve
comparability over time and between surveys within the DHS Program and to facilitate comparability
with data collected in other surveys including the MICS surveys undertaken in many countries with
UNICEF support. Bradley et al. (2012) detail the changes involved in revising the unmet need Definition
in DHS Analytical Study No. 25.
Several changes have occurred over time in the calculation of unmet need for family planning. Due to
these changes, comparisons of unmet need and demand for family planning between surveys may not
be valid if based on country reports.
References
Bradley, S.E.K., T.N. Croft, J.D. Fishel, and C. Westoff. 2012. Revising Unmet Need for Family Planning.
DHS Analytical Studies No. 25. Calverton, Maryland, USA, ICF International.
https://www.dhsprogram.com/publications/publication-AS25-Analytical-Studies.cfm
Westoff, C.F. 2012. Unmet need for modern contraceptive methods. DHS Analytical Studies No. 28.
Calverton, Maryland, USA: ICF International. https://www.dhsprogram.com/publications/publication-
AS28-Analytical-Studies.cfm
MacQuarrie, K.L.D. 2014. Unmet need for family planning among young women: levels and trends. DHS
Comparative Reports No. 34. Rockville, Maryland, USA: ICF International.
https://www.dhsprogram.com/publications/publication-CR34-Comparative-Reports.cfm
Wang, W., S. Staveteig, R. Winter, and C. Allen. 2017. Women’s Marital Status, Contraceptive Use, and
Unmet Need in Sub-Saharan Africa, Latin America, and the Caribbean. DHS Comparative Reports No. 44.

Guide to DHS Statistics 7.43 August 2018
Rockville, Maryland, USA: ICF. https://www.dhsprogram.com/publications/publication-CR44-
Comparative-Reports.cfm
Westoff, C.F. 2006. New estimates of unmet need and the demand for family planning. DHS Comparative
Reports No. 14. Calverton, Maryland, USA: Macro International.
https://www.dhsprogram.com/publications/publication-CR14-Comparative-Reports.cfm
Westoff, C.F. 2001. Unmet need at the end of the century. DHS Comparative Reports No. 1. Calverton,
Maryland, USA: ORC Macro. https://www.dhsprogram.com/publications/publication-CR1-Comparative-
Reports.cfm
Westoff, C.F. and A. Bankole. 1995. Unmet need: 1990-1994. DHS Comparative Studies No. 16.
Calverton, Maryland, USA: Macro International.
https://www.dhsprogram.com/publications/publication-CS16-Comparative-Reports.cfm
Westoff, C.F. and L.H. Ochoa. 1991. Unmet need and the demand for family planning. DHS Comparative
Studies No. 5. Columbia, Maryland, USA: Institute for Resource Development.
https://www.dhsprogram.com/publications/publication-CS5-Comparative-Reports.cfm
UNAIDS. 2017. Global AIDS Monitoring 2018: Indicators for monitoring the 2016 United Nations Political
Declaration on Ending AIDS http://www.unaids.org/en/resources/documents/2018/Global-AIDS-
Monitoring
Resources
DHS Program website: Unmet Need: https://www.dhsprogram.com/topics/Unmet-Need.cfm
DHS Indicator Snapshot: Demand Satisfied by Modern Methods:
https://www.youtube.com/watch?v=RceOuLjJwKY&list=PLagqLv-
gqpTMx2Q10C_prJRnCtM55C0o8&index=29&t=0s
DHS-7 Tabulation plan: Tables 7.13.1, 7.13.2 and 15.15
API Indicator IDs:
Currently married women:
FP_NADM_W_UNS, FP_NADM_W_UNL, FP_NADM_W_UNT, FP_NADM_W_MNS, FP_NADM_W_MNL,
FP_NADM_W_MNT,
FP_NADM_W_TDS, FP_NADM_W_TDL, FP_NADM_W_TDT, FP_NADM_W_PDS, FP_NADM_W_PDM
(API link, STATcompiler link)
All women:
FP_NADA_W_UNS, FP_NADA_W_UNL, FP_NADA_W_UNT, FP_NADA_W_MNS, FP_NADA_W_MNL,
FP_NADA_W_MNT,
FP_NADA_W_TDS, FP_NADA_W_TDL, FP_NADA_W_TDT, FP_NADA_W_PDS, FP_NADA_W_PDM
(API link, STATcompiler link)
Sexually active unmarried women:
FP_NADU_W_UNS, FP_NADU_W_UNL, FP_NADU_W_UNT, FP_NADU_W_MNS, FP_NADU_W_MNL,
FP_NADU_W_MNT,
FP_NADU_W_TDS, FP_NADU_W_TDL, FP_NADU_W_TDT, FP_NADU_W_PDS, FP_NADU_W_PDM
(API link, STATcompiler link)
Guide to DHS Statistics 7.44 August 2018
SDG Indicator 3.7.1: Proportion of women of reproductive age (aged 15-49 years) who have their need
for family planning satisfied with modern methods
WHO 100 Core Health Indicators: Demand for family planning satisfied with modern methods
MICS6 Indicator TM.4: Need for family planning satisfied with modern contraception
UNAIDS Indicator 5.2: Demand for family planning satisfied by modern methods

Guide to DHS Statistics 7.45 August 2018
Decision making about Family Planning
Percent distribution of currently married women who are current users of family planning
by who makes the decision to use family planning, and percent distribution of currently
married women who are not currently using family planning by who makes the decision
not to use family planning
Definition
1) Percent distribution of currently married women age 15-49 who are current users of family
planning by who makes the decision to use family planning.
2) Percent distribution of currently married women age 15-49 who are not currently using family
planning and are not pregnant by who makes the decision not to use family planning.
Coverage:
Population base: There are two population bases for these indicators:
1) Currently married women who are not pregnant and are current users of family
planning (v502 = 1 & v213 = 0 & v312 ≠ 0) (IR file)
2) Currently married women who are not pregnant and not currently using (v502 = 1 &
v213 = 0 & v312 = 0) (IR file)
Time period: Current status at time of survey
Numerator: Number of women within each base population according to who:
1) makes the decision to use family planning (v632)
2) makes the decision not to use family planning (v632a)
Denominator: Total number of currently married women who are not pregnant and:
1) are current users of family planning (v502 = 1 & v213 = 0 & v312 ≠ 0)
2) not currently using (v502 = 1 & v213 = 0 & v312 = 0)
Variables: IR file.
v213
Currently pregnant
v312
Current contraceptive method
v632
Decision maker for using contraception
v632a
Decision maker for not using contraception
v005
Woman’s individual sample weight
Calculation
Numerators divided by the denominator and multiplied by 100 to obtain percentages.
Handling of Missing Values
Women with missing values are included in the other response category.
Guide to DHS Statistics 7.46 August 2018
Notes and Considerations
Pregnant women are excluded from the table.
Percentages add up to 100 percent for each indicator.
Changes over Time
This indicator was not reported prior to DHS-7.
Resources
DHS-7 Tabulation plan: Table 7.14

Guide to DHS Statistics 7.47 August 2018
Future Use of Contraception
Percent distribution of currently married women who are not using a contraceptive
method, by intention to use in the future.
Definition
Percent distribution of currently married women age 15-49 who are not using a contraceptive method,
by intention to use in the future.
Coverage:
Population base: Currently married women age 15-49 who are not currently using a
contraceptive method (IR file)
Time period: Current status at time of survey
Numerator: Number of currently married women who do not currently use a method of contraception,
by whether they intend to use contraception at any time in the future: Intends to use, Unsure, Does not
intend to use, Missing (v362)
Denominator: Total number of currently married women who are not currently using a method of
contraception (v502 = 1 & v312 = 0)
Variables: IR file.
v219
Living children + current pregnancy
v312
Current contraceptive method
v362
Intention to use
v005
Woman’s individual sample weight
Calculation
Numerators divided by the denominator and multiplied by 100 to obtain percentages.
Handling of Missing Values
Women who are unsure or with missing values for intention to use are included as separate categories.
Notes and Considerations
Percentages add up to 100 percent.
Typically disaggregated by number of living children including the current pregnancy.
Resources
DHS-7 Tabulation plan: Table 7.15


Guide to DHS Statistics 7.49 August 2018
Exposure to Family Planning Messages
Percentages of all women and men who heard or saw a family planning message on the
radio, television, in a newspaper or magazine, or on a mobile phone in the past few
months or in none of the four media sources.
Definition
Percentages of all women and men age 15-49 who heard or saw a family planning message in the past
few months:
1) on the radio,
2) on the television,
3) in a newspaper or magazine,
4) or on a mobile phone,
5) or in none of the four media sources.
Coverage:
Population base: All women (or men) age 15-49 (IR file, MR file)
Time period: Current status at time of survey
Numerators:
1) Number of women (or men) age 15-49 who heard a family planning message on the radio in the
past few months (women: v384a = 1; men: mv384a = 1)
2) Number of women (or men) age 15-49 who saw a family planning messages on television in the
past few months (women: v384b = 1; men: mv384b = 1)
3) Number of women (or men) age 15-49 who read a family planning message in the newspaper or
in a magazine in the past few months (women: v384c = 1; men: mv384c = 1)
4) Number of women (or men) age 15-49 who read a family planning message on mobile phone in
the past few months (women: v384d = 1; men: mv384d = 1)
5) Number of women (or men) age 15-49 who did not hear a family planning message on the radio,
did not see a family planning message on television, did not read a family planning message in a
newspaper or a magazine, did not see/read a family planning message on mobile phone, in the
past few months (women: v384a ≠ 1 & v384b ≠ 1 & v384c ≠ 1 & v384d ≠ 1; men: mv384a ≠ 1 &
mv384b ≠ 1 & mv384c ≠ 1 & mv384d ≠ 1)
Denominator: Total number of women (or men) age 15-49
Variables: IR file, MR file.
v384a
Heard family planning in newspaper/magazine last few months
v384b
Heard family planning on TV last few months
v384c
Heard family planning in newspaper/magazine last few months
v384d
Heard family planning by text messages on mobile phone
v005
Woman’s individual sample weight
mv384a
On radio heard about Family Planning in the last few months
mv384b
On TV saw about Family Planning in the last few months
mv384c
In newspaper read about Family Planning in the last few months

Guide to DHS Statistics 7.50 August 2018
mv384d
Heard family planning by text messages on mobile phone
mv005
Man’s individual sample weight
Calculation
Numerators divided by the denominator and multiplied by 100 to obtain percentages.
Handling of Missing Values
Women or men who are unsure or with missing values for heard, saw, or read a family planning
message are considered as not hearing, seeing, or reading a message, and are excluded from
numerators but included in the denominator.
Changes over Time
The reference period in the question on the exposure to family planning messages has changed over
time. In DHS I and DHS II “last month” was used and this was changed to the “last few months” in later
rounds of DHS.
The question on hearing of family planning by text messages on a mobile phone was added in DHS-7,
and the indicator on hearing of family planning messages through none of the media was changed to
reflect none of the four media rather than the three media used previously.
Resources
DHS-7 Tabulation plan: Table 7.16
API Indicator IDs:
Women:
FP_EFPM_W_RDO, FP_EFPM_W_TLV, FP_EFPM_W_NWS, FP_EFPM_W_NON
Men:
FP_EFPM_M_RDO, FP_EFPM_M_TLV, FP_EFPM_M_NWS, FP_EFPM_M_NON
(API link, STATcompiler link)

Guide to DHS Statistics 7.51 August 2018
Contact of Nonusers with Family Planning Providers
Percentages of women who are not using contraception who were visited by a fieldworker
who discussed family planning, who visited a health facility and discussed family planning,
who visited a health facility but did not discuss family planning and who did not discuss
family planning with a fieldworker or at a health facility during the 12 months preceding
the survey.
Definition
Percentages of all women age 15-49 who are not using contraception who:
1) were visited by a fieldworker who discussed family planning,
2) visited a health facility and discussed family planning,
3) visited a health facility but did not discuss family planning,
4) who did not discuss family planning with a fieldworker or at a health facility
during the 12 months preceding the survey
Coverage:
Population base: All women age 15-49 who are not using a contraceptive method (IR file)
Time period: 12 months preceding the survey
Numerators:
1) Number of all women age 15-49 who were visited by a fieldworker in the preceding 12 months
who discussed family planning (v393a = 1)
2) Number of all women age 15-49 who visited a health facility in the preceding 12 months and
who discussed family planning (v394 = 1 & v395 = 1)
3) Number of all women age 15-49 who visited a health facility in the preceding 12 months but
who did not discuss family planning (v394 = 1 & v395 ≠ 1)
4) Number of all women age 15-49 who did not discuss family planning with either a field worker
or at a health facility in the preceding 12 months (v393 ≠ 1 & v395 ≠ 1)
Denominator: Number of all women age 15-49 who are not using a contraceptive method (v312=0)
Variables: IR file.
v312
Current contraceptive method
v393a
Did fieldworker talk about family planning
v394
Visited health facility last 12 months
v395
At health facility, told of family planning
v005
Woman’s individual sample weight
Calculation
Numerators divided by the denominator and multiplied by 100 to obtain percentages.

Guide to DHS Statistics 7.52 August 2018
Handling of Missing Values
Women who are unsure or with missing values are considered as not having been visited by a field
worker or visited a health facility or having discussed family planning. These women are included in the
denominator of the percentages.
Changes over Time
The wording of the questions on contact with a fieldworker or health facility staff member have differed
over time. In DHS-III, the question on fieldworker contact referred specifically to a family planning
worker while later phases DHS asked about contact with a fieldworker without reference to FP. The
question on health facility contacts in the past 12 months also varied slightly between rounds: the DHS-
III question referred to visits to a health facility for any reason while in subsequent rounds the question
specifically asked about visits for care for the woman or her children.
Resources
DHS-7 Tabulation plan: Table 7.17
API Indicator IDs: FP_NFPP_W_FPW, FP_NFPP_W_HFP, FP_NFPP_W_HNF, FP_NFPP_W_NFP
(API link, STATcompiler link)

Guide to DHS Statistics 8.1 August 2018
Infant and Child Mortality
This chapter reports information on levels, trends and differentials in perinatal, neonatal, postneonatal,
infant, child and under age five years mortality. This information is relevant both to the demographic
assessment of the population and to health policies and programs. Estimates of infant and child
mortality may be an input into population projections, particularly if the level of adult mortality is
known from another source or can be inferred with reasonable confidence. Information on mortality of
children also serves the needs of health ministries by identifying sectors of the population that are at
high risk.
Included in this chapter are indicators of the distribution of children and women according to fertility
behavior that place children at an elevated risk of mortality (e.g., childbearing under age 18, over age 34
or after a birth interval less than 24 months). This information is useful for designing and monitoring
programs to avoid high-risk behavior and to cope with the elevated risks.
Notes and Considerations
Birth History
The indicators related to infant and child mortality are calculated from the DHS birth history:
A full birth history is a complete list of all children the woman has ever given birth to including
their date of birth, sex, survival status, age (if alive), and age at death (if died). This is the form of
birth history found in the majority of DHS surveys. Birth histories include all live births, including
children who later died, but omit stillbirths, miscarriages or abortions. Birth histories are
collected in chronological order from first to last.
A truncated birth history is a list of all births since a particular date, typically for the five year
preceding the survey. Truncated birth histories are used in many of the Malaria Indicator
Surveys, and are collected in reverse chronological order. Truncated birth histories may
demonstrate different characteristics than a full birth history as births in the particular time
period may be omitted, transferred out of the time period, transferred into the time period.
A pregnancy history is a complete list of all pregnancies the woman has ever had, including all
live births, stillbirths, miscarriages and abortions. Pregnancy histories have been used in surveys
in countries of the Commonwealth of Independent States, as well as Nepal, Philippines,
Vietnam, and in some special surveys such as the Afghanistan Mortality Survey, and the Ghana
Maternal Health Surveys. In surveys using pregnancy histories, the birth history is extracted
from the full pregnancy history and is found in the b* series variables. The full pregnancy history
is also available in the recode files for these surveys, typically in an s2* series of variables.

Guide to DHS Statistics 8.2 August 2018
Early Childhood Mortality
Methodology of DHS Mortality Rates Estimation
There are two principal categories of estimation methods for calculating infant and child mortality rates:
direct and indirect. Direct methods of calculation use data on the date of birth of children, their survival
status, and the dates of death or ages at death of deceased children. Indirect methods use information
on survival status of children to specific cohorts of mothers, typically age cohorts or time since first birth
cohorts.
The direct methods require data that are usually obtained only in specifically designed surveys with birth
histories or from vital statistics systems (which are generally deficient in less-developed countries). The
indirect methods can utilize data that are commonly collected in censuses and many general surveys:
the number of children ever born and the number living to women and the age or time since first birth
for the women. Unlike the direct methods, the indirect methods are very dependent upon several
assumptions that may or may not hold true: little or no change in fertility levels and age patterns, no
change or a linear decline in mortality, and a pattern of mortality by age that conforms to known
“families,” basically derived from European experience. The indirect methods are problematic in a
number of settings, but especially for countries affected by HIV/AIDS mortality which have different
mortality patterns.
Both types of methods can suffer from errors in data. Both methods suffer, probably equally, from the
omission of deceased children. Estimation of infant mortality, using direct methods, depends on the
correct reporting of age at death as under or over one year. The heaping of deaths at age 12 months is
common, and to the extent that it causes a transfer of deaths across the one-year boundary, infant
mortality rates may be somewhat underestimated. On the other hand, under-two and under-five
mortality rates are little affected by heaping. The misreporting of birth dates can also affect direct
estimates, but unless the misreporting occurs much more for deceased children, mortality rates are little
affected.
Estimates of indirect methods can suffer if women do not know their ages or the age of their first child,
as is common in many less-developed countries. The bias that results can be even greater if age is
estimated on the basis of characteristics linked directly or indirectly to mortality levels; for example,
number of children ever born. Censuses and surveys not specifically designed to gather data for
mortality estimation have also been shown to be very prone to suffer from omission of reports of dead
children. On the other hand, there have also been some cases where both stillbirths and live births have
been included in the answer to the question on children ever born, thus leading to overestimates of
mortality rates. Violations of the assumptions of the indirect methods also commonly occur.
An implicit assumption of the indirect methods is that the births of a cohort of women represent the
children born in a time period. Studies have shown that births to women 20–24 (and in some cases to
women 25–29) have more elements of high risk of mortality than do all children born within the last five
years of a survey.
Another problem with indirect methods is the location of the estimate in time. Indirect methods
estimate the probability of dying on the basis of experience that can extend over many years, resulting
Guide to DHS Statistics 8.3 August 2018
in an average over that period. Depending on changes in fertility and trends in mortality, the methods
used to place the mortality estimate in time can be more or less in error.
Because of the number of assumptions that may or may not hold, but that need to be made to use the
indirect methods and the limited amount of information that they provide, DHS has chosen to use direct
estimation methods. There are three variants of direct estimation methods for estimating infant
mortality rates and other rates:
1. A vital statistics approach in which the numbers of deaths to children under age 12 months in a
particular period are divided by the numbers of births in the same period. What is estimated is a
rate
of mortality but not a probability; a variation in the number of births with time will change
the rate
without changes in the underlying probabilities. To correct this, separation factors would
need to be
used, which would have to come from the other variants.
2. A true cohort life table approach in which deaths to children under age 12 months of a specific
cohort of births are divided by the number of births in that cohort. This procedure gives true
probabilities of death, but has the drawback that all children in the cohort must have been born at
least 12 months before the survey to be fully exposed to mortality, thus not taking into account
the
most recent experience. This requirement of full exposure becomes more limiting the higher
the age
segment of interest: For under-five mortality rates, only the information on children born
five or
more years before the survey can be utilized. Another drawback is that true cohort rates are
not
specific to a particular period at death, but instead relate to the date of birth of the cohort.
Therefore
the effects of events that affect several cohorts at the same time, for example, a famine
appears to be
spread out over time.
3. A synthetic cohort life table approach in which mortality probabilities for small age segments
based
on real cohort mortality experience are combined into the standard age segments. This
approach allows full use of the most recent data and is also specific for time periods. It is the
method that the DHS has chosen to use.
In the synthetic cohort life table approach, there are still several decisions to be made:
The length of the individual age
segments,
How to handle the heaping of deaths at 12 months,
How to handle deaths with incomplete information on age
at death.
Length of the individual age
segments
The information on age at death is recorded on the DHS questionnaire in days for less than 0-30 days, in
months for 1-23 months, and in years for two years or higher. The DHS adopted the following
age
segments 0, 1-2, 3-5, 6-11, 12-23, 24-35, 36-47, 48-59 months (completed ages) for the calculation
of the
individual probabilities of dying. A different approach could have been to use monthly segments up
to
two years, or monthly segments up to five years with imputation of the number of months for deaths at
2 years and above. These approaches were more processing intensive when the DHS Program started in
1984, and studies done during
the World Fertility Survey showed the difference to be negligible.
Heaping of deaths at 12 months
No adjustment for heaping on age
at death at 12 months or one year is done for the rates presented in
the survey reports. Because heaping is likely to
come unequally from both sides of the one-year
boundary and the correct number of deaths to reallocate
is unknown, the rates are presented using the
Guide to DHS Statistics 8.4 August 2018
information as reported. Indeed, the extent of rounding up
probably varies by country and within
country, and in some cases all or most of the heaping may be due
to reporting only whole year ages for
children dying in the second year of life (rounding down or
truncating age).
Deaths with incomplete information on age
at death
For children with missing information, the ages at death have been assigned according
to a “hot deck”
technique in which the information of the child of the same birth order and form of
reporting (day,
month, or year), if available, that most nearly precedes in the data file is assigned to the child for
whom
age at death is missing. This is a quasi-random technique that preserves the variation of responses
in the
data set.
Guide to DHS Statistics 8.5 August 2018
Neonatal Mortality Rate (NNMR), Post-Neonatal Mortality Rate (PNMR), Infant Mortality
Rate (IMR), Child Mortality Rate (CMR) (Ages 1-4), Under-five Mortality Rate (U5MR)
Definition
1) The neonatal mortality rate is the probability of a child exposed in a specific period dying before
reaching the age of 1 month.
2) The post-neonatal mortality rate is the probability of a child exposed in a specific period on or
after the age of 1 month but before reaching the age of 1 year, calculated as the difference
between the infant mortality rate and the neonatal mortality rate.
3) The infant mortality rate is the probability of a child exposed in a specific period dying before
reaching their first birthday.
4) The child mortality rate is the probability of a child exposed in a specific period dying on or after
their first birthday but before reaching the age of five years.
5) The under-five mortality rate is the probability (expressed as a rate per 1,000 live births) of a
child exposed in a specific period dying before reaching the age of five years.
Coverage:
Population base: Live births to respondents (BR file)
Time period: Five-year or ten-year periods of time preceding the survey (v008-1 to v008-60 or
v008-120 months), excluding the month of interview
Live birth: The complete expulsion or extraction from its mother of a product of conception,
irrespective of the duration of the pregnancy, which, after such separation, breathes or shows
any
other evidence of life, such as beating of heart, pulsation of the umbilical cord, or definite
movement
of voluntary muscles, whether or not the umbilical cord has been cut or the
placenta is attached.
(WHO, 1950 and 1992).
Numerators: Number of deaths to live-born children during specified age range and specified time
period
Neonatal mortality: Deaths at ages 0 to 30 days, including deaths reported at age zero months
Post-neonatal mortality: Deaths at ages 1 to 11 months, including deaths reported at ages 31 to 99
days, defined as the difference between the infant mortality rate and the
neonatal mortality rate
Infant mortality: Deaths at ages 0 to 11 months, including deaths reported at ages 0 to 99 days
Child mortality: Deaths at ages 1 to 4 years, including deaths reported at ages 12 to 59 months
Under-five mortality: Deaths at ages 0 to 4 years, including deaths reported at ages 0 to 59 months
and 0 to 99 days
Denominator: Number of surviving children at beginning of specified age range during the
specified time period
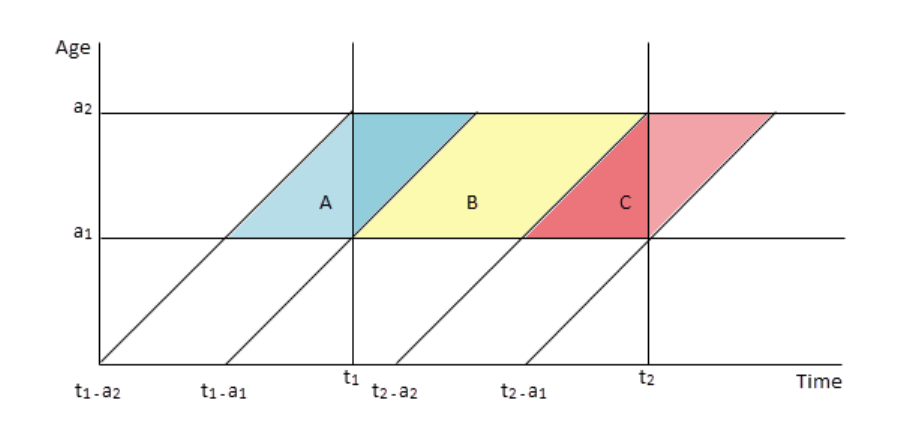
Guide to DHS Statistics 8.6 August 2018
Variables: BR file.
b3
Date of birth of child (CMC)
b5
Child is alive (1 = Yes, 0 = No)
b7
Age at death in months (imputed)
v008
Date of interview (CMC)
v005
Woman’s individual sample weight
Calculation
Component probabilities
Component death probabilities are first tabulated. Then the component death probabilities are
combined into the mortality rates. The component death probabilities are calculated for age
segments 0, 1-2, 3-5, 6-11, 12-23, 24-35, 36-47, and 48-59 months of completed age.
Each component death probability is defined by a time period and an age interval. Within these two
parameters, three birth cohorts of children are included, as indicated in the figure below:
One cohort of children (cohort B) is completely included and two (cohorts A and C) are partially
included in the time period. If the lower and
upper limits of the age interval are given by a1 and a2,
respectively, and the lower and upper limits
of the time period are given by t1 and t2, respectively, then
the three cohorts are defined as
children born between dates:
t1 - a2 and t1 - a1 (cohort A),
t1 - a1 and t2 - a2 (cohort B), and
t2 - a2 and
t2 - a1 (cohort C)
Cohorts A and C are only partially exposed to mortality between ages a1 and a2 during time period
t1 to t2.
Therefore, account needs to be taken of the partial exposure. Because of the small age
intervals of the
component probabilities, the assumption is made that the exposure to mortality
and deaths of birth
cohorts A and C are well represented by taking one-half of the total exposure
and one-half of the deaths
(with the exception noted below).

Guide to DHS Statistics 8.7 August 2018
Time periods:
The time period used is typically five years or ten years preceding the month of interview (v008-1 to v008-60,
or v008-1 to v008-120), excluding the month of interview as this would only contribute a partial month. Time
periods are expressed in the form [t1, t2), i.e. from t1 up to but not including t2 as follows:
0-4 years preceding the survey t1 = v008-60 t2 = v008
5-9 years preceding the survey t1 = v008-120 t2 = v008-60
10-14 years preceding the survey t1 = v008-120 t2 = v008-180
etc.
Age groups:
Age groups are expressed in the form [a1, a2), i.e. from a1 up to but not including a2 as follows:
0 a1 = 0 a2 = 1
1-2 a1 = 1 a2 = 3
3-5 a1 = 3 a2 = 6
6-11 a1 = 6 a2 = 12
12-23 a1 = 12 a2 = 24
24-35 a1 = 24 a2 = 36
36-47 a1 = 36 a2 = 48
48-59 a1 = 48 a2 = 60
For each age group and time period the numerators and denominators are calculated.
Numerators:
A.
One-half of the deaths between ages a1 and a2 to children of cohort A
(a1 <= b7 < a2 & t1 - a2 <= b3 < t1 - a1), plus
B.
All of deaths between ages a1 and a2 to children of cohort B
(a1 <= b7 < a2 & t1 - a1 <= b3 < t2 - a2), plus
C.
One-half* of the deaths between ages a1 and a2 to children of cohort C
(a1 <= b7 < a2 & t2 - a2 <= b3 < t2 - a1)
Denominators:
A.
One-half of the survivors at age a1 of children of cohort A
((b5 = 1 or a1 <= b7) & t1 - a2 <= b3 < t1 - a1), plus
B.
All of
the survivors at age a1 of children of cohort B
((b5 = 1 or a1 <= b7) & t1 - a1 <= b3 < t2 - a2), plus
C.
One-half of the survivors at age a1 of children
of cohort C
((b5 = 1 or a1 <= b7) & t2 - a2 <= b3 < t2 - a1)
Component death probabilities are calculated by dividing the numerator for each age range and
time
period by the denominator for that age range and period.
*Special exception: For the time period that ends with the date of the survey, numerators are
calculated
as the sum of one-half of the deaths between ages a1 and a2 to children of cohort A,
plus all of deaths
between ages a1 and a2 to children of cohort B, plus all of the deaths between
ages a1 and a2 to children
Guide to DHS Statistics 8.8 August 2018
of cohort C. This change is because all of the deaths reported in the
survey for cohort C for this time
period represent one-half of the deaths that would have occurred to
the cohort between ages a1 and a2.
Mortality rates
Neonatal mortality rate (NNMR):
This is the component death probability for 0 months of age multiplied by 1000.
Infant mortality rate (IMR):
1) Calculate the component survival probabilities by subtracting each component death
probability
from one.
2) Calculate the product of the component survival probabilities for 0, 1-2, 3-5, and 6-11
months of age.
3) Subtract the product from 1 and multiply by 1000 to get the infant mortality rate.
Post neonatal mortality rate (PNMR):
Subtract the neonatal mortality rate from the infant mortality rate.
Child mortality rate (CMR):
1) Calculate the component survival probabilities by subtracting each component death
probability
from 1.
2) Calculate the product of the component survival probabilities for 12-23, 24-35, 36-47, and
48-59 months of age.
3) Subtract the product from 1 and multiply by 1000 to get the child mortality rate.
Under-five mortality rate (U5MR):
1) Calculate the component survival probabilities by subtracting each component death
probability from 1.
2) Calculate the product of the component survival probabilities for 0, 1-2, 3-5, 6-11, 12-23, 24-
35, 36-47, and 48-59 months of age.
3) Subtract the product from 1 and multiply by 1000 to get the under-five mortality rate.
Handling of Missing Values
Five variables are used in the calculation of infant and child mortality: date of interview, date of birth
of
the child, survival of the child, age at death of the child, and the women’s sampling weight. The
date of interview is not allowed to be
missing on the questionnaire. Survival status for children is also
not allowed to be missing. If missing or
unknown, the date of birth and age at death are imputed
before the creation of the standard recode. See
Croft, 1991 for the imputation procedures.
Notes and Considerations
Typically, mortality rates are calculated for five-year periods preceding the date of the survey for
national estimates. To provide
stability in estimates for smaller subgroups, the ten-year period before
the survey is used. To calculate the
component death probabilities for the ten-year period, the
numerators for the 2 five-year periods
are summed, as are the denominators, before dividing the
numerators by the denominators.

Guide to DHS Statistics 8.9 August 2018
The reliability of mortality estimates depends upon full recall of children who have died, the absence of
differential displacement of birth dates of surviving and dead children, and accurate reporting of ages at
death. Previous survey results have often been characterized by some heaping of age at death at exactly
12 months or 1 year of age. Because age at death is recorded in completed months or years, deaths at
12 months are classified as child rather than infant deaths. In reality, some of these deaths may have
occurred before the first birthday so that their classification as child deaths tends to negatively bias
infant mortality estimates and positively bias child mortality estimates. The analyst should be aware that
this may occur in DHS surveys, although the probable effect is usually modest and unlikely to bias the
estimates by as much as 5 percent.
Changes over Time
In prior rounds of the DHS Program, five-year periods were used only for national estimates, and ten-
year periods were used for all disaggregations of the mortality rates. In DHS-7, as sample sizes have
increased over the years, five-year periods are also used for mortality rates disaggregated by sex and by
urban/rural residence.
References
Croft, T. 1991. “Date Editing and Imputation.” Demographic and Health Surveys World Conference
Proceedings, II: 1337–1356, Columbia, Maryland: IRD/ORC Macro.
https://dhsprogram.com/publications/publication-dhsg3-dhs-questionnaires-and-manuals.cfm
Moultrie T.A., R.E. Dorrington, A.G. Hill, K. Hill, I.M. Timæus and B. Zaba (eds). 2013. Tools for
Demographic Estimation. Paris: International Union for the Scientific Study of Population.
http://demographicestimation.iussp.org/content/direct-estimation-child-mortality-birth-histories
Pullum, T., S. Assaf, and S. Staveteig. 2017. Comparisons of DHS Estimates of Fertility and Mortality with
Other Estimates. DHS Methodological Reports No. 21. Rockville, Maryland, USA: ICF.
https://www.dhsprogram.com/publications/publication-MR21-Methodological-Reports.cfm
UNICEF, WHO, World Bank, UN-DESA Population Division. Child Mortality Estimation Methods.
http://collections.plos.org/cme
UNICEF, WHO, World Bank, UN-DESA Population Division. 2017. Levels and Trends in Child Mortality.
http://www.who.int/maternal_child_adolescent/documents/levels_trends_child_mortality_2017/en/
World Health Organization. 2018. Global reference list of 100 core health indicators. Geneva: World
Health Organization. http://www.who.int/healthinfo/indicators/2018/en/
Resources
UN IGME Child Mortality Estimates
http://childmortality.org/
R package DHS.rates: Calculate Key DHS Indicators
https://CRAN.R-project.org/package=DHS.rates

Guide to DHS Statistics 8.10 August 2018
DHS-7 Tabulation plan: Tables 8.1, 8.2, 8.3, and 15.17
API Indicator IDs: CM_ECMR_C_NNR, CM_ECMR_C_PNR, CM_ECMR_C_IMR, CM_ECMR_C_CMR, CM_ECMR_C_U5M
(API link, STATcompiler link)
SDG Indicator 3.2.1: Under-five mortality rate
SDG Indicator 3.2.2: Neonatal mortality rate
WHO 100 Core Health Indicators: Under-five mortality rate
WHO 100 Core Health Indicators: Infant mortality rate
WHO 100 Core Health Indicators: Neonatal mortality rate
MICS6 Indicator CS.1: Neonatal mortality rate
MICS6 Indicator CS.2: Post-neonatal mortality rate
MICS6 Indicator CS.3: Infant mortality rate
MICS6 Indicator CS.4: Child mortality rate
MICS6 Indicator CS.5: Under-five mortality rate

Guide to DHS Statistics 8.11 August 2018
Perinatal Mortality
Perinatal mortality rate
Definition
The perinatal mortality rate is the sum of the number of perinatal deaths (stillbirths and early neonatal
deaths) divided by the number of pregnancies of seven or more months' duration (all live births plus
stillbirths).
Coverage:
Population base: Pregnancies of seven or more months to women age 15–49 at time of
survey (IR file, BR file)
Time period: Five-year period preceding the survey (v008 to v008-59)
Numerator: Number of fetal deaths in pregnancies of seven or more months plus number of
deaths of live-born children in the 0–6 days following birth
Denominator: Number of pregnancies of seven or more months that terminated in a fetal death
plus pregnancies that ended with a live birth
Variables: IR file, BR file.
vcal_1
Calendar
v008
Date of interview (CMC)
v018
Row (position) in calendar of month of interview
b3
Date of birth of child (CMC)
b5
Child is alive (1 = yes, 0 = no)
b7
Age at death in months (imputed)
v005
Woman’s individual sample weight
Calculation
Numerator: The sum of the number of stillbirths plus the number of early neonatal deaths in the five
years preceding the survey.
1) Number of stillbirths: From the reproductive calendar, number of pregnancies that lasted
seven or more months and terminated in a fetal death in the five years preceding the survey.
For each position in the calendar (vcal_1) from v018 to v018+59: tally stillbirth if
there is a “T” (termination) in the position followed by six “P”s (pregnancy)
(“TPPPPPP”).
2) Number of early neonatal deaths: Number of children who died at age 0–6 days after birth in
the five years preceding the survey.
For births in the birth history tally all early neonatal deaths (b6 in 100:106) if the birth
took place in the five years preceding the survey (v008 >= b3 >= v008-59).
Denominator: The sum of the number of stillbirths plus the number of live births in the five years
preceding the survey.
1) Number of stillbirths, given in numerator 1 above.

Guide to DHS Statistics 8.12 August 2018
2) Number of live births in the five years preceding the survey (v008 >= b3 >= v008-59).
Perinatal mortality rate: Quotient of numerator divided by denominator multiplied by 1000.
Handling of Missing Values
Missing values are not allowed for any of the variables that make up the rate. Age at death for living
children is imputed if unknown or missing.
Notes and Considerations
The perinatal mortality rate is defined by dividing the number of perinatal deaths (stillbirths and early
neonatal deaths) by either the number of live births or by the sum of live births and stillbirths. Both
definitions are prevalent in the literature. The DHS Program has chosen to report the latter.
The definition of the pregnancy duration for stillbirth in general has changed in the literature over time.
Originally, it was
pregnancies lasting 28 weeks that ended in a fetal death. The duration limit was
subsequently lowered to 24, 22, and even 20 weeks. For the purpose of calculating perinatal mortality,
however, the definition remains at 28 weeks. DHS asks and records pregnancy duration in months so
the equivalent of seven months is used. The durations of pregnancy are taken as reported by the
respondents and do not necessarily have a clinical basis.
The number of stillbirths is estimated from the Contraceptive Calendar. See the Contraceptive
Calendar Tutorial at https://www.dhsprogram.com/data/Calendar-Tutorial/index.cfm for a
description of the calendar, how the data are stored and how to analyze the calendar data, and videos
on Completing the Contraceptive Calendar and the Data Structure of the Contraceptive Calendar. See
particularly Example 4: Still births and perinatal mortality at
https://www.dhsprogram.com/data/Calendar-Tutorial/index.cfm#example4.
Changes over Time
Earlier DHS reports prior to about 1998 used a somewhat different basis for perinatal rates. Deaths of
live-born children were
considered early neonatal deaths if they occurred 0 to 7 days after birth, given
the large amount of
heaping on day 7 and the consideration of the likelihood of rounding “in the first
week of life” by
interviewers to seven days, due to questionnaire coding requirements. In more recent
years The DHS Program has used the stricter definition of 0 to 6 days. Also, the denominator for the rates
was previously the number of live births rather than the sum of live births and stillbirths.
References
DHS Contraceptive Calendar Tutorial. Example 4 – Still births and Perinatal Mortality.
https://www.dhsprogram.com/data/Calendar-Tutorial/index.cfm#example4
Resources
DHS-7 Tabulation plan: Tables 8.4

Guide to DHS Statistics 8.13 August 2018
API Indicator IDs: CM_PNMR_C_PMR
(API link, STATcompiler link)
DHS Contraceptive Calendar Tutorial: https://www.dhsprogram.com/data/Calendar-Tutorial/index.cfm
DHS Contraceptive Calendar Tutorial Video Part 1: Completing the Contraceptive Calendar
https://www.youtube.com/watch?v=_7V6S5ljnZc
DHS Contraceptive Calendar Tutorial Video Part 2: Data Structure of the Contraceptive Calendar
https://www.youtube.com/watch?v=T2pS8IM0jyU

Guide to DHS Statistics 8.14 August 2018
High-Risk Fertility Behavior
Risk ratio of children in high-risk fertility behavior categories
Definition
The relative risk ratio is the ratio of children in high-risk fertility behavior categories to children not in
any high-risk category.
Coverage:
Population base: Children born to all women (BR or KR file)
Time period: Five years preceding the survey (b19 < 60)
Numerator: Proportion dead of children born in each high-risk
category
Denominator: Proportion dead of children born in non-high-risk category
Risk categories:
High-risk fertility behavior categories:
Children born to mothers under age 18 years (b3 - v011 < 216)
Children born to mothers 35 years and older (b3 - v011 >= 420)
Children of birth order 4 or higher (order >= 4 – see calculation below)
Children born less than 24 months since a preceding birth (b11 < 24)
Unavoidable risk category:
First birth order children born to mothers between ages 18 and 34 years
(order = 1 & b3 - v011 in 216:419)
Children not in any high-risk category:
Second- and third-birth-order children born to mothers between ages 18 and 34 years
(order = 2 or 3 & b3 - v011 in 216:419)
The high-risk categories are also combined into two-way and three-way combinations of
elevated
risk.
Variables: BR file.
v011
Date of birth of respondent (CMC)
b5
Child is alive (1 = yes, 0 = no)
bord
Birth order number
b0
Child is twin
b19
Age of child in months
v005
Woman’s individual sample weight
Calculation
To calculate relative risk ratios by categories of high-risk due to fertility behavior, first the
proportions dead for each category need to be calculated. For each risk category:
Guide to DHS Statistics 8.15 August 2018
Numerator: Number of children born in the five years preceding the survey who died at any age
(b19 < 60 & b5 = 0).
Denominator: Number of children born in the five years preceding the survey (b19 < 60).
Proportion dead: Numerator divided by denominator.
Then the risk ratio is calculated as a ratio of the proportions dead:
Risk ratio numerators: Proportion dead of children born in each high-risk
category.
Risk ratio denominator: Proportion dead of children born in non-high-risk category
(see definition
above).
Relative risk ratios: Risk ratio numerators for each category divided by the risk ratio
denominator.
Handling of Missing Values
None of the information needed to calculate relative risk ratios is allowed to have missing or unknown
data. Note that age at death is not used, only survival status at the time of the survey.
Notes and Considerations
To provide a more robust estimate of the elevated relative risk, proportions dead are used instead of
period mortality rates in the calculation of relative risk, since period mortality rates have higher
sampling
errors. In DHS reports, risk ratios are not shown where the proportion dead is based on
fewer than 25
births. Risk ratios where the proportion dead is based on 25 to 49 births are placed in
parentheses to
indicate large variability due to sampling.
Assumptions: It is assumed that the number of births and death rates do not vary substantially by time
period within the
preceding five years.
Risk ratios are presented in single high-risk categories where the births were only in one of the high-
risk categories, and in multiple high-risk categories where births were in two or three of the high-risk
categories. Subtotals by single category and multiple category are also presented, and in DHS-7
onwards for individual high-risk categories irrespective of whether the birth was in a single or
multiple risk categories.
Changes over Time
Originally, prior to about 1998, the denominator for the risk ratio included the unavoidable risk category
of first-order births to
mothers between 18 and 24 years of age.
The calculation of months since birth has changed in DHS-7 compared to prior rounds of DHS. In DHS-7
recode files b19 provides months since birth for both living and dead children calculated from the date
of birth in days. In prior rounds of The DHS Program, months since birth were calculated based on the
date of birth in months as v008-b3. The selection for births in the five years preceding the survey is
based on b19 < 60 or, in datasets without b19, v008-b3 < 60.

Guide to DHS Statistics 8.16 August 2018
References
Govindasamy, P., M.K. Stewart, S.O. Rutstein, J.T. Boerma, and A.E. Sommerfelt. 1993. High-risk birth
and maternity care. DHS Comparative Studies No. 8. Columbia, Maryland, USA: Macro International.
https://www.dhsprogram.com/publications/publication-CS8-Comparative-Reports.cfm
Resources
DHS-7 Tabulation plan: Tables 8.5
API Indicator ID:
CM_HRFR_C_NON, CM_HRFR_C_FOB, CM_HRFR_C_A18, CM_HRFR_C_A34, CM_HRFR_C_B24,
CM_HRFR_C_BO3, CM_HRFR_C_SNG, CM_HRFR_C_A1B, CM_HRFR_C_A2B, CM_HRFR_C_ABO,
CM_HRFR_C_A3B, CM_HRFR_C_BIO, CM_HRFR_C_MLT, CM_HRFR_C_ANY
(API link, STATcompiler link)
Guide to DHS Statistics 8.17 August 2018
Percentage of births in high-risk fertility behavior categories
Definition
Percentage of children born in the five years preceding the survey by category of elevated risk of
mortality.
Coverage:
Population base: Children born to all women (BR or KR file)
Time period: Births in the five years preceding the survey (b19 < 60)
Numerator: Number of births in each risk category for children born in the five years preceding
the survey
Denominator: Number of children born in the five years preceding the survey (b19 < 60)
Risk categories:
High-risk fertility behavior categories:
Children born to mothers under age 18 years (b3 - v011 < 216)
Children born to mothers 35 years and older (b3 - v011 >= 420)
Children of birth order 4 or higher (order >= 4 – see calculation below)
Children born less than 24 months since a preceding birth (b11 < 24)
Unavoidable high-risk category:
First birth order children born to mothers between ages 18 and 34 years
(order = 1 & b3 - v011 in 216:419)
Children not in any high-risk category:
Second- and third-birth-order children born to mothers between ages 18 and 34 years
(order = 2, 3 & b3 - v011 in 216:419)
The high-risk categories are also combined into two-way and three-way combinations of
elevated
risk.
Variables: BR file.
v011
Date of birth of respondent (CMC)
bord
Birth order number
b0
Child is twin
b19
Age of child in months
v005
Woman’s individual sample weight
Calculation
Numerators for percentages are divided by the same denominator and multiplied by 100 to obtain
percentages.
Handling of Missing Values

Guide to DHS Statistics 8.18 August 2018
None of the information needed to calculate the high-risk categories is allowed to have missing or
unknown
data.
Notes and Considerations
Percentages are presented in single high-risk categories where the births were only in one of the
high-risk categories, and in multiple high-risk categories where births were in two or three of the
high-risk categories. Subtotals by single category and multiple category are also presented, and in
DHS-7 onwards for individual high-risk categories irrespective of whether the birth was in a single or
in multiple risk categories.
Changes over Time
The calculation of months since birth has changed in DHS-7 compared to prior rounds of DHS. In DHS-7
recode files b19 provides months since birth for both living and dead children calculated from the date
of birth in days. In prior rounds of The DHS Program, months since birth were calculated based on the
date of birth in months as v008-b3. The selection for births in the five years preceding the survey is
based on b19 < 60 or, in datasets without b19, v008-b3 < 60.
Resources
DHS-7 Tabulation plan: Tables 8.5
API Indicator IDs:
CM_HRFB_C_NON, CM_HRFB_C_FOB, CM_HRFB_C_A18, CM_HRFB_C_A34, CM_HRFB_C_B24,
CM_HRFB_C_BO3, CM_HRFB_C_SNG, CM_HRFB_C_A1B, CM_HRFB_C_A2B, CM_HRFB_C_ABO,
CM_HRFB_C_A3B, CM_HRFB_C_BIO, CM_HRFB_C_MLT, CM_HRFB_C_ANY
(API link, STATcompiler link)
Guide to DHS Statistics 8.19 August 2018
Percentage of currently married women in high-risk fertility behavior categories
Definition
Percentage of women currently married or in union by category of risk if they were to conceive a child at
the time of the survey.
Coverage:
Population base: Women currently married or in union (v502 = 1) (IR file)
Time period: Current status at time of survey
Numerator: Number of currently married women in each risk category
Denominator: Number of currently married women (v502 = 1)
Risk categories:
High-risk fertility behavior categories:
Women under age 17 years and 3 months (v008 - v011 < 207)
Women over age 34 years and 2 months (v008 - v011 > 410)
Women who have given birth to 3 or more children (v201 >= 3)
Women whose last birth was less than 15 months ago (v222 < 15)
Unavoidable high-risk category:
Women who have never given birth (v201 = 0) and are between 17 years and 3 months of
age and 34 years and 2 months of age (v008 - v011 in 207:410)
Women not in any high-risk category:
Women who have given birth to one or two children (v201 = 1 or 2) and are between 17 years
and 3 months of age and 34 years and 2 months of age (v008 - v011 in 207:410). Women who
are sterilized (v312 = 6) are also included in this category
Women are assigned to risk categories according to the status they would have at the birth of a child
if they were to conceive at the time of the survey, assuming the birth would take place in 9 months
from the time of the survey. Current pregnancy is not taken into account in this definition.
The high-risk categories are also combined into two-way and three-way combinations of
elevated
risk.
Variables: IR file.
v008
Date of interview (CMC)
v011
Date of birth of respondent (CMC)
v502
Currently/formerly/never in union
v201
Total children ever born
v222
Last birth to interview (months)
v312
Current contraceptive method
v005
Woman’s individual sample weight

Guide to DHS Statistics 8.20 August 2018
Calculation
Numerators for percentages are divided by the same denominator and multiplied by 100 to obtain
percentages.
Handling of Missing Values
None of the information needed to calculate the high-risk categories is allowed to have missing or
unknown
data.
Notes and Considerations
Percentages are presented in single high-risk categories where the women were only in one of the
high-risk categories, and in multiple high-risk categories where women were in two or three of the
high-risk categories. Subtotals by single category and multiple category are also presented, and in
DHS-7 onwards for individual high-risk categories irrespective of whether the woman was in a single
or in multiple risk categories.
References
Rutstein, S., and R. Winter. 2015. Contraception Needed to Avoid High-Fertility-Risk Births, and
Maternal and Child Deaths That Would Be Averted. DHS Analytical Studies No. 50. Rockville, Maryland,
USA: ICF International. https://dhsprogram.com/publications/publication-as50-analytical-studies.cfm
Resources
DHS-7 Tabulation plan: Tables 8.5
API Indicator IDs:
CM_HRFW_C_NON, CM_HRFW_C_FOB, CM_HRFW_C_A18, CM_HRFW_C_A34, CM_HRFW_C_B24,
CM_HRFW_C_BO3, CM_HRFW_C_SNG, CM_HRFW_C_A1B, CM_HRFW_C_A2B, CM_HRFW_C_ABO,
CM_HRFW_C_A3B, CM_HRFW_C_BIO, CM_HRFW_C_MLT, CM_HRFW_C_ANY
(API link, STATcompiler link)

Guide to DHS Statistics 9.1 August 2018
Reproductive Health
This chapter presents findings from several areas of importance to maternal and reproductive health,
including antenatal, delivery and postnatal care, and general access to health services.
Information on antenatal, delivery and postnatal care is of great value in identifying subgroups of
women who do not utilize such services and is useful in planning for improvements in service delivery.
Information on antenatal care is shown according to the number of ANC visits made, the stage of
pregnancy at the time of the first visit, the type of provider and the specific services and information
provided during antenatal visits, including whether tetanus toxoid was received. Similarly, delivery
services are described according to the place of the delivery, the type of person assisting the delivery
and the rate of caesarean section. Information on postnatal care is shown by whether a woman
delivered in a health facility or elsewhere and describes the time since delivery of the first postnatal care
and from whom it was received. This information helps identify population groups who are underserved
with maternity care services.
General information for access and barriers to use of health services for the woman herself is also
presented in this chapter.

Guide to DHS Statistics 9.2 August 2018
Antenatal Care
Percent distribution of antenatal care by type of provider, and percentage of antenatal
care from a skilled provider
Definition
1) Percentage of women with a birth in the last 5 years, distributed by highest type of provider of
antenatal care for most recent birth.
2) Percentage of women with a birth in the last 5 years receiving antenatal care from a skilled
provider for the most recent birth.
Coverage:
Population base: Women who have had one or more births in the 5 years preceding the survey
(KR file or IR file)
Time period: Five years preceding the survey
Numerators:
1) Number of women who were attended for antenatal care (ANC) for their last birth (midx = 1),
distributed according to the type of provider with the highest level of qualification (m2a – m2n =
1). (Note that types of providers and variables below are based on the standard DHS 7
questionnaire. Actual provider types and variables are survey specific, but will be from the m2a–
m2n series.) The professional qualifications The types of provider are country specific but
typically include:
a) Doctor (m2a = 1)
b) Nurse/midwife (m2b = 1)
c) Auxiliary nurse/midwife (m2c = 1)
d) Community health worker (m2i = 1)
e) Other health worker (m2d = 1 or m2e = 1 or m2f = 1)
f) Traditional birth attendant (m2g = 1)
g) Other (m2h = 1 or m2j = 1 or m2k = 1 or m2l = 1 or m2m = 1)
h) No ANC (m2n = 1)
i) Missing (none of the above)
2) Number of women receiving antenatal care from a skilled provider for the most recent birth.
The classification of skilled provider is also country specific, but typically includes providers such
as Doctor, Nurse/midwife, and Auxiliary nurse/midwife (often m2a = 1 or m2b = 1 or m2c = 1,
but depends on the survey)
Denominator: Number of women with a birth in the last 5 years (midx = 1)
Variables: KR file or IR file.
midx
Index to birth history (1 = last birth)
m2a
Prenatal: Doctor
m2b
Prenatal: Country specific health professional
m2c
Prenatal: Country specific health professional
m2d
Prenatal: Country specific health professional
Guide to DHS Statistics 9.3 August 2018
m2e
Prenatal: Country specific health professional
m2f
Prenatal: Country specific health professional
m2g
Prenatal: Traditional birth attendant
m2h
Prenatal: Country specific other person
m2i
Prenatal: Country specific other person
m2j
Prenatal: Country specific other person
m2k
Prenatal: Other
m2l
Prenatal: Country specific other
m2m
Prenatal: Country specific other
m2n
Prenatal: No one
v005
Woman’s individual sample weight
Variables from the m series in the IR file will have _1 after each variable representing care sought during
pregnancy resulting in the most recent live birth.
Calculation
During data collection respondents may mention more than one provider. The percent distribution by
type of provider takes the highest type of provider from the list above, and does not include other
providers mentioned by the respondent.
For each type of provider, the numerator divided by the overall denominator, multiplied by 100.
Handling of Missing Values
Missing value for type of provider is included in its own category in the distribution.
Notes and Considerations
Percentage distribution adds up to 100 percent.
The category “Trained nurse/midwife” includes only medically trained and licensed personnel.
Traditional birth attendants (also sometimes called midwives) are not considered skilled providers,
whether trained or untrained.
The category “Traditional birth attendant/other” includes auxiliary health personnel and cases where
the respondent did not know the level of qualification.
The category skilled provider typically includes doctor/nurse, midwife and auxiliary nurse/midwife. The
category ‘auxiliary nurse/ midwife’ may or may not be considered skilled in providing ANC and should be
adapted to reflect the country’s healthcare system as in most countries, not all cadres of health care
professionals are considered “skilled” in providing ANC. Country managers must find out which cadres of
providers should be considered skilled providers of ANC in a given country.

Guide to DHS Statistics 9.4 August 2018
References
Wang, W., S. Alva, S. Wang, and A. Fort. 2011. Levels and trends in the use of maternal health services in
developing countries. DHS Comparative Reports No. 26. Calverton, Maryland, USA: ICF Macro.
https://dhsprogram.com/publications/publication-cr26-comparative-reports.cfm
Footman, K., L. Benova, C. Goodman, D. Macleod, C. A. Lynch, L. Penn‐Kekana, and O. M. R. Campbell.
2015. "Using multi‐country household surveys to understand who provides reproductive and maternal
health services in low‐and middle‐income countries: a critical appraisal of the Demographic and Health
Surveys." Tropical Medicine & International Health, 20(5): 589-606.
Resources
DHS-7 Tabulation plan: Table 9.1
API Indicator IDs:
RH_ANCP_W_DOC, RH_ANCP_W_NRS, RH_ANCP_W_AUX, RH_ANCP_W_CHW, RH_ANCP_W_OHW,
RH_ANCP_W_TBA, RH_ANCP_W_OTH, RH_ANCP_W_MIS, RH_ANCP_W_NON, RH_ANCP_W_SKP
(API link, STATcompiler link)
MICS6 Indicator TM.5a: Antenatal care coverage: at least once by skilled health personnel.
Note that the DHS indicator includes all women who had a live birth in the past 5 years, but the MICS
indicator is restricted to women who had a live birth in the past 2 years.
Guide to DHS Statistics 9.5 August 2018
Percent distribution of number of antenatal care visits, and of timing of first antenatal visit
Definition
1) Percentage of women with a birth in the last 5 years, distributed by number of antenatal care
visits for most recent birth.
2) Percentage of women with a birth in the last 5 years, distributed by number of months pregnant
at time of first antenatal care visit for most recent birth.
Coverage:
Population base: Women who have had one or more births in the 5 years preceding the survey
(KR file or IR file)
Time period: Five years preceding the survey
Numerators:
1) Numbers of women who received antenatal care for their last birth, according to grouped
number of visits (m14)
2) Numbers of women who received antenatal care for their last birth, according to grouped
number of months they were pregnant at time of first visit (m13)
Denominator: Number of women with a birth in the last 5 years (midx = 1)
Variables: KR file or IR file.
midx
Index to birth history (1 = last birth)
m14
Number of antenatal visits during pregnancy
m13
Timing of 1st antenatal check (months)
m2n
Prenatal: no one
v005
Woman’s individual sample weight
Calculation
Number of antenatal visits is grouped into categories of no antenatal care, 1 visit, 2-3 visits, 4+ visits,
and missing/don’t know before calculating percentages. Timing of first antenatal visit is grouped into
categories of no antenatal visit, <= 3 months, 4-5 months, 6-7 months, 8+ months, and missing/don’t
know before calculating percentages. The percentages are the quotients of the numerators divided by
the denominator, multiplied by 100.
Handling of Missing Values
“Don’t know” and missing values included in percent distributions. For timing of first antenatal check
the non-applicable cases (those with no antenatal care) are recoded into a category for no antenatal
care.
Notes and Considerations
Percent distributions add up to 100 percent.

Guide to DHS Statistics 9.6 August 2018
Changes over Time
The World Health Organization recently increased the number of recommended antenatal visits from
four to eight. Future DHS surveys may adopt this indicator.
References
Benova, L., Ö. Tunçalp, A.C. Moran and O.M.R. Campbell, 2018. “Not just a number: examining coverage
and content of antenatal care in low-income and middle-income countries.” BMJ Global Health, 3(2),
p.e000779. https://gh.bmj.com/content/3/2/e000779
MacQuarrie, K.L.D., L. Mallick, and C. Allen. 2017. Sexual and reproductive health in early and later
adolescence: DHS data on youth Age 10-19. DHS Comparative Reports No. 45. Rockville, Maryland, USA:
ICF. https://dhsprogram.com/publications/publication-cr45-comparative-reports.cfm
Owolabi, O.O., K.L.M. Wong, M.L. Dennis, E. Radovich, F.L. Cavallaro, C.A. Lynch, A. Fatusi, I. Sombie, and
L. Benova. 2017. "Comparing the Use and Content of Antenatal Care in Adolescent and Older First-Time
Mothers in 13 Countries of West Africa: A Cross-Sectional Analysis of Demographic and Health Surveys."
The Lancet Child & Adolescent Health 1(3):203-212.
https://www.sciencedirect.com/science/article/pii/S2352464217300251
Wang, W., S. Alva, S. Wang, and A. Fort. 2011. Levels and trends in the use of maternal health services in
developing countries. DHS Comparative Reports No. 26. Calverton, Maryland, USA: ICF Macro.
https://dhsprogram.com/publications/publication-cr26-comparative-reports.cfm
World Health Organization. 2016. WHO recommendations on antenatal care for a positive pregnancy
experience. Geneva: World Health Organization.
http://www.who.int/reproductivehealth/publications/maternal_perinatal_health/anc-positive-
pregnancy-experience/en/
World Health Organization. 2018. Global reference list of 100 core health indicators. Geneva: World
Health Organization. http://www.who.int/healthinfo/indicators/2018/en/
Resources
DHS-7 Tabulation plan: Table 9.2
API Indicator IDs:
RH_ANCN_W_NON, RH_ANCN_W_N01, RH_ANCN_W_N23, RH_ANCN_W_N4P, RH_ANCN_W_DKM,
RH_ANCT_W_NON, RH_ANCT_W_TL4, RH_ANCT_W_T45, RH_ANCT_W_T67, RH_ANCT_W_T8P,
RH_ANCT_W_DKM
(API link, STATcompiler link)
WHO 100 Core Health Indicators: Antenatal care coverage
Guide to DHS Statistics 9.7 August 2018
MICS6 Indicator TM.5b: Antenatal care coverage: at least four times by any provider.
Note that the DHS indicator includes all women who had a live birth in the past 5 years, but the MICS
indicator is restricted to women who had a live birth in the past 2 years.

Guide to DHS Statistics 9.8 August 2018
Median number of months pregnant at time of first antenatal care visit
Definition
Median number of months pregnant at the time of first antenatal care visit for the most recent birth in
the 5 years preceding the survey.
Coverage:
Population base: Women who have had one or more births in the 5 years preceding the survey
(KR file or IR file).
Time period: Five years preceding the survey.
Numerator: Numbers of women who received antenatal care for their last birth according to the single
number of months they were pregnant at time of first visit (m13)
Denominator: Number of women with a birth in the last 5 years who received antenatal care for their
last birth (midx = 1 & m13 < 96)
Variables: KR file or IR file.
midx
Index to birth history (1 = last birth)
m13
Timing of 1st antenatal check (months)
v005
Woman’s individual sample weight
Calculation
For the median, first calculate percentages of single months pregnant at first visit by dividing the
numerators by the denominator. Cumulate the percentages by single months starting with the lowest
value.
Linearly interpolate between the number of months immediately before and after where the cumulated
distribution exceeds 50 percent to determine the median. See Median Calculations in Chapter 1.
Handling of Missing Values
“Don’t know” and missing values excluded from numerators and denominator of percentages for
median calculation.
Resources
DHS-7 Tabulation plan: Table 9.2
API Indicator IDs: RH_ANCT_W_MED
(API link, STATcompiler link)
Guide to DHS Statistics 9.9 August 2018
Percentage of women receiving components of antenatal care
Definition
1) Percentage of women with a birth in the past 5 years who took iron tablets or syrup during the
pregnancy for the most recent live birth.
2) Percentage of women with a birth in the last 5 years who took intestinal parasite drugs during
the pregnancy for the most recent live birth.
3) Among women who received antenatal care for their most recent live birth in the past 5 years,
the percentage that had their blood pressure measured.
4) Among women who received antenatal care for their most recent live birth in the past 5 years,
the percentage that had a urine sample taken.
5) Among women who received antenatal care for their most recent live birth in the past 5 years,
the percentage that had a blood sample taken.
Coverage:
Population base: Women with a birth in the 5 years preceding the survey (KR file or IR file)
Time period: Five years preceding the survey
Numerators:
1) Number of women with a birth in the past 5 years who took iron tablets or syrup during the
pregnancy for the most recent live birth (m45 = 1)
2) Number of women with a birth in the past 5 years who took intestinal parasite drugs during the
pregnancy for the most recent live birth (m60 = 1)
3) Number of women who received antenatal care for their most recent live birth in the past 5
years who had their blood pressure measured (m2n = 0 & m42c = 1)
4) Number of women who received antenatal care for their most recent live birth in the past 5
years who had a urine sample taken (m2n = 0 & m42d = 1)
5) Number of women who received antenatal care for their most recent live birth in the past 5
years who had a blood sample taken (m2n = 0 & m42e = 1)
Denominators:
1) Numerators 1, 2) Number of women with a birth in the past 5 years (midx = 1)
2) Numerators 3, 4, 5) Number of women with a birth in the past 5 years who received antenatal
care for their most recent birth (midx = 1 & m2n = 0)
Variables: KR file or IR file.
midx
Index to birth history (1 = last birth)
m2n
Prenatal: no one (0 = received antenatal care)
m45
During pregnancy, given or bought iron tablets/syrup
m60
Drugs for intestinal parasites during pregnancy
m42c
During pregnancy: blood pressure taken
m42d
During pregnancy: urine sample taken
m42e
During pregnancy: blood sample taken
v005
Woman’s individual sample weight

Guide to DHS Statistics 9.10 August 2018
Calculation
For percentages, 100 times the quotient of the numerators divided by the denominator.
Handling of Missing Values
“Don’t know” and missing values on key components of antenatal care (e.g. iron supplements) are
excluded from numerators but included in denominators, assuming that they did not receive the
antenatal care component.
References
Benova, L., Ö. Tunçalp, A.C. Moran and O.M.R. Campbell, 2018. “Not just a number: examining coverage
and content of antenatal care in low-income and middle-income countries.” BMJ Global Health, 3(2),
p.e000779. https://gh.bmj.com/content/3/2/e000779
Owolabi, O.O., K.L.M. Wong, M.L. Dennis, E. Radovich, F.L. Cavallaro, C.A. Lynch, A. Fatusi, I. Sombie, and
L. Benova. 2017. "Comparing the Use and Content of Antenatal Care in Adolescent and Older First-Time
Mothers in 13 Countries of West Africa: A Cross-Sectional Analysis of Demographic and Health Surveys."
The Lancet Child & Adolescent Health 1(3):203-212.
https://www.sciencedirect.com/science/article/pii/S2352464217300251
World Health Organization. 2016. WHO recommendations on antenatal care for a positive pregnancy
experience. Geneva: World Health Organization.
http://www.who.int/reproductivehealth/publications/maternal_perinatal_health/anc-positive-
pregnancy-experience/en/
Resources
DHS-7 Tabulation plan: Table 9.3
API Indicator IDs:
RH_ANCC_W_IRN, RH_ANCC_W_PAR, RH_ANCS_W_BLP, RH_ANCS_W_URN, RH_ANCS_W_BLS
(API link, STATcompiler link)
MICS6 Indicator TM.6: Content of antenatal care
Note that the DHS indicator includes all women who had a live birth in the past 5 years, but the MICS
indicator is restricted to women who had a live birth in the past 2 years

Guide to DHS Statistics 9.11 August 2018
Tetanus Toxoid Injections
Percentage of women receiving two or more tetanus toxoid injections during pregnancy,
and percentage whose most recent live birth was protected against neonatal tetanus
Definition
1) Percentage of women with a live birth in the 5 years preceding the survey receiving two or more
injections during the pregnancy for the most recent live birth.
2) Percentage of women with a live birth in the 5 years preceding the survey whose most recent
live birth was protected against neonatal tetanus.
Coverage:
Population base: Women who had a birth in the 5 years preceding the survey (KR file or IR file)
Time period: Five years preceding the survey
Numerators:
1) Number of women with a live birth in the 5 years preceding the survey with two or more of
tetanus toxoid injections received during the pregnancy of the most recent birth (m1 in 2:7)
2) Number of women with a live birth in the 5 years preceding the survey who received either:
two tetanus toxoid injections during the pregnancy for her most recent live birth, or
two or more injections (the last within 3 years of the most recent live birth), or
three or more injections (the last within 5 years of the most recent live birth), or
four or more injections (the last within 10 years of the most recent live birth), or
five or more injections at any time prior to the most recent live birth
Denominator: Number of women with a birth in the last 5 years (midx = 1)
Variables: KR file or IR file.
midx
index to birth history (1 = last birth)
b19
Current age of child in months
m1
Number of tetanus injections before birth (during pregnancy)
m1a
Number of tetanus injections before pregnancy
m1d
Years ago received last tetanus injection before pregnancy
v005
Woman’s individual sample weight
Calculation
Numerators:
1) Numbers of women with a live birth in the 5 years preceding the survey with two or more of
tetanus toxoid injections received during the pregnancy of the most recent birth (midx = 1 & m1
in 2:7)
2) For the percentage of women with a live birth in the 5 years preceding the survey whose most
recent live birth was protected against neonatal tetanus, the calculation of the numerator
requires calculating two intermediate variables – the total number of tetanus injections in the
woman’s life (total_tetanus) and the number of years since the last tetanus injection

Guide to DHS Statistics 9.12 August 2018
(last_injection). total_tetanus is the sum of the number of injections during the pregnancy (m1)
and the number of injections prior to the pregnancy (m1a) if these are in the range 1 to 7
(values of m1 or m1a outside of the range 1 to 7 are counted as 0). last_injection is initialized to
a high value (99). If any injection was given during the pregnancy (m1 in 1:7) then last_injection
is set to 0. Otherwise if m1d (years ago received last tetanus toxoid injection) is in the range 1 to
40 then last_injection is set to m1d minus the age of the child (or years since birth if died) ( int(
b19 / 12 ) ). Using these two intermediate variables, the following conditions are used for the
numerator:
two tetanus toxoid injections during the pregnancy for her most recent live birth
(midx = 1 & m1 in 2:7) , or
two or more injections (the last within 3 years of the most recent live birth)
(midx = 1 & total_tetanus >= 2 & last_injection < 3), or
three or more injections (the last within 5 years of the most recent live birth)
(midx = 1 & total_tetanus >= 3 & last_injection < 5), or
four or more injections (the last within 10 years of the most recent live birth)
(midx = 1 & total_tetanus >= 4 & last_injection < 10), or
five or more injections at any time prior to the most recent live birth
(midx = 1 & total_tetanus >= 5)
The percentages are calculated as 100 times the quotient of the numerators divided by the
denominator.
Handling of Missing Values
“Don’t know” or missing on the number of tetanus toxoid injections during the pregnancy (m1) or prior
to the pregnancy (m1a) are treated as 0 injections in the calculation of total_tetanus. “Don’t know” or
missing on the number of years ago received the last tetanus toxoid injection before the pregnancy
(m1d) are treated as a large number of years (99) prior to the pregnancy.
Notes and Considerations
Tetanus toxoid injections are given to women during pregnancy to protect infants from neonatal
tetanus, an important cause of infant death that is due primarily to unsanitary conditions at childbirth.
References
Benova, L., Ö. Tunçalp, A.C. Moran and O.M.R. Campbell, 2018. “Not just a number: examining coverage
and content of antenatal care in low-income and middle-income countries.” BMJ Global Health, 3(2),
p.e000779. https://gh.bmj.com/content/3/2/e000779
World Health Organization, Department of Making Pregnancy Safer and Department of Reproductive
Health and Research. 2007. Standards for Maternal and Neonatal Care: Maternal immunization against
tetanus. http://www.who.int/reproductivehealth/publications/maternal_perinatal_health/a91272/en/
World Health Organization. 2017. Tetanus vaccines: WHO position paper – February 2017. Weekly
epidemiological record. No 6, 2017, 92, 53–76.
http://www.who.int/immunization/diseases/WER9206.pdf

Guide to DHS Statistics 9.13 August 2018
Resources
DHS-7 Tabulation plan: Table 9.4
API Indicator IDs: RH_TTIJ_W_TT2, RH_TTIJ_W_PRT
(API link, STATcompiler link)
MICS6 Indicator TM.7: Neonatal tetanus protection.
Note that the DHS indicator includes all women who had a live birth in the past 5 years, but the MICS
indicator is restricted to women who had a live birth in the past 2 years.

Guide to DHS Statistics 9.14 August 2018
Place of Delivery
Percent distribution of live births by place of delivery, and the percentage of live births
delivered in a health facility
Definition
1) Percent distribution of live births in the past 5 years by place of delivery.
2) Percentage of live births in the past 5 years delivered in a health facility.
Coverage:
Population base: Live births to interviewed women in the 5 years preceding the survey (KR file)
Time period: Five years preceding the survey
Numerators:
1) Number of live births distributed according to whether the delivery took place in a:
a) Public health facility (m15 in 20:29)
b) Private health facility (m15 in 30:39)
c) At home (m15 = 11 or 12), or
d) In another place (m15 = 96)
e) Place of delivery is missing/“don’t know” (m15 = 98 or 99)
2) Number of births that took place in a health facility (m15 in 20:39)
Denominator: Number of live births in the 5 years preceding the survey
Variables: KR file.
m15
Place of delivery
v005
Woman’s individual sample weight
Calculation
For percent distribution, numerators divided by denominator multiplied by 100.
For the percentage of births delivered in a health facility: numerator divided by denominator and
multiplied by 100.
Handling of Missing Values
Births with missing information are included in the denominator for both the distribution of place of
delivery and percentage of all births delivered in a health facility. The percent distribution of place of
delivery includes a separate category for missing values.
Notes and Considerations
Percent distribution adds up to 100 percent. While this table includes all live births to interviewed
women in the 5 years preceding the survey, the background characteristic for number of antenatal care

Guide to DHS Statistics 9.15 August 2018
visits is calculated for only the most recent birth. In some surveys an additional column for NGO sector
facilities may also be included in the distribution, typically with codes for m15 = 41-49. These are also
typically included as health facilities for the percentage of births delivered in a health facility.
References
Campbell, O.M., L. Benova, D. MacLeod, R.F. Baggaley, L.C. Rodrigues, K. Hanson, T. PowellJackson, L.
PennKekana, R. Polonsky, K. Footman, and A. Vahanian. 2016. “Family planning, antenatal and delivery
care: crosssectional survey evidence on levels of coverage and inequalities by public and private sector
in 57 lowand middleincome countries.” Tropical medicine & international health, 21(4), pp.486-503.
https://www.ncbi.nlm.nih.gov/pubmed/26892335
Fort, A.L., M.T. Kothari, and N. Abderrahim. 2006. Postpartum care: levels and determinants in
developing countries. DHS Comparative Reports No. 15. Calverton, Maryland, USA: Macro International.
https://dhsprogram.com/publications/publication-cr15-comparative-reports.cfm
MacQuarrie, K. L.D., L. Mallick, and C. Allen. 2017. Sexual and reproductive health in early and later
adolescence: DHS data on youth Age 10-19. DHS Comparative Reports No. 45. Rockville, Maryland, USA:
ICF. https://dhsprogram.com/publications/publication-cr45-comparative-reports.cfm
Resources
DHS-7 Tabulation plan: Table 9.5
API Indicator IDs:
RH_DELP_C_PUB, RH_DELP_C_PRV, RH_DELP_C_HOM, RH_DELP_C_OTH, RH_DELP_C_DKM,
RH_DELP_C_DHF
(API link, STATcompiler link)
MICS6 Indicator TM.8: Institutional deliveries.
Note that the DHS indicator includes all women who had a live birth in the past 5 years, but the MICS
indicator is restricted to women who had a live birth in the past 2 years.

Guide to DHS Statistics 9.16 August 2018
Assistance during Delivery
Percent distribution of live births by person providing assistance during delivery, and the
percentage assisted by a skilled provider
Definition
1) Percent distribution of live births in the 5 years preceding the survey by person providing
assistance during delivery.
2) Percentage of births in the 5 years preceding the survey that were assisted by a skilled provider.
Coverage:
Population base: Live births to interviewed women in the 5 years preceding the survey (KR file).
Time period: Five years preceding survey.
Numerators:
1) Numbers of live births distributed according to type of person providing delivery assistance
(m3a-n):
a) Doctor (m3a = 1)
b) Nurse/midwife (m3b = 1)
c) Auxiliary nurse/midwife (m3c = 1)
d) Other health worker (m3d = 1 or m3e = 1 or m3f = 1)
e) Traditional birth attendant (m3g = 1)
f) Relative/other (m3h = 1 or m3i = 1 or m3j = 1 or m3k = 1 or m3l = 1 or m3m = 1)
g) No one (m3n = 1)
h) Don’t know/missing (none of the above)
(Note that variables used above are based on the standard DHS 7 questionnaire. Actual variables
will be country specific but will be from the m3a-n series.)
2) Number of live births delivered by a skilled provider. Skilled provider includes the cadres that
are considered skilled attendants for delivery in the country (selection from m3a-n, typically
m3a = 1 or m3b = 1 or m3c = 1, however the coding is specific to the country/survey)
Denominators: Number of live births in the 5 years preceding the survey
Variables: KR file.
m3a
Assistance: Doctor
m3b
Assistance: Country specific health professional
m3c
Assistance: Country specific health professional
m3d
Assistance: Country specific health professional
m3e
Assistance: Country specific health professional
m3f
Assistance: Country specific health professional
m3g
Assistance: Traditional birth attendant
m3h
Assistance: Country specific other person
m3i
Assistance: Country specific other person
m3j
Assistance: Country specific other person

Guide to DHS Statistics 9.17 August 2018
m3k
Assistance: Other
m3l
Assistance: Country specific other
m3m
Assistance: Country specific other
m3n
Assistance: No one
v005
Woman’s individual sample weight
Calculation
During data collection respondents may mention more than one provider. The percent distribution by
type of provider takes the highest type of provider from the list above and does not include other
providers mentioned by the respondent.
For percentages, numerators divided by the denominator multiplied by 100.
Handling of Missing Values
Included separately in the distribution and in the denominator but excluded from the numerator for
skilled attendance at delivery.
Notes and Considerations
Percent distribution adds up to 100 percent. The variables for each type of provider are country specific.
The variables listed above are based on the standard DHS 7 questionnaire, but the survey specific
variables may be differ. Traditional birth attendants are not considered skilled providers, whether
trained or untrained.
References
World Health Organization, 2018. Definition of skilled health personnel providing care during childbirth:
the 2018 joint statement by WHO, UNFPA, UNICEF, ICM, ICN, FIGO and IPA. World Health
Organization.http://www.who.int/reproductivehealth/publications/statement-competent-mnh-
professionals/en/
MacQuarrie, K. L.D., L. Mallick, and C. Allen. 2017. Sexual and reproductive health in early and later
adolescence: DHS data on youth Age 10-19. DHS Comparative Reports No. 45. Rockville, Maryland, USA:
ICF. https://dhsprogram.com/publications/publication-cr45-comparative-reports.cfm
Wang, W., S. Alva, S. Wang, and A. Fort. 2011. Levels and trends in the use of maternal health services in
developing countries. DHS Comparative Reports No. 26. Calverton, Maryland, USA: ICF Macro.
https://dhsprogram.com/publications/publication-cr26-comparative-reports.cfm
World Health Organization. 2018. Global reference list of 100 core health indicators. Geneva: World
Health Organization. http://www.who.int/healthinfo/indicators/2018/en/
Resources

Guide to DHS Statistics 9.18 August 2018
DHS-7 Tabulation plan: Table 9.6
API Indicator IDs:
RH_DELA_C_DOC, RH_DELA_C_NRS, RH_DELA_C_AUX, RH_DELA_C_OHW, RH_DELA_C_TBA,
RH_DELA_C_REL, RH_DELA_C_NON, RH_DELA_C_DKM, RH_DELA_C_SKP
(API link, STATcompiler link)
SDG Indicator 3.1.2: Proportion of births attended by skilled health personnel
WHO 100 Core Health Indicators: Births attended by skilled health personnel
MICS6 Indicator TM.9: Skilled attendant at delivery.
Note that the DHS indicator includes all women who had a live birth in the past 5 years, but the MICS
indicator is restricted to women who had a live birth in the past 2 years.

Guide to DHS Statistics 9.19 August 2018
Caesarean Section
Percentage of live births delivered by caesarean section, the percentage that was planned
before the onset of labor pains, and that was decided after the onset of labor pains
Definition
1) Percentage of live births in the 5 years preceding the survey delivered by caesarean section.
2) Percentage of live births in the 5 years preceding the survey delivered by caesarean section that
was planned before the onset of labor pains.
3) Percentage of live births in the 5 years preceding the survey delivered by caesarean section that
was decided after the onset of labor pains.
Coverage:
Population base: Live births to interviewed women in the 5 years preceding the survey (KR file)
Time period: Five years preceding the survey
Numerators:
1) Number of live births delivered by caesarean section (m17 = 1)
2) Number of live births delivered by caesarean section that was planned before the onset of labor
pains (m17a = 1)
3) Number of live births delivered by caesarean section that was decided after the onset of labor
pains (m17a = 2)
Denominator: Number of live births in the last 5 years (all births in the KR file)
Variables: KR file.
m17
Delivery by caesarean section
m17a
Timing on decision for caesarean section
v005
Woman’s individual sample weight
Calculation
For percentages, 100 times the quotient of the numerators divided by the same denominator.
Handling of Missing Values
Excluded from numerator of percentage delivered by Caesarean section (assumed not Caesarean
section). For timing on decision for caesarean section, “Don’t know” and missing are presented in a
separate column so that the percentages who planned before the onset of labor pains, those who
planned after the onset of labor pains, plus the “don’t know” and missing add up to the percentage
delivered by caesarean section.

Guide to DHS Statistics 9.20 August 2018
References
Cavallaro, F.L., J.A. Cresswell, G.V. França, C.G. Victora, A.G. Barros, and C. Ronsmans. 2013. “Trends in
caesarean delivery by country and wealth quintile: cross-sectional surveys in southern Asia and sub-
Saharan Africa.” Bulletin of the World Health Organization, 91, pp.914-922D.
http://www.who.int/bulletin/volumes/91/12/13-117598/en/
MacQuarrie, K.L.D., L. Mallick, and C. Allen. 2017. Sexual and reproductive health in early and later
adolescence: DHS data on youth Age 10-19. DHS Comparative Reports No. 45. Rockville, Maryland, USA:
ICF. https://dhsprogram.com/publications/publication-cr45-comparative-reports.cfm
Resources
DHS-7 Tabulation plan: Table 9.7
API Indicator IDs: RH_DELA_C_CSC
(API link, STATcompiler link)
MICS6 Indicator TM.10: Caesarean section.
Note that the DHS indicator includes all women who had a live birth in the past 5 years, but the MICS
indicator is restricted to women who had a live birth in the past 2 years.

Guide to DHS Statistics 9.21 August 2018
Duration of Stay in Health Facility after Birth
Percent distribution by duration of stay in the health facility following the most recent live
birth by type of delivery
Definition
Among women with a birth in the 5 years preceding the survey who delivered their most recent live
birth in a health facility, percent distribution by duration of stay in the health facility following their most
recent live birth, according to type of delivery.
Coverage:
Population base: Women age 15-49 with a live birth in the 5 years preceding the survey who
delivered their most recent birth in a health facility (KR file or IR File)
Time period: Five years preceding the survey
Numerator: Number of women age 15-49 with a live birth in the 5 years preceding the survey who
delivered their most recent birth in a health facility, by duration of stay (m61), for each type of delivery
(m17). Duration of stay is grouped into <6 hours, 6-11 hours, 12-23 hours, 1-2 days, 3+ days
Denominator: Number of women age 15-49 with a live birth in the 5 years preceding the survey who
delivered their most recent birth in a health facility (midx = 1 & m15 in 20:39), for each type of delivery
(m17)
Variables: KR file or IR file.
midx
Index to birth history (1 = last birth)
m15
Place of delivery
m17
Delivery by caesarean section
m61
Time spent at place of delivery
v005
Woman’s individual sample weight
Calculation
For percentage distribution, 100 times the quotient of the numerators divided by the denominator for
the particular type of delivery (vaginal birth or caesarean section).
Handling of Missing Values
Missing values on type of health facility are excluded from the indicator. Missing values on duration of
stay are included in the denominator and are presented in a separate category in the percent
distribution.
Notes and Considerations
Note the denominator only includes women who delivered in a health facility.

Guide to DHS Statistics 9.22 August 2018
References
Campbell, O.M., L. Cegolon, D. Macleod, and L. Benova. 2016. “Length of stay after childbirth in 92
countries and associated factors in 30 low-and middle-income countries: compilation of reported data
and a cross-sectional analysis from nationally representative surveys.” PLoS medicine, 13(3),
p.e1001972. https://journals.plos.org/plosmedicine/article?id=10.1371/journal.pmed.1001972
Resources
DHS-7 Tabulation plan: Table 9.8
MICS6 Indicator TM.12: Post-partum stay in health facility.
Note that the DHS indicator includes all women who had a live birth in the past 5 years, but the MICS
indicator is restricted to women who had a live birth in the past 2 years.

Guide to DHS Statistics 9.23 August 2018
Postnatal Care
Percent distribution of timing of first postnatal check for the mother, and percentage who
received a postnatal check during the first 2 days
Definition
1) Among women giving birth in the 2 years preceding the survey, percent distribution of the
mother’s first postnatal check for the most recent live birth by time after delivery.
2) Percentage of women with a live birth in the 2 years preceding the survey who received a
postnatal check during the first 2 days after giving birth.
Coverage:
Population base: Women with a live birth in the 2 years preceding the survey (midx = 1 & b19 <
24) (KR file or IR file)
Time period: Two years preceding the survey
Numerators:
1) Number of women with a live birth in the 2 years preceding the survey, distributed by the timing
of first postnatal check by a health provider for the mother (less than 4 hours, 4-23 hours, 1-2
days, 3-6 days, 7-41 days, Don’t Know/Missing, No Postnatal Check)
2) Number of women with a live birth in the 2 years preceding the survey who had a postnatal
check by a health provider during the first 2 days after giving birth
Denominator: Number of women with a live birth in the 2 years preceding the survey (midx = 1 & b19 <
24)
Variables: KR file or IR file.
b19
Current age of child in months (months since birth for dead children)
midx
Index to birth history (1 = last birth)
m62
Respondent's health checked before discharge
m63
How long before discharging respondent health check took place
m64
Who checked respondent health before discharge
m66
Respondent's health checked after discharge/delivery at home
m67
How long after discharge/delivery at home respondent health check took place
m68
Who checked respondent health after discharge/delivery at home
v005
Woman’s individual sample weight
Calculation
Numerators: For the last birth (midx = 1) in the 2 years preceding the survey (b19 < 24), if the
respondent was checked after delivery (m62 = 1) or after discharge/delivery at home (m66 = 1):
The type of provider before discharge is verified to ensure that it is a health provider (m64 in
10:29) and if so the timing of the check is taken from m63; otherwise
The type of provider after discharge or delivery at home is verified to ensure that it is a health
provider (m68 in 10:29) and if so the timing of that check is taken from m67. All categories of
Guide to DHS Statistics 9.24 August 2018
health providers are considered, including community health workers and traditional birth
attendants, which is different from the definitions of skilled providers of antenatal and delivery
care.
If neither case is true it is considered that no postnatal check took place. Additionally, if the postnatal
check was 42 or more days after delivery it is also considered that no postnatal check took place.
Categories from m63 or m67 are 100:103 = less than 4 hours; 104:123,200 = 4-23 hours; 124-
171,201,202 = 1-2 days; 172:197,203:206 = 3-6 days; 207:241,300:305 = 7-41 days; 198, 199, 298, 299,
398, 399, 998, 999 = Don’t Know/Missing.
If the timing of the mother’s postnatal check from m63 or m67 is in the range 0-71 hours (m63/m67 in
100:171), or is reported in hours but the number of hours was missing or “don’t know” (m63/m67 = 198
or 199), or timing was 2 days or less (m63/m67 in 200:202) then the postnatal care was considered as
taking place during the first 2 days, otherwise is categorized as no postnatal check during the first 2
days.
For percentages, numerators divided by the same denominator multiplied by 100.
Handling of Missing Values
If the type of health provider is missing, the check is considered not to have been performed by a health
provider and is treated as no check performed.
If the timing of the check is missing or “don’t know”, this is included in a separate category in the
percent distribution.
For the postnatal check with the first 2 days, if the timing of the check is reported as in hours, but is
missing or “don’t know” (m63/m67 = 198 or 199), this is considered as within the first 2 days. If the
timing of the check is reported in days, but is missing or “don’t know” (m63/m67 = 298 or 299) or the
reporting of hours or days is missing (m63/m67 = 998 or 999), this is considered as no postnatal check in
the first 2 days.
Notes and Considerations
Percent distribution adds up to 100 percent.
The recommended indicators for postnatal care are based on births in the 2 years preceding the survey,
rather than the 5 years used for antenatal care and delivery assistance.
Postnatal check includes women who received a check from a doctor, midwife, nurse, community health
worker, or traditional birth attendant. Other persons such as family members or friends are not included
as postnatal checks.
The category “Did not receive prenatal checkup” is included in the distribution. This category also
includes women whose first postnatal checkup occurred 42 or more days after delivery.

Guide to DHS Statistics 9.25 August 2018
Changes over Time
This indicator has changed substantially over time. Prior to DHS-V (2003), women whose last birth was
delivered in a health facility were excluded from this indicator based on the assumption that women
who delivered in a health facility received post-partum care. After 2003, all women regardless of place
of delivery were assessed for whether they had a check as well as the timing, and provider.
In DHS-V and DHS-VI (2003-2013), women who delivered in a facility were asked if their health was
checked before discharge and, if so, the timing and provider of the check. If not, they were asked if their
health was checked after discharge, and then about the timing and provider of the first check. Women
who delivered at home were also asked if they received a check, as well as about the timing and the
provider. In DHS-V and DHS-VI, women who delivered in a health facility could only provide responses
about a postnatal check for the newborn either before discharge or after discharge.
In DHS-7 (2013-2018), however, women who delivered in a facility were asked about a postnatal check
both before and after discharge. Women’s responses about timing and provider of a check after
discharge or among women who delivered at home are combined into single variables (m66, m67, and
m68). In the calculation of the indicator for postnatal care among all women, women’s report of a check
prior to discharge is prioritized over the check after discharge or among women delivering at home.
References
Carvajal–Aguirre, L., A. Amouzou, V. Mehra, M. Ziqi, N. Zaka, and H. Newby. 2017. “Gap between
contact and content in maternal and newborn care: An analysis of data from 20 countries in sub–
Saharan Africa.” Journal of global health, 7(2). https://www.ncbi.nlm.nih.gov/pubmed/29423178
MacQuarrie, K.L.D., L. Mallick, and C. Allen. 2017. Sexual and reproductive health in early and later
adolescence: DHS data on youth Age 10-19. DHS Comparative Reports No. 45. Rockville, Maryland, USA:
ICF. https://dhsprogram.com/publications/publication-cr45-comparative-reports.cfm
Moran, A.C., K. Kerber, D. Sitrin, T. Guenther, C.S. Morrissey, H. Newby, J. Fishel, P.S. Yoder, Z. Hill and
J.E. Lawn, 2013. “Measuring coverage in MNCH: indicators for global tracking of newborn care.” PLoS
medicine, 10(5), p.e1001415.
https://journals.plos.org/plosmedicine/article?id=10.1371/journal.pmed.1001415
World Health Organization. 2018. Global reference list of 100 core health indicators. Geneva: World
Health Organization. http://www.who.int/healthinfo/indicators/2018/en/
Resources
DHS-7 Tabulation plan: Table 9.9
API Indicator IDs:
RH_PCMT_W_L4H, RH_PCMT_W_23H, RH_PCMT_W_D12, RH_PCMT_W_D36, RH_PCMT_W_D7P,
RH_PCMT_W_DKM, RH_PCMT_W_NON, RH_PCMT_W_DY2
(API link, STATcompiler link)
WHO 100 Core Health Indicators: Postpartum care coverage - women
MICS6 Indicator TM.20: Postnatal health check for the mother.
Guide to DHS Statistics 9.26 August 2018
Percent distribution of type of provider for the first postnatal check for the mother
Definition
Among women giving birth in the 2 years preceding the survey, percent distribution by type of provider
for the mother’s first postnatal check during the first 2 days after the last live birth.
Coverage:
Population base: Women with a live birth in the 2 years preceding the survey
(midx = 1 & b19 < 24) (KR file or IR file)
Time period: Two years preceding the survey
Numerator: Number of women with a live birth in the 2 years preceding the survey, distributed by the
type of provider for the first postnatal check for the mother:
1) Doctor/nurse/midwife (m64/m68 = 11 or 12)
2) Auxiliary nurse/midwife (m64/m68 = 13)
3) Community health worker (m64/m68 = 22)
4) Other health worker (m64/m68 in 14:19)
5) Traditional birth attendant (m64/m68 = 21)
6) No postnatal check during the first 2 days after the birth
Denominator: Number of women with a live birth in the 2 years preceding the survey (midx = 1 & b19 <
24)
Variables: KR file or IR file.
b19
Current age of child in months (months since birth for dead children)
midx
Index to birth history (1 = last birth)
m62
Respondent's health checked before discharge
m63
How long before discharging respondent health check took place
m64
Who checked respondent health before discharge
m66
Respondent's health checked after discharge/delivery at home
m67
How long after discharge/delivery at home respondent health check took place
m68
Who checked respondent health after discharge/delivery at home
v005
Woman’s individual sample weight
Calculation
For the last birth (midx = 1) in the 2 years preceding the survey (b19 < 24), if the respondent was
checked after delivery (m62 = 1) or after discharge/delivery at home (m66 = 1):
The type of provider before discharge is verified to ensure that it is a health provider (inclusive
of all providers—skilled attendants as well as community health workers or traditional birth
attendants—m64 in 10:29) and if so the timing of the check is taken from m63; otherwise
The type of provider after discharge/delivery at home is verified to ensure that it is a health
provider (m68 in 10:29) and if so the timing of that check is taken from m67.
If neither case is true it is considered that no postnatal check took place.
Guide to DHS Statistics 9.27 August 2018
If the timing of the mother’s postnatal check from m63 or m67 is in the range 0-71 hours (m63/m67 in
100:171), or is reported in hours but the number of hours was missing or “don’t know” (m63/m67 = 198
or 199), or timing was 2 days or less (m63/m67 in 200:202) then the postnatal care was considered as
taking place during the first 2 days, otherwise is categorized as no postnatal check during the first 2
days.
For percent distribution, 100 times the quotient of the numerators divided by the same denominator.
Handling of Missing Values
If the type of health provider is missing, the check is considered not to have been performed by a health
provider and is treated as no check performed.
If the timing of the check is reported as in hours, but is missing or “don’t know” (m63/m67 = 198 or
199), this is considered as within the first 2 days. If the timing of the check is reported in days, but is
missing or “don’t know” (m63/m67 = 298 or 299) or the reporting of hours or days is missing (m63/m67
= 998 or 999), this is considered as no postnatal check in the first 2 days.
Notes and Considerations
Percent distribution adds up to 100 percent.
The recommended indicators for postnatal care are based on births in the 2 years preceding the survey,
rather than the 5 years used for antenatal care and delivery assistance.
Postnatal check includes women who received a check from a doctor, midwife, nurse, community health
worker, or traditional birth attendant. Other persons such as family members or friends are not included
as postnatal checks.
The category “Did not received prenatal checkup during the first 2 days” is included in the distribution.
Changes over Time
This indicator has changed substantially over time. Prior to DHS-V (2003), women whose last birth was
delivered in a health facility were excluded from this indicator based on the assumption that women
who delivered in a health facility received post-partum care. After 2003, all women regardless of place
of delivery were assessed for whether they had a check as well as the timing, and provider.
In DHS-V and DHS-VI (2003-2013), women who delivered in a facility were asked if their health was
checked before discharge and, if so, the timing and provider of the check. If not, they were asked if their
health was checked after discharge, and then about the timing and provider of the first check. Women
who delivered at home were also asked if they received a check, as well as about the timing and the
provider. In DHS-V and DHS-VI, women who delivered in a health facility could only provide responses
about a postnatal check for the newborn either before discharge or after discharge.
In DHS-7 (2013-2018), however, women who delivered in a facility were asked about a postnatal check
both before and after discharge. Women’s responses about timing and provider of a check after

Guide to DHS Statistics 9.28 August 2018
discharge or among women who delivered at home are combined into one variable (m66, m67, m68). In
the calculation of the indicator for postnatal care among all women, women’s report of a check prior to
discharge is prioritized over the check after discharge or among women delivering at home.
References
Moran, A.C., K. Kerber, D. Sitrin, T. Guenther, C.S. Morrissey, H. Newby, J. Fishel, P.S. Yoder, Z. Hill and
J.E. Lawn, 2013. “Measuring coverage in MNCH: indicators for global tracking of newborn care.” PLoS
medicine, 10(5), p.e1001415.
https://journals.plos.org/plosmedicine/article?id=10.1371/journal.pmed.1001415
Resources
DHS-7 Tabulation plan: Table 9.10
API Indicator IDs:
RH_PCMP_W_DOC, RH_PCMP_W_NRS, RH_PCMP_W_CHW, RH_PCMP_W_OHW, RH_PCMP_W_TBA,
RH_PCMP_W_DKM, RH_PCMP_W_NON
(API link, STATcompiler link)
Guide to DHS Statistics 9.29 August 2018
Percent distribution of timing of first postnatal check for the newborn, and percentage
receiving a postnatal check during the first 2 days
Definition
1) Percent distribution of most recent live birth in the 2 years preceding the survey by time after
birth of first postnatal check for the newborn.
2) Percentage of most recent live birth in the 2 years preceding the survey with a postnatal check
for the newborn during the first 2 days after birth.
Coverage:
Population base: Most recent live births of interviewed mothers in the 2 years preceding the
survey (midx = 1 & b19 < 24) (KR file or IR File)
Time period: Two years preceding the survey
Numerators:
1) The numbers of most recent live birth of interviewed mothers who had a birth in the 2 years
preceding the survey, by category of timing of newborn check during the first week after birth,
including newborns who did not have a checkup in that time (less than 1 hour, 1-3 hours, 4-23
hours, 1-2 days, 3-6 days, don’t know/missing, no postnatal check)
2) The number of most recent birth in the 2 years preceding the survey with a postnatal check
during the first 2 days after birth
Denominator: Last live birth of interviewed mothers who had at least one live birth in the 2 years
preceding the survey (midx = 1 & b19 < 24)
Variables: KR file or IR file.
b19
Current age of child in months (months since birth for dead children)
midx
Index to birth history (1 = last birth)
m70
Baby postnatal check within 2 months
m71
Time after delivery postnatal check took place
m72
Person who performed postnatal checkup
m74
Child's health checked before discharge
m75
How long before discharging child health check took place
m76
Who checked child health before discharge
v005
Woman’s individual sample weight
Calculation
Numerators: For the last birth (midx = 1) in the 2 years preceding the survey (b19 < 24), if the newborn
was checked before discharge (m74 = 1) or had a postnatal check within two months (m70 = 1):
The type of provider before discharge is verified to ensure that it is a health provider (m76 in
10:29) and if so the timing of the check is taken from m75; otherwise
The type of provider for the postnatal check is verified to ensure that it is a health provider (m72
in 10:29) and if so the timing of that check is taken from m71
If neither case is true it is considered that no postnatal check took place. Additionally, if the postnatal
check was 7 or more days after delivery it is also considered that no postnatal check took place.
Guide to DHS Statistics 9.30 August 2018
Categories from m71 or m75 are 100:103 = less than 4 hours; 104:123,200 = 4-23 hours; 124-
171,201,202 = 1-2 days; 172:197,203:206 = 3-6 days; 207:241,300:305 = 7-41 days; 198, 199, 298, 299,
398, 399, 998, 999 = Don’t Know/Missing.
If the timing of the newborn’s postnatal check from m75 or m71 is in the range 0-71 hours (m75/m71 in
100:171), or is reported in hours but the number of hours was missing or “don’t know” (m75/m71 = 198
or 199), or timing was 2 days or less (m75/m71 in 200:202) then the postnatal care was considered as
taking place during the first 2 days, otherwise is categorized as no postnatal check during the first 2
days.
For percentages, 100 times the quotient of the numerators divided by the same denominator.
Handling of Missing Values
If the type of health provider is missing, the check is considered not to have been performed by a health
provider and is treated as no check performed.
If the timing of the check is reported as in hours, but is missing or “don’t know” (m75/m71 = 198 or
199), this is considered as within the first 2 days. If the timing of the check is reported in days, but is
missing or “don’t know” (m75/m71 = 298 or 299) or the reporting of hours or days is missing (m75/m71
= 998 or 999), this is considered as no postnatal check in the first 2 days.
Notes and Considerations
Percent distribution adds up to 100 percent.
The recommended indicators for postnatal care are based on births in the 2 years preceding the survey,
rather than the 5 years used for antenatal care and delivery assistance.
Postnatal check includes newborns who received a check from a doctor, midwife, nurse, community
health worker, or traditional birth attendant. Other persons such as family members or friends are not
included as postnatal checks.
The category “Did not received postnatal checkup during the first 2 days” is included in the distribution.
Changes over Time
This indicator has changed substantially over time. Prior to DHS-V (2003), the DHS survey did not ask
separately about postnatal checks for the mother and for the newborn.
In DHS-V and DHS-VI (2003-2013), women who delivered in a facility were asked if their newborn’s
health was checked before discharge and, if so, about the timing and provider giving performing the
check. If they did not have a check before discharge, they were asked if the baby’s health was checked
after discharge, as well as about the timing and provider of the first check. Women who delivered at
home were also asked if their baby received a check, and about the timing and provider of the check. In

Guide to DHS Statistics 9.31 August 2018
DHS-V and DHS-VI, women who delivered in a health facility could only provide responses about a
postnatal check for the newborn either before discharge or after discharge.
In DHS-7 (2013-2018), however, women who delivered in a facility were asked about a postnatal check
both before and after discharge. Women’s responses about timing and provider of the baby’s check
after discharge or among women who delivered at home are combined into one variable (m71 and 72).
In the calculation of the indicator, women’s report of the baby’s check prior to discharge is prioritized
over the check after discharge or among women delivering at home.
References
Carvajal–Aguirre, L., A. Amouzou, V. Mehra, M. Ziqi, N. Zaka, and H. Newby. 2017. “Gap between
contact and content in maternal and newborn care: An analysis of data from 20 countries in sub–
Saharan Africa.” Journal of global health, 7(2). https://www.ncbi.nlm.nih.gov/pubmed/29423178
Moran, A.C., K. Kerber, D. Sitrin, T. Guenther, C.S. Morrissey, H. Newby, J. Fishel, P.S. Yoder, Z. Hill and
J.E. Lawn, 2013. “Measuring coverage in MNCH: indicators for global tracking of newborn care.” PLoS
medicine, 10(5), p.e1001415.
https://journals.plos.org/plosmedicine/article?id=10.1371/journal.pmed.1001415
World Health Organization. 2018. Global reference list of 100 core health indicators. Geneva: World
Health Organization. http://www.who.int/healthinfo/indicators/2018/en/
Resources
DHS-7 Tabulation plan: Table 9.11
API Indicator IDs:
RH_PCCT_C_L1H, RH_PCCT_C_H13, RH_PCCT_C_H4P, RH_PCCT_C_D12, RH_PCCT_C_D36,
RH_PCCT_C_DKM, RH_PCCT_C_NON, RH_PCCT_C_DY2
(API link, STATcompiler link)
WHO 100 Core Health Indicators: Postnatal care coverage - newborn
MICS6 Indicator TM.13: Postnatal health check for the newborn.
Guide to DHS Statistics 9.32 August 2018
Percent distribution of type of provider for the first postnatal check for the newborn
Definition
Among most recent live births in the 2 years preceding the survey, percent distribution by type of
provider for the newborn’s first postnatal check during the first 2 days after birth.
Coverage:
Population base: Most recent live births of interviewed mothers in the 2 years preceding the
survey (midx = 1 & b19 < 24) (KR file or IR File)
Time period: Two years preceding the survey
Numerator: Number of most recent live births in the 2 years preceding the survey, distributed by the
type of provider for the first postnatal check for the newborn:
1) Doctor/nurse/midwife (m64/m68 = 11 or 12)
2) Auxiliary nurse/midwife (m64/m68 = 13)
3) Community health worker (m64/m68 = 22)
4) Other health worker (m64/m68 in 14:19)
5) Traditional birth attendant (m64/m68 = 21)
6) No postnatal check during the first 2 days after the birth
Denominator: Number of most recent live births in the 2 years preceding the survey (midx = 1 & b19 <
24)
Variables: KR file or IR file.
b19
Current age of child in months (months since birth for dead children)
midx
Index to birth history (1 = last birth)
m70
Baby postnatal check within 2 months
m71
Time after delivery postnatal check took place
m72
Person who performed postnatal checkup
m74
Child's health checked before discharge
m75
How long before discharging child health check took place
m76
Who checked child health before discharge
v005
Woman’s individual sample weight
Calculation
Numerators: For the last birth (midx = 1) in the 2 years preceding the survey (b19 < 24), if the newborn
was checked before discharge (m74 = 1) or had a postnatal check within two months (m70 = 1):
The type of provider before discharge is verified to ensure that it is a health provider (m76 in
10:29) and if so the timing of the check is taken from m75; otherwise
The type of provider for the postnatal check is checked to ensure that it is a health provider
(m72 in 10:29) and if so the timing of that check is taken from m71
If neither case is true it is considered that no postnatal check took place.
If the timing of the newborn’s postnatal check from m75 or m71 is in the range 0-71 hours (m75/m71 in
100:171), or is reported in hours but the number of hours was missing or “don’t know” (m75/m71 = 198
Guide to DHS Statistics 9.33 August 2018
or 199), or timing was 2 days or less (m75/m71 in 200:202) then the postnatal care was considered as
taking place during the first 2 days, otherwise is categorized as no postnatal check during the first 2
days.
For percent distribution, 100 times the quotient of the numerators divided by the same denominator.
Handling of Missing Values
If the type of health provider is missing, the check is considered not to have been performed by a health
provider and is treated as no check performed.
If the timing of the check is missing or “don’t know”, this is included in a separate category in the
percent distribution.
For the postnatal check with the first 2 days, if the timing of the check is reported as in hours, but is
missing or “don’t know” (m75/m71 = 198 or 199), this is considered as within the first 2 days. If the
timing of the check is reported in days, but is missing or “don’t know” (m75/m71 = 298 or 299) or the
reporting of hours or days is missing (m75/m71 = 998 or 999), this is considered as no postnatal check in
the first 2 days.
Notes and Considerations
Percent distribution adds up to 100 percent.
The recommended indicators for postnatal care are based on births in the 2 years preceding the survey,
rather than the 5 years used for antenatal care and delivery assistance.
Postnatal check includes newborns who received a check from a doctor, midwife, nurse, community
health worker, or traditional birth attendant. Other persons such as family members or friends are not
included a postnatal checks.
The category “Did not received prenatal checkup” is included in the distribution. This category also
includes newborns whose first postnatal checkup occurred 7 or more days after delivery.
Changes over Time
This indicator has changed substantially over time. Prior to DHS-V (2003), the DHS survey did not ask
separately about postnatal checks for the mother and for the newborn.
In DHS-V and DHS-VI (2003-2013), women who delivered in a facility were asked if their newborn’s
health was checked before discharge and, if so, about the timing and provider giving performing the
check. If they did not have a check before discharge, they were asked if the baby’s health was checked
after discharge, as well as about the timing and provider of the first check. Women who delivered at
home were also asked if their baby received a check, and about the timing and provider of the check. In
DHS-V and DHS-VI, women who delivered in a health facility could only provide responses about a
postnatal check for the newborn either before discharge or after discharge.

Guide to DHS Statistics 9.34 August 2018
In DHS-7 (2013-2018), however, women who delivered in a facility were asked about a postnatal check
both before and after discharge. Women’s responses about timing and provider of the baby’s check
after discharge or among women who delivered at home are combined into one variable (m71 and 72).
In the calculation of the indicator, women’s report of the baby’s check prior to discharge is prioritized
over the check after discharge or among women delivering at home.
Resources
DHS-7 Tabulation plan: Table 9.12
API Indicator IDs:
RH_PCCP_C_DOC, RH_PCCP_C_NRS, RH_PCCP_C_CHW, RH_PCCP_C_OHW, RH_PCCP_C_TBA,
RH_PCCP_C_DKM, RH_PCCP_C_NON
(API link, STATcompiler link)
Guide to DHS Statistics 9.35 August 2018
Percentage of newborns receiving selected function of postnatal care
Definition
Among the last live births in the 2 years preceding the survey, percentage for whom each of the selected
functions of the postnatal newborn care were performed during the first 2 days after birth.
Among the last live births in the 2 years preceding the survey, percentage for whom at least two signal
functions of the newborn postnatal care were performed during the first 2 days after birth.
Coverage:
Population base: Most recent live births of interviewed mothers in the 2 years preceding the
survey (midx = 1 & b19 < 24) (KR file or IR File)
Time period: Two years preceding the survey
Numerators:
1) Numbers of last live births (midx = 1) in the 2 years preceding the survey (b19 < 24) who
received each of the selected functions of the newborn postnatal care during the first 2 days
after the birth
a) Cord examined (m78a = 1)
b) Temperature measured (m78b = 1)
c) Counseling on danger signs (m78c = 1)
d) Counseling on breastfeeding (m78d = 1)
e) Observation of breastfeeding (m78e = 1)
f) Weighed (m19a = 1 or 2)
2) Number of last live births in the last 2 years where the newborn received a least two signal
postnatal care functions within 2 days after birth (2 or more of the above list)
Denominator: Number of most recent live births in the 2 years preceding the survey (b19 < 24)
Variables: KR file or IR file.
b19
Current age of child in months (months since birth for dead children)
m19a
Weight at birth/recall
m78a
During first 2 days health provider: examine cord
m78b
During first 2 days health provider: measure temperature
m78c
During first 2 days health provider: counsel on newborn dangers
m78d
During first 2 days health provider: counsel on breastfeeding
m78e
During first 2 days health provider: observe breastfeeding
v005
Woman’s individual sample weight
Calculation
For percentages, 100 times the quotient of the numerators divided by the same denominator.
Handling of Missing Values

Guide to DHS Statistics 9.36 August 2018
Missing data or “Don’t know” responses on any of the signal functions are excluded from the numerator
but included in the denominator.
Notes and Considerations
Signal functions of the newborn postnatal care are 1) Examine the cord, 2) Measure newborn's
temperature, 3) Counsel on danger signs for newborn 4) Counsel on breastfeeding 5) Observe
breastfeeding and 6) Weighing the baby. The category “Weighed” captures newborns who were
weighed "at birth." May exclude some newborns were weighed during the 2 days after birth.
Changes over Time
This is a relatively new indicator and is not available in surveys before DHS 7.
References
Carvajal–Aguirre, L., A. Amouzou, V. Mehra, M. Ziqi, N. Zaka, and H. Newby. 2017. “Gap between
contact and content in maternal and newborn care: An analysis of data from 20 countries in sub–
Saharan Africa.” Journal of global health, 7(2). https://www.ncbi.nlm.nih.gov/pubmed/29423178
Moran, A.C., K. Kerber, D. Sitrin, T. Guenther, C.S. Morrissey, H. Newby, J. Fishel, P.S. Yoder, Z. Hill and
J.E. Lawn, 2013. “Measuring coverage in MNCH: indicators for global tracking of newborn care.” PLoS
medicine, 10(5), p.e1001415.
https://journals.plos.org/plosmedicine/article?id=10.1371/journal.pmed.1001415
World Health Organization. WHO recommendations on postnatal care of the mother and newborn.
World Health Organization, 2013.
http://www.who.int/maternal_child_adolescent/documents/postnatal-care-recommendations/en/
Resources
DHS-7 Tabulation plan: Table 9.13
MICS6 Indicator TM.11: Children weighed at birth
MICS6 Indicator TM.19: Postnatal care signal functions

Guide to DHS Statistics 9.37 August 2018
Problems in Accessing Health Care
Percentage of women who reported serious problems in accessing health care for
themselves, by type of problem
Definition
Percentage of women age 15-49 who reported that they have serious problems in accessing health care
for themselves when they are sick, by type of problem.
Coverage:
Population base: All women age 15-49 at the time of the survey (IR File)
Time period: Current status at the time of the survey
Numerator: Number of women age 15-49 who reported that they have serious problems in accessing
health care for themselves when they are sick, for each type of problem:
a) Getting permission to go for treatment (v467b = 1)
b) Getting money for treatment (v467c = 1)
c) Distance to the health facility (v467d = 1)
d) Not wanting to go alone (v467f = 1)
e) At least one problem accessing health care (one or more of the above)
Denominator: Number of women age 15-49 at the time of the survey
Variables: IR file.
v467b
Getting medical help for self: getting permission to go
v467c
Getting medical help for self: getting money needed for treatment
v467d
Getting medical help for self: distance to health facility
v467f
Getting medical help for self: not wanting to go alone
v005
Woman’s individual sample weight
v005
Woman’s individual sample weight
Calculation
Numerators divided by denominator and multiplied by 100.
Handling of Missing Values
Women with missing information are included in the denominator.
Notes and Considerations
Accessing health care applies to any type of health care when the respondent is sick and is not limited to
reproductive health care.

Guide to DHS Statistics 9.38 August 2018
Changes over Time
Prior to DHS-V (2003), this question was asked only of women who had at least one child living with.
Although DHS-V and DHS-VI included the above response options in the core questionnaire, prior phases
have also included various additional response options; surveys may add country-specific response
options at their discretion.
References
Gupta, S., G. Yamada, R. Mpembeni, G. Frumence, J.A. Callaghan-Koru, R. Stevenson, N. Brandes, and
A.H. Baqui. 2014. “Factors associated with four or more antenatal care visits and its decline among
pregnant women in Tanzania between 1999 and 2010.” PloS one, 9(7), p.e101893.
https://journals.plos.org/plosone/article?id=10.1371/journal.pone.0101893
Woldemicael, G. and E.Y. Tenkorang. 2010. “Women’s autonomy and maternal health-seeking behavior
in Ethiopia.” Maternal and child health journal, 14(6), pp.988-998.
Resources
DHS-7 Tabulation plan: Table 9.14
API Indicator IDs:
RH_PAHC_W_PRM, RH_PAHC_W_MON, RH_PAHC_W_DIS, RH_PAHC_W_ALN, RH_PAHC_W_PR1
(API link, STATcompiler link)

Guide to DHS Statistics 10.1 August 2018
Child Health
This chapter presents findings from several areas of importance to child health; characteristics of the
neonate (birth weight and size at birth), vaccination status of children and important childhood illnesses
and their treatment.
The information on birth weight and neonate’s size assists in monitoring programs to decrease neonatal
and infant mortality through a reduction in low birth weight infants.
The vaccination coverage information focuses on the age groups 12-23 months and 24-25 months and
the vaccinations recommended in the two years of life. Overall coverage levels at the time of the survey
and by 12 months of age are shown for this age group. Additionally, the source of the vaccination
information (whether based on a written vaccination card or on the mother’s recall), and the presence
of home-based records are included. Differences in vaccination coverage between different subgroups
of the population are an aid in program planning.
Treatment practices and contact with health services among children with the three most important
childhood illnesses (acute respiratory infection, fever and diarrhea) help in the assessment of national
programs aimed at reducing the mortality impact of these illnesses. Information is provided on the
prevalence and treatment of ARI and its treatment with antibiotics and the prevalence of fever and its
treatment with antimalarial drugs and antibiotics. The treatment of diarrhea disease with oral
rehydration therapy (including increased fluids) aids in the assessment of programs that recommend
such treatment. Because appropriate sanitary practices can help prevent and reduce the severity of
diarrheal disease, indicators are also provided on the manner of disposing of children’s fecal matter.

Guide to DHS Statistics 10.2 August 2018
Child Size and Weight at Birth
Percent distribution of live births by birth size and birth weight
Definition
1) Percent distribution of live births in the 5 years preceding the survey by mother’s estimate of
baby’s size at birth.
2) Percentage of live births in the 5 years preceding the survey with a reported birth weight.
3) Percentage of live births in the 5 years preceding the survey weighed at birth reported as less
than 2.5 kg.
Coverage:
Population base: Live births to interviewed women (KR file)
Time period: 5 years preceding the survey
Numerators:
1) Number of live births in the 5 years preceding the survey distributed according to mother’s
estimate of baby’s size at time of birth (very small, smaller than average, average or larger, don’t
know/missing) (m18 = 5, 4, 1:3, 8 or 9)
2) Number of live births in the 5 years preceding the survey with a reported birth weight (m19 in
0:9000)
3) Number of live births in the 5 years preceding the survey who were weighed at birth and were
reported as weighing less than 2.5 kg (m19 in 0:2499)
Denominators:
1) Number of live births in the last 5 years
2) Number of live births in the last 5 years
3) Number of live births in the last 5 years who were weighed at birth (m19 in 0:9000)
Variables: KR file.
m18
Size of child at birth
m19
Birth weight in kilograms
v005
Woman’s individual sample weight
Calculation
Quotient of the numerator divided by the denominator, multiplied by 100.
Handling of Missing Values
Included in distributions of birth size but excluded from numerator of reported weight at birth, and
numerator and denominator for birth weight less than 2.5 kg.

Guide to DHS Statistics 10.3 August 2018
Notes and Considerations
Percent distribution of birth size adds up to 100 percent.
Reporting of birth weight is based on either a written record or mother’s recall.
Changes over Time
In DHS-V and DHS-VI a percent distribution of birth weight was provided for children weighed at birth. In
earlier rounds the percent distribution also included the category “Not weighed” and was based on all
births. Care should be taken when comparing birth weight data with data reported in earlier DHS
reports.
References
Blanc, A. K., and T. Wardlaw. 2005. “Monitoring low birth weight: an evaluation of international
estimates and an updated estimation procedure.” Bulletin of the World Health Organization, 83,
pp.178-185d. https://www.ncbi.nlm.nih.gov/pmc/articles/PMC2624216/
WHO. 2017. Global Nutrition Monitoring Framework: Operational Guidance for Tracking Progress in
Meeting Targets for 2025. http://www.who.int/nutrition/publications/operational-guidance-GNMF-
indicators/en/
Resources
DHS-7 Tabulation plan: Table 10.1
API Indicator IDs:
CH_SZWT_C_VSM, CH_SZWT_C_SML, CH_SZWT_C_AVG, CH_SZWT_C_DKM, CH_SZWT_C_REP, CH_SZWT_C_L25
(API link, STATcompiler link)
GNMF Indicator 3: Prevalence of infants born <2,500g

Guide to DHS Statistics 10.4 August 2018
Vaccination
Percentage of children age 12-23 months and children age 24-35 months who received
specific vaccines at any time before the survey according to vaccination card, according to
mother’s report, according to either vaccination card or mother’s report, and percentage
who received specific vaccines by appropriate age
Definition
1) Percentage of children age 12-23 months who received specific vaccines at any time before the
survey according to vaccination card.
2) Percentage of children age 12-23 months who received specific vaccines at any time before the
survey according to mother’s report.
3) Percentage of children age 12-23 months who received specific vaccines at any time before the
survey according to either vaccination card or mother’s report.
4) Percentage of children age 12-23 months who received specific vaccines by appropriate age.
5) Percentage of children age 24-35 months who received specific vaccines at any time before the
survey according to vaccination card.
6) Percentage of children age 24-35 months who received specific vaccines at any time before the
survey according to mother’s report.
7) Percentage of children age 24-35 months who received specific vaccines at any time before the
survey according to either vaccination card or mother’s report.
8) Percentage of children age 24-35 months who received specific vaccines by appropriate age.
Specific vaccines:
The following provides a list of the typical vaccines reported, based on the national schedule of vaccines.
The specific vaccines provided may differ from country to country and will change over time.
BCG (Bacille Calmette-Guérin)—Anti-tuberculosis vaccine received shortly after birth.
HepB—A birth dose of hepatitis B vaccine should be given within 24 hours of birth; it is classified as
given within 1 day of birth and after 1 day of birth.
DPT-HepB-Hib—A pentavalent vaccine against diphtheria, pertussis, tetanus (DPT), hepatitis B (HepB),
and Haemophilus influenza type b (Hib) received in 3 doses typically at 6, 10, and 14 weeks after birth. If
DPT, HepB, and Hib are not provided as a single pentavalent vaccine, each vaccine type is reported
separately.
Polio—Given either as oral polio vaccine (OPV) or inactivated polio vaccine (IPV). Received in 3 doses
usually given at same time as DPT-containing vaccine (6, 10, and 14 weeks after birth). In some
countries, an additional birth dose of OPV (polio 0) is given. Increasingly a single dose of IPV is given at
the same time as the third dose of OPV.
Guide to DHS Statistics 10.5 August 2018
Pneumococcal—Pneumococcal conjugate vaccine is given in 3 doses: 2 doses before age 6 months of
age, plus booster dose at age 9-15 months or on the same schedule as DPT-containing vaccine (6, 10,
and 14 weeks after birth).
Rotavirus—Depending on the type of vaccine, rotavirus vaccine is given on a 2 or 3 dose schedule at the
same time as DPT-containing vaccine.
Measles containing vaccine (MCV)—In countries with ongoing measles transmission, dose 1 is
recommended to be given at age 9 months. In countries with low levels of measles transmission, MCV 1
is recommended to be given at age 12 months. MCV 2, where given, is usually at 15-18 months.
Basic Vaccinations:
BCG, 3 doses of DPT-containing vaccine, 3 doses of polio vaccine (excluding polio vaccine given at birth),
and 1 dose of MCV.
Age-Appropriate Vaccinations:
For children age 12-23 months: BCG, HepB (birth dose), 3 doses of DPT-HepB-Hib, 3 [4] doses of polio
vaccine, 3 [2] doses of pneumococcal vaccine, 3 [2] doses of rotavirus vaccine, and 1 dose of MCV,
according to the national vaccination schedule.
For children age 24-35 months, BCG, HepB (birth dose), 3 doses of DPT-HepB-Hib, 3 [4] doses of polio
vaccine, 3 [2] doses of pneumococcal vaccine, 3 [2] doses of rotavirus vaccine, and 2 doses of MCV,
according to the national vaccination schedule.
No vaccines. None of the above specified childhood vaccinations was given to the child.
Coverage:
Population base: Living children age 12–23 months and 24-35 months (KR file)
Time period: 3 years preceding the survey
Numerators:
1) Number of living children age 12–23 months and 24-35 months receiving specified vaccines, all
basic vaccinations, all age appropriate vaccinations, and no specified vaccines, according to
information on vaccination card (h1 = 1 & vaccination given [see Calculation])
2) Number of living children age 12–23 months and 24-35 months receiving specified vaccines, all
basic vaccinations, all age appropriate vaccinations, and no specified vaccines, according to
mother’s report (h1 ≠ 1)
3) Number of living children age 12–23 months and 24-35 months receiving specified vaccines, all
basic vaccinations, all age appropriate vaccinations, and no specified vaccines, according to
information on vaccination card or mother’s report (vaccination given [see Calculation])
4) Number of living children age 12–23 months and 24-35 months receiving specified vaccines, all
basic vaccinations, all age appropriate vaccinations, by the appropriate age (vaccination given by
appropriate age [see Calculation])
Denominators:
1) Number of living children age 12–23 months (b5 = 1 & b19 in 12:23)
2) Number of living children age 24-35 months (b5 = 1 & b19 in 24:35)
Guide to DHS Statistics 10.6 August 2018
Variables: KR file
b5
Child is alive
b19
Current age of child in months
h0, h0d/h0m/h0y
Received POLIO 0
h1
Has health card
h2, h2d/h2m/h2y
Received BCG
h3, h3d/h3m/h3y
Received DPT 1
h4, h4d/h4m/h4y
Received POLIO 1
h5, h5d/h5m/h5y
Received DPT 2
h6, h6d/h6m/h6y
Received POLIO 2
h7, h7d/h7m/h7y
Received DPT 3
h8, h8d/h8m/h8y
Received POLIO 3
h9, h9d/h9m/h9y
Received MEASLES 1
h9a, h9ad/h9am/h9ay
Received MEASLES 2
h50, h50d/h50m/h50y
Received Hepatitis B at birth
h51, h51d/h51m/h51y
Received Pentavalent 1
h52, h52d/h52m/h52y
Received Pentavalent 2
h53, h53d/h53m/h53y
Received Pentavalent 3
h54, h54d/h54m/h54y
Received Pneumococcal 1
h55, h55d/h55m/h55y
Received Pneumococcal 2
h56, h56d/h56m/h56y
Received Pneumococcal 3
h57, h57d/h57m/h57y
Received Rotavirus 1
h58, h58d/h58m/h58y
Received Rotavirus 2
h59, h59d/h59m/h59y
Received Rotavirus 3
h60, h60d/h60m/h60y
Received Polio inactivated
h61, h61d/h61m/h61y
Received Hepatitis B 1
h62, h62d/h62m/h62y
Received Hepatitis B 2
h63, h63d/h63m/h63y
Received Hepatitis B 3
h64, h64d/h64m/h64y
Received Hib 1
h65, h65d/h65m/h65y
Received Hib 2
h66, h66d/h66m/h66y
Received Hib 3
v005
Woman’s individual sample weight
For the above, hxxd, hxxm, and hxxy are the day, month, and year the child received the vaccination.
Calculation
Numerators:
Number of living children between age 12 and 23 months or between age 24 and 35 months at the time
of the survey who received the specified vaccine.
Vaccinated at any time
Where the information is present on a vaccination card shown to the interviewer, the record of the
vaccination is used. Where no card was shown to the interviewer or there was no record of the
vaccination, the mother’s report of the vaccination is used. A vaccination is considered given if
information is provided from either source (hxx in 1:3).

Guide to DHS Statistics 10.7 August 2018
For multi-dose vaccines, the record of vaccines may include gaps in the vaccination history. The DHS
Program assumes that the missing vaccination has not been given and renumbers the vaccines to match
the number of a specific type of vaccine given. For example, if a child is recorded as having received
DPT-HepB-Hib 2 only and there is no record of DPT-HepB-Hib 1, it is assumed that DPT-HepB-Hib 1 has
been given, but not DPT-HepB-Hib 2. Similarly if a child has a record with Polio 1 and Polio 3 completed,
but not Polio 2, it is assumed that Polio 1 and Polio 2 have been given but not Polio 3. That is the logic
goes by the number of vaccinations known to have been given, not by the position in the record that the
vaccinations are recorded.
The logic for multi-dose vaccinations is as follows:
Vacc 1: Sum of (hxx in 1:3) + (hyy in 1:3) + (hzz in 1:3) > 1
Vacc 2: Sum of (hxx in 1:3) + (hyy in 1:3) + (hzz in 1:3) > 2
Vacc 3: Sum of (hxx in 1:3) + (hyy in 1:3) + (hzz in 1:3) > 3
Where hxx is the first vaccination in a series, hyy is the second, and hzz is the third.
For example for DPT-HepB-Hib:
DPT-HepB-Hib 1: Sum of (h3 in 1:3) + (h5 in 1:3) + (h7 in 1:3) > 1
DPT-HepB-Hib 2: Sum of (h3 in 1:3) + (h5 in 1:3) + (h7 in 1:3) > 2
DPT-HepB-Hib 3: Sum of (h3 in 1:3) + (h5 in 1:3) + (h7 in 1:3) > 3
Vaccinated by appropriate age
A vaccination is considered to have been given at the appropriate age if the vaccination was given within
the first 12 months for vaccines scheduled to be given in the first year of life, and given within the first
24 months for vaccines scheduled to be given in the second year of life. Typically all childhood vaccines
reported in a DHS survey are given in the first year of life except for MCV 2, which is usually scheduled to
be given in the second year of life. In some countries MCV1 is given at 12 months and MCV2 at 24
months or later, and the appropriate age is adjusted accordingly for these vaccines in this case.
The logic for assessing if a vaccine was given at the appropriate age is similar to that for vaccinated at
any time, except for the additional test for the vaccination having been given in the first year of life or
the second year of life as appropriate. This test is only possible for children with vaccination dates
reported on a vaccination card. When a child does not have a vaccination card that was shown to the
interviewer, an assumption is made that the ages at vaccinations for children whose mothers reported
the vaccination are the same as those derived from the dates on the vaccination cards. Additionally
there may be vaccination dates that are unknown or not fully recorded on the vaccination cards, some
of which provide enough information to determine if the vaccination was given by the appropriate age,
while others do not. Therefore, the number of all children with the specific vaccination dose is
multiplied by the proportion of that dose given before age 12 months compared with those for which it
is possible to determine if the vaccination was given by the appropriate age, as determined by
information taken from the vaccination card. The calculation of this proportion requires two steps:
a) Number of vaccinations where the vaccination was given by the appropriate age, if:
Year of vaccination is the same as year of birth and vaccination was given after date of
birth, or
Year of vaccination equals the year of birth plus 1 (or plus 2 for MCV2) years and
o month of vaccination is before month of birth, or
o month of vaccination equals month of birth and day of vaccination is before day
of birth
Guide to DHS Statistics 10.8 August 2018
or
Year of vaccination equals the year of birth plus 1 for MCV2 only.
b) Number of vaccinations where it is possible to say whether the vaccination was given by the
appropriate age:
Year of vaccination equals year of birth and vaccination was given after date of birth, or
Year of vaccination equals year of birth plus 1 (or plus 2 for MCV2) years, and month of
vaccination is given and, if month of vaccination equals month of birth, day of
vaccination is also given, or
Year of vaccination is any other year after the year of birth.
It is the ratio of these two that provides the proportion that is applied to the number of all children
having received the specific vaccination to produce the percentage given by the appropriate age.
Denominators:
1) Number of living children age 12–23 months (b5 = 1 & b19 in 12:23)
2) Number of living children age 24-35 months (b5 = 1 & b19 in 24:35)
Indicator Definitions:
Indicators 1-3, 5-7: Quotient of numerator divided by denominator for the age group, multiplied by 100.
Indicators 4, 8: Indicator 3 or 7, respectively, multiplied by the quotient of the number of vaccinations
where the vaccination was given by the appropriate (a) above) age divided by the number of
vaccinations where it is possible to say whether the vaccination was given by the appropriate age (b)
above) (see Calculation).
Handling of Missing Values
Missing vaccination card: Mother’s report of vaccination, if any, is used. Missing vaccination on card:
Use mother’s report of vaccination, if any, and otherwise assume vaccination is not given.
Missing or invalid date on vaccination card: Impute whether before or after age 12 months or before or
after age 24 months according to distributions on vaccination cards with valid dates – applied in
aggregate after calculation of number of children receiving each vaccine.
Missing mother’s (respondent’s) report of vaccination or mother does not know if vaccination given:
Treat as vaccine not received when no valid information is on the vaccination card.
Notes and Considerations
The complexity of the vaccination landscape and the fact that it has changed over time (and is expected
to continue to do so) complicates trend analysis, and cross-country comparisons. The all basic
vaccinations indicator can be used for trend analysis, although the components of this indicator too
have changed over time (for example, DPT has been replaced by DPT-HepB-Hib or other DPT-containing
vaccines in most countries).
In some countries, especially those of Latin America and the Commonwealth of Independent States
(CIS), the recommended age for MCV1 is at 12 months or later, compared with at 9 months in many
other countries. In such cases, MCV1 will only be reported for children age 24-35 months. Similarly, in
many of these same countries, the recommended age for giving MCV2 is at 24 months or later, in which

Guide to DHS Statistics 10.9 August 2018
case MCV2 is not reported for children age 24-35 months. Similarly other vaccines may be given at later
ages according to the national vaccination schedule and will be excluded from reporting for age groups
where all children in the age group have not had the opportunity to receive the vaccine.
The all age appropriate vaccinations indicator will change every time a country adds an additional
vaccine to its national vaccination schedule. The age-appropriate vaccinations will vary depending on
the national vaccination schedule, and the numbers of doses, the types of vaccine included, or the ages
at which they are given may vary from country to country or from survey to survey.
Care needs to be taken not to confuse the polio vaccine dose given at birth (called polio 0) from the
doses given later (polio 1, polio 2, and polio 3). Similarly the inactivated polio dose may be given at the
same time as the third oral polio dose and should not be confused with the third dose of oral polio.
Changes over Time
In some countries, especially those of Latin America, the recommended age for MCV has changed from
below age 12 months to age 12 months or above. In DHS-VI and earlier, where this was the case, the age
range of the children in both numerator and denominator was changed from 12-23 months to 18-29
months. Additionally, age 18 months instead of age 12 months was used as the age by which
vaccinations should have taken place. However, in DHS-7, The DHS Program is consistently reporting
vaccination rates across the age 12-23 and 24-35 month cohorts. Thus, in the instance where a child
should receive MCV1 at age 18 months, the survey would report on whether or not a child age 24-35
months received the MCV1, and this vaccine would not be reported for children age 12-23 months.
In surveys before DHS-7, the calculation of whether vaccinations were given in the first year of life was
only calculated to the month because the day of birth of the child was not collected. In DHS-7, the
calculation is performed to the day using the day, month, and year of birth and of vaccination.
References
Assaf, S., L. Horton, M. Bornstein, and T. Pullum. 2017. Levels and Trends of Maternal and Child Health
Indicators in 11 Middle East and North African Countries. DHS Comparative Report No. 46. Rockville,
Maryland, USA: ICF. https://www.dhsprogram.com/publications/publication-CR46-Comparative-
Reports.cfm
Cutts, F.T., P. Claquin, M.C. Danovaro-Holliday, D.A. Rhoda. 2016. “Monitoring vaccination coverage:
Defining the role of surveys.” Vaccine 34: 4103-4109. https://www.ncbi.nlm.nih.gov/pubmed/27349841
Cutts, F.T., H.S. Izurieta, D.A. Rhoda. 2013. “Measuring Coverage in MNCH: Design, Implementation, and
Interpretation Challenges Associated with Tracking Vaccination Coverage Using Household Surveys.”
PLOS Medicine 10: 1-11.
https://journals.plos.org/plosmedicine/article?id=10.1371/journal.pmed.1001404
Rutstein, S.O., S. Staveteig, R. Winter, and J. Yourkavitch. 2016. Urban child poverty, health, and survival
in low- and middle-income countries. DHS Comparative Reports No. 40. Rockville, Maryland, USA: ICF
International. https://www.dhsprogram.com/publications/publication-CR40-Comparative-Reports.cfm

Guide to DHS Statistics 10.10 August 2018
WHO, UNICEF, World Bank. 2009. State of the world’s vaccines and immunization, 3rd ed. Geneva,
World Health Organization. http://www.who.int/immunization/sowvi/en/
World Health Organization. 2018. Global reference list of 100 core health indicators. Geneva: World
Health Organization. Available: http://www.who.int/healthinfo/indicators/2018/en/.
Resources
DHS-7 Tabulation plan: Tables 10.2 and 10.3
API Indicator IDs:
By source of information:
CH_VACS_C_BCG, CH_VACS_C_DP1, CH_VACS_C_DP2, CH_VACS_C_DP3, CH_VACS_C_OP0,
CH_VACS_C_OP1, CH_VACS_C_OP2, CH_VACS_C_OP3, CH_VACS_C_MSL, CH_VACS_C_MS2,
CH_VACS_C_HP0, CH_VACS_C_HP1, CH_VACS_C_HP2, CH_VACS_C_HP3, CH_VACS_C_HB1,
CH_VACS_C_HB2, CH_VACS_C_HB3, CH_VACS_C_PN1, CH_VACS_C_PN2, CH_VACS_C_PN3,
CH_VACS_C_RT1, CH_VACS_C_RT2, CH_VACS_C_RT3, CH_VACS_C_BAS, CH_VACS_C_APP,
CH_VACS_C_NON
(API link, STATcompiler link)
By background characteristics:
CH_VACC_C_BCG, CH_VACC_C_DP1, CH_VACC_C_DP2, CH_VACC_C_DP3, CH_VACC_C_OP0,
CH_VACC_C_OP1, CH_VACC_C_OP2, CH_VACC_C_OP3, CH_VACC_C_MSL, CH_VACC_C_MS2,
CH_VACC_C_HP0, CH_VACC_C_HP1, CH_VACC_C_HP2, CH_VACC_C_HP3, CH_VACC_C_HB1,
CH_VACC_C_HB2, CH_VACC_C_HB3, CH_VACC_C_PN1, CH_VACC_C_PN2, CH_VACC_C_PN3,
CH_VACC_C_RT1, CH_VACC_C_RT2, CH_VACC_C_RT3, CH_VACC_C_BAS, CH_VACC_C_APP,
CH_VACC_C_NON
(API link, STATcompiler link)
UNICEF. 2018. Immunization. https://data.unicef.org/topic/child-health/immunization/
WHO. WHO vaccine-preventable diseases: monitoring system. 2018 global summary. 2018.
http://apps.who.int/immunization_monitoring/globalsummary/schedules
SDG Indicator 3.b.1: Proportion of the target population covered by all vaccines included in their
national programme
WHO 100 Core Health Indicators: National vaccination rate by vaccine
MICS6 Indicator TC.1: Tuberculosis immunization coverage
MICS6 Indicator TC.3: Diphtheria, tetanus, and pertussis (DTP) immunization coverage
MICS6 Indicator TC.4: Hepatitis B immunization coverage
MICS6 Indicator TC.5: Haemophilus influenza type B (Hib) immunization coverage
MICS6 Indicator TC.6: Pneumococcal (conjugate) immunization coverage
MICS6 Indicator TC.7: Rotavirus immunization coverage
MICS6 Indicator TC.10: Measles immunization coverage
MICS6 Indicator TC.11: Full immunization coverage
Guide to DHS Statistics 10.11 August 2018
Percentage of children who ever had a vaccination card and who had a vaccination card
seen
Definition
1) Percentage of children age 12–23 months who ever had a vaccination card.
2) Percentage of children age 12–23 months who had a vaccination card seen.
3) Percentage of children age 24-35 months who ever had a vaccination card.
4) Percentage of children age 24-35 months who had a vaccination card seen.
Coverage:
Population base: Living children age 12–23 months and 24-35 months (KR file)
Time period: 3 years before survey; at the time of interview
Numerators:
1) Number of living children age 12-23 months who ever had a vaccination card (h1 in 1:3)
2) Number of living children age 12-23 months whose vaccination card was seen at the time of the
interview (h1 = 1)
3) Number of living children age 24-35 months who ever had a vaccination card (h1 in 1:3)
4) Number of living children age 24-35 months whose vaccination card was seen at the time of the
interview (h1 = 1)
Denominators:
1) Number of living children age 12-23 months (b5 = 1 & b19 in 12:23)
2) Number of living children age 24-35 months (b5 = 1 & b19 in 24:35)
Variables: KR file.
b5
Child is alive
b19
Current age of child in months
h1
Has health card
Calculation
For percentages, 100 times the quotient of the numerators divided by the denominators.
Handling of Missing Values
Missing data or “don’t know” response for whether ever had a card or whether it was seen are excluded
from numerators.
Notes and Considerations
The term vaccination card encompasses card, booklet, or other home-based record in which vaccination
information has been recorded.

Guide to DHS Statistics 10.12 August 2018
Changes over Time
Percentage who ever had a card was first included in DHS-7.
References
Brown, D.W., and M. Gacic-Dobo. 2015. “Home-based record prevalence among children age 12-23
months from 180 demographic and health surveys.” Vaccine. 33: 2584-2593.
https://www.sciencedirect.com/science/article/pii/S0264410X15004405
Resources
DHS-7 Tabulation plan: Table 10.4
API Indicator IDs: CH_VACS_C_CSN
(API link, STATcompiler link)

Guide to DHS Statistics 10.13 August 2018
Prevalence and Treatment of Symptoms of Acute Respiratory Infection (ARI)
Percentage of children under age 5 with symptoms of ARI, and among children under age 5
with symptoms of ARI, the percentage for whom advice or treatment was sought and for
whom advice or treatment was sought the same or next day.
Definition
1) Percentage of children under age 5 with symptoms of ARI at any time in the 2 weeks preceding
the survey.
2) Percentage of children under age 5 with symptoms of ARI at any time in the 2 weeks preceding
the survey for whom advice or treatment was sought.
3) Percentage of children under age 5 with symptoms of ARI at any time in the 2 weeks preceding
the survey for whom advice or treatment was sought the same or next day.
Coverage:
Population base: Living children under age 5 (KR file)
Time period: 2 weeks preceding the survey
Numerators:
1) Number of living children under age 5 with symptoms of ARI (short, rapid breathing which was
chest-related and/or difficult breathing which was chest-related) in the 2 weeks preceding the
survey (h31b = 1 & h31c in 1,3)
2) Number of living children under age 5 with symptoms of ARI in the 2 weeks preceding the
survey for whom treatment was sought (h31c = 1 & h31c in 1,3 & any of h32a – x = 1 excluding
advice or treatment from a traditional practitioner (usually h32t))
3) Number of living children under age 5 with symptoms of ARI in the 2 weeks preceding the
survey for whom treatment was sought the same or next day (h31b = 1 & h31c in 1,3 & any of
h32a – x = 1 excluding advice or treatment from a traditional practitioner (usually h32t) & h46b
in 0,1)
Denominators:
1) Number of living children under age 5 (b5=1 & b19 < 60)
2) Number of children under age 5 with symptoms of ARI at in the 2 weeks preceding the survey
(b5=1 and b19 < 60 and h31b = 1 & h31c in 1,3)
3) Same as denominator 2
Variables: KR file.
b5
Child is alive
b19
Current age of child in months
h31b
Short, rapid breaths
h31c
Problem in the chest or blocked or running nose
h32a
Fever/cough: government hospital
h32b
Fever/cough: CS public sector
h32c
Fever/cough: CS public sector
h32d
Fever/cough: CS public sector
Guide to DHS Statistics 10.14 August 2018
h32e
Fever/cough: CS public sector
h32f
Fever/cough: CS public sector
h32g
Fever/cough: CS public sector
h32h
Fever/cough: CS public sector
h32i
Fever/cough: CS public sector
h32j
Fever/cough: private hospital/clinic
h32k
Fever/cough: private pharmacy
h32l
Fever/cough: private doctor
h32m
Fever/cough: CS private medical
h32n
Fever/cough: CS private medical
h32o
Fever/cough: CS private medical
h32p
Fever/cough: CS private medical
h32q
Fever/cough: CS private medical
h32r
Fever/cough: CS private medical
h32s
Fever/cough: CS other sector
h32t
Fever/cough: CS other sector
h32u
Fever/cough: CS other sector
h32v
Fever/cough: CS other sector
h32w
Fever/cough: CS other sector
h32x
Fever/cough: other
h46b
Number of days after fever began sought advice or treatment
v005
Women’s individual sample weight
Calculation
Quotient of the numerators divided by the denominators multiplied by 100.
Handling of Missing Values
Missing data or “don’t know” responses on the questions on short, rapid breathing and/or difficult
breathing and whether it was chest-related are excluded from numerator 1, and from numerators and
denominators 2 & 3, assuming no illness.
Missing data or “don’t know” responses for whether sought advice or treatment and who from are
excluded from numerators 2 & 3, assuming no treatment sought from a health facility or provider.
Notes and Considerations
Indicators 2 & 3 include advice or treatment from the public sector, private medical sector, shops,
market, and itinerant drug sellers, but excludes advice or treatment from a traditional practitioner.
Changes over Time
For DHS-7, symptoms or ARI is defined as short, rapid breathing which was chest-related and/or difficult
breathing which was chest-related. In prior surveys, the definition of symptoms of ARI included cough.
Specifically, in DHS-VI and later DHS-V surveys, symptoms of ARI was defined a cough accompanied by

Guide to DHS Statistics 10.15 August 2018
short, rapid breathing which was chest-related and/or by difficult breathing which was chest-related
(h31b = 1 & h31c in 1,3). In earlier DHS-V and DHS-IV surveys, the wording of the question about
breathing only defined the symptoms of ARI as cough accompanied by short, rapid breathing. In prior
surveys symptoms of ARI was defined as cough accompanied by rapid breaths alone (h31b = 1) as the
question on whether the illness was chest-related (h13c) was not included.
For surveys prior to DHS-7, care seeking was defined differently. The indicator measured care seeking
from a medical source or provider, and excluded pharmacy, shop, market, itinerant drug seller and
traditional practitioner.
References
Assaf, S., L. Horton, M. Bornstein, and T. Pullum. 2017. Levels and Trends of Maternal and Child Health
Indicators in 11 Middle East and North African Countries. DHS Comparative Report No. 46. Rockville,
Maryland, USA: ICF. https://www.dhsprogram.com/publications/publication-CR46-Comparative-
Reports.cfm
Rutstein, S.O., S. Staveteig, R. Winter, and J. Yourkavitch. 2016. Urban child poverty, health, and survival
in low- and middle-income countries. DHS Comparative Reports No. 40. Rockville, Maryland, USA: ICF
International. https://www.dhsprogram.com/publications/publication-CR40-Comparative-Reports.cfm
WHO and UNICEF. 2013. Ending preventable child deaths from Pneumonia and Diarrhoea by 2025: The
integrated Global Action Plan for Pneumonia and Diarrhoea (GAPPD). Geneva: WHO
http://www.who.int/maternal_child_adolescent/documents/global_action_plan_pneumonia_diarrhoea
/en/
World Health Organization. 2018. Global reference list of 100 core health indicators. Geneva: World
Health Organization. http://www.who.int/healthinfo/indicators/2018/en/.
UNICEF. 2012. Pneumonia and diarrhea: Tackling the deadliest diseases for the world’s poorest children.
New York, New York, USA:UNICEF https://www.unicef.org/publications/index_65491.html
Resources
DHS-7 Tabulation plan: Table 10.5
API Indicator IDs: CH_ARIS_C_ARI
(API link, STATcompiler link)
WHO 100 Core Health Indicators: Care-seeking for symptoms of pneumonia
MICS6 Indicator TC.19: Care-seeking for children with acute respiratory infection (ARI) symptoms
Guide to DHS Statistics 10.16 August 2018
Percentage of children under age 5 with symptoms of ARI for whom advice or treatment
was sought from specific sources, and among those for whom advice or treatment was
sought, percentage for whom advice or treatment was sought from specific sources
Definition
1) Percentage of children under age 5 with symptoms of ARI for whom advice or treatment was
sought from specific sources.
2) Among children under age 5 with symptoms of ARI for whom advice or treatment was sought,
the percentage for whom advice or treatment was sought from specific sources.
Coverage:
Population base: Living children under age 5 with symptoms of ARI (KR file)
Time period: 2 weeks preceding the survey
Numerator:
1) Number of living children under age 5 with symptoms of ARI (short, rapid breathing which was
chest-related and/or by difficult breathing which was chest-related) in the 2 weeks preceding
the survey for whom care was sought from each specific source (h31b = 1 & h31c in 1,3 & h32a
– x = 1)
2) Same as numerator 1
Denominators:
1) Number of living children under age 5 with symptoms of ARI in the 2 weeks preceding the
survey (b5=1 & h31b = 1 & h31c in 1,3)
2) Number of living children under age 5 with symptoms of ARI in the 2 weeks preceding the
survey for whom treatment was sought from any source (b5=1 & h31b = 1 & h31c in 1,3 & h32y
= 0)
Variables: KR file.
b5
Child is alive
b19
Current age of child in months
h31b
Short, rapid breaths
h31c
Problem in the chest or blocked or running nose
h32a
Fever/cough: government hospital
h32b
Fever/cough: CS public sector
h32c
Fever/cough: CS public sector
h32d
Fever/cough: CS public sector
h32e
Fever/cough: CS public sector
h32f
Fever/cough: CS public sector
h32g
Fever/cough: CS public sector
h32h
Fever/cough: CS public sector
h32i
Fever/cough: CS public sector
h32j
Fever/cough: private hospital/clinic
h32k
Fever/cough: private pharmacy
h32l
Fever/cough: private doctor
Guide to DHS Statistics 10.17 August 2018
h32m
Fever/cough: CS private medical
h32n
Fever/cough: CS private medical
h32o
Fever/cough: CS private medical
h32p
Fever/cough: CS private medical
h32q
Fever/cough: CS private medical
h32r
Fever/cough: CS private medical
h32s
Fever/cough: CS other sector
h32t
Fever/cough: CS other sector
h32u
Fever/cough: CS other sector
h32v
Fever/cough: CS other sector
h32w
Fever/cough: CS other sector
h32x
Fever/cough: other
h32y
Fever/cough: no treatment
v005
Women’s individual sample weight
Calculation
For percentages, 100 times the quotient of the numerators divided by the denominators.
Handling of Missing Values
Missing data or “don’t know” responses on the questions on short, rapid breathing and/or difficult
breathing and whether it was chest-related are excluded from numerators and denominators, assuming
no illness.
Missing data or “don’t know” responses for whether sought advice or treatment and who from are
excluded from numerators, assuming no treatment sought from a specific health facility or provider.
Notes and Considerations
In contrast to the indicator Percentage of children under age 5 with symptoms of ARI, and among
children under age 5 with symptoms of ARI, the percentage for whom advice or treatment was sought
and for whom advice or treatment was sought the same or next day., these indicators include advice or
treatment from a traditional practitioner.
Changes over Time
For DHS-7, symptoms or ARI is defined as short, rapid breathing which was chest-related and/or difficult
breathing which was chest-related. In prior surveys, the definition of symptoms of ARI included cough.
Specifically, in DHS-VI and later DHS-V surveys, symptoms of ARI was defined as a cough accompanied
by short, rapid breathing which was chest-related and/or by difficult breathing which was chest-related
(h31b = 1 & h31c in 1,3). In earlier DHS-V and DHS-IV surveys, the wording of the question about
breathing only defined the symptoms of ARI as cough accompanied by short, rapid breathing. In prior
surveys symptoms of ARI was defined as cough accompanied by rapid breaths alone (h31b = 1) as the
question on whether the illness was chest-related (h13c) was not included.
Guide to DHS Statistics 10.18 August 2018
Resources
DHS-7 Tabulation plan: Table 10.6

Guide to DHS Statistics 10.19 August 2018
Prevalence and Treatment of Fever
Percentage of children under age 5 with fever, percentage with fever for whom advice or
treatment was sought, for whom advice or treatment was sought the same or next day,
and who took antibiotic drugs
Definition
1) Percentage of children under age 5 with fever at any time in the 2 weeks preceding the survey.
2) Percentage of children under age 5 with fever at any time in the 2 weeks preceding the survey
for whom advice or treatment was sought.
3) Percentage of children under age 5 with fever at any time in the 2 weeks preceding the survey
for whom advice or treatment was sought the same or next day.
4) Percentage of children under age 5 with fever at any time in the 2 weeks preceding the survey
who took antibiotic drugs.
Coverage:
Population base: Living children under age 5 (KR file)
Time period: 2 weeks preceding the survey
Numerators:
1) Number of living children under age 5 with fever in the 2 weeks preceding the survey (b5 = 1 &
h22 = 1)
2) Number of living children under age 5 with fever in the 2 weeks preceding the survey for whom
treatment was sought (b5 = 1 & h22 = 1 & any of h32a – x = 1 excluding advice or treatment
from a traditional practitioner (usually h32t))
3) Number of children under age 5 with fever in the 2 weeks preceding the survey for whom
treatment was sought the same or next day (55 = 1 & h22 = 1 & any of h32a – x = 1 excluding
advice or treatment from a traditional practitioner (usually h32t) & h46b in 0, 1)
4) Number of living children under age 5 with fever in the 2 weeks preceding the interview who
took antibiotic drugs (b5 = 1 & h22 = 1 & (h37i = 1 or h37j = 1) [or ml13i = 1 or m13j = 1])
Denominators:
1) Number of living children under age 5 (b5 = 1 & b19 < 60)
2) Number of living children under age 5 with fever in the 2 weeks preceding the survey b5 = 1 &
b19 < 60 and h22=1). This is the denominator for numerators 2, 3 and 4
Variables: KR file.
b5
Child is alive
b19
Current age of child in months
h22
Had fever in last two weeks
h32a
Fever/cough: government hospital
h32b
Fever/cough: CS public sector
h32c
Fever/cough: CS public sector
h32d
Fever/cough: CS public sector
h32e
Fever/cough: CS public sector
Guide to DHS Statistics 10.20 August 2018
h32f
Fever/cough: CS public sector
h32g
Fever/cough: CS public sector
h32h
Fever/cough: CS public sector
h32i
Fever/cough: CS public sector
h32j
Fever/cough: private hospital/clinic
h32k
Fever/cough: private pharmacy
h32l
Fever/cough: private doctor
h32m
Fever/cough: CS private medical
h32n
Fever/cough: CS private medical
h32o
Fever/cough: CS private medical
h32p
Fever/cough: CS private medical
h32q
Fever/cough: CS private medical
h32r
Fever/cough: CS private medical
h32s
Fever/cough: CS other sector
h32t
Fever/cough: CS other sector
h32u
Fever/cough: CS other sector
h32v
Fever/cough: CS other sector
h32w
Fever/cough: CS other sector
h32x
Fever/cough: other
h37i
Antibiotic pill/syrup taken for fever
h37j
Antibiotic injection taken for fever
h46b
Number of days after fever began sought advice or treatment
ml13i
Antibiotic pill/syrup taken for fever
ml13j
Antibiotic injection taken for fever
v005
Women’s individual sample weight
Calculation
For percentages, 100 times the quotient of the numerators divided by the denominators.
Handling of Missing Values
Missing data or “don’t know” responses on the question on fever are excluded from numerator 1, and
from numerators and denominators 2, 3 & 4, assuming no illness.
Missing data or “don’t know” responses for whether sought advice or treatment and from whom are
excluded from numerators 2 & 3, assuming no treatment sought from a health facility or provider.
Missing data or “don’t know” responses for whether the child took antibiotics are excluded from
numerator 4, assuming no antibiotics were given.
Notes and Considerations
Indicators 2 & 3 include advice or treatment from the public sector, private medical sector, shops,
markets, and itinerant drug sellers, but excludes advice or treatment from a traditional practitioner.

Guide to DHS Statistics 10.21 August 2018
Changes over Time
For surveys prior to DHS-7, care seeking was defined differently. The indicator measured care seeking
from a medical source or provider, and excluded pharmacy, shop, market, itinerant drug seller and
traditional practitioner.
References
Rutstein, S.O., S. Staveteig, R. Winter, and J. Yourkavitch. 2016. Urban child poverty, health, and survival
in low- and middle-income countries. DHS Comparative Reports No. 40. Rockville, Maryland, USA: ICF
International. https://www.dhsprogram.com/publications/publication-CR40-Comparative-Reports.cfm
Resources
DHS-7 Tabulation plan: Table 10.7
API Indicator IDs: CH_FEVT_C_FEV, CH_FEVT_C_ABI
(API link, STATcompiler link)
MICS6 Indicator TC.26: Care-seeking for fever

Guide to DHS Statistics 10.22 August 2018
Prevalence and Treatment of Diarrhea
Percentage of children under age 5 with diarrhea, and percentage for whom advice or
treatment was sought
Definition
1) Percentage of children under age 5 with diarrhea at any time in the 2 weeks preceding the
survey.
2) Percentage of children under age 5 with diarrhea at any time in the 2 weeks preceding the
survey for whom advice or treatment was sought.
Coverage:
Population base: Living children under age 5 (KR file)
Time period: 2 weeks preceding the interview
Numerators:
1) Number of living children under age 5 with diarrhea in the 2 weeks preceding the survey (b5 = 1
& h11 in 1,2)
2) Number of living children under age 5 with diarrhea in the 2 weeks preceding the survey for
whom advice or treatment was sought (b5 = 1 & h11 in 1,2 & any of h12a – x = 1, excluding
advice or treatment from a traditional practitioner)
Denominators:
1) Number of living children under age 5 (b5 = 1 and b19 < 60)
2) Number of living children under age 5 with diarrhea in the 2 weeks preceding the survey (b5 = 1
and b19 < 60 and h11 in 1,2)
Variables: KR file.
b5
Child is alive
b19
Current age of child in months
h11
Had diarrhea recently
h12a
Diarrhea: government hospital
h12b
Diarrhea: CS public sector
h12c
Diarrhea: CS public sector
h12d
Diarrhea: CS public sector
h12e
Diarrhea: CS public sector
h12f
Diarrhea: CS public sector
h12g
Diarrhea: CS public sector
h12h
Diarrhea: CS public sector
h12i
Diarrhea: CS public sector
h12j
Diarrhea: private hospital/clinic
h12k
Diarrhea: private pharmacy
h12l
Diarrhea: private doctor
h12m
Diarrhea: CS private medical
h12n
Diarrhea: CS private medical

Guide to DHS Statistics 10.23 August 2018
h12o
Diarrhea: CS private medical
h12p
Diarrhea: CS private medical
h12q
Diarrhea: CS private medical
h12r
Diarrhea: CS private medical
h12s
Diarrhea: CS other sector
h12t
Diarrhea: CS other sector
h12u
Diarrhea: CS other sector
h12v
Diarrhea: CS other sector
h12w
Diarrhea: CS other sector
h12x
Diarrhea: other
v005
Women’s individual sample weight
Calculation
For percentages, 100 times the quotient of the numerators divided by the denominators.
Handling of Missing Values
Missing data or “don’t know” responses on the question on fever are excluded from numerator 1, and
from numerator and denominator 2, assuming no illness.
Missing data or “don’t know” responses for whether sought advice or treatment and from whom are
excluded from numerator 2, assuming no treatment sought from a health facility or provider.
Notes and Considerations
Indicator 2 includes advice or treatment from the public sector, private medical sector, shops, markets,
and itinerant drug sellers, but excludes advice or treatment from a traditional practitioner.
Changes over Time
For surveys prior to DHS-7, care seeking was defined differently. The indicator measured care seeking
from a medical source or provider, and excluded pharmacy, shop, market, itinerant drug seller and
traditional practitioner.
References
Rutstein, S.O., S. Staveteig, R. Winter, and J. Yourkavitch. 2016. Urban child poverty, health, and survival
in low- and middle-income countries. DHS Comparative Reports No. 40. Rockville, Maryland, USA: ICF
International. https://www.dhsprogram.com/publications/publication-CR40-Comparative-Reports.cfm
WHO and UNICEF. 2013. Ending preventable child deaths from Pneumonia and Diarrhoea by 2025: The
integrated Global Action Plan for Pneumonia and Diarrhoea (GAPPD). Geneva: WHO
http://www.who.int/maternal_child_adolescent/documents/global_action_plan_pneumonia_diarrhoea
/en/

Guide to DHS Statistics 10.24 August 2018
UNICEF. 2012. Pneumonia and diarrhea: Tackling the deadliest diseases for the world’s poorest children.
New York, New York, USA:UNICEF https://www.unicef.org/publications/index_65491.html
Resources
DHS-7 Tabulation plan: Table 10.8
API Indicator IDs: CH_DIAR_C_DIA
(API link, STATcompiler link)
MICS6 Indicator TC.12: Care-seeking for diarrheoa

Guide to DHS Statistics 10.25 August 2018
Feeding Practices during Diarrhea
Percent distribution of children under age 5 with diarrhea by amount of liquids given, and
by amount of foods given
Definition
1) Percent distribution of children under age 5 with diarrhea at any time in the 2 weeks preceding
the survey by amount of liquids given.
2) Percent distribution of children under age 5 with diarrhea at any time in the 2 weeks preceding
the survey by amount of foods given.
Coverage:
Population base: Living children under age 5 (KR file)
Time period: 2 weeks preceding the interview
Numerators:
1) Number of living children under age 5 with diarrhea in the 2 weeks preceding the interview in
categories of amount of liquids given: more than usual, same as usual, somewhat less, much
less, none, or don’t know (h38 = 5/4/3/2/0/8,9)
2) Number of living children under age 5 with diarrhea in the 2 weeks preceding the interview in
categories of amount foods offered: more than usual, same as usual, somewhat less, much less,
none, never gave food, or don’t know (h39 = 5/4/3/2/0/1/8,9)
Denominator: Number of living children under age 5 with diarrhea in the 2 weeks preceding the survey
(b5 = 1 and b19 < 60 and h11 in 1,2)
Variables: KR file.
b5
Child is alive
b19
Current age of child in months
h11
Had diarrhea recently
h38
Diarrhea in last 2 weeks: amount offered to drink
h39
Diarrhea in last 2 weeks: amount offered to eat
v005
Women’s individual sample weight
Calculation
For percentages, 100 times the quotient of the numerators divided by the denominator.
Handling of Missing Values
“Don’t know” responses and missing values are included in the “Don’t know” category in the percent
distributions. Percent distributions add up to 100 percent.

Guide to DHS Statistics 10.26 August 2018
Resources
DHS-7 Tabulation plan: Table 10.9
API Indicator IDs:
CH_DIFP_C_LMR, CH_DIFP_C_LSM, CH_DIFP_C_LLS, CH_DIFP_C_LML, CH_DIFP_C_LNO, CH_DIFP_C_LDK,
CH_DIFP_C_FMR, CH_DIFP_C_FSM, CH_DIFP_C_FLS, CH_DIFP_C_FML, CH_DIFP_C_FNO, CH_DIFP_C_FNV,
CH_DIFP_C_FDK
(API link, STATcompiler link)

Guide to DHS Statistics 10.27 August 2018
Oral Rehydration Therapy, Zinc, and Other Treatments for Diarrhea
Among children under age 5 who had diarrhea in the 2 weeks preceding the survey,
percentage given fluid from an ORS packet or pre-packaged ORS fluid, recommended
homemade fluids (RHF), ORS or RHF, zinc, ORS and zinc, ORS or increased fluids, oral
rehydration therapy (ORT), continued feeding and ORT, and other treatments; and
percentage given no treatment
Definition
Percentage of living children under age 5 with diarrhea who were given:
1) Fluid from oral rehydration salts (ORS) packet or pre-packaged ORS fluid
2) Recommended homemade fluids (RHF)
3) Either ORS or RHF
4) Zinc
5) ORS and zinc
6) ORS or increased fluids
7) Oral rehydration treatment (ORT – ORS, RHF, or increased fluids)
8) Continued feeding and ORT
9) Antibiotic drugs
10) Antimotility drugs
11) Intravenous solution
12) Home remedy/other treatment
13) No treatment
Coverage:
Population base: Living children under age 5 (KR file)
Time period: 2 weeks preceding the interview
Numerators:
Number of living children under age 5 with diarrhea at any time during the 2 weeks preceding the
interview who were given:
1) Fluid from oral rehydration salts (ORS) packet or pre-packaged ORS fluid (h13 in 1,2 or h13b = 1)
2) Recommended homemade fluids (RHF) (h14 in 1,2)
3) Either ORS or RHF (h13 in 1,2 or h13b = 1 or h14 in 1,2)
4) Zinc (h15e = 1)
5) ORS and Zinc ((h13 in 1,2 or h13b = 1) & h15e = 1)
6) ORS or increased fluids (h13 in 1,2 or h13b = 1 or h38 = 5)
7) Oral rehydration treatment (ORT – ORS, RHF, or increased fluids) (h13 in 1,2 or h13b = 1 or h14
in 1,2 or h38 = 5)
8) Continued feeding and ORT ( (h13 in 1,2 or h13b = 1 or h14 in 1,2 or h38 = 5) & h39 in 3:5)
9) Antibiotic drugs (h15 = 1 or h15b = 1)
10) Antimotility drugs (h15a = 1)
11) Intravenous solution (h15c = 1)
12) Home remedy/other treatment (any of h15d, f – m = 1 or h20 = 1)
13) No treatment (h21a = 1)
Guide to DHS Statistics 10.28 August 2018
Denominator: Number of children under age 5 with diarrhea in the 2 weeks preceding the interview (b5
= 1 and b19 < 60 and h11 in 1,2)
Variables: KR file.
b5
Child is alive
b19
Current age of child in months
h11
Had diarrhea recently
h13
Given oral rehydration
h13b
Given pre-packaged ORS liquid
h14
Given recommended home solution
h15
Given antibiotic pills or syrups
h15a
Given antimotility
h15b
Given antibiotic injection
h15c
Given intravenous (IV)
h15d
Given home remedy, herbal medicine
h15e
Given zinc
h15f
Given other (not antibiotic, antimotility, zinc)
h15g
Given unknown pill or syrup
h15h
Given non-antibiotic injection
h15i
Given unknown injection
h15j
Given CS
h15k
Given CS
h15l
Given CS
h15m
Given CS
h20
Given other treatment
h21a
Given no treatment
h38
Diarrhea in last 2 weeks: amount offered to drink
h39
Diarrhea in last 2 weeks: amount offered to eat
v005
Women’s individual sample weight
Calculation
For percentages, 100 times the quotient of the numerators divided by the denominators.
Handling of Missing Values
“Don’t know” responses and missing values on whether had diarrhea are excluded from numerators and
denominator, assuming no illness. “Don’t know” responses and missing values for each type of
treatment are excluded from the numerator but included in the denominator assuming the treatment
was not given.
Notes and Considerations
Continued feeding includes children who were given more than usual, same as usual, or somewhat less
food during the diarrhea episode.

Guide to DHS Statistics 10.29 August 2018
Changes over Time
The terminology has changed since DHS-VI. Oral rehydration therapy (ORT) used to be defined as ORS or
RHF. ORT is now defined as ORS, RHF, or increased fluids to be comparable with MICS.
References
Rutstein, S.O., S. Staveteig, R. Winter, and J. Yourkavitch. 2016. Urban child poverty, health, and survival
in low- and middle-income countries. DHS Comparative Reports No. 40. Rockville, Maryland, USA: ICF
International. https://www.dhsprogram.com/publications/publication-CR40-Comparative-Reports.cfm
WHO and UNICEF. 2013. Ending preventable child deaths from Pneumonia and Diarrhoea by 2025: The
integrated Global Action Plan for Pneumonia and Diarrhoea (GAPPD). Geneva: WHO
http://www.who.int/maternal_child_adolescent/documents/global_action_plan_pneumonia_diarrhoea
/en/
World Health Organization. 2018. Global reference list of 100 core health indicators. Geneva: World
Health Organization. Available: http://www.who.int/healthinfo/indicators/2018/en/.
UNICEF. 2012. Pneumonia and diarrhea: Tackling the deadliest diseases for the world’s poorest children.
New York, New York, USA:UNICEF https://www.unicef.org/publications/index_65491.html
Resources
DHS-7 Tabulation plan: Table 10.10
API Indicator IDs:
CH_DIAT_C_ORS, CH_DIAT_C_RHF, CH_DIAT_C_ORT, CH_DIAT_C_INC, CH_DIAT_C_ORI,
CH_DIAT_C_ABI, CH_DIAT_C_AMO, CH_DIAT_C_ZNC, CH_DIAT_C_IVS, CH_DIAT_C_HOM,
CH_DIAT_C_NOT
(API link, STATcompiler link)
WHO 100 Core Health Indicators: Coverage of diarrhea treatment
MICS6 Indicator TC.13a: Diarrhoea treatment with oral rehydration salt solution (ORS)
MICS6 Indicator TC.13b: Diarrhoea treatment with oral rehydration salt solution (ORS) and zinc
MICS6 Indicator TC.14: Diarrhoea treatment with oral rehydration therapy (ORT) and continued feeding

Guide to DHS Statistics 10.30 August 2018
Source of Advice or Treatment for Children with Diarrhea
Percentage of children under age 5 with diarrhea for whom advice or treatment was
sought from specific sources, among children with diarrhea for whom advice or treatment
was sought, percentage sought from specific sources, and among children with diarrhea
who received ORS, the percentage for whom advice or treatment was sought from specific
sources
Definition
1) Percentage of living children under age 5 with diarrhea for whom advice or treatment was
sought from specific sources.
2) Among living children under age 5 with diarrhea for whom advice or treatment was sought,
percentage for whom advice or treatment was sought from specific sources.
3) Among living children under age 5 with diarrhea who received ORS, the percentage for whom
advice or treatment was sought from specific sources.
Coverage:
Population base: Living children under age 5 (KR file)
Time period: 2 weeks preceding the interview
Numerators:
1) Number of living children under 5 age years with diarrhea at any time during the 2 weeks
preceding the interview for whom advice or treatment was sought from specific sources (h32a –
h32x = 1)
2) Same as numerator 1
3) Number of living children under age 5 with diarrhea at any time during the 2 weeks preceding
the interview who received ORS and for whom advice or treatment was sought from specific
sources ((h13 in 1,2 or h13b = 1) & h32a – h32x = 1)
Denominators:
1) Number of living children under age 5 with diarrhea in the 2 weeks preceding the interview (b5
= 1 & b19 < 60 & h11 in 1,2)
2) Number of living children under age 5 with diarrhea in the 2 weeks preceding the interview for
whom advice or treatment was sought (b5 = 1 & b19 < 60 & h11 in 1,2 & h32y = 0)
3) Number of living children under age 5 with diarrhea in the 2 weeks preceding the interview who
received ORS (b5 = 1 & b19 < 60 & h11 in 1,2 & (h13 in 1,2 or h13b = 1))
Variables:
b5
Child is alive
b19
Current age of child in months
h11
Had diarrhea recently
h12a
Diarrhea: government hospital
h12b
Diarrhea: CS public sector
h12c
Diarrhea: CS public sector
Guide to DHS Statistics 10.31 August 2018
h12d
Diarrhea: CS public sector
h12e
Diarrhea: CS public sector
h12f
Diarrhea: CS public sector
h12g
Diarrhea: CS public sector
h12h
Diarrhea: CS public sector
h12i
Diarrhea: CS public sector
h12j
Diarrhea: private hospital/clinic
h12k
Diarrhea: private pharmacy
h12l
Diarrhea: private doctor
h12m
Diarrhea: CS private medical
h12n
Diarrhea: CS private medical
h12o
Diarrhea: CS private medical
h12p
Diarrhea: CS private medical
h12q
Diarrhea: CS private medical
h12r
Diarrhea: CS private medical
h12s
Diarrhea: CS other sector
h12t
Diarrhea: CS other sector
h12u
Diarrhea: CS other sector
h12v
Diarrhea: CS other sector
h12w
Diarrhea: CS other sector
h12x
Diarrhea: Other
h12y
Diarrhea: no treatment
h13
Given oral rehydration
h13b
Given pre-packaged ORS liquid
v005
Women’s individual sample weight
Calculation
For percentages, 100 times the quotient of the numerators divided by the denominators.
Handling of Missing Values
Missing data or “don’t know” responses on the questions on whether the child had diarrhea are
excluded from numerators and denominators, assuming no illness.
Missing data or “don’t know” responses for whether sought advice or treatment and from whom are
excluded from numerators, assuming no treatment sought from a specific health facility or provider.
Resources
DHS-7 Tabulation plan: Table 10.11

Guide to DHS Statistics 10.32 August 2018
Knowledge of ORS packets
Percentage of mothers who know about ORS packets or ORS pre-packaged liquids
Definition
Percentage of women with a live birth in the 5 years preceding the survey who know about ORS packets
or ORS pre-packaged liquids for treatment of diarrhea.
Coverage:
Population base: Women with one or more live births in the 5 years preceding the survey (IR
file)
Time period: Current status at time of survey
Numerator: Number of women with a live birth in the 5 years preceding the survey who know about oral
rehydration salts (ORS) packets or ORS pre-packaged liquids (v208 > 0 & v416 in 1,2)
Denominator: Number of women with a live birth in the 5 years preceding the survey (v208 > 0)
Variables: IR file.
v208
Births in the last five years
v416
Heard of oral rehydration
v005
Women’s individual sample weight
Calculation
For percentage, 100 times the quotient of the numerator divided by the denominator.
Handling of Missing Values
“Don’t know” or missing responses on whether heard of or used ORS are excluded from the numerator,
assuming that the respondent does not know about ORS.
Resources
DHS-7 Tabulation plan: Table 10.12
API Indicator IDs: CH_KORS_W_ORS
(API link, STATcompiler link)

Guide to DHS Statistics 10.33 August 2018
Disposal of children’s stool
Percent distribution of youngest children under age 2 living with the mother, by the
manner of disposal of child’s last fecal matter, and the percentage of children whose stools
are disposed of appropriately
Definition
1) Percent distribution of youngest children under age 2 living with the mother, by the manner of
disposal of child’s last fecal matter.
2) Percentage of children whose stools are disposed of appropriately.
Coverage:
Population base: Youngest child under age 2 living with the mother (KR file)
Time period: Disposal of child’s most recent fecal matter
Numerators:
1) Number of youngest children under age 2 living with mother distributed by way in which
youngest child’s fecal matter is disposed of in the following manner: Child uses toilet or latrine,
fecal matter put or rinsed into toilet or latrine, buried, put or rinsed into drain or ditch, thrown
into garbage, left in the open, other, or unknown/missing (v465 = 1/2/5/3/4/9/6/7,8,96/98,99)
2) Numbers of youngest children under age 2 living with mother whose last fecal matter is
disposed of appropriately: if the child used a toilet or latrine, if the fecal matter was put or
rinsed into a toilet or latrine or if it was buried (v465 in 1,2,5)
Denominator: Number of youngest children under age 2 living with mother (see calculation below)
Variables: KR file.
b9
Child lives with whom
b19
Current age of child in months
v465
Disposal of youngest child's stools when not using toilet
v005
Women’s individual sample weight
Calculation
Numerators divided by the denominator, multiplied by 100.
Denominator:
To select the cases for the denominator, first filter or keep only children living with the mother born in
the preceding 24 months (keep/select if b19 < 24 & b9 = 0), then keep only the youngest child
(keep/select if the first entry in the dataset (_n = 0) or the first for this respondent (caseid ≠ caseid[_n-
1]) as the youngest child is the first listed for the respondent in the data file). The commands in Stata
and SPSS are given below:

Guide to DHS Statistics 10.34 August 2018
Stata
* keep if under 24 months and living with mother
keep if b19 < 24 & b9 == 0
* and keep the last born of those.
* if caseid is the same as the prior case, then not the last born
keep if _n == 1 | caseid != caseid[_n-1]
SPSS
* keep if under 24 months and living with mother.
select if (b19 < 24 & b9 = 0).
* and keep the last born of those.
* if caseid is the same as the prior case, then not the last born.
select if (caseid <> lag(caseid)).
Handling of Missing Values
Included in distribution of disposal of child’s stools as a separate category.
Notes and Considerations
Children’s stools are considered to be disposed of appropriately if the child used a toilet or latrine, if the
fecal matter was put or rinsed into a toilet or latrine, or if it was buried.
Changes over Time
The denominator has changed over time from children under age 5 to children under 3, and now in DHS-
7 to children under age 2. The response categories are those proposed by the WHO/UNICEF Joint
Monitoring Programme (see page 15 of Core questions on drinking-water and sanitation for household
surveys, dated August 2006, by WHO and UNICEF).
References
WHO and UNICEF. 2006. Core questions on drinking-water and sanitation for household surveys.
http://www.who.int/water_sanitation_health/monitoring/household_surveys/en/
Resources
DHS-7 Tabulation plan: Table 10.13
API Indicator IDs:
CH_DSTL_C_TLT, CH_DSTL_C_RTL, CH_DSTL_C_BUR, CH_DSTL_C_RDR, CH_DSTL_C_GBG,
CH_DSTL_C_OPN, CH_DSTL_C_OTH
(API link, STATcompiler link)

11.1
Nutrition of Children and Adults
This chapter covers nutritional concerns for children and adults. The section on children covers the
following related topics: anthropometric assessment of the nutritional status of children under five
years of age; infant and young child feeding practices, including breastfeeding and feeding with
solid/semi-solid foods; diversity of foods fed; frequency of feeding; and micronutrient status,
supplementation and fortification. The section on adults covers: nutritional status of women and men
15 to 49 years of age; and micronutrient status, supplementation and fortification.
Anthropometric indicators for young children and for adults provide outcome measures of nutritional
status. Marked differences, especially in regard to height-for-age and weight-for-age are often seen
between different subgroups of children within a country. An adult’s nutritional status has important
implications for the health status of the adult her/himself as well as that of the children that women
may bear.
Adequate nutrition is critical to child development. The period from birth to two years of age is
important for optimal growth, health and development. This period is one marked for growth faltering,
micronutrient deficiencies, and common childhood illnesses, such as diarrhea and acute respiratory
infections (ARI).
Optimal feeding practices reported in this chapter include early initiation of breastfeeding, exclusive
breastfeeding during the first six months of life, continued breastfeeding for up to two years of age and
beyond, timely introduction of complementary feeding at six months of age, frequency of feeding
solid/semi solid foods, and the diversity of food groups fed to children between 6 and 23 months of age.
Malnutrition in adults results in reduced productivity, an increased susceptibility to infections, retarded
recovery from illness, and for women, heightened risks of adverse pregnancy outcomes. Moreover, a
woman who has poor nutritional status as indicated by a low Body Mass Index (BMI), short stature,
anemia, or other micronutrient deficiency has a greater risk of obstructed labor, of having a baby with a
low birth weight, of producing lower quality breast milk, of mortality due to postpartum hemorrhage,
and of morbidity of both herself and her baby.
Micronutrient deficiencies are a result of inadequate intake of micronutrient-rich foods and the
inadequate utilization of available micronutrients in the diet due to infections, parasitic infestations, and
other dietary factors. Measures of micronutrient status (e.g. anemia), consumption of vitamin-A rich and
iron-rich foods, micronutrient supplementation for iron and vitamin A, and micronutrient fortification
(iodized or iodated household cooking salt) are included in this chapter for both women and children.
References
Benedict, R.K., A. Schmale, and S. Namaste. 2018. Adolescent Nutrition 2000-2017: DHS Data on
Adolescents Age 15-19. DHS Comparative Report No. 47. Rockville, Maryland, USA: ICF.
https://dhsprogram.com/publications/publication-cr47-comparative-reports.cfm
Black, R.E., L.H. Allen, Z.A. Bhutta, L.E. Caulfield, M. de Onis, M. Ezzati, C. Mathers, and J. Rivera, for the
Maternal and Child Undernutrition Study Group. 2008. “Maternal and child undernutrition: Global and

11.2
regional exposures and health consequences.” The Lancet. 371:243. doi:10.1016/S0140-6736(07)61690-
0. https://www.thelancet.com/journals/lancet/article/PIIS0140-6736(07)61690-0/fulltext
International Food Policy Research Institute. 2016. Global Nutrition Report 2016: From Promise to
Impact: Ending Malnutrition by 2030. Washington, DC., USA. http://www.ifpri.org/publication/global-
nutrition-report-2016-promise-impact-ending-malnutrition-2030
The Lancet. 2008. Maternal and Child Undernutrition series.
https://www.thelancet.com/series/maternal-and-child-undernutrition
The Lancet. 2013. Maternal and Child Nutrition series.
https://www.thelancet.com/series/maternal-and-child-nutrition
UNICEF. 2013. Improving Child Nutrition: The achievable imperative for global progress.
https://www.unicef.org/nutrition/index_68661.html
Victora, C.G., R. Bahl, A.J.D Barros, G.V.A França, S. Horton, J. Krasevec, S. Murch, M.J. Sankar, N. Walker,
N.C. Rollins for The Lancet Breastfeeding Series Group. 2016. “Breastfeeding in the 21st century:
epidemiology, mechanisms, and lifelong effect.” The Lancet 387(10017): 475-490.
DOI:https://doi.org/10.1016/S0140-6736(15)01024-7
https://www.thelancet.com/journals/lancet/article/PIIS0140-6736(15)01024-7/fulltext

11.3
Initial Breastfeeding
Percentage of children ever breastfed, who started breastfeeding within one hour of birth,
who started breastfeeding within one day of birth, and who received a prelacteal feed
Definition
1) Percentage of last-born children born in the past 2 years ever breastfed.
2) Percentage of last-born children born in the past 2 years who started breastfeeding within one
hour of birth.
3) Percentage of last-born children born in the past 2 years who started breastfeeding within one day
of birth.
4) Percentage of last-born children born in the past 2 years who were ever breastfed and who received
a prelacteal feed.
Coverage:
Population base: Last-born children born in the 2 years preceding the survey, surviving and dead (KR file)
Time period: Two years preceding the survey
Numerators: Number of last-born children age 0-23 months (midx = 1 & b19 < 24) who:
1) Were ever breastfed (m4 ≠ 94,99).
2) Started breastfeeding within one hour of birth (m4 ≠ 94,99 & m34 in 0,100).
3) Started breastfeeding within one day of birth (m4 ≠ 94,99 & m34 in 0:123 [23 hours]).
4) Were ever breastfed and given something other than breast milk during the first three days of life
(m4 ≠ 94,99 & m55 = 1).
Denominators:
1) For numerator 1, 2, 3: Number of last-born children who were born in the 2 years preceding the
survey (midx = 1 & b19 < 24).
2) For numerator 4: Number of last-born children who were born in the 2 years preceding the survey
who were ever breastfed (midx = 1 & b19 < 24 & m4 ≠ 94,99).
Variables: KR file.
midx
Index to Birth History
b19
Current age of child in months (months since birth for dead children)
m4
Duration of breastfeeding
m34
When child put to breast
m55
Given child anything other than breast milk
v005
Woman’s individual sample weight
Calculation
Numerators divided by denominator multiplied by 100.
Handling of Missing Values

11.4
Missing data are excluded from numerators, but are included in denominators.
Notes and Considerations
The DHS6 and DHS7 indicators on ever breastfed, started breastfeeding within one hour and within one
day of birth are based on last-born children born in the 2 years preceding the survey; and the indicator
on received a prelacteal feed is based on last-born children born in the 2 years preceding the survey
ever breastfed.
Changes over Time
The initial breastfeeding indicators have changed over time. For DHS-IV and DHS-V surveys, the initiation
of breastfeeding indicators were reported for all children born in the 5 years before the survey.
Initiation of breastfeeding within one hour and within one day of birth were calculated among the
children who were ever-breastfed, whereas for the DHS-VI and DHS-7 results were based on last-born
children who were born in the 2 years preceding the survey. Hence, caution should be observed when
comparing the figures in DHS-VI and DHS-7 with the results published in the final reports for previous
DHS surveys.
References
WHO. 2007. Indicators for assessing infant and young child feeding practices.
Part I Definitions: http://www.who.int/nutrition/publications/infantfeeding/9789241596664/en/
Part II Measurement: http://www.who.int/nutrition/publications/infantfeeding/9789241599290/en/
Resources
DHS-7 Tabulation plan: Table 11.2
API Indicator IDs: CN_BRFI_C_EVR, CN_BRFI_C_1HR, CN_BRFI_C_1DY, CN_BRFI_C_PLF
(API link, STATcompiler link)
IYCF Indicator 1 (WHO core indicator): Early initiation of breastfeeding
IYCF Indicator 9 (WHO optional indicator): Children ever breastfed
WHO 100 Core Health Indicators: Early initiation of breastfeeding
MICS6 Indicator TC.30: Children ever breastfed
MICS6 Indicator TC.31: Early initiation of breastfeeding

11.5
Breastfeeding and Complementary Feeding
Percent distribution of children exclusively breastfeeding, or breastfeeding and consuming
plain water only, non-milk liquids, consuming other milk, and consuming complementary
foods
Definition
Percent distribution of youngest children under 2 years who are living with their mother who are:
1) Not breastfeeding
2) Exclusively breastfeeding
3) Breastfeeding and consuming plain water only
4) Breastfeeding and consuming non-milk liquids
5) Breastfeeding and consuming other milk
6) Breastfeeding and consuming complementary foods
Coverage:
Population base: Living children living with their mother born 0 to 23 months before the survey (KR file)
Time period: 24 hours before the survey
Numerators: Number of youngest children under 2 years who are living with their mother (see
calculation below) who were given:
1) Not breastfeeding (m4 ≠ 95), or
Breastfeeding (m4 = 95):
2) and nothing else in the 24 hours preceding the interview (exclusive breastfeeding) (not in
numerators 3-6)
3) plus plain water only in the 24 hours preceding the interview (v409 = 1 & not in numerators 4-6).
4) and non-milk liquids in the 24 hours preceding the interview ((v409a = 1 or v410 = 1 or v410a = 1
or v412c = 1 or v413 = 1 or any of v413a – d = 1) & not in numerators 5 or 6).
5) and other milk in the 24 hours preceding the interview ((v411 = 1 or v411a = 1) & not in
numerator 6).
6) and solid or semi-solid foods in the 24 hours preceding the interview. Children may also be given
non-breast milk. (v412a = 1 or v412b = 1 or any of v414a – w = 1 or m39a = 1).
Denominator: Number of youngest children who were born in the 2 years preceding the survey and are
living with their mother (see calculation below).
Variables: KR file.
caseid
Case Identification
b5
Child is alive
b9
Child lives with whom
b19
Current age of child in months
m4
Duration of breastfeeding
m39a
Did eat any solid, semi-solid or soft foods yesterday
v409
Gave child plain water
11.6
v409a
Gave child sugar water
v410
Gave child juice
v410a
Gave child tea or coffee
v411
Gave child tinned, powdered or fresh milk
v411a
Gave child baby formula
v412
Gave child fresh milk
v412a
Gave child fortified baby food (cerelac, etc)
v412b
Gave child other porridge/gruel
v412c
Gave child soup/clear broth
v413
Gave child other liquid
v413a
Gave child CS liquid
v413b
Gave child CS liquid
v413c
Gave child CS liquid
v413d
Gave child CS liquid
v414a
Gave child CS foods
v414b
Gave child CS foods
v414c
Gave child CS foods
v414d
Gave child CS foods
v414e
Gave child bread, noodles, other made from grains
v414f
Gave child potatoes, cassava, or other tubers
v414g
Gave child eggs
v414h
Gave child meat (beef, pork, lamb, chicken, etc)
v414i
Gave child pumpkin, carrots, squash (yellow or orange inside)
v414j
Gave child any dark green leafy vegetables
v414k
Gave child mangoes, papayas, other vitamin A fruits
v414l
Gave child any other fruits
v414m
Gave child liver, heart, other organs
v414n
Gave child fish or shellfish
v414o
Gave child food made from beans, peas, lentils, nuts
v414p
Gave child cheese, yogurt, other milk products
v414q
Gave child oil, fats, butter, products made of them
v414r
Gave child chocolates, sweets, candies, pastries, etc
v414s
Gave child other solid, semi-solid food
v414t
Gave child CS foods
v414u
Gave child CS foods
v414v
Gave child yogurt
v414w
Gave child CS foods
v005
Woman’s individual sample weight
Calculation
Numerators divided by denominator, multiplied by 100.
Denominator:
To select the cases for the denominator, first filter or keep only living children living with the mother
born in the preceding 24 months (keep/select if b19 < 24 & b9 = 0), then keep only the youngest child
(keep/select if the first entry in the dataset (_n = 0) or the first for this respondent (caseid ≠ caseid[_n-
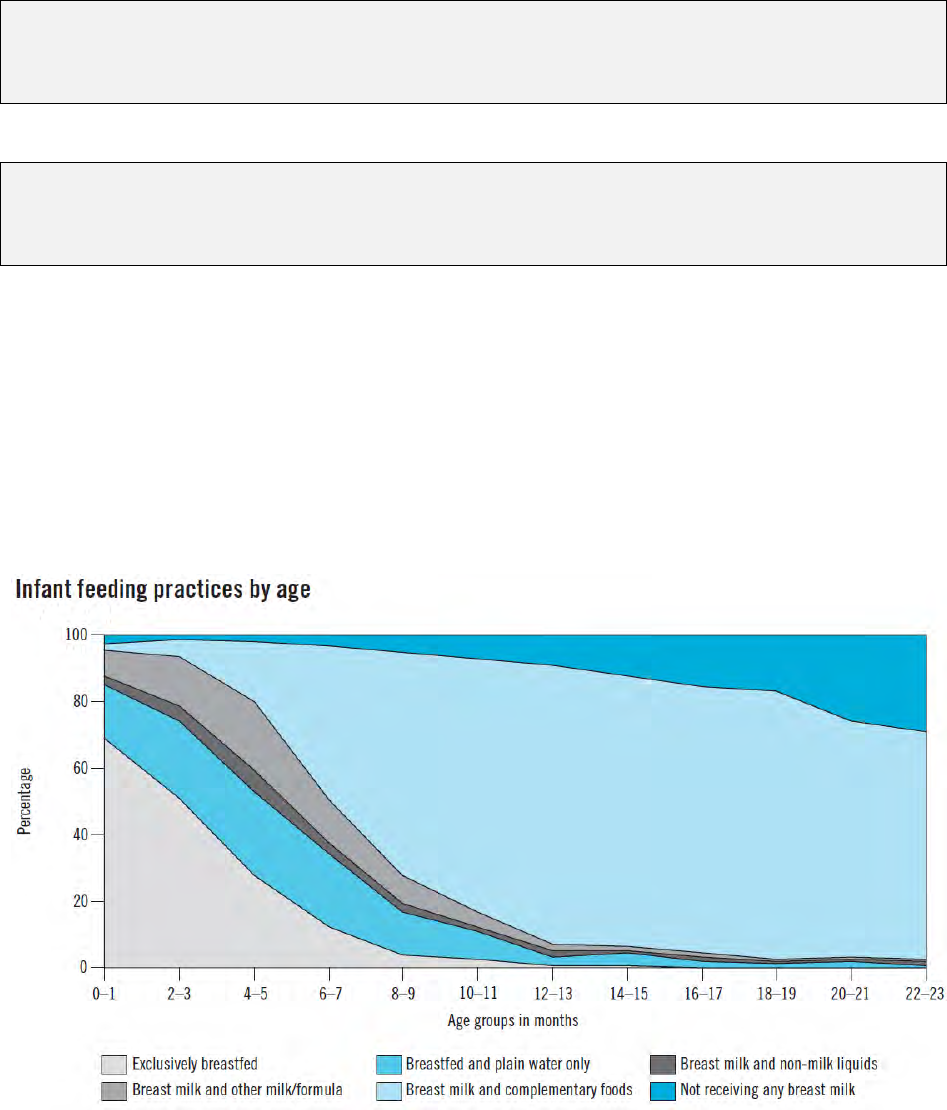
11.7
1]) as the youngest child is the first listed for the respondent in the data file). The commands in Stata
and SPSS are given below:
Stata
* keep if under 24 months and living with mother
keep if b19 < 24 & b9 == 0
* and keep the last born of those.
* if caseid is the same as the prior case, then not the last born
keep if _n == 1 | caseid != caseid[_n-1]
SPSS
* keep if under 24 months and living with mother.
select if (b19 < 24 & b9 = 0).
* and keep the last born of those.
* if caseid is the same as the prior case, then not the last born.
select if (caseid <> lag(caseid)).
Handling of Missing Values
Missing data on breastfeeding is treated as not currently breastfeeding in numerator and included in the
denominator. Missing and “don’t know” data on foods and liquids given is treated as not given in
numerator and included in denominator.
Notes and Considerations
Data may also be presented in an area graph such as below:
Data are typically disaggregated by age groups of 2 or 3 months.

11.8
If the last-born child is deceased or not living with the mother, questions on foods and liquids are asked
of the prior child born in the two years preceding the interview. However, the question on breastfeeding
is not asked of this child. In this situation the child will be treated as not currently breastfeeding in the
numerator and included in the denominator.
Changes over Time
Surveys based on the DHS-VI or DHS-7 questionnaire only ask about the feeding status of the youngest
living child who lives with the mother and born in the preceding two years. When comparing the results
of the DHS-VI and DHS-7 to the earlier surveys, it should be noted that in DHS-VI and DHS-7 the
indicators on breastfeeding status by age are restricted to the youngest children under age 2 living with
their mothers instead of the youngest children under age 3 living with their mothers (DHS-V surveys);
and instead of all children under age 3 (DHS-IV surveys).
Wording of questions in the DHS-VI or DHS-7 surveys differ from those in DHS-V and DHS-IV, and
questions about foods made with oil, fat, or butter were not asked.
The list of foods asked about has changed from round to round of DHS, and food lists can vary by survey.
Users should check the questionnaires used when comparing results from different surveys.
Additionally, in DHS-IV surveys, respondents were asked how many times yesterday/last night the child
received the specific food.
Note that previous surveys used children age 6-9 months (rather than 6-8 months) for the indicator of
introduction of solid, semi-solid or soft foods.
An alternative formulation of exclusive breastfeeding would be to consider only children who have
never received anything but breast milk. The required information was collected only in DHS-II, when
respondents were asked about the age of introduction of liquids and foods. These questions were
dropped when they were found to produce older ages at introduction of foods than that estimated from
current status.
References
WHO. 2007. Indicators for assessing infant and young child feeding practices.
Part I Definitions: http://www.who.int/nutrition/publications/infantfeeding/9789241596664/en/
Part II Measurement: http://www.who.int/nutrition/publications/infantfeeding/9789241599290/en/
WHO. 2017. Global Nutrition Monitoring Framework: Operational Guidance for Tracking Progress in
Meeting Targets for 2025. http://www.who.int/nutrition/publications/operational-guidance-GNMF-
indicators/en/
Xiaodong C., T. Wardlaw and D.W Brown. 2012. “Global trends in exclusive breastfeeding.” International
Breastfeeding Journal 7:12 DOI: https://doi.org/10.1186/1746-4358-7-12
https://internationalbreastfeedingjournal.biomedcentral.com/articles/10.1186/1746-4358-7-12

11.9
WHO. 2003. Guiding principles for complementary feeding of the breastfed child
http://www.who.int/nutrition/publications/infantfeeding/a85622/en/
Resources
DHS-7 Tabulation plan: Tables 11.3 and 11.4
API Indicator IDs:
CN_BRFS_C_NOT, CN_BRFS_C_EXB, CN_BRFS_C_WAT, CN_BRFS_C_LIQ, CN_BRFS_C_MLK, CN_BRFS_C_CMP
(API link, STATcompiler link)
GNMF Indicator 5: Prevalence of exclusive breastfeeding in infants aged six months or less
IYCF Indicator 2: Exclusive breastfeeding under 6 months
WHO 100 Core Health Indicators: Exclusive breastfeeding rate 0-5 months of age
MICS6 Indicator TC.32: Exclusive breastfeeding under 6 months
11.10
Percentage of children exclusively breastfed, predominantly breastfed, age-appropriately
breastfed, and introduced to solid, semi-solid, or soft foods
Definition
1) Percentage of youngest children under 6 months who are living with their mother who are
exclusively breastfed under 6 months of age
2) Percentage of youngest children under 6 months who are living with their mother who are
predominantly breastfed under 6 months of age
3) Percentage of youngest children under 2 years who are living with their mother who are age-
appropriately breastfed
4) Percentage of youngest children 6-8 months who are living with their mother who are introduced
to solid, semi-solid, or soft foods
Coverage:
Population base: Living children living with their mother born 0-5, 6-8, or 0-23 months before the survey
(KR file)
Time period: 24 hours before the survey
Numerators: Number of youngest children under 2 years who are living with their mother who were
given:
1) Number of youngest children under 6 months who are living with their mother who were
breastfed (m4 = 95) but given nothing else in the 24 hours preceding the interview (see
numerator 2 for Percent distribution of children exclusively breastfeeding, or breastfeeding and
consuming plain water only, non-milk liquids, consuming other milk, and consuming
complementary foods)
2) Number of youngest children under 6 months who are living with their mother who were
Breastfed (m4 = 95) and either exclusively breastfed or given plain water and/or non-milk liquids
(see numerators 2, 3 & 4 for Percent distribution of children exclusively breastfeeding, or
breastfeeding and consuming plain water only, non-milk liquids, consuming other milk, and
consuming complementary foods)
3) Number of youngest children under 2 years who are living with their mother who were
breastfed (m4 = 95) and:
If under 6 months (b19 <6): given nothing else in the 24 hours preceding the interview
(see numerator 1), or
if age 6-23 months (b19 in 6:23): given solid or semi-solid foods in the 24 hours
preceding the interview (v412a = 1 or v412b = 1 or any of v414a – w = 1 or m39a = 1).
4) Number of youngest children 6-8 months who are living with their mother who were given solid
or semi-solid foods in the 24 hours preceding the interview (b19 in 6:8 & (v412a = 1 or v412b = 1
or any of v414a – w = 1 or m39a = 1)).
Denominator:
See Calculation for Percent distribution of children exclusively breastfeeding, or breastfeeding and
consuming plain water only, non-milk liquids, consuming other milk, and consuming complementary
foods for the selection for the denominator, and select for the appropriate age group.
1) Number of youngest children born in the 6 months preceding the survey who are living with their
mother (select denominator for b19 < 6)
11.11
2) Same as 1).
3) Number of youngest children born in the 2 years preceding the survey who are living with their
mother (select denominator for b19 < 24)
4) Number of youngest children born in the 2 years preceding the survey who are living with their
mother and age 6-8 months (select denominator for b19 in 6:8)
Variables: KR file.
See variable list for Percent distribution of children exclusively breastfeeding, or breastfeeding and
consuming plain water only, non-milk liquids, consuming other milk, and consuming complementary
foods.
Calculation
See Calculation for Percent distribution of children exclusively breastfeeding, or breastfeeding and
consuming plain water only, non-milk liquids, consuming other milk, and consuming complementary
foods for selection of children for the denominator, including Stata and SPSS code.
Numerators divided by denominator, multiplied by 100.
Handling of Missing Values
Missing data on breastfeeding is treated as not currently breastfeeding in numerator and included in the
denominator. Missing and “don’t know” data on foods and liquids given is treated as not given in
numerator and included in denominator.
Notes and Considerations
Exclusive breastfeeding under 6 months is calculated identically to the calculation in Percent distribution
of children exclusively breastfeeding, or breastfeeding and consuming plain water only, non-milk liquids,
consuming other milk, and consuming complementary foods but restricted to children age under 6
months.
Exclusive breastfeeding at 4-5 months is also presented, selecting for children age 4-5 months.
If the last-born child is deceased or not living with the mother, questions on foods and liquids are asked
of the prior child born in the two years preceding the interview. However, the question on breastfeeding
is not asked of this child. In this situation the child will be treated as not currently breastfeeding in the
numerator and included in the denominator.
Changes over Time
See Changes over Time for Percent distribution of children exclusively breastfeeding, or breastfeeding
and consuming plain water only, non-milk liquids, consuming other milk, and consuming complementary
foods.
References

11.12
WHO. 2003. Guiding principles for complementary feeding of the breastfed child
http://www.who.int/nutrition/publications/infantfeeding/a85622/en/
WHO. 2007. Indicators for assessing infant and young child feeding practices.
Part I Definitions: http://www.who.int/nutrition/publications/infantfeeding/9789241596664/en/
Part II Measurement: http://www.who.int/nutrition/publications/infantfeeding/9789241599290/en/
WHO. 2017. Global Nutrition Monitoring Framework: Operational Guidance for Tracking Progress in
Meeting Targets for 2025. http://www.who.int/nutrition/publications/operational-guidance-GNMF-
indicators/en/
Xiaodong C., T. Wardlaw and D.W Brown. 2012. “Global trends in exclusive breastfeeding.” International
Breastfeeding Journal 7:12 DOI: https://doi.org/10.1186/1746-4358-7-12
https://internationalbreastfeedingjournal.biomedcentral.com/articles/10.1186/1746-4358-7-12
Resources
DHS-7 Tabulation plan: Table 11.4
API Indicator IDs:
CN_BRFS_C_EXB, CN_BRFS_C_CMP
(API link, STATcompiler link)
GNMF Indicator 5: Prevalence of exclusive breastfeeding in infants aged six months or less
IYCF Indicator 2 (Core): Exclusive breastfeeding under 6 months
IYCF Indicator 4 (Core): Introduction of solid, semi-solid or soft foods
IYCF Indicator 11 (Optional): Age-appropriate breastfeeding
IYCF Indicator 12 (Optional): Predominant breastfeeding under 6 months
WHO 100 Core Health Indicators: Exclusive breastfeeding rate 0-5 months of age
MICS6 Indicator TC.32: Exclusive breastfeeding under 6 months
MICS6 Indicator TC.33: Predominant breastfeeding under 6 months
MICS6 Indicator TC.37: Age-appropriate breastfeeding
MICS6 Indicator TC.38: Introduction of solid, semi-solid or soft foods
11.13
Percentage of children currently breastfeeding, continuing breastfeeding at 1 year and at 2
years
Definition
Percentage of youngest children born in the 2 years preceding the survey living with their mother who
are:
1) Currently breastfeeding
2) Continuing breastfeeding at 1 year (12-15 months)
3) Continuing breastfeeding at 2 years (20-23 months)
Coverage:
Population base: Living children living with their mother born 0 to 23 months before the survey (KR file)
Time period: Current status at time of survey
Numerators:
Number of youngest children born in the 2 years preceding the survey living with their mother who are:
1) Currently breastfeeding (m4 = 95)
2) Currently breastfeeding and age 12-15 months (m4 = 95 & b19 in 12:15)
3) Currently breastfeeding and age 20-23 months (m4 = 95 & b19 in 20:23)
Denominator:
Number of youngest children who were born in the 2 years preceding the survey and are living with their
mother (see Calculation of denominator in Percent distribution of children exclusively breastfeeding, or
breastfeeding and consuming plain water only, non-milk liquids, consuming other milk, and consuming
complementary foods):
1) Age 0-23 months (b19 < 24)
2) Age 12-15 months (b19 in 12:15)
3) Age 20-23 months (b19 in 20:23)
Variables: KR file.
caseid
Case Identification
b5
Child is alive
b9
Child lives with whom
b19
Current age of child in months (months since birth for dead children)
m4
Duration of breastfeeding
v005
Woman’s individual sample weight
Calculation
Numerators divided by denominator multiplied by 100.
Handling of Missing Values
Missing data on breastfeeding is treated as not currently breastfeeding in numerator and included in the
denominator.

11.14
Notes and Considerations
Note that the wording of the question asks “Are you still breastfeeding (NAME)?” rather than “Was
(NAME) breastfed yesterday during the day or at night?” The question is only asked about the last born
child, and if the last born child is dead or does not live with the mother, the assumption is that the child
was not being breastfed.
References
WHO. 2007. Indicators for assessing infant and young child feeding practices.
Part I Definitions: http://www.who.int/nutrition/publications/infantfeeding/9789241596664/en/
Part II Measurement: http://www.who.int/nutrition/publications/infantfeeding/9789241599290/en/
Resources
DHS-7 Tabulation plan: Tables 11.3 and 11.4
API Indicator IDs: CN_BRFS_C_BRF
(API link, STATcompiler link)
IYCF Indicator 3 (Core): Continued breastfeeding at 1 year
IYCF Indicator 10 (Optional): Continued breastfeeding at 2 years
MICS6 Indicator TC.34: Continued breastfeeding at 1 year
MICS6 Indicator TC.35: Continued breastfeeding at 2 years

11.15
Percentage of children using a bottle with a nipple
Definition
Percentage of all children under 2 years who drank from a bottle with a nipple yesterday during the day
or night.
Coverage:
Population base: Living children born 0 to 23 months before the survey (KR file)
Time period: Current status at time of survey
Numerators: Number of children under 2 years who drank from a bottle with a nipple yesterday during
the day or night (m38 = 1)
Denominator: Number of living children born in the 2 years preceding the survey (b5 = 1 & b19 < 24)
Variables: KR file.
b5
Child is alive
b19
Current age of child in months (months since birth for dead children)
m38
Drank from bottle with nipple yesterday/last night
v005
Woman’s individual sample weight
Calculation
Numerators divided by denominator multiplied by 100.
Handling of Missing Values
Missing and “don’t know” responses on whether drank from a bottle with nipple yesterday during the
day or night are excluded from the numerator but included in the denominator.
References
WHO. 2007. Indicators for assessing infant and young child feeding practices.
Part I Definitions: http://www.who.int/nutrition/publications/infantfeeding/9789241596664/en/
Part II Measurement: http://www.who.int/nutrition/publications/infantfeeding/9789241599290/en/
Resources
DHS-7 Tabulation plan: Tables 11.3 and 11.4
API Indicator IDs: CN_BRFS_C_BNP
(API link, STATcompiler link)
IYCF Indicator 14 (Optional): Bottle feeding.
MICS6 Indicator TC.43: Bottle feeding

11.16
Median and mean durations of breastfeeding among children born in the past three years
for any breastfeeding, exclusive breastfeeding, predominant breastfeeding
Definition
1) Median duration (in months) of breastfeeding among children born in the past three years for
any breastfeeding
2) Median duration (in months) of breastfeeding among children born in the past three years for
exclusive breastfeeding
3) Median duration (in months) of breastfeeding among children born in the past three years for
predominant breastfeeding
4) Mean duration (in months) of breastfeeding among children born in the past three years for any
breastfeeding
5) Mean duration (in months) of breastfeeding among children born in the past three years for
exclusive breastfeeding
6) Mean duration (in months) of breastfeeding among children born in the past three years for
predominant breastfeeding
Coverage:
Population base: All births in the 0-35 months preceding the interview (KR file)
Time period: 24 hours preceding the survey
Numerators:
4) Number of children born at specified times before the survey for which the mother is still
breastfeeding the child (m4 = 95)
5) Number of children born at specified times before the survey for which the mother is exclusively
breastfeeding the child (m5 = 95 & numerator 2 only for Percent distribution of children
exclusively breastfeeding, or breastfeeding and consuming plain water only, non-milk liquids,
consuming other milk, and consuming complementary foods)
6) Number of children born at specified times before the survey for which the mother is
predominantly breastfeeding the child. Predominant breastfeeding is defined as children either
exclusively breastfed or breastfeeding and receiving water or other liquids only, excluding non-
human milk and food-based fluids (m4 = 95 & numerators 2, 3, or 4 only for Percent distribution
of children exclusively breastfeeding, or breastfeeding and consuming plain water only, non-milk
liquids, consuming other milk, and consuming complementary foods)
Denominator: Number of births at specified times in the three years preceding the survey (b19 < 36)
Variables: KR file.
See variable list for Percent distribution of children exclusively breastfeeding, or breastfeeding and
consuming plain water only, non-milk liquids, consuming other milk, and consuming complementary
foods.
Calculation
11.17
Utilizes similar numerators and denominators calculated for the proportions any breastfeeding,
exclusive breastfeeding, and predominant breastfeeding by time since birth in two-month groups, as
given in Percent distribution of children exclusively breastfeeding, or breastfeeding and consuming plain
water only, non-milk liquids, consuming other milk, and consuming complementary foods. The medians
and means are based on all births that occurred within the three years preceding the interview,
including last and other births, surviving or not. Tabulations assume that last-born children age 24
months or older who live with the mother and are breastfeeding are neither exclusively nor
predominantly breastfed.
Twins living with their mother are assumed to have the same breastfeeding and complimentary feeding
status, and the grouping calculated in Percent distribution of children exclusively breastfeeding, or
breastfeeding and consuming plain water only, non-milk liquids, consuming other milk, and consuming
complementary foods for the youngest child living with their mother is applied to any twin of that child
who is also living with their mother; other children born in the past 3 years are assumed to not be
exclusively or predominantly breastfeeding.
Next-to-last birth assumed to not be breastfeeding, thus excluded from numerator but included in
denominator.
Numerators and denominators are calculated for each two-month group of time since birth. Numerators
and denominators are each smoothed by a three-group moving average. For example, the value of the
numerators and denominators for births that occurred 4-5 months before the interview is the average
of groups 2-3, 4-5, and 6-7 months. Groups < 2 months and 34-35 months are not smoothed. Smoothed
proportions are calculated by dividing the smoothed numerator values by the smoothed denominator
values of each two-month group.
Median
Beginning with the lowest time-since-birth group, each group is examined to see whether the
proportion breastfeeding, exclusively breastfeeding, or predominantly breastfeeding is less than 0.5.
Value of median is determined by linear interpolation of percentage of first group below 0.5 and
previous group percentage using the following formula:
median = mi-1 + (p i-1 - 0.5)/(p i-1 - p i) * (w i)
where p i is the proportion breastfeeding, exclusively breastfeeding, or predominantly breastfeeding for
the first group where the proportion is below 0.5, p i-1 is the proportion breastfeeding, exclusively
breastfeeding, or predominantly breastfeeding for the preceding group, mi-1 is the midpoint value for the
preceding group, and w i is the time width of the group taken as the difference between the midpoint
value of the current group and the preceding group.
Prior to DHS-7: In The DHS Program rounds prior to DHS-7, for all groups except the first, the midpoint
values are one-half month above the lower limit. This midpoint value comes about because the time
since birth is calculated as the difference between birth dates and the date of interview, which are
accurate for month only (day of month is not ascertained).
For example, if the date of interview were April 2018, the interview could have occurred at any time
during the month, from the 1st to the 30th. The same holds true for a birth that occurred in January 2018,
11.18
at any time between the 1st and the 31st of the month. Thus, the time difference between the date of
birth and the date of interview could be between 60 days and 120 days. Assuming a constant
distribution by day of month for interviews and for births, the midpoint is 90 days or three months,
which is the value of the difference in the century- month codes of the dates. The midpoint value for the
group of the difference of two months and three months together is therefore 2.5.
The first group is special. The value of the previous group is assumed to be equal to the percentage of
children born 0-35 months before the survey who were ever breastfed. Moreover, births that occur in
the month of interview can only come before the date of interview, rather than on any day of the month
of interview. Based on simulations, 0.75 is chosen as the midpoint value for the group < 2 months (0-1).
The midpoint of the previous group is 0 (day of interview).
DHS-7: The midpoint values are at the midpoints of the range as the difference between the births dates
and date of interview are accurate to the day, and month 0 now contains a full month of births.
Using the example above, if the date of interview were April 2018, the interview could have occurred at
any time during the month, from the 1st to the 30th. The same holds true for a birth that occurred in
January 2018, at any time between the 1st and the 31st of the month. With the day of interview known,
and the day of birth known, or imputed, it is possible to calculate the exact age of the child to the day
and the age would be between 2.0 months and just less than 4.0 months, and would be either 2 month
or 3 months when truncated. Similarly, a child born in February 2018 would either be 1 or 2 months old.
Combining all date combinations together, a child categorized as 2 months old would on average be 2.5
month, and a child categorized as 3 months old would on average be 3.5 months old. The midpoint
value for the group of the difference of 2 months and 3 months together is therefore 3.0.
In DHS-7, the first group is still special, and the value of the previous group is still assumed to be 1 equal
to the percentage of children born 0-35 months before the survey who were ever breastfed. However,
because births in the month 0 group now come from births in the month of interview and in the
preceding month, the midpoint of the month 0 group is 0.5 and the month 1 group is 1.5, so for the
group 0-1 months, the midpoint is 1.0.
Example:
DHS-7
Rounds prior to DHS-7
Group
Pi
Midpoint
Width
Group
Pi
Midpoint
Width
<2
0.88
1.0
1.0
<2
0.90
0.75
0.75
2–3
0.67
3.0
2.0
2–3
0.70
2.5
1.75
4–5
0.52
5.0
2.0
4–5
0.55
4.5
2.00
6–7
0.40
7.0
2.0
6–7
0.43
6.5
2.00
Note that the proportions in age each group are not the same between the DHS-7 approach and the
prior approach as the calculation of months since birth has changed in DHS-7 to provide a more accurate
estimate, thus requiring the change in the method of calculating the median.
DHS-7: median duration = 5.0 + (0.52-0.50)/(0.52-0.40)*(7.0-5.0) = 5.33 months
Prior to DHS-7: median duration = 4.5 + (0.55-0.50)/(0.55-0.43)*(6.5-4.5) = 5.33 months
11.19
Note also that due to a number of factors including the different calculation of the age groups, and the
application of the three-month moving average, the actual calculations are unlikely to result in exactly
the same estimates (as the example does) from the two approaches, but they should be quite close. In
general the DHS-7 approach is a more accurate estimate.
Mean
The mean duration is the accumulation over all groups of the proportions breastfeeding, exclusively
breastfeeding, or predominantly breastfeeding (pi) multiplied by the width of the time-since-birth group
(wi). For the first group, the proportion breastfeeding is taken as the proportion ever breastfed for
children born 0 to 35 months before the survey.
mean duration = ∑ pi wi
The calculation of the mean is also affected by the change in approach in the calculation of the time-
since-birth groups, which will result in slightly different proportions in each group, and a change in the
width of the first two groups.
Handling of Missing Values
Birth dates were imputed if missing. Dates of interview are not allowed to have missing data.
Respondents with missing reports of breastfeeding are considered to be not breastfeeding. Respondents
with missing reports for liquids and foods or who “don’t know” whether the child received the liquids or
foods are treated as the liquid or food not given.
Notes and Considerations
Medians and means are based on current status of mothers of the births. The distributions of the
proportions of births, by month of birth of the child, are analogous to the lx column of the synthetic life
table. The basic assumption is that there has been no change in the proportions breastfeeding,
exclusively breastfeeding, and predominantly breastfeeding over time so that proportions that are
calculated from births with small times since birth are the same as those of births that occurred earlier,
when those earlier births had those durations. For the short period of 36 months, this assumption is
very likely to be approximately correct. The proportions are assumed to be the proportion ever
breastfed at the time of birth and to decrease monotonically with time since birth. The time at which
the proportions decline to 0.5 is taken as the median. The mean is taken similarly from the lx column of
the life table, which in this case is the series of proportions by time since birth. Because the sum of
proportions equals 1, there is no need to divide the sum of the proportions times the width of the
interval.
Because of the relatively small number of births in each month before the interview, the months are
first grouped and then smoothed to reduce random fluctuations due to sampling variance.

11.20
Mean
Truncated Mean: Because of the limitation to births that occurred within the three years preceding the
survey, the mean is truncated if there are mothers who are breastfeeding longer than three years after
their last birth. It is very unlikely that the proportions exclusively or predominantly breastfeeding are
more than negligible after 35 months since birth. Therefore, it is felt that the truncated mean is very
close to the full mean for both of these statistics. On the other hand, any breastfeeding can continue for
considerably longer than 35 months so that the mean may be biased somewhat downwards. To get an
idea of the possible extent of this bias, the proportions of children who are breastfeeding, by age of
child in months, should be examined.
The measures are based on all births that occurred within the three years preceding the interview,
including last and other births, surviving or not.
Decisions on Alternatives
Current status medians and means are used instead of measures based on the recall of durations
because
of the severe heaping (digit preference) on multiples of 3 and 6 months in the recall data.
In the current calculation of median and mean durations, a woman can contribute more than once if she
had more than one birth in the three years preceding the survey. An alternative calculation would be to
base the medians and means on women rather than births. In this alternative, each woman is
represented
only once, which is equivalent to durations based on only the last birth. Estimates of
durations based on
last births (open interval durations) are thought to overestimate average durations of
breastfeeding, since
they almost always exceed those based on recall after other births (closed interval
durations).
Changes over Time
As described above under the median calculation the change in the calculation of time since birth
required changes in the calculation of the current status median from the proportions amenorrheic,
abstaining or insusceptible. See also Age of Children in Chapter 1 for more information on the change in
the calculation of time since birth.
References
WHO. 2007. Indicators for assessing infant and young child feeding practices.
Part I Definitions: http://www.who.int/nutrition/publications/infantfeeding/9789241596664/en/
Part II Measurement: http://www.who.int/nutrition/publications/infantfeeding/9789241599290/en/
Resources
DHS-7 Tabulation plan: Table 11.5
API Indicator IDs:
CN_BFDR_C_MDA, CN_BFDR_C_MDE, CN_BFDR_C_MDP,
CN_BFDR_C_MNA, CN_BFDR_C_MNE, CN_BFDR_C_MNP


11.22
Foods and Liquids Consumed by Children
Percentage of breastfeeding and non-breastfeeding children consuming specific foods
Definition
Percentage of youngest children under age 2 who are living with the mother consuming specific types of
foods in the day or night before the interview, disaggregated by whether breastfeeding or not.
Coverage:
Population base: Youngest living child born in the 2 years preceding the survey who is living with
the mother (KR file)
Time period: 24 hours preceding the interview
Numerators: Number of youngest children born in the 2 years preceding the survey living with the
mother who consumed the specific foods, disaggregated by whether breastfeeding or not (m4 = 95):
Liquids:
1) Infant formula (v411a = 1)
2) Other milk, including fresh, tinned, and powdered animal milk (v411 = 1)
3) Other liquids, including juice, juice drinks, clear broth, or other non-milk liquids. Does not
include plain water (v410 = 1 or v412c = 1 or v413 = 1)
Solid or semi-solid foods:
4) Fortified baby foods (v412a = 1)
5) Food made from grains (v412a = 1 or v414e = 1)
6) Fruits and vegetables rich in vitamin A, including pumpkin, red or yellow yams or squash,
carrots, red sweet potatoes, dark green leafy vegetables, ripe mangoes, ripe papayas, and other
locally grown fruits and vegetables that are rich in vitamin A (v414i = 1 or v414j = 1 or v414k = 1)
7) Other fruits and vegetables (v414l = 1)
8) Food made from roots and tubers (v414f = 1)
9) Food made from legumes and nuts (v414o = 1)
10) Meat, fish, shellfish and poultry (v414h = 1 or v414m = 1 or v414n = 1)
11) Eggs (v414g = 1)
12) Cheese, yogurt and other milk products (v414p = 1 or v414v = 1)
13) Any solid or semisolid food (any of 4 – 12 above or v414s = 1)
Denominators: Number of youngest children born in the 2 years preceding the survey living with the
mother, disaggregated by whether breastfeeding or not (m4 = 95). See Calculation of denominator in
Percent distribution of children exclusively breastfeeding, or breastfeeding and consuming plain water
only, non-milk liquids, consuming other milk, and consuming complementary foods for the selection for
the denominator
Variables: KR file.
caseid
Case Identification
b5
Child is alive
b9
Child lives with whom
b19
Current age of child in months (months since birth for dead children)
m4
Duration of breastfeeding
11.23
v410
Gave child juice
v411
Gave child tinned, powdered or fresh milk
v411a
Gave child baby formula
v412a
Gave child fortified baby food (cerelac, etc)
v412c
Gave child soup/clear broth
v413
Gave child other liquid
v414e
Gave child bread, noodles, other made from grains
v414f
Gave child potatoes, cassava, or other tubers
v414g
Gave child eggs
v414h
Gave child meat (beef, pork, lamb, chicken, etc)
v414i
Gave child pumpkin, carrots, squash (yellow or orange inside)
v414j
Gave child any dark green leafy vegetables
v414k
Gave child mangoes, papayas, other vitamin A fruits
v414l
Gave child any other fruits
v414m
Gave child liver, heart, other organs
v414n
Gave child fish or shellfish
v414o
Gave child food made from beans, peas, lentils, nuts
v414p
Gave child cheese, yogurt, other milk products
v414s
Gave child other solid, semi-solid food
v414v
Gave child yogurt
Based on DHS-7 standard questionnaires. Other variables may be needed if survey-specific foods are
included.
Calculation
Numerators divided by denominator multiplied by 100.
Handling of Missing Values
Breastfeeding: Missing values and “don’t know” assumed not breastfeeding.
Specific foods: Missing values and “don’t know” excluded from numerators in all percentages but
included in denominators.
Notes and Considerations
Country-specific foods may be added to each category. Percentages are based only on children living
with the mother. Children living elsewhere are excluded from both the numerators and the
denominators.
Changes over Time
The groupings of types of foods have changed over time. Other milk, and cheese, yogurt or other milk
product were previously combined. Fruits and vegetables rich in vitamin A, and other fruits and
vegetables were previously grouped together. Meat, fish, shellfish and poultry, and eggs were also
grouped together in earlier surveys. Food made with oil, fat, or butter was also presented in DHSIV and
DHS-V surveys. Sugary foods, such as chocolates, sweets, candies, pastries, cakes of biscuits were also
presented in DHS-V surveys.

11.24
Additional variables related to fresh milk, tea and coffee, porridge gruel, and other foods or drinks have
been used in older surveys (see v412, v412b, v413a – d, v414a – d, t, u, w), and should be taken into
consideration when comparing results with the surveys reports.
Resources
DHS-7 Tabulation plan: Table 11.6
API Indicator IDs:
Breastfeeding children:
CN_FDBF_C_INF, CN_FDBF_C_MLK, CN_FDBF_C_LIQ, CN_FDBF_C_BBY, CN_FDBF_C_GRN,
CN_FDBF_C_VTA, CN_FDBF_C_FVG, CN_FDBF_C_RTS, CN_FDBF_C_LEG, CN_FDBF_C_MTF,
CN_FDBF_C_EGG, CN_FDBF_C_MFE, CN_FDBF_C_CHS, CN_FDBF_C_OTH, CN_FDBF_C_SLD
(API link, STATcompiler link)
Non-breastfeeding children:
CN_FDNB_C_INF, CN_FDNB_C_MLK, CN_FDNB_C_LIQ, CN_FDNB_C_BBY, CN_FDNB_C_GRN,
CN_FDNB_C_VTA, CN_FDNB_C_FVG, CN_FDNB_C_RTS, CN_FDNB_C_LEG, CN_FDNB_C_MTF,
CN_FDNB_C_EGG, CN_FDNB_C_MFE, CN_FDNB_C_CHS, CN_FDNB_C_OTH, CN_FDNB_C_SLD
(API link, STATcompiler link)

11.25
Minimum Dietary Diversity, Minimum Meal Frequency and Minimum Acceptable
Diet
Percentage of children fed the minimum dietary diversity, the minimum meal frequency,
and the minimum acceptable diet
Definition
Percentage of youngest children age 6-23 months who are living with the mother who are fed:
1) Milk or milk products two or more times during the day or night preceding the survey or are
breastfeeding.
2) A minimum dietary diversity of 4 out of 7 food groups fed during the day or night preceding the
survey:
a) Grains, roots and tubers
b) Legumes and nuts
c) Dairy products (milk, yogurt, cheese)
d) Flesh foods (meat, fish, poultry and liver/organ meats)
e) Eggs
f) Vitamin A rich fruits and vegetables
g) Other fruits and vegetables
(note that the definition recently changed to 5 out of 8, adding breastmilk as a category – see
Changes over Time below).
3) A minimum meal frequency of:
a) 2 or more solid or semi-solid feeds for breastfeeding children age 6-8 months, or
3 or more solid or semi-solid feeds for breastfeeding children age 9-23 months, or
b) 4 or more solid or semi-solid or milk feeds for non-breastfeeding children age 6-23
months.
4) A minimum acceptable diet based on minimum dietary diversity and minimum meal frequency
they are fed during the day or night preceding the survey:
a) Breastfed children – minimum dietary diversity and minimum meal frequency as above.
b) Non-breastfed children – minimum dietary diversity but excluding the dairy products
category (4 out of 6 groups) and minimum meal frequency and 2 or more milk feeds.
Coverage:
Population base: Youngest living child age 6-23 month who is living with the mother (KR file)
Time period: 24 hours preceding the interview
Numerators: Number of youngest children age 6-23 months living with the mother who were fed:
1) Milk or milk products two or more times during the day or night preceding the survey (sum of
v469e (if in 1:7) plus v469f (if in 1:7) plus v469x (if in 1:7) >= 2), or breastfeeding (m4 = 95)
2) A minimum dietary diversity of 4 or more of the following food groups:
a. Grains, roots and tubers (v412a = 1 or v414e = 1 or v414f = 1)
b. Legumes and nuts (v414o = 1)
c. Dairy products (milk, yogurt, cheese) (v411 = 1 or v411a = 1 or v414v = 1 or v414p = 1)
d. Flesh foods (meat, fish, poultry and liver/organ meats) (v414h = 1 or v414m = 1 or v414n
= 1)

11.26
e. Eggs (v414g = 1)
f. Vitamin A rich fruits and vegetables (v414i = 1 or v414j = 1 or v414k = 1)
g. Other fruits and vegetables (v414l = 1)
3) A minimum meal frequency of:
a. For breastfed children, receiving solid or semi-solid food
at least twice a day for infants 6-8 months (m4 = 95 & b19 in 6:8 & m39 in 2:7) or
at least three times a day for children 9-23 months (m4 = 95 & b19 in 9:23 & m39
in 3:7)
b. For non-breastfed children age 6-23 months, receiving solid or semi-solid food or milk
feeds at least four times a day (m4 ≠ 95 & total milk feeds (see numerator 1) plus solid
feeds (m39 – if in 1:7) >= 4)
4) A minimum acceptable diet
a. Breastfed children – minimum dietary diversity and minimum meal frequency as above
b. Non-breastfed children – minimum dietary diversity but excluding the dairy products
category (4 out of 6 groups) and minimum meal frequency and 2 or more milk feeds
Disaggregated by whether breastfeeding or not (m4 = 95)
Denominators: Number of youngest children under 2 years living with the mother who is age 6-23
months, disaggregated by whether breastfeeding or not (m4 = 95). See Calculation of denominator in
Percent distribution of children exclusively breastfeeding, or breastfeeding and consuming plain water
only, non-milk liquids, consuming other milk, and consuming complementary foods for the selection for
the denominator, but further selecting for children age 6-23 months (b19 in 6:23)
Variables: KR file.
caseid
Case Identification
b5
Child is alive
b9
Child lives with whom
b19
Current age of child in months (months since birth for dead children)
m4
Duration of breastfeeding
v411
Gave child tinned, powdered or fresh milk
v411a
Gave child baby formula
v412a
Gave child fortified baby food (cerelac, etc)
v413
Gave child other liquid
v414e
Gave child bread, noodles, other made from grains
v414f
Gave child potatoes, cassava, or other tubers
v414g
Gave child eggs
v414h
Gave child meat (beef, pork, lamb, chicken, etc)
v414i
Gave child pumpkin, carrots, squash (yellow or orange inside)
v414j
Gave child any dark green leafy vegetables
v414k
Gave child mangoes, papayas, other vitamin A fruits
v414l
Gave child any other fruits
v414m
Gave child liver, heart, other organs
v414n
Gave child fish or shellfish
v414o
Gave child food made from beans, peas, lentils, nuts
v414p
Gave child cheese, yogurt, other milk products
v414v
Gave child yogurt
v469e
Times gave child powdered/tinned/fresh milk
v469f
Times gave child infant formula
11.27
v469x
Times gave child yogurt
m39
Number of times ate solid, semi-solid or soft food yesterday
Based on DHS-7 standard questionnaires. Other variables may be needed if survey-specific foods are
included.
Calculation
Numerators divided by denominator multiplied by 100.
Handling of Missing Values
Breastfeeding: Missing values and “don’t know” assumed not breastfeeding.
Specific foods: Missing values and “don’t know” excluded from numerators in all percentages but
included in denominators.
Solid, semi-solid or soft foods: Missing values and “don’t know” excluded from numerator but included
in denominator.
Notes and Considerations
Country-specific foods may be added to each category. Percentages are based only on children living
with the mother. Children living elsewhere are excluded from both the numerators and the
denominators.
Indicator is disaggregated by breastfeeding and non-breastfeeding. However, results should not be
compared between these groups of children because breastmilk is not included as part of the indicator
as currently defined. This can result in non-breastfed children appearing to have a better diet than non-
breastfed children (see changes over time below for how this is being addressed).
If the last-born child is deceased or not living with the mother, questions on foods and liquids are asked
of the prior child born in the two years preceding the interview. However, the question on breastfeeding
is not asked of this child. In this situation the child will be treated as not currently breastfeeding in the
numerator and included in the denominator.
Changes over Time
In “Indicators for assessing infant and young child feeding practices” (WHO, 2007), minimum dietary
diversity was defined as having received 4 out of 7 food groups. In 2017 this definition was changed to 5
out of 8 food groups with a group for breastfeeding being added to the groups (WHO, 2017). This
change was made to eliminate disparities in the indicator for breastfeeding compared with non-
breastfeeding children. This change will be introduced in DHS surveys in late 2018.
Potential modifications to minimum meal frequency and minimum acceptable diet are currently under
review by global experts as of August 2018.
Additional variables related to fresh milk, tea and coffee, porridge gruel, and other foods or drinks have
been used in older surveys (see v412, v412b, v413a – d, v414a – d, t, u, w), and should be taken into
consideration when comparing results with the surveys reports.

11.28
References
WHO. 2007. Indicators for assessing infant and young child feeding practices.
Part I Definitions: http://www.who.int/nutrition/publications/infantfeeding/9789241596664/en/
Part II Measurement: http://www.who.int/nutrition/publications/infantfeeding/9789241599290/en/
WHO. 2017. Global Nutrition Monitoring Framework: Operational Guidance for Tracking Progress in
Meeting Targets for 2025. http://www.who.int/nutrition/publications/operational-guidance-GNMF-
indicators/en/
Ruel, M.T. 2017. “Measuring infant and young child complementary feeding practices: Indicators,
current practice, and research gaps. In Complementary Feeding: Building the Foundations for a Healthy
Life” eds.R.E. Black, M. Makrides, K.K. Ong. Nestle Nutrition Institute Workshops Series. Basel,
Switzerland: Nestec Ltd., Vevey/S. Karger AG, Basel. 87:73-87. https://doi.org/10.1159/000448939
Resources
DHS-7 Tabulation plan: Table 11.7
API Indicator IDs:
Breastfeeding children:
CN_IYCF_C_4FB, CN_IYCF_C_MNB, CN_IYCF_C_BTB
Non-breastfeeding children:
CN_IYCF_C_MKN, CN_IYCF_C_4FN, CN_IYCF_C_MNN, CN_IYCF_C_3PN
All children:
CN_IYCF_C_MKA, CN_IYCF_C_4FA, CN_IYCF_C_MNA, CN_IYCF_C_3PA
(API link, STATcompiler link)
GNMF Indicator 12: Proportion of children aged 6–23 months who receive a minimum acceptable diet
IYCF Indicator 5 (Core): Minimum dietary diversity.
IYCF Indicator 6 (Core): Minimum meal frequency.
IYCF Indicator 7 (Core): Minimum acceptable diet.
MICS6 Indicator TC.39a: Minimum acceptable diet (breastfed children)
MICS6 Indicator TC.39b: Minimum acceptable diet (non-breastfed children)
MICS6 Indicator TC.40: Milk feeding frequency for non-breastfed children
MICS6 Indicator TC.41: Minimum dietary diversity
MICS6 Indicator TC.42: Minimum meal frequency

11.29
Iodization of Household Salt
Percentage of households with salt tested for iodine content, with salt but salt not tested,
with no salt, and among households tested percentage with iodized salt
Definition
1) Percentage of households with salt tested for iodine content.
2) Percentage of households with salt, but the salt was not tested.
3) Percentage of households with no salt.
4) Percentage of households with salt tested which contained iodized salt.
Coverage:
Population base: Interviewed households (HR file)
Time period: Current status at time of survey
Numerators:
1) Number of households with salt tested for iodine content (hv234a 0 or hv234a = 1)
2) Number of households with salt, but the salt was not tested (hv234a = 6)
3) Number of households with no salt (hv234a = 3)
4) Number of households with salt tested with iodized salt (hv234a = 1)
Denominators:
1) For numerators 1-3: Number of households interviewed
2) For numerator 4: Number of households where salt was tested for iodine content (hv234a in
0,1)
Variables: HR file.
hv234a
Result of salt test for iodine
hv005
Household sample weight
Calculation
Numerators divided by denominator multiplied by 100.
Handling of Missing Values
Missing values and “don’t know” on iodine content or whether salt was available or tested excluded
from the numerators but included from the first denominator.
Changes over Time
DHS tests household salt iodization using a Rapid Test Kit (RDK). The WHO recommends RTKs should
only be used to report the proportion of household using salt containing iodine (non-iodized or iodized),
because the RTK does not provide accurate estimates of the quantity of iodine in salt. DHS-V and earlier
surveys reported iodine content of salt in households tested as none (0 ppm), inadequate (<15ppm),

11.30
and adequate (15+ ppm) (hv234). Surveys in DHS-VI and DHS-7 report the percentage of any iodized salt
in households in which salt was tested.
References
UNICEF. 2018. Guidance on the Monitoring of Salt Iodization Programmes and Determination of
Population Iodine Status. https://www.unicef.org/nutrition/files/Monitoring-of-Salt-Iodization.pdf
WHO. 2007. Assessment of iodine deficiency disorders and monitoring their elimination: a guide for
programme managers. – 3rd ed.
http://www.who.int/nutrition/publications/micronutrients/iodine_deficiency/9789241595827/en/
Resources
DHS-7 Tabulation plan: Table 11.9
API Indicator IDs: CN_IODZ_H_SLT, CN_IODZ_H_NSL, CN_IODZ_H_IOD
(API link, STATcompiler link)
MICS6 Indicator TC.48: Iodized salt consumption

11.31
Micronutrient Intake among Children
Percentage of children who consumed foods rich in vitamin A, who consumed foods rich in
iron, who were given multiple micronutrient powder, who were given iron supplements,
who received vitamin A supplements, who received deworming medication, or who live in
household with tested iodized salt
Definition
1) Percentage of youngest children age 6-23 months living with their mother who consumed foods
rich in vitamin A.
2) Percentage of youngest children age 6-23 months living with their mother who consumed foods
rich in iron.
3) Percentage of children age 6-23 months who were given multiple micronutrient powder.
4) Percentage of children age 6-59 months who were given iron supplements.
5) Percentage of children age 6-59 months who received vitamin A supplements.
6) Percentage of children age 6-59 months who received deworming medication.
7) Percentage of children age 6-59 months who live in a household with iodized salt.
Coverage:
Population base: (KR file, HR file).
1) Youngest living children 6-23 months of age living with their mother
2) Living children 6-23 months of age
3) Living children 6-59 months of age
4) Living children 6-59 months of age living in households with salt tested
Time period:
1) 24 hours preceding the interview
2) 7 days preceding interview
3) 6 months preceding interview
4) Current status at time of interview
Numerators:
1) Number of youngest living children 6-23 months living with their mother who consumed foods
rich in vitamin A at any time in 24 hours preceding the interview (any of v414g, h, i, j, k, m, n = 1)
2) Number of youngest living children 6-23 months living with their mother who consumed foods
rich in iron at any time in 24 hours preceding the interview (any of v414g, h, m, n = 1)
3) Number of living children 6-23 months who received multiple micronutrient powder in the
seven days preceding the interview (b5 = 1 & b19 in 6:23 & h80a = 1)
4) Number of living children 6-59 months who received iron supplements in the seven days
preceding the interview (b5 = 1 & b19 in 6:59 & h42 = 1)
5) Number of living children 6-59 months who received vitamin A supplements in the six months
preceding the interview (b5 = 1 & b19 in 6:59 & ((v008a – CDCode(h33d, h33m, h33y)) < 7 or
h34 = 1))
6) Number of living children 6-59 months who received deworming medication in the six months
preceding the interview (b5 = 1 & b19 in 6:59 & h43 = 1)
11.32
7) Number of children 6-59 months living in households in which salt was tested having iodized salt
(b5 = 1 & b19 in 6:59 & h234a = 1)
Denominators:
1) For numerators 1-2: Number of youngest living children 6-23 months of age living with their
mother (b5 = 1 & b19 in 6:23 & youngest child living with mother – see Calculation of denominator
in Percent distribution of children exclusively breastfeeding, or breastfeeding and consuming plain
water only, non-milk liquids, consuming other milk, and consuming complementary foods)
2) For numerator 3: Number of living children 6-23 months of age (b5 = 1 & b19 in 6:23)
3) For numerators 4-6: Number of living children 6-59 months of age (b5 = 1 & b19 in 6:59)
4) For numerator 7: Number of living children 6-59 months of age living in households with salt tested
(b5 = 1 & b19 in 6:59 & h234a in 0,1)
Variables: KR file, HR file.
b5
Child is alive
b19
Current age of child in months
h33d
Vitamin A1 day
h33m
Vitamin A1 month
h33y
Vitamin A1 year
h34
Vitamin A in last 6 months
h42
Taking iron pills, sprinkles or syrup
h43
Drugs for intestinal parasites in last 6 months
h80a
In the last 7 days given: LOCAL NAME for multiple micronutrient powder
v414g
Gave child eggs
v414h
Gave child meat (beef, pork, lamb, chicken, etc)
v414i
Gave child pumpkin, carrots, squash (yellow or orange inside)
v414j
Gave child any dark green leafy vegetables
v414k
Gave child mangoes, papayas, other vitamin A fruits
v414m
Gave child liver, heart, other organs
v414n
Gave child fish or shellfish
hv234a
Result of salt test for iodine
v005
Women’s individual sample weight
Calculation
For denominator 1: See Calculation in Percent distribution of children exclusively breastfeeding, or
breastfeeding and consuming plain water only, non-milk liquids, consuming other milk, and consuming
complementary foods for the selection for the denominator, but further selecting for children age 6-23
months (b19 in 6:23).
For numerator 5: CDCode represents the century day code (CDC) calculated from the day, month and
year when the child last received a vitamin A supplement (See Century Day Code in Chapter 1).
For numerator 7/denominator 4: To calculate the salt iodization indicator for children, it is first
necessary to merge the salt iodization variables from the household recode (HR file) to the children’s
recode (KR file) using the cluster and household numbers (see Matching and Merging Datasets in
Chapter 1).

11.33
Numerators divided by denominators multiplied by 100.
Handling of Missing Values
Missing values and “don’t know” excluded from numerator (assumes did not consume or receive).
Missing values and “don’t know” for month and year of last vitamin A supplement are excluded from
numerator (assumes did not receive), but if only day is missing or “don’t know” day is imputed as 15.
Children living in households that were not tested or where information is missing on salt content are
excluded from numerator and denominator.
Notes and Considerations
Mothers are asked whether their child had iron supplementation defined as iron pills, sprinkles with
iron, or iron syrup in the previous 7 days. Similarly, mothers are asked whether their child had
micronutrient powders in a separate location in the questionnaire in the previous 7 days. Multiple
micronutrient powders contain a range of vitamins and minerals (and nearly always include iron, per
WHO recommendations) enclosed in a single-dose sachet added to foods; Sprinkles™ is a brand name
used for micronutrient powders.
WHO does not recommend giving deworming to children to 6-12 months and country programs do
follow this so by including those younger kids you will be underestimating the coverage of deworming in
children
References
Lo, N.C., J. Snyder, D.G. Addiss, S. Heft-Neal, J.R. Andrews, and E. Bendavid. 2018. "Deworming in pre-
school age children: A global empirical analysis of health outcomes." PLoS neglected tropical diseases
12(5):e0006500.
http://journals.plos.org/plosntds/article?id=10.1371/journal.pntd.0006500
UNICEF. 2018. Coverage at a Crossroads: New directions for vitamin A supplementation programmes.
New York: UNICEF. https://data.unicef.org/resources/vitamin-a-coverage/
FAO. 2012. Guidelines for measuring household and individual dietary diversity.
http://www.fao.org/docrep/014/i1983e/i1983e00.htm
Resources
DHS-7 Tabulation plan: Table 11.10
API Indicator IDs:
CN_MIAC_C_VAF, CN_MIAC_C_IRF, CN_MIAC_C_VAS, CN_MIAC_C_IRS, CN_MIAC_C_DWM,
CN_MIAC_C_IOD
(API link, STATcompiler link)
11.34

11.35
Therapeutic and Supplemental Foods
Percentage of children who received Plumpy’Nut or who received Plumpy’Doz
Definition
1) Percentage of children age 6-35 months who received Plumpy’Nut in the 7 days preceding the
interview.
2) Percentage of children age 6-35 months who received Plumpy’Doz in the 7 days preceding the
interview.
Coverage:
Population base: Living children 6-35 months of age (KR file)
Time period: 7 days preceding interview
Numerators:
1) Number of living children 6 -35 months who received Plumpy’Nut (or local name) in the 7 days
preceding the interview (b5 = 1 & b19 in 6:35 & h80b = 1)
2) Number of living children 6 -35 months who received Plumpy’Doz (or local name) in the 7 days
preceding the interview (b5 = 1 & b19 in 6:35 & h80c = 1)
Denominator: Number of living children 6-35 months of age (b5 = 1 & b19 in 6:35).
Variables: KR file.
b5
Child is alive
b19
Current age of child in months
h80b
In the last 7 days given: LOCAL NAME for ready to use therapeutic food
h80c
In the last 7 days given: LOCAL NAME for ready to use supplemental food
Calculation
Numerators divided by denominators multiplied by 100.
Handling of Missing Values
Missing values and “don’t know” excluded from numerator (assumes did not receive), but included in
denominator.
Notes and Considerations
Plumpy'Nut is a peanut-based paste given as a ready-to-use therapeutic food (RUTF) for treatment of
severe acute malnutrition. Plumpy’Doz is a soy-based ready-to-use supplementary food (RUSF) for
treatment of moderate acute malnutrition.
References

11.36
UNICEF. 2013. Position Paper: Ready-to-use therapeutic food for children with severe acute malnutrition.
https://www.unicef.org/media/files/Position_Paper_Ready-to-
use_therapeutic_food_for_children_with_severe_acute_malnutrition__June_2013.pdf
Valid International. 2006. Community-Based Therapeutic Care (CTC): Field Manual and Special
Supplement https://www.fantaproject.org/focus-areas/nutrition-emergencies-mam/ctc-field-manual-
and-supplement
WHO. Severe acute malnutrition. http://www.who.int/nutrition/topics/severe_malnutrition/en/
Resources
DHS-7 Tabulation plan: Table 11.11

11.37
Micronutrient Intake among Women
Percent distribution of women with a birth in last five years, by number of days they took
iron tablets or syrup during pregnancy of last birth, percentage who took deworming
medication, and percentage who live in a household with tested iodized salt
Definition
1) Percent distribution of women with a birth in last 5 years, by number of days they took iron
tablets or syrup during pregnancy of last birth.
2) Percentage of women with a birth in last 5 years who took deworming medication during
pregnancy of last birth.
3) Percentage of women with a birth in last 5 years who live in a household with salt tested with
iodized salt
Coverage:
Population base: Women with a birth in the 5 years preceding the survey (IR file)
Time period: 5 years preceding the survey
Numerators:
1) Number of women distributed by the number of days they took iron tablets or syrup during the
pregnancy of their last birth (none, < 60, 60-89, 90+, ”don’t know”/missing) (m45 = 0, m46 in
0:59, m46 in 60:89, m46 in 90:300, m45 = 8, 9 or m46 = 998, 999)
2) Number of women who took deworming medication during pregnancy of last birth (m60 = 1).
3) Number of women living in households with tested iodized salt (hv234a = 1)
Denominators:
1) For numerators 1, 2: Number of women with a birth in the 5 years preceding the survey (v208 >
0)
2) For numerator 3: Number of women with a birth in the 5 years preceding the survey who live in
households where salt was tested (v208 > 0 & hv234a in 0, 1)
Variables: IR file.
v208
Births in last five years
m45_1
During pregnancy, given or bought iron tablets/syrup
m46_1
Days tablets or syrup taken
m60_1
Drugs for intestinal parasites during pregnancy
hv234a
Result of salt test for iodine
v005
Women’s individual sample weight
Calculation
For numerator 3/denominator 2: To calculate the salt iodization indicator for women, it is first necessary
to merge the salt iodization variables from the household recode (HR file) to the women’s recode (IR
file) using the cluster and household numbers (see Matching and Merging Datasets in Chapter 1).

11.38
Numerators divided by denominators multiplied by 100.
Handling of Missing Values
Missing values and “don’t know” on whether given iron tablets/syrup or missing and “don’t know” on
number of days given iron tablets/syrup are included in a separate category.
Missing values and “don’t know” for deworming during pregnancy excluded from numerator and
included in denominator.
Women living in households in which salt was not tested or for which information is missing on salt
content are excluded from the numerator and denominator.
References
Sununtnasuk, C., A. D’Agostino, & J. Fiedler. 2016. “Iron folic acid distribution and consumption through
antenatal care: Identifying barriers across countries.” Public Health Nutrition, 19(4), 732-742.
doi:10.1017/S1368980015001652
https://www.cambridge.org/core/journals/public-health-nutrition/article/ironfolic-acid-distribution-
and-consumption-through-antenatal-care-identifying-barriers-across-
countries/B6645437C3E9493D83765E9AD862F21F#
WHO. 2016. WHO recommendations on antenatal care for a positive pregnancy experience. Geneva.
http://www.who.int/nutrition/publications/guidelines/antenatalcare-pregnancy-positive-
experience/en/
Resources
DHS-7 Tabulation plan: Table 11.14
API Indicator IDs:
AN_MIAM_W_NON, AN_MIAM_W_L60, AN_MIAM_W_L89, AN_MIAM_W_90P, AN_MIAM_W_DKM,
AN_MIAM_W_DWM, AN_MIAM_W_IOD
(API link, STATcompiler link)

11.39
Anemia Status
Percentage of children with anemia
Definition
Percentage of children age 6-59 months with mild, moderate or severe anemia or with any anemia.
Coverage:
Population base: Living children born 6-59 months before the survey who stayed in the
household on the night before the survey (PR file).
Time period: Current status at time of survey.
Numerators:
1) Any anemia: Number of children whose hemoglobin count is less than 11 grams per deciliter
(g/dl) (hc57 in 1:3)
2) Mild anemia: Number of children whose hemoglobin count is between 10.0 and 10.9 grams per
deciliter (g/dl) (hc57 = 3)
3) Moderate anemia: Number of children whose hemoglobin count is between 7.0 and 9.9 grams
per deciliter (g/dl) (hc57 = 2)
4) Severe anemia: Number of children whose hemoglobin count is less than 7.0 grams per deciliter
(g/dl) (hc57 = 1)
Denominator: Number of children between age 6-59 months who were measured in households
selected for anemia testing who stayed in the household on the night before the survey (hv042 = 1 &
hc1 in 6:59 & hc55 = 0 & hv103 = 1)
Variables: PR file.
hv042
Household selected for hemoglobin
hv103
Slept in household
hc1
Child's age in months
hc55
Result of measurement – hemoglobin
hc57
Anemia level
Calculation
At the time of creation of a recode file, an adjustment of the hemoglobin count is made for altitude.
Rather than change the cutoff points, the effective hemoglobin count is lowered as altitude increases,
since oxygen is less available. The adjustment is made with the following formula:
adjust = - 0.032*alt + 0.022*alt2
adjHb = Hb - adjust (for adjust > 0)
where adjust is the amount of the adjustment, alt is altitude in 1,000 feet (converted from meters by
dividing by 1,000 and multiplying by 3.3), adjHb is the adjusted hemoglobin level, and Hb is the

11.40
measured hemoglobin level in grams per deciliter. No adjustment is made for altitudes below 1,000
meters. Both the adjusted and unadjusted hemoglobin counts are included in the recode files.
The percentage anemic, by category, is obtained by dividing the numerators by the denominator and
multiplying by 100.
Handling of Missing Values
Children whose mothers are not listed in the Household Questionnaire are excluded.
Children who were not tested and those children whose hemoglobin values were not recorded are
excluded from both the denominator and the numerators.
Notes and Considerations
Children less than six months of age are not included because they have higher levels of hemoglobin at
birth and just after birth and thus may distort the indication of prevalence of anemia.
People residing at higher altitudes (greater than 1,000 meters (3,300 feet)) have higher Hb levels than
those residing at sea level. This variation is due to the lower oxygen partial pressure at higher altitudes,
a reduction in oxygen saturation of blood, and a compensatory increase in red cell production to ensure
adequate oxygen supply to the tissues. Thus, higher altitude causes a generalized upward shift of the Hb
distributions. This shift may be associated with the underdiagnosis of anemia for residents of higher
altitudes when sea-level cutoffs are applied (CDC, unpublished data). Therefore, the proper diagnosis of
anemia for those residing at higher altitudes requires an upward adjustment of Hb cutoffs. The values
for altitude-specific adjustment of Hb are derived from data collected by the CDC Pediatric Nutrition
Surveillance System on children residing at various altitudes in the mountain states. Altitude affects Hb
levels throughout pregnancy in a similar way (J.N. Chatfield, unpublished data). Altitude data should
always be obtained to adjust where the altitude of the dwelling is more than 1,000 meters. The DHS
Program uses cluster altitude instead of altitude for each dwelling in the cluster. Note that both the
adjusted and unadjusted altitude data are available in the recode files.
References
Centers for Disease Control and Prevention. 1998. “Recommendations to prevent and control iron
deficiency in the United States.” Morbidity and Mortality Weekly Report 47 (RR-3): 1–29.
https://www.cdc.gov/mmwr/pdf/rr/rr4703.pdf
Centers for Disease Control and Prevention. 1989. “Current trends CDC criteria for anemia in children
and childbearing-aged women.” Morbidity and Mortality Weekly Report 38, (22): 400–404.
https://www.cdc.gov/mmwr/preview/mmwrhtml/00001405.htm
Kassebaum, N.J., R. Jasrasaria, M. Naghavi, S.K. Wulf, N. Johns, R. Lozano, M. Regan, D. Weatherall, D.P.
Chou, T.P. Eisele, S.R. Flaxman, R.L. Pullan, S.J. Brooker and C.J. L. Murray. 2014. “A systematic analysis
of global anemia burden from 1990 to 2010.” Blood 2014 123:615-624; doi:
https://doi.org/10.1182/blood-2013-06-508325 http://www.bloodjournal.org/content/123/5/615

11.41
Nestel P. and The INACG Steering Committee. 2002. Adjusting Hemoglobin Values in Program Surveys.
http://pdf.usaid.gov/pdf_docs/Pnacq927.pdf
Sullivan, K. M., Z. Mei, L. Grummer-Strawn, and I. Parvanta. 2008. “Haemoglobin Adjustments to Define
Anaemia.” Tropical Medicine International Health 13(10):1267-71.
https://onlinelibrary.wiley.com/doi/full/10.1111/j.1365-3156.2008.02143.x
Sharman, A. 2000. Anemia testing in population-based surveys: General information and guidelines for
country monitors and program managers. Calverton, Maryland USA: ORC Macro.
https://dhsprogram.com/publications/publication-OD22-Other-Documents.cfm
Pullum, T., D.K. Collison, S. Namaste, and D. Garrett. 2017. Hemoglobin Data in DHS Surveys: Intrinsic
Variation and Measurement Error. DHS Methodological Reports No. 18. Rockville, Maryland, USA: ICF.
https://www.dhsprogram.com/publications/publication-MR18-Methodological-Reports.cfm
WHO. 2011. Haemoglobin concentrations for the diagnosis of anaemia and assessment of severity .
http://www.who.int/vmnis/indicators/haemoglobin/en/
WHO. 2015. The global prevalence of anaemia in 2011.
http://www.who.int/nutrition/publications/micronutrients/global_prevalence_anaemia_2011/en/
Resources
DHS-7 Tabulation plan: Table 11.8
API Indicator IDs:
CN_ANMC_C_ANY, CN_ANMC_C_MLD, CN_ANMC_C_MOD, CN_ANMC_C_SEV
(API link, STATcompiler link)
WHO 100 Core Health Indicators: Anaemia prevalence in children
11.42
Percentage of women with anemia
Definition
Percentage of women age 15-49 with mild, moderate or severe anemia or with any anemia.
Coverage:
Population base: All women age 15–49 (IR file)
Time period: Current status at time of survey
Numerators:
1) Any anemia: Number of not pregnant women whose hemoglobin count is less than 12.0 grams
per deciliter (g/dl) plus number of pregnant women whose count is less than 11.0 g/dl (v457 in
1:3)
2) Mild anemia: Number of not pregnant women whose hemoglobin count is between 10.0 and
11.9 g/dl plus number of pregnant women whose hemoglobin count is between 10.0 and 10.9
g/dl (v457 = 3)
3) Moderate anemia: Number of women pregnant or not whose hemoglobin count is between 7.0
and 9.9 g/dl (v457 = 2)
4) Severe anemia: Number of women pregnant or not whose hemoglobin count is less than 7.0
g/dl (v457 = 1)
Denominator: Number of women age 15-49 years measured for anemia in households selected for
anemia testing (v042 = 1 and v455 = 0)
Variables: IR file.
v042
Household selected for hemoglobin
v455
Result of measurement - hemoglobin
v457
Anemia level
v005
Women's individual sample weight
Calculation
At the time of creation of a recode file, an adjustment of the hemoglobin count is made for altitude.
Rather than change the cutoff points, the effective hemoglobin count is lowered as altitude increases,
since oxygen is less available. The adjustment is made with the following formulas:
adjust = – 0.032*alt + 0.022*alt2
adjHb = Hb – adjust (for adjust > 0)
where adjust is the amount of the adjustment, alt is altitude in 1,000 feet (converted from meters by
dividing by 1,000 and multiplying by 3.3), adjHb is the adjusted hemoglobin level, and Hb is the
measured hemoglobin level in grams per deciliter. No adjustment is made for altitudes below 1,000
meters. Both the adjusted and unadjusted hemoglobin counts are included in the recode files.

11.43
Similarly, an adjustment is made for women who smoke (if information was collected). The adjustment
is to be made in accordance with the following table:
Cigarettes Smoked
Adjust Hb (g/dl) concentration by
Less than 10 per day
No adjustment
10-19 per day
-0.3
20-39 per day
-0.5
40 or more per day
-0.7
Unknown quantity or non-cigarettes smoking
-0.3
In ever-married women samples, the data in the IR file are augmented with data from the PR file for
never-married women to provide anemia prevalence estimates for all women. In ever-married samples
(hv020 = 1), never-married women who are de facto residents and were tested for anemia (hv115 = 0 &
hv103 = 1 & hv042 = 1 & ha55 = 0) are added to the denominator, and to the numerators if their
hemoglobin levels were in the appropriate categories (ha57 in 1:3).
Added variables required for ever-married samples:
hv020
Ever-married sample
hv042
Household selected for hemoglobin
hv103
Slept last night
ha55
Result of measurement – hemoglobin
ha57
Anemia level
hv005
Household sample weight
The percentage anemic, by category, is obtained by dividing the numerators by the denominator and
multiplying by 100.
Handling of Missing Values
Women who were not tested and women whose values were not recorded are excluded from both the
denominator and the numerators.
Notes and Considerations
Pregnancy causes an increase in blood fluid diluting somewhat the concentration of hemoglobin.
Therefore, the cutoff for mild anemia is lowered for pregnant women. No adjustment is made for the
cutoff values for either moderate or severe anemia. Because the availability of oxygen is less at higher
altitudes (lower partial pressures) and because smoking interferes with the blood’s capacity to transfer
oxygen, adjustments need to be made for both altitude and smoking.
People residing at higher altitudes (greater than 1,000 meters (3,300 feet)) have higher Hb levels than
those residing at sea level. This variation is due to the lower oxygen partial pressure at higher altitudes,
a reduction in oxygen saturation of blood, and a compensatory increase in red cell production to ensure
adequate oxygen supply to the tissues. Thus, higher altitude causes a generalized upward shift of the Hb
distributions. This shift may be associated with the under diagnosis of anemia for residents of higher
altitudes when sea-level cutoffs are applied (CDC, unpublished data). Therefore, the proper diagnosis of
anemia for those residing at higher altitudes requires an upward adjustment of Hb cutoffs. The values
for altitude-specific adjustment of Hb are derived from data collected by the CDC Pediatric Nutrition

11.44
Surveillance System on children residing at various altitudes in the mountain states. Altitude affects Hb
levels throughout pregnancy in a similar way (Chatfield, unpublished data).
The influence of cigarette smoking is similar to that of altitude; smoking increases Hb level substantially.
The higher Hb of smokers is a consequence of an increased carboxyhemoglobin from inhaling carbon
monoxide while smoking. Because carboxyhemoglobin has no oxygen-carrying capacity, its presence
causes a generalized upward shift of the Hb distribution curves (CDC, unpublished data). Therefore, a
smoking-specific adjustment to the anemia cutoff is necessary for the proper diagnosis of anemia in
smokers.
The adjustment for altitude can be substantial, but the adjustment for smoking is less substantial. Thus,
where no smoking information is available, no adjustment is made. However, altitude data should
always be obtained to adjust where the altitude of the dwelling is more than 1,000 meters. The DHS
Program uses cluster altitude instead of altitude for each dwelling in the cluster. Note that both the
adjusted and unadjusted altitude data are available in the recode files.
The World Health Organization recommends slightly different hemoglobin cutoffs to define anemia for
non-pregnant women: mild anemia (11.0-11.9 g/dL), moderate anemia (8.0-10.9 g/dL), and severe
anemia.
These indicators could be presented based on the IR file or the PR file. Using the PR file would result in a
slightly larger sample size, but the IR file is chosen for consistency with other women’s indicators, and as
some of the women’s characteristics used in presenting the results are only available for women with
completed interviews.
References
Centers for Disease Control and Prevention. 1998. “Recommendations to prevent and control iron
deficiency in the United States.” Morbidity and Mortality Weekly Report 47 (RR-3): 1–29.
Centers for Disease Control and Prevention. 1989. “Current trends CDC criteria for anemia in children
and childbearing-aged women.” Morbidity and Mortality Weekly Report 38, (22): 400–404.
Kassebaum, N.J., R. Jasrasaria, M. Naghavi, S.K. Wulf, N. Johns, R. Lozano, M. Regan, D. Weatherall, D.P.
Chou, T.P. Eisele, S.R. Flaxman, R.L. Pullan, S.J. Brooker and C.J.L. Murray. 2014. “A systematic analysis of
global anemia burden from 1990 to 2010.” Blood 2014 123:615-624; doi: https://doi.org/10.1182/blood-
2013-06-508325 http://www.bloodjournal.org/content/123/5/615
Nestel P. and The INACG Steering Committee. 2002. Adjusting Hemoglobin Values in Program Surveys.
http://pdf.usaid.gov/pdf_docs/Pnacq927.pdf
Sullivan, K. M., Z. Mei, L. Grummer-Strawn, and I. Parvanta. 2008. “Haemoglobin Adjustments to Define
Anaemia.” Tropical Medicine International Health 13(10):1267-71.
https://onlinelibrary.wiley.com/doi/full/10.1111/j.1365-3156.2008.02143.x
Sharman, A. 2000. Anemia testing in population-based surveys: General information and guidelines for
country monitors and program managers. Calverton, Maryland USA: ORC Macro.
https://dhsprogram.com/publications/publication-OD22-Other-Documents.cfm

11.45
Pullum, T., D.K. Collison, S. Namaste, and D. Garrett. 2017. Hemoglobin Data in DHS Surveys: Intrinsic
Variation and Measurement Error. DHS Methodological Reports No. 18. Rockville, Maryland, USA: ICF.
https://www.dhsprogram.com/publications/publication-MR18-Methodological-Reports.cfm
WHO. 2011. Haemoglobin concentrations for the diagnosis of anaemia and assessment of severity
http://www.who.int/vmnis/indicators/haemoglobin/en/
WHO. 2015. The global prevalence of anaemia in 2011.
http://www.who.int/nutrition/publications/micronutrients/global_prevalence_anaemia_2011/en/
WHO. 2017. Global Nutrition Monitoring Framework: Operational Guidance for Tracking Progress in
Meeting Targets for 2025. http://www.who.int/nutrition/publications/operational-guidance-GNMF-
indicators/en/
Resources
DHS-7 Tabulation plan: Table 11.13.1
API Indicator IDs:
AN_ANEM_W_ANY, AN_ANEM_W_MLD, AN_ANEM_W_MOD, AN_ANEM_W_SEV
(API link, STATcompiler link)
GNMF Indicator 2: Prevalence of haemoglobin <11 g/dL in pregnant women; Prevalence of haemoglobin
<12 g/dL in non-pregnant women
WHO 100 Core Health Indicators: Anaemia prevalence in women
11.46
Percentage of men with anemia
Definition
Percentage of men age 15-49 with any anemia.
Coverage:
Population base: All men age 15–49 (MR file, PR file)
Time period: Current status at time of survey
Numerator: Any anemia: Number of men whose hemoglobin count is less than 13.0 grams per deciliter
(g/dl)
Denominator: Number of men age 15-49
Variables: MR file, PR file.
hv042
Household selected for hemoglobin
hb55
Result of measurement – hemoglobin
hb56
Hemoglobin level adjusted for altitude and smoking (g/dl - 1 decimal)
mv005
Household sample weight
Calculation
To calculate the anemia status for men, it is first necessary to merge the anemia test variables from the
household members recode (PR file) to the men’s recode (MR file) using the cluster, household and line
numbers (see Matching and Merging Datasets in Chapter 1).
At the time of creation of a recode file, an adjustment of the hemoglobin count is made for altitude.
Rather than change the cutoff points, the effective hemoglobin count is lowered as altitude increases,
since oxygen is less available. The adjustment is made with the following formulas:
adjust = – 0.032*alt + 0.022*alt2
adjHb = Hb – adjust
where adjust is the amount of the adjustment, alt is altitude in 1,000 feet (converted from meters by
dividing by 1,000 and multiplying by 3.3), adjHb is the adjusted hemoglobin level, and Hb is the
measured hemoglobin level in grams per deciliter. No adjustment is made for altitudes below 1,000
meters. Both the adjusted and unadjusted hemoglobin counts are included in the recode files.
Similarly, an adjustment is made for men who smoke (if information was collected). The adjustment is to
be made in accordance with the following table:
Cigarettes Smoked
Adjust Hb (g/dl) concentration by
Less than 10 per day
No adjustment
10-19 per day
-0.3
20-39 per day
-0.5
40 or more per day
-0.7
Unknown quantity or non-cigarettes smoking
-0.3
11.47
The percentage anemic, by category, is obtained by dividing the numerators by the denominator and
multiplying by 100.
Handling of Missing Values
Men who were not tested and men whose values were not recorded are excluded from both the
denominator and the numerators.
Notes and Considerations
No adjustment is made for the cutoff values for either moderate or severe anemia. Because the
availability of oxygen is less at higher altitudes (lower partial pressures) and because smoking interferes
with the blood’s capacity to transfer oxygen, adjustments need to be made for both altitude and
smoking.
People residing at higher altitudes (greater than 1,000 meters (3,300 feet)) have higher Hb and Hct
levels than those residing at sea level. This variation is due to the lower oxygen partial pressure at higher
altitudes, a reduction in oxygen saturation of blood, and a compensatory increase in red cell production
to ensure adequate oxygen supply to the tissues. Thus, higher altitude causes a generalized upward shift
of the Hb distributions. This shift may be associated with the under diagnosis of anemia for residents of
higher altitudes when sea-level cutoffs are applied (CDC, unpublished data). Therefore, the proper
diagnosis of anemia for those residing at higher altitudes requires an upward adjustment of Hb cutoffs.
The values for altitude-specific adjustment of Hb are derived from data collected by the CDC Pediatric
Nutrition Surveillance System on children residing at various altitudes in the mountain states. Altitude
affects Hb levels throughout pregnancy in a similar way (Chatfield, unpublished data).
The influence of cigarette smoking is similar to that of altitude; smoking increases Hb level substantially.
The higher Hb of smokers is a consequence of an increased carboxyhemoglobin from inhaling carbon
monoxide while smoking. Because carboxyhemoglobin has no oxygen-carrying capacity, its presence
causes a generalized upward shift of the Hb distribution curves (CDC, unpublished data). Therefore, a
smoking-specific adjustment to the anemia cutoff is necessary for the proper diagnosis of anemia in
smokers.
The adjustment for altitude can be substantial, but the adjustment for smoking is less substantial. Thus,
where no smoking information is available, no adjustment is made. However, altitude data should
always be obtained to adjust where the altitude of the dwelling is more than 1,000 meters. The DHS
Program uses cluster altitude instead of altitude for each dwelling in the cluster. Note that both the
adjusted and unadjusted altitude data are available in the recode files.
These indicators could be presented based on the MR file or the PR file. Using the PR file would result in
a slightly larger sample size, but the MR file is chosen for consistency with other men’s indicators, and as
some of the men’s characteristics used in presenting the results are only available for men with
completed interviews.

11.48
Cutoff values for mild, moderate and severe anemia may be used for adult men in addition to reporting
any anemia. Prevalence of anemia in men, though, is generally low in most settings, so this
disaggregation is often not useful.
References
Centers for Disease Control and Prevention. 1998. Recommendations to prevent and control iron
deficiency in the United States. Morbidity and Mortality Weekly Report 47 (RR-3): 1–29.
Centers for Disease Control and Prevention. 1989. “Current trends CDC criteria for anemia in children
and childbearing-aged women.” Morbidity and Mortality Weekly Report 38, (22): 400–404.
Nestel P. and The INACG Steering Committee. 2002. Adjusting Hemoglobin Values in Program Surveys.
http://pdf.usaid.gov/pdf_docs/Pnacq927.pdf
Sullivan, K. M., Z. Mei, L. Grummer-Strawn, and I. Parvanta. 2008. “Haemoglobin Adjustments to Define
Anaemia.” Tropical Medicine International Health 13(10):1267-71.
https://onlinelibrary.wiley.com/doi/full/10.1111/j.1365-3156.2008.02143.x
Sharman, A. 2000. Anemia testing in population-based surveys: General information and guidelines for
country monitors and program managers. Calverton, Maryland USA: ORC Macro.
https://dhsprogram.com/publications/publication-OD22-Other-Documents.cfm
Pullum, T., D.K. Collison, S. Namaste, and D. Garrett. 2017. Hemoglobin Data in DHS Surveys: Intrinsic
Variation and Measurement Error. DHS Methodological Reports No. 18. Rockville, Maryland, USA: ICF.
https://www.dhsprogram.com/publications/publication-MR18-Methodological-Reports.cfm
WHO. 2011. Haemoglobin concentrations for the diagnosis of anaemia and assessment of severity
http://www.who.int/vmnis/indicators/haemoglobin/en/
Resources
DHS-7 Tabulation plan: Table 11.13.2
API Indicator IDs: AN_ANEM_M_ANY
(API link, STATcompiler link)

11.49
Nutritional Status
Percentage of children stunted, wasted, and underweight, and mean z-scores for stunting,
wasting and underweight.
Definition
1) Percentage of children under 5 years of age, by nutritional status:
a. Stunted
b. Wasted and overweight
c. Underweight and overweight for age
2) Mean z-score for height-for-age, weight-for-height, and weight-for-age.
Coverage:
Population base: Living children born 0-59 months before the survey (PR file)
Time period: Current status at time of survey
Numerators:
Stunting:
1) Severely stunted: Number of children whose height-for-age z-score is below minus 3 (-3.0)
standard deviations (SD) below the mean on the WHO Child Growth Standards (hc70 < -300)
2) Moderately or severely stunted: Number of children whose height-for-age z-score is below
minus 2 (-2.0) standard deviations (SD) below the mean on the WHO Child Growth Standards
(hc70 < -200)
3) Mean z-score for height-for-age: Sum of the z-scores of children with a non-flagged height for
age score (∑ hc70/100, if hc70 < 9990)
Wasting and overweight:
4) Severely wasted: Number of children whose weight-for-height z-score is below minus 3 (-3.0)
standard deviations (SD) below the mean on the WHO Child Growth Standards (hc72 < -300)
5) Moderately or severely wasted: Number of children whose weight-for-height z-score is below
minus 2 (-2.0) standard deviations (SD) below the mean on the WHO Child Growth Standards
(hc72 < -200)
6) Overweight: Number of children whose weight-for-height z-score is above plus 2 (+2.0) standard
deviations (SD) above the mean on the WHO Child Growth Standards (hc72 > 200 & hc72 <
9990)
7) Mean z-score for weight for height: Sum of the z-scores of children with a non-flagged weight
for height score (∑ hc72/100, if hc72 < 9990)
Underweight and overweight for age:
8) Severely underweight: Number of children whose weight-for-age z-score is below minus 3 (-3.0)
standard deviations (SD) below the mean on the WHO Child Growth Standards (hc71 < -300)
9) Moderately underweight: Number of children whose weight-for-age z-score is below minus 2
(-2.0) standard deviations (SD) below the mean on the WHO Child Growth Standards (hc71
< -200)

11.50
10) Overweight for age: Number of children whose weight-for-age z-score is above plus 2 (+2.0)
standard deviations (SD) above the mean on the WHO Child Growth Standards (hc71 > 200 &
hc71 < 9990)
11) Mean z-score for weight for age: Sum of the z-scores of children with a non-flagged weight for
age score (∑ hc71/100, if hc71 < 9990)
Denominators: Number of de facto living children between ages 0 and 59 months before the survey
(hv103 = 1 & hc1 in 0:59) who have:
1) Stunting: valid non-flagged height for age z-scores (hc70 < 9990)
2) Wasting and overweight: valid non-flagged weight for height z-scores (hc72 < 9990)
3) Underweight and overweight for age: valid non-flagged weight for age z-scores (hc71 < 9990)
Variables: PR file.
hv103
Slept last night
hc1
Child's age in months
hc70
Height/Age standard deviation (new WHO)
hc71
Weight/Age standard deviation (new WHO)
hc72
Weight/Height standard deviation (new WHO)
Calculation
The assignment of anthropometric z-scores based on the WHO Child Growth Standards is done through
a complicated interpolation function that takes into account sex, age (measured by difference in date of
birth and date of interview, both precise to day of month), height in centimeters, and weight in
kilograms (precise to 100 grams). As part of the creation of a recode file, variables with the z-scores are
calculated and included in that file. The z-scores are calculated using software based on the WHO
Anthro program and the macros for statistical packages at
http://www.who.int/childgrowth/software/en/.
In the process of assigning the z-scores, checks are made on their plausibility. Z-scores for height-for-age
and weight-for-age are assigned special values to children with incomplete date of birth (month or year
missing or “don’t know”) as the z-scores are sensitive to changes in age. Children with height-for-age z-
scores below -6 SD or above +6 SD, with weight-for-age z-scores below -6 SD or above +5 SD, or with
weight for height z-scores below -5 SD or above +5 SD are flagged as having invalid data.
The percentage of children stunted, wasted, and underweight are equal to the specific numerators
divided by the appropriate denominators and multiplied by 100.
The mean z-scores are equal to the numerator divided by the appropriate denominator.
Handling of Missing Values
Children who were not weighed and measured and children whose values for weight and height were
not recorded are excluded from both the denominators and the numerators. Children whose month or
year of birth are missing or unknown are flagged and excluded from both the denominators and the
numerators. Children whose day of birth is missing or unknown are assigned day 15. Children who are

11.51
flagged for out-of-range z-scores or invalid z-scores are excluded from both the denominator and the
numerators.
Notes and Considerations
Stunting, based on a child’s height and age, is a measure of chronic nutritional deficiency. Wasting,
based on a child’s weight and height, is a measure of acute nutritional deficiency. Underweight, based
on weight and age, is a composite measure of both acute and chronic statuses. Overweight, based on
weight and height, is a measure of excess weight than is optimally healthy.
The World Health Organization (WHO) released an international growth standard statistical distribution
in 2006, which describes the growth of children ages 0 to 59 months living in environments believed to
support optimal growth of children in six countries throughout the world, including the U.S. The
distribution shows how infants and young children grow under these conditions, rather than how they
grow in environments that may not support optimal growth. The WHO Child Growth Standards (WHO,
2006) have replaced the NCHS/CDC/WHO international reference standard as the standard for assessing
the nutritional status of children.
Due to natural variations in a well-nourished population, 2.2 percent of children will be between -2.0
and -2.99 SD below the mean, and 0.1 percent will be -3.0 or more SD below the mean. The extent of
malnutrition in a population should be taken by the extent the proportions moderate and severe exceed
these percentages that occur in a well-fed population of children.
Changes over Time
In phases of the DHS survey before DHS-IV, only children of interviewed women and who were under 5
years old (or the cutoff for the health section of the individual questionnaire) were weighed and
measured. In many surveys, only a subsample of these children were selected for anthropometry.
The later DHS surveys (DHS-V onwards) included height and weight measurements of all children born in
the 5 years preceding the survey and listed in the Household Questionnaire, irrespective of the interview
status of their mother.
The levels of stunting, wasting, and underweight since DHS-VI are calculated using the 2006 WHO Child
Growth Standards. In earlier survey the NCHS/CDC/WHO international reference standards was used
and results published in the earlier survey reports will differ from those using the newer standard. In
order to assess trends in nutritional status, the earlier DHS nutrition indicators should be re-calculated
using the 2006 WHO Child Growth Standards.
Prior to DHS-7 if any of the three sets of z-scores (height-for-age, weight-for-height, and weight-for-age)
was flagged for a child, all were considered flagged and excluded from the numerators and
denominators of the indicators. In DHS-7 this was changed so that there is a separate denominator for
indicators based on height-for-age, weight-for-height and weight-for-age.
All comparisons between surveys, either over time or between countries, should take into account the
possible differences in the defined population base and in the reference standard used.

11.52
References
WHO. 2006. The WHO Child Growth Standards
http://www.who.int/childgrowth/en/ and
http://www.who.int/childgrowth/publications/technical_report_pub/en/
Assaf, S., M.T. Kothari, and T.Pullum. 2015. An Assessment of the Quality of DHS Anthropometric Data. In
DHS Methodological Reports No. 16. Rockville, Maryland, USA: ICF International.
https://dhsprogram.com/publications/publication-mr16-methodological-reports.cfm
Black, R.E., et al. 2013. “Maternal and child undernutrition and overweight in low-income and middle-
income countries.” The Lancet 382(9890):427-451.
https://www.thelancet.com/journals/lancet/article/PIIS0140-6736(13)60937-X/fulltext
Corsi, D. J., J. M. Perkins, and S.V. Subramanian. 2017. “Child Anthropometry Data Quality from
Demographic and Health Surveys, Multiple Indicator Cluster Surveys, and National Nutrition Surveys in
the West Central Africa Region: Are We Comparing Apples and Oranges?” Glob Health Action
10(1):1328185. https://www.tandfonline.com/doi/full/10.1080/16549716.2017.1328185
Mei, Z., and L.M. Grummer-Strawn. "Standard deviation of anthropometric Z-scores as a data quality
assessment tool using the 2006 WHO growth standards: a cross country analysis." Bulletin of the World
Health Organization 85 (2007): 441-448.
http://www.who.int/bulletin/volumes/85/6/06-034421/en/
Roth, D.E., A. Krishna, M. Leung, J. Shi, D.G Bassani, A.J.D. Barros. 2017.
“Early childhood linear growth faltering in low-income and middle-income countries as a whole-
population condition: analysis of 179 Demographic and Health Surveys from 64 countries (1993–2015).”
The Lancet Global Health 5, no. 12 (2017): e1249-e1257
https://www.thelancet.com/journals/langlo/article/PIIS2214-109X(17)30418-7/fulltext
Stevens G.A., M.M. Finucane, C.J. Paciorek, S.R. Flaxman, R.A. White, A.J. Donner A.J., M. Ezzati;
Nutrition Impact Model Study Group (Child Growth). 2012. “Trends in mild, moderate, and severe
stunting and underweight, and progress towards MDG 1 in 141 developing countries: a systematic
analysis of population representative data.” Lancet. 380(9844): p824-34. doi: 10.1016/S0140-
6736(12)60647-3. https://www.thelancet.com/journals/lancet/article/PIIS0140-6736(12)60647-
3/fulltext
United Nations Department of Technical Co-operation for Development and Statistical Office. 1986. How
to weigh and measure children: Assessing the nutritional status of young children in household surveys.
United Nations, New York. https://www.popline.org/node/383898
WHO. 2017. Global Nutrition Monitoring Framework: Operational Guidance for Tracking Progress in
Meeting Targets for 2025. http://www.who.int/nutrition/publications/operational-guidance-GNMF-
indicators/en/

11.53
Resources
WHO Anthro program and macros. http://www.who.int/childgrowth/software/en/
DHS-7 Tabulation plan: Table 11.1
API Indicator IDs:
CN_NUTS_C_HA3, CN_NUTS_C_HA2, CN_NUTS_C_WH3, CN_NUTS_C_WH2, CN_NUTS_C_WHP,
CN_NUTS_C_WA3, CN_NUTS_C_WA2, CN_NUTS_C_WAP
(API link, STATcompiler link)
SDG Indicator 2.2.1: Prevalence of stunting among children under 5 years of age
SDG Indicator 2.2.2: Prevalence of malnutrition among children under 5 years of age, by type (wasting
and overweight)
GNMF Indicator 1: Prevalence of low height-for-age in children under five years of age
GNMF Indicator 4: Prevalence of weight-for-height >+2 SD in children under five years of age
GNMF Indicator 6: Prevalence of low weight-for-height in children under five years of age
WHO 100 Core Health Indicators: Children under 5 years who are stunted
WHO 100 Core Health Indicators: Children under 5 years who are wasted
WHO 100 Core Health Indicators: Children under 5 years who are overweight
MICS6 Indicator TC.44: Underweight prevalence
MICS6 Indicator TC.45: Stunting prevalence
MICS6 Indicator TC.46: Wasting prevalence
MICS6 Indicator TC.47: Overweight prevalence
11.54
Percentage of women by nutritional status
Definition
1) Percentage of women age 15-49 with height under 145 cm.
2) Percentage of non-pregnant, non-postpartum women age 15–49 by nutritional status based on
specific body mass index (BMI) levels.
3) Mean body mass index (BMI) for non-pregnant, non-postpartum women age 15–49.
Coverage:
Population base: All women age 15-49; Non-pregnant and non-postpartum women age 15–49
years at the time of the survey (IR file)
Time period: Current status at time of survey
Numerators:
1) Number of women age 15-49 with height below 145cm (v438 < 1450, if v438 in 1300:2200)
2) Number of non-pregnant, non-postpartum women age 15-49 with a body mass index (BMI) with
the following values:
a) Normal: 18.5 to 24.9 (v445 in 1850:2499)
b) Total thin: less than 18.5 (v445 in 1200:1849)
c) Mildly thin: 17.0 to 18.4 (v445 in 1700:1849)
d) Moderately and severely thin: less than 17.0 (v445 in 1200:1699)
e) Total overweight or obese (>=25.0) (v445 in 2500:6000)
f) Overweight: 25.0 to 29.9 (v445 in 2500:2999)
g) Obese: 30.0 or more (v445 in 3000:6000)
3) Mean BMI: Sum of BMI for non-pregnant, non-postpartum women age 15–49 who were
weighed and measured (∑ v445/100, if v445 in 1200:6000)
Denominator:
1) Number of women age 15–49 with a valid height measurement (v438 in 1300:2200)
2) Number of women age 15–49, excluding women who are pregnant or who gave birth in the 2
months preceding the date of the interview (v213 ≠ 1 and (v208 = 0 or b19_01 >= 2)), with a
valid BMI (v445 in 1200:6000)
3) Same as denominator 2
Variables: IR file.
v208
Births in last five years
v213
Currently pregnant
b19_01
Current age of child in months (months since birth for dead children) (01 is last birth)
v438
Respondent's height in centimeters
v445
Body Mass Index
v005
Women's individual sample weight
b19_01 exists in DHS-7 surveys. For older surveys use b19_01 = v008 - b3_01 to create its equivalent.
11.55
Calculation
The body mass index is calculated as weight in kilograms divided by the square of height in meters.
The percentages of women, by category, are equal to the category numerators divided by the
denominator and multiplied by 100.
In ever-married women samples, the data in the IR file are augmented with data from the PR file for
never-married women to provide nutritional status estimates for all women. In ever-married samples
(hv020 = 1), never-married women who are de facto residents and were weighed and measured (hv115
= 0 & hv103 = 1 & either ha3 in 1300:2200 or ha40 in 1200:6000 depending on the denominator) are
added to the denominator, and to the numerators if their height (ha3) was below 145 cm, and if their
BMI were in the appropriate categories (ha40). In ever-married samples, never-married women are
assumed to not be pregnant nor to have had a recent birth.
Added variables required for ever-married samples:
hv020
Ever-married sample
hv103
Slept last night
ha3
Woman's height in centimeters
ha40
Body Mass Index
hv005
Household sample weight
The mean BMI is equal to the numerator divided by the denominator.
Handling of Missing Values
Women who were not weighed and measured and women whose values for weight and height were not
recorded are excluded from both the denominator and the numerators. Women whose calculated BMI
is below 12.0 or above 60.0 are flagged as out of range and are excluded from both the denominator
and the numerators.
Notes and Considerations
BMI, also known as the Quetelet Index, is a measure of acute nutritional status. It is based on the
Fogarty Metropolitan Life tables of ideal weight for height.
These indicators could be presented based on the IR file or the PR file. Using the PR file would result in a
slightly larger sample size, but the IR file is chosen for consistency with other women’s indicators, and as
some of the women’s characteristics used in presenting the results are only available for women with
completed interviews.
Changes over Time
In phases of the DHS survey before DHS-IV, either only interviewed women or mothers of children under
5 years (or the cutoff for the health section of the individual questionnaire) were weighed and
measured. In some surveys, only a subsample of these women were selected for anthropometry. All
comparisons between surveys, either over time or between countries, should take into account the
possible differences in the defined population base. While pregnant women and women two months

11.56
postpartum are weighed and measured, they are excluded from the report tabulations because of
weight gain during pregnancy.
References
NCD Risk Factor Collaboration. 2017. “Worldwide Trends in Body-Mass Index, Underweight, Overweight,
and Obesity from 1975 to 2016: A Pooled Analysis of 2416 Population-Based Measurement Studies in
128.9 Million Children, Adolescents, and Adults. Lancet 390: 2627–42.
https://www.thelancet.com/journals/lancet/article/PIIS0140-6736(17)32129-3/fulltext
Nestel, P., and S. Rutstein 2002. “Defining nutritional status of women in developing countries.” Public
Health Nutrition, 5 (1): 17–27.
https://pdfs.semanticscholar.org/6e92/a38ce0272be6f6804b48a47fa7909d467de3.pdf
Metropolitan Life Insurance Company. 1942. “Ideal weights for women”. New York Statistical Bulletin,
23 (6).
James, W. P., T.A. Ferro-Luzzi, and J.C. Waterlow, 1988. “Definition of chronic energy deficiency in
adults: Report of a working party of the International Dietary Energy Consultative Group.” European
Journal of Clinical Nutrition, 42: 969–981.
https://www.researchgate.net/publication/20006752_Definition_of_chronic_energy_deficiency_in_adu
lts_Report_of_a_working_party_of_the_International_Dietary_Energy_Consultative_Group
WHO. 2017. Global Nutrition Monitoring Framework: Operational Guidance for Tracking Progress in
Meeting Targets for 2025. http://www.who.int/nutrition/publications/operational-guidance-GNMF-
indicators/en/
Resources
DHS-7 Tabulation plan: Table 11.12.1
API Indicator IDs:
AN_NUTS_W_SHT, AN_NUTS_W_NRM, AN_NUTS_W_THN, AN_NUTS_W_TH1, AN_NUTS_W_TH2,
AN_NUTS_W_OWT, AN_NUTS_W_OVW, AN_NUTS_W_OBS, AN_NUTS_W_BMI
(API link, STATcompiler link)
GNMF Indicator 10: Proportion of overweight and obese women 18+ years of age (body mass index ≥25
kg/m2)
11.57
Percentage of men by nutritional status
Definition
1) Percentage of men age 15–49 by nutritional status based on specific body mass index (BMI)
levels.
2) Mean body mass index (BMI) for men age 15–49.
Coverage:
Population base: All men age 15-49 (MR file, PR file)
Time period: Current status at time of survey
Numerators:
1) Number of men age 15-49 with a body mass index (BMI) with the following values:
a) Normal: 18.5 to 24.9 (hb40 in 1850:2499)
b) Total thin: less than 18.5 (hb40 in 1200:1849)
c) Mildly thin: 17.0 to 18.4 (hb40 in 1700:1849)
d) Moderately and severely thin: less than 17.0 (hb40 in 1200:1699)
e) Total overweight or obese (>= 25.0) (hb40 in 2500:6000)
f) Overweight: 25.0 to 29.9 (hb40 in 2500:2999)
g) Obese: 30.0 or more (hb40 in 3000:6000)
2) Mean BMI: Sum of BMI for men age 15–49 who were weighed and measured (∑ hb40/100, if
hb40 in 1200:6000)
Denominator: Number of men age 15–49 with a valid BMI (hb40 in 1200:6000)
Variables: MR file, PR file.
hv103
Slept last night
hb40
Body Mass Index
mv005
Men’s sample weight
Calculation
To calculate the nutritional status for men, it is first necessary to merge the anthropometric variables
from the household members recode (PR file) to the men’s recode (MR file) using the cluster, household
and line numbers (see Matching and Merging Datasets in Chapter 1).
The body mass index is calculated as weight in kilograms divided by the square of height in meters.
The percentages of men, by category, are equal to the category numerators divided by the denominator
and multiplied by 100.
The mean BMI is equal to the numerator divided by the denominator.
Handling of Missing Values
Men who were not weighed and measured and women whose values for weight and height were not
recorded are excluded from both the denominator and the numerators. Men whose calculated BMI is

11.58
below 12.0 or above 60.0 are flagged as out of range and are excluded from both the denominator and
the numerators.
Notes and Considerations
BMI, also known as the Quetelet Index, is a measure of acute nutritional status. It is based on the
Fogarty Metropolitan Life tables of ideal weight for height.
These indicators could be presented based on the MR file or the PR file. Using the PR file would result in
a slightly larger sample size, but the MR file is chosen for consistency with other men’s indicators, and as
some of the men’s characteristics used in presenting the results are only available for men with
completed interviews.
Changes over Time
In some surveys, only a subsample of men were selected for anthropometry. All comparisons between
surveys, either over time or between countries, should take into account the possible differences in the
defined population base.
References
See References for Percentage of women by nutritional status.
Resources
DHS-7 Tabulation plan: Table 11.12.2
API Indicator IDs:
AN_NUTS_M_NRM, AN_NUTS_M_THN, AN_NUTS_M_TH1, AN_NUTS_M_TH2, AN_NUTS_M_OWT,
AN_NUTS_M_OVW, AN_NUTS_M_OBS, AN_NUTS_M_BMI
(API link, STATcompiler link)

Guide to DHS Statistics 12.1 August 2018
Malaria
This chapter presents data that are useful for assessing the implementation of malaria control
strategies, including the availability and use of mosquito nets, the prophylactic and therapeutic use of
antimalarial drugs, and the collection of blood for diagnostic tests for children with fever.
Indicators are presented which provide information on the percentage of households possessing
mosquito nets by category (any nets or insecticide treated nets (ITNs)) and the percentages of
household members, of pregnant women, and of children who slept under a net the night before the
survey is provided. Indicators are also presented, for women who gave birth in the two years preceding
the survey, of the percentage who took SP/Fansidar during pregnancy by number of doses (two doses is
referred to as Intermittent Preventive Treatment for pregnancy (IPTp), and the percentage who
obtained IPTp as part of antenatal care. Additionally, among children under age five, indicators are
provided on the percentage of children who experienced an episode of fever in the two weeks
preceding the survey, whether they had blood taken from a finger or heel for testing at any time during
the fever, whether they were treated with antimalarial drugs, the specific drug(s) they received and the
timeliness with which they received drug treatment. Indicators for the percentage of children under age
five with hemoglobin levels less than 8.0 g/dl are given. Note that the cutoff value for malaria-related
anemia (8.0 g/dl) is different from the cutoff value used for severe anemia in the nutrition chapter (7.0
g/dl).
In surveys that collected specimens for malaria testing (primarily Malaria Indicator Surveys), indicators
of the prevalence of malaria in children are provided, based on both rapid diagnostic tests (RDT) and on
laboratory analysis.
Changes over Time
Insecticide-Treated Net
An insecticide-treated net (ITN) is a factory-treated net that does not require any further treatment.
Prior to 2018, this was known as a long-lasting insecticidal net (LLIN), and an insecticide-treated net
(ITN) was either (1) a factory-treated net that does not require any further treatment (LLIN) or (2) a net
that has been soaked with insecticide within the past 12 months.
The definition of an ITN used to include another category of “pre-treated” nets that would not require
treatment with insecticide 12 months after it was obtained. In 2018 the definition of ITN was changed
to only include what was previously known as a long-lasting insecticidal net (LLIN).
Bednets that require annual retreatment and the products used for retreatment are no longer
distributed. Therefore, factory-treated nets that do not require any further treatment are the only kind
of treated bednets available. Following guidance from the Roll Back Malaria Vector Working Group the
terminology ITN should be used for these nets.
References
Roll Back Malaria Monitoring and Evaluation Reference Group Survey and Indicator Task Force. 2018.
Household Survey Indicators for Malaria Control. (Forthcoming)

Guide to DHS Statistics 12.2 August 2018
Roll Back Malaria Monitoring and Evaluation Reference Group Survey and Indicator Task Force. 2013.
Household Survey Indicators for Malaria Control. https://data.unicef.org/resources/household-survey-
indicators-for-malaria-control-2013-edition/
Resources
DHS Malaria Topics page: https://www.dhsprogram.com/topics/Malaria.cfm

Guide to DHS Statistics 12.3 August 2018
Household Possession of Mosquito Nets
Percentage of households with at least one mosquito net, with at least one insecticide-
treated net (ITN), average number of mosquito nets, average number of ITNs, percentage
of households with at least one mosquito net for every two persons who stayed in the
household last night, and percentage of households with at least one ITN for every two
persons who stayed in the household last night
Definition
1) Percentage of households with at least one mosquito net.
2) Percentage of households with at least one insecticide-treated net (ITN).
3) Average number of mosquito nets per household.
4) Average number of insecticide-treated nets (ITNs) per household.
5) Percentage of households with at least one mosquito net for every 2 persons who stayed in the
household last night.
6) Percentage of households with at least one insecticide-treated net (ITN) for every 2 persons who
stayed in the household last night.
Coverage:
Population base: Surveyed households (HR file)
Time period: Current status at time of survey
Numerators:
1) Number of households surveyed with at least one mosquito net (treated or untreated) (hv227 =
1)
2) Number of households surveyed with at least one ITN (any of hml10_1 – hml10_7 = 1)
3) Sum of the number of mosquito nets (hml1)
4) Sum of the number of ITNs (sum of nets with hml10_1 – hm10_7 = 1)
5) Number of households surveyed with at least one mosquito net (treated or untreated) for every
2 persons who stayed in the household the night prior to the survey, in households with at least
one de facto person who stayed in the household the night prior to the survey (hv013 > 0 &
hml1/hv013 >= 0.5)
6) Number of households surveyed with at least one ITN for every 2 persons who stayed in the
household the night prior to the survey, in households with at least one de facto person who
stayed in the household the night prior to the survey (hv013 > 0 & (sum of hml10_1 – hml10_7 =
1)/hv013 >= 0.5)
Denominator:
1) Numerators 1-4: Number of surveyed households
2) Numerators 5-6: Number of households with at least one de facto person who stayed in the
household the night prior to the survey (hv013 > 0)
Variables: HR file.
hv013
Number of de facto members
hv227
Has mosquito bed net for sleeping

Guide to DHS Statistics 12.4 August 2018
hml1
Number of mosquito bed nets
hml10_1 – _7
Insecticide-Treated Net (ITN)
hv005
Household sample weight
Calculation
Percentage – Numerator divided by denominator multiplied by 100.
Average – Numerator divided by denominator.
Handling of Missing Values
Households with missing information on ownership of nets are considered not to own nets. For the
average number of mosquito nets, missing information on the total number of nets is counted as one
net if the household reports at least one net (hv227 = 1). Nets with missing information on type are
considered not to be ITNs.
Notes and Considerations
May be biased by the seasonality of the survey data collection.
Changes over Time
An insecticide-treated net (ITN) is a factory-treated net that does not require any further treatment.
Prior to 2018, this was known as a long-lasting insecticidal net (LLIN).
References
Burgert, C. R., S.E.K. Bradley, E. Eckert, and F. Arnold. 2012. Improving Estimates of Insecticide-Treated
Mosquito Net Coverage from Household Surveys: Using Geographic Coordinates to Account for
Endemicity and Seasonality. DHS Analytical Studies No. 32. Calverton, Maryland, USA: ICF International.
https://dhsprogram.com/publications/publication-AS32-Analytical-Studies.cfm
Fullman, N., R. Burstein, S. S. Lim, C. Medlin, and E. Gakidou. 2013. "Nets, spray or both? The
effectiveness of insecticide-treated nets and indoor residual spraying in reducing malaria morbidity and
child mortality in sub-Saharan Africa." Malaria journal 12(1): 62.
https://malariajournal.biomedcentral.com/articles/10.1186/1475-2875-12-62
Kilian, A., H. Koenker, E. Baba, E.O. Onyefunafoa, R.A. Selby, K. Lokko, and M. Lynch. 2013. "Universal
coverage with insecticide-treated nets–applying the revised indicators for ownership and use to the
Nigeria 2010 malaria indicator survey data." Malaria journal 12(1): 314.
https://www.ncbi.nlm.nih.gov/pubmed/24020332
Lim, S. S., N. Fullman, A. Stokes, N. Ravishankar, F. Masiye, C. JL Murray, and E. Gakidou. 2011. "Net
benefits: a multicountry analysis of observational data examining associations between insecticide-
treated mosquito nets and health outcomes." PLoS medicine 8(9): e1001091
http://www.plosmedicine.org/article/info%3Adoi%2F10.1371%2Fjournal.pmed.1001091

Guide to DHS Statistics 12.5 August 2018
Taylor, C., L. Florey, and Y. Ye. 2017. "Equity trends in ownership of insecticide-treated nets in 19 sub-
Saharan African countries." Bulletin of the World Health Organization 95(5): 322.
http://www.who.int/bulletin/volumes/95/5/16-172924/en/
Wanzira, H., H. Katamba, and D. Rubahika. 2016. "Use of long-lasting insecticide-treated bed nets in a
population with universal coverage following a mass distribution campaign in Uganda." Malaria journal
15(1): 311. https://malariajournal.biomedcentral.com/articles/10.1186/s12936-016-1360-0
Resources
DHS-7 Tabulation plan: Table 12.1
API Indicator IDs:
ML_NETP_H_MOS, ML_NETP_H_ITN, ML_NETP_H_LLN, ML_NETP_H_MNM, ML_NETP_H_MNI,
ML_NETP_H_MNL, ML_NETP_H_MS2, ML_NETP_H_IT2, ML_NETP_H_LL2
(API link, STATcompiler link)
Household Survey Indicators for Malaria Control Indicator 1: Proportion of households with at least one
ITN
Household Survey Indicators for Malaria Control Indicator 2: Proportion of households with at least one
ITN for every two people
MICS6 Indicator TC.21a: Household availability of insecticide treated nets (ITNs) – at least one ITN
MICS6 Indicator TC.21b: Household availability of insecticide treated nets (ITNs) – at least one ITN for
every two people

Guide to DHS Statistics 12.6 August 2018
Source of Mosquito Nets
Percent distribution of mosquito nets by source of net
Definition
Percent distribution of mosquito nets by source of net.
Coverage:
Population base: Mosquito nets owned by surveyed households (HR file)
Time period: Current status at time of survey
Numerator: Number of mosquito nets (treated or untreated) from each source owned by surveyed
households (hml22_1 – hml22_7 = 1,2,3 or hml23_1 – hml23_7 = 11-19,21-29,31-35,96,98-99)
Denominator: Number of mosquito nets owned by surveyed households (hmlidx1 – hmlidx_7 > 0)
Variables: HR file.
hmlidx_1 – _7
Mosquito Bed Net Designation Number
hml22_1 – _7
Obtained net from campaign, antenatal or immunization visit
hml23_1 – _7
Place where net was obtained
hv005
Household sample weight
Calculation
Numerator divided by the denominator multiplied by 100.
Handling of Missing Values
Nets with missing information on source are included as “Don’t know.”
Notes and Considerations
Data are stratified by type of net: ITN and other. See Changes over Time for this chapter details about
the term ITN. An insecticide-treated net (ITN) is a factory-treated net that does not require any further
treatment. Prior to 2018, this was known as a long-lasting insecticidal net (LLIN). May be biased by the
seasonality of the survey data collection.
Changes over Time
An insecticide-treated net (ITN) is a factory-treated net that does not require any further treatment.
Prior to 2018, this was known as a long-lasting insecticidal net (LLIN). See Changes over Time for this
chapter.

Guide to DHS Statistics 12.7 August 2018
References
Koenker, H., and J. O. Yukich. 2017. "Effect of user preferences on ITN use: a review of literature and
data." Malaria journal 16(1): 233. https://malariajournal.biomedcentral.com/articles/10.1186/s12936-
017-1879-8
Njau, J. D., R. Stephenson, M. Menon, S. P. Kachur, and D. A. McFarland. 2013. "Exploring the impact of
targeted distribution of free bed nets on households bed net ownership, socio-economic disparities and
childhood malaria infection rates: analysis of national malaria survey data from three sub-Saharan Africa
countries." Malaria journal 12(1): 245.
https://malariajournal.biomedcentral.com/articles/10.1186/1475-2875-12-245
Resources
DHS-7 Tabulation plan: Table 12.2

Guide to DHS Statistics 12.8 August 2018
Access to an Insecticide-Treated Net (ITN)
Percent distribution of the household population by number of ITNs the household owns
Definition
Percent distribution of the de facto household population by number of insecticide-treated nets (ITNs)
the household owns.
Coverage:
Population base: De facto household members (PR file, HR file)
Time period: Night before the survey
Numerator: Distribution of the number of de facto persons (hv103 = 1) in the household by the number
of ITNs the household owns (sum of hml10_1 – hml10_7 = 1)
Denominator: Number of persons who stayed in the household the night before the survey (hv103 = 1)
Variables: HR file, PR file.
hhid
Household identification
hml10_1 – _7
Insecticide-Treated Net (ITN)
hv103
Slept last night
hv005
Household sample weight
Calculation
This indicator uses the net roster from the HR file to produce summary variables applied to the
household members. First merge hml10_1 – hml10_7 from the HR file to the PR file using hhid as the
variable for matching before calculating the indicator (see Matching and Merging Datasets in Chapter
1).
Numerators divided by denominator multiplied by 100.
Handling of Missing Values
Households with missing information on ownership of nets are considered not to own nets. Nets with
missing information on type are considered not to be ITNs.
Notes and Considerations
May be biased by the seasonality of the survey data collection.
Changes over Time
Guide to DHS Statistics 12.9 August 2018
An insecticide-treated net (ITN) is a factory-treated net that does not require any further treatment.
Prior to 2018, this was known as a long-lasting insecticidal net (LLIN). See Changes over Time for this
chapter.
References
See References for this chapter.
Resources
DHS-7 Tabulation plan: Table 12.3
Guide to DHS Statistics 12.10 August 2018
Percentage of the population with access to an ITN
Definition
Percentage of the de facto household population with access to an ITN in the household, defined as the
proportion of the de facto household population who slept under an ITN if each ITN in the household
were used by up to two people.
Coverage:
Population base: De facto household members (PR file, HR file)
Time period: Night before the survey
Numerator: Number of de facto persons (hv103 = 1) who could sleep under an ITN if each ITN in the
household is used by up to 2 people, calculated for each household as the minimum of (1) number of de
facto persons in the household (hv013), and (2) twice the number of ITNs per household (2 * sum of
hml10_1 – hml10_7 = 1)
Denominator: Number of persons who stayed in the household the night before the survey (hv103 = 1)
Variables: HR file, PR file.
hhid
Household identification
hml10_1 – _7
Insecticide-Treated Net (ITN)
hv013
Number of de facto members
hv103
Slept last night
hv005
Household sample weight
Calculation
This indicator uses the net roster from the HR file to produce summary variables applied to the
household members. First merge hml10_1 – hml10_7 from the HR file to the PR file using hhid as the
variable for matching before calculating the indicator (see Matching and Merging Datasets in Chapter
1).
ITN access is calculated by dividing the sum of all potential ITN users in the sample by the total number
of individuals who spent the previous night in surveyed households.
Numerator: Sum the total number of ITNs in the household (sum of hml10_1 – hml10_7 = 1). Calculate
an intermediate variable which is “potential users” calculated by multiplying the number of ITNs in each
household by 2. In households which have more than one ITN for every 2 people, the product of this
calculation will be greater than the number of individuals who spent the previous night. In this case, the
“potential users” variable in that household should be modified to reflect the number of individuals who
spent the previous night in the household because the number of potential users in a household cannot
exceed the number of individuals who spent the previous night in that household.
For example, in a household with 10 people and 4 ITNs, there are eight potential users; however, in a
household with 5 people and 4 ITNs, there are 5 potential users even though the number of ITNs
available could cover more than 5 people.

Guide to DHS Statistics 12.11 August 2018
Denominator: Number of persons who stayed in the household the night before the survey (hv103 = 1).
Handling of Missing Values
Households with missing information on ownership of nets are considered not to own nets. Nets with
missing information on type are considered not to be ITNs.
Notes and Considerations
This indicator is based on the assumption that 2 people can sleep under one ITN. For example, a
household with 6 residents will require 3 ITNs. It excludes surplus ITNs in households which have more
than one ITN for every 2 people; household-level access is limited to 100%.
May be biased by the seasonality of the survey data collection.
Stata code useful for calculating this indicator can be found in the Household Survey Indicators for
Malaria Control manual.
Changes over Time
An insecticide-treated net (ITN) is a factory-treated net that does not require any further treatment.
Prior to 2018, this was known as a long-lasting insecticidal net (LLIN). See Changes over Time for this
chapter.
References
Koenker, H, E. Ricotta, B. Olapeju. 2018. Insecticide-Treated Nets (ITN) Access and Use Report. Baltimore,
MD. PMI | VectorWorks Project, Johns Hopkins Center for Communication Programs.
https://www.vector-works.org/resources/itn-access-and-use/
Kilian, A, H. Koenker, and L. Paintain. 2013. "Estimating population access to insecticide-treated nets
from administrative data: correction factor is needed." Malaria journal 12(1): 259.
https://malariajournal.biomedcentral.com/articles/10.1186/1475-2875-12-259
Koenker, H and A. Kilian. 2014. "Recalculating the net use gap: a multi-country comparison of ITN use
versus ITN access." PLoS One 9(5): e97496.
http://journals.plos.org/plosone/article?id=10.1371/journal.pone.0097496
Resources
DHS-7 Tabulation plan: Tables 12.3 and 12.4
DHS Malaria Topics page: https://www.dhsprogram.com/topics/Malaria.cfm

Guide to DHS Statistics 12.12 August 2018
DHS Indicator Snapshot: Insecticide Treated Net Access:
https://www.youtube.com/watch?v=YfTXcc13GOI
API Indicator IDs: ML_ITNA_P_ACC
(API link, STATcompiler link)
Household Survey Indicators for Malaria Control Indicator 3: Proportion of population with access to an
ITN in their household

Guide to DHS Statistics 12.13 August 2018
Use of Mosquito Nets by Persons in the Household
Percentage of the household population who slept the night before the survey under a
mosquito net, under an insecticide-treated net (ITN), and among the population in
households with at least one ITN, the percentage who slept under an ITN the night before
the survey
Definition
1) Percentage of the de facto household population who slept the night before the survey under a
mosquito net (treated or untreated).
2) Percentage of the de facto household population who slept the night before the survey under
an insecticide-treated net (ITN).
3) Among the de facto household population in households with at least one ITN, the percentage
who slept under an ITN the night before the survey.
Coverage:
Population base: De facto household members (PR file, HR file)
Time period: Night before the survey
Numerators:
1) Number of de facto persons who reported sleeping under any mosquito net the night before the
survey (hv103 = 1 & hml12 in 1:3)
2) Number of de facto persons who reported sleeping under an ITN the night before the survey
(hv103 = 1 & hml12 in 1:2)
3) Number of de facto persons in households with at least one ITN who reported sleeping under an
ITN the night before the survey (hv103 = 1 & hml12 in 1:2 & any of hml10_1 – hml10_7 = 1)
Denominators:
1) Number of persons in the de facto household population (hv103 = 1)
2) Number of persons in the de facto household population (hv103 = 1)
3) Number of persons in the de facto household population in households owning at least one ITN
(hv103 = 1 & any of hml10_1 – hml10_7 = 1)
Variables: HR file, PR file.
hhid
Household identification
hv103
Slept last night
hml10_1 – _7
Insecticide-Treated Net (ITN)
hv005
Household sample weight
Calculation
This indicator uses the net roster from the HR file to produce summary variables applied to the
household members. First merge hml10_1 – hml10_7 from the HR file to the PR file using hhid as the
variable for matching before calculating the indicator (see Matching and Merging Datasets in Chapter
1).

Guide to DHS Statistics 12.14 August 2018
Numerator divided by the denominator multiplied by 100.
Handling of Missing Values
Households with missing information on ownership of nets are considered not to own nets. Nets with
missing information on type are considered not to be ITNs.
Notes and Considerations
May be biased by the seasonality of the survey data collection.
Changes over Time
An insecticide-treated net (ITN) is a factory-treated net that does not require any further treatment.
Prior to 2018, this was known as a long-lasting insecticidal net (LLIN). See Changes over Time for this
chapter.
References
Jima, D., A. Getachew, H. Bilak, R.W. Steketee, P.M. Emerson, P.M. Graves, T. Gebre, R. Reithinger, and J.
Hwang. 2010. "Malaria indicator survey 2007, Ethiopia: coverage and use of major malaria prevention
and control interventions." Malaria journal 9(1): 58.
https://malariajournal.biomedcentral.com/articles/10.1186/1475-2875-9-58
Samadoulougou, S., M. Pearcy, Y. Yé, and F. Kirakoya-Samadoulougou. 2017. "Progress in coverage of
bed net ownership and use in Burkina Faso 2003–2014: evidence from population-based surveys."
Malaria journal 16(1): 302. https://link.springer.com/article/10.1186/s12936-017-1946-1
Resources
DHS-7 Tabulation plan: Table 12.5
API Indicator IDs: ML_NETU_P_ANY, ML_NETU_P_ITN, ML_NETU_P_LLN, ML_NETU_P_IT1
(API link, STATcompiler link)
Household Survey Indicators for Malaria Control Indicator 4: Proportion of population that slept under
an ITN the previous night
WHO 100 Core Health Indicators: Use of insecticide treated nets (ITNs)
MICS6 Indicator TC.22: Population that slept under an ITN

Guide to DHS Statistics 12.15 August 2018
Use of Existing ITNs
Percentage of insecticide-treated nets (ITNs) used the night before the survey
Definition
Percentage of the insecticide-treated nets (ITNs) that were used by anyone the night before the survey.
Coverage
Population base: Total number of ITNs in all households (HR file)
Time period: The night before the survey
Numerator: Number of ITNs in surveyed households that were used by anyone the night prior to the
survey (sum of hml10_i = 1 & hml21_i = 1 where i = 1 –7)
Denominator: Number of ITNs in surveyed households (sum of hml10_1 – hml10_7 = 1)
Variables: HR file.
hml10_1 – _7
Insecticide-Treated Net (ITN)
hml21_1 – _7
Someone slept under this net last night
hv005
Household sample weight
Calculation
Numerator divided by denominator multiplied by 100.
Handling of Missing Values
Households with missing information on ownership of nets are considered not to own nets. Nets with
missing information on type are considered not to be ITNs.
Notes and Considerations
May be biased by the seasonality of the survey data collection.
Changes over Time
An insecticide-treated net (ITN) is a factory-treated net that does not require any further treatment.
Prior to 2018, this was known as a long-lasting insecticidal net (LLIN). See Changes over Time for this
chapter.
References
Koenker, H., and J.O. Yukich. 2017. "Effect of user preferences on ITN use: a review of literature and
data." Malaria journal 16(1): 233. https://malariajournal.biomedcentral.com/articles/10.1186/s12936-
017-1879-8


Guide to DHS Statistics 12.17 August 2018
Use of Mosquito Nets by Children
Percentage of children under age 5 who slept the night before the survey under a
mosquito net, under an insecticide treated net (ITN), and among children under age 5 in
households with at least one ITN, the percentage who slept under an ITN the night before
the survey
Definition
1) Percentage of children under age 5 who slept the night before the survey under a mosquito net
(treated or untreated).
2) Percentage of children under age 5 who slept the night before the survey under an insecticide
treated net (ITN).
3) Among children under age 5 in households with at least one ITN, the percentage who slept
under an ITN the night before the survey.
Coverage:
Population base: Children under age 5 who slept in the household the night before the survey
(PR file, HR file)
Time period: The night before the survey
Numerators:
1) Number of de facto children under age 5 who reported sleeping under any mosquito net the
night before the survey (hv103 = 1 & hml16 in 0:4 & hml12 in 1:3)
2) Number of de facto children under age 5 who reported sleeping under an ITN the night before
the survey (hv103 = 1 & hml16 in 0:4 & hml12 in 1:2)
3) Number of de facto children under age 5 in households with at least one ITN who reported
sleeping under an ITN the night before the survey (hv103 = 1 & hml16 in 0:4 & hml12 in 1:2 &
any of hml10_1 – hml10_7 = 1) > 0)
Denominators:
1) Number of children under age 5 in the de facto household population (hv103 = 1 & hml16 in 0:4)
2) Same as 1
3) Number of children under age 5 in the de facto household population in households owning at
least one ITN (hv103 = 1 & hml16 in 0:4 & sum of (hml10_1 – hml10_7 = 1) > 0)
Variables: HR file, PR file.
hhid
Household identification
hv103
Slept last night
hml10_1 – _7
Insecticide-Treated Net (ITN)
hml12
Type of Mosquito Bed Net(s) person slept under last night
hml16
Corrected age from individual file
hv005
Household sample weight
Calculation

Guide to DHS Statistics 12.18 August 2018
Indicator 3 uses the net roster from the HR file to produce summary variables applied to the household
members. First merge hml10_1 – hml10_7 from the HR file to the PR file using hhid as the variable for
matching before calculating the indicator (see Matching and Merging Datasets in Chapter 1).
Numerator divided by denominator multiplied by 100.
Handling of Missing Values
Households with missing information on ownership of nets are considered not to own nets. Nets with
missing information on type are considered not to be ITNs.
Notes and Considerations
May be biased by the seasonality of the survey data collection.
Changes over Time
An insecticide-treated net (ITN) is a factory-treated net that does not require any further treatment.
Prior to 2018, this was known as a long-lasting insecticidal net (LLIN). See Changes over Time for this
chapter.
References
Boulay, M., M. Lynch, and H. Koenker. 2014. "Comparing two approaches for estimating the causal
effect of behaviour-change communication messages promoting insecticide-treated bed nets: an
analysis of the 2010 Zambia malaria indicator survey." Malaria journal 13(1): 342.
https://malariajournal.biomedcentral.com/articles/10.1186/1475-2875-13-342
Resources
DHS-7 Tabulation plan: Table 12.7
API Indicator IDs: ML_NETC_C_ANY, ML_NETC_C_ITN, ML_NETC_C_LLN, ML_NETC_C_IT1
(API link, STATcompiler link)
Household Survey Indicators for Malaria Control Indicator 5: Proportion of children under five years old
who slept under an ITN the previous night
MICS6 Indicator TC.23: Children under age 5 who slept under an ITN

Guide to DHS Statistics 12.19 August 2018
Use of Mosquito Nets by Pregnant Women
Percentage of pregnant women who slept the night before the survey under a mosquito
net, who slept the night before the survey under an insecticide-treated net (ITN), and
among pregnant women age 15-49 in households with at least one ITN, the percentage
who slept under an ITN the night before the survey
Definition
1) Percentage of pregnant women age 15-49 who slept the night before the survey under a
mosquito net (treated or untreated).
2) Percentage of pregnant women age 15-49 who slept the night before the survey under an
insecticide-treated net (ITN).
3) Among pregnant women age 15-49 in households with at least one ITN, the percentage who
slept under an ITN the night before the survey.
Coverage:
Population base: Pregnant women (PR file, HR file)
Time period: The night before the survey
Numerators:
1) Number of pregnant women age 15-49 who reported sleeping under any mosquito net the night
before the survey (hv103 = 1 & hv104 = 2 & hml18 = 1 & hml16 in 15:49 & hml12 in 1:3)
2) Number of pregnant women age 15-49 who reported sleeping under an ITN the night before the
survey (hv103 = 1 & hv104 = 2 & hml18 = 1 & hml16 in 15:49 & hml12 in 1:2)
3) Number of pregnant women age 15-49 in households with at least one ITN who reported
sleeping under an ITN the night before the survey (hv103 = 1 & hv104 = 2 & hml18 = 1 & hml16
in 15:49 & & hml12 in 1:2 & any of hml10_1 – hml10_7 = 1)
Denominators:
1) Number of pregnant women age 15-49 in the de facto household population (hv103 = 1 & hv104
= 2 & hml18 = 1 & hml16 in 15:49)
2) Same as 1
3) Number of pregnant women age 15-49 in the de facto household population in households
owning at least one ITN (hv103 = 1 & hv104 = 2 & hml18 = 1 & hml16 in 15:49 & any of hml10_1
– hml10_7 = 1)
Variables: HR file, PR file.
hhid
Household identification
hv103
Slept last night
hml10_1 – _7
Insecticide-Treated Net (ITN)
hml12
Type of Mosquito Bed Net(s) person slept under last night
hml16
Corrected age from Individual file
hml18
Pregnancy status from Individual file
hv005
Household sample weight

Guide to DHS Statistics 12.20 August 2018
Calculation
These indicators use the net roster from the HR file to produce summary variables applied to the
pregnant women. First merge hml10_1 – hml10_7 from the HR file to the PR file using hhid as the
variable for matching before calculating the indicator (see Matching and Merging Datasets in Chapter
1).
Numerator divided by the denominator multiplied by 100.
Handling of Missing Values
Households with missing information on ownership of nets are considered not to own nets. Nets with
missing information on type are considered not to be ITNs.
Notes and Considerations
May be biased by the seasonality of the survey data collection.
For women with completed individual interview pregnancy status is taken from the woman’s individual
questionnaire, otherwise it is taken from the equivalent question in the household questionnaire. Also
note that for Malaria Indicator Surveys, pregnancy status is not included in the household questionnaire.
Changes over Time
An insecticide-treated net (ITN) is a factory-treated net that does not require any further treatment.
Prior to 2018, this was known as a long-lasting insecticidal net (LLIN). See Changes over Time for this
chapter.
References
Eisele, T.P., D. A. Larsen, P.A. Anglewicz, J. Keating, J. Yukich, A. Bennett, P. Hutchinson, and R.W.
Steketee. 2012. "Malaria prevention in pregnancy, birthweight, and neonatal mortality: a meta-analysis
of 32 national cross-sectional datasets in Africa." The Lancet infectious diseases 12(12): 942-949.
https://www.ncbi.nlm.nih.gov/pubmed/22995852
Ricotta, E., H. Koenker, A. Kilian, and M. Lynch. 2014. "Are pregnant women prioritized for bed nets? An
assessment using survey data from 10 African countries." Global Health: Science and Practice 2(2): 165-
172. http://www.ghspjournal.org/content/2/2/165
van Eijk, A.J., J. Hill, V.A. Alegana, V. Kirui, P. W. Gething, F.O. ter Kuile, and R. W. Snow. 2011. "Coverage
of malaria protection in pregnant women in sub-Saharan Africa: a synthesis and analysis of national
survey data." The Lancet infectious diseases 11(3): 190-207.
https://www.ncbi.nlm.nih.gov/pmc/articles/PMC3119932/
Resources

Guide to DHS Statistics 12.21 August 2018
DHS-7 Tabulation plan: Table 12.8
API Indicator IDs:
ML_NETW_W_ANY, ML_NETW_W_ITN, ML_NETW_W_LLN, ML_NETW_W_IT1
(API link, STATcompiler link)
Household Survey Indicators for Malaria Control Indicator 6: Proportion of pregnant women who slept
under an ITN the previous night
MICS6 Indicator TC.24: Pregnant women who slept under an ITN

Guide to DHS Statistics 12.22 August 2018
Use of Intermittent Preventive Treatment (IPTp) by Women during Pregnancy
Percentage of women who, during the pregnancy that resulted in the last live birth,
received one or more doses of SP/Fansidar, received two or more doses of SP/Fansidar,
and who received three or more doses of SP/Fansidar
Definition
1) Percentage of women age 15-49 with a live birth in the 2 years preceding the survey who, during
the pregnancy that resulted in the last live birth, received one or more doses of SP/Fansidar.
2) Percentage of women age 15-49 with a live birth in the 2 years preceding the survey who, during
the pregnancy that resulted in the last live birth, received two or more doses of SP/Fansidar.
3) Percentage of women age 15-49 with a live birth in the 2 years preceding the survey who, during
the pregnancy that resulted in the last live birth, received three or more doses of SP/Fansidar.
Coverage:
Population base: Women age 15-49 who had a live birth in the 2 years preceding the survey (IR
file)
Time period: Two years preceding the survey
Numerators:
1) Number of women who had a live birth in the 2 years preceding the interview who received one
or more doses of SP/Fansidar, in the 2 years preceding the interview (m49a_1)
2) Number of women who had a live birth in the 2 years preceding the interview who received two
or more doses of SP/Fansidar, in the 2 years preceding the interview (m49a_1 & ml1_1 in 2:97)
3) Number of women who had a live birth in the 2 years preceding the interview who received
three or more doses of SP/Fansidar, in the 2 years preceding the interview (m49a_1 & ml1_1 in
3:97)
Denominator: Number of women who had a live birth in the 2 years preceding the interview (b19_01 <
24)
Variables: IR file.
b19_01
Current age of child in months
m49a_1
During pregnancy took: SP/Fansidar for malaria
ml1_1
Number of times took Fansidar during pregnancy
v005
Women’s individual sample weight
Calculation
Numerators divided by denominator multiplied by 100.
Handling of Missing Values
“Don’t know” and missing values for receiving any SP/Fansidar, and numbers of doses of SP/Fansidar
received are treated as “no” responses in calculating the indicators.

Guide to DHS Statistics 12.23 August 2018
Changes over Time
This indicator has recently changed to remove the specification that at least one of the SP doses was
received during an ANC visit (ml2_1=1). The source of the SP doses is still of interest and the data are
collected in the survey (ml2_1).
References
Chikwasha, V., I. Phiri, P. Chimberengwa, D. Bangure, and S. Rusakaniko. 2014. Predictors of IPTp uptake
among pregnant women in the 2010–2011 Zimbabwe demographic and health survey. No. 112. DHS
working papers. https://dhsprogram.com/publications/publication-WP112-Working-Papers.cfm
Florey, L. 2013. Preventing malaria during pregnancy in sub-Saharan Africa: Determinants of effective
IPTp delivery. DHS Analytical Studies No. 39. Calverton, Maryland, USA: ICF International.
https://dhsprogram.com/publications/publication-as39-analytical-studies.cfm
Resources
DHS-7 Tabulation plan: Table 12.9
API Indicator IDs:
ML_IPTP_W_SPF, ML_IPTP_W_2SP, ML_IPTP_W_3SP, ML_IPTP_W_SPA, ML_IPTP_W_2SA, ML_IPTP_W_3SA
(API link, STATcompiler link)
Household Survey Indicators for Malaria Control Indicator 8: Proportion of women who received three
or more doses of IPTp for malaria during their last pregnancy
WHO 100 Core Health Indicators: Intermittent preventive treatment for malaria during pregnancy (IPTp)
MICS6 Indicator TC.25: Intermittent preventive treatment for malaria during pregnancy

Guide to DHS Statistics 12.24 August 2018
Prevalence, Diagnosis, and Prompt Treatment of Children with Fever
Percentage of children with fever in the 2 weeks preceding the survey; and among children
with fever, percentage for whom advice or treatment was sought, percentage for whom
advice or treatment was sought the same or next day following the onset of fever, and
percentage who had blood taken from a finger or heel for testing
Definition
1) Percentage of children under age 5 years with fever in the 2 weeks preceding the survey.
2) Among children under age 5 years with fever in the 2 weeks preceding the survey, percentage
for whom advice or treatment was sought.
3) Among children under age 5 years with fever in the 2 weeks preceding the survey, percentage
for whom advice or treatment was sought the same or next day following the onset of fever.
4) Percentage of children under age 5 years with fever in the 2 weeks preceding the survey who
had blood taken from a finger or heel for testing.
Coverage:
Population base: Living children under age 5 years (KR file)
Time period: Two weeks preceding the interview
Numerators:
1) Number of living children under age 5 years with a fever at any time during the 2 weeks
preceding the interview (b5 = 1 & h22 = 1)
2) Number of living children under age 5 years with a fever at any time during the 2 weeks
preceding the interview for whom advice or treatment was sought (b5 = 1 & h22 = 1 & any of
h32a – x = 1 except traditional practitioner (usually h32t))
3) Number of living children under age 5 years with a fever at any time during the 2 weeks
preceding the interview for whom advice or treatment was sought the same day or next day
following the onset of fever (b5 = 1 & h22 = 1 & any of h32a – x = 1 excluding advice or
treatment from a traditional practitioner (usually h32t) & h46b in 0,1)
4) Number of living children under age 5 years with a fever at any time during the 2 weeks
preceding the interview who had blood taken from a finger or heel for testing (b5 = 1 & h22 = 1
& h47 = 1)
Denominators:
1) Numerator 1: Number of living children under age 5 years (b5=1 & b19 < 60).
2) Numerators 2, 3 and 4: Number of living children under age 5 years with a fever at any time
during the 2 weeks preceding the interview (b5 = 1 & b19 < 60 & h22 = 1).
Variables: KR file.
b5
Child is alive
b19
Current age of child in months
h22
Had fever in last two weeks
h32a
Fever/cough: government hospital
h32b
Fever/cough: CS public sector
Guide to DHS Statistics 12.25 August 2018
h32c
Fever/cough: CS public sector
h32d
Fever/cough: CS public sector
h32e
Fever/cough: CS public sector
h32f
Fever/cough: CS public sector
h32g
Fever/cough: CS public sector
h32h
Fever/cough: CS public sector
h32i
Fever/cough: CS public sector
h32j
Fever/cough: private hospital/clinic
h32k
Fever/cough: private pharmacy
h32l
Fever/cough: private doctor
h32m
Fever/cough: CS private medical
h32n
Fever/cough: CS private medical
h32o
Fever/cough: CS private medical
h32p
Fever/cough: CS private medical
h32q
Fever/cough: CS private medical
h32r
Fever/cough: CS private medical
h32s
Fever/cough: CS other sector
h32t
Fever/cough: CS other sector
h32u
Fever/cough: CS other sector
h32v
Fever/cough: CS other sector
h32w
Fever/cough: CS other sector
h32x
Fever/cough: other
h46b
Number of days after fever began sought advice or treatment
h47
Blood taken from child's finger/heel for testing
v005
Women’s individual sample weight
Calculation
Numerator divided by denominator multiplied by 100.
Handling of Missing Values
Missing data or “don’t know” responses on the question on fever are excluded from numerator 1, and
from numerators and denominators 2, 3 & 4, assuming no illness.
Missing data or “don’t know” responses for whether sought advice or treatment and who from are
excluded from numerators 2 & 3, assuming no treatment sought from a health facility or provider.
Missing data or “don’t know” responses for whether blood was taken from the child’s finger or heel are
excluded from numerator 4, assuming no blood was taken.
Notes and Considerations
As fever is an important symptom of malaria, this indicator provides a useful measure of the proportion
of children under age 5 years who might require diagnosis or treatment for malaria. The number of
children under age 5 years with recent fever is the denominator for several care seeking indicators. The
limitations of the indicator are that it is based on mother’s or caregiver’s information, which may not

Guide to DHS Statistics 12.26 August 2018
provide reliable estimates of fever episodes in the 2 weeks preceding the survey and may miss fostered
children or others living in a household without a parent/caregiver. Additionally, a fever may not have
been the result of a malaria infection. Trends in this indicator may be biased by the season of data
collection.
Indicators 2 & 3 include advice or treatment from the public sector, private medical sector, shops,
market, and itinerant drug sellers, but excludes advice or treatment from a traditional practitioner.
Changes over Time
For surveys prior to DHS-7, care seeking was defined differently. The indicator measured care seeking
from a medical source or provider, and excluded pharmacy, shop, market, itinerant drug seller and
traditional practitioner.
References
Johansson, E.W., P.W. Gething, H. Hildenwall, B. Mappin, M. Petzold, S.S. Peterson, and K.E. Selling.
2014. “Diagnostic testing of pediatric fevers: meta-analysis of 13 national surveys assessing influences of
malaria endemicity and source of care on test uptake for febrile children under five years.” PLoS
One, 9(4), p.e95483. http://journals.plos.org/plosone/article?id=10.1371/journal.pone.0095483
Johansson, E.W., P.W. Gething, H. Hildenwall, B. Mappin, M. Petzold, S.S. Peterson, and K.E. Selling.
2015. “Effect of diagnostic testing on medicines used by febrile children less than five years in 12
malaria-endemic African countries: a mixed-methods study.” Malaria journal, 14(1), p.194.
https://malariajournal.biomedcentral.com/articles/10.1186/s12936-015-0709-0
Prasad, N., Sharples, K.J., Murdoch, D.R. and Crump, J.A., 2015. “Community prevalence of fever and
relationship with malaria among infants and children in low-resource areas.” The American journal of
tropical medicine and hygiene, 93(1), pp.178-180. https://www.ncbi.nlm.nih.gov/pubmed/25918207
Uggla, C. and Mace, R., 2016. “Parental investment in child health in sub-Saharan Africa: a cross-national
study of health-seeking behaviour.” Royal Society open science, 3(2), p.150460.
http://rsos.royalsocietypublishing.org/content/3/2/150460
Resources
DHS-7 Tabulation plan: Table 12.10
API Indicator IDs: ML_FEVR_C_FEV, ML_FEVT_C_ADV, ML_FEVT_C_ADS, ML_FEVT_C_BLD
(API link, STATcompiler link)
Household Survey Indicators for Malaria Control Indicator 9: Proportion of children under five years old
with fever in the last two weeks who had a finger or heel stick
Household Survey Indicators for Malaria Control Indicator 10: Proportion of children under five years old
with fever in the last two weeks for whom advice or treatment was sought
MICS6 Indicator TC.27: Malaria diagnostics usage
MICS6 Indicator TC.28: Antimalarial treatment of children under age 5
Guide to DHS Statistics 12.27 August 2018
Percentage of children under age 5 with fever in the 2 weeks preceding the survey for
whom advice or treatment was sought from specific sources; and among children under
age 5 with fever in the 2 weeks preceding the survey for whom advice or treatment was
sought, the percentage for whom advice or treatment was sought from specific sources
Definition
1) Percentage of children under age 5 with fever in the 2 weeks preceding the survey for whom
advice or treatment was sought from specific sources.
2) Among children under age 5 with fever in the 2 weeks preceding the survey for whom advice or
treatment was sought, the percentage for whom advice or treatment was sought from specific
sources.
Coverage:
Population base: Children under age 5 born to interviewed women (KR file)
Time period: Two weeks preceding the interview
Numerators:
1) Number of children under age 5 ill with a fever at any time during the 2 weeks preceding the
interview for whom advice or treatment was sought from each specific source (h32a – h32x = 1)
2) Same as 1
Denominators:
1) Number of children under age 5 who were ill with a fever in the 2 weeks preceding the interview
(b5 = 1 & b19 < 60 & h22 = 1)
2) Number of children under age 5 who were ill with a fever in the 2 weeks preceding the interview
and for whom advice or treatment was sought (b5 = 1 & b19 < 60 & h22 = 1 & h32y = 0)
Variables: KR file.
b5
Child is alive
b19
Current age of child in months
h22
Had fever in last two weeks
h32a
Fever/cough: government hospital
h32b
Fever/cough: CS public sector
h32c
Fever/cough: CS public sector
h32d
Fever/cough: CS public sector
h32e
Fever/cough: CS public sector
h32f
Fever/cough: CS public sector
h32g
Fever/cough: CS public sector
h32h
Fever/cough: CS public sector
h32i
Fever/cough: CS public sector
h32j
Fever/cough: private hospital/clinic
h32k
Fever/cough: private pharmacy
h32l
Fever/cough: private doctor
h32m
Fever/cough: CS private medical
h32n
Fever/cough: CS private medical

Guide to DHS Statistics 12.28 August 2018
h32o
Fever/cough: CS private medical
h32p
Fever/cough: CS private medical
h32q
Fever/cough: CS private medical
h32r
Fever/cough: CS private medical
h32s
Fever/cough: CS other sector
h32t
Fever/cough: CS other sector
h32u
Fever/cough: CS other sector
h32v
Fever/cough: CS other sector
h32w
Fever/cough: CS other sector
h32x
Fever/cough: other
h32y
Fever/cough: no treatment
v005
Women’s individual sample weight
Calculation
Numerator divided by denominator multiplied by 100.
Handling of Missing Values
Missing values for fever status and whether advice or treatment was sought for children with fever are
not included in the denominator. Missing values for sources of advice or treatment for children with
fever are treated as “no” responses.
Notes and Considerations
The limitations of the indicator are that it is based on mother’s or caregiver’s information, which may
not provide reliable estimates of fever episodes in the 2 weeks preceding the survey and may miss
fostered children or others living in a household without a parent/caregiver. The mother of a child does
not always know the exact qualifications of or the type of provider and, thus, may not be able to tell the
interviewer this information.
Changes over Time
There may be survey-specific changes over time to the response options for sources of care for fever.
References
Battle, K.E., D. Bisanzio, H.S. Gibson, S. Bhatt, E. Cameron, D.J. Weiss, B. Mappin, U. Dalrymple, R.E.
Howes, S.I. Hay, and P.W. Gething. 2016. “Treatment-seeking rates in malaria endemic
countries.” Malaria journal, 15(1), p.20.
https://malariajournal.biomedcentral.com/articles/10.1186/s12936-015-1048-x
Shah, J.A., J.B. Emina, E. Eckert, and Y. Ye,.2015. “Prompt access to effective malaria treatment among
children under five in sub-Saharan Africa: a multi-country analysis of national household survey
data.” Malaria journal, 14(1), p.329.
https://malariajournal.biomedcentral.com/articles/10.1186/s12936-015-0844-7
Guide to DHS Statistics 12.29 August 2018
Resources
DHS-7 Tabulation plan: Table 12.11

Guide to DHS Statistics 12.30 August 2018
Type of Antimalarial Drugs Used
Among children with fever in the 2 weeks preceding the survey who took any antimalarial
medication, percentage who took specific antimalarial drugs
Definition
Among children under age 5 years with fever in the 2 weeks preceding the survey who took any
antimalarial medication, percentage who took specific antimalarial drugs:
1) Any Artemisinin-based Combination Therapy (ACT)
2) SP/Fansidar
3) Chloroquine
4) Amodiaquine
5) Quinine pills
6) Quinine injection or intravenous (IV)
7) Artesunate rectal
8) Artesunate injection or intravenous (IV)
9) Other antimalarial
The purpose of this indicator is to measure the proportion of anti-malarial treatments that are in
accordance with national treatment policy, an important component of access to effective treatment for
uncomplicated malaria.
Coverage:
Population base: Children under age 5 (KR file)
Time period: Two weeks preceding the interview
Numerator: Number of children under age 5 with fever, at any time during the 2 weeks preceding the
interview, who took specific antimalarial drugs:
1) Any Artemisinin-based Combination Therapy (ACT) (ml13e = 1)
2) SP/Fansidar (ml13a = 1)
3) Chloroquine (ml13b = 1)
4) Amodiaquine (ml13c = 1)
5) Quinine pills (ml13d = 1)
6) Quinine injection or intravenous (IV) (ml13da = 1)
7) Artesunate rectal (ml13aa = 1)
8) Artesunate injection or intravenous (IV) (ml13ab = 1)
9) Other antimalarial (ml13h = 1)
Note that other survey-specific antimalarials may also be included using ml13f and ml13g.
Denominator: Number of children under age 5 who were ill with a fever in the 2 weeks preceding the
interview who were given any anti-malarial drugs (b5 = 1 & b19 < 60 & h22 = 1 and any of ml13a –
ml13h = 1)
Variables: HR file. IR file.
b19
Current age of child in months
h22
Had fever in last two weeks
Guide to DHS Statistics 12.31 August 2018
ml13a
Fansidar taken for fever
ml13aa
Artesunate rectal taken for fever
ml13ab
Artesunate injection/IV taken for fever
ml13b
Chloroquine taken for fever
ml13c
Amodiaquine taken for fever
ml13d
Quinine taken for fever
ml13da
Quinine injection/IV taken for fever
ml13e
Combination with artemisinin taken for fever
ml13f
CS antimalarial taken for fever
ml13g
CS antimalarial taken for fever
ml13h
Other antimalarial taken for fever
v005
Women’s individual sample weight
Calculation
Numerator divided by denominator multiplied by 100.
Handling of Missing Values
Children with missing values for fever status will be excluded from this indicator. Missing values are
assumed to be “no” responses and are thus Included in both numerator and denominator (assumes no
ACT taken, or no anti-malarial drugs taken).
Notes and Considerations
The current guidelines in most countries with predominantly Plasmodium falciparum malaria are for
Artemisinin-based Combination Therapy (ACT) to be given as a first-line treatment.
Due to the challenges of measuring confirmed malaria cases among children under age 5 years through
household surveys, this indicator is considered an interim measure of access to effective treatment for
malaria. The limitations of the indicator are that it is based on mother’s or caregiver’s information,
which may not provide reliable estimates of fever episodes in the previous 2 weeks and may miss
fostered children or others living in a household without a parent/caregiver. Additionally, a fever may
not have been the result of a malaria infection.
Changes over Time
In previous surveys before ACT was the recommended first line antimalarial for uncomplicated malaria
these indicator were not calculated. Previously, the denominator was specified as all children under age
5 with recent fever. As WHO now recommends testing before treating, the denominator has been
changed.
References
Bennett, A., D. Bisanzio, J.O. Yukich, B. Mappin, C.A. Fergus, M. Lynch, R.E. Cibulskis, S. Bhatt, D.J. Weiss,
E. Cameron, and P.W. Gething. 2017. “Population coverage of artemisinin-based combination treatment
in children younger than 5 years with fever and Plasmodium falciparum infection in Africa, 2003–2015: a

Guide to DHS Statistics 12.32 August 2018
modelling study using data from national surveys.” The Lancet Global Health, 5(4), pp.e418-e427.
https://www.thelancet.com/journals/langlo/article/PIIS2214-109X(17)30076-1/fulltext
Flegg, J.A., C.J. Metcalf, M. Gharbi, M. Venkatesan, T. Shewchuk, C.H. Sibley, and P.J. Guerin. 2013.
“Trends in antimalarial drug use in Africa.” The American journal of tropical medicine and hygiene, 89(5),
pp.857-865. http://www.ajtmh.org/content/journals/10.4269/ajtmh.13-0129
Resources
DHS-7 Tabulation plan: Table 12.12
API Indicator IDs:
ML_AMLD_C_ACT, ML_AMLD_C_SPF, ML_AMLD_C_CHL, ML_AMLD_C_AMQ, ML_AMLD_C_QNN,
ML_AMLD_C_ART, ML_AMLD_C_OAM
(API link, STATcompiler link)
Household Survey Indicators for Malaria Control Indicator 11: Proportion receiving first-line treatment,
among children under five years old with fever in the last two weeks who received any antimalarial
drugs
MICS6 Indicator TC.29: Treatment with Artemisinin-based Combination therapy (ACT) among children
who received anti-malarial treatment

Guide to DHS Statistics 12.33 August 2018
Coverage of Testing for Anemia and Malaria in Children
Percentage of eligible children who were tested for anemia and for malaria
Definition
Percentage of eligible children age 6-59 months who were tested for anemia and for malaria.
Coverage:
Population base: Children age 6-59 months from interviewed households (PR file)
Time period: Current status at the time of the survey
Numerators:
1) Number of de facto children age 6-59 months tested for anemia (hc55 = 0)
2) Number of de facto children age 6-59 months tested for malaria with an RDT (hml35 in 0,1)
3) Number of de facto children age 6-59 months tested for malaria by microscopy (hml32 in 0,1,6)
Denominator: Total number of de facto children age 6-59 months in households selected for hemoglobin
and malaria testing (hv103 = 1 & hc1 in 6:59 & hv042 = 1)
Variables: PR file.
hv042
Household selected for hemoglobin
hv103
Slept last night
hc1
Child's age in months
hc55
Result of measurement – hemoglobin
hml32
Final result of malaria from blood smear test
hml35
Result of malaria rapid test
Calculation
The coverage of testing for anemia and malaria indicators are produced unweighted as they reflect the
coverage of the survey, not a population estimate.
Numerator divided by denominator, multiplied by 100.
Handling of Missing Values
Children who were not tested and those children whose values were not recorded are excluded from
both the denominator and the numerators.
Notes and Considerations
Prevalence estimates may be biased by the seasonality of survey data collection; survey fieldwork for
DHS is most often done during the dry season, while fieldwork for Malaria Indicator Surveys (MIS) is
typically conducted at the end of or just after the rainy season.

Guide to DHS Statistics 12.35 August 2018
Hemoglobin <8.0 g/dl in Children
Percentage of children with hemoglobin lower than 8.0 g/dl
Definition
Percentage of children age 6-59 months who stayed in the household the night before the interview
with hemoglobin lower than 8.0 g/dl.
This is an impact indicator, as the prevalence of moderate-to-severe anemia can reflect malaria
morbidity and responds to changes in the coverage of malaria interventions. Hemoglobin is measured
with the HemoCue system, which requires capillary blood samples from the children in the sample.
Coverage:
Population base: Children age 6-59 months from interviewed households (PR file)
Time period: Current status at the time of the survey
Numerator: Number of de facto children age 6-59 months with a hemoglobin measurement of <8 grams
per deciliter (hc56<80)
Denominator: Number of de facto children age 6-59 months who had hemoglobin measurements
obtained during the survey (hv042 = 1 & hv103 = 1 & hc1 in 6:59 & hc55=0)
Variables: HR file. IR file.
hv042
Household selected for hemoglobin
hv103
Slept last night
hc1
Child's age in months
hc55
Result of measurement – hemoglobin
hc56
Hemoglobin level adjusted for altitude
hv005
Household sample weight
Calculation
At the time of creation of a recode file, an adjustment of the hemoglobin count is made for altitude.
Rather than change the cutoff points, the effective hemoglobin count is lowered as altitude increases,
since oxygen is less available. The adjustment is made with the following formula:
adjust = - 0.032*alt + 0.022*alt2
adjHb = Hb - adjust (for adjust > 0)
where adjust is the amount of the adjustment, alt is altitude in 1,000 feet (converted from meters by
dividing by 1,000 and multiplying by 3.3), adjHb is the adjusted hemoglobin level, and Hb is the
measured hemoglobin level in grams per deciliter. No adjustment is made for altitudes below 1,000
meters.

Guide to DHS Statistics 12.36 August 2018
The percentage with low hemoglobin is obtained by dividing the numerator by the denominator and
multiplying the quotient by 100.
Handling of Missing Values
Children who were not tested and those children whose values were not recorded are excluded from
both the denominator and the numerators.
Notes and Considerations
Prevalence estimates may be biased by the seasonality of survey data collection; survey fieldwork for
DHS is most often done during the dry season, while fieldwork for Malaria Indicator Surveys (MIS) is
typically conducted at the end of or just after the rainy season.
An Hb concentration cut-off of less than 7.0 g/dL has been widely used to classify severe nutritional
anemia, but a different cut-off, 8.0 g/dL, is used to classify malaria-related anemia, as intervention trials
have shown that malaria control reduces the prevalence of moderate-to-severe anemia (below 8.0 g/dL)
more so than it reduces the prevalence of any anemia (below 11.0 g/dL).
Use of anemia as a malaria indicator will be compromised by a lack of specificity, particularly in areas
with low malaria transmission, given other anemia determinants such as pediatric HIV/AIDS,
malnutrition and helminth infections. Even in areas of intense malaria transmission, moderate to severe
anemia in young children may depend more on undernutrition than on malaria, and separating
malnutrition from malaria as the cause of anemia is not possible, as the proportions will vary from
population to population and cannot be known. Consequently, data must be interpreted cautiously,
with consideration of the many other causes of anemia present in the survey area.
Children less than six months of age are not included because they have higher levels of hemoglobin at
birth and just after birth and thus may distort the indication of prevalence of anemia.
References
Centers for Disease Control and Prevention. Recommendations to control and prevent iron deficiency in
the United States. Morbidity and Mortality Weekly Report. Atlanta (GA): CDC (US); 1998. 47(RR-3): 1.29.
https://www.cdc.gov/mmwr/pdf/rr/rr4703.pdf
Florey, L.. 2012. Anemia as an Impact Measure of ITN use Among Young Children. DHS Analytical Studies
No. 31. Calverton, Maryland, USA: ICF International. https://dhsprogram.com/publications/publication-
as31-analytical-studies.cfm
Korenromp E.L., J. Armstrong-Schellenberg, B. Williams, B. Nahlen, RW Snow. 2004 “Impact of malaria
control on childhood anemia in Africa – a quantitative review.” Tropical Medicine International Health.
9(10): 1050-1065. https://onlinelibrary.wiley.com/doi/full/10.1111/j.1365-3156.2004.01317.x
Magalhaes, R.J.S. and A.C. Clements. 2011. “Mapping the risk of anaemia in preschool-age children: the
contribution of malnutrition, malaria, and helminth infections in West Africa.” PLoS medicine, 8(6),
p.e1000438. http://www.plosmedicine.org/article/info%3Adoi%2F10.1371%2Fjournal.pmed.1000438

Guide to DHS Statistics 12.37 August 2018
Resources
DHS-7 Tabulation plan: Table 12.14
API Indicator IDs: ML_HEMO_C_HL8
(API link, STATcompiler link)
Household Survey Indicators for Malaria Control Indicator 13: Moderate-to-severe anemia prevalence:
proportion of children aged 6-59 months with a hemoglobin measurement of <8 g/dL

Guide to DHS Statistics 12.38 August 2018
Prevalence of Malaria in Children
Percentage of children classified in two tests as having malaria
Definition
1) Percentage of children age 6-59 months classified as having malaria according to a rapid
diagnostic test (RDT).
2) Percentage of children age 6-59 months classified as having malaria according to microscopy.
Coverage:
Population base: De facto children age 6-59 months (PR file)
Time period: Current status at the time the blood sample was taken
Numerators:
1) Number of de facto children tested using RDT who are positive for malaria (hml35 = 1)
2) Number of de facto children tested using microscopy who are positive for malaria (hml32 = 1)
Denominators:
1) Number of de facto children tested using RDT (hv042 = 1 & hv103 = 1 & hc1 in 6:59 & hml35 in
0,1)
2) Number of de facto children tested using microscopy (hv042 = 1 & hv103 = 1 & hc1 in 6:59 &
hml32 in 0,1,6)
Variables: PR file.
hv042
Household selected for hemoglobin
hv103
Slept last night
hc1
Child's age in months
hml32
Final result of malaria from blood smear test
hml35
Result of malaria rapid test
hv005
Household sample weight
Calculation
Numerators divided by the denominator, multiplied by 100.
Handling of Missing Values
Children who were not tested and those children whose values were not recorded are excluded from
both the denominator and the numerators.
Notes and Considerations
Some studies of malaria interventions showing mortality reductions have found large decreases in
parasite prevalence; however, other studies of control interventions have found that despite reductions
in mortality, parasite prevalence changes little.

Guide to DHS Statistics 12.39 August 2018
As measurement of parasite prevalence requires finger stick blood, some caretakers may not consent to
parasitemia testing of their child. Additionally, survey personnel require extra training to use RDTs or to
collect blood on slides for microscopy.
Parasite prevalence can fluctuate dramatically throughout the course of a year with the seasonality of
malaria, and thus values of the indicator may be influenced by the timing of a survey in relation to peak
transmission. Accordingly, parasite prevalence should not be used for tracking the short-term impact of
scaling up prevention efforts, as the prevalence rates may merely reflect differences in the timing of
surveys in relation to within year variation in parasite prevalence. Parasite prevalence is better suited to
measuring changes in malaria burden of over a longer term during which changes in parasite prevalence
are expected to be much greater and outweigh within-year variation. To demonstrate a reliable trend,
no more than four data points within a ten-year span are generally needed.
When interpreting this indicator, the method of measuring parasite prevalence should be considered
(microscopy vs. RDT). Microscopy detects parasites present in the blood at the time of the survey and
therefore provides point parasite prevalence. By contrast, HRP2-based RDTs detect antigens to malaria
parasites, which may endure for some weeks after treatment. This is especially important when
interpreting trends over time, as parasite prevalence before the advent of RDTs was measured primarily
using microscopy.”
Changes over Time
Microscopy testing used to be considered the gold standard for measuring malaria parasitemia
prevalence in household survey settings. The Roll Back Malaria Monitoring and Evaluation Reference
Group currently recommend using only RDTs in most settings.
References
Alegana, V.A., J. Wright, C. Bosco, E.A. Okiro, P.M. Atkinson, R.W. Snow, A.J. Tatem, and A.M. Noor.
2017. “Malaria prevalence metrics in low-and middle-income countries: an assessment of precision in
nationally-representative surveys.” Malaria journal, 16(1), p.475.
https://malariajournal.biomedcentral.com/articles/10.1186/s12936-017-2127-y
Dalrymple, U., R. Arambepola, P.W. Gething. and E. Cameron. 2018. “How long do rapid diagnostic tests
remain positive after anti-malarial treatment?” Malaria journal, 17(1), p.228.
https://malariajournal.biomedcentral.com/articles/10.1186/s12936-018-2371-9
Florey, Lia. 2014. Measures of Malaria Parasitemia Prevalence in National Surveys: Agreement between
Rapid Diagnostic Testing and Microscopy. DHS Analytical Studies No. 43. Rockville, Maryland, USA: ICF
International. https://dhsprogram.com/publications/publication-as43-analytical-studies.cfm
Florey, L., and C. Taylor. 2016. Using Household Survey Data to Explore the Effects of Improved Housing
Conditions on Malaria Infection in Children in Sub-Saharan Africa. DHS Analytical Studies No. 61.
Rockville, Maryland, USA: ICF International. https://dhsprogram.com/publications/publication-as61-
analytical-studies.cfm

Guide to DHS Statistics 12.40 August 2018
Roll Back Malaria Monitoring and Evaluation Reference Group Survey and Indicator Task Force. 2013.
Household Survey Indicators for Malaria Control. https://data.unicef.org/resources/household-survey-
indicators-for-malaria-control-2013-edition/
Zgambo, M., B.C. Mbakaya, and F.W. Kalembo. 2017. “Prevalence and factors associated with malaria
parasitaemia in children under the age of five years in Malawi: A comparison study of the 2012 and 2014
Malaria Indicator Surveys (MISs).” PloS one, 12(4), p.e0175537.
https://journals.plos.org/plosone/article?id=10.1371/journal.pone.0175537
Resources
DHS-7 Tabulation plan: Table 12.15
API Indicator IDs: ML_PMAL_C_RDT, ML_PMAL_C_MSY
(API link, STATcompiler link)
Household Survey Indicators for Malaria Control Indicator 12: Parasite prevalence: proportion of
children aged 6-59 months with malaria infection

Guide to DHS Statistics 13.1 August 2018
HIV-AIDS Related Knowledge, Attitudes, and Behaviors
This chapter covers a number of HIV/AIDS-related issues and presents indicators for monitoring and
evaluating HIV/AIDS prevention programs. The indicators in this chapter present information reported
by both female and male respondents and can be grouped into five broad categories:
HIV Knowledge: Indicators concerning knowledge of AIDS, knowledge of HIV prevention
methods, detailed or comprehensive knowledge about AIDS including knowledge of prevention
of mother-to-child transmission of HIV.
Attitudes concerning HIV: Indicators about the willingness to provide care for a family member
with HIV and willingness to interact with people living with AIDS, women’s attitudes toward
negotiating sexual relation with their husbands and support for education about condom use to
prevent HIV.
HIV-related behavior: Indicators such as having multiple sexual partners in the past 12 months,
commercial sexual relations and condom use in those circumstances, testing for HIV, self-
reported prevalence of sexually-transmitted infections (STI) and care-seeking for STIs.
Young people and HIV: These indicators are for respondents age 15-24. They present detailed
information about age at first sexual intercourse, multiple sexual partners and condom use at
last intercourse in the past 12 months, and testing for HIV in the past 12 months.
Self-testing for HIV: These indicators look at the percentage of respondents who have ever used
an HIV self-test kit.

Guide to DHS Statistics 13.2 August 2018
Knowledge of HIV or AIDS
Percentage of women and men who have heard of HIV or AIDS
Definition
Percentage of women and men age 15-49 who have heard of HIV or AIDS.
Coverage:
Population base: Women and men age 15-49 (IR file, MR file)
Time period: Current status at time of survey
Numerator: Number of women (or men) age 15-49 who respond “Yes” that they have heard of HIV or
AIDS (women: v751 = 1; men: mv751 = 1)
Denominator: Number of women age 15-49 or number of men (age range varies by survey)
Variables: IR file, MR file.
v751
Ever heard of HIV or AIDS (women)
v005
Woman’s individual sample weight
mv751
Ever heard of HIV or AIDS (men)
mv005
Man’s individual sample weight
Calculation
Numerators divided by denominator and multiplied by 100.
Handling of Missing Values
Missing values are assumed to reflect a lack of knowledge about HIV or AIDS and are therefore not
included in the numerator.
Changes over Time
Previous DHS questionnaires asked if women and men had “ever heard of an illness called AIDS”. Due to
improved knowledge about HIV/AIDS and the decrease in AIDS cases as treatment is more common,
some respondents may be more familiar with the term “HIV” than “AIDS”. The purpose of the question
is to assess basic knowledge of either HIV or AIDS.
References
Bankole, A., S. Singh, V. Woog, and D. Wulf. 2004. "Risk and protection: youth and HIV/AIDS in sub-
Saharan Africa.”. https://www.guttmacher.org/news-release/2004/new-resource-documents-hiv-risk-
and-protection-african-youth

Guide to DHS Statistics 13.3 August 2018
Khan, M.A.2002. "Knowledge on AIDS among female adolescents in Bangladesh: evidence from the
Bangladesh demographic and health survey data." Journal of health, population and nutrition: 130-137.
Resources
DHS-7 Tabulation plan: Table 13.0
API Indicator IDs: HA_KAID_W_HRD, HA_KAID_M_HRD
(API link, STATcompiler link)

Guide to DHS Statistics 13.4 August 2018
Knowledge of HIV Prevention Methods
Percentage of women and men who know that people can reduce the risk of getting HIV by
use of condoms and having just one uninfected faithful partner
Definition
1) Percentage of women and men age 15-49 who know that people can reduce the risk of getting
HIV by using condoms every time they have sexual intercourse
2) Percentage of women and men age 15-49 who know that people can reduce the risk of getting
HIV by limiting sexual intercourse to one partner who is not infected and has no other partners
3) Percentage of women and men age 15-49 who know that people can reduce the risk of getting
HIV by using condoms every time they have sexual intercourse and by limiting sexual
intercourse to one partner who is not infected and has no other partners
Coverage:
Population base: Women and men age 15-49 (IR file, MR file)
Time period: Current status at time of survey
Numerators:
1) Number of women (or men) age 15-49 who respond “Yes” that people can reduce the risk of
getting HIV by using a condom every time they have sex
(women: v754cp = 1; men: mv754cp = 1)
2) Number of women (or men) age 15-49 who respond “Yes” that people can reduce the risk of
getting HIV by having just one uninfected sex partner who has no other sex partners
(women: v754dp = 1; men: mv754dp = 1)
3) Number of women (or men) age 15-49 who respond “Yes” to both of the above questions
(women: v754cp = 1 & v754dp = 1; men: mv754cp = 1 & mv754dp = 1)
Denominator: Number of women (or men) age 15-49
Variables: IR file, MR file.
v754cp
Reduce risk of getting HIV: always use condoms during sex (women)
v754dp
Reduce risk of getting HIV: have 1 sex partner only, who has no other partners
(women)
v005
Woman’s individual sample weight
mv754cp
Reduce risk of getting HIV: always use condoms during sex (men)
mv754dp
Reduce risk of getting HIV: have 1 sex partner only, who has no other partners (men)
mv005
Man’s individual sample weight
Calculation
The numerator divided by the denominator, expressed as a percentage.
Handling of Missing Values

Guide to DHS Statistics 13.5 August 2018
Missing values are assumed to reflect a lack of knowledge about HIV or AIDS and are therefore not
included in the numerator. Respondents can also indicate “don’t know” which is treated as a lack of
knowledge. Note that women and men who have not heard of HIV or AIDS are not asked these
questions but are still included in the denominator; if they have not heard of HIV/AIDS they are assumed
not to have this knowledge.
Changes over Time
Previous questionnaires used the term “AIDS virus” to refer to HIV because research had indicated that
respondents were less familiar with the term “HIV”. This has changed in recent years as knowledge of
HIV/AIDS has improved and treatment has led to many more cases of HIV than AIDS. In DHS7, the
respondent is first asked if they have heard of HIV or AIDS. If the respondent says yes, the interviewer
says “HIV is the virus that can lead to AIDS” and then asks a series of knowledge questions about HIV.
References
Wang, W., S. Alva, and S. Wang. 2012. HIV-Related Knowledge and Behaviors among People Living with
HIV in Eight High HIV Prevalence Countries in Sub-Saharan Africa. DHS Analytical Studies No. 29.
Calverton, Maryland, USA: ICF International https://dhsprogram.com/publications/publication-AS29-
Analytical-Studies.cfm
Resources
DHS-7 Tabulation plan: Table 13.1
API Indicator IDs:
Women:
HA_KHVP_W_CND, HA_KHVP_W_SX1, HA_KHVP_W_CS1
Men:
HA_KHVP_M_CND, HA_KHVP_M_SX1, HA_KHVP_M_CS1
(API link, STATcompiler link)

Guide to DHS Statistics 13.6 August 2018
Comprehensive Knowledge about HIV (Total and Youth)
Percentage of women and men who know that a healthy looking person can have HIV and
reject local misconceptions about transmission or prevention of HIV
Definition
1) Percentage of women and men age 15-49 who know that a healthy looking person can have
HIV.
2) Percentage of women and men age 15-49 who know that HIV cannot be transmitted by
mosquito bites.
3) Percentage of women and men age 15-49 who know that HIV cannot be transmitted by
supernatural means.
4) Percentage of women and men age 15-49 who know that a person cannot become infected by
sharing food with a person who has HIV.
5) Percentage of women and men age 15-49 who say that a healthy-looking person can have HIV
and who reject the two most common local misconceptions.
Indicators 2, 3 and 4 are surveys-specific and may refer to other local misconceptions.
Coverage:
Population base: Women and men age 15-49
Time period: Current status at time of survey
Numerators: Number of women (or men) who indicate that they:
1) Know that a healthy-looking person can have HIV (women: v756 = 1; men: mv756 = 1).
2) Know that HIV cannot be transmitted by mosquito bites (women: v754jp = 0; men: mv754jp =
0).
3) Know that HIV cannot be transmitted by supernatural means (women: v823 = 0; men: mv823 =
0).
4) Know that a person cannot become infected by sharing food with a person who has HIV
(women: v754wp = 0; men: mv754wp = 0).
5) Know that a healthy-looking person can have HIV (see 1 above) and reject the two most
common local misconceptions about HIV transmission or prevention (these two most common
misconceptions are footnoted in DHS 7 table 13.2). Survey specific but typically two of the
following three (see Calculation below):
HIV cannot be transmitted by mosquito bites (women: v754jp = 0; men: mv754jp = 0).
HIV cannot be transmitted by supernatural means (women: v823 = 0; men: mv823 = 0).
A person cannot become infected by sharing food with a person who has HIV (women:
v754wp = 0; men: mv754wp = 0)
Denominator: Number of women (or men) age 15-49
Variables: IR file, MR file.
v756
A healthy looking person can have HIV (women)
v754jp
Can get HIV from mosquito bites (women)

Guide to DHS Statistics 13.7 August 2018
v754wp
Can get HIV by sharing food with person who has AIDS (women)
v823
Can get HIV by witchcraft or supernatural means (women)
v005
Woman’s individual sample weight
mv756
A healthy looking person can have HIV (men)
mv754jp
Can get HIV from mosquito bites (men)
mv754wp
Can get HIV by sharing food with person who has AIDS (men)
mv823
Can get HIV by witchcraft or supernatural means (men)
mv005
Man’s individual sample weight
Calculation
The numerators divided by the denominator, expressed as a percentage.
Misconceptions are incorrect beliefs about modes of transmission—believing that HIV can be
transmitted in ways it cannot be transmitted. Calculation of the two most common misconceptions is
based on a working table including frequencies of responses of women and men on each misconception
question included in the questionnaire. If men are interviewed in a subsample of households, the male
cases are inflated by the inverse of the sub-sample proportion to produce frequencies for women and
men combined. The most common misconceptions are those to which the greatest percentage of
women and men respond “Yes”, meaning they believe HIV can be transmitted through the false mode
stated in the question. The misconceptions are survey specific, but typically include:
HIV can be transmitted by mosquito bites.
HIV can be transmitted by supernatural means.
A person can become infected by sharing food with a person who has HIV.
Handling of Missing Values
Missing values are assumed to reflect a lack of knowledge about HIV or AIDS and are therefore not
included in the numerator. Respondents can also indicate “don’t know” which is treated as a lack of
knowledge. Note that women and men who have not heard of HIV or AIDS are not asked these
questions but are still included in the denominator; if they have not heard of HIV/AIDS they are assumed
not to have this knowledge.
Changes over Time
The language used in this series of questions has changed in recent years to refer to “HIV” rather than
“the AIDS virus” (see Changes over Time under Knowledge of HIV Prevention Methods.)
References
Bankole, A., S. Singh, V. Woog, and D. Wulf. 2004. "Risk and protection: youth and HIV/AIDS in sub-
Saharan Africa.”. https://www.guttmacher.org/news-release/2004/new-resource-documents-hiv-risk-
and-protection-african-youth
Wang, W., S. Alva, and S. Wang. 2012. HIV-Related Knowledge and Behaviors among People Living with
HIV in Eight High HIV Prevalence Countries in Sub-Saharan Africa. DHS Analytical Studies No. 29.
Calverton, Maryland, USA: ICF International https://dhsprogram.com/publications/publication-AS29-
Analytical-Studies.cfm

Guide to DHS Statistics 13.9 August 2018
Percentage of women and men with comprehensive knowledge about HIV, percentage of
young women and young men with comprehensive knowledge about HIV
Definition
1) Percentage of women and men with comprehensive knowledge about HIV.
2) Percentage of young women and young men age 15-24 with comprehensive knowledge about
HIV.
Women and men are defined as having comprehensive knowledge of HIV if they:
Know the two primary prevention methods (use of condoms and having just one uninfected
faithful partner - see Knowledge of HIV Prevention Methods) that reduce the chance of getting
HIV; and
Know that a healthy-looking person can have HIV; and
Reject the two most common local misconceptions about HIV/AIDS transmission or prevention.
(see Percentage of women and men who know that a healthy looking person can have HIV and
reject local misconceptions about transmission or prevention of HIV)
Coverage:
Population base: Women and men age 15-49, or women and men age 15-24 (IR file, MR file)
Time period: Current status at time of survey
Numerators: Number of women (or men) (total and age 15-24) who indicate that they:
a) Know both prevention methods (women: v754cp = 1 & v754dp = 1; men: mv754cp = 1 &
mv754dp = 1); AND
b) Know that a healthy-looking person can have HIV (women: v756 = 1; men: mv756 = 1); AND
c) Reject the two most common local misconceptions about HIV transmission of prevention (these
two most common misconceptions are footnoted in DHS 7 table 13.2). Survey specific but
typically two of the following three (see Calculation below):
HIV cannot be transmitted by mosquito bites (women: v754jp = 0; men: mv754jp = 0)
HIV cannot be transmitted by supernatural means (women: v823 = 0; men: mv823 = 0)
A person cannot become infected by sharing food with a person who has HIV (women:
v754wp = 0; men: mv754wp = 0)
Denominators:
1) Number of women (or men) age 15-49
2) Number or young women (or men) age 15-24 (women: v012 in 15:24; men: mv012 in 15:24)
Variables: IR file, MR file.
v754cp
Reduce risk of getting HIV: always use condoms during sex (women)
v754dp
Reduce risk of getting HIV: have 1 sex partner only, who has no other partners
(women)
v756
A healthy looking person can have HIV (women)
v754jp
Can get HIV from mosquito bites (women)
v754wp
Can get HIV by sharing food with person who has AIDS (women)
v823
Can get HIV by witchcraft or supernatural means (women)

Guide to DHS Statistics 13.10 August 2018
v005
Woman’s individual sample weight
mv754cp
Reduce risk of getting HIV: always use condoms during sex (men)
mv754dp
Reduce risk of getting HIV: have 1 sex partner only, who has no other partners (men)
mv756
A healthy looking person can have HIV (men)
mv754jp
Can get HIV from mosquito bites (men)
mv754wp
Can get HIV by sharing food with person who has AIDS (men)
mv823
Can get HIV by witchcraft or supernatural means (men)
mv005
Man’s individual sample weight
Calculation
The numerator divided by the denominator, expressed as a percentage.
Misconceptions are incorrect beliefs about modes of transmission—believing that HIV can be
transmitted in ways it cannot be transmitted. Calculation of the two most common misconceptions is
based on a working table including frequencies of responses of women and men on each misconception
question included in the questionnaire. If men are interviewed in a subsample of households, the male
cases are inflated by the inverse of the sub-sample proportion to produce frequencies for women and
men combined. The most common misconceptions are those to which the greatest percentage of
women and men respond “Yes”, meaning they believe HIV can be transmitted through the false mode
stated in the question. The misconceptions are survey specific, but typically include:
HIV can be transmitted by mosquito bites.
HIV can be transmitted by supernatural means.
A person can become infected by sharing food with a person who has HIV.
Handling of Missing Values
Missing values are assumed to reflect a lack of knowledge about HIV or AIDS and are therefore not
included in the numerator. Respondents can also indicate “don’t know” which is treated as a lack of
knowledge. Note that women and men who have not heard of HIV or AIDS are not asked these
questions but are still included in the denominator; if they have not heard of HIV/AIDS they are assumed
not to have this knowledge.
Changes over Time
The language used in this series of questions has changed in recent years to refer to “HIV” rather than
“the AIDS virus” (see Changes over Time under Knowledge of HIV Prevention Methods.)
References
UNAIDS. 2017. Global AIDS Monitoring 2018: Indicators for monitoring the 2016 United Nations Political
Declaration on Ending. http://www.unaids.org/en/resources/documents/2018/Global-AIDS-Monitoring
(page 102).
Wang, W., S. Alva, and S. Wang. 2012. HIV-Related Knowledge and Behaviors among People Living with
HIV in Eight High HIV Prevalence Countries in Sub-Saharan Africa. DHS Analytical Studies No. 29.

Guide to DHS Statistics 13.11 August 2018
Calverton, Maryland, USA: ICF International https://dhsprogram.com/publications/publication-AS29-
Analytical-Studies.cfm
Resources
DHS-7 Tabulation plan: Tables 13.2 and 13.12
API Indicator IDs: HA_CKNA_W_CKA, HA_CKNA_M_CKA
(API link, STATcompiler link)
UNAIDS Indicator 5.1: Young people: Knowledge about HIV prevention
MICS6 Indicator TM.29: Knowledge about HIV prevention among young people

Guide to DHS Statistics 13.12 August 2018
Knowledge of Prevention of Mother-to-Child Transmission
Percentage of women and men who know that HIV can be transmitted from mother to
child during pregnancy, during delivery, by breastfeeding, and in all 3 ways; Percentage of
women and men who know that the risk of mother-to-child transmission can be reduced
by the mother taking special drugs
Definition
1) Percentage of women and men who know that HIV can be transmitted from mother to child
during pregnancy.
2) Percentage of women and men who know that HIV can be transmitted from mother to child
during delivery.
3) Percentage of women and men who know that HIV can be transmitted from mother to child by
breastfeeding.
4) Percentage of women and men who know that HIV can be transmitted from mother to child
during pregnancy, during delivery, and by breastfeeding.
5) Percentage of women and men who know that the risk of mother-to-child transmission can be
reduced by the mother taking special drugs.
Coverage:
Population base: Women and men age 15-49 (IR file, MR file)
Time period: Current status at time of survey
Numerators:
Number of women (or men) who respond “Yes” that HIV can be transmitted from a mother to her baby:
1) during pregnancy (women: v774a = 1; men: mv774a = 1)
2) during delivery (women: v774b = 1; men: mv774b = 1)
3) by breastfeeding (women: v774c = 1; men: mv774c = 1)
4) during pregnancy, delivery, and by breastfeeding (women: v774a = 1 & v774b = 1 & v774c = 1;
men: mv774a = 1 & mv774b = 1 & mv774c = 1)
Number of women (or men) who respond “Yes” to the question:
5) “Are there any special drugs that a doctor or a nurse can give to a woman infected with HIV to
reduce the risk of transmission to the baby?” (women: v824 = 1; men: mv824 = 1)
Denominator: Number of women (or men) age 15-49
Variables: IR file, MR file.
v774a
HIV transmitted during pregnancy (women)
v774b
HIV transmitted during delivery (women)
v774c
HIV transmitted during breastfeeding (women)
v824
Drugs to avoid HIV transmission to baby during pregnancy (women)
v005
Woman’s individual sample weight
mv774a
HIV transmitted during pregnancy (men)
mv774b
HIV transmitted during delivery (men)
mv774c
HIV transmitted during breastfeeding (men)

Guide to DHS Statistics 13.13 August 2018
mv824
Drugs to avoid HIV transmission to baby during pregnancy (men)
mv005
Man’s individual sample weight
Calculation
The numerator divided by the denominator, expressed as a percentage.
Handling of Missing Values
Missing values are assumed to reflect a lack of knowledge about HIV or AIDS and are therefore not
included in the numerator. Respondents can also indicate “don’t know” which is treated as a lack of
knowledge.
Note that women and men who have not heard of HIV or AIDS are not asked these questions but are still
included in the denominator; if they have not heard of HIV or AIDS they are assumed not to have this
knowledge.
Changes over Time
Previously DHS reported an indicator that combined knowledge that HIV can be transmitted by
breastfeeding and that special drugs taken by mother during pregnancy can reduce risk of MTCT. The
DHS7 tabulation plan does not combine these indicators.
References
Mishra, V., P. Agrawal, S. Alva, Y. Gu, and S. Wang. 2009. Changes in HIV-Related Knowledge and
Behaviors in Sub-Saharan Africa. DHS Comparative Reports No. 24. Calverton, Maryland, USA: ICF
Macro. https://dhsprogram.com/publications/publication-CR24-Comparative-Reports.cfm
Wang, W., S. Alva, and S. Wang. 2012. HIV-Related Knowledge and Behaviors among People Living with
HIV in Eight High HIV Prevalence Countries in Sub-Saharan Africa. DHS Analytical Studies No. 29.
Calverton, Maryland, USA: ICF International https://dhsprogram.com/publications/publication-AS29-
Analytical-Studies.cfm
Resources
DHS-7 Tabulation plan: Table 13.3
API Indicator IDs:
Women: HA_KMTC_W_BRF, HA_KMTC_W_DRG, HA_KMTC_W_BFD
Men: HA_KMTC_M_BRF, HA_KMTC_M_DRG, HA_KMTC_M_BFD
(API link, STATcompiler link)
MICS6 Indicator TM.30: Knowledge of mother-to-child transmission

Guide to DHS Statistics 13.14 August 2018
Discriminatory Attitudes towards People Living with HIV
Percentage who have discriminatory attitudes towards people living with HIV among
women and men who have heard of HIV or AIDS
Definition
Among women and men who have heard of HIV or AIDS:
1) Percentage who do not think that children living with HIV should be able to attend school with
children who are HIV negative.
2) Percentage who would not buy fresh vegetables from a shopkeeper who has HIV.
3) Percentage who have discriminatory attitudes towards people living with HIV.
Coverage:
Population base: Women and men age 15-49 who have heard of HIV or AIDS (IR file, MR file)
Time period: Current status at time of survey
Numerators:
1) Number of women (or men) who say “No” to the question, “Should children living with HIV be
able to attend school with children who do not have HIV?” (women: v857a = 1; men: mv857a =
1)
2) Number of women (or men) who say “No” to the question, “Would you buy fresh vegetables
from a shopkeeper or vendor if you knew that this person had HIV?” (women: v825 = 1; men:
mv825 = 1)
3) Number of women (or men) who answer “No” to either of the two questions listed above
(women: v857a = 1 or v825 = 1; men: mv857a = 1 or mv825 = 1)
Denominator: Number of women and men age 15-49 who have heard of HIV or AIDS (women: v751 = 1;
men: mv751 = 1)
Variables: IR file, MR file.
v751
Ever heard of AIDS (women)
v857a
Children with HIV should be allowed to attend school with children without HIV
(women)
v825
Would buy vegetables from vendor with HIV (women)
v005
Woman’s individual sample weight
mv751
Ever heard of AIDS (men)
mv857a
Children with HIV should be allowed to attend school with children without HIV (men)
mv825
Would buy vegetables from vendor with HIV (men)
mv005
Man’s individual sample weight
Calculation
The numerator divided by the denominator, expressed as a percentage.

Guide to DHS Statistics 13.15 August 2018
Handling of Missing Values
Respondents are considered to have discriminatory attitudes only if they answer “No” on either
question. Missing values or answers of “Don’t know/Not sure/Depends” are not considered to represent
discriminatory attitudes.
Changes over Time
Previous DHS questionnaires had a different list of questions to assess HIV-related stigma. The two
included in the DHS7 questionnaire and tabulation plan are in line with UNAIDS Global AIDS Monitoring
(GAM) indicator 4.1 on discriminatory attitudes.
References
UNAIDS. 2017. Global AIDS Monitoring 2018: Indicators for monitoring the 2016 United Nations Political
Declaration on Ending AIDS http://www.unaids.org/en/resources/documents/2018/Global-AIDS-
Monitoring
Resources
DHS-7 Tabulation plan: Table 13.4
API Indicator IDs: HA_AATT_W_VEG, HA_AATT_M_VEG
(API link, STATcompiler link)
UNAIDS Global AIDS Monitoring (GAM) indicator 4.1: “Discriminatory attitudes towards people living
with HIV”
MICS6 Indicator TM.31: Discriminatory attitudes towards people living with HIV

Guide to DHS Statistics 13.16 August 2018
Multiple Sexual Partners, Higher-Risk Sexual Partners, and Condom Use
Percentage of all women and men and of young women and men who had multiple sexual
partners, higher-risk sexual partners, condom use with multiple partners, and condom use
at last high-risk sex
Definition
1) Percentage of women and men age 15-49, and of young women and men age 15-24, who had
two or more sexual partners in the past 12 months.
2) Percentage of women and men age 15-49, and of young women and men age 15-24, who had
intercourse in the past 12 months with a person who was neither their spouse nor lived with
them.
3) Percentage of women and men age 15-49, and of young women and men age 15-24, with 2+
partners in the past 12 months who used a condom at last sexual intercourse.
4) Among women and men age 15-49, and of young women and men age 15-24, who had
intercourse in the past 12 months with a person who was neither their spouse nor lived with
them, percentage who used a condom as last sexual intercourse with such a partner.
Coverage:
Population base: Women and men age 15-49; Young women and men age 15-24 (IR file, MR file)
Time period: 12 months preceding the survey
Numerators:
1) Number of women (or men) age 15-49, or young women (or men) age 15-24, who reported two
or more sexual partners in the 12 months preceding the survey:
Women: (v527 in 100:251,300:311 & v766b in 2:99),
Men: (mv527 in 100:251,300:311 & mv766b in 2:99).
2) Number of women (or men) age 15-49, or young women (or men) age 15-24, who had sexual
intercourse in the 12 months preceding the survey with a person who was neither their spouse
nor lived with them:
Women: risk1 = (v767a in 2:6, 8, 96) (last partner)
risk2 = (v767b in 2:6, 8, 96) (next-to-last partner)
risk3 = (v767c in 2:6, 8, 96) (third-to-last partner)
Number of women with (risk1 or risk2 or risk3).
Men: risk1 = (v767a in 2:6, 8, 96) (last partner)
risk2 = (v767b in 2:6, 8, 96) (next-to-last partner)
risk3 = (v767c in 2:6, 8, 96) (third to last partner)
Number of men with (risk1 or risk2 or risk3).
3) Number of women (or men) age 15-49, or young women (or men) age 15-24, with two or more
sexual partners in the past 12 months who used a condom at last sexual intercourse:
Women: (v527 in 100:251,300:311 & v766b in 2:99 & v761 = 1),
Men: (mv527 in 100:251,300:311 & mv766b in 2:99 & mv761 = 1).
4) Number of women (or men) age 15-49, or young women (or men) age 15-24, who used a
condom the last time they had sexual intercourse with a person who was neither their spouse
nor lived with them.
Guide to DHS Statistics 13.17 August 2018
Women: ((risk1 & v761 = 1) or
(not risk1 & risk2 & v761b = 1) or
(not risk1 & not risk2 & risk3 & v761c = 1)).
Men: ((risk1 & mv761 = 1) or
(not risk1 & risk2 & mv761b = 1) or
(not risk1 & not risk2 & risk3 & mv761c = 1)).
Denominators:
1) Number of women (or men) age 15-49 (women: v012 in 15:49; men: mv012 in 15:49), or
number of young women (or men) age 15-24 (women: v012 in 15:24; men: mv012 in 15:24)
2) Number of women (or men) age 15-49 (women: v012 in 15:49; men: mv012 in 15:49), or
number of young women (or men) age 15-24 (women: v012 in 15:24; men: mv012 in 15:24)
3) Number of women (or men) age 15-49, or young women (or men) age 15-24, who reported two
or more sexual partners in the 12 months preceding the survey – same as numerator 1 above
selecting the corresponding age group
4) Number of women (or men) age 15-49, or young women (or men) age 15-24, who had sexual
intercourse in the 12 months preceding the survey with a person who was neither their spouse
nor lived with them – same as numerator 2 above selecting the corresponding age group
Variables: IR file, MR file.
v527
Time since last sex (women)
v766b
Number of sex partners, including spouse, in last 12 months (women)
v767a
Relationship with most recent sex partner (women)
v767b
Relationship with 2nd to most recent sex partner (women)
v767c
Relationship with 3rd to most recent sex partner (women)
v761
Condom used during last sex with most recent partner (women)
v761b
Condom used during last sex with 2nd to most recent partner (women)
v761c
Condom used during last sex with 3rd to most recent partner (women)
v005
Woman’s individual sample weight
mv527
Time since last sex (men)
mv766b
Number of sex partners, including spouse, in last 12 months (men)
mv767a
Relationship with most recent sex partner (men)
mv767b
Relationship with 2nd to most recent sex partner (men)
mv767c
Relationship with 3rd to most recent sex partner (men)
mv761
Condom used during last sex with most recent partner (men)
mv761b
Condom used during last sex with 2nd to most recent partner (men)
mv761c
Condom used during last sex with 3rd to most recent partner (men)
mv005
Man’s individual sample weight
Calculation
The numerator divided by the denominator, expressed as a percentage.
Handling of Missing Values
Time since last sex: If the time since last sex is reported as missing or “don’t know” it is assumed to be
more than 12 months ago.

Guide to DHS Statistics 13.18 August 2018
Number of sexual partners in the past 12 months: If the number of partners in the past 12 months is
missing or “don’t know” the respondent is still considered to have had 2+ partners in the past 12
months as the direct question on number of partners in the past 12 months is only asked if at least 3
partners are listed in the sexual partner history. Otherwise the number of sexual partners is calculated
from the exact number listed in the history. See Notes and Consideration below.
Relationship with partner: If the relationship to the partner is missing it is not considered as high risk
sex. If the response to a question concerning condom use with a partner is missing it is assumed that a
condom was not used with that partner.
Notes and Considerations
Number of sexual partners in the past 12 months, respondent’s relationship to sexual partner, and
condom use are all self-reported and based on questions in the sexual partner history section of the
individual questionnaire. If a respondent had sexual intercourse in the past 12 months, a series of
questions is repeated for the respondent’s most-recent, next-to-most recent, and third-to-most recent
sexual partners. At the end of the series of questions for the most-recent and next-to-most recent
partners, the respondent is asked, “Apart from this person, have you had sexual intercourse with any
other person in the last 12 months?” Respondents who answer “Yes” to this question when it is asked at
the end of the series of questions about the most-recent sexual partner are considered to have two or
more sexual partners in the past 12 months. At the end of the series of questions for the third-to-most
recent partner, the respondent is asked “In total, with how many different people have you had sexual
intercourse in the last 12 months?”
References
UNAIDS. 2017. Global AIDS Monitoring 2018: Indicators for monitoring the 2016 United Nations Political
Declaration on Ending AIDS http://www.unaids.org/sites/default/files/media_asset/global-aids-
monitoring_en.pdf#page=95
Resources
DHS-7 Tabulation plan: Table 13.5.1 and 13.5.2, and 13.15.1 and 13.15.2
API Indicator IDs:
Women: HA_HRSX_W_HRS, HA_HRSX_W_CND, HA_MSXP_W_2PP, HA_MSXP_W_CND
Men: HA_HRSX_M_HRS, HA_HRSX_M_CND, HA_MSXP_M_2PP, HA_MSXP_M_CND
Young women and men: HA_MSPY_W_2PP, HA_MSPY_W_CND, HA_MSPY_M_2PP, HA_MSPY_M_CND
(API link, STATcompiler link)
UNAIDS Global AIDS Monitoring (GAM) indicator 3.18: “Condom use at last high-risk sex”
MICS6 Indicator TM.22: Multiple sexual partnerships
MICS6 Indicator TM.23: Condom use at last sex among people with multiple sexual partnerships
MICS6 Indicator TM.27: Sex with non-regular partners
MICS6 Indicator TM.28: Condom use with non-regular partners

Guide to DHS Statistics 13.19 August 2018
Mean number of sexual partners
Definition
Mean number of lifetime sexual partners.
Coverage:
Population base: Women and men age 15-49 who ever had sexual intercourse (IR file, MR file)
Time period: Lifetime of the respondent
Numerator: Sum of number of lifetime sexual partners reported in response to the question, “In total,
with how many different people have you had sexual intercourse in your lifetime?” Excludes non-
numeric answers such as “Don’t know” (women: v836; men: mv836).
Denominator: Number of women (or men) age 15-49 who ever had sexual intercourse and who gave a
numeric response to the question on number of lifetime sexual partners (women: v836 in 1:95; men:
mv836 in 1:95)
Variables: IR file, MR file.
v836
Total lifetime number of sex partners (women)
v005
Woman’s individual sample weight
mv836
Total lifetime number of sex partners (men)
mv005
Man’s individual sample weight
Calculation
Numerator divided by denominator.
Handling of Missing Values
Respondents with missing or non-numeric values for number of lifetime sexual partners are excluded
from the numerator and denominator.
References
Lo, N.C., A. Lowe, and E. Bendavid. "Abstinence funding was not associated with reductions in HIV risk
behavior in sub-Saharan Africa." Health affairs 35, no. 5 (2016): 856-863.
Resources
DHS-7 Tabulation plan: Tables 13.5.1 and 13.5.2
API Indicator IDs: HA_MSXP_W_MNP, HA_MSXP_M_MNP
(API link, STATcompiler link)

Guide to DHS Statistics 13.20 August 2018
Payment for Sexual Intercourse and Condom Use
Percentage of men who ever paid for sexual intercourse, percentage who paid for sexual
intercourse in the past 12 months, and percentage reporting using a condom at last paid
sexual intercourse
Definition
1) Percentage of men age 15-49 who ever paid for sexual intercourse.
2) Percentage of men age 15-49 who paid for sexual intercourse in the past 12 months.
3) Percentage of men age 15-49 reporting using a condom at last paid sexual intercourse in the
past 12 months.
Coverage:
Population base: Men age 15-49 (MR file)
Time period: At any time prior to the survey. In the 12 months preceding the survey.
Numerators:
1) Number of men age 15-49 who answer “Yes” in response to the question, “Have you ever paid
anyone in exchange for having sexual intercourse?” (mv791 = 1)
2) Number of men age 15-49 who either:
a) In response to a question about the relationship to each of their last three sexual
partners in the past 12 months, reported that any of the three partners was a sex
worker, or
b) If no sex workers were reported in the detailed partner history, responds “Yes” to the
question “In the last 12 months, did you pay anyone in exchange for having sexual
intercourse?” (mv793 = 1)
3) Number of men age 15-49 who had paid for sex in the past 12 months and who either:
a) Reported they used a condom at last sex with a sex partner in the sexual partner history
who was reported to be a sex worker, or
b) If no sex workers were reported in the detailed partner history, answered “Yes” to the
question “The last time you paid someone in exchange for having sexual intercourse,
was a condom used?” (mv793 = 1 & mv793a = 1)
Denominators:
1) Number of men age 15-49
2) Number of men age 15-49
3) Number of men age 15-49 who paid for sex in the past 12 months (mv793 = 1)
Variables: MR file.
mv791
Have ever paid anyone in exchange for sex
mv793
Paid for sex in last 12 months
mv793a
Condom used last time paid for sex in last 12 months
mv005
Man’s individual sample weight

Guide to DHS Statistics 13.21 August 2018
Calculation
The numerator divided by the denominator, expressed as a percentage.
Data for these indicators is collected in one of two ways: from the detailed questions about relationship
to partner and condom use at last sex with each partner in the history of sexual partners in the past 12
months, or from direct questions on payment for sex and condom use at last paid sex for respondents
did not report these events in the sexual partner history. Men are asked the direct question on paying
for sexual intercourse in the past 12 months even if they reported it has been more than 12 months
since the last time they had sex.
Handling of Missing Values
Men with missing values on the payment for sex question are considered not to have paid for sex. Men
with missing values on the use of condom at last paid sex question are considered not to have used a
condom with paid sex.
Notes and Considerations
These indicators pertain only to payment of money for sex. Transactional sex involving exchange of
goods or services is not addressed.
References
Stephenson, R., A. Winter, and M. Elfstrom. 2013. "Community environments shaping transactional sex
among sexually active men in Malawi, Nigeria, and Tanzania." AIDS care 25, no. 6: 784-792.
Resources
DHS-7 Tabulation plan: Table 13.6
API Indicator IDs: HA_PYSX_M_EPD, HA_PYSX_M_PD1, HA_PYSX_M_CLS
(API link, STATcompiler link)

Guide to DHS Statistics 13.22 August 2018
Coverage of Prior HIV Testing
Percentage of women and men who know where to get an HIV test, percent distribution by
prior HIV testing status and whether they received the result of their last test, percentage
ever tested for HIV, percentage who have been tested for HIV in the past 12 months and
received the results of the last test
Definition
1) Percentage of women and men age 15-49 who know where to get an HIV test.
2) Percent distribution of women and men age 15-49 by prior HIV testing status and whether they
received the result of their last test.
3) Percentage of women and men age 15-49 ever tested for HIV.
4) Percentage of women and men age 15-49 who have been tested for HIV in the past 12 months
and received the results of the last test.
Coverage:
Population base: Women and men age 15-49
Time period: Lifetime of the respondent. 12 months preceding the survey
Numerators:
1) Number of women (or men) who know where to get an HIV test (women: v781 = 1 or v783 = 1;
men: mv781 = 1 or mv783 = 1)
2) Percent distribution includes three mutually exclusive, exhaustive categories:
Number of women (or men) who have ever been tested for HIV and received the result
of their most recent HIV test (women: v781 = 1 & v828 = 1; men: mv781 = 1 & mv828 =
1)
Number of women (or men) who have ever been tested for HIV and did not receive the
result of their most recent HIV test (women: v781 = 1 & v828 ≠ 1; men: mv781 = 1 &
mv828 ≠ 1)
Number of women (or men) who have never been tested for HIV (women: v781 ≠ 1;
men: mv781 ≠ 1)
3) Number of women (or men) who have ever received an HIV test (women: v781 = 1; men: mv781
= 1)
4) Number of women (or men) who have been tested for HIV in the past 12 months and received
the result of their most recent HIV test (women: v828 = 1 & v826a in 0:11; men: mv828 = 1 &
mv826a in 0:11)
Denominators: Number of women (or men) age 15-49
Variables: IR file, MR file.
v781
Ever been tested for HIV (women)
v783
Know a place to get HIV test (women)
v826a
Months ago most recent HIV test (women)
v828
Received result from last HIV test (women)
v005
Woman’s individual sample weight

Guide to DHS Statistics 13.23 August 2018
mv781
Ever been tested for HIV (men)
mv783
Know a place to get HIV test (men)
mv826a
Months ago most recent HIV test (men)
mv828
Received result from last HIV test (men)
mv005
Man’s individual sample weight (men)
Calculation
The numerator divided by the denominator, expressed as a percentage.
Handling of Missing Values
Missing values on receiving an HIV test are interpreted as not tested, and missing values on receiving the
test result are interpreted as not receiving the result.
Notes and Considerations
Only respondents who report they have never been tested for HIV are asked if they know where to get
an HIV test. If a respondent has received an HIV test, this indicator assumes they know where to get an
HIV test. It is assumed that respondents who report that they have never heard of HIV or AIDS have
never been tested for HIV.
Changes over Time
Previous versions of this indicator included a condition that the HIV test was also offered by a provider
(as opposed to requested by the respondent). This condition is no longer included.
References
Staveteig, S., S.K. Head, T.N. Croft, and K.T. Kampa. 2016. Factors associated with prior testing among
HIV-positive adults in Sub-Saharan Africa. DHS Comparative Reports No. 43. Rockville, Maryland, USA:
ICF International. https://dhsprogram.com/publications/publication-CR43-Comparative-Reports.cfm
Staveteig, S., S. Wang, S.K. Head, S.E.K. Bradley, and E. Nybro. 2013. Demographic patterns of HIV testing
uptake in sub-Saharan Africa. DHS Comparative Reports No. 30. Calverton, Maryland, USA: ICF
International. https://dhsprogram.com/publications/publication-CR30-Comparative-Reports.cfm
Resources
DHS-7 Tabulation plan: Tables 13.7.1 and 13.7.2
API Indicator IDs:
Women:
HA_CPHT_W_KNW, HA_CPHT_W_ETR, HA_CPHT_W_ETN, HA_CPHT_W_NEV, HA_CPHT_W_EVT,
HA_CPHT_W_T1R
Men:

Guide to DHS Statistics 13.24 August 2018
HA_CPHT_M_KNW, HA_CPHT_M_ETR, HA_CPHT_M_ETN, HA_CPHT_M_NEV, HA_CPHT_M_EVT,
HA_CPHT_M_T1R
(API link, STATcompiler link)
MICS6 Indicator TM.32: People who know where to be tested for HIV
MICS6 Indicator TM.33: People who have been tested for HIV and know the results

Guide to DHS Statistics 13.25 August 2018
Pregnant Women Counseled and Tested for HIV
Percentage of women who received counseling on HIV during antenatal care; percentage
tested for HIV during antenatal care according to whether they received their test results
and post-test counseling; percentage who received counseling on HIV and an HIV test
during antenatal care and received the test result; and percentage who received an HIV
test during antenatal care or labor, according to whether they received the test result
Definition
1) Percentage of women age 15-49 who gave birth in the 2 years preceding the survey who
received counseling on HIV during antenatal care.
2) Percentage of women age 15-49 who gave birth in the 2 years preceding the survey who were
tested for HIV during antenatal care according to whether they received their test results and
post-test counseling.
3) Percentage of women age 15-49 who gave birth in the 2 years preceding the survey who
received counseling on HIV and an HIV test during antenatal care, and received the test result.
4) Percentage of women age 15-49 who gave birth in the 2 years preceding the survey who
received an HIV test during antenatal care or labor, according to whether they received the test
result.
Coverage:
Population base: Women who had a live birth in the two years preceding the survey (IR file)
Time period: During the pregnancy resulting in a live birth in the two years preceding the survey
Numerators:
1) Number of women who received counseling on HIV during antenatal care (ANC). In this context,
“counseling” means that someone talked with the respondent about all three of the following
topics: a) babies getting HIV from their mother, b) preventing the virus, and c) getting tested for
HIV (v838a = 1 & v838b = 1 & v838c = 1)
2) Number of women who received an HIV test, and:
Received the test result and received post-test counseling (v841 = 1 & v855 = 1)
Received the test result and did not receive post-test counseling (v841 = 1 & v855 ≠ 1)
Did not receive the test result (v841 ≠ 1)
3) Number of women who received counseling on HIV during ANC, received an HIV test during
ANC, and received the results of the test
(v838a = 1 & v838b = 1 & v838c = 1 & v840 = 1 & v841 = 1).
4) Number of women who received an HIV test during ANC or labor and
Received the result of the HIV test
((v840 = 1 | v840a = 1) & (v841 = 1 | v841a = 1))
Did not receive the result of the HIV test
((v840 = 1 | v840a = 1) & (v841 ≠ 1 & v841a ≠ 1))
Denominator: Number of women who had a live birth in the two years preceding the survey (v201 > 0 &
b19_1 < 24)

Guide to DHS Statistics 13.26 August 2018
Variables: IR file.
v201
Total children ever born
b19_1
Current age of child in months (months since birth for dead children)
v838a
During antenatal visit talked about: HIV transmitted mother to child
v838b
During antenatal visit talked about: things to do to prevent getting HIV
v838c
During antenatal visit talked about: getting tested for HIV
v840
Tested for HIV as part of antenatal visit
v840a
Tested for HIV between the time went for delivery and before baby was born
v841
Got results of HIV test as part of antenatal visit
v841a
Got results of HIV test when tested before baby was born
v855
Received counseling after tested for AIDS during antenatal care
v005
Woman’s individual sample weight
Calculation
The numerator divided by the denominator, expressed as a percentage.
Handling of Missing Values
Respondents who have missing values on the questions about testing, receiving the result, or receiving
post-test counseling are assumed not to have received these services.
Notes and Considerations
This indicator is about the pregnancy leading to a live birth in the two years preceding the survey. For
women with more than one live birth in the two years preceding the survey, these indicators report
information only for the pregnancy preceding the most recent live birth.
Resources
DHS-7 Tabulation plan: Table 13.8
API Indicator IDs:
HA_CATH_W_CSL, HA_CATH_W_TRC, HA_CATH_W_TNC, HA_CATH_W_NRS, HA_CATH_W_CTR,
HA_CATH_W_ATR, HA_CATH_W_ATN
(API link, STATcompiler link)
MICS6 Indicator TM.35a: HIV counselling during antenatal care – counselling on HIV
MICS6 Indicator TM.35b: HIV counselling during antenatal care – information or counselling on HIV after
receiving the HIV test results
MICS6 Indicator TM.36: HIV testing during antenatal care

Guide to DHS Statistics 13.27 August 2018
Male Circumcision
Percentage of men circumcised, and percent distribution of men according to circumcision
status and circumcision provider
Definition
1) Percentage of men age 15-49 circumcised.
2) Percent distribution of men age 15-49 according to circumcision status and circumcision
provider.
Coverage:
Population base: Men age 15-49 (MR file)
Time period: Current status at time of survey
Numerators:
1) Number of men age 15-49 who say “Yes” in response to the question “Some men are
circumcised, that is, the foreskin is completely removed from the penis. Are you circumcised?”
(mv483 = 1)
2) Number of men age 15-49 who:
Were circumcised by a health worker or health professional (mv483b = 2)
Were circumcised by a traditional practitioner, family member, or friend (mv483b = 1)
Were circumcised by another individual, who do not know who circumcised them, or for
whom information on person conducting the circumcision is missing (mv483b = 96, 98,
99)
Are not circumcised (mv483 = 0)
Do not know whether or not they are circumcised, or for whom information on
circumcision status is missing (mv483 = 8, 9)
Denominator: Number of men age 15-49
Variables: MR file.
mv483
Respondent circumcised
mv483b
Who performed the circumcision
mv005
Man’s individual sample weight
Calculation
The numerator divided by the denominator, expressed as a percentage. For each background category,
the numerator for each indicator is divided by the denominator of that background category and
multiplied by 100 to obtain percentages.
Numerators divided by denominators and quotient multiplied by 100 to get percent distribution and
percentages.

Guide to DHS Statistics 13.28 August 2018
Handling of Missing Values
“Don’t know” circumcision status or missing is included in the denominator and excluded from the
numerator (assumes not circumcised).
“Don’t know” circumcision status or missing is included in the denominator and as a separate category
in the percent distribution.
Notes and Considerations
The male circumcision indicator corresponds to UNAIDS Global AIDS Monitoring (GAM) indicator 3.16
“Prevalence of male circumcision”.
Changes over Time
Earlier questions on circumcision in the DHS standard questionnaire did not include the text defining
circumcision as complete removal of the foreskin. Earlier questionnaires did not include a question on
provider of circumcision.
References
UNAIDS. 2017. Global AIDS Monitoring 2018: Indicators for monitoring the 2016 United Nations Political
Declaration on Ending AIDS http://www.unaids.org/en/resources/documents/2018/Global-AIDS-
Monitoring
Resources
DHS-7 Tabulation plan: Table 13.9
API Indicator IDs: HA_MCRC_M_MCC
(API link, STATcompiler link)
UNAIDS Global AIDS Monitoring (GAM) Indicator 3.16: “Prevalence of male circumcision”
MICS6 Indicator TM.37: Male circumcision

Guide to DHS Statistics 13.29 August 2018
Prevalence of Sexually Transmitted Infections (STIs) and STI Symptoms
Percentage of women and men who had an STI in the past 12 months, had an abnormal
genital discharge in the past 12 months, had a genital sore or ulcer in the past 12 months,
had an STI or symptoms of an STI in the past 12 months
Definition
1) Percentage of women and men age 15-49 who had a sexually transmitted infection (STI) in the
past 12 months.
2) Percentage of women and men age 15-49 who had an abnormal (or bad-smelling) genital
discharge in the past 12 months.
3) Percentage of women and men age 15-49 who had a genital sore or ulcer in the past 12 months.
4) Percentage of women and men age 15-49 who had an STI or symptoms of an STI in the past 12
months.
Coverage:
Population base: Women and men age 15-49 who have ever had sexual intercourse (IR file, MR
file)
Time period: 12 months preceding the survey
Numerators:
1) Number of women (or men) age 15-49 who reported they had a disease they got through sexual
contact in the past 12 months (women: v763a = 1; men: mv763a = 1)
2) Number of women age 15-49 who report having a bad-smelling or abnormal genital discharge
(v763c = 1), or number of men age 15-49 who report having an abnormal discharge from the
penis in the past 12 months (mv763c = 1)
3) Number of women (or men) age 15-49 who report they had a genital sore or ulcer in the past 12
months (women: v763b = 1; men: mv763b = 1)
4) Number of women (or men) age 15-49 who report they had an STI, or a genital discharge, or a
genital sore or ulcer in the past 12 months (women: v763a = 1 or v763b = 1 or v763c = 1; men:
mv763a = 1 or mv763b = 1 or mv763c = 1)
Denominator: Number of women (or men) age 15-49 who ever had sexual intercourse (women: v525 ≠
0,99; men: mv525 ≠ 0,99)
Variables: IR file, MR file.
v525
Age at first sex (women)
v763a
Had any STI in last 12 months (women)
v763b
Had genital sore/ulcer in last 12 months (women)
v763c
Had genital discharge in last 12 months (women)
v005
Woman’s individual sample weight
mv525
Age at first sex (men)
mv763a
Had any STI in last 12 months (men)
mv763b
Had genital sore/ulcer in last 12 months (men)
mv763c
Had genital discharge in last 12 months (men)

Guide to DHS Statistics 13.30 August 2018
mv005
Man’s individual sample weight
Calculation
The numerator divided by the denominator, expressed as a percentage.
Respondents with an STI or symptoms of an STI are those with an affirmative response to any of the
following: self-reported STI, abnormal genital discharge, or genital sore/ulcer.
Handling of Missing Values
Those with missing responses on the question about age at first sex are assumed not to have had sexual
intercourse. Those with missing or “don’t know” responses on the questions about STI, genital
discharge, or genital sore/ulcer are included in the denominator but excluded from the numerator for
the corresponding indicator (assumed not to have an STI).
Notes and Considerations
All information is self-reported and does not reflect confirmed diagnosis of an STI. The question on self-
reported STI is asked only of respondents to answer “yes” to a preceding question about knowledge of
diseases that can be transmitted through sexual contact. Questions on genital discharge and genital
sore/ulcer are asked of all respondents.
Changes over Time
References
Kishor, S., and K. Johnson. "Reproductive health and domestic violence: Are the poorest women
uniquely disadvantaged?." Demography 43, no. 2 (2006): 293-307.
Resources
DHS-7 Tabulation plan: Table 13.10
API Indicator IDs:
Women: HA_STIS_W_STI, HA_STIS_W_DIS, HA_STIS_W_SOR, HA_STIS_W_AST
Men: HA_STIS_M_STI, HA_STIS_M_DIS, HA_STIS_M_SOR, HA_STIS_M_AST
(API link, STATcompiler link)

Guide to DHS Statistics 13.31 August 2018
Care-Seeking Behavior for Sexually Transmitted Infections (STI)
Among women and men who reported an STI or symptoms of an STI in the past 12 months,
the percentage who sought advice or treatment
Definition
Among women and men who reported a sexually transmitted infection (STI) or symptoms of an STI in
the past 12 months, the percentage who sought advice or treatment.
Coverage:
Population base: Women and men age 15-49 years (IR file, MR file)
Time period: 12 months preceding the survey interview
Numerators:
1) Number of women (or men) age 15-49 who sought advice or treatment from a
clinic/hospital/private doctor:
(women: any of v770a – l, n – s = 1; excludes pharmacy [usually v770m],
men: any of mv770a – l, n – s = 1; excludes pharmacy [usually mv770m])
2) Number of women (or men) age 15-49 who sought advice or treatment from a shop/pharmacy:
(women: v770m [pharmacy] = 1 or v770t [shop] = 1,
men: mv770m [pharmacy] = 1 or mv770t [shop] = 1)
3) Number of women (or men) age 15-49 who sought advice or treatment from any other source:
(women: v770u = 1 or v770v = 1 or v770w = 1 or v770x = 1,
men: mv770u = 1 or mv770v = 1 or mv770w = 1 or mv770x = 1)
4) Number of women (or men) age 15-49 who sought no advice or treatment:
(women: v770 = 0; men: mv770 = 0)
Denominator: Number of women (or men) age 15-49 with an STI or symptoms of an STI in the past 12
months (women: v763a = 1 or v763b = 1 or v763c = 1; men: mv763a = 1 or mv763b = 1 or mv763c = 1)
Variables: IR file, MR file.
v763a
Had any STI in last 12 months (women)
v763b
Had genital sore/ulcer in last 12 months (women)
v763c
Had genital discharge in last 12 months (women)
v770
Sought advice/treatment for last STI infection (women)
v770a
Sought STI advice/treatment from: government hospital
v770b
Sought STI advice/treatment from: CS public
v770c
Sought STI advice/treatment from: CS public
v770d
Sought STI advice/treatment from: CS public
v770e
Sought STI advice/treatment from: CS public
v770f
Sought STI advice/treatment from: CS public
v770g
Sought STI advice/treatment from: CS public
v770h
Sought STI advice/treatment from: CS public
v770i
Sought STI advice/treatment from: CS public
v770j
Sought STI advice/treatment from: CS public
v770k
Sought STI advice/treatment from: private hospital/clinic/doctor
Guide to DHS Statistics 13.32 August 2018
v770l
Sought STI advice/treatment from: CS private
v770m
Sought STI advice/treatment from: CS private (pharmacy)
v770n
Sought STI advice/treatment from: CS private
v770o
Sought STI advice/treatment from: CS private
v770p
Sought STI advice/treatment from: CS private
v770q
Sought STI advice/treatment from: CS private
v770r
Sought STI advice/treatment from: CS private
v770s
Sought STI advice/treatment from: CS private
v770t
Sought STI advice/treatment from: CS other (shop)
v770u
Sought STI advice/treatment from: CS other
v770v
Sought STI advice/treatment from: CS other
v770w
Sought STI advice/treatment from: CS other
v770x
Sought STI advice/treatment from: other
v005
Woman’s individual sample weight
mv763a
Had any STI in last 12 months (men)
mv763b
Had genital sore/ulcer in last 12 months (men)
mv763c
Had genital discharge in last 12 months (men)
mv770
Sought advice/treatment for last STI infection (men)
mv770a
Sought STI advice/treatment from: government hospital
mv770b
Sought STI advice/treatment from: CS public
mv770c
Sought STI advice/treatment from: CS public
mv770d
Sought STI advice/treatment from: CS public
mv770e
Sought STI advice/treatment from: CS public
mv770f
Sought STI advice/treatment from: CS public
mv770g
Sought STI advice/treatment from: CS public
mv770h
Sought STI advice/treatment from: CS public
mv770i
Sought STI advice/treatment from: CS public
mv770j
Sought STI advice/treatment from: CS public
mv770k
Sought STI advice/treatment from: private hospital/clinic/doctor
mv770l
Sought STI advice/treatment from: CS private
mv770m
Sought STI advice/treatment from: CS private (pharmacy)
mv770n
Sought STI advice/treatment from: CS private
mv770o
Sought STI advice/treatment from: CS private
mv770p
Sought STI advice/treatment from: CS private
mv770q
Sought STI advice/treatment from: CS private
mv770r
Sought STI advice/treatment from: CS private
mv770s
Sought STI advice/treatment from: CS private
mv770t
Sought STI advice/treatment from: CS other (shop)
mv770u
Sought STI advice/treatment from: CS other
mv770v
Sought STI advice/treatment from: CS other
mv770w
Sought STI advice/treatment from: CS other
mv770x
Sought STI advice/treatment from: other
mv005
Man’s individual sample weight
Calculation
Within each category of advice or treatment sought, and in the ‘No advice or treatment’ category, the
numerator divided by the denominator, expressed as a percentage.
Guide to DHS Statistics 13.33 August 2018
Handling of Missing Values
Missing values are assumed to reflect no advice or treatment sought (in the numerator) or no STI or
symptoms of STI (in the denominator). Respondents can also indicate “don’t know” about STI or STI
symptoms, which is counted as no STI or STI symptoms and therefore not included in the denominator.
Resources
DHS-7 Tabulation plan: Table 13.11

Guide to DHS Statistics 13.34 August 2018
Age at First Sexual Intercourse among Young People
Percentage of young women and men who had sexual intercourse before age 15 or age 18
Definition
1) Percentage of young women and young men age 15-24 who had sexual intercourse before age
15.
2) Percentage of young women and young men age 18-24 who had sexual intercourse before age
18.
Coverage:
Population base: Young women and men age 15-24 (IR file, MR file)
Time period: Current status at time of survey
Numerators:
1) Number of women (or men) age 15-24 who had sexual intercourse before age 15 (women: v012
in 15:24 & v531 in 1:14; men: mv012 in 15:24 & mv531 in 1:14)
2) Number of women (or men) age 18-24 who had sexual intercourse before age 18 (women: v012
in 18:24 & v531 in 1:17; men: mv012 in 18:24 & mv531 in 1:17)
Denominator:
1) Number of women (or men) age 15-24 (women: v012 in 15:24; men: mv012 in 15:24)
2) Number of women (or men) age 18-24 (women: v012 in 18:24; men: mv012 in 18:24)
Variables: IR file, MR file.
v012
Current age
v531
Age at first sex (imputed)
v005
Woman’s individual sample weight
mv012
Current age
mv531
Age at first sex (imputed)
mv005
Man’s individual sample weight
Calculation
The numerator divided by the denominator, expressed as a percentage.
Handling of Missing Values
Women and men with unknown and missing ages at first sexual intercourse are excluded from both the
denominator and the numerators.
Notes and Considerations
Age at first sexual intercourse is reported as age in completed years.

Guide to DHS Statistics 13.35 August 2018
Presented by age group, percentages are not calculated where the youngest member of the cohort
defined by the age group has not yet reached the specified age at which first sexual intercourse
occurred. For example, percentages for the cohort of women 20-24 at the time of the survey will not be
calculated for age group categories 15-17 or 15-19 because some women in those age groups who have
never had intercourse could still have their first intercourse before aging out of their age group
categories.
Resources
DHS-7 Tabulation plan: Table 13.13
API Indicator IDs:
Women: HA_AFSY_W_A15, HA_AFSY_W_A18
Men: HA_AFSY_M_A15, HA_AFSY_M_A18
(API link, STATcompiler link)
MICS6 Indicator TM.24: Sex before age 15 among young people

Guide to DHS Statistics 13.36 August 2018
Premarital Sexual Intercourse among Young People
Percentage of never-married young women and men who have never had sexual
intercourse
Definition
Percentage of never-married women and men age 15-24 who have never had sexual intercourse.
Coverage:
Population base: Never married women and men age 15-24 (IR file, MR file)
Time period: Current status at time of survey
Numerator: Number of never-married women (or men) age 15-24 who have never had sexual
intercourse (women: v012 in 15:24 & v501 = 0 & v525 ≠ 0,99; men: mv012 in 15:24 & mv501 = 0 &
mv525 ≠ 0,99)
Denominators: Number of never married women (or men) age 15-24 (women: v012 in 15:24 & v501 = 0;
men: mv012 in 15:24 & mv501 = 0)
Variables: IR file, MR file.
v012
Current age
v501
Current marital status
v525
Age at first sex
v005
Woman’s individual sample weight
mv012
Current age
mv501
Current marital status
mv525
Age at first sex
mv005
Man’s individual sample weight
Calculation
The numerator divided by the denominator, expressed as a percentage.
Handling of Missing Values
Missing values on age at first sex are considered as not having had sexual intercourse and are included
in both the numerator and denominator.
Resources
DHS-7 Tabulation plan: Table 13.14
API Indicator IDs: HA_PSXY_W_NSX, HA_PSXY_M_NSX
(API link, STATcompiler link)
Guide to DHS Statistics 13.37 August 2018
MICS6 Indicator TM.25: Young people who have never had sex

Guide to DHS Statistics 13.38 August 2018
Recent HIV Tests among Young People
Among young women and men age 15-24 who have had sexual intercourse in the past 12
months, percentage who have been tested for HIV in the past 12 months and received the
results
Definition
Among young women and men age 15-24 who have had sexual intercourse in the past 12 months,
percentage who have been tested for HIV in the past 12 months and received the results.
Coverage:
Population base: Sexually active young women and men age 15-24 (IR file, MR file)
Time period: 12 months preceding the survey interview
Numerator: Number of sexually active young women and men age 15-24 who were tested for HIV in the
past 12 months and received the result of their most recent HIV test
(women: v012 in 15:24 & v527 in 100:251,300:311 & v828 = 1 & v826a in 0:11,
men: mv012 in 15:24 & mv527 in 100:251,300:311 & mv828 = 1 & mv826a in 0:11)
Denominator: Number of women and men age 15-24 who had sexual intercourse in the past 12 months
(women: v012 in 15:24 & v527 in 100:251,300:311,
men: mv012 in 15:24 & mv527 in 100:251,300:311)
Variables: IR file, MR file.
v012
Current age (women)
v527
Time since last sex (women)
v828
Received result from last HIV test (women)
v826a
Months ago most recent HIV test (women)
v005
Woman’s individual sample weight
mv012
Current age (men)
mv527
Time since last sex (men)
mv828
Received result from last HIV test (men)
mv826a
Months ago most recent HIV test (men)
mv005
Man’s individual sample weight
Calculation
Numerator divided by the denominator, expressed as a percentage.
Handling of Missing Values
Missing values on time since last sex are excluded from the numerator and denominator. Missing values
on ever tested for HIV, received test result, or time since last test are included in the denominator and
excluded from the numerator.


Guide to DHS Statistics 13.40 August 2018
Self-Testing for HIV
Percentage of women and men who have ever heard of HIV self-test kits and percentage
who have ever used a self-test kit
Definition
1) Percentage of women and men age 15-49 who have ever heard of HIV self-test kits
2) Percentage of women and men age 15-49 who have ever used a self-test kit
HIV self-testing is a process in which a person collects her or his own specimen (oral fluid or blood) and
then performs a test and interprets the result, often in a private setting, either alone or in the presence
of a trusted individual (WHO, 2016).
Coverage:
Population base: Women and men age 15-49 (IR file, MR file)
Time period: Current status at time of survey
Numerators:
1) Number of women (or men) age 15-49 who have ever heard of HIV self-test kits
(women: v856 in 1:3; men: mv856 in 1:3)
2) Number of women (or men) age 15-49 who have ever used an HIV self-test kit
(women: v856 = 1; men: mv856 = 1)
Denominator: Number of women (or men) age 15-49
Variables: IR file, MR file.
v856
Knowledge and use of HIV test kits (women)
v005
Woman’s individual sample weight
mv856
Knowledge and use of HIV test kits (men)
mv005
Man’s individual sample weight
Calculation
Numerator divided by denominator, expressed as a percentage.
Handling of Missing Values
Missing values on the question about knowledge of HIV self-test kits is assumed to represent a lack of
knowledge and is excluded from the numerators but included in the denominator. If a “don’t know”
response is given to whether a test kit had been used it is assumed that a test kit has not been used.
Changes over Time
The questions on the use of HIV self-test kits were introduced in DHS-7.

Guide to DHS Statistics 13.41 August 2018
References
World Health Organization (WHO). 2016. Guidelines on self-testing and partner notification: Supplement
to consolidated guidelines on HIV testing services. Geneva: WHO. http://www.who.int/hiv/pub/self-
testing/hiv-self-testing-guidelines/en/
Resources
DHS-7 Tabulation plan: Table 13.17

Guide to DHS Statistics 14.1 August 2018
HIV Prevalence
This chapter is for surveys where HIV testing has been performed and is primarily based on respondents
who received the test. The first indicators are used to report the response rate of testing by background
characteristics. The remaining indicators report the HIV prevalence rates by social, economic,
demographic, and behavioral characteristics of the tested respondents, for all respondents and for
young people age 15-24 years. Separate indicators also assess the prevalence rate according to
circumcision of men, and to ascertain concordance in HIV status among couples.

Guide to DHS Statistics 14.2 August 2018
Coverage of HIV Testing
Percent distribution of women and men eligible for HIV testing
Definition
Percent distribution of women and men age 15-49 eligible for HIV testing who were tested, refused to
provide blood, were absent at the time of blood collection, or had other/missing results, by result of
individual interview.
Coverage:
Population base: Women and men age 15-49 eligible for HIV testing (PR file, AR file)
Time period: Current status at time of survey
Numerators: Number of women (or men) age 15-49 eligible for HIV testing who:
1) Were DBS tested (women: ha63 = 1 & hiv03 ≠ 8, na, men: hb63 = 1 & hiv03 ≠ 8, na)
2) Refused to provide blood (women: ha63 = 3, men: hb63 = 3)
3) Were absent at the time of blood collection (women: ha63 = 2, men: hb63=2)
4) Had other/missing results (women: ha63 in 4, 5, 6, 9 or hiv03 in 8, na, men: hb63 in 4, 5, 6, 9 or
hiv03 in 8, na)
By completeness of individual interview (women: ha65 = 1, men: hb65 = 1).
Numerator 1 includes women (or men) whose blood specimen completed the HIV testing algorithm for
the survey with a final HIV test result of positive, negative, indeterminate, or inconclusive.
Denominator: Number of de facto women (or men) age 15-49 eligible for HIV testing (household
selected for HIV testing and hv103 = 1). In some surveys, HIV testing is conducted in a sub-sample of
households, usually those selected for the men’s survey (hv027 = 1)
Variables: PR file, AR file.
hv001
Cluster number
hv002
Household number
hv027
Household selected for male interview
hvidx
Line number
hv103
Slept last night
ha63
Result of measurement – HIV (women)
ha65
Result of woman's individual interview
hb63
Result of measurement – HIV (men)
hb65
Result of man's individual interview
hivclust
Cluster
hivnumb
Household
hivline
Line
hiv03
Blood test result
Calculation
Guide to DHS Statistics 14.3 August 2018
The HIV test results data (AR file) should first be merged to the household members dataset (PR file) by
cluster number (hv001/hivclust), household number (hv002/hivnumb) and line number (hvidx/hivline).
Numerator 1) includes all blood specimens tested at the lab and for which there is a final result, i.e.,
positive, negative, or inconclusive. If the woman or man provided a blood specimen for HIV testing
(ha63 = 1 or hb63 = 1) but either there was no laboratory test result (hiv03 = na) or there was
insufficient sample to complete the testing protocol (hiv03 = 8) then the result of testing is updated
from numerator 1 (blood specimen tested) to numerator 4 (other/missing result).
Numerator 4) includes: 1) other results of blood collection (e.g., technical problem in the field), 2) lost
specimens, 3) non-corresponding bar codes, and 4) laboratory results such as blood not tested for
technical reason or not enough blood to complete the algorithm.
Quotient of the numerator divided by the denominator multiplied by 100.
Handling of Missing Values
Individuals who consented to the HIV test and provided a blood specimen for testing, but who do not
have a corresponding final HIV test result are considered “not tested”. They are excluded from the
denominator and numerator of the HIV prevalence estimate. Thus missing data on blood specimen
tested (ha63/hb63) are included in numerator 4 (other/missing result).
Notes and Considerations
HIV prevalence estimates for surveys conducted by The DHS Program are derived from centralized
laboratory testing on blood samples collected from respondents during the survey fieldwork. Response
rates are calculated among all persons listed in the household roster as de facto household members in
the age range defined as eligible for the survey interview and HIV testing. HIV testing is often conducted
in a subsample of selected households. The population eligible for survey interview and HIV testing in
this response rate is restricted to the population in households selected for the subsample with HIV
testing. This is often the same group of households in the subsample for male interview. As a general
rule, only those who agree to be interviewed, and successfully complete the interview, are offered HIV
testing.
Technical reasons for the absence of an HIV test result include a poor quality or insufficient blood
specimen that could not be tested or inability to link the individual tested with their HIV test result due
to loss of the specimen or incorrect labeling of the specimen.
The coverage of HIV testing indicators are produced unweighted as they reflect the coverage of the
survey, not a population estimate.
An overall HIV test response rate can be also calculated by multiplying the individual HIV response rate
by the response rate for the household interview.
The indicators are presented separately by sex and for both sexes combined. For both sexes combined
the data are restricted to women and men age 15-49.

Guide to DHS Statistics 14.4 August 2018
References
UNAIDS/WHO Working Group on Global HIV/AIDS and STI Surveillance. 2005. Guidelines for measuring
national HIV prevalence in population-based surveys. http://apps.who.int/iris/handle/10665/43349
World Health Organization (WHO). 2015. Consolidated Guidelines on HIV Testing Services. Geneva:
WHO. http://www.who.int/hiv/pub/guidelines/hiv-testing-services/en/
Resources
DHS-7 Tabulation plan: Tables 14.1 and 14.2
API Indicator IDs:
Women:
HA_CHVT_W_DBI, HA_CHVT_W_DBN, HA_CHVT_W_RFI, HA_CHVT_W_RFN, HA_CHVT_W_ABI,
HA_CHVT_W_ABN, HA_CHVT_W_OTI, HA_CHVT_W_OTN
(API link, STATcompiler link)
Men:
HA_CHVT_M_DBI, HA_CHVT_M_DBN, HA_CHVT_M_RFI, HA_CHVT_M_RFN, HA_CHVT_M_ABI,
HA_CHVT_M_ABN, HA_CHVT_M_OTI, HA_CHVT_M_OTN
(API link, STATcompiler link)
Both sexes:
HA_CHVT_B_DBI, HA_CHVT_B_DBN, HA_CHVT_B_RFI, HA_CHVT_B_RFN, HA_CHVT_B_ABI,
HA_CHVT_B_ABN, HA_CHVT_B_OTI, HA_CHVT_B_OTN
(API link, STATcompiler link)

Guide to DHS Statistics 14.5 August 2018
HIV Prevalence
Among women and men interviewed and tested, percentage HIV positive
Definition
For surveys without testing to distinguish between HIV-1 and HIV-2:
1) Among the de facto women age 15-49 and men age 15-49/54/59 who were interviewed and
tested, percentage HIV positive.
For surveys with testing to distinguish between HIV-1 and HIV-2:
2) Among the de facto women age 15-49 and men age 15-49/54/59 who were interviewed and
tested, percentage HIV-1 positive.
3) Among the de facto women age 15-49 and men age 15-49/54/59 who were interviewed and
tested, percentage HIV-2 positive.
4) Among the de facto women age 15-49 and men age 15-49/54/59 who were interviewed and
tested, percentage HIV-1 or HIV-2 positive.
Indicators are also calculated for young people age 15-24.
Coverage:
Population base: Women (or men) age 15-49 [15-49/54/59] interviewed and tested (IR file, MR
file, AR file)
Time period: Current status at time of survey
Numerators:
For surveys without testing to distinguish between HIV-1 and HIV-2:
1) Number of de facto women age 15-49 (or men 15-49/54/59) who are HIV positive (hiv03 = 1)
For surveys with testing to distinguish between HIV-1 and HIV-2:
2) Number of de facto women age 15-49 (or men 15-49/54/59) who are HIV-1 positive (hiv03 in 1,
3)
3) Number of de facto women age 15-49 (or men 15-49/54/59) who are HIV-2 positive (hiv03 = 2)
4) Number of de facto women age 15-49 (or men 15-49/54/59) who are HIV-1 or HIV-2 positive
(hiv03 in 1, 2, 3)
These are the number of women and men who completed an individual interview and whose blood
specimen completed the HIV testing algorithm for the survey with a final HIV test result of HIV positive.
Denominator: Number of de facto women age 15-49 (or men 15-49/54/59) interviewed and tested
(hiv03 in 0:7,9). This is the number of women and men who completed an individual interview, whose
blood specimen completed the HIV testing algorithm for the survey with a final HIV test result, i.e.,
positive, negative, indeterminate, or inconclusive
Variables: IR file, MR file, AR file.
v001
Cluster number (women)
v002
Household number (women)
v003
Line number (women)
mv001
Cluster number (men)
Guide to DHS Statistics 14.6 August 2018
mv002
Household number (men)
mv003
Line number (men)
hivclust
Cluster
hivnumb
Household
hivline
Line
hiv03
Blood test result
hiv05
HIV Sample weight
Calculation
The HIV test results data (AR file) should first be merged to the women’s dataset (IR file) or the men’s
dataset (MR file) by cluster number (v001/mv001/hivclust), household number (v002/mv002/hivnumb)
and line number (v003/mv003/hivline). This file also contains a sample weight variable with a separate
non-response adjustment for participation in the survey HIV test (HIV05).
Cases are weighted by the HIV sample weight (hiv05), not the women’s or men’s sample weights.
Quotient of the numerator divided by the denominator multiplied by 100.
Handling of Missing Values
Individuals who consented to the HIV test and provided a blood specimen for testing, but who do not
have a corresponding final HIV test result are considered “not tested”. They are excluded from the
denominator and numerator of the HIV prevalence estimate.
Notes and Considerations
The HIV prevalence reflects current HIV infection on the day the blood sample was taken. In surveys
which include both centralized laboratory testing for HIV and rapid testing for HIV in the household, the
survey prevalence is based on the results of the laboratory testing only.
For surveys with testing to distinguish between HIV-1 and HIV-2, only those tested and found positive
for HIV-1 (including those found positive for HIV-1 only, as well as those found positive for both HIV-1
and HIV-2, numerator 2) are included in tabulations except in DHS-7 table 14.3.
The indicators are presented separately by sex and for both sexes combined. For both sexes combined
the data are restricted to women and men age 15-49 (or 15-24 for indicators for young people).
Changes over Time
In the first three DHS surveys including HIV testing (Mali 2001, Dominican Republic 2001, and Zambia
2001-02), HIV test results cannot be linked to specific survey respondents. In all subsequent surveys, the
HIV status can be linked to an individual survey respondent.
In surveys from 2003-2014, The DHS Program used the HIV testing algorithm consistent with that
published in the 2005 UNAIDS/WHO Guidelines for measuring national HIV prevalence in population-
based surveys. In surveys starting in 2015, The DHS Program used a new HIV testing algorithm based on

Guide to DHS Statistics 14.7 August 2018
the 2015 WHO HIV testing guidelines (WHO, 2015). Two significant changes include (1) specimens with
discrepant results on the first two HIV tests are no-longer rendered positive by a third “tie-breaker”
assay, and (2) all specimens with positive results on the first two HIV assays now receive a third
“confirmatory” assay, and are rendered positive only if the third assay is also positive.
The change in algorithm can impact the integrity of trends in HIV prevalence over time. Specifically, the
change in the HIV testing algorithm can augment decreases in HIV prevalence, or moderate increases.
The degree to which the trend is impacted is difficult to assess quantitatively and depends on the quality
of the HIV testing in the particular surveys in question.
References
UNAIDS/WHO Working Group on Global HIV/AIDS and STI Surveillance. 2005. Guidelines for measuring
national HIV prevalence in population-based surveys. http://apps.who.int/iris/handle/10665/43349
World Health Organization (WHO). 2015. Consolidated Guidelines on HIV Testing Services. Geneva:
WHO. http://www.who.int/hiv/pub/guidelines/hiv-testing-services/en/
Resources
DHS-7 Tabulation plan: Tables 14.3, 14.4, 14.5, 14.6, 14.7, 14.8, and 14.9
API Indicator IDs:
Women:
HA_HIVP_W_HIV, HA_HIVP_W_HVE, HA_HIVP_W_HVR, HA_HIVP_W_HVL, HA_HIVP_W_HVU,
HA_HIVY_W_HIV, HA_HIVY_W_HVE, HA_HIVY_W_HVR, HA_HIVY_W_HVL, HA_HIVY_W_HVU
(API link, STATcompiler link)
Men:
HA_HIVP_M_HIV, HA_HIVP_M_HVE, HA_HIVP_M_HVR, HA_HIVP_M_HVL, HA_HIVP_M_HVU,
HA_HIVY_M_HIV, HA_HIVY_M_HVE, HA_HIVY_M_HVR, HA_HIVY_M_HVL, HA_HIVY_M_HVU
(API link, STATcompiler link)
Both sexes:
HA_HIVP_B_HIV, HA_HIVP_B_HVE, HA_HIVP_B_HVR, HA_HIVP_B_HVL, HA_HIVP_B_HVU,
HA_HIVY_B_HIV, HA_HIVY_B_HVE, HA_HIVY_B_HVR, HA_HIVY_B_HVL, HA_HIVY_B_HVU
(API link, STATcompiler link)
WHO 100 Core Health Indicators: HIV prevalence rate

Guide to DHS Statistics 14.8 August 2018
Prior HIV Testing
Percent distribution of women and men who tested HIV positive and who tested HIV
negative according to HIV testing status prior to the survey
Definition
1) Percent distribution of women and men age 15-49 who tested HIV positive according to HIV
testing status prior to the survey.
2) Percent distribution of women and men age 15-49 who tested HIV negative according to HIV
testing status prior to the survey.
Coverage:
Population base: Women (or men) age 15-49 tested for HIV in the survey blood test, according
to HIV testing status prior to the survey (IR file, MR file, AR file)
Time period: Current status at time of survey
Numerators:
1) Number of women (or men) age 15-49 who tested HIV positive (hiv03 = 1, 3) in the survey blood
test, according to HIV testing status prior to the survey
2) Number of women (or men) age 15-49 who tested HIV negative (hiv03 in 0, 2, 7, 9) in the survey
blood test, according to HIV testing status prior to the survey
HIV testing status prior to the survey is defined as:
a) Ever tested for HIV and received the result of the most recent test (women: v781 = 1 & v828
= 1, men: mv781 = 1 & mv828 = 1):
Tested in the past 12 months and received the result (women: v781 = 1 & v826a < 12 &
v828 = 1, men: mv781 = 1 & mv826a < 12 & mv828 = 1)
Tested 12 or more months ago and received the result (women: v781 = 1 & v826a >= 12
& v828 = 1, men: mv781 = 1 & mv826a >= 12 & mv828 = 1)
b) Ever tested for HIV and did not receive the result of the most recent test (women: v781 = 1
& v828 ≠ 1, men: mv781 = 1 & mv828 ≠ 1)
c) Not previously tested (women: v781 ≠ 1, men: mv781 ≠ 1)
Denominators:
1) Number of women (or men) age 15-49 who tested HIV positive (hiv03 in 1, 3) in the survey
blood test
2) Number of women (or men) age 15-49 who tested HIV negative (hiv03 in 0, 2, 7, 9) in the survey
blood test
Variables: IR file, MR file, AR file.
v001
Cluster number (women)
v002
Household number (women)
v003
Line number (women)
v781
Ever been tested for HIV (women)
v826a
Months ago most recent HIV test (women)

Guide to DHS Statistics 14.9 August 2018
v828
Received result from last HIV test (women)
mv001
Cluster number (men)
mv002
Household number (men)
mv003
Line number (men)
mv781
Ever been tested for HIV (men)
mv826a
Months ago most recent HIV test (men)
mv828
Received result from last HIV test (men)
hivclust
Cluster
hivnumb
Household
hivline
Line
hiv03
Blood test result
hiv05
HIV Sample weight
Calculation
The HIV test results data (AR file) should first be merged to the women’s dataset (IR file) or the men’s
dataset (MR file) by cluster number (v001/mv001/hivclust), household number (v002/mv002/hivnumb)
and line number (v003/mv003/hivline). Cases are weighted by the HIV sample weight (hiv05), not the
women’s or men’s sample weights.
Numerator divided by the denominator multiplied by 100.
Handling of Missing Values
Missing data or “don’t know” responses on whether tested for HIV are treated as never tested. Missing
data or “don’t know” responses on whether received results are treated as having not received results.
Missing data and “don’t know” responses for the time since the last test are treated as being 12 or more
months before the survey.
Notes and Considerations
For surveys with testing to distinguish between HIV-1 and HIV-2, only those tested and found positive
for HIV-1 (including those found positive for HIV-1 only, as well as those found positive for both HIV-1
and HIV-2) are considered as HIV positive in these indicators.
Resources
DHS-7 Tabulation plan: Table 14.10
API Indicator IDs:
Women: HA_PHVT_W_PTD, HA_PHVT_W_PTR, HA_PHVT_W_PTN, HA_PHVT_W_NPT, HA_PHVT_W_DKM
(API link, STATcompiler link)
Men: HA_PHVT_M_PTD, HA_PHVT_M_PTR, HA_PHVT_M_PTN, HA_PHVT_M_NPT, HA_PHVT_M_DKM
(API link, STATcompiler link)
Both sexes: HA_PHVT_B_PTD, HA_PHVT_B_PTR, HA_PHVT_B_PTN, HA_PHVT_B_NPT, HA_PHVT_B_DKM
(API link, STATcompiler link)

Guide to DHS Statistics 14.10 August 2018
HIV Prevalence by Male Circumcision
Among men who were tested for HIV, percentage HIV positive by circumcision status
Definition
Among men age 15-49 who were tested for HIV the percentage of:
1) Men circumcised by a health professional who were HIV positive.
2) Men circumcised by a traditional practitioner, family or friend who were HIV positive.
3) All men circumcised who were HIV positive.
4) All uncircumcised men who were HIV positive.
Coverage:
Population base: Men age 15-49 who were tested for HIV (MR file, AR file)
Time period: Current status at time of survey
Numerators:
1) Number of men age 15-49 who were circumcised by a health professional and are HIV positive
according to the survey blood test (mv483 = 1 & mv483b = 2 & hiv03 = 1, 3)
2) Number of men age 15-49 who were circumcised by a traditional practitioner, family or friend,
and are HIV positive according to the survey blood test (mv483 = 1 & mv483b = 1 & hiv03 = 1, 3)
3) Number of men age 15-49 who are circumcised and are HIV positive according to the survey
blood test (mv483 = 1 & hiv03 = 1, 3)
4) Number of men age 15-49 who are uncircumcised and are HIV positive according to the survey
blood test (mv483 ≠ 1 & hiv03 = 1, 3)
Denominators:
1) Number of men age 15-49 who were tested for HIV in the survey and were circumcised by a
health professional (mv483 = 1 & mv483b = 2 & hiv03 in 0:7,9)
2) Number of men age 15-49 who were tested for HIV in the survey and were circumcised by a
traditional practitioner, family or friend (mv483 = 1 & mv483b = 1 & hiv03 in 0:7,9)
3) Number of men age 15-49 who were tested for HIV in the survey and are circumcised
(mv483 = 1 & hiv03 = in 0:7,9)
4) Number of men age 15-49 who were tested for HIV in the survey and are uncircumcised (mv483
≠ 1 & hiv03 = in 0:7,9)
Variables: MR file, AR file.
mv001
Cluster number
mv002
Household number
mv003
Line number
mv483
Respondent circumcised
mv483b
Who performed circumcision
hivclust
Cluster
hivnumb
Household
hivline
Line
hiv03
Blood test result

Guide to DHS Statistics 14.11 August 2018
hiv05
HIV Sample weight
Calculation
The HIV test results data (AR file) should first be merged to the men’s dataset (MR file) by cluster
number (mv001/hivclust), household number (mv002/hivnumb) and line number (mv003/hivline).
Cases are weighted by the HIV sample weight (hiv05), not the men’s sample weights.
Numerator divided by the denominator multiplied by 100.
Handling of Missing Values
Missing data and “don’t know” responses on whether the man is circumcised are treated as not
circumcised. Missing data and “don’t know” responses on who performed the circumcision are excluded
from numerators 1 and 2, but included in numerator 3 in addition to those reporting other practitioners.
Notes and Considerations
Numerator 3 includes all men who report they are circumcised, including men circumcised by medical or
traditional practitioners. It also includes those circumcised by other practitioners, those who don't know
what practitioner performed their circumcision, and those who did not report a practitioner of
circumcision.
For surveys with testing to distinguish between HIV-1 and HIV-2, only those tested and found positive
for HIV-1 (including those found positive for HIV-1 only, as well as those found positive for both HIV-1
and HIV-2) are considered as HIV positive in these indicators.
Resources
DHS-7 Tabulation plan: Table 14.11
API Indicator IDs: HA_HPMC_M_HVC, HA_HPMC_M_HVU
(API link, STATcompiler link)

Guide to DHS Statistics 14.12 August 2018
HIV Prevalence among Couples
Percent distribution of couples living in the same household by HIV status
Definition
Percent distribution of couples living in the same household, both of whom were tested for HIV in the
survey, by HIV status of each partner.
Coverage:
Population base: Couples living in the same household, both of whom were tested for HIV (CR
file, AR file).
Time period: Current status at time of survey.
Numerators: Number of couples living in the same household where:
1) Both were HIV positive (w_hiv03 in 1:3 & m_hiv03 in 1:3)
2) The man was HIV positive and the woman was HIV negative (w_hiv03 ≠ 1:3 & m_hiv03 in 1:3)
3) The woman was HIV positive and the man was HIV negative (w_hiv03 in 1:3 & m_hiv03 ≠ 1:3)
4) Both were HIV negative (w_hiv03 ≠ 1:3 & m_hiv03 ≠ 1:3)
See Calculation below for creation of w_hiv03 and m_hiv03.
Denominator: Number of couples living in the same household, both of whom were tested for HIV
(w_hiv03 in 0:7, 9 & m_hiv03 in 0:7, 9)
Variables: CR file, AR file.
v001
Cluster number (women)
v002
Household number (women)
v003
Line number (women)
mv001
Cluster number (men)
mv002
Household number (men)
mv003
Line number (men)
hivclust
Cluster
hivnumb
Household
hivline
Line
hiv03
Blood test result
hiv05
HIV Sample weight
Calculation
The HIV test results data (AR file) should first be merged to the data for the female member of the
couple in the CR file by cluster number (v001/hivclust), household number (v002/hivnumb) and line
number (v003/hivline), merging in just the HIV test results variable (hiv03). The merged variables hiv03
should be renamed as w_hiv03. Then merge the AR file to the data for the male member of the couple
in the CR file by cluster number (mv001/hivclust), household number (mv002/hivnumb) and line number
(mv003/hivline), merging in the HIV test results variable (hiv03) and the HIV sample weight (hiv05). The

Guide to DHS Statistics 14.13 August 2018
merged variables hiv03 should be renamed as m_hiv03. See Matching and Merging Datasets in Chapter
1.
Cases are weighted by the HIV sample weight from the man’s HIV test results data (hiv05), not the
women’s or men’s sample weights.
Quotient of the numerator divided by the denominator multiplied by 100.
Notes and Considerations
The couples recode (CR file) contains a dataset of merged variables combining data from the women’s
dataset (IR file) and the men’s dataset (MR file). The data are merged on the following variables: Cluster
number (v001/mv001), household number (v002/mv002) and husband’s/man’s line number
(v034/mv003). Note that the husband’s line number (v034) from the women’s data is matched to the
man’s line number (mv003) in the men’s data.
Changes over Time
In DHS-7, for surveys with testing to distinguish between HIV-1 and HIV-2, those found positive for
either HIV-1 or HIV-2 are considered as HIV positive in these indicators.
Prior to DHS-7, for surveys with testing to distinguish between HIV-1 and HIV-2, only those tested and
found positive for HIV-1 (including those found positive for HIV-1 only, as well as those found positive
for both HIV-1 and HIV-2) are considered as HIV positive in these indicators.
Resources
DHS-7 Tabulation plan: Table 14.12
API Indicator IDs: HA_HPAC_B_CPP, HA_HPAC_B_CPN, HA_HPAC_B_CNP, HA_HPAC_B_CNN
(API link, STATcompiler link)

Guide to DHS Statistics 15.1 August 2018
Women’s Empowerment
This chapter provides indicators of women’s empowerment, develops two empowerment indices, and
relates those indices to select demographic and health outcomes.
The DHS Woman’s Questionnaire collects data on the general background characteristics of female
respondents (e.g., age, education, wealth quintile and employment status) and also data more specific
related to women’s empowerment such as receipt of cash earnings, the magnitude of a woman’s
earnings relative to those of her husband, control over the use of a her own earnings and those of her
husband. The chapter includes indicators of woman’s empowerment according to the general
background characteristics of female respondents.
The Woman’s Questionnaire also collects data on a woman’s participation in household decision making
and on her attitude toward wife beating. Two separate indices of empowerment are developed based
on the number of household decisions in which the respondent participates and her opinion on the
number of reasons that justify wife beating. The ranking of women on these two indices can then be
related to selected demographic and health outcomes including contraceptive use, ideal family size and
unmet need for contraception as well as the receipt of health care services during pregnancy, at delivery
and in the postnatal period, and the mortality of children.

Guide to DHS Statistics 15.2 August 2018
Employment and Cash Earnings
Percentage of currently married women and men employed in the past 12 months, and
percent distribution of currently married women and men employed in the past 12 months
by type of earnings
Definition
1) Percentage of currently married women and men age 15-49 who were employed at any time in
the past 12 months.
2) Percent distribution of currently married women and men employed in the past 12 months by
type of earnings.
Coverage:
Population base: Currently married women (or men) age 15-49 (IR file, MR file)
Time period: 12 months preceding the survey
Numerators:
1) Number of currently married women (or men) age 15-49 who were employed at any time in the
past 12 months (women: v502 = 1 & v731 in 1:3; men: mv502 = 1 & mv731 in 1:3)
2) Number of currently married women (or men) age 15-49 who were employed at any time in the
past 12 months distributed by type of earnings (cash only, cash and in-kind, in-kind only, not
paid, missing) (women: v502 = 1 & v731 in 1:3 & v741 = 1/2/3/0/9; men: mv502 = 1 & mv731 in
1:3 & mv741 = 1/2/3/0/9)
Denominators:
1) Number of currently married women (or men) age 15-49 (women: v502 = 1; men: mv502 = 1)
2) Number of currently married women (or men) age 15-49 employed in the past 12 months
(women: v502 = 1 & v731 in 1:3; men: mv502 = 1 & mv731 in 1:3)
Variables: IR file, MR file.
v502
Currently/formerly/never in union
v731
Respondent worked in last 12 months (women)
v741
Type of earnings from respondent's work (women)
v005
Women's sample weight
mv502
Currently/formerly/never in union
mv731
Worked in last 12 months (men)
mv741
Type of earnings from respondent's work (men)
mv005
Men's sample weight
Calculation
Quotient of the numerators divided by the denominators multiplied by 100.

Guide to DHS Statistics 15.3 August 2018
Handling of Missing Values
Missing and “don’t know” responses on whether worked in last 12 months are excluded from both
numerator and denominator. Missing and “don’t know” responses on type of earnings are reported in a
separate category in the percent distribution.
Changes over Time
There have been no significant changes over time in the questions that contribute to this indicator or
the indicator.
Resources
DHS-7 Tabulation plan: Table 15.1
API Indicator IDs:
Women:
EM_EMPM_W_EMP, EM_ERNM_W_CSH, EM_ERNM_W_CAK, EM_ERNM_W_KND, EM_ERNM_W_NPD, EM_ERNM_W_DKM
Men:
EM_EMPM_M_EMP, EM_ERNM_M_CSH, EM_ERNM_M_CAK, EM_ERNM_M_KND, EM_ERNM_M_NPD, EM_ERNM_M_DKM
(API link, STATcompiler link)

Guide to DHS Statistics 15.4 August 2018
Control over Women’s Cash Earnings
Percent distribution of currently married women who received cash earnings for
employment in the 12 months preceding the survey by person who decides how wife’s
cash earnings are used, and percent distribution by whether she earned more or less than
her husband
Definition
1) Percent distribution of currently married women age 15-49 who received cash earnings for
employment in the 12 months preceding the survey by person who decides how wife’s cash
earnings are used.
2) Percent distribution of currently married women age 15-49 by whether she earned more, the
same, or less than her husband.
Coverage:
Population base: Currently married women age 15-49 (IR file)
Time period: 12 months preceding the survey
Numerators:
1) Number of currently married women age 15-49 who received cash earnings for employment in
the 12 months preceding the survey distributed by person who decides how wife’s cash earnings
are used (mainly wife, wife and husband, mainly husband, other, missing) (v739 = 1/2/4/3,5,6/9)
2) Number of currently married women age 15-49 who received cash earnings for employment in
the 12 months distributed by whether she earned more or less than her husband (more, less,
about the same, husband has no earnings, don’t know, missing) (v746 = 1/2/3/4/8/9 or (for
category 4, v743f = 7))
Denominator: Number of currently married women age 15-49 employed in the past 12 months who
received cash earnings (v731 in 1:3 & v741 in 1,2)
Variables: IR file.
v502
Currently/formerly/never in union
v731
Respondent worked in last 12 months
v739
Person who usually decides how to spend respondent's earnings
v741
Type of earnings from respondent's work
v743f
Person who usually decides what to do with money husband earns (7 = Husband/
partner has no earnings)
v746
Respondent earns more than husband/partner
v005
Women's sample weight
Calculation
Quotient of the numerators divided by the denominator multiplied by 100.

Guide to DHS Statistics 15.5 August 2018
Handling of Missing Values
Missing and “don’t know” responses on whether worked in last 12 months or whether paid in cash are
excluded from both numerator and denominator. Missing and “don’t know” responses on how wife’s
earnings are spent, or wife’s cash earnings compared with husband’s cash earnings are reported in
separate categories in the percent distribution.
Notes and Considerations Assumptions
Employed women who received cash earnings includes women who were paid in cash only and women
paid in cash and kind.
Changes over Time
There have been no significant changes over time in the questions that contribute to this indicator or
the indicator.
References
Jennings, L., M. Na, M. Cherewick, M. Hindin, B. Mullany, and S. Ahmed. 2014. "Women’s empowerment
and male involvement in antenatal care: analyses of Demographic and Health Surveys (DHS) in selected
African countries." BMC pregnancy and childbirth 14, no. 1: 297.
Resources
DHS-7 Tabulation plan: Tables 15.2.1 and 15.3
API Indicator IDs:
EM_WERN_W_WIF, EM_WERN_W_JNT, EM_WERN_W_HUS, EM_WERN_W_OTH, EM_WERN_W_DKM
EM_RERN_W_MOR, EM_RERN_W_LES, EM_RERN_W_SAM, EM_RERN_W_NON, EM_RERN_W_DKM
(API link, STATcompiler link)

Guide to DHS Statistics 15.6 August 2018
Control over Men’s Cash Earnings
Percent distribution of currently married men who receive cash earnings by person who
decides how husband’s cash earnings are used, and percent distribution of currently
married women whose husbands receive cash earnings, by person who decides how
husband’s cash earnings are used
Definition
1) Percent distribution of currently married men age 15-49 who receive cash earnings by person
who decides how husband’s cash earnings are used.
2) Percent distribution of currently married women age 15-49 whose husbands receive cash
earnings, by person who decides how husband’s cash earnings are used.
Coverage:
Population base: Number of currently married men and women age 15-49 (MR file, IR file)
Time period: 12 months preceding the survey
Numerators:
1) Number of currently married men age 15-49 who received cash earnings (mainly wife, wife and
husband, mainly husband, other, missing) (mv739 = 4/2/1/3,5,6/9)
2) Number of currently married women age 15-49 who received cash earnings (mainly wife, wife
and husband, mainly husband, other, missing) (v743f = 1/2/4/3,5,6/9)
Denominators:
1) Number of currently married men age 15-49 who receive cash earnings for work in the past 12
months (mv502 = 1 & mv731 in 1:3 & mv741 in 1:2)
2) Number of currently married women age 15-49 whose husband received cash earnings in the
past 12 months (v502 = 1 & v746 ≠ 4 & v743f ≠ 7)
Variables: MR file, IR file.
mv502
Currently/formerly/never in union
mv731
Respondent worked in last 12 months (men)
mv739
Person who usually decides how to spend respondent's earnings (men)
mv741
Type of earnings from respondent's work (men)
mv005
Men's sample weight
v502
Currently/formerly/never in union
v743f
Person who usually decides what to do with money husband earns (women)
v746
Respondent earns more than husband/partner (women)
v005
Women's sample weight
Calculation
Quotient of the numerators divided by the denominator multiplied by 100.

Guide to DHS Statistics 15.7 August 2018
Handling of Missing Values
Missing and “don’t know” responses on whether worked in last 12 months or whether paid in cash are
excluded from both numerator and denominator. Missing and “don’t know” responses on how
husband’s earnings are spent are reported in a separate category in the percent distribution.
Notes and Considerations Assumptions
Employed women and men who received cash earnings includes women and men who were paid in cash
only or were paid in cash and kind.
References
Jennings, L., M. Na, M. Cherewick, M. Hindin, B. Mullany, and S. Ahmed. 2014. "Women’s empowerment
and male involvement in antenatal care: analyses of Demographic and Health Surveys (DHS) in selected
African countries." BMC pregnancy and childbirth 14, no. 1: 297.
Resources
DHS-7 Tabulation plan: Tables 15.2.2 and 15.3
API Indicator IDs:
Women: EM_MERN_W_WIF, EM_MERN_W_JNT, EM_MERN_W_HUS, EM_MERN_W_OTH, EM_MERN_W_DKM
Men: EM_MERN_M_WIF, EM_MERN_M_JNT, EM_MERN_M_HUS, EM_MERN_M_OTH, EM_MERN_M_DKM
(API link, STATcompiler link)

Guide to DHS Statistics 15.8 August 2018
Ownership of Assets
Percent distribution of women and men by ownership of housing and land
Definition
1) Percent distribution of women and men age 15-49 by ownership of housing.
2) Percent distribution of women and men age 15-49 by ownership of land.
Coverage:
Population base: Women and men age 15-49 (IR file, MR file)
Time period: Current status at time of survey
Numerators:
1) Number of women (or men) age 15-49 by ownership of housing (alone, jointly, alone and jointly,
do not own a house, missing) (women: v745a = 1/2/3/0/9; men: mv745a = 1/2/3/0/9)
2) Number of women (or men) age 15-49 by ownership of land (alone, jointly, alone and jointly, do
not own a house, missing) (women: v745b = 1/2/3/0/9; men: mv745b = 1/2/3/0/9)
Denominator: Number of women (or men) age 15-49
Variables: IR file, MR file.
v745a
Owns a house alone or jointly
v745b
Owns land alone or jointly
v005
Women's sample weight
mv745a
Owns a house alone or jointly
mv745b
Owns land alone or jointly
mv005
Men's sample weight
Calculation
Quotient of the numerators divided by the denominator multiplied by 100.
Handling of Missing Values
Missing values for ownership of housing or land are included in separate categories in the percent
distribution.
References
Doss, C., C. Kovarik, A. Peterman, A. Quisumbing, and M. van den Bold. 2015 "Gender inequalities in
ownership and control of land in Africa: myth and reality." Agricultural Economics 46, no. 3: 403-434.
Kieran, C., K. Sproule, C. Doss, A. Quisumbing, and S. Mi Kim. 2015. "Examining gender inequalities in
land rights indicators in Asia." Agricultural Economics 46, no. S1: 119-138.

Guide to DHS Statistics 15.9 August 2018
Resources
DHS-7 Tabulation plan: Table 15.4.1 and 15.4.2
API Indicator IDs:
Women:
WE_OWNA_W_HAL, WE_OWNA_W_HJN, WE_OWNA_W_HAJ, WE_OWNA_W_HNO, WE_OWNA_W_HDK
WE_OWNA_W_LAL, WE_OWNA_W_LJN, WE_OWNA_W_LAJ, WE_OWNA_W_LNO, WE_OWNA_W_LDK
(API link, STATcompiler link)
Men:
WE_OWNA_M_HAL, WE_OWNA_M_HJN, WE_OWNA_M_HAJ, WE_OWNA_M_HNO, WE_OWNA_M_HDK
WE_OWNA_M_LAL, WE_OWNA_M_LJN, WE_OWNA_M_LAJ, WE_OWNA_M_LNO, WE_OWNA_M_LDK
(API link, STATcompiler link)

Guide to DHS Statistics 15.10 August 2018
Ownership of Title or Deed for House or Land
Percent distribution of women (or men) who own a house or own land by whether the
house or land owned has a title or deed, and whether or not the woman/man's name
appears on the title or deed
Definition
1) Among women and men age 15-49 who own a house, percent distribution by whether the
house owned has a title or deed and whether or not the woman's (or man’s) name appears on
the title or deed.
2) Among women and men age 15-49 who own land, percent distribution by whether the land
owned has a title or deed and whether or not the woman's (or man’s) name appears on the title
or deed.
Coverage:
Population base: Women (or men) age 15-49 who own a house or own land (IR file, MR file)
Time period: Current status at time of survey
Numerators:
1) Number of women (or men) who own a house by whether the house owned has a title or deed:
a) If so whether or not the woman’s (or man’s) name appears on the title or deed (women:
v745c = 1, 2; men: mv745c = 1, 2)
b) Does not have a title deed (women: v745c = 0; men: mv745c = 0)
c) Don’t know/missing (women: v745c in 3,8,9; men: mv745c in 3,8,9)
2) Number of women (or men) who own land by whether the land owned has a title or deed:
a) If so whether or not the woman’s (or man’s) name appears on the title or deed (women:
v745d = 1, 2; men: mv745d = 1, 2)
b) Does not have a title deed (women: v745d = 0; men: mv745d = 0)
c) Don’t know/missing (women: v745d in 3,8,9; men: mv745d in 3,8,9)
Denominators:
1) Number of women (or men) age 15-49 who own a house (women: v745a in 1:3; men: mv745a in
1:3)
2) Number of women (or men) age 15-49 who own land (women: v745b in 1:3; men: mv745b in
1:3)
Variables: IR file, MR file.
v745a
Owns a house alone or jointly (women)
v745b
Owns land alone or jointly (women)
v745c
Title deed on house own by respondent (women)
v745d
Title deed on land own by respondent (women)
v005
Women's sample weight
mv745a
Owns a house alone or jointly (men)
mv745b
Owns land alone or jointly (men)
mv745c
Title deed on house own by respondent (men)

Guide to DHS Statistics 15.11 August 2018
mv745d
Title deed on land own by respondent (men)
mv005
Men's sample weight
Calculation
Numerators divided by denominator multiplied by 100.
Handling of Missing Values
Missing values for ownership of title of housing or land are include in separate categories in the percent
distribution.
References
Jennings, L., M. Na, M. Cherewick, M. Hindin, B. Mullany, and S. Ahmed. 2014. "Women’s empowerment
and male involvement in antenatal care: analyses of Demographic and Health Surveys (DHS) in selected
African countries." BMC pregnancy and childbirth 14, no. 1: 297.
Resources
DHS-7 Tabulation plan: Tables 15.5.1, 15.5.2, 15.6.1 and 15.6.2

Guide to DHS Statistics 15.12 August 2018
Ownership and Use of Bank Accounts and Mobile Phones
Percentage of women and men who use an account in a bank or other financial institution
and percentage who own a mobile phone, and among women and men who own a mobile
phone, percentage who use it for financial transactions
Definition
1) Percentage of women and men age 15-49 who use an account in a bank or other financial
institution.
2) Percentage of women and men age 15-49 who own a mobile phone.
3) Percentage of women and men age 15-49 women (or men) who own a mobile phone, who use it
for financial transactions.
Coverage:
Population base: Women and men age 15-49 (IR file, MR file)
Time period: Current status at time of survey
Numerators:
1) Number of women (or men) age 15-49 who use an account in a bank or other financial
institution (women: v170 = 1; men: mv170 = 1)
2) Number of women (or men) age 15-49 who own a mobile phone (women: v169a = 1; men:
mv169a = 1)
3) Among women (or men) age 15-49 who own a mobile phone, percentage who use it for
financial transactions (women: v169a = 1 & v169b = 1; men: mv169a = 1 & mv169b = 1)
Denominators:
1) Number of women (or men) age 15-49
2) Number of women (or men) age 15-49
3) Number of women (or men) age 15-49 who own a mobile phone (women: v169a = 1; men:
mv169a = 1)
Variables: IR file, MR file.
v170
Has an account in a bank or other financial institution (women)
v169a
Owns a mobile telephone (women)
v169b
Use mobile telephone for financial transactions (women)
v005
Women's sample weight
mv170
Has an account in a bank or other financial institution (men)
mv169a
Owns a mobile telephone (men)
mv169b
Use mobile telephone for financial transactions (men)
mv005
Men's sample weight
Calculation
Numerators divided by denominator multiplied by 100.
Guide to DHS Statistics 15.13 August 2018
Handling of Missing Values
Missing values on ownership of a bank account or a mobile phone are assumed to indicate a lack of the
asset and are excluded from the numerator for the first two indicators and from both the numerator
and the denominator for the third indicator. Missing values on use of a mobile phone for financial
transactions are excluded from the numerator of the third indicator.
Resources
DHS-7 Tabulation plan: Table 15.7.1 and 15.7.2

Guide to DHS Statistics 15.14 August 2018
Participation in Decision Making
Percent distribution of currently married women and men by person who usually makes
decisions about various issues
Definition
Percent distribution of currently married women (or men) age 15-49 by person who usually makes
decisions about:
1) Own health care.
2) Large household purchases.
3) Visits to family or relatives.
Coverage:
Population base: Currently married women (or men) and currently married men age 15-49 (IR
file, MR file)
Time period: Current status at time of survey
Numerators: Number of currently married women (or men) age 15-49 by person who usually makes
decisions about:
1) Own health care (women: v743a; men: mv743a)
2) Large household purchases (women: v743b; men: mv743b)
3) Visits to family or relatives (women: v743d)
Denominator: Number of currently married women (or men) age 15-49 (women: v502 = 1; men: mv502
= 1)
Variables: IR file, MR file.
v743a
Person who should have greater say: respondent's health care (women)
v743b
Person who should have greater say: large household purchases (women)
v743d
Person who usually decides on visits to family or relatives (women)
v005
Women's sample weight
mv743a
Person who should have greater say: respondent's health care (men)
mv743b
Person who should have greater say: large household purchases (men)
mv005
Men's sample weight
Calculation
Quotient of the numerators divided by the denominator multiplied by 100.
Handling of Missing Values
Missing values for person who usually makes decisions about each of the issues is included in a separate
category in the percent distribution.

Guide to DHS Statistics 15.15 August 2018
Notes and Considerations
The question on who makes decisions about visits to family or relatives is only asked to women so does
not apply for men.
Changes over Time
When these questions were first introduced into the DHS standard questionnaire, they were asked from
both married and unmarried women. From about 2004, the questions were restricted to only currently
married women. In addition, till about 2014, women were also asked who usually made decisions about
making daily household purchases. This decision item was removed from the questionnaire in the 2014
questionnaire revision.
From about 2004, the standard Man’s Questionnaire had a question that asked men “In a couple who do
you think should have the greater say in each of the following decisions: the husband, the wife, or both
equally” followed by five different types of decisions. This set of questions was asked of both married
and unmarried men, and was meant to capture men’s gender role attitudes and not what actually
happens in a household. In the 2014 revision of the questionnaire, this set of questions was dropped
and was replaced by the same questions that are asked of women on who usually makes decisions in the
household. As for women, the questions were restricted to only currently married men.
References
Hanmer, L., and J. Klugman. 2016 "Exploring women's agency and empowerment in developing
countries: Where do we stand?." Feminist Economics 22, no. 1: 237-263.
Kishor, S. and L. Subaiya. 2008. Understanding Women’s Empowerment: A Comparative Analysis of
Demographic and Health Surveys (DHS) Data. DHS Comparative Reports No. 20. Calverton, Maryland,
USA: Macro International Inc. https://dhsprogram.com/publications/publication-cr20-comparative-
reports.cfm
Jennings, L., M. Na, M. Cherewick, M. Hindin, B. Mullany, and S. Ahmed. 2014. "Women’s empowerment
and male involvement in antenatal care: analyses of Demographic and Health Surveys (DHS) in selected
African countries." BMC pregnancy and childbirth 14, no. 1: 297.
Resources
DHS-7 Tabulation plan: Table 15.8
API Indicator IDs:
Women:
WE_DMKH_W_WIF, WE_DMKH_W_JNT, WE_DMKH_W_HUS, WE_DMKH_W_ELS, WE_DMKH_W_OTH, WE_DMKH_W_DKM,
WE_DMKP_W_WIF, WE_DMKP_W_JNT, WE_DMKP_W_HUS, WE_DMKP_W_ELS, WE_DMKP_W_OTH, WE_DMKP_W_DKM,
WE_DMKV_W_WIF, WE_DMKV_W_JNT, WE_DMKV_W_HUS, WE_DMKV_W_ELS, WE_DMKV_W_OTH, WE_DMKV_W_DKM
(API link, STATcompiler link)
Men:
WE_DMKH_M_WIF, WE_DMKH_M_JNT, WE_DMKH_M_HUS, WE_DMKH_M_ELS, WE_DMKH_M_OTH, WE_DMKH_M_DKM,
WE_DMKP_M_WIF, WE_DMKP_M_JNT, WE_DMKP_M_HUS, WE_DMKP_M_ELS, WE_DMKP_M_OTH, WE_DMKP_M_DKM
(API link, STATcompiler link)
Guide to DHS Statistics 15.16 August 2018
Percentage of currently married women and men who usually make specific decisions
either alone or jointly with their husband/wife
Definition
Percentage of currently married women and men age 15-49 who usually make specific decisions either
alone or jointly with their husband or wife for:
1) Own health care.
2) Large household purchases.
3) Visits to family or relatives.
4) All three (or two [men]) decisions.
5) None of the decisions.
Coverage:
Population base: Currently married women (or men) age 15-49 (IR file, MR file)
Time period: Current status at time of survey
Numerators: Number of currently married women (or men) age 15-49 who usually make specific
decisions alone or jointly with their husband (or wife) for:
1) Own health care (women: v743a in 1,2; men: mv743a in 1,2)
2) Large household purchases (women: v743b in 1,2; men: mv743b in 1,2)
3) Visits to family or relatives (women: v743d in 1,2; men: mv743d in 1,2)
4) All three decisions (women: v743a in 1,2 & v743b in 1,2 & v743d in 1,2; men: mv743a in 1,2 &
mv743b in 1,2)
5) None of the decisions (women: v743a ≠ 1,2 & v743b ≠ 1,2 & v743d ≠ 1,2; men: mv743a ≠ 1,2 &
mv743b ≠ 1,2)
Denominator: Number of currently married women (or men) age 15-49 (women: v502 = 1; men: mv502
= 1)
Variables: IR file, MR file.
v743a
Person who usually decides on respondent's health care (women)
v743b
Person who usually decides on large household purchases (women)
v743d
Person who usually decides on visits to family or relatives (women)
v005
Women's sample weight
mv743a
Person who usually decides on respondent's health care (men)
mv743b
Person who usually decides on large household purchases (men)
mv005
Men's sample weight
Calculation
Quotient of the numerators divided by the denominator multiplied by 100.
Handling of Missing Values

Guide to DHS Statistics 15.17 August 2018
Missing values on who usually make specific decisions are assumed to be someone other than the
respondent and are excluded from the numerators for the first four indicators but may be included in
numerator for the fifth indicator.
Changes over Time
See Participation in Decision Making for Changes over Time.
References
Kishor, S., and L. Subaiya. 2008. Understanding Women’s Empowerment: A Comparative
Analysis of Demographic and Health Surveys (DHS) Data. DHS Comparative Reports No. 20. Calverton,
Maryland, USA: Macro International Inc.
https://www.dhsprogram.com/publications/publication-CR20-Comparative-Reports.cfm
Resources
DHS-7 Tabulation plan: Tables 15.9.1 and 15.9.2
Kishor, S., Ed. 2005. A Focus on Gender: Collected Papers on Gender Using DHS Data. Calverton,
Maryland, USA: ORC Macro.
https://www.dhsprogram.com/publications/publication-OD32-Other-Documents.cfm
API Indicator IDs:
Women: WE_DMAK_W_OHC, WE_DMAK_W_MPC, WE_DMAK_W_FAM, WE_DMAK_W_3DC, WE_DMAK_W_NON
Men: WE_DMAK_M_OHC, WE_DMAK_M_MPC, WE_DMAK_M_2DC, WE_DMAK_M_NON
(API link, STATcompiler link)

Guide to DHS Statistics 15.18 August 2018
Attitude towards Wife Beating
Percentage of all women and men who agree that a husband is justified in hitting or
beating his wife for specific reasons
Definition
Percentage of all women and men age 15-49 who agree that a husband is justified in hitting or beating
his wife for specific reasons:
1) Burning food.
2) Arguing with him.
3) Going out without telling him.
4) Neglecting the children.
5) Refusing to have sexual intercourse with him.
6) At least one reason.
Coverage:
Population base: All women (or men) age 15-49 (IR file, MR file)
Time period: Current status at time of survey
Numerators: Number of women (or men) age 15-49 who agree that a husband is justified in hitting or
beating his wife for:
1) Burning food (women: v744e = 1; men: mv744e = 1)
2) Arguing with him (women: v744c = 1; men: mv744c = 1)
3) Going out without telling him (women: v744a = 1; men: mv744a = 1)
4) Neglecting the children (women: v744b = 1; men: mv744b = 1)
5) Refusing to have sexual intercourse with him (women: v744d = 1; men: mv744d = 1)
6) At least one reason (women: any of v744a – e = 1; men: any of mv744a – e = 1)
Denominator: Number of women (or men) age 15-49
Variables: IR file, MR file.
v744a
Beating justified if wife argues with husband (women)
v744b
Beating justified if wife neglects the children (women)
v744c
Beating justified if wife goes out without telling husband (women)
v744d
Beating justified if wife refuses to have sex with husband (women)
v744e
Beating justified if wife burns the food (women)
v005
Women's sample weight
mv744a
Beating justified if wife argues with husband (men)
mv744b
Beating justified if wife neglects the children (men)
mv744c
Beating justified if wife goes out without telling husband (men)
mv744d
Beating justified if wife refuses to have sex with husband (men)
mv744e
Beating justified if wife burns the food (men)
mv005
Men's sample weight

Guide to DHS Statistics 15.19 August 2018
Calculation
Quotient of the numerators divided by the denominator multiplied by 100.
Handling of Missing Values
Missing values on attitudes towards wife beating are excluded from the numerator but included in the
denominator.
Changes over Time
The list of reasons and/or wording of specified reasons justifying wife beating has varied over time.
Some countries also add more reasons and some countries modify the wording of the standard reasons.
In some surveys the questions are only asked to married women or men.
References
Asaolu, I., H. Alaofè, J.K.L. Gunn, A. Adu, A. Monroy, J. Ehiri, M.H. Hayden, and K. Ernst. 2018.
"Measuring Women’s Empowerment in sub-Saharan Africa: Exploratory and Confirmatory Factor
Analyses of the Demographic and Health Surveys." Frontiers in psychology 9: 994.
Hanmer, L., and J. Klugman. 2016 "Exploring women's agency and empowerment in developing
countries: Where do we stand?". Feminist Economics 22, no. 1: 237-263.
Kishor, S., and L. Subaiya. 2008. Understanding Women’s Empowerment: A Comparative Analysis of
Demographic and Health Surveys (DHS) Data. DHS Comparative Reports No. 20. Calverton, Maryland,
USA: Macro International Inc. https://dhsprogram.com/publications/publication-cr20-comparative-
reports.cfm
Jennings, L., M. Na, M. Cherewick, M. Hindin, B. Mullany, and S. Ahmed. 2014. "Women’s empowerment
and male involvement in antenatal care: analyses of Demographic and Health Surveys (DHS) in selected
African countries." BMC pregnancy and childbirth 14, no. 1: 297.
Resources
DHS-7 Tabulation plan: Tables 15.10.1 and 15.10.2
API Indicator IDs:
Women:
WE_AWBT_W_BFD, WE_AWBT_W_ARG, WE_AWBT_W_OUT, WE_AWBT_W_NEG, WE_AWBT_W_REF,
WE_AWBT_W_AGR
Men:
WE_AWBT_M_BFD, WE_AWBT_M_ARG, WE_AWBT_M_OUT, WE_AWBT_M_NEG, WE_AWBT_M_REF, WE_AWBT_M_AGR
(API link, STATcompiler link)
MICS6 Indicator PR.15: Attitudes towards domestic violence

Guide to DHS Statistics 15.20 August 2018
Attitudes towards Negotiating Safer Sexual Relations with Husband
Percentage of women and men who believe that a woman is justified in refusing to have
sexual intercourse with her husband if she knows that he has sexual intercourse with other
women, and percentage who believe that a woman is justified in asking that they use a
condom if she knows that her husband has a sexually transmitted infection (STI)
Definition
1) Percentage of women and men age 15-49 who believe that a woman is justified in refusing to
have sexual intercourse with her husband if she knows that he has sexual intercourse with other
women.
2) Percentage of women and men age 15-49 who believe that a woman is justified in asking that
they use a condom if she knows that her husband has a sexually transmitted infection (STI).
Coverage:
Population base: Women (or men) age 15-49 (IR file, MR file)
Time period: Current status at time of survey
Numerators:
1) Number of women (or men) age 15-49 who believe that a woman is justified in refusing to have
sexual intercourse with her husband if she knows that he has sexual intercourse with other
women (women: v633b = 1; men: mv633b = 1)
2) Number of women (or men) age 15-49 who believe that a woman is justified in asking that they
use a condom if she knows that her husband has a sexually transmitted infection (STI) (women:
v822 = 1; men: mv822 = 1)
Denominator: Number of women (or men) age 15-49
Variables: IR file, MR file.
v633b
Wife justified refusing sex: husband has other women (women)
v822
Wife justified asking husband to use condom if he has STI (women)
v005
Women's sample weight
mv633b
Wife justified refusing sex: husband has other women (men)
mv822
Wife justified asking husband to use condom if he has STI (men)
mv005
Men's sample weight
Calculation
Quotient of the numerators divided by the denominator multiplied by 100.
Handling of Missing Values
Missing values on attitudes towards negotiating safer sexual relations with husband are excluded from
the numerator but included in the denominator.

Guide to DHS Statistics 15.21 August 2018
Changes over Time
The number of reasons for a wife to justify refusing sexual intercourse to her husband that have been
included in the standard DHS questionnaire has changed over time and was reduced to two in the 2014
revision of the questionnaire. It was also about this time that these questions began to be asked from
men.
References
Hanmer, L., and J. Klugman. 2016 "Exploring women's agency and empowerment in developing
countries: Where do we stand?". Feminist Economics 22, no. 1: 237-263.
Kishor, S., and L. Subaiya. 2008. Understanding Women’s Empowerment: A Comparative Analysis of
Demographic and Health Surveys (DHS) Data. DHS Comparative Reports No. 20. Calverton, Maryland,
USA: Macro International Inc. https://dhsprogram.com/publications/publication-cr20-comparative-
reports.cfm
Resources
DHS-7 Tabulation plan: Table 15.11
API Indicator IDs: WE_JRSX_W_SEX, WE_JRSX_W_STI
(API link, STATcompiler link)

Guide to DHS Statistics 15.22 August 2018
Ability to Negotiate Sexual Relations with Husband
Percentage of currently married women who can say no to their husband if they do not
want to have sexual intercourse, and percentage who can ask their husband to use a
condom
Definition
1) Percentage of currently married women age 15-49 who can say no to their husband if they do
not want to have sexual intercourse.
2) Percentage of currently married women age 15-49 who can ask their husband to use a condom.
Coverage:
Population base: Currently married women age 15-49 (IR file)
Time period: Current status at time of survey
Numerators:
1) Currently married women age 15-49 who can say no to their husband if they do not want to
have sexual intercourse (v502 = 1 & v850a = 1)
2) Currently married women age 15-49 who can ask their husband to use a condom (v502 = 1 &
v850b = 1)
Denominator: Number of currently married women age 15-49 (v502 = 1)
Variables: IR file.
v502
Currently/formerly/never in union
v850a
Respondent can refuse sex
v850b
Respondent can ask partner to use a condom
v005
Women's sample weight
Calculation
Quotient of the numerators divided by the denominator multiplied by 100.
Handling of Missing Values
Missing values on whether the respondent is able to negotiate safer sexual relations are excluded from
the numerator but included in the denominator.
Changes over Time
Although several surveys have included these or similar questions over time, they became standard in
the DHS only at the time of the 2008 questionnaire revision.

Guide to DHS Statistics 15.23 August 2018
References
Hanmer, L., and J. Klugman. 2016 "Exploring women's agency and empowerment in developing
countries: Where do we stand?". Feminist Economics 22, no. 1: 237-263.
Kishor, S., and L. Subaiya. 2008. Understanding Women’s Empowerment: A Comparative Analysis of
Demographic and Health Surveys (DHS) Data. DHS Comparative Reports No. 20. Calverton, Maryland,
USA: Macro International Inc. https://dhsprogram.com/publications/publication-cr20-comparative-
reports.cfm
Resources
DHS-7 Tabulation plan: Table 15.12

Guide to DHS Statistics 15.24 August 2018
Indicators of Women’s Empowerment
Percentage of currently married women who participate in all decision making, and
percentage who disagree with all of the reasons justifying wife-beating
Definition
1) Percentage of currently married women age 15-49 who usually make all three specific decisions
either alone or jointly with their husband for:
a) Own health care.
b) Large household purchases.
c) Visits to family or relatives.
2) Percentage of currently married women age 15-49 who disagree with all of the specific reasons
justifying wife-beating:
a) Burning food.
b) Arguing with him.
c) Going out without telling him.
d) Neglecting the children.
e) Refusing to have sexual intercourse with him.
Coverage:
Population base: Currently married women age 15-49 (IR file, MR file)
Time period: Current status at time of survey
Numerators:
1) Number of currently married women age 15-49 who usually make specific decisions alone or
jointly with their husband for:
a) Own health care (v743a in 1,2), and
b) Large household purchases (v743b in 1,2), and
c) Visits to family or relatives (v743d in 1,2)
2) Number of currently married women age 15-49 (v502 = 1) who disagree with all of the specific
reasons justifying wife-beating:
a) Burning food (v744e ≠ 1), and
b) Arguing with him (v744c ≠ 1), and
c) Going out without telling him (v744a ≠ 1), and
d) Neglecting the children (v744b ≠ 1), and
e) Refusing to have sexual intercourse with him (v744d ≠ 1)
Denominator: Number of currently married women age 15-49 (v502 = 1)
Variables: IR file, MR file.
v743a
Person who usually decides on respondent's health care (women)
v743b
Person who usually decides on large household purchases (women)
v743d
Person who usually decides on visits to family or relatives (women)
v744a
Beating justified if wife argues with husband (women)
v744b
Beating justified if wife neglects the children (women)

Guide to DHS Statistics 15.25 August 2018
v744c
Beating justified if wife goes out without telling husband (women)
v744d
Beating justified if wife refuses to have sex with husband (women)
v744e
Beating justified if wife burns the food (women)
v005
Women's sample weight
Calculation
Quotient of the numerators divided by the denominator multiplied by 100.
Handling of Missing Values
Missing values on who usually make specific decisions are assumed to be someone other than the
respondent and are excluded from the numerators. Missing values on attitudes towards wife beating
are assumed to not be agreeing and are included from the numerators and the denominator.
Notes and Considerations
See Notes and Considerations for Participation in Decision Making and Attitude towards Wife Beating.
Changes over Time
See Changes over Time for Participation in Decision Making and Attitude towards Wife Beating.
References
Kishor, S., and L. Subaiya. 2008. Understanding Women’s Empowerment: A Comparative Analysis of
Demographic and Health Surveys (DHS) Data. DHS Comparative Reports No. 20. Calverton, Maryland,
USA: Macro International Inc. https://dhsprogram.com/publications/publication-cr20-comparative-
reports.cfm
Resources
DHS-7 Tabulation plan: Table 15.13
API Indicator IDs: WE_EMPW_W_DMK, WE_WMPW_W_DWB
(API link, STATcompiler link)

Guide to DHS Statistics 16.1 August 2018
Adult and Maternal Mortality
This chapter presents indicators for the calculation of adult mortality rates for both sexes, and for both
pregnancy-related and maternal mortality rates and ratios for women. Indicators of age-specific rates
are provided for the adult mortality rates and the pregnancy-related and maternal mortality rates, as
well as age-standardized total rates. The difference between pregnancy-related mortality and maternal
mortality is described in Notes and Considerations for Age-specific pregnancy-related and maternal
mortality rates, and total pregnancy-related and maternal mortality rate.
In addition to indicators for adult mortality rates for 5-year age groups, the chapter also includes a
summary measure (35q15) that represents the probability of a person dying between exact ages 15 and
50—that is, between his or her 15th and 50th birthdays.
Indicators for the pregnancy-related mortality ratio and the maternal mortality ratio are given, as well as
indicators for the lifetime risk or pregnancy-related and maternal mortality.
The chapter provides indicators estimated from sibling history data collected in the sibling survival
module (commonly referred to as the adult and maternal mortality module) that is part of the Woman’s
Questionnaire. The adult and maternal mortality module is an optional module and data are only
available for surveys that included this module. It is recommended that the module be used in surveys
no more frequently than every ten years.

Guide to DHS Statistics 16.2 August 2018
Adult Mortality Rates
Age-specific adult mortality rates, and age 15-49 mortality rate
Definition
1) Age-specific adult mortality rates.
2) Age 15-49 years total mortality rate.
Coverage:
Population base: Women and men age 15-49 years (IR file)
Time period: Seven-year periods preceding the survey, excluding the month of interview.
Typically, 0-6 years preceding the survey (v008-1 to v008-84), but other time periods may also
be calculated such as 7-13 years, 0-13 years, 0-10 years preceding the survey. Description below
is for 0-6 years preceding the survey
Numerator:
Number of siblings of respondents who died in the period 0-6 years prior to the interview by five-year
age group at time of death, disaggregated by sex.
Deaths are tabulated according to period of death and the age of sibling at the time of the death:
Period of death: The period of death is calculated as the difference in months between the date
of interview and the date of death of the sibling, both in century month code (CMC) format.
Deaths of siblings are included if they occurred within the period of interest (v008-84 <= mm8
<= v008-1).
Age of sibling at the time of the death: The difference in months between the date of death of
the sibling and the date of birth of the sibling, both in CMC. The difference is then divided by 60
and truncated to whole numbers to form the age groups ( int( ( m8 - m4 ) / 60 ) ). Deaths are
tabulated by age group.
Denominator:
Number of person-years of exposure of siblings of respondents during the period 0-6 years prior to the
survey by five-year age group, disaggregated by sex.
Person-years of exposure are calculated as the sum of the number of months exposed in the five-year
age group during the time period divided by 12. A sibling can contribute exposure to two or three five-
year age groups during an 84-month period.
Variables: IR file.
v008
CMC Date of interview
mm1
Sex of sibling
mm2
Survival status of sibling
mm4
Sibling's date of birth (CMC)
mm8
Date of death of sibling (CMC)
Guide to DHS Statistics 16.3 August 2018
v005
Women's individual sample weight
Calculation
The data for the calculating adult mortality are based on reports of siblings from the survey
respondents, collected in the sibling history. The sibling history is stored as part of the individual recode
dataset (IR file). Before using the sibling history it is necessary to transform the sibling history data into
a dataset where the sibling, rather than the survey respondent, is the unit of analysis. In Stata this is
done with the reshape long command and in SPSS with the varstocases command.
Period:
First determine the limits of the time period and the total exposure in the time period. The limits for the
0-6 year period are the date of interview minus 60 months and the date of interview minus one month
(lowlim = v008 - 84, upplim = v008 - 1). If the sibling had died the upper limit is replaced with the date
of death of the sibling (upplim = mm8 if mm2 = 0). The total exposure is the difference between the
upper and lower limits plus one month (exposure = upplim - lowlim + 1). If the total exposure is negative
because the sibling died before the start of the period the total exposure is 0 (exposure = 0 if exposure <
0), and the sibling will not be included in the numerator or denominator.
Numerator (deaths):
For each dead sibling:
Number of deaths of siblings in the period (death1 = (mm2 = 0 & exposure > 0)).
Age at death is determined directly from the response by classification into 5 year age groups
(agegroup = int( ( m8 - m4 ) / 60 )).
Period of death is determined by using the sibling’s date of death.
Deaths at ages less than 15 years (agegroup < 3) or more than 49 years (agegroup > 9) are not tabulated
as are deaths occurring earlier or later than the period (lowlim <= mm8 <= upplim).
Denominator (exposure):
The exposure in each age group is then calculated for each of up to 3 five-year age groups (for periods of
up to 10 years – beyond 10 years additional age groups would be needed).
Highest age group:
A surviving sibling’s age at the end of the period determines the highest age group. The highest
age group is calculated by subtracting the sibling’s date of birth from the upper limit of the
period (for 0-6 year period this is the date of interview minus one in CMC), dividing the
difference by 60 and truncating to a whole number (agegrp1 = int( (upplim - mm4) / 60), where
upplim = v008 - 1. For dead siblings this will be the same as agegroup above).
The exposure or number of months spent in the highest age group is the difference in months
between the age at the end of the period of exposure (date of interview less one month) and
the lower age limit of the age group plus one month (expo1 = upplim - (mm4 + agegrp1*60) + 1).
If the sibling had died, the total exposure may be reduced as some exposure occurred outside
the period of interest – the exposure for the age group is reduced to the total exposure (expo1 =
min(exposure, expo1)).
The remaining exposure is the total exposure minus the exposure in the highest age group
(rem_exposure = exposure - expo1).
Guide to DHS Statistics 16.4 August 2018
Middle age group:
A surviving sibling’s age at the end of the period less 60 months determines the middle age
group (agegrp2 = agegrp1 - 1). The middle age group can also be calculated by subtracting the
sibling’s date of birth from the end of the period minus 60 months (date of interview minus 61
in CMC), dividing the difference by 60 and truncating to a whole number (agegrp2 = int( (upplim
- 60 - mm4) / 60), however the first calculation is simpler and is mathematically identical.
The exposure or number of months spent in the middle age group is the difference in months
between the age at the end of the period of exposure less 60 months (date of interview minus
61 months for living siblings) and the lower age limit of the age group plus one month. More
easily, the exposure is the minimum of the remaining exposure and 60 (expo2 =
min(rem_exposure, 60)).
If the sum of number of months exposed in both the highest and middle age groups is less than
84, then the sibling contributes exposure to both the middle age group and the lowest age
group. The remaining exposure is the total exposure minus the exposure in the highest and
middle age groups, or just the remaining exposure after the highest age group minus the
exposure in the middle age group (rem_exposure = rem_exposure - expo2).
Lowest age group:
The lowest age group is one less than the middle age group (agegrp3 = agegrp2 - 1).
The contribution to the lowest age group is just the remaining exposure (expo3 =
rem_exposure).
For other periods (7-13 years and 0-13 years prior to survey): The limits of the periods and the durations
of the periods are adjusted accordingly. For the 0-13 year period, there are two middle age groups.
Tabulation: Each sibling is tabulated up to three times, once according to her/his highest age group
accumulating the exposure she/he contributes to that group, once in the middle age group
accumulating middle age group exposure, and once in the lowest age group accumulating lowest age
group exposure. In Stata and SPSS this can be achieved by transforming the sibling history data into a
dataset of age groups using reshape long in Stata or varstocases in SPSS, and counting the deaths in the
highest age group (death1, setting death2 = 0 and death3 = 0 for the middle and lower age groups)
before transforming the data.
For ever-married samples, all women factors are applied in the tabulation of both the numerators and
the denominators.
Once the numerators and denominators are properly established, age-specific mortality rates are
obtained by the division of the numerators by the corresponding denominators and multiplying by 1000.
The general mortality rate for age 15-49 is obtained by multiplying the age-specific mortality rates by
the proportion of respondents in the five-year age group and then summing the age-distribution-
adjusted mortality rates.
Guide to DHS Statistics 16.5 August 2018
Example: Calculation of working variables for individual siblings based on DHS model dataset
sibling
mm1
mm2
mm4
mm8
lowlim
upplim
exposure
agegrp1
expo1
death1
agegrp2
expo2
agegrp3
expo3
1
1
1
876
1302
1385
84
8
30
0
7
54
6
0
2
1
1
912
1302
1385
84
7
54
0
6
30
5
0
3
1
1
960
1302
1385
84
7
6
0
6
60
5
18
4
2
1
1044
1302
1385
84
5
42
0
4
42
3
0
5
2
1
1068
1302
1385
84
5
18
0
4
60
3
6
6
1
1
1080
1302
1385
84
5
6
0
4
60
3
18
7
2
0
1111
1356
1302
1356
55
4
6
1
3
49
2
0
8
2
1
1056
1302
1385
84
5
30
0
4
54
3
0
9
1
1
1092
1302
1385
84
4
54
0
3
30
2
0
10
1
1
1152
1302
1385
84
3
54
0
2
30
1
0
The above example provides the results of the calculations of the working variables for the first 10
records in the DHS model IR dataset, based on a date of interview (v008) of June 2015 (cmc 1386). The
total exposure is 84 months for all siblings except those that have died. In the example, the 7th sibling
died in December 2012 (mm8 = 1356), and was only exposed 55 months in the period. For the 1st case
the sibling contributes 30 months in age group 8 (40-44), and 54 months in age group 7 (35-39). The 3rd
case contributes 6 months in age group 7 (35-39), 60 months in age group 6 (30-34) and 18 months in
age group 5 (25-29). The 7th case contributes 6 months and 1 death in age group 4 (20-24) and 49
months in age group 3 (15-19).
To tabulate the deaths and exposure by age group and sex, the age group, exposure and death data
above is transformed into a file by age group as below, selecting only age groups 3 – 9 to exclude any
exposure outside of the age range 15-49.
sibling
index
sex
agegrp
expo
death
1
1
1
8
30
0
1
2
1
7
54
0
1
3
1
6
0
0
…
…
…
…
…
…
6
1
1
5
6
0
6
2
1
4
60
0
6
3
1
3
18
0
7
1
0
4
6
1
7
2
0
3
49
0
…
…
…
…
…
…
From this file the deaths and exposure at each age group and sex are tabulated and the adult mortality
rate is calculated as the ratio of the deaths over the exposure.
Handling of Missing Values
Siblings whose sex or survival status is missing or unknown to the respondent are excluded from both
numerators and denominators. Dates of birth are calculated from current age for living siblings and age
at death and number of years ago sibling died for dead siblings. Dates of birth and death are imputed
where age, age at death, or number of years ago is missing or unknown, taking into consideration the
sibling’s birth order.

Guide to DHS Statistics 16.6 August 2018
Notes and Considerations
The DHS adult and maternal mortality questionnaire module collects information from respondents
(female and, in some surveys, male) about all of their siblings born to the same mother, starting with the
oldest. For living siblings, the upper and lower bounds of the date of birth in the recode data file are
calculated by subtracting the age from the date of interview for the upper bound, and the upper bound
minus 11 months for the lower bound. For dead siblings, the upper and lower bounds of the date of
birth are calculated by subtracting the sum of the responses on age at death and the number of years
ago the death occurred from the date of interview for the upper bound, and the upper bound minus 23
months for the lower bound. To calculate the upper and lower bound of the date of death, the number
of years ago the death occurred is subtracted from the date of interview for the upper bound, and the
upper bound minus 11 months for the lower bound. After these calculations, month of date of birth and
date of death are assigned by midpoint imputation between lower and upper bounds of the dates
calculated and making sure that the birth order and minimum birth intervals are maintained between
dates of birth of the siblings.
The age distribution of siblings is very different than the age distribution of the population since only
eligible women (and in some surveys, men) can report on their siblings. For example, if a girl or boy is
sixteen years old and has only siblings younger than 15 years, she or he will not be represented. The
same holds true at the upper end of the eligible age range. Thus, the age distribution of siblings is a
curve with minimums at the ends of the eligible age range of respondents and a maximum at about the
midpoint of the eligible age range (30 to 35 years). In order to properly calculate general or total rates,
age-specific rates must be adjusted to a more representative age distribution. The distribution of
respondents is used for this adjustment.
One might think that the calculation of mortality rates is biased because the (living) respondent is not
included. Similarly, people with no siblings are not included since there is no one to report on them.
However, it has been shown by James Trussell and German Rodriguez (1990) that these two potential
biases cancel each other out, under the assumption that mortality rates are unrelated to the size of the
sibship.
Another important issue is location. The DHS Program does not collect information on the residence of
siblings who died nor on the residence, during the exposure period, of living and dead siblings. The
residence of respondents at the time of interview is not necessarily the same as that of their siblings.
Therefore, The DHS Program usually does not publish adult mortality rates by region or residence.
References
Pullum, Thomas, Shireen Assaf, and Sarah Staveteig. 2017. Comparisons of DHS Estimates of Fertility and
Mortality with Other Estimates. DHS Methodological Reports No. 21. Rockville, Maryland, USA: ICF.
https://www.dhsprogram.com/publications/publication-MR21-Methodological-Reports.cfm
Moultrie TA, RE Dorrington, AG Hill, K Hill, IM Timæus and B Zaba (eds). 2013. Tools for Demographic
Estimation. Paris: International Union for the Scientific Study of Population.
http://demographicestimation.iussp.org/content/estimation-adult-mortality-sibling-histories
United Nations. 2002. Methods for estimating adult mortality. Working Paper No. ESA/P/WP.175.
http://www.un.org/esa/population/techcoop/DemEst/methods_adultmort/methods_adultmort.html

Guide to DHS Statistics 16.7 August 2018
Trussell J. and G. Rodriguez. 1990. A Note on the Sisterhood Estimation of Maternal Mortality. Studies in
Family Planning, 21, 6: 344-346.
Resources
DHS-7 Tabulation plan: Table MM.1
API Indicator IDs:
Female: MM_AMRT_W_DTH, MM_AMRT_W_EXP, MM_AMRT_W_AMR
Male: MM_AMRT_M_DTH, MM_AMRT_M_EXP, MM_AMRT_M_AMR
(API link, STATcompiler link)
Guide to DHS Statistics 16.8 August 2018
Probability of dying between the ages of 15 and 50 for women and men
Definition
The probability of dying between the ages of 15 and 50 for women and men during the seven years
preceding the survey.
Coverage:
Population base: Women and men age 15-49 (IR file)
Time period: 7 years preceding the survey
Numerators: See Numerators for This chapter presents indicators for the calculation of adult mortality
rates for both sexes, and for both pregnancy-related and maternal mortality rates and ratios for women.
Indicators of age-specific rates are provided for the adult mortality rates and the pregnancy-related and
maternal mortality rates, as well as age-standardized total rates. The difference between pregnancy-
related mortality and maternal mortality is described in Notes and Considerations for Age-specific
pregnancy-related and maternal mortality rates, and total pregnancy-related and maternal mortality
rate.
In addition to indicators for adult mortality rates for 5-year age groups, the chapter also includes a
summary measure (35q15) that represents the probability of a person dying between exact ages 15 and
50—that is, between his or her 15th and 50th birthdays.
Indicators for the pregnancy-related mortality ratio and the maternal mortality ratio are given, as well as
indicators for the lifetime risk or pregnancy-related and maternal mortality.
The chapter provides indicators estimated from sibling history data collected in the sibling survival
module (commonly referred to as the adult and maternal mortality module) that is part of the Woman’s
Questionnaire. The adult and maternal mortality module is an optional module and data are only
available for surveys that included this module. It is recommended that the module be used in surveys
no more frequently than every ten years.
Guide to DHS Statistics 16.9 August 2018
Adult Mortality RatesNumerator:
Denominator: See Denominators for This chapter presents indicators for the calculation of adult
mortality rates for both sexes, and for both pregnancy-related and maternal mortality rates and ratios
for women. Indicators of age-specific rates are provided for the adult mortality rates and the
pregnancy-related and maternal mortality rates, as well as age-standardized total rates. The difference
between pregnancy-related mortality and maternal mortality is described in Notes and Considerations
for Age-specific pregnancy-related and maternal mortality rates, and total pregnancy-related and
maternal mortality rate.
In addition to indicators for adult mortality rates for 5-year age groups, the chapter also includes a
summary measure (35q15) that represents the probability of a person dying between exact ages 15 and
50—that is, between his or her 15th and 50th birthdays.
Indicators for the pregnancy-related mortality ratio and the maternal mortality ratio are given, as well as
indicators for the lifetime risk or pregnancy-related and maternal mortality.
The chapter provides indicators estimated from sibling history data collected in the sibling survival
module (commonly referred to as the adult and maternal mortality module) that is part of the Woman’s
Questionnaire. The adult and maternal mortality module is an optional module and data are only
available for surveys that included this module. It is recommended that the module be used in surveys
no more frequently than every ten years.
Guide to DHS Statistics 16.10 August 2018
Adult Mortality Rates
Variables: IR file.
v008
CMC Date of interview
mm1
Sex of sibling
mm2
Survival status of sibling
mm4
Sibling's date of birth (CMC)
mm8
Date of death of sibling (CMC)
v005
Women's individual sample weight
Calculation
The adult mortality rates are first calculated as described in This chapter presents indicators for the
calculation of adult mortality rates for both sexes, and for both pregnancy-related and maternal
mortality rates and ratios for women. Indicators of age-specific rates are provided for the adult
mortality rates and the pregnancy-related and maternal mortality rates, as well as age-standardized
total rates. The difference between pregnancy-related mortality and maternal mortality is described in
Notes and Considerations for Age-specific pregnancy-related and maternal mortality rates, and total
pregnancy-related and maternal mortality rate.
In addition to indicators for adult mortality rates for 5-year age groups, the chapter also includes a
summary measure (35q15) that represents the probability of a person dying between exact ages 15 and
50—that is, between his or her 15th and 50th birthdays.
Indicators for the pregnancy-related mortality ratio and the maternal mortality ratio are given, as well as
indicators for the lifetime risk or pregnancy-related and maternal mortality.
The chapter provides indicators estimated from sibling history data collected in the sibling survival
module (commonly referred to as the adult and maternal mortality module) that is part of the Woman’s
Questionnaire. The adult and maternal mortality module is an optional module and data are only
available for surveys that included this module. It is recommended that the module be used in surveys
no more frequently than every ten years.

Guide to DHS Statistics 16.11 August 2018
Adult Mortality Rates. The probability that an individual will die in an age group x () is calculated as:
where the are the adult mortality rates for each age group, n is the width of the age group (5 years),
and ax is the average number of years lived in the age group by those dying in the age group. A simple
assumption would be to use 2.5 for ax, but in real populations, within the age range 15-49, it is more
than 2.5 and it increases as age increases. As an approximation The DHS Program uses 2.6 for a. Thus
the formula used is:
The probability of dying between exact ages 15 and 50 is then
Handling of Missing Values
See Handling of Missing Values for This chapter presents indicators for the calculation of adult mortality
rates for both sexes, and for both pregnancy-related and maternal mortality rates and ratios for women.
Indicators of age-specific rates are provided for the adult mortality rates and the pregnancy-related and
maternal mortality rates, as well as age-standardized total rates. The difference between pregnancy-
related mortality and maternal mortality is described in Notes and Considerations for Age-specific
pregnancy-related and maternal mortality rates, and total pregnancy-related and maternal mortality
rate.
In addition to indicators for adult mortality rates for 5-year age groups, the chapter also includes a
summary measure (35q15) that represents the probability of a person dying between exact ages 15 and
50—that is, between his or her 15th and 50th birthdays.
Indicators for the pregnancy-related mortality ratio and the maternal mortality ratio are given, as well as
indicators for the lifetime risk or pregnancy-related and maternal mortality.
The chapter provides indicators estimated from sibling history data collected in the sibling survival
module (commonly referred to as the adult and maternal mortality module) that is part of the Woman’s
Questionnaire. The adult and maternal mortality module is an optional module and data are only
available for surveys that included this module. It is recommended that the module be used in surveys
no more frequently than every ten years.
Guide to DHS Statistics 16.12 August 2018
Adult Mortality Rates.
Notes and Considerations
See Notes and Considerations for This chapter presents indicators for the calculation of adult mortality
rates for both sexes, and for both pregnancy-related and maternal mortality rates and ratios for women.
Indicators of age-specific rates are provided for the adult mortality rates and the pregnancy-related and
maternal mortality rates, as well as age-standardized total rates. The difference between pregnancy-
related mortality and maternal mortality is described in Notes and Considerations for Age-specific
pregnancy-related and maternal mortality rates, and total pregnancy-related and maternal mortality
rate.
In addition to indicators for adult mortality rates for 5-year age groups, the chapter also includes a
summary measure (35q15) that represents the probability of a person dying between exact ages 15 and
50—that is, between his or her 15th and 50th birthdays.
Indicators for the pregnancy-related mortality ratio and the maternal mortality ratio are given, as well as
indicators for the lifetime risk or pregnancy-related and maternal mortality.
The chapter provides indicators estimated from sibling history data collected in the sibling survival
module (commonly referred to as the adult and maternal mortality module) that is part of the Woman’s
Questionnaire. The adult and maternal mortality module is an optional module and data are only
available for surveys that included this module. It is recommended that the module be used in surveys
no more frequently than every ten years.

Guide to DHS Statistics 16.13 August 2018
Adult Mortality Rates.
References
Shryock, Henry S., Jacob S. Siegel, and associates. 1976. The Methods and Materials of Demography.
New York: Academic Press.
Moultrie TA, RE Dorrington, AG Hill, K Hill, IM Timæus and B Zaba (eds). 2013. Tools for Demographic
Estimation. Paris: International Union for the Scientific Study of Population.
http://demographicestimation.iussp.org/content/estimation-adult-mortality-sibling-histories
Resources
DHS-7 Tabulation plan: Table MM.2
API Indicator IDs: MM_AMPB_W_AMP, MM_AMPB_M_AMP
(API link, STATcompiler link)

Guide to DHS Statistics 16.14 August 2018
Maternal Mortality and Pregnancy-related Mortality
Age-specific pregnancy-related and maternal mortality rates, and total pregnancy-related
and maternal mortality rate
Definition
1) Age-specific pregnancy-related mortality rates.
2) Age-specific maternal mortality rates.
3) Total pregnancy-related mortality rate.
4) Total maternal mortality rate.
Pregnancy-related and maternal mortality rates are the ratio of pregnancy-related deaths or maternal
deaths to the women-years of exposure for women aged 15–49 years.
See Notes and Considerations for the definitions of pregnancy-related mortality and maternal mortality.
See also Pregnancy-related mortality ratio and maternal mortality ratio.
Coverage:
Population base: Women age 15-49 years (IR file)
Time period: Seven-year periods of time preceding the survey, excluding the month of interview.
Typically 0-6 years preceding the survey (v008-1 to v008-84), but other time periods may also be
calculated such as 7-13 years, 0-13 years, 0-10 years preceding the survey
Numerators:
1) Number of female siblings of respondents who died during pregnancy, delivery or within two
months of delivery in the period 0-6 years prior to the interview by five-year age group at time
of death
2) Number of female siblings of respondents who died during pregnancy, delivery or within 42 days
of delivery, excluding due to accidents or violence, in the period 0-6 years prior to the interview
by five-year age group at time of death
Denominator: Number of years of exposure of female siblings of respondents during the period 0-6
years prior to the survey by five-year age group
Variables: IR file.
v008
CMC Date of interview
mm1
Sex of sibling
mm2
Survival status of sibling
mm4
Sibling's date of birth (CMC)
mm8
Date of death of sibling (CMC)
mm9
Sibling's death and pregnancy
mm12
Amount of time between sibling's delivery and death
mm16
Sibling's death due to violence or accident
v005
Women's individual sample weight
Guide to DHS Statistics 16.15 August 2018
Calculation
Numerator: Deaths are tabulated in a similar way to the adult age-specific mortality rates (see
Calculation for This chapter presents indicators for the calculation of adult mortality rates for both sexes,
and for both pregnancy-related and maternal mortality rates and ratios for women. Indicators of age-
specific rates are provided for the adult mortality rates and the pregnancy-related and maternal
mortality rates, as well as age-standardized total rates. The difference between pregnancy-related
mortality and maternal mortality is described in Notes and Considerations for Age-specific pregnancy-
related and maternal mortality rates, and total pregnancy-related and maternal mortality rate.
In addition to indicators for adult mortality rates for 5-year age groups, the chapter also includes a
summary measure (35q15) that represents the probability of a person dying between exact ages 15 and
50—that is, between his or her 15th and 50th birthdays.
Indicators for the pregnancy-related mortality ratio and the maternal mortality ratio are given, as well as
indicators for the lifetime risk or pregnancy-related and maternal mortality.
The chapter provides indicators estimated from sibling history data collected in the sibling survival
module (commonly referred to as the adult and maternal mortality module) that is part of the Woman’s
Questionnaire. The adult and maternal mortality module is an optional module and data are only
available for surveys that included this module. It is recommended that the module be used in surveys
no more frequently than every ten years.
Guide to DHS Statistics 16.16 August 2018
Adult Mortality Rates), but are restricted to:
1) Deaths to female siblings who died during pregnancy, delivery or within two months of delivery
(mm1 = 2 & mm2 = 0 & mm9 in 2:6).
2) Deaths to female siblings who died during pregnancy, delivery or within 42 days of delivery,
excluding deaths due to accidents or violence (mm1 = 2 & mm2 = 0 & mm9 in 2:6 & mm12 in
100:141,198,199 & mm16 ≠ 1 & mm16 ≠ 2).
Denominator: Women-years of exposure are calculated in exactly the same way as for adult age-specific
mortality. See Calculation for This chapter presents indicators for the calculation of adult mortality rates
for both sexes, and for both pregnancy-related and maternal mortality rates and ratios for women.
Indicators of age-specific rates are provided for the adult mortality rates and the pregnancy-related and
maternal mortality rates, as well as age-standardized total rates. The difference between pregnancy-
related mortality and maternal mortality is described in Notes and Considerations for Age-specific
pregnancy-related and maternal mortality rates, and total pregnancy-related and maternal mortality
rate.
In addition to indicators for adult mortality rates for 5-year age groups, the chapter also includes a
summary measure (35q15) that represents the probability of a person dying between exact ages 15 and
50—that is, between his or her 15th and 50th birthdays.
Indicators for the pregnancy-related mortality ratio and the maternal mortality ratio are given, as well as
indicators for the lifetime risk or pregnancy-related and maternal mortality.
The chapter provides indicators estimated from sibling history data collected in the sibling survival
module (commonly referred to as the adult and maternal mortality module) that is part of the Woman’s
Questionnaire. The adult and maternal mortality module is an optional module and data are only
available for surveys that included this module. It is recommended that the module be used in surveys
no more frequently than every ten years.
Guide to DHS Statistics 16.17 August 2018
Adult Mortality Rates.
Once the numerators and denominators are calculated, age-specific pregnancy-related and maternal
mortality rates are obtained by the division of the numerators by the corresponding denominators and
multiplying by 1000. The total pregnancy-related and maternal mortality rates (for age 15-49) are
obtained by multiplying the age-specific mortality rates by the proportion of respondents in the five-
year age group and then summing the age distribution-adjusted pregnancy-related and maternal
mortality rates.
Handling of Missing Values
Siblings whose maternal status at the time of death are unknown to the respondent or are missing are
assumed not to be pregnancy-related or maternal deaths.
For maternal deaths, if the number of days after delivery is missing or the response was “don’t know”, it
is already known that the death was within 2 months and it is assumed to be within the first 42 days.
If the response to whether the death was caused by an accident or violence is missing or the response
was “don’t know”, the death is assumed to have not been due to an accident or violence.
See also Handling of Missing Values for This chapter presents indicators for the calculation of adult
mortality rates for both sexes, and for both pregnancy-related and maternal mortality rates and ratios
for women. Indicators of age-specific rates are provided for the adult mortality rates and the
pregnancy-related and maternal mortality rates, as well as age-standardized total rates. The difference
between pregnancy-related mortality and maternal mortality is described in Notes and Considerations
for Age-specific pregnancy-related and maternal mortality rates, and total pregnancy-related and
maternal mortality rate.
In addition to indicators for adult mortality rates for 5-year age groups, the chapter also includes a
summary measure (35q15) that represents the probability of a person dying between exact ages 15 and
50—that is, between his or her 15th and 50th birthdays.
Indicators for the pregnancy-related mortality ratio and the maternal mortality ratio are given, as well as
indicators for the lifetime risk or pregnancy-related and maternal mortality.
The chapter provides indicators estimated from sibling history data collected in the sibling survival
module (commonly referred to as the adult and maternal mortality module) that is part of the Woman’s
Questionnaire. The adult and maternal mortality module is an optional module and data are only
available for surveys that included this module. It is recommended that the module be used in surveys
no more frequently than every ten years.
Guide to DHS Statistics 16.18 August 2018
Adult Mortality Rates.
Notes and Considerations
The World Health Organization (WHO) defines pregnancy-related deaths and maternal deaths as
follows:
Pregnancy-related death is defined as the death of a woman while pregnant or within 42 days of
termination of pregnancy, irrespective of the cause of death.
Maternal death is the death of a woman while pregnant or within 42 days of termination of
pregnancy, irrespective of the duration and site of the pregnancy, from any cause related to or
aggravated by the pregnancy or its management but not from accidental or incidental causes.
The DHS Program indicators differ from these definitions in two ways: 1) for the pregnancy-related
mortality, the period of two months (rather than 42 days) following termination of pregnancy is used to
provide consistent trend data with previously reported estimates of maternal mortality from earlier
surveys (see Changes over Time), and 2) for maternal mortality, a survey such as DHS cannot capture the
definition of maternal mortality precisely due to the complexity of the issues, but limits the period
following termination of pregnancy to 42 days, and, as a proxy for the accidental or incidental causes,
excludes deaths reported due to accidents or violence.
The DHS adult and maternal mortality module collects information from respondents about the
maternal status of the death of their sisters born to the same mother by asking if the sister died while
pregnant, during delivery or within two months after the end of a pregnancy or a childbirth. Younger
(and male) respondents may not know that their older sister was even pregnant if the sister was several
years older or died during pregnancy or from an induced abortion, thus biasing pregnancy-related and
maternal mortality rates downward. Women who intend to have an induced abortion may also not
disclose their pregnancy status to family members. On the other hand, deaths due to non-maternal
causes, such as accidents and illnesses, will be included as pregnancy-related deaths if they occurred
during pregnancy or within two months after the end of the pregnancy or childbirth. Simulation models
show that up to one-third of classified as pregnancy-related may not be due to maternal causes,
resulting in an upward bias. The final result of both these biases, which operate simultaneously, is
unknown.
Another important issue is location. The DHS does not collect information on the residence of neither
sisters who died nor of the residence during the exposure period of both living and dead sisters. The
residence at the time of interview of respondents is not necessarily the same as that of their sisters.
Therefore, DHS usually does not publish pregnancy-related and maternal mortality rates by area.
Pregnancy-related and maternal mortality rates are subject to high levels of sampling error due to their
relatively rare occurrence.
Age-adjusted pregnancy-related and maternal mortality rates are expressed per 1,000 women age 15-49
and represent the risk of pregnancy-related death or death due to maternal causes per 1,000 women.
Changes over Time

Guide to DHS Statistics 16.19 August 2018
In DHS-7, The DHS Program changed the definition and calculation of maternal mortality. The new
definition of maternal mortality more closely agrees with the WHO definition of mortality. The prior
definition of maternal mortality corresponds with the WHO definition of pregnancy-related mortality.
When comparing estimates over time, the pregnancy-related mortality estimates from surveys since
2015 should be compared with those labeled maternal mortality in survey reports prior to 2015. Do not
compare maternal mortality for surveys after 2015 with those from before 2015 as the definitions are
different.
For more information on the definitions of pregnancy-related mortality and maternal mortality, and
how they compare with the WHO definitions, see The DHS Program YouTube video series on
Maternal and Pregnancy-Related Mortality, including:
Maternal Mortality Ratio (MMR) Indicator Snapshot
Differences Between Maternal and Pregnancy-Related Mortality
Interpreting Trends in Pregnancy-Related Mortality
In addition, The DHS Program made changes to the Adult and Maternal Mortality Module in order to
collect a more complete list of all siblings of respondents. The changes include asking more questions to
capture information about siblings who may have died, live elsewhere, or have a different father but the
same mother. See the Adult and Maternal Mortality Module in the DHS Questionnaire Modules at
https://www.dhsprogram.com/publications/publication-DHSQM-DHS-Questionnaires-and-Manuals.cfm.
In DHS-IV and earlier surveys, siblings whose maternal status at the time of death were unknown to the
respondent or were missing in the data set were allocated to maternal deaths in the proportion they
were to deaths of any maternal status. For each age group of siblings, the number of deaths of known
maternal status was divided by the number of deaths of any status to get the proportion of maternal
deaths. This proportion was then multiplied by the number of deaths of unknown status to calculate the
number of deaths to add to the known maternal deaths to get the total number of maternal deaths in
each age group.
Also, in DHS-IV and earlier surveys, maternal deaths of sisters 50 years and older were added to the
number of maternal deaths of sisters 45-49 years.
References
Pullum, Thomas, Shireen Assaf, and Sarah Staveteig. 2017. Comparisons of DHS Estimates of Fertility and
Mortality with Other Estimates. DHS Methodological Reports No. 21. Rockville, Maryland, USA: ICF.
https://www.dhsprogram.com/publications/publication-MR21-Methodological-Reports.cfm
Assaf, Shireen, Leah Horton, Marta Bornstein, and Thomas Pullum. 2017. Levels and Trends of Maternal
and Child Health Indicators in 11 Middle East and North African Countries. DHS Comparative Report No.
46. Rockville, Maryland, USA: ICF. https://www.dhsprogram.com/publications/publication-CR46-
Comparative-Reports.cfm
Moultrie TA, RE Dorrington, AG Hill, K Hill, IM Timæus and B Zaba (eds). 2013. Tools for Demographic
Estimation. Paris: International Union for the Scientific Study of Population.
http://demographicestimation.iussp.org/content/direct-estimation-child-mortality-birth-histories

Guide to DHS Statistics 16.20 August 2018
Stanton, Cynthia, Noureddine Abderrahim, and Kenneth Hill. 1997. DHS maternal mortality indicators:
An assessment of data quality and implications for data use. DHS Analytical Reports No. 4. Calverton,
Maryland, USA: Macro International. https://www.dhsprogram.com/publications/publication-AR4-
Analytical-Studies.cfm
Trussell J. and Rodriguez G. (1990) A Note On the Sisterhood Estimation of Maternal Mortality. Studies
in Family Planning, 21, 6: 344-346.
Resources
DHS-7 Tabulation plan: Tables MM.3 and C.10
API Indicator IDs:
MM_MMRT_W_PDT, MM_MMRT_W_MDT, MM_MMRT_W_EXP, MM_MMRT_W_PRT, MM_MMRT_W_MRT
(API link, STATcompiler link)
WHO. Maternal mortality ratio: http://www.who.int/healthinfo/statistics/indmaternalmortality/en/
The DHS Program YouTube video series:
Maternal and Pregnancy-Related Mortality
https://www.youtube.com/playlist?list=PLagqLv-gqpTO6YQasXjBnRvPGJpB6jePf
Maternal Mortality Ratio (MMR) Indicator Snapshot: https://youtu.be/Z_VraFDfGxQ
Differences Between Maternal and Pregnancy-Related Mortality: https://youtu.be/HPT2usn0v-o
Interpreting Trends in Pregnancy-Related Mortality: https://youtu.be/imJq-XmC3e4
Guide to DHS Statistics 16.21 August 2018
Percentage of female deaths that are pregnancy-related deaths and maternal deaths
Definition
1) Percentage of female deaths to women age 15-49 that are pregnancy-related deaths.
2) Percentage of female deaths to women age 15-49 that are maternal deaths.
Coverage:
Population base: Women age 15-49 years (IR file)
Time period: Seven-year periods of time preceding the survey (v008-1 to v008-84), excluding the
month of interview
Numerators:
1) Number of female siblings of respondents who died during pregnancy, delivery or within two
months of delivery in the period 0-6, 7-13, and 0-13 years prior to the interview by five-year age
group at time of death
2) Number of female siblings of respondents who died during pregnancy, delivery or within 42 days
of delivery, excluding due to accidents or violence, in the period 0-6, 7-13, and 0-13 years prior
to the interview by five-year age group at time of death.
Denominator: Number of female siblings of respondents who died within the period of interest
Variables: IR file.
v008
CMC Date of interview
mm1
Sex of sibling
mm2
Survival status of sibling
mm4
Sibling's date of birth (CMC)
mm8
Date of death of sibling (CMC)
mm9
Sibling's death and pregnancy
mm12
Amount of time between sibling's delivery and death
mm16
Sibling's death due to violence or accident
v005
Women's individual sample weight
Calculation
Numerator: Pregnancy-related and maternal deaths are tabulated in a similar way to the adult age-
specific mortality rates (see Calculation for This chapter presents indicators for the calculation of adult
mortality rates for both sexes, and for both pregnancy-related and maternal mortality rates and ratios
for women. Indicators of age-specific rates are provided for the adult mortality rates and the
pregnancy-related and maternal mortality rates, as well as age-standardized total rates. The difference
between pregnancy-related mortality and maternal mortality is described in Notes and Considerations
for Age-specific pregnancy-related and maternal mortality rates, and total pregnancy-related and
maternal mortality rate.
Guide to DHS Statistics 16.22 August 2018
In addition to indicators for adult mortality rates for 5-year age groups, the chapter also includes a
summary measure (35q15) that represents the probability of a person dying between exact ages 15 and
50—that is, between his or her 15th and 50th birthdays.
Indicators for the pregnancy-related mortality ratio and the maternal mortality ratio are given, as well as
indicators for the lifetime risk or pregnancy-related and maternal mortality.
The chapter provides indicators estimated from sibling history data collected in the sibling survival
module (commonly referred to as the adult and maternal mortality module) that is part of the Woman’s
Questionnaire. The adult and maternal mortality module is an optional module and data are only
available for surveys that included this module. It is recommended that the module be used in surveys
no more frequently than every ten years.
Guide to DHS Statistics 16.23 August 2018
Adult Mortality Rates), but are restricted to:
3) Deaths to female siblings who died during pregnancy, delivery or within two months of delivery
(mm1 = 2 & mm2 = 0 & mm9 in 2:6).
4) Deaths to female siblings who died during pregnancy, delivery or within 42 days of delivery,
excluding deaths due to accidents or violence (mm1 = 2 & mm2 = 0 & mm9 in 2:6 & mm12 in
100:141,198,199 & mm16 ≠ 1 & mm16 ≠ 2).
Denominator: Female deaths are tabulated in the same way as the numerator for the adult age-specific
mortality rates for females (see Calculation for This chapter presents indicators for the calculation of
adult mortality rates for both sexes, and for both pregnancy-related and maternal mortality rates and
ratios for women. Indicators of age-specific rates are provided for the adult mortality rates and the
pregnancy-related and maternal mortality rates, as well as age-standardized total rates. The difference
between pregnancy-related mortality and maternal mortality is described in Notes and Considerations
for Age-specific pregnancy-related and maternal mortality rates, and total pregnancy-related and
maternal mortality rate.
In addition to indicators for adult mortality rates for 5-year age groups, the chapter also includes a
summary measure (35q15) that represents the probability of a person dying between exact ages 15 and
50—that is, between his or her 15th and 50th birthdays.
Indicators for the pregnancy-related mortality ratio and the maternal mortality ratio are given, as well as
indicators for the lifetime risk or pregnancy-related and maternal mortality.
The chapter provides indicators estimated from sibling history data collected in the sibling survival
module (commonly referred to as the adult and maternal mortality module) that is part of the Woman’s
Questionnaire. The adult and maternal mortality module is an optional module and data are only
available for surveys that included this module. It is recommended that the module be used in surveys
no more frequently than every ten years.

Guide to DHS Statistics 16.24 August 2018
Adult Mortality Rates) (mm1 = 2 & mm2 = 0).
The total proportion of female deaths that are pregnancy-related or maternal is calculated by dividing
the total pregnancy-related mortality rate or maternal mortality rate by the general 15-49 adult
mortality rate of women (see Age-specific pregnancy-related and maternal mortality rates, and total
pregnancy-related and maternal mortality rate).
Handling of Missing Values
See Handling of Missing Values for Age-specific pregnancy-related and maternal mortality rates, and
total pregnancy-related and maternal mortality rate.
Changes over Time
See Changes over Time for Age-specific pregnancy-related and maternal mortality rates, and total
pregnancy-related and maternal mortality rate.
References
See References for Age-specific pregnancy-related and maternal mortality rates, and total pregnancy-
related and maternal mortality rate.
Resources
DHS-7 Tabulation plan: Tables MM.3
API Indicator IDs: MM_MMRT_W_FDP, MM_MMRT_W_FDM
(API link, STATcompiler link)
Guide to DHS Statistics 16.25 August 2018
Pregnancy-related mortality ratio and maternal mortality ratio
Definition
1) Pregnancy-related mortality ratio (PRMR): Number of pregnancy-related deaths per 100 000 live
births.
2) Maternal mortality ratio (MMR): Number of maternal deaths per 100 000 live births.
Coverage:
Population base: Women age 15-49 years (IR file)
Time period: Seven-year periods of time preceding the survey, excluding the month of interview.
Typically 0-6 years preceding the survey (v008-1 to v008-84), but other time periods may also be
calculated such as 7-13 years, 0-13 years, 0-10 years preceding the survey
Numerators:
1) Total pregnancy-related mortality rate for the period
2) Total maternal mortality rate for the period
Denominator: Age-adjusted general fertility rate (GFR) for the same time period
See below for the calculation of the pregnancy-related and maternal mortality ratios.
Variables: IR file.
v008
CMC Date of interview
mm1
Sex of sibling
mm2
Survival status of sibling
mm4
Sibling's date of birth (CMC)
mm8
Date of death of sibling (CMC)
mm9
Sibling's death and pregnancy
mm12
Amount of time between sibling's delivery and death
mm16
Sibling's death due to violence or accident
v005
Women's individual sample weight
Calculation
See Age-specific pregnancy-related and maternal mortality rates, and total pregnancy-related and
maternal mortality rate for the calculation of these rates.
The pregnancy-related mortality ratio (PRMR) and the maternal mortality ratio (MMR) are calculated by
dividing the total pregnancy-related mortality rate and the total maternal mortality rate by the general
fertility rate for the same period and are expressed per 100,000 births.
Note that the general fertility rate is age-standardized by multiplying the age-specific fertility rates by
the proportion of women surveyed in each age group, and then summing the products. The general
fertility rate is calculated for the same time period as for the pregnancy-related mortality rate and the
maternal mortality rate. See General Fertility Rate in Chapter 5.
Guide to DHS Statistics 16.26 August 2018
Handling of Missing Values
Siblings whose maternal status at the time of death are unknown to the respondent or are missing are
assumed not to be pregnancy-related or maternal deaths.
For maternal deaths, if the number of days after delivery is missing or the response was “don’t know”, it
is already known that the death was within 2 months and it is assumed to be within the first 42 days.
If the response to whether the death was caused by an accident or violence is missing or the response
was “don’t know”, the death is assumed to have not been due to an accident or violence.
See also Handling of Missing Values for This chapter presents indicators for the calculation of adult
mortality rates for both sexes, and for both pregnancy-related and maternal mortality rates and ratios
for women. Indicators of age-specific rates are provided for the adult mortality rates and the
pregnancy-related and maternal mortality rates, as well as age-standardized total rates. The difference
between pregnancy-related mortality and maternal mortality is described in Notes and Considerations
for Age-specific pregnancy-related and maternal mortality rates, and total pregnancy-related and
maternal mortality rate.
In addition to indicators for adult mortality rates for 5-year age groups, the chapter also includes a
summary measure (35q15) that represents the probability of a person dying between exact ages 15 and
50—that is, between his or her 15th and 50th birthdays.
Indicators for the pregnancy-related mortality ratio and the maternal mortality ratio are given, as well as
indicators for the lifetime risk or pregnancy-related and maternal mortality.
The chapter provides indicators estimated from sibling history data collected in the sibling survival
module (commonly referred to as the adult and maternal mortality module) that is part of the Woman’s
Questionnaire. The adult and maternal mortality module is an optional module and data are only
available for surveys that included this module. It is recommended that the module be used in surveys
no more frequently than every ten years.
Guide to DHS Statistics 16.27 August 2018
Adult Mortality Rates.
Notes and Considerations
The World Health Organization (WHO) defines pregnancy-related deaths and maternal deaths as
follows:
Pregnancy-related death is defined as the death of a woman while pregnant or within 42 days of
termination of pregnancy, irrespective of the cause of death.
Maternal death is the death of a woman while pregnant or within 42 days of termination of
pregnancy, irrespective of the duration and site of the pregnancy, from any cause related to or
aggravated by the pregnancy or its management but not from accidental or incidental causes.
The DHS Program indicators differ from these definitions in two ways: 1) for the pregnancy-related
mortality, the period of two months (rather than 42 days) following termination of pregnancy is used to
provide consistent trend data with previously reported estimates of maternal mortality from earlier
surveys (see Changes over Time), and 2) for maternal mortality, a survey such as DHS cannot capture the
definition of maternal mortality precisely due to the complexity of the issues, but limits the period
following termination of pregnancy to 42 days, and, as a proxy for the accidental or incidental causes,
excludes deaths reported due to accidents or violence.
The DHS adult and maternal mortality module collects information from respondents about the
maternal status of the death of their sisters born to the same mother by asking if the sister died while
pregnant, during delivery or within two months after the end of a pregnancy or a childbirth. Younger
(and male) respondents may not know that their older sister was even pregnant if the sister was several
years older or died during pregnancy or from an induced abortion, thus biasing pregnancy-related and
maternal mortality rates downward. Women who intend to have an induced abortion may also not
disclose their pregnancy status to family members. On the other hand, deaths due to non-maternal
causes, such as accidents and illnesses, will be included as pregnancy-related deaths if they occurred
during pregnancy or within two months after the end of the pregnancy or childbirth. Simulation models
show that up to one-third of classified as pregnancy-related may not be due to maternal causes,
resulting in an upward bias. The final result of both these biases, which operate simultaneously, is
unknown.
Another important issue is location. The DHS does not collect information on the residence of neither
sisters who died nor of the residence during the exposure period of both living and dead sisters. The
residence at the time of interview of respondents is not necessarily the same as that of their sisters.
Therefore, DHS usually does not publish pregnancy-related and maternal mortality rates by area.
Expressed per 100,000 live births; calculated as the age-adjusted maternal mortality rate times 100
divided by the age-adjusted general fertility rate .
Maternal mortality rates and ratios are subject to high levels of relative sampling error due to their
relatively rare occurrence. For example, a maternal mortality ratio of 500 maternal deaths per 100,000
births has the same sampling error as an infant mortality rate of 5 infant deaths per 1000 births. For a
sample of about 15,000 respondents, the 95% confidence interval of the MMR would be about 406 to
594 maternal deaths per 100,000 births.

Guide to DHS Statistics 16.28 August 2018
Changes over Time
In DHS-7, The DHS Program changed the definition and calculation of maternal mortality. The new
definition of maternal mortality more closely agrees with the WHO definition of mortality. The prior
definition of maternal mortality corresponds with the WHO definition of pregnancy-related mortality.
When comparing estimates over time, the pregnancy-related mortality estimates from surveys since
2015 should be compared with those labeled maternal mortality in survey reports prior to 2015. Do not
compare maternal mortality for surveys after 2015 with those from before 2015 as the definitions are
different.
For more information on the definitions of pregnancy-related mortality and maternal mortality, and
how they compare with the WHO definitions, see The DHS Program YouTube video series on
Maternal and Pregnancy-Related Mortality, including:
Maternal Mortality Ratio (MMR) Indicator Snapshot
Differences Between Maternal and Pregnancy-Related Mortality
Interpreting Trends in Pregnancy-Related Mortality
In addition, The DHS Program made changes to the Adult and Maternal Mortality Module in order to
collect a more complete list of all siblings of respondents. The changes include asking more questions to
capture information about siblings who may have died, live elsewhere, or have a different father but the
same mother. See the Adult and Maternal Mortality Module in the DHS Questionnaire Modules at
https://www.dhsprogram.com/publications/publication-DHSQM-DHS-Questionnaires-and-Manuals.cfm.
In DHS-IV and earlier surveys, siblings whose maternal status at the time of death were unknown to the
respondent or were missing in the data set were allocated to maternal deaths in the proportion they
were to deaths of any maternal status. For each age group of siblings, the number of deaths of known
maternal status was divided by the number of deaths of any status to get the proportion of maternal
deaths. This proportion was then multiplied by the number of deaths of unknown status to calculate the
number of deaths to add to the known maternal deaths to get the total number of maternal deaths in
each age group.
Also, in DHS-IV and earlier surveys, maternal deaths of sisters 50 years and older were added to the
number of maternal deaths of sisters 45-49 years.
References
Alkema, Leontine, et al. 2015. Global, regional, and national levels and trends in maternal mortality
between 1990 and 2015, with scenario-based projections to 2030: a systematic analysis by the UN
Maternal Mortality Estimation Inter-Agency Group. The Lancet. Volume 387, Issue 10017, p462-474,
January 30, 2016.
https://www.thelancet.com/journals/lancet/article/PIIS0140-6736(15)00838-7/fulltext
https://www.thelancet.com/action/showPdf?pii=S0140-6736%2815%2900838-7
WHO, UNICEF, UNFPA, World Bank Group and the United Nations Population Division. 2015. Trends in
maternal mortality: 1990 to 2015.
http://www.who.int/reproductivehealth/publications/monitoring/maternal-mortality-2015/en/

Guide to DHS Statistics 16.29 August 2018
Pullum, Thomas, Shireen Assaf, and Sarah Staveteig. 2017. Comparisons of DHS Estimates of Fertility and
Mortality with Other Estimates. DHS Methodological Reports No. 21. Rockville, Maryland, USA: ICF.
https://www.dhsprogram.com/publications/publication-MR21-Methodological-Reports.cfm
Assaf, Shireen, Leah Horton, Marta Bornstein, and Thomas Pullum. 2017. Levels and Trends of Maternal
and Child Health Indicators in 11 Middle East and North African Countries. DHS Comparative Report No.
46. Rockville, Maryland, USA: ICF. https://www.dhsprogram.com/publications/publication-CR46-
Comparative-Reports.cfm
Rutenberg, N. and Sullivan, J.M. Direct and indirect estimates of maternal mortality from the sisterhood
method. IRD/Macro International Inc., Washington DC, 1991.
Hanley, J.A., Hagen, C.A. and Shiferaw, T. Confidence intervals and sample size calculations for the
sisterhood method of estimating maternal mortality. Studies in Family Planning 27(4) July/August 1996.
WHO/UNICEF. The Sisterhood method to estimate maternal mortality. Report of a technical meeting, 5-
6 December 1996.
WHO/UNICEF. 1997. The sisterhood method for estimating maternal mortality: Guidance notes for
potential users. http://whqlibdoc.who.int/hq/1997/WHO_RHT_97.28.pdf
Moultrie TA, RE Dorrington, AG Hill, K Hill, IM Timæus and B Zaba (eds). 2013. Tools for Demographic
Estimation. Paris: International Union for the Scientific Study of Population.
http://demographicestimation.iussp.org/content/direct-estimation-child-mortality-birth-histories
Stanton, Cynthia, Noureddine Abderrahim, and Kenneth Hill. 1997. DHS maternal mortality indicators:
An assessment of data quality and implications for data use. DHS Analytical Reports No. 4. Calverton,
Maryland, USA: Macro International. https://www.dhsprogram.com/publications/publication-AR4-
Analytical-Studies.cfm
Trussell J. and Rodriguez G. (1990) A Note On the Sisterhood Estimation of Maternal Mortality. Studies
in Family Planning, 21, 6: 344-346.
Resources
DHS-7 Tabulation plan: Tables MM.4 and C.10
API Indicator IDs: MM_MMRO_W_PMR, MM_MMRO_W_MMR, MM_MMRO_W_LTP, MM_MMRO_W_LTR
(API link, STATcompiler link)
SDG Indicator 3.1.1: Maternal mortality ratio
WHO 100 Core Health Indicators: Maternal mortality ratio
MICS6 Indicator TM.21: Maternal mortality ratio
WHO. Maternal mortality ratio: http://www.who.int/healthinfo/statistics/indmaternalmortality/en/
The DHS Program YouTube video series:

Guide to DHS Statistics 16.30 August 2018
Maternal and Pregnancy-Related Mortality
https://www.youtube.com/playlist?list=PLagqLv-gqpTO6YQasXjBnRvPGJpB6jePf
Maternal Mortality Ratio (MMR) Indicator Snapshot: https://youtu.be/Z_VraFDfGxQ
Differences Between Maternal and Pregnancy-Related Mortality: https://youtu.be/HPT2usn0v-o
Interpreting Trends in Pregnancy-Related Mortality: https://youtu.be/imJq-XmC3e4
Guide to DHS Statistics 16.31 August 2018
Lifetime risk of pregnancy-related death and maternal death
Definition
1) Lifetime risk of pregnancy-related death: The probability of a 15-year-old girl eventually dying
from a pregnancy-related cause, assuming she is subjected throughout her lifetime to the risks
of pregnancy-related death estimated for the population.
2) Lifetime risk of maternal death: The probability of a 15-year-old girl eventually dying from a
maternal cause, assuming she is subjected throughout her lifetime to the risks of maternal
death estimated for the population.
Coverage:
Population base: Women age 15-49 years (IR file)
Time period: Seven-year periods of time preceding the survey, excluding the month of interview.
Typically 0-6 years preceding the survey (v008-1 to v008-84), but other time periods may also be
calculated such as 7-13 years, 0-13 years, 0-10 years preceding the survey
See below for the calculation of the lifetime risk of pregnancy-related or maternal death.
Variables: IR file.
v008
CMC Date of interview
mm1
Sex of sibling
mm2
Survival status of sibling
mm4
Sibling's date of birth (CMC)
mm8
Date of death of sibling (CMC)
mm9
Sibling's death and pregnancy
mm12
Amount of time between sibling's delivery and death
mm16
Sibling's death due to violence or accident
v005
Women's individual sample weight
Calculation
See Age-specific pregnancy-related and maternal mortality rates, and total pregnancy-related and
maternal mortality rate for the calculation of these rates, and Pregnancy-related mortality ratio and
maternal mortality ratio for the calculation of the PRMR and MMR.
The lifetime risk of pregnancy-related death or maternal death is calculated as 1-(1-PRMR)TFR or 1-(1-
MMR)TFR, respectively, where TFR represents the total fertility rate for the seven years preceding the
survey. See Total Fertility Rate in Chapter 5.
The total fertility rate is calculated for the same time period as for the pregnancy-related mortality rate
and the maternal mortality rate.

Guide to DHS Statistics 16.32 August 2018
Handling of Missing Values
See Handling of Missing Values for Age-specific pregnancy-related and maternal mortality rates, and
total pregnancy-related and maternal mortality rate.
Notes and Considerations
See Notes and Considerations for Age-specific pregnancy-related and maternal mortality rates, and total
pregnancy-related and maternal mortality rate.
Changes over Time
See Changes over Time for Age-specific pregnancy-related and maternal mortality rates, and total
pregnancy-related and maternal mortality rate.
References
See References for Age-specific pregnancy-related and maternal mortality rates, and total pregnancy-
related and maternal mortality rate.
Resources
DHS-7 Tabulation plan: Tables MM.4 and C.10
API Indicator IDs: MM_MMRO_W_LTP, MM_MMRO_W_LTR
(API link, STATcompiler link)

Guide to DHS Statistics 16.33 August 2018
Completeness of Information on Siblings
Completeness of data on survival status of sisters and brothers, age of living siblings and
age at death and years since death of dead siblings.
Definition
Completeness of data on survival status of sisters and brothers reported by interviewed women, age of
living siblings and age at death (AD) and years since death (YSD) of dead siblings.
Number and percentage of siblings:
1) All siblings
2) Living siblings
3) Dead siblings
4) Siblings with survival status unknown
Number and percentage of living siblings:
5) Age reported
6) Age missing
Number and percentage of dead siblings:
7) Age at death and years since death reported
8) Missing only age at death
9) Missing only years since death
10) Missing age at death and years since death.
Coverage:
Population base: Women and men age 15-49 years (IR file)
Time period: Current status at time of interview
Numerators:
1) Number of all siblings
2) Number of living siblings (mm2 = 1)
3) Number of dead siblings (mm2 = 0)
4) Number of siblings with survival status unknown (mm2 ≠ 1,2)
Of living siblings:
5) Number of living siblings with age reported (mm2 = 1 & mm3 in 0:97)
6) Number of living siblings with age missing (mm2 = 1 & mm3 in 98,99)
Of dead siblings:
7) Number of living siblings with age at death and years since death reported (mm2 = 0 & mm6 in
0:97 & mm7 in 0:97)
8) Number of living siblings missing only age at death (mm2 = 0 & mm6 in 0:97 & mm7 in 98,99)
9) Number of living siblings missing only years since death (mm2 = 0 & mm6 in 98,99 & mm7 in
0:97)
10) Number of living siblings missing age at death and years since death (mm2 = 0 & mm6 in 98,99
& mm7 in 98,99)
Guide to DHS Statistics 16.34 August 2018
Denominators:
1) For numerators 1-4: Number of all siblings
2) For numerators 5-6: Number of living siblings (mm2 = 1)
3) For numerators 7-10: Number of dead siblings (mm2 = 0)
Variables: IR file.
mm1
Sex of sibling
mm2
Survival status of sibling
mm3
Sibling's current age
mm6
Years since sibling died
mm7
Sibling's age at death
mm15
Sibling's year of death
Calculation
For percentages, numerators divided by denominators multiplied by 100.
Indicators are produced unweighted.
Handling of Missing Values
Missing survival status, age, years since death or age at death are presented in separate categories.
Resources
DHS-7 Tabulation plan: Table C.8

Guide to DHS Statistics 16.35 August 2018
Sibship Size and Sex Ratio of Siblings
Mean sibship size and sex ratio of siblings at birth
Definition
1) Mean sibship size
2) Sex ratio of siblings at birth
Coverage:
Population base: Women and men age 15-49 years (IR file).
Time period: Current status at time of interview.
Numerators:
1) Number of siblings of respondent (mm1 in 1,2), plus number of respondents with a valid
number of siblings (mmc1 in 0:90).
2) Number of male siblings of respondents (mm1 = 1).
Denominator:
1) Number of respondents with a valid number of siblings (mmc1 in 0:90).
2) Number of female siblings of respondents (mm1 = 2).
Variables: IR file.
mm1
Sex of sibling
mmc1
Number of siblings of respondent
v005
Women's sample weight
Calculation
1) Numerator divided by denominator.
2) Numerator divided by denominator multiplied by 100.
Handling of Missing Values
Missing values for number of siblings are excluded from numerator and denominator.
Notes and Considerations
Mean sibship size includes respondent. Sex ratio of siblings at birth excludes the respondent.
Resources
DHS-7 Tabulation plan: Table C.9

Guide to DHS Statistics 17.1 August 2018
Domestic Violence
Data on domestic violence in DHS surveys comes from an optional module of questions. Thus, indicators in
this chapter are available for some, but not all countries. Additionally, The DHS Program, in accordance with
the WHO guidelines “Putting Women First: Ethical and Safety Recommendations for Research on Domestic
Violence against Women” World Health Organization, 2001, randomly selects only one woman per
household among all eligible women in the household selected for the individual questionnaire for this
module. Thus, the number of women who have information for domestic violence will always be less than
the number of women selected for the complete DHS individual interview.
A large part of the domestic violence module asks about violence perpetrated by the current
husband/partner for women who are currently married and the most recent husband/partner for women
who are currently divorced, separated or widowed. Thus, women who have been ever-married are asked
many more questions about their experience of violence than women who have never been married. Note
also that ever-married women are women who self-report as being married, divorced, separated, or
widowed, or living with or having ever lived with a man as if married. Thus, a “partner” is a man with whom
the respondent lives with or lived with as if married. A previous husband/partner is a husband/partner other
than the current husband/partner for currently married women and the most recent husband/partner for
divorced, separated, or widowed women.
References
Hindin, Michelle J., Sunita Kishor, and Donna L. Ansara. 2008. Intimate Partner Violence among Couples in
10 DHS Countries: Predictors and Health Outcomes. DHS Analytical Studies No. 18. Calverton, Maryland,
USA: Macro International Inc.
https://www.dhsprogram.com/publications/publication-AS18-Analytical-Studies.cfm
Kishor, Sunita and Sarah E.K. Bradley. 2012. Women’s and Men’s Experience of Spousal Violence in
Two African Countries: Does Gender Matter? DHS Analytical Studies No. 27. Calverton, Maryland,
USA: ICF International.
https://www.dhsprogram.com/publications/publication-AS27-Analytical-Studies.cfm
Kishor, Sunita and Kiersten Johnson. 2004. Profiling Domestic Violence – A Multi-Country Study.
Calverton, Maryland: ORC Macro.
https://www.dhsprogram.com/publications/publication-OD31-Other-Documents.cfm
MacQuarrie, Kerry L.D., Lindsay Mallick, and Sunita Kishor. 2016. Intimate Partner Violence and
Interruption to Contraceptive Use. DHS Analytical Studies No. 57. Rockville, Maryland, USA: ICF
International.
https://www.dhsprogram.com/publications/publication-AS57-Analytical-Studies.cfm
MacQuarrie, Kerry L.D., Rebecca Winter, and Sunita Kishor. 2013. Spousal Violence and HIV: Exploring the
Linkages in Five Sub-Saharan African Countries. DHS Analytical Studies No. 36. Calverton,
Maryland, USA: ICF International.
https://www.dhsprogram.com/publications/publication-AS36-Analytical-Studies.cfm

Guide to DHS Statistics 17.2 August 2018
World Health Organization (WHO). 2001. Putting Women First: Ethical and Safety Recommendations for
Research on Domestic Violence against Women. http://www.who.int/gender/violence/womenfirtseng.pdf
World Health Organization (WHO), London School of Hygiene and Tropical Medicine, South African Medical
Research Council. 2013. Global and regional estimates of violence against women: Prevalence and health
effects of intimate partner violence and non-partner sexual violence
http://apps.who.int/iris/bitstream/handle/10665/85239/9789241564625_eng.pdf

Guide to DHS Statistics 17.3 August 2018
Experience of Physical Violence
Percentage of women who have experienced physical violence, and who have experienced
physical violence in the past 12 months
Definition
1) Percentage of women age 15-49 who have experienced physical violence since age 15.
2) Percentage of women age 15-49 who have experienced physical violence in the past 12 months.
Coverage:
Population base: All women age 15-49 selected and interviewed for the domestic violence module
(v044 = 1) (IR file)
Time period: Current status at time of survey
Numerators:
1) Number of women who have experienced any form of physical violence asked about (see variable
list below) by:
Any husband/partner ever if ever-married (any of d105a – g, j in 1:4 or d130a in 1:4); or
Anyone other than any husband/partner since they were age 15 years (d115y = 0); or
Anyone during any pregnancy, if ever pregnant (d118y = 0)
2) Number of women who have experienced any physical violence in the 12 months (often or
sometimes) preceding the survey:
Often: (any of d105a – g, j = 1 or d117a = 1).
Sometimes: (any of d105a – g, j = 2 or d117a = 2).
Often or sometimes: (any of d105a – g, j in 1:2 or d117a in 1:2 or d130a = 1)
Denominator: Number of women age 15-49 selected and interviewed for the domestic violence module
(v044 = 1)
Variables: IR file.
v044
Selected for Domestic Violence module
d105a
Ever been pushed, shook or had something thrown by husband/partner
d105b
Ever been slapped by husband/partner
d105c
Ever been punched with fist or hit by something harmful by husband/partner
d105d
Ever been kicked or dragged by husband/partner
d105e
Ever been strangled or burnt by husband/partner
d105f
Ever been threatened with knife/gun or other weapon by husband/partner
d105g
Ever CS physical violence by husband/partner
d105j
Ever had arm twisted or hair pulled by husband/partner
d115y
No person other than husband/partner ever physically hurt respondent
d117a
Frequency of being hit in last 12 months by other than husband/partner
d118y
Respondent was not hurt by anyone during a pregnancy
d130a
Previous husband: ever hit, slap, kick, or physically hurt respondent
d005
Weight for Domestic Violence
Guide to DHS Statistics 17.4 August 2018
Calculation
Numerators divided by denominator multiplied by 100.
Handling of Missing Values
Women with missing information on physical violence are included in the denominator but not the
numerator.
Notes and Considerations
The number of questions from which information is taken for the numerator varies by the current marital
status of women. Ever-married women are asked many more questions about their experience of physical
violence than never married women because there are several questions on the different types of physical
violence perpetrated by ever-married women’s husbands/partners in addition to violence perpetrated by
anyone else. Women who were first married before age 15 and report violence by their husbands/partners,
could have experienced the violence before they were 15.
For some types of violence women are also asked if they experienced the violence frequently or sometimes
in the past 12 months. For violence committed by a previous husband or partner, the respondent is asked
when it last took place, but a question on the frequency is not asked, and the information is included for the
combined “often or sometimes” indicator, but not for the separate “often” or “sometimes” indicators. No
information on frequency of violence is available for violence during pregnancy.
Changes over Time
The questions on physical violence have not changed significantly over time. Till about 2005-06, however,
the groups of acts of physical violence were organized somewhat differently. However, since most of the
same acts were covered, this indicator is likely to be fairly comparable over time. Another change worth
noting is that more recently, from about 2010-11, a question was added for women married more than once
that asks specifically about their experience of physical violence by a previous husband/partner. Before this
addition, physical violence by a previous husband/partner could only be reported in response to a more
general question on women’s experience of physical violence by anyone other than the current
husband/partner. For that question, “previous husband/partner” was one of several possible answer codes.
Nonetheless, always, but particularly when making comparisons over time, users are strongly advised to
check the questions in each survey.
References
See References for this chapter.


Guide to DHS Statistics 17.6 August 2018
Persons Committing Physical Violence
Among women who have experienced physical violence since age 15, percentage who report
specific persons who committed the violence
Definition
Among women age 15-49 who have experienced physical violence since age 15, percentage who report
specific persons who committed the violence.
Coverage:
Population base: All women age 15-49 selected and interviewed for the domestic violence module
(v044 = 1) (IR file) who have experienced physical violence since age 15
Time period: Current status at time of survey
Numerator: Number of women age 15-49 who have experienced physical violence since age 15 who report
specific persons who committed the violence:
1) Current husband/partner (v502 = 1 & (any of d105a – g, j in 1:4 or d118a = 1)).
2) Former husband/partner
a) if currently or formerly married: ((v502 in 1:2 & (d115j = 1 or d118j = 1 or d130a in 1:4)), or
b) if formerly married: ((v502 = 2 & (any of d105a – g, j in 1:4)
3) Current boyfriend (d115k = 1 or d118k = 1)
4) Former boyfriend (d115l = 1 or d118l = 1)
5) Father/step-father (d115c = 1 or d118c = 1)
6) Mother/step-mother (d115b = 1 or d118b = 1)
7) Sister/brother (d115f = 1 or d118f = 1)
8) Daughter/son (d115d = 1 or d118d = 1)
9) Other relative (d115g = 1 or d118g = 1)
10) Mother-in-law (d115o = 1 or d118o = 1)
11) Father-in-law (d115p = 1 or d118p = 1)\
12) Other in-law (d115q = 1 or d118q = 1)
13) Teacher (d115v = 1 or d118v = 1)
14) Employer/someone at work (d115w = 1 or d118w = 1)
15) Police/soldier (d115xe = 1 or d118xe = 1)
16) Other (d115x = 1 or d118x = 1)
Denominator: Number of women age 15-49 selected and interviewed for the domestic violence module
(v044 = 1) who have experienced physical violence since age 15 (see numerator 1 for Percentage of women
who have experienced physical violence, and who have experienced physical violence in the past 12 months)
Variables: IR file.
v044
Selected for Domestic Violence module
v502
Currently/formerly/never in union
d105a
Ever been pushed, shook or had something thrown by husband/partner
d105b
Ever been slapped by husband/partner
d105c
Ever been punched with fist or hit by something harmful by husband/partner
d105d
Ever been kicked or dragged by husband/partner
Guide to DHS Statistics 17.7 August 2018
d105e
Ever been strangled or burnt by husband/partner
d105f
Ever been threatened with knife/gun or other weapon by husband/partner
d105g
Ever CS physical violence by husband/partner
d105j
Ever had arm twisted or hair pulled by husband/partner
d115b
Mother: Person who has ever physically hurt respondent
d115c
Father: Person who has ever physically hurt respondent
d115d
Daughter/son: Person who has ever physically hurt respondent
d115f
Sister/brother: Person who has ever physically hurt respondent
d115g
Other relative: Person who has ever physically hurt respondent
d115j
Former partner: Person who has ever physically hurt respondent
d115k
Current boyfriend: Person who has ever physically hurt respondent
d115l
Former boyfriend: Person who has ever physically hurt respondent
d115o
Mother-in-law: Person who has ever physically hurt respondent
d115p
Father-in-law: Person who has ever physically hurt respondent
d115q
Other in-law: Person who has ever physically hurt respondent
d115v
Teacher: Person who has ever physically hurt respondent
d115w
Employer: Person who has ever physically hurt respondent
d115x
Other: Person who has ever physically hurt respondent
d115xe
Police: Person who has ever physically hurt respondent
d115y
No person other than husband/partner ever physically hurt respondent
d118a
Husband/partner: Person who hurt respondent during a pregnancy
d118b
Mother-in-law: Person who hurt respondent during a pregnancy
d118c
Father/step-father: Person who hurt respondent during a pregnancy
d118d
Daughter: Person who hurt respondent during a pregnancy
d118f
Sister/brother: Person who hurt respondent during a pregnancy
d118g
Other relative: Person who hurt respondent during a pregnancy
d118j
Former partner: Person who hurt respondent during a pregnancy
d118k
Current boyfriend: Person who hurt respondent during a pregnancy
d118l
Former boyfriend: Person who hurt respondent during a pregnancy
d118o
Mother-in-law: Person who hurt respondent during a pregnancy
d118p
Father-in-law: Person who hurt respondent during a pregnancy
d118q
Other-in-law: Person who hurt respondent during a pregnancy
d118v
Teacher: Person who hurt respondent during a pregnancy
d118w
Employer: Person who hurt respondent during a pregnancy
d118x
Other: Person who hurt respondent during a pregnancy
d118xe
Police: Person who hurt respondent during a pregnancy
d118y
Respondent was not hurt by anyone during a pregnancy (0 = was hurt)
d130a
Previous husband: ever hit, slap, kick, or physically hurt respondent
d005
Weight for Domestic Violence
Calculation
Numerator divided the denominator multiplied by 100.

Guide to DHS Statistics 17.8 August 2018
Handling of Missing Values
Women with missing information on persons committing physical violence are included in the denominator
but not the numerators. Women with missing information on ever experience of physical violence are
excluded from the numerators and denominator.
Notes and Considerations
See Notes and Considerations for Percentage of women who have experienced physical violence, and who
have experienced physical violence in the past 12 months.
Changes over Time
See Notes and Considerations for Percentage of women who have experienced physical violence, and who
have experienced physical violence in the past 12 months.
References
See References for this chapter.
Resources
DHS-7 Tabulation plan: Table DV.2
API Indicator IDs:
DV_PCPV_W_CHP, DV_PCPV_W_FHP, DV_PCPV_W_CBF, DV_PCPV_W_FBF, DV_PCPV_W_FTH, DV_PCPV_W_MTH,
DV_PCPV_W_SIB, DV_PCPV_W_CHD, DV_PCPV_W_REL, DV_PCPV_W_MLW, DV_PCPV_W_FLW, DV_PCPV_W_OLW,
DV_PCPV_W_TCH, DV_PCPV_W_EMP, DV_PCPV_W_POL, DV_PCPV_W_OTH
(API link, STATcompiler link)

Guide to DHS Statistics 17.9 August 2018
Experience of Sexual Violence
Percentage of women who have ever experienced sexual violence, and who experienced
sexual violence in the 12 months preceding the survey
Definition
1) Percentage of women age 15-49 who have ever experienced sexual violence.
2) Percentage of women age 15-49 who have experienced sexual violence in the 12 months preceding
the survey.
Coverage:
Population base: All women age 15-49 selected and interviewed for the domestic violence
module (v044= 1) (IR file)
Time period: Current status at time of survey
Numerators:
1) Number of women who have ever experienced any form of sexual violence asked about (see
variable list below), as a child or as an adult:
By any husband/partner ever if ever-married (any of d105h, i, k in 1:4 or d130b in 1:4), or
By anyone other than any husband/partner in the last 12 months (d124 = 1), or
Ever forced to perform unwanted sexual acts (d125 = 1)
2) Number of women who have experienced any form of sexual violence in the 12 months (frequently
or sometimes) preceding the survey:
Often: (any of d105h, i, k = 1)
Sometimes: (any of d105h, i, k = 2)
Often or sometimes: (any of d105h, i, k in 1:2 or d130b = 1 or d124 = 1)
Denominator: Number of women age 15-49 selected and interviewed for the domestic violence module
(v044 = 1)
Variables: IR file.
v044
Selected for Domestic Violence module
d105h
Ever been physically forced into unwanted sex by husband/partner
d105i
Ever been forced into other unwanted sexual acts by husband/partner
d105k
Ever been physically forced to perform sexual acts respondent didn't want to
d124
Ever forced to have sex by anyone other than husband/partner in last 12 months
d125
Ever forced to perform unwanted sexual acts
d130b
Previous husband: physically forced to have sex or to perform sexual acts
d005
Women’s sample weight
Calculation
Numerators divided by denominator multiplied by 100.
Guide to DHS Statistics 17.10 August 2018
Handling of Missing Values
Women with missing information on sexual violence are included in the denominator but not the
numerator.
Notes and Considerations
The number of questions from which information is taken for the numerator varies by the current marital
status of women. Ever-married women are asked more questions about their experience of sexual violence
than never married women because there are several questions on the different types of sexual violence
perpetrated by ever-married women’s husbands/partners in addition to violence perpetrated by anyone
else.
Changes over Time
There have been several changes over time to the wording and number of questions on women’s
experience of sexual violence. The change that has a significant effect on comparability over time is the
following: In some countries, a version of the module that included a question on whether first sex was
wanted or not was implemented. The estimate of sexual violence in these surveys included women who said
that their first sex was unwanted. This question is no longer included in the DHS domestic violence module.
Thus, when examining trends over time for this variable, the user should check to see if the earlier survey(s)
included the question on unwanted first sex or not. If it was included, the percentage of women who have
experienced sexual violence should be rerun to exclude the question on first sex being unwanted. Only then
will the previous survey estimate be comparable to the estimate from the more recent survey.
Additionally, ever-married women now are asked about sexual violence by a non-husband/partner whether
or not they reported sexual violence by any husband/partner. In earlier surveys, only ever-married women
who had not reported sexual violence by their current or most recent husband/partner were asked about
sexual violence by anyone other than their husband/partner.
Another more recent change is that in about 2010-11, a question was added for women married more than
once that asks specifically about their experience of sexual violence by a previous husband/partner. Before
this addition, sexual violence by a previous husband/partner could only be reported in response to a more
general question on women’s experience of sexual violence by anyone, and “previous husband/partner” was
one of several possible answer codes. Additionally, spousal sexual violence by the most recent
husband/partner is, since about 2009, being measured through three questions instead of two.
Given these changes, when making comparisons over time of sexual violence, users are strongly advised to
check the questions in each survey.
References
See References for this chapter.
Resources
DHS-7 Tabulation plan: Table DV.3


Guide to DHS Statistics 17.12 August 2018
Persons Committing Sexual Violence
Among women who have experienced sexual violence, percentage who report specific
persons who committed the violence
Definition
Among women age 15-49 who have experienced sexual violence, percentage who report specific persons
who committed the violence.
Coverage:
Population base: All women age 15-49 selected and interviewed for the domestic violence
module (v044 = 1) (IR file) who have ever experienced sexual violence
Time period: Current status at time of survey
Numerator: Number of women age 15-49 who have experienced sexual violence who report specific persons
who committed the violence:
1) Current husband/partner (v502 = 1 & (d127 = 1 or any of d105h, i, k in 1:4)).
2) Former husband/partner
a) if currently married: (v502 = 1 & (d127 = 2 & v503 ≠ 1)), or
b) if formerly married: (v502 = 2 & (d127 = 2 or any of d105h, i, k in 1:4)), or
c) If currently or formerly married: (v502 in 1, 2 & d130b in 1:4)
3) Current/former boyfriend
a) if currently married: (v502 = 1 & d127 = 2 & v503 = 1) [boyfriend assumed], or
b) if never married: (v502 = 0 & d127 = 1, 2) [boyfriend assumed], or
c) boyfriend reported: (d127 = 3)
4) Father/step-father (d127 = 4)
5) Brother/step-brother (d127 = 5)
6) Other relative (d127 = 6)
7) In-law (d127 = 7)
8) Own friend/acquaintance (d127 = 8)
9) Family friend (d127 = 9)
10) Teacher (d127 = 10)
11) Employer/someone at work (d127 = 11)
12) Police/soldier (d127 = 12)
13) Priest/religious leader (d127 = 13)
14) Stranger (d127 = 14)
15) Other (d127 = 96)
16) Missing (d127 = 99)
Denominator: Number of women age 15-49 selected and interviewed for the domestic violence module
(v044 = 1) who have ever experienced sexual violence (see numerator 1 for Percentage of women who have
ever experienced sexual violence, and who experienced sexual violence in the 12 months preceding the
survey)
Variables: IR file.
v044
Selected for Domestic Violence module
Guide to DHS Statistics 17.13 August 2018
v502
Currently/formerly/never in union
v503
Number of unions
d105h
Ever been physically forced into unwanted sex by husband/partner
d105i
Ever been forced into other unwanted sexual acts by husband/partner
d105k
Ever been physically forced to perform sexual acts respondent didn't want to
d127
Person who forced respondent into first sexual act
d130b
Previous husband: physically forced to have sex or to perform sexual acts
d005
Weight for Domestic Violence
Calculation
Numerator divided by denominator multiplied by 100.
Handling of Missing Values
Women with missing information on persons committing sexual violence are included in the denominator
and are in a separate category for the numerators. Women with missing information on ever experience of
sexual violence are excluded from the numerators and denominator.
Notes and Considerations
The maximum number of perpetrators of sexual violence that can be reported varies between ever-married
and never married women. Ever-married women can report up to three perpetrators of sexual violence—
their current or most recent husband, a former husband/partner if married more than once, and/or a non-
husband/partner who was the one who perpetrated the violence the first time it occurred. Never-married
women can report only one perpetrator, namely the person who perpetrated the sexual violence the time it
first occurred.
See also Notes and Considerations for Percentage of women who have ever experienced sexual violence, and
who experienced sexual violence in the 12 months preceding the survey.
Changes over Time
See Changes over Time for Percentage of women who have ever experienced sexual violence, and who
experienced sexual violence in the 12 months preceding the survey.
References
See References for this chapter.
Resources
DHS-7 Tabulation plan: Table DV.4
API Indicator IDs:
DV_PCSV_W_CHP, DV_PCSV_W_FHP, DV_PCSV_W_BFR, DV_PCSV_W_FTH, DV_PCSV_W_BRH, DV_PCSV_W_REL,


Guide to DHS Statistics 17.15 August 2018
Age at First Experience of Sexual Violence
Percentage of women who have experienced sexual violence by exact ages
Definition
1) Percentage of women age 15-49 who have experienced sexual violence by specific exact ages.
2) Percentage of women age 15-49 who have not experienced sexual violence.
Coverage:
Population base: All women age 15-49 selected and interviewed for the domestic violence
module (v044= 1)
Time period: Current status at the time of survey
Numerators:
1) Number of women age 15-49 whose first experience of sexual violence occurred before they
attained the specified age (10, 12, 15, 18, 22) (d126 in 1:49 & d126 < specified age)
2) Number of women age 15-49 who have not experienced sexual violence. This is the number of
women not included in numerator 1 for Percentage of women who have ever experienced sexual
violence, and who experienced sexual violence in the 12 months preceding the survey
Denominator: Number of women age 15-49 selected and interviewed for the domestic violence module
(v044 = 1)
Variables: IR file.
v044
Selected for Domestic Violence module
d126
Age at first forced sexual act
d105h
Ever been physically forced into unwanted sex by husband/partner
d105i
Ever been forced into other unwanted sexual acts by husband/partner
d105k
Ever been physically forced to perform sexual acts respondent didn't want to
d124
Ever forced to have sex by anyone other than husband/partner in last 12 months
d125
Ever forced to perform unwanted sexual acts
d130b
Previous husband: physically forced to have sex or to perform sexual acts
d005
Weight for Domestic Violence
Calculation
All respondents are asked about their experience of sexual violence in their lifetime. Those who report any
experience of violence are also asked the age at which the sexual violence first occurred. These two pieces
of information (a “yes” on one or more of the sexual violence questions and the age at first experience of
sexual violence) are used to determine the percentage of all women who have experienced violence by the
specified age.
Numerator divided by denominator multiplied by 100.

Guide to DHS Statistics 17.16 August 2018
Handling of Missing Values
Women with missing or don’t know information on age at first sexual violence are included in the
denominator but not the numerator; their age at first experience of sexual violence is considered as
unknown but not before the specified age.
Notes and Considerations
Women who have experienced violence by an exact age are the women who have experienced sexual
violence at any age before the specified age. Thus, for example, women who have experienced violence by
exact age 15, include those who have experienced violence before exact age 10 and exact age 12.
Note also that the number of questions from which information is taken for the numerator varies by the
current marital status of women. Ever-married women are asked more questions about sexual violence than
never married women because there are several questions on the different types of sexual violence
perpetrated by ever-married women’s husbands/partners in addition to violence perpetrated by anyone
else.
Changes over Time
In several earlier surveys, women who reported sexual violence by only a current/most recent
husband/partner were not asked about the age at which the sexual violence first occurred. This makes it
difficult to look at trends over time.
See also Changes over Time for Percentage of women who have ever experienced sexual violence, and who
experienced sexual violence in the 12 months preceding the survey.
References
See References for this chapter.
Resources
DHS-7 Tabulation plan: Table DV.5
API Indicator IDs:
DV_AFSV_W_A10, DV_AFSV_W_A12, DV_AFSV_W_A15, DV_AFSV_W_A18, DV_AFSV_W_A22, DV_AFSV_W_NON
(API link, STATcompiler link)

Guide to DHS Statistics 17.17 August 2018
Experience of Physical or Sexual Violence by Anyone: Different Combinations
Percentage of women who have experienced physical violence only, sexual violence only,
physical and sexual violence, and experienced physical or sexual violence
Definition
1) Percentage of women age 15-49 who have experienced physical violence only.
2) Percentage of women age 15-49 who have experienced sexual violence only.
3) Percentage of women age 15-49 who have experienced physical and sexual violence.
4) Percentage of women age 15-49 who have experienced physical or sexual violence.
Coverage:
Population base: All women age 15-49 selected and interviewed for the domestic violence
module (v044 = 1)
Time period: Current status at the time of survey
Numerators:
1) Number of women who have experienced any form of physical violence asked about by anyone (see
numerator 1 for Percentage of women who have experienced physical violence, and who have
experienced physical violence in the past 12 months) and have not experienced any form of sexual
violence, as a child or as an adult, by anyone (number of women not included in numerator 1 for
Percentage of women who have ever experienced sexual violence, and who experienced sexual
violence in the 12 months preceding the survey)
2) Number of women who have ever experienced any form of sexual violence, as a child or as an adult,
by anyone (see numerator 1 for Percentage of women who have ever experienced sexual violence,
and who experienced sexual violence in the 12 months preceding the survey) and have not
experienced any form of physical violence asked about by anyone (women not in numerator 1 for
Percentage of women who have experienced physical violence, and who have experienced physical
violence in the past 12 months)
3) Number of women who have experienced any form of physical violence asked about by anyone (see
numerator 1 for Percentage of women who have experienced physical violence, and who have
experienced physical violence in the past 12 months) and have experienced any form of sexual
violence, as a child or as an adult, by anyone (see numerator 1 for Percentage of women who have
ever experienced sexual violence, and who experienced sexual violence in the 12 months preceding
the survey)
4) Number of women who have experienced any form of physical violence asked about by anyone (see
numerator 1 for Percentage of women who have experienced physical violence, and who have
experienced physical violence in the past 12 months) or have experienced any form of sexual
violence, as a child or as an adult, by anyone (see numerator 1 for Percentage of women who have
ever experienced sexual violence, and who experienced sexual violence in the 12 months preceding
the survey)
Denominator: Number of women age 15-49 selected and interviewed for the domestic violence module
(v044 = 1)
Variables: IR file.
Guide to DHS Statistics 17.18 August 2018
See variables for:
Percentage of women who have experienced physical violence, and who have experienced physical violence
in the past 12 months
Percentage of women who have ever experienced sexual violence, and who experienced sexual violence in
the 12 months preceding the survey
Calculation
Numerator divided by denominator multiplied by 100.
Numerators can be summarized as:
1) Women who say “yes” to one or more of questions on experience of physical violence and say “no”
to all questions on experience of sexual violence
2) Women who say “yes” to one or more questions on experience of sexual violence and say “no” to all
questions on experience of physical violence.
3) Women who say “yes” to one or more of questions on experience of physical violence and say “yes”
to one or more questions on experience of sexual violence
4) Women who say “yes” to one or more questions on experience of physical violence and/or say “yes”
to one or more questions on experience of sexual violence
Handling of Missing Values
Women with missing information on physical and/or sexual violence are included in the denominator but
not the numerators.
Notes and Considerations
The number of questions from which information is taken for the numerator in each case varies by the
current marital status of women. Ever-married women are asked many more questions about physical
and/or sexual violence than never married women because ever-married women are asked several
questions on the different types of physical violence and sexual violence perpetrated by their
husbands/partners in addition to violence perpetrated by anyone else.
Changes over Time
See Changes over Time in the indicator descriptions for Experience of Physical Violence and Experience of
Sexual Violence.
References
See References for this chapter.
Resources
DHS-7 Tabulation plan: Table DV.6


Guide to DHS Statistics 17.20 August 2018
Experience of Physical Violence during Pregnancy
Percentage of women who have experienced violence during pregnancy
Definition
Percentage of women age 15-49 who have experienced violence during pregnancy
Coverage:
Population base: All women age 15-49 who have ever been pregnant selected and interviewed for
the domestic violence module (IR file)
Time period: Current status at the time of survey
Numerator: Number of women age 15-49 who say that they have ever experienced physical violence during
any pregnancy (d118y = 0)
Denominator: Number of women age 15-49 selected and interviewed for the domestic violence module who
have ever been pregnant (v044 = 1 and (v201 > 0 or v213 = 1 or v228 = 1))
Variables: IR file.
v044
Selected for Domestic Violence module
v201
Total children ever born
v213
Currently pregnant
v228
Ever had a terminated pregnancy
d118y
Respondent was not hurt by anyone during a pregnancy (0 = was hurt)
d005
Weight for Domestic Violence
Calculation
Women who have ever been pregnant (v201 > 0 or v213 = 1 or v228 = 1) were asked if during any of their
pregnancies anyone had ever hit, slapped, kicked or done anything else to hurt them physically (d118y = 0).
The number of women who say “yes” to this question as a proportion of those who have ever been
pregnant multiplied by 100.
Handling of Missing Values
Women with missing information on violence during pregnancy are included in the denominator but not the
numerator.
Notes and Considerations
This indicator includes information only on physical violence during pregnancy.
Changes over Time
There have been no changes over time in this variable.


Guide to DHS Statistics 17.22 August 2018
Marital Control
Percentage of ever-married women whose husbands/partners demonstrated types of
controlling behaviors
Definition
1) Percentage of ever-married women age 15-49 whose current husband/partner for currently married
women or most recent husband/partner for divorced, separated, or widowed women ever
demonstrated each of the following controlling behaviors:
a) jealous or angry if she talks to other men;
b) frequently accuses her of being unfaithful;
c) does not permit her to meet her female friends;
d) tries to limit her contact with her family;
e) insists on knowing where she is at all times;
f) does not trust her with money.
2) Percentage of ever-married women age 15-49 whose current husband/partner for currently married
women or most recent husband/partner for divorced, separated, or widowed women displays 3 or
more of the specific behaviors.
3) Percentage of ever-married women age 15-49 whose current husband/partner for currently married
women or most recent husband/partner for divorced, separated, or widowed women displays none
of the specific behaviors.
Coverage:
Population base: All ever-married women age 15-49 selected and interviewed for the domestic
violence module (v044 = 1 & v502 in 1:2) (IR file)
Time period: Current status at time of survey
Numerators:
1) Number of women who say “yes” when asked about each of the five different types of the specified
marital control behaviors displayed by their husbands/partners:
a) Is jealous or angry if she talks to other men (d101a = 1)
b) Frequently accuses her of being unfaithful (d101b = 1)
c) Does not permit her to meet her female friends (d101c = 1)
d) Tries to limit her contact with her family (d101d = 1)
e) Insists on knowing where she is at all times (d101e = 1)
f) Does not trust respondent with money (d101f = 1)
2) Number of women who say “yes” to at least three of the five different types of specified marital
control behaviors displayed by their husbands/partners (At least three of d101a – f = 1)
3) Number of women who say “no” to all of the five different types of specified marital control
behaviors displayed by their husbands/partners (None of d101a – f = 1)
Denominator: Number of ever-married women age 15-49 selected and interviewed for the domestic
violence module (v044 = 1 & v502 in 1:2)
Guide to DHS Statistics 17.23 August 2018
Variables: IR file.
v044
Selected for Domestic Violence module
v502
Currently/formerly/never in union
d101a
Husband/partner jealous if respondent talks with other men
d101b
Husband/partner accuses respondent of unfaithfulness
d101c
Husband/partner does not permit respondent to meet female friends
d101d
Husband/partner tries to limit respondent's contact with family
d101e
Husband/partner insists on knowing where respondent is
d101f
Husband/partner doesn't trust respondent with money
d005
Weight for Domestic Violence
Calculation
Women who say “yes” to the relevant questions as a proportion of all eligible women multiplied by 100.
Display any marital control behavior (Any of d101a – e = 1).
At least 3 marital control behaviors (At least three of d101a – e = 1).
None of marital control behaviors (None of d101a – e = 1).
Handling of Missing Values
Women with missing information on one or more of the questions used for the indicator are included in the
denominator but not the numerator.
Notes and Considerations
Ever-married women include women who have ever had a partner who they lived with as-if married. For
women who have had one or more husbands/partners, only behaviors of the most recent husband/partner
are included.
Changes over Time
There are no notable systematic changes over time in the questions used to calculate these variables,
although before 2011, the list of marital control behaviors included a sixth one, namely “He does/did not
trust you with any money?” This item is no longer in the core module. Note also that in some countries,
minor modifications to the wording of each kind of behavior are sometimes made and in some countries,
additional behaviors may be asked about.
References
See References for this chapter.
Resources
DHS-7 Tabulation plan: Table DV.8


Guide to DHS Statistics 17.25 August 2018
Spousal Physical Violence
Percentage of ever-married women who have experienced spousal physical violence ever or in
the 12 months preceding the survey by their current or most recent husbands/partners
Definition
Percentage of ever-married women age 15-49 who have experienced spousal physical violence ever or in
the 12 months preceding the survey by their current or most recent husbands/partners.
Coverage:
Population base: All ever-married women age 15-49 selected and interviewed for the domestic
violence module (v044 = 1 & v502 in 1:2) (IR file)
Time period: Current status at time of survey
Numerators:
1) Number of women who say “yes” to ever experiencing one or more of the following acts of physical
violence by their husbands/partners:
a) Pushed her, shook her, or threw something at her (d105a in 1:4)
b) Slapped her (d105b in 1:4)
c) Twisted her arm or pulled her hair (d105j in 1:4)
d) Punched her with his fist or with something that could hurt her (d105c in 1:4)
e) Kicked her, dragged her, or beat her up (d105d in 1:4)
f) Tried to choke her or burn her on purpose (d105e in 1:4)
g) Threatened or attacked her with a knife, gun, or other weapon (d105f in 1:4)
h) Any physical violence (any of d105a – g, j in 1:4)
2) Number of women who say “often” or “sometimes” when, for each act of spousal physical violence
that they said they have ever experienced, they are asked how frequently this happened during the
past 12 months:
Often (d105a – g, j = 1)
Sometimes (d105a – g, j = 2)
Total (d105a – g, j in 1:2)
Denominator: Number of ever-married women age 15-49 selected and interviewed for the domestic
violence module (v044 = 1 & v502 in 1:2)
Variables: IR file.
v044
Selected for Domestic Violence module
v502
Currently/formerly/never in union
d105a
Ever been pushed, shook or had something thrown by husband/partner
d105b
Ever been slapped by husband/partner
d105c
Ever been punched with fist or hit by something harmful by husband/partner
d105d
Ever been kicked or dragged by husband/partner
d105e
Ever been strangled or burnt by husband/partner
d105f
Ever been threatened with knife/gun or other weapon by husband/partner
d105g
Ever CS physical violence by husband/partner

Guide to DHS Statistics 17.26 August 2018
d105j
Ever had arm twisted or hair pulled by husband/partner
d005
Weight for Domestic Violence
Calculation
Numerators divided by denominator multiplied by 100.
Handling of Missing Values
Women with missing information on one or more of the questions used for the indicator are included in the
denominator but not the numerator.
Notes and Considerations
Ever-married women include women who have ever had a partner who they lived with as-if married. For
women who have had one or more husbands/partners, only violence by the most recent husband/partner is
included.
Changes over Time
There are no notable systematic changes over time in the questions used to calculate these variables,
although before 2005, the acts of physical violence were organized somewhat differently across the
questions asked. Additionally, in some countries minor modifications to the wording of each kind of act
specified are sometimes made and in some countries additional acts may be asked about. Always, but
especially when making comparisons over time, users are strongly advised to check the questions in each
survey.
In some surveys before 2011, widowed women were asked about ever experience of spousal physical
violence but were excluded from the questions on violence during the 12 months preceding the survey. This
filter was removed in 2010-11.
References
See References for this chapter.
Resources
DHS-7 Tabulation plan: Tables DV.9 and DV.11
API Indicator IDs:
DV_FSVL_W_PHS, DV_FSVL_W_PSH, DV_FSVL_W_SLP, DV_FSVL_W_TWS, DV_FSVL_W_PCH, DV_FSVL_W_KIK,
DV_FSVL_W_CHK, DV_FSVL_W_KNF, DV_SPVL_W_PHS
(API link, STATcompiler link)

Guide to DHS Statistics 17.27 August 2018
Spousal Sexual Violence
Percentage of ever-married women who have experienced spousal sexual violence ever or in
the 12 months preceding the survey
Definition
Percentage of ever-married women age 15-49 who have experienced spousal sexual violence ever or in the
12 months preceding the survey by their current or most recent husbands/partners.
Coverage:
Population base: All ever-married women age 15-49 selected and interviewed for the domestic
violence module (v044 = 1 & v502 in 1:2) (IR file)
Time period: Current status at time of survey
Numerators:
1) Number of women who say “yes” to ever experiencing one or more of the following acts of sexual
violence perpetrated by their husbands/partners:
a) Physically forced her to have sexual intercourse with him when she did not want to (d105h
in 1:4)
b) Physically forced her to perform any other sexual acts she did not want to (d105k in 1:4)
c) Forced her with threats or in any other way to perform sexual acts she did not want to
(d105i in 1:4)
d) Any sexual violence (any of d105h, i, k in 1:4).
2) Number of women who say “often” or “sometimes” when, for each act of spousal sexual violence
that they said they have ever experienced, they are asked how frequently this happened during the
past 12 months:
Often (d105h, i, k = 1)
Sometimes (d105h, i, k = 2)
Total (d105h, i, k in 1:2)
Denominator: Number of ever-married women age 15-49 selected and interviewed for the domestic
violence module (v044 = 1 & v502 in 1:2)
Variables: IR file.
v044
Selected for Domestic Violence module
v502
Currently/formerly/never in union
d105h
Ever been physically forced into unwanted sex by husband/partner
d105i
Ever been forced into other unwanted sexual acts by husband/partner
d105k
Ever been physically forced to perform sexual acts respondent didn't want to
d005
Weight for Domestic Violence
Calculation
Numerators divided by denominator multiplied by 100.

Guide to DHS Statistics 17.28 August 2018
Handling of Missing Values
Women with missing information on one or more of the questions used for the indicator are included in the
denominator but not the numerator.
Notes and Considerations
Ever-married women include women who have ever had a partner who they lived with as-if married. For
women who have had one or more husbands/partners, only violence by the most recent husband/partner is
included.
The percentage of women who have experienced each specific act of sexual violence can also be calculated
using the same logic: in the numerator are women who say “yes” to ever experiencing the act as a
proportion of all ever-married women. Similarly, the percentage of women who have experienced any
specific act of spousal sexual violence at all in the past 12 months are the proportion of all ever-married
women who say that they experienced the specific act “frequently” or “sometimes” in the past 12 months.
Changes over Time
In the past, sexual violence by a current or most recent husband/partner was measured based on only two
specified acts of sexual violence. More recently, there were changes made to the wording of the acts and an
additional act of sexual violence was added. However, since the third act was originally subsumed under the
earlier two, the changes in wording and the addition of third act does not seem to affect the indicator.
In some surveys before 2011, widowed women were asked about ever experience of spousal physical
violence but were excluded from the questions on violence during the 12 months preceding the survey. This
filter was removed in 2010-11.
References
See References for this chapter.
Resources
DHS-7 Tabulation plan: Tables DV.9 and DV.11
API Indicator IDs: DV_FSVL_W_SEX, DV_FSVL_W_FRC, DV_FSVL_W_ACT, DV_FSVL_W_SXO, DV_SPVL_W_SEX
(API link, STATcompiler link)

Guide to DHS Statistics 17.29 August 2018
Spousal Emotional Violence
Percentage of ever-married women who have experienced spousal emotional violence ever or
in the 12 months preceding the survey
Definition
Percentage of ever-married women age 15-49 who have experienced spousal emotional violence ever or in
the 12 months preceding the survey by their current or most recent husbands/partners.
Coverage:
Population base: All ever-married women age 15-49 selected and interviewed for the domestic
violence module (v044 = 1 & v502 in 1:2) (IR file)
Time period: Current status at time of survey
Numerators:
1) Number of women who say “yes” to ever experiencing one or more of the following acts of
emotional violence by their husbands/partners:
a) Said or did something to humiliate her in front of others (d103a in 1:4)
b) Threatened to hurt or harm her or someone she cared about (d103b in 1:4)
c) Insulted her or made her feel bad about herself (d103c in 1:4)
d) Any emotional violence (any of d103a, b, c in 1:4)
2) Number of women who say “often” or “sometimes” when, for each act of spousal emotional
violence that they said they have ever experienced, they are asked how frequently this happened
during the past 12 months:
Often (d103a, b, c = 1)
Sometimes (d103a, b, c = 2)
Total (d103a, b, c in 1:2)
Denominator: Number of ever-married women age 15-49 selected and interviewed for the domestic
violence module (v044 = 1 & v502 in 1:2)
Variables: IR file.
v044
Selected for Domestic Violence module
v502
Currently/formerly/never in union
d103a
Ever been humiliated by husband/partner
d103b
Ever been threatened with harm by husband/partner
d103c
Ever been insulted or made to feel bad by husband/partner
d005
Weight for Domestic Violence
Calculation
Numerators divided by denominator multiplied by 100.
Handling of Missing Values

Guide to DHS Statistics 17.30 August 2018
Women with missing information on one or more of the questions used for the indicator are included in the
denominator but not the numerator.
Notes and Considerations
Ever-married women include women who have ever had a partner who they lived with as-if married. For
women who have had one or more husbands/partners, only violence by the most recent husband/partner is
included.
Changes over Time
This indicator was measured based on only two questions between about 2000 and 2005; thereafter, a third
act of emotional violence was added to the domestic violence module. Additionally, in some countries,
minor modifications to the wording of each kind of act specified are sometimes made and, in some
countries, additional acts may be asked about. Always, but especially when making comparisons over time,
users are strongly advised to check the questions used in each survey.
In some surveys before 2011, widowed women were asked about ever experience of spousal physical
violence but were excluded from the questions on violence during the 12 months preceding the survey. This
filter was removed in 2010-11.
References
See References for this chapter.
Resources
DHS-7 Tabulation plan: Tables DV.9 and DV.11
API Indicator IDs: DV_FSVL_W_EMT, DV_FSVL_W_HUM, DV_FSVL_W_HRT, DV_FSVL_W_BAD, DV_SPVL_W_EMT
(API link, STATcompiler link)

Guide to DHS Statistics 17.31 August 2018
Combinations of Types of Spousal Violence: Ever Experienced
Percentage of ever-married women who have ever experienced physical violence and sexual
violence, physical violence and sexual violence and emotional violence, physical violence or
sexual violence, physical violence or sexual violence or emotional violence by their current or
most recent husbands/partners
Definition
1) Percentage of ever-married women age 15-49 who have ever experienced physical violence and
sexual violence by their current husbands/partners if currently married or most recent
husbands/partners if divorced, separated, or widowed.
2) Percentage of ever-married women age 15-49 who have ever experienced physical violence and
sexual violence and emotional violence by their current husbands/partners if currently married or
most recent husbands/partners if divorced, separated, or widowed.
3) Percentage of ever-married women age 15-49 who have ever experienced physical violence or
sexual violence by their current husbands/partners if currently married or most recent
husbands/partners if divorced, separated, or widowed.
4) Percentage of ever-married women age 15-49 who have ever experienced physical violence or
sexual violence or emotional violence by their current husbands/partners if currently married or
most recent husbands/partners if divorced, separated, or widowed.
Coverage:
Population base: All ever-married women age 15-49 selected and interviewed for the domestic
violence module (v044 = 1 & v502 in 1:2) (IR file)
Time period: Current status at time of survey
Numerators:
Numbers of women who say “yes” to ever experiencing:
1) One or more of the specified acts of spousal physical violence (any of d105a – g, j in 1:4) and
one or more of the specified acts of spousal sexual violence (any of d105h, i, k in 1:4)
2) One or more of the specified acts of spousal physical violence (any of d105a – g, j in 1:4) and
one or more of the specified acts of spousal sexual violence (any of d105h, i, k in 1:4) and
one or more of the specified acts of spousal emotional violence (any of d103a, b, c in 1:4)
3) One or more of the specified acts of spousal physical violence (any of d105a – g, j in 1:4) or
one or more of the specified acts of spousal sexual violence (any of d105h, i, k in 1:4)
4) One or more of the specified acts of spousal physical violence (any of d105a – g, j in 1:4) or
one or more of the specified acts of spousal sexual violence (any of d105h, i, k in 1:4) or
one or more of the specified acts of spousal emotional violence (any of d103a, b, c in 1:4)
Denominator: Number of ever-married women age 15-49 selected and interviewed for the domestic
violence module (v044 = 1 & v502 in 1:2)
Variables: IR file.
v044
Selected for Domestic Violence module
v502
Currently/formerly/never in union

Guide to DHS Statistics 17.32 August 2018
d103a
Ever been humiliated by husband/partner
d103b
Ever been threatened with harm by husband/partner
d103c
Ever been insulted or made to feel bad by husband/partner
d105a
Ever been pushed, shook or had something thrown by husband/partner
d105b
Ever been slapped by husband/partner
d105c
Ever been punched with fist or hit by something harmful by husband/partner
d105d
Ever been kicked or dragged by husband/partner
d105e
Ever been strangled or burnt by husband/partner
d105f
Ever been threatened with knife/gun or other weapon by husband/partner
d105g
Ever CS physical violence by husband/partner
d105h
Ever been physically forced into unwanted sex by husband/partner
d105i
Ever been forced into other unwanted sexual acts by husband/partner
d105j
Ever had arm twisted or hair pulled by husband/partner
d105k
Ever been physically forced to perform sexual acts respondent didn't want to
d005
Weight for Domestic Violence
Calculation
Numerators divided by denominator multiplied by 100.
Handling of Missing Values
Women with missing information on one or more of the questions used for the indicator are included in the
denominator but not the numerator.
Notes and Considerations
Ever-married women include women who have ever had a partner who they lived with as-if married. For
women who have had one or more husbands/partners, only violence by the most recent husband/partner is
included.
Changes over Time
See Changes over Time for the indicators Spousal Physical Violence, Spousal Sexual Violence and Spousal
Emotional Violence.
References
See References for this chapter.
Resources
DHS-7 Tabulation plan: Tables DV.9, DV.10 and DV. 11
API Indicator IDs: DV_SPVL_W_PAS, DV_SPVL_W_ALL, DV_SPVL_W_POS, DV_SPVL_W_ANY
(API link, STATcompiler link)

Guide to DHS Statistics 17.33 August 2018
Combinations of Types of Spousal Violence: 12 months preceding the Survey
Percentage of ever-married women who have experienced physical violence and sexual
violence, physical violence and sexual violence and emotional violence, physical violence or
sexual violence, physical violence or sexual violence or emotional violence by their current or
most recent husbands/partners in the 12 months preceding the survey
Definition
1) Percentage of ever-married women who have experienced physical violence and sexual violence by
their current or most recent husbands/partners in the 12 months preceding the survey.
2) Percentage of ever-married women who have experienced physical violence and sexual violence and
emotional violence by their current or most recent husbands/partners in the 12 months preceding
the survey.
3) Percentage of ever-married women who have experienced physical violence or sexual violence by
their current or most recent husbands/partners in the 12 months preceding the survey.
4) Percentage of ever-married women who have experienced physical violence or sexual violence or
emotional violence by their current or most recent husbands/partners in the 12 months preceding
the survey.
Coverage:
Population base: All ever-married women age 15-49 selected and interviewed for the domestic
violence module (v044 = 1 & v502 in 1:2) (IR file)
Time period: Current status at time of survey
Numerator:
Number of women who say “yes” to experiencing in the 12 months preceding the survey:
1) One or more of the specified acts of spousal physical violence (any of d105a – g, j in 1:2) and
one or more of the specified acts of spousal sexual violence (any of d105h, i, k in 1:2)
2) One or more of the specified acts of spousal physical violence (any of d105a – g, j in 1:2) and
one or more of the specified acts of spousal sexual violence (any of d105h, i, k in 1:2) and
one or more of the specified acts of spousal emotional violence (any of d103a, b, c in 1:2)
3) One or more of the specified acts of spousal physical violence (any of d105a – g, j in 1:2) or
one or more of the specified acts of spousal sexual violence (any of d105h, i, k in 1:2)
4) One or more of the specified acts of spousal physical violence (any of d105a – g, j in 1:2) or
one or more of the specified acts of spousal sexual violence (any of d105h, i, k in 1:2) or
one or more of the specified acts of spousal emotional violence (any of d103a, b, c in 1:2)
Denominator: Number of ever-married women age 15-49 selected and interviewed for the domestic
violence module (v044 = 1 & v502 in 1:2)
Variables: IR file.
v044
Selected for Domestic Violence module
v502
Currently/formerly/never in union
d103a
Ever been humiliated by husband/partner
d103b
Ever been threatened with harm by husband/partner

Guide to DHS Statistics 17.34 August 2018
d103c
Ever been insulted or made to feel bad by husband/partner
d105a
Ever been pushed, shook or had something thrown by husband/partner
d105b
Ever been slapped by husband/partner
d105c
Ever been punched with fist or hit by something harmful by husband/partner
d105d
Ever been kicked or dragged by husband/partner
d105e
Ever been strangled or burnt by husband/partner
d105f
Ever been threatened with knife/gun or other weapon by husband/partner
d105g
Ever CS physical violence by husband/partner
d105h
Ever been physically forced into unwanted sex by husband/partner
d105i
Ever been forced into other unwanted sexual acts by husband/partner
d105j
Ever had arm twisted or hair pulled by husband/partner
d105k
Ever been physically forced to perform sexual acts respondent didn't want to
d005
Weight for Domestic Violence
Calculation
Numerators divided by denominator multiplied by 100.
Handling of Missing Values
Women with missing information on one or more of the questions used for the indicator are included in the
denominator but not the numerator.
Notes and Considerations
Ever-married women include women who have ever had a partner who they lived with as-if married. For
women who have had one or more husbands/partners or partners, only violence by the most recent
husband/partner is included.
Changes over Time
See Changes over Time for the indicators Spousal Physical Violence, Spousal Sexual Violence and Spousal
Emotional Violence.
References
See References for this chapter.
Resources
DHS-7 Tabulation plan: Table DV.9
API Indicator IDs: DV_SPV1_W_PAS, DV_SPV1_W_ALL, DV_SPV1_W_POS, DV_SPV1_W_ANY
(API link, STATcompiler link)

Guide to DHS Statistics 17.35 August 2018
Types of Spousal Violence
Percentage of ever-married women who have experienced emotional violence, physical
violence, sexual violence, physical violence and sexual violence, physical violence and sexual
violence and emotional violence, physical violence or sexual violence, physical violence or
sexual violence or emotional violence by any husband or partner in the 12 months preceding
the survey
Definition
1) Percentage of ever-married women who have experienced emotional violence by any
husband/partner in the 12 months preceding the survey.
2) Percentage of ever-married women who have experienced physical violence by any
husband/partner in the 12 months preceding the survey.
3) Percentage of ever-married women who have experienced sexual violence by any husband/partner
in the 12 months preceding the survey.
4) Percentage of ever-married women who have experienced physical violence and sexual violence by
any husband/partner in the 12 months preceding the survey.
5) Percentage of ever-married women who have experienced physical violence and sexual violence and
emotional violence by any husband/partner in the 12 months preceding the survey.
6) Percentage of ever-married women who have experienced physical violence or sexual violence by
any husband/partner in the 12 months preceding the survey.
7) Percentage of ever-married women who have experienced physical violence or sexual violence or
emotional violence by any husband/partner in the 12 months preceding the survey.
Coverage:
Population base: All ever-married women age 15-49 selected and interviewed for the domestic
violence module (v044 = 1 & v502 in 1:2) (IR file)
Time period: Current status at time of survey
Numerator:
Numbers of women who say “yes” to experiencing in the 12 months preceding the survey:
1) One or more of the specified acts of spousal physical violence (any of d105a – g, j in 1:2), or physical
violence by any previous husband/partner (d130a = 1)
2) One or more of the specified acts of spousal sexual violence (any of d105h, i, k in 1:2), or sexual
violence by any previous husband/partner (d130b = 1)
3) One or more of the specified acts of spousal emotional violence (any of d103a, b, c in 1:2) by their
current or most recent husband/partner, or emotional violence by any previous husband/partner
(d130c = 1)
4) One or more of the specified acts of spousal physical violence (any of d105a – g, j in 1:2) or physical
violence by any previous husband/partner (d130a = 1) and
one or more of the specified acts of spousal sexual violence (any of d105h, i, k in 1:2) or sexual
violence by any previous husband/partner (d130b = 1)
5) One or more of the specified acts of spousal physical violence (any of d105a – g, j in 1:2) or physical
violence by any previous husband/partner (d130a = 1) and

Guide to DHS Statistics 17.36 August 2018
one or more of the specified acts of spousal sexual violence (any of d105h, i, k in 1:2) or sexual
violence by any previous husband/partner (d130b = 1) and
one or more of the specified acts of spousal emotional violence (any of d103a, b, c in 1:2) or
emotional violence by any previous husband (d130c = 1)
6) One or more of the specified acts of spousal physical violence (any of d105a – g, j in 1:2) or physical
violence by any previous husband/partner (d130a = 1) or
one or more of the specified acts of spousal sexual violence (any of d105h, i, k in 1:2) or sexual
violence by any previous husband/partner (d130b = 1)
7) One or more of the specified acts of spousal physical violence (any of d105a – g, j in 1:2) or physical
violence by any previous husband/partner (d130a = 1) or
one or more of the specified acts of spousal sexual violence (any of d105h, i, k in 1:2) or sexual
violence by any previous husband/partner (d130b = 1) or
one or more of the specified acts of spousal emotional violence (any of d103a, b, c in 1:2) or
emotional violence by any previous husband/partner (d130c = 1)
Denominator: Number of ever-married women age 15-49 selected and interviewed for the domestic
violence module (v044 = 1 & v502 in 1:2)
Variables: IR file.
v044
Selected for Domestic Violence module
v502
Currently/formerly/never in union
d103a
Ever been humiliated by husband/partner
d103b
Ever been threatened with harm by husband/partner
d103c
Ever been insulted or made to feel bad by husband/partner
d105a
Ever been pushed, shook or had something thrown by husband/partner
d105b
Ever been slapped by husband/partner
d105c
Ever been punched with fist or hit by something harmful by husband/partner
d105d
Ever been kicked or dragged by husband/partner
d105e
Ever been strangled or burnt by husband/partner
d105f
Ever been threatened with knife/gun or other weapon by husband/partner
d105g
Ever CS physical violence by husband/partner
d105h
Ever been physically forced into unwanted sex by husband/partner
d105i
Ever been forced into other unwanted sexual acts by husband/partner
d105j
Ever had arm twisted or hair pulled by husband/partner
d105k
Ever been physically forced to perform sexual acts respondent didn't want to
d130a
Previous husband: ever hit, slap, kick, or physically hurt respondent
d130b
Previous husband: physically forced to have sex or to perform sexual acts
d130c
Previous husband: humiliate, threaten to hurt, insult or make feel bad
d005
Weight for Domestic Violence
Calculation
Numerators divided by denominator multiplied by 100.

Guide to DHS Statistics 17.37 August 2018
Handling of Missing Values
Women with missing information on one or more of the questions used for the indicator are included in the
denominator but not the numerator.
Notes and Considerations
Ever-married women include women who have ever had a partner who they lived with as-if married. For
women who have had one or more husband/partner or partner, only violence by the most recent
husband/partner is included.
The indicator for physical violence or sexual violence or emotional violence in the past 12 months
corresponds to the SDG indicator 5.2.1.
Changes over Time
In about 2010-11, separate questions were added for women married more than once that ask specifically
about their experience of physical violence and of sexual violence by any previous husband/partner. Before
this addition, physical violence and sexual violence by a previous husband/partner could only be reported in
response to more general questions on women’s experience of physical violence and of sexual violence by
anyone other than the current husband/partner. A separate question on emotional violence by any previous
husband/partner was added to the module only in 2017.
See also Changes over Time for the indicators Spousal Physical Violence, Spousal Sexual Violence and
Spousal Emotional Violence.
References
SDG Indicator 5.2.1 metadata: https://unstats.un.org/sdgs/metadata/files/Metadata-05-02-01.pdf
See References for this chapter.
Resources
DHS-7 Tabulation plan: Table DV.12
API Indicator IDs:
DV_SPV1_W_PHS, DV_SPV1_W_SEX, DV_SPV1_W_EMT, DV_SPV1_W_PAS, DV_SPV1_W_ALL, DV_SPV1_W_POS,
DV_SPV1_W_ANY
(API link, STATcompiler link)
SDG Indicator 5.2.1: Proportion of ever-partnered women and girls aged 15 years and older subjected to
physical, sexual or psychological violence by a current or former intimate partner in the previous 12 months.
WHO 100 Core Health Indicators: Intimate partner violence prevalence

Guide to DHS Statistics 17.38 August 2018
Experience of spousal violence by duration of marriage
Among married women married only once, the percentage who first experienced spousal
physical or sexual violence by specific exact years since marriage
Definition
1) Among currently married women age 15-49 who have been married only once, the percentage who
first experienced physical or sexual violence committed by their current husband/partner by specific
exact years since marriage.
2) Percentage of currently married women age 15-49 who have been married only once who have not
experienced spousal sexual or physical violence.
Coverage:
Population base: All currently married women age 15-49 who have been married only once (IR
file)
Time period: Current status at time of survey
Numerators:
1) Numbers of currently married women age 15-49 who have been married only once (v502 = 1 & v503
= 1) and who first experienced physical or sexual violence committed by their current
husband/partner by specified exact durations of marriage (before marriage, 2 years, 5 years, 10
years) (d109 = 95, d109 < 2, d109 < 5, d109 < 10)
2) Numbers of currently married women age 15-49 who have been married only once (v502 = 1 & v503
= 1) and who have not experienced sexual or physical violence (none of d105a – k in 1:4)
Denominator: Number of currently married women age 15-49 who have been married only once (v502 = 1 &
v503 = 1)
Variables: IR file.
v502
Currently/formerly/never in union
v503
Number of unions
d105a
Ever been pushed, shook or had something thrown by husband/partner
d105b
Ever been slapped by husband/partner
d105c
Ever been punched with fist or hit by something harmful by husband/partner
d105d
Ever been kicked or dragged by husband/partner
d105e
Ever been strangled or burnt by husband/partner
d105f
Ever been threatened with knife/gun or other weapon by husband/partner
d105g
Ever CS physical violence by husband/partner
d105h
Ever been physically forced into unwanted sex by husband/partner
d105i
Ever been forced into other unwanted sexual acts by husband/partner
d105j
Ever had arm twisted or hair pulled by husband/partner
d105k
Ever been physically forced to perform sexual acts respondent didn't want to
d005
Weight for Domestic Violence

Guide to DHS Statistics 17.39 August 2018
Calculation
Numerator divided by denominator multiplied by 100.
Handling of Missing Values
“Don’t know” and missing responses to the timing when women first experienced physical or sexual violence
committed by their current husband/partner are not considered as being before the specified exact
durations of marriage and are included in the denominator but excluded from the numerators.
References
See References for this chapter.
Resources
DHS-7 Tabulation plan: Table DV.13
API Indicator IDs: DV_SPVM_W_BEF, DV_SPVM_W_M2Y, DV_SPVM_W_M5Y, DV_SPVM_W_M10, DV_SPVM_W_NON
(API link, STATcompiler link)

Guide to DHS Statistics 17.40 August 2018
Injuries to Women due to Spousal Violence
Among ever-married women who have experienced violence committed by their current or
most recent husband/partner, the percentage who have been injured as a result of the
violence
Definition
Among ever-married women age 15-49 who have experienced violence committed by their current or most
recent husband/partner, the percentage who have been injured as a result of the violence, by type of injury.
Coverage:
Population base: Ever-married women age 15-49 selected and interviewed for the domestic violence
module who reported experiencing one or more types of physical or sexual violence by their current
husband (if currently married) or most recent husband (if divorced, separated, or widowed) (IR file)
Time period: Current status at time of survey
Numerator: Number of women 15-49 who say “yes” to experiencing the following types of injuries:
1) Cuts, bruises, or aches (d110a = 1)
2) Eye injuries, sprains, dislocations or burns (d110b = 1)
3) Deep wounds, broken bones, broken teeth or any other serious injury (d110d = 1)
4) Any of these injuries (d110a = 1 or d110b = 1 or d110d = 1)
Denominator: Number of ever-married women age 15-49 selected and interviewed for the domestic
violence module who have experienced physical and/or sexual violence by their current or most recent
husband/partner (v044 = 1 & v502 in 1:2 & any of d105a – k in 1:4)
Variables: IR file.
v044
Selected for Domestic Violence module
v502
Currently/formerly/never in union
d105a
Ever been pushed, shook or had something thrown by husband/partner
d105b
Ever been slapped by husband/partner
d105c
Ever been punched with fist or hit by something harmful by husband/partner
d105d
Ever been kicked or dragged by husband/partner
d105e
Ever been strangled or burnt by husband/partner
d105f
Ever been threatened with knife/gun or other weapon by husband/partner
d105g
Ever CS physical violence by husband/partner
d105h
Ever been physically forced into unwanted sex by husband/partner
d105i
Ever been forced into other unwanted sexual acts by husband/partner
d105j
Ever had arm twisted or hair pulled by husband/partner
d105k
Ever been physically forced to perform sexual acts respondent didn't want to
d110a
Ever had bruises because of husband/partner's actions
d110b
Ever had eye injuries, sprains, dislocations or burns because of husband/partner's
actions
d110d
Ever had wounds, broken bones, broken teeth or other serious injury because of
husband/partner's actions

Guide to DHS Statistics 17.41 August 2018
Calculation
Numerators divided by denominator multiplied by 100.
Handling of Missing Values
Women with missing information on types of injuries are included in the denominator but not in the
numerator.
Notes and Considerations
Experience of injuries can be calculated by type of spousal violence experienced and also by whether the
violence took place ever and in the past 12 months.
Changes over Time
The questions on injuries were substantially modified in 2005; thus, data on injuries from earlier surveys are
not strictly comparable with data from later surveys.
Also, since only women who say “yes” to the experience of physical or sexual violence by the most recent
spouse are asked the questions on injuries experienced as a result of the violence and changes to those
questions affects the eligibility for the questions on injuries. See Changes over Time for the indicators
Spousal Physical Violence and Spousal Sexual Violence to see how eligibility for this question may have
changed over time.
As always, when making comparisons over time, users are strongly advised to check the questions used in
each survey.
References
See References for this chapter.
Resources
DHS-7 Tabulation plan: Table DV.14
API Indicator IDs: DV_INJR_W_CUT, DV_INJR_W_INJ, DV_INJR_W_WND, DV_INJR_W_ANY
(API link, STATcompiler link)

Guide to DHS Statistics 17.42 August 2018
Initiation of Spousal Violence by Women
Percentage of ever-married women who have committed physical violence against their
current or most recent husband/partner when he was not already beating or physically hurting
her, ever and in the past 12 months
Definition
1) Percentage of ever-married women age 15-49 who have ever committed physical violence against
their current husband/partner if married or most recent husband/partner if divorced, separated,
widowed when he was not already beating or physically hurting her
2) Percentage of ever-married women age 15-49 who have committed physical violence in the 12
months preceding the survey against their current husband/partner if married or most recent
husband/partner if divorced, separated, widowed when he was not already beating or physically
hurting her
Coverage:
Population base: Ever-married women age 15-49 (IR file)
Time period: Current status at time of survey. 12 months preceding the survey
Numerators: Number of ever-married women age 15-49 who have committed physical violence against their
current or most recent husband/partner when he was not already beating or physically hurting her:
1) Ever (d112 = 1)
2) In the 12 months preceding the survey (d112a in 1:2)
Denominator: Number of ever-married women age 15-49 selected and interviewed for the domestic
violence module (v044 = 1 & v502 in 1:2)
Variables: IR file.
v044
Selected for Domestic Violence Module
v502
Currently/formerly/never in union
d112
Respondent ever physically hurt husband/partner when he was not hurting her
d112a
Frequency of physically hurting husband/partner in last 12 months
d005
Weight for Domestic Violence
Calculation
Numerator divided by denominator multiplied by 100.
Handling of Missing Values
Women with missing information on whether they initiated violence against their husbands/partners are
excluded from the numerators but included in the denominator. Women with missing information on the
frequency of initiating violence are excluded from the numerator but included in the denominator for the
indicator on initiation of violence in the past 12 months.

Guide to DHS Statistics 17.43 August 2018
Notes and Considerations
The question on violence perpetrated by women against their husbands/partners focuses on physical
violence initiated by women and does not include the violence that may occur when women retaliate during
an episode of on-going violence by their husbands.
Changes over Time
There have been no notable changes over time to this indicator.
References
See References for this chapter.
Resources
DHS-7 Tabulation plan: Table DV.15 and DV.16
API Indicator IDs: DV_VIOW_W_EVR, DV_VIOW_W_12M
(API link, STATcompiler link)

Guide to DHS Statistics 17.44 August 2018
Help Seeking to Stop the Violence
Percent distribution of women who have experienced physical or sexual violence by help-
seeking behavior
Definition
Percent distribution of women age 15-49 who have ever experienced physical or sexual violence by their
help-seeking behavior (sought help to stop the violence, never sought help but told someone, never sought
help and never told anyone).
Coverage:
Population base: All women age 15-49 selected and interviewed for the domestic violence module
who have ever experienced any physical or sexual violence by anyone (IR file)
Time period: Current status at time of survey
Numerators:
1) Number of women age 15-49 who say “yes” to the question on whether they have ever sought help
to stop the violence (d119y = 0)
2) Number of women age 15-49 who say “no” to the question on whether they have ever sought help
to stop the violence but say “yes” to the question on whether they have ever told anyone about the
violence (d128 = 1)
3) Number of women age 15-49 who say “no” to the question on whether they have ever sought help
to stop the violence and say “no” to the question on whether they have ever told anyone about the
violence (d128 = 0)
4) Number of women age 15-49 who say “no” to the question on whether they have ever sought help
to stop the violence and have a missing response to the question on whether they have ever told
anyone about the violence (d119y = 1 & d128 ≠ 0,1)
Denominator: Number of ever-married women age 15-49 selected and interviewed for the domestic
violence module who have experienced any physical or sexual violence (v044 = 1 & v502 in 1:2 & (any of
d105a – k in 1:4 or d130a in 1:4 or d130b in 1:4 or d115y = 0 or d118y = 0 or d124 = 1 or d125 = 1))
Variables: IR file.
v044
Selected for Domestic Violence module
d105a
Ever been pushed, shook or had something thrown by husband/partner
d105b
Ever been slapped by husband/partner
d105c
Ever been punched with fist or hit by something harmful by husband/partner
d105d
Ever been kicked or dragged by husband/partner
d105e
Ever been strangled or burnt by husband/partner
d105f
Ever been threatened with knife/gun or other weapon by husband/partner
d105g
Ever CS physical violence by husband/partner
d105h
Ever been physically forced into unwanted sex by husband/partner
d105i
Ever been forced into other unwanted sexual acts by husband/partner
d105j
Ever had arm twisted or hair pulled by husband/partner
d105k
Ever been physically forced to perform sexual acts respondent didn't want to

Guide to DHS Statistics 17.45 August 2018
d115y
No person other than husband/partner ever physically hurt respondent
d117a
Frequency of being hit in last 12 months by other than husband/partner
d118y
Respondent was not hurt by anyone during a pregnancy
d124
Ever forced to have sex by anyone other than husband/partner in last 12 months
d125
Ever forced to perform unwanted sexual acts
d130a
Previous husband: ever hit, slap, kick, or physically hurt respondent
d130b
Previous husband: physically forced to have sex or to perform sexual acts
d119y
Respondent did not seek help from anyone (0 = sought help)
d128
Ever told anyone else about violence
d005
Weight for Domestic Violence
Calculation
Numerators divided by denominator multiplied by 100.
Handling of Missing Values
Women who have missing information on the variable are excluded from the numerator but included in the
denominator.
Notes and Considerations
Help seeking questions are asked only from women who report physical or sexual violence. Women
experiencing only emotional violence are not asked questions on help seeking.
Changes over Time
Before 2005, women reporting violence were asked questions about help seeking only for physical violence.
From 2005, the help seeking questions were asked from all women reporting physical or sexual violence.
The question on telling someone about the violence even if they had not sought help was also added in
2005.
References
See References for this chapter.
Resources
DHS-7 Tabulation plan: Table DV.17
API Indicator IDs: DV_STPV_W_HLP, DV_STPV_W_TLD, DV_STPV_W_NTL, DV_STPV_W_DKM
(API link, STATcompiler link)

Guide to DHS Statistics 17.46 August 2018
Sources for Help to Stop the Violence
Percentage of women age who have experienced physical or sexual violence and sought help
by sources from which they sought help
Definition
Percentage of women age 15-49 who have ever experienced physical or sexual violence and sought help by
sources from which they sought help.
Coverage:
Population base: All women age 15-49 selected and interviewed for the domestic violence module
who have ever experienced any physical or sexual violence by anyone and sought help to stop the
violence (IR file)
Time period: Current status at time of survey
Numerators: Number of women age 15-49 who say “yes” to the question on whether they have ever sought
help to stop the violence (d119y = 0) by source of help sought:
1) Own family (any of d119b – h, m, n = 1)
2) Husband/partner’s family (any of d119i, o – r = 1)
3) Husband/partner (d119a or d119j = 1)
4) Boyfriend (d119k or d119l = 1)
5) Friend (any of d119s, t, xd = 1)
6) Neighbor (d119u = 1)
7) Religious leader (d119xf = 1)
8) Doctor/medical personnel (d119xh = 1)
9) Police (d119xe = 1)
10) Lawyer (d119xg = 1)
11) Social work organization (d119xb = 1)
12) Other (any of d119v, w, x, xa, xc, xi, xj, xk = 1)
Denominator: Number of ever-married women age 15-49 selected and interviewed for the domestic
violence module v044 = 1 & v502 in 1:2) who have experienced any physical or sexual violence (any of d105a
– k in 1:4 or d130a in 1:4 or d130b in 1:4 or d115y = 0 or d118y = 0 or d124 = 1 or d125 = 1) and sought help
to stop the violence (d119y = 0)
Variables: IR file.
v044
Selected for Domestic Violence module
d105a
Ever been pushed, shook or had something thrown by husband/partner
d105b
Ever been slapped by husband/partner
d105c
Ever been punched with fist or hit by something harmful by husband/partner
d105d
Ever been kicked or dragged by husband/partner
d105e
Ever been strangled or burnt by husband/partner
d105f
Ever been threatened with knife/gun or other weapon by husband/partner
d105g
Ever CS physical violence by husband/partner
d105h
Ever been physically forced into unwanted sex by husband/partner
d105i
Ever been forced into other unwanted sexual acts by husband/partner
Guide to DHS Statistics 17.47 August 2018
d105j
Ever had arm twisted or hair pulled by husband/partner
d105k
Ever been physically forced to perform sexual acts respondent didn't want to
d115y
No person other than husband/partner ever physically hurt respondent
d117a
Frequency of being hit in last 12 months by other than husband/partner
d118y
Respondent was not hurt by anyone during a pregnancy
d124
Ever forced to have sex by anyone other than husband/partner in last 12 months
d125
Ever forced to perform unwanted sexual acts
d130a
Previous husband: ever hit, slap, kick, or physically hurt respondent
d130b
Previous husband: physically forced to have sex or to perform sexual acts
d119a
Husband/partner: Person respondent went to seek help
d119b
Mother: Person respondent went to seek help
d119c
Father: Person respondent went to seek help
d119d
Daughter: Person respondent went to seek help
d119e
Son: Person respondent went to seek help
d119f
Sister: Person respondent went to seek help
d119g
Brother: Person respondent went to seek help
d119h
Own family: Person respondent went to seek help
d119i
Husband/partner family: Person respondent went to seek help
d119j
Current/former husband/partner: Person respondent went to seek help
d119k
Current/former boyfriend: Person respondent went to seek help
d119l
Former boyfriend alone: Person respondent went to seek help
d119m
Step-mother: Person respondent went to seek hel
d119n
Step-father: Person respondent went to seek hel
d119o
Mother-in-law: Person respondent went to seek help
d119p
Father-in-law: Person respondent went to seek help
d119q
Other female in-law: Person respondent went to seek help
d119r
Other male in-law: Person respondent went to seek help
d119s
Female friend: Person respondent went to seek help
d119t
Male friend: Person respondent went to seek help
d119u
Neighbor: Person respondent went to seek help
d119v
Teacher: Person respondent went to seek help
d119w
Employer: Person respondent went to seek help
d119x
Teacher: Person respondent went to seek help
d119xa
Stranger: Person respondent went to seek help
d119xb
Social service organization: Person respondent went to seek help
d119xc
CS: Person respondent went to seek help
d119xd
Friend: Person respondent went to seek help
d119xe
Police: Person respondent went to seek help
d119xf
Religious leader: Person respondent went to seek help
d119xg
Lawyer: Person respondent went to seek help
d119xi
CS: Person respondent went to seek help
d119xj
CS: Person respondent went to seek help
d119xk
CS: Person respondent went to seek help
d119y
Respondent did not seek help from anyone (0 = sought help)
d005
Weight for Domestic Violence
Calculation

Guide to DHS Statistics 17.48 August 2018
Numerators divided by denominator multiplied by 100.
Handling of Missing Values
Women who have missing information on the variable are excluded from the numerator but included in the
denominator.
Notes and Considerations
Help seeking questions are asked only from women who report physical or sexual violence. Women
experiencing only emotional violence are not asked questions on help seeking.
Women may report more than one source from which they sought help.
Changes over Time
Before 2005, women reporting violence were asked questions about help seeking only for physical violence.
From 2005, the help seeking questions were asked from all women reporting physical or sexual violence.
The question on telling someone about the violence even if they had not sought help was also added in
2005.
References
See References for this chapter.
Resources
DHS-7 Tabulation plan: Table DV.18
API Indicator IDs:
DV_STPS_W_FAM, DV_STPS_W_HFM, DV_STPS_W_HSB, DV_STPS_W_BFR, DV_STPS_W_FRD, DV_STPS_W_NEI,
DV_STPS_W_RLG, DV_STPS_W_DRM, DV_STPS_W_POL, DV_STPS_W_LWY, DV_STPS_W_SWO, DV_STPS_W_OTH
(API link, STATcompiler link)
