Handout Instructions
Handout%20instructions-checkpoint
Handout%20instructions-checkpoint
Handout%20instructions
User Manual:
Open the PDF directly: View PDF ![]() .
.
Page Count: 10
RMOTR Data Science - Final
project
Analyzing FIFA 19 player dataset
We'll FIFA 19 Dataset from Kaggle
(https://www.kaggle.com/karangadiya/fifa19/) which includes thorough
information about the FIFA19 game. The data was scraped from https://sofifa.com/ (https://sofifa.com/).
There are +80 features per player, including attributes (eg: shooting, passing, defending skills, value & wage,
release clause and others).
For a detailed description of the columns of the datasetcheck the associated notebook
Columns detail.ipynb
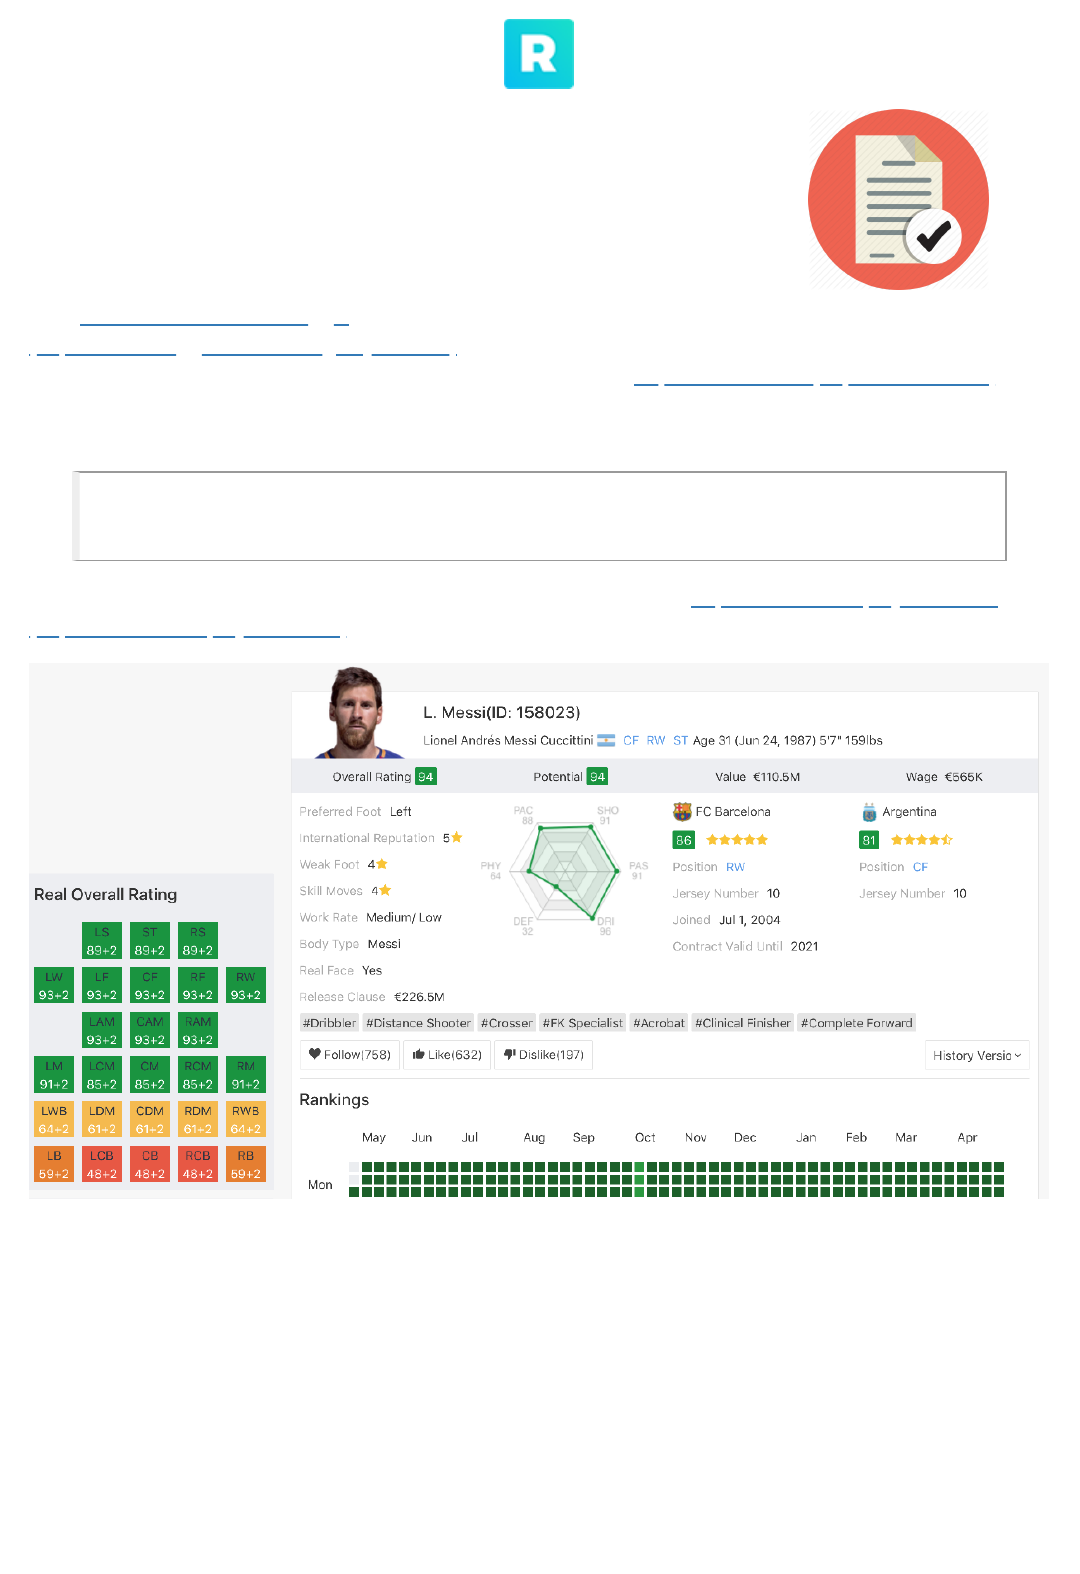
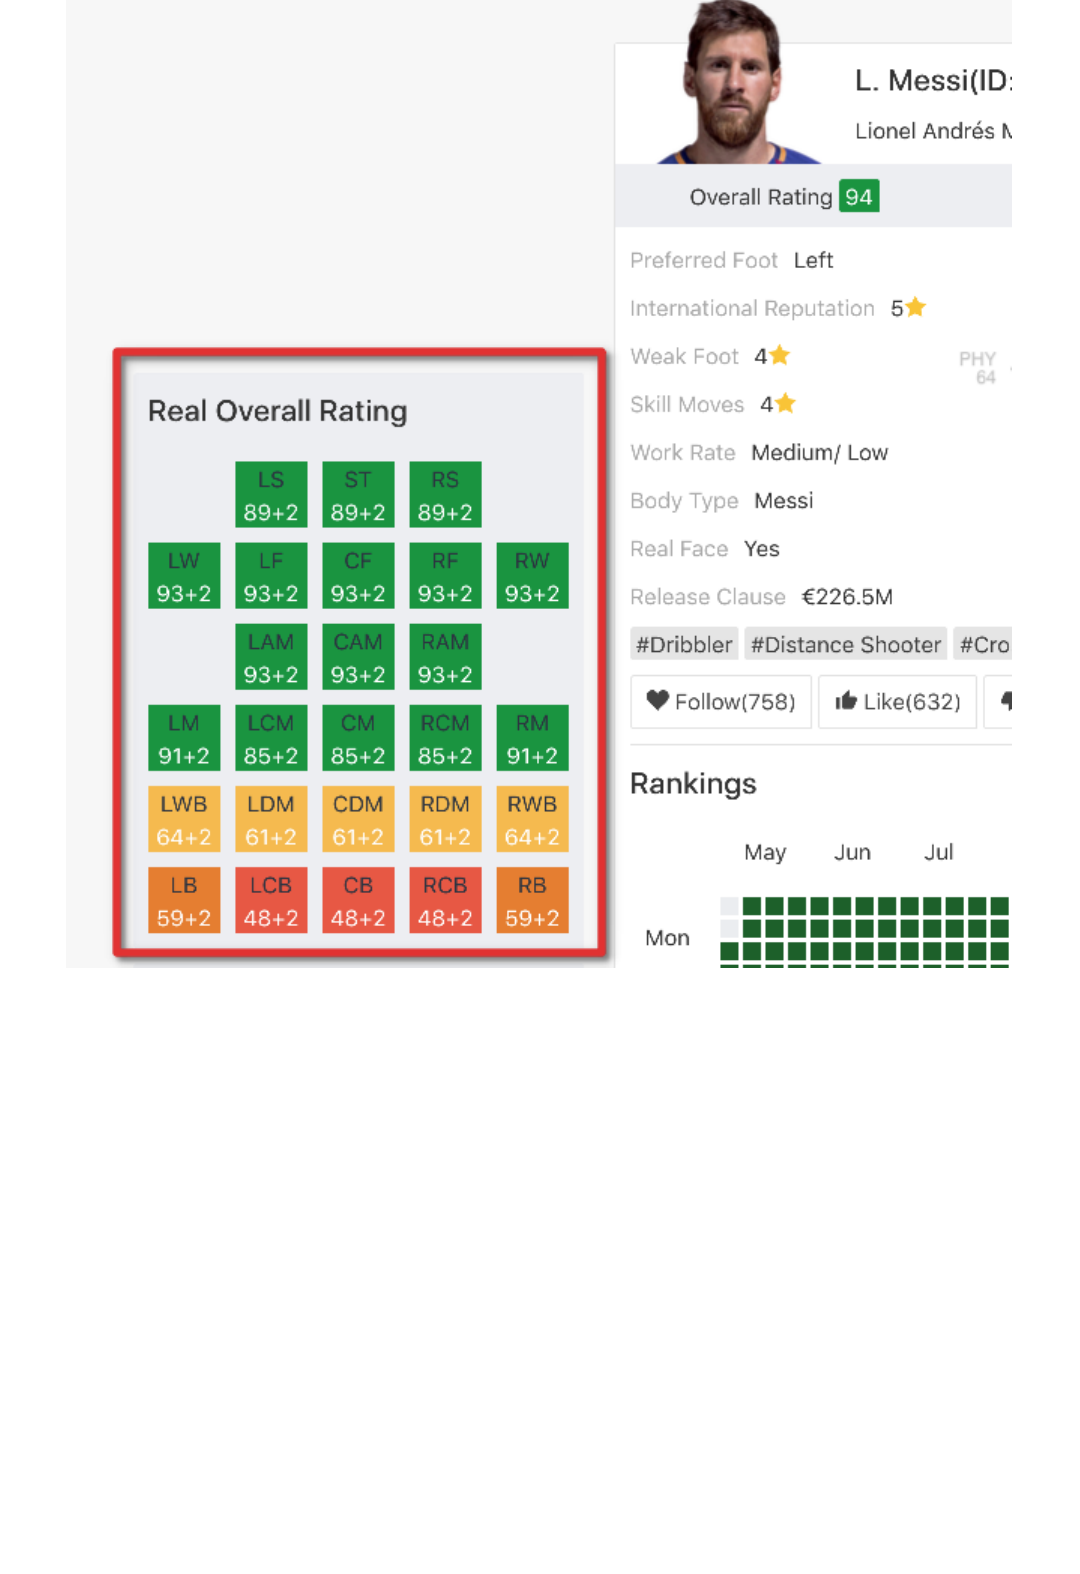
This is an example of the page that was scraped to generate the data: https://sofifa.com/player/158023
(https://sofifa.com/player/158023)
Dataset
The data is contained in /data/fifa19.zip . There are 89 columns in the dataset. There's a detailed
description of it in the associated notebook Handout instructions.ipynb .
Initial cleaning
This dataset is fairly well structured and cleaned, but there are still some tasks to do. We'll give you a few
initial pointers to get things started, and you can finish the process according to your own criteria.
1. Parse Value , Wage and Release Clause to make them numeric:
These fields have a "human" format (eg: €226.5M . Your job is to turn them into numeric fields. M means
Millions and K thousands. You're in charge of coming to the real value. Example, €226.5M is actually
226.5 * 1_000_000 = 226_500_000.0 .
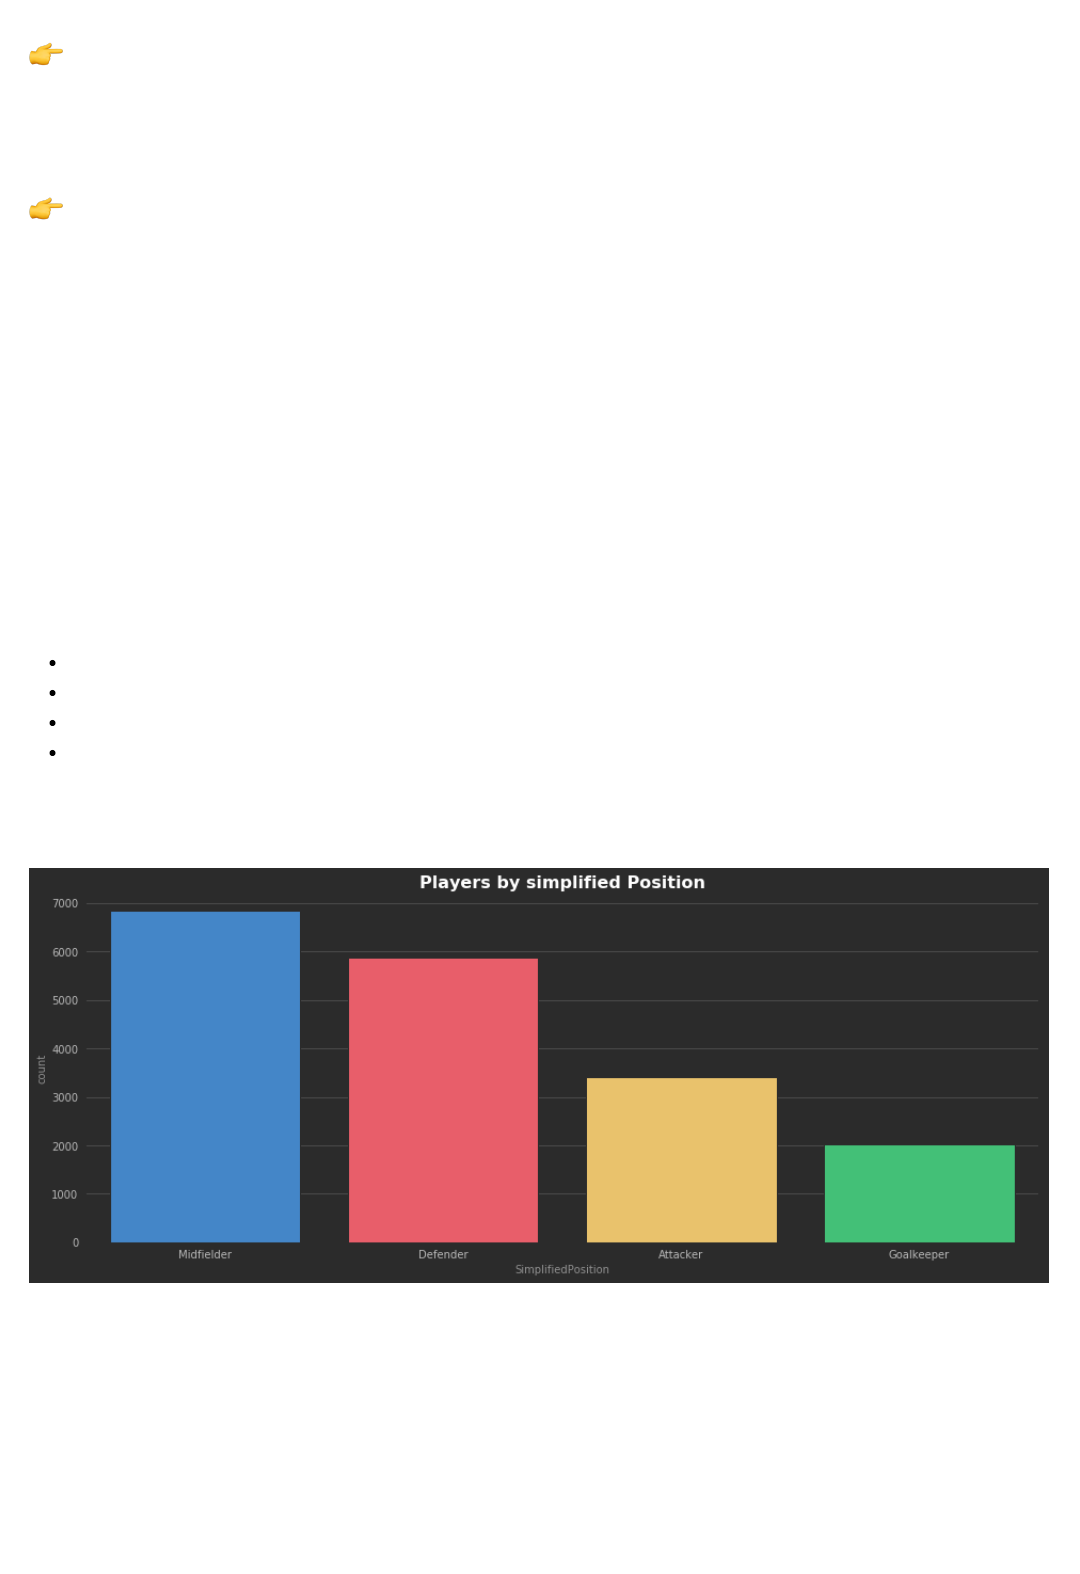
2. Create a new column SimplifiedPosition :
The SimplifiedPosition column should have the position of the player simplified into the possible
values:
Goalkeeper: GK
Defender: LWB, RWB, LB, LCB, CB, RCB, RB
Midfielder: LAM, CAM, RAM, LM, LCM, CM, RCM, RM, LDM, CDM, RDM
Attacker: LS, ST, RS, LW, LF, CF, RF, RW
According to our calculations, there should be 2025 GKs, 5866 DFs, 6838 MFs, 3418 ATs. If your numbers
are different, please explain why.
3. Parse Joined and Contract Valid Until to Timestamps
Remember to use the pandas function pd.to_datetime() .
4. The rest is for you to decide
There might be more things to clean from this dataset. If you find some other things to improve, please
document them to present it to the rest of your classmates.
EDA: Exploratory Data Analysis
The analysis phase will include a couple of predefined questions given by us, as a way to get things started.
We estimate these predefined questions should take around 30% of your time, the other 70% is more
"exploratory", in which you're in charge of coming up with questions, findings and conclusions.
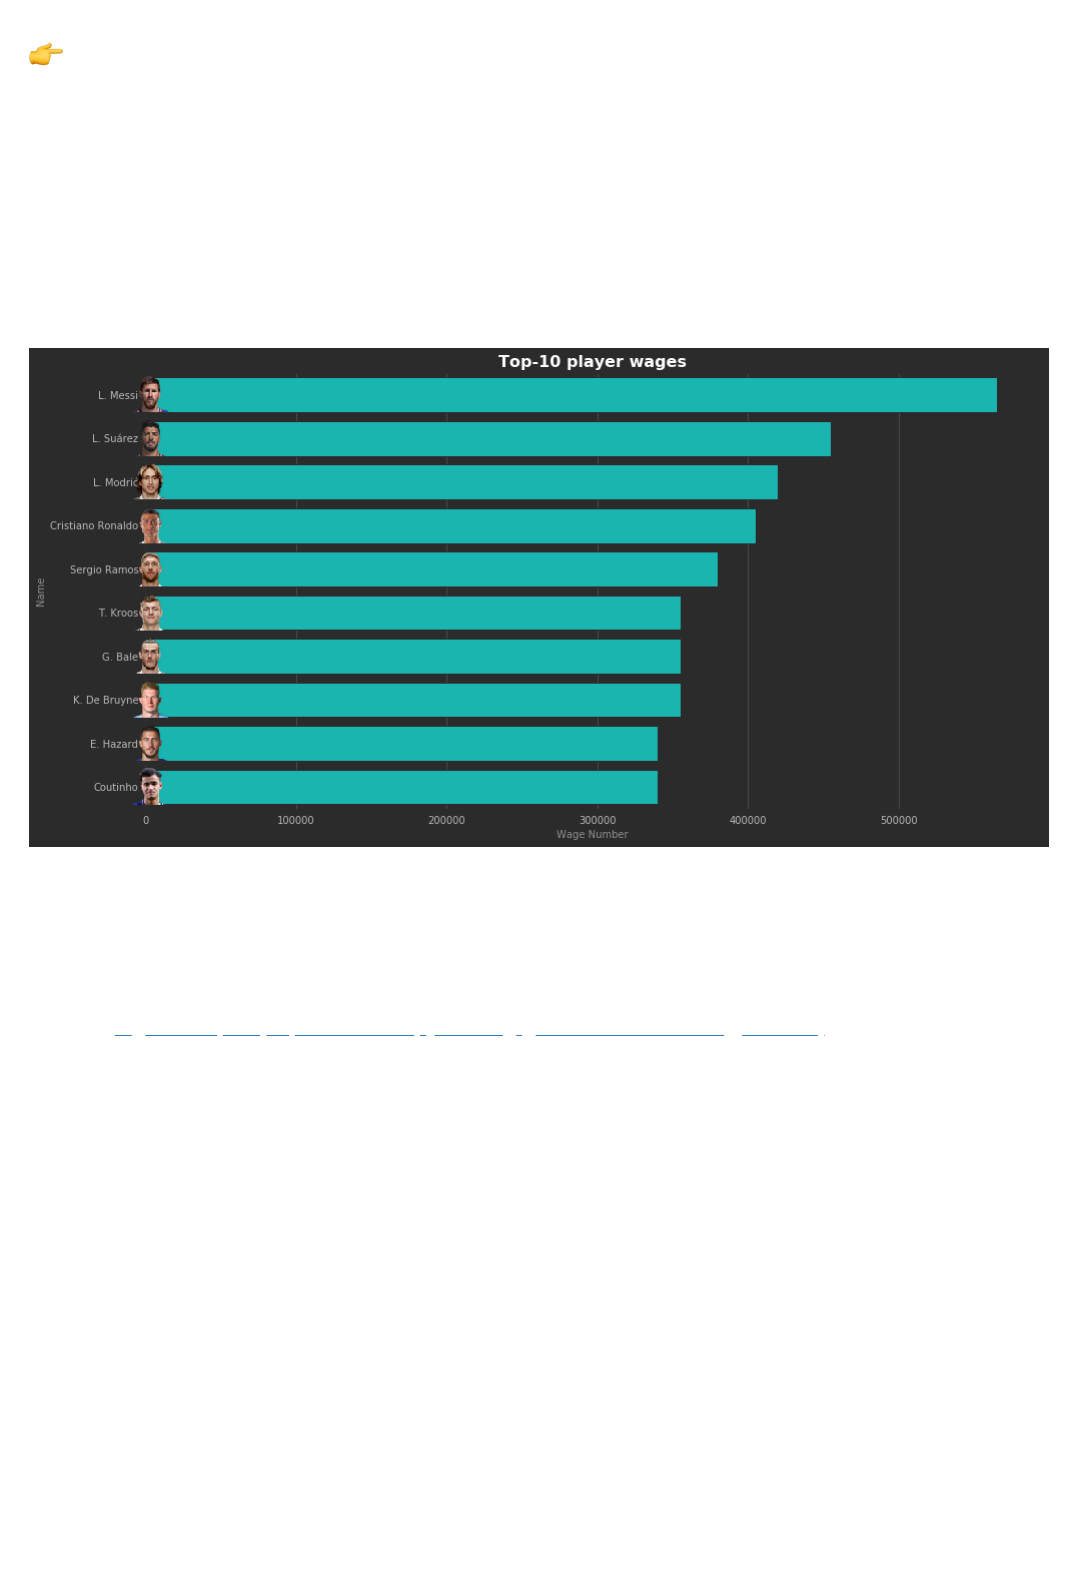
1. Which are the 10 highest paid players
To kick things off, we'll start with a simple one. Identify and plot the top 10 highest paid players, defined by
Wage . Here's an illustrative example:
2. Value vs Wage
Some players have a low market value, but they have very good salaries, for some others is the other way
around. Some clubs will prefer to pay a high value, but have less weekly wages.
Create a regression plot (https://seaborn.pydata.org/generated/seaborn.regplot.html) comparing Value to
Wage. Can you tell which players are "cheaper" compared to their salary or the other way around?
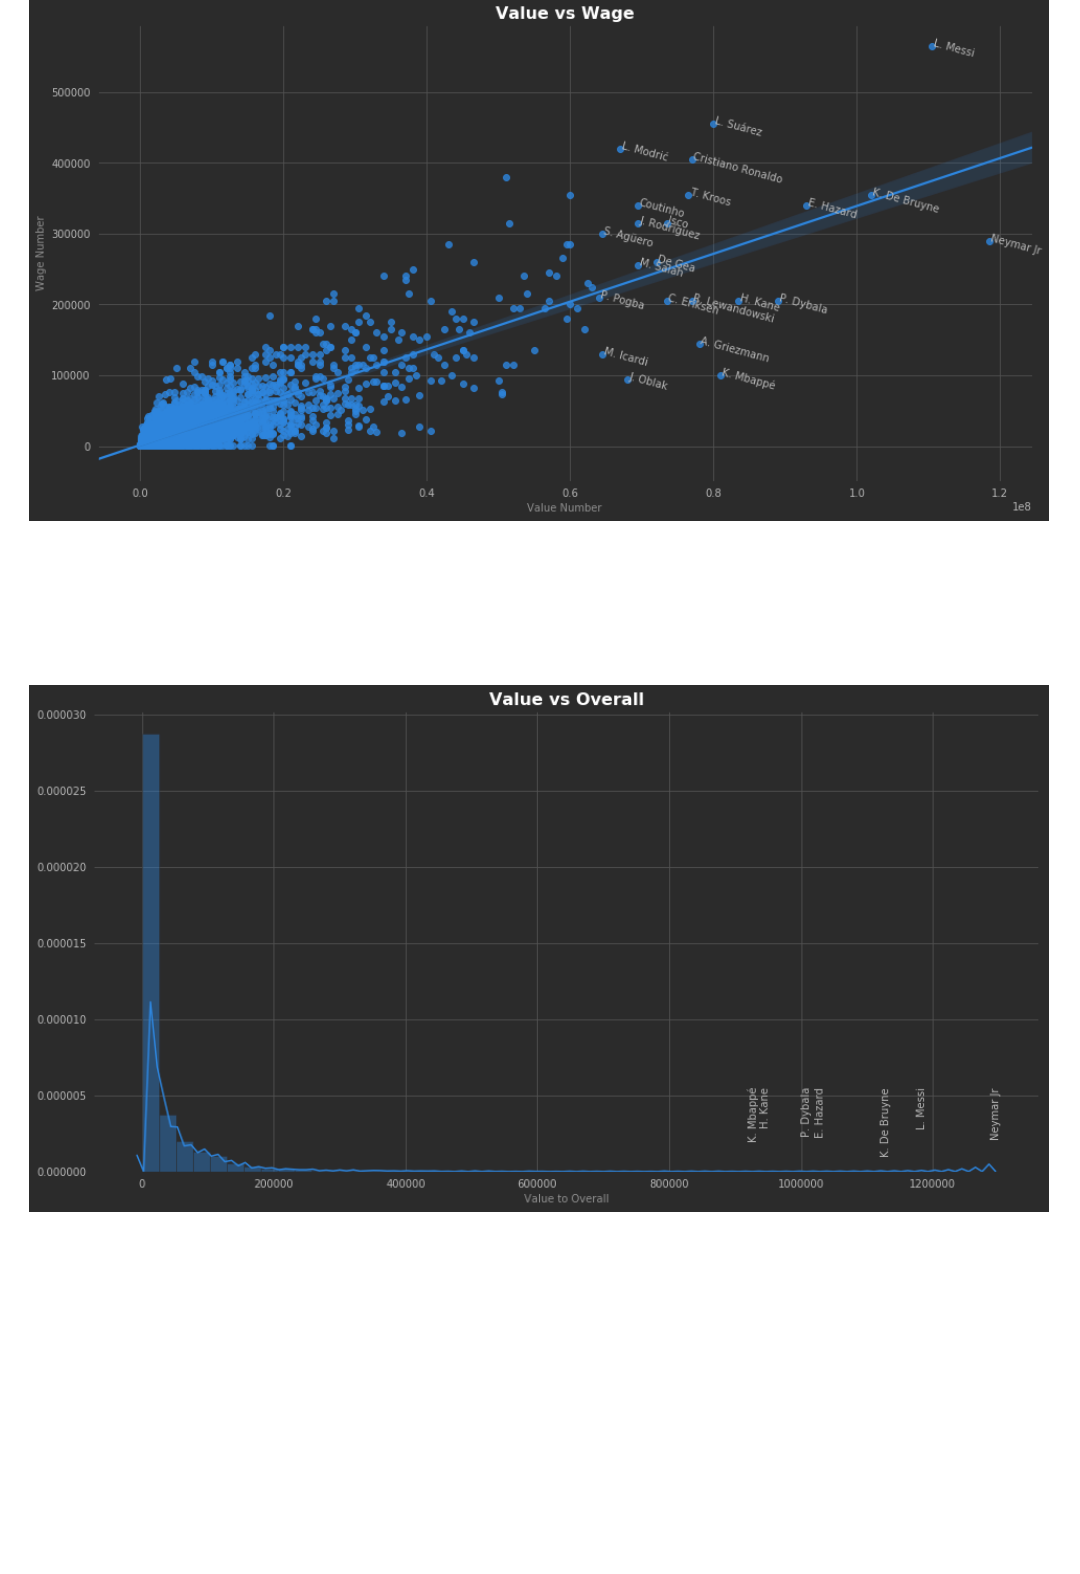
3. Value vs Overall
Create a figure to relate the value of a player with it's "overall rating". You can use a simple scatter plot or
more advanced analysis as the one below:
4. What are the top 5 most "valuable" nations?
What are the top 5 nations for which the sum of players value is the highest?
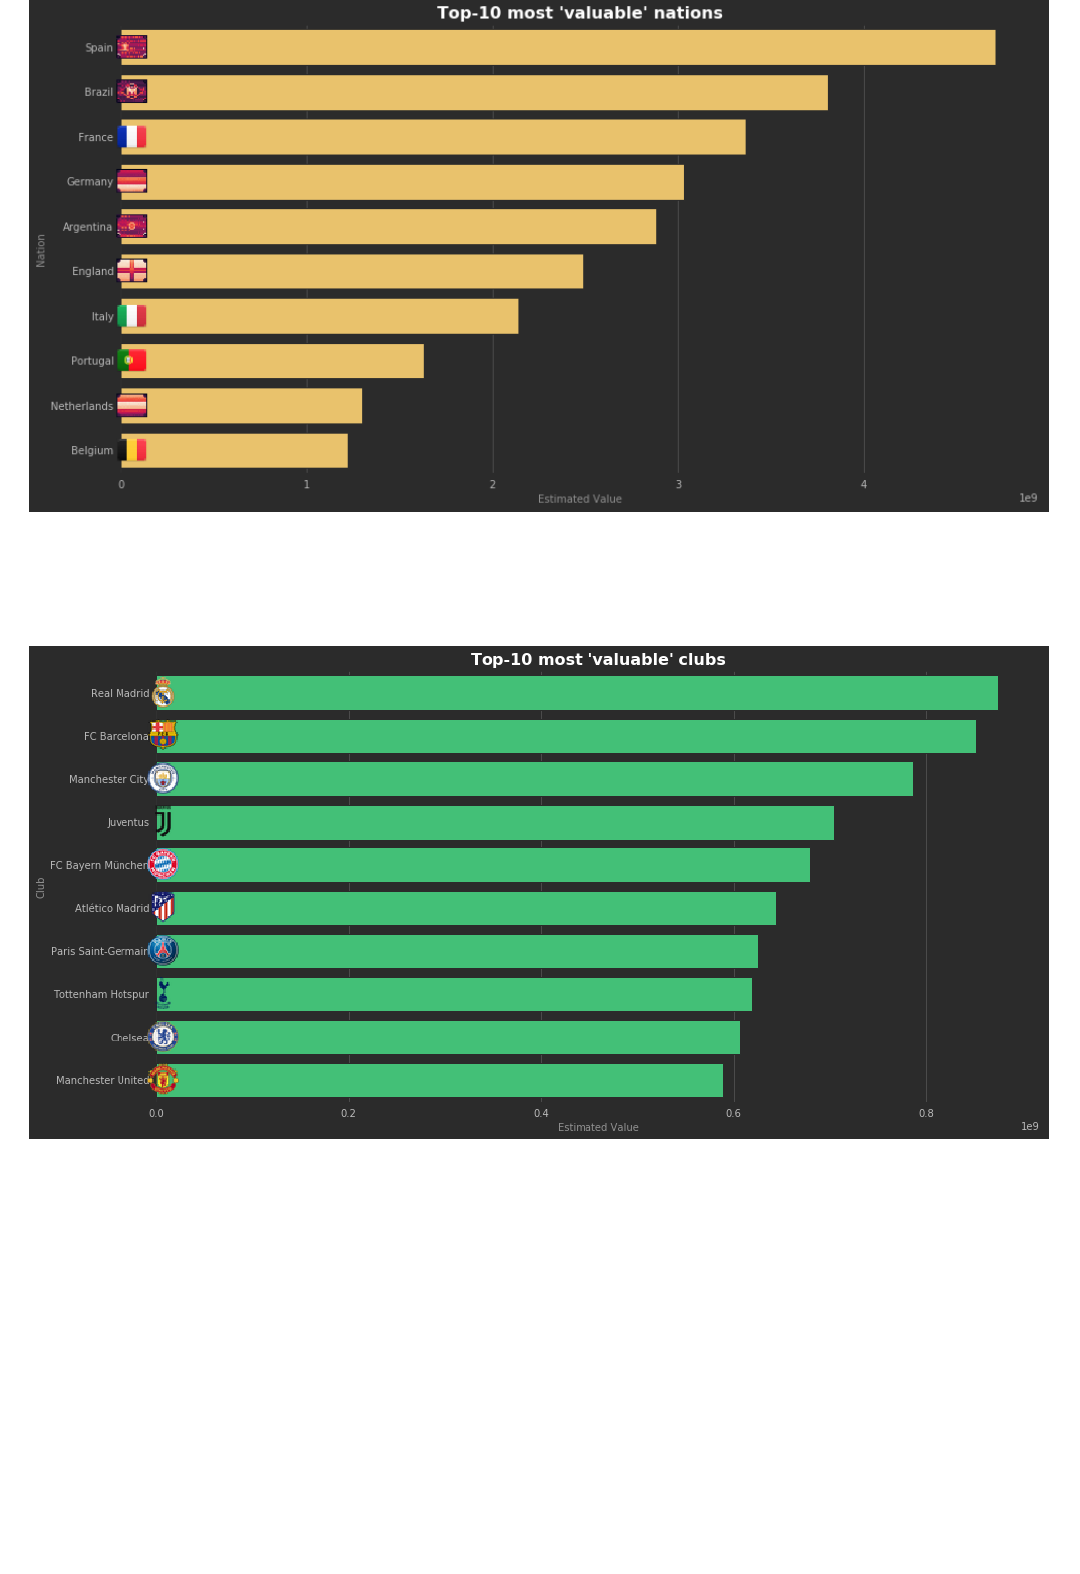
5. What are the top 5 most "valuable" clubs?
Calculate the total value of each club, defined as the sum of each players total value. Display the top 5.
6. Most valuable clubs on the 90th percentile.
Instead of calculating the total value of the club, we'll explore the 90th percentiles of values. Display the top
5 clubs with highest salaries in the 90th percentile:
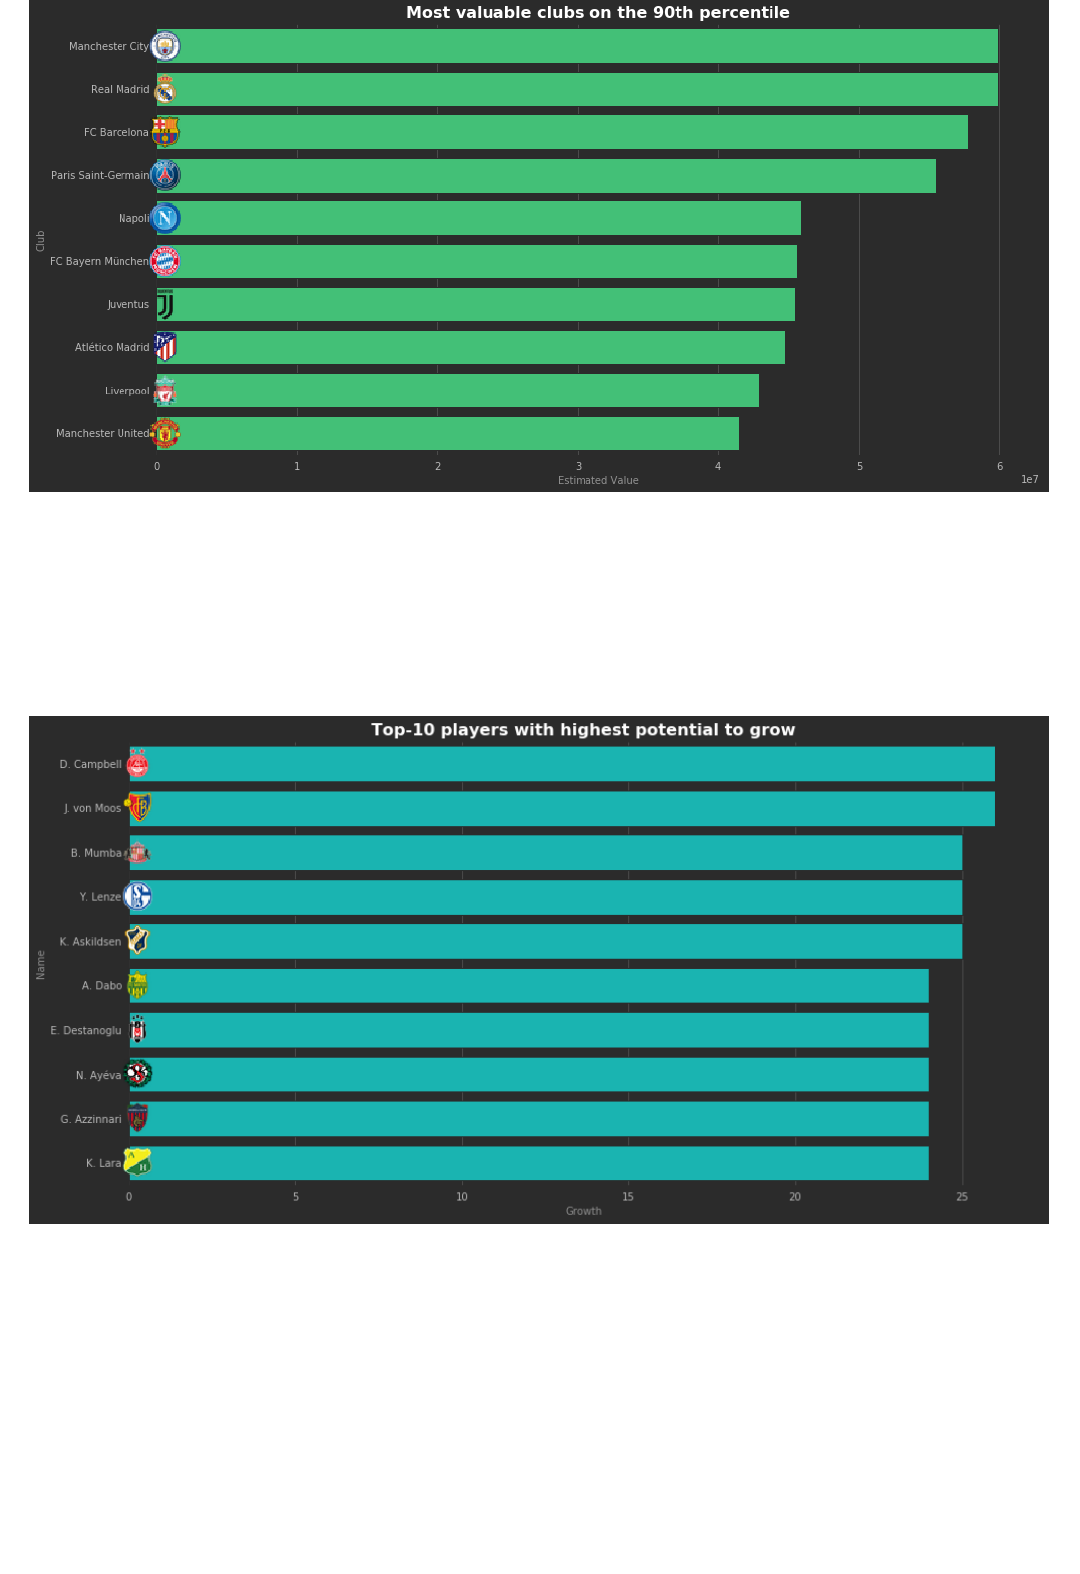
7. What players have the highest potential to grow?
The column Potential shows the Maximum overall rating a player can reach (with the correct training).
Overall shows the current rating. We'll define "Growth Potential" as Potential - Overall . For
example, Vinícius Júnior has an Overall of 77, but a potential of 92. He has 15 points to grow. What are the
10 most promising players? Defined as the ones with highest "Growth potential".
8. What are the top 5 most promising players, with a potential over 90?
Similar to the previous point, but the players with a potential over 90.
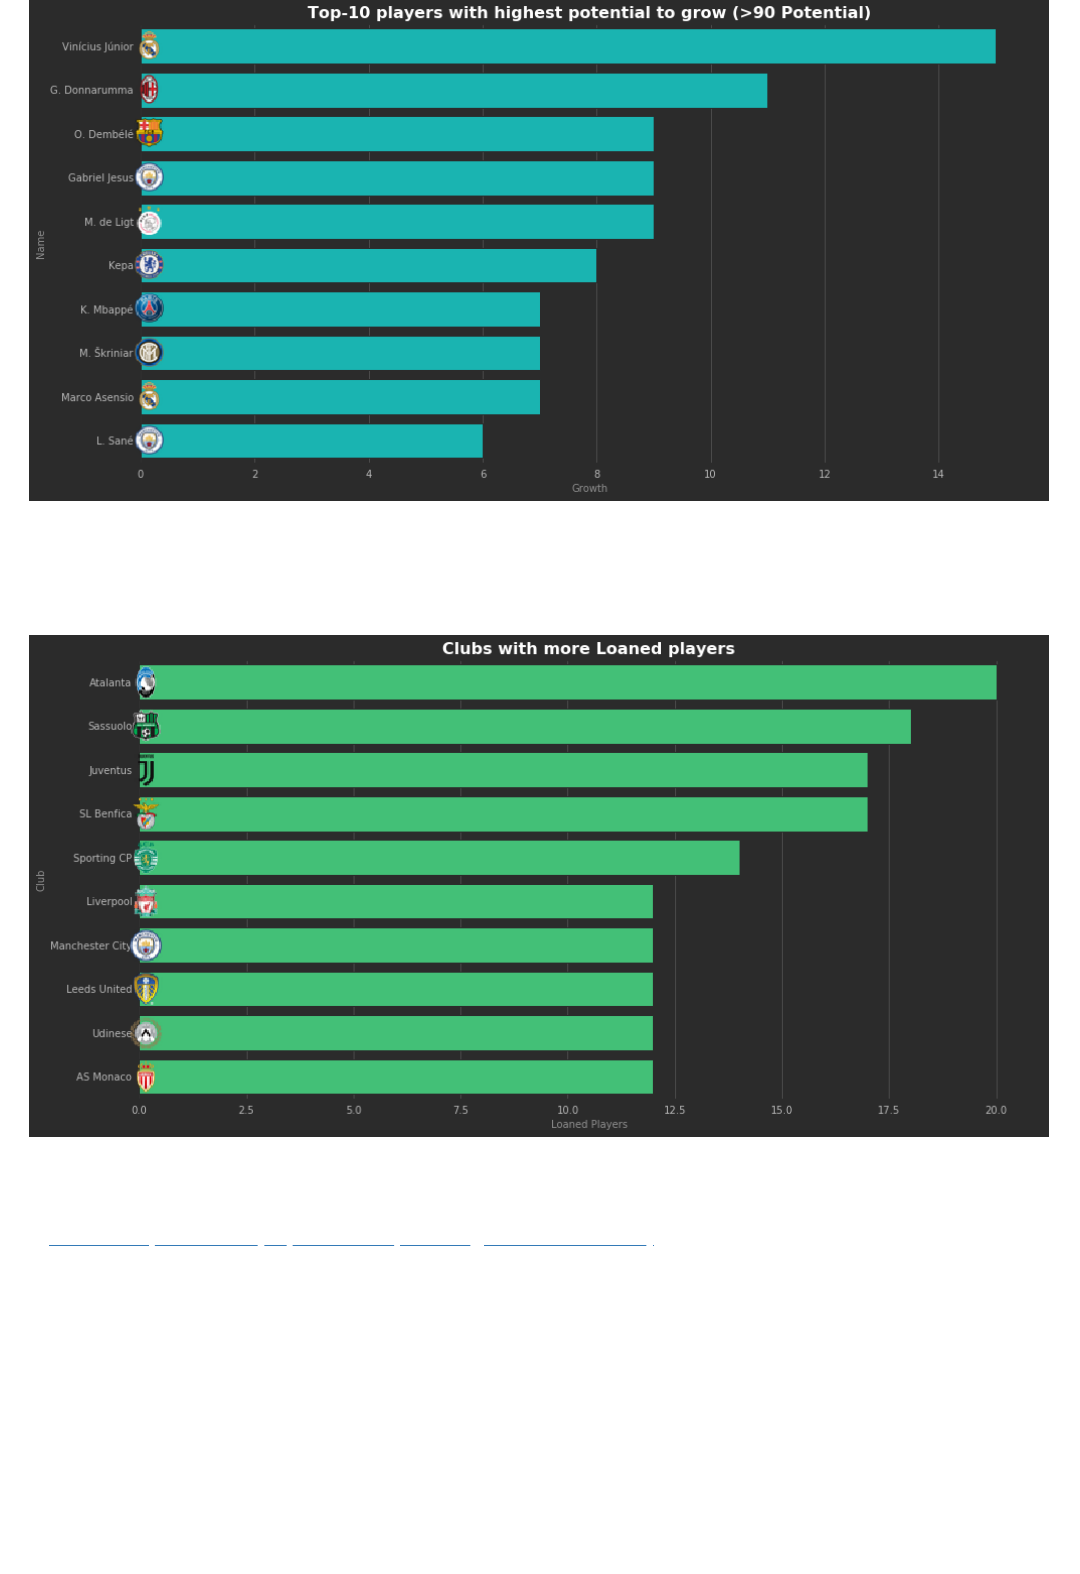
9. What clubs have the most number of loaned players?
Some clubs loan more than others. What are the top 10 clubs with more loaned players?
10. Create a Radar chart with the most important features of the player.
A Radar or Spider chart (https://en.wikipedia.org/wiki/Radar_chart) lets you plot multiple features at the
same time. Define a function plot_radar(player_names, features) that receives players and
features to plot and create radars:
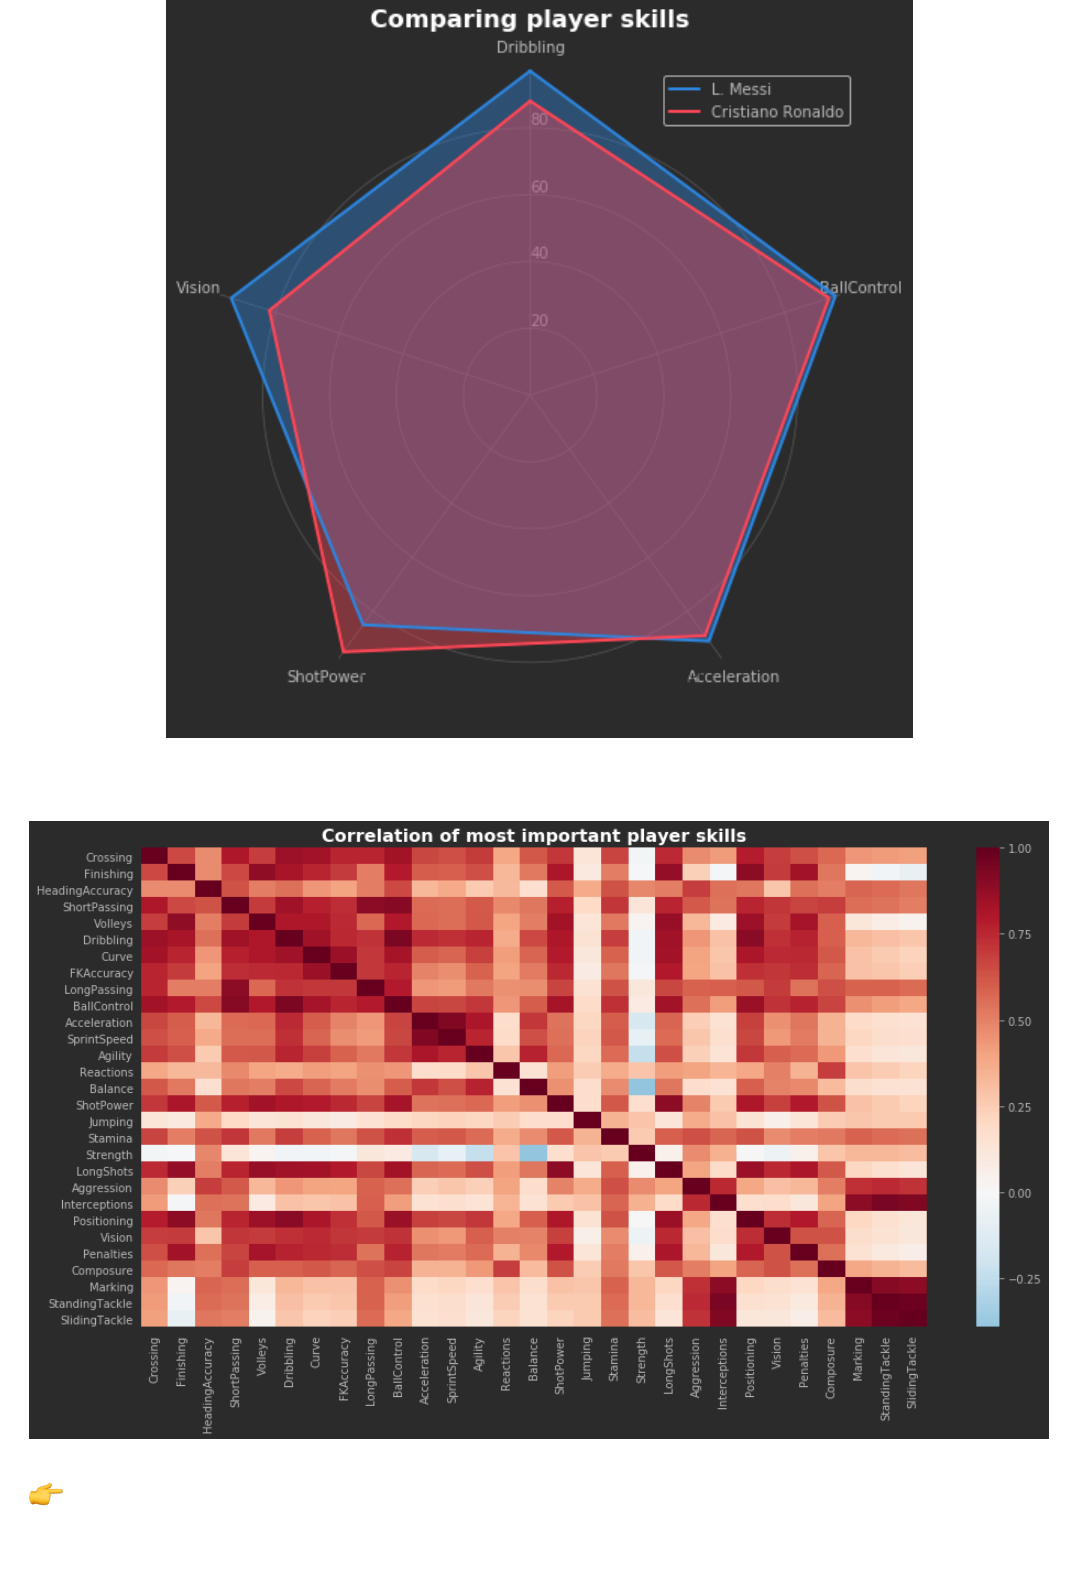
11. Create a correlation heatmap of the most important skills of players.
Your EDA

ML & Predictions
Time for some Machine Learning! We'll give you a recommendation of the easiest thing to predict, which is
the Overall value of a player. If you want to create other models (example: classifying the
SimplifiedPosition , or estimating the Value/Wage), you're welcome to do it.
Predicting player's Overall (regression)
Create a model that predicts the overall ranking of a player. What are the most relevant variables when
comes to predicting that overall value and why?
Optional
Finally, if you have extra time, here are optional points to work on:
1. Backfill missing positions (scraping)
Some players have their Position missing. The https://sofifa.com/ (https://sofifa.com/) website has
positions for them, so it's probably just the result of poorly scraping. Use your scraping techniques
(beautifulsoup recommended) to fill those missing positions.
2. Create an API endpoint to predict a players overall
Using the regression created in the previous point, create a simple API endpoint that receives the features
you're analyzing and predicts the overall value of the players.
