Handson Instructions Workshop Monitoring With Prometheus And Grafana September 2018
User Manual:
Open the PDF directly: View PDF ![]() .
.
Page Count: 57
Workshop Monitoring with Prometheus
and Grafana
To walk through the steps in these handson instructions, you need an environment with
Prometheus, Grafana and Docker Engine. This document describes two approaches that both
require Virtual Box on your laptop:
1. Use the fully prepared Virtual Machine
Just import the.ova file into Virtual Box, run the machine and login with vagrant/vagrant
2. Create and run the environment ‘from scratch’ using Vagrant; then connect using ssh
You need to pick one of these two approaches.
Quick online handson
A third option is to run a Prometheus handson completely in the cloud, at
https://www.katacoda.com/courses/prometheus/getting-started (at Katacoda, a Prometheus
instance is spun up for you in the cloud and you can walk through the basic steps of scraping the
Node Exporter).
Use the fully prepared Virtual Machine
Download the Virtual Machine from this URL: One Drive - monitoring-with-prometheus-
workshop2018_VirtualBoxMachine.ova - or copy it from the USB drive handed to you by the
workshop instructor.
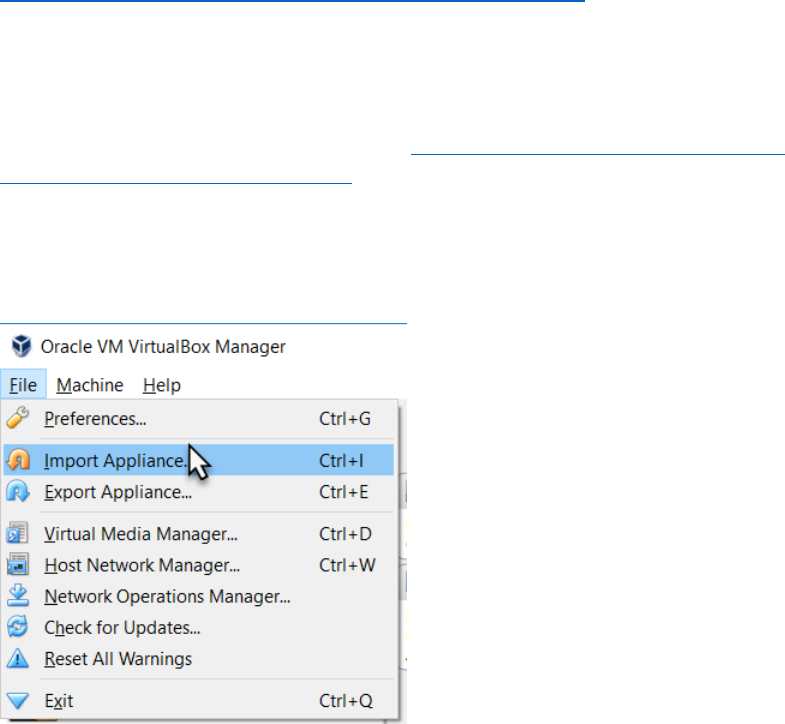
Run VirtualBox.
Open the File menu and select Import Appliance
Browse for the ova file monitoring-with-prometheus-workshop2018_VirtualBoxMachine.ova
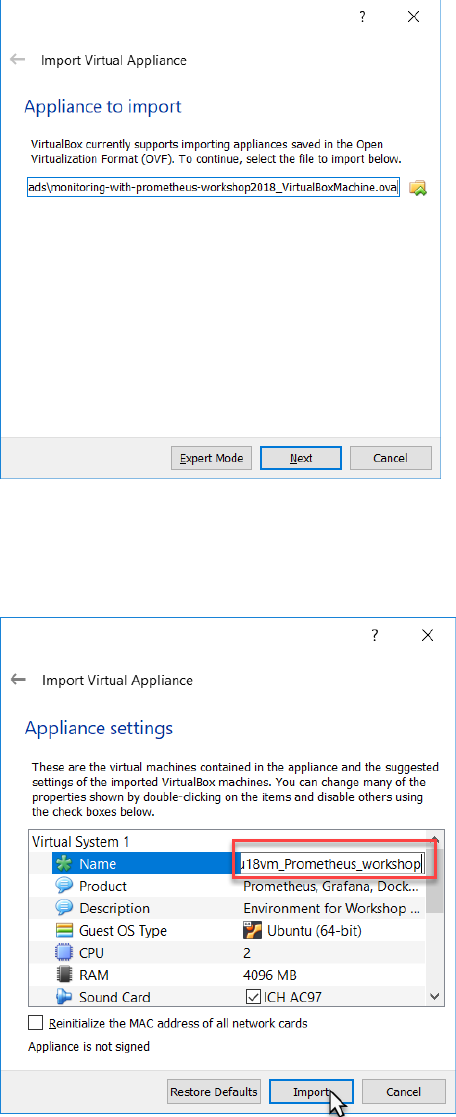
And press Next.
You may want to edit the title or any of the other properties – although the current settings will do
nicely.
Press Import to do import the appliance.
The appliance is imported. This will take a few minutes.
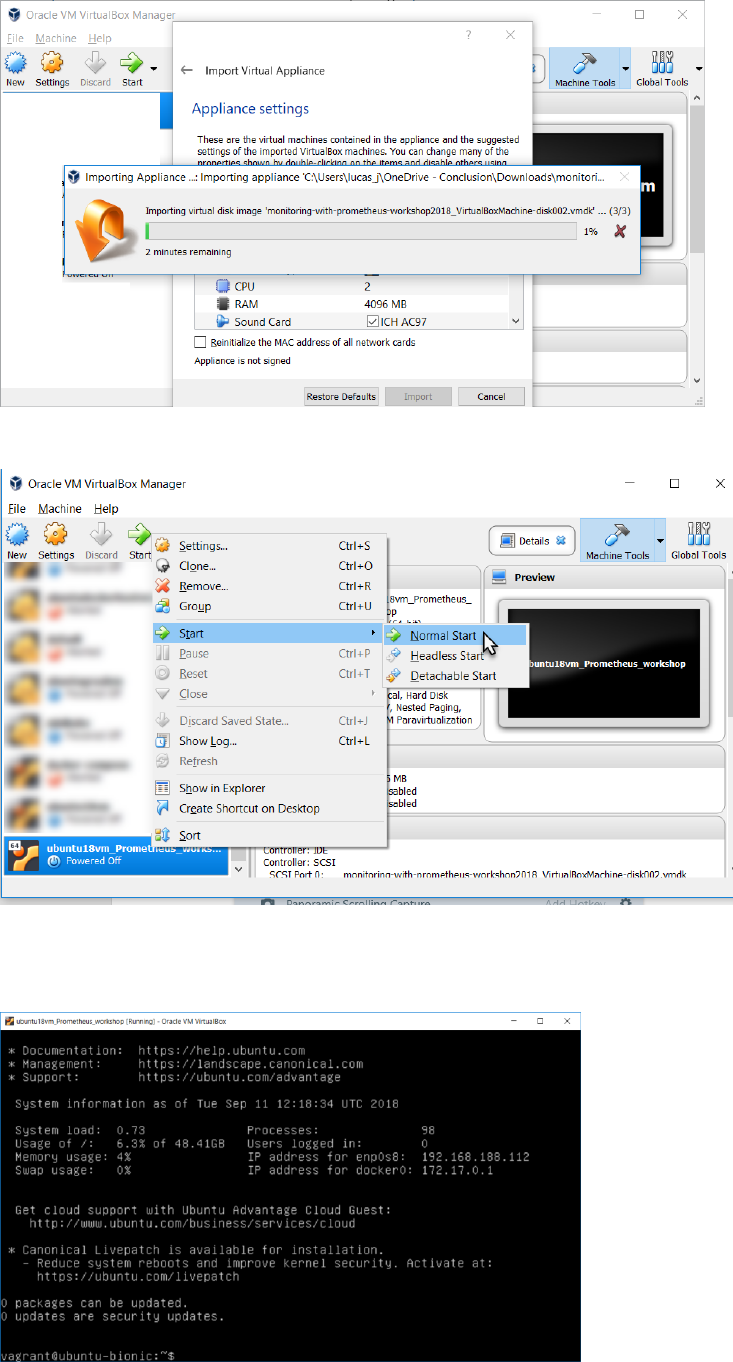
After the appliance is loaded, either double click on it or use the Start option context menu .
When the VM is running,
Login as vagrant/vagrant
You can skip the next section and turn to the section titled First Run Prometheus.
Note:
You can start (multiple) programs in background using the
nohup <command> &
construction.
For example:
nohup ./prometheus &
To stop a background job, use
ps -ef | grep <string identifying the job>
to learn the process id of the job and then use
kill <job_id>
to stop the background job.

Create the environment from scratch
Note: in order to successfully complete these steps, you need to have both VirtualBox
(https://www.virtualbox.org/wiki/Downloads ) and Vagrant
(https://www.vagrantup.com/downloads.html ) installed on your laptop.
Clone GitHub Repo https://github.com/lucasjellema/monitoring-workshop-prometheus-grafana to
your laptop.
Create Virtual Machine using Vagrant
Open a command line (or terminal) window and navigate to the root directory of the cloned
repository. Then run:
vagrant plugin install vagrant-disksize
This installs a plugin for Vagrant that allows us to specify the disksize of the VMs produced by
Vagrant. Then execute:
vagrant up
This will create and run a Virtual Machine, accessible at IP address 192.168.188.112 and with Ubuntu
18 LTS (Bionic – see https://wiki.ubuntu.com/BionicBeaver/ReleaseNotes for release notes) and
Docker Engine set up. This step will take several minutes.
Next, run:
vagrant ssh
This will connect you to the Virtual Machine, as user vagrant.
Download resources
First the Prometheus server. Execute this command:
wget
https://github.com/prometheus/prometheus/releases/download/v2.3.2/promethe
us-2.3.2.linux-amd64.tar.gz
to download the Prometheus server. Then extract the archive using:
tar -xzf prometheus-2.3.2.linux-amd64.tar.gz
Then download the alertmanager – a standalone component:
wget
https://github.com/prometheus/alertmanager/releases/download/v0.15.2/alert
manager-0.15.2.linux-amd64.tar.gz
That also needs to be extracted:
tar xvfz alertmanager-0.15.2.linux-amd64.tar.gz
At this point, all required resources have been added to the Virtual Machine and you are ready to
proceed.

First Run Prometheus
Prometheus is ready to run. It has a minimal configuration at this point – in the prometheus.yml file
in directory ~/prometheus-2.3.2.linux-amd64. This file has one scrape-config entry called
prometheus– one that instructs Prometheus to scrape itself – at port 9090. The application
Prometheus exposes metrics for monitoring purposes – to allow administrators to observe the
behaviour and health of the Prometheus platform. Prometheus – the same or a different instance -
can be used to gather and analyse these metrics.
Navigate to the home directory for Prometheus:
cd prometheus-2.3.2.linux-amd64/
And list the files
ls
You should see the prometheus.yml file. Use
cat prometheus.yml
to inspect the contents of the file. You should find the scrape config for prometheus itself.
Start Prometheus:
./prometheus
This will bring up the Prometheus server that will load and interpret the prometheus.yml
configuration file and start acting according to its contents. This means that Prometheus starts
scraping he metrics exposed by Prometheus itself.
Open a browser window on your laptop for the URL http://192.168.188.112:9090/targets . This will
show a page with all the scrape targets currently configured for this Prometheus instance. There will
be only one target shown – Prometheus itself.
The metrics th at Prometheus exposes can be inspected in their raw form at
http://192.168.188.112:9090/metrics . Here you will see the metrics that the developers of the
Prometheus platform have decided to expose in order to optimize the observability of their
platform.
A more pleasing presentation of these same metrics – after scraping and processing by Prometheus
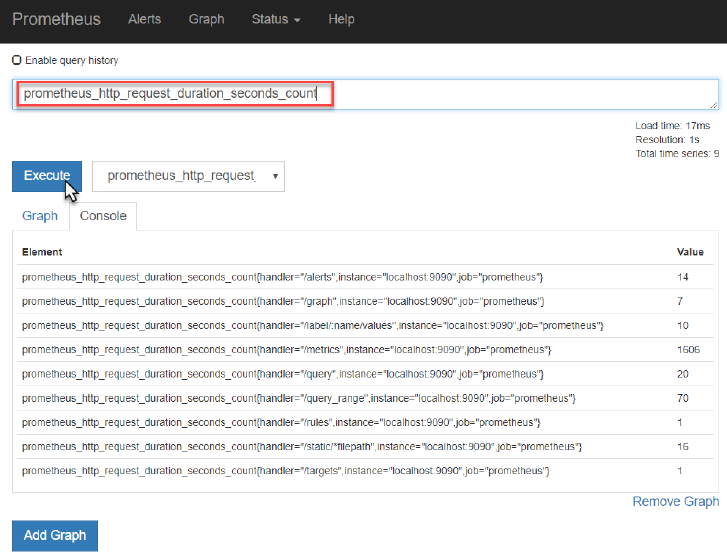
– can be seen at http://192.168.188.112:9090/graph .
Check for example the metric prometheus_http_request_duration_seconds_count - the running
count for the number of measurements of the latency for HTTP requests.
Toggle to the Graph tab to see the evolution over time for this metric – for each of the label
combinations. At this point, only the handler label has different values for this metric.
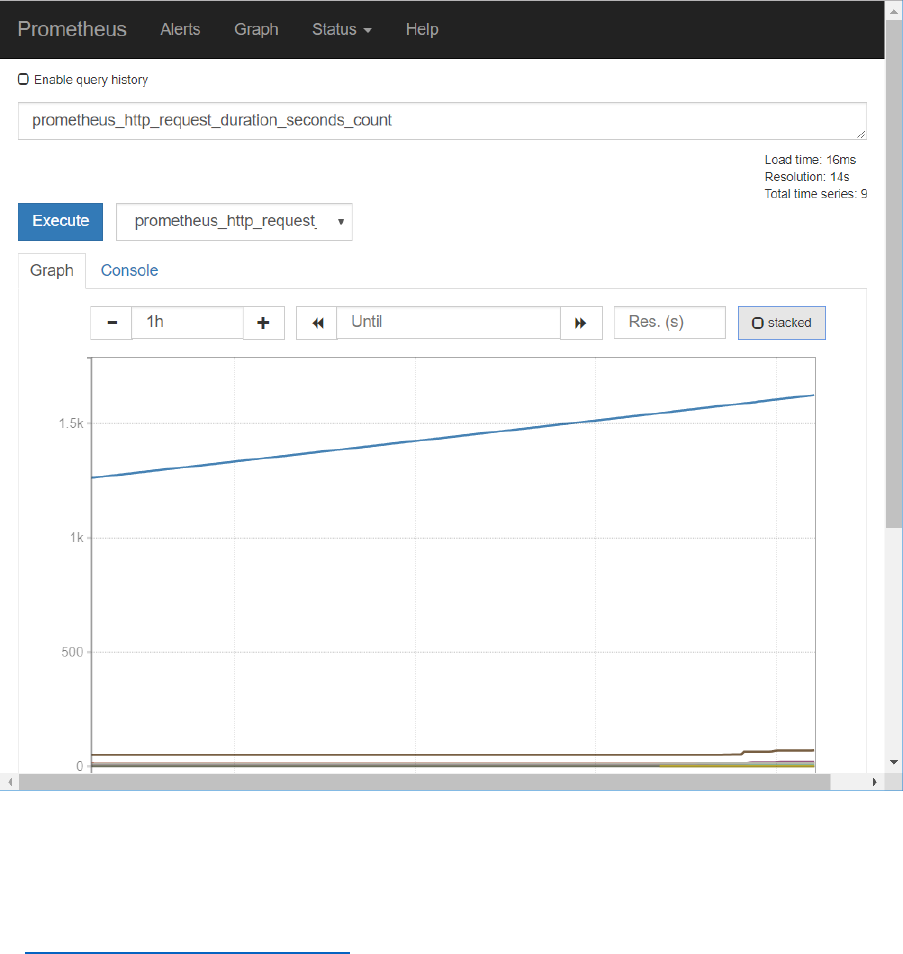
You can toggle between stacked and unstacked presentation of the data.
Feel free to explore some of the other metrics published by Prometheus – although I fear most are
only meaningful to Prometheus experts.
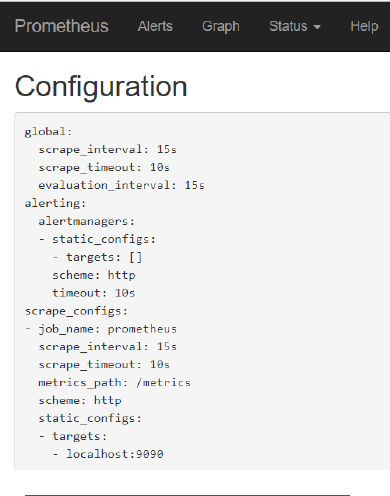
At http://192.168.188.112:9090/config you can inspect the contents of the prometheus.yml
configuration file.

Make Prometheus scrape Linux server metrics
It is of limited interest at this point to be looking with Prometheus at how Prometheus is doing.
More interesting is to monitor a more pressing component, say our Linux server. The Linux operating
system sits on any many status indicators and operational metrics – but does not expose them out of
the box in a format that Prometheus understands.
The Node Exporter is a component that acts as the adapter between the Linux operating system and
Prometheus. When the Node Exporter is running on a Linux system, it exposes an HTTP endpoint (by
default this will be /metrics on port 9100) where Prometheus can come to collect all available
metrics. It exposes machine-level metrics, largely from your operating system’s kernel, such as CPU,
memory, disk space, disk I/O, network bandwidth, and motherboard temperature.
Let’s monitor the Virtual Machine using Prometheus. First, let’s run Node Exporter in a Docker
container (in order to scrape metrics for the Linux system):
docker run -d -p 9100:9100 -v "/proc:/host/proc" -v "/sys:/host/sys" -v
"/:/rootfs" --net="host" --name=prometheus quay.io/prometheus/node-
exporter:v0.13.0 -collector.procfs /host/proc -collector.sysfs /host/sys
-collector.filesystem.ignored-mount-points
"^/(sys|proc|dev|host|etc)($|/)"
You can check with docker ps that the node_exporter container is indeed running in the
background.
In the browser on the laptop host machine, navigate to
http://192.168.188.112:9100/metrics
This is the endpoint at which the Prometheus Node exporter for Linux publishes its metrics – for
Prometheus to scrape. If we can see the raw metrics at this end point, we can now proceed to
configure our Prometheus instance to start scraping these metrics.
Return to the command line in the VM. Change directory to ~/prometheus-2.3.2.linux-amd64.
Edit the configuration file prometheus.yml. Add the following snippet under scrape-configs:
- job_name: linux-server-node
static_configs:
- targets:
- localhost:9100
This entry instructs Prometheus to start scraping metrics from the endpoint localhost:9100/metrics
– using the global time interval (since no specific interval is specified for this job). This endpoint – as
we have seen for ourselves – is the endpoint where the node_exporter publishes the Linux metrics
for the Linux host on which Prometheus is running.
Now start Prometheus Server
./prometheus

In the browser on your laptop, navigate to http://192.168.188.112:9090/targets . You will see the
targets from which your Prometheus instance is scraping metrics. In addition to Prometheus target
that we saw before, we now also should see the linux-server-node.
Open the Graph tab – or navigate to http://192.168.188.112:9090/graph . Open the dropdown next
to the Execute button. You will now see a list of all the metrics currently available in the metrics
store of your Prometheus instance.
Select the metric called node_network_receive_bytes or node_network_receive_bytes_total and
press Execute.
This will list the total number bytes received over each of the network devices for the Linux server in
the VM.
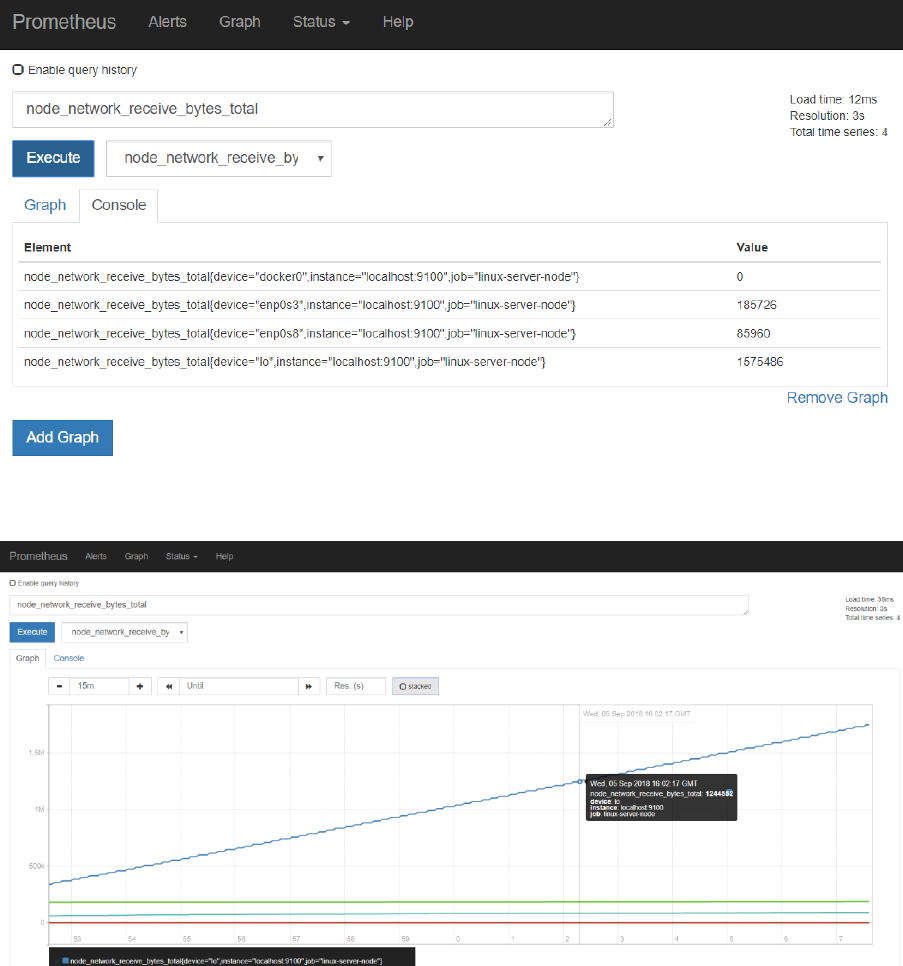
Press Graph to get a graphical representation of these values and their evolution over time:
Using wget to download some additional files should have an effect on this metric.
Feel free to inspect some of the other metrics available from the Linux system – such as
• node_cpu_seconds_total (a counter indicating how much time each CPU spent in each
mode)
• node_filesystem_size_bytes and node_filesystem_avail_bytes (gauges indicating the total
filesystem size and the available sizes).
• node_memory_MemFree_bytes - the amount of memory that isn’t used by anything
Quick intro to PromQL
In addition to inspecting and visualizing the values of metrics, the Prometheus Web UI also allows us
to use PromQL – the Prometheus query language. This allows us to perform calculations with metrics
– resulting in more meaningful values than just the bare metrics themselves.
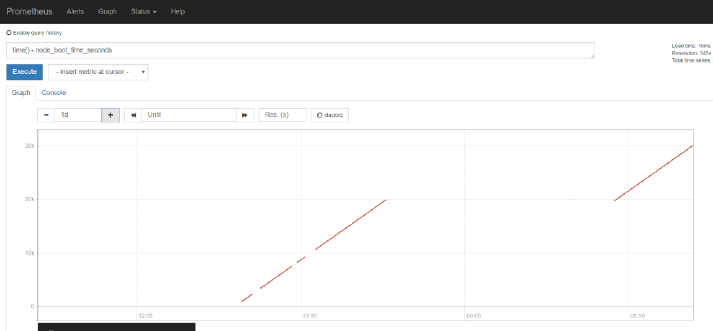
For example, enter the following PromQL expression in the input field
time() - node_boot_time_seconds
and press execute. The resulting value is how long the kernel has been up. The result of an
expression can both be presented in tabular format and as a graph.
Try this expression
rate(node_network_receive_bytes_total[1m])
It tells you about the bandwidth used up by each network device – by calculating the change rate in
the total number of bytes received. Do another wget operation to create some network traffic.
And :
avg without(cpu, mode)(rate(node_cpu_seconds_total{mode="idle"}[1m]))
the proportion of idle time across all CPUs . This works as it calculates the idle time per second per
CPU and then averages that across all the CPUs in the machine.
If you want to know the proportion of idle time for each CPU, then remove cpu from the without
expression:
avg without( mode)(rate(node_cpu_seconds_total{mode="idle"}[1m]))
See https://prometheus.io/docs/prometheus/latest/querying/basics/ for more details on PromQL
and the operators and functions at our disposal.
See https://prometheus.io/docs/guides/node-exporter/ for details on the Node Exporter and all
metrics it exposes.

MySQL Exporter
To give you a taste of what using Exporters for third party applications and platform components
looks like, we will now run a MySQL server instance in a Docker container, then attach a MySQL
Exporter for Prometheus to this instance and scrape the MySQL metrics in our Prometheus server.
On the command line in the VM, stop Prometheus. Then, to run the MySQL server instance, execute
this command:
docker run --name mysql-db -e MYSQL_ROOT_PASSWORD=my-secret -d mysql:8
Note: this will cause quite some network traffic - if you started with a fresh image using Vagrant–
which you can easily verify in the Prometheus Console later on by inspecting the metric
node_network_receive_bytes_total.
Note: you could connect to this MySQL instance using this command – but for the purpose
of these practice steps you do not have to:
docker run -it --link mysql-db:mysql --rm mysql sh -c 'exec mysql -
h"$MYSQL_PORT_3306_TCP_ADDR" -P"$MYSQL_PORT_3306_TCP_PORT" -uroot -
p"my-secret"'
and execute MySQL command line statements such as:
show databases;
Next, run the Prometheus Exporter for MySQL, in its own Docker container:
docker run --name mysql-exporter -d \
-p 9104:9104 \
--link mysql-db:mysql \
-e DATA_SOURCE_NAME="root:my-secret@(mysql:3306)/" \
prom/mysqld-exporter
To make the Prometheus server scrape the metrics from the MySQL Exporter, we have to add the
following entry to the prometheus.yml file:
- job_name: 'mysqld'
static_configs:
- targets:
- localhost:9104
This instructs Prometheus to check the /metrics endpoint at port 9104 on the localhost – which is
mapped to port 9104 in the container running the MySQL Exporter.
Note: Prometheus can reload the configuration file while it continues to run; you have to send a
POST request to the /-/reload endpoint. Alternatively, when you restart Prometheus it will of course
also pick up the changes in the prometheus.yml file.
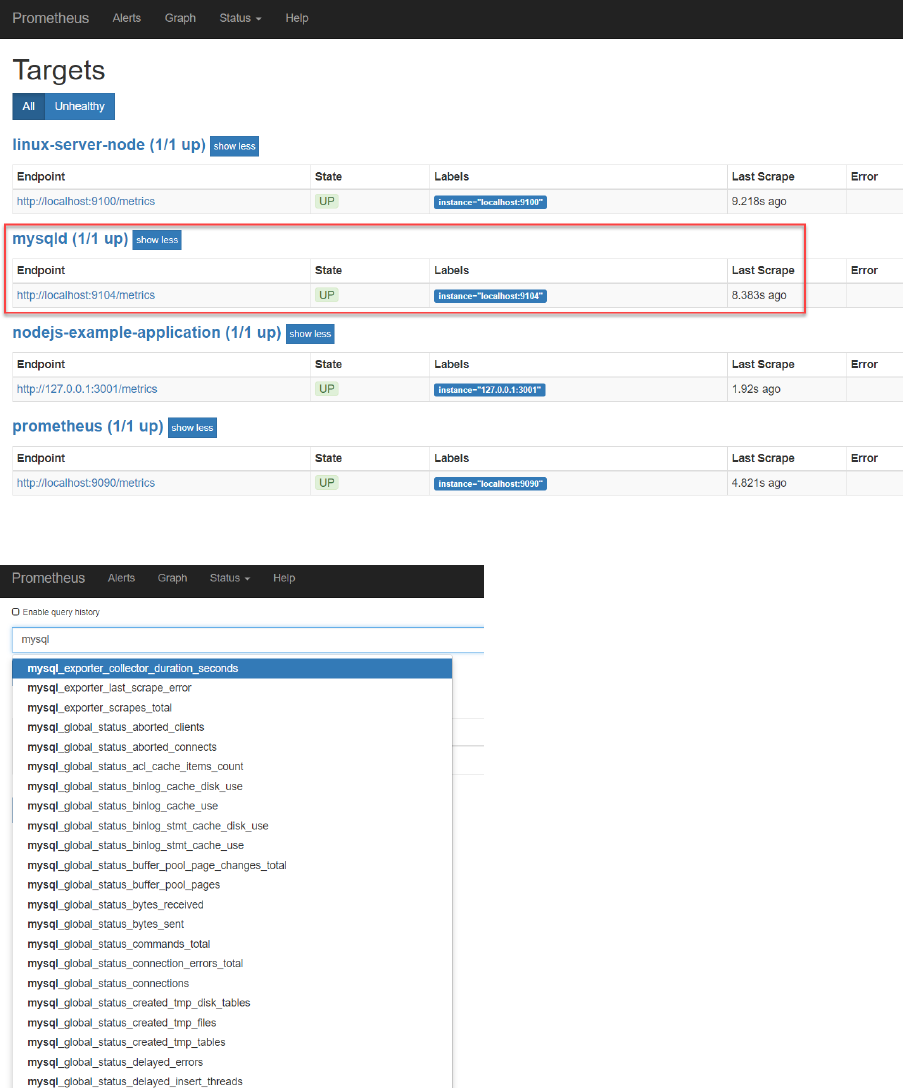
After restarting the Prometheus server, you will find that MySQL has been added as a target:
And that now MySQL Metrics are available in the Prometheus UI.
Check for example the number of connections:

It seems that all these connections are created for the MySQL exporter itself. Some tuning may be in
order.
On the command line in the VM, stop the Docker container with the MySQL Exporter.
docker stop mysql-exporter
Now check on the targets page in the Prometheus UI:
It should be obvious that the MySQL target is no longer available.
When you check under Alerts, you will find no alerts – because none have been configured yet.
Application Specific metrics from a NodeJS application
Prometheus can be used to monitor any metric – produced by any type of component.
Infrastructure components – such as Linux servers – and platform components such as Databases
and Messaging Systems – are commonly monitored. Even more important is monitoring business
applications for the aspects that really matter to end users. For that to happen, metrics that are
indicative of those aspects should be exposed by the business applications.
Developers creating business applications should make sure that meaningful, functional metrics are
exposed by their application. Generic exporters generally not be able to extract metrics that
translate directly into meaningful business indicators. Prometheus Client Libraries are available for
all prominent programming languages. Using such libraries, it becomes straightforward to add
metric exposing capabilities to an application. Note: defining what those metrics should be is still the
responsibility of the DevOps team.
We will now take a look at a simple Node JS application that has been instrumented: it exposes
application specific metrics that are deemed relevant for observing application behaviour.
Additionally, the client libraries expose generic metrics for their specific runtime technology stack.
First you need to install Node JS – if it is not already set up in your VM (you can check this by
executing “node --version"). To install Node JS, execute
sudo apt install nodejs
Answer yes when asked ‘Do you want to continue?’ during the package installation.
Do the same for NPM:
sudo apt install npm
Note: this will take considerable time, probably several minutes.
If you now execute
node --version
you should get the version label for he the installed version of the Node JS runtime.
And with
npm --version
you should get the version label for he the installed version of the NPM runtime.
From the command line, navigate to the user’s home directory.
cd ~
Then clone a GitHub repo:
git clone https://github.com/lucasjellema/example-prometheus-nodejs
This will copy the sources of an instrumented NodeJS application to the VM.
Navigate into the directory example-prometheus-nodejs and execute
npm install

to install the library dependencies for this application.
Inspect the source code of the Node application at this URL:
https://github.com/lucasjellema/example-prometheus-nodejs/blob/master/src/server.js . You will
see how the /metrics endpoint is exposed and how GET requests are handled by
Prometheus.register.metrics(). This generic function returns the proper Prometheus format – and
injects all generic NodeJS metrics as well as all application specific metrics: checkoutsTotal and
httpRequestDurationMicroseconds.
Run the NodeJS application using
nohup npm start &
You can now access the NodeJS application at http://192.168.188.112:3001/ and invoke its most
special functionality at: http://192.168.188.112:3001/checkout . This resource will return a
payment_method; a Prometheus counter metric keeps track of the number of instances for each
payment_method.
Note: a query parameter payment_method can be added to the URL request – to force a specific
payment_method, like this:
http://192.168.188.112:3001/checkout?payment_method=cash
Every payment_method you introduce will result in additional metric values – for the
payment_method label value.
The Prometheus metrics exposed by the application – through the use of the NodeJS Client Library -
can be read at: http://192.168.188.112:3001/metrics. The custom – application specific – metrics
can be found at the bottom of the document. See documentation on prom-client -
https://www.npmjs.com/package/prom-client - for details on the standard metrics.
In order to make Prometheus scrape the metrics from the NodeJS example application, you should
add another scrape-job in the prometheus.yml file:
- job_name: nodejs-example-application
scrape_interval: 5s
static_configs:
- targets:
- 127.0.0.1:3001
Restart the Prometheus server – or: have the configuration file reloaded by sending a HTTP POST to
the /-/reload endpoint:
curl -X POST http://localhost:9090/-/reload
Note: this reload action is only allowed if the Prometheus server has been started with this flag:
--web.enable-lifecycle
Verify if the NodeJS Example application is now added as a target :
http://192.168.188.112:9090/targets

Go to the graph tab. Type check in the input field. The auto suggest option should now list
checkouts_total as a metric available for inspection. This is one of the two custom metrics defined in
the NodeJS application, through the Prometheus Client Application for NodeJS .
Select checkouts_total and press the Execute button:
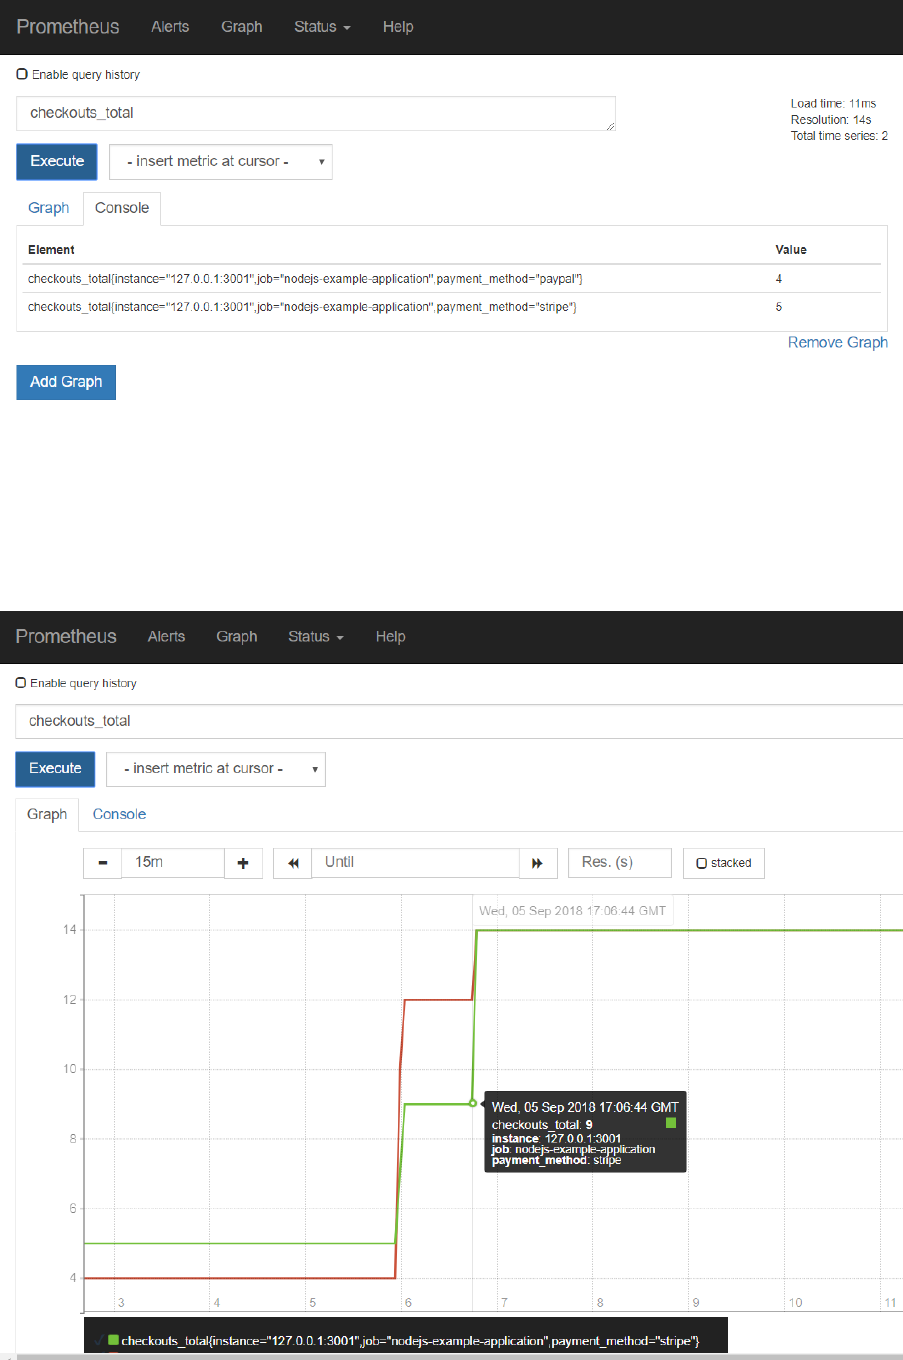
Make a few more calls to http://192.168.188.112:3001/checkout .
Press Execute again in the Graph tab of the Prometheus console. The values for the checkout_totals
metric for each of the payment_method dimension values are probably updated.
Switch to the Graph tab to a visual representation of the metric over time:

Another custom metric defined by the Node JS Example application is http_request_duration_ms.
This metric is available as bucket, count and sum
Select the http_request_duration_ms_bucket entry and press Execute. On the Console tab, you will
get an overview for each of the predefined buckets (each one specifying a certain duration in
microseconds of handling the request) how many requests were in that bucket (or in a lower one). In
the example, 16 requests were handled within 0.1 milisecond and 27 were handled within 5 ms.
Note: the value for this Histogram metric is set in the server.js file in lines 63 through 71.
cAdvisor – The Docker Container Exporter
In the same way the Node exporter provides metrics about the machine, cAdvisor is an exporter that
provides metrics about cgroups. CGroups are a Linux kernel isolation feature that are usually used to
implement containers on Linux. cAdvisor (short for container Advisor) analyzes and exposes
resource usage and performance data from running containers. cAdvisor exposes Prometheus
metrics out of the box.
cAdvisor itself can easily be run as a Docker container. Use the following statement to run a Docker
container with cAdvisor inside it; this cAdvisor instance will start observing the Docker Engine it is
running in and it will publish metrics for Prometheus to scrape:
docker run \
--volume=/:/rootfs:ro \
--volume=/var/run:/var/run:rw \
--volume=/sys:/sys:ro \
--volume=/var/lib/docker/:/var/lib/docker:ro \
--volume=/dev/disk/:/dev/disk:ro \
--publish=8080:8080 \
--detach=true \
--name=cadvisor \
google/cadvisor:v0.28.3
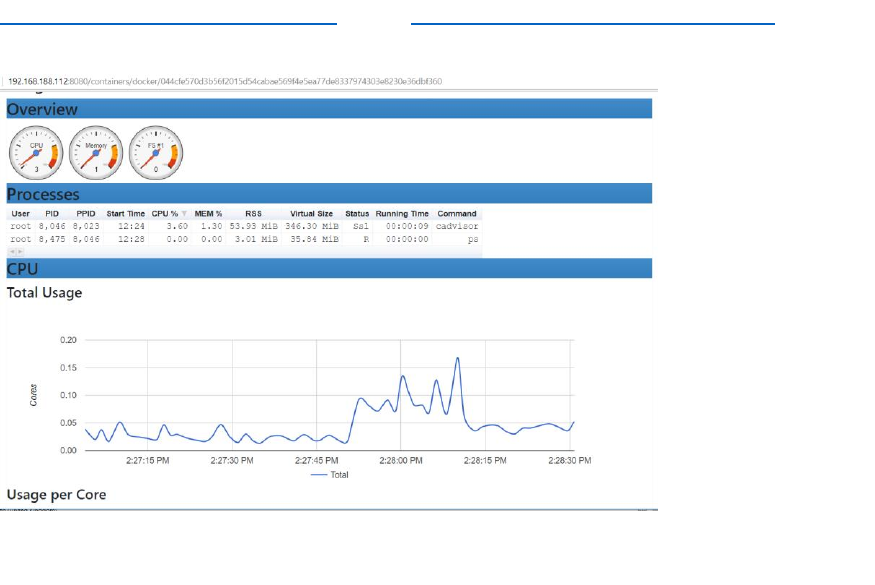
Once the container is running, you can see the metrics produced by cAdvisor at
http://192.168.188.112:8080/metrics. (check http://192.168.188.112:8080/containers for the
normal UI for cAdvisor).
In order for Prometheus to scrape the metrics from cAdvisor, we have to add cAdvisor as target in
the prometheus.yml file.
Open prometheus.yml in an editor and add this snippet:
- job_name: 'cadvisor_ub18_vm'
scrape_interval: 5s
static_configs:
- targets:
- 127.0.0.1:8080
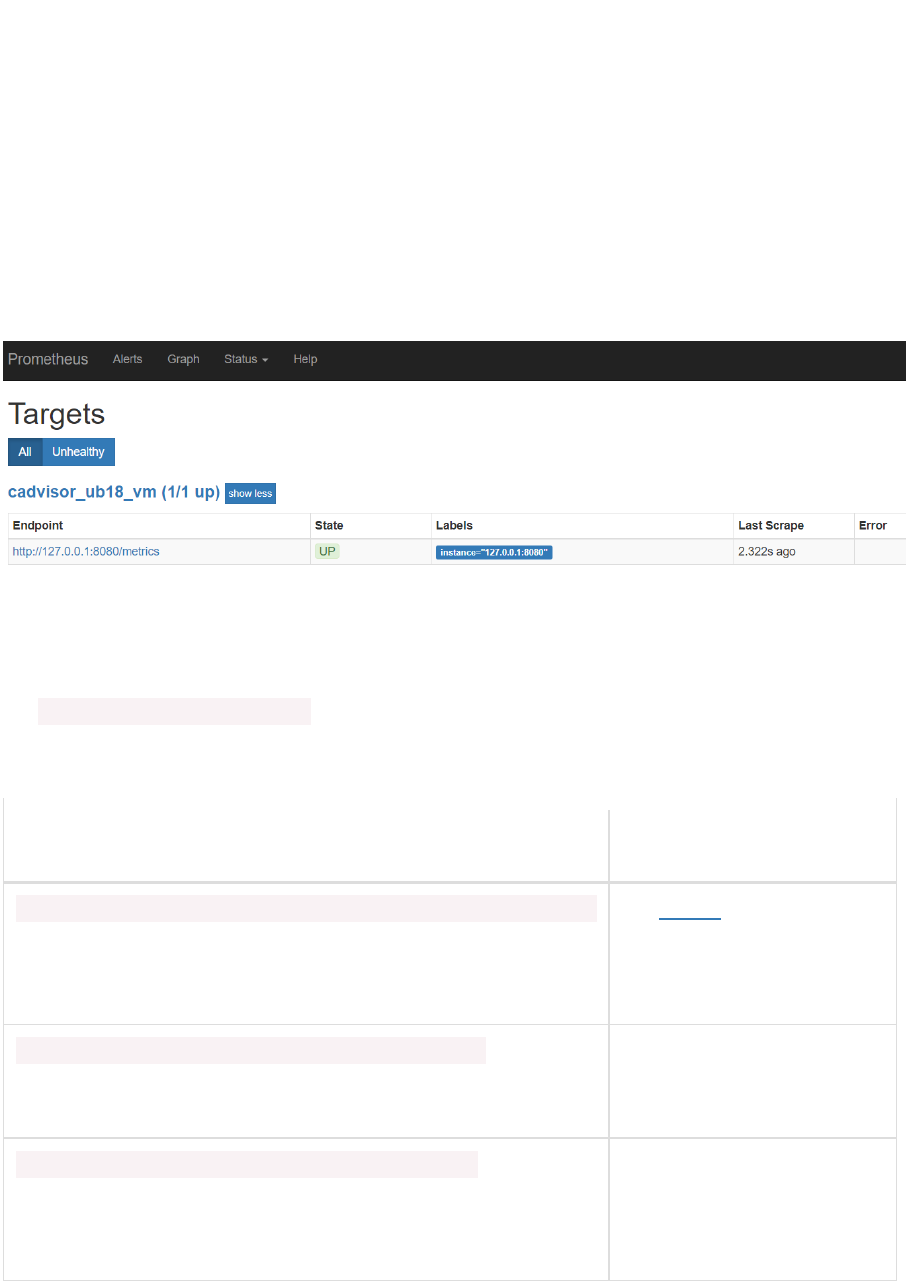
Save the changes. Restart Prometheus.
Now check the list of targets. The cAdvisor should be added:
The metrics from cAdvisor are prefixed with container_. All container specific metrics have labels id
and name – referring to the unique identifier and name of the Docker container.
In the Graph tab of the Prometheus web ui, start by exploring
the container_start_time_seconds metric, which records the start time of containers (in seconds).
The table below lists some other example expressions
Expression
Description
rate(container_cpu_usage_seconds_total{name="grafana"}[1m])
The cgroup's CPU usage in
the last minute (split up by
core)
container_memory_usage_bytes{name="mysql-db"}
The cgroup's total memory
usage (in bytes)
rate(container_network_transmit_bytes_total[1m])
Bytes transmitted over the
network by the container per
second in the last minute


Observing the Unobservable - the BlackBox Exporter
Mostly, metrics are exported from within or at least very close the system that is to be monitored.
Metrics are exported by an application itself or exporters are running on the same system to tap into
the observed component.
This is however not always the case. Sometimes we cannot get into the application or even close to
it. Or sometimes we do not want to observe from within the system but rather from much farther
away, just like a business user would.
The BlackBox Exporter can be used in general – and therefore also in these two cases –to perform
ICMP, TCP, HTTP, and DNS probing. The results of this probing are exported as regular Prometheus
metrics.
In order to try out the Black Box Exporter, you can run the Docker Container Image:
docker run -d -p 9115:9115 --name blackbox_exporter -v `pwd`:/config
prom/blackbox-exporter
You can access the UI for the Black Box Exporter at : http://192.168.188.112:9115/.
Try out the probing mechanism of the Black Box Exporter – and the Prometheus metrics format it
returns – by entering a URL like this one in your browser:
http://192.168.188.112:9115/probe?target=github.com&module=http_2xx
Make a deliberate mistake in the url – for example:
http://192.168.188.112:9115/probe?target=github.comx&module=http_2xx – and see how the
metrics change.
Black Box Exporter can be configured with all the endpoints it should watch and check the health of.
This can be done from a scrape-config in the prometheus.yml file. Edit the file and add this snippet:
- job_name: blackbox
metrics_path: /probe
params:
module: [http_2xx]
static_configs:
- targets:
- http://www.prometheus.io
- http://github.com
- https://hub.docker.com
- http://my.own.domain
relabel_configs:
- source_labels: [__address__]
target_label: __param_target
- source_labels: [__param_target]
target_label: instance
- target_label: __address__
replacement: 127.0.0.1:9115
Save changes. Then restart Prometheus.
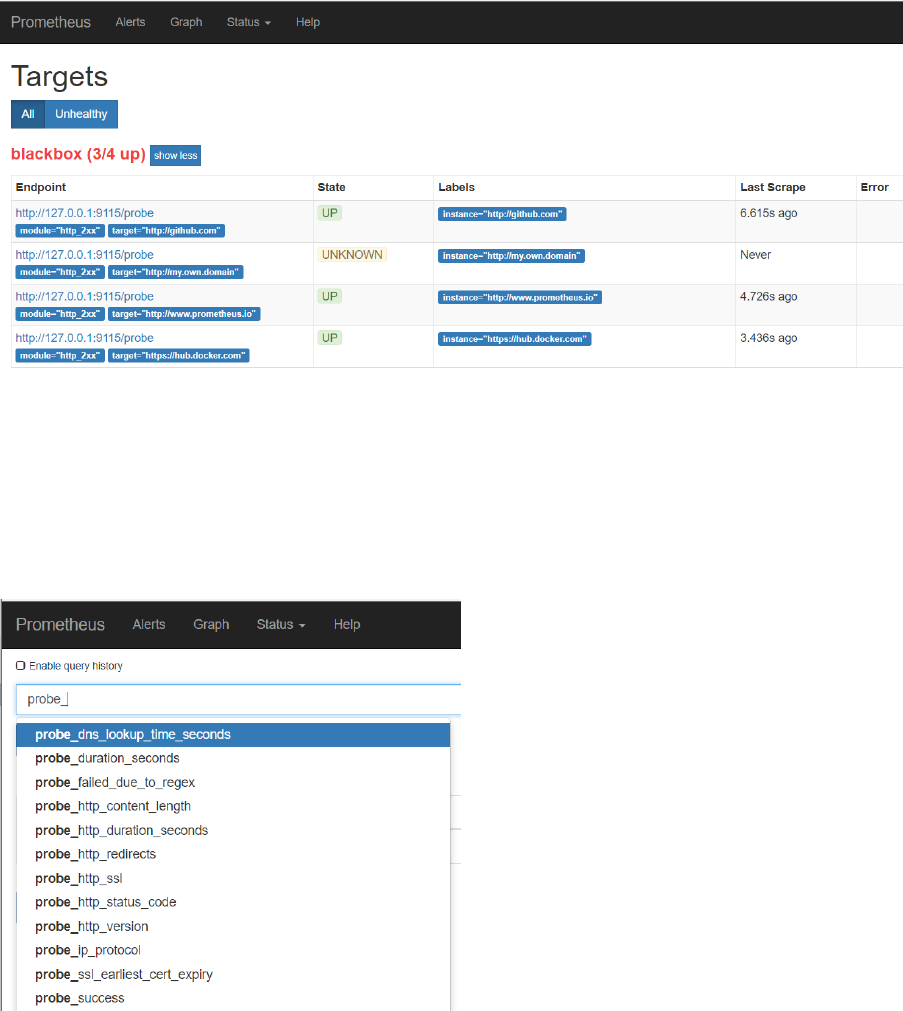
Check the Prometheus targets:
One target is added – blackbox – with four endpoints. After a little while, three are probably,
hopefully up. The last one will probably be up eventually – although the UP-ness of the
my.own.domain probe only indicates that the probe is up (the Black Box Exporter) – but not that the
endpoint my.own.domain could be reached.
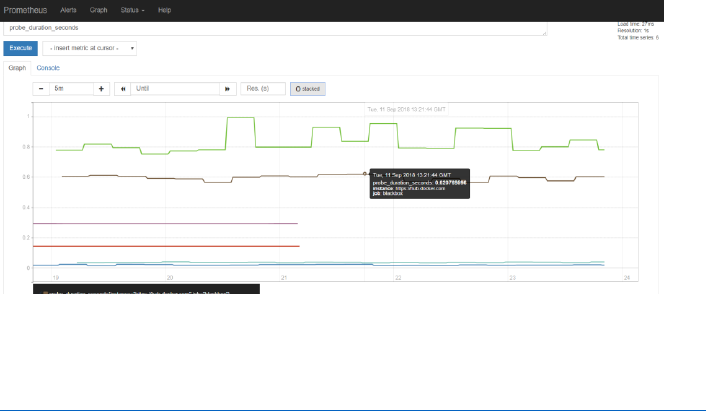
The blackbox exporter produced metrics with the prefix probe_. Check in the Graph tab for these
metrics:
And inspect for example the metric probe_http_duration_seconds.
Alerts
There are two parts to alerting. First, adding alerting rules to Prometheus, defining the logic of what
constitutes an alert. Secondly, configuring the Alertmanager to convert firing alerts into
notifications, such as emails, pages, and chat messages.
Configure Alert Rules on Prometheus
Alert Rules can be configured in yml files that are referenced from prometheus.yml. In the home
directory for Prometheus, create a new file called rules.yml:
cd ~ /prometheus-2.3.2.linux-amd64
vi rules.yml
and enter the following content into this new file:
groups:
- name: target_rules
rules:
- alert: InstanceDown
expr: up == 0
for: 1m
Save the change.
This configures an alert called InstanceDown that should fire if the metric up – which for each scrape
job indicates of the corresponding target is available – equals 0 and does so for at least 1 minute.
This condition is true if the target is not available.
Stop Prometheus if it is running.
Edit prometheus.yml:
vi prometheus.yml
and type
- "rules.yml"
under “rule_files:” . Save the change.
Start Prometheus again.
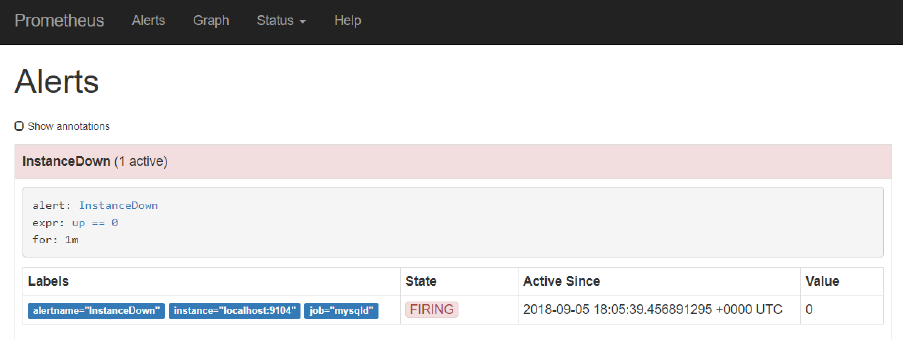
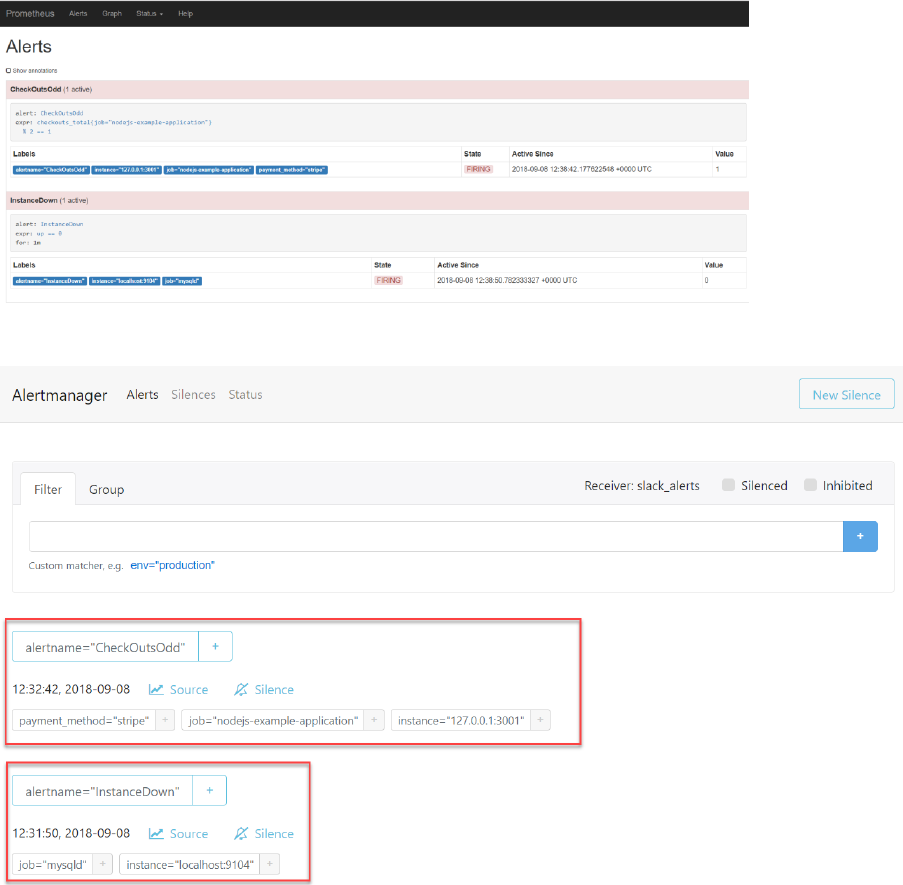
If you now check under Alerts in the Prometheus console, you should find one alert active – because
the MySQL target can still not be scraped:
The InstanceDown alert – which is automatically configured – is firing because one of the target
instances has been down for at least one minute.
No notification is sent and no automatic remediation is performed. This alert will continue to fire
until the MySQL Exporter is back on line – or the Prometheus configuration has been changed.
Define a Business Alert Rule
Alerts can be defined on any metric – to watch out for technical conditions, related to infrastructure
and platform errors, or to guard business conditions. We will look at a more functional, business
oriented alert now – although the example is somewhat farfetched.
Define the following entry in the rules.yml file under the groups entry:
- name: my_custom_rules
rules:
- alert: CheckOutsOdd
expr: checkouts_total{job="nodejs-example-application"} % 2 == 1
Here we specify that an alert should be fired if the checkouts_total metric – exposed by the example
Node JS application - has an odd (not even) value.
After saving this change to rule.yml, restart the Prometheus server. Check in the Status | Rules page
if the new custom rule is loaded correctly.
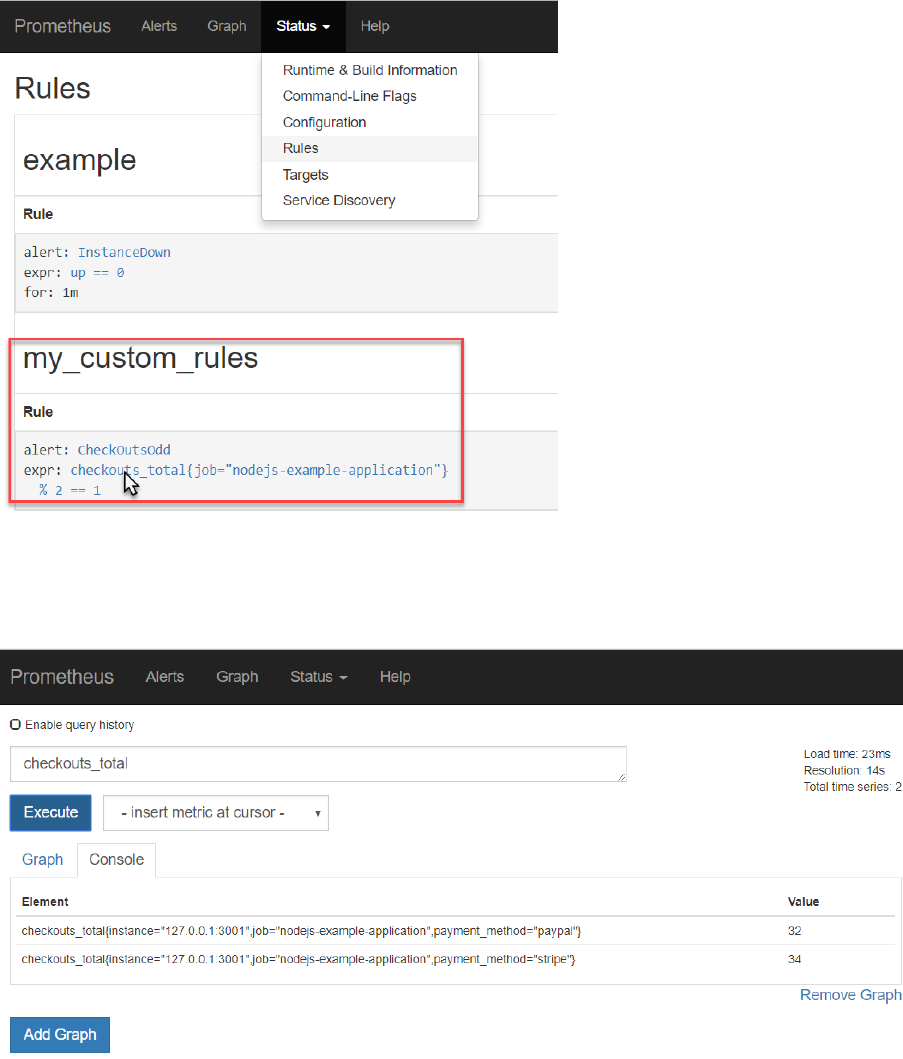
Now you can check the current values for the checkouts_total metric (note: there is one value for
each payment type) in the Prometheus UI:
In the Alerts tab, you can check if the CheckOutsOdd alert is firing:
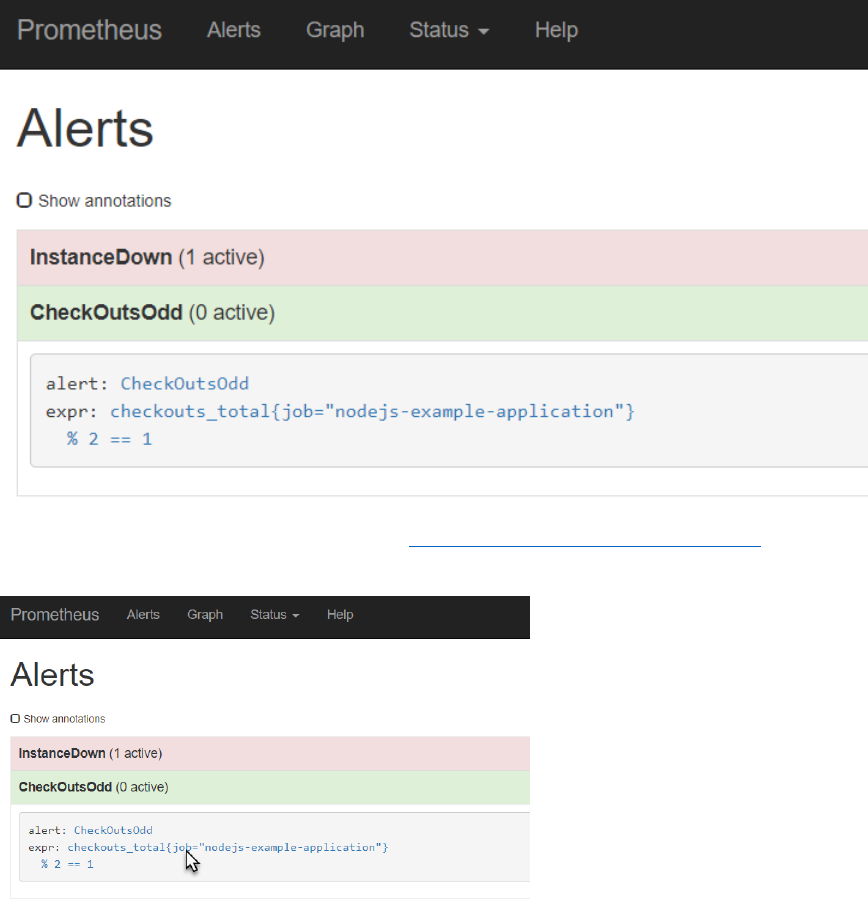
If it is not firing, make one or two requests to http://192.168.188.112:3001/checkout . Before too
long, the alert will fire – or will stop firing.
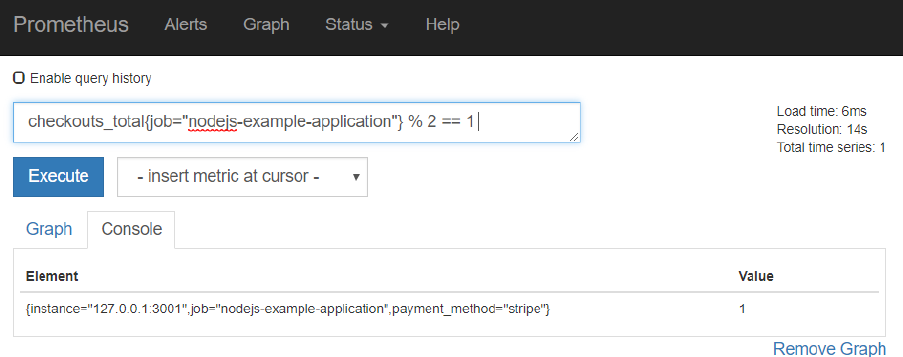
Note: The expression used in the rules.yml entry can also be tested in PromQL field in the web ui, ,
simply by clicking on the expression in the alert rule:
Optional: Add Annotations to Alerts
The Alert definition in the rules file can be further enhanced with labels and annotations. Labels can
be used later on for routing alerts and annotations provided human-oriented context for an alert.
Labels are for example used to indicate the severity of an alert, its business domain or to suggest the
team or specialism required to investigate.
Edit the rules.yml file and extend the alert node with:
labels:
severity: purple
service: finance
Annotations provide context that are available to human staff. They consist of a combination of
static text and dynamically evaluated expressions. The expression $value can be used to include the
value of the alert expression in an annotation and the expression $labels returns an map with the
labels from which an individual label can be retrieved like this: {{$labels.job}}.
Specify annotations for the CheckOutsOdd alert like this:
annotations:
descriptions: 'The number of checkouts is odd for payment method
{{$labels.payment_method}} . This has been recognized as a business oddity
that deserves notification'
summary: 'Odd number of Checkouts for payment method
{{$labels.payment_method}}'
Restart Prometheus.
When the alert conditions are satisfied, you will find the values for the newly defined labels as well
as the annotation in the Alert page of the Prometheus console:
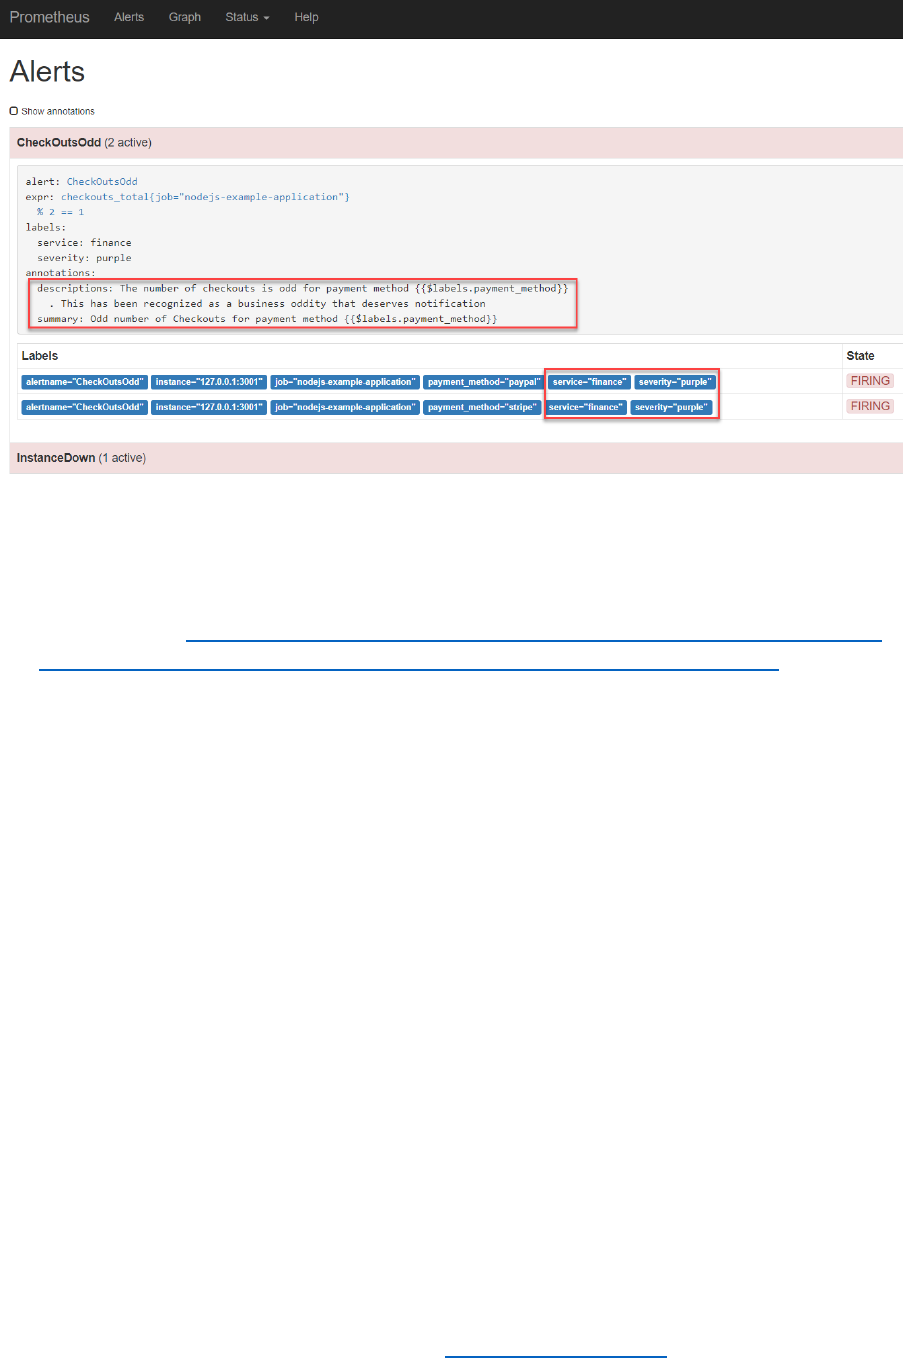
In a little while, you will see the actual values of the annotations in the Alertmanager – with the
expressions resolved.
Documentation: see https://prometheus.io/docs/prometheus/latest/configuration/alerting_rules/
and https://petargitnik.github.io/blog/2018/01/04/how-to-write-rules-for-prometheus
Turning Alerts into Notifications
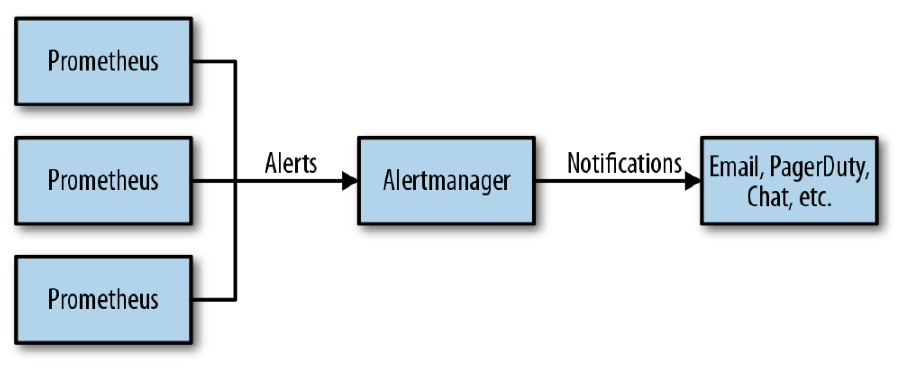
The alert manager keeps track of all firing alerts from one or even multiple Prometheus instances.
Based on rules setup in the file alertmanager.yml in directory ~/alertmanager-0.15.2.linux-amd64, it
decides if notifications should be sent and if so where to. Channels for sending notifications include
email, PagerDuty, HipChat, Slack, WeChat and Web Hook.
Note: The alert manager should already be installed in your environment. Either it was set up in the
prepared VM – or you installed it yourself just after starting up the VM through downloading and
unpacking the tar-file.
In this section, we will use a Slack channel as our notification target. We will configure the
alertmanager to send notifications to a selected channel in a Slack Workspace. We will leverage the
‘Incoming WebHooks’ app in Slack – that takes the HTTP request from the Alert Manager and
interprets it as a Slack message.
Prepare Slack Workspace
You can either create and/or configure your own Slack Worksapce or make use of a predefined one.
Your own Slack Workspace
Create your own new Slack Workspace – through https://slack.com/create .
Follow the instructions to create and log in to your own new workspace.
Create the channel into which Alert notifications should be sent – this can also be the general
channel.
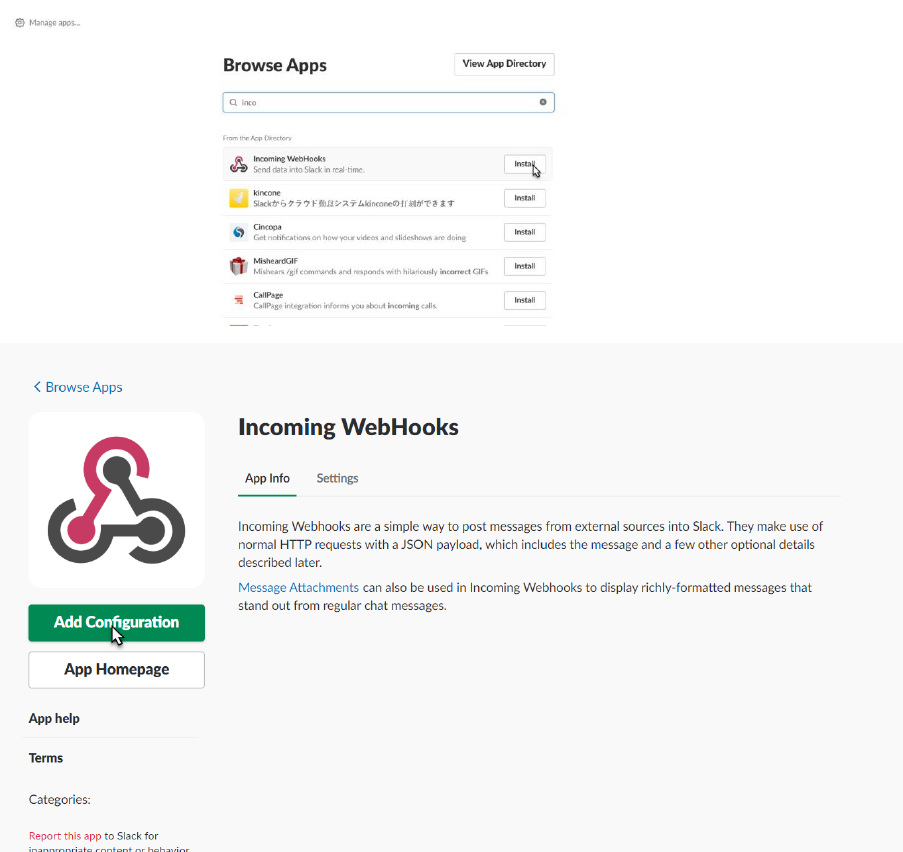
When done, add the “Incoming WebHooks App” from App Directory to your workspace.
Configure the Incoming WebHooks app for the specific channel:
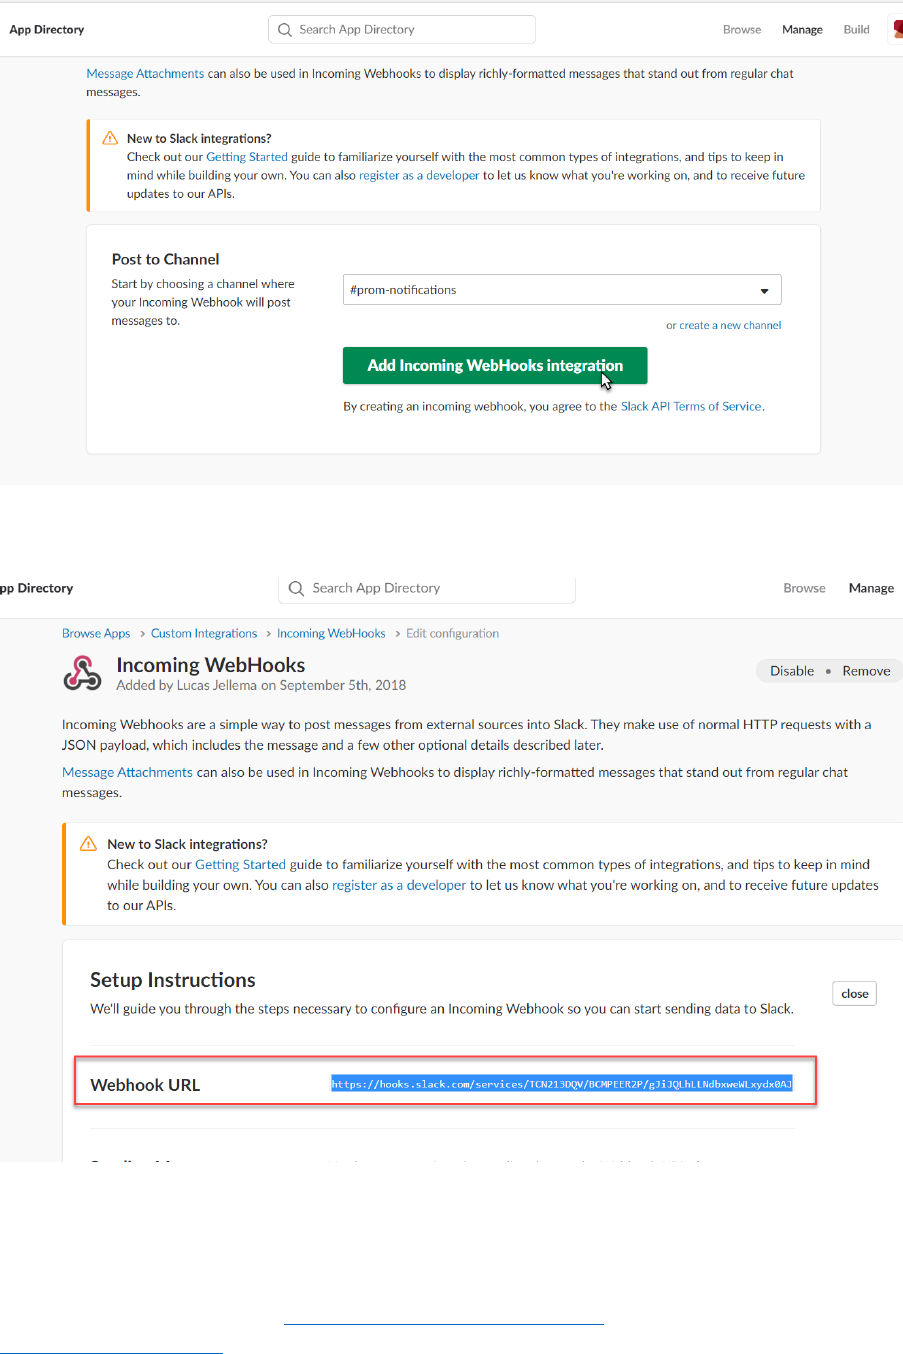
And click on ‘Add Incoming WebHooks integration’.
Get the WebHook URL
We will configure this URL in the alert manager’s configuration.
Leverage a Predefined Workspace
Open this URL in your browser: https://amis-prometheus.slack.com . Sign in with credentials
lucasjellema@gmail.com and password 123321.

Click on Apps in the lower left hand corner.
Click on View for the incoming-webhook app:
Click on Settings for the app to inspect the details:
And when the app details are shown:
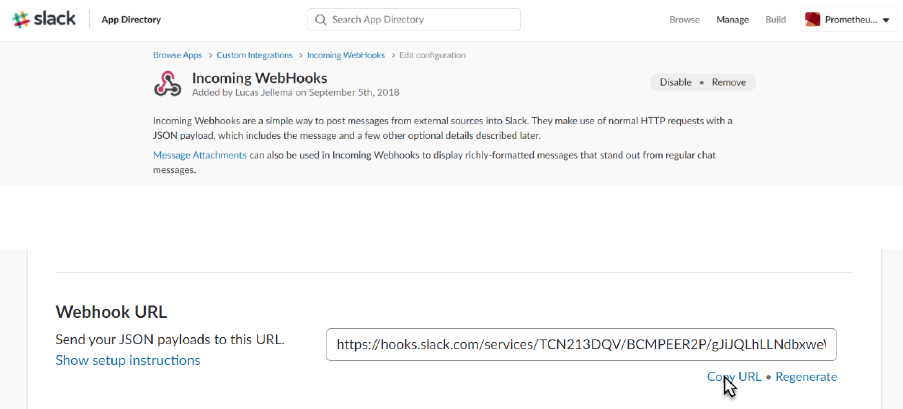
Scroll down to locate the webhook url:
And copy this URL. You need it to configure the (Prometheus) Alert Manager.
Configure Alert Manager to Send Notifications to Slack
Navigate to directory ~/alertmanager-0.15.2.linux-amd64/:
cd ~/alertmanager-0.15.2.linux-amd64/
Configure alertmanager.yml
Add this entry under the receivers node, just after web.hook:
- name: slack_alerts
slack_configs:
- api_url: <the WebHook URL for Slack>
channel: '#prom-notifications'
Change the value of the receiver property under the route root node from ‘web.hook’ to
‘slack_alerts’:
route:
group_by: ['alertname']
group_wait: 10s
group_interval: 10s
repeat_interval: 1h
receiver: 'slack_alerts'
Start Alertmanager
nohup ./alertmanager &
The Alert Manager also has a Web UI, which is available at: http://192.168.188.112:9093 .
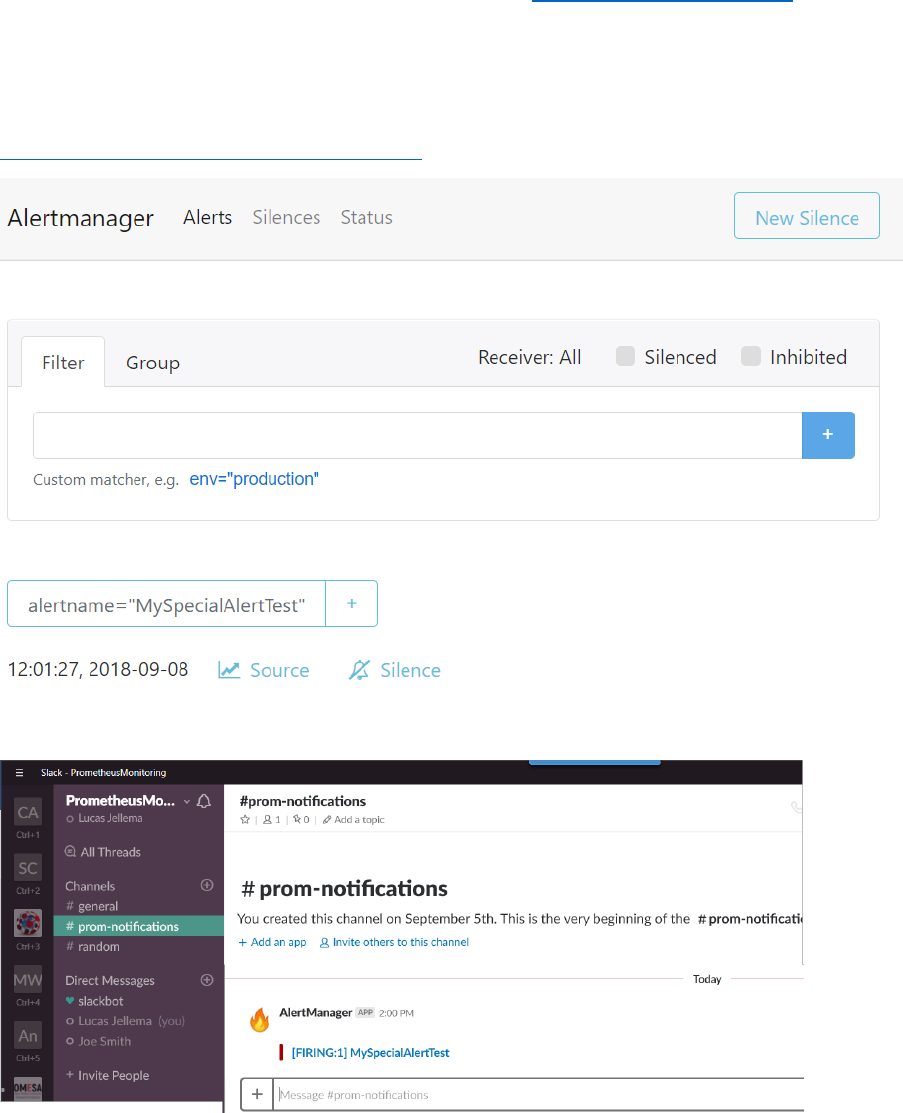
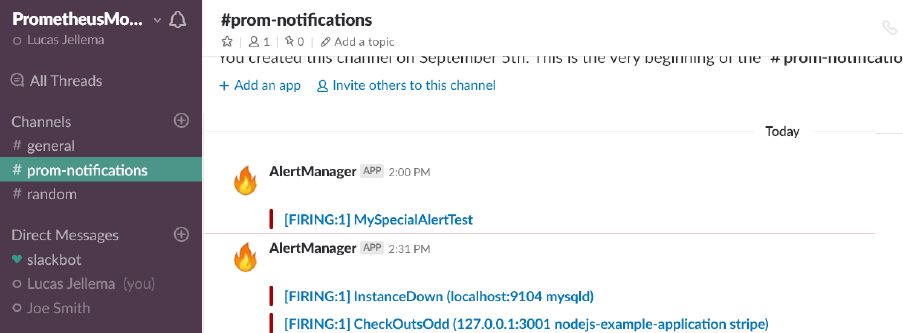
Test – have an alert raised directly, not from Prometheus:
curl -d '[{"labels": {"alertname": "MySpecialAlertTest"}}]'
http://localhost:9093/api/v1/alerts
And in Slack:
Configure Prometheus to Forward Alerts to Alert Manager
Now let’s try to get the alerts identified by Prometheus into the Alert Manager.
Edit prometheus.yml. Configure the locally active Alert Manager in the alerting node by specifying
the end point 127.0.0.1:9093 as target;
alerting:
alertmanagers:
- static_configs:
- targets:
- 127.0.0.1:9093
Save the changes and restart Prometheus.
The Alerts that are visible on the Alerts tab in the Prometheus Console
are now also visible in the Web UI of the Alert Manager:
These alerts are sent as notification to the Slack channel, as per the configuration you have just
created in the alertmanager.yml file:
Optional: Create Pretty Notification Messages using Templates
The notifications in Slack are a little unrefined. Our core technical staff may be fine with this, but
some engineers may prefer a little more refined message. That can be done – using notification
templates configured for the Alert Manager in alertmanager.yml.
First create a special route for the CheckOutsOdd alert in a routes node under the route root.
routes:
- receiver: businessticket
group_by: [service]
match:
alertname: CheckOutsOdd
In this route, we can also add instructions for [more complex] grouping, throttling and repeating
notifications.
Then, create a new receiver entry in this same file, called businessticket and defined like this:
- name: businessticket
slack_configs:
- api_url: <Incoming WebHook URL Slack Workspace>
channel: '#prom-notifications'
title: 'Alerts in Service {{ .GroupLabels.service }}'
text: >
{{ .Alerts | len }} alerts:
{{ range .Alerts }}
{{ range .Labels.SortedPairs }}{{ .Name }}={{ .Value }} {{ end }}
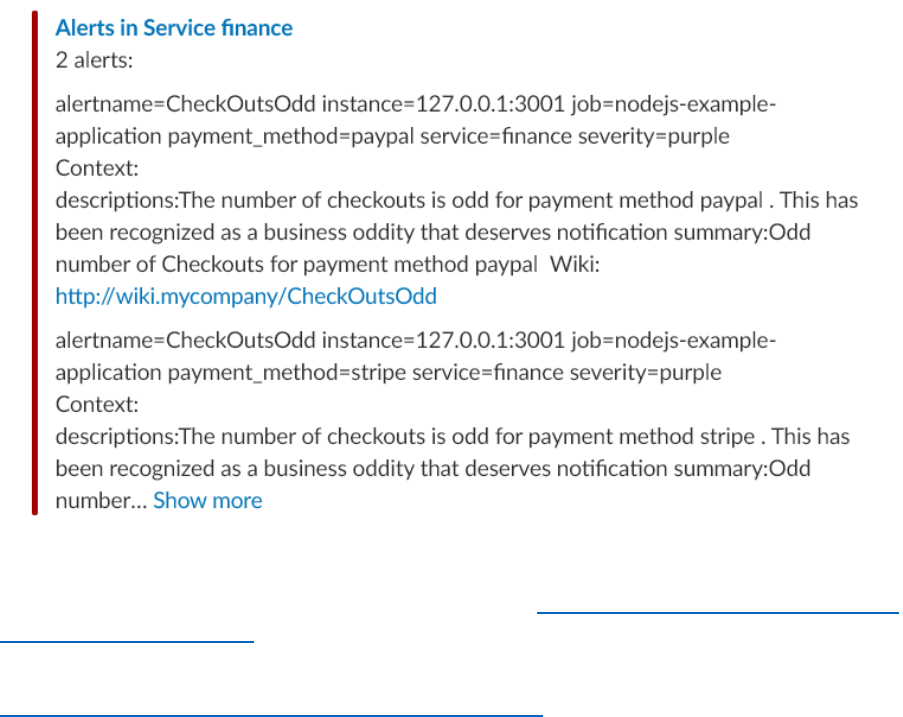
Context:
{{ range .Annotations.SortedPairs}}{{ .Name }}:{{ .Value }} {{ end
}}
Wiki: http://wiki.mycompany/{{ .Labels.alertname }}
{{ end }}
Note: the blank lines are intentional. Simply using \n did not create the new line characters I was
hoping for.
Save the file alertmanager.yml with these changes and restart the alertmanager. This configuration
file is reloaded. When next you trigger alerts, the notification shown in Slack will be extended with
the information configured in the template:
Resources
Using the Slack notification channel with the Alert Manager https://www.robustperception.io/using-
slack-with-the-alertmanager
Documentation on Notification Templates:
https://prometheus.io/docs/alerting/notification_examples/
Dashboards with Grafana
A lot of information about the metrics gathered by Prometheus can already be learned from the
Prometheus Web UI. The alert rules in combination with the Alert Manager’s capability of translating
firing alerts into notifications into virtually any channel allow us to take action when undesirable
conditions occur. What then do we need a dashboard for?
A well-designed dashboard – and that is a stiff challenge right there – can support engineers acting
on alerts by providing contextual information about the alert itself and the components from which
the alert originated and their recent history. The dashboard also provides insight – both for incident
analysis as well as for more tactical insight – in trends over time, such as slowly increasing load or
decreasing remaining capacity.
A common companion to Prometheus for Dashboarding – although both play with others too – is
Grafana. We will now take a quick look on how we can use Grafana to visualize the metrics gathered
and preprocessed by Prometheus.
Try out Grafana On Line
Navigate in your browser to: https://grafana.com/grafana#visualize . You can scroll to get a quick
introduction to all main features of Grafana.
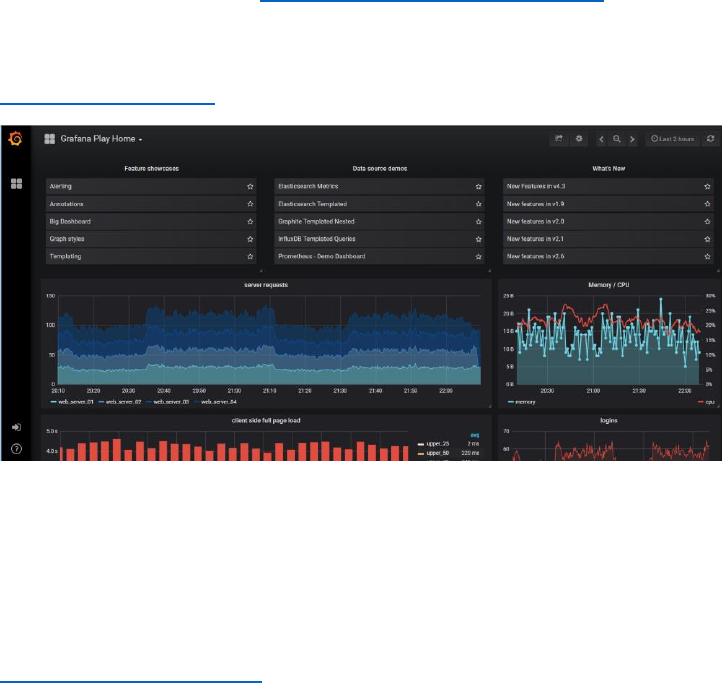
To play with a number of fancy live dashboards and have real interaction, navigate to
https://play.grafana.org :
Get Going with Grafana on your laptop
Run Grafana in a Docker container using the following command:
docker run -d --name=grafana -p 3000:3000 grafana/grafana:5.2.3
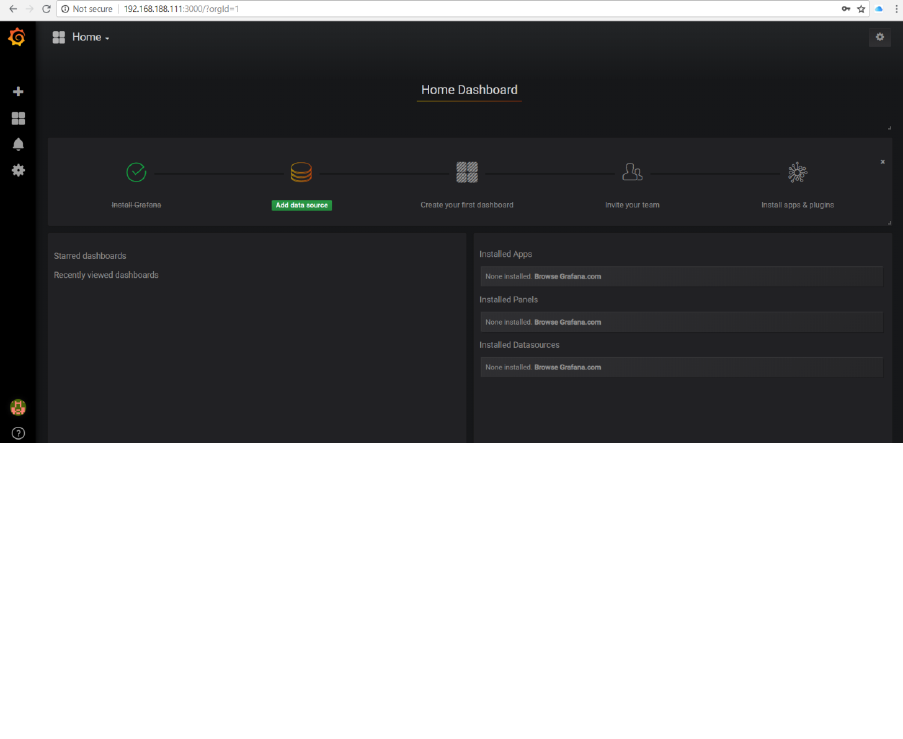
When the container is running – this will take a few minutes because the Grafana Docker Container
Images needs to be downloaded - , the Grafana UI can be accessed on your laptop at
http://192.168.188.112:3000.
Default credentials are: admin/admin.
Note: when logging in for the first time, you are prompted to change the password. In this workshop
environment you can safely change to admin (so not really change at all).
Grafana uses data sources to fetch information used for graphs. There are a variety of types of data
sources supported out of the box, including MySQL, CloudWatch, Elastic Search, OpenTSDB,
PostgreSQL, and of course, Prometheus. A Grafana dashboard can have graphs from variety of
sources, and you can even mix sources in a graph panel.
Let’s now add a Data Source for your Prometheus instance.
Click on Add data source and add a data source with a Name of Prometheus, a Type of Prometheus,
and a URL of http://192.168.188.112:9090
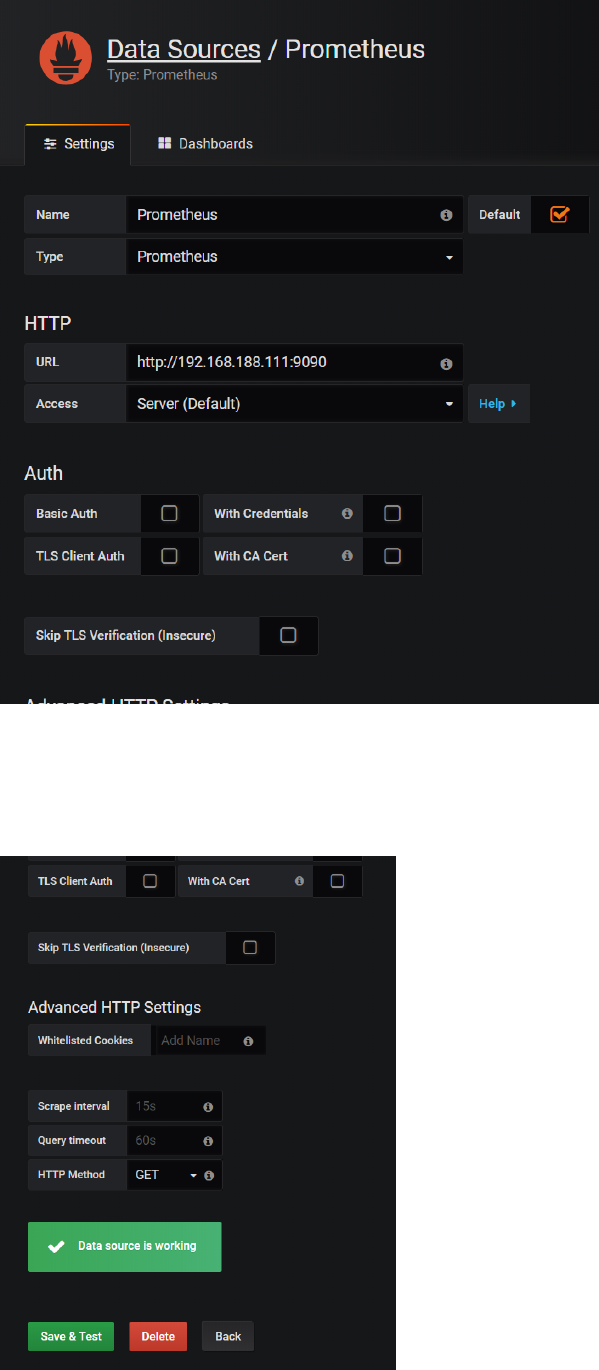
Press Save & Test.
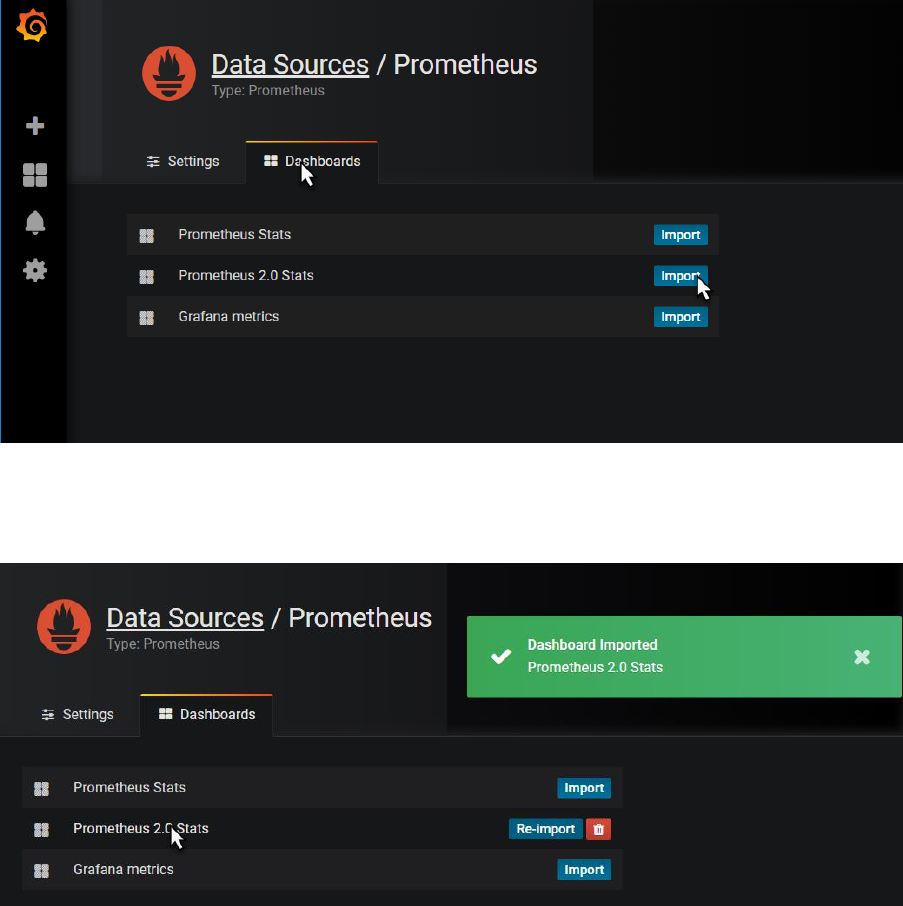
Toggle to the tab Dashbaords and click to import the Prometheus 2.0 Stats dashboard.
This will import the definition of this dashboard to quickly get us going with a dashboard that
displays various metrics on the operational condition of our Prometheus instance, supporting those
engineers that have a responsibility for keeping Prometheus in good working order.
When the dashboard is imported, click on the name of the dashboard – which is a hyperlink to now
open the dashboard.
The dashboard appears:
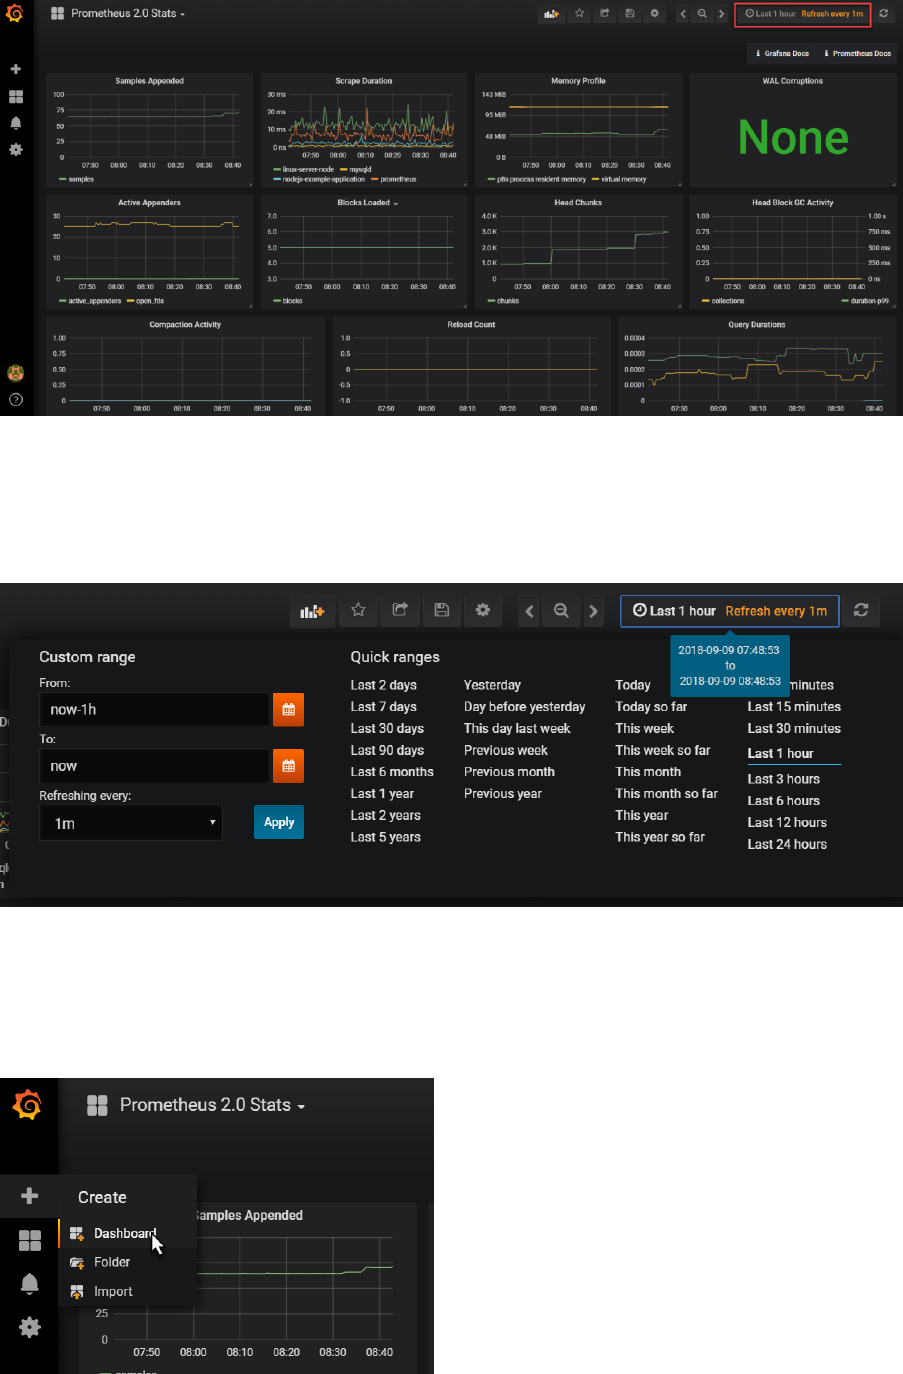
It shows a little of what Grafana is capable of, in terms of visualizing and organizing data. Hover over
the graphs with your mouse for example.
Click on the time window widget in the upper right hand corner, to zoom in and out over a time
range:
Creating a New Dashboard
To create your own new dashboard, click on the plus icon in the upper left hand area of the page
and select the create a new Dashboard:
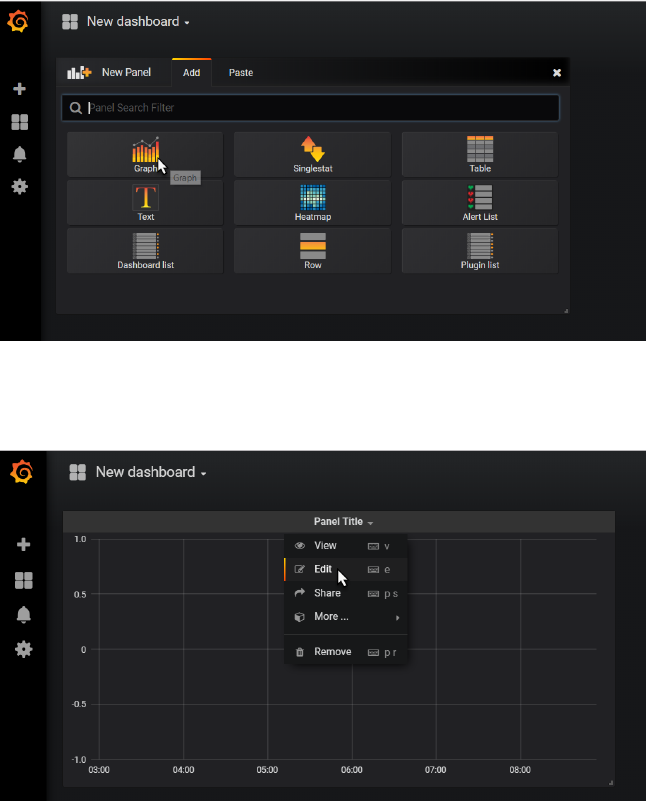
Click on Graph:
A new Panel with an initial graph appears. Click on Edit in the dropdown menu under Panel Title.
Set the Data Source for the Graph to Prometheus.
Then start typing the name of metric A. Type check and that should bring up a list of applicable
metrics. Select checkouts_total.
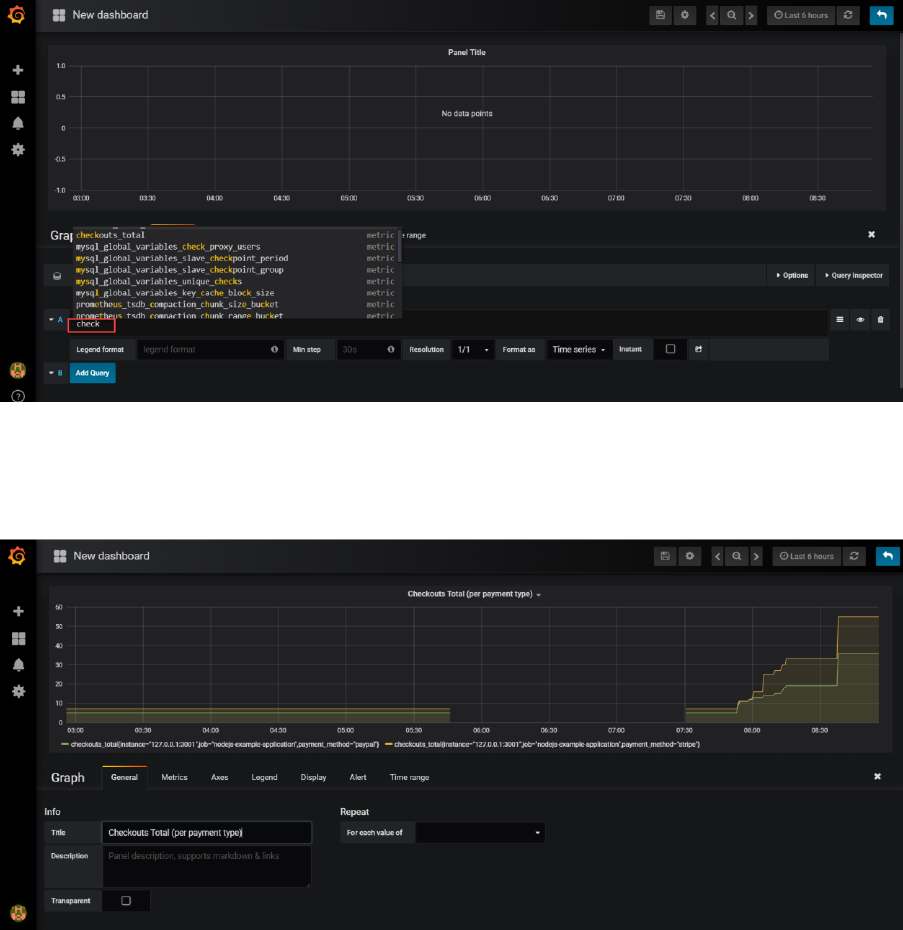
The graph will start to show.
Switch to the General tab and update the title of the graph, for example to Checkout Total (per
payment type):
Click on the save icon to save the current state of the dashboard.
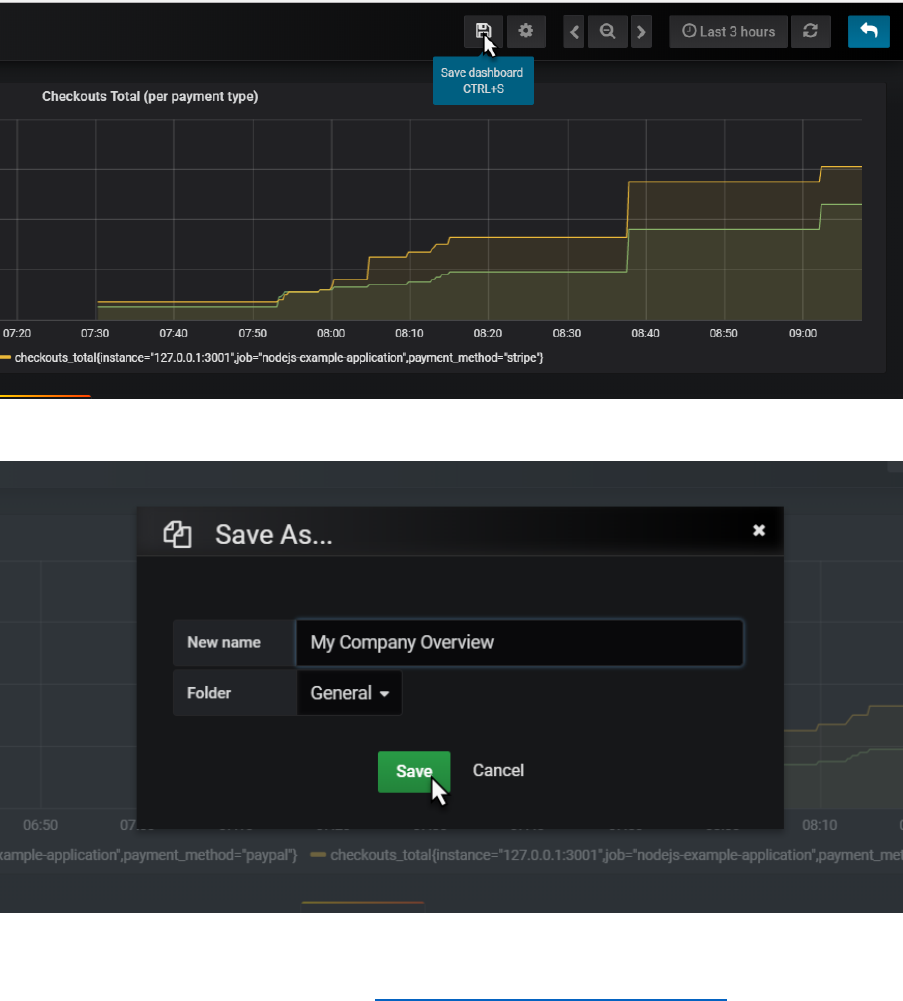
Provide a name for your dashboard
And click on Save.
You now may want to make some calls to http://192.168.188.112:3001/checkout to influence the
checkouts_total metric that this dashboard is proudly visualizing. If you do so, this should result in a
visible step in the chart. Because of a user action in a business application, and because that
business application publishes Prometheus metrics, and because Prometheus periodically scrapes
and process and stores those metrics and because Grafana periodically collects those stored data
and visualizes them, we - with our Ops engineer hat on - are aware of that activity. And could
respond to it.
Extend the Dashboard
Adding additional metrics in a graph is dead easy. They can come from the same or a different data
source and they can be related or totally unrelated. And they can also be calculated using the
expression engine in Grafana.
Add Sum of Checkout Totals [over all payment methods]
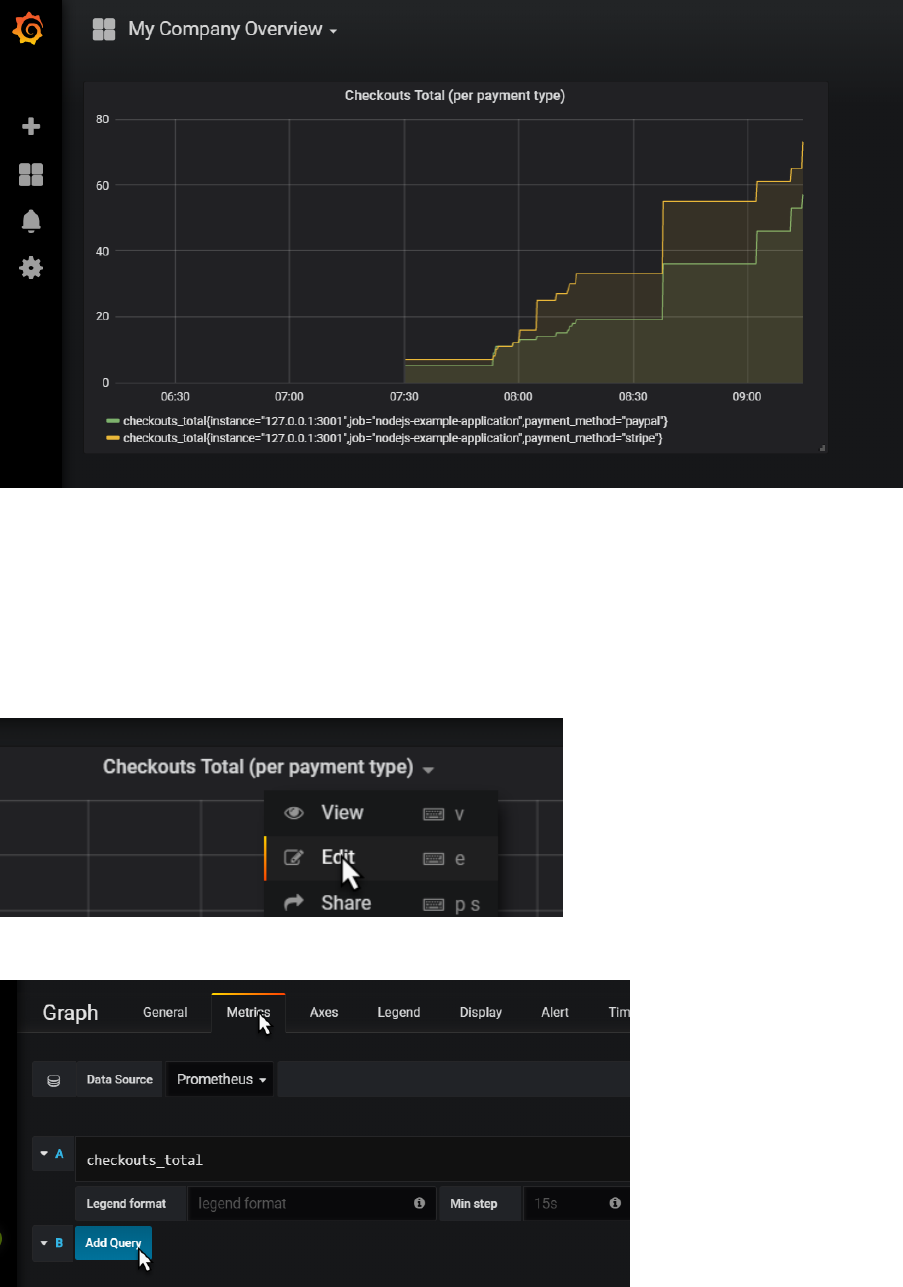
Click on the panel title for the graph. Click on edit in the dropdown menu:
Switch to the metrics tab and click on Add Query
Type sum(ch and select checkouts_total from the suggestion list:
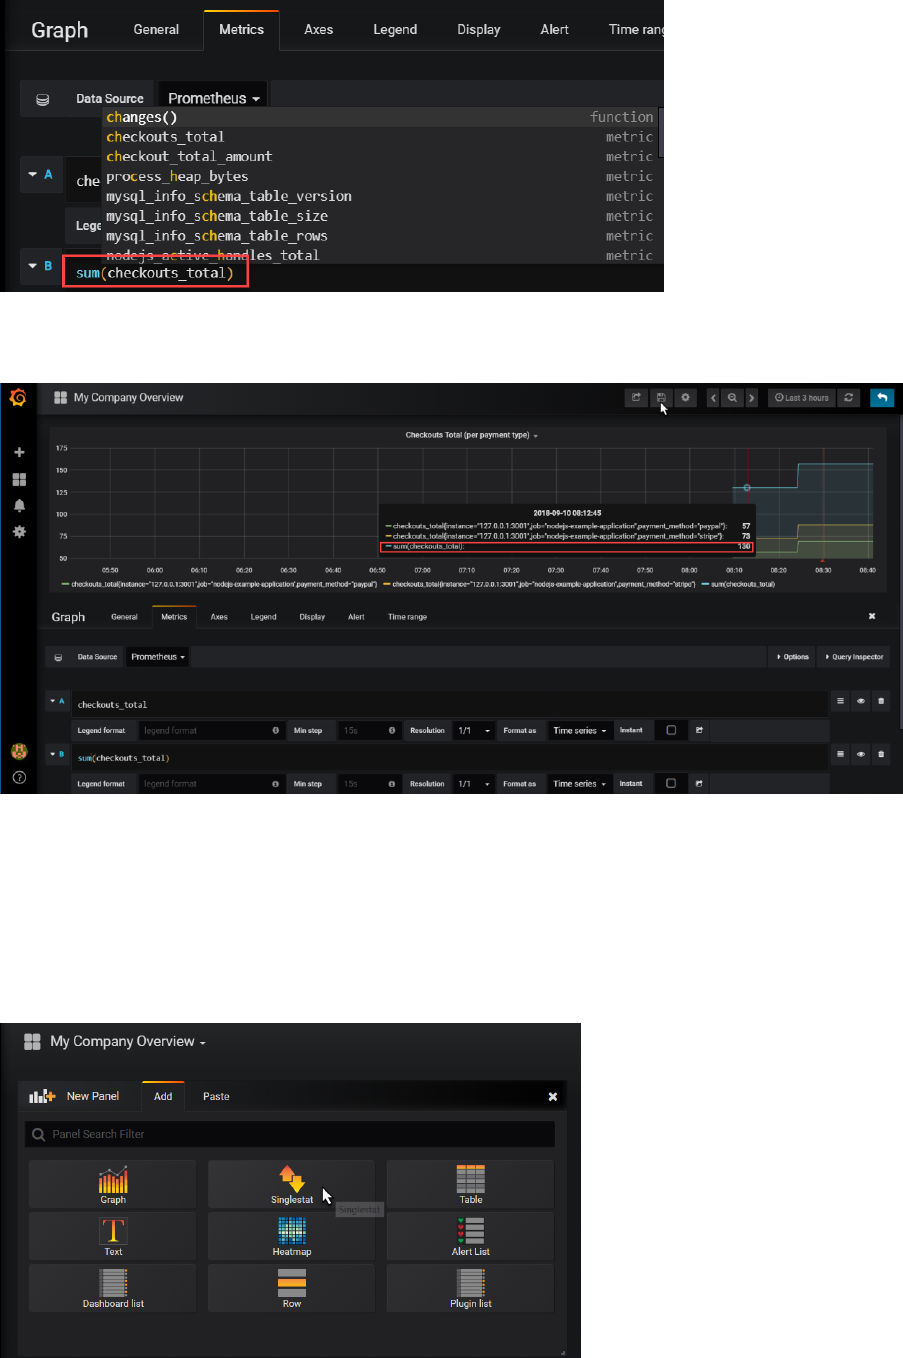
When you tab out of the field, the graph is immediately updated. It now shows the sum over all
checkouts_total values:
Click on the Save icon to save the updated dashboard definition.
Add Panel to Show Current Value of Total of Checkout Totals
Grafana panels can be crated for displaying one single value that needs to be highlighted.
As a quick example:
Add a panel, of type Single Stat.
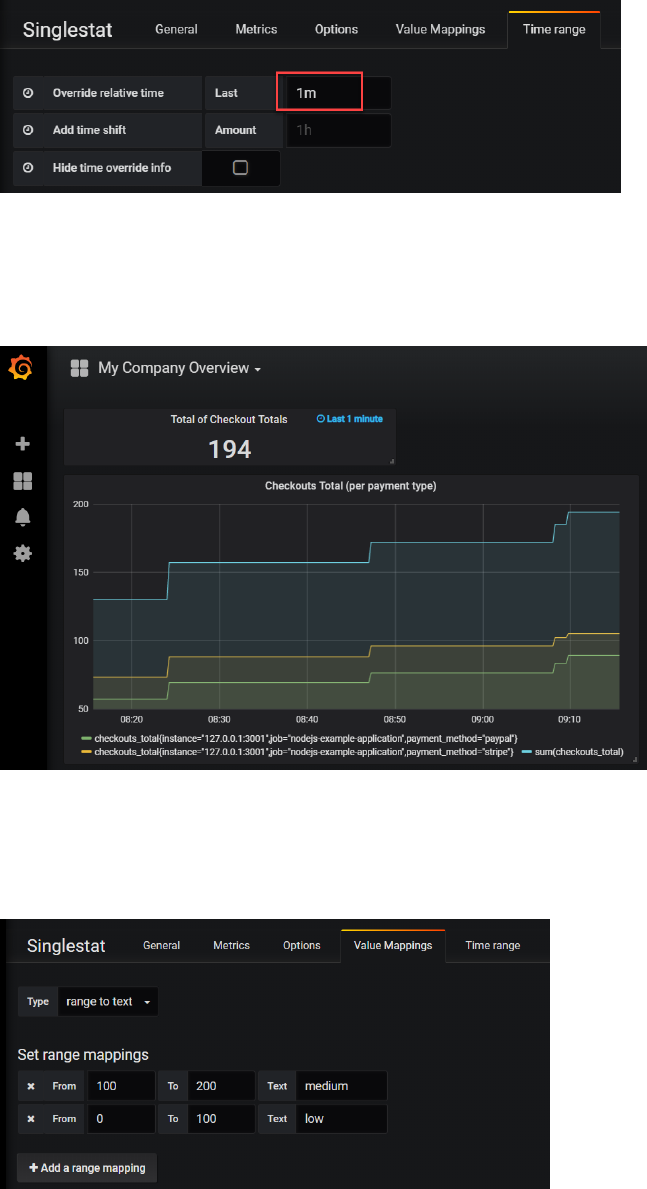
Click on Panel Title | Edit.
Switch to Metrics tab. Type
sum(checkouts_total)
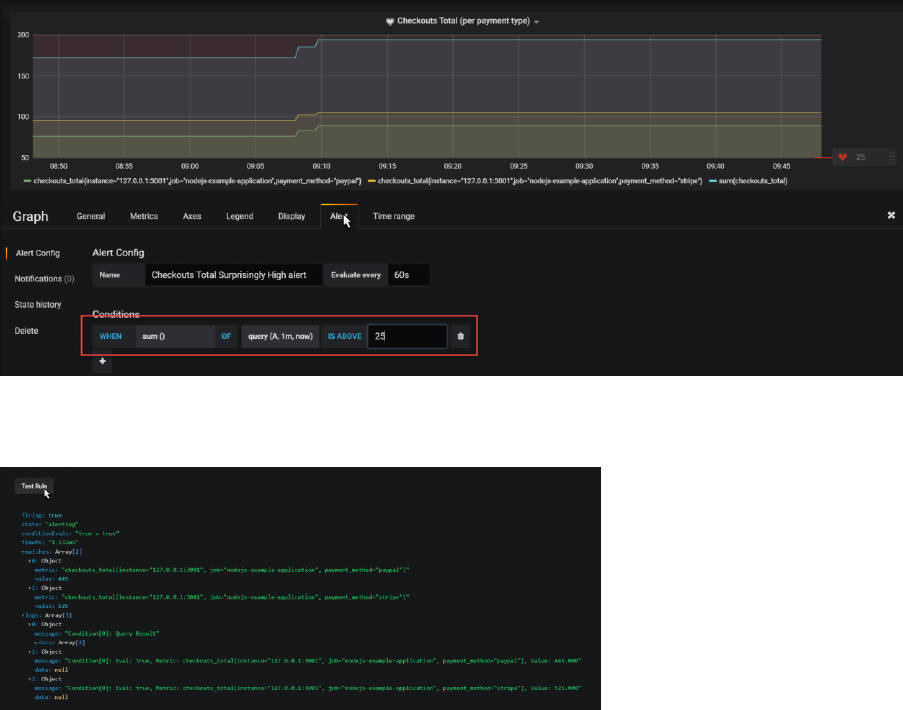
Switch to Time Range tab. Set override relative time to 1m – to get only the most recent value for
the sum.
Switch to tab General and set a more meaningful title for the panel.
Save your changes and return to the dashboard.
Finally resize this panel to a more proper size.
Note: in the Single Stat panel editor is the Options tab where you can define display options – for
example to associate specials colors with values or value ranges. In the Value Mappings tab, you can
define labels that should be displayed for specific value ranges – for example labels such as low,
medium, high or relax, watch out and go crazy.
Using the Alert Mechanism in Grafana
Grafana contains an alert mechanism, somewhat similar to that in Prometheus. Note: there is no
direct connection to the Alertmanager or the Alert rules in Prometheus.
Alerts can be defined on panels. Click on the panel title for the checkout totals chart and open the
panel editor.
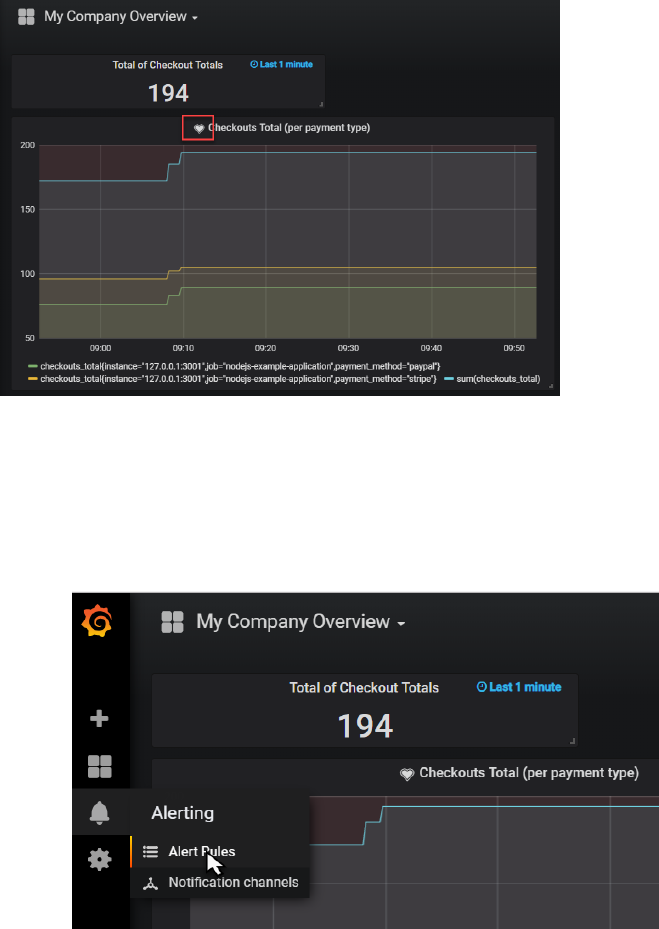
Click on the Alert tab. Then click on Create Alert.
Define a name – for example Checkouts Total Surprisingly High alert. Then specify the alert condition
– for example:
WHEN sum() OF query(A,1m,now) IS ABOVE 25
When you scroll down a little, you will find the Test Rule button. When you press this button, the
rule is evaluated and info is shown:
Save your changes and return to the dashboard.
A little icon is shown on the Panel title to indicate that alerts have been defined for this panel.
When the alert is active, the heart icon will turn red. You may have make a few more call to the
/checkout endpoint to make this alert fire.
There are several ways to inspect a firing alert:
- drill down to the Panel editor
- check the Alert Rules option from the main dashboard menu
- add a panel of type Alert List
Do the latter:

And when the alert is firing, you will see this:
When you click on the active alert, you drill down to the alert definition in the panel editor:
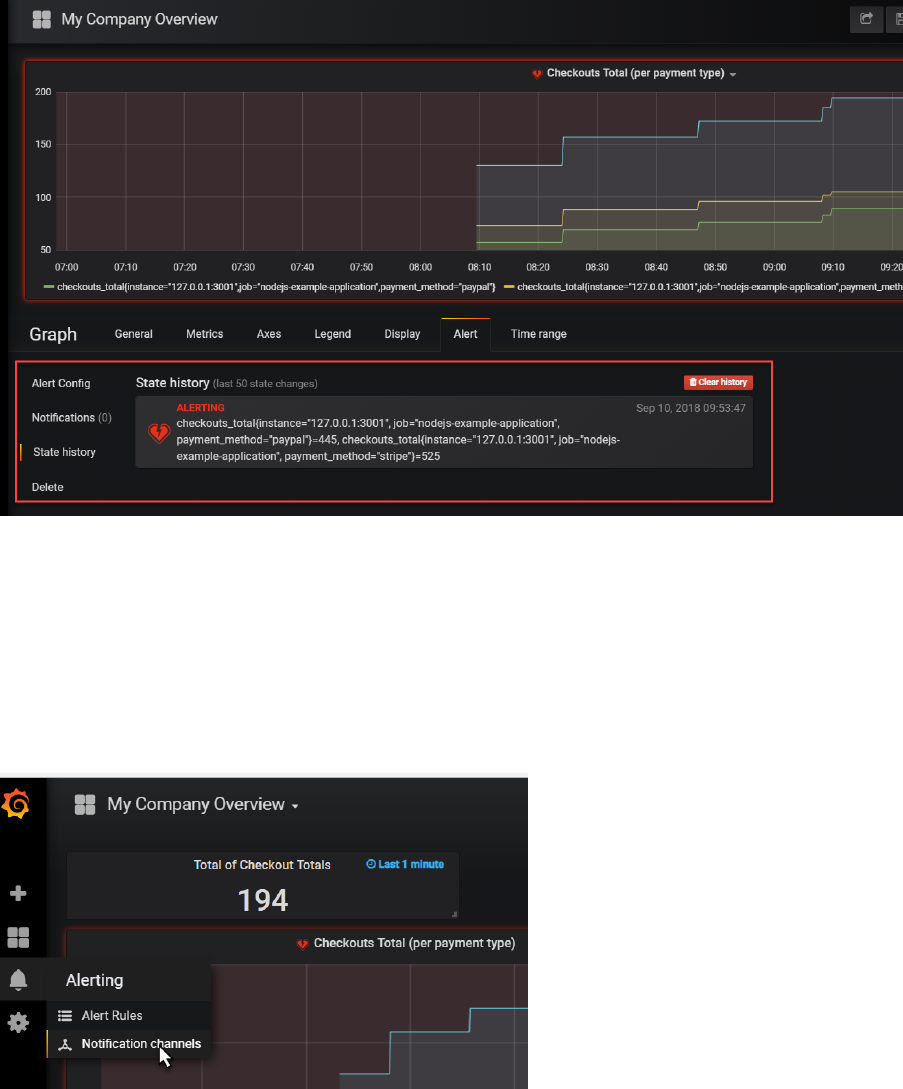
Here you can inspect details and check the history of the alert.
Note: just like in the Prometheus Alert Manager, you can configure notification channels and
associate them with the alerts.
The Notification Channels are set up from the Alerting | Notification Channels option on the main
menu.
Notify on Alerts from Grafana
Grafana has out of the box support for a substantial number of notification and communication
channels:
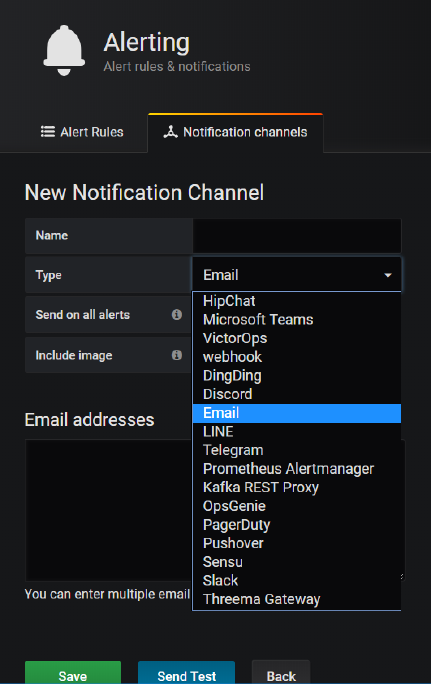
Feel free to configure the Slack notification channel – using the same Slack WebHook endpoint as
before with the Prometheus alert manager – and make Grafana send notifications to Slack – or one
of the other channels.
