IRMA User Guide
User Manual:
Open the PDF directly: View PDF ![]() .
.
Page Count: 12

USER GUIDE
Source Code Visualization User Guide
March 2018
Version 1.0
Team Irma:
Samuel Matloob
Charlotte Morrison

USER GUIDE
Copyright is retained by the original authors of the program: Samuel Matloob and Charlotte Morrison.

USER GUIDE
Document Revisions
Date
Version
Number
Document Changes
3/30/2018
1.0
Initial Draft

USER GUIDE
Table of Contents
1 Introduction ................................................................................................................................................................ 5
1.1 .... Scope and Purpose ............................................................................................................................................................. 5
1.2 .... Process Overview ................................................................................................................................................................ 5
2 Running Source Code Visualization .................................................................................................................. 6
2.1 .... Selecting a source file. ...................................................................................................................................................... 6
2.1.1 Open file explorer: ......................................................................................................................................................................6
2.2 .... Selecting Display Options ............................................................................................................................................... 8
2.2.1 [Procedures for Step 2]: ...........................................................................................................................................................8
3 Appendices .................................................................................................. Error! Bookmark not defined.
4 Index............................................................................................................... Error! Bookmark not defined.
4.1 .... Style Sheet Information .................................................................................. Error! Bookmark not defined.
5 Heading 1 ..................................................................................................... Error! Bookmark not defined.
5.1 .... Heading 2 .............................................................................................................. Error! Bookmark not defined.
5.1.1 Heading 3 ....................................................................................................................... Error! Bookmark not defined.

USER GUIDE
5 | P a g e
1 Introduction
1.1 Scope and Purpose
The purpose of the Source Code Visualization program is to provide a support tool for software
developers. The Source Code Visualization program provides a visual representation of source
code dependencies. The tool will allow users to more easily understand the source code from a
different perspective.
The purpose of the user guide is to provide instructions on using the Source Code Visualization
program. This guide will cover the input file requirements, how to select files, using the
visualization options and running the tool. The user should be familiar with the basic
operations of a computer and should understand how to navigate through the file system and
select a file. This user guide
1.2 Process Overview
The Source Code Visualization program is designed to simple in execution. The user will open
a file, choose options and then run the visualization.
Workflows covered in this document:
1. Loading a file
2. Selecting display options
3. Using the visualization
USER GUIDE
6 | P a g e
2 Running Source Code Visualization
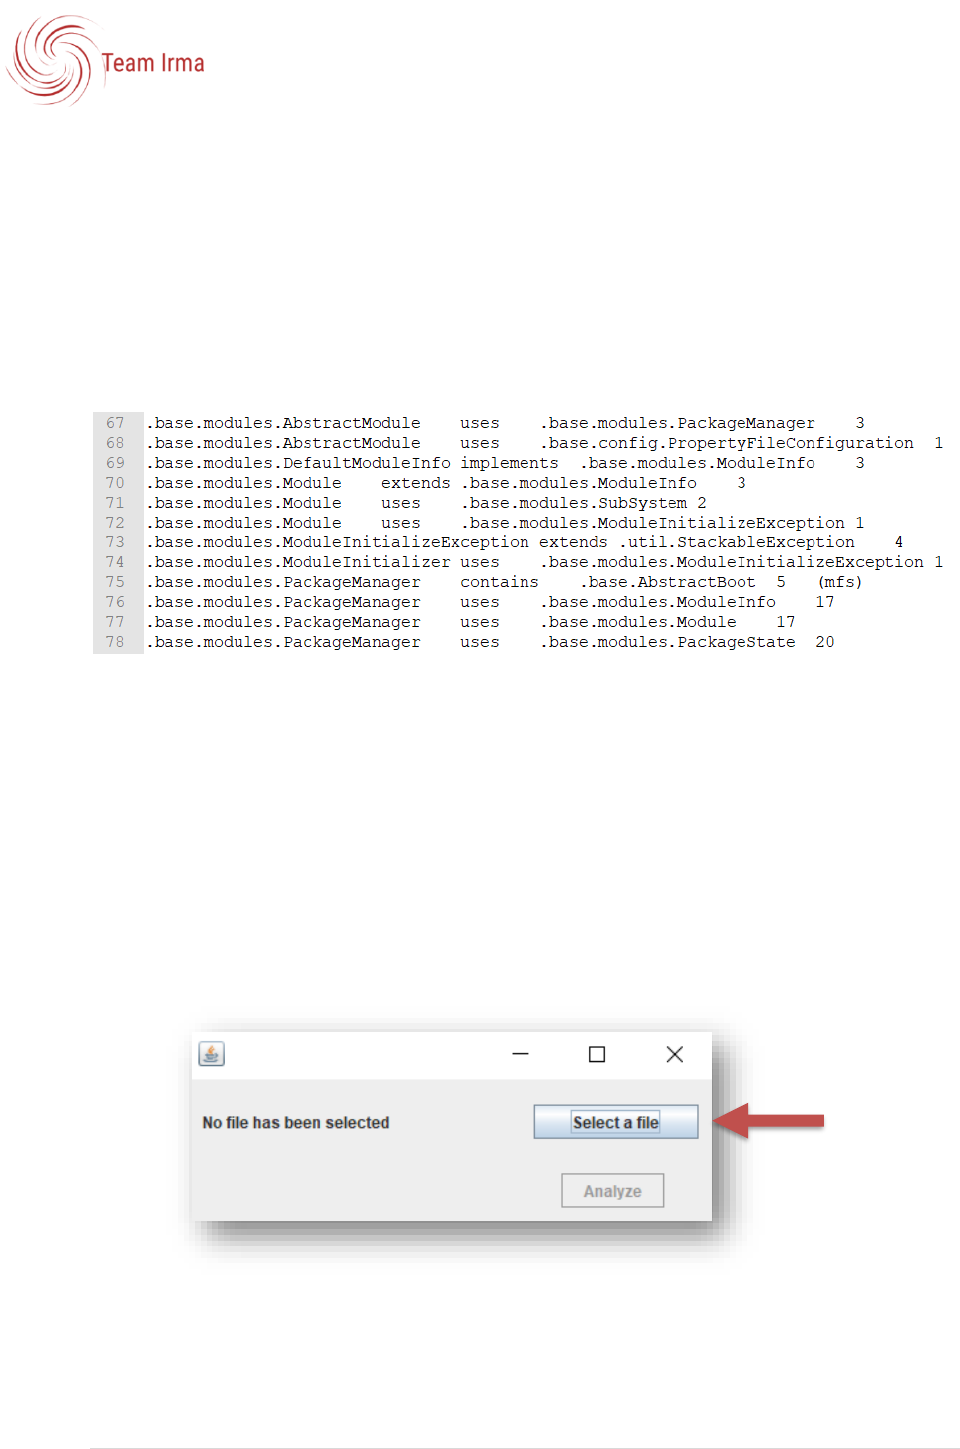
Source Code Visualization is a stand-alone application that does not interface with external
software applications. A text document including the classes and dependencies is required
for use of the program. The source (text document) must be in a tab delimited format with
one relationship on each line in the following information (in order) Class Name,
Relationship, Class Name, Number of connections.
Example source file:
The source file can be manually created by the user or it can be created by a program as
long as it meets these criteria.
2.1 Selecting a source file.
The following information provides instructions on how to select a source file to run
analysis.
2.1.1 Open file explorer:
1. Run the program.
2. Click on “Select a file”.
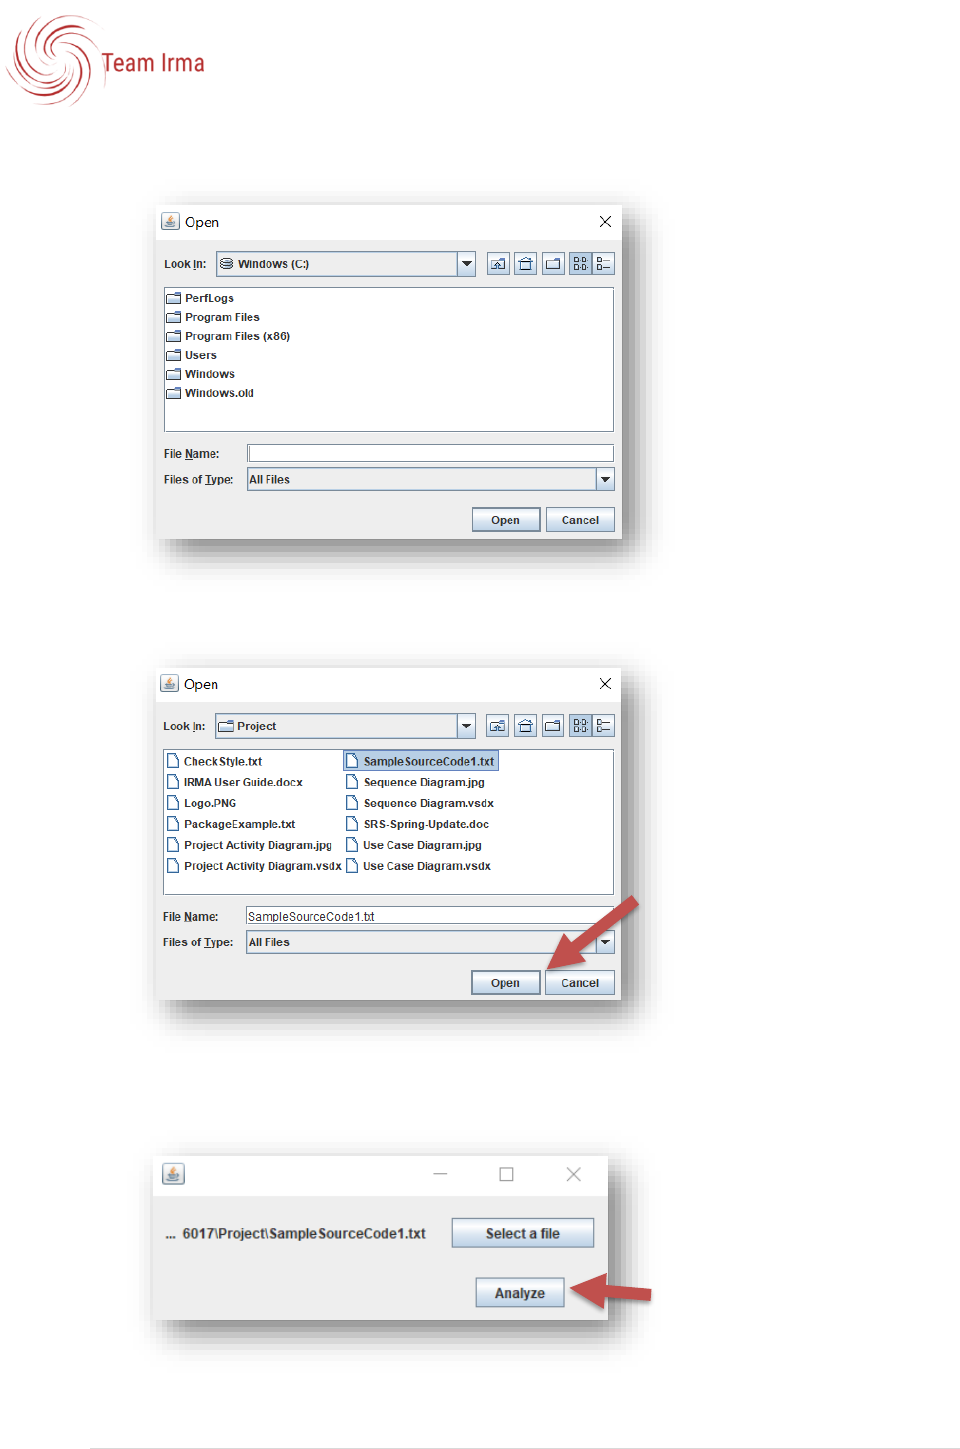
USER GUIDE
7 | P a g e
3. The “Open” window will be displayed.
4. Navigate to your desired source file.
5. Select open.
6. The file location will now be populated in the window.
7. Select Analyze.
USER GUIDE
8 | P a g e
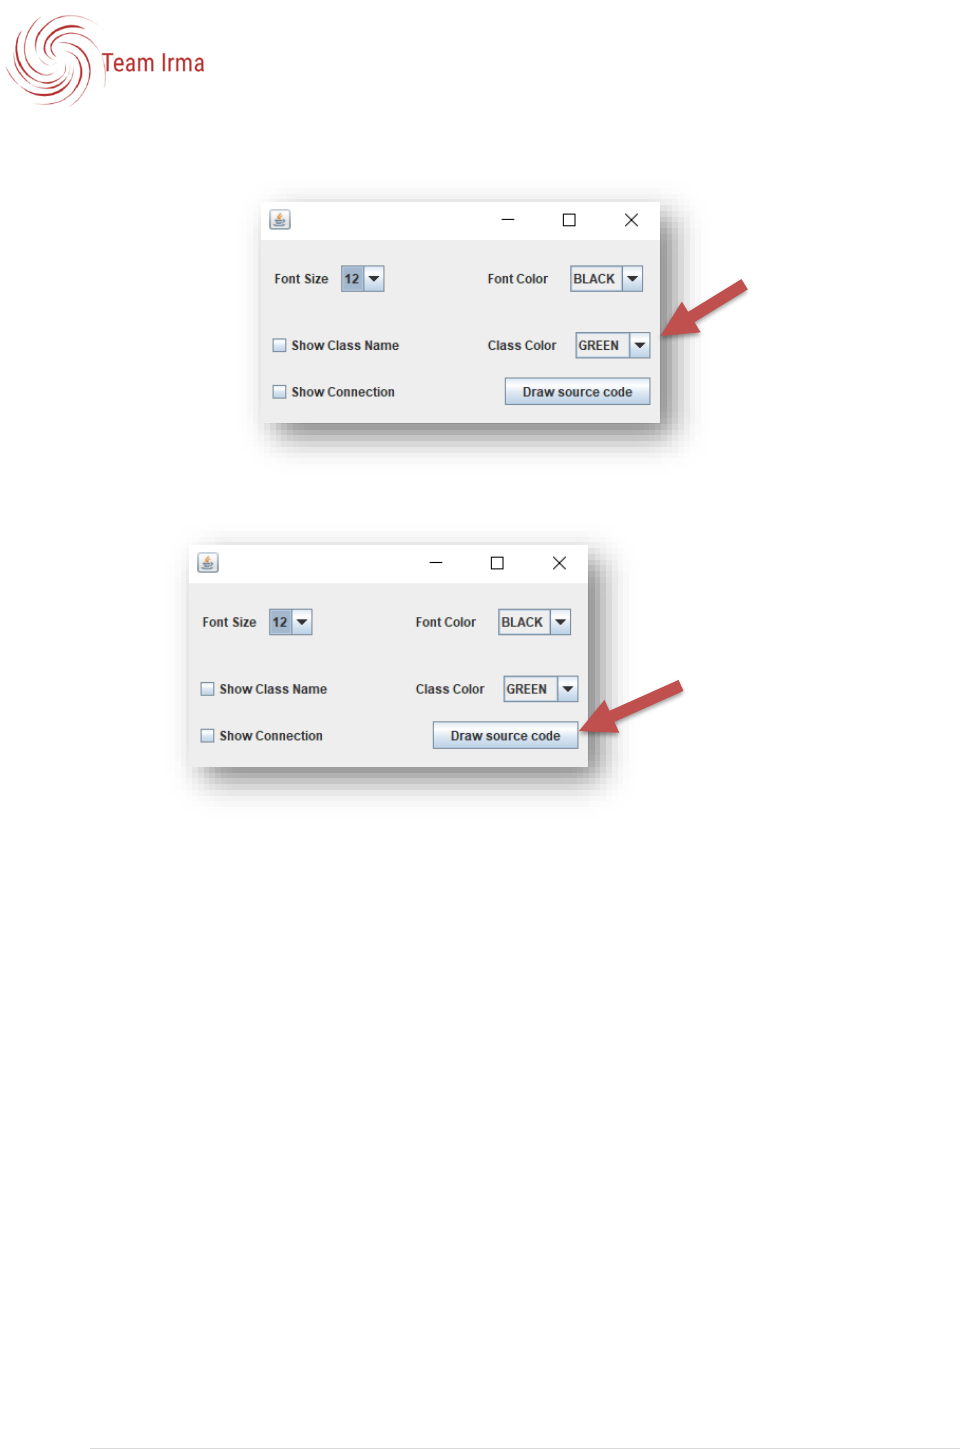
2.2 Selecting Display Options
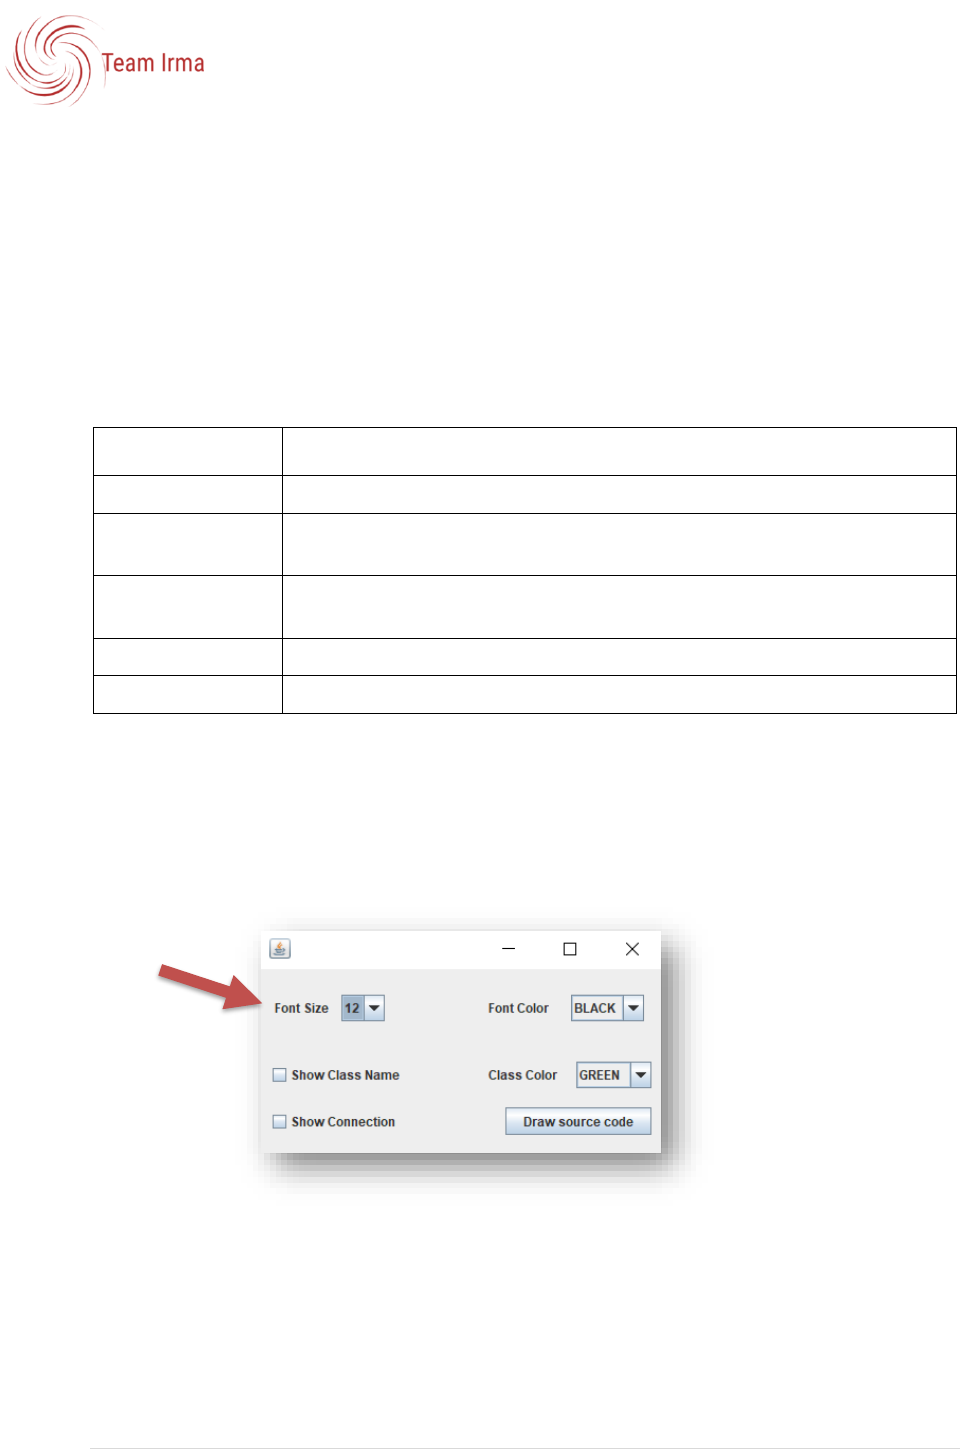
The analyze options window allows a user to choose from a variety of options explained
below in fig. 1-1. The purpose of the display options is to provide a user with customization
that will provide the maximum utility from the visualizations. The options also provide
accessibility for users with disabilities through font and color options. These options will
apply to the final visualization.
Options
Definition
Font Size
The font size can be adjusted between 12 and 18.
Show Class Name
This option allows the user to show class name (checked) or to hide the
class name (not checked).
Show Connection
This option allows the user to show class connections (checked) or to hide
the class connections (not checked).
Font Color
White and black are the available font colors.
Class Color
Red and green are the available class colors.
Figure 1-1: Display options available.
2.2.1 Choosing display options:
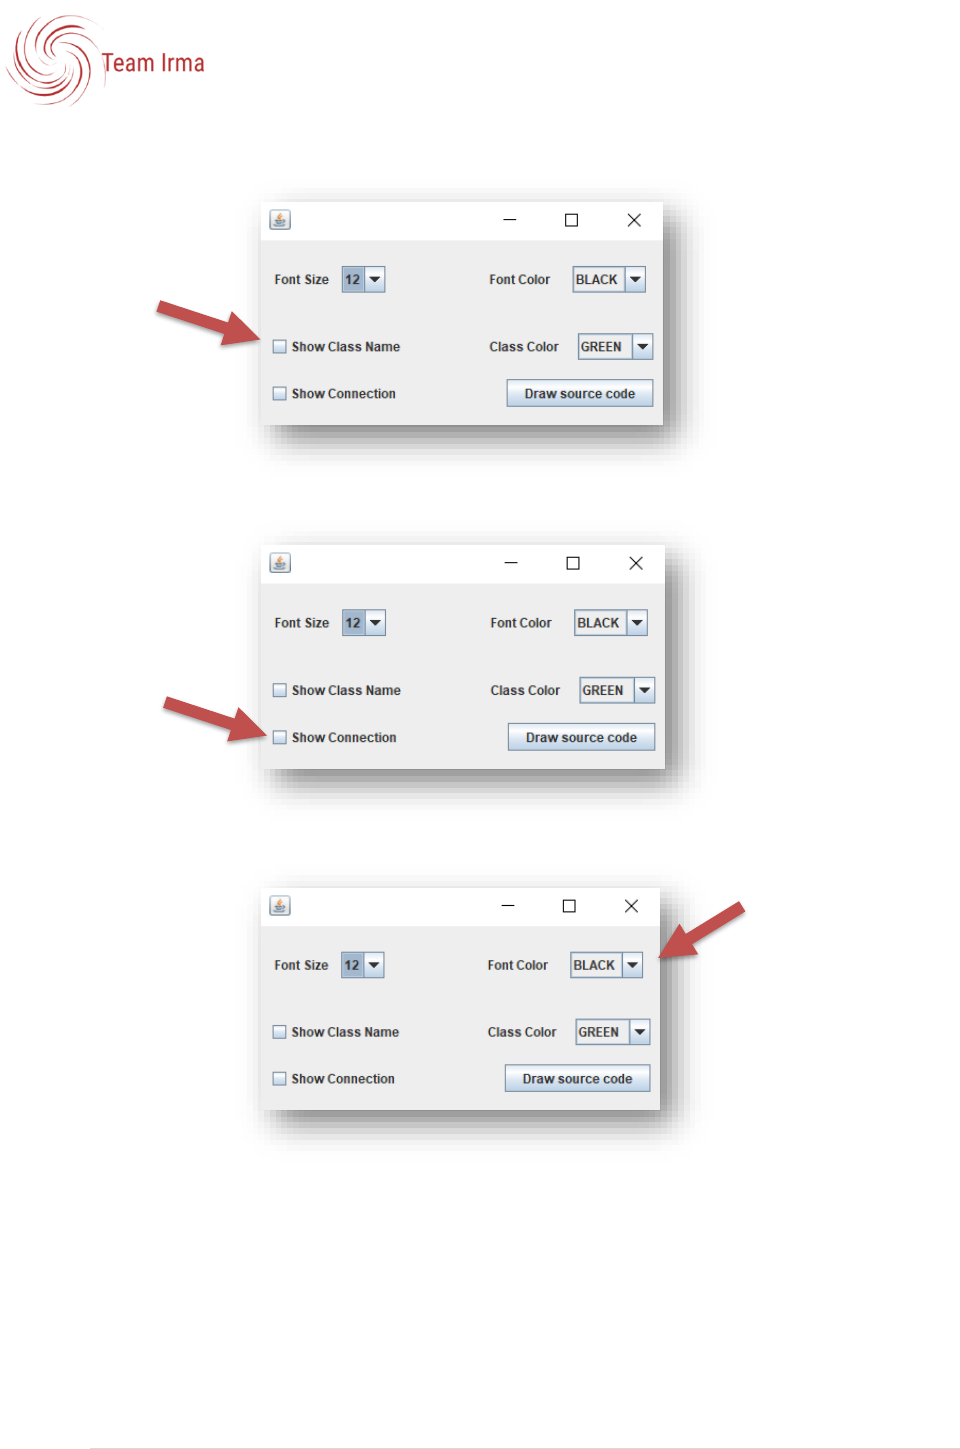
1. Choose the options for the display.
a) Select font size between 12 and 18 from the drop down.
USER GUIDE
9 | P a g e
b) Choose to either show or hide class names.
c) Choose to show or hide connection.
d) Choose font color.
USER GUIDE
10 | P a g e
e) Choose class color.
2. Select “draw source code” button.
USER GUIDE
11 | P a g e
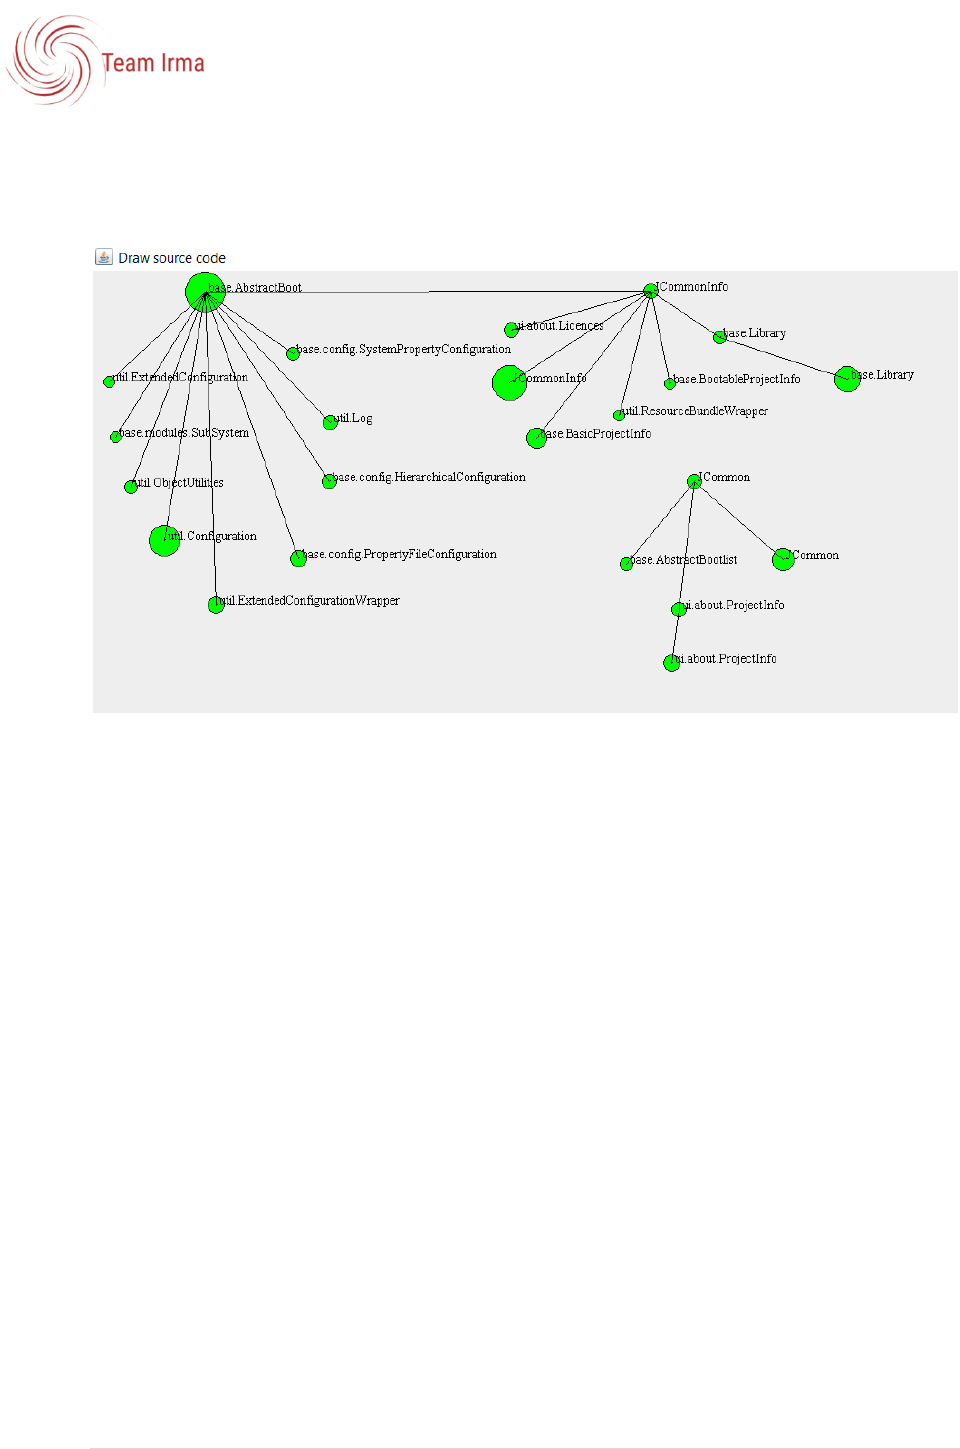
2.3 Using the Visualization
The visualization shows nodes of different sizes base on the number of dependencies, the
connections between the nodes and the names of the classes. The nodes are placed
randomly on the screen and need to be arranged by the user to create a usable display. The
user will simply click and drag the nodes to move them in the window. The connections will
automatically update when the node is moved.
2.3.1 Using the visualization:
1. Select a node that will be moved, click and drag to relocate it on the screen.
This area needs
to be
untangled
The nodes are
more readable
USER GUIDE
12 | P a g e
2. Continue moving the nodes until the visualization meets the user needs.
