Ini Motif Manual
User Manual:
Open the PDF directly: View PDF ![]() .
.
Page Count: 10

IniMotif User Manual
Lu Cheng, May 12, 2009
lu.cheng@cs.helsinki.fi
1 Preface
IniMotif devotes to discovers motifs from large amounts of sequencing data. All sequences should
be with the same length. We also assume the existence of a consensus sequence in the data.
The software is designed based on Hamming distance Model. At first the substring with the highest
count will be chosen as the consensus sequence, then all substrings of a sequence will be compared
to the consensus sequence. The substring with the lowest hamming distance is regarded as the
binding site of this sequence.
2 Instructions for running the program
The IniMotif software consists of three modules: The first java module produces all necessary data,
including the motif logos; the second matlab module draws figures from the data produced by the
first module; the third perl module organizes all information in the form of HTML pages.
We strongly recommend you to read Section 4 if you are not clear about the predefined specifics.
2.1 The java module
1. How to run the module?
cd IniMotif_directory
make compile
java -jar InitialMotif.jar -MODE
# please make sure the “para.txt” under “paras” directory is set properly for the
corresponding -MODE; in case of low memory, please use “java -Xms512m
-Xmx1024m -jar InitialMotif.jar -MODE” instead #
2. Different Modes
the “-MODE” can be replaced by the following parameters:
-cycle: the input directory contains a cycle of SELEX data, each filename should contain the
full barcode
-batch: the input directory contains a batch of SELEX data, which is orgnized as several
cycle directories, each cycle directory of the batch should be named as 0,1,2... e.g. the batch
directory is B, which contains "1,3,4,5" cycle directories, each cycle direcotry contains the
fullbarcode files, like "B_ACTCG_4.txt"
-allbatches: the input directory contains several batch directories, which is organized as
descripted above
-uniform: the input directory contains all barcode files of all cycles and all batchs in one
folder. (The whole process may take 5 or 6 hours)
3. Parameter setting (in para.txt)
The first line is the explanation for the parameters
The second line is the input directory
The third line is the output directory
The fourth line tells the location of the background distribution file
The fifth line shows the location of the barcode-TfName table file
The sixth line is the minimum motif width
The seventh line is the maximum motif width
The eighth line is the length of the input sequences
4. skip Mode
In the practical usage of IniMotif, sometimes we put new data with the old data, then we
need to run IniMotif for the merged dataset using old parameter settings. This causes lots of
redundant computation: those old files which has already been processed should not be
processed again. Thus we introduce the skip Mode, just type the following command in your
console:
java -jar InitialMotif.jar -MODE -skip
For a sequence file, IniMotif checks whether the necessary data files are available in the
corresponding output directory. If all data files are available, then this sequence file will not
be processed.
2.2 The Matlab Module
1. How to run the module?
cd IniMotif_directory/CreateFigure
matlab &
drawAllBatches(root_dir, widths, MODE)
# In matlab console, type drawAllbatches('selex/IniMotifOutput', [6:10], 'normal'). If
you want to skip producing already existed figures, please just type
drawAllbatches(selex/IniMotifOutput, [6:10], 'skip') ,
# Here the 'root_dir' contains all dataset for different batches, including the initial
batch 0. Batch 0 should only contain one 0 cycle
# width specifies the widths for producing figures. For example, [6 8 9] means only
produce figures for motif width 6, 8, and 9
# MODE should be a string, you can either use 'normal' or 'skip'. 'normal' mode
always produces new figures; 'skip' mode will skip producing already existed figures.
# This function draw all figures needed
# The whole process takes more than 12 hours
2. Other useful function-1: drawOneCycle(CYCLE_DIR, WIDTH)
# This function draw SubStrCount-HamDisFig and PosDisFig under one cycle
directory. CYCLE_DIR is the directory of one cycle, which includes processed data
for all different widthes, WIDTH specifies the widths under this cycle directory.
3. Other useful function-2: drawTrendFig(batch_dir,back_dir,WIDTH,out_dir)
# This function draw the TrendFig for all barcodes under one batch directory. The
batch directory contains different cycles
# 'batch_dir' is the directory of the batch for drawing the Trend figure. ' back_dir' is
the directory of the initial cycle, i.e. 'IniMotifOuput/0/0'. 'WIDTH' should be an
integer here, 'out_dir' specifies the output directory for the trend figures.
2.3 The perl Module
This module organizes all the data in the form of HTML pages. After running this module, the
whole procedure of IniMotif ended.
1. How to run this module?
cd IniMotif_directory/HTML
perl genPages.pl ROOT_DIR min_width max_width
# 'ROOT_DIR' means the IniMotif output directory which contains data of all
batches, 'min_width' is the minimum width of the motif, while 'max_width' is the
maximum width of the motif.
# You may set the size of the figures in the 'barcode.css' under the ROOT_DIR for
better visualization. Note that the figures could be zoomed by press Ctrl++ and Ctrl--
2. Other useful script-1: downloadPages.pl
# usage: perl downloadPages.pl ROOT_DIR OUT_DIR
# This script downloads all necessary figures for visualization from the output
directory of IniMotif. 'ROOT_DIR' is the IniMotif output directory which contains
data of all batches; 'OUT_DIR' is the output directory for storing the webpages
3 Result Explanation
This section explains all the files under the WIDTH directories, which are the most basic unit
folders in the IniMotif output directory. Our default directory are these WIDTH directories. Here we
use 'fullbarcode' to represent any legal fullbarcode, and 'barcode' to represent the central part of the
fullbarcode.
3.1 Motif & logo
The fullbarcode.pwm shows motif information of the given motif
The first line gives fullbarcode and its corresponding TF name
The following are the consensus sequence and its reverse complement
Then the Alignment matrix, Frequency matrix, Information content-based weight matrix (for
calculating binding affinity) are given
Finally the logo matrix for drawing the logo and the background are provided
The fullbarcode.png files under the 'logo' directory show the logos drawn from the logo matrixes in
the corresponding motif files
The title of logo consists of the fullbarcode and its corresponding TF name
3.2 SubStrDis
Fullbarcode.cnt files in this folder provide the counts of the each w-width substring (overlapping) in
the original sequence files. The .cnt files are used for drawing the substring changing trend figures.
The first column are the indexes of each w-width substring
The second column are the counts of each w-width substring
Note that the count of each w-width substring (exclude palindrome) are the sum of this
substring and its reverse complement.
If the count of a w-width substring is less than 3 or 1/10 of the expected number of a random
sequence, it will not be recorded in the .cnt file
3.3 SubStrDis-HamDis & SubStrDis-HamDis-Figure
The fullbarcode.dat files under SubStrDis-HamDis provide data for drawing the fullbarcode.png
files in the SubStrDis-HamDis-Figure files.
The .dat files structure
The first row shows the fullbarcode and TF name
Each of the following rows represents the w-width substring with the least Hamming
distance to the consensus sequence for each l-width sequence in the input sequencing file.
The first column indicates whether the w-width substring is on the original sequence or on
its reverse complement. If it is 1, it means the binding site is on the reverse complement
sequence; while if it is 0, it means the binding site is on the original sequence.
The second column shows the Hamming distance to the consensus sequence
The third column is the count of this w-width substring, note that it is not the sum of both
strands this time
The fourth column is the index of the substring
The .png file explanation
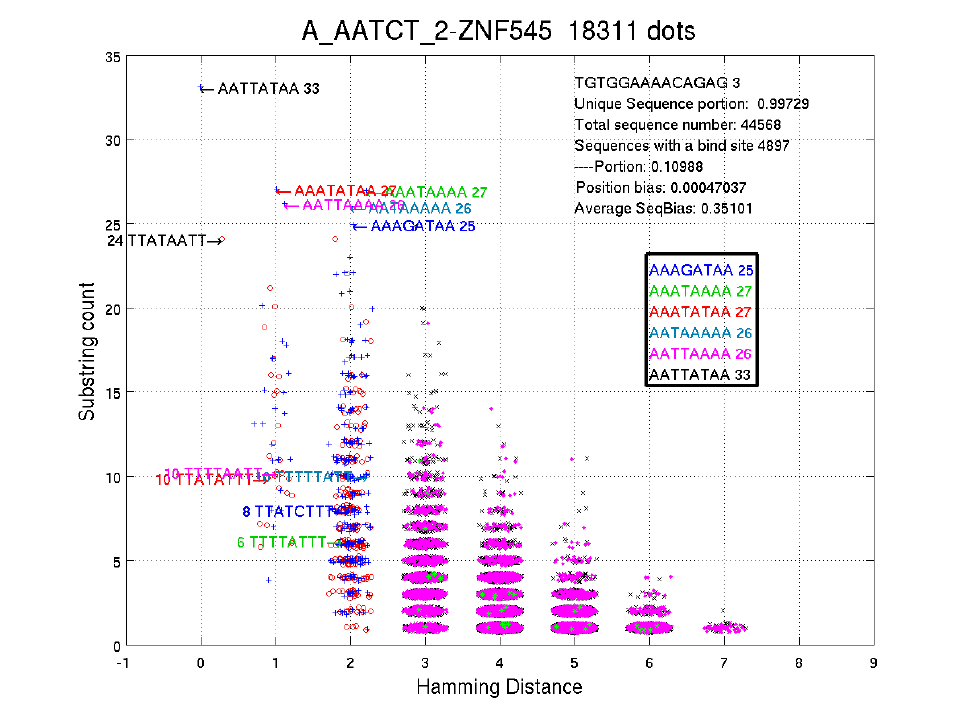
The title shows the fullbarcode-name of the TF, and the total number of dots in this figure.
Each dot in the figure is a 8-width 'binding site', i.e. with the least Hamming distance to the
consensus sequence among all 8-width substrings of a 14-width sequence. The X value of a
dot is the Hamming distance to the consensus sequence; the Y value of the dot is its count in
the input sequence file. Note that some variations have been added to the dots for better
visualization.
As in the figure, the sequences with Hamming distance 0 should be the consensus
sequences, one of which is the reverse complementary sequence of the other.
The text on the up-right corner shows the 14-width sequence with the highest count,
followed by the portion of unique 14-width sequences. There are 44,568 sequences (14bp) in
the input file, 4897 of which contain a binding site. The position bias shows the bias for
location of the 8-width binding sites on the 14-width sequences. The 'Average SeqBias'
shows the average sequencing bias (See section 3.5).
3.4 BindSitePosDis & PosDis_Figure
The .dis files under BindSitePosDis directory contains other information besides data for
drawing .png files under PosDis_Figure.
The .dis file structure
The first row is the l-width sequence with the highest count in the input sequencing file.
The second row is the count of the highest l-width sequence
The third row is the proportion of unique sequences in the input sequencing file
The fourth row is the total number of l-width sequences in the input sequencing file
The fifth row shows binding site position distribution on the original sequences
The sixth row shows binding site position distribution on the reverse complements
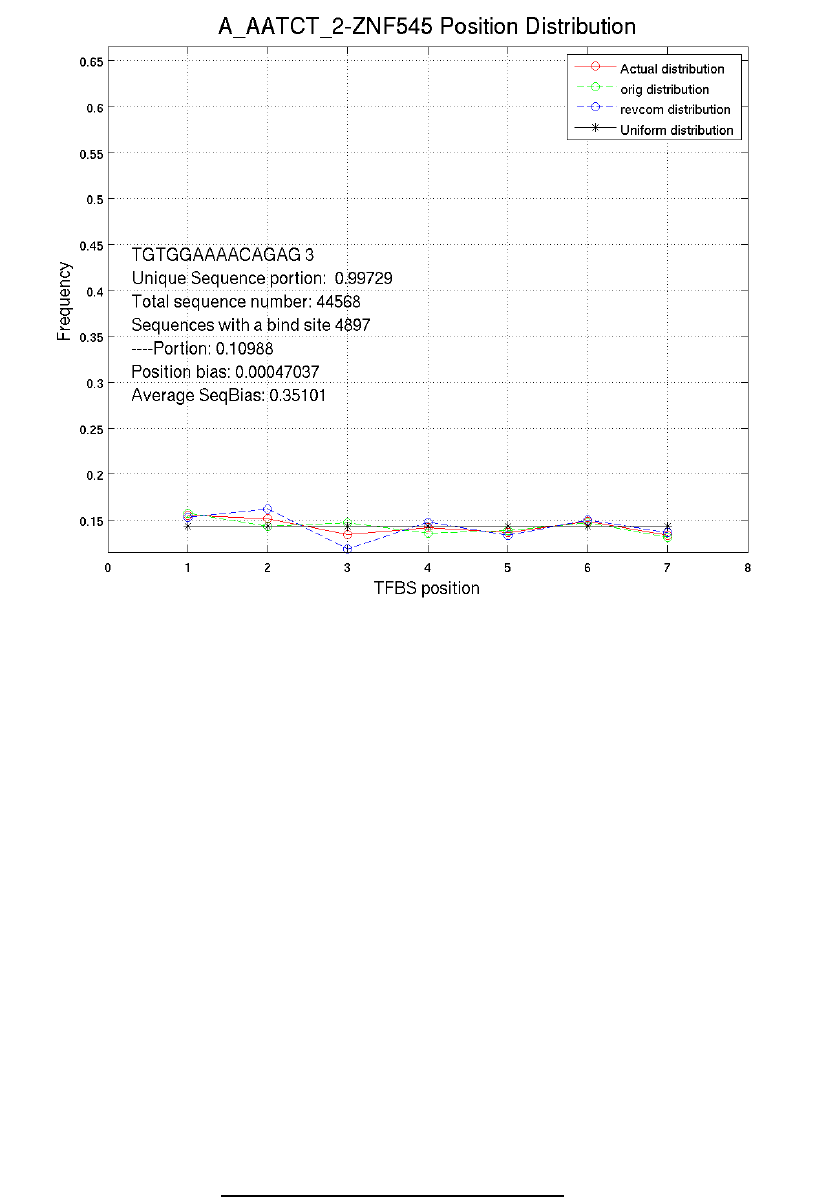
Explanation to position distribution figures
The green line shows binding site position distribution on original sequences; the blue line
shows binding site position distribution on reverse complements; the red line shows position
distribution of both strands; the black line shows uniform distribution.
Note that the positions are defined according to the positions on original sequences, i.e. if
the reverse complement of a w-width substring is thought to be a binding site, the position of
this w-width substring on its l-width substring will be recorded.
All distributions have been normalized to 0~1
3.5 SeqBias
The .bias files under SeqBias provides information of the sequencing bias.
Since DNA is double stranded, we have equal chance to sequence both strands. This are supposed to
show in our data. But in real case, the numbers of both strands differ a lot from each other. We use
seqbias to indicate the difference.
Here we denote all w-width substrings as A, and the count of a random substring s in A as Count[s].
The following formula calculates the average sequencing bias.
seqbias=
∑
s∈A
∣
Count [s]−Count [RevCom s]
∣
∑
t∈A
∣
Count [t]Count [RevComt]
∣
(Formula 5-1)
The numerator of Formula 5-1 represents the sum of sequencing difference between each sequence
and its reverse complementary sequence. The denominator normalizes the sequencing bias to [0, 1].
If both strands are equally sequenced in the data, the value of the formula is 0. If only one strand is
sequenced, the value of this formula is 1. By experience, if the sequencing bias exceeds 0.3, we
think there exists large sequencing bias in the data and thus needs further investigation.
Structure of .bias file
The first row is fullbarcode and TF name
The following rows show counts of each w-width substrings and its reverse complement in
the input sequencing files
Note that w-width substrings with count smaller than 5 or 1/10 of the expected number of a
random w-width substring will not be recorded.
3.6 log.txt
The log.txt reports which sequences are ignored by IniMotif, and how many binding sites have been
extracted.
4 Technical specifics
This section introduces the specifics of the IniMotif software.
4.1 Full barcode structure
The fullbarcode looks like: 0_ACGTC_0, A_ACGTC_3
The first part shows the sequencing batch, the central part is the barcode, and the last part is the
selex cycle.
Here we use the regular expression to represent the full barcode: [0A-Z][A-Z]*_[A-Z]+_[0-9]+
4.2 Hierarchy of Input and output
The following figure shows the hierarchy of input and output.
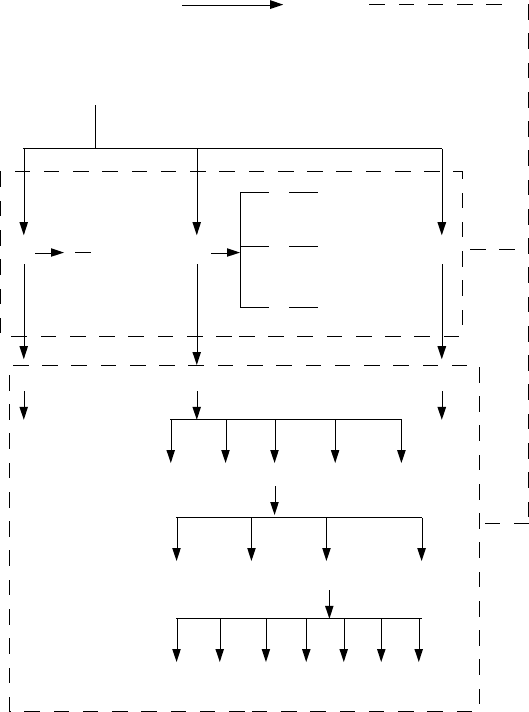
We assume all sequences files are placed in one folder. Then the sequences files are separated to
different subfolders according to their batches and cycles, as shown in the 'sourcedata' folder. For
the unseparated folder, we can apply the '-uniform' mode of IniMotif; for the separated 'sourcedata'
folder, we may apply '-allbatches' mode; for each batch folder such as 'A', we may apply '-batch'
mode; for each cycle folder under a batch folder, such as '2' under 'A', we need to apply '-cycle'
mode.
The output of IniMotif is organized the same way as the input. The top level are the batch folders,
then there are cycle folders under the batch folders, under the cycle folders, the data are organized
as different widths. For the contents in the width directories, please refer to Section 3.
4.3 Organization of the background distribution file
The background distribution file tells the frequencies of 'A', 'C', 'G', 'T' in the initial SELEX pool. It
should be one line file which consists of 4 numbers between 0 and 1, whose summation should be
1. The numbers are tab separated.
0_ACGTC_0.txt
0_AAAAT_0.txt
.............
A_ACTGT_1.txt
A_CCCCT_3.txt
.............
B_CCTGT_2.txt
B_TTTAT_3.txt
.............
Original sequence files
(INPUT, -uniform mode)
0AB
Sourcedata
(-allbatches
mode)
0_ACGTC_0
0_ATTTC_0
0_CCCCC_0
.............
A_ACGTC_2
A_ATTTC_2
A_CCCCC_2
.........
1 2 3 HTML TrendFig
.......... ........
WIDTH6 WIDTH7 WIDTH8 WIDTH9
logo motif .............
(cycle dirs)
IniMotifOutput
0
A
B
(batch dirs)
0
1
2
3
A_ACTGT_1
.........
A_ACTGT_3
.........
IniMotif
OUTPUT
(-cycle mode)
(-batch mode)
4.4 Organization of the Barcode-TfName.txt file
This file constructs the mapping from fullbarcode to TF names.
This file contains two columns. The first column should contain the fullbarcode, the second column
are their corresponding TF names. The columns are tab separated.
4.5 Organization of the Well_Plate_Barcode.txt file
This file constructs the mapping from barcode to Plate, well of SELEX experiments. Note that we
use barcode here, which is the central part of the full barcode.
This file contains three columns. The first column shows the well of a SELEX experiment; the
second column is the plate; the third column is the barcode.
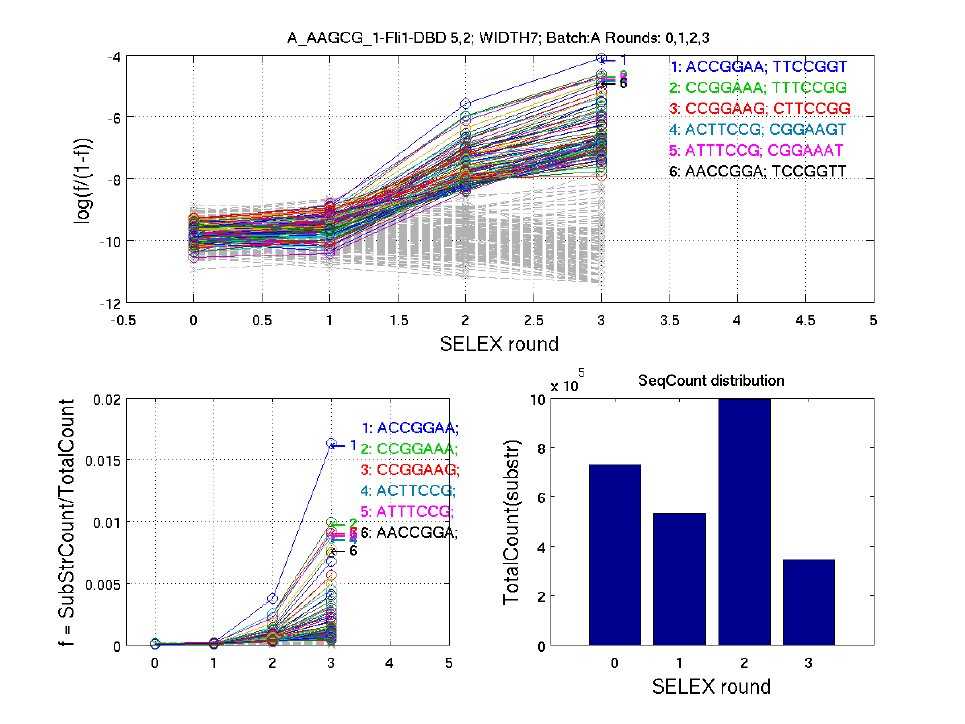
5 TrendFig
This section gives a simple introduction to the substring trend changing figures.
We count all the 7-width substrings (overlapping) of the original sequences. Identical repetitive
9-width substrings within one 14-width sequences are excluded. Then the substring counts are
normalized to the total substring count. The portion of each 9-width substring is represented as f =
SubStrCount/TotalCount, as shown in the lower left part of the figure. For better illustration, we
also plot the relative portion of each 9-width substring, as shown in the upper part of the figure.
Each line in the above figure represents a substring. Top 100 substrings (in different colors) with the
highest average counts over all selex rounds, and 200 substrings (grey dashed line) randomly
selected from all substrings are shown in the figure above.
The title includes TF names, barcode, width, and cycles used to construct this figure.
The bar shows the total count of substrings in each round.
To produce the trend figure, the substring distribution of the initial pool (cycle 0) needs to be
specified.
