J Link / Trace User Guide Link, Manual Web
User Manual:
Open the PDF directly: View PDF ![]() .
.
Page Count: 367 [warning: Documents this large are best viewed by clicking the View PDF Link!]
- About this document
- Table of contents
- Introduction
- Licensing
- J-Link software and documentation package
- Software overview
- J-Link Commander (Command line tool)
- J-Link GDB Server
- J-Link GDB Server CL (Windows, Linux, Mac)
- Debugging with J-Link GDB Server
- Supported remote (monitor) commands
- clrbp
- cp15
- device
- DisableChecks
- EnableChecks
- flash breakpoints
- getargs
- go
- halt
- interface
- jtagconf
- memU8
- memU16
- memU32
- reg
- regs
- reset
- semihosting breakOnError
- semihosting enable
- semihosting IOClient
- semihosting ARMSWI
- semihosting ThumbSWI
- setargs
- setbp
- sleep
- speed
- step
- SWO DisableTarget
- SWO EnableTarget
- SWO GetMaxSpeed
- SWO GetSpeedInfo
- waithalt
- wice
- SEGGER-specific GDB protocol extensions
- Command line options
- Program termination
- Semihosting
- J-Link Remote Server
- J-Mem Memory Viewer
- J-Flash
- J-Link RTT Viewer
- J-Link SWO Viewer
- SWO Analyzer
- JTAGLoad (Command line tool)
- J-Link RDI (Remote Debug Interface)
- Processor specific tools
- J-Link Software Developer Kit (SDK)
- Setup
- Working with J-Link and J-Trace
- Supported IDEs
- Connecting the target system
- Indicators
- JTAG interface
- SWD interface
- Multi-core debugging
- Connecting multiple J-Links / J-Traces to your PC
- J-Link control panel
- Reset strategies
- Strategies for ARM 7/9 devices
- Type 0: Hardware, halt after reset (normal)
- Type 1: Hardware, halt with BP@0
- Type 2: Software, for Analog Devices ADuC7xxx MCUs
- Type 3: No reset
- Type 4: Hardware, halt with WP
- Type 5: Hardware, halt with DBGRQ
- Type 6: Software
- Type 7: Reserved
- Type 8: Software, for ATMEL AT91SAM7 MCUs
- Type 9: Hardware, for NXP LPC MCUs
- Strategies for Cortex-M devices
- Type 0: Normal
- Type 1: Core
- Type 2: ResetPin
- Type 3: Connect under Reset
- Type 4: Reset core & peripherals, halt after bootloader
- Type 5: Reset core & peripherals, halt before bootloader
- Type 6: Reset for Freescale Kinetis devices
- Type 7: Reset for Analog Devices CPUs (ADI Halt after kernel)
- Type 8: Reset core and peripherals
- Type 9: Reset for LPC1200 devices
- Type 10: Reset for Samsung S3FN60D devices
- Strategies for ARM 7/9 devices
- Using DCC for memory access
- The J-Link settings file
- J-Link script files
- Actions that can be customized
- Script file API functions
- JLINK_CORESIGHT_AddAP()
- JLINK_CORESIGHT_Configure()
- JLINK_CORESIGHT_ReadAP()
- JLINK_CORESIGHT_ReadDP()
- JLINK_CORESIGHT_WriteAP()
- JLINK_CORESIGHT_WriteDP()
- JLINK_CORESIGHT_WriteDAP()
- JLINK_ExecCommand()
- JLINK_JTAG_GetDeviceId()
- JLINK_JTAG_GetU32()
- JLINK_JTAG_Reset()
- JLINK_JTAG_SetDeviceId()
- JLINK_JTAG_Store()
- JLINK_JTAG_StoreClocks()
- JLINK_JTAG_StoreDR()
- JLINK_JTAG_StoreIR()
- JLINK_JTAG_Write()
- JLINK_JTAG_WriteClocks()
- JLINK_JTAG_WriteDR()
- JLINK_JTAG_WriteDRCont()
- JLINK_JTAG_WriteDREnd()
- JLINK_JTAG_WriteIR()
- JLINK_MemRegion()
- JLINK_MEM_WriteU8()
- JLINK_MEM_WriteU16()
- JLINK_MEM_WriteU32()
- JLINK_MEM_ReadU8()
- JLINK_MEM_ReadU16()
- JLINK_MEM_ReadU32()
- JLINK_SYS_MessageBox()
- JLINK_SYS_MessageBox1()
- JLINK_SYS_Report()
- JLINK_SYS_Report1()
- JLINK_SYS_Sleep()
- JLINK_SYS_UnsecureDialog()
- Global DLL variables
- Global DLL constants
- Script file language
- Script file writing example
- Executing J-Link script files
- Command strings
- List of available commands
- AppendToLogFile
- CORESIGHT_SetIndexAHBAPToUse
- CORESIGHT_SetIndexAPBAPToUse
- device
- DisableAutoUpdateFW
- DisableCortexMXPSRAutoCorrectTBit
- DisableFlashBPs
- DisableFlashDL
- DisableInfoWinFlashBPs
- DisableInfoWinFlashDL
- DisableMOEHandling
- DisablePowerSupplyOnClose
- EnableAutoUpdateFW
- EnableEraseAllFlashBanks
- EnableFlashBPs
- EnableFlashDL
- EnableInfoWinFlashBPs
- EnableInfoWinFlashDL
- EnableMOEHandling
- EnableRemarks
- ExcludeFlashCacheRange
- Hide device selection
- HSSLogFile
- InvalidateCache
- InvalidateFW
- map exclude
- map illegal
- map indirectread
- map ram
- map region
- map reset
- ProjectFile
- ReadIntoTraceCache
- ScriptFile
- SelectTraceSource
- SetAllowFlashCache
- SetAllowSimulation
- SetBatchMode
- SetCFIFlash
- SetCheckModeAfterRead
- SetCompareMode
- SetCPUConnectIDCODE
- SetDbgPowerDownOnClose
- SetETBIsPresent
- SetETMIsPresent
- SetFlashDLNoRMWThreshold
- SetFlashDLThreshold
- SetIgnoreReadMemErrors
- SetIgnoreWriteMemErrors
- SetMonModeDebug
- TraceSampleAdjust
- SetResetPulseLen
- SetResetType
- SetRestartOnClose
- SetRTTAddr
- SetRTTTelnetPort
- SetRTTSearchRanges
- SetRXIDCode
- SetSkipProgOnCRCMatch
- SetSysPowerDownOnIdle
- SetVerifyDownload
- SetWorkRAM
- ShowControlPanel
- SilentUpdateFW
- SupplyPower
- SupplyPowerDefault
- SuppressControlPanel
- SuppressInfoUpdateFW
- SWOSetConversionMode
- Using command strings
- List of available commands
- Switching off CPU clock during debug
- Cache handling
- Virtual COM Port (VCOM)
- Flash download
- Flash breakpoints
- Monitor Mode Debugging
- Low Power Debugging
- Open Flashloader
- J-Flash SPI
- RDI
- RTT
- Trace
- Target interfaces and adapters
- Background information
- Designing the target board for trace
- Semihosting
- Introduction
- Debugger support
- Implementation
- Communication protocol
- Register R0
- Command SYS_OPEN (0x01)
- Command SYS_CLOSE (0x02)
- Command SYS_WRITEC (0x03)
- Command SYS_WRITE0 (0x04)
- Command SYS_WRITE (0x05)
- Command SYS_READ (0x06)
- Command SYS_READC (0x07)
- Command SYS_ISTTY (0x09)
- Command SYS_SEEK (0x0A)
- Command SYS_FLEN (0x0C)
- Command SYS_REMOVE (0x0E)
- Command SYS_RENAME (0x0F)
- Command SYS_GET_CMDLINE (0x15)
- Command SYS_EXIT (0x18)
- Enabling semihosting in J-Link GDBServer
- Enabling Semihosting in J-Link RDI + AXD
- Support and FAQs

2
Disclaimer
Specifications written in this document are believed to be accurate, but are not guaranteed to
be entirely free of error. The information in this manual is subject to change for functional or
performance improvements without notice. Please make sure your manual is the latest edition.
While the information herein is assumed to be accurate, SEGGER Microcontroller GmbH & Co.
KG (SEGGER) assumes no responsibility for any errors or omissions. SEGGER makes and you
receive no warranties or conditions, express, implied, statutory or in any communication with you.
SEGGER specifically disclaims any implied warranty of merchantability or fitness for a particular
purpose.
Copyright notice
You may not extract portions of this manual or modify the PDF file in any way without the prior
written permission of SEGGER. The software described in this document is furnished under a
license and may only be used or copied in accordance with the terms of such a license.
© 2004-2017 SEGGER Microcontroller GmbH & Co. KG, Hilden / Germany
Trademarks
Names mentioned in this manual may be trademarks of their respective companies.
Brand and product names are trademarks or registered trademarks of their respective holders.
Contact address
SEGGER Microcontroller GmbH & Co. KG
In den Weiden 11
D-40721 Hilden
Germany
Tel. +49 2103-2878-0
Fax. +49 2103-2878-28
E-mail: support@segger.com
Internet: www.segger.com
J-Link / J-Trace (UM08001) © 2004-2017 SEGGER Microcontroller GmbH & Co. KG

3
Manual versions
This manual describes the current software version. If you find an error in the manual or a
problem in the software, please report it to us and we will try to assist you as soon as possible.
Contact us for further information on topics or functions that are not yet documented.
Print date: June 21, 2017
Manual
version Revision Date By Description
6.14 6 170407 NV
Chapter “Working with J-Link and J-Trace”
* Section “J-Link scriptfiles”: Updated
“ JLINK_ExecCommand()” description
6.14 5 170320 EL Chapter “J-Flash SPI”
Updated screenshots
6.14 4 170317 NV
Chapter “Working with J-Link and J-Trace”
* Section “J-Link scriptfiles”:
Added: “ JLINK_ExecCommand()”
Section “Keil MDK-ARM” added for Command string execution
6.14 3 170220 NV
Chapter “Working with J-Link and J-Trace”
* Section “J-Link scriptfiles”:
Added: “OnTraceStart()” and “ JLINK_TRACE_Portwidth”
Chapter “Trace”
* Added crossreference to “JLINK_TRACE_Portwidth”
6.14 2 170216 NV
Chapter “Introduction”
*Added Subsubsection “Software and Hardware
Features Overview” to all device Subsections.
*Edited Subsection “”J-Trace ARM.
*Section “Target interfaces and adapters”:
edited “RESET” to “nRESET” and updated description.
6.14 1 170210 NV
Chapter “Working with J-Link and J-Trace”
* Section “Exec Commands”: Updated
SetResetPulseLen
TraceSampleAdjust
Chapter “Trace”
* Section “Tracing via trace pins”: Updated
6.14 0 170201 AG
Chapter “Working with J-Link”
* Section “Exec Commands”: Updated
SelectTraceSource
SetRAWTRACEPinDelay
ReadIntoTraceCache
Chapter “Trace” added.
6.10a 0 160820 EL Chapter “Working With J-Link”
* Section “Exec Commands”: Updated ExcludeFlashCacheRanges.
6.00i 0 160802 EL
Chapter “Introduction”
* Removed “Model Feature Lists”
Chapter “Adding Support for New Devices”:
renamed to “Open Flash Loader”
Chapter “Open Flash Loader” updated.
6.00 1 160617 EL Chapter “J-Flash SPI”
* Added chapter “Custom Command Sequences”
6.00 0 160519 AG Chapter “Adding Support for New Devices” added.
5.12f 0 160503 AB Chapter “Related Software”
* Section “J-Link RTT Viewer” updated and moved from section “RTT”.
5.12d 1 160427 AG Chapter “Working with J-Link and J-Trace”
* Section “J-Link script files” updated.
5.12d 0 160425 AG Chapter “Working with J-Link and J-Trace”
* Section “J-Link script files” updated.
5.12c 0 160413 NG
Chapter “Related Software”
* Section “J-Link Commander”
Typo fixed.
5.12c 1 160418 NG
Chapter “Related Software”
* Section “J-Link Commander”
Commands and commandline options added.
Chapter “Working with J-Link and J-Trace”
J-Link / J-Trace (UM08001) © 2004-2017 SEGGER Microcontroller GmbH & Co. KG

4
Manual
version Revision Date By Description
* Section “Command strings”
Command “SetRTTTelnetPort” added.
Chapter “Flash Download”
* Section “Debugging applications that change flash contents at runtime”
added.
5.10u 0 160317 AG Chapter “Monitor Mode Debugging”
* Section “Target application performs reset” added.
5.10t 0 160314 AG
Chapter “Monitor Mode Debugging”
* Section “Enable Monitor Debugging” updated.
* Section “Forwarding of Monitor Interrupts” added.
5.10 3 160309 EL Chapter “J-Flash SPI” updated.
5.10 2 160215 AG Chapter “RTT” updated.
5.10 1 151204 AG Chapter “RDI” updated.
Chapter “Semihosting” added.
5.10 0 151127 NG Chapter “Related Software”
* Section “J-Scope” removed.
5.02m 0 151125 AG
Chapter “Working with J-Link and J-Trace”
* Section “The J-Link settings file” added.
Chapter “Low Power Debugging” added.
5.02l 0 151123 AG Various Chapters
* Some typos corrected.
5.02i 1 151106 RH Chapter “J-Flash SPI”
* Section “Send custom commands” added.
5.02i 0 151105 RH
Chapter “Related Software”
* Section “J-Link Commander”
exec command added.
Chapter “Working with J-Link and J-Trace”
* Section “Command strings”
New commands added.
5.02f 1 151022 NG Chapter “Related Software”
* Section “J-Scope” updated.
5.02f 1 151022 EL Chapter “Target interfaces and adapters”
* Section “Reference voltage (VTref)” added.
5.02f 0 151007 RH Chapter “Working with J-Link and J-Trace”
* Section “J-Link script files” updated.
5.02e 0 151001 AG Chapter “Working with J-Link and J-Trace”
* Section “J-Link script files” updated
5.02c 1 150925 NG
Chapter “Licensing”
* Section “Original SEGGER products” updated.
Chapter “Flash download”
* Section “Setup for various debuggers (CFI flash)” updated.
5.02c 0 150916 RH Chapter “Flash download”
* Section “Setup for various debuggers (SPIFI flash)” added.
5.02c 0 150914 RH
Chapter “Introduction”
* Section “J-Link / J-Trace models” updated.
* Section “Supported OS”
Added Windows 10
5.02a 0 150903 AG Chapter “Monitor Mode Debugging” added.
5.02 0 150820 AG
Chapter “Working with J-Link and J-Trace”
* Section “Command strings”
“DisableCortexMXPSRAutoCorrectTBit” added.
5.02 0 150813 AG Chapter “Monitor Mode Debugging” added.
5.00 1 150728 NG
Chapter “Related Software”
* Section “J-Link Commander”
Sub-Section “Command line options” updated.
5.00 0 150609 AG
Chapter “Flash download”
* Section “QSPI flash support” added.
Chapter “Flash breakpoints”
* Section “Flash Breakpoints in QSPI flash” added
5.00 0 150520 EL Chapter “J-Flash SPI”
J-Link / J-Trace (UM08001) © 2004-2017 SEGGER Microcontroller GmbH & Co. KG

5
Manual
version Revision Date By Description
* Initial version added
4.99b 0 150520 EL
Chapter “Related Software”
* Section “J-Link STM32 Unlock”
Added command line options
4.99a 0 150429 AG Chapter “Target interfaces and Adapters”
Chapter “20-pin J-Link connector”, section “Pinout for SPI” added.
4.98d 0 150427 EL Chapter “Related Software”
* Section “Configure SWO output after device reset” updated.
4.98b 0 150410 AG Chapter “Licensing”
* Section “J-Trace for Cortex-M” updated.
4.98 0 150320 NG
Chapter “Related Software”
* Section “J-Link Commander”
Sub-Section “Commands” added.
Chapter “Working with J-Link and J-Trace”
* Section “J-Link script files” updated
4.96f 0 150204 JL
Chapter “Related Software”
* Section “GDB Server”
Exit code description added.
4.96 0 141219 JL
Chapter “RTT” added.
Chapter “Related Software”
* Section “GDB Server”
Command line option “-strict” added.
Command line option “-timeout” added.
4.90d 0 141112 NG
Chapter “Related Software”
* Section “J-Link Remote Server” updated.
* Section “J-Scope” updated.
4.90c 0 140924 JL Chapter “Related Software”
* Section “JTAGLoad” updated.
4.90b 1 140813 EL
Chapter “Working with J-Link and J-Trace”
* Section “Connecting multiple J-Links / J-Traces to your PC” updated
Chapter “J-Link software”
* Section “J-Link Configurator” updated.
4.90b 0 140813 NG Chapter “Related Software”
* Section “J-Scope” added.
4.86 2 140606 AG Chapter “Device specifics”
* Section “Silicon Labs - EFM32 series devices” added
4.86 1 140527 JL
Chapter “Related Software”
* Section “GDB Server”
Command line options -halt / -nohalt added.
Description for GDB Server CL version added.
4.86 0 140519 AG Chapter “Flash download”
Section “Mentor Sourcery CodeBench” added.
4.84 0 140321 EL
Chapter “Working with J-Link”
* Section “Virtual COM Port (VCOM) improved.
Chapter ”Target interfaces and adapters“
* Section ”Pinout for SWD + Virtual COM Port (VCOM) added.“
4.82 1 140228 EL
Chapter ”Related Software“
* Section ”Command line options“
Extended command line option -speed.
Chapter ”J-Link software and documentation package“
* Section ”J-Link STR91x Commander“
Added command line option parameter to specify a customized
scan-chain.
Chapter ”Working with J-Link“
* Section ”Virtual COM Port (VCOM) added.
Chapter “Setup”
* Section “Getting started with J-Link and DS-5”
4.82 0 140218 JL
Chapter “Related Software”
* Section “GDB Server”
Command line option -notimeout added.
4.80f 0 140204 JL
Chapter “Related Software”
* Section “GDB Server”
Command line options and remote commands added.
J-Link / J-Trace (UM08001) © 2004-2017 SEGGER Microcontroller GmbH & Co. KG

6
Manual
version Revision Date By Description
4.80 1 131219 JL/
NG
Chapter “Related Software”
* Section “GDB Server”
Remote commands and command line options description improved.
Several corrections.
4.80 0 131105 JL
Chapter “Related Software”
* Section “GDB Server”
SEGGER-specific GDB protocol extensions added.
4.76 3 130823 JL
Chapter “Flash Download”
* Replaced references to GDB Server manual.
Chapter “Working with J-Link”
* Replaced references to GDB Server manual.
4.76 2 130821 JL
Chapter “Related Software”
* Section “GDB Server”
Remote commands added.
4.76 1 130819 JL
Chapter “Related Software”
* Section “SWO Viewer”
Sample code updated.
4.76 0 130809 JL
Chapter “Related Software”
* Sections reordered and updated.
Chapter “Setup”
* Section “Using JLinkARM.dll moved here.
4.71b 0 130507 JL
Chapter ”Related Software“
* Section ”SWO Viewer“
Added new command line options.
4.66 0 130221 JL
Chapter ”Introduction“
* Section ”Supported OS“
Added Linux and Mac OSX
4.62b 0 130219 EL
Chapter ”Introduction“
* Section ”J-Link / J-Trace models“
Clock rise and fall times updated.
4.62 0 130129 JL
Chapter ”Introduction“
* Section ”J-Link / J-Trace models“
Sub-section ”J-link ULTRA“ updated.
4.62 0 130124 EL
Chapter ”Target interfaces and adapters“
* Section ”9-pin JTAG/SWD connector“
Pinout description corrected.
4.58 1 121206 AG Chapter ”Introduction“
* Section ”J-Link / J-Trace models“ updated.
4.58 0 121126 JL
Chapter ”Working with J-Link“
* Section ”J-Link script files“
Sub-section ”Executing J-Link script files“ updated.
4.56b 0 121112 JL
Chapter ”Related Software“
* Section ”J-Link SWO Viewer“
Added sub-section ”Configure SWO output after device reset“
4.56a 0 121106 JL
Chapter ”Related Software“
* Section ”J-Link Commander“
Renamed ”Commander script files“ to ”Commander files“ and
”script mode“ to ”batch mode“.
4.56 0 121022 AG Renamed ”J-Link TCP/IP Server“ to ”J-Link Remote Server“
4.54 1 121009 JL Chapter ”Related Software“
* Section ”TCP/IP Server“, subsection ”Tunneling Mode“ added.
4.54 0 120913 EL
Chapter ”Flash Breakpoints“
* Section ”Licensing“ updated.
Chapter ”Device specifics“
* Section ”Freescale“, subsection ”Data flash support“ added.
4.53c 0 120904 EL Chapter ”Licensing“
* Section ”Device-based license“ updated.
4.51h 0 120717 EL
Chapter ”Flash download“
* Section ”J-Link commander“ updated.
Chapter ”Support and FAQs“
* Section ”Frequently asked questions“ updated.
Chapter ”J-Link and J-Trace related software“
J-Link / J-Trace (UM08001) © 2004-2017 SEGGER Microcontroller GmbH & Co. KG

7
Manual
version Revision Date By Description
* Section ”J-Link Commander“ updated.
4.51e 1 120704 EL Chapter ”Working with J-Link“
* Section ”Reset strategies“ updated and corrected. Added reset type 8.
4.51e 0 120704 AG Chapter ”Device specifics“
* Section ”ST“ updated and corrected.
4.51b 0 120611 EL Chapter ”J-Link and J-Trace related software“
* Section ”SWO Viewer“ added.
4.51a 0 120606 EL
Chapter ”Device specifics“
* Section ”ST“, subsection ”ETM init“ for some STM32 devices added.
* Section ”Texas Instruments“ updated.
Chapter ”Target interfaces and adapters“
* Section ”Pinout for SWD“ updated.
4.47a 0 120419 AG Chapter ”Device specifics“
* Section ”Texas Instruments“ updated.
4.46 0 120416 EL Chapter ”Support“ updated.
4.42 0 120214 EL Chapter ”Working with J-Link“
* Section ”J-Link script files“ updated.
4.36 1 110927 EL
Chapter ”Flash download“ added.
Chapter ”Flash breakpoints“ added.
Chapter ”Target interfaces and adapters“
* Section ”20-pin JTAG/SWD connector“ updated.
Chapter ”RDI“ added.
Chapter ”Setup“ updated.
Chapter ”Device specifics“ updated.
4.36 0 110909 AG Chapter ”Working with J-Link“
* Section ”J-Link script files“ updated.
4.26 1 110513 KN Chapter ”Introduction“
* Section ”J-Link / J-Trace models“ corrected.
4.26 0 110427 KN Several corrections.
4.24 1 110228 AG
Chapter ”Introduction“
* Section ”J-Link / J-Trace models“ corrected.
Chapter ”Device specifics“
* Section ”ST Microelectronics“ updated.
4.24 0 110216 AG
Chapter ”Device specifics“
* Section ”Samsung“ added.
Chapter ”Working with J-Link“
* Section ”Reset strategies“ updated.
Chapter ”Target interfaces and adapters“
* Section ”9-pin JTAG/SWD connector“ added.
4.23d 0 110202 AG
Chapter ”J-Link and J-Trace related software“
* Section ”J-Link software and documentation package in detail“ updated.
Chapter ”Introduction“
* Section ”Built-in intelligence for supported CPU-cores“ added.
4.21g 0 101130 AG
Chapter ”Working with J-Link“
* Section ”Reset strategies“ updated.
Chapter ”Device specifics“
* Section ”Freescale“ updated.
Chapter ”Flash download and flash breakpoints
* Section “Supported devices” updated
* Section “Setup for different debuggers (CFI flash)” updated.
4.21 0 101025 AG Chapter “Device specifics”
* Section “Freescale” updated.
4.20j 0 101019 AG Chapter “Working with J-Link”
* Section “Reset strategies” updated.
4.20b 0 100923 AG Chapter “Working with J-Link”
* Section “Reset strategies” updated.
0.00 90 100818 AG
Chapter “Working with J-Link”
* Section “J-Link script files” updated.
* Section “Command strings” updated.
Chapter “Target interfaces and adapters”
* Section “19-pin JTAG/SWD and Trace connector” corrected.
Chapter “Setup”
J-Link / J-Trace (UM08001) © 2004-2017 SEGGER Microcontroller GmbH & Co. KG

8
Manual
version Revision Date By Description
* Section “J-Link Configurator added.”
0.00 89 100630 AG Several corrections.
0.00 88 100622 AG Chapter “J-Link and J-Trace related software”
* Section “SWO Analyzer” added.
0.00 87 100617 AG Several corrections.
0.00 86 100504 AG
Chapter “Introduction”
* Section “J-Link / J-Trace models” updated.
Chapter “Target interfaces and adapters”
* Section “Adapters” updated.
0.00 85 100428 AG Chapter “Introduction”
* Section “J-Link / J-Trace models” updated.
0.00 84 100324 KN
Chapter “Working with J-Link and J-Trace”
* Several corrections
Chapter Flash download & flash breakpoints
* Section “Supported devices” updated
0.00 83 100223 KN Chapter “Introduction”
* Section “J-Link / J-Trace models” updated.
0.00 82 100215 AG Chapter “Working with J-Link”
* Section “J-Link script files” added.
0.00 81 100202 KN
Chapter “Device Specifics”
* Section “Luminary Micro” updated.
Chapter “Flash download and flash breakpoints”
* Section “Supported devices” updated.
0.00 80 100104 KN Chapter “Flash download and flash breakpoints
* Section ”Supported devices“ updated
0.00 79 091201 AG
Chapter ”Working with J-Link and J-Trace“
* Section ”Reset strategies“ updated.
Chapter ”Licensing“
* Section ”J-Link OEM versions“ updated.
0.00 78 091023 AG Chapter ”Licensing“
* Section ”J-Link OEM versions“ updated.
0.00 77 090910 AG Chapter ”Introduction“
* Section ”J-Link / J-Trace models“ updated.
0.00 76 090828 KN
Chapter ”Introduction“
* Section” Specifications“ updated
* Section ”Hardware versions“ updated
* Section ”Common features of the J-Link product family“ updated
Chapter ”Target interfaces and adapters“
* Section ”5 Volt adapter“ updated
0.00 75 090729 AG
Chapter ”Introduction“
* Section ”J-Link / J-Trace models“ updated.
Chapter ”Working with J-Link and J-Trace“
* Section ”SWD interface“ updated.
0.00 74 090722 KN
Chapter ”Introduction“
* Section ”Supported IDEs“ added
* Section ”Supported CPU cores“ updated
* Section ”Model comparison chart“ renamed to
”Model comparison“
* Section ”J-Link bundle comparison chart“ removed
0.00 73 090701 KN
Chapter ”Introduction“
* Section ”J-Link and J-Trace models“ added
* Sections ”Model comparison chart“ &
”J-Link bundle comparison chart“added
Chapter ”J-Link and J-Trace models“ removed
Chapter ”Hardware“ renamed to ”Target interfaces & adapters“
* Section ”JTAG Isolator“ added
Chapter ”Target interfaces and adapters“
* Section ”Target board design“ updated
Several corrections
0.00 72 090618 AG
Chapter ”Working with J-Link“
* Section ”J-Link control panel“ updated.
Chapter ”Flash download and flash breakpoints“
* Section ”Supported devices“ updated.
J-Link / J-Trace (UM08001) © 2004-2017 SEGGER Microcontroller GmbH & Co. KG

9
Manual
version Revision Date By Description
Chapter ”Device specifics“
* Section ”NXP“ updated.
0.00 71 090616 AG Chapter ”Device specifics“
* Section ”NXP“ updated.
0.00 70 090605 AG
Chapter ”Introduction“
* Section ”Common features of the J-Link
product family“ updated.
0.00 69 090515 AG
Chapter ”Working with J-Link“
* Section ”Reset strategies“ updated.
* Section ”Indicators“ updated.
Chapter ”Flash download and flash breakpoints“
* Section ”Supported devices“ updated.
0.00 68 090428 AG
Chapter ”J-Link and J-Trace related software“
* Section ”J-Link STM32 Commander“ added.
Chapter ”Working with J-Link“
* Section ”Reset strategies“ updated.
0.00 67 090402 AG Chapter ”Working with J-Link“
* Section ”Reset strategies“ updated.
0.00 66 090327 AG
Chapter ”Background information“
* Section ”Embedded Trace Macrocell (ETM)“ updated.
Chapter ”J-Link and J-Trace related software“
* Section ”Dedicated flash programming utilities for J-Link“ updated.
0.00 65 090320 AG Several changes in the manual structure.
0.00 64 090313 AG Chapter ”Working with J-Link“
* Section ”Indicators“ added.
0.00 63 090212 AG
Chapter ”Hardware“
* Several corrections.
* Section ”Hardware Versions“ Version 8.0 added.
0.00 62 090211 AG
Chapter ”Working with J-Link and J-Trace“
* Section ”Reset strategies“ updated.
Chapter J-Link and J-Trace related software
* Section ”J-Link STR91x Commander (Command line tool)“ updated.
Chapter ”Device specifics“
* Section ”ST Microelectronics“ updated.
Chapter ”Hardware“ updated.
0.00 61 090120 TQ Chapter ”Working with J-Link“
* Section ”Cortex-M3 specific reset strategies“
0.00 60 090114 AG Chapter ”Working with J-Link“
* Section ”Cortex-M3 specific reset strategies“
0.00 59 090108 KN
Chapter Hardware
* Section ”Target board design for JTAG“ updated.
* Section ”Target board design for SWD“ added.
0.00 58 090105 AG Chapter ”Working with J-Link Pro“
* Section ”Connecting J-Link Pro the first time“ updated.
0.00 57 081222 AG
Chapter ”Working with J-Link Pro“
* Section ”Introduction“ updated.
* Section ”Configuring J-Link Pro via web interface“ updated.
Chapter ”Introduction“
* Section ”J-Link Pro overview“ updated.
0.00 56 081219 AG
Chapter ”Working with J-Link Pro“
* Section ”FAQs“ added.
Chapter ”Support and FAQs“
* Section ”Frequently Asked Questions“ updated.
0.00 55 081218 AG Chapter ”Hardware“ updated.
0.00 54 081217 AG Chapter ”Working with J-Link and J-Trace“
* Section ”Command strings“ updated.
0.00 53 081216 AG Chapter ”Working with J-Link Pro“ updated.
0.00 52 081212 AG
Chapter ”Working with J-Link Pro“ added.
Chapter ”Licensing“
* Section ”Original SEGGER products“ updated.
0.00 51 081202 KN Several corrections.
J-Link / J-Trace (UM08001) © 2004-2017 SEGGER Microcontroller GmbH & Co. KG

10
Manual
version Revision Date By Description
0.00 50 081030 AG Chapter ”Flash download and flash breakpoints“
* Section ”Supported devices“ corrected.
0.00 49 081029 AG Several corrections.
0.00 48 080916 AG
Chapter ”Working with J-Link and J-Trace“
* Section ”Connecting multiple J-Links /
J-Traces to your PC“ updated.
0.00 47 080910 AG Chapter ”Licensing“ updated.
0.00 46 080904 AG
Chapter ”Licensing“ added.
Chapter ”Hardware“
Section ”J-Link OEM versions“ moved to chapter ”Licensing“
0.00 45 080902 AG
Chapter ”Hardware“
Section ”JTAG+Trace connector“ JTAG+Trace
connector pinout corrected.
Section ”J-Link OEM versions“ updated.
0.00 44 080827 AG Chapter ”J-Link control panel“ moved to chapter ”Working with J-Link“.
Several corrections.
0.00 43 080826 AG Chapter ”Flash download and flash breakpoints“
Section ”Supported devices“ updated.
0.00 42 080820 AG Chapter ”Flash download and flash breakpoints“
Section ”Supported devices“ updated.
0.00 41 080811 AG
Chapter ”Flash download and flash breakpoints“ updated.
Chapter ”Flash download and flash breakpoints“,
section ”Supported devices“ updated.
0.00 40 080630 AG
Chapter ”Flash download and flash breakpoints“ updated.
Chapter ”J-Link status window“ renamed to ”J-Link control panel“
Various corrections.
0.00 39 080627 AG
Chapter ”Flash download and flash breakpoints“
Section ”Licensing“ updated.
Section ”Using flash download and flash
breakpoints with different debuggers“ updated.
Chapter ”J-Link status window“ added.
0.00 38 080618 AG
Chapter ”Support and FAQs“
Section ”Frequently Asked Questions“ updated
Chapter ”Reset strategies“
Section ”Cortex-M3 specific reset strategies“ updated.
0.00 37 080617 AG Chapter ”Reset strategies“
Section ”Cortex-M3 specific reset strategies“ updated.
0.00 36 080530 AG
Chapter ”Hardware“
Section ”Differences between different versions“ updated.
Chapter ”Working with J-Link and J-Trace“
Section ”Cortex-M3 specific reset strategies“ added.
0.00 35 080215 AG Chapter ”J-Link and J-Trace related software“
Section ”J-Link software and documentation package in detail“ updated.
0.00 34 080212 AG
Chapter ”J-Link and J-Trace related software“
Section ”J-Link TCP/IP Server (Remote J-Link / J-Trace use)“ updated.
Chapter ”Working with J-Link and J-Trace“
Section ”Command strings“ updated.
Chapter ”Flash download and flash breakpoints“
Section ”Introduction“ updated.
Section ”Licensing“ updated.
Section ”Using flash download and flash breakpoints with
different debuggers“ updated.
0.00 33 080207 AG
Chapter ”Flash download and flash breakpoints“ added
Chapter ”Device specifics:“
Section ”ATMEL - AT91SAM7 - Recommended init sequence“ added.
0.00 32 080129 SK Chapter ”Device specifics“:
Section ”NXP - LPC - Fast GPIO bug“ list of device enhanced.
0.00 31 080103 SK Chapter ”Device specifics“:
Section ”NXP - LPC - Fast GPIO bug“ updated.
0.00 30 071211 AG
Chapter ”Device specifics“:
Section ”Analog Devices“ updated.
Section ”ATMEL“ updated.
J-Link / J-Trace (UM08001) © 2004-2017 SEGGER Microcontroller GmbH & Co. KG

11
Manual
version Revision Date By Description
Section ”Freescale“ added.
Section ”Luminary Micro“ added.
Section ”NXP“ updated.
Section ”OKI“ added.
Section ”ST Microelectronics“ updated.
Section ”Texas Instruments“ updated.
Chapter ”Related software“:
Section ”J-Link STR91x Commander“ updated
0.00 29 070912 SK Chapter ”Hardware“, section ”Target board design“ updated.
0.00 28 070912 SK
Chapter ”Related software“:
Section ”J-LinkSTR91x Commander“ added.
Chapter ”Device specifics“:
Section ”ST Microelectronics“ added.
Section ”Texas Instruments“ added.
Subsection ”AT91SAM9“ added.
0.00 28 070912 AG Chapter ”Working with J-Link/J-Trace“:
Section ”Command strings“ updated.
0.00 27 070827 TQ Chapter ”Working with J-Link/J-Trace“:
Section ”Command strings“ updated.
0.00 26 070710 SK
Chapter ”Introduction“:
Section ”Features of J-Link“ updated.
Chapter ”Background Information“:
Section ”Embedded Trace Macrocell“ added.
Section ”Embedded Trace Buffer“ added.
0.00 25 070516 SK
Chapter ”Working with J-Link/J-Trace“:
Section ”Reset strategies in detail“
- ”Software, for Analog Devices ADuC7xxx MCUs“ updated
- ”Software, for ATMEL AT91SAM7 MCUs“ added.
Chapter ”Device specifics“
Section ”Analog Devices“ added.
Section ”ATMEL“ added.
0.00 24 070323 SK
Chapter ”Setup“:
”Uninstalling the J-Link driver“ updated.
”Supported ARM cores“ updated.
0.00 23 070320 SK Chapter ”Hardware“:
”Using the JTAG connector with SWD“ updated.
0.00 22 070316 SK Chapter ”Hardware“:
”Using the JTAG connector with SWD“ added.
0.00 21 070312 SK Chapter ”Hardware“:
”Differences between different versions“ supplemented.
0.00 20 070307 SK Chapter ”J-Link / J-Trace related software“:
”J-Link GDB Server“ licensing updated.
0.00 19 070226 SK
Chapter ”J-Link / J-Trace related software“ updated and reorganized.
Chapter ”Hardware“
”List of OEM products“ updated
0.00 18 070221 SK Chapter ”Device specifics“ added
Subchapter ”Command strings“ added
0.00 17 070131 SK
Chapter ”Hardware“:
”Version 5.3“: Current limits added
”Version 5.4“ added
Chapter ”Setup“:
”Installating the J-Link USB driver“ removed.
”Installing the J-Link software and documentation pack“ added.
Subchapter ”List of OEM products“ updated.
”OS support“ updated
0.00 16 061222 SK Chapter ”Preface“: ”Company description“ added.
J-Link picture changed.
0.00 15 060914 OO
Subchapter 1.5.1: Added target supply voltage and target supply current
to specifications.
Subchapter 5.2.1: Pictures of ways to connect J-Trace.
0.00 14 060818 TQ Subchapter 4.7 ”Using DCC for memory reads“ added.
0.00 13 060711 OO Subchapter 5.2.2: Corrected JTAG+Trace connector pinout table.
J-Link / J-Trace (UM08001) © 2004-2017 SEGGER Microcontroller GmbH & Co. KG

12
Manual
version Revision Date By Description
0.00 12 060628 OO Subchapter 4.1: Added ARM966E-S to List of supported ARM cores.
0.00 11 060607 SK Subchapter 5.5.2.2 changed.
Subchapter 5.5.2.3 added.
0.00 10 060526 SK
ARM9 download speed updated.
Subchapter 8.2.1: Screenshot ”Start sequence“ updated.
Subchapter 8.2.2 ”ID sequence“ removed.
Chapter ”Support“ and ”FAQ“ merged.
Various improvements
0.00 9 060324 OO
Chapter ”Literature and references“ added.
Chapter ”Hardware“:
Added common information trace signals.
Added timing diagram for trace.
Chapter ”Designing the target board for trace“ added.
0.00 8 060117 OO Chapter ”Related Software“: Added JLinkARM.dll.
Screenshots updated.
0.00 7 051208 OO Chapter Working with J-Link: Sketch added.
0.00 6 051118 OO
Chapter Working with J-Link: ”Connecting multiple J-Links to your PC“
added.
Chapter Working with J-Link: ”Multi core debugging“ added.
Chapter Background information: ”J-Link firmware“ added.
0.00 5 051103 TQ Chapter Setup: ”JTAG Speed“ added.
0.00 4 051025 OO
Chapter Background information: ”Flash programming“ added.
Chapter Setup: ”Scan chain configuration“ added.
Some smaller changes.
0.00 3 051021 TQ Performance values updated.
0.00 2 051011 TQ Chapter ”Working with J-Link“ added.
0.00 1 050818 TW Initial Version
J-Link / J-Trace (UM08001) © 2004-2017 SEGGER Microcontroller GmbH & Co. KG

13
About this document
Assumptions
This document assumes that you already have a solid knowledge of the following:
• The software tools used for building your application (assembler, linker, C compiler).
• The C programming language.
• The target processor.
• DOS command line.
If you feel that your knowledge of C is not sufficient, we recommend The C Programming Lan-
guage by Kernighan and Richie (ISBN 0–13–1103628), which describes the standard in C pro-
gramming and, in newer editions, also covers the ANSI C standard.
How to use this manual
This manual explains all the functions and macros that the product offers. It assumes you have
a working knowledge of the C language. Knowledge of assembly programming is not required.
Typographic conventions for syntax
This manual uses the following typographic conventions:
Style Used for
Body Body text.
Keyword Text that you enter at the command prompt or that appears on
the display (that is system functions, file- or pathnames).
Parameter Parameters in API functions.
Sample Sample code in program examples.
Sample comment Comments in program examples.
Reference Reference to chapters, sections, tables and figures or other doc-
uments.
GUIElement Buttons, dialog boxes, menu names, menu commands.
Emphasis Very important sections.
J-Link / J-Trace (UM08001) © 2004-2017 SEGGER Microcontroller GmbH & Co. KG
14
J-Link / J-Trace (UM08001) © 2004-2017 SEGGER Microcontroller GmbH & Co. KG

15
Table of contents
1 Introduction ..................................................................................................................22
1.1 Requirements .............................................................................................. 23
1.2 Supported OS ..............................................................................................24
1.3 Common features of the J-Link product family .................................................25
1.4 Supported CPU cores ....................................................................................26
1.5 Built-in intelligence for supported CPU-cores ....................................................27
1.5.1 Intelligence in the J-Link firmware ...................................................... 27
1.5.2 Intelligence on the PC-side (DLL) ........................................................27
1.5.3 Firmware intelligence per model ..........................................................28
1.6 Where to find further information ...................................................................29
1.6.1 SEGGER debug probes .......................................................................29
1.6.2 Using a feature in a specific development environment .......................... 29
2 Licensing ..................................................................................................................... 30
2.1 Components requiring a license ..................................................................... 31
2.2 Legal use of SEGGER J-Link software ............................................................. 32
2.2.1 Use of the software with 3rd party tools .............................................. 32
2.3 Illegal Clones ...............................................................................................33
3 J-Link software and documentation package ............................................................. 34
3.1 Software overview ........................................................................................35
3.2 J-Link Commander (Command line tool) ......................................................... 36
3.2.1 Commands ....................................................................................... 36
3.2.2 Command line options ....................................................................... 52
3.2.3 Using command files ......................................................................... 55
3.3 J-Link GDB Server ........................................................................................56
3.3.1 J-Link GDB Server CL (Windows, Linux, Mac) ........................................56
3.3.2 Debugging with J-Link GDB Server ......................................................56
3.3.3 Supported remote (monitor) commands ...............................................60
3.3.4 SEGGER-specific GDB protocol extensions ............................................ 72
3.3.5 Command line options ....................................................................... 76
3.3.6 Program termination ..........................................................................87
3.3.7 Semihosting ..................................................................................... 88
3.4 J-Link Remote Server ................................................................................... 89
3.4.1 List of available commands ................................................................ 89
3.4.2 Tunneling mode ................................................................................ 89
3.5 J-Mem Memory Viewer ................................................................................. 93
3.6 J-Flash ........................................................................................................94
3.7 J-Link RTT Viewer ........................................................................................ 95
J-Link / J-Trace (UM08001) © 2004-2017 SEGGER Microcontroller GmbH & Co. KG
16
3.7.1 RTT Viewer Startup ........................................................................... 95
3.7.2 Connection Settings ...........................................................................96
3.7.3 The Terminal Tabs ............................................................................. 96
3.7.4 Sending Input ...................................................................................97
3.7.5 Logging Terminal output .................................................................... 97
3.7.6 Logging Data ....................................................................................97
3.7.7 Command line options ....................................................................... 98
3.7.8 Menus and Shortcuts ....................................................................... 100
3.7.9 Using "virtual" Terminals in RTT ........................................................ 101
3.7.10 Using Text Control Codes ................................................................101
3.8 J-Link SWO Viewer ..................................................................................... 103
3.8.1 Usage ............................................................................................ 104
3.8.2 List of available command line options ............................................... 104
3.8.3 Configure SWO output after device reset ............................................106
3.8.4 Target example code for terminal output ............................................ 107
3.9 SWO Analyzer ............................................................................................109
3.10 JTAGLoad (Command line tool) .................................................................. 110
3.11 J-Link RDI (Remote Debug Interface) ..........................................................111
3.11.1 Flash download and flash breakpoints .............................................. 111
3.12 Processor specific tools ..............................................................................112
3.12.1 J-Link STR91x Commander (Command line tool) ................................112
3.12.2 J-Link STM32 Unlock (Command line tool) ........................................ 115
3.13 J-Link Software Developer Kit (SDK) ...........................................................118
4 Setup .........................................................................................................................119
4.1 Installing the J-Link software and documentation pack .................................... 120
4.1.1 Setup procedure ..............................................................................120
4.2 Setting up the USB interface ....................................................................... 121
4.2.1 Verifying correct driver installation .....................................................121
4.2.2 Uninstalling the J-Link USB driver ......................................................122
4.3 Setting up the IP interface .......................................................................... 124
4.3.1 Configuring J-Link using J-Link Configurator ........................................124
4.3.2 Configuring J-Link using the webinterface ...........................................124
4.4 FAQs .........................................................................................................126
4.5 J-Link Configurator ..................................................................................... 127
4.5.1 Configure J-Links using the J-Link Configurator ................................... 127
4.6 J-Link USB identification ..............................................................................129
4.6.1 Connecting to different J-Links connected to the same host PC via USB ... 129
4.7 Using the J-Link DLL ...................................................................................130
4.7.1 What is the JLink DLL? .................................................................... 130
4.7.2 Updating the DLL in third-party programs ...........................................130
4.7.3 Determining the version of JLink DLL .................................................130
4.7.4 Determining which DLL is used by a program ......................................131
5 Working with J-Link and J-Trace ..............................................................................132
5.1 Supported IDEs ..........................................................................................133
5.2 Connecting the target system ...................................................................... 134
5.2.1 Power-on sequence ..........................................................................134
5.2.2 Verifying target device connection ..................................................... 134
5.2.3 Problems ........................................................................................ 134
5.3 Indicators .................................................................................................. 135
5.3.1 Main indicator ................................................................................. 135
5.3.2 Input indicator ................................................................................ 135
5.3.3 Output indicator .............................................................................. 136
5.4 JTAG interface ............................................................................................137
5.4.1 Multiple devices in the scan chain ..................................................... 137
5.4.2 Sample configuration dialog boxes .....................................................137
5.4.3 Determining values for scan chain configuration .................................. 139
5.4.4 JTAG Speed .................................................................................... 140
J-Link / J-Trace (UM08001) © 2004-2017 SEGGER Microcontroller GmbH & Co. KG
17
5.5 SWD interface ............................................................................................141
5.5.1 SWD speed .....................................................................................141
5.5.2 SWO .............................................................................................. 141
5.6 Multi-core debugging .................................................................................. 143
5.6.1 How multi-core debugging works .......................................................143
5.6.2 Using multi-core debugging in detail ..................................................144
5.6.3 Things you should be aware of ......................................................... 145
5.7 Connecting multiple J-Links / J-Traces to your PC ........................................... 146
5.7.1 How does it work? .......................................................................... 146
5.8 J-Link control panel .................................................................................... 148
5.8.1 Tabs ...............................................................................................148
5.9 Reset strategies ......................................................................................... 154
5.9.1 Strategies for ARM 7/9 devices ......................................................... 154
5.9.2 Strategies for Cortex-M devices .........................................................155
5.10 Using DCC for memory access ................................................................... 159
5.10.1 What is required? .......................................................................... 159
5.10.2 Target DCC handler ........................................................................159
5.10.3 Target DCC abort handler ............................................................... 159
5.11 The J-Link settings file .............................................................................. 160
5.11.1 SEGGER Embedded Studio ..............................................................160
5.11.2 Keil MDK-ARM (uVision) ................................................................. 160
5.11.3 IAR EWARM .................................................................................. 160
5.11.4 Mentor Sourcery CodeBench for ARM ............................................... 160
5.12 J-Link script files ...................................................................................... 161
5.12.1 Actions that can be customized ....................................................... 161
5.12.2 Script file API functions .................................................................. 163
5.12.3 Global DLL variables ...................................................................... 172
5.12.4 Global DLL constants ..................................................................... 176
5.12.5 Script file language ........................................................................178
5.12.6 Script file writing example .............................................................. 179
5.12.7 Executing J-Link script files .............................................................179
5.13 Command strings ..................................................................................... 180
5.13.1 List of available commands ............................................................. 180
5.13.2 Using command strings .................................................................. 199
5.14 Switching off CPU clock during debug ......................................................... 201
5.15 Cache handling .........................................................................................202
5.15.1 Cache coherency ........................................................................... 202
5.15.2 Cache clean area ...........................................................................202
5.15.3 Cache handling of ARM7 cores ........................................................ 202
5.15.4 Cache handling of ARM9 cores ........................................................ 202
5.16 Virtual COM Port (VCOM) ...........................................................................203
5.16.1 Configuring Virtual COM Port ...........................................................203
6 Flash download .........................................................................................................205
6.1 Introduction ...............................................................................................206
6.2 Licensing ................................................................................................... 207
6.3 Supported devices ...................................................................................... 208
6.4 Setup for various debuggers (internal flash) .................................................. 209
6.5 Setup for various debuggers (CFI flash) ........................................................ 210
6.6 Setup for various debuggers (SPIFI flash) ..................................................... 211
6.7 QSPI flash support ..................................................................................... 212
6.7.1 Setup the DLL for QSPI flash download ..............................................212
6.8 Using the DLL flash loaders in custom applications ......................................... 213
6.9 Debugging applications that change flash contents at runtime .......................... 214
7 Flash breakpoints ......................................................................................................215
7.1 Introduction ...............................................................................................216
7.2 Licensing ................................................................................................... 217
7.2.1 Free for evaluation and non-commercial use ....................................... 217
J-Link / J-Trace (UM08001) © 2004-2017 SEGGER Microcontroller GmbH & Co. KG
18
7.3 Supported devices ...................................................................................... 218
7.4 Setup & compatibility with various debuggers ................................................ 219
7.4.1 Setup .............................................................................................219
7.4.2 Compatibility with various debuggers ................................................. 219
7.5 Flash Breakpoints in QSPI flash ....................................................................220
7.5.1 Setup .............................................................................................220
7.6 FAQ .......................................................................................................... 221
8 Monitor Mode Debugging ......................................................................................... 222
8.1 Introduction ...............................................................................................223
8.2 Enable Monitor Debugging ...........................................................................224
8.3 Availability and limitations of monitor mode ...................................................225
8.3.1 Cortex-M3 ...................................................................................... 225
8.3.2 Cortex-M4 ...................................................................................... 225
8.4 Monitor code ..............................................................................................226
8.5 Debugging interrupts .................................................................................. 227
8.6 Having servicing interrupts in debug mode .................................................... 228
8.7 Forwarding of Monitor Interrupts ..................................................................229
8.8 Target application performs reset (Cortex-M) ................................................. 230
9 Low Power Debugging ..............................................................................................231
9.1 Introduction ...............................................................................................232
9.2 Activating low power mode handling for J-Link ...............................................233
9.3 Restrictions ................................................................................................234
10 Open Flashloader ................................................................................................... 235
10.1 Introduction ............................................................................................. 236
10.2 General procedure .................................................................................... 237
10.3 Adding a new device .................................................................................238
10.4 Editing/Extending an Existing Device ...........................................................239
10.5 XML Tags and Attributes ............................................................................240
10.5.1 <Database> ..................................................................................240
10.5.2 <Device> ..................................................................................... 240
10.5.3 <ChipInfo> ...................................................................................240
10.5.4 <FlashBankInfo> ........................................................................... 242
10.6 Example XML file ......................................................................................244
10.7 Add. Info / Considerations / Limitations .......................................................245
10.7.1 CMSIS Flash Algorithms Compatibility .............................................. 245
10.7.2 Customized Flash Banks ................................................................. 245
10.7.3 Supported Cores ............................................................................245
10.7.4 Information for Silicon Vendors ....................................................... 245
10.7.5 Template Projects and How To's ...................................................... 245
11 J-Flash SPI ............................................................................................................. 246
11.1 Introduction ............................................................................................. 247
11.1.1 What is J-Flash SPI? ...................................................................... 247
11.1.2 J-Flash SPI CL (Windows, Linux, Mac) .............................................. 247
11.1.3 Features ....................................................................................... 248
11.1.4 Requirements ................................................................................ 248
11.2 Licensing ................................................................................................. 249
11.2.1 Introduction .................................................................................. 249
11.3 Getting Started ........................................................................................ 250
11.3.1 Setup ........................................................................................... 250
11.3.2 Using J-Flash SPI for the first time .................................................. 250
11.3.3 Menu structure ..............................................................................251
11.4 Settings ...................................................................................................254
11.4.1 Project Settings .............................................................................254
11.4.2 Global Settings ..............................................................................258
J-Link / J-Trace (UM08001) © 2004-2017 SEGGER Microcontroller GmbH & Co. KG
19
11.5 Command Line Interface ........................................................................... 260
11.5.1 Overview ...................................................................................... 260
11.5.2 Command line options ....................................................................260
11.5.3 Batch processing ........................................................................... 262
11.5.4 Programming multiple targets in parallel ...........................................262
11.6 Creating a new J-Flash SPI project ............................................................. 264
11.7 Custom Command Sequences .................................................................... 265
11.7.1 Init / Exit steps ............................................................................. 265
11.7.2 Example ....................................................................................... 265
11.7.3 J-Flash SPI Command Line Version .................................................. 266
11.8 Device specifics ........................................................................................ 269
11.8.1 SPI flashes with multiple erase commands ........................................269
11.9 Target systems .........................................................................................270
11.9.1 Which flash devices can be programmed? ......................................... 270
11.10 Performance ........................................................................................... 271
11.10.1 Performance values ...................................................................... 271
11.11 Background information ...........................................................................272
11.11.1 SPI interface connection ............................................................... 272
11.12 Support ................................................................................................. 273
11.12.1 Troubleshooting ........................................................................... 273
11.12.2 Contacting support .......................................................................273
12 RDI ..........................................................................................................................274
12.1 Introduction ............................................................................................. 275
12.1.1 Features ....................................................................................... 275
12.2 Licensing ................................................................................................. 276
12.3 Setup for various debuggers ...................................................................... 277
12.3.1 ARM AXD (ARM Developer Suite, ADS) .............................................277
12.3.2 ARM RVDS (RealView developer suite) ..............................................279
12.3.3 GHS MULTI ................................................................................... 284
12.4 Configuration ........................................................................................... 287
12.4.1 Configuration file JLinkRDI.ini ..........................................................287
12.4.2 Using different configurations ..........................................................287
12.4.3 Using multiple J-Links simultaneously ...............................................287
12.4.4 Configuration dialog ....................................................................... 287
12.5 Semihosting ............................................................................................. 296
12.5.1 Unexpected / unhandled SWIs .........................................................296
13 RTT ......................................................................................................................... 297
13.1 Introduction ............................................................................................. 298
13.2 How RTT works ........................................................................................ 299
13.2.1 Target implementation ....................................................................299
13.2.2 Locating the Control Block .............................................................. 299
13.2.3 Internal structures ......................................................................... 299
13.2.4 Requirements ................................................................................ 300
13.2.5 Performance ..................................................................................300
13.2.6 Memory footprint ...........................................................................300
13.3 RTT Communication .................................................................................. 301
13.3.1 RTT Viewer ................................................................................... 301
13.3.2 RTT Client .....................................................................................301
13.3.3 RTT Logger ................................................................................... 301
13.3.4 RTT in other host applications ......................................................... 301
13.4 Implementation ........................................................................................ 302
13.4.1 API functions ................................................................................ 302
13.4.2 Configuration defines ..................................................................... 308
13.5 ARM Cortex - Background memory access ................................................... 310
13.6 Example code .......................................................................................... 311
13.7 FAQ ........................................................................................................ 312
J-Link / J-Trace (UM08001) © 2004-2017 SEGGER Microcontroller GmbH & Co. KG
20
14 Trace ....................................................................................................................... 313
14.1 Introduction ............................................................................................. 314
14.1.1 What is backtrace? ........................................................................ 314
14.1.2 What is streaming trace? ................................................................314
14.1.3 What is code coverage? ..................................................................314
14.1.4 What is code profiling? ...................................................................315
14.2 Tracing via trace pins ................................................................................316
14.2.1 Cortex-M specifics ..........................................................................316
14.2.2 Trace signal timing ........................................................................ 316
14.2.3 Adjusting trace signal timing on J-Trace ............................................316
14.2.4 J-Trace models with support for streaming trace ................................ 317
14.3 Tracing with on-chip trace buffer ................................................................ 318
14.3.1 CPUs that provide tracing via pins and on-chip buffer ......................... 318
14.4 Target devices with trace support ............................................................... 319
14.5 Streaming trace ....................................................................................... 320
14.5.1 Download and execution address differ .............................................320
14.5.2 Do streaming trace without prior download ....................................... 320
15 Target interfaces and adapters ...............................................................................321
15.1 20-pin J-Link connector ............................................................................. 322
15.1.1 Pinout for JTAG ............................................................................. 322
15.1.2 Pinout for SWD ............................................................................. 324
15.1.3 Pinout for SWD + Virtual COM Port (VCOM) ...................................... 325
15.1.4 Pinout for SPI ............................................................................... 326
15.2 19-pin JTAG/SWD and Trace connector ........................................................328
15.2.1 Target power supply ...................................................................... 328
15.3 9-pin JTAG/SWD connector ........................................................................ 330
15.4 Reference voltage (VTref) .......................................................................... 331
15.5 Adapters ..................................................................................................332
16 Background information .......................................................................................... 333
16.1 JTAG ....................................................................................................... 334
16.1.1 Test access port (TAP) ....................................................................334
16.1.2 Data registers ............................................................................... 334
16.1.3 Instruction register ........................................................................ 334
16.1.4 The TAP controller ......................................................................... 334
16.2 Embedded Trace Macrocell (ETM) ................................................................337
16.2.1 Trigger condition ............................................................................337
16.2.2 Code tracing and data tracing ......................................................... 337
16.2.3 J-Trace integration example - IAR Embedded Workbench for ARM ......... 337
16.3 Embedded Trace Buffer (ETB) .................................................................... 341
16.4 Flash programming ................................................................................... 342
16.4.1 How does flash programming via J-Link / J-Trace work? ...................... 342
16.4.2 Data download to RAM ...................................................................342
16.4.3 Data download via DCC ..................................................................342
16.4.4 Available options for flash programming ........................................... 342
16.5 J-Link / J-Trace firmware ........................................................................... 344
16.5.1 Firmware update ........................................................................... 344
16.5.2 Invalidating the firmware ................................................................344
17 Designing the target board for trace .......................................................................346
17.1 Overview of high-speed board design ..........................................................347
17.1.1 Avoiding stubs ...............................................................................347
17.1.2 Minimizing Signal Skew (Balancing PCB Track Lengths) ....................... 347
17.1.3 Minimizing Crosstalk ...................................................................... 347
17.1.4 Using impedance matching and termination ...................................... 347
17.2 Terminating the trace signal .......................................................................348
17.2.1 Rules for series terminators ............................................................ 348
J-Link / J-Trace (UM08001) © 2004-2017 SEGGER Microcontroller GmbH & Co. KG
21
17.3 Signal requirements .................................................................................. 349
18 Semihosting .............................................................................................................350
18.1 Introduction ............................................................................................. 351
18.1.1 Advantages ................................................................................... 351
18.1.2 Disadvantages ...............................................................................351
18.2 Debugger support .....................................................................................352
18.3 Implementation ........................................................................................ 353
18.3.1 SVC instruction ............................................................................. 353
18.3.2 Breakpoint instruction .................................................................... 353
18.3.3 J-Link GDBServer optimized version .................................................353
18.4 Communication protocol ............................................................................ 356
18.4.1 Register R0 ...................................................................................356
18.4.2 Command SYS_OPEN (0x01) .......................................................... 356
18.4.3 Command SYS_CLOSE (0x02) ......................................................... 357
18.4.4 Command SYS_WRITEC (0x03) ....................................................... 357
18.4.5 Command SYS_WRITE0 (0x04) ....................................................... 358
18.4.6 Command SYS_WRITE (0x05) .........................................................358
18.4.7 Command SYS_READ (0x06) .......................................................... 358
18.4.8 Command SYS_READC (0x07) .........................................................359
18.4.9 Command SYS_ISTTY (0x09) .......................................................... 359
18.4.10 Command SYS_SEEK (0x0A) .........................................................359
18.4.11 Command SYS_FLEN (0x0C) ......................................................... 360
18.4.12 Command SYS_REMOVE (0x0E) .....................................................360
18.4.13 Command SYS_RENAME (0x0F) ..................................................... 360
18.4.14 Command SYS_GET_CMDLINE (0x15) ............................................ 361
18.4.15 Command SYS_EXIT (0x18) ..........................................................361
18.5 Enabling semihosting in J-Link GDBServer ................................................... 362
18.5.1 SVC variant .................................................................................. 362
18.5.2 Breakpoint variant ......................................................................... 362
18.5.3 J-Link GDBServer optimized variant ................................................. 362
18.6 Enabling Semihosting in J-Link RDI + AXD .................................................. 363
18.6.1 Using SWIs in your application ........................................................363
19 Support and FAQs ..................................................................................................364
19.1 Measuring download speed ........................................................................ 365
19.2 Troubleshooting ........................................................................................ 366
19.2.1 General procedure ......................................................................... 366
19.3 Contacting support ................................................................................... 367
19.3.1 Contact Information ....................................................................... 367
J-Link / J-Trace (UM08001) © 2004-2017 SEGGER Microcontroller GmbH & Co. KG

Chapter 1
Introduction
This is the user documentation for owners of SEGGER debug probes, J-Link and J-Trace.
This manual documents the software which with the J-Link Software and Documentation
Package as well as advanced features of J-Link and J-Trace, like Real Time Transfer (RTT),
J-Link Script Files or Trace.
J-Link / J-Trace (UM08001) © 2004-2017 SEGGER Microcontroller GmbH & Co. KG
23 CHAPTER 1 Requirements
1.1 Requirements
Host System
To use J-Link or J-Trace you need a host system running Windows 2000 or later. For a list
of all operating systems which are supported by J-Link, please refer to Supported OS on
page 24.
Target System
A target system with a supported CPU is required. You should make sure that the emulator
you are looking at supports your target CPU. For more information about which J-Link fea-
tures are supported by each emulator, please refer to SEGGER debug probes on page 29.
J-Link / J-Trace (UM08001) © 2004-2017 SEGGER Microcontroller GmbH & Co. KG
24 CHAPTER 1 Supported OS
1.2 Supported OS
J-Link/J-Trace can be used on the following operating systems:
• Microsoft Windows 2000
• Microsoft Windows XP
• Microsoft Windows XP x64
• Microsoft Windows 2003
• Microsoft Windows 2003 x64
• Microsoft Windows Vista
• Microsoft Windows Vista x64
• Microsoft Windows 7
• Microsoft Windows 7 x64
• Microsoft Windows 8
• Microsoft Windows 8 x64
• Microsoft Windows 10
• Microsoft Windows 10 x64
• Linux
• macOS 10.5 and higher
J-Link / J-Trace (UM08001) © 2004-2017 SEGGER Microcontroller GmbH & Co. KG
25 CHAPTER 1 Common features of the J-Link product family
1.3 Common features of the J-Link product family
• USB 2.0 interface (Full-Speed/Hi-Speed, depends on J-Link model)
• Any ARM7/ARM9/ARM11 (including thumb mode), Cortex-A5/A7/A8/A9/A12/A15/A17,
Cortex-M0/M1/M3/M4/M7/M23/M33, Cortex-R4/R5 core supported
• Automatic core recognition
• Maximum interface speed 15/50 MHz (depends on J-Link model)
• Seamless integration into all major IDEs ( List of supported IDEs )
• No power supply required, powered through USB
• Support for adaptive clocking
• All JTAG signals can be monitored, target voltage can be measured
• Support for multiple devices
• Fully plug and play compatible
• Standard 20-pin JTAG/SWD connector, 19-pin JTAG/SWD and Trace connector, standard
38-pin JTAG+Trace connector
• USB and 20-pin ribbon cable included
• Memory viewer (J-Mem) included
• Remote server included, which allows using J-Trace via TCP/IP networks
• RDI interface available, which allows using J-Link with RDI compliant software
• Flash programming software (J-Flash) available
• Flash DLL available, which allows using flash functionality in custom applications
• Software Developer Kit (SDK) available
• 14-pin JTAG adapter available
• J-Link 19-pin Cortex-M Adapter available
• J-Link 9-pin Cortex-M Adapter available
• Adapter for 5V JTAG targets available for hardware revisions up to 5.3
• Optical isolation adapter for JTAG/SWD interface available
• Target power supply via pin 19 of the JTAG/SWD interface (up to 300 mA to target
with overload protection), alternatively on pins 11 and 13 of the Cortex-M 19-pin trace
connector
J-Link / J-Trace (UM08001) © 2004-2017 SEGGER Microcontroller GmbH & Co. KG
26 CHAPTER 1 Supported CPU cores
1.4 Supported CPU cores
J-Link / J-Trace supports any common ARM Cortex core, ARM legacy core, Microchip PIC32
core and Renesas RX core. For a detailed list, please refer to:
SEGGER website: Supported Cores .
If you experience problems with a particular core, do not hesitate to contact SEGGER.
J-Link / J-Trace (UM08001) © 2004-2017 SEGGER Microcontroller GmbH & Co. KG
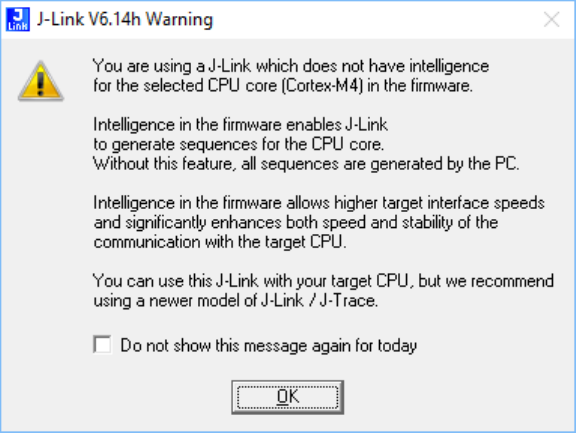
27 CHAPTER 1 Built-in intelligence for supported CPU-cores
1.5 Built-in intelligence for supported CPU-cores
In general, there are two ways to support a CPU-core in the J-Link software:
1. Intelligence in the J-Link firmware
2. Intelligence on the PC-side (DLL)
Having the intelligence in the firmware is ideal since it is much more powerful and robust.
The J-Link PC software automatically detects which implementation level is supported for
the connected CPU-core. If intelligence in the firmware is available, it is used. If you are
using a J-Link that does not have intelligence in the firmware and only PC-side intelligence
is available for the connected CPU, a warning message is shown.
1.5.1 Intelligence in the J-Link firmware
On newer J-Links, the intelligence for a new CPU-core is also available in the J-Link firmware
which means that for these J-Links, the target sequences are no longer generated on the PC-
side but directly inside the J-Link. Having the intelligence in the firmware leads to improved
stability and higher performance.
1.5.2 Intelligence on the PC-side (DLL)
This is the basic implementation level for support of a CPU-core. This implementation is
not J-Link model dependent, since no intelligence for the CPU-core is necessary in the J-
Link firmware. This means, all target sequences (JTAG/SWD/…) are generated on the PC-
side and the J-Link simply sends out these sequences and sends the result back to the DLL.
Using this way of implementation also allows old J-Links to be used with new CPU cores as
long as a DLL-Version is used which has intelligence for the CPU.
But there is one big disadvantage of implementing the CPU core support on the DLL-side:
For every sequence which shall be sent to the target a USB or Ethernet transaction is
triggered. The long latency especially on a USB connection significantly affects the perfor-
mance of J-Link. This is true especially when performing actions where J-Link has to wait
for the CPU frequently. An example is a memory read/write operation which needs to be
followed by status read operations or repeated until the memory operation is completed.
Performing this kind of task with only PC-side intelligence requires to either make some
assumption like: Operation is completed after a given number of cycles. Or it requires to
make a lot of USB/Ethernet transactions. The first option (fast mode) will not work under
some circumstances such as low CPU speeds, the second (slow mode) will be more reliable
but very slow due to the high number of USB/Ethernet transactions. It simply boils down
to: The best solution is having intelligence in the emulator itself!
J-Link / J-Trace (UM08001) © 2004-2017 SEGGER Microcontroller GmbH & Co. KG

28 CHAPTER 1 Built-in intelligence for supported CPU-cores
1.5.2.1 Limitations of PC-side implementations
•Instability, especially on slow targets
Due to the fact that a lot of USB transactions would cause a very bad performance of J-
Link, PC-side implementations are on the assumption that the CPU/Debug interface is
fast enough to handle the commands/requests without the need of waiting. So, when
using the PC-side-intelligence, stability cannot be guaranteed in all cases, especially if
the target interface speed (JTAG/SWD/…) is significantly higher than the CPU speed.
•Poor performance
Since a lot more data has to be transferred over the host interface (typically USB),
the resulting download speed is typically much lower than for implementations with
intelligence in the firmware, even if the number of transactions over the host interface
is limited to a minimum (fast mode).
•No support
Please understand that we cannot give any support if you are running into problems
when using a PC-side implementation.
Note
Due to these limitations, we recommend to use PC-side implementations for evaluation
only.
1.5.3 Firmware intelligence per model
There are different models of J-Link / J-Trace which have built-in intelligence for different
CPU-cores. Please refer to J-Link / J-Trace hardware revisions for further information.
J-Link / J-Trace (UM08001) © 2004-2017 SEGGER Microcontroller GmbH & Co. KG
29 CHAPTER 1 Where to find further information
1.6 Where to find further information
The following items are not the scope of the J-Link / J-Trace User Guide (UM08001) and
therefore documented elsewhere in the respective place described/listed below.
1.6.1 SEGGER debug probes
1.6.1.1 J-Link / J-Trace current model overview
In order to compare features, performance specifications, capabilities and included licenses
of current J-Link / J-Trace or Flasher models, please refer to the SEGGER website:
J-Link Model overview
1.6.1.2 J-Link / J-Trace hardware revisions
For feature comparisons between different hardware revisions of J-Link / J-Trace or Flasher
models, please refer to:
SEGGER Wiki: J-Link / J-Trace / Flasher Software and Hardware features overview
1.6.1.3 J-Link / J-Trace hardware specifications
For detailed general, mechanical and electrical specifications of a specific J-Link / J-Trace
or Flasher model, please refer to:
SEGGER Wiki: J-Link / J-Trace / Flasher general, mechanical, electrical specifications
1.6.2 Using a feature in a specific development environment
For many features described in this manual, detailed explanations on how to use them
with popular debuggers, IDEs and other applications are available in the SEGGER wiki.
Therefore, for information on how to use a feature in a specific development environment,
please refer to:
SEGGER Wiki: Getting Started with Various IDEs .
If a explanation is missing for the IDE used or the IDE used is not listed at all, please
contact us. (see Contact Information )
J-Link / J-Trace (UM08001) © 2004-2017 SEGGER Microcontroller GmbH & Co. KG

Chapter 2
Licensing
This chapter describes the different license types of J-Link related software and the legal
use of the J-Link software with original SEGGER and OEM products.
J-Link / J-Trace (UM08001) © 2004-2017 SEGGER Microcontroller GmbH & Co. KG
31 CHAPTER 2 Components requiring a license
2.1 Components requiring a license
J-Link PLUS and higher are fully featured J-Links and come with all licenses included. Other
models may do not come with all features enabled. For a detailed overview of the included
licenses of the SEGGER debug probes, please refer to:
J-Link Model overview: Licenses
J-Link / J-Trace (UM08001) © 2004-2017 SEGGER Microcontroller GmbH & Co. KG
32 CHAPTER 2 Legal use of SEGGER J-Link software
2.2 Legal use of SEGGER J-Link software
The software consists of proprietary programs of SEGGER, protected under copyright and
trade secret laws. All rights, title and interest in the software are and shall remain with
SEGGER. For details, please refer to the license agreement which needs to be accepted
when installing the software. The text of the license agreement is also available as entry
in the start menu after installing the software.
Use of software
SEGGER J-Link software may only be used with original SEGGER products and authorized
OEM products. The use of the licensed software to operate SEGGER product clones is pro-
hibited and illegal.
2.2.1 Use of the software with 3rd party tools
For simplicity, some components of the J-Link software are also distributed by partners
with software tools designed to use J-Link. These tools are primarily debugging tools, but
also memory viewers, flash programming utilities as well as software for other purposes.
Distribution of the software components is legal for our partners, but the same rules as
described above apply for their usage: They may only be used with original SEGGER prod-
ucts and authorized OEM products. The use of the licensed software to operate SEGGER
product clones is prohibited and illegal.
J-Link / J-Trace (UM08001) © 2004-2017 SEGGER Microcontroller GmbH & Co. KG
33 CHAPTER 2 Illegal Clones
2.3 Illegal Clones
Clones are copies of SEGGER products which use the copyrighted SEGGER Firmware with-
out a license. It is strictly prohibited to use SEGGER J-Link software with illegal clones of
SEGGER products. Manufacturing and selling these clones is an illegal act for various rea-
sons, amongst them trademark, copyright and unfair business practice issues. The use of
illegal J-Link clones with this software is a violation of US, European and other international
laws and is prohibited. If you are in doubt if your unit may be legally used with SEGGER
J-Link software, please get in touch with us. End users may be liable for illegal use of J-
Link software with clones.
J-Link / J-Trace (UM08001) © 2004-2017 SEGGER Microcontroller GmbH & Co. KG


35 CHAPTER 3 Software overview
3.1 Software overview
The J-Link Software and Documentation Package, which is available for download from
segger.com/jlink-software.html , includes some applications to be used with J-Link. It also
comes with USB-drivers for J-Link and documentations in pdf format.
Software Description
J-Link Commander Command-line tool with basic functionality for target analysis.
J-Link GDB Server The J-Link GDB Server is a server connecting to the GNU De-
bugger (GDB) via TCP/IP. It is required for toolchains using the
GDB protocol to connect to J-Link.
J-Link GDB Server
command line version Command line version of the J-Link GDB Server. Same func-
tionality as the GUI version.
J-Link Remote Server Utility which provides the possibility to use J-Link / J-Trace re-
motely via TCP/IP.
J-Mem Memory Viewer Target memory viewer. Shows the memory content of a run-
ning target and allows editing as well.
J-FlashaStand-alone flash programming application. For more infor-
mation about J-Flash please refer to J-Flash ARM User’s Guide
(UM08003).
J-Link RTT Viewer Free-of-charge utility for J-Link. Displays the terminal output
of the target using RTT. Can be used in parallel with a debug-
ger or stand-alone.
J-Link SWO Viewer Free-of-charge utility for J-Link. Displays the terminal output
of the target using the SWO pin. Can be used in parallel with a
debugger or stand-alone.
J-Link SWO Analyzer Command line tool that analyzes SWO RAW output and stores
it into a file.
JTAGLoad Command line tool that opens an svf file and sends the data in
it via J-Link / J-Trace to the target.
J-Link Configurator
GUI-based configuration tool for J-Link. Allows configuration of
USB identification as well as TCP/IP identification of J-Link. For
more information about the J-Link Configurator, please refer
to J-Link Configurator .
RDI supportaProvides Remote Debug Interface (RDI) support. This allows
the user to use J-Link with any RDI-compliant debugger.
Processor specific tools Free command-line tools for handling specific processors.
Included are: STR9 Commander and STM32 Unlock.
a Full-featured J-Link (PLUS, PRO, ULTRA+) or an additional license for J-Link base model
required.
J-Link / J-Trace (UM08001) © 2004-2017 SEGGER Microcontroller GmbH & Co. KG
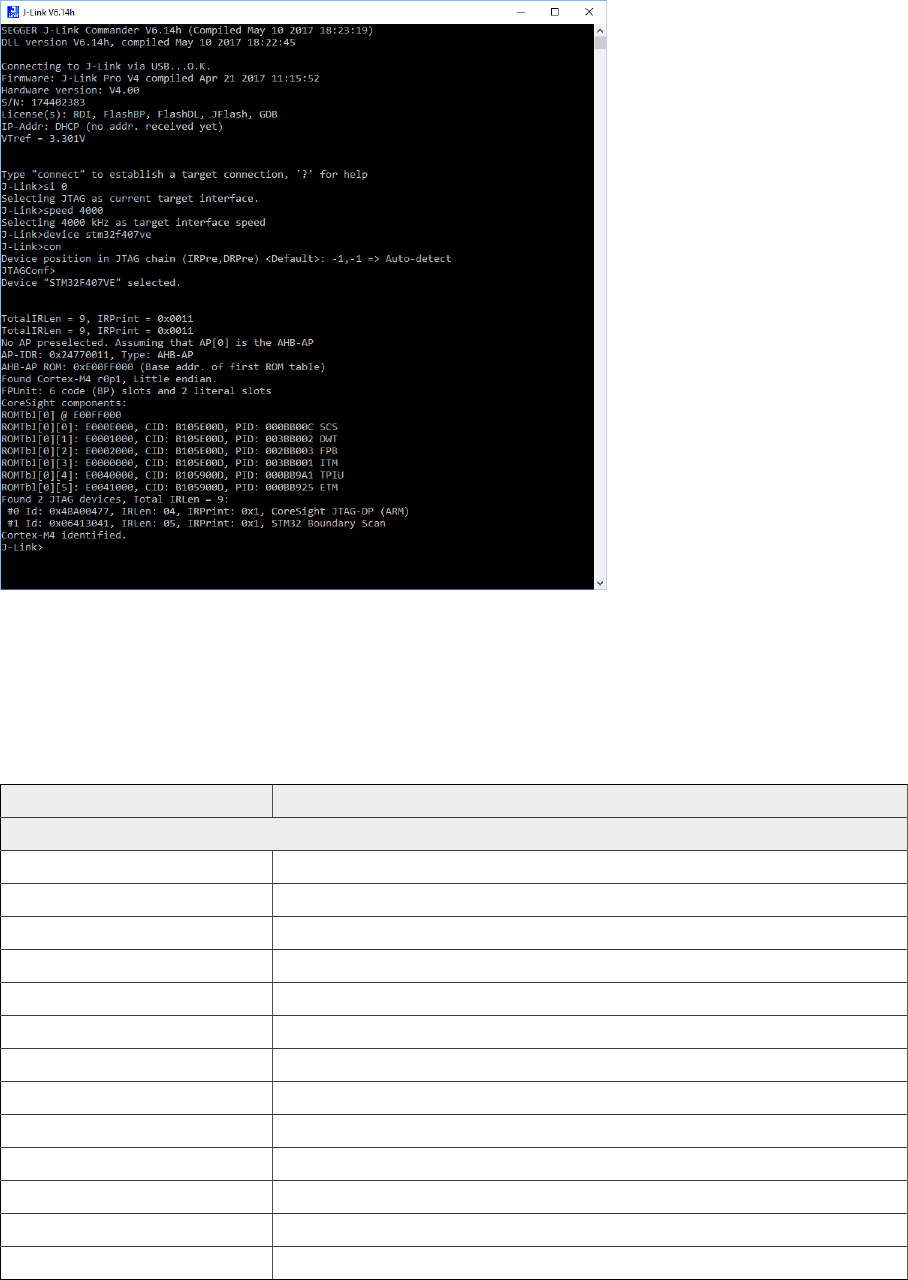
36 CHAPTER 3 J-Link Commander (Command line tool)
3.2 J-Link Commander (Command line tool)
J-Link Commander (JLink.exe) is a tool that can be used for verifying proper installation
of the USB driver and to verify the connection to the target CPU, as well as for simple
analysis of the target system. It permits some simple commands, such as memory dump,
halt, step, go etc. to verify the target connection.
J-Link Commander: JTAG connection
3.2.1 Commands
The table below lists the available commands of J-Link Commander. All commands are
listed in alphabetical order within their respective categories. Detailed descriptions of the
commands can be found in the sections that follow.
Command (short form) Explanation
Basic
clrBP Clear breakpoint.
clrWP Clear watchpoint.
device Selects a device.
erase Erase internal flash of selected device.
exec Execute command string.
exit (qc, q) Closes J-Link Commander.
exitonerror (eoe) Commander exits after error.
fPrints firmware info.
go (g) Starts the CPU core.
halt (h) Halts the CPU core.
hwinfo Show hardware info.
is Scan chain select register length.
loadfile Load data file into target memory.
J-Link / J-Trace (UM08001) © 2004-2017 SEGGER Microcontroller GmbH & Co. KG

37 CHAPTER 3 J-Link Commander (Command line tool)
Command (short form) Explanation
log Enables log to file.
mem Read memory.
mem8 Read 8-bit items.
mem16 Read 16-bit items.
mem32 Read 32-bit items.
mem64 Read 64-bit items.
mr Measures reaction time of RTCK pin.
ms Measures length of scan chain.
power Switch power supply for target.
rResets and halts the target.
readAP Reads from a CoreSight AP register.
readDP Reads from a CoreSight DP register.
regs Shows all current register values.
rnh Resets without halting the target.
rreg Shows a specific register value.
rx Reset target with delay.
savebin Saves target memory into binary file.
setBP Set breakpoint.
setPC Set the PC to specified value.
setWP Set watchpoint.
sleep Waits the given time (in milliseconds).
speed Set target interface speed.
st Shows the current hardware status.
step (s) Single step the target chip.
unlock Unlocks a device.
verifybin Compares memory with data file.
w1 Write 8-bit items.
w2 Write 16-bit items.
w4 Write 32-bit items.
writeAP Writes to a CoreSight AP register.
writeDP Writes to a CoreSight DP register.
wreg Write register.
Flasher I/O
fdelete (fdel) Delete file on emulator.
flist List directory on emulator.
fread (frd) Read file from emulator.
fshow Read and display file from emulator.
fsize (fsz) Display size of file on emulator.
fwrite (fwr) Write file to emulator.
Connection
ip Connect to J-Link Pro via TCP/IP.
usb Connect to J-Link via USB.
J-Link / J-Trace (UM08001) © 2004-2017 SEGGER Microcontroller GmbH & Co. KG
38 CHAPTER 3 J-Link Commander (Command line tool)
3.2.1.1 clrBP
This command removes a breakpoint set by J-Link.
Syntax
clrBP <BP_Handle>
Parameter Meaning
BP_Handle Handle of breakpoint to be removed.
Example
clrBP 1
3.2.1.2 clrWP
This command removes a watchpoint set by J-Link.
Syntax
clrWP <WP_Handle>
Parameter Meaning
WP_Handle Handle of watchpoint to be removed.
Example
clrWP 0x2
3.2.1.3 device
Selects a specific device J-Link shall connect to and performs a reconnect. In most cases
explicit selection of the device is not necessary. Selecting a device enables the user to make
use of the J-Link flash programming functionality as well as using unlimited breakpoints
in flash memory. For some devices explicit device selection is mandatory in order to allow
the DLL to perform special handling needed by the device. Some commands require that
a device is set prior to use them.
Syntax
device <DeviceName>
Parameter Meaning
DeviceName Valid device name: Device is selected.
?: Shows a device selection dialog.
Example
device stm32f407ig
3.2.1.4 erase
Erases all flash sectors of the current device. A device has to be specified previously.
Syntax
erase
3.2.1.5 exec
Execute command string. For more information about the usage of command strings please
refer to Command strings .
J-Link / J-Trace (UM08001) © 2004-2017 SEGGER Microcontroller GmbH & Co. KG
39 CHAPTER 3 J-Link Commander (Command line tool)
Syntax
exec <Command>
Parameter Meaning
Command Command string to be executed.
Example
exec SupplyPower = 1
3.2.1.6 exit
This command closes the target connection, the connection to the J-Link and exits J-Link
Commander.
Syntax
q
3.2.1.7 exitonerror
This command toggles whether J-Link Commander exits on error or not.
Syntax
ExitOnError <1|0>
Parameter Meaning
<1|0> 1: J-Link Commander will now exit on Error.
0: J-Link Commander will no longer exit on Error.
Example
eoe 1
3.2.1.8 f
Prints firmware and hardware version info. Please notice that minor hardware revisions may
not be displayed, as they do not have any effect on the feature set.
Syntax
f
3.2.1.9 fdelete
On emulators which support file I/O this command deletes a specific file.
Syntax
fdelete <FileName>
Parameter Meaning
FileName File to delete from the Flasher.
Example
fdelete Flasher.dat
3.2.1.10 flist
On emulators which support file I/O this command shows the directory tree of the Flasher.
J-Link / J-Trace (UM08001) © 2004-2017 SEGGER Microcontroller GmbH & Co. KG
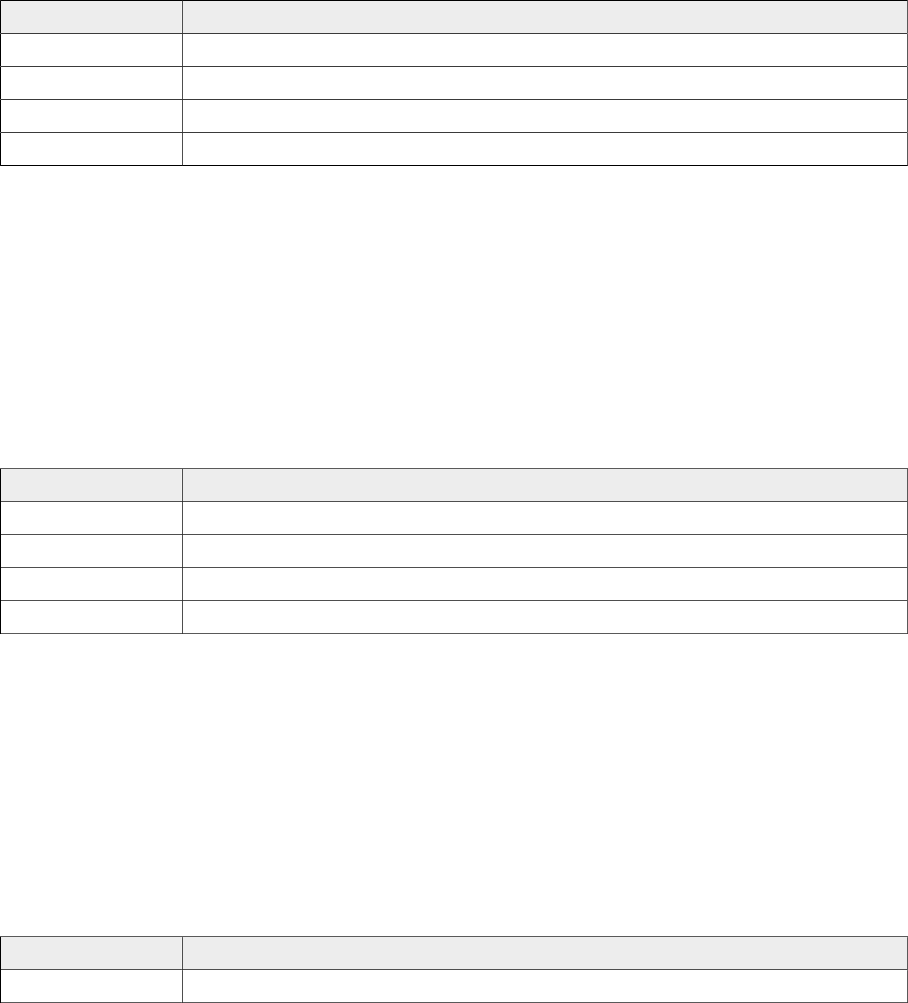
40 CHAPTER 3 J-Link Commander (Command line tool)
Syntax
flist
3.2.1.11 fread
On emulators which support file I/O this command reads a specific file. Offset applies to
both destination and source file.
Syntax
fread <EmuFile> <HostFile> [<Offset> [<NumBytes>]]
Parameter Meaning
EmuFile File name to read from.
HostFile Destination file on the host.
Offset Specifies the offset in the file, at which data reading is started.
NumBytes Maximum number of bytes to read.
Example
fread Flasher.dat C:\Project\Flasher.dat
3.2.1.12 fshow
On emulators which support file I/O this command reads and prints a specific file. Currently,
only Flasher models support file I/O.
Syntax
fshow <FileName> [-a] [<Offset> [<NumBytes>]]
Parameter Meaning
FileName Source file name to read from the Flasher.
aIf set, Input will be parsed as text instead of being shown as hex.
Offset Specifies the offset in the file, at which data reading is started.
NumBytes Maximum number of bytes to read.
Example
fshow Flasher.dat
3.2.1.13 fsize
On emulators which support file I/O this command gets the size of a specific file. Currently,
only Flasher models support file I/O.
Syntax
fsize <FileName>]
Parameter Meaning
FileName Source file name to read from the Flasher.
Example
fsize Flasher.dat
J-Link / J-Trace (UM08001) © 2004-2017 SEGGER Microcontroller GmbH & Co. KG
41 CHAPTER 3 J-Link Commander (Command line tool)
3.2.1.14 fwrite
On emulators which support file I/O this command writes a specific file. Currently, only
Flasher models support file I/O. NumBytes is limited to 512 bytes at once.
This means, if you want to write e.g. 1024 bytes, you have to send the command twice,
using an appropriate offset when sending it the second time. Offset applies to both desti-
nation and source file.
Syntax
fwrite <EmuFile> <HostFile> [<Offset> [<NumBytes>]]
Parameter Meaning
EmuFile File name to write to.
HostFile Source file on the host
Offset Specifies the offset in the file, at which data writing is started.
NumBytes Maximum number of bytes to write.
Example
fwrite Flasher.dat C:\Project\Flasher.dat
3.2.1.15 go
Starts the CPU. In order to avoid setting breakpoints it allows to define a maximum num-
ber of instructions which can be simulated/emulated. This is particularly useful when the
program is located in flash and flash breakpoints are used. Simulating instructions avoids
to reprogram the flash and speeds up (single) stepping.
Syntax
Syntax
go [<NumSteps> [<Flags>]]
Parameter Meaning
NumSteps
Maximum number of instructions allowed to be simulated. Instruc-
tion simulation stops whenever a breakpointed instruction is hit,
an instruction which cannot be simulated/emulated is hit or when
NumSteps is reached.
Flags 0: Do not start the CPU if a BP is in range of NumSteps
1: Overstep BPs
Example
go //Simply starts the CPU
go 20, 1
3.2.1.16 halt
Halts the CPU Core. If successful, shows the current CPU registers.
Syntax
halt
3.2.1.17 hwinfo
This command can be used to get information about the power consumption of the target (if
the target is powered via J-Link). It also gives the information if an overcurrent happened.
J-Link / J-Trace (UM08001) © 2004-2017 SEGGER Microcontroller GmbH & Co. KG

42 CHAPTER 3 J-Link Commander (Command line tool)
Syntax
hwinfo
3.2.1.18 ip
Closes any existing connection to J-Link and opens a new one via TCP/IP. If no IP Address
is specified, the Emulator selection dialog shows up.
Syntax
ip [<Addr>]
Parameter Meaning
Addr
Valid values:
IP Address: Connects the J-Link with the specified IP-Address
Host Name: Resolves the host name and connects to it.
*: Invokes the Emulator selection dialog.
Example
ip 192.168.6.3
3.2.1.19 is
This command returns information about the length of the scan chain select register.
Syntax
is
3.2.1.20 loadfile
This command programs a given data file to a specified destination address. Currently
supported data files are:
• *.mot
• *.srec
• *.s19
• *.s
• *.hex
• *.bin
Syntax
loadfile <Filename> [<Addr>]
Parameter Meaning
Filename Source filename
Addr Destination address (Required for *.bin files)
Example
loadfile C:\Work\test.bin 0x20000000
3.2.1.21 log
Set path to logfile allowing the DLL to output logging information. If the logfile already
exist, the contents of the current logfile will be overwritten.
Syntax
log <Filename>
J-Link / J-Trace (UM08001) © 2004-2017 SEGGER Microcontroller GmbH & Co. KG

43 CHAPTER 3 J-Link Commander (Command line tool)
Parameter Meaning
Filename Log filename
Example
log C:\Work\log.txt
3.2.1.22 mem
The command reads memory from the target system. If necessary, the target CPU is halted
in order to read memory.
Syntax
mem [<Zone>:]<Addr>, <NumBytes> (hex)
Parameter Meaning
Zone Name of memory zone to access.
Addr Start address.
Numbytes Number of bytes to read. Maximum is 0x100000.
Example
mem 0, 100
3.2.1.23 mem8
The command reads memory from the target system in units of bytes. If necessary, the
target CPU is halted in order to read memory.
Syntax
mem [<Zone>:]<Addr>, <NumBytes> (hex)
Parameter Meaning
Zone Name of memory zone to access.
Addr Start address.
Numbytes Number of bytes to read. Maximum is 0x100000.
Example
mem8 0, 100
3.2.1.24 mem16
The command reads memory from the target system in units of 16-bits. If necessary, the
target CPU is halted in order to read memory.
Syntax
mem [<Zone>:]<Addr>, <NumBytes> (hex)
Parameter Meaning
Zone Name of memory zone to access.
Addr Start address.
Numbytes Number of halfwords to read. Maximum is 0x80000.
Example
mem16 0, 100
J-Link / J-Trace (UM08001) © 2004-2017 SEGGER Microcontroller GmbH & Co. KG
44 CHAPTER 3 J-Link Commander (Command line tool)
3.2.1.25 mem32
The command reads memory from the target system in units of 32-bits. If necessary, the
target CPU is halted in order to read memory.
Syntax
mem [<Zone>:]<Addr>, <NumBytes> (hex)
Parameter Meaning
Zone Name of memory zone to access.
Addr Start address.
Numbytes Number of words to read. Maximum is 0x40000.
Example
mem32 0, 100
3.2.1.26 mem64
The command reads memory from the target system in units of 64-bits. If necessary, the
target CPU is halted in order to read memory.
Syntax
mem [<Zone>:]<Addr>, <NumBytes> (hex)
Parameter Meaning
Zone Name of memory zone to access.
Addr Start address.
Numbytes Number of double words to read. Maximum is 0x20000.
Example
mem64 0, 100
3.2.1.27 mr
Measure reaction time of RTCK pin.
Syntax
mr [<RepCount>]
Parameter Meaning
RepCount Number of times the test is repeated (Default: 1).
Example
mr 3
3.2.1.28 ms
Measures the number of bits in the specified scan chain.
Syntax
ms <ScanChain>
Parameter Meaning
ScanChain Scan chain to be measured.
J-Link / J-Trace (UM08001) © 2004-2017 SEGGER Microcontroller GmbH & Co. KG
45 CHAPTER 3 J-Link Commander (Command line tool)
Example
ms 1
3.2.1.29 power
This command sets the status of the power supply over pin 19 of the JTAG connector. The
KS(Kickstart) versions of J-Link have the 5V supply over pin 19 activated by default. This
feature is useful for some targets that can be powered over the JTAG connector.
Syntax
power <State> [perm]
Parameter Meaning
State Valid values: On, Off
perm Sets the specified State value as default.
Example
power on perm
3.2.1.30 r
Resets and halts the target.
Syntax
r
3.2.1.31 readAP
Reads from a CoreSight AP register. This command performs a full-qualified read which
means that it tries to read until the read has been accepted or too many WAIT responses
have been received. In case actual read data is returned on the next read request (this is
the case for example with interface JTAG) this command performs the additional dummy
read request automatically.
Syntax
ReadAP <RegIndex>
Parameter Meaning
RegIndex Index of AP register to read
Example
//
// Read AP[0], IDR (register 3, bank 15)
//
WriteDP 2, 0x000000F0 // Select AP[0] bank 15
ReadAP 3 // Read AP[0] IDR
3.2.1.32 readDP
Reads from a CoreSight DP register. This command performs a full-qualified read which
means that it tries to read until the read has been accepted or too many WAIT responses
have been received. In case actual read data is returned on the next read request (this is
the case for example with interface JTAG) this command performs the additional dummy
read request automatically.
J-Link / J-Trace (UM08001) © 2004-2017 SEGGER Microcontroller GmbH & Co. KG
46 CHAPTER 3 J-Link Commander (Command line tool)
Syntax
ReadDP <RegIndex>
Parameter Meaning
RegIndex Index of DP register to read
Example
//
// Read DP-CtrlStat
//
ReadDP 1
3.2.1.33 regs
Shows all current register values.
Syntax
regs
3.2.1.34 rnh
This command performs a reset but without halting the device.
Syntax
rnh
3.2.1.35 rreg
The function prints the value of the specified CPU register.
Syntax
rreg <RegIndex>
Parameter Meaning
RegIndex Register to read.
Example
rreg 15
3.2.1.36 rx
Resets and halts the target. It is possible to define a delay in milliseconds after reset. This
function is useful for some target devices which already contain an application or a boot
loader and therefore need some time before the core is stopped, for example to initialize
hardware, the memory management unit (MMU) or the external bus interface.
Syntax
rx <DelayAfterReset>
Parameter Meaning
DelayAfterRe-
set Delay in ms.
Example
rx 10
J-Link / J-Trace (UM08001) © 2004-2017 SEGGER Microcontroller GmbH & Co. KG

47 CHAPTER 3 J-Link Commander (Command line tool)
3.2.1.37 savebin
Saves target memory into binary file.
Syntax
savebin <Filename>, <Addr>, <NumBytes> (hex)
Parameter Meaning
Filename Destination file
Addr Source address.
NumBytes Number of bytes to read.
Example
savebin C:\Work\test.bin 0x0000000 0x100
3.2.1.38 setBP
This command sets a breakpoint of a specific type at a specified address. Which breakpoint
modes are available depends on the CPU that is used.
Syntax
setBP <Addr> [[A/T]/[W/H]] [S/H]
Parameter Meaning
Addr Address to be breakpointed.
A/T
Only for ARM7/9/11 and Cortex-R4 devices:
A: ARM mode
T: THUMB mode
W/H
Only for MIPS devices:
W: MIPS32 mode (Word)
H: MIPS16 mode (Half-word)
S/H S: Force software BP
H: Force hardware BP
Example
setBP 0x8000036
3.2.1.39 setPC
Sets the PC to the specified value.
Syntax
setpc <Addr>
Parameter Meaning
Addr Address the PC should be set to.
Example
setpc 0x59C
3.2.1.40 setWP
This command inserts a new watchpoint that matches the specified parameters. The enable
bit for the watchpoint as well as the data access bit of the watchpoint unit are set auto-
matically by this command. Moreover the bits DBGEXT, CHAIN and the RANGE bit (used to
J-Link / J-Trace (UM08001) © 2004-2017 SEGGER Microcontroller GmbH & Co. KG

48 CHAPTER 3 J-Link Commander (Command line tool)
connect one watchpoint with the other one) are automatically masked out. In order to use
these bits you have to set the watchpoint by writing the ICE registers directly.
Syntax
setWP <Addr> [<AccessType>] [<Size>] [<Data> [<DataMask> [<AddrMask>]]]
Parameter Meaning
Addr Address to be watchpointed.
Accesstype
Specifies the control data on which data event has been set:
R: read access
W: write access
Size Valid values: S8 | S16 | S32
Specifies to monitor an n-bit access width at the selected address.
Data Specifies the Data on which watchpoint has been set.
DataMask
Specifies data mask used for comparison. Bits set to 1 are masked
out, so not taken into consideration during data comparison. Please
note that for certain cores not all Bit-Mask combinations are support-
ed by the core-debug logic. On some cores only complete bytes can
be masked out (e.g. PIC32) or similar.
AddrMask
Specifies the address mask used for comparison. Bits set to 1 are
masked out, so not taken into consideration during address compar-
ison. Please note that for certain cores not all Bit-Mask combinations
are supported by the core-debug logic. On some cores only complete
bytes can be masked out (e.g. PIC32) or similar.
Example
setWP 0x20000000 W S8 0xFF
3.2.1.41 sleep
Waits the given time (in milliseconds).
Syntax
sleep <Delay>
Parameter Meaning
Delay Amount of time to sleep in ms.
Example
sleep 200
3.2.1.42 speed
This command sets the speed for communication with the CPU core.
Syntax
speed <Freq>|auto|adaptive
Parameter Meaning
Freq Specifies the interface frequency in kHz.
auto Selects auto detection of the interface speed.
adaptive Selects adaptive clocking as JTAG speed.
J-Link / J-Trace (UM08001) © 2004-2017 SEGGER Microcontroller GmbH & Co. KG
49 CHAPTER 3 J-Link Commander (Command line tool)
Example
speed 4000
speed auto
3.2.1.43 st
This command prints the current hardware status. Prints the current status of TCK, TDI,
TDO, TMS, TRES, TRST and the interface speeds supported by the target. Also shows the
Target Voltage.
Syntax
st
3.2.1.44 step
Target needs to be halted before calling this command. Executes a single step on the target.
The instruction is overstepped even if it is breakpointed. Prints out the disassembly of the
instruction to be stepped.
Syntax
step
3.2.1.45 unlock
This command unlocks a device which has been accidentally locked by malfunction of user
software.
Syntax
unlock <DeviceName>
Parameter Meaning
DeviceName
Name of the device family to unlock. Supported Devices:
LM3Sxxx
Kinetis
EFM32Gxxx
Example
unlock Kinetis
3.2.1.46 usb
Closes any existing connection to J-Link and opens a new one via USB. It is possible to
select a specific J-Link by port number.
Syntax
usb [<Port>]
Parameter Meaning
Port Valid values: 0..3
Example
usb
3.2.1.47 verifybin
Verifies if the specified binary is already in the target memory at the specified address.
J-Link / J-Trace (UM08001) © 2004-2017 SEGGER Microcontroller GmbH & Co. KG

50 CHAPTER 3 J-Link Commander (Command line tool)
Syntax
verifybin <Filename>, <Addr>
Parameter Meaning
Filename Sample bin.
Addr Start address of memory to verify.
Example
verifybin C:\Work\test.bin 0x0000000
3.2.1.48 w1
The command writes one single byte to the target system.
Syntax
w1 [<Zone>:]<Addr>, <Data> (hex)
Parameter Meaning
Zone Name of memory zone to access.
Addr Start address.
Data 8-bits of data to write.
Example
w1 0x10, 0xFF
3.2.1.49 w2
The command writes a unit of 16-bits to the target system.
Syntax
w2 [<Zone>:]<Addr>, <Data> (hex)
Parameter Meaning
Zone Name of memory zone to access.
Addr Start address.
Data 16-bits of data to write.
Example
w2 0x0, 0xFFFF
3.2.1.50 w4
The command writes a unit of 32-bits to the target system.
Syntax
w4 [<Zone>:]<Addr>, <Data> (hex)
Parameter Meaning
Zone Name of memory zone to access.
Addr Start address.
Data 32-bits of data to write.
J-Link / J-Trace (UM08001) © 2004-2017 SEGGER Microcontroller GmbH & Co. KG
51 CHAPTER 3 J-Link Commander (Command line tool)
Example
w4 0x0, 0xAABBCCFF
3.2.1.51 writeAP
Writes to a CoreSight AP register. This command performs a full-qualified write which means
that it tries to write until the write has been accepted or too many WAIT responses have
been received.
Syntax
WriteAP <RegIndex>, <Data32Hex>
Parameter Meaning
RegIndex Index of AP register to write
Data32Hex Data to write
Example
//
// Select AHB-AP and configure it
//
WriteDP 2, 0x00000000 // Select AP[0] (AHB-AP) bank 0
WriteAP 4, 0x23000010 // Auto-increment, Private access, Access size: word}
3.2.1.52 writeDP
Writes to a CoreSight DP register. This command performs a full-qualified write which means
that it tries to write until the write has been accepted or too many WAIT responses have
been received.
Syntax
WriteDP <RegIndex>, <Data32Hex>
Parameter Meaning
RegIndex Index of DP register to write
Data32Hex Data to write
Example
//
// Write DP SELECT register: Select AP 0 bank 15
//
WriteDP 2, 0x000000F0
3.2.1.53 wreg
Writes into a register. The value is written into the register on CPU start.
Syntax
wreg <RegName>, <Data>
Parameter Meaning
RegName Register to write to.
Data Data to write to the specified register.
J-Link / J-Trace (UM08001) © 2004-2017 SEGGER Microcontroller GmbH & Co. KG

52 CHAPTER 3 J-Link Commander (Command line tool)
Example
wreg R14, 0xFF
3.2.2 Command line options
J-Link Commander can be started with different command line options for test and automa-
tion purposes. In the following, the command line options which are available for J-Link
Commander are explained. All command line options are case insensitive.
Command Explanation
-AutoConnect Automatically start the target connect sequence
-CommanderScript Passes a CommandFile to J-Link
-CommandFile Passes a CommandFile to J-Link
-Device Pre-selects the device J-Link Commander shall connect to
-ExitOnError Commander exits after error.
-If Pre-selects the target interface
-IP Selects IP as host interface
-JLinkScriptFile Passes a JLinkScriptFile to J-Link
-JTAGConf Sets IRPre and DRPre
-RTTTelnetPort Sets the RTT Telnetport
-SelectEmuBySN Connects to a J-Link with a specific S/N over USB
-SettingsFile Passes a SettingsFile to J-Link
-Speed Starts J-Link Commander with a given initial speed
3.2.2.1 -AutoConnect
This command can be used to let J-Link Commander automatically start the connect se-
quence for connecting to the target when entering interactive mode.
Syntax
-autoconnect <1|0>
Example
JLink.exe -autoconnect 1
3.2.2.2 -CommanderScript
Similar to -CommandFile.
3.2.2.3 -CommandFile
Selects a command file and starts J-Link Commander in batch mode. The batch mode of
J-Link Commander is similar to the execution of a batch file. The command file is parsed
line by line and one command is executed at a time.
Syntax
-CommandFile <CommandFilePath>
Example
See Using command files on page 55.
J-Link / J-Trace (UM08001) © 2004-2017 SEGGER Microcontroller GmbH & Co. KG
53 CHAPTER 3 J-Link Commander (Command line tool)
3.2.2.4 -Device
Pre-selects the device J-Link Commander shall connect to. For some devices, J-Link already
needs to know the device at the time of connecting, since special handling is required for
some of them. For a list of all supported device names, please refer to List of supported
target devices .
Syntax
-Device <DeviceName>
Example
JLink.exe -Device STM32F103ZE
3.2.2.5 -ExitOnError
Similar to the exitonerror command.
3.2.2.6 -If
Selects the target interface J-Link shall use to connect to the target. By default, J-Link
Commander first tries to connect to the target using the target interface which is currently
selected in the J-Link firmware. If connecting fails, J-Link Commander goes through all
target interfaces supported by the connected J-Link and tries to connect to the device.
Syntax
-If <TargetInterface>
Example
JLink.exe -If SWD
Additional information
Currently, the following target interfaces are supported:
• JTAG
• SWD
3.2.2.7 -IP
Selects IP as host interface to connect to J-Link. Default host interface is USB.
Syntax
-IP <IPAddr>
Example
JLink.exe -IP 192.168.1.17
Additional information
To select from a list of all available emulators on Ethernet, please use * as <IPAddr> .
3.2.2.8 -JLinkScriptFile
Passes the path of a J-Link script file to the J-Link Commander. J-Link scriptfiles are mainly
used to connect to targets which need a special connection sequence before communication
with the core is possible. For more information about J-Link script files, please refer to J-
Link Script Files .
J-Link / J-Trace (UM08001) © 2004-2017 SEGGER Microcontroller GmbH & Co. KG
54 CHAPTER 3 J-Link Commander (Command line tool)
Syntax
JLink.exe -JLinkScriptFile <File>
Example
JLink.exe -JLinkScriptFile “C:\My Projects\Default.JLinkScript”
3.2.2.9 -JTAGConf
Passes IRPre and DRPre in order to select a specific device in a JTAG-chain. “-1,-1” can be
used to let J-Link select a device automatically.
Syntax
-JTAGConf <IRPre>,<DRPre>
Example
JLink.exe -JTAGConf 4,1
JLink.exe -JTAGConf -1,-1
3.2.2.10 -SelectEmuBySN
Connect to a J-Link with a specific serial number via USB. Useful if multiple J-Links are
connected to the same PC and multiple instances of J-Link Commander shall run and each
connects to another J-Link.
Syntax
-SelectEmuBySN <SerialNo>
Example
JLink.exe -SelectEmuBySN 580011111
3.2.2.11 -RTTTelnetPort
This command alters the RTT telnet port. Default is 19021.
Syntax
-RTTTelnetPort <Port>
Example
JLink.exe -RTTTelnetPort 9100
3.2.2.12 -SettingsFile
Select a J-Link settings file to be used for the target device. The settings file can contain
all configurable options of the Settings tab in J-Link Control panel.
Syntax
-SettingsFile <PathToFile>
Example
JLink.exe -SettingsFile “C:\Work\settings.txt”
3.2.2.13 -Speed
Starts J-Link Commander with a given initial speed. Available parameters are “adaptive”,
“auto” or a freely selectable integer value in kHz. It is recommended to use either a fixed
speed or, if it is available on the target, adaptive speeds. Default interface speed is 100kHz.
J-Link / J-Trace (UM08001) © 2004-2017 SEGGER Microcontroller GmbH & Co. KG

55 CHAPTER 3 J-Link Commander (Command line tool)
Syntax
-Speed <Speed_kHz>
Example
JLink.exe -Speed 4000
3.2.3 Using command files
J-Link commander can also be used in batch mode which allows the user to use J-Link com-
mander for batch processing and without user interaction. Please do not confuse command
file with J-Link script files (please refer to J-Link script files for more information about J-
Link script files). When using J-Link commander in batch mode, the path to a command
file is passed to it. The syntax in the command file is the same as when using regular
commands in J-Link commander (one line per command). SEGGER recommends to always
pass the device name via command line option due some devices need special handling on
connect/reset in order to guarantee proper function.
Example
JLink.exe -device STM32F103ZE -CommanderScript C:\CommandFile.jlink
Contents of CommandFile.jlink:
si 1
speed 4000
r
h
loadbin C:\\firmware.bin,0x08000000
J-Link / J-Trace (UM08001) © 2004-2017 SEGGER Microcontroller GmbH & Co. KG
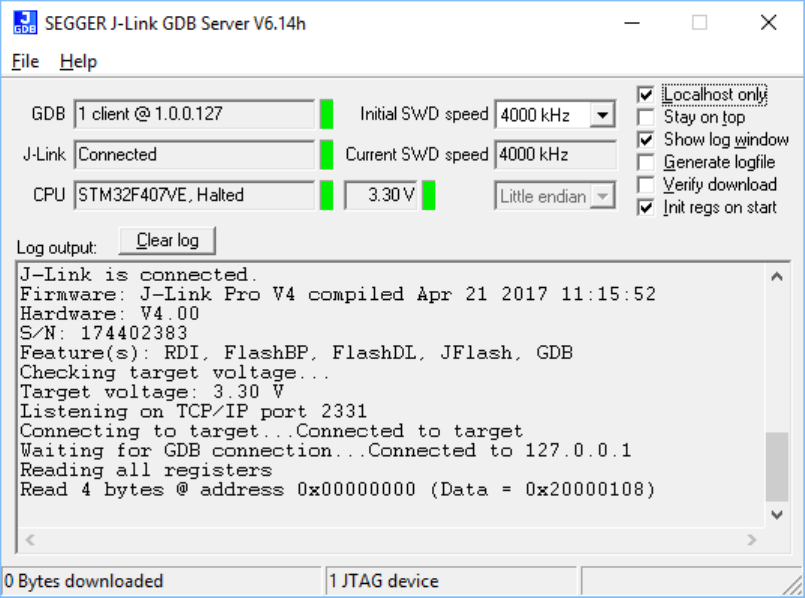
56 CHAPTER 3 J-Link GDB Server
3.3 J-Link GDB Server
The GNU Project Debugger (GDB) is a freely available and open source debugger. It can
be used in command line mode, but is also integrated in many IDEs like emIDE or Eclipse.
J-Link GDB Server is a remote server for GDB making it possible for GDB to connect to and
communicate with the target device via J-Link. GDB Server and GDB communicate via a
TCP/IP connection, using the standard GDB remote protocol. GDB Server receives the GDB
commands, does the J-Link communication and replies with the answer to GDB.
With J-Link GDB Server debugging in ROM and Flash of the target device is possible and the
Unlimited Flash Breakpoints can be used. It also comes with some functionality not directly
implemented in the GDB. These can be accessed via monitor commands, sent directly via
GDB, too.
J-Link GDB Server
The GNU Project Debugger (GDB) is a freely available debugger, distributed under the terms
of the GPL. The latest Unix version of the GDB is freely available from the GNU committee
under: http://www.gnu.org/software/gdb/download/
J-Link GDB Server is distributed free of charge.
3.3.1 J-Link GDB Server CL (Windows, Linux, Mac)
J-Link GDB Server CL is a commandline-only version of the GDB Server. The command
line version is part of the Software and Documentation Package and also included in the
Linux and MAC versions.
Except for the missing GUI, J-Link GDB Server CL is identical to the normal version. All
sub-chapters apply to the command line version, too.
3.3.2 Debugging with J-Link GDB Server
With J-Link GDB Server programs can be debugged via GDB directly on the target device
like a normal application. The application can be loaded into RAM or flash of the device.
Before starting GDB Server make sure a J-Link and the target device are connected.
J-Link / J-Trace (UM08001) © 2004-2017 SEGGER Microcontroller GmbH & Co. KG
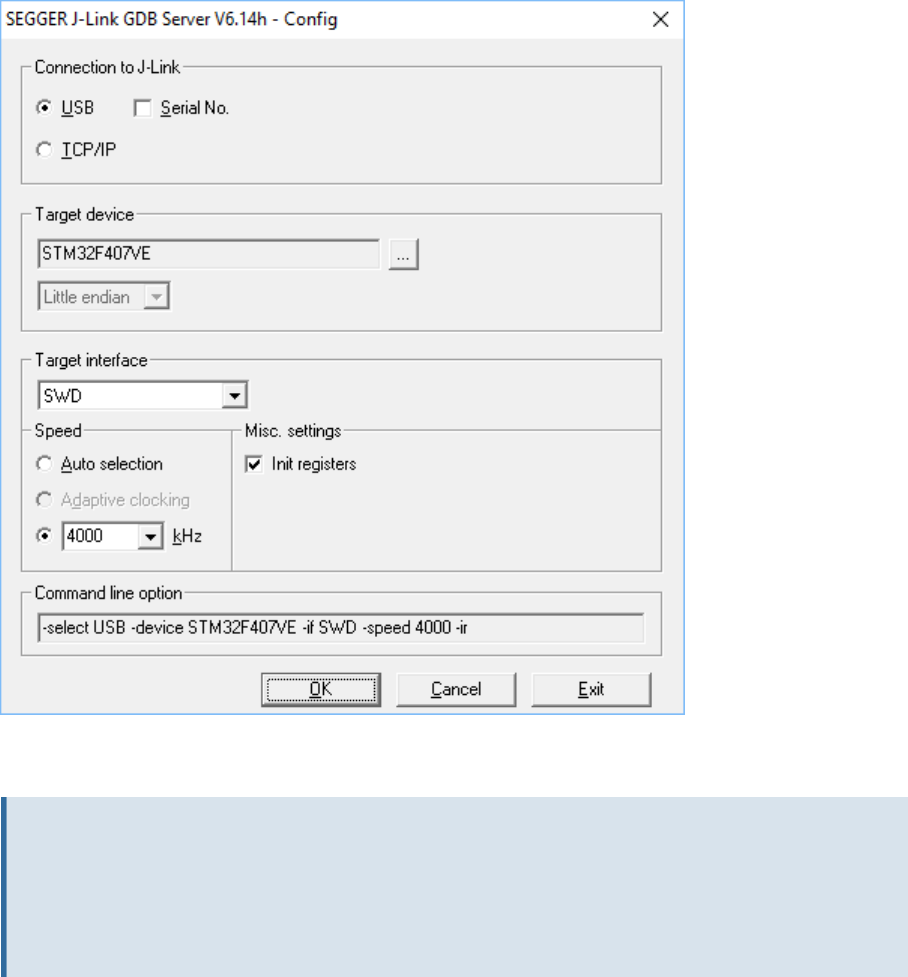
57 CHAPTER 3 J-Link GDB Server
3.3.2.1 Setting up GDB Server GUI version
The GUI version of GDB Server is part of the Windows J-Link Software Package
(JLinkGDBServer.exe).
When starting GDB Server a configuration dialog pops up, letting you select the needed
configurations to connect to J-Link and the target.
J-Link GDB Server: Configuration
All configurations can optionally be given in the command line options.
Note
To make sure the connection to the target device can be established correctly, the
device, as well as the interface and interface speed have to be given on start of GDB
Server, either via command line options or the configuration dialog. If the target device
option (-device) is given, the configuration dialog will not pop up.
3.3.2.2 Setting up GDB Server CL version
The command line version of GDB Server is part of the J-Link Software Package for all
supported platforms. On Windows its name is JLinkGDBServerCL.exe, on Linux and Mac
it is JLinkGDBServer.
Starting GDB Server on Windows
To start GDB Server CL on Windows, open the ’Run’ prompt (Windows-R) or a command
terminal (cmd) and enter
<PathToJLinkSoftware>\JLinkGDBServerCL.exe <CommandLineOptions>.
J-Link / J-Trace (UM08001) © 2004-2017 SEGGER Microcontroller GmbH & Co. KG
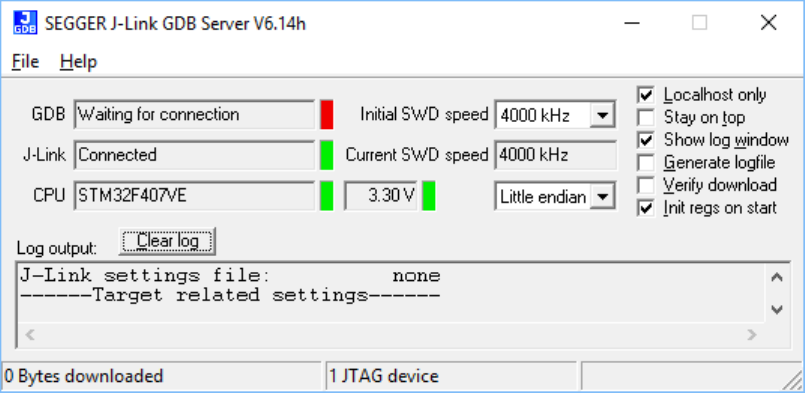
58 CHAPTER 3 J-Link GDB Server
Starting GDB Server on Linux / Mac
To start GDB Server CL on Linux / Mac, open a terminal and call JLinkGDBServer <Com-
mandLineOptions>
Command Line Options
When using GDB Server CL, at least the mandatory command line options have to be
given. Additional command line options can be given to change the default behavior of GDB
Server. For more information about the available command line options, please refer to
Command line options .
3.3.2.3 GDB Server user interface
The J-Link GDB Server’s user interface shows information about the debugging process and
the target and allows to configure some settings during execution.
J-Link GDB Server: UI
It shows following information:
• The IP address of host running debugger.
• Connection status of J-Link.
• Information about the target core.
• Measured target voltage.
• Bytes that have been downloaded.
• Status of target.
• Log output of the GDB Server (optional, if Show log window is checked).
• Initial and current target interface speed.
• Target endianness.
These configurations can be made from inside GDB Server:
• Localhost only: If checked only connections from 127.0.0.1 are accepted.
• Stay on top
• Show log window.
• Generate logfile: If checked, a log file with the GDB <-> GDB Server <-> J-Link
communication will be created.
• Verify download: If checked, the memory on the target will be verified after download.
• Init regs on start: If checked, the register values of the target will be set to a reasonable
value before on start of GDB Server.
3.3.2.4 Running GDB from different programs
We assume that you already have a solid knowledge of the software tools used
for building your application (assembler, linker, C compiler) and especially the
debugger and the debugger frontend of your choice. We do not answer questions
about how to install and use the chosen toolchain.
J-Link / J-Trace (UM08001) © 2004-2017 SEGGER Microcontroller GmbH & Co. KG
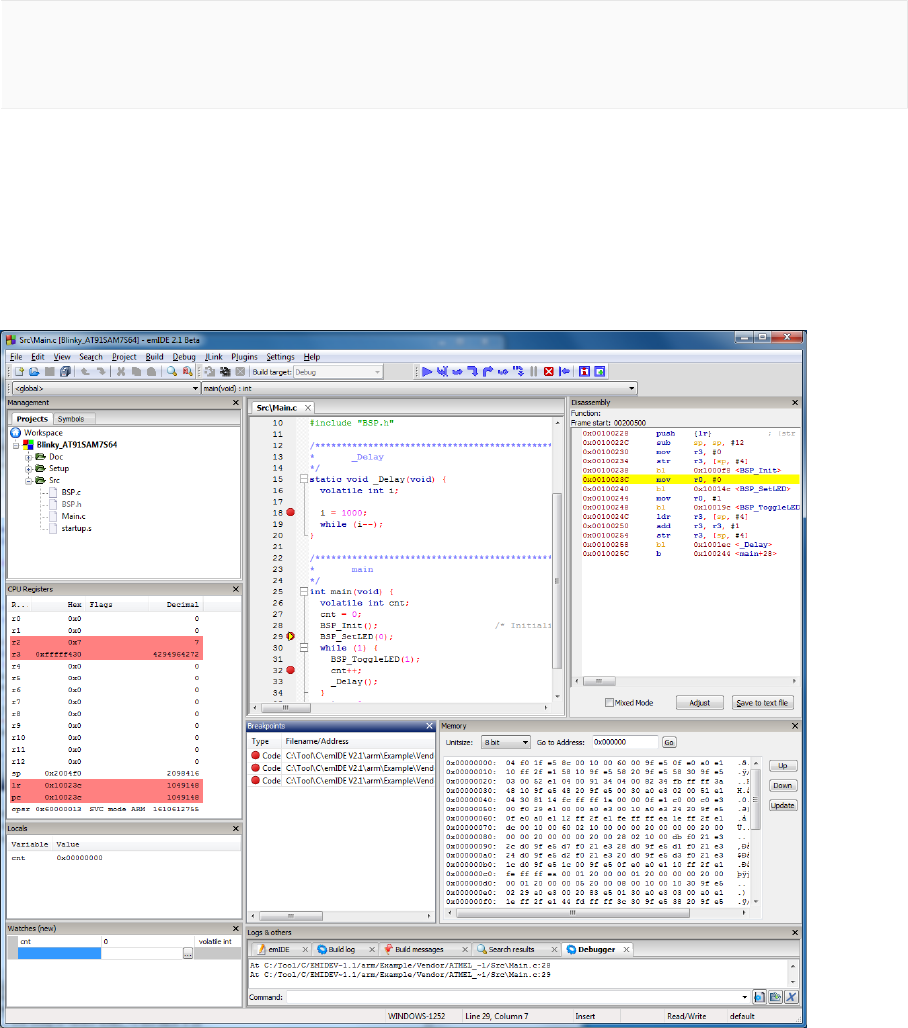
59 CHAPTER 3 J-Link GDB Server
GDB is included in many IDEs and most commonly used in connection with the GCC compiler
toolchain. This chapter shows how to configure some programs to use GDB and connect
to GDB Server. For more information about any program using GDB, please refer to its
user manual.
emIDE
emIDE is a full-featured, free and open source IDE for embedded development including
support for debugging with J-Link.
To connect to GDB Server with emIDE, the GDB Server configurations need to be set in
the project options at Project -> Properties… -> Debugger. Select the target device you
are using, the target connection, endianness and speed and enter the additional GDB start
commands. The typically required GDB commands are:
#Initially reset the target
monitor reset
#Load the application
load
Other commands to set up the target (e.g. Set PC to RAM, initialize external flashes) can
be entered here, too.
emIDE will automatically start GDB Server on start of the debug session. If it does not,
or an older version of GDB Server starts, in emIDE click on JLink -> Run the JLink-plugin
configuration.
The screenshot below shows a debug session in IDE. For download and more information
about emIDE, please refer to http://emide.org .
Console
GDB can be used stand-alone as a console application.
J-Link / J-Trace (UM08001) © 2004-2017 SEGGER Microcontroller GmbH & Co. KG

60 CHAPTER 3 J-Link GDB Server
To connect GDB to GDB Server enter target remote localhost:2331 into the running
GDB. Within GDB all GDB commands and the remote monitor commands are available. For
more information about debugging with GDB refer to its online manual available at http://
sourceware.org/gdb/current/onlinedocs/gdb/ .
A typical startup of a debugging session can be like:
(gdb) file C:/temp/Blinky.elf
Reading symbols from C:/temp/Blinky.elf...done.
(gdb) target remote localhost:2331
Remote debugging using localhost:2331
0x00000000 in ?? ()
(gdb) monitor reset
Resetting target
(gdb) load
Loading section .isr_vector, size 0x188 lma 0x8000000
Loading section .text, size 0x568 lma 0x8000188
Loading section .init_array, size 0x8 lma 0x80006f0
Loading section .fini_array, size 0x4 lma 0x80006f8
Loading section .data, size 0x428 lma 0x80006fc
Start address 0x8000485, load size 2852
Transfer rate: 146 KB/sec, 570 bytes/write.
(gdb) break main
Breakpoint 1 at 0x800037a: file Src\main.c, line 38.
(gdb) continue
Continuing.
Breakpoint 1, main () at Src\main.c:38
38 Cnt = 0;
(gdb)
Eclipse (CDT)
Eclipse is an open source platform-independent software framework, which has typically
been used to develop integrated development environment (IDE). Therefore Eclipse can be
used as C/C++ IDE, if you extend it with the CDT plug-in ( http://www.eclipse.org/cdt/ ).
CDT means “C/C++ Development Tooling” project and is designed to use the GDB as default
debugger and works without any problems with the GDB Server. Refer to http://www.e-
clipse.org for detailed information about Eclipse.
Note
We only support problems directly related to the GDB Server. Problems and questions
related to your remaining toolchain have to be solved on your own.
3.3.3 Supported remote (monitor) commands
J-Link GDB Server comes with some functionalities which are not part of the standard GDB.
These functions can be called either via a gdbinit file passed to GDB Server or via monitor
commands passed directly to GDB, forwarding them to GDB Server.
To indicate to GDB to forward the command to GDB Server ’monitor’ has to be prepended
to the call. For example a reset can be triggered in the gdbinit file with “reset” or via GDB
with “monitor reset”.
The following remote commands are available:
Remote command Explanation
clrbp Removes an instruction breakpoint.
cp15 Reads or writes from/to cp15 register.
device Select the specified target device.
J-Link / J-Trace (UM08001) © 2004-2017 SEGGER Microcontroller GmbH & Co. KG

61 CHAPTER 3 J-Link GDB Server
Remote command Explanation
DisableChecks Do not check if an abort occurred after memory read
(ARM7/9 only).
EnableChecks Check if an abort occurred after memory read (ARM7/9 on-
ly).
flash breakpoints Enables/Disables flash breakpoints.
getargs Get the arguments for the application.
go Starts the target CPU.
halt Halts the target CPU.
jtagconf Configures a JTAG scan chain with multiple devices on it.
memU8 Reads or writes a byte from/to given address.
memU16 Reads or writes a halfword from/to given address.
memU32 Reads or writes a word from/to given address.
reg Reads or writes from/to given register.
regs Reads and displays all CPU registers.
reset Resets and halts the target CPU.
semihosting breakOn-
Error Enable or disable halting the target on semihosting error.
semihosting enable Enables semihosting.
semihosting IOClient Set semihosting I/O to be handled via Telnet port or GDB.
semihosting ARMSWI Sets the SWI number used for semihosting in ARM mode.
semihosting ThumbSWI Sets the SWI number used for semihosting in thumb mode.
setargs Set the arguments for the application.
setbp Sets an instruction breakpoint at a given address.
sleep Sleeps for a given time period.
speed Sets the JTAG speed of J-Link / J-Trace.
step Performs one or more single instruction steps.
SWO DisableTarget Undo target configuration for SWO and disable it in J-Link.
SWO EnableTarget Configure target for SWO and enable it in J-Link.
SWO GetMaxSpeed Prints the maximum supported SWO speed for J-Link and
Target CPU.
SWO GetSpeedInfo Prints the available SWO speed and its minimum divider.
waithalt Waits for target to halt code execution.
wice Writes to given IceBreaker register.
The Following remote commands are deprecated and only available for backward compat-
ibility:
Remote command Explanation
device Selects the specified target device.
Note: Use command line option -device instead.
interface Selects the target interface.
Note: Use command line option -if instead.
speed Sets the JTAG speed of J-Link / J-Trace.
Note: For the initial connection speed, use command line
option -speed instead.
Note
J-Link / J-Trace (UM08001) © 2004-2017 SEGGER Microcontroller GmbH & Co. KG

62 CHAPTER 3 J-Link GDB Server
The remote commands are case-insensitive.
Note
Optional parameters are set into square brackets.
Note
The examples are described as follows:
Lines starting with ’#’ are comments and not used in GDB / GDB Server.
Lines starting with ’>’ are input commands from the GDB.
Lines starting with ’<’ is the output from GDB Server as printed in GDB.
3.3.3.1 clrbp
Removes an instruction breakpoint, where <BPHandle> is the handle of breakpoint to be
removed. If no handle is specified this command removes all pending breakpoints.
Syntax
ClrBP [<BPHandle>]
or
ci [<BPHandle>]
Example
> monitor clrbp 1
> monitor ci 1
3.3.3.2 cp15
Reads or writes from/to cp15 register. If <data> is specified, this command writes the data
to the cp15 register. Otherwise this command reads from the cp15 register. For further
information please refer to the ARM reference manual.
Syntax
cp15 <CRn>, <CRm>, <op1>, <op2> [= <data>]
The parameters of the function are equivalent to the MCR instructions described in the ARM
documents.
Example
#Read:
> monitor cp15 1, 2, 6, 7
< Reading CP15 register (1,2,6,7 = 0x0460B77D)
#Write:
> monitor cp15 1, 2, 6, 7 = 0xFFFFFFFF
3.3.3.3 device
Note
Deprecated. Use command line option -device instead.
J-Link / J-Trace (UM08001) © 2004-2017 SEGGER Microcontroller GmbH & Co. KG

63 CHAPTER 3 J-Link GDB Server
Selects the specified target device. This is necessary for the connection and some special
handling of the device.
Note
The device should be selected via commandline option -device when starting GDB
Server.
Syntax
device <DeviceName>
Example
> monitor device STM32F417IG
< Selecting device: STM32F417IG
3.3.3.4 DisableChecks
Disables checking if a memory read caused an abort (ARM7/9 devices only). On some CPUs
during the init sequence for enabling access to the internal memory (for example on the
TMS470) some dummy reads of memory are required which will cause an abort as long as
the access-init is not completed.
Syntax
DisableChecks
3.3.3.5 EnableChecks
Enables checking if a memory read caused an abort (ARM7/9 devices only). On some CPUs
during the init sequence for enabling access to the internal memory (for example on the
TMS470) some dummy reads of memory are required which will cause an abort as long as
the access-init is not completed. The default state is: Checks enabled.
Syntax
EnableChecks
3.3.3.6 flash breakpoints
This command enables/disables the Flash Breakpoints feature. By default Flash Breakpoints
are enabled and can be used for evaluation.
Syntax
monitor flash breakpoints = <Value>
Example
#Disable Flash Breakpoints:
> monitor flash breakpoints = 0
< Flash breakpoints disabled
#Enable Flash Breakpoins:
> monitor flash breakpoints = 1
< Flash breakpoints enabled
3.3.3.7 getargs
Get the currently set argument list which will be given to the application when calling
semihosting command SYS_GET_CMDLINE (0x15). The argument list is given as one string.
J-Link / J-Trace (UM08001) © 2004-2017 SEGGER Microcontroller GmbH & Co. KG

64 CHAPTER 3 J-Link GDB Server
Syntax
getargs
Example
#No arguments set via setargs:
> monitor getargs
< No arguments.
#Arguments set via setargs:
> monitor getargs
< Arguments: test 0 1 2 arg0=4
3.3.3.8 go
Starts the target CPU.
Syntax
go
Example
> monitor go
3.3.3.9 halt
Halts the target CPU.
Syntax
halt
Example
> monitor halt
3.3.3.10 interface
Note
Deprecated. Use command line option -if instead.
Selects the target interface used by J-Link / J-Trace.
Syntax
interface <InterfaceIdentifier>
3.3.3.11 jtagconf
Configures a JTAG scan chain with multiple devices on it. <IRPre> is the sum of IRLens of all
devices closer to TDI, where IRLen is the number of bits in the IR (Instruction Register) of
one device. <DRPre> is the number of devices closer to TDI. For more detailed information
of how to configure a scan chain with multiple devices please refer to Determining values
for scan chain configuration .
Note
J-Link / J-Trace (UM08001) © 2004-2017 SEGGER Microcontroller GmbH & Co. KG

65 CHAPTER 3 J-Link GDB Server
To make sure the connection to the device can be established correctly, it is recom-
mended to configure the JTAG scan chain via command line options at the start of
GDB Server.
Syntax
jtagconf <IRPre> <DRPre>
Example
#Select the second device, where there is 1 device in front with IRLen 4
> monitor jtagconf 4 1
3.3.3.12 memU8
Reads or writes a byte from/to a given address. If <value> is specified, this command writes
the value to the given address. Otherwise this command reads from the given address.
Syntax
memU8 <address> [= <value>]
Example
#Read:
> monitor memU8 0x50000000
< Reading from address 0x50000000 (Data = 0x04)
#Write:
> monitor memU8 0x50000000 = 0xFF
< Writing 0xFF @ address 0x50000000
3.3.3.13 memU16
Reads or writes a halfword from/to a given address. If <value> is specified, this command
writes the value to the given address. Otherwise this command reads from the given ad-
dress.
Syntax
memU16 <address> [= <value>]
Example
#Read:
> monitor memU16 0x50000000
< Reading from address 0x50000000 (Data = 0x3004)
#Write:
> monitor memU16 0x50000000 = 0xFF00
< Writing 0xFF00 @ address 0x50000000
3.3.3.14 memU32
Reads or writes a word from/to a given address. If <value> is specified, this command writes
the value to the given address. Otherwise this command reads from the given address.
This command is similar to the long command.
Syntax
memU32 <address> [= <value>]
J-Link / J-Trace (UM08001) © 2004-2017 SEGGER Microcontroller GmbH & Co. KG

66 CHAPTER 3 J-Link GDB Server
Example
#Read:
> monitor memU32 0x50000000
< Reading from address 0x50000000 (Data = 0x10023004)
#Write:
> monitor memU32 0x50000000 = 0x10023004
< Writing 0x10023004 @ address 0x50000000
3.3.3.15 reg
Reads or writes from/to given register. If <value> is specified, this command writes the
value into the given register. If <address> is specified, this command writes the memory
content at address <address> to register <RegName>. Otherwise this command reads the
given register.
Syntax
reg <RegName> [= <value>]
or
reg <RegName> [= (<address>)]
Example
#Write value to register:
> monitor reg pc = 0x00100230
< Writing register (PC = 0x00100230)
#Write value from address to register:
> monitor reg r0 = (0x00000040)
< Writing register (R0 = 0x14813004)
#Read register value:
> monitor reg PC
< Reading register (PC = 0x00100230)
3.3.3.16 regs
Reads all CPU registers.
Syntax
regs
Example
> monitor regs
< PC = 00100230, CPSR = 20000013 (SVC mode, ARM)
R0 = 14813004, R1 = 00000001, R2 = 00000001, R3 = 000003B5
R4 = 00000000, R5 = 00000000, R6 = 00000000, R7 = 00000000
USR: R8 =00000000, R9 =00000000, R10=00000000, R11 =00000000, R12 =00000000
R13=00000000, R14=00000000
FIQ: R8 =00000000, R9 =00000000, R10=00000000, R11 =00000000, R12 =00000000
R13=00200000, R14=00000000, SPSR=00000010
SVC: R13=002004E8, R14=0010025C, SPSR=00000010
ABT: R13=00200100, R14=00000000, SPSR=00000010
IRQ: R13=00200100, R14=00000000, SPSR=00000010
UND: R13=00200100, R14=00000000, SPSR=00000010
J-Link / J-Trace (UM08001) © 2004-2017 SEGGER Microcontroller GmbH & Co. KG

67 CHAPTER 3 J-Link GDB Server
3.3.3.17 reset
Resets and halts the target CPU. Make sure the device is selected prior to using this com-
mand to make use of the correct reset strategy.
Note
There are different reset strategies for different CPUs. Moreover, the reset strategies
which are available differ from CPU core to CPU core. J-Link can perform various reset
strategies and always selects the best fitting strategy for the selected device.
Syntax
reset
Example
> monitor reset
< Resetting target
3.3.3.18 semihosting breakOnError
Enables or disables halting the target at the semihosting breakpoint / in SVC handler if an
error occurred during a semihosting command, for example a bad file handle for SYS_WRITE.
The GDB Server log window always shows a warning in these cases. breakOnError is dis-
abled by default.
Syntax
semihosting breakOnerror <Value>
Example
#Enable breakOnError:
> monitor semihosting breakOnError 1
3.3.3.19 semihosting enable
Enables semihosting with the specified vector address. If no vector address is specified,
the SWI vector (at address 0x8) will be used. GDBServer will output semihosting terminal
data from the target via a separate connection on port 2333. Some IDEs already establish
a connection automatically on this port and show terminal data in a specific window in the
IDE. For IDEs which do not support semihosting terminal output directly, the easiest way
to view semihosting output is to open a telnet connection to the GDBServer on port 2333.
The connection on this port can be opened all the time as soon as GDBServer is started,
even before this remote command is executed.
Syntax
semihosting enable [<VectorAddr>]
Example
> monitor semihosting enable
< Semihosting enabled (VectorAddr = 0x08)
3.3.3.20 semihosting IOClient
GDB itself can handle (file) I/O operations, too. With this command it is selected whether
to print output via TELNET port (2333), GDB, or both.
J-Link / J-Trace (UM08001) © 2004-2017 SEGGER Microcontroller GmbH & Co. KG

68 CHAPTER 3 J-Link GDB Server
<ClientMask> is
• 1 for TELNET Client (Standard port 2333) (Default)
• 2 for GDB Client
• or 3 for both (Input via GDB Client)
Syntax
semihosting IOClient <ClientMask>
Example
#Select TELNET port as output source
> monitor semihosting ioclient 1
< Semihosting I/O set to TELNET Client
#Select GDB as output source
> monitor semihosting ioclient 2
< Semihosting I/O set to GDB Client
#Select TELNET port and GDB as output source
> monitor semihosting ioclient 3
< Semihosting I/O set to TELNET and GDB Client
3.3.3.21 semihosting ARMSWI
Sets the SWI number used for semihosting in ARM mode. The default value for the ARMSWI
is 0x123456.
Syntax
semihosting ARMSWI <Value>
Example
> monitor semihosting ARMSWI 0x123456
< Semihosting ARM SWI number set to 0x123456
3.3.3.22 semihosting ThumbSWI
Sets the SWI number used for semihosting in thumb mode. The default value for the Thum-
bSWI is 0xAB
Syntax
semihosting ThumbSWI <Value>
Example
> monitor semihosting ThumbSWI 0xAB
< Semihosting Thumb SWI number set to 0xAB
3.3.3.23 setargs
Set arguments for the application, where all arguments are in one <ArgumentString> sep-
arated by whitespaces. The argument string can be gotten by the application via semihost-
ing command SYS_GET_CMDLINE (0x15). Semihosting has to be enabled for getting the ar-
gumentstring (see semihosting enable ). “monitor setargs” can be used before enabling
semihosting. The maximum length for <ArgumentString> is 512 characters.
Syntax
setargs <ArgumentString>
J-Link / J-Trace (UM08001) © 2004-2017 SEGGER Microcontroller GmbH & Co. KG

69 CHAPTER 3 J-Link GDB Server
Example
> monitor setargs test 0 1 2 arg0=4
< Arguments: test 0 1 2 arg0=4
3.3.3.24 setbp
Sets an instruction breakpoint at the given address, where <Mask> can be 0x03 for ARM
instruction breakpoints (Instruction width 4 Byte, mask out lower 2 bits) or 0x01 for THUMB
instruction breakpoints (Instruction width 2 Byte, mask out lower bit). If no mask is given,
an ARM instruction breakpoint will be set.
Syntax
setbp <Addr> [<Mask>]
Example
#Set a breakpoint (implicit for ARM instructions)
> monitor setbp 0x00000000
#Set a breakpoint on a THUMB instruction
> monitor setbp 0x00000100 0x01
3.3.3.25 sleep
Sleeps for a given time, where <Delay> is the time period in milliseconds to delay. While
sleeping any communication is blocked until the command returns after the given period.
Syntax
sleep <Delay>
Example
> monitor sleep 1000
< Sleep 1000ms
3.3.3.26 speed
Note
Deprecated. For setting the initial connection speed, use command line option -speed
instead.
Sets the JTAG speed of J-Link / J-Trace. Speed can be either fixed (in kHz), automatic
recognition or adaptive. In general, Adaptive is recommended if the target has an RTCK
signal which is connected to the corresponding RTCK pin of the device (S-cores only). For
detailed information about the different modes, refer to JTAG Speed . The speed has to be
set after selecting the interface, to change it from its default value.
Syntax
speed <kHz>|auto|adaptive
Example
> monitor speed auto
< Select auto target interface speed (8000 kHz)
> monitor speed 4000
J-Link / J-Trace (UM08001) © 2004-2017 SEGGER Microcontroller GmbH & Co. KG

70 CHAPTER 3 J-Link GDB Server
< Target interface speed set to 4000 kHz
> monitor speed adaptive
< Select adaptive clocking instead of fixed JTAG speed
3.3.3.27 step
Performs one or more single instruction steps, where <NumSteps> is the number of in-
struction steps to perform. If <NumSteps> is not specified only one instruction step will
be performed.
Syntax
step [<NumSteps>]
or
si [<NumSteps>]
Example
> monitor step 3
3.3.3.28 SWO DisableTarget
Disables the output of SWO data on the target (Undoes changes from SWO EnableTarget)
and stops J-Link to capture it.
Syntax
SWO DisableTarget <PortMask[0x01-0xFFFFFFFF]>
Example
#Disable capturing SWO from stimulus ports 0 and 1
> monitor SWO DisableTarget 3
< SWO disabled successfully.
3.3.3.29 SWO EnableTarget
Configures the target to be able to output SWO data and starts J-Link to capture it. CPU
and SWO frequency can be 0 for auto-detection.
If CPUFreq is 0, J-Link will measure the current CPU speed.
If SWOFreq is 0, J-Link will use the highest available SWO speed for the selected / measured
CPU speed.
Note
CPUFreq has to be the speed at which the target will be running when doing SWO. If
the speed is different from the current speed when issuing CPU speed auto-detection,
getting SWO data might fail. SWOFreq has to be a quotient of the CPU and SWO speeds
and their prescalers. To get available speed, use SWO GetSpeedInfo. PortMask can
be a decimal or hexadecimal Value. Values starting with the Prefix “0x” are handled
hexadecimal.
Syntax
SWO EnableTarget <CPUFreq[Hz]> <SWOFreq[Hz]> <PortMask[0x01-0xFFFFFFFF]
<Mode[0]>
J-Link / J-Trace (UM08001) © 2004-2017 SEGGER Microcontroller GmbH & Co. KG

71 CHAPTER 3 J-Link GDB Server
Example
#Configure SWO for stimulus port 0, measure CPU frequency and calculate SWO
frequency
> monitor SWO EnableTarget 0 0 1 0
< SWO enabled successfully.
#Configure SWO for stimulus ports 0-2, fixed SWO frequency and measure CPU
frequency
> monitor SWO EnableTarget 0 1200000 5 0
< SWO enabled successfully.
#Configure SWO for stimulus ports 0-255, fixed CPU and SWO frequency
> monitor SWO EnableTarget 72000000 6000000 0xFF 0
< SWO enabled successfully.
3.3.3.30 SWO GetMaxSpeed
Prints the maximum SWO speed supported by and matching both, J-Link and the target
CPU frequency.
Syntax
SWO GetMaxSpeed <CPUFrequency [Hz]>
Example
#Get SWO speed for 72MHz CPU speed
> monitor SWO GetMaxSpeed 72000000
< Maximum supported SWO speed is 6000000 Hz.
3.3.3.31 SWO GetSpeedInfo
Prints the base frequency and the minimum divider of the connected J-Link. With this
information, the available SWO speeds for J-Link can be calculated and the matching one
for the target CPU frequency can be selected.
Syntax
SWO GetSpeedInfo
Example
> monitor SWO GetSpeedInfo
< Base frequency: 60000000Hz, MinDiv: 8
# Available SWO speeds for J-Link are: 7.5MHz, 6.66MHz, 6MHz, ...
3.3.3.32 waithalt
Waits for target to halt code execution, where <Timeout> is the maximum time period in
milliseconds to wait.
Syntax
waithalt <Timeout>
or
wh <Timeout>
Example
#Wait for halt with a timeout of 2 seconds
J-Link / J-Trace (UM08001) © 2004-2017 SEGGER Microcontroller GmbH & Co. KG
72 CHAPTER 3 J-Link GDB Server
> monitor waithalt 2000
3.3.3.33 wice
Writes to given IceBreaker register, where <value> is the data to write.
Syntax
wice <RegIndex> <value>
or
rmib <RegIndex> <value>
Example
> monitor wice 0x0C 0x100
3.3.4 SEGGER-specific GDB protocol extensions
J-Link GDB Server implements some functionality which are not part of the standard GDB
remote protocol in general query packets. These SEGGER-specific general query packets
can be sent to GDB Server on the low-level of GDB, via maintenance commands, or with a
custom client connected to GDB Server. General query packets start with a ’q’. SEGGER-spe-
cific general queries are followed by the identifier ’Segger’ plus the command group, the
actual command and its parameters. Following SEGGER-specific general query packets are
available:
Query Packet Explanation
qSeggerSTRACE:config Configure STRACE for usage.
qSeggerSTRACE:start Start STRACE.
qSeggerSTRACE:stop Stop STRACE.
qSeggerSTRACE:read Read STRACE data.
qSeggerSWO:start Starts collecting SWO data.
qSeggerSWO:stop Stops collecting SWO data.
qSeggerSWO:read Reads data from SWO buffer.
qSeggerSWO:GetNumBytes Returns the SWO buffer status.
qSeggerSWO:GetSpeedInfo Returns info about supported speeds.
3.3.4.1 qSeggerSTRACE:config
Configures STRACE for usage.
Note
For more information please refer to UM08002 (J-Link SDK user guide), chapter
STRACE .
Syntax
qSeggerSTRACE:config:<ConfigString>
Parameter Meaning
ConfigString String containing the configuration data separating settings by ’;’.
J-Link / J-Trace (UM08001) © 2004-2017 SEGGER Microcontroller GmbH & Co. KG
73 CHAPTER 3 J-Link GDB Server
Response
<ReturnValue>
ReturnValue is a 4 Byte signed integer.
Value Meaning
ReturnValue ≥ 0 O.K.
<0 Error.
Note
ReturnValue is hex-encoded.
Return value 0 is “00000000”, return value -1 is “FFFFFFFF”.
3.3.4.2 qSeggerSTRACE:start
Starts capturing of STRACE data.
Note
For more information please refer to UM08002 (J-Link SDK user guide), chapter
STRACE .
Syntax
qSeggerSTRACE:start
Response
<ReturnValue>
ReturnValue is a 4 Byte signed integer.
Value Meaning
ReturnValue ≥ 0 O.K.
<0 Error.
Note
ReturnValue is hex-encoded.
Return value 0 is “00000000”, return value -1 is “FFFFFFFF”.
3.3.4.3 qSeggerSTRACE:stop
Stops capturing of STRACE data.
Note
For more information please refer to UM08002 (J-Link SDK user guide), chapter
STRACE .
Syntax
qSeggerSTRACE:stop
Response
<ReturnValue>
ReturnValue is a 4 Byte signed integer.
J-Link / J-Trace (UM08001) © 2004-2017 SEGGER Microcontroller GmbH & Co. KG
74 CHAPTER 3 J-Link GDB Server
Value Meaning
ReturnValue ≥ 0 O.K.
<0 Error.
Note
ReturnValue is hex-encoded.
Return value 0 is “00000000”, return value -1 is “FFFFFFFF”.
3.3.4.4 qSeggerSTRACE:read
Reads the last recently called instruction addresses. The addresses are returned LIFO,
meaning the last recent address is returned first.
Note
For more information please refer to UM08002 (J-Link SDK user guide), chapter
STRACE .
Syntax
qSeggerSTRACE:read:<NumItems>
Parameter Meaning
NumItems Maximum number of trace data (addresses) to be read. Hexadecimal.
Response
<ReturnValue>[<Item0><Item1>…] ReturnValue is a 4 Byte signed integer.
Value Meaning
ReturnValue ≥ 0 Number of items read.
<0 Error.
Note
ReturnValue and ItemN are hex-encoded.
e.g. 3 Items read: 0x08000010, 0x08000014, 0x08000018
Response will be: 00000003080000100800001408000018
3.3.4.5 qSeggerSWO:start
Starts collecting SWO data with the desired interface speed. The target is not being touched
in any way, therefore you are responsible for doing the necessary target setup afterwards.
Syntax
qSeggerSWO:start:<Enc>:<Freq>
Parameter Meaning
Enc Encoding type, only 0 (“UART encoding”) is allowed. Hexadecimal.
Freq The desired interface speed. Hexadecimal.
Response
<ReturnValue>
ReturnValue is “OK” or empty on error.
J-Link / J-Trace (UM08001) © 2004-2017 SEGGER Microcontroller GmbH & Co. KG

75 CHAPTER 3 J-Link GDB Server
3.3.4.6 qSeggerSWO:stop
Stops collecting SWO data and returns the remaining bytes to be read from the buffer.
Syntax
qSeggerSWO:stop
Response
<ReturnValue>
ReturnValue is the hexadecimal number of bytes in the buffer or empty on error.
3.3.4.7 qSeggerSWO:read
Reads the specified number of SWO data bytes from the buffer.
Syntax
qSeggerSWO:read:<NumBytes>
Parameter Meaning
NumBytes Number of bytes to read (up to max. 64MB).
Response
<ReturnValue>
ReturnValue is a hex-encoded string or empty on error.
Note
The function will always return as much data bytes as requested. If more bytes than
available are requested, excessive data has undefined values.
3.3.4.8 qSeggerSWO:GetNumBytes
Returns the amount of available bytes in the buffer.
Syntax
qSeggerSWO:GetNumBytes
Response
<ReturnValue>
ReturnValue is the hexadecimal number of bytes in the buffer or empty on error.
3.3.4.9 qSeggerSWO:GetSpeedInfo
Returns the base frequency and the minimum divider of the connected J-Link. With this
information, the available SWO speeds for J-Link can be calculated and the matching one
for the target CPU frequency can be selected.
Syntax
qSeggerSTRACE:GetSpeedInfo:<Enc>
Parameter Meaning
Enc Encoding type, only 0 (“UART encoding”) is allowed. Hexadecimal.
Response
<BaseFreq>,<MinDiv>
J-Link / J-Trace (UM08001) © 2004-2017 SEGGER Microcontroller GmbH & Co. KG
76 CHAPTER 3 J-Link GDB Server
Value Meaning
BaseFreq Base frequency of the connected J-Link.
MinDiv Minimum divider of the connected J-Link.
ReturnValue is empty on error.
3.3.5 Command line options
There are several command line options available for the GDB Server which allow configu-
ration of the GDB Server before any connection to a J-Link is attempted or any connection
from a GDB client is accepted.
Note
Using GDB Server CL, device, interface, endian and speed are mandatory options
to correctly connect to the target, and should be given before connection via GDB.
Using GDB Server GUI the mandatory options can also be selected in the configuration
dialog.
Command line option Explanation
-device Selects the connected target device.
-endian Selects the device endianness.
-if Selects the interface to connect to the target.
-speed Selects the target communication speed.
Note
Using multiple instances of GDB Server, setting custom values for port, SWOPort and
TelnetPort is necessary.
Command line option Explanation
-port Select the port to listen for GDB clients.
-swoport Select the port to listen for clients for SWO RAW output.
-telnetport Select the port to listen for clients for printf output.
The GDB Server GUI version uses persistent settings which are saved across different in-
stances and sessions of GDB Server. These settings can be toggled via the checkboxes in
the GUI.
Note
GDB Server CL always starts with the settings marked as default.
For GUI and CL, the settings can be changed with following command line options. For all
persistent settings there is a pair of options to enable or disable the feature.
Command line option Explanation
-ir Initialize the CPU registers on start of GDB Server. (Default)
-noir Do not initialize CPU registers on start of GDB Server.
-localhostonly Allow only localhost connections (Windows default)
-nolocalhostonly Allow connections from outside localhost (Linux default)
-logtofile Generate a GDB Server log file.
J-Link / J-Trace (UM08001) © 2004-2017 SEGGER Microcontroller GmbH & Co. KG
77 CHAPTER 3 J-Link GDB Server
Command line option Explanation
-nologtofile Do not generate a GDB Server log file. (Default)
-halt Halt the target on start of GDB Server.
-nohalt Do not halt the target on start of GDB Server. (Default)
-silent Do not show log output.
-nosilent Show log output. (Default)
-stayontop Set the GDB Server GUI to be the topmost window.
-nostayontop Do not be the topmost window. (Default)
-timeout Set the time after which the target has to be connected.
-notimeout Set infinite timeout for target connection.
-vd Verify after downloading.
-novd Do not verify after downloading. (Default)
Following additional command line options are available. These options are temporary for
each start of GDB Server.
Command line option Explanation
-excdbg Enable exception debugging.
-jtagconf Configures a JTAG scan chain with multiple devices on it.
-log Logs the GDB Server communication to a specific file.
-rtos Selects a RTOS plugin (DLL file)
-singlerun Starts GDB Server in single run mode.
-jlinkscriptfile Specifies a J-Link script file.
-select Selects the interface to connect to J-Link (USB/IP).
-settingsfile Selects the J-Link Settings File.
-strict Starts GDB Server in strict mode.
-x Executes a gdb file on first connection.
-xc Executes a gdb file on every connection.
-cpu Selects the CPU core. Deprecated, use -device instead.
3.3.5.1 -cpu
Pre-select the CPU core of the connected device, so the GDB Server already knows the
register set, even before having established a connection to the CPU.
Note
Deprecated, please use -device instead. Anyhow, it does not hurt if this option is set,
too.
Syntax
-CPU <CPUCore>
Example
jlinkgdbserver -CPU ARM7_9
Add. information
The following table lists all valid values for <CPUCore> :
J-Link / J-Trace (UM08001) © 2004-2017 SEGGER Microcontroller GmbH & Co. KG

78 CHAPTER 3 J-Link GDB Server
<CPUCore> Supported CPU cores
CPU_FAMILY_ARM7_9 Pre-select ARM7 and ARM9 as CPU cores.
CPU_FAMILY_CORTEX_A_R Pre-select Cortex-A and Cortex-R as CPU cores.
CPU_FAMILY_CORTEX_M Pre-select Cortex-M as CPU core.
CPU_FAMILY_RX600 Pre-select Renesas RX600 as CPU core.
3.3.5.2 -device
Tells GDBServer to which device J-Link is connected before the connect sequence is actually
performed. It is recommended to use the command line option to select the device instead
of using the remote command since for some devices J-Link already needs to know the
device at the time of connecting to it since some devices need special connect sequences
(e.g. devices with TI ICEPick modules). In such cases, it is not possible to select the device
via remote commands since they are configured after the GDB client already connected
to GDBServer and requested the target registers which already requires a connection to
the target.
Note
Using GDB Server CL this option is mandatory to correctly connect to the target, and
should be given before connection via GDB.
Syntax
-device <DeviceName>
Example
jlinkgdbserver -device AT91SAM7SE256
Add. information
For a list of all valid values for <DeviceName> , please refer to List of supported target
devices .
3.3.5.3 -endian
Sets the endianness of the target where endianness can either be “little” or “big”.
Syntax
-endian <endianness>
Example
jlinkgdbserver -endian little
Note
When using GDB Server CL this option is mandatory to correctly connect to the target,
and should be given before connection via GDB.
3.3.5.4 -if
Selects the target interface which is used by J-Link to connect to the device. The default
value is JTAG.
Syntax
-if <Interface>
J-Link / J-Trace (UM08001) © 2004-2017 SEGGER Microcontroller GmbH & Co. KG

79 CHAPTER 3 J-Link GDB Server
Example
jlinkgdbserver -if SWD
Add. information
Currently, the following values are accepted for <Interface> :
• JTAG
• SWD
• FINE
• 2-wire-JTAG-PIC32
3.3.5.5 -ir
Initializes the CPU register with default values on startup.
Note
For the GUI version, this setting is persistent for following uses of GDB Server until
changed via -noir or the GUI.
Example
jlinkgdbserver -ir
3.3.5.6 -excdbg
Enables exception debugging. Exceptions on ARM CPUs are handled by exception handlers.
Exception debugging makes the debugging of exceptions more user-friendly by passing a
signal to the GDB client and returning to the causative instruction. In order to do this, a
special exception handler is required as follows:
__attribute((naked)) void OnHardFault(void){
__asm volatile (
" bkpt 10 \\n"
" bx lr \\n"
);
}
The signal passed to the GDB client is the immediate value (10 in the example) of the
software breakpoint instruction. <nSteps> specifies, how many instructions need to be
executed until the exception return occurs. In most cases this will be 2 (which is the default
value), if the handler function is set as the exception handler. If it is called indirectly as a
subroutine from the exception handler, there may be more steps required. It is mandatory
to have the function declared with the “naked” attribute and to have the bx lr instruction
immediately after the software breakpoint instruction. Otherwise the software breakpoint
will be treated as a usual breakpoint.
Syntax
-excdbg <nSteps>
Example
jlinkgdbserver -excdbg 4
3.3.5.7 -jtagconf
Configures a JTAG scan chain with multiple devices on it. <IRPre> is the sum of IRLens of all
devices closer to TDI, where IRLen is the number of bits in the IR (Instruction Register) of
one device. <DRPre> is the number of devices closer to TDI. For more detailed information
J-Link / J-Trace (UM08001) © 2004-2017 SEGGER Microcontroller GmbH & Co. KG

80 CHAPTER 3 J-Link GDB Server
of how to configure a scan chain with multiple devices please refer to Determining values
for scan chain configuration .
Syntax
-jtagconf <IRPre>,<DRPre>
Example
#Select the second device, where there is 1 device in front with IRLen 4
jlinkgdbserver -jtagconf 4,1
3.3.5.8 -localhostonly
Starts the GDB Server with the option to listen on localhost only (This means that only TCP/
IP connections from localhost are accepted) or on any IP address. To allow remote debug-
ging (connecting to GDBServer from another PC), deactivate this option. If no parameter
is given, it will be set to 1 (active).
Note
For the GUI version, this setting is persistent for following uses of GDB Server until
changed via command line option or the GUI.
Syntax
-LocalhostOnly <State>
Example
jlinkgdbserver -LocalhostOnly 0 //Listen on any IP address (Linux/MAC default)
jlinkgdbserver -LocalhostOnly 1 //Listen on localhost only (Windows default)
3.3.5.9 -log
Starts the GDB Server with the option to write the output into a given log file. The file
will be created if it does not exist. If it exists the previous content will be removed. Paths
including spaces need to be set between quotes.
Syntax
-log <LogFilePath>
Example
jlinkgdbserver -log “C:\my path\to\file.log”
3.3.5.10 -logtofile
Starts the GDB Server with the option to write the output into a log file. If no file is given
via -log , the log file will be created in the GDB Server application directory.
Note
For the GUI version, this setting is persistent for following uses of GDB Server until
changed via -nologtofile or the GUI.
Syntax
logtofile
J-Link / J-Trace (UM08001) © 2004-2017 SEGGER Microcontroller GmbH & Co. KG

81 CHAPTER 3 J-Link GDB Server
Example
jlinkgdbserver -logtofile
jlinkgdbserver -logtofile -log “C:\my path\to\file.log”
3.3.5.11 -halt
Halts the target after connecting to it on start of GDB Server. For most IDEs this option is
mandatory since they rely on the target to be halted after connecting to GDB Server.
Note
For the GUI version, this setting is persistent for following uses of GDB Server until
changed via -nohalt or the GUI.
Syntax
-halt
Example
jlinkgdbserver -halt
3.3.5.12 -noir
Do not initialize the CPU registers on startup.
Note
For the GUI version, this setting is persistent for following uses of GDB Server until
changed via -ir or the GUI.
Syntax
noir
3.3.5.13 -nolocalhostonly
Starts GDB Server with the option to allow remote connections (from outside localhost).
Same as -localhostonly 0
Note
For the GUI version, this setting is persistent for following uses of GDB Server until
changed via command line option or the GUI.
Syntax
-nolocalhostonly
3.3.5.14 -nologtofile
Starts the GDB Server with the option to not write the output into a log file.
Note
For the GUI version, this setting is persistent for following uses of GDB Server until
changed via -nologtofile or the GUI. When this option is used after -log, no log file
J-Link / J-Trace (UM08001) © 2004-2017 SEGGER Microcontroller GmbH & Co. KG

82 CHAPTER 3 J-Link GDB Server
will be generated, when -log is used after this option, a log file will be generated and
this setting will be overridden.
Syntax
-nologtofile
Example
jlinkgdbserver -nologtofile // Will not generate a log file
jlinkgdbserver -nologtofile -log “C:\pathto\file.log” // Will generate a log
file
jlinkgdbserver -log “C:\pathto\file.log” -nologtofile // Will not generate
a log file
3.3.5.15 -nohalt
When connecting to the target after starting GDB Server, the target is not explicitly halt-
ed and the CPU registers will not be inited. After closing all GDB connections the target
is started again and continues running. Some IDEs rely on the target to be halted after
connect. In this case do not use -nohalt, but -halt.
Note
For the GUI version, this setting is persistent for following uses of GDB Server until
changed via -halt or the GUI.
Syntax
-nohalt
Example
jlinkgdbserver -nohalt
3.3.5.16 -nosilent
Starts the GDB Server in non-silent mode. All log window messages will be shown.
Note
For the GUI version, this setting is persistent for following uses of GDB Server until
changed via command line option or the GUI.
Syntax
-nosilent
3.3.5.17 -nostayontop
Starts the GDB Server in non-topmost mode. All windows can be placed above it.
Note
For the CL version this setting has no effect. For the GUI version, this setting is per-
sistent for following uses of GDB Server until changed via command line option or
the GUI.
J-Link / J-Trace (UM08001) © 2004-2017 SEGGER Microcontroller GmbH & Co. KG

83 CHAPTER 3 J-Link GDB Server
Syntax
-nostayontop
Example
3.3.5.18 -notimeout
GDB Server automatically closes after a timeout of 5 seconds when no target voltage can
be measured or connection to target fails. This command line option prevents GDB Server
from closing, to allow connecting a target after starting GDB Server.
Note
The recommended order is to power the target, connect it to J-Link and then start
GDB Server.
Syntax
-notimeout
3.3.5.19 -novd
Do not explicitly verify downloaded data.
Note
For the GUI version, this setting is persistent for following uses of GDB Server until
changed via command line option or the GUI.
Syntax
-vd
3.3.5.20 -port
Starts GDB Server listening on a specified port. This option overrides the default listening
port of the GDB Server. The default port is 2331.
Note
Using multiple instances of GDB Server, setting custom values for this option is nec-
essary.
Syntax
-port <Port>
Example
jlinkgdbserver -port 2345
3.3.5.21 -rtos
Specifies a RTOS plug-in (.DLL file for Windows, .SO file for Linux and Mac). If the file-name
extension is not specified, it is automatically added depending on the PC’s operating system.
The J-Link Software and Documentation Package comes with RTOS plug-ins for embOS
and FreeRTOS pre-installed in the sub-directory “GDBServer”. A software development kit
(SDK) for creating your own plug-ins is also available upon request.
J-Link / J-Trace (UM08001) © 2004-2017 SEGGER Microcontroller GmbH & Co. KG

84 CHAPTER 3 J-Link GDB Server
Syntax
-rtos <filename>[.dll|.so]
Example
jlinkgdbserver -rtos GDBServer\RTOSPlugin_embOS
3.3.5.22 -jlinkscriptfile
Passes the path of a J-Link script file to the GDB Server. This scriptfile is executed before
the GDB Server starts the debugging / identifying communication with the target. J-Link
scriptfiles are mainly used to connect to targets which need a special connection sequence
before communication with the core is possible. For more information about J-Link script
files, please refer to J-Link script files .
Syntax
-jlinkscriptfile <ScriptFilePath>
Example
-jlinkscriptfile “C:\My Projects\Default.JLinkScript”
3.3.5.23 -select
Specifies the host interface to be used to connect to J-Link. Currently, USB and TCP/IP
are available.
Syntax
-select <Interface#<SerialNo>/<IPAddr>
Example
jlinkgdbserver -select usb=580011111
jlinkgdbserver -select ip=192.168.1.10
Additional information
For backward compatibility, when USB is used as interface serial numbers from 0-3 are
accepted as USB=0-3 to support the old method of connecting multiple J-Links to a PC.
This method is no longer recommended to be used. Please use the “connect via emulator
serial number” method instead.
3.3.5.24 -settingsfile
Select a J-Link settings file to be used for the target device. The settings fail can contain
all configurable options of the Settings tab in J-Link Control panel.
Syntax
-SettingsFile <PathToFile>
Example
jlinkgdbserver -SettingsFile “C:\Temp\GDB Server.jlink”
3.3.5.25 -silent
Starts the GDB Server in silent mode. No log window messages will be shown.
Note
J-Link / J-Trace (UM08001) © 2004-2017 SEGGER Microcontroller GmbH & Co. KG

85 CHAPTER 3 J-Link GDB Server
For the GUI version, this setting is persistent for following uses of GDB Server until
changed via command line option or the GUI.
Syntax
-silent
3.3.5.26 -singlerun
Starts GDB Server in single run mode. When active, GDB Server will close when all client
connections are closed. In normal run mode GDB Server will stay open and wait for new
connections. When started in single run mode GDB Server will close immediately when
connecting to the target fails. Make sure it is powered and connected to J-Link before
starting GDB Server.
Syntax
-s
-singlerun
3.3.5.27 -speed
Starts GDB Server with a given initial speed. Available parameters are “adaptive”, “auto”
or a freely selectable integer value in kHz. It is recommended to use either a fixed speed
or, if it is available on the target, adaptive speeds.
Note
Using GDB Server CL this option is mandatory to correctly connect to the target, and
should be given before connection via GDB.
Syntax
-speed <Speed_kHz>
Example
jlinkgdbserver -speed 2000
3.3.5.28 -stayontop
Starts the GDB Server in topmost mode. It will be placed above all non-topmost windows
and maintains it position even when it is deactivated.
Note
For the CL version this setting has no effect. For the GUI version, this setting is per-
sistent for following uses of GDB Server until changed via command line option or
the GUI.
Syntax
-stayontop
3.3.5.29 -timeout
Set the timeout after which the target connection has to be established. If no connection
could be established GDB Server will close. The default timeout is 5 seconds for the GUI
version and 0 for the command line version.
J-Link / J-Trace (UM08001) © 2004-2017 SEGGER Microcontroller GmbH & Co. KG

86 CHAPTER 3 J-Link GDB Server
Note
The recommended order is to power the target, connect it to J-Link and then start
GDB Server.
Syntax
-timeout <Timeout[ms]>
Example
Allow target connection within 10 seconds.
jlinkgdbserver -timeout 10000
3.3.5.30 -strict
Starts GDB Server in strict mode. When strict mode is active GDB Server checks the cor-
rectness of settings and exits in case of a failure. Currently the device name is checked. If
no device name is given or the device is unknown to the J-Link, GDB Server exits instead
of selecting “Unspecified” as device or showing the device selection dialog.
Syntax
-strict
Example
Following executions of GDB Server (CL) will cause exit of GDB Server. jlinkgdbserver
-strict -device UnknownDeviceName
jlinkgdbservercl -strict
Following execution of GDB Server will show the device selection dialog under Windows or
select “Unspecified” directly under Linux / OS X.
jlinkgdbserver -device UnknownDeviceName
3.3.5.31 -swoport
Set up port on which GDB Server should listen for an incoming connection that reads the
SWO data from GDB Server. Default port is 2332.
Note
Using multiple instances of GDB Server, setting custom values for this option is nec-
essary.
Syntax
-SWOPort <Port>
Example
jlinkgdbserver -SWOPort 2553
3.3.5.32 -telnetport
Set up port on which GDB Server should listen for an incoming connection that gets target’s
printf data (Semihosting and analyzed SWO data). Default port is 2333.
Note
J-Link / J-Trace (UM08001) © 2004-2017 SEGGER Microcontroller GmbH & Co. KG

87 CHAPTER 3 J-Link GDB Server
Using multiple instances of GDB Server, setting custom values for this option is nec-
essary.
Syntax
-TelnetPort <Port>
Example
jlinkgdbserver -TelnetPort 2554
3.3.5.33 -vd
Verifies the data after downloading it.
Note
For the GUI version, this setting is persistent for following uses of GDB Server until
changed via command line option or the GUI.
Syntax
-vd
3.3.5.34 -x
Starts the GDB Server with a gdbinit (configuration) file. In contrast to the -xc command
line option the GDB Server runs the commands in the gdbinit file once only direct after the
first connection of a client.
Syntax
-x <ConfigurationFilePath>
Example
jlinkgdbserver -x C:\MyProject\Sample.gdb
3.3.5.35 -xc
Starts the GDB Server with a gdbinit (configuration) file. GDB Server executes the com-
mands specified in the gdbinit file with every connection of a client / start of a debugging
session.
Syntax
-xc <ConfigurationFilePath>
Example
jlinkgdbserver -xc C:\MyProject\Sample.gdb
3.3.6 Program termination
J-Link GDB Server is normally terminated by a close or Ctrl-C event. When the single run
mode is active it will also close when an error occurred during start or after all connections
to GDB Server are closed.
On termination GDB Server will close all connections and disconnect from the target device,
letting it run.
J-Link / J-Trace (UM08001) © 2004-2017 SEGGER Microcontroller GmbH & Co. KG

88 CHAPTER 3 J-Link GDB Server
3.3.6.1 Exit codes
J-Link GDB Server terminates with an exit code indicating an error by a non-zero exit code.
The following table describes the defined exit codes of GDB Server.
Exit code Description
0 No error. GDB Server closed normally.
-1 Unknown error. Should not happen.
-2 Failed to open listener port (Default: 2331)
-3 Could not connect to target. No target voltage detected or
connection failed.
-4 Failed to accept a connection from GDB.
-5 Failed to parse the command line options, wrong or missing
command line parameter.
-6 Unknown or no device name set.
-7 Failed to connect to J-Link.
3.3.7 Semihosting
Semihosting can be used with J-Link GDBServer and GDB based debug environments but
needs to be explicitly enabled. For more information, please refer to Enabling semihosting
in J-Link GDBServer .
J-Link / J-Trace (UM08001) © 2004-2017 SEGGER Microcontroller GmbH & Co. KG

89 CHAPTER 3 J-Link Remote Server
3.4 J-Link Remote Server
J-Link Remote Server allows using J-Link / J-Trace remotely via TCP/IP. This enables you
to connect to and fully use a J-Link / J-Trace from another computer. Performance is just
slightly (about 10%) lower than with direct USB connection.
J-Link Remote Server
3.4.1 List of available commands
The table below lists the commands line options accepted by the J-Link Remote Server
Command Description
-port Selects the IP port on which the J-Link Remote Server is lis-
tening.
-UseTunnel Starts J-Link Remote Server in tunneling mode
-SelectEmuBySN Selects the J-Link to connect to by its serial number.
3.4.2 Tunneling mode
The Remote server provides a tunneling mode which allows remote connection to a J-Link /
J-Trace from any computer, even from outside the local network.
To give access to a J-Link neither a remote desktop or VPN connection nor changing some
difficult firewall settings is necessary.
When started in tunneling mode the Remote server connects to the SEGGER tunnel server
via port 19020 and registers with its serial number. To connect to the J-Link from the
remote computer an also simple connection to tunnel:<SerialNo> can be established and
the debugger is connected to the J-Link.
J-Link / J-Trace (UM08001) © 2004-2017 SEGGER Microcontroller GmbH & Co. KG
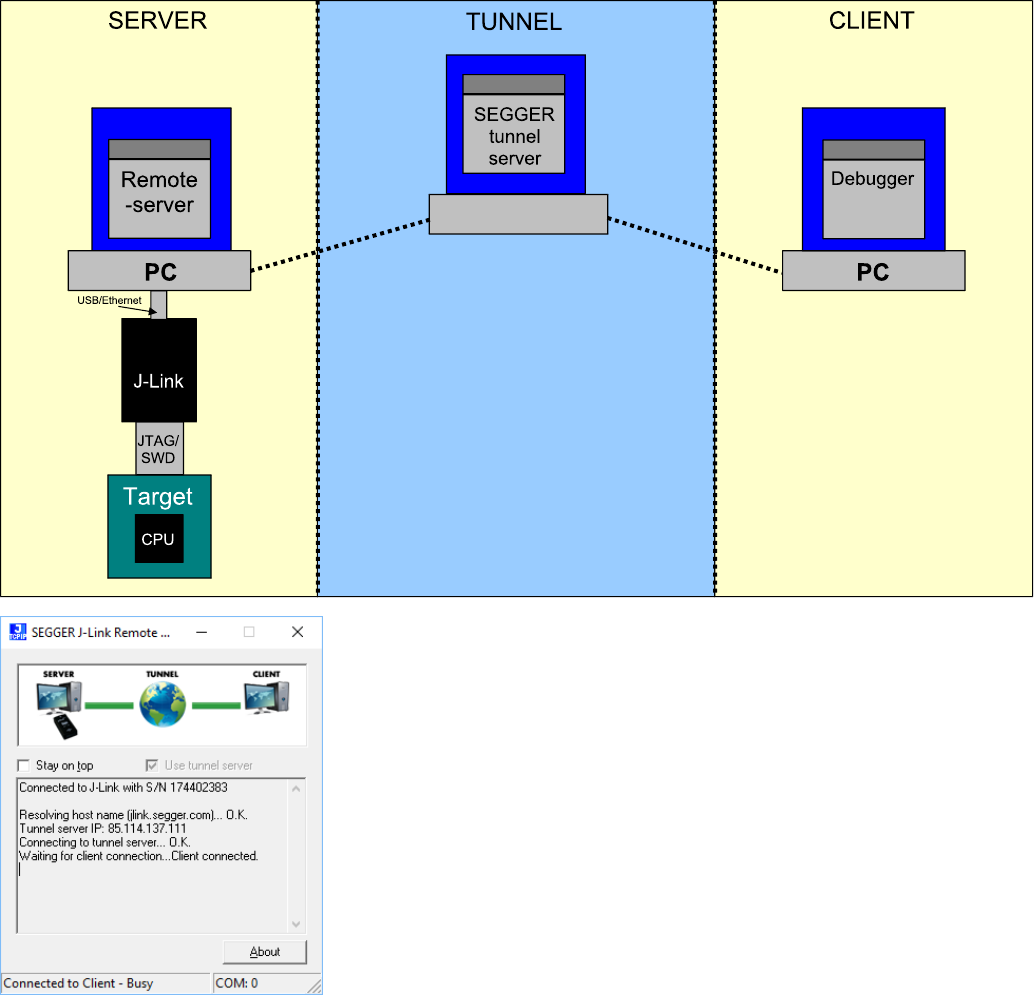
90 CHAPTER 3 J-Link Remote Server
J-Link Remote Server: Connected to SEGGER tunnel server
Example scenario
A device vendor is developing a new device which shall be supported by J-Link. Because
there is only one prototype, a shipment to SEGGER is not possible.
Instead the vendor can connect the device via J-Link to a local computer and start the
Remote server in tunneling mode. The serial number of the J-Link is then sent to a to an
engineer at SEGGER.
The engineer at SEGGER can use J-Link Commander or a debugger to test and debug the
new device without the need to have the device on the desk.
J-Link / J-Trace (UM08001) © 2004-2017 SEGGER Microcontroller GmbH & Co. KG
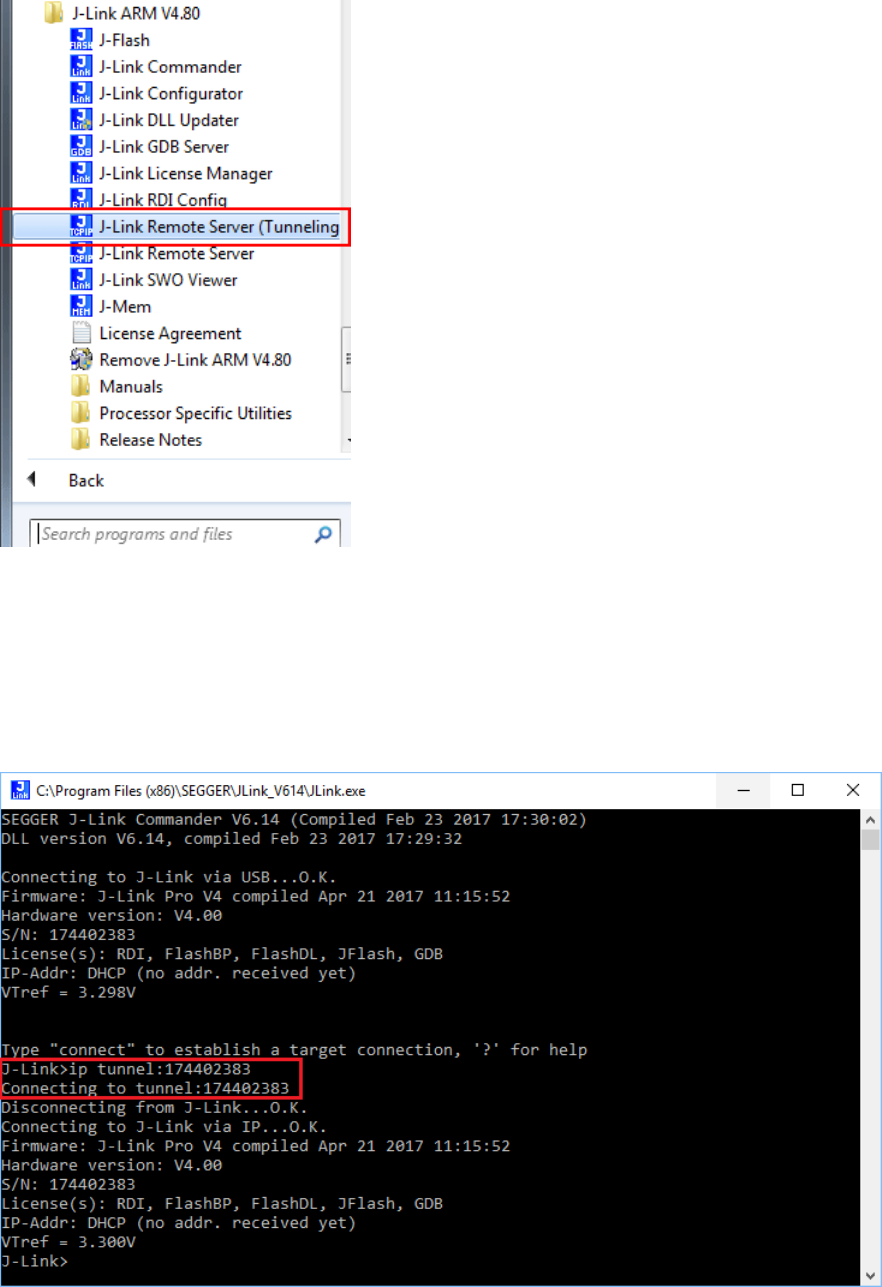
91 CHAPTER 3 J-Link Remote Server
Start J-Link Remote Server in tunneling mode
Connect to the J-Link / J-Trace via J-Link Commander
J-Link Commander can be used to verify a connection to the J-Link can be established as
follows: Start J-Link Commander
From within J-Link Commander enter
ip tunnel:<SerialNo>
If the connection was successful it should look like in this screenshot.
J-Link / J-Trace (UM08001) © 2004-2017 SEGGER Microcontroller GmbH & Co. KG
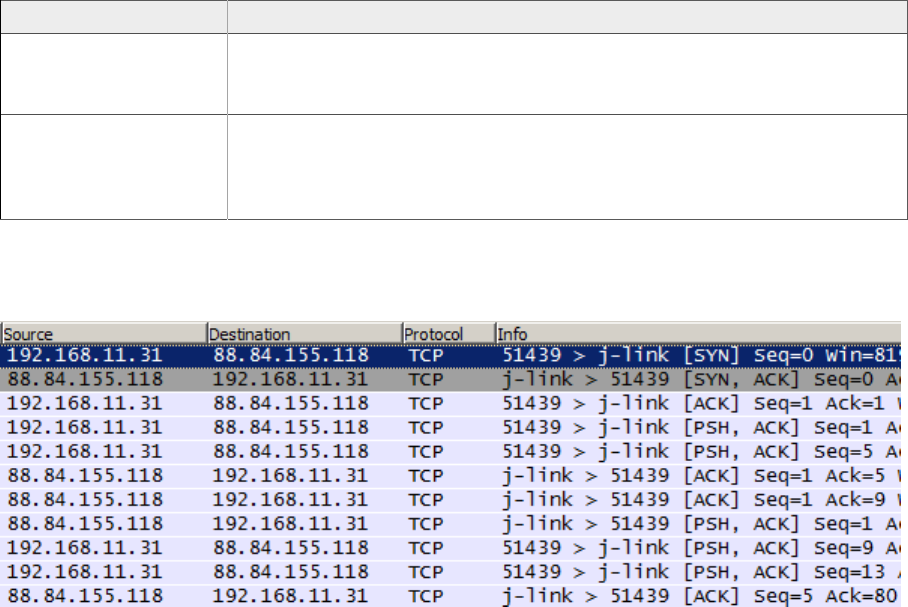
92 CHAPTER 3 J-Link Remote Server
Troubleshooting
Problem Solution
Remote server can-
not connect to tun-
nel server.
1. Make sure the Remote server is not blocked by any firewall.
2. Make sure port 19020 is not blocked by any firewall.
3. Contact network admin.
J-Link Commander
cannot connect to
tunnel server.
1. Make sure Remote server is started correctly.
2. Make sure the entered serial number is correct.
3. Make sure port 19020 is not blocked by any firewall. Contact
network admin.
To test whether a connection to the tunnel server can be established or not a network
protocol analyzer like Wireshark can help. The network transfer of a successful connection
should look like:
J-Link / J-Trace (UM08001) © 2004-2017 SEGGER Microcontroller GmbH & Co. KG
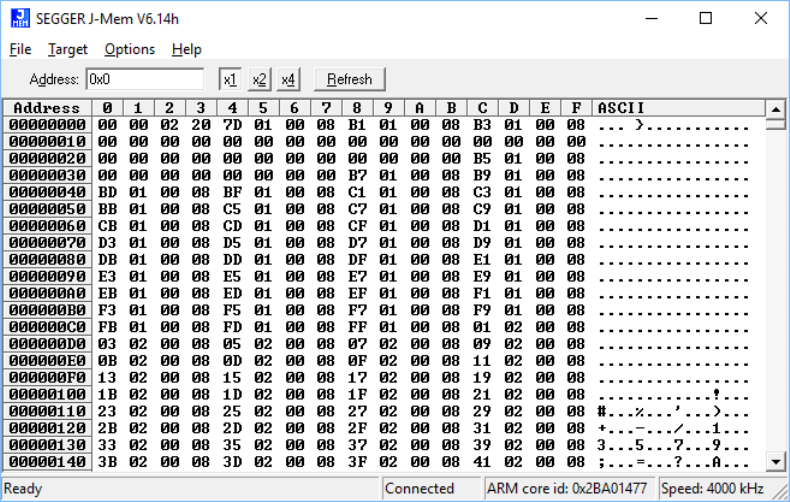
93 CHAPTER 3 J-Mem Memory Viewer
3.5 J-Mem Memory Viewer
J-Mem displays memory contents of target systems and allows modifications of RAM and
SFRs (Special Function Registers) while the target is running. This makes it possible to look
into the memory of a target system at run-time; RAM can be modified and SFRs can be
written. You can choose between 8/16/32-bit size for read and write accesses. J-Mem works
nicely when modifying SFRs, especially because it writes the SFR only after the complete
value has been entered.
J-Link / J-Trace (UM08001) © 2004-2017 SEGGER Microcontroller GmbH & Co. KG
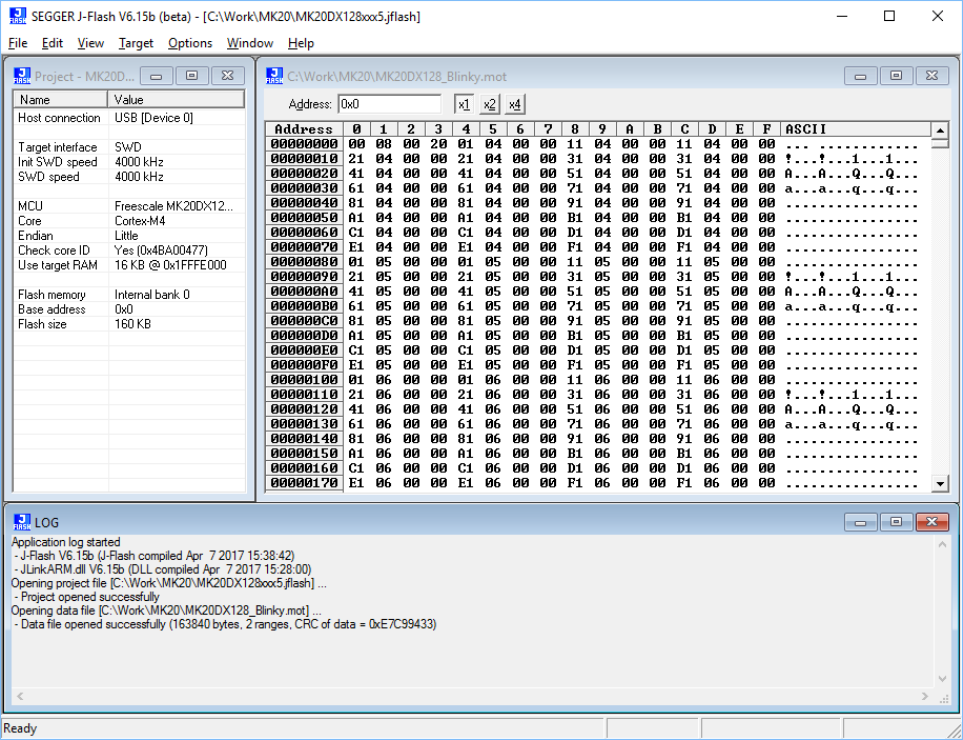
94 CHAPTER 3 J-Flash
3.6 J-Flash
J-Flash is an application to program data images to the flash of a target device. With J-
Flash the internal flash of all J-Link supported devices can be programmed, as well as
common external flashes connected to the device. Beside flash programming all other flash
operations like erase, blank check and flash content verification can be done.
J-Flash requires an additional license from SEGGER to enable programming. For license
keys, as well as evaluation licenses got to www.segger.com or contact us directly.
J-Link / J-Trace (UM08001) © 2004-2017 SEGGER Microcontroller GmbH & Co. KG
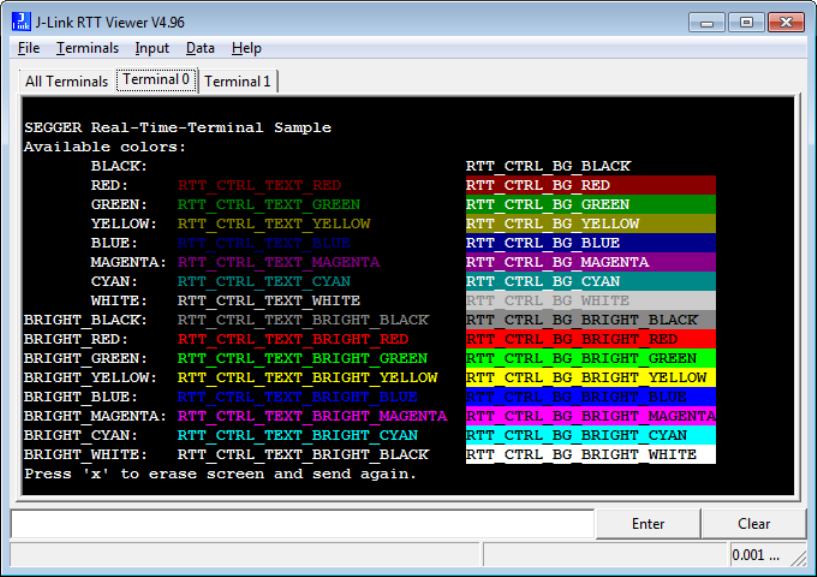
95 CHAPTER 3 J-Link RTT Viewer
3.7 J-Link RTT Viewer
J-Link RTT Viewer is a Windows GUI application to use all features of RTT in one application.
It supports:
• Displaying terminal output of Channel 0.
• Up to 16 virtual Terminals on Channel 0.
• Sending text input to Channel 0.
• Interpreting text control codes for colored text and controlling the Terminal.
• Logging terminal data into a file.
• Logging data on Channel 1.
For general information about RTT, please refer to RTT on page 297.
3.7.1 RTT Viewer Startup
Make sure J-Link and target device are connected and powered up.
Start RTT Viewer by opening the executable (JLinkRTTViewer.exe) from the installation
folder of the J-Link Software or the start menu. Unless the command line parameter –
autoconnect is set, the Configuration Dialog will pop up.
Configure the Connection Settings as described below and click OK. The connection settings
and all in app configuration will be saved for the next start of J-Link RTT Viewer.
J-Link / J-Trace (UM08001) © 2004-2017 SEGGER Microcontroller GmbH & Co. KG
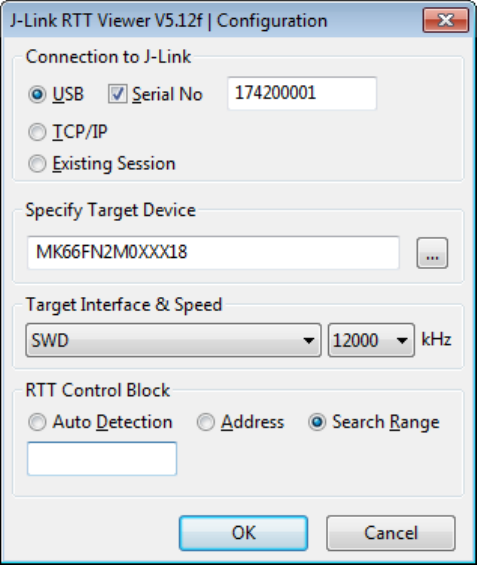
96 CHAPTER 3 J-Link RTT Viewer
3.7.2 Connection Settings
RTT Viewer can be used in two modes:
• Stand-alone, opening an own connection to J-Link and target.
• In attach mode, connecting to an existing J-Link connection of a debugger.
Stand-alone connection settings
In stand-alone mode RTT Viewer needs to know some settings of J-Link and target device.
Select USB or TCP/IP as the connection to J-Link. For USB a specific J-Link serial number
can optionally be entered, for TCP/IP the IP or hostname of the J-Link has to be entered.
Select the target device to connect to. This allows J-Link to search in the known RAM of
the target.
Select the target interface and its speed. The RTT Control Block can be searched for fully
automatically, it can be set to a fixed address or it can be searched for in one or more
specific memory ranges.
Attaching to a connection
In attach mode RTT Viewer does not need any settings. Select Existing Session. For attach
mode a connection to J-Link has to be opened and configured by another application like a
debugger or simply J-Link Commander. If the RTT Control Block cannot be found automat-
ically, configuration of its location has to be done by the debugger / application.
3.7.3 The Terminal Tabs
RTT Viewer allows displaying the output of Channel 0 in different “virtual” Terminals. The
target application can switch between terminals with SEGGER_RTT_SetTerminal() and SEG-
GER_RTT_TerminalOut(). RTT Viewer displays the Terminals in different tabs.
J-Link / J-Trace (UM08001) © 2004-2017 SEGGER Microcontroller GmbH & Co. KG
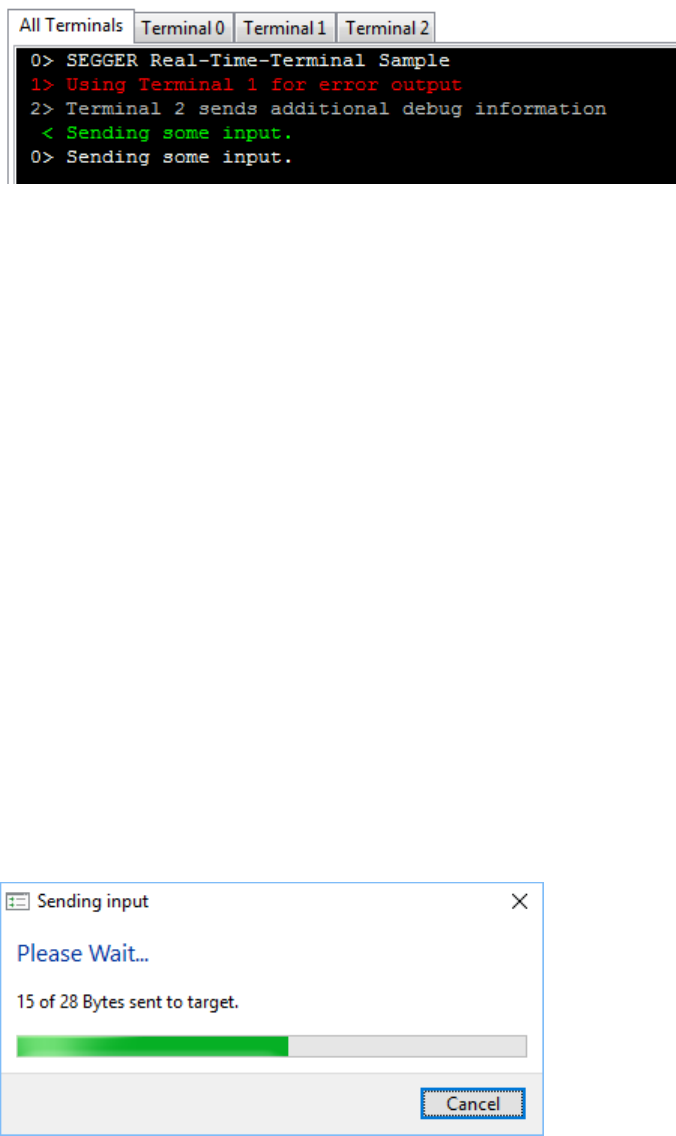
97 CHAPTER 3 J-Link RTT Viewer
All Terminals
The All Terminals tab displays the complete output of RTT Channel 0 and can display the
user input (Check Input -> Echo input… -> Echo to “All Terminals”).
Each output line is prefixed by the Terminal it has been sent to. Additionally, output on
Terminal 1 is shown in red, output on Terminals 2 - 15 in gray.
Terminal 0 - 15
Each tab Terminal 0 - Terminal 15 displays the output which has been sent to this Terminal.
The Terminal tabs interpret and display Text Control Codes as sent by the application to
show colored text or erase the screen.
By default, if the RTT application does not set a Terminal Id, the output is displayed in
Terminal 0.
The Terminal 0 tab can additionally display the user input. (Check Input -> Echo input…
-> Echo to “Terminal 0”)
Each Terminal tab can be shown or hidden via the menu Terminals -> Terminals… or their
respective shortcuts as described below.
3.7.4 Sending Input
RTT Viewer supports sending user input to RTT Down Channel 0 which can be read by the
target application with SEGGER_RTT_GetKey() and SEGGER_RTT_Read().
Input can be entered in the text box below the Terminal Tabs.
RTT Viewer can be configured to directly send each character while typing or buffer it until
Enter is pressed (Menu Input -> Sending…).
In stand-alone mode RTT Viewer can retry to send input, in case the target input buffer is
full, until all data could be sent to the target via Input -> Sending… -> Block if FIFO full.
3.7.5 Logging Terminal output
The output of Channel 0 can be logged into a text file. The format is the same as used in the
All Terminals tab. Terminal Logging can be started via Logging -> Start Terminal Logging…
3.7.6 Logging Data
Additionally to displaying output of Channel 0, RTT Viewer can log data which is sent on
RTT Channel 1 into a file. This can for example be used to sent instrumented event tracing
data. The data log file contains header and footer and the binary data as received from
the application.
J-Link / J-Trace (UM08001) © 2004-2017 SEGGER Microcontroller GmbH & Co. KG
98 CHAPTER 3 J-Link RTT Viewer
Data Logging can be started via Logging -> Start Data Logging…
Note
Data Logging is only available in stand-alone mode.
3.7.7 Command line options
J-Link RTT Viewer can be configured via command line parameters. In the following, the
command line options which are available for J-Link RTT Viewer are explained. All command
line options are case insensitive. Short and long command names have the same syntax.
Command line option Explanation
-d, –device Select the connected target device.
-ct, –connection Sets the connection type
-if, –interface Sets the interface type
-ip, –host The IP address of the J-Link
-s, –speed Interface speed in kHz
-sn, –serialnumber Select the J-Link with a specific S/N
-ra, –rttaddr Sets the address of the RTT control block
-rr, –rttrange Specify RTT search range
-a, –autoconnect Automatically connect to target, suppress settings dialog
3.7.7.1 --device
Selects the device J-Link RTT Viewer shall connect to.
Syntax
–device <DeviceName>
Example
JLinkRTTViewer.exe –device STM32F103ZE
3.7.7.2 --connection
Sets the connection type. The connection to the J-Link can either be made directly over
USB, IP or using an existing running session (e.g. the IDE’s debug session). In case of using
an existing session, no further configuration options are required.
Syntax
–connection <usb|ip|sess>
Example
JLinkRTTViewer.exe –connection ip
3.7.7.3 --interface
Sets the interface J-Link shall use to connect to the target. As interface types FINE, JTAG
and SWD are supported.
Syntax
–interface <fine|jtag|swd>
J-Link / J-Trace (UM08001) © 2004-2017 SEGGER Microcontroller GmbH & Co. KG
99 CHAPTER 3 J-Link RTT Viewer
Example
JLinkRTTViewer.exe –interface swd
3.7.7.4 --host
Enter the IP address or hostname of the J-Link. This option only applies, if connection type
IP is used. Use * as <IPAddr> for a list of available J-Links in the local subnet.
Syntax
–host <IPAddr>
Example
JLinkRTTViewer.exe –host 192.168.1.17
3.7.7.5 --speed
Sets the interface speed in kHz for target communication.
Syntax
–speed <speed>
Example
JLinkRTTViewer.exe –speed 4000
3.7.7.6 --serialnumber
Connect to a J-Link with a specific serial number via USB. Useful if multiple J-Links are
connected to the same PC and multiple instances of J-Link RTT Viewer shall run and each
connects to another J-Link.
Syntax
–serialnumber <SerialNo>
Example
JLinkRTTViewer.exe –serialnumber 580011111
3.7.7.7 --rttaddr
Sets a fixed address as location of the RTT control block. Automatic searching for the RTT
control block is disabled.
Syntax
–rttaddr <RTTCBAddr>
Example
JLinkRTTViewer.exe -rttaddr 0x20000000
3.7.7.8 --rttrange
Sets one or more memory ranges, where the J-Link DLL shall search for the RTT control
block.
Syntax
–rttrange <RangeStart[Hex]> <RangeSize >[, <Range1Start [Hex]> <Range1Size>]>
J-Link / J-Trace (UM08001) © 2004-2017 SEGGER Microcontroller GmbH & Co. KG
100 CHAPTER 3 J-Link RTT Viewer
Example
JLinkRTTViewer.exe -rttrange “20000000 400”
3.7.7.9 --autoconnect
Let J-Link RTT Viewer connect automatically to the target without showing the Connection
Settings (see Connection Settings ).
Syntax
–autoconnect
Example
JLinkRTTViewer.exe –autoconnect
3.7.8 Menus and Shortcuts
File menu elements
Menu entry Contents Shortcut
-> Connect… Opens the connect dialog and connects to the tar-
gets F2
-> Disconnect Disconnects from the target F3
-> Exit Closes connection and exit RTT Viewer. Alt-F4
Terminals menu elements
Menu entry Contents Shortcut
-> Add next terminal Opens the next available Terminal Tab. Alt-A
-> Clear active terminal Clears the currently selected terminal tab. Alt-R
-> Close active terminal Closes the active Terminal Tab. Alt-W
-> Open Terminal on
output If selected, a terminal is automatically created, if
data for this terminal is received.
-> Show Log Opens or closes the Log Tab. Alt-L
Terminals -> Terminals…
–> Terminal 0 - 15 Opens or closes the Terminal Tab.
Alt-
Shift-0
Alt-
Shift-F
Input menu elements
Menu entry Contents Shortcut
-> Clear input field Clears the input field without sending entered da-
ta. Button
“Clear”
Input -> Sending…
–> Send on Input If selected, entered input will be sent directly to
the target while typing.
–> Send on Enter If selected, entered input will be sent when press-
ing Enter.
–> Block if FIFO full If checked, RTT Viewer will retry to send all input
to the target when the target buffer is full.
Input -> End of line…
J-Link / J-Trace (UM08001) © 2004-2017 SEGGER Microcontroller GmbH & Co. KG

101 CHAPTER 3 J-Link RTT Viewer
Menu entry Contents Shortcut
–> Windows format (CR
+LF)
–> Unix format (LF)
–> Mac format (CR)
–> None
Selects the end of line character to be sent on En-
ter.
Input -> Echo input…
–> Echo to “All Termi-
nals” If checked, sent input will be displayed in the All
Terminals Tab.
–> Echo to “Terminal 0” If checked, sent input will be displayed in the Ter-
minal Tab 0.
Logging menu elements
Menu entry Contents Shortcut
-> Start Terminal log-
ging… Starts logging terminal data to a file. F5
-> Stop Terminal logging Stops logging terminal data and closes the file. Shift-F5
-> Start Data logging… Starts logging data of Channel 1 to a file. F6
-> Stop Data logging Stops logging data and closes the file. Shift-F6
Help menu elements
Menu entry Contents Shortcut
-> About… Shows version info of RTT Viewer. F12
-> J-Link Manual… Opens the J-Link Manual PDF file. F11
-> RTT Webpage… Opens the RTT webpage. F10
Tab context menu elements
Menu entry Contents Shortcut
-> Close Terminal Closes this Terminal Tab Alt-W
-> Clear Terminal Clears the displayed output of this Terminal Tab. Alt-R
3.7.9 Using "virtual" Terminals in RTT
For virtual Terminals the target application needs only Up Channel 0. This is especially
important on targets with low RAM.
If nothing is configured, all data is sent to Terminal 0.
The Terminal to output all following via Write, WriteString or printf can be set with SEG-
GER_RTT_SetTerminal().
Output of only one string via a specific Terminal can be done with SEGGER_RTT_Termi-
nalOut().
The sequences sent to change the Terminal are interpreted by RTT Viewer. Other applica-
tions like a Telnet Client will ignore them.
3.7.10 Using Text Control Codes
RTT allows using Text Control Codes (ANSI escape codes) to configure the display of text.
RTT Viewer supports changing the text color and background color and can erase the Ter-
minal. These Control Codes are pre-defined in the RTT application and can easily be used
in the application.
J-Link / J-Trace (UM08001) © 2004-2017 SEGGER Microcontroller GmbH & Co. KG

102 CHAPTER 3 J-Link RTT Viewer
Example 1
SEGGER_RTT_WriteString(0,
RTT_CTRL_RESET"Red: " \
RTT_CTRL_TEXT_BRIGHT_RED"This text is red. " \
RTT_CTRL_TEXT_BLACK"" \
RTT_CTRL_BG_BRIGHT_RED"This background is red. " \
RTT_CTRL_RESET"Normal text again."
);
Example 2
SEGGER_RTT_printf(0, "%sTime:%s%s %.7d\n",
RTT_CTRL_RESET,
RTT_CTRL_BG_BRIGHT_RED,
RTT_CTRL_TEXT_BRIGHT_WHITE,
1111111
);
//
// Clear the terminal.
// The first line will not be shown after this command.
//
SEGGER_RTT_WriteString(0, RTT_CTRL_CLEAR);
SEGGER_RTT_printf(0, "%sTime: %s%s%.7d\n",
RTT_CTRL_RESET,
RTT_CTRL_BG_BRIGHT_RED,
RTT_CTRL_TEXT_BRIGHT_WHITE,
2222222
);
J-Link / J-Trace (UM08001) © 2004-2017 SEGGER Microcontroller GmbH & Co. KG
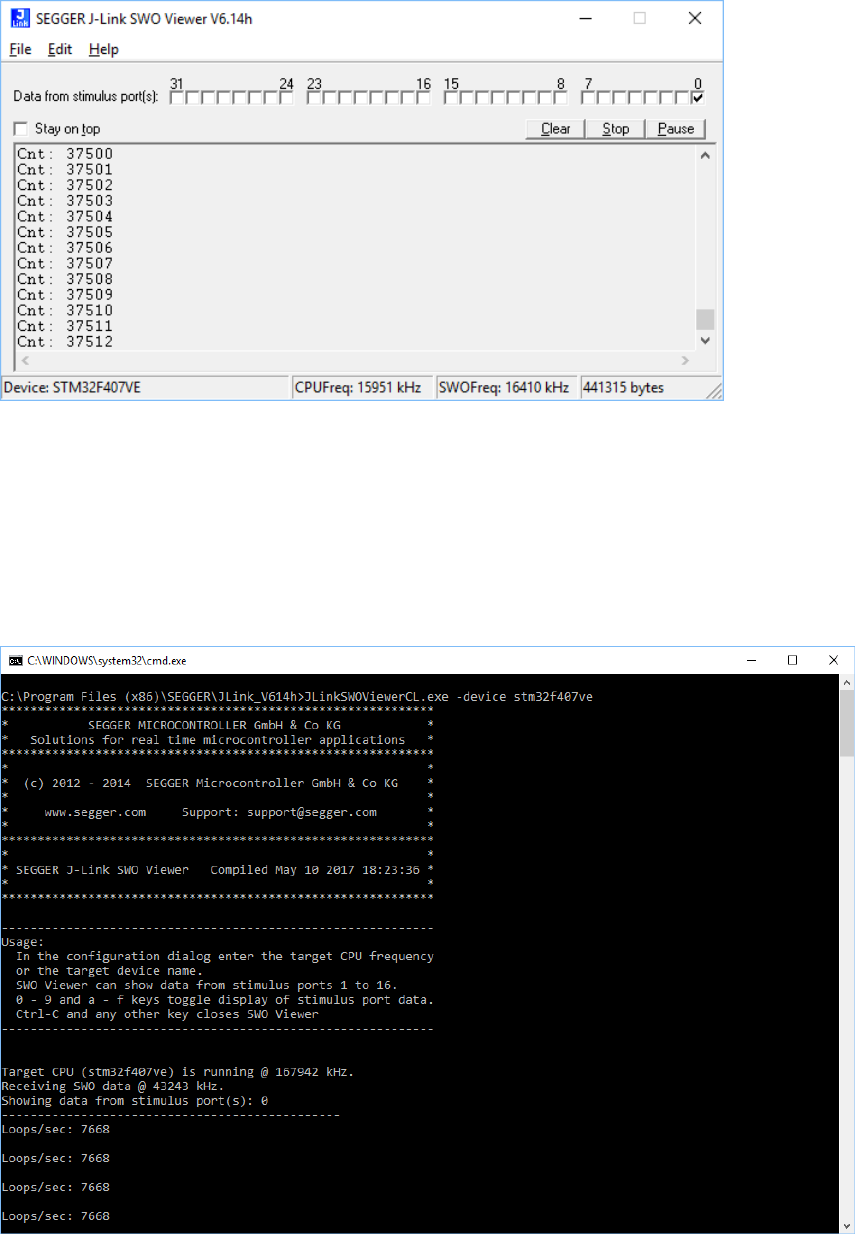
103 CHAPTER 3 J-Link SWO Viewer
3.8 J-Link SWO Viewer
Free-of-charge utility for J-Link. Displays the terminal output of the target using the SWO
pin. The stimulus port(s) from which SWO data is received can be chosen by using the
port checkboxes 0 to 31. Can be used in parallel with a debugger or stand-alone. This is
especially useful when using debuggers which do not come with built-in support for SWO
such as most GDB / GDB+Eclipse based debug environments.
3.8.0.1 J-Link SWO Viewer CL
Command line-only version of SWO Viewer. All commands available for J-Link SWO Viewer
can be used with J-Link SWO Viewer Cl. Similar to the GUI Version, J-Link SWO Viewer Cl
asks for a device name or CPU clock speed at startup to be able to calculate the correct
SWO speed or to connect to a running J-Link GDB Server.
Using the syntax given below(see List of available command line options ), J-Link SWO
Viewer Cl can be directly started with parameters.
J-Link / J-Trace (UM08001) © 2004-2017 SEGGER Microcontroller GmbH & Co. KG

104 CHAPTER 3 J-Link SWO Viewer
3.8.1 Usage
J-Link SWO Viewer is available via the start menu. It asks for a device name or CPU clock
speed at startup to be able to calculate the correct SWO speed or to connect to a running
J-Link GDB Server.
When running in normal mode J-Link SWO Viewer automatically performs the necessary
initialization to enable SWO output on the target, in GDB Server mode the initialization has
to be done by the debugger.
3.8.2 List of available command line options
J-Link SWO Viewer can also be controlled from the command line if used in a automated
test environment etc. When passing all necessary information to the utility via command
line, the configuration dialog at startup is suppressed. Minimum information needed by J-
Link SWO Viewer is the device name (to enable CPU frequency auto detection) or the CPU
clock speed. The table below lists the commands accepted by the J-Link SWO View
Command Description
-cpufreq Select the CPU frequency.
-device Select the target device.
-itmmask Selects a set of itm stimulus ports which should be used to
listen to.
-itmport Selects a itm stimulus port which should be used to listen to.
-outputfile Print the output of SWO Viewer to the selected file.
-settingsfile Specify a J-Link settings file.
-swofreq Select the CPU frequency.
3.8.2.1 -cpufreq
Defines the speed in Hz the CPU is running at. If the CPU is for example running at 96 MHz,
the command line should look as below.
Syntax
-cpufreq <CPUFreq>
Example
-cpufreq 96000000
3.8.2.2 -device
Select the target device to enable the CPU frequency auto detection of the J-Link DLL. To
select a ST STM32F207IG as target device, the command line should look as below. For a
list of all supported device names, please refer to:
List of supported target devices
J-Link / J-Trace (UM08001) © 2004-2017 SEGGER Microcontroller GmbH & Co. KG
105 CHAPTER 3 J-Link SWO Viewer
Syntax
-device <DeviceID>
Example
-device STM32F207IG
3.8.2.3 -itmmask
Defines a set of stimulusports from which SWO data is received and displayed by SWO
Viewer. If itmmask is given, itmport will be ignored.
Syntax
-itmmask <Mask>
Example
Listen on ports 0 and 2
-itmmask 0x5
3.8.2.4 -itmport
Defines the stimulus port from which SWO data is received and displayed by the SWO
Viewer. Default is stimulus port 0. The command line should look as below.
Syntax
-itmport <ITMPortIndex>
Example
-itmport 0
3.8.2.5 -outputfile
Define a file to which the output of SWO Viewer is printed.
Syntax
-outputfile <PathToFile>
Example
-outputfile “C:\Temp\Output.log”
3.8.2.6 -settingsfile
Select a J-Link settings file to use for the target device.
Syntax
-settingsfile <PathToFile>
Example
-settingsfile “C:\Temp\Settings.jlink”
3.8.2.7 -swofreq
Define the SWO frequency that shall be used by J-Link SWO Viewer for sampling SWO data.
Usually not necessary to define since optimal SWO speed is calculated automatically based
on the CPU frequency and the capabilities of the connected J-Link.
J-Link / J-Trace (UM08001) © 2004-2017 SEGGER Microcontroller GmbH & Co. KG

106 CHAPTER 3 J-Link SWO Viewer
Syntax
-swofreq <SWOFreq>
Example
-swofreq 6000
3.8.3 Configure SWO output after device reset
In some situations it might happen that the target application is reset and it is desired to log
the SWO output of the target after reset during the booting process. For such situations, the
target application itself needs to initialize the CPU for SWO output, since the SWO Viewer
is not restarted but continuously running.
Example code for enabling SWO out of the target application
#define ITM_ENA (*(volatile unsigned int*)0xE0000E00) // ITM Enable
#define ITM_TPR (*(volatile unsigned int*)0xE0000E40) // Trace Privilege
// Register
#define ITM_TCR (*(volatile unsigned int*)0xE0000E80) // ITM Trace Control Reg.
#define ITM_LSR (*(volatile unsigned int*)0xE0000FB0) // ITM Lock Status
// Register
#define DHCSR (*(volatile unsigned int*)0xE000EDF0) // Debug register
#define DEMCR (*(volatile unsigned int*)0xE000EDFC) // Debug register
#define TPIU_ACPR (*(volatile unsigned int*)0xE0040010) // Async Clock
// prescaler register
#define TPIU_SPPR (*(volatile unsigned int*)0xE00400F0) // Selected Pin Protocol
// Register
#define DWT_CTRL (*(volatile unsigned int*)0xE0001000) // DWT Control Register
#define FFCR (*(volatile unsigned int*)0xE0040304) // Formatter and flush
// Control Register
U32 _ITMPort = 0; // The stimulus port from which SWO data is received
// and displayed.
U32 TargetDiv = 1; // Has to be calculated according to
// the CPU speed and the output baud rate
static void _EnableSWO() {
U32 StimulusRegs;
//
// Enable access to SWO registers
//
DEMCR |= (1 << 24);
ITM_LSR = 0xC5ACCE55;
//
// Initially disable ITM and stimulus port
// To make sure that nothing is transferred via SWO
// when changing the SWO prescaler etc.
//
StimulusRegs = ITM_ENA;
StimulusRegs &= ~(1 << _ITMPort);
ITM_ENA = StimulusRegs; // Disable ITM stimulus port
ITM_TCR = 0; // Disable ITM
//
// Initialize SWO (prescaler, etc.)
//
TPIU_SPPR = 0x00000002; // Select NRZ mode
TPIU_ACPR = TargetDiv - 1; // Example: 72/48 = 1,5 MHz
ITM_TPR = 0x00000000;
DWT_CTRL = 0x400003FE;
FFCR = 0x00000100;
//
// Enable ITM and stimulus port
//
ITM_TCR = 0x1000D; // Enable ITM
ITM_ENA = StimulusRegs | (1 << _ITMPort); // Enable ITM stimulus port
J-Link / J-Trace (UM08001) © 2004-2017 SEGGER Microcontroller GmbH & Co. KG

107 CHAPTER 3 J-Link SWO Viewer
}
3.8.4 Target example code for terminal output
/*********************************************************************
* SEGGER MICROCONTROLLER GmbH & Co KG *
* Solutions for real time microcontroller applications *
**********************************************************************
* *
* (c) 2012-2017 SEGGER Microcontroller GmbH & Co KG *
* *
* www.segger.com Support: support@segger.com *
* *
**********************************************************************
----------------------------------------------------------------------
File : SWO.c
Purpose : Simple implementation for output via SWO for Cortex-M processors.
It can be used with any IDE. This sample implementation ensures
that output via SWO is enabled in order to guarantee that the
application does not hang.
-------- END-OF-HEADER ---------------------------------------------
*/
/*********************************************************************
*
* Prototypes (to be placed in a header file such as SWO.h)
*/
void SWO_PrintChar (char c);
void SWO_PrintString(const char *s);
/*********************************************************************
*
* Defines for Cortex-M debug unit
*/
#define ITM_STIM_U32 (*(volatile unsigned int*)0xE0000000) // STIM word access
#define ITM_STIM_U8 (*(volatile char*)0xE0000000) // STIM Byte access
#define ITM_ENA (*(volatile unsigned int*)0xE0000E00) // ITM Enable Register
#define ITM_TCR (*(volatile unsigned int*)0xE0000E80) // ITM Trace Control
// Register
/*********************************************************************
*
* SWO_PrintChar()
*
* Function description
* Checks if SWO is set up. If it is not, return,
* to avoid program hangs if no debugger is connected.
* If it is set up, print a character to the ITM_STIM register
* in order to provide data for SWO.
* Parameters
* c: The character to be printed.
* Notes
* Additional checks for device specific registers can be added.
*/
void SWO_PrintChar(char c) {
//
// Check if ITM_TCR.ITMENA is set
//
if ((ITM_TCR & 1) == 0) {
return;
}
//
// Check if stimulus port is enabled
//
J-Link / J-Trace (UM08001) © 2004-2017 SEGGER Microcontroller GmbH & Co. KG

108 CHAPTER 3 J-Link SWO Viewer
if ((ITM_ENA & 1) == 0) {
return;
}
//
// Wait until STIMx is ready,
// then send data
//
while ((ITM_STIM_U8 & 1) == 0);
ITM_STIM_U8 = c;
}
/*********************************************************************
*
* SWO_PrintString()
*
* Function description
* Print a string via SWO.
*
*/
void SWO_PrintString(const char *s) {
//
// Print out character per character
//
while (*s) {
SWO_PrintChar(*s++);
}
}
J-Link / J-Trace (UM08001) © 2004-2017 SEGGER Microcontroller GmbH & Co. KG
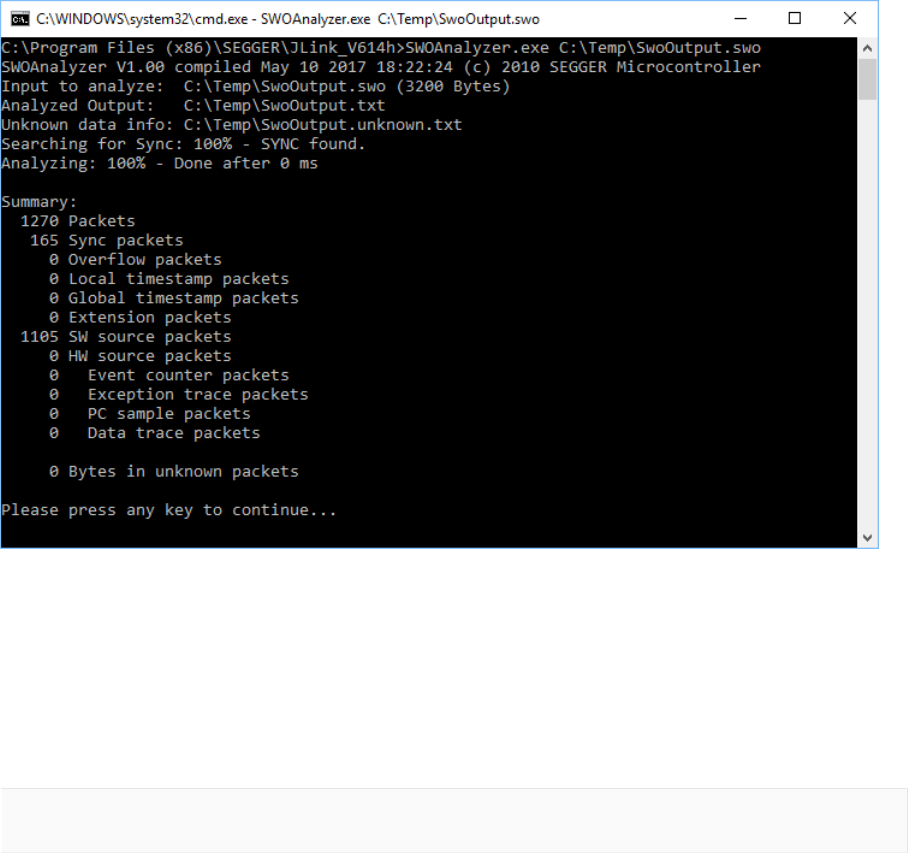
109 CHAPTER 3 SWO Analyzer
3.9 SWO Analyzer
SWO Analyzer (SWOAnalyzer.exe) is a tool that analyzes SWO output. Status and summary
of the analysis are output to standard out, the details of the analysis are stored in a file.
Usage
SWOAnalyzer.exe <SWOfile> This can be achieved by simply dragging the SWO output file
created by the J-Link DLL onto the executable.
Creating an SWO output file
In order to create the SWO output file, which is the input file for the SWO Analyzer, the J-
Link config file needs to be modified. It should contain the following lines:
[SWO]
SWOLogFile="C:\TestSWO.dat"
J-Link / J-Trace (UM08001) © 2004-2017 SEGGER Microcontroller GmbH & Co. KG
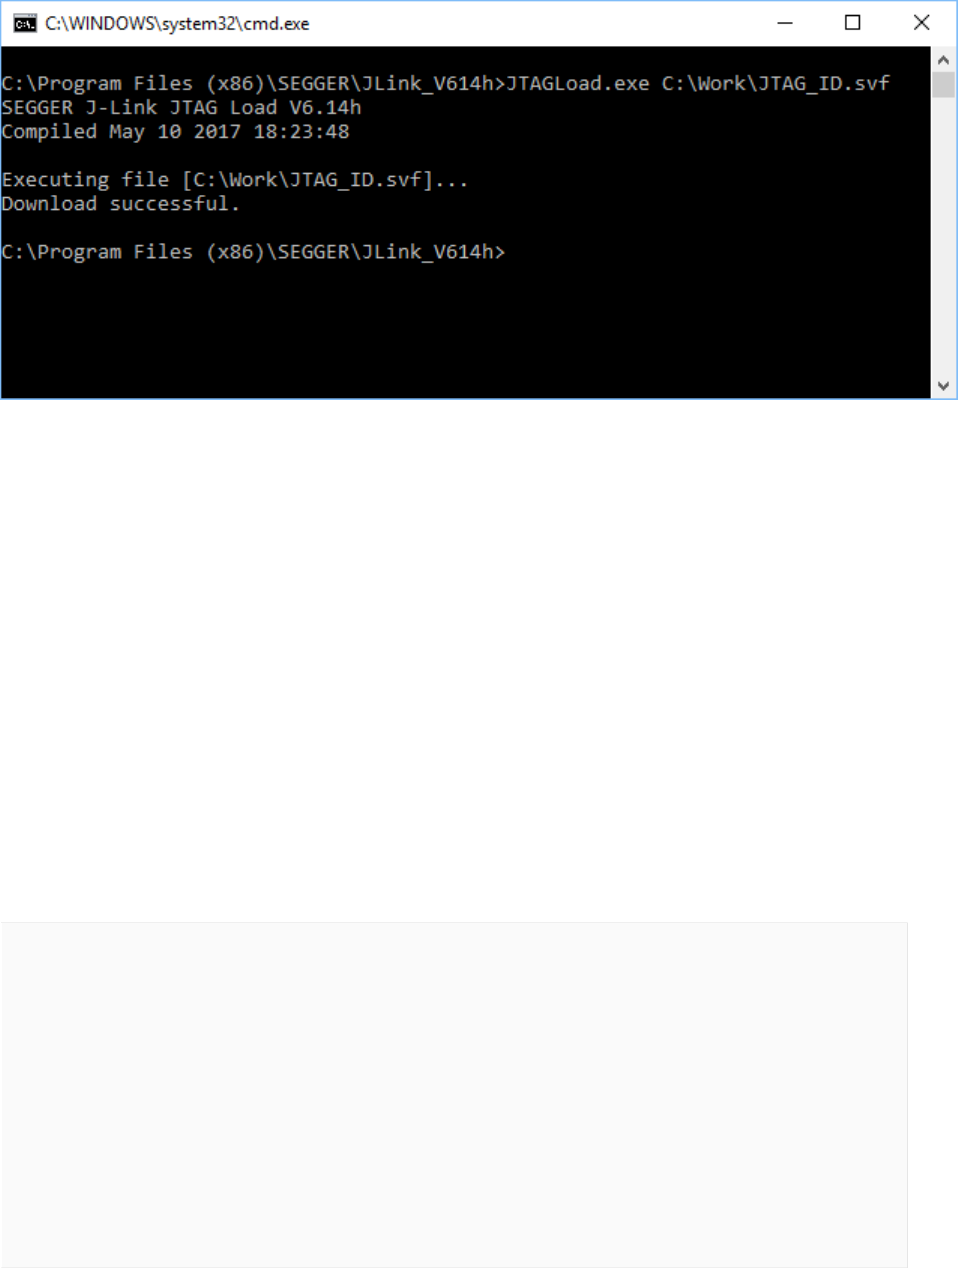
110 CHAPTER 3 JTAGLoad (Command line tool)
3.10 JTAGLoad (Command line tool)
JTAGLoad is a tool that can be used to open and execute an svf (Serial vector format) file for
JTAG boundary scan tests. The data in the file will be sent to the target via J-Link / J-Trace.
SVF is a standard format for boundary scan vectors to be used with different tools and
targets. SVF files contain human-readable ASCII SVF statements consisting of an SVF com-
mand, the data to be sent, the expected response, a mask for the response or additional
information.
JTAGLoad supports following SVF commands:
• ENDDR
• ENDIR
• FREQUENCY
• HDR
• HIR
• PIOMAP
• PIO
• RUNTEST
• SDR
• SIR
• STATE
• TDR
• TIR
A simple SVF file to read the JTAG ID of the target can look like following:
! Set JTAG frequency
FREQUENCY 12000000HZ;
! Configure scan chain
! For a single device in chain, header and trailer data on DR and IR are 0
! Set TAP to IDLE state
STATE IDLE;
! Configure end state of DR and IR after scan operations
ENDDR IDLE;
ENDIR IDLE;
! Start of test
! 32 bit scan on DR, In: 32 0 bits, Expected out: Device ID (0x0BA00477)
SDR 32 TDI (0) TDO (0BA00477) MASK (0FFFFFFF);
! Set TAP to IDLE state
STATE IDLE;
! End of test
SVD files allow even more complex tasks, basically everything which is possible via JTAG
and the devices in the scan chain, like configuring an FPGA or loading data into memory.
J-Link / J-Trace (UM08001) © 2004-2017 SEGGER Microcontroller GmbH & Co. KG

111 CHAPTER 3 J-Link RDI (Remote Debug Interface)
3.11 J-Link RDI (Remote Debug Interface)
The J-Link RDI software is a remote debug interface for J-Link. It makes it possible to use
J-Link with any RDI compliant debugger. The main part of the software is an RDI-compliant
DLL, which needs to be selected in the debugger. here are two additional features available
which build on the RDI software foundation. Each additional feature requires an RDI license
in addition to its own license. Evaluation licenses are available free of charge. For further
information go to our website or contact us directly.
Note
The RDI software (as well as flash breakpoints and flash downloads) do not require a
license if the target device is an LPC2xxx. In this case the software verifies that the
target device is actually an LPC 2xxx and have a device-based license.
3.11.1 Flash download and flash breakpoints
Flash download and flash breakpoints are supported by J-Link RDI. For more informa-
tion about flash download and flash breakpoints, please refer to J-Link RDI User’s Guide
(UM08004) , chapter Flash download and chapter Breakpoints in flash memory .
J-Link / J-Trace (UM08001) © 2004-2017 SEGGER Microcontroller GmbH & Co. KG
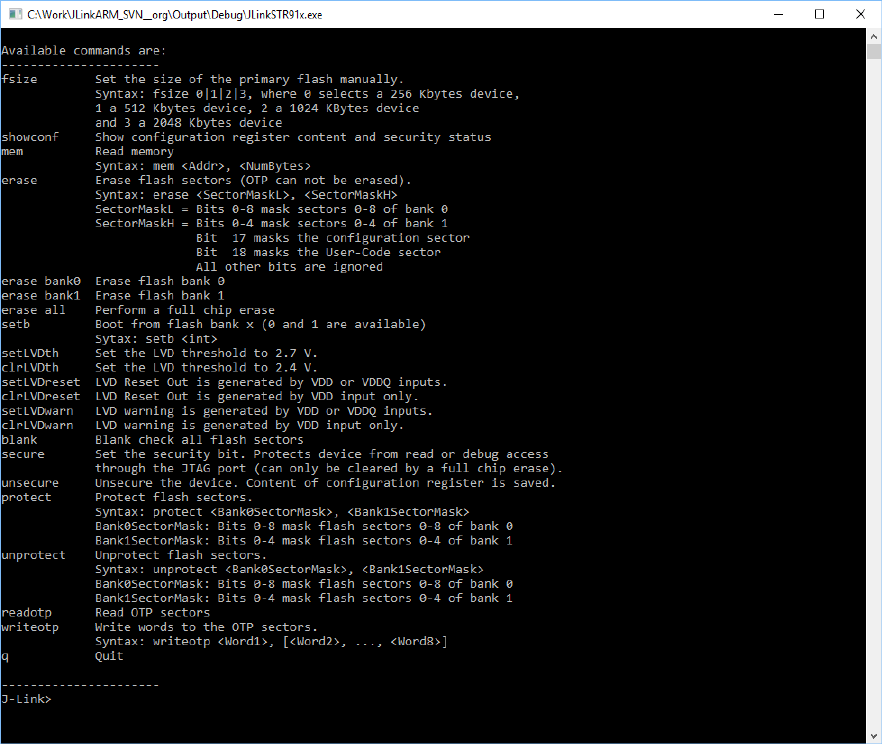
112 CHAPTER 3 Processor specific tools
3.12 Processor specific tools
The J-Link Software and Documentation Package includes some tools which support proces-
sor specific functionalities, like unlocking a device.
3.12.1 J-Link STR91x Commander (Command line tool)
J-Link STR91x Commander (JLinkSTR91x.exe) is a tool that can be used to configure
STR91x cores. It permits some STR9 specific commands like:
• Set the configuration register to boot from bank 0 or 1.
• Erase flash sectors.
• Read and write the OTP sector of the flash.
• Write-protect single flash sectors by setting the sector protection bits.
• Prevent flash from communicate via JTAG by setting the security bit.
All of the actions performed by the commands, excluding writing the OTP sector and erasing
the flash, can be undone. This tool can be used to erase the flash of the controller even if
a program is in flash which causes the CPU core to stall.
When starting the STR91x commander, a command sequence will be performed which
brings MCU into Turbo Mode.
“While enabling the Turbo Mode, a dedicated test mode signal is set and controls the GPIOs
in output. The IOs are maintained in this state until a next JTAG instruction is sent.” (ST
Microelectronics)
Enabling Turbo Mode is necessary to guarantee proper function of all commands in the
STR91x Commander.
J-Link / J-Trace (UM08001) © 2004-2017 SEGGER Microcontroller GmbH & Co. KG

113 CHAPTER 3 Processor specific tools
Commands
Command Description
fsize
Set the size of the primary flash manually.
Syntax: fsize 0|1|2|3, where 0 selects a 256 Kbytes device,
1 a 512 Kbytes device, 2 a 1024 KBytes device
and 3 a 2048 Kbytes device
showconf Show configuration register content and security status
mem Read memory
Syntax: mem <Addr>, <NumBytes>
erase
Erase flash sectors (OTP can not be erased).
Syntax: erase <SectorMaskL>, <SectorMaskH>
SectorMaskL = Bits 0-%d mask sectors 0-%d of bank 0
SectorMaskH = Bits 0-%d mask sectors 0-%d of bank 1
Bit 17 masks the configuration sector
Bit 18 masks the User-Code sector
All other bits are ignored
erase bank0 Erase flash bank 0
erase bank1 Erase flash bank 1
erase all Perform a full chip erase
setb Boot from flash bank x (0 and 1 are available)
Syntax: setb <int>
setLVDth Set the LVD threshold to 2.7 V.
clrLVDth Set the LVD threshold to 2.4 V.
setLVDreset LVD Reset Out is generated by VDD or VDDQ inputs.
clrLVDreset LVD Reset Out is generated by VDD input only.
setLVDwarn LVD warning is generated by VDD or VDDQ inputs.
clrLVDwarn LVD warning is generated by VDD input only.
blank Blank check all flash sectors
secure Set the security bit. Protects device from read or debug access
through the JTAG port (can only be cleared by a full chip erase).
unsecure Unsecure the device. Content of configuration register is saved.
protect
Protect flash sectors.
Syntax: protect <Bank0SectorMask>, <Bank1SectorMask>
Bank0SectorMask: Bits 0-%d mask flash sectors 0-%d of bank 0
Bank1SectorMask: Bits 0-%d mask flash sectors 0-%d of bank 1
unprotect
Unprotect flash sectors.
Syntax: unprotect <Bank0SectorMask>, <Bank1SectorMask>
Bank0SectorMask: Bits 0-%d mask flash sectors 0-%d of bank 0
Bank1SectorMask: Bits 0-%d mask flash sectors 0-%d of bank 1
readotp Read OTP sectors
writeotp Write words to the OTP sectors.
Syntax: writeotp <Word1>, [<Word2>, …, <Word8>]
q Quit
Command line options
J-Link STR91x Commander can be started with different command line options for test and
automation purposes. In the following, the command line options which are available for
J-Link Commander are explained. All command line options are case insensitive.
J-Link / J-Trace (UM08001) © 2004-2017 SEGGER Microcontroller GmbH & Co. KG

114 CHAPTER 3 Processor specific tools
Command Explanation
-CommanderScript Passes a CommandFile to J-Link
-CommandFile Passes a CommandFile to J-Link
-IP Selects IP as host interface
-SelectEmuBySN Connects to a J-Link with a specific S/N over USB
-IRPre Scan-Chain Configuration
-IRPost Scan-Chain Configuration
-DRPre Scan-Chain Configuration
-DRPost Scan-Chain Configuration
3.12.1.1 -CommanderScript
Similar to -CommandFile .
3.12.1.2 -CommandFile
Selects a command file and starts J-Link STR91x Commander in batch mode. The batch
mode of J-Link STR91x Commander is similar to the execution of a batch file. The command
file is parsed line by line and one command is executed at a time.
Syntax
-CommandFile <CommandFilePath>
Example
See Using command files .
3.12.1.3 -DRPre, -DRPost, -IRPre and -IRPost (Scan-Chain Configura-
tion )
STR91x allows to configure a specific scan-chain via command-line. To use this feature four
command line options have to be specified in order to allow a proper connection to the prop-
er device. In case of passing an incomplete configuration, the utility tries to auto-detect.
Syntax
-DRPre <DRPre>
-DRPost <DRPost>
-IRPre <IRPre>
-IRPost <IRPost>
Example
JLinkSTR91x.exe -DRPre 1 -DRPost 4 -IRPre 16 -IRPost 20
3.12.1.4 -IP
Selects IP as host interface to connect to J-Link. Default host interface is USB.
Syntax
-IP <IPAddr>
Example
JLinkSTR91x.exe -IP 192.168.1.17
Additional information
To select from a list of all available emulators on Ethernet, please use * as <IPAddr> .
J-Link / J-Trace (UM08001) © 2004-2017 SEGGER Microcontroller GmbH & Co. KG
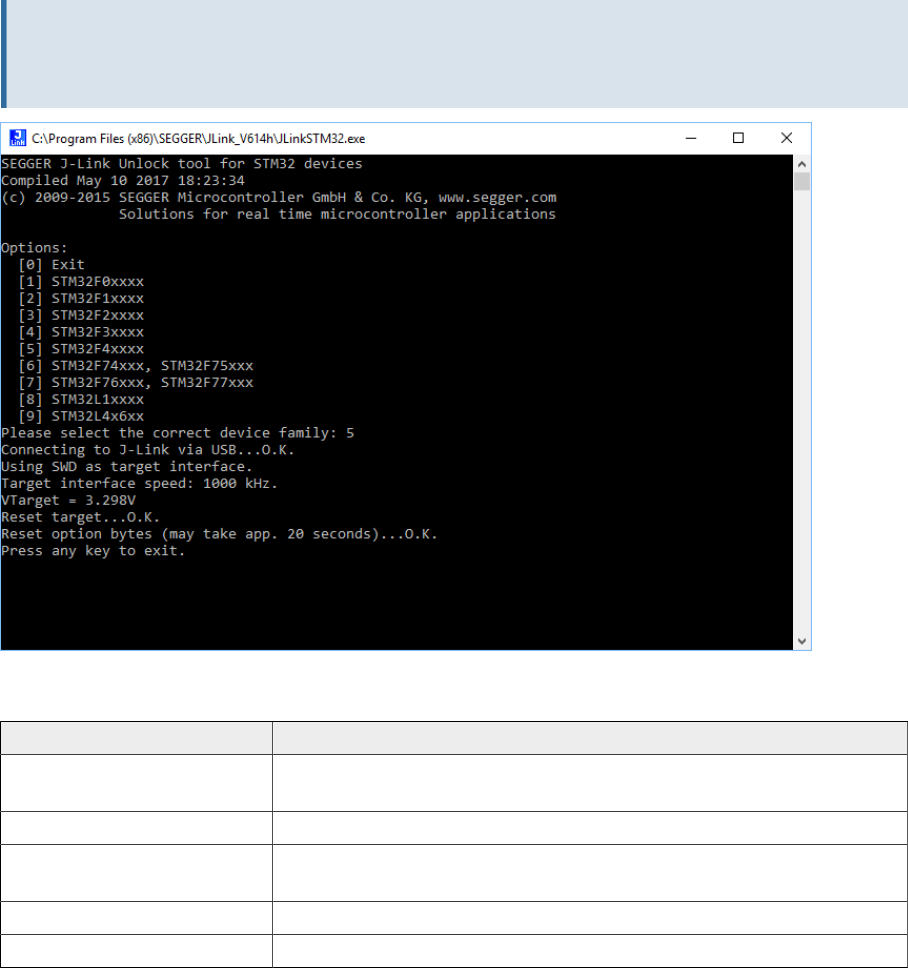
115 CHAPTER 3 Processor specific tools
3.12.1.5 -SelectEmuBySN
Connect to a J-Link with a specific serial number via USB. Useful if multiple J-Links are
connected to the same PC and multiple instances of J-Link Commander shall run and each
connects to another J-Link.
Syntax
-SelectEmuBySN <SerialNo>
Example
JLinkSTR91x.exe -SelectEmuBySN 580011111
3.12.2 J-Link STM32 Unlock (Command line tool)
J-Link STM32 Unlock (JLinkSTM32.exe) is a free command line tool which can be used
to disable the hardware watchdog of STM32 devices which can be activated by program-
ming the option bytes. Moreover the J-Link STM32 Commander unsecures a read-protected
STM32 device by re-programming the option bytes.
Note
Unprotecting a secured device or will cause a mass erase of the flash memory.
Command Line Options
Command line option Explanation
-IP Selects IP as host interface to connect to J-Link. Default host
interface is USB.
-SelectEmuBySN Connects to a J-Link with a specific S/N over USB
-Speed Starts the J-Link STM32 Unlock Utility with a given initial in-
terface speed.
-SetPowerTarget Enables target power supply via pin 19.
-SetDeviceFamily Specifies a device family
J-Link / J-Trace (UM08001) © 2004-2017 SEGGER Microcontroller GmbH & Co. KG
116 CHAPTER 3 Processor specific tools
Command line option Explanation
-Exit J-Link STM32 Unlock will close automatically
3.12.2.1 -IP
Selects IP as host interface to connect to J-Link. Default host interface is USB.
Syntax
-IP <IPAddr>
Example
JLinkSTM32.exe -IP 192.168.1.17
Note
To select from a list of all available emulators on Ethernet, please use * as <IPAddr>.
3.12.2.2 -SelectEmuBySN
Connect to a J-Link with a specific serial number via USB. Useful if multiple J-Links are
connected to the same PC.
Syntax
-SelectEmuBySN <SerialNo>
Example
JLinkSTM32.exe -SelectEmuBySN 580011111
3.12.2.3 -Speed
Starts J-Link STM32 Unlock Utility with a given initial speed. Available parameters are
“adaptive”, “auto” or a freely selectable integer value in kHz. It is recommended to use
either a fixed speed or, if it is available on the target, adaptive speeds. Default interface
speed is 1000 kHz.
Syntax
-Speed <Speed_kHz>
Example
-Speed 1000
3.12.2.4 -SetPowerTarget
The connected debug probe will power the target via pin 19 of the debug connector.
Syntax
-SetPowerTarget <Mode>
Example
JLinkSTM32.exe -SetPowerTarget 1 // Target power will be set
3.12.2.5 -SetDeviceFamily
This command allows to specify a device family, so that no user input is required to start
the unlocking process.
J-Link / J-Trace (UM08001) © 2004-2017 SEGGER Microcontroller GmbH & Co. KG

117 CHAPTER 3 Processor specific tools
Syntax
-SetDeviceFamily <Parameter>
Parameter
There are two different options to specify the device family to be used:
a) Pass the list index from the list below
b) Pass the defined device name
ID Device
0 STM32F0xxxx
1 STM32F1xxxx
2 STM32F2xxxx
3 STM32F3xxxx
4 STM32F4xxxx
5 STM32L1xxxx
6STM32F74_F75xxx
7STM32F76_F77xxx
8 STM32L4xxxx
9 STM32L0xxxx
Note
The IDs specified in the table above are different from the IDs the user selects from
in interactive mode.
Example
JLinkSTM32.exe -SetDeviceFamily 5 // Selects STM32L1 series}
JLinkSTM32.exe -SetDeviceFamily STM32F2xxxx // Selects STM32F2 series}
3.12.2.6 -Exit
In general, the J-Link STM32 utility waits at the end of the unlock process for any user
input before application closes. This option allows to skip this step, so that the utility closes
automatically.
Syntax
-Exit <Mode>
Example
JLinkSTM32.exe -Exit 1 // J-Link STM32 utility closes automatically
J-Link / J-Trace (UM08001) © 2004-2017 SEGGER Microcontroller GmbH & Co. KG
118 CHAPTER 3 J-Link Software Developer Kit (SDK)
3.13 J-Link Software Developer Kit (SDK)
The J-Link Software Developer Kit is needed if you want to write your own program with J-
Link / J-Trace. The J-Link DLL is a standard Windows DLL typically used from C programs
(Visual Basic or Delphi projects are also possible). It makes the entire functionality of J-
Link / J-Trace available through its exported functions, such as halting/stepping the CPU
core, reading/writing CPU and ICE registers and reading/writing memory. Therefore it can
be used in any kind of application accessing a CPU core. The standard DLL does not have
API functions for flash programming. However, the functionality offered can be used to
program flash. In this case, a flash loader is required. The table below lists some of the
included files and their respective purpose.
Further information can be found on the SEGGER website:
J-Link SDK
The J-Link SDK requires an additional license and is available upon request from www.seg-
ger.com .
J-Link / J-Trace (UM08001) © 2004-2017 SEGGER Microcontroller GmbH & Co. KG

Chapter 4
Setup
This chapter describes the setup procedure required in order to work with J-Link / J-Trace.
Primarily this includes the installation of the J-Link Software and Documentation Package,
which also includes a kernel mode J-Link USB driver in your host system.
J-Link / J-Trace (UM08001) © 2004-2017 SEGGER Microcontroller GmbH & Co. KG

120 CHAPTER 4 Installing the J-Link software and documentation
pack
4.1 Installing the J-Link software and documentation
pack
J-Link is shipped with a bundle of applications, corresponding manuals and some example
projects and the kernel mode J-Link USB driver. Some of the applications require an addi-
tional license, free trial licenses are available upon request from www.segger.com .
Refer to chapter J-Link software and documentation package on page 34 for an overview
of the J-Link Software and Documentation Pack.
4.1.1 Setup procedure
To install the J-Link Software and Documentation Pack, follow this procedure:
Note
We recommend to check if a newer version of the J-Link Software and Documentation
Pack is available for download before starting the installation. Check therefore the J-
Link related download section of our website:
segger.com/jlink-software.html
The setup wizard will install the software and documentation pack that also includes the
certified J-Link USB driver. Before you plug your J-Link / J-Trace into your computer’s USB
port, start the setup by double clicking Setup_JLinkARM_V<VersionNumber>.exe .
J-Link / J-Trace (UM08001) © 2004-2017 SEGGER Microcontroller GmbH & Co. KG
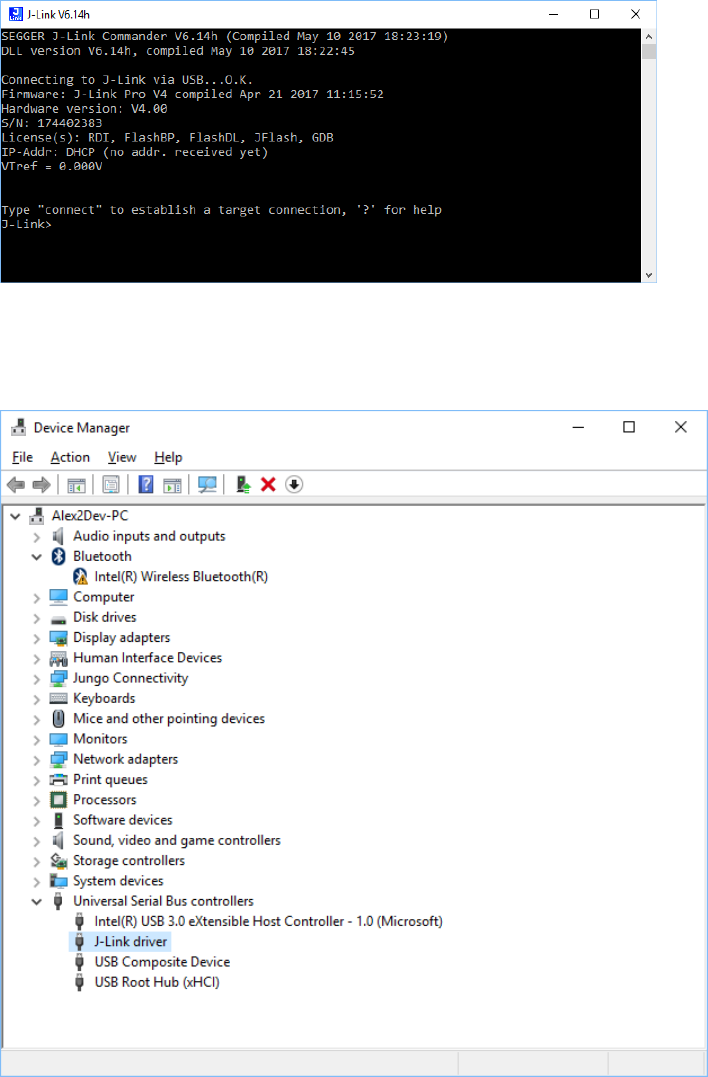
121 CHAPTER 4 Setting up the USB interface
4.2 Setting up the USB interface
After installing the J-Link Software and Documentation Package it should not be necessary
to perform any additional setup sequences in order to configure the USB interface of J-Link.
4.2.1 Verifying correct driver installation
To verify the correct installation of the driver, disconnect and reconnect J-Link / J-Trace to
the USB port. During the enumeration process which takes about 2 seconds, the LED on J-
Link / J-Trace is flashing. After successful enumeration, the LED stays on permanently. Start
the provided sample application JLink.exe, which should display the compilation time of
the J-Link firmware, the serial number, a target voltage of 0.000V, a complementary error
message, which says that the supply voltage is too low if no target is connected to J-Link /
J-Trace, and the speed selection. The screenshot below shows an example.
In addition you can verify the driver installation by consulting the Windows device manager.
If the driver is installed and your J-Link / J-Trace is connected to your computer, the device
manager should list the J-Link USB driver as a node below “Universal Serial Bus controllers”
as shown in the following screenshot:
J-Link / J-Trace (UM08001) © 2004-2017 SEGGER Microcontroller GmbH & Co. KG
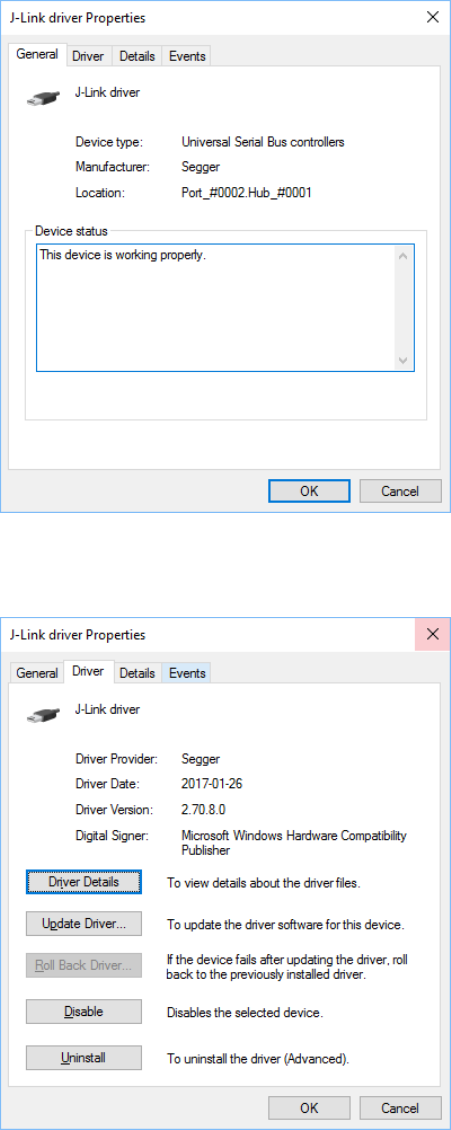
122 CHAPTER 4 Setting up the USB interface
Right-click on the driver to open a context menu which contains the command Properties. If
you select this command, a J-Link driver Properties dialog box is opened and should report:
This device is working properly.
If you experience problems, refer to the chapter See Support and FAQs for help. You can
select the Driver tab for detailed information about driver provider, version, date and digital
signer.
4.2.2 Uninstalling the J-Link USB driver
If J-Link / J-Trace is not properly recognized by Windows and therefore does not enumerate,
it makes sense to uninstall the J-Link USB driver. This might be the case when:
• The LED on the J-Link / J-Trace is rapidly flashing.
• The J-Link / J-Trace is recognized as Unknown Device by Windows.
To have a clean system and help Windows to reinstall the J-Link driver, follow this proce-
dure:
J-Link / J-Trace (UM08001) © 2004-2017 SEGGER Microcontroller GmbH & Co. KG
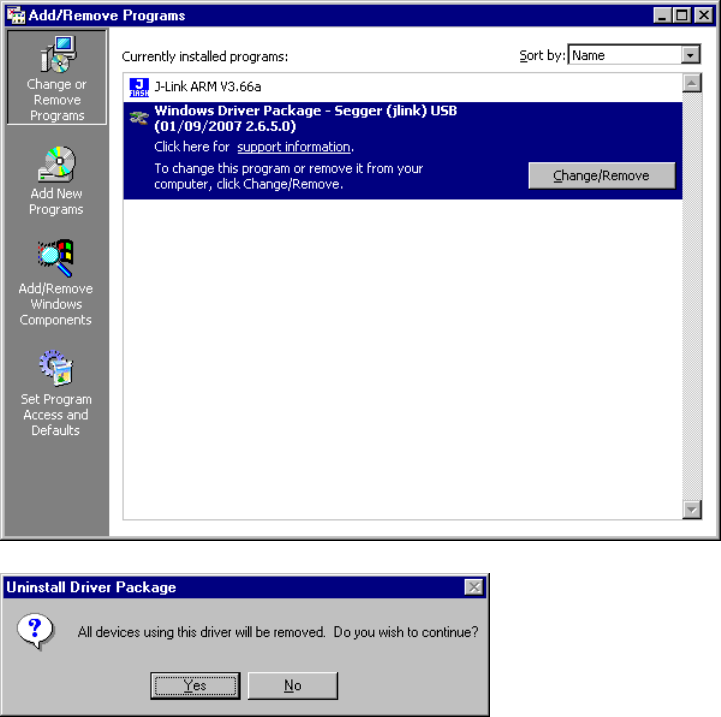
123 CHAPTER 4 Setting up the USB interface
1. Disconnect J-Link / J-Trace from your PC.
2. Open the Add/Remove Programs dialog ( Start > Settings > Control Panel > Add/
Remove Programs ) select Windows Driver Package - Segger (jlink) USB and click the
Change/Remove button.
3. Confirm the uninstallation process.
J-Link / J-Trace (UM08001) © 2004-2017 SEGGER Microcontroller GmbH & Co. KG
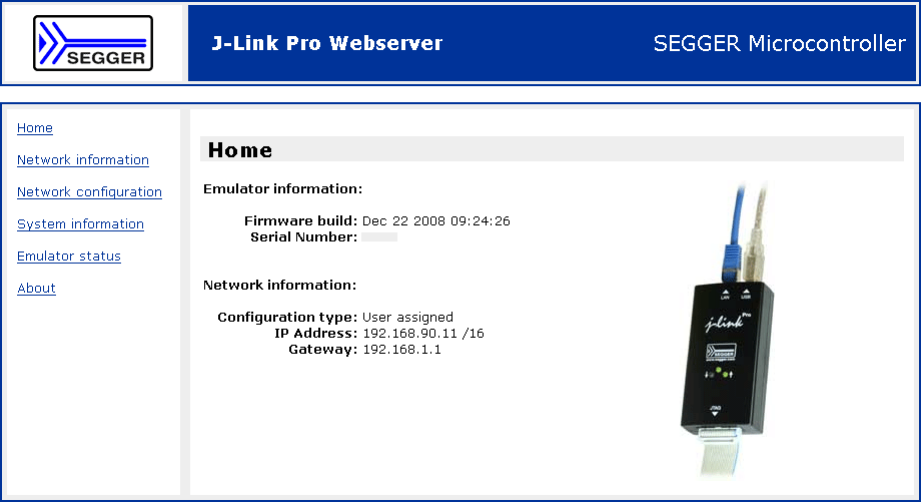
124 CHAPTER 4 Setting up the IP interface
4.3 Setting up the IP interface
Some emulators of the J-Link family have (or future members will have) an additional
Ethernet interface, to communicate with the host system. These emulators will also come
with a built-in web server which allows configuration of the emulator via web interface. In
addition to that, you can set a default gateway for the emulator which allows using it even
in large intranets. For simplicity the setup process of J-Link Pro (referred to as J-Link) is
described in this section.
4.3.1 Configuring J-Link using J-Link Configurator
The J-Link Software and Documentation Package comes with a free GUI-based utility called
J-Link Configurator which auto-detects all J-Links that are connected to the host PC via
USB & Ethernet. The J-Link Configurator allows the user to setup the IP interface of J-
Link. For more information about how to use the J-Link Configurator, please refer to J-
Link Configurator .
4.3.2 Configuring J-Link using the webinterface
All emulators of the J-Link family which come with an Ethernet interface also come with
a built-in web server, which provides a web interface for configuration. This enables the
user to configure J-Link without additional tools, just with a simple web browser. The Home
page of the web interface shows the serial number, the current IP address and the MAC
address of the J-Link.
The Network configuration page allows configuration of network related settings (IP ad-
dress, subnet mask, default gateway) of J-Link. The user can choose between automatic
IP assignment (settings are provided by a DHCP server in the network) and manual IP
assignment by selecting the appropriate radio button.
J-Link / J-Trace (UM08001) © 2004-2017 SEGGER Microcontroller GmbH & Co. KG
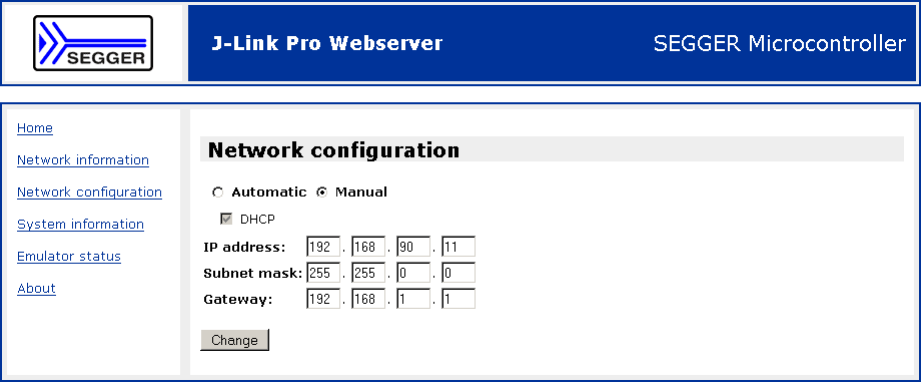
125 CHAPTER 4 Setting up the IP interface
J-Link / J-Trace (UM08001) © 2004-2017 SEGGER Microcontroller GmbH & Co. KG
126 CHAPTER 4 FAQs
4.4 FAQs
Q: How can I use J-Link with GDB and Ethernet?
A: You have to use the J-Link GDB Server in order to connect to J-Link via GDB and
Ethernet.
J-Link / J-Trace (UM08001) © 2004-2017 SEGGER Microcontroller GmbH & Co. KG
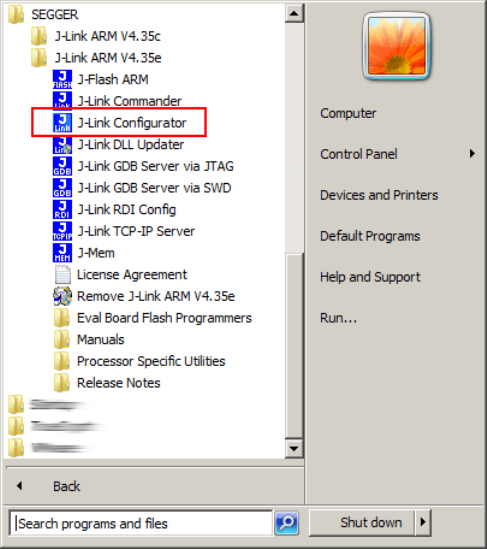
127 CHAPTER 4 J-Link Configurator
4.5 J-Link Configurator
Normally, no configuration is required, especially when using J-Link via USB. For special
cases like having multiple older J-Links connected to the same host PC in parallel, they need
to be re-configured to be identified by their real serial number when enumerating on the
host PC. This is the default identification method for current J-Links (J-Link with hardware
version 8 or later). For re-configuration of old J-Links or for configuration of the IP settings
(use DHCP, IP address, subnet mask, …) of a J-Link supporting the Ethernet interface,
SEGGER provides a GUI-based tool, called J-Link Configurator. The J-Link Configurator is
part of the J-Link Software and Documentation Package and can be used free of charge.
4.5.1 Configure J-Links using the J-Link Configurator
A J-Link can be easily configured by selecting the appropriate J-Link from the emulator list
and using right click -> Configure.
J-Link / J-Trace (UM08001) © 2004-2017 SEGGER Microcontroller GmbH & Co. KG
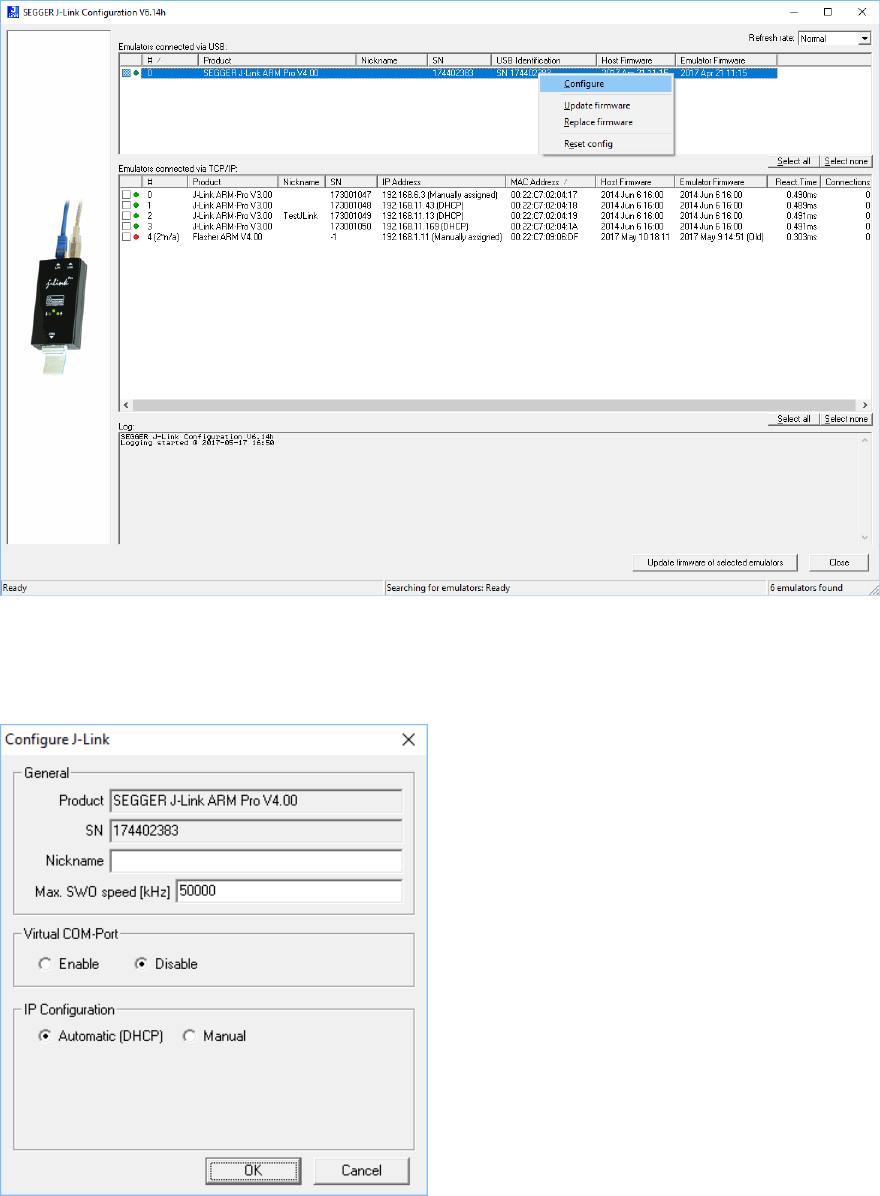
128 CHAPTER 4 J-Link Configurator
In order to configure an old J-Link, which uses the old USB 0 - 3 USB identification method,
to use the new USB identification method (reporting the real serial number) simply select
“Real SN” as USB identification method and click the OK button. The same dialog also allows
configuration of the IP settings of the connected J-Link if it supports the Ethernet interface.
J-Link / J-Trace (UM08001) © 2004-2017 SEGGER Microcontroller GmbH & Co. KG
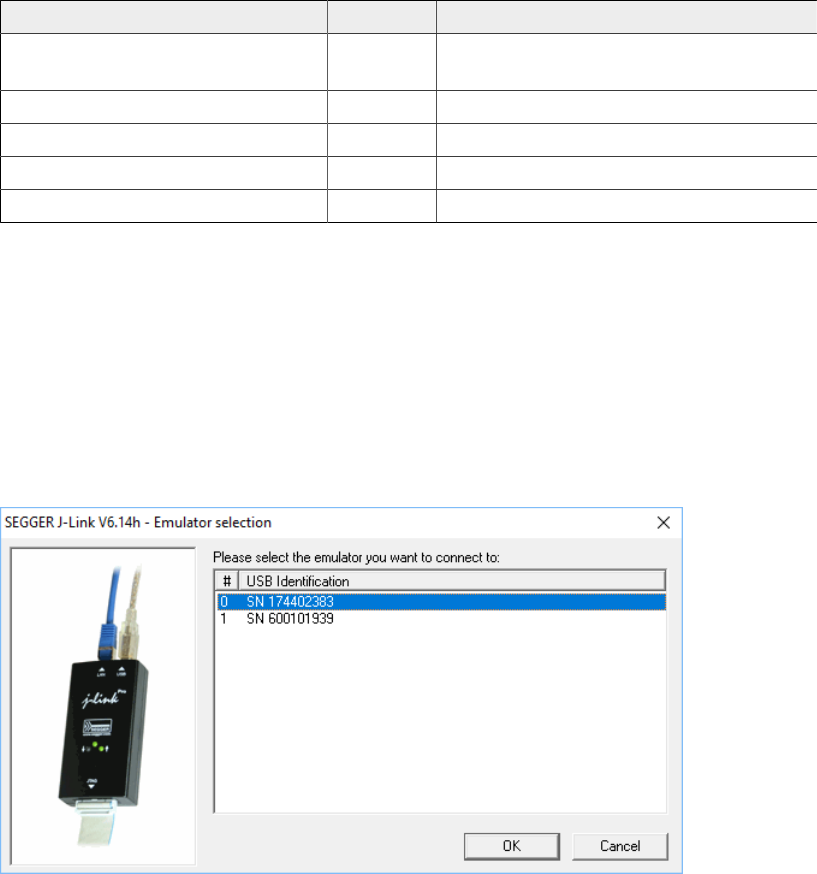
129 CHAPTER 4 J-Link USB identification
4.6 J-Link USB identification
In general, when using USB, there are two ways in which a J-Link can be identified:
• By serial number
• By USB address
Default configuration of J-Link is: Identification by serial number. Identification via USB
address is used for compatibility and not recommended.
Background information
“USB address” really means changing the USB-Product ID (PID). The following table shows
how J-Links enumerate in the different identification modes.
Identification PID Serial number
Serial number (default) 0x0101 Serial number is real serial number
of the J-Link or user assigned.
USB address 0 (Deprecated) 0x0101 123456
USB address 1 (Deprecated) 0x0102 123456
USB address 2 (Deprecated) 0x0103 123456
USB address 3 (Deprecated) 0x0104 123456
4.6.1 Connecting to different J-Links connected to the same
host PC via USB
In general, when having multiple J-Links connected to the same PC, the J-Link to connect
to is explicitly selected by its serial number. Most software/debuggers provide an extra field
to type-in the serial number of the J-Link to connect to.
A debugger / software which does not provide such a functionality, the J-Link DLL auto-
matically detects that multiple J-Links are connected to the PC and shows a selection dialog
which allows the user to select the appropriate J-Link to connect to.
So even in IDEs which do not have an selection option for the J-Link, it is possible to connect
to different J-Links.
J-Link / J-Trace (UM08001) © 2004-2017 SEGGER Microcontroller GmbH & Co. KG

130 CHAPTER 4 Using the J-Link DLL
4.7 Using the J-Link DLL
4.7.1 What is the JLink DLL?
The J-LinkARM.dll is a standard Windows DLL typically used from C or C++, but also Visual
Basic or Delphi projects. It makes the entire functionality of the J-Link / J-Trace available
through the exported functions. The functionality includes things such as halting/stepping
the ARM core, reading/writing CPU and ICE registers and reading/writing memory. There-
fore, it can be used in any kind of application accessing a CPU core.
4.7.2 Updating the DLL in third-party programs
The JLink DLL can be used by any debugger that is designed to work with it. Some debuggers
are usually shipped with the J-Link DLL already installed. Anyhow it may make sense to
replace the included DLL with the latest one available, to take advantage of improvements
in the newer version.
4.7.2.1 Updating the J-Link DLL in the IAR Embedded Workbench for
ARM (EWARM)
4.7.3 Determining the version of JLink DLL
To determine which version of the JLinkARM.dll you are using, the DLL version can be viewed
by right clicking the DLL in explorer and choosing Properties from the context menu. Click
the Version tab to display information about the product version.
J-Link / J-Trace (UM08001) © 2004-2017 SEGGER Microcontroller GmbH & Co. KG

131 CHAPTER 4 Using the J-Link DLL
4.7.4 Determining which DLL is used by a program
To verify that the program you are working with is using the DLL you expect it to use, you
can investigate which DLLs are loaded by your program with tools like Sysinternals’ Process
Explorer. It shows you details about the DLLs used by your program, such as manufacturer
and version.
Process Explorer is - at the time of writing - a free utility which can be downloaded from
www.sysinternals.com .
J-Link / J-Trace (UM08001) © 2004-2017 SEGGER Microcontroller GmbH & Co. KG

Chapter 5
Working with J-Link and J-
Trace
This chapter describes functionality and how to use J-Link and J-Trace.
J-Link / J-Trace (UM08001) © 2004-2017 SEGGER Microcontroller GmbH & Co. KG
133 CHAPTER 5 Supported IDEs
5.1 Supported IDEs
J-Link supports almost all popular IDEs available today. If support for a IDE is lacking, feel
free to get in contact with SEGGER. (see Contact Information )
For a list of supported 3rd-party debuggers and IDEs and documentation on how to get
started with those IDEs and J-Link / J-Trace es well as on how to use the advanced features
of J-Link / J-Trace with any of them, please refer to:
SEGGER Wiki: Getting Started with Various IDEs and
List of supported IDEs
J-Link / J-Trace (UM08001) © 2004-2017 SEGGER Microcontroller GmbH & Co. KG

134 CHAPTER 5 Connecting the target system
5.2 Connecting the target system
5.2.1 Power-on sequence
In general, J-Link / J-Trace should be powered on before connecting it with the target
device. That means you should first connect J-Link / J-Trace with the host system via USB
and then connect J-Link / J-Trace with the target device via JTAG. Power-on the device after
you connected J-Link / J-Trace to it.
5.2.2 Verifying target device connection
If the USB driver is working properly and your J-Link / J-Trace is connected with the host
system, you may connect J-Link / J-Trace to your target hardware. Then start JLink.exe
which should now display the normal J-Link / J-Trace related information and in addition to
that it should report that it found a JTAG target and the target’s core ID. The screenshot
below shows the output of JLink.exe . As can be seen, it reports a J-Link with one JTAG
device connected.
5.2.3 Problems
If you experience problems with any of the steps described above, read the chapter Support
and FAQs for troubleshooting tips. If you still do not find appropriate help there and your J-
Link / J-Trace is an original SEGGER product, you can contact SEGGER support via e-mail.
Provide the necessary information about your target processor, board etc. and we will try
to solve your problem. A checklist of the required information together with the contact
information can be found in chapter Support and FAQs as well.
J-Link / J-Trace (UM08001) © 2004-2017 SEGGER Microcontroller GmbH & Co. KG

135 CHAPTER 5 Indicators
5.3 Indicators
J-Link uses indicators (LEDs) to give the user some information about the current status
of the connected J-Link. All J-Links feature the main indicator. Some newer J-Links such
as the J-Link Pro / Ultra come with additional input/output Indicators. In the following, the
meaning of these indicators will be explained.
5.3.1 Main indicator
For J-Links up to V7, the main indicator is single color (Green). J-Link V8 comes with a bi-
color indicator (Green & Red LED), which can show multiple colors: green, red and orange.
5.3.1.1 Single color indicator (J-Link V7 and earlier)
Indicator status Meaning
GREEN, flashing at 10 Hz Emulator enumerates.
GREEN, flickering
Emulator is in operation. Whenever the emulator is execut-
ing a command, the LED is switched off temporarily. Flick-
ering speed depends on target interface speed. At low inter-
face speeds, operations typically take longer and the “OFF”
periods are typically longer than at fast speeds.
GREEN, constant Emulator has enumerated and is in idle mode.
GREEN, switched off for
10ms once per second J-Link heart beat. Will be activated after the emulator has
been in idle mode for at least 7 seconds.
GREEN, flashing at 1 Hz Emulator has a fatal error. This should not normally happen.
5.3.1.2 Bi-color indicator (J-Link V8)
Indicator status Meaning
GREEN, flashing at 10 Hz Emulator enumerates.
GREEN, flickering
Emulator is in operation. Whenever the emulator is execut-
ing a command, the LED is switched off temporarily. Flick-
ering speed depends on target interface speed. At low inter-
face speeds, operations typically take longer and the “OFF”
periods are typically longer than at fast speeds.
GREEN, constant Emulator has enumerated and is in idle mode.
GREEN, switched off for
10ms once per second J-Link heart beat. Will be activated after the emulator has
been in idle mode for at least 7 seconds.
ORANGE Reset is active on target.
RED, flashing at 1 Hz Emulator has a fatal error. This should not normally happen.
5.3.2 Input indicator
Some newer J-Links such as the J-Link Pro/Ultra come with additional input/output indica-
tors. The input indicator is used to give the user some information about the status of the
target hardware.
5.3.2.1 Bi-color input indicator
Indicator status Meaning
GREEN Target voltage could be measured. Target is connected.
ORANGE Target voltage could be measured. RESET is pulled low (ac-
tive) on target side.
J-Link / J-Trace (UM08001) © 2004-2017 SEGGER Microcontroller GmbH & Co. KG
136 CHAPTER 5 Indicators
Indicator status Meaning
RED RESET is pulled low (active) on target side. If no target is
connected, reset will also be active on target side.
5.3.3 Output indicator
Some newer J-Links such as the J-Link Pro/Ultra come with additional input/output indica-
tors. The output indicator is used to give the user some information about the emulator-to-
target connection.
5.3.3.1 Bi-color output indicator
Indicator status Meaning
OFF Target power supply via Pin 19 is not active.
GREEN Target power supply via Pin 19 is active.
ORANGE Target power supply via Pin 19 is active. Emulator pulls
RESET low (active).
RED Emulator pulls RESET low (active).
J-Link / J-Trace (UM08001) © 2004-2017 SEGGER Microcontroller GmbH & Co. KG
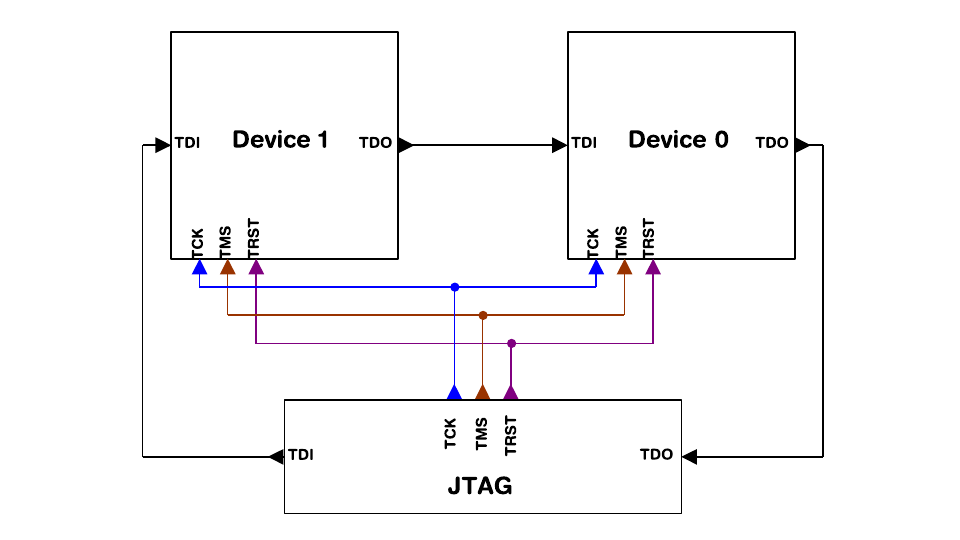
137 CHAPTER 5 JTAG interface
5.4 JTAG interface
By default, only one device is assumed to be in the JTAG scan chain. If you have multiple
devices in the scan chain, you must properly configure it. To do so, you have to specify the
exact position of the CPU that should be addressed. Configuration of the scan is done by
the target application. A target application can be a debugger such as the IAR C-SPY®
debugger, ARM’s AXD using RDI, a flash programming application such as SEGGER’s J-
Flash, or any other application using J-Link / J-Trace. It is the application’s responsibility
to supply a way to configure the scan chain. Most applications offer a dialog box for this
purpose.
5.4.1 Multiple devices in the scan chain
J-Link / J-Trace can handle multiple devices in the scan chain. This applies to hardware
where multiple chips are connected to the same JTAG connector. As can be seen in the
following figure, the TCK and TMS lines of all JTAG device are connected, while the TDI
and TDO lines form a bus.
Currently, up to 8 devices in the scan chain are supported. One or more of these devices
can be CPU cores; the other devices can be of any other type but need to comply with
the JTAG standard.
5.4.1.1 Configuration
The configuration of the scan chain depends on the application used. Read JTAG interface
for further instructions and configuration examples.
5.4.2 Sample configuration dialog boxes
As explained before, it is the responsibility of the application to allow the user to configure
the scan chain. This is typically done in a dialog box; some sample dialog boxes are shown
below.
SEGGER J-Flash configuration dialog
This dialog box can be found at Options|Project settings.
J-Link / J-Trace (UM08001) © 2004-2017 SEGGER Microcontroller GmbH & Co. KG
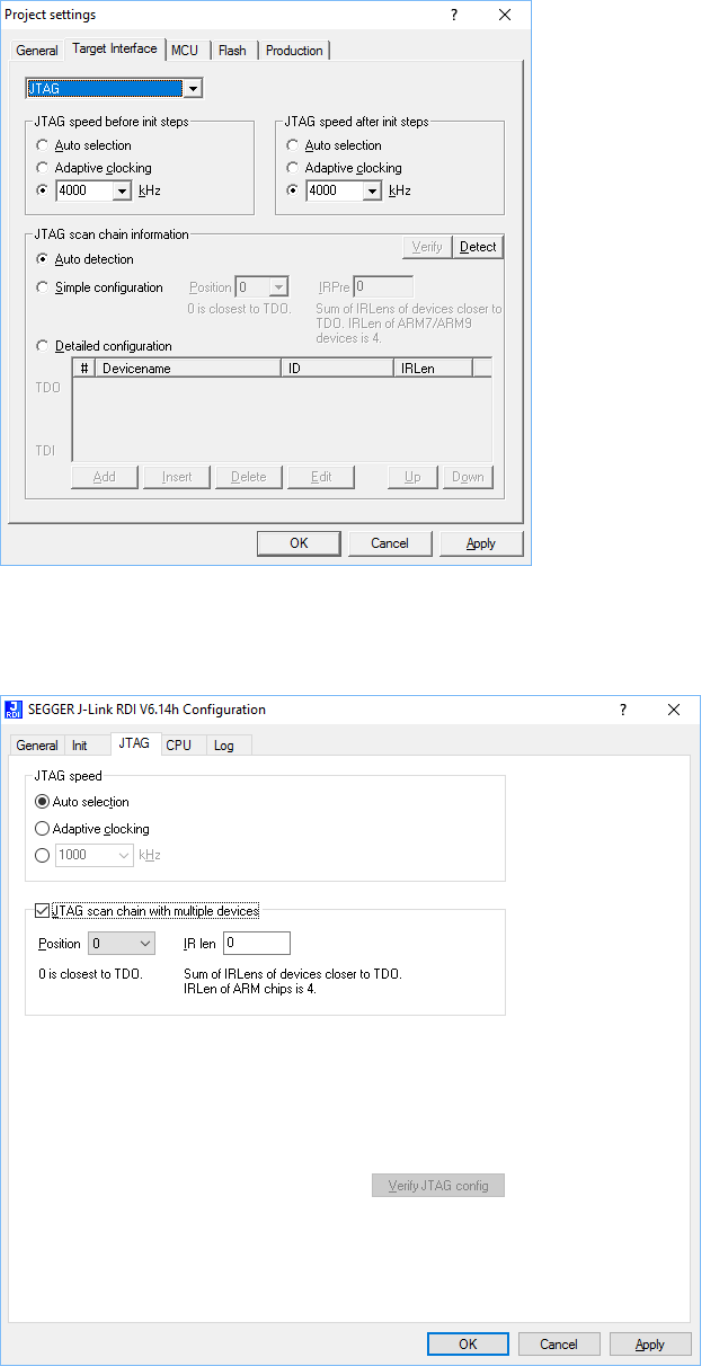
138 CHAPTER 5 JTAG interface
SEGGER J-Link RDI configuration dialog box
This dialog can be found under RDI|Configure for example in IAR Embedded Workbench®.
For detailed information check the IAR Embedded Workbench user guide.
J-Link / J-Trace (UM08001) © 2004-2017 SEGGER Microcontroller GmbH & Co. KG
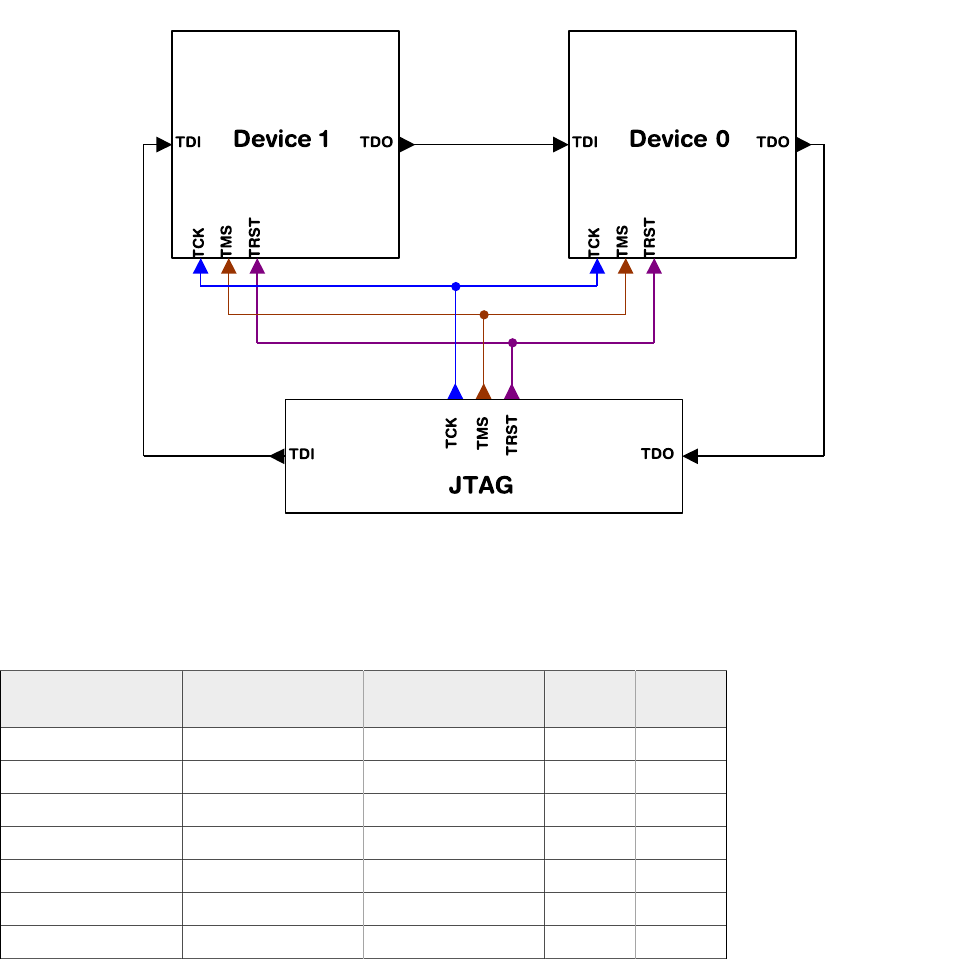
139 CHAPTER 5 JTAG interface
5.4.3 Determining values for scan chain configuration
If only one device is connected to the scan chain, the default configuration can be used. In
other cases, J-Link / J-Trace may succeed in automatically recognizing the devices on the
scan chain, but whether this is possible depends on the devices present on the scan chain.
How do I configure the scan chain?
2 values need to be known:
• The position of the target device in the scan chain.
• The total number of bits in the instruction registers of the devices before the target
device (IR len).
The position can usually be seen in the schematic; the IR len can be found in the manual
supplied by the manufacturers of the others devices. ARM7/ARM9 have an IR len of four.
Sample configurations
The diagram below shows a scan chain configuration sample with 2 devices connected to
the JTAG port.
Examples
The following table shows a few sample configurations with 1,2 and 3 devices in different
configurations.
Device 0
Chip(IR len) Device 1
Chip(IR len) Device 2
Chip(IR len) Position IR len
ARM(4) - - 0 0
ARM(4) Xilinx(8) - 0 0
Xilinx(8) ARM(4) - 1 8
Xilinx(8) Xilinx(8) ARM(4) 2 16
ARM(4) Xilinx(8) ARM(4) 0 0
ARM(4) Xilinx(8) ARM(4) 2 12
Xilinx(8) ARM(4) Xilinx(8) 1 8
The target device is marked in blue.
J-Link / J-Trace (UM08001) © 2004-2017 SEGGER Microcontroller GmbH & Co. KG

140 CHAPTER 5 JTAG interface
5.4.4 JTAG Speed
There are basically three types of speed settings:
• Fixed JTAG speed.
• Automatic JTAG speed.
• Adaptive clocking. These are explained below.
5.4.4.1 Fixed JTAG speed
The target is clocked at a fixed clock speed. The maximum JTAG speed the target can
handle depends on the target itself. In general CPU cores without JTAG synchronization logic
(such as ARM7-TDMI) can handle JTAG speeds up to the CPU speed, ARM cores with JTAG
synchronization logic (such as ARM7-TDMI-S, ARM946E-S, ARM966EJ-S) can handle JTAG
speeds up to 1/6 of the CPU speed. JTAG speeds of more than 10 MHz are not recommended.
5.4.4.2 Automatic JTAG speed
Selects the maximum JTAG speed handled by the TAP controller.
Note
On ARM cores without synchronization logic, this may not work reliably, because the
CPU core may be clocked slower than the maximum JTAG speed.
5.4.4.3 Adaptive clocking
If the target provides the RTCK signal, select the adaptive clocking function to synchronize
the clock to the processor clock outside the core. This ensures there are no synchronization
problems over the JTAG interface. If you use the adaptive clocking feature, transmission
delays, gate delays, and synchronization requirements result in a lower maximum clock
frequency than with non-adaptive clocking.
J-Link / J-Trace (UM08001) © 2004-2017 SEGGER Microcontroller GmbH & Co. KG
141 CHAPTER 5 SWD interface
5.5 SWD interface
The J-Link support ARMs Serial Wire Debug (SWD). SWD replaces the 5-pin JTAG port with a
clock (SWDCLK) and a single bi-directional data pin (SWDIO), providing all the normal JTAG
debug and test functionality. SWDIO and SWCLK are overlaid on the TMS and TCK pins. In
order to communicate with a SWD device, J-Link sends out data on SWDIO, synchronous
to the SWCLK. With every rising edge of SWCLK, one bit of data is transmitted or received
on the SWDIO.
5.5.1 SWD speed
Currently only fixed SWD speed is supported by J-Link. The target is clocked at a fixed
clock speed. The SWD speed which is used for target communication should not exceed
target CPU speed * 10 . The maximum SWD speed which is supported by J-Link depends on
the hardware version and model of J-Link. For more information about the maximum SWD
speed for each J-Link / J-Trace model, please refer to J-Link / J-Trace models on page 29.
5.5.2 SWO
Serial Wire Output (SWO) support means support for a single pin output signal from the
core. The Instrumentation Trace Macrocell (ITM) and Serial Wire Output (SWO) can be used
to form a Serial Wire Viewer (SWV). The Serial Wire Viewer provides a low cost method of
obtaining information from inside the MCU. Usually it should not be necessary to configure
the SWO speed because this is usually done by the debugger.
5.5.2.1 Max. SWO speeds
The supported SWO speeds depend on the connected emulator. They can be retrieved from
the emulator. To get the supported SWO speeds for your emulator, use J-Link Commander:
J-Link> si 1 //Select target interface SWD
J-Link> SWOSpeed
Currently, following speeds are supported:
Emulator Speed formula Resulting max. speed
J-Link V9 60MHz/n, n ≥ 8 7.5 MHz
J-Link Pro/ULTRA V4 3.2GHz/n, n ≥ 64 50 MHz
5.5.2.2 Configuring SWO speeds
The max. SWO speed in practice is the max. speed which both, target and J-Link can
handle. J-Link can handle the frequencies described in SWO whereas the max. deviation
between the target and the J-Link speed is about 3%. The computation of possible SWO
speeds is typically done in the debugger. The SWO output speed of the CPU is determined
by TRACECLKIN, which is normally the same as the CPU clock.
Example 1
Target CPU running at 72 MHz. n is between 1 and 8192.
Possible SWO output speeds are:
72MHz, 36MHz, 24MHz, ...
J-Link V9: Supported SWO input speeds are: 60MHz / n, n>= 8:
7.5MHz, 6.66MHz, 6MHz, ...
Permitted combinations are:
SWO output SWO input Deviation percent
6MHz, n = 12 6MHz, n = 10 0
J-Link / J-Trace (UM08001) © 2004-2017 SEGGER Microcontroller GmbH & Co. KG
142 CHAPTER 5 SWD interface
SWO output SWO input Deviation percent
4MHz, n = 18 4MHz, n = 15 0
… … ≤ 3
2MHz, n = 36 2MHz, n = 30 0
………
TEXT TEXT TEXT
TEXT TEXT TEXT
TEXT TEXT TEXT
TEXT TEXT TEXT
Example 2
Target CPU running at 10 MHz.
Possible SWO output speeds are:
10MHz, 5MHz, 3.33MHz, ...
J-Link V7: Supported SWO input speeds are: 6MHz / n, n>= 1:
6MHz, 3MHz, 2MHz, 1.5MHz, ...
Permitted combinations are:
SWO output SWO input Deviation percent
2MHz, n = 5 2MHz, n = 3 0
1MHz, n = 10 1MHz, n = 6 0
769kHz, n = 13 750kHz, n = 8 2.53
………
J-Link / J-Trace (UM08001) © 2004-2017 SEGGER Microcontroller GmbH & Co. KG
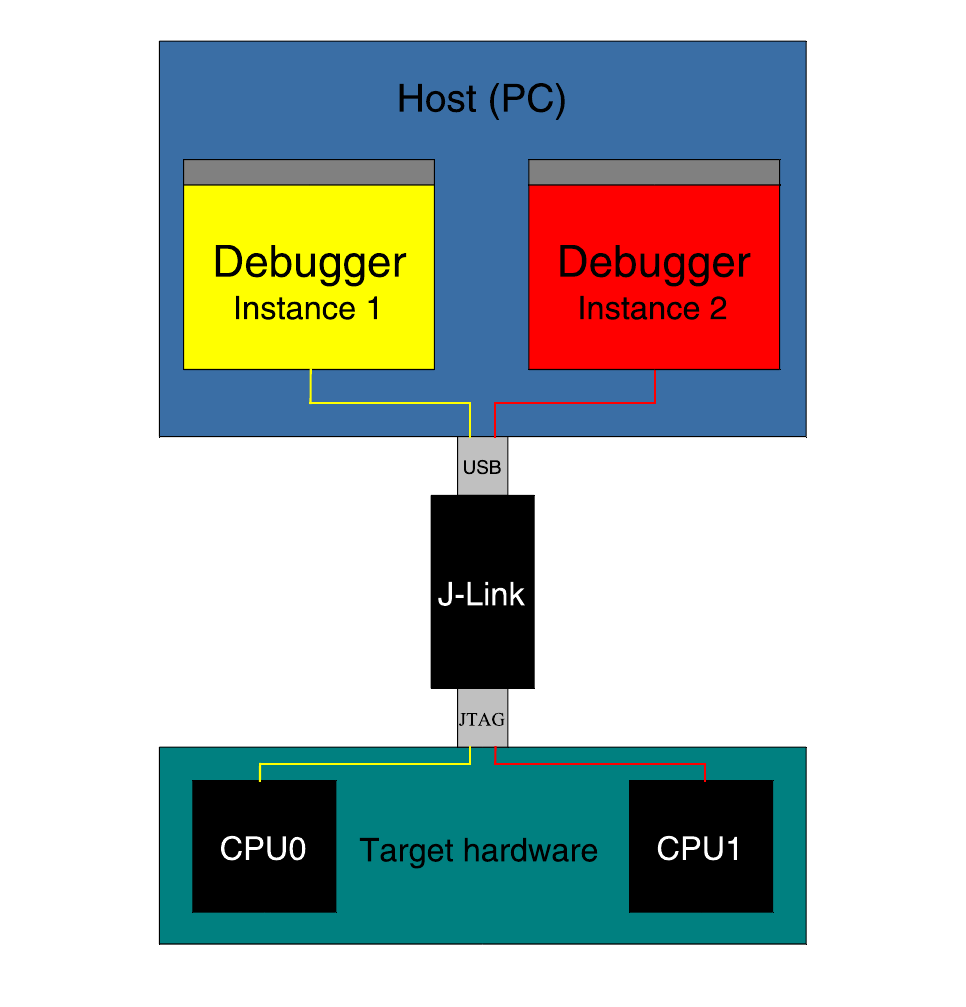
143 CHAPTER 5 Multi-core debugging
5.6 Multi-core debugging
J-Link / J-Trace is able to debug multiple cores on one target system connected to the same
scan chain. Configuring and using this feature is described in this section.
5.6.1 How multi-core debugging works
Multi-core debugging requires multiple debuggers or multiple instances of the same debug-
ger. Two or more debuggers can use the same J-Link / J-Trace simultaneously. Configuring
a debugger to work with a core in a multi-core environment does not require special set-
tings. All that is required is proper setup of the scan chain for each debugger. This enables
J-Link / J-Trace to debug more than one core on a target at the same time. The following
figure shows a host, debugging two CPU cores with two instances of the same debugger.
Both debuggers share the same physical connection. The core to debug is selected through
the JTAG-settings as described below.
J-Link / J-Trace (UM08001) © 2004-2017 SEGGER Microcontroller GmbH & Co. KG
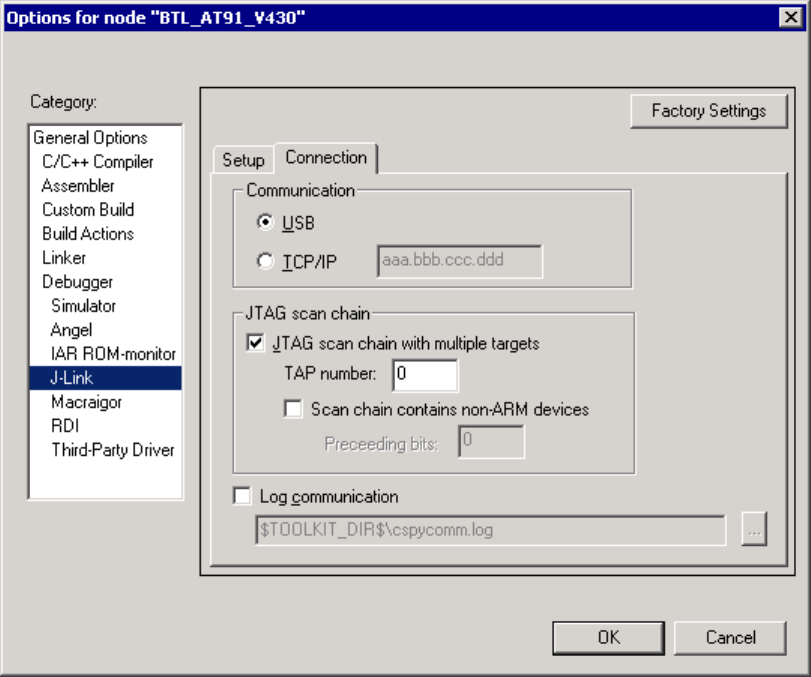
144 CHAPTER 5 Multi-core debugging
5.6.2 Using multi-core debugging in detail
1. Connect your target to J-Link / J-Trace.
2. Start your debugger, for example IAR Embedded Workbench for ARM.
3. Choose Project|Options and configure your scan chain. The picture below shows the
configuration for the first CPU core on your target.
4. Start debugging the first core.
5. Start another debugger, for example another instance of IAR Embedded Workbench for
ARM.
6. Choose Project|Options and configure your second scan chain. The following dialog box
shows the configuration for the second ARM core on your target.
J-Link / J-Trace (UM08001) © 2004-2017 SEGGER Microcontroller GmbH & Co. KG
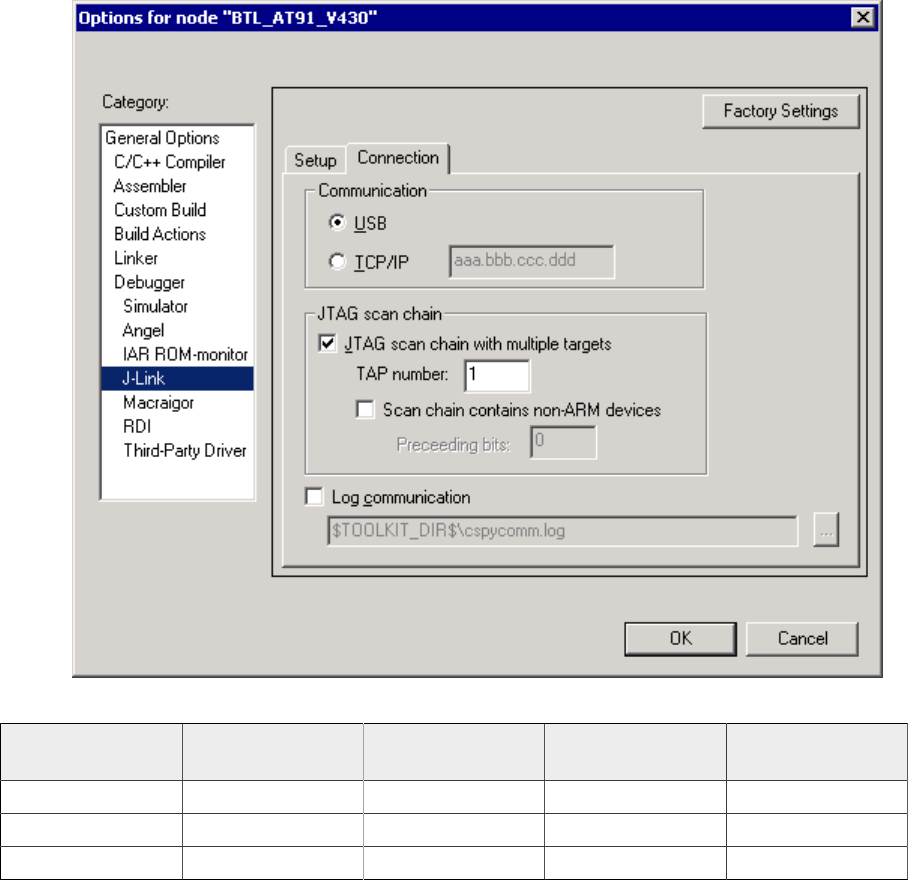
145 CHAPTER 5 Multi-core debugging
7. Start debugging your second core.
Core #1 Core #2 Core #3 TAP number
debugger #1 TAP number
debugger #2
ARM7TDMI ARM7TDMI-S ARM7TDMI 0 1
ARM7TDMI ARM7TDMI ARM7TDMI 0 2
ARM7TDMI-S ARM7TDMI-S ARM7TDMI-S 1 2
5.6.3 Things you should be aware of
Multi-core debugging is more difficult than single-core debugging. You should be aware of
the pitfalls related to JTAG speed and resetting the target.
5.6.3.1 JTAG speed
Each core has its own maximum JTAG speed. The maximum JTAG speed of all cores in the
same chain is the minimum of the maximum JTAG speeds. For example:
• Core #1: 2MHz maximum JTAG speed
• Core #2: 4MHz maximum JTAG speed
• Scan chain: 2MHz maximum JTAG speed
5.6.3.2 Resetting the target
All cores share the same RESET line. You should be aware that resetting one core through
the RESET line means resetting all cores which have their RESET pins connected to the
RESET line on the target.
J-Link / J-Trace (UM08001) © 2004-2017 SEGGER Microcontroller GmbH & Co. KG
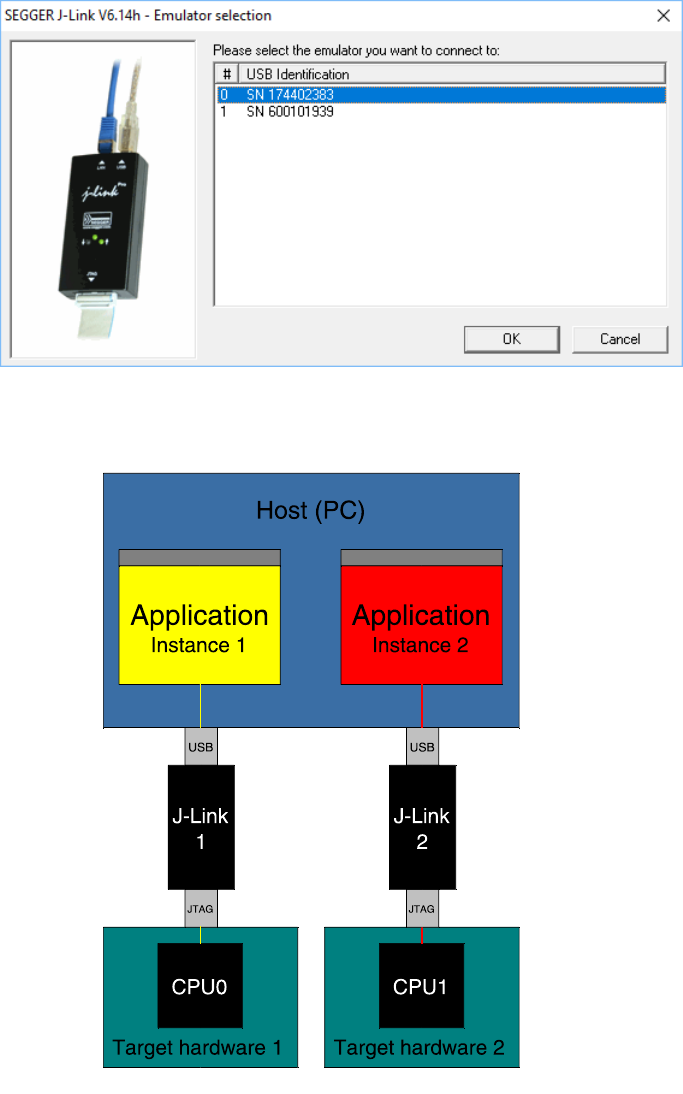
146 CHAPTER 5 Connecting multiple J-Links / J-Traces to your PC
5.7 Connecting multiple J-Links / J-Traces to your PC
In general, it is possible to have an unlimited number of J-Links / J-Traces connected to the
same PC. Current J-Link models are already factory-configured to be used in a multi-J-Link
environment, older J-Links can be re-configured to use them in a multi-J-link environment.
5.7.1 How does it work?
USB devices are identified by the OS by their product ID, vendor id and serial number.
The serial number reported by current J-Links is a unique number which allows to have
an almost unlimited number of J-Links connected to the same host at the same time. In
order to connect to the correct J-Link, the user has to make sure that the correct J-Link is
selected (by SN or IP). In cases where no specific J-Link is selected, following pop up will
shop and allow the user to select the proper J-Link:
The sketch below shows a host, running two application programs. Each application com-
municates with one CPU core via a separate J-Link.
J-Link / J-Trace (UM08001) © 2004-2017 SEGGER Microcontroller GmbH & Co. KG

147 CHAPTER 5 Connecting multiple J-Links / J-Traces to your PC
Older J-Links may report USB0-3 instead of unique serial number when enumerating via
USB. For these J-Links, we recommend to re-configure them to use the new enumeration
method (report real serial number) since the USB0-3 behavior is obsolete.
Re-configuration can be done by using the J-Link Configurator, which is part of the J-Link
Software and Documentation Package. For further information about the J-Link Configurator
and how to use it, please refer to J-Link Configurator .
Re-configuration to the old USB 0-3 enumeration method
In some special cases, it may be necessary to switch back to the obsolete USB 0-3 enu-
meration method. For example, old IAR EWARM versions supports connecting to a J-Link
via the USB0-3 method only. As soon as more than one J-Link is connected to the pc, there
is no opportunity to pre-select the J-Link which should be used for a debug session.
Below, a small instruction of how to re-configure J-Link to enumerate with the old obsolete
enumeration method in order to prevent compatibility problems, a short instruction is give
on how to set USB enumeration method to USB 2 is given:
Config area byte Meaning
0USB-Address. Can be set to 0-3, 0xFF is default which
means USB-Address 0.
1Enumeration method
0x00 / 0xFF: USB-Address is used for enumeration.
0x01: Real-SN is used for enumeration.
Example for setting enumeration method to USB 2:
1. Start J-Link Commander (JLink.exe) which is part of the J-Link software
2. Enter wconf 0 02 // Set USB-Address 2
3. Enter wconf 1 00 // Set enumeration method to USB-Address
4. Power-cycle J-Link in order to apply new configuration. Re-configuration to REAL-SN
enumeration can be done by using the J-Link Configurator, which is part of the J-
Link Software and Documentation Package. For further information about the J-Link
Configurator and how to use it, please refer to J-Link Configurator .
J-Link / J-Trace (UM08001) © 2004-2017 SEGGER Microcontroller GmbH & Co. KG
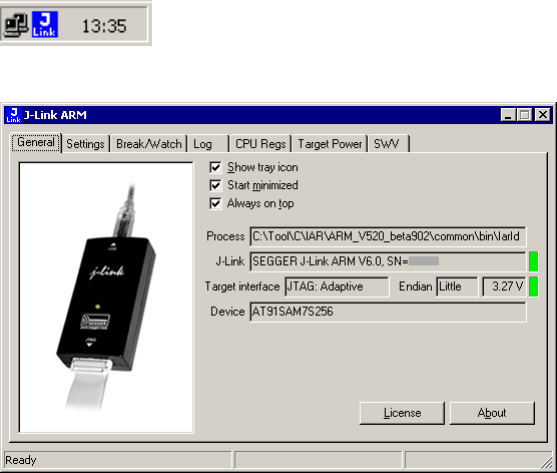
148 CHAPTER 5 J-Link control panel
5.8 J-Link control panel
Since software version V3.86 J-Link the J-Link control panel window allows the user to
monitor the J-Link status and the target status information in real-time. It also allows the
user to configure the use of some J-Link features such as flash download, flash breakpoints
and instruction set simulation. The J-Link control panel window can be accessed via the J-
Link tray icon in the tray icon list. This icon is available when the debug session is started.
To open the status window, simply click on the tray icon.
5.8.1 Tabs
The J-Link status window supports different features which are grouped in tabs. The orga-
nization of each tab and the functionality which is behind these groups will be explained
in this section
5.8.1.1 General
In the General section, general information about J-Link and the target hardware are shown.
Moreover the following general settings can be configured:
• Show tray icon: If this checkbox is disabled the tray icon will not show from the next
time the DLL is loaded.
• Start minimized: If this checkbox is disabled the J-Link status window will show up
automatically each time the DLL is loaded.
• Always on top: If this checkbox is enabled the J-Link status window is always visible
even if other windows will be opened.
The general information about target hardware and J-Link which are shown in this section,
are:
• Process: Shows the path of the file which loaded the DLL.
• J-Link: Shows OEM of the connected J-Link, the hardware version and the Serial number.
If no J-Link is connected it shows “not connected” and the color indicator is red.
• Target interface: Shows the selected target interface (JTAG/SWD) and the current JTAG
speed. The target current is also shown. (Only visible if J-Link is connected)
• Endian: Shows the target endianness (Only visible if J-Link is connected)
• Device: Shows the selected device for the current debug session.
• License: Opens the J-Link license manager.
• About: Opens the about dialog.
J-Link / J-Trace (UM08001) © 2004-2017 SEGGER Microcontroller GmbH & Co. KG

149 CHAPTER 5 J-Link control panel
5.8.1.2 Settings
In the Settings section project- and debug-specific settings can be set. It allows the con-
figuration of the use of flash download and flash breakpoints and some other target specific
settings which will be explained in this topic. Settings are saved in the configuration file.
This configuration file needs to be set by the debugger. If the debugger does not set it, set-
tings can not be saved. All settings which are modified during the debug session have to be
saved by pressing Save settings, otherwise they are lost when the debug session is closed.
Section: Flash download
In this section, settings for the use of the J-Link FlashDL feature and related settings can
be configured. When a license for J-Link FlashDL is found, the color indicator is green and
“License found” appears right to the J-Link FlashDL usage settings.
• Auto: This is the default setting of J-Link FlashDL usage. If a license is found J-Link
FlashDL is enabled. Otherwise J-Link FlashDL will be disabled internally.
• On: Enables the J-Link FlashDL feature. If no license has been found an error message
appears.
• Off: Disables the J-Link FlashDL feature.
• Skip download on CRC match: J-Link checks the CRC of the flash content to determine if
the current application has already been downloaded to the flash. If a CRC match occurs,
the flash download is not necessary and skipped. (Only available if J-Link FlashDL usage
is configured as Auto or On )
• Verify download: If this checkbox is enabled J-Link verifies the flash content after the
download. (Only available if J-Link FlashDL usage is configured as Auto or On )
Section: Flash breakpoints:
In this section, settings for the use of the FlashBP feature and related settings can be
configured. When a license for FlashBP is found, the color indicator is green and “License
found” appears right to the FlashBP usage settings.
• Auto: This is the default setting of FlashBP usage. If a license has been found the FlashBP
feature will be enabled. Otherwise FlashBP will be disabled internally.
• On: Enables the FlashBP feature. If no license has been found an error message appears.
• Off: Disables the FlashBP feature.
• Show window during program : When this checkbox is enabled the “Programming flash”
window is shown when flash is re-programmed in order to set/clear flash breakpoints.
Flash download and flash breakpoints independent settings
These settings do not belong to the J-Link flash download and flash breakpoints settings
section. They can be configured without any license needed.
J-Link / J-Trace (UM08001) © 2004-2017 SEGGER Microcontroller GmbH & Co. KG

150 CHAPTER 5 J-Link control panel
• Log file: Shows the path where the J-Link log file is placed. It is possible to override
the selection manually by enabling the Override checkbox. If the Override checkbox is
enabled a button appears which let the user choose the new location of the log file.
• Settings file: Shows the path where the configuration file is placed. This configuration
file contains all the settings which can be configured in the Settings tab.
• Override device selection: If this checkbox is enabled, a dropdown list appears, which
allows the user to set a device manually. This especially makes sense when J-Link can
not identify the device name given by the debugger or if a particular device is not yet
known to the debugger, but to the J-Link software.
• Allow caching of flash contents : If this checkbox is enabled, the flash contents are
cached by J-Link to avoid reading data twice. This speeds up the transfer between
debugger and target.
• Allow instruction set simulation: If this checkbox is enabled, instructions will be
simulated as far as possible. This speeds up single stepping, especially when FlashBPs
are used.
• Save settings: When this button is pushed, the current settings in the Settings tab will
be saved in a configuration file. This file is created by J-Link and will be created for each
project and each project configuration (e.g. Debug_RAM, Debug_Flash). If no settings
file is given, this button is not visible.
• Modify breakpoints during execution: This dropdown box allows the user to change
the behavior of the DLL when setting breakpoints if the CPU is running. The following
options are available:
Allow: Allows settings breakpoints while the CPU is running. If the CPU needs to be
halted in order to set the breakpoint, the DLL halts the CPU, sets the breakpoints and
restarts the CPU.
Allow if CPU does not need to be halted: Allows setting breakpoints while the CPU is
running, if it does not need to be halted in order to set the breakpoint. If the CPU has
to be halted the breakpoint is not set.
Ask user if CPU needs to be halted: If the user tries to set a breakpoint while the CPU
is running and the CPU needs to be halted in order to set the breakpoint, the user is
asked if the breakpoint should be set. If the breakpoint can be set without halting the
CPU, the breakpoint is set without explicit confirmation by the user.
Do not allow: It is not allowed to set breakpoints while the CPU is running.
5.8.1.3 Break/Watch
In the Break/Watch section all breakpoints and watchpoints which are in the DLL internal
breakpoint and watchpoint list are shown.
J-Link / J-Trace (UM08001) © 2004-2017 SEGGER Microcontroller GmbH & Co. KG
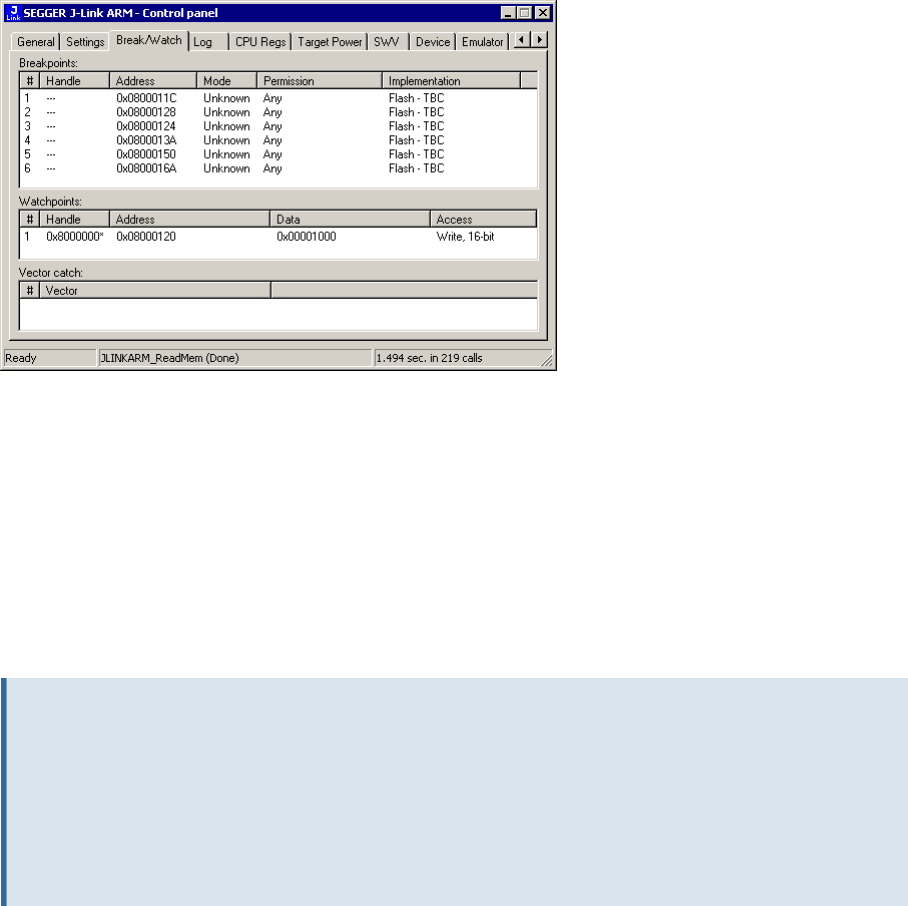
151 CHAPTER 5 J-Link control panel
Section: Code
Lists all breakpoints which are in the DLL internal breakpoint list are shown.
• Handle: Shows the handle of the breakpoint.
• Address: Shows the address where the breakpoint is set.
• Mode: Describes the breakpoint type (ARM/THUMB)
• Permission: Describes the breakpoint implementation flags.
• Implementation: Describes the breakpoint implementation type. The breakpoint types
are: RAM, Flash, Hard. An additional TBC (to be cleared) or TBS (to be set) gives
information about if the breakpoint is (still) written to the target or if it’s just in the
breakpoint list to be written/cleared.
Note
It is possible for the debugger to bypass the breakpoint functionality of the J-Link soft-
ware by writing to the debug registers directly. This means for ARM7/ARM9 cores write
accesses to the ICE registers, for Cortex-M3 devices write accesses to the memory
mapped flash breakpoint registers and in general simple write accesses for software
breakpoints (if the program is located in RAM). In these cases, the J-Link software
cannot determine the breakpoints set and the list is empty.
Section: Data
In this section, all data breakpoints which are listed in the DLL internal breakpoint list are
shown.
• Handle: Shows the handle of the data breakpoint.
• Address: Shows the address where the data breakpoint is set.
• AddrMask: Specifies which bits of Address are disregarded during the comparison for a
data breakpoint match. (A 1 in the mask means: disregard this bit)
• Data: Shows on which data to be monitored at the address where the data breakpoint
is set.
• Data Mask: Specifies which bits of Data are disregarded during the comparison for a
data breakpoint match. (A 1 in the mask means: disregard this bit)
• Ctrl: Specifies the access type of the data breakpoint (read/write).
• CtrlMask: Specifies which bits of Ctrl are disregarded during the comparison for a data
breakpoint match.
5.8.1.4 Log
In this section the log output of the DLL is shown. The user can determine which function
calls should be shown in the log window. Available function calls to log: Register read/write,
Memory read/write, set/clear breakpoint, step, go, halt, is halted.
J-Link / J-Trace (UM08001) © 2004-2017 SEGGER Microcontroller GmbH & Co. KG
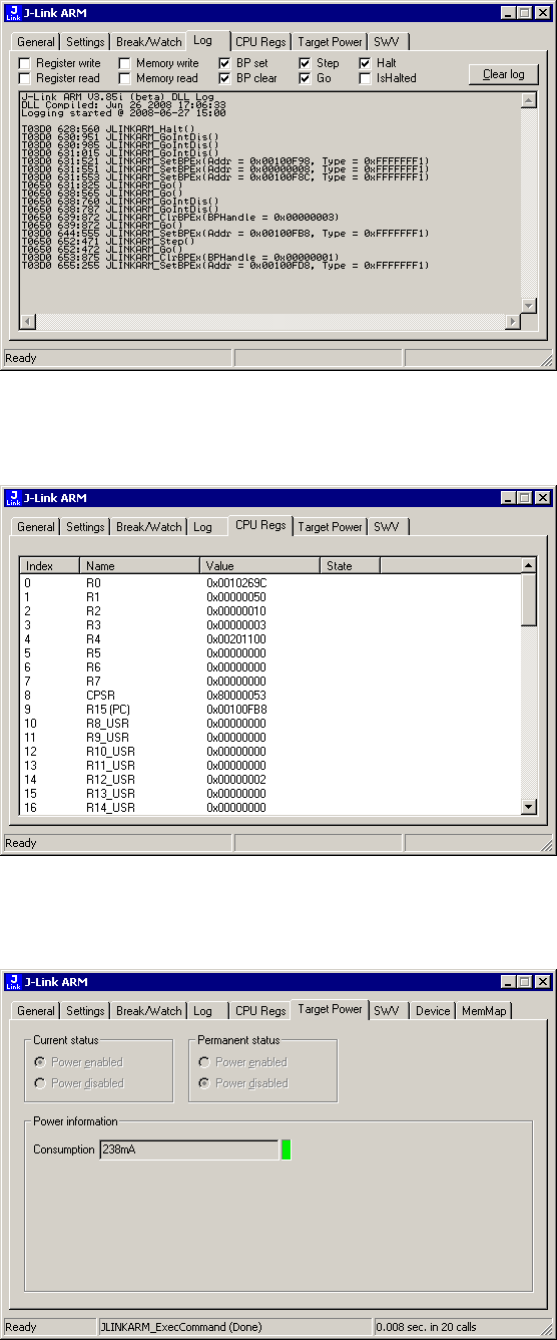
152 CHAPTER 5 J-Link control panel
5.8.1.5 CPU Regs
In this section the name and the value of the CPU registers are shown.
5.8.1.6 Target Power
In this section currently just the power consumption of the target hardware is shown.
5.8.1.7 SWV
In this section SWV information are shown.
J-Link / J-Trace (UM08001) © 2004-2017 SEGGER Microcontroller GmbH & Co. KG

153 CHAPTER 5 J-Link control panel
• Status: Shows the encoding and the baudrate of the SWV data received by the target
(Manchester/UART, currently J-Link only supports UART encoding).
• Bytes in buffer: Shows how many bytes are in the DLL SWV data buffer.
• Bytes transferred: Shows how many bytes have been transferred via SWV, since the
debug session has been started.
• Refresh counter: Shows how often the SWV information in this section has been updated
since the debug session has been started.
• Host buffer: Shows the reserved buffer size for SWV data, on the host side.
• Emulator buffer: Shows the reserved buffer size for SWV data, on the emulator side.
J-Link / J-Trace (UM08001) © 2004-2017 SEGGER Microcontroller GmbH & Co. KG
154 CHAPTER 5 Reset strategies
5.9 Reset strategies
J-Link / J-Trace supports different reset strategies. This is necessary because there is no
single way of resetting and halting a CPU core before it starts to execute instructions. For
example reset strategies which use the reset pin can not succeed on targets where the
reset pin of the CPU is not connected to the reset pin of the JTAG connector. Reset strategy
0 is always the recommended one because it has been adapted to work on every target
even if the reset pin (Pin 15) is not connected.
What is the problem if the core executes some instructions after RESET?
The instructions which are executed can cause various problems. Some cores can be com-
pletely “confused”, which means they can not be switched into debug mode (CPU can not be
halted). In other cases, the CPU may already have initialized some hardware components,
causing unexpected interrupts or worse, the hardware may have been initialized with ille-
gal values. In some of these cases, such as illegal PLL settings, the CPU may be operated
beyond specification, possibly locking the CPU.
5.9.1 Strategies for ARM 7/9 devices
5.9.1.1 Type 0: Hardware, halt after reset (normal)
The hardware reset pin is used to reset the CPU. After reset release, J-Link continuously
tries to halt the CPU. This typically halts the CPU shortly after reset release; the CPU can
in most systems execute some instructions before it is halted. The number of instructions
executed depends primarily on the JTAG speed: the higher the JTAG speed, the faster the
CPU can be halted.
Some CPUs can actually be halted before executing any instruction, because the start of
the CPU is delayed after reset release. If a pause has been specified, J-Link waits for the
specified time before trying to halt the CPU. This can be useful if a bootloader which resides
in flash or ROM needs to be started after reset.
This reset strategy is typically used if nRESET and nTRST are coupled. If nRESET and nTRST
are coupled, either on the board or the CPU itself, reset clears the breakpoint, which means
that the CPU can not be stopped after reset with the BP@0 reset strategy.
5.9.1.2 Type 1: Hardware, halt with BP@0
The hardware reset pin is used to reset the CPU. Before doing so, the ICE breaker is pro-
grammed to halt program execution at address 0; effectively, a breakpoint is set at address
0. If this strategy works, the CPU is actually halted before executing a single instruction.
This reset strategy does not work on all systems for two reasons:
• If nRESET and nTRST are coupled, either on the board or the CPU itself, reset clears the
breakpoint, which means the CPU is not stopped after reset.
• Some MCUs contain a bootloader program (sometimes called kernel), which needs to
be executed to enable JTAG access.
5.9.1.3 Type 2: Software, for Analog Devices ADuC7xxx MCUs
This reset strategy is a software strategy. The CPU is halted and performs a sequence which
causes a peripheral reset. The following sequence is executed:
• The CPU is halted.
• A software reset sequence is downloaded to RAM.
• A breakpoint at address 0 is set.
• The software reset sequence is executed.
This sequence performs a reset of CPU and peripherals and halts the CPU before executing
instructions of the user program. It is the recommended reset sequence for Analog Devices
ADuC7xxx MCUs and works with these chips only.
J-Link / J-Trace (UM08001) © 2004-2017 SEGGER Microcontroller GmbH & Co. KG
155 CHAPTER 5 Reset strategies
5.9.1.4 Type 3: No reset
No reset is performed. Nothing happens.
5.9.1.5 Type 4: Hardware, halt with WP
The hardware RESET pin is used to reset the CPU. After reset release, J-Link continuously
tries to halt the CPU using a watchpoint. This typically halts the CPU shortly after reset
release; the CPU can in most systems execute some instructions before it is halted.
The number of instructions executed depends primarily on the JTAG speed: the higher the
JTAG speed, the faster the CPU can be halted. Some CPUs can actually be halted before
executing any instruction, because the start of the CPU is delayed after reset release.
5.9.1.6 Type 5: Hardware, halt with DBGRQ
The hardware RESET pin is used to reset the CPU. After reset release, J-Link continuously
tries to halt the CPU using the DBGRQ. This typically halts the CPU shortly after reset
release; the CPU can in most systems execute some instructions before it is halted.
The number of instructions executed depends primarily on the JTAG speed: the higher the
JTAG speed, the faster the CPU can be halted. Some CPUs can actually be halted before
executing any instruction, because the start of the CPU is delayed after reset release.
5.9.1.7 Type 6: Software
This reset strategy is only a software reset. “Software reset” means basically no reset, just
changing the CPU registers such as PC and CPSR. This reset strategy sets the CPU registers
to their after-Reset values:
• PC = 0
• CPSR = 0xD3 (Supervisor mode, ARM, IRQ / FIQ disabled)
• All SPSR registers = 0x10
• All other registers (which are unpredictable after reset) are set to 0.
• The hardware RESET pin is not affected.
5.9.1.8 Type 7: Reserved
Reserved reset type.
5.9.1.9 Type 8: Software, for ATMEL AT91SAM7 MCUs
The reset pin of the device is disabled by default. This means that the reset strategies which
rely on the reset pin (low pulse on reset) do not work by default. For this reason a special
reset strategy has been made available.
It is recommended to use this reset strategy. This special reset strategy resets the periph-
erals by writing to the RSTC_CR register. Resetting the peripherals puts all peripherals in
the defined reset state. This includes memory mapping register, which means that after
reset flash is mapped to address 0. It is also possible to achieve the same effect by writing
0x4 to the RSTC_CR register located at address 0xfffffd00.
5.9.1.10 Type 9: Hardware, for NXP LPC MCUs
After reset a bootloader is mapped at address 0 on ARM 7 LPC devices. This reset strategy
performs a reset via reset strategy Type 1 in order to reset the CPU. It also ensures that
flash is mapped to address 0 by writing the MEMMAP register of the LPC. This reset strategy
is the recommended one for all ARM 7 LPC devices.
5.9.2 Strategies for Cortex-M devices
J-Link supports different specific reset strategies for the Cortex-M cores. All of the following
reset strategies are available in JTAG and in SWD mode. All of them halt the CPU after
the reset.
J-Link / J-Trace (UM08001) © 2004-2017 SEGGER Microcontroller GmbH & Co. KG

156 CHAPTER 5 Reset strategies
Note
It is recommended that the correct device is selected in the debugger so the debugger
can pass the device name to the J-Link DLL which makes it possible for J-Link to
detect what is the best reset strategy for the device. Moreover, we recommend that
the debugger uses reset type 0 to allow J-Link to dynamically select what reset is the
best for the connected device.
5.9.2.1 Type 0: Normal
This is the default strategy. It does whatever is the best way to reset the target device.
If the correct device is selected in the debugger this reset strategy may also perform some
special handling which might be necessary for the connected device. This for example is
the case for devices which have a ROM bootloader that needs to run after reset and before
the user application is started (especially if the debug interface is disabled after reset and
needs to be enabled by the ROM bootloader).
For most devices, this reset strategy does the same as reset strategy 8 does:
1. Make sure that the device halts immediately after reset (before it can execute any
instruction of the user application) by setting the VC_CORERESET in the DEMCR .
2. Reset the core and peripherals by setting the SYSRESETREQ bit in the AIRCR .
3. Wait for the S_RESET_ST bit in the DHCSR to first become high (reset active) and then
low (reset no longer active) afterwards.
4. Clear VC_CORERESET.
5.9.2.2 Type 1: Core
Only the core is reset via the VECTRESET bit. The peripherals are not affected. After setting
the VECTRESET bit, J-Link waits for the S_RESET_ST bit in the Debug Halting Control and
Status Register ( DHCSR ) to first become high and then low afterwards. The CPU does
not start execution of the program because J-Link sets the VC_CORERESET bit before reset,
which causes the CPU to halt before execution of the first instruction.
Note
In most cases it is not recommended to reset the core only since most target applica-
tions rely of the reset state of some peripherals (PLL, External memory interface etc.)
and may be confused if they boot up but the peripherals are already configured.
5.9.2.3 Type 2: ResetPin
J-Link pulls its RESET pin low to reset the core and the peripherals. This normally causes the
CPU RESET pin of the target device to go low as well, resulting in a reset of both CPU and
peripherals. This reset strategy will fail if the RESET pin of the target device is not pulled
low. The CPU does not start execution of the program because J-Link sets the VC_CORERESET
bit before reset, which causes the CPU to halt before execution of the first instruction.
5.9.2.4 Type 3: Connect under Reset
J-Link connects to the target while keeping Reset active (reset is pulled low and remains
low while connecting to the target). This is the recommended reset strategy for STM32
devices. This reset strategy has been designed for the case that communication with the
core is not possible in normal mode so the VC_CORERESET bit can not be set in order to
guarantee that the core is halted immediately after reset.
5.9.2.5 Type 4: Reset core & peripherals, halt after bootloader
Same as type 0, but bootloader is always executed. This reset strategy has been designed
for MCUs/CPUs which have a bootloader located in ROM which needs to run at first, after
J-Link / J-Trace (UM08001) © 2004-2017 SEGGER Microcontroller GmbH & Co. KG
157 CHAPTER 5 Reset strategies
reset (since it might initialize some target settings to their reset state). When using this
reset strategy, J-Link will let the bootloader run after reset and halts the target immediately
after the bootloader and before the target application is started. This is the recommended
reset strategy for LPC11xx and LPC13xx devices where a bootloader should execute after
reset to put the chip into the “real” reset state.
5.9.2.6 Type 5: Reset core & peripherals, halt before bootloader
Basically the same as reset type 8. Performs a reset of core & peripherals and halts the
CPU immediately after reset. The ROM bootloader is NOT executed.
5.9.2.7 Type 6: Reset for Freescale Kinetis devices
Performs a via reset strategy 0 (normal) first in order to reset the core & peripherals and
halt the CPU immediately after reset. After the CPU is halted, the watchdog is disabled,
since the watchdog is running after reset by default. If the target application does not feed
the watchdog, J-Link loses connection to the device since it is reset permanently.
5.9.2.8 Type 7: Reset for Analog Devices CPUs (ADI Halt after kernel)
Performs a reset of the core and peripherals by setting the SYSRESETREQ bit in the AIRCR.
The core is allowed to perform the ADI kernel (which enables the debug interface) but the
core is halted before the first instruction after the kernel is executed in order to guarantee
that no user application code is performed after reset.
5.9.2.9 Type 8: Reset core and peripherals
J-Link tries to reset both, core and peripherals by setting the SYSRESETREQ bit in the AIR-
CR. VC_CORERESET in the DEMCR is also set to make sure that the CPU is halted immediately
after reset and before executing any instruction.
Reset procedure:
1. Make sure that the device halts immediately after reset (before it can execute any
instruction of the user application) by setting the VC_CORERESET in the DEMCR .
2. Reset the core and peripherals by setting the SYSRESETREQ bit in the AIRCR .
3. Wait for the S_RESET_ST bit in the DHCSR to first become high (reset active) and then
low (reset no longer active) afterwards.
4. Clear VC_CORERESET. This type of reset may fail if:
• J-Link has no connection to the debug interface of the CPU because it is in a low power
mode.
• The debug interface is disabled after reset and needs to be enabled by a device internal
bootloader. This would cause J-Link to lose communication after reset since the CPU is
halted before it can execute the internal bootlader.
5.9.2.10 Type 9: Reset for LPC1200 devices
On the NXP LPC1200 devices the watchdog is enabled after reset and not disabled by the
bootloader, if a valid application is in the flash memory. Moreover, the watchdog keeps
counting if the CPU is in debug mode. When using this reset strategy, J-Link performs a
reset of the CPU and peripherals, using the SYSRESETREQ bit in the AIRCR and halts the
CPU after the bootloader has been performed and before the first instruction of the user
code is executed. Then the watchdog of the LPC1200 device is disabled. This reset strategy
is only guaranteed to work on “modern” J-Links (J-Link V8, J-Link Pro, J-link ULTRA, J-Trace
for Cortex-M, J-Link Lite) and if a SWD speed of min. 1 MHz is used. This reset strategy
should also work for J-Links with hardware version 6, but it can not be guaranteed that
these J-Links are always fast enough in disabling the watchdog.
5.9.2.11 Type 10: Reset for Samsung S3FN60D devices
On the Samsung S3FN60D devices the watchdog may be running after reset (if the watch-
dog is active after reset or not depends on content of the smart option bytes at addr 0xC0).
The watchdog keeps counting even if the CPU is in debug mode (e.g. halted by a halt re-
J-Link / J-Trace (UM08001) © 2004-2017 SEGGER Microcontroller GmbH & Co. KG
158 CHAPTER 5 Reset strategies
quest or halted by vector catch). When using this reset strategy, J-Link performs a reset
of the CPU and peripherals, using the SYSRESETREQ bit and sets VC_CORERESET in order
to halt the CPU after reset, before it executes a single instruction. Then the watchdog of
the S3FN60D device is disabled.
J-Link / J-Trace (UM08001) © 2004-2017 SEGGER Microcontroller GmbH & Co. KG
159 CHAPTER 5 Using DCC for memory access
5.10 Using DCC for memory access
The ARM7/9 architecture requires cooperation of the CPU to access memory when the CPU is
running (not in debug mode). This means that memory cannot normally be accessed while
the CPU is executing the application program. The normal way to read or write memory
is to halt the CPU (put it into debug mode) before accessing memory. Even if the CPU is
restarted after the memory access, the real time behavior is significantly affected; halting
and restarting the CPU costs typically multiple milliseconds. For this reason, most debuggers
do not even allow memory access if the CPU is running.
However, there is one other option: DCC (Direct communication channel) can be used to
communicate with the CPU while it is executing the application program. All that is required
is the application program to call a DCC handler from time to time. This DCC handler
typically requires less than 1 s per call.
The DCC handler, as well as the optional DCC abort handler, is part of the J-Link software
package and can be found in the Samples\DCC\IAR directory of the package.
5.10.1 What is required?
• An application program on the host (typically a debugger) that uses DCC.
• A target application program that regularly calls the DCC handler.
• The supplied abort handler should be installed (optional).
An application program that uses DCC is JLink.exe .
5.10.2 Target DCC handler
The target DCC handler is a simple C-file taking care of the communication. The function
DCC_Process() needs to be called regularly from the application program or from an in-
terrupt handler. If an RTOS is used, a good place to call the DCC handler is from the timer
tick interrupt. In general, the more often the DCC handler is called, the faster memory can
be accessed. On most devices, it is also possible to let the DCC generate an interrupt which
can be used to call the DCC handler.
5.10.3 Target DCC abort handler
An optional DCC abort handler (a simple assembly file) can be included in the application.
The DCC abort handler allows data aborts caused by memory reads/writes via DCC to be
handled gracefully. If the data abort has been caused by the DCC communication, it returns
to the instruction right after the one causing the abort, allowing the application program to
continue to run. In addition to that, it allows the host to detect if a data abort occurred.
In order to use the DCC abort handler, 3 things need to be done:
• Place a branch to DCC_Abort at address 0x10 (“vector” used for data aborts).
• Initialize the Abort-mode stack pointer to an area of at least 8 bytes of stack memory
required by the handler.
• Add the DCC abort handler assembly file to the application.
J-Link / J-Trace (UM08001) © 2004-2017 SEGGER Microcontroller GmbH & Co. KG
160 CHAPTER 5 The J-Link settings file
5.11 The J-Link settings file
Most IDEs provide a path to a J-Link settings file on a per-project-per-debug-configuration
basis. This file is used by J-Link to store various debug settings that shall survive between
debug sessions of a project. It also allows the user to perform some override of various
settings. If a specific behavior / setting can be overridden via the settings file, is explained
in the specific sections that describe the behavior / setting. Since the location and name
of the settings file is different for various IDEs, in the following the location and naming
convention of the J-Link settings file for various IDEs is explained.
5.11.1 SEGGER Embedded Studio
Settings file with default settings is created on first start of a debug session. There is one
settings file per build configuration for the project.
Naming is: _<ProjectName>_<DebugConfigName>.jlink
The settings file is created in the same directory where the project file (*.emProject) is
located.
Example: The SES project is called “MyProject” and has two configurations “Debug” and
“Release”. For each of the configurations, a settings file will be created at the first start
of the debug session:
_MyProject_Debug.jlink _MyProject_Release.jlink
5.11.2 Keil MDK-ARM (uVision)
Settings file with default settings is created on first start of a debug session. There is one
settings file per project.
Naming is: JLinksettings.ini
The settings file is created in the same directory where the project file (*.uvprojx) is located.
5.11.3 IAR EWARM
Settings file with default settings is created on first start of a debug session. There is one
settings file per build configuration for the project.
Naming is: <ProjectName>_<DebugConfig>.jlink
The settings file is created in a “settings” subdirectory where the project file is located.
5.11.4 Mentor Sourcery CodeBench for ARM
CodeBench does not directly specify a J-Link settings file but allows the user to specify
a path to one in the project settings under Debugger -> Settings File . We recommend
to copy the J-Link settings file template from $JLINK_INST_DIR$\Samples\JLink\Settings-
Files\Sample.jlinksettings to the directory where the CodeBench project is located, once
when creating a new project. Then select this file in the project options.
J-Link / J-Trace (UM08001) © 2004-2017 SEGGER Microcontroller GmbH & Co. KG

161 CHAPTER 5 J-Link script files
5.12 J-Link script files
In some situations it it necessary to customize some actions performed by J-Link. In most
cases it is the connection sequence and/or the way in which a reset is performed by J-Link,
since some custom hardware needs some special handling which cannot be integrated into
the generic part of the J-Link software. J-Link script files are written in C-like syntax in
order to have an easy start to learning how to write J-Link script files. The script file syntax
supports most statements (if-else, while, declaration of variables, …) which are allowed in
C, but not all of them. Moreover, there are some statements that are script file specific. The
script file allows maximum flexibility, so almost any target initialization which is necessary
can be supported.
5.12.1 Actions that can be customized
The script file support allows customizing of different actions performed by J-Link. Depend-
ing on whether the corresponding function is present in the script file or not, a generically
implemented action is replaced by an action defined in a script file. In the following all J-
Link actions which can be customized using a script file are listed and explained.
Action Prototype
ConfigTargetSettings() int ConfigTargetSettings (void);
InitTarget() int InitTarget (void);
SetupTarget() int SetupTarget (void);
ResetTarget() int ResetTarget (void);
InitEMU() int InitEMU (void);
OnTraceStop() int OnTraceStop (void);
OnTraceStart() int OnTraceStart (void);
5.12.1.1 ConfigTargetSettings()
Called before InitTarget(). Mainly used to set some global DLL variables to customize the
normal connect procedure. For ARM CoreSight devices this may be specifying the base
address of some CoreSight components (ETM, …) that cannot be auto-detected by J-Link
due to erroneous ROM tables etc. May also be used to specify the device name in case
debugger does not pass it to the DLL.
Prototype
int ConfigTargetSettings(void);
Notes / Limitations
• May not, under absolutely NO circumstances, call any API functions that perform target
communication.
• Should only set some global DLL variables
5.12.1.2 InitTarget()
Replaces the target-CPU-auto-find procedure of the J-Link DLL. Useful for target CPUs that
are not accessible by default and need some special steps to be executed before the normal
debug probe connect procedure can be executed successfully. Example devices are MCUs
from TI which have a so-called ICEPick JTAG unit on them that needs to be configured via
JTAG, before the actual CPU core is accessible via JTAG.
Prototype
int InitTarget(void);
J-Link / J-Trace (UM08001) © 2004-2017 SEGGER Microcontroller GmbH & Co. KG
162 CHAPTER 5 J-Link script files
Notes / Limitations
• If target interface JTAG is used: JTAG chain has to be specified manually before leaving
this function (meaning all devices and their TAP IDs have to be specified by the user).
Also appropriate JTAG TAP number to communicate with during the debug session has
to be manually specified in this function.
• MUST NOT use any MEM_ API functions
• Global DLL variable “CPU” MUST be set when implementing this function, so the DLL
knows which CPU module to use internally.
5.12.1.3 SetupTarget()
If present, called after InitTarget() and after general debug connect sequence has been
performed by J-Link. Usually used for more high-level CPU debug setup like writing certain
memory locations, initializing PLL for faster download etc.
Prototype
int SetupTarget(void);
Notes / Limitations
• Does not replace any DLL functionality but extends it.
• May use MEM_ API functions
5.12.1.4 ResetTarget()
Replaces reset strategies of DLL. No matter what reset type is selected in the DLL, if this
function is present, it will be called instead of the DLL internal reset.
Prototype
int ResetTarget(void);
Notes / Limitations
• DLL expects target CPU to be halted / in debug mode, when leaving this function
• May use MEM_ API functions
5.12.1.5 InitEMU()
If present, it allows configuration of the emulator prior to starting target communication.
Currently this function is only used to configure whether the target which is connected to
J-Link has an ETB or not. For more information on how to configure the existence of an
ETB, please refer to Global DLL variables .
Prototype
int InitEMU(void);
5.12.1.6 OnTraceStop()
Called right before capturing of trace data is stopped on the J-Link / J-Trace. On some
target, an explicit flush of the trace FIFOs is necessary to get the latest trace data. If such
a flush is not performed, the latest trace data may not be output by the target
Prototype
int OnTraceStop(void);
Notes / Limitations
• May use MEM_ functions
J-Link / J-Trace (UM08001) © 2004-2017 SEGGER Microcontroller GmbH & Co. KG

163 CHAPTER 5 J-Link script files
5.12.1.7 OnTraceStart()
If present, called right before trace is started. Used to initialize MCU specific trace related
things like configuring the trace pins for alternate function.
Prototype
int OnTraceStart(void);
Return value Meaning
# 0 O.K.
< 0 Error
Notes / Limitations
• May use high-level API functions like JLINK_MEM_ etc.
• Should not call JLINK_TARGET_Halt(). Can rely on target being halted when entering
this function.
5.12.1.8 AfterResetTarget()
If present, called after ResetTarget(). Usually used to initialize peripheries which have been
reset during reset, disable watchdogs which may be active after reset, etc… Apart from this,
for some cores it is necessary to perform some special operations after reset to guarantee
proper device functionality after reset. This is mainly the case on devices which have some
bugs that occur at the time of a system reset (not power on reset).
Prototype
int AfterResetTarget(void);
Notes / Limitations
• DLL expects target CPU to be halted / in debug mode, when leaving this function
• May use MEM_ API functions
5.12.2 Script file API functions
In the following, the API functions which can be used in a script file to communicate with
the DLL are explained.
Function Prototype
JLINK_CORESIGHT_AddAP() int JLINK_CORESIGHT_AddAP(int Index, U32 Type);
JLINK_CORESIGHT_Configure() int JLINK_CORESIGHT_Configure(const char* sConfig);
JLINK_CORESIGHT_ReadAP() int JLINK_CORESIGHT_ReadAP(int RegIndex);
JLINK_CORESIGHT_ReadDP() int JLINK_CORESIGHT_ReadDP(int RegIndex);
JLINK_CORESIGHT_WriteAP() int JLINK_CORESIGHT_WriteAP(int RegIndex, U32 Data);
JLINK_CORESIGHT_WriteDP() int JLINK_CORESIGHT_WriteDP(int RegIndex, U32 Data);
JLINK_CORESIGHT_WriteDAP() int JLINK_WriteDAP(int RegIndex, int APnDP, U32 Data);
JLINK_ExecCommand() int JLINK_ExecCommand(const char* sMsg);
JLINK_JTAG_GetDeviceId() int JLINK_JTAG_GetDeviceId(int DeviceIndex);
JLINK_JTAG_GetU32() int JLINK_JTAG_GetU32(int BitPos);
JLINK_JTAG_Reset() int JLINK_JTAG_Reset(void);
JLINK_JTAG_SetDeviceId() int JLINK_JTAG_SetDeviceId(int DeviceIndex, U32 Id);
JLINK_JTAG_Store() int JLINK_JTAG_Store(U32 tms, U32 tdi, U32 NumBits);
JLINK_JTAG_StoreClocks() int JLINK_JTAG_StoreClocks(int NumClocks);
JLINK_JTAG_StoreDR() int JLINK_JTAG_StoreDR(U32 tdi, int NumBits);
J-Link / J-Trace (UM08001) © 2004-2017 SEGGER Microcontroller GmbH & Co. KG

164 CHAPTER 5 J-Link script files
Function Prototype
JLINK_JTAG_StoreIR() int JLINK_JTAG_StoreIR(U32 Cmd);
JLINK_JTAG_Write() int JLINK_JTAG_Write(U32 tms, U32 tdi, U32 NumBits);
JLINK_JTAG_WriteClocks() int JLINK_JTAG_WriteClocks(int NumClocks);
JLINK_JTAG_WriteDR() int JLINK_JTAG_WriteDR(U32 tdi, int NumBits);
JLINK_JTAG_WriteDRCont() int JLINK_JTAG_WriteDRCont(U32 Data, int NumBits);
JLINK_JTAG_WriteDREnd() int JLINK_JTAG_WriteDREnd(U32 Data, int NumBits);
JLINK_JTAG_WriteIR() int JLINK_JTAG_WriteIR(U32 Cmd);
JLINK_MemRegion() int JLINK_MemRegion(const char* sConfig);
JLINK_MEM_WriteU8() int JLINK_MEM_WriteU8 (U32 Addr, U32 Data);
JLINK_MEM_WriteU16() int JLINK_MEM_WriteU16(U32 Addr, U32 Data);
JLINK_MEM_WriteU32() int JLINK_MEM_WriteU32(U32 Addr, U32 Data);
JLINK_MEM_ReadU8() U8 MEM_ReadU8 (U32 Addr);
JLINK_MEM_ReadU16() U16 MEM_ReadU16(U32 Addr);
JLINK_MEM_ReadU32() U32 MEM_ReadU32(U32 Addr);
JLINK_SYS_MessageBox() int JLINK_SYS_MessageBox(const char * sMsg);
JLINK_SYS_MessageBox1() int JLINK_SYS_MessageBox1(const char * sMsg, int v);
JLINK_SYS_Report() int JLINK_SYS_Report(const char * sMsg);
JLINK_SYS_Report1() int JLINK_SYS_Report1(const char * sMsg, int v);
JLINK_SYS_Sleep() int JLINK_SYS_Sleep(int Delayms);
JLINK_SYS_UnsecureDialog() int JLINK_SYS_UnsecureDialog(const char* sText, const char*
sQuestion, const char* sIdent, int DefaultAnswer, U32 Flags);
5.12.2.1 JLINK_CORESIGHT_AddAP()
Allows the user to manually configure the AP-layout of the device J-Link is connected to.
This makes sense on targets on which J-Link can not perform a auto-detection of the APs
which are present on the target system. Type can only be a known global J-Link DLL AP
constant. For a list of all available constants, please refer to Global DLL constants .
Prototype
int JLINK_CORESIGHT_AddAP(int Index, U32 Type);
Example
JLINK_CORESIGHT_AddAP(0, CORESIGHT_AHB_AP); // First AP is a AHB-AP
JLINK_CORESIGHT_AddAP(1, CORESIGHT_APB_AP); // Second AP is a APB-AP
JLINK_CORESIGHT_AddAP(2, CORESIGHT_JTAG_AP); // Third AP is a JTAG-AP
5.12.2.2 JLINK_CORESIGHT_Configure()
Has to be called once, before using any other _CORESIGHT_ function that accesses the DAP.
Takes a configuration string to prepare target and J-Link for CoreSight function usage.
Configuration string may contain multiple setup parameters that are set. Setup parameters
are separated by a semicolon.
At the end of the JLINK_CORESIGHT_Configure(), the appropriate target interface switch-
ing sequence for the currently active target interface is output, if not disabled via setup
parameter.
This function has to be called again, each time the JTAG chain changes (for dynamically
changing JTAG chains like those which include a TI ICEPick), in order to setup the JTAG
chain again.
J-Link / J-Trace (UM08001) © 2004-2017 SEGGER Microcontroller GmbH & Co. KG

165 CHAPTER 5 J-Link script files
For JTAG
The SWD -> JTAG switching sequence is output. This also triggers a TAP reset on the
target (TAP controller goes through -> Reset -> Idle state) The IRPre, DRPre, IRPost,
DRPost parameters describe which device inside the JTAG chain is currently selected for
communication.
For SWD
The JTAG -> SWD switching sequence is output. It is also made sure that the “overrun mode
enable” bit in the SW-DP CTRL/STAT register is cleared, as in SWD mode J-Link always
assumes that overrun detection mode is disabled.
Make sure that this bit is NOT set by accident when writing the SW-DP CTRL/STAT register
via the _CORESIGHT_ functions.
Prototype
int JLINK_CORESIGHT_Configure(const char* sConfig);
Example
if (JLINK_ActiveTIF == JLINK_TIF_JTAG) {
// Simple setup where we have TDI -> Cortex-M (4-bits IRLen) -> TDO
JLINK_CORESIGHT_Configure("IRPre=0;DRPre=0;IRPost=0;DRPost=0;IRLenDevice=4");
} else {
// For SWD, no special setup is needed, just output the switching sequence
JLINK_CORESIGHT_Configure("");
}
v = JLINK_CORESIGHT_ReadDP(JLINK_CORESIGHT_DP_REG_CTRL_STAT);
Report1("DAP-CtrlStat: " v);
// Complex setup where we have
// TDI -> ICEPick (6-bits IRLen) -> Cortex-M (4-bits IRLen) -> TDO
JLINK_CORESIGHT_Configure("IRPre=0;DRPre=0;IRPost=6;DRPost=1;IRLenDevice=4;");
v = JLINK_CORESIGHT_ReadDP(JLINK_CORESIGHT_DP_REG_CTRL_STAT);
Report1("DAP-CtrlStat: " v)
Known setup parameters
Parameter Type Explanation
IRPre DecValue Sum of IRLen of all JTAG devices in the JTAG chain, closer
to TDO than the actual one J-Link shall communicate with.
DRPre DecValue Number of JTAG devices in the JTAG chain, closer to TDO
than the actual one, J-Link shall communicate with.
IRPost DecValue Sum of IRLen of all JTAG devices in the JTAG chain, follow-
ing the actual one, J-Link shall communicate with.
DRPost DecValue Number of JTAG devices in the JTAG chain, following the ac-
tual one, J-Link shall communicate with.
IRLenDevice DecValue IRLen of the actual device, J-Link shall communicate with.
PerformTIFInit DecValue 0: Do not output switching sequence etc. once
JLINK_CORESIGHT_Configure() completes.
5.12.2.3 JLINK_CORESIGHT_ReadAP()
Reads a specific AP register. For JTAG, makes sure that AP is selected automatically. Makes
sure that actual data is returned, meaning for register read-accesses which usually only
return data on the second access, this function performs this automatically, so the user
will always see valid data.
Prototype
int JLINK_CORESIGHT_ReadAP(int RegIndex);
J-Link / J-Trace (UM08001) © 2004-2017 SEGGER Microcontroller GmbH & Co. KG

166 CHAPTER 5 J-Link script files
Example
v = JLINK_CORESIGHT_ReadAP(JLINK_CORESIGHT_AP_REG_DATA);
Report1("DATA: " v);
5.12.2.4 JLINK_CORESIGHT_ReadDP()
Reads a specific DP register. For JTAG, makes sure that DP is selected automatically. Makes
sure that actual data is returned, meaning for register read-accesses which usually only
return data on the second access, this function performs this automatically, so the user
will always see valid data.
Prototype
int JLINK_CORESIGHT_ReadDP(int RegIndex);
Example
v = JLINK_CORESIGHT_ReadDP(JLINK_CORESIGHT_DP_REG_IDCODE);
Report1("DAP-IDCODE: " v);
5.12.2.5 JLINK_CORESIGHT_WriteAP()
Writes a specific AP register. For JTAG, makes sure that AP is selected automatically.
Prototype
int JLINK_CORESIGHT_WriteAP(int RegIndex, U32 Data);
Example
JLINK_CORESIGHT_WriteAP(JLINK_CORESIGHT_AP_REG_BD1, 0x1E);
5.12.2.6 JLINK_CORESIGHT_WriteDP()
Writes a specific DP register. For JTAG, makes sure that DP is selected automatically.
Prototype
int JLINK_CORESIGHT_WriteDP(int RegIndex, U32 Data);
Example
JLINK_CORESIGHT_WriteDP(JLINK_CORESIGHT_DP_REG_ABORT, 0x1E);
5.12.2.7 JLINK_CORESIGHT_WriteDAP()
Writes to a CoreSight AP/DP register. This function performs a full-qualified write which
means that it tries to write until the write has been accepted or too many WAIT responses
have been received.
Prototype
int JLINK_WriteDAP(int RegIndex, int APnDP, U32 Data);
Parameter Description
RegIndex Specifies the index of the AP/DP
register to write.
APnDP 0: DP register
1: AP register
J-Link / J-Trace (UM08001) © 2004-2017 SEGGER Microcontroller GmbH & Co. KG

167 CHAPTER 5 J-Link script files
Parameter Description
Data Data to written
Return
value Description
≥ 0 O.K. (Number of repetitions needed before
write was accepted)
< 0 Error
-2 Not supported by the current CPU + target
interface combination
Example
JLINK_CORESIGHT_WriteDAP(JLINK_CORESIGHT_DP_REG_ABORT, 0, 0x1E);
5.12.2.8 JLINK_ExecCommand()
Gives the option to use Command strings in the J-Link script file.
Prototype
int JLINK_ExecCommand(const char* sMsg);
Example
JLINK_ExecCommand("TraceSampleAdjust TD=2000");
Note
Has no effect when executed in Flasher stand-alone mode or when calling this function
from a function that implements the __probe attribute.
5.12.2.9 JLINK_JTAG_GetDeviceId()
Retrieves the JTAG ID of a specified device, in the JTAG chain. The index of the device
depends on its position in the JTAG chain. The device closest to TDO has index 0.
Prototype
int JLINK_JTAG_GetDeviceId(int DeviceIndex);
5.12.2.10 JLINK_JTAG_GetU32()
Gets 32 bits JTAG data, starting at given bit position.
Prototype
int JLINK_JTAG_GetU32(int BitPos);
5.12.2.11 JLINK_JTAG_Reset()
Performs a TAP reset and tries to auto-detect the JTAG chain (Total IRLen, Number of
devices). If auto-detection was successful, the global DLL variables which determine the
JTAG chain configuration, are set to the correct values. For more information about the
known global DLL variables, please refer to Global DLL variables .
Note
J-Link / J-Trace (UM08001) © 2004-2017 SEGGER Microcontroller GmbH & Co. KG

168 CHAPTER 5 J-Link script files
This will not work for devices which need some special init (for example to add the
core to the JTAG chain), which is lost at a TAP reset.
Prototype
int JLINK_JTAG_Reset(void);
5.12.2.12 JLINK_JTAG_SetDeviceId()
Sets the JTAG ID of a specified device, in the JTAG chain. The index of the device depends
on its position in the JTAG chain. The device closest to TDO has index 0. The Id is used
by the DLL to recognize the device. Before calling this function, please make sure that the
JTAG chain has been configured correctly by setting the appropriate global DLL variables.
For more information about the known global DLL variables, please refer to Global DLL
variables .
Prototype
int JLINK_JTAG_SetDeviceId(int DeviceIndex, U32 Id);
5.12.2.13 JLINK_JTAG_Store()
Stores a JTAG sequence (max. 64 bits per pin) in the DLL JTAG buffer.
Prototype
int JLINK_JTAG_Store(U32 tms, U32 tdi, U32 NumBits);
5.12.2.14 JLINK_JTAG_StoreClocks()
Stores a given number of clocks in the DLL JTAG buffer.
Prototype
int JLINK_JTAG_StoreClocks(int NumClocks);
5.12.2.15 JLINK_JTAG_StoreDR()
Stores JTAG data in the DLL JTAG buffer.
Before calling this function, please make sure that the JTAG chain has been configured
correctly by setting the appropriate global DLL variables. For more information about the
known global DLL variables, please refer to Global DLL variables .
Prototype
int JLINK_JTAG_StoreDR(U32 tdi, int NumBits);
5.12.2.16 JLINK_JTAG_StoreIR()
Stores a JTAG instruction in the DLL JTAG buffer.
Before calling this function, please make sure that the JTAG chain has been configured
correctly by setting the appropriate global DLL variables. For more information about the
known global DLL variables, please refer to Global DLL variables .
Prototype
int JLINK_JTAG_StoreIR(U32 Cmd);
5.12.2.17 JLINK_JTAG_Write()
Writes a JTAG sequence (max. 64 bits per pin).
J-Link / J-Trace (UM08001) © 2004-2017 SEGGER Microcontroller GmbH & Co. KG

169 CHAPTER 5 J-Link script files
Prototype
int JLINK_JTAG_Write(U32 tms, U32 tdi, U32 NumBits);
5.12.2.18 JLINK_JTAG_WriteClocks()
Writes a given number of clocks.
Prototype
int JLINK_JTAG_WriteClocks(int NumClocks);
5.12.2.19 JLINK_JTAG_WriteDR()
Writes JTAG data. Before calling this function, please make sure that the JTAG chain has
been configured correctly by setting the appropriate global DLL variables. For more infor-
mation about the known global DLL variables, please refer to Global DLL variables .
Prototype
int JLINK_JTAG_WriteDR(U32 tdi, int NumBits);
5.12.2.20 JLINK_JTAG_WriteDRCont()
Writes data of variable length and remains in UPDATE-DR state. This function expects that
the JTAG chain has already be configured before. It does not try to perform any JTAG
identification before sending the DR-data.
Prototype
int JLINK_JTAG_WriteDRCont(U32 Data, int NumBits);
5.12.2.21 JLINK_JTAG_WriteDREnd()
Writes data of variable length and remains in UPDATE-DR state. This function expects that
the JTAG chain has already be configured before. It does not try to perform any JTAG
identification before sending the DR-data.
Prototype
int JLINK_JTAG_WriteDREnd(U32 Data, int NumBits);
5.12.2.22 JLINK_JTAG_WriteIR()
Writes a JTAG instruction.
Before calling this function, please make sure that the JTAG chain has been configured
correctly by setting the appropriate global DLL variables. For more information about the
known global DLL variables, please refer to Global DLL variables .
Prototype
int JLINK_JTAG_WriteIR(U32 Cmd);
5.12.2.23 JLINK_MemRegion()
This command is used to specify memory areas with various region types.
Syntax
map region <StartAddressOfArea>-<EndAddressOfArea> <RegionType>
Region type Description
N Normal
J-Link / J-Trace (UM08001) © 2004-2017 SEGGER Microcontroller GmbH & Co. KG
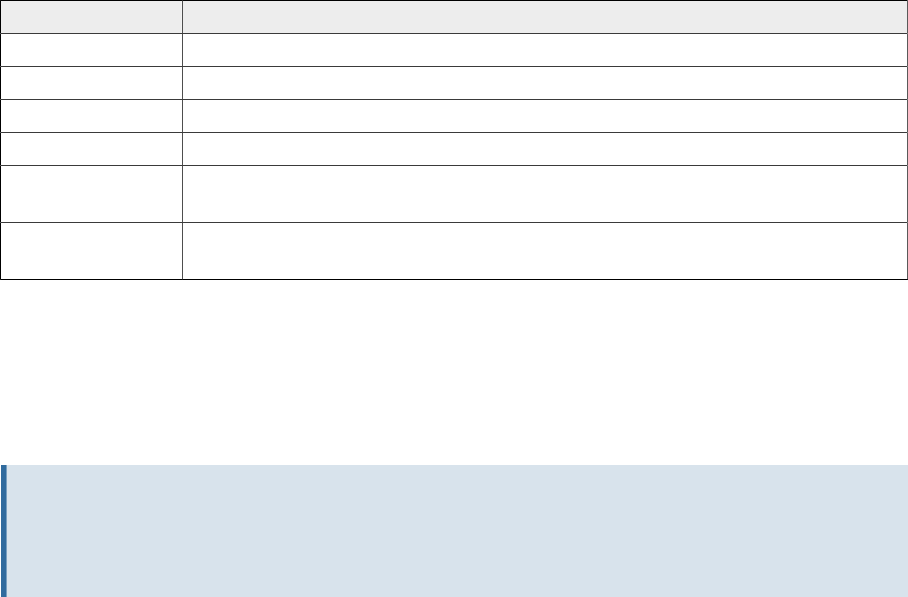
170 CHAPTER 5 J-Link script files
Region type Description
C Cacheable
X Excluded
XI Excluded & Illegal
I Indirect access
AAlias (static, e.g. RAM/flash that is aliased multiple times in one area.
Does not change during the debug session.)
AD Alias (dynamic, e.g. memory areas where different memories can be
mapped to.)
Prototype
int JLINK_MemRegion(const char* sConfig);
Example
map region 0x100000-0x1FFFFF C
Note
Has no effect when executed in Flasher stand-alone mode or when calling this function
from a function that implements the __probe attribute.
5.12.2.24 JLINK_MEM_WriteU8()
Writes a byte to the specified address.
Prototype
int JLINK_MEM_WriteU8 (U32 Addr, U32 Data);
5.12.2.25 JLINK_MEM_WriteU16()
Writes a halfword to the specified address.
Prototype
int JLINK_MEM_WriteU16(U32 Addr, U32 Data);
5.12.2.26 JLINK_MEM_WriteU32()
Writes a word to the specified address.
Prototype
int JLINK_MEM_WriteU32(U32 Addr, U32 Data);
5.12.2.27 JLINK_MEM_ReadU8()
Reads a byte from the specified address.
Prototype
U8 MEM_ReadU8 (U32 Addr);
5.12.2.28 JLINK_MEM_ReadU16()
Reads a halfword from the specified address.
J-Link / J-Trace (UM08001) © 2004-2017 SEGGER Microcontroller GmbH & Co. KG
171 CHAPTER 5 J-Link script files
Prototype
U16 MEM_ReadU16(U32 Addr);
5.12.2.29 JLINK_MEM_ReadU32()
Reads a word from the specified address.
Prototype
U32 MEM_ReadU32(U32 Addr);
5.12.2.30 JLINK_SYS_MessageBox()
Outputs a string in a message box.
Prototype
int JLINK_SYS_MessageBox(const char * sMsg);
5.12.2.31 JLINK_SYS_MessageBox1()
Outputs a constant character string in a message box. In addition to that, a given value
(can be a constant value, the return value of a function or a variable) is added, right behind
the string.
Prototype
int JLINK_SYS_MessageBox1(const char * sMsg, int v);
5.12.2.32 JLINK_SYS_Report()
Outputs a constant character string on stdio.
Prototype
int JLINK_SYS_Report(const char * sMsg);
5.12.2.33 JLINK_SYS_Report1()
Outputs a constant character string on stdio. In addition to that, a given value (can be a
constant value, the return value of a function or a variable) is added, right behind the string.
Prototype
int JLINK_SYS_Report1(const char * sMsg, int v);
5.12.2.34 JLINK_SYS_Sleep()
Waits for a given number of milliseconds. During this time, J-Link does not communicate
with the target.
Prototype
int JLINK_SYS_Sleep(int Delayms);
5.12.2.35 JLINK_SYS_UnsecureDialog()
Informs the user that the device needs to be unsecured for further debugging. This is
usually done via a message box where possible (except on Linux & Mac).
Prototype
int JLINK_SYS_UnsecureDialog (const char* sText, const char* sQuestion, const
char* sIdent, int DefaultAnswer, U32 Flags);
J-Link / J-Trace (UM08001) © 2004-2017 SEGGER Microcontroller GmbH & Co. KG
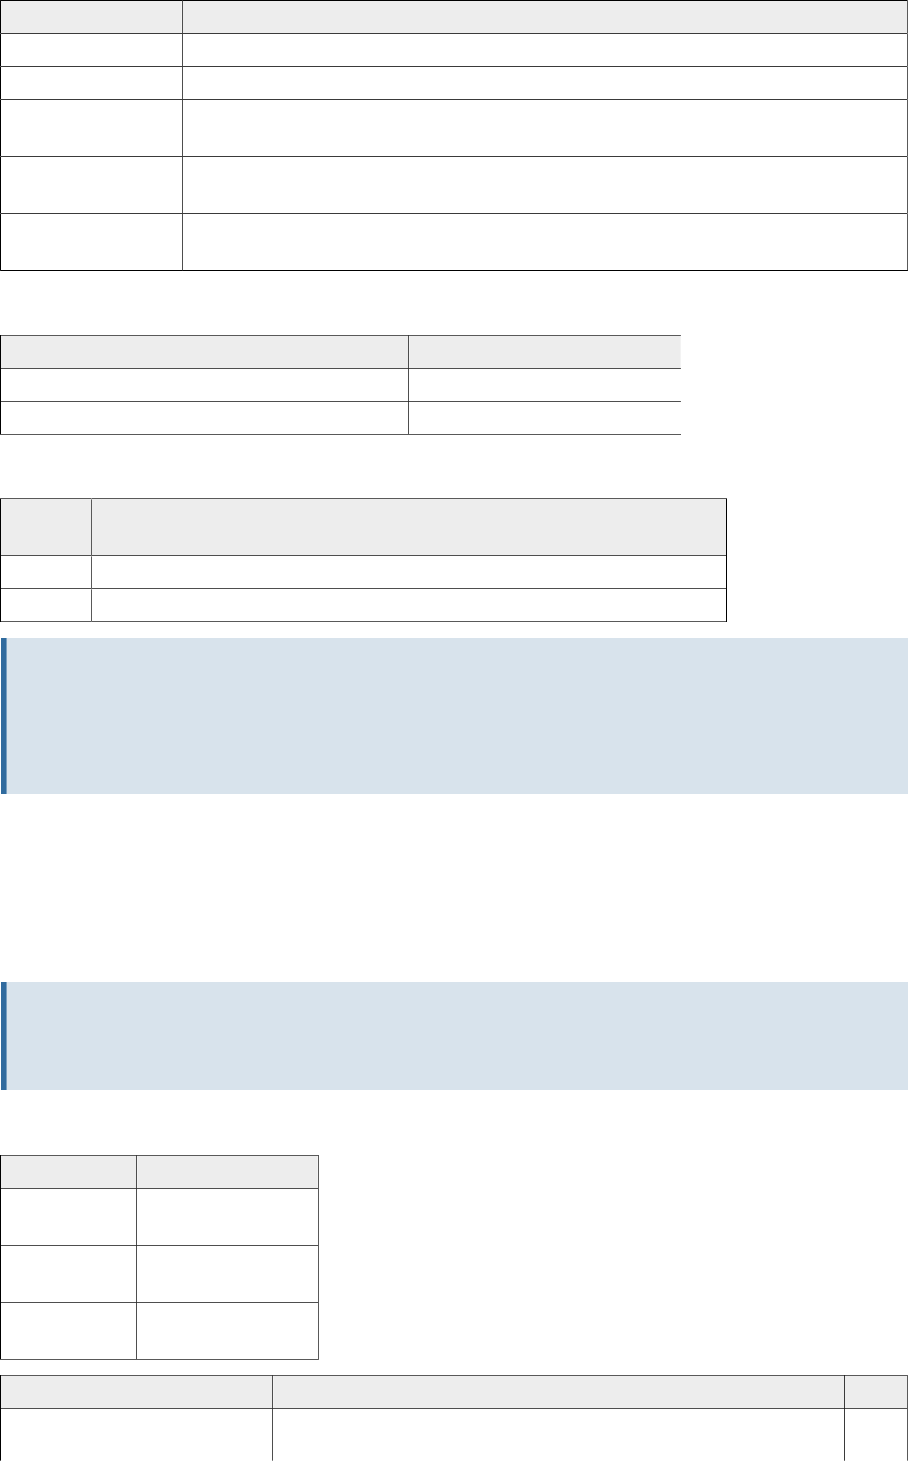
172 CHAPTER 5 J-Link script files
Parameter Description
sText Text printed to the logfile or presented in a message box
sQuestion Question printed in the message box after sText
sIdent Unique ID for the request. User settings like “Do not show again” are
saved per Unique ID.
DefaultAnswer Default answer for messages with timeout or non-GUI versions. Only
used if not setting is saved for the Unique ID.
Flags Please consult the table below for valid values. Specifying a valid
JLINK_DLG_TYPE flag is mandatory.
Parameter Flags
Return value Description
JLINK_DLG_TYPE_PROT_READ Read protection dialog
JLINK_DLG_TYPE_PROT_WRITE Write protection dialog
Return Value
Return
value Description
1 User selected to unsecure the device
0 User selected to NOT unsecure the device
Note
If executed in Flasher stand-alone mode or when calling this function from a function
that implements the __probe attribute, no dialog is shown but the default answer is
used
5.12.3 Global DLL variables
The script file feature also provides some global variables which are used for DLL config-
uration. Some of these variables can only be set to some specific values, others can be
set to the whole data type with. In the following all global variables and their value ranges
are listed and described.
Note
All global variables are treated as unsigned 32-bit values and are zero-initialized.
Legend
Abbreviation Description
RO: Variable is
read-only
WO: Variable is
write-only
R/W: Variable is
read-write
Variable Description R/W
CPU Pre-selects target CPU J-Link is communicating with.
Used in InitTarget() to skip the core autodetection of WO
J-Link / J-Trace (UM08001) © 2004-2017 SEGGER Microcontroller GmbH & Co. KG

173 CHAPTER 5 J-Link script files
Variable Description R/W
J-Link. This variable can only be set to a known glob-
al J-Link DLL constant. For a list of all valid values,
please refer to Global DLL constants
Example
CPU = ARM926EJS;
JTAG_IRPre
Used for JTAG chain configuration. Sets the number of
IR-bits of all devices which are closer to TDO than the
one we want to communicate with.
Example
JTAG_IRPre = 6;
R/W
JTAG_DRPre
Used for JTAG chain configuration. Sets the number of
devices which are closer to TDO than the one we want
to communicate with.
Example
JTAG_DRPre = 2;
RO
JTAG_IRPost
Used for JTAG chain configuration. Sets the number of
IR-bits of all devices which are closer to TDI than the
one we want to communicate with.
Example
JTAG_IRPost = 6;
RO
JTAG_DRPost
Used for JTAG chain configuration. Sets the number of
devices which are closer to TDI than the one we want
to communicate with.
Example
JTAG_DRPost = 0;
RO
JTAG_IRLen
IR-Len (in bits) of the device we want to communicate
with.
Example
JTAG_IRLen = 4
RO
JTAG_TotalIRLen
Computed automatically, based on the values of
JTAG_IRPre, JTAG_DRPre, JTAG_IRPost and JTAG_DR-
Post.
Example
v = JTAG_TotalIRLen;
RO
JTAG_AllowTAPReset
En-/Disables auto-JTAG-detection of J-Link. Has to be
disabled for devices which need some special init (for
example to add the core to the JTAG chain), which is
lost at a TAP reset.
Allowed values
0 Auto-detection is enabled.
1 Auto-detection is disabled.
WO
JTAG_Speed
Sets the JTAG interface speed. Speed is given in kHz.
Example
JTAG_Speed = 2000; // 2MHz JTAG speed R/W
JTAG_ResetPin
Pulls reset pin low / Releases nRST pin. Used to issue
a reset of the CPU. Value assigned to reset pin reflects
the state. 0 = Low, 1 = high.
Example
JTAG_ResetPin = 0;
SYS_Sleep(5); // Give pin some time to get low
JTAG_ResetPin = 1;
WO
JTAG_TRSTPin
Pulls reset pin low / Releases nTRST pin. Used to issue
a reset of the debug logic of the CPU. Value assigned
to reset pin reflects the state. 0 = Low, 1 = high.
Example
JTAG_TRSTPin = 0;
WO
J-Link / J-Trace (UM08001) © 2004-2017 SEGGER Microcontroller GmbH & Co. KG

174 CHAPTER 5 J-Link script files
Variable Description R/W
SYS_Sleep(5); // Give pin some time to get low
JTAG_TRSTPin = 1;
JTAG_TCKPin
Pulls TCK pin LOW / HIGH. Value assigned to reset pin
reflects the state. 0 = LOW, 1 = HIGH.
Example
JTAG_TCKPin = 0;
R/W
JTAG_TDIPin
Pulls TDI pin LOW / HIGH. Value assigned to reset pin
reflects the state. 0 = LOW, 1 = HIGH.
Example
JTAG_TDIPin = 0;
R/W
JTAG_TMSPin
Pulls TMS pin LOW / HIGH. Value assigned to reset pin
reflects the state. 0 = LOW, 1 = HIGH.
Example
JTAG_TMSPin = 0;
R/W
JLINK_TRACE_Portwidth
Sets or reads Trace Port width. Possible values: 1,2, 4.
Default value is 4.
Example
JLINK_TRACE_Portwidth = 4;
R/W
EMU_ETB_IsPresent
If the connected device has an ETB and you want to
use it with J-Link, this variable should be set to 1. Set-
ting this variable in another function as InitEmu() does
not have any effect.
Example
void InitEmu(void) {
EMU_ETB_IsPresent = 1;
}
WO
EMU_ETB_UseETB
Uses ETB instead of RAWTRACE capability of the emu-
lator. Setting this variable in another function as InitE-
mu() does not have any effect.
Example
EMU_ETB_UseETB = 0;
RO
EMU_ETM_IsPresent
Selects whether an ETM is present on the target or
not. Setting this variable in another function as InitE-
mu() does not have any effect.
Example
EMU_ETM_IsPresent= 0;
R/W
EMU_ETM_UseETM
Uses ETM as trace source. Setting this variable in an-
other function as InitEmu() does not have any effect.
Example
EMU_ETM_UseETM = 1;
WO
EMU_JTAG_DisableHW-
Transmissions
Disables use of hardware units for JTAG transmissions
since this can cause problems on some hardware de-
signs.
Example
EMU_JTAG_DisableHWTransmissions = 1;
WO
CORESIGHT_CoreBaseAd-
dr
Sets base address of core debug component for
CoreSight compliant devices. Setting this variable dis-
ables the J-Link auto-detection of the core debug com-
ponent base address. Used on devices where auto-de-
tection of the core debug component base address is
not possible due to incorrect CoreSight information.
Example
CORESIGHT_CoreBaseAddr = 0x80030000;
R/W
CORESIGHT_IndexAHBAP-
ToUse
Pre-selects an AP as an AHB-AP that J-Link uses
for debug communication (Cortex-M). Setting this WO
J-Link / J-Trace (UM08001) © 2004-2017 SEGGER Microcontroller GmbH & Co. KG

175 CHAPTER 5 J-Link script files
Variable Description R/W
variable is necessary for example when debug-
ging multi-core devices where multiple AHB-APs are
present (one for each device). This function can on-
ly be used if a AP-layout has been configured via
JLINK_CORESIGHT_AddAP() .
Example
JLINK_CORESIGHT_AddAP(0, CORESIGHT_AHB_AP);
JLINK_CORESIGHT_AddAP(1, CORESIGHT_AHB_AP);
JLINK_CORESIGHT_AddAP(2, CORESIGHT_APB_AP);
//
// Use second AP as AHB-AP
// for target communication
//
CORESIGHT_IndexAHBAPToUse = 1;
CORESIGHT_IndexAPBAP-
ToUse
Pre-selects an AP as an APB-AP that J-Link uses
for debug communication (Cortex-A/R). Setting
this variable is necessary for example when debug-
ging multi-core devices where multiple APB-APs are
present (one for each device). This function can on-
ly be used if an AP-layout has been configured via
JLINK_CORESIGHT_AddAP() .
Example
JLINK_CORESIGHT_AddAP(0, CORESIGHT_AHB_AP);
JLINK_CORESIGHT_AddAP(1, CORESIGHT_APB_AP);
JLINK_CORESIGHT_AddAP(2, CORESIGHT_APB_AP);
//
// Use third AP as APB-AP
// for target communication
//
CORESIGHT_IndexAPBAPToUse = 2;
WO
CORESIGHT_AHBAPCSWDe-
faultSettings
Overrides the default settings to be used by the DLL
when configuring the AHB-AP CSW register. By de-
fault, the J-Link DLL will use the following settings for
the CSW:
Cortex-M0, M0+, M3, M4
[30] = 0
[28] = 0
[27] = 0
[26] = 0
[25] = 1
[24] = 1
Configurable settings
[30] = SPROT: 0 = secure transfer request
[28] = HRPOT[4]: Always 0
[27] = HRPOT[3]: 0 = uncachable
[26] = HRPOT[2]: 0 = unbufferable
[25] = HRPOT[1]: 0 = unprivileged
[24] = HRPOT[0]: 1 = Data access
WO
MAIN_ResetType
Used to determine what reset type is currently select-
ed by the debugger. This is useful, if the script has to
behave differently in case a specific reset type is se-
lected by the debugger and the script file has a Re-
setTarget() function which overrides the J-Link reset
strategies.
Example
if (MAIN_ResetType = 2) {
[…]
} else {
RO
J-Link / J-Trace (UM08001) © 2004-2017 SEGGER Microcontroller GmbH & Co. KG

176 CHAPTER 5 J-Link script files
Variable Description R/W
[…]
}
JLINK_ActiveTIF
Returns the currently used target interface used by
the DLL to communicate with the target. Useful in cas-
es where some special setup only needs to be done for
a certain target interface, e.g. JTAG. For a list of possi-
ble values this variable may hold, please refer to Con-
stants for global variable“JLINK_ActiveTIF”.
RO
MAIN_IsFirstIdentify
Used to check if this is the first time we are running
into InitTarget(). Useful if some init steps only need to
be executed once per debug session.
Example
if (MAIN_IsFirstIdentify = 1) {
[…]
} else {
[…]
}
RO
JLINK_TargetEndian-
ness
Sets the target data and instruction endianness. For
a list of possible values this variable may hold, please
refer to Constants for global variable “JLINK_Targe-
tEndianess”
Example
JLINK_TargetEndianness = JLINK_TARGET_ENDIAN-
NESS_I_LITTLE_D_LITTLE
RW
JLINK_SkipInitECCRA-
MOnConnect
Used to disable ECC RAM init on connect, e.g. in case
only a attach to a running CPU shall be performed. Al-
lowed values are 0 (do not skip) or 1 (skip).
Example
SetSkipInitECCRAMOnConnect = 1
RW
5.12.4 Global DLL constants
Currently there are only global DLL constants to set the global DLL variable CPU. If neces-
sary, more constants will be implemented in the future.
5.12.4.1 Constants for global variable: CPU
The following constants can be used to set the global DLL variable CPU:
• ARM7
• ARM7TDMI
• ARM7TDMIR3
• ARM7TDMIR4
• ARM7TDMIS
• ARM7TDMISR3
• ARM7TDMISR4
• ARM9
• ARM9TDMIS
• ARM920T
• ARM922T
• ARM926EJS
• ARM946EJS
• ARM966ES
• ARM968ES
• ARM11
• ARM1136
• ARM1136J
• ARM1136JS
J-Link / J-Trace (UM08001) © 2004-2017 SEGGER Microcontroller GmbH & Co. KG
177 CHAPTER 5 J-Link script files
• ARM1136JF
• ARM1136JFS
• ARM1156
• ARM1176
• ARM1176J
• ARM1176JS
• ARM1176IF
• ARM1176JFS
•CORTEX_M0
•CORTEX_M1
•CORTEX_M3
•CORTEX_M3R1P0
•CORTEX_M3R1P1
•CORTEX_M3R2P0
•CORTEX_M4
•CORTEX_M7
•CORTEX_A5
•CORTEX_A7
•CORTEX_A8
•CORTEX_A9
•CORTEX_A12
•CORTEX_A15
•CORTEX_A17
•CORTEX_R4
•CORTEX_R5
5.12.4.2 Constants for "JLINK_CORESIGHT_xxx" functions
APs
•CORESIGHT_AHB_AP
•CORESIGHT_APB_AP
•CORESIGHT_JTAG_AP
•CORESIGHT_CUSTOM_AP
DP/AP register indexes
•JLINK_CORESIGHT_DP_REG_IDCODE
•JLINK_CORESIGHT_DP_REG_ABORT
•JLINK_CORESIGHT_DP_REG_CTRL_STAT
•JLINK_CORESIGHT_DP_REG_SELECT
•JLINK_CORESIGHT_DP_REG_RDBUF
•JLINK_CORESIGHT_AP_REG_CTRL
•JLINK_CORESIGHT_AP_REG_ADDR
•JLINK_CORESIGHT_AP_REG_DATA
•JLINK_CORESIGHT_AP_REG_BD0
•JLINK_CORESIGHT_AP_REG_BD1
•JLINK_CORESIGHT_AP_REG_BD2
•JLINK_CORESIGHT_AP_REG_BD3
•JLINK_CORESIGHT_AP_REG_ROM
•JLINK_CORESIGHT_AP_REG_IDR
5.12.4.3 Constants for global variable "JLINK_ActiveTIF"
•JLINK_TIF_JTAG
•JLINK_TIF_SWD
5.12.4.4 Constants for global variable "JLINK_TargetEndianness"
•JLINK_TARGET_ENDIANNESS_I_LITTLE_D_LITTLE
•JLINK_TARGET_ENDIANNESS_I_LITTLE_D_BIG
•JLINK_TARGET_ENDIANNESS_I_BIG_D_LITTLE
•JLINK_TARGET_ENDIANNESS_I_BIG_D_BIG
J-Link / J-Trace (UM08001) © 2004-2017 SEGGER Microcontroller GmbH & Co. KG

178 CHAPTER 5 J-Link script files
5.12.5 Script file language
The syntax of the J-Link script file language follows the conventions of the C-language, but
it does not support all expressions and operators which are supported by the C-language.
In the following, the supported operators and expressions are listed.
5.12.5.1 Supported Operators
The following operators are supported by the J-Link script file language:
• Multiplicative operators: *, /, %
• Additive operators: +, -
• Bitwise shift operators: <<, >>
• Relational operators: <, >, ≤, ≥
• Equality operators: =, ≠
• Bitwise operators: &, |, ^
• Logical operators: &&, ||
• Assignment operators: =, *=, /=, +=, -=, <≤, >≥, &=, ^=, |=
5.12.5.2 Supported basic type specifiers
The following basic type specifiers are supported by the J-Link script file language:
Name Size (Bit) Signed
void N/A N/A
char 8 signed
short 16 signed
int 32 signed
long 32 signed
U8 8 unsigned
U16 16 unsigned
U32 32 unsigned
I8 8 signed
I16 16 signed
I32 32 signed
5.12.5.3 Supported type qualifiers
The following type qualifiers are supported by the J-Link script file language:
• const
• signed
• unsigned
5.12.5.4 Supported declarators
The following declarators are supported by the J-Link script file language:
• Array declarators
5.12.5.5 Supported selection statements
The following selection statements are supported by the J-Link script file language:
• if-statements
• if-else-statements
5.12.5.6 Supported iteration statements
The following iteration statements are supported by the J-Link script file language:
J-Link / J-Trace (UM08001) © 2004-2017 SEGGER Microcontroller GmbH & Co. KG

179 CHAPTER 5 J-Link script files
• while
• do-while
5.12.5.7 Jump statements
The following jump statements are supported by the J-Link script file language:
• return
5.12.5.8 Sample script files
The J-Link Software and Documentation Package comes with sample script files for different
devices. The sample script files can be found at $JLINK_INST_DIR$\Samples\JLink\Scripts .
5.12.6 Script file writing example
In the following, a short example of how a J-Link script file could look like. In this example
we assume a JTAG chain with two devices on it (Cortex-A8 4 bits IRLen, custom device
5-bits IRLen).
void InitTarget(void) {
Report("J-Link script example.");
JTAG_Reset(); // Perform TAP reset and J-Link JTAG auto-detection
if (JTAG_TotalIRLen != 9) { // Basic check if JTAG chain information matches
MessageBox("Can not find xxx device");
return 1;
}
JTAG_DRPre = 0; // Cortex-A8 is closest to TDO, no no pre devices
JTAG_DRPost = 1; // 1 device (custom device) comes after the Cortex-A8
JTAG_IRPre = 0; // Cortex-A8 is closest to TDO, no no pre IR bits
JTAG_IRPost = 5; // Custom device after Cortex-A8 has 5 bits IR len
JTAG_IRLen = 4; // We selected the Cortex-A8, it has 4 bits IRLen
CPU = CORTEX_A8; // We are connected to a Cortex-A8
JTAG_AllowTAPReset = 1; // We are allowed to enter JTAG TAP reset
//
// We have a non-CoreSight compliant Cortex-A8 here
// which does not allow auto-detection of the Core debug components base address.
// so set it manually to overwrite the DLL auto-detection
//
CORESIGHT_CoreBaseAddr = 0x80030000;
}
5.12.7 Executing J-Link script files
For instructions on how to execute J-Link script files depending on the debug environment
used, please refer to:
SEGGER Wiki: Getting Started with Various IDEs
J-Link / J-Trace (UM08001) © 2004-2017 SEGGER Microcontroller GmbH & Co. KG

180 CHAPTER 5 Command strings
5.13 Command strings
The behavior of the J-Link can be customized via command strings passed to the JLinkAR-
M.dll which controls J-Link. Applications such as J-Link Commander, but also the C-SPY
debugger which is part of the IAR Embedded Workbench, allow passing one or more com-
mand strings. Command line strings can be used for passing commands to J-Link (such as
switching on target power supply), as well as customize the behavior (by defining memory
regions and other things) of J-Link. The use of command strings enables options which can
not be set with the configuration dialog box provided by C-SPY.
5.13.1 List of available commands
The table below lists and describes the available command strings.
Command Description
AppendToLogFile Enables/Disables always appending new loginfo to logfile.
CORESIGHT_SetIndexAHBAPToUse Selects a specific AHB-AP to be used to connect to a Cortex-M
device.
CORESIGHT_SetIndexAPBAPToUse Selects a specific APB-AP to be used to connect to a Cortex-A or
Cortex-R device.
device Selects the target device.
DisableAutoUpdateFW Disables automatic firmware update.
DisableCortexMXPSRAutoCorrect-
TBit Disables auto-correction of XPSR T-bit for Cortex-M devices.
DisableFlashBPs Disables the FlashBP feature.
DisableFlashDL Disables the J-Link FlashDL feature.
DisableInfoWinFlashBPs Disables info window for programming FlashBPs.
DisableInfoWinFlashDL Disables info window for FlashDL.
DisableMOEHandling Disables output of additional information about mode of entry in
case the target CPU is halted / entered debug mode.
DisablePowerSupplyOnClose Disables power supply on close.
EnableAutoUpdateFW Enables automatic firmware update.
EnableEraseAllFlashBanks Enables erase for all accessible flash banks.
EnableFlashBPs Enables the FlashBP feature.
EnableFlashDL Enables the J-Link FlashDL feature.
EnableInfoWinFlashBPs Enables info window for programming FlashBPs.
EnableInfoWinFlashDL Enables info window for FlashDL.
EnableMOEHandling Enables output of additional information about mode of entry in
case the target CPU is halted / entered debug mode.
EnableRemarks Enable detailed output during CPU-detection / connection
process.
ExcludeFlashCacheRange Invalidate flash ranges in flash cache, that are configured to be
excluded from flash cache.
HideDeviceSelection Hide device selection dialog.
HSSLogFile Logs all HSS-Data to file, regardless of the application using
HSS.
InvalidateCache Invalidates Cache.
InvalidateFW Invalidating current firmware.
map exclude Ignores all memory accesses to specified area.
J-Link / J-Trace (UM08001) © 2004-2017 SEGGER Microcontroller GmbH & Co. KG

181 CHAPTER 5 Command strings
Command Description
map illegal Marks a specified memory region as an illegal memory area.
Memory accesses to this region are ignored.
map indirectread Specifies an area which should be read indirect.
map ram Specifies location of target RAM.
map region Specifies a memory region.
map reset Restores the default mapping, which means all memory accesses
are permitted.
ProjectFile Specifies a file or directory which should be used by the J-Link
DLL to save the current configuration.
ReadIntoTraceCache Reads the given memory area into the streaming trace instruc-
tion cache.
ScriptFile Set script file path.
SelectTraceSource Selects which trace source should be used for tracing.
SetAllowFlashCache Enables/Disables flash cache usage.
SetAllowSimulation Enables/Disables instruction set simulation.
SetBatchMode Enables/Disables batch mode.
SetCFIFlash Specifies CFI flash area.
SetCheckModeAfterRead Enables/Disables CPSR check after read operations.
SetCompareMode Specifies the compare mode to be used.
SetCPUConnectIDCODE Specifies an CPU IDCODE that is used to authenticate the debug
probe, when connecting to the CPU.
SetDbgPowerDownOnClose Used to power-down the debug unit of the target CPU when the
debug session is closed.
SetETBIsPresent Selects if the connected device has an ETB.
SetETMIsPresent Selects if the connected device has an ETM.
SetFlashDLNoRMWThreshold Specifies a threshold when writing to flash memory does not
cause a read-modify-write operation.
SetFlashDLThreshold Set minimum amount of data to be downloaded.
SetIgnoreReadMemErrors Specifies if read memory errors will be ignored.
SetIgnoreWriteMemErrors Specifies if write memory errors will be ignored.
SetMonModeDebug Enables/Disables monitor mode debugging.
SetResetPulseLen Defines the length of the RESET pulse in milliseconds.
SetResetType Selects the reset strategy.
SetRestartOnClose Specifies restart behavior on close.
SetRTTAddr Set address of the RTT buffer.
SetRTTSearchRanges Set ranges to be searched for RTT buffer.
SetRTTTelnetPort Set the port used for RTT telnet.
SetRXIDCode Specifies an ID Code for Renesas RX devices to be used by the J-
Link DLL.
SetSysPowerDownOnIdle
Used to power-down the target CPU, when there are no trans-
missions between J-Link and target CPU, for a specified time
frame.
SetVerifyDownload Specifies the verify option to be used.
SetWorkRAM Specifies RAM area to be used by the J-Link DLL.
ShowControlPanel Opens control panel.
SilentUpdateFW Update new firmware automatically.
J-Link / J-Trace (UM08001) © 2004-2017 SEGGER Microcontroller GmbH & Co. KG

182 CHAPTER 5 Command strings
Command Description
SupplyPower Activates/Deactivates power supply over pin 19 of the JTAG con-
nector.
SupplyPowerDefault Activates/Deactivates power supply over pin 19 of the JTAG con-
nector permanently.
SuppressControlPanel Suppress pop up of the control panel.
SuppressInfoUpdateFW Suppress information regarding firmware updates.
SWOSetConversionMode Set SWO Conversion mode.
TraceSampleAdjust Allows to adjust the sampling timing on the specified pins, inside
the J-Trace firmware
5.13.1.1 AppendToLogFile
This command can be used to configure the AppendToLogFile feature. If enabled, new log
data will always be appended to an existing logfile. Otherwise, each time a new connection
will be opened, existing log data will be overwritten. By default new log data will not be
always appended to an existing logfile.
Syntax
AppendToLogFile = 0 | 1
Example
AppendToLogFile 1 // Enables AppendToLogFile
5.13.1.2 CORESIGHT_SetIndexAHBAPToUse
This command is used to select a specific AHB-AP to be used when connected to an ARM
Cortex-M device. Usually, it is not necessary to explicitly select an AHB-AP to be used, as
J-Link auto-detects the AP automatically. For multi-core systems with multiple AHB-APs it
might be necessary.
The index selected here is an absolute index. For example, if the connected target provides
the following AP layout:
• AP[0]: AHB-AP
• AP[1]: APB-AP
• AP[2]: AHB-AP
• AP[3]: JTAG-AP
In order to select the second AHB-AP to be used, use “2” as index.
Syntax
CORESIGHT_SetIndexAHBAPToUse = <Index>
Example
CORESIGHT_SetIndexAHBAPToUse = 2
5.13.1.3 CORESIGHT_SetIndexAPBAPToUse
This command is used to select a specific APB-AP to be used when connected to an ARM
Cortex-A or Cortex-R device. Usually, it is not necessary to explicitly select an AHB-AP to
be used, as J-Link auto-detects the AP automatically. For multi-core systems with multiple
APB-APs it might be necessary.
The index selected here is an absolute index. For example, if the connected target provides
the following AP layout:
• AP[0]: APB-AP
• AP[1]: AHB-AP
• AP[2]: APB-AP
J-Link / J-Trace (UM08001) © 2004-2017 SEGGER Microcontroller GmbH & Co. KG
183 CHAPTER 5 Command strings
• AP[3]: JTAG-AP
In order to select the second APB-AP to be used, use “2” as index.
Syntax
CORESIGHT_SetIndexAPBAPToUse = <Index>
Example
CORESIGHT_SetIndexAPBAPToUse = 2
5.13.1.4 device
This command selects the target device.
Syntax
device = <DeviceID> DeviceID has to be a valid device identifier. For a list of all available
device identifiers, please refer to Supported devices .
Example
device = AT91SAM7S256
5.13.1.5 DisableAutoUpdateFW
This command is used to disable the automatic firmware update if a new firmware is avail-
able.
Syntax
DisableAutoUpdateFW
5.13.1.6 DisableCortexMXPSRAutoCorrectTBit
Usually, the J-Link DLL auto-corrects the T-bit of the XPSR register to 1, for Cortex-M
devices. This is because having it set as 0 is an invalid state and would cause several
problems during debugging, especially on devices where the erased state of the flash is
0x00 and therefore on empty devices the T-bit in the XPSR would be 0. Anyhow, if for some
reason explicit disable of this auto-correction is necessary, this can be achieved via the
following command string.
Syntax
DisableCortexMXPSRAutoCorrectTBit
5.13.1.7 DisableFlashBPs
This command disables the FlashBP feature.
Syntax
DisableFlashBPs
5.13.1.8 DisableFlashDL
This command disables the J-Link FlashDL feature.
Syntax
DisableFlashDL
J-Link / J-Trace (UM08001) © 2004-2017 SEGGER Microcontroller GmbH & Co. KG
184 CHAPTER 5 Command strings
5.13.1.9 DisableInfoWinFlashBPs
This command is used to disable the flash download window for the flash breakpoint feature.
Enabled by default.
Syntax
DisableInfoWinFlashBPs
5.13.1.10 DisableInfoWinFlashDL
This command is used to disable the flash download information window for the flash down-
load feature. Enabled by default.
Syntax
DisableInfoWinFlashDL
5.13.1.11 DisableMOEHandling
The J-Link DLL outputs additional information about mode of entry (MOE) in case the target
CPU halted / entered debug mode. Disabled by default.
Syntax
DisableMOEHandling
5.13.1.12 DisablePowerSupplyOnClose
This command is used to ensure that the power supply for the target will be disabled on
close.
Syntax
DisablePowerSupplyOnClose
5.13.1.13 EnableAutoUpdateFW
This command is used to enable the automatic firmware update if a new firmware is avail-
able.
Syntax
EnableAutoUpdateFW
5.13.1.14 EnableEraseAllFlashBanks
Used to enable erasing of other flash banks than the internal, like (Q)SPI flash or CFI flash.
Syntax
EnableEraseAllFlashBanks
5.13.1.15 EnableFlashBPs
This command enables the FlashBP feature.
Syntax
EnableFlashBPs
5.13.1.16 EnableFlashDL
This command enables the J-Link ARM FlashDL feature.
J-Link / J-Trace (UM08001) © 2004-2017 SEGGER Microcontroller GmbH & Co. KG
185 CHAPTER 5 Command strings
Syntax
EnableFlashDL
5.13.1.17 EnableInfoWinFlashBPs
This command is used to enable the flash download window for the flash breakpoint feature.
Enabled by default.
Syntax
EnableInfoWinFlashBPs
5.13.1.18 EnableInfoWinFlashDL
This command is used to enable the flash download information window for the flash down-
load feature.
Syntax
EnableInfoWinFlashDL
5.13.1.19 EnableMOEHandling
The J-Link DLL outputs additional information about mode of entry (MOE) in case the target
CPU halted / entered debug mode. Disabled by default. Additional information is output via
log-callback set with JLINK_OpenEx(JLINK_LOG* pfLog, JLINK_LOG* pfErrorOut)
Syntax
EnableMOEHandling
5.13.1.20 EnableRemarks
The J-Link DLL provides more detailed output during CPU-detection / connection process.
Kind of “verbose” option. Disabled by default, therefore only an enable option. Will be reset
to “disabled” on each call to JLINK_Open() (reconnect to J-Link).
Syntax
EnableRemarks
5.13.1.21 ExcludeFlashCacheRange
This command is used to invalidate flash ranges in flash cache, that are configured to be
excluded from the cache. Per default, all areas that J-Link knows to be Flash memory,
are cached. This means that it is assumed that the contents of this area do not change
during program execution. If this assumption does not hold true, typically because the
target program modifies the flash content for data storage, then the affected area should
be excluded. This will slightly reduce the debugging speed.
Syntax
ExcludeFlashCacheRange <Range>
Example
ExcludeFlashCacheRange 0x10000000-0x100FFFFF
5.13.1.22 Hide device selection
This command can be used to suppress the device selection dialog. If enabled, the device
selection dialog will not be shown in case an unknown device is selected.
J-Link / J-Trace (UM08001) © 2004-2017 SEGGER Microcontroller GmbH & Co. KG
186 CHAPTER 5 Command strings
Syntax
HideDeviceSelection = 0 | 1
Example
HideDeviceSelection 1 // Device selection will not show up
5.13.1.23 HSSLogFile
This command enables HSS-Logging. Separate to the application using HSS, all HSS Data
will be stored in the specified file.
Syntax
HSSLogFile = <Path>
Example
HSSLogFile = C:\Test.log
5.13.1.24 InvalidateCache
This command is used to invalidate cache.
Syntax
InvalidateCache
5.13.1.25 InvalidateFW
This command is used to invalidate the current firmware of the J-Link / J-Trace. Invalidating
the firmware will force a firmware update. Can be used for downdating. For more informa-
tion please refer to J-Link / J-Trace firmware .
Syntax
InvalidateFW
5.13.1.26 map exclude
This command excludes a specified memory region from all memory accesses. All subse-
quent memory accesses to this memory region are ignored.
Memory mapping
Some devices do not allow access of the entire 4GB memory area. Ideally, the entire mem-
ory can be accessed; if a memory access fails, the CPU reports this by switching to abort
mode. The CPU memory interface allows halting the CPU via a WAIT signal. On some de-
vices, the WAIT signal stays active when accessing certain unused memory areas. This
halts the CPU indefinitely (until RESET) and will therefore end the debug session. This is
exactly what happens when accessing critical memory areas. Critical memory areas should
not be present in a device; they are typically a hardware design problem. Nevertheless,
critical memory areas exist on some devices.
To avoid stalling the debug session, a critical memory area can be excluded from access:
J-Link will not try to read or write to critical memory areas and instead ignore the access
silently. Some debuggers (such as IAR C-SPY) can try to access memory in such areas
by dereferencing non-initialized pointers even if the debugged program (the debuggee) is
working perfectly. In situations like this, defining critical memory areas is a good solution.
Syntax
map exclude <SAddr>-<EAddr>
J-Link / J-Trace (UM08001) © 2004-2017 SEGGER Microcontroller GmbH & Co. KG
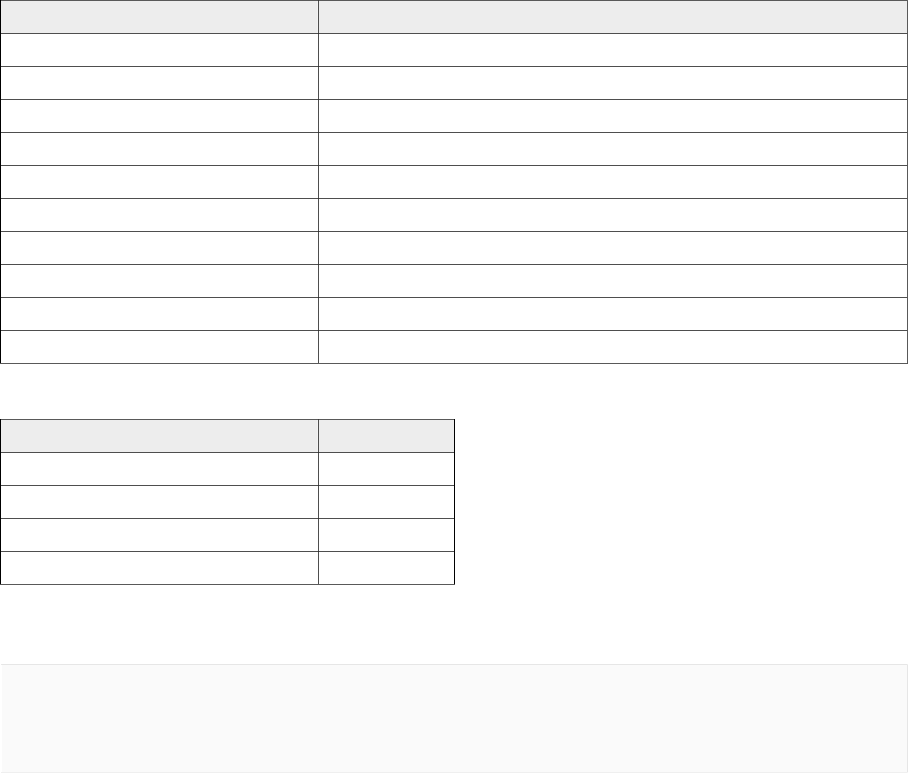
187 CHAPTER 5 Command strings
Example
This is an example for the map exclude command in combination with an NXP LPC2148 MCU.
Memory map
Range Description
0x00000000-0x0007FFFF On-chip flash memory
0x00080000-0x3FFFFFFF Reserved
0x40000000-0x40007FFF On-chip SRAM
0x40008000-0x7FCFFFFF Reserved
0x7FD00000-0x7FD01FFF On-chip USB DMA RAM
0x7FD02000-0x7FD02000 Reserved
0x7FFFD000-0x7FFFFFFF Boot block (remapped from on-chip flash memory)
0x80000000-0xDFFFFFFF Reserved
0xE0000000-0xEFFFFFFF VPB peripherals
0xF0000000-0xFFFFFFFF AHB peripherals
The “problematic” memory areas are:
Range Description
0x00080000-0x3FFFFFFF Reserved
0x40008000-0x7FCFFFFF Reserved
0x7FD02000-0x7FD02000 Reserved
0x80000000-0xDFFFFFFF Reserved
To exclude these areas from being accessed through J-Link the map exclude command
should be used as follows:
map exclude 0x00080000-0x3FFFFFFF
map exclude 0x40008000-0x7FCFFFFF
map exclude 0x7FD02000-0x7FD02000
map exclude 0x80000000-0xDFFFFFFF
5.13.1.27 map illegal
This command marks a specified memory region as an illegal memory area. All subsequent
memory accesses to this memory region produces a warning message and the memory
access is ignored. This command can be used to mark more than one memory region as
an illegal area by subsequent calls.
Syntax
Map Illegal <SAddr>-<EAddr>
Example
Map Illegal 0xF0000000-0xFFDFFFFF
Additional information
• SAddr has to be a 256-byte aligned address.
The region size has to be a multiple of 256 bytes.
5.13.1.28 map indirectread
This command can be used to read a memory area indirectly. Indirect reading means that a
small code snippet is downloaded into RAM of the target device, which reads and transfers
J-Link / J-Trace (UM08001) © 2004-2017 SEGGER Microcontroller GmbH & Co. KG

188 CHAPTER 5 Command strings
the data of the specified memory area to the host. Before map indirectread can be called
a RAM area for the indirect read code snippet has to be defined. Use therefor the map ram
command and define a RAM area with a size of ≥ 256 byte.
Typical applications
Syntax
map indirectread <StartAddressOfArea>-<EndAddress>
Example
map indirectread 0x3fffc000-0x3fffcfff
Additional information
• StartAddressOfArea has to be a 256-byte aligned address.
The region size has to be a multiple of 256 bytes.
5.13.1.29 map ram
This command should be used to define an area in RAM of the target device. The area must
be 256-byte aligned. The data which was located in the defined area will not be corrupted.
Data which resides in the defined RAM area is saved and will be restored if necessary. This
command has to be executed before map indirectread will be called.
Typical applications
Syntax
map ram <StartAddressOfArea>-<EndAddressOfArea>
Example
map ram 0x40000000-0x40003fff;
Additional information
• StartAddressOfArea has to be a 256-byte aligned address.
The region size has to be a multiple of 256 bytes.
5.13.1.30 map region
This command is used to specify memory areas with various region types.
Syntax
map region <StartAddressOfArea>-<EndAddressOfArea> <RegionType>
Region type Description
N Normal
C Cacheable
X Excluded
XI Excluded & Illegal
I Indirect access
AAlias (static, e.g. RAM/flash that is aliased multiple times in one area.
Does not change during the debug session.)
AD Alias (dynamic, e.g. memory areas where different memories can be
mapped to.)
J-Link / J-Trace (UM08001) © 2004-2017 SEGGER Microcontroller GmbH & Co. KG

189 CHAPTER 5 Command strings
Example
map region 0x100000-0x1FFFFF C
5.13.1.31 map reset
This command restores the default memory mapping, which means all memory accesses
are permitted.
Typical applications
Used with other “map” commands to return to the default values. The map reset command
should be called before any other “map” command is called.
Syntax
map reset
Example
map reset
5.13.1.32 ProjectFile
This command is used to specify a file used by the J-Link DLL to save the current config-
uration.
Using this command is recommended if settings need to be saved. This is typically the
case if Flash breakpoints are enabled and used. It is recommended that an IDE uses this
command to allow the JLinkARM.dll to store its settings in the same directory as the project
and settings file of the IDE. The recommended extension for project files is *.jlink.
Assuming the Project is saved under C:\Work\Work and the project contains to targets
name Debug and Release, the debug version could set the file name
C:\Work\Work\Debug.jlink .
The release version could use
C:\Work\Work\Release.jlink .
Note
Spaces in the filename are permitted.
Syntax
ProjectFile = <FullFileName>
Example
ProjectFile = C:\Work\Release.jlink
5.13.1.33 ReadIntoTraceCache
This command is used to read a given memory area into the trace instruction cache. It
is mainly used for cases where the download address of the application differs from the
execution address. As for trace analysis only cached memory contents are used as mem-
ory accesses during trace (especially streaming trace) cause an overhead that is too big,
by default trace will only work if execution address is identical to the download address.
For other cases, this command can be used to read specific memory areas into the trace
instruction cache.
Note
This command causes an immediate read from the target, so it should only be called
at a point where memory contents at the given area are known to be valid
J-Link / J-Trace (UM08001) © 2004-2017 SEGGER Microcontroller GmbH & Co. KG

190 CHAPTER 5 Command strings
Syntax
ReadIntoTraceCache <Addr> <NumBytes>
Example
ReadIntoTraceCache 0x08000000 0x2000
5.13.1.34 ScriptFile
This command is used to set the path to a J-Link script file which shall be executed. J-Link
scriptfiles are mainly used to connect to targets which need a special connection sequence
before communication with the core is possible.
Syntax
ScriptFile = <FullFileName>
Example
ScriptFile = C:\Work\Default.JLinkScript
5.13.1.35 SelectTraceSource
This command selects the trace source which shall be used for tracing.
Note
This is only relevant when tracing on a target that supports trace via pins as well
as trace via on-chip trace buffer and a J-Trace (which supports both) is connected
to the PC.
Syntax
SelectTraceSource = <SourceNumber>
Trace source number Description
0 ETB
1 ETM
2 MTB
Example
SelectTraceSource = 0 // Select ETB
5.13.1.36 SetAllowFlashCache
This command is used to enable / disable caching of flash contents. Enabled by default.
Syntax
SetAllowFlashCache = 0 | 1
Example
SetAllowFlashCache = 1 // Enables flash cache
5.13.1.37 SetAllowSimulation
This command can be used to enable or disable the instruction set simulation. By default
the instruction set simulation is enabled.
J-Link / J-Trace (UM08001) © 2004-2017 SEGGER Microcontroller GmbH & Co. KG
191 CHAPTER 5 Command strings
Syntax
SetAllowSimulation = 0 | 1
Example
SetAllowSimulation 1 // Enables instruction set simulation
5.13.1.38 SetBatchMode
This command is used to tell the J-Link DLL that it is used in batch-mode / automatized
mode, so some dialogs etc. will automatically close after a given timeout. Disabled by
default.
Syntax
SetBatchMode = 0 | 1
Example
SetBatchMode 1 // Enables batch mode
5.13.1.39 SetCFIFlash
This command can be used to set a memory area for CFI compliant flashes.
Syntax
SetCFIFlash <StartAddressOfArea>-<EndAddressOfArea>
Example
SetCFIFlash 0x10000000-0x100FFFFF
5.13.1.40 SetCheckModeAfterRead
This command is used to enable or disable the verification of the CPSR (current processor
status register) after each read operation. By default this check is enabled. However this
can cause problems with some CPUs (e.g. if invalid CPSR values are returned). Please note
that if this check is turned off (SetCheckModeAfterRead = 0), the success of read operations
cannot be verified anymore and possible data aborts are not recognized.
Typical applications
This verification of the CPSR can cause problems with some CPUs (e.g. if invalid CPSR
values are returned). Note that if this check is turned off (SetCheckModeAfterRead = 0),
the success of read operations cannot be verified anymore and possible data aborts are
not recognized.
Syntax
SetCheckModeAfterRead = 0 | 1
Example
SetCheckModeAfterRead = 0
5.13.1.41 SetCompareMode
This command is used to configure the compare mode.
Syntax
SetCompareMode = <Mode>
J-Link / J-Trace (UM08001) © 2004-2017 SEGGER Microcontroller GmbH & Co. KG

192 CHAPTER 5 Command strings
<Mode> Description
0 Skip
1 Using fastest method (default)
2 Using CRC
3 Using readback
Example
SetCompareMode = 1 // Select using fastest method
5.13.1.42 SetCPUConnectIDCODE
Used to specify an IDCODE that is used by J-Link to authenticate itself when connecting
to a specific device. Some devices allow the user to lock out a debugger by default, until
a specific unlock code is provided that allows further debugging. This function allows to
automate this process, if J-Link is used in a production environment.
The IDCODE stream is expected as a hex-encoded byte stream. If the CPU e.g. works on a
word-basis for the IDCODE, this stream is interpreted as a little endian formatted stream
where the J-Link library then loads the words from and passes them to the device during
connect.
Syntax
SetCPUConnectIDCODE = <IDCODE_Stream>
Example
CPU has a 64-bit IDCODE (on word-basis) and expects 0x11223344 0x55667788 as IDCODE.
SetCPUConnectIDCODE = 4433221188776655
5.13.1.43 SetDbgPowerDownOnClose
When using this command, the debug unit of the target CPU is powered-down when the
debug session is closed.
Note
This command works only for Cortex-M3 devices
Typical applications
This feature is useful to reduce the power consumption of the CPU when no debug session
is active.
Syntax
SetDbgPowerDownOnClose = <value>
Example
SetDbgPowerDownOnClose = 1 // Enables debug power-down on close.
SetDbgPowerDownOnClose = 0 // Disables debug power-down on close.
5.13.1.44 SetETBIsPresent
This command is used to select if the connected device has an ETB.
Syntax
SetETBIsPresent = 0 | 1
J-Link / J-Trace (UM08001) © 2004-2017 SEGGER Microcontroller GmbH & Co. KG

193 CHAPTER 5 Command strings
Example
SetETBIsPresent = 1 // ETB is available
SetETBIsPresent = 0 // ETB is not available
5.13.1.45 SetETMIsPresent
This command is used to select if the connected device has an ETM.
Syntax
SetETMIsPresent = 0 | 1
Example
SetETMIsPresent = 1 // ETM is available
SetETMIsPresent = 0 // ETM is not available
5.13.1.46 SetFlashDLNoRMWThreshold
This command sets the J-Link DLL internal threshold when a write to flash memory does not
cause a read-modify-write (RMW) operation. For example, when setting this value to 0x800,
all writes of amounts of data < 2 KB will cause the DLL to perform a read-modify-write
operation on incomplete sectors.
Default: Writing amounts of < 1 KB (0x400) to flash causes J-Link to perform a read-
modify-write on the flash.
Example 1 with default config
• Flash has 2 * 1 KB sectors
• Debugger writes 512 bytes
J-Link will perform a read-modify-write on the first sector, preserving contents of 512 -
1023 bytes. Second sector is left untouched.
Example 2 with default config
• Flash has 2 * 1 KB sectors
• Debugger writes 1280 bytes
J-Link will erase + program 1 KB of first sector.
J-Link will erase + program 256 bytes of second sector.
Previous 768 bytes from second sector are lost.
The default makes sense for flash programming where old contents in remaining space
of affected sectors are usually not needed anymore. Writes of < 1 KB usually mean that
the user is performing flash manipulation from within a memory window in a debugger to
manipulate the application behavior during runtime (e.g. by writing some constant data
used by the application). In such cases, it is important to preserve the remaining data in
the sector to allow the application to further work correctly.
Syntax
SetFlashDLNoRMWThreshold = <value>
Example
SetFlashDLNoRMWThreshold = 0x100 // 256 Bytes
5.13.1.47 SetFlashDLThreshold
This command is used to set a minimum amount of data to be downloaded by the flash
download feature.
J-Link / J-Trace (UM08001) © 2004-2017 SEGGER Microcontroller GmbH & Co. KG

194 CHAPTER 5 Command strings
Syntax
SetFlashDLThreshold = <value>
Example
SetFlashDLThreshold = 0x100 // 256 Bytes
5.13.1.48 SetIgnoreReadMemErrors
This command can be used to ignore read memory errors. Disabled by default.
Syntax
SetIgnoreReadMemErrors = 0 | 1
Example
SetIgnoreReadMemErrors = 1 // Read memory errors will be ignored
SetIgnoreReadMemErrors = 0 // Read memory errors will be reported
5.13.1.49 SetIgnoreWriteMemErrors
This command can be used to ignore read memory errors. Disabled by default.
Syntax
SetIgnoreWriteMemErrors = 0 | 1
Example
SetIgnoreWriteMemErrors = 1 // Write memory errors will be ignored
SetIgnoreWriteMemErrors = 0 // Write memory errors will be reported
5.13.1.50 SetMonModeDebug
This command is used to enable / disable monitor mode debugging. Disabled by default.
Syntax
SetMonModeDebug = 0 | 1
Example
SetMonModeDebug = 1 // Monitor mode debugging is enabled
SetMonModeDebug = 0 // Monitor mode debugging is disabled
5.13.1.51 TraceSampleAdjust
Allows to adjust the sample point for the specified trace data signals inside the J-Trace
firmware. This can be useful to compensate certain delays on the target hardware (e.g.
caused by routing etc.).
Syntax
TraceSampleAdjust <PinName> = <Adjust_Ps>[ <PinName#<Adjust_Ps> …]
<PinName> Description
TD Adjust all trace data signals
TD0 Adjust trace data 0
TD1 Adjust trace data 1
J-Link / J-Trace (UM08001) © 2004-2017 SEGGER Microcontroller GmbH & Co. KG

195 CHAPTER 5 Command strings
<PinName> Description
TD2 Adjust trace data 2
TD3 Adjust trace data 3
TD3..0 Adjust trace data 0-3
TD2..1 Adjust trace data 1-2
TDx..y Adjust trace data x-y
<Adjust_Ps> Description
-5000 to 5000 Adjustment in [ps]
Example
TraceSampleAdjust TD = 1000
5.13.1.52 SetResetPulseLen
This command defines the length of the RESET pulse in milliseconds. The default for the
RESET pulse length is 20 milliseconds.
Syntax
SetResetPulseLen = <value>
Example
SetResetPulseLen = 50
5.13.1.53 SetResetType
This command selects the reset strategy which shall be used by J-Link, to reset the device.
The value which is used for this command is analog to the reset type which shall be selected.
For a list of all reset types which are available, please refer to Reset strategies . Please note
that there different reset strategies for ARM 7/9 and Cortex-M devices.
Syntax
SetResetType = <value>
Example
SetResetType = 0 // Selects reset strategy type 0: normal
5.13.1.54 SetRestartOnClose
This command specifies whether the J-Link restarts target execution on close. The default
is to restart target execution. This can be disabled by using this command.
Syntax
SetRestartOnClose = 0 | 1
Example
SetRestartOnClose = 1
5.13.1.55 SetRTTAddr
In some cases J-Link cannot locate the RTT buffer in known RAM. This command is used
to set the exact address manually.
J-Link / J-Trace (UM08001) © 2004-2017 SEGGER Microcontroller GmbH & Co. KG

196 CHAPTER 5 Command strings
Syntax
SetRTTAddr <RangeStart>
Example
SetRTTAddr 0x20000000
5.13.1.56 SetRTTTelnetPort
This command alters the RTT telnet port. Default is 19021. This command must be called
before a connection to a J-Link is established. In J-Link Commander, command strings
(“exec <CommandString>”) can only be executed after a connection to J-Link is estab-
lished, therefore this command string has no effect in J-Link Commander. The -RTTTelnet-
Port command line parameter can be used instead .
Syntax
SetRTTTelnetPort <value>
Example
SetRTTTelnetPort 9100
5.13.1.57 SetRTTSearchRanges
In some cases J-Link cannot locate the RTT buffer in known RAM. This command is used to
set (multiple) ranges to be searched for the RTT buffer.
Syntax
SetRTTSearchRanges <RangeAddr> <RangeSize> [, <RangeAddr1> <RangeSize1>, ..]
Example
SetRTTSearchRanges 0x10000000 0x1000, 0x20000000 0x1000,
5.13.1.58 SetRXIDCode
This command is used to set the ID Code for Renesas RX devices to be used by the J-
Link DLL.
Syntax
SetRXIDCode = <RXIDCode_String>
Example
Set 16 IDCode Bytes (32 Characters).
SetRXIDCode = 112233445566778899AABBCCDDEEFF00
5.13.1.59 SetSkipProgOnCRCMatch
Note
Deprecated. Use SetCompareMode instead.
This command is used to configure the CRC match / compare mode.
Syntax
SetSkipProgOnCRCMatch = <CompareMode>
J-Link / J-Trace (UM08001) © 2004-2017 SEGGER Microcontroller GmbH & Co. KG
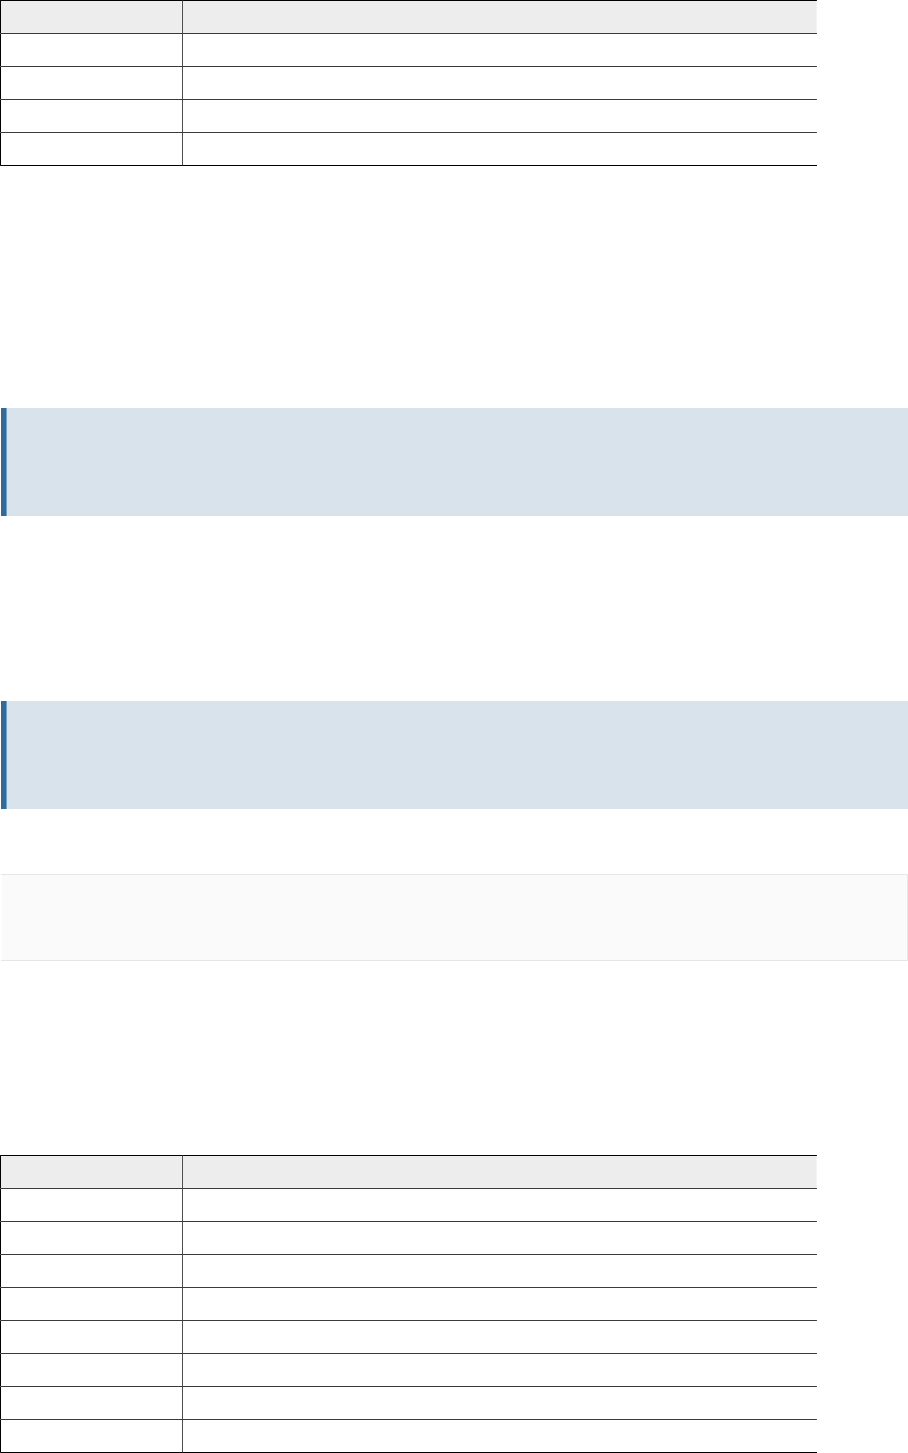
197 CHAPTER 5 Command strings
Compare mode Description
0 Skip
1 Using fastest method (default)
2 Using CRC
3 Using readback
Example
SetSkipProgOnCRCMatch = 1 // Select using fastest method
5.13.1.60 SetSysPowerDownOnIdle
When using this command, the target CPU is powered-down when no transmission between
J-Link and the target CPU was performed for a specific time. When the next command is
given, the CPU is powered-up.
Note
This command works only for Cortex-M3 devices.
Typical applications
This feature is useful to reduce the power consumption of the CPU.
Syntax
SetSysPowerDownOnIdle = <value>
Note
A 0 for <value> disables the power-down on idle functionality.
Example
SetSysPowerDownOnIdle = 10; // The target CPU is powered-down when there is no
// transmission between J-Link and target CPU for
// at least 10ms
5.13.1.61 SetVerifyDownload
This command is used to configure the verify mode.
Syntax
SetVerifyDownload = <VerifyMode>
Compare mode Description
0 Skip
1 Programmed sectors, fastest method (default)
2 Programmed sectors using CRC
3 Programmed sectors using readback
4 All sectors using fastest method
5 All sectors using CRC
6 All sectors using read back
7 Programmed sectors using checksum
J-Link / J-Trace (UM08001) © 2004-2017 SEGGER Microcontroller GmbH & Co. KG

198 CHAPTER 5 Command strings
Compare mode Description
8 All sectors using checksum
Example
SetVerifyDownload = 1 // Select programmed sectors, fastest method
5.13.1.62 SetWorkRAM
This command can be used to configure the RAM area which will be used by J-Link.
Syntax
SetWorkRAM <StartAddressOfArea>-<EndAddressOfArea>
Example
SetWorkRAM 0x10000000-0x100FFFFF
5.13.1.63 ShowControlPanel
Executing this command opens the control panel.
Syntax
ShowControlPanel
5.13.1.64 SilentUpdateFW
After using this command, new firmware will be updated automatically without opening a
message box.
Syntax
SilentUpdateFW
5.13.1.65 SupplyPower
This command activates power supply over pin 19 of the JTAG connector. The KS (Kickstart)
versions of J-Link have the V5 supply over pin 19 activated by default.
Typical applications
This feature is useful for some eval boards that can be powered over the JTAG connector.
Syntax
SupplyPower = 0 | 1
Example
SupplyPower = 1
5.13.1.66 SupplyPowerDefault
This command activates power supply over pin 19 of the JTAG connector permanently. The
KS (Kickstart) versions of J-Link have the V5 supply over pin 19 activated by default.
Typical applications
This feature is useful for some eval boards that can be powered over the JTAG connector.
Syntax
SupplyPowerDefault = 0 | 1
J-Link / J-Trace (UM08001) © 2004-2017 SEGGER Microcontroller GmbH & Co. KG
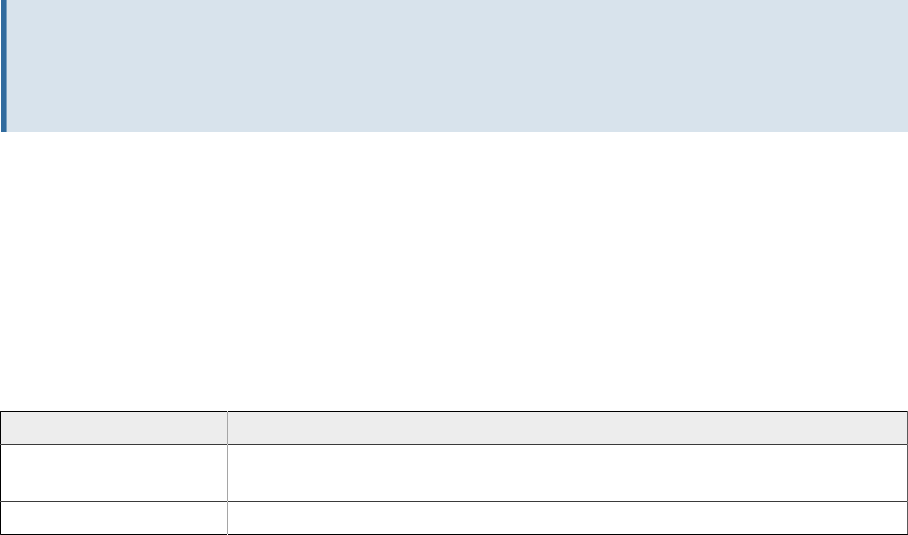
199 CHAPTER 5 Command strings
Example
SupplyPowerDefault = 1
5.13.1.67 SuppressControlPanel
Using this command ensures, that the control panel will not pop up automatically.
Syntax
SuppressControlPanel
5.13.1.68 SuppressInfoUpdateFW
After using this command information about available firmware updates will be suppressed.
Note
We strongly recommend not to use this command, latest firmware versions should
always be used!
Syntax
SuppressInfoUpdateFW
5.13.1.69 SWOSetConversionMode
This command is used to set the SWO conversion mode.
Syntax
SWOSetConversionMode = <ConversionMode>
Conversion mode Description
0If only ’\n’ is received, make it “\r\n” to make the line end Win-
dows-compliant. (Default behavior)
1 Leave everything as it is, do not add any characters.
Example
SWOSetConversionMode = 0
5.13.2 Using command strings
For instructions on how to execute J-Link script files depending on the debug environment
used, please refer to:
SEGGER Wiki: Getting Started with Various IDEs
5.13.2.1 In J-Link commander
The J-Link command strings can be tested with the J-Link Commander. Use the command
exec supplemented by one of the command strings.
J-Link / J-Trace (UM08001) © 2004-2017 SEGGER Microcontroller GmbH & Co. KG
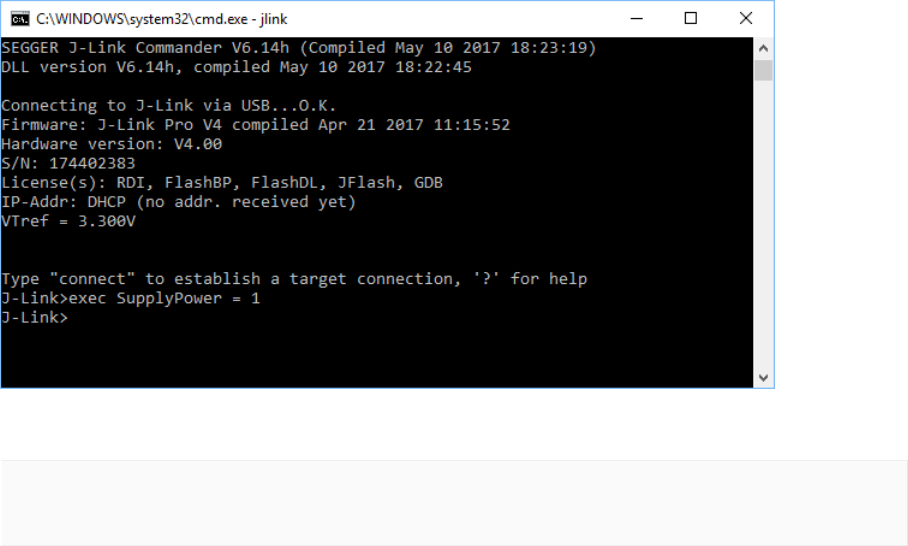
200 CHAPTER 5 Command strings
Example
exec SupplyPower = 1
exec map reset
exec map exclude 0x10000000-0x3FFFFFFF
J-Link / J-Trace (UM08001) © 2004-2017 SEGGER Microcontroller GmbH & Co. KG
201 CHAPTER 5 Switching off CPU clock during debug
5.14 Switching off CPU clock during debug
We recommend not to switch off CPU clock during debug. However, if you do, you should
consider the following:
Non-synthesizable cores (ARM7TDMI, ARM9TDMI, ARM920, etc.)
With these cores, the TAP controller uses the clock signal provided by the emulator, which
means the TAP controller and ICE-Breaker continue to be accessible even if the CPU has
no clock.
Therefore, switching off CPU clock during debug is normally possible if the CPU clock is
periodically (typically using a regular timer interrupt) switched on every few ms for at least
a few us. In this case, the CPU will stop at the first instruction in the ISR (typically at
address 0x18).
Synthesizable cores (ARM7TDMI-S, ARM9E-S, etc.)
With these cores, the clock input of the TAP controller is connected to the output of a three-
stage synchronizer, which is fed by clock signal provided by the emulator, which means
that the TAP controller and ICE-Breaker are not accessible if the CPU has no clock.
If the RTCK signal is provided, adaptive clocking function can be used to synchronize the
JTAG clock (provided by the emulator) to the processor clock. This way, the JTAG clock is
stopped if the CPU clock is switched off.
If adaptive clocking is used, switching off CPU clock during debug is normally possible if
the CPU clock is periodically (typically using a regular timer interrupt) switched on every
few ms for at least a few us. In this case, the CPU will stop at the first instruction in the
ISR (typically at address 0x18).
J-Link / J-Trace (UM08001) © 2004-2017 SEGGER Microcontroller GmbH & Co. KG

202 CHAPTER 5 Cache handling
5.15 Cache handling
Most target systems with external memory have at least one cache. Typically, ARM7 sys-
tems with external memory come with a unified cache, which is used for both code and data.
Most ARM9 systems with external memory come with separate caches for the instruction
bus (I-Cache) and data bus (D-Cache) due to the hardware architecture.
5.15.1 Cache coherency
When debugging or otherwise working with a system with processor with cache, it is im-
portant to maintain the cache(s) and main memory coherent. This is easy in systems with
a unified cache and becomes increasingly difficult in systems with hardware architecture.
A write buffer and a D-Cache configured in write-back mode can further complicate the
problem.
ARM9 chips have no hardware to keep the caches coherent, so that this is the responsibility
of the software.
5.15.2 Cache clean area
J-Link / J-Trace handles cache cleaning directly through JTAG commands. Unlike other em-
ulators, it does not have to download code to the target system. This makes setting up J-
Link / J-Trace easier. Therefore, a cache clean area is not required.
5.15.3 Cache handling of ARM7 cores
Because ARM7 cores have a unified cache, there is no need to handle the caches during
debug
5.15.4 Cache handling of ARM9 cores
ARM9 cores with cache require J-Link / J-Trace to handle the caches during debug. If the
processor enters debug state with caches enabled, J-Link / J-Trace does the following:
When entering debug state
J-Link / J-Trace performs the following:
• It stores the current write behavior for the D-Cache.
• It selects write-through behavior for the D-Cache.
When leaving debug state
J-Link / J-Trace performs the following:
• It restores the stored write behavior for the D-Cache.
• It invalidates the D-Cache.
Note
The implementation of the cache handling is different for different cores. However,
the cache is handled correctly for all supported ARM9 cores.
J-Link / J-Trace (UM08001) © 2004-2017 SEGGER Microcontroller GmbH & Co. KG
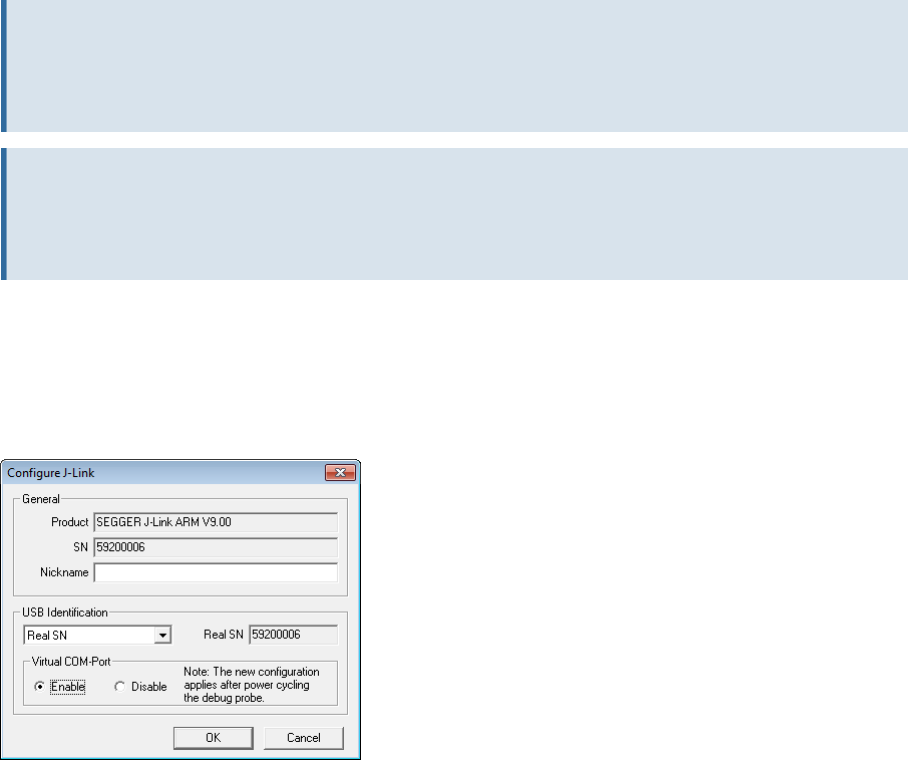
203 CHAPTER 5 Virtual COM Port (VCOM)
5.16 Virtual COM Port (VCOM)
5.16.1 Configuring Virtual COM Port
In general, the VCOM feature can be disabled and enabled for debug probes which comes
with support for it via J-Link Commander and J-Link Configurator. Below, a small description
of how to use use them to configure the feature is given.
Note
VCOM can only be used when debugging via SWD target interface. Pin 5 = J-Link-Tx
(out), Pin 17 = J-Link-Rx (in).
Note
Currently, only J-Link models with hardware version 9 or newer comes with VCOM
capabilities.
5.16.1.1 Via J-Link Configurator
The J-Link Software and Documentation Package comes with a free GUI-based utility called
J-Link Configurator which auto-detects all J-Links that are connected to the host PC via USB
& Ethernet. The J-Link Configurator allows the user to enable and disable the VCOM. For
more information about the J-Link Configurator, please refer to J-Link Configurator .
5.16.1.2 Via J-Link Commander
Simply start J-Link Commander, which is part of the J-Link Software and Documentation
Package and enter the vcom enable|disable command as in the screenshot below. After
changing the configuration a power on cycle of the debug probe is necessary in order to use
the new configuration. For feature information about how to use the J-Link Commander,
please refer to J-Link Commander (Command line tool) .
J-Link / J-Trace (UM08001) © 2004-2017 SEGGER Microcontroller GmbH & Co. KG
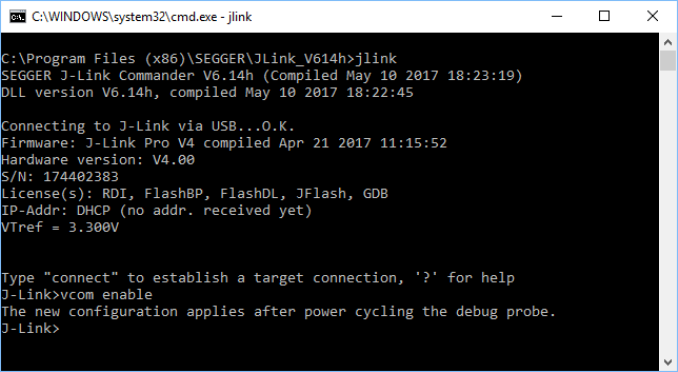
204 CHAPTER 5 Virtual COM Port (VCOM)
J-Link / J-Trace (UM08001) © 2004-2017 SEGGER Microcontroller GmbH & Co. KG

Chapter 6
Flash download
This chapter describes how the flash download feature of the DLL can be used in different
debugger environments.
J-Link / J-Trace (UM08001) © 2004-2017 SEGGER Microcontroller GmbH & Co. KG
206 CHAPTER 6 Introduction
6.1 Introduction
The J-Link DLL comes with a lot of flash loaders that allow direct programming of internal
flash memory for popular microcontrollers. Moreover, the J-Link DLL also allows program-
ming of CFI-compliant external NOR flash memory. The flash download feature of the J-
Link DLL does not require an extra license and can be used free of charge.
Why should I use the J-Link flash download feature?
Being able to download code directly into flash from the debugger or integrated IDE signif-
icantly shortens the turn-around times when testing software. The flash download feature
of J-Link is very efficient and allows fast flash programming. For example, if a debugger
splits the download image into several pieces, the flash download software will collect the
individual parts and perform the actual flash programming right before program execution.
This avoids repeated flash programming. Moreover, the J-Link flash loaders make flash be-
have like RAM. This means that the debugger only needs to select the correct device which
enables the J-Link DLL to automatically activate the correct flash loader if the debugger
writes to a specific memory address.
This also makes it very easy for debugger vendors to make use of the flash download feature
because almost no extra work is necessary on the debugger side since the debugger does
not have to differ between memory writes to RAM and memory writes to flash.
J-Link / J-Trace (UM08001) © 2004-2017 SEGGER Microcontroller GmbH & Co. KG
207 CHAPTER 6 Licensing
6.2 Licensing
No extra license required. The flash download feature can be used free of charge.
J-Link / J-Trace (UM08001) © 2004-2017 SEGGER Microcontroller GmbH & Co. KG
208 CHAPTER 6 Supported devices
6.3 Supported devices
J-Link supports download into the internal flash of a large number of microcontrollers. You
can always find the latest list of supported devices on our website:
List of supported target devices
In general, J-Link can be used with any ARM7/ARM9/ARM11, Cortex-M0/M1/M3/M4/M7/
M23/M33, Cortex-A5/A7/A8/A9/A12/A15/A17 and Cortex-R4/R5 core even if it does not
provide internal flash.
Furthermore, flash download is also available for all CFI-compliant external NOR-flash de-
vices.
J-Link / J-Trace (UM08001) © 2004-2017 SEGGER Microcontroller GmbH & Co. KG

209 CHAPTER 6 Setup for various debuggers (internal flash)
6.4 Setup for various debuggers (internal flash)
The J-Link flash download feature can be used by different debuggers, such as IAR Embed-
ded Workbench, Keil MDK, GDB based IDEs, … . For different debuggers there are different
steps required to enable J-Link flash download.
Most debuggers will use the J-Link flashloader by default if the target device is specified.
A few debuggers come with their own flashloaders and need to be configured to use the J-
Link flashloader in order to achieve the maximum possible performance.
For further information on how to specify the target device and on how to use the J-Link
flashloader in different debuggers, please refer to:
SEGGER Wiki: Getting Started with Various IDEs
Note
While using flashloaders of a 3rd party applications works in most cases, SEGGER can
neither offer support for those nor guarantee that other features won’t be impaired
as a side effect of not using the J-Link flashloader
J-Link / J-Trace (UM08001) © 2004-2017 SEGGER Microcontroller GmbH & Co. KG
210 CHAPTER 6 Setup for various debuggers (CFI flash)
6.5 Setup for various debuggers (CFI flash)
The setup for download into CFI-compliant memory is different from the one for internal
flash. Initialization of the external memory interface the CFI flash is connected to, is user’s
responsibility and is expected by the J-Link software to be done prior to performing accesses
to the specified CFI area.
Specifying of the CFI area is done in a J-Link script file, as explained below.
For further information on J-Link script files, please refer to J-Link Script Files and for further
information on how to use J-Link script files with different debuggers, please refer to:
SEGGER Wiki: Getting Started with Various IDEs .
J-Link / J-Trace (UM08001) © 2004-2017 SEGGER Microcontroller GmbH & Co. KG
211 CHAPTER 6 Setup for various debuggers (SPIFI flash)
6.6 Setup for various debuggers (SPIFI flash)
The J-Link DLL supports programming of SPIFI flash and the J-Link flash download feature
can be used therefore by different debuggers, such as IAR Embedded Work bench, Keil
MDK, GDB based IDEs, …
There is nothing special to be done by the user to also enable download into SPIFI flash.
The setup and behavior is the same as if download into internal flash. For more information
about how to setup different debuggers for downloading into SPIFI flash memory, please
refer to Setup for various debuggers (internal flash) on page 209.
J-Link / J-Trace (UM08001) © 2004-2017 SEGGER Microcontroller GmbH & Co. KG
212 CHAPTER 6 QSPI flash support
6.7 QSPI flash support
The J-Link DLL also supports programming of any (Q)SPI flash connected to a device that is
supported by the J-Link DLL, if the device allows memory-mapped access to the flash. Most
modern MCUs / CPUs provide a so called “QSPI area” in their memory-map which allows
the CPU to read-access a (Q)SPI flash as regular memory (RAM, internal flash etc.).
6.7.1 Setup the DLL for QSPI flash download
There is nothing special to be done by the user to also enable download into a QSPI flash
connected to a specific device. The setup and behavior is the same as if download into
internal flash, which mainly means the device has to be selected and nothing else, would be
performed. For more information about how to setup the J-Link DLL for download into inter-
nal flash memory, please refer to Setup for various debuggers (internal flash) on page 209.
The sectorization, command set and other flash parameters are fully auto-detected by the
J-Link DLL, so no special user setup is required.
J-Link / J-Trace (UM08001) © 2004-2017 SEGGER Microcontroller GmbH & Co. KG
213 CHAPTER 6 Using the DLL flash loaders in custom
applications
6.8 Using the DLL flash loaders in custom
applications
The J-Link DLL flash loaders make flash behave as RAM from a user perspective, since flash
programming is triggered by simply calling the J-Link API functions for memory reading /
writing. For more information about how to setup the J-Link API for flash programming
please refer to the J-Link SDK documentation (UM08002) (available for J-Link SDK cus-
tomers only).
J-Link / J-Trace (UM08001) © 2004-2017 SEGGER Microcontroller GmbH & Co. KG
214 CHAPTER 6 Debugging applications that change flash
contents at runtime
6.9 Debugging applications that change flash
contents at runtime
The J-Link DLL cashes flash contents in order to improve overall performance and therefore
provide the best debugging experience possible. In case the debugged application does
change the flash contents, it is necessary to disable caching of the effected flash range.
This can be done using the J-Link command string ExcludeFlashCacheRange .
The SEGGER Wiki provides an article about this topic that provides further information,
which can be found here:
SEGGER Wiki: Debugging self-modifying code in flash
J-Link / J-Trace (UM08001) © 2004-2017 SEGGER Microcontroller GmbH & Co. KG

Chapter 7
Flash breakpoints
This chapter describes how the flash breakpoints feature of the DLL can be used in different
debugger environments.
J-Link / J-Trace (UM08001) © 2004-2017 SEGGER Microcontroller GmbH & Co. KG
216 CHAPTER 7 Introduction
7.1 Introduction
The J-Link DLL supports a feature called flash breakpoints which allows the user to set
an unlimited number of breakpoints in flash memory rather than only being able to use
the hardware breakpoints of the device. Usually when using hardware breakpoints only, a
maximum of 2 (ARM 7/9/11) to 8 (Cortex-A/R) breakpoints can be set. The flash memory
can be the internal flash memory of a supported microcontroller or external CFI-compliant
flash memory. In the following sections the setup for different debuggers for use of the
flash breakpoints feature is explained.
How do breakpoints work?
There are basically 2 types of breakpoints in a computer system: Hardware breakpoints and
software breakpoints. Hardware breakpoints require a dedicated hardware unit for every
breakpoint. In other words, the hardware dictates how many hardware breakpoints can be
set simultaneously. ARM 7/9 cores have 2 breakpoint units (called “watchpoint units” in
ARM’s documentation), allowing 2 hardware breakpoints to be set. Hardware breakpoints do
not require modification of the program code. Software breakpoints are different: The de-
bugger modifies the program and replaces the breakpointed instruction with a special val-
ue. Additional software breakpoints do not require additional hardware units in the proces-
sor, since simply more instructions are replaced. This is a standard procedure that most
debuggers are capable of, however, this usually requires the program to be located in RAM.
What is special about software breakpoints in flash?
Flash breakpoints allows setting an unlimited number of breakpoints even if the user ap-
plication is not located in RAM. On modern microcontrollers this is the standard scenario
because on most microcontrollers the internal RAM is not big enough to hold the complete
application. When replacing instructions in flash memory this requires re-programming of
the flash which takes much more time than simply replacing a instruction when debugging
in RAM. The J-Link flash breakpoints feature is highly optimized for fast flash programming
speed and in combination with the instruction set simulation only re-programs flash that
is absolutely necessary. This makes debugging in flash using flash breakpoints almost as
flawless as debugging in RAM.
What performance can I expect?
Flash algorithm, specially designed for this purpose, sets and clears flash breakpoints ex-
tremely fast; on microcontrollers with fast flash the difference between software break-
points in RAM and flash is hardly noticeable.
How is this performance achieved?
We have put a lot of effort in making flash breakpoints really usable and convenient. Flash
sectors are programmed only when necessary; this is usually the moment execution of
the target program is started. A lot of times, more than one breakpoint is located in the
same flash sector, which allows programming multiple breakpoints by programming just
a single sector. The contents of program memory are cached, avoiding time consuming
reading of the flash sectors. A smart combination of software and hardware breakpoints
allows us to use hardware breakpoints a lot of times, especially when the debugger is source
level-stepping, avoiding re-programming the flash in these situations. A built-in instruction
set simulator further reduces the number of flash operations which need to be performed.
This minimizes delays for the user, while maximizing the life time of the flash. All resources
of the ARM microcontroller are available to the application program, no memory is lost for
debugging.
J-Link / J-Trace (UM08001) © 2004-2017 SEGGER Microcontroller GmbH & Co. KG
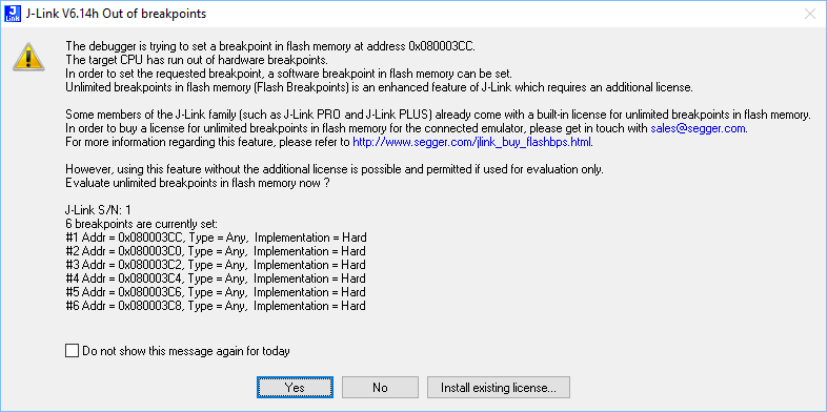
217 CHAPTER 7 Licensing
7.2 Licensing
In order to use the flash breakpoints feature a separate license is necessary for each J-
Link. For some devices J-Link comes with a device-based license and some J-Link models
also come with a full license for flash breakpoints but the normal J-Link comes without any
licenses. For more information about licensing itself and which devices have a device-based
license, please refer to J-Link Model overview .
7.2.1 Free for evaluation and non-commercial use
In general, the unlimited flash breakpoints feature of the J-Link DLL can be used free of
charge for evaluation and non-commercial use. If used in a commercial project, a license
needs to be purchased when the evaluation is complete. There is no time limit on the eval-
uation period. This feature allows setting an unlimited number of breakpoints even if the
application program is located in flash memory, thereby utilizing the debugging environ-
ment to its fullest.
J-Link / J-Trace (UM08001) © 2004-2017 SEGGER Microcontroller GmbH & Co. KG
218 CHAPTER 7 Supported devices
7.3 Supported devices
J-Link supports flash breakpoints for a large number of microcontrollers. You can always
find the latest list of supported devices on our website:
List of supported target devices
In general, J-Link can be used with any ARM7/ARM9/ARM11, Cortex-M0/M1/M3/M4/M7/
M23/M33, Cortex-A5/A7/A8/A9/A12/A15/A17 and Cortex-R4/R5 core even if it does not
provide internal flash.
Furthermore, flash breakpoints are also available for all CFI compliant external NOR-flash
devices.
J-Link / J-Trace (UM08001) © 2004-2017 SEGGER Microcontroller GmbH & Co. KG
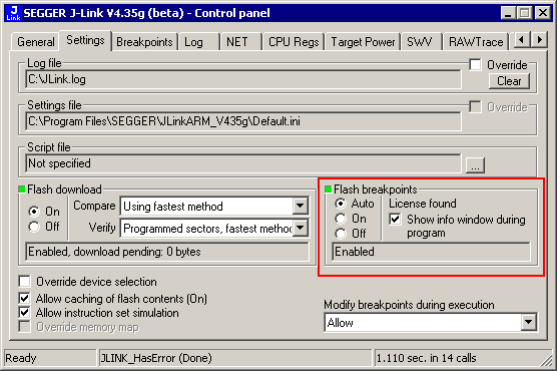
219 CHAPTER 7 Setup & compatibility with various debuggers
7.4 Setup & compatibility with various debuggers
7.4.1 Setup
In compatible debuggers, flash breakpoints work if the J-Link flash loader works and a
license for flash breakpoints is present. No additional setup is required. The flash breakpoint
feature is available for internal flashes and for external flash (parallel NOR CFI flash as
well as QSPI flash). For more information about how to setup various debuggers for flash
download, please refer to Setup for various debuggers (internal flash) . Whether flash
breakpoints are available can be verified using the J-Link control panel:
7.4.2 Compatibility with various debuggers
Flash breakpoints can be used in all debugger which use the proper J-Link API to set break-
points. Compatible debuggers/ debug interfaces are:
• IAR Embedded Workbench
• Keil MDK
• GDB-based debuggers
• Freescale Codewarrior
• Mentor Graphics Sourcery CodeBench
• RDI-compliant debuggers
Incompatible debuggers / debug interfaces:
• Rowley Crossworks
J-Link / J-Trace (UM08001) © 2004-2017 SEGGER Microcontroller GmbH & Co. KG
220 CHAPTER 7 Flash Breakpoints in QSPI flash
7.5 Flash Breakpoints in QSPI flash
Many modern CPUs allow direct execution from QSPI flash in a so-called “QSPI area” in their
memory-map. This feature is called execute-in-place (XIP). On some cores like Cortex-M
where hardware breakpoints are only available in a certain address range, sometimes J-
Link flash breakpoints are the only possibility to set breakpoints when debugging code
running in QSPI flash.
7.5.1 Setup
The setup for the debugger is the same as for downloading into QSPI flash. For more
information please refer to QSPI flash support .
J-Link / J-Trace (UM08001) © 2004-2017 SEGGER Microcontroller GmbH & Co. KG
221 CHAPTER 7 FAQ
7.6 FAQ
Why can flash breakpoints not be used with Rowley Crossworks? Because Rowley Cross-
works does not use the proper J-Link API to set breakpoints. Instead of using the break-
point-API, Crossworks programs the debug hardware directly, leaving J-Link no choice to
use its flash breakpoints.
J-Link / J-Trace (UM08001) © 2004-2017 SEGGER Microcontroller GmbH & Co. KG

Chapter 8
Monitor Mode Debugging
This chapter describes how to use monitor mode debugging support with J-Link.
J-Link / J-Trace (UM08001) © 2004-2017 SEGGER Microcontroller GmbH & Co. KG
223 CHAPTER 8 Introduction
8.1 Introduction
In general, there are two standard debug modes available for CPUs:
1. Halt mode
2. Monitor mode
Halt mode is the default debug mode used by J-Link. In this mode the CPU is halted and
stops program execution when a breakpoint is hit or the debugger issues a halt request.
This means that no parts of the application continue running while the CPU is halted (in
debug mode) and peripheral interrupts can only become pending but not taken as this
would require execution of the debug interrupt handlers. In circumstances halt mode may
cause problems during debugging specific systems:
1. Certain parts of the application need to keep running in order to make sure that
communication with external components does not break down. This is the case for
Bluetooth applications where the Bluetooth link needs to be kept up while the CPU is in
debug mode, otherwise the communication would fail and a resume or single stepping
of the user application would not be possible
2. Some peripherals are also stopped when the CPU enters debug mode. For example;
Pulse-width modulation (PWM) units for motor control applications may be halted while
in an undefined / or even dangerous state, resulting in unwanted side-effects on the
external hardware connected to these units.
This is where monitor mode debugging becomes effective. In monitor debug mode the CPU
is not halted but takes a specific debug exception and jumps into a defined exception handler
that executes (usually in a loop) a debug monitor software that performs communication
with J-Link (in order to read/write CPU registers and so on). The main effect is the same
as for halting mode: the user application is interrupted at a specific point but in contrast
to halting mode, the fact that the CPU executes a handler also allows it to perform some
specific operations on debug entry / exit or even periodically during debug mode with almost
no delay. This enables the handling of such complex debug cases as those explained above.
J-Link / J-Trace (UM08001) © 2004-2017 SEGGER Microcontroller GmbH & Co. KG
224 CHAPTER 8 Enable Monitor Debugging
8.2 Enable Monitor Debugging
As explained before, by default J-Link uses halt mode debugging. In order to enable mon-
itor mode debugging, the J-Link software needs to be explicitly told to use monitor mode
debugging. This is done slightly differently from IDE to IDE. In general, the IDE does not
notice any difference between halting and monitor debug mode. If J-Link is unable to locate
a valid monitor in the target memory, it will default back to halt mode debugging in order
to still allow debugging in general.
For instructions on how to enable Monitor Mode Debugging in any debug environment,
please refer to:
Using a feature in a specific development environment
J-Link / J-Trace (UM08001) © 2004-2017 SEGGER Microcontroller GmbH & Co. KG
225 CHAPTER 8 Availability and limitations of monitor mode
8.3 Availability and limitations of monitor mode
Many CPUs only support one of these debug modes, halt mode or monitor mode. In the
following it is explained for which CPU cores monitor mode is available and any limitations,
if any.
8.3.1 Cortex-M3
See Cortex-M4 on page 225.
8.3.2 Cortex-M4
For Cortex-M4, monitor mode debugging is supported. The monitor code provided by SEG-
GER can easily be linked into the user application.
Considerations & Limitations
The user-specific monitor functions must not block the generic monitor for more than
100ms. Manipulation of the stack pointer register (SP) from within the IDE is not possible
as the stack pointer is necessary for resuming the user application on Go(). The unlimited
number of flash breakpoints feature cannot be used in monitor mode. This restriction may
be removed in a future version. It is not possible to debug the monitor itself, when using
monitor mode.
J-Link / J-Trace (UM08001) © 2004-2017 SEGGER Microcontroller GmbH & Co. KG
226 CHAPTER 8 Monitor code
8.4 Monitor code
A CPU core-specific monitor code is necessary to perform monitor mode debugging with J-
Link. This monitor performs the communication with J-Link while the CPU is in debug mode
(meaning in the monitor exception). The monitor code needs to be compiled and linked as
a normal part of the application. Monitors for different cores are available from SEGGER
upon request at support_jlink@segger.com .
In general, the monitor code consists of three files:
•JLINK_MONITOR.c: Contains user-specific functions that are called on debug mode entry,
exit and periodically while the CPU is in debug mode. Functions can be filled with user-
specific code. None of the functions must block the generic monitor for more than
100ms.
•JLINK_MONITOR.h: Header file to populate JLINK_MONITOR_ functions.
•JLINK_MONITOR_ISR.s: Generic monitor assembler file. (Should not be modified by the
user)Do NOT touch.
J-Link / J-Trace (UM08001) © 2004-2017 SEGGER Microcontroller GmbH & Co. KG
227 CHAPTER 8 Debugging interrupts
8.5 Debugging interrupts
In general it is possible to debug interrupts when using monitor mode debugging but there
are some things that need to be taken care of when debugging interrupts in monitor mode:
• Only interrupts with a lower priority than the debug/monitor interrupt can be debugged /
stepped.
• Setting breakpoints in interrupt service routines (ISRs) with higher priority than the
debug/monitor interrupt will result in malfunction because the CPU cannot take the
debug interrupt when hitting the breakpoint.
J-Link / J-Trace (UM08001) © 2004-2017 SEGGER Microcontroller GmbH & Co. KG
228 CHAPTER 8 Having servicing interrupts in debug mode
8.6 Having servicing interrupts in debug mode
Under some circumstances it may be useful or even necessary to have some servicing
interrupts still firing while the CPU is “halted” for the debugger (meaning it has taken the
debug interrupt and is executing the monitor code). This can be for keeping motor controls
active or a Bluetooth link etc. In general it is possible to have such interrupts by just
assigning a higher priority to them than the debug interrupt has. Please keep in mind that
there are some limitations for such interrupts:
• They cannot be debugged
• No breakpoints must be set in any code used by these interrupts
J-Link / J-Trace (UM08001) © 2004-2017 SEGGER Microcontroller GmbH & Co. KG
229 CHAPTER 8 Forwarding of Monitor Interrupts
8.7 Forwarding of Monitor Interrupts
In some applications, there might be an additional software layer that takes all interrupts in
the first place and forwards them to the user application by explicitly calling the ISRs from
the user application vector table. For such cases, it is impossible for J-Link to automatically
check for the existence of a monitor mode handler as the handler is usually linked in the
user application and not in the additional software layer, so the DLL will automatically switch
back to halt mode debugging. In order to enable monitor mode debugging for such cases,
the base address of the vector table of the user application that includes the actual monitor
handler needs to be manually specified. For more information about how to do this for
various IDEs, please refer to Enable Monitor Debugging .
J-Link / J-Trace (UM08001) © 2004-2017 SEGGER Microcontroller GmbH & Co. KG
230 CHAPTER 8 Target application performs reset (Cortex-M)
8.8 Target application performs reset (Cortex-M)
For Cortex-M based target CPUs if the target application contains some code that issues a
reset (e.g. a watchdog reset), some special care needs to be taken regarding breakpoints.
In general, a target reset will leave the debug logic of the CPU untouched meaning that
breakpoints etc. are left intact, however monitor mode gets disabled (bits in DEMCR get
cleared). J-Link automatically restores the monitor bits within a few microseconds, after
they have been detected as being cleared without explicitly being cleared by J-Link.
However, there is a small window in which it can happen that a breakpoint is hit before
J-Link has restored the monitor bits. If this happens, instead of entering debug mode, a
HardFault is triggered. To avoid hanging of the application, a special version of the Hard-
Fault_Handler is needed which detects if the reason for the HardFault was a breakpoint
and if so, just ignores it and resumes execution of the target application. A sample for
such a HardFault handler can be downloaded from the SEGGER website: https://www.seg-
ger.com/downloads/appnotes “Generic SEGGER HardFault handler”.
J-Link / J-Trace (UM08001) © 2004-2017 SEGGER Microcontroller GmbH & Co. KG

Chapter 9
Low Power Debugging
This chapter describes how to debug low power modes on a supported target CPU.
J-Link / J-Trace (UM08001) © 2004-2017 SEGGER Microcontroller GmbH & Co. KG
232 CHAPTER 9 Introduction
9.1 Introduction
As power consumption is an important factor for embedded systems, CPUs provide different
kinds of low power modes to reduce power consumption of the target system. The useful
this is for the application, the problematic it is during debug. In general, how far debugging
target applications that make use of low power modes is possible, heavily depends on the
device being used as several behavior is implementation defined and differs from device to
device. The following cases are the most common ones:
1. The device provides specific special function registers for debugging to keep some clocks
running necessary for debugging, while the device is in a low power mode.
2. The device wakes up automatically, as soon as there is a request by the debug probe
on the debug interface
3. The device powers off the debug interface partially, allowing the debug probe to read-
access certain parts but does not allow to control the CPU.
4. The device powers off the debug interface completely and the debug probe loses the
connection to the device (temporarily)
While cases 1-3 are the most convenient ones from the debug perspective because the
low power mode is transparent to the end user, they do not provide a real-world scenario
because certain things cannot be really tested if certain clocks are still active which would
not be in the release configuration with no debug probe attached. In addition to that,
the power consumption is significantly higher than in the release config which may cause
problems on some hardware designs which are specifically designed for very low power
consumption.
The last case (debug probes temporarily loses connection) usually causes the end of a
debug session because the debugger would get errors on accesses like “check if CPU is
halted/hit a BP”. To avoid this, there is a special setting for J-Link that can be activated, to
handle such cases in a better way, which is explained in the following.
J-Link / J-Trace (UM08001) © 2004-2017 SEGGER Microcontroller GmbH & Co. KG
233 CHAPTER 9 Activating low power mode handling for J-Link
9.2 Activating low power mode handling for J-Link
While usually the J-Link DLL handles communication losses as errors, there is a possibili-
ty to enable low power mode handling in the J-Link DLL, which puts the DLL into a less
restrictive mode (low-power handling mode) when it comes to such loss-cases. The low-
power handling mode is disabled by default to allow the DLL to react on target communi-
cation breakdowns but this behavior is not desired when debugging cases where the target
is unresponsive temporarily. How the low-power mode handling mode is enabled, depends
on the debug environment.
Please refer to SEGGER Wiki: Getting Started with Various IDEs for instructions on how
to enable low power mode handling in different IDEs.
J-Link / J-Trace (UM08001) © 2004-2017 SEGGER Microcontroller GmbH & Co. KG
234 CHAPTER 9 Restrictions
9.3 Restrictions
As the connection to the target is temporary lost while it is in low power mode, some
restrictions during debug apply:
• Make sure that the IDE does not perform periodic accesses to memory while the target
is in a low power mode. E.g.: Disable periodic refresh of memory windows, close live
watch windows etc.
• Avoid issuing manual halt requests to the target while it is in a low power mode.
• Do not try to set breakpoints while the target already is in a low power mode. If a
breakpoint in a wake-up routine shall be hit as soon as the target wakes up from low
power mode, set this breakpoint before the target enters low power mode.
• Single stepping instructions that enter a low power mode (e.g. WFI/WFE on Cortex-M)
is not possible/supported.
• Debugging low power modes that require a reset to wake-up can only be debugged on
targets where the debug interface is not reset by such a reset. Otherwise breakpoints
and other settings are lost which may result in unpredictable behavior.
J-Link does it’s best to handle cases where one or more of the above restrictions is not
considered but depending on how the IDE reacts to specific operations to fail, error mes-
sages may appear or the debug session will be terminated by the IDE.
J-Link / J-Trace (UM08001) © 2004-2017 SEGGER Microcontroller GmbH & Co. KG

Chapter 10
Open Flashloader
This chapter describes how to add support for new devices to the J-Link DLL and software
that uses the J-Link DLL using the Open Flashloader concept.
J-Link / J-Trace (UM08001) © 2004-2017 SEGGER Microcontroller GmbH & Co. KG
236 CHAPTER 10 Introduction
10.1 Introduction
As the number of devices being available is steadily growing and sometimes in an early
stage of the MCU development only a few samples/boards are available that may not be
provided to third parties (e.g. SEGGER) to add support for a new device. Also the existence
of the device may have confidential status, so it might not be mentioned as being supported
in public releases yet. Therefore it might be desirable to be able to add support for new
devices on your own, without depending on SEGGER and a new release of the J-Link soft-
ware package being available.
The J-Link DLL allows customers to add support for new devices on their own. It is also
possible to edit/extend existing devices of the device database by for example adding new
flash banks (e.g. to add support for internal EEPROM programming or SPIFI programming
etc.). This chapter explains how new devices can be added to the DLL and how existing
ones can be edited/extended.
J-Link / J-Trace (UM08001) © 2004-2017 SEGGER Microcontroller GmbH & Co. KG
237 CHAPTER 10 General procedure
10.2 General procedure
By default, the J-Link DLL comes with a build-in device database that defines which device
names are known and therefore officially supported by the J-Link DLL and software that
uses the J-Link DLL. This list can also be viewed on our website:
List of supported target devices
It is possible to add new devices to the currently used DLL by specifying them in an XML
file, named JLinkDevices.xml . It is also possible to edit/extend an device from the built-
in device database via this XML file. The DLL is looking for this file in the same directory
where the J-Link settings file is located. The location of the settings file depends on the
IDE / software being used. For more information about where the settings file is located for
various IDEs and software that use the J-Link DLL, please refer to SEGGER Wiki: Getting
Started with Various IDEs .
J-Link / J-Trace (UM08001) © 2004-2017 SEGGER Microcontroller GmbH & Co. KG

238 CHAPTER 10 Adding a new device
10.3 Adding a new device
In order to add support for a new device to the J-Link DLL, the following needs to be added
to the JLinkDevices.xml :
<Database>
<Device>
<ChipInfo Vendor="..."
Name="..."
WorkRAMAddr="..."
WorkRAMSize="..."
Core="..." />
<FlashBankInfo Name="..."
BaseAddr="..."
MaxSize="..."
Loader="..."
LoaderType="..." />
</Device>
</Database>
When adding a new device, the following attributes for the <ChipInfo> tag are mandatory:
• Vendor
• Name
• Core
In case a <FlashBankInfo> tag is also added, the following attributes in addition to the
ones mentioned before, become mandatory:
ChipInfo-Tag
• WorkRAMAddr
• WorkRAMSize
• FlashBankInfo
FlashBankInfo-Tag
• Name
• BaseAddr
• MaxSize
• Loader
• LoaderType
For more information about the tags and their attributes, please refer to XML Tags and
Attributes .
In order to add more than one device to the device database, just repeat the <Device> …
</Device> tag structure from above for each device.
J-Link / J-Trace (UM08001) © 2004-2017 SEGGER Microcontroller GmbH & Co. KG

239 CHAPTER 10 Editing/Extending an Existing Device
10.4 Editing/Extending an Existing Device
In order to edit/extend a device that is already in the built-in device database of the J-Link
DLL, the following needs to be added to the JLinkDevices.xml :
<Database>
<Device>
<ChipInfo Vendor="..."
Name="..." />
<FlashBankInfo Name="..."
BaseAddr="..."
MaxSize="..."
Loader="..."
LoaderType="..." />
</Device>
</Database>
The attribute Name of the tag <ChipInfo> must specify exactly the same name as the
device in the built-in device database specifies. In case the value of the attribute BaseAddr
specifies an address of an existing flash bank for the existing device, in the built-in device
database, the flash bank from the built-in database is replaced by the one from the XML file.
When adding new flash banks or if the device in the built-in database does not specify any
flash banks so far, the same attribute requirements as for adding a new device, apply. For
more information, please refer to Adding a new device .
In order to add more than one flash bank, just repeat the <FlashBankInfo … />> tag
structure from above, inside the same <Device> tag.
For more information about the tags and their attributes, please refer to XML Tags and
Attributes .
J-Link / J-Trace (UM08001) © 2004-2017 SEGGER Microcontroller GmbH & Co. KG

240 CHAPTER 10 XML Tags and Attributes
10.5 XML Tags and Attributes
In the following, the valid XML tags and their possible attributes are explained.
General rules
• Attributes may only occur inside an opening tag
• Attribute values must be enclosed by quotation marks
Tag Description
<Database> Opens the XML file top-level tag.
<Device> Opens the description for a new device.
<ChipInfo> Specifies basic information about the device to be added, like the
core it incorporates etc.
<FlashBankInfo> Specifies a flash bank for the device.
10.5.1 <Database>
Opens the XML file top-level tag. Only present once per XML file.
Valid attributes
This tag has no attributes
Notes
• Must only occur once per XML file
• Must be closed via </Database>
10.5.2 <Device>
Opens the description for a new device.
Valid attributes
This tag has no attributes
Notes
• Must be closed via </Device> .
• May occur multiple times in an XML file
10.5.3 <ChipInfo>
Specifies basic information about the device to be added, like the core it incorporates etc.
Valid attributes
Parameter Meaning
Vendor String that specifies the name of the vendor of the device.
This attribute is mandatory.
E.g. Vendor=“ST”.
Name Name of the device. This attribute is mandatory.
E.g. Name=“STM32F407IE”
WorkRAMAddr
Hexadecimal value that specifies the address of a RAM area
that can be used by J-Link during flash programming etc.
Should not be used by any DMAs on the device. Cannot exist
without also specifying WorkRAMSize. If no flash banks are
added for the new device, this attribute is optional.
E.g. WorkRAMAddr=“0x20000000”
J-Link / J-Trace (UM08001) © 2004-2017 SEGGER Microcontroller GmbH & Co. KG

241 CHAPTER 10 XML Tags and Attributes
Parameter Meaning
WorkRAMSize
Hexadecimal value that specifies the size of the RAM area
that can be used by J-Link during flash programming etc.
Cannot exist without also specifying WorkRAMAddr. If no
flash banks are added for the new device, this attribute is
optional.
E.g. WorkRAMSize=“0x10000”
Core
Specifies the core that the device incorporates. If a new de-
vice added, this attribute is mandatory.
E.g. Core=“JLINK_CORE_CORTEX_M0”
For a list of valid attribute values, please refer to Attribute
values - Core .
JLinkScriptFile
String that specifies the path to a J-Link script file if required
for the device. Path can be relative or absolute. If path is
relative, is relative to the location of the JLinkDevices.xml
file. This attribute is mandatory.
E.g. JLinkScriptFile=“ST/Example.jlinkscript”
Notes
• No separate closing tag.
Directly closed after attributes have been specified: <ChipInfo … />
• Must not occur outside a <Device> tag.
10.5.3.1 Attribute values - Core
The following values are valid for the Core attribute:
•JLINK_CORE_CORTEX_M1
•JLINK_CORE_CORTEX_M3
•JLINK_CORE_CORTEX_M3_R1P0
•JLINK_CORE_CORTEX_M3_R1P1
•JLINK_CORE_CORTEX_M3_R2P0
•JLINK_CORE_CORTEX_M3_R2P1
•JLINK_CORE_CORTEX_M0
•JLINK_CORE_CORTEX_M_V8BASEL
•JLINK_CORE_ARM7
•JLINK_CORE_ARM7TDMI
•JLINK_CORE_ARM7TDMI_R3
•JLINK_CORE_ARM7TDMI_R4
•JLINK_CORE_ARM7TDMI_S
•JLINK_CORE_ARM7TDMI_S_R3
•JLINK_CORE_ARM7TDMI_S_R4
•JLINK_CORE_CORTEX_A8
•JLINK_CORE_CORTEX_A7
•JLINK_CORE_CORTEX_A9
•JLINK_CORE_CORTEX_A12
•JLINK_CORE_CORTEX_A15
•JLINK_CORE_CORTEX_A17
•JLINK_CORE_ARM9
•JLINK_CORE_ARM9TDMI_S
•JLINK_CORE_ARM920T
•JLINK_CORE_ARM922T
•JLINK_CORE_ARM926EJ_S
•JLINK_CORE_ARM946E_S
•JLINK_CORE_ARM966E_S
•JLINK_CORE_ARM968E_S
•JLINK_CORE_ARM11
•JLINK_CORE_ARM1136
•JLINK_CORE_ARM1136J
•JLINK_CORE_ARM1136J_S
J-Link / J-Trace (UM08001) © 2004-2017 SEGGER Microcontroller GmbH & Co. KG
242 CHAPTER 10 XML Tags and Attributes
•JLINK_CORE_ARM1136JF
•JLINK_CORE_ARM1136JF_S
•JLINK_CORE_ARM1156
•JLINK_CORE_ARM1176
•JLINK_CORE_ARM1176J
•JLINK_CORE_ARM1176J_S
•JLINK_CORE_ARM1176JF
•JLINK_CORE_ARM1176JF_S
•JLINK_CORE_CORTEX_R4
•JLINK_CORE_CORTEX_R5
•JLINK_CORE_RX
•JLINK_CORE_RX62N
•JLINK_CORE_RX62T
•JLINK_CORE_RX63N
•JLINK_CORE_RX630
•JLINK_CORE_RX63T
•JLINK_CORE_RX621
•JLINK_CORE_RX62G
•JLINK_CORE_RX631
•JLINK_CORE_RX65N
•JLINK_CORE_RX21A
•JLINK_CORE_RX220
•JLINK_CORE_RX230
•JLINK_CORE_RX231
•JLINK_CORE_RX23T
•JLINK_CORE_RX24T
•JLINK_CORE_RX110
•JLINK_CORE_RX113
•JLINK_CORE_RX130
•JLINK_CORE_RX71M
•JLINK_CORE_CORTEX_M4
•JLINK_CORE_CORTEX_M7
•JLINK_CORE_CORTEX_M_V8MAINL
•JLINK_CORE_CORTEX_A5
•JLINK_CORE_POWER_PC
•JLINK_CORE_POWER_PC_N1
•JLINK_CORE_POWER_PC_N2
•JLINK_CORE_MIPS
•JLINK_CORE_MIPS_M4K
•JLINK_CORE_MIPS_MICROAPTIV
•JLINK_CORE_EFM8_UNSPEC
•JLINK_CORE_CIP51
10.5.4 <FlashBankInfo>
Specifies a flash bank for the device. This allows to use the J-Link flash download func-
tionality with IDEs, debuggers and other software that uses the J-Link DLL (e.g. J-Link
Commander) for this device. The flash bank can then be programmed via the normal flash
download functionality of the J-Link DLL. For more information about flash download, please
refer to Flash download . For possible limitations etc. regarding newly added flash banks,
please refer to Add. Info / Considerations / Limitations .
Valid attributes
Parameter Meaning
Name
String that specifies the name of the flash bank. Only used
for visualization. Can be freely chosen.
This attribute is mandatory.
E.g. Name=“SPIFI flash”
J-Link / J-Trace (UM08001) © 2004-2017 SEGGER Microcontroller GmbH & Co. KG

243 CHAPTER 10 XML Tags and Attributes
Parameter Meaning
BaseAddr
Hexadecimal value that specifies the start address of the
flash bank. The J-Link DLL uses this attribute together with
MaxSize to determine which memory write accesses per-
formed by the debugger, shall be redirected to the flash
loader instead of being written directly to the target as nor-
mal memory access.
This attribute is mandatory.
E.g. BaseAddr=“0x08000000”
MaxSize
Hexadecimal value that specifies the max. size of the flash
bank in bytes. For many flash loader types the real bank size
may depend on the actual flash being connected (e.g. SPIFI
flash where the loader can handle different SPIFI flashes so
size may differ from hardware to hardware). Also, for some
flash loaders the sectorization is extracted from the flash
loader at runtime. The real size of the flash bank may be
smaller than MaxSize but must never be bigger. The J-Link
DLL uses this attribute together with BaseAddr to determine
which memory write accesses performed by the debugger,
shall be redirected to the flash loader instead of being writ-
ten directly to the target as normal memory access.
This attribute is mandatory.
E.g. MaxSize=“0x80000”
Loader
String that specifies path to the ELF file that holds the flash
loader. Path can be relative or absolute. If path is relative, it
is relative to the location of the JLinkDevices.xml file.
This attribute is mandatory.
E.g. Loader=“ST/MyFlashLoader.elf”
For CMSIS flash loaders the file extension is usually FLM,
however any extension is accepted by the J-Link DLL.
LoaderType
Specifies the type of the loader specified by Loader.
This attribute is mandatory. E.g. LoaderType=“FLASH_AL-
GO_TYPE_OPEN” For a list of valid attribute values, please re-
fer to Attribute values LoaderType .
Notes
• No separate closing tag. Directly closed after attributes have been specified:
<FlashBankInfo … />
• Must not occur outside a <Device> tag
10.5.4.1 Attribute values - LoaderType
The following values are valid for the LoaderType attribute:
•FLASH_ALGO_TYPE_OPEN
Describes that the used algorithm is an Open Flashloader algorithm. CMSIS based
algorithms are also supported via the Open Flashloader concept. For additional
information, see Add. Info / Considerations / Limitations .
J-Link / J-Trace (UM08001) © 2004-2017 SEGGER Microcontroller GmbH & Co. KG

244 CHAPTER 10 Example XML file
10.6 Example XML file
<Database>
<Device>
<ChipInfo Vendor="Vendor0"
Name="Device0"
WorkRAMAddr="0x20000000"
WorkRAMSize="0x4000"
Core="JLINK_CORE_CORTEX_M0" />
<FlashBankInfo Name="Int. Flash"
BaseAddr="0x0"
MaxSize="0x10000"
Loader="Vendor0/Loader0.FLM"
LoaderType="FLASH_ALGO_TYPE_OPEN" />
<FlashBankInfo Name="SPIFI Flash"
BaseAddr="0x30000000"
MaxSize="0x100000"
Loader="Vendor0/Loader1.FLM"
LoaderType="FLASH_ALGO_TYPE_OPEN" />
</Device>
<Device>
<ChipInfo Vendor="Vendor1"
Name="Device1"
WorkRAMAddr="0x20000000"
WorkRAMSize="0x4000"
JLinkScriptFile="Vendor1/Device1.jlinkscript"
Core="JLINK_CORE_CORTEX_M0" />
<FlashBankInfo Name="Int. Flash"
BaseAddr="0x70000000"
MaxSize="0x10000"
Loader="Vendor1/Loader0.FLM"
LoaderType="FLASH_ALGO_TYPE_OPEN" />
</Device>
<Device>
<ChipInfo Vendor="ST"
Name="STM32F746NGH6" />
<FlashBankInfo Name="SPIFI Flash"
BaseAddr="0x30000000"
MaxSize="0x80000"
Loader="ST/STM32F7xx_SPIFI.FLM"
LoaderType="FLASH_ALGO_TYPE_OPEN" />
</Device>
</Database>
J-Link / J-Trace (UM08001) © 2004-2017 SEGGER Microcontroller GmbH & Co. KG

245 CHAPTER 10 Add. Info / Considerations / Limitations
10.7 Add. Info / Considerations / Limitations
Note
SEGGER does not give any guarantee for correct functionality nor provide any support
for customized devices / flash banks. Using J-Link support for customized devices that
have been added via a XML device description file is done at user’s own risk.
In the following, some considerations / limitations when adding support for a new device
or editing/extending an existing device, are given:
10.7.1 CMSIS Flash Algorithms Compatibility
CMSIS flash algorithms are also supported by the Open Flashloader concept. Therefore,
an existing *.FLM file can be simply referenced in a J-Link XML device description file. The
LoaderType attribute needs to be set to FLASH_ALGO_TYPE_OPEN .
10.7.2 Customized Flash Banks
Currently, customized flash banks (added via XML device description file) cannot be used
in Flasher stand-alone mode. This limitation will be lifted in a future version of the J-Link
software.
10.7.3 Supported Cores
Currently, the Open Flashloader supports the following cores:
• Cortex-M
• Cortex-A
• Cortex-R
10.7.4 Information for Silicon Vendors
SEGGER offers the opportunity to hand in custom created flash algorithms which will then
be included in the official J-Link Software and Documentation Package hence distributed to
any J-Link customer who is using the latest software package.
The following files need to be provided to SEGGER:
• JLinkDevices.xml - including the device entry / entries
• Flash loader file - referenced in the JLinkDevices.xml (source code is optional)
• Readme.txt which may includes additional information or at least a contact e-mail
address which can be used by customers in case support is needed.
10.7.5 Template Projects and How To's
SEGGER provides template projects for Cortex-M as well as Cortex-A/R based on the SEG-
GER Embedded Studio IDE plus an detailed step-by-step instruction and further informa-
tion are provided on a separate SEGGER wiki page: SEGGER Wiki: Adding Support for
New Devices
J-Link / J-Trace (UM08001) © 2004-2017 SEGGER Microcontroller GmbH & Co. KG

Chapter 11
J-Flash SPI
This chapter describes J-Flash SPI and J-Flash SPI CL, which are separate software (exe-
cutables) which allow direct programming of SPI flashes, without any additional hardware.
Both, J-Flash SPI and J-Flash SPI CL are part of the J-Link Software and Documentation
Package which is available free of charge. This chapter assumes that you already possess
working knowledge of the J-Link device.
J-Link / J-Trace (UM08001) © 2004-2017 SEGGER Microcontroller GmbH & Co. KG
247 CHAPTER 11 Introduction
11.1 Introduction
The following chapter introduces J-Flash SPI, highlights some of its features, and lists its
requirements on host and target systems.
11.1.1 What is J-Flash SPI?
J-Flash SPI is a stand-alone flash programming software for PCs running Microsoft Windows,
which allows direct programming of SPI flashes, without any additional hardware. J-Flash
SPI has an intuitive user interface and makes programming flash devices convenient. J-
Flash SPI requires a J-Link or Flasher to interface to the hardware. It is able to program
all kinds of SPI flashes, even if the CPU they are connected to, is not supported by J-Link /
Flasher because J-Flash SPI communicates directly with the SPI flash bypassing all other
components of the hardware.
11.1.1.1 Supported OS
The following Microsoft Windows versions are supported by J-Flash SPI:
• Microsoft Windows 2000
• Microsoft Windows XP
• Microsoft Windows XP x64
• Microsoft Windows 2003
• Microsoft Windows 2003 x64
• Microsoft Windows Vista
• Microsoft Windows Vista x64
• Microsoft Windows 7
• Microsoft Windows 7 x64
• Microsoft Windows 8
• Microsoft Windows 8 x64
• Microsoft Windows 10
• Microsoft Windows 10 x64
11.1.2 J-Flash SPI CL (Windows, Linux, Mac)
J-Flash SPI CL is a commandline-only version of the J-Flash SPI programming tool. The
command line version is included in the J-Link Software and Documentation Package for
Windows, Linux and Mac (cross-platform). Except from the missing GUI, J-Flash SPI CL is
identical to the normal version. The commands, used to configure / control J-Flash SPI CL,
are exactly the same as for the command line interface of the J-Flash SPI GUI version. For
further information, please refer to Command Line Interface on page 260.
11.1.2.1 Supported OS
The following operating systems are supported by J-Flash CL:
• Microsoft Windows 2000
• Microsoft Windows XP
• Microsoft Windows XP x64
• Microsoft Windows 2003
• Microsoft Windows 2003 x64
• Microsoft Windows Vista
• Microsoft Windows Vista x64
• Microsoft Windows 7
• Microsoft Windows 7 x64
• Microsoft Windows 8
• Microsoft Windows 8 x64
• Microsoft Windows 10
• Microsoft Windows 10 x64
• Linux
• macOS 10.5 and higher
J-Link / J-Trace (UM08001) © 2004-2017 SEGGER Microcontroller GmbH & Co. KG
248 CHAPTER 11 Introduction
11.1.3 Features
• Directly communicates with the SPI flash via SPI protocol, no MCU in between needed.
• Programming of all kinds of SPI flashes is supported.
• Can also program SPI flashes that are connected to CPUs that are not supported by
J-Link.
• Supports any kind of custom command sequences (e.g. write protection register)
• Verbose logging of all communication.
• .hex, .mot, .srec, and .bin support.
• Intuitive user interface.
11.1.4 Requirements
11.1.4.1 Host
J-Flash SPI requires a PC running one of the supported operating system (see above) with
a free USB port dedicated to a J-Link. A network connection is required only if you want to
use J-Flash SPI together with J-Link Remote Server.
11.1.4.2 Target
The flash device must be an SPI flash that supports standard SPI protocols.
J-Link / J-Trace (UM08001) © 2004-2017 SEGGER Microcontroller GmbH & Co. KG
249 CHAPTER 11 Licensing
11.2 Licensing
The following chapter provides an overview of J-Flash SPI related licensing options.
11.2.1 Introduction
A J-Link PLUS, ULTRA+, PRO or Flasher ARM/PRO is required to use J-Flash SPI. No addi-
tional license is required / available.
J-Link / J-Trace (UM08001) © 2004-2017 SEGGER Microcontroller GmbH & Co. KG

250 CHAPTER 11 Getting Started
11.3 Getting Started
This chapter presents an introduction to J-Flash SPI. It provides an overview of the included
sample projects and describes the menu structure of J-Flash SPI in detail.
11.3.1 Setup
For J-Link setup procedure required in order to work with J-Flash SPI, please refer to chapter
Setup on page 119.
11.3.1.1 What is included?
Tons of defines. The following table shows the contents of all subdirectories of the J-Link
Software and Documentation Pack with regard to J-Flash SPI:
Directory Contents
.
The J-Flash SPI application. Please refer to the J-Link Manual
(UM08001) for more information about the other J-Link re-
lated tools.
.\Doc Contains the J-Flash SPI documentation (part of J-Link Man-
ual (UM08001)) and the other J-Link related manuals.
.\Samples\JFlashSPI
\ProjectFiles Contains sample projects for J-Flash SPI.
11.3.2 Using J-Flash SPI for the first time
Start J-Flash SPI from the Windows Start menu. The main window will appear, which con-
tains a log window at the bottom and the Project window of a default project on the left.
The application log will initially display:
• The version and time of compilation for the application.
• The version and time of compilation for the J-Link DLL.
• The location of the default project.
The Project window contains an overview of the current project settings (initially, a default
project is opened).
J-Link / J-Trace (UM08001) © 2004-2017 SEGGER Microcontroller GmbH & Co. KG
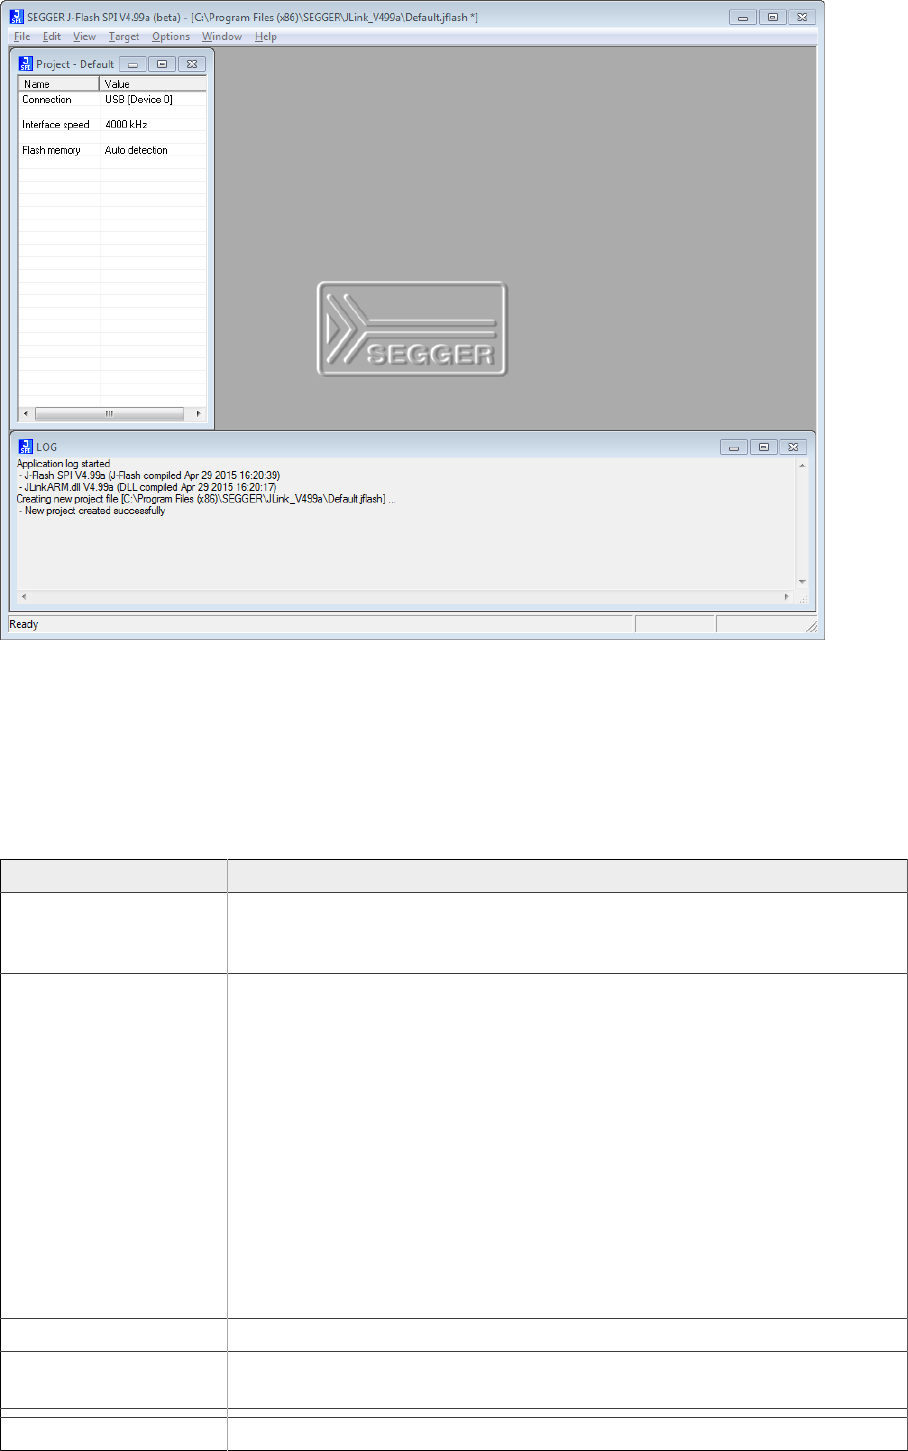
251 CHAPTER 11 Getting Started
11.3.3 Menu structure
The main window of J-Flash SPI contains seven drop-down menus (File, Edit, View, Tar-
get, Options, Window, Help). Any option within these drop-down menus that is followed
by a three period ellipsis (…), is an option that requires more information before proceeding.
File menu elements
Command Description
Open data file… Opens a data file that may be used to flash the target device.
The data file must be an Intel HEX file, a Motorola S file, or a Bi-
nary file (.hex, .mot, .srec, or .bin).
Merge data file
Merges two data files (.hex, .mot, .srec, or .bin). All gaps will be
filled with FF. Find below a short example of merging two data
files named, File0.bin and File1.bin into File3.bin.
File0.bin –> Addr 0x0200 - 0x02FF
File1.bin –> Addr 0x1000 - 0x13FF
Merge File0.bin & File1.bin
0x0200 - 0x02FF Data of File0.bin
0x0300 - 0x0FFF gap (will be filled with 0xFF if image is saved as
*.bin file)
0x1000 - 0x13FF Data of File1.bin
Can be saved in new data file (File3.bin).
Save data file Saves the data file that currently has focus.
Save data file as… Saves the data file that currently has focus using the name and
location given.
New Project Creates a new project using the default settings.
J-Link / J-Trace (UM08001) © 2004-2017 SEGGER Microcontroller GmbH & Co. KG

252 CHAPTER 11 Getting Started
Command Description
Open Project… Opens a project file. Note that only one project file may be open
at a time. Opening a project will close any other project currently
open.
Save Project Saves a project file.
Save Project as… Saves a project file using the name and location given.
Close Project Closes a project file.
Recent Files > Contains a list of the most recently open data files.
Recent Projects > Contains a list of the most recently open project files.
Exit Exits Exits the application.
Edit menu elements
Command… Description
Relocate… Relocates the start of the data file to the supplied hex offset from
the current start location.
Delete range… Deletes a range of values from the data file, starting and ending
at given addresses. The End address must be greater than the
Start address otherwise nothing will be done.
Eliminate blank ar-
eas… Eliminates blank regions within the data file.
View menu elements
Command Description
Log Opens and/or sets the focus to the log window.
Project Opens and/or sets the focus to the project window.
Target menu elements
Command Description
Connect Creates a connection through the J-Link using the configura-
tion options set in the Project settings… of the Options dropdown
menu.
Disconnect Disconnects a current connection that has been made through
the J-Link.
Test > Generate test
data
Generates data which can be used to test if the flash can be pro-
grammed correctly. The size of the generated data file can be de-
fined.
Erase Sectors Erases all selected flash sectors.
Erase Chip Erases the entire chip.
Program Programs the chip using the currently active data file.
Program & Verify Programs the chip using the currently active data file and then
verifies that it was written successfully.
Auto
Performs a sequence of steps, which can be configured in the
Production tab of the Project settings. Additionally, the first step
executed are the init steps and the last step executed are the
exit steps, which both can be configured in the MCU tab of the
project settings. The range of sectors to be erased can be config-
ured through the Global settings dialog.
J-Link / J-Trace (UM08001) © 2004-2017 SEGGER Microcontroller GmbH & Co. KG
253 CHAPTER 11 Getting Started
Command Description
Verify Verifies the data found on the chip with the data file.
Read back > Entire
chip Reads back the data found on the chip and creates a new data
file to store this information.
Read back > Range Reads back the data found in a range specified by the user and
creates a new data file to store this information.
Options menu elements
Command Description
Project settings…
Location of the project settings that are displayed in the snap-
shot view found in the Project window of the J-Flash SPI appli-
cation. Furthermore various settings needed to locate the J-Link
and pass specified commands needed for chip initialization.
Global settings… Settings that influence the general operation of J-Flash SPI.
Window menu elements
Command Description
Cascade Arranges all open windows, one above the other, with the active
window at the top
Tile Horizontal Tiles the windows horizontally with the active window at the top.
Tile Vertical Tiles the windows vertically with the active window at the left.
<List of currently
open windows> A entry of the list can be selected to move the focus to the re-
spective window.
Help menu elements
Command Description
J-Link User Guide Opens the J-Link Manual (UM08001) in the default .PDF applica-
tion of the system.
About… J-Flash SPI and company information.
J-Link / J-Trace (UM08001) © 2004-2017 SEGGER Microcontroller GmbH & Co. KG
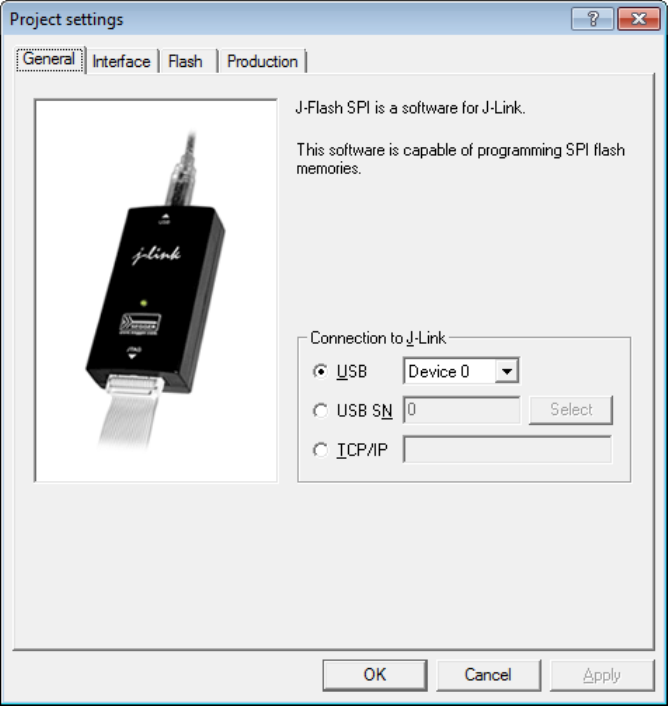
254 CHAPTER 11 Settings
11.4 Settings
The following chapter provides an overview of the program settings. Both general and per
project settings are considered.
11.4.1 Project Settings
Project settings are available from the Options menu in the main window or by using the
ALT-F7 keyboard shortcut.
11.4.1.1 General Settings
This dialog is used to choose the connection to J-Link. The J-Link can either be connected
over USB or via TCP/IP to the host system. Refer to the J-Link Manual (UM08001) for more
information regarding the operation of J-Link and J-Link Remote Server.
USB
If this option is checked, J-Flash SPI will connect to J-Link over the USB port. You may
change the device number if you want to connect more than one J-Link to your PC. The
default device number is 0. For more information about how to use multiple J-Links on one
PC, please see also the chapter “Working with J-Link” of the J-Link Manual (UM08001).
TCP/IP
If this option is selected, J-Flash SPI will connect to J-Link via J-Link Remote Server. You
have to specify the hostname of the remote system running the J-Link Remote Server.
J-Link / J-Trace (UM08001) © 2004-2017 SEGGER Microcontroller GmbH & Co. KG
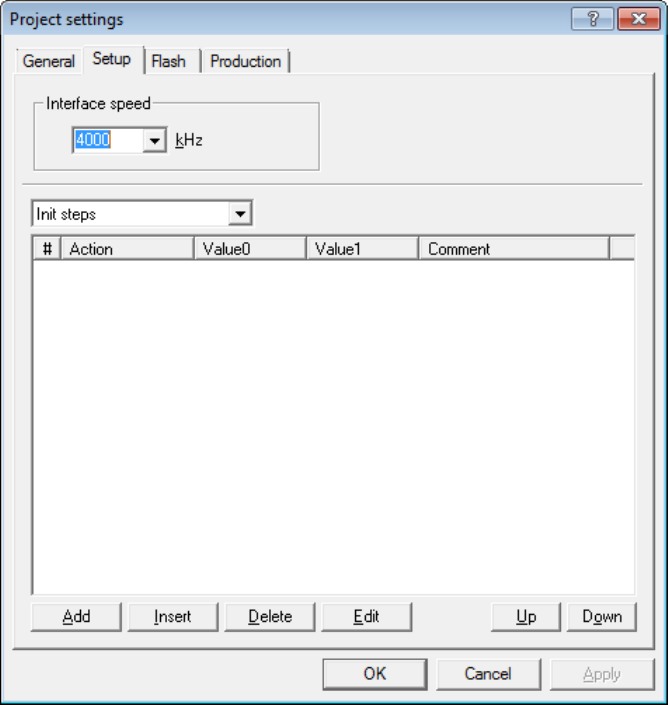
255 CHAPTER 11 Settings
11.4.1.2 Setup
This dialog is used to configure the SPI interface settings like SPI communication speed
and allows to add Init steps and Exit steps which can be used to execute custom command
sequences.
Interface Speed
Specifies the SPI communication speed J-Link uses to communicate with the SPI flash.
Init and Exit steps
Can be used to add custom command sequences like for example write protection register.
For further information regarding this, please refer to Custom Command Sequences on
page 265.
11.4.1.3 Flash Settings
This dialog is used to select and configure the parameters of the SPI flash that J-Flash SPI
will connect to. Examples for flash parameters are: Sector size (Smallest erasable unit),
page size (smallest programmable unit), Flash ID, etc. There is also the option to try to
auto-detect the connected flash device. The latter option will prompt J-Flash SPI to try to
identify the flash by its Flash ID, looking up in an internal list of known flash devices.
J-Link / J-Trace (UM08001) © 2004-2017 SEGGER Microcontroller GmbH & Co. KG

256 CHAPTER 11 Settings
J-Link / J-Trace (UM08001) © 2004-2017 SEGGER Microcontroller GmbH & Co. KG
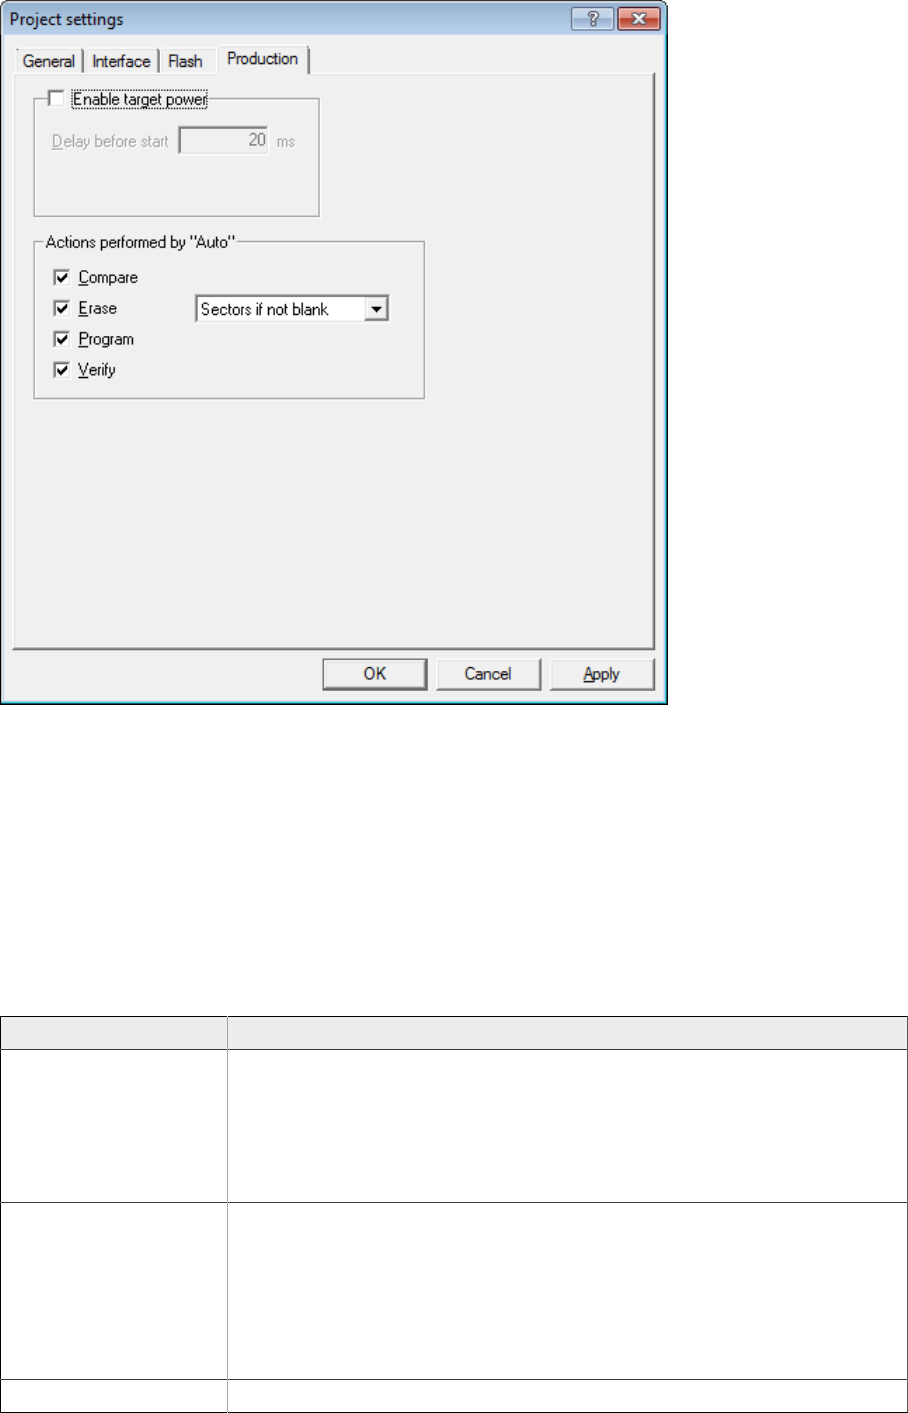
257 CHAPTER 11 Settings
11.4.1.4 Production Settings
Enable target power
Enables 5V target power supply via pin 19 of the emulator. Can be used for targets which
can be powered through the emulator for production. Delay before start defines the delay
(in ms) after enabling the target power supply and before starting to communicate with
the target.
Actions performed by "Auto"
The checked options will be performed when auto programming a target (Target -> Auto,
shortcut: F7). The default behavior is Compare, Erase sectors if not blank, Program and
Verify. Find below a table which describes the commands:
Command Description
Compare
Performs a compare of the current flash content and the da-
ta to be programmed. Sectors which do already match will be
skipped by Erase / Program operation. Note: If Erase is enabled
and Erase type is “Chip”, the compare will be skipped as after
mass erase, the entire device is empty and needs to be re-pro-
grammed.
Erase
Performs an erase depending on the settings, selected in the
drop down box:
• Sectors: Erases all sectors which are effected by the image to
be programmed.
• Sectors if not blank: Erases all sectors which are both, effected
by the image to be programmed and not already blank.
• Chip: Erase the entire chip independent of the content.
Program Programs the data file.
J-Link / J-Trace (UM08001) © 2004-2017 SEGGER Microcontroller GmbH & Co. KG
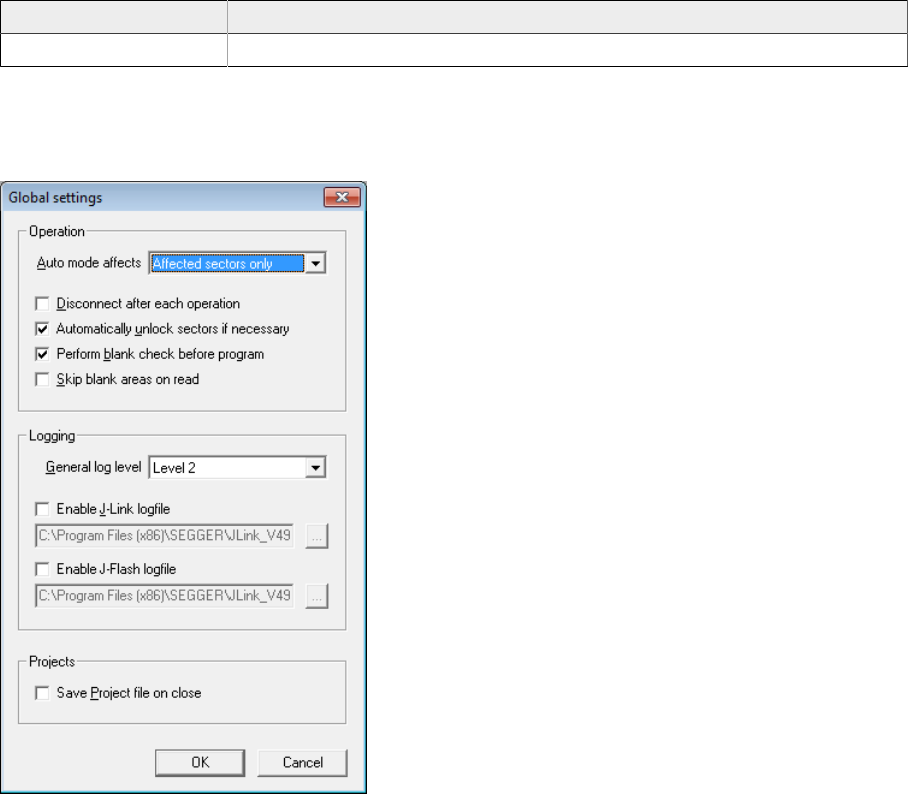
258 CHAPTER 11 Settings
Command Description
Verify Verifies the programmed data by reading them back.
11.4.2 Global Settings
Global settings are available from the Options menu in the main window.
11.4.2.1 Operation
You may define the behavior of some operations such as “Auto” or “Program & Verify”.
Disconnect after each operation
If this option is checked, connection to the target will be closed at the end of each operation.
Automatically unlock sectors
If this option is checked, all sectors affected by an erase or program operation will be
automatically unlocked if necessary.
Perform blank check
If this option is checked, a blank check is performed before any program operation to
examine if the affected flash sectors are completely empty. The user will be asked to erase
the affected sectors if they are not empty.
Skip blank areas on read
If this option is checked, a blank check is performed before any read back operation to
examine which flash areas need to be read back from target. This improves performance
of read back operations since it minimizes the amount of data to be transferred via JTAG
and USB.
11.4.2.2 Logging
You may set some logging options to customize the log output of J-Flash SPI.
J-Link / J-Trace (UM08001) © 2004-2017 SEGGER Microcontroller GmbH & Co. KG
259 CHAPTER 11 Settings
General log level
This specifies the log level of J-Flash SPI. Increasing log levels result in more information
logged in the log window.
Enable J-Link logfile
If this option is checked, you can specify a file name for the J-Link logfile. The J-Link logfile
differs from the log window output of J-Flash SPI. It does not log J-Flash SPI operations
performed. Instead of that, it logs the J-Link ARM DLL API functions called from within J-
Flash SPI.
J-Link / J-Trace (UM08001) © 2004-2017 SEGGER Microcontroller GmbH & Co. KG
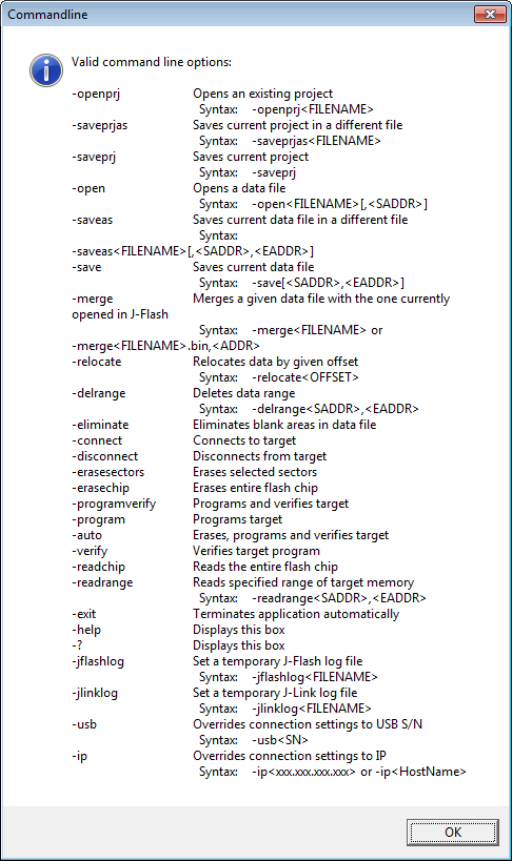
260 CHAPTER 11 Command Line Interface
11.5 Command Line Interface
This chapter describes the J-Flash SPI command line interface. The command line allows
using J-Flash SPI in batch processing mode and other advanced uses.
11.5.1 Overview
In addition to its traditional Windows graphical user interface (GUI), J-Flash SPI supports a
command line mode as well. This makes it possible to use J-Flash SPI for batch processing
purposes. All important options accessible from the menus are available in command line
mode as well. If you provide command line options, J-Flash SPI will still start its GUI, but
processing will start immediately.
The screenshot below shows the command line help dialog, which is displayed if you start
J-Flash SPI in a console window with JFlashSPI.exe -help or JFlashSPI.exe -? .
11.5.2 Command line options
This section lists and describes all available command line options. Some options accept
additional parameters which are enclosed in angle brackets, e.g. <FILENAME>. If these
parameters are optional they are enclosed in square brackets too, e.g. [<SADDR>]. Neither
the angel nor the square brackets must be typed on the command line, they are used here
only to denote (optional) parameters. Also, note that a parameter must follow immediately
after the option, e.g. JFlashSPI.exe -openprjC:\Projects\Default.jflash .
J-Link / J-Trace (UM08001) © 2004-2017 SEGGER Microcontroller GmbH & Co. KG

261 CHAPTER 11 Command Line Interface
The command line options are evaluated in the order they are passed to J-Flash, so please
ensure that a project and data file has already been opened when evaluating a command
line option which requires this.
It is recommended to always use -open<FILENAME>[,<SADDR>] to make sure the right data
file is opened.
All command line options return 0 if the processing was successful. A return value unequal
0 means that an error occurred.
Option Description
-? Displays the help dialog.
-auto Executes the steps selected in Production Pro-
gramming. Default: Erases, programs and veri-
fies target.
-connect Connects to the target.
-delrange<SADDR>,<EADDR> Deletes data in the given range.
-disconnect Disconnects from the target.
-eliminate Eliminates blank areas in data file.
-erasechip Erases the entire flash chip.
-erasesectors Erases selected sectors.
-exit Exits J-Flash SPI.
-help Displays the help dialog.
-jflashlog Sets a temporary J-Flash SPI logfile.
-jlinklog Sets a temporary J-Link logfile.
• -merge<FILENAME>
• -merge<FILENAME>.bin,<ADDR>
Saves the current data file into the specified
file. Please note that the parameters <SAD-
DR>, <EADDR> apply only if the data file is a
*.bin file or *.c file.
-open<FILENAME>[,<SADDR>] Opens a data file. Please note that the <SAD-
DR> parameter applies only if the data file is a
*.bin file
-openprj<FILENAME> Opens an existing project file. This will also au-
tomatically open the data file that has been re-
cently used with this project.
-program Programs the target.
-programverify Programs and verify the target.
-readchip Reads the entire flash chip.
-readrange<SADDR>,<EADDR> Reads specified range of target memory.
-save[<SADDR>,<EADDR>] Saves the current data file. Please note that
the parameters <SADDR>,<EADDR> apply on-
ly if the data file is a *.bin file or *.c file.
-saveas<FILENAME>[<SAD-
DR>,<EADDR>]
Saves the current data file into the specified
file. Please note that the parameters <SAD-
DR>,<EADDR> apply only if the data file is a
*.bin file or *.c file.
-saveprj Saves the current project.
-saveprjas<FILENAME> Saves the current project in the specified file.
-verify Verifies the target memory.
-usb<SN> Overrides connection settings to USB S/N.
• -ip<xxx.xxx.xxx.xxx>
• -ip<HostName> Overrides connection settings to IP.
J-Link / J-Trace (UM08001) © 2004-2017 SEGGER Microcontroller GmbH & Co. KG

262 CHAPTER 11 Command Line Interface
11.5.3 Batch processing
J-Flash SPI can be used for batch processing purposes. All important options are available
in command line mode as well. When providing command line options, the application does
not wait for manual user input. All command line operations will be performed in exactly
the order they are passed. So, for example issuing a program command before a project
has been opened will cause the program command to fail.
The example batchfile below will cause J-Flash SPI to perform the following operations:
1. Open project C:\Projects\Default.jflash
2. Open bin file C:\Data\data.bin and set start address to 0x100000
3. Perform “Auto” operation in J-Flash (by default this performs erase, program, verify)
4. Close J-Flash SPI
The return value will be checked and in case of an error message will be displayed.
Adapt the example according to the requirements of your project.
@ECHO OFF
ECHO Open a project and data file, start auto processing and exit
JFlashSPI.exe -openprjC:\\Projects\\Default.jflash -openC:\\Data\
\data.bin,0x100000 -auto -exit
IF ERRORLEVEL 1 goto ERROR
goto END
:ERROR
ECHO J-Flash SPI: Error!
pause
:END
Starting J-Flash minimized
Adapt this example call to start J-Flash SPI minimized:
start /min /wait "J-Flash" "JFlashSPI.exe" -openprjC:\\Projects\\Default.jflash \
-openC:\Data\data.bin,0x100000 -auto -exit
Note
Every call of JFlashSPI.exe has to be completed with the -exit option, otherwise the
execution of the batch file stops and the following commands will not be processed.
11.5.4 Programming multiple targets in parallel
In order to program multiple targets in parallel using J-Flash SPI, the following is needed:
• Multiple J-Flash SPI projects, each configured to connect to a specific J-Link / Flasher
(emulator to connect to is selected by serial number).
The easiest way is to setup the appropriate project once and then make multiple copies of
this project. Now modify the Connection to J-Link setting in each project, in order to let
J-Flash SPI connect to the different programmers as shown in the screenshot below: Find
below a small sample which shows how to program multiple targets in parallel:
J-Link / J-Trace (UM08001) © 2004-2017 SEGGER Microcontroller GmbH & Co. KG
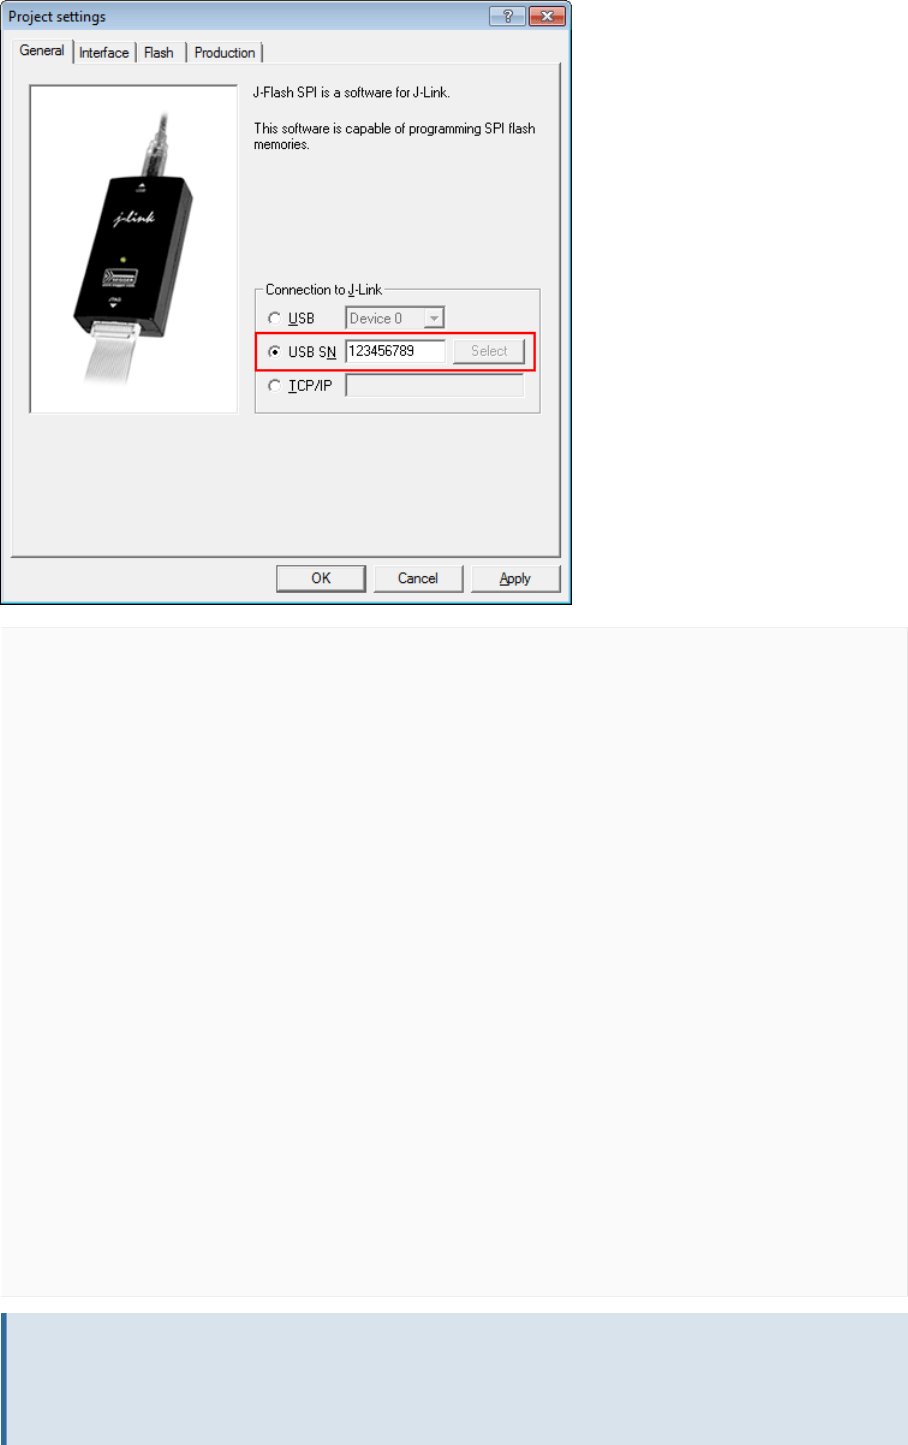
263 CHAPTER 11 Command Line Interface
@ECHO OFF
ECHO Open first project which is configured to connect to the first J-Link.
ECHO Open data file, start auto processing and exit
open JFlashSPI.exe -openprjC:\\Projects\\Project01.jflash -openC:\\Data\
\data.bin,
0x100000 -auto -exit
IF ERRORLEVEL 1 goto ERROR
ECHO Open second project which is configured to connect to the second J-Link.
ECHO Open data file, start auto processing and exit
open JFlashSPI.exe -openprjC:\\Projects\\Project02.jflash -openC:\\Data\
\data.bin,
0x100000 -auto -exit
IF ERRORLEVEL 1 goto ERROR
ECHO Open third project which is configured to connect to the third J-Link.
ECHO Open data file, start auto processing and exit
open JFlashSPI.exe -openprjC:\\Projects\\Project03.jflash -openC:\\Data\
\data.bin,
0x100000 -auto -exit
IF ERRORLEVEL 1 goto ERROR
goto END
:ERROR
ECHO J-Flash SPI: Error!
pause
:END
Note
Every call of JFlashSPI.exe has to be completed with the -exit option, otherwise the
execution of the batch file stops and the following commands will not be processed.
J-Link / J-Trace (UM08001) © 2004-2017 SEGGER Microcontroller GmbH & Co. KG

264 CHAPTER 11 Creating a new J-Flash SPI project
11.6 Creating a new J-Flash SPI project
Creating a new project for J-Flash is pretty simple. In the following, all necessary steps to
create a project file are explained.
1. Select File -> New Project to create a new project with default settings.
2. Open the Project Settings context menu. Select Options -> Project Settings to
open the Project settings dialog and select the type of connection to J-Link.
3. Define the SPI communication speed. The default settings work without any problem
for most targets, but to achieve the last quantum of performance, manual tuning may
be necessary.
4. Open the Flash and either select Automatically detect SPI flash or manually enter
the flash parameters.
5. Save the project (File -> Save Project) and test it.
J-Link / J-Trace (UM08001) © 2004-2017 SEGGER Microcontroller GmbH & Co. KG

265 CHAPTER 11 Custom Command Sequences
11.7 Custom Command Sequences
J-Flash SPI supports sending custom command sequences, which may be different for dif-
ferent SPI flashes (e.g. program OTP, program security register, etc…), via the SPI inter-
face. Due to the generic syntax, this feature can be used to implement any kind of required
command sequence. The sequence is stored in the J-Flash SPI project file (*.jflash) and
therefore it can be included in automated production environments without any problems
and be used with the command line version of J-Flash SPI as well.
The custom command sequence can be configured in the Setup tab of the J-Flash project
settings as part of the Init / Exit Steps which allow to enter custom sequences using
a pre-defined list of operations. The following list shows all valid commands which can be
used:
Command Value0 Value1 Description
Delay Delay in ms – Waits a given time
Activate CS – – Sets the CS signal low
Deactivate CS – – Sets the CS signal high
Write data NumByte(s) ByteStream
separated by
commas (hex)
Sends a number of bytes via the SPI
interface to the SPI. (e.g.: 9F,13,CA)
Var Read Data OffInVarBuffer NumByte(s)
max. 16 bytes
Reads the specified number of bytes
via the SPI interface into the Var-
Buffer which is 16 bytes in size.
Var Write Data OffInVarBuffer NumByte(s)
max. 16 bytes
Writes the specified number of bytes
via the SPI interface from the Var-
Buffer (filled via Var Read).
Var AND ByteIndex Value (hex) Logical AND combination of the inter-
nal var buffer at the specified index
with a given value.
Var OR ByteIndex Value (hex) Logical OR combination of the internal
var buffer at the specified index with a
given value.
Var XOR ByteIndex Value (hex) Logical XOR combination of the inter-
nal var buffer at the specified index
with a given value.
11.7.1 Init / Exit steps
The init sequence will be performed as part of the connect sequence, for example to disable
security, while the exit sequence will be executed after programming, for example to enable
the security in order to secure the SPI flash.
11.7.2 Example
The example below demonstrates how to use the custom command sequence feature to
implement a read-modify-write security register on the Winbond W25Q128FVSIG SPI flash
using the init steps. To make sure that the output of the example is exactly the same, the
sample erases the security register to have defined values.
Step #0 to Step#2: Set Write Enable
Step #3 to Step#6: Erase security register to have a defined values (0xFF)
Step #7 to Step#11: Read 16 byte security register into Var buffer
Step #12 to Step#19: Modify the data in the Var buffer
Step #20 to Step#22: Set Write Enable
Step #23 to Step#27: Program security register with values from Var buffer
Step #28 to Step#32: Read back security register to verify successful programming
J-Link / J-Trace (UM08001) © 2004-2017 SEGGER Microcontroller GmbH & Co. KG

266 CHAPTER 11 Custom Command Sequences
# Action Value0 Value1 Comment
0 Activate CS – – Activate CS
1 Write Data 1 06 Send command: Write Enable
2 Deactivate CS – – Deactivate CS
3 Activate CS – – Activate CS
4 Write Data 4 44,00,10,00 Send command: Erase Security Register 1
5 Deactivate CS – – Deactivate CS
6 Delay 200ms – Wait until security register 1 has been erased
7 Activate CS – – Activate CS
8 Write Data 4 48,00,10,00 Send Read Security Register: 1b command +
3b addr
9 Write Data 1 FF Send 8 dummy clocks
10 Var Read Data 0 16 Read actual security register data (16 byte)
into Varbuffer[0]
11 Deactivate CS – – Deactivate CS
12 Var AND 0 0x00 Set byte 0 to 0x00 using Var AND
13 Var OR 0 0x12 Set byte 0 to 0x12 using Var OR
14 Var AND 6 0x00 Set byte 6 to 0x00 using Var AND
15 Var OR 6 0x12 Set byte 6 to 0xAB using Var OR
16 Var AND 12 0x00 Set byte 12 to 0x00 using Var AND
17 Var OR 12 0x12 Set byte 12 to 0xCC using Var OR
18 Var AND 15 0x00 Set byte 15 to 0x00 using Var AND
19 Var OR 15 0x12 Set byte 15 to 0x4E using Var OR
20 Activate CS – – Activate CS
21 Write Data 1 06 Send command: Write Enable
22 Deactivate CS – – Deactivate CS
23 Activate CS – – Activate CS
24 Write Data 4 42,00,10,00 Send command: Program Security Register 1
25 Var Write Data 0 16 Send data: Program sec reg 1_1
26 Deactivate CS – – Deactivate CS
27 Delay 200ms – Wait until security register 1 has been erased
28 Activate CS – – Activate CS
29 Write Data 4 48,00,10,00 Send Read Security Register: 1b command +
3b addr
30 Write Data 1 FF Send 8 dummy clocks
31 Var Read Data 0 16 Read actual security register data (16 byte)
into Varbuffer[0]
32 Deactivate CS – – Deactivate CS
11.7.3 J-Flash SPI Command Line Version
As the Init / Exit Steps are stored in the J-Flash project file, which is evaluated in the
command line version of J-Flash SPI too, the custom command sequence feature can be
used under Linux / MAC, as well. The project can be either created using the GUI version of
J-Flash SPI or by editing the *.jflash project, manually. The expected format of the custom
command sequences in the J-Flash project file is described below.
J-Link / J-Trace (UM08001) © 2004-2017 SEGGER Microcontroller GmbH & Co. KG
267 CHAPTER 11 Custom Command Sequences
11.7.3.1 J-Flash project layout
Basically, the custom sequence is separated into different steps where each step contains
the fields as in the table below. Some commands require to pass parameter to it. They are
stored in Value0 and Value1 as described in the table below.
Step Description
ExitStepX_Action = “$Action$” Any action as described in the table below.
ExitStepX_Comment = “$Comment$” User can specify any comment here. This field
is optional and not taken into account.
ExitStepX_Value0 = “$Value0$” Value depends on the action. See table below
ExitStepX_Value1 = “$Value1$” Value depends on the action. See table below
The number of exit steps needs to be specified right behind the ExitStep sequence with the
line “NumExitSteps = <NumExitSteps>” (see example below).
Actions Parameter Description
Activate CS none Set CS signal low
Deactivate CS none Set CS signal high
Write data Value0=NumBytes
Value1[x]=ByteStream
max. NumBytes is 16
Send a number of bytes via the SPI inter-
face to the SPI. Please note, that the num-
ber of bytes has to be specified right be-
hind Value1 in square brackets (e.g.: Ex-
itStep4_Value1[3] = 0x44,0x00,0x10)
Delay Value0=Delay in ms Waits a given time
Below is a small example excerpt from a J-Flash project, which shows a example sequence
to erase sector 0 of the SPI flash using the 0xD8 command. Further examples can be found
in the installation directory of the J-Link software and documentation package.
[CPU]
//
// Set write enable
//
ExitStep0_Action = "Activate CS"
ExitStep0_Value0 = 0x00000000
ExitStep0_Value1 = 0x00000000
ExitStep1_Action = "Write data"
ExitStep1_Comment = "Set write enable"
ExitStep1_Value0 = 1
ExitStep1_Value1[1] = 0x06
ExitStep2_Action = "Deactivate CS"
ExitStep2_Comment = "Deactivate CS"
ExitStep2_Value0 = 0x00000000
ExitStep2_Value1 = 0x00000000
//
// Erase sector 0
//
ExitStep3_Action = "Activate CS"
ExitStep3_Comment = "Activate CS"
ExitStep3_Value0 = 0x00000000
ExitStep3_Value1 = 0x00000000
ExitStep4_Action = "Write data"
ExitStep4_Comment = "Set write enable"
ExitStep4_Value0 = 4
ExitStep4_Value1[4] = 0xD8,0x00,0x00,0x00
ExitStep5_Action = "Deactivate CS"
ExitStep5_Comment = "Deactivate CS"
ExitStep5_Value0 = 0x00000000
ExitStep5_Value1 = 0x00000000
//
// Wait until sector has been erased
J-Link / J-Trace (UM08001) © 2004-2017 SEGGER Microcontroller GmbH & Co. KG

268 CHAPTER 11 Custom Command Sequences
//
ExitStep6_Action = "Delay"
ExitStep6_Comment = "Wait until sector has been erased"
ExitStep6_Value0 = 0x00000080
ExitStep6_Value1 = 0x00000000
NumExitSteps = 7
J-Link / J-Trace (UM08001) © 2004-2017 SEGGER Microcontroller GmbH & Co. KG
269 CHAPTER 11 Device specifics
11.8 Device specifics
This chapter gives some additional information about specific devices.
11.8.1 SPI flashes with multiple erase commands
Some SPI flashes support multiple erase commands that allow to erase different units on
the flash. For example some flashes provide a sector erase (erase 4 KB units) and a
block erase (erase 16 KB or 64 KB units) command. In general, it is up to the user which
command to use, as the EraseSector command can be overridden by the user. When
manually changing the SectorErase command in the Options -> Project settings… ->
Flash tab, make sure that the SectorSize parameter matches the command being used
J-Link / J-Trace (UM08001) © 2004-2017 SEGGER Microcontroller GmbH & Co. KG
270 CHAPTER 11 Target systems
11.9 Target systems
11.9.1 Which flash devices can be programmed?
In general, all kinds of SPI flash can be programmed. Since all flash parameters are con-
figurable, also flashes with non-standard command sets can be programmed.
J-Link / J-Trace (UM08001) © 2004-2017 SEGGER Microcontroller GmbH & Co. KG
271 CHAPTER 11 Performance
11.10 Performance
The following chapter lists programming performance for various SPI flash devices.
11.10.1 Performance values
In direct programming mode (J-Link directly connects to the pins of the SPI flash), the
programming speed is mainly limited by the SPI communication speed, the USB speed of
J-Link (if a Full-Speed or Hi-Speed based J-Link is used) and the maximum programming
speed of the flash itself.
For most SPI flash devices, in direct programming mode speeds of ≥ 50 KB/s can be
achieved.
J-Link / J-Trace (UM08001) © 2004-2017 SEGGER Microcontroller GmbH & Co. KG
272 CHAPTER 11 Background information
11.11 Background information
This chapter provides some background information about specific parts of the J-Flash SPI
software.
11.11.1 SPI interface connection
For direct SPI flash programming, J-Link needs to be wired to the SPI flash in a specific way.
For more information about the pinout for the J-Link SPI target interface, please refer to the
J-Link Manual (UM08001). The minimum pins that need to be connected, are: VTref, GND,
SPI-CLK, MOSI, MISO. If other components on the target hardware need to be kept in reset
while programming the SPI flash (e.g. a CPU etc.), nRESET also needs to be connected.
J-Link / J-Trace (UM08001) © 2004-2017 SEGGER Microcontroller GmbH & Co. KG
273 CHAPTER 11 Support
11.12 Support
The following chapter provides advises on troubleshooting for possible typical problems and
information about how to contact our support.
11.12.1 Troubleshooting
11.12.1.1 Typical problems
Target system has no power
Meaning:
J-Link could not measure the target (flash) reference voltage on pin 1 of its connector.
Remedy:
The target interface of J-Link works with level shifters to be as flexible as possible. There-
fore, the reference I/O voltage the flash is working with also needs to be connected to pin
1 of the J-Link connector.
Programming / Erasing failed
Meaning:
The SPI communication speed may be too high for the given signal quality.
Remedy:
Try again with a slower speed. If it still fails, check the quality of the SPI signals.
Failed to verify Flash ID
Meaning:
J-Link could not verify the ID of the connected flash.
Remedy:
Check the Flash ID entered in the flash parameters dialog, for correctness.
11.12.2 Contacting support
If you experience a J-Flash SPI related problem and advice given in the sections above
does not help you to solve it, you may contact our support. In this case, please provide
us with the following information:
• A detailed description of the problem.
• The relevant log file and project file. In order to generate an expressive log file, set the
log level to “All messages” (see section Global Settings for information about changing
the log level in J-Flash SPI).
• The relevant data file as a .hex or .mot file (if possible).
• The processor and flash types used.
Once we received this information we will try our best to solve the problem for you. Our
contact address is as follows:
SEGGER Microcontroller GmbH & Co. KG
In den Weiden 11
D-40721 Hilden
Germany
Tel. +49 2103-2878-0
Fax. +49 2103-2878-28
E-mail: support@segger.com
Internet: www.segger.com
J-Link / J-Trace (UM08001) © 2004-2017 SEGGER Microcontroller GmbH & Co. KG

Chapter 12
RDI
RDI (Remote Debug Interface) is a standard defined by ARM, trying to standardize a de-
bugger / debug probe interface. It is defined only for cores that have the same CPU register
set as ARM7 CPUs. This chapter describes how to use the RDI DLL which comes with the
J-Link Software and Documentation Package. The J-Link RDI DLL allows the user to use J-
Link with any RDI-compliant debugger and IDE.
J-Link / J-Trace (UM08001) © 2004-2017 SEGGER Microcontroller GmbH & Co. KG
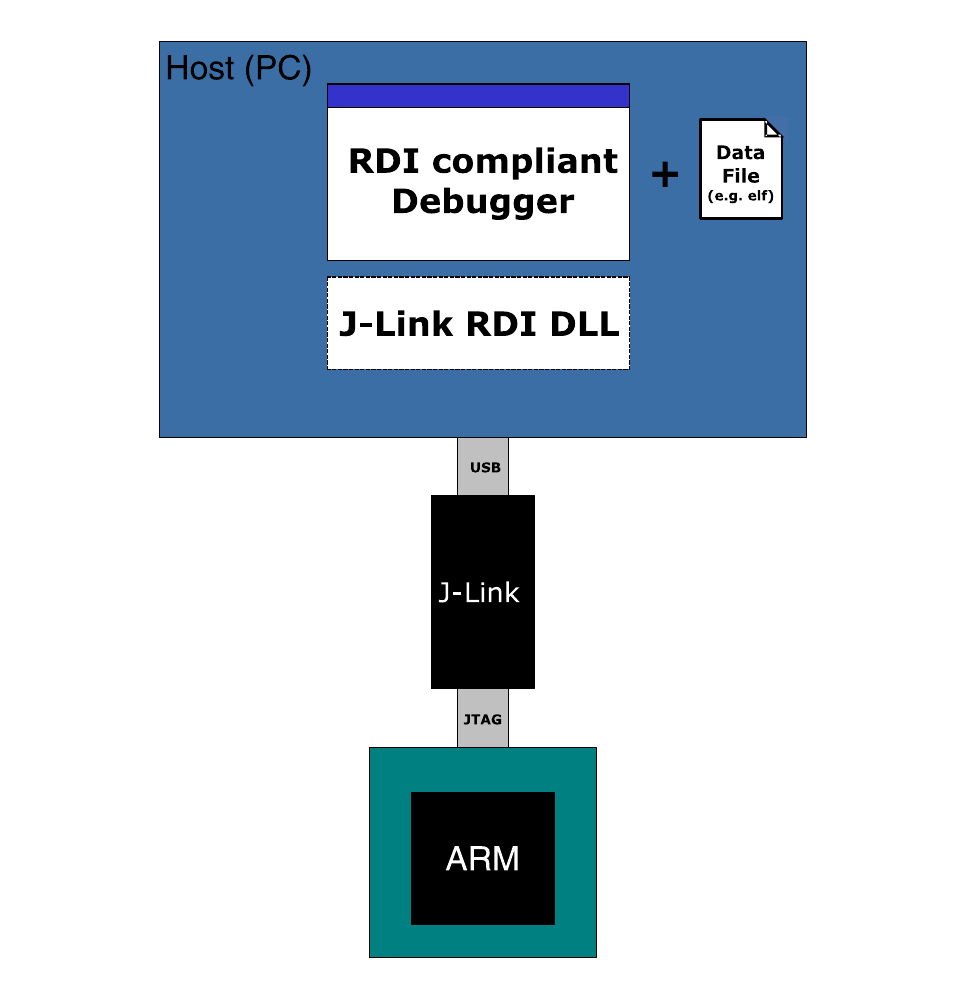
275 CHAPTER 12 Introduction
12.1 Introduction
Remote Debug Interface (RDI) is an Application Programming Interface (API) that defines
a standard set of data structures and functions that abstract hardware for debugging pur-
poses. J-Link RDI mainly consists of a DLL designed for ARM cores to be used with any
RDI compliant debugger. The J-Link DLL feature flash download and flash breakpoints can
also be used with J-Link RDI.
12.1.1 Features
• Can be used with every RDI compliant debugger.
• Easy to use.
• Flash download feature of J-Link DLL can be used.
• Flash breakpoints feature of J-Link DLL can be used.
• Instruction set simulation (improves debugging performance).
J-Link / J-Trace (UM08001) © 2004-2017 SEGGER Microcontroller GmbH & Co. KG
276 CHAPTER 12 Licensing
12.2 Licensing
In order to use the J-Link RDI software a separate license is necessary for each J-Link. For
some devices J-Link comes with a device-based license and some J-Link models also come
with a full license for J-Link RDI. The normal J-Link however, comes without any licenses.
For more information about licensing itself and which devices have a device-based license,
please refer to:
J-Link Model overview: Licenses
J-Link / J-Trace (UM08001) © 2004-2017 SEGGER Microcontroller GmbH & Co. KG
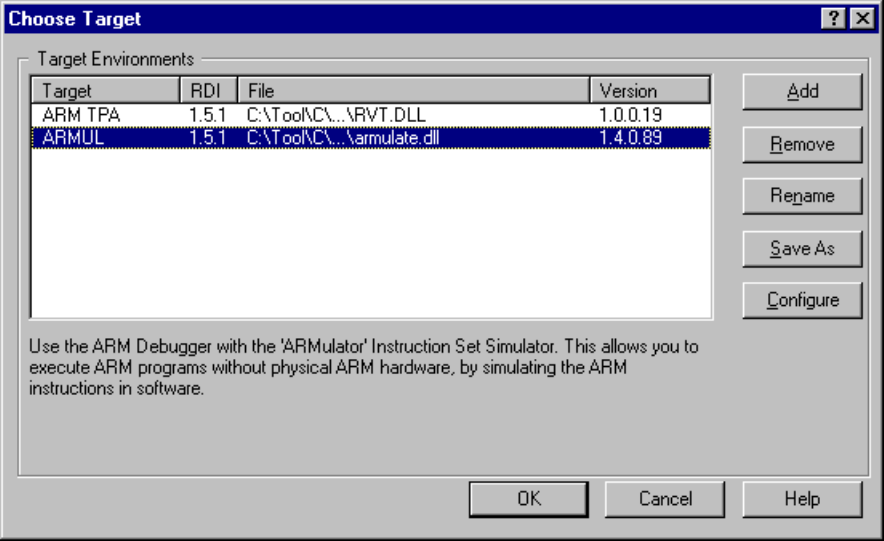
277 CHAPTER 12 Setup for various debuggers
12.3 Setup for various debuggers
The J-Link RDI software is an ARM Remote Debug Interface (RDI) for J-Link. It makes it
possible to use J-Link with any RDI compliant debugger. Basically, J-Link RDI consists of
a additional DLL ( JLinkRDI.dll ) which builds the interface between the RDI API and the
normal J-Link DLL. The JLinkRDI.dll itself is part of the J-Link Software and Documentation
Package.
Please refer to SEGGER Wiki: Getting Started with Various IDEs for information on how
to get started with any IDE officially supported by J-Link / J-Trace. If official support is not
implemented natively but via RDI, the RDI setup procedure will also be explained there.
In the following, the RDI setup procedure for a few not officially supported IDEs is
explained.
12.3.1 ARM AXD (ARM Developer Suite, ADS)
Software version
The JLinkRDI.dll has been tested with ARM’s AXD version 1.2.0 and 1.2.1. There should
be no problems with other versions of ARM’s AXD. All screenshots are taken from ARM’s
AXD version 1.2.0.
Configuring to use J-Link RDI
1. Start the ARM debugger and select Options | Configure Target… . This opens the
Choose Target dialog box:
2. Press the Add Button to add the JLinkRDI.dll.
J-Link / J-Trace (UM08001) © 2004-2017 SEGGER Microcontroller GmbH & Co. KG
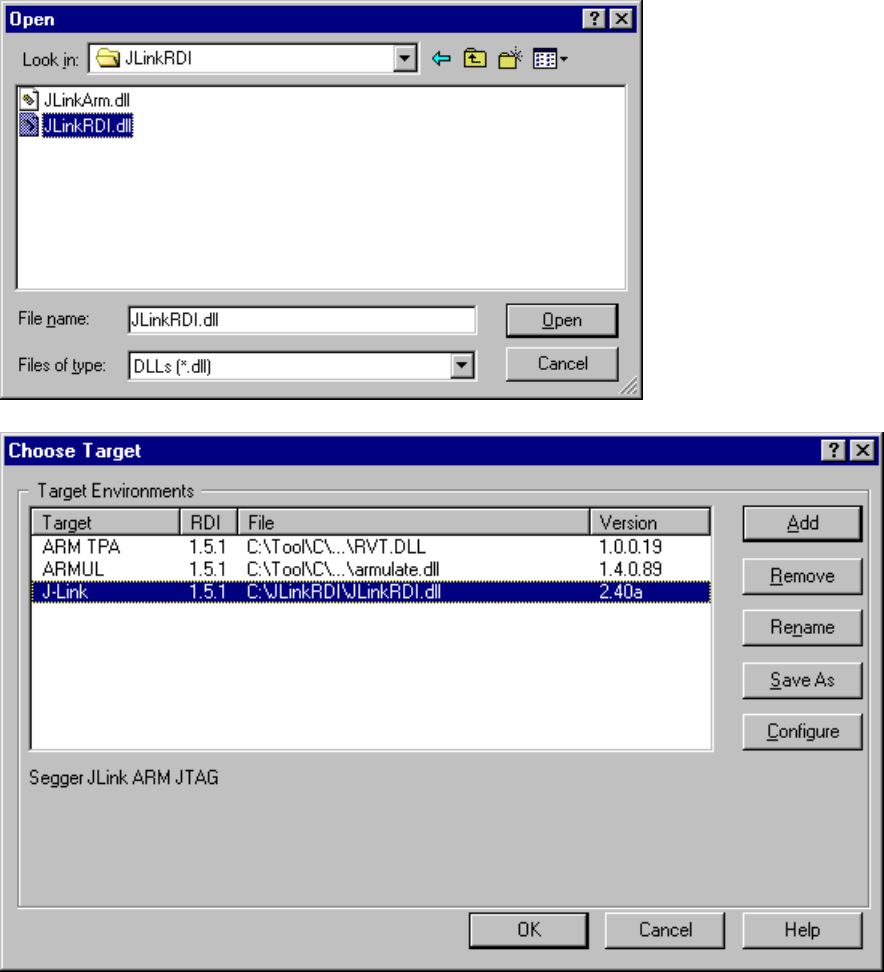
278 CHAPTER 12 Setup for various debuggers
3. Now J-Link RDI is available in the Target Environments list.
4. Select J-Link and press OK to connect to the target via J-Link. For more information
about the generic setup of J-Link RDI, please refer to Configuration on page 287. After
downloading an image to the target board, the debugger window looks as follows:
J-Link / J-Trace (UM08001) © 2004-2017 SEGGER Microcontroller GmbH & Co. KG
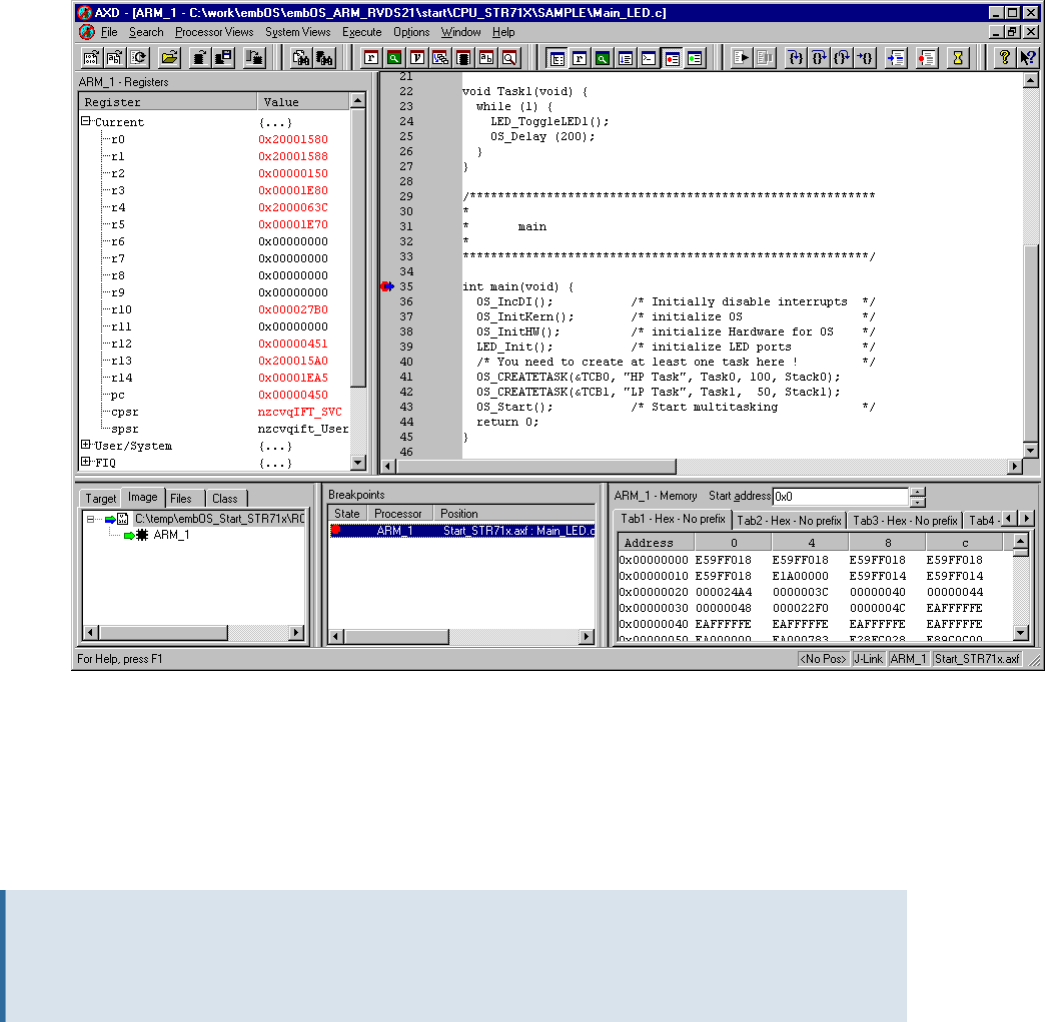
279 CHAPTER 12 Setup for various debuggers
12.3.2 ARM RVDS (RealView developer suite)
Software version
J-Link RDI has been tested with ARM RVDS version 2.1 and 3.0. There should be no prob-
lems with earlier versions of RVDS (up to version v3.0.1). All screenshots are taken from
ARM’s RVDS version 2.1.
Note
RVDS version 3.1 does not longer support RDI protocol to communicate with the
debugger.
Configuring to use J-Link RDI
1. Start the Real View debugger:
J-Link / J-Trace (UM08001) © 2004-2017 SEGGER Microcontroller GmbH & Co. KG
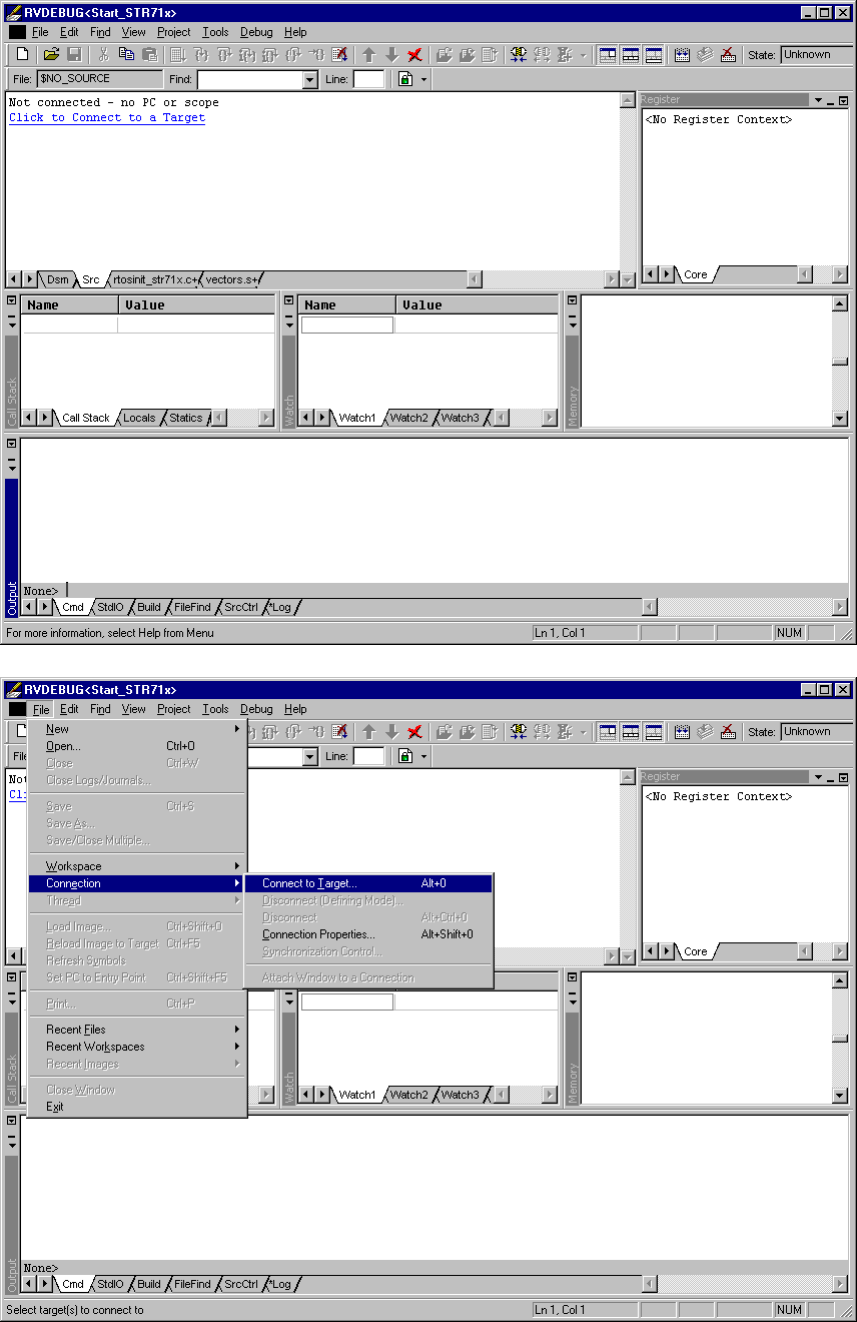
280 CHAPTER 12 Setup for various debuggers
2. Select File | Connection | Connect to Target.
3. In the Connection Control dialog use the right mouse click on the first item and select
Add/Remove/Edit Devices.
J-Link / J-Trace (UM08001) © 2004-2017 SEGGER Microcontroller GmbH & Co. KG
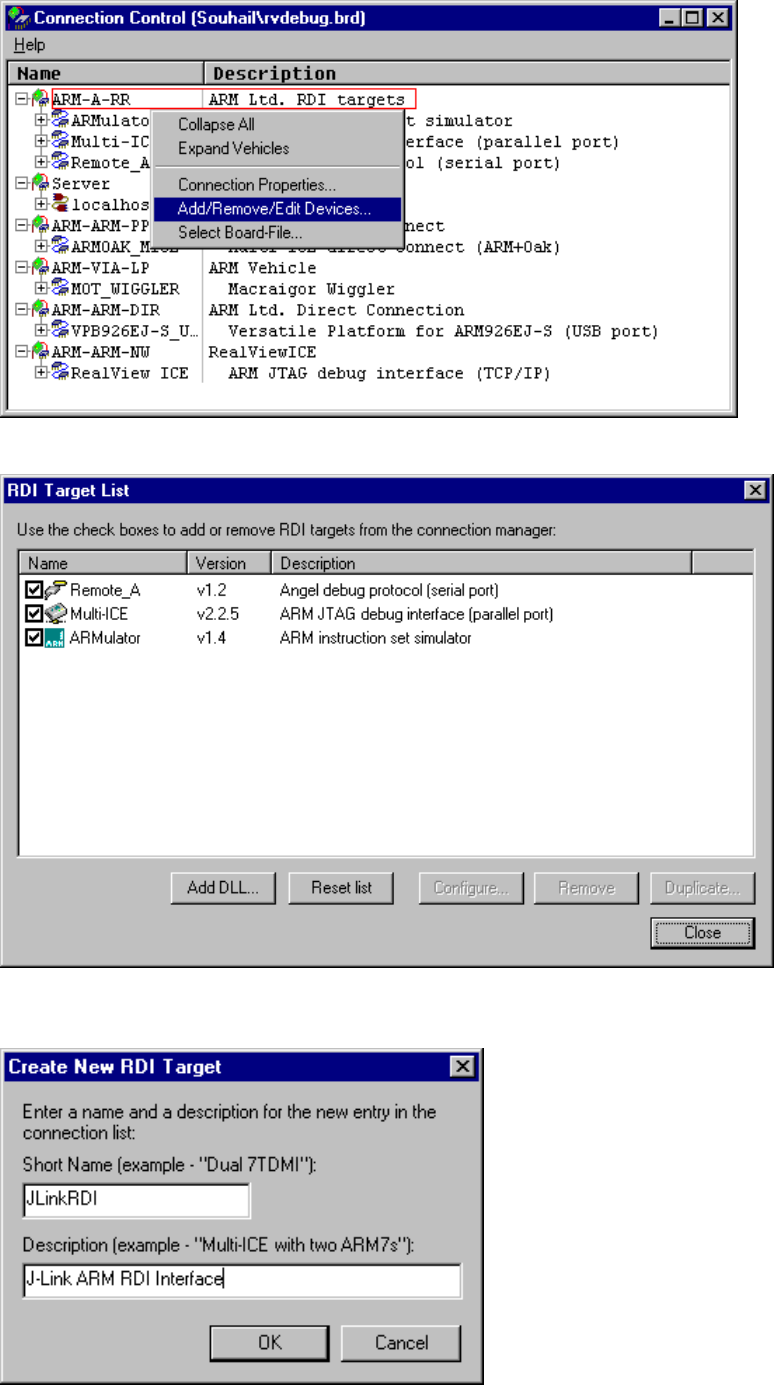
281 CHAPTER 12 Setup for various debuggers
4. Now select Add DLL to add the JLinkRDI.dll. Select the installation path of the
software, for example: C:\Program Files\SEGGER\JLinkARM_V350g\JLinkRDI.dll
5. After adding the DLL, an additional Dialog opens and asks for description: (These values
are voluntary, if you do not want change them, just click OK) Use the following values
and click on OK, Short Name: JLinkRDI Description: J-Link RDI Interface.
6. Back in the RDI Target List Dialog, select JLink-RDI and click Configure. For more
information about the generic setup of J-Link RDI, please refer to Configuration on
page 287.
J-Link / J-Trace (UM08001) © 2004-2017 SEGGER Microcontroller GmbH & Co. KG
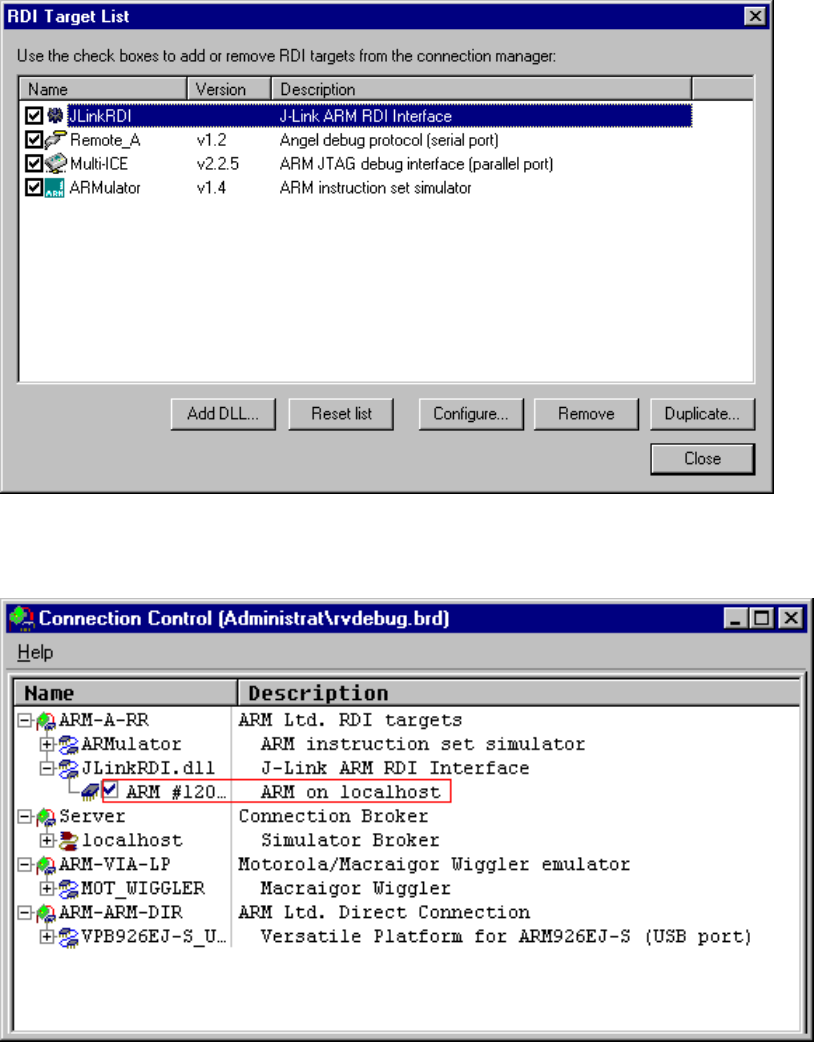
282 CHAPTER 12 Setup for various debuggers
7. Click the OK button in the configuration dialog. Now close the RDI Target List dialog.
Make sure your target hardware is already connected to J-Link.
8. In the Connection control dialog, expand the JLink ARM RDI Interface and select
the ARM_0 processor. Close the Connection Control window.
9. Now the RealView Debugger is connected to J-Link.
J-Link / J-Trace (UM08001) © 2004-2017 SEGGER Microcontroller GmbH & Co. KG
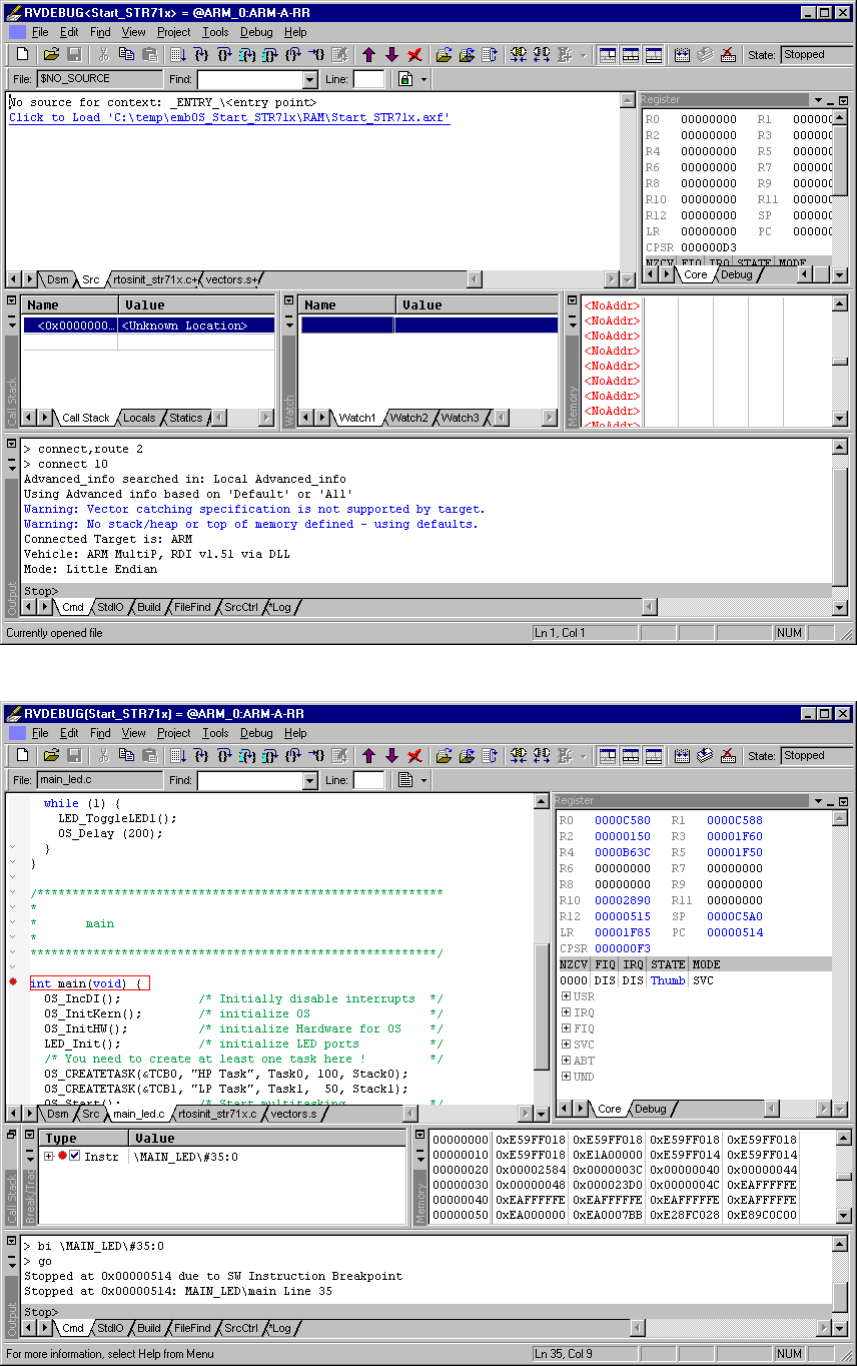
283 CHAPTER 12 Setup for various debuggers
10. A project or an image is needed for debugging. After downloading, J-Link is used to
debug the target.
J-Link / J-Trace (UM08001) © 2004-2017 SEGGER Microcontroller GmbH & Co. KG
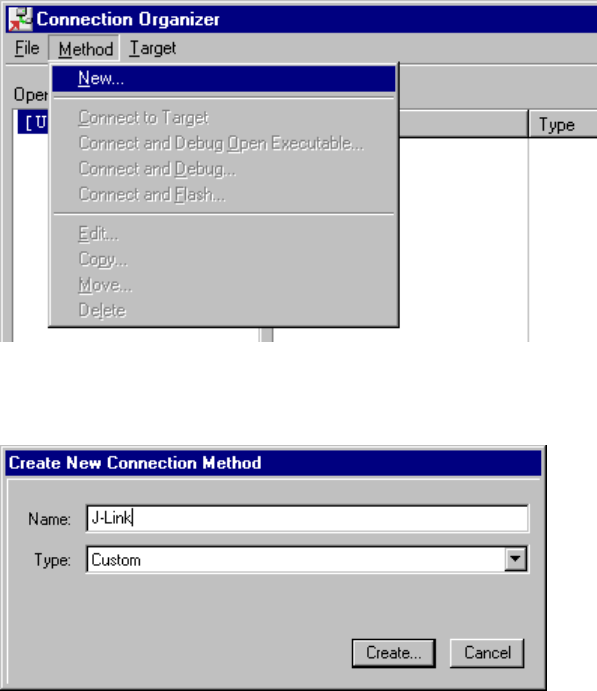
284 CHAPTER 12 Setup for various debuggers
12.3.3 GHS MULTI
Software version
J-Link RDI has been tested with GHS MULTI version 4.07. There should be no problems
with other versions of GHS MULTI. All screenshots are taken from GHS MULTI version 4.07.
Configuring to use J-Link RDI
1. Start Green Hills Software MULTI integrated development environment. Click Connect
| Connection Organizer to open the Connection Organizer.
2. Click Method | New in the Connection Organizer dialog.
3. The Create a new Connection Method will be opened. Enter a name for your
configuration in the Name field and select Custom in the Type list. Confirm your choice
with the Create… button.
4. The Connection Editor dialog will be opened. Enter rdiserv in the Server field and
enter the following values in the Arguments field:
-config -dll <FullPathToJLinkDLLs>
Note that JLinkRDI.dll and JLinkARM.dll must be stored in the same directory. If the
standard J-Link installation path or another path that includes spaces has been used,
enclose the path in quotation marks.
Example:
-config -dll “C:\Program Files\SEGGER\JLinkARM_V350g\JLinkRDI.dll”
Refer to GHS manual “MULTI: Configuring Connections for ARM Targets”, chapter
“ARM Remote Debug Interface (rdiserv) Connections” for a complete list of possible
arguments.
J-Link / J-Trace (UM08001) © 2004-2017 SEGGER Microcontroller GmbH & Co. KG
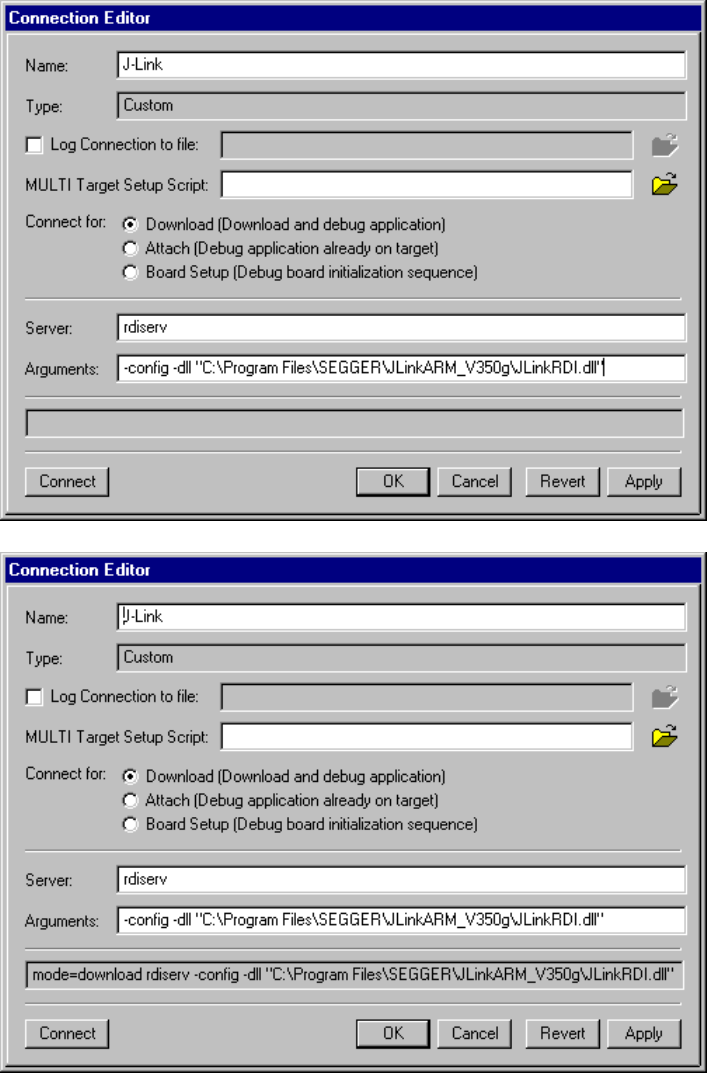
285 CHAPTER 12 Setup for various debuggers
5. Confirm the choices by clicking the Apply button after the Connect button.
6. The J-Link RDI Configuration dialog will open. For more information about the generic
setup of J-Link RDI, please refer to Configuration on page 287.
7. Click the OK button to connect to the target. Build the project and start the debugger.
Note that at least one action (for example step or run) has to be performed in order
to initiate the download of the application.
J-Link / J-Trace (UM08001) © 2004-2017 SEGGER Microcontroller GmbH & Co. KG
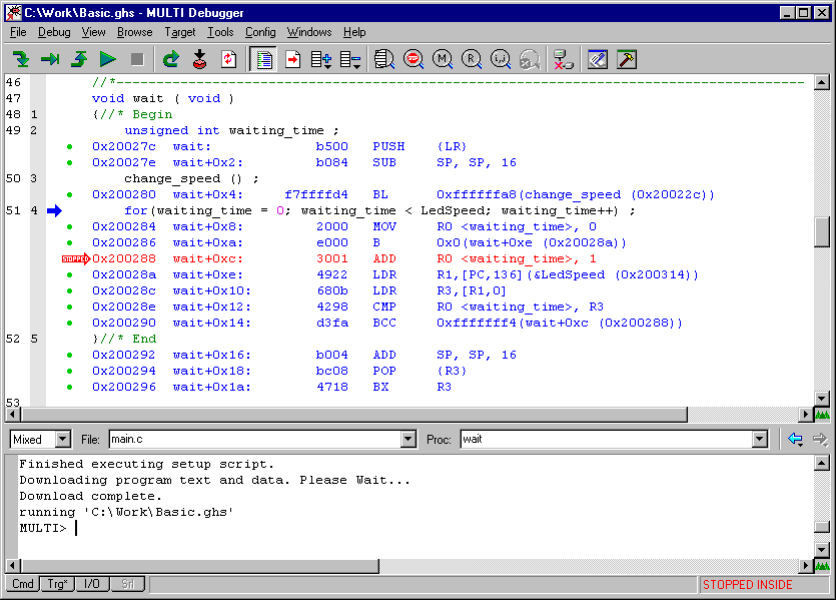
286 CHAPTER 12 Setup for various debuggers
J-Link / J-Trace (UM08001) © 2004-2017 SEGGER Microcontroller GmbH & Co. KG
287 CHAPTER 12 Configuration
12.4 Configuration
This section describes the generic setup of J-Link RDI (same for all debuggers) using the
J-Link RDI configuration dialog.
12.4.1 Configuration file JLinkRDI.ini
All settings are stored in the file JLinkRDI.ini. This file is located in the same directory
as JLinkRDI.dll.
12.4.2 Using different configurations
It can be desirable to use different configurations for different targets. If this is the case, a
new folder needs to be created and the JLinkARM.dll as well as the JLinkRDI.dll needs
to be copied into it.
Project A needs to be configured to use JLinkRDI.dll A in the first folder, project B needs
to be configured to use the DLL in the second folder. Both projects will use separate con-
figuration files, stored in the same directory as the DLLs they are using.
If the debugger allows using a project-relative path (such as IAR EWARM: Use for example
$PROJ_DIR$\RDI\), it can make sense to create the directory for the DLLs and configuration
file in a subdirectory of the project.
12.4.3 Using multiple J-Links simultaneously
Same procedure as using different configurations. Each debugger session will use their own
instance of the JLinkRDI.dll.
12.4.4 Configuration dialog
The configuration dialog consists of several tabs making the configuration of J-Link RDI
very easy.
J-Link / J-Trace (UM08001) © 2004-2017 SEGGER Microcontroller GmbH & Co. KG

288 CHAPTER 12 Configuration
12.4.4.1 General tab
Connection to J-Link
This setting allows the user to configure how the DLL should connect to the J-Link. Some J-
Link models also come with an Ethernet interface which allows to use an emulator remotely
via TCP/IP connection.
License (J-Link RDI License management)
1. The License button opens the J-Link RDI License management dialog. J-Link RDI
requires a valid license.
2. Click the Add license button and enter your license. Confirm your input by clicking
the OK button.
J-Link / J-Trace (UM08001) © 2004-2017 SEGGER Microcontroller GmbH & Co. KG
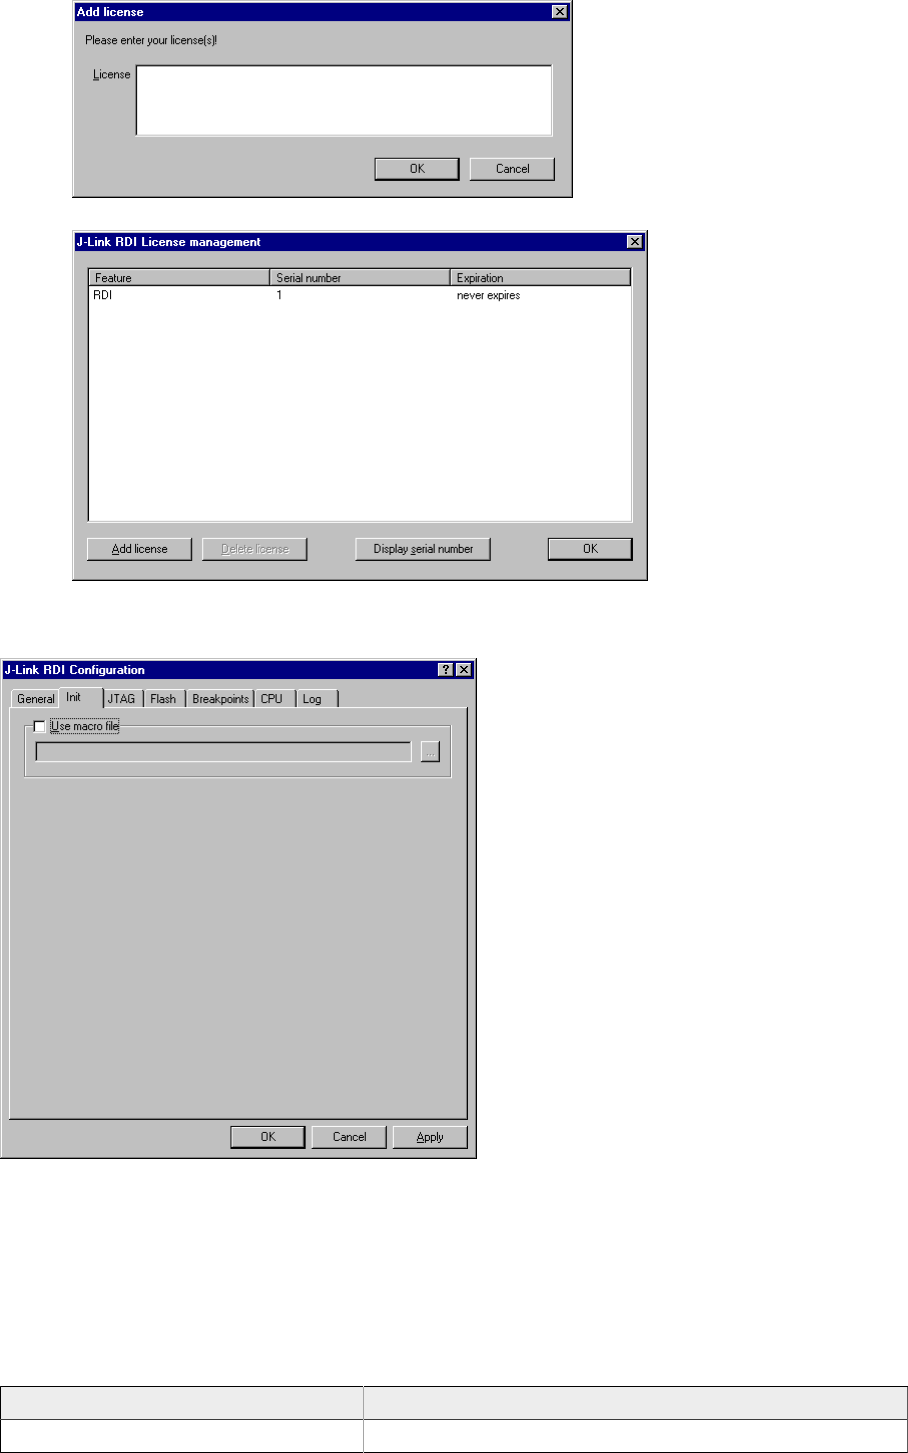
289 CHAPTER 12 Configuration
3. The J-Link RDI license is now added.
12.4.4.2 Init tab
Macro file
A macro file can be specified to load custom settings to configure J-Link RDI with advanced
commands for special chips or operations. For example, a macro file can be used to initialize
a target to use the PLL before the target application is downloaded, in order to speed up
the download.
Commands in the macro file
Command Description
SetJTAGSpeed(x); Sets the JTAG speed, x = speed in kHz (0=Auto)
J-Link / J-Trace (UM08001) © 2004-2017 SEGGER Microcontroller GmbH & Co. KG

290 CHAPTER 12 Configuration
Command Description
Delay(x); Waits a given time, x = delay in milliseconds
Reset(x); Resets the target, x = delay in milliseconds
Go(); Starts the ARM core
Halt(); Halts the ARM core
Read8(Addr);
Read16(Addr);
Read32(Addr);
Reads a 8/16/32 bit value,
Addr = address to read (as hex value)
Verify8(Addr, Data);
Verify16(Addr, Data);
Verify32(Addr, Data);
Verifies a 8/16/32 bit value,
Addr = address to verify (as hex value)
Data = data to verify (as hex value)
Write8(Addr, Data);
Write16(Addr, Data);
Write32(Addr, Data);
Writes a 8/16/32 bit value,
Addr = address to write (as hex value)
Data = data to write (as hex value)
WriteVerify8(Addr, Data);
WriteVerify16(Addr, Data);
WriteVerify32(Addr, Data);
Writes and verifies a 8/16/32 bit value,
Addr = address to write (as hex value)
Data = data to write (as hex value)
WriteRegister(Reg, Data); Writes a register
WriteJTAG_IR(Cmd); Writes the JTAG instruction register
WriteJTAG_DR(nBits, Data); Writes the JTAG data register
Example of macro file
/*********************************************************************
*
* Macro file for J-LINK RDI
*
**********************************************************************
* File: LPC2294.setup
* Purpose: Setup for Philips LPC2294 chip
**********************************************************************
*/
SetJTAGSpeed(1000);
Reset(0);
Write32(0xE01FC040, 0x00000001); // Map User Flash into Vector area at (0-3f)
Write32(0xFFE00000, 0x20003CE3); // Setup CS0
Write32(0xE002C014, 0x0E6001E4); // Setup PINSEL2 Register
SetJTAGSpeed(2000);
J-Link / J-Trace (UM08001) © 2004-2017 SEGGER Microcontroller GmbH & Co. KG

291 CHAPTER 12 Configuration
12.4.4.3 JTAG tab
JTAG speed
This allows the selection of the JTAG speed. There are basically three types of speed settings
(which are explained below):
• Fixed JTAG speed
• Automatic JTAG speed
• Adaptive clocking
JTAG scan chain with multiple devices
The JTAG scan chain allows to specify the instruction register organization of the target
system. This may be needed if there are more devices located on the target system than
the ARM chip you want to access or if more than one target system is connected to one
J-Link at once.
J-Link / J-Trace (UM08001) © 2004-2017 SEGGER Microcontroller GmbH & Co. KG
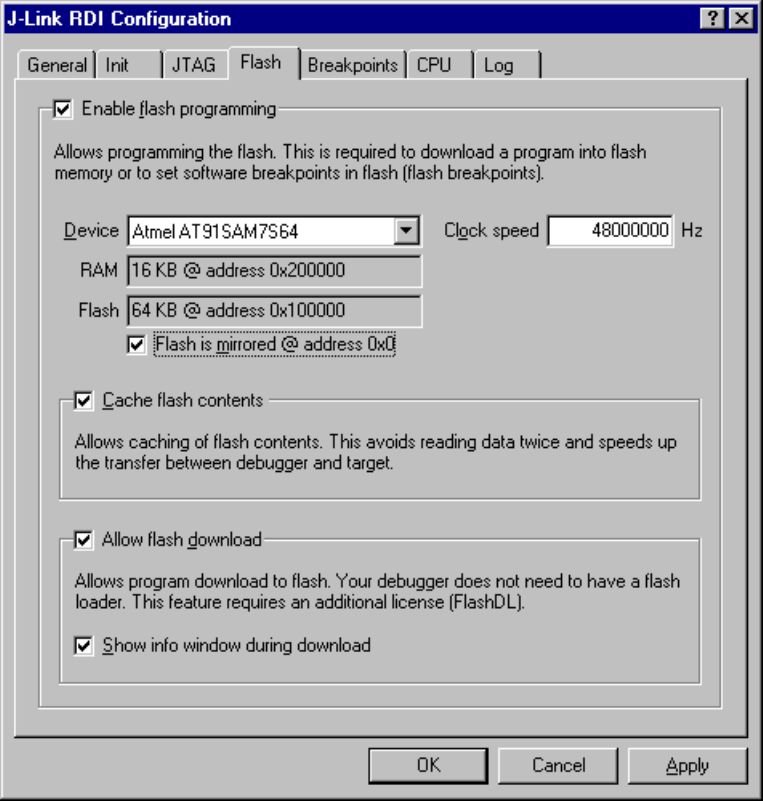
292 CHAPTER 12 Configuration
12.4.4.4 Flash tab
Enable flash programming
This checkbox enables flash programming. Flash programming is needed to use either flash
download or flash breakpoints.
If flash programming is enabled you must select the correct flash memory and flash base
address. Furthermore it is necessary for some chips to enter the correct CPU clock frequen-
cy.
Cache flash contents
If enabled, the flash content is cached by the J-Link RDI software to avoid reading data
twice and to speed up the transfer between debugger and target.
Allow flash download
This allows the J-Link RDI software to download program into flash. A small piece of code
will be downloaded and executed in the target RAM which then programs the flash memory.
This provides flash loading abilities even for debuggers without a build-in flash loader.
An info window can be shown during download displaying the current operation. Depending
on your JTAG speed you may see the info window only very short.
J-Link / J-Trace (UM08001) © 2004-2017 SEGGER Microcontroller GmbH & Co. KG
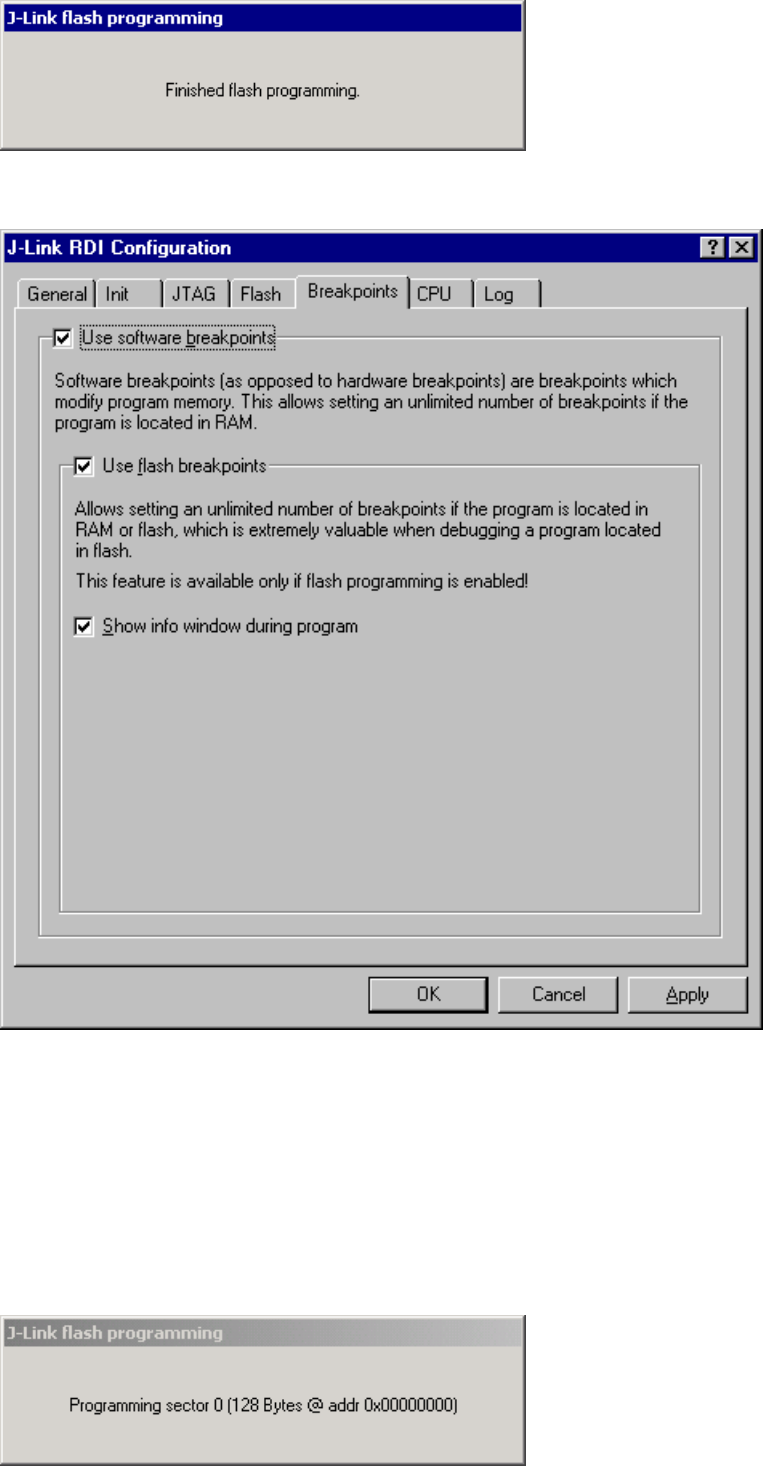
293 CHAPTER 12 Configuration
12.4.4.5 Breakpoints tab
Use software breakpoints
This allows to set an unlimited number of breakpoints if the program is located in RAM by
setting and resetting breakpoints according to program code.
Use flash breakpoints
This allows to set an unlimited number of breakpoints if the program is located either in
RAM or in flash by setting and resetting breakpoints according to program code.
An info window can be displayed while flash breakpoints are used showing the current
operation. Depending on your JTAG speed the info window may hardly to be seen.
J-Link / J-Trace (UM08001) © 2004-2017 SEGGER Microcontroller GmbH & Co. KG
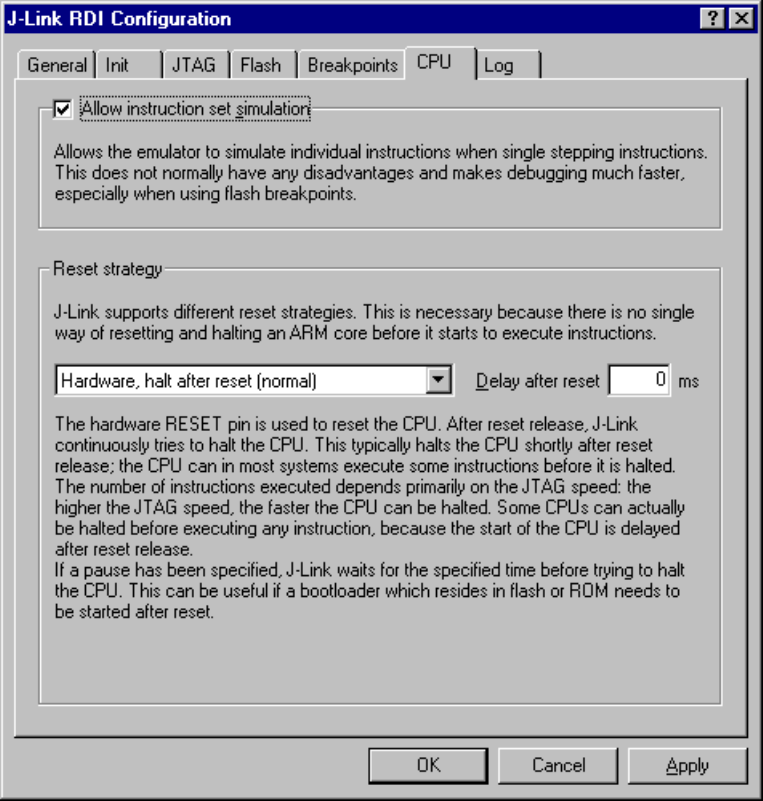
294 CHAPTER 12 Configuration
12.4.4.6 CPU tab
Instruction set simulation
This enables instruction set simulation which speeds up single stepping instructions espe-
cially when using flash breakpoints.
Reset strategy
This defines the way J-Link RDI should handle resets called by software.
J-Link supports different reset strategies. This is necessary because there is no single way
of resetting and halting an ARM core before it starts to execute instructions.
For more information about the different reset strategies which are supported by J-Link and
why different reset strategies are necessary, please refer to Reset strategies .
12.4.4.7 Log tab
A log file can be generated for the J-Link DLL and for the J-Link RDI DLL. This log files may
be useful for debugging and evaluating. They may help you to solve a problem yourself,
but is also needed by customer support help you.
Default path of the J-Link log file: c:\JLinkARM.log
Default path of the J-Link RDI log file: c:\JLinkRDI.log
Example of
logfile content:
J-Link / J-Trace (UM08001) © 2004-2017 SEGGER Microcontroller GmbH & Co. KG

295 CHAPTER 12 Configuration
060:028 (0000) Logging started @ 2005-10-28 07:36
060:028 (0000) DLL Compiled: Oct 4 2005 09:14:54
060:031 (0026) ARM_SetMaxSpeed - Testing speed 3F0F0F0F 3F0F0F0F 3F0F0F0F
3F0F0F0F 3F0F0F0F 3F0F0F0F 3F0F0F0F 3F0F0F0F 3F0F0F0F 3F0F0F0F 3F0F0F0F
3F0F0F0FAuto JTAG speed: 4000 kHz
060:059 (0000) ARM_SetEndian(ARM_ENDIAN_LITTLE)
060:060 (0000) ARM_SetEndian(ARM_ENDIAN_LITTLE)
060:060 (0000) ARM_ResetPullsRESET(ON)
060:060 (0116) ARM_Reset(): SpeedIsFixed == 0 -> JTAGSpeed = 30kHz >48> >2EF>
060:176 (0000) ARM_WriteIceReg(0x02,00000000)
060:177 (0016) ARM_WriteMem(FFFFFC20,0004) -- Data: 01 06 00 00 - Writing 0x4
bytes @ 0xFFFFFC20 >1D7>
060:194 (0014) ARM_WriteMem(FFFFFC2C,0004) -- Data: 05 1C 19 00 - Writing 0x4
bytes @ 0xFFFFFC2C >195>
060:208 (0015) ARM_WriteMem(FFFFFC30,0004) -- Data: 07 00 00 00 - Writing 0x4
bytes @ 0xFFFFFC30 >195>
060:223 (0002) ARM_ReadMem (00000000,0004)JTAG speed: 4000 kHz -- Data: 0C 00 00
EA
060:225 (0001) ARM_WriteMem(00000000,0004) -- Data: 0D 00 00 EA - Writing 0x4
bytes @ 0x00000000 >195>
060:226 (0001) ARM_ReadMem (00000000,0004) -- Data: 0C 00 00 EA
060:227 (0001) ARM_WriteMem(FFFFFF00,0004) -- Data: 01 00 00 00 - Writing 0x4
bytes @ 0xFFFFFF00 >195>
060:228 (0001) ARM_ReadMem (FFFFF240,0004) -- Data: 40 05 09 27
060:229 (0001) ARM_ReadMem (FFFFF244,0004) -- Data: 00 00 00 00
060:230 (0001) ARM_ReadMem (FFFFFF6C,0004) -- Data: 10 01 00 00
060:232 (0000) ARM_WriteMem(FFFFF124,0004) -- Data: FF FF FF FF - Writing 0x4
bytes @ 0xFFFFF124 >195>
060:232 (0001) ARM_ReadMem (FFFFF130,0004) -- Data: 00 00 00 00
060:233 (0001) ARM_ReadMem (FFFFF130,0004) -- Data: 00 00 00 00
060:234 (0001) ARM_ReadMem (FFFFF130,0004) -- Data: 00 00 00 00
060:236 (0000) ARM_ReadMem (FFFFF130,0004) -- Data: 00 00 00 00
060:237 (0000) ARM_ReadMem (FFFFF130,0004) -- Data: 00 00 00 00
060:238 (0001) ARM_ReadMem (FFFFF130,0004) -- Data: 00 00 00 00
060:239 (0001) ARM_ReadMem (FFFFF130,0004) -- Data: 00 00 00 00
060:240 (0001) ARM_ReadMem (FFFFF130,0004) -- Data: 00 00 00 00
060:241 (0001) ARM_WriteMem(FFFFFD44,0004) -- Data: 00 80 00 00 - Writing 0x4
bytes @ 0xFFFFFD44 >195>
060:277 (0000) ARM_WriteMem(00000000,0178) -- Data: 0F 00 00 EA FE FF FF EA ...
060:277 (0000) ARM_WriteMem(000003C4,0020) -- Data: 01 00 00 00 02 00 00 00 ... -
Writing 0x178 bytes @ 0x00000000
060:277 (0000) ARM_WriteMem(000001CC,00F4) -- Data: 30 B5 15 48 01 68 82 68 ... -
Writing 0x20 bytes @ 0x000003C4
060:277 (0000) ARM_WriteMem(000002C0,0002) -- Data: 00 47
060:278 (0000) ARM_WriteMem(000002C4,0068) -- Data: F0 B5 00 27 24 4C 34 4D ... -
Writing 0xF6 bytes @ 0x000001CC
060:278 (0000) ARM_WriteMem(0000032C,0002) -- Data: 00 47
060:278 (0000) ARM_WriteMem(00000330,0074) -- Data: 30 B5 00 24 A0 00 08 49 ... -
Writing 0x6A bytes @ 0x000002C4
060:278 (0000) ARM_WriteMem(000003B0,0014) -- Data: 00 00 00 00 0A 00 00 00 ... -
Writing 0x74 bytes @ 0x00000330
060:278 (0000) ARM_WriteMem(000003A4,000C) -- Data: 14 00 00 00 E4 03 00 00 ... -
Writing 0x14 bytes @ 0x000003B0
060:278 (0000) ARM_WriteMem(00000178,0054) -- Data: 12 4A 13 48 70 B4 81 B0 ... -
Writing 0xC bytes @ 0x000003A4
060:278 (0000) ARM_SetEndian(ARM_ENDIAN_LITTLE)
060:278 (0000) ARM_SetEndian(ARM_ENDIAN_LITTLE)
060:278 (0000) ARM_ResetPullsRESET(OFF)
060:278 (0009) ARM_Reset(): - Writing 0x54 bytes @ 0x00000178 >3E68>
060:287 (0001) ARM_Halt(): **** Warning: Chip has already been halted.
...
J-Link / J-Trace (UM08001) © 2004-2017 SEGGER Microcontroller GmbH & Co. KG
296 CHAPTER 12 Semihosting
12.5 Semihosting
Semihosting can be used with J-Link RDI. For more information how to enable semihosting
in J-Link RDI, please refer to Enabling Semihosting in J-Link RDI + AXD .
12.5.1 Unexpected / unhandled SWIs
When an unhandled SWI is detected by J-Link RDI, the message box below is shown.
J-Link / J-Trace (UM08001) © 2004-2017 SEGGER Microcontroller GmbH & Co. KG

Chapter 13
RTT
SEGGER’s Real Time Terminal (RTT) is a technology for interactive user I/O in embedded ap-
plications. It combines the advantages of SWO and semihosting at very high performance.
J-Link / J-Trace (UM08001) © 2004-2017 SEGGER Microcontroller GmbH & Co. KG
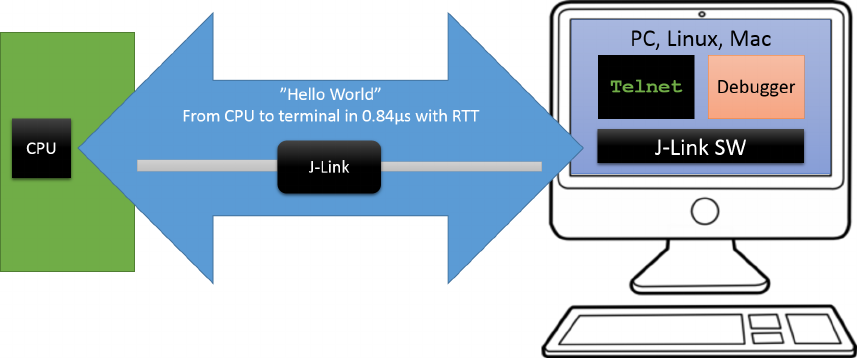
298 CHAPTER 13 Introduction
13.1 Introduction
With RTT it is possible to output information from the target microcontroller as well as
sending input to the application at a very high speed without affecting the target’s real
time behavior.
SEGGER RTT can be used with any J-Link model and any supported target processor which
allows background memory access, which are Cortex-M and RX targets.
RTT supports multiple channels in both directions, up to the host and down to the target,
which can be used for different purposes and provide the most possible freedom to the user.
The default implementation uses one channel per direction, which are meant for printable
terminal input and output. With the J-Link RTT Viewer this channel can be used for multiple
“virtual” terminals, allowing to print to multiple windows (e.g. one for standard output, one
for error output, one for debugging output) with just one target buffer. An additional up (to
host) channel can for example be used to send profiling or event tracing data.
J-Link / J-Trace (UM08001) © 2004-2017 SEGGER Microcontroller GmbH & Co. KG
299 CHAPTER 13 How RTT works
13.2 How RTT works
13.2.1 Target implementation
Real Time Terminal uses a SEGGER RTT Control Block structure in the target’s memory
to manage data reads and writes. The control block contains an ID to make it findable
in memory by a connected J-Link and a ring buffer structure for each available channel,
describing the channel buffer and its state. The maximum number of available channels
can be configured at compile time and each buffer can be configured and added by the
application at run time. Up and down buffers can be handled separately. Each channel can
be configured to be blocking or non-blocking. In blocking mode the application will wait
when the buffer is full, until all memory could be written, resulting in a blocked application
state but preventing data from getting lost. In non-blocking mode only data which fits into
the buffer, or none at all, will be written and the rest will be discarded. This allows running
in real-time, even when no debugger is connected. The developer does not have to create
a special debug version and the code can stay in place in a release application.
13.2.2 Locating the Control Block
When RTT is active on the host computer, either by using RTT directly via an application
like RTT Viewer or by connecting via Telnet to an application which is using J-Link, like a
debugger, J-Link automatically searches for the SEGGER RTT Control Block in the target’s
known RAM regions. The RAM regions or the specific address of the Control Block can
also be set via the host applications to speed up detection or if the block cannot be found
automatically.
13.2.2.1 Manual specification of the Control Block location
While auto-detection of the RTT control block location works fine for most targets, it is
always possible to manually specify either the exact location of the control block or to
specify a certain address range J-Link shall search for a control block for in. This is done
via the following command strings:
•SetRTTAddr
•SetRTTSearchRanges
For more information about how to use J-Link command strings in various environments,
please refer to Using command strings
13.2.3 Internal structures
There may be any number of “Up Buffer Descriptors” (Target -> Host), as well as any
number of “Down Buffer Descriptors” (Host -> Target). Each buffer size can be configured
individually.
The gray areas in the buffers are the areas that contain valid data.
For Up buffers, the Write Pointer is written by the target, the Read Pointer is written by
the debug probe (J-Link, Host).
When Read and Write Pointers point to the same element, the buffer is empty. This assures
there is never a race condition. The image shows the simplified structure in the target.
J-Link / J-Trace (UM08001) © 2004-2017 SEGGER Microcontroller GmbH & Co. KG
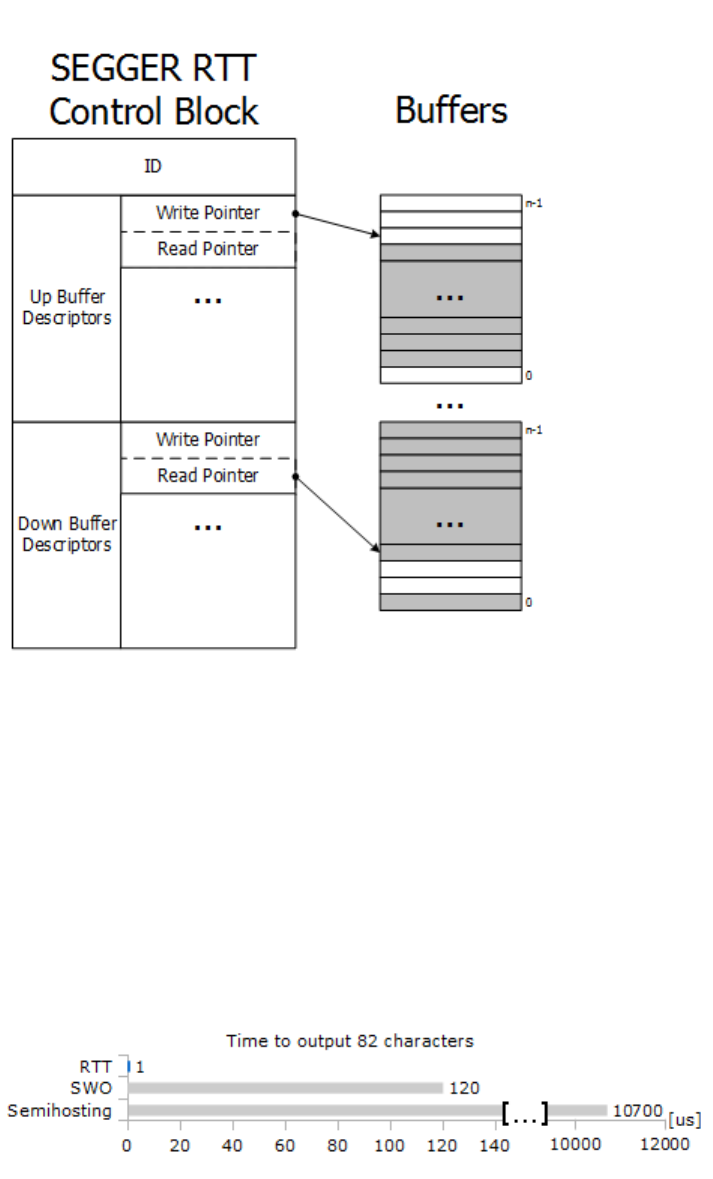
300 CHAPTER 13 How RTT works
13.2.4 Requirements
SEGGER RTT does not need any additional pin or hardware, despite a J-Link connected via
the standard debug port to the target. It does not require any configuration of the target
or in the debugging environment and can even be used with varying target speeds.
RTT can be used in parallel to a running debug session, without intrusion, as well as without
any IDE or debugger at all.
13.2.5 Performance
The performance of SEGGER RTT is significantly higher than any other technology used to
output data to a host PC. An average line of text can be output in one microsecond or less.
Basically only the time to do a single memcopy().
13.2.6 Memory footprint
The RTT implementation code uses ~500 Bytes of ROM and 24 Bytes ID + 24 Bytes per
channel for the control block in RAM. Each channel requires some memory for the buffer.
The recommended sizes are 1 kByte for up channels and 16 to 32 Bytes for down channels
depending on the load of in- / output.
J-Link / J-Trace (UM08001) © 2004-2017 SEGGER Microcontroller GmbH & Co. KG
301 CHAPTER 13 RTT Communication
13.3 RTT Communication
Communication with the RTT implementation on the target can be done with different ap-
plications. The functionality can even be integrated into custom applications using the J-
Link SDK.
Using RTT in the target application is made easy. The implementation code is freely available
for download and can be integrated into any existing application. To communicate via RTT
any J-Link can be used.
The simple way to communicate via the Terminal (Channel 0) is to create a connection
to localhost:19021 with a Telnet client or similar, when a connection to J-Link (e.g. via a
debug session) is active.
The J-Link Software Package comes with some more advanced applications, which demon-
strates RTT functionality for different purposes.
13.3.1 RTT Viewer
The J-Link RTT Viewer is described in J-Link RTT Viewer .
13.3.2 RTT Client
J-Link RTT Client acts as a Telnet client, but automatically tries to reconnect to a J-Link
connection when a debug session is closed.
The J-Link RTT Client is part of the J-Link Software and Documentation Pack for Windows,
Linux and OS X and can be used for simple RTT use cases.
13.3.3 RTT Logger
With J-Link RTT Logger, data from Up-Channel 1 can be read and logged to a file. This
channel can for example be used to send performance analysis data to the host.
J-Link RTT Logger opens a dedicated connection to J-Link and can be used stand-alone,
without running a debugger.
The application is part of the J-Link Software and Documentation Pack for Windows, Linux
and OS X.
The source of J-Link RTT Logger can be used as a starting point to integrate RTT in other
PC applications, like debuggers, and is part of the J-Link SDK.
13.3.4 RTT in other host applications
RTT can also be integrated in any other PC application like a debugger or a data visualizer
in either of two ways.
• The application can establish a socket connection to the RTT Telnet Server which is
opened on localhost:19021 when a J-Link connection is active.
• The application creates its own connection to J-Link and uses the J-Link RTT API which
is part of the J-Link SDK to directly configure and use RTT.
J-Link / J-Trace (UM08001) © 2004-2017 SEGGER Microcontroller GmbH & Co. KG
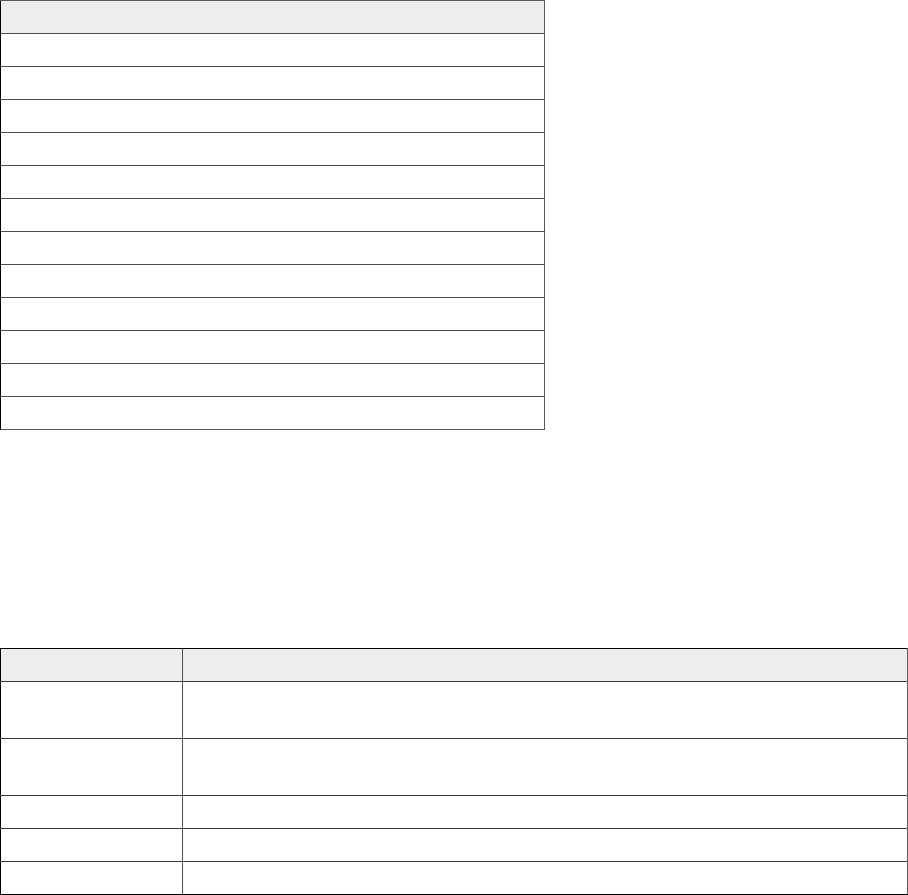
302 CHAPTER 13 Implementation
13.4 Implementation
The SEGGER RTT implementation code is written in ANSI C and can be integrated into any
embedded application by simply adding the available sources.
RTT can be used via a simple and easy to use API. It is even possible to override the standard
printf() functions to be used with RTT. Using RTT reduces the time taken for output to a
minimum and allows printing debug information to the host computer while the application
is performing time critical real time tasks.
The implementation code also includes a simple version of printf() which can be used to
write formatted strings via RTT. It is smaller than most standard library printf() implemen-
tations and does not require heap and only a configurable amount of stack.
The SEGGER RTT implementation is fully configurable at compile time with pre-processor
defines. The number of channels, the size of the default channels can be set. Reading and
writing can be made task-safe with definable Lock() and Unlock() routines.
13.4.1 API functions
The following API functions are available in the RTT Implementation. To use them SEG-
GER_RTT.h has to be included in the calling sources.
API functions
SEGGER_RTT_ConfigDownBuffer()
SEGGER_RTT_ConfigUpBuffer()
SEGGER_RTT_GetKey()
SEGGER_RTT_HasKey()
SEGGER_RTT_Init()
SEGGER_RTT_printf()
SEGGER_RTT_Read()
SEGGER_RTT_SetTerminal()
SEGGER_RTT_TerminalOut()
SEGGER_RTT_WaitKey()
SEGGER_RTT_Write()
SEGGER_RTT_WriteString()
13.4.1.1 SEGGER_RTT_ConfigDownBuffer()
Configure or add a down buffer by specifying its name, size and flags.
Syntax
int SEGGER_RTT_ConfigDownBuffer (unsigned BufferIndex, const char* sName,
char* pBuffer, int BufferSize, int Flags);
Parameter Meaning
BufferIndex Index of the buffer to configure.
Must be lower than SEGGER_RTT_MAX_NUM_DOWN_CHANNELS.
sName Pointer to a 0-terminated string to be displayed as the name of the
channel.
pBuffer Pointer to a buffer used by the channel.
BufferSize Size of the buffer in Bytes.
Flags Flags of the channel (blocking or non-blocking).
J-Link / J-Trace (UM08001) © 2004-2017 SEGGER Microcontroller GmbH & Co. KG
303 CHAPTER 13 Implementation
Return value
Value Meaning
≥ 0 O.K.
< 0 Error
Example
//
// Configure down channel 1
//
SEGGER_RTT_ConfigDownChannel(1, "DataIn", &abDataIn[0], sizeof(abDataIn),
SEGGER_RTT_MODE_NO_BLOCK_SKIP);
Additional information
Once a channel is configured only the flags of the channel should be changed.
13.4.1.2 SEGGER_RTT_ConfigUpBuffer()
Configure or add an up buffer by specifying its name, size and flags.
Syntax
int SEGGER_RTT_ConfigUpBuffer (unsigned BufferIndex, const char* sName, char*
pBuffer, int BufferSize, int Flags);
Parameter Meaning
BufferIndex Index of the buffer to configure.
Must be lower than SEGGER_RTT_MAX_NUM_UP_CHANNELS.
sName Pointer to a 0-terminated string to be displayed as the name of the
channel.
pBuffer Pointer to a buffer used by the channel.
BufferSize Size of the buffer in Bytes.
Flags Flags of the channel (blocking or non-blocking).
Return value
Value Meaning
≥ 0 O.K.
< 0 Error
Example
//
// Configure up channel 1 to work in blocking mode
//
SEGGER_RTT_ConfigUpChannel(1, "DataOut", &abDataOut[0], sizeof(abDataOut),
SEGGER_RTT_MODE_BLOCK_IF_FIFO_FULL);
Additional information
Once a channel is configured only the flags of the channel should be changed.
13.4.1.3 SEGGER_RTT_GetKey()
Reads one character from SEGGER RTT buffer 0. Host has previously stored data there.
J-Link / J-Trace (UM08001) © 2004-2017 SEGGER Microcontroller GmbH & Co. KG
304 CHAPTER 13 Implementation
Syntax
int SEGGER_RTT_GetKey (void);
Return value
Value Meaning
≥ 0 Character which has been read (0 - 255).
< 0 No character available (empty buffer).
Example
int c;
c = SEGGER_RTT_GetKey();
if (c == 'q') {
exit();
}
13.4.1.4 SEGGER_RTT_HasKey()
Checks if at least one character for reading is available in SEGGER RTT buffer.
Syntax
int SEGGER_RTT_HasKey (void);
Return value
Value Meaning
1 At least one character is available in the buffer.
0 No characters are available to be read.
Example
if (SEGGER_RTT_HasKey()) {
int c = SEGGER_RTT_GetKey();
}
13.4.1.5 SEGGER_RTT_Init()
Initializes the RTT Control Block.
Syntax
void SEGGER_RTT_Init (void);
Additional information
Should be used in RAM targets, at start of the application.
13.4.1.6 SEGGER_RTT_printf()
Send a formatted string to the host.
Syntax
int SEGGER_RTT_printf (unsigned BufferIndex, const char * sFormat, …)
Parameter Meaning
BufferIndex Index of the up channel to sent the string to.
sFormat Pointer to format string, followed by arguments for conversion.
J-Link / J-Trace (UM08001) © 2004-2017 SEGGER Microcontroller GmbH & Co. KG
305 CHAPTER 13 Implementation
Return value
Value Meaning
≥ 0 Number of bytes which have been sent.
< 0 Error.
Example
SEGGER_RTT_printf(0, "SEGGER RTT Sample. Uptime: %.10dms.", /*OS_Time*/ 890912);
// Formatted output on channel 0: SEGGER RTT Sample. Uptime: 890912ms.
Additional information
(1) Conversion specifications have following syntax:
• %[flags][FieldWidth][.Precision]ConversionSpecifier
(2) Supported flags:
• -: Left justify within the field width
• +: Always print sign extension for signed conversions
• 0: Pad with 0 instead of spaces. Ignored when using ’-’-flag or precision
(3) Supported conversion specifiers:
• c: Print the argument as one char
• d: Print the argument as a signed integer
• u: Print the argument as an unsigned integer
• x: Print the argument as an hexadecimal integer
• s: Print the string pointed to by the argument
• p: Print the argument as an 8-digit hexadecimal integer. (Argument shall be a pointer
to void.)
13.4.1.7 SEGGER_RTT_Read()
Read characters from any RTT down channel which have been previously stored by the host.
Syntax
unsigned SEGGER_RTT_Read (unsigned BufferIndex, char* pBuffer, unsigned
BufferSize);
Parameter Meaning
BufferIndex Index of the down channel to read from.
pBuffer Pointer to a character buffer to store the read characters.
BufferSize Number of bytes available in the buffer.
Return value
Value Meaning
≥ 0 Number of bytes that have been read.
Example
char acIn[4];
unsigned NumBytes = sizeof(acIn);
NumBytes = SEGGER_RTT_Read(0, &acIn[0], NumBytes);
if (NumBytes) {
AnalyzeInput(acIn);
}
J-Link / J-Trace (UM08001) © 2004-2017 SEGGER Microcontroller GmbH & Co. KG
306 CHAPTER 13 Implementation
13.4.1.8 SEGGER_RTT_SetTerminal()
Set the “virtual” terminal to send following data on channel 0.
Syntax
void SEGGER_RTT_SetTerminal(char TerminalId);
Parameter Meaning
TerminalId Id of the virtual terminal (0-9).
Example
//
// Send a string to terminal 1 which is used as error out.
//
SEGGER_RTT_SetTerminal(1); // Select terminal 1
SEGGER_RTT_WriteString(0, "ERROR: Buffer overflow");
SEGGER_RTT_SetTerminal(0); // Reset to standard terminal
Additional information
All following data which is sent via channel 0 will be printed on the set terminal until the
next change.
13.4.1.9 SEGGER_RTT_TerminalOut()
Send one string to a specific “virtual” terminal.
Syntax
int SEGGER_RTT_TerminalOut (char TerminalID, const char* s);
Parameter Meaning
TerminalId Id of the virtual terminal (0-9).
sPointer to 0-terminated string to be sent.
Return value
Value Meaning
≥ 0 Number of bytes sent to the terminal.
< 0 Error
Example
//
// Sent a string to terminal 1 without changing the standard terminal.
//
SEGGER_RTT_TerminalOut(1, "ERROR: Buffer overflow.");
Additional information
SEGGER_RTT_TerminalOut does not affect following data which is sent via channel 0.
13.4.1.10 SEGGER_RTT_Write()
Send data to the host on an RTT channel.
J-Link / J-Trace (UM08001) © 2004-2017 SEGGER Microcontroller GmbH & Co. KG
307 CHAPTER 13 Implementation
Syntax
unsigned SEGGER_RTT_Write (unsigned BufferIndex, const char* pBuffer, un-
signed NumBytes);
Parameter Meaning
BufferIndex Index of the up channel to send data to.
pBuffer Pointer to data to be sent.
NumBytes Number of bytes to send.
Return value
Value Meaning
≥ 0 Number of bytes which have been
sent
Additional information
With SEGGER_RTT_Write() all kinds of data, not only printable one can be sent.
13.4.1.11 SEGGER_RTT_WaitKey()
Waits until at least one character is available in SEGGER RTT buffer 0. Once a character
is available, it is read and returned.
Syntax
int SEGGER_RTT_WaitKey (void);
Return value
Value Meaning
≥ 0 Character which has been read (0 - 255).
Example
int c = 0;
do {
c = SEGGER_RTT_WaitKey();
} while (c != 'c');
13.4.1.12 SEGGER_RTT_WriteString()
Write a 0-terminated string to an up channel via RTT.
Syntax
unsigned SEGGER_RTT_WriteSting (unsigned BufferIndex, const char* s);
Parameter Meaning
BufferIndex Index of the up channel to send string to.
sPointer to 0-terminated string to be sent.
Return value
Value Meaning
≥ 0 Number of bytes which have been sent.
J-Link / J-Trace (UM08001) © 2004-2017 SEGGER Microcontroller GmbH & Co. KG

308 CHAPTER 13 Implementation
Example
SEGGER_RTT_WriteString(0, "Hello World from your target.\n");
13.4.2 Configuration defines
13.4.2.1 RTT configuration
SEGGER_RTT_MAX_NUM_DOWN_BUFFERS
Maximum number of down (to target) channels.
SEGGER_RTT_MAX_NUM_UP_BUFFERS
Maximum number of up (to host) channels.
BUFFER_SIZE_DOWN
Size of the buffer for default down channel 0.
BUFFER_SIZE_UP
Size of the buffer for default up channel 0.
SEGGER_RTT_PRINT_BUFFER_SIZE
Size of the buffer for SEGGER_RTT_printf to bulk-send chars.
SEGGER_RTT_LOCK()
Locking routine to prevent interrupts and task switches from within an RTT operation.
SEGGER_RTT_UNLOCK()
Unlocking routine to allow interrupts and task switches after an RTT operation.
SEGGER_RTT_IN_RAM
Indicate the whole application is in RAM to prevent falsely identifying the RTT Control Block
in the init segment by defining as 1.
13.4.2.2 Channel buffer configuration
SEGGER_RTT_MODE_BLOCK_IF_FIFO_FULL
A call to a writing function will block, if the up buffer is full.
SEGGER_RTT_NO_BLOCK_SKIP
If the up buffer has not enough space to hold all of the incoming data, nothing is written
to the buffer.
SEGGER_RTT_NO_BLOCK_TRIM
If the up buffer has not enough space to hold all of the incoming data, the available space
is filled up with the incoming data while discarding any excess data.
Note
SEGGER_RTT_TerminalOut ensures that implicit terminal switching commands are al-
ways sent out, even while using the non-blocking modes.
J-Link / J-Trace (UM08001) © 2004-2017 SEGGER Microcontroller GmbH & Co. KG
309 CHAPTER 13 Implementation
13.4.2.3 Color control sequences
RTT_CTRL_RESET
Reset the text color and background color.
RTT_CTRL_TEXT_*
Set the text color to one of the following colors.
• BLACK
• RED
• GREEN
• YELLOW
• BLUE
• MAGENTA
• CYAN
• WHITE (light grey)
•BRIGHT_BLACK (dark grey)
•BRIGHT_RED
•BRIGHT_GREEN
•BRIGHT_YELLOW
•BRIGHT_BLUE
•BRIGHT_MAGENTA
•BRIGHT_CYAN
•BRIGHT_WHITE
RTT_CTRL_BG_*
Set the background color to one of the following colors.
• BLACK
• RED
• GREEN
• YELLOW
• BLUE
• MAGENTA
• CYAN
• WHITE (light grey)
•BRIGHT_BLACK (dark grey)
•BRIGHT_RED
•BRIGHT_GREEN
•BRIGHT_YELLOW
•BRIGHT_BLUE
•BRIGHT_MAGENTA
•BRIGHT_CYAN
•BRIGHT_WHITE
J-Link / J-Trace (UM08001) © 2004-2017 SEGGER Microcontroller GmbH & Co. KG
310 CHAPTER 13 ARM Cortex - Background memory access
13.5 ARM Cortex - Background memory access
On ARM Cortex targets, background memory access necessary for RTT is performed via a
so-called AHB-AP which is similar to a DMA but exclusively accessible by the debug probe.
While on Cortex-M targets there is always an AHB-AP present, on Cortex-A and Cortex-R
targets this is an optional component. CortexA/R targets may implement multiple APs (some
even not an AHB-AP at all), so in order to use RTT on Cortex-A/R targets, the index of the
AP which is the AHB-AP that shall be used for RTT background memory access, needs to
be manually specified.
This is done via the following J-Link Command string: CORESIGHT_SetIndexAHBAPToUse .
For more information about how to use J-Link command strings in various environments,
please refer to Using command strings .
J-Link / J-Trace (UM08001) © 2004-2017 SEGGER Microcontroller GmbH & Co. KG

311 CHAPTER 13 Example code
13.6 Example code
/*********************************************************************
* SEGGER MICROCONTROLLER GmbH & Co KG *
* Solutions for real time microcontroller applications *
**********************************************************************
* *
* (c) 2014-2017 SEGGER Microcontroller GmbH & Co KG *
* *
* www.segger.com Support: support@segger.com *
* *
**********************************************************************
----------------------------------------------------------------------
File : RTT.c
Purpose : Simple implementation for output via RTT.
It can be used with any IDE.
---------------------------- END-OF-HEADER ---------------------------
*/
#include "SEGGER_RTT.h"
static void _Delay(int period) {
int i = 100000*period;
do { ; } while (i--);
}
int main(void) {
int Cnt = 0;
SEGGER_RTT_WriteString(0, "Hello World from SEGGER!\n");
do {
SEGGER_RTT_printf("%sCounter: %s%d\n",
RTT_CTRL_TEXT_BRIGHT_WHITE,
RTT_CTRL_TEXT_BRIGHT_GREEN,
Cnt);
if (Cnt > 100) {
SEGGER_RTT_TerminalOut(1, RTT_CTRL_TEXT_BRIGHT_RED"Counter overflow!");
Cnt = 0;
}
_Delay(100);
Cnt++;
} while (1);
return 0;
}
/*************************** End of file ****************************/
J-Link / J-Trace (UM08001) © 2004-2017 SEGGER Microcontroller GmbH & Co. KG

312 CHAPTER 13 FAQ
13.7 FAQ
Q: How does J-Link find the RTT buffer?
A: There are two ways: If the debugger (IDE) knows the address of the SEGGER RTT
Control Block, it can pass it to J-Link. This is for example done by J-Link Debugger. If
another application that is not SEGGER RTT aware is used, then J-Link searches for the
ID in the known target RAM during execution of the application in the background. This
process normally takes just fractions of a second and does not delay program execution.
Q: I am debugging a RAM-only application. J-Link finds an RTT buffer, but I get no output.
What can I do?
A: In case the init section of an application is stored in RAM, J-Link might falsely identify
the block in the init section instead of the actual one in the data section. To prevent
this, set the define SEGGER_RTT_IN_RAM to 1. Now J-Link will find the correct RTT
buffer, but only after calling the first SEGGER_RTT function in the application. A call to
SEGGER_RTT_Init() at the beginning of the application is recommended.
Q: Can this also be used on targets that do not have the SWO pin?
A: Yes, the debug interface is used. This can be JTAG or SWD (2pins only!) on most Cortex-
M devices, or even the FINE interface on some Renesas devices, just like the Infineon
SPD interface (single pin!).
Q: Can this also be used on Cortex-M0 and M0+?
A: Yes.
Q: Some terminal output (printf) Solutions “crash” program execution when executed
outside of the debug environment, because they use a Software breakpoint that triggers
a hardfault without debugger or halt because SWO is not initialized. That makes it
impossible to run a Debug-build in stand-alone mode. What about SEGGER-RTT?
A: SEGGER-RTT uses non-blocking mode per default, which means it does not halt program
execution if no debugger is present and J-Link is not even connected. The application
program will continue to work.
Q: I do not see any output, although the use of RTT in my application is correct. What
can I do?
A: In some cases J-Link cannot locate the RTT buffer in the known RAM region. In this case
the possible region or the exact address can be set manually via a J-Link exec command:
• Set ranges to be searched for RTT buffer: SetRTTSearchRanges <RangeStart [Hex]>
<RangeSize >[, <Range1Start [Hex]> <Range1Size>, …] (e.g. “SetRTTSearchRanges
0x10000000 0x1000, 0x2000000 0x1000”)
• Set address of the RTT buffer: SetRTTAddr <RTTBufferAddress [Hex]> (e.g.
“SetRTTAddr 0x20000000”)
• Set address of the RTT buffer via J-Link Control Panel -> RTTerminal
Note
J-Link exec commands can be executed in most applications, for example in J-Link
Commander via “exec <Command>”, in J-Link GDB Server via “monitor exec <Com-
mand>” or in IAR EW via “__jlinkExecCommand(”<Command>“);” from a macro file.
J-Link / J-Trace (UM08001) © 2004-2017 SEGGER Microcontroller GmbH & Co. KG

Chapter 14
Trace
This chapter provides information about tracing in general as well as information about how
to use SEGGER J-Trace.
J-Link / J-Trace (UM08001) © 2004-2017 SEGGER Microcontroller GmbH & Co. KG

314 CHAPTER 14 Introduction
14.1 Introduction
With increasing complexity of embedded systems, demands to debug probes and utilities
(IDE, …) increase too. With tracing, it is possible to get an even better idea about what is
happening / has happened on the target system, in case of tracking down a specific error.
A special trace component in the target CPU (e.g. ETM on ARM targets) registers instruc-
tion fetches done by the CPU as well as some additional actions like execution/skipping
of conditional instructions, target addresses of branch/jump instructions etc. and provides
these events to the trace probe. Instruction trace allows reproducing what instructions have
been executed by the CPU in which order, which conditional instructions have been exe-
cuted/skipped etc., allowing to reconstruct a full execution flow of the CPU.
Note
To use any of the trace features mentioned in this chapter, the CPU needs to implement
this specific trace hardware unit. For more information about which targets support
tracing, please refer to Target devices with trace support .
14.1.1 What is backtrace?
Makes use of the information got from instruction trace and reconstructs the instruction
flow from a specific point (e.g. when a breakpoint is hit) backwards as far as possible with
the amount of sampled trace data.
Example scenario: A breakpoint is set on a specific error case in the source that the ap-
plication occasionally hits. When the breakpoint is hit, the debugger can recreate the in-
struction flow, based on the trace data provided by J-Trace, of the last xx instructions that
have been executed before the breakpoint was hit. This for example allows tracking down
very complex problems like interrupts related ones, that are hard to find with traditional
debugging methods (stepping, printf debugging, …) as they change the real-time behavior
of the application and therefore might make the problem to disappear.
14.1.2 What is streaming trace?
There are two common approaches how a trace probe collects trace data:
1. Traditional trace:
Collects trace data while the CPU is running and stores them in a buffer on the trace robe.
If the buffer is full, writes continues at the start of the buffer, overwriting the oldest trace
data in it. The debugger on the PC side can request trace data from the probe only when
the target CPU is halted. This allows doing backtrace as described in What is backtrace?
on page 314.
2. Streaming trace:
Trace data is collected while the CPU is running but streamed to the PC in real-time, while
the target CPU continues to execute code. This increases the trace buffer (and therefore
the amount of trace data that can be stored) to an theoretically unlimited size (on modern
systems multiple terabytes). Streaming trace allows to implement more complex trace
features like code coverage and code profiling as these require a complete instruction flow,
not only the last xx executed instructions, to provide real valuable data.
14.1.3 What is code coverage?
Code coverage metrics are a way to describe the “quality” of code, as “code that is not
tested does not work”. A code coverage analyzer measures the execution of code and shows
how much of a source line, block, function or file has been executed. With this information it
is possible to detect code which has not been covered by tests or may even be unreachable.
J-Link / J-Trace (UM08001) © 2004-2017 SEGGER Microcontroller GmbH & Co. KG

315 CHAPTER 14 Introduction
This enables a fast and efficient way to improve the code or to create a suitable test suite
for uncovered blocks.
Note
This feature also requires a J-Trace that supports streaming trace.
14.1.4 What is code profiling?
Code profiling is a form of measuring the execution time and the execution count of func-
tions, blocks or instructions. It can be used as a metric for the complexity of a system and
can highlight where computing time is spent. This provides a great insight into the running
system and is essential when identifying code that is executed frequently, potentially plac-
ing a high load onto a system. The code profiling information can help to easier optimize a
system, as it accurately shows which blocks take the most time and are worth optimizing.
Note
This feature also requires a J-Trace that supports streaming trace.
J-Link / J-Trace (UM08001) © 2004-2017 SEGGER Microcontroller GmbH & Co. KG
316 CHAPTER 14 Tracing via trace pins
14.2 Tracing via trace pins
This is the most common tracing method, as it also allows to use streaming trace. The
target outputs trace data + a trace clock on specific pins. These pins are sampled by J-
Trace and trace data is collected. As trace data is output with a relatively high frequency
(easily ≥ 100 MHz on modern embedded systems) a high end hardware is necessary on
the trace probe (J-Trace) to be able to sample and digest the trace data sent by the target
CPU. Our J-Trace models support up to 4-bit trace which can be manually set by the user
by overwriting the global variable JLINK_TRACE_Portwidth which is set to 4 by default.
Please refer to Global DLL variables .
14.2.1 Cortex-M specifics
The trace clock output by the CPU is usually 1/2 of the speed of the CPU clock, but trace
data is output double data rate, meaning on each edge of the trace clock. There are usually
4 trace data pins on which data is output, resulting in 1 byte trace data being output per
trace clock (2 * 4 bits).
14.2.2 Trace signal timing
There are certain signal timings that must be met, such as rise/fall timings for clock and
data, as well as setup and hold timings for the trace data. These timings are specified by
the vendor that designs the trace hardware unit (e.g. ARM that provides the ETM as a trace
component for their cores). For more information about what timings need to be met for a
specific J-Trace model, please refer to J-Link / J-Trace models .
14.2.3 Adjusting trace signal timing on J-Trace
Some target CPUs do not meet the trace timing requirements when it comes to the trace
data setup times (some output the trace data at the same time they output a trace clock
edge, resulting on effectively no setup time). Another case where timing requirements may
not be met is for example when having one trace data line on a hardware that is longer than
the other ones (necessary due to routing requirements on the PCB). For such cases, higher
end J-Trace models, like J-Trace PRO, allow to adjust the timing of the trace signals, inside
the J-Trace firmware. For example, in case the target CPU does not provide a (sufficient)
trace data setup time, the data sample timing can be adjusted inside J-Trace. This causes
the data edges to be recognized by J-Trace delayed, virtually creating a setup time for the
trace data.
The trace signals can be adjusted via the TraceSampleAdjust command string. For more
information about the syntax of this command string, please refer to Command strings .
For more information about how to use command strings in different environments, please
refer to Using command strings . The following graphic illustrates how a adjustment of the
trace data signal affects the sampling of the trace data inside the J-Trace firmware.
• TCLK = trace clock output by target
• TDx = Trace data 0-3 output by target
• TDx + Δtd = Trace data seen by J-Trace firmware
As can be seen in the following drawings, by moving the sampling point of the TDx signal,
a setup time for the trace data is generated (∆td). This can be used to enable tracing on
targets that do not provide a setup time for the trace data.
J-Link / J-Trace (UM08001) © 2004-2017 SEGGER Microcontroller GmbH & Co. KG
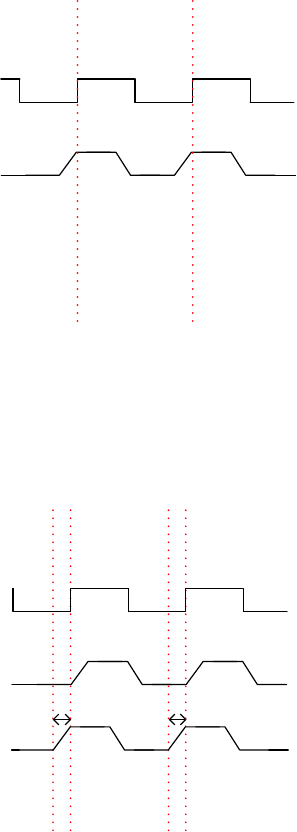
317 CHAPTER 14 Tracing via trace pins
a)
TCLK
TDx
Drawing a) shows the correct behavior of a target and b) shows a target that does not
apply setup times. Therefore in b) the undelayed signal TDx would be sampled as a logical
0 at the rising edge of TCLK which would give the J-Trace wrong tracing information. In the
case where the sample point of TDx is moved to the left (negative) by ∆td at each rising
TCLK edge a logical 1 is sampled which in this case means that the J-Trace now receives
the correct trace information.
TCLK
TDx
TDx + Δtd
ΔtdΔtd
b)
14.2.4 J-Trace models with support for streaming trace
For an overview which J-Trace models support streaming trace, please refer to
SEGGER Wiki: J-Link / J-Trace / Flasher Software and Hardware features overview .
J-Link / J-Trace (UM08001) © 2004-2017 SEGGER Microcontroller GmbH & Co. KG

318 CHAPTER 14 Tracing with on-chip trace buffer
14.3 Tracing with on-chip trace buffer
Some target CPUs provide trace functionality also provide an on-chip trace buffer that is
used to store the trace data output by the trace hardware unit on the device. This allows
to also do trace on such targets with a regular J-Link, as the on-chip trace buffer can be
read out via the regular debug interface J-Link uses to communicate with the target CPU.
Downside of this implementation is that it needs RAM on the target CPU that can be used
as a trace buffer. This trace buffer is very limited (usually between 1 and 4 KB) and reduces
the RAM that can be used by the target application, while tracing is done.
Note
Streaming trace is not possible with this trace implementation
14.3.1 CPUs that provide tracing via pins and on-chip buffer
Some CPUs provide a choice to either use the on-chip trace buffer for tracing (e.g. when
the trace pins are needed as GPIOs etc. or are not available on all packages of the device).
•For J-Link: The on-chip trace buffer is automatically used, as this is the only method
J-Link supports.
•For J-Trace: By default, tracing via trace pins is used. If, for some reason, the on-chip
trace buffer shall be used instead, the J-Link software needs to be made aware of this.
The trace source can be selected via the SelectTraceSource command string. For more
information about the syntax of this command string, please refer to Command strings
. For more information about how to use command strings in different environments,
please refer to Using command strings .
J-Link / J-Trace (UM08001) © 2004-2017 SEGGER Microcontroller GmbH & Co. KG
319 CHAPTER 14 Target devices with trace support
14.4 Target devices with trace support
For an overview for which target devices trace is supported (either via pins or via on-chip
trace buffer), please refer to List of supported target devices .
J-Link / J-Trace (UM08001) © 2004-2017 SEGGER Microcontroller GmbH & Co. KG
320 CHAPTER 14 Streaming trace
14.5 Streaming trace
With introducing streaming trace, some additional concepts needed to be introduced in or-
der to make real time analysis of the trace data possible. In the following, some considera-
tions and specifics, that need to be kept in mind when using streaming trace, are explained.
14.5.1 Download and execution address differ
Analysis of trace data requires that J-Trace needs know which instruction is present at what
address on the target device. As reading from the target memory every time is not feasible
during live analysis (would lead to a too big performance drop), a copy of the application
contents is cached in the J-Link software at the time the application download is performed.
This implies that streaming trace is only possible with prior download of the application in
the same debug session. This also implies that the execution address needs to be the same
as the download address. In case both addresses differ from each other, the J-Link software
needs to be told that the unknown addresses hold the same data as the cached ones. This is
done via the ReadIntoTraceCache command string. For more information about the syntax
of this command string, please refer to Command strings . For more information about how
to use command strings in different environments, please refer to Using command strings .
14.5.2 Do streaming trace without prior download
Same specifics as for “load and execution address differ” applies.
Please refer to Download and execution address differ .
J-Link / J-Trace (UM08001) © 2004-2017 SEGGER Microcontroller GmbH & Co. KG

Chapter 15
Target interfaces and adapters
This chapter gives an overview about J-Link / J-Trace specific hardware details, such as the
pinouts and available adapters.
J-Link / J-Trace (UM08001) © 2004-2017 SEGGER Microcontroller GmbH & Co. KG

322 CHAPTER 15 20-pin J-Link connector
15.1 20-pin J-Link connector
15.1.1 Pinout for JTAG
J-Link and J-Trace have a JTAG connector compatible to ARM’s Multi-ICE. The JTAG con-
nector is a 20 way Insulation Displacement Connector (IDC) keyed box header (2.54mm
male) that mates with IDC sockets mounted on a ribbon cable.
*On later J-Link products like the J-link ULTRA, these pins are reserved for firmware exten-
sion purposes. They can be left open or connected to GND in normal debug environment.
They are not essential for JTAG/SWD in general.
The following table lists the J-Link / J-Trace JTAG pinout.
PIN SIGNAL TYPE Description
1VTref Input
This is the target reference voltage. It is used to check if the
target has power, to create the logic-level reference for the in-
put comparators and to control the output logic levels to the
target. It is normally fed from VDD of the target board and
must not have a series resistor.
2Not
connected NC This pin is not connected in J-Link.
3nTRST Output
JTAG Reset. Output from J-Link to the Reset signal of the tar-
get JTAG port. Typically connected to nTRST of the target CPU.
This pin is normally pulled HIGH on the target to avoid unin-
tentional resets when there is no connection.
5TDI Output JTAG data input of target CPU. It is recommended that this pin
is pulled to a defined state on the target board. Typically con-
nected to TDI of the target CPU.
7TMS Output JTAG mode set input of target CPU. This pin should be pulled
up on the target. Typically connected to TMS of the target
CPU.
9TCK Output JTAG clock signal to target CPU. It is recommended that this
pin is pulled to a defined state of the target board. Typically
connected to TCK of the target CPU.
11 RTCK Input
Return test clock signal from the target. Some targets must
synchronize the JTAG inputs to internal clocks. To assist in
meeting this requirement, you can use a returned, and re-
timed, TCK to dynamically control the TCK rate. J-Link sup-
ports adaptive clocking, which waits for TCK changes to be
echoed correctly before making further changes. Connect to
RTCK if available, otherwise to GND.
13 TDO Input JTAG data output from target CPU. Typically connected to TDO
of the target CPU.
15 nRESET I/O Target CPU reset signal. Typically connected to the RESET pin
of the target CPU, which is typically called “nRST”, “nRESET”
or “RESET”. This signal is an active low signal.
17 DBGRQ NC
This pin is not connected in J-Link. It is reserved for compat-
ibility with other equipment to be used as a debug request
signal to the target system. Typically connected to DBGRQ if
available, otherwise left open.
19 5V-Supply Output
This pin can be used to supply power to the target hardware.
Older J-Links may not be able to supply power on this pin. For
more information about how to enable/disable the power sup-
ply, please refer to Target power supply .
J-Link / J-Trace (UM08001) © 2004-2017 SEGGER Microcontroller GmbH & Co. KG
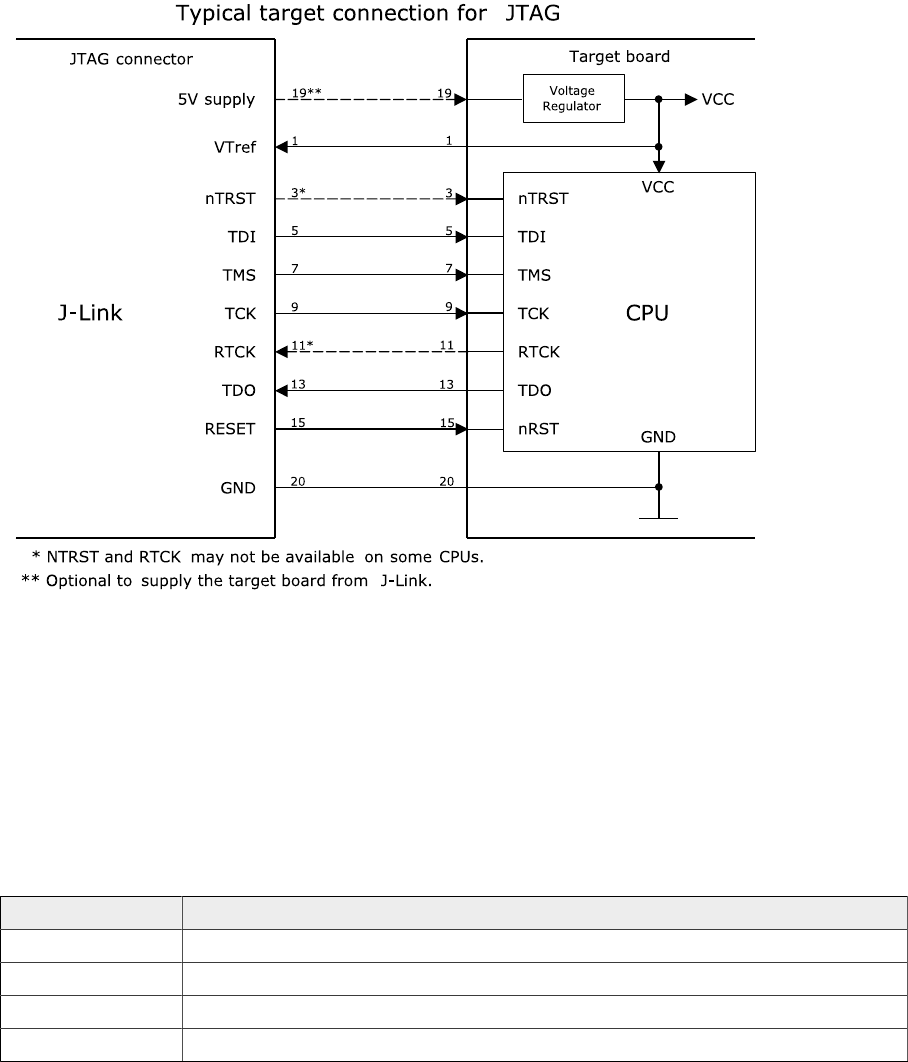
323 CHAPTER 15 20-pin J-Link connector
Pins 4, 6, 8, 10, 12, 14, 16, 18, 20 are GND pins connected to GND in J-Link. They should
also be connected to GND in the target system.
15.1.1.1 Target board design
We strongly advise following the recommendations given by the chip manufacturer. These
recommendations are normally in line with the recommendations given in the table Pinout
for JTAG on page 322. In case of doubt you should follow the recommendations given by
the semiconductor manufacturer. You may take any female header following the specifica-
tions of DIN 41651. For example:
Harting part-no. 09185206803
Molex part-no. 90635-1202
Tyco Electronics part-no. 2-215882-0
15.1.1.2 Pull-up/pull-down resistors
Unless otherwise specified by developer’s manual, pull-ups/pull-downs are recommended
to 100 kOhms.
15.1.1.3 Target power supply
Pin 19 of the connector can be used to supply power to the target hardware. Supply voltage
is 5V, max. current is 300mA. The output current is monitored and protected against over-
load and short-circuit. Power can be controlled via the J-Link commander. The following
commands are available to control power:
Command Explanation
power on Switch target power on
power off Switch target power off
power on perm Set target power supply default to “on”
power off perm Set target power supply default to “off”
J-Link / J-Trace (UM08001) © 2004-2017 SEGGER Microcontroller GmbH & Co. KG

324 CHAPTER 15 20-pin J-Link connector
15.1.2 Pinout for SWD
The J-Link and J-Trace JTAG connector is also compatible to ARM’s Serial Wire Debug (SWD).
*On later J-Link products like the J-link ULTRA, these pins are reserved for firmware exten-
sion purposes. They can be left open or connected to GND in normal debug environment.
They are not essential for JTAG/SWD in general.
The following table lists the J-Link / J-Trace SWD pinout.
PIN SIGNAL TYPE Description
1VTref Input
This is the target reference voltage. It is used to check if the
target has power, to create the logic-level reference for the in-
put comparators and to control the output logic levels to the
target. It is normally fed from Vdd of the target board and
must not have a series resistor.
2Not
connected NC This pin is not connected in J-Link.
3Not used NC This pin is not used by J-Link. If the device may also be ac-
cessed via JTAG, this pin may be connected to nTRST, other-
wise leave open.
5Not used NC This pin is not used by J-Link. If the device may also be ac-
cessed via JTAG, this pin may be connected to TDI, otherwise
leave open.
7SWDIO I/O Single bi-directional data pin. A pull-up resistor is required.
ARM recommends 100 kOhms.
9SWCLK Output Clock signal to target CPU. It is recommended that this pin is
pulled to a defined state on the target board. Typically con-
nected to TCK of the target CPU.
11 Not used NC This pin is not used by J-Link. If the device may also be ac-
cessed via JTAG, this pin may be connected to RTCK, other-
wise leave open.
13 SWO Input Serial Wire Output trace port. (Optional, not required for SWD
communication.)
15 nRESET I/O Target CPU reset signal. Typically connected to the RESET pin
of the target CPU, which is typically called “nRST”, “nRESET”
or “RESET”. This signal is an active low signal.
17 Not Used NC This pin is not connected in J-Link.
19 5V-Supply Output
This pin can be used to supply power to the target hardware.
Older J-Links may not be able to supply power on this pin. For
more information about how to enable/disable the power sup-
ply, please refer to Target power supply .
Pins 4, 6, 8, 10, 12, 14, 16, 18, 20 are GND pins connected to GND in J-Link. They should
also be connected to GND in the target system.
15.1.2.1 Target board design
We strongly advise following the recommendations given by the chip manufacturer. These
recommendations are normally in line with the recommendations given in the table Pinout
for SWD on page 324. In case of doubt you should follow the recommendations given by
the semiconductor manufacturer.
J-Link / J-Trace (UM08001) © 2004-2017 SEGGER Microcontroller GmbH & Co. KG
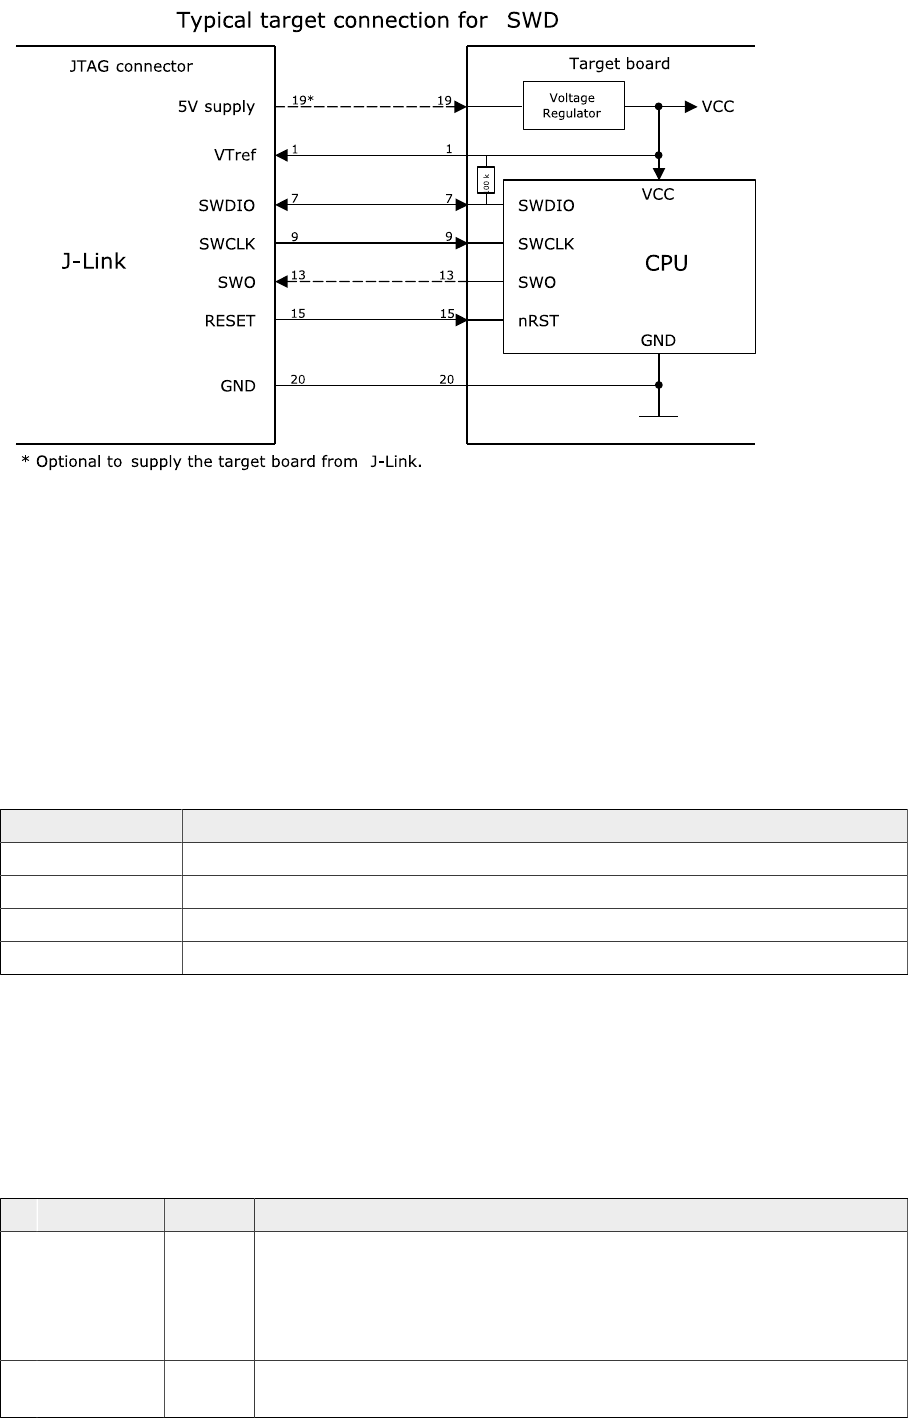
325 CHAPTER 15 20-pin J-Link connector
15.1.2.2 Pull-up/pull-down resistors
A pull-up resistor is required on SWDIO on the target board. ARM recommends 100 kOhms.
In case of doubt you should follow the recommendations given by the semiconductor man-
ufacturer.
15.1.2.3 Target power supply
Pin 19 of the connector can be used to supply power to the target hardware. Supply voltage
is 5V, max. current is 300mA. The output current is monitored and protected against over-
load and short-circuit. Power can be controlled via the J-Link commander. The following
commands are available to control power:
Command Explanation
power on Switch target power on
power off Switch target power off
power on perm Set target power supply default to “on”
power off perm Set target power supply default to “off”
15.1.3 Pinout for SWD + Virtual COM Port (VCOM)
The J-Link and J-Trace JTAG connector is also compatible to ARM’s Serial Wire Debug (SWD).
*On later J-Link products like the J-link ULTRA, these pins are reserved for firmware exten-
sion purposes. They can be left open or connected to GND in normal debug environment.
They are not essential for JTAG/SWD in general.
The following table lists the J-Link / J-Trace SWD pinout.
PIN SIGNAL TYPE Description
1VTref Input
This is the target reference voltage. It is used to check if the
target has power, to create the logic-level reference for the in-
put comparators and to control the output logic levels to the
target. It is normally fed from Vdd of the target board and
must not have a series resistor.
2Not
connected NC This pin is not connected in J-Link.
J-Link / J-Trace (UM08001) © 2004-2017 SEGGER Microcontroller GmbH & Co. KG

326 CHAPTER 15 20-pin J-Link connector
PIN SIGNAL TYPE Description
3Not used NC This pin is not used by J-Link. If the device may also be ac-
cessed via JTAG, this pin may be connected to nTRST, other-
wise leave open.
5J-Link Tx Output This pin is used as VCOM Tx (out on J-Link side) in case VCOM
functionality of J-Link is enabled. For further information about
VCOM, please refer to Virtual COM Port (VCOM) .
7SWDIO I/O Single bi-directional data pin. A pull-up resistor is required.
ARM recommends 100 kOhms.
9SWCLK Output Clock signal to target CPU. It is recommended that this pin is
pulled to a defined state on the target board. Typically con-
nected to TCK of the target CPU.
11 Not used NC This pin is not used by J-Link. If the device may also be ac-
cessed via JTAG, this pin may be connected to RTCK, other-
wise leave open.
13 SWO Input Serial Wire Output trace port. (Optional, not required for SWD
communication.)
15 nRESET I/O Target CPU reset signal. Typically connected to the RESET pin
of the target CPU, which is typically called “nRST”, “nRESET”
or “RESET”. This signal is an active low signal.
17 J-Link Rx Input This pin is used as VCOM Rx (in on J-Link side) in case VCOM
functionality of J-Link is enabled. For further information,
please refer to Virtual COM Port (VCOM) .
19 5V-Supply Output
This pin can be used to supply power to the target hardware.
Older J-Links may not be able to supply power on this pin. For
more information about how to enable/disable the power sup-
ply, please refer to Virtual COM Port (VCOM) .
15.1.4 Pinout for SPI
*On later J-Link products like the J-link ULTRA, these pins are reserved for firmware exten-
sion purposes. They can be left open or connected to GND in normal debug environment.
The following table lists the pinout for the SPI interface on J-Link.
PIN SIGNAL TYPE Description
1VTref Input
This is the target reference voltage. It is used to check if the
target has power, to create the logic-level reference for the in-
put comparators and to control the output logic levels to the
target. It is normally fed from Vdd of the target board and
must not have a series resistor.
2Not
connected NC Leave open on target side
3Not
connected NC Leave open on target side
5DI Output Data-input of target SPI. Output of J-Link, used to transmit
data to the target SPI.
7nCS Output Chip-select of target SPI (active LOW).
9CLK Output SPI clock signal.
11 Not
connected NC Leave open on target side
13 DO Input Data-out of target SPI. Input of J-Link, used to receive data
from the target SPI.
J-Link / J-Trace (UM08001) © 2004-2017 SEGGER Microcontroller GmbH & Co. KG

327 CHAPTER 15 20-pin J-Link connector
PIN SIGNAL TYPE Description
15 nRESET I/O Target CPU reset signal. Typically connected to the RESET pin
of the target CPU, which is typically called “nRST”, “nRESET”
or “RESET”. This signal is an active low signal.
17 Not
connected NC Leave open on target side
19 5V-Supply Output
This pin can be used to supply power to the target hardware.
Older J-Links may not be able to supply power on this pin. For
more information about how to enable/disable the power sup-
ply, please refer to Target power supply .
J-Link / J-Trace (UM08001) © 2004-2017 SEGGER Microcontroller GmbH & Co. KG

328 CHAPTER 15 19-pin JTAG/SWD and Trace connector
15.2 19-pin JTAG/SWD and Trace connector
J-Trace provides a JTAG/SWD+Trace connector. This connector is a 19-pin connector. It
connects to the target via an 1-1 cable.
The following table lists the J-Link / J-Trace SWD pinout.
PIN SIGNAL TYPE Description
1VTref Input
This is the target reference voltage. It is used to check if the
target has power, to create the logic-level reference for the in-
put comparators and to control the output logic levels to the
target. It is normally fed from Vdd of the target board and
must not have a series resistor.
2SWDIO /
TMS I/O /
output
SWDIO: (Single) bi-directional data pin. JTAG mode set input
of target CPU. This pin should be pulled up on the target. Typi-
cally connected to TMS of the target CPU.
4SWCLK /
TCK Output
SWCLK: Clock signal to target CPU. It is recommended that
this pin is pulled to a defined state of the target board. Typi-
cally connected to TCK of target CPU. JTAG clock signal to tar-
get CPU.
6SWO /
TDO Input
JTAG data output from target CPU. Typically connected to TDO
of the target CPU. When using SWD, this pin is used as Serial
Wire Output trace port. (Optional, not required for SWD com-
munication)
— — — This pin (normally pin 7) is not existent on the 19-pin JTAG/
SWD and Trace connector.
8TDI Output
JTAG data input of target CPU. It is recommended that this pin
is pulled to a defined state on the target board. Typically con-
nected to TDI of the target CPU. For CPUs which do not pro-
vide TDI (SWD-only devices), this pin is not used. J-Link will
ignore the signal on this pin when using SWD.
9NC NC Not connected inside J-Link. Leave open on target hardware.
10 nRESET I/O Target CPU reset signal. Typically connected to the RESET pin
of the target CPU, which is typically called “nRST”, “nRESET”
or “RESET”. This signal is an active low signal.
11 5V-Supply Output This pin can be used to supply power to the target hardware.
For more information about how to enable/disable the power
supply, please refer to Target power supply .
12 TRACECLK Input Input trace clock. Trace clock = 1/2 CPU clock.
13 5V-Supply Output This pin can be used to supply power to the target hardware.
For more information about how to enable/disable the power
supply, please refer toTarget power supply .
14 TRACE-
DATA[0] Input Input Trace data pin 0.
16 TRACE-
DATA[1] Input Input Trace data pin 1.
18 TRACE-
DATA[2] Input Input Trace data pin 2.
20 TRACE-
DATA[3] Input Input Trace data pin 3.
15.2.1 Target power supply
Pins 11 and 13 of the connector can be used to supply power to the target hardware.
Supply voltage is 5V, max. current is 300mA. The output current is monitored and protected
J-Link / J-Trace (UM08001) © 2004-2017 SEGGER Microcontroller GmbH & Co. KG

329 CHAPTER 15 19-pin JTAG/SWD and Trace connector
against overload and short-circuit. Power can be controlled via the J-Link commander. The
following commands are available to control power:
Command Explanation
power on Switch target power on
power off Switch target power off
power on perm Set target power supply default to “on”
power off perm Set target power supply default to “off”
J-Link / J-Trace (UM08001) © 2004-2017 SEGGER Microcontroller GmbH & Co. KG

330 CHAPTER 15 9-pin JTAG/SWD connector
15.3 9-pin JTAG/SWD connector
PIN SIGNAL TYPE Description
1VTref Input
This is the target reference voltage. It is used to check if the
target has power, to create the logic-level reference for the in-
put comparators and to control the output logic levels to the
target. It is normally fed from Vdd of the target board and
must not have a series resistor.
2SWDIO /
TMS I/O /
output
SWDIO: (Single) bi-directional data pin. JTAG mode set input
of target CPU. This pin should be pulled up on the target. Typi-
cally connected to TMS of the target CPU.
4SWCLK /
TCK Output
SWCLK: Clock signal to target CPU. It is recommended that
this pin is pulled to a defined state of the target board. Typi-
cally connected to TCK of target CPU. JTAG clock signal to tar-
get CPU.
6SWO /
TDO Input
JTAG data output from target CPU. Typically connected to TDO
of the target CPU. When using SWD, this pin is used as Serial
Wire Output trace port. (Optional, not required for SWD com-
munication)
— — — This pin (normally pin 7) is not existent on the 19-pin JTAG/
SWD and Trace connector.
8TDI Output
JTAG data input of target CPU.- It is recommended that this
pin is pulled to a defined state on the target board. Typical-
ly connected to TDI of the target CPU. For CPUs which do not
provide TDI (SWD-only devices), this pin is not used. J-Link
will ignore the signal on this pin when using SWD.
9NC (TRST) NC By default, TRST is not connected, but the Cortex-M Adapter
comes with a solder bridge (NR1) which allows TRST to be
connected to pin 9 of the Cortex-M adapter.
J-Link / J-Trace (UM08001) © 2004-2017 SEGGER Microcontroller GmbH & Co. KG

331 CHAPTER 15 Reference voltage (VTref)
15.4 Reference voltage (VTref)
VTref is the target reference voltage. It is used by the J-Link to check if the target has
power, to create the logic-level reference for the input comparators and to control the
output logic levels to the target. It is normally fed from Vdd of the target board and must
not have a series resistor.
In cases where the VTref signal should not be wired to save one more pin / place on the
target hardware interface connector (e.g. in production environments), SEGGER offers a
special adapter called J-Link Supply Adapter which can be used for such purposes. Further
information regarding this, can be found on the SEGGER website ( J-Link supply adapter )
To guarantee proper debug functionality, please make sure to connect at least on of the
GND pins to GND (Pin 4, 6, 8, 10, 12, 14*, 16*, 18*, 20*).
Note
*On later J-Link products like the J-Link ULTRA+, these pins are reserved for firmware
extension purposes. They can be left open or connected to GND in normal debug
environment. They are not essential for JTAG/SWD in general.
J-Link / J-Trace (UM08001) © 2004-2017 SEGGER Microcontroller GmbH & Co. KG
332 CHAPTER 15 Adapters
15.5 Adapters
There are various adapters available for J-Link as for example the JTAG isolator, the J-Link
RX adapter or the J-Link Cortex-M adapter.
For more information about the different adapters, please refer to
J-Link adapters
J-Link / J-Trace (UM08001) © 2004-2017 SEGGER Microcontroller GmbH & Co. KG

Chapter 16
Background information
This chapter provides background information about JTAG and ARM. The ARM7 and ARM9
architecture is based on Reduced Instruction Set Computer (RISC) principles. The instruc-
tion set and the related decode mechanism are greatly simplified compared with micropro-
grammed Complex Instruction Set Computer (CISC).
J-Link / J-Trace (UM08001) © 2004-2017 SEGGER Microcontroller GmbH & Co. KG

334 CHAPTER 16 JTAG
16.1 JTAG
JTAG is the acronym for Joint Test Action Group. In the scope of this document, “the JTAG
standard” means compliance with IEEE Standard 1149.1-2001.
16.1.1 Test access port (TAP)
JTAG defines a TAP (Test access port). The TAP is a general-purpose port that can provide
access to many test support functions built into a component. It is composed as a mini-
mum of the three input connections (TDI, TCK, TMS) and one output connection (TDO).
An optional fourth input connection (nTRST) provides for asynchronous initialization of the
test logic.
PIN Type Explanation
TCK Input The test clock input (TCK) provides the clock for the test logic.
TDI Input Serial test instructions and data are received by the test logic at
test data input (TDI).
TMS Input The signal received at test mode select (TMS) is decoded by the TAP
controller to control test operations.
TDO Output Test data output (TDO) is the serial output for test instructions and
data from the test logic.
nTRST Input
(optional) The optional test reset (nTRST) input provides for asynchronous ini-
tialization of the TAP controller.
16.1.2 Data registers
JTAG requires at least two data registers to be present: the bypass and the boundary-scan
register. Other registers are allowed but are not obligatory.
Bypass data register
A single-bit register that passes information from TDI to TDO.
Boundary-scan data register
A test data register which allows the testing of board interconnections, access to input and
output of components when testing their system logic and so on.
16.1.3 Instruction register
The instruction register holds the current instruction and its content is used by the TAP
controller to decide which test to perform or which data register to access. It consist of at
least two shift-register cells.
16.1.4 The TAP controller
The TAP controller is a synchronous finite state machine that responds to changes at the
TMS and TCK signals of the TAP and controls the sequence of operations of the circuitry.
16.1.4.1 State descriptions
Reset
The test logic is disabled so that normal operation of the chip logic can continue unhindered.
No matter in which state the TAP controller currently is, it can change into Reset state if
TMS is high for at least 5 clock cycles. As long as TMS is high, the TAP controller remains
in Reset state.
J-Link / J-Trace (UM08001) © 2004-2017 SEGGER Microcontroller GmbH & Co. KG
335 CHAPTER 16 JTAG
Idle
Idle is a TAP controller state between scan (DR or IR) operations. Once entered, this state
remains active as long as TMS is low.
DR-Scan
Temporary controller state. If TMS remains low, a scan sequence for the selected data
registers is initiated.
IR-Scan
Temporary controller state. If TMS remains low, a scan sequence for the instruction register
is initiated.
Capture-DR
Data may be loaded in parallel to the selected test data registers.
Shift-DR
The test data register connected between TDI and TDO shifts data one stage towards the
serial output with each clock.
Exit1-DR
Temporary controller state.
Pause-DR
The shifting of the test data register between TDI and TDO is temporarily halted.
Exit2-DR
Temporary controller state. Allows to either go back into Shift-DR state or go on to Up-
date-DR.
Update-DR
Data contained in the currently selected data register is loaded into a latched parallel output
(for registers that have such a latch). The parallel latch prevents changes at the parallel
output of these registers from occurring during the shifting process.
Capture-IR
Instructions may be loaded in parallel into the instruction register.
Shift-IR
The instruction register shifts the values in the instruction register towards TDO with each
clock.
Exit1-IR
Temporary controller state.
Pause-IR
Wait state that temporarily halts the instruction shifting.
Exit2-IR
Temporary controller state. Allows to either go back into Shift-IR state or go on to Up-
date-IR.
J-Link / J-Trace (UM08001) © 2004-2017 SEGGER Microcontroller GmbH & Co. KG
336 CHAPTER 16 JTAG
Update-IR
The values contained in the instruction register are loaded into a latched parallel output
from the shift-register path. Once latched, this new instruction becomes the current one.
The parallel latch prevents changes at the parallel output of the instruction register from
occurring during the shifting process.
J-Link / J-Trace (UM08001) © 2004-2017 SEGGER Microcontroller GmbH & Co. KG
337 CHAPTER 16 Embedded Trace Macrocell (ETM)
16.2 Embedded Trace Macrocell (ETM)
Embedded Trace Macrocell (ETM) provides comprehensive debug and trace facilities for ARM
processors. ETM allows to capture information on the processor’s state without affecting
the processor’s performance. The trace information is exported immediately after it has
been captured, through a special trace port.
Microcontrollers that include an ETM allow detailed program execution to be recorded and
saved in real time. This information can be used to analyze program flow and execution
time, perform profiling and locate software bugs that are otherwise very hard to locate. A
typical situation in which code trace is extremely valuable, is to find out how and why a
“program crash” occurred in case of a runaway program count.
A debugger provides the user interface to J-Trace and the stored trace data. The debugger
enables all the ETM facilities and displays the trace information that has been captured. J-
Trace is seamlessly integrated into the IAR Embedded Workbench® IDE. The advanced
trace debugging features can be used with the IAR C-SPY debugger.
16.2.1 Trigger condition
The ETM can be configured in software to store trace information only after a specific se-
quence of conditions. When the trigger condition occurs the trace capture stops after a
programmable period.
16.2.2 Code tracing and data tracing
Code trace
Code tracing means that the processor outputs trace data which contain information about
the instructions that have been executed at last.
Data trace
Data tracing means that the processor outputs trace data about memory accesses (read /
write access to which address and which data has been read / stored). In general, J-Trace
supports data tracing, but it depends on the debugger if this option is available or not. Note
that when using data trace, the amount of trace data to be captured rises enormously.
16.2.3 J-Trace integration example - IAR Embedded Work-
bench for ARM
In the following a sample integration of J-Trace and the trace functionality on the debugger
side is shown. The sample is based on IAR’s Embedded Workbench for ARM integration
of J-Trace.
J-Link / J-Trace (UM08001) © 2004-2017 SEGGER Microcontroller GmbH & Co. KG
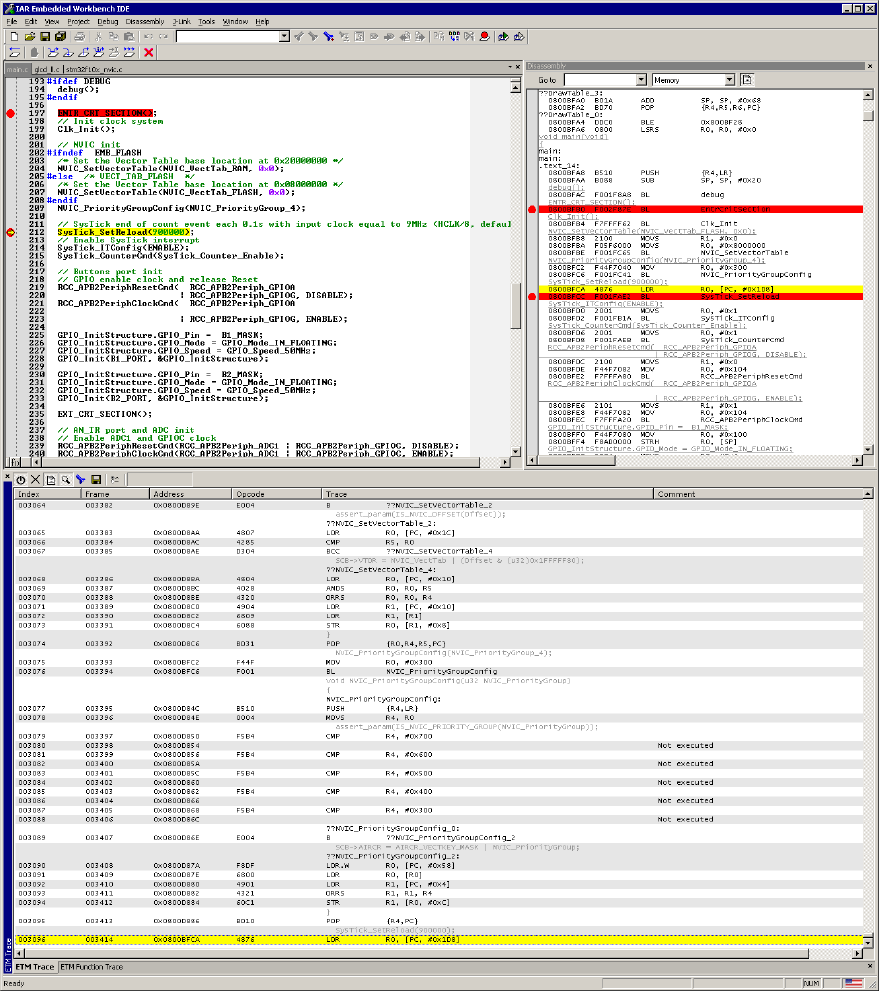
338 CHAPTER 16 Embedded Trace Macrocell (ETM)
16.2.3.1 Code coverage - Disassembly tracing
J-Link / J-Trace (UM08001) © 2004-2017 SEGGER Microcontroller GmbH & Co. KG
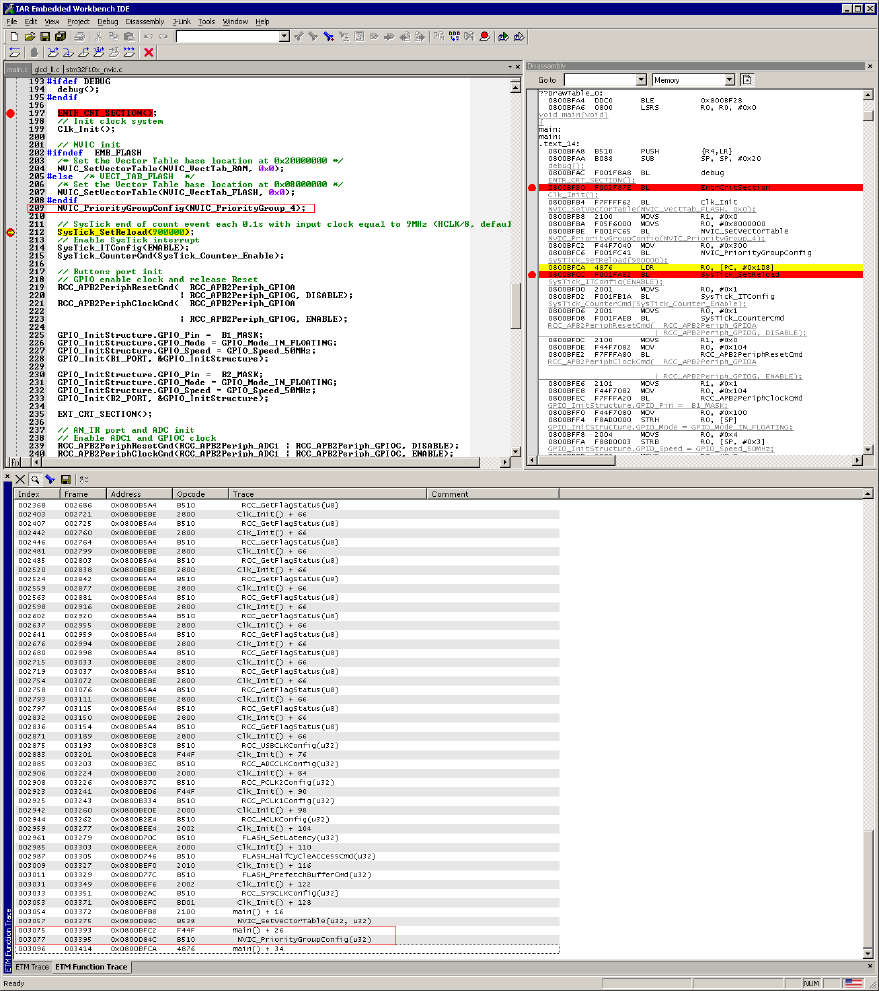
339 CHAPTER 16 Embedded Trace Macrocell (ETM)
16.2.3.2 Code coverage - Source code tracing
J-Link / J-Trace (UM08001) © 2004-2017 SEGGER Microcontroller GmbH & Co. KG
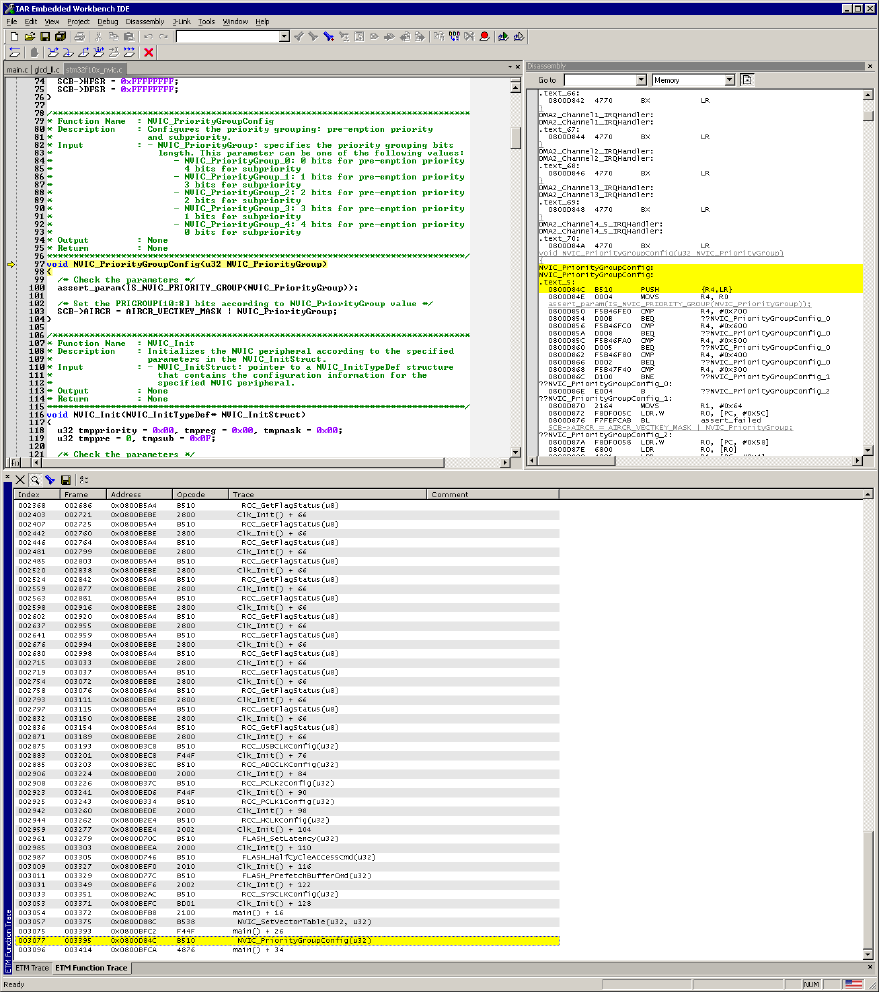
340 CHAPTER 16 Embedded Trace Macrocell (ETM)
J-Link / J-Trace (UM08001) © 2004-2017 SEGGER Microcontroller GmbH & Co. KG
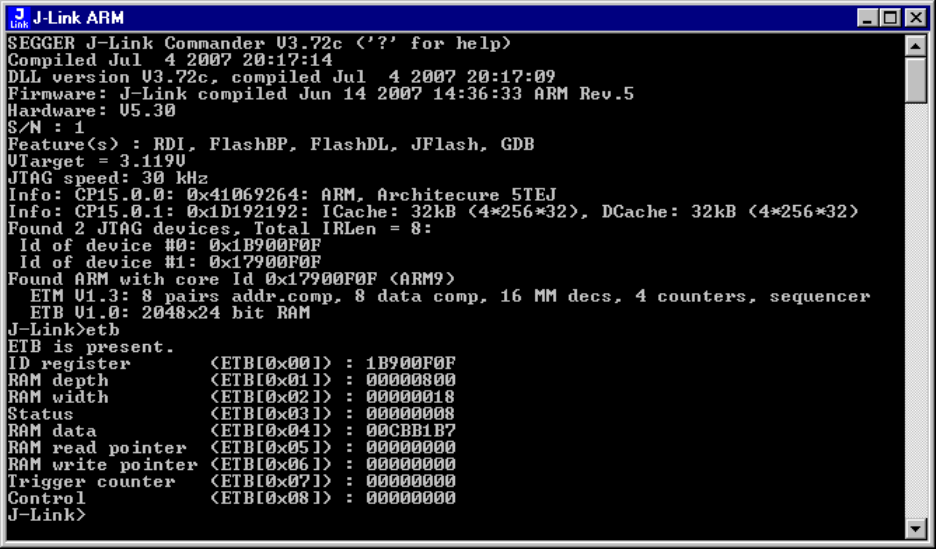
341 CHAPTER 16 Embedded Trace Buffer (ETB)
16.3 Embedded Trace Buffer (ETB)
The ETB is a small, circular on-chip memory area where trace information is stored during
capture. It contains the data which is normally exported immediately after it has been
captured from the ETM. The buffer can be read out through the JTAG port of the device
once capture has been completed. No additional special trace port is required, so that the
ETB can be read via J-Link. The trace functionality via J-Link is limited by the size of the
ETB. While capturing runs, the trace information in the buffer will be overwritten every time
the buffer size has been reached.
The result of the limited buffer size is that not more data can be traced than the buffer
can hold. Because of this limitation, an ETB is not a fully- alternative to the direct access
to an ETM via J-Trace.
J-Link / J-Trace (UM08001) © 2004-2017 SEGGER Microcontroller GmbH & Co. KG
342 CHAPTER 16 Flash programming
16.4 Flash programming
J-Link / J-Trace comes with a DLL, which allows - amongst other functionalities - reading
and writing RAM, CPU registers, starting and stopping the CPU, and setting breakpoints. The
standard DLL does not have API functions for flash programming. However, the functionality
offered can be used to program the flash. In that case, a flashloader is required.
16.4.1 How does flash programming via J-Link / J-Trace
work?
This requires extra code. This extra code typically downloads a program into the RAM of
the target system, which is able to erase and program the flash. This program is called
RAM code and “knows” how to program the flash; it contains an implementation of the
flash programming algorithm for the particular flash. Different flash chips have different
programming algorithms; the programming algorithm also depends on other things such
as endianness of the target system and organization of the flash memory (for example 1 *
8 bits, 1 * 16 bits, 2 * 16 bits or 32 bits). The RAM code requires data to be programmed
into the flash memory. There are 2 ways of supplying this data: Data download to RAM
or data download via DCC.
16.4.2 Data download to RAM
The data (or part of it) is downloaded to another part of the RAM of the target system. The
Instruction pointer (R15) of the CPU is then set to the start address of the RAM code, the
CPU is started, executing the RAM code. The RAM code, which contains the programming
algorithm for the flash chip, copies the data into the flash chip. The CPU is stopped after this.
This process may have to be repeated until the entire data is programmed into the flash.
16.4.3 Data download via DCC
In this case, the RAM code is started as described above before downloading any data.
The RAM code then communicates with the host computer (via DCC, JTAG and J-Link / J-
Trace), transferring data to the target. The RAM code then programs the data into flash and
waits for new data from the host. The WriteMemory functions of J-Link / J-Trace are used
to transfer the RAM code only, but not to transfer the data. The CPU is started and stopped
only once. Using DCC for communication is typically faster than using WriteMemory for RAM
download because the overhead is lower.
16.4.4 Available options for flash programming
There are different solutions available to program internal or external flashes connected to
ARM cores using J-Link / J-Trace. The different solutions have different fields of application,
but of course also some overlap.
16.4.4.1 J-Flash - Complete flash programming solution
J-Flash is a stand-alone Windows application, which can read / write data files and program
the flash in almost any ARM system. J-Flash requires an extra license from SEGGER.
16.4.4.2 RDI flash loader: Allows flash download from any RDI-compli-
ant tool chain
RDI (Remote debug interface) is a standard for “debug transfer agents” such as J-Link.
It allows using J-Link from any RDI compliant debugger. RDI by itself does not include
download to flash. To debug in flash, you need to somehow program your application pro-
gram (debuggee) into the flash. You can use J-Flash for this purpose, use the flash loader
supplied by the debugger company (if they supply a matching flash loader) or use the flash
loader integrated in the J-Link RDI software. The RDI software as well as the RDI flash
loader require licenses from SEGGER.
J-Link / J-Trace (UM08001) © 2004-2017 SEGGER Microcontroller GmbH & Co. KG
343 CHAPTER 16 Flash programming
16.4.4.3 Flash loader of compiler / debugger vendor such as IAR
A lot of debuggers (some of them integrated into an IDE) come with their own flash loaders.
The flash loaders can of course be used if they match your flash configuration, which is
something that needs to be checked with the vendor of the debugger.
16.4.4.4 Write your own flash loader
Implement your own flash loader using the functionality of the JLinkARM.dll as described
above. This can be a time consuming process and requires in-depth knowledge of the flash
programming algorithm used as well as of the target system.
J-Link / J-Trace (UM08001) © 2004-2017 SEGGER Microcontroller GmbH & Co. KG
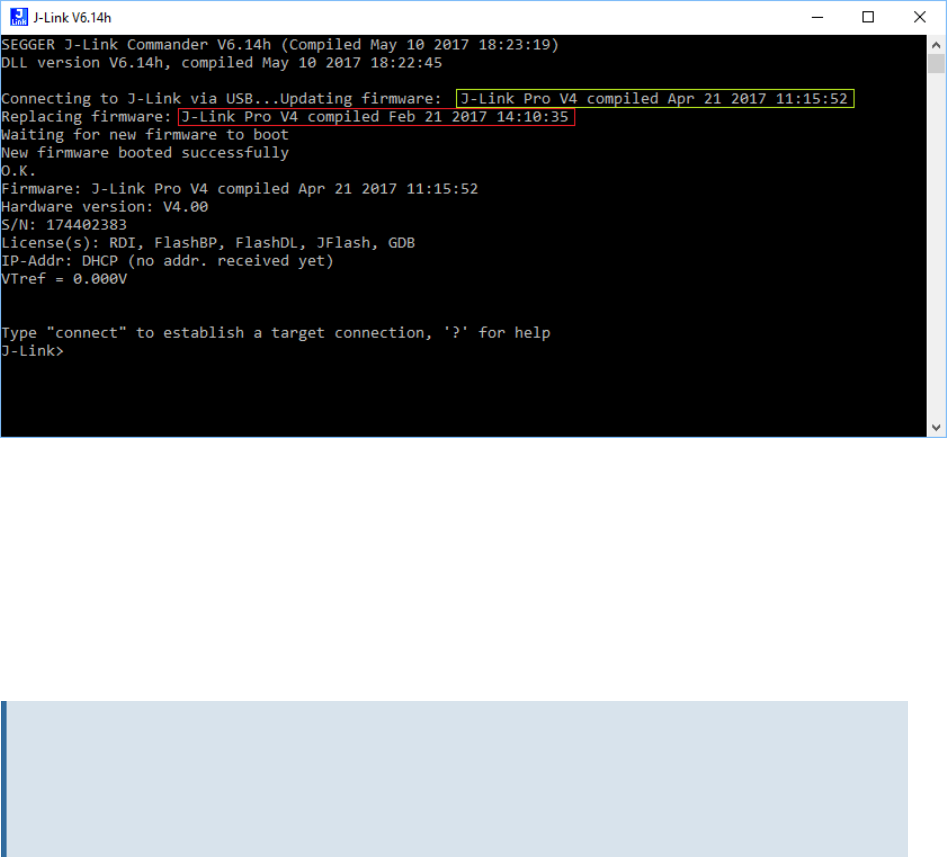
344 CHAPTER 16 J-Link / J-Trace firmware
16.5 J-Link / J-Trace firmware
The heart of J-Link / J-Trace is a microcontroller. The firmware is the software executed by
the microcontroller inside of the J-Link / J-Trace. The J-Link / J-Trace firmware sometimes
needs to be updated. This firmware update is performed automatically as necessary by the
JLinkARM.dll.
16.5.1 Firmware update
Every time you connect to J-Link / J-Trace, JLinkARM.dll checks if its embedded firmware
is newer than the one used the J-Link / J-Trace. The DLL will then update the firmware
automatically. This process takes less than 3 seconds and does not require a reboot.
It is recommended that you always use the latest version of JLinkARM.dll.
In the screenshot:
• The red box identifies the new firmware.
• The green box identifies the old firmware which has been replaced.
16.5.2 Invalidating the firmware
Downdating J-Link / J-Trace is not performed automatically through an old JLinkARM.dll.
J-Link / J-Trace will continue using its current, newer firmware when using older versions
of the JLinkARM.dll.
Note
Downdating J-Link / J-Trace is not recommended, you do it at your own risk!
Note also the firmware embedded in older versions of JLinkARM.dll might not execute
properly with newer hardware versions.
To downdate J-Link / J-Trace, you need to invalidate the current J-Link / J-Trace firmware,
using the command exec InvalidateFW (first red box) .
In the screenshot, the yellow box contains information about the formerly used J-Link / J-
Trace firmware version, which is invalidated. Use an application (for example JLink.exe )
which uses the desired version of JLinkARM.dll. This automatically replaces the invalidated
firmware with its embedded firmware.
This is also show in the screenshot, were the invalidated firmware (2nd red box) is replaced
with the one provided by the currently used J-Link DLL (green box).
J-Link / J-Trace (UM08001) © 2004-2017 SEGGER Microcontroller GmbH & Co. KG
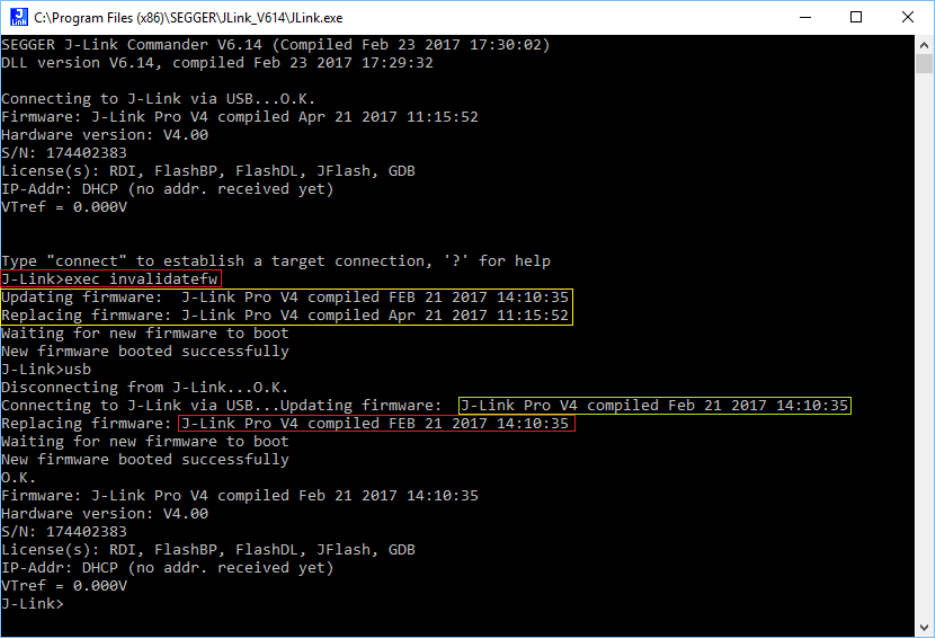
345 CHAPTER 16 J-Link / J-Trace firmware
In the screenshot:
• “Updating firmware” identifies the new firmware.
• “Replacing firmware” identifies the old firmware which has been replaced.
J-Link / J-Trace (UM08001) © 2004-2017 SEGGER Microcontroller GmbH & Co. KG

Chapter 17
Designing the target board for
trace
This chapter describes the hardware requirements which have to be met by the target
board.
J-Link / J-Trace (UM08001) © 2004-2017 SEGGER Microcontroller GmbH & Co. KG

347 CHAPTER 17 Overview of high-speed board design
17.1 Overview of high-speed board design
Failure to observe high-speed design rules when designing a target system containing an
ARM Embedded Trace Macrocell (ETM) trace port can result in incorrect data being captured
by J-Trace. You must give serious consideration to high-speed signals when designing the
target system.
The signals coming from an ARM ETM trace port can have very fast rise and fall times, even
at relatively low frequencies.
Note
These principles apply to all of the trace port signals (TRACEPKT[0:15], PIPES-
TAT[0:2], TRACESYNC), but special care must be taken with TRACECLK.
17.1.1 Avoiding stubs
Stubs are short pieces of track that tee off from the main track carrying the signal to, for
example, a test point or a connection to an intermediate device. Stubs cause impedance
discontinuities that affect signal quality and must be avoided.
Special care must therefore be taken when ETM signals are multiplexed with other pin
functions and where the PCB is designed to support both functions with differing tracking
requirements.
17.1.2 Minimizing Signal Skew (Balancing PCB Track
Lengths)
You must attempt to match the lengths of the PCB tracks carrying all of TRACECLK, PIPES-
TAT, TRACESYNC, and TRACEPKT from the ASIC to the mictor connector to be within ap-
proximately 0.5 inches (12.5mm) of each other. Any greater differences directly impact
the setup and hold time requirements.
17.1.3 Minimizing Crosstalk
Normal high-speed design rules must be observed. For example, do not run dynamic signals
parallel to each other for any significant distance, keep them spaced well apart, and use a
ground plane and so forth. Particular attention must be paid to the TRACECLK signal. If in
any doubt, place grounds or static signals between the TRACECLK and any other dynamic
signals.
17.1.4 Using impedance matching and termination
Termination is almost certainly necessary, but there are some circumstances where it is
not required. The decision is related to track length between the ASIC and the JTAG+Trace
connector, see Terminating the trace signal on page 348 for further reference.
J-Link / J-Trace (UM08001) © 2004-2017 SEGGER Microcontroller GmbH & Co. KG
348 CHAPTER 17 Terminating the trace signal
17.2 Terminating the trace signal
To terminate the trace signal, you can choose between three termination options:
• Matched impedance.
• Series (source) termination.
• DC parallel termination.
Matched impedance
Where available, the best termination scheme is to have the ASIC manufacturer match
the output impedance of the driver to the impedance of the PCB track on your board. This
produces the best possible signal.
Series (source) termination
This method requires a resistor fitted in series with signal. The resistor value plus the output
impedance of the driver must be equal to the PCB track impedance.
DC parallel termination
This requires either a single resistor to ground, or a pull-up/pull-down combination of re-
sistors (Thevenin termination), fitted at the end of each signal and as close as possible to
the JTAG+Trace connector. If a single resistor is used, its value must be set equal to the
PCB track impedance. If the pull-up/pull-down combination is used, their resistance values
must be selected so that their parallel combination equals the PCB track impedance.
Caution:
At lower frequencies, parallel termination requires considerably more drive capability from
the ASIC than series termination and so, in practice, DC parallel termination is rarely used.
17.2.1 Rules for series terminators
Series (source) termination is the most commonly used method. The basic rules are:
1. The series resistor must be placed as close as possible to the ASIC pin (less than 0.5
inches).
2. The value of the resistor must equal the impedance of the track minus the output
impedance of the output driver. So for example, a 50 PCB track driven by an output
with a 17 impedance, requires a resistor value of 33.
3. A source terminated signal is only valid at the end of the signal path. At any point
between the source and the end of the track, the signal appears distorted because of
reflections. Any device connected between the source and the end of the signal path
therefore sees the distorted signal and might not operate correctly. Care must be taken
not to connect devices in this way, unless the distortion does not affect device operation.
J-Link / J-Trace (UM08001) © 2004-2017 SEGGER Microcontroller GmbH & Co. KG

349 CHAPTER 17 Signal requirements
17.3 Signal requirements
The table below lists the specifications that apply to the signals as seen at the JTAG+Trace
connector.
Signal Value
Fmax 200MHz
Ts setup time (min.) 2.0ns
Th hold time (min.) 1.0ns
TRACECLK high pulse width (min.) 1.5ns
TRACECLK high pulse width (min.) 1.5ns
J-Link / J-Trace (UM08001) © 2004-2017 SEGGER Microcontroller GmbH & Co. KG

Chapter 18
Semihosting
J-Link supports semihosting for ARM targets. This chapter explains what semihosting is,
what it can be used for and how to enable semihosting in different environments.
J-Link / J-Trace (UM08001) © 2004-2017 SEGGER Microcontroller GmbH & Co. KG
351 CHAPTER 18 Introduction
18.1 Introduction
Semihosting is a mechanism for ARM based target devices to provide a way to communi-
cate/interact with a host system (the PC where the debugger is running on) to allow dif-
ferent operations to be performed /automatized. Typical use-cases for semihosting are:
• Calls to printf() in the target to be forwarded to the host system and then output in a
console/terminal on the host
• Calls to scanf() to retrieve user input entered in a console/terminal on the host and
then being received and evaluated by the target
• Performing file I/O operations on the host system (reading / writing files)
• Writing a flashloader that reads the bin file to be flashed from the host system and
performs the flashing operation chunk-wise
Most standard I/O libraries for embedded applications come with semihosting implemen-
tations for printf() and scanf().
18.1.1 Advantages
• Provides standardized commands for file I/O operations on the host, allowing relatively
complex operations with minimal logic in the target application
• Does not need chip-specific hardware capabilities
• Semihosting handling is natively supported by many debuggers/IDEs, for example GDB.
18.1.2 Disadvantages
• Target CPU is halted on each semihosting command, debugger evaluates the
semihosting command and restarts the CPU. This affects real-time behavior of the
system.
J-Link / J-Trace (UM08001) © 2004-2017 SEGGER Microcontroller GmbH & Co. KG
352 CHAPTER 18 Debugger support
18.2 Debugger support
If semihosting is supported or not depends on the actual debugger being used. Most mod-
ern IDEs / Debuggers support semihosting. The following debuggers / IDEs are known to
support semihosting:
• J-Link Debugger
• J-Link GDBServer + GDB
• SEGGER Embedded Studio
• J-Link RDI (and therefor most RDI compliant debuggers)
• IAR Embedded Workbench for ARM
• Keil MDK-ARM
• ARM AXD
J-Link / J-Trace (UM08001) © 2004-2017 SEGGER Microcontroller GmbH & Co. KG
353 CHAPTER 18 Implementation
18.3 Implementation
In general, there are two ways of implement semihosting which are explained in the fol-
lowing:
• SVC instruction (called SWI on legacy CPUs)
• Breakpoint instruction
• J-Link GDBServer optimized version
18.3.1 SVC instruction
Inside printf() calls etc. that shall perform semihosting, an SVC instruction is present which
causes the CPU to issue a software interrupt and jump to the SVC exception handler. The
debugger usually sets a breakpoint on the first instruction of the SVC exception handler or
sets a vector catch that has the same effect but does not waste one hardware breakpoint. If
vector catch is available depends on the CPU. Once the CPU has been halted, the debugger
can identify the cause of the SVC exception by analyzing the SVC instruction that caused
the exception. In the instruction there is a SVC reason/number encoded. The number may
differ if the CPU was in ARM or Thumb mode when the SVC instruction was executed. The
following SVC reasons are reserved for semihosting:
• ARM mode: 0x123456
• Thumb mode: 0xAB
Once the debugger has performed the semihosting operation and evaluated the command,
it will restart the target CPU right behind the SVC instruction that caused the semihosting
call. So it is debuggers responsibility to perform the exception return.
Disadvantages
If the SVC instruction is also used by the user application or a operating system on the
target, the CPU will be halted on every semihosting exception and be restarted by the
debugger. This affects real-time behavior of the target application.
18.3.2 Breakpoint instruction
A breakpoint instruction is compiled into the code that makes use of semihosting (usually
somewhere inside the printf() function in a library). The CPU halts as soon as the breakpoint
instruction is hit and allows the debugger to perform semihosting operations. Once the CPU
has been halted, the debugger is able to determine the halt reason by analyzing the break-
point instruction that caused the halt. In the breakpoint instruction, a “halt reason” can be
encoded. The halt reason may differ if the breakpoint instruction is an ARM instruction or
Thumb instruction. The following halt reasons are reserved for semihosting:
• ARM mode: 0x123456
• Thumb mode: 0xAB
Disadvantages
Having a breakpoint instruction compiled in a library call will make it necessary to have
different compile options for debug and release configurations as the target application will
not run stand-alone, without debugger intervention.
18.3.3 J-Link GDBServer optimized version
When using J-Link GDBServer with a GDB-based environment, there is a third implemen-
tation for semihosting available which is a hybrid of the other implementations, combining
the advantages of both. With this implementation, an SVC instruction with the usual SVC
reason is used to issue a semihosting call but the debugger does not set a breakpoint or
vector catch on the start of the SVC exception handler. Instead, the SVC exception handler
provides some code that detects if the reason was a semihosting call, if yes it immediately
performs a return from exception on which the debugger has set a hardware breakpoint.
This allows the application to continue normally in case no debugger is connected and han-
J-Link / J-Trace (UM08001) © 2004-2017 SEGGER Microcontroller GmbH & Co. KG

354 CHAPTER 18 Implementation
dling the semihosting call. It also inhibits the CPU from being halted on each non-semi-
hosting call, preserving the real-time behavior of the target application.
Advantages
Application also runs stand-alone (no debugger connected). Real-time behavior of the ap-
plication is preserved.
Disadvantages
One hardware breakpoint is not available for debugging / stepping as it is permanently
used while semihosting is enabled. Only works with J-Link GDBServer as other debuggers
do not support this specialized version.
18.3.3.1 SVC exception handler sample code
In the following, some sample code for the SVC handler, prepared to be used with J-Link
GDBServer optimized semihosting, is given:
SVC_Handler:
;
; For semihosting R0 and R1 contain the semihosting information and may not
; be changed before semihosting is handled.
; If R2 and R3 contain values for the SVC handler or need to be restored for
; the calling function, save them on the stack.
;
#if SAVE_REGS_IN_SVC
PUSH {R2,R3}
#endif
BIC R2, LR, #0xFFFFFFFE
CMP R2, #0x01 ; Check whether we come from Thumb or ARM mode
BNE CheckSemiARM
CheckSemiThumb:
#if BIG_ENDIAN
LDRB R2, [LR, #-2]
#else
LDRB R2, [LR, #-1]
#endif
LDR R3, _DataTable2
CMP R2, R3 ; ARM semihosting call?
BNE DoSVC
B SemiBreak
CheckSemiARM:
LDR R2, [LR, #-4]
BIC R2, R2, #0xFF000000
LDR R3, _DataTable1
CMP R2, R3 ; Thumb semihosting call?
BNE DoSVC
#if SAVE_REGS_IN_SVC
POP {R2,R3} ; Restore regs needed for semihosting
#endif
SemiBreak: ; Debugger will set a breakpoint here and perform exception return
NOP
MOVS R0, #+0 ; Make sure we have a valid return value in case
BX LR ; debugger is not connected
DoSVC:
;
; Customer specific SVC handler code
;
MOVS R0, #+0 ; Replace this code with your SVC Handler
BX LR
_DataTable1:
.word 0x00123456
_DataTable2:
.byte 0xAB
.byte 0x00
J-Link / J-Trace (UM08001) © 2004-2017 SEGGER Microcontroller GmbH & Co. KG

355 CHAPTER 18 Implementation
.byte 0x00
.byte 0x00
J-Link / J-Trace (UM08001) © 2004-2017 SEGGER Microcontroller GmbH & Co. KG

356 CHAPTER 18 Communication protocol
18.4 Communication protocol
Semihosting defines a standardized set of semihosting commands that need to be supported
by a debugger, claiming that it supports semihosting. In the following, the communication
protocol for semihosting as well as the specified commands are explained.
18.4.1 Register R0
Right before the operation that halts the CPU for semihosting, is performed, the target
application needs to prepare CPU register R0 and (depending on the command) also some
other CPU registers. On halt, R0 will hold the semihosting command, so the debugger can
determine further parameters and operation to be performed, from it.
Command RO value
SYS_OPEN 0x01
SYS_CLOSE 0x02
SYS_WRITEC 0x03
SYS_WRITE0 0x04
SYS_WRITE 0x05
SYS_READ 0x06
SYS_READC 0x07
SYS_ISTTY 0x09
SYS_SEEK 0x0A
SYS_FLEN 0x0C
SYS_REMOVE 0x0E
SYS_RENAME 0x0F
SYS_GET_CMDLINE 0x15
SYS_EXIT 0x18
18.4.2 Command SYS_OPEN (0x01)
Opens a file on the host system. Register R1 holds a pointer to an address on the target,
that specifies a 3-word (32-bit each) buffer where additional information for the command
can be found.
Word 0
Pointer to a null-terminated string that specifies the file to open. Special: The string “:tt”
specifies the console input/output (usually stdin / stdout). Which one is selected depends
on if the stream is opened for reading or writing.
Word 1
A number that specifies how the file is to be opened (reading/writing/appending etc.). In
the following, the corresponding ISO C fopen() modes for the numbers are listed. ISO C
fopen() modes
Word1 ISO C
fopen()
mode
0 r
1 rb
2 r+
3 r+b
J-Link / J-Trace (UM08001) © 2004-2017 SEGGER Microcontroller GmbH & Co. KG
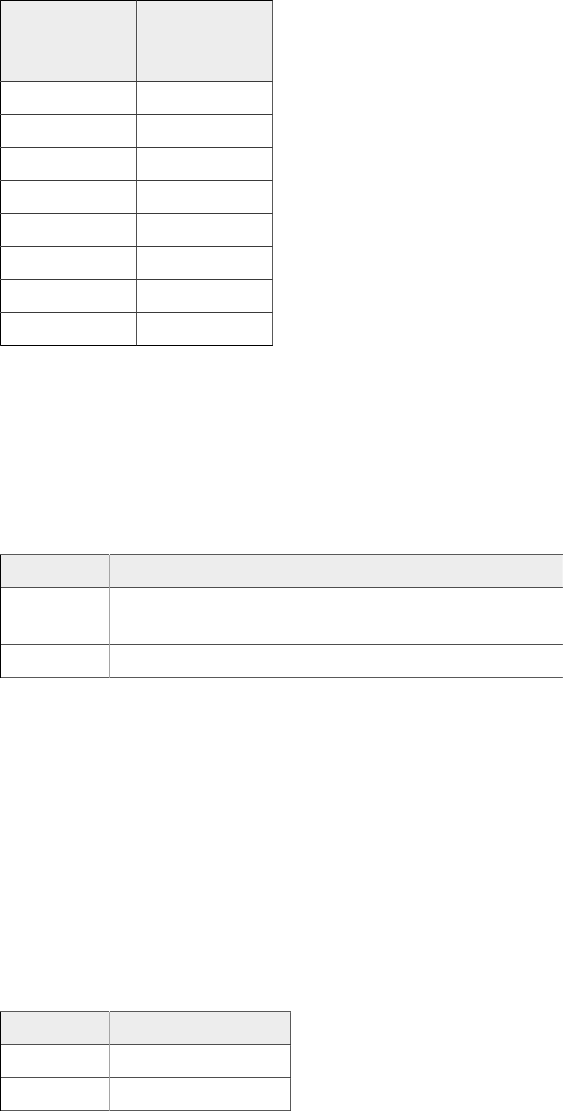
357 CHAPTER 18 Communication protocol
Word1 ISO C
fopen()
mode
4 w
5 wb
6 w+
7 w+b
8 a
9 ab
10 a+
11 a+b
Word 2
Integer that specifies the length of the string (excluding the terminating null character)
pointed to by word 0.
Return value
Operation result is written to register R0 by the debugger.
Value Meaning
≠ 0 O.K., handle of the file (needed for
SYS_CLOSE etc.)
= -1 Error
18.4.3 Command SYS_CLOSE (0x02)
Closes a file on the host system. Register R1 holds a pointer to an address on the target,
that specifies a 1-word (32-bit each) buffer where additional information for the command
can be found.
Word 0
Handle of the file retrieved on SYS_OPEN
Return value
Operation result is written to register R0 by the debugger.
Value Meaning
= 0 O.K.
= -1 Error
18.4.4 Command SYS_WRITEC (0x03)
Writes a single character to the debug channel on the host system (stdout in most cases).
Register R1 holds a pointer to an address on the target, that specifies a 1-word (32-bit
each) buffer where additional information for the command can be found.
Word 0
Pointer to the character to the written.
Return value
None
J-Link / J-Trace (UM08001) © 2004-2017 SEGGER Microcontroller GmbH & Co. KG
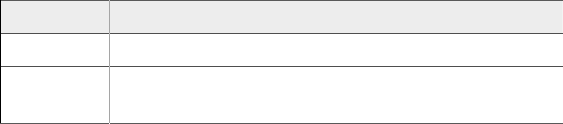
358 CHAPTER 18 Communication protocol
18.4.5 Command SYS_WRITE0 (0x04)
Writes a null-terminated string (excluding the null character) to the debug channel on the
host system. Register R1 holds a pointer to the string that shall be written.
Return value
None
18.4.6 Command SYS_WRITE (0x05)
Writes a given number of bytes to a file that has been previously opened via SYS_OPEN .
Exceptions: Handle 0-2 which specify stdin, stdout, stderr (in this order) do not require to
be opened with SYS_OPEN before used. This command behaves compatible to the ANSI C
function fwrite() meaning that writing is started at the last position of the write pointer on
the host. Register R1 holds a pointer to an address on the target, that specifies a 3-word
(32-bit each) buffer where additional information for the command can be found.
Word 0
Handle of the file to be written.
Word 1
Pointer to the data on the target, to be written.
Word 2
Number of bytes to write
Return value
Operation result is written to register R0 by the debugger.
Value Meaning
= 0 O.K.
≠ 0 Number of bytes to write left (in case not
all bytes could be written)
18.4.7 Command SYS_READ (0x06)
Reads a given number of bytes from a file that has been previously opened via SYS_OPEN .
Exceptions: Handle 0-2 which specify stdin, stdout, stderr (in this order) do not require to
be opened with SYS_OPEN before used. This command behaves compatible to the ANSI C
function fread() meaning that reading is started at the last position of the read pointer on
the host. Register R1 holds a pointer to an address on the target, that specifies a 3-word
(32-bit each) buffer where additional information for the command can be found.
Word 0
Handle of the file to be read.
Word 1
Pointer to a buffer on the target where data from file is written to.
Word 2
Number of bytes to read
Return value
Operation result is written to register R0 by the debugger.
J-Link / J-Trace (UM08001) © 2004-2017 SEGGER Microcontroller GmbH & Co. KG
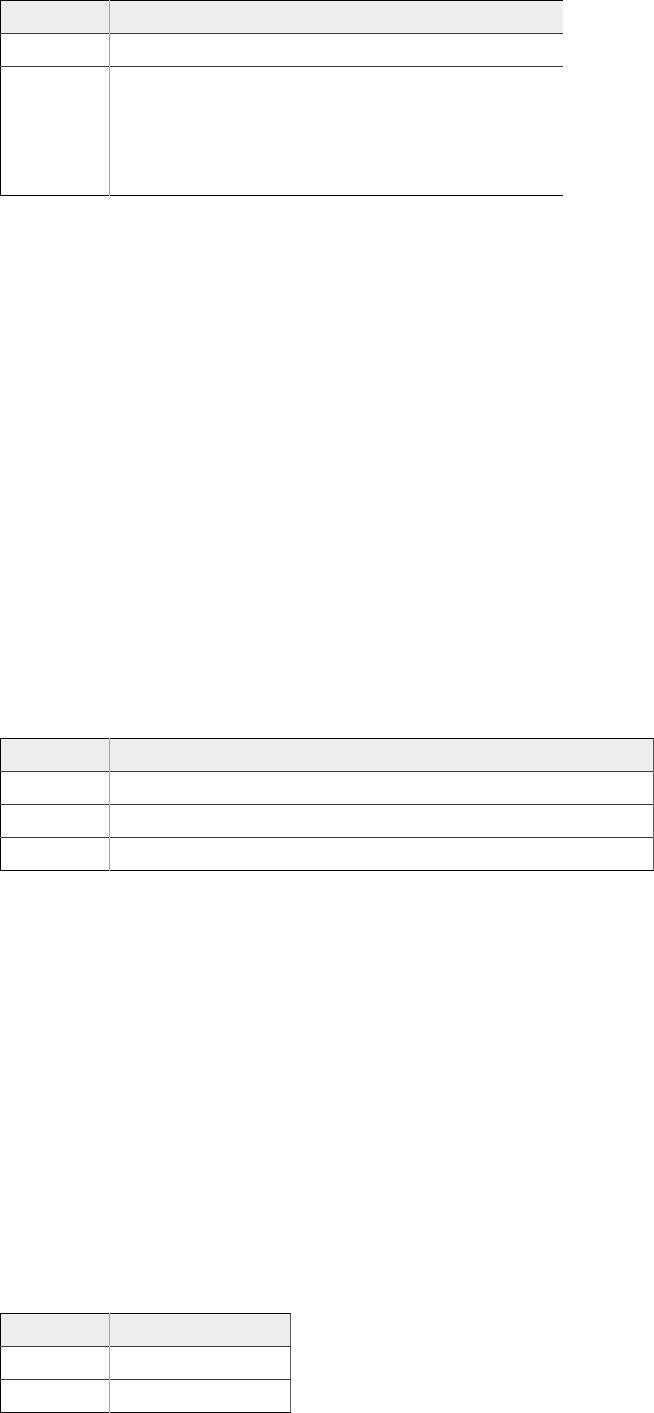
359 CHAPTER 18 Communication protocol
Value Meaning
= 0 O.K.
≠ 0
Number of bytes to read left (in case not
all bytes could be read). If identical to the
number of bytes to be read, read pointer
was pointing to end-of-file and no bytes
have been read.
18.4.8 Command SYS_READC (0x07)
Reads a single character from the debug channel on the host (usually stdin). Register R1
is set to 0.
Return value
Character that has been read is written to register R0.
18.4.9 Command SYS_ISTTY (0x09)
Checks if a given handle is an “interactive device” (stdin, stdout, …). Register R1 holds
a pointer to an address on the target, that specifies a 1-word (32-bit each) buffer where
additional information for the command can be found.
Word 0
Handle of the file to be checked.
Return value
Operation result is written to register R0 by the debugger.
Value Meaning
= 1 O.K., given handle is an interactive device.
= 0 O.K., given handle is not an interactive device.
Else Error
18.4.10 Command SYS_SEEK (0x0A)
Moves the filepointer of a file previously opened via SYS_OPEN to a specific position in the file.
Behaves compliant to the ANSI C function fseek(). Register R1 holds a pointer to an address
on the target, that specifies a 2-word (32-bit each) buffer where additional information for
the command can be found.
Word 0
Handle of the file.
Word 1
Position of the filepointer inside the file, to set to.
Return value
Operation result is written to register R0 by the debugger.
Value Meaning
= 0 O.K.
≠ 0 Error
J-Link / J-Trace (UM08001) © 2004-2017 SEGGER Microcontroller GmbH & Co. KG

360 CHAPTER 18 Communication protocol
18.4.11 Command SYS_FLEN (0x0C)
Retrieves the size of a file, previously opened by SYS_OPEN , in bytes. Register R1 holds
a pointer to an address on the target, that specifies a 1-word (32-bit each) buffer where
additional information for the command can be found.
Word 0
Handle of the file.
Return value
Operation result is written to register R0 by the debugger.
Value Meaning
≥ 0 File size in byte
= -1 Error
18.4.12 Command SYS_REMOVE (0x0E)
Deletes a file on the host system. Register R1 holds a pointer to an address on the target,
that specifies a 2-word (32-bit each) buffer where additional information for the command
can be found.
Word 0
Pointer to a null-terminated string that specifies the path + file to be deleted.
Word 1
Length of the string pointed to by word 0 .
Return value
Operation result is written to register R0 by the debugger.
Value Meaning
= 0 O.K.
≠ 0 Error
18.4.13 Command SYS_RENAME (0x0F)
Renames a file on the host system. Register R1 holds a pointer to an address on the target,
that specifies a 4-word (32-bit each) buffer where additional information for the command
can be found.
Word 0
Pointer to a null-terminated string that specifies the old name of the file.
Word 1
Length of the string (without terminating null-character) pointed to by word 0 .
Word 2
Pointer to a null-terminated string that specifies the new name of the file.
Word 3
Length of the string (without terminating null-character) pointed to by word 2 .
J-Link / J-Trace (UM08001) © 2004-2017 SEGGER Microcontroller GmbH & Co. KG

361 CHAPTER 18 Communication protocol
Return value
Operation result is written to register R0 by the debugger.
Value Meaning
= 0 O.K.
≠ 0 Error
18.4.14 Command SYS_GET_CMDLINE (0x15)
Gets the command line (argc, argv) from the process on the host system as a single string.
argv elements will be separated by spaces. Register R1 holds a pointer to an address on
the target, that specifies a 2-word (32-bit each) buffer where additional information for the
command can be found.
Word 0
Pointer to a buffer on the target system to store the command line to.
Word 1
Size of the buffer in bytes.
Return value
After the operation, word 1 will hold the length of the command line string. Operation result
is written to register R0 by the debugger.
Value Meaning
= 0 O.K.
≠ 0 Error
18.4.15 Command SYS_EXIT (0x18)
Used to tell the debugger if an application exited/completed with success or error. Usually,
this also ends the debug session automatically. Register R1 is one of the following values:
Exit code Meaning
0x20026 Application exited normally.
0x20023 Application exited with error.
Return value
None.
J-Link / J-Trace (UM08001) © 2004-2017 SEGGER Microcontroller GmbH & Co. KG
362 CHAPTER 18 Enabling semihosting in J-Link GDBServer
18.5 Enabling semihosting in J-Link GDBServer
By default, semihosting is disabled in J-Link GDBServer. Depending on the mechanism to
be used, different setups are necessary
18.5.1 SVC variant
The following commands need to be added to the gdbinit file that is executed at the start
of a debug session:
monitor semihosting enable
monitor semihosting breakOnError
monitor semihosting IOclient 3
monitor semihosting setargs “<argv>” (in case SYS_GET_CMDLINE command is used)
For more detailed information about the monitor commands supported by J-Link GDBServ-
er, please refer to Supported remote (monitor) commands on page 60.
18.5.2 Breakpoint variant
The following commands need to be added to the gdbinit file that is executed at the start
of a debug session:
monitor semihosting enable
18.5.3 J-Link GDBServer optimized variant
The following commands need to be added to the gdbinit file that is executed at the start
of a debug session:
monitor semihosting enable <AddrSemiBreak>
Please also make sure that an appropriate SVC exception handler is linked in the application.
For sample code, please refer to SVC exception handler sample code on page 354.
J-Link / J-Trace (UM08001) © 2004-2017 SEGGER Microcontroller GmbH & Co. KG
363 CHAPTER 18 Enabling Semihosting in J-Link RDI + AXD
18.6 Enabling Semihosting in J-Link RDI + AXD
This semihosting mechanism can be disabled or changed by the following debugger internal
variables:
$semihosting_enabled
Set this variable to 0 to disable semihosting. If you are debugging an application running
from ROM, this allows you to use an additional watchpoint unit.
Set this variable to 1 to enable semihosting. This is the default.
Set this variable to 2 to enable Debug Communications Channel (DCC) semihosting.
The S bit in $vector_catch has no effect unless semihosting is disabled.
$semihosting_vector
This variable controls the location of the breakpoint set by J-Link RDI to detect a semihosted
SWI. It is set to the SWI entry in the exception vector table () by default.
18.6.1 Using SWIs in your application
If your application requires semihosting as well as having its own SWI handler, set $semi-
hosting_vector to an address in your SWI handler. This address must point to an instruc-
tion that is only executed if your SWI handler has identified a call to a semihosting SWI. All
registers must already have been restored to whatever values they had on entry to your
SWI handler.
J-Link / J-Trace (UM08001) © 2004-2017 SEGGER Microcontroller GmbH & Co. KG

Chapter 19
Support and FAQs
This chapter contains troubleshooting tips as well as solutions for common problems which
might occur when using J-Link / J-Trace. There are several steps you can take before con-
tacting support. Performing these steps can solve many problems and often eliminates the
need for assistance. This chapter also contains a collection of frequently asked questions
(FAQs) with answers.
J-Link / J-Trace (UM08001) © 2004-2017 SEGGER Microcontroller GmbH & Co. KG
365 CHAPTER 19 Measuring download speed
19.1 Measuring download speed
Test environment
JLink.exe has been used for measurement performance. The hardware consisted of:
• PC with 2.6 GHz Pentium 4, running Win2K
• USB 2.0 port
• USB 2.0 hub
• J-Link
• Target with ARM7 running at 50MHz
J-Link / J-Trace (UM08001) © 2004-2017 SEGGER Microcontroller GmbH & Co. KG
366 CHAPTER 19 Troubleshooting
19.2 Troubleshooting
19.2.1 General procedure
If you experience problems with J-Link / J-Trace, you should follow the steps below to solve
these problems:
• Close all running applications on your host system.
• Disconnect the J-Link / J-Trace device from USB.
• Disable power supply on the target.
• Re-connect J-Link / J-Trace with the host system (attach USB cable).
• Enable power supply on the target.
• Try your target application again. If the problem remains continue the following
procedure.
• Close all running applications on your host system again.
• Disconnect the J-Link / J-Trace device from USB.
• Disable power supply on the target.
• Re-connect J-Link / J-Trace with the host system (attach the USB cable).
• Enable power supply on the target.
• Start JLink.exe .
• If JLink.exe displays the J-Link / J-Trace serial number and the target processor’s core
ID, the J-Link / J-Trace is working properly and cannot be the cause of your problem.
• If the problem persists and you own an original product (not an OEM version), see
section Contacting support .
J-Link / J-Trace (UM08001) © 2004-2017 SEGGER Microcontroller GmbH & Co. KG
367 CHAPTER 19 Contacting support
19.3 Contacting support
Before contacting support, make sure you tried to solve your problem by following the steps
outlined in section General procedure on page 366. You may also try your J-Link / J-Trace
with another PC and if possible with another target system to see if it works there. If the
device functions correctly, the USB setup on the original machine or your target hardware
is the source of the problem, not J-Link / J-Trace. If you need to contact support, send the
following information to
support@segger.com :
• A detailed description of the problem.
• J-Link/J-Trace serial number.
• Output of JLink.exe if available.
• Your findings of the signal analysis.
• Information about your target hardware (processor, board, etc.).
J-Link / J-Trace is sold directly by SEGGER or as OEM-product by other vendors. SEGGER
can support only official SEGGER products.
19.3.1 Contact Information
SEGGER Microcontroller GmbH & Co. KG
In den Weiden 11
D-40721 Hilden
Germany
Tel. +49 2103-2878-0
Fax. +49 2103-2878-28
E-mail: support@segger.com
Internet: www.segger.com
J-Link / J-Trace (UM08001) © 2004-2017 SEGGER Microcontroller GmbH & Co. KG
