TIBCO Jaspersoft Studio User Guide
User Manual:
Open the PDF directly: View PDF ![]() .
.
Page Count: 458 [warning: Documents this large are best viewed by clicking the View PDF Link!]
- Chapter 1 Getting Started with Jaspersoft Studio
- Chapter 2 Creating a Simple Report
- Chapter 3 User Interface and Design View
- Chapter 4 Report Elements
- 4.1 Common Element Properties
- 4.2 Inserting, Selecting, and Positioning Elements
- 4.3 Formatting Elements
- 4.4 Working with Advanced Properties
- 4.5 Graphic Elements
- 4.6 Text Elements
- 4.7 Frames
- 4.8 Inserting Page and Column Breaks
- 4.9 Working with Spreadsheet Layout
- 4.10 Working with Composite Elements
- 4.11 Anchors, Bookmarks, and Hyperlinks
- 4.12 Advanced Elements and Custom Components
- 4.13 Custom Visualization Component
- Chapter 5 Fields
- Chapter 6 Parameters
- Chapter 7 Variables
- Chapter 8 Expressions
- Chapter 9 Fonts
- Chapter 10 Data Adapters
- 10.1 Creating and Editing Data Adapters
- 10.2 Using Data Adapters in Reports and Datasets
- 10.3 Working with Database JDBC Connections
- 10.4 Working with a MongoDB Data Adapter
- 10.5 Working with a Native Cassandra Connection
- 10.6 Working with a Collection of JavaBeans Data Adapter
- 10.7 Working with XML Data Adapters
- 10.8 Working with XML/A Data Adapters
- 10.9 Working with CSV Data Adapters
- 10.10 Using the Empty Record Data Adapter
- 10.11 Working with the JRDataSource Interface
- 10.12 A Look at TIBCO Spotfire Information Links
- Chapter 11 Creating Queries
- Chapter 12 Accessing JasperReports Server from Jaspersoft Studio
- 12.1 Connecting to JasperReports Server
- 12.2 Publishing a Report to JasperReports Server
- 12.3 Working with JasperReports Server Templates
- 12.4 Creating and Uploading a Topic for Ad Hoc Views
- 12.5 Managing Repository Objects through Jaspersoft Studio
- 12.6 Creating and Uploading Chart Themes
- 12.7 Working with Domains
- 12.8 Understanding the repo: Syntax
- 12.9 Adding a Date/Time Stamp to Scheduled Output in JasperReports Server
- Chapter 13 Working with JasperReports IO
- Chapter 14 Datasets and Subdatasets
- Chapter 15 Working with Tables
- Chapter 16 Working with Charts
- Chapter 17 HTML5 Charts in Commercial Editions
- 17.1 Overview of HTML5 Charts
- 17.2 Example of a Bar Chart Using Simple Configuration
- 17.3 Example of a Pie Chart
- 17.4 Example of a Tree Map Using Multiple Levels and Advanced Formatting
- 17.5 Example of a Scatter Chart Using Advanced Configuration
- 17.6 Example of a Column-Spline Chart
- 17.7 Creating Hyperlinks in HTML5 Charts
- 17.8 Advanced Formatting of HTML5 Charts
- Chapter 18 Working with Crosstabs
- Chapter 19 Working With the Map Component
- Chapter 20 Working with TIBCO GeoAnalytics Maps
- Chapter 21 Working with Subreports
- Chapter 22 Report Templates
- Chapter 23 Report Books
- Chapter 24 Preferences and Configuration
- Appendix A Concepts of JasperReports
- Glossary
- Index

Jaspersoft® Studio User Guide
Software Release 7.3

Important Information
SOME TIBCO SOFTWARE EMBEDS OR BUNDLES OTHER TIBCO SOFTWARE. USE OF SUCH EMBEDDED OR BUNDLED TIBCO
SOFTWARE IS SOLELY TO ENABLE THE FUNCTIONALITY (OR PROVIDE LIMITED ADD-ON FUNCTIONALITY) OF THE LICENSED
TIBCO SOFTWARE. THE EMBEDDED OR BUNDLED SOFTWARE IS NOT LICENSED TO BE USED OR ACCESSED BY ANY OTHER TIBCO
SOFTWARE OR FOR ANY OTHER PURPOSE.
USE OF TIBCO SOFTWARE AND THIS DOCUMENT IS SUBJECT TO THE TERMS AND CONDITIONS OF A LICENSE AGREEMENT
FOUND IN EITHER A SEPARATELY EXECUTED SOFTWARE LICENSE AGREEMENT, OR, IF THERE IS NO SUCH SEPARATE
AGREEMENT, THE CLICKWRAP END USER LICENSE AGREEMENT WHICH IS DISPLAYED DURING DOWNLOAD OR INSTALLATION OF
THE SOFTWARE (AND WHICH IS DUPLICATED IN THE LICENSE FILE) OR IF THERE IS NO SUCH SOFTWARE LICENSE AGREEMENT
OR CLICKWRAP END USER LICENSE AGREEMENT, THE LICENSE(S) LOCATED IN THE “LICENSE” FILE(S) OF THE SOFTWARE. USE OF
THIS DOCUMENT IS SUBJECT TO THOSE TERMS AND CONDITIONS, AND YOUR USE HEREOF SHALL CONSTITUTE ACCEPTANCE OF
AND AN AGREEMENT TO BE BOUND BY THE SAME.
ANY SOFTWARE ITEM IDENTIFIED AS THIRD PARTY LIBRARY IS AVAILABLE UNDER SEPARATE SOFTWARE LICENSE TERMS AND
IS NOT PART OF A TIBCO PRODUCT. AS SUCH, THESE SOFTWARE ITEMS ARE NOT COVERED BY THE TERMS OF YOUR
AGREEMENT WITH TIBCO, INCLUDING ANY TERMS CONCERNING SUPPORT, MAINTENANCE, WARRANTIES, AND INDEMNITIES.
DOWNLOAD AND USE OF THESE ITEMS IS SOLELY AT YOUR OWN DISCRETION AND SUBJECT TO THE LICENSE TERMS
APPLICABLE TO THEM. BY PROCEEDING TO DOWNLOAD, INSTALL OR USE ANY OF THESE ITEMS, YOU ACKNOWLEDGE THE
FOREGOING DISTINCTIONS BETWEEN THESE ITEMS AND TIBCO PRODUCTS.
This document is subject to U.S. and international copyright laws and treaties. No part of this document may be reproduced in any form without the
written authorization of TIBCO Software Inc.
TIBCO, the TIBCO logo, Jaspersoft, JasperReports, and Visualize.js are registered trademarks of TIBCO Software Inc. in the United States and/or other
countries.
Java and all Java based trademarks and logos are trademarks or registered trademarks of Oracle and/or its affiliates.
All other product and company names and marks mentioned in this document are the property of their respective owners and are mentioned for
identification purposes only.
THIS DOCUMENT IS PROVIDED “AS IS” WITHOUT WARRANTY OF ANY KIND, EITHER EXPRESS OR IMPLIED, INCLUDING, BUT NOT
LIMITED TO, THE IMPLIED WARRANTIES OF MERCHANTABILITY, FITNESS FOR A PARTICULAR PURPOSE, OR NON-INFRINGEMENT.
THIS DOCUMENT COULD INCLUDE TECHNICAL INACCURACIES OR TYPOGRAPHICAL ERRORS. CHANGES ARE PERIODICALLY
ADDED TO THE INFORMATION HEREIN; THESE CHANGES WILL BE INCORPORATED IN NEW EDITIONS OF THIS DOCUMENT. TIBCO
SOFTWARE INC. MAY MAKE IMPROVEMENTS AND/OR CHANGES IN THE PRODUCT(S) AND/OR THE PROGRAM(S) DESCRIBED IN
THIS DOCUMENT AT ANY TIME.
THE CONTENTS OF THIS DOCUMENT MAY BE MODIFIED AND/OR QUALIFIED, DIRECTLY OR INDIRECTLY, BY OTHER
DOCUMENTATION WHICH ACCOMPANIES THIS SOFTWARE, INCLUDING BUT NOT LIMITED TO ANY RELEASE NOTES AND "READ
ME" FILES.
This and other products of TIBCO Software Inc. may be covered by registered patents. Please refer to TIBCO's Virtual Patent Marking document
(https://www.tibco.com/patents) for details.
Copyright © 2005-2019. TIBCO Software Inc. All Rights Reserved.
Version 0619-JSP73-14 of the TIBCO Jaspersoft Studio User Guide

TABLE OF CONTENTS
Chapter 1 Getting Started with Jaspersoft Studio 13
1.1 Introduction to Jaspersoft Studio 13
1.2 Installing Jaspersoft Studio 14
1.2.1 Requirements 14
1.2.2 Available Packages 15
1.2.3 Command-Line Installation on Windows 15
1.2.4 Updating Your Workspace 16
1.2.5 Compatibility Between Versions 20
1.2.6 Accessing the Source Code 21
Chapter 2 Creating a Simple Report 23
2.1 Creating a New Report 23
2.2 Adding and Deleting Report Elements 28
2.2.1 Adding Fields to a Report 28
2.2.2 Deleting Fields 29
2.2.3 Adding Other Elements 29
2.3 Previewing a Report 29
2.4 Creating a Project Folder 30
Chapter 3 User Interface and Design View 33
3.1 Eclipse Interface 34
3.1.1 Learning More About Eclipse 34
3.2 User Interface Components 34
3.3 The Design Tab 35
3.4 Understanding Bands 36
3.4.1 Band Types 36
3.5 Specifying Report Properties 37
3.5.1 Columns 39
3.5.2 Advanced Options 39
3.6 The Preview Tab 40
3.7 Exporting Reports with Jaspersoft Studio 42
3.7.1 Compiling the Report 42
3.7.2 Preview and Exporting 42
3.7.3 Choosing Report Templates for PDF 43
TIBCO Software Inc. 3

TIBCO Jaspersoft Studio User Guide
Chapter 4 Report Elements 45
4.1 Common Element Properties 46
4.1.1 The Palette 46
4.1.2 Element Properties 46
4.2 Inserting, Selecting, and Positioning Elements 47
4.2.1 Inserting Elements 47
4.2.2 Selecting Elements 48
4.2.3 Positioning Elements 48
4.2.4 Positioning Elements in Containers 49
4.3 Formatting Elements 53
4.4 Working with Advanced Properties 56
4.4.1 Example of Using the Properties Dialog 57
4.4.2 Variables in Property Names 58
4.4.3 Adding a Custom Property 59
4.5 Graphic Elements 60
4.5.1 Line 60
4.5.2 Rectangle and Ellipse 60
4.5.3 Images 60
4.5.4 Padding and Borders 60
4.6 Text Elements 61
4.6.1 Static Text 61
4.6.2 Text Fields 61
4.7 Frames 62
4.7.1 Sizing the Frame 63
4.8 Inserting Page and Column Breaks 64
4.9 Working with Spreadsheet Layout 64
4.9.1 Example of Using Spreadsheet Layout 64
4.10 Working with Composite Elements 67
4.10.1 Creating and Editing Composite Elements 67
4.10.2 Exporting and Importing Composite Elements 69
4.11 Anchors, Bookmarks, and Hyperlinks 71
4.11.1 Anchors and Bookmarks 71
4.11.2 Hyperlinks 72
4.11.3 Hyperlink Types 74
4.11.4 Creating a Hyperlink 75
4.12 Advanced Elements and Custom Components 76
4.13 Custom Visualization Component 76
Chapter 5 Fields 79
5.1 Understanding Fields 79
5.2 Registration of Fields from an SQL Query 81
5.3 Registration of JavaBean Fields 83
5.4 Fields and Text Fields 84
5.5 Data Centric Exporters 84
5.5.1 Configuring a Report's Metadata for PDF 508 Tags 84
5.5.2 Configuring a Report's Metadata for Use With the JSON Data Exporter 87
4 TIBCO Software Inc.

Chapter 6 Parameters 91
6.1 Working With Parameters 91
6.1.1 Managing Parameters 91
6.1.2 Working with Parameter Properties 94
6.2 Default Parameters 96
6.3 Using Parameters in Queries 98
6.3.1 Using Parameters in a SQL Query 98
6.3.2 Using Parameters with Null Values 99
6.3.3 IN and NOTIN Clauses 99
6.3.4 Relative Dates 100
6.3.5 Passing Parameters from a Program 102
6.4 Parameters Prompt 104
6.5 Parameter Sets 105
Chapter 7 Variables 109
7.1 Defining or Editing a Variable 109
7.2 Base Properties of a Variable 109
7.3 Other Properties of a Variable 110
7.3.1 Evaluation Time 110
7.3.2 Calculation Function 111
7.3.3 Increment Type 111
7.3.4 Reset Type 112
7.3.5 Incrementer Factory Class Name 112
7.4 Built-In Variables 112
7.5 Tips & Tricks 113
Chapter 8 Expressions 115
8.1 Expression Types 115
8.2 Expression Operators and Object Methods 116
8.3 Using an If-Else Construct in an Expression 118
8.4 Using Unicode Characters in Expressions 119
8.5 Using Java as a Language for Expressions 119
8.6 Using Groovy as a Language for Expressions 120
8.7 Using JavaScript as a Language for Expressions 121
Chapter 9 Fonts 123
9.1 Font Extensions Reference 123
9.1.1 The Fonts Page 123
9.1.2 The Font Family Dialog 125
9.1.3 Font Sets 129
9.2 Example of Using Font Extensions 130
9.2.1 Creating Font Extensions and Font Sets 131
9.2.2 Using Font Extensions in a Report 135
9.3 Deploying Font Extensions to JasperReports Server 138
Chapter 10 Data Adapters 141
10.1 Creating and Editing Data Adapters 142
10.1.1 Creating a Data Adapter 142
TIBCO Software Inc. 5

TIBCO Jaspersoft Studio User Guide
10.1.2 Importing and Exporting Data Adapters 143
10.1.3 Copying a Data Adapter 144
10.2 Using Data Adapters in Reports and Datasets 144
10.2.1 Data Adapter For a Report 144
10.2.2 Data Adapters and Report Deployment 145
10.2.3 Default Data Adapter 145
10.3 Working with Database JDBC Connections 147
10.3.1 Creating a Database JDBC Connection 147
10.3.2 Troubleshooting a Database JDBC Connection 149
10.3.3 Using a Database JDBC Connection 151
10.4 Working with a MongoDB Data Adapter 153
10.4.1 Creating a Native MongoDB Connection 153
10.4.2 Creating a MongoDB JDBC Data Source 156
10.5 Working with a Native Cassandra Connection 158
10.5.1 Creating a Native Cassandra Data Adapter 158
10.5.2 Using a Cassandra Connection 160
10.6 Working with a Collection of JavaBeans Data Adapter 160
10.6.1 Implementing the Factory Class for a Collection of JavaBeans 161
10.6.2 Creating a Data Adapter from a Factory Class 162
10.6.3 Registering the Fields 163
10.7 Working with XML Data Adapters 163
10.7.1 Creating a Node Set for an XML Document 163
10.7.2 Creating an XML Data Adapter 165
10.7.3 Registration of Fields for an XML Data Adapter 167
10.7.4 XML Data Adapters and Subreports 168
10.8 Working with XML/A Data Adapters 170
10.8.1 Registration of fields in XML/A Providers 171
10.9 Working with CSV Data Adapters 172
10.9.1 Registration of the Fields for a CSV Data Adapter 175
10.9.2 Connecting to a Web Service Using a JSON Data Adapter 175
10.9.3 Adding HTTPParameters to the Report 181
10.10 Using the Empty Record Data Adapter 183
10.10.1 Understanding the Empty Record Implementation 184
10.11 Working with the JRDataSource Interface 184
10.11.1 Understanding the JRDataSource Interface 184
10.11.2 Implementing a New JRDataSource 185
10.11.3 Using a Custom JasperReports Data Source with Jaspersoft Studio 186
10.12 A Look at TIBCO Spotfire Information Links 188
10.12.1 Working With Prompts 190
Chapter 11 Creating Queries 195
11.1 Using the Dataset and Query Dialog 195
11.1.1 Configuring the Data Adapter and Query Language Drop downs 197
11.1.2 The Data Adapter Tab 198
11.1.3 Discovering Fields 198
11.2 Working with the Query Builder 199
6 TIBCO Software Inc.

11.2.1 Query Outline View and Diagram View 199
11.2.2 Selecting Columns 201
11.2.3 Joining Tables 202
11.2.4 Data Selection Criteria (WHERE Conditions) 203
11.2.5 Acquiring Fields 204
11.2.6 Data Preview 204
Chapter 12 Accessing JasperReports Server from Jaspersoft Studio 205
12.1 Connecting to JasperReports Server 206
12.1.1 Advanced Connection Settings 207
12.1.2 Connecting to JasperReports Server Over SSL 208
12.1.3 Using Single Sign-on with JasperReports Server 209
12.2 Publishing a Report to JasperReports Server 212
12.2.1 Publishing Report Resources 212
12.2.2 Choosing a Data Source for a Published Report 212
12.2.3 Example of Publishing a Report 214
12.3 Working with JasperReports Server Templates 216
12.3.1 Creating a Custom JasperReports Server Template 216
12.3.2 Report Template Styles in Jaspersoft Studio 219
12.4 Creating and Uploading a Topic for Ad Hoc Views 220
12.5 Managing Repository Objects through Jaspersoft Studio 222
12.5.1 Adding, Modifying and Deleting Resources 222
12.5.2 Running a Report 223
12.5.3 Editing a Report 223
12.6 Creating and Uploading Chart Themes 224
12.7 Working with Domains 227
12.7.1 Using the domain Query Language 228
12.8 Understanding the repo: Syntax 231
12.9 Adding a Date/Time Stamp to Scheduled Output in JasperReports Server 231
Chapter 13 Working with JasperReports IO 235
13.1 JasperReports IO Repository File System 235
13.1.1 JasperReports IO Repository Directory Structure 235
13.2 JasperReports IO Report Execution Contexts 236
13.2.1 Report Execution Context Configuration 236
13.2.2 Configuring a Report Execution Context 238
13.3 Testing Reports with JasperReports IO 239
13.3.1 Importing JasperReports IO Resources into Your Project 239
13.3.2 Configuring Jaspersoft Studio for JasperReports IO 240
13.3.3 Previewing a Report in JasperReports IO 241
13.3.4 Exporting the JasperReports IO Templates and Resources 241
Chapter 14 Datasets and Subdatasets 243
14.1 Understanding Datasets and Dataset Runs 243
14.1.1 Understanding Datasets 243
14.1.2 Dataset Runs 244
14.2 Subdatasets 245
TIBCO Software Inc. 7

TIBCO Jaspersoft Studio User Guide
14.2.1 The Dataset Wizard 245
14.2.2 Dataset Objects 246
14.2.3 Dataset Properties 247
14.3 Dataset Runs 249
14.3.1 Connection/Data Source Expression Menu 250
14.3.2 Parameters Tab 251
14.3.3 Parameters Map Tab 252
14.3.4 Return Values Tab 252
14.4 Creating an Example Subdataset 252
Chapter 15 Working with Tables 259
15.1 Creating a Table 259
15.2 Editing a Table 265
15.2.1 Editing Table Properties 265
15.2.2 Editing Table Styles 265
15.2.3 Editing Cell Contents 266
15.2.4 Editing Table Data 267
15.2.5 Editing Table Source 268
15.3 Table Structure 268
15.3.1 Table Elements 268
15.3.2 Table Cells 269
15.4 Working with Columns 270
15.4.1 Table Properties for Managing Columns 270
15.4.2 Working with Individual Columns 270
15.4.3 Column Groups 271
Chapter 16 Working with Charts 273
16.1 Creating a Simple Chart 273
16.2 Setting Chart Properties 278
16.3 Spider Charts 278
16.4 Chart Themes 282
16.4.1 Using the Chart Theme Designer 282
16.4.2 Editing Chart Theme XML 282
16.4.3 Creating a JasperReports Extension for a Chart Theme 282
16.4.4 Applying a Chart Theme 283
16.5 Chart Customizers 283
16.5.1 Using Chart Customizers 283
16.5.2 Creating a Chart Customizer 286
Chapter 17 HTML5 Charts in Commercial Editions 291
17.1 Overview of HTML5 Charts 291
17.2 Example of a Bar Chart Using Simple Configuration 298
17.2.1 Creating an HTML5 Chart 298
17.2.2 Adding a Measure to a Bar Chart 302
17.2.3 Formatting a Chart 303
17.2.4 Creating a Hyperlink 305
17.3 Example of a Pie Chart 306
8 TIBCO Software Inc.

17.3.1 Example of a Time-Series Spline Chart 310
17.4 Example of a Tree Map Using Multiple Levels and Advanced Formatting 312
17.4.1 Creating a Tree Map 312
17.4.2 Using Advanced Formatting Properties 313
17.5 Example of a Scatter Chart Using Advanced Configuration 316
17.6 Example of a Column-Spline Chart 320
17.6.1 Creating the Chart Using Simple Configuration 320
17.6.2 Using Advanced Configuration 322
17.7 Creating Hyperlinks in HTML5 Charts 327
17.7.1 Creating a Simple Hyperlink 327
17.7.2 Working with Bucket Properties and Hidden Measures 329
17.7.3 Working with Hyperlinks to Report Units 333
17.8 Advanced Formatting of HTML5 Charts 335
17.8.1 Setting Advanced Options for HTML5 Charts in Properties View 337
Chapter 18 Working with Crosstabs 339
18.1 Example of Creating a Crosstab 340
18.2 Working with Crosstab Properties 345
18.3 Using the Crosstab Editor 346
18.3.1 Formatting Columns, Rows, and Cells 346
18.3.2 Editing Row or Column Group Properties 347
18.3.3 Adding and Deleting Row and Column Groups 349
18.3.4 Working with Measures 351
18.4 Working with Crosstab Parameters 355
Chapter 19 Working With the Map Component 357
19.1 Working with Map Properties 357
19.2 Viewing Authentication Properties 359
19.3 Working with Markers 360
19.3.1 Marker Properties 361
19.3.2 Adding Markers Manually 361
19.3.3 Adding Markers Using the Map 363
19.3.4 Adding Markers Using a Dataset 364
19.3.5 Modifying Markers 368
19.4 Working with Paths 369
19.4.1 Defining Path Styles 369
19.4.2 Defining a Path Manually 371
19.4.3 Defining a Path Using a Dataset 372
19.4.4 Modifying Paths and Path Styles 373
19.5 Properties for Markers and Paths 373
Chapter 20 Working with TIBCO GeoAnalytics Maps 377
20.1 Configuring a Basic Map 378
20.2 Using Expressions for Properties 380
20.3 Understanding Layers 381
20.4 Working with Markers 382
20.4.1 Static Markers 382
TIBCO Software Inc. 9

TIBCO Jaspersoft Studio User Guide
20.4.2 Dynamic Markers 385
20.5 Working with Paths 388
Chapter 21 Working with Subreports 391
21.1 Creating a New Report via the Subreport Wizard 391
21.2 Understanding Subreports 394
21.2.1 Subreports 394
21.2.2 Subreport Elements 395
21.2.3 The Expression Property 396
21.2.4 Specifying the Data Source 397
21.2.5 Subreport Parameters 397
Chapter 22 Report Templates 401
22.1 Template Structure 401
22.2 Creating and Customizing Templates 403
22.2.1 Creating a New Template 403
22.2.2 Customizing a Template 405
22.3 Saving Templates 406
22.3.1 Creating a Template Directory 406
22.3.2 Exporting a Template 407
22.3.3 Creating a Template Thumbnail 409
22.4 Adding Templates to Jaspersoft Studio 409
Chapter 23 Report Books 411
23.1 Creating the Report Book Framework 411
23.2 Creating and Adding Reports to the Report Book 413
23.2.1 Creating a Report for the Report Book 413
23.2.2 Adding a Report to the Report Book 413
23.3 Refining the Report Book 414
23.3.1 Sorting on Additional Fields 414
23.3.2 Adding Section Introductory Pages 415
23.4 Configuring the Table of Contents 416
23.5 Report Book Pagination 417
23.6 Publishing the Report Book 418
Chapter 24 Preferences and Configuration 419
24.1 Properties 419
24.2 JasperReports Samples 419
24.3 Units of Measure in Jaspersoft Studio 419
24.3.1 Configuration 420
24.3.2 Changing the Field Unit of Measure 420
24.3.3 Alias and Auto-complete 420
24.3.4 Approximations 421
24.4 Cleaning Cached Data 421
24.4.1 Cleaning From the Command Line 421
24.4.2 Setting the -clean Flag in the .ini File 422
24.5 Disabling Usage Statistics 422
24.6 Export and Import 423
10 TIBCO Software Inc.

24.7 Setting Compatibility with Earlier Versions of JasperReports Library 425
24.8 Working with Java in Eclipse 427
24.8.1 Adding a JAR to Jaspersoft Studio 428
24.9 Using Data Snapshots 428
Appendix A Concepts of JasperReports 431
A.1 JRXML Sources and Jasper Files 431
A.1.1 The Report Lifecycle 431
A.2 Data Sources and Print Formats 437
A.3 Using JasperReports Extensions in Jaspersoft Studio 437
A.4 A Simple Program 438
Glossary 439
Index 451
TIBCO Software Inc. 11

TIBCO Jaspersoft Studio User Guide
12 TIBCO Software Inc.

CHAPTER 1 GETTING STARTED WITH JASPERSOFT STUDIO
Jaspersoft Studio is the latest incarnation of the well-known iReport Editor. Because it is built on the Eclipse
platform, Jaspersoft Studio is a more complete solution that allows users to extend its capabilities and
functionality.
This chapter contains the following sections:
•Introduction to Jaspersoft Studio
•Installing Jaspersoft Studio
•Exporting Reports with Jaspersoft Studio
1.1 Introduction to Jaspersoft Studio
Jaspersoft Studio is an Eclipse-based report designer for JasperReports Library and JasperReports Server; it's
available as an Eclipse plug-in or as a stand-alone application. Jaspersoft Studio allows you to create
sophisticated layouts containing charts, images, subreports, crosstabs, and more. You can access your data
through a variety of sources including JDBC, TableModels, JavaBeans, XML, Hibernate, Big Data (such as
Hive), CSV, XML/A, as well as custom sources, then publish your reports as PDF, RTF, XML, XLS, CSV,
HTML, XHTML, text, DOCX, or OpenOffice.
TIBCO JasperReports® Server builds on TIBCOJasperReports® Library as a comprehensive family of Business
Intelligence (BI) products, providing robust static and interactive reporting, report server, and data analysis
capabilities. These capabilities are available as either stand-alone products, or as part of an integrated end-to-end
BI suite utilizing common metadata and provide shared services, such as security, a repository, and scheduling.
The server exposes comprehensive public interfaces enabling seamless integration with other applications and
the capability to easily add custom functionality.
This section describes functionality that can be restricted by the software license for JasperReports
Server. If you don’t see some of the options described in this section, your license may prohibit you from
using them. To find out what you're licensed to use, or to upgrade your license, contact Jaspersoft.
The heart of the TIBCO Jaspersoft® BI Suite is the server, which provides the ability to:
•Easily create new reports based on views designed in an intuitive, web-based, drag and drop Ad Hoc
Editor.
•Efficiently and securely manage many reports.
•Interact with reports, including sorting, changing formatting, entering parameters, and drilling on data.
•Schedule reports for distribution through email and storage in the repository.
TIBCO Software Inc. 13

TIBCO Jaspersoft Studio User Guide
•Arrange reports and web content to create appealing, data-rich Jaspersoft Dashboards that quickly convey
business trends.
For users interested in multi-dimensional modeling, we offer Jaspersoft® OLAP, which runs as part of the server.
While the Ad Hoc Editor lets users create simple reports, more complex reports can be created outside of the
server. You can either use Jaspersoft® Studio or manually write JRXML code to create a report that can be run
in the server. We recommend that you use Jaspersoft Studio unless you have a thorough understanding of the
JasperReports file structure.
You can use the following sources of information to learn about JasperReports Server:
•Our core documentation describes how to install, administer, and use JasperReports Server and Jaspersoft
Studio. Core documentation is available as PDFs in the doc subdirectory of your JasperReports Server
installation. You can also access PDF and HTML versions of these guides online from the Documentation
section of the Jaspersoft Community website.
•Our Ultimate Guides document advanced features and configuration. They also include best practice
recommendations and numerous examples. You can access PDF and HTML versions of these guides online
from the Documentation section of the Jaspersoft Community website.
•Our Online Learning Portal lets you learn at your own pace, and covers topics for developers, system
administrators, business users, and data integration users. The Portal is available online from the Professional
Services section of our website.
•Our free samples, which are installed with JasperReports Library, Jaspersoft Studio, and JasperReports
Server, are available and documented online. Please visit our GitHub repository.
•If you have a subscription to our professional support offerings, please contact our Technical Support team
when you have questions or run into difficulties. They're available on the web at and through email at
http://support.tibco.com and js-support@tibco.com.
JasperReports Server is a component of both a community project and commercial offerings. Each integrates the
standard features such as security, scheduling, a web services interface, and much more for running and sharing
reports. Commercial editions provide additional features, including Ad Hoc views and reports, advanced charts,
dashboards, Domains, auditing, and a multi-organization architecture for hosting large BI deployments.
1.2 Installing Jaspersoft Studio
Jaspersoft Studio is available as an Eclipse Rich Client Package (RCP), downloadable from the following
location:
http://community.jaspersoft.com/project/jaspersoft-studio/releases.
1.2.1 Requirements
1.2.1.1 Software Requirements
Jaspersoft Studio requires the Java Runtime Environment (JRE). To compile the report scriptlets, a full
distribution of Java is required. The JSS installer includes the required version of Java.
During the JSS download, you must accept the Java license agreement and select the correct operating system.
Jaspersoft Studio supports the following common operating systems:
•Windows 7/8, 32 or 64 bit
•Linux, 32 or 64 bit
•MacOS X, 64 bit
14 TIBCO Software Inc.

Chapter 1 Getting Started with Jaspersoft Studio
1.2.1.2 Hardware Requirements
Jaspersoft Studio needs a 64-bit or 32-bit processor and at least 500 MB of Hard Disk space. The amount of
RAM needed is dependent upon report complexity. A value of 1 GB dedicated to Jaspersoft Studio is
recommended, 2 GB is suggested.
1.2.2 Available Packages
The Eclipse RCP package is available in the following formats for community and commercial versions.
Linux versions:
•TIBCOJaspersoftStudio-x.x.x.final-linux-x86.tgz
•TIBCOJaspersoftStudio-x.x.x.final-linux-x86_64.tgz
Mac:
•TIBCOJaspersoftStudio-x.x.x.final-mac-x86_64.dmg
Windows:
•TIBCOJaspersoftStudio-x.x.x.final-windows-installer-x86.exe
•TIBCOJaspersoftStudio-x.x.x.final-windows-installer-x86_64.exe
x.x.x represents the version number of Jaspersoft Studio.
Note that on a 64-bit operating system you can install the 32-bit version of Jaspersoft Studio (although the 64-
bit is recommended), but you cannot install the 64- bit version of Jaspersoft Studio on a 32-bit operating system.
For community only, unsupported versions for the Eclipse RCP on Windows and Debian are available as a
convenience for users who are in a restricted environment and can't download or install an .exe. file:
•TIBCOJaspersoftstudio_x.x.x.final_amd64.deb
•TIBCOJaspersoftstudio_x.x.x.final_i386.deb
•TIBCOJaspersoftStudio-x.x.x.final.win32.x86_64.zip
•TIBCOJaspersoftStudio-x.x.x.final.win32.x86.zip
The community version is also available as an unsupported Eclipse plug-in, called the Jaspersoft Studio plugin.
You can install it from the Eclipse Marketplace or download using the Eclipse Update Manager. See the
following article on the community website for more information about working with the Jaspersoft Studio
plugin.
http://community.jaspersoft.com/wiki/contributing-jaspersoft-studio-and-building-sources
1.2.3 Command-Line Installation on Windows
The Jaspersoft Studio installer can be executed via the command line on Windows. The command-line
installation supports an unattended (silent) mode.
1.2.3.1 Options for the Command-Line Installer
Option Description Notes
/S Silent mode (optional) Flag to run the installer in silent mode. When /S is present, no prompt is
required from the user.
TIBCO Software Inc. 15
TIBCO Jaspersoft Studio User Guide
Option Description Notes
/LICENSE License Path (optional -
commercial versions
only)
Path to the license file to use for this installation. The license file is copied
into the Jaspersoft Studio installation folder and given the following
filename: TIBCOJaspersoft-JSS.license. If no license is specified, Jaspersoft
Studio looks for the file TIBCOJaspersoft-JSS.license in the installation
directory.
If this option is specified it must appear before the /D option.
You can place the license file there directly instead of using the /LICENSE
option.
/D Destination Directory
(Mandatory) The path of the installation directory for this Jaspersoft Studio instance.
1.2.3.2 Sample Install Command
Suppose you want to use a silent install for Jaspersoft Studio and have the following setup:
•Installer Path: \JASPERSOFT\Installer\TIBCOJaspersoftStudioPro-x.x.x.final-windows-installer-x86_64.exe
•License File (downloaded from support portal): C:\Jaspersoft\My Licenses\jasperserver.license
•Desired destination Folder : C:\SW\JASPERSOFT\JSS\xxx
The install command is:
\JASPERSOFT\Installer\TIBCOJaspersoftStudioPro-x.x.x.final-windows-installer-x86_64.exe /S
/LICENSE=C:\Jaspersoft\My Licenses\jasperserver.license /D=C:\SW\JASPERSOFT\JSS\xxx
The command-line installer looks for the license in the following order:
1. (Optional) If the command is executed including the /LICENSE option, the license at the specified
path will be copied into the installation folder with filename TIBCOJaspersoft-JSS.license.
2. Jaspersoft Studio will look in the installation folder for a license with name TIBCOJaspersoft-
JSS.license .
3. If no license is present, the evaluation license is used.
1.2.4 Updating Your Workspace
Due to incompatibilities between Eclipse and earlier versions of the Jaspersoft Studio workspace, the workspace
format has been updated. The new workspace format can't be used with older versions of Jaspersoft Studio.
If you are not prompted to update your workspace, you do not need to.
If you are updating from an old version of Jaspersoft Studio, you are prompted to choose a new workspace when
you launch Jaspersoft Studio. When you choose a new workspace, a new, empty workspace is created and set as
the workspace for your Jaspersoft Studio instance. This workspace will be used for newer versions. Your
previous workspace remains unchanged and can still be used with older versions.
To update the reports and data from your earlier version of Jaspersoft Studio, you can import some or all of your
projects, server connections, data adapters, and project settings into your new workspace.
16 TIBCO Software Inc.

Chapter 1 Getting Started with Jaspersoft Studio
Importing projects:
1. (Optional) To import a version of the MyReports project, you must first delete the existing MyReports
folder from your current workspace. You can do this, for example, if you have just upgraded and have
created a new empty workspace. To delete MyReports in your current workspace, navigate to the workspace
location in your file system and delete or move the MyReports directory.
2. Select File> Import ...
3. Select Existing Projects into Workspace from the General category.
Figure 1-1 Selecting projects in Import dialog
4. Browse to the workspace with you want, click OK, and then click Next.
The Import dialog opens.
TIBCO Software Inc. 17
TIBCO Jaspersoft Studio User Guide
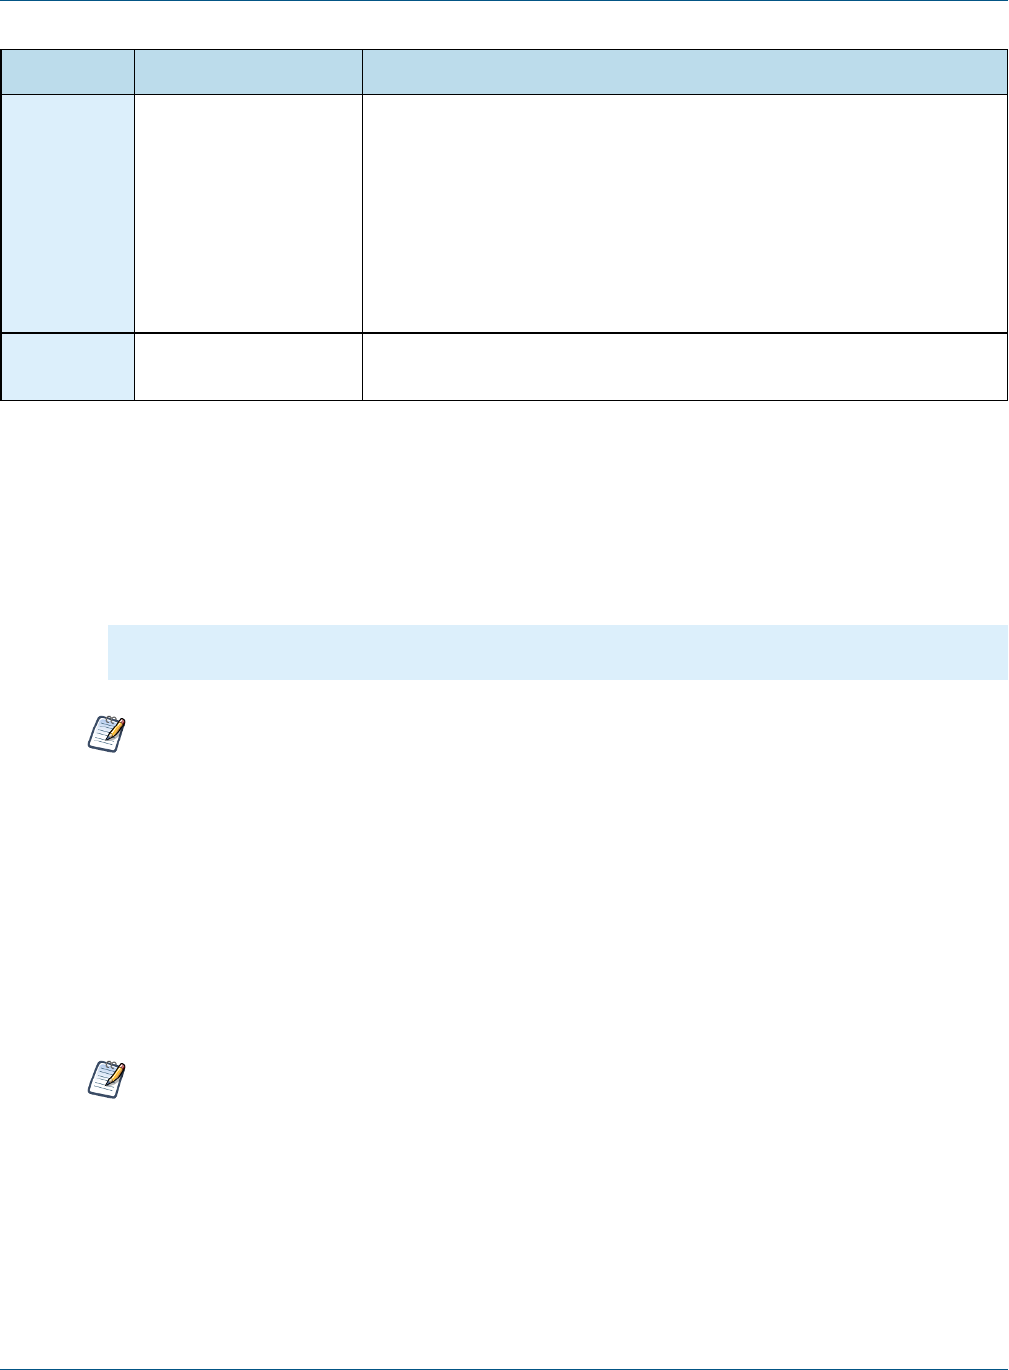
Figure 1-2 Import Projects dialog
5. To work on a copy without modifying the originals, select Copy projects into workspace.
6. Click Finish.
The projects you selected are imported into your current workspace.
Your workspace contains server connections, global data adapters, and your Jaspersoft Studio preferences in
addition to your projects. You must import each type separately.
Importing server connections:
1. Select File> Import ....
2. Select External JasperReports Server Connections from the Jaspersoft Studio category.
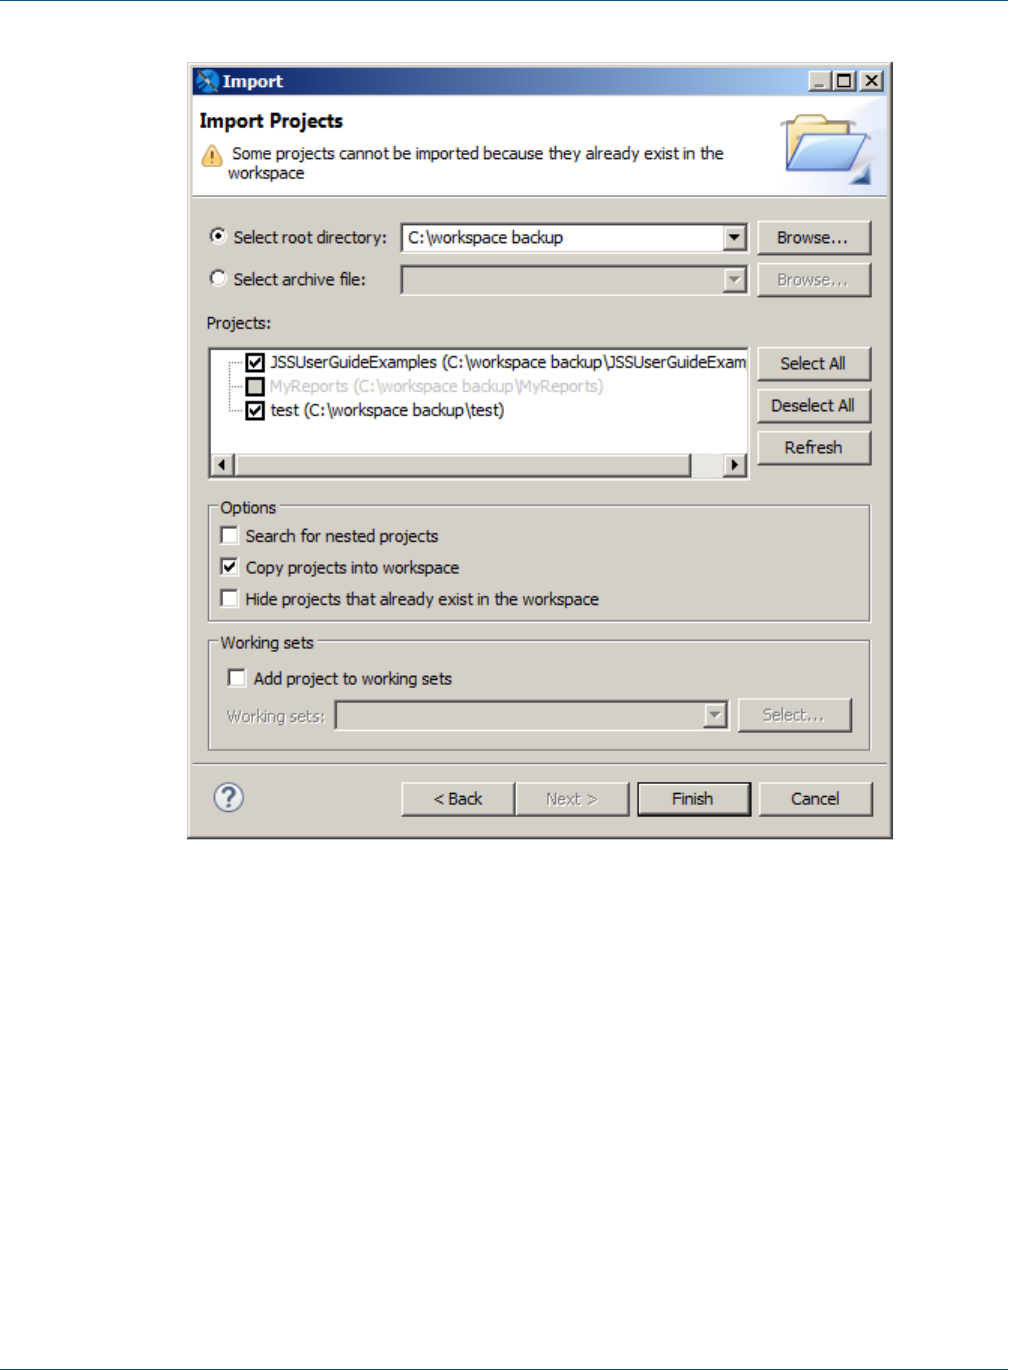
3. Browse to the workspace with you want, click OK, and then click Next.
The Select the Server Connections dialog opens.
18 TIBCO Software Inc.
Chapter 1 Getting Started with Jaspersoft Studio
Figure 1-3 Select the Server Connections dialog
4. Choose the connections you want.
5. Click Finish to import the connections.
The selected server connections are imported into your Jaspersoft Studio instance.
Importing data adapters and settings:
1. Select File> Import ....
2. Select External Properties and Data Adapters from the Jaspersoft Studio category.
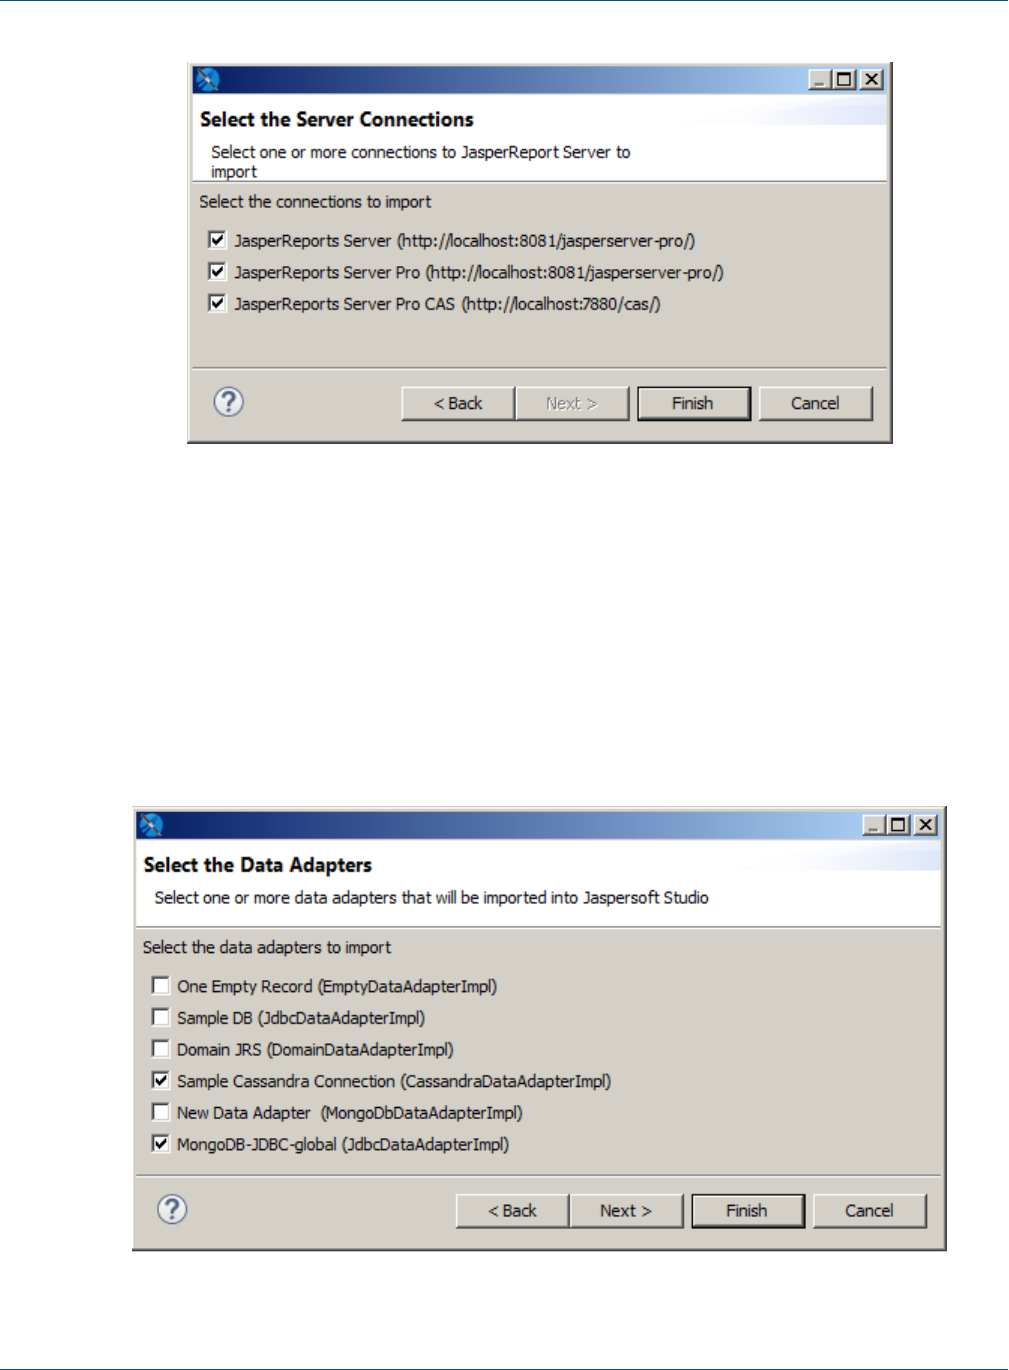
3. Browse to the workspace with you want, click OK, and then click Next.
The Select the Data Adapters dialog opens.
Figure 1-4 Select the Data Adapters dialog
TIBCO Software Inc. 19
TIBCO Jaspersoft Studio User Guide
4. Choose the data adapters you want. You do not need to import the built-in adapters (One Empty Record
and Sample DB).
5. Click Next.
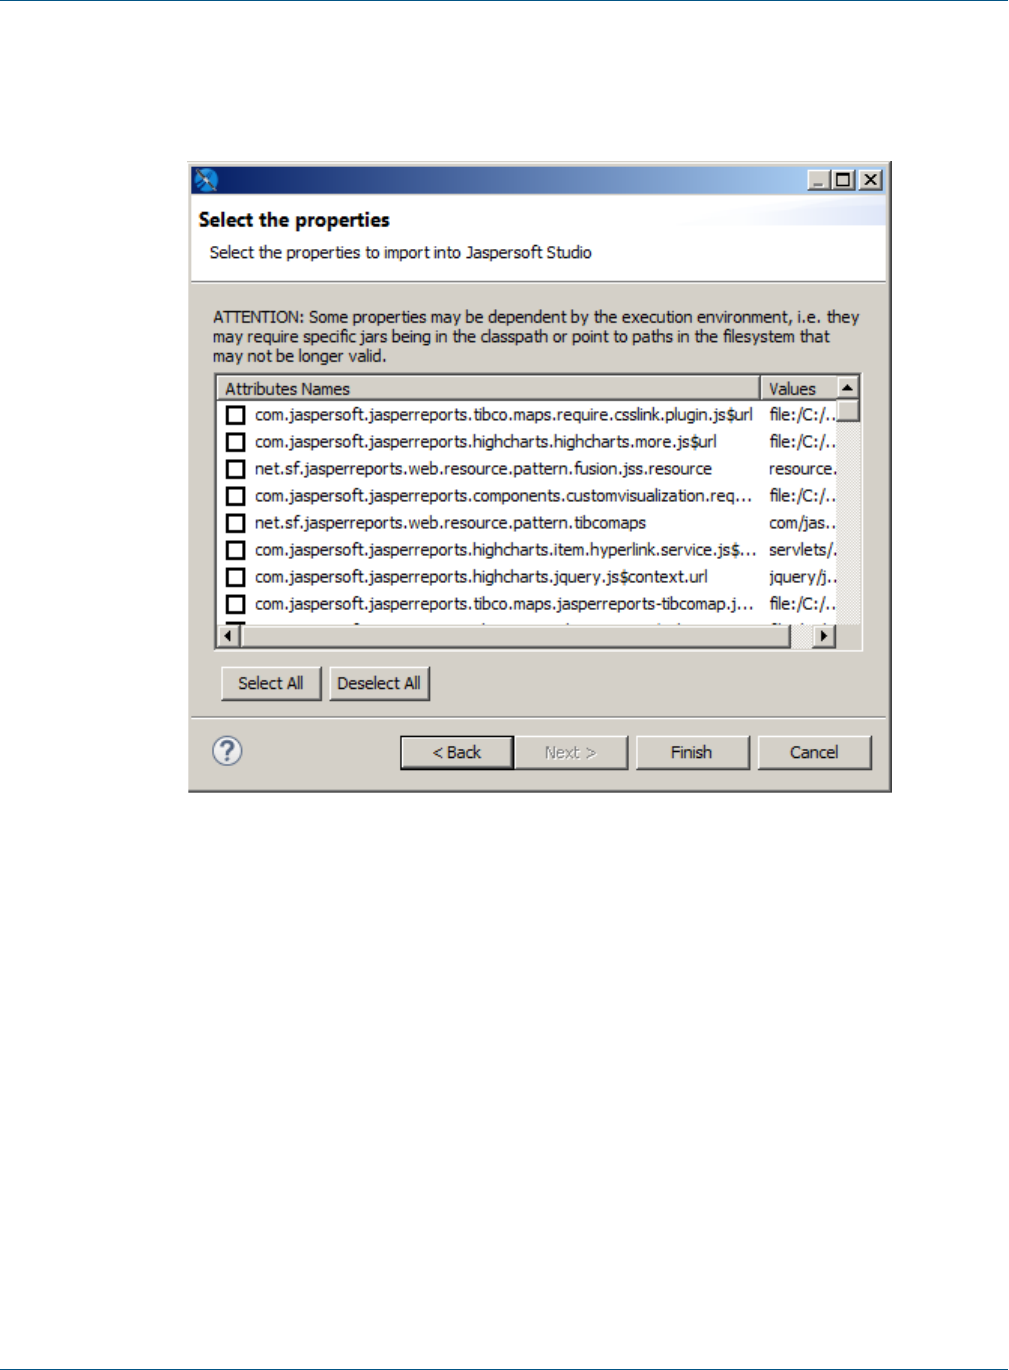
Figure 1-5 Select the properties dialog
6. Choose the properties you want and click Finish.
The selected data adapters and properties are imported into your Jaspersoft Studio instance.
1.2.5 Compatibility Between Versions
When a new version of JasperReports is distributed, some classes usually change. These modified classes
typically impact the XML syntax and the JASPER file structure.
Before JasperReports 1.1.0, this was a serious problem and a major upgrade deterrent, since it required
recompiling all the JRXML files in order to be used with the new library version. Things changed after the
release of Version 1.1.0, in which JasperReports assured backwards compatibility, that is, the library is able to
understand and execute any JASPER file generated with a previous version of JasperReports.
With JasperReports 3.1, the JRXML syntax moved from a DTD-based definition to XML-based schema. The
XML source declaration syntax now references a schema file, rather than a DTD. Based on what we said
previously, this is not a problem since JasperReports assures backwards compatibility. However, many people
are used to designing reports with early versions of iReport then generating the reports by compiling JRXML in
20 TIBCO Software Inc.

Chapter 1 Getting Started with Jaspersoft Studio
JasperReports. This was always a risky operation, but it was still valid because the user was not using a new tag
in the XML. With the move to an XML schema, the JRXML output of iReport 3.1.1 and newer can only be
compiled with a JasperReports 3.1.0 or later. All versions of Jaspersoft Studio produce output that is only
compatible with later versions of JasperReports Library.
For information on exporting or compiling a report to an earlier version of JasperReports Library, see 24.7,
“Setting Compatibility with Earlier Versions of JasperReports Library,” on page425.
1.2.6 Accessing the Source Code
The last version of the source code is available from http://community.jaspersoft.com/project/jaspersoft-
studio/releases by clicking Browse Source Code, which lets you access the Subversion (SVN) repository
(read only mode) where the most up-to-date version is available. You can download and compile this source
code, but since it is a work in progress it might contain new, unreleased features and bugs. All the information
necessary to download the Source Code, configure a development environment on the Eclipse IDE, and compile
and run the source code are described in the tutorial "Contributing to Jaspersoft Studio and building from
sources".
TIBCO Software Inc. 21

TIBCO Jaspersoft Studio User Guide
22 TIBCO Software Inc.

CHAPTER 2 CREATING A SIMPLE REPORT
JasperReports Library is a powerful tool, and Jaspersoft Studio exposes much of its functionality to help you
design reports. This chapter introduces the basic steps for defining a report and includes the following sections:
•Creating a New Report
•Adding and Deleting Report Elements
•Previewing a Report
•Creating a Project Folder
2.1 Creating a New Report
To create a new report:
1. Go to File> New >Jasper Report or click on the main toolbar.
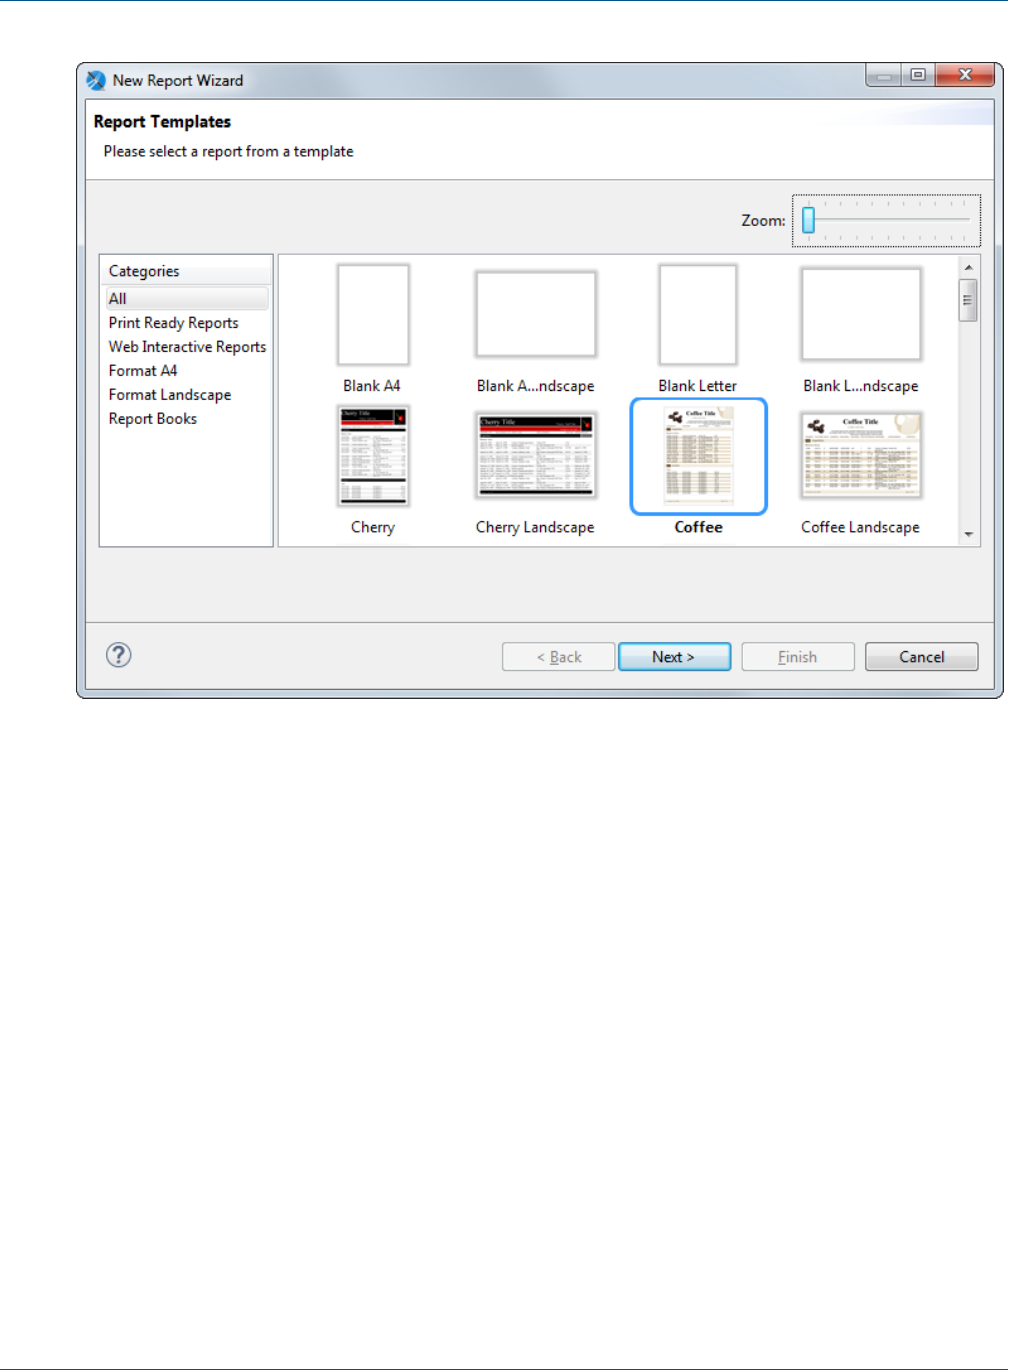
The New Report Wizard window displays the Report Templates page. Jaspersoft Studio includes a
number of pre-installed templates; you can also create your own. See Chapter 22, “Report Templates,” on
page401 for more information.
TIBCO Software Inc. 23
TIBCO Jaspersoft Studio User Guide
Figure 2-1 New Report Wizard
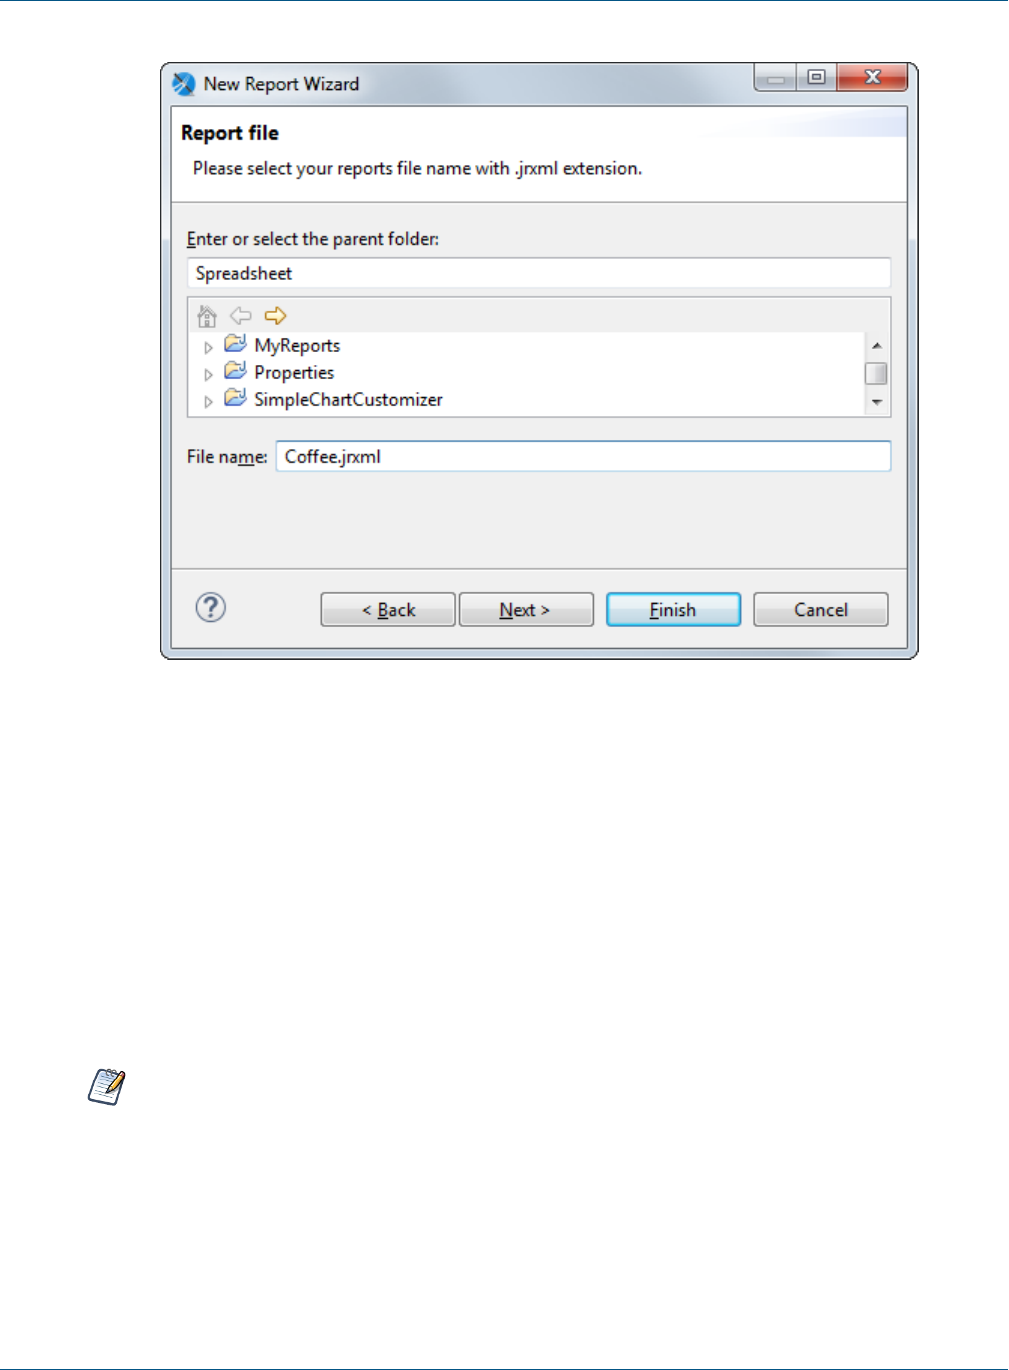
2. Select the Coffee template and click Next. The New Report Wizard shows the Report file page.
24 TIBCO Software Inc.
Chapter 2 Creating a Simple Report
Figure 2-2 New Report Wizard>Report file
3. Navigate to the folder you want the report in and name the report. To create a new folder, see “Creating a
Project Folder” on page30.
4. Click Next.
The New Report Wizard displays the Data Source page. This is where you choose the data that will fill
the report.The drop-down menu shows the pre-installed data adapters as well any data adapters you have
added. The following adapters are pre-installed:
•One Empty Record - Empty rows: Data adapter that lets you create a report without data. You
might use this option to define the layout of a report and connect it to a data source later.
•Sample DB - Database JBDC Connection: Data adapter that connects to an SQL database
provided with the Jaspersoft Studio installation. If you are getting your data from a JDBC database, you
must also supply an SQL query.
You can create a data adapter separately or click New... to create a data adapter directly from this dialog.
Adapters can be created globally (embedded in the workspace) or local to a specific project. Using a
local adapter makes it easier to deploy the report to JasperReports Server. See 10.1, “Creating and
Editing Data Adapters,” on page142 for more information.
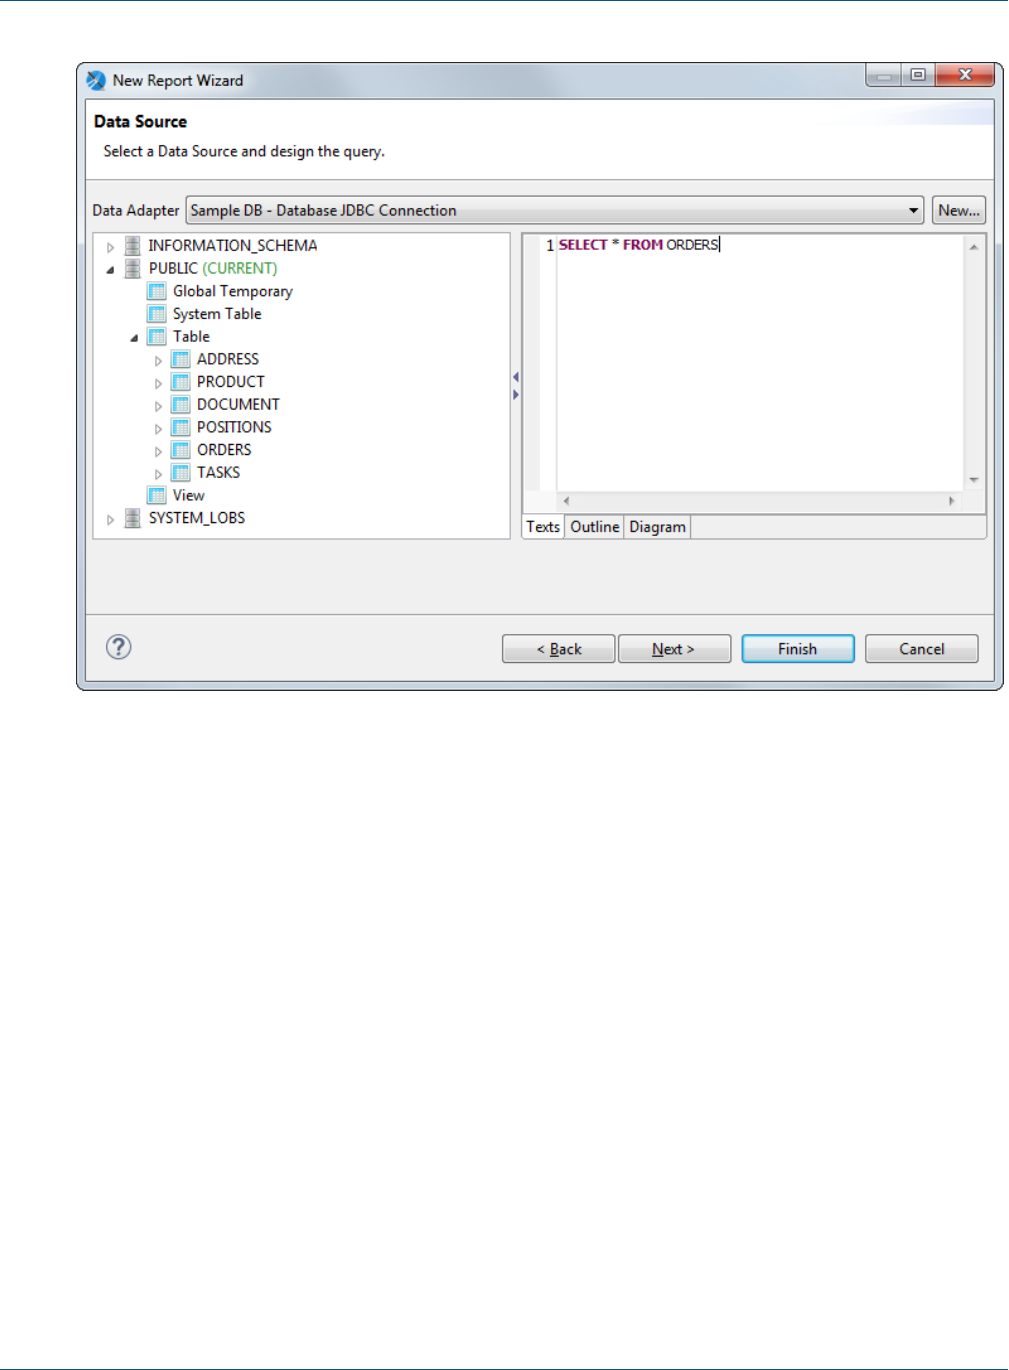
5. Choose Sample DB - Database JDBC Connection. With a JDBC connection, the Data Source dialog
shows the database schema on the left and your query on the right.
TIBCO Software Inc. 25
TIBCO Jaspersoft Studio User Guide
Figure 2-3 New Report Wizard>Data Source
6. Enter the query SELECT * FROM ORDERS on the right. Note that you can view your query in three different
ways: as text, as an outline, or as a diagram.
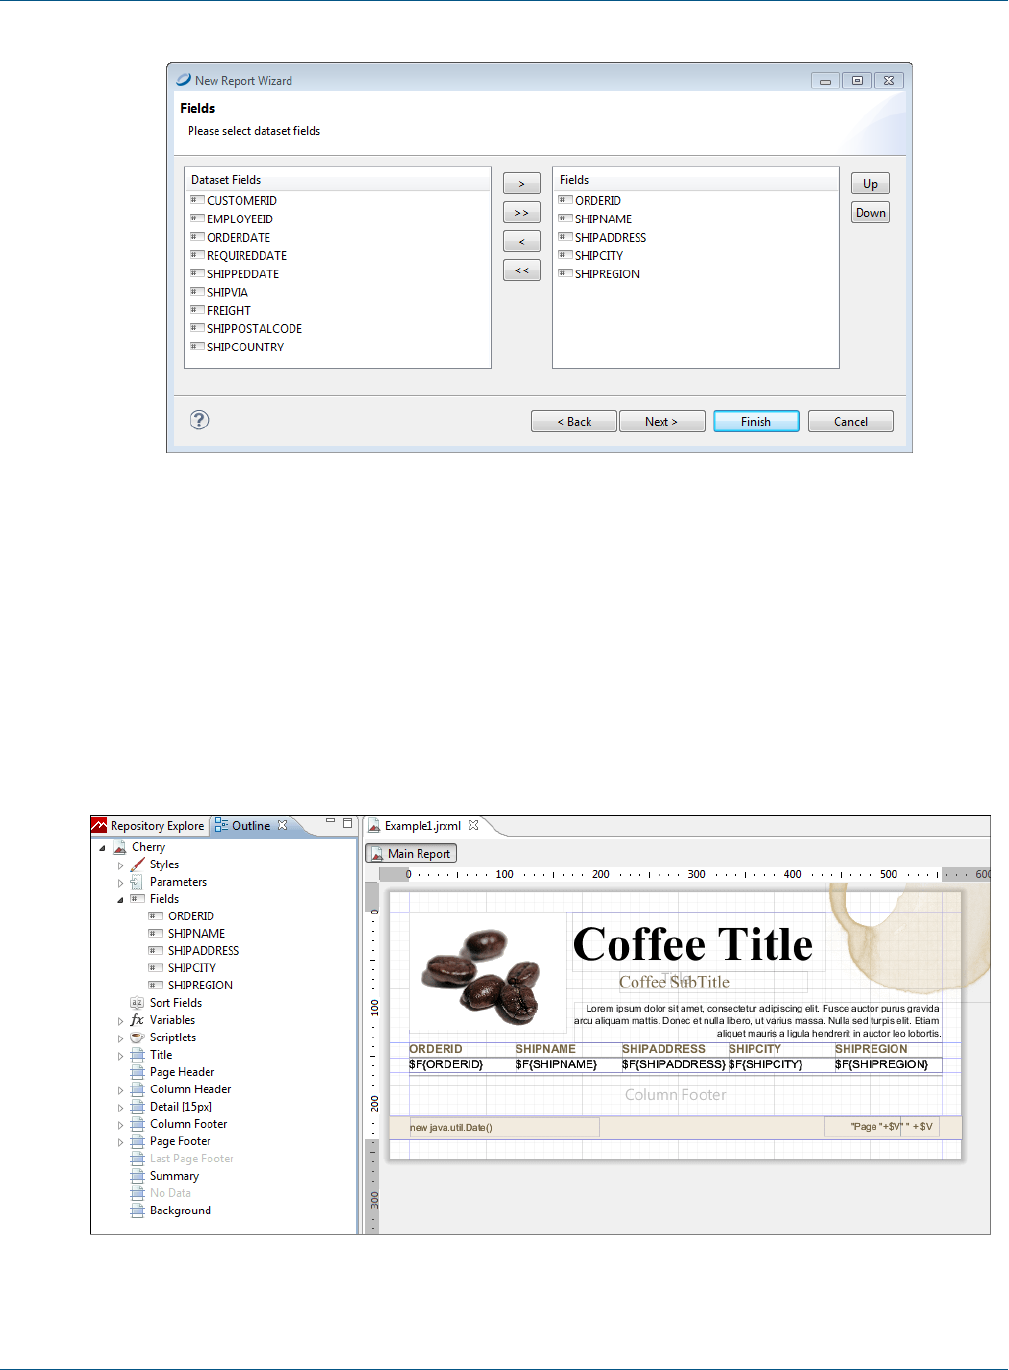
7. Click Next. The Fields window is displayed. The Dataset list shows all the discovered fields.
26 TIBCO Software Inc.
Chapter 2 Creating a Simple Report
Figure 2-4 New Report Wizard>Fields
8. Select the following fields and click the right arrow to add them to your report.
•ORDERID
•SHIPNAME
•SHIPADDRESS
•SHIPCITY
•SHIPREGION
9. Click Next. The Grouping window is displayed. You do not want any grouping for this report.
10. Click Next and Finish.
Jaspersoft Studio now builds the report layout with the selected fields included as shown.
Figure 2-5 New Report in the Design Tab
TIBCO Software Inc. 27
TIBCO Jaspersoft Studio User Guide
2.2 Adding and Deleting Report Elements
You can add and delete fields and other elements to your report.
2.2.1 Adding Fields to a Report
To add fields to an already created report:
1. Select the main node of the report from the Outline view.
2. Select the Report tab in the Properties view and click the Edit query, filter and sort options button in
the Dataset section.
Figure 2-6 Dataset section in properties view
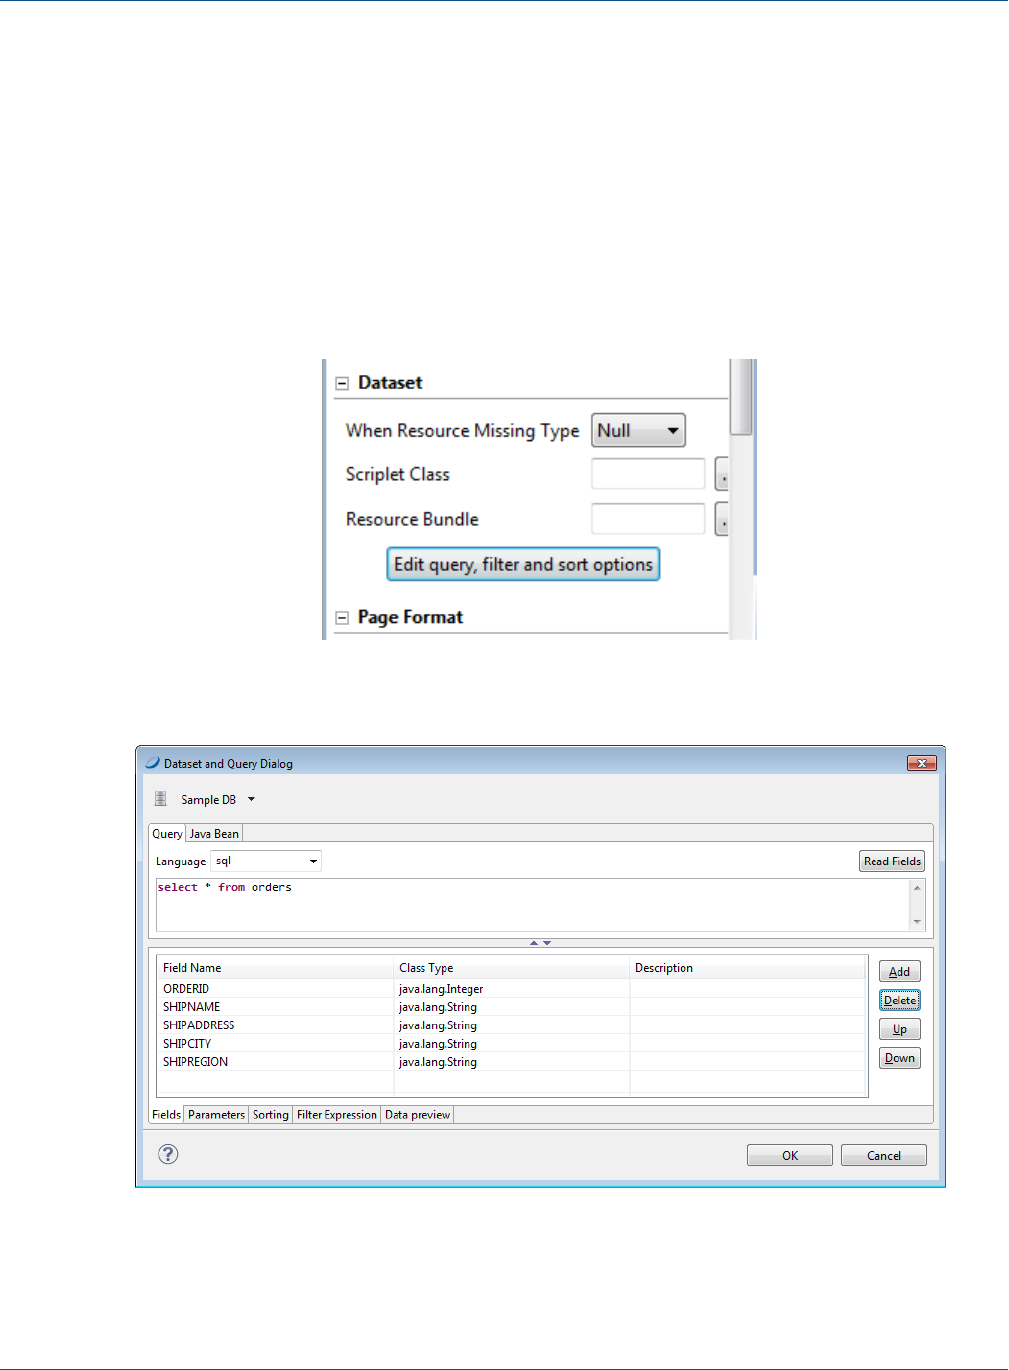
The Dataset and Query Dialog opens.
Figure 2-7 Dataset and Query Dialog
28 TIBCO Software Inc.
Chapter 2 Creating a Simple Report
3. Add more fields by clicking the Read Fields button. All the fields discovered are added as new fields in
the report.
You can also change your query in the same dialog. If a new query discovers fewer fields than used in the
existing report, the fields not included the new query are removed from your report.
4. Click OK to return to the Design tab.
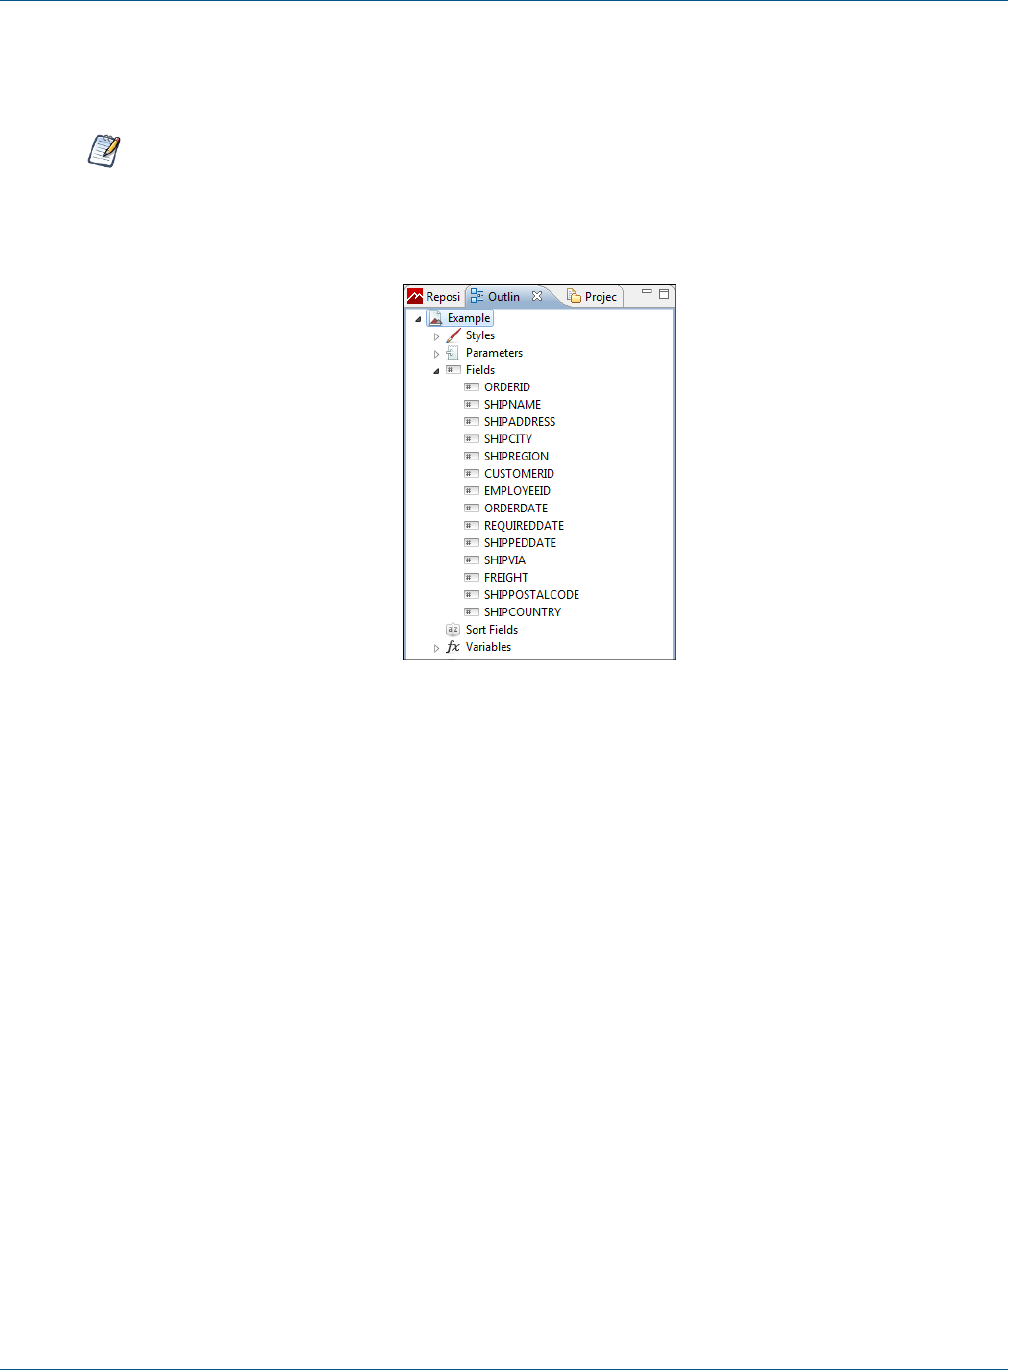
5. Expand Fields in the Outline view to see all the fields now available for your report.
Figure 2-8 Fields
6. To add a field to your report, click the field and drag it into the Design.
When the field object is dragged inside the detail band, Jaspersoft Studio creates a text field element and
sets the text field expression for that element.
2.2.2 Deleting Fields
To delete a field from a report, right click the field in the Design and select Delete.
2.2.3 Adding Other Elements
To add other elements, such as lines, images, or charts, drag the element from the Palette into the Design. See
4.2.1, “Inserting Elements,” on page47 for more information.
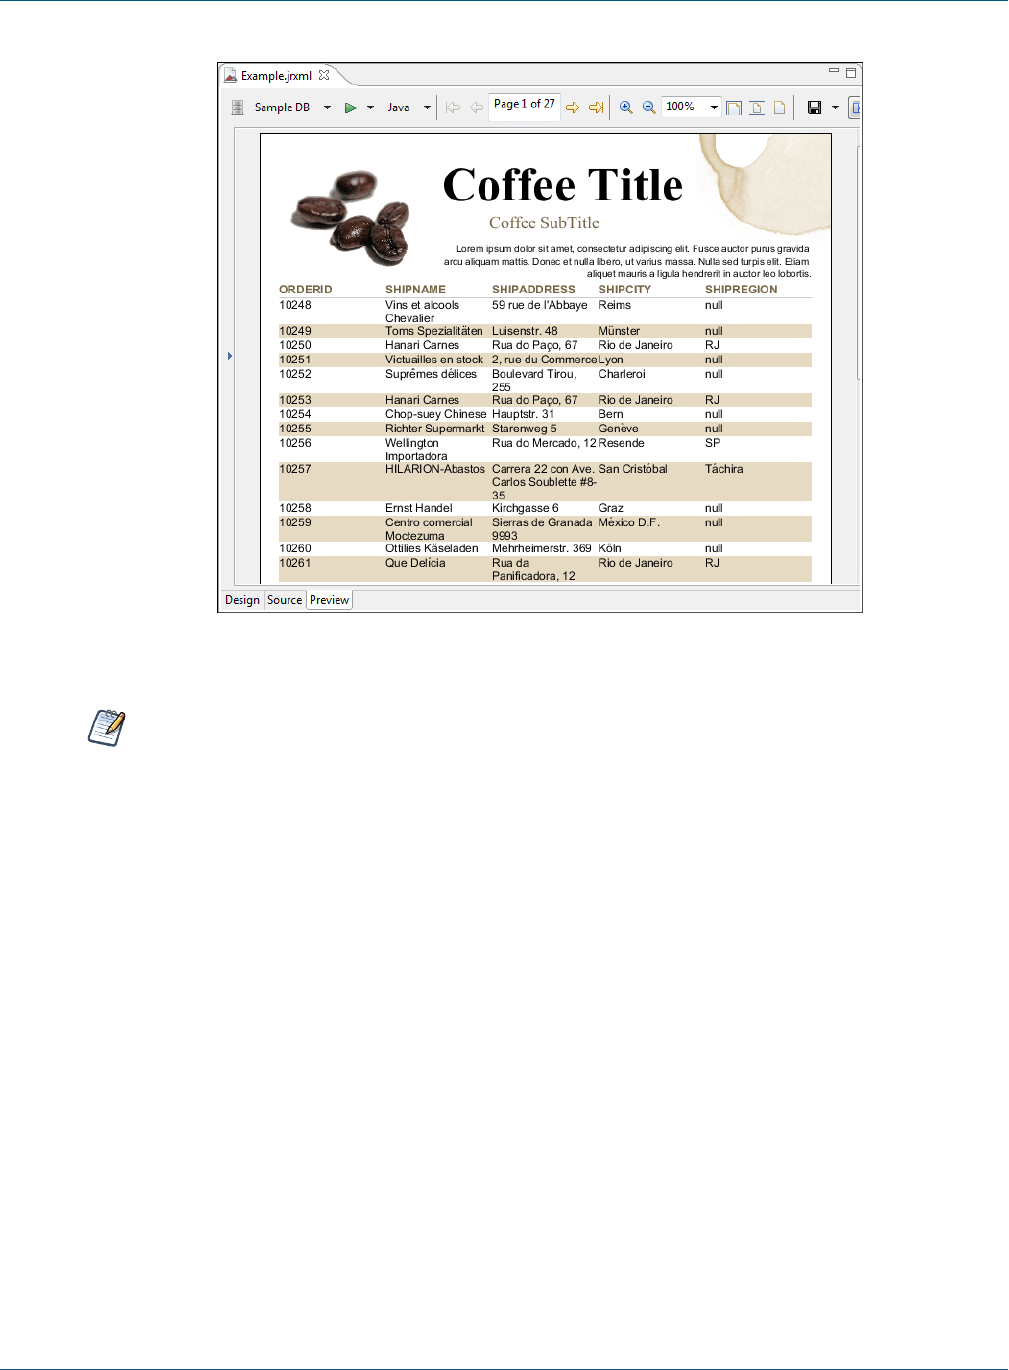
2.3 Previewing a Report
Click the Preview tab at the bottom of the report. The preview compiles the report in the background with data
retrieved by the query through your JDBC connection. The Detail band repeats for every row in the query
results, creating a simple table report.
TIBCO Software Inc. 29
TIBCO Jaspersoft Studio User Guide
Figure 2-9 Report Preview
Each subreport is saved in a separate report file. Reflecting standard Eclipse design, saving or
previewing a report that contains subreports does not update the subreports. When you edit a subreport,
you must first build the subreport and then save the file in order for the subreport changes to be visible
when you preview the report that contains it.
• To build a subreport explicitly, use the Build All button on the toolbar, or type Ctrl-B. Alternatively,
select Project> Build Automatically to have Jaspersoft Studio do it for you.
• To save a subreport, use File> Save or File> Save As.
2.4 Creating a Project Folder
Project folders help you organize your reports.
To create a project folder:
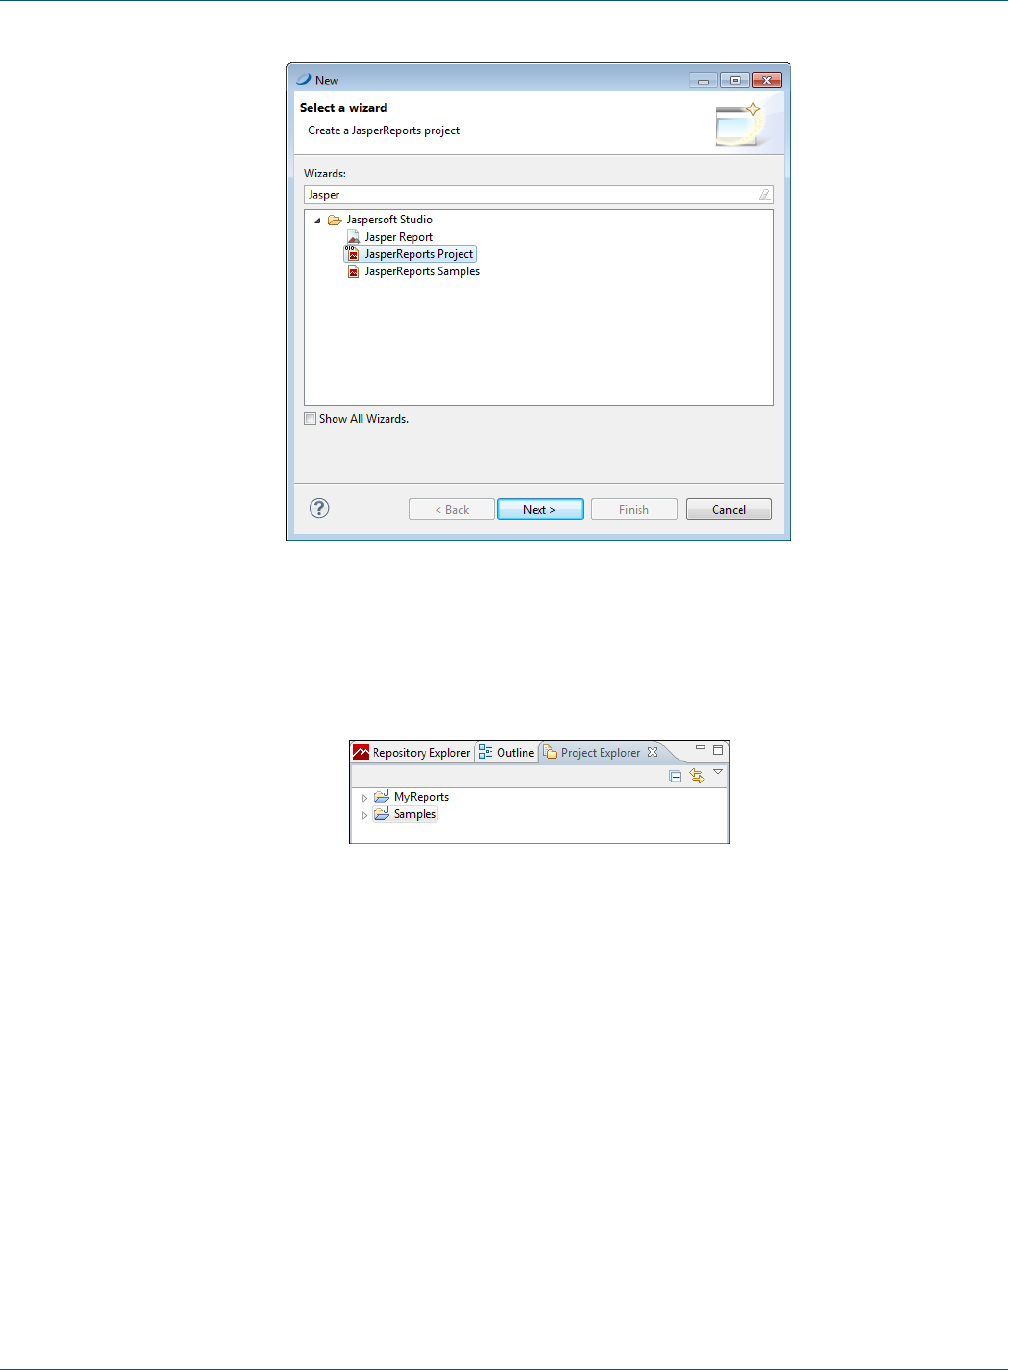
1. Choose File> New> Project. The Select a wizard dialog is displayed.
30 TIBCO Software Inc.
Chapter 2 Creating a Simple Report
Figure 2-10 Select a Wizard
2. Enter Jasper in the Wizards bar to filter actions to those related to Jaspersoft Studio
3. Select JasperReports Project. Click Next. The New JasperReports Project wizard appears.
4. Enter a name for your project and click Finish. The Project Explorer displays your project.
Figure 2-11
TIBCO Software Inc. 31

TIBCO Jaspersoft Studio User Guide
32 TIBCO Software Inc.
CHAPTER 3 USER INTERFACE AND DESIGN VIEW
Jaspersoft Studio is based on the Eclipse platform. If you have worked with Eclipse, you are likely familiar with
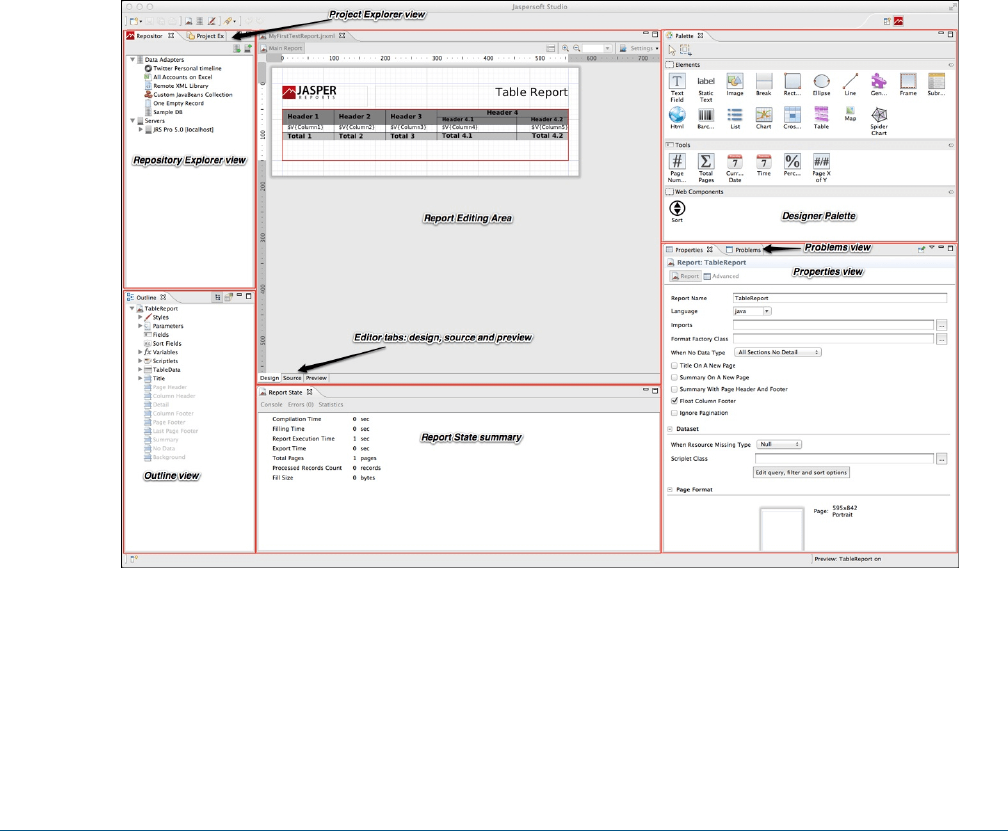
the user interface. Figure 3-1 shows a preview of the Jaspersoft Studio interface, with the main areas
highlighted. Some views have additional menus and actions, accessed through icons in the upper right of the
view.
Figure 3-1 Jaspersoft Studio User Interface
TIBCO Software Inc. 33
TIBCO Jaspersoft Studio User Guide
3.1 Eclipse Interface
In Eclipse terminology, the initial layout of the Jaspersoft Studio interface is called a perspective. The default
Jaspersoft Studio perspective contains an editor area and views. Some views appear by themselves, while others
are stacked together in tabbed notebooks. You can open and close views and drag them to different positions in
the Eclipse workbench.
•To open a window you have closed, select Window> Open View from the menu. Select the window you
want to open from the drop-down list.
•To reset the interface to the default perspective, select Window> Reset Perspective.
•To save a perspective, select Window> Save Perspective As and enter a name for your perspective.
3.1.1 Learning More About Eclipse
If you are not familiar with Eclipse, there are many excellent resources available:
•The Eclipse help is a good place to start. You can access Eclipse help by selecting Help> Help
Contents> Subclipse - Subversion Eclipse Plugin.
•If you are setting up Eclipse for a team, search the internet for a phrase such as "configuration management
for Eclipse".
•To work with version control such as CSV, Git, or SVN, use the corresponding Eclipse perspective
included with Jaspersoft Studio. To add a different perspective, click at the upper right of the Eclipse
interface and select the perspective you want from the Open Perspective dialog. Once a perspective has
been added, you will see an icon for it at the top right. Use this perspective for all interactions with your
version control repository, such as checking out projects, synchronizing files, and resolving conflicts. For
information about working with a particular package, use an internet search such as "Eclipse Subversion".
To return to the Jaspersoft Studio perspective, click .
3.2 User Interface Components
Jaspersoft Studio has a multi-tab editor, which includes three tabs that allow you to interact with your reports in
different ways: Design, Source, and Preview:
•The Design tab is the main one selected when you open a report file and it allows you to graphically create
your report.
•The Source tab contains the JRXML source code for your report.
•The Preview tab lets you run the report preview after having selected a data source and output format.
You can explore the data using the following views:
•The Repository Explorer view maintains the list of JasperReports Server connections and available data
adapters.
•The Project Explorer view maintains the list of the projects in the current workspace, usually a Jaspersoft
Studio project.
•The Outline view shows the complete structure of the report in a tree. When the Design or Source tab is
active, clicking an element in the Outline view highlights that element in the editor. The Outline tab is
empty when the Preview tab is active.
•The Properties view lets you view and edit the properties of the element that is currently selected in the
report editor or in the Outline view. The properties shown depend on the type of element. For example, the
Properties view for a table shows four tabs: Appearance, Dataset, Table, and Advanced, while the Properties
view for a line shows Appearance, Borders, Line, Inheritance, and Advanced. Some properties are read-only,
34 TIBCO Software Inc.
Chapter 3 User Interface and Design View
but most are editable. When the root node of a report is selected in Outline view, the Properties view shows
the properties for the report.
Unlike many other views, you can open multiple instances of the Properties view at one time and you can
pin a selection to a specific Properties view instance. This allows you to view or edit the properties for a
specific element while working with other elements in your report, or with another report entirely.
•The Problems view shows a list of problems and errors that can, for example, block the correct compilation
of a report.
•The Report state summary provides statistics on report compilation/filling/execution. Errors are shown here
as well.
This comparison table shows the differences in terminology between iReport and Jaspersoft Studio.
iReport Jaspersoft Studio
JasperReports Server Repository Repository Explorer
Report Inspector Outline view
Report Designer Report editing area
Problems List Problems view
Elements palette Designer Palette
Formatting tools Available via context menu on the element
Property sheet Properties view
Styles library ---
--- Project Explorer
iReport Output window Report State summary
Table 3-1 Comparison of Features in iReport and Jaspersoft Studio
3.3 The Design Tab
You design a report using the Design tab, which is divided into different horizontal portions, named bands,
where you can place report elements. When the report design is combined with the data to generate the print,
each band is printed multiple times based on its function (and according to the rules that the report designer has
set). For instance, the page header is repeated at the beginning of every page, while the detail band is repeated
for each record.
Jaspersoft Studio provides a graphical interface for creating JRXML files. The layout is visual, so you can
ignore the underlying structure of the JRXML. You can specify the precise page locations of different types of
text and data, such as title, footers, detailed records, groups, and summary information. Some portions of a page
defined in this way are reused, others stretch to fit the content, and so on. Additional tools let you add charts
and subreports, set up an optional query retrieve data out of a data source, and more.
TIBCO Software Inc. 35

TIBCO Jaspersoft Studio User Guide
3.4 Understanding Bands
The Design tab is divided into nine predefined bands to which new groups are added. In addition, Jaspersoft
Studio manages a heading band (group header) and a recapitulation band (group footer) for every group.
A band is as wide as the page width (right and left margins excluded). However, its height, even if it is
established during the design phase, can vary during print creation according to the contained elements; it can
“lengthen” toward the bottom of a page in an arbitrary way. This typically occurs when bands contain
subreports or text fields that have to adapt to the content vertically. Generally, the height specified by the user
should be considered “the minimal height” of the band. Not all bands can be stretched dynamically according
to content; in particular the column footer, page footer, and last page footer bands are statically sized.
The sum of all band heights (except for the background) has to always be less than or equal to the page height
minus the top and bottom margins.
3.4.1 Band Types
The following table contains brief descriptions of the available bands:
Band Name Description
Title The title band is the first visible band. It is created only once and can be printed on a
separate page. It is not possible during design to exceed the report page height (top and
bottom margins are included). If the title is printed on a separate page, this band height is
not included in the calculation of the total sum of all band heights.
Page Header The page header band allows you to define a page header. The height specified during the
design phase usually does not change during the creation process, except for the insertion
of vertically resizable components such as text fields. The page header appears on all
printed pages in the position defined during the design phase. Title and summary bands do
not include the page header when printed on a separate page.
Column Header The column header band is printed at the beginning of each detail column. Usually labels
containing the column names of a tabular report are inserted in this band.
Group Header A report can contains zero or more group bands which permit the collection of detail records
in real groups. A group header is always accompanied by a group footer (both can be
independently visible or not). Different properties are associated with a group. They
determine its behavior from the graphic point of view. It is possible to always force a group
header on a new page or in a new column and to print this band on all pages if the bands
below it overflow the single page (as a page header, but at group level). It is possible to fix a
minimum height required to print a group header: if it exceeds this height, the group header
band is printed on a new page (please note that a value too large for this property can
create an infinite loop during printing).
Group Footer The group footer band completes a group. Usually it contains fields to view subtotals or
separation graphic elements, such as lines.
36 TIBCO Software Inc.

Chapter 3 User Interface and Design View
Band Name Description
Column Footer The column footer band appears on at the end of every column. Its dimension are not
resizable at run time (not even if it contains resizable elements such as subreports or text
fields with a variable number of text lines).
Page Footer The page footer band appears on every page where there is a page header. Like the
column footer, it is not resizable at run time.
Last Page
Footer
If you want to make the last page footer different from the other footers, it is possible to use
the special last page footer band. If the band height is 0, it is completely ignored, and the
layout established for the common page is used for the last page.
Summary The summary band allows you to insert fields containing total calculations, means, or any
other information you want to include at the end of the report.
Background The background enables you to create watermarks and similar effects, such as a frame
around the whole page. It can have a maximum height equal to the page height.
3.5 Specifying Report Properties
To view or edit report properties, select the report root node in the Outline view. The report properties are
shown in the Properties view.
To change the page dimensions of a report, click the Report tab in the Properties view for the report, then click
Edit Page Format to open the Page Format dialog. Here you can edit the width, height, units, orientation and
margins of the report.
The unit of measurement used by Jaspersoft Studio and JasperReports is the pixel. However, it is possible to
specify report dimension using other units of measurement, such as centimeters, millimeters, or inches. Note that
because the dimensions management is based on pixels, some rough adjustments can take place when viewing
the same data using different units of measurement. The following table shows standard page sizes and their
dimensions in pixels.
Page Type Dimensions in Pixels
Letter 612x792
Note 540x720
Legal 612x1008
A0 2380x3368
A1 1684x3368
A2 1190x1684
TIBCO Software Inc. 37
TIBCO Jaspersoft Studio User Guide
Page Type Dimensions in Pixels
A3 842x1190
A4 595x842
A5 421x595
A6 297x421
A7 210x297
A8 148x210
A9 105X148
A10 74X105
B0 2836x4008
B1 2004x2836
B2 1418x2004
B3 1002x1418
B4 709x1002
B5 501x709
ARCH_E 2592x3456
ARCH_D 1728x2593
ARCH_C 1296x1728
ARCH_B 864x1296
ARCH_A 648x864
FLSA 612x936
FLSE 612x936
HALFLETTER 396x612
11X17 792x1224
LEDGER 1224x792
38 TIBCO Software Inc.

Chapter 3 User Interface and Design View
By modifying width and height, it is possible to create a report of whatever size you like. Although Jaspersoft
enables you to create pixel-perfect reports, the page orientation options, Landscape or Portrait, are there because
they are used by certain report exporters. The page margin dimensions are set by means of the four options on
the Page Margin tab.
3.5.1 Columns
Pages, one or more of which make up a report, present bands that are independent from the data (such as the
title or the page footers) and other bands that are printed only if there are one or more data records to print (such
as the group headers and the detail band). These last sections can be divided into vertical columns in order to
take advantage of the available space on the page. A column does not concern the record fields, but it does
concern the detail band. This means that if you have a record with ten fields and you desire a table view, ten
columns are not needed. However, the element must be placed correctly to have a table effect. Ten columns are
returned when long records lists (that are horizontally very narrow) are printed.
Next, let's set up columns in a report as an example. Create a new report from File> New> Jasper Report.
Choose as template BlankA4 and name it ColumnExample. Use Sample DB - Database JBDC Connection
for the data adapter, with the following SQL query: select * from orders. Fields from the database are
discovered. Double-click SHIPNAME, to add it to the report field and click Next twice. Finally, click Finish.
From the outline view drag the SHIPNAME field in the report in the detail band, resize the detail band, and
remove the unused bands. Go to the Preview tab to see the compiled report.
By default the number of columns is 1, and its width is equal to the entire page, except the margins. The space
between columns is zero by default. Most of the page is unused. If multiple columns are used, this report would
look better. On the Page Format dialog set the number of columns to two and compile the report to see the
changes.
Jaspersoft Studio automatically calculates maximum column width according to the margins and the page width.
If you want to increase the space between the columns, increase the value of the Space field.
The restricted area is used to mark every column after the first, to show that all the elements should be placed in
the first column; the other columns are replicated automatically during compilation. If you want you can also
put elements in the other columns, but in most cases you need only the first. It is not recommended that you use
parts of the report as margins and columns after the first, if they have to be considered as though they were a
continuation of the first.
Multiple columns are commonly used for print-outs of very long lists (for example, a phone directory). It is
important to remember that when you have more than one column, the width of the detail band and of linked
bands is reduced to the width of the columns.
The sum of the margins, column widths, and space between columns has to be less than or equal to the page
width. If this condition is not met, the compilation results in an error.
3.5.2 Advanced Options
From the Properties view of the report there are many other options for the report configuration. Select the
report root node from the outline view, and in the Properties view you see:
•Report Name: It is a logical name, independent from the source file's name, and is used only by the
JasperReports library (for example, to name the produced Java file when a report is compiled).
TIBCO Software Inc. 39

TIBCO Jaspersoft Studio User Guide
•Title on a new page: This option specifies that the title band is to be printed on a new page, which forces
a page break at the end of the title band. In the first page only the title band is printed. However this page
is still included in total page count.
•Summary on a new page: This option is similar to Title on a new page except that the summary band
is printed as the last page. If you need to print this band on a new page, the new page only contains the
summary band.
•Summary with page header and footer: This option specifies if the summary band is to be accompanied
by the page header and the page footer.
•Floating column footer: This option forces the printing of the column footer band immediately after the
last detail band (or group footer) rather than the end of the column. This option is used, for example, when
you want to create tables using the report elements.
•When no data type: When an empty data is supplied as the print number (or the SQL associated with the
report returns no records), an empty file is created (or a stream of zero bytes is returned). This default
behavior can be modified by specifying what to do in the case of absence of data. The possible values for
this field are:
•No Pages: This is the default value; the final result is an empty buffer.
•Blank Page: This returns an empty page.
•All Sections No Detail: This returns a page containing all bands except for the detail band.
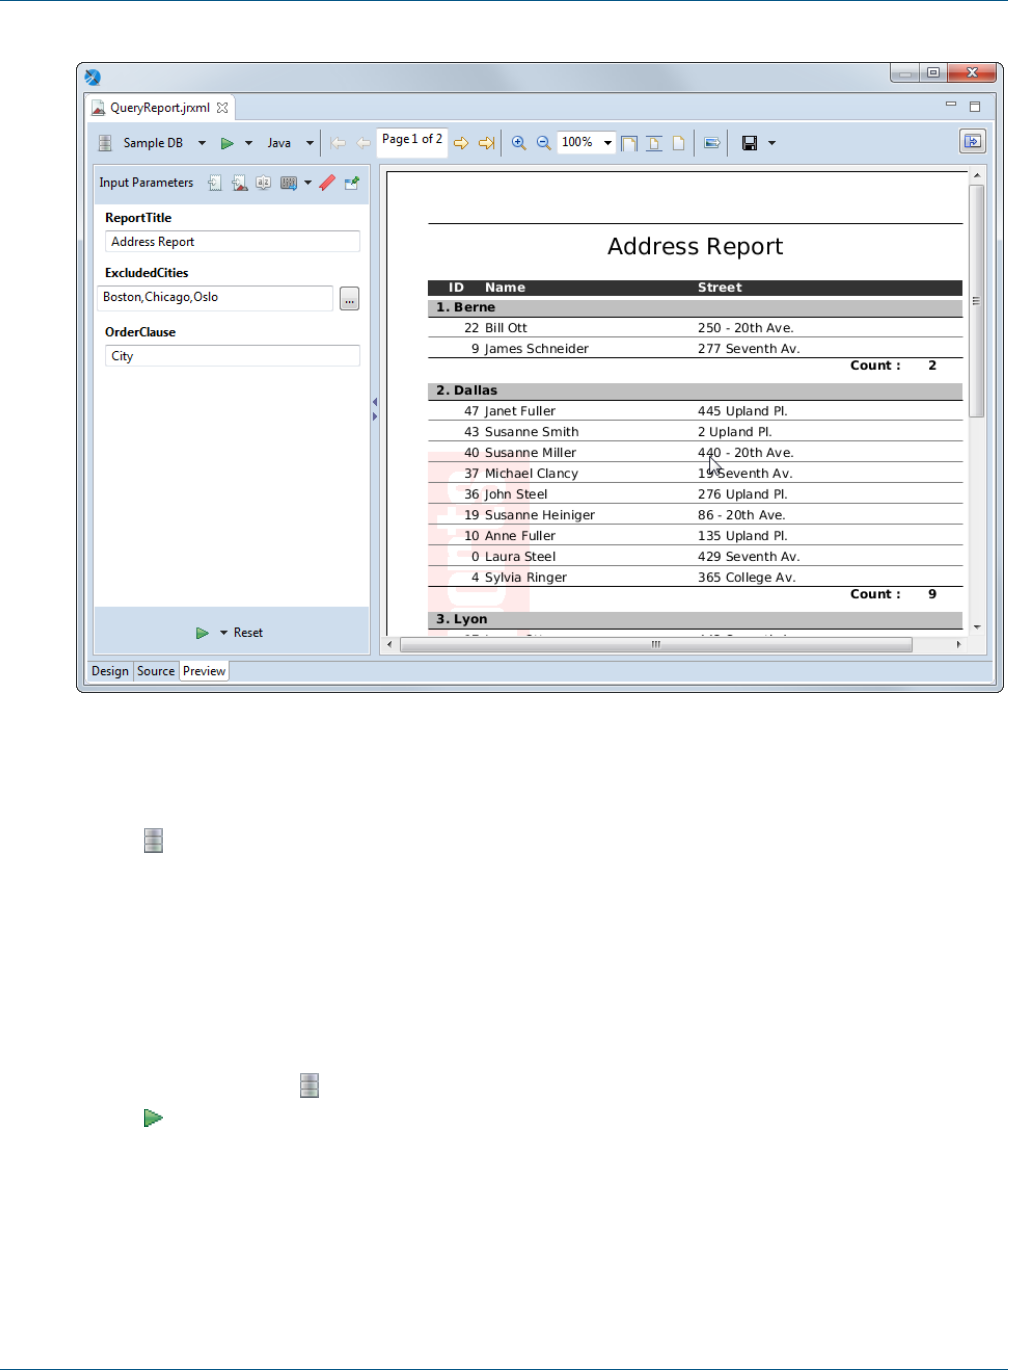
3.6 The Preview Tab
The Preview tab lets you preview the report inside Jaspersoft Studio.
40 TIBCO Software Inc.
Chapter 3 User Interface and Design View
Figure 3-2 Preview Tab of a Report
The Preview tab has the following three areas:
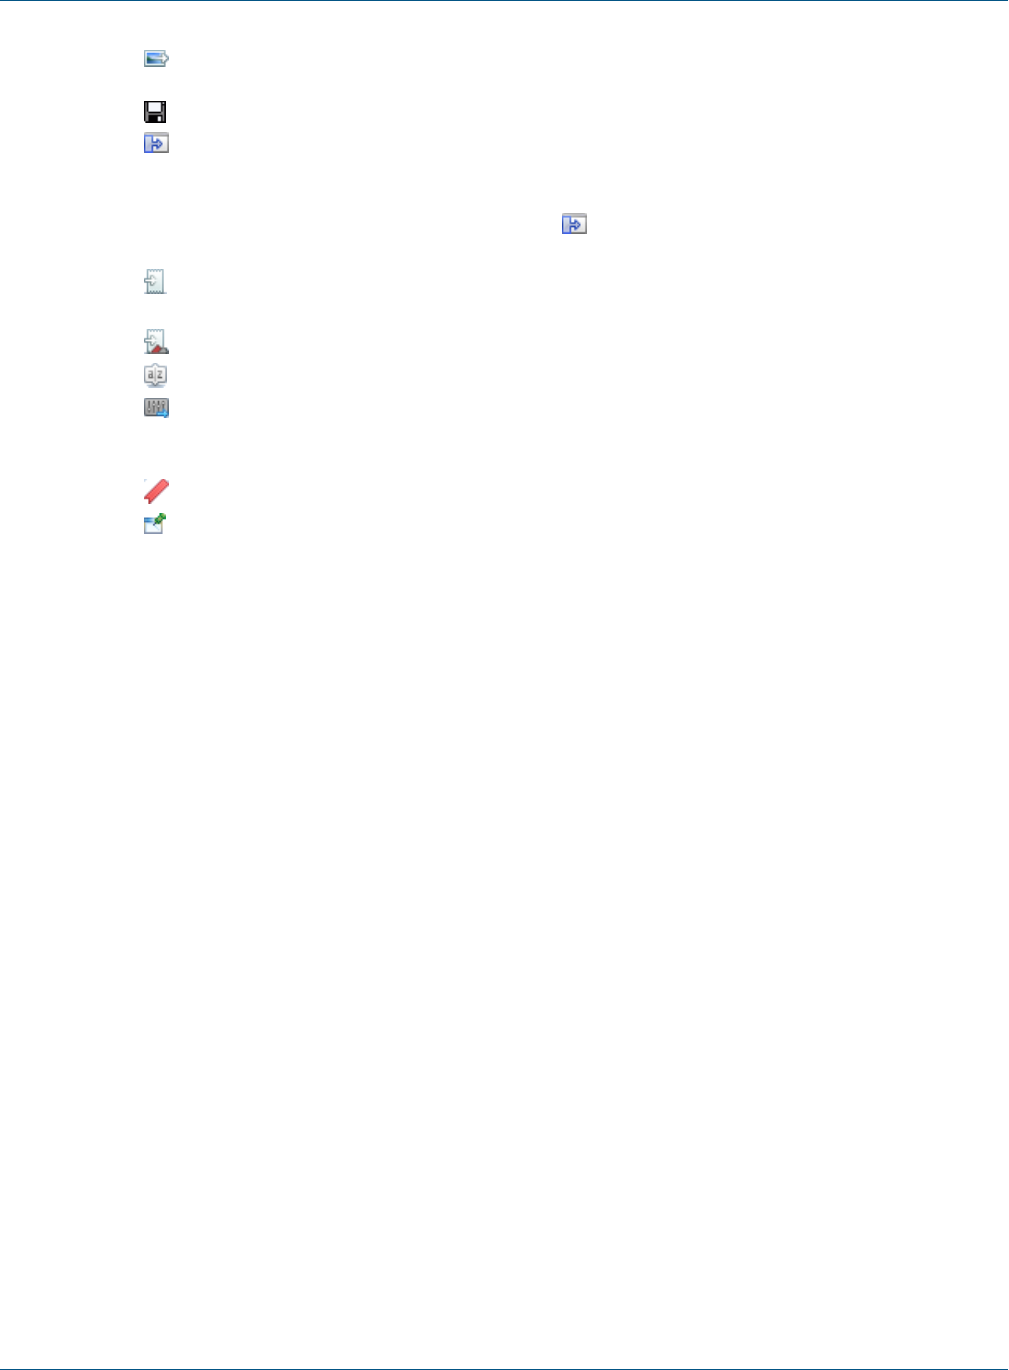
•Main menu. Displays options for viewing, exporting, and creating data snapshots:
•– Displays a drop-down menu with options for data snapshots and for restricting the list of data
adapters:
•Cache Data in Memory: Creates a data snapshot in RAM.
•Save Data to File…: Saves the data snapshot to a file.
•Load Data from File…: Runs the report using the data in the specified data snapshot.
•Filter Data Adapters by Report Language: Lets you restrict the list of data adapters to only
those adapters that are compatible with a specified language, for example, only those adapters that
use SQL.
•Data adapter drop-down – Lists all available data adapters. Use Filter Data Adapters by Report
Language on the menu to restrict the list to adapters that are compatible with a specified language.
•Run the report – Runs the report. Use the menu immediately to the right to choose between a normal
report and an interactive report. Interactive reports only support HTML format.
•Output format menu – Let you select the output format for the report.
•Pagination tools – Use the arrows to go to page through the report or to go to the first or last page.
You can also edit the page text to specify the number you want (for example, Page 7 of 12) and press
Enter.
•Display tools: Zoom in or out, specify a percent, or click the icon to zoom to fit page width, zoom to
fit page, or zoom to actual size.
TIBCO Software Inc. 41
TIBCO Jaspersoft Studio User Guide
•Export a sample image – Saves a PNG file of the current page of the report in a location you
specify.
•Export report – Saves the report to a file in the format you specify from the drop-down list.
•Show parameters – Expands the parameters panel.
•Parameters panel. Automatically displayed for a report that has parameters that have been specified for
prompting; otherwise it is hidden. You can display or hide the parameters pane using the expand/collapse
arrows to the right of the panel or show it by clicking on the Preview menu. Use the following icons to
choose what is displayed in this panel:
•Input parameters – Shows any input parameters that are set for prompting and lets you manually
enter values.
•Report parameters –Shows all parameters for the report.
•Sort fields – Shows any fields set for sorting.
•Export options – Displays any export properties set at the report level. Click the down arrow to
open the Properties dialog for Jaspersoft Studio and see the export properties set at the Jaspersoft Studio
level.
•Bookmarks – Lists the bookmarks set in the report.
•Pin Parameters Panel – Click this to have the parameters panel display for all reports.
•Report preview.
3.7 Exporting Reports with Jaspersoft Studio
In addition to generating and viewing reports, Jaspersoft Studio allows you to export reports into many formats,
including PDF, XLS, HTML and others.
3.7.1 Compiling the Report
When you select the Preview tab in the designer bottom bar, Jaspersoft Studio performs a set of operations to
create the final report. The first operation compiles the JRXML source file in a Jasper file. This first step can fail
if the elements are not correctly positioned (for example, if an element is placed outside of a band), or if an
expression in the report has errors and cannot be compiled.
If the compilation runs successfully, the produced Jasper file is loaded and filled using the active connection or
data source. This second operation can also lead to errors. This can happen if the referenced database is not
active, an invalid query has been provided, or a null field produced an error in an expression during the filling
process. If all operations complete without error, the report is displayed in the integrated viewer. Errors are
shown in the Report State window, after clicking the Errors button.
If errors occur during the compilation, the tab focus changes from Preview to Design.
3.7.2 Preview and Exporting
If the compilation completes and there are no errors in the file, the preview is shown. From there you can
browse the generated report and change its visualization, change the data source or export the report. Note that
after changing the data source the report is recompiled automatically. You can also change the preview format
as well as save the report in different formats.
42 TIBCO Software Inc.

Chapter 3 User Interface and Design View
When you set a preview format, the report is automatically regenerated in the chosen format, and the
corresponding viewer application is opened.
In some cases, bugs in the export format may result in issues in the final output. For example, some
versions of Microsoft Word incorrectly render borders on a table element exported to DOCX (the left top
and bottom borders are missing). You may be able to find a workaround based on the output format. For
example for the Microsoft Word bug, you might try the following:
1. In Jaspersoft Studio, create a style named Table_Padding, with 1-pixel left and right padding.
2. Apply this style to each table element in the report.
3.7.3 Choosing Report Templates for PDF
If you are exporting your report to PDF, choose a report template based on the size of the output.
•For most PDF exports, you can use Actual Size, which supports a maximum size of 14400px by 14400px.
•For reports with an output height exceeding 14400 px, use a paginated report template that is wide enough
for your report. For example, if you have a long report with width less than 842px, you can use the
paginated A4 Landscape theme. A report designer can create additional custom templates in Jaspersoft
Studio.
•Reports with output width exceeding 14400 px will be truncated in PDF.
TIBCO Software Inc. 43

TIBCO Jaspersoft Studio User Guide
44 TIBCO Software Inc.

CHAPTER 4 REPORT ELEMENTS
The basic building block of a report is the element. An element is a graphical object, such as a text string or a
rectangle. In Jaspersoft Studio, the concept of line or paragraph does not exist, as it does in word processing
programs. Everything is created by means of elements, which can contain text, create tables, display images, and
so on. This approach follows the model used by the majority of report authoring tools.
Jaspersoft Studio relies on all the basic elements provided in the JasperReports library:
•Line
•Rectangle
•Ellipse
•Static text
•Text field (or simply Field)
•Image
•Frame
•Subreport
•Crosstab
•Chart
•Break
Combining these elements, you can produce every kind of report. JasperReports also allows developers to
implement their own generic elements and custom components for which they can add support in Jaspersoft
Studio to create a proper plug-in.
This chapter contains the following sections:
•Common Element Properties
•Inserting, Selecting, and Positioning Elements
•Formatting Elements
•Graphic Elements
•Text Elements
•Frames
•Working with Composite Elements
•Anchors, Bookmarks, and Hyperlinks
•Custom Visualization Component
TIBCO Software Inc. 45
TIBCO Jaspersoft Studio User Guide
4.1 Common Element Properties
All elements have a set of common properties. Other properties are specific to element type. An element's
properties determine its appearance and position on the page. You can access the properties of a selected
element in the Properties view (by default in the upper right area of the UI). In Jaspersoft Studio you place
elements within bands (containers). Depending on the elements it contains, you can change the vertical size of a
band.
4.1.1 The Palette
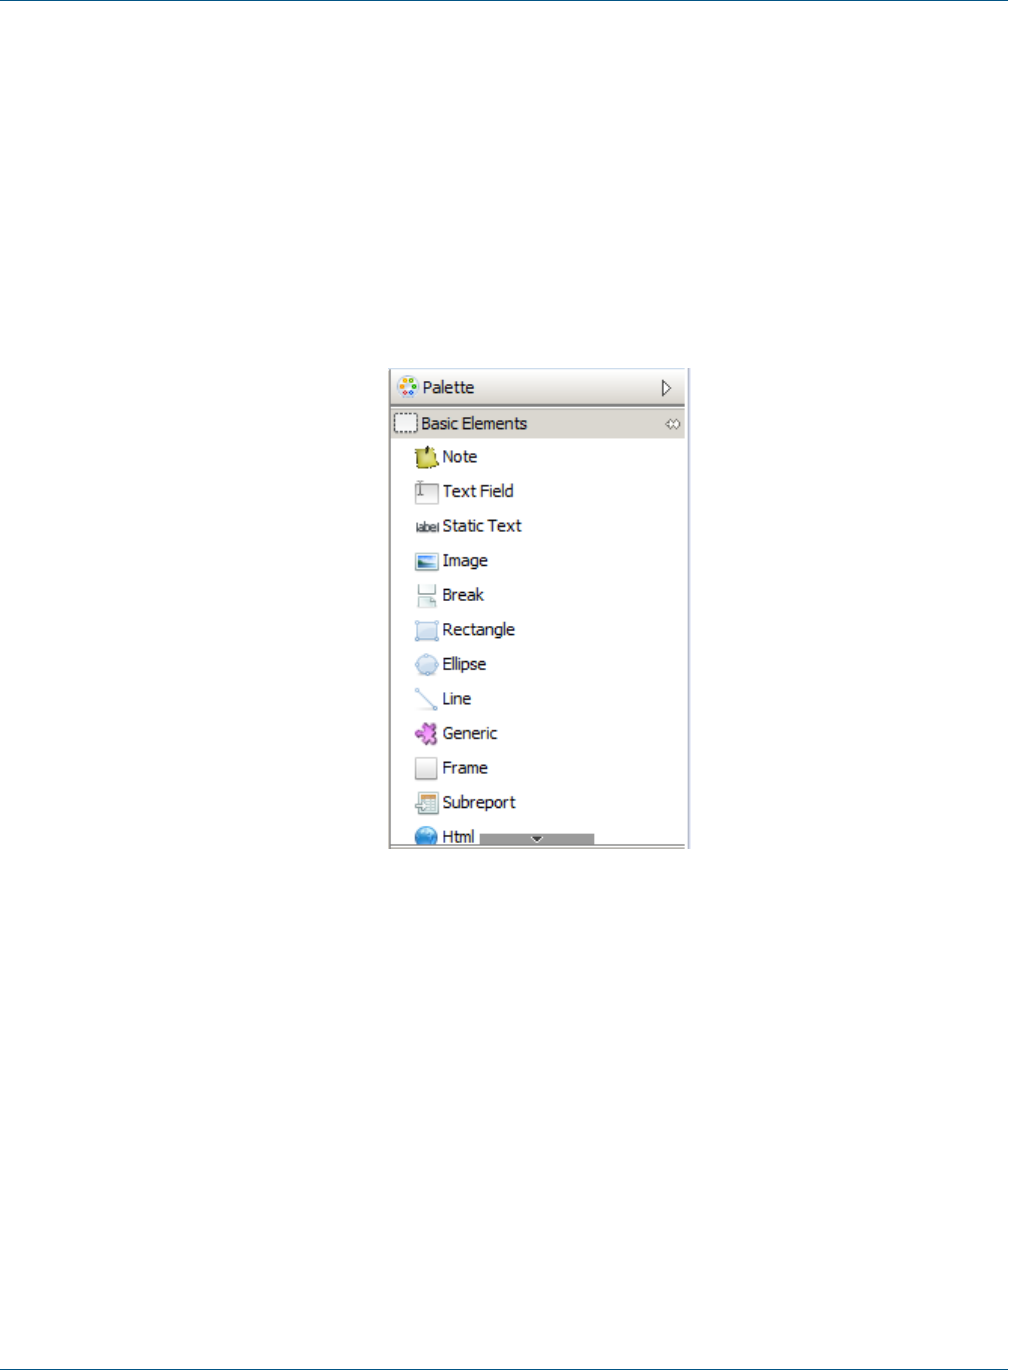
Elements appear in the Palette, located by default in the top right of the UI.
Figure 4-1 Elements in the Palette
The palette contains three subpalettes:
•Basic Elements contains the elements and components available in all editions of Jaspersoft Studio.
•Composite Elements contains elements created as combinations of other elements, such as Page Number and
Time. You can add your own composite elements to any palette.
•Components Pro contains elements only available in commercial versions of Jaspersoft Studio. This
subpalette is not visible in the community edition.
4.1.2 Element Properties
Element properties are divided into categories, visible via tabs in the Properties view. The attributes available
depend on the element type.
46 TIBCO Software Inc.
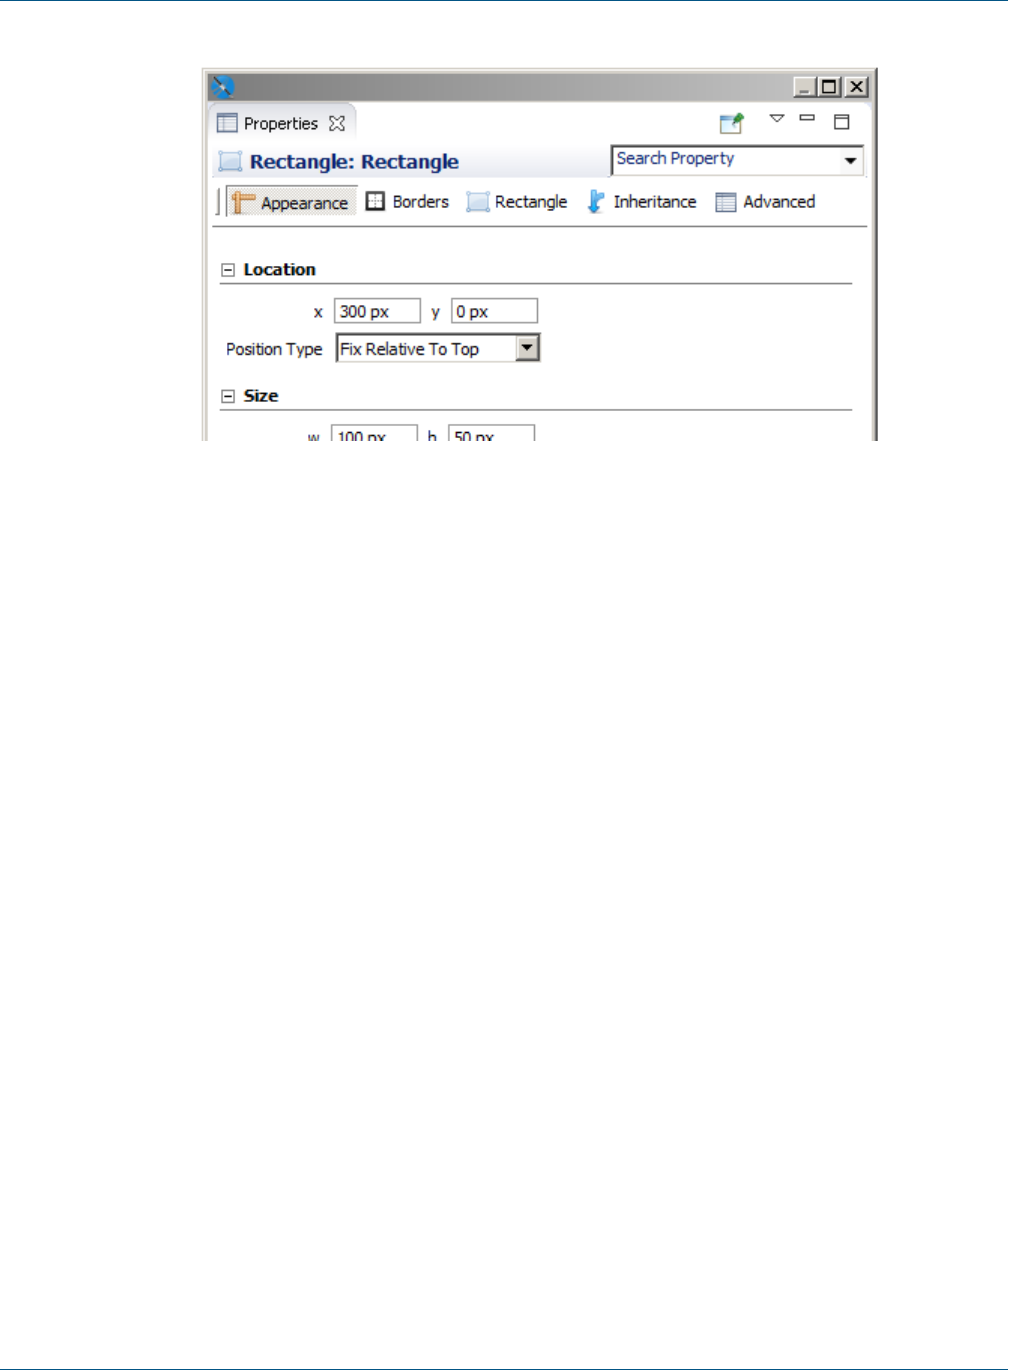
Chapter 4 Report Elements
Figure 4-2 Properties view for a rectangle
•The Appearance tab allows you to set the location, size, color, and text style of the element.
•The Borders tab allows you to set the padding and border style, color, and width of the element.
•An element tab allows you to set evaluation time along with properties specific to the element type. For
example:
•The Static Text tab allows you to define unchangeable text for a field, and control its appearance.
•The Text Field tab allows you to format and position a text field element.
•The Image tab allows you to set image alignment, fill, and scale properties.
Some elements have more than one element-specific tab. For example, the Chart component has the Chart
and Chart Plot tabs, and the Map component has the Map,Authentication,Markers, and Paths tabs.
•The Inheritance tab allows you to view any attributes inherited from another level, and override those
attributes when possible.
•The Hyperlink tab, available for image, text field, and chart elements, allows you to define a hyperlink in
an element.
•The Advanced tab displays detailed information about the element.
Frequently, the value of an attribute is undefined, and it has a common default value. This means that the
element does not have a specific behavior defined, but gets a behavior from somewhere else. For example, the
default value of the attribute "background color" is undefined in most of cases, but when a non-transparent
element is added to a report in the design tab, you can see that it has a white background. The value of the
background color attribute is inherited from a lower level.
4.2 Inserting, Selecting, and Positioning Elements
4.2.1 Inserting Elements
When you insert an element, you can let Jaspersoft Studio autosize it, or you can size it as you insert it. Setting
the size of an element when you insert it is useful for tabular elements such as tables and crosstabs.
TIBCO Software Inc. 47

TIBCO Jaspersoft Studio User Guide
To let Jaspersoft Studio autosize an element:
•Drag an element from the palette to place it in the report editing area.
To size an element at insertion time:
•Click on the element in the palette. The cursor changes to show that an element is selected. Click and
drag in the report editing area to size and place the element. If you insert a crosstab or table using click and
drag, the columns fill the whole crosstab or table.
4.2.2 Selecting Elements
•Click to select an element in the report editing area.
•Drag to adjust the element's position or change its size by selecting it and dragging a corner of the selection
frame.
•To select several elements at the same time drag the cursor in a rectangle around them. When two or more
elements are selected, only their common properties are displayed in the Properties view. If the values of the
properties are different, the value fields are blank (usually the field is shown empty). To edit properties
unique to one element, select only that element.
•Shift-click to select the parent of the current object. For example, shift-click an element contained directly
in a band to select the band.
4.2.3 Positioning Elements
Jaspersoft Studio offers a number of ways to place the elements in your report with precision.
4.2.3.1 Using the Grid
To show a grid for aligning elements in the page, go to View > Show Grid from the main menu. To force the
elements to snap to the grid, also select Snap to Grid.
4.2.3.2 Using Bands
The top and left values that define the element’s position are always relative to the parent container (a band or
frame).
If you want to move an element from one band to another or to a frame, drag the element node from the Outline
view to the new band (or frame) node.
In the report editing area, you can drag an element from one band to another band, but the element’s parent
band does not change. In general, an element must stay in its band, but there are exceptions to this rule. For
example, you can move an element anywhere in the report without changing or updating the parent band.
4.2.3.3 Guides
When dragging or resizing an element, Jaspersoft Studio suggests places to align it based on the elements
currently in the Design tab, the band bounds, and any guides. When the element you're moving or resizing is in
line with another element in the report, a guideline appears, allowing you align the elements. To force elements
to align with guidelines, select View> Snap to Guides from the main menu.
You can drag and change the position of a guideline at any time with no effect on the element’s position.
To remove a guideline, drag it to the upper-left corner of the report editing area.
48 TIBCO Software Inc.

Chapter 4 Report Elements
4.2.3.4 The Properties View
You can use the Properties view to edit an element’s properties. By default the Properties view is at the right
side of the UI. The Properties view is for more than just elements. You'll use it to edit all the components of a
report. When you select something in the designer or the Outline view, the Properties view shows the options
specific to that object.
4.2.4 Positioning Elements in Containers
Some elements that can contain many other elements are called containers. Containers include bands, frames,
table cells, and crosstab cells. The following tools help you position items inside containers:
•Sizing tools – Let you size an element to fit the height, width, or entire container.
•Container layouts – Let you set how elements are automatically arranged in a container.
Elements inside containers must obey the following rules.
•Elements in table cell, and crosstab cells must be fully contained by the parent in the design time.
Otherwise, an error will occur at compilation time.
•Elements in bands can extend horizontally past the document margins and/or overflow the top of the band.
Otherwise, an error will occur at compilation time.
•Frames are able to adapt their size to content.
4.2.4.1 Container Layouts
A container layout is a design-time tool that adjusts the size and the position of elements when they are added
to or removed from a container. The concept of layout is specific to Jaspersoft Studio and works only at design
time. Layouts don't make a report stretchable or resizable. At run-time, depending on the design, JasperReports
Library may still let elements overlap or change their position relative to other elements.
There are four container layouts:
•Free layout
•Horizontal layout
•Vertical layout (default)
•Grid layout
An additional layout, spreadsheet layout, is displayed on the same context menu, but is actually applied across
bands. See 4.9, “Working with Spreadsheet Layout,” on page64 for more information.
To choose a layout:
•Right-click in the container, select Arrange in Container from the menu, then select the layout you want.
or
•Click on the container and then select the option you want from the Layouts menu on the Appearance tab
of the Properties view. This is the only way to select Free Layout.
4.2.4.2 Working with Grid Layout
Grid layout positions elements in a container in a grid of rows and columns. By setting properties on individual
elements, you can control the element's placement in the grid, as well as influence the overall height of the rows
and width of the columns. Elements can span multiple rows and/or columns. If you resize the container during
design, the elements are resized based on their properties.
When grid layout is selected for a container, such as a band, elements inside the container have a Layout
section on the Appearance tab of the Properties dialog. The following table shows the properties you can set on
TIBCO Software Inc. 49
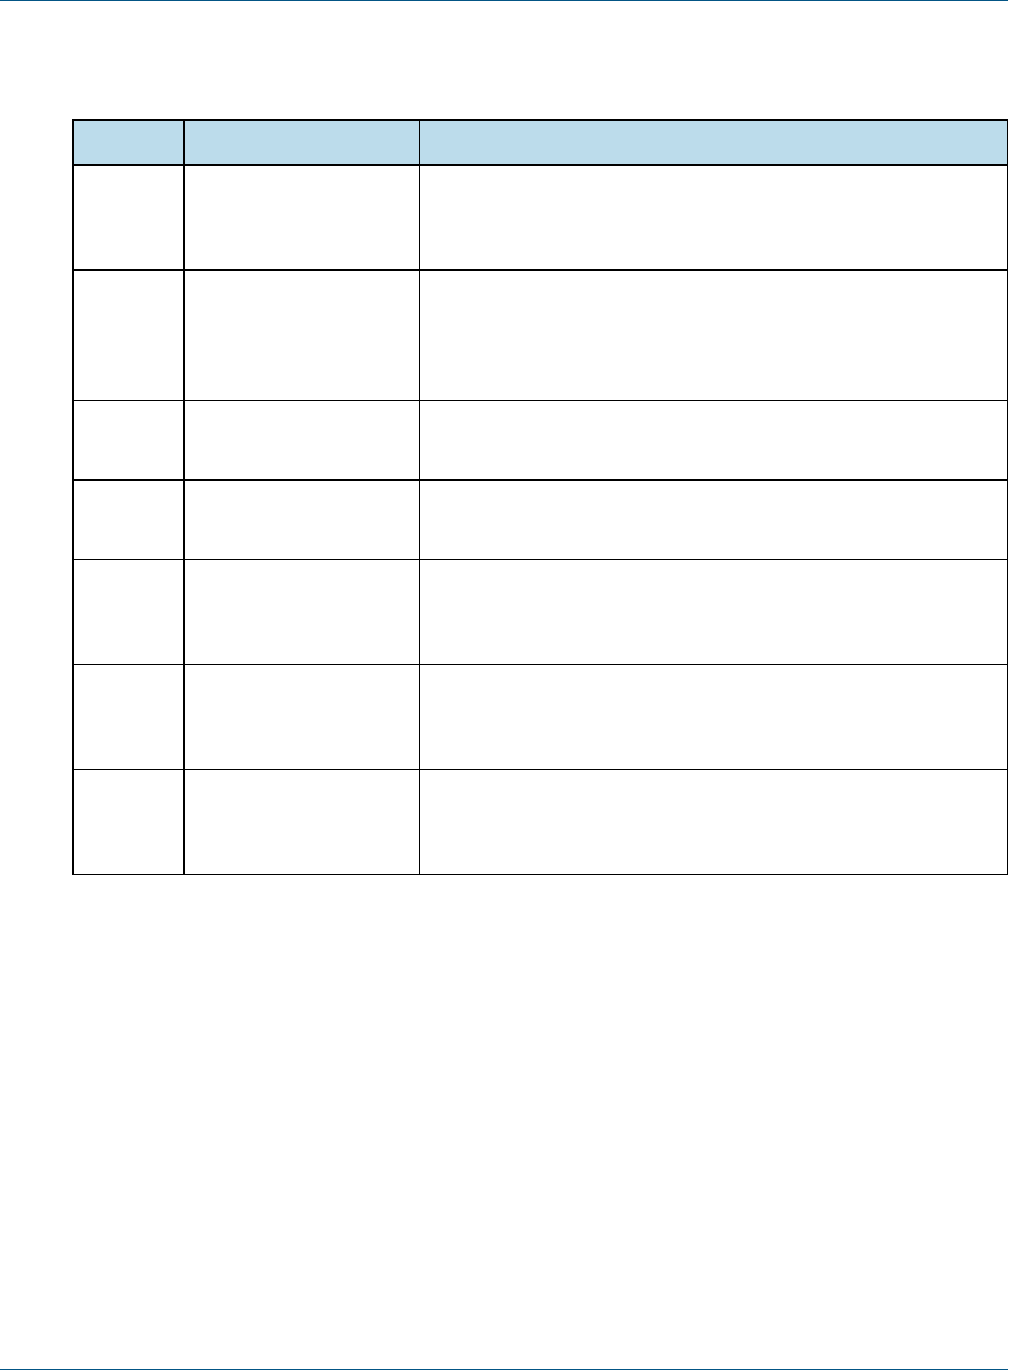
TIBCO Jaspersoft Studio User Guide
a element in a container with grid layout. The property name to use in source view is included in the
description.
Property Value Description
Row
Number
Relative (default) or an
integer between 0 and
1000
Number of the row from which this element starts. 0 is the first row.
When set to Relative, increments the last evaluated row by 1.
com.jaspersoft.layout.grid.y
Column
Number
Relative (default) or an
integer between 0 and
250
Number of the column from which this element starts. 0 is the first
column. When set to Relative, increments the last evaluated column
by 1.
com.jaspersoft.layout.grid.x
Row
Span
Integer between 0 and
1000; default = 1
Number of rows that the element spans.
com.jaspersoft.layout.grid.colspan
Column
Span
Integer between 0 and
250; default = 1
Number of columns that the element spans
com.jaspersoft.layout.grid.rowspan
Fixed
Size
Boolean; default = false. Set to true to manually size the element. Set to false to have the
element size automatically using the element's settings
com.jaspersoft.layout.grid.fixed
Row
Weight
Number; default = 1 Number that specifies how much space the element's row takes
relative to other rows. Not available when Fixed Size is True.
com.jaspersoft.layout.grid.weight.x
Column
Weight
Number; default = 1 Number that specifies how much space the element's column takes
relative to other rows. Not available when Fixed Size is True.
com.jaspersoft.layout.grid.weight.y
To use grid layout:
1. This example uses a vertical image, that is, an image much taller than it is wide. You can use any vertical
image, for example, a company logo rotated vertically. To create the exact image used in this example,
create a report with the Green Leaf template. This creates a leaf_banner_green.png file in your workspace.
In your file system, use a graphics editor to rotate the image 90°. Note that this will rotate the image in any
report where it is used.
2. Create a report using the BlankA4 template and the Empty data source. Do not reuse the report created in
the previous step.
3. Add your vertical image to the title band of your report.
4. Add a chart to the title band of your report, to the right of your image.
5. Resize the title band to fit a chart.
50 TIBCO Software Inc.
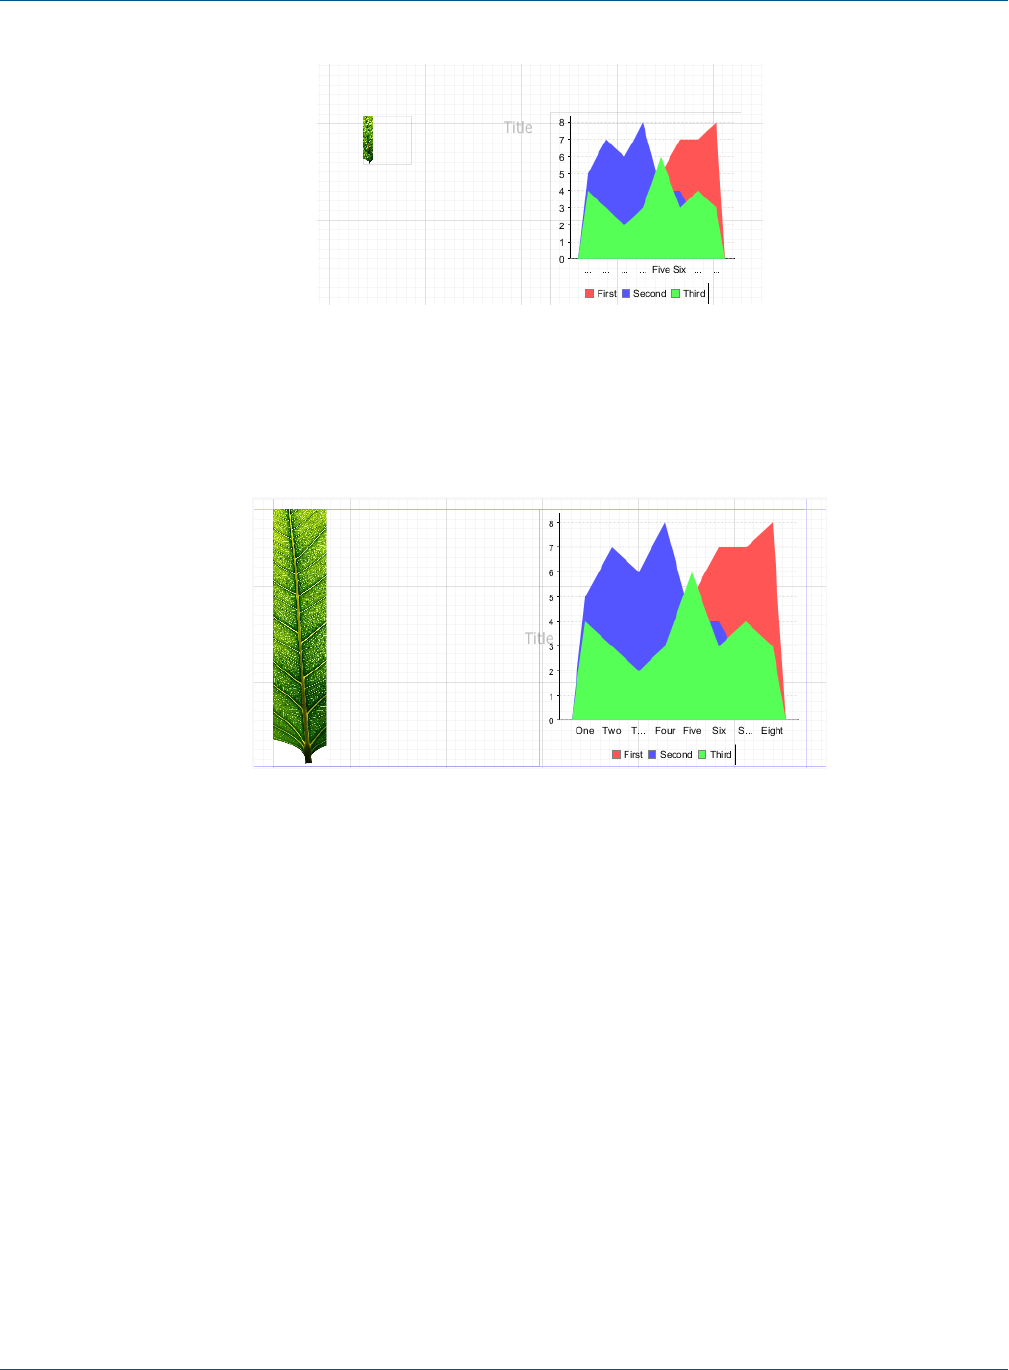
Chapter 4 Report Elements
Figure 4-3 Title band before applying grid layout
6. Right-click in a blank space in the Title band and select Arrange in Container> Grid Layout, or select
the Title band and select Grid Layout in the Properties view.
The two elements are arranged to fill the band equally.
Figure 4-4 Title band with grid layout
7. Resize the elements so that the chart takes up most of the space. To do this, select the chart. In Properties
view, in the Layout section of the Appearance tab, set Column Weight to 5.
The elements adjust so that the chart width is five times the image width.
TIBCO Software Inc. 51
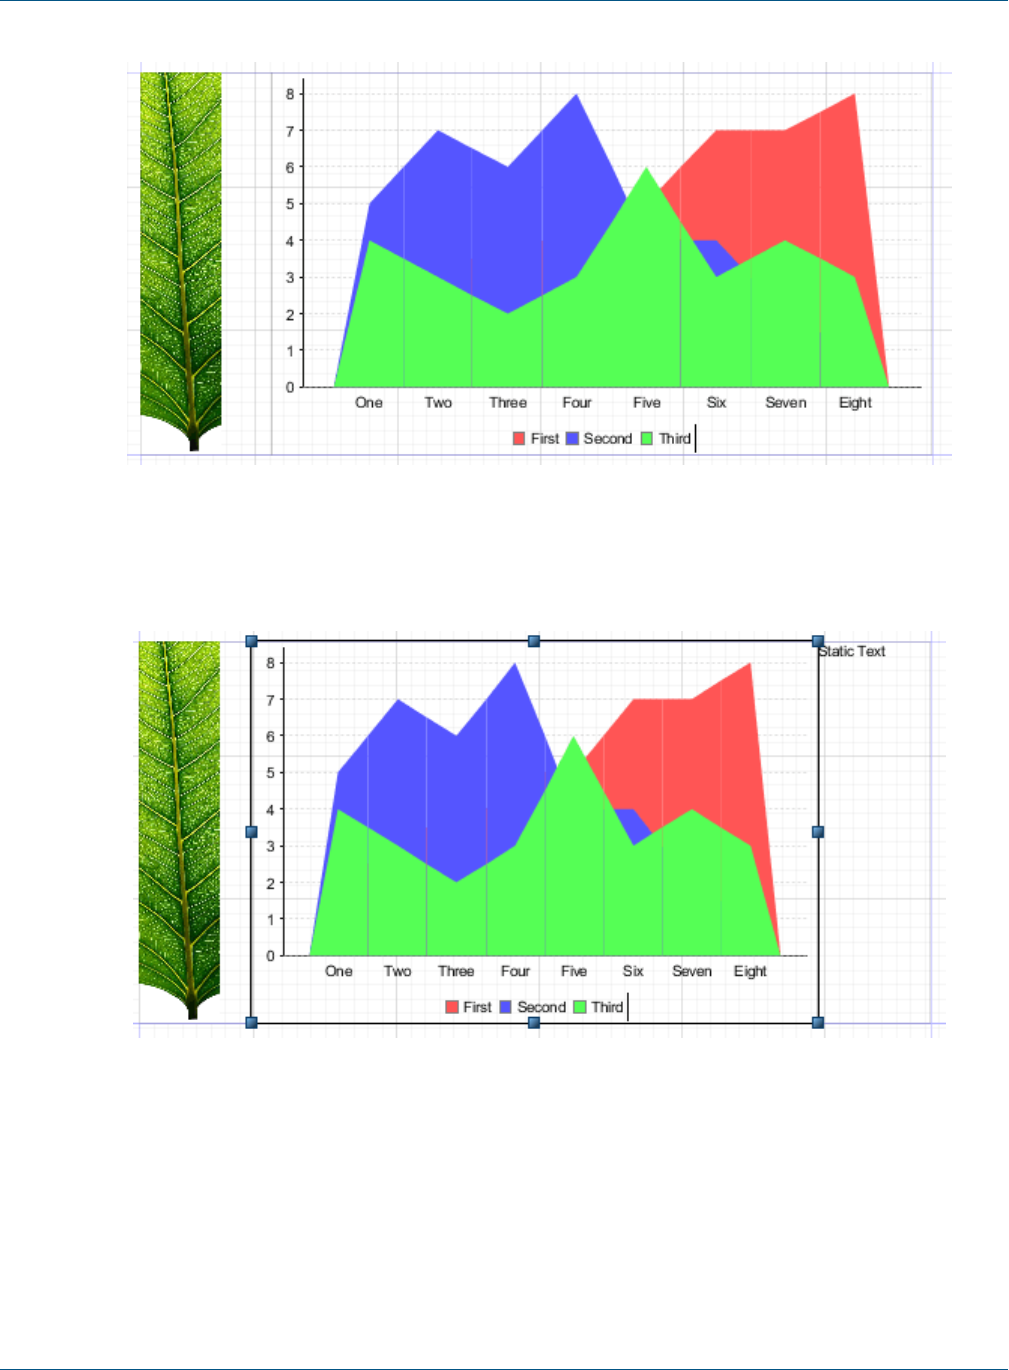
TIBCO Jaspersoft Studio User Guide
Figure 4-5 Grid layout with column weight
8. Now add a static text element to the far right of the title band.
The static text is added at the end of the first row.
Figure 4-6 Adding an element to a grid layout
9. Position the static text. To do this, select the static text. In Properties view, in the Layout section of the
Appearance tab, set the following:
•Set Row Number to 1 to move the element to the second row. You could also have added the static
text directly below the first row, but setting the row explicitly gives you more control.
•Set Column Span to 2 to have the element span both columns. You could instead set the Column
Number to 2 to move the static text under the chart.
52 TIBCO Software Inc.

Chapter 4 Report Elements
Figure 4-7 Using two rows in grid layout
10. Set the relative heights of the rows. To do this, select the chart and set Row Weight to 10 in the Layout
section of the Appearance tab of Properties view. You could actually do this by changing the settings on
any of the three elements, but in this case, the chart is the main element and you want other elements to
adjust to it.
Figure 4-8 Using row weight in grid layout
4.3 Formatting Elements
Formatting tools help organize the elements in the report. Right-click the element you want to work on and
select a tool from the context menu.
TIBCO Software Inc. 53
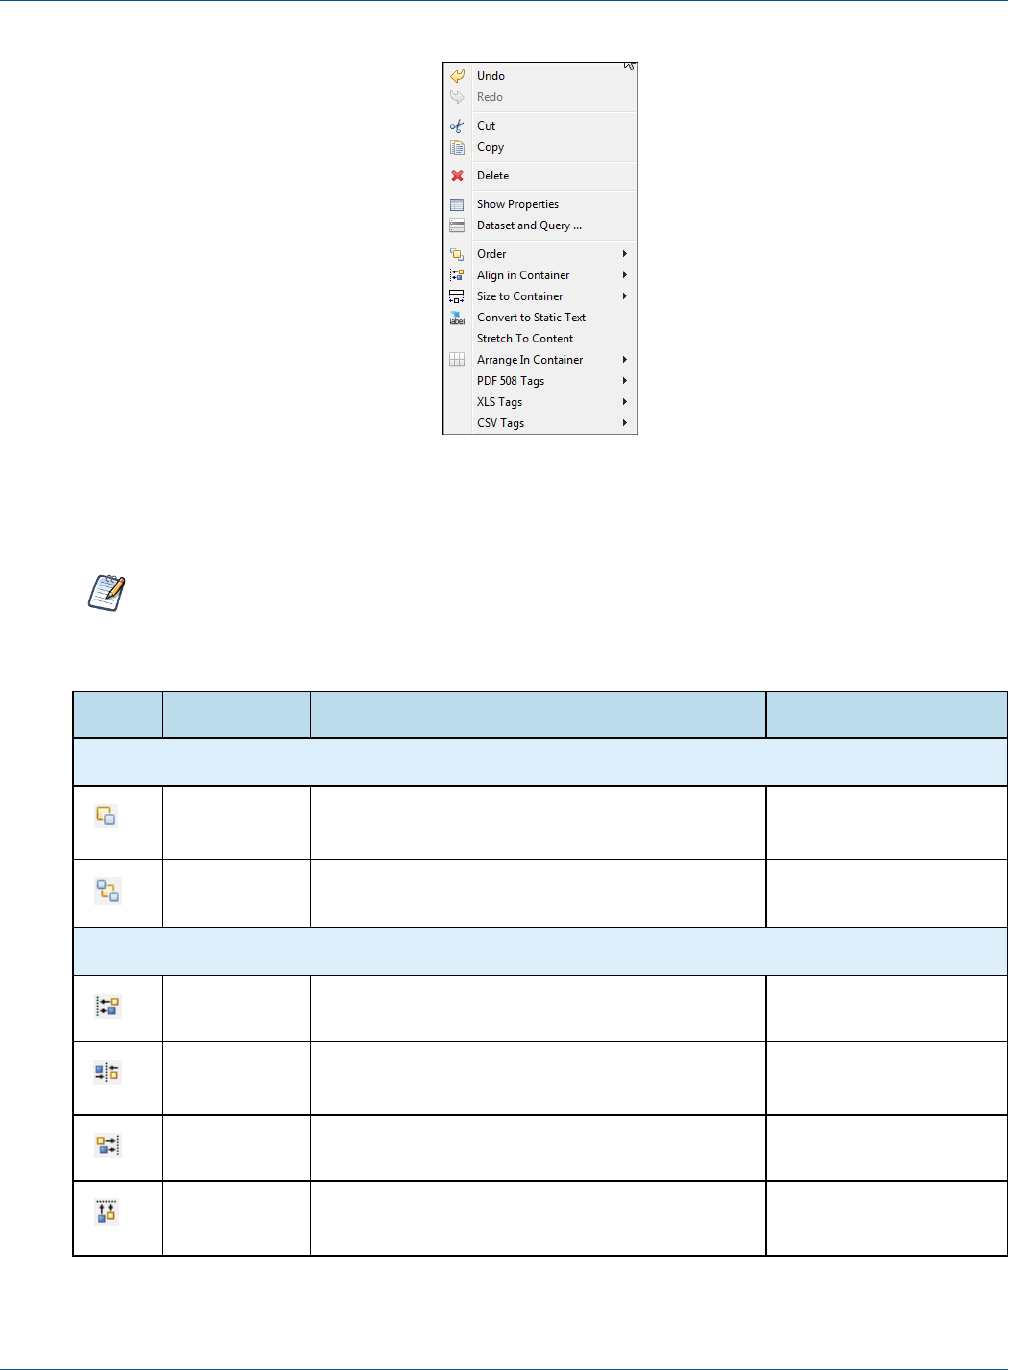
TIBCO Jaspersoft Studio User Guide
Figure 4-9 Formatting Tools Menu
The tools in the context menu are specific to the selected item(s). The following tables explain the tools.
A container is the band, frame, or cell that contains the element.
Icon Tool Name Description Multiple Select?
Order Tools
Send
Backward
Moves the element behind its current layer. Yes
Send to Back Moves the element to the bottom layer. Yes
Align in Container Tools
Align to Left Aligns the left sides to that of the primary element. Yes
Align to
Center
Aligns the centers to that of the primary element. Yes
Align to Right Aligns the right sides to that of the primary element. Yes
Align to Top Aligns the top sides (or the upper part) to that of the
primary element.
Yes
Table 4-1 Formatting Tools
54 TIBCO Software Inc.
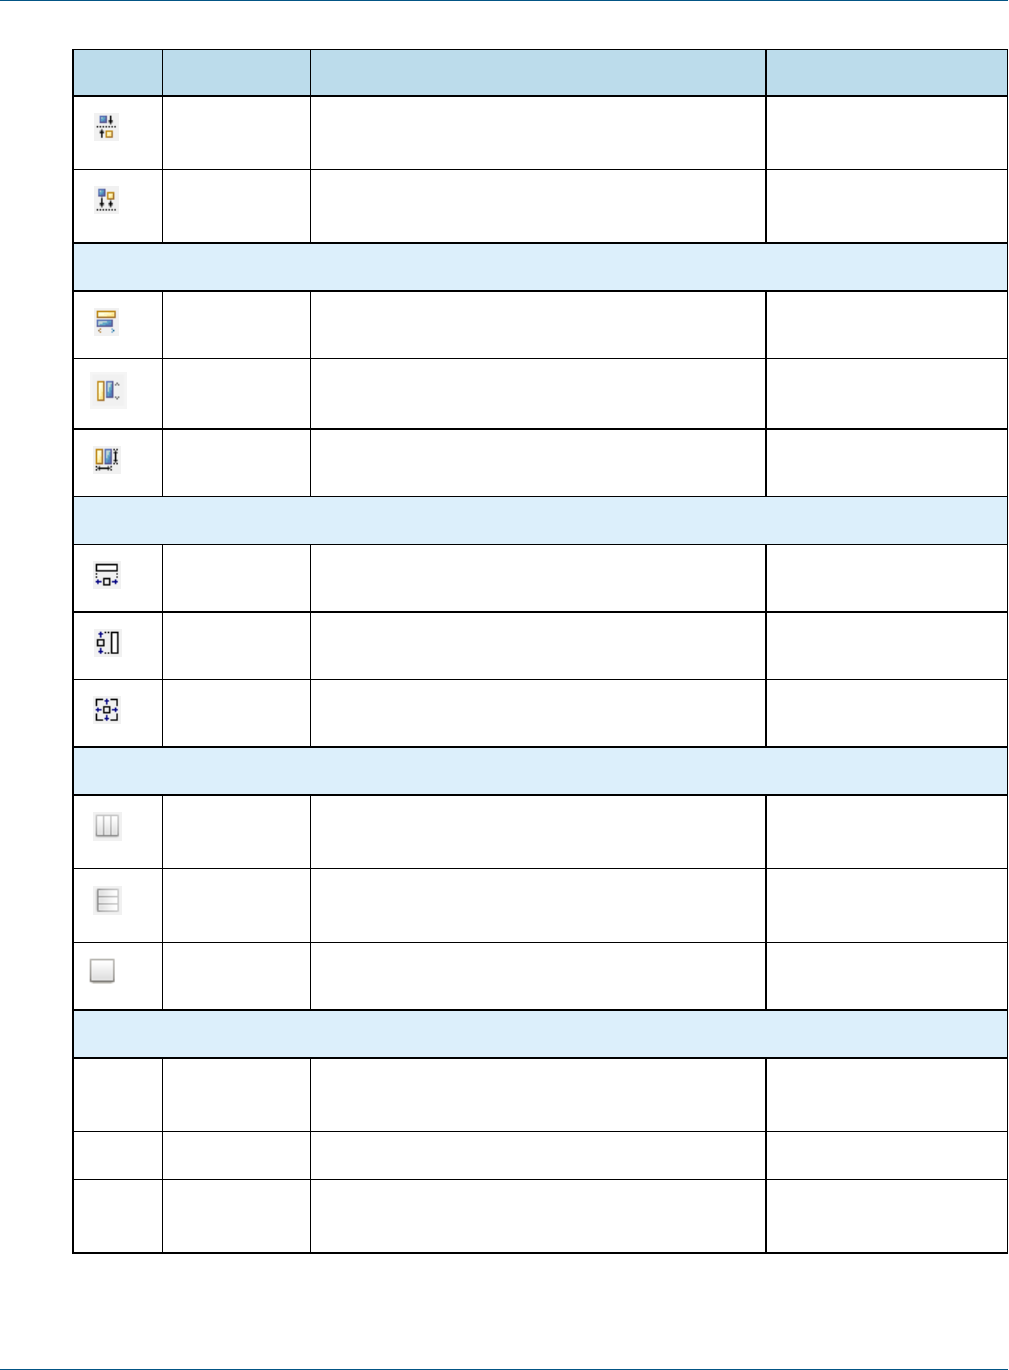
Chapter 4 Report Elements
Icon Tool Name Description Multiple Select?
Align to
Middle
Aligns the middles to that of the primary element. Yes
Align to
Bottom
Aligns the bottom sides (or the lower part) to that of
the primary element.
Yes
Size Components Tools
Match Width Adjusts width to that of primary element. Yes
Match Height Adjusts height to that of primary element. Yes
Match Size Resizes to that of primary element. Yes
Size to Container Tools
Fit to Width Adjusts elements to fill width of container. Yes
Fit to Height Adjusts elements to fill height of container. Yes
Fit to Both Adjusts elements to fill width and height of container. Yes
Arrange in Container Tools
Horizontal
Layout
Centers selected elements vertically. Yes
Vertical
Layout
Centers selected elements horizontally. Yes
Grid Layout Positions elements in a grid based on properties set
on each element.
Yes
Miscellaneous Tools
Stretch to
Content
Resizes element to fit the content N/A
PDF 508 Tags Adds tags required for PDF 508C compliance
XLS Tags Adds tags that define how data is exported to the
Microsoft Excel format
TIBCO Software Inc. 55
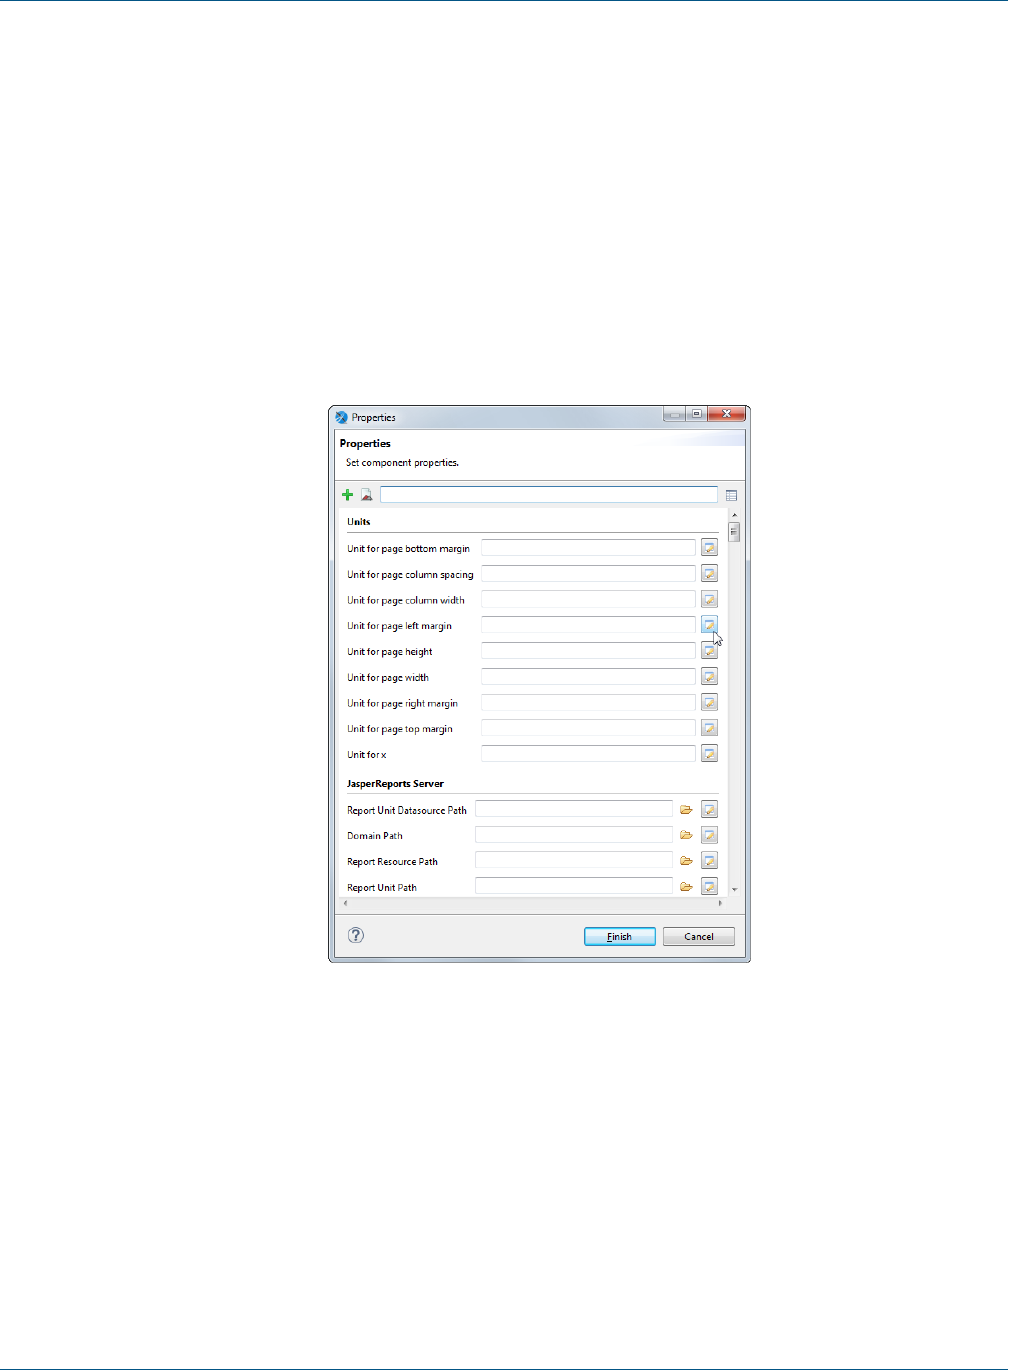
TIBCO Jaspersoft Studio User Guide
4.4 Working with Advanced Properties
You can use the Properties dialog to view and set properties for elements, bands, or a report. The Properties
dialog shows all the properties that can be set in Properties view along with additional properties not shown
elsewhere in the user interface.
Most element types support static values or expressions in properties. Some element types only allow static
properties, including bands and parameters. The properties available for fields depend on the query language.
The steps to open the Properties dialog differ depending on the element you select. For example:
•To open the Properties dialog for a text field, go to the Appearance tab in Properties view and click the
Edit Properties button.
•To open the Properties dialog for a report, go the Advanced tab in Properties view and select Edit
Properties, then click ....
Figure 4-10 Properties dialog for a report
By default, the Properties dialog displays a form with available properties grouped by category. The available
categories depend on the element type. For example, reports allow you to set a number of JDBC and timezone
properties. Each property has a widget that allows you to set the property. Deprecated properties are displayed
with strikethrough.
The Properties dialog box supports the following actions:
•Hover to view the description of a property.
•Right-click on an entry box to set the property to Null or reset it to the default value (when available).
56 TIBCO Software Inc.

Chapter 4 Report Elements
•Click to switch to a summary table view. Using this view, you can manage multiple properties at the
same time. For example, you can select and copy multiple properties, and then paste them into another
element. To return to form view, click .
•Click to show only properties that have been already been set at element level.
•Enter a string in the Search property entry bar to search for a property by name.
•Some properties include variables in the property names, shown with curly brackets {}. To use these
properties, replace the entire value, including the brackets, with the name you want to use.
You can also use styles to format some types of elements. Styles can be applied to multiple elements, but
are more restrictive. Properties must be individually applied to each element.
4.4.1 Example of Using the Properties Dialog
This example shows how to set a property expression that turns values in a text field red when they are greater
than 10.
Create a report:
To create the report for the chart
1. Create a new, blank report using the Sample DB data adapter and the query: select * from PRODUCT.
2. Click Next.
3. Click to select all fields, then click Finish.
4. Delete all bands except for Column Header and Details.
5. In Outline view, expand the Fields node, select all fields, and drag them to the detail band.
The fields are added to the detail band and headers are automatically added to the Column Header band.
6. Drag to select the fields in the detail band, right-click, and select Align in Container> Align to Top
Margin. Then double-click the detail band to resize it to fit the fields.
Set properties on a text field:
1. Select the $F{COST} field in the detail band.
2. First, set this field to display as currency. Select the Text Field tab in Properties view, click *** and enter
the following expression:
"$###,###.00"
3. Select the Appearance tab in Properties view and click Edit Properties at the bottom of the view.
4. To see properties related to color, type "color" in the search bar.
TIBCO Software Inc. 57
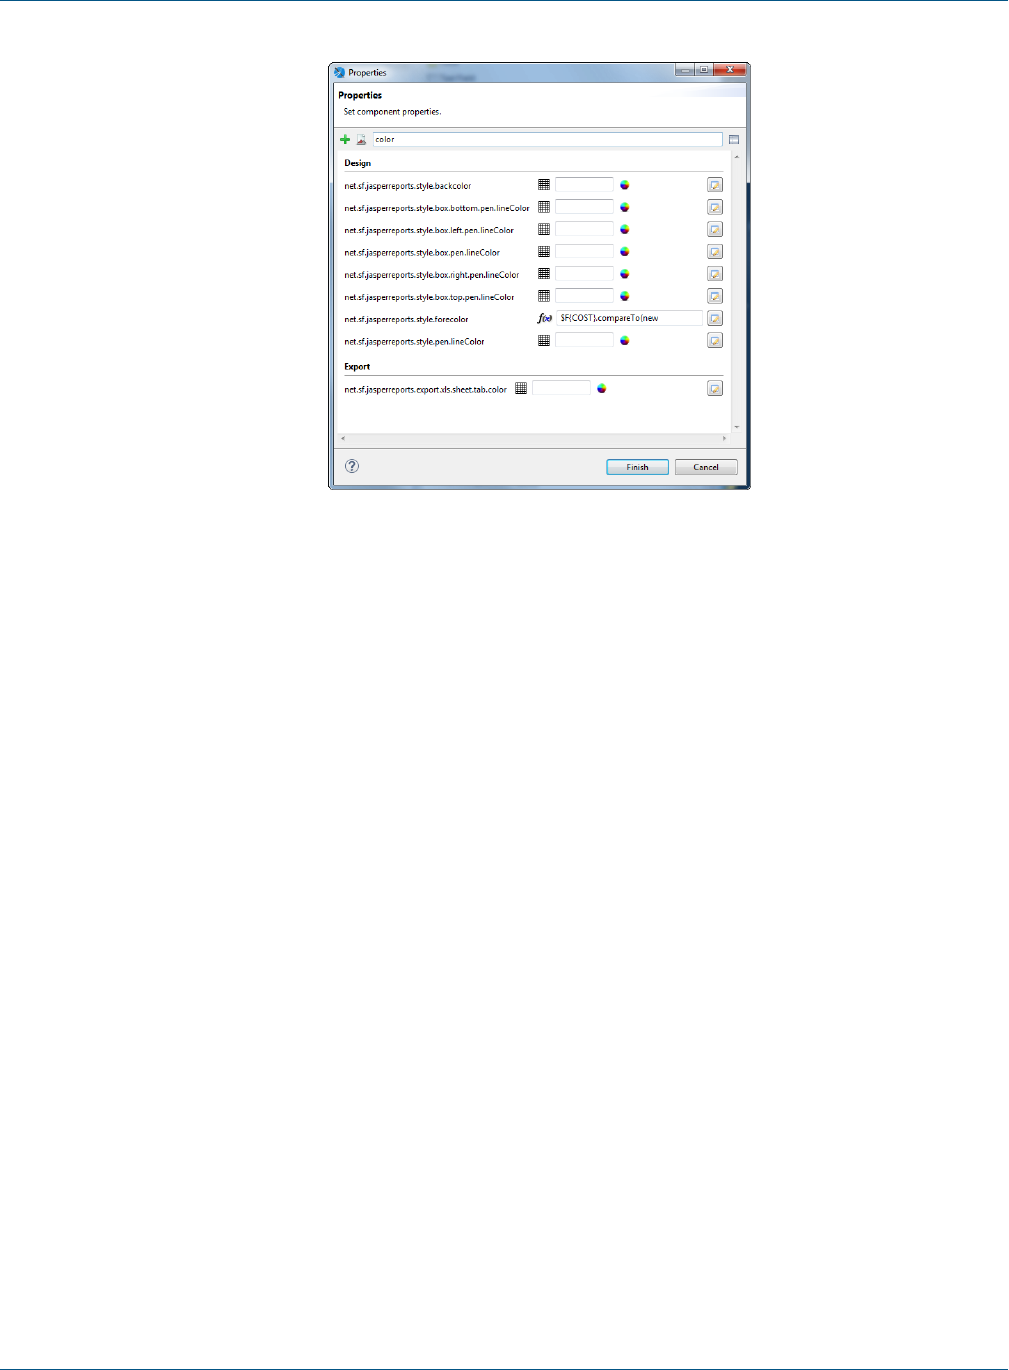
TIBCO Jaspersoft Studio User Guide
Figure 4-11 Properties dialog for a report
5. Click the expression editor icon next to net.sf.jasperreports.style.forecolor to open the expression editor.
6. Select Use Expression and enter the following expression:
$F{COST}.compareTo(new BigDecimal(10)) > 0 ? "#FF0000" :"#000000"
7. Click Finish.
8. Click Preview to view the report.
4.4.2 Variables in Property Names
Variables in property names are shown inside curly brackets ({}). To use these properties, replace the entire
variable (including the brackets) with the name you want to use. You can create multiple properties and set
them to different expressions.
4.4.2.1 Sample Property with Variables in the Name
To see an example of a property with variables in the name:
1. Select the root node of any report.
2. Go to the Advanced tab in Properties view and select Edit Properties … .
3. In the Properties dialog, and scroll down to the Export properties or search on "export". You see the
property net.sf.jasperreports.export.csv.column.names.{arbitrary_name}.
You can use an instance of this property to set a comma-separated list of names of columns you want to appear
in CSV exports of the report. Each report element associated with one of these column names will be exported.
Elements that are not associated with these column names won't be part of the export. For example, setting
<property name="net.sf.jasperreports.export.csv.column.names.1"
value="id,name,department"/> tells the CSV exporter to export those columns.
You can also set this property on a higher level, such as a dataset or crosstab. To associate an element with a
column name, set the net.sf.jasperreports.export.csv.column.name property for that element.
58 TIBCO Software Inc.

Chapter 4 Report Elements
4.4.2.2 Using Multiple Properties With the Same Prefix
You can create multiple properties with this prefix and set column names for each instance. At runtime, all
properties starting with the net.sf.jasperreports.export.csv.column.names. prefix are collected and
their values are parsed to get the list of all column names to be exported.
For instance, in a report you can have:
<property name="net.sf.jasperreports.export.csv.column.names.1" value="id,name,department"/>
<property name="net.sf.jasperreports.export.csv.column.names.2" value="address"/>
For this example, the result is the following columns, in this order: id, name, department, address.
The {arbitrary_name} suffix can be any name you choose. The following code gives the same result at
runtime:
<property name="net.sf.jasperreports.export.csv.column.names.first.column.set"
value="id,name,department"/>
<property name="net.sf.jasperreports.export.csv.column.names.address" value="address"/>
You can use multiple properties with the same prefix for dynamic properties. For example, you could generate
column names from two different parameters:
<propertyExpression name="net.sf.jasperreports.export.csv.column.names.db.columns">
<![CDATA[$P{columns1}]]>
</propertyExpression>
and
<propertyExpression name="net.sf.jasperreports.export.csv.column.names.additional.columns">
<![CDATA[$P{other_columns}]]>
</propertyExpression>
When using multiple properties with the same prefix
•Properties are collected in the same order they are declared in the report.
•If you have a single column name, you do not need a comma.
•Each instance should have a different name, in order to make them distinct. If you have two instances with
the same name, the second instance overwrites the first.
•If a column name appears in both instances of the property, it will be collected twice. This behavior should
be avoided.
4.4.3 Adding a Custom Property
When you create custom components using JasperReports Library, properties for these custom components may
not be discovered by the Jaspersoft Studio UI. In this case, you can add the property to the Jaspersoft Studio
interface by clicking + in the Properties dialog and manually entering the property name. All properties in the
Properties dialog are loosely coupled to the JRXML, which means that adding or removing these properties
does not change the JRXML document structure.
TIBCO Software Inc. 59

TIBCO Jaspersoft Studio User Guide
4.5 Graphic Elements
Graphic elements like lines and shapes are used to make reports more attractive and readable. You can also add
these by dragging them from the palette to the report editing area.
4.5.1 Line
In Jaspersoft Studio, a line is defined by a rectangle for which the line represents the diagonal. By default, the
foreground color is used as the default color and a 1-pixel-width line is used as the line style.
You can customize the look, style, and direction of the line in the element’s Properties view.
4.5.2 Rectangle and Ellipse
The rectangle element is usually used to draw frames around other elements. By default, the foreground color
setting is used and a normal 1 pixel width
The ellipse is the only element that has no attributes specific to it. The ellipse is drawn in a rectangle that
defines the maximum height and width. By default, the foreground color is used, and a normal 1-pixel-width
line is used as line style. The background is filled with the background color setting if the element has not been
defined as transparent.
4.5.3 Images
An image is the most complex of the graphic elements. You can insert raster images (such as GIF, PNG and
JPEG images) in the report, but you can also use an image element as a canvas object to render, for example, a
Swing component, or to leverage some custom rendering code.
Dragging an image element from the Palette into the report editing area launches the Create new image
element dialog. This is the most convenient way to specify an image to use in the report. Jaspersoft Studio
does not save or store the selected image anywhere, it just uses the file location, translating the absolute path of
the selected image into an expression to locate the file when the report is executed. The expression is then set as
the value for the Image Expression property.
You can add an image by explicitly defining the full absolute path of the image file in your expression. This is
an easy way to add an image to the report, but, overall, it has a big impact on the report’s portability, since the
file may not be found on another machine (for instance, after deploying the report on a web server or running
the report on a different computer).
4.5.4 Padding and Borders
For the image and text elements you can visualize a frame or define a particular padding (the space between the
element border and its content) for the four sides. Border and padding are specified by selecting the element in
the report editing area, and using the Properties view.
60 TIBCO Software Inc.

Chapter 4 Report Elements
In the Properties view, click the Borders option. This includes the following controls:
•Padding allows you to define padding widths for each of the four sides, or to apply the same value to all
sides.
•Borders allow you to select their color, style, and width, as well as choose where it appears.
As always, all the measurements are shown in pixels.
4.6 Text Elements
Two elements are specifically designed to display text in a report: static text and text field. Static text is used
for creating labels or to print static text set at design time, that is not meant to change when the report is
generated. That said, in some cases you still use a text field to print labels too, since the nature of the static text
elements prevents the ability to display text dynamically translated in different languages when the report is
executed with a specific locale and it is configured to use a resource bundle leveraging the JasperReports
internationalization capabilities.
A text field is similar to a static text string, but the content (the text in the field) is provided using an
expression (which can be a simple static text string itself). That expression can return several kinds of value
types, allowing the user to specify a pattern to format that value. Since the text specified dynamically can have
an arbitrary length, a text field provides several options about how the text must be treated regarding alignment,
position, line breaks and so on. Optionally, the text field is able to grow vertically to fit the content when
required.
By default both text elements are transparent with no border, with a black text color. The most used text
properties can be modified using the text tool bar displayed when a text element is selected. Text element
properties can also be modified using the Properties view.
Text fields support hyperlinks as well. See 4.11.4, “Creating a Hyperlink,” on page75 for more information.
4.6.1 Static Text
The static text element is used to show non-dynamic text in reports. The only parameter that distinguishes this
element from a generic text element is the Text property, where the text to view is specified: it is normal text,
not an expression, and so it is not necessary to enclose it in double quotes in order to respect the conventions of
Java, Groovy, or JavaScript syntax.
4.6.2 Text Fields
A text field allows you to print an arbitrary section of text (or a number or a date) created using an expression.
The simplest case of use of a text field is to print a constant string (java.lang.String) created using an
expression like this:
"This is a text"
A text field that prints a constant value like the one returned by this expression can be easily replaced by a
static field; actually, the use of an expression to define the content of a text field provides a high level of
control on the generated text (even if it’s just constant text). A common case is when labels have to be
internationalized and loaded from a resource bundle. In general, an expression can contain fields, variables and
parameters, so you can print in a text field the value of a field and set the format of the value to present. For this
purpose, a text field expression does not have to return necessarily a string (that’s a text value): the text field
TIBCO Software Inc. 61
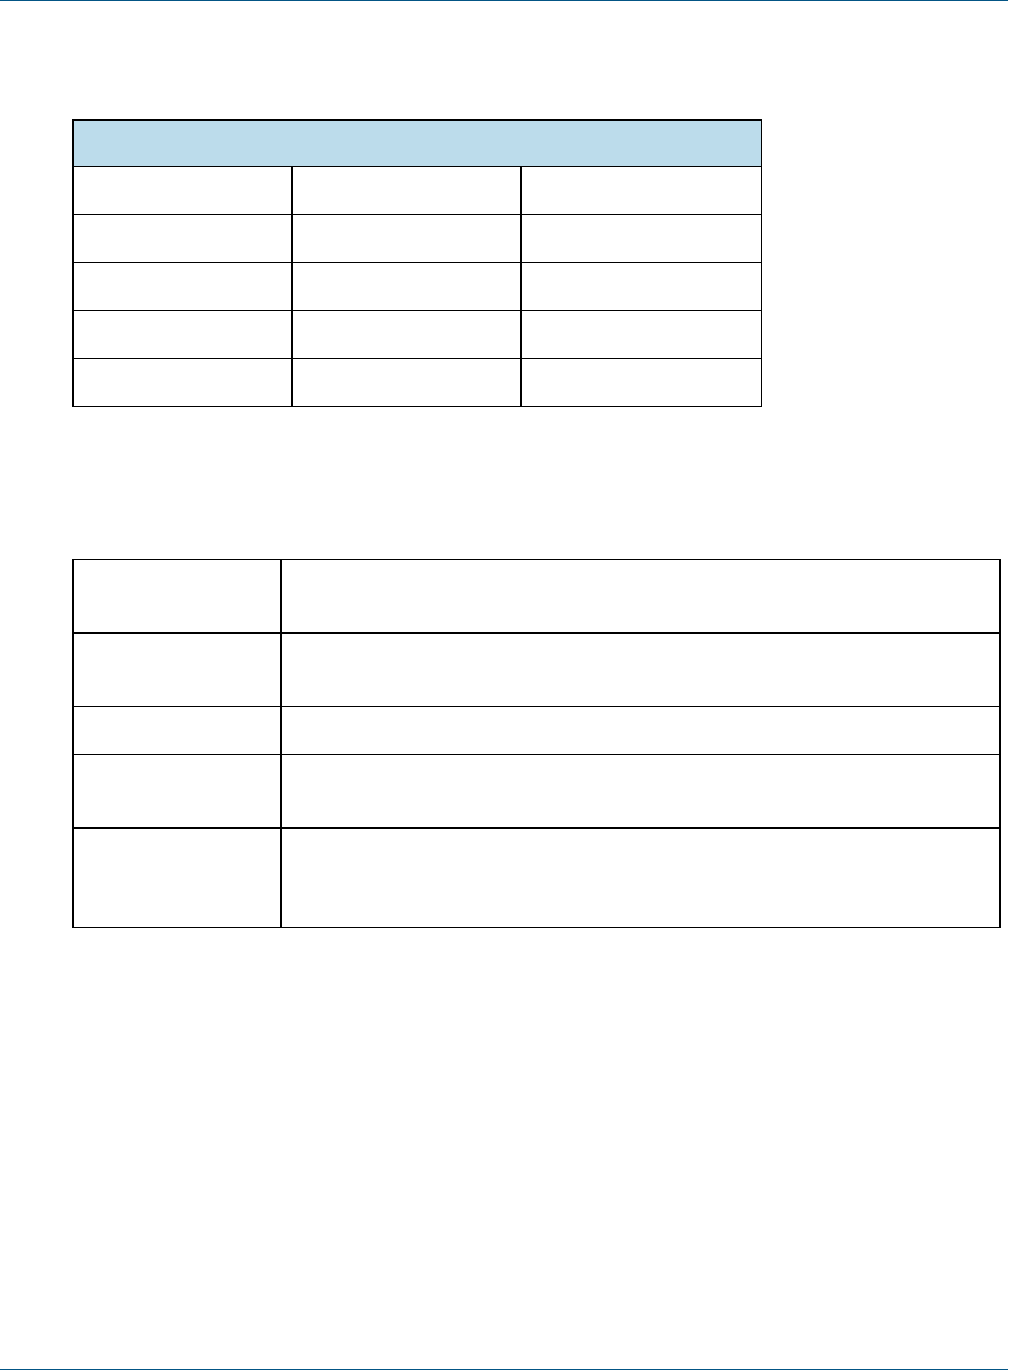
TIBCO Jaspersoft Studio User Guide
expression class name property specifies what type of value is returned by the expression. It can be one of
the following:
Valid Expression Types
java.lang.Object java.sql.Time java.lang.Long
java.lang.Boolean java.lang.Double java.lang.Short
java.lang.Byte java.lang.Float java.math.BigDecimal
java.util.Date java.lang.Integer java.lang.String
java.sql.Timestamp java.io.InputStream
An incorrect expression class is frequently the cause of compilation errors. If you use Groovy or JavaScript you
can choose String as expression type without causing an error when the report is compiled. The side effect is
that without specifying the right expression class, the pattern (if set) is not applied to the value.
Let’s see what properties can be set for a text field:
Blank when null If set to true, this option avoids printing the text field content if the expression result is
a null object that would be produce the text “null” when converted in a string.
Evaluation time Determines in which phase of the report creation the Text field Expression has
to be elaborated.
Evaluation group The group to which the evaluation time is referred if it is set to Group.
Stretch with over-
flow
When it is selected, this option allows the text field to adapt vertically to the content, if
the element is not sufficient to contain all the text lines.
Pattern The pattern property allows you to set a mask to format a value. It is used only when
the expression class is congruent with the pattern to apply, meaning you need a
numeric value to apply a mask to format a number, or a date to use a date pattern.
4.7 Frames
A frame is an element that can contain other elements and optionally draw a border around them. Since a frame
is a container of other elements, in Outline view the frame is represented as a node containing other elements.
A frame can contain other frames, and so on recursively. To add an element to a frame, just drag the new
element from the palette inside the frame. Alternatively you can use Outline view and drag elements from a
band into the frame. The position of an element is always relative to the container position. If the container is a
band, the element position is relative to the top of the band and to the left margin. If the container (or element
parent) is a frame, the element coordinates are relative to the top left corner of the frame. Since an element
dragged from a container to another does not change its top/left properties, when moving an element from a
container to another its position is recalculated based on the new container location.
62 TIBCO Software Inc.
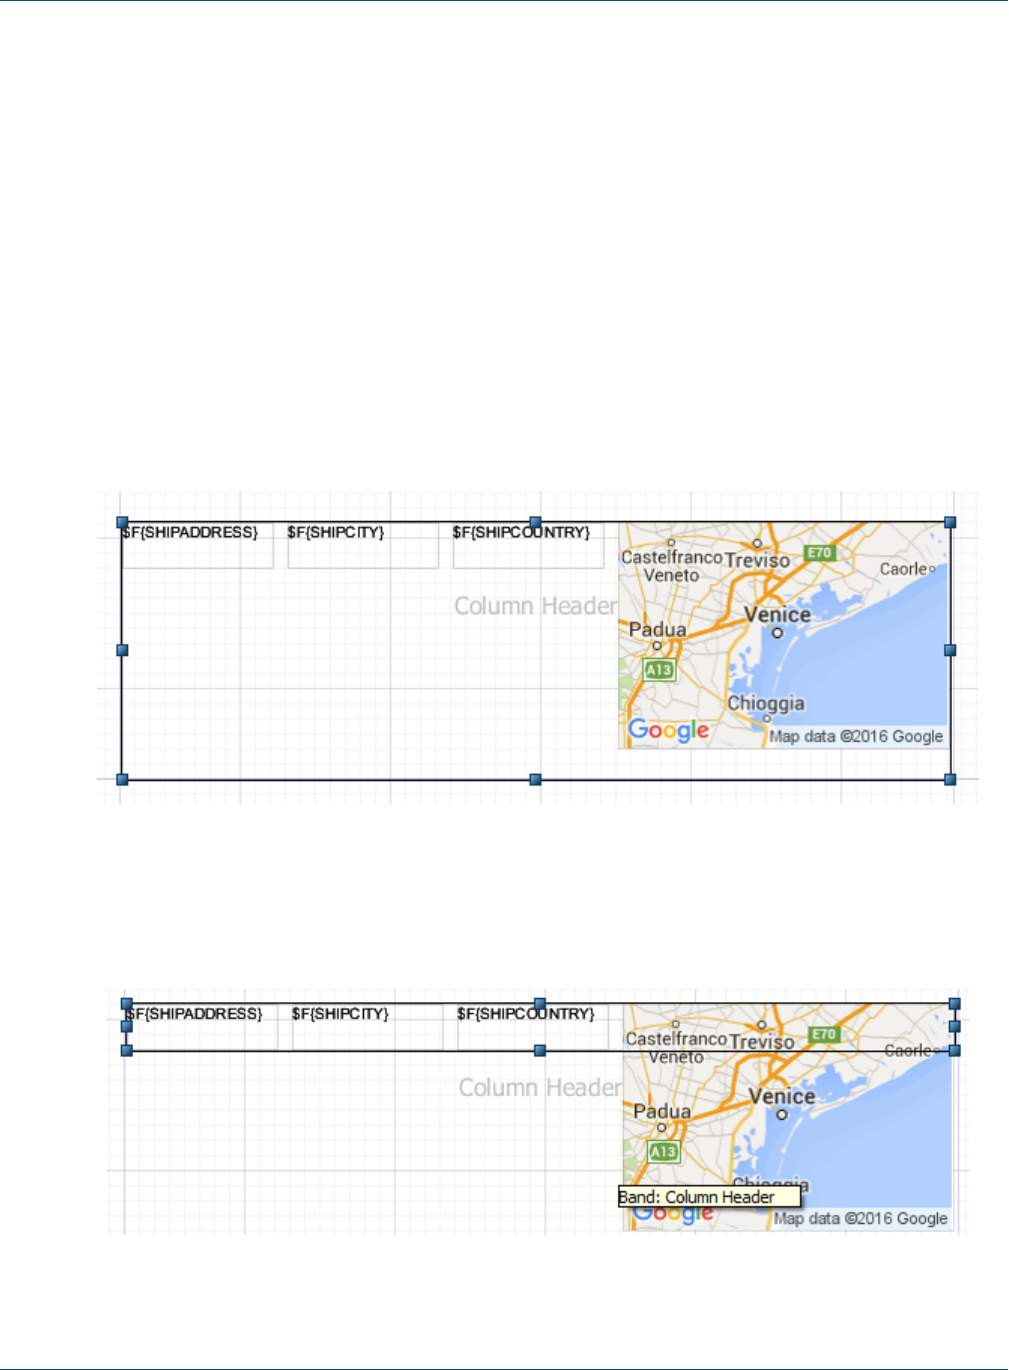
Chapter 4 Report Elements
The advantages of using a frame to draw a border around a set of elements, with respect to using a simple
rectangle element, are:
•When you move a frame, all the elements contained in the frame move.
•While using a rectangle to overlap some elements, the elements inside the rectangle are not treated as if
they overlap (with respect to the frame), so you don't have problems when exporting in HTML (which does
not support overlapped elements).
•Finally, the frame automatically stretches according to its content, and the element position type
property of its elements refer to the frame itself, not to the band, making the design a bit easier to manage.
4.7.1 Sizing the Frame
Frames can be sized to appear smaller than their contents. This is useful because by default, each time a frame is
used in a report, the report uses the height of the frame for each record. A frame that is too large can cause
unwanted white space.
For example, suppose you have a frame that contains some fields and a map:
Figure 4-12 Frame size larger than contents
Now suppose your map is configured with an expression that only displays the map some of the time. If you
size the frame to be bigger than the map, the report inserts white space when the map is not displayed. Instead,
you can size the frame to be smaller than the map:
Figure 4-13 Frame size smaller than contents
TIBCO Software Inc. 63

TIBCO Jaspersoft Studio User Guide
Now, the frame expands as necessary to include any non-null content, but no additional white space is added if
the map is not present.
Be careful when creating and modifying reports that use frames that are smaller than their contents. The
user interface does not always make it clear which elements are contained in a frame. For example, it is
possible to add a field to a frame and then resize the frame so that the frame no longer overlaps the ele-
ment. To see which elements are in a frame, select the frame and expand its node in outline view. If you
have trouble moving an element inside or outside a frame, move it in outline view.
4.8 Inserting Page and Column Breaks
Page and column breaks are used to force the report engine to make a jump to the next page or column. A
column break in a single column report has the same effect as a page break.
In the Design tab, they are represented as a small line. If you try to resize them, the size is reset to the default,
this because they are used just to set a particular vertical position in the page (or better, in the band) at which
Jaspersoft Studio forces a page or column break.
The type of break can be changed in the Properties view.
4.9 Working with Spreadsheet Layout
Spreadsheet layout allows you to create a tabular layout without the complexity of lists or tables. You can
create columns that span different bands in your report.
When you enable spreadsheet layout, the elements in the detail band are arranged according to horizontal
layout. This means that elements are positioned horizontally across the band with no space between them, and if
you resize an element horizontally, the elements to the right of it automatically move so there is no overlap. In
addition, elements in other bands, such as the header band, are associated with the elements in the detail band.
When you resize elements in one band, elements in the associated bands are resized to match.
You can only associate one element per column
4.9.1 Example of Using Spreadsheet Layout
Create a report:
1. Go to File> New >Jasper Report or click on the main toolbar.
The New Report Wizard window displays the Report Templates page.
2. Select the Coffee Landscape template and click Next.
The New Report Wizard displays the Report file page.
3. Navigate to the folder you want the report in and name the report, then click Next.
The New Report Wizard displays the Data Source page.
4. Choose Sample DB - Database JDBC Connection.
5. Enter the query SELECT * FROM ORDERS and click Next.
The Fields window is displayed.
6. Select the following fields and click the right arrow to add them to your report.
•ORDERID
64 TIBCO Software Inc.
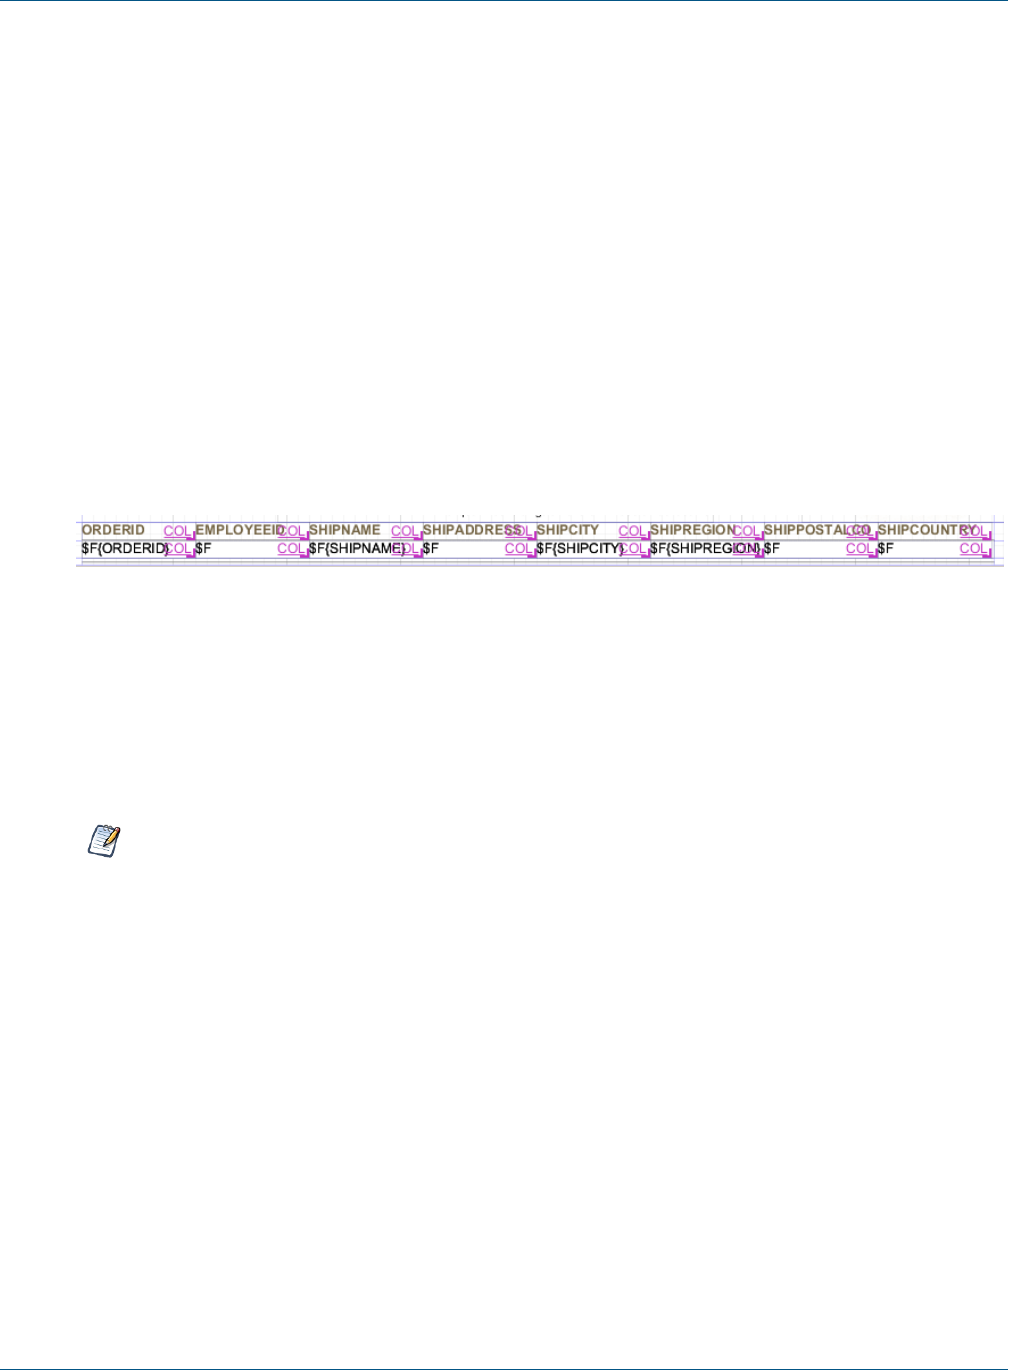
Chapter 4 Report Elements
•EMPLOYEEID
•SHIPNAME
•SHIPADDRESS
•SHIPCITY
•SHIPREGION
•SHIPCOUNTRY
7. Click Finish.
Jaspersoft Studio builds the report layout with the selected fields.
Enable spreadsheet layout:
1. Right-click on any column heading and select Arrange in Container> Spreadsheet Layout from the
context menu.
All elements in the band display a COL annotation at the right of the element.
2. Right-click on any field and select Arrange in Container> Spreadsheet Layout from the context menu
again.
Again, all elements in the band display the COL annotation. Spreadsheet layout is now enabled.
Figure 4-14 Spreadsheet layout in Design view
Remove a Column:
1. Select the EMPLOYEEID heading and press the Delete key.
2. Click Delete Entire Column when prompted.
All elements in the same column are deleted. In this case, the header and the field are deleted. The other
elements move to the right as necessary to close the gap.
There is no option to cancel a delete. However, you can undo the action immediately.
Resize Columns:
The real advantage to spreadsheet layout is that it lets you quickly resize columns and keep the elements
aligned across bands.
1. Select the ORDERID header or text field.
2. Click the right side and move the handles to the left to reduce the size of the OrderID column. All elements
in the column are resized together.
3. Select the SHIPADDRESS header or text field. Use the handles on the right to expand the column. Again,
the columns are resized together.
Remove a Header:
1. Select the Region header and press Delete.
2. When prompted, select Delete Selected. The item is removed, but column layout is preserved.
TIBCO Software Inc. 65
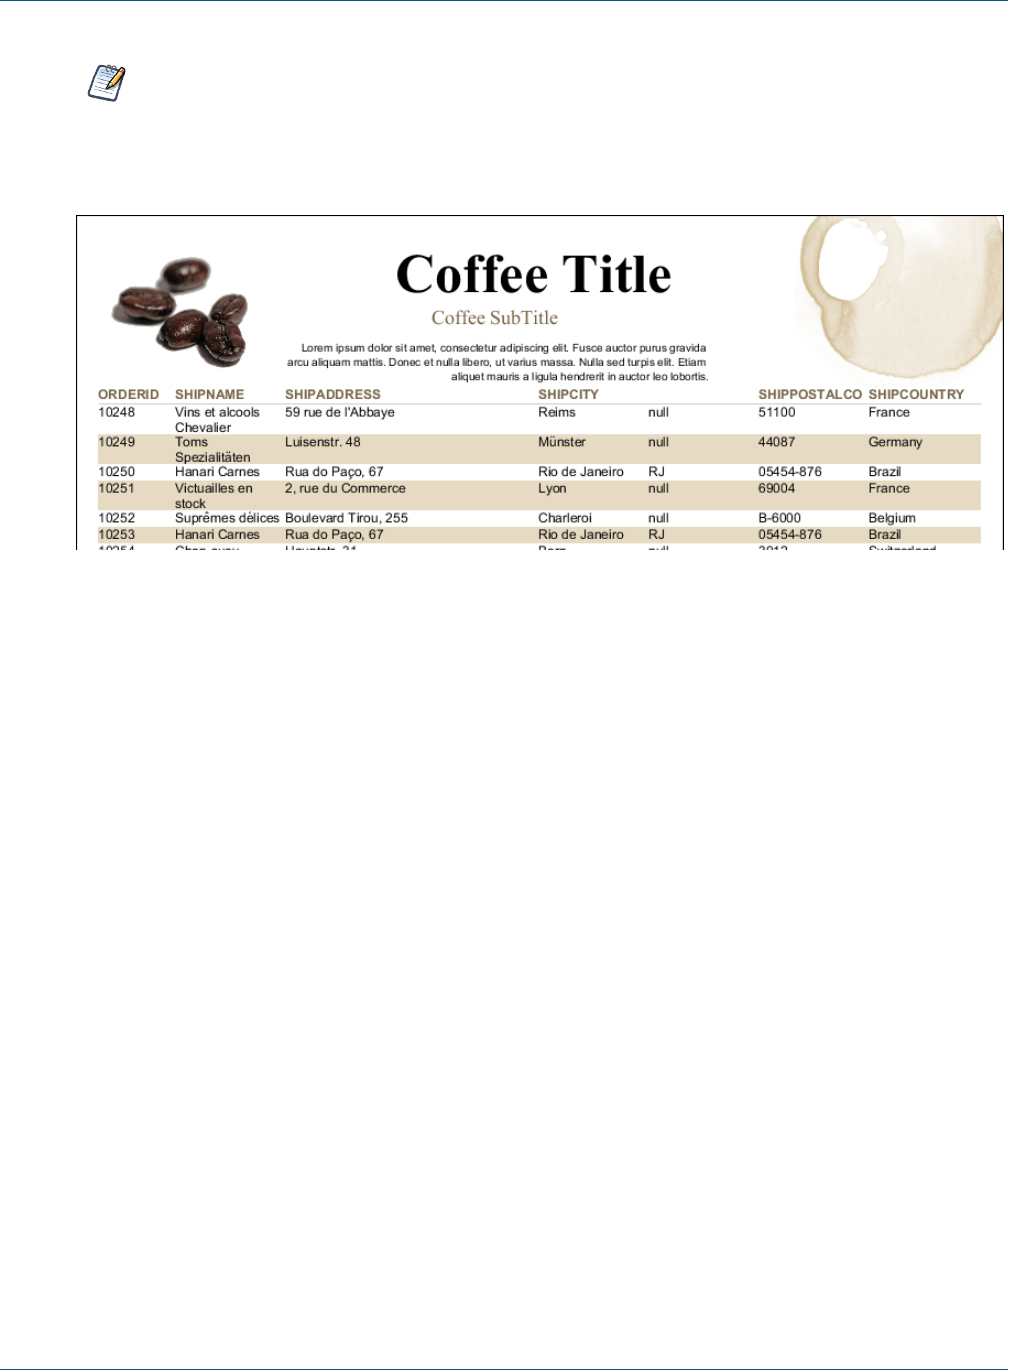
TIBCO Jaspersoft Studio User Guide
When you delete an element from the detail band, the associated elements in other bands are no longer
part of the column layout. When you delete an element from a band other than the detail band, column
layout is not removed.
If you preview the report, it should look something like the following image.
Figure 4-15 Report output using spreadsheet layout
Add an element to a column:
1. In Outline view, select the Column Footer.
2. In Properties view, set the Height to 16px and press Enter.
3. In Outline view, expand the fields node, then drag ORDERID to the column footer. The TextField Wizard
is displayed.
4. In the TextField Wizard, select Count, then click Finish. The ORDERID field is added to the column
footer.
5. Select the $F{ORDERID} field in the Detail band, and the $V{ORDERID1} element you want to add, then
right-click the $V{ORDERID1} field and select Add to Column.
The element you select is added to the column. Now if you resize one of the elements, all three elements
resize together.
Notes on adding column elements:
•You can add at most one element in a band to each column. However, you can add a frame to a column
and then add elements inside the frame.
•The element in the detail band is the element that drives the column. Select this element to specify the
column you want to add another element to.
•You can only add a variable to a column that contains its related field.
•If you resize the band, the column elements will resize vertically to fit.
Remove an element from a column:
1. Select the element you want to remove. This element should not be in the detail band.
2. Select Remove from column from the context menu.
The column formatting on the element is removed, but the element remains in the report.
66 TIBCO Software Inc.
Chapter 4 Report Elements
4.10 Working with Composite Elements
Composite elements are one or more pre-configured elements that you can use in your reports. You can
configure properties such as the size, color, or font of an element, or create a text field with a complex
expression you frequently use, and then save it as a composite element. Jaspersoft Studio also ships with several
pre-existing composite elements, such as page number and total pages.
Some element types are hard to reuse in other reports, in particular, those elements that depend on the
availability of a specific subdataset having certain fields. You cannot include elements based on a dataset in a
composite element. In particular, composite elements can not include charts, tables, lists and crosstabs.
Composite elements can include notes, text fields, static text, images, breaks, rectangles, ellipses, lines, frames
(must contain only permitted elements), barcodes, HTML elements, and other composite elements.
If your composite element contains elements that use expressions (text-field expressions or print-when
expressions), the objects you are referencing in those expressions (such as variables, fields or parameters) should
available in the report in which you use the composite elements. If the objects are not present, you may receive
an error when compiling or previewing the report.
Composite elements cannot include elements based on a dataset, such as charts or crosstabs.
4.10.1 Creating and Editing Composite Elements
To create a composite element:
1. Open or create a report.
For example:
a. Go to File> New >Jasper Report or click on the main toolbar.
b. In the New Report Wizard, select Blank A4 in the Report Templates window and click Next.
c. Select a name and location for your file (for example, Composite Element Sample Report in MyReports)
and click Next.
d. Choose One Empty Record in the Data Source window and click Finish.
2. Place the elements you want in the Title band and format and position them.
Composite elements must be created from the Title band.
For example, to create a footer that includes your company name and the page number:
a. Drag the Static Text element to the Title band in your report and type My Company. Then align the
company name to the to the left by right-clicking the Static Text element and selecting Align in
Container> Align to Left Margin.
b. Drag the Page Number element to the Title band in your report. Align the Page Number to the right by
right-clicking the Page Number element and selecting Align in Container> Align to Right Margin.
Then, with the Page Number element selected, go to the Text Field tab in the Properties view and
click to align the text right.
c. Select both elements, right-click, and choose Align Components>Align Top.
3. Select all the elements you want in your composite.
TIBCO Software Inc. 67
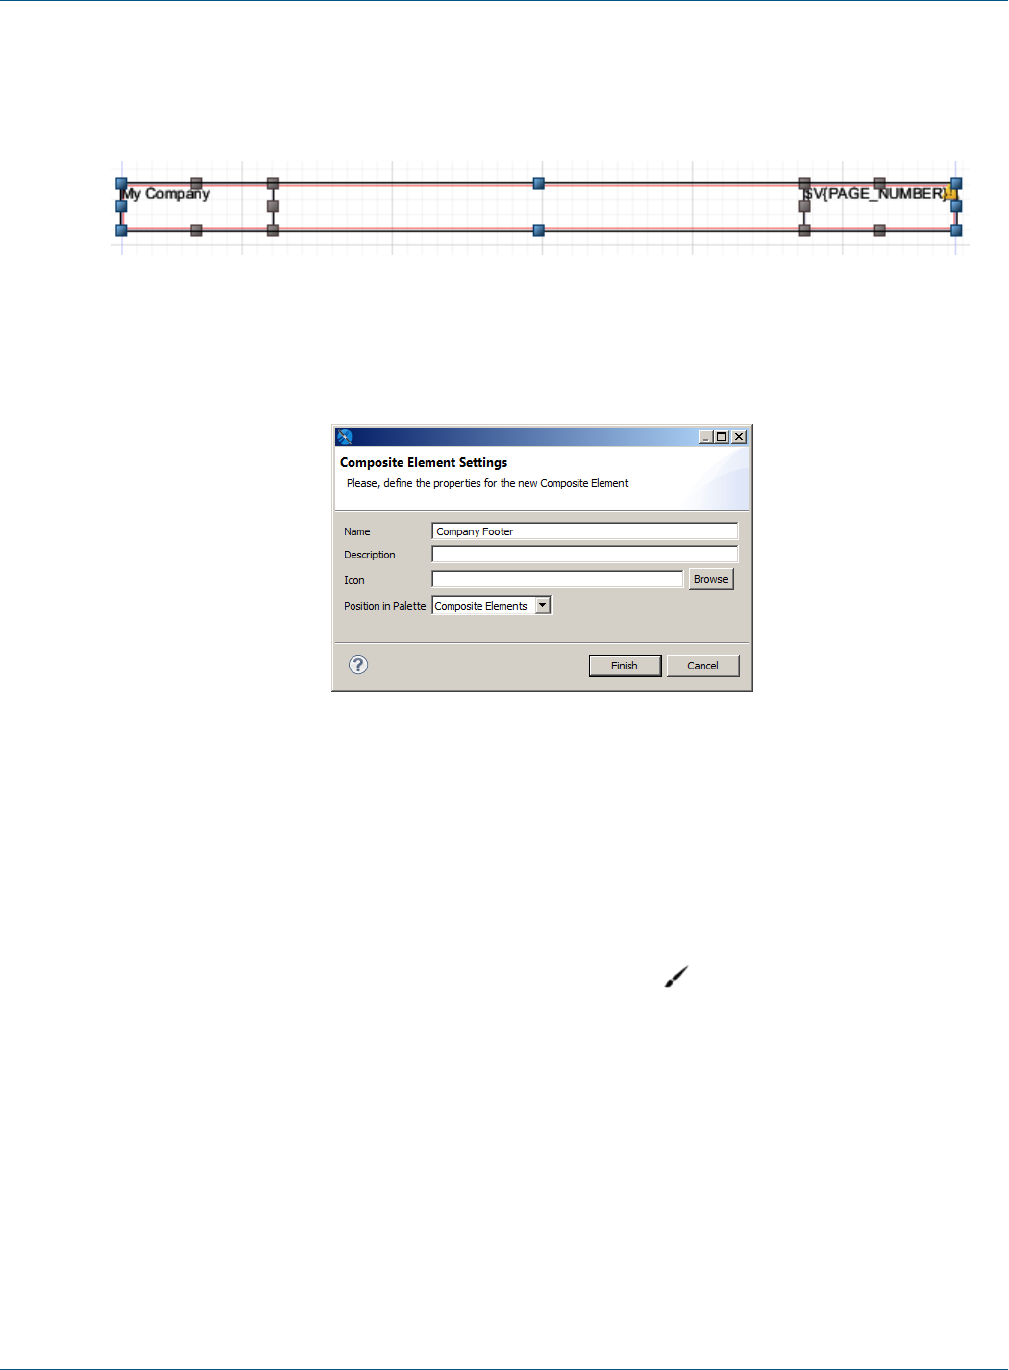
TIBCO Jaspersoft Studio User Guide
4. (Optional) To have your elements move together, right-click and select Enclose into Frame from the
context menu.
5. Make sure all elements are still selected.
Figure 4-16 Selected Elements For Composite Element Creation
6. Right-click and select Save as Composite Element.
The Composite Element Settings dialog box opens.
Figure 4-17 Composite Element Settings Dialog Box
7. Enter the following information:
•Name: Enter a unique name you want to appear in the palette.
•Description (optional): Enter a description. If the element uses text fields or expressions, it may be
useful to mention these, or the expected data adapter, in the description.
•Icon (optional): Choose the icon that will show in the palette for this composite element. You can
choose an icon in JPG, PNG, or GIF format. If you click Browse to locate an icon, and you want to use
a PNG or a GIF, you must choose the correct format at the bottom right of the file open dialog. If you
do not choose an icon, Jaspersoft Studio uses the default icon .
•Position in Palette: Select one of Basic Elements, Composite Elements, or Components Pro.
8. Click Finish.
9. Click OK on the confirmation message.
The new composite element is saved as a .jrtool file in the same location as your report. An icon is added to
the bottom of the subpalette you selected.
68 TIBCO Software Inc.

Chapter 4 Report Elements
Figure 4-18 Composite Element in the Palette
To edit the contents of a composite element:
1. Right-click on the composite element in the palette and select Open in Designer.
The composite element opens in the Designer as a .jrtool file.
2. You can add and remove elements and change element formatting. If you add elements, remember to select
all elements and create a frame.
3. Save the file.
To edit the name or location of a composite element:
1. Right-click on the composite element in the palette and select Edit.
The Composite Element Settings dialog box opens.
2. Change the name, description, icon, or position in palette.
3. Click Finish.
4. Click OK on the confirmation message.
To delete a composite element you have created:
1. Right-click on the composite element in the palette and select Delete.
The element is removed from the palette.
You cannot delete the composite elements that are shipped with Jaspersoft Studio.
4.10.2 Exporting and Importing Composite Elements
You can share composite elements between Jaspersoft Studio installations using import/export.
To export one or more composite elements:
1. Right-click on a custom composite element in the palette.
2. Select Export Composite Elements from the context menu.
TIBCO Software Inc. 69

TIBCO Jaspersoft Studio User Guide
Figure 4-19 Exporting Composite Elements
3. Select the elements you want to export in the Export Composite Elements dialog.
4. Click Finish.
5. When prompted, navigate to the location where you want to save the export file, and click OK.
The selected composite elements are saved as a .zip file in the location you chose.
To import a composite element set:
1. Right-click on any element in the palette.
2. Select Import Composite Elements from the context menu.
3. Navigate to the location where your zip file is stored, select the file you want to upload, and click Open.
4. Choose a name, optional description, and optional icon in the Import Composite Element dialog and select
the palette where you want the composite element to appear. The name in the palette must be unique.
Figure 4-20 Importing Composite Elements
70 TIBCO Software Inc.
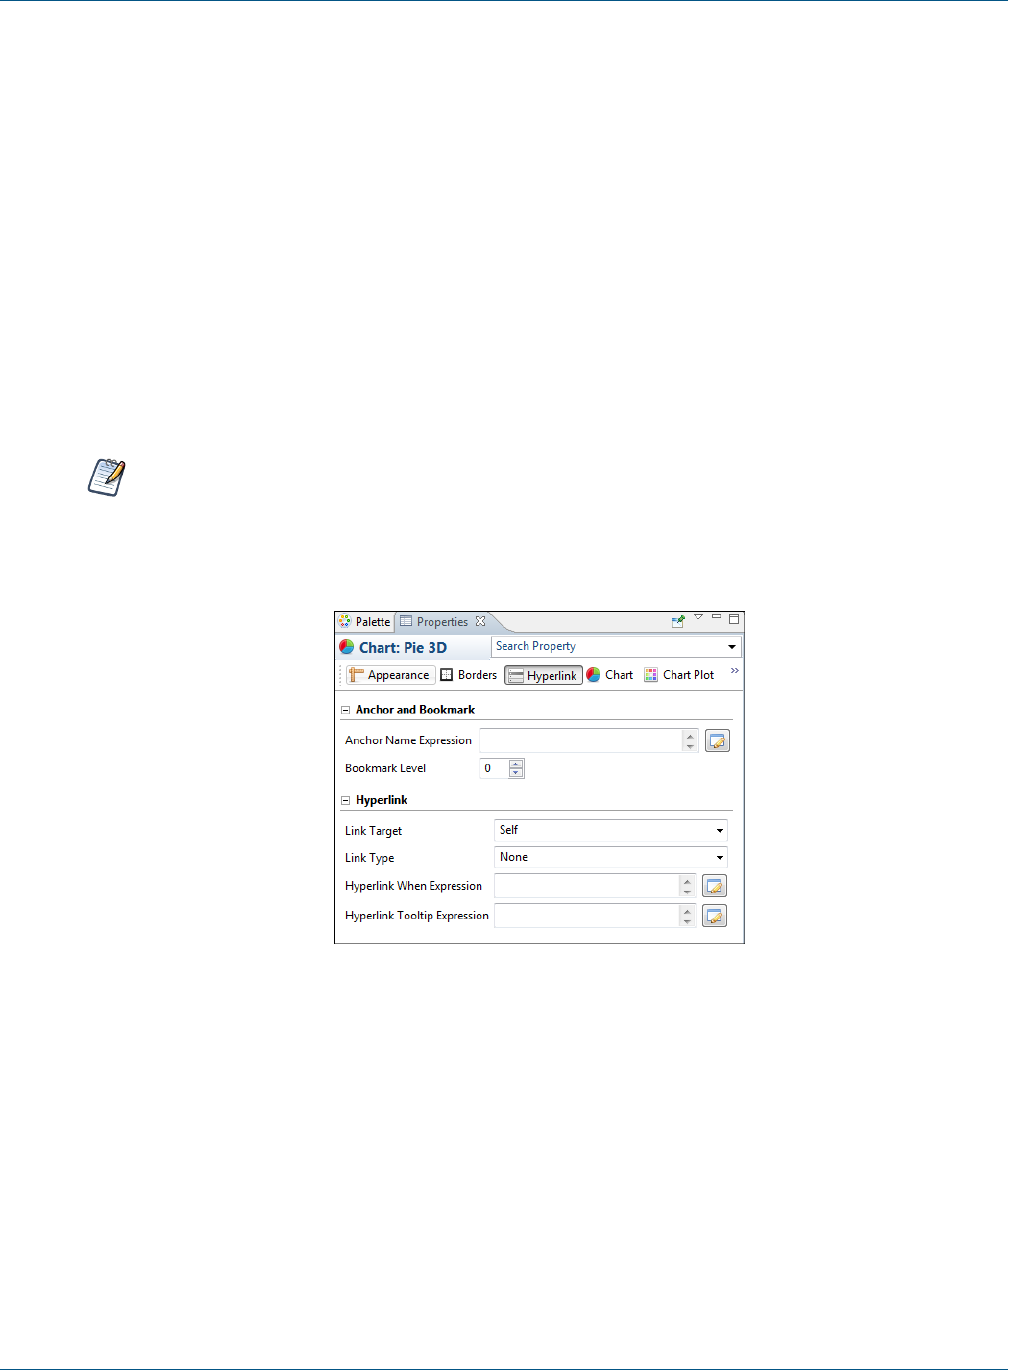
Chapter 4 Report Elements
5. If there are additional elements in the file, click Next and configure the next element as in the previous
step.
6. When you have configured all your imported elements, click Finish.
The composite elements are placed in the palette with the settings you configured.
4.11 Anchors, Bookmarks, and Hyperlinks
JasperReports Library provides a powerful combination of settings to define hyperlinks. While a hyperlink
usually opens a specific URL, JasperReports broadens the concept, extending it to a more complex object that
can be used for more complicated functionality, such as executing a report in JasperReports to perform a drill-
down or drill-up operation, pointing to a page within a PDF document, and so on.
Image, text field, and chart elements can be used both as anchors in a document and as hypertext links to
external sources or to other local anchors.
This section describes hyperlinks for images, text fields, and charts. Hyperlinks for HTML5 charts are
defined differently, as described in 17.7, “Creating Hyperlinks in HTML5 Charts,” on page327.
To set anchor, bookmark, or hyperlink properties, select an image, text field, or chart element and go to the
Hyperlink tab in the Properties view.
Figure 4-21 Anchor, Bookmark, and Hyperlink Properties
This window is divided in two sections:
•Anchor and Bookmark
•Hyperlink
4.11.1 Anchors and Bookmarks
An anchor identifies a specific position in a document. If you plan to export your report to PDF, you can
optionally set a bookmark level to have the anchor show up as a PDF bookmark. The Anchor and Bookmark
area lets you set the following:
TIBCO Software Inc. 71

TIBCO Jaspersoft Studio User Guide
•Anchor Name Expression – Expression for the name of the anchor. This name can be referenced by other
hyperlinks. Click the button to open the Expression Editor, where you can write or build the
expression.
•Bookmark Level – Bookmark level when the report is exported to PDF. If you plan to export your report
as a PDF, set a bookmark level to populate the bookmark tree, making the final document navigation much
easier. To make an anchor available as a bookmark, simply choose a bookmark level higher than 1.
Defining different levels creates nested bookmarks.
Bookmarks can also be displayed in JasperReports Server when the report is displayed in the interactive
viewer. To display bookmarks in the server, set the following property:
<property name="net.sf.jasperreports.print.create.bookmarks" value="true"/>
This property can be set on the report level or globally in the JasperReports Server
WEB-INF\classes\jasperreports.properties file.
The same table of contents is also available in the JasperPrint object, and can be explored by calling the
method:
List<PrintBookmark> getBookmarks()
4.11.2 Hyperlinks
Hyperlinks let you link a location in a report to another destination. The most important property of a hyperlink
is its type, which determines the format of the target. Jaspersoft Studio supports the following types of
hyperlink: The exact properties of a hyperlink depend on the hyperlink type. The following properties may
appear for a hyperlink:
•Link Target – Specifies where to open the link target. The Link Target is similar to the target attribute of
an HTML link. The dropdown box shows the following options: Self, Blank, Top, Parent. You can also
possible specify a target name, which actually makes sense only when the hyperlink is used in a web
environment.
•Link Type – The following link types are supported in Jaspersoft Studio: Reference, Local Anchor, Local
Page, Remote Anchor, Remote Page, and ReportExecution. You can also defined your own custom
hyperlink types.
•Target Expressions – Expressions that determine the location of the link target. May include:
•Hyperlink Anchor Expression – Anchor in document to use as hyperlink target.
•Hyperlink Page Expression – Page in document to use as hyperlink target.
•Hyperlink Reference Expression – Location of remote document. For link of type Reference, use a
URL; for a link of type Remote Anchor or Remote Page, use a file reference.
•Hyperlink When Expression – Expression that determines when the hyperlink is implemented. A
hyperlink is only available if the Hyperlink When expression returns the Boolean value True (default).
•Tooltip Expression – String to use as a tooltip when a user hovers the cursor over the hyperlink.
•Parameters – Parameters that specify information about the target; only available for ReportExecution
hyperlinks and custom hyperlink types.
ReportExecution is implemented as a custom hyperlink type in JasperReports Library.
4.11.2.1 Linking to a URL
To link to a URL, http://www.jaspersoft.com/, select Reference from the Link Type dropdown in the Properties
view. Hyperlinks of type Reference are rendered in all output formats that support web links, including
Microsoft Excel and Word.
72 TIBCO Software Inc.

Chapter 4 Report Elements
When working with a hyperlink of type Reference, you can add parameters via the Hyperlink Reference
Expression. For example, the following expression uses the values of the city and country fields to
dynamically build a URL:
"http://www.someurl.com/search?city=" + $F{city} + "&country= " + $F{country}
4.11.2.2 Linking to a Report
Several hyperlink types link to an existing report. These types are primarily supported in PDF and HTML
formats:
•LocalAnchor – Links between two locations into the same document. It can be used, for example, to link
the titles of a summary to the chapters to which they refer. To define the local anchor, it is necessary to
specify a hyperlink anchor expression, which will have to produce a valid anchor name, for example,
"title".
•LocalPage – Point to a specific page in the current report. In this case, it is necessary to specify the page
number you are pointing to by means of a hyperlink page expression, for example Integer.valueOf(2).
The expression must return an Integer object.
•RemoteAnchor – Points to an anchor that resides in an external document. In this case, the location of the
external file must be specified in the Hyperlink Reference Expression field, and the name of the anchor
must be specified in the Hyperlink Anchor Expression field.
•RemotePage – Points to a particular page of an external document. In this case the location of the external
file must be specified in the Hyperlink Reference Expression field, and the page number must specified in
the Hyperlink Reference Expression.
Similar to links of type Reference, you can specify additional parameters for these hyperlink types by appending
them to the expression string.
4.11.2.3 Creating a Link Between Reports on a JasperReports Server Instance
Hyperlinks of type ReportExecution execute one JasperReports Server report from another JasperReports Server
report, for example, when drilling down to a report in the context of JasperReports Server. Instead of a hyperlink
reference or similar expression, ReportExecution hyperlinks use JasperReports parameters to specify the target.
The following report-execution parameters are available:
•_report (required) – String that points to the JasperReports Server report to execute. Usually a path on
JasperReports Server, enclosed in quotes, such as "/public/Samples/Reports/myReport"
•_page (optional) – Specifies a page to display in the target report. Only one of _page and _anchor should
be used. If both are used, _page takes precedence and _anchor is ignored.
•_anchor (optional) – Specifies a named anchor to display in the target report.
•_output (optional) – Specifies an output format for the report, such as PDF, DOCX, etc. Default is HTML.
•If the destination report contains one or more input controls, their value can be set by specifying the name
of the input control as a parameter name and providing a value.
ReportExecution hyperlinks are an example of custom hyperlink extensions in JasperReports Library.
More generally, these parameters can be used by URL Handlers, especially JasperReports Library
extensions, to manipulate and generate hyperlinks.
Creating a ReportExecution hyperlink by dragging:
The easiest way to configure a ReportExecution hyperlink in Jaspersoft Studio is to drag a report unit from
the JasperReports Server repository explorer over an element that supports hyperlinks (such as a textfield).
TIBCO Software Inc. 73
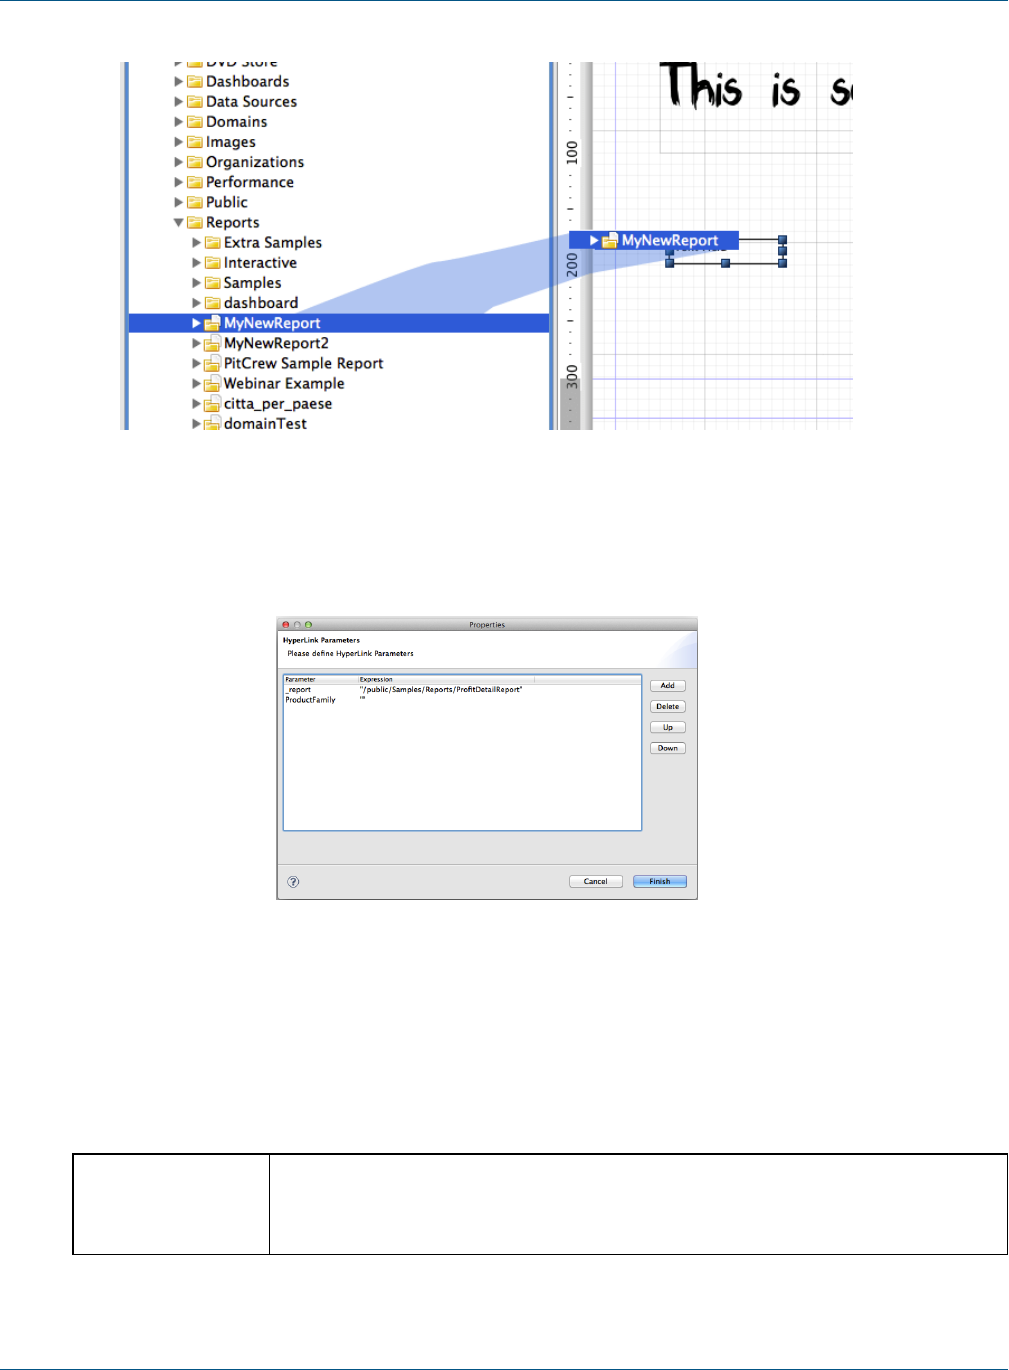
TIBCO Jaspersoft Studio User Guide
Figure 4-22 Dragging a report from the server into the Report Design
The auto-configured hyperlink automatically sets the type to ReportExecution and configures the _report
parameter. Moreover, if the JasperReports Server Report has input controls, they are added to the list of
parameters, ready to be populated with a proper value expression, as shown below.
Figure 4-23 Configuring Hyperlink Parameters
4.11.3 Hyperlink Types
Jaspersoft Studio provides six types of built-in hypertext links: Reference, LocalAnchor, LocalPage,
RemoteAnchor and RemotePage. Other types of hyperlinks can be implemented and plugged into JasperReports.
The following table describes the hyperlink types.
Reference The Reference link indicates an external source that is identified by a normal URL. This
is ideal to point, for example, to a servlet to manage a record drill-down tool. The only
expression required is the hyperlink reference expression.
74 TIBCO Software Inc.
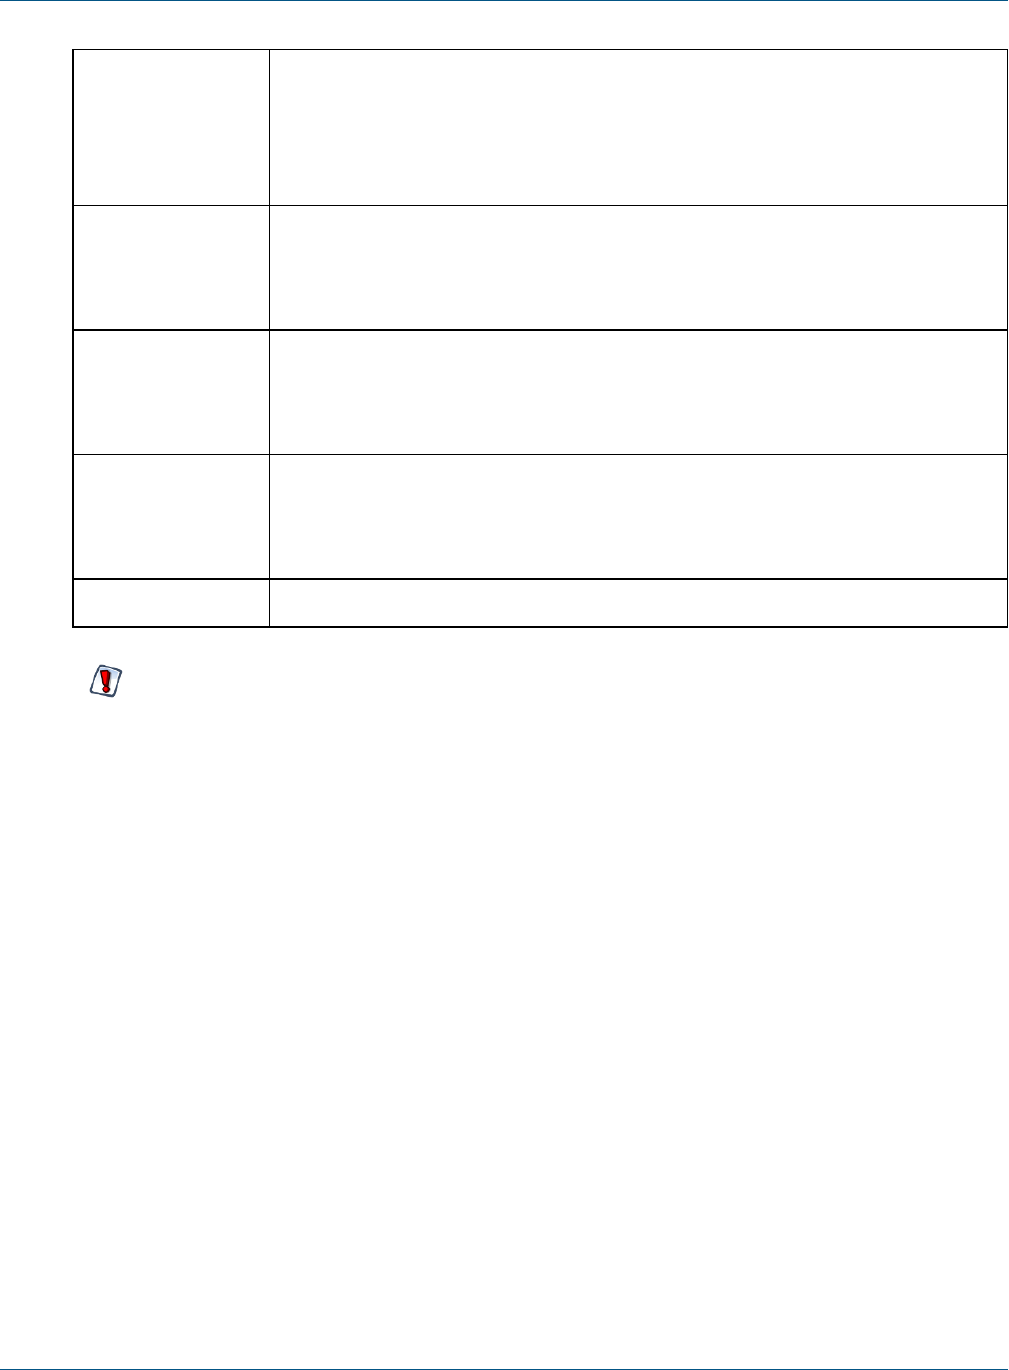
Chapter 4 Report Elements
LocalAnchor To point to a local anchor means to create a link between two locations into the same
document. It can be used, for example, to link the titles of a summary to the chapters to
which they refer.
To define the local anchor, specify a hyperlink anchor expression that produces a valid
anchor name.
LocalPage If instead of pointing to an anchor you want to point to a specific current report page,
you need to create a LocalPage link. In this case, it is necessary to specify the page
number you are pointing to by means of a hyperlink page expression (the expression
has to return an Integer object).
RemoteAnchor If you want to point to a particular anchor that resides in an external document, you use
the RemoteAnchor link. In this case, the URL of the external file referenced must be
specified in the Hyperlink Reference Expression field, and the name of the anchor must
be specified in the Hyperlink Anchor Expression field.
RemotePage This link allows you to point to a particular page of an external document. Similarly, in
this case the URL of the external file pointed to must be specified in the Hyperlink
Reference Expression field, and the page number must be specified by means of the
hyperlink page expression. Some export formats have no support for hypertext links.
ReportExecution This type of hyperlink is used to implement JasperReports Server’s drill-down feature.
Some export formats have no support for hypertext links.
4.11.4 Creating a Hyperlink
Some types of datasets let you assign a hyperlink to the value represented in the chart; in the report output,
clicking the chart opens a web page or navigates to a different location in the report.
The click-enabled area depends on the chart type. For example, in pie charts, the hyperlink is linked to each
slice of the pie; in bar charts, the click-enabled areas are the bars themselves.
Image, text field, and chart elements can be used both as anchors into a document and as hypertext links to
external sources or local anchors.
To create a hyperlink:
1. Click the Hyperlink tab in the Properties view.
2. In the Link Target drop-down, choose one of the following target types:
•Self: This is the default setting. It opens the link in the current window.
•Blank: Opens the target in a new window. Used for output formats such as HTML and PDF.
•Top: Opens the target in the current window but outside eventually frames. Used for output formats
such as HTML and PDF.
•Parent: Opens the target in the parent window (if available). Used for output formats such as HTML
and PDF.
3. In the Link Type drop-down, choose whether the link type is None, Reference, LocalAnchor, LocalPage,
RemoteAnchor, RemotePage, or ReportExecution.
TIBCO Software Inc. 75

TIBCO Jaspersoft Studio User Guide
See “Hyperlink Types” on page74 for an explanation of the different choices.
4. Click the button next to Hyperlink Tool Expression to create a tooltip for your hyperlink.
5. Save your report.
4.12 Advanced Elements and Custom Components
Besides the built-in elements seen up to now, JasperReports supports two technologies that enable you to plug-
in new JasperReport objects respectively called “custom components” and “generic elements.” Both are
supported by Jaspersoft Studio. Without a specific plug-in offered by the custom element provider, there is not
much you can do with it; you can just set the common element properties. Therefore, a custom element
developer should provide a plug-in for Jaspersoft Studio through which you can, at least, add the element to a
report (maybe adding a palette item) and modify the element properties (implementing what is required to
display the additional properties in the Properties view when the element is selected.
4.13 Custom Visualization Component
The custom visualization component lets you leverage JavaScript in Jaspersoft Studio and JasperReports Server.
You can create JavaScript modules and use them in your reports to extend their functionality. The main purpose
of the custom visualization component is to render SVG (Scalable Vector Graphics) images. Your modules can
leverage third-party JavaScript libraries, such as JQuery. For example, perhaps you want to create reports with
dynamic behaviors for interaction and animation; you could leverage D3 (d3js.org) to bind data to the
Document Object Model (DOM) and manipulate the SVG. Such a report is shown in , “D3-enabled report,” on
page77.
Please note that this component is only supported by the Jaspersoft Community
(community.jaspersoft.com). TIBCO Jaspersoft Technical Support and Engineering do not support it.
76 TIBCO Software Inc.
Chapter 4 Report Elements
D3-enabled report
The custom visualization component is a powerful and flexible feature, suitable for advanced users of
JasperReports Library. Using the component requires advanced coding skills in the following technologies:
•JavaScript
•CSS
•HTML/DHTML
•Optionally, any third-party library you want to expose in Jaspersoft Studio and JasperReports Server.
Before creating reports that use your third-party library, you must configure various applications to work
together; you must:
1. Install PhantomJS (phantomjs.org), which renders your JavaScript module's visual component.
2. Configure Jaspersoft Studio and JasperReports Server to use PhantomJS.
3. Create a JavaScript module that renders an SVG. This main module, as well as any JavaScript it relies on,
are optimized and combined into a single JavaScript file (using a RequireJS build file (build.js). Jaspersoft
Studio simplifies the optimization process to generate the JavaScript implementation of the component.
Place your JavaScript files somewhere that Jaspersoft Studio can find it, such as attaching it to the report
unit or placing it on the classpath.
Next, create and deploy reports that rely on your custom visualization component to render SVG images. Drag
the Custom Visualization component from the Elements palette into the Design tab, and create a report-level
property of type com.jaspersoft.jasperreports.components.customvisualization.require.js; it
TIBCO Software Inc. 77

TIBCO Jaspersoft Studio User Guide
must specify the main JavaScript file for your custom visualization. The custom visualization component
appears as a rectangular area of your report. A single custom visualization component can be used by any
number of reports that require the same JavaScript functionality. When exported to HTML format, these reports
can be interactive (assuming that your module attaches events to the DOM).
You can also create a custom component descriptor in JSON, which lets you add the following to your
component:
•A component UI – You can specify the property names and types and the data items used by the
component.
•A thumbnail image – Used when the component is presented in the component choose, which appears
when a component is dragged into the design view.
•Location of implementation files – You can specify the location of the JavaScript file and CSS file which
implement the component.
This component can help you leverage any number of JavaScript libraries, such as:
•D3.js
•Raphäel
•Highcharts
•JQuery
For more in-depth information, please see the articles on our Community wiki that describe the custom
visualization component.
78 TIBCO Software Inc.

CHAPTER 5 FIELDS
In a report, there are three groups of objects that can store values:
•Fields
•Parameters
•Variables
Jaspersoft Studio uses these objects in data source queries. In order to use these objects in a report, they must be
declared with a discrete type that corresponds to a Java class, such as String or Double. After they have been
declared in a report design, the objects can be modified or updated during the report generation process.
This chapter contains the following sections:
•Understanding Fields
•Registration of Fields from an SQL Query
•Registration of JavaBean Fields
•Fields and Text Fields
5.1 Understanding Fields
A print is commonly created starting from a data source that provides a set of records composed of a series of
fields. This behavior is exactly like obtaining the results of an SQL query.
Jaspersoft Studio displays available fields as children of the Fields node in the document outline view. To
create a field, right-click the Fields node and select Create Field. The new field is included as an undefined
entry on the Properties tab. You can configure the field properties by selecting it.
Select the Object tab to name your field, enter a description, and choose a class.
TIBCO Software Inc. 79
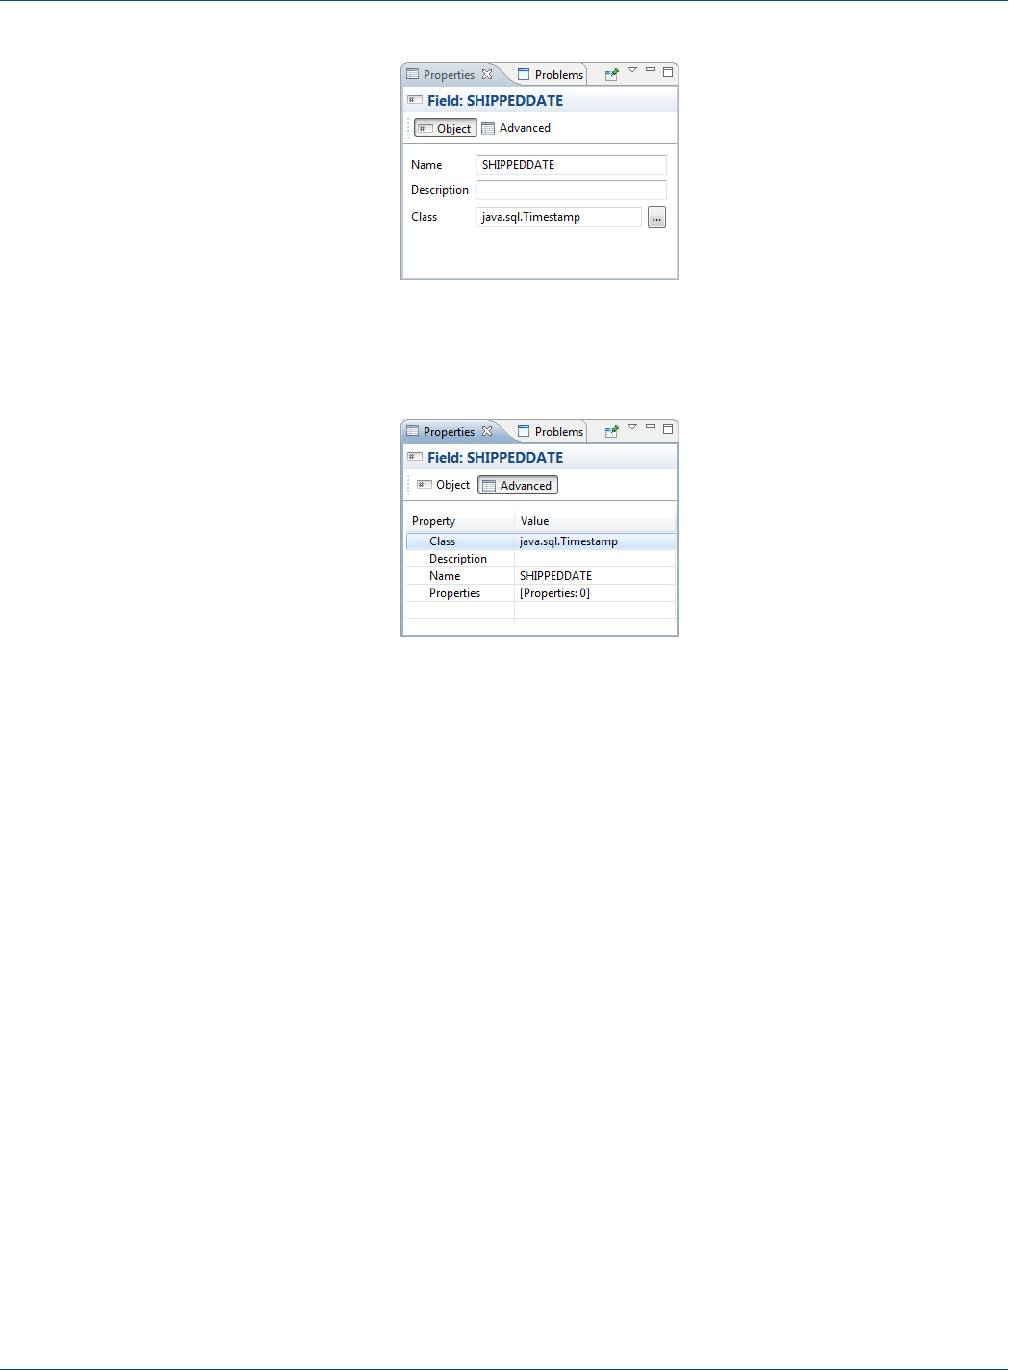
TIBCO Jaspersoft Studio User Guide
Figure 5-1 Object Tab in Properties View of a Field
Select the Advanced tab to enter advanced properties for the field.
Figure 5-2 Advanced Tab in Properties View of a Field
A field is identified by a unique name, a type, and an optional description.
You can also define a set of name/value pair properties for each field. Field properties are used by
QueryExecutors to configure fields, for example, to set up the timezone or date, or to configure the number
format to be used. In many QueryExecuters where the data source is not a flat table (such as MDX, JSON, or
XPath), properties can contain instructions or addresses to data. For JDBC, properties can be used to indicate the
index of the column in the dataset; you can also set a property for the column name, which functions as an
alias. Applications like Jaspersoft Studio can use properties to store useful information: for example, column size
could be used to size the TextFields or Table cells during report design. Field properties can be static or
dynamic; that is, you can set the value using an expression, which will be evaluated at the beginning of dataset
iteration.
Jaspersoft Studio determines the value for a field based on your data source. For example, when using an SQL
query to fill a report, Jaspersoft Studio assumes that the name of the field matches the name of a field in the
query result set. You must ensure that the field name and type match the field name and type in the data source.
You can systematically declare and configure large numbers of fields using the tools provided by Jaspersoft
Studio. Because the number of fields in a report can be quite large (possibly reaching the hundreds), Jaspersoft
Studio provides different tools for handling declaration fields retrieved from particular types of data sources.
Inside each report expression (like the one used to set the content of a text field) Jaspersoft Studio specifies a
field object, using the following syntax:
$F{<field name>}
80 TIBCO Software Inc.

Chapter 5 Fields
where <field name> must be replaced with the name of the field. When using a field expression (for example,
calling a method on it), keep in mind that it can have a value of null, so you should check for that condition.
An example of a Java expression that checks for a null value is:
($F{myField} != null) ? $F{myFiled}.doSomething() : null
This method is generally valid for all the objects, not just fields. Using Groovy or JavaScript this is rarely a
problem, since those languages handle a null value exception in a more transparent way, usually returning an
empty string.
In some cases a field can be a complex object, like a JavaBean, not just a simple value like a String or an
Integer. A trick to convert a generic object to a String is to concatenate it to an empty string this way:
$F{myfield}+ “”
All Java objects can be converted to a string; the result of this expression depends on the individual object
implementation (specifically, by the implementation of the toString() method). If the object is null, the result
returns the literal text string “null” as a value.
5.2 Registration of Fields from an SQL Query
An SQL query is the most common way to fill a report. Jaspersoft Studio provides several tools for working
with SQL, including a query designer and a way to automatically retrieve and register the fields derived from a
query in the report.
Before opening the query dialog, be sure you select the correct connection/data source. All operations performed
by the tools in the query dialog use this data source.
To open the query dialog (Figure 5-3) right-click the name of your report in the Outline view and choose
Dataset and Query....
TIBCO Software Inc. 81
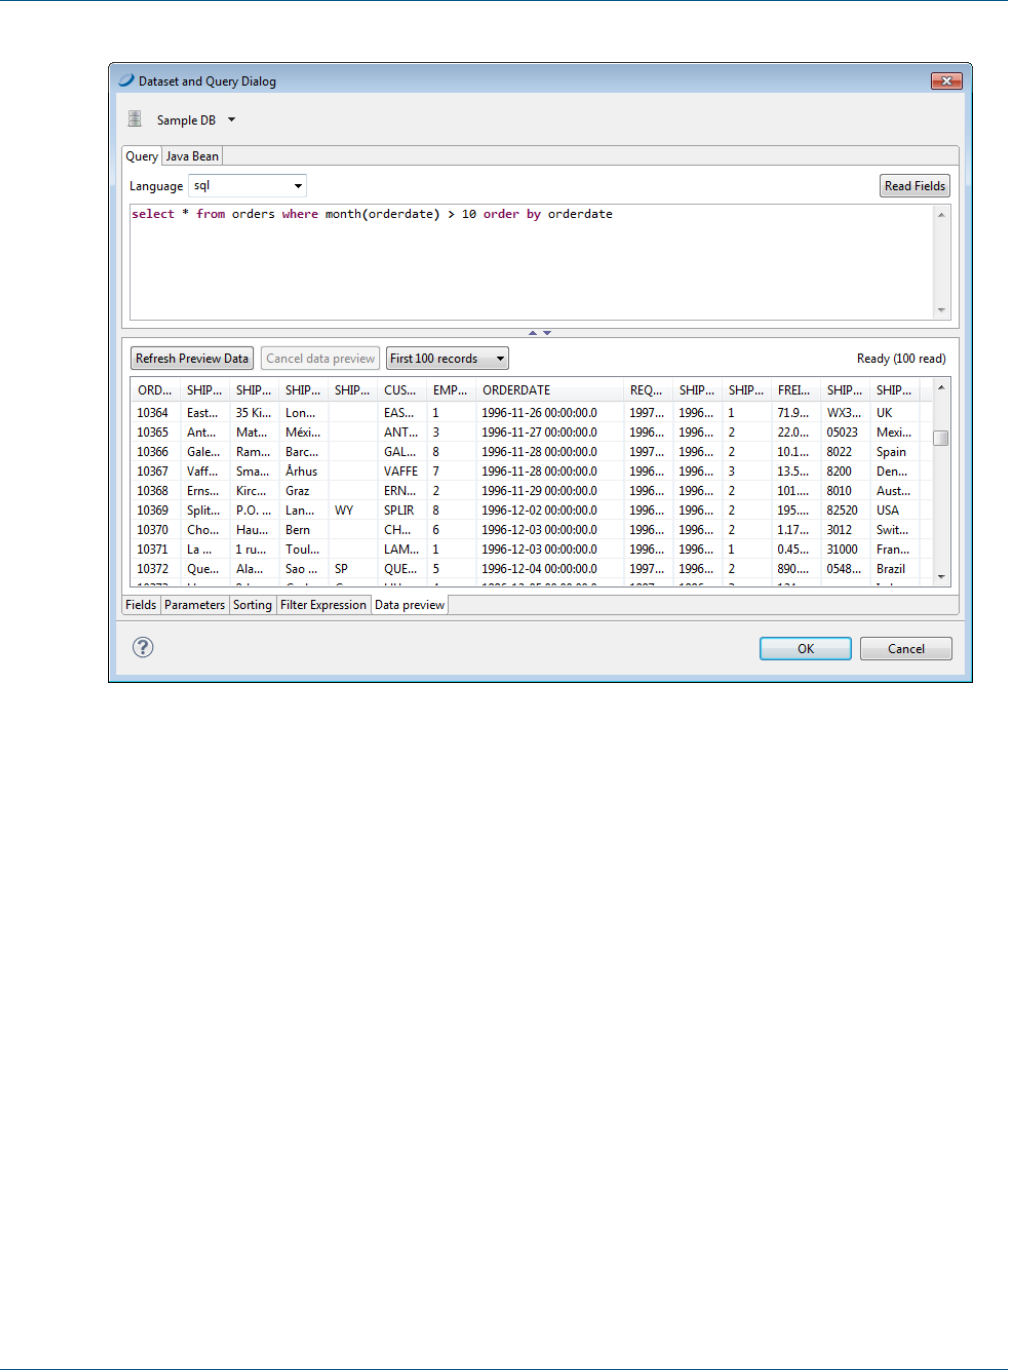
TIBCO Jaspersoft Studio User Guide
Figure 5-3 Query Dialog with Data Preview
Jaspersoft Studio doesn't require a query to generate a report. It can obtain data from a data source that is not
defined by a query execution. JasperReports supports multiple query languages including:
•CQL
•HiveQL
•JSON
•MongoDBQuery
•PLSQL
•SQL
•XLS
•XPath
If the selected data source is a JDBC connection, Jaspersoft Studio tests the access connection to the data source
as you define the query. This allows Jaspersoft Studio to identify the fields using the query metadata in the
result set. The design tool lists the discovered fields in the bottom portion of the window. For each field,
Jaspersoft Studio determines the name and Java type specified by the JDBC driver.
If your query accesses tables containing large amounts of data, scanning the data source for field names could
take a while. In this case you might consider disabling the Automatically Retrieve Fields option to quickly
finish your query definition. When you've completed the query, click the Read Fields button to start the fields
discovery scan.
82 TIBCO Software Inc.
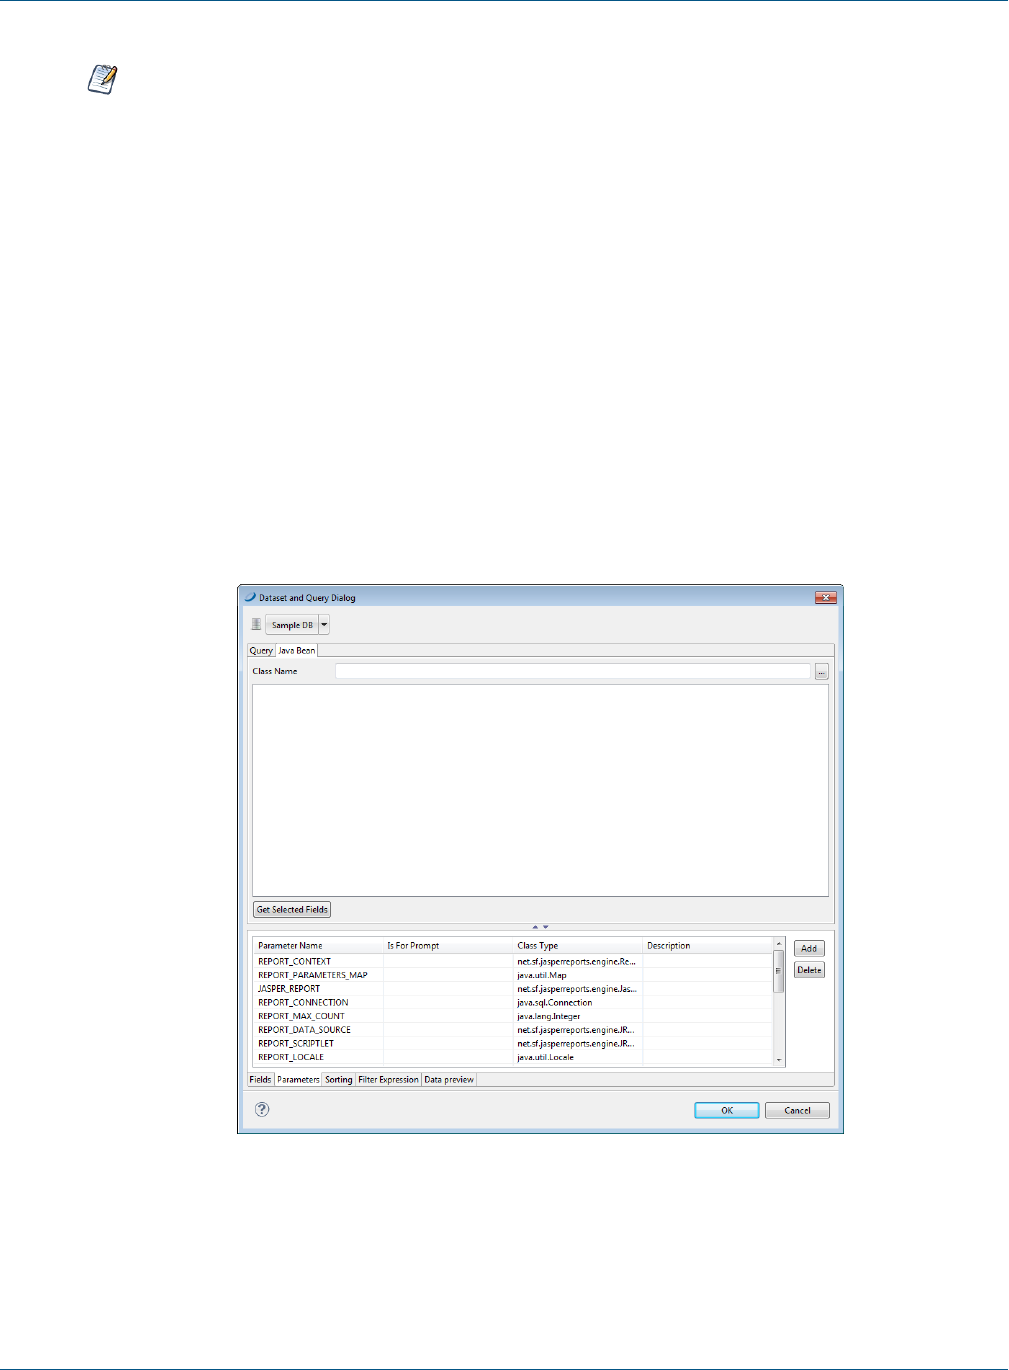
Chapter 5 Fields
All fields used in a query must have a unique name. Use alias field names in the query for fields having
the same name.
The field name scan may return a large number of field names if you are working with complex tables. To
reduce unnecessary complexity, we suggest that you review the list of discovered names and remove fields
you're not using in your report. When you click OK all the fields in the list are included in the report design.
Although you can remove them later in the outline view, it’s a good idea at this point in the design process to
remove any field names that you won’t be using.
5.3 Registration of JavaBean Fields
One of the most advanced features of JasperReports is its ability to manage data sources that aren't based on
simple SQL queries. One example of this is JavaBean collections. In a JavaBean collection, each item in the
collection represents a record. JasperReports assumes that all objects in the collection are instances of the same
Java class. In this case the “fields” are the object attributes (or even attributes of attributes).
By selecting the Java Bean tab in the query designer, you can register the fields that correspond to the
specified Java classes. We assume you know the Java classes that correspond to the objects that you use in your
report.
Figure 5-4 JavaBeans Tab
Suppose you're using objects of this Java class:
com.jaspersoft.ireport.examples.beans.PersonBean
TIBCO Software Inc. 83

TIBCO Jaspersoft Studio User Guide
To register fields for the class:
1. Put the class name in the name field and click Read attributes. Jaspersoft Studio scans the class.
2. Check the scan results to make sure Jaspersoft Studio has captured the correct object attributes for the class
type.
3. Select the fields you want to use in your report and click Add.
Jaspersoft Studio creates new fields corresponding to the selected attributes and adhesion to the list. The
description, in this case, stores the method that the data source must invoke to retrieve the value for the
specified field.
Jaspersoft Studio parses a description such as address.state (with a period between the two attributes) as an
attribute path. This attribute path is passed to the function getAddress() to locate the target attribute, and then
to getState() to query the status of the attribute. Paths may be arbitrary and long, and Jaspersoft Studio can
recursively parse attribute trees within complex JavaBeans and in order to register very specific fields.
We have just discussed the two tools used most frequently to register fields, but we’re not done yet. There are
many other tools you can use to discover and register fields, for instance, the HQL and XML node mapping
tools.
5.4 Fields and Text Fields
To print a field in a text element, you must set the expression and the textfield class type correctly. You may
also need to define a formatting pattern for the field.
To create a corresponding text field, drag the field you want to display from the Outline view into the design
panel. Jaspersoft Studio creates a new text field with the correct expression (for example, $F{fieldname}) and
assigns the correct class name.
5.5 Data Centric Exporters
Jaspersoft Studio supports two data-oriented export formats designed to be used programmatically when another
application embeds TIBCO Jaspersoft products:
•CSV: exports the report's data to a list of comma-separated values (CSV).
•JSON: exports the report's data to a JavaScript Object Notation (JSON) object.
In both cases, the metadata defines the structure of the exported data.
Jaspersoft Studio also supports other types of field-level metadata:
•PDF 508 Tags are used to create report output in Adobe Acrobat format that provides functionality in
accordance with the Americans with Disabilities 508 specification.
•XLS Tags are used to define how data is exported to the Microsoft Excel format. In addition to numerous
layout settings, you can define XLS metadata that define the structure of the data when exported.
This section describes how to work with metadata for PDF 508 Tags and for the JSON exporter.
5.5.1 Configuring a Report's Metadata for PDF 508 Tags
To add 508 functionality to a report, you must add tags to the report elements. Jaspersoft Studio has menu items
that let you explicitly insert tags for headings, tables, and table-like elements. For more information about tags
for 508 functionality in JasperReports Library, see the JasperReports Library Ultimate Guide.
84 TIBCO Software Inc.

Chapter 5 Fields
5.5.1.1 Tagging Headings
You can tag text fields or static text elements as headings. You can include a range of static text elements
and/or text fields in the same heading.
To tag a single element as a heading:
1. Right-click the text field or static text and select PDF508Tags> Heading> Heading n> Full from the
context menu.
The setting is displayed in the upper left-hand corner of the element in design view. It is underlined to
show the element is the full heading.
Figure 5-5 A static text element tagged as Full
To tag multiple elements as a heading:
1. Right-click the first text field or static text element in your heading section and select PDF508Tags>
Heading> Heading n> Start from the context menu.
2. Right-click the last text field or static text element in your heading section and select PDF508Tags>
Heading> Heading n> End from the context menu.
In design view, the start of a multi-element heading is shown in the upper left-hand corner of the Start
element, and the end is shown in the lower right-hand corner of the End element.
Figure 5-6 Text fields tagged as start and end
To remove a heading tag from an element:
1. Right-click the text field or static text element in your heading section and select PDF508Tags>
Heading> Heading n> None from the context menu.
5.5.1.2 Using Automatic Table Tagging
To have Jaspersoft Studio automatically generate tags for the tables in your report, enable the
net.sf.jasperreports.components.table.generate.pdf.tags property. This property can be set at the
global, report, or table level.
To set this property globally:
1. Select Window> Preferences to open the Preferences dialog box (Eclipse> Preferences on Mac).
2. Navigate to Jaspersoft Studio> Properties.
3. Click Add to open the Properties dialog.
4. Enter the following values:
•Property Name –net.sf.jasperreports.components.table.generate.pdf.tags
•Value – Enter true to enable table tagging or false to disable table tagging.
TIBCO Software Inc. 85
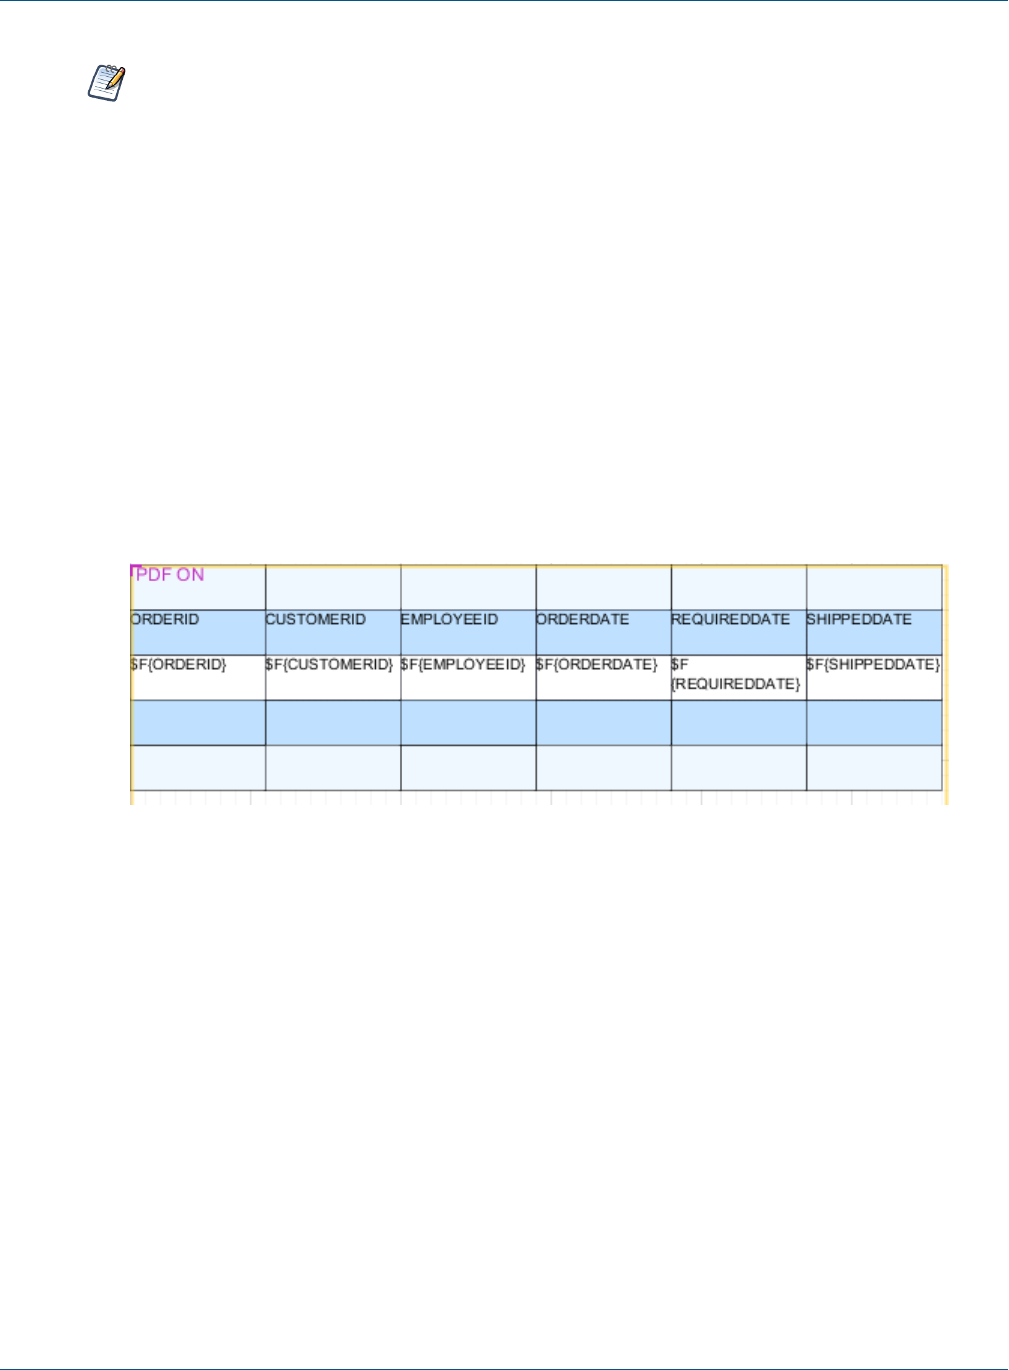
TIBCO Jaspersoft Studio User Guide
Setting the property globally inserts tags when you export a report to PDF directly from Jaspersoft Studio.
If you are publishing your reports to another environment, such as JasperReports Server, you must
enable this property in the jasperreports.properties file in your environment. See the JasperReports
Server Administrator Guide for more information about enabling this property for JasperReports Server.
To set this property for a report or table:
1. For a table, right-click in the table. For a report, right-click on the root node in outline view.
2. Select PDF508Tags> Autotag Table from the context menu.
3. Select one of the following options:
•Default – Inherits the property settings from a higher level. If the property has been set explicitly at a
higher level, the current setting is shown on the menu, for example Default (Enabled).
•Enabled – Enables the property for this table or report. This setting overrides any value set at a higher
level.
•Disabled – Disables the property for this table or report. This setting overrides any value set at a
higher level.
When the net.sf.jasperreports.components.table.generate.pdf.tags is set at the table level, the
setting is displayed in the upper left-hand corner of the table in design view.
Figure 5-7 Table with tagging enabled
5.5.1.3 Manually Tagging Tables and Lists
Automatic table tagging only works with table elements. If you have a table-like element in your report, such as
a list or a tabular arrangement of fields, it cannot be tagged automatically. However, you can manually insert
list or table tags using the context menu. Like tables, manual tagging only works with text fields and static text.
You manually tag lists and tables using a CSS-type structure. The general steps necessary to tag tables are
shown.
To manually tag a tabular arrangement of elements as a table:
1. Tag the first element in your table: PDF508Tags> Table> Start.
2. Tag the start and end of each row:
a. Tag the first element in your row: PDF508Tags> TableRow> Start.
b. Tag the last element in your row: PDF508Tags> TableRow> End.
3. To make a row a header row, add header tags to the start and end:
a. Tag the first element in each header row: PDF508Tags> TableHeader> Start.
b. Tag the last element in each header row: PDF508Tags> TableHeader> End.
86 TIBCO Software Inc.
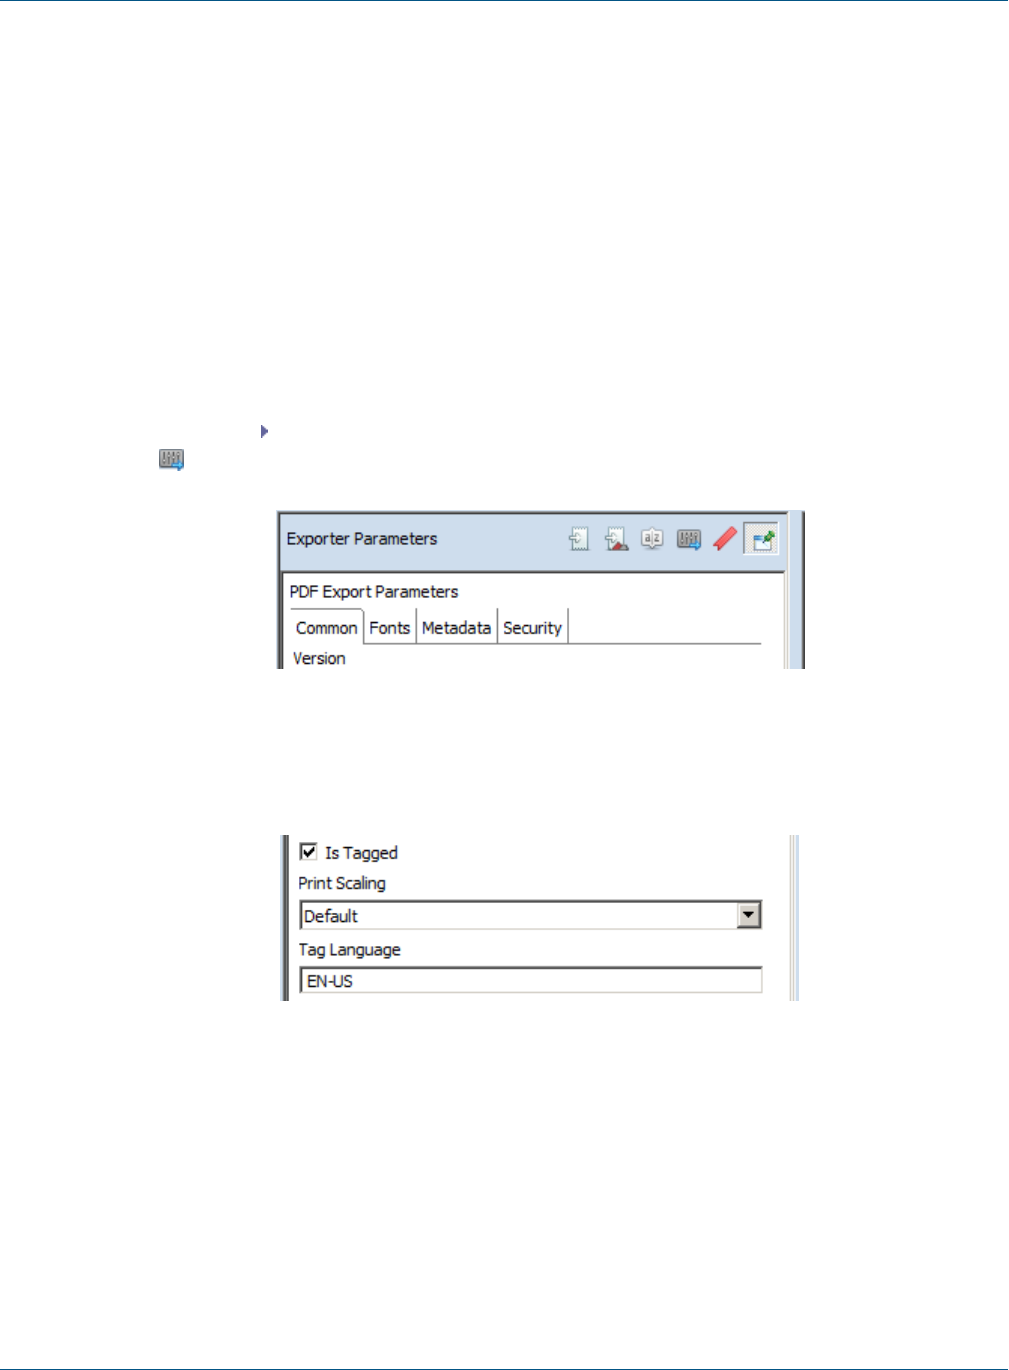
Chapter 5 Fields
4. Tag each detail element in each row: PDF508Tags> TableDetails> Full.
5. Tag the final element in your table: PDF508Tags> Table> End.
To manually tag elements as a list:
1. Tag the first element in your list: PDF508Tags> List> Start.
2. Tag each list item: PDF508Tags>ListItem> Full.
3. Tag the final element in your list: PDF508Tags> List> End.
5.5.1.4 Setting Export Parameters
Once you have inserted your 508C tags correctly, you must set the PDF export parameters in your report.
1. Click on the report preview.
2. The first time the report runs, it will not have tags. To speed up the initial run, select One Empty Record.
3. Select PDF from the format menu and wait for the report to run.
4. If necessary, click to open the panel on the left of the preview window.
5. Click to view the exporter parameters.
Figure 5-8 PDF Export Parameters tab in report preview
6. Select Is Tagged.
7. Enter a language code in the Tag Language field.
Figure 5-9 508C tags in PDF Export Parameters tab
8. Select the correct data adapter and run your report.
5.5.2 Configuring a Report's Metadata for Use With the JSON Data Exporter
JasperReports Server's REST API includes a JSON (JavaScript Object Notation) data exporter that enables you
to feed pure data into applications you integrate with the server. During report generation, this exporter skips all
layout-related steps and returns a dataset. The structure of this data is determined by metadata you define in
your report. You can also define expressions to determine how data from a specific filed is exported.
TIBCO Software Inc. 87

TIBCO Jaspersoft Studio User Guide
Note: The ability to define metadata and export data in JSON format is sometimes referred to as the
JasperReports Data API.
You can define a structure by separating the names of the levels you want to create with periods (.). For
example, consider a report with three fields configured with these JSON properties:
Field Expression JSON Path
$F{salesamount} store.sale.amount
$F{salesyear} store.sale.year
$F{cust.name} store.cust.name
When exported to JSON, the data is structured with three distinct paths:
store
sale
amount
year
cust
name
Example exported data would be similar to:
[
{store:
[
{
sale:[{amount:"19000", year:2014}],
cust:[{name:"Acme"}],
}
]
}
]
Note that when you preview your report as JSON, the data is not formatted to be human readable, as above.
You may want to use one of the many JSON formatting tools to review the output of your JSON tagged report,
you can copy the JSON output from the Preview tab.
It's important to define paths that create a structure that the application receiving the data can interpret.
To define JSON export object metadata in your report:
1. Open a report that includes the fields you want to export to your application.
2. Right-click a field in the Design tab, and select JSON tags > JSON Metadata Path.
If the field you selected appears in a frame, you're warned that JasperReports Library may ignore the
property. This warning relates only to older versions of the library; it remains in the product for backwards-
compatibility. For current versions of JasperReports Server, JasperReports Server, and Jaspersoft Studio,
properties defined in frames aren't ignored.
3. If you receive this warning, click OK. The JSON Exporter Property Configuration window is displayed.
4. In the Path field, enter a string that specifies the way the data from this field should be exported. For
example, if you are working with a field that returns a sales amount value, you might enter
store.sale.amount.
5. If the data being returned necessitates it, check the Repeat value if missing check box.
88 TIBCO Software Inc.
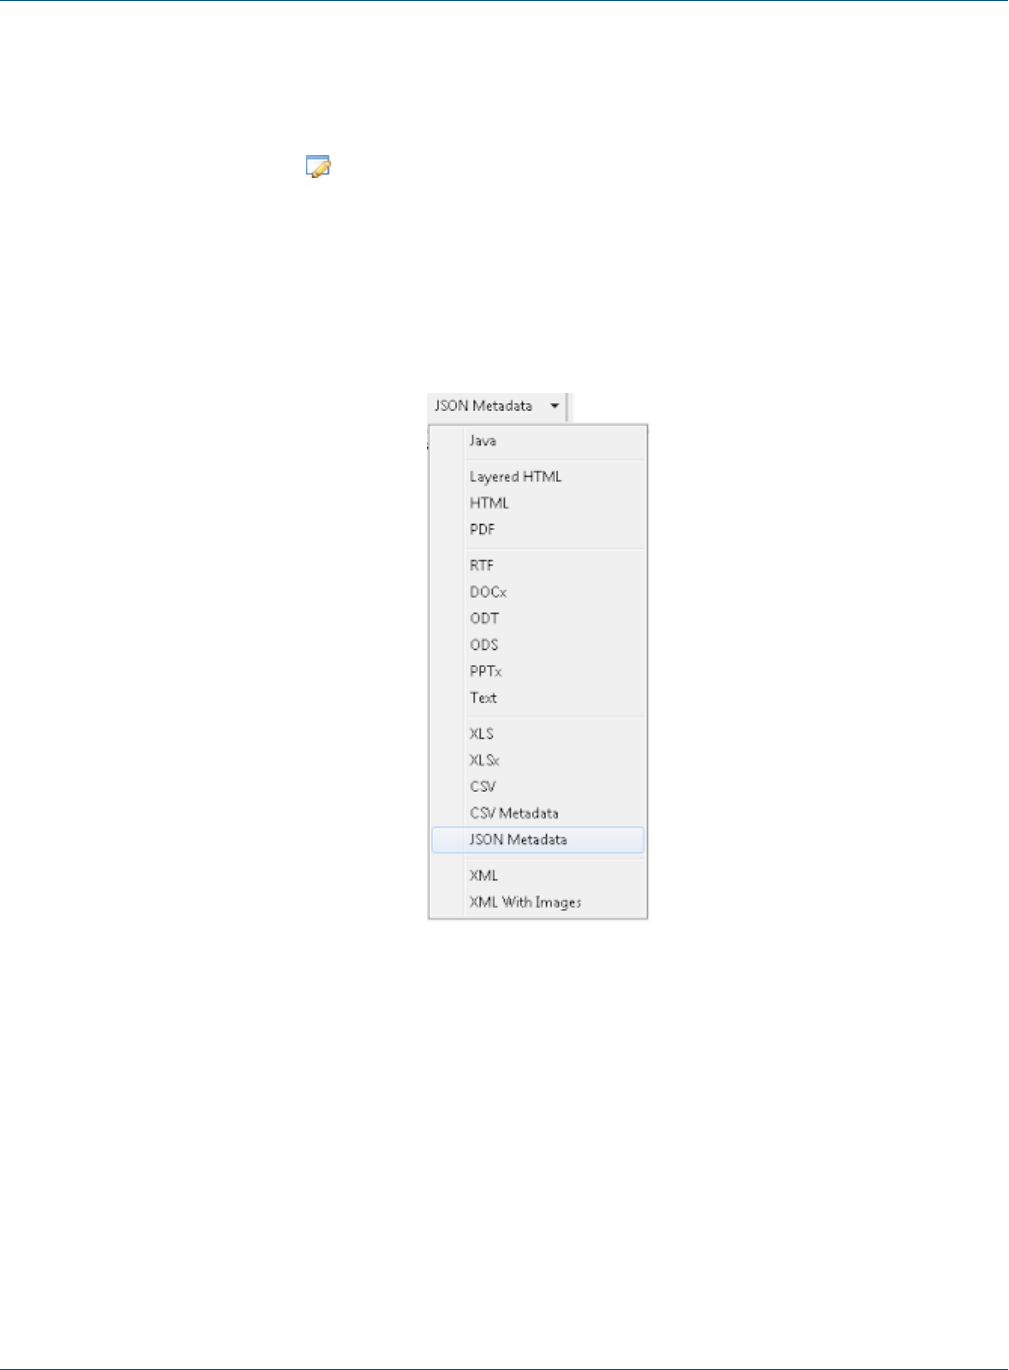
Chapter 5 Fields
This option is helpful if your source data doesn't include values for every row of data returned. Selecting
this option instructs Jaspersoft Studio to simply use the last value passed when a value is missing, which
may prevent problems in the application receiving the JSON object.
6. If you want to manipulate the data being exported, check the Use custom expression for exported
value check box, click , and define an expression.
7. Click OK.
8. Select each field you want to export to JSON and define its metadata.
9. Click File > Save.
10. Click Preview.
11. If the JSON Metadata preview isn't selected, click the arrow next to the current preview format, and select
JSON Metadata.
Figure 5-10 Selecting the JSON Metadata Preview
12. Review the structure of the data to ensure your application can interpret it.
13. If the data isn't structured correctly, click Design and edit each field's JSON export properties.
14. When you're satisfied with the data returned by Jaspersoft Studio, you can publish your report to
JasperReports Server and begin testing your own application's ability to use the data passed by the server.
TIBCO Software Inc. 89

TIBCO Jaspersoft Studio User Guide
90 TIBCO Software Inc.

CHAPTER 6 PARAMETERS
Parameters are values usually passed to the report from the application that originally requested it. They can be
used for configuring report features at generation time (like the value to use in an SQL query), or to supply
additional data that's not provided by the data source (like a custom report title, an application-specific path for
images).
Report parameters have many functions in a report. They can be used in the "where" condition of an SQL query,
or to provide additional data to the report (like the value of a title or name of the user that executed the report).
A parameter is defined by a name and a Class, which is a Java class type. For example a parameter of type
java.sql.Connection may be used to populate a subreport, while a simple java.lang.Boolean parameter may be
used to show or hide a section of the report.
This chapter contains the following sections:
•Working With Parameters
•Default Parameters
•Using Parameters in Queries
•Parameters Prompt
6.1 Working With Parameters
Parameters are the best communication channel between the report engine and the execution environment (your
application). Parameters are used inside expressions and queries. By setting parameters, you can change the
behavior of an expression or return different fields from a query.
A parameter can have a default value defined by means of the default expression property. This expression is
evaluated by JasperReports only when a value for the parameter has not been provided by the user at run time.
6.1.1 Managing Parameters
You can manage parameters using outline view or on the Parameters tab of the Dataset and Query dialog.
TIBCO Software Inc. 91
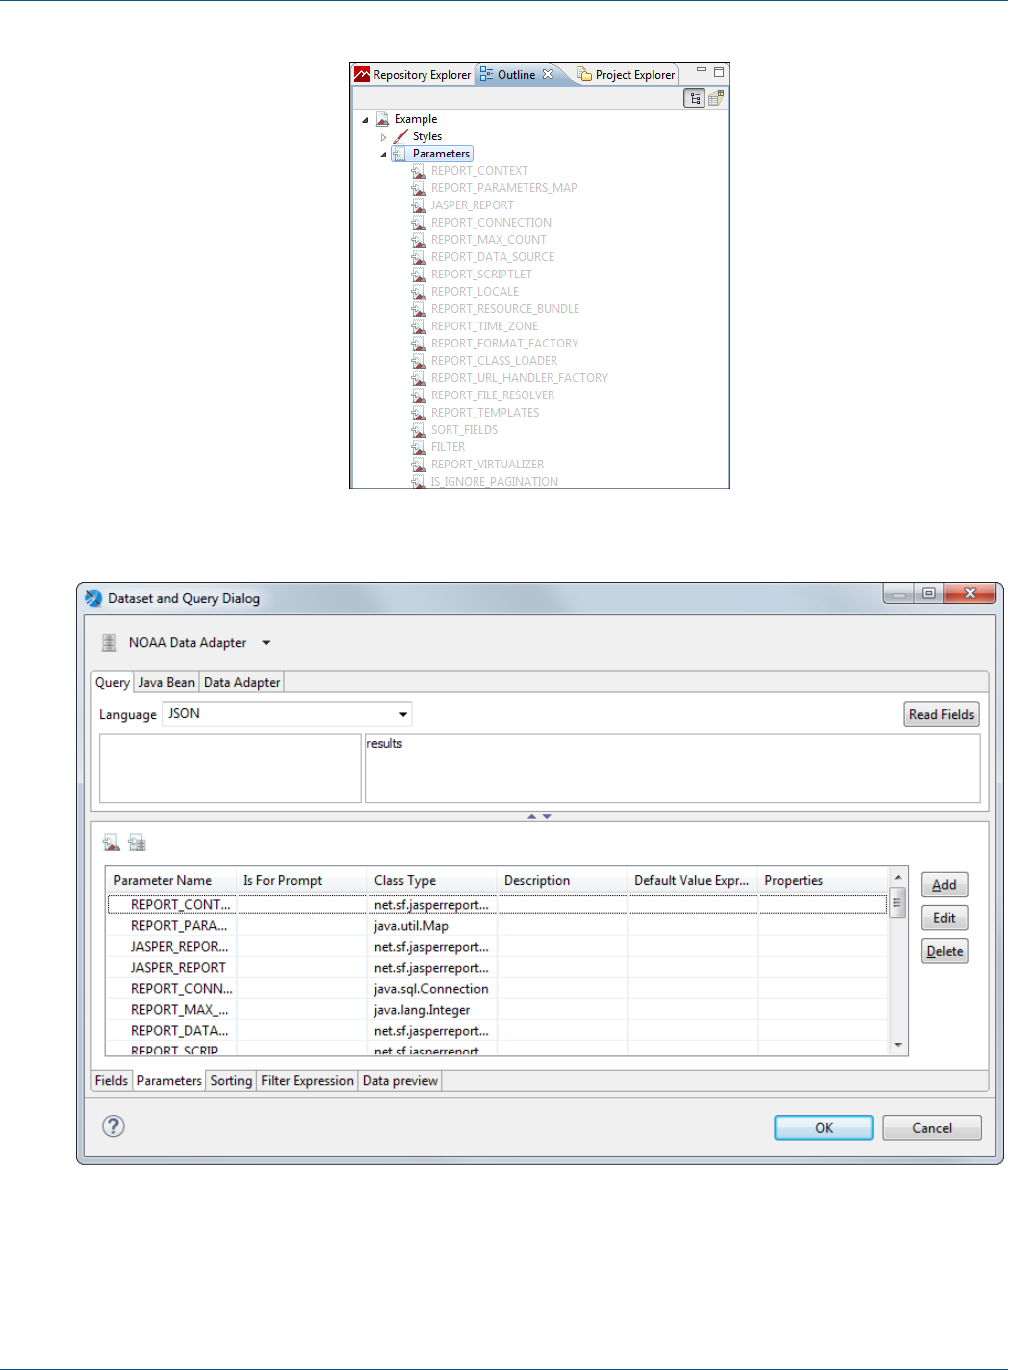
TIBCO Jaspersoft Studio User Guide
Figure 6-1 Parameters in Outline View
Figure 6-2 Parameters in Dataset and Query Dialog
92 TIBCO Software Inc.

Chapter 6 Parameters
6.1.1.1 Managing Parameters Using Outline View
•To delete a parameter, right-click on it and select Delete. Parameters with light gray names are created by
the system and can not be deleted or edited.
•To view or edit parameter properties, right-click on the parameter and choose Show Properties. To view
or edit advanced properties, click the Advanced tab in Properties view, select Properties, and click ….
•To sort the list of parameters alphabetically in the Outline view, right-click the Parameters node and
select Sort Alphabetically. This does not affect the order of the parameters in the report.
•To toggle show/hide system parameters, right-click the Parameters node and select Hide Default
Parameters.
•To add a parameter, right-click the Parameters node and choose Create Parameter.
•To add a parameter set, right-click the Parameters node and choose Create Parameter Set.
•To change the order of parameters on the menu, select the parameter you want to move and drag it up and
down.
6.1.1.2 Managing Parameters Using the Parameters tab in the Dataset and Query Dialog
•To toggle show/hide system parameters, click .
•To toggle show/hide parameter properties, click .
•To add a parameter, click Add on the Parameters tab.
•To delete a parameter, select it in the Parameters tab and click Delete. The Delete button is grayed out for
system parameters, which cannot be deleted or edited.
•To add a parameter property, make sure parameter properties are displayed, select the Parameter, and click
Add Property.
•To view or edit parameter properties, double-click the parameter, or select it in the Parameters tab and click
Edit (grayed out for system parameters). A Parameter dialog opens. To view or edit advanced properties,
click …next to Properties in the Parameter dialog.
Also see 11.1, “Using the Dataset and Query Dialog,” on page195.
TIBCO Software Inc. 93
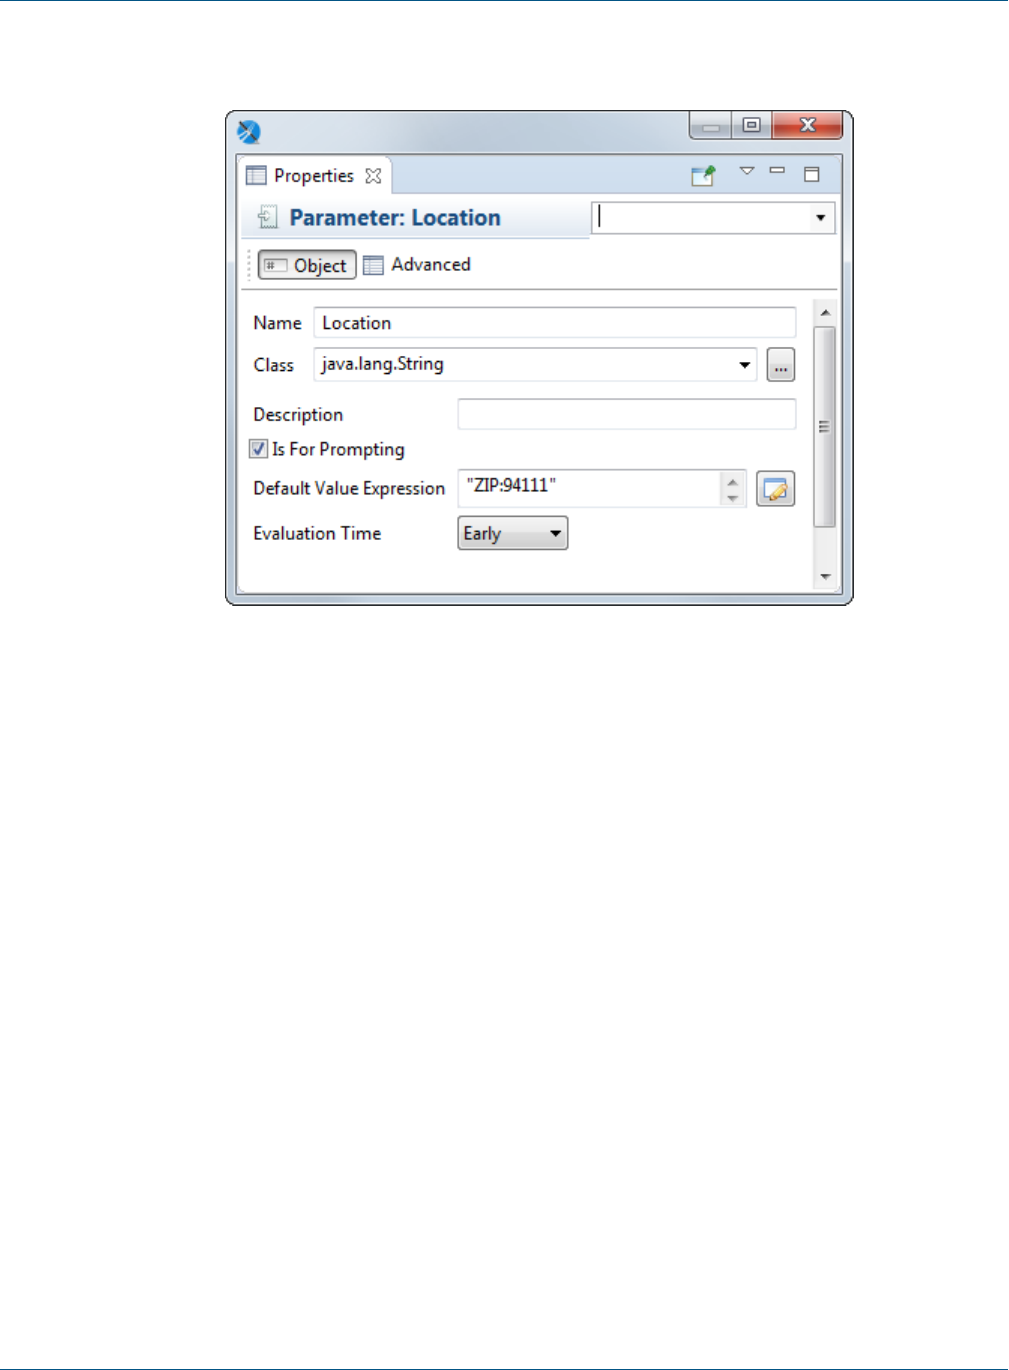
TIBCO Jaspersoft Studio User Guide
6.1.2 Working with Parameter Properties
Figure 6-3 Parameters - Properties
6.1.2.1 Basic Parameter Properties
Parameters have the following properties on the Object tab in outline view or in the Parameters dialog:
•Name – Name of the parameter.
•Class – Class type of the parameter.
•Description – A string describing the parameter. This is shown as the parameter tooltip in the Input
Parameters pane in preview.
•Is for Prompting – Enable this to have Jaspersoft Studio prompt for the parameter when you preview the
report. If you have this selected and are publishing the report to the server, you will need to create input
controls on the server. May also be passed to an external application.
•Default Value Expression – Pre-defined value for the parameter. This value is used if no value is
provided for the parameter from the application that executes the report. The type of value must match the
type declared in the Class field.
You may legally define another parameter as the value of Default Value Expression, but this method
requires careful report design. Jaspersoft Studio parses parameters in the same order in which they are
declared, so a default value parameter must be declared before the current parameter.
•Evaluation Time – Use this to specify the evaluation time for the parameter:
•Early – Evaluate the parameter default value expression before the data adapter.
•Late – Evaluate the parameter default value expression before the data adapter.
6.1.2.2 Advanced Parameter Properties
On the Advanced tab, you can use the Properties field to specify pairs of type name/value as properties for
each parameter. This is a way to add extra information to the parameter for use by external applications. For
94 TIBCO Software Inc.
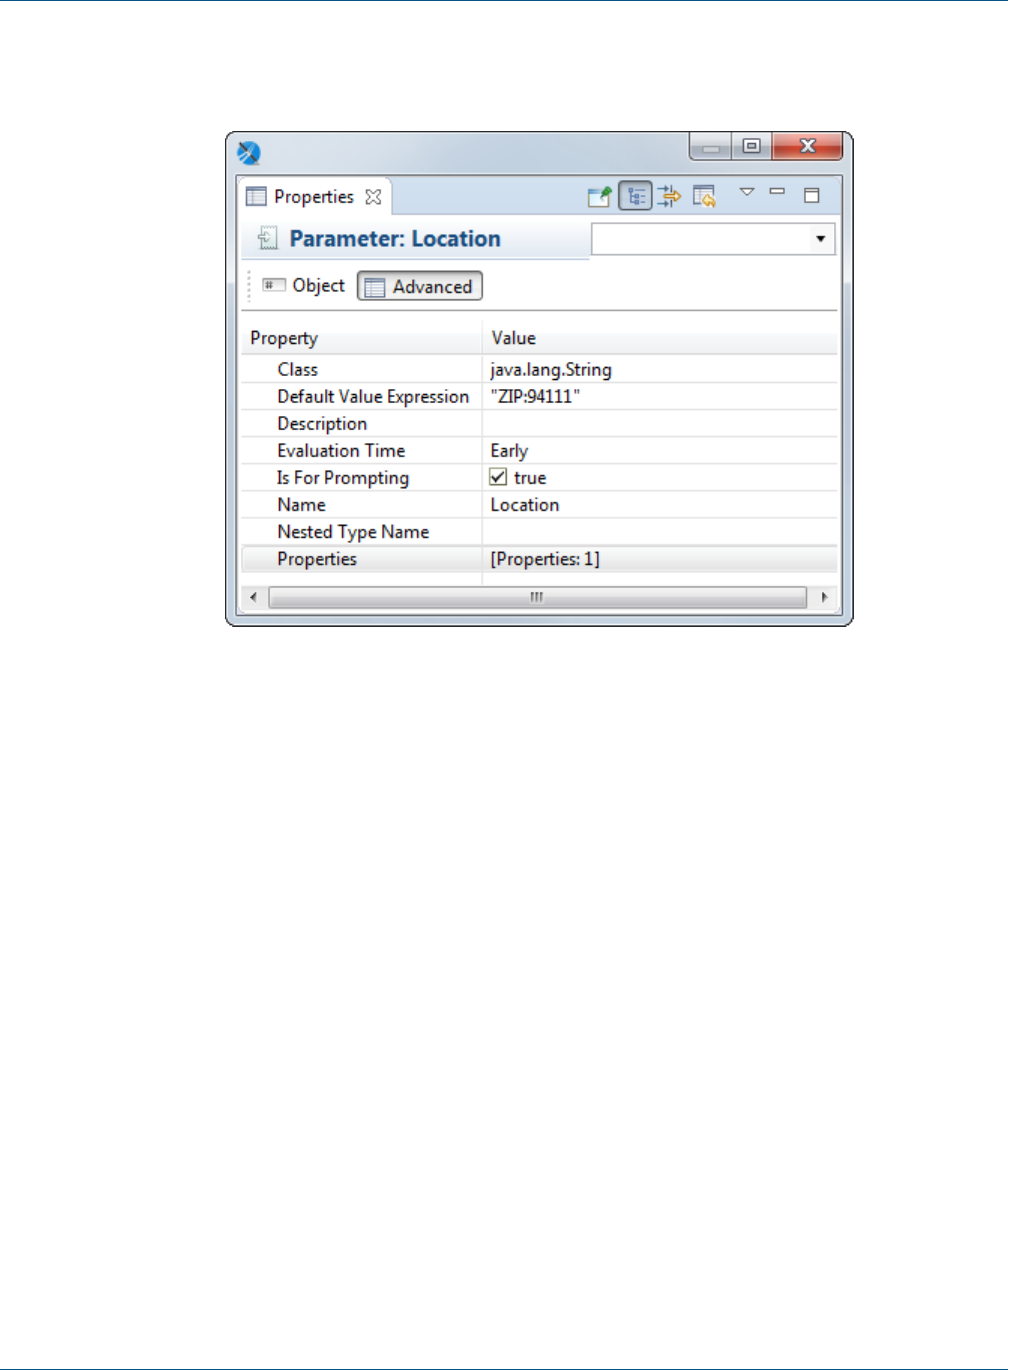
Chapter 6 Parameters
example, you can use properties to include the description of the parameter in different languages or to add
instructions about the format of the input prompt.
Figure 6-4 Advanced properties for a parameter
Selecting Properties, and clicking …brings up the Properties dialog box. For example, if you have a web
services type data adapter, you see the following properties.
TIBCO Software Inc. 95

TIBCO Jaspersoft Studio User Guide
Figure 6-5 Advanced Properties for Parameters
6.2 Default Parameters
JasperReports provides some built-in parameters (internal to the reporting engine). You can read the built-in
parameters, but you can't modify or delete them. Some important built-in parameters are:
•REPORT_CONNECTION - For a report using JDBC, this parameter holds the JDBC connection used to run the
SQL query.
•REPORT_DATA_SOURCE - This parameter contains the data source used to fill the report (if available)
•REPORT_LOCALE - This parameter contains the Locale used to fill the report.
96 TIBCO Software Inc.
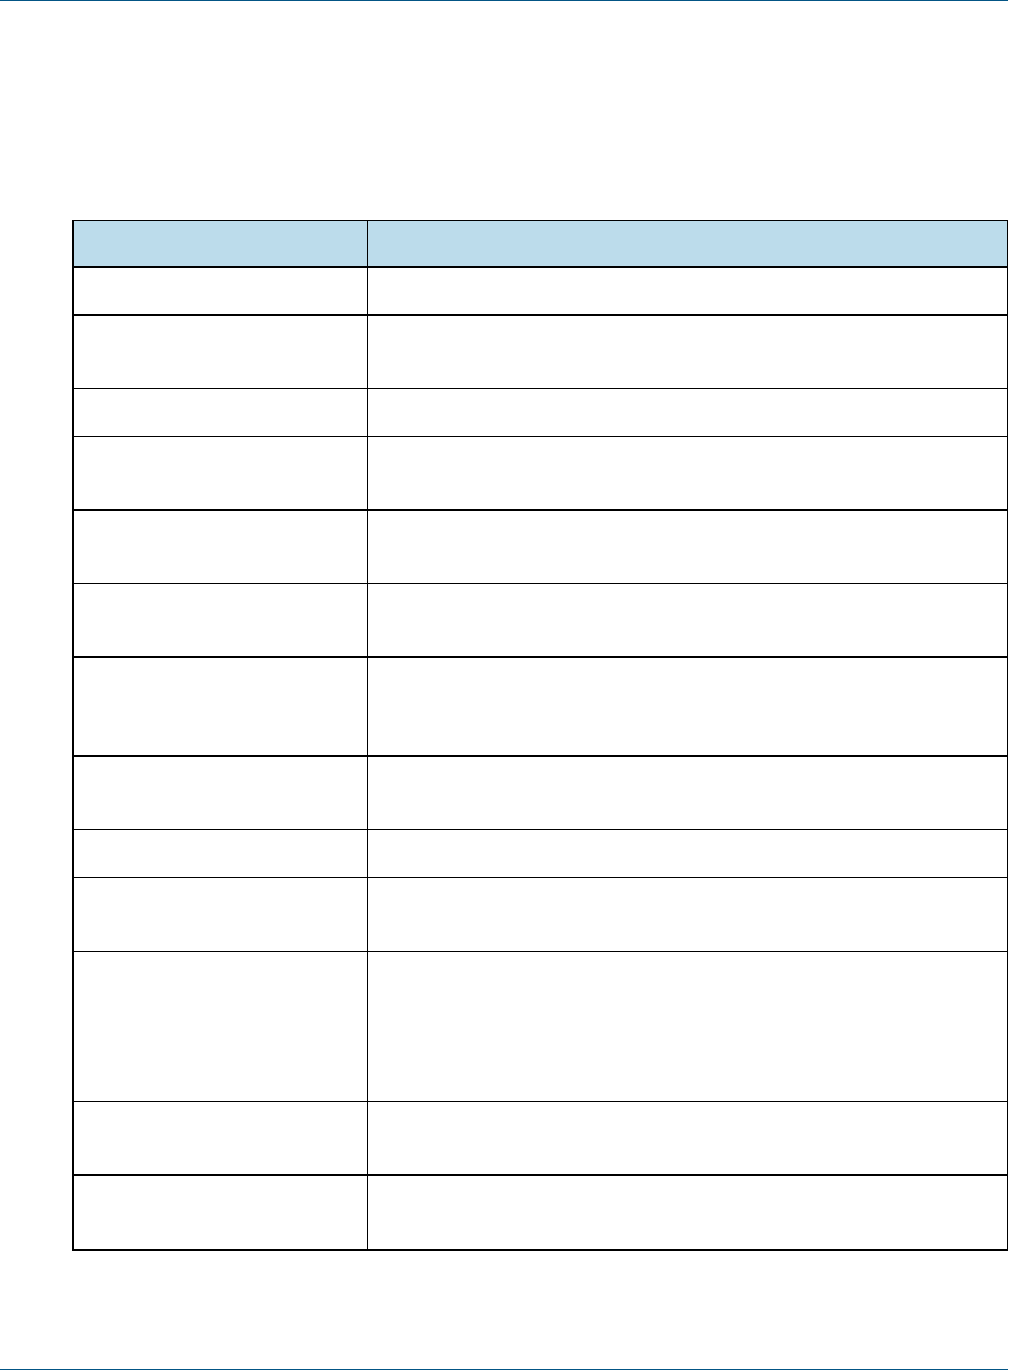
Chapter 6 Parameters
Some built-in parameters are specific to a query language. For example if you're using the Hibernate query
language, the reports automatically includes the HIBERNATE_SESSION parameter that holds the Hibernate
session for the HQL query.
The built-in parameters are:
Parameter Description
REPORT_CONTEXT
REPORT_PARAMETERS_MAP This is the java.util.Map passed to the fillReport method; it contains
the parameter values defined by the user.
JASPER_REPORT
REPORT_CONNECTION This is the JDBC connection passed to the report when the report is created
through an SQL query.
REPORT_MAX_COUNT This is limits the number of records filling a report. If no value is provided,
no limit is set.
REPORT_DATA_SOURCE This is the data source used by the report when it's not using a JDBC
connection.
REPORT_SCRIPTLET This represents the scriptlet instance used during report creation. If no
scriptlet is specified, this parameter uses an instance of
net.sf.jasperreports.engine.JRDefaultScriptlet.
REPORT_LOCALE This is specifies the locale used to fill the report. If no locale is provided, the
system default is used.
REPORT_RESOURCE_BUNDLE This is the resource bundle loaded for this report.
REPORT_TIME_ZONE This is used to set the time zone used to fill the report. If no value is
provided, the system default is used.
REPORT_FORMAT_FACTORY This is an instance of a
net.sf.jasperreports.engine.util.FormatFactory. The user can
replace the default one and specify a custom version using a parameter.
Another way to use a particular format factory is by setting the report
property format factory class.
REPORT_CLASS_LOADER This parameter can be used to set the class loader to use when filling the
report.
REPORT_URL_HANDLER_
FACTORY
Class used to create URL handlers. If specified, it replaces the default.
Table 6-1 JasperReports Default Parameters
TIBCO Software Inc. 97
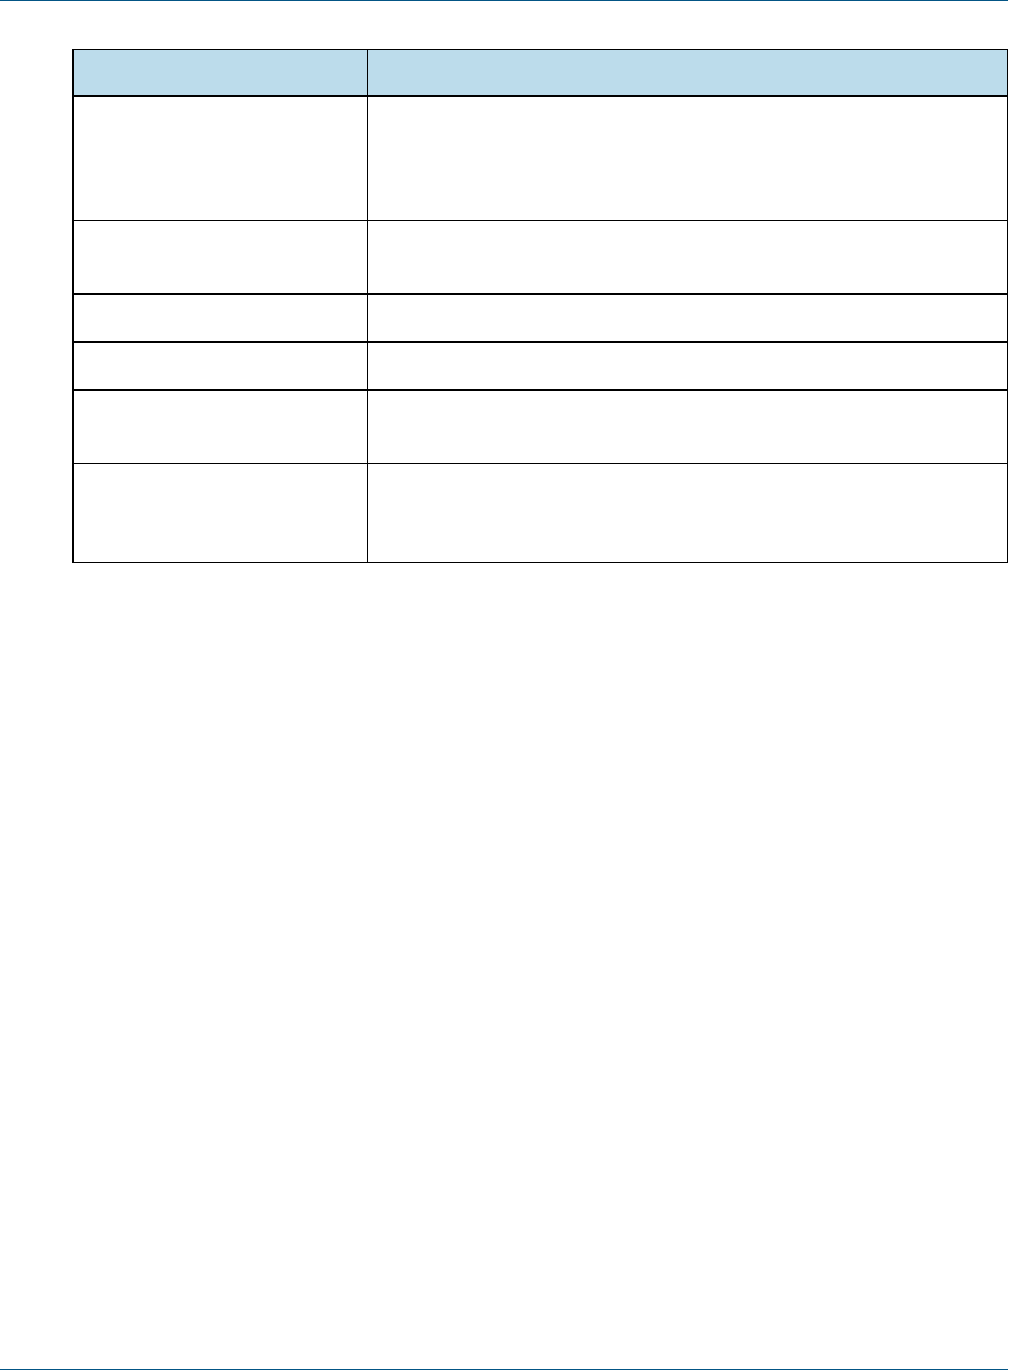
TIBCO Jaspersoft Studio User Guide
Parameter Description
REPORT_FILE_RESOLVER This is an instance of
net.sf.jasperreports.engine.util.FileResolver used to resolve
resource locations that can be passed to the report in order to replace the
default implementation.
REPORT_TEMPLATES This is an optional collection of styles (JRTemplate) that can be used in
addition to those defined in the report.
SORT_FIELDS
FILTER
REPORT_VIRTUALIZER This defines the class for the report filler that implements the
JRVirtualizer interface for filling the report.
IS_IGNORE_PAGINATION You can switch the pagination system on and off with this parameter (it
must be a Boolean object). By default, pagination is used except when
exporting to HTML and Excel formats.
6.3 Using Parameters in Queries
Generally, you can use parameters in a report query whether or not the language supports them.
JasperReports executes queries, passing the value of each parameter used in the query to the statement.
This approach has a major advantage with respect to concatenating the parameter value to the query string—you
don't have to take care of special characters or sanitize your parameter. The database can do it for you. At the
same time, this method limits your control of the query structure. For example, you can't specify a portion of a
query with a parameter.
6.3.1 Using Parameters in a SQL Query
You can use parameters in SQL queries to filter records in a where condition or to add/replace pieces of raw
SQL or even to pass the entire SQL string to execute.
In the first case the parameters act as standard SQL parameters. For example:
SELECT * FROM ORDERS WHERE ORDER_ID = $P{my_order_id}
In this example the my_order_id parameter contains the ID of the order to be read. This parameter can be
passed to the report from the application running it to select only a specific order. Please note that the parameter
here is a valid SQL parameter, meaning that the query can be executed using a prepared statement like:
SELECT * FROM ORDERS WHERE ORDER_ID = ?
and the value of the parameter my_order_id is then passed to the statement.
In this query:
SELECT * FROM ORDERS ORDER BY $P!{my_order_field}
98 TIBCO Software Inc.

Chapter 6 Parameters
my_order_field cannot be treated as an SQL parameter. JasperReports considers this parameter a placeholder
(note the special syntax $P!{}) is replaced with the text value of the parameter.
Using the same logic, a query can be fully passed using a parameter. The query string would look like:
$P!{my_query}
A query can contain any number of parameters. When passing a value using the $P!{} syntax, the value of the
parameter is taken as is, the user is responsible of the correctness of the passed value (SQL escaping is not
performed by JasperReports in this case). When using a parameter in a query, a default value must be set for the
parameter to allow Jaspersoft Studio to execute the query to retrieve the available fields.
6.3.2 Using Parameters with Null Values
The parameter form $P{parametername} doesn't work correctly with null values. In an operation in which your
value could be null, use the form $X{EQUAL,fieldname,parametername}.
For example:
1. $P{param}: "select * where num_column > $P{num_param}"
In this case $P should be used, because we don't have $X{GREATER,…}, and Null has no meaning for the
operation “greater than”.
2. $X{EQUAL, column_name, param_name}
Let's compare two expressions:
"select * where num_column = $P{num_param}"
and
"select * where $X{EQUAL, num_column, num_param}"
Both generate the same output if parameter value is not Null: "select * where num_column = 1"
However, if the parameter has a Null value the output is different:
•$P:"select * where num_column = null"
•$X:"select * where num_column IS null"
Databases don't understand the key difference "= null", but "is null". So if you want your query with
the condition "=" to work with null values, you need to use $X{EQUAL/NOTEQUAL, column, parameter}.
6.3.3 IN and NOTIN Clauses
JasperReports provides a special syntax to use with a where condition: the IN and NOTIN clauses.
The IN clause checks whether a particular value is present in a discrete set of values. Here is an example:
SELECT * FROM ORDERS WHERE SHIPCOUNTRY IS IN ('USA','Italy','Germany')
The set here is defined by the countries USA, Italy and Germany. Assuming we are passing the set of countries
in a list (or better a java.util.Collection) or in an array, the syntax to make the previous query dynamic in
reference to the set of countries is:
SELECT * FROM ORDERS WHERE $X{IN, SHIPCOUNTRY, myCountries}
where myCountries is the name of the parameter that contains the set of country names. The $X{} clause
recognizes three parameters:
•Type of function to apply (IN or NOTIN)
•Field name to be evaluated (SHIPCOUNTRY)
•Parameter name (myCountries)
TIBCO Software Inc. 99
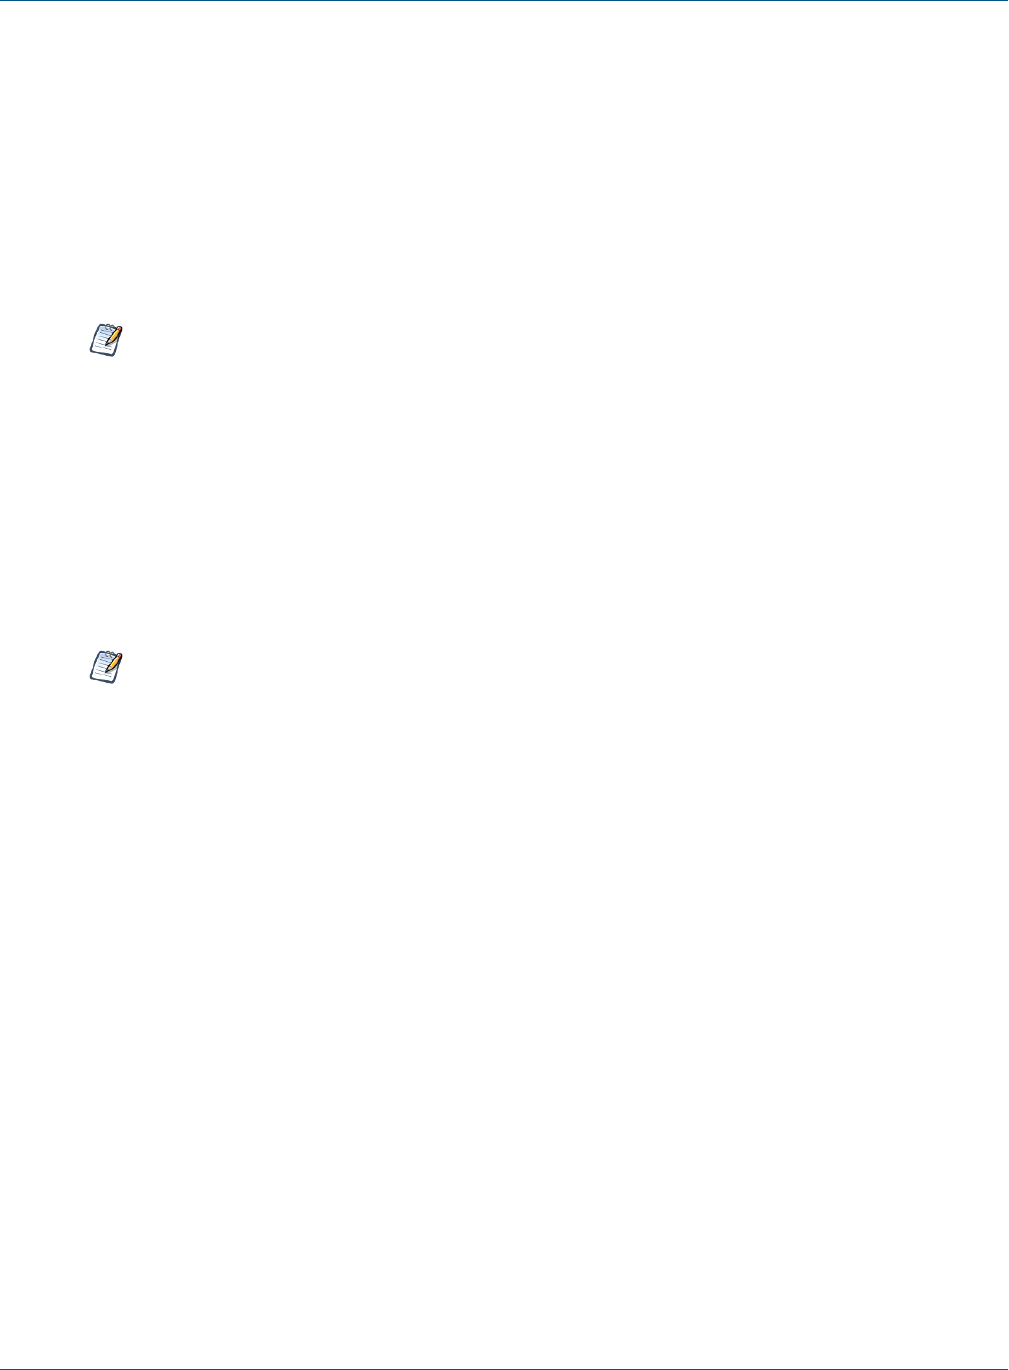
TIBCO Jaspersoft Studio User Guide
JasperReports handles special characters in each value. If the parameter is null or contains an empty list,
meaning no value has been set for the parameter, the entire $X{} clause is evaluated as the always true
statement “0=0”.
6.3.4 Relative Dates
You can create a report that filters information based on a date range relative to the current system date using a
parameter of type DateRange. A date range parameter can take either a date or a text expression that specifies a
date range relative to the current system date.
A relative date expression is always calculated in the time zone of the logged-in user. However, the
start day of the week can be configured independent of locale.
6.3.4.1 Relative Date Keywords
The text expression for the relative date must be in the format <Keyword>+/-<N> where:
•<Keyword> – Specifies the time span you want to use. Options include: DAY,WEEK,MONTH,QUARTER,SEMI,
and YEAR.
•<+/-> – Specifies whether the time span occurs before (-) or after (+) the chosen date.
•<N> – Specifies the number of the above-mentioned time spans you want to include in the filter.
For example, if you want to look at Sales for the prior month, your expression would be MONTH - 1.
Relative dates don't currently support keywords like "Week-To-Date" (from the start of the current week to
the end of the current day). However, you can set a relative date period in a query in JRXMLusing
BETWEEN, which has the syntax:
$X{BETWEEN, column, startParam, endParam}
For example, to create a week-to-date query, set startParam to WEEK and endParam to DAY. You can do
this for other time ranges, such as Year-To-Day, Year-To-Week, and so forth.
6.3.4.2 Creating a Date Range Parameter
The class attribute of a JasperReports date range parameter must have one of the following values:
•net.sf.jasperreports.types.date.DateRange (Date only) – Accepts text strings with relative date
keywords as described above and date strings in YYYY-MM-DD format. For example:
<parameter name="myParameter" class="net.sf.jasperreports.types.date.DateRange">
•net.sf.jasperreports.types.date.TimestampRange (Date and Time) – Accepts text strings with
relative date keywords as described above and date strings in YYYY-MM-DD HH:mm:ss format. For
example:
<parameter name="myParam" class="net.sf.jasperreports.types.date.TimestampRange">
6.3.4.3 Using Date Ranges in Queries
You must use $X{} functions with date ranges, because $P{} does not support the date-range types (DateRange
and TimestampRange).
To use date ranges, create a parameter with type date range and use it as the third argument in the $X{}
function. To set the default value expression of a date range parameter, use the DateRangeBuilder() class to
cast the expression to the correct type:
100 TIBCO Software Inc.
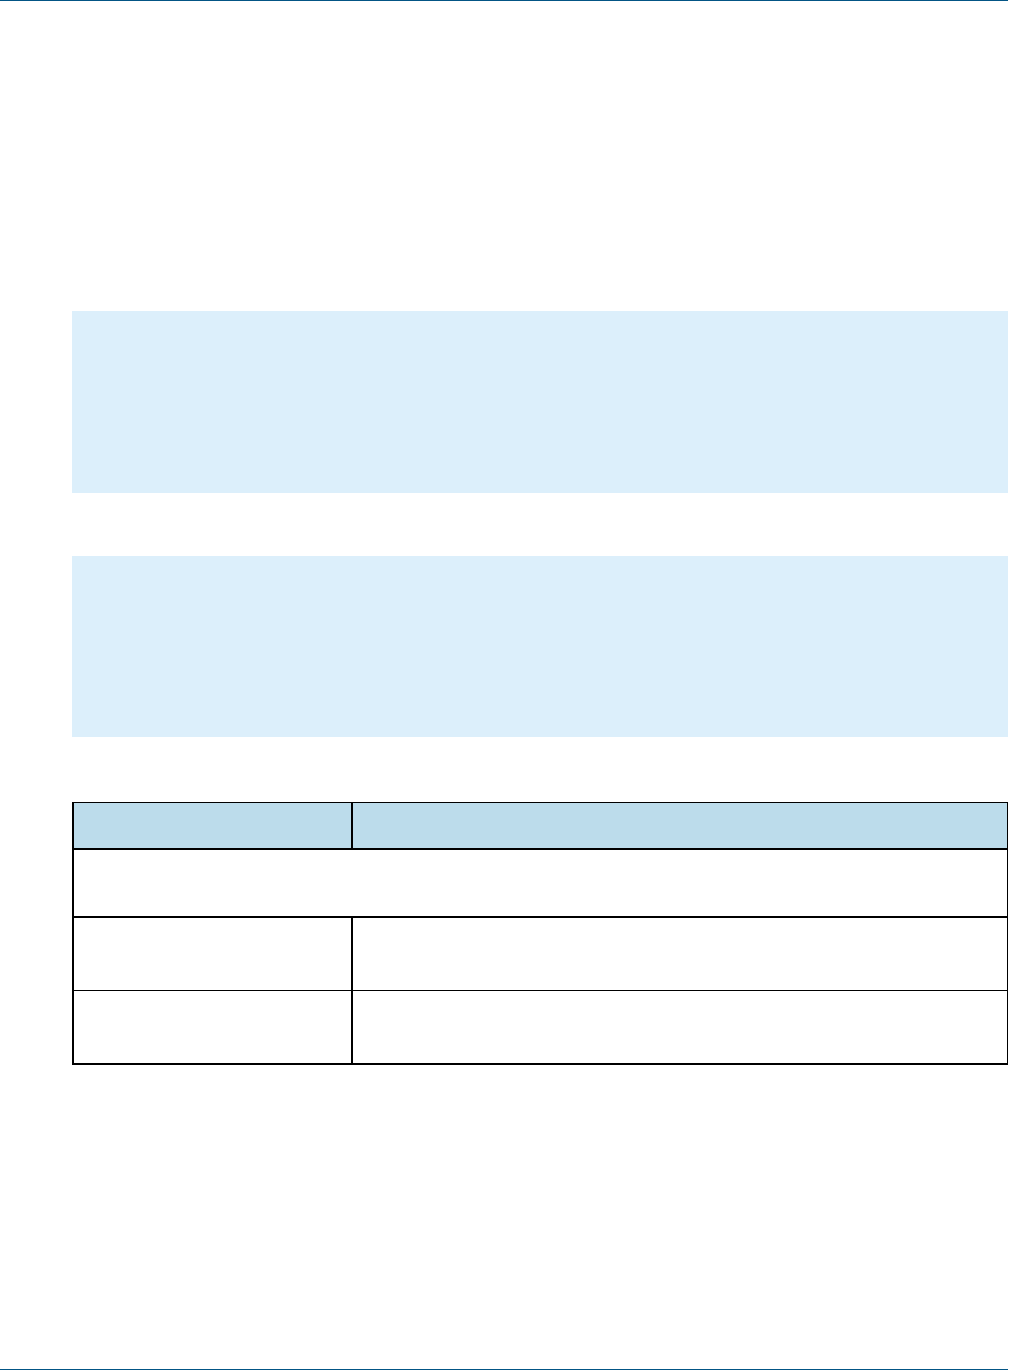
Chapter 6 Parameters
•new net.sf.jasperreports.types.date.DateRangeBuilder("DAY-1").toDateRange() – casts a keyword text
string to a DateRange.
•new net.sf.jasperreports.types.date.DateRangeBuilder("WEEK").set(Timestamp.class).toDateRange() –
casts a keyword text string to a TimestampRange.
•new net.sf.jasperreports.types.date.DateRangeBuilder("2012-08-01").toDateRange()– casts a date in
YYYY-MM-DD format to a DateRange.
•new net.sf.jasperreports.types.date.DateRangeBuilder("2012-08-01 12:34:56").toDateRange()– casts a
date in YYYY-MM-DD HH:mm:ss format to a TimestampRange.
The following JRXML example shows data from the previous day:
<parameter name="myParameter" class="net.sf.jasperreports.types.date.DateRange">
<defaultValueExpression>
<![CDATA[new DateRangeBuilder("DAY-1").toDateRange()]]>
</defaultValueExpression>
</parameter>
<queryString>
<![CDATA[Select * from account where $X{EQUAL, OpportunityCloseDate, myParameter}]]>
</queryString>
This JRXML example shows results prior to the end of last month:
<parameter class="net.sf.jasperreports.types.date.DateRange" name="EndDate">
<defaultValueExpression>
<![CDATA[new net.sf.jasperreports.types.date.DateRangeBuilder("MONTH-1").toDateRange().getEnd()]]>
</defaultValueExpression>
</parameter>
<queryString>
<![CDATA[SELECT * FROM orders WHERE $X{LESS, order_date, EndDate}]]>
</queryString>
The following table shows two additional examples of relative dates.
Problem Solution
Set up a relative date parameter called StartDate that takes the value: QUARTER.QUARTER evaluates to the
first day (the first instant, really) of this quarter.
Find all purchases made
previous to this quarter
SQL: select * from orders where $X{LESS, order_date,
StartDate}
Find all purchases made in
this quarter
select * from orders where $X{EQUAL, order_date, StartDate}
6.3.4.4 Using Relative Dates in Input Controls
When you create an input control for a DateRange or TimestampRange parameter, the user can either type a
relative date expression or enter a specific date (either by typing or by using the calendar widget).
Use BETWEEN to set up input controls that allow the user to specify a range (other than a day) using either a
relative date expression or actual dates. To do this:
•Define two date range parameters, for example, StartDate and EndDate.
•Optionally, set default values for one or both parameters using defaultValueExpression.
TIBCO Software Inc. 101

TIBCO Jaspersoft Studio User Guide
•Use a $X{} expression with a BETWEEN function in your query.
•Create a date type input control for each parameter, for example, StartDate and EndDate.
The following JRXML example uses the BETWEEN keyword in the $X() function to find all data from the
previous 20 years:
<parameter name="StartDate" class="net.sf.jasperreports.types.date.DateRange">
<defaultValueExpression>
<![CDATA[(new net.sf.jasperreports.types.date.DateRangeBuilder("YEAR-20")).toDateRange()]]>
</defaultValueExpression>
</parameter>
<parameter name="EndDate" class="net.sf.jasperreports.types.date.DateRange">
<defaultValueExpression>
<![CDATA[(new net.sf.jasperreports.types.date.DateRangeBuilder("DAY")).toDateRange()]]>
</defaultValueExpression>
</parameter>
<queryString language="SQL">
<![CDATA[select HIRE_DATE, MANAGEMENT_ROLE, GENDER, SUPERVISOR_ID,SALARY from employee where
$X{BETWEEN, HIRE_DATE, StartDate, EndDate} limit 200]]>
</queryString>
You can use the getStart() and getEnd() methods to get the precise beginning and end of a relative date.
Both of these methods return a date instead of a date range. The following example shows how to get the
precise start date as a default value expression.
<parameter name="StartDate" class="java.util.Date" nestedType="java.util.Date">
<defaultValueExpression><![CDATA[$P{UserPeriod}.getStart()]]></defaultValueExpression>
</parameter>
6.3.4.5 Publishing Reports with Relative Dates to JasperReports Server
Jaspersoft Studio automatically enables support for date range expressions on connections to JasperReports
Server. To verify that date range expressions are enabled:
1. Right-click on the server connection in the Repository and select Edit.
2. In the Server profile wizard, display the Advanced settings and select Supports DateRange
Expressions.
When Supports DateRange Expressions is enabled, input controls for date range parameters work correctly
when published to JasperReports Server.
6.3.5 Passing Parameters from a Program
Jaspersoft Studio passes parameters from a program “caller” to the print generator using a class that extends the
java.util.Map interface. For example:
...
HashMap hm = new HashMap();
...
JasperPrint print = JasperFillManager.fillReport(
fileName,
hm,
new JREmptyDataSource());
...
102 TIBCO Software Inc.
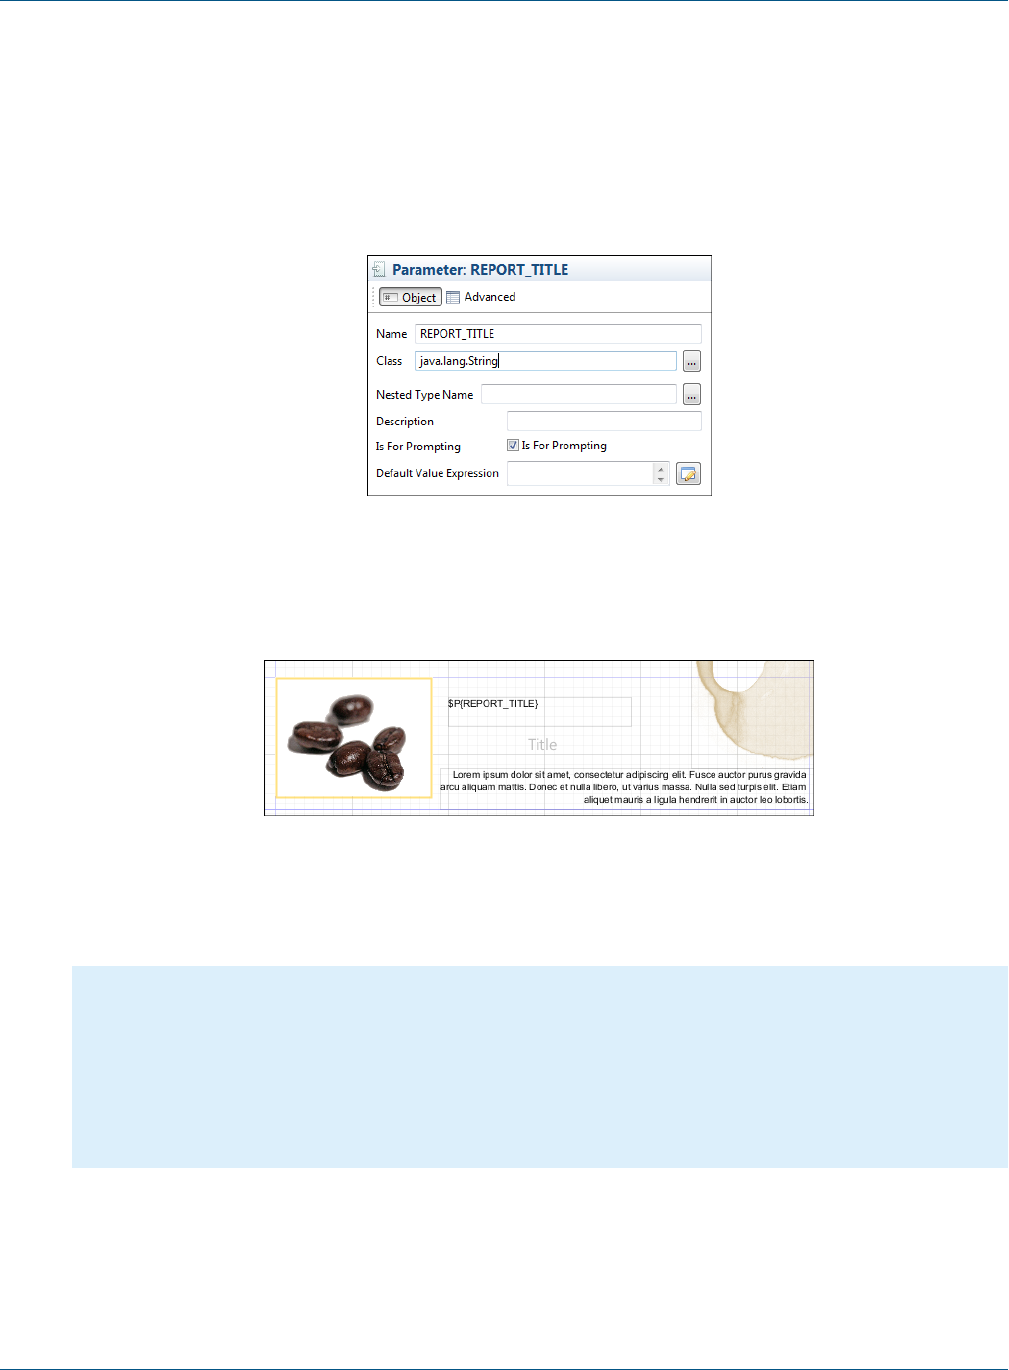
Chapter 6 Parameters
fillReport is a key method that allows you to create a report instance by specifying the file name as a
parameter, a parameter map, and a data source. (This example uses a dummy data source created with the class
JREmptyDataSource and an empty parameter map created using a java.util.HashMap object.)
Let’s see how to pass a simple parameter to a reporting order to specify the title of a report.
The first step is to create a parameter in the report to host the title (that is a String). We can name this parameter
REPORT_TITLE and the class is java.lang.String (Figure 6-6).
Figure 6-6 Definition of REPORT_TITLE
All the other properties can be left as they are. Drag the parameter into the Title band to create a text field to
display the REPORT_TITLE parameter.
Figure 6-7 Design Panel with REPORT_TITLE in the Title Band
To set the value of the REPORT_TITLE parameter in our application, modify the code of the previous source
code example by adding:
...
HashMap hm = new HashMap();
hm.put(“REPORT_TITLE”,”This is the title of the report”);
...
JasperPrint print = JasperFillManager.fillReport(
fileName,
hm,
new JREmptyDataSource());
...
We have included a value for the REPORT_TITLE parameter in the parameter map. You don't need to pass values
for all the parameters. If you don’t provide a value for a certain parameter, JasperReports assigns the value of
Default Value Expression to the parameter with the empty expression evaluated as null.
TIBCO Software Inc. 103

TIBCO Jaspersoft Studio User Guide
When printing the report, Jaspersoft Studio includes the String This is the title of the report in the
Title band. In this case we just used a simple String. But you can pass much more complex objects as
parameters, such as an image (java.awt.Image) or a data source instance configured to provide a specified
subreport with data. The most important thing to remember is that the object passed in the map as the value for
a certain parameter must have the same type (or at least be a super class) of the type of the parameter in the
report. Otherwise, Jaspersoft Studio fails to generate the report and returns a ClassCastException error.
6.4 Parameters Prompt
If you set a parameter to be used as a prompt, when executing the report, Jaspersoft Studio asks for the value of
the parameter.
To create a parameter prompt:
Create a simple report with the template Blank A4, name ParameterExample and data adapter One
Empty Record - Empty Rows.
1. In this report create a parameter and rename it (from its Properties view) to MESSAGE, with type
java.lang.String, and select the Is For Prompting) checkbox.
2. Drag the parameter from the outline view into the Title band. Jaspersoft Studio creates a text field to
display the parameter value. You should have something like the following image.
Figure 6-8 Parameter in Title Band
To compile and preview the report:
1. Click the Preview tab.
Be sure the Input Parameter window is open. If not, click the gray right-arrow to the left of the Preview
screen.
2. Add a value for the MESSAGE parameter. For this example, type Parameter Example.
3. Press the Play button. The message is printed in the title band.
104 TIBCO Software Inc.
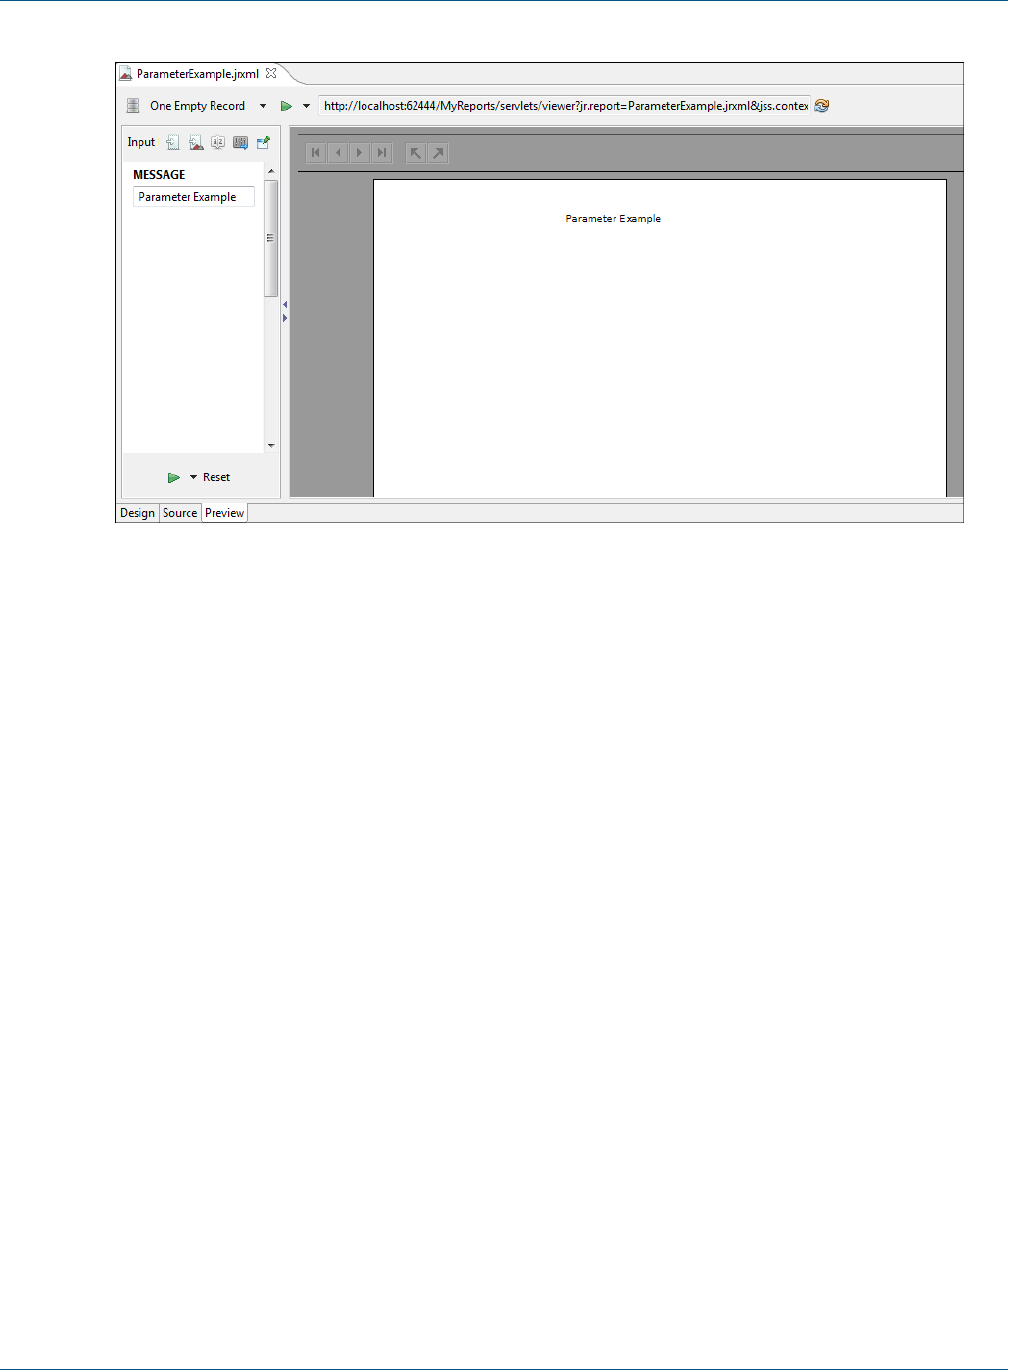
Chapter 6 Parameters
Figure 6-9 Preview Tab with Parameter Value
Jaspersoft Studio provides input dialogs for parameters of type String, Date, Time, Number, and Collection.
6.5 Parameter Sets
A parameter set is a set of pre-defined parameters that you can add to your report. For example, you could create
a set that contains parameters for your database address fields (Country, State, City, Zip Code, Street). Then
whenever you want to use address parameters, you can add the set to the report and use the parameters, instead
of adding individual parameters.
Jaspersoft Studio includes the following parameter sets:
•Http Data Adapters Built In Parameters – Parameters that can be used with a data adapter that connects to a
web service.
•Jaspersoft Server Built In Parameters – Parameters used to retrieve user metadata from JasperReports Server.
For example, these parameters let you filter the data in your report depending on user roles or organization.
You must have a valid connection to a JasperReports Server instance to use these parameters. See Chapter
12, “Accessing JasperReports Server from Jaspersoft Studio,” on page205 for more information.
To add a parameter set to your report:
1. Right-click the Parameters node and choose Create Parameter Set.
The Parameters dialog is displayed with the list of available parameter sets.
TIBCO Software Inc. 105
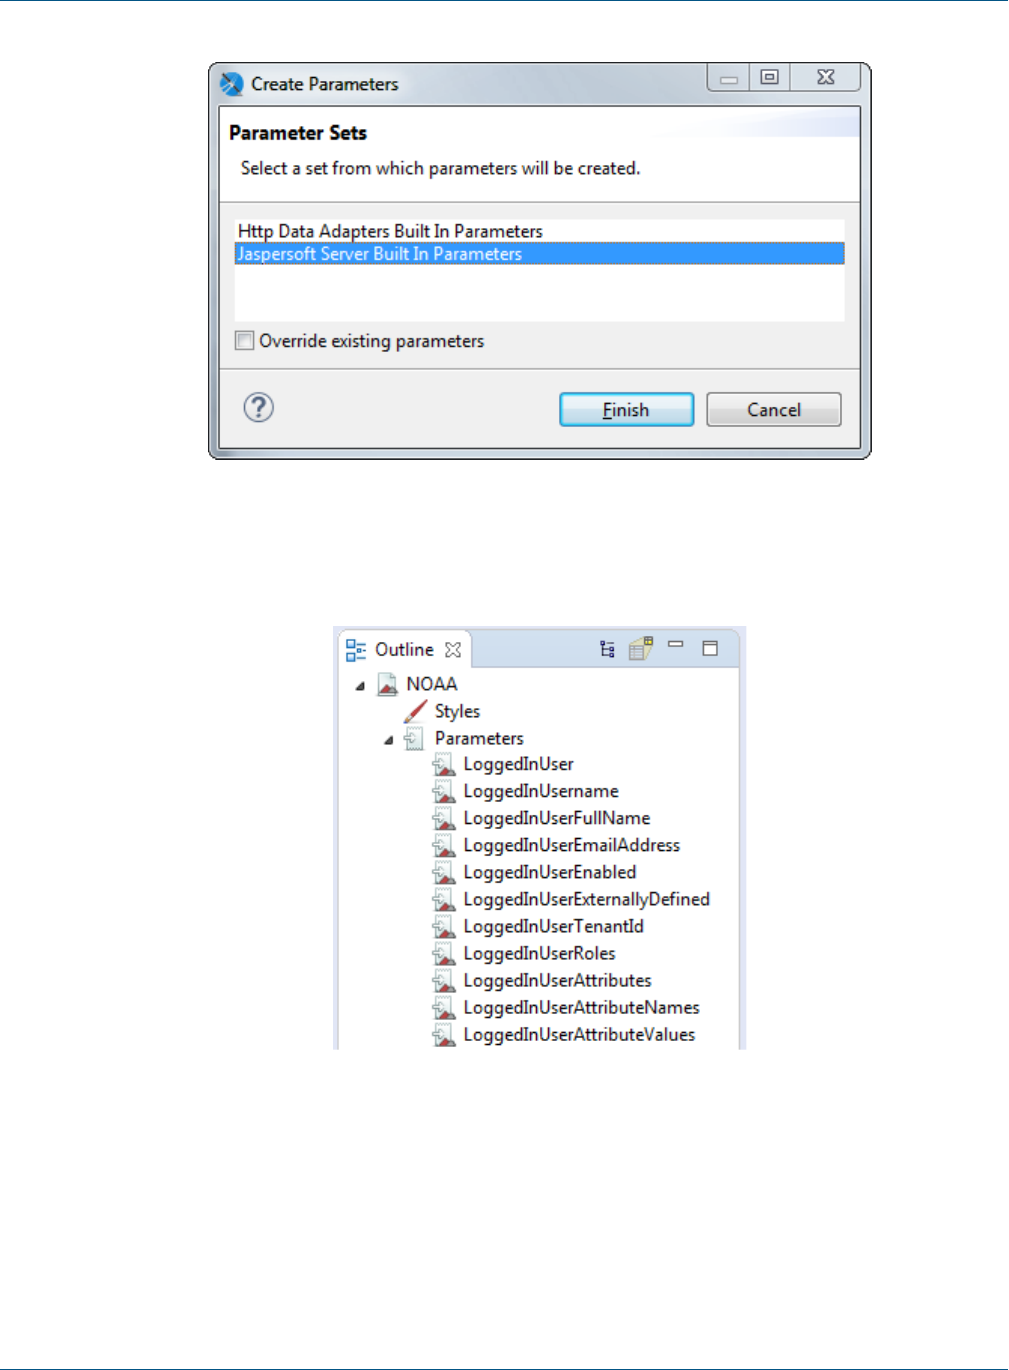
TIBCO Jaspersoft Studio User Guide
Figure 6-10 Adding a parameter set
2. Select the parameter set you want to add to your report and click Finish.
The parameters in the set are added to your report.
Figure 6-11 Result of adding a parameter set
To create a new parameter set:
1. Select Window> Preferences to open the Preferences dialog box (Eclipse> Preferences on Mac).
2. Select Jaspersoft Studio>Parameter Sets.
106 TIBCO Software Inc.
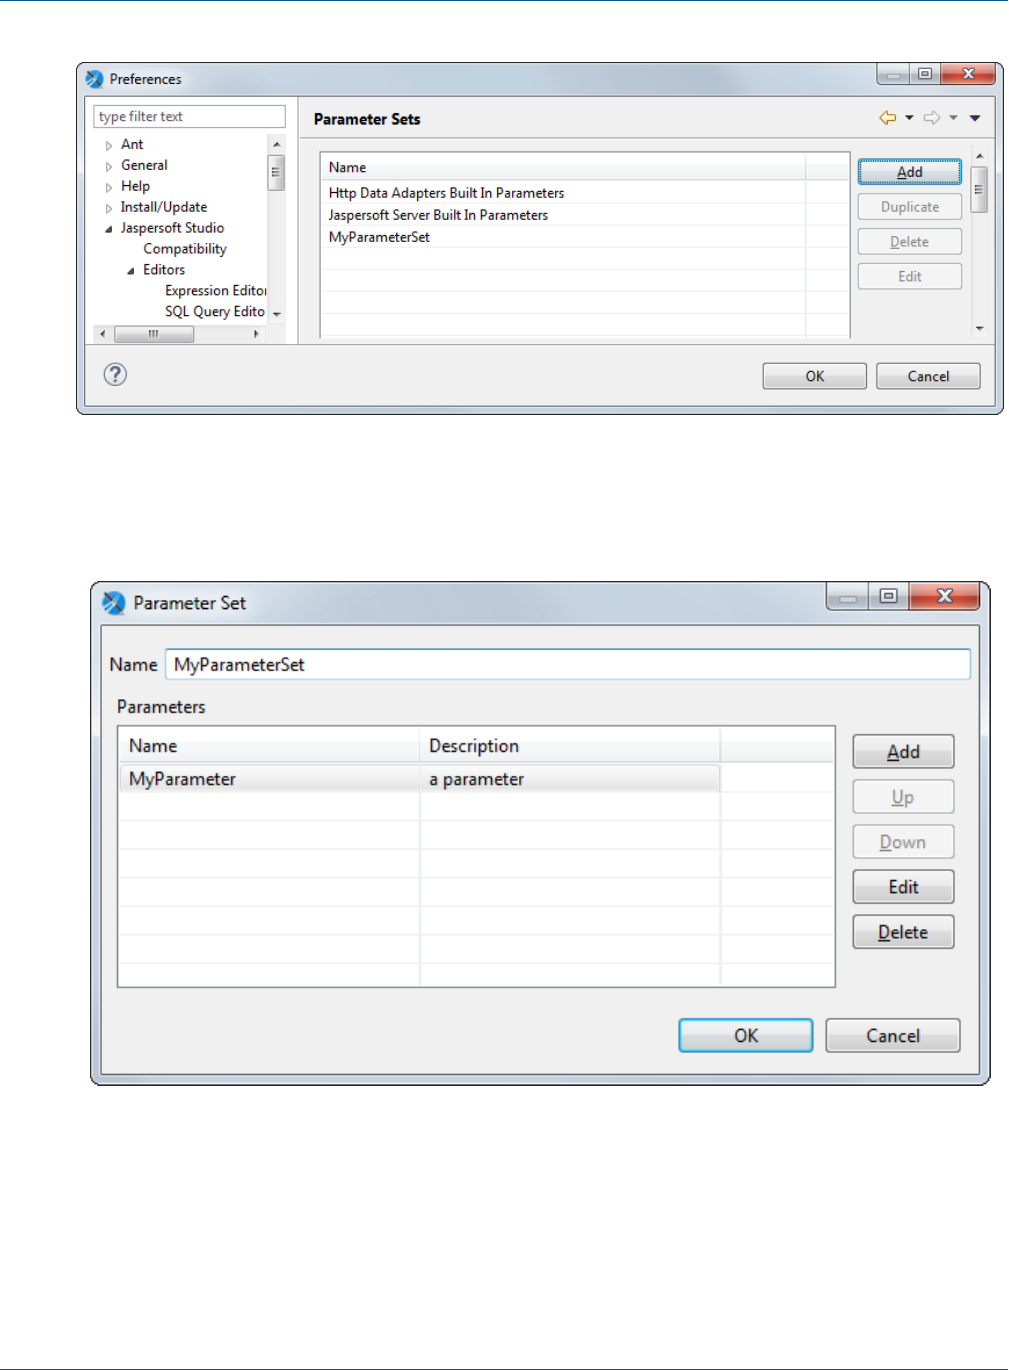
Chapter 6 Parameters
Figure 6-12 Preferences>Jaspersoft Studio>Parameter Sets
3. To create a parameter set, click Add.
The Parameter Set dialog is displayed.
Figure 6-13 Parameter Set dialog
4. To create an individual parameter inside your set, click Add in the Parameter Set dialog.
The Parameter dialog is displayed.
TIBCO Software Inc. 107
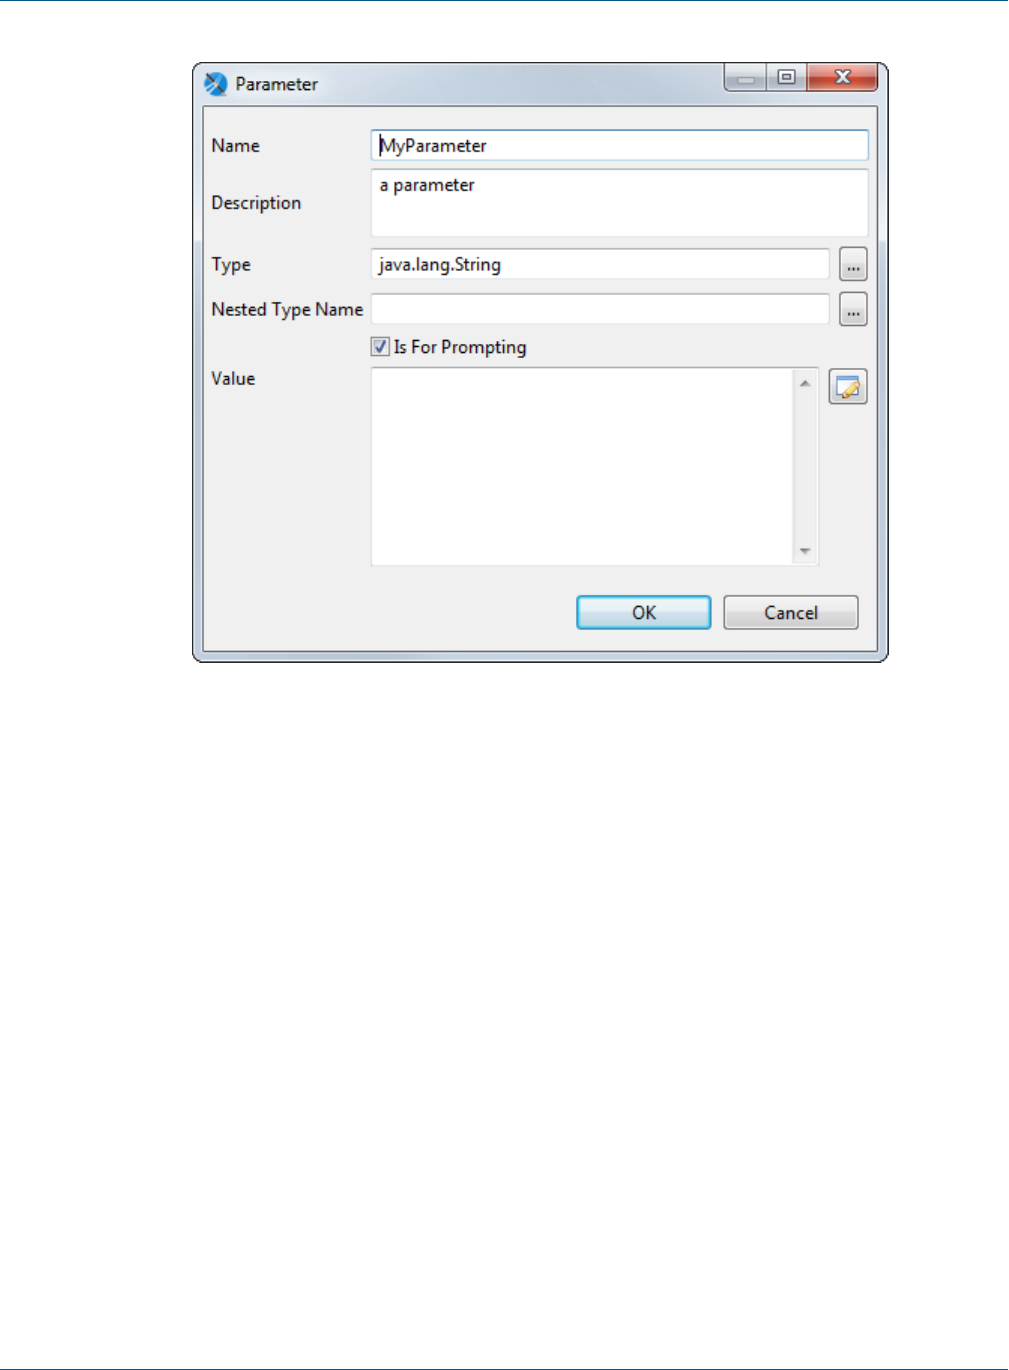
TIBCO Jaspersoft Studio User Guide
Configuring a parameter in a set.
5. Add and configure the parameter. The following settings are available:
•Name – Name of the parameter.
•Class – Class type of the parameter.
•Description – A string describing the parameter. This is shown as the parameter tooltip in the Input
Parameters pane in preview.
•Nested Type Name –
•Is for Prompting – Enable this to have Jaspersoft Studio prompt for the parameter when you preview
the report. If you have this selected and are publishing the report to the server, you will need to create
input controls on the server. May also be passed to an external application.
•Value – Default value for the parameter. This value is used if no value is provided for the parameter
from the application that executes the report. The type of value must match the type declared in the
Class field. For example, if you are creating a Country parameter, you might use the value $F
{SHIPCOUNTRY} for your parameter.
6. Click OK to create the parameter and return to the Parameter Set dialog.
7. When you have created all the parameters you want, click OK to return to the Preferences dialog.
8. Click OK to return to design view and create your parameter set.
To use your parameter set in a report, select Create Parameter Set from the Parameters context menu in
outline view.
108 TIBCO Software Inc.

CHAPTER 7 VARIABLES
You can use variables to store partial results and do complex calculations with the data extracted from a data
source. You can then use these values in other parts of the report, including other variables.
This chapter contains the following sections:
•Defining or Editing a Variable
•Base Properties of a Variable
•Other Properties of a Variable
•Built-In Variables
•Tips & Tricks
7.1 Defining or Editing a Variable
As with many other elements, all defined variables are visible in the Outline view, where you can create a new
variable and edit its properties in the Properties view.
To define a new variable:
1. In the Outline view, right click the Variables item and select Create Variable. A new variable is added to
the list of variables.
2. Click to select the new variable. The Properties view shows information about the new variable.
3. In the Properties view, click the Object tab.
4. Update the variable properties. See “Base Properties of a Variable” on page109 for information on these
options.
Jaspersoft Studio has some built-in variables that are present in every report. These variables can't be edited.
You'll notice their names are light gray; other variables are black. For more information see “Built-In
Variables” on page112
7.2 Base Properties of a Variable
At a minimum, all variables must have the following defined:
•Name: A string used to refer to a variable. It is necessary to use this variable inside other expressions like
the evaluation of a Text Field or the computation of another variable. Use the following syntax to refer to a
variable: $V{variable_name}.
TIBCO Software Inc. 109

TIBCO Jaspersoft Studio User Guide
•Type: Necessary because a variable is an object that is probably used in other expressions, so its type must
be known to be manipulated correctly.
•Expression: The function used to define the variable value, it can be composed of more fields and
variables, which could be logic operators, math operators and so on. Jaspersoft Studio provides an
expression editor. To open it, click the button to the right of the expression text field. The expression is
evaluated on each iteration (every time a record is read from the data source). If no calculation function is
defined, the result of the expression is assigned to the variable. So it's important that the result has a type
compatible with the one in the variable.
•Initial Value: The value assumed from the variable at the beginning, before the first computation of its
expression. The initial value is an expression itself, so it can be defined through the expression editor.
•It's not mandatory, but it's good practice to define an initial value. For example, if you have a variable
called variable1 with the expression new Integer(5), at every iteration, the variable is assigned the
integer value 5. In this context the initial value isn't important. But if you change the expression to $V
{variable1}+5, at every iteration the variable is incremented by 5. In this case, an initial value is
necessary because if the variable1 is undefined at the first iteration, all future evaluations will break.
7.3 Other Properties of a Variable
The most complex property of a variable is its temporal value. Because its expression is evaluated at every
iteration, it's important to understand which value has a variable, and at which time. This can be complicated,
considering that a variable can use other variables inside its expression. For these reasons there are mechanisms
that can be used to simplify the evaluation or reading of the variable value during iterations.
7.3.1 Evaluation Time
Evaluation time is not an attribute of the variable but of elements that can use the variable in their expressions
(like a Text Field). Evaluation time determines when the value of the variable should be read. A variable can
potentially change value at every iteration, so a value read at one time may be different from the value read
another time.
For every element using a variable in its expression, it's possible to say when to evaluate the variable. And
because an expression can contain multiple variables, this parameter also influences when these variables are
read.
The possible evaluation times are:
•Report: The expression is evaluated ad the end of the report.
•Page: The expression is evaluated at the end of every page of the report.
•Column: The expression is evaluated at the end of each column (for a single column report, this is the
same as Page).
•Group: The expression is evaluated after the break of the specified group (available only if at least one
group is defined).
•Band: The expression is evaluated after the end of the band where the element with this evaluation time is
placed.
•This is a very specific case, introduced to wait until the other elements in the band are completely created.
Typically the value of the variables are read at the start of the band. But suppose, for example, you have a
subreport with an output parameter to print in the main report. To print this parameter it must be read after
the subreport is computed, so the value can be printed when the band is completely created. In this case the
Band evaluation time is necessary.
110 TIBCO Software Inc.

Chapter 7 Variables
•Auto: This is used when the expression contains variables and fields that need to be evaluated at different
times. The variables are evaluated at a time corresponding to their Reset Type (see below for more
information), instead the fields are always evaluated at time -now. This type is useful when report elements
have expressions that combine values evaluated at different times (for example, percentage out of a total).
•Now: The value of the expression is evaluated after the read of every record, so at every iteration, this is the
default behavior.
7.3.2 Calculation Function
A calculation function is an attribute that specifies when a variable can be used in association with the
expression to determine the value of the variable. When using a calculation function, the value of the variable is
not determined directly by its expression. Instead, it's passed to the calculation function that uses it to determine
its value.
There are many calculation functions built-in to Jaspersoft Studio:
•Sum: At every iteration the variable value is summed. This is one of the cases where the initial value is
really important.
•Count: At every iteration the variable value is incremented by one unit (this is only if the expression isn't
null).
•Distinct Count: At every iteration the variable value is incremented by one unit, but only if the value of
the expression was never returned before.
•Average: The value of the variable is the arithmetic average of all values received in input from the
expression.
•Lowest: The variable takes the value of the lowest element received from the expression.
•Highest: The variable takes the value of the highest element received from the expression.
•Standard Deviation: The standard deviation of all the values received from the expression.
•First: The variable takes the value from the first value returned by the expression.
•System: No calculation is done and the expression is not evaluated, the value of the variable is the last
value set on it. This is useful to store partial results or the final result of a computation.
7.3.3 Increment Type
As stated above, when a calculation function is defined, the value of the expression passed to the function that
calculates the variable. By default this occurs for every record read, but sometimes a different behavior is
desired. The increment type parameter enables you to change the "time" at which the calculation function is
used.
The possible values for this attribute are:
•Report: The Calculation Function is called only at the end of the report, passing to it the expression's
value at that moment.
•Page: The Calculation Function is called at the end of each page, passing to it expression's value at each of
those moments.
•Column: The Calculation Function is called at the end of each column (for a one-column report, this is the
same as Page).
•Group: The Calculation Function is called at the start of every occurrence of the specified group. This
option is visible only if at least one group is defined.
•None: The Calculation Function is called after the read of every record, this is the default behavior.
TIBCO Software Inc. 111
TIBCO Jaspersoft Studio User Guide
Remember the expression is evaluated at every record read, independent of the increment type selected, but the
calculation function is used only when the times match those defined in the increment type.
7.3.4 Reset Type
The reset type specifies when a variable should be reset to its initial value (or to null if no initial value is
defined). This is useful when the variable is used to compute a partial value, like a sum or an average of only
some of the records read.
The possible values for this attribute are:
•Report: The variable is initialized only one time at the beginning of the report creation.
•Page: The variable is initialized on each page.
•Column: The variable is initialized again in each new column (for a one-column report, this is the same as
Page).
•Group: The variable is initialized at the start of every occurrence of the specified group. This option is
available only if at least one group is defined.
•None: The variable is never initialized, so the initial value expression is ignored.
7.3.5 Incrementer Factory Class Name
The calculation functions are useful, but limited to numeric types. You may have a case where something more
specific is needed. Suppose you have a String type field and you want to concatenate the value read. You can
do this by defining a new Incrementer. An incrementer is a piece of Java code that extends the
JRIncrementerFactory interface, and can build a personalized calculation function to do what you need.
Every calculation function receives the expression value and the variable value and returns the result of the
incrementation, so there is everything needed to do the calculation and return the right value.
7.4 Built-In Variables
Jaspersoft Studio makes some built-in variables available to you. See the table below. These variables can't be
edited. You'll notice their names are light gray; other variables are black.
Variable Name Description
PAGE_NUMBER Contains the current number of pages in the report at report time.
COLUMN_NUMBER Contains the current number of columns.
REPORT_COUNT Contains the number of records processed.
PAGE_COUNT Contains the current number of records processed in the current page.
COLUMN_COUNT Contains the current number of records processed during the current column
creation.
112 TIBCO Software Inc.

Chapter 7 Variables
7.5 Tips & Tricks
Pay attention to the variable type. For example if your expression returns a number but the variable type is
string (the default type) then its value is always zero.
The form of the expression is very important for the computation of a value, especially when the variable itself
is used in the expression. Consider the following example:
A field with name Money_Gained with an integer value, which could be null, is read from the data source.
A variable Total1 with the expression:
IF(EQUALS($F{Money_Gained}, null), $V{Total1}, $V{Total1}+$F{Money_Gained})
initial value zero, and no calculation function;
A variable Total2 with the expression
$V{Money_Gained} == null ? $V{Total2} : $V{Total2}+$F{Money_Gained}
initial value zero, and no calculation function;
The two expressions seem equivalent. They both add the money gained to the variable when it's not null
(remember that if there's no calculation function, the value of the expression is assigned to the variable). The
check if the Money_Gained has a null value is necessary because the sum of a number with the value null is
null. So adding null to Total1 or Total2 changes the variable to null. But even with this check when Money_
Gained becomes null for the first time even Total1 is null, instead Total2 has the correct value.
This happens because these two expressions have different interpreters, the first is interpreted by Groovy, the
second by Java. The Java behavior evaluates the condition and then selects the correct branch. The Groovy
behavior computes the two branches, then evaluates the expression, and finally returns the correct branch. Doing
this adds the null value to Total1 before doing the check, and makes Total1 null. To avoid this, use the
variable in the main branch only, for example Total1 could be rewritten as:
$V{Total1} + IF(EQUALS($F{Money_Gained}, null),0,F{Money_Gained}).
The syntax is still interpreted by Groovy, but now the variable is out of the IF branches, so even if they are
both evaluated, the variable maintains its value.
TIBCO Software Inc. 113

TIBCO Jaspersoft Studio User Guide
114 TIBCO Software Inc.

CHAPTER 8 EXPRESSIONS
Many settings in a report are defined by formulas, such as conditions that can hide an element, special
calculations, or text processing that requires knowledge of a scripting language.
Formulas can be written in at least three languages, two of which (JavaScript and Groovy) can be used without
knowledge of programming methods.
All formulas in JasperReports are defined through expressions. The default expression language is Java, but if
you're not a programmer, we recommend JavaScript or Groovy, because those languages hide a lot of the Java
complexity. The language is a property of the document. To set it, select the document root node in the Outline
view and choose your language in the Language property in the Properties view.
An expression is a formula that operates on some values and returns a result, like a formula in a spreadsheet cell.
A cell can have a simple value or a complex formula that refers to other values. In a spreadsheet you refer to
values contained in other cells; in JasperReports you use the report fields, parameters, and variables. Whatever is
in your expression, when it's computed, it returns a value (which can be null).
8.1 Expression Types
An expression's type is determined by the context in which the expression is used. For example, if your
expression is used to evaluate a condition, the expression should be Boolean (true or false); if you're creating an
expression to display in a text field, it's probably a String or a number (Integer or Double). Using the right type
is crucial; JasperReports requires precision when choosing an expression type.
Some of the most important Java types are:
java.lang.Boolean Defines an Object that represents a Boolean value such as true
and false
java.lang.Byte Defines an Object that represents a byte
java.lang.Short Defines an Object that represents an short integer
java.lang.Integer Defines an Object that represents integer numbers
java.lang.Long Defines an Object that represents long integer numbers
java.lang.Float Defines an Object that represents floating point numbers
java.lang.Double Defines an Object that represents real numbers
TIBCO Software Inc. 115

TIBCO Jaspersoft Studio User Guide
java.lang.String Defines an Object that represents a text
java.util.Date Defines an Object that represents a date or a timestamp
java.lang.Object A generic java Object
If an expression is used to determine the value of a condition that determines, for instance, whether an element
should be printed, the return type is java.lang.Boolean. To create it, you need an expression that returns an
instance of a Boolean object. Similarly, if an expression shows a number in a text field, the return type is
java.lang.Integer or java.lang.Double.
Neither JavaScript nor Groovy is particularly formal about types, since they are not typed languages; the
language itself treats a value in the best way by trying to guess the value type or by performing implicit casts
(conversion of the type).
8.2 Expression Operators and Object Methods
Operators in Java, Groovy and JavaScript are similar because these languages share the same basic syntax.
Operators can be applied to a single operand (unary operators) or on two operands (binary operators). The
following table shows a number of operators, but it is not a complete list. For example, there is a unary operator
to add 1 to a variable (++), but it is easier to use x + 1.
Operator Description Example
+Sum (it can be used to sum two numbers or to concatenate two strings) A+B
-Subtraction A-B
/Division A/B
%Rest, it returns the rest of an integer division A%B
|| Boolean operator OR A || B
&& Boolean operator AND A && B
== Equals A == B
!= Not equals A != B
!Boolean operator NOT !A
Table 8-1 Expression operators
Regarding the Equals operator: in Java, the == operator can only be used to compare two primitive
values. With objects, you need to use the special method “equals”; for example, you cannot write an
expression like "test" == "test", you need to write "test".equals("test").
Regarding the Equals operator: in Java, the != operator can only be used to compare two primitive
values.
116 TIBCO Software Inc.
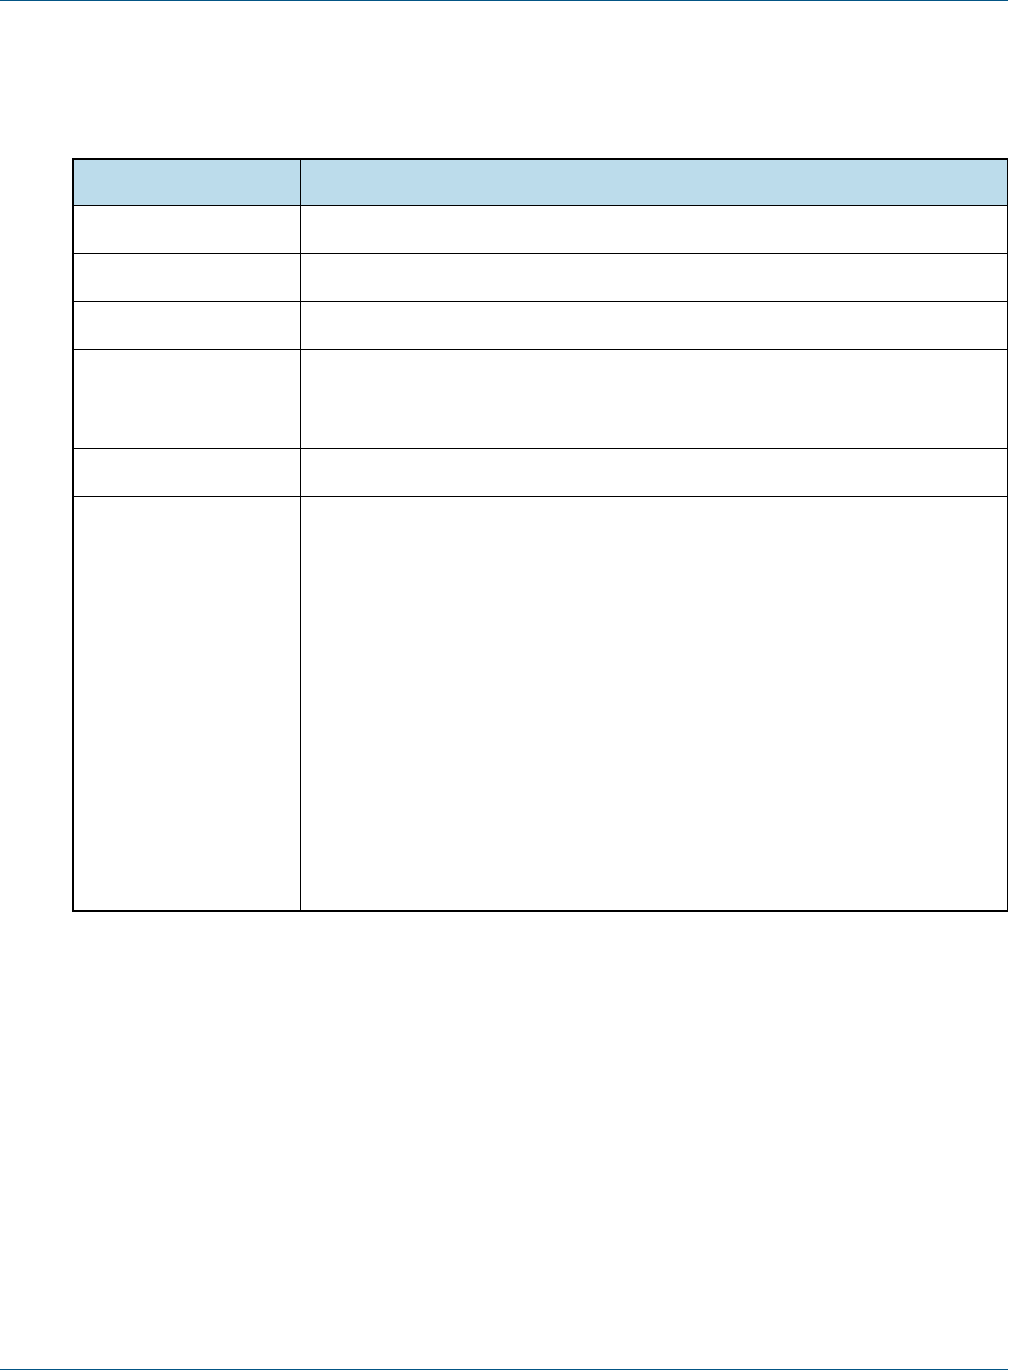
Chapter 8 Expressions
Within an expression, you can use the syntax summarized in Table 8-2, “Syntax for referring to report
objects,” on page117 to refer to the parameters, variables, and fields defined in the report.
Syntax Description
$F{name_field} Specifies the name_field field ("F" means field).
$V{name_variable} Specifies the name_variable variable.
$P{name_parameter} Specifies the name_parameter parameter.
$P!{name_parameter} Special syntax used in the report SQL query to indicate that the parameter does not
have to be dealt as a value to transfer to a prepared statement, but that it represents
a little piece of the query.
$R{resource_key} Special syntax for localization of strings.
$X{functionName,
col_name, param1,
[param2]}
Syntax for complex queries, such as comparing a column value to a parameter
value. Based on the function in the first argument, JasperReports constructs a SQL
clause. The following functions are available:
• Functions expecting three arguments for $X{} –EQUAL,NOTEQUAL,LESS,
LESS] (less than or equal to), GREATER,[GREATER (greater than or equal to),
IN,NOTIN. For example:
$X{EQUAL, order_date, date_parameter}
• Functions expecting four arguments for $X{} –
BETWEEN (excludes both endpoints)
BETWEEN] (includes right endpoint)
[BETWEEN (includes left endpoint)
[BETWEEN] (includes both endpoints)
For example:
$X{BETWEEN, order_date, start_date_param, end_date_param}
Table 8-2 Syntax for referring to report objects
In summary, fields, variables and parameters represent objects; specify their type when you declare them within
a report.
Although expressions can be complicated, usually it is a simple operation that returns a value. There is a simple
if-else expression that is very useful in many situations. An expression is just an arbitrary operation that any
stage must represent a value. In Java, these operators can be applied only to primitive values, except for the sum
operator (+). The sum operator can be applied to a String expression with the special meaning of concatenate.
For example:
$F{city} + “, ” + $F{state}
results in a string like:
San Francisco, California
TIBCO Software Inc. 117
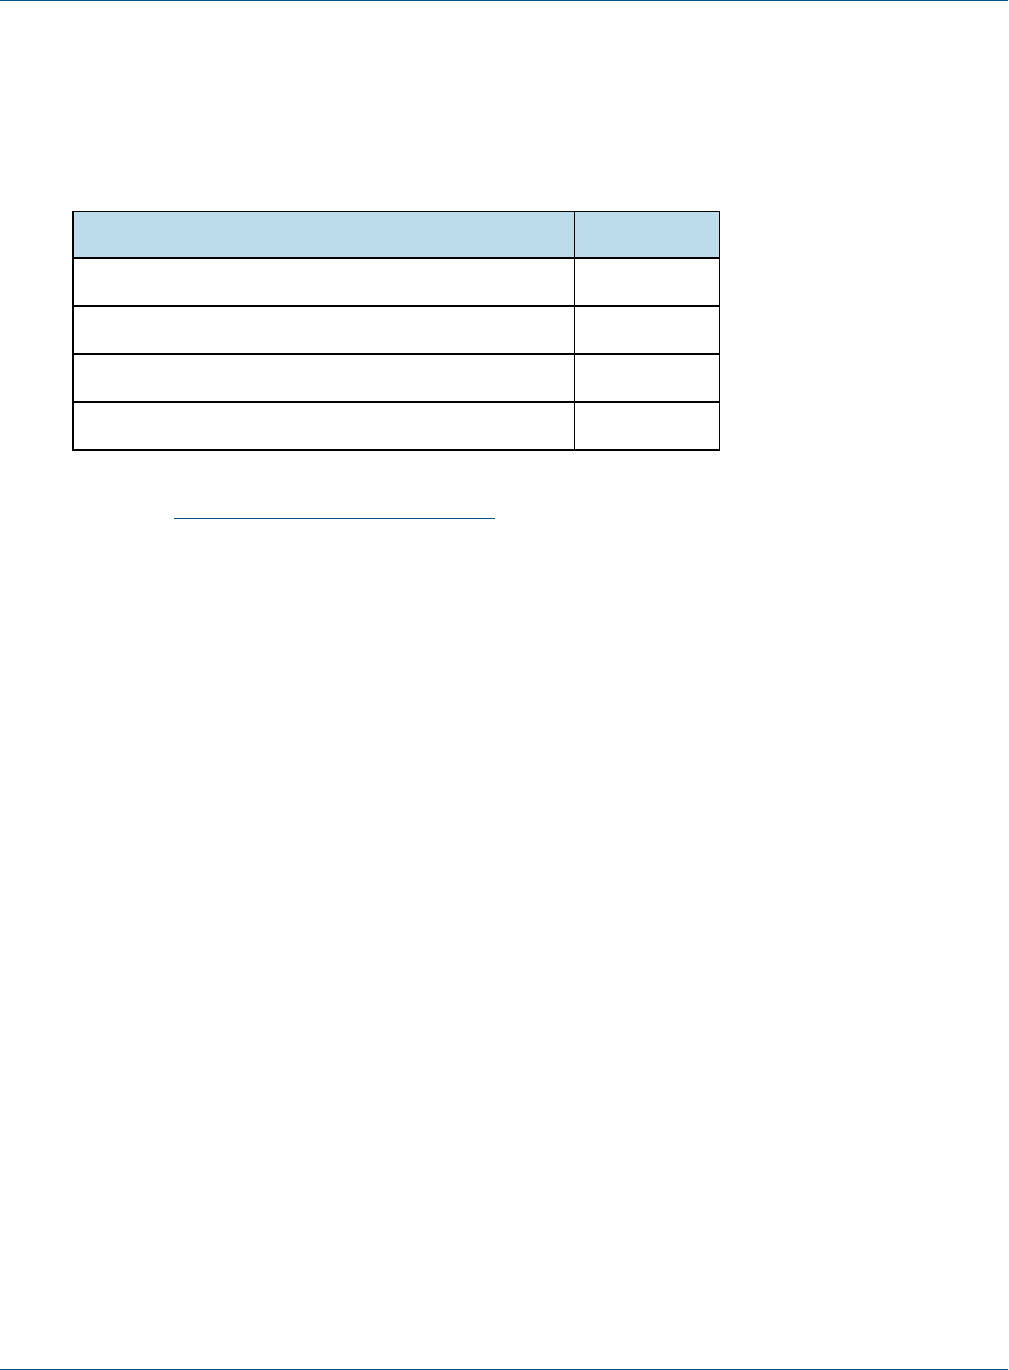
TIBCO Jaspersoft Studio User Guide
Any object in an expression can include methods. A method can accept zero or more arguments, and it can
return or not a value. In an expression you can use only methods that return a value; otherwise, you would have
nothing to return from your expression. The syntax of a method call is:
Object.method(argument1, argument2, <etc.>)
Some examples:
Expression Result
“test”.length() 4
“test”.substring(0, 3) “tes”
“test”.startsWith(“A”) false
“test”.substring(1, 2).startsWith(“e”) true
The methods of each object are usually explained in the JasperReports Library Javadocs, which that are
available at http://jasperreports.sourceforge.net/api/.
You can use parentheses to isolate expressions and make the overall expression more readable.
8.3 Using an If-Else Construct in an Expression
A way to create an if-else-like expression is by using the special question mark operator. For example:
(($F{name}.length() > 50) ? $F{name}.substring(0,50) : $F{name})
The syntax is (<condition>) ? <value on true> : <value on false>. It is extremely useful, and can be
recursive, meaning that the value on true and false can be represented by another expression which can be a
new condition:
(($F{name}.length() > 50) ?
(($F{name}.startsWidth(“A”)) ? “AAAA” : “BBB”)
:
$F{name})
This expression returns the String AAAA when the value of the field name is longer than 50 characters and starts
with A, returns BBB if it is longer than 50 characters but does not start with A, and, finally, returns the original
field value if neither of these conditions is true.
Despite the possible complexity of an expression, it can be insufficient to define a needed value. For example, if
you want to print a number in Roman numerals or return the name of the weekday of a date, it is possible to
transfer the elaborations to an external Java class method, which must be declared as static, as shown in the
following example:
MyFormatter.toRomanNumber( $F{MyInteger}.intValue() )
The function operand toRomanNumber is a static method of the MyFormatter class, which takes an int as
argument (the conversion from Integer to int is done by means of the intValue() method; it is required only
when using Java as language) and gives back the Roman version of a number in a lace.
This technique can be used for many purposes; for example, to read the text from a CLOB field or to add a
value into a HashMap (a Java object that represents a set of key/value pairs).
118 TIBCO Software Inc.

Chapter 8 Expressions
8.4 Using Unicode Characters in Expressions
You can use Unicode syntax to write non-Latin-based characters (such as Greek, Cyrillic, and Asian characters).
For these characters, specify the Unicode code in the expression that identifies the field text. For example, to
print the Euro symbol, use the Unicode \u20ac character escape. The expression \u20ac is not simple text; it is
a Java expression that identifies a string containing the € character.
If you use this character in a static text element, “\u20ac” will appear. The value of a static field is not
interpreted as a Java expression.
8.5 Using Java as a Language for Expressions
Java was the first language supported by JasperReports and is still the most commonly-used language as well as
being the default.
Following are some examples of Java expressions:
•“This is an expression”
•new Boolean(true)
•new Integer(3)
•(($P{MyParam}.equals("S")) ? "Yes" : "No")
The first thing to note is that each of these expressions represents a Java Object, meaning that the result of each
expression is a non-primitive value. The difference between an object and a primitive value makes sense only in
Java, but it is very important: a primitive value is a pure value like the number 5 or the Boolean value true.
Operations between primitive values have as a result a new primitive value, so the expression:
5+5
results in the primitive value 10. Objects are complex types that can have methods, can be null, and must be
“instanced” with the keyword “new” most of the time. In the second example above, for instance (new Boolean
(true)), we must wrap the primitive value true in an object that represents it.
By contrast, in a scripting language such as Groovy and JavaScript, primitive values are automatically wrapped
into objects, so the distinction between primitive values and objects wanes. When using Java, the result of our
expression must be an object, which is why the expression 5+3 is not legal as-is but must be fixed with
something like this:
new Integer( 5 + 3 )
The fix creates a new object of type Integer representing the primitive value 10.
So, if you use Java as the default language for your expressions, remember that expressions like the following
are not valid:
•3+2*5
•true
•(($P{MyParam} == 1) ? "Yes" : "No")
These expressions don’t make the correct use of objects. In particular, the first and the second expressions are
not valid because they are of primitive types (integer in the first case and boolean in the second case) which
do not produce an object as a result. The third expression is not valid because it assumes that the MyParam
parameter is a primitive type and that it can be compared through the == operator with an int, but it cannot. In
fact, we said that parameters, variables, and fields are always objects and primitive values cannot be compared
or used directly in a mathematical expression with an object.
TIBCO Software Inc. 119

TIBCO Jaspersoft Studio User Guide
8.6 Using Groovy as a Language for Expressions
The modular architecture of JasperReports provides a way to plug in support for languages other than Java. By
default, the library supports Groovy and JavaScript.
Groovy is a full language for the Java 2 Platform. Inside the Groovy language you can use all classes and JARs
that are available for Java. The following table compares some typical JasperReports expressions written in Java
and Groovy:
Expression Java Groovy
Field $F{field_name} $F{field_name}
Sum of two
double fields
new Double($F{f1}.doubleValue() + $F{f2}.doubleValue()) $F{f1} + $F
{f2}
Comparison
of numbers
new Boolean($F{f}.intValue() == 1) $F{f} == 1
Comparison
of strings
new Boolean($F{f} != null && $F{f}.equals("test")) $F{f} ==
"test"
Table 8-3 Groovy and Java code samples
The following is a correct Groovy expression:
new JREmptyDataSource($F{num_of_void_records})
JREmptyDataSource is a class of JasperReports that creates an empty record set (meaning with the all fields set
to null). You can see how you can instance this class (a pure Java class) in Groovy without any problem. At the
same time, Groovy allows you to use a simple expression like this one:
5+5
The language automatically encapsulates the primitive value 10 (the result of that expression) in a proper object.
Actually, you can do more: you can treat this value as an object of type String and create an expression such
as:
5 + 5+ ”my value”
Whether or not such an expression resolves to a rational value, it is still a legal expression and the result is an
object of type String with the value:
10 my value
Hiding the difference between objects and primitive values, Groovy allows the comparison of different types of
objects and primitive values, such as the legal expression:
$F{Name} == “John”
This expression returns true or false, or, again:
$F{Age} > 18 Returns true if the Age object interpreted as a number is greater
than 18.
“340” < 100 Always returns false.
120 TIBCO Software Inc.

Chapter 8 Expressions
“340”.substring(0,2) < 100 Always returns true (since the substring method call produces the
string “34”, which is less than 100).
Groovy provides a way to greatly simplify expressions and never complains about null objects that can crash a
Java expression throwing a NullPointerException. It really does open the doors of JasperReports to people
who don’t know Java.
8.7 Using JavaScript as a Language for Expressions
JavaScript is a popular scripting language with a syntax very similar to Java and Groovy. JavaScript has a set of
functions and object methods that in some cases differ from Java and Groovy. For example, the method
String.startsWith(...) does not exist in JavaScript. You can still use Java objects in JavaScript. An
example is:
(new java.lang.String("test")).startsWith("t")
This is a valid JavaScript expression creating a Java object (in this case a java.lang.String) and using its
methods.
JavaScript is the best choice for users who have no knowledge of other languages. The other significant
advantage of JavaScript is that it is not interpreted at run time, but instead generates pure Java byte-code. As a
result, it offers almost the same performance as Java itself.
TIBCO Software Inc. 121

TIBCO Jaspersoft Studio User Guide
122 TIBCO Software Inc.

CHAPTER 9 FONTS
The best way to define and use a font in JasperReports Library is to create and use a font extension. Font
extensions force JasperReports to work with external TTF, SVG, WOFF, or EOT fonts instead of using built-in
or system fonts. This ensures that a specific font behaves in the same way wherever the report is executed.
Using system fonts usually results in unacceptable changes in report format when the report is deployed on
another system. Subtle differences in font size and spacing can affect not only the appearance of the text but the
layout of the report itself. You may lose part of the text in a text element or the font might not be available at
all. Font extensions help avoid these problems:
•A font can be available in one operating system but not in another. In this case, the default font is used for
the element, but it may not support the expected character set.
•The Java virtual machine can map logical font family names to different physical fonts.
•A font that is available in different operating systems can be slightly different from one operating system to
another.
You can incorporate additional information in a font extension, such as: bold and italic fonts, the text encoding
for the font, and a list of locales where the font should be used. You can also use font extensions to embed your
fonts in PDF files.
In addition, you can combine several font extensions into a font set. For example, if you have data in English
and Japanese, you can create a single font set that combines fonts for those languages.
9.1 Font Extensions Reference
You work with font extensions using the Fonts page in the Preferences dialog.
9.1.1 The Fonts Page
The Fonts page displays all your font extensions and font sets, and lets you create, copy, edit, delete, and
reorder fonts and font sets.
To access the Fonts page:
1. Select Window> Preferences (Eclipse> Preferences on Mac). The Preferences dialog is displayed.
2. In the Preferences dialog, select Jaspersoft Studio> Fonts.
The Fonts page is displayed.
TIBCO Software Inc. 123

TIBCO Jaspersoft Studio User Guide
Figure 9-1 Fonts page
The Fonts page shows the following:
•Font List – The list of font extensions and font sets. Font sets are prepended with +; click to expand and
show the font extensions contained in the font set. When you create a font set, the default font for the set is
the font that appears highest in the list when the font set is created. Inside a font set, non-default fonts are
applied in the order they appear in the font list.
•Add from URL – Specify a URL location for a zip file of the fonts you want to add as extensions. To add
all the Noto fonts from Google, click and select the Noto URL.
•Add from Path – Specify a folder containing the fonts you want to add as extensions.
•Duplicate – Create a copy of the selected font extension(s) and/or font set(s). Each copy has a unique
name, which can be edited.
124 TIBCO Software Inc.

Chapter 9 Fonts
•Delete – Delete the selected font extension(s) and/or font set(s). This does not remove the original font files
from your system.
•Up – Move the selected font extension and/or font set up in the list of fonts.
•Down – Move the selected font extension and/or font set down in the list of fonts.
•Create Set – Combine the selected font extensions into a font set.
•Add to Set – Add the selected font extension(s) to an existing font set. Clicking this displays a dialog
where you can select the font set you want to add the extensions to.
•Edit – Edit the selected font extension or set. For a font extension, displays The Font Family Dialog. For a
font set, displays the Font Set dialog.
•Export – Export the selected font extension or set.
9.1.2 The Font Family Dialog
The Font Family dialog lets you configure an existing font extension and create and configure font sets. This
dialog has three pages.
To access the Font Family dialog:
Select a font extension in the Fonts list and click Edit.
9.1.2.1 Font Family Page
The Font Family page lets you define the basic configuration of the font or font set.
TIBCO Software Inc. 125
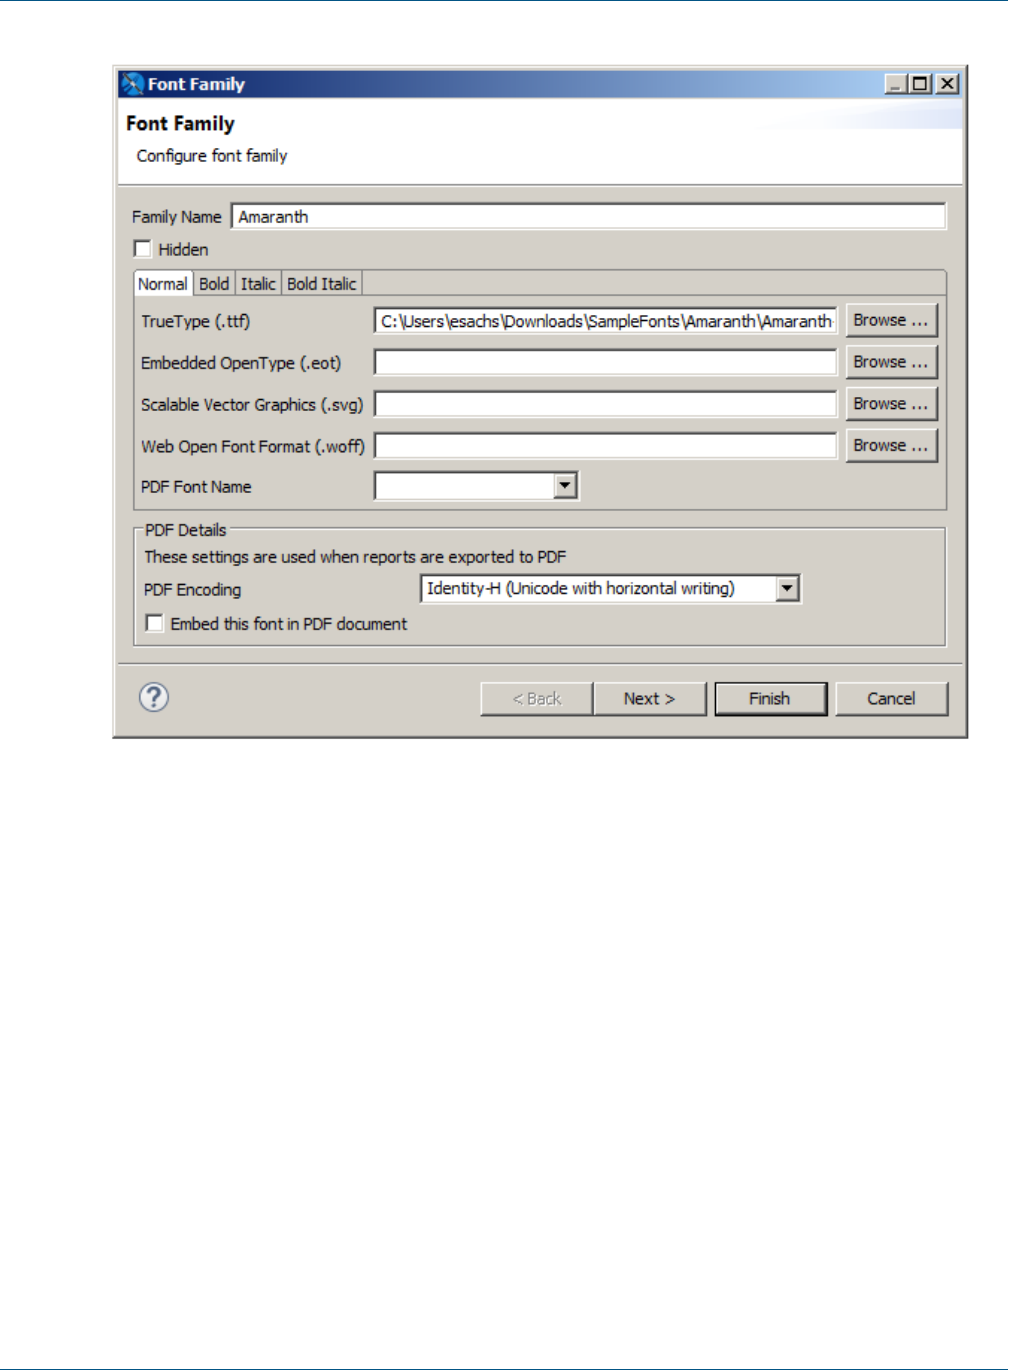
TIBCO Jaspersoft Studio User Guide
Figure 9-2 Font Family dialog – Font Family
The Font Family page shows the following:
•Family Name – Name JasperReports Library uses to identify the font extension or font set. When you
create a font extension from an external font file, by default, the font name is used for the family name. This
can be edited.
•Hidden – Flag that determines whether the font is shown as an available font extension "above the line" in
the Font property of a report element. Use the Hidden flag to hide internal fonts from the user. See 9.2.2,
“Using Font Extensions in a Report,” on page135 for more information.
•Normal/Bold/Italic/Bold Italic – Tabs that let you configure the individual files that define the specified
attributes. For each attribute, you can configure the following:
•[Font Format] – File location for the specific font and attribute. To change or add a file, use the
Browse button to navigate to the file location for the specific font and attribute. You can only select
one file for each tab.
•PDF Font Name (deprecated) – The name of the font when exported to PDF. This can be a pre-
defined PDF font or the name of the font file. Not necessary when using font extensions.
•PDF Details – Settings used for the font when exported to PDF. Deprecated for static text and textfields.
•PDF Encoding (deprecated) – The font encoding to use for the font. Defaults to Identity-H. To avoid
Identity-H printing issues, set this to the correct encoding for your font.
126 TIBCO Software Inc.
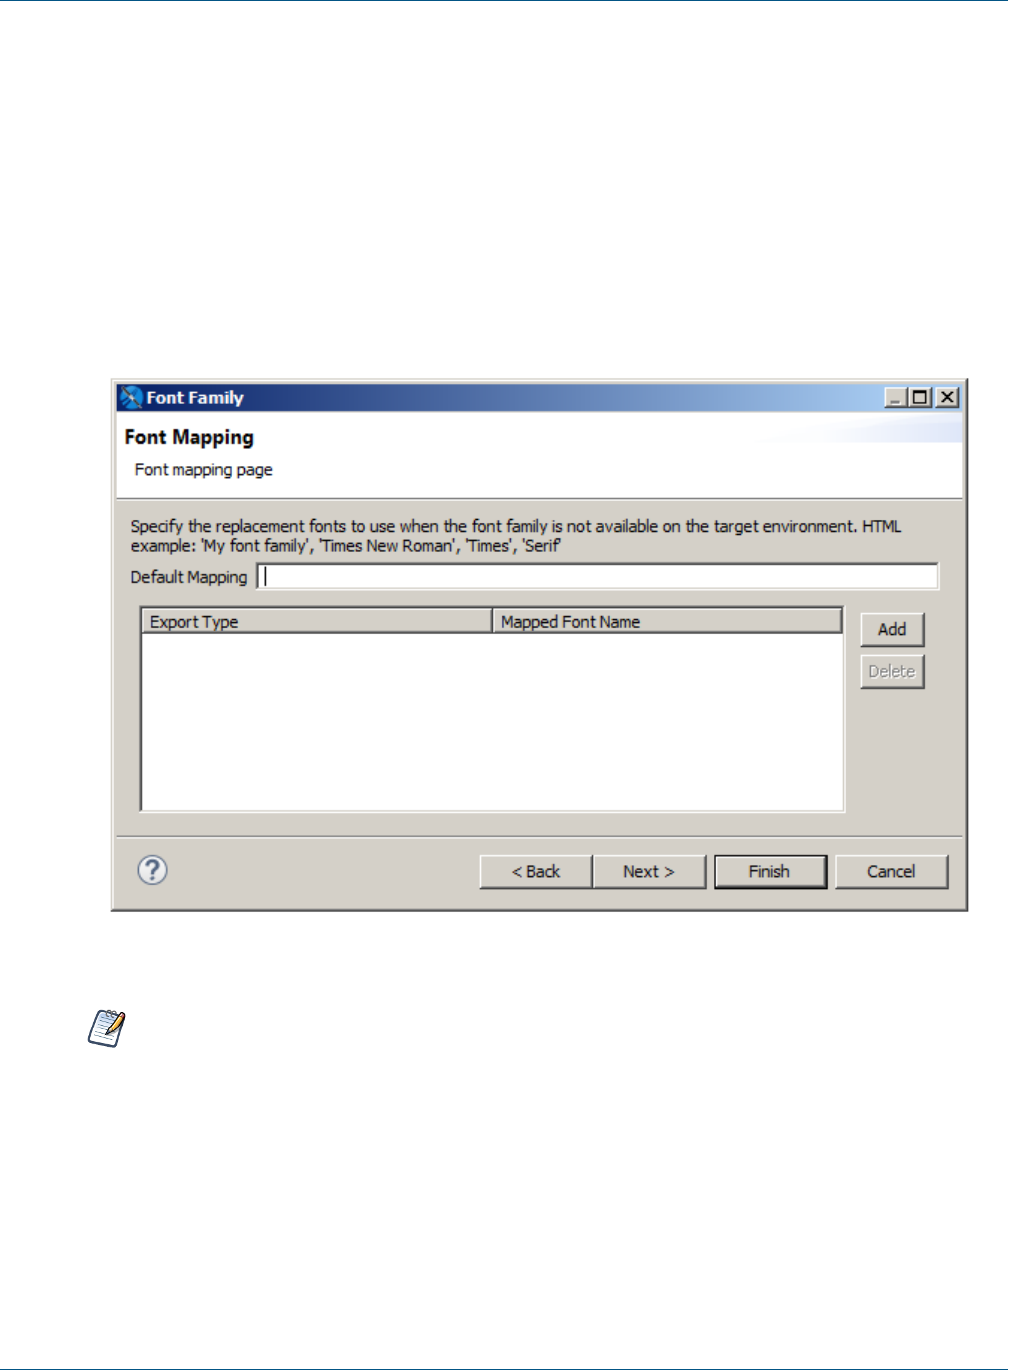
Chapter 9 Fonts
•Embed this font in PDF document (deprecated) – Flag that specifies whether to embed the font in a
generated PDF or not. Embedding fonts is recommended to ensure consistency across platforms.
9.1.2.2 Font Mapping Page
The Font Mapping page lets you specify a font mapping to use when one or more font files are not installed in
the target environment. The order of the font names indicates the order in which the web browser should search
for the replacement font. Once a replacement font is found, the browser stops searching and renders the text. If
no font mapping is available for HTML, then web fonts are used.
To access the Font Mapping Page:
Click Next on the Font Family page.
Figure 9-3 Font Family dialog – Font Mapping
If a mapping is present, then web fonts are not used. Do not define a font mapping unless you want to
override the web font functionality.
The Font Mapping page shows the following:
•Default Mapping – A string that defines a mapping for the font. For example, a serif font might be set to:
'My font family', 'Times New Roman', 'Times', 'Serif'.
•Add button – Adds the string in the Default Mapping field to the list of mappings.
•Delete button – Deletes the currently highlighted mapping.
•Export Type – Sets the file type (html, xhtml, or rtf). Click on a value to display a down arrow, then click
on the arrow to select a type from the cascading menu. Defaults to html. You can define different mappings
for different file types.
TIBCO Software Inc. 127
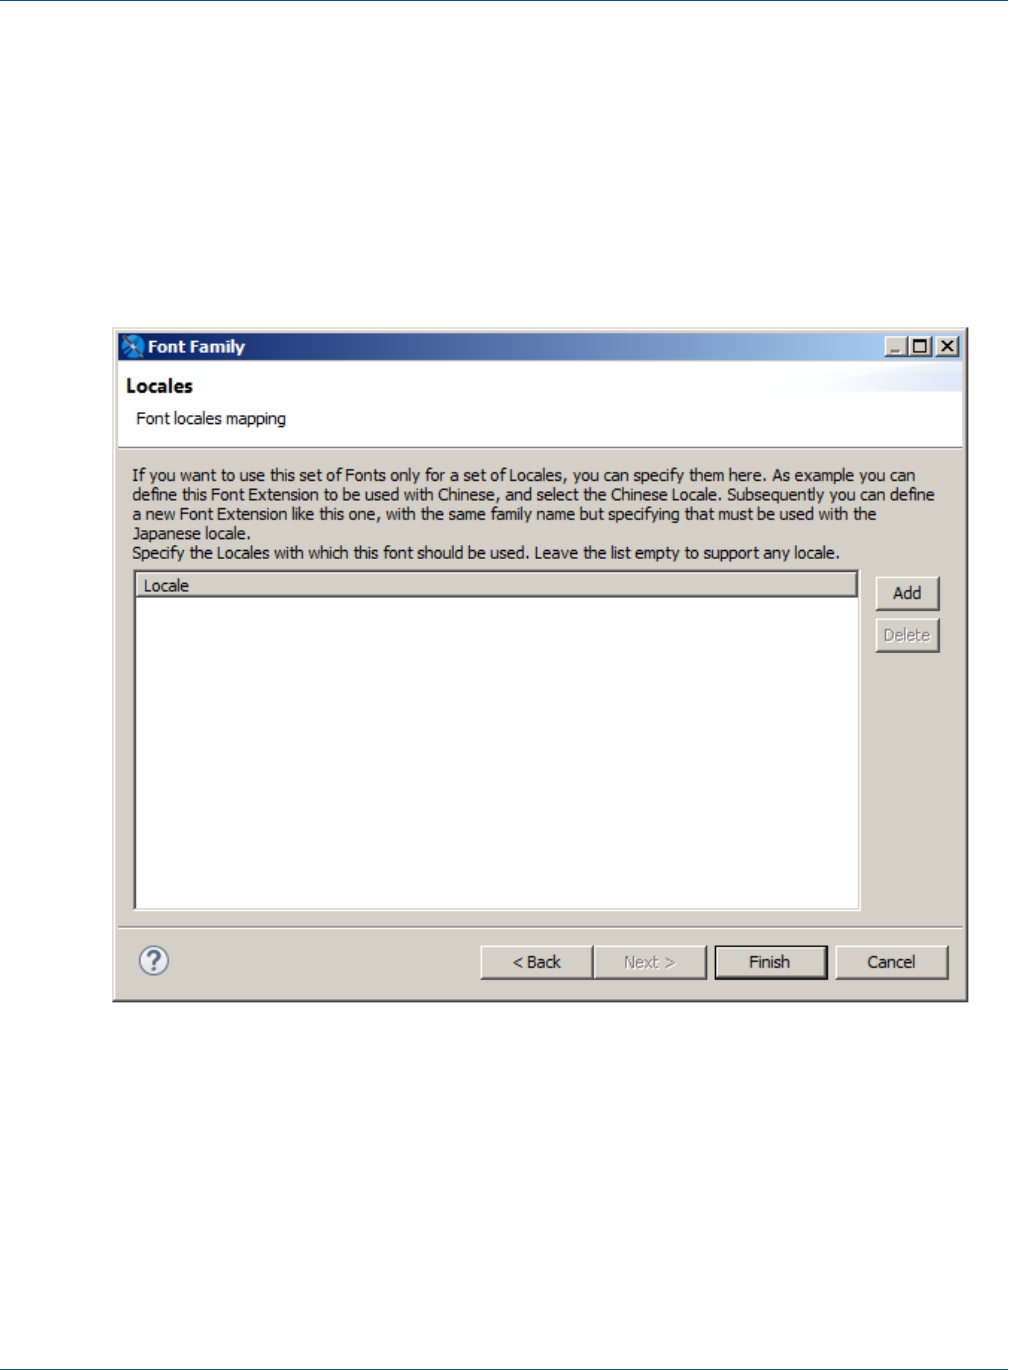
TIBCO Jaspersoft Studio User Guide
•Mapped Font Name – Click on a value to edit the name of the mapped font.
9.1.2.3 Locale Mapping Page
The Locale Mapping page lets you set the locales where this font family is used. If you have different font
extensions that support different languages, (for example, a font for Western European and a font for Japanese),
you can set the locales for these fonts. It is preferable to use font sets.
To access the Font Locale Page:
Click Next on the Font Mapping page.
Figure 9-4 Font Family dialog – Locale
The Locales page shows the following:
•Locale – List of locales supported by the font.
•Add button – Add a locale where the font is supported.
•Delete button – Delete the selected locale.
Clicking Add opens the Locales dialog box, where you can set the locales supported by the font. This dialog
has two tabs:
•Predefined Locales – Choose from a list of available locales.
128 TIBCO Software Inc.

Chapter 9 Fonts
•Custom Locales – Enter the ISO language code for a language not on the list of predefined locales. You
can enter the language (required), an optional country, and an optional variant, as supported by ISO 639-1.
9.1.3 Font Sets
Font sets let you group font extensions in supersets that can include several languages and/or scripts. When you
use a font set, the font family resolution occurs during text processing on a per-character basis, allowing you to
include characters from different languages or character sets in the same text element. For example, if you have
data that includes Japanese and English entries, you can create a single font set that contains Western European
and Japanese fonts and use that font set for your data.
9.1.3.1 The Font Set Dialog
When you create or edit a font set, the Font Set dialog lets you edit the name for the font set.
Accessing the font set dialog:
•To create a font set, select the font extensions you want to combine, and click Create Font Set. Enter a
name for the set and click OK.
•To edit the name of an existing font set, select the set and click Edit.
Figure 9-5 Font Set dialog
9.1.3.2 The Font Set Family Dialog
The Font Set Family dialog lets you control the mapping between fonts and characters sets for a font set. In
many cases, multiple fonts inside a font family may support the same character set or "script". In this case,
JasperReports Library uses a greedy algorithm to display as much contiguous text as possible in a single font. If
you want to ensure that a specific font extension is used for a specific script, you can set the included/excluded
scripts for the fonts in your font set.
To access the Font Set Family dialog:
Expand a font set in the Fonts list, then double-click a font inside the set.
TIBCO Software Inc. 129

TIBCO Jaspersoft Studio User Guide
Figure 9-6 Font Set Family dialog
The Font Set Family dialog shows the following:
•Primary – Toggle that sets the primary font for the font set.
•Include Scripts – Language/character sets that should use this font extension when the font set is applied.
Click Add to add a script; highlight a dis
•Exclude Scripts – Language/character sets that should never use this font extension when the font set is
applied.
9.2 Example of Using Font Extensions
This example shows how to create font extensions for two font and then combine them in a font set.
130 TIBCO Software Inc.
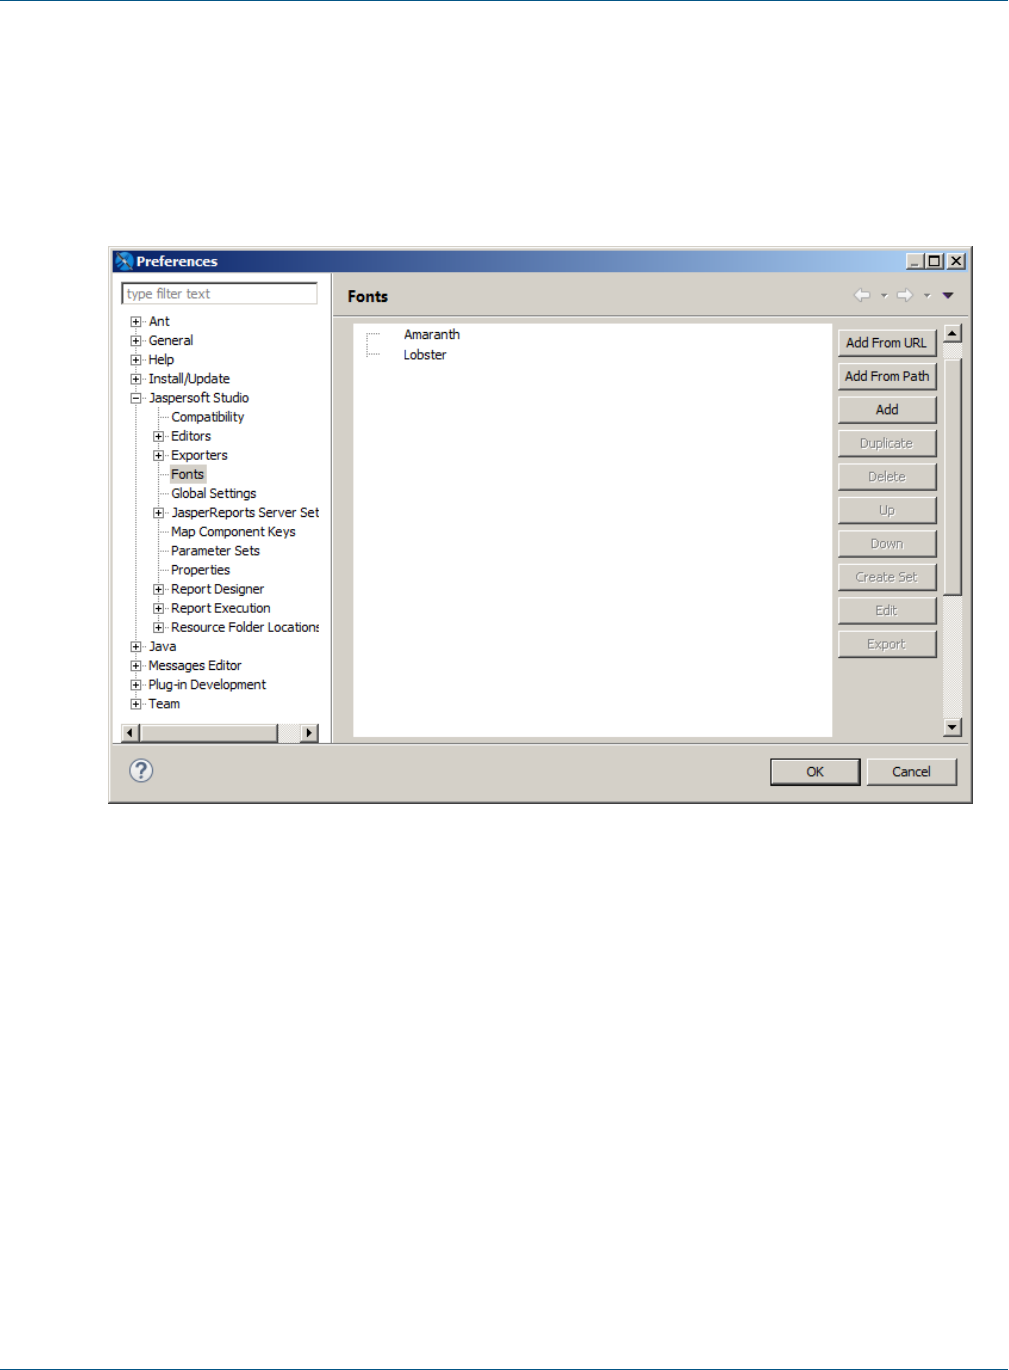
Chapter 9 Fonts
9.2.1 Creating Font Extensions and Font Sets
To access the Fonts page:
1. Select Window> Preferences (Eclipse> Preferences on Mac). The Preferences dialog box is displayed.
2. In the Preferences dialog box, select Jaspersoft Studio> Fonts.
The Fonts page is displayed:
Figure 9-7 Fonts preferences
To create a font extension:
This example uses two external Google fonts, Amaranth (a Latin-only font) and Lobster (supports Latin and
Cyrillic characters). If you don't have these fonts available, you can work with other fonts. However, you must
have the correct license to embed your fonts in a PDF.
1. Make sure the font files for the fonts have been downloaded and decompressed. You can also use fonts from
a URL.
2. Click Add from Path to open the Fonts path dialog.
TIBCO Software Inc. 131
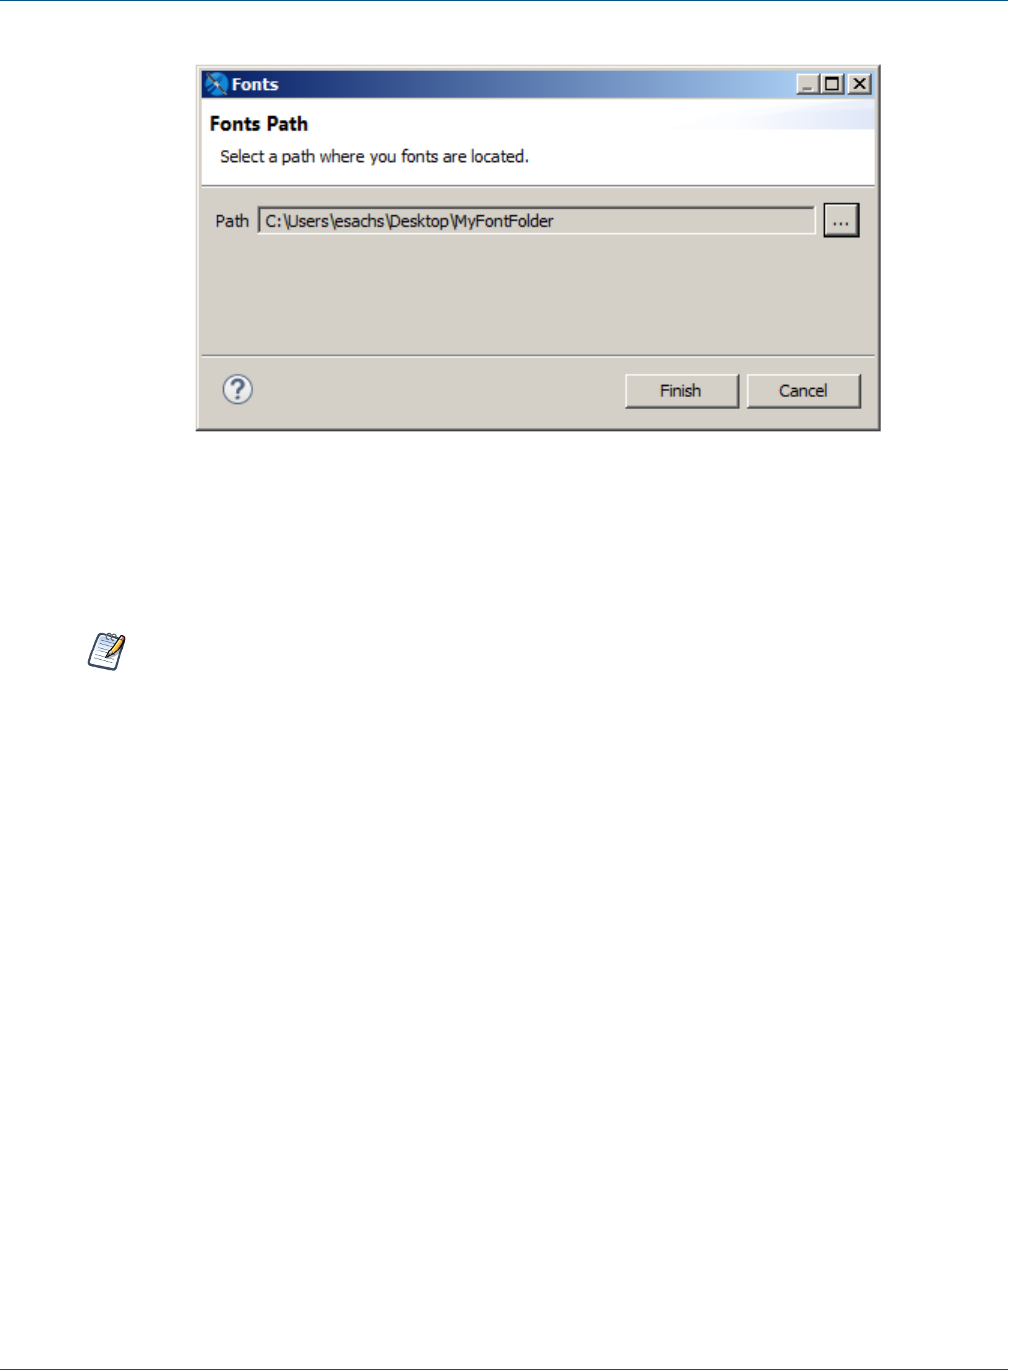
TIBCO Jaspersoft Studio User Guide
Figure 9-8 Adding fonts from a path
3. Click ... and browse to the folder that contains the fonts you want, then click Finish.
Jaspersoft Studio loads all the fonts at that location, extracts the font family name embedded in the font
files, and displays all the extracted fonts in the Preferences dialog.
Once you have create a font extension, you can edit it by double-clicking its name in the font list or by
selecting it and clicking Edit. See 9.1.2, “The Font Family Dialog,” on page125 for more information.
Next, combine these two font extensions in a single font set.
To create a font set:
1. In the Font section of the Preferences dialog, select the fonts you want in your set.
132 TIBCO Software Inc.
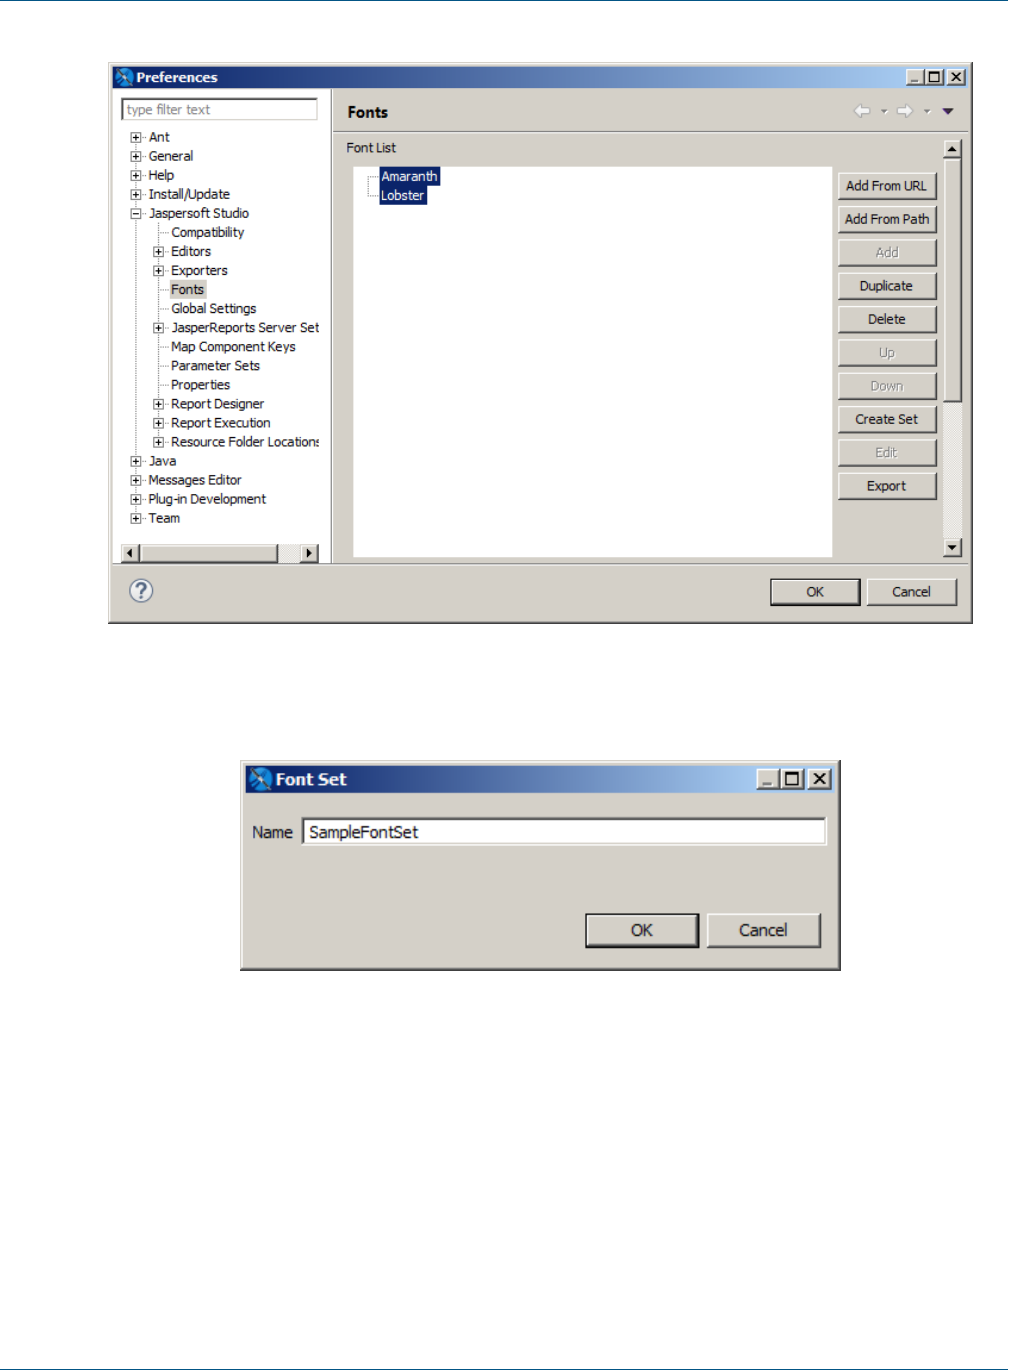
Chapter 9 Fonts
Figure 9-9 Selecting font extensions
2. Click Create Font Set. The Font Set dialog is displayed.
Figure 9-10 Font Set dialog
3. Enter a name for your font set and click OK. This example uses SampleFontSet.
The new font set is displayed in the font list.
Next, configure the fonts in the font set so that Lobster is only used for Cyrillic characters, even though it
supports Latin characters.
Configure fonts in a font set:
1. Expand the font set to display the names of the individual font extensions.
TIBCO Software Inc. 133
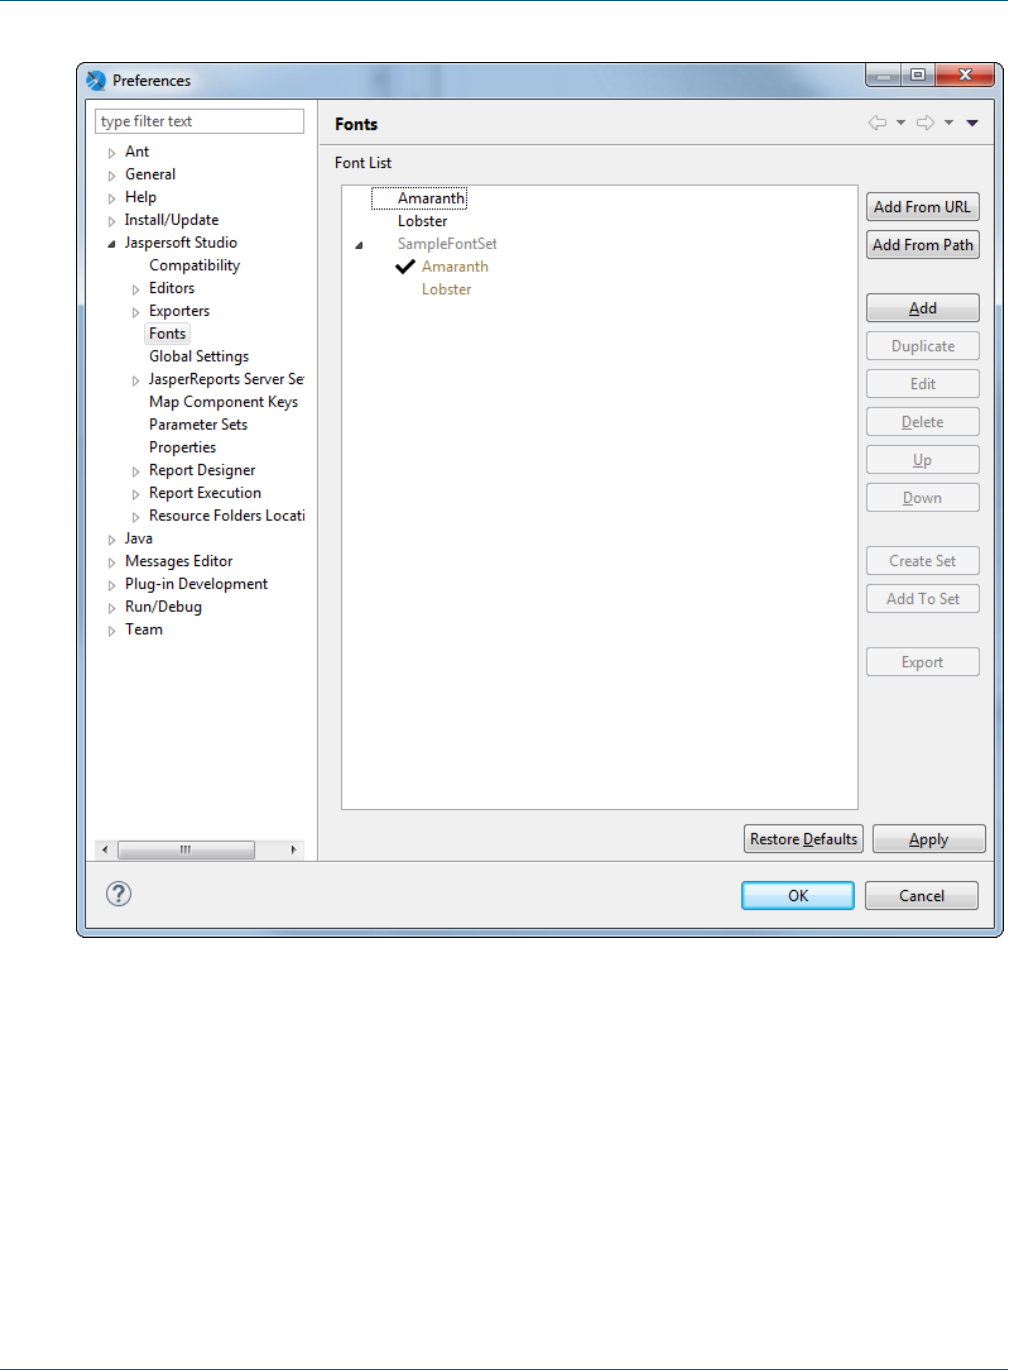
TIBCO Jaspersoft Studio User Guide
Figure 9-11 Fonts window with expanded font set
2. Select Lobster and click Edit or double-click Lobster.
The Font Set Family dialog is displayed.
134 TIBCO Software Inc.
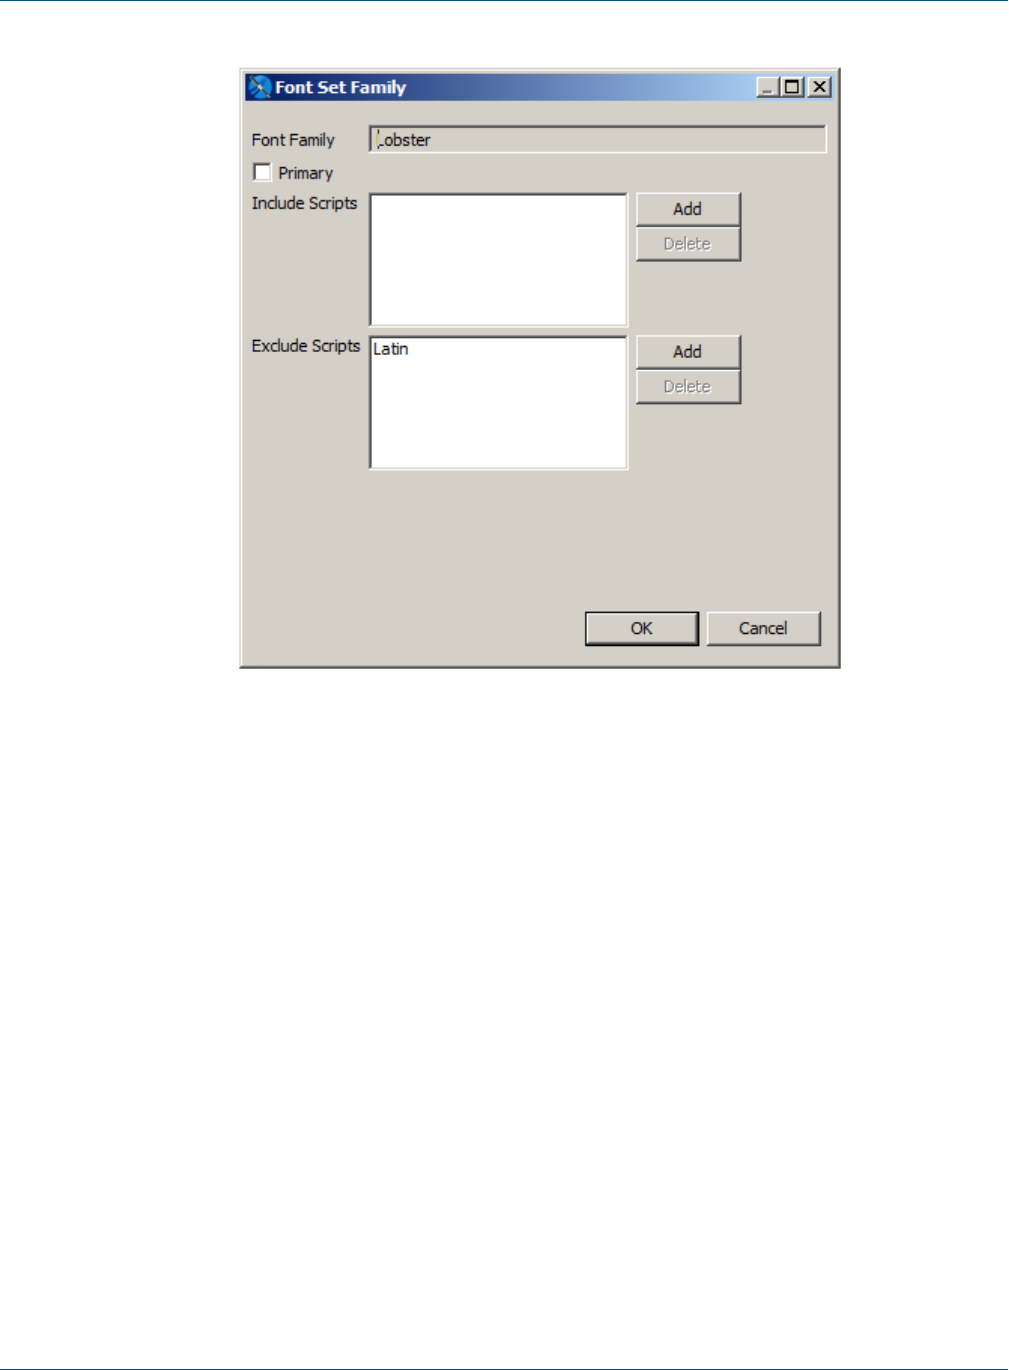
Chapter 9 Fonts
Figure 9-12 Font Set Family dialog
3. To prevent Lobster from being used by Latin characters, click Add next to the Exclude Scripts list.
The Scripts name dialog is displayed.
4. Select Latin in the Scripts Name dialog and click OK.
Latin is added to the list of excluded scripts.
5. Click OK to close the Scripts Name dialog; click OK again to close the Font Set Family dialog and click
OK a third time to close the Preference dialog.
9.2.2 Using Font Extensions in a Report
Once you have set up your font set, you can use it in a report.
Create a report with a local data adapter:
1. Export the One Empty Record adapter to your project. To do this:
a. In the Repository Explorer, right-click the One Empty Record adapter and select Export to File.
TIBCO Software Inc. 135

TIBCO Jaspersoft Studio User Guide
Figure 9-13 Exporting a global data adapter
b. Select the project you want and click OK.
A data adapter file is created in your project.
2. Go to File> New >Jasper Report or click on the main toolbar.
3. In the New Report Wizard window, select a blank template, such as the Blank A4 template, then click
Next.
4. Select the project folder with the data adapter file you just created, give the report a name, and click Next.
5. On the Data Source page, select the One Empty Record - [OneEmptyRecord.xml] adapter. Make sure to
select this adapter, which is local, and not the One Empty Record adapter which is selected by default.
Figure 9-14 Selecting the local data adapter
6. Click Finish.
136 TIBCO Software Inc.

Chapter 9 Fonts
7. Set the default data adapter for the report:
a. Select the report node in Outline view.
b. In the Properties view for the report, on the Report tab, scroll down to Dataset> Default Data
Adapter and click ...
c. In the Open Data Adapter dialog, select Custom Value.
d. Enter OneEmptyRecord.xml in the Path entry box.
Figure 9-15 Default Data Adapter
e. Click Finish.
Create a report with multi-lingual text:
1. Create a new report with a blank template
2. Drag the Static Text element into the Title band of the report.
3. Enter English and Cyrillic text in the element you just created:
Report Отчёт
4. Select the element.
5. Expand the Font menu on the Static Text tab of the Properties View for the static text element.
The menu is divided into two sections. Installed font extensions or font sets appear above the line. Fonts
below the line are not installed as font extensions. In this example, Amaranth, Lobster, and SampleFontSet
are all above the line.
Figure 9-16 Font menu with font extensions
TIBCO Software Inc. 137
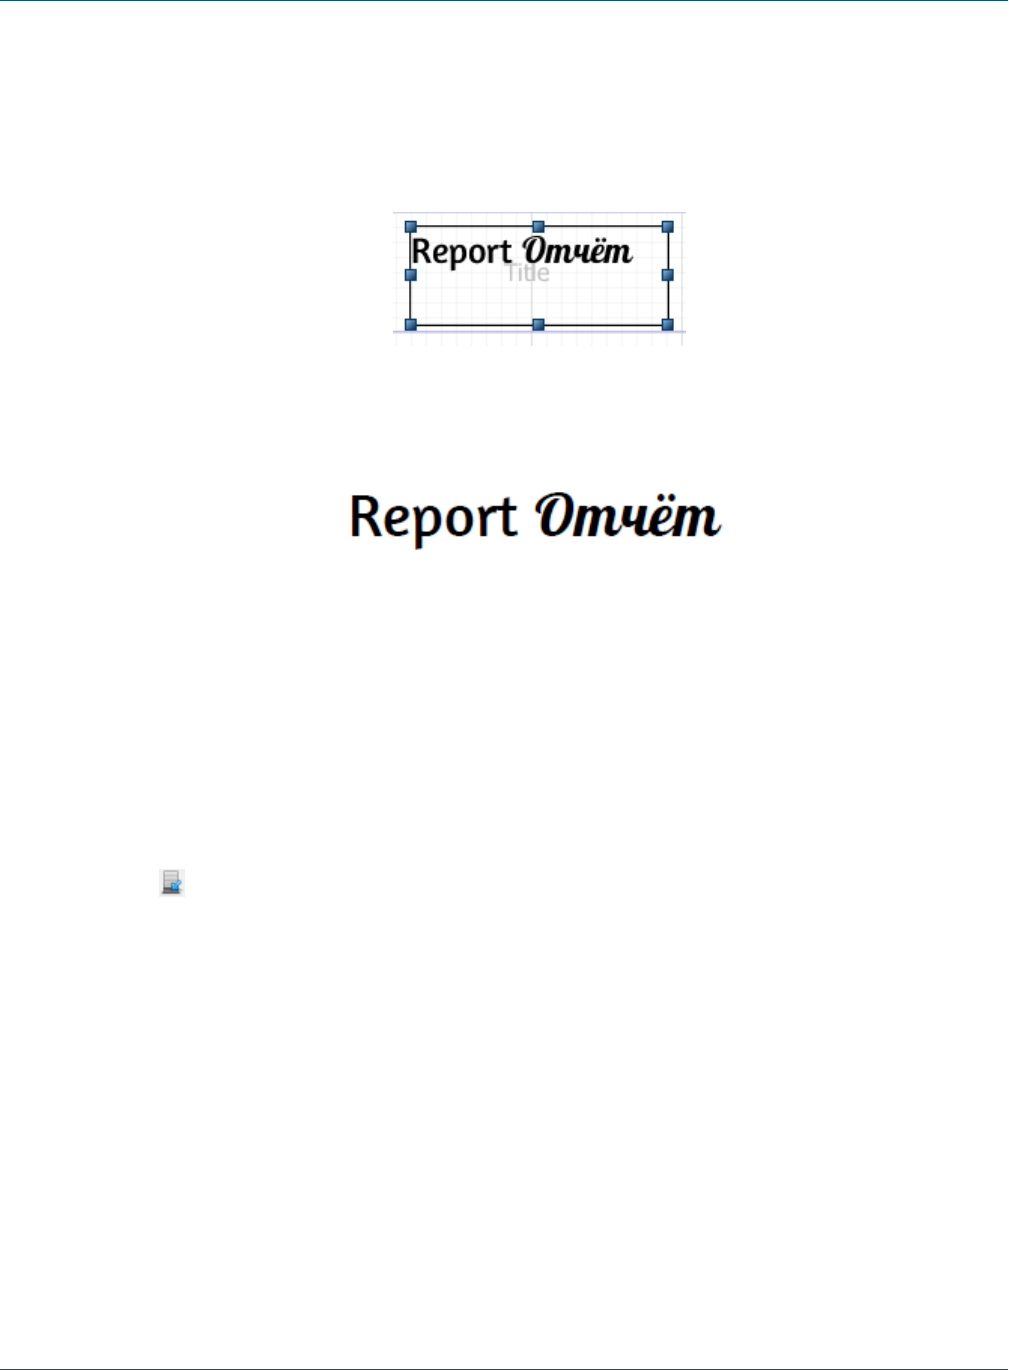
TIBCO Jaspersoft Studio User Guide
The default font used for a new static text element is SansSerif. This font does support for extended
characters, but because it's a Java logical font that is translated to a physical font by the JVM, you won't
know what font will be selected when the report is run.
6. Select SampleFontSet from the Font menu and 24 from the size menu next to it. Then resize the static
text element so it is large enough to display the text.
Figure 9-17 Font set in design view
7. Save and preview the report. The license for these fonts let you preview the report as a PDF.
Figure 9-18 Font set in preview
9.3 Deploying Font Extensions to JasperReports Server
When you use font extensions in a report, the font extensions are not automatically available on the server. You
need to export your font extensions as a jar and upload them to the server. For reports in HTML, add the jar to
the server classpath and enable font support in jasperreports.properties. For reports in PDF, add the jar to the
report as a resource.
Deploy the report to JasperReports Server:
1. Click on the main menu bar.
2. In the Publish To JasperReports Server dialog, select the JasperReports Server instance you want and choose
a location for the report. This example uses Public> Samples> Reports.
3. Enter a name for the report on JasperReports Server. This example uses SampleFontSetReport.
4. Click Next.
5. Verify that OneEmptyRecord appears as a resource to publish on the next page, then click Next.
6. Verify that Don't use any Data Source is selected on the Configure the Data Source page. Making this
selection ensures that the uploaded adapter will be used for the report.
7. Click Finish. If the publishing process succeeds, a success dialog is displayed.
8. Click OK to exit the success dialog.
View the report on JasperReports Server:
1. Log in to the server, navigate to the report you just created, and run the report.
You will see that the report does not use the correct fonts. You need to export the fonts in Jaspersoft Studio
and upload them to the server.
138 TIBCO Software Inc.
Chapter 9 Fonts
When working with fonts, look carefully at your uploaded reports. For some fonts or character sets, you
will not see misformatted text; instead, the text will not be displayed at all.
Export the font set in Jaspersoft Studio:
1. In Window>Preferences> Jaspersoft Studio> Fonts, select the font set and the fonts within it and
click Export. For this example, select Amaranth, Lobster, and SampleFontSet.
2. In the Export Font to Jar dialog, select a name and location for the exported file and click Save. For this
example, use SampleFontSet.jar.
The font set is exported as a jar in the location you chose. This is not a regular font jar; it is a jar file that
includes additional information used by Jaspersoft.
Add the font set as a jar on your JasperReports Server instance:
1. On the machine hosting your JasperReports Server instance, enable font support by adding the following to
your <js-install>\WEB-INF\classes\jasperreports.properties file:
net.sf.jasperreports.web.resource.pattern.fonts=fonts/.*
You only have to enable font support once.
2. Add the exported font set jar to your <js-install>WEB-INF\lib directory.
3. Stop and restart your JasperReports Server instance. See the JasperReports Server Installation Guide for
more information.
Upload the font set as a resource:
You can attach the resource directly to the report, or you can upload it to another location, for example the
report directory and link the report to it. Uploading a resource to another location makes it easier to reuse the
resource.
1. In the Repository Explorer in Jaspersoft Studio, navigate to the folder on your JasperReports Server instance
where you want to add this resource. For this example, it is the Public> Samples> Resources folder.
2. Right-click the folder and select New from the cascading menu.
TIBCO Software Inc. 139
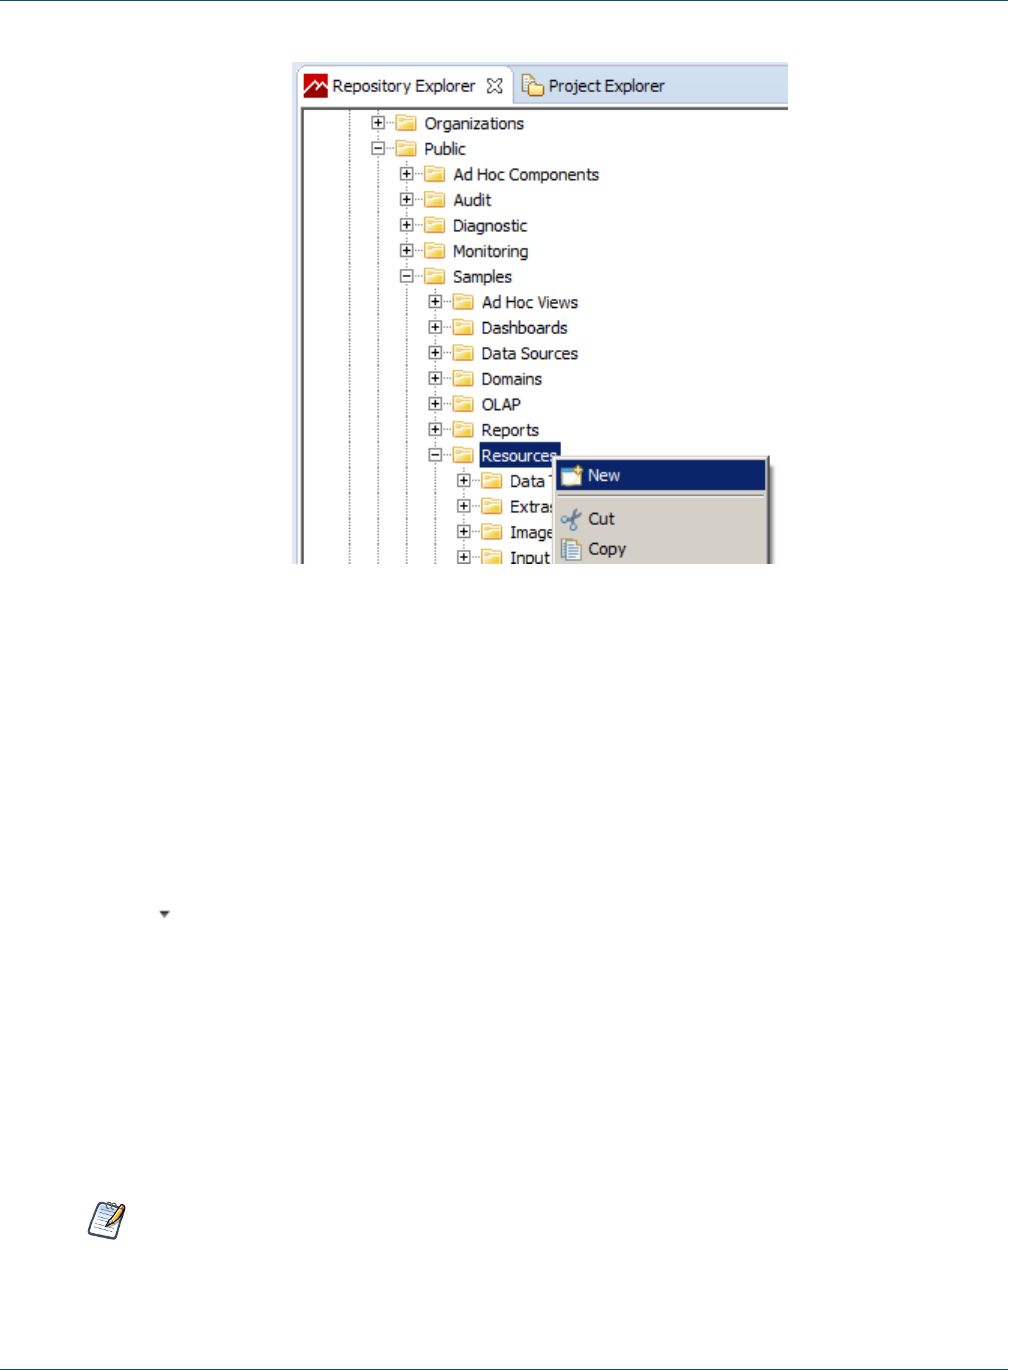
TIBCO Jaspersoft Studio User Guide
Figure 9-19 Adding a resource in the Repository Explorer
3. Select Jar in the Add Resource wizard and click Next.
4. Enter a name and ID for your jar and click Next.
5. Select Upload from File System, select the jar you want, and click Open.
6. Click Finish to upload the selected jar.
Add the resource to your report:
1. Right-click your report in the Repository Explorer and select New from the cascading menu.
2. Select Link in the Add Resource Wizard and click Next.
3. Enter a name and ID for the link and click Next.
4. Click to open the Find Resource dialog.
5. Navigate to the jar you uploaded and click Open.
6. Click Finish to attach the jar to the report as a resource.
View the report on JasperReports Server:
1. Open a web browser, log in to the server, navigate to the report you just created, and run the report. You
should see the correct fonts. If you do not see your fonts, there has been a problem with uploading the jar to
the file system.
2. Export the report as PDF. You should see the updated fonts. If not, there has been some problem uploading
and linking the resource.
When verifying font extensions and sets, it is best to run the report in JasperReports Server from a web
browser. Running the report from Repository Explorer in Jaspersoft Studio may not show the fonts
correctly.
140 TIBCO Software Inc.

CHAPTER 10 DATA ADAPTERS
A data adapter is a resource that specifies how and where to obtain data. Specifically, it is an object that
contains information about how to connect to or retrieve the data, and the logic to do that. Data adapters are
stored in XML files and simplify porting of the report configuration and data source creation between
JasperReports environments. Whether you use a report with a data adapter XML file in Jaspersoft Studio,
publish it to JasperReports Server or deploy it to a custom JasperReports environment, JasperReports Library can
use it to obtain the data you specify.
This chapter starts by telling you how to create and use data adapters based on the data adapter types available
in Jaspersoft Studio. Data adapters are designed to simplify the complexities of working with data in
JasperReports Library. However, data adapters are only one of the ways that JasperReports Library can get data
from a data source. As you get more familiar with Jaspersoft Studio, you may want to go a little deeper and
learn about data in JasperReportsLibrary and the JRDataSource interface.
Usually data adapters are stored as XML files in the same project as the report to simplify deployment to
JasperReports Server or another environment. In Jaspersoft Studio, data adapters can also be stored in the
Repository Explorer, in which case they are visible from all the projects. If you plan to deploy the report outside
Jaspersoft Studio, it is better to store it in the project from the beginning.
This chapter has the following sections:
•Creating and Editing Data Adapters
•Using Data Adapters in Reports and Datasets
•Working with Database JDBC Connections
•Working with a MongoDB Data Adapter
•Working with a Native Cassandra Connection
•Working with a Collection of JavaBeans Data Adapter
•Working with XML Data Adapters
•Working with XML/A Data Adapters
•Working with CSV Data Adapters
•Using the Empty Record Data Adapter
•Working with the JRDataSource Interface
•A Look at TIBCO Spotfire Information Links
TIBCO Software Inc. 141

TIBCO Jaspersoft Studio User Guide
10.1 Creating and Editing Data Adapters
10.1.1 Creating a Data Adapter
You create data adapters using the Data Adapter Wizard. The exact steps and information you need to provide
vary with the type of adapter that you select. However, the initial steps are similar.
Data adapters can be created locally in projects or globally in the Repository Explorer.
•Data adapters in projects are stored as XML files, which simplifies deployment to JasperReports Server. A
project-level data adapter cannot be seen from other projects, but you can easily copy it from one project to
another.
•Global data adapters are saved as Eclipse settings and are visible to all projects. Global data adapters are
saved as Eclipse settings. To deploy a global adapter to JasperReports Server, you need to export it to an
XML file located in the same project as your report.
To create a data adapter in a project:
When you create a data adapter in a project, it is saved as an XML file in that project. Saving the XML file in
the same project as your reports makes it easier to deploy the data adapter to JasperReports Server.
1. Click on the main toolbar OR right-click a project in the Project Explorer and select New> Data
Adapter.
2. In the DataAdapter File window, choose the project where you want to save the data adapter file. This
should be the project that contains the report(s) you want to use with your data adapter.
3. Enter a name for your adapter and click Next.
The Data Adapters Wizard opens.
Figure 10-1 Data Adapter Wizard
4. Select the data adapter type you want and click Next.
142 TIBCO Software Inc.
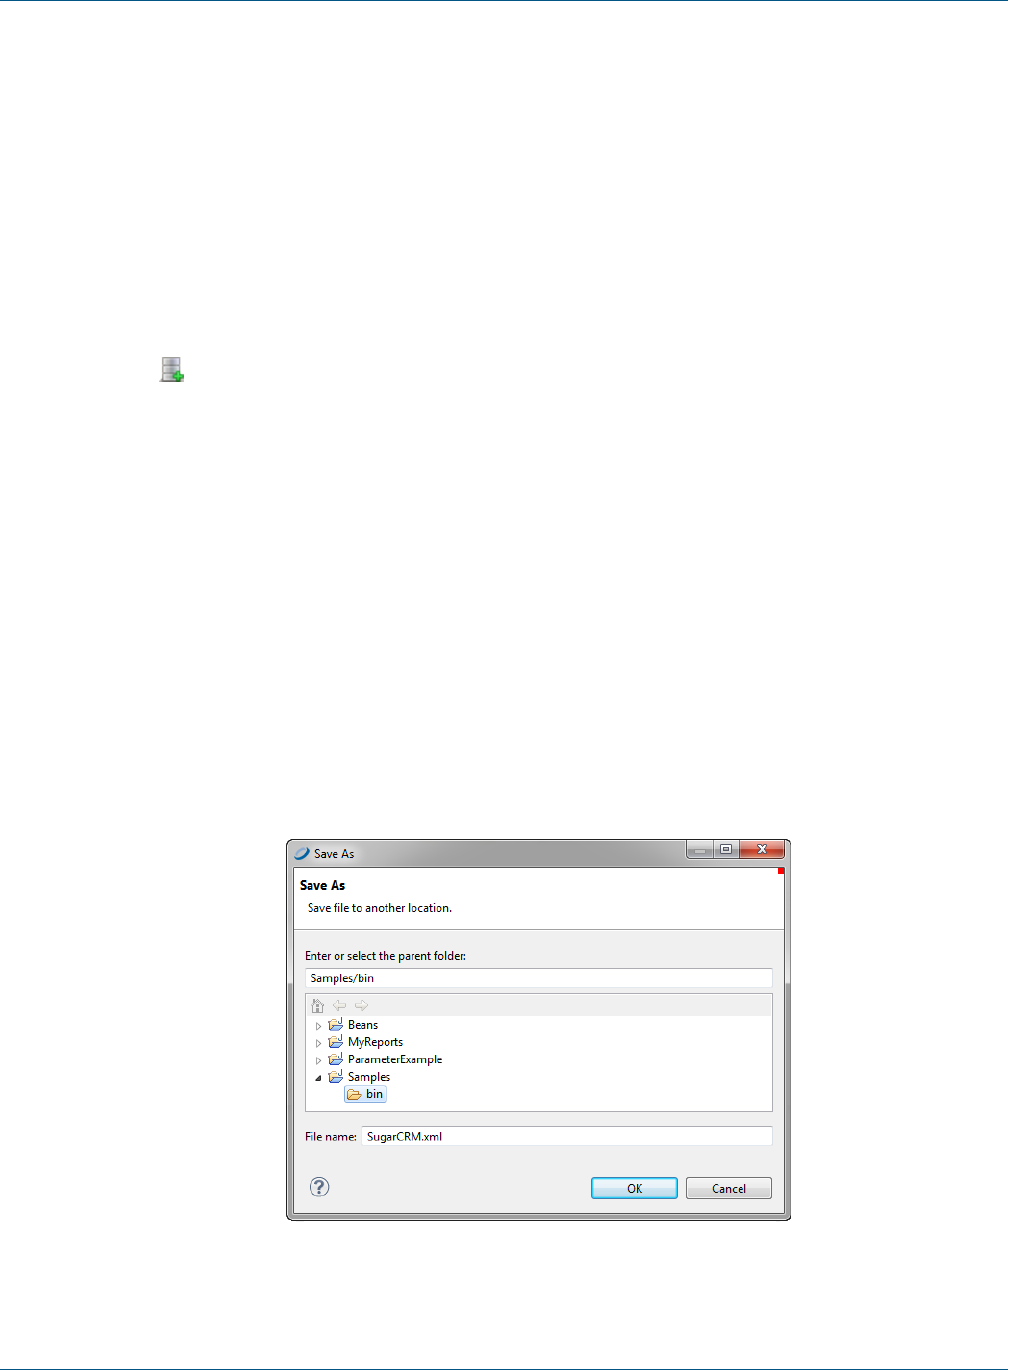
Chapter 10 Data Adapters
5. Enter a name for your adapter. This name is used when you select an adapter for a report.
6. Enter the properties needed by the adapter type you selected. For example, for a database JDBC connection
you need to select a JDBC driver and set the URL and database username and password. For a CSV file,
you need to enter a filename, column names, and the column separator.
7. (Optional) If you want to test the connection, click the Test button if available.
8. Click Finish to create the adapter.
The adapter is saved as an XML file in the project location you selected.
To create a global data adapter:
When you create a global data adapter, it is available to all reports. However, if you want to deploy it to
JasperReports Server, you must export it explicitly.
1. Click in the Repository Explorer ORright-click Data Adapters in the Repository Explorer and choose
Create Data Adapter.
The Data Adapters Wizard opens.
2. Select the data adapter type you want and click Next.
3. Enter a name for your adapter and the properties needed by the adapter type you selected. To optionally test
the adapter, click the Test button.
4. Click Finish to create the adapter.
10.1.2 Importing and Exporting Data Adapters
Jaspersoft Studio enables you to import and export data adapter definitions to simplify the process of sharing
data source configurations.
To export a global data adapter as an XML file:
1. In the Repository Explorer, right-click your data adapter and select Export to File.
Jaspersoft Studio prompts you to name the file and select the destination for the exported information.
Figure 10-2 Export to File Dialog
TIBCO Software Inc. 143

TIBCO Jaspersoft Studio User Guide
2. Select a location in the same project as the report that will be using this adapter, enter a name for the file,
and click OK.
A simple XML file is created in the location you chose. The data adapter must be in the same project as
your report. To use the same adapter in more than one project, see 10.1.3, “Copying a Data Adapter,” on
page144.
To promote a data adapter file to a global data adapter:
You can make any file-based data adapter into a global adapter by importing it.
1. Right-click on the Data Adapter node in the Repository Explorer, and choose Import from Workspace.
2. Select the data adapter(s) you want to import.
3. You can optionally select Overwrite Data Adapter if exists. Otherwise, if a duplicate data source name is
found during the import, Jaspersoft Studio appends a number to the imported data source name.
4. Click OK.
The import process adds all the selected data adapters to the current list.
10.1.3 Copying a Data Adapter
If you have saved your data adapter as an XML file, you can easily copy it between projects.
To copy a data adapter from one project to another:
1. In the Project Explorer, right-click your data adapter and select Copy OR use Ctrl-C.
2. Still in the Project Explorer, right-click the project or folder in your Jaspersoft Studio workspace that you
want to use and select Paste OR Ctrl-V.
The data adapter is copied to the new location.
10.2 Using Data Adapters in Reports and Datasets
You can use the Jaspersoft Studio user interface to select the data adapter to use for previewing reports and
datasets. However, this selection is specific to Jaspersoft Studio. When you want to deploy your reports to
JasperReports Server or to a custom JasperReports deployment, you must specify the data adapter or data source
you want to use.
10.2.1 Data Adapter For a Report
When you choose a data adapter during report creation, the drop-down lists all available adapters, with global
adapters on top and project file-based adapters below. The example below shows the global adapters available
with Jaspersoft Studio followed by a sample file-based adapter local to the project, named
SampleDataAdapter.xml.
144 TIBCO Software Inc.

Chapter 10 Data Adapters
Figure 10-3 List of Data Adapters During Report Creation
Data adapters are hierarchical. That is, if no adapter is directly defined for a subdataset, it looks for the adapter
of its parent dataset, then its parent's parent, and so forth.
10.2.2 Data Adapters and Report Deployment
When you use a drop-down to select a data adapter for a report or dataset, you are just setting the current
default data adapter used for preview. As you continue to design your report, you can easily change this data
adapter by selecting a different data adapter during preview, or by editing the dataset and changing the adapter.
If you do not select a data adapter during preview, Jaspersoft Studio defaults to whichever data adapter was
used most recently. If no data adapter is selected when you create a report, Jaspersoft Studio defaults to the pre-
configured empty data adapter.
This data adapter is internal to Jaspersoft Studio. It is stored in an internal property
(com.jaspersoft.studio.data.defaultdataadapter) which cannot be used in JasperReports Server or
JasperReports Library. Therefore, when you publish or deploy a report, you need to specify the data source you
want to use in the deployed report. You can do this in the following ways:
•When you publish a report to JasperReports Server, you can select a JasperReports Server data source to use.
See 12.2, “Publishing a Report to JasperReports Server,” on page212 for more information. If you
choose this method to select a data source, any subdatasets in the report must use the same data source.
•You can choose to set the default data adapter explicitly for the report and/or any subdatasets. You can set
this property separately for any dataset in the report. If this property is present, you cannot choose a
different adapter to preview the report.
10.2.3 Default Data Adapter
You can explicitly set the data adapter for a report or dataset using the
net.sf.jasperreports.data.adapter property.
Setting the default data adapter:
1. In Outline view, to set the data adapter for the report, click the report's root node. To set the data adapter for
a dataset, click the dataset.
TIBCO Software Inc. 145
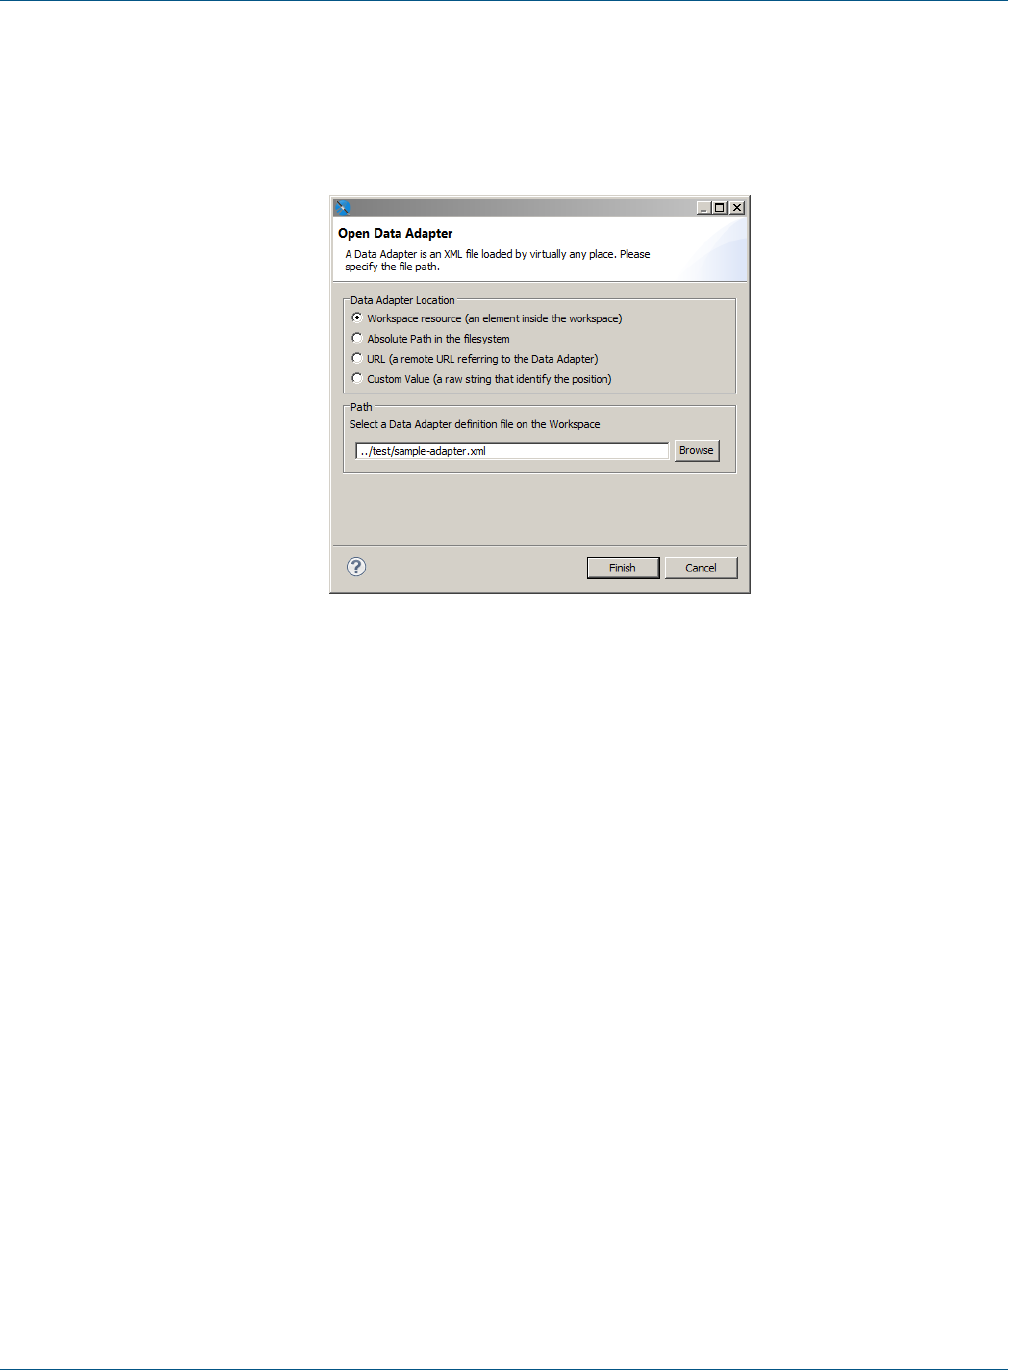
TIBCO Jaspersoft Studio User Guide
2. In the Properties view, to set the data adapter for a report, go to the Report tab. To set the data adapter for a
dataset, go to the Dataset tab.
3. Click ... at the right of the Default Data Adapter property.
The Open Data Adapter dialog opens.
Figure 10-4 Open Data Adapter Dialog
4. Choose the format to use for specifying the data adapter location:
•Workspace resource – A file in your workspace, for example, value="../test/sample-
adapter.xml"/>. This should be a file in the same project as your report. If you want to use a global
adapter, you need to export it to a file first. See 10.1.2, “Importing and Exporting Data Adapters,” on
page143 for more information.
•Absolute Path in the file system – A file path, for example,
value="file:///C:/Adapters/sample-adapter.xml"
•URL – A remote URL that hosts the data adapter file, for example,
value="http://myserver:8080/sample-adapter.xml"
•Custom value – A free-form string that identifies the location of the data adapter to use. You could
use this if you wanted to enter a string in the repo: syntax, for example,
value="repo:/reports/interactive/CustomersDataAdapter" See 12.8, “Understanding the
repo: Syntax,” on page231 for more information.
5. If you selected Workspace resource or Absolute Path, click Browse to locate the file in the workspace
or in your file system. Otherwise, enter the URL or free-form string.
6. Click Finish.
The default data adapter is set for the dataset. It is represented in the JRXML file using the
net.sf.jasperreports.data.adapter property.
146 TIBCO Software Inc.
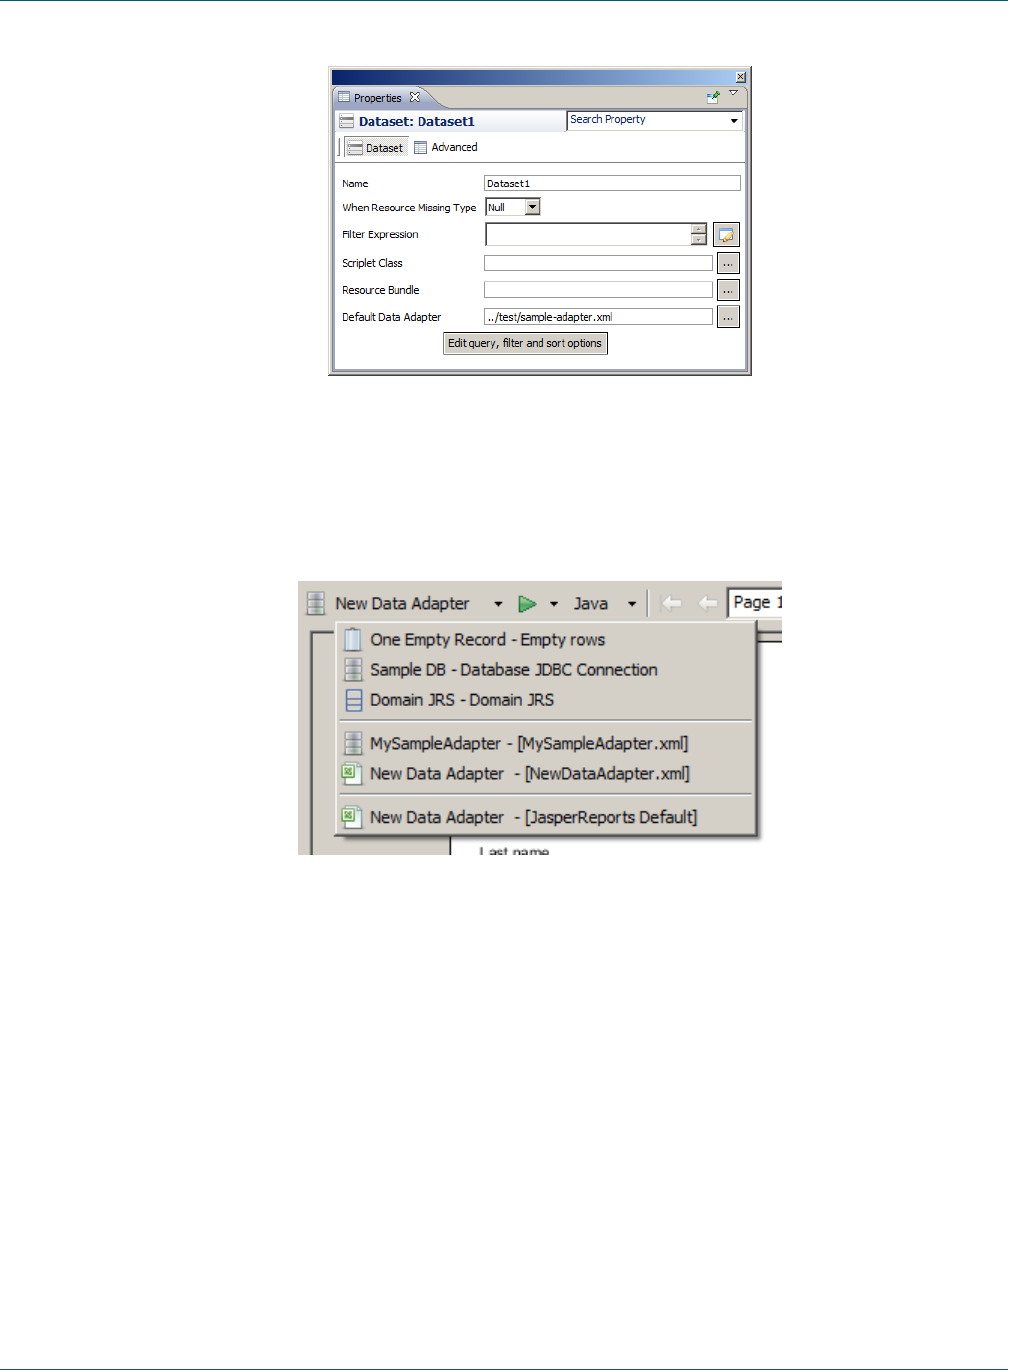
Chapter 10 Data Adapters
Figure 10-5 Dataset with Default Data Adapter
10.2.3.1 The JasperReports Data Adapter in the UI
When the JasperReports data adapter is present, it is shown as the bottom adapter on the list of available
adapters. In the example below, New Data Adapter has been set as the default data adapter:
Figure 10-6 List of Data Adapters Including Default Data Adapter
10.3 Working with Database JDBC Connections
A JDBC connection lets you use a database accessed through a JDBC driver (such as a relational DBMS). When
you use a JDBC connection in a report, you must specify a query.
10.3.1 Creating a Database JDBC Connection
To create a new JDBC connection:
1. Create the connection globally or locally:
•To create the connection globally, right-click Data Adapters in the Repository Explorer and choose
Create Data Adapter.
TIBCO Software Inc. 147
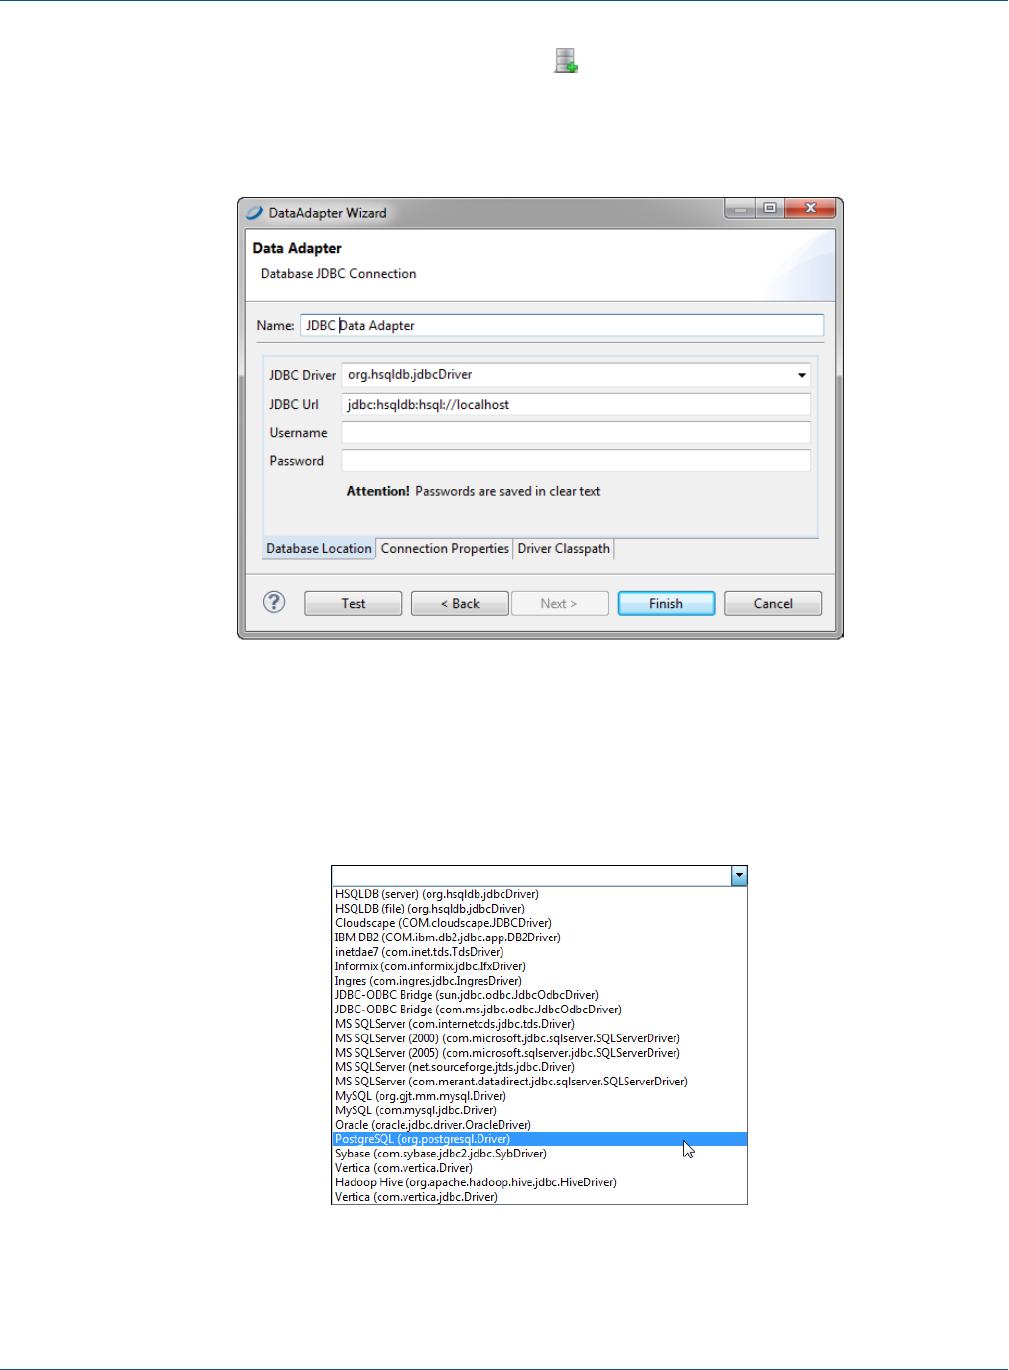
TIBCO Jaspersoft Studio User Guide
•To create the connection local to a project, click , enter a name and location for the data adapter in
the DataAdapter File dialog box, and then click Next.
The Data Adapter wizard appears (see Figure 10-1, “Data Adapter Wizard,” on page142).
2. From the list, select Database JDBC connection to open the Data Adapter dialog.
Figure 10-7 Configuring a JDBC Connection
3. Name the connection (use a significant name like Mysql – Test). This is the name that will appear on the
list of available connections when you create a report.
4. In the JDBC Driver field, specify the JDBC driver to use for your database connection. The drop-down
displays the names of the most common JDBC drivers.
Figure 10-8 JDBC Drivers List
148 TIBCO Software Inc.

Chapter 10 Data Adapters
If a driver is displayed in red, the JDBC driver class for that driver is not present in the class path and you
must obtain and install the driver before using it. See 10.3.3, “Using a Database JDBC Connection,” on
page151.
JasperReports Server includes the TIBCO JDBC drivers for the following commercial databases:Oracle,
MS SQLServer and DB2. In some cases, these drivers provide functionality not provided by the vendors'
driver. However, there may be some differences in queries between the two drivers. You can use the
TIBCOdrivers, or you can choose to install and use the driver supplied by the database vendor.
If you upload your reports to JasperReports Server, make sure to use the same driver in both
JasperReports Server and Jaspersoft Studio.
5. Enter the connection URL. To have Jaspersoft Studio construct the URL, click the Wizard button. The
JDBC URL Wizard inserts the server name and the database name in the correct text fields.
6. Enter a username and password to access the database. If the password is empty, it is better if you specify
that it be saved. You can choose to save the password in one of two ways:
•Clear text – This is not secure, but can sometimes be convenient when working in a developer or
staging environment.
•Eclipse secure storage – This is the correct option for security, but can be difficult to work with when
testing and saving adapters. In addition, it can make it difficult to share adapters with other developers
or deploy data adapters to JasperReports Server.
7. After you've inserted all the data, click the Test button to verify the connection. If everything's okay, you'll
see a message that the test was successful.
8. Click OK to exit the message.
9. Click Finish to create the connection.
10.3.2 Troubleshooting a Database JDBC Connection
When the tests fail, the most common exceptions are:
•AClassNotFoundError was thrown.
•The URL is not correct.
•Parameters are not correct for the connection (database is not found, the username or password is wrong,
etc.).
10.3.2.1 ClassNotFoundError
The ClassNotFoundError exception occurs whenever a data adapter fails to load a class it requires. In the
context of JDBC connections, the most likely cause is that the required JDBC driver is not present in the
classpath. In general, a data adapter has two classpaths it uses to find libraries. First the adapter looks at any
paths that were specified inside the data adapter when it was created. If it cannot load the libraries or classes it
needs using its internal paths, the data adapter uses the Jaspersoft Studio classpath to look for them.
The Jaspersoft Studio classpath is defined in your Eclipse project. As Jaspersoft Studio uses its own class loader,
it's enough to add resources such as jar files and directories containing classes to the Jaspersoft Studio classpath.
For example, suppose you want to create a connection to an Oracle database. Jaspersoft Studio does not ship the
vendor's driver for this database. If you choose the oracle.jdbc.driver.OracleDriver driver, when you test
the connection, you'll see the ClassNotFoundException, as shown in Figure 10-9. You need to add the JDBC
driver for Oracle, ojdbc14.jar, to the classpath.
TIBCO Software Inc. 149

TIBCO Jaspersoft Studio User Guide
Figure 10-9 ClassNotFoundError exception
To add a resource to the Jaspersoft Studio classpath:
If you add a resource to the Jaspersoft Studio classpath, it will be available to all data adapters. In addition to
JARs, you can add variables, libraries, class folders, and external class folders. To add a jar to the Jaspersoft
Studio classpath:
1. Click Project >Properties >Java Build Path>Libraries, and click Add JARsor Add External JARs.
2. Browse to locate the jar you want to add.
3. Select the file you want to add to the classpath.
4. Click OK.
To add a JAR file to a data adapter's classpath:
If you need to use the driver only for this data adapter, you can instead add the driver on the data adapter's
Driver Classpath tab.
1. If the adapter is not already open, double-click its icon in the Repository Explorer or Project Explorer to
open it.
2. Click on the Driver Classpath tab.
3. Click Add and browse to locate the jar you want to add. If you want to add a different file type, use the
menu at the bottom right.
4. Click on the jar and Open.
The location of the file you chose is added to the driver classpath.
10.3.2.2 URL Not Correct
If a wrong URL is specified, you’ll get an exception when you click the Test button. You can find the exact
cause of the error using the stack trace provided in the exception.
Use the JDBC URL Wizard to build the JDBC URL and try again.
150 TIBCO Software Inc.
Chapter 10 Data Adapters
10.3.2.3 Parameters Not Correct for the Connection
If you try to establish a connection to a database with the wrong parameters (for example, invalid credentials or
inaccessible database), the database returns a message is fairly explicit about the reason behind the failure of the
connection.
10.3.3 Using a Database JDBC Connection
When you create a report with a JDBC connection, you specify a query to extract records from the database.
The query language you use depends on the connection type; the most common query type is an SQL query.
The use of JDBC or SQL connections is the simplest and easiest way to fill a report.
10.3.3.1 Fields Registration
In order to use SQL query fields in a report, you need to register them. You don't need to register all the
selected fields—only those actually used in the report. For each field, specify name and type. Table 10-1,
“Conversion of SQL and JAVA types ,” on page151 shows SQL types and the Java objects they map to.
SQL Type Java Object SQL Type Java Object
CHAR String REAL Float
VARCHAR String FLOAT Double
LONGVARCHAR String DOUBLE Double
NUMERIC java.math.BigDecimal BINARY byte[]
DECIMAL java.math.BigDecimal VARBINARY byte[]
BIT Boolean LONGVARBINARY byte[]
TINYINT Integer DATE java.sql.Date
SMALLINT Integer TIME java.sql.Time
INTEGER Integer TIMESTAMP java.sql.Timestamp
BIGINT Long
Table 10-1 Conversion of SQL and JAVA types
The table doesn't include special types like BLOB, CLOB, ARRAY, STRUCT, and REF, because these types
cannot be managed automatically by JasperReports. However, you can use them by declaring them generically
as Object and managing them by writing supporting static methods. The BINARY, VARBINARY, and
LONGBINARY types should be dealt with in a similar way. With many databases, BLOB and CLOB can be
declared as java.io.InputStream.
Whether an SQL type is converted to a Java object depends on the JDBC driver used.
For the automatic registration of SQL query fields, Jaspersoft Studio relies on the type proposed for each field
by the driver itself.
TIBCO Software Inc. 151
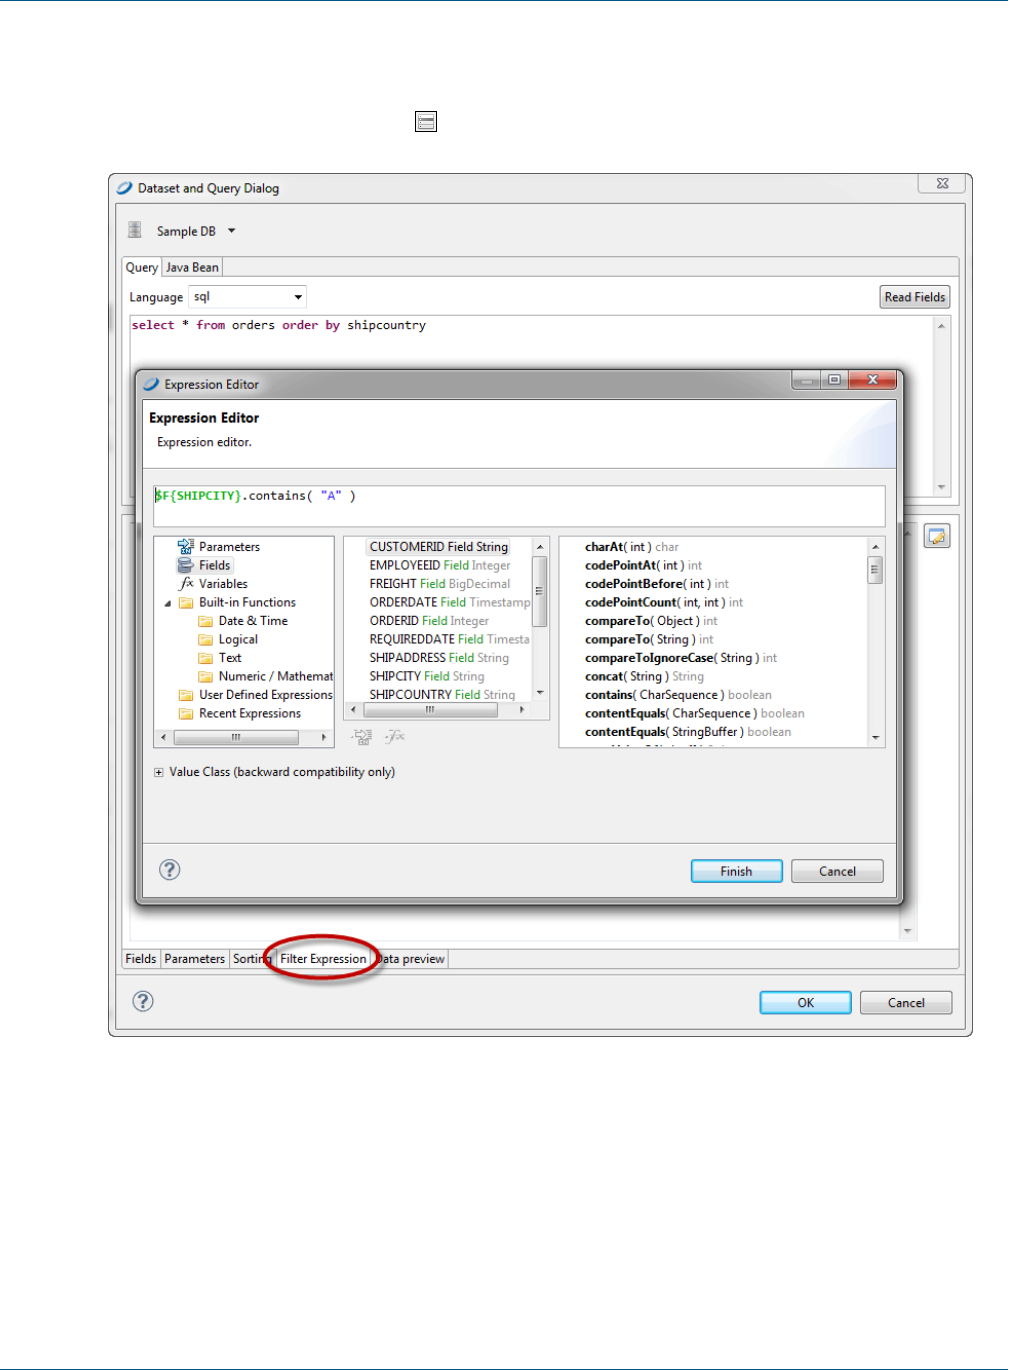
TIBCO Jaspersoft Studio User Guide
10.3.3.2 Filtering Records
The records in a report can be ordered and filtered. Set sort and filter options in the Report query dialog by
clicking the Dataset and Query button .
Figure 10-10 Filter Expression Tab and Expression Editor
Clicking the Data Preview tab shows a subset of your filtered data. The filter expression must return a Boolean
object: true if a particular record can be kept, false otherwise.
152 TIBCO Software Inc.
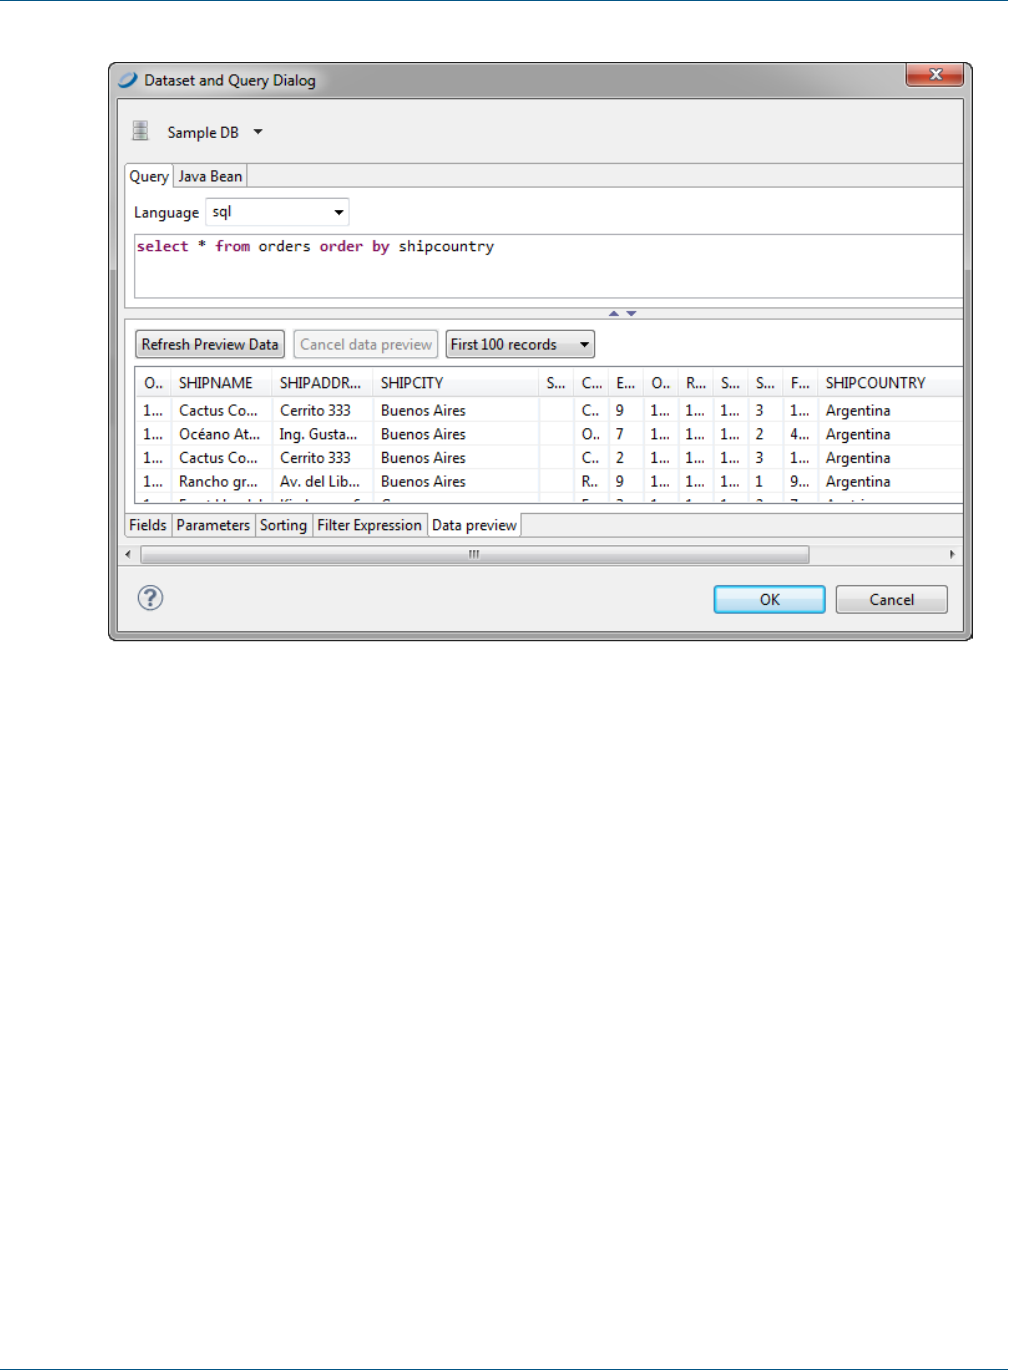
Chapter 10 Data Adapters
Figure 10-11 Data Preview
If no fields can be selected with the Add field button, check to see if the report contains fields. If not, close the
query dialog, register the fields, and resume the sorting.
10.3.3.3 Using JDBC Connections for Subreports
You can also use a JDBC connection for a subreport or a personalized lookup function for decoding specific
data. For this reason, JasperReports provides a java.sql.Connection parameter called REPORT_CONNECTION.
You can use this parameter in any expression you like, with this parameters syntax:
$P{REPORT_CONNECTION}
This parameter contains the java.sql.Connection class passed to JasperReports from the calling program.
10.4 Working with a MongoDB Data Adapter
MongoDB is a big data architecture based on the NoSQL model that is neither relational nor SQL-based.
Jaspersoft Studio includes data adapters that allow reports to use a native MongoDB data connection or a
MongoDB JDBC data adapter. JasperReports Server also supports SSL and x509 authentication for MongoDB.
10.4.1 Creating a Native MongoDB Connection
To create a MongoDB data adapter with the native driver:
Follow these steps to create a MongoDB data source with the native MongoDB driver.
TIBCO Software Inc. 153
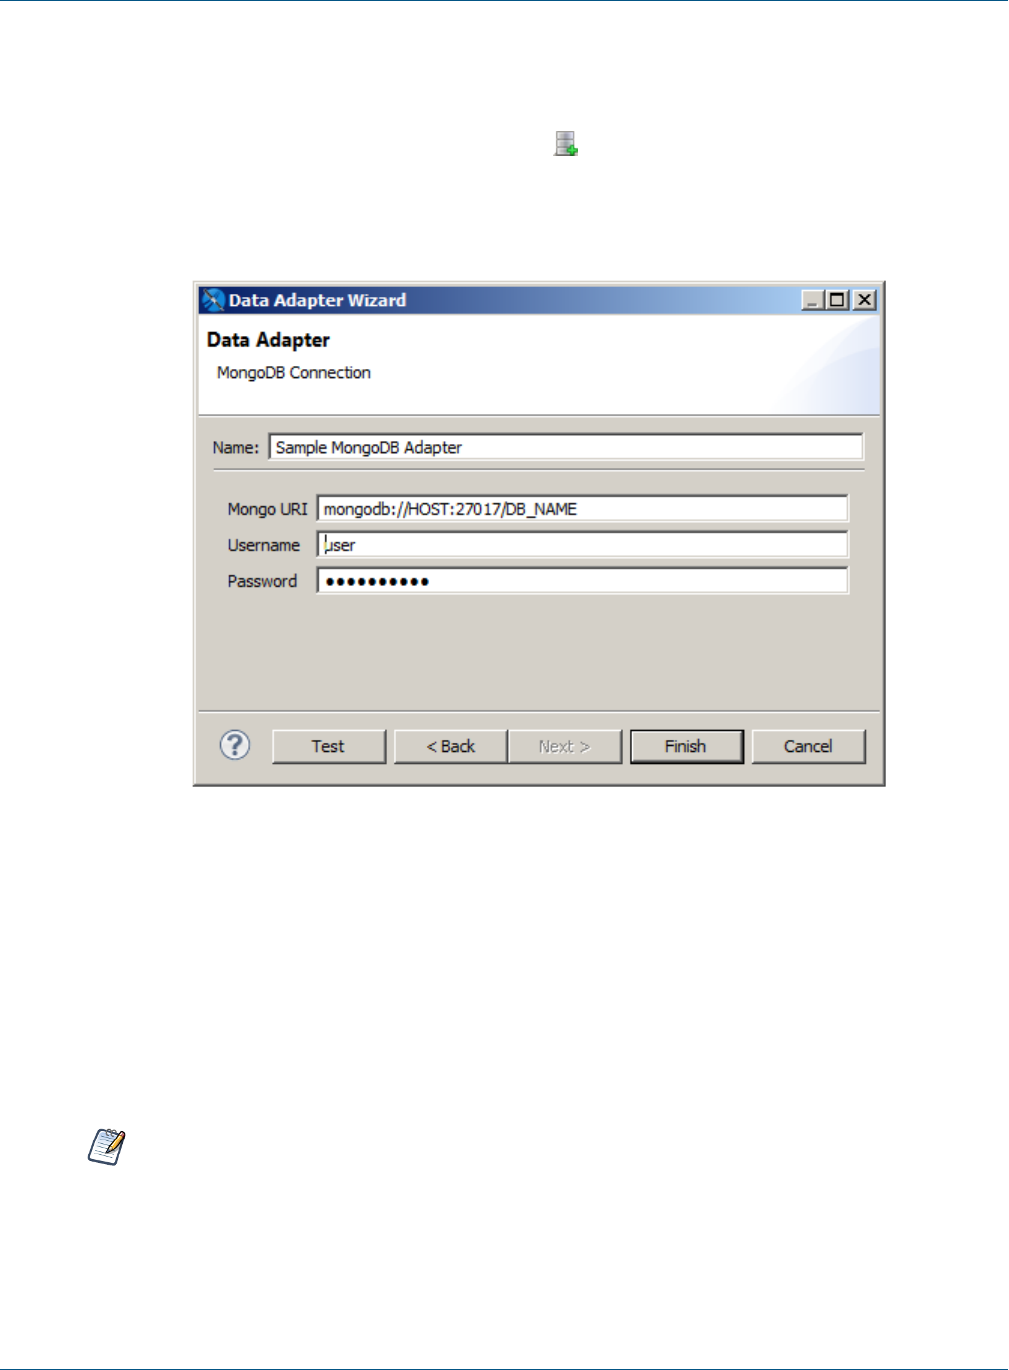
TIBCO Jaspersoft Studio User Guide
1. Create the connection globally or locally:
•To create the connection globally, right-click Data Adapters in the Repository Explorer and choose
Create Data Adapter.
•To create the connection local to a project, click , enter a name and location for the data adapter in
the DataAdapter File dialog box, and then click Next.
The Data Adapter wizard appears (see Figure 10-1, “Data Adapter Wizard,” on page142).
2. From the list, select MongoDB Connection to open the Data Adapter dialog.
Figure 10-12 Configuring a MongoDB Connection
3. Fill in the required fields:
•Name: The name that will appear on the list of available data adapters when you create or run a report.
•Mongo URI: The URI of your MongoDB data.
4. If you have configured your MongoDB source to be password protected, specify a valid username and
password.
5. Click Test to check the values you entered. If everything's okay, you'll see a success message.
6. Click OK to exit the message.
7. Click Finish to create the connection.
If you get a ClassNotFoundError exception, the most likely cause is that the required driver is not
present in the classpath. See 10.3.2.1, “ClassNotFoundError,” on page149 for more information.
10.4.1.1 The Jaspersoft MongoDB Query Language
MongoDB is designed to be accessed through API calls in an application or a command shell. As a
consequence, it does not have a defined query language. In order to write queries for MongoDB data sources,
154 TIBCO Software Inc.

Chapter 10 Data Adapters
we have developed a query language based on the JSON-like objects upon which MongoDB operates. JSON is
the JavaScript Object Notation, a textual representation of data structures that is both human- and machine-
readable.
The Jaspersoft MongoDB Query Language is a declarative language for specifying what data to retrieve from
MongoDB. The connector converts this query into the appropriate API calls and uses the MongoDB Java
connector to query the MongoDB instance. The following examples give an overview of the Jaspersoft
MongoDB Query Language, with SQL-equivalent terms in parentheses:
•Retrieve all documents (rows) in the given collection (table):
{ 'collectionName' : 'accounts' }
•From all documents in the given collection, select the named fields (columns) and sort the results:
{
'collectionName' : 'accounts',
'findFields' : {'name':1,'phone_office':1,'billing_address_city':1,
'billing_address_street':1,'billing_address_country':1},
'sort' : {'billing_address_country':-1,'billing_address_city':1}
}
•Retrieve only the documents (rows) in the given collection (table) that match the query (where clause). In
this case, the date is greater-than-or-equal to the input parameter, and the name matches a string (starts with
N):
{
'collectionName' : 'accounts',
'findQuery' : {
'status_date' : { '$gte' : $P{StartDate} },
'name' : { '$regex' : '^N', '$options' : '' }
}
}
The Jaspersoft MongoDB Query Language also supports advanced features of MongoDB such as map-reduce
functions and aggregation that are beyond the scope of this document. For more information, see the language
reference on the Community website.
When you create a report or subdatasource from a native MongoDB connection, Jaspersoft Studio automatically
selects MongoDBQuery as the query language. You can explicitly view and set the query language using the
Dataset and Query Dialog.
TIBCO Software Inc. 155
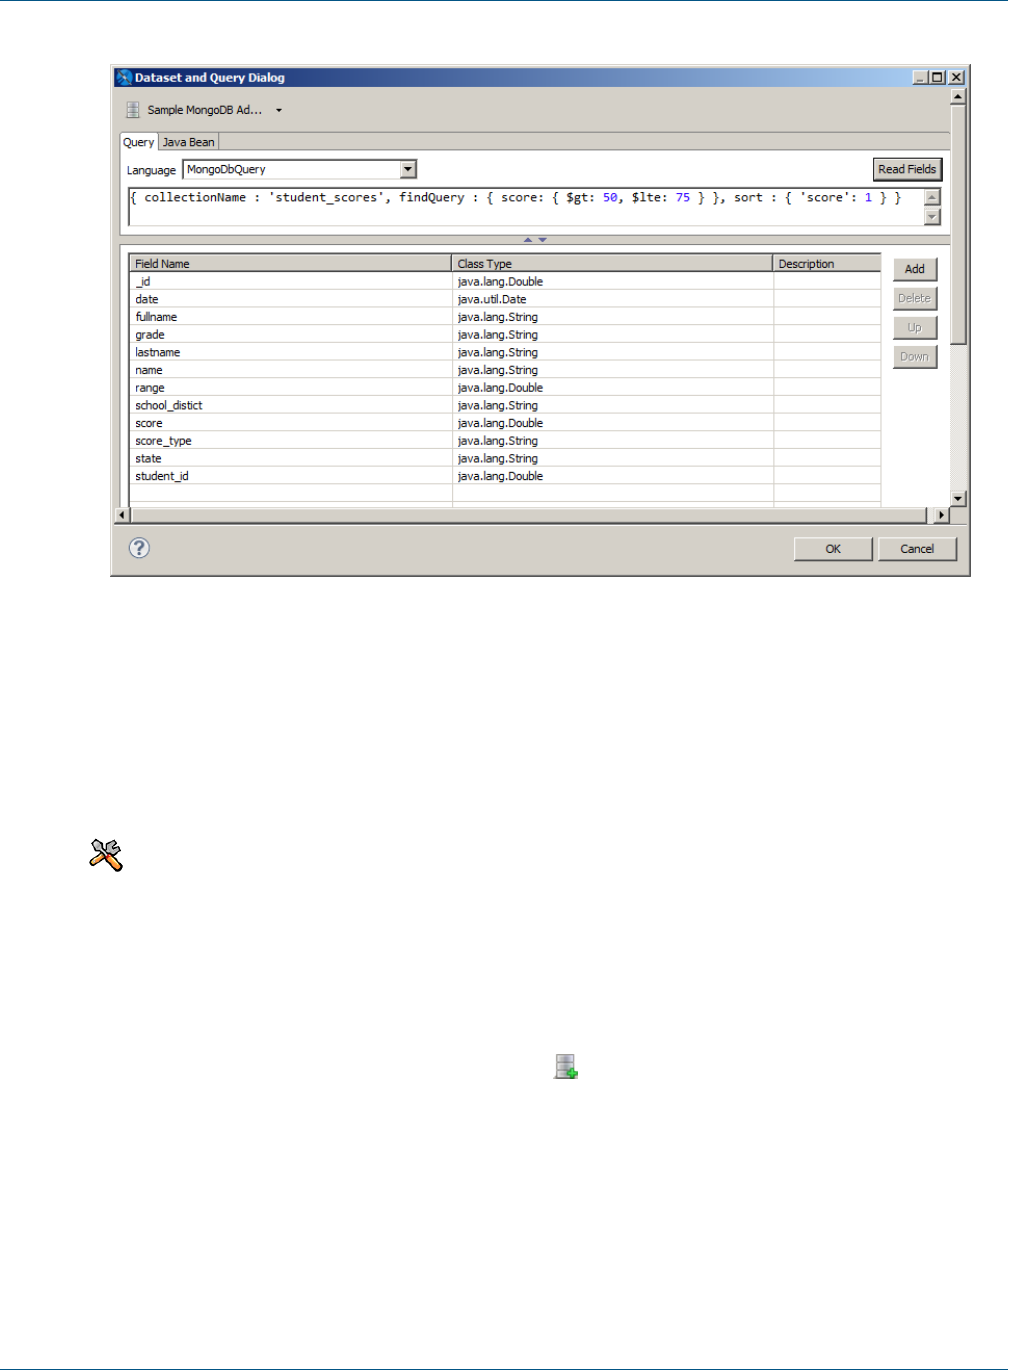
TIBCO Jaspersoft Studio User Guide
Figure 10-13 Example Dataset and Query Dialog for a MongoDB Data Adapter
10.4.2 Creating a MongoDB JDBC Data Source
If you want to wrap your MongoDB data source in a domain or virtual data source, create a MongoDB JDBC
data source. The MongoDB JDBC driver can create a default normalized schema for your data or, if you prefer,
you can load a schema from the repository or your server file system.
This section describes functionality that can be restricted by the software license for JasperReports
Server. If you don’t see some of the options described in this section, your license may prohibit you from
using them. To find out what you're licensed to use, or to upgrade your license, contact Jaspersoft.
To create a MongoDB JDBC data source:
1. Create the connection globally or locally:
•To create the connection globally, right-click Data Adapters in the Repository Explorer and choose
Create Data Adapter.
•To create the connection local to a project, click , enter a name and location for the data adapter in
the DataAdapter File dialog box, and then click Next.
The Data Adapter wizard appears (see Figure 10-1, “Data Adapter Wizard,” on page142).
2. From the list, select Database JDBC Connection to open the Data Adapter dialog.
3. In the JDBC Driver field, select MongoDB (TIBCO Jaspersoft).
156 TIBCO Software Inc.
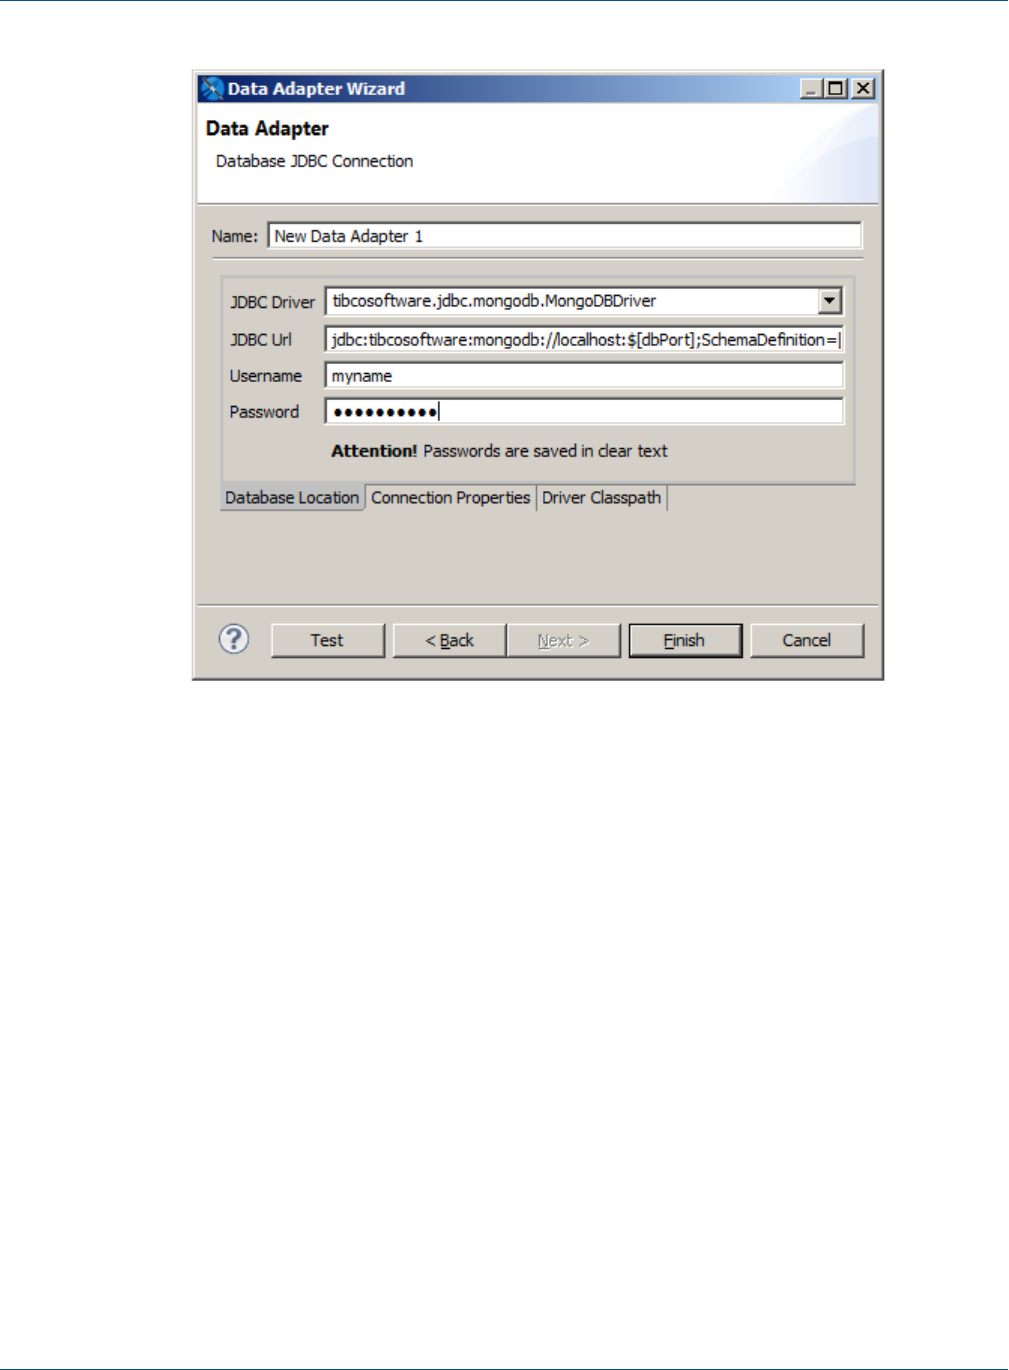
Chapter 10 Data Adapters
Figure 10-14 MongoDB JDBC Data Adapter Dialog
4. Fill in the required fields:
•Name: The name that will appear on the list of available data adapters when you create or run a report.
•JDBC URL: The URL for your MongoDB instance. This is in the following format:
jdbc:tibcosoftware:mongodb://host:port;databaseName=db;SchemaDefinition=file
where:
•host:port is the host and port of your MongoDB instance
•db is the name of the database to use in your MongoDB instance
•file (optional) is a location on your local disk where you want to store the schema definition.
When you first connect to a MongoDB server, the driver automatically creates a normalized
schema of the data and generates a SchemaDefinition for housing and sharing the normalized
schema. You can also specify the path of an existing schema on your local disk.
5. If you have configured your MongoDB source to be password protected, specify a valid username and
password.
6. (Optional) Click Connection Properties to specify any additional properties for your connection. For
example, if you're using MongoDB 3.0 and you want to enable SSL, enter:
EncryptionMethod=SSL;ValidateServerCertificate=false
To enable both SSL encryption and self-signed CA, enter the TrustStore and KeyStore paths and the
KeyStore password. For example:
EncryptionMethod=SSL;TrustStore=<path>;KeyStore=<path>;KeyStorePassword=<password>;
TIBCO Software Inc. 157

TIBCO Jaspersoft Studio User Guide
7. Click Test to check the values you entered. If everything's okay, you'll see this message:
Figure 10-15 Test Confirmation Dialog
8. Click OK to exit the message.
9. Click Finish to create the connection.
If you get a ClassNotFoundError exception, it may be due to one of the following:
• You are not licensed to use the TIBCO MongoDB JDBC driver. This driver is only available in
commercial editions.
• The required driver is not present in the classpath. See 10.3.2.1, “ClassNotFoundError,” on
page149 for more information.
10.5 Working with a Native Cassandra Connection
The Apache Cassandra database provides scalability and high availability for certain applications of big data.
For more information about Cassandra, see http://cassandra.apache.org/.
The Cassandra data adapter relies on a driver that has certain limitations on how your data can be structured and
accessed:
•The current version of Cassandra does not support NULL values in the data. All required fields must have
non-NULL default values.
•The current version of the driver does not support aggregate functions (sum, min, max).
•For query parameters, the current version of the driver supports $X(IN...), but no other $X functions.
The Cassandra data adapter supports queries in the Cassandra Query Language 3 (CQL3). To improve
performance, design your Cassandra data using the following guidelines:
•Specify the ALLOW FILTERING suffix to speed up queries.
•All fields referenced in WHERE clauses of a query should be indexed.
10.5.1 Creating a Native Cassandra Data Adapter
To create a new Cassandra adapter:
1. Create the connection globally or locally:
•To create the connection globally, right-click Data Adapters in the Repository Explorer and choose
Create Data Adapter.
•To create the connection local to a project, click , enter a name and location for the data adapter in
the DataAdapter File dialog box, and then click Next.
The Data Adapter wizard appears (see Figure 10-1, “Data Adapter Wizard,” on page142).
158 TIBCO Software Inc.
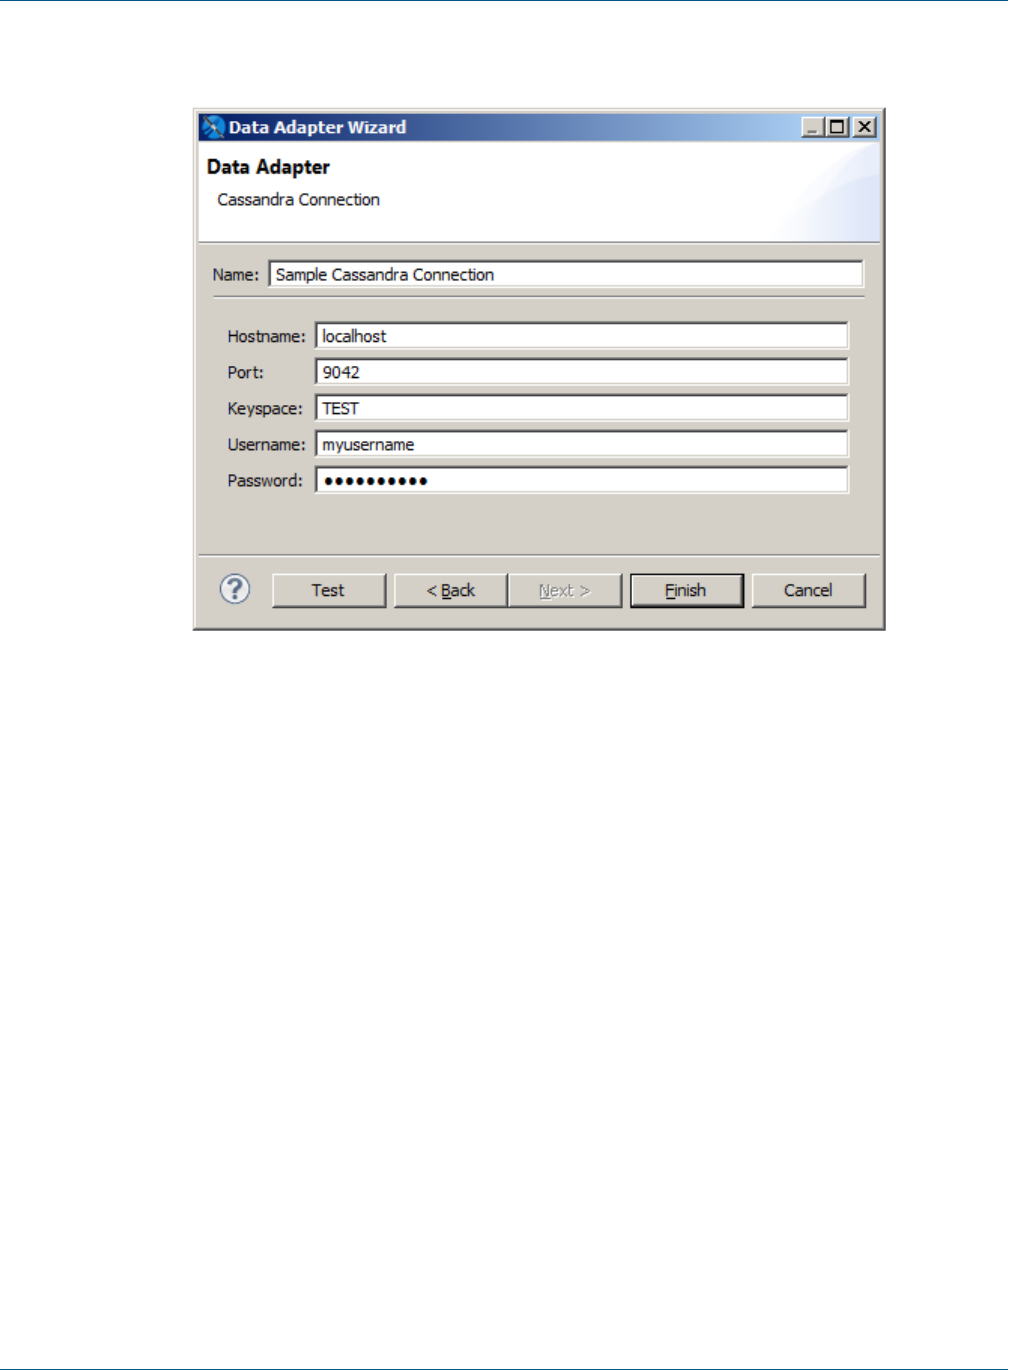
Chapter 10 Data Adapters
2. From the list, select Cassandra Connection to open the Data Adapter dialog.
Figure 10-16 Configuring a Cassandra Native Connection
3. Fill in the required fields:
•Name: The name that will appear on the list of available data adapters when you create a report.
•Port: Use port 9042 with the Cassandra data source. Cassandra's default port of 9160 is for the Thrift
client that is commonly used with Cassandra. To use the Cassandra Query Language (CQL) with your
Cassandra data source, you may need to configure your Cassandra instance as follows:
start_native_transport: true
native_transport_port: 9042
•Keyspace: The keyspace of your Cassandra instance.
4. If you have configured your Cassandra source to be password protected, specify a valid username and
password. Due to compatibility issues, Cassandra authentication is supported only when you use Cassandra
1.12.18 and above. If the password is empty, it is better if you specify that it be saved. You can choose to
save the password in one of two ways:
•Clear text – This is not secure, but can sometimes be convenient when working in a developer or
staging environment.
•Eclipse secure storage – This is the correct option for security, but can be difficult to work with when
testing and saving adapters. In addition, it can make it difficult to share adapters with other developers
or deploy data adapters to JasperReports Server.
5. Click Test to check the values you entered. Make sure that the port is set to 9042, because the connection
test will also work with the wrong port (9160). If everything's okay, you'll see a success message.
6. Click OK to exit the message.
7. Click Finish to create the connection.
TIBCO Software Inc. 159
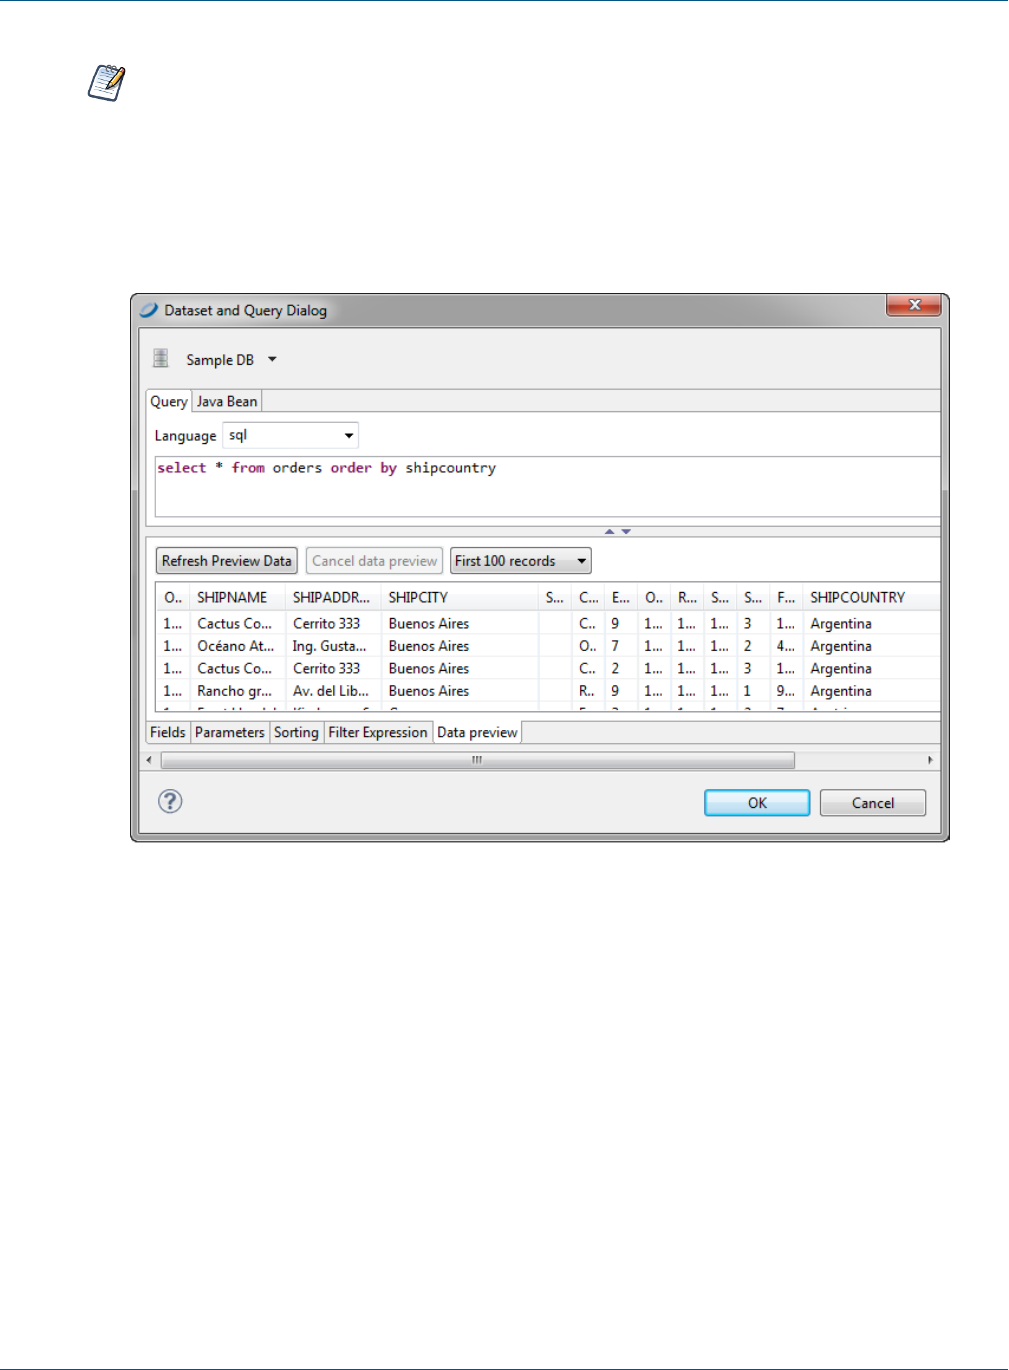
TIBCO Jaspersoft Studio User Guide
If you get a ClassNotFoundError exception, the most likely cause is that the required driver is not
present in the classpath. See 10.3.2.1, “ClassNotFoundError,” on page149 for more information.
10.5.2 Using a Cassandra Connection
When you create a report or subdatasource from a native Cassandra connection, specify a CQL query to extract
records from the database.
Figure 10-17 Data Preview
If no fields can be selected with the Add field button, check to see if the report contains fields. If not, close the
query dialog, register the fields, and resume the sorting.
10.6 Working with a Collection of JavaBeans Data Adapter
A collection of JavaBeans data adapter allows you to use JavaBeans as data for a report. In this context, a
JavaBean is a Java class that exposes its attributes with a series of get methods, with the following syntax:
public <returnType> getXXX()
where <returnType>(the return value) is a generic Java class or a primitive type (such as int,double, and so
on).
160 TIBCO Software Inc.

Chapter 10 Data Adapters
10.6.1 Implementing the Factory Class for a Collection of JavaBeans
The collection of JavaBeans data adapter uses an external class (named Factory) to produce some objects (the
JavaBeans) that constitute the data to pass to the report. To use a collection of JavaBeans as a data adapter in
Jaspersoft Studio, you must create an instance of the Factory class and provide a static method to instantiate
different JavaBeans and to return them as a collection (java.util.Collection) or an array (Object[]). The
following example shows how you might create write an instance of the Factory class.
Suppose that you have an collection of JavaBeans, where the data is represented by a set of objects of type
PersonBean. The following table shows the code for PersonBean, which contains two fields: name (the
person’s name) and age:
public class PersonBean
{
private String name = "";
private int age = 0;
public PersonBean(String name, int age)
{
this.name = name;
this.age = age;
}
public int getAge()
{
return age;
}
public String getName()
{
return name;
}
}
Table 10-2 PersonBean example
To use this collection of beans, you need to create an instance of the Factory class. Your class, named
TestFactory, must contain the actual data that is used by the report. In this case, it will be something similar
to this:
public class TestFactory
{
public static java.util.Collection generateCollection()
{
java.util.Vector collection = new java.util.Vector();
collection.add(new PersonBean("Ted", 20) );
collection.add(new PersonBean("Jack", 34) );
collection.add(new PersonBean("Bob", 56) );
collection.add(new PersonBean("Alice",12) );
collection.add(new PersonBean("Robin",22) );
collection.add(new PersonBean("Peter",28) );
return collection;
}
}
Table 10-3 PersonBean example - Class result
TIBCO Software Inc. 161

TIBCO Jaspersoft Studio User Guide
A data adapter based on this class would represent five JavaBeans of PersonBean type.
10.6.2 Creating a Data Adapter from a Factory Class
Once you have created your Factory class instance, you can create a data adapter that uses your collection of
JavaBeans.
1. Create the connection globally or locally:
•To create the connection globally, right-click Data Adapters in the Repository Explorer and choose
Create Data Adapter.
•To create the connection local to a project, click , enter a name and location for the data adapter in
the DataAdapter File dialog box, and then click Next.
The Data Adapter wizard appears (see Figure 10-1, “Data Adapter Wizard,” on page142).
2. To create a connection to handle JavaBeans, select Collection of JavaBeans in the list of data adapter
types.
The fields necessary to create a collection JavaBeans appear.
Figure 10-18 Collection of JavaBeans Data Adapter
3. Create a name for your adapter.
4. Enter the name of your Java class in the Factory class. For the example above, you would need to specify
the class name for TestFactory.
5. Enter the name of the static method in your Factory class. In the example above, this is
generateCollection.
6. By default, the field names in your JavaBeans become the field names in your data adapter. If your
JavaBeans definition has field descriptions, and you want to use these as names in Jaspersoft Studio, select
Use field description.
7. If necessary, you can add the path to your jar files.
162 TIBCO Software Inc.
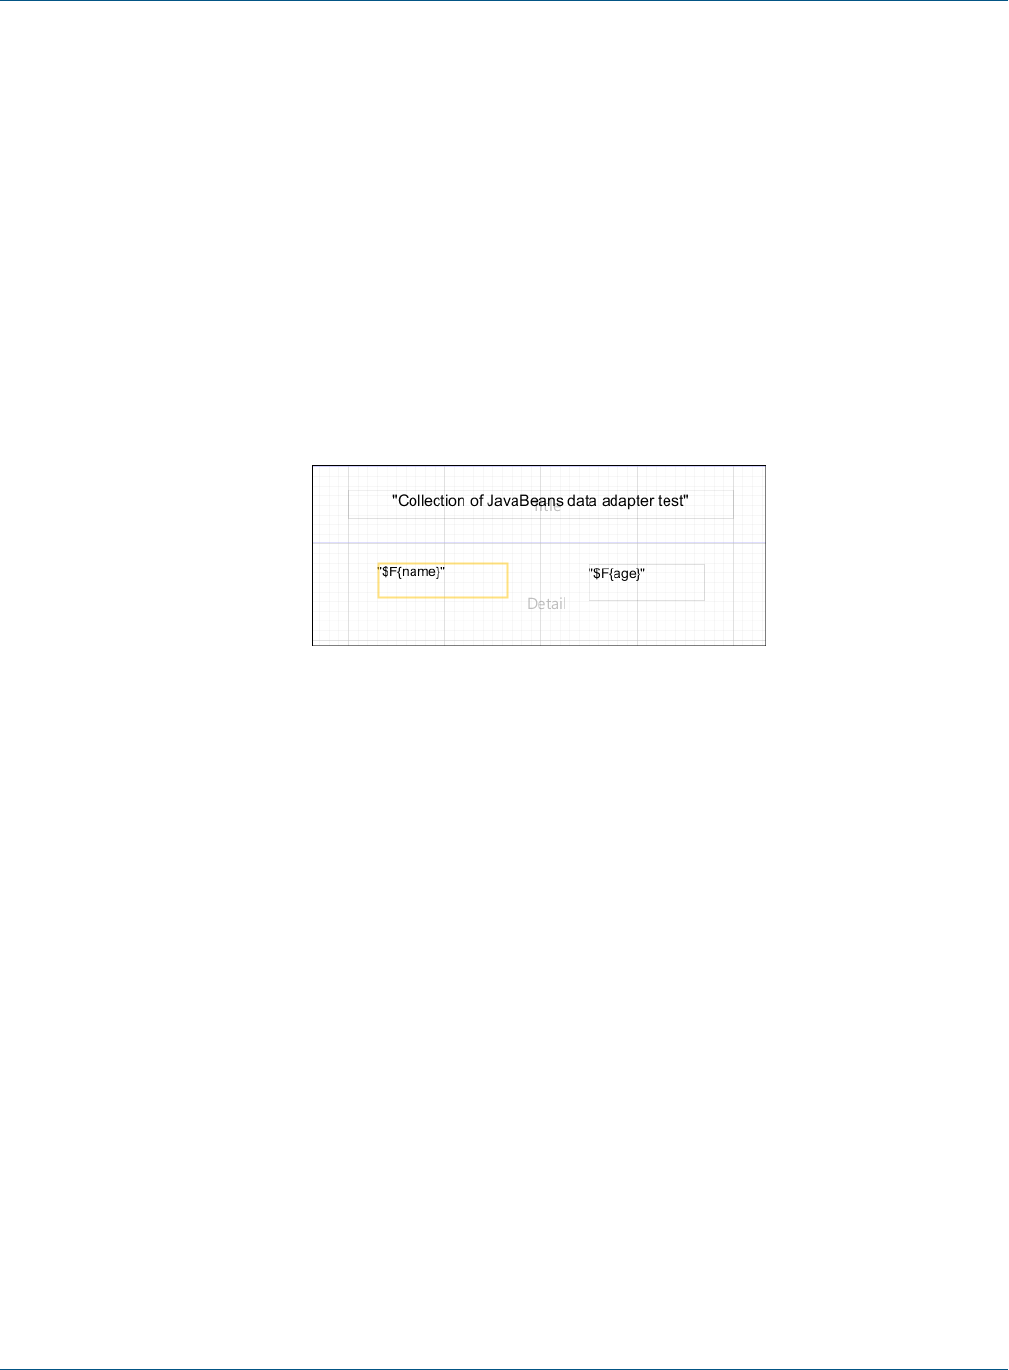
Chapter 10 Data Adapters
10.6.3 Registering the Fields
One peculiarity of a collection of JavaBeans data adapter is that the fields are exposed through get methods.
This means that if the JavaBean has a getXyz() method, xyz becomes the name of a record field (the JavaBean
represents the record).
In this example, the PersonBean object shows two fields: name and age. Register them in the fields list as a
String and an Integer, respectively.
Create a new empty report and add the two fields by right-clicking the Fields node in the outline view and
selecting Add field. The field names and the types of the fields are: name (java.lang.String) and age
(java.lang.Integer).
Drag the fields into the Detail band and run the report. (Make sure the active connection is the
TestFactoryAdapter.) To refer to an attribute of an attribute, use periods as a separator. For example, to access
the street attribute of an Address class contained in the PersonBean, the syntax would be address.street.
The real call would be <someBean>.getAddress().getStreet().
Figure 10-19 Layout of a Report Based on JavaBeans
If you selected Use field description when you specified the properties of your data adapter, the mapping
between JavaBean attribute and field value uses the field description instead of the field name.
Jaspersoft Studio provides a visual tool to map JavaBean attributes to report fields. To use it, open the query
window, go to the tab JavaBean Data Source, insert the full class name of the bean you want to explore, and
click Read attributes. The tab displays the attributes of the specified bean class.
•If an attribute is also a Java object, you can double-click the object to display its other attributes.
•To map a field, select an attribute name and click the Add Selected Field(s) button.
10.7 Working with XML Data Adapters
JasperReports supports data adapters for XML documents.
10.7.1 Creating a Node Set for an XML Document
An XML document is typically organized as a tree, and doesn't match the table-like form required by
JasperReports. For this reason, you have to use an XPath expression to define a node set. The specifications of
the XPath language are available at http://www.w3.org/TR/xpath. Some examples can help you understand how
to define the nodes.
TIBCO Software Inc. 163

TIBCO Jaspersoft Studio User Guide
The XML file below is an address book in which people are grouped in categories, followed by a second list of
favorite objects. In this case, you can define different node set types. First you'll need to decide how you want
to organize the data in your report.
<addressbook>
<category name="home">
<person id="1">
<lastname>Davolio</lastname>
<firstname>Nancy</firstname>
</person>
<person id="2">
<lastname>Fuller</lastname>
<firstname>Andrew</firstname>
</person>
<person id="3">
<lastname>Leverling</lastname>
</person>
</category>
<category name="work">
<person id="4">
<lastname>Peacock</lastname>
<firstname>Margaret</firstname>
</person>
</category>
<favorites>
<person id="1"/>
<person id="3"/>
</favorites>
</addressbook>
Table 10-4 Example XML file
To select only the people contained in the categories (that is, all the people in the address book), use the
following expression:
/addressbook/category/person
Four nodes are returned as shown in the following table.
<person id="1">
<lastname>Davolio</lastname>
<firstname>Nancy</firstname>
</person>
<person id="2">
<lastname>Fuller</lastname>
<firstname>Andrew</firstname>
</person>
<person id="3">
<lastname>Leverling</lastname>
</person>
<person id="4">
<lastname>Peacock</lastname>
<firstname>Margaret</firstname>
</person>
Table 10-5 Node set with expression /addressbook/category/person
164 TIBCO Software Inc.

Chapter 10 Data Adapters
If you want to select the people appearing in the favorites node, the expression to use is
/addressbook/favorites/person
Two nodes are returned.
<person id="1"/>
<person id="3"/>
Here's another expression. It's a bit more complex, but it shows all the power of the Xpath language. The idea is
to select the person nodes belonging to the work category. The expression to use is the following:
/addressbook/category[@name = "work"]/person
The expression returns only one node, the one with an ID equal to 4, as shown here:
<person id="4">
<lastname>Peacock</lastname>
<firstname>Margaret</firstname>
</person>
10.7.2 Creating an XML Data Adapter
After you've created an expression to select a node set, you can create an XML data adapter.
1. Create the connection globally or locally:
•To create the connection globally, right-click Data Adapters in the Repository Explorer and choose
Create Data Adapter.
•To create the connection local to a project, click , enter a name and location for the data adapter in
the DataAdapter File dialog box, and then click Next.
The Data Adapter wizard appears (see Figure 10-1, “Data Adapter Wizard,” on page142).
2. From the list, select XML document to open the Data Adapter dialog.
TIBCO Software Inc. 165
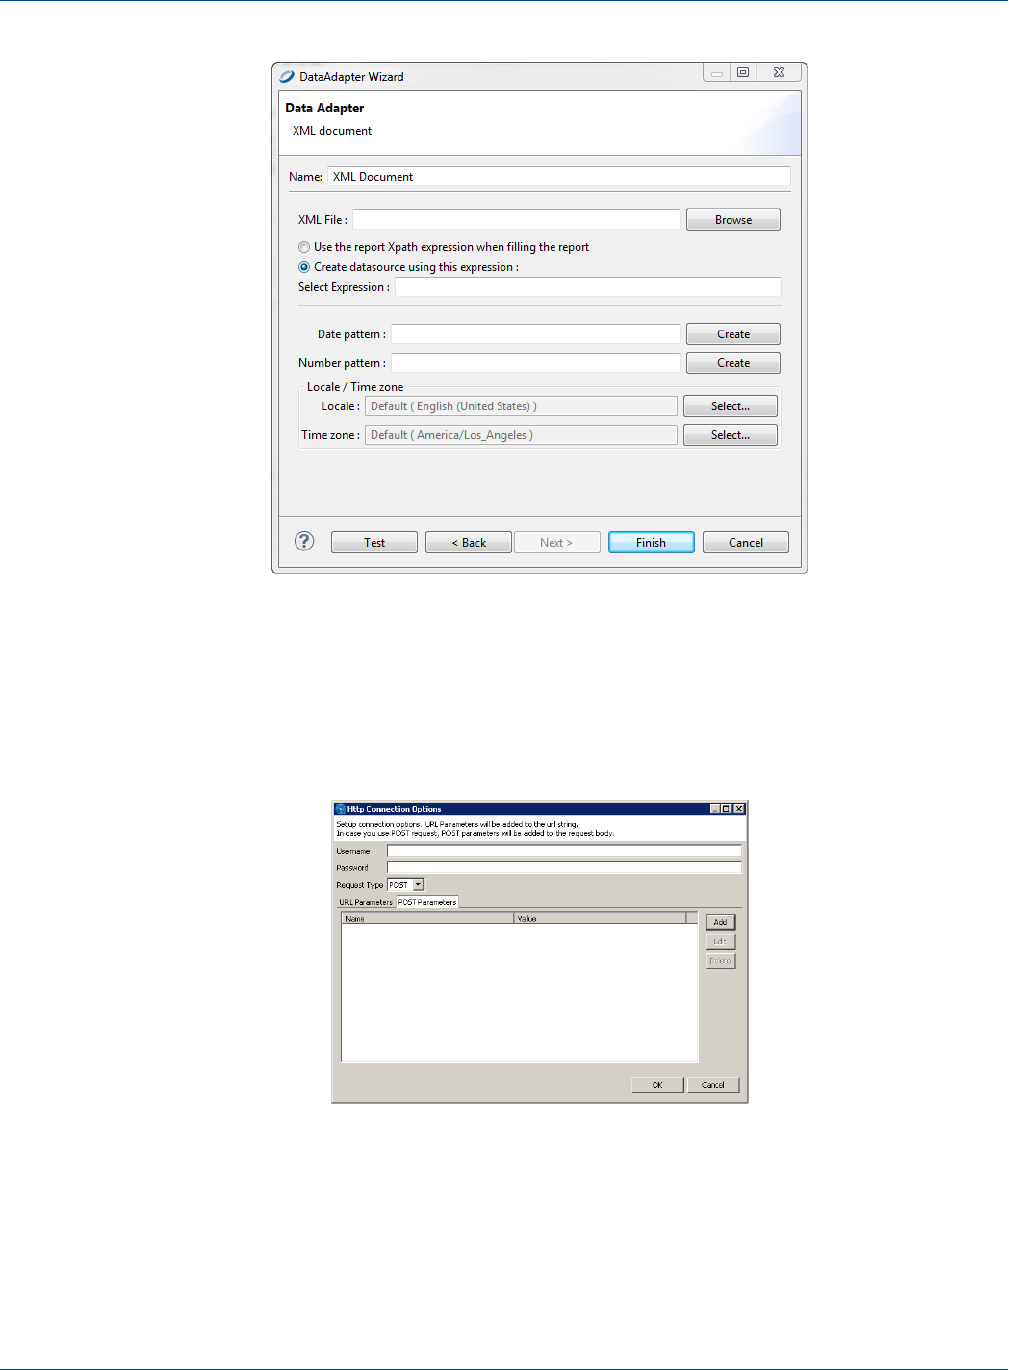
TIBCO Jaspersoft Studio User Guide
Figure 10-20 Configuring an XML Data Adapter
3. Enter a name for your adapter.
4. XML file is the only required field. Choose an XML file or enter the URLwhere your XML data is located.
5. (URL only.) If you entered a URL in the XML file field, click the Options button to open the Http
Connection Options dialog box.
Figure 10-21 HTTP Connection Options
In this dialog you can enter the following options:
•Username and Password (optional) – The username and password to use if your XML location
requires authentication.
•Request Type – Select GET (default), POST, or PUT.
166 TIBCO Software Inc.

Chapter 10 Data Adapters
•To add a parameter to the request URL, click Add in the URL Parameters tab. Enter the name and
value of your parameters in the Parameter dialog and click OK. For multiple parameters, add each
parameter separately.
•For a POST request, to add parameters to the body of the POST, click Add in the POST Parameters tab.
Enter the name and value of your parameters in the Parameter dialog and click OK. For multiple
parameters, add each parameter separately.
When you have configured your request, click OK.
You can configure an XML data adapter to connect to a REST web service. For an example of connecting
to a web service using the JSON adapter, see 10.9.2, “Connecting to a Web Service Using a JSON
Data Adapter,” on page175.
6. Choose whether to provide a set of nodes using a pre-defined static XPath expression, or set the XPath
expression directly in the report.
We recommend using a report-defined XPath expression. This enables you to use parameters inside the
XPath expression, which acts like a real query on the supplied XML data.
Optionally, you can specify Java patterns to convert dates and numbers from plain strings to more
appropriate Java objects (like Date and Double). For the same purpose, you can define a specific locale
and time zone to use when parsing the XML stream.
10.7.3 Registration of Fields for an XML Data Adapter
In addition to the type and name, the definition of a field in a report using an XML data adapter requires an
expression inserted as a field description. As the data adapter aims always to be one node of the selected node
set, the expressions are relative to the current node.
To select the value of an attribute of the current node, use the following syntax:
@<name attribute>
For example, to define a field that must point to the id attribute of a person (attribute id of the node person), it's
sufficient to create a new field, name it, and set the description to:
@id
It's also possible to get to the child nodes of the current node. For example, if you want to refer to the lastname
node, child of person, use the following syntax:
lastname
To move to the parent value of the current node (for example, to determine the category to which a person
belongs), use a slightly different syntax:
ancestor::category/@name
The ancestor keyword indicates that you're referring to a parent node of the current node. Specifically, the first
parent of category type, of which you want to know the value of the name attribute.
Now, let’s see everything in action. Prepare a simple report with the registered fields shown here:
Field name Description Type
id @id Integer
TIBCO Software Inc. 167

TIBCO Jaspersoft Studio User Guide
Field name Description Type
lastname lastname String
firstname firstname String
name of category ancestor::category/@name String
Jaspersoft Studio provides a visual tool to map XML nodes to report fields; to use it, open the query window
and select XPath as the query language. If the active connection is a valid XML data adapter, the associated
XML document is shown in a tree view. To register the fields, set the record node by right-clicking a Person
node and selecting the menu item Set record node. The record nodes are displayed in bold.
Then one by one, select the nodes or attributes and select the pop-up menu item Add node as field to map
them to report fields. Jaspersoft Studio determines the correct XPath expression to use and creates the fields for
you. You can modify the generated field name and set a more suitable field type after the registration of the
field in the report (which happens when you close the query dialog).
Insert the different fields in the Detail band. The XML file used to fill the report is that shown:
The XPath expression for the node set selection specified in the query dialog is:
/addressbook/category/person
10.7.4 XML Data Adapters and Subreports
A node set allows you to identify a series of nodes that represent records from a JRDataSource point of view.
However, due to the tree-like nature of an XML document, it may be necessary to see other node sets that are
subordinate to the main nodes.
Consider the XML in Table 10-6, “Complex XML example,” on page169. This is a slightly modified version
of Table 10-4, “Example XML file,” on page164. For each person node, a hobbies node is added which
contains a series of hobby nodes and one or more e-mail addresses.
168 TIBCO Software Inc.

Chapter 10 Data Adapters
<addressbook>
<category name="home">
<person id="1">
<lastname>Davolio</lastname>
<firstname>Nancy</firstname>
<email>davolio1@sf.net</email>
<email>davolio2@sf.net</email>
<hobbies>
<hobby>Music</hobby>
<hobby>Sport</hobby>
</hobbies>
</person>
<person id="2">
<lastname>Fuller</lastname>
<firstname>Andrew</firstname>
<email>af@test.net</email>
<email>afullera@fuller.org</email>
<hobbies>
<hobby>Cinema</hobby>
<hobby>Sport</hobby>
</hobbies>
</person>
</category>
<category name="work">
<person id="3">
<lastname>Leverling</lastname>
<email>leverling@xyz.it</email>
</person>
<person id="4">
<lastname>Peacock</lastname>
<firstname>Margaret</firstname>
<email>margaret@foo.org</email>
<hobbies>
<hobby>Food</hobby>
<hobby>Books</hobby>
</hobbies>
</person>
</category>
<favorites>
<person id="1"/>
<person id="3"/>
</favorites>
</addressbook>
Table 10-6 Complex XML example
What we want to produce is a document that is more elaborate than those you have seen so far. For each person,
we want to present their e-mail addresses, hobbies, and favorite people.
You can create this document using subreports. You'll need a subreport for the e-mail address list, one for
hobbies, and one for favorite people (that is a set of nodes out of the scope of the XPath query we used). To
generate these subreports, you need to understand how to produce new data sources to feed them. In this case,
you'll use the JRXmlDataSource, which exposes two extremely useful methods:
public JRXmlDataSource dataSource(String selectExpression)
public JRXmlDataSource subDataSource(String selectExpression)
TIBCO Software Inc. 169

TIBCO Jaspersoft Studio User Guide
The first method processes the expression by applying it to the whole document, starting from the actual root.
The second assumes the current node is the root.
Both methods can be used in the data source expression of a subreport element to dynamically produce the data
source to pass to the element. The most important thing to note is that this mechanism allows you to make both
the data source production and the expression of node selection dynamic.
The expression to create the data source that feeds the subreport of the e-mail addresses is:
((net.sf.jasperreports.engine.data.JRXmlDataSource)
$P{REPORT_DATA_SOURCE}).subDataSource("/person/email")
This code returns all the e-mail nodes that descend directly from the present node (person).
The expression for the hobbies subreport is similar, except for the node selection:
((net.sf.jasperreports.engine.data.JRXmlDataSource)
$P{REPORT_DATA_SOURCE}).subDataSource("/person/hobbies/hobby")
Next, declare the master report’s fields. In the subreport, you have to refer to the current node value, so the field
expression is simply a dot (.),
Proceed with building your three reports: xml_addressbook.jasper,xml_addresses.jasper, and xml_
hobbies.jasper.
In the master report, xml_addressbook.jrxml, insert a group named “Name of category,” in which you
associate the expression for the category field ($F{name of category}). In the header band for Name of
category, insert a field to display the category name. By doing this, the names of the people are grouped by
category (as in the XML file).
In the Detail band, position the id,lastname, and firstname fields. Below these fields, add the two Subreport
elements, the first for the e-mail addresses, the second for the hobbies.
The e-mail and hobby subreports are identical except for the name of the field in each one. The two reports
should be as large as the Subreport elements in the master report, so remove the margins and set the report width
accordingly.
Preview both the subreports just to compile them and generate the relative .jasper files. Jaspersoft Studio
returns an error during the fill process, but that's expected. We haven't set an Xpath query, so JasperReports can't
get any data. You can resolve the problem by setting a simple Xpath query (it isn't used in the final report), or
you can preview the subreport using the empty data adapter (select it from the drop-down in the tool bar).
When the subreports are done, execute the master report. If everything is okay, the report groups people by
home and work categories and the subreports associated with each person.
As this example demonstrates, the real power of the XML data adapter is the versatility of XPath, which allows
navigation of the node selection in a refined manner.
10.8 Working with XML/A Data Adapters
XML/A (XML for Analysis) is an XML standard for accessing remote data in an OLAP schema. Jaspersoft
Studio supports an XML/A data adapter that can connect various XML/A providers such as JasperReports
Server and Microsoft SQL Server Analytic Services (SSAS). Because Jaspersoft Studio uses OLAP4J
(http://www.olap4j.org/), it may also be able to connect to other types of XML/A providers.
The remote server must also be configured for XML/A. For more information, including instructions for
configuring Jaspersoft OLAP, see the Jaspersoft OLAP User Guide .
170 TIBCO Software Inc.

Chapter 10 Data Adapters
To create an XML/A Data Adapter:
1. Right-click Data Adapters in the Repository Explorer, and select Create Data Adapter.
2. Select XML/A Server and click Next.
3. Enter a name for the data adapter.
4. Enter the URL for your XML/A provider. The type of server determines the value. For example:
•If the XML/A server is JasperReports Server, the URL is something like:
http://<hostname>:<port>/jasperserver-pro/xmla
•If the XML/A server is Microsoft SSAS 2012, the URL is something like:
http://<hostname>/MSSQL_2012/msmdpump.dll
5. Enter a user name and password of a user that has sufficient access in the report server to return your data.
6. Click Get Metadata.
Jaspersoft Studio attempts to connect to the server and return information about its data sources, catalogs,
and cubes. If it's successful, default values appear in the drop-downs. If the connection fails, check the URL,
ensure that the remote server is available, and try again.
7. Select the data source, catalog, and cube that stores the data you want for your report.
8. Click Test.
Jaspersoft Studio connects to the server and read the cube you selected. If the connection fails, check the
URL, ensure that the remote server is available, and try again.
9. When the test succeeds, click OK to close the message and click Finish to close the New Data Adapter
wizard.
When you create a report using this data adapter, you may see a message indicating that the data adapter doesn't
support the ability to retrieve fields. This means Jaspersoft Studio doesn't have enough information to preview
your data. After you provide an MDX query, Jaspersoft Studio can automatically read fields and suggest their
datatypes.
10.8.1 Registration of fields in XML/A Providers
When you create an XML/A data adapter, you define the cube from which to read data. Jaspersoft Studio can
then inspect the remote server and suggest datatypes for the fields returned.
To register fields returned by an XML/A data adapter:
1. With your report open in the Design tab, click to open the Dataset and Query window.
2. Select the data adapter that points to your XML/A provider from the drop-down in the upper-left corner.
3. Select MDX from the Language drop-down.
4. Enter a valid MDX query in the text field.
To create a good MDX query, you must be familiar with both the language itself and the data you want to
work with. You can also use a tool (such as the Jaspersoft OLAP Workbench) to load your OLAP schema
and automatically generate MDX queries from it.
5. Click Read Fields.
Jaspersoft Studio returns the XML/A provider's data, including fields and parameters, and populates the
window's tabs with information. For more on how these tabs can be used to define the data in your report,
see Chapter 11, “Creating Queries,” on page195.
Jaspersoft Studio also sets the class type of each field to an appropriate Java datatype. If Jaspersoft Studio
sets an incorrect datatype, you can set the correct type after the fields are added to your report.
TIBCO Software Inc. 171

TIBCO Jaspersoft Studio User Guide
6. When the data in the Data Preview tab looks like the data you want to fill your report, click OK to close
the Dataset and Query window.
10.9 Working with CSV Data Adapters
You can create a connection based on a CSV file or URL location.
To create a connection based on a CSV file:
1. Click the New button in the Connections/Datasources dialog and select CSV File from the list of data
adapter types.
172 TIBCO Software Inc.
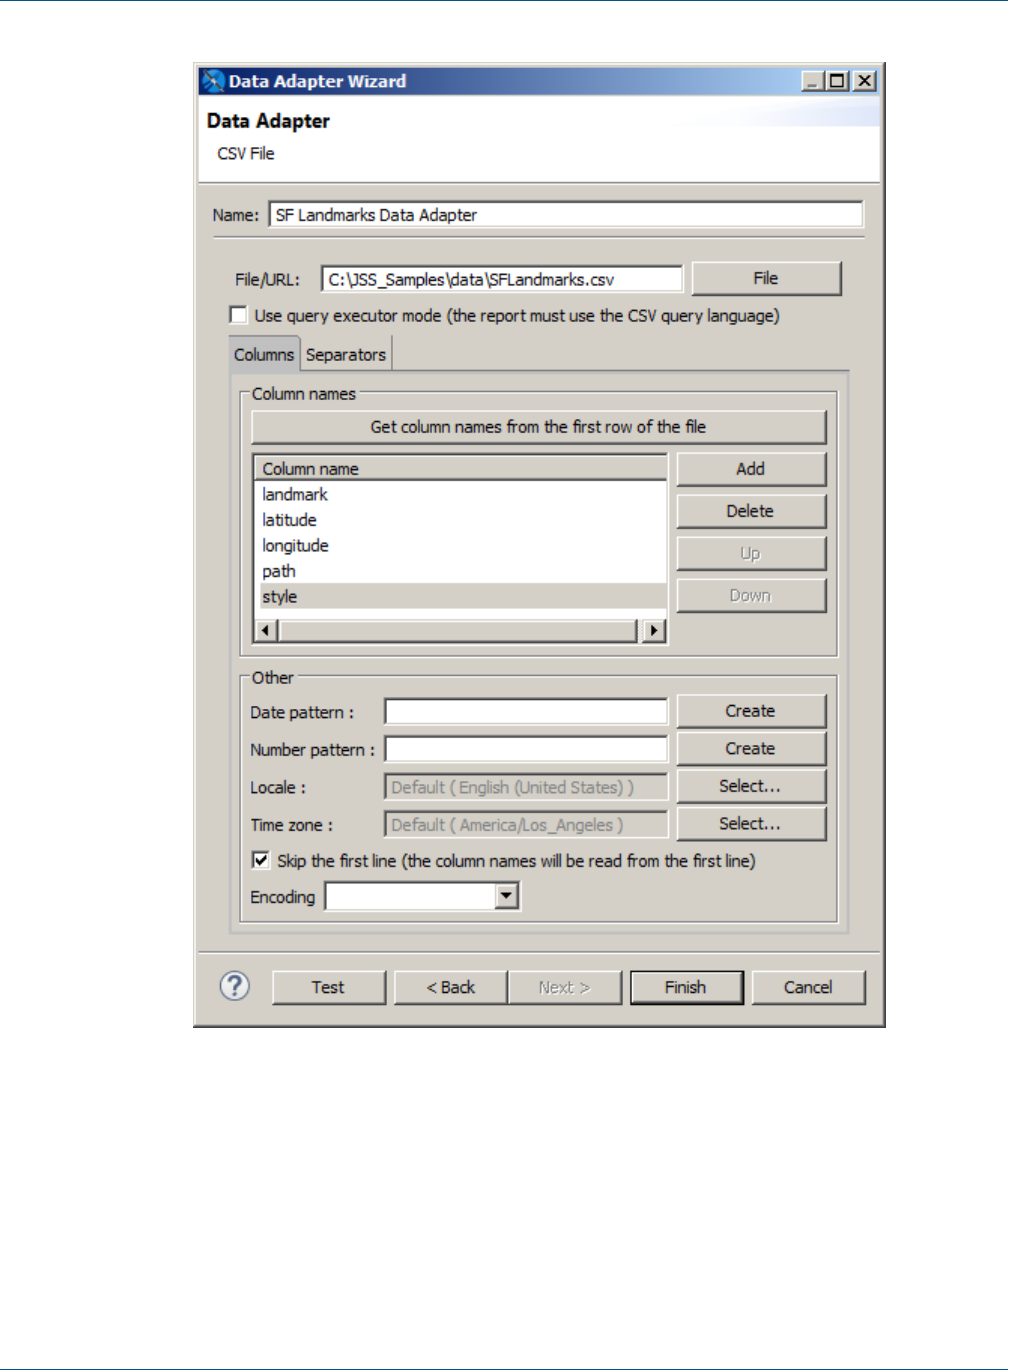
Chapter 10 Data Adapters
Figure 10-22 CSV Data Adapter
2. Set a name for the connection.
3. In the File\URL field, choose a CSV file or enter the URLwhere your CSV data is located.
4. (URL only.) If you entered a URL in the CSV file field, click the Options button to open the Http
Connection Options dialog box.
TIBCO Software Inc. 173
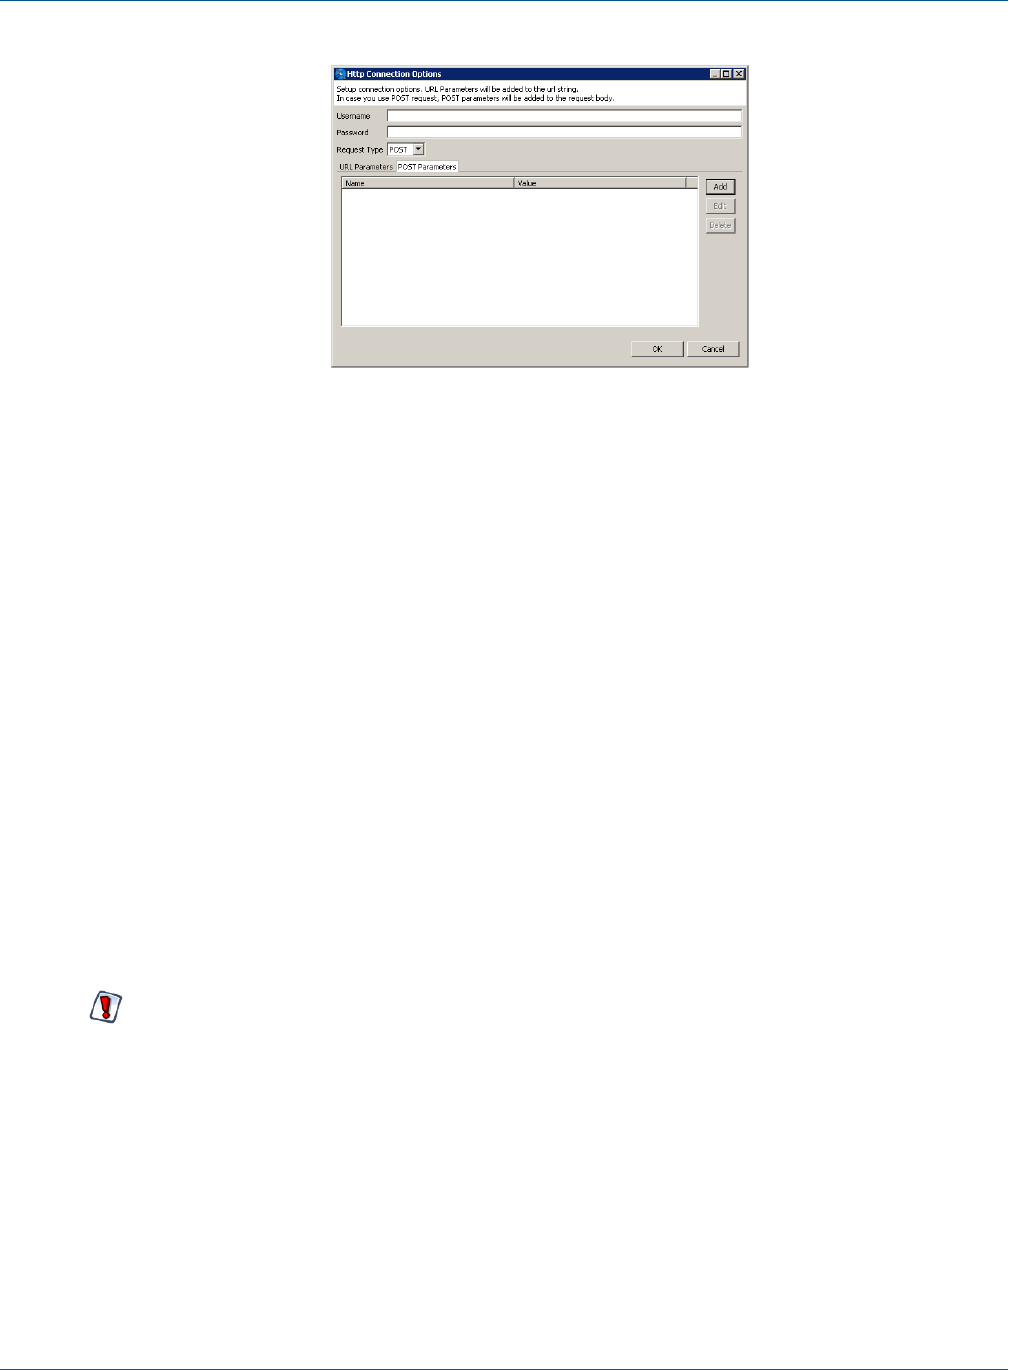
TIBCO Jaspersoft Studio User Guide
Figure 10-23 HTTP Connection Options
In this dialog you can enter the following options:
•Username and Password (optional) – The username and password to use if your CSV location
requires authentication.
•Request Type – Select GET (default) or POST.
•To add a parameter to the request URL, click Add in the URL Parameters tab. Enter the name and
value of your parameters in the Parameter dialog and click OK. For multiple parameters, add each
parameter separately.
•For a POST request, to add parameters to the body of the POST, click Add in the POST Parameters tab.
Enter the name and value of your parameters in the Parameter dialog and click OK. For multiple
parameters, add each parameter separately.
When you have configured your request, click OK.
5. Declare the fields in the data adapter.
•If the first line in your file contains the names of the columns, click Get column names from the
first row of the file and select the Skip the first line check box . This forces JasperReports to skip
the first line (the one containing your column labels). In any case, the column names read from the file
are used instead of the declared ones, so avoid modifying the names found with the Get column
names button.
•If the first line of your CSV file doesn’t contain the column names, set a name for each column using
the syntax COLUMN_0, COLUMN_1, and so on.
If you define more columns than the ones available, you’ll get an exception at report filling time.
JasperReports assumes that for each row all the columns have a value (even if they are empty).
6. If your CSV file uses nonstandard characters to separate fields and rows, you can adjust the default setting
for separators using the Separators tab.
174 TIBCO Software Inc.
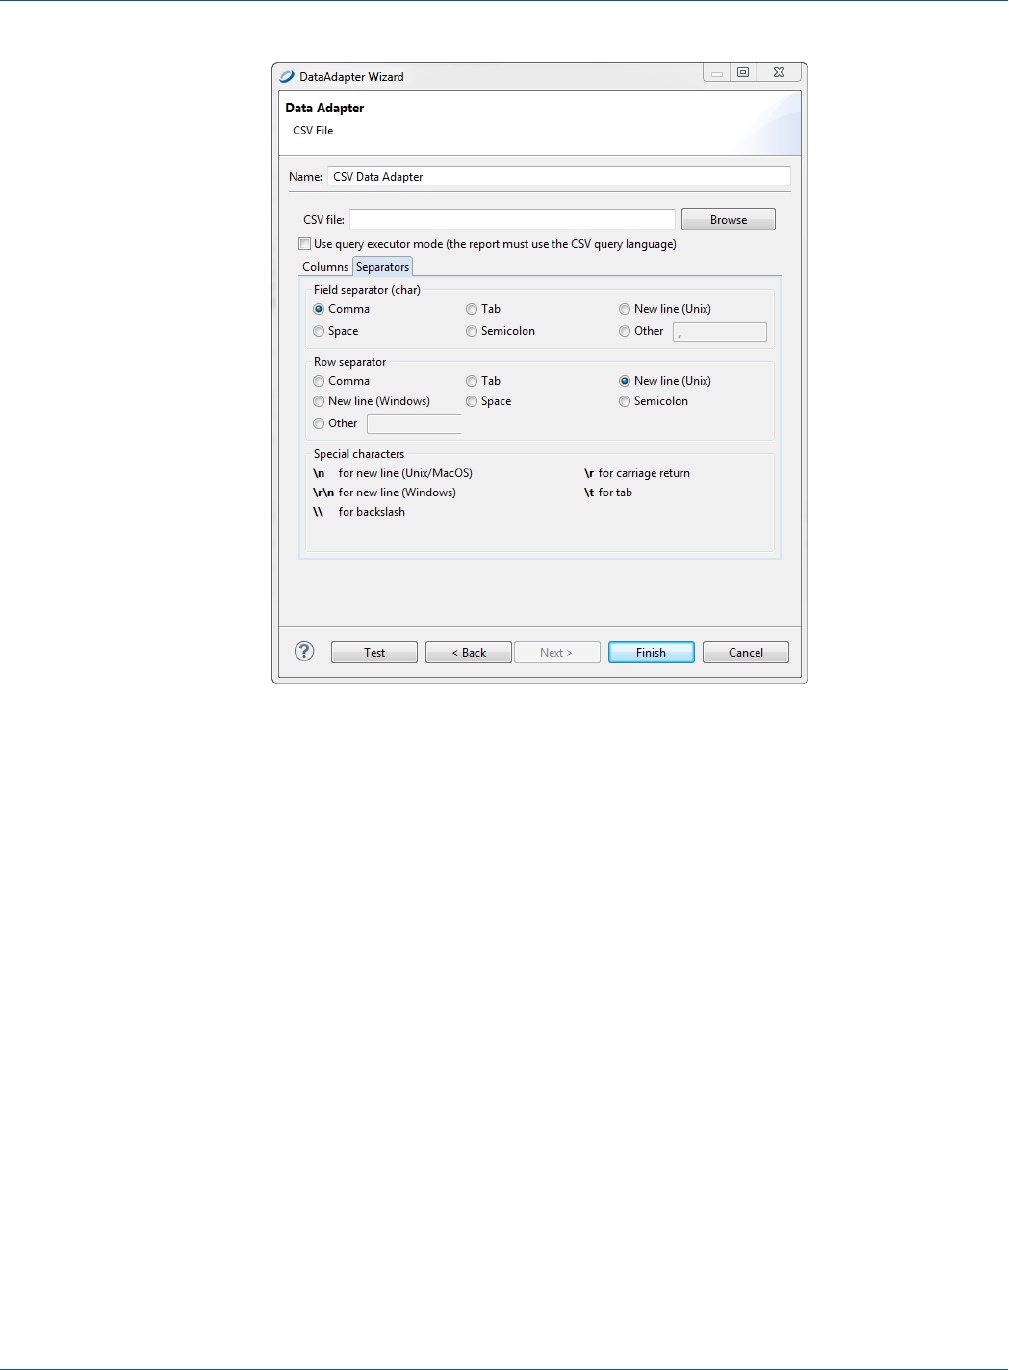
Chapter 10 Data Adapters
Figure 10-24 Separators Tab
7. Click Finish.
10.9.1 Registration of the Fields for a CSV Data Adapter
When you create a CSV data adapter, you must define a set of column names as fields for your report. To add
them to the fields list, set your CSV data adapter as the active connection and open the Report query dialog.
Open the Dataset and Query Dialog and click the Read Fields button.
By default, Jaspersoft Studio sets the class type of all fields to java.lang.String. If you're sure the text of a
particular column can be easily converted to a number, a date, or a Boolean value, set the correct field type
yourself after the fields are added to your report.
The pattern used to recognize a timestamp (or date) object can be configured at the data adapter level by
selecting the Use custom date format check box.
10.9.2 Connecting to a Web Service Using a JSON Data Adapter
You can configure a data adapter to connect to a REST web service. This mechanism is supported by the JSON
and XML data adapters and supports the PUT, POST, and GET verbs.
TIBCO Software Inc. 175
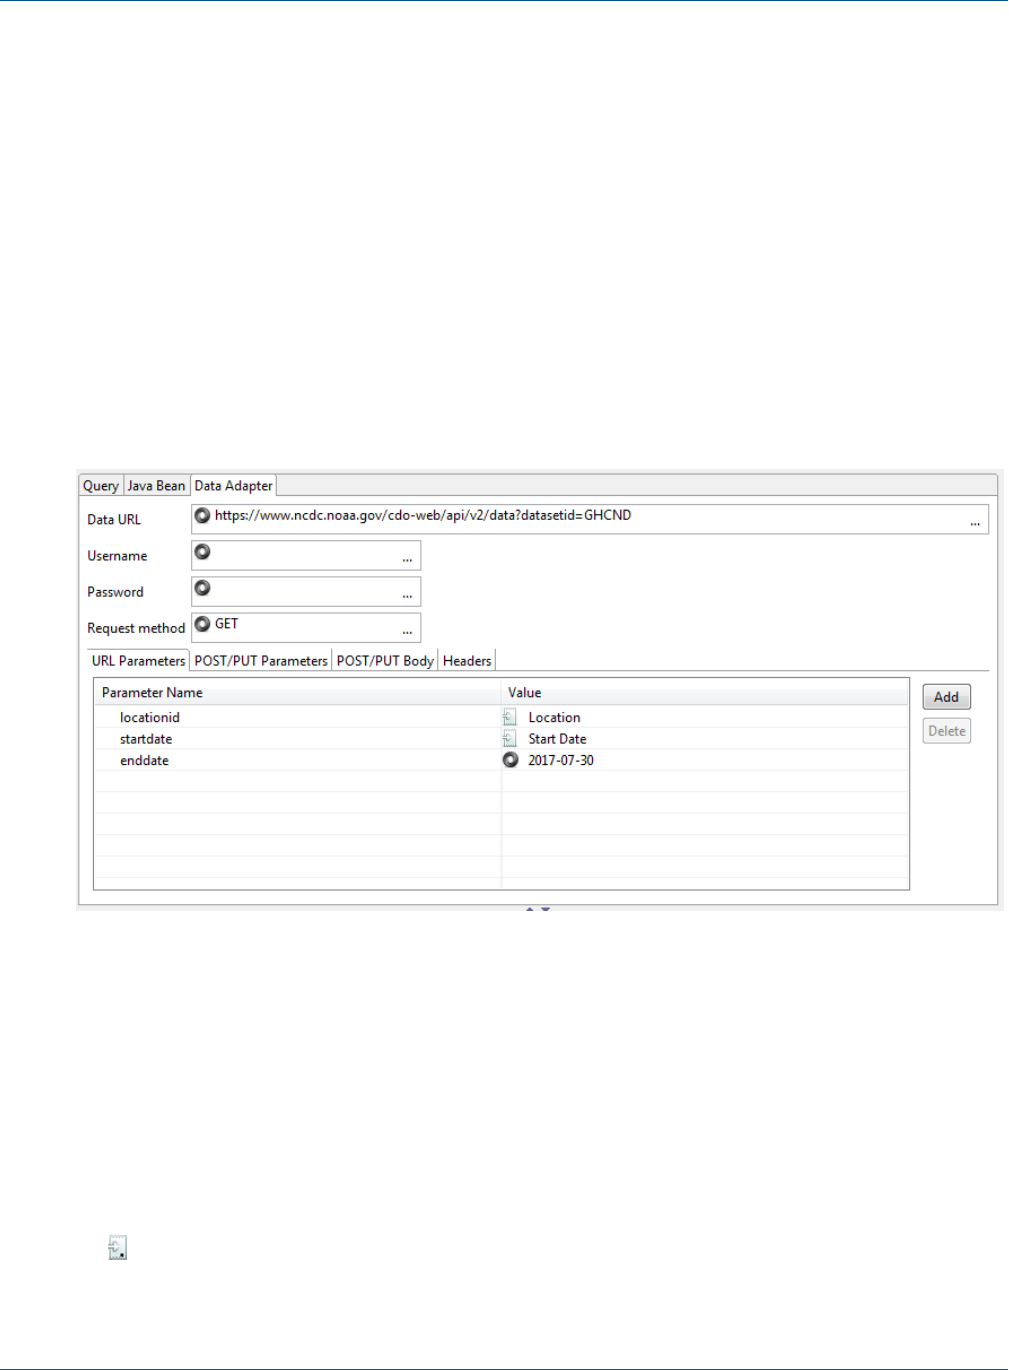
TIBCO Jaspersoft Studio User Guide
10.9.2.1 Web Services Configuration in the Data Adapter Dialog
In addition to the usual data adapter settings, you can configure the following for a JSON or XML adapter that
connects to a web service:
•Data URL – Base URI for the request.
•Username and Password – Credentials for web services that require authentication.
•Request method – The method to use for the data adapter. Supported methods are GET, POST, and PUT.
•URL Parameters tab – Parameters to append to the URI.
•POST/PUT Parameters tab – Parameters to send in the request body.
•POST/PUT Body tab – Data to send in the request body.
•Headers tab – Parameters to send in the HTTP header.
10.9.2.2 The Data Adapter Tab in the Dataset and Query Dialog
When you create a report using a data adapter that connects to a web service, you see the following Data
Adapter tab in the Dataset and Query dialog:
Figure 10-25 Data Adapter tab
This tab lets you configure the following information for the data adapter:
•Data URL – Base URI for the request.
•Username and Password – Credentials for web services that require authentication.
•Request method – The method to use for the data adapter. Supported methods are GET, POST, and PUT.
•URL Parameters tab – Parameters to append to the URI.
•POST/PUT Parameters tab – Parameters to send in the request body.
•POST/PUT Body tab – Data to send in the request body.
•Headers tab – Parameters to send in the HTTP header.
•The following additional information is shown:
•– The URL parameter in the data adapter has been associated with an HTTP parameter in the report. The
name of the report parameter is shown to the right.
176 TIBCO Software Inc.
Chapter 10 Data Adapters
•– The URL parameter in the data adapter has a default value.
10.9.2.3 Example of Connecting to a Web Service
The example in this section uses a GET request to retrieve information from the National Oceanic and
Atmospheric Administration (NOAA) and display it in a report. The service shows weather from a location. An
example query that you would enter in your browser would be:
https://www.ncdc.noaa.gov/cde-
web/api/v2/data?datasetid=GHCND&locationid=ZIP:28801&startdate=2017-07-01&enddate=2017-
07-15&token=[token]
where [token] is the web services token you request in the first step below.
This example uses a public API from a third party to generate a report. This API is not controlled by
TIBCO, Inc. and is subject to change without notice.
The overall steps are:
•Create a data adapter that will construct the web services request. You can enter the following components
of your request: a base URL, a header, and HTTP parameters.
•Create a report that uses the data adapter and discover fields.
•Add HTTP parameters to the report and connect them to the parameters in your adapter.
Request a web services token:
Before you can use this example, you must get a web services token from the NOAA at
https://www.ncdc.noaa.gov/cdo-web/token. Follow the directions on this page to have a token sent to your
email. If you do not receive your token, check your spam folder.
Create the data adapter:
1. Click on the main toolbar OR right-click a project in the Project Explorer and select New> Data
Adapter.
2. In the DataAdapter File window, choose the project where you want to save the data adapter file. This
should be the project that contains the report(s) you want to use with your data adapter.
3. Enter a name for your adapter, for example NOAA adapter, and click Next.
The Data Adapters Wizard is displayed.
4. Select the data adapter type that corresponds to the type of information the web service provides. This
example uses JSON.
5. Click Next.
6. Enter a name for your adapter. This name is used when you select an adapter for a report.
7. In the File/URL field, enter the base web services request for your data. You want this request to be general
enough that you can use it for multiple datasets and reports, but you also want it to contain as much
reusable information as possible. For example, for NOAA, you might enter this request:
https://www.ncdc.noaa.gov/cdo-web/api/v2/data?datasetid=GHCND
8. Select Use the report JSON expression when filling report.
9. Click Options to open the Http Connection Options dialog to configure additional request parameters.
You can later configure these parameters in your report.
TIBCO Software Inc. 177
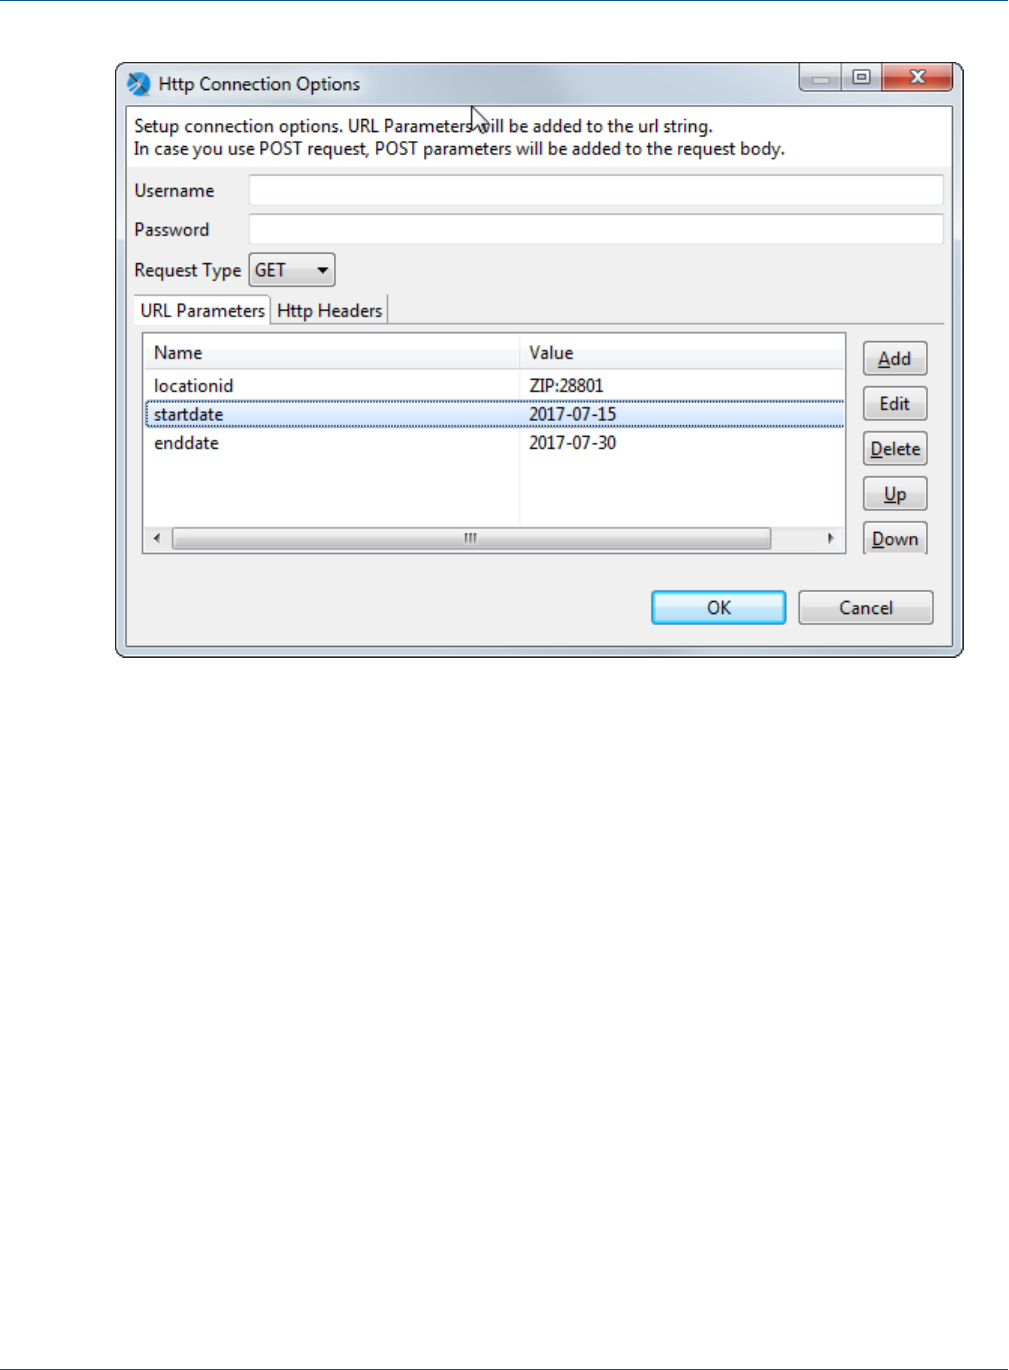
TIBCO Jaspersoft Studio User Guide
Figure 10-26 HTTP Connection Options
The following parameters are available:
•Username and Password (optional) – The username and password to use if your location requires
authentication. For this example, leave them blank.
•Request Type – For this example, select GET to retrieve data from the web service.
•To add a parameter to the request URL, click Add in the URL Parameters tab. Enter the name and
value of your parameter in the Parameter dialog and click OK.These parameters are added to the request
URL. Use the parameter names required by your web service. Later, when you create a report using this
data adapter, you can connect the web services parameter to a parameter in the report. In this case, the
Value field is overridden by the parameter configuration in the report. For multiple parameters, add
each parameter separately.
For this example, set the following parameters:
•locationid: Set Name to the NOAA parameter locationid and Value to a default location in
NOAA format, for example ZIP:.
•startdate: Set Name to startdate and Value to the current date. (Note: The NOAA parameter
startdate is optional and defaults to the current date.)
•enddate: Set Name to enddate and Value to the current date. (Note: The NOAA parameter
enddate is optional and defaults to the current date.)
•Click on the Http Headers tab to add headers to the HTTP request. To do this, click Add, enter the
name and value of your parameter in the Parameter dialog and click OK. For this example, add the
NOAA token you requested:
178 TIBCO Software Inc.
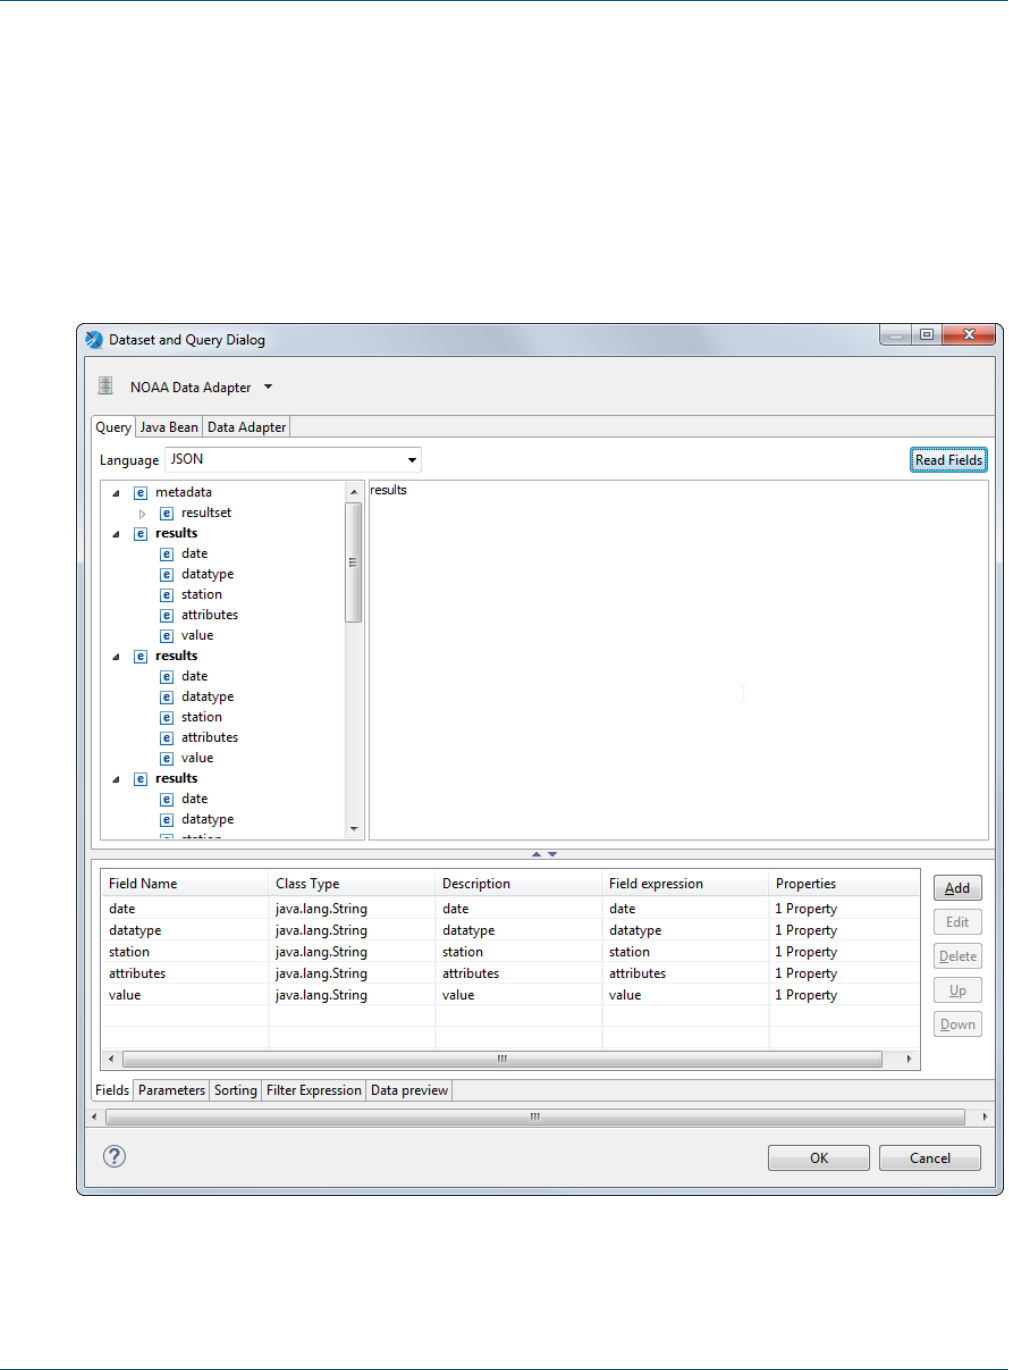
Chapter 10 Data Adapters
•token: Set Name to the NOAA parameter token and Value to the NOAA key you requested
previously.
10. Click OK.
11. Click Test Connection to verify the data can be received.
10.9.2.4 Using the Data Adapter in a Report
1. Create a report using a blank template and the data adapter you just created.
2. In the Dataset and Query dialog, select JSON as the language.
The right-hand side is populated with nested object names for each individual result.
Figure 10-27 Fields for JSON data
TIBCO Software Inc. 179
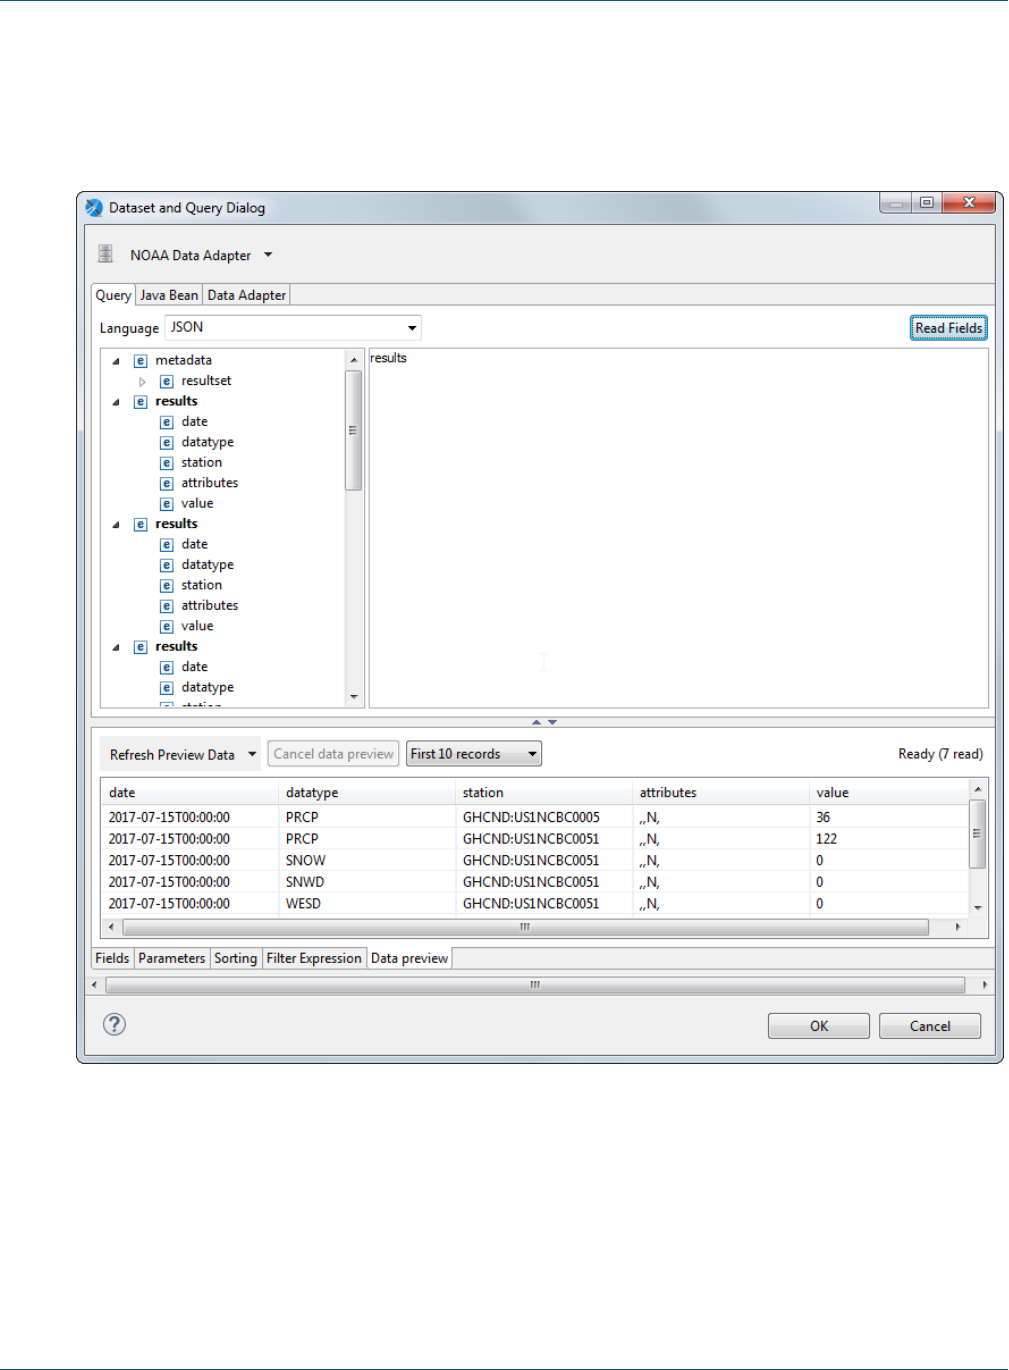
TIBCO Jaspersoft Studio User Guide
3. Enter the objects you want to use in your dataset. For this example, enter results. If you only wanted to
get the datatype values for each record, you could enter results.datatype.
4. Click Read Fields to load the list of fields in the dataset.
5. To optionally preview a subset of the data, select the Data preview tab, then click Refresh Preview Data.
Figure 10-28 Data preview for JSON data
6. Click OK.
Lay out the report:
1. Select Design view.
2. For this simple report, select all the fields and drag them to the Detail band.
3. You can preview the report to see the data.
180 TIBCO Software Inc.
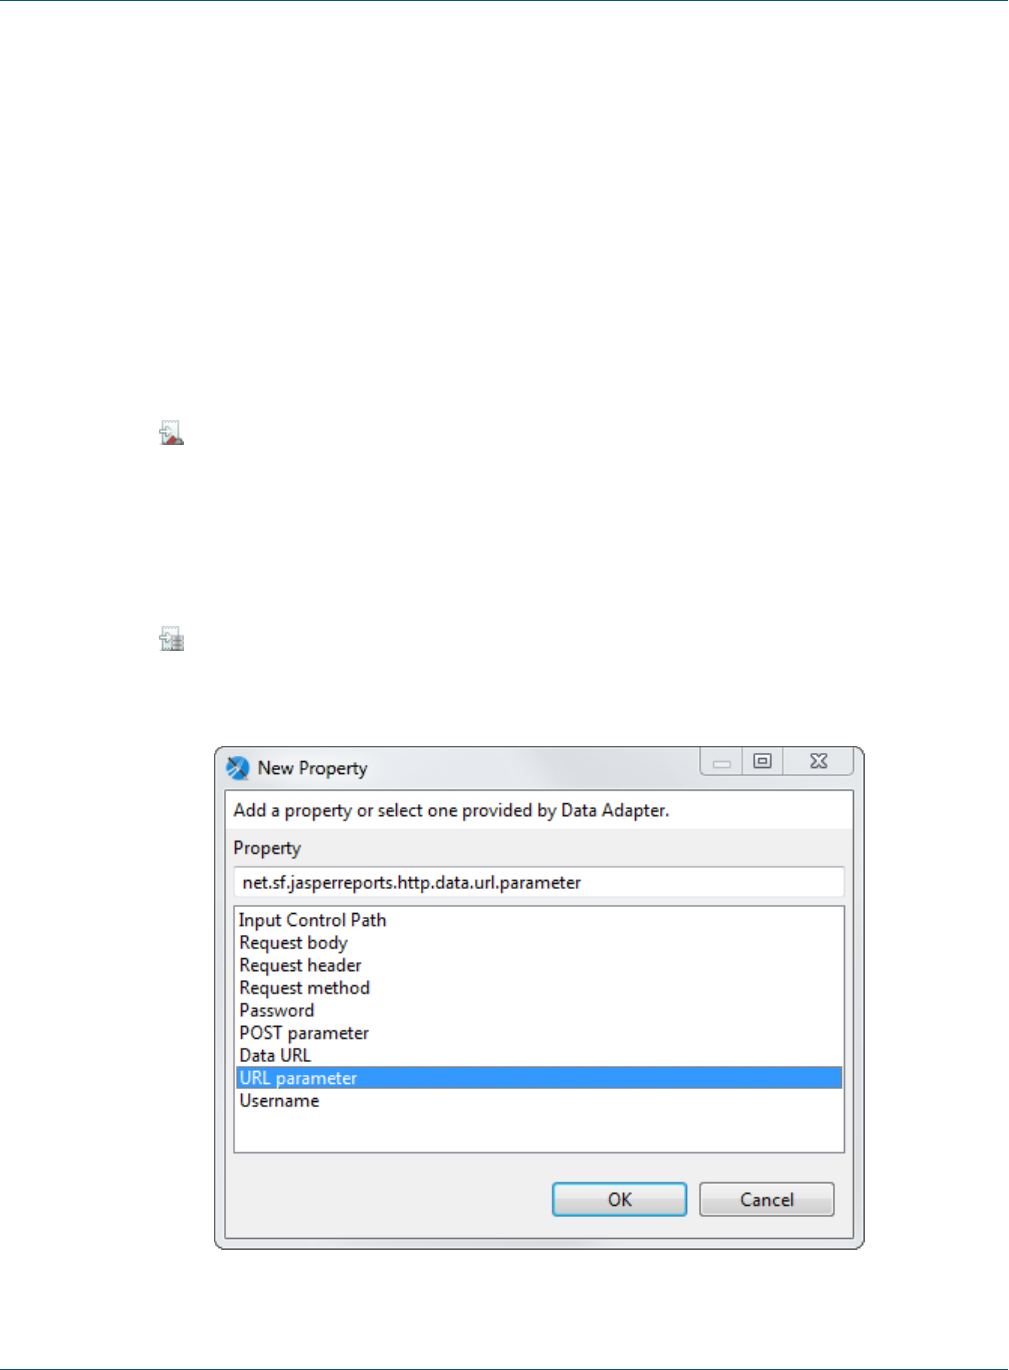
Chapter 10 Data Adapters
10.9.3 Adding HTTPParameters to the Report
Normally, you do not want your parameters to be fixed values. You may want to use an expression or to prompt
for user input. You can add HTTP input parameters in three ways:
•Using the Parameters tab in the Dataset and Query dialog
•Using the Outline and Properties views
•Using the Data Adapter tab in the Dataset and Query dialog, with additional configuration on the
Parameters tab
This section shows how to create parameters that override the parameters from the data adapter and prompt the
user for data.
10.9.3.1 Configuring a Parameter using the Parameters tab in the Dataset and Query dialog
1. Right-click the root node of your report and select Dataset and Query….
2. In the Dataset and Query dialog, click the Parameters tab.
3. Click to hide the system parameters.
4. Click Add to create a new parameter.
5. Select the parameter you just created, click Editand enter the following, then click OK:
•Parameter Name – Location
•Is For Prompt –true (default)
•Class Type –java.lang.String (default)
•Default Value Expression –"ZIP:94111"
6. Click to display parameter properties.
7. Select your parameter and click Add Property. A dialog displays a list of properties available for a web
services data adapter.
Figure 10-29 Properties for an HTTP Parameter
TIBCO Software Inc. 181
TIBCO Jaspersoft Studio User Guide
8. Select URL Parameter and click OK.
9. Select the property you just created and click Edit.
10. Enter locationid to map this parameter to the locationid URLparameter in your request and click OK.
11. If you click on the Data Adapters tab, you see that the value for locationid has been set to Location.
12. Click OK to exit the Dataset and Query dialog.
13. Preview the report.
14. You are now prompted to enter a value for the location, for example, ZIP:99501. For more information
about location formats, see the NOAA API documentation.
15. Click to run the report.
10.9.3.2 Configuring a Parameter Using the Data Adapter Tab in the Dataset and Query Dialog
The names and default values you set for the URL parameters in your data adapter are shown on the Data
Adapter tab in the Dataset and Query dialog. You can use this tab to associate your HTTP parameter directly to
a parameter in the report.
1. Display your report in design view.
1. Right-click the root node of your report and select Dataset and Query….
2. In the Dataset and Query dialog, click the Parameters tab.
3. Click Add to create a new parameter. A new parameter is created with a name such as Parameter1.
4. Click the Data Adapter tab.
For this example, you see three data adapter parameters, one of which has been mapped to the Location
parameter in your report, shown with an icon .
5. Double-click the value field after enddate and click the icon that appears.
6. Select Parameter1 from the drop-down. This associates Parameter1 in the report with the enddate URL
parameter in the data adapter.
7. On the Parameters tab, select Parameter1 and click Edit. You see that the evaluation time and properties
have been set automatically. Enter the following and click OK:
•Parameter Name – End Date
•Default Value Expression – 2017-07-30
8. Click OK to exit the Dataset and Query dialog.
9. If you wish, you can preview the report. You are now prompted to enter a value for the end date as well as
the location. Make sure the end date you enter is after the default start date you entered when you created
the data adapter.
10. Click to run the report.
10.9.3.3 Configuring a Parameter Using the Outline and Properties Views
1. Display your report in design view.
2. In the outline, right-click Parameters and select Create Parameter.
A parameter is created with a generic name, such as Parameter1.
3. Right-click the parameter you just created and select Properties, or simply locate the properties view.
4. Enter the following on the Object tab:
•Name – Start Date
•Class – java.lang.String (default)
•Default Value Expression – 2017-07-15
•Is For Prompting – Selected
182 TIBCO Software Inc.
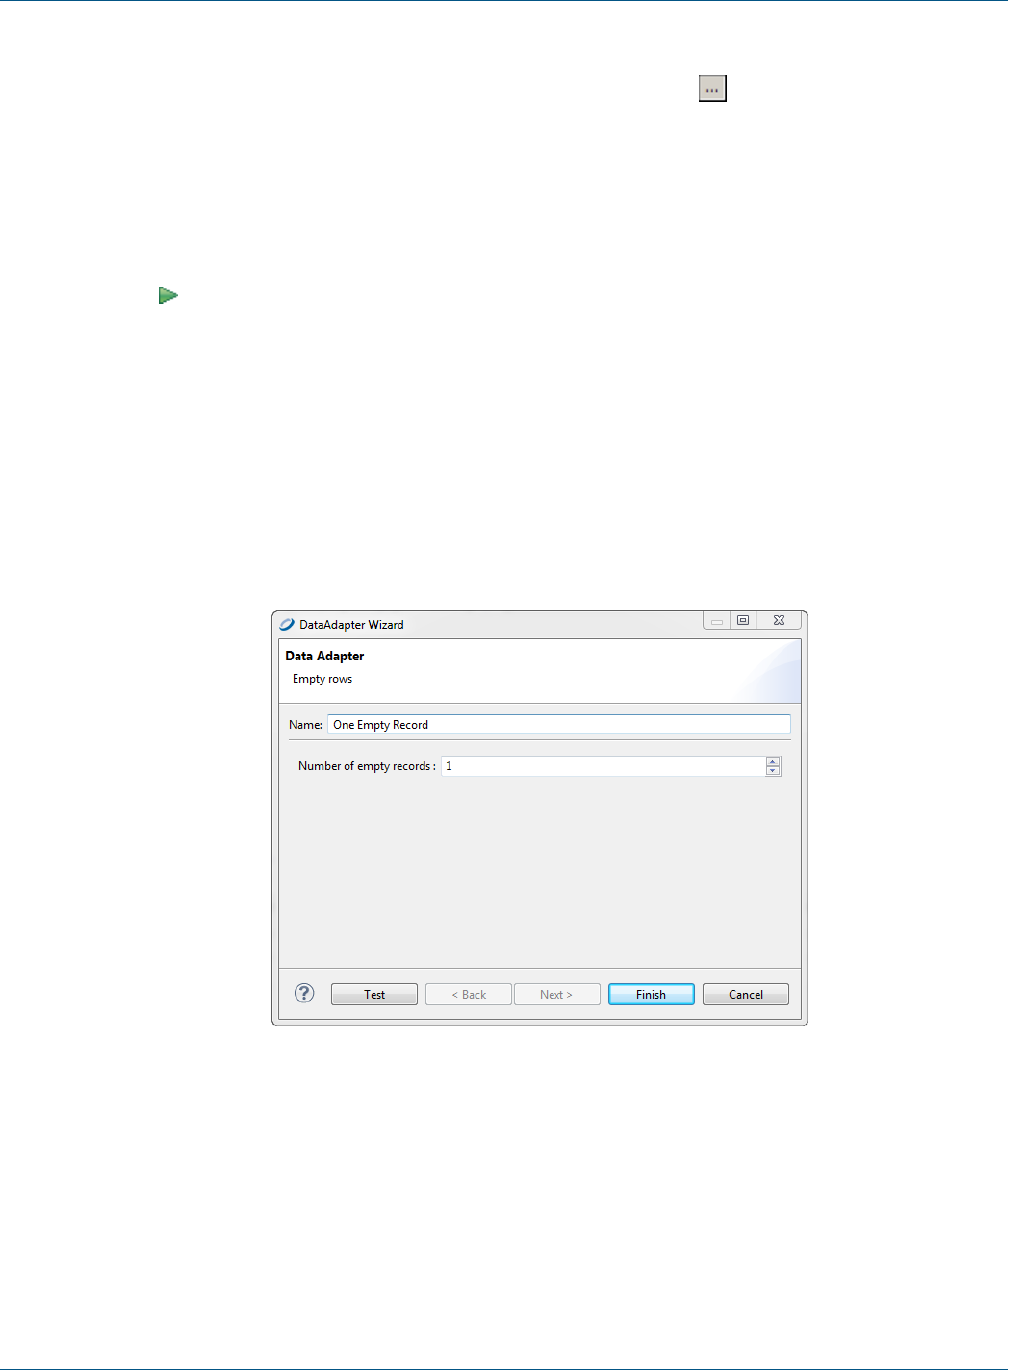
Chapter 10 Data Adapters
•Evaluation Time – Early
5. Click the Advanced tab in properties view, click Properties, then click .
6. The Properties dialog is displayed, showing options specific to a web services data source.
7. In the URL parameter field, enter the name of the URL parameter you wish to use for input, in this case,
startdate.
8. Click Finish.
9. If you wish, you can preview the report. You are now prompted to enter a value for the start date as well as
location and end date. Make sure the start date you enter is before the end date.
10. Click to run the report.
10.10 Using the Empty Record Data Adapter
By default, Jaspersoft Studio provides a pre-configured empty data source that returns a single record.
To create a new empty data source with more records:
1. Double-click One Empty Record in the Repository Explorer. The Data Adapter Wizard appears with
Empty rows.
Figure 10-30 Data Adapter Wizard>Empty Record
2. Set the number of empty records you need. Remember, whatever field you add to the report, its value is set
to null. Since this data adapter doesn’t care about field names or types, this is a perfect way to test any
report (keeping in mind that the fields are always set to null).
3. Click Finish.
TIBCO Software Inc. 183

TIBCO Jaspersoft Studio User Guide
10.10.1 Understanding the Empty Record Implementation
The empty record data adapter in Jaspersoft Studio uses the special JasperReports data source
JREmptyDataSource. This data source returns true to the next method for the record number (by default only
one), and always returns null to every call of the getFieldValue method. It's like having records without
fields, that is, an empty data source.
The two constructors of this class are:
public JREmptyDataSource(int count)
public JREmptyDataSource()
The first constructor indicates how many records to return, and the second sets the number of records to one.
10.11 Working with the JRDataSource Interface
All data adapters implement the JRDataSource interface. Some data adapters, such the JDBC data connections,
do this indirectly using a connection and a query; other data adapters, such as adapters for CSV files, XML
documents, and collections of JavaBeans, do this directly. This section is useful if you want to understand more
about the direct data adapters, or if you are interested in creating a custom data adapter.
10.11.1 Understanding the JRDataSource Interface
Data supplied by a JRDataSource is ideally organized into records as in a table. Every JRDataSource must
implement the following two methods:
public boolean next() – Returns true if the cursor is positioned correctly in the subsequent record, false
if no more records are available.
public Object getFieldValue(JRField jrField) – Moves a virtual cursor to the next record
Every time JasperReports executes the public boolean next() method, all the fields declared in the report
are filled and all the expressions (starting from those associated with the variables) are calculated again.
Subsequently, JasperReports determines whether to print the header of a new group, to go to a new page, and so
on. When next returns false, the report is ended by printing all final bands (Group Footer, Column Footer, Last
Page Footer, and Summary). The method can be called as many times as there are records present (or represented)
from the data source instance.
The method public Object getFieldValue(JRField jrField) is called by JasperReports after a call to
next results in a true value. In particular, it's executed for every single field declared in the report. In the call, a
JRField object is passed as a parameter. It's used to specify the name, the description and the type of the field
from which to obtain the value (all this information, depending on the specific data source implementation, can
be combined to extract the field value).
The type of the value returned by the public Object getFieldValue(JRField jrField) method has to be
adequate for that declared in the JRField parameter, except when a null is returned. If the type of the field was
declared as java.lang.Object, the method can return an arbitrary type. In this case, if required, a cast can be
used in the expressions. A cast is a way to dynamically indicate the type on an object, the syntax of a cast is:
(type)object
in example:
(com.jaspersoft.ireport.examples.beans.PersonBean)$F{my_person}
Usually a cast is required when you need to call a method on the object that belongs to a particular class.
184 TIBCO Software Inc.

Chapter 10 Data Adapters
10.11.2 Implementing a New JRDataSource
If the JRDataSource supplied with JasperReports doesn't meet your requirements, you can write a new
JRDataSource. This is not a complex operation. In fact, all you have to do is create a class that implements the
JRDataSource interface that exposes two simple methods: next and getFieldValue.
package net.sf.jasperreports.engine;
public interface JRDataSource
{
public boolean next() throws JRException;
public Object getFieldValue(JRField jrField) throws JRException;
}
Table 10-7 The JRDataSource interface
The next method is used to set the current record into the data source. It has to return true if a new record to
elaborate exists; otherwise it returns false.
If the next method has been called positively, the getFieldValue method has to return the value of the
requested field or null. Specifically, the requested field name is contained in the JRField object passed as a
parameter. Also, JRField is an interface through which you can get information associated with a field—the
name, description, and Java type that represents it.
Now try writing your personalized data source. You have to write a data source that explores the directory of a
file system and returns the found objects (files or directories). The fields you create to manage your data source
are the same as the file name, which should be named FILENAME; a flag that indicates whether the object is a
file or a directory, which should be named IS_DIRECTORY; and the file size, if available, which should be
named SIZE.
You data source should have two constructors: the first receives the directory to scan as a parameter; the second
has no parameters and uses the current directory to scan.
Once instantiated, the data source looks for the files and the directories present in the way you indicate and fills
the array files.
The next method increases the index variable you use to keep track of the position reached in the array files,
and returns true until you reach the end of the array.
import net.sf.jasperreports.engine.*;
import java.io.*;
public class JRFileSystemDataSource implements JRDataSource
{
File[] files = null;
int index = -1;
public JRFileSystemDataSource(String path)
{
File dir = new File(path);
if (dir.exists() && dir.isDirectory())
{
files = dir.listFiles();
}
}
public JRFileSystemDataSource()
{
Table 10-8 Sample personalized data source
TIBCO Software Inc. 185

TIBCO Jaspersoft Studio User Guide
this(".");
}
public boolean next() throws JRException
{
index++;
if (files != null && index < files.length)
{
return true;
}
return false;
}
public Object getFieldValue(JRField jrField) throws JRException
{
File f = files[index];
if (f == null) return null;
if (jrField.getName().equals("FILENAME"))
{
return f.getName();
}
else if (jrField.getName().equals("IS_DIRECTORY"))
{
return new Boolean(f.isDirectory());
}
else if (jrField.getName().equals("SIZE"))
{
return new Long(f.length());
}
// Field not found...
return null;
}
}
The getFieldValue method returns the requested file information. Your implementation doesn't use the
information regarding the return type expected by the caller of the method. It assumes the name has to be
returned as a string. The flag IS_DIRECTORY as a Boolean object, and the file size as a Long object.
The next section shows how to use your personalized data source in Jaspersoft Studio and test it.
10.11.3 Using a Custom JasperReports Data Source with Jaspersoft Studio
Jaspersoft Studio provides a special connection for your personalized data sources. It's useful for employing
whatever JRDataSource you want to use through some kind of factory class that provides an instance of that
JRDataSource implementation. The factory is just a simple Java class useful for testing your data source and
filling a report in Jaspersoft Studio. The idea is the same as what you have seen for the collection of JavaBeans
data adapter — you need to write a Java class that creates the data source through a static method and returns it.
For example, if you want to test the JRFileSystemDataSource in the previous section, you need to create a
simple class like that shown in this code sample:
import net.sf.jasperreports.engine.*;
public class FileSystemDataSourceFactory {
public static JRDataSource createDatasource()
Table 10-9 Class for testing a custom data source
186 TIBCO Software Inc.
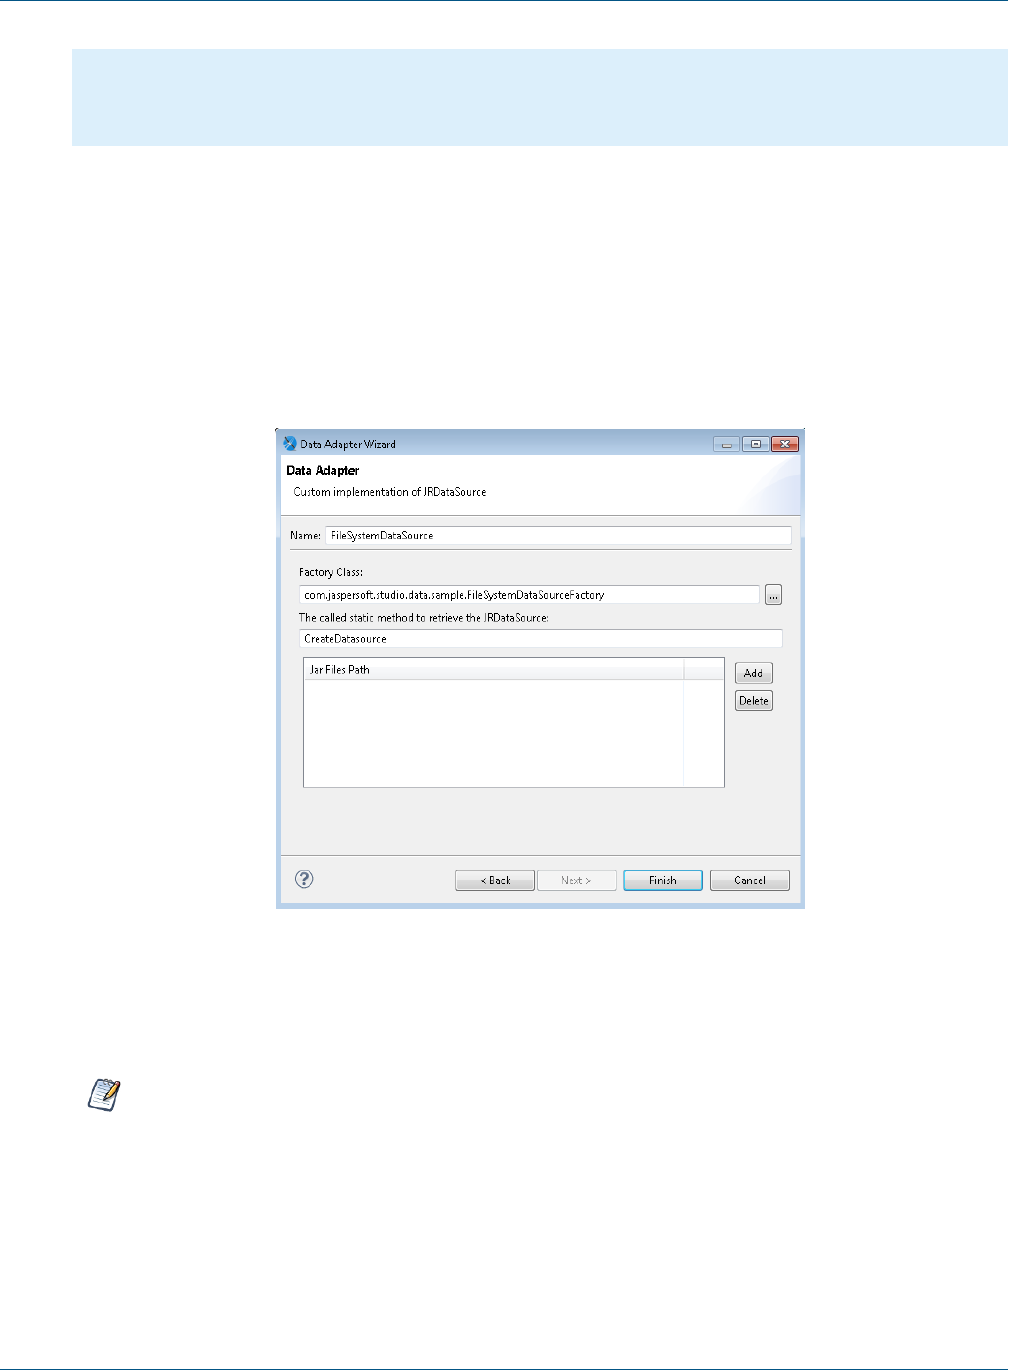
Chapter 10 Data Adapters
{
return new JRFileSystemDataSource("/");
}
}
This class, and in particular the static method that's called, executes all the necessary code for instancing the
data source correctly. In this case, you create a new JRFileSystemDataSource object by specifying a way to
scan the directory root ("/").
Now that you have defined the way to obtain the JRDataSource you prepared and the data source is ready to
be used, you can create the connection through which it can be used.
Create a new connection as you normally would (see “Working with Database JDBC Connections” on
page147), then select Custom implementation of JRDataSource from the list and specify a data source
name like TestFileSystemDataSource (or whatever name you want), as shown below.
Figure 10-31 Configuring a Custom Data Adapter
Next, specify the class and method to obtain an instance of your JRFileSystemDataSource, that is,
TestFileSystemDataSource and test.
There is no automatic method to find the fields managed by a custom data source.
In this case, you know that the JRFileSystemDataSource provides three fields: FILENAME (String), IS_
DIRECTORY (Boolean), and SIZE (Long). After you have created these fields, insert them in the report’s Detail
band.
Divide the report into two columns and in the Column Header band, insert Filename and Size tags. Then add
two images, one representing a document and the other an open folder. In the Print when expression setting of
TIBCO Software Inc. 187

TIBCO Jaspersoft Studio User Guide
the Image element placed in the foreground, insert the expression $F{IS_DIRECTORY}, or use as your image
expression a condition like the following:
($F{IS_DIRECTORY}) ? “folder.png” : “file.png”
In this example, the class that instantiated the JRFileSystemDataSource was very simple. But you can use
more complex classes, such as one that obtains the data source by calling an Enterprise JavaBean or by calling a
web service.
10.12 A Look at TIBCO Spotfire Information Links
You can populate reports created in Jaspersoft Studio with data from TIBCO Spotfire. You can navigate your
Spotfire library, select Information Links and Spotfire Binary Data Files (SBDFs), and inspect their data. To load
Spotfire data, create a data adapter to connect to the data. The data adapter will return data in tabular form.
Before you publish the report to JasperReports Server, export your data adapter as an XML file so you can add
it to the server's repository.
This version of Jaspersoft Studio was verified with Spotfire version 7.7. Other versions may also work but
have not been tested extensively.
To create a data adapter for a Spotfire Information Link:
1. In the Repository Explorer, right-click Data Adapters and select Create Data Adapter to display the Data
Adapter wizard.
2. Enter a name for the data adapter.
3. Enter the URL to your Spotfire Web Player in this form:
http://<web-player-host>/SpotfireWeb
where <web-player-host> is the IP address or name of the computer hosting the Spotfire Web Player where
you access your Information Link.
4. Enter your Spotfire user name and password.
5. Click Browse next to the Resource ID field to locate and select your Information Link in the Spotfire
library.
188 TIBCO Software Inc.
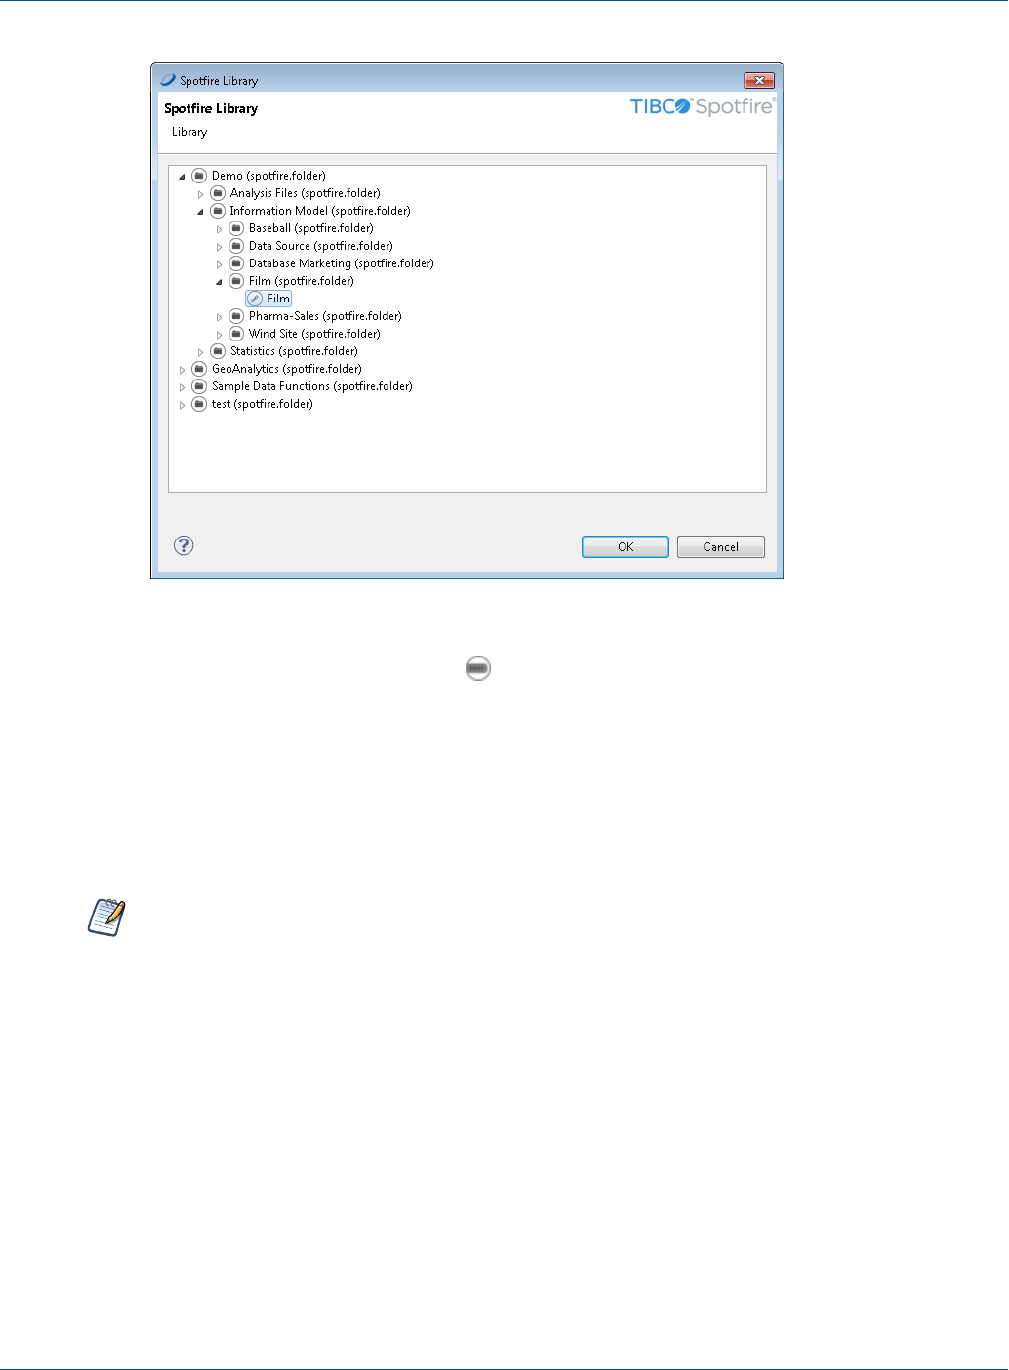
Chapter 10 Data Adapters
Figure 10-32 Spotfire Library displayed in Jaspersoft Studio
You can also create reports against SBDFs ; to do so, select one from your Spotfire library.
6. If you have prompts in your information link and want to set their values using parameters in Jaspersoft
Studio, make sure Use a query (required to use parameters) is selected.
7. Click OK.
8. Click Test to test your connection.
9. If the test fails, check your URL, credentials, and resource ID.
10. When the test succeeds, click Finish.
It isn't uncommon for an Information Link to return millions of rows of data, which may take a some time for
Jaspersoft Studio to process when data is loaded, such as when previewing the report; the same may
hold true in JasperReports Server.
To create your report:
1. Click File >New >JasperReport.
2. Select template and enter a name for your report.
3. Click Next. The Data Source dialog is displayed.
4. Select the Spotfire Information Link data adapter you created above.
5. If you have prompts, you need to configure parameters to work with them. See 10.12.1, “Working With
Prompts,” on page190 for more information.
6. Click Read Fields.
7. Select the fields to include in your data set.
8. Click Next.
TIBCO Software Inc. 189

TIBCO Jaspersoft Studio User Guide
9. Optionally select a field to define grouping.
10. Click Finish. Jaspersoft Studio displays the report in the Design tab.
11. Edit the report as needed. For example, add fields and components and configure your query and dataset.
12. Click Preview to ensure that the report is correctly configured.
13. When your report is ready, click File >Save.
To export your data adapter as an XML file:
1. In the Repository Explorer, right-click your Spotfire Information Link data adapter and select Export to
File.
2. Select the folder in your Jaspersoft Studio workspace that contains your report, enter a name for the data
adapter, and click OK.
To configure the report to use the exported data adapter:
1. In the Outline view, click the root node of your report to display the report properties.
2. Click Advanced.
3. Expand Misc and click the ellipsis to the right of Properties to open the Properties window.
4. Click Add to create a property that indicates the data adapter to use.
5. In the Property Name field, enter net.sf.jasperreports.data.adapter.
6. In the Value field, enter the name of the data adapter you exported (this is an XML file).
7. Click OK.
You're ready to publish your report.
To publish your report:
1. Click at the top of the Design tab. You're prompted to select a location for publishing the report.
2. Select a server connection and navigate its repository to the desired location.
3. Optionally enter a new label, name (ID), and description of the report unit.
4. Click Next. You're prompted to select a resource used by the report, including the data adapter you
exported above.
5. Click Next. You're prompted to select a data source.
6. Select Don't use any Data Source. Since the data adapter has already been defined, the report doesn't
need a separate data source.
7. Click Finish. Jaspersoft Studio adds your report to the repository.
While it's uploaded, Jaspersoft Studio modifies your JRXML so that it will run properly on the server. In
particular, it changes how the data adapter is specified. On the server, the data adapter is uploaded to the folder
you selected when you published the report.
To test your report, open the server's web UI, locate your report, and click it to run it.
10.12.1 Working With Prompts
If your Information Link uses prompts, you need to configure parameters for those prompts before you can read
fields. You must configure parameters for all prompts, even if they are not Mandatory in Spotfire.
To use prompts, make sure that you selected Use a query (required to use parameters) in your data adapter.
Create the report as described in the previous steps.
190 TIBCO Software Inc.

Chapter 10 Data Adapters
10.12.1.1 Configuring Jaspersoft Studio Parameters for Use With Spotfire Prompts
The Dataset and Query dialog shows the prompts for your Spotfire Information Link. You must configure
parameters for your prompt based on the Type and Extra values.
Figure 10-33 Prompts in Dataset and Query dialog
List (corresponds to prompt type Values)
Class Type –java.util.Collection; the objects in the collection should correspond to the Type of the
prompt. The data adapter mechanism formats the Collection contents appropriately.
Sample Default Value Expression –Arrays.asList(1,2,3,4,5,6,7)
Range
Class Type –java.lang.String
Default Value Expression – The default value expression must be two Strings with a caret (^) between them.
Most often, you will want to create three parameters in Jaspersoft Studio: two parameters that define the
endpoints of the range and a third parameters of type String that is used to pass the Range to Spotfire. The
endpoint parameters should correspond to the Type of the prompt.
For example, for a Range prompt of type DateTime, you might create two parameters of type
java.sql.Timestamp that are used to take input for the start and end time:
<parameter name="OrderStartDate" class="java.sql.Timestamp">
<defaultValueExpression><![CDATA[DATE(2006,10,1)]]></defaultValueExpression>
</parameter>
<parameter name="OrderEndDate" class="java.sql.Timestamp">
<defaultValueExpression><![CDATA[DATE(2007,10,1)]]></defaultValueExpression>
</parameter>
Then you would create a dependent parameter that uses these two parameters to construct a String to pass to
Spotfire:
TIBCO Software Inc. 191
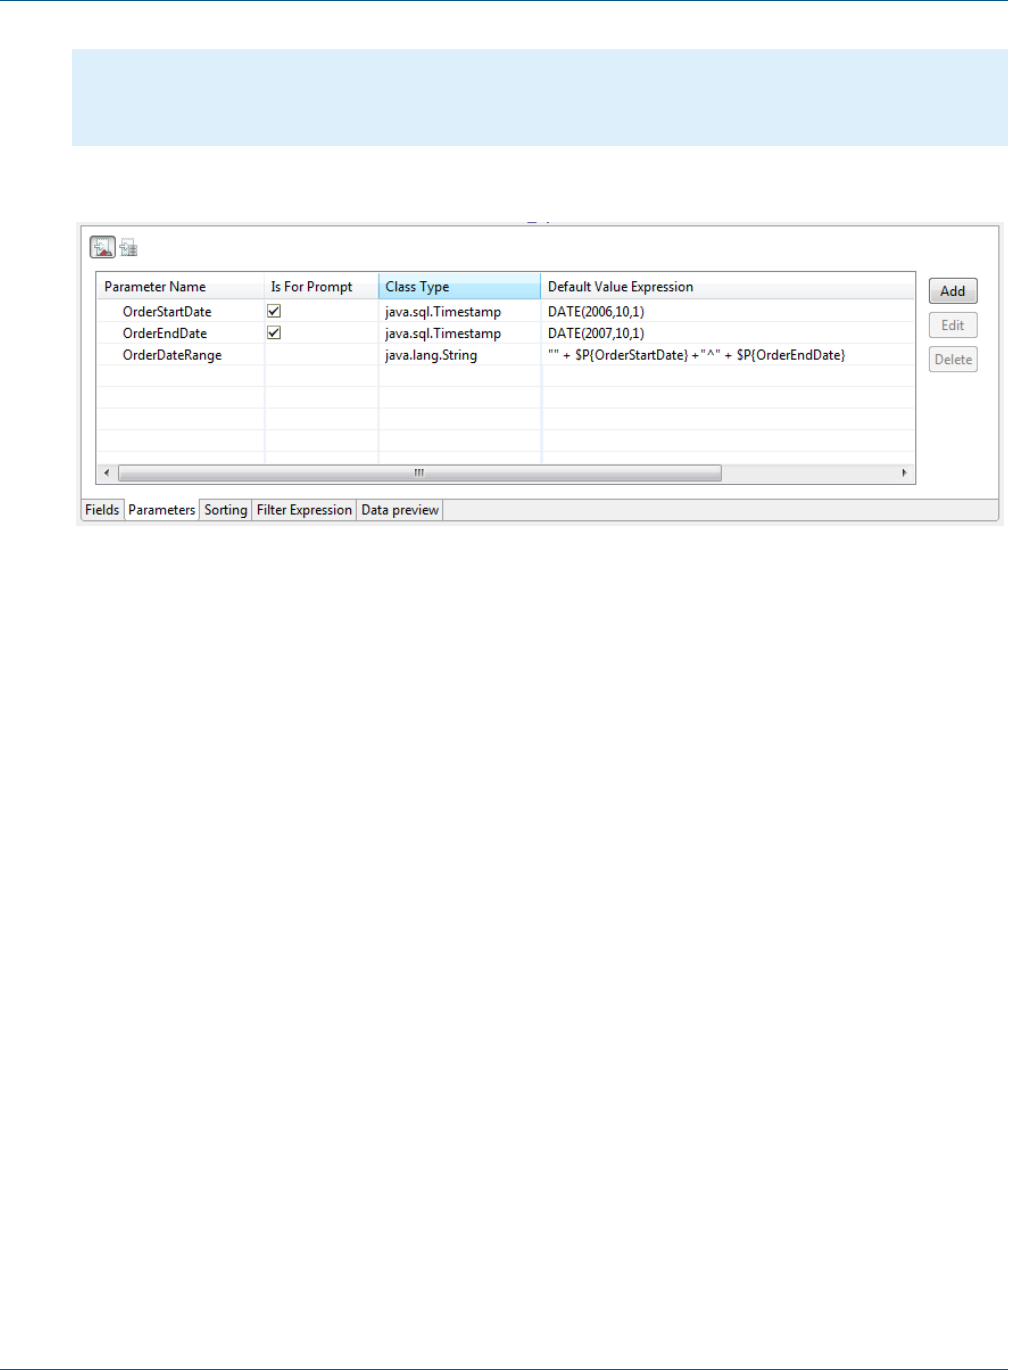
TIBCO Jaspersoft Studio User Guide
<parameter name="OrderDateRange" class="java.lang.String" isForPrompting="false">
<defaultValueExpression><![CDATA["" + $P{OrderStartDate} +"^" + $P{Order-
EndDate}]]></defaultValueExpression>
</parameter>
The parameters would look like this on the parameters tab.
Figure 10-34 Range parameters in Parameters tab
Multiple selection
Class Type –java.util.Collection; the objects in the collection should correspond to the Type of the
prompt. The data adapter mechanism formats the Collection contents appropriately.
Sample Default Value Expression –Arrays.asList(1,2,3,4,5,6,7)
Single selection
Class Type – Corresponds to the Type for the prompt. Numbers (and Currency) are passed with a “9.9999”
format; no $or ,are used.
10.12.1.2 Connecting Prompts from Spotfire to Parameters in Jaspersoft Studio
1. If you have not done so, create the parameters you need as described in 10.12.1.1, “Configuring Jaspersoft
Studio Parameters for Use With Spotfire Prompts,” on page191.
1. If you are not in the Dataset and Query dialog, open it by right-clicking on the root node of your report in
Outline view and selecting Dataset and Query… from the context menu.
2. Select the correct data adapter and select spotfire as the language.
Jaspersoft Studio connects to the Spotfire server and returns the list of prompts for the Spotfire Information
Link.
3. To map a prompt to a parameter:
a. Double-click on a prompt. The GUID for the prompt is displayed, followed by an equals sign (=).
b. Type the name of the parameter you want to use after the equals sign (=) in the form $P
{ParameterName}. For example, for the date range prompt above, you would enter $P
{OrderDateRange}.
192 TIBCO Software Inc.
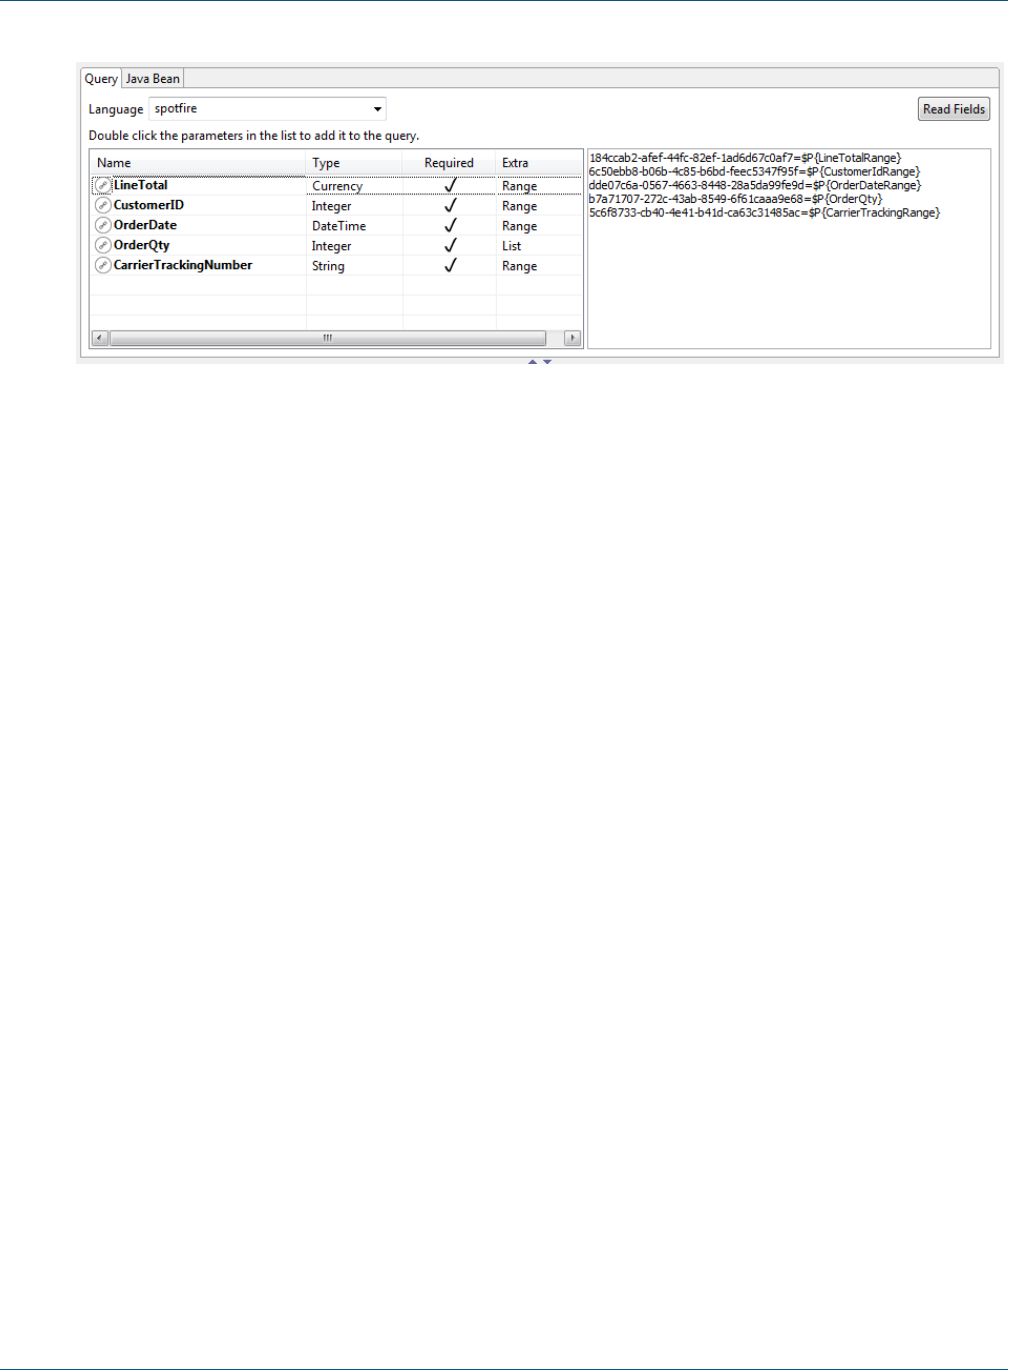
Chapter 10 Data Adapters
Figure 10-35 Prompts with GUIDs mapped to parameters
4. Repeat these steps for each prompt.
5. Once you have correctly configured your parameters, click Read Fields to read the fields.
6. Click OK to close the Dataset and Query dialog.
TIBCO Software Inc. 193

TIBCO Jaspersoft Studio User Guide
194 TIBCO Software Inc.
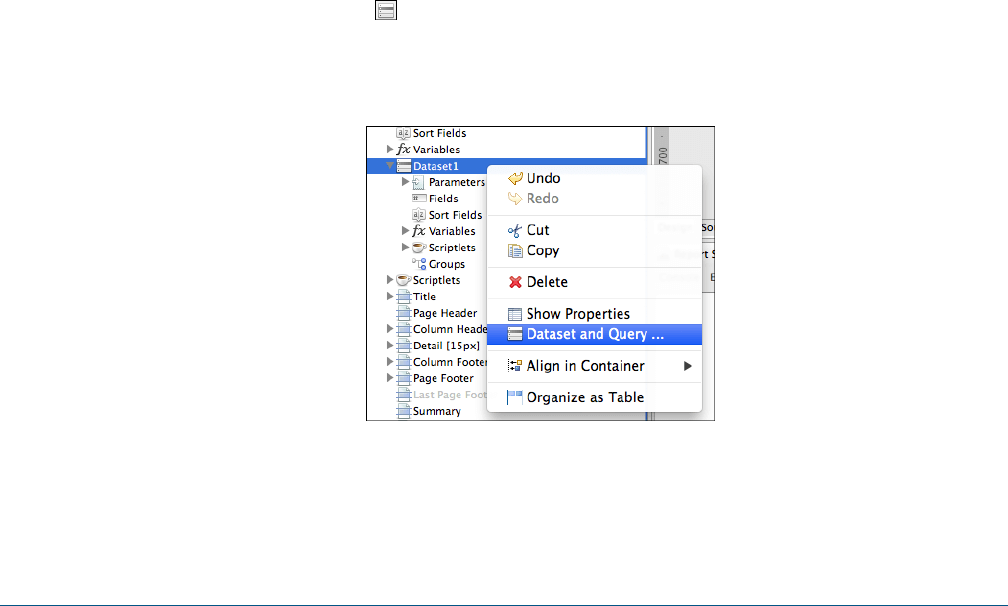
CHAPTER 11 CREATING QUERIES
Jaspersoft Studio provides tools to help you define report fields and create a proper query (if a query is needed
to fetch the report data). You'll find these tools in the Dataset and Query dialog.
It also provides a drag-and-drop query builder for easily creating SQL queries. This allows users who aren't
familiar with SQL to quickly join tables and produce complex data filters and where conditions. SQL Builder
also provides a way for skilled users to explore the database and list the metadata such as schemas and available
tables.
This chapter contains the following sections:
•Using the Dataset and Query Dialog
•Working with the Query Builder
11.1 Using the Dataset and Query Dialog
Click the Dataset and Query icon .
When working with a sub-dataset, open the dialog by right-clicking the dataset name inside the Outline view,
and selecting Dataset and Query....
Figure 11-1 Right-click menu
TIBCO Software Inc. 195

TIBCO Jaspersoft Studio User Guide
Use the Dataset and Query dialog to configure your dataset as follows:
•Select a data adapter from the menu next to the icon. Usually a data adapter is selected, but you can
change it.
•Select a query language for the current dataset from the Language menu. (This can be the main dataset or a
sub-dataset that populates a chart or a table.)
•Enter a query. A query editor is available for several languages including SQL, XPath, JSON, and the Ad
Hoc Query API query language.
•Click Read Fields to have Jaspersoft Studio discover fields for you. These can be provided directly by the
data adapter or by executing the query and reading the response metadata.
For certain types of data adapters, below the data adapter menu let you view additional information about the
data adapter.
•For Java bean data sources, view the configuration on the Java Bean tab.
•For data adapters that get their information via a web service, use the Data Adapter tab.
The tabs at the top provide the user interface for working with your data adapter:
•Query tab – Displays a language and query editor that helps you construct the query for your dataset.
•Java Bean tab – Displays a tool that helps you introspect a Java class and build dataset fields from the
fields in the class. This is useful for Java data sources.
•Data Adapter tab – Displays any additional user interface specific to the chosen data adapter type.
Use the tabs at the bottom different tabs at the bottom to perform the following additional tasks:
•Add, edit, or remove fields on the Fields tab.
•Add, edit, or remove parameters on the Parameters tab. See 6.1.1.2, “Managing Parameters Using the
Parameters tab in the Dataset and Query Dialog,” on page93 for more information.
•Edit sort options for dataset records on the Sorting tab.
•Provide an expression to filter dataset records on the Filter Expression tab.
•Preview your data on the Preview tab, if supported by the selected data adapter.
196 TIBCO Software Inc.
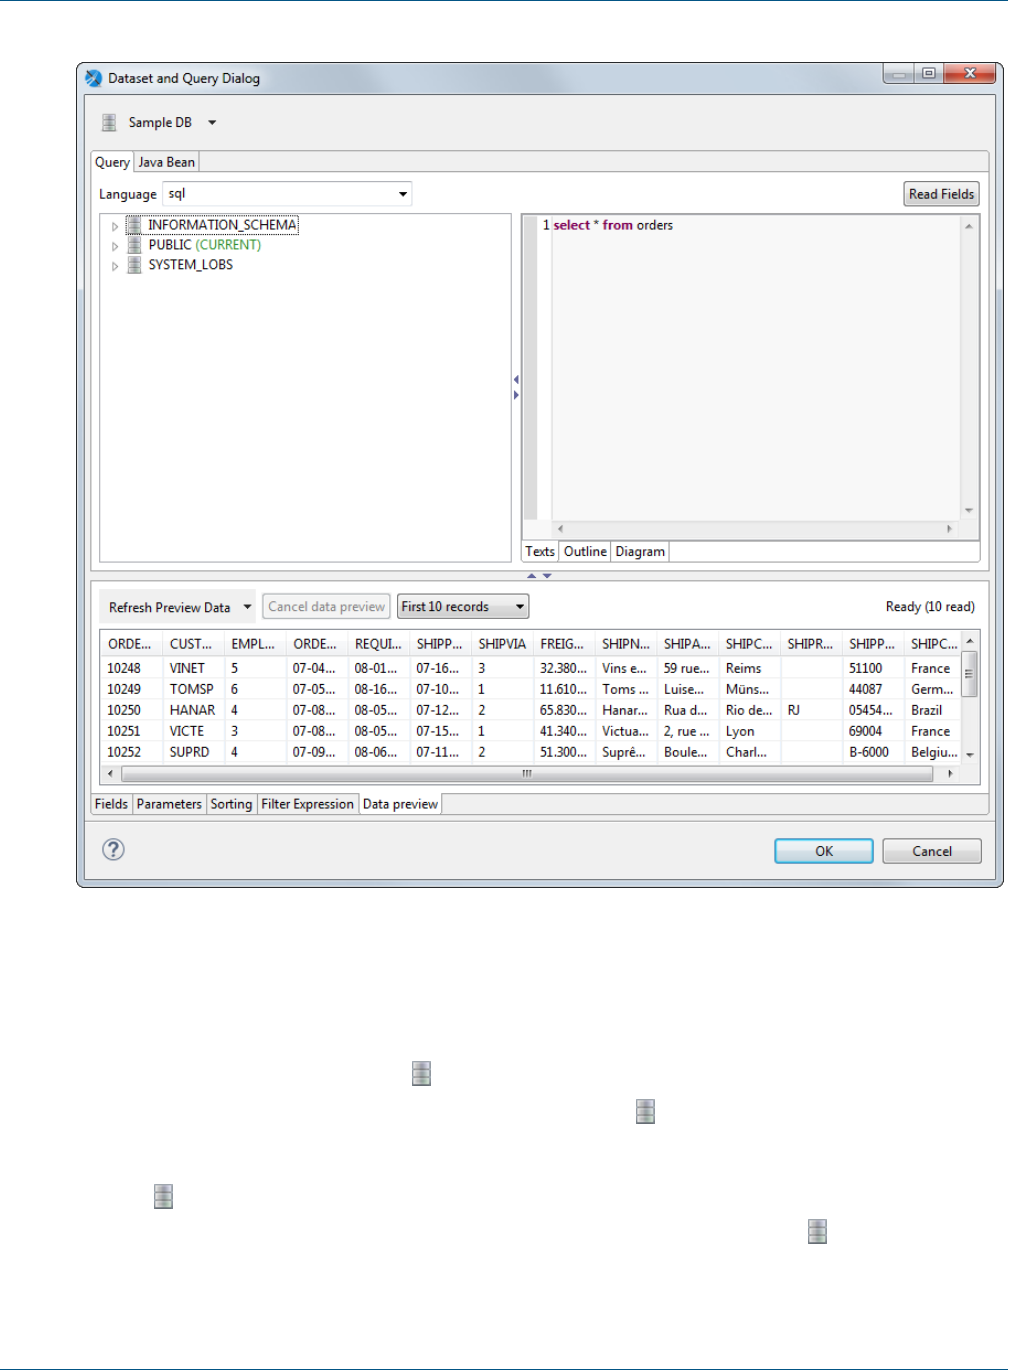
Chapter 11 Creating Queries
Figure 11-2 Data Preview tab
11.1.1 Configuring the Data Adapter and Query Language Drop downs
By default, the Dataset and Query dialog shows all available data adapters and all available query languages.
However, you can change this using the icon next to the data adapter menu as follows:
•To show all available data adapters and query languages, click and choose Show All Data Adapters
(default).
•To choose a data adapter and restrict the query languages to ones compatible with the chosen data adapter,
click and choose Show Languages For Data Adapter.
•To choose a query language and restrict the view to compatible data adapters, click and choose Show
Data Adapters For Language.
TIBCO Software Inc. 197
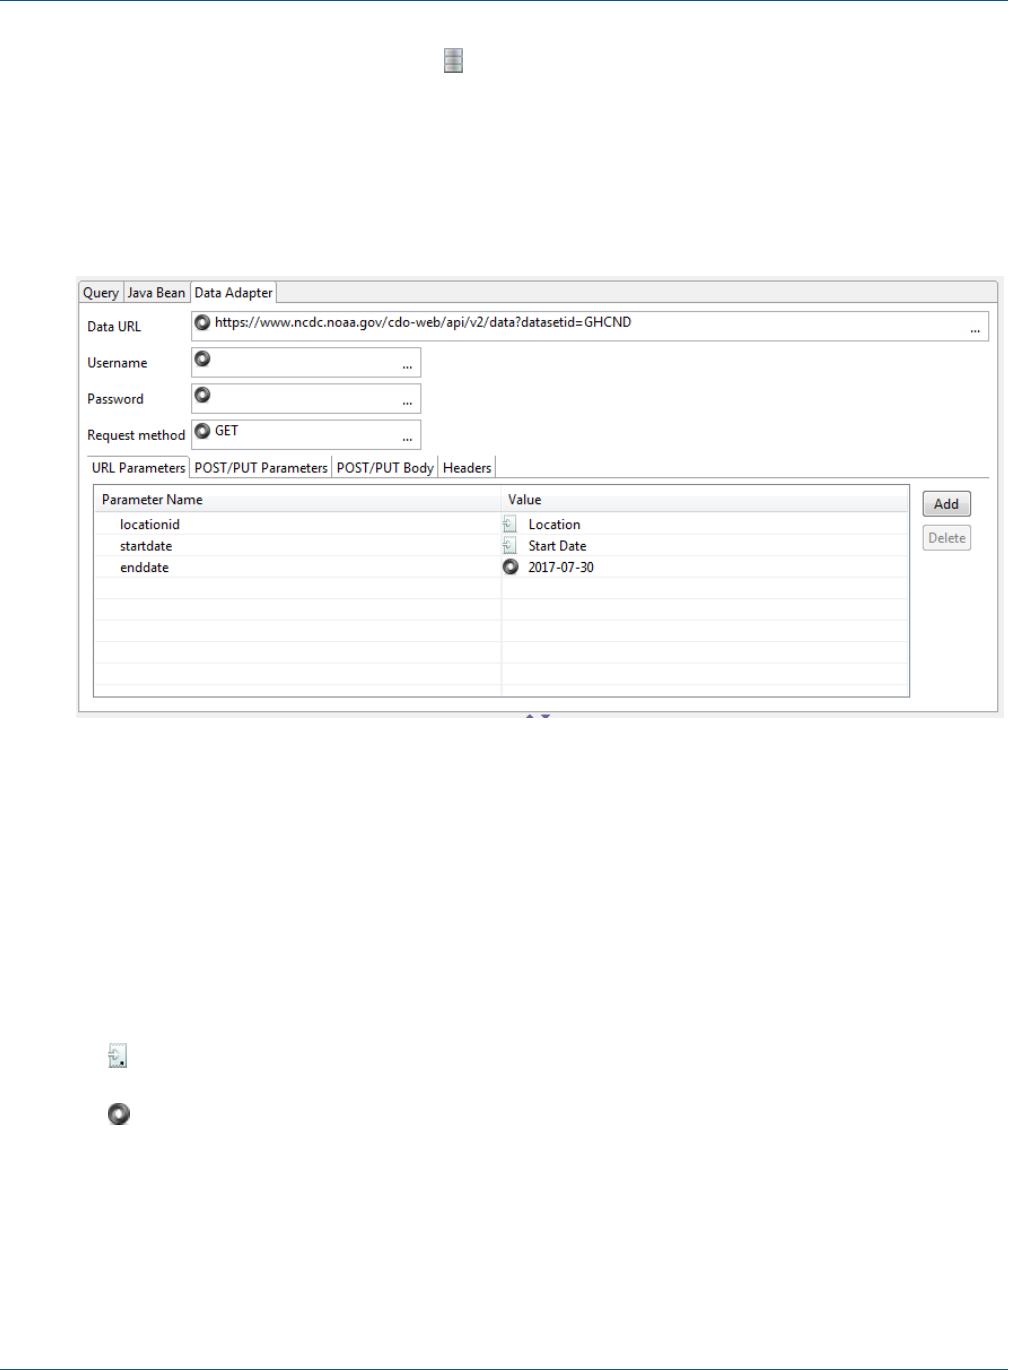
TIBCO Jaspersoft Studio User Guide
•To configure this setting globally, click and choose Global Preferences, then make your selection in
the Preferences dialog.
11.1.2 The Data Adapter Tab
The Data Adapter tab is visible when the selected data adapter supports additional UI, for example, in the case
of a data adapter that connects to a web service.
Figure 11-3 Data Adapter tab
This tab lets you configure the following information for the data adapter:
•Data URL – Base URI for the request.
•Username and Password – Credentials for web services that require authentication.
•Request method – The method to use for the data adapter. Supported methods are GET, POST, and PUT.
•URL Parameters tab – Parameters to append to the URI.
•POST/PUT Parameters tab – Parameters to send in the request body.
•POST/PUT Body tab – Data to send in the request body.
•Headers tab – Parameters to send in the HTTP header.
•The following additional information is shown:
•– The URL parameter in the data adapter has been associated with an HTTP parameter in the report. The
name of the report parameter is shown to the right.
•– The URL parameter in the data adapter has a default value.
11.1.3 Discovering Fields
Defining all the fields of a report by hand can be tedious. JasperReports requires all report fields to be named
and configured with a proper class type. The Dataset and Query dialog simplifies the process by automatically
discovering the available fields provided by a data adapter, without using a query. To execute a query you need
198 TIBCO Software Inc.
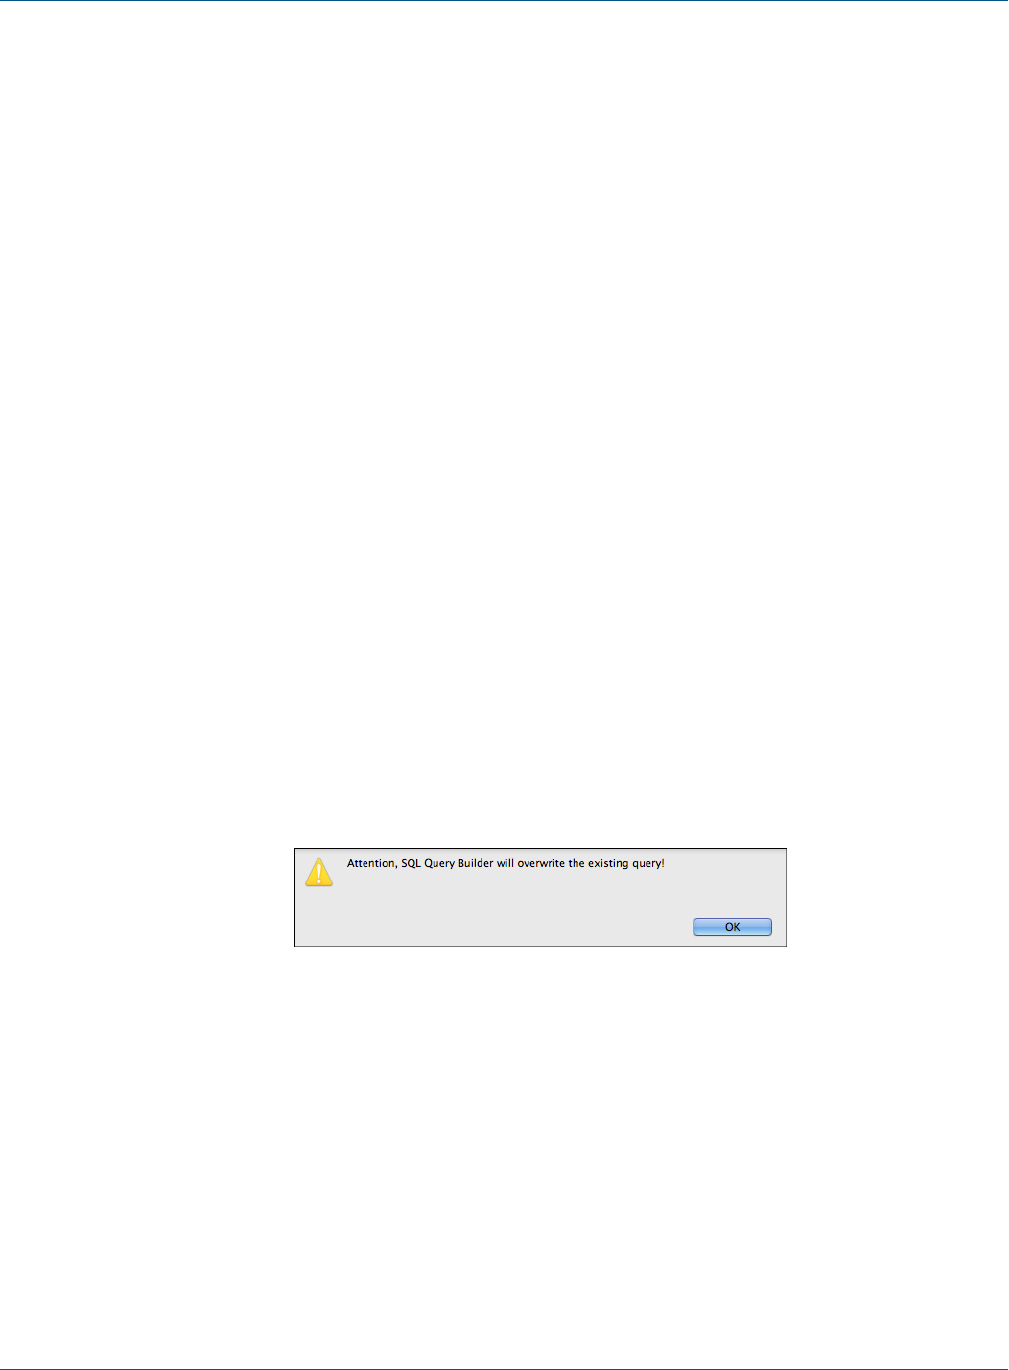
Chapter 11 Creating Queries
to use the proper data adapter: for example to execute an SQL query you must use a JDBC data adapter. The
Read Fields button starts the discovery process: the fields found are listed in the Fields tab and added to the
report. Click OK to close this window.
Some query languages, like XPath, do not produce a result that resemble a table, but more complex structures
that require extra steps to correctly map result data to report fields. An example of this is the multidimensional
result coming from MDX results (MDX is the query language used with OLAP and XML/A connections): in
this case each field is mapped using one or more properties depending on the requirements of the data. For some
languages, such as instance XPath and JSON query, the Query dialog displays a tool that simplifies the creation
of both the query and the mapping.
11.2 Working with the Query Builder
When your language is SQL, the Query Builder is called the SQL Builder. The tool requires a JDBC data
adapter.
The builder has two parts. On the left a tree-view shows all the available schemas and relative objects like
tables, views, etc. found by using the JDBC connection provided by the data adapter. On the right there are
three tabs that present the query in different ways.
The first Text tab contains a text area for writing a query. You can drag tables and other objects from the
metadata view into the text area, so you don't have to write the entire qualified names of those objects.
Although the SQL builder doesn't support arbitrary complex queries (which may use database-specific syntax),
this text area can be used for any supported query, including stored procedures if supported by the report query
executer.
If a query has already been set for the report, this text area shows it when the query dialog is open.
Use the Outline and Diagram tabs to visually build the query. The current version of Jaspersoft Studio doesn't
support back-parsing of SQL. For this reason, you should use Outline and Diagram editing mode only to create
new queries, otherwise the new query replaces any existing query. If you do attempt to overwrite an existing
query, Jaspersoft Studio alerts you.
Figure 11-4 Query Overwrite Warning
11.2.1 Query Outline View and Diagram View
The purpose of SQL is to select data from the tables of the database. SQL allows you to join tables, so that you
can get data from more than one table at a time.
TIBCO Software Inc. 199
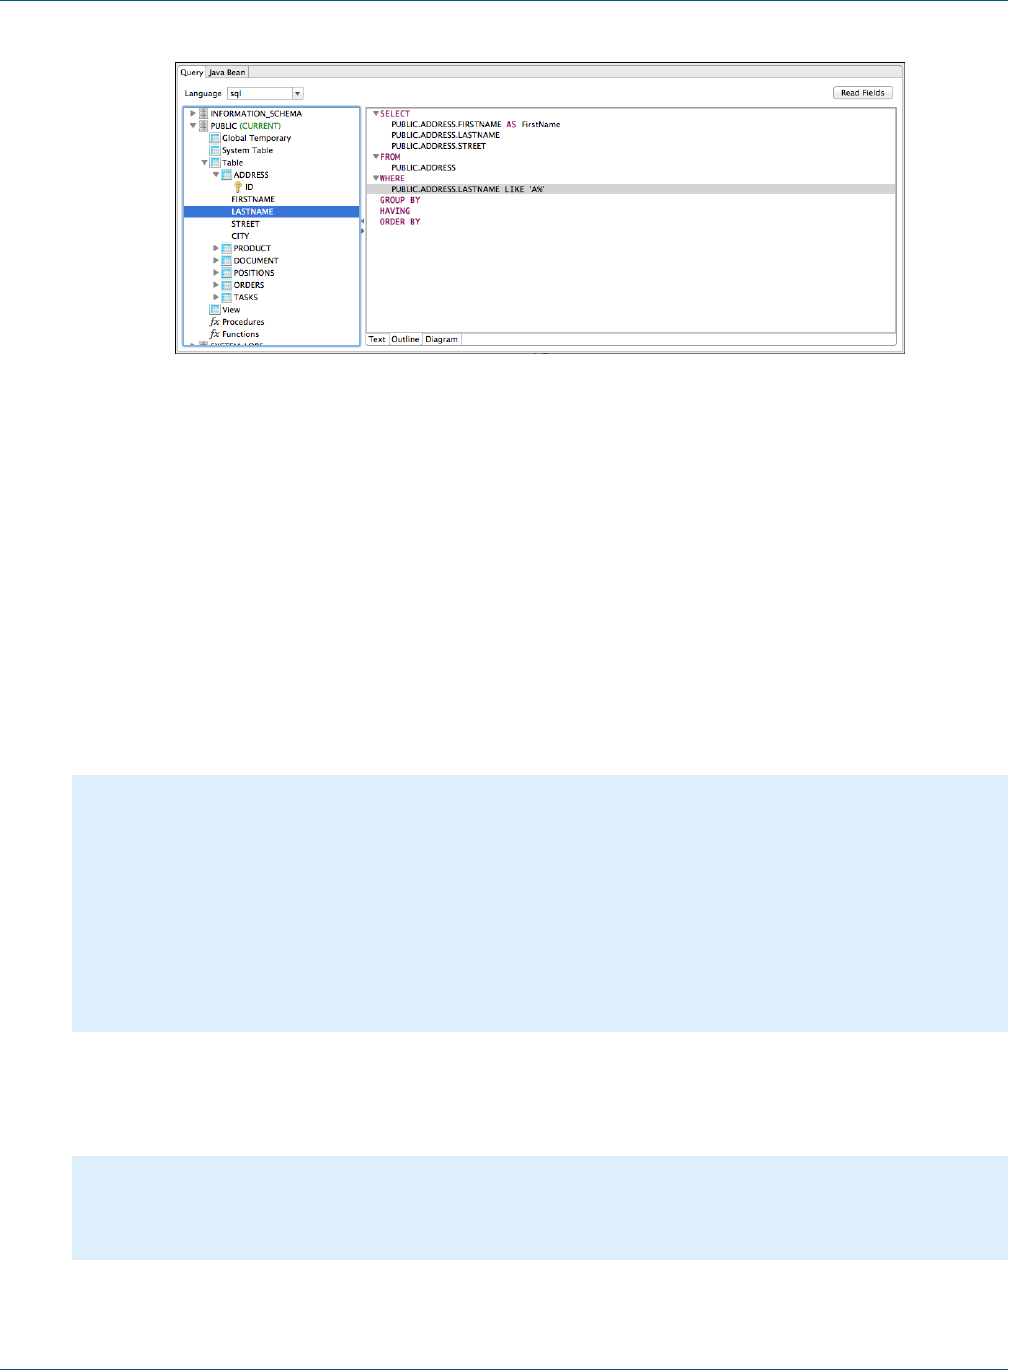
TIBCO Jaspersoft Studio User Guide
Figure 11-5 Outline View
The Outline view is a good tool for people with a basic understanding of SQL. It works in conjunction with
the Diagram view, which represents the simplest way to design a query. In the outline view the query is split
in its main parts introduced by the relative keyword. Those parts include:
SELECT introduces the portion of query where are listed all the columns that form a record of the final result set
(which is basically a list of records).
FROM contains the list of tables involved in our queries and if specified the rules to join that tables.
WHERE is the portion of query that describes the filters and conditions that the data must satisfy in order to be
part of the final result, conditions can be combined by using the OR and AND logical operators and can be
aggregated by using parentheses.
GROUP BY indicates a set of fields used to aggregate data and is used when an aggregation function is present in
the SELECT. For example, the following query counts the number of orders placed in each country.
SELECT
count(*) as number_of_orders,
Orders.country
FROM
Orders
GROUP BY
Orders.country
HAVING works in a i bit like WHERE, but it's used with aggregate functions. For example the following query
filters the records by showing only the countries that have at least 40 orders:
ORDER BY specifies a set of columns for sorting the result set.
SELECT
count(*) as number_of_orders,
Orders.country
200 TIBCO Software Inc.
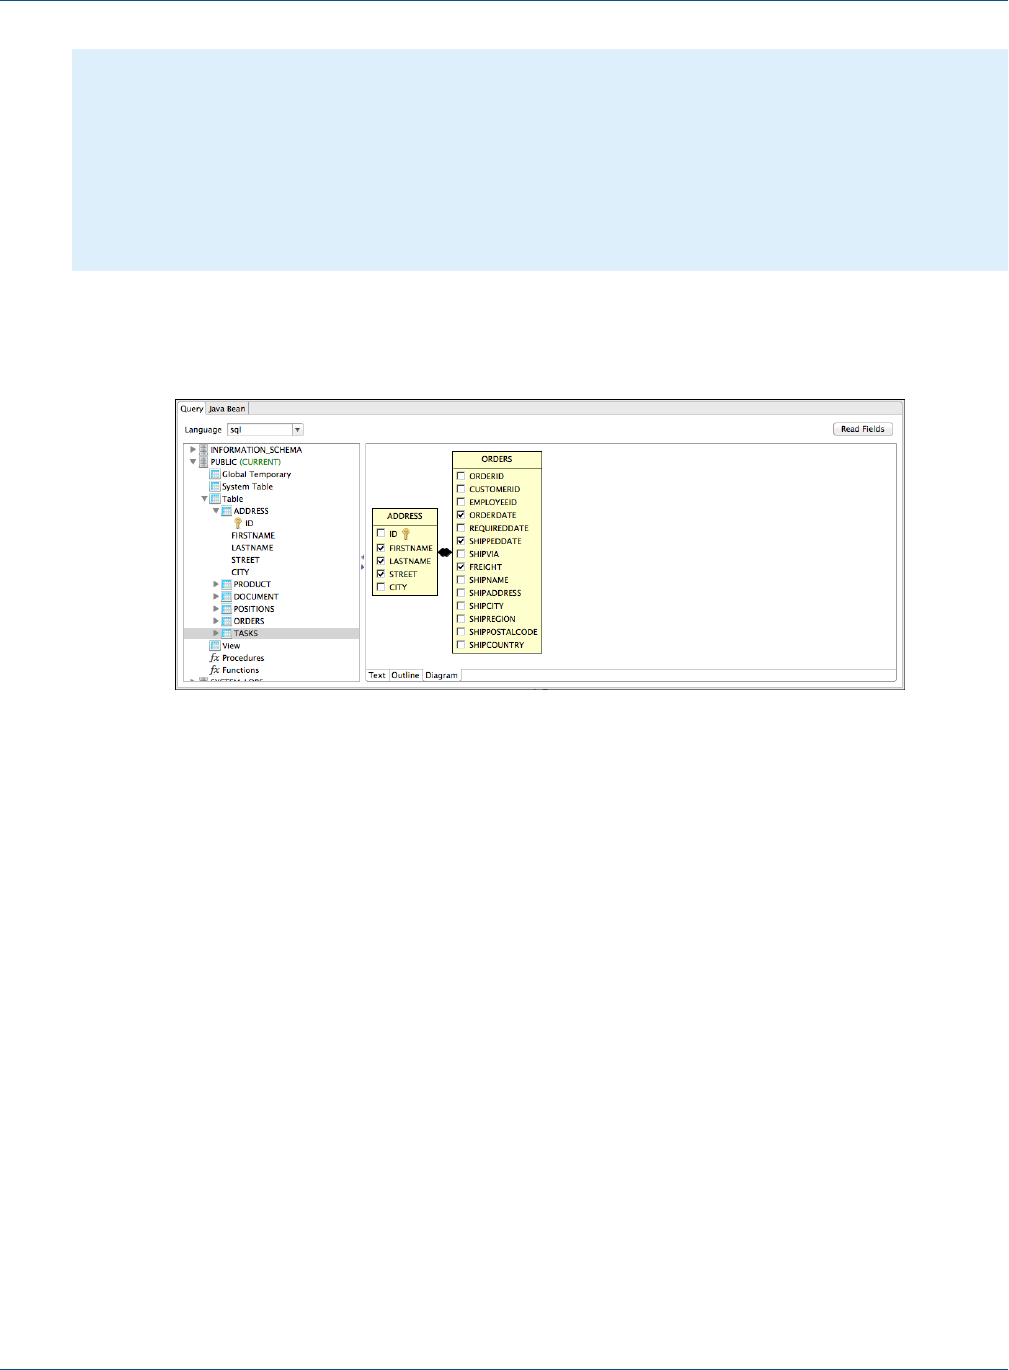
Chapter 11 Creating Queries
FROM
Orders
GROUP BY
Orders.country
HAVING
count(*) > 40
The Diagram view shows the tables in the query with the relative join connections and the selected fields. This
view is very useful especially to select the relevant fields and easily edit the table joins by double-clicking the
connection arrows.
Figure 11-6 Diagram View
11.2.2 Selecting Columns
You can drag columns from the database explorer into the SELECT node or other nodes in the outline view.
Make sure the columns you select are from tables present in the FROM part of your query.
You can also select fields by their check boxes in the diagram view.
Finally you can add a column by right-clicking the SELECT node in the outline view and selecting Add
Column. A new dialog prompts you to pick the column from the those in the tables mentioned in the FROM
clause. If a column you want to add is not a table column, but a more complex expression, for instance an
aggregation function like COUNT(*), add it by right-clicking the SELECT node in the outline view and selecting
Add Expression.
When a column is added to the query as part of the SELECT section, you can set an alias for it by double-
clicking it.
TIBCO Software Inc. 201
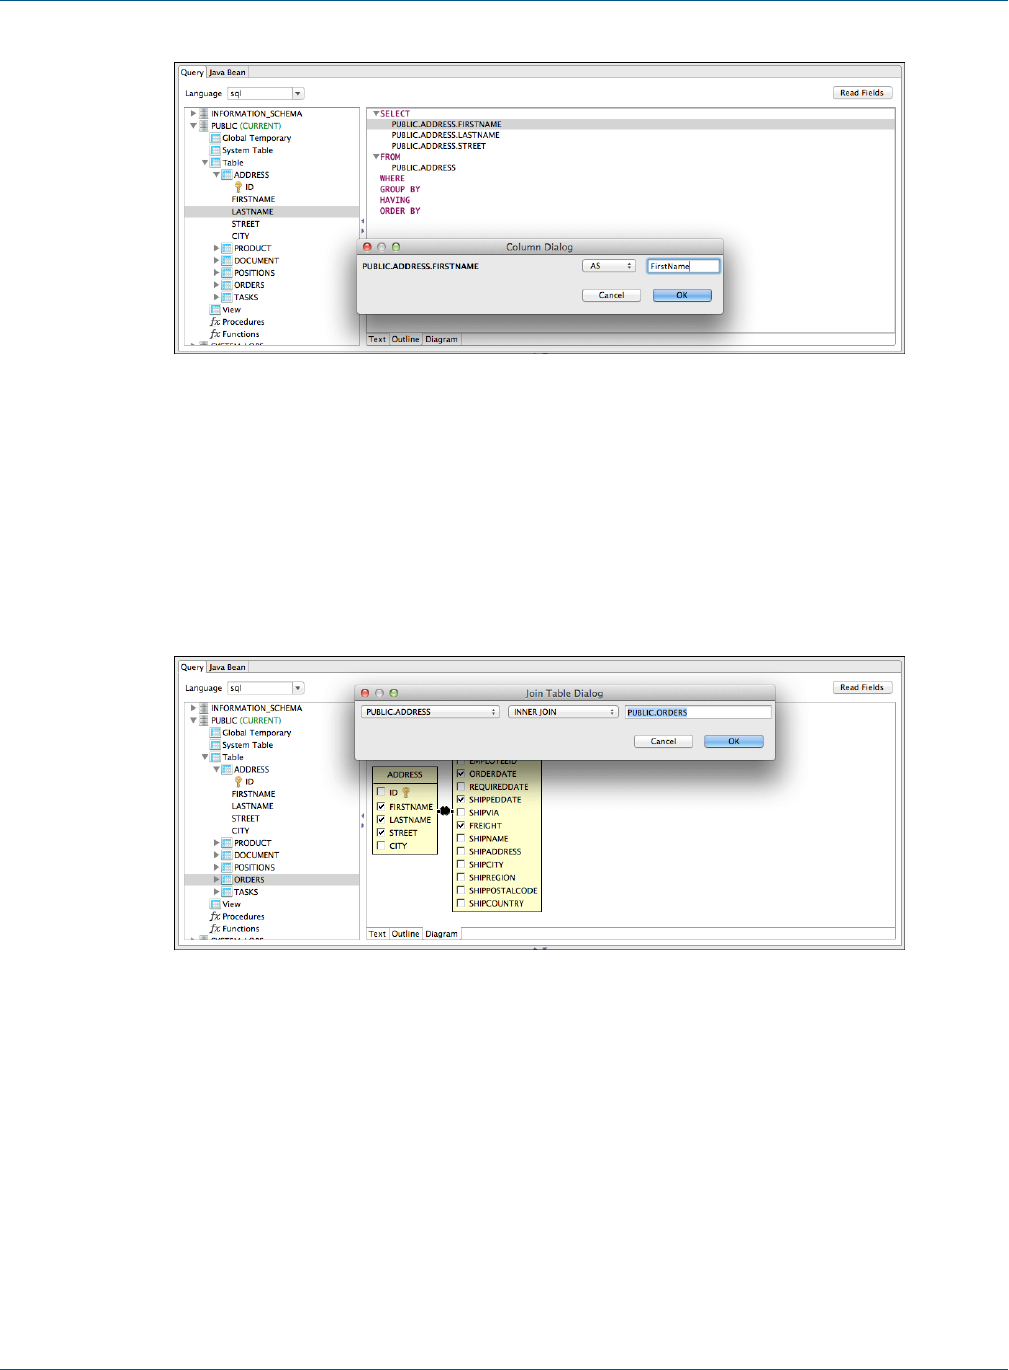
TIBCO Jaspersoft Studio User Guide
Figure 11-7 Setting an Alias
Aliases are useful when you have several fields with the same name coming from two different tables.
11.2.3 Joining Tables
You can join tables you've added by selecting shared fields. You can create the relationship the Diagram view
by dragging a column of the first table onto the column of the table you're joining to. You can edit this type of
join by double-clicking the join arrows. Currently a single join condition is supported.
Figure 11-8 Column Dialog
You can also edit joins in the outline view by right-clicking a table name and selecting Add or Edit Table
Join.
202 TIBCO Software Inc.
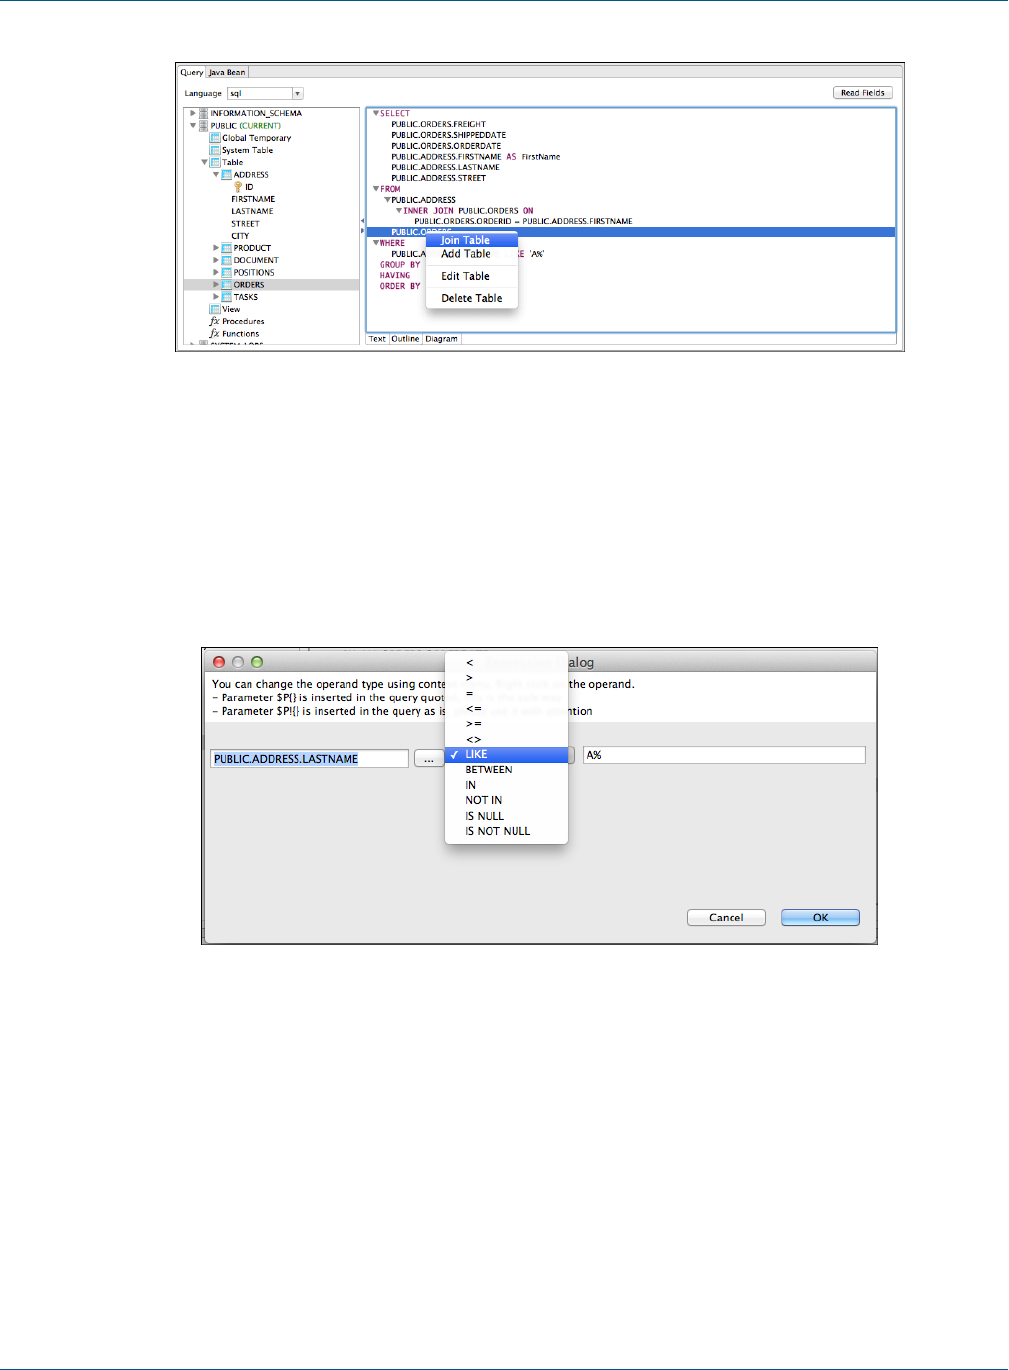
Chapter 11 Creating Queries
Figure 11-9 Join Table
11.2.4 Data Selection Criteria (WHERE Conditions)
Use a WHERE clause to specify the criteria to be for each record's part in the query result. Right click the WHERE
node in the outline view and select Add Condition to add a new condition.
If you know in advance which column should be involved in the condition, you can drag this column on the
WHERE node to create the condition. In both cases the condition dialog is displayed.
Figure 11-10 Add Condition
You can organize conditions by creating condition groups, and then combining them with or and and
operators. At least one condition must be true for an OR group. All conditions must be true for the AND operator.
You can double-click to change the value of either of these group operators.
If the value of a condition is not fixed, you can express it by using a parameter with the expression: $P
{parameter_name}.
When using collection type parameters, the $X{}expressions allow you to use operators like IN and NOT IN,
which determine whether a value is present in the provided list. The $X{} syntax also allows you to use other
operators like BETWEEN for numbers, Date Range and Time Range type of parameters. See 8.2, “Expression
Operators and Object Methods,” on page116 for more information about the $X{} syntax.
TIBCO Software Inc. 203
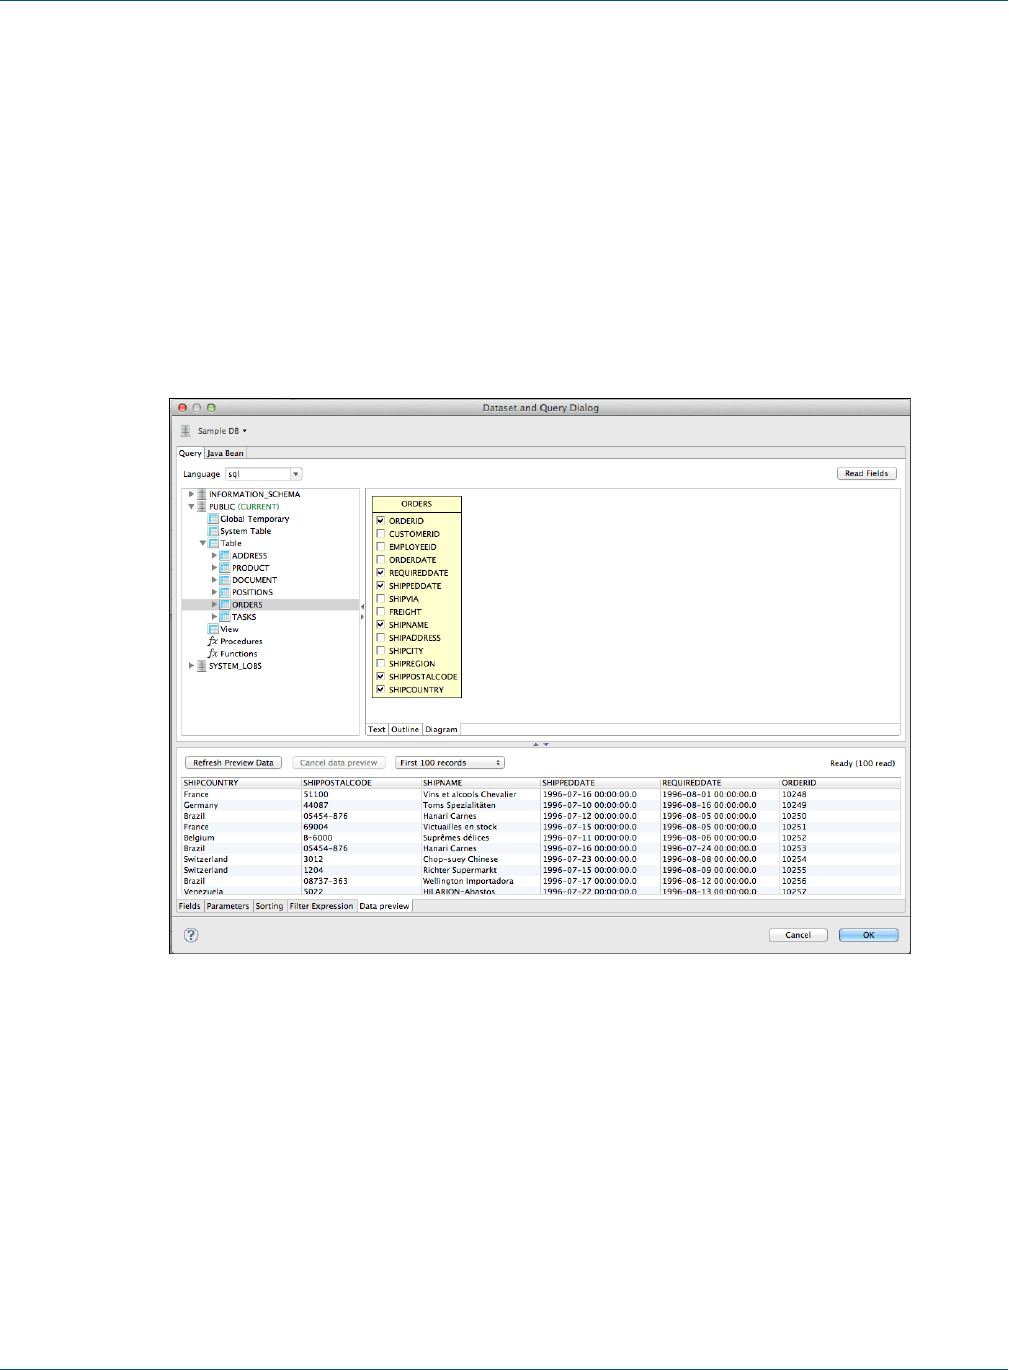
TIBCO Jaspersoft Studio User Guide
11.2.5 Acquiring Fields
When your query is ready, it's time map the columns of the result set to fields of the report. When using SQL,
this is a pretty straight forward operation.
Press the Read button to execute the query. If the query is valid and no errors occur Jaspersoft Studio adds a
field for each column with the proper class type to the fields list.
11.2.6 Data Preview
Use the Data Preview tab to generate a ghost report that maps the fields to the fields tab using your query and
selected Data Adapter. This tool is independent of the query language and a good way to debug a query or
check which records the dataset returns.
Figure 11-11 Data Preview Tab
204 TIBCO Software Inc.

Chapter 12 Accessing JasperReports Server from Jaspersoft Studio
CHAPTER 12 ACCESSING JASPERREPORTS SERVER FROM JASPERSOFT
STUDIO
This section describes functionality that can be restricted by the software license for JasperReports
Server. If you don’t see some of the options described in this section, your license may prohibit you from
using them. To find out what you're licensed to use, or to upgrade your license, contact Jaspersoft.
You can connect Jaspersoft Studio to JasperReports Server and move reports between the two. Jaspersoft Studio
uses web services to interact with the server.
Connecting with JasperReports Server enables you to:
•Browse the repository on the server from Jaspersoft Studio.
•Add reports and subreports to the repository from Jaspersoft Studio.
•Drag and drop images and other resources from the repository to Jaspersoft Studio.
•Add and delete folders and resources on the server from Jaspersoft Studio.
•Modify resource properties on the server from Jaspersoft Studio.
•Link input controls to reports on the server.
•Import and export data sources (JDBC, JNDI, and JavaBean).
•Download, edit, and upload JRXML files.
•Connect to multiple servers for access to both test and production environments.
•Create a report in Jaspersoft Studio based on a Domain in JasperReports Server (commercial edition only).
This chapter contains the following sections:
•Connecting to JasperReports Server
•Publishing a Report to JasperReports Server
•Working with JasperReports Server Templates
•Creating and Uploading a Topic for Ad Hoc Views
•Managing Repository Objects through Jaspersoft Studio
•Creating and Uploading Chart Themes
•Working with Domains
•Understanding the repo: Syntax
•Adding a Date/Time Stamp to Scheduled Output in JasperReports Server
TIBCO Software Inc. 205

TIBCO Jaspersoft Studio User Guide
12.1 Connecting to JasperReports Server
To connect Jaspersoft Studio to the server:
1. Start Jaspersoft Studio.
2. Open the Repository Explorer, then click the Create a JasperReports Server Connection icon .
The Server profile wizard appears.
Figure 12-1 Server Profile Wizard
3. Enter the URL, user names and password for your server. If the server hosts multiple organizations, enter the
name of your organization as well.
The defaults are:
•URL:
•Commercial editions: http://localhost:8080/jasperserver-pro/
•Community edition: http://localhost:8080/jasperserver/
The Server profile wizard automatically detects a server connection beginning with https and
displays a icon. See 12.1.2, “Connecting to JasperReports Server Over SSL,” on
page208 for more information.
•Organization: There is no default value for this field. If the server hosts multiple organizations, enter
the ID of the organization to which you belong.
•User name:jasperadmin
•Password:jasperadmin
Note that if you are upgrading from a previous version of Jaspersoft Studio, the old URL
(http://localhost:8080/jasperserver-pro/services/repository ) still works.
206 TIBCO Software Inc.
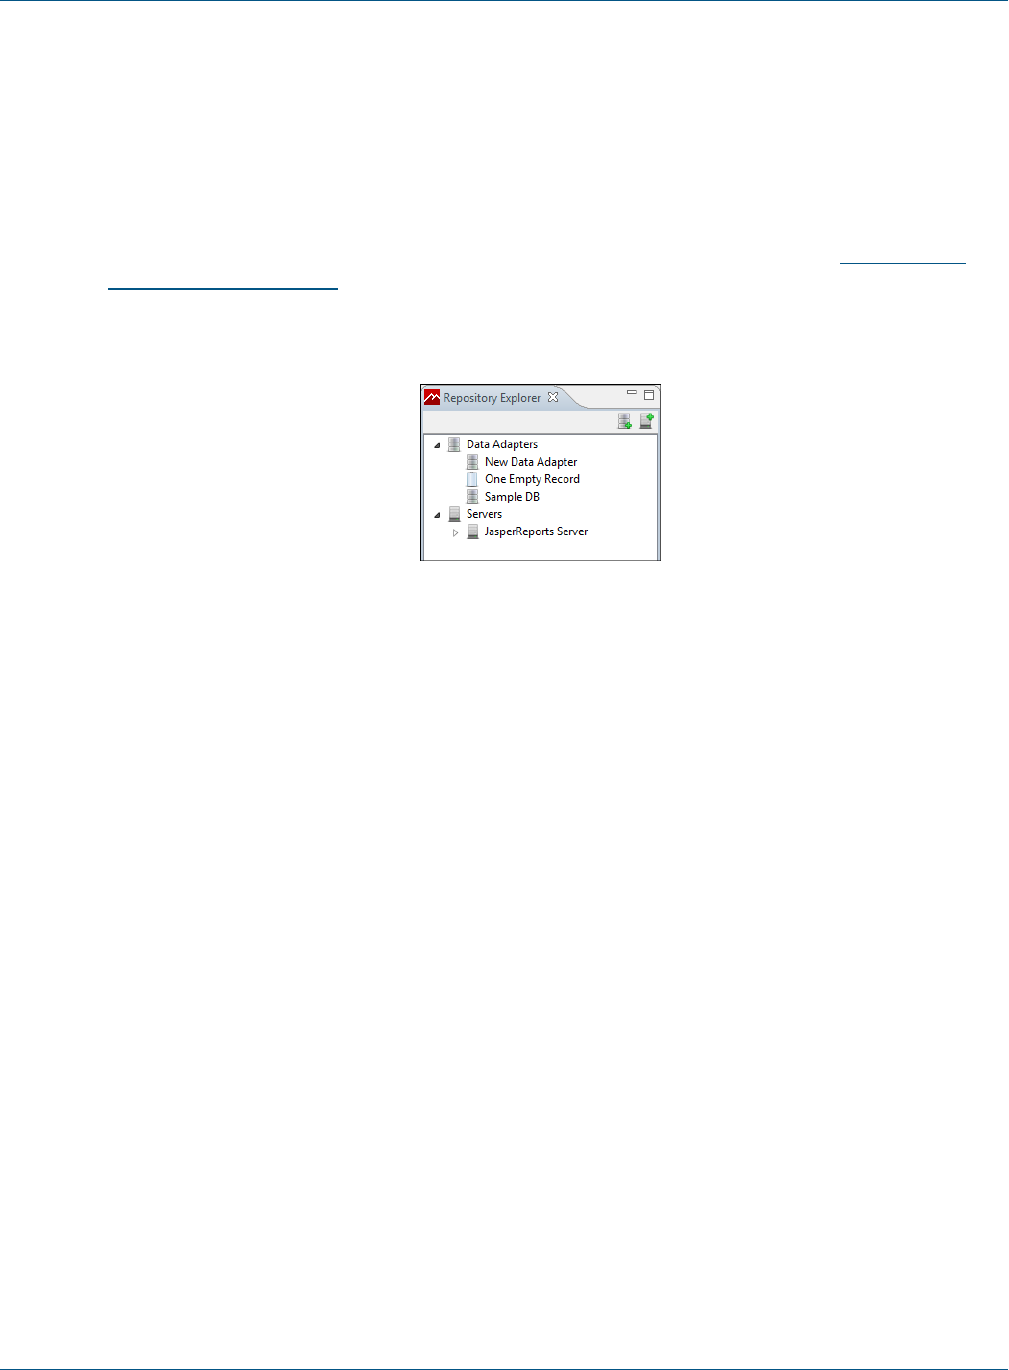
Chapter 12 Accessing JasperReports Server from Jaspersoft Studio
4. Click Test Connection.
5. (SSL connections only.) If you are connecting over SSL, the SSL certificate is displayed. To add the
certificate to your trust store, click Trust. If you do not click Trust, the certificate will be displayed each
time you connect to this JasperReports Server instance. See 12.1.2, “Connecting to JasperReports Server
Over SSL,” on page208 for more information.
6. If the test fails, check your URL, organization, user name, and password.
Connection problems can sometimes be caused by Eclipse's secure storage feature, which improves your
security by storing passwords in an encrypted format. For more information, refer to our Eclipse Secure
Storage in Jaspersoft Studio Community wiki page.
7. If the test is successful, click Finish.
The server appears in the Repository Explorer.
Figure 12-2 Repository Explorer
12.1.1 Advanced Connection Settings
You can configure additional properties for your JasperReports Server connection using the Advanced Settings
in the Server profile wizard. The following options are available:
•Authentication – Sets how the server connection is authenticated:
•Password – Password is stored with the connection.
•Ask Password – The JasperReports Server username is set as part of the connection, but the Jaspersoft
Studio user is prompted to enter the password when accessing the server. This
•Single Sign-On – Lets you connect to a JasperReports Server instance that has been configured to
work with the Central Authentication Service (CAS) protocol. See 12.1.3, “Using Single Sign-on with
JasperReports Server,” on page209 for more information.
•JasperReports Library Version – Sets the version of the JRXML output generated by Jaspersoft Studio.
When you connect to a JasperReports Server instance that is earlier than your version of Jaspersoft Studio,
use this setting to convert your JRXML to the version used by the server. You can view server information,
including the server version, on the info tab.
•Connection Timeout [ms] – Sets the connection timeout in milliseconds.
•HTTP Chunked Requests – Enables chunked transfer encoding. Disable this option if your firewall
blocks incomplete response chunks.
•Use SOAP protocol only – Sets communication between Jaspersoft Studio and the server to use the
SOAP format. Can't be used with single sign-on.
•Supports DateRange Expressions – Lets you upload queries with relative dates to JasperReports Server.
See 6.3.4, “Relative Dates ,” on page100for more information.
•Synchronize DataAdapter Properties – Synchronizes the net.sf.jasperreports.data.adapter
property with the Jaspersoft Studio data adapter setting.
•Format of Attachements – Sets the message attachment format to MIME or DIME.
TIBCO Software Inc. 207

TIBCO Jaspersoft Studio User Guide
•Workspace Folder – Lets you designate the folder in the workspace where you want to store files
downloaded from this JasperReports Server instance.
•Locale – Sets the locale to use for the Jaspersoft Studio connection to the server.
•Time Zone – Sets the timezone to use for the Jaspersoft Studio connection to the server.
•Info tab – Shows information about the JasperReports Server instance, including version number, edition,
license expiration, licensed features, and data and timestamp format.
12.1.2 Connecting to JasperReports Server Over SSL
Jaspersoft Studio lets you trust and manage certificates for connections to JasperReports Server instances over
SSL.
12.1.2.1 Viewing the Certificate
When you create a JasperReports Server connection over SSL, the Server profile wizard automatically detects
the https scheme in the URL and displays a icon. To open the Security Certificate dialog and view the
security certificate, click . If you do not click Trust, the certificate will be displayed each time you connect
to this JasperReports Server instance.
To view the trust store from the Security Certificate dialog, click Show Trust Store.
12.1.2.2 Adding the Certificate to the Trust Store in Jaspersoft Studio
To add a connection's certificate to the trust store, click Test Connection in the server profile wizard, and then
click Trust. This trusts the topmost certificate in the certificate chain.
12.1.2.3 Setting the SSL Properties
SSL properties, including the location of the trust store, are set at the JVM-level via system properties. This
means you can set SSL properties in one of two ways:
•in code using System.setProperty
•using java -D… syntax when running the program from the command line or in Jaspersoft Studio's .ini file.
See 24.4.2, “Setting the -clean Flag in the .ini File,” on page422 for more information about the .ini file.
You can set the following keys for Jaspersoft Studio:
•javax.net.ssl.trustStore – Location of the Jaspersoft Studio trust store. On Windows, the specified
pathname must use forward slashes, /, in place of backslashes, \. Jaspersoft Studio defaults to the internal
configuration directory.
•javax.net.ssl.trustStorePassword – Password to unlock the trust store.
•javax.net.ssl.trustStoreType (Optional) – Format of the trust store. Defaults to Java keystore file
format (JKS).
•javax.net.debug – Debug flag. To enable logging for the SSL/TLS layer, set this property to ssl.
For more information, see Oracle's documentation for your Java version.
12.1.2.4 Working with the Trust Store
To view the trust store in the Jaspersoft Studio user interface:
1. Select Window> Preferences to open the Preferences dialog box (Eclipse> Preferences on Mac).
2. Navigate to Jaspersoft Studio> JasperReports Server Settings> Trust Store.
3. The Trust Store dialog is displayed.
208 TIBCO Software Inc.

Chapter 12 Accessing JasperReports Server from Jaspersoft Studio
Figure 12-3 Trust Store dialog
You can also open the Trust Store dialog when you are creating a secure connection by clicking Show Trust
Store in the Security Certificate dialog.
The Trust Store dialog lets you do the following:
•To view a certificate and its certificate chain, select the certificate.
•To remove a certificate from the store, select the certificate and delete it.
12.1.3 Using Single Sign-on with JasperReports Server
You can use single sign-on (SSO) to connect to a JasperReports Server instance that has been configured to
work with the Central Authentication Service (CAS) protocol. For information about configuring CAS for
JasperReports Server, see the JasperReports Server External Authentication Cookbook.
Configure JasperReports Server:
1. Before you begin, configure your JasperReports Server instance for CAS, as described in the JasperReports
Server External Authentication Cookbook.
Add the CAS server to your Jaspersoft Studio workspace:
1. In Jaspersoft Studio, select Window> Preferences (Eclipse> Preferences on Mac).
2. In the Preferences window, navigate to Jaspersoft Studio> Jaspersoft Server Setting> Single Sign
On Server.
TIBCO Software Inc. 209
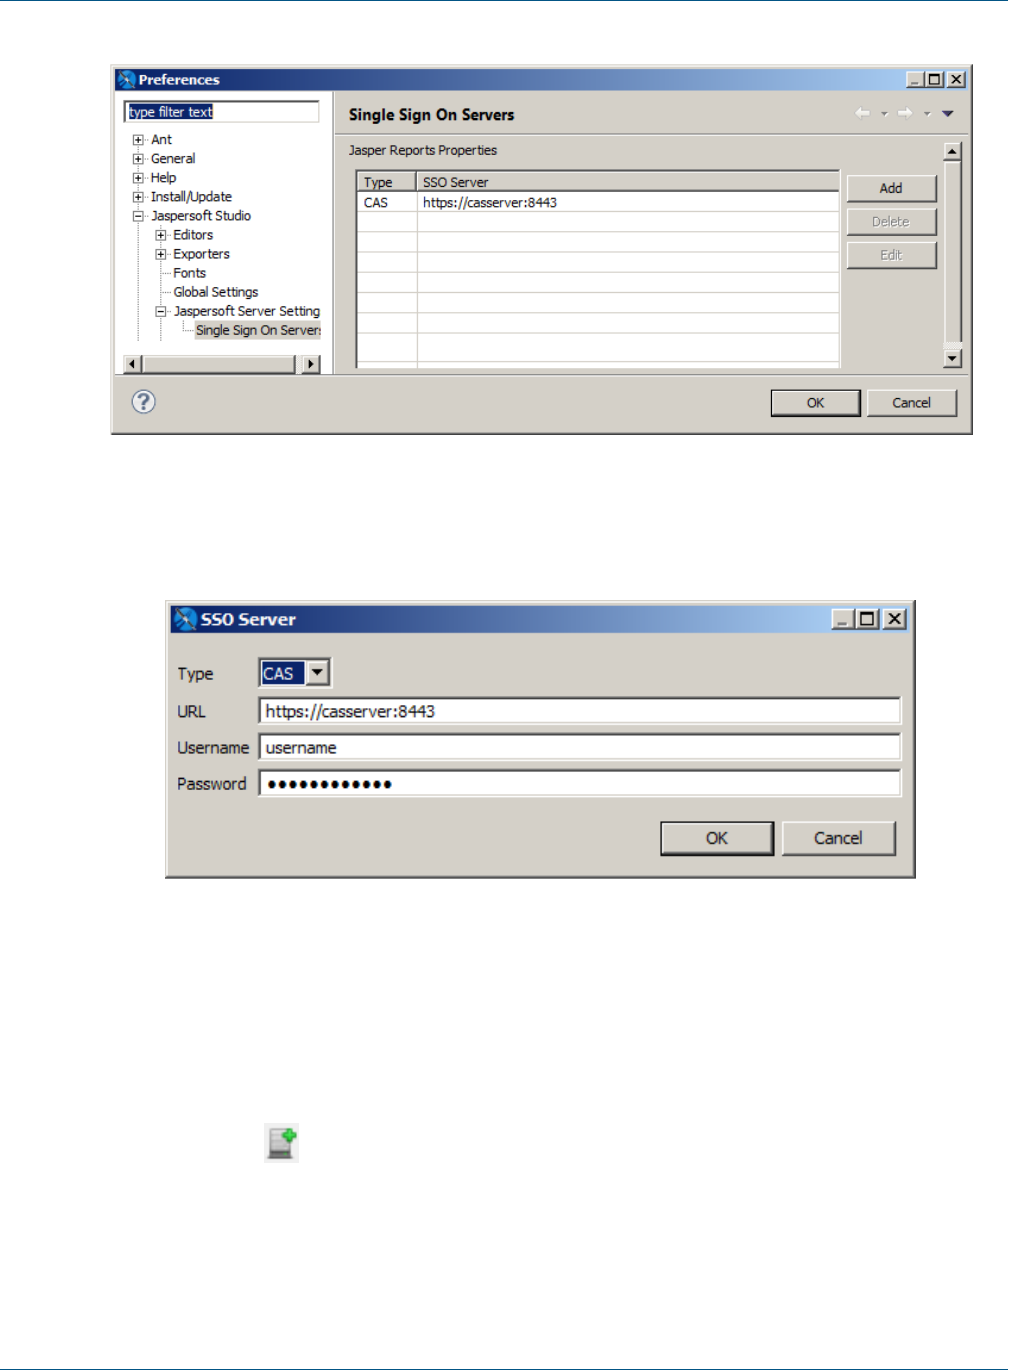
TIBCO Jaspersoft Studio User Guide
Figure 12-4 Single Sign On Servers in Preferences Dialog
3. In the Single Sign On Servers pane, click Add.
4. Enter the URL of your CAS server along with the username and password you want to use for access.
Figure 12-5 SSO Server Settings Dialog
5. Click OK.
The CAS server is added to the list of available single sign-on servers.
6. Click OK.
Configure your JasperReports Server connection to use CAS:
1. In Jaspersoft Studio, open the Repository Explorer, then click the Create a JasperReports Server
Connection icon .
2. Select Advanced Settings.
3. Enable the Use Single Sign On option.
The Account section of the Server profile wizard changes.
210 TIBCO Software Inc.
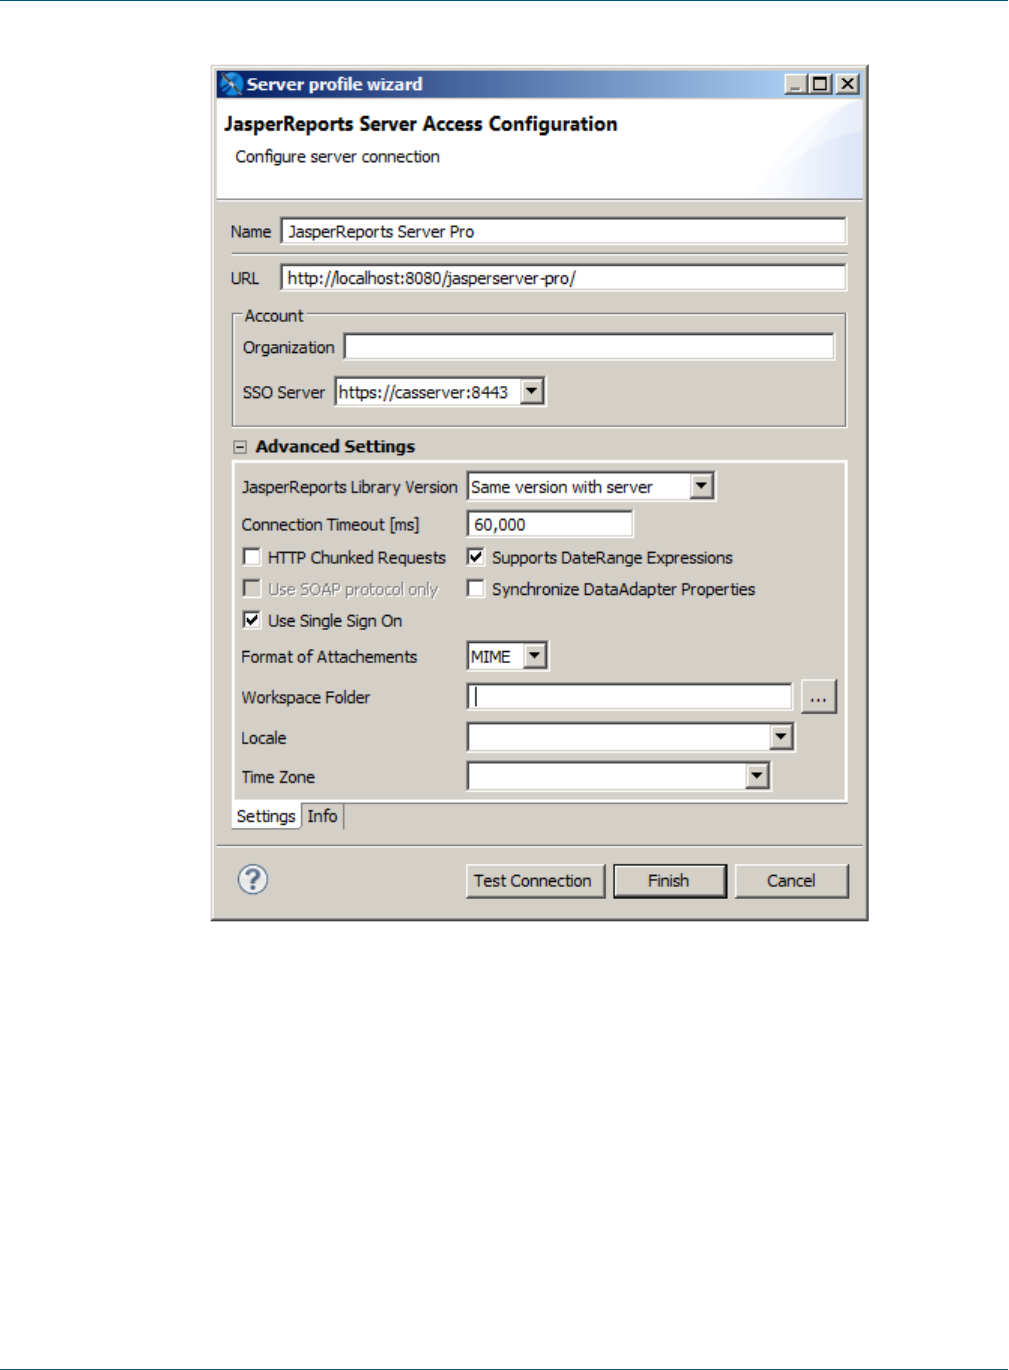
Chapter 12 Accessing JasperReports Server from Jaspersoft Studio
Figure 12-6 Setting Single Sign-on in the Server Profile Wizard
4. If the server hosts multiple organizations, enter the ID of the organization to which you belong. This can be
the root organization (in which case you can leave this entry bar blank) or another organization.
5. Select the CAS server you want to use for this connection from the SSO Server menu.
6. Click Test Connection to test the connection. This may take some time, especially the first time you
connect.
7. Click OK in the confirmation dialog.
8. Click OK to create the connection.
TIBCO Software Inc. 211

TIBCO Jaspersoft Studio User Guide
12.2 Publishing a Report to JasperReports Server
You can easily publish your reports from Jaspersoft Studio to any JasperReports Server connection. Publishing
to the server uploads the JRXML for the report, along with any resources that the report needs such as images
and query resources. You must also configure the data source for the report on the server.
12.2.1 Publishing Report Resources
The reports you create in Jaspersoft Studio can have embedded resources, such as such as images, query
resources, and data adapters using net.sf.jasperreports.data.adapter. You can use the following
columns in Select Resources to publish page of the Report Publishing Wizard to control the resources you
upload:
•Overwrite – Controls whether or not you overwrite a resource if it already exists. This setting is important
when you republish a report that has been published before. Click on the value in this column to display a
drop-down menu with the following choices:
•Overwrite – Creates a new resource or overwrites an existing resource with the current version.
•Ignore – Ignores the resource.
•Overwrite Only Expression – Updates the expression for the resource. Enter the new value in the
Expression column. Does not create or overwrite the resource.
•Expression – When Overwrite or Overwrite Only Expression is selected, lets you choose the
expression you want to use. Click on the value in this column and then click ... to open the Expression
Editor and edit the expression that specifies the location where the file is saved. By default, resources such
as images are published to a repository location, and the uploaded report uses the repo: syntax to refer to
the report location.
•Type – When Overwrite is selected, specifies the existing resource to overwrite. Click on the value in this
column to display a drop-down menu with the following choices:
•Save to Folder – Save to a location anywhere on your JasperReports Server instance. When you
choose this option, you are prompted to navigate to the location you want.
•Link to Resource – Links to an existing resource on your JasperReports Server instance. When you
choose this option, you are prompted to navigate to the resource you want. If you modify a report and
the report is set to Overwrite, changes overwrite only the path, not the resource.
•Use Local Resource – Save as a resource inside the report unit on JasperReports Server.
12.2.2 Choosing a Data Source for a Published Report
In JasperReports Server, data is usually specified using a JasperReports Server data source. Like a data adapter, a
JasperReports Server data source does not contain data; instead it contains the information JasperReports Library
needs to construct a JRDataSource when the report is run. Choosing a JasperReports Server data source instead
of a data adapter when you publish a report to JasperReports Server lets you take advantage of features specific
to JasperReports Server or to use a JNDI connection configured on your application server.
When you upload a report from Jaspersoft Studio to JasperReports Server, you can choose one of the following
options:
•Data Source from Repository – Use an existing JasperReports Server data source for your report.
•Local Data Source –Create a JasperReports Server data source or upload a Jaspersoft Studio data adapter
file to use in your report.
•No Data Source – Make no changes to the data adapter information in your report.
212 TIBCO Software Inc.
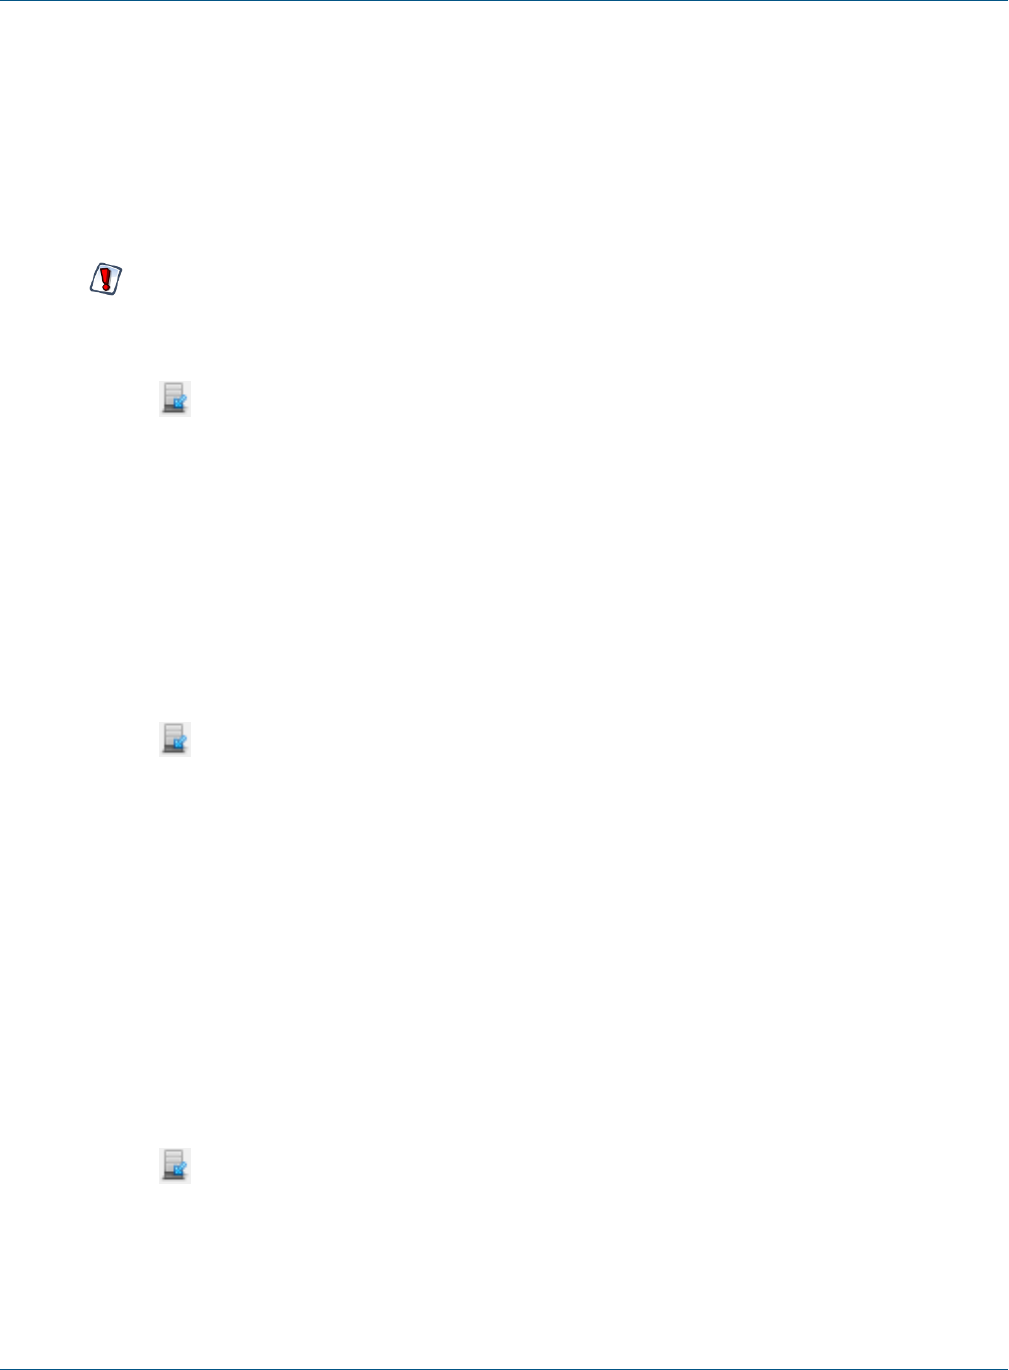
Chapter 12 Accessing JasperReports Server from Jaspersoft Studio
12.2.2.1 Data Source from Repository
The Data Source from Repository option lets you choose an existing data source from the JasperReports
Server repository.
To use the Data Source from Repository option:
•Make sure the data source is available in JasperReports Server. If you want to create a data source, select
Local Data Source instead.
If you are using a JDBC or JNDI data source, make sure that your connection uses the same driver as
your Jaspersoft Studio data adapter. For example, if you connect to an Oracle database from a com-
mercial edition, you can download and use the native Oracle driver or you can use the TIBCO Oracle
JDBC driver that is included with Jaspersoft Studio. If your driver in JasperReports Server does not match
the driver used in Jaspersoft Studio, you could see different data in your uploaded report.
•Click to publish your report and select a JasperReports Server instance and repository location where
you want to save the report. Then click OK. If you are prompted to upload resources, select your settings.
•Select Data Source from Repository when prompted.
•Click ... and select the correct JasperReports Server data source from the repository.
12.2.2.2 Local Data Source
The Local Data Source option lets you create a new data source in JasperReports Server to use with your
report, or to upload a data adapter from Jaspersoft Studio to JasperReports Server. To use this option to create a
new data source:
•If you want to use a JNDI data source, first set up the JNDIconnection for your database in your
application server. Make sure to use the same JDBC driver for your Jaspersoft Studio adapter and the JNDI
connection in JasperReports Server.
•Click to publish your report and select a JasperReports Server instance and repository location where
you want to save the report. Then click OK. If you are prompted to upload resources, select your settings.
•Select Local Data Source when prompted.
•Click ... to open the Add Resource wizard.
•Select the type of data source you want to create , for example, Datasource JDBC, and click Next.
•On the Resource Editor page, enter a name and unique ID for the data source. You can also enter an
optional description. Then click Next.
•On the next page, manually fill in the required information for the data source you want to create.
•Click Finish to create the data source and use it in your uploaded report.
For some types of data sources, such as JDBC, JNDI, and bean data sources, you can publish a data adapter from
Jaspersoft Studio and set it as the data source for the report:
•Make sure that the data adapter you want to upload is saved locally as an xml file in the same project as
your report. See 10.1.2, “Importing and Exporting Data Adapters,” on page143 for information about
exporting a global data adapter to your project; see 10.1.3, “Copying a Data Adapter,” on page144 for
information about copying a data adapter from one project to another.
•Click to publish your report. Select a JasperReports Server instance and repository location where you
want to save the report. Then click OK.
•If you are prompted to upload resources, select your resource settings and click OK.
•Select Local Data Source when prompted.
•Click ... to open the Add Resource wizard.
TIBCO Software Inc. 213

TIBCO Jaspersoft Studio User Guide
•Select the type of data source you want to create and click Next. Only some data source types can be
imported from data adapters in Jaspersoft Studio, such as Datasource Bean, Datasource JDBC, and
Datasource JNDI.
•On the Resource Editor page, click Import from Jaspersoft Studio. If this button is not available, you
can't import the data source type you selected.
•The Import dialog shows a list of local and global adapters. Make sure to select a local adapter, which will
include the name of a file. Click OK then Finish to select the adapter.
•Click Finish to publish the report and selected data adapter to the repository.
If you are using a custom data adapter or any other adapter that uses one or more jars that aren't
included in JasperReports Server, add the jar(s) to a location on your server classpath.
12.2.2.3 No Data Source
Use No Data Source when you have configured net.sf.jasperreports.data.adapter in your JRXML, as
described in 10.2.3, “Default Data Adapter,” on page145. Setting net.sf.jasperreports.data.adapter
lets you use multiple data adapters in the same report, for example, using a different data adapter for a subreport.
To use this option:
•Set the default data adapter(s) for the datasets and subdatasets used in your report, as described in 10.2.3,
“Default Data Adapter,” on page145.
•Follow these guidelines when setting default data adapters in a report that you want to publish:
•Do not use global data adapters. The default data adapter must reference a local file in the same project
as your report, or a data adapter already in your repository.
•Where possible, use inheritance to reduce the number of times you actually set the default data adapter.
If your report uses a specific adapter multiple times, try to structure the report so that the data adapter is
set for a single dataset and other datasets inherit it. For example, if you have a crosstab and a table that
use the same data adapter, you could create a subreport that contains the table and crosstab. Then if you
set your data adapter as the default for the subreport, the table and crosstab inherit this adapter. Reusing
the data adapter improves performance when you run the report.
•Publish your report and select No Data Source when prompted.
•When you publish the report, the default data adapters are uploaded to the repository.
12.2.3 Example of Publishing a Report
To publish a report to the server:
1. Open a report.
2. Click the Publish Report button in the upper-right corner of the Designer. The Report Publishing
Wizard opens.
214 TIBCO Software Inc.
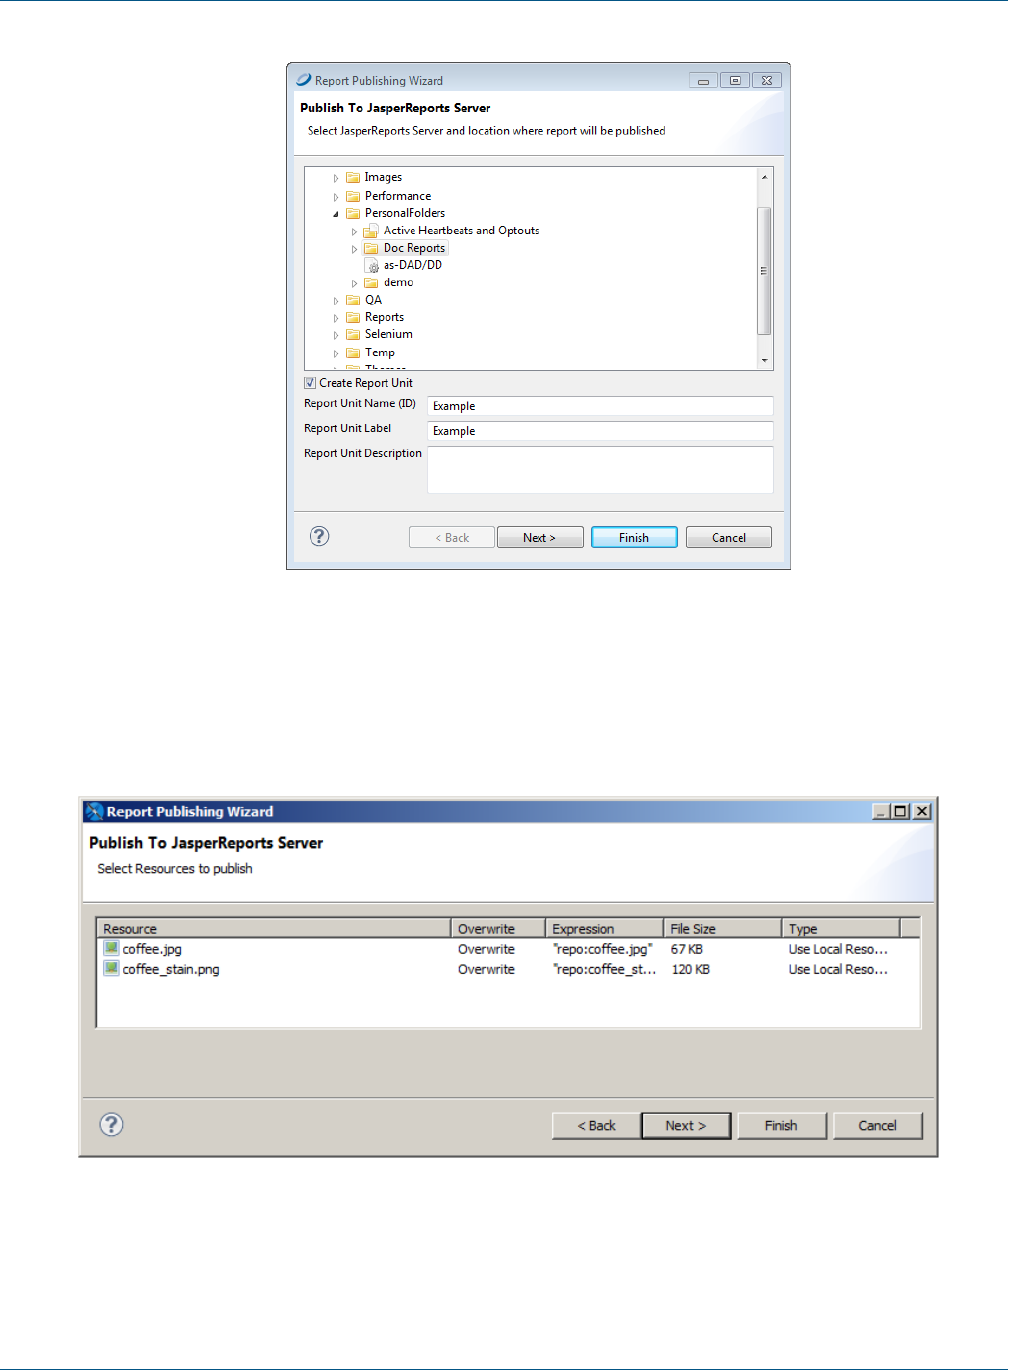
Chapter 12 Accessing JasperReports Server from Jaspersoft Studio
Figure 12-7 Report Publishing Wizard
3. Locate the directory for storing your report.
4. Name the report unit. The report unit contains all report files.
5. Click Next. The Select Resources window opens. This window displays any resources required by your
report, such as images, query resources, and embedded data adapters.
Figure 12-8 Select Resources
6. Select any resources you want to upload with your report and check the box if you want to overwrite
previous versions of those resources. Click Next. The Configure the data source window opens.
TIBCO Software Inc. 215
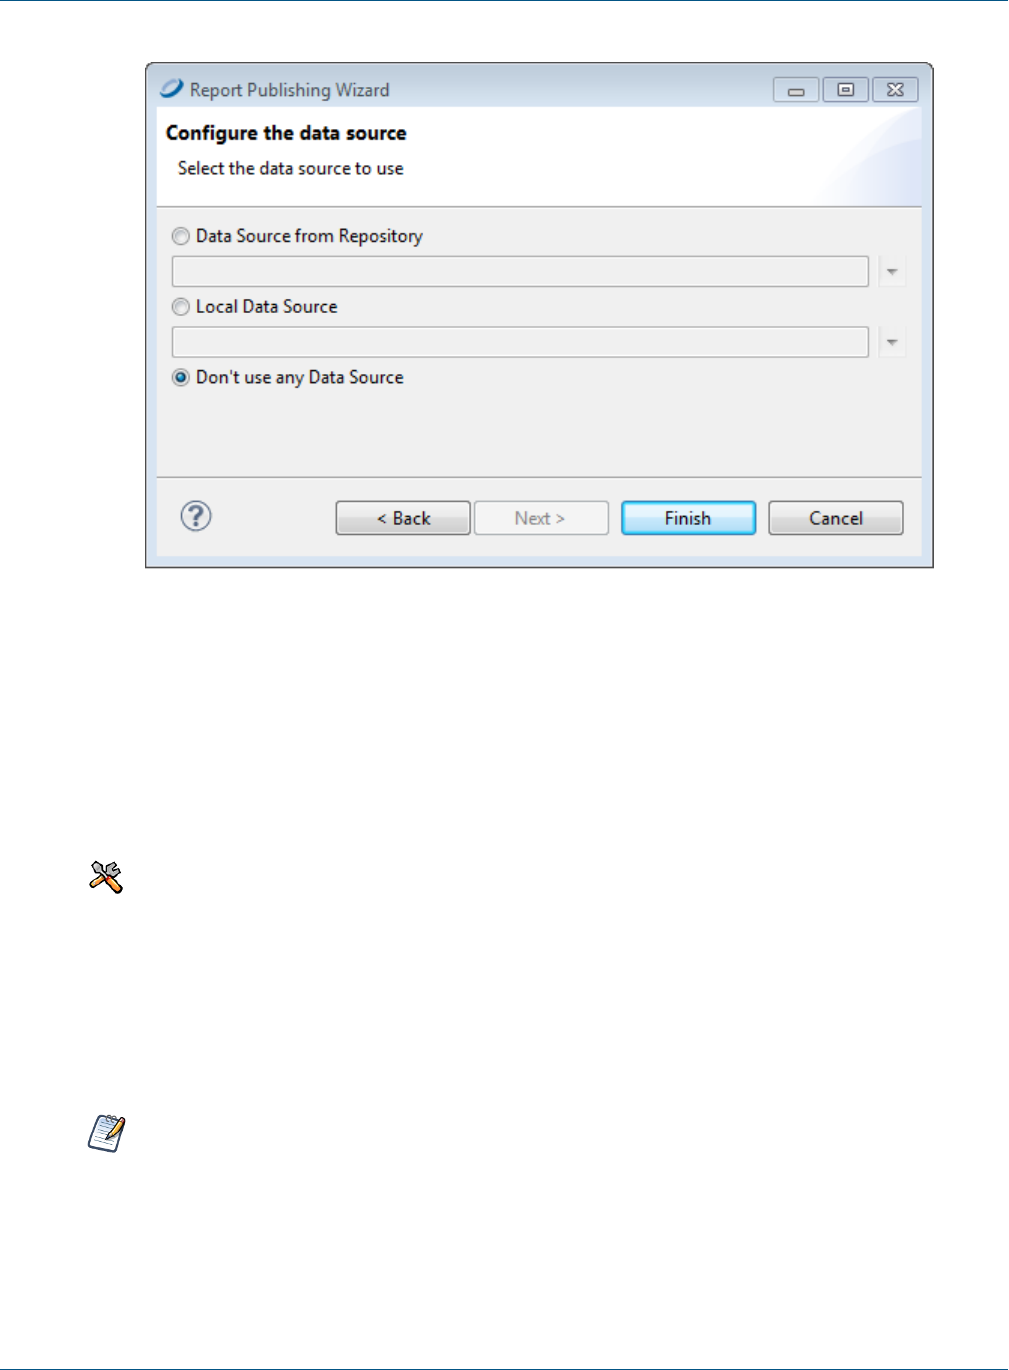
TIBCO Jaspersoft Studio User Guide
Figure 12-9 Configure Data Source
7. Select a data source configuration. See 12.2.2, “Choosing a Data Source for a Published Report,” on
page212 for more information.
8. Click Finish. The report is uploaded to the server. If there are no errors, an appropriate message is shown.
12.3 Working with JasperReports Server Templates
This section describes functionality that can be restricted by the software license for Jaspersoft Studio. If
you don’t see some of the options described in this section, your license may prohibit you from using
them. To find out what you're licensed to use, or to upgrade your license, contact Jaspersoft.
JasperReports Server includes several templates that affect the layout of your reports. You can add custom
templates to your JasperReports Server instance by uploading a JRXML file to a Templates directory. In
addition to font and color choice, templates can contain images such as logos. In a JasperReports Server
template, the absolute path of an image is in the repository and cannot be overwritten. Other users can apply
your template by selecting Custom Report Template when they create a report from an Ad Hoc View.
JasperReports Server templates are different from report templates in Jaspersoft Studio. See Chapter 22,
“Report Templates,” on page401 for more information.
12.3.1 Creating a Custom JasperReports Server Template
It's easiest to start with a template in JasperReports Server and change its properties (such as colors, fonts, and
logos) in Jaspersoft Studio. Then, publish the new template to the server. This example shows how to change
216 TIBCO Software Inc.
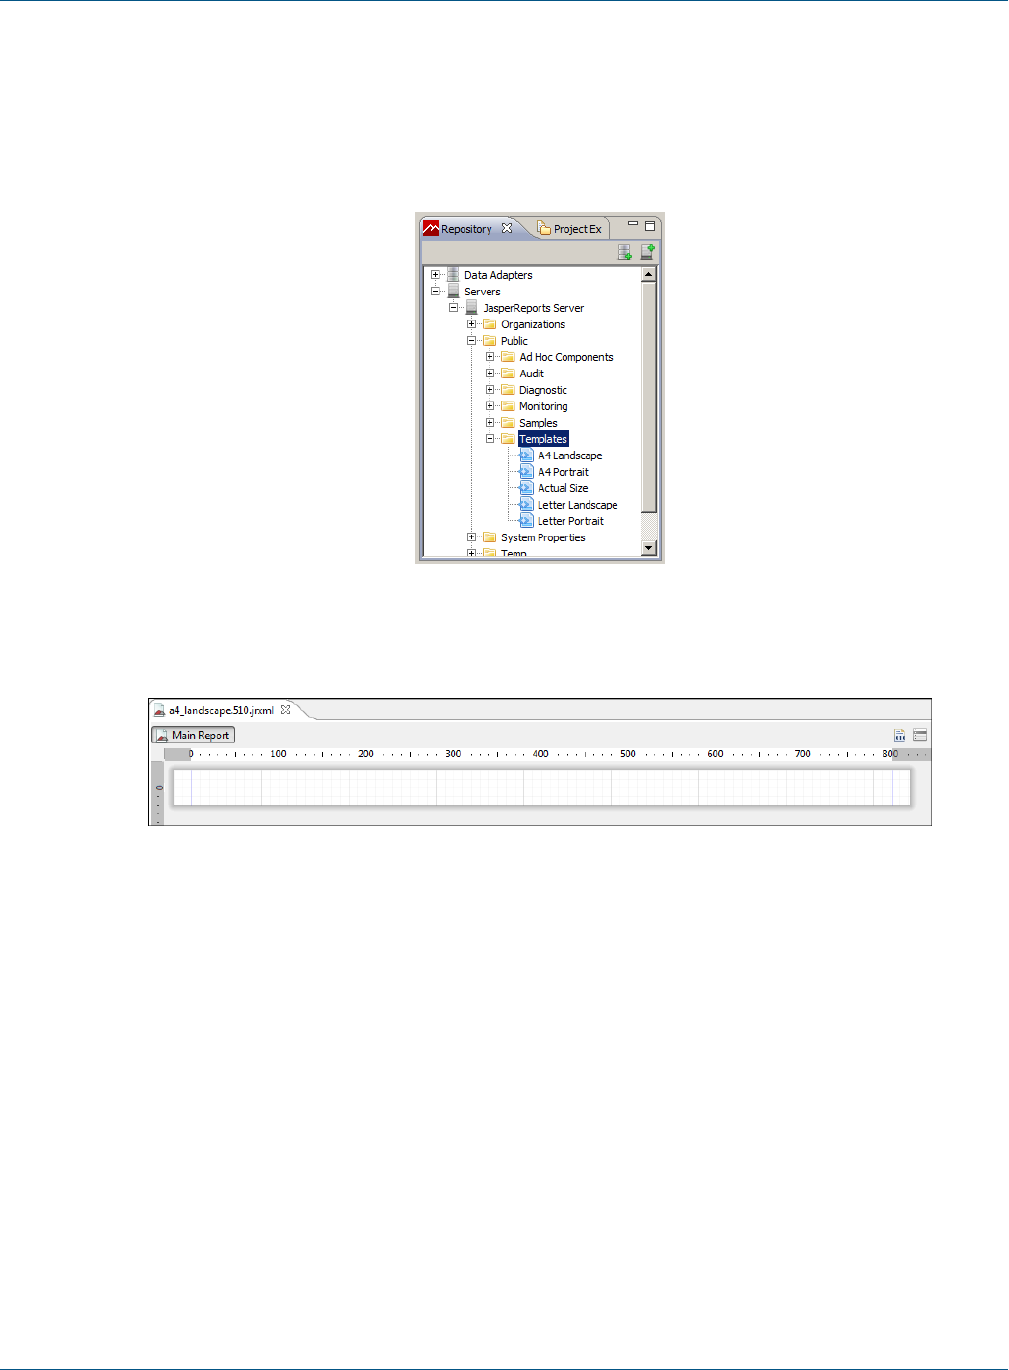
Chapter 12 Accessing JasperReports Server from Jaspersoft Studio
the font for a chart title.
To create a template:
1. Connect to JasperReports Server as superuser.
2. In the Repository Explorer, navigate to the Public/Templates directory.
Figure 12-10 Accessing the Templates directory from Jaspersoft Studio
3. Right-click A4 Landscape and choose Open in Editor.
Figure 12-11 Default A4 landscape template
The document will look empty, but if you click the Source tab, you see that attributes are set at the
JRXML level. Note the attributes for ChartTitle:
<style name="ChartTitle" forecolor="#000000" fontName="DejaVu Sans" fontSize="12"
isBold="true"/>
You can edit styles directly on the Source tab if you choose.
4. Click the Design tab and in the Outline view, click the arrow next to Styles.
5. Click ChartTitle. The styles open in the Properties view.
TIBCO Software Inc. 217
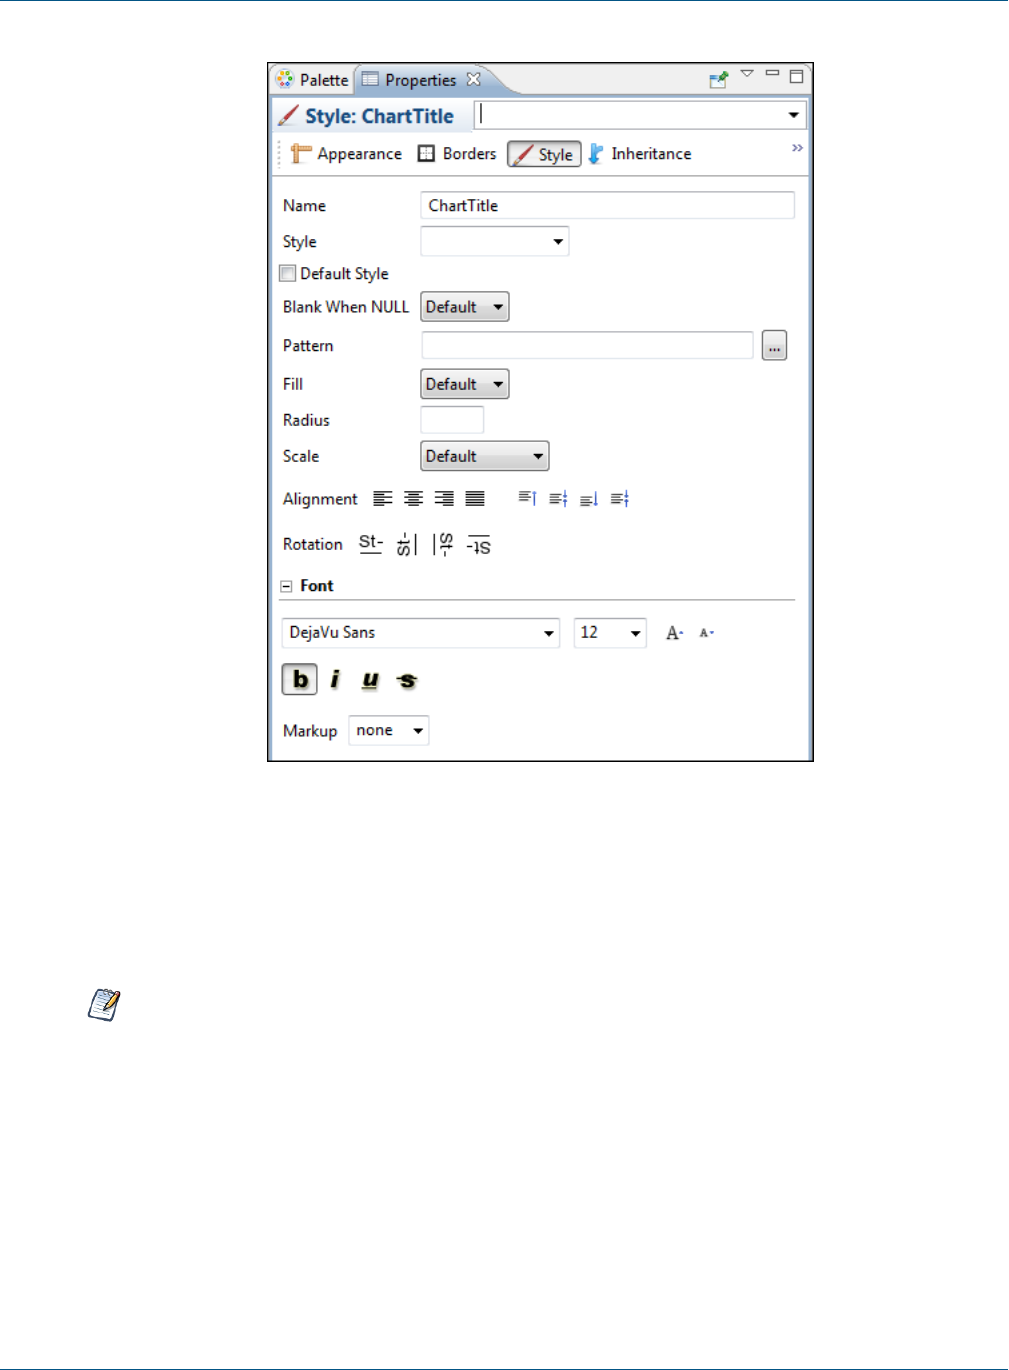
TIBCO Jaspersoft Studio User Guide
Figure 12-12 Style tab in Properties view
6. Make these changes:
a. Font: Century Gothic, 14 pt, bold, italic.
b. Change the forecolor to red (Click Appearance for that change.)
c. Alignment: Center
You can link to an image in your template by uploading the image to the repository and then dragging it
into the appropriate band in the template. The template uses the absolute path to the image in the
repository and the image cannot be changed or overwritten.
To save and publish a template:
1. Save the template with a new name.
2. Click Yes in the pop-up to publish the report to JasperReports Server.
The Report Publishing wizard appears.
218 TIBCO Software Inc.
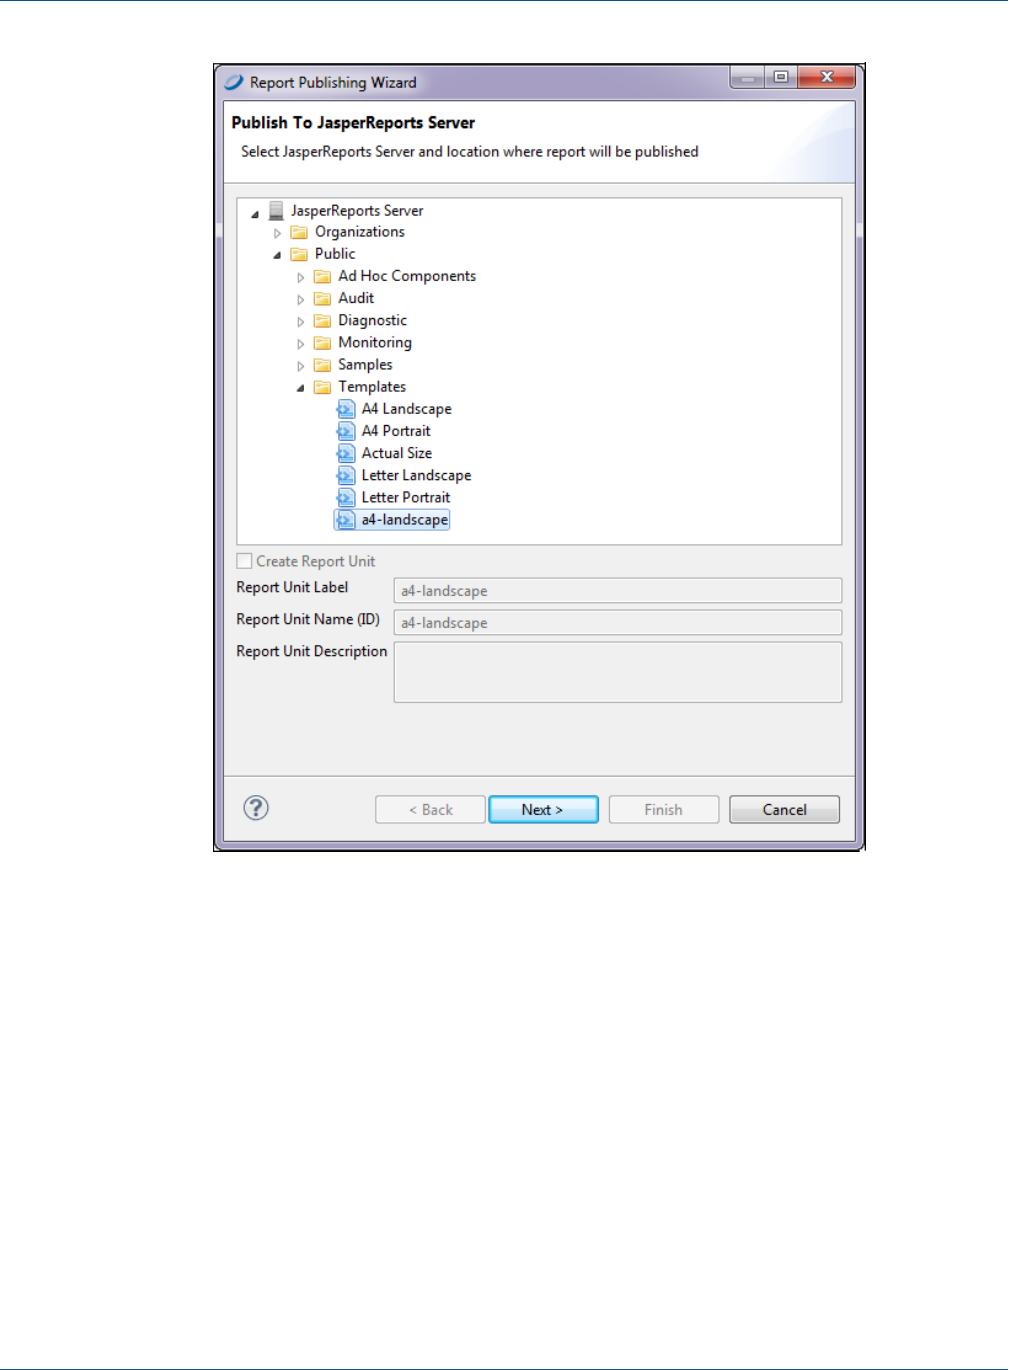
Chapter 12 Accessing JasperReports Server from Jaspersoft Studio
Figure 12-13 Report Publishing wizard
3. Select a folder to store your template, and click Next.
12.3.2 Report Template Styles in Jaspersoft Studio
In Jaspersoft Studio a report template includes styles that inherit attributes from other styles or from default
values. Open one of the default templates in Jaspersoft Studio to see the available styles listed in the Outline
view. When a report template is applied to a report that includes a basic chart, only the ChartTitle style is
applied to the chart. In general, report styles control the general look of the report, while chart themes control
the look of basic charts (implemented through JFreeCharts). For more information on chart themes, see 16.4,
“Chart Themes,” on page282.
The Inheritance tab in the Properties view shows you which styles are inherited and from where. That makes it
easy if you want to change a style at a higher level, or have an attribute inherited by more styles.
TIBCO Software Inc. 219
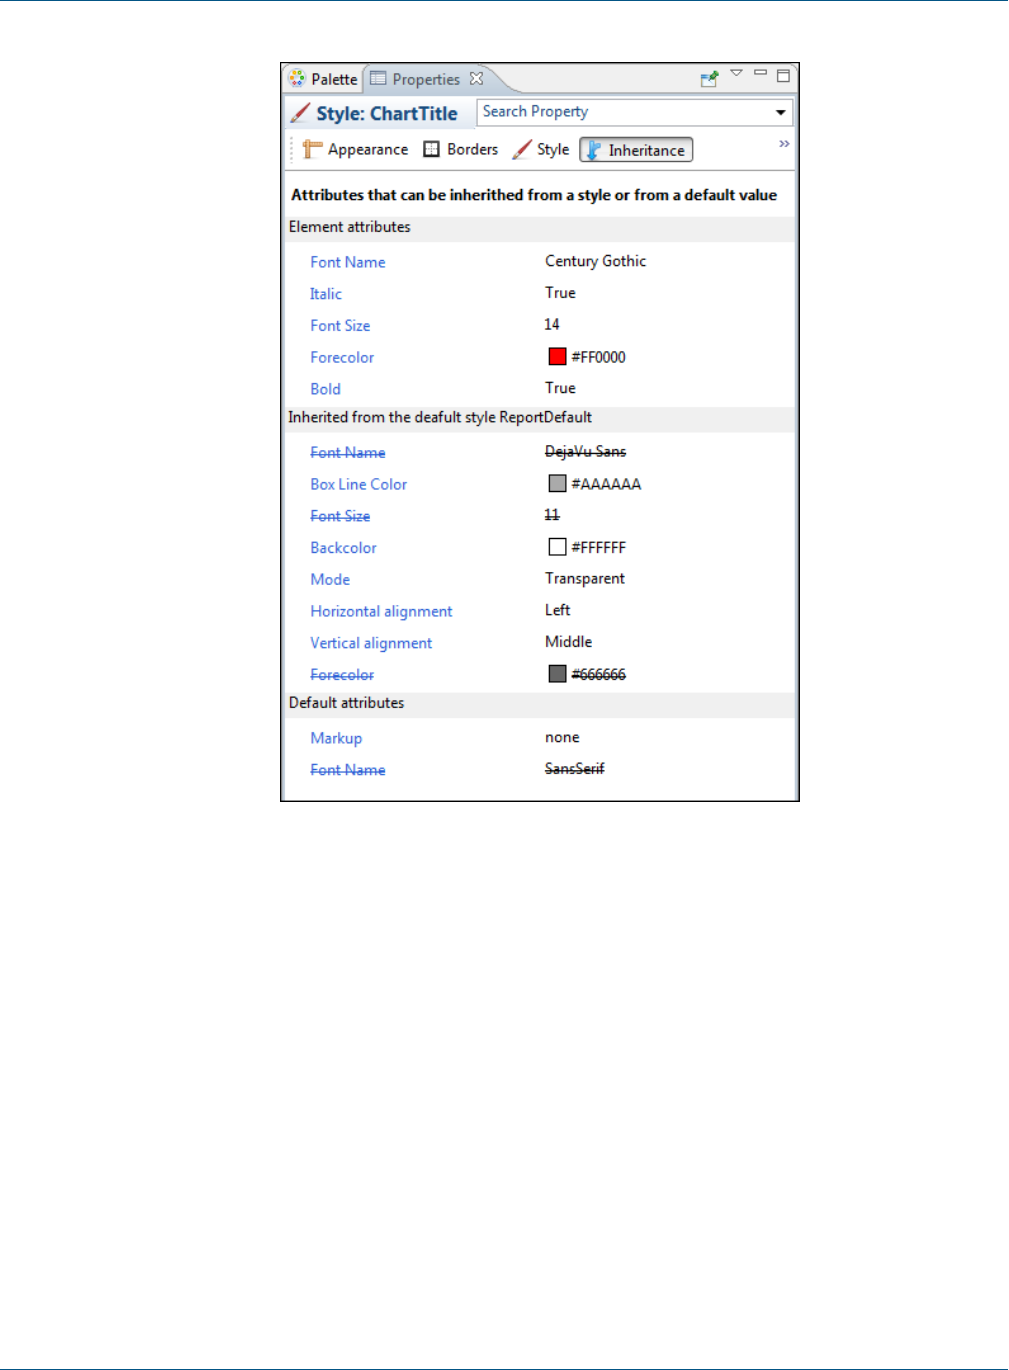
TIBCO Jaspersoft Studio User Guide
Figure 12-14 Inheritance tab
12.4 Creating and Uploading a Topic for Ad Hoc Views
When a JasperReports Server user creates an Ad Hoc view, she can select a Topic, Domain, or OLAP client
connection to provide data to the view. This determines the data presented in the editor and the features
available to the user. A Topic is the simplest to create, because it's just a report unit that defines a query. Most
other elements of the report unit (such as its layout) are ignored when it's used as a Topic, though input controls
you define in the report unit are carried over to the topic's Ad Hoc views and their dependent reports. Topics
also support resource bundles and localization.
The following steps show how to create a new Topic based on the sample database provided with Jaspersoft
Studio, and then upload it to the Topics folder in the JasperReports Server repository.
To create a Topic's JRXML:
1. In Jaspersoft Studio, click File >New >Jasper Report. The report wizard appears.
2. Select a report template and click Next.
3. Select a location to save the JRXML, enter a name for it, and click Next.
220 TIBCO Software Inc.

Chapter 12 Accessing JasperReports Server from Jaspersoft Studio
In this case, name the file my-topic.jrxml.
4. Select a data adapter for the Topic. In this case, select the Sample DB - database JDBC connection.
This sample includes the same data as the SugarCRM data source in the JasperReports Server samples.
5. In the text field, enter a query. In this case, enter:
select * from orders
6. Click Next.
7. Move all the fields in the left list into the right list and click Next.
8. Click Next again to skip past the Group By option.
9. Click Finish. The wizard closes and Jaspersoft Studio displays the JRXML, which has been saved in the
location specified.
To upload the Topic:
1. In the Repository Explorer, expand the Servers node and select the JasperReports Server instance where you
want to put the Topic.
If you haven't created any server connections, create one before proceeding. For more information, see 12.1,
“Connecting to JasperReports Server,” on page206.
2. Navigate to the Topic folder. For example, if you are logged in as jasperadmin, navigate to Ad Hoc
Components >Topics.
3. Right-click the Topics folder and select New. The Add Resource wizard appears.
4. Click Report Unit and click Next.
5. Enter a name and optional description it and click Next.
6. Enable the Local Resource radio button it and click to locate and select the JRXML you created
above. For example, click Upload/Download Resource, click Upload from Workspace, select the my-
topic.jrxml file.
7. Click OK to close the upload window and click Next.
8. Click the Data Source from Repository radio button and click to its right.
9. Navigate to Analysis Components >Analysis connections, select the SugarCRM data source, and
click OK.
10. Click Finish to upload the report unit to the Topics folder so it can be used in the JasperReports Server Ad
Hoc Editor.
To test the Topic:
1. Log in to JasperReports Server.
2. Click Create >Ad Hoc View.
3. On the topics tab of the Data Chooser, open the Topics folder. For example, navigate to Organizations >
Topics.
4. Click the Topic you created above and click Table,Chart, or Crosstab.
5. Verify that the fields you selected in Jaspersoft Studio all appear in the list of available fields.
If the Topic includes fields with unusual datatypes, those fields don't appear in the Ad Hoc Editor because
JasperReports Server is not equipped to manage them properly. For example, if the Topic is defined
against a MongoDB instance that returns data of type array, this field isn't available in the Ad Hoc Editor.
For more information on datatype support in the Ad Hoc editor, see the JasperReports Server
Administrator Guide.
TIBCO Software Inc. 221

TIBCO Jaspersoft Studio User Guide
When you create a JRXML file for use as a Topic, you can specify the name to display for each field the Topic
returns. To do so, define a field property named adhoc.display for each field declared in the JRXML. The
adhoc.display field property must have the following syntax:
<property name=”adhoc.display” value=”Any Name”/>
For example, this JRXML code declares a StoreState field displayed in reports as Store State:
<field name=”StoreState” class=”java.lang.String”>
<property name=”adhoc.display” value=”Store State”/>
</field>
Topics also support the $R expressions for field names; for more information, see Chapter 8, “Expressions,” on
page115.
For fields in a non-domain topic the following properties may be of interest:
•dimensionOrMeasure, which marks a field as a field or a measure
•defaultAgg, the aggregation to use for this measure (for example, avg)
•semantic.item.desc, a description of the field
•DefaultMask, which sets a measure as a $or date
12.5 Managing Repository Objects through Jaspersoft Studio
The Repository Explorer lets you create, view, modify, and delete reports units and the resources they reply on.
This section describes these tasks:
•Adding, Modifying and Deleting Resources
•Running a Report
•Editing a Report
•Creating and Uploading Chart Themes
12.5.1 Adding, Modifying and Deleting Resources
You need to create and manage the resources associated with your reports, such as images, JARs, JRXML files,
property files for localized reports, input controls, datatypes, lists of values, style templates (JRTX), and data
sources. If you’re maintaining existing reports, you may need to modify existing resources. You can also change
the location, name, or description of the repository folders.
You can add, modify, or delete repository resources from Jaspersoft Studio. In the Repository panel, expand your
JasperReports Server repository and take one of the following actions:
•To add a resource, right-click a folder, select New, then select the type of object you want to add.
If you choose to add an item other than a JasperReport, a dialog allows you to enter information about
the object. If you choose to add a JasperReport, a wizard guides you through the process. For the
best results when adding a JasperReport, open the JRXML in Jaspersoft Studio and click . Follow
the steps in the wizard to publish your report. See 12.2, “Publishing a Report to JasperReports
Server,” on page212
•To change the location of a repository resource, drag it to a new location.
•To delete a resource from the repository, right-click it and select Delete.
222 TIBCO Software Inc.
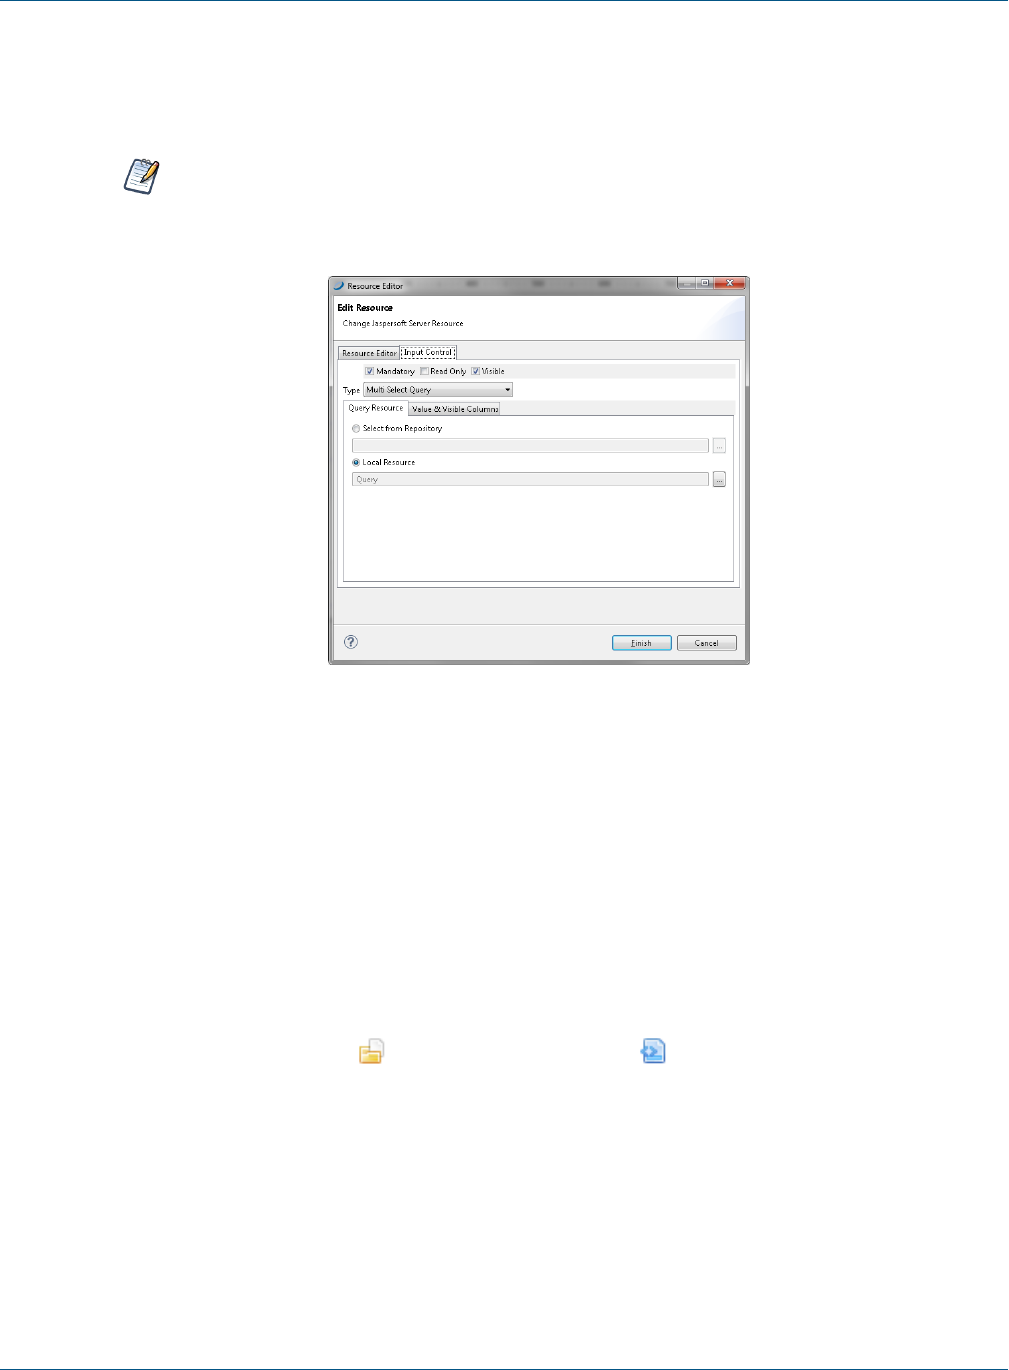
Chapter 12 Accessing JasperReports Server from Jaspersoft Studio
•To modify a repository resource, right-click it, select Properties, and make your changes in the Properties
dialog. On the General tab, you can view the object’s repository ID, name, and description. (Available tabs
depend on the selected resource.)
If you are logged in as a user with sufficient access rights (such as jasperadmin or superuser), you
can modify property values and save them back to the repository.
•To change an input control, use the Input Control Resource tab.
Figure 12-15 Properties of an Input Control Resource
12.5.2 Running a Report
Connect to JasperReports Server to test report changes you make in Jaspersoft Studio. See 12.1, “Connecting to
JasperReports Server,” on page206.
Navigate to your report's JRXML, and click Run Report Unit. If prompted to save the report unit, specify a
location on your local computer and click OK. If the report has input controls that require values, you'll be
prompted to specify them. The report appears in a browser window.
12.5.3 Editing a Report
In the Repository Explorer, the icon means a report unit, and means a JRXML file. When you work
with a JRXML file in the Repository, Jaspersoft Studio operates on a copy of the file. You need to upload the
JRXML file to put it back into the repository when finished.
To edit a JRXML file in the Repository:
1. In the Repository Explorer, right-click the JRXML file, and select Open in Editor. The JRXML appears
in the Design tab.
The JRXML is stored locally in your workspace. The default location is in the user directory of your
operating system. For example, in Windows, the default workspace is
C:\Users\<username>\JaspersoftWorkspace\MyReports.
TIBCO Software Inc. 223
TIBCO Jaspersoft Studio User Guide
2. Edit the file, either in the Design tab or in the Source tab. For example, in the Repository Explorer
navigate to the Images\JR Logo image resource, and drag it into to the report's Title band. The logo appears
in the Design tab.
3. Click Save. If you're prompted to publish the report, click Yes.
4. Specify a server and a repository location. To save the JRXML to the same report unit where you opened it,
click Next.
If the report relies on resources, you're asked if you want to overwrite the resources currently in the
repository. If you added resources to the report, you are prompted to add them to the repository.
5. Click Next. and specify a data source for the report. You can't change a data source through the Publish
wizard.
Click Finish. Your changes are saved to the repository.
To edit a Report Unit in the Repository:
1. In the Repository Explorer, right-click the report unit and select Properties.
2. On the Resource Editor tab, change the name and description.
3. On the Report Unit tab, you can change the JRXML file for the report, either by selecting one from the
repository, or uploading one through Jaspersoft Studio.
4. On the Data Source tab, select the data source from the repository or from Jaspersoft Studio.
5. On the Input Controls tab, set the display properties for any input controls:
•Pop-up Screen: the controls are shown on-top of the report viewer.
•Separate Page: the controls are shown in a different page than the report viewer.
•Top of Page: the controls are shown at the top of the report viewer.
•In Page: the controls are shown next to the report viewer.
Input controls can be created in the JasperReports Server repository and referenced in reports. If you
want to use an input control from JasperReports Server in a report, the input control must meet two
conditions:
• The parameter name in the input control must correspond to the name of the parameter in the report.
No error occurs for a mismatch, but at run time NULL is passed instead of actual value of the
parameter.
• The input control and its corresponding parameter must be of compatible datatypes (for example, both
must be text types or date types). If there is a mismatch, the report fails and an exception is returned.
See the JasperReports Server Administrator Guide for more information.
6. You can also use the JSP field to modify the appearance of the controls. Specify a name of a JSP file in
WEB-INFof the server's host to define the page that displays input controls.
7. Click Finish.
12.6 Creating and Uploading Chart Themes
Using Jaspersoft Studio, you can create new chart themes to give a custom look to any JFreeChart. You can set
the fonts, colors, line widths, and other settings that determine the appearance of charts. Then upload the chart
theme for use in reports generated on the server, either on a report-by-report basis or as a global setting for all
charts that don't provide their own theme.
224 TIBCO Software Inc.
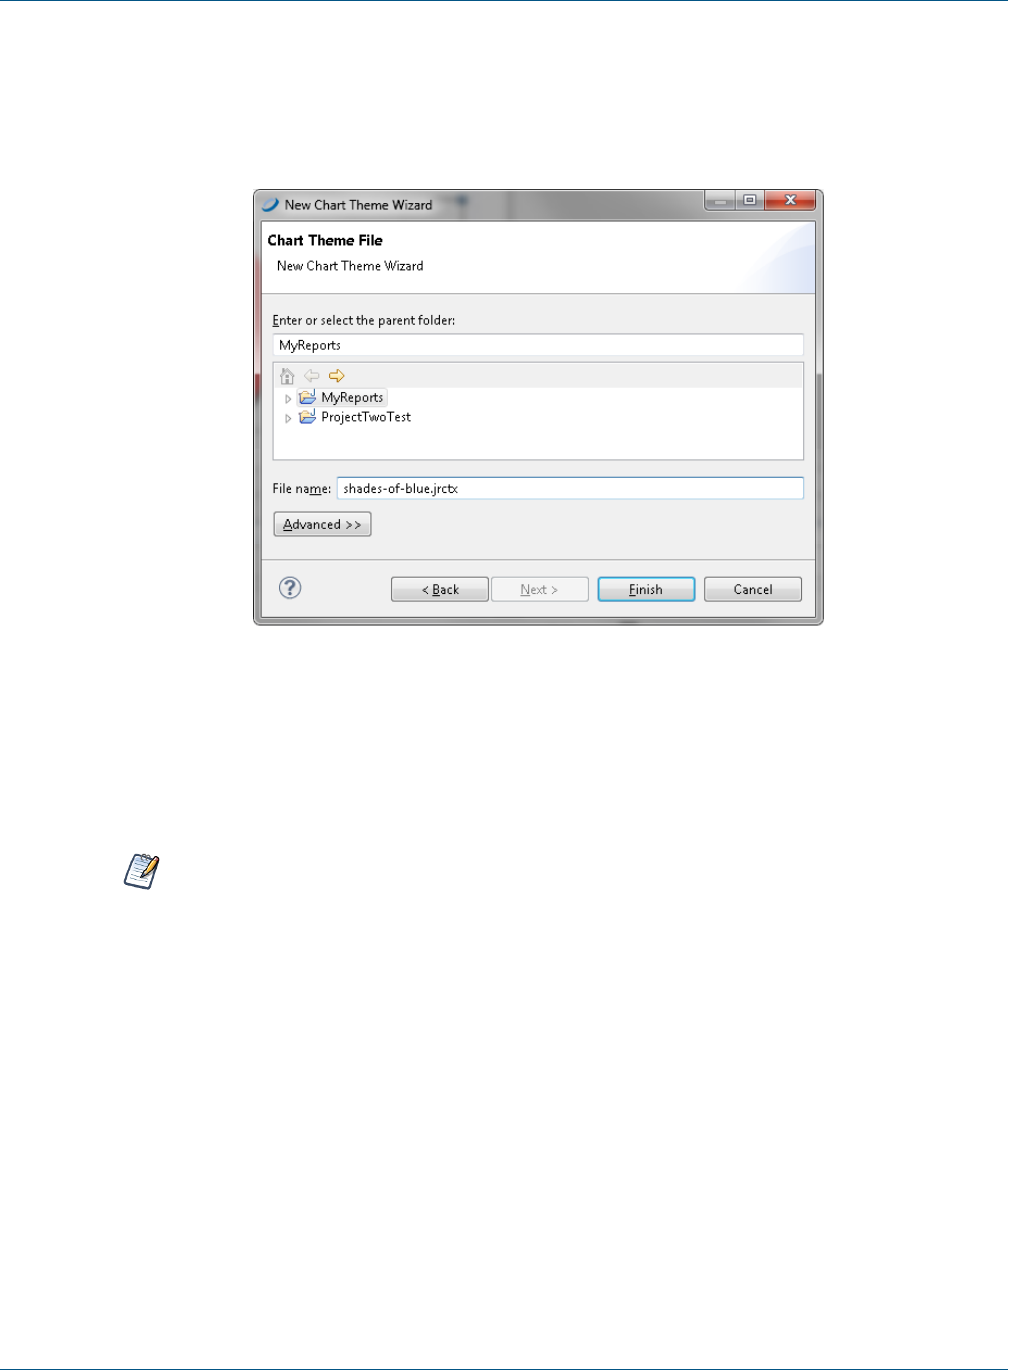
Chapter 12 Accessing JasperReports Server from Jaspersoft Studio
To create a new chart theme in Jaspersoft Studio:
1. Select File> New> Other. The New wizard appears.
2. Expand Jaspersoft Studio, select Chart Themes, and click Next. The new file dialog suggests a default
file name. Chart themes use the .jrctx file extension.
Figure 12-16 New Chart Theme in Jaspersoft Studio
3. Specify a location, enter a name, and click Finish.
The chart theme editor appears; it displays several types of charts to help you understand how the theme
will be applied to each.
The available options are based on the JFreeChart library used to generate charts.
Jaspersoft Studio supports only the most common options provided by JFreeCharts.
4. In the Outline view, select each category and review the available options in the Properties view.
5. Select a property to change its value.
Depending on the nature of the property, you might type text, select a color, check or clear a check box, or
select a value from a drop-down. As you update the chart theme, the Preview tab shows your changes. For
example, select Title in the Outline view and choose Bottom from the Position drop-down to move the title
beneath the chart.
6. Click a chart type in the Preview tab to zoom in to examine the effects of your changes more closely. Click
again to zoom out.
TIBCO Software Inc. 225
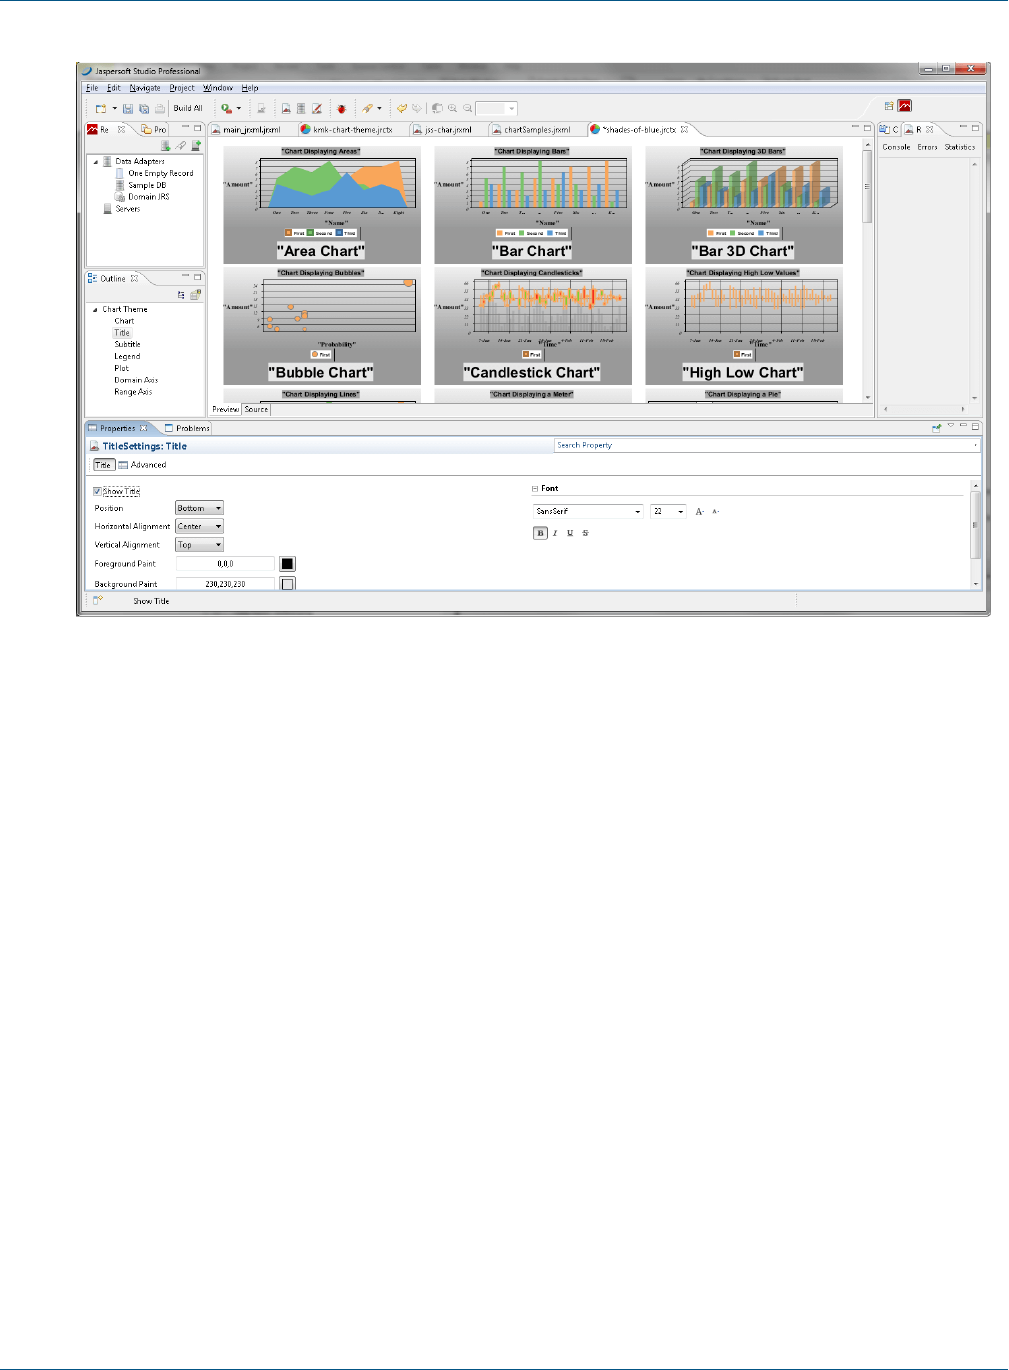
TIBCO Jaspersoft Studio User Guide
Figure 12-17 A Chart Theme Edited in Jaspersoft Studio
7. To view the XML that defines the chart theme’s appearance, click the Source tab.
8. When you are satisfied with the chart theme, click File> Save to save the chart theme. This saves the chart
theme to your local hard drive.
To export your theme as a JAR File:
1. Select your chart theme and click the Export Chart Theme jar icon on the toolbar. A Save As dialog opens.
226 TIBCO Software Inc.
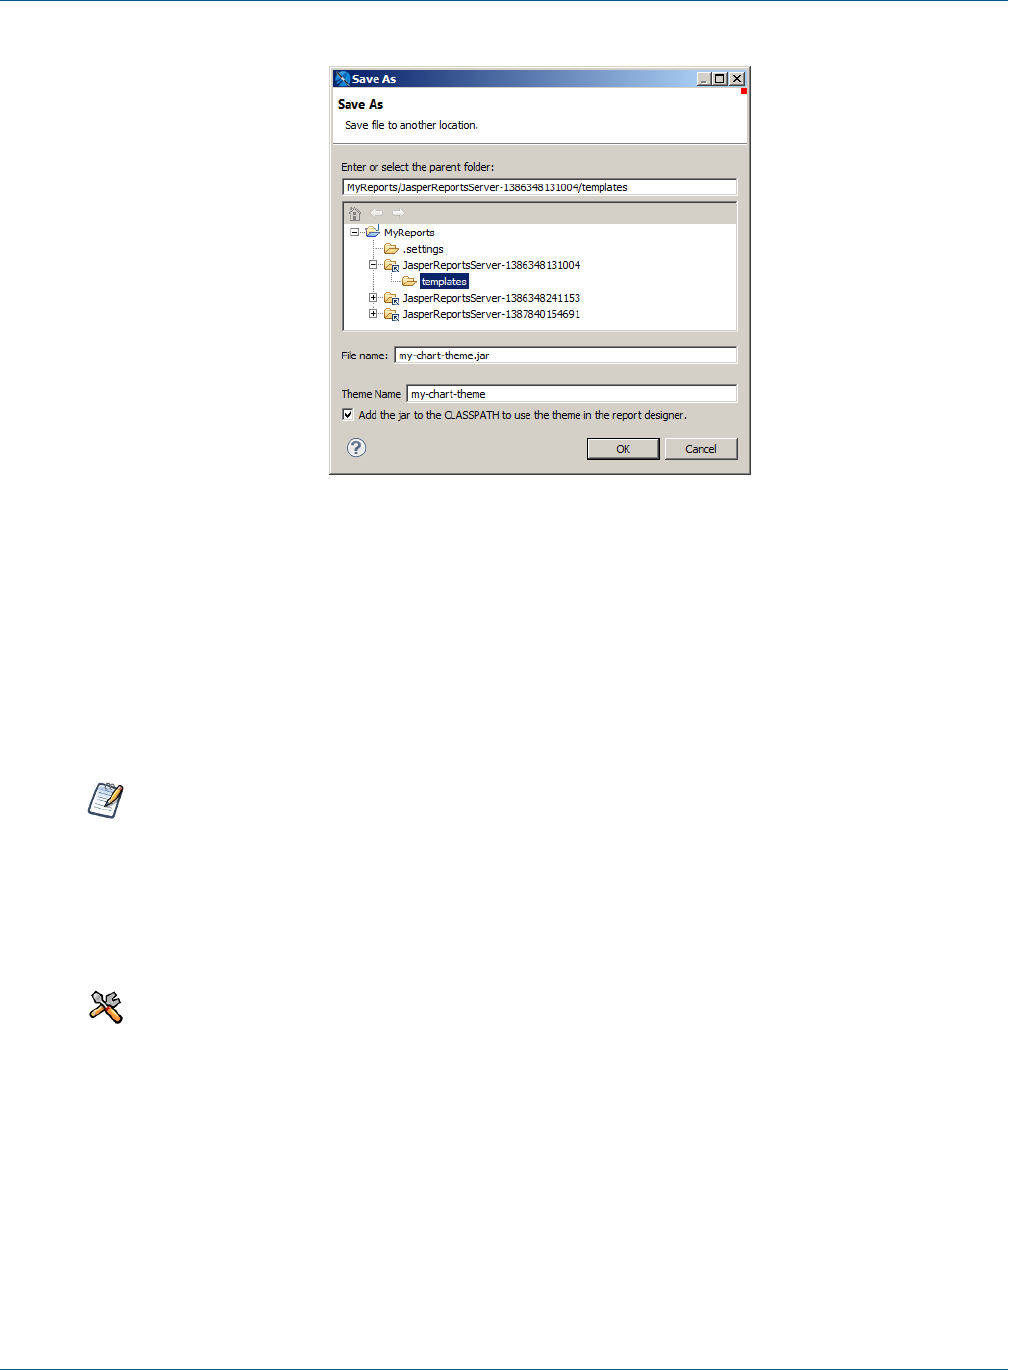
Chapter 12 Accessing JasperReports Server from Jaspersoft Studio
Figure 12-18 Exporting a Chart Theme
2. Choose the location where you want to save your JAR. To upload to an instance of JasperReports Server,
select your server instance and then select the Templates directory. To create a jar on your current system,
select a location on your hard drive.
3. Enter a file name and theme name for your theme.
4. If you want to use the theme to design reports on your current system, save to a location on your hard drive
and select Add the jar to the CLASSPATH to use the theme in the report designer.
5. Click OK. The chart theme is exported as a JAR.
Once you have uploaded a theme to JasperReports Server, you can use the repo: syntax in your reports
to specify this JAR as your chart theme. The theme can be used at the report or server level in
JasperReports Server. For more information, refer to the JasperReports Server Administrator Guide.
12.7 Working with Domains
This section describes functionality that can be restricted by the software license for JasperReports
Server. If you don’t see some of the options described in this section, your license may prohibit you from
using them. To find out what you're licensed to use, or to upgrade your license, contact Jaspersoft.
You can create reports based on Domains defined in JasperReports Server. Such reports use data adapters to load
data stored in the Domains. To create a Domain-based report, create a data adapter and design a report with its
data. Before you create these objects, you'll need a connection to the server.See 12.1, “Connecting to
JasperReports Server,” on page206.
TIBCO Software Inc. 227
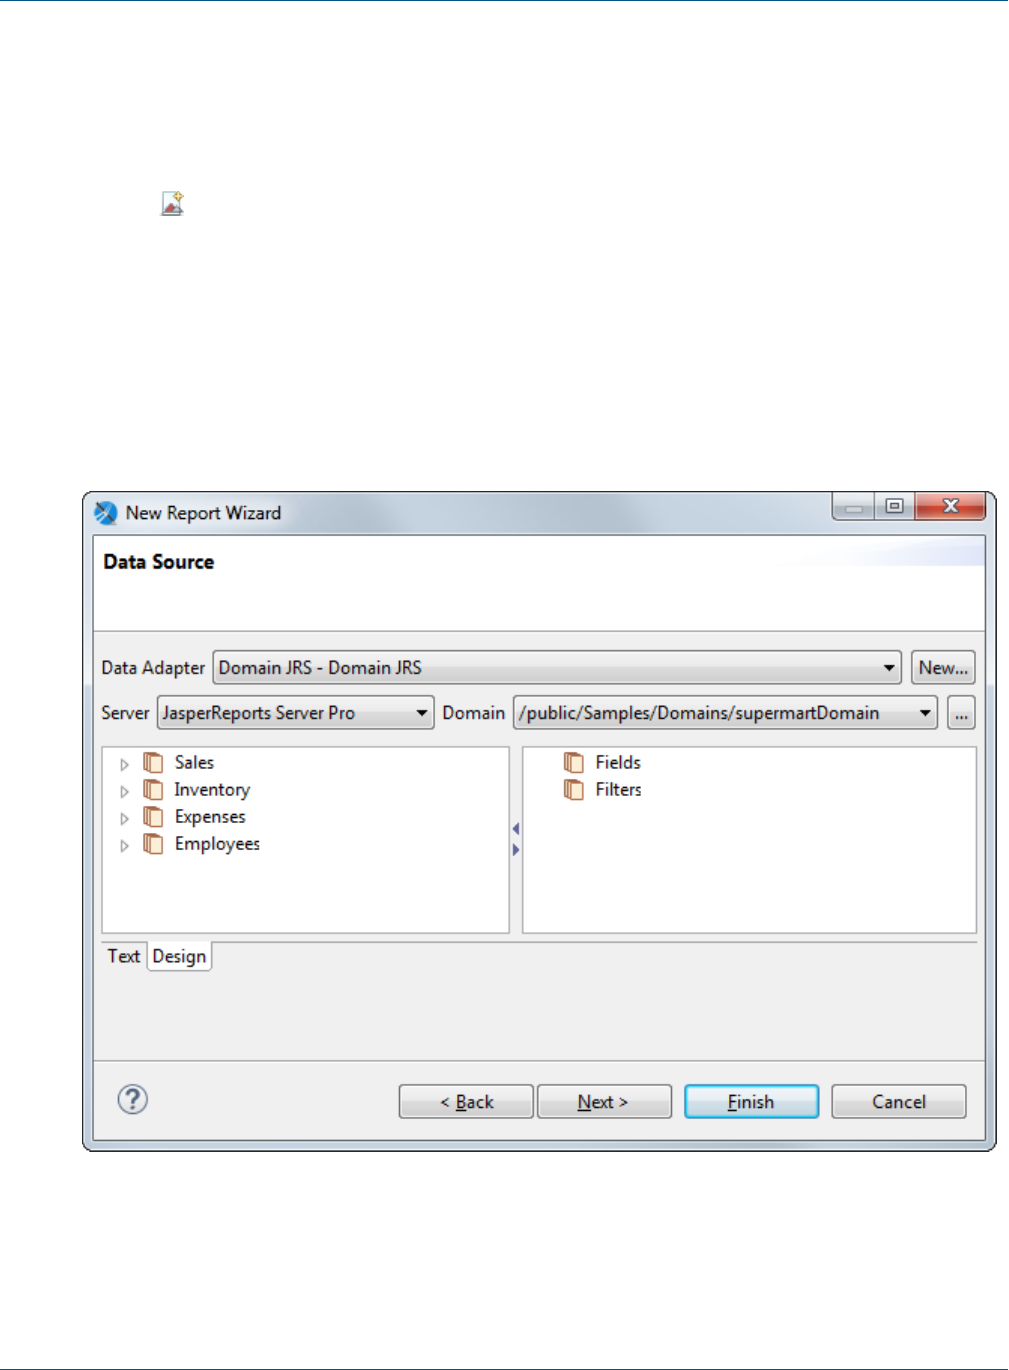
TIBCO Jaspersoft Studio User Guide
12.7.1 Using the domain Query Language
The domain query language is the default query language for a Domain report. You can create a domain-
language query when you first create the report or you can add it later using the Dataset and Query dialog.
To create a Domain-based report when you create a report:
1. Click or select File > New > JasperReport from the menu. The New Report Wizard is displayed.
2. Select a template and click Next.
3. Select a location to save your report, enter its name, and click Next.
4. Select Domain JRS as the adapter.
The wizard updates to show choices for a server and Domain.
5. Select a server connection from the drop-down.
The Domain drop-down is populated with a list of Domains defined on the server.
6. Select the Domain containing the data for your report. For example, select
/public/Samples/Domains/supermartDomain.
Figure 12-19 Selecting a server and a Domain
7. Select fields or folders in the Domain on the left of the dialog, and drag them to the Fields folder on the
right to create fields. You can instead right-click on the item and select Add to Fields. For example, drag
Sales> Stores.
228 TIBCO Software Inc.
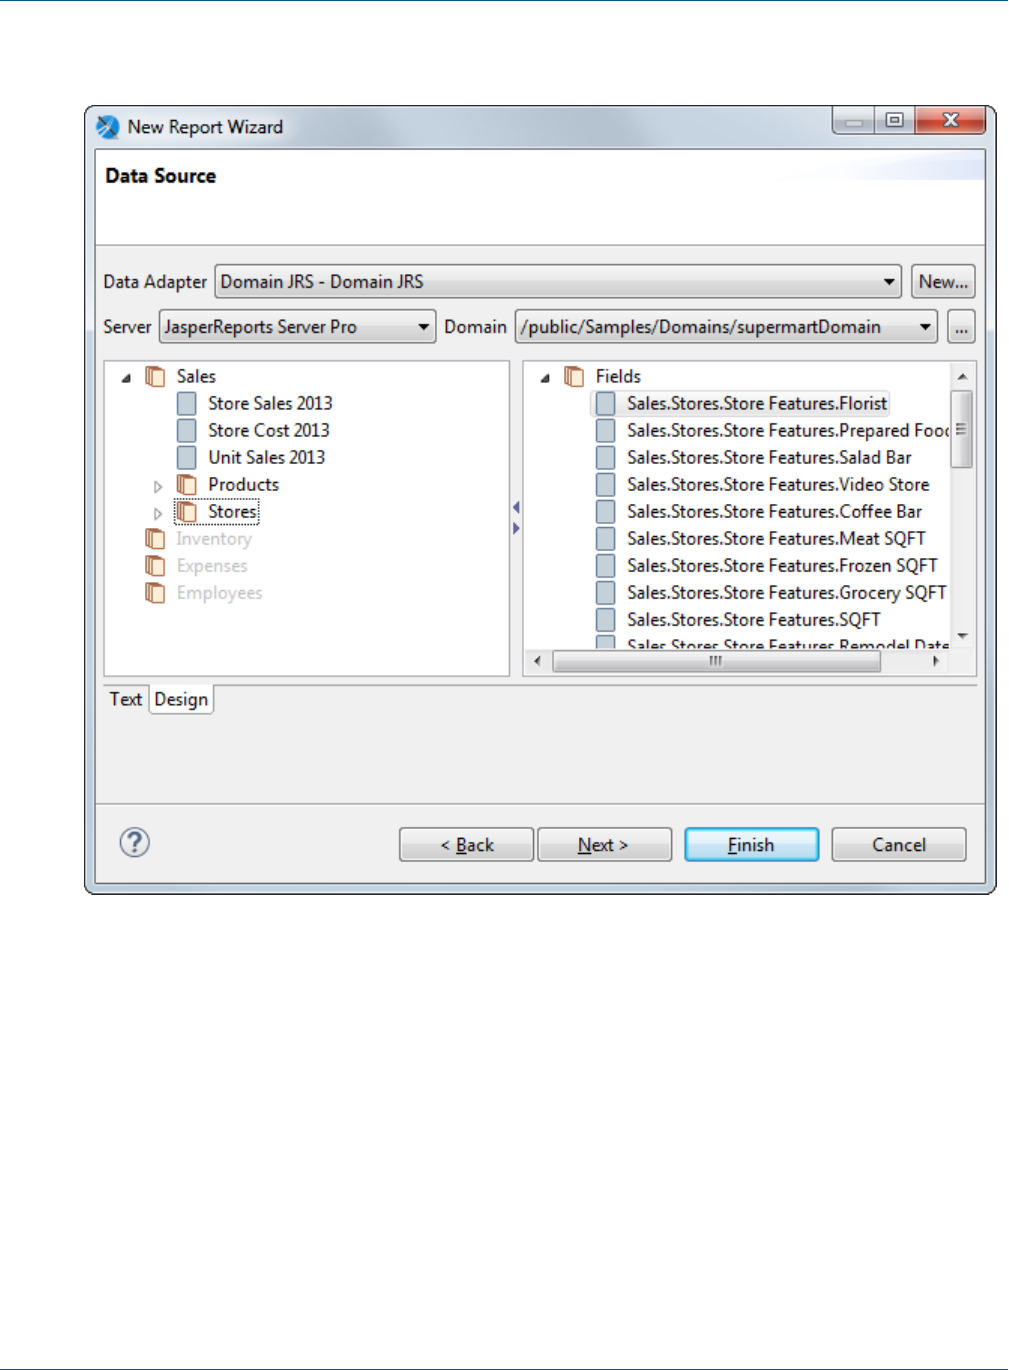
Chapter 12 Accessing JasperReports Server from Jaspersoft Studio
The fields are added as a flat list.
Figure 12-20 Adding fields from a Domain
8. (Optional) Create one or more filters:
a. Drag a single item to the Filters folder., For example, drag Sales> Stores> Region> Country.
b. Choose the comparison operator from the menu, for example, equals.
c. Type the value you want for the filter or click ... to select from a list of available values.
d. If you want to display an input control dialog when the report runs, select Is For Prompting and
select a parameter. Click Generate Parameter to have Jaspersoft Studio create a parameter for you.
e. Click OK.
f. Repeat these steps for each filter you want.
TIBCO Software Inc. 229
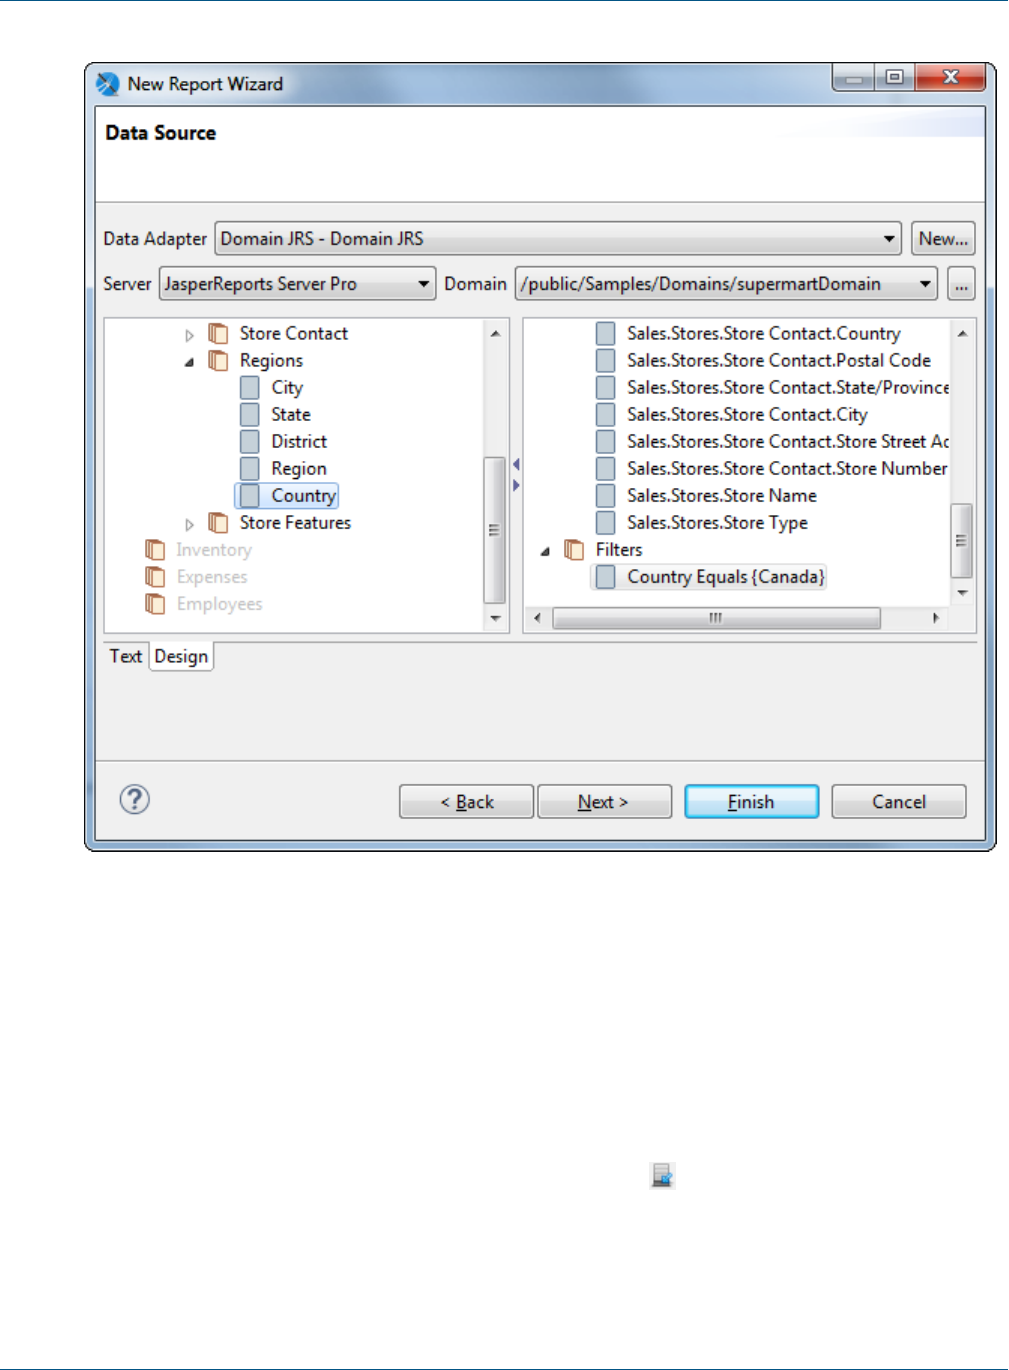
TIBCO Jaspersoft Studio User Guide
Figure 12-21 Creating a filter for a Domain query
9. When you have the fields and filters you need for your report, click Next.
10. Select the fields to include in your dataset and click Next.
11. Select the fields, if any, for grouping your data and click Finish. The blank report appears in the Design
tab.
12. Click OK to create the dataset.
13. Define your report as usual, using the Palette and Outline to add and organize components.
14. Click Preview to test your report. Jaspersoft Studio compiles your report; if it's successful your report is
filled and displayed.
15. You will be prompted to publish your report upon save, or click to publish your report. For more
information, see 12.2, “Publishing a Report to JasperReports Server,” on page212.
230 TIBCO Software Inc.

Chapter 12 Accessing JasperReports Server from Jaspersoft Studio
12.8 Understanding the repo: Syntax
In some cases, you may see the repo: syntax used to refer to a location in a JasperReports Server repository.
The repo: syntax can be used to refer to any type of resource, such as reports, images, data sources, and input
controls. The repo: syntax can be used in two ways:
•repo: used without a path – A resource of a report. This syntax is generated when a resource is selected
when a report is published to the repository. For example, if you upload an image as a resource of a report,
you might see JRXML like this:
<imageExpression class="java.lang.String">
<![CDATA["repo:AllAccounts_Res2"]]>
</imageExpression>
When you publish a report to JasperReports Server and upload your resources, Jaspersoft Studio updates the
JRXML in the published report to use the repo: syntax to refer to the uploaded resources in the repository.
•repo: used with a path – A resource saved somewhere in the repository. For example, to refer to an image
in the repository, you might see JRXML like this:
<imageExpression class="java.lang.String">
<![CDATA["repo:/Images/myimage.jpg"]]>
</imageExpression>
In a multi-organization deployment of JasperReports Server, the path used in a repo: expression is relative
to the organization of the current user. For example, if User1 in Organization_1 accesses the report,
JasperReports Server looks for myimage.jpg in the Images folder of Organization_1. If User2 in
Organization_2 accesses the report, JasperReports Server looks for myimage.jpg in Images folder of
Organization_2.
12.9 Adding a Date/Time Stamp to Scheduled Output in JasperReports
Server
When you add a parameter named _ScheduledTime to a JRXML report design in Jaspersoft Studio, and then
schedule the report to run in JasperReports Server, the output includes a date/time stamp showing when the
report ran. The following procedure describes how to set up and use this parameter:
To display the date/time that the report ran:
1. Launch Jaspersoft Studio, and open an existing report.
2. In the Outline view, right-click Parameters, and select Create Parameter.
3. Rename the parameter _ScheduledTime.
The new parameter appears in the outline view.
TIBCO Software Inc. 231
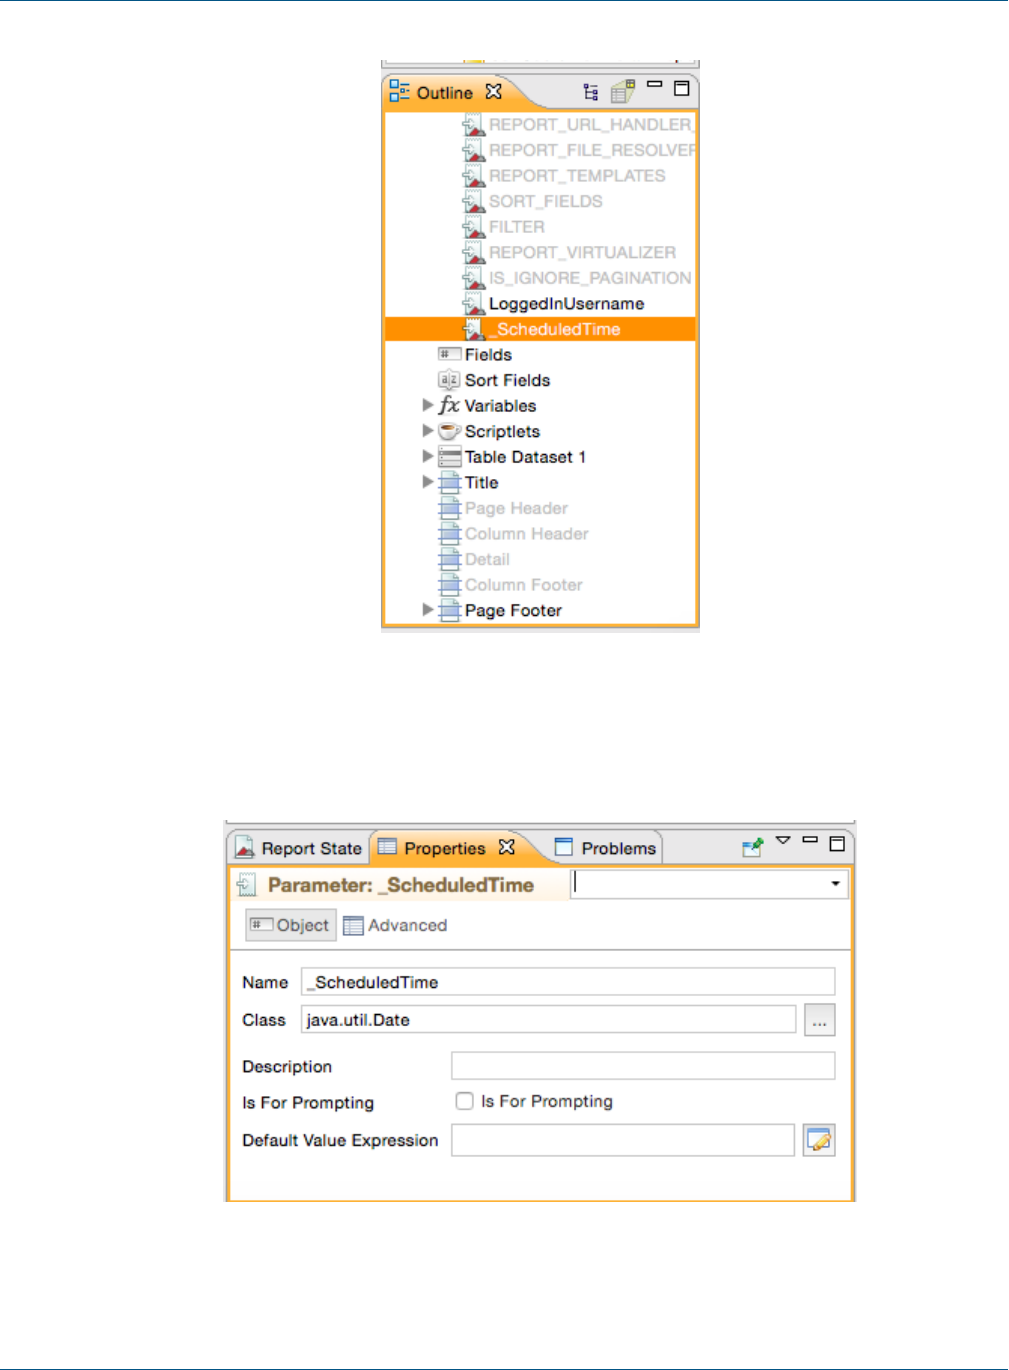
TIBCO Jaspersoft Studio User Guide
Figure 12-22 _ScheduledTime Parameter in Outline View
4. Set the following parameter properties:
•Class = java.util.Date
•Is for Prompting = unchecked
Figure 12-23 _ScheduledTime Parameter Properties
232 TIBCO Software Inc.
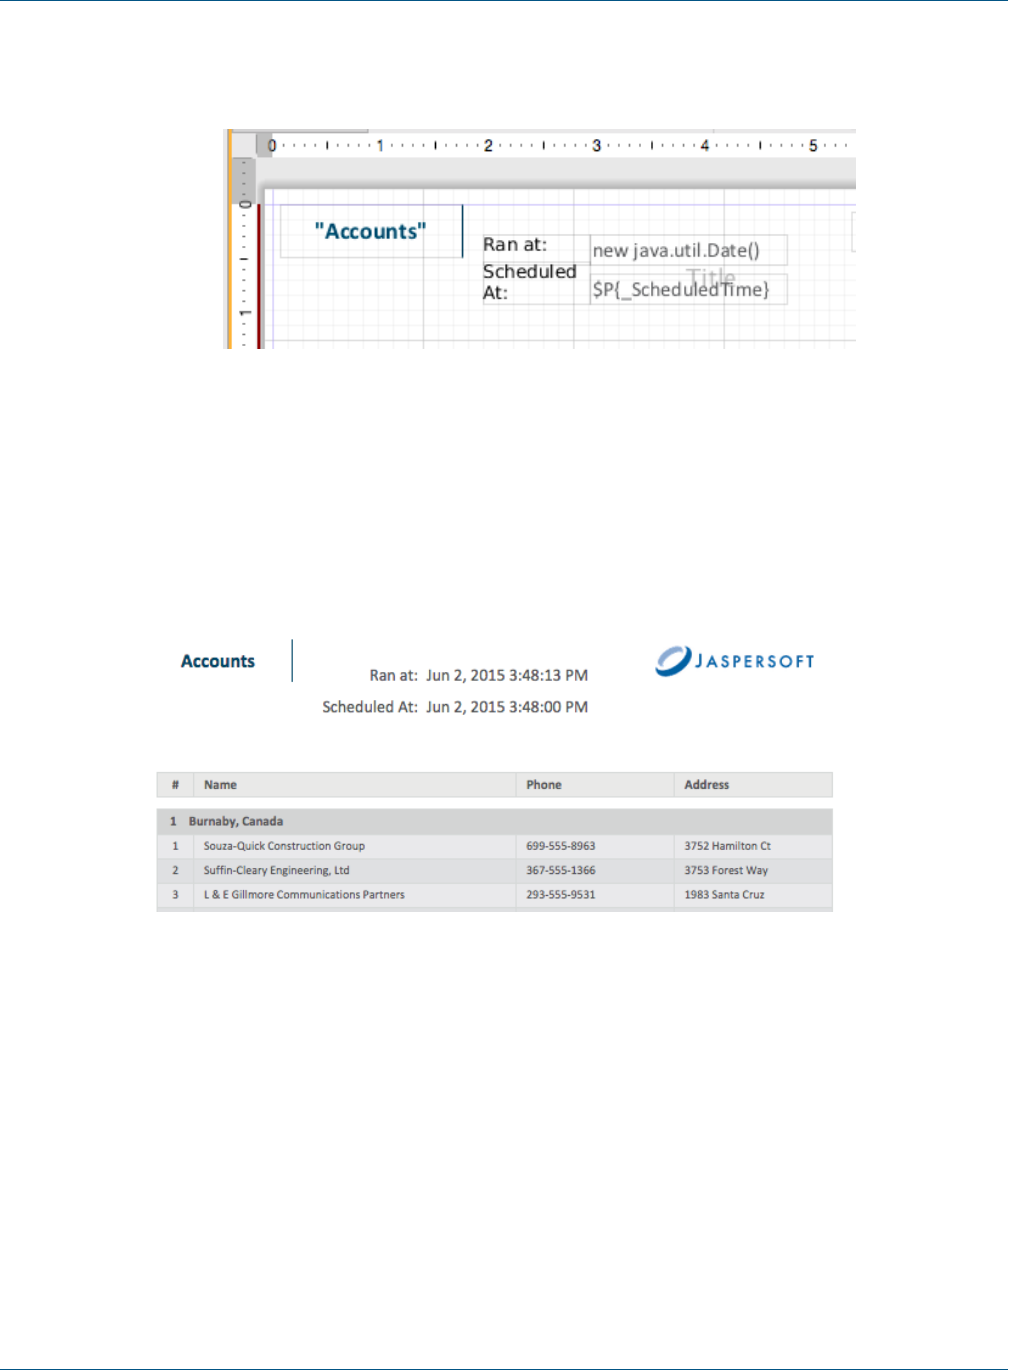
Chapter 12 Accessing JasperReports Server from Jaspersoft Studio
5. Drag the _ScheduledTime element from the Outline View to a valid location, such as the Title Band, in
the Designer:
Figure 12-24 Report Design Includes the _ScheduledTime Parameter Element
6. Now you can set other properties, such as the text color of the date/time stamp. In Properties, check Blank
when Null to prevent the word null from appearing on the report when it runs unscheduled.
7. Compile the report, and upload it to JasperReports Server. For more information about uploading reports to
JasperReports Server, see “Accessing JasperReports Server from Jaspersoft Studio” on page205.
8. In the server, schedule the report to run immediately.
9. Open the output file.
Figure 12-25 Output Showing the Scheduled Time the Report Actually Ran
The date and time the report actually ran appears in the output, as well as the scheduled time. In the screenshot
above there was a 13-second delay between the scheduled start time and the actual run time.
TIBCO Software Inc. 233

TIBCO Jaspersoft Studio User Guide
234 TIBCO Software Inc.

Chapter 13 Working with JasperReports IO
CHAPTER 13 WORKING WITH JASPERREPORTS IO
This section describes functionality that can be restricted by the software license for JasperReports IO. To
find out what you're licensed to use, or to upgrade your license, contact Jaspersoft.
JasperReports IO is an HTTP-based reporting service for JasperReports Library, providing an interface to the
JasperReports Library reporting engine through the use of a REST API and a JavaScript API. Starting with
Jaspersoft Studio 7.2, you can build report templates for JasperReports IO and test them using Jaspersoft Studio's
built-in JasperReports IO reporting engine. After previewing your reports you can export the templates and
resources to an external folder to use with JasperReports IO.
This chapter contains the following sections:
•JasperReports IO Repository File System
•JasperReports IO Report Execution Contexts
•Testing Reports with JasperReports IO
13.1 JasperReports IO Repository File System
The JasperReports IO uses a folder-based repository to store all of the templates and resources used by the
JasperReports IO reporting service. You can import the templates and resources into your Jaspersoft Studio
project as a file system, which copies the files and recreates the repository directory structure in your project.
You can then use Jaspersoft Studio to create and edit report templates and preview reports using the built-in
JasperReports IO engine. You can export the repository when the reports are ready to use in production.
The built-in JasperReports IO preview engine only works for files located in your workspace. It is not
available for previewing linked files outside your workspace.
JasperReports IO comes with sample reports and resources in its repository for you to use.
13.1.1 JasperReports IO Repository Directory Structure
When you import files from an existing JasperReports IO repository, Jaspersoft Studio recreates the directory
structure of repository in your workspace. If you want to create a workspace for a JasperReports IO project
without importing an existing repository, you can structure the folders in your project to replicate the
JasperReports IO repository.
The JasperReports IO repository is structured as follows:
TIBCO Software Inc. 235
TIBCO Jaspersoft Studio User Guide
Directory Description
data Contains the data source adapters and data source files for your reports. JasperReports IO
supports the following types of data adapters:
• JDBC connection
• CSV connection
• Excel connection
• Empty connection
• JNDI connection
• Remote XML connection
You can create your own data adapters for JasperReports IO either by using the DataAdapter
Wizard or by creating a custom data adapter using an XML file. See “Creating and Editing Data
Adapters” on page142 for more information.
images Contains image files used in reports.
JR-INF Contains the configuration files for report execution. See “JasperReports IO Report Execution
Contexts” on page236 for information on creating the files.
reports Contains report templates.
Table 13-1 Repository Directories
13.2 JasperReports IO Report Execution Contexts
When a report is executed by the JasperReports IO reporting service, it is run within a "report execution
context." This context is defined by custom Java code and JasperReports Library configuration properties that
direct the behavior of the reporting engine.
The report execution context is defined using a context.xml file located in a folder named JR-INF, which has
the same parent folder as the report's main template file.
For example, a report that stores its JRXML template file at
/samples/reports/chartcustomizers/ChartCustomizersReport.jrxml within the JasperReports IO repository must use
/samples/reports/chartcustomizers/JR_INF/context.xml for its report execution context file.
If multiple report templates are stored in the same folder, they will share the same its report execution context
file found in the JR-INF subfolder. If you don't want a report template to share its report execution context with
any other reports, it will need to be in its own subfolder along with the JR-INF folder containing the
context.xml file.
13.2.1 Report Execution Context Configuration
The context.xml defines the classpath for any custom Java code, JasperReports Library properties, and
inheritance rules needed to execute a report using JasperReports IO.
13.2.1.1 Parent Context
Report execution contexts inherit the classpaths and properties from other context files and you can control
which files it inherits from.
236 TIBCO Software Inc.
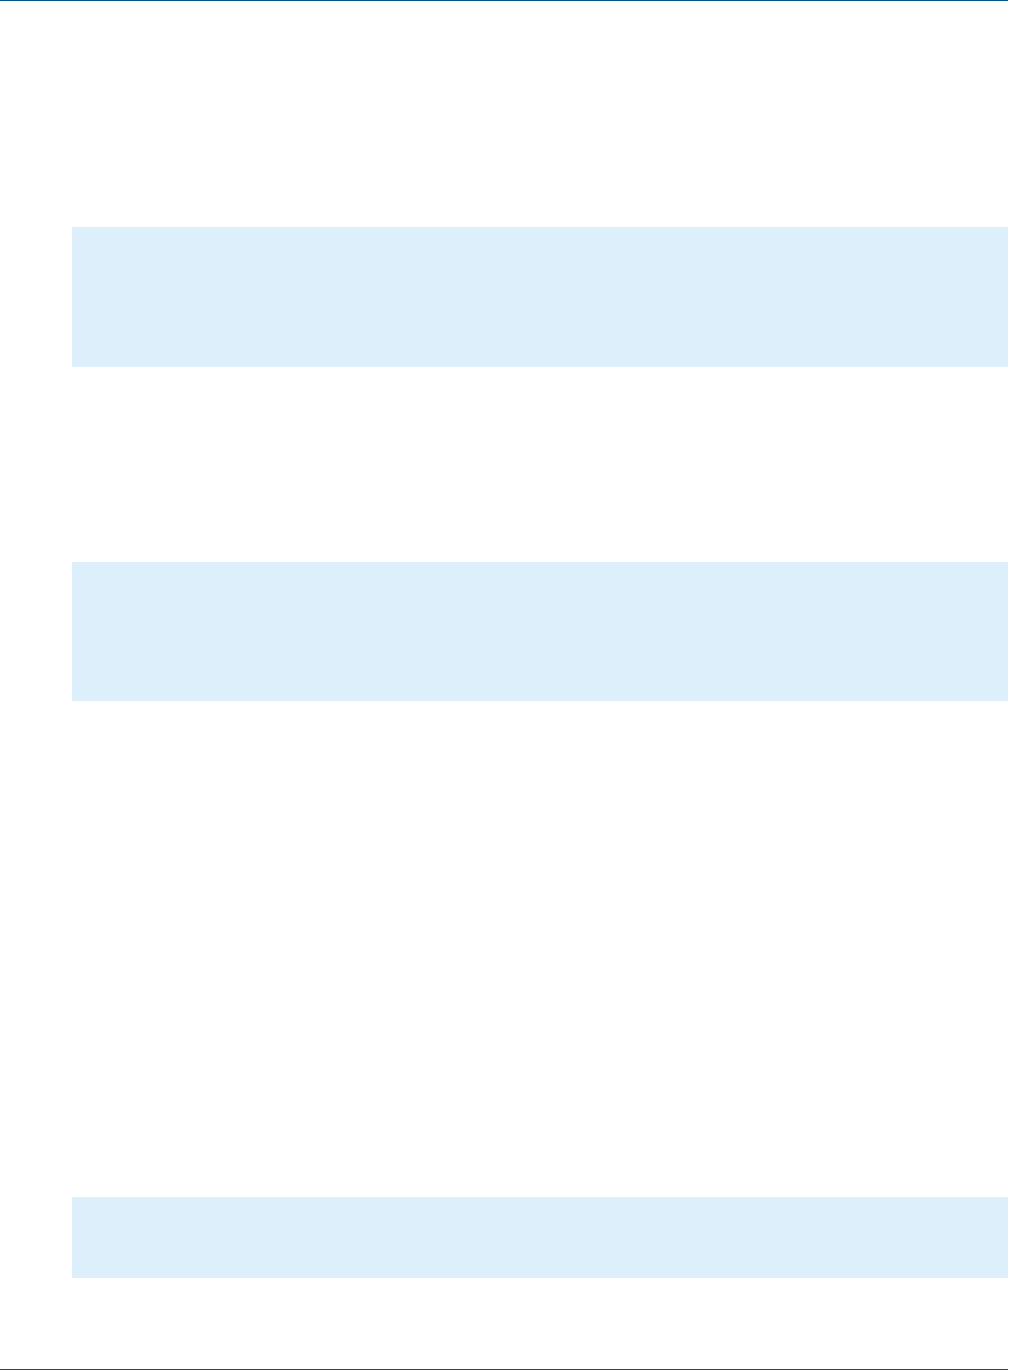
Chapter 13 Working with JasperReports IO
•Folder Inheritance (Default)
By default, any report execution context stored in a JR-INF folder inherits from the contexts stored the JR-
INF folders found in all parent folders up to the root folder of the repository.
•Direct Inheritance
You can specify a path to a parent context by using the <parentContext> tag in the context file as
follows:
<context>
<parentContext>
<path>/parent</path>
</parentContext>
...
</context>
The path needs to specify the absolute repository path to the parent folder containing the target JR-INF
context that you want to use as parent context. Notice that the path specifies only the parent folder of the
target report execution context and does not specify the JR-INF folder.
For example, if you want the report execution context located at /samples/reports/chartcustomizers/JR-
INF/context.xml to inherit from the context located at /samples/reports/unicode/JR-INF/context.xml, you
need to add the following to the context.xml file:
<context>
<parentContext>
<path>/samples/reports/unicode</path>
</parentContext>
...
</context>
The report execution context will also inherit from the parents of the specified context, up to the root folder
of the repository.
13.2.1.2 Classpath
As a Java reporting library, JasperReports has various extension points which allow the customization of its
functionality using custom code in the form of compiled Java classes.
These classes are among the various types of resources that a report might need at execution time and they can
also be stored in the repository, along with the subreports, style templates, images, fonts and other report
resources.
The custom Java classes needed during a certain report execution need to be packaged as JAR files and placed
in the repository, preferably under the JR-INF/lib subfolder of the report execution context that uses it.
The JAR then needs to be referenced from within the target context.xml file using a pair of <entry><path>
tags within the <classpath> tag so that it will be loaded by the JasperReports IO reporting service when it
runs the report.
For example, a report can use the custom Java code packaged in /samples/reports/chartcustomizers/JR_
INF/lib/repo-sample.jar JAR file when it's referenced in the context.xml file as follows:
<context>
<classpath>
<entry><path>/samples/reports/chartcustomizers/JR-INF/lib/repo-sample.jar</path></entry>
TIBCO Software Inc. 237

TIBCO Jaspersoft Studio User Guide
</classpath>
...
</context>
13.2.1.3 Properties
JasperReports IO can use JasperReports Library configuration settings to define specific behavior in reports.
Some of these configuration settings can be set at the report context execution level by using the <property>
tags in the context.xml file.
The following is an example of setting the chart render type configuration property:
<context>
...
<properties>
<property>
<name>net.sf.jasperreports.chart.render.type</name>
<value>svg</value>
</property>
...
</properties>
</context>
13.2.2 Configuring a Report Execution Context
To create a Report Execution Context:
1. Start Jaspersoft Studio.
2. Select File >New >Other.
The wizard opens.
3. Select JasperReports IO Report Execution Context from the Jaspersoft Studio category and click
Next.
4. Select the folder in your project to store the context file.
5. Click Finish.
Jaspersoft Studio creates a new subfolder called JR-INF and a context.xml file in the new subfolder.
Jaspersoft Studio opens the file in the JasperReports IO Report Execution Context Editor.
6. Enter the parent context, classpaths, and properties for your report execution context. See “Report
Execution Context Configuration” on page236 for more information.
7. Save the context file.
To edit a Report Execution Context Using the Report Execution Context Editor:
1. Right-click on the context file in the Project Explorer and select Open With >JasperReports IO
Report Execution Context Editor.
Jaspersoft Studio opens the context file.
2. Edit the context file's parent context, classpaths, and properties.
3. Save the context file.
To edit a Report Execution Context Using the Text Editor:
1. Right-click on the context file in the Project Explorer and select Open With >Text Editor.
238 TIBCO Software Inc.

Chapter 13 Working with JasperReports IO
Jaspersoft Studio opens the context file.
2. Edit the context file's parent context, classpaths, and properties.
a. Add a parent context using the <parentContext><path> tags.
b. Add a classpath using the <entry><path> tags within the <classpath> tag
c. Add a property using <property> tags.
3. Save the context file.
13.3 Testing Reports with JasperReports IO
Jaspersoft Studio comes with a built-in JasperReports IO reporting engine. When you preview a report with
JasperReports IO, Jaspersoft Studio starts an instance of a web application server running JasperReports IO on
the local machine.
This section assumes that you have already set up a JasperReports IO repository under your workspace.
13.3.1 Importing JasperReports IO Resources into Your Project
To import resources from the JasperReports IO file system:
1. Start Jaspersoft Studio.
2. Open the Project Explorer and select your project.
3. Select File > Import.
4. Select File System from the General category.
5. Click Next.
The import wizard opens.
6. Use the Browse button for From directory to navigate to the top-level directory of the JasperReports IO
repository.
7. Select the directory and click OK.
8. Check the folder's checkbox in the left panel.
9. Use the Browse button for Into directory to navigate to the workspace folder into which you're importing
the repository.
10. Select the workspace folder and click OK.
11. Select how Jaspersoft Studio will import the repository's resources into your workspace using the following
options:
a. Overwrite existing resources without warning- Select this option to replace existing resources in
the workspace with newer versions without any warning prompts.
b. Create top-level folder - Select this option if you want the selected top-level directory of the
repository to be recreated as part of the project. If you do not select this option, Jaspersoft Studio will
import the contents of the selected directory directly into the project folder.
The options under Advanced allow you to create links to files located outside of your workspace.
However, the built-in JasperReports IO preview engine only works for files located in your workspace. It is
not available for previewing linked files located outside your workspace.
12. Click Finish.
The repository and its resources are imported into your project and appear in the Project Explorer.
TIBCO Software Inc. 239

TIBCO Jaspersoft Studio User Guide
13.3.2 Configuring Jaspersoft Studio for JasperReports IO
Previewing reports using Jaspersoft Studio's JasperReports IO reporting engine requires you to first configure the
following:
•The project's repository type
•The repository's root folder
•The starting port for the JasperReports IO web application server
13.3.2.1 Changing the Project's Repository Type
When working with report templates for JasperReports IO, you will need to switch your project's repository type
to JasperReports IO to preview your reports using the JasperReports IO reporting engine.
To change the repository type, right-click the root folder for your report templates in the Project Explorer. This
can be the project root folder or another folder in the project. Then select Report Repository Type
>JasperReports IO. Jaspersoft Studio can now preview these reports with the JasperReports IO web
application server.
You can change the repository type of any folder in your workspace to one of the
following:JasperReports IO,JasperReports Library, or JasperReports Server. This allows you to
design and test your reports in different environments.
13.3.2.2 Setting a Project Folder as the Repository Folder
By default, your project's root directory is the root directory for your JasperReports IO repository, which allows
reports to use all the resources in your project. You can limit the resources that your reports can use by
specifying a new repository root folder. You can specify multiple repository root folders for your JasperReports
IO resources and the order in which your reports will look in them.
To set a repository folder:
1. Select your project in the Project Explorer.
2. Select Project > Properties to open the Properties window for the project.
3. Expand the Jaspersoft Studio node.
4. Select the JasperReports IO Repository node.
5. Click New.
6. Select the folder you want to use as the repository root directory.
7. Click OK.
8. Repeat steps 5 though 8 for each folder you want to use.
9. If you have multiple repository root folders, you can use the Up and Down buttons to move them into the
order in which your JasperReports IO web application server will look for its resources.
10. Click Apply.
13.3.2.3 Setting the Starting Port for the JasperReports IO Preview
Jaspersoft Studio starts a web application server the first time you preview any report with JasperReports IO. By
default, the JasperReports IO web application server runs on port 8080. If that port is already in use, either by
another application or another JasperReports IO instance, the web application server will attempt to use port
8081 and will continue to try the next port until it finds one that is not in use. You can specify a different port
for JasperReports IO to use when it starts by setting a new starting port.
240 TIBCO Software Inc.

Chapter 13 Working with JasperReports IO
Jaspersoft Studio keeps the web application server running until you delete the project or close Jaspersoft
Studio.
If you have multiple JasperReports IO projects in Jaspersoft Studio, each one uses its own web
application server. You can have multiple JasperReports IO instances running on different ports at the
same time until you delete a project or close Jaspersoft Studio.
To set the starting port:
1. Select Window > Preferences to open the Preferences window (Eclipse> Preferences on Mac).
2. Expand the Jaspersoft Studio node.
3. Select the JasperReports IO node.
4. Enter a new starting port for the Port Range Start Number.
5. Click Apply.
13.3.3 Previewing a Report in JasperReports IO
When you select the Preview tab at the bottom of your report, Jaspersoft Studio starts a web application server
running a JasperReports IO instance. The Jaspersoft Studio compiles the report using the data retrieved by the
query through the selected data source and the resources in your JasperReports IO repository. If the compilation
runs successfully, the produced report is loaded by JasperReports IO and filled using the data source.
Note that Jaspersoft Studio automatically saves the report without prompting you.
You can change the data source to use with the report and enter any input. You will be prompted to save the
report template when you change the data source. If you click Save, Jaspersoft Studio will save the report
template with a new parameter that specifies the data source type and path.
If you change the data source or enter any new input parameters, click the button to run the report.
13.3.4 Exporting the JasperReports IO Templates and Resources
When the report templates are ready for JasperReports IO, you can export the templates and resources to an
external folder to later be used by JasperReports IO.
To export the JasperReports IO templates and resources to an external folder:
1. Select the repository folder in the Project Explorer.
2. Select File > Export.
3. Select File System from the General category.
4. Click Next.
The export wizard opens. The selected folder appears in the left panel. The folder's checkbox is checked
along with all of the sub-folders. Clear the checkbox for any folder or file you don't want to export.
5. Use the Browse button for To directory to navigate to the destination directory.
6. Select the destination directory and click OK.
7. Select how Jaspersoft Studio will export the JasperReports IO resources to the destination directory using
the following options.
a. Overwrite existing resources without warning- Select this option to replace existing resources in
the destination directory with newer versions without any warning prompts.
TIBCO Software Inc. 241

TIBCO Jaspersoft Studio User Guide
b. Create directory structure for files - Select this option to create a directory structure in the
destination directory based on the full folder structure of the repository as seen in the Project Explorer.
c. Create only selected directories - Select this option to create a directory structure in the destination
directory based only on the folders selected in the export wizard.
d. Resolve and export linked resources - Select this option to export copies of selected linked
resources to the destination directory.
8. Click Finish.
The files are exported to the destination directory.
242 TIBCO Software Inc.

CHAPTER 14 DATASETS AND SUBDATASETS
You can execute multiple queries in a single report using subdatasets and dataset runs. A dataset describes the
shape of the data that is supplied to a report or element – for example, the list of fields and field types to use –
but does not contain any information about where the data will come from. You can include an arbitrary
number of subdatasets in your report, each with its own fields, variables, parameters, and groups. A subdataset
can use the same connection as the main report (optionally with a different query), or it can use a different data
source or connection.
To use a subdataset, you add an element which contains a dataset and define a dataset run for the element. A
dataset run specifies all the information needed by JasperReports Library to fill the subdataset, including the
information about where the data comes from. Because a dataset run for a subdataset is defined at element level,
you can use the same dataset in more than one element. For example, if your report uses a connection, you can
use the main dataset in two different elements, such as a chart and a crosstab, with different queries. Dataset runs
can only be defined inside elements that contain datasets, including: charts, crosstabs, tables, lists, and maps.
This chapter has the following sections:
•Understanding Datasets and Dataset Runs
•Subdatasets
•Dataset Runs
•Creating an Example Subdataset
14.1 Understanding Datasets and Dataset Runs
14.1.1 Understanding Datasets
Datasets allow the engine to iterate through virtual records, just as data sources do, but they also enable
calculations and data grouping using variables and groups. However, they have no visual or layout information
and do not specify how to find the data that will be used to fill the element at run time.
A report can include two types of datasets:
•Main Dataset – The main dataset is responsible for iterating through the data source records, calculating
variables, filtering out records, and estimating group breaks during the report-filling process. The report data
source, along with the parameters, fields, variables, and groups declared at the report level, represent the
building blocks of the main dataset for the report. All report templates implicitly declare and use this main
dataset.
TIBCO Software Inc. 243

TIBCO Jaspersoft Studio User Guide
•Subdataset – You can use a subdataset to provide a secondary record nested within a report. A subdataset
iterates through its data source records similar to a dataset. However, a dataset can use the same connection
that is used to fill the master report or it can use a different connection or data source. Subdatasets can be
used to iterate through data that is not the main report data source itself, for example, to gather data for a
chart or perform data bucketing for a crosstab.
Because dataset declarations can contain parameters, fields, variables, and groups, they closely
resemble subreports, but they completely lack any visual content (that is, they have no sections or layout
information at the dataset level).
Datasets, when instantiated, expect to receive parameter values and a data source to iterate through. As a
convenience, you can associate an SQL query with a dataset that uses a JDBC connection.
A dataset gives an abstract description of your record metadata but does not say where the data is coming from.
For example, you can create a dataset that stores the information that you have three fields – Last Name, First
Name, City – and that those fields are text fields.
When you create a subdataset, you can optionally choose a connection or data source to use as a resource to
specify your fields. For example, if you will ultimately be retrieving the records above from a JDBC database,
you can use the JDBC connection to retrieve the field information from your data, rather than entering it
manually. However, when you save the dataset it does not specify the data source, so, for example, you could
later retrieve the field values from the JDBC connection or you could retrieve them from a CSV file. The final
binding of the subdataset to its data retrieval method does not occur until you add an element to your report
and define a dataset run.
14.1.2 Dataset Runs
To use a subdataset, you must define a dataset run. A dataset run is always defined at the element level and tells
where to get the data for the element.
Datasets are filled similar to reports. This means that they require a data source or connection from which to get
the data when they are filled. They can also rely on parameters for additional information to use when being
filled. The dataset run binds the dataset used by the element with a data source and supplies the values for the
dataset parameters. You can use the same dataset in different elements, and you configure the dataset run at the
element level.
A dataset run can only be declared elements that contain datasets, including: charts, crosstabs, tables, lists, and
maps.
Unlike other elements, a table always requires a subdataset; it cannot use the main dataset.
When you create a dataset run, you can set the value of the subdataset parameters using expressions containing
main report objects (like fields, variables, and parameters), define a parameters map to set values for the
subdataset parameters at run time, and define the connection or data source that will be used by the subdataset.
244 TIBCO Software Inc.
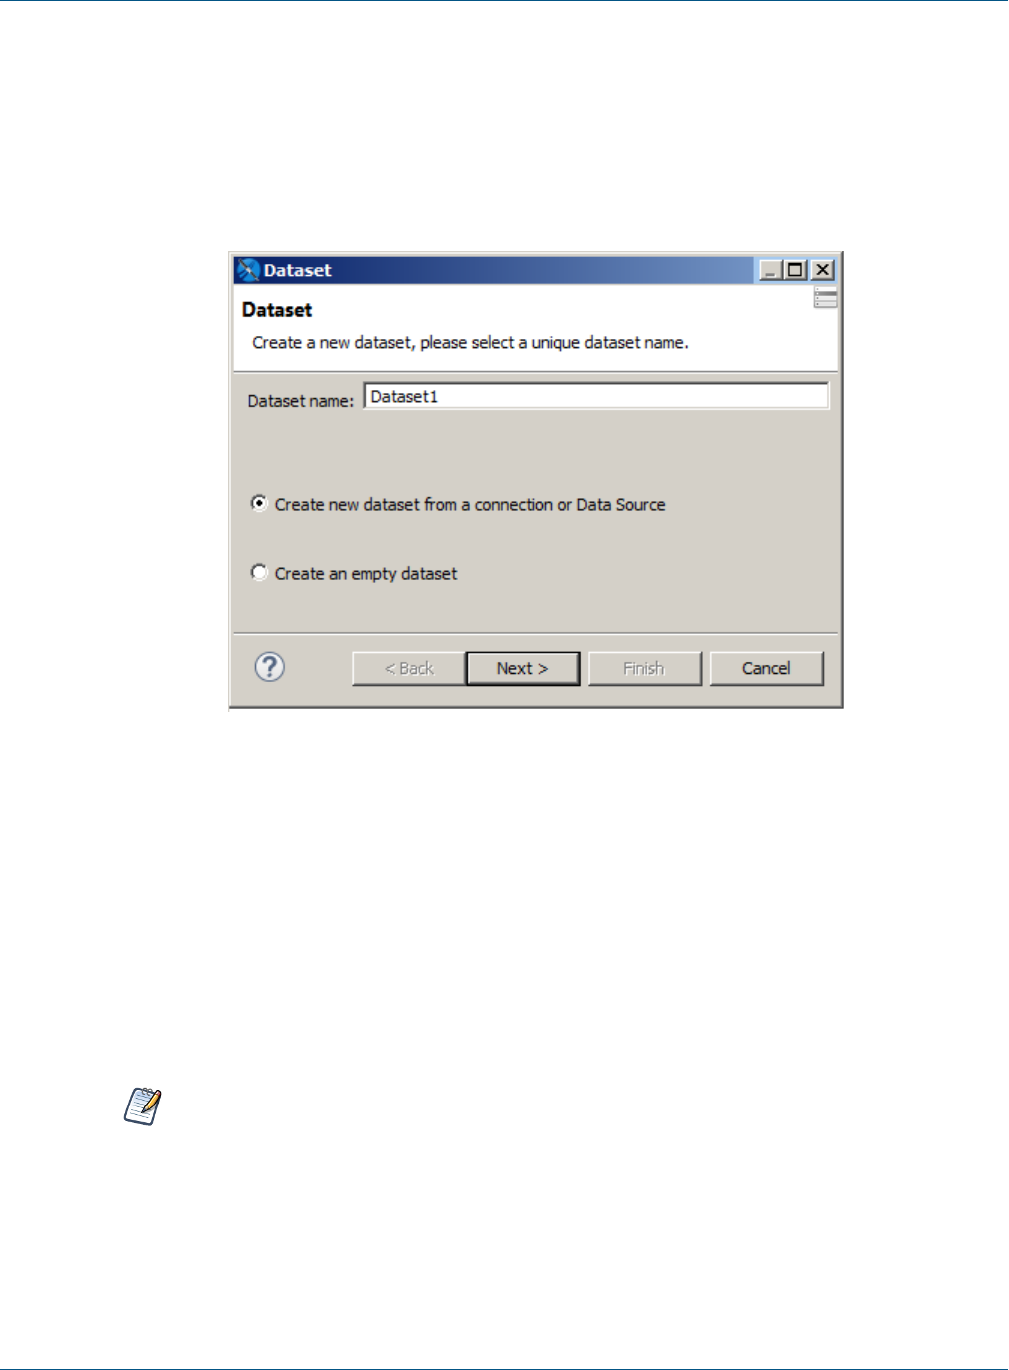
Chapter 14 Datasets and Subdatasets
14.2 Subdatasets
14.2.1 The Dataset Wizard
You create a new subdataset using the Dataset wizard. To open the Dataset wizard, right-click your report's root
node in outline view and select Add Dataset from the context menu.
Figure 14-1 Dataset Wizard
The Dataset page of the Dataset wizard shows the following options:
•Dataset name – A name for the subdataset. Must be unique in the report.
•Dataset radio buttons:
•Create new dataset from a connection or Data Source – Select this to use a connection or data
source to define the metadata for the dataset. The connection or data source will introspect its
associated data and suggest fields and field types for the dataset. Later, when you add an element and
create a dataset run, you make the final choice on where to retrieve the data for the element. At that
point, you can use the same data source/connection, or select a different one.
•Create an empty dataset – Select this to create a dataset without metadata. In this case, you will
need to define the metadata later, when you create a dataset run that uses this dataset.
A dataset is called empty when it does not have metadata.
A dataset that is configured to use the empty data source is not an empty dataset, because it still
defines fields and other metadata. The empty data source just creates a number of records where
each field value is set to null.
•Next – Displays the Data Source page (only available when Create new dataset from a connection or
Data Source is selected).
TIBCO Software Inc. 245
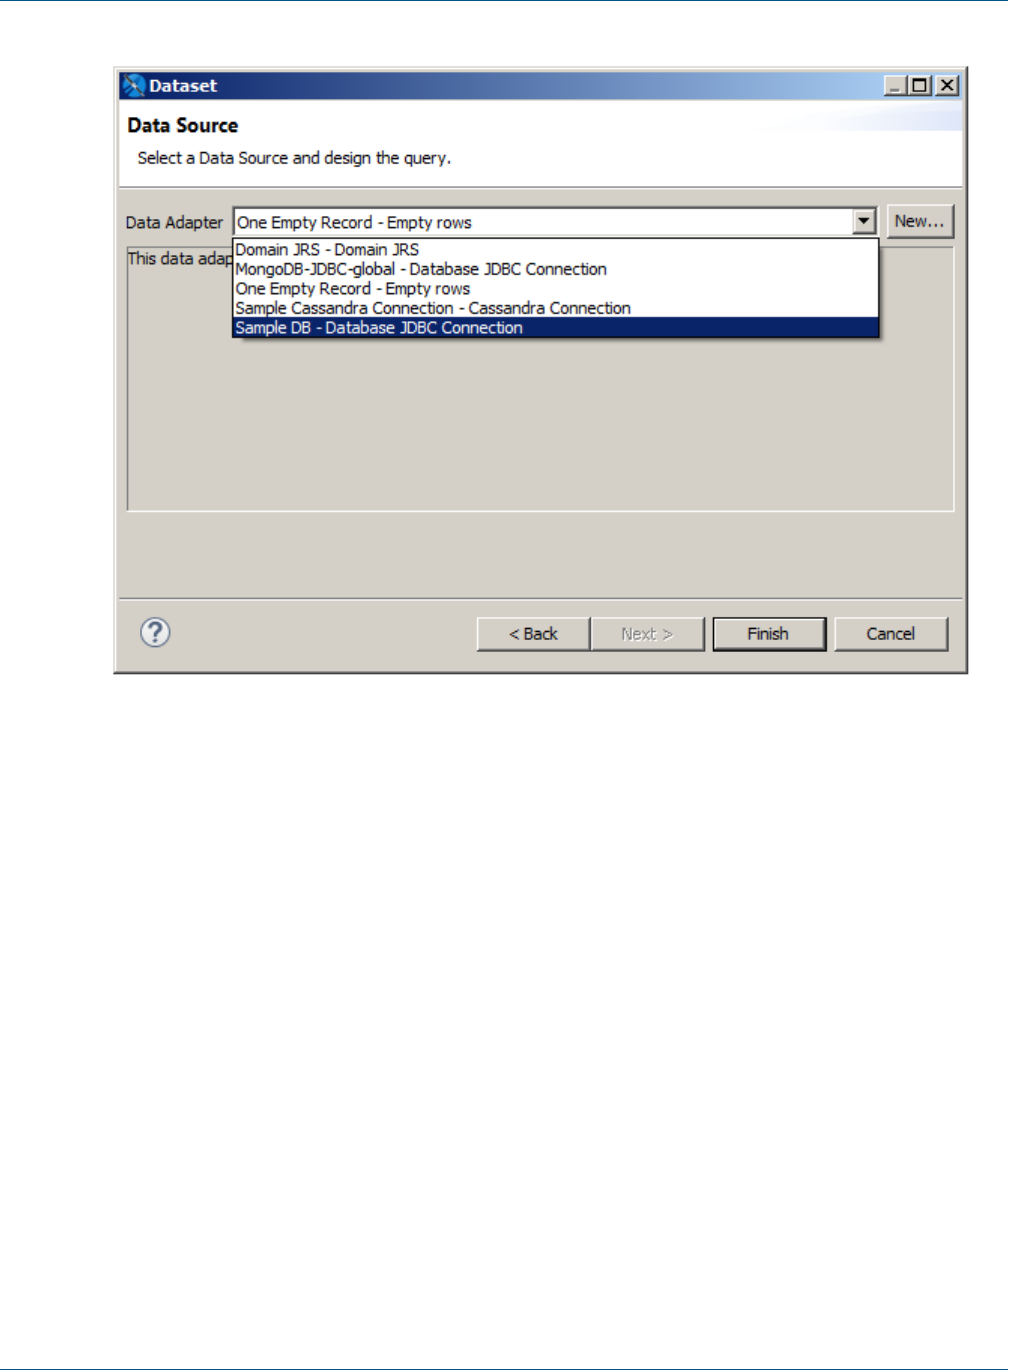
TIBCO Jaspersoft Studio User Guide
Figure 14-2 Data Source page of the Dataset wizard
The Data Source page shows the following options:
•Data Adapter – Drop down that displays available data adapters you can use.
•New – Button that opens the Data Adapter wizard for creating a new data adapter.
•Query area – Area to enter the query for the new dataset. Only displayed for adapters that use connections.
•Next – Click to display the Fields page.
The Fields page shows the fields retrieved using the data adapter and lets you choose fields to your dataset
metadata. Click Next to display the Group By page.
The Group By page lets you group fields. In the context of a dataset, groups are only used to group records and
there is no discrete portion of the report tied to them (for example, like the header and footer bands associated
with groups). Primarily, dataset groups are used in conjunction with variable calculations.
14.2.2 Dataset Objects
When you create a subdataset, it appears as a node in the outline view for your report. Expand the node to see
the dataset's fields, variables, parameters, and other objects.
246 TIBCO Software Inc.
Chapter 14 Datasets and Subdatasets
Figure 14-3 Subdataset in report outline view
You cannot use objects coming from the master report dataset directly in an element that uses a subdataset.
Only subdataset objects can be used in these cases. To use objects from your main report, you must declare them
as parameters in your subdataset. You configure the binding between the main dataset object with the
subdataset parameter inside the dataset definition, and then set the values for the parameters inside the dataset
run.
For example, suppose you have a parameter named MyParam of type String in the main report and you want to
use it with a subdataset. Add it as a parameter to the subdataset by right-clicking the Parameters node in the
subdataset and selecting Create Parameter. Then in the Properties view for your new parameter, set the name
as MyParam, and the class as java.lang.String. To set the value that this parameter will have at runtime,
define an expression in the dataset run of the element that will use the parameter. Setting the expression for a
parameter inside the dataset run means that the parameter is evaluated when the element is evaluated. This
means that when you use a parameter in two different elements, one inside the title band and one inside the
summary band, the parameter's value can be different in the two different elements.
14.2.3 Dataset Properties
The Properties view for a dataset shows a number of advanced options, most of which can only be understood
and applied in a useful way after you become familiar with JasperReports. To see the properties for a dataset:
•For a report, select the root node of the report in outline view. The dataset properties are shown in the
Dataset section on the Report tab in Properties view.
•For a subdataset, select the subdataset node in outline view. The dataset properties are shown in Properties
view.
TIBCO Software Inc. 247
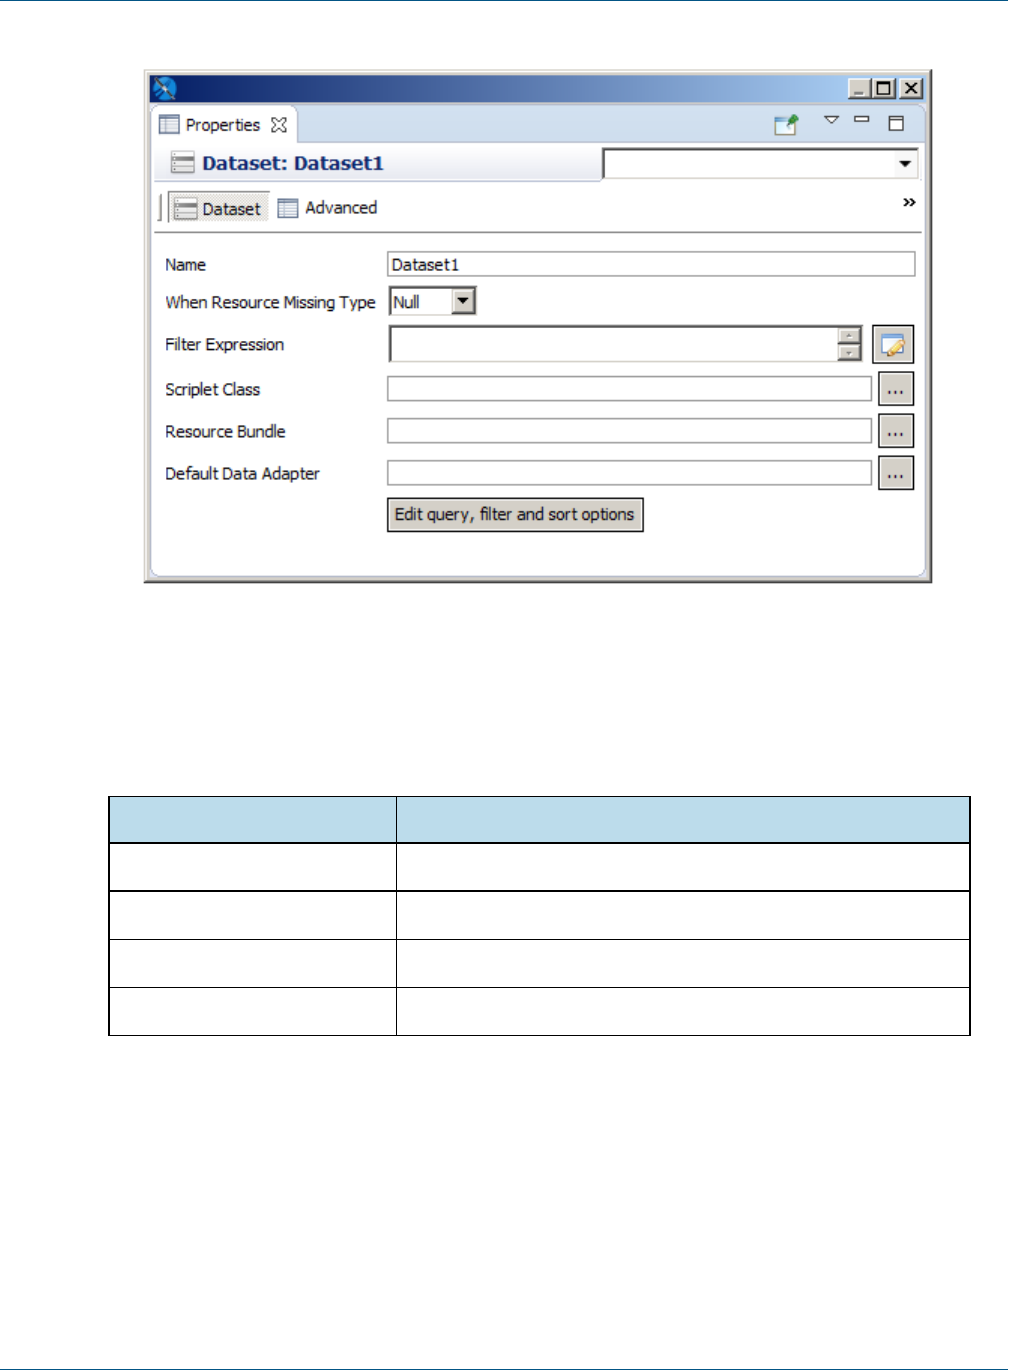
TIBCO Jaspersoft Studio User Guide
Figure 14-4 Dataset properties
A dataset has the following properties:
•Name (Required) – A name for the subdataset. Must be unique in the report.
•When Resource Missing Type – Specifies what to do when a specific resource (such as a label) is not
available in the resource bundle defined below. The available options are listed in the following table.
Option Description
Null Prints the "Null" string (default).
Empty Prints nothing.
AllSectionsNoDetails Prints the missing key name.
Error Throws an exception and stops the fill process.
•Filter Expression – Boolean expression that determines whether records that are read from the data source
should be used. Can use all the objects of the dataset (parameters, variables, and fields). Here are some
examples of filter expressions:
•Filter only records where the field FIRSTNAME starts with the letter “L”:
•JavaScript: $F{FIRSTNAME}.substr(0,1) == "L"
•Groovy: $F{FIRSTNAME}.startsWith("L")
•Filter only records where the length of the field FIRSTNAME is less than 5:
•JavaScript: $F{FIRSTNAME}.length < 5
•Groovy: $F{FIRSTNAME}.length() < 5
248 TIBCO Software Inc.

Chapter 14 Datasets and Subdatasets
•Filter only records where the field FIRSTNAME is the one provided by the parameter NAME:
•JavaScript: $F{FIRSTNAME} == $P{NAME}
•Groovy: $F{FIRSTNAME} == $P{NAME}
•Scriptlet Class – A scriptlet is a Java class whose methods are executed according to specific events
during report creation, such as the beginning of a new page or the end of a group. For those who are
familiar with visual tools such as Microsoft Access or Microsoft Excel, a scriptlet can be compared with a
module in which procedures associated with other events or functions (for example, the expression of a
textfield) are inserted. The scriptlet property identifies only the main scriptlet, but other scriptlets can be
added to the report by using outline view.
•Resource Bundle – Used to internationalize a report. A resource bundle is the set of files that contain the
text of the labels, sentences, and expressions used within a report in one defined language. What you set in
the resource bundle property is the resource bundle base name, which is the prefix through which you can
find the file with the correct translation. In order to reconstruct the file name required for a particular
language, some language/country initials (for example, “_it_IT” for Italian-Italy) are added to this prefix, as
well as the .properties extension.
•Default Data Adapter – Sets the name and location of the XML data adapter resource that JasperReports
should use.
•Edit query, filter and sort options button – Opens the Dataset and Query dialog, where you can edit
the query, sorting, and filter options for the subdataset. See 11.1, “Using the Dataset and Query Dialog,”
on page195 for more information.
14.3 Dataset Runs
You create a dataset run when you insert an element that contains a dataset into your report. For example, the
fields for defining a dataset run for a basic chart are in the lower right of the Chart Data Configuration dialog.
TIBCO Software Inc. 249
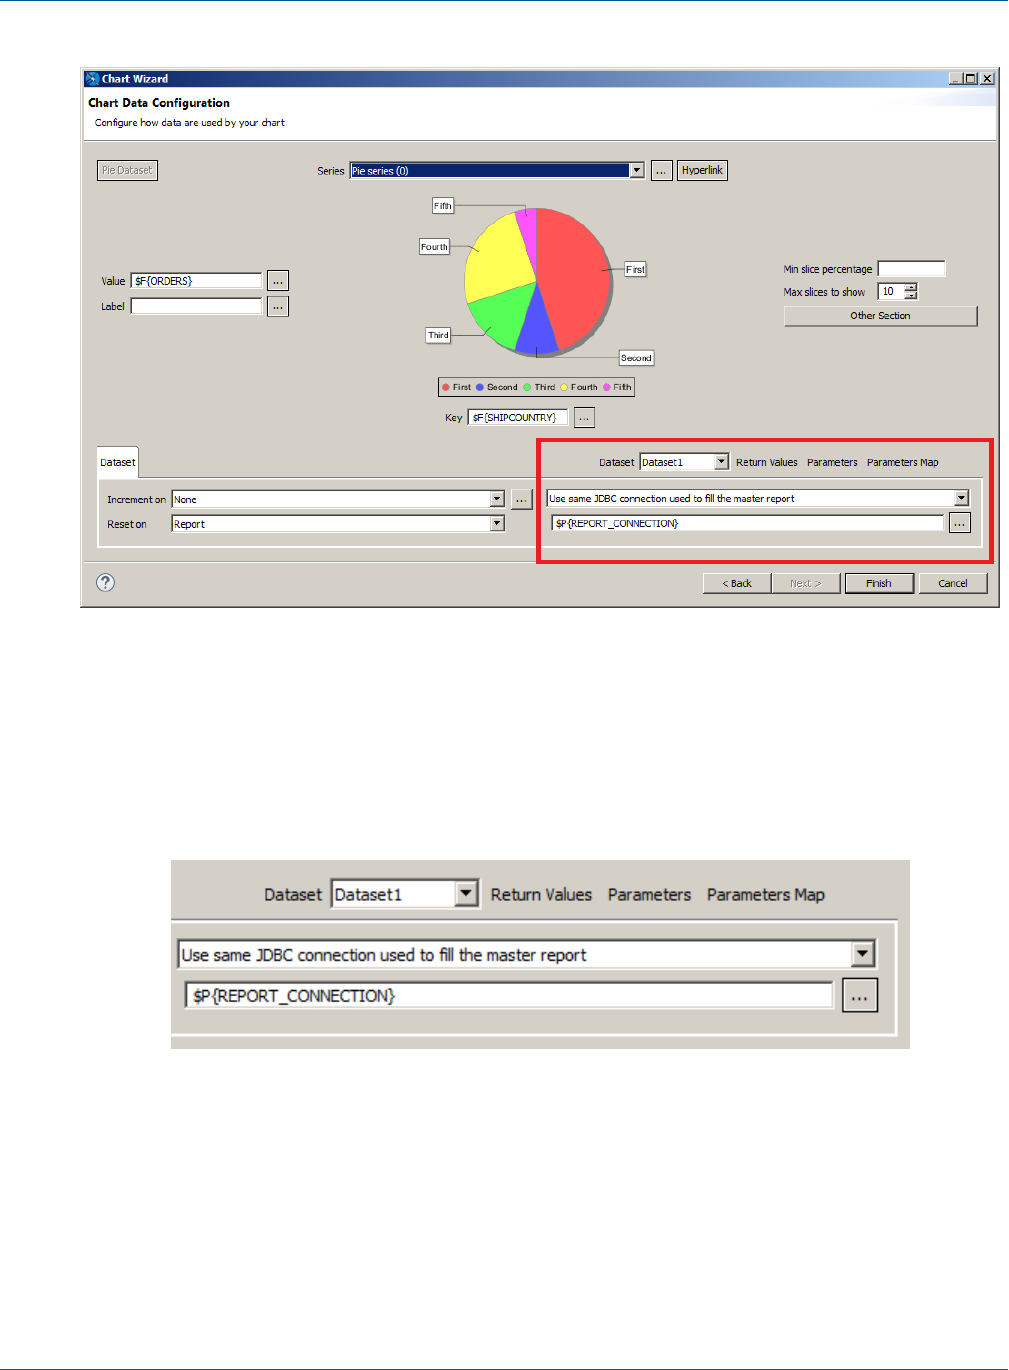
TIBCO Jaspersoft Studio User Guide
Figure 14-5 Dataset run definition for a chart
•Dataset dropdown list – Displays all available datasets.
14.3.1 Connection/Data Source Expression Menu
The Connection/Data Source Expression menu lets you specify where to get the data to fill the report.
Figure 14-6 Specifying the Data for a Dataset Run
If the main report dataset uses a connection, such as a JDBC connection, you see the following options:
•Don't use any connection or Data Source – Select this if you do not want to specify any data for the
dataset run. You can set this if you have set a data adapter via properties view, and want JasperReports
Library to use that adapter. This setting can be used when you want to publish a report with multiple
connections to JasperReports Server.
250 TIBCO Software Inc.

Chapter 14 Datasets and Subdatasets
•Use another connection – Select this and enter a connection expression to use a connection that is
different from the connection in the main dataset. You can use this for any connection, such as a JDBC
connection or big data connection.
•Use a JRDatasource expression – Select this and enter a data source expression if you want to use a
data source. Note that, even when the main report uses a data source, such as a CSV file or JSON data
source, you cannot simply reuse the data source from the main report. Instead, you must define a subdataset
and create a dataset run that accesses the data source. This is because, unlike a connection, a data source is
consumed when JasperReports iterates through it to fill the element. This means that when you use the same
data source in two different elements, you must access the data source twice.
•Use same JDBC connection used to fill the master report – If the report uses a connection, such as a
JDBC connection or a Hibernate connection, select this to have the dataset run use the same connection as
the main report. You can optionally enter a different query from the query in the main report.
When Use same JDBC connection used to fill the master report is selected, the connection
expression uses the built-in parameter for the report's JDBC connection, $P{REPORT_CONNECTION}.
•Use an empty Data Source – Select this to fill the dataset using an instance of JREmptyDataSource,
that is, a data source that contains a specified number of records, where the field values are all NULL. See
10.10, “Using the Empty Record Data Adapter,” on page183 for more information.
If the main report uses a data source, the menu and options are slightly different.
Figure 14-7 Dataset Run For a Dataset with Metadata
•Don't use connection or data source – Select this if you do not want to specify any data for the dataset
run
•Use a Connection expression – Select this to use any connection, such as a connection to a JDBC
database or a big data store.
•Use a DataSource expression – Select this to connect to a non-JDBC data source, for example, a JSON
or XML data source.
14.3.2 Parameters Tab
This tab allows you to set values for the subdataset parameters using calculated expressions. Expressions can
reference main report objects such as fields, variables, and parameters. However, objects from your main report
are not directly available in a subdataset. To use parameters from your main report, you must declare them in
your subdataset and then assign their values in a dataset run.
TIBCO Software Inc. 251

TIBCO Jaspersoft Studio User Guide
14.3.3 Parameters Map Tab
When you configure parameters using the Parameters tab, you create a parameters map. You can take this
another level of abstraction, and specify an optional expression that produces an object of type java.util.Map
at runtime. The map object contains a set of coupled names/objects that is passed to the subdataset in order to
set a value for its parameters. Parameters map values can be provided as expressions, making the map potentially
dynamic. For example, you can use a parameters map to pass the username of the user executing the report, or
define the connection or data source used by the subdataset.
Your application can create a map designed for subdataset, pass it to the master report using a parameter, then
use that parameter as an expression (for example, $P{myMap}) to pass the map to the subdataset. If you want,
you can pass the same parameters map to the main report and to the subdataset, using the built-in parameter
REPORT_PARAMETERS_MAP. In this case, the parameters map expressions $P{REPORT_PARAMETERS_MAP}.
14.3.4 Return Values Tab
In a report, it is often useful to get the result of some kind of calculation that has been performed in a subdataset
or subreport (for instance, the number of records). The Return Values tab allows you to retrieve values
calculated or processed by the subdataset (such as totals and record count) and store them in a variable in the
main report.
Bindings between calculated values and local variables can be set in the Subdataset Return Values property
in property view. When you define a variable that hosts or collects subdataset return values, you should set its
calculation time to System to prevent the values from being recalculated at each iteration of the main dataset.
A value from the subdataset run is available only after the whole band containing the subdataset has been
printed.
If you need to print this value using a textfield placed in the same band as your subdataset run, set the
evaluation time of the textfield to Band.
14.4 Creating an Example Subdataset
The following step-by-step example shows how to use a subdataset to fill a chart using the same connection as
the main report, but with a different query.
Create a report:
1. Create a basic report using a blank template, for example, Blank A4, and click Next.
2. Give your report a name, for example, DataSetReport, and click Next.
3. Choose Sample DB - Database JDBC Connection and click Next.
You can create a data adapter separately or click New... to create a data adapter directly from this dialog.
Adapters can be created globally (embedded in the workspace) or local to a specific project. Using a
local adapter makes it easier to deploy the report to JasperReports Server. See 10.1, “Creating and
Editing Data Adapters,” on page142 for more information.
4. Enter the SQL query select count(*) as tot_orders from orders and click Next.
5. Add TOT_ORDERS as a field and click Finish. The report is displayed.
6. Drag the TOT_ORDERS field to the Detail band. If you want, you can remove all bands except the Title,
Detail, and Summary bands, and add a static text field to the title band to identify the report.
252 TIBCO Software Inc.
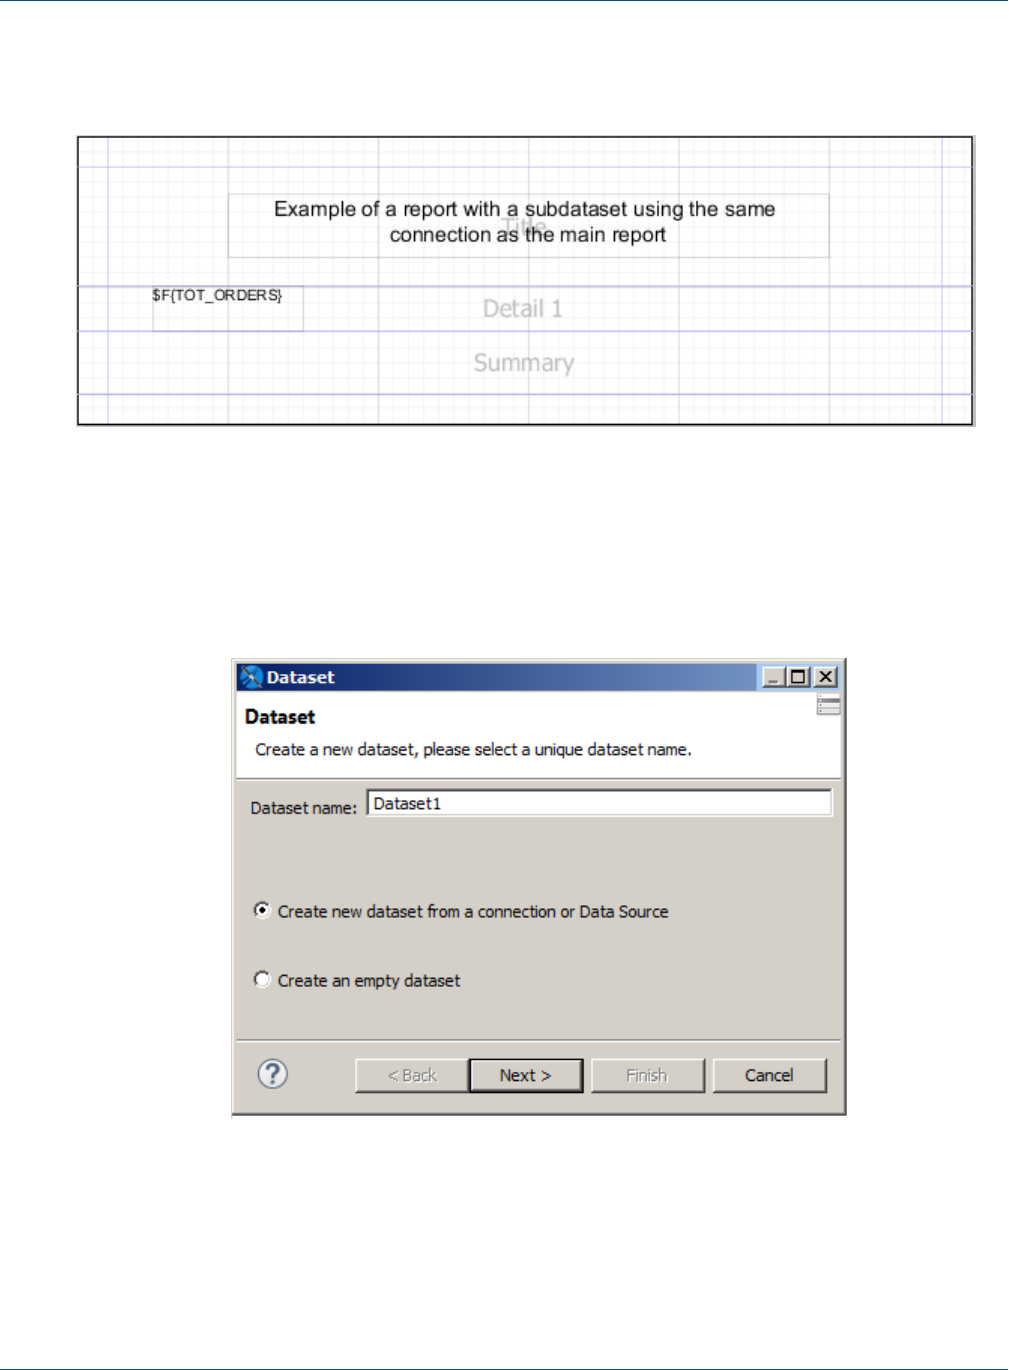
Chapter 14 Datasets and Subdatasets
7. Preview the report.
The resulting main report has a single record containing the total number of orders.
Figure 14-8 Initial report layout
Create a subdataset:
1. Right-click your report's root node in outline view.
2. Select Add Dataset from the context menu.
The Dataset wizard is displayed.
Figure 14-9 Creating a new subdataset
3. Enter a name for your dataset. For this tutorial, name it ExampleDataset.
4. For this tutorial, select Create new dataset from a connection or Data Source. This includes a data
adapter as part of your dataset definition.
TIBCO Software Inc. 253
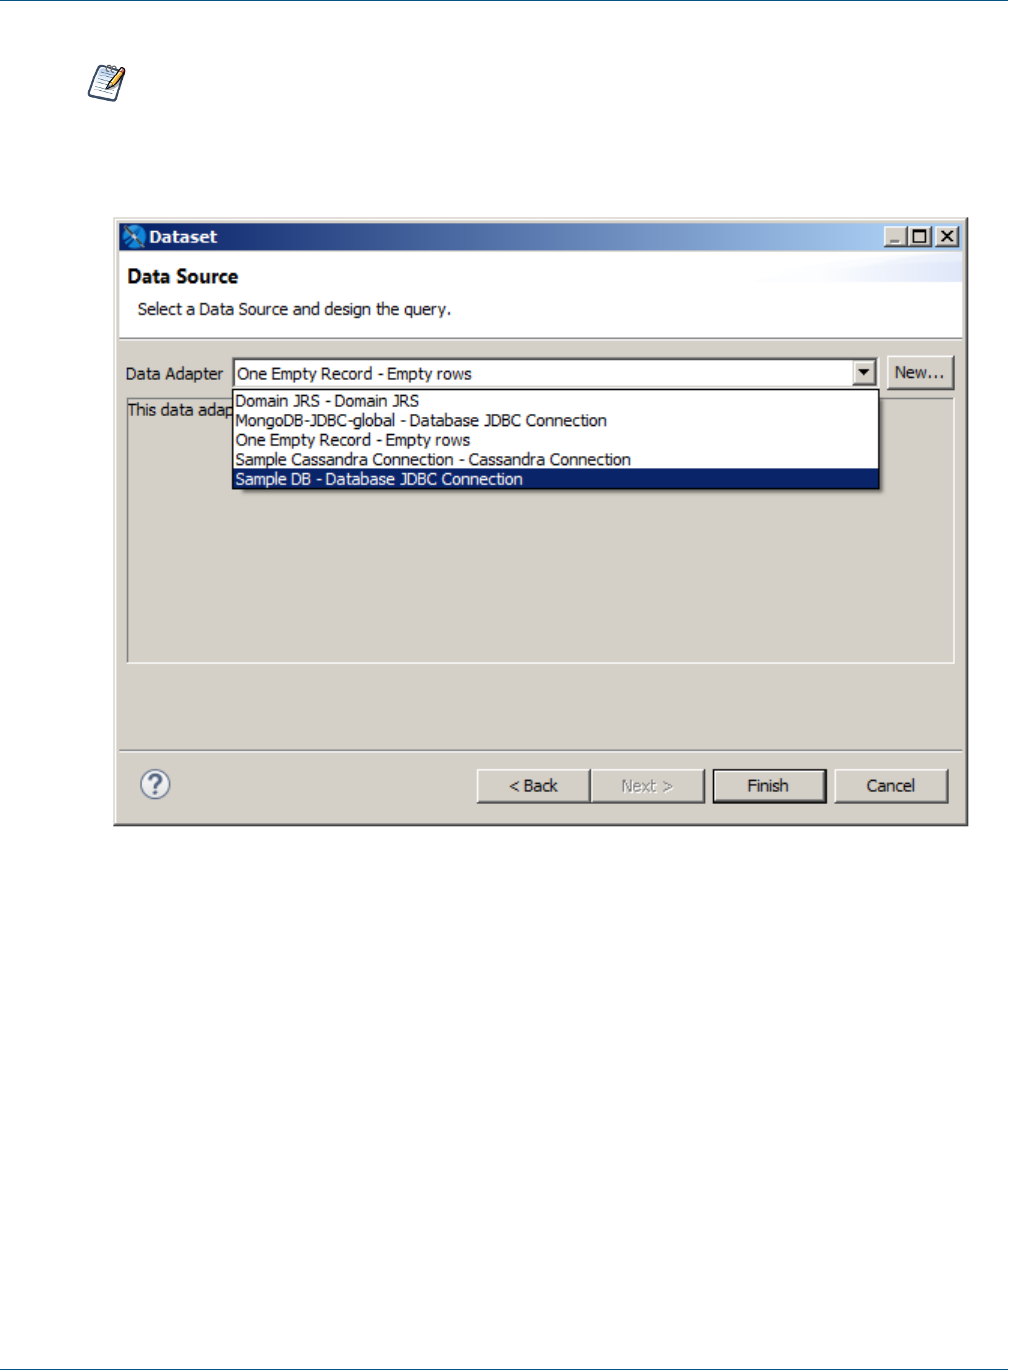
TIBCO Jaspersoft Studio User Guide
If you select Create an empty dataset, your dataset does not include any data adapter or field
information. You will need to configure this information separately for each dataset run.
5. Click Next.
6. Select the data source you want for your dataset and click Next. For this example, select Sample DB.
Figure 14-10 Data Source page of the Dataset wizard
7. Create a subdataset query and set it to:
select SHIPCOUNTRY, COUNT(*) country_orders from ORDERS group by SHIPCOUNTRY
Then click Next.
8. On the next screen, select all the fields and add them to the dataset, then click Finish.
The fields are registered in the subdataset and appear in outline view.
254 TIBCO Software Inc.
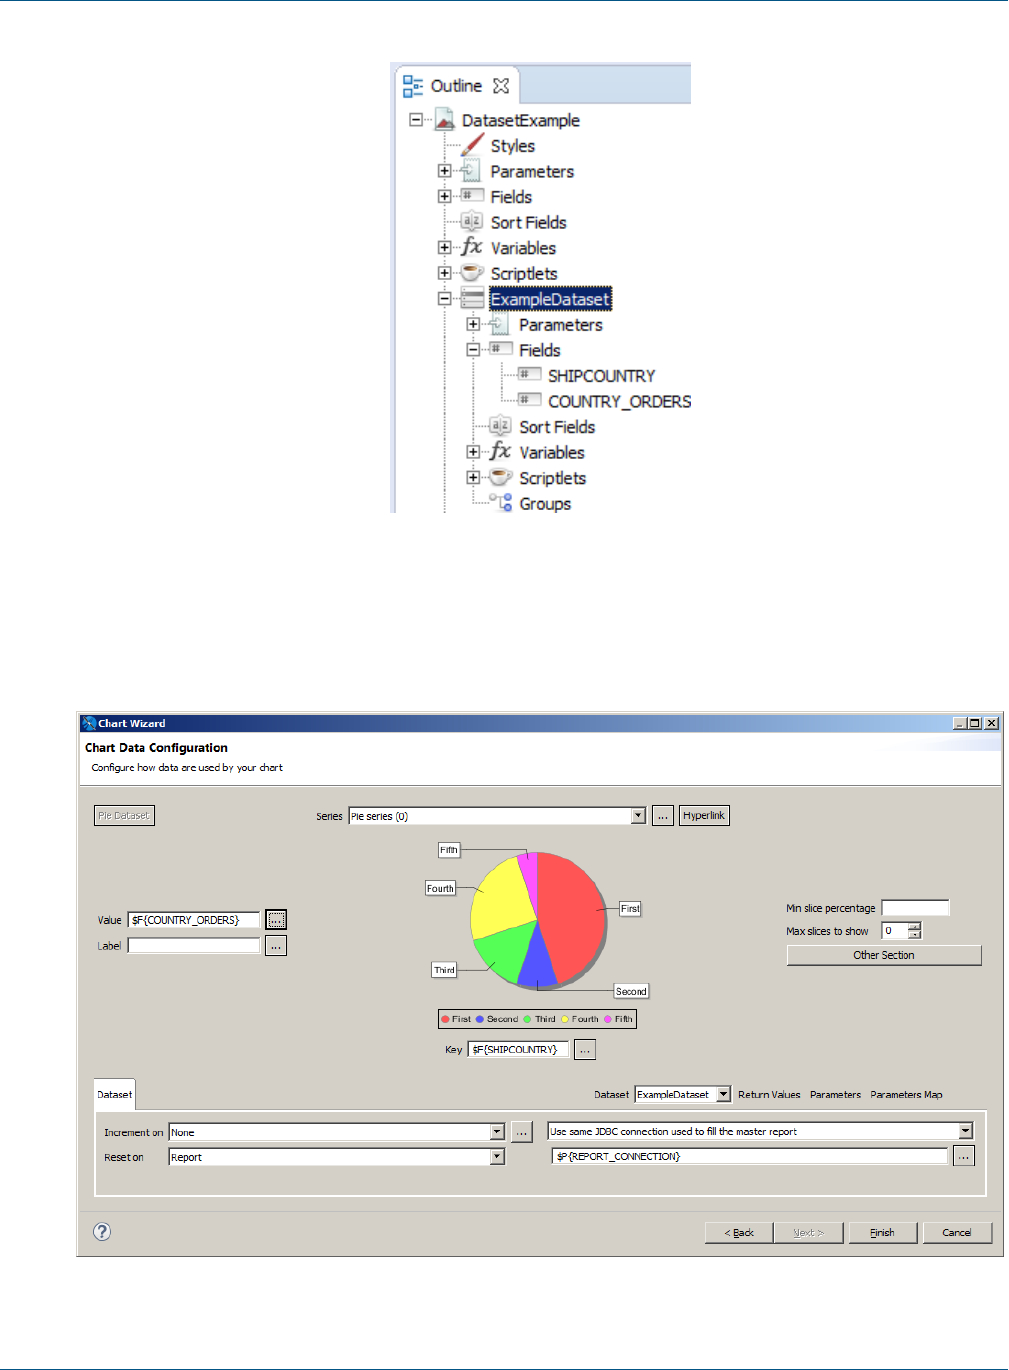
Chapter 14 Datasets and Subdatasets
Figure 14-11 The subdataset to fill the chart
Create a chart and its dataset run:
1. Now drag the Chart element to the summary band.
2. Select Pie Chart when prompted and click Next.
TIBCO Software Inc. 255

TIBCO Jaspersoft Studio User Guide
Figure 14-12 Chart Wizard
3. In the dataset run section of the Chart Wizard, select the dataset you created, ExampleDataset.
4. Select Use same JDBC connection used to fill the master report from the dropdown menu. This
causes the expression to be set automatically to the connection used by the main report ($P{REPORT_
CONNECTION}).
5. To force the expression context to update the fields, parameters, and values after the dataset run
configuration, close the dialog, then reopen it by double-clicking the chart. If you do not force an update,
you will not see the correct fields in the expression editor.
6. Set the chart dataset expressions (the expressions used to fill the chart):
•Click …next to Series to open the Series dialog. Then select SERIES1 and click …to open the
expression editor and enter the following expression:
$F{SHIPCOUNTRY}
Click Finish, then click OK to return to the Chart Wizard. Note that the Key field below the chart
updates to show the same value as the series.
•Click …next to Value to open the expression editor. Enter the following expression:
$$F{COUNTRY_ORDERS}}
Click Finish to return to the Chart Wizard.
You cannot use objects from the master report dataset in a element that uses a subdataset. Only
subdataset objects can be used. To use an objects from the master report dataset, you must pass it as a
variable or a parameter.
7. Click Finish to apply the expressions and return to the report.
8. When you are done, run the report.
256 TIBCO Software Inc.
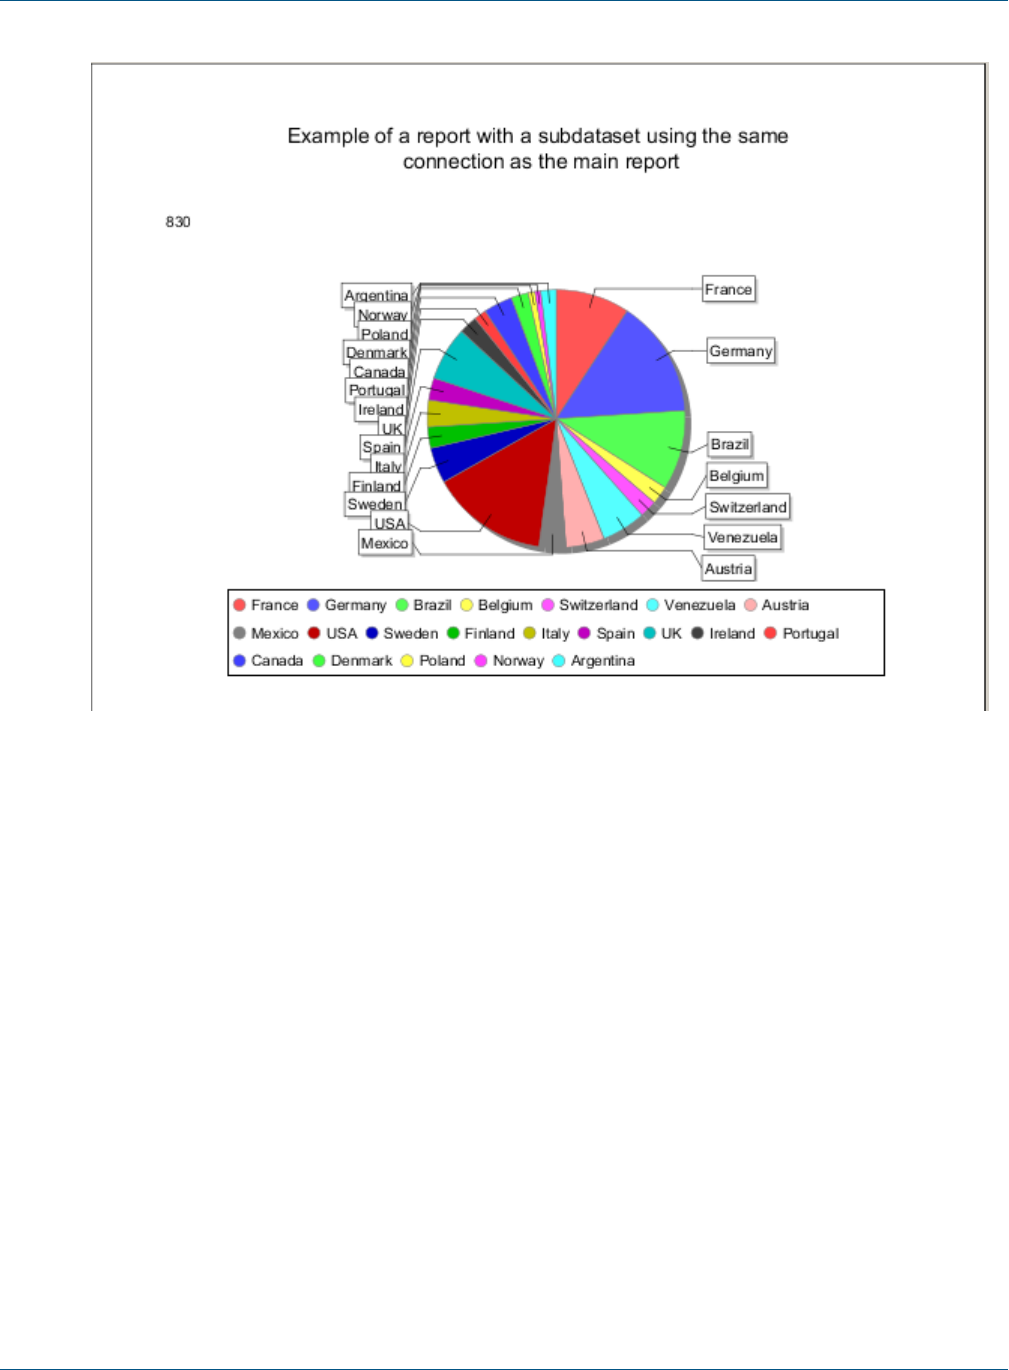
Chapter 14 Datasets and Subdatasets
Figure 14-13 Chart filled using a subdataset
TIBCO Software Inc. 257

TIBCO Jaspersoft Studio User Guide
258 TIBCO Software Inc.

CHAPTER 15 WORKING WITH TABLES
The Table component displays data coming from a secondary dataset. This powerful component can often make
subreports unnecessary.
The Table wizard allows you to create a complex table with a few clicks. Each table cell can be simple as a text
element or it can contain a set of report elements including nested tables, creating very sophisticated layouts.
To create a tabular layout for a simple report with columns that resize together, you can use spreadsheet
layout. While not as complex as the Table component, you can use it directly in a report without defining a
dataset. See 4.9, “Working with Spreadsheet Layout,” on page64 for more information.
This chapter contains the following sections:
•Creating a Table
•Editing a Table
•Table Structure
•Working with Columns
15.1 Creating a Table
To create a new table:
•To have Jaspersoft Studio autosize your table, drag the Table element from the Elements palette into any
band of the report.
•To manually set the size of the table when you insert it, click on the Table element , but do not drag.
The cursor changes to show that an element is selected. Click and drag in the report editing area to size
and place the element. When you size the table when you first insert it, the columns fill the whole table.
Once you have placed your table in your report, use the Table Wizard to choose a new or existing dataset for
your table.
TIBCO Software Inc. 259

TIBCO Jaspersoft Studio User Guide
Figure 15-1 Table Wizard - New Table
To create a new dataset for your table:
1. Select Create a Table from a new dataset and click Next. The Dataset window is displayed.
Figure 15-2 Table Wizard - Dataset
2. Name your dataset and select your option: Create new dataset from a connection or data source or
Create an empty dataset. For this example, choose the first option and click Next. You'll be prompted to
select a data source and design query.
260 TIBCO Software Inc.
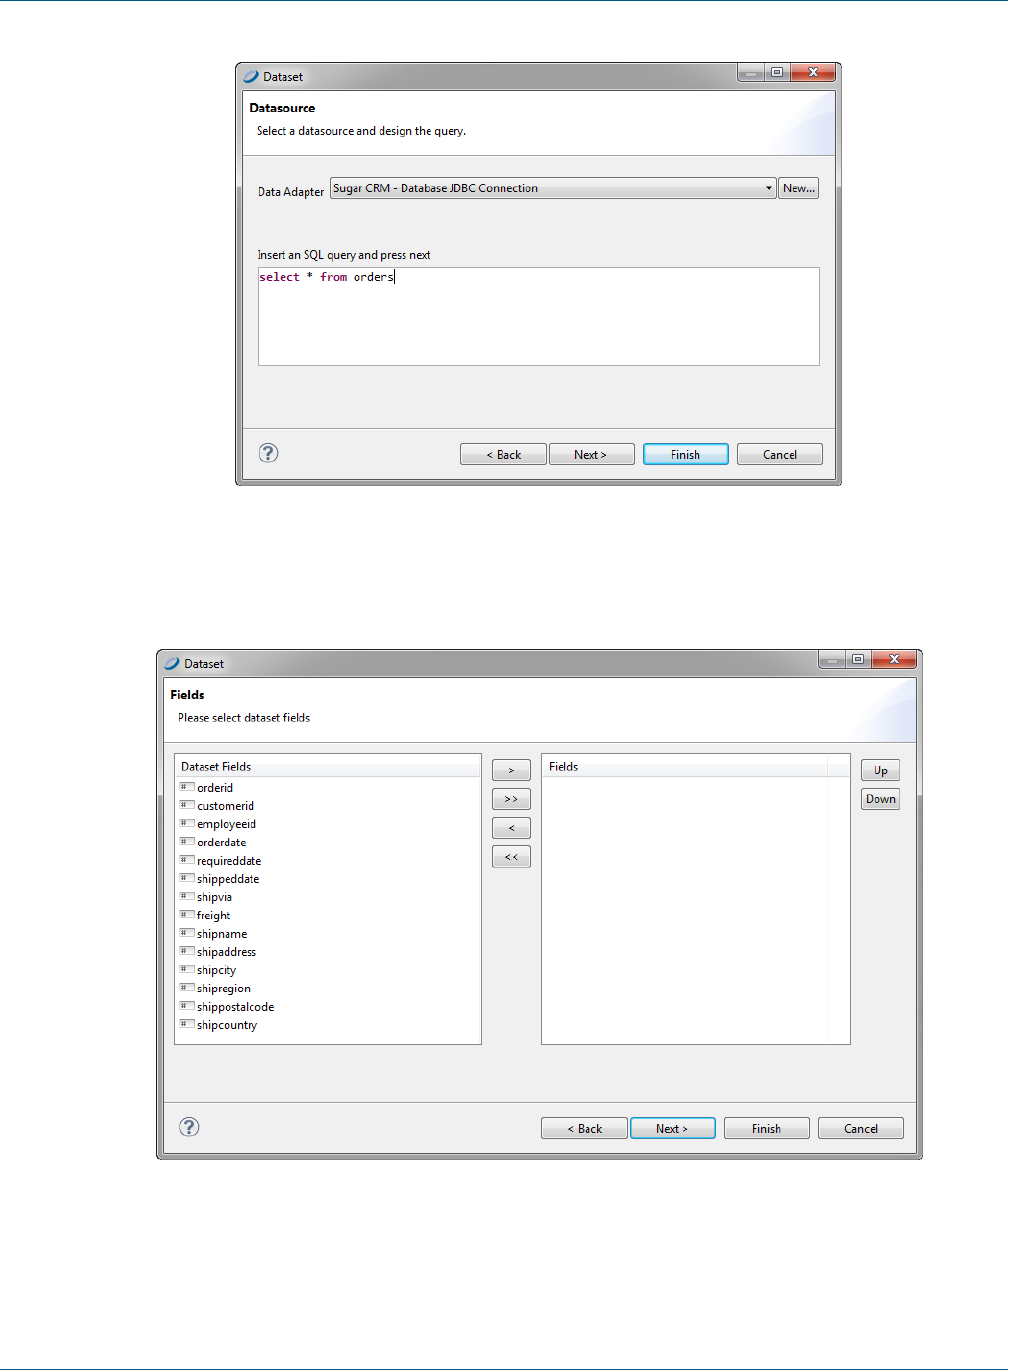
Chapter 15 Working with Tables
Figure 15-3 Table Wizard - Dataset Datasource
3. Select a data source and enter an SQL query such as: select * from orders and click Next. You'll be
prompted to select dataset fields.
Figure 15-4 Table Wizard - Dataset Fields
4. Select the fields you want in your table and add them to the Fields list on the right. Then click Next.
You'll be prompted to select the fields to group by from among your chosen fields.
TIBCO Software Inc. 261
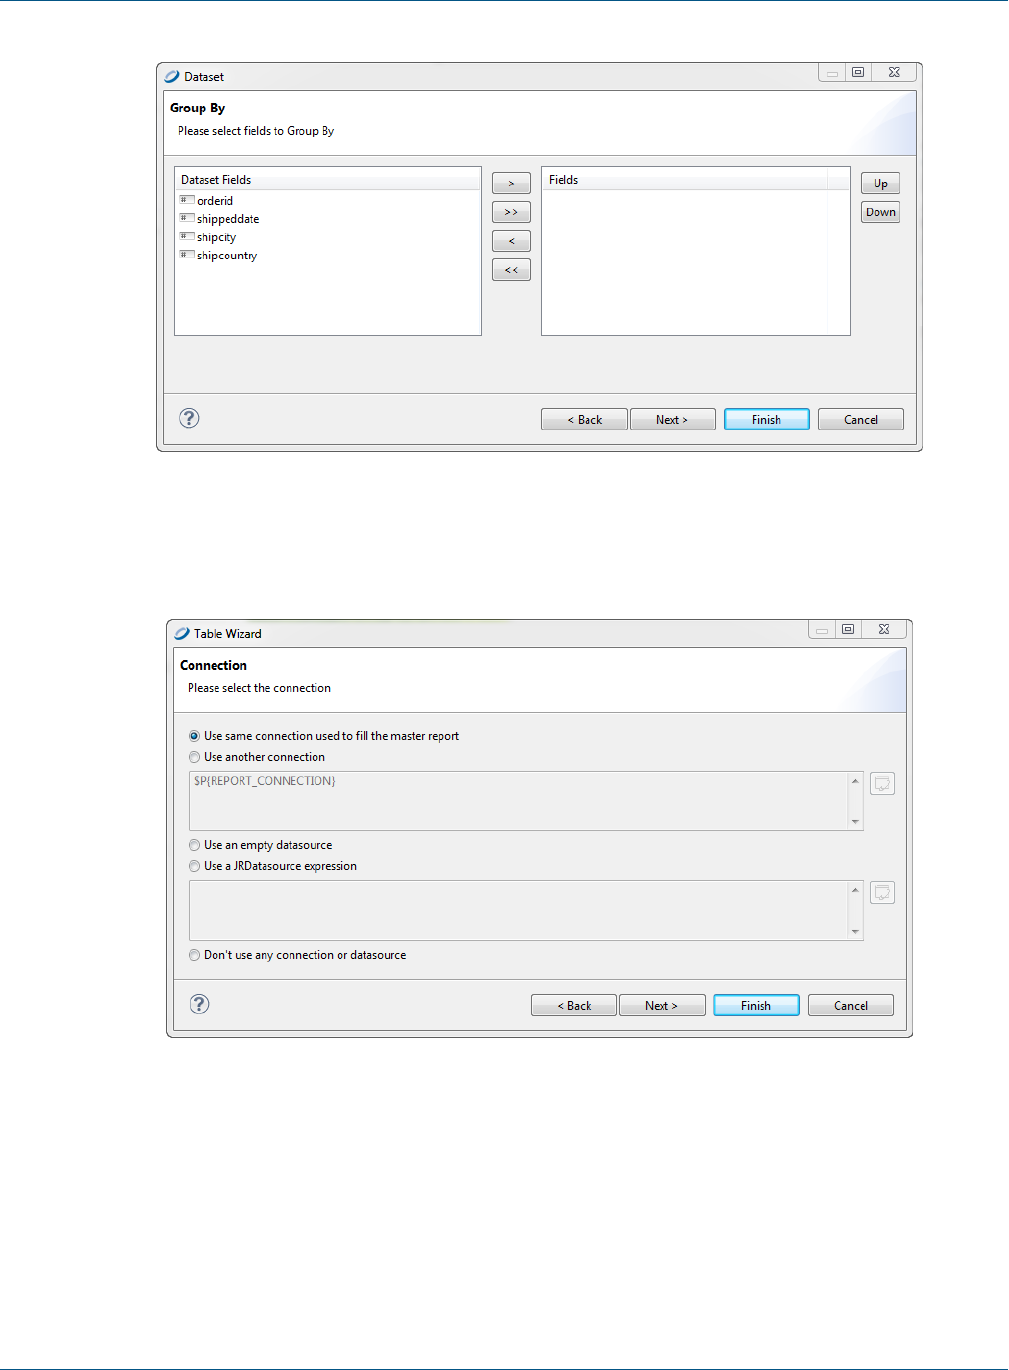
TIBCO Jaspersoft Studio User Guide
Figure 15-5 Table Wizard - Dataset>Group By
5. Select one or more fields to group by and move them to the Fields list on the right. Click Next. You'll be
prompted to select a connection.
Figure 15-6 Table Wizard - Connection
6. Select a data connection option. Your options are:
•Use the same connection used to fill the master report (the option used in this example)
•Use another connection (you'll provide a connection)
•Use an empty data source
•Use a JRDatasource expression (you'll enter a JRDatasource expression)
•Don't use any data source or connection
7. Click Next. You'll be prompted to choose the fields for produce table columns.
262 TIBCO Software Inc.
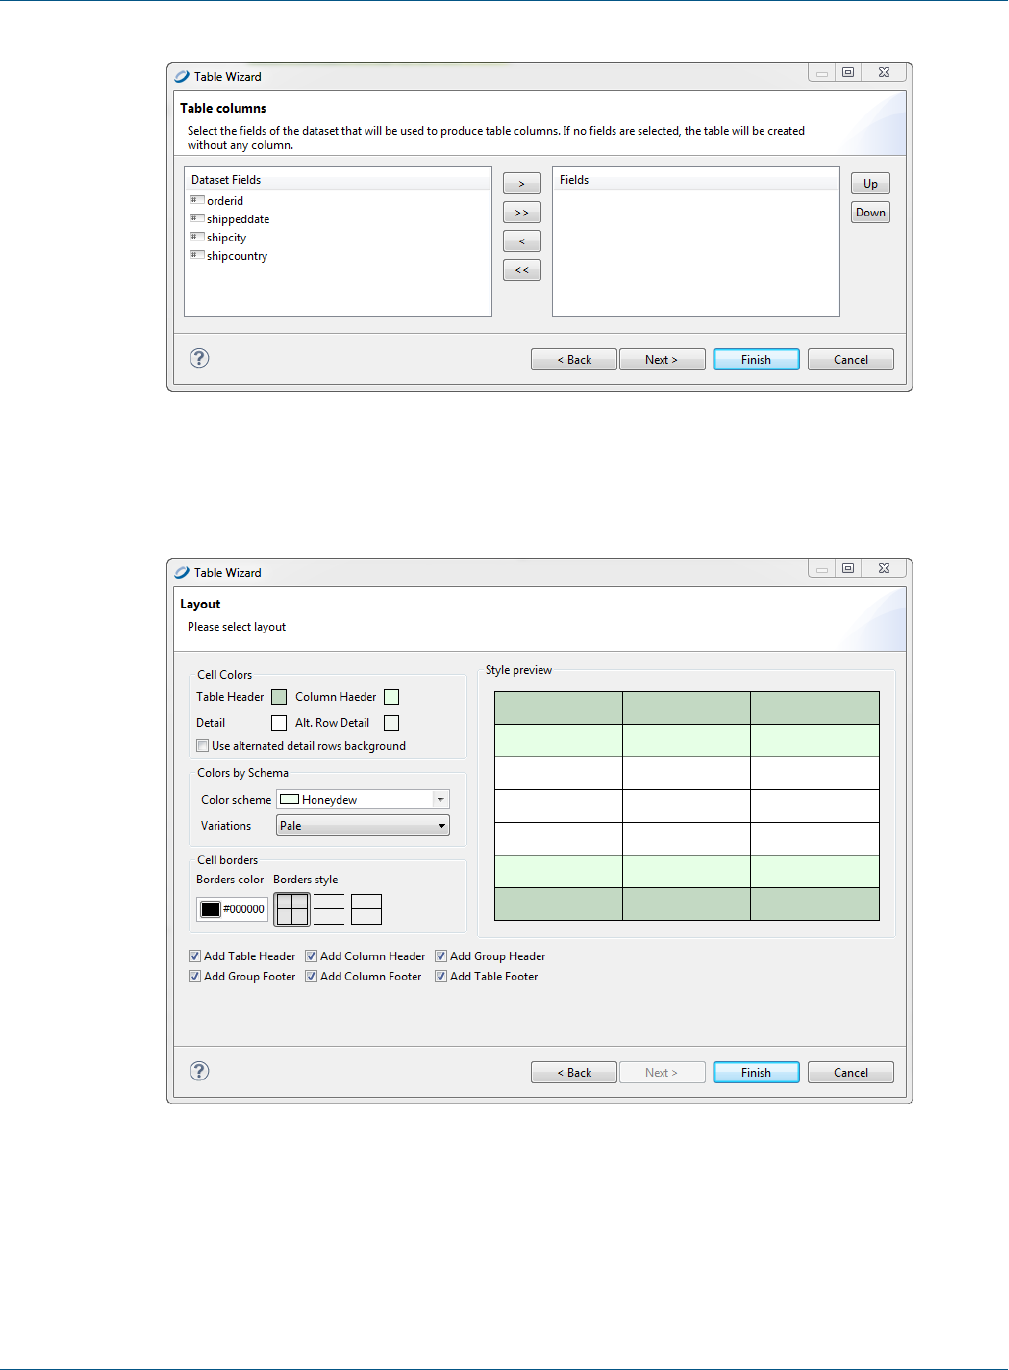
Chapter 15 Working with Tables
Figure 15-7 Table Wizard - Table Columns
8. Select one or more fields to for table columns and move them to the Fields list on the right. Click Next.
You'll be prompted to select a layout.
Figure 15-8 Table Wizard - Layout
9. Select the layout for your table, and click Finish. The table appears where you dragged the table element
in your report.
TIBCO Software Inc. 263
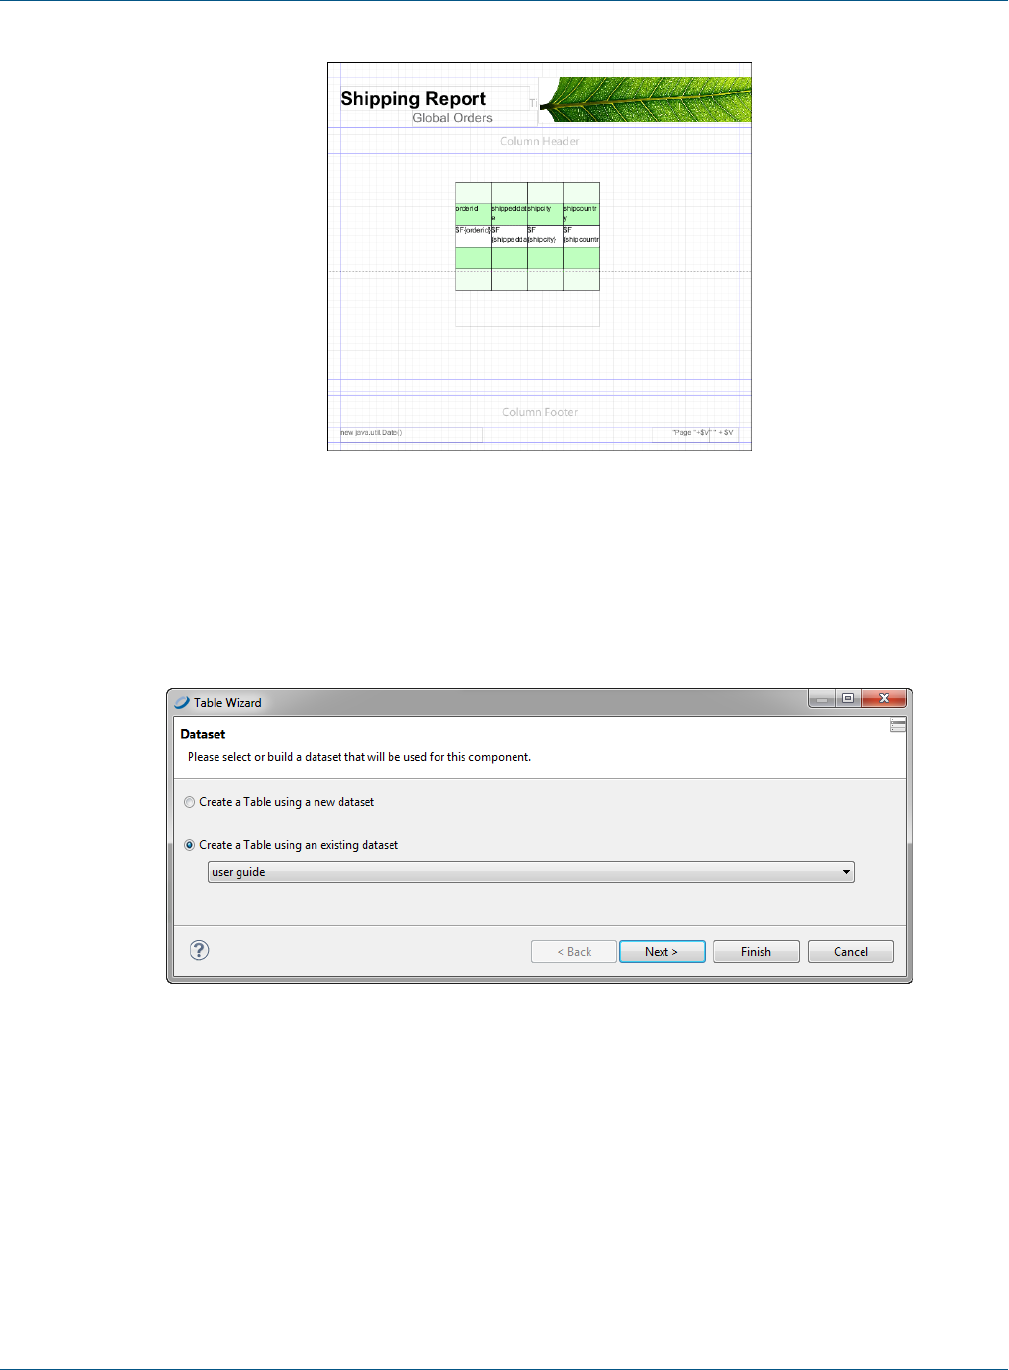
TIBCO Jaspersoft Studio User Guide
Figure 15-9 Report Containing a Table
To use an existing dataset when creating a table:
Creating a table using an existing dataset is largely the same as creating a table using a new dataset.
1. In the Dataset window of the Table Wizard, select Create a Table using an existing dataset.
2. Select a dataset from the drop-down.
Figure 15-10 Table Wizard - Dataset
3. Click Next. You'll be prompted to select the connection.
From this point the steps are the same as creating a table using a new dataset.
264 TIBCO Software Inc.
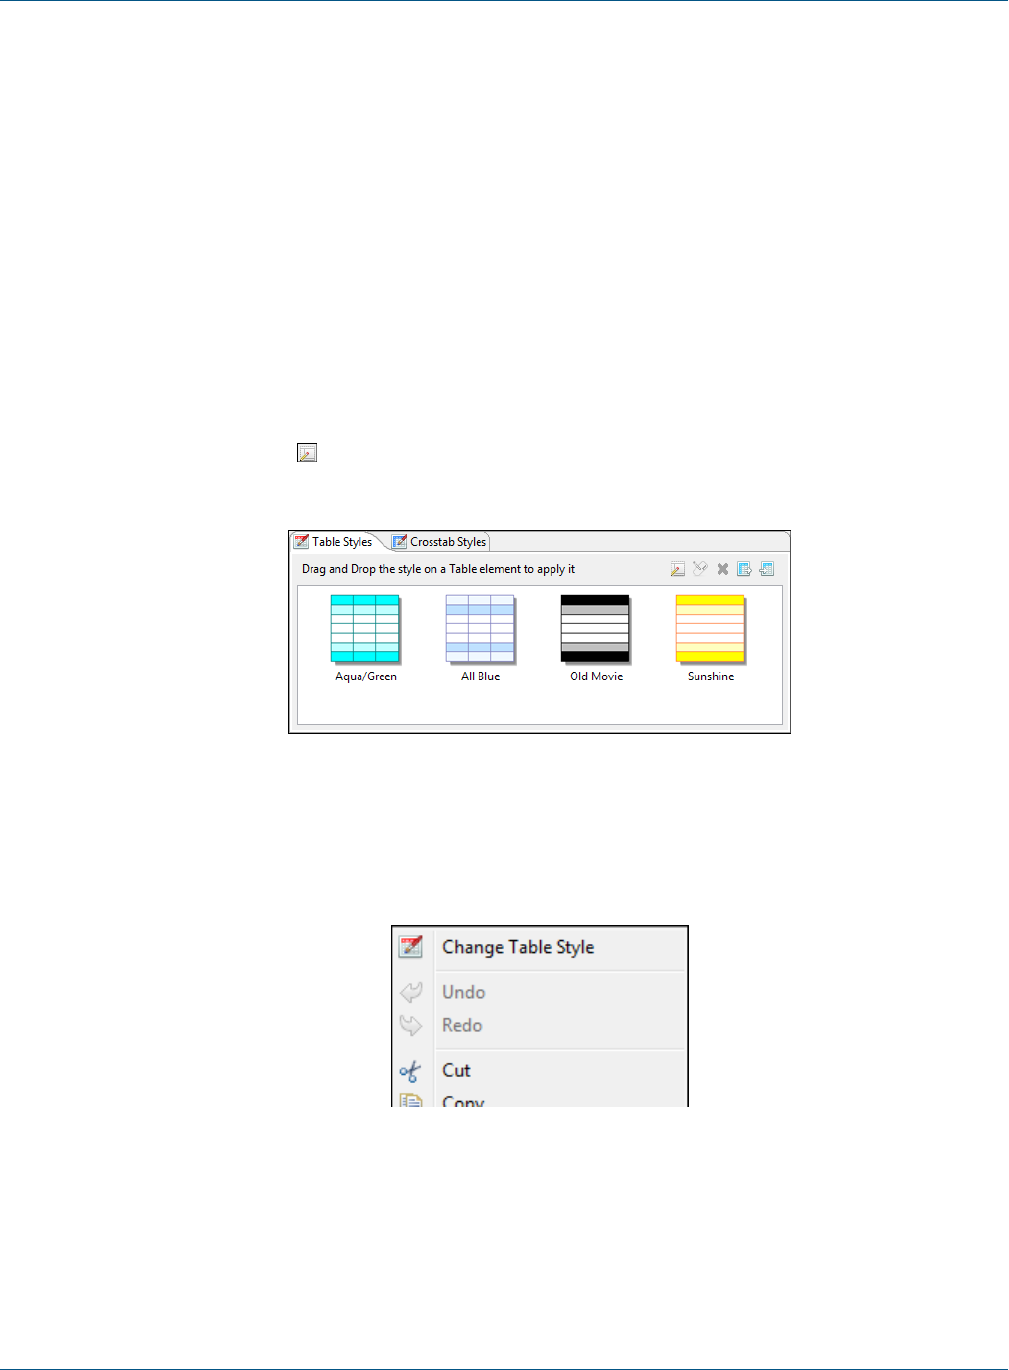
Chapter 15 Working with Tables
15.2 Editing a Table
15.2.1 Editing Table Properties
You can edit the following on the Tables tab in the Properties view:
•Name – Enter a name for the table; the name appears in the Outline view.
•Fit columns to table element – Select this to have the columns automatically stretch or shrink to fit the
table width.
•Resize the columns taking the space from the next one – Select this to configure the table so that
resizing a column by moving its border means one column grows wider and the other narrower.
15.2.2 Editing Table Styles
You can edit the look and feel of a table by choosing elements from the Table Styles tab. To create a style,
click the new style button . In the Table Wizard Layout window, you can select a style to add to your palette
or create a new style to save to your palette.
Figure 15-11 Table Styles Tab
To edit a style in the palette, double-click the style and edit it in the Layout window. You can save it either as
a new style or with the same name. To a edit table layout in the Design tab, right-click the table and choose
Change Table Style.
Figure 15-12 Change Table Style
You can also decide which table sections to create. If the dataset for the table contains groups, it can be
convenient to select the Add Group Headers and Add Group Footers check boxes.
To delete a style right click it in the Table Styles tab and choose Delete Style.
TIBCO Software Inc. 265
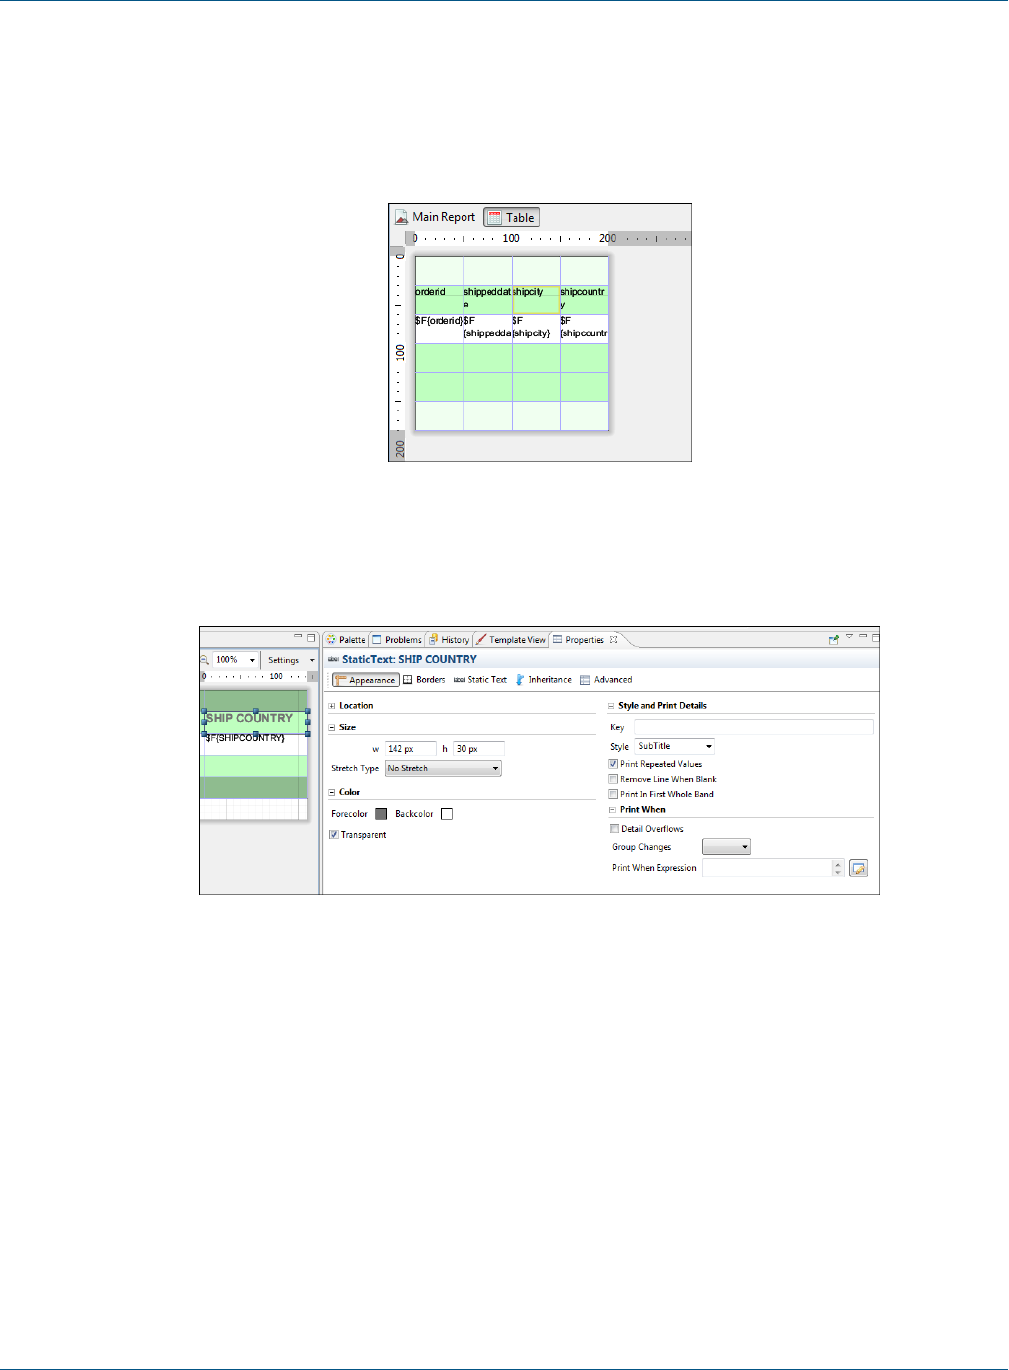
TIBCO Jaspersoft Studio User Guide
15.2.3 Editing Cell Contents
You can edit the content, style, and size of each cell or group of cells in your table.
•To edit table content, double-click your table. The table opens in a separate tab inside the Design tab for
your report.
Figure 15-13 Table Editing Tab
•To edit the content and style of a cell, click the cell. Switch to the Properties view where you can edit
location, size, color, style, and print details for the cell.
Figure 15-14 Cell with Properties View
•To edit the size and position of a cell, or copy or delete it, right-click on the cell and select an action from
the context menu.
266 TIBCO Software Inc.
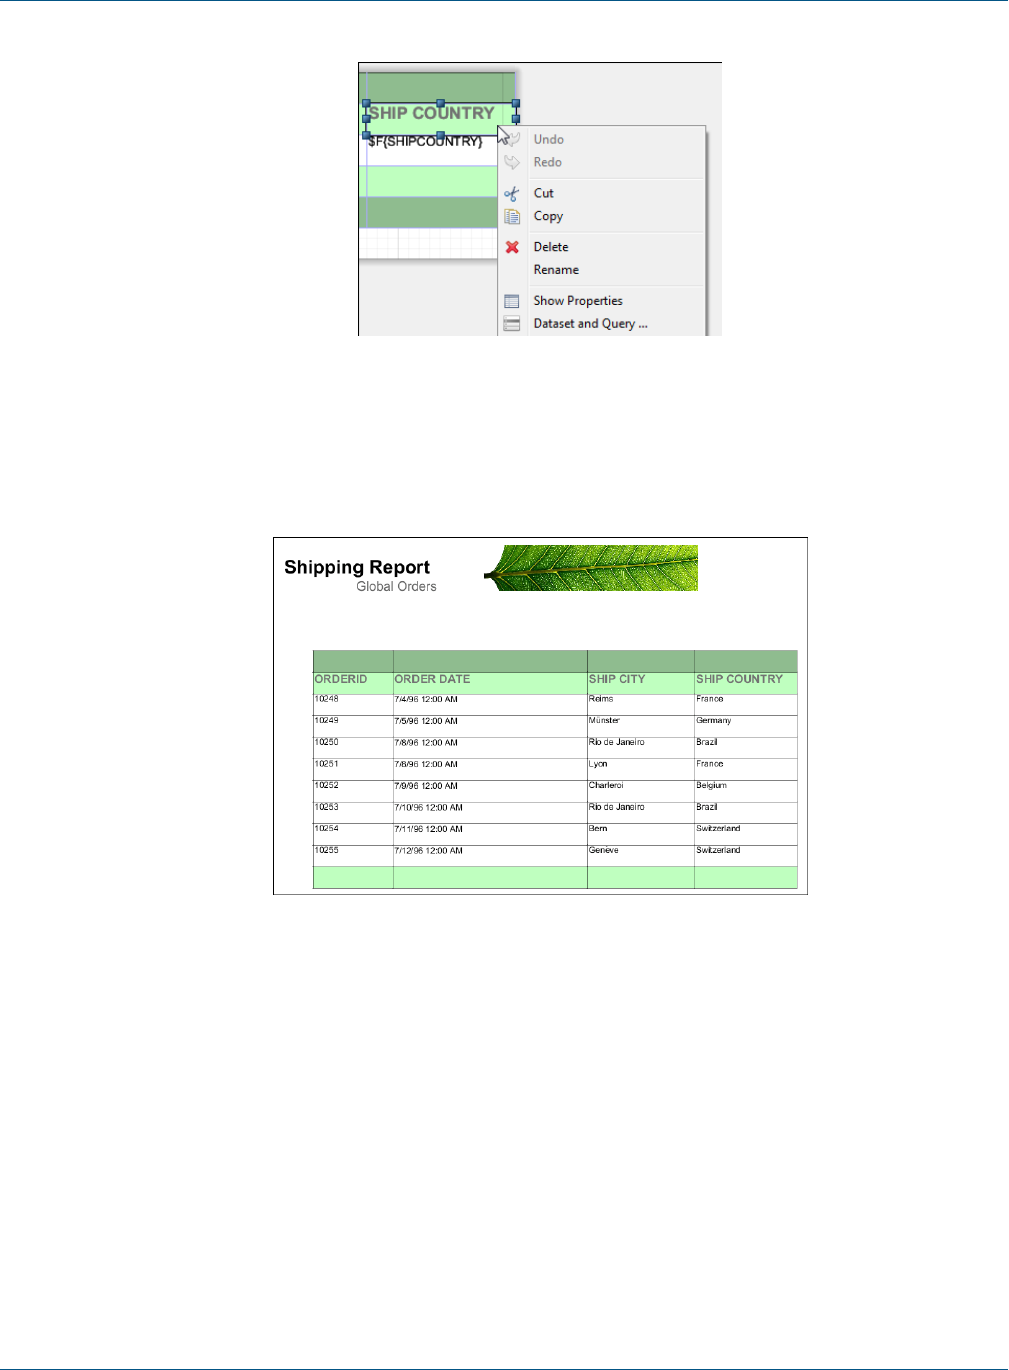
Chapter 15 Working with Tables
Figure 15-15 Cell Right-Click Menu
•Use Shift-click to select all cells in a row.
•See “Working with Columns” on page270 for information about working with columns.
The following figure is the table created in “Creating a Table” on page259, after formatting and editing:
Figure 15-16 Formatted Table
15.2.4 Editing Table Data
You can edit the dataset used for the table by right-clicking the table and selecting Dataset and Query to
display the Dataset and Query Dialog.
TIBCO Software Inc. 267
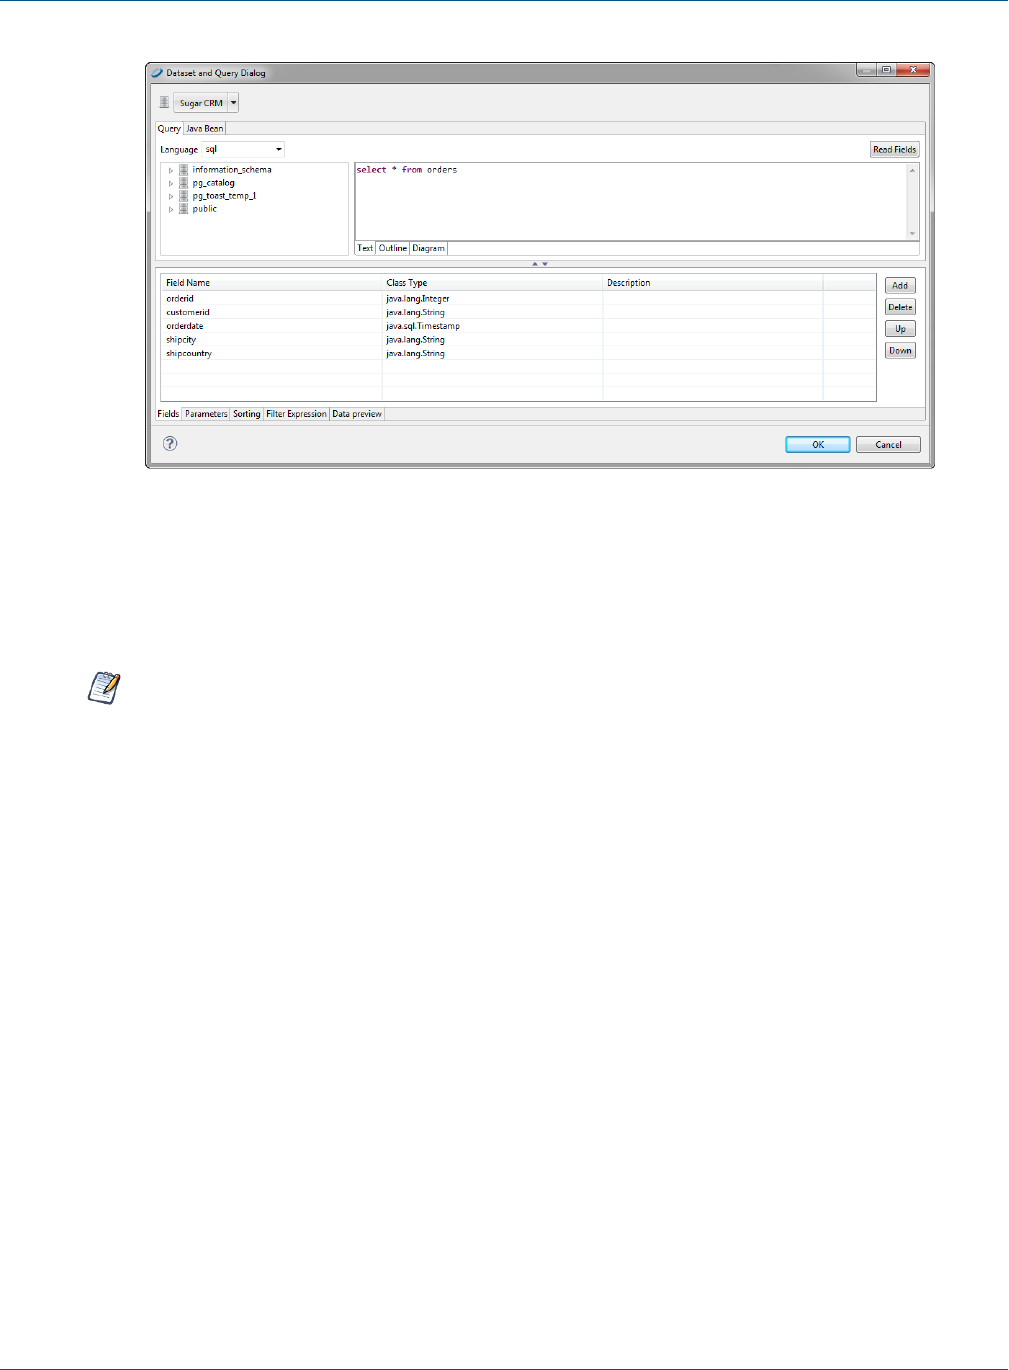
TIBCO Jaspersoft Studio User Guide
Figure 15-17 Dataset and Query Dialog
Here you can set the dataset parameters to dynamically filter the data used in the table.
Suppose, for instance, you have a report that displays order details in a table, you can use a parameter in your
SQL query to specify the order ID to filter the order details.
Unlike charts and crosstabs, a table always requires a subdataset. Tables cannot use the main dataset.
15.2.5 Editing Table Source
You can also edit tables using the Source tab. In the source the tags are labeled as follows:
•Table: External border of the table.
•Table_TH: Table header background color and cell borders.
•Table_CH: Table column background.
•Table_TD: Detailed cell style. Table_TD can be nested to display alternating background color for the
detail rows.
15.3 Table Structure
Tables consist of cells and columns. This section provides more information about working with each of these
elements.
15.3.1 Table Elements
A table must have at least one column, but it can have any number. A set of columns can collected into a
column group with a heading that spans several all those columns.
268 TIBCO Software Inc.
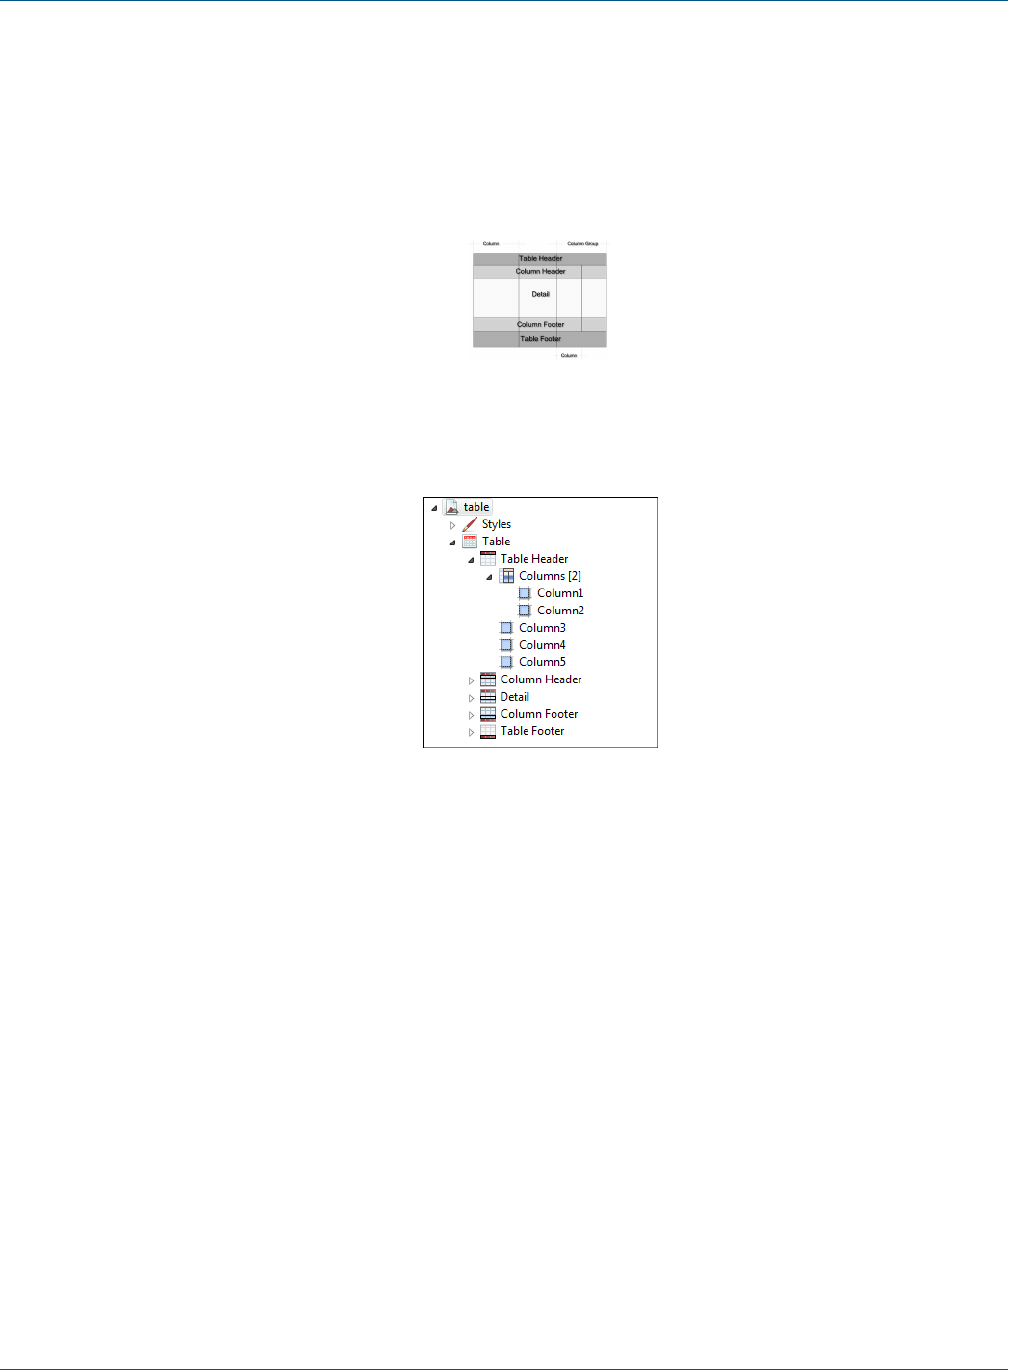
Chapter 15 Working with Tables
Each table is divided into sections similar to the main document bands:
•Table header and footer - each printed only once.
•Column header and footer - repeated on each page the table spans. For column groups, the table can
display a group header and footer section for each group and for each column.
•Detail - repeated for each record of the table. Each column contains only one detail section, and the section
cannot span multiple columns.
Figure 15-18 Table Structure
In the Outline view, table sections are shown as child nodes of the table element node.
Figure 15-19 Table in Outline View
In the Design tab, each column has a cell for each section (for example, one cell for the table header section,
another for the table footer, etc.). A cell can be undefined. If all the cells of a section are undefined, the section
is not printed. If the height of all the cells of a section is zero, the section is printed but is not visible in the
Design tab.
15.3.2 Table Cells
A cell can contain any JasperReports element. When an element is dropped on a cell, Jaspersoft Studio
automatically arranges the element to fit the cell size. To change the arrangement of the elements, right-click the
cell (or element) and select an option from the context menu. Alternatively, you can insert a frame element in
the cell and add all the required elements in that frame.
You can delete a cell by right-clicking and choosing Delete cell. If the cell is the only defined cell in the
column, the entire column is removed. Similarly, if a cell is undefined, right-click it and select Add cell to
create the cell. An undefined cell is automatically created when the user drags an element into it (see “Working
with Columns” on page270).
Edit cell properties from the Properties tab:
•The Appearance sub-tab allows you to set location, size, color, style and print details.
TIBCO Software Inc. 269
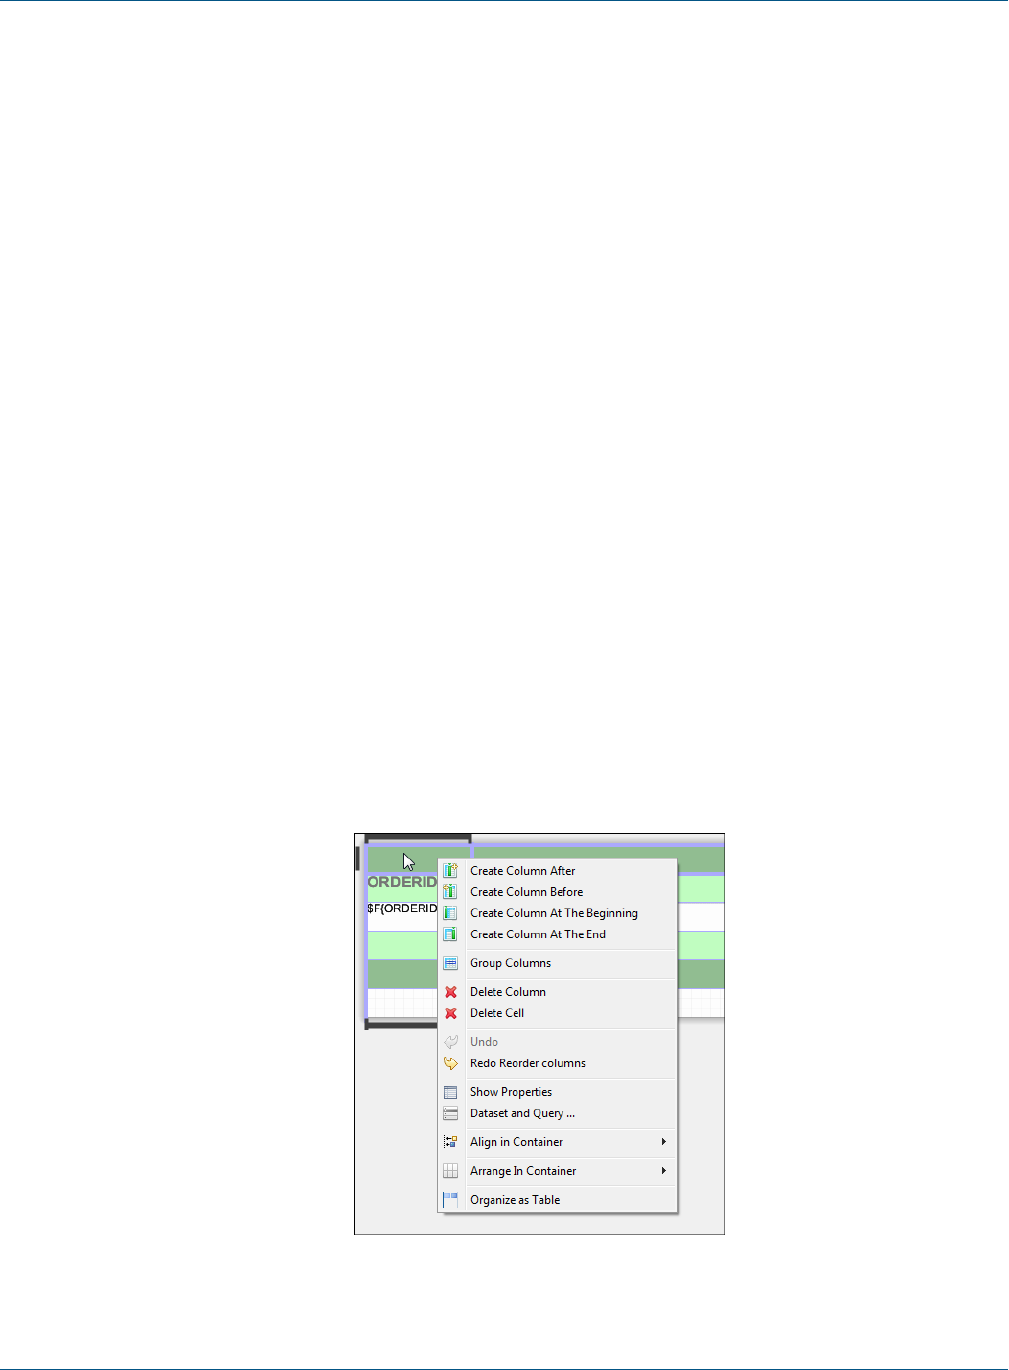
TIBCO Jaspersoft Studio User Guide
•You can set cell padding as well as borders from the Properties> Borders tab.
•Cell height defines the vertical dimension of a cell. When its value is changed, the new dimension is
propagated to all the cells in the row.
15.4 Working with Columns
There are number of tools that can help you lay out the columns of a table.
15.4.1 Table Properties for Managing Columns
Use the following settings on the Table tab in Properties view to control column behavior:
•To expand the columns to fit the table width, select Fit columns to table element.
•To configure the table so that resizing a column by moving the border means one column grows wider and
the other narrower, select Resize the columns taking the space from the next one.
15.4.2 Working with Individual Columns
To edit individual columns, double-click your table. The table opens in a separate tab inside the Design tab for
your report. Here you can do the following:
•To edit cell content, double-click on the column and enter the new content in the editor. See 15.2.3,
“Editing Cell Contents,” on page266 for more information.
•To resize a cell, click on a cell with content to display its handles, then click and drag on any handle.
•To resize a column or row, click in an empty cell in the column. The selected row and column are outlined.
Drag the outline to resize.
•To add and delete columns, click in the column header or footer. The selected row and column are outlined.
Select an option from the action menu. By default, when Jaspersoft Studio adds a column to a table, the
new column inherits the properties of the other columns.
Figure 15-20 Column Context Menu
270 TIBCO Software Inc.
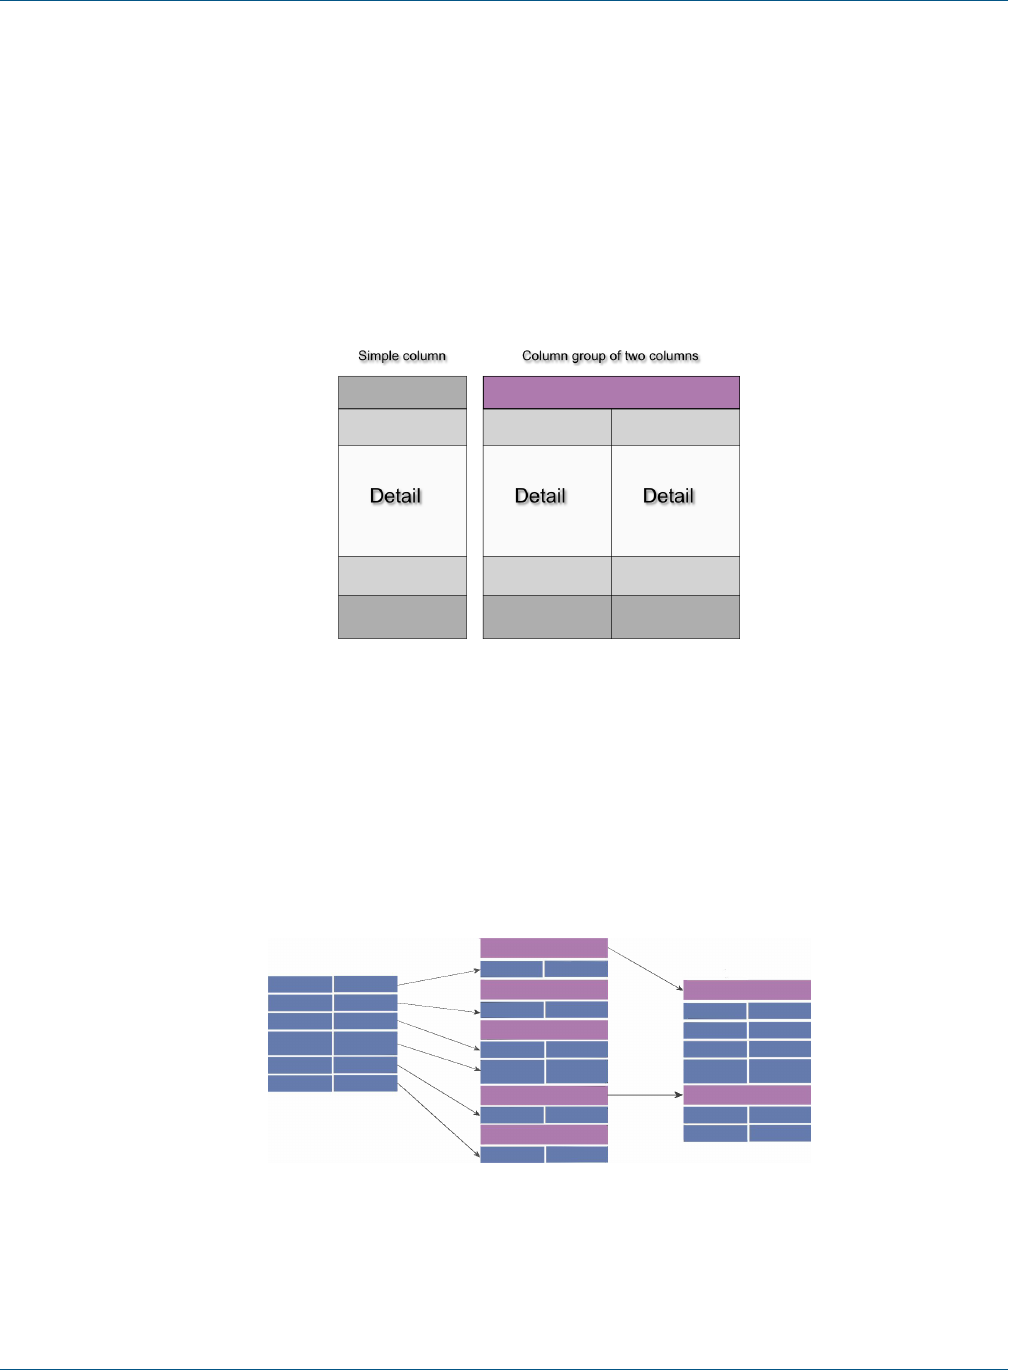
Chapter 15 Working with Tables
•Table cells are containers that can include other elements. To set a layout for the cell contents, click in the
column header or footer and select Arrange in Container from the action menu, then select a layout option.
See 4.2.4, “Positioning Elements in Containers,” on page49
•You can drag a column to any position, inside or outside a group. Move a column within the same section
by dragging the nodes that represent the columns in outline view.
15.4.3 Column Groups
A column is composed of a set of cells. If you create a column group, a column heading can span all columns in
the group. A column group can include other column groups.
Figure 15-21 Simple Column vs. Column Group
A column group acts as a single unit when you drag it. If you drag the last column out of a column group, the
column becomes a simple column and the remaining group cells are deleted.
When you create a column group, every column section gets a group heading, as shown in Figure 15-22, but
you can remove unnecessary headings. On the left of the figure there are two columns (most of the sections in
the columns have only one record; one section has two records). When the columns are grouped, each column
section gets a group heading, as shown in the center. However, most of the group headings are unnecessary, so
their heights have been set to zero to hide them, as shown on the right.
Figure 15-22 Group headings
TIBCO Software Inc. 271

TIBCO Jaspersoft Studio User Guide
272 TIBCO Software Inc.

CHAPTER 16 WORKING WITH CHARTS
The Chart element in the Palette view lets you easily add charts to your reports. In Jaspersoft Studio you can
render charts inside a report two different ways. You can use the data coming from the main dataset or use a
subdataset. This allows you to include many different charts in one document without using subreports.
When you generate a report, chart data is collected and stored within the chart's dataset.
The dataset types are:
•Pie
•Category
•Time period
•Time series
•XY
•XYZ
•High low
•Value
This chapter has the following sections:
•Creating a Simple Chart
•Setting Chart Properties
•Spider Charts
•Chart Themes
•Chart Customizers
16.1 Creating a Simple Chart
This section shows you how to use the Chart tool to build a report containing a Pie 3D chart and explore chart
configuration.
To add a chart to a report:
1. Create a new report using the Sugar CRM data source.
2. Use this query to display the count of orders in different countries:
select COUNT(*) as orders, shipcountry from orders group by shipcountry
3. Drag the fields from the Outline to the Detail band to create a small table of values to display in the chart.
TIBCO Software Inc. 273
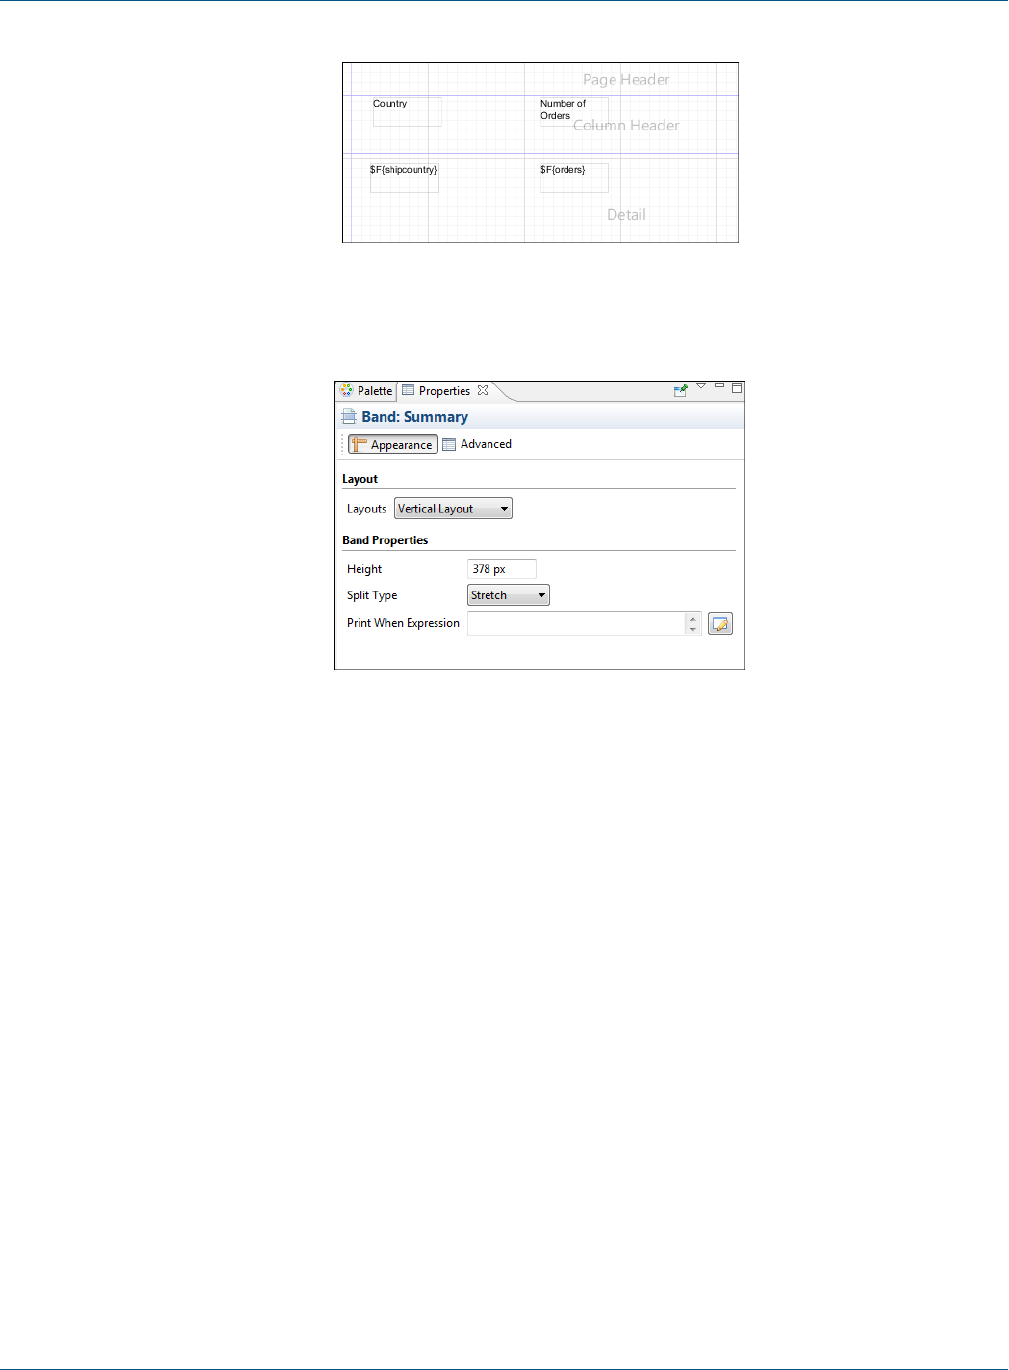
TIBCO Jaspersoft Studio User Guide
Figure 16-1 Initial Report Design
4. Expand the Summary band to 378 pixels.
Figure 16-2 Summary Band Properties
5. Drag the Chart tool from the Palette into the Summary band. The Chart Wizard opens.
274 TIBCO Software Inc.

Chapter 16 Working with Charts
Figure 16-3 Chart Wizard
6. Select the Pie 3D Chart and click Next.
7. Accept the default configuration and click Finish.
8. Expand the chart to fit the Summary band.
Figure 16-4 Chart in Summary Band
In the Design tab, the chart is a placeholder and doesn't display your data.
TIBCO Software Inc. 275
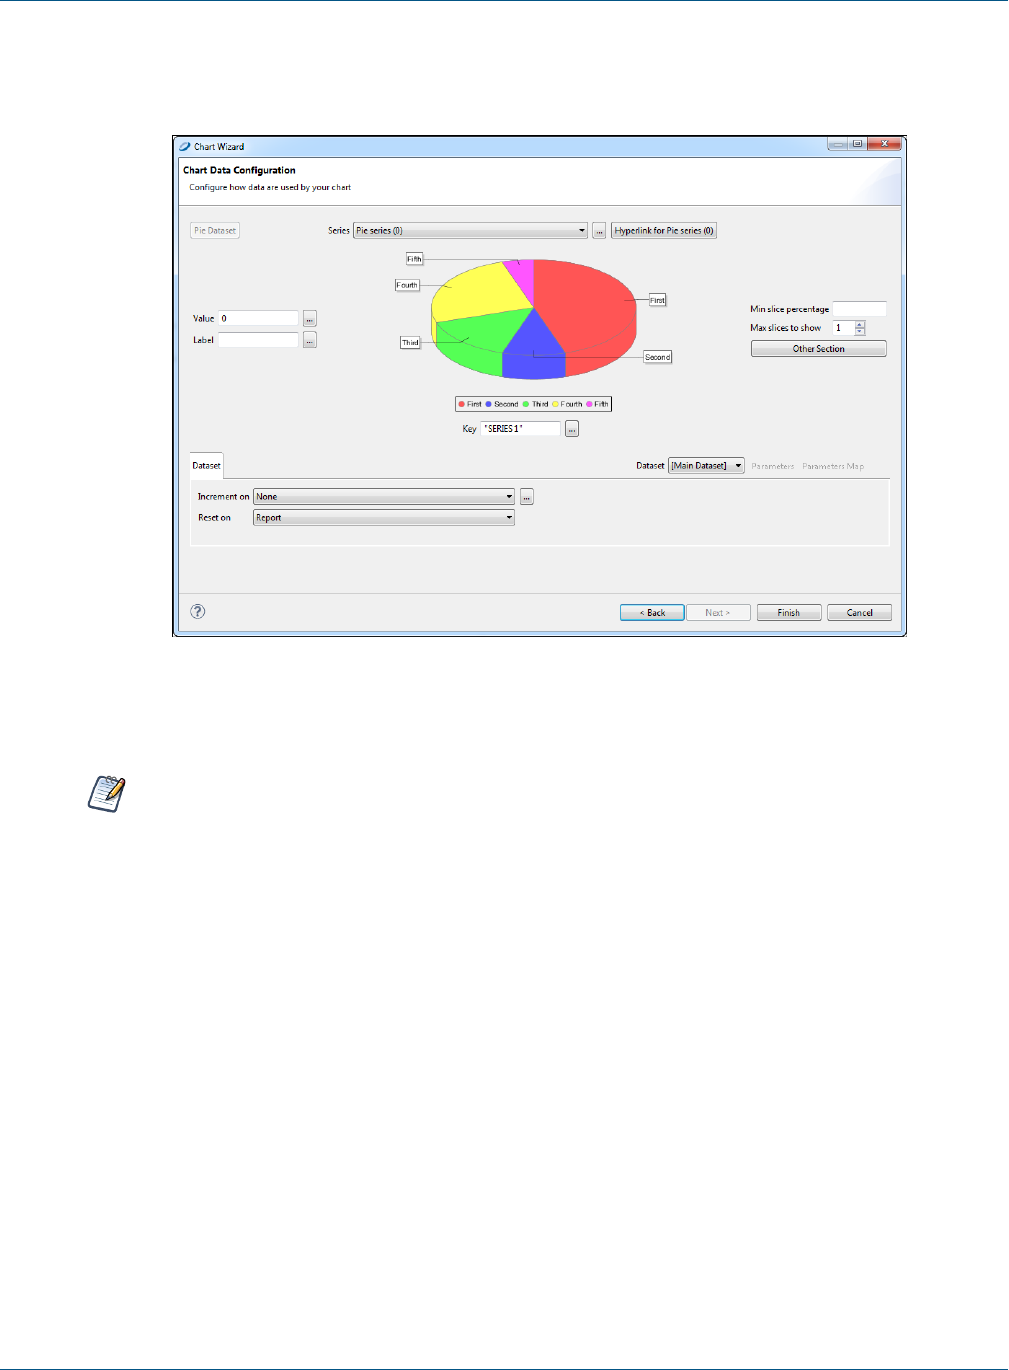
TIBCO Jaspersoft Studio User Guide
To configure a chart:
1. Double click the chart. The Chart Data Configuration window opens.
Figure 16-5 Chart Wizard - Chart Data Configuration
2. Select data to use in your chart.
The Chart Data tab shows the fields within the specified dataset. You'll find detailed descriptions of
field types and their functionality in the JasperReports Library Ultimate Guide.
3. Set 10 for Max slices to show For a chart of many slices, this field specifies the number to show. A chart
slice labeled Other contains the slices not shown.
4. On the Dataset tab, you can define the dataset within the context of the report.
You can use the Reset on controls to periodically reset the dataset. This is useful, for example, when
summarizing data relative to a special grouping. Use the Increment on control to specify the events that
trigger addition of new values to the dataset. By default, each record of the chart's dataset corresponds to a
value printed in the chart. You can change this behavior and force the engine to collect data at a specific
time (for instance, every time the end of a group is reached).
Set Reset on to Report since you don’t want the data to be reset, and leave Increment Type set to None
so that each record is appended to your dataset.
276 TIBCO Software Inc.
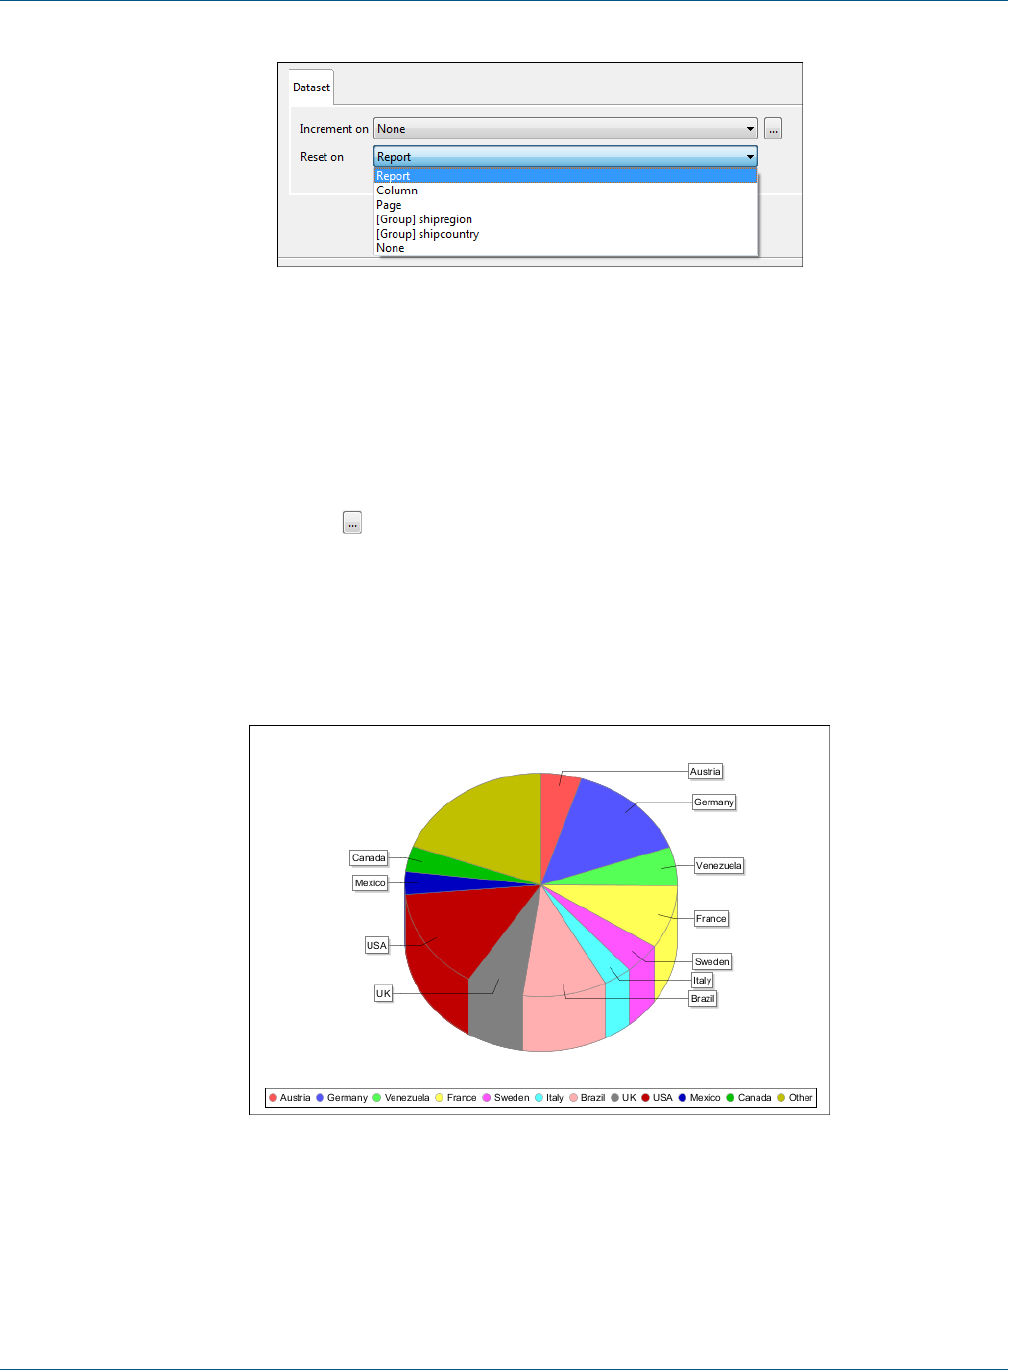
Chapter 16 Working with Charts
Figure 16-6 Dataset Tab
5. Also in the Chart Data Configuration dialog, enter an expression to associate with each value in the data
source. For a Pie 3D chart, three expressions can be entered: key,value, and label.
•Key expression identifies a slice of the chart. Each key expression must be a unique. Any repeated
key simply overwrites the duplicate key. A key can never be null.
•Value expression specifies the numeric value of the key.
•Label expression specifies the label of a pie chart slice. This is the key expression by default.
Next to each field, click the button. Enter the following:
Value:$F{orders}
Label:$F{shipcountry}
Key:$F{shipcountry}
6. Click Finish.
7. Save your report, and preview it to see the result.
Figure 16-7 Final Chart
In this chart, each slice represents a country and the shipping total for that country.
TIBCO Software Inc. 277
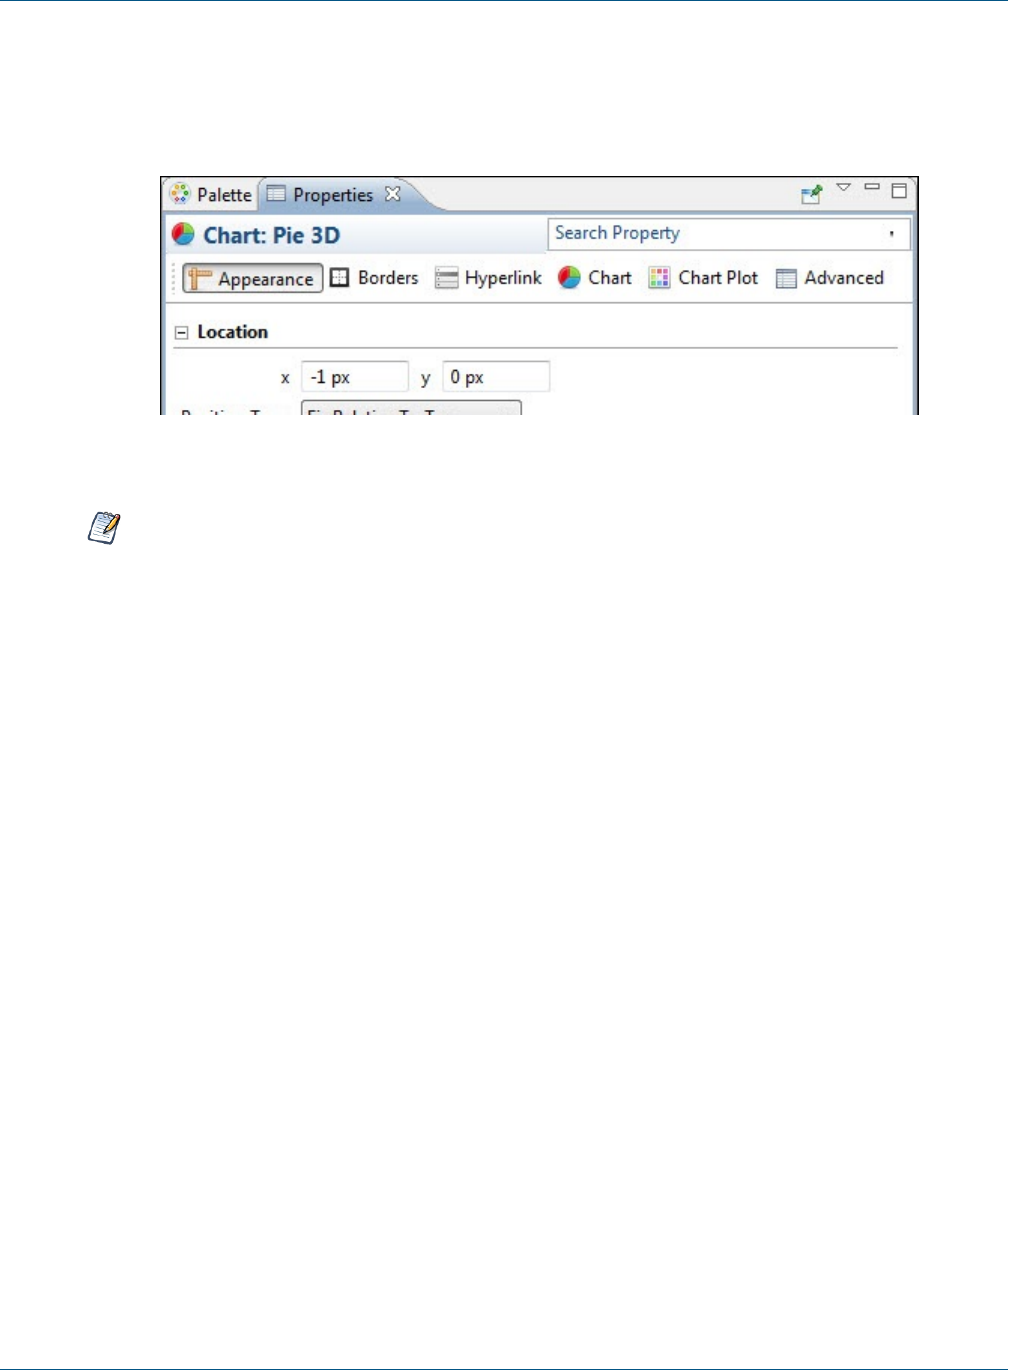
TIBCO Jaspersoft Studio User Guide
16.2 Setting Chart Properties
When you select a chart component in the Design tab, the Properties view shows Hyperlinks, Chart, and Chart
Plot tabs, in addition to the standard Appearance, Borders, and Advanced tabs.
Figure 16-8 Properties View
For more information about setting hyperlinks, see “Anchors, Bookmarks, and Hyperlinks” on page71.
JasperReports Server takes advantage of only a small portion of the capabilities of the JFreeChart library. To
customize a graph, you must write a class that implements the following interface:
net.sf.jasperreports.engine.JRChartCustomizer
The only method available from this interface is the following:
public void customize(JFreeChart chart, JRChart jasperChart);
It takes a JFreeChart object and a JRChart object as its arguments. The first object is used to actually produce
the image, while the second contains all the features you specify during the design phase that are relevant to the
customize method.
16.3 Spider Charts
Spider charts (or radar charts) are two-dimensional charts designed to plot series of values over multiple common
quantitative variables by providing an axis for each variable, arranged as spokes around a central point. The
values for adjacent variables in a single series are connected by lines. Frequently the shape created by these
lines is filled in with color.
In Jaspersoft Studio, spider charts are separate from the rest of the charts available in the Community Project,
because they're a separate component in JasperReports Library. But you use them just as other JFree Charts.
To create the report for the chart:
1. Open a new, blank report using a landscape template and the Sugar CRM database. Use the following
query:
select * from orders
Click Next.
2. Move all the fields into the right box. Click Next and Finish.
3. Delete all bands except Title and Summary.
278 TIBCO Software Inc.

Chapter 16 Working with Charts
4. Drag a Static Text element into the title bar, and name your report something like “Employee Orders by
Month and Country”.
5. Enlarge the Summary band to 350 pixels by changing the Height entry in the Band Properties view.
To create a spider chart:
1. Drag the Spider Chart element from the Palette into your report.
Figure 16-9 Spider Chart
2. Select the report in the Outline view, and in the Properties view, click the Edit query, filter, and sort
options button. The Dataset and Query dialog opens.
TIBCO Software Inc. 279
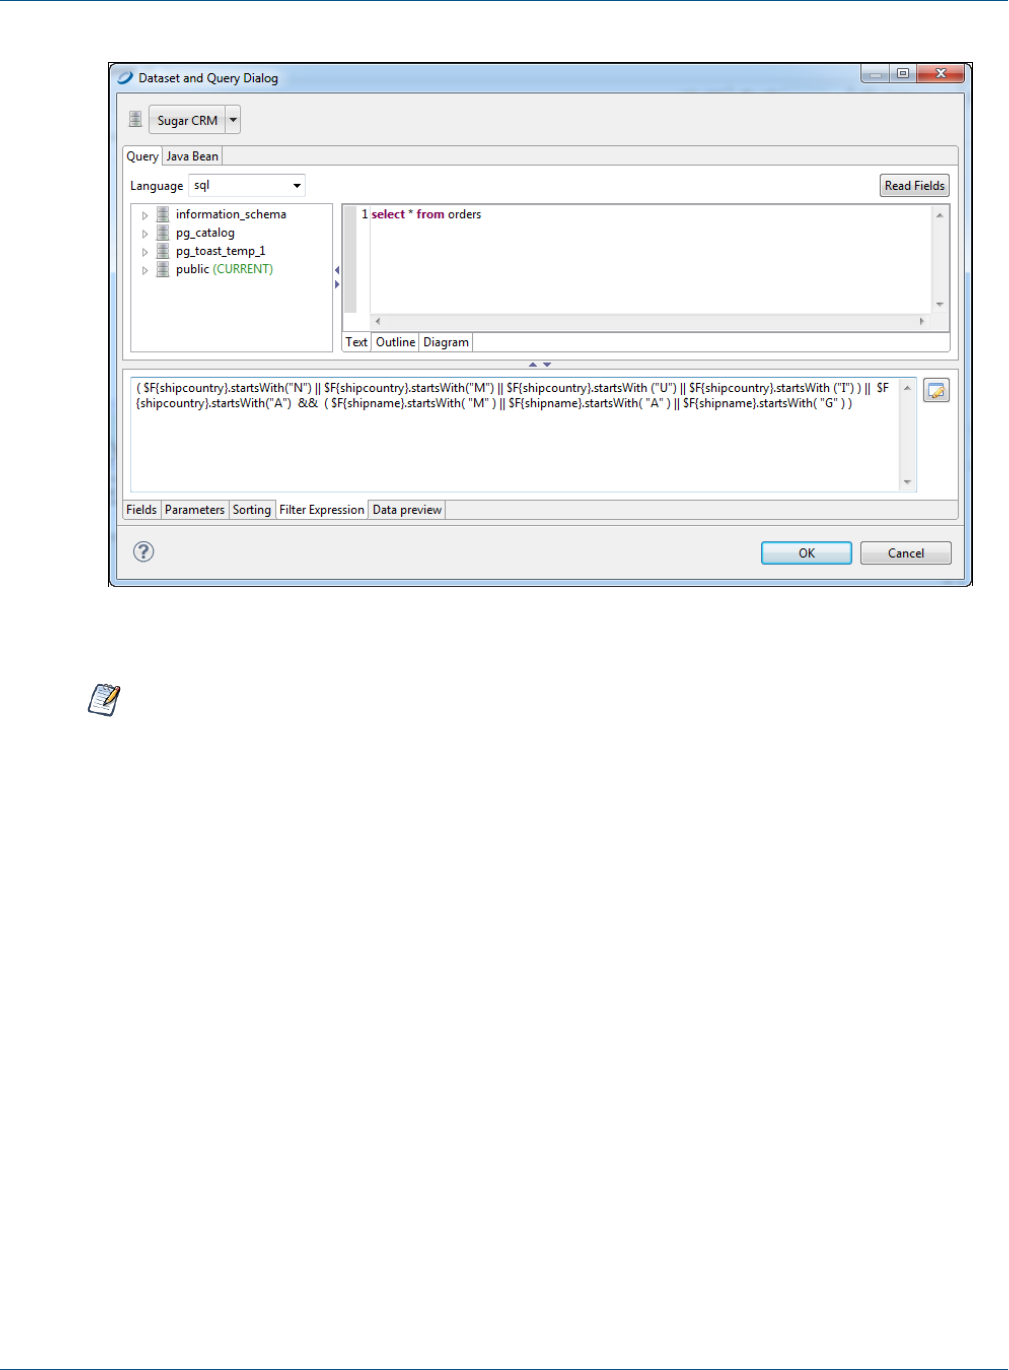
TIBCO Jaspersoft Studio User Guide
Figure 16-10 Increment Expression for Spider Chart
To filter your data in a Spider Chart, you must filter it in the Dataset and Query dialog.
3. To filter data for a more readable chart, click the Increment Expression tab and enter the expression
below with no manual line breaks, then click OK.
( $F{shipcountry}.startsWith("N") || $F{shipcountry}.startsWith("M") || $F
{shipcountry}.startsWith ("U") || $F{shipcountry}.startsWith ("I") ) || $F
{shipcountry}.startsWith("A") && ( $F{shipname}.startsWith( "M" ) || $F
{shipname}.startsWith( "A" ) || $F{shipname}.startsWith( "G" ) )
4. Double-click the chart to display the Chart Data Configuration dialog.
5. Click the Series button and create the series $F{employeeid}.
6. Click the Value button and create the value MONTH($F{orderdate}).
7. Click the Category button and create the category $F{shipcountry}.
8. Click Finish.
To customize the look of your chart:
1. Single-click your chart, and click the Properties tab.
2. Click the Legend category and select True in the Show Legend drop-down menu.
3. Use the Position drop-down, to move the legend to the left.
4. Drag a Static Text element just to the left and above the legend. Label the legend Employee Number.
5. Save your report. The Design tab should look like the following figure.
280 TIBCO Software Inc.
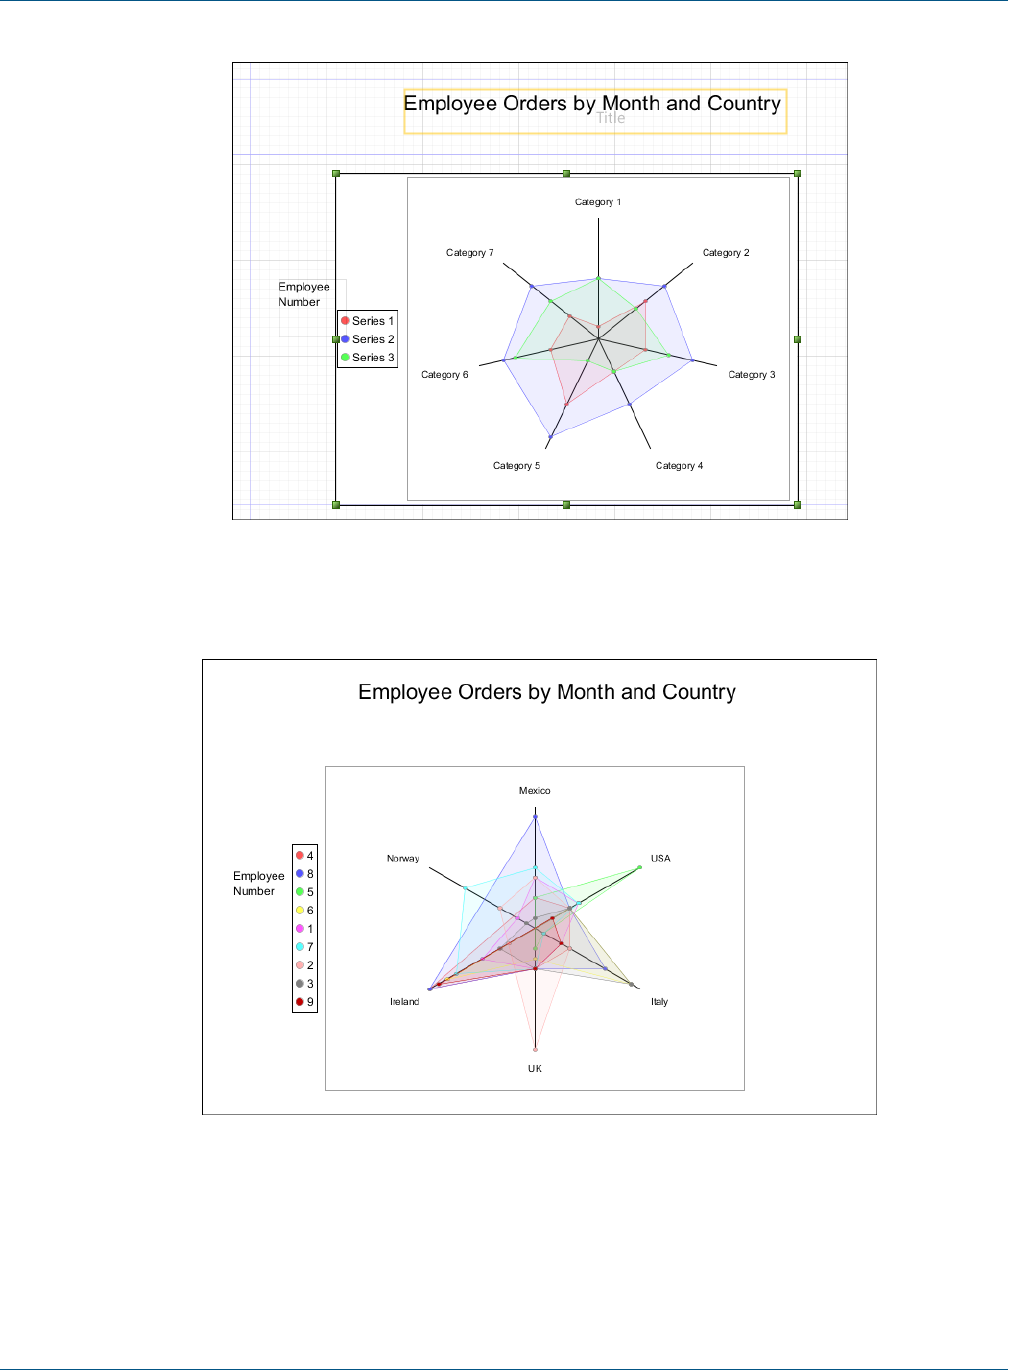
Chapter 16 Working with Charts
Figure 16-11 Spider Chart Design
6. Preview your report. It should look like the following:
Figure 16-12 Spider Chart Preview
TIBCO Software Inc. 281
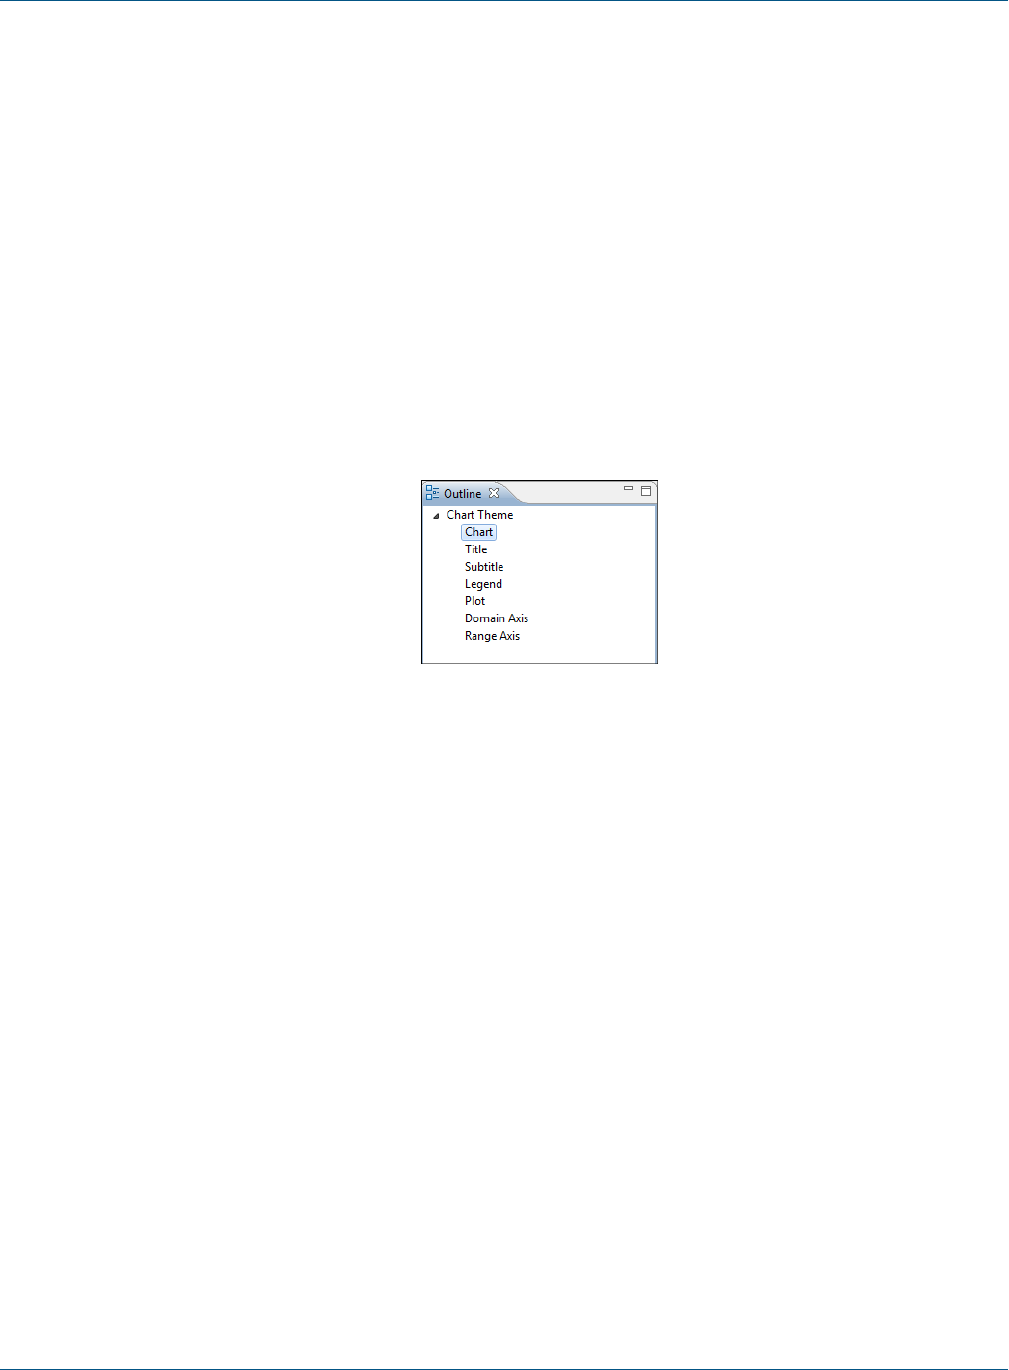
TIBCO Jaspersoft Studio User Guide
16.4 Chart Themes
Chart themes give you full control over the style of your JFree charts. You can create a chart theme and use it in
multiple reports for a uniform look. And you can update that look for all those reports simply by updating the
chart theme. Jaspersoft Studio is the supported tool for creating JFree chart themes.
To create a JasperReports chart theme:
1. Select File> New> Other to open the Select a Wizard window.
2. Select the Chart Themes wizard and click Next to open the New Chart Theme Wizard.
3. Select a folder and enter a file name for your theme. The file extension must be .jrctx.
4. Click Finish. The Chart Theme Designer opens.
16.4.1 Using the Chart Theme Designer
In the Outline view, expand the Chart Theme list to view the subsections of a theme design.
Figure 16-13 Chart Theme Designer Outline View
•Chart: Set properties for borders, color, background, and padding.
•Title: Set properties for position, color, alignment, padding, and font.
•Subtitle: Set properties for subtitles. These can be set to INHERITED on the Advanced tab.
•Legend: Specify whether to show a legend and, if so, its configuration.
•Plot: Set properties for label rotation, foreground, orientation, colors, image alignment, padding, grid lines,
chart outline, series stroke and colors, and display and tick label fonts.
•Domain Axis: Set properties for elements along the domain axis.
•Range Axis: Set properties for elements along the range axis.
Your settings are applied to all chart types. If you want to see one of the chart types close up, click that chart.
Click the close up view to all charts.
16.4.2 Editing Chart Theme XML
You can see and edit the chart theme XML from the Source tab. However, the XML appears as one long line.
It is better paste it into a text editor for editing.
16.4.3 Creating a JasperReports Extension for a Chart Theme
To be used in a report, the .jrtx file must be exported to a JasperReports extension JAR file
282 TIBCO Software Inc.
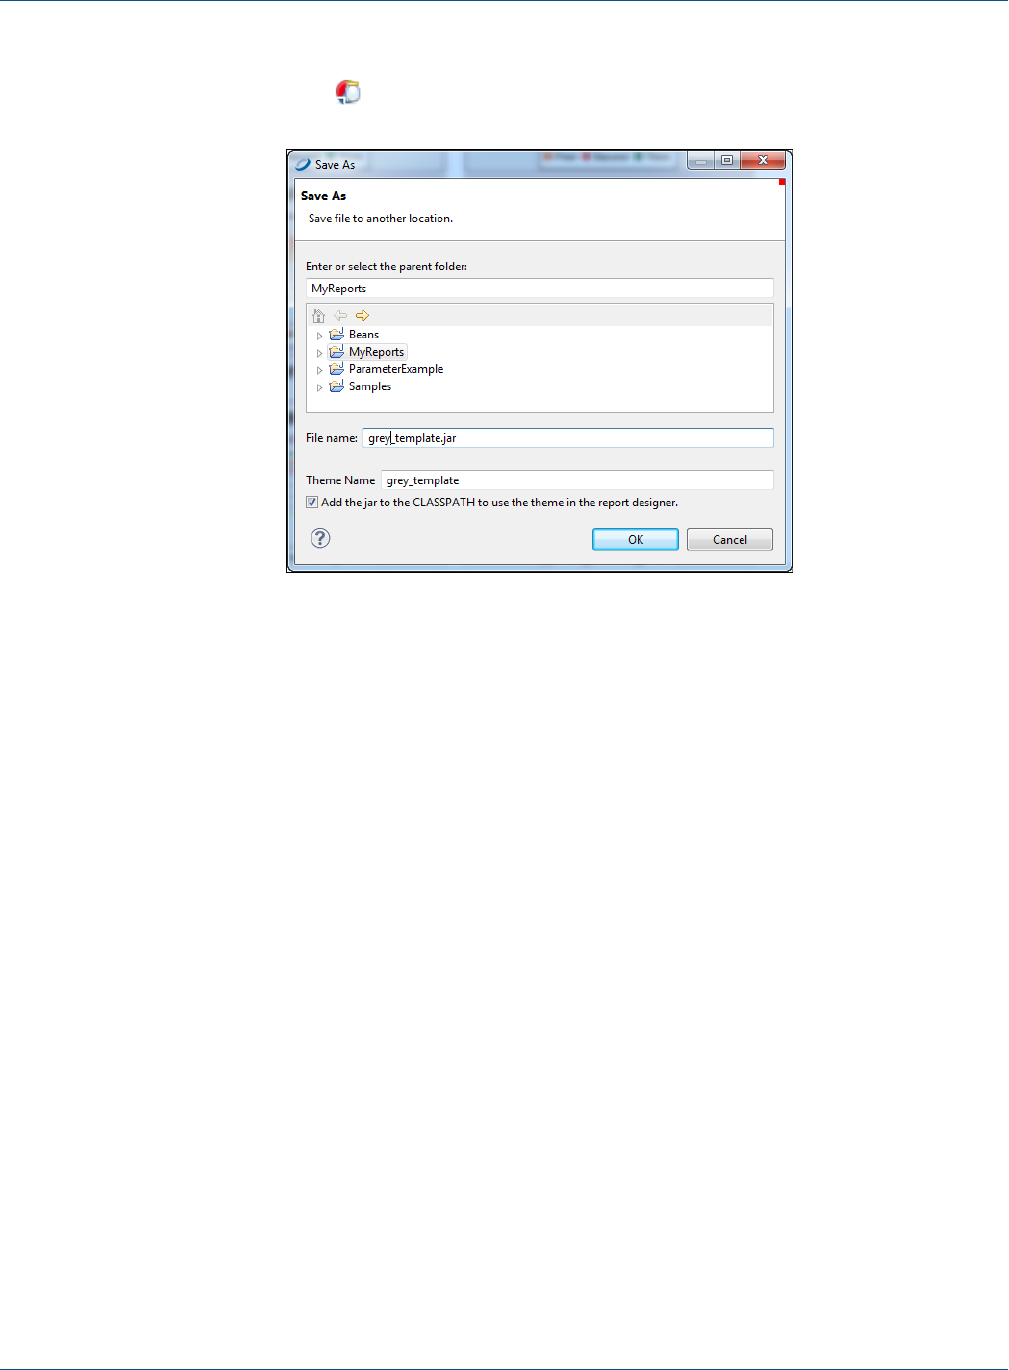
Chapter 16 Working with Charts
To export the theme as a JAR:
1. On the Preview tab, click . The Save As window opens.
Figure 16-14 Save As JAR
2. Enter or select the parent folder, name the file, and name your theme. Click OK.
A dialog indicates that the Chart Theme was generated.
16.4.4 Applying a Chart Theme
Add the theme to your class path to make it available in the list of themes.
16.5 Chart Customizers
Chart customizers are Java classes that change the appearance of charts. Chart customizers let you implement
JFreeChart functionality that has not been directly included in JasperReports. For example, you can use chart
customizer classes to change the shape of the legend icons in a chart or change the colors or pattern of the bars
in a bar chart.
Jaspersoft Studio provides a simple UI for applying chart customizers. This includes a number of out-of-the-box
customizers for common configurations as well as a mechanism to let you add your own customizers to the UI.
In addition, if you create a configurable customizer, that is, a customizer that lets the user set values in the
report rather than hard-coding them, you can create a user interface for it using a JSON file.
16.5.1 Using Chart Customizers
16.5.1.1 Adding a Chart Customizer to a Chart
To apply an existing customizer to a chart:
TIBCO Software Inc. 283
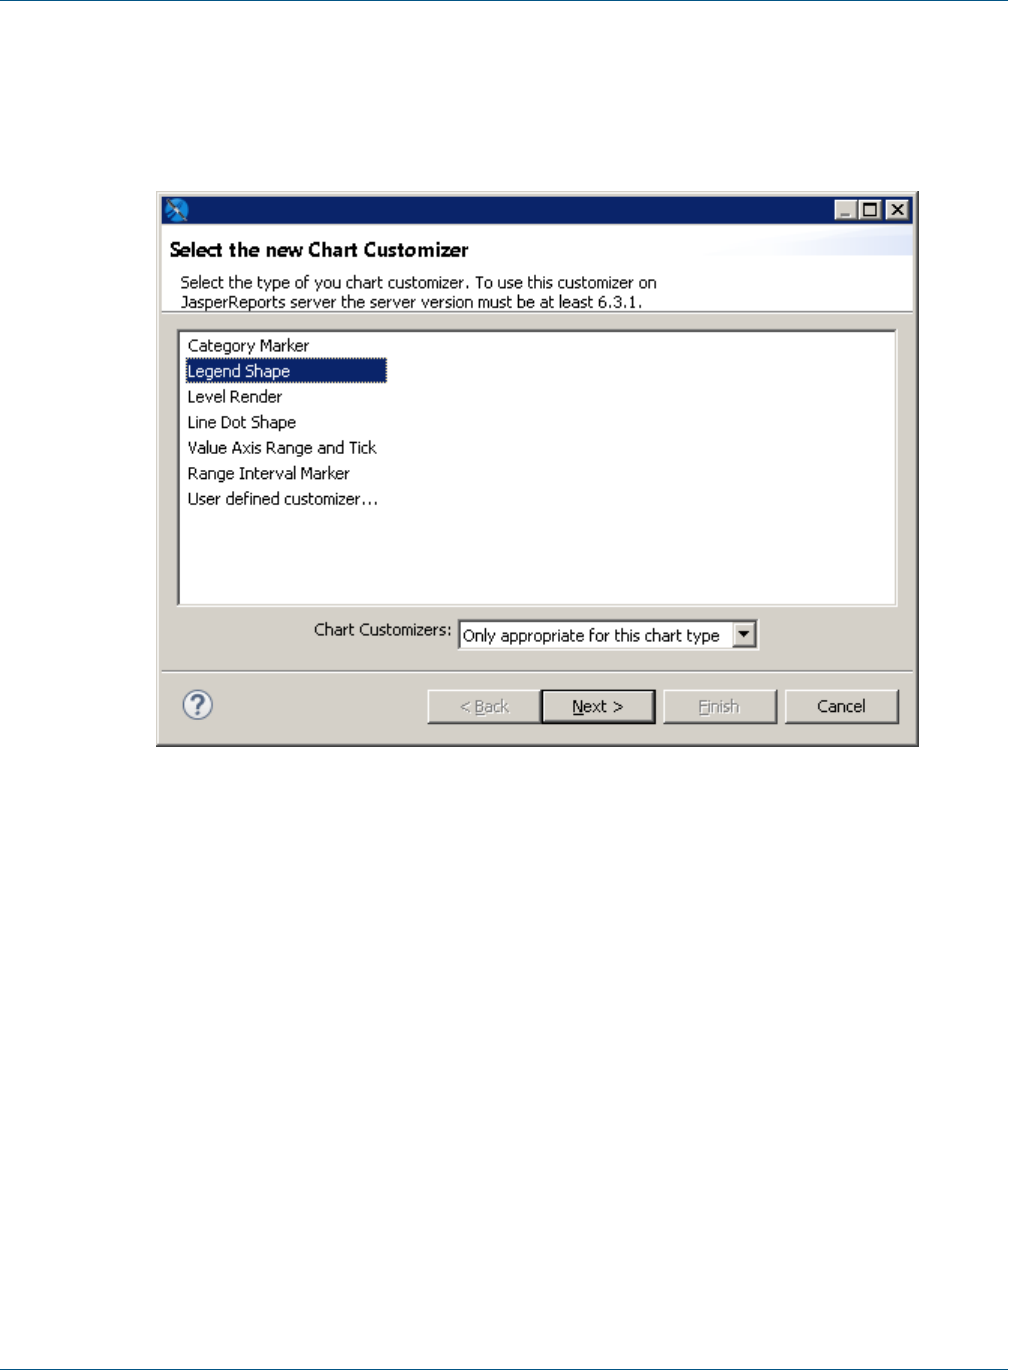
TIBCO Jaspersoft Studio User Guide
1. Select your chart in Design view.
2. On the Chart tab of Properties view, click New next to the Chart Customizers section.
The Select Chart Customizers dialog is displayed. By default, only chart customizers that support your
current chart type are shown.
Figure 16-15 Chart customizer selection dialog
3. Select a chart customizer from the list.
If the customizer is configurable and has a user interface, the Next button is available. Otherwise, the
Finish button is available.
4. Click Next if it is available.
The user interface for the customizer is displayed. For example, the interface for Legend Shape is shown
below.
284 TIBCO Software Inc.
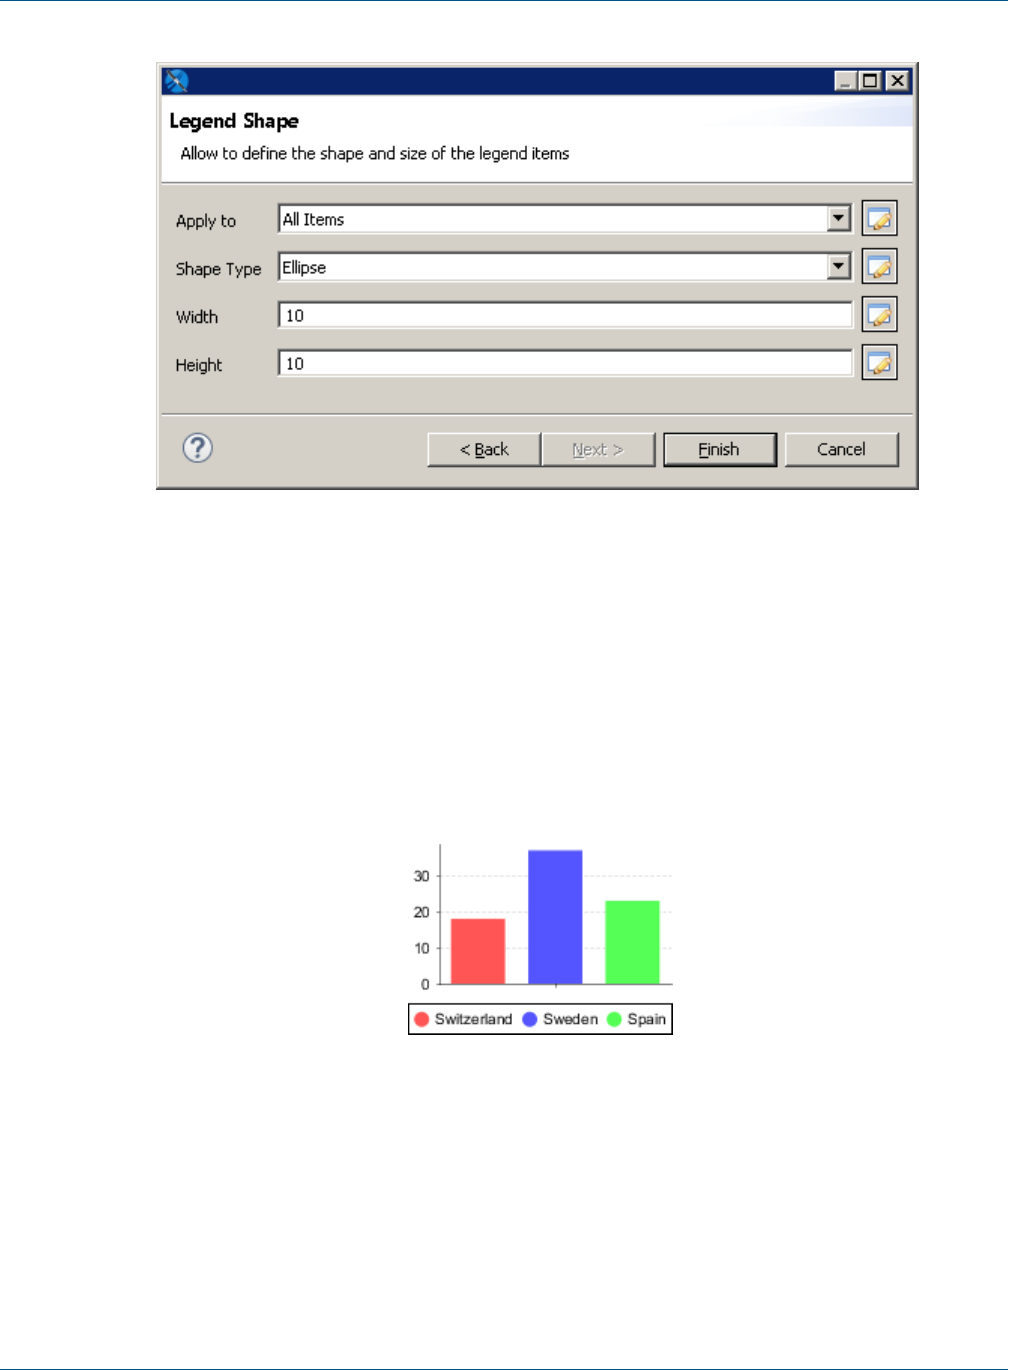
Chapter 16 Working with Charts
Figure 16-16 User interface for a chart customizer
5. Fill in the properties as prompted by the user interface. For example, the following values for Legend Shape
change the legend to an circle:
•Apply to – All Items
•Shape Type – Ellipse
•Width – 10
•Height – 10
6. Click Finish.
The customizer selection dialog box is closed and the customizer is applied to your chart. Click Preview to
view your chart.
Figure 16-17 Result of chart customizer
16.5.1.2 Adding a Customizer to a Chart in Earlier Versions of Jaspersoft Studio
You can add a customizer to a chart in an earlier version of Jaspersoft Studio using advanced properties. You
cannot add more than one customizer and the customizer cannot be configurable. For more information about
creating a customizer jar, see 16.5.2, “Creating a Chart Customizer,” on page286:
1. Add the customizer jar to your classpath.
2. Select the chart in Design view.
TIBCO Software Inc. 285

TIBCO Jaspersoft Studio User Guide
3. In the Advanced tab of Properties view, click …next to Common Chart Properties> Customizer
Class.
The Open Type dialog is displayed.
4. Enter the name of your class in the Open Type dialog and click OK.
16.5.2 Creating a Chart Customizer
To create a chart customizer, you must extend or implement JRAbstractChartCustomizer, which defines a
customize method that takes a JFreeChart object and a JasperReports chart object as parameters. The
customize method lets you access the settings for a chart. You can also create configurable chart customizers.
JasperReports Library provides customizer classes that extend JRAbstractChartCustomizer, which you can
use for your chart customizers. To see the available customizer classes, see the Javadoc for the JasperReports
Library API. You can also download the JasperReports Library source and look at the samples in the
demo/samples/chartcustomizer directory.
Jaspersoft Studio uses a JSON descriptor format to register certain components and optionally create a UI for the
component. This framework is used for JFreeChart customizers as well as being used internally.
16.5.2.1 Example of Creating a Customizer Class
The following example shows a customizer, RangeAxisCustomizerSample, and a JSON file for the user
interface. This example allows the user to set the maximum and minimum values on the X and Y axis and to set
the interval for the ticks on the Y axis.
To use this customizer in a report:
1. Create and compile the customizer and add the jar to your classpath. For information about compiling your
files with Jaspersoft Studio and Eclipse, see 24.8, “Working with Java in Eclipse,” on page427.
2. Create a JSON file that references your customizer and defines its UI.
3. Add the JSON file to the Jaspersoft Studio user interface.
To create the example customizer class:
A customizer class takes two arguments, a JFreeChart and a JasperReports Chart object. The
RangeAxisCustomizerSample customizer extends the AbstractAxisCustomizer class, which is an extension
of JRAbstractChartCustomizer for working with axis properties. AbstractAxisCustomizer exposes three
constants for a chart axis: the minimum and maximum values on the Y axis and the spacing of the ticks on the
Y-axis display:
public static final String PROPERTY_MIN_VALUE = "minValue";
public static final String PROPERTY_MAX_VALUE = "maxValue";
public static final String PROPERTY_TICK_UNIT = "tickUnit";
Table 16-1 Constants in AbstractAxisCustomizer class
A chart customizer defines a customize method that takes a JFreeChart object and a JRChart object. The
customize method can access chart settings and make changes to them. During report execution, JasperReports
calls the customize method for the chart and applies the settings, along with the settings from the JSON file.
RangeAxisCustomizerSample is as shown below.
286 TIBCO Software Inc.

Chapter 16 Working with Charts
package com.jaspersoft.studio.sample.customizer;
import org.jfree.chart.JFreeChart;
import org.jfree.chart.axis.NumberAxis;
import org.jfree.chart.axis.ValueAxis;
import org.jfree.chart.plot.CategoryPlot;
import org.jfree.chart.plot.XYPlot;
import net.sf.jasperreports.customizers.axis.AbstractAxisCustomizer;
import net.sf.jasperreports.engine.JRChart;
/**
* Customizer to define the minimum and maximum value of the domain axis, works for
* XY plot
*/
public class RangeAxisCustomizerSample extends AbstractAxisCustomizer
{
@Override
public void customize(JFreeChart jfc, JRChart jrc)
{
ValueAxis valueAxis = null;
if ((jfc.getPlot() instanceof XYPlot))
{
valueAxis = jfc.getXYPlot().getRangeAxis();
}
else if (jfc.getPlot() instanceof CategoryPlot)
{
valueAxis = jfc.getCategoryPlot().getRangeAxis();
}
if (valueAxis != null)
{
configValueAxis(valueAxis, PROPERTY_MIN_VALUE, PROPERTY_MAX_VALUE);
if (valueAxis instanceof NumberAxis)
{
configNumberAxis((NumberAxis)valueAxis, PROPERTY_TICK_UNIT);
}
}
}
}
Table 16-2 RangeAxisCustomizerSample
Example of a JSON file for the user interface:
The following JSON file lets a user enter values for the configurable properties in
RangeAxisCustomizerSample. The JSON file uses the generic framework for the Jaspersoft Studio user
interface.
{
"label": "Range Axis Range and Tick - Sample",
"description": "Customizer to set the range for the axes and the tick spacing for an axis chart.",
"customizerClass": "com.jaspersoft.studio.sample.customizer.RangeAxisCustomizerSample",
"supportedPlot": ["13","14","15"],
TIBCO Software Inc. 287
TIBCO Jaspersoft Studio User Guide
"sections": [
{
"name": "Customizer configuration",
"expandable": false,
"properties": [
{
"name": "minValue",
"label": "Range Min",
"description": "The minimum value on the axis",
"mandatory": false,
"readOnly": false,
"type": "double"
},
{
"name": "maxValue",
"label": "Range Max",
"description": "The maximum value on the axis",
"mandatory": false,
"readOnly": false,
"type": "double"
},
{
"name": "tickUnit",
"label": "Distance",
"description": "The space between ticks.",
"mandatory": false,
"defaultValue": "1",
"readOnly": false,
"type": "double"
}
]
}
]
}
A JSON file for a chart customizer has the following members:
•label – Name for the customizer in the chart customizer selection dialog box.
•description – Text that appears upon hover.
•customizerClass – Full class name of your customizer.
•supportedPlot – Array of chart types supported by the customizer. Chart types are designated by a
numeric code, shown in the following table.
Chart Type Code in JasperReports
CHART_TYPE_AREA 1
CHART_TYPE_BAR3D 2
CHART_TYPE_BAR 3
CHART_TYPE_BUBBLE 4
Table 16-3 Chart Codes for supportedPlot in JSON Files
288 TIBCO Software Inc.
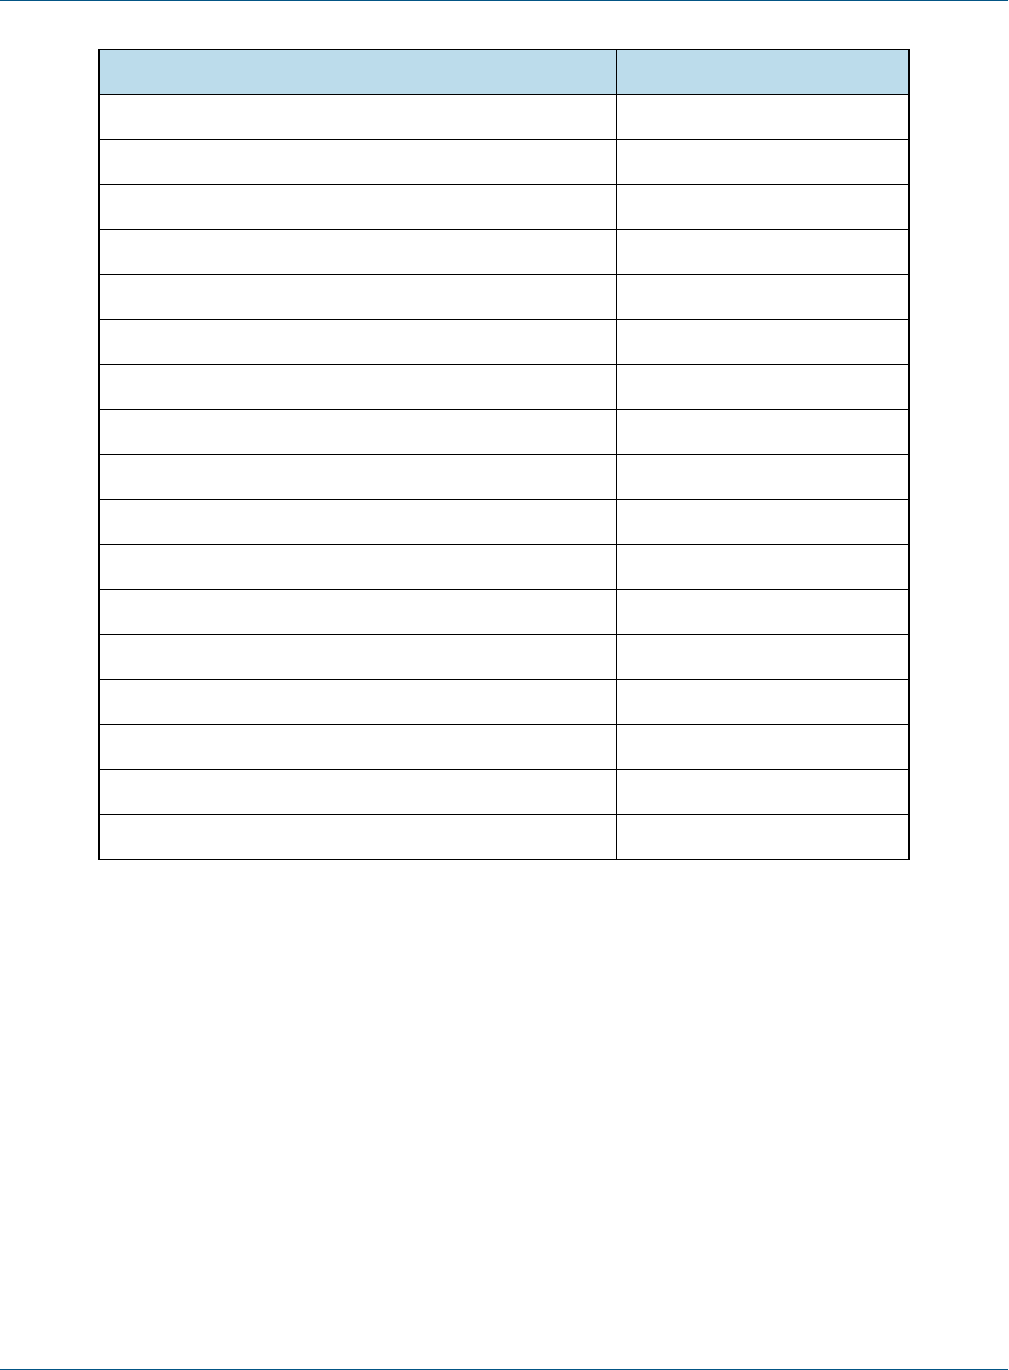
Chapter 16 Working with Charts
Chart Type Code in JasperReports
CHART_TYPE_CANDLESTICK 5
CHART_TYPE_HIGHLOW 6
CHART_TYPE_LINE 7
CHART_TYPE_PIE3D 8
CHART_TYPE_PIE 9
CHART_TYPE_SCATTER 10
CHART_TYPE_STACKEDBAR3D 11
CHART_TYPE_STACKEDBAR 12
CHART_TYPE_XYAREA 13
CHART_TYPE_XYBAR 14
CHART_TYPE_XYLINE 15
CHART_TYPE_TIMESERIES 16
CHART_TYPE_METER 17
CHART_TYPE_THERMOMETER 18
CHART_TYPE_MULTI_AXIS 19
CHART_TYPE_STACKEDAREA 20
CHART_TYPE_GANTT 21
•sections – Property that controls the display of the user interface. Has the following attributes:
•name – Name for the user interface dialog box.
•expandable – Boolean; for chart customizers, always set to false.
•properties – Attribute that contains sections to define each entry box in the user interface. Each entry
box has the following attributes:
•name – Name of the argument to pass to the customizer class.
•label – Name that appears in the user interface.
•description – Tooltip that appears on hover.
•mandatory – Boolean. When true, the property is required; when false, property is optional.
•readOnly – Sets attribute as read-only. Not used for chart customizers.
•type – Type of the attribute, as expected by the customizer class.
•defaultValue (optional) – Default value for an optional property.
TIBCO Software Inc. 289

TIBCO Jaspersoft Studio User Guide
To add a non-configurable customizer, use an empty list for the properties. For example:
"sections": [
{
"name": "Customizer configuration",
"expandable": false,
"properties": []
}
]
To add a JSON UI definition file to the Report Designer:
1. Select Window> Preferences (Eclipse> Preferences on Mac).
2. In the Preferences dialog, select Jaspersoft Studio> Report Designer> Chart Customizers.
3. Click Add.
4. In the Select Destination Dialog, browse to the location of your JSON file.
5. Click OK.
6. Click OK again to close the Preferences dialog.
290 TIBCO Software Inc.

CHAPTER 17 HTML5 CHARTS IN COMMERCIAL EDITIONS
All editions of Jaspersoft Studio include basic charting functionality in the form of JFree Charts. Commercial
editions provide more advanced HTML5 charts implemented through Highcharts. Written in pure HTML5 and
JavaScript, Highcharts offer sophisticated, interactive charts that animate automatically. Jaspersoft Studio
currently supports many of the charts available in the Highcharts library.
This section describes functionality that can be restricted by the software license for Jaspersoft Studio. If
you don’t see some of the options described in this section, your license may prohibit you from using
them. To find out what you're licensed to use, or to upgrade your license, contact Jaspersoft.
The HTML5 Chart Edit dialog has two configuration views: simple and advanced.
•Simple view lets you quickly configure your categories, measure, and series contributor
•Advanced view gives you more control and access to advanced features.
You can also preview a chart from the chart dialog by clicking in the HTML5 Chart Edit dialog.
This chapter has the following sections:
•Overview of HTML5 Charts
•Example of a Bar Chart Using Simple Configuration
•Example of a Pie Chart
•Example of a Time-Series Spline Chart
•Example of a Tree Map Using Multiple Levels and Advanced Formatting
•Example of a Scatter Chart Using Advanced Configuration
•Example of a Column-Spline Chart
•Creating Hyperlinks in HTML5 Charts
•Advanced Formatting of HTML5 Charts
•Setting Advanced Options for HTML5 Charts in Properties View
For details about charts implemented through JFreeCharts, see “Working with Charts” on page273.
17.1 Overview of HTML5 Charts
HTML5 charts are a flexible, interactive way to explore your data graphically. You can choose different levels
of aggregation for rows and columns and create attractive interactive reports.
TIBCO Software Inc. 291

TIBCO Jaspersoft Studio User Guide
The following terminology is used to describe HTML5 charts:
•Values: Static properties.
•Expressions: Dynamic properties.
•Categories: Rows. In a pie chart, the categories are the slices.
•Levels: Some chart types let you add multiple categories or series ranked hierarchically, with the topmost
category set as Level 1. When you export a chart with multiple levels to JasperReports Server, users see a
slider which they can use to select the level of aggregation. For example, you might have a chart that has
three categories — Country, Region, and City — and users can choose a level for viewing the data.
•Measures: Measures contain summarized values. They are typically numeric fields that determine the
length of bars, size of pie slices, location of points (in line charts), or the height of areas.
•Series Contributors: In the Design tab, these are defined at the measure level. In JRXML these are
defined as Series.
In HTML5 Charts Jaspersoft Studio are similar to Ad Hoc charts in JasperReports Server.
Before you add a chart to your report, consider the best way to display your data. The following table describes
the available chart types.
Icon Description
Column charts - Compare values displayed as columns
Column. Multiple measures of a group are depicted as individual columns.
Stacked Column. Multiple measures of a group are depicted as portions of a single
column whose size reflects the aggregate value of the group.
Percent Column. Multiple measures of a group are depicted as portions of a single
column of fixed size representing 100% of the amounts for a category. Used when you
have three or more data series and want to compare distributions within categories and
at the same time display the differences between categories.
Bar charts - Compare values displayed as bars
Bar. Graphically summarize and display categories of data to let users easily compare
amounts or values among categories.
Table 17-1 HTML5 Chart Types
292 TIBCO Software Inc.

Chapter 17 HTML5 Charts in Commercial Editions
Icon Description
Stacked Bar. Multiple measures of a group are depicted as portions of a single bar
whose size reflects the aggregate value of the group.
Percent Bar. Multiple measures of a group are depicted as portions of a single bar of
fixed size representing 100% of the amounts for a category. Used when you have three
or more data series and want to compare distributions within categories and at the
same time display the differences between categories.
Line charts - Compare values displayed as points connected by lines
Line. Displays data points connected with straight lines, typically to show trends.
Spline. Displays data points connected with a fitted curve. Allow you to take a limited
set of known data points and approximate intervening values.
Stacked Line. Displays series as a set of points connected by a line. Values are
represented on the y-axis and categories are displayed on the x-axis. Lines do not
overlap because they are cumulative at each point.
Stacked Spline. Displays series as a set of points connected with a fitted curve. Values
are represented on the y-axis and categories are displayed on the x-axis. Lines do not
overlap because they are cumulative at each point
Percent Line. A variation of a line chart in which each series adjoins but does not
overlap the preceding series.
Percent Spline. A variation of a spline chart in which each series adjoins but does not
overlap the preceding series.
TIBCO Software Inc. 293
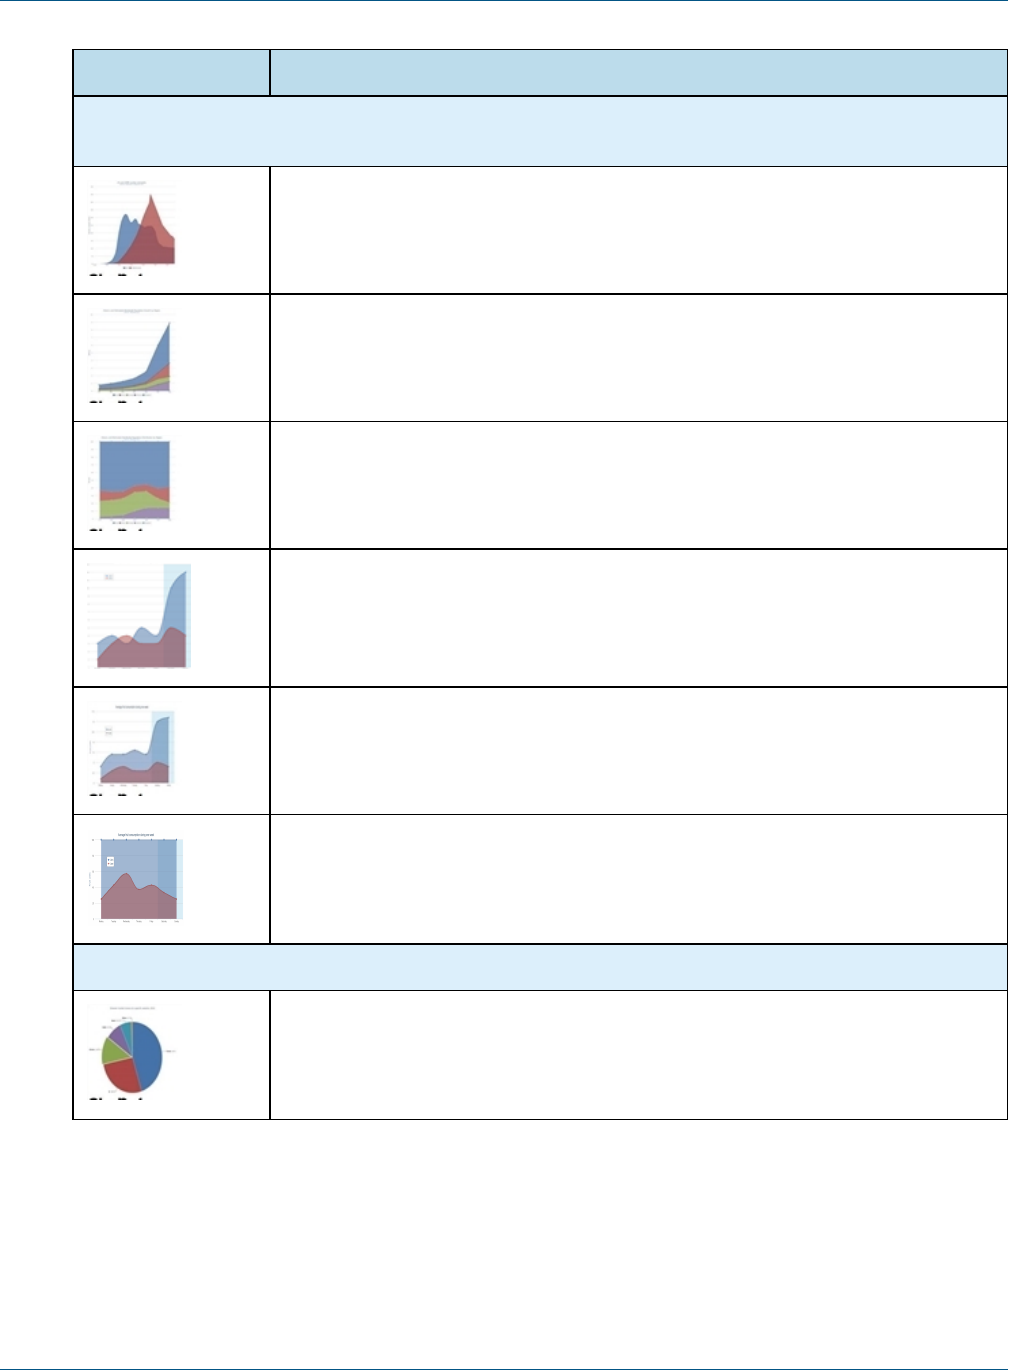
TIBCO Jaspersoft Studio User Guide
Icon Description
Area charts - Compare values displayed as shaded areas. Compared to line charts, area charts
emphasize quantities rather than trends.
Area. Displays data points connected with a straight line and a color below the line;
groups are displayed as transparent overlays.
Stacked Area. Displays data points connected with a straight line and a solid color
below the line; groups are displayed as solid areas arranged vertically, one on top of
another.
Percent Area. Displays data points connected with a straight line and a solid color
below the line; groups are displayed as portions of an area of fixed sized, and arranged
vertically one on top of the another.
Area Spline. Displays data points connected with a fitted curve and a color below the
line; groups are displayed as transparent overlays.
Stacked Area Spline. Displays a series as a set of points connected by a smooth line
with the area below the line filled in. Values are represented on the y-axis and
categories are displayed on the x-axis. Areas do not overlap because they are
cumulative at each point.
Percent Area Spline. A variation of area spline charts that present values as trends for
percentages, totaling 100% for each category.
Pie charts - Compare values displayed as slices of a circular graph
Pie. Multiple items of a single group are displayed as sectors of a circle.
294 TIBCO Software Inc.
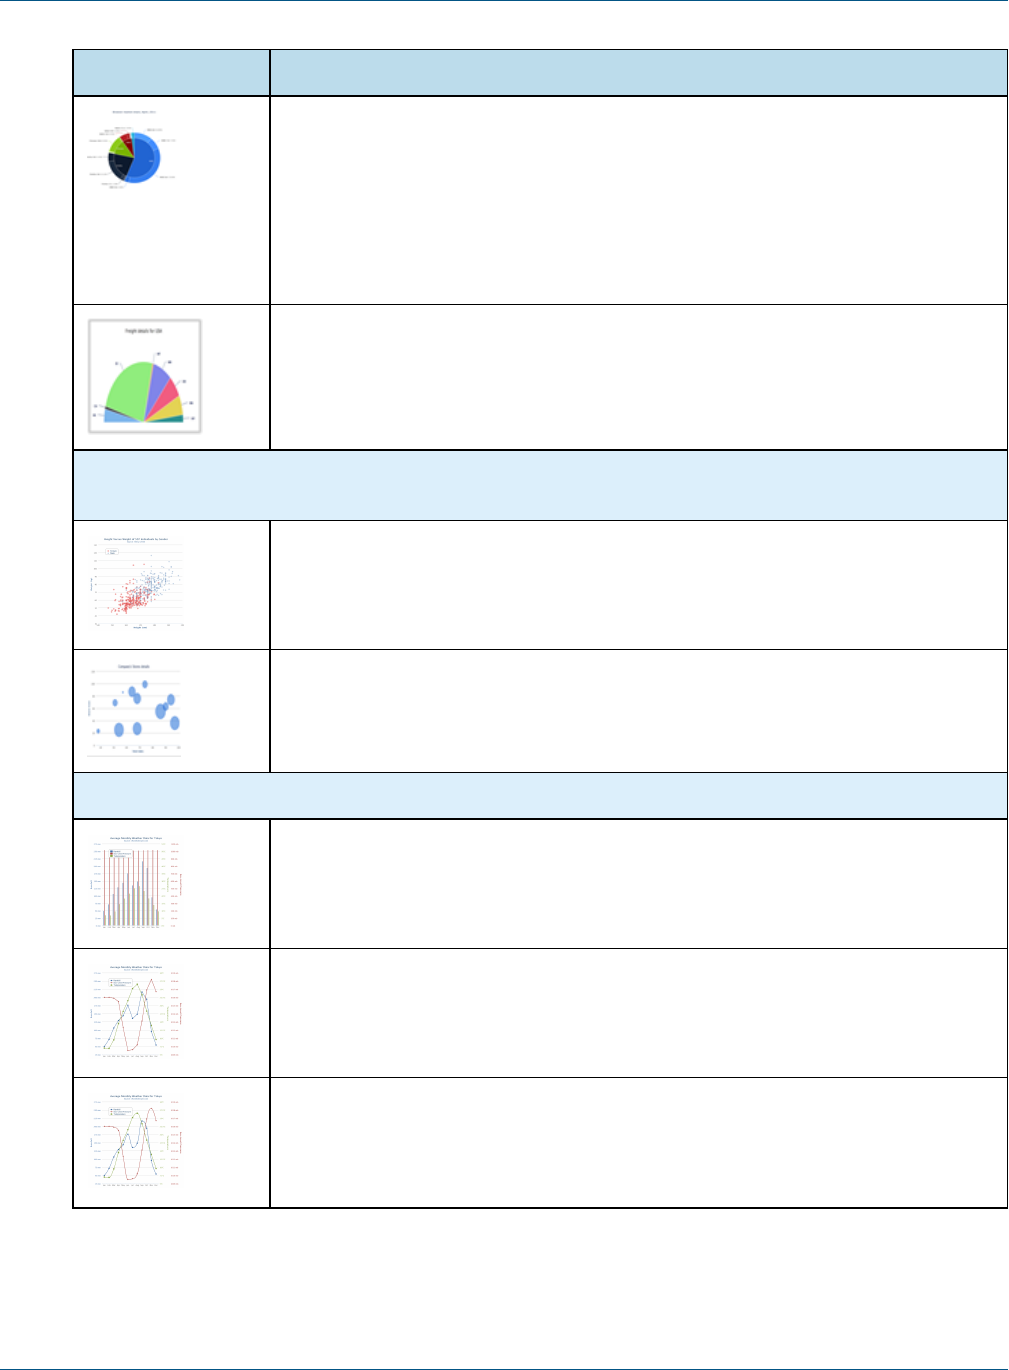
Chapter 17 HTML5 Charts in Commercial Editions
Icon Description
Dual-Level Pie. A variation of pie charts that present grouped values in two concentric
circles; the inner circle represents the coarsest grouping level in the data. In Jaspersoft
Studio, note these rules about data configuration for dual-level pie charts:
• Only one measure is displayed (the first)
• The last row level is rendered as the outer pie
• The next to last row level is rendered as the inner pie; if only one row level is
defined, the inner pie consists of a single section representing the total
Semi-Pie. Multiple measures of a group are displayed as sectors of a half-circle.
Scatter and Bubble Charts - Show the extent of correlation, if any, between the values of observed
quantities.
Scatter. Displays a single point for each point in a data series without connecting the
points.
Bubble. Compares the relationships between three measures displayed on the x-y
axis. The location and size of each bubble indicates the relative values of each data
point
Multi-Axis Charts - Compare trends in two or more data sets whose numeric range differ greatly.
Multi-Axis Column. A column chart with two series and two axis ranges.
Multi-Axis Line. A line chart with two series and two axis ranges.
Multi-Axis Spline. A spline chart with two series and two axis ranges.
TIBCO Software Inc. 295

TIBCO Jaspersoft Studio User Guide
Icon Description
Combination Charts - Display multiple data series in a single chart, combining the features of a area, bar,
column, or line charts.
Column Line. Combines the features of a column chart with a line chart.
Column Spline. Combines the features of a column chart with a spline chart.
Stacked Column Line. Combines the features of a stacked column chart with a line
chart.
Stacked Column Spline. Combines the features of a stacked column chart with a line
chart.
Time Series Charts - Illustrate data points at successive time intervals. Also called Fever Chart.
Time Series Area. Displays data points over time connected with a straight line and a
color below the line.
Time Series Area Spline. Displays data points over time connected with a fitted curve
and a color below the line.
Time Series Line. Displays data points over time connected with straight lines.
296 TIBCO Software Inc.

Chapter 17 HTML5 Charts in Commercial Editions
Icon Description
Time Series Spline. Displays data points over time connected with a fitted curve.
Spider Charts - Display data in line or data bars arranged on a circular spider web chart. Also called a
Radar Chart.
Spider Column. Plots one or more series over multiple common quantitative variables
by providing axes for each variable arranged as spokes around a central point. The
column variation of spider charts displays values as bars that extend out from the
central point towards the edges of the circular web. The bar's length indicates the
relative value.
Spider Line. Plots one or more series over multiple common quantitative variables by
providing axes for each variable arranged as spokes around a central point. The line
variation of spider charts displays values as points arranged around the circular web.
The data points are joined by a line. Each point's distance from the central point
indicates the relative value.
Spider Area. Plots one or more series over multiple common quantitative variables by
providing axes for each variable arranged as spokes around a central point. The area
variation of spider charts is similar to the line variation, but the shape defined by the
line that connects each series' points is filled with color.
Range Charts
Heat Map. Represents data in a matrix format, using color coding to show values.
Time Series Heat Map. Represents data across time in a heat map, using color coding
to show values.
Dual Measure Tree Map. Displays data as color-coded rectangles; the size of each
rectangle is proportional to the first measure and the color represents the second meas-
ure.
TIBCO Software Inc. 297
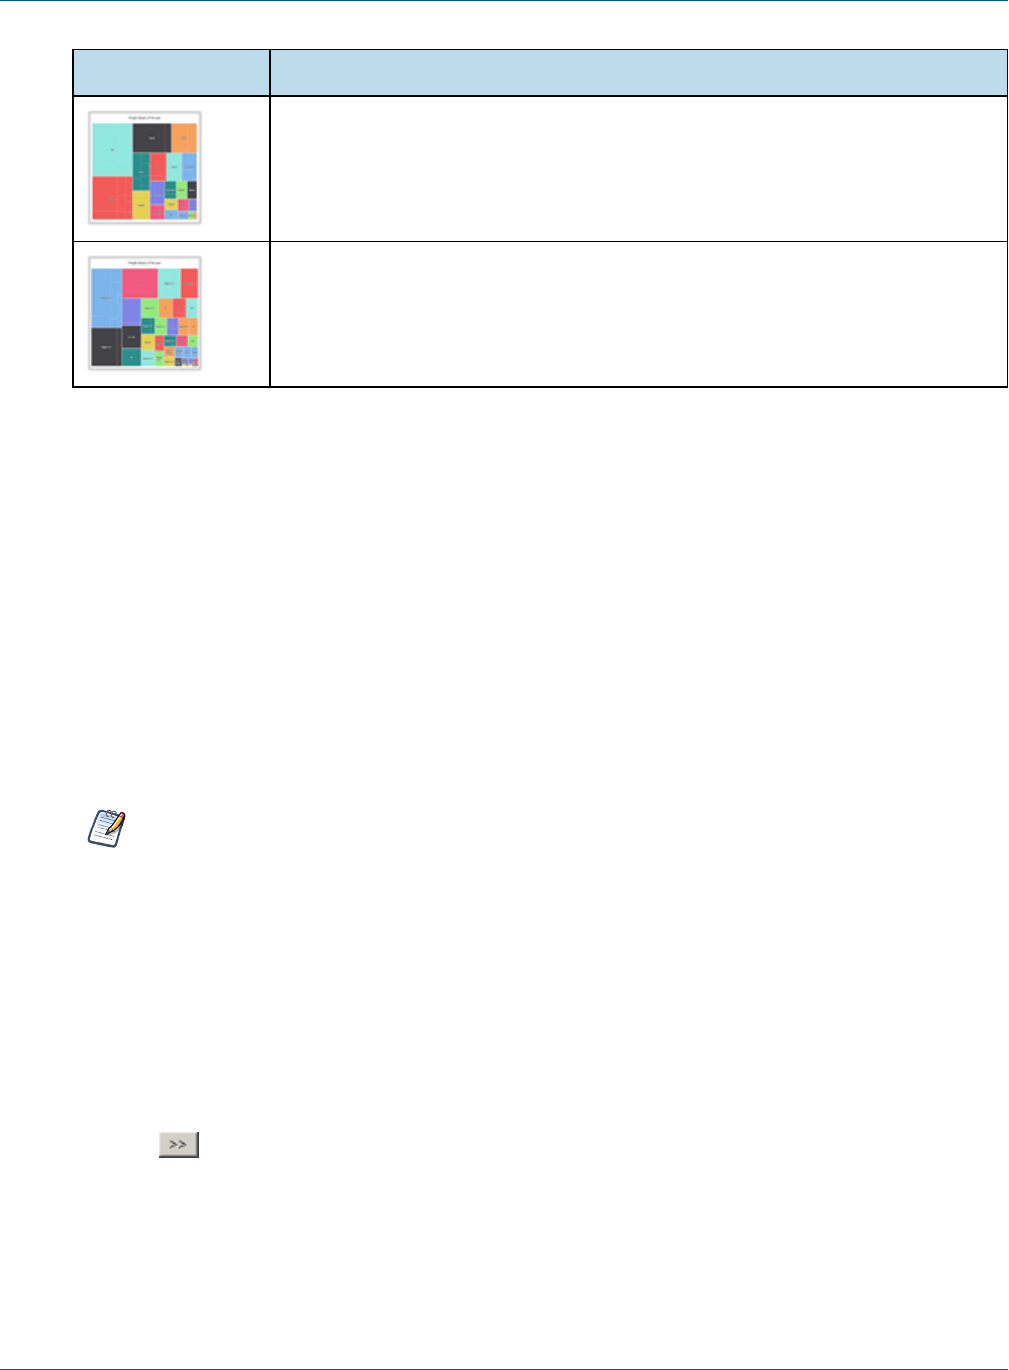
TIBCO Jaspersoft Studio User Guide
Icon Description
Tree Map. Displays data as rectangles; the size of each rectangle is proportional to the
measure of the data it represents. The tree map displays nested rectangles when you
have more than one field; the parent rectangle represents the leftmost measure while
the nested rectangles represent the current level of aggregation. Click on a parent rect-
angle to drill down to the nest rectangles
One Parent Tree Map. Displays data as nested rectangles; the size of each rectangle
is proportional to the measure of the data it represents. The nested rectangles rep-
resent the current level of aggregation while the larger rectangle represents the parent
level in the hierarchy. Click on a parent rectangle to drill down to the nest rectangles.
17.2 Example of a Bar Chart Using Simple Configuration
This example shows how to configure a bar chart using simple configuration view. A similar panel is shown for
charts that use one category, one series, and one measure and for charts that use one category and multiple
measures.
Before you add a chart, consider the best way to display your data. Available chart types are listed in Table 17-
1.
This example contains the following sections:
•Creating an HTML5 Chart
•Adding a Measure to a Bar Chart
•Formatting a Chart
•Creating a Hyperlink
A panel similar to the one in this section is used for the following chart types: Bar, Column, Line, Area,
Spline, AreaSpline, StackedBar, StackedColumn, StackedLine, StackedArea, StackedSpline,
StackedAreaSpline, StackedPercentBar, StackedPercentColumn, StackedPercentLine,
StackedPercentArea, StackedPercentSpline, StackedPercentAreaSpline, SpiderColumn, SpiderLine,
SpiderArea.
17.2.1 Creating an HTML5 Chart
To create the report for the chart:
1. Create a new, blank report using the Sample DB data adapter and the query: select * from orders.
2. Click Next.
3. Click to select all fields, then click Finish.
4. Delete all bands except for Title and Summary.
5. Enlarge the Summary band to 500 pixels by changing the Height entry in the Band Properties view.
298 TIBCO Software Inc.
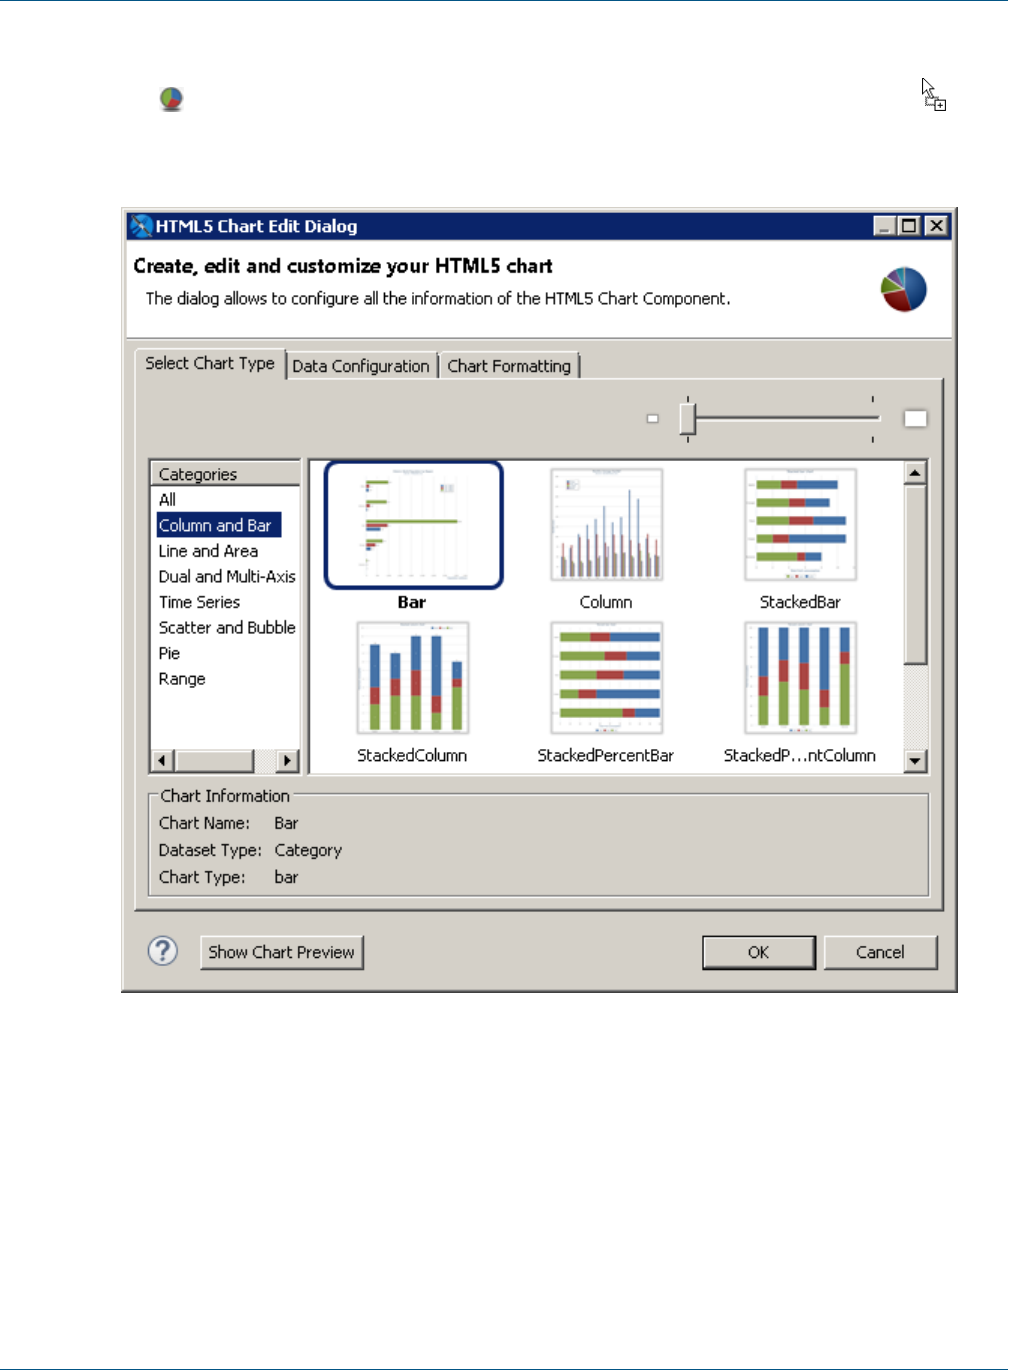
Chapter 17 HTML5 Charts in Commercial Editions
To create the chart:
1. Click HTML5 Charts in the Components Pro section of the Palette. The cursor changes to to
show that an element is selected. Click and drag in the Summary band to size and place the chart.
The HTML5 Chart Edit Dialog is displayed.
Figure 17-1 Chart Types
2. Select a chart type based on the information you want to display. See “HTML5 Chart Types” on
page292 for help. You can use the menu at the left to restrict the selection to a particular type of chart. For
this example, choose Bar.
3. Click the Data Configuration tab. This tab includes options for configuring chart dataset, chart properties,
and hyperlinks. The options on this tab reflect the type of chart you selected.
TIBCO Software Inc. 299
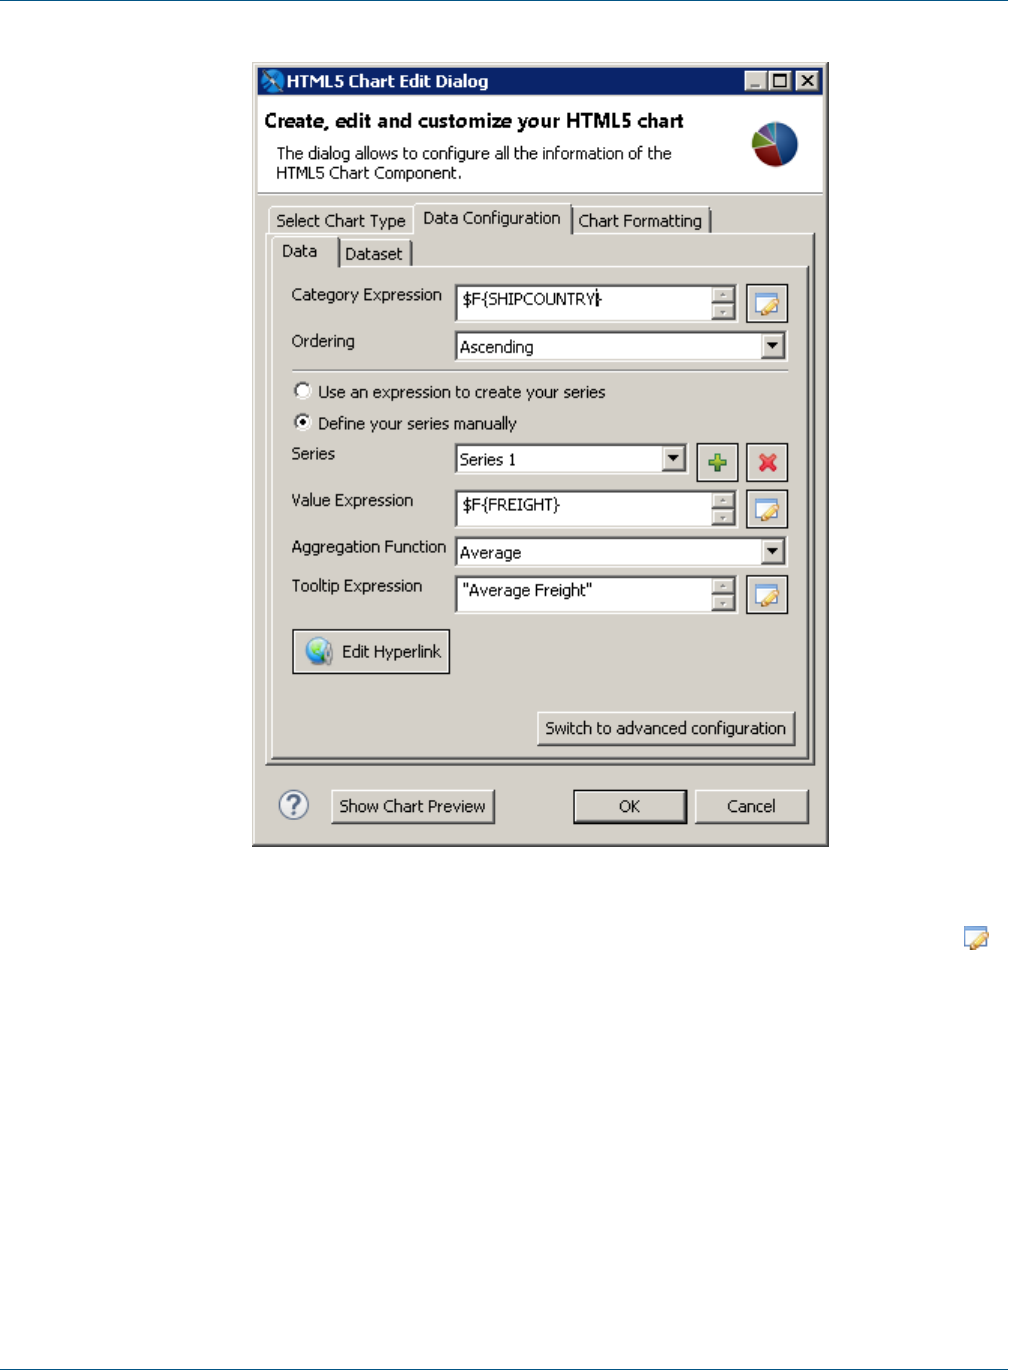
TIBCO Jaspersoft Studio User Guide
Figure 17-2 HTML5 Charts Properties>Chart Data>Configuration
4. Enter the expression you want to use for the categories. You can enter the expression directly, or click
to open the Expression Editor. For this example, enter the following:
•Category Expression –$F{SHIPCOUNTRY}.
5. Enter the information you want for the series:
•Series – This menu displays the default name of the series, for example, Series 1. If you want to
change the name, use advanced configuration.
•Value Expression – Enter the expression you want to use as a base for the measure calculation. For
this example, use $F{Freight}.
•Aggregation Function – Select the function to apply to the value expression. For this example, use
Average.
•Tooltip Expression – Enter an expression to display as a label for the measure. For this example,
enter "Average Freight".
6. To preview the chart from inside the dialog box, click Show Chart Preview.
300 TIBCO Software Inc.
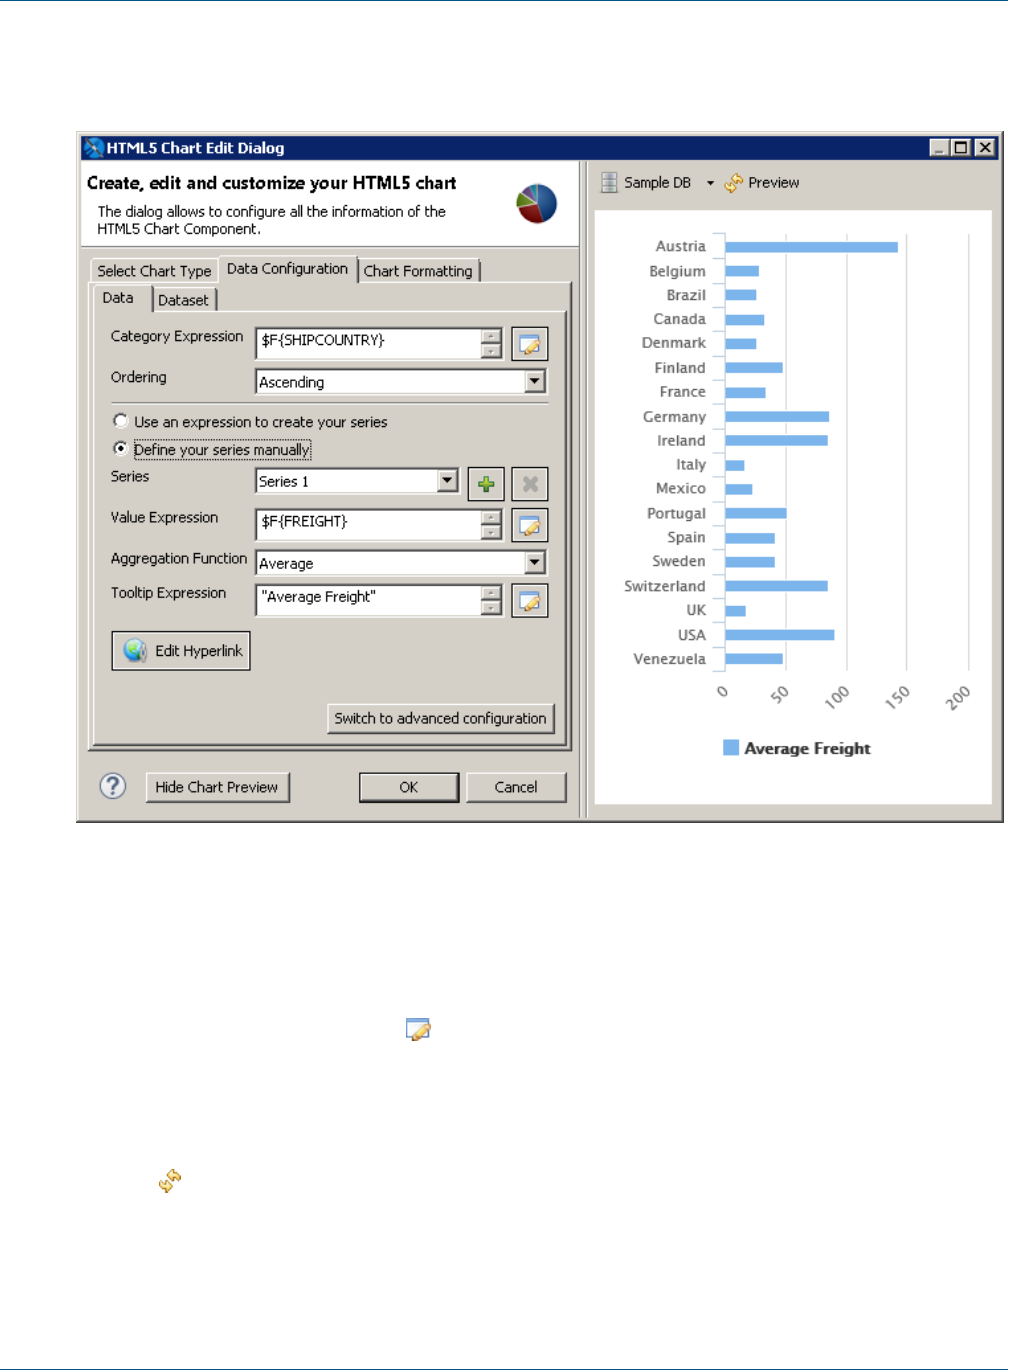
Chapter 17 HTML5 Charts in Commercial Editions
A preview is displayed in the right of the dialog. This preview can take some time to load the first time it is
run.
Figure 17-3 Preview in the HTML5 Chart Edit Dialog
Configure the dataset:
7. Click the Dataset sub-tab. This sub-tab lets you choose a dataset and dataset properties. This example uses
the default [Report main dataset].
8. You can optionally filter the dataset by entering an expression in the Increment expression text box.
You can enter text directly or click to open the Expression Editor. For this example, filter your dataset
using the following increment expression:
$F{SHIPCOUNTRY}.startsWith("I") ||
$F{SHIPCOUNTRY}.startsWith ("S") ||
$F{SHIPCOUNTRY}.startsWith ("U")
9. Click to refresh the preview
10. Click OK to close the HTML5 Chart Edit dialog.
A placeholder for the chart is inserted in design view of your report. The Design view of a report doesn't
display live data for a chart.
TIBCO Software Inc. 301
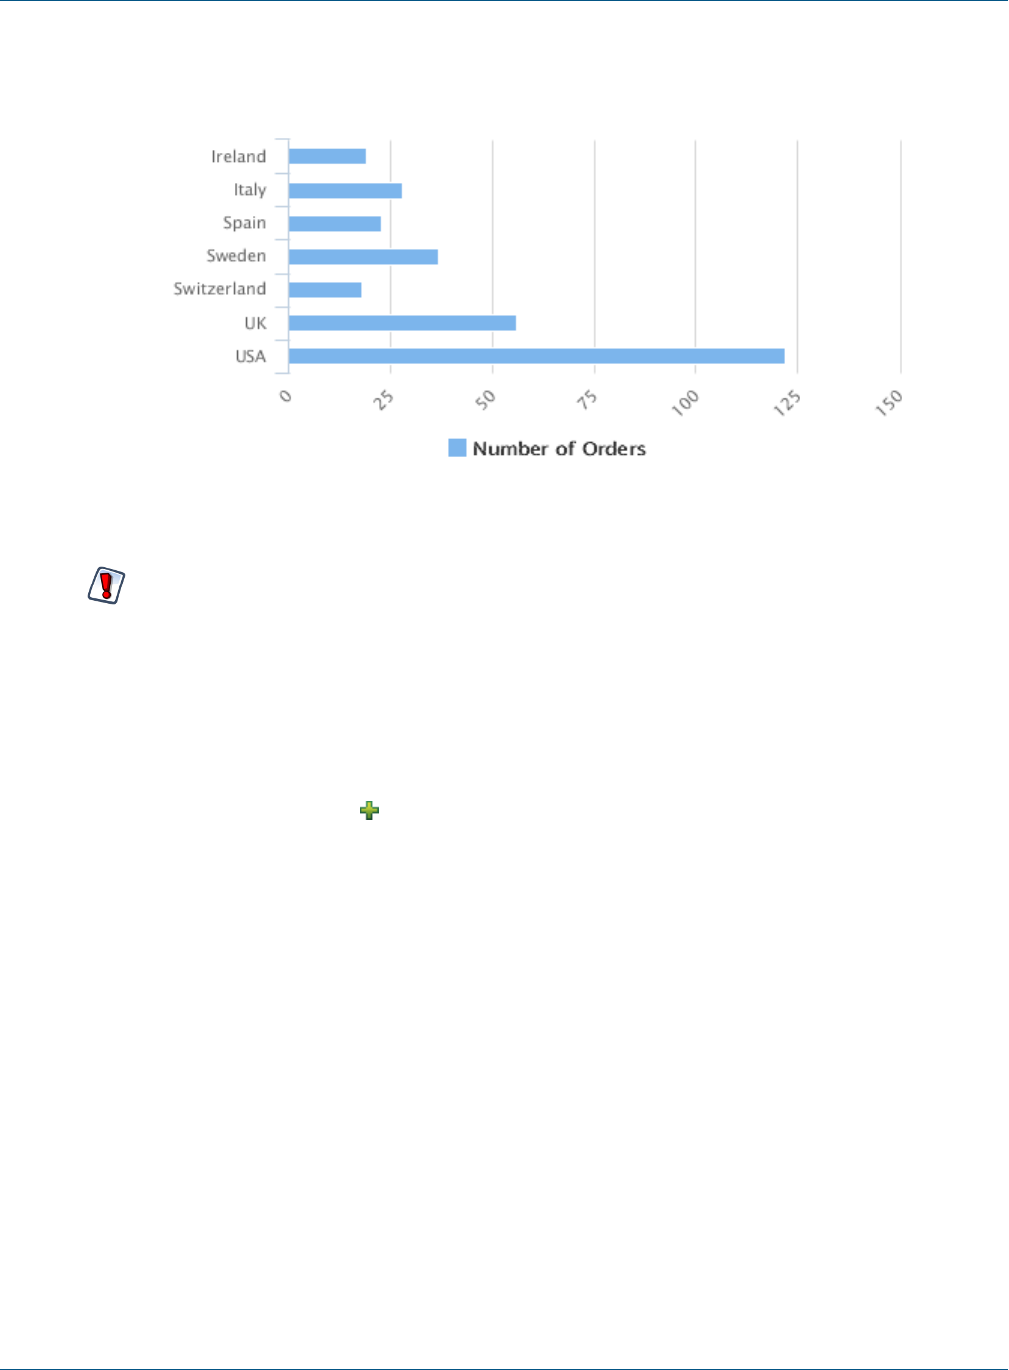
TIBCO Jaspersoft Studio User Guide
11. Save, then click the Preview tab to see your chart. To see an interactive preview, select HTML from the
Preview drop-down. Hover over a bar to see the average freight.
Figure 17-4 Bar Chart Example
The preview works best when you are using the same dataset as the main report. Parameters may not be
applied and multiple levels or series may not display.
17.2.2 Adding a Measure to a Bar Chart
Start with the HTML5 bar chart from the previous example to complete the following tasks.
1. On the Design tab, double-click your chart, or right-click it and choose Edit Chart Properties.
2. In the HTML5 Chart Edit dialog, click the Data Configuration tab.
3. In the Measures section, click . Anew series is created with the name Series 2. Enter the following
information:
•Value Expression:$F{ORDERID}
•Aggregation Function:Average
•Tooltip Expression:"Average Freight"
4. Click OK.
5. Save and preview the chart.
302 TIBCO Software Inc.
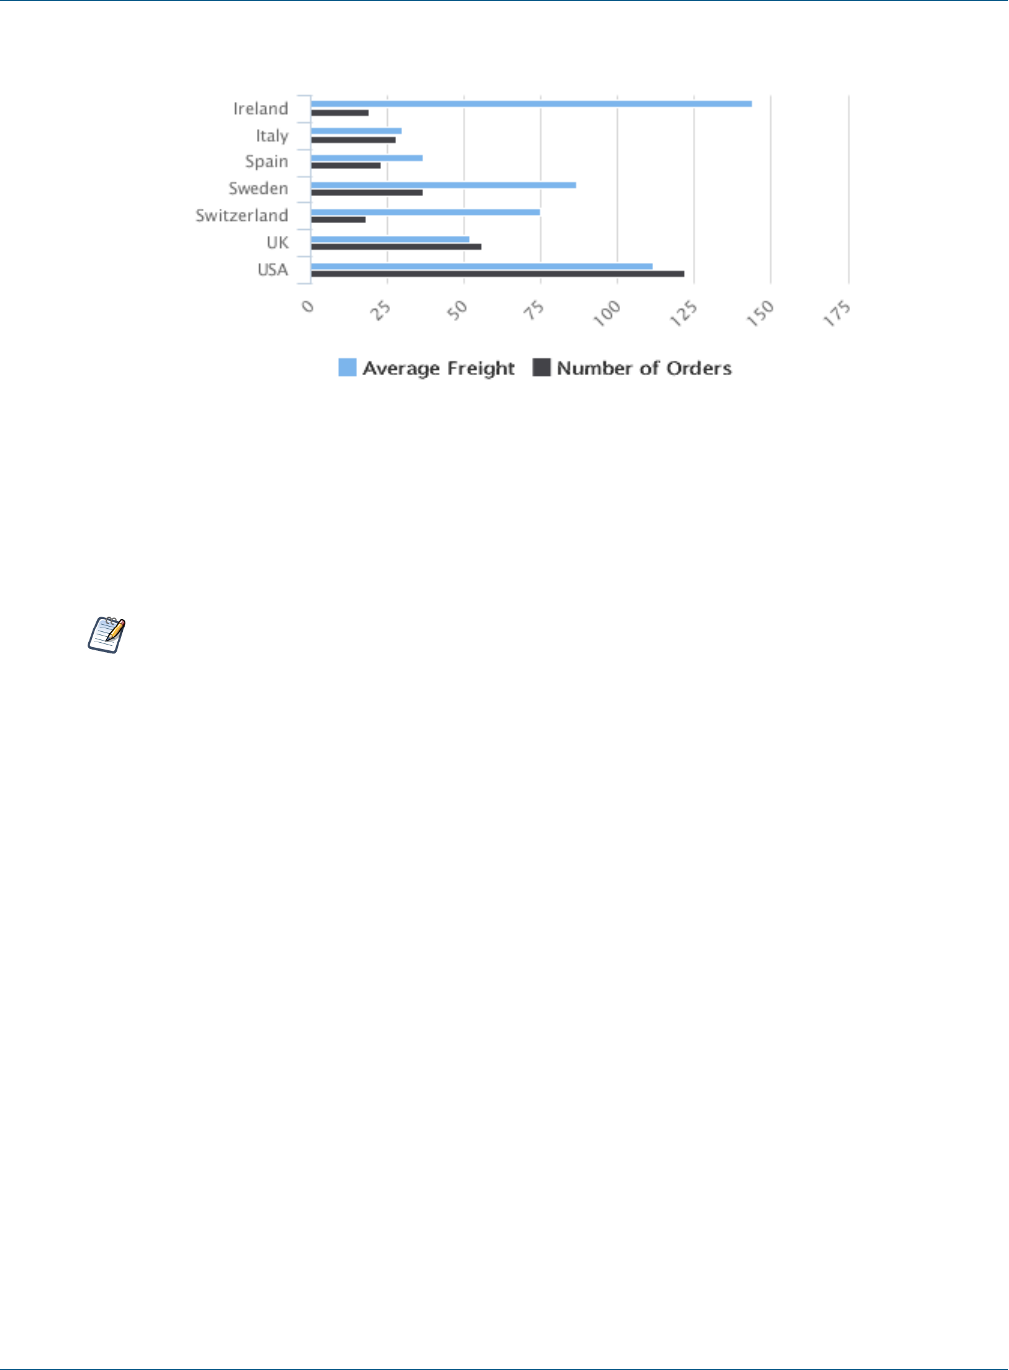
Chapter 17 HTML5 Charts in Commercial Editions
Figure 17-5 Bar chart with multiple measures
17.2.3 Formatting a Chart
You can set the HTML formatting of the chart using the Chart Formatting tab in the HTML5 Edit Charts
dialog. Most of these properties can be set using an expression.
You can set additional options using the Show Advanced Properties button. See 17.8, “Advanced
Formatting of HTML5 Charts,” on page335 for more information.
You can set JasperReport element properties for an HTML5 chart, such as position or evaluation time, in
Properties view. See 17.8.1, “Setting Advanced Options for HTML5 Charts in Properties View,” on
page337 for more information.
To add a title to an HTML5 chart:
1. Double-click the chart or right-click and select Edit Chart properties.
2. Click the Chart Formatting tab.
3. Select Title on the left and enter your title in the Title text box. For this example, enter Orders and
Freight by Country. You can also customize the alignment, position, color, and font.
To change the position or layout of the legend:
4. On the Chart Formatting tab of the HTML5 Chart Edit dialog, select Legend and set the following:
•Floating Legend – true.
TIBCO Software Inc. 303
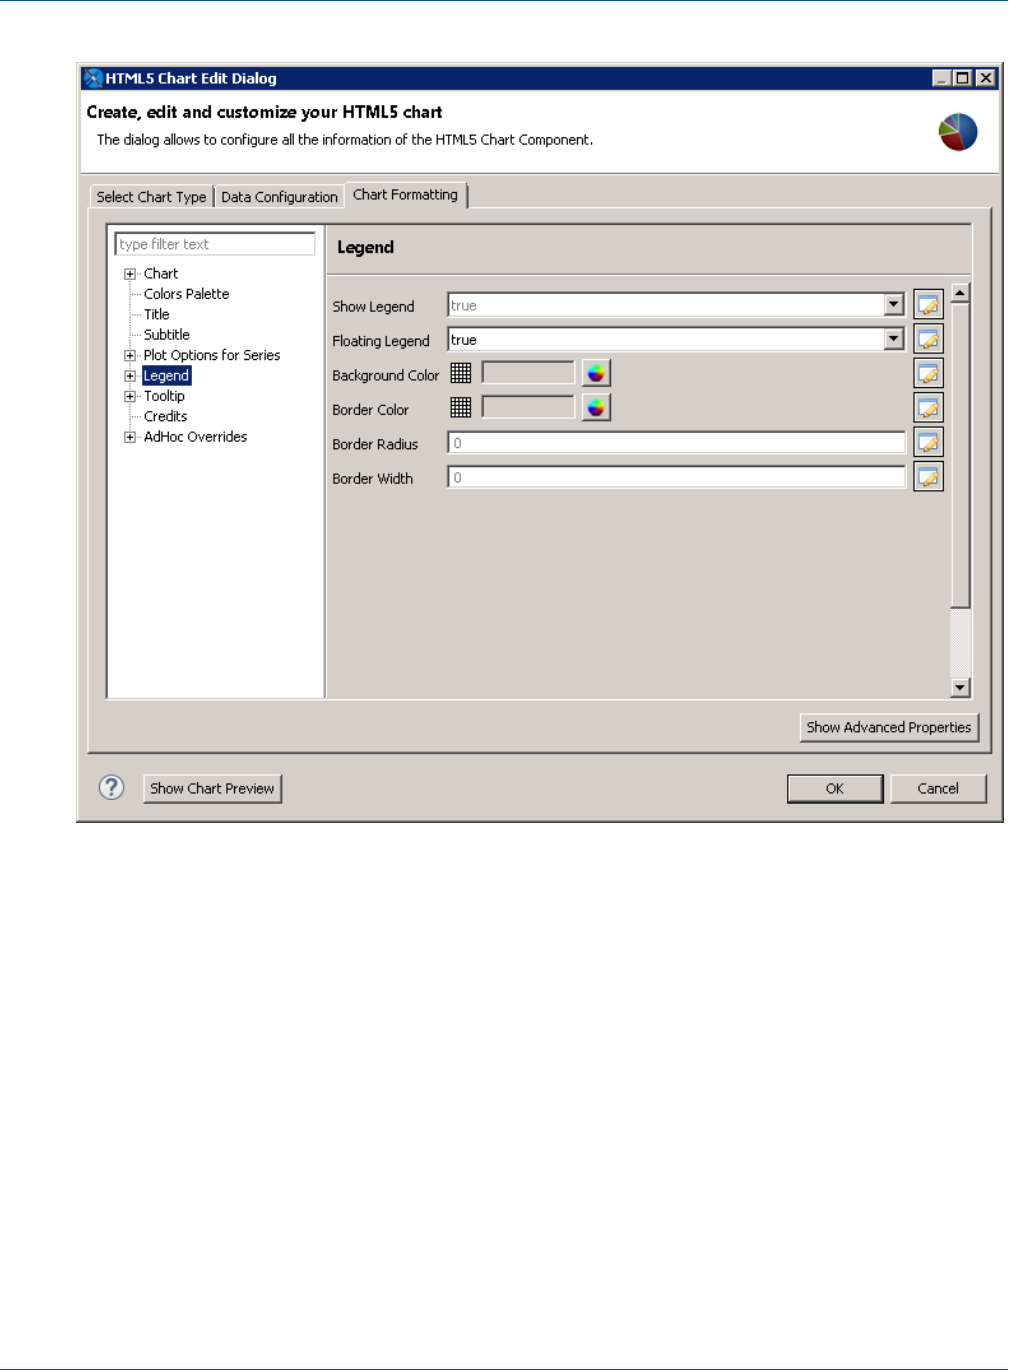
TIBCO Jaspersoft Studio User Guide
Figure 17-6 Legend Properties
5. Expand Legend, select Legend> Sizes and Position, and set the location of the legend on the graph:
•Horizontal Alignment – right.
•Vertical Alignment – middle.
•X offset – -6. This moves the legend inside the plot background color.
6. Select Legend> Items and set the following:
•Items Layout – vertical.
Click OK.
To set the chart's background color:
1. On the Chart Formatting tab of the HTML5 Chart Edit dialog, select Chart.
2. Click the color wheel next to Background Color and select a color. For this example, enter #E9967A. This
sets the background color of the whole chart.
3. Next, select Chart> Borders and Plot Areas.
304 TIBCO Software Inc.
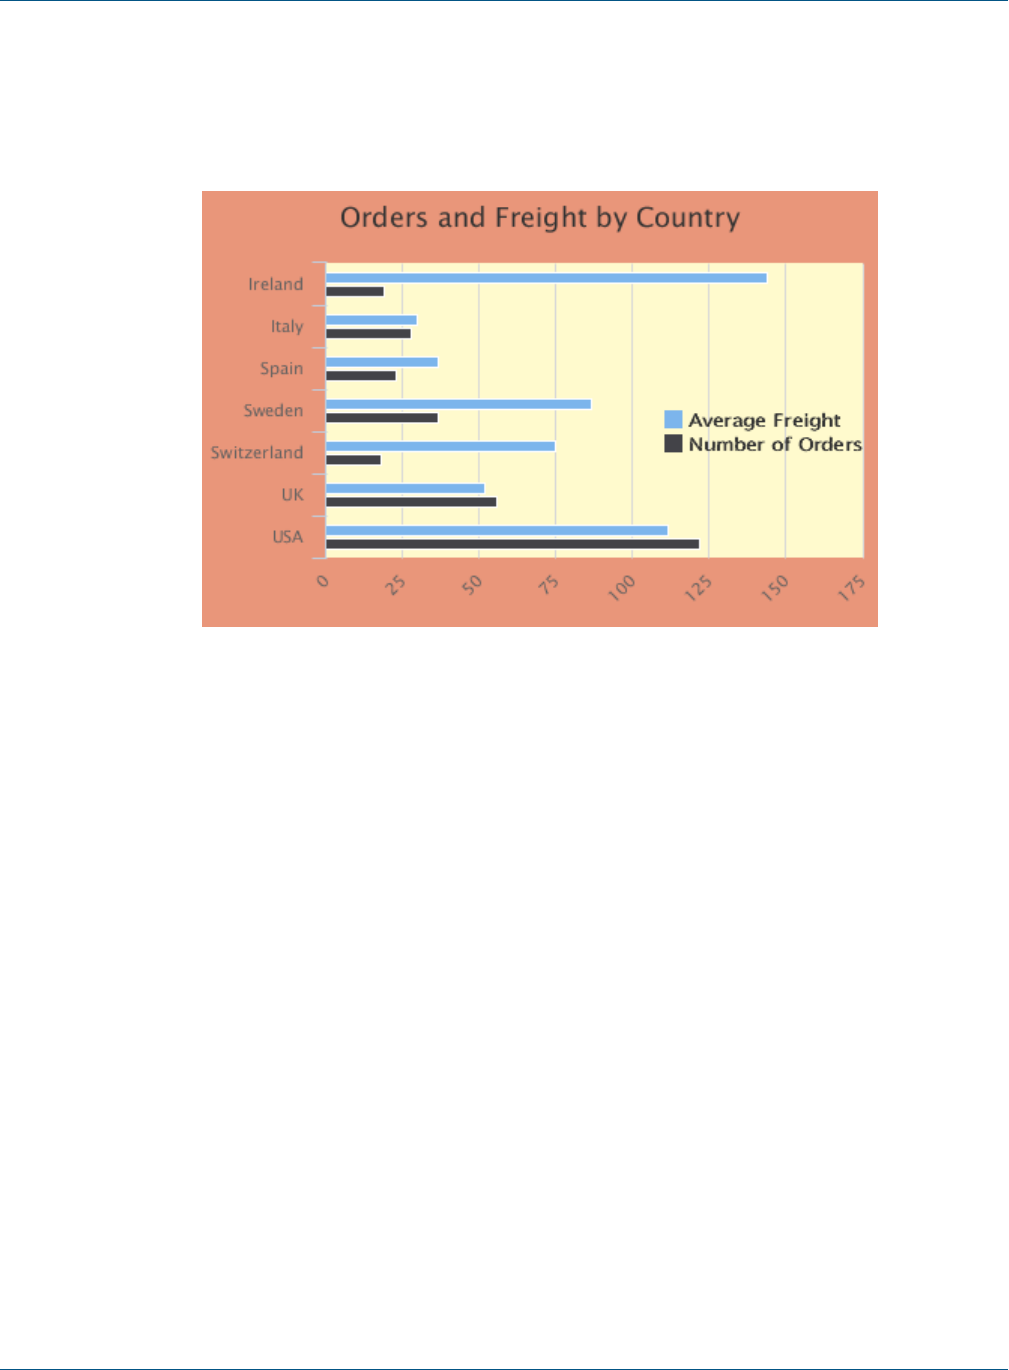
Chapter 17 HTML5 Charts in Commercial Editions
4. Click the color wheel next to Plot Background Color and select a color. For this example, enter
#FFFACD. This sets the background color of the plot area only.
5. Click OK.
6. Save and preview your report.
Figure 17-7 Formatted report
17.2.4 Creating a Hyperlink
1. Double-click your bar chart or right-click and select Edit Chart properties.
2. Click the Data Configuration tab.
3. Click Edit Hyperlink.
TIBCO Software Inc. 305
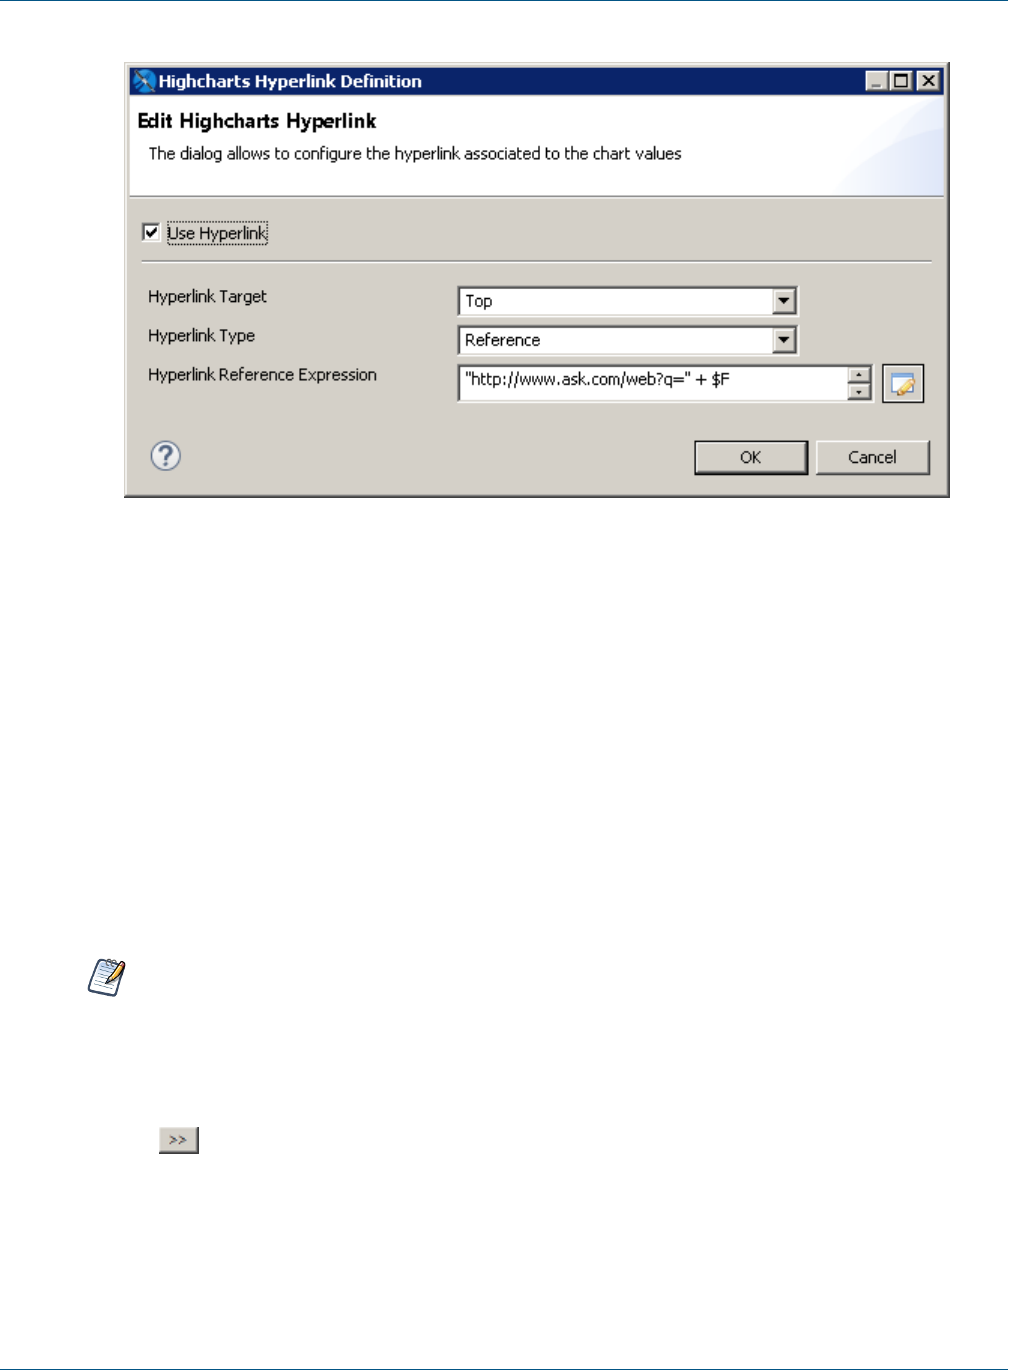
TIBCO Jaspersoft Studio User Guide
Figure 17-8 Editing a hyperlink
4. Set the following:
•Hyperlink Target – Top.
•Hyperlink Type – Reference.
•Hyperlink Reference Expression –"http://www.ask.com/web?q=" + $F{SHIPCOUNTRY}
5. Click OK.
6. Click OK again to return to design mode.
7. Save and preview your report. In the HTML preview, click the bar for any country to open an Ask.com
page for that country.
17.3 Example of a Pie Chart
This example shows how to create a pie chart using simple configuration view.
A panel similar to the one in this section is used for the following chart types: Pie, SemiPie.
To create the report for the chart:
1. Create a new, blank report using the Sample DB data adapter and the query: select * from orders.
2. Click Next.
3. Click to select all fields, then click Finish.
4. Delete all bands except for Title and Summary.
5. Enlarge the Summary band to 500 pixels by changing the Height entry in the Band Properties view.
306 TIBCO Software Inc.
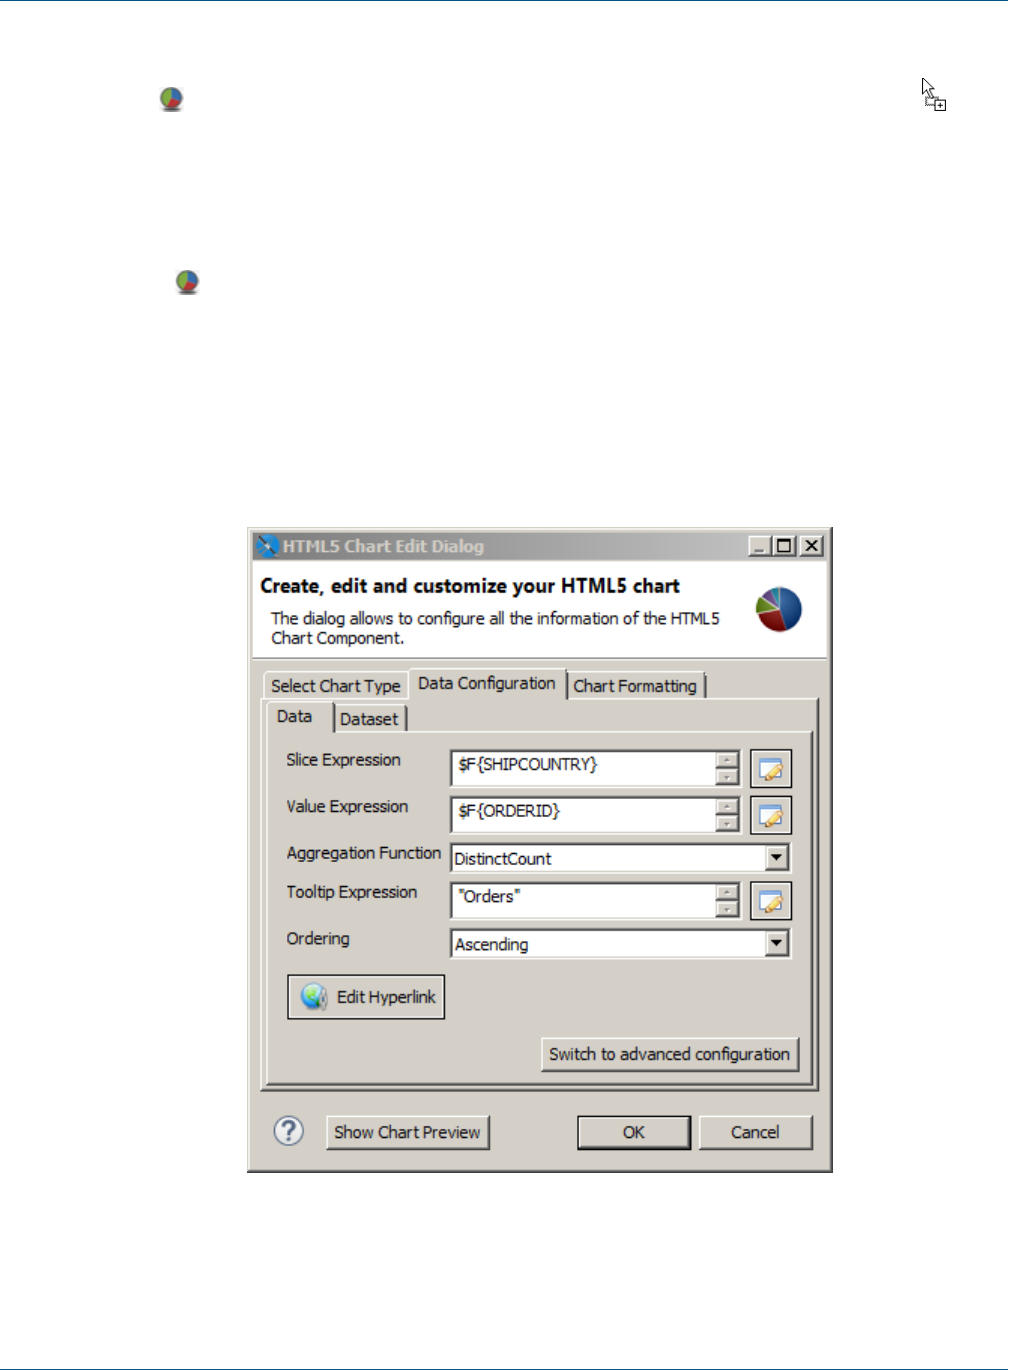
Chapter 17 HTML5 Charts in Commercial Editions
To create the chart:
1. Click HTML5 Charts in the Components Pro section of the Palette. The cursor changes to to
show that an element is selected. Click and drag in the Summary band to size and place the chart.
The HTML5 Chart Edit Dialog is displayed.
1. Create a new report using the Sample DB data adapter.
2. Start with the query:
select * from orders
3. Choose HTML5 Charts from the Components Pro section of the Palette, and drag it into the
Summary band of your report.
The HTML5 Chart Edit Dialog is displayed.
4. Select a chart type based on the information you want to display. You can use the menu at the left to
restrict the selection to a particular type of chart. For this example, choose Pie.
5. Click the Data Configuration tab. This tab includes options for configuring chart dataset, chart properties,
and hyperlinks. The options on this tab reflect the type of chart you selected. The dialog shown in this
example is used for pie and semi-pie charts.
Figure 17-9 HTML5 Charts Properties>Chart Data>Configuration
TIBCO Software Inc. 307

TIBCO Jaspersoft Studio User Guide
6. Enter the required information on the Data sub-tab. For this example:
•Slice Expression – Enter the expression you want to use for the slices. You can enter the expression
directly, or click to open the Expression Editor. For this example, use $F{SHIPCOUNTRY}.
•Value Expression – Enter the expression you want to use as a base for the measure calculation. For
this example, use $F{ORDERID}.
•Aggregation Function – Select the function to apply to the value expression. For this example, use
DistinctCount.
•Tooltip Expression – Enter an expression to display when a user hovers over a slice of the pie. For
this example, enter "Orders".
•Ordering – Select an order for the slices. For this example, choose Ascending. This displays the slices
in alphabetical order.
7. To preview the chart from inside the dialog box, click Show Chart Preview.
A preview is displayed to the right of the dialog. This preview can take some time to load the first time it is
run.
8. Click the Dataset sub-tab. This sub-tab lets you choose a dataset and dataset properties. For this example,
use the default [Report main dataset].
9. You can optionally filter the dataset by entering an expression in the Increment expression text box.
You can enter text directly or click to open the Expression Editor. For this example, filter your dataset
using the following increment expression:
$F{SHIPCOUNTRY}.startsWith("I") ||
$F{SHIPCOUNTRY}.startsWith ("S") ||
$F{SHIPCOUNTRY}.startsWith ("U")
10. Click to refresh the preview.
308 TIBCO Software Inc.
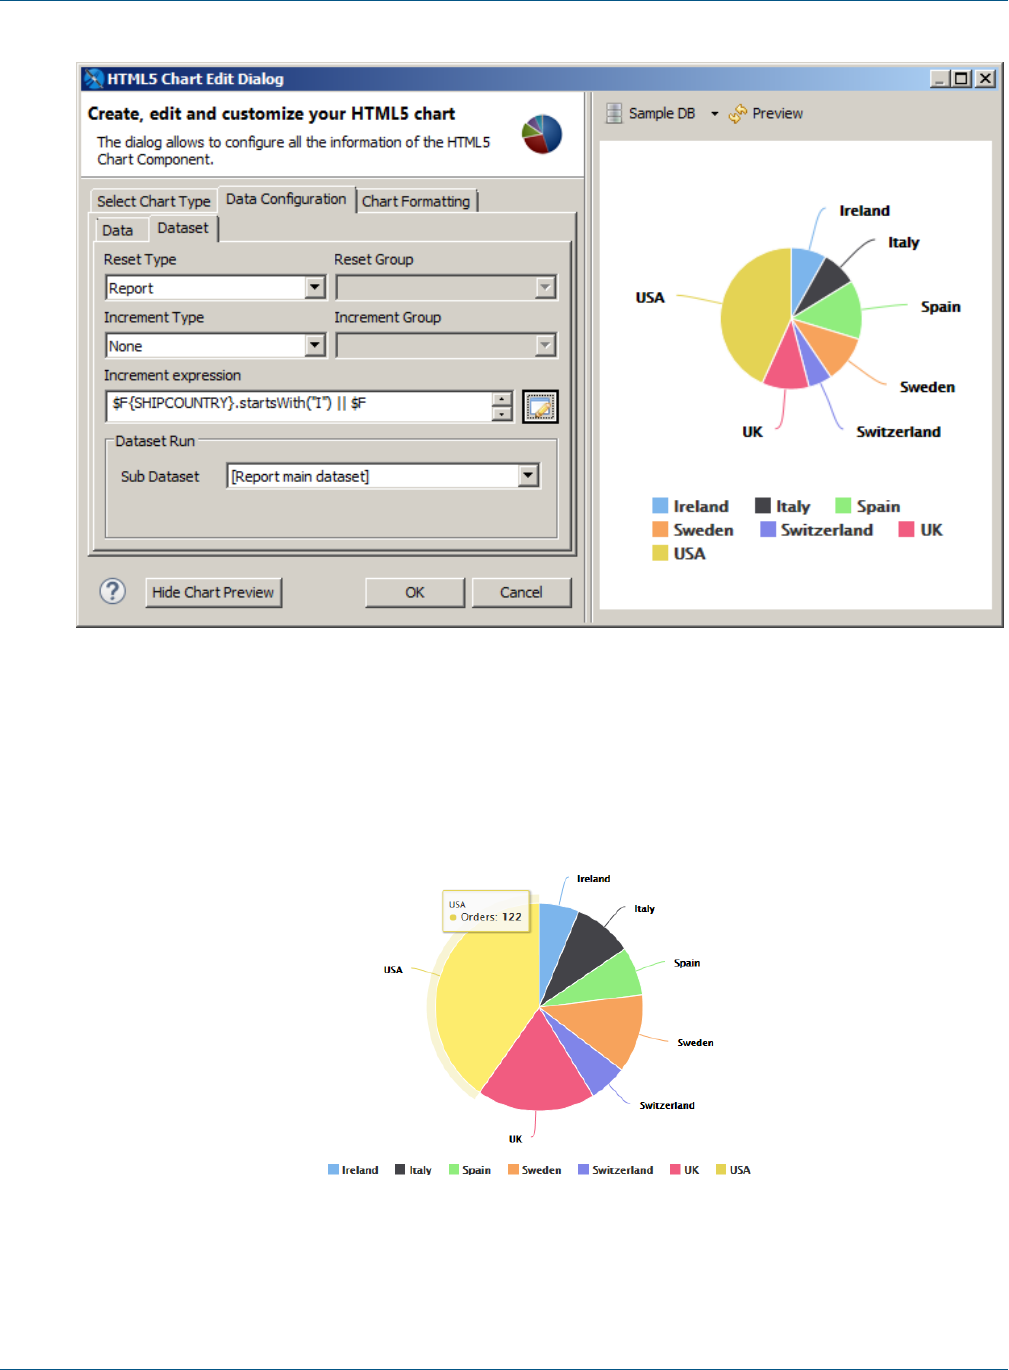
Chapter 17 HTML5 Charts in Commercial Editions
Figure 17-10 HTML5 Charts Properties>Chart Data>Configuration
11. Click OK to close the HTML5 Chart Edit dialog.
A placeholder for the chart is inserted in design view of your report. The Design view of a report doesn't
display live data for a chart.
12. Save, then click the Preview tab to see your chart. To see an interactive preview, select HTML from the
Preview drop-down. Hover over a pie segment to see the number of orders
Figure 17-11 Pie Chart Example
TIBCO Software Inc. 309
TIBCO Jaspersoft Studio User Guide
17.3.1 Example of a Time-Series Spline Chart
Time-series charts illustrate data points at successive time intervals and let you follow events over time. This
example shows how to create a time-series spline chart.
The following chart types use a similar interface: TimeSeriesLine, TimeSeriesSpline, TimeSeriesArea,
TimeSeriesAreaSpline.
To create the report for the chart:
1. Create a new, blank report using the Sample DB data adapter and the query: select * from orders.
2. Click Next.
3. Click to select all the fields, then click Finish.
4. Delete all bands except for Title and Summary.
5. Enlarge the Summary band to 500 pixels by changing the Height entry in the Band Properties view.
To create the chart:
1. Click HTML5 Charts on the Components Pro section of the Palette. The cursor changes to an
element is selected. Drag to fill the Summary band of your report.
The HTML5 Chart Edit Dialog is displayed.
2. Select TimeSeriesSpline for your chart type.
3. Click the Data Configuration tab.
310 TIBCO Software Inc.
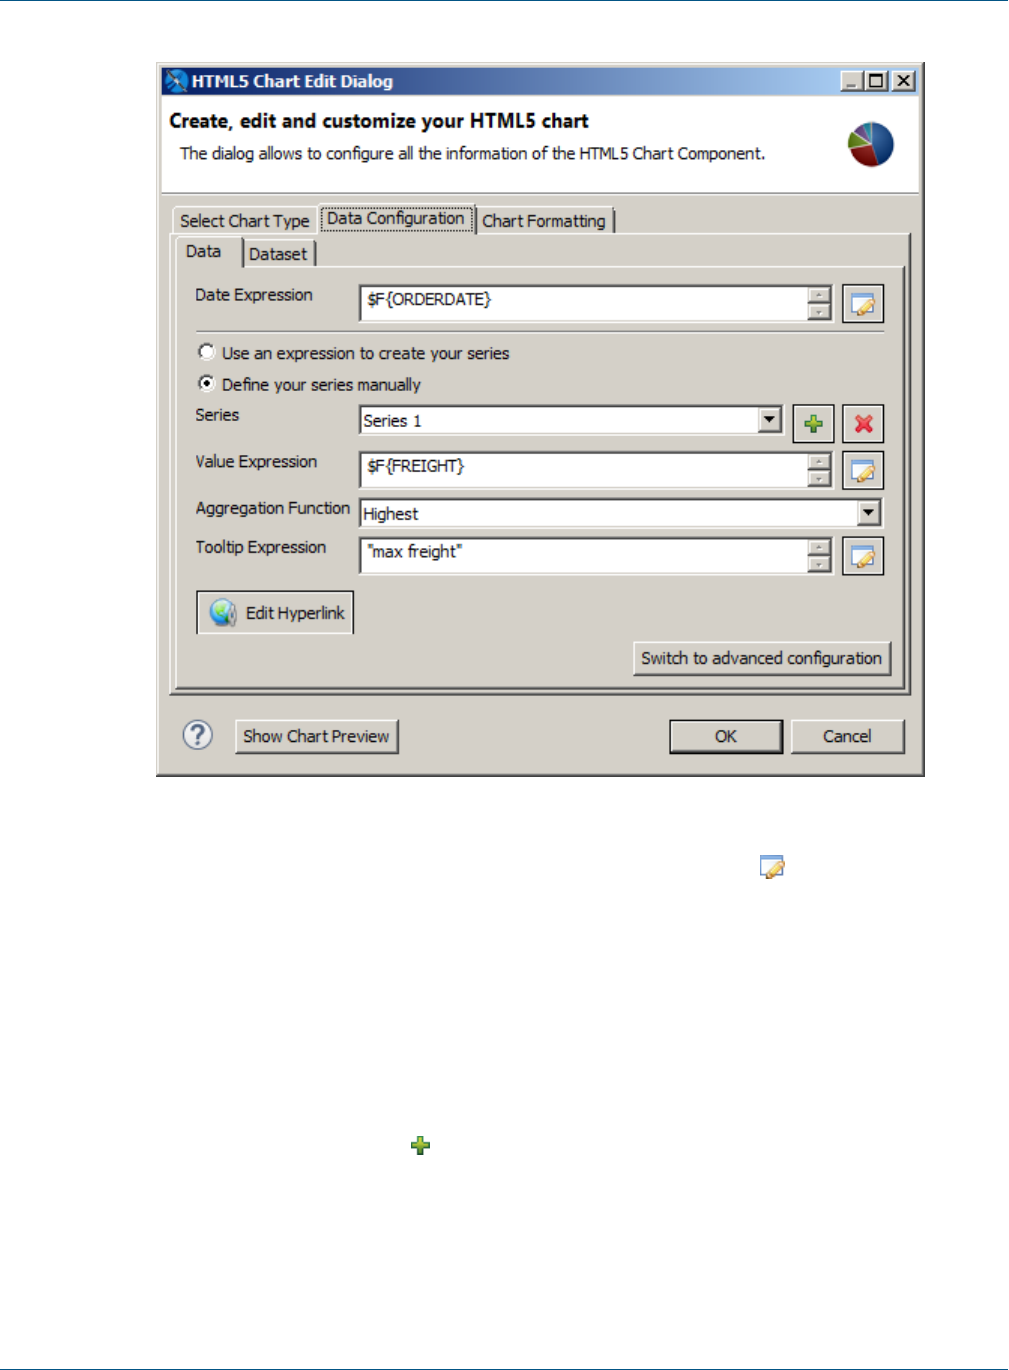
Chapter 17 HTML5 Charts in Commercial Editions
Figure 17-12 Simple data configuration view for time-series charts
4. Enter an expression for the date in the Date Expression field. You can click to use the expression
editor or enter the expression manually. For this example, enter :
$F{ORDERDATE}.
5. To use multiple series, select Define your series manually.
6. Define your first series. For this example, use the following data:
•Series – Series 1. The name of the series is automatically generated. You can't change it in the simple
configuration.
•Value Expression –$F{FREIGHT}.
•Aggregation Function – Highest
•Tooltip Expression – "max freight"
7. To define an additional series, click . For this example, define a second measure using the following data.
•Series – Series 2.
•Value Expression –$F{FREIGHT}.multiply(new BigDecimal(0.5))
•Aggregation Function – Sum
•Tooltip Expression – "total freight/2"
8. Click OK to close the HTML5 Chart Edit dialog.
TIBCO Software Inc. 311
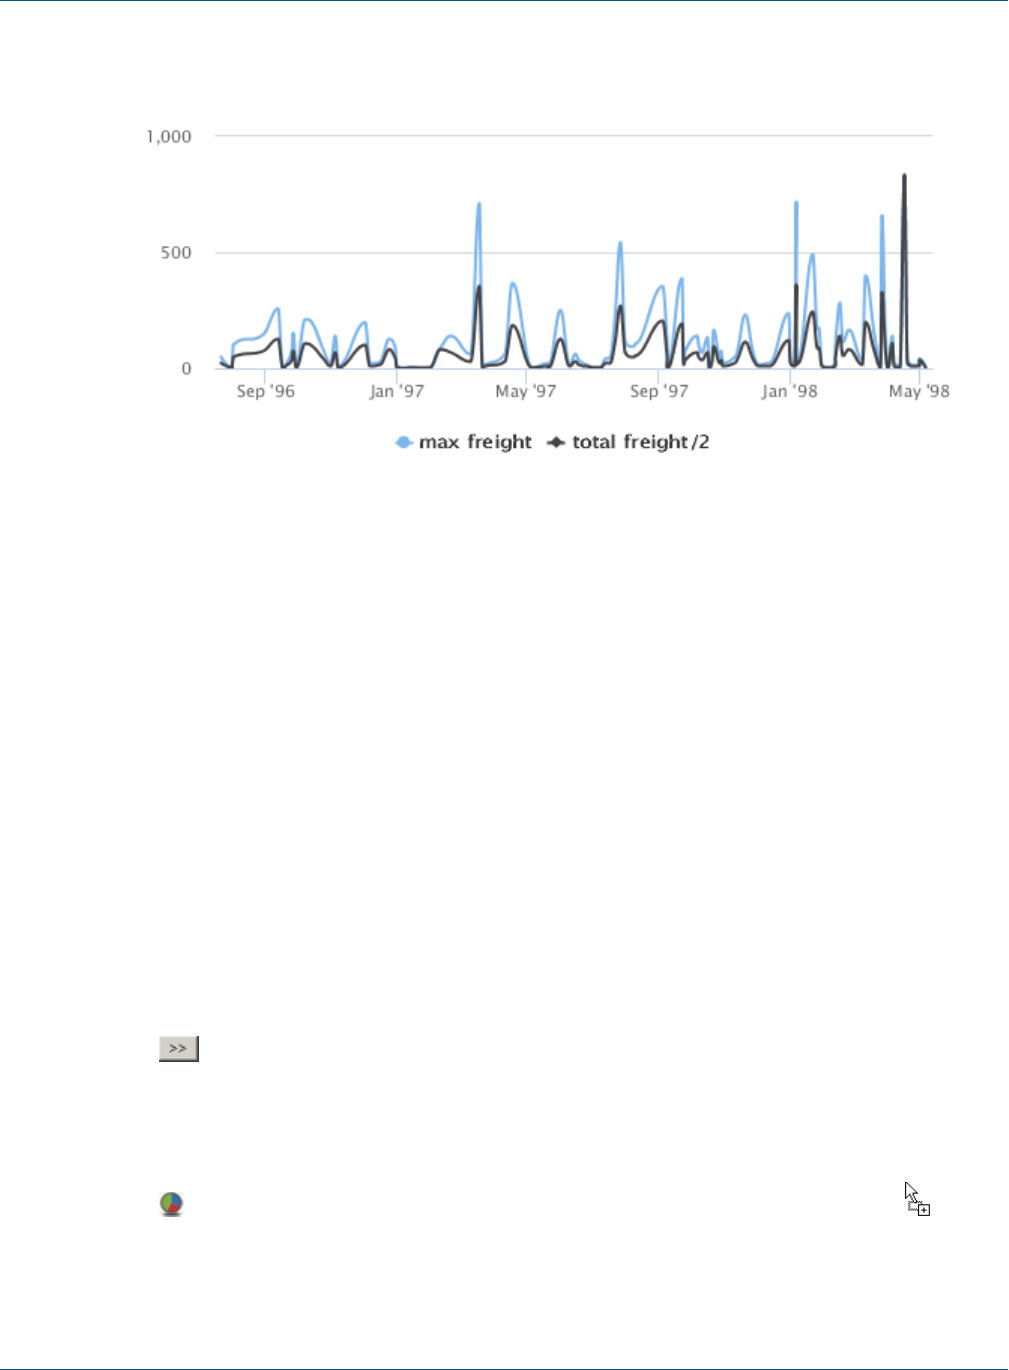
TIBCO Jaspersoft Studio User Guide
9. Preview the report.
Figure 17-13 Time series spline chart
17.4 Example of a Tree Map Using Multiple Levels and Advanced
Formatting
A tree map shows hierarchical data as nested rectangles. The size of each rectangle is proportional to the
measure of the data it represents. Users can click on a parent rectangle to drill through to the nest rectangles.
Tree maps are a compact way of showing tree data and can help you see patterns in your data that are difficult
to see in other ways.
This example shows a tree map for three levels of data: country, region, and city. The dialog shown is this
example is used for TreeMap and OneParentTreeMap.
17.4.1 Creating a Tree Map
To create the report for the chart:
1. Create a new, blank report using the Sample DB data adapter and the query: select * from orders
order by shipcountry.
2. Click Next.
3. Click to select all fields, then click Finish.
4. Delete all bands except for Title and Summary.
5. Enlarge the Summary band to 500 pixels by changing the Height entry in the Band Properties view.
To create the chart:
1. Click HTML5 Charts in the Components Pro section of the Palette. The cursor changes to show
that an element is selected. Click and drag in the Summary band to size and place the chart.
The HTML5 Chart Edit Dialog is displayed.
2. Select your chart type. For this example, select TreeMap.
312 TIBCO Software Inc.
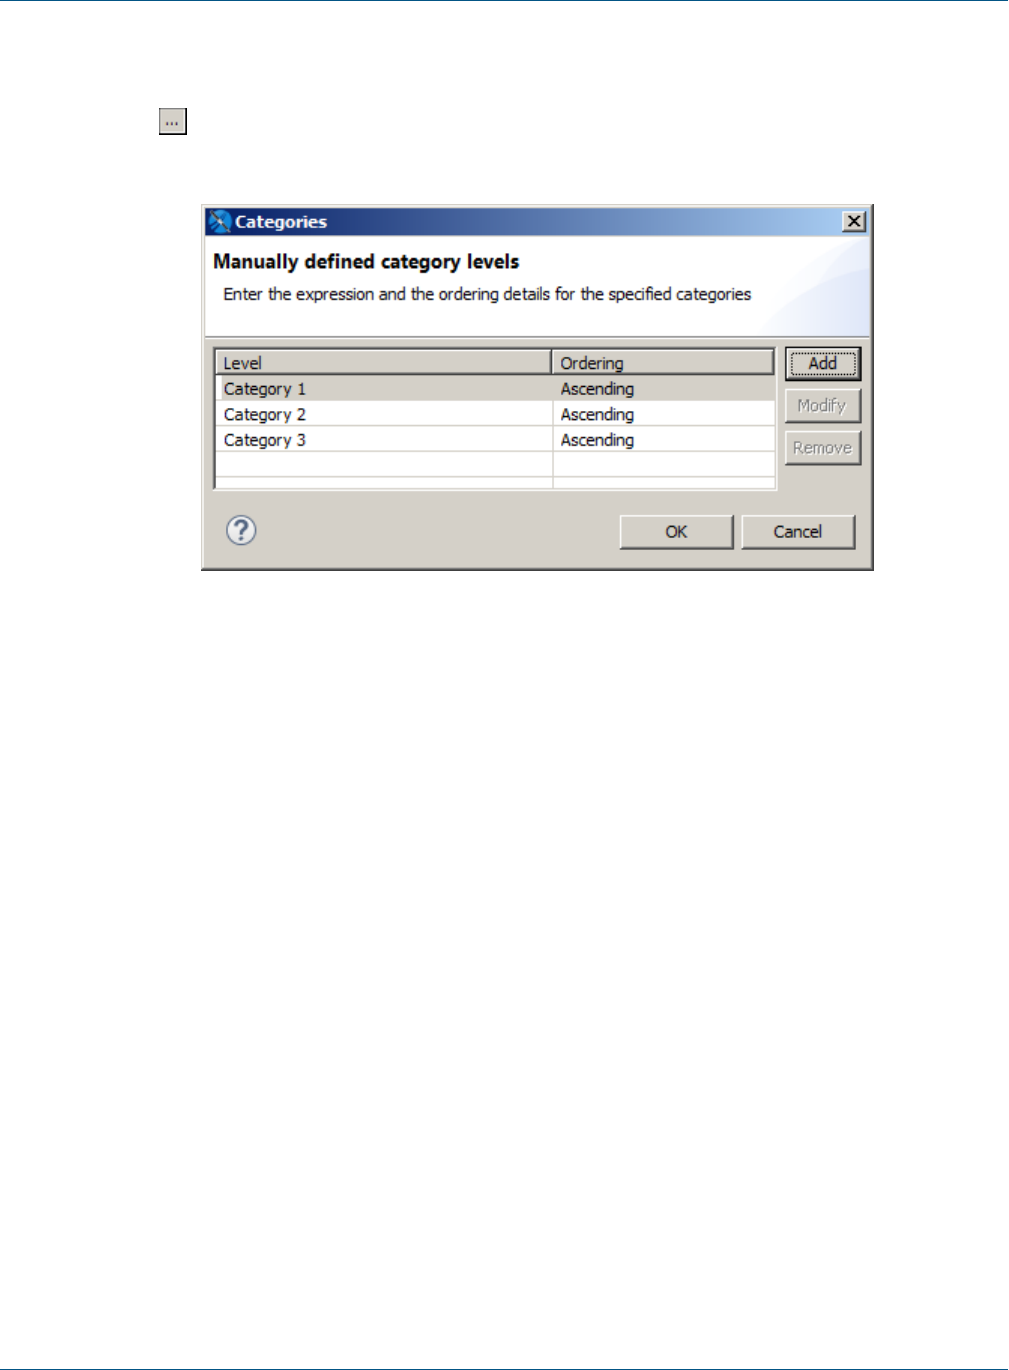
Chapter 17 HTML5 Charts in Commercial Editions
3. Click the Data Configuration tab.
The HTML5 Chart Edit dialog is displayed.
4. Click next to Levels.
The Categories dialog opens.
Figure 17-14 Defining Multiple Categories in a Chart
5. Select Category 1 and click Modify.
The Expression Editor is displayed.
6. Enter your highest level of data for Category 1 then click Finish. For this example, enter
$F{SHIPCOUNTRY}.
7. Click Add in the Categories dialog box, enter $F{SHIPREGION}, and click Finish.
8. Click Add in the Categories dialog box, enter $F{SHIPCITY}, and click Finish.
9. When you have created all your levels, click OK to return to the HTML5 Chart Edit Dialog.
10. Enter the following to create the measure:
•Value Expression –$F{FREIGHT}.doubleValue()
•Aggregation Function – Sum
•Tooltip Expression - "Total Freight"
11. Click OK, and save and preview the chart as HTML.
17.4.2 Using Advanced Formatting Properties
When you preview the chart as HTML, you can click on a rectangle to zoom in. However, you can see some
problems with the chart view.
TIBCO Software Inc. 313
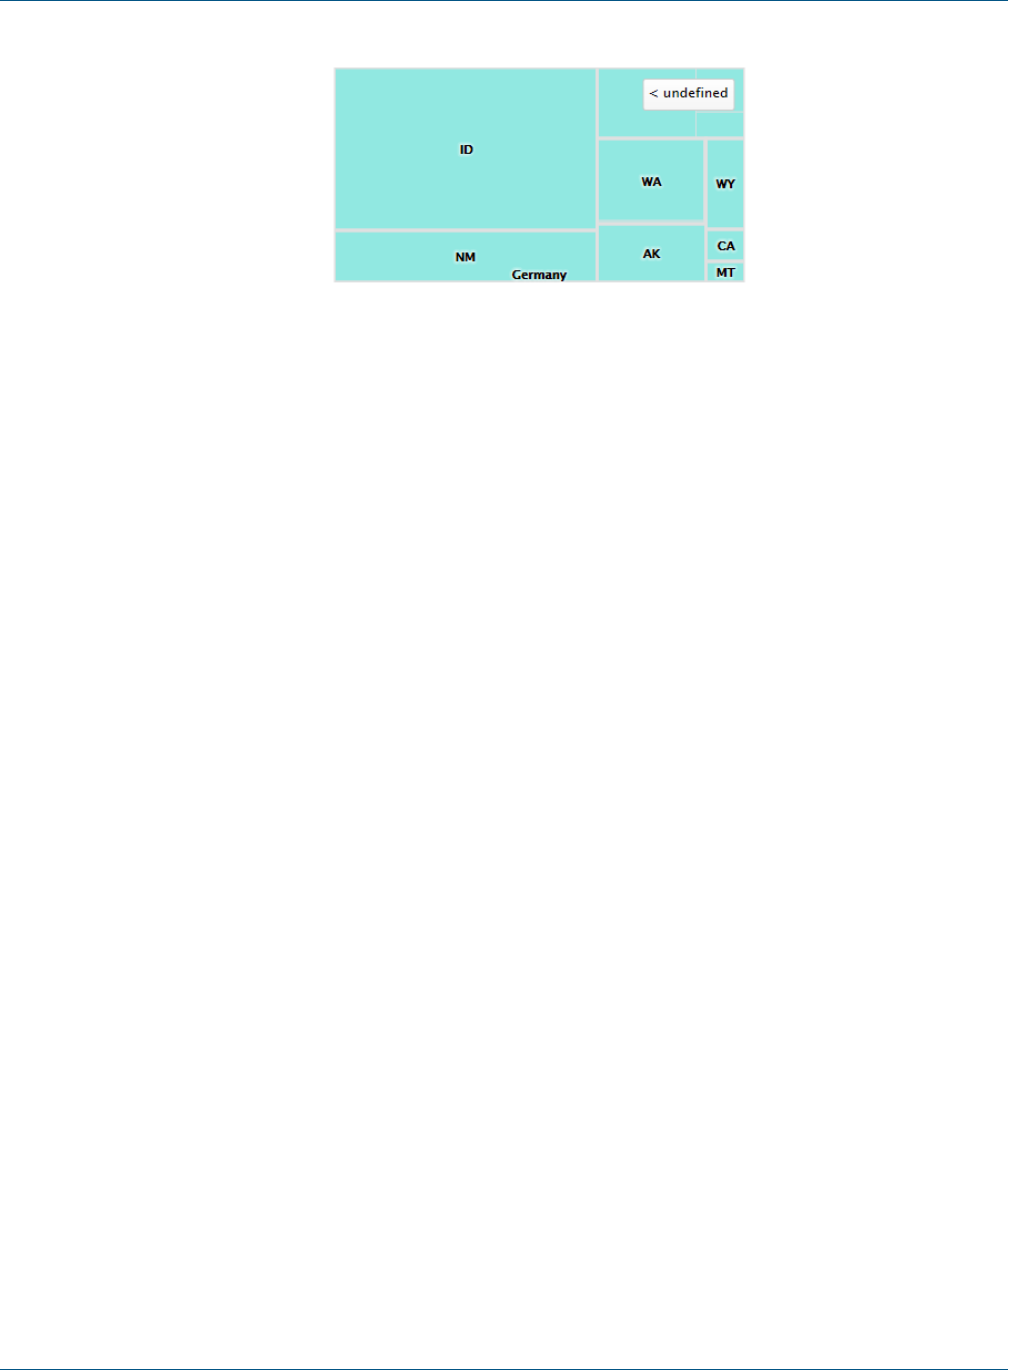
TIBCO Jaspersoft Studio User Guide
Figure 17-15 Tree Map After Drill Through, Showing Formatting Issues
•When a country, such as USA, is selected, the adjacent country is shown on the chart.
•The label to return to a higher level reads undefined.
You can use advanced formatting to set these properties. For more information about advanced formatting, see
17.8, “Advanced Formatting of HTML5 Charts,” on page335
To set advanced properties for the chart:
1. Return to Design view and double-click the chart to open the HTML5 Chart Edit dialog.
2. Click the Chart Formatting tab and click Show Advanced Properties.
314 TIBCO Software Inc.
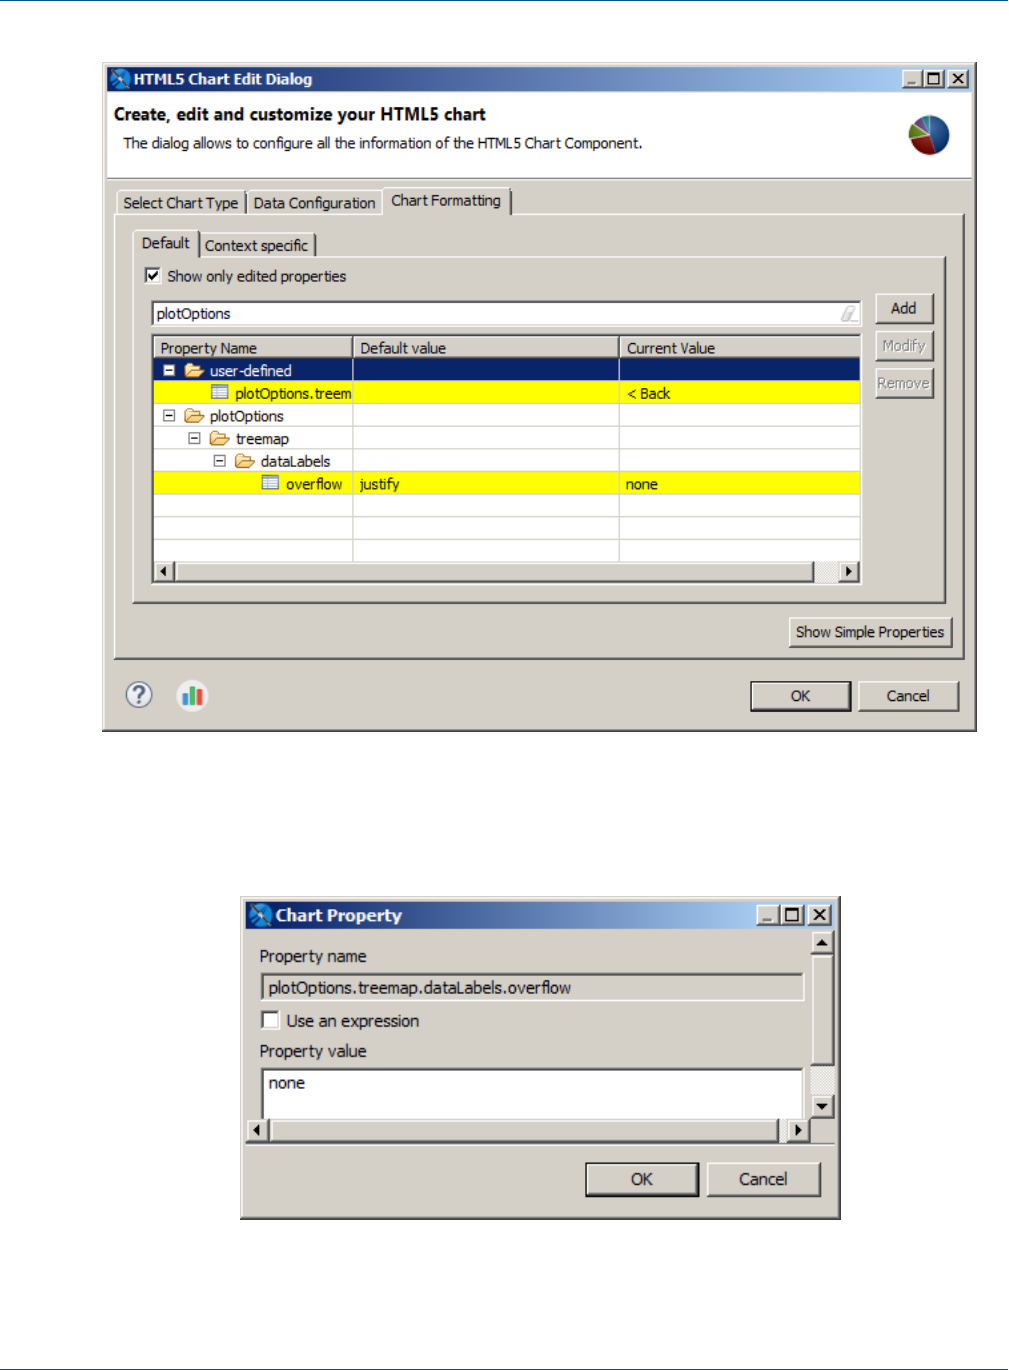
Chapter 17 HTML5 Charts in Commercial Editions
Figure 17-16 Advanced Formatting Properties
3. Click Add.
4. The Chart Property dialog is displayed.
Figure 17-17 Setting Advanced Chart Formatting
TIBCO Software Inc. 315
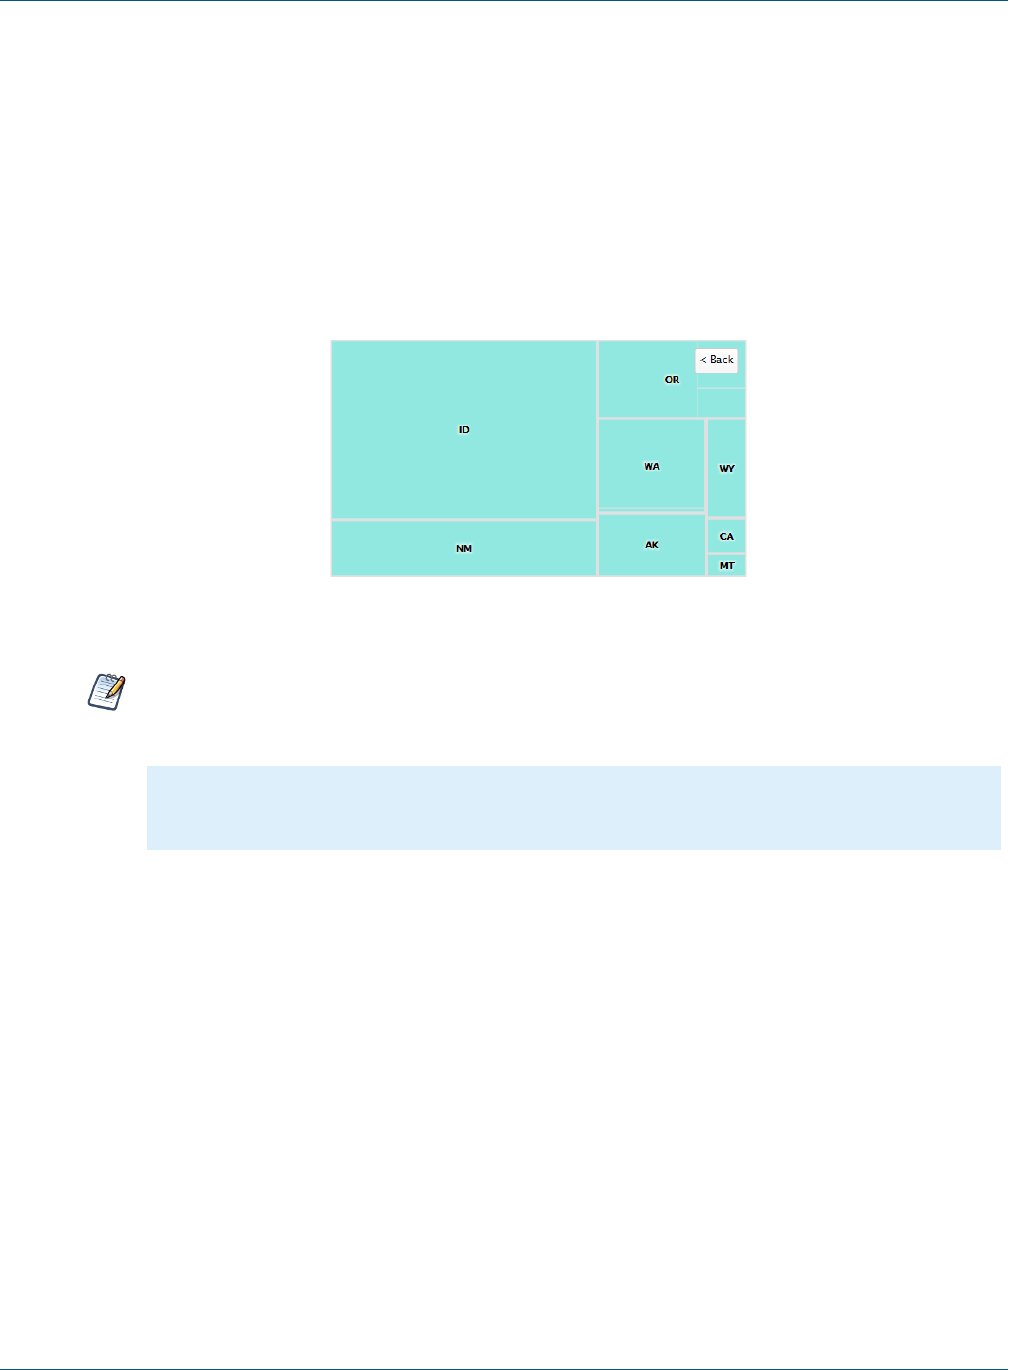
TIBCO Jaspersoft Studio User Guide
5. To prevent the names of other countries from showing on the border of the charts, enter the following, then
click OK:
•Property name –plotOptions.treemap.dataLabels.overflow
•Property value –none
6. To change the text of the button, click Add, enter the following, then click OK:
•Property name –plotOptions.treemap.drillUpButton.text
•Property value –Back
7. Click OK to apply your properties and return to Design view.
Preview the chart in HTML to drill through and see your changes.
Figure 17-18 Tree map after formatting issues have been corrected
Static Highcharts properties are always recognized as String. If you have problems setting a static
Boolean or numeric property, set it as an expression. For example, to set
plotOptions.series.dataLabels.enabled to false, use the following JRXML:
<hc:chartPropertyname="plotOptions.series.dataLabels.enabled">
<hc:propertyExpression><![CDATA[false]]></hc:propertyExpression>
</hc:chartProperty>
17.5 Example of a Scatter Chart Using Advanced Configuration
Advanced configuration for HTML5 charts exposes the details of the underlying multi-dimensional dataset and
gives you greater control over your charts. This example shows how to use the advanced tab to create a scatter
chart.
Scatter charts plot two or more data series as points. The charts are intended to show raw data distribution of the
series. The data is represented as follows:
1. The first data series is represented as the X values.
2. The second data series is represented as correlated Y values.
3. Any additional data series are also plotted as Y values correlated to the X values provided by the first
series.
As a result, a scatter chart always displays one less plot than the number of data series included.
316 TIBCO Software Inc.

Chapter 17 HTML5 Charts in Commercial Editions
This example shows how to use advanced configuration to create a scatter chart that shows maximum and
average freight in each city for each year. You can also create a scatter chart using simple configuration view.
To create the report for the chart:
1. Create a new, blank report using the Sample DB data adapter and the query: select * from orders.
2. Click Next.
3. Click to select all the fields, then click Finish.
4. Delete all bands except for Title and Summary.
5. Enlarge the Summary band to 500 pixels by changing the Height entry in the Band Properties view.
To create the chart:
1. Give your report a title like “Maximum and Average Freight in Years for City”.
2. Drag the HTML5 Charts element into the summary band.
3. Select Scatter. If a verification dialog is displayed, click Yes.
4. Click the Data Configuration tab.
5. Click Switch to Advanced Configuration.
TIBCO Software Inc. 317
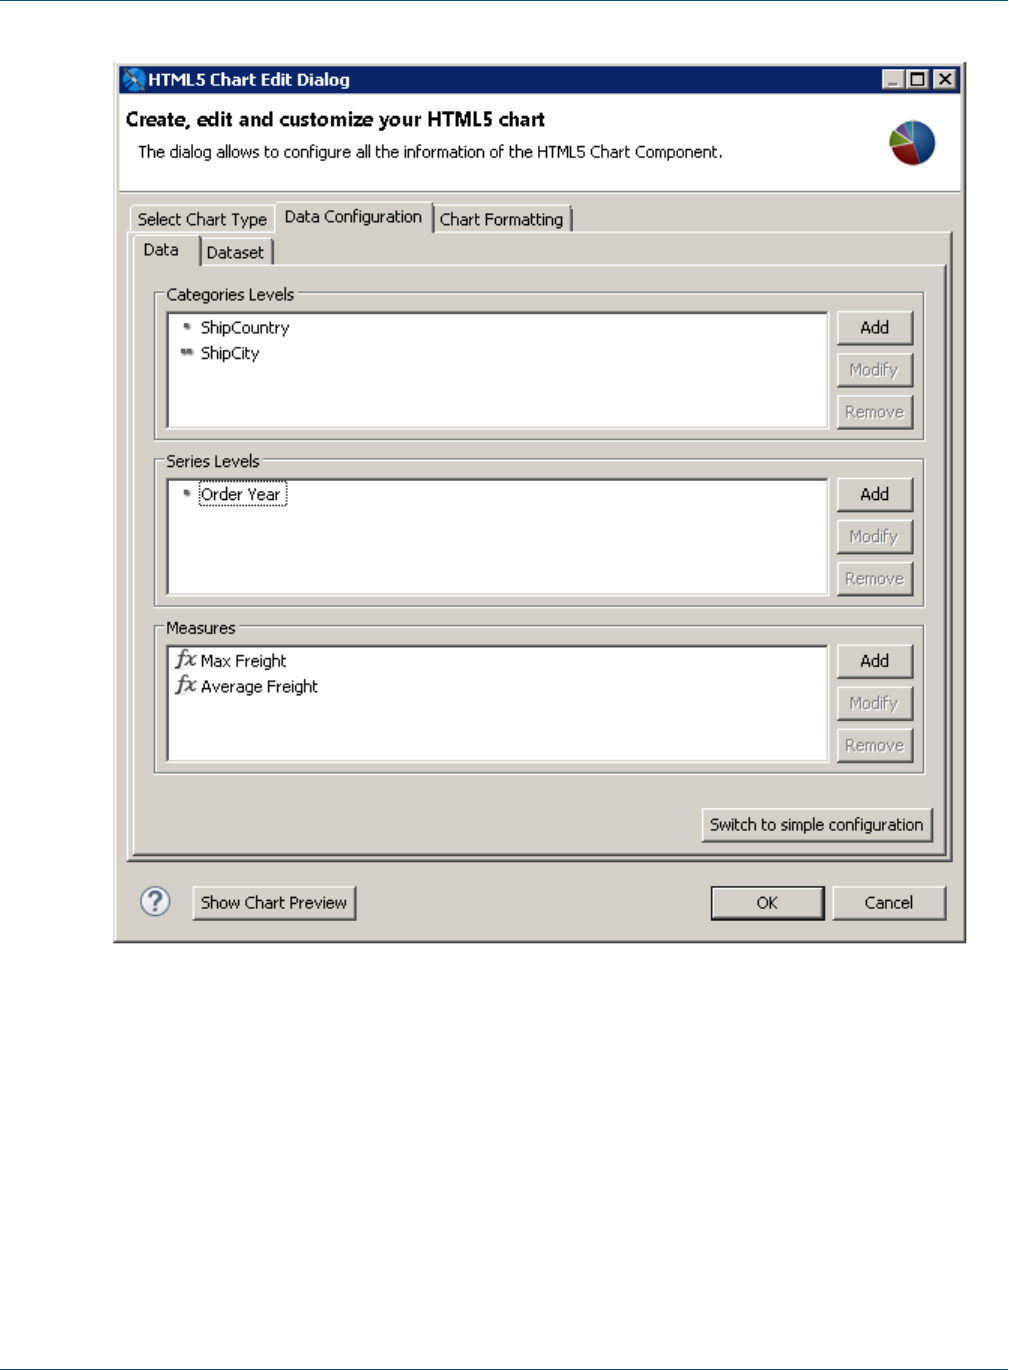
TIBCO Jaspersoft Studio User Guide
Figure 17-19 Scatter Chart Properties
6. Under Categories Levels, select Level1 and click Modify. Then enter the following:
•Name:ShipCountry
•Expression:$F{SHIPCOUNTRY}
•Value Class Name:java.lang.String
•Order:Ascending
Click OK.
7. Under Categories Levels, click Add and create a second Category with the following information:
•Name:ShipCity
•Expression:$F{SHIPCITY}
•Value Class Name:java.lang.String
318 TIBCO Software Inc.
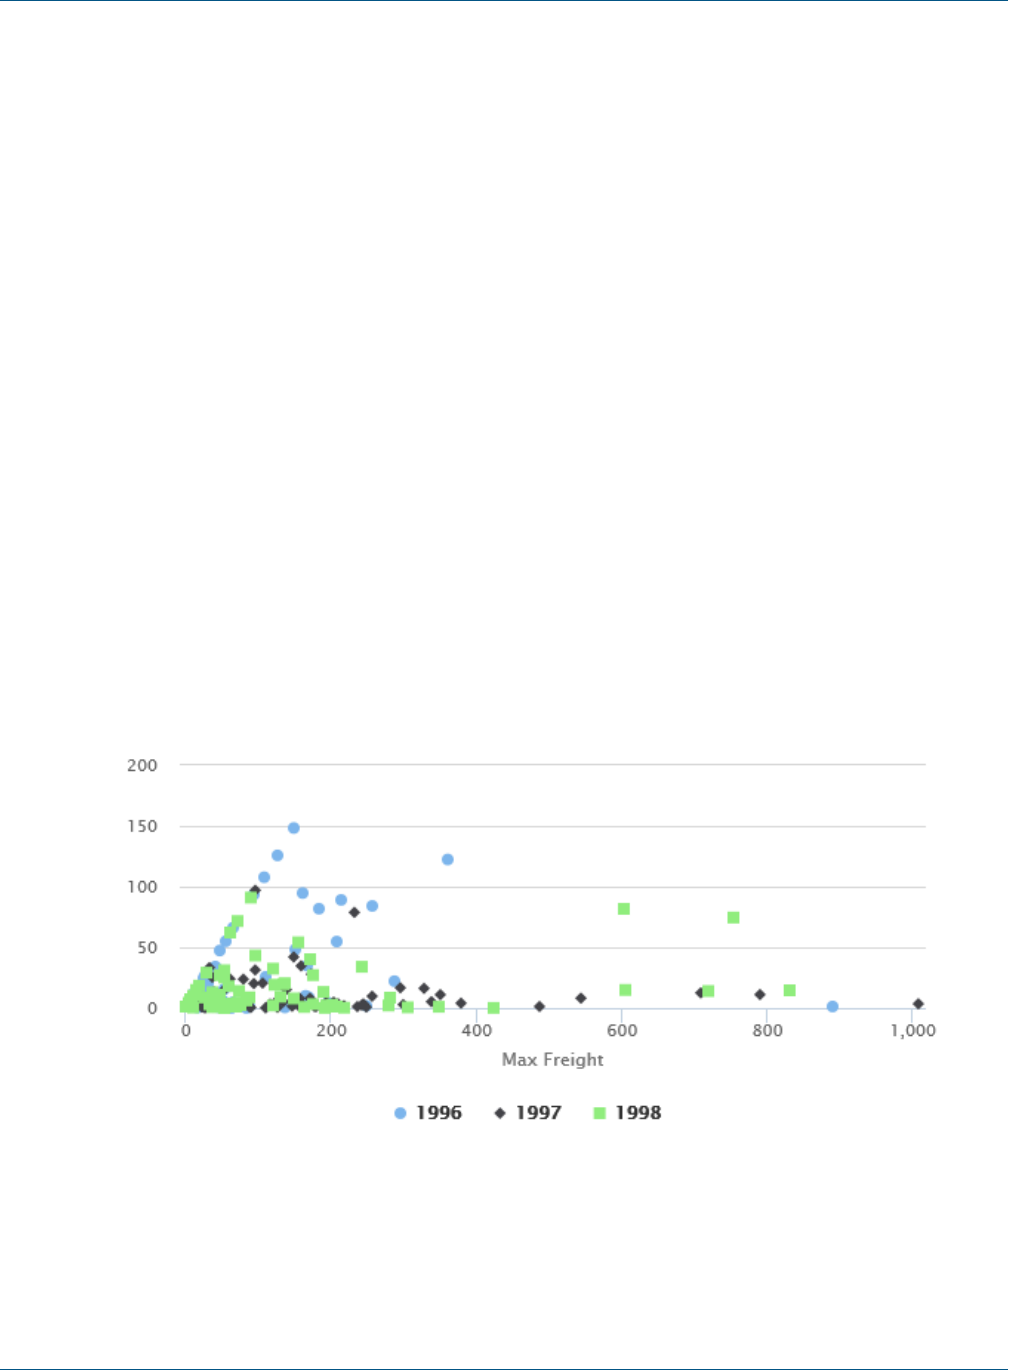
Chapter 17 HTML5 Charts in Commercial Editions
•Order:Ascending
Click OK.
8. Under Series Level, select Series1 and click Modify. Then enter the following:
•Name:Order Year
•Expression:YEAR($F{ORDERDATE})
•Value Class Name:java.lang.Integer
•Order:Ascending
Click OK.
9. Under Measures, select Measure1 and click Modify. Then enter the following for maximum freight:
•Name:Max Freight
•Label Expression:"Max Freight"
•Calculation:Highest
•Value Expression:$F{FREIGHT}
•Value Class Name:java.math.BigDecimal
Click OK.
10. Under Measures, select Measure0 and click Modify. Then enter the following for average freight:
•Name:Average Freight
•Label Expression:"Average Freight"
•Calculation:Average
•Value Expression:$F{FREIGHT}
•Value Class Name:java.math.BigDecimal
Click OK.
The chart is now configured. Click OK to close the dialog, then preview the chart.
Figure 17-20 Scatter chart
TIBCO Software Inc. 319
TIBCO Jaspersoft Studio User Guide
17.6 Example of a Column-Spline Chart
This example shows how to create a column-spline chart that plots average freight and total orders per country.
It then shows how to switch to advanced configuration, edit your chart, and add a series.
A similar dialog is used for the following types of charts:
•Dual- and multi-axis charts that use different scales for each y-axis. (This enables you to easily compare
data items with very different scales.)
•Combination charts that display multiple data series in a single chart that combines the features of two
different charts.
The following chart types use this dialog: ColumnLine, ColumnSpline, StackedColumnLine,
StackedColumnSpline, MultiAxisLine, MultiAxisSpline, MultiAxisColumn.
17.6.1 Creating the Chart Using Simple Configuration
To create the report for the chart:
1. Create a new, blank report using the Sample DB data adapter and the following query:
select * from orders where shipcountry = 'GERMANY'
Click Next.
2. Click to select all the fields. Click Finish.
3. Delete all bands except for Title and Summary.
4. Enlarge the Summary band to 500 pixels by changing the Height entry in the Band Properties view.
To create the chart using simple configuration:
1. Click HTML5 Charts in the Components Pro section of the Palette. The cursor changes to show
that an element is selected. Click and drag in the Summary band to size and place the chart.
2. In the HTML5 Chart Edit dialog, select ColumnSpline. If you are prompted to confirm, click Yes.
3. Click the Data Configuration tab.
The HTML5 Chart Edit dialog is displayed.
320 TIBCO Software Inc.
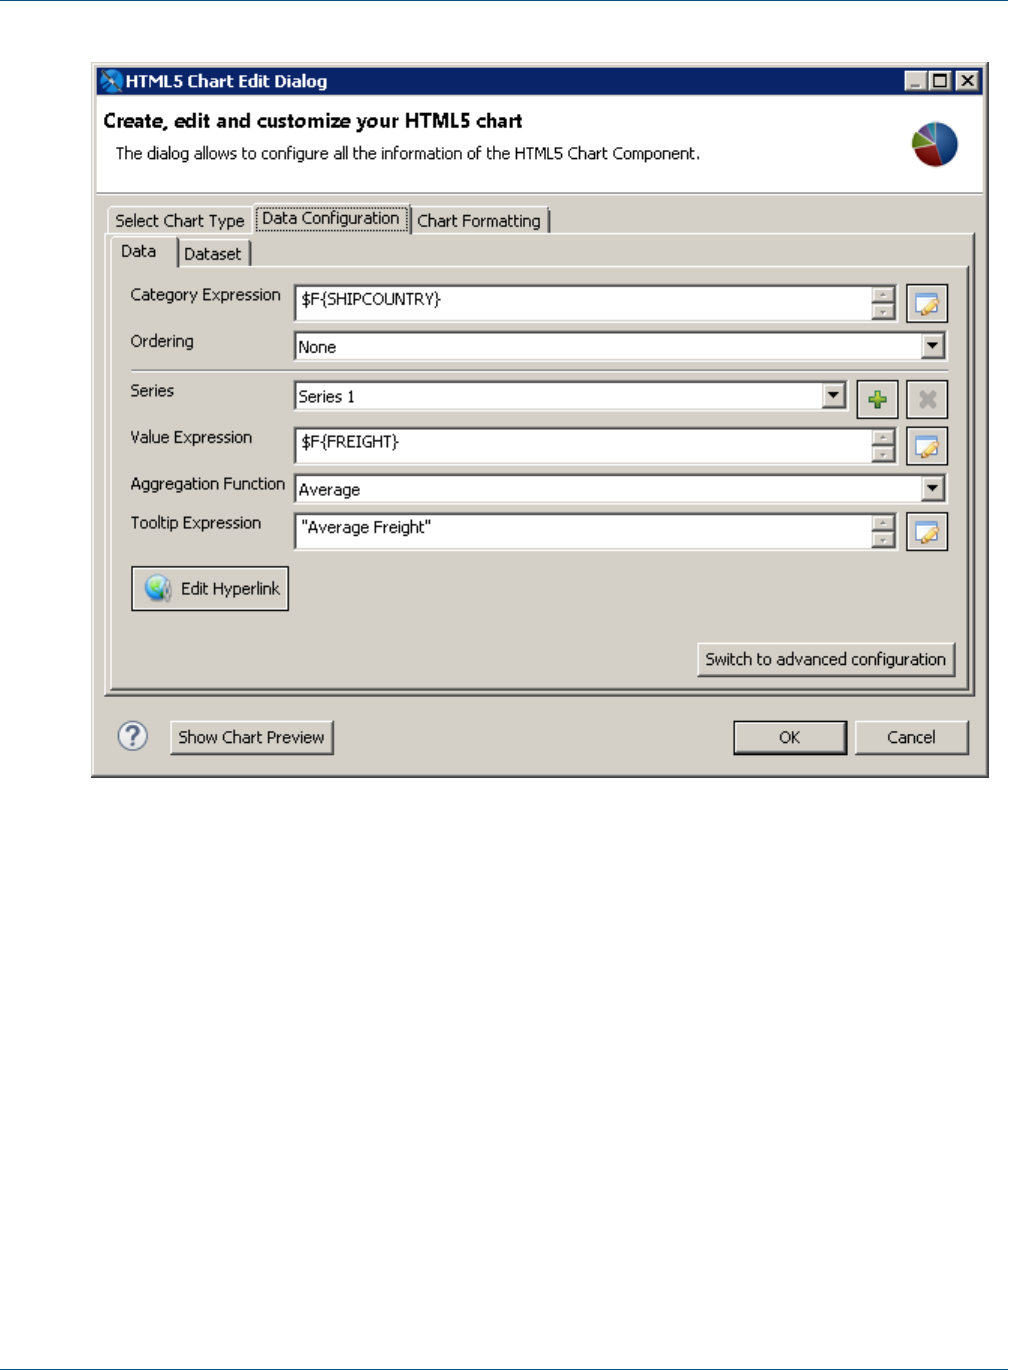
Chapter 17 HTML5 Charts in Commercial Editions
Figure 17-21 Simple Configuration for Column-Spline Chart
4. Enter the following to create your category:
•Category Expression:$F{SHIPCOUNTRY}
•Ordering:Ascending
5. Select Series 1 and configure the first measure for total freight. This measure is used for columns. You can
change this using advanced configuration:
•Value Expression:$F{FREIGHT}
•Aggregation Function:Average
•Tooltip Expression:"Average Freight"
6. Select Series 2 from the dropdown and configure the second measure for total orders. This measure is used
for spline:
•Value Expression:$F{ORDERID}
•Aggregation Function:DistinctCount
•Tooltip Expression:"Total Orders"
7. Click OK to return to design view.
8. Save and preview your report. It should look like the following figure.
TIBCO Software Inc. 321
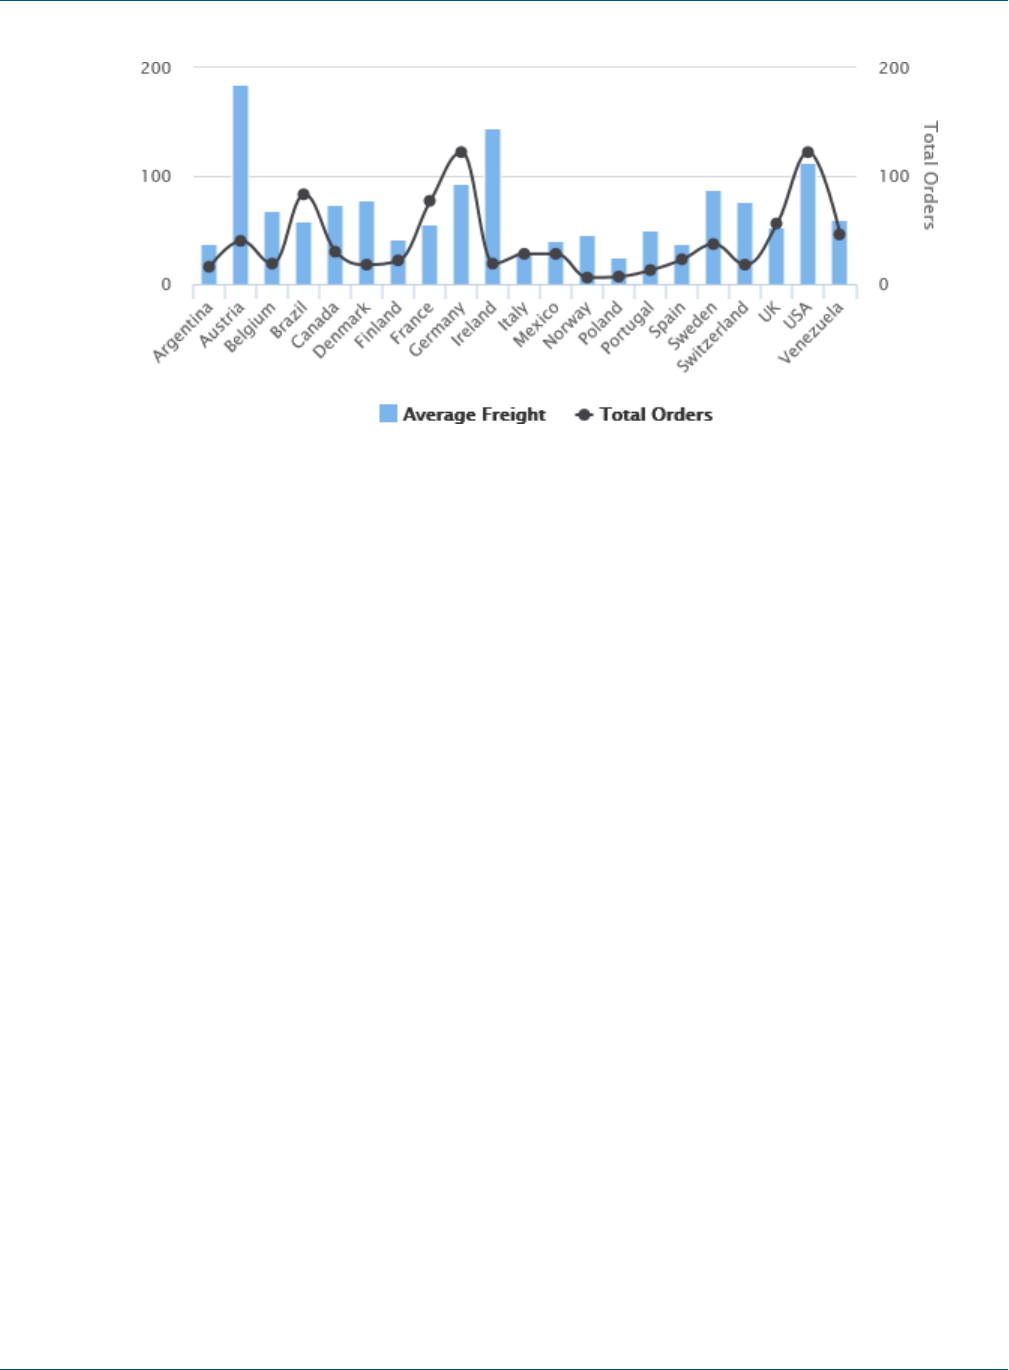
TIBCO Jaspersoft Studio User Guide
Figure 17-22 Column Spline Chart
17.6.2 Using Advanced Configuration
You can use advanced configuration to modify your measures and to add a series level.
To use advanced configuration to edit measures:
Simple configuration lets you add a measure, but does not let you choose set whether the measure is used for
columns or spline. To change this setting, use advanced configuration to set the series property type (column,
line, or spline).
1. From design view, double-click the chart to open the HTML5 Chart Edit dialog.
2. Click Switch to advanced configuration.
322 TIBCO Software Inc.
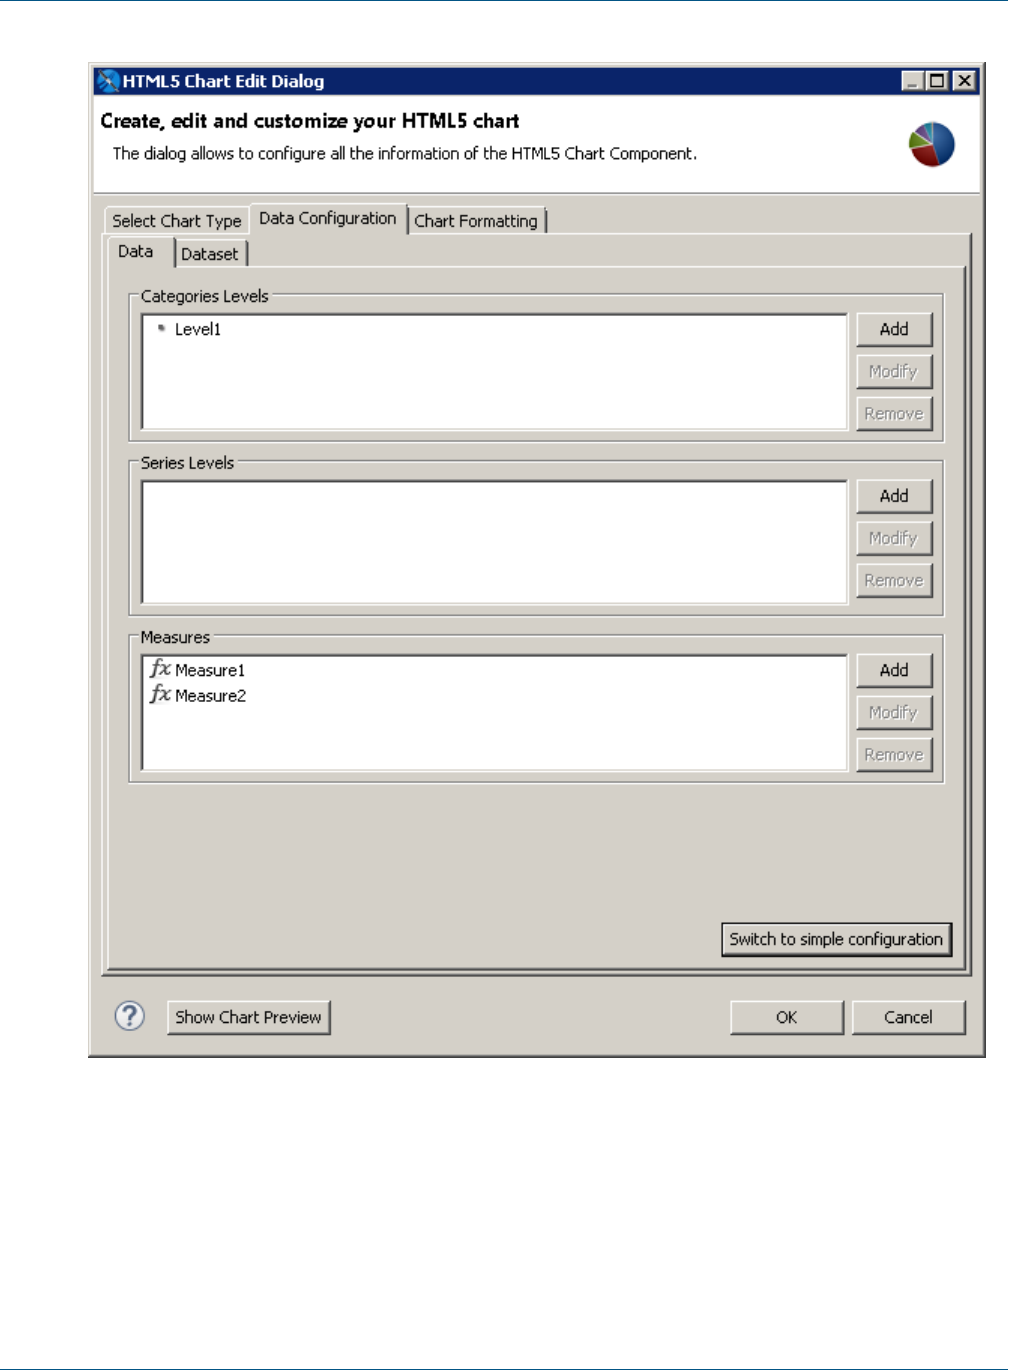
Chapter 17 HTML5 Charts in Commercial Editions
Figure 17-23 Advanced Configuration for a Chart
3. Select Measure1 and click Modify.
The Measure dialog is displayed. The dialog contains the settings generated when you created the measure
in simple configuration, although some of the settings have different names. If you want, you can use this
dialog to change the name to Average Freight.
TIBCO Software Inc. 323
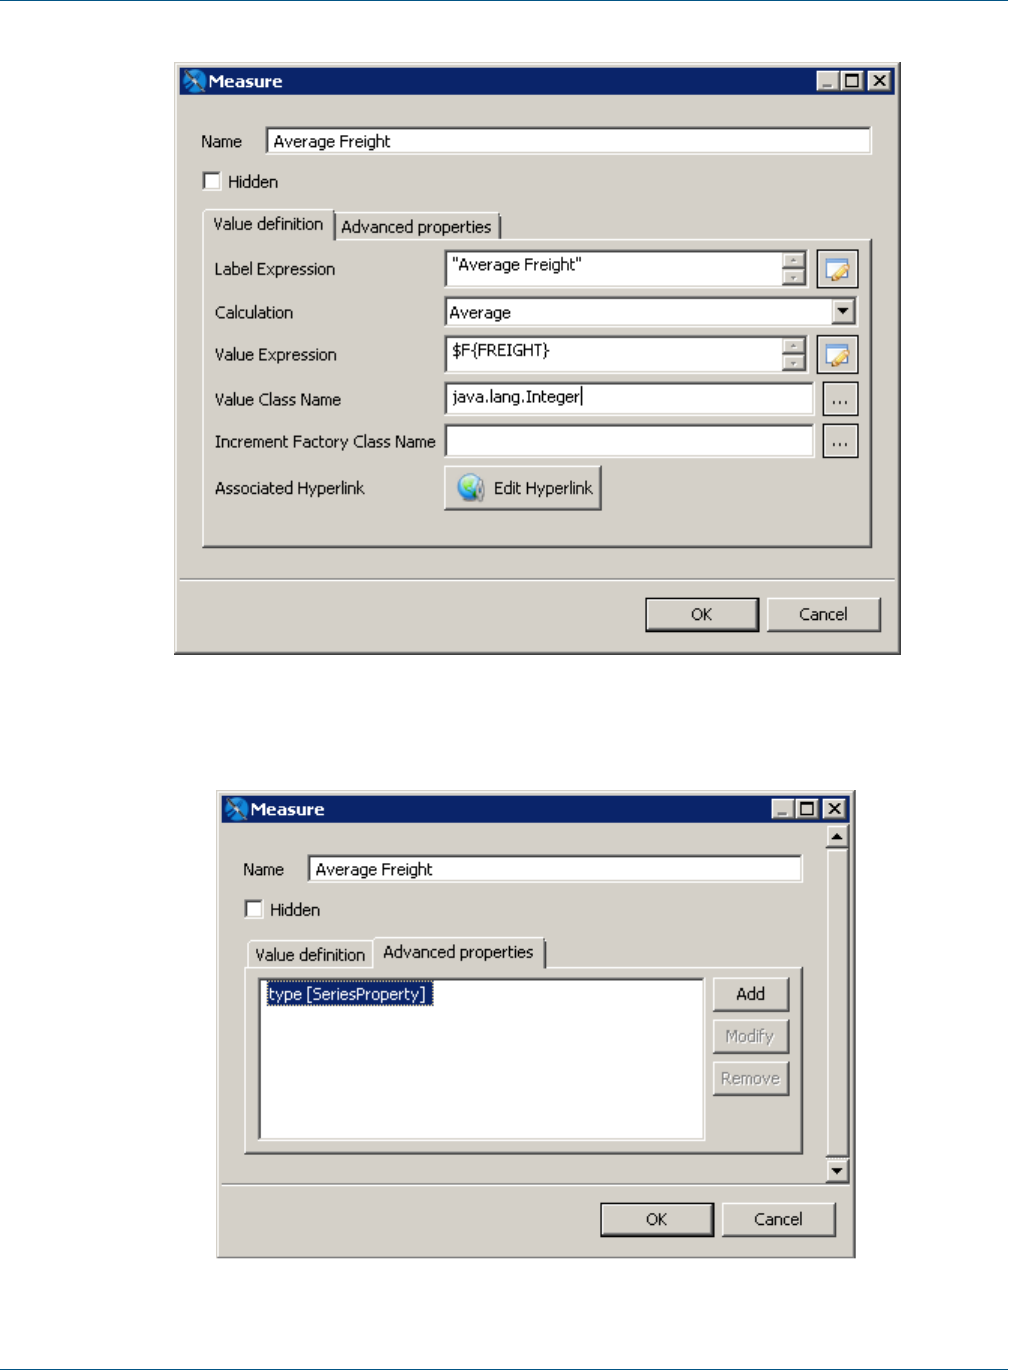
TIBCO Jaspersoft Studio User Guide
Figure 17-24 Editing a Measure
4. Click the Advanced Properties tab.
324 TIBCO Software Inc.
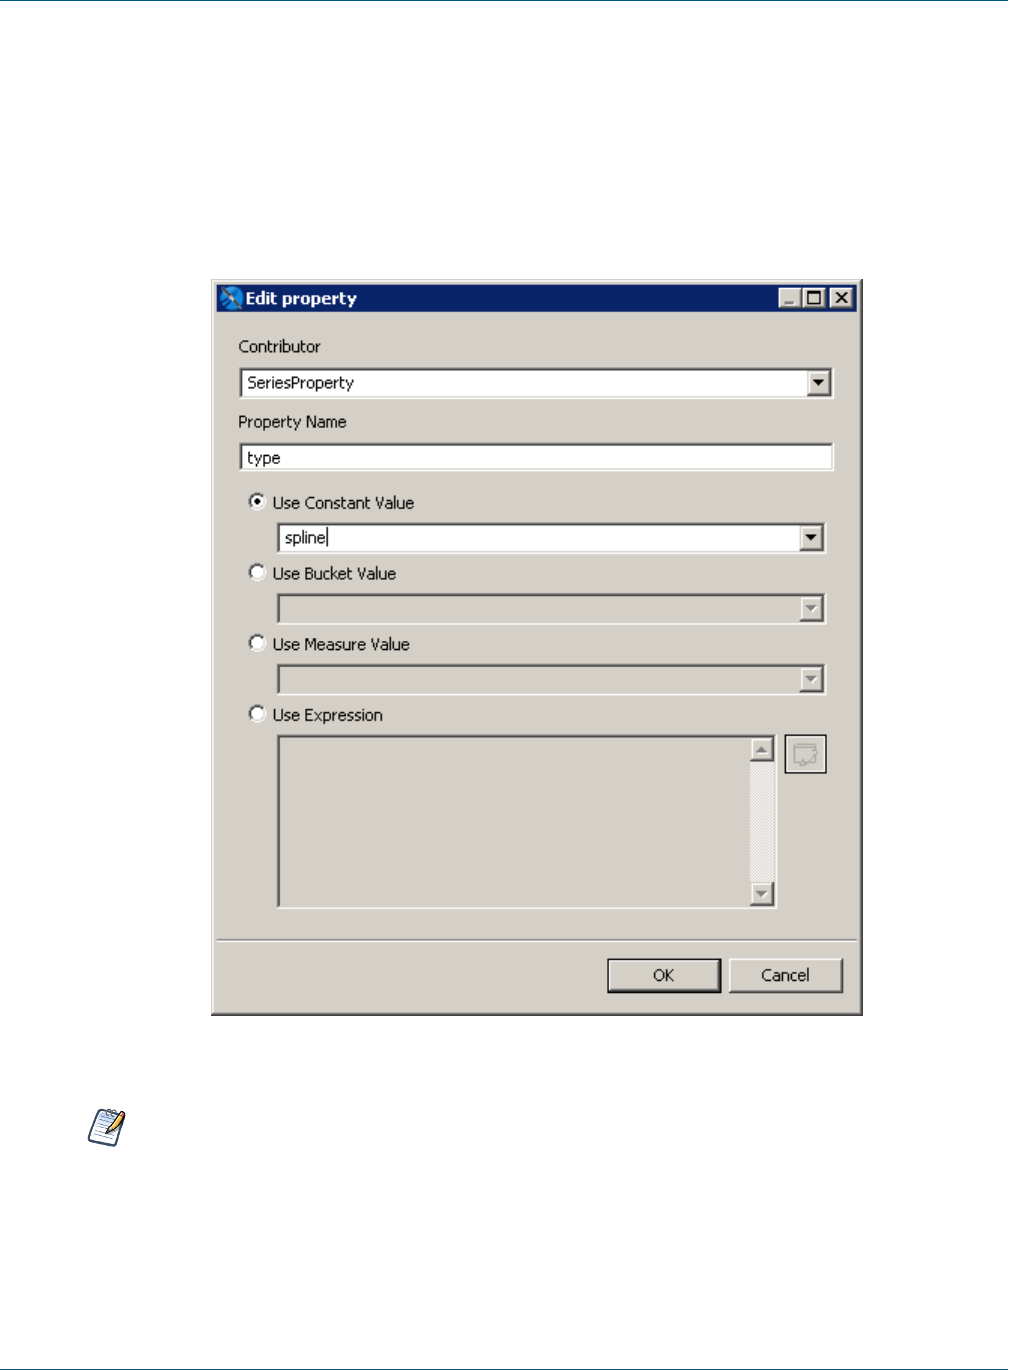
Chapter 17 HTML5 Charts in Commercial Editions
Figure 17-25 Advanced Properties for a Measure in a Column-Spline Chart
5. Click Add to specify the series type:
•Contributor:SeriesProperty
•Property Name:type
•Use Constant Value:spline
Click OK, then click OK again.
Figure 17-26 Adding a Series Property
The supported constant values for series property type are column,line, and spline.
6. Select Measure2 and click Modify.
The Measure dialog is displayed. If you want, you can change the name to Total Orders.
7. Click the Advanced Properties tab.
8. Click Add to specify the series type:
•Contributor:SeriesProperty
TIBCO Software Inc. 325
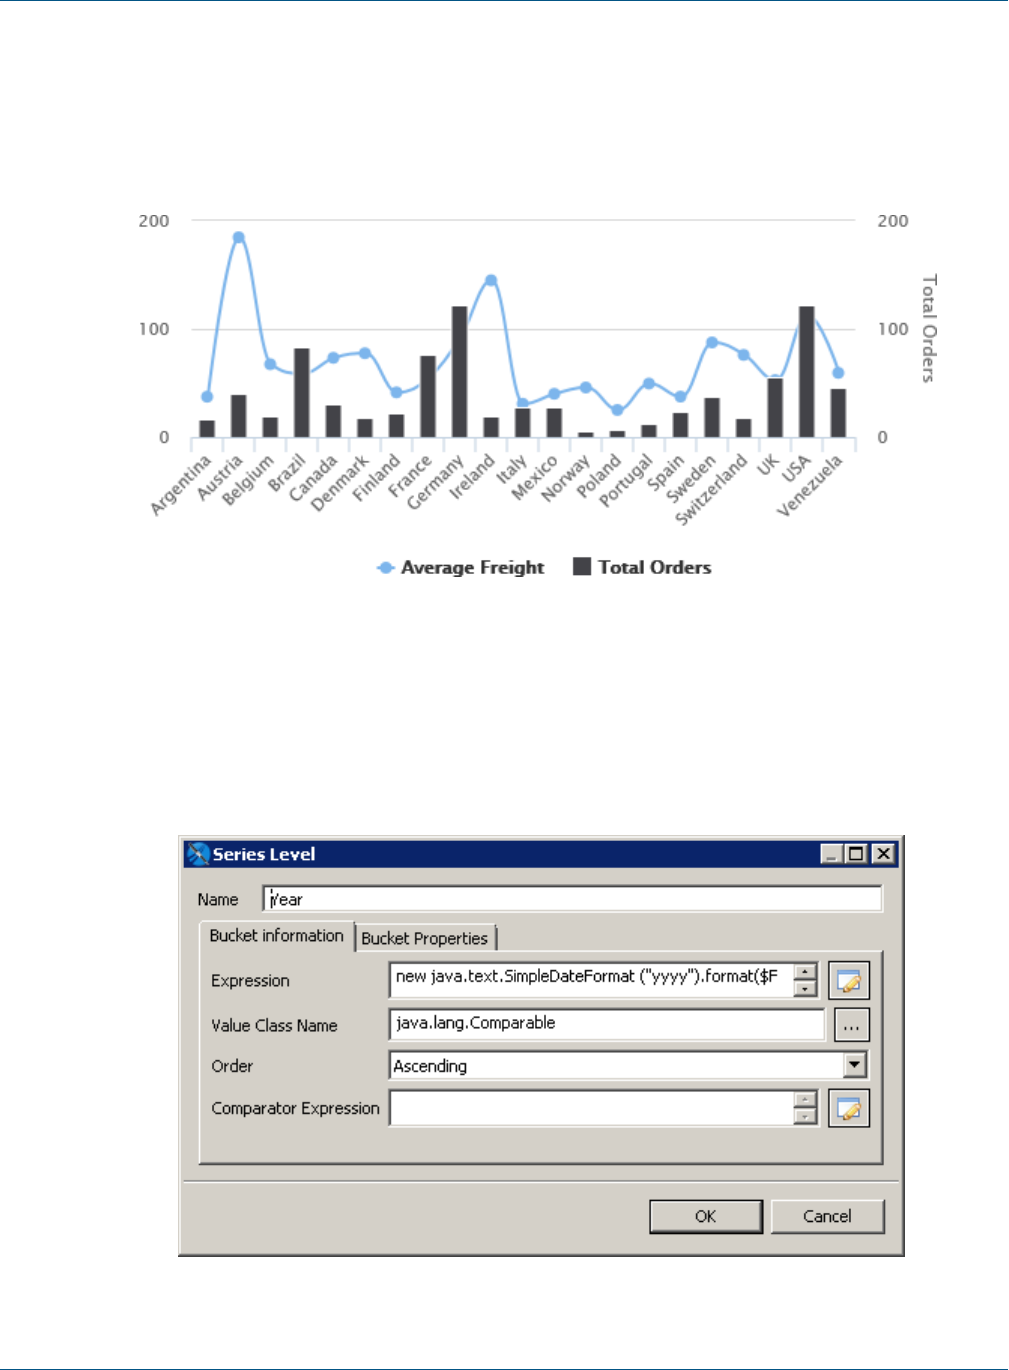
TIBCO Jaspersoft Studio User Guide
•Property Name:type
•Use Constant Value:column
Click OK, then click OK again.
9. Click OK three times to return to design view, then save and preview the chart. The display has changed to
reflect your settings.
Figure 17-27 Chart After Changing the Measure Types
To add a series level:
1. From design view, double-click the chart to open the HTML5 Chart Edit dialog.
2. Make sure you are the advanced configuration view of the Data Configuration tab.
3. Set the series type for any existing measures, as described above.
4. Click Add in the Series Levels section to open the Series Level dialog.
Figure 17-28 Adding a Series Level to a Column-Spline Chart
326 TIBCO Software Inc.
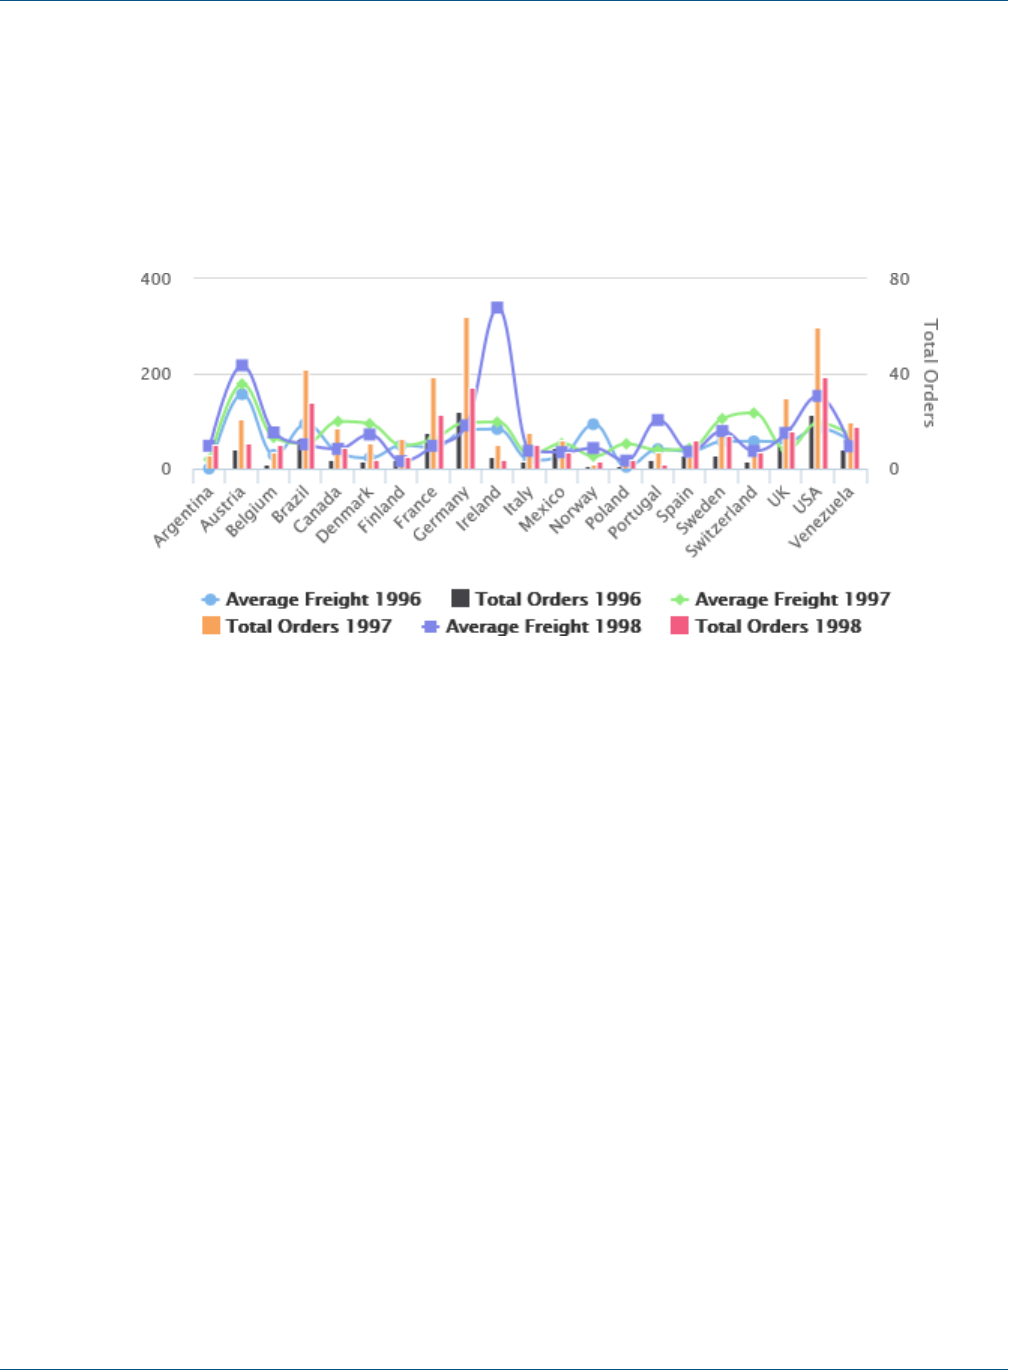
Chapter 17 HTML5 Charts in Commercial Editions
5. Create a series with the following:
•Name:Year
•Expression:new java.text.SimpleDateFormat ("yyyy").format($F{ORDERDATE})
•Value Class Name:java.lang.Comparable
•Order:Ascending
Click OK twice to return to design view.
6. Save and preview the report.
Figure 17-29 Adding a Series Level to a Column-Spline Chart
17.7 Creating Hyperlinks in HTML5 Charts
To follow a link in an HTML 5 chart, the user clicks a chart component that represents a measure. This
hyperlink is created by a specific extension to that chart component, which evaluates properties of the measure.
You can create hyperlinks in two ways:
•Use simple configuration to create hyperlinks that are automatically bucketed by the category in a simple
chart.
•Use advanced configuration to create more complex values for a hyperlink. To do this, you define a bucket
property, a key/value pair associated with a category or series level, and then define the hyperlink value
using an expression.
This example shows how to combine a URL with a hidden measure to create an interesting user experience.
17.7.1 Creating a Simple Hyperlink
Create the report:
1. Create a new report:
a. Choose a blank template and click Next.
b. Set a name and location for the report and click Next.
TIBCO Software Inc. 327
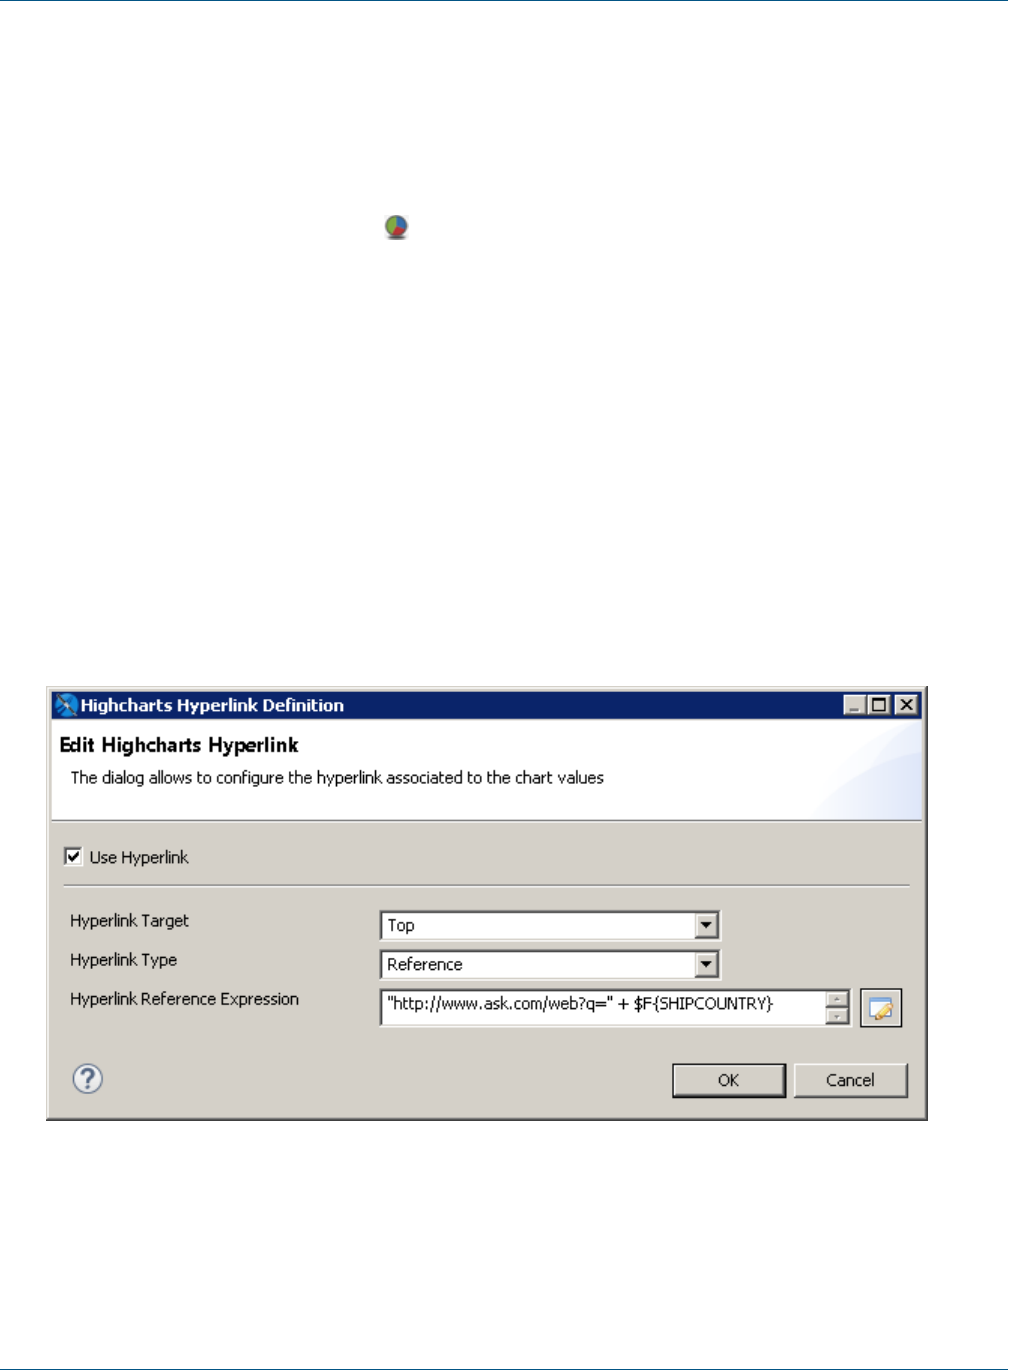
TIBCO Jaspersoft Studio User Guide
c. Select the Sample DB data adapter and click Next.
d. Enter the following query:
select * from orders
e. On the Fields page, select all fields and click Finish.
Add a column chart:
1. Add the HTML5 Charts element to the title band and select Column.
2. Select the Data Configuration tab.
3. For the Category Expression section:
a. Enter $F{SHIPCOUNTRY} for the Category Expression.
b. Verify that Ordering is set to Ascending.
4. For the Series section, use the following settings:
a. Series: Series 1
b. Value Expression:$F{ORDERID}
c. Aggregation Function: DistinctCount
d. Tooltip Expression: "Number of Orders"
At this point the chart is configured. You can click Show Chart Preview to preview it from the dialog.
Configure a simple hyperlink:
1. On the Data Configuration tab, click Edit Hyperlink.
The Edit Hyperlink information dialog box is displayed.
Figure 17-30 Editing the Number of Orders a Second Time
2. Click Use Hyperlink and enter the following information:
•Hyperlink Target – Top
•Hyperlink Type – Reference
•Hyperlink Reference Expression –"http://google.com/#q=" + $F{SHIPCOUNTRY}
328 TIBCO Software Inc.

Chapter 17 HTML5 Charts in Commercial Editions
3. Click OK twice to return to design view.
4. Preview your chart as HTMLor using the interactive report viewer. Click any column to verify it points to
the Ask.com search for that country.
17.7.2 Working with Bucket Properties and Hidden Measures
To create a hyperlink with more complexity, use advanced configuration.
Open advanced configuration for your chart:
1. From design view, double-click the chart to open the HTML5 Chart Edit dialog.
2. Click Switch to advanced configuration.
Before creating a new hyperlink, you can view the hyperlink you just created to see how it is configured in
advanced view.
View the existing hyperlink:
1. Select Category Levels> Level 1 and click Modify.
The Category Levels dialog for this category is displayed. This dialog shows details for the category, such
as name and value type.
2. If you want, take the opportunity to name the category. For this example, you can name it Country.
3. Click Bucket Properties to see the hyperlink bucket properties for the existing hyperlink.
4. Click OK to return to the HTML5 Chart Edit dialog
TIBCO Software Inc. 329
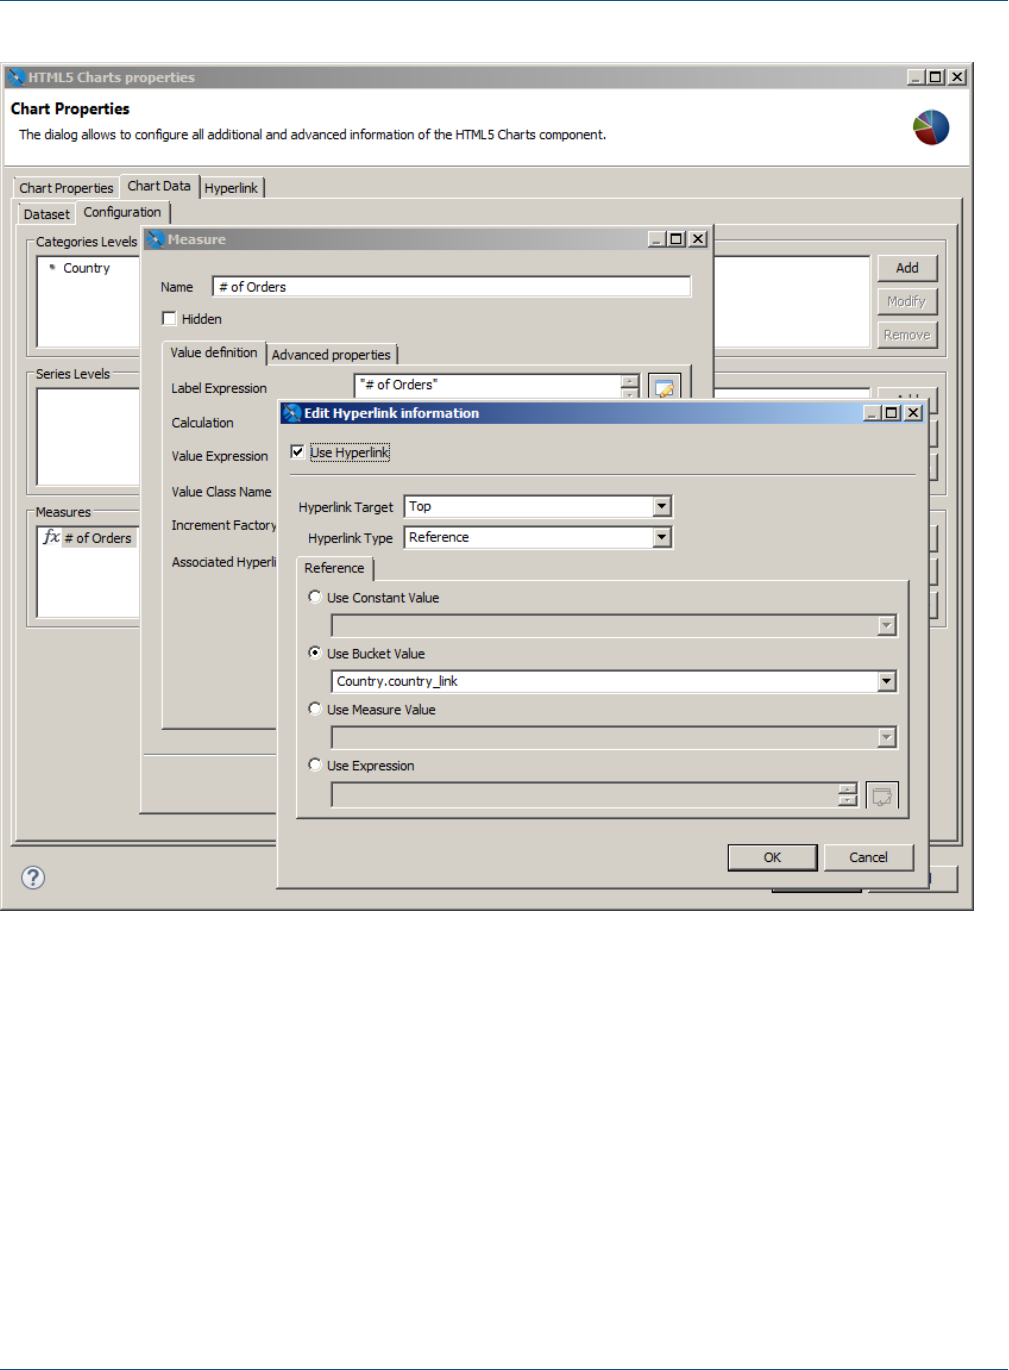
TIBCO Jaspersoft Studio User Guide
Figure 17-31 Defining Bucket Properties for HTML5 Chart Hyperlinking
Add a series for Year:
To make this example a little bit more useful, and to see how you can use hyperlink information from different
dimensions, thisexample shows how to add an extra dimension called Year, so the chart can display the number
of orders placed in a specific country in a specific year. Then you can create a hyperlink that contains both the
country and the year.
1. Double-click the chart.
2. Click the Chart Data tab and select the Configuration sub-tab.
3. Click Add in the Series Levels area.
4. Add a new series level configured as shown below:
•Name: Year
•Expression: YEAR($F{ORDERDATE} )
330 TIBCO Software Inc.
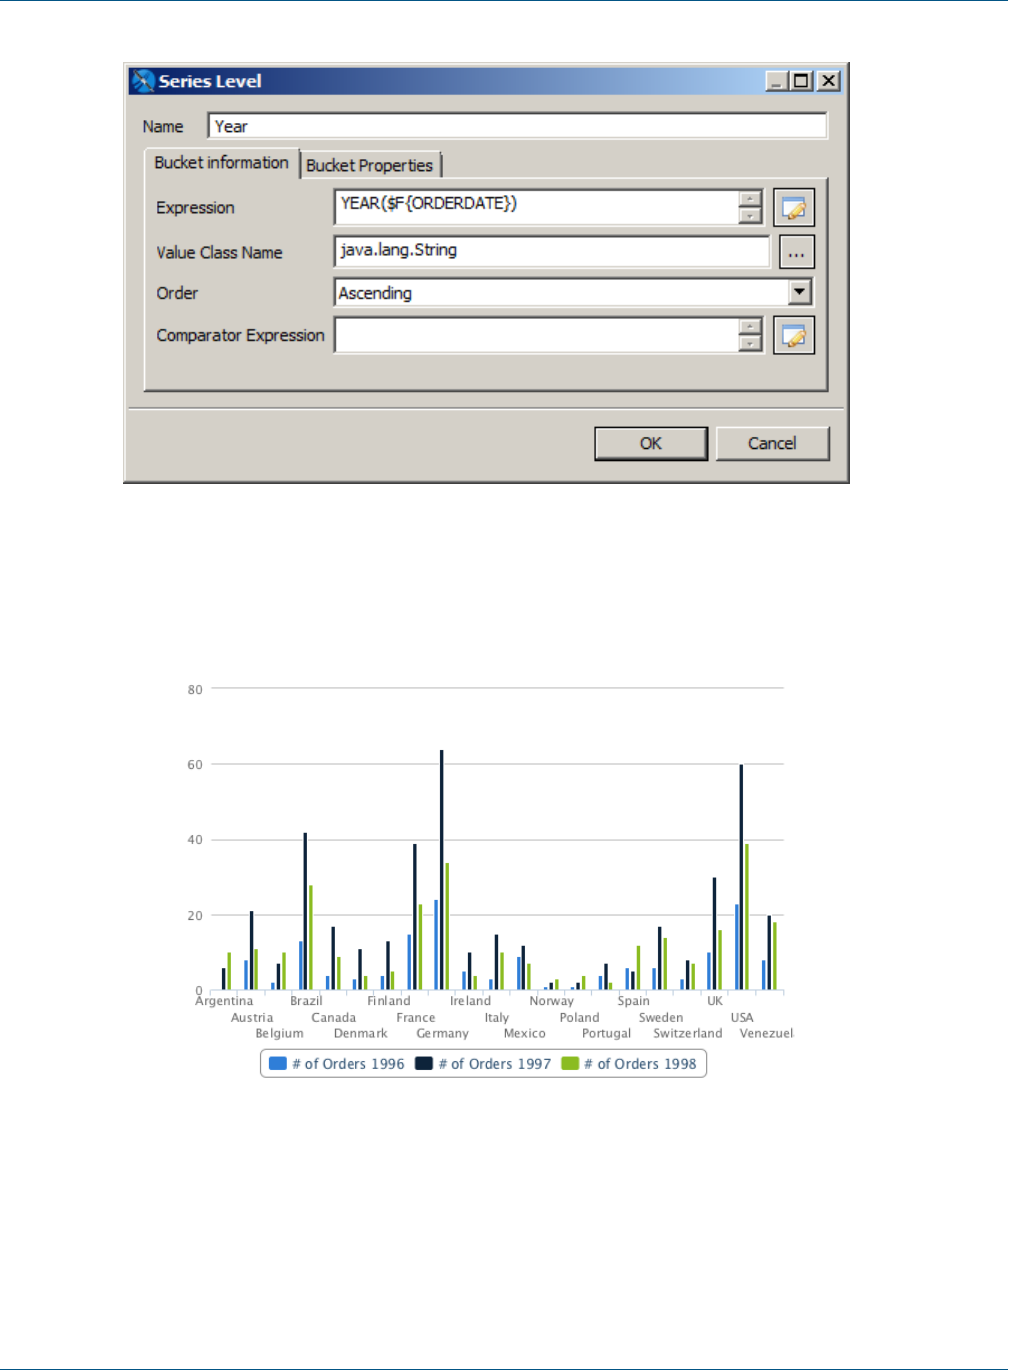
Chapter 17 HTML5 Charts in Commercial Editions
Figure 17-32 Adding a Series Level to Define Buckets
5. Click OK twice.
Once again, you can preview the chart. Now, for each country, the chart shows the number of orders split
by year.
Figure 17-33 Column Chart with Order Numbers Split by Year
Create a measure to hold the series hyperlink:
To create a more complex hyperlink, you can use a measure. Measures are usually designed to hold numeric
values, most of the time the result of some aggregation function (in our example we show the count of orders).
But a measure can actually be anything.
TIBCO Software Inc. 331
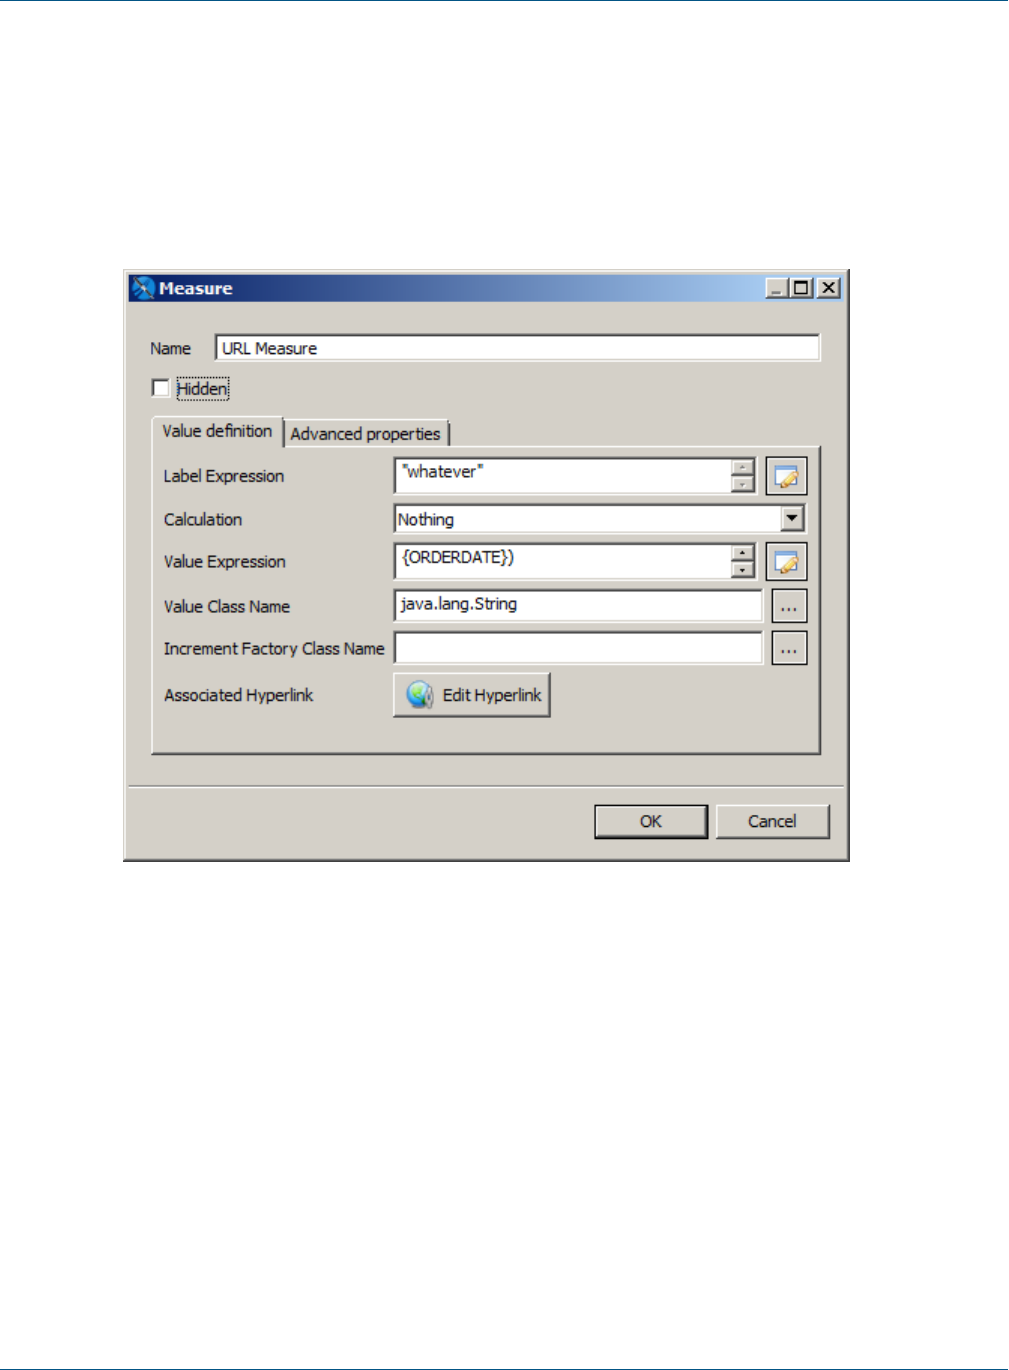
TIBCO Jaspersoft Studio User Guide
The following example creates a URL string:
•Name: URL Measure
•Hidden: true (It is very important to check the checkbox, because you are not going to display this
measure, it would not make sense as it's not numeric.)
•Calculation: Nothing
•Value Expression:"http://google.com/#q=" + $F{SHIPCOUNTRY} + " " + YEAR($F{ORDERDATE})
•Value Class Name:java.lang.String
Figure 17-34 Defining the URL to Open when the Measure is Clicked
For this example, the most important things to note are:
•The measure is marked as Hidden.
•The calculation type is set to Nothing.
•The class of the measure is String. Specifically the example creates a String URL with a reference to
both the country and the year of the order.
Create a hyperlink that uses a hidden measure:
6. Click OK to return to the HTML5 Chart Edit dialog box.
7. Select Measure 1, the visible measure used for the columns in the chart.
8. Click Modify.
9. If you want, change the name of Measure 1 to Number of Orders.
10. Click Edit Hyperlink.
332 TIBCO Software Inc.
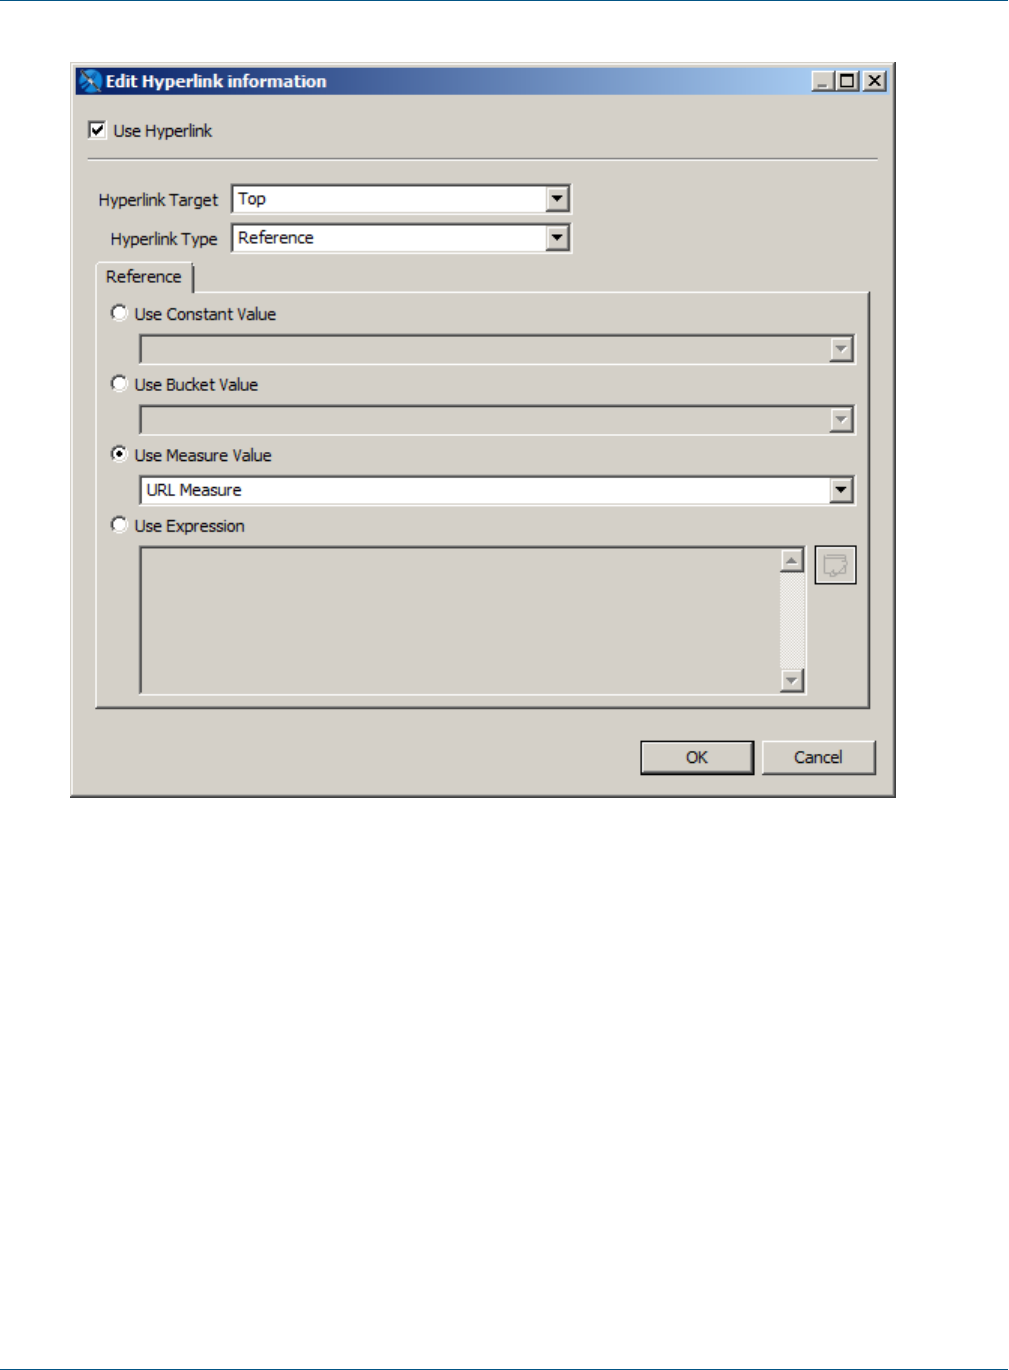
Chapter 17 HTML5 Charts in Commercial Editions
Figure 17-35 Creating a Hyperlink for the Measure
11. Set the following values:
•Use Hyperlink: true
•Hyperlink Target: Top
•Hyperlink Type: Reference
•Use Measure Value: Select this and enter the name of the measure that contains the expression for the
hyperlink, URLMeasure.
12. Click OK three times to return to design view. Then save the report and preview it as HTML.
Now, each column in the stacked column chart points to a search for the corresponding country and year.
17.7.3 Working with Hyperlinks to Report Units
If you are exporting your reports to JasperReports Server, you can use hyperlinks of type ReportExecution to
invoke another JasperReports Server report and set values for its input controls. For example, users may want to
click a bar in a bar chart related to a country to run a report that shows more about this country, or just show
TIBCO Software Inc. 333
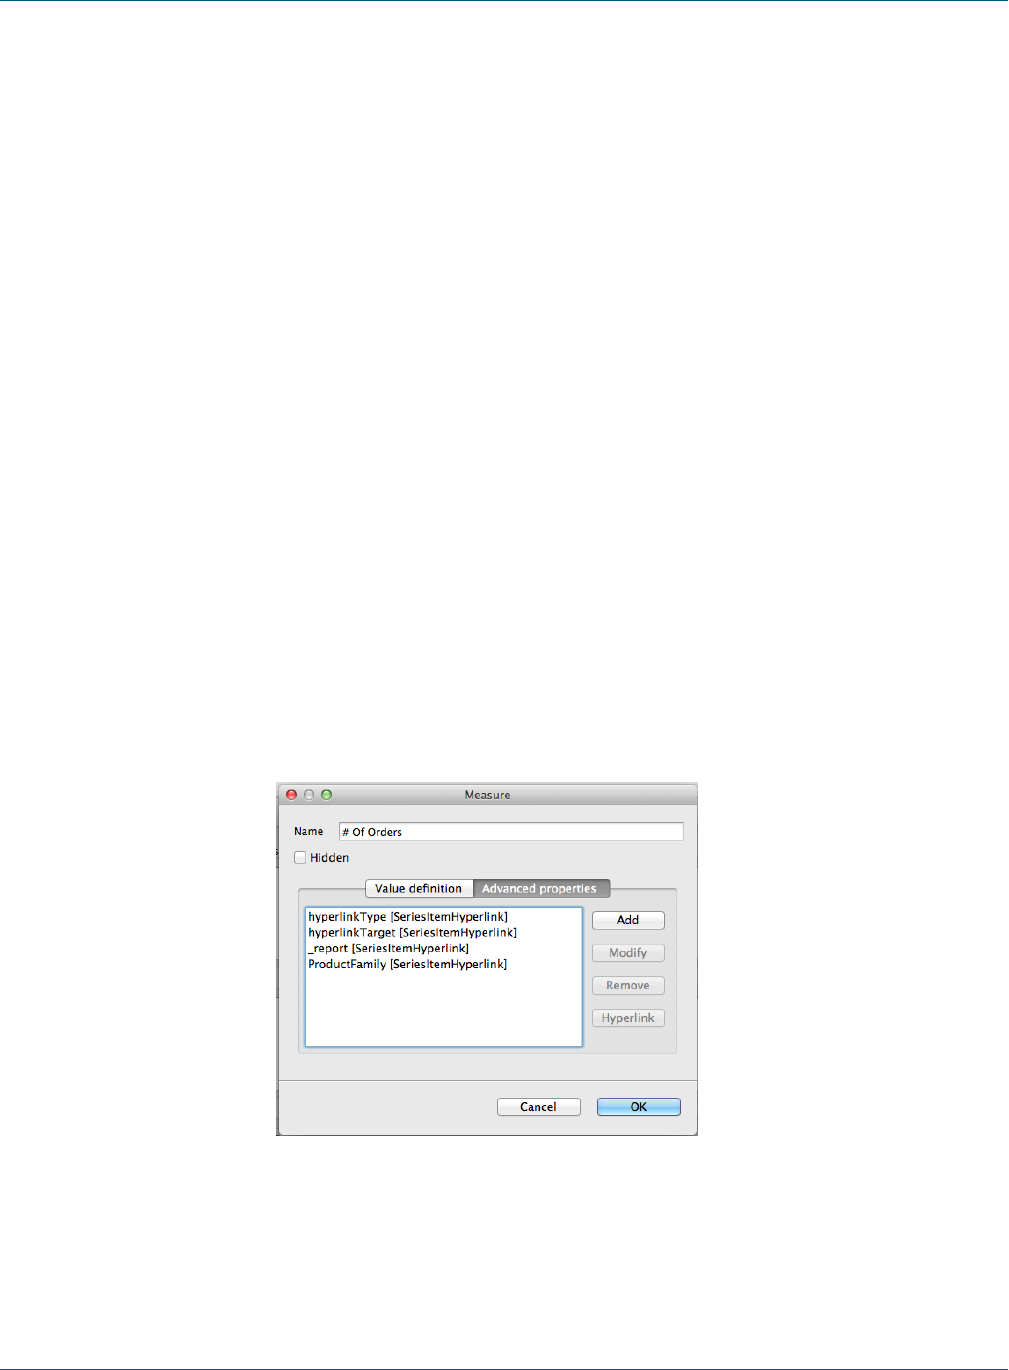
TIBCO Jaspersoft Studio User Guide
details about the number represented by the bar itself. This mechanism is a way to move from one report unit to
another, realizing what is more generally called drill-down and drill-up.
The execution of report units can be done by using hyperlink of type ReportExecution. This type requires to
define a hyperlink parameter called “_report”, which holds the location of the report unit inside the
JasperReports server repository.
Other hyperlink parameters can be defined to set values for input controls exposed by the report unit.
The next tutorial shows how to create a link to the report unit 04. Product Results by Store Type Report”,
located at /public/Samples/Reports/4_Product_Results_by_Store_Type_Report.
When executed, this report can be filtered by country, anyway, since this report unit does not expose through
input controls defined at report unit the country parameter, we cannot pass the country value we have.
1. Create a new report, following the steps described at the beginning of 17.7, “Creating Hyperlinks in
HTML5 Charts,” on page327
2. Modify the # of orders measure by adding the following properties in the advanced properties tab:
a. hyperlinkType (contributor: SeriesItemHyperlink, Static value: ReportExecution)
b. hyperlinkTarget (contributor: SeriesItemHyperlink, Static value: Blank)
c. 3_report (contributor: SeriesItemHyperlink, Static value: /public/Samples/Reports/4_Product_Results_
by_Store_Type_Report)
3. Publish the report in JasperReports Server and preview it on the web. Click a bar column to open the report
units we defined in the previous step.
Note that there is no special syntax to define a parameter, just use the name of the parameter as the property
name, and select the value (static, bucket or measure based).
The report unit 06. Profit Detail Report (/public/Samples/Reports/ProfitDetailReport) is a good candidate for this
test. It exposes the parameter ProductFamily, so by adding the ProductFamily hyperlink property, and by setting
it to a value like Drink, can pre-filter its results.
Figure 17-36 Measure Configuration for # of Orders
334 TIBCO Software Inc.
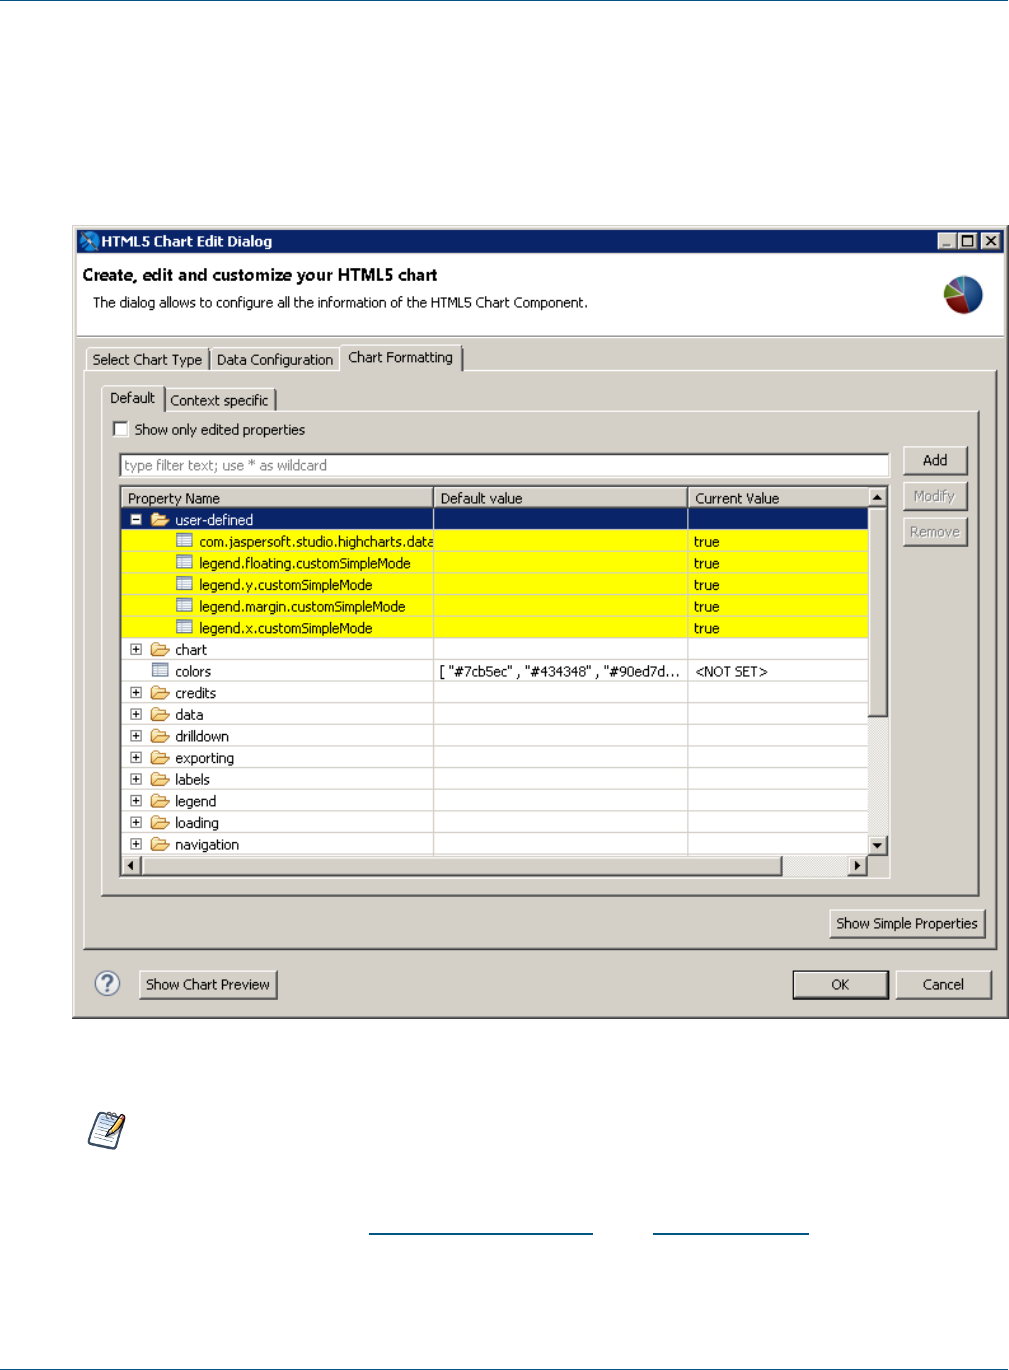
Chapter 17 HTML5 Charts in Commercial Editions
17.8 Advanced Formatting of HTML5 Charts
You can set some basic element properties for an HTML5 chart, such as position or evaluation time, in the
Chart Formatting tab of the Edit HTML5 Charts dialog. You can also view and set all available properties,
including those not exposed as simple properties, by clicking Show Advanced Properties. Properties that
differ from the defaults are highlighted in yellow.
Figure 17-37 Advanced properties for formatting HTML5 charts
You can set a subset of properties for an Ad Hoc chart in Jaspersoft Studio, using the Chart Properties>
AdHoc Overrides section. However, this is not recommended. If you are working with Ad Hoc charts in
JasperReports Server, set your chart properties on the server, using the Advanced Properties tab in the
Chart Formatting dialog box. For more information about setting properties for Ad Hoc charts in
JasperReports Server, see Advanced Chart Formatting on the community website.
TIBCO Software Inc. 335
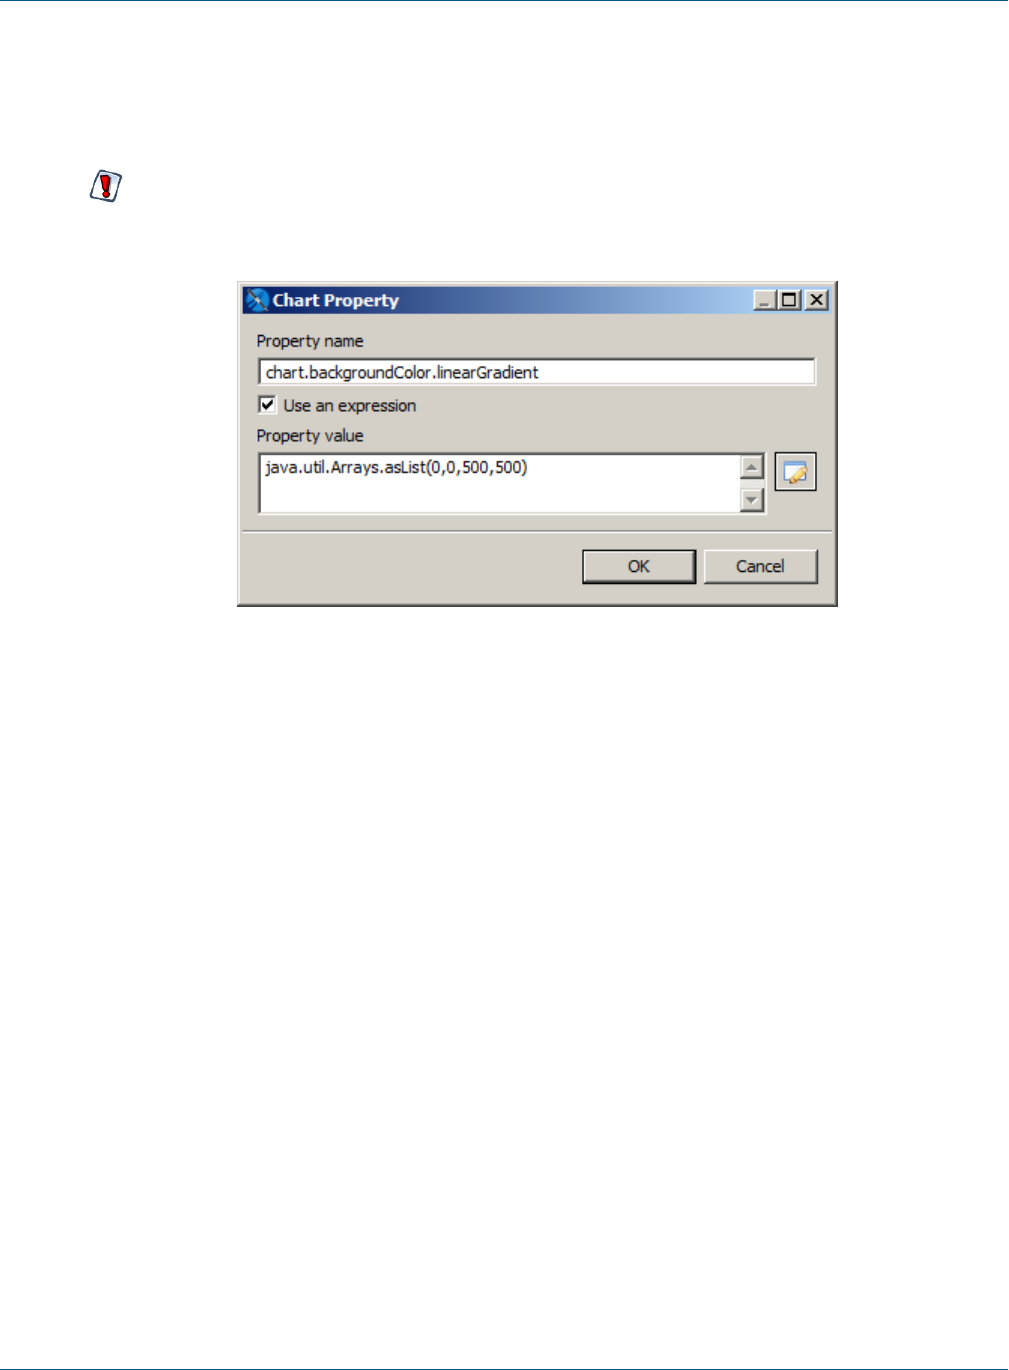
TIBCO Jaspersoft Studio User Guide
To set user-defined properties:
Not all properties are displayed in the advanced view. To set a property that isn't shown on the Advanced
Properties tab, do the following.
For a list of available properties, see the Highcharts website. Note that some cases, user-defined prop-
erties may not be compatible with Jaspersoft Studio.
1. Click Add in the advanced view of the Chart Formatting tab in the HTML Chart Edit dialog.
Figure 17-38 Chart Property dialog
2. Enter the following values:
•Name – The name of the property you want to set.
•Use an expression – Enable this flag to enter an expression for the property value.
•Property value – Value or expression to use for the property.
For example, to set a gradient background for a chart, you need to add two properties.
Gradient property:
•Name –chart.backgroundColor.linearGradient
This setting is nested below the chart and background color settings.
•Use an expression – true
•Property value –java.util.Arrays.asList(0,0,500,500)
All settings must be cast to a Java data type, either explicitly or implicitly. The gradient setting takes an
array as a parameter and therefore must explicitly be returned as a list, using the static
java.util.Arrays.asList method.
Stops property:
•Name –chart.backgroundColor.stops
This setting requires an array of arrays and is expressed through the nested use of java.util.Arrays.
•Use an expression – true
336 TIBCO Software Inc.

Chapter 17 HTML5 Charts in Commercial Editions
•Property value:
java.util.Arrays.asList
(
java.util.Arrays.asList(0, "#b5bdc8"),
java.util.Arrays.asList(0.36, "#828c95"),
java.util.Arrays.asList(1, "#28343b")
)
The resulting chart has a gradient background.
Figure 17-39 Chart with a gradient background, set via user-defined properties
17.8.1 Setting Advanced Options for HTML5 Charts in Properties View
You can add or edit advanced options for HTML5 Charts using the Chart Properties dialog. This section shows
how to prevent users from changing chart types in reports you upload to JasperReports Server.
When you create an HTML5 chart in Jaspersoft Studio and upload it to JasperReports Server, users may see a
Canvas Options icon . Clicking this icon displays a Chart Types... option that allows the user to select a
different chart type. You can disable this option at any level – for the chart, for the report, or for this instance of
Jaspersoft Studio.
To disable this option for a chart:
1. Select the chart element in the Design or Outline view.
2. In the Properties view for the chart element, click the Advanced tab.
3. Expand the Misc section and click ... next to Edit Properties.
TIBCO Software Inc. 337

TIBCO Jaspersoft Studio User Guide
The Properties dialog opens.
4. Click Add to add a new property.
5. Enter the following information:
•Name:com.jaspersoft.jasperreports.highcharts.interactive
•Value:false
6. Click OK and then click Finish.
Like many advanced charting options, this option can be set at a higher level. If you set an option at multiple
levels, the lowest level is the one that is applied.
•To disable this option for a report, click on the report's root node in Outline view and make sure the
Properties view is displayed. In the Properties view, on the tab, select Advanced> Misc> Properties and
click ... to open the Properties Dialog. Enter the values shown above and click OK twice to apply the
setting.
•To disable this option Jaspersoft Studio, select Window> Preferences from the menu (Eclipse>
Preferences on Mac). In the Preferences dialog box, select Properties and click Add to open the
Properties Dialog. Enter the values shown above and click OK twice to apply the setting.
You can also set this particular option in JasperReports Server. See the JasperReports Server Administrator
Guide for more information.
338 TIBCO Software Inc.
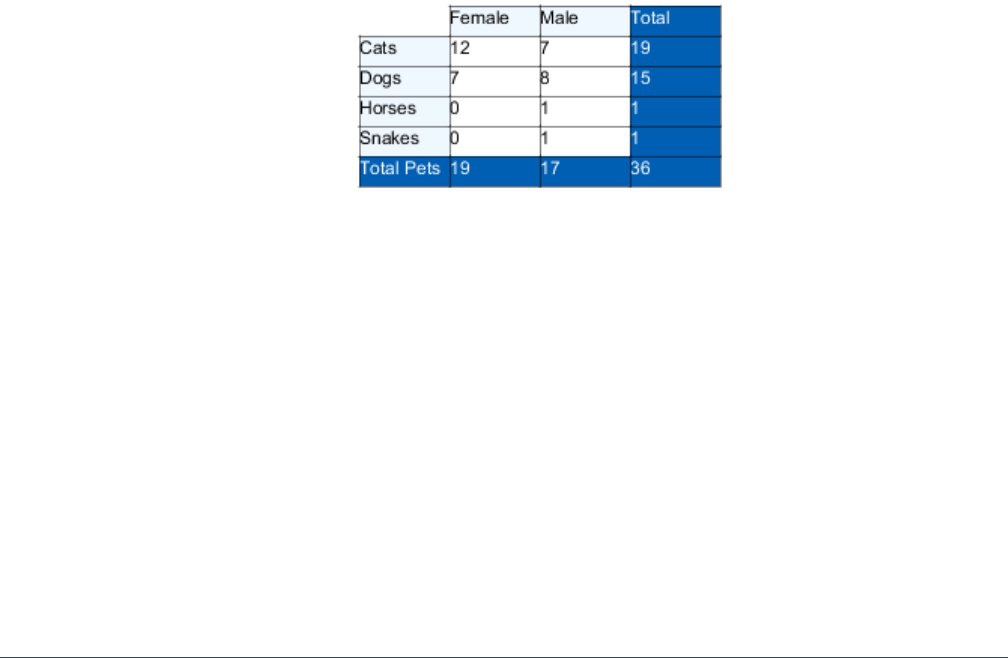
CHAPTER 18 WORKING WITH CROSSTABS
In contrast to a table or tabular report showing individual records, a crosstab shows aggregate data for two or
more variables in a tabular matrix.
You do not specify the individual row and column values for a crosstab at design time. Instead you specify
fields in your dataset, called row or column groups, and your crosstab displays a row or column for each unique
value of the field. This means the exact number of rows and columns remains undefined at design time and the
crosstab automatically updates to reflect your dataset. A crosstab must include at least one row and one column
group.
The cells in a crosstab show summary data for the corresponding row and column, based on a measure and a
summary function. The simplest crosstab is a frequency matrix, such as the following example, which shows the
count of pets (measure) by gender (column) and species (row).
Figure 18-1 Example of a simple crosstab
You can increase the complexity of a crosstab by adding more row or column groups, or by using another
summary function, such as sum, average, or percent. For example, the following crosstab shows the sum of the
monthly cost of food for each pet (measure) by gender (column) and group and species (rows). Note that when
there are multiple row or column groups in a crosstab, they are displayed hierarchically.
TIBCO Software Inc. 339
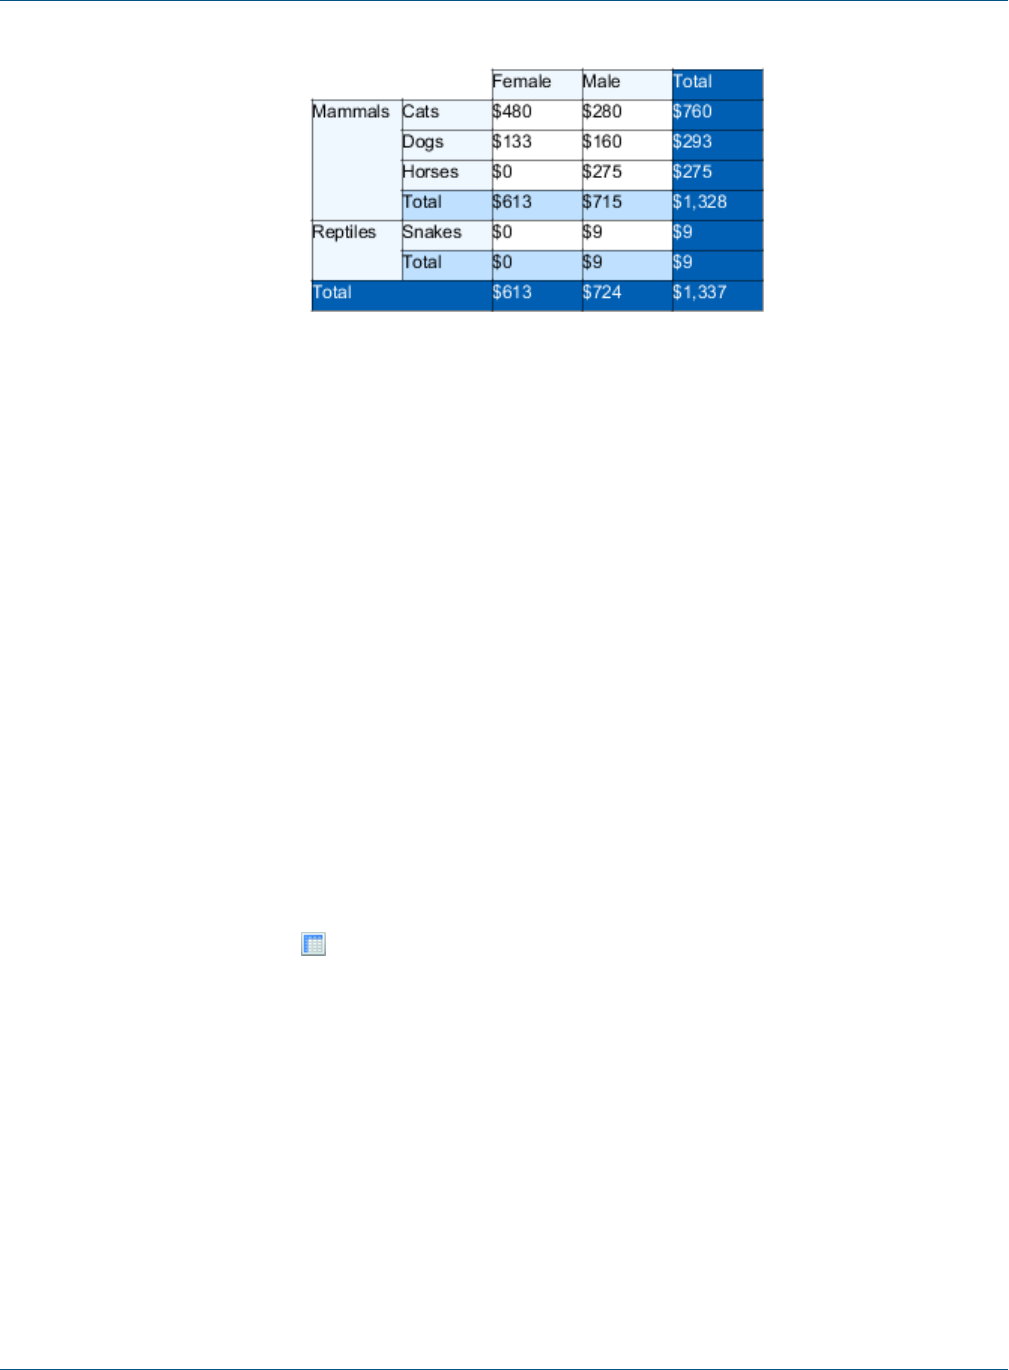
TIBCO Jaspersoft Studio User Guide
Figure 18-2 Example of a crosstab with multiple row groups and a sum
Crosstabs in JasperReports support row and column groups, totals and subtotals, and individual cell formatting.
Data to fill the crosstab can come from the main report dataset or from a subdataset.
This chapter has the following sections:
•Example of Creating a Crosstab
•Working with Crosstab Properties
•Using the Crosstab Editor
•Working with Crosstab Parameters
18.1 Example of Creating a Crosstab
When you add a Crosstab element to a report, Jaspersoft Studio displays the Crosstab Wizard automatically.
1. Create a new report:
a. Choose a blank template.
b. Select the Sample DB data adapter and click Next.
c. Enter the query select * from orders.
d. On the Fields page, select all fields and click Finish.
2. Because a crosstab summarizes information, you put it in the Summary band. For this example, delete all
bands except the Title and Summary bands. This eliminates blank pages in the final report.
3. Drag the Crosstab tool into the Summary band. The Dataset page of the Crosstab wizard is displayed.
340 TIBCO Software Inc.

Chapter 18 Working with Crosstabs
Figure 18-3 Dataset page of the Crosstab wizard
4. For this example, make sure that Create a Crosstab using an existing dataset is selected, and select
[Main Dataset] from the drop-down menu.
5. Click Next. The Columns screen is displayed.
6. Enter one or more fields you want as column groups. For this example, choose the ORDERDATE field.
Figure 18-4 Defining column groups
TIBCO Software Inc. 341
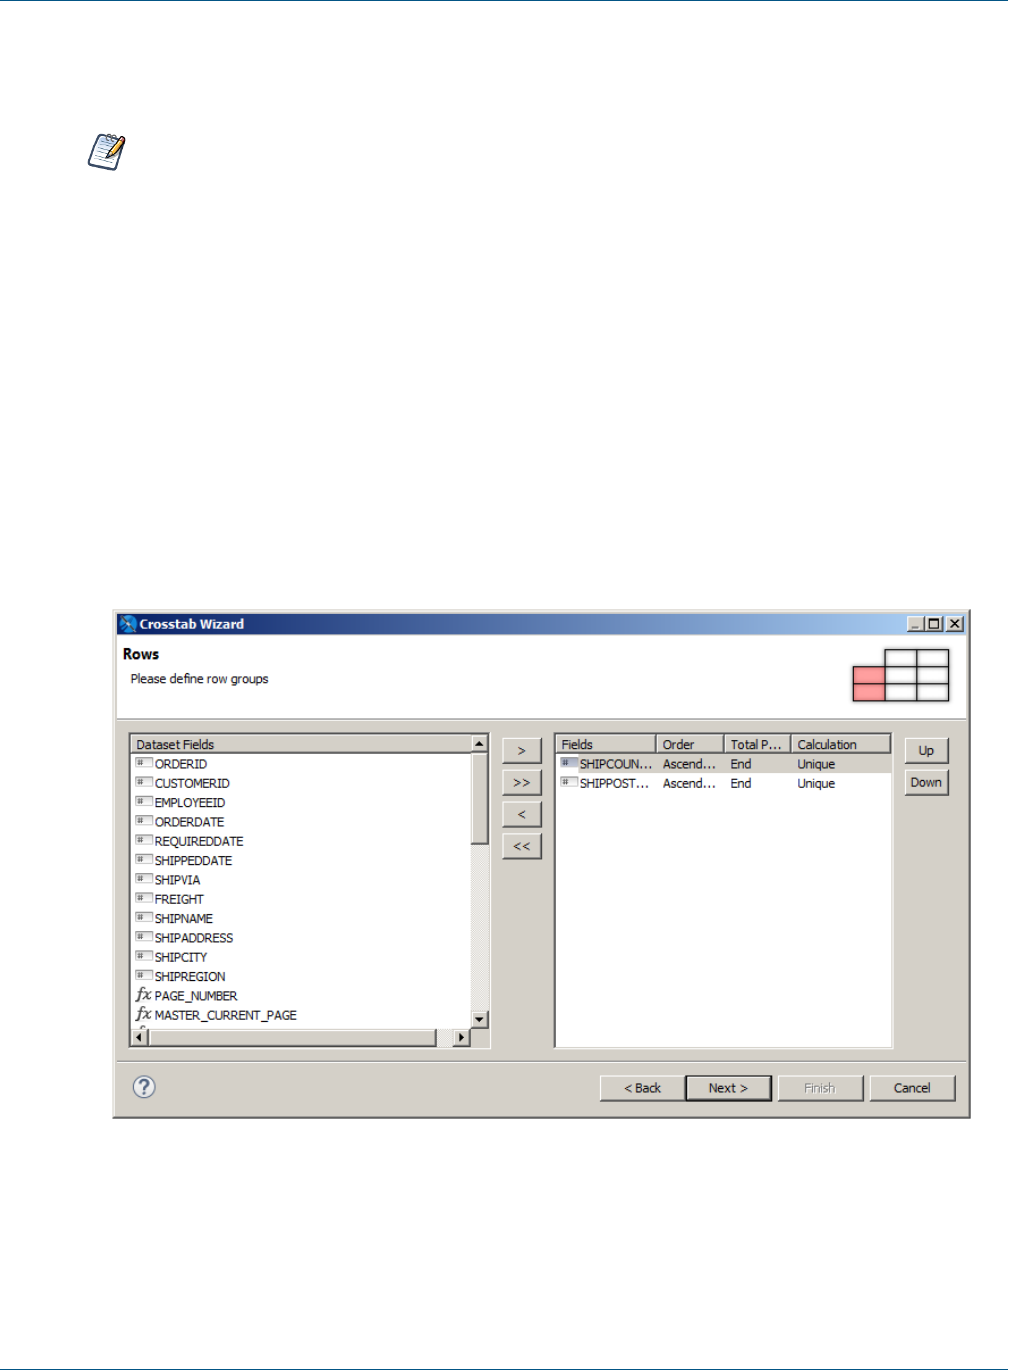
TIBCO Jaspersoft Studio User Guide
7. Select the ORDERDATE field. Then click on the Unique value in the Calculation column and select Year
from the drop-down menu. This aggregates the orders by year.
When you have a time field in your crosstab, you can use the Unique aggregation function to group
records having the same value, or you can aggregate it any of the following ways:
• Using a time-based aggregation function (such as Year,Month,Week, or Day) when you define the
group
In this example, this is shown in the previous step.
• Using a dataset query when you create the crosstab.
In this example, in the first step of the wizard, you could create a dataset that uses a query that
returns the year, such as select ORDERDATE, SHIPVIA, SHIPPOSTALCODE, SHIPCOUNTRY,
SHIPPEDDATE, YEAR(SHIPPEDDATE) as SHIPPEDYEAR from orders
• Manually editing the element expression in the crosstab editor after the crosstab has been created, as
described in , “Editing the expression of a group,” on page347.
In this example, you could change the column element expression from $F{SHIPPEDDATE} to
YEAR($F{SHIPPEDDATE}).
8. Click Next. The Rows screen is displayed.
9. Enter one or more fields you want as row groups. For this example, choose SHIPCOUNTRY and
SHIPPOSTALCODE.
Figure 18-5 Defining row groups
10. Make sure that the fields appear in the order you want them in the crosstab. For this example, ensure that
SHIPCOUNTRY appears first in the list by selecting it and clicking Up.
Grouping by SHIPCOUNTRY and then SHIPPOSTALCODE results in each row in the crosstab referring to a
specific country, with subgroups by postal code within the country. Unlike in the main report,
342 TIBCO Software Inc.
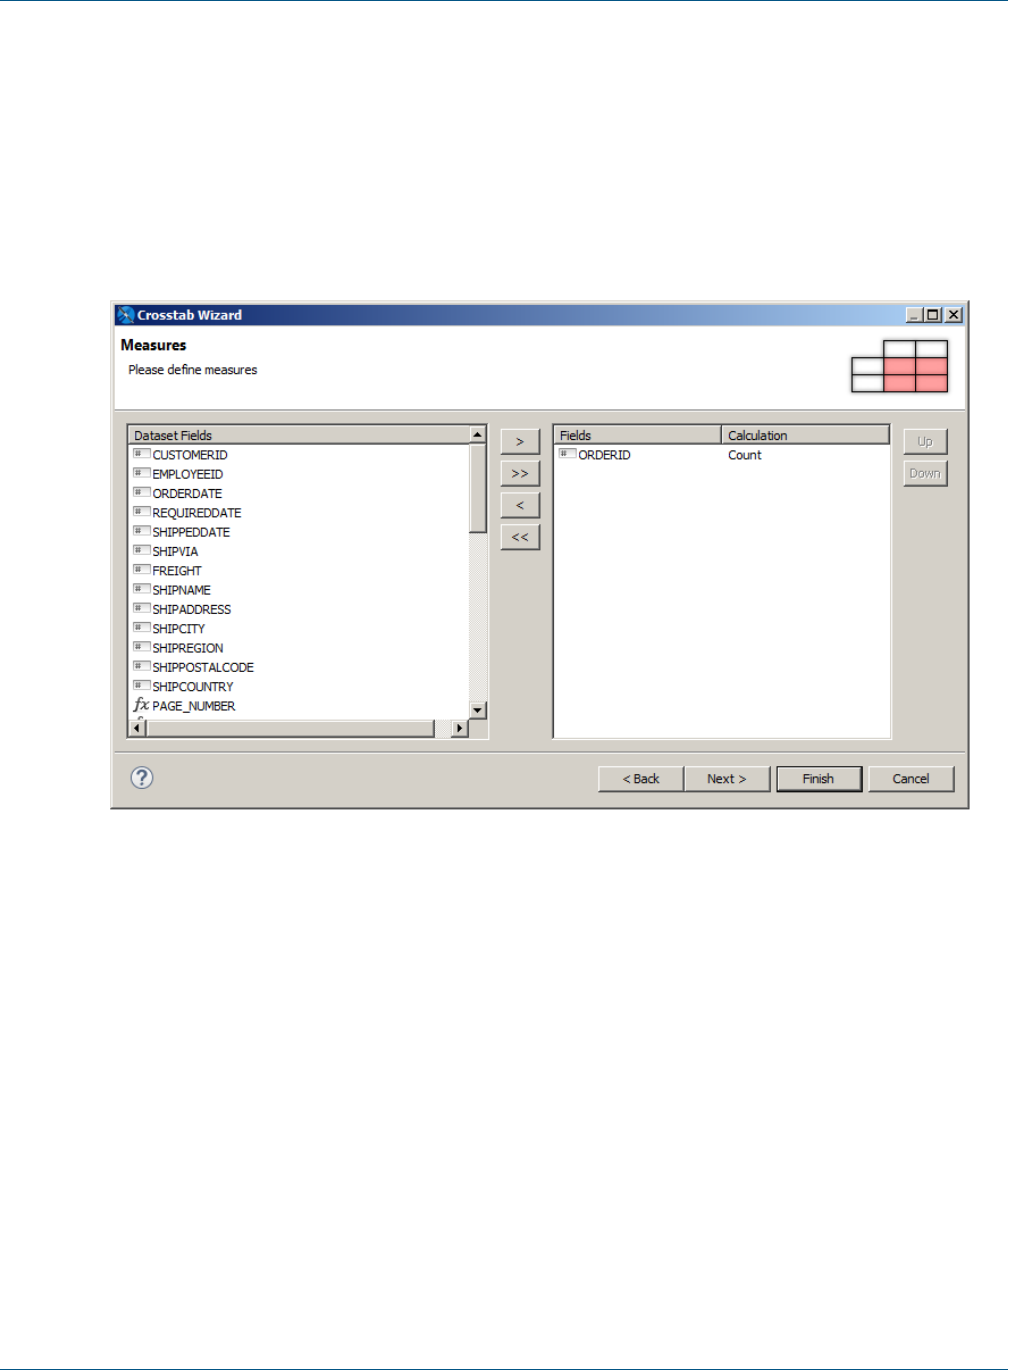
Chapter 18 Working with Crosstabs
JasperReports will sort the data for you, although you can disable this function to speed up the fill process
if your data is already sorted.
11. Click Next. The Measures screen is displayed.
12. Enter one or more fields you want as measures. For this example, choose ORDERID.
Measures define the detail data in the crosstab; normally, this is the result of an aggregation function like
the count of orders by country by year, or the sum of freight for the same combination (country/ year). By
default, the aggregate function is Count, which is what we want for this example. To change the aggregate
function, you would select ORDERID, click on Count, and select a different value from the drop-down menu.
Figure 18-6 Defining measures
13. Click Next. The Layout page is displayed.
14. Set options for the crosstab layout. You can indicate whether you want to see grid lines, use color set to
distinguish totals, headers, and detail cells, and whether to total the rows and columns.
For this example, select the Burleywood color scheme.
TIBCO Software Inc. 343
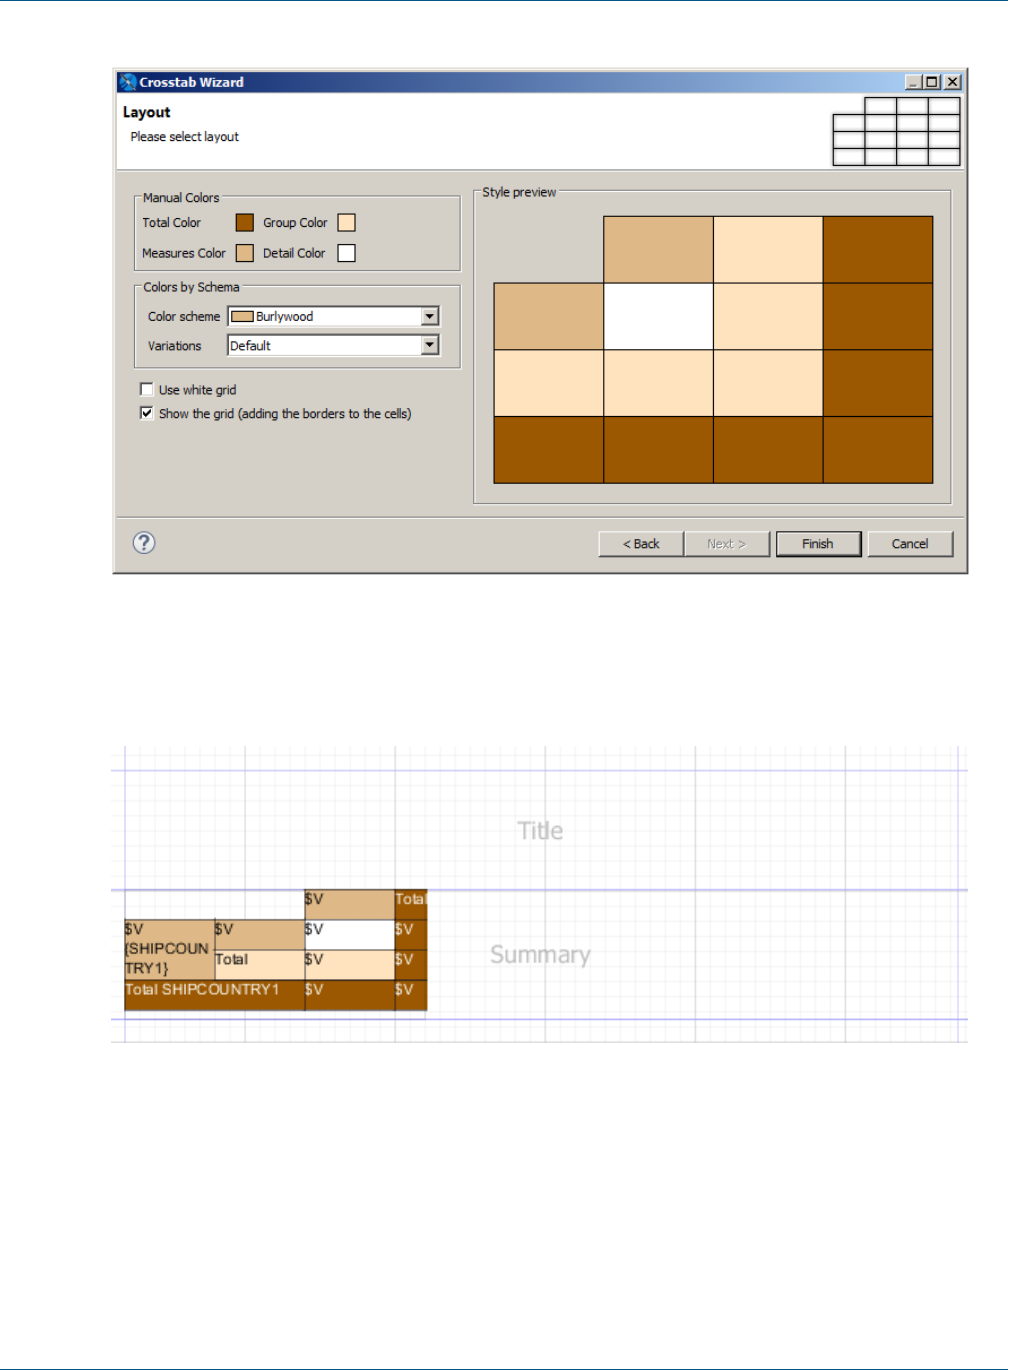
TIBCO Jaspersoft Studio User Guide
Figure 18-7 Choosing layout options
15. Click Finish.
The crosstab is created and added to your report.
Figure 18-8 Crosstab in Design view
16. Select the crosstab to display a border with handles. Drag the right-hand handle of the crosstab to the right
margin of the report.
17. Preview your report. You see a crosstab. The row and column headers are the values of the fields you
selected for the rows and columns. For each row and column, the value is the number of orders for that year
and postal code.
344 TIBCO Software Inc.
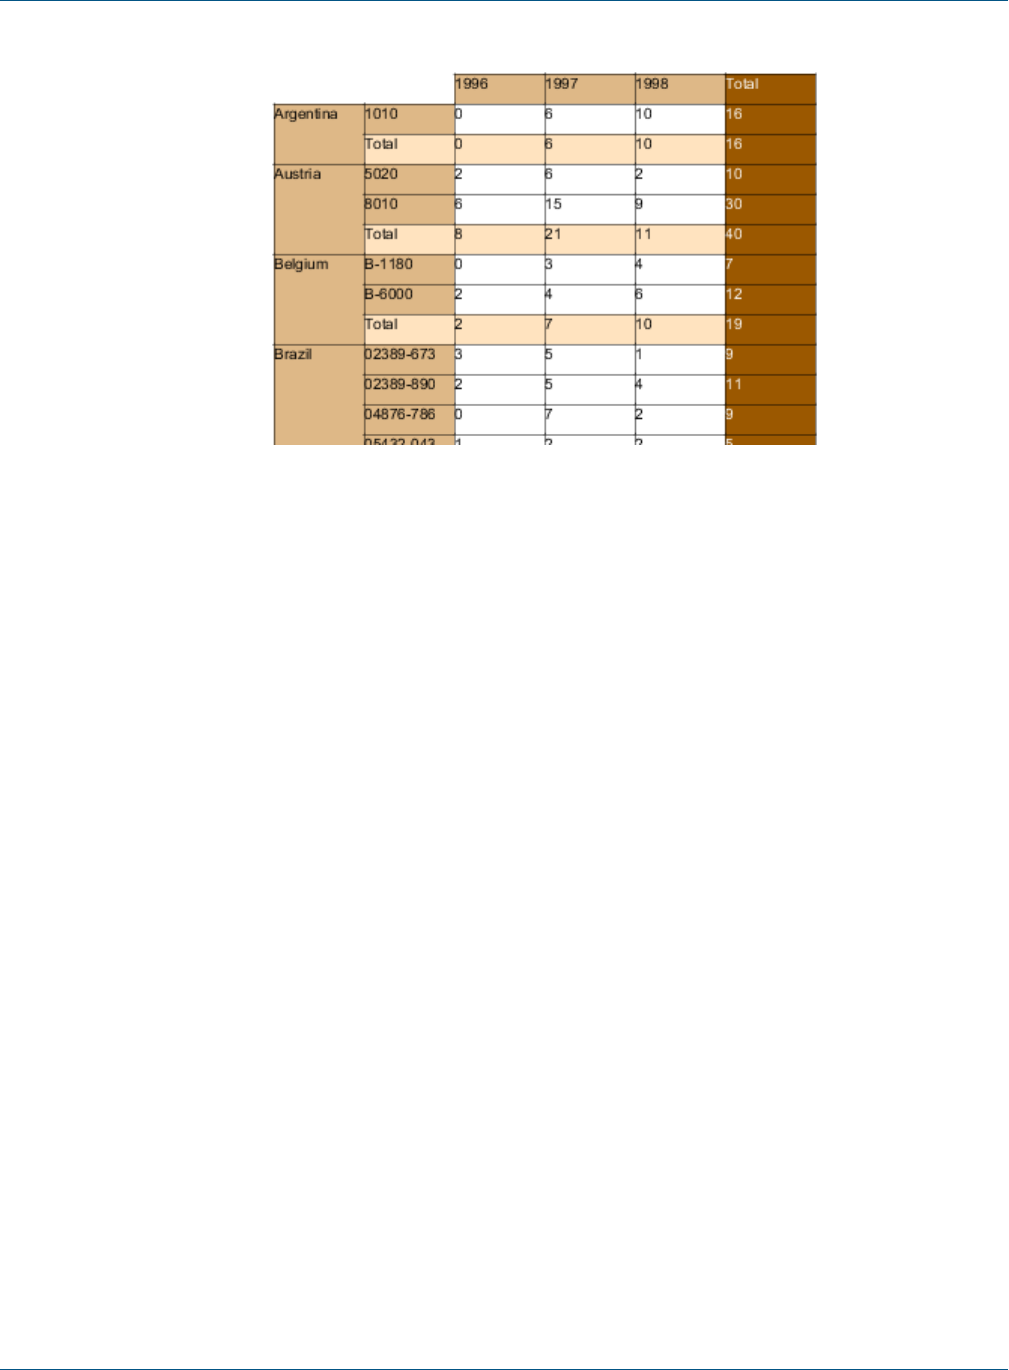
Chapter 18 Working with Crosstabs
Figure 18-9 Preview of the crosstab
18.2 Working with Crosstab Properties
To view or edit crosstab properties, select the crosstab node in the outline view. The properties are displayed in
the properties view.
Expressions for elements in a crosstab, such as print-when expressions and text field expressions, can only
contain measures. In this context, you cannot use fields, variables, or parameters directly; you always have to
use a measure.
You can edit the following crosstab-specific properties on the Crosstab tab in the properties view:
•Repeat Column Headers – When selected, the column headers are printed on every page when the
crosstab spans additional pages.
•Repeat Row Headers – When selected, the row headers are printed on every page when the crosstab
spans additional pages.
•Column Break Offset – Specifies the vertical space between sections of a crosstab when the crosstab
exceeds the page width and two sections appear on the same page.
TIBCO Software Inc. 345

TIBCO Jaspersoft Studio User Guide
Figure 18-10 Column break offset
18.3 Using the Crosstab Editor
You can edit the fields, expressions, and layout of the crosstab in the crosstab editor. Like the report editor, the
crosstab editor has a design view and an outline view. Using the crosstab editor you can:
•Resize rows and columns and format individual cells
•Add and delete row and column groups and edit group properties
•Add, delete, and edit measures
•Edit crosstab totals
To open the crosstab editor:
1. Double-click on the crosstab node in Outline view for the main report.
OR
2. Double-click on the crosstab in Design view for the main report.
When the crosstab editor is selected, a crosstab element is displayed in outline view. This crosstab element
shows the whole crosstab structure, including the crosstab parameters and the row and column groups, measures,
and cells.
18.3.1 Formatting Columns, Rows, and Cells
Manually resizing a row or column:
1. Open the crosstab editor.
2. Shift-click in the header of the row or column you want to change.
The row and column you selected are outlined.
346 TIBCO Software Inc.
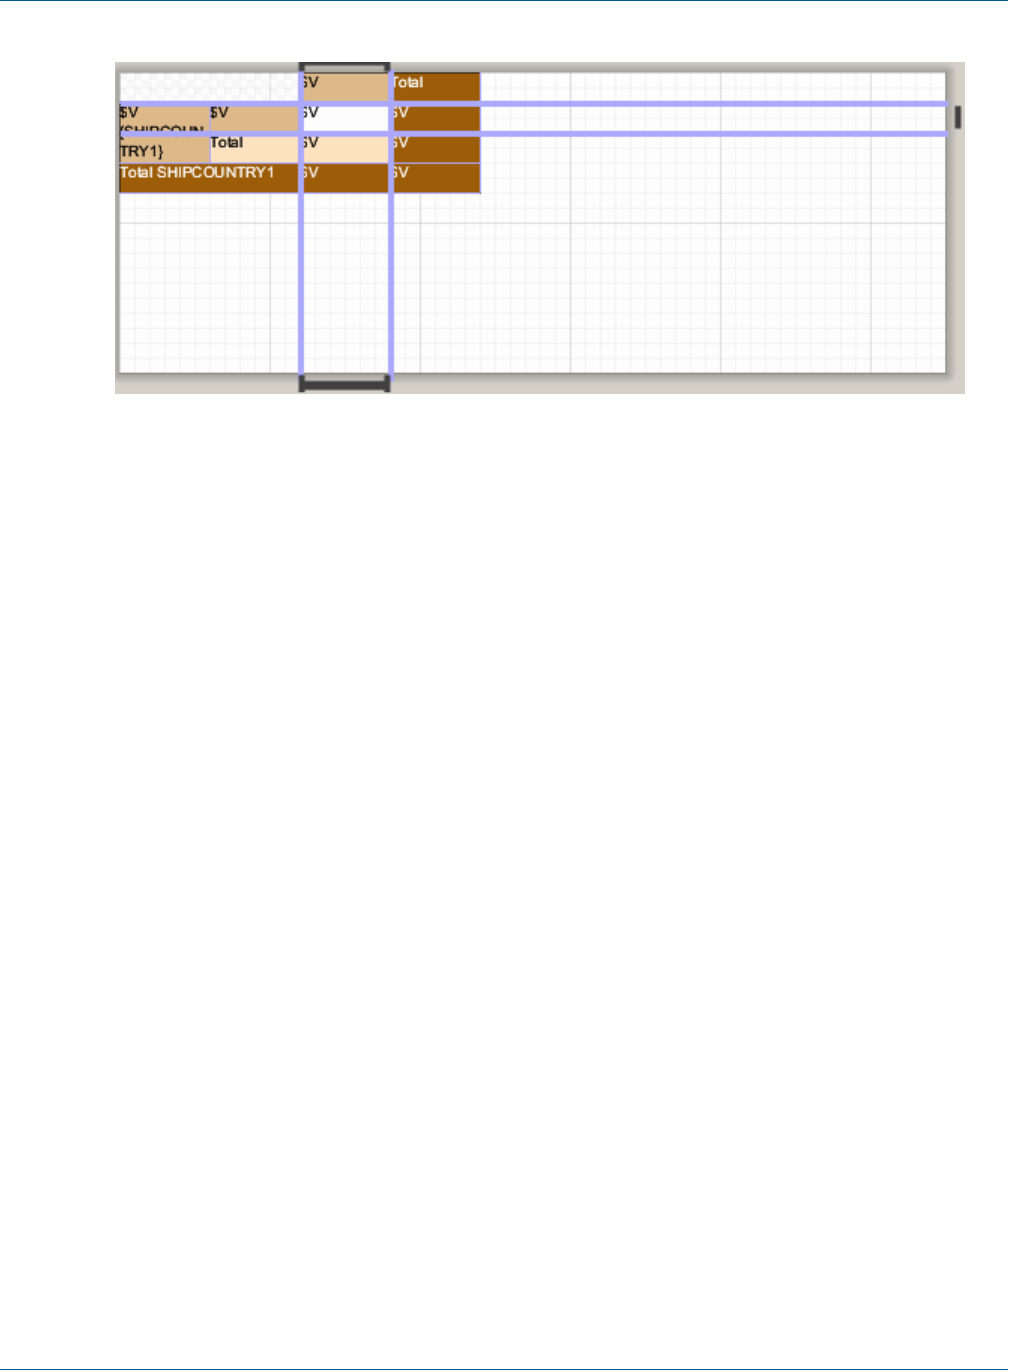
Chapter 18 Working with Crosstabs
Figure 18-11 Row and column selected in crosstab editor
3. Drag an outline to resize the row or column. Make sure that the cells are large enough to completely
contain their content when you run the report.
18.3.1.1 Working with Cells
Each intersection between a row and a column defines a cell. Crosstabs have header cells, total cells, detail
cells, and (optional) when-no-data cells. Each cell can contain one or more elements that do not use a dataset,
such as text fields, static text, rectangles, and images. Cells can’t contain subreports, charts, or another crosstab.
Changing cell borders:
1. Open the crosstab editor and select the cell in editor or in outline view.
2. Edit the cell borders on the Borders tab of the property view.
18.3.2 Editing Row or Column Group Properties
You can edit the following properties for a row or column group:
•Name – Name of the group. Renaming a group using the Properties dialog renames it everywhere the group
is used.
•Total Position – Location of the row or column that shows subtotals. Values are None, Start, End
(default).
•Order – Order of the values in the group (Ascending or Descending).
•Order By Expression – Optional expression to use for ordering the values.
•Comparator Expression – Optional instance of java.util.Comparator to use for ordering the values.
If no expression is present, the default ordering for the data type is used (for example, numeric or alphabetic
ordering). Expression – Bucket expression used to group the rows or columns. The default is to group by
field value, for example, $F{SHIPPOSTALCODE}.
•Value Class Name – Field type.
Editing the expression of a group:
The following example shows how to edit the sample crosstab to group by the first letter or digit of the postal
code:
1. Double-click the crosstab to open the crosstab editor.
TIBCO Software Inc. 347
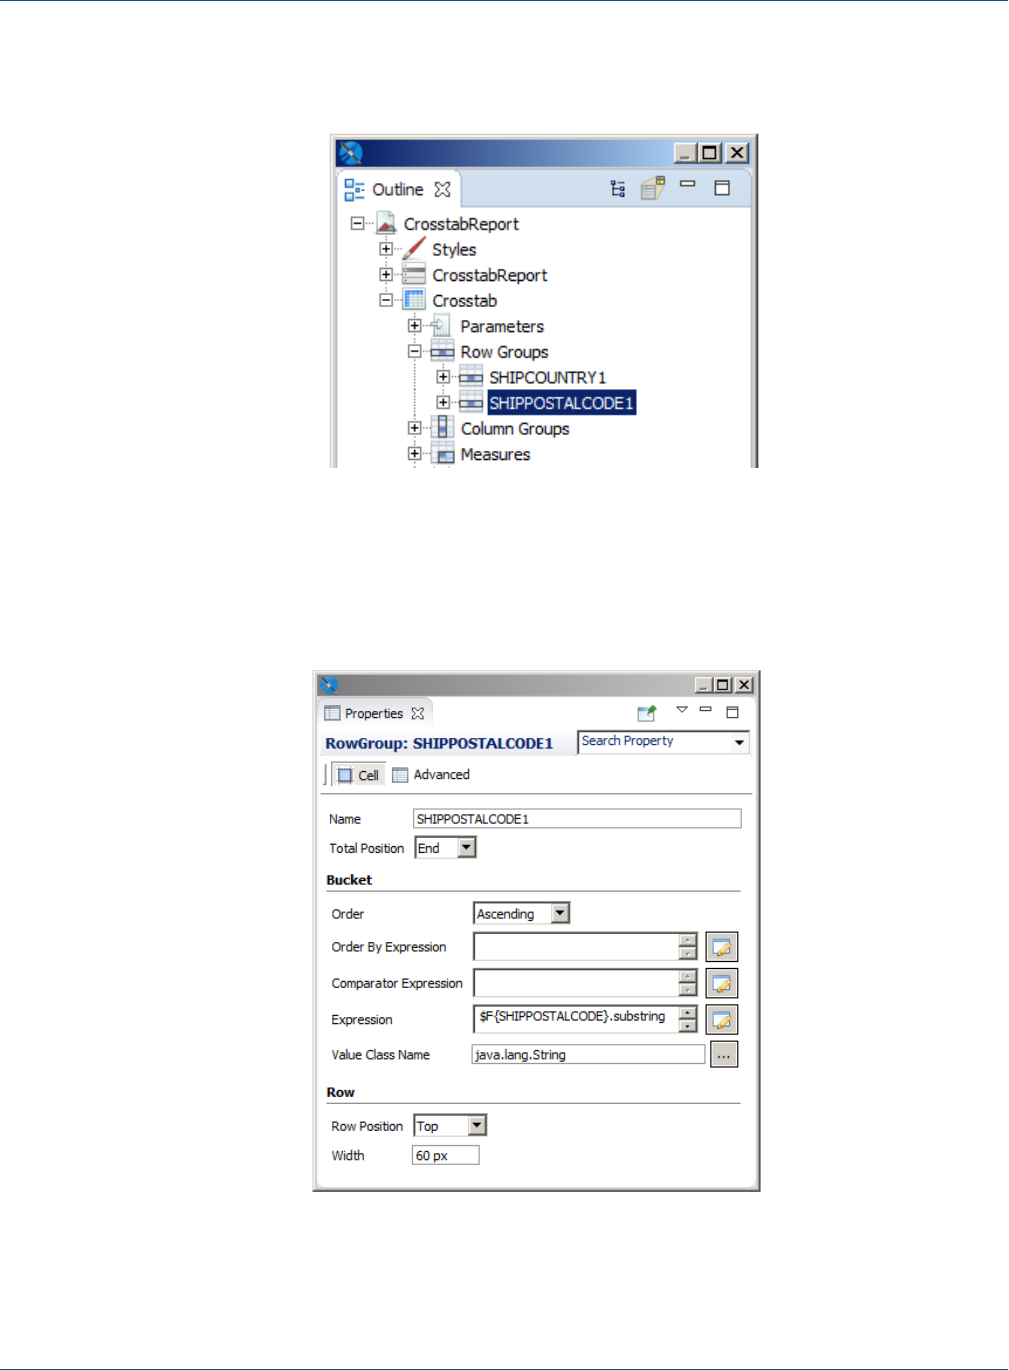
TIBCO Jaspersoft Studio User Guide
2. In Outline view, select the group you want to edit. For this example, select Crosstab> RowGroups>
SHIPPOSTALCODE1.
Figure 18-12 Outline tree view – crosstab details in the crosstab editor
3. In Properties view, select the Cell tab.
4. Change the expression in the Expression entry bar to $F{SHIPPOSTALCODE}.substring(0,1).
Figure 18-13 Properties for SHIPPOSTALCODE1
When you preview the crosstab, the second row group is now bucketed by the first character of the postal code.
348 TIBCO Software Inc.
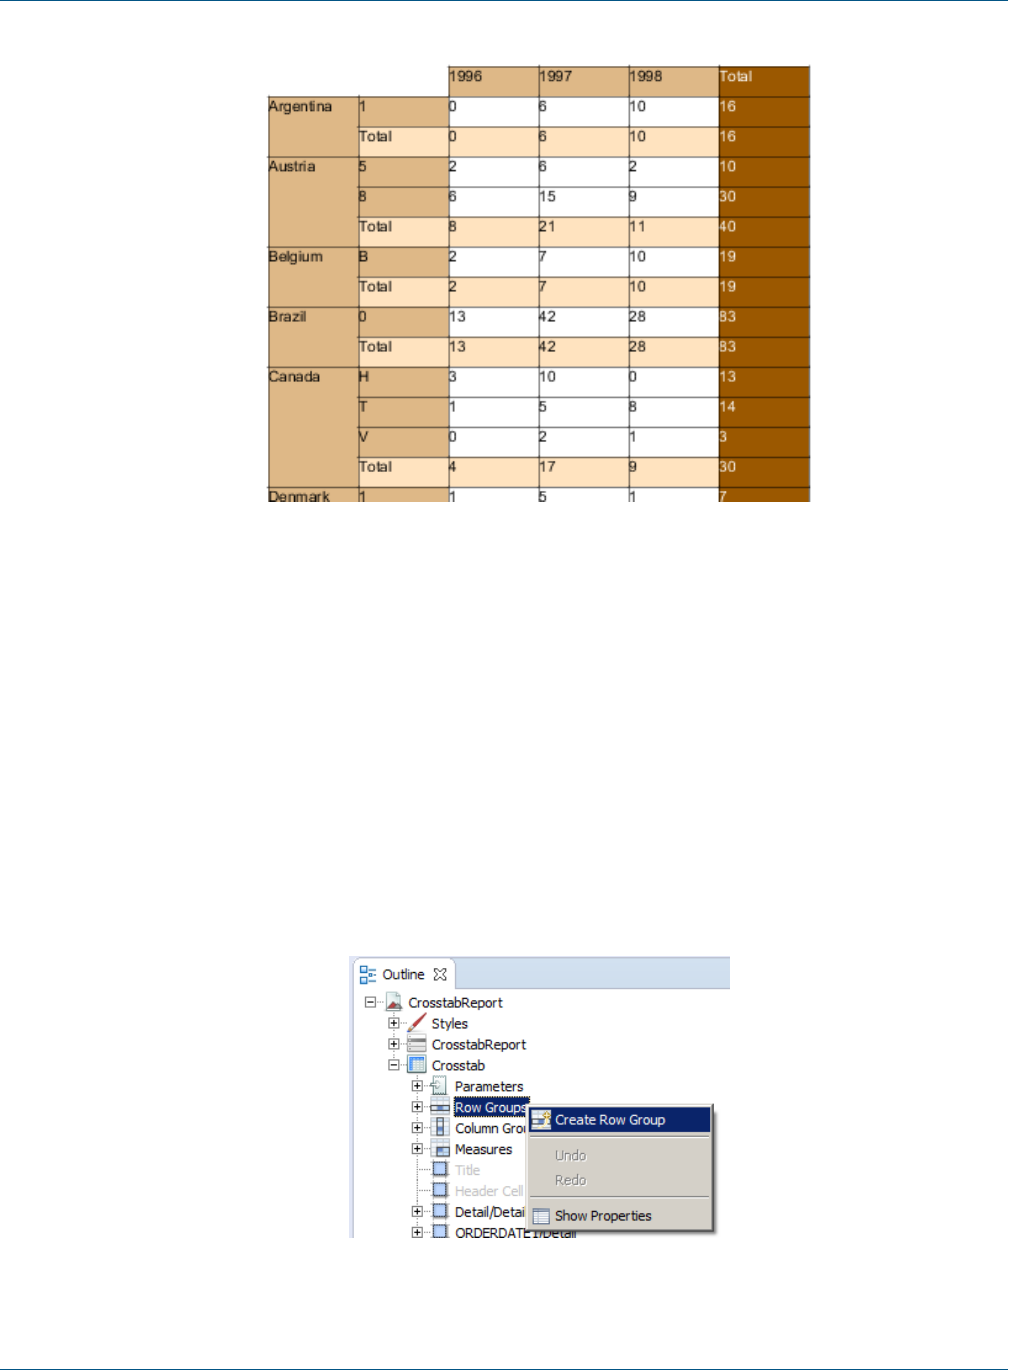
Chapter 18 Working with Crosstabs
Figure 18-14 Crosstab after expression has been edited
18.3.3 Adding and Deleting Row and Column Groups
A crosstab must have at least one row group and one column group. It is easiest to add all the rows and
columns you want when you create the crosstab with the Crosstab Wizard. However, if necessary, you can add a
row or column group manually.
The following example shows how to add a row group, SHIPREGION, to the example crosstab. Adding a column
is similar.
Example of adding a row group:
1. Double-click on the crosstab to open the crosstab editor.
2. In outline view, double-click the Crosstab node to expand it.
3. Right-click the Row Groups node and select Create Row Group from the context menu.
Figure 18-15 Adding a row group
TIBCO Software Inc. 349
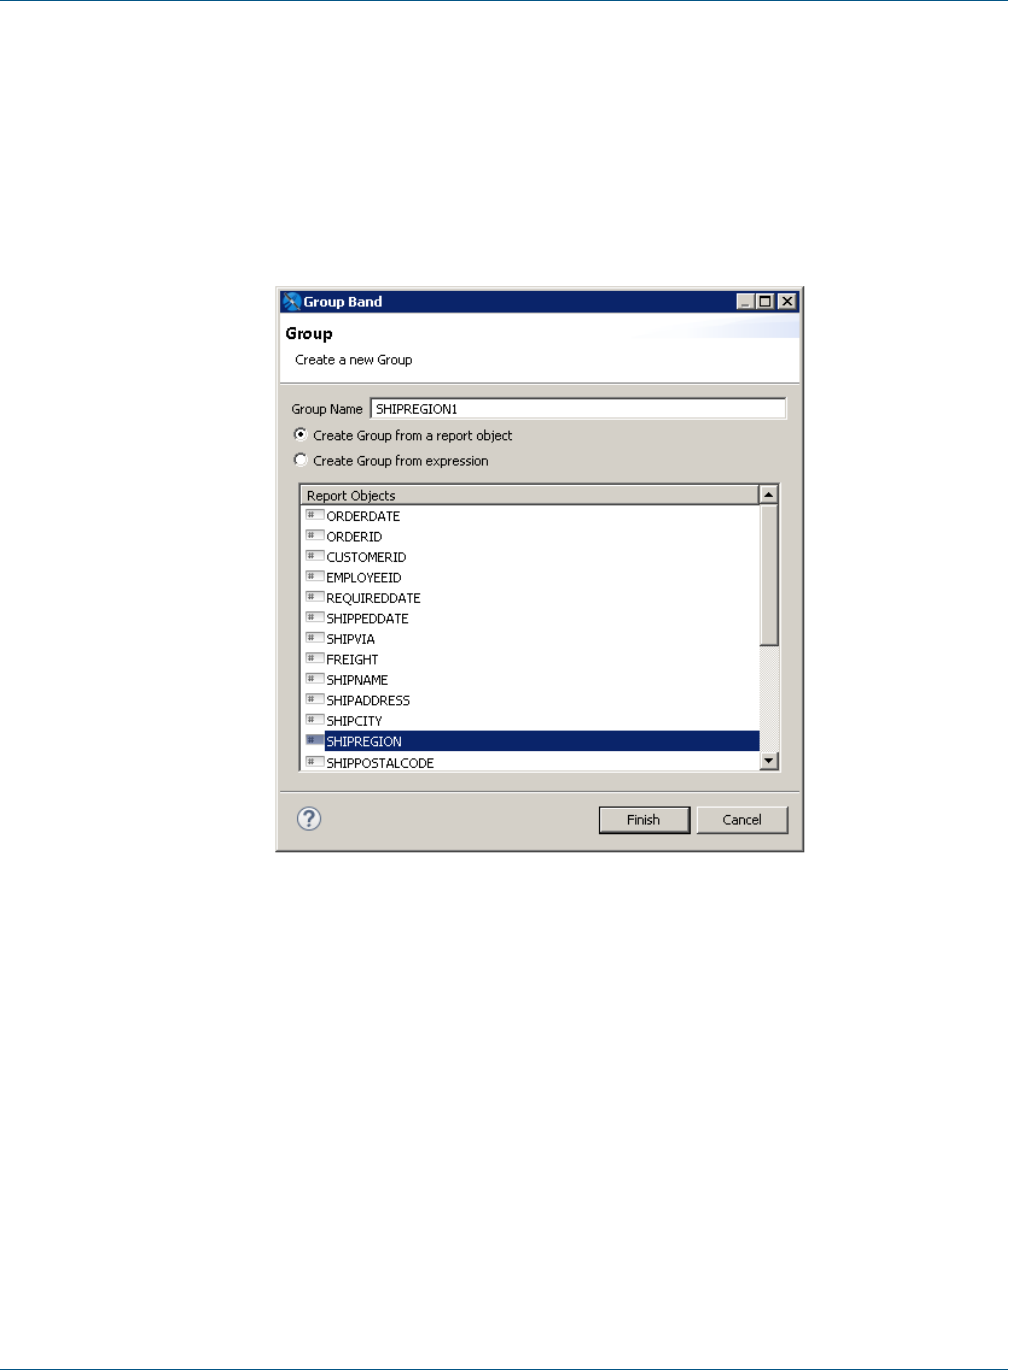
TIBCO Jaspersoft Studio User Guide
The Group Band dialog is displayed.
4. Enter the information for your group in the Group Band dialog. For this example:
a. Enter SHIPREGION1 for the Group Name.
b. Select Create Group from a report object and select SHIPREGION.
c. Click Finish.
The new group is added to the crosstab as the innermost row group.
Figure 18-16 Group Band dialog
5. To set the value class of the group, select the top-level node of the new SHIPREGION group in outline
view of the crosstab editor. Then, in the Cell tab of the properties view, enter the following value:
•Value Class Name –java.lang.String
350 TIBCO Software Inc.
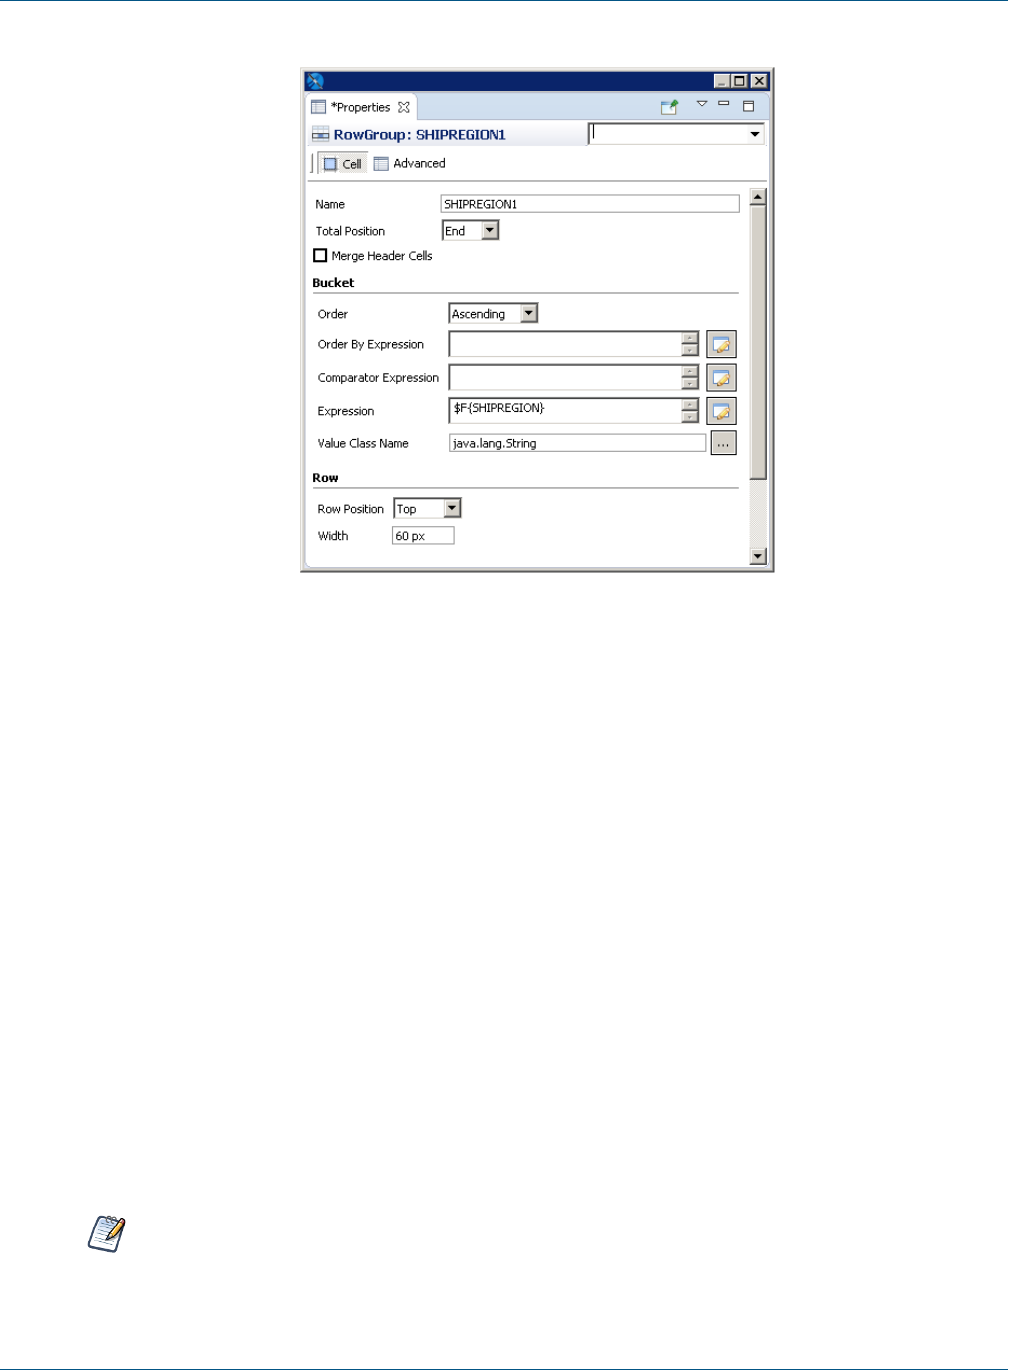
Chapter 18 Working with Crosstabs
Figure 18-17 Setting Value Class Name of a row group
6. Change the order of the groups by selecting the top-level node of SHIPREGION in outline view and
dragging it above SHIPPOSTALCODE.
7. Preview the report.
Deleting a row or column group:
1. Double-click on the crosstab to open the crosstab editor.
2. In outline view, double-click the Crosstab node to expand it.
3. Double-click the Row or Column Groups node to expand it.
4. Right-click on the row or column group you want to delete and select Delete from the menu.
18.3.4 Working with Measures
A measure in a crosstab is a object, similar to a variable, that appears in an individual cell. It is the result of a
calculation performed on the values for each row and column group that intersect in a cell.
A crosstab can have multiple measures. If you add multiple measures when you first create a crosstab, each
measure shows up under the Measure node in the outline view of the crosstab editor. You can also add measures
after the crosstab has been created by dragging a text field into a measure cell in your crosstab and setting an
expression. In this case, the measure is only visible in the Detail node of the outline view. For an example of
adding a measure and setting its expression, see 18.3.4.3, “Adding a Measure as a Text Field,” on page353.
Expressions for elements in a crosstab, such as print-when expressions and text field expressions, can
only contain measures. In this context, you cannot use fields, variables, or parameters directly; you
always have to use a measure.
TIBCO Software Inc. 351

TIBCO Jaspersoft Studio User Guide
18.3.4.1 Measure Properties
The following properties are available for measures that you added when you first created the crosstab:
•Name – Name of the measure.
•Calculation – Calculation to use for the measure. See 7.3.2, “Calculation Function,” on page111 for
more information.
•Percentage of Type – Set this to Grand Total to display your measure as a percentage of the grand total.
•Value Expression – Expression to use for calculating the measure. To edit this expression, click .
•Value Class – Java class to use for the expression.
•Incrementer Factory Class Name – Optional custom Incrementer class. Use this to implement your
own calculation if the available calculation types are not sufficient. Class must be instantiated via a factory
that implements the net.sf.jasperreports.engine.fil.JRIncrementerFactory interface .
•Percentage Calculation Class Name – Optional custom calculator class to perform the percentage
calculation. Must use the net.sf.jasperreports.crosstabs.fill.JRPercentageCalculator
interface.
To display measure properties:
1. Double-click the crosstab to open the crosstab editor.
2. Expand the Crosstab node in outline view.
3. Expand the Measures node.
4. Right-click the measure you want and select Show Properties from the menu.
18.3.4.2 Understanding Crosstab Total Variables
When you have multiple row or column groups, you can use crosstab total variables to combine data at different
aggregation levels (for example, to calculate a percentage). The following built-in variables are available:
•<Measure>_<Column Group>_ALL: The total of all the entries in the specified column group and the
current row.
•<Measure>_<Row Group>_ALL: The total of all the entries in the specified row group and the current
column.
•<Measure>_<Row Group>_<Column Group>_ALL: The combined total of all the entries in the specified
row and column groups.
You can also select these variables from the expression editor for the Expression field on the Text Field tab of
the Properties view for a measure.
352 TIBCO Software Inc.

Chapter 18 Working with Crosstabs
Figure 18-18 Total variables in the expression editor
18.3.4.3 Adding a Measure as a Text Field
This example shows how to add a measure to an existing crosstab using a text field. This example uses crosstab
total variables to calculate a percentage. However, measures added as text fields do not have measure properties
such as a calculation or an incrementer calculation class.
Adding a measure:
1. Create a new report:
a. Choose a blank template.
b. Select the Sample DB data adapter and click Next.
c. Enter the query select * from orders and click Next.
d. On the Fields page, select all fields and click Finish.
2. Delete all bands except the Summary band. This eliminates blank pages in the final report.
3. Add a crosstab to the Summary band with the following settings:
a. Dataset – [Main Dataset].
b. Column group – ORDERDATE; select Year from the drop-down menu in the Calculation column.
c. Row group – SHIPCOUNTRY.
d. Measure – ORDERID.
4. In design view for the report, double-click on the crosstab to open the crosstab editor.
TIBCO Software Inc. 353
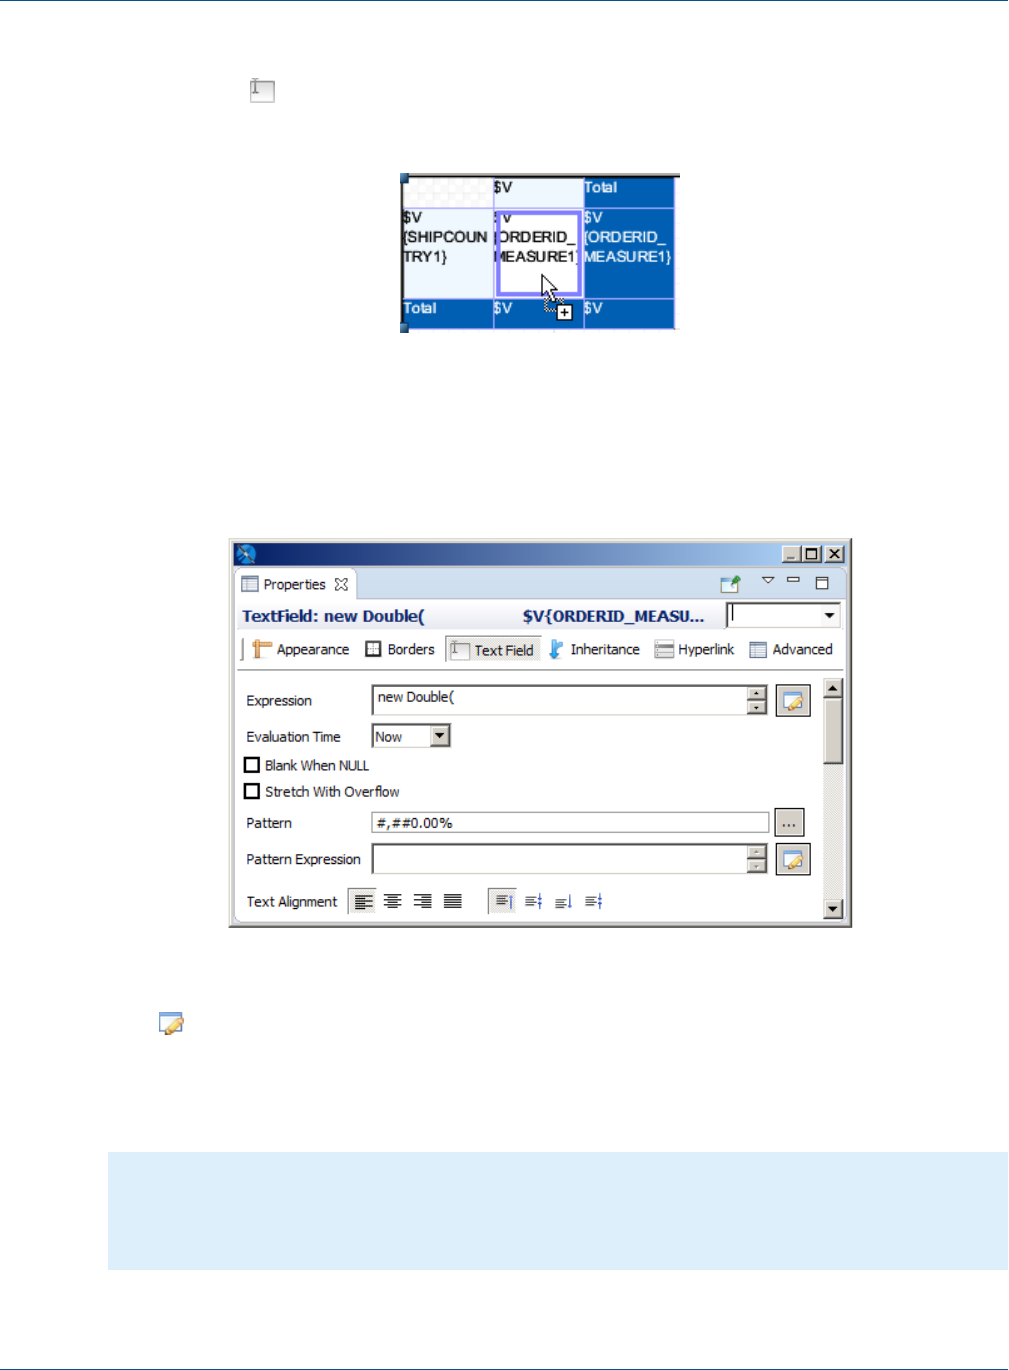
TIBCO Jaspersoft Studio User Guide
5. Shift-click in the second row and drag to expand the row height.
6. Drag a text field into the intersection of the first row and column.
The text field is added to the column.
Figure 18-19 Adding a text field to an existing measure
Setting the measure expression:
7. Select the text field you added.
8. Select the Text Field tab in Properties view.
Figure 18-20 Text field properties after setting the expression
9. Click to the right of the Expression field to open the expression editor.
10. Add a formula to calculate the following percentage:
(Number of orders placed in this country and in this year) / (All orders placed in this country)
For Java, use the following expression:
new Double(
$V{ORDERID_MEASURE1}.doubleValue()
/
$V{ORDERID_MEASURE1_ORDERDATE1_ALL}.doubleValue()
)
354 TIBCO Software Inc.
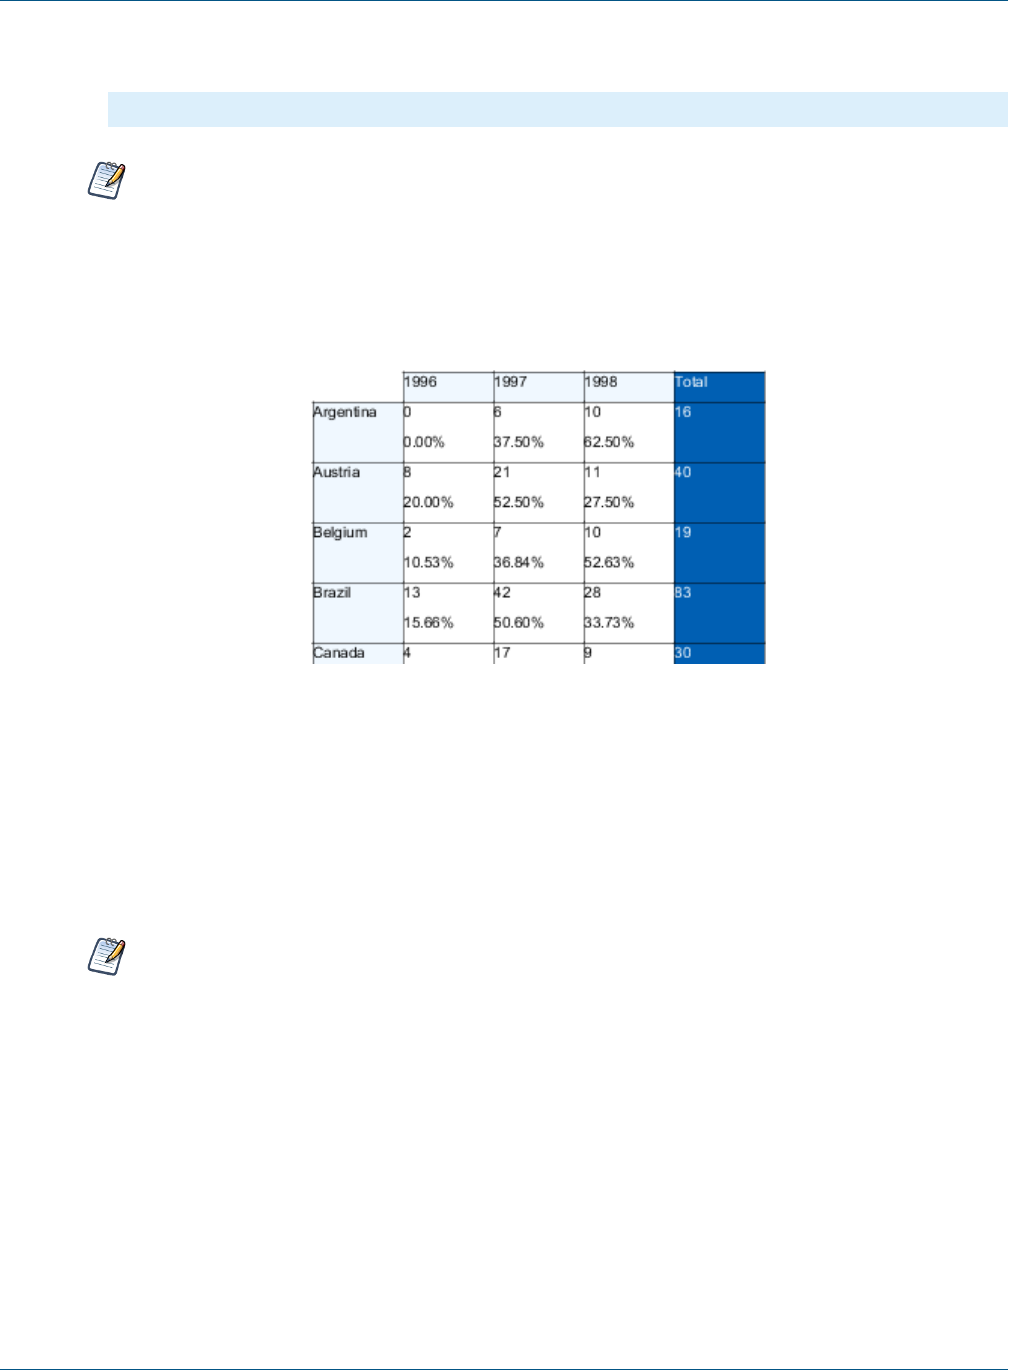
Chapter 18 Working with Crosstabs
For Groovy, use the following expression:
(double)$V{ORDERID_MEASURE1} / (double)$V{ORDERID_MEASURE1_ORDERDATE1_ALL}
A percentage must be treated as a floating-point number. For this reason, extract the double-scalar
values from ORDERID_MEASURE1 and ORDERID_MEASURE1_ORDERDATE1_ALL objects even if they are
objects of class-type Integer.
11. Click Finish to close the expression editor.
12. Enter #,##0.00% in the Pattern field to format the result as a percentage.
13. Click Preview to run the report.
Figure 18-21 The final report with percentages included
18.4 Working with Crosstab Parameters
Crosstab parameters let you pass dynamic values from the main report to the crosstab as crosstab parameters.
They can be used in the expressions of elements displayed in the crosstab. Crosstab parameters are defined and
managed using outline view in the crosstab editor.
Crosstab parameters are designed to be used in crosstab elements. They are not the same as the
dataset parameters that are used in expressions, in the crosstab context, to filter a query and calculate
values.
To add a crosstab parameter:
1. Double-click your crosstab in design view to open the crosstab editor.
2. In outline view, right-click the Parameters node in the Crosstab element and select Create Parameter.
3. To set the value of the crosstab parameter, double-click the parameter to open the expression editor. Create
an expression for your parameter and click OK.
You can use a map to set the value of the declared crosstab parameters at run time. In this case, you’ll need to
provide a valid parameters map expression in the crosstab properties.
TIBCO Software Inc. 355

TIBCO Jaspersoft Studio User Guide
356 TIBCO Software Inc.

CHAPTER 19 WORKING WITH THE MAP COMPONENT
The Map element in the Palette view lets you add Google Maps to your reports. You can set the center, zoom,
and scale for your map, as well as markers and paths. The Properties view for a map element has tabs to control
appearance and map properties, set authentication for Google business license, and create markers and paths.
To add a Map component to your report:
1. Drag the Map component from the Palette to your report. Usually, you want to add the map to a
component that is included only once, such as the Title band or Summary band.
This topic contains the following sections:
•Working with Map Properties
•Viewing Authentication Properties
•Working with Markers
•Working with Paths
•Properties for Markers and Paths
19.1 Working with Map Properties
The Map tab in the Properties view lets you set the basic properties for the map:
1. Select a map component in your report and click Map in the Properties view.
TIBCO Software Inc. 357
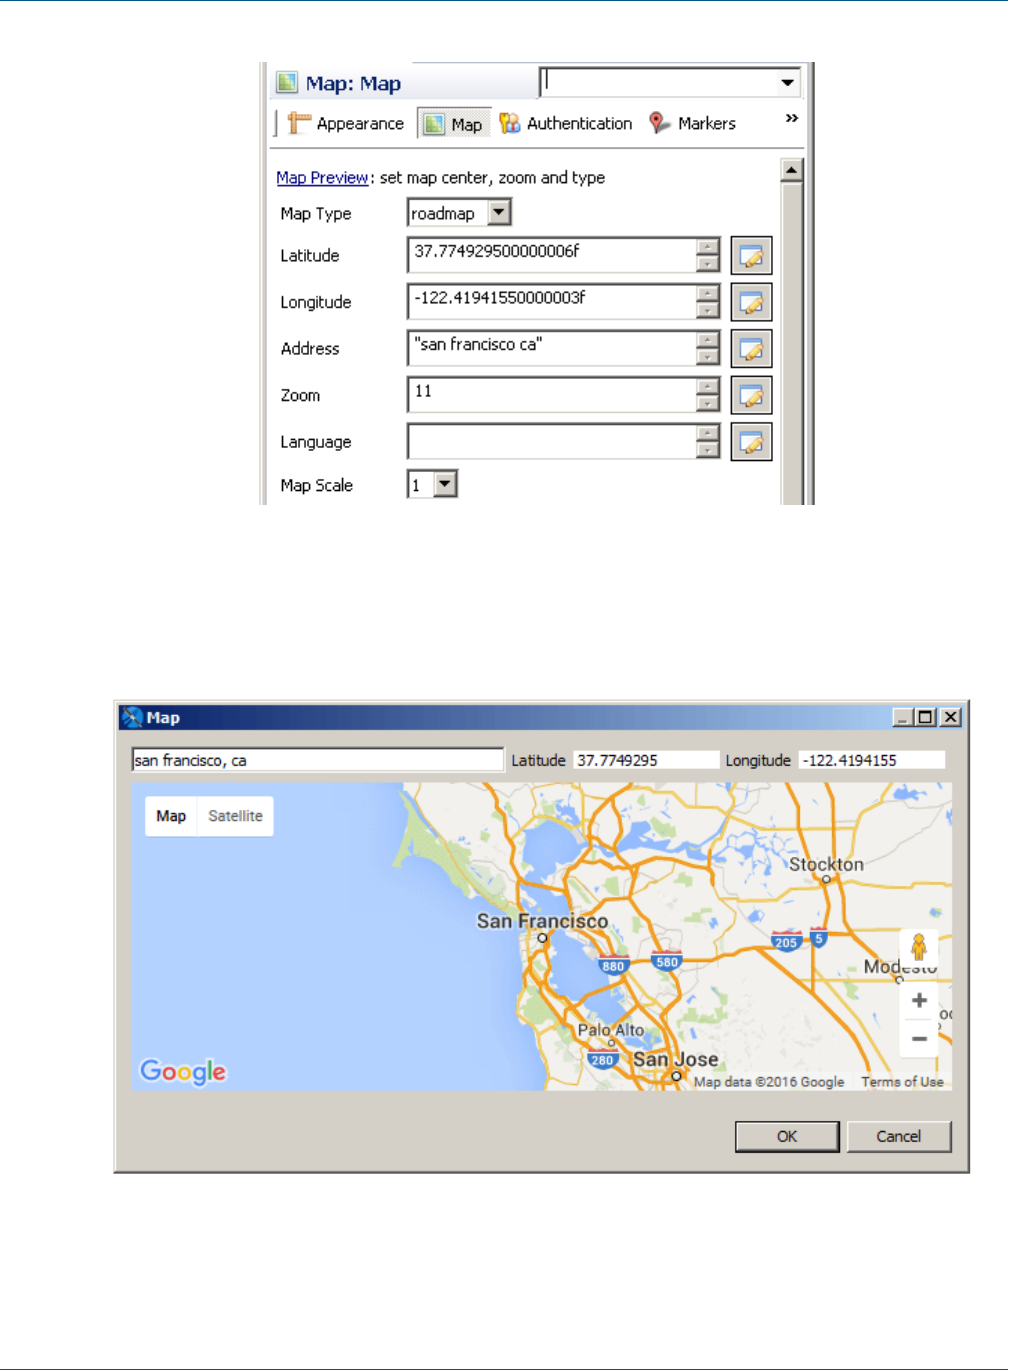
TIBCO Jaspersoft Studio User Guide
Figure 19-1 Map tab in Map Properties
You can set the following map properties using the Map tab:
•Map Preview – Opens a Google Maps window. This window supports standard Google Maps
functionality, such as dragging, zooming, and switching between Map and Satellite views.
Figure 19-2 Setting a map location
358 TIBCO Software Inc.

Chapter 19 Working With the Map Component
Changes to this window are reflected in the map in your report. In addition, you can change the map's
center in any of the following ways. When you close the preview, the map is automatically centered at the
selected location:
•Address – Enter an address in the entry bar to center the map at that location.
•Latitude and Longitude – Enter a latitude and longitude to center your map at that location.
•Double-click – Double-click anywhere on the map to center it at that location.
•Map Type – The Google Maps view. Options are: roadmap, satellite, terrain, and hybrid.
•Latitude – The latitude of the map center. You can type directly in the entry bar, or click to enter an
expression.
•Longitude – The longitude of the map center. You can type directly in the entry bar, or click to enter
an expression.
•Address – A String representing the address of the center. You can type directly in the entry bar, or click
to enter an expression. Must be enclosed in quotes, for example, "350 Rhode Island Ave., San Francisco,
CA".
•Zoom – Integer representing the Google Maps zoom level. You can type directly in the entry bar, or click
to enter an expression.
•Language – String that sets the in-map language. You can type directly in the entry bar, or click to
enter an expression. Must be enclosed in quotes, for example, "ru-RU". See the Google Maps documentation
for more information.
•Map Scale – Sets the size of the scale bar at the bottom of the map.
•Evaluation Time – Drop-down that lets you set the evaluation time of the map. See 7.3.1, “Evaluation
Time,” on page110 for more information.
•Image Type – Drop-down that lets you set the image type to use when the map is embedded in your
report.
•On Error Type – Drop-down that lets you set the type of message to display when there is an error with
the map.
19.2 Viewing Authentication Properties
If you want to use a Google Maps key or business client license, we recommend that you configure these as
global Jaspersoft Studio properties. You can view the status of your Google Maps license information on the
Authentication tab.
TIBCO Software Inc. 359
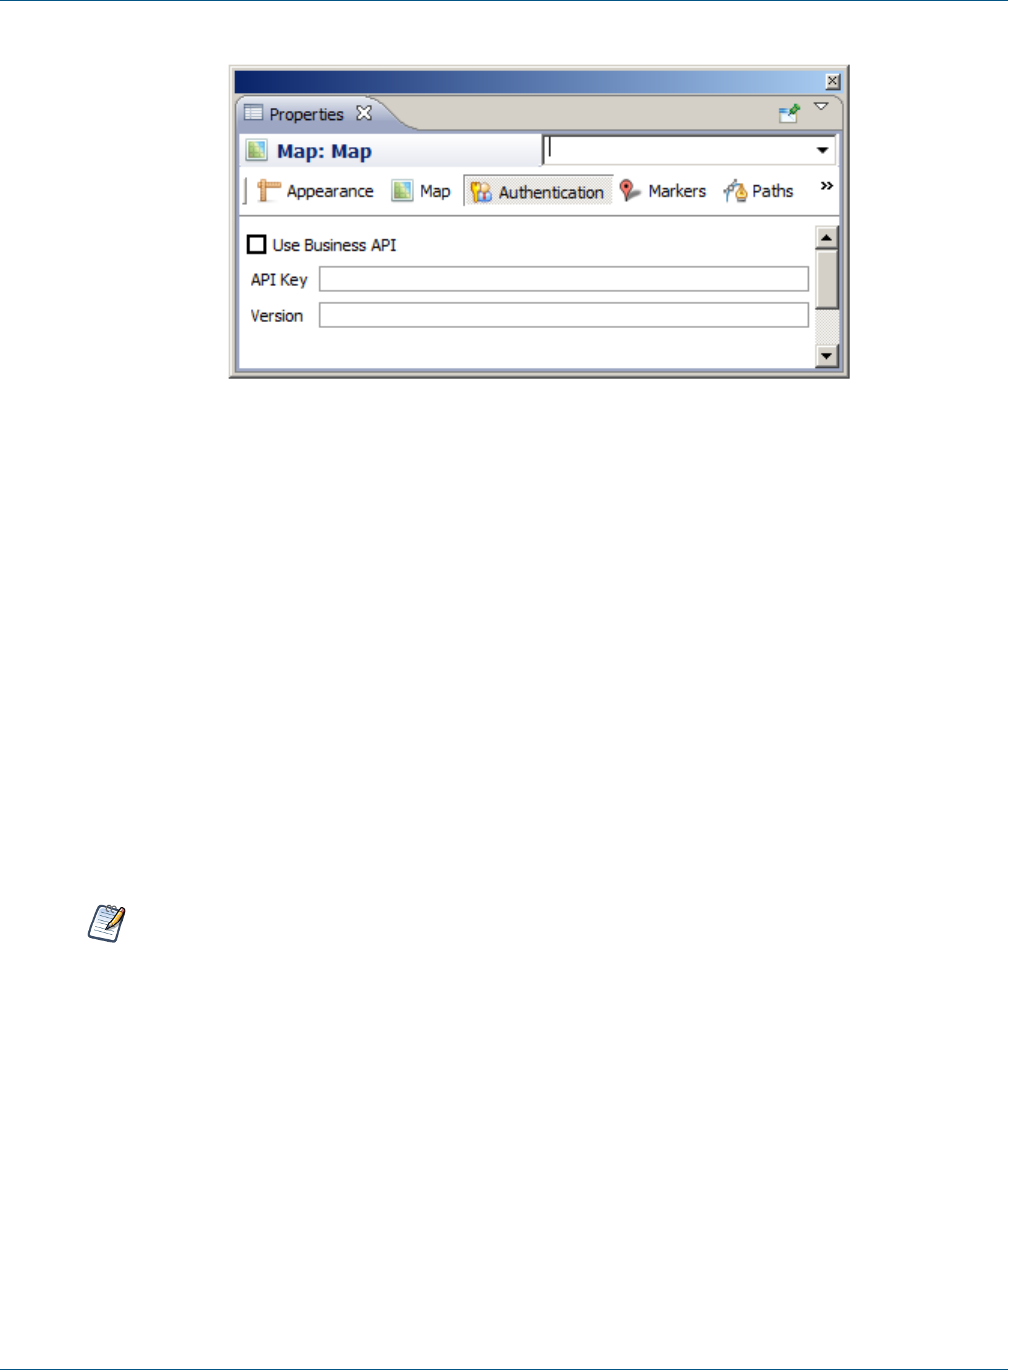
TIBCO Jaspersoft Studio User Guide
Figure 19-3 Authentication tab in Properties view for a map component
To configure your Google Maps license and/or version information:
1. Select Window> Preferences to open the Preferences dialog box (Eclipse> Preferences on Mac).
2. Navigate to Jaspersoft Studio> Properties.
3. To configure a property, click Add to open the Properties dialog, enter the name of the property and the
property's value, then click OK. You can configure the following Google Maps APIs properties. See the
JasperReports Library configuration reference for more information on each property:
•net.sf.jasperreports.components.map.client.id – Specifies the client ID for Google Maps API
for Business. If set, it takes precedence over the API key property. Usually works along with the
signature property for signed URLs.
•net.sf.jasperreports.components.map.key – Specifies the Google Maps API key.
•net.sf.jasperreports.components.map.signature – Specifies the encrypted client signature for
signed request URLs.
•net.sf.jasperreports.components.map.version – Indicates which version of the Google Maps
API should be loaded.
4. When you have specified all your properties, click OK to exit the Preferences dialog box.
Setting the property globally sets the properties when the report is run inside Jaspersoft Studio. If you are
publishing your reports to another environment, you must enable these properties in the
jasperreports.properties file in your environment.
19.3 Working with Markers
A marker identifies a location on a map. You can create markers manually, either using a fixed location that is
known when the report is created, or using an expression based on report data. You can also define markers
based on a dataset. A single map can include both manual markers and markers from one or more datasets. This
section describes:
•Marker Properties
•Adding Markers Manually
•Adding Markers Using the Map
•Adding Markers Using a Dataset
360 TIBCO Software Inc.

Chapter 19 Working With the Map Component
•Modifying Markers
19.3.1 Marker Properties
You can set properties for each marker. The marker properties available are a subset of Google Maps' properties.
See Table 19-5, “Marker and Path Properties,” on page373 for more information.
19.3.2 Adding Markers Manually
Manually-added markers can be used for a fixed address or location that is known when the report is created.
You can also use an expression, for example to set a location based on a parameter value. This method only
displays as many markers as you explicitly create.
To manually define a marker:
1. Open or create a report and add a map component. Make sure to set the map's center to a location near your
marker. For this example, use the following coordinates:
Latitude – 37.7656842
Longitude – -122.403
2. With the map component selected, click the Markers tab in the Properties view.
Table 19-1 Markers tab with one marker
3. To specify the marker properties, click Add in the Markers tab.
The Markers dialog box opens.
4. To enter an individual marker, select the Markers tab and click Add again.
The Marker dialog box opens.
TIBCO Software Inc. 361
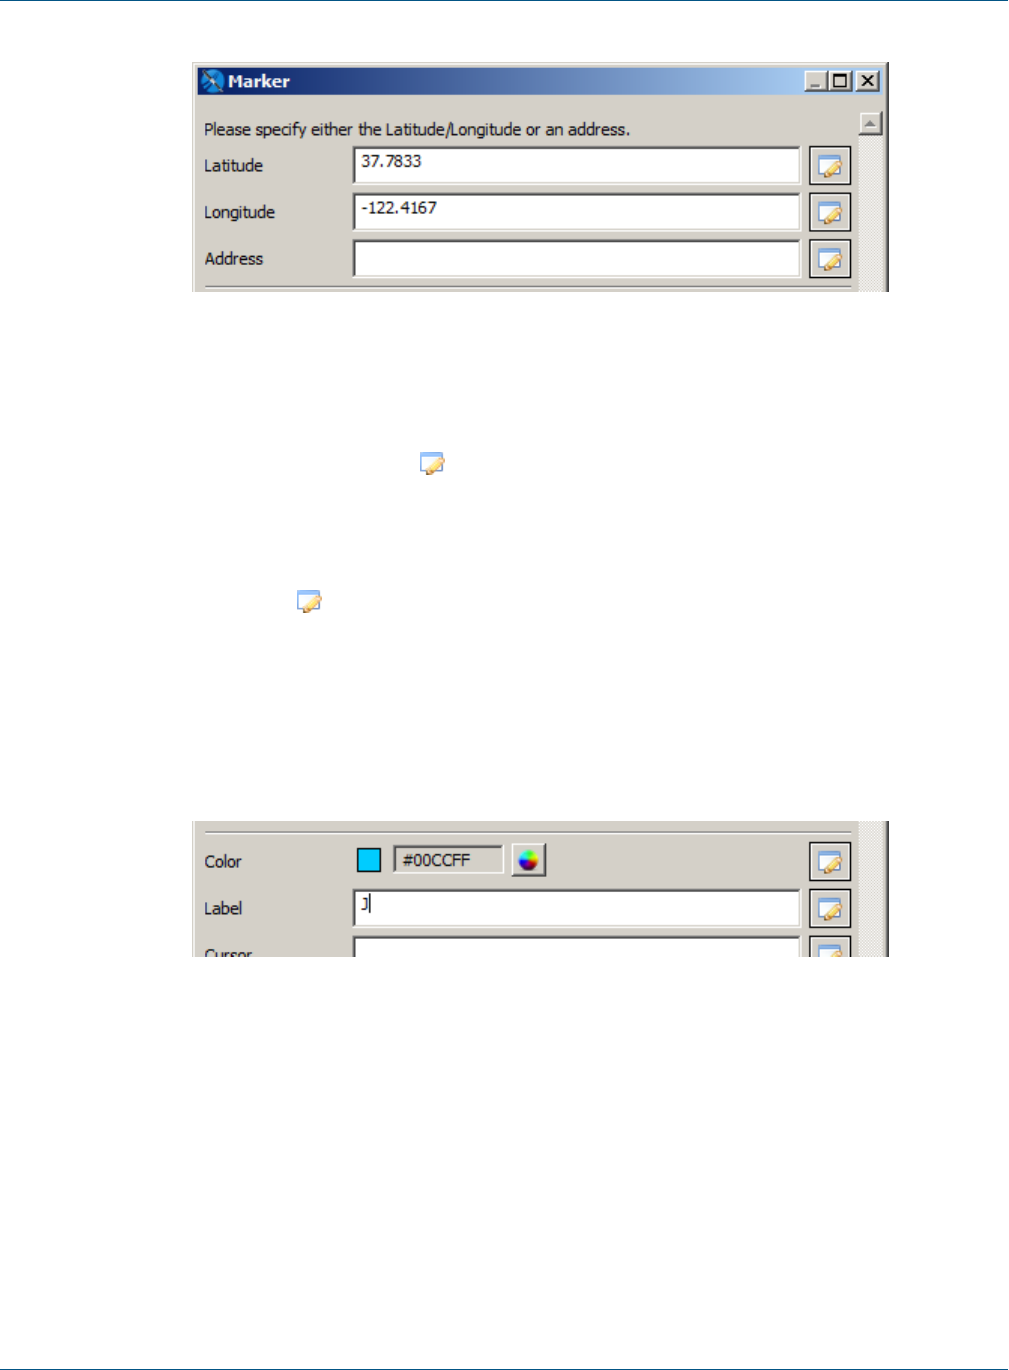
TIBCO Jaspersoft Studio User Guide
Figure 19-4 Defining a static marker
5. Specify a location for your marker. You can do this by entering latitude and longitude, entering an address,
or defining markers on the map preview:
•Latitude and Longitude – Enter the latitude and longitude coordinates for your marker. You can type
directly in the entry bar, or click to enter an expression. For this example, enter the following
values:
•Latitude – 37.833
•Longitude – -122.4167
•Address – The address is used only if Latitude and Longitude are blank. You can type directly in the
entry bar, or click to enter an expression.
6. (Optional) Set the title for your marker, if any.
7. (Optional) To have a new browser window or tab open with related information when a user clicks on the
marker, enter the URL and select the Target type.
8. (Optional) Set your icon type (default or custom) and icon properties:
•If you are using the default marker, you can set additional properties, such as color, label, etc. These
properties are not available for a custom icon. This example uses the color 00CCFF and the label J.
Figure 19-5 Setting color and label for a marker
•To use a marker icon other than the default, click Custom Icon to specify a URL that points to the
image to use. Currently, we don't support loading an image directly from the repository or as a resource
local to the report. Instead, the JavaScript API loads the icon from the URL. Then set additional
optional properties for your marker, such as icon height, width, origin, and anchor.
9. Click OK to return to the Markers dialog box.
10. To create additional markers, click Add, enter the marker properties, then click OK to return to the Markers
dialog box.
11. Click OK to create your markers.
12. Once you have defined your markers, preview your report in HTML. For the example, select the Empty
Data Set for your preview.
362 TIBCO Software Inc.
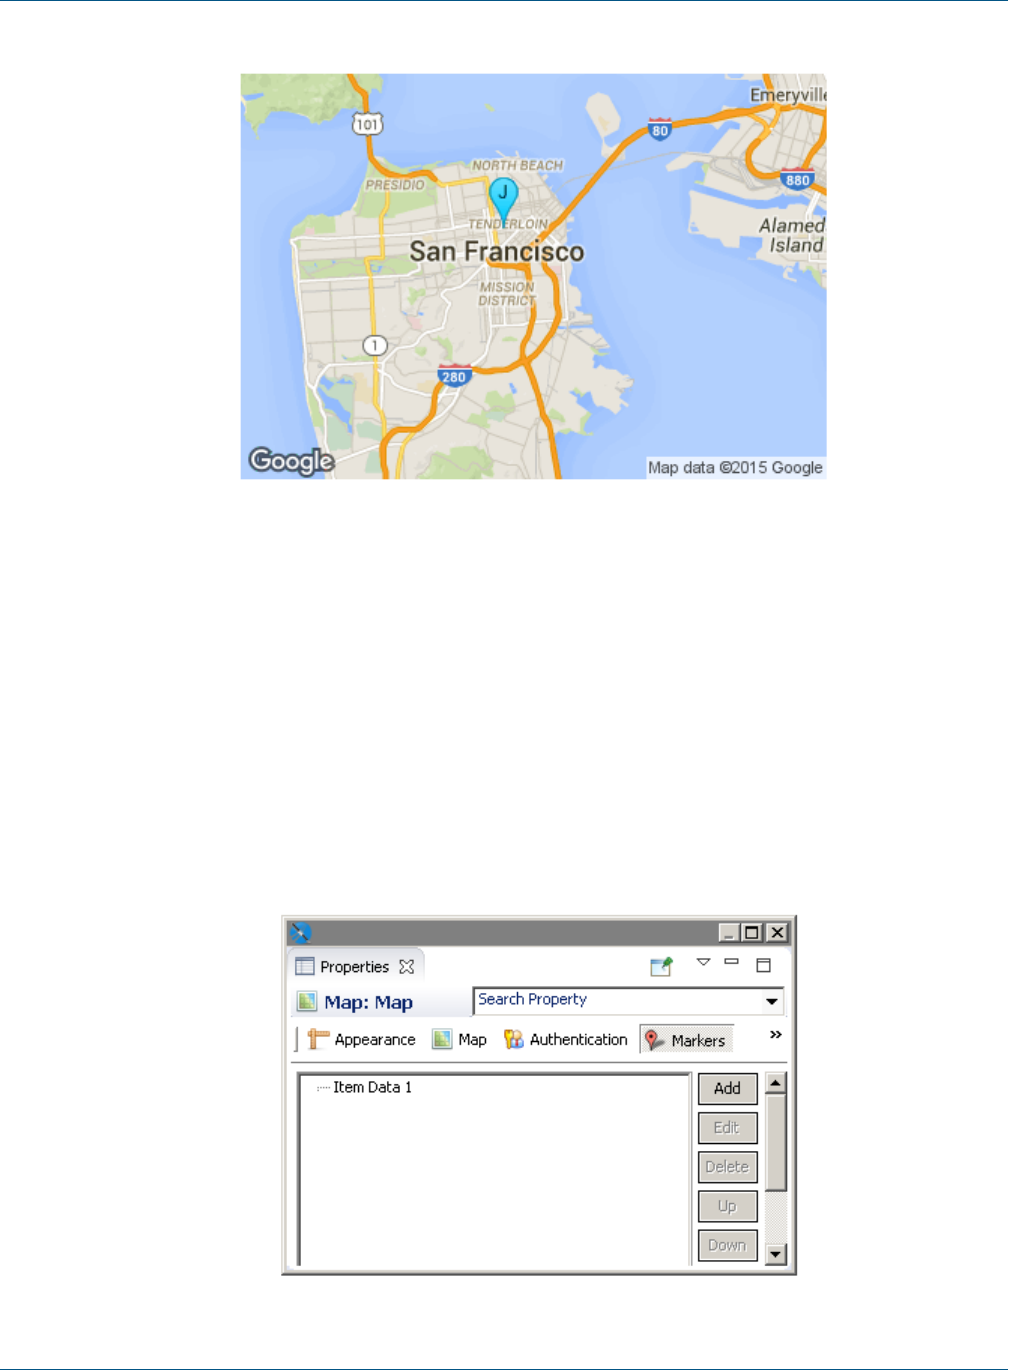
Chapter 19 Working With the Map Component
Figure 19-6 A map with a marker
19.3.3 Adding Markers Using the Map
You can also add markers using the map preview. This only supports a fixed address or location that is known
when the report is created.
To manually define a marker using the map:
1. Open or create a report and add a map component. Make sure to set the map's center to a location near your
marker. For this example, use the following coordinates:
Latitude – 37.7656842
Longitude – -122.403
2. With the map component selected, click the Markers tab in the Properties view.
TIBCO Software Inc. 363

TIBCO Jaspersoft Studio User Guide
Table 19-2 Markers tab with one marker
3. To specify the marker properties, click Add in the Markers tab.
The Markers dialog box opens.
4. To enter an individual marker, select the Map tab. You can perform the following tasks:
•To create a marker by selecting a location on the map, right-click on the location you want and select
Add marker.
•To delete one or more markers, select the marker(s) in the panel at the right and press Delete, or right-
click on the marker and select Delete.
•To edit a marker's location, double-click on the marker to open the Marker dialog box.
19.3.4 Adding Markers Using a Dataset
The steps above define a fixed number of markers. You can also dynamically define the markers based on
locations defined in your report's data or another dataset. A single map can include both manual markers and
markers from one or more datasets.
19.3.4.1 Sample Data
In this example, we'll use a CSV file containing the following data for San Francisco landmarks. This file
includes data used by markers and paths.
landmark, latitude, longitude, path, style
Fisherman's Wharf, 37.8085636, -122.409714, path1, style1
Golden Gate Bridge, , , path1, style1
Cliff House, 37.778485, -122.513963, path1, style1
Stern Grove, 37.7358667, -122.4771518, path1, style1
Stern Grove, 37.7358667, -122.4771518, path2, style2
Golden Gate Park, , , path2, style2
Union Square, 37.788527, -122.407235, path2, style2
"Willie Mays Plaza, San Francisco, CA", 37.778595, -122.38927, path1, style1
Twin Peaks, 37.7544066, -122.4476845, path2, style2
Table 19-3 Sample CSV Data for Markers and Paths
Define the San Francisco data adapter:
1. Create a data file with the path data you want. For this example, create a CSV file with the data provided
above. Make sure to include a blank line at the end of the file.
2. Click on the main toolbar. When prompted, navigate to the same folder as your report.
3. Name the file SFDataAdapter.xml and click Next.
4. Select CSV File as the data adapter type and click Next. The CSV File dialog opens.
364 TIBCO Software Inc.
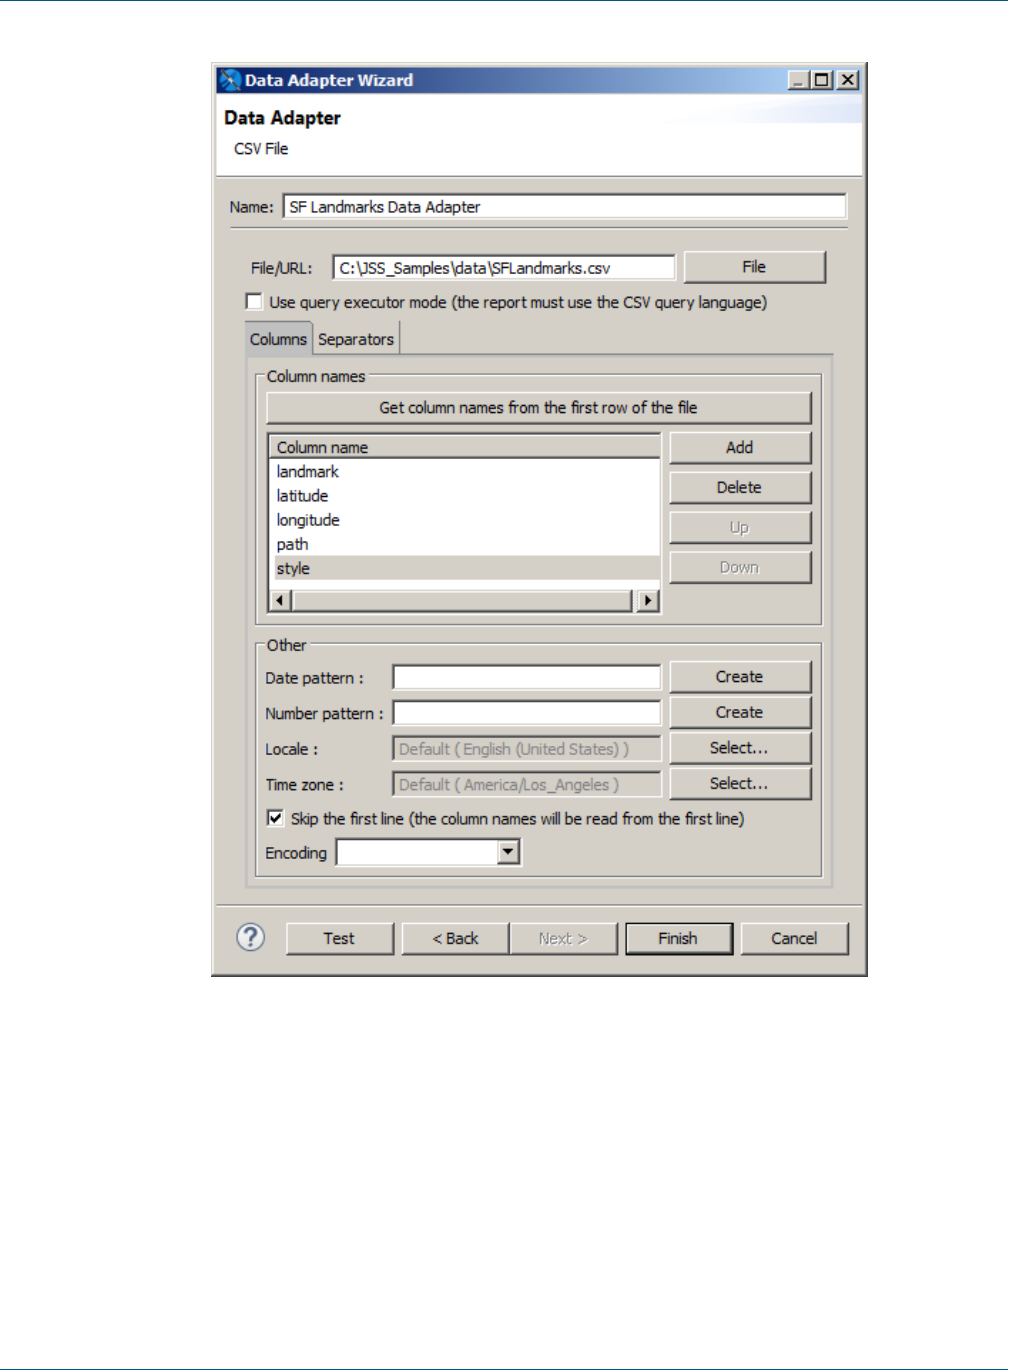
Chapter 19 Working With the Map Component
Figure 19-7 Creating a sample data adapter for markers and paths
5. Name your adapter, for example, SF Landmarks Data Adapter.
6. Click File and select the CSV file you created.
7. Click Get column names from the first row of the file.
8. Select Skip the first line.
9. Click Finish to create the adapter.
Create a dataset in your report:
1. Right-click the root node of the report in the outline view and select Create Dataset.
TIBCO Software Inc. 365
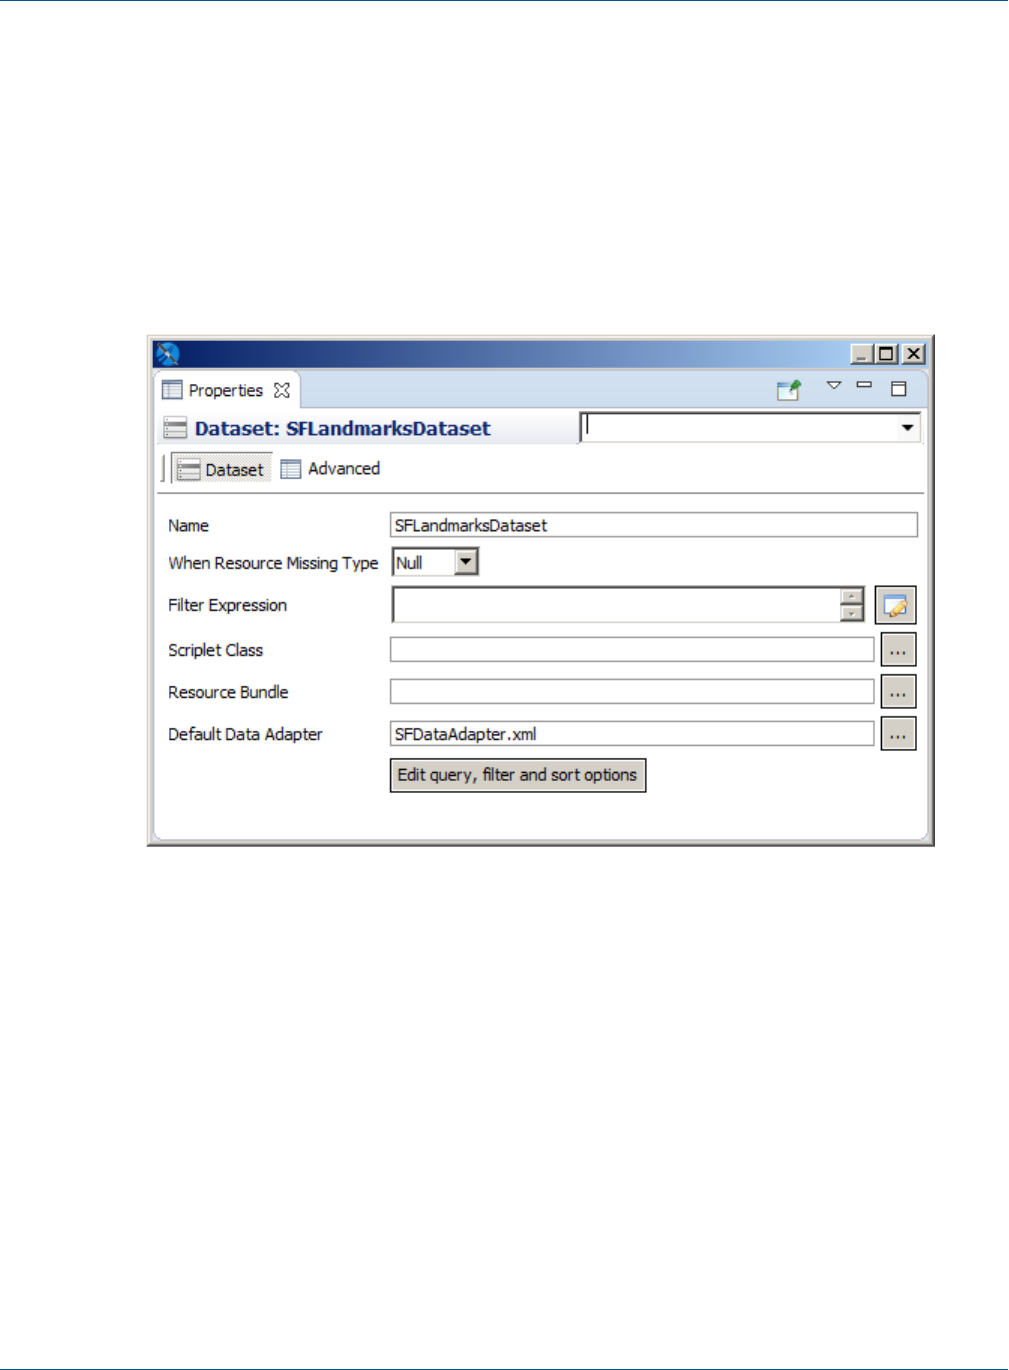
TIBCO Jaspersoft Studio User Guide
2. Name the dataset SFLandmarksDataset, make sure Create new dataset from a connection or Data
Source is selected, and click Next.
3. Select the SFDataAdapter.xml data adapter and click Next.
4. Click >> to select all fields and click Finish.
The dataset is created in your report.
5. Click on the SFLandmarksDataset in outline view.
6. In the Properties view, enter SFDataAdapter.xml in the Default Data Adapter entry box. Setting the
default data adapter lets you use a different dataset from the one used in the main report. See 10.2.3,
“Default Data Adapter,” on page145 for more information.
Figure 19-8 Setting the default data adapter for a dataset
19.3.4.2 Using the dataset to set markers
1. Add a map component to the report, or select an existing map in the Design tab.
2. If you have not set the map center or zoom level, do so. For this example, click the Map tab in the
Properties view, and use the map preview to select "San Francisco, CA" as the center. Then enter 11 in the
Zoom field.
3. Click the Markers tab in the Properties view.
4. Click Add to open the Markers dialog box.
5. Select the Dataset tab and select Use Dataset.
6. In the Dataset Run section, select your dataset and accept the default settings. For this example, use
SFLandmarksDataset. You have already set the default data adapter for this dataset.
7. Click the Markers tab and then click Add. The Marker dialog box opens.
366 TIBCO Software Inc.
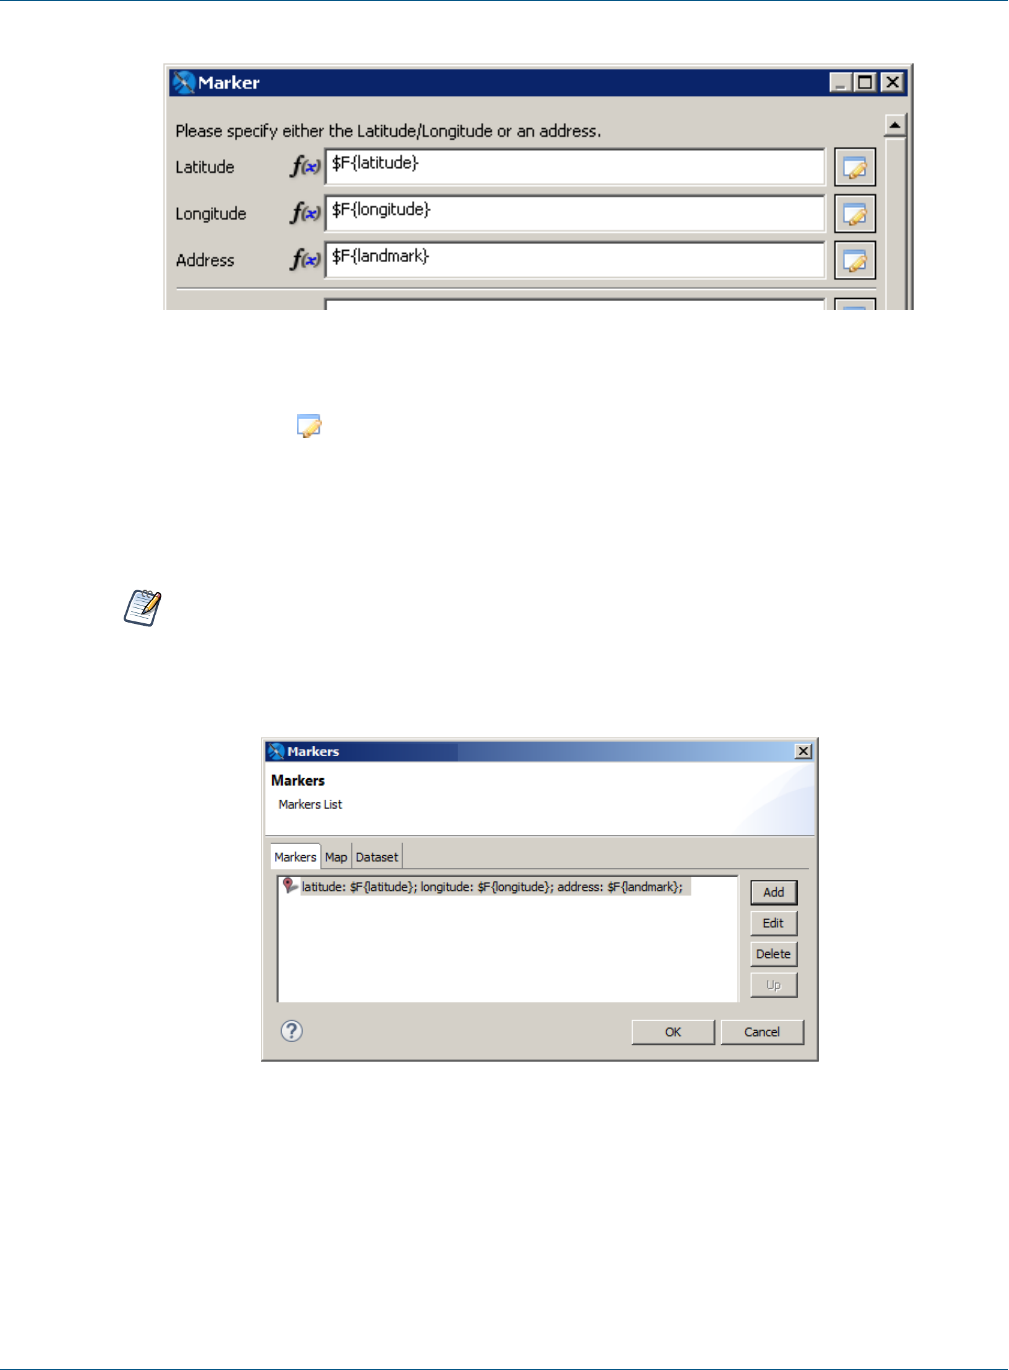
Chapter 19 Working With the Map Component
Figure 19-9 Using expressions to set markers from a dataset
8. For a dataset, you typically want to use expressions for your values. For each property you want to read
from the dataset, click on the entry bar, select Use Expression and enter the expression to use. For this
example, use the following expressions:
•Latitude – $F{latitude}
•Longitude – $F{longitude}
•Address – $F{landmark}
You can use expressions to pass parameters to a map component dynamically. Expressions allow
you to evaluate data in your dataset and use the results to populate the map. In the component's
properties, properties based on expressions show f(x) next to the field.
9. Click OK. The Markers dialog box displays the markers you just created.
Figure 19-10 Item data for markers created from a dataset
10. Click OK. Your markers are displayed on the Marker tab of the Properties view, along with any other
markers you have created.
TIBCO Software Inc. 367
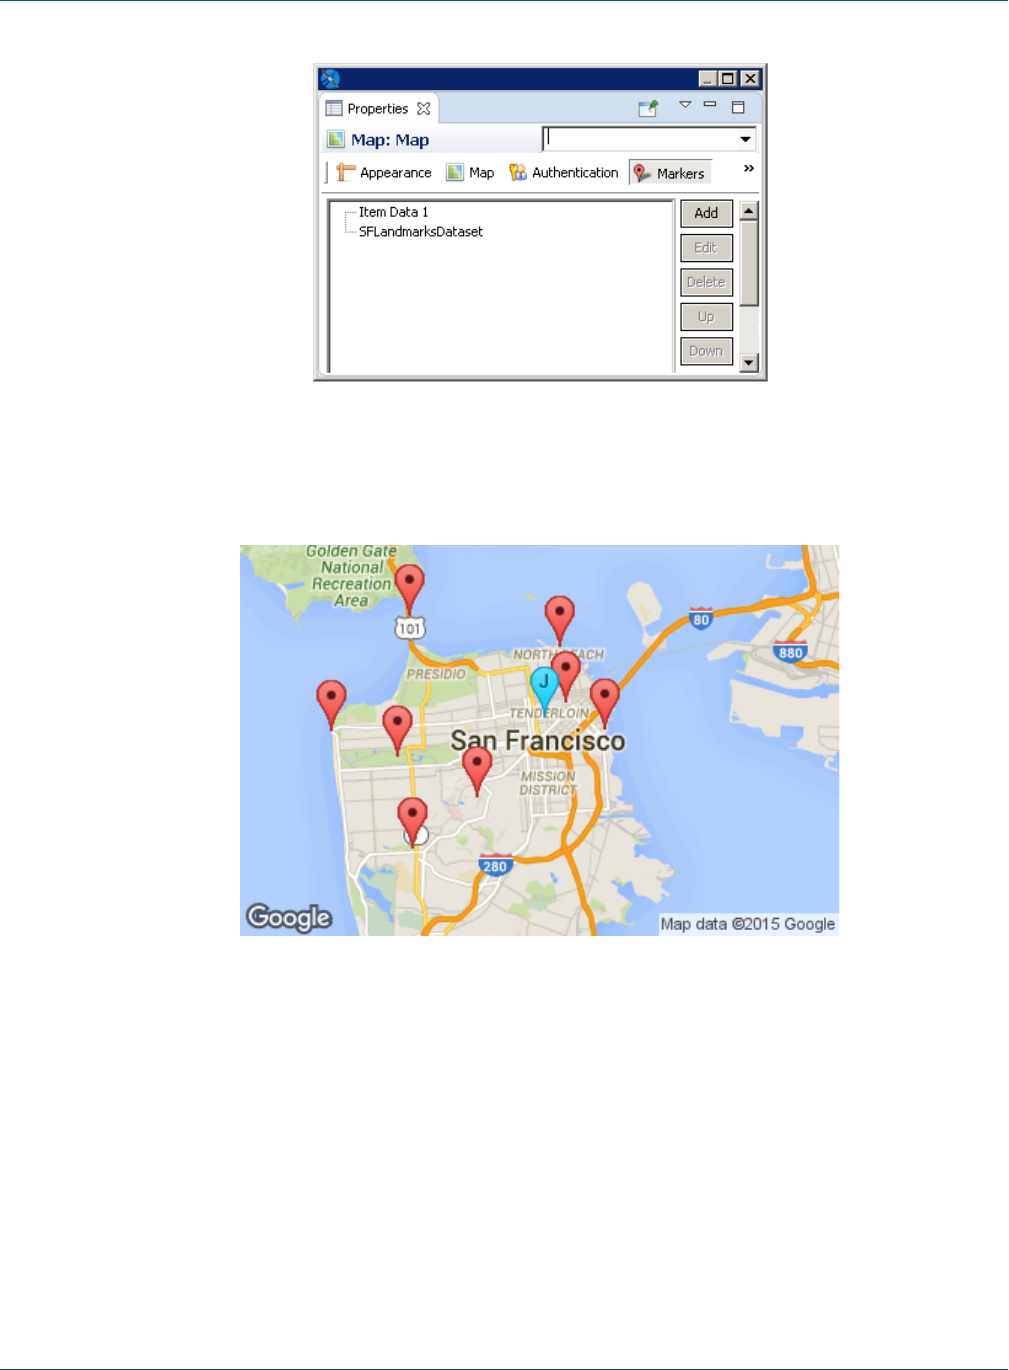
TIBCO Jaspersoft Studio User Guide
Figure 19-11 Properties view showing markers added manually and markers defined from a dataset
11. Preview your report in HTML. The example below shows the markers from the sample dataset along with a
static marker.
Figure 19-12 San Francisco landmarks shown on a map
19.3.5 Modifying Markers
To edit a marker:
1. Select the map and click on the Markers tab in Properties view.
2. Select the marker you want to change and click Edit.
3. To change the dataset, make sure you have set up another dataset in your report before editing the marker.
Then you can select the Dataset tab here and select the new dataset from the Dataset Run menu.
4. To change marker properties, select the Markers tab, and edit your properties.
368 TIBCO Software Inc.

Chapter 19 Working With the Map Component
To delete a marker:
1. Select the map and click on the Markers tab in Properties view.
2. Select the marker you want to delete and click Delete.
19.4 Working with Paths
You can add one or more paths to your maps. A path is defined by:
•A name that serves as a path identifier; the name must be unique in your report
•A collection of places (points) on the map defined by latitude/longitude coordinates or addresses; these are
connected to form the path
•(Optional) A style that specifies various style configuration properties, such as line and fill color, line
weight, and opacity
19.4.1 Defining Path Styles
A path style specifies the properties (for example, color and weight) of the lines between the points on your
path. See Table 19-5, “Marker and Path Properties,” on page373 for more information. You can create a path
style manually, or you can save your path styles as a dataset.
19.4.1.1 Defining Path Styles Manually
1. Edit the map component's properties.
2. On the Paths tab, in the Styles section, click Add.
3. In the Style dialog box, enter the properties you want for the path. See Table 19-5, “Marker and Path
Properties,” on page373 for more information about available properties.
4. Click OK.
19.4.1.2 Defining Path Styles Using a Dataset
name, strokecolor, strokeopacity, strokeweight, fillcolor, fillopacity, ispolygon
"style1", "#0000FF", 0.6, 1, "#FF33FF", 0.4, true
"style2", "#FF0000", 0.8, 2, , , false
Table 19-4 Sample CSV Data for Path Styles
Create a data adapter for your path styles:
1. Create a data file with the path data you want. For this example, create a CSV file with the data provided
above. Make sure to include a blank line at the end of the file.
2. Click on the main toolbar.
3. When prompted, navigate to the same folder as your report.
4. For this example, name the file PathStylesDataAdapter.xml and click Next.
5. Select CSV File as the data adapter type and click Next.
6. Name your adapter, for example, Path Styles Adapter.
7. Click File and select the CSV file you created.
8. For this example, click Get column names from the first row of the fileand select Skip the first line.
9. Click Finish to create the adapter.
TIBCO Software Inc. 369

TIBCO Jaspersoft Studio User Guide
Create a dataset in your report:
1. Right-click the root in the outline view and select Create Dataset.
2. Name the dataset and click Next. For this example, name the dataset PathStyles.
3. Select the data adapter for your path styles (Path Styles Data Adapter) and click Next.
4. Click >> to select all fields and click Finish.
5. Select the dataset (PathStyles) you just created in outline view.
6. In the Properties view, enter the filename of the data adapter (PathStylesDataAdapter.xml) in the Default
Data Adapter entry box. Setting the default data adapter lets you use a different dataset from the one used
in the main report. See 10.2.3, “Default Data Adapter,” on page145 for more information.
Define a style using a dataset:
1. Create your data source, a data adapter that points to it, and a dataset that uses the data adapter.
2. Add a map component to the report, or select an existing map in the Design tab.
3. Select the Paths tab in the Properties view.
4. In the Styles section, click Add to open the Items dialog box.
5. Click the Dataset tab in the Path dialog box and select Use Dataset.
6. In the Dataset Run section, select your styles dataset (PathStyles) and accept the default settings. You have
already set the default data adapter for this dataset.
7. Select the Items tab and click Add to open the Style dialog box.
8. For each property you want to read from the dataset, click on the entry bar, select Use Expression and
enter the expression to use. For this example, use the following expressions:
•Name – $F{name}
•Stroke Color – $F{strokecolor}
•Stroke Opacity – $F{strokeopacity}
•Stroke Weight – $F{strokeweight}
•Fill Color – $F{fillcolor}
•Fill Opacity – $F{fillopacity}
•Is Polygon– $F{ispolygon}
9. Click OK to return to the Items dialog box.
10. Click OK to create the style set.
370 TIBCO Software Inc.

Chapter 19 Working With the Map Component
Figure 19-13 Styles on the Path tab of the Properties view for a map
19.4.2 Defining a Path Manually
To define a path using the Add button:
1. On the Paths tab, use the Styles section to define a style to associate with the path: click Add to do so.
Style properties can be added manually or by specifying a dataset. The style name sets the style property
when adding points to the path.
2. In the Paths section, click Add to open the Markers dialog.
3. To add a point to the path, click Add to open Path dialog box. For each point, specify the following:
a. the path name (to identify which path includes the point)
b. the latitude/longitude coordinates or the address of the point
c. additional optional properties, such as the name of a path style
Click OK to add your point.
4. Use the Up and Down buttons to change the order in which the points appear.
5. Preview your report in HTML to see your path.
To add points to a path using the map preview:
1. On the Paths tab, use the Styles section to define a style to associate with the path: click Add to do so.
Style properties can be added manually or by specifying a dataset. The style name sets the style property
when adding points to the path.
2. In the Paths section, click Add to open the Markers dialog.
3. Select the Maps tab in the Markers dialog box.
TIBCO Software Inc. 371

TIBCO Jaspersoft Studio User Guide
4. Select your path from the Paths menu. The Paths menu has the following characteristics:
•If you already have static paths defined for your map, you can select a path name from the Paths menu.
Points you create are added to the currently-selected path. You can switch between paths at any time.
•If you have not created any static paths, then you can enter a name on this menu. If a static path
already exists, you cannot create a new one.
5. To add a point to the current path, right-click on the location you want and select Add marker.
6. To delete one or more markers, select the marker(s) in the panel at the right and press Delete, or right-click
on the marker and select Delete.
You can't set formatting or styles using the map preview.
19.4.3 Defining a Path Using a Dataset
1. Create a CSV file, a data adapter that points to it, and a dataset that uses the data adapter. This example
uses the same data as in “Sample Data” on page364. Pay close attention when adding points to your data:
they are connected on the map in the order that they appear in the data. If they aren't in a sensible order in
the data, the path won't make sense, either.
2. Define any styles your paths use. This example uses the styles defined in 19.4.1.2, “Defining Path Styles
Using a Dataset,” on page369.
3. Add a map component to the report, or select an existing map in the Design tab.
4. If you have not set the center or zoom, do so. For this example, click the Map tab in the Properties view,
enter "San Francisco, CA" in the Address field, and enter 11 in the Zoom field.
5. Select the Paths tab in the Properties view.
6. In the Paths section, click Add to open the Markers dialog box.
7. Click the Dataset tab in the Markers dialog box and select Use Dataset.
8. In the Dataset Run section, select SFLandmarksDataset and accept the default settings. You have already
set the default data adapter for this dataset.
9. For each property you want to read from the dataset, click on the entry bar, select Use Expression, and
enter the expression to use. For this example, use the following expressions:
•Path Name – $F{path}
•Latitude – $F{latitude}
•Longitude – $F{longitude}
•Address – $F{landmark}
•Style – $F{style}
10. Click OK. The path information is added to the Path section in the Properties view.
11. Preview your report in HTML. The following image shows the example without markers. If you added the
markers earlier, they will also be visible.
372 TIBCO Software Inc.

Chapter 19 Working With the Map Component
Figure 19-14 Paths on a map
19.4.4 Modifying Paths and Path Styles
To edit a path or path style:
1. Select the map and click on the Paths tab in Properties view.
2. Select the path or style you want to change and click Edit.
3. To change the dataset, make sure you have set up another dataset in your report before editing the path or
path style. Then you can select the Dataset tab here and select the new dataset from the Dataset Run
menu.
4. To change path or style properties, select the Items tab, and edit your properties.
To delete a path or path style:
1. Select the map and click on the Paths tab in Properties view.
2. Select the path or style you want to delete and click Delete.
19.5 Properties for Markers and Paths
The available properties are a subset of the properties available through the Google Maps APIs. See
https://developers.google.com/maps for more information.
Property Description
Name String. Name used to identify the marker or path; must be unique for markers or paths in the
report.
Table 19-5 Marker and Path Properties
TIBCO Software Inc. 373
TIBCO Jaspersoft Studio User Guide
Property Description
Latitude Number between -90 and 90. The latitude of a location in degrees.
Longitude Number between -180 and 180. The longitude of a location in degrees.
Address String. The address or placeID of a location. Only used if Latitude and Longitude are not
available.
Color String. The color of the path or marker. For best results, use hexadecimal representation, as
not all Google API implementations will support color strings.
Clickable Boolean. When true, the marker or path can handle mouse events. Default is true.
Draggable Boolean. When true, a user can drag the marker or path contour. Default is false.
Visible Boolean. When true, the marker or path is visible. Defaults to true.
Z Index Number. Index determining the order in which objects are displayed on the map. Elements
with higher values are displayed in front of similar elements with lower values. Markers are
always displayed in front of paths.
Properties for Markers Only
Title String. Text shown on rollover.
Url String. Target URL to access when marker is clicked.
Target String. Target attribute specifying where to open linked document.
Icon String. URL for the icon.
Custom Icon Use Custom Icon settings to use a marker icon other than the default. You must specify a
URL that points to the image to use. Currently, we don't support loading an image directly
from the repository or as a resource local to the report. Instead, the JavaScript API loads the
icon from the URL.
You can set additional optional properties for your marker, such as icon height, width, origin,
and anchor.
Shadow String. URL for the shadow.
Custom
Shadow Icon
Use Custom Shadow Icon settings to use a shadow icon other than the default. You must
specify a URL that points to the image to use. Currently, we don't support loading an image
directly from the repository or as a resource local to the report. Instead, the JavaScript API
loads the icon from the URL.
You can set additional optional properties for your shadow, such as height, width, origin, and
anchor.
Info Window Use Info Window settings to add an info window. You can define the window content, pixel
offset, and maximum width.
374 TIBCO Software Inc.
Chapter 19 Working With the Map Component
Property Description
Label String. Single character that appears on the marker. Not available for custom markers.
Cursor String. Mouse cursor to show on hover. Not available for custom markers.
Flat Boolean. Not available for custom markers.
Optimized Boolean. Not available for custom markers.
Raise on Drag Boolean. Not available for custom markers.
Size String. Not available for custom markers.
Properties for Paths and Path Styles Only
Parent Style String. Name of path style to use as a parent style. The current style inherits the parent's
properties if the parent style is present in the report. Elements set locally in the current style
override elements set in the parent.
Stroke Color String. Color of the stroke; for most consistent results, use hexadecimal format. Default is
#000000.
Stroke Opacity Number. The path's opacity. Number between 0 (transparent) and 1 (opaque). Default is 1.
Stroke Weight Number. Path weight in pixels. Default
Fill Color String. Color of the fill for the polygon when Is Polygon is true. Takes values hexadecimal
format. Default is null.
Fill Opacity Number. The opacity for the polygon's fill when Is Polygon is true. Number between 0
(transparent) and 1 (opaque). Default is 1.
Is Polygon Boolean. When true, creates a polygon (closed path) by connecting the last point on the
path to the first point. Default is false (open polyline).
Editable Boolean. When true, a user can edit the path by dragging the control points on the path
line. Default is false.
Geodesic Boolean. When true, dragged paths follow the great circles on the earth's surface; in this
case, since the map is a projection, the lines may not appear straight. When false, paths
are straight lines on the map. Defaults to false.
TIBCO Software Inc. 375

TIBCO Jaspersoft Studio User Guide
376 TIBCO Software Inc.

CHAPTER 20 WORKING WITH TIBCO GEOANALYTICS MAPS
Jaspersoft Studio leverages TIBCO GeoAnalytics Maps to produce data-rich maps. This section describes their set-up and configuration, including:
•Configuring a Basic Map
•Using Expressions for Properties
•Understanding Layers
•Working with Markers
•Working with Paths
This section describes functionality that can be restricted by the software license for JasperReports Server. If you
don’t see some of the options described in this section, your license may prohibit you from using them. To find out
what you're licensed to use, or to upgrade your license, contact Jaspersoft.
In addition to the other types of map component that Jaspersoft Studio supports, TIBCO GeoAnalytics Maps are also supported. These multi-layer maps are
designed for use in interactive web environments, and support both markers and paths. They also support the ability to provide a street address and resolve
it to the correct latitude and longitude (sometimes called geolocation).
Because these components download content from either TIBCO's service or from Google Maps, they require a connection to the Internet. While the maps
themselves are freely available, using the GeoAnalytics geolocation serve to resolve street addresses requires an additional license.
TIBCO Software Inc. 377
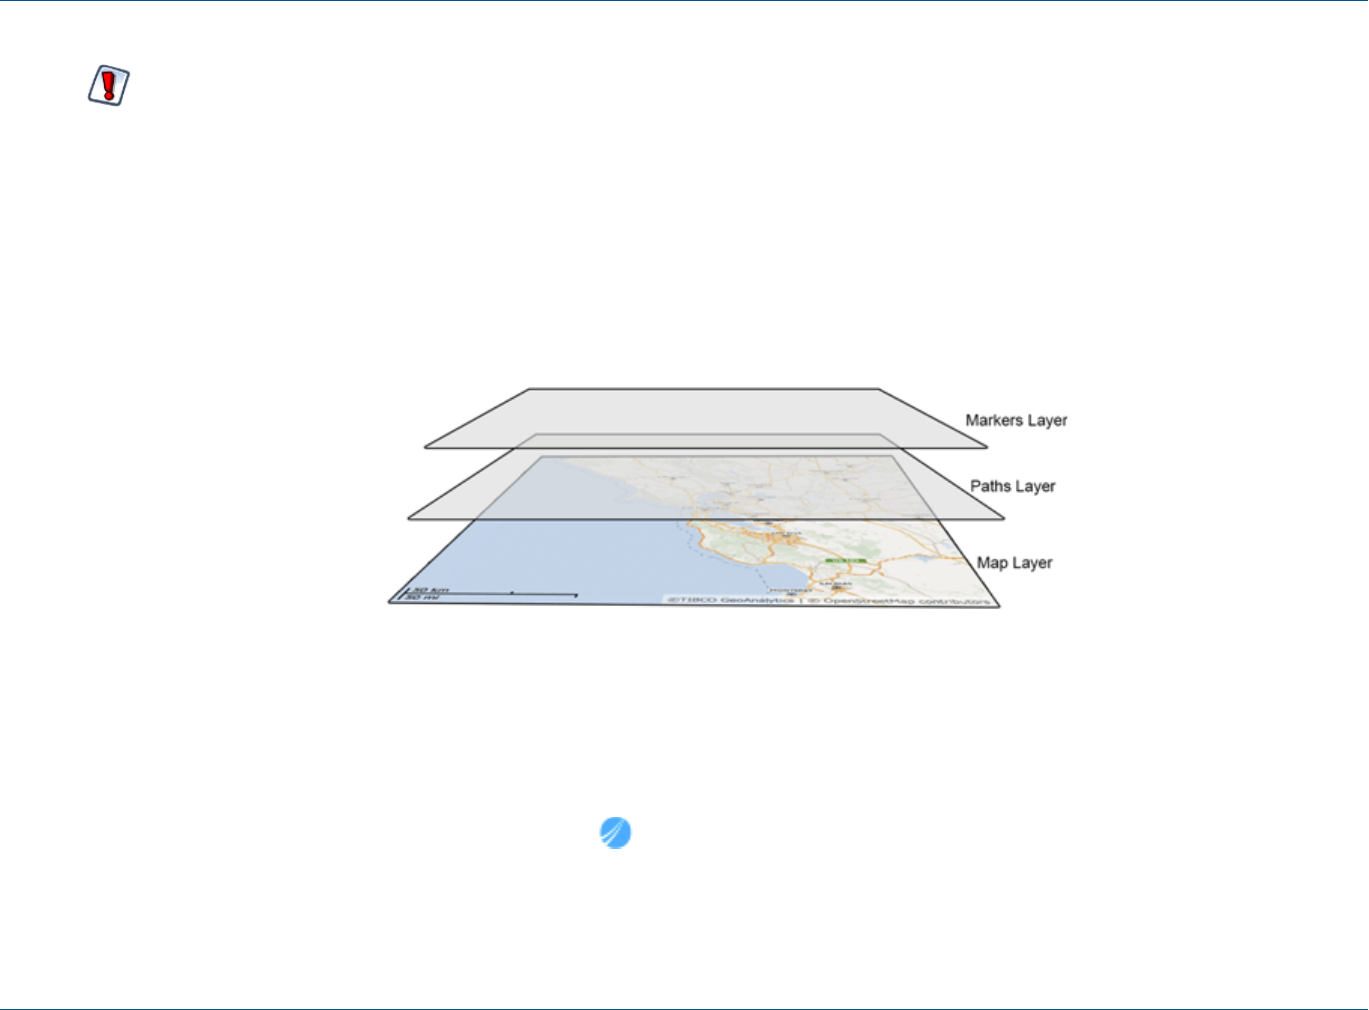
TIBCO Jaspersoft Studio User Guide
These maps are well suited to web-based environments, such as HTML export or when viewed through an
interactive viewer such as JasperReports Server; however, limitations in the underlying technology prevent
some TIBCO GeoAnalytics Map features from working in static formats, such as PDF. In this case, the map is
converted to an image, which is always downloaded from Google Maps instead of TIBCO's server. In addition, if
the map's location is resolved from a street address, the canvas may be blank (or blue); this happens when the
address's latitude and longitude aren't available.
If your target output format is something other than HTML, consider using the standard map component.
The map component consists of three layers: a map, a set of paths, and a set of markers. The lowest layer contains the map itself, rendered by your choice of
providers: TIBCO Maps or Google Maps. In both cases, the image is formed of tiles retrieved from a remote server. The next two layers (first paths then
markers) can contain paths and markers or shapes.
Figure 20-1 Basic structure of the TIBCO GeoAnalytics Map component
20.1 Configuring a Basic Map
To create a TIBCO Map component:
1. First locate the component in the Palette; it uses this icon: ;drag it onto the canvas.
At a minimum, the TIBCO Map component requires the location of the area to display, which can be defined by these manually-exclusive options:
a. The latitude and longitude of the location.
378 TIBCO Software Inc.
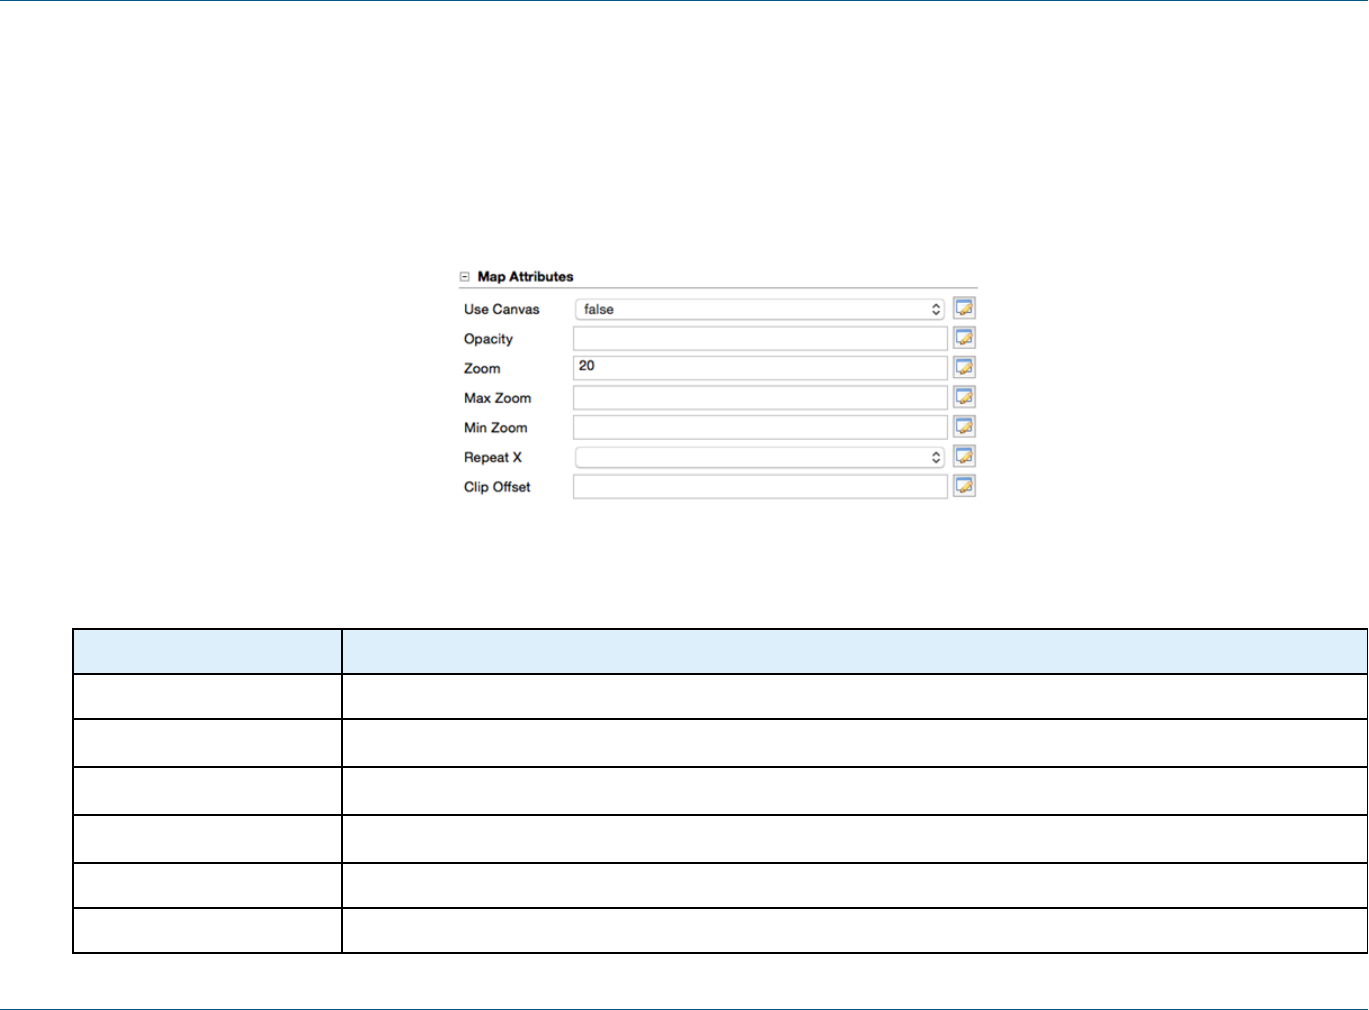
Chapter 20 Working with TIBCO GeoAnalytics Maps
b. The street address of the location (assuming you have a license for TIBCO GeoAnalytics geolocation services). To use this option, you must also
provide credentials for TIBCO's geolocation service. You can either enter these in the Maparama Credentials section of the TIBCO map
component's properties, or by defining them in the jasperreports.properties file so that they can shared across multiple reports. These properties are:
•com.jaspersoft.jasperreports.tibco.maps.customer - the customer name used with TIBCO GeoAnalytics Maps
•com.jaspersoft.jasperreports.tibco.maps.key - the corresponding license key for the specified user
2. To define a location, edit the TIBCO Maps component's Location properties. Entering a latitude/longitude pair or address defines a static location. You
can also use parameters to dynamically define the components location as well as all other TIBCO Map properties.
Figure 20-2 TIBCO Map Attributes
Map attributes determine how the map layer of the component is rendered. The attributes are all optional:
Property Property Value
Use Canvas true false This property refers to the way the map is rendered (by using a canvas or SVG layers)
Opacity 0.0- 1.0 Level of opacity of the map.
Max Zoom 1 - 18 The maximum allowed zoom
Min Zoom 1 - 18 The minimum allowed zoom
Repeat X true | false Specifies whether tiles are repeated when the world's bounds are exceeded horizontally
Clip Offset integer The clip offset of the map
TIBCO Software Inc. 379
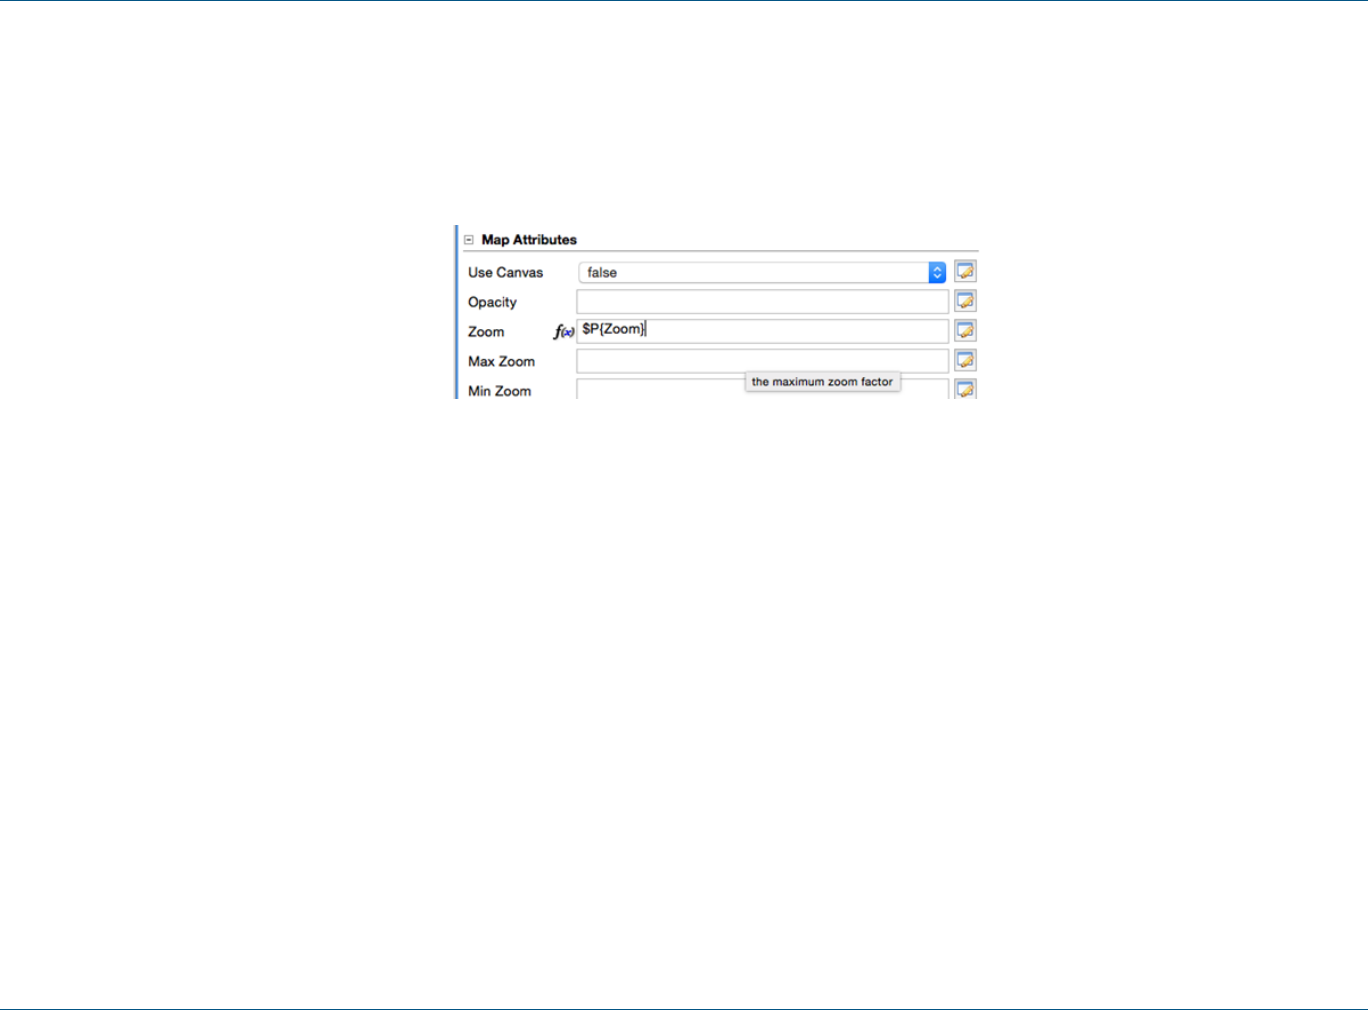
TIBCO Jaspersoft Studio User Guide
20.2 Using Expressions for Properties
The simplest way to define the map layer's properties is to set them to static values; however, this is a much more limited approach than using expressions
to pass parameters to the component dynamically, which allows you to evaluate data in your data set and use the results to populate the map layer's
properties. If you don't specify a different data set, the component uses the main dataset of the report. In the components properties, properties based on
expressions are indicated by displaying f(x) next to the field, as shown below.
Figure 20-3 Map properties showing Zoom defined by an expression
To specify a different dataset to resolve the map attributes based on expressions, click the Use Dataset check box to select it, and select the dataset to use
in the Dataset Run.
380 TIBCO Software Inc.
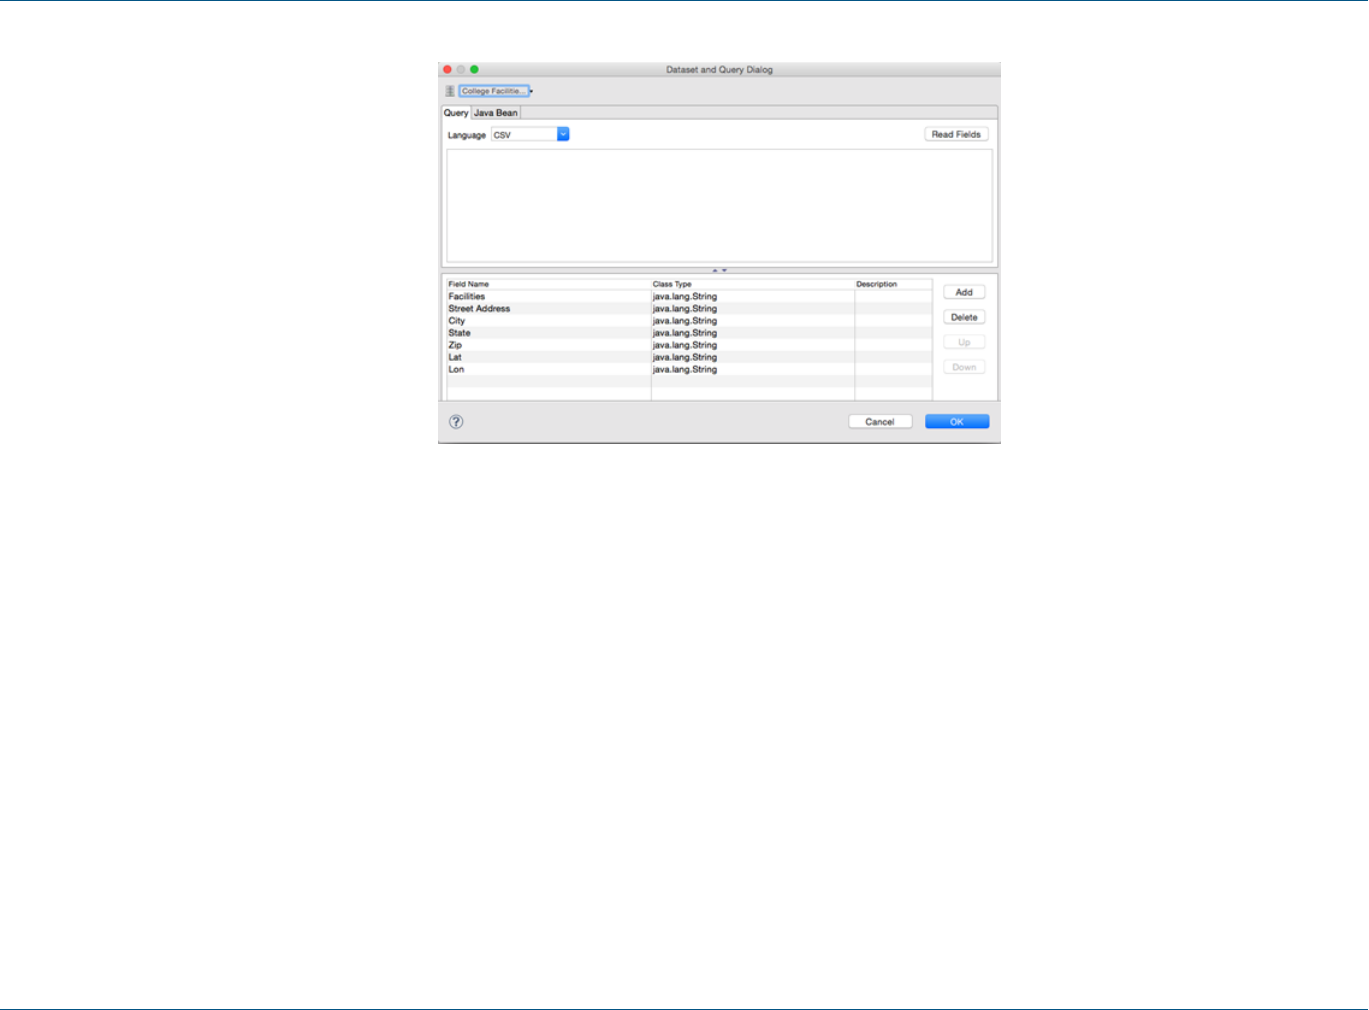
Chapter 20 Working with TIBCO GeoAnalytics Maps
Figure 20-4 Defining the Dataset to use to resolve map attribute expressions
Data Runs are used throughout Jaspersoft Studio and its related products when a report includes a subdataset. Use a Data Run to define values for the
subdataset's parameters.
20.3 Understanding Layers
Each layer in the map component controls different aspects of the final map rendered in your report:
•The maps layer defines the map tiles that are displayed by the component's image, which are determined by its location and zoom, the maximum and
minimum zoom allowed in the component, and the image's opacity.
•The marker layer defines locations on the map that display an image you select.
•The path layer defines lines between locations on the map.
Each layer can be named uniquely; these names can be displayed in the JasperReports Server interactive report viewer in the Layers drop down; this allows
your user to select which layers to drawn.
TIBCO Software Inc. 381
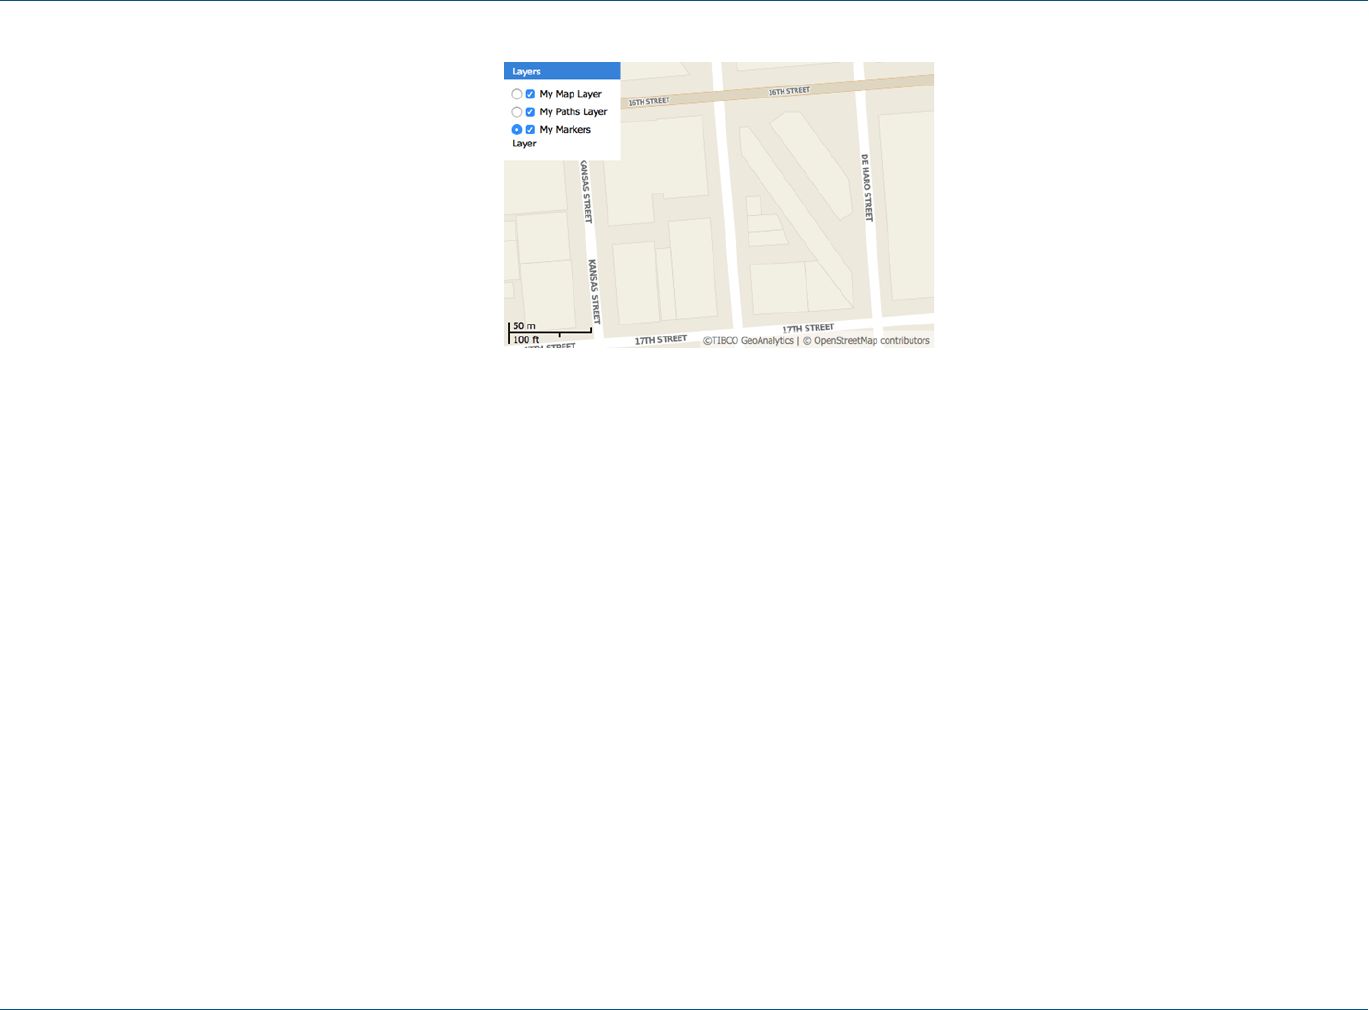
TIBCO Jaspersoft Studio User Guide
Figure 20-5 Layer names defined in the component can control the layers drawn in the final report
20.4 Working with Markers
Markers are points rendered on the second layer of the TIBCO Map component.
This section describes:
•Static Markers
•Dynamic Markers
20.4.1 Static Markers
1. Edit the map component's properties.
2. On the Markers tab, click Add.
3. Define your marker by specifying a location and icon. The list of properties for a marker includes:
•target
•string
•optional
•_blank
•the hyperlink target for the marker
382 TIBCO Software Inc.
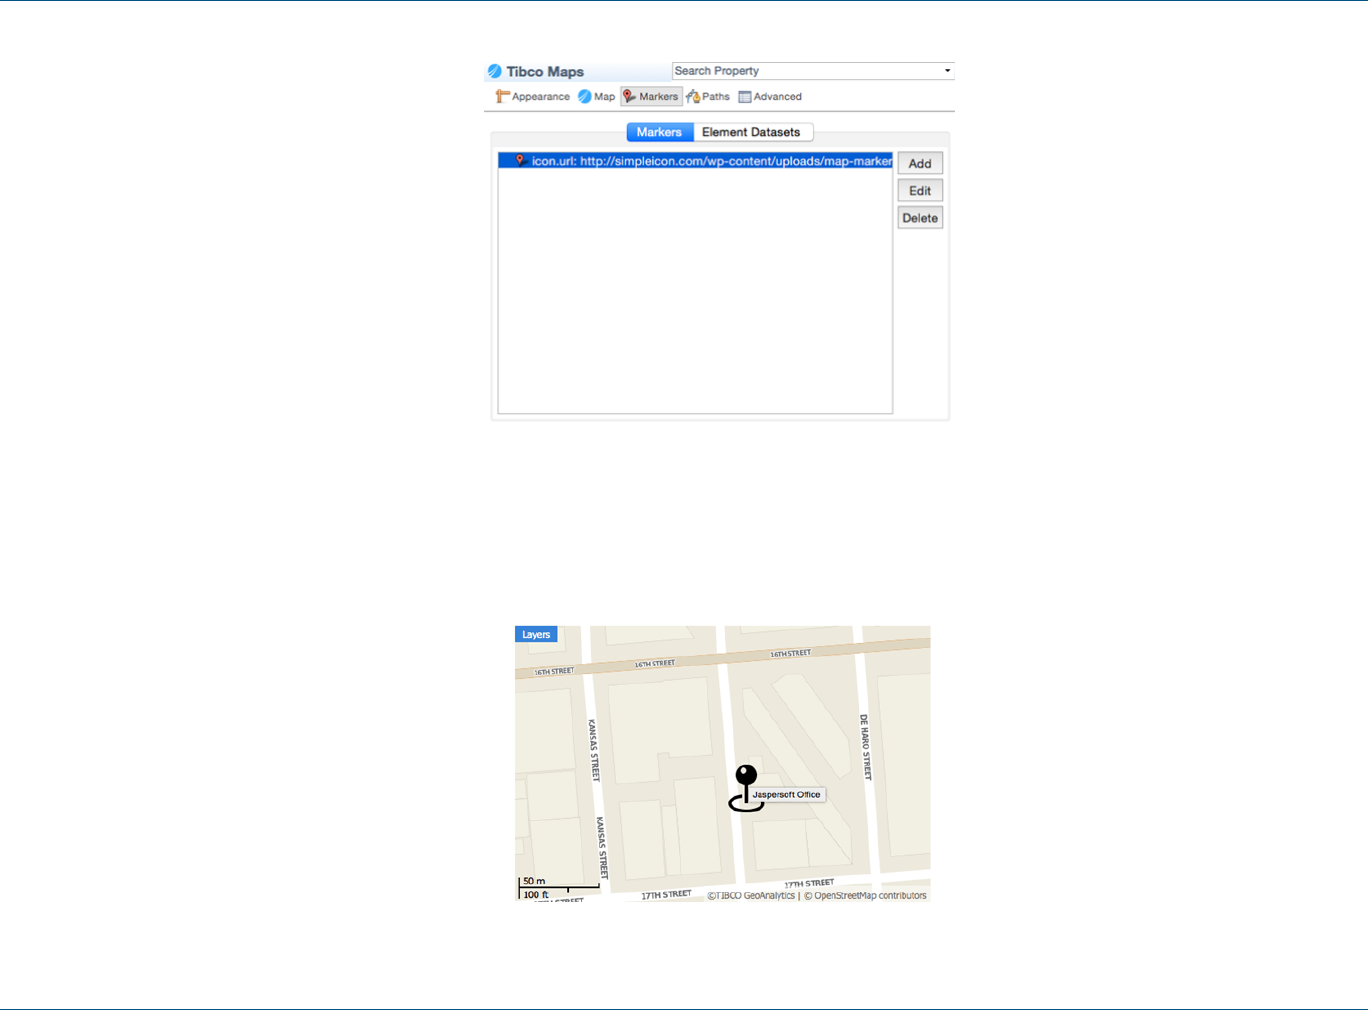
Chapter 20 Working with TIBCO GeoAnalytics Maps
Figure 20-6 Defining a map's markers
4. Specify the icon as a URL that points to the image to use; it's loaded by the JavaScript API.
Jaspersoft doesn't currently support loading an image directly from the repository, or as a resource local to the report.
The location can be set by latitude/longitude coordinates or an address to be geolocated, as described above.
TIBCO Software Inc. 383
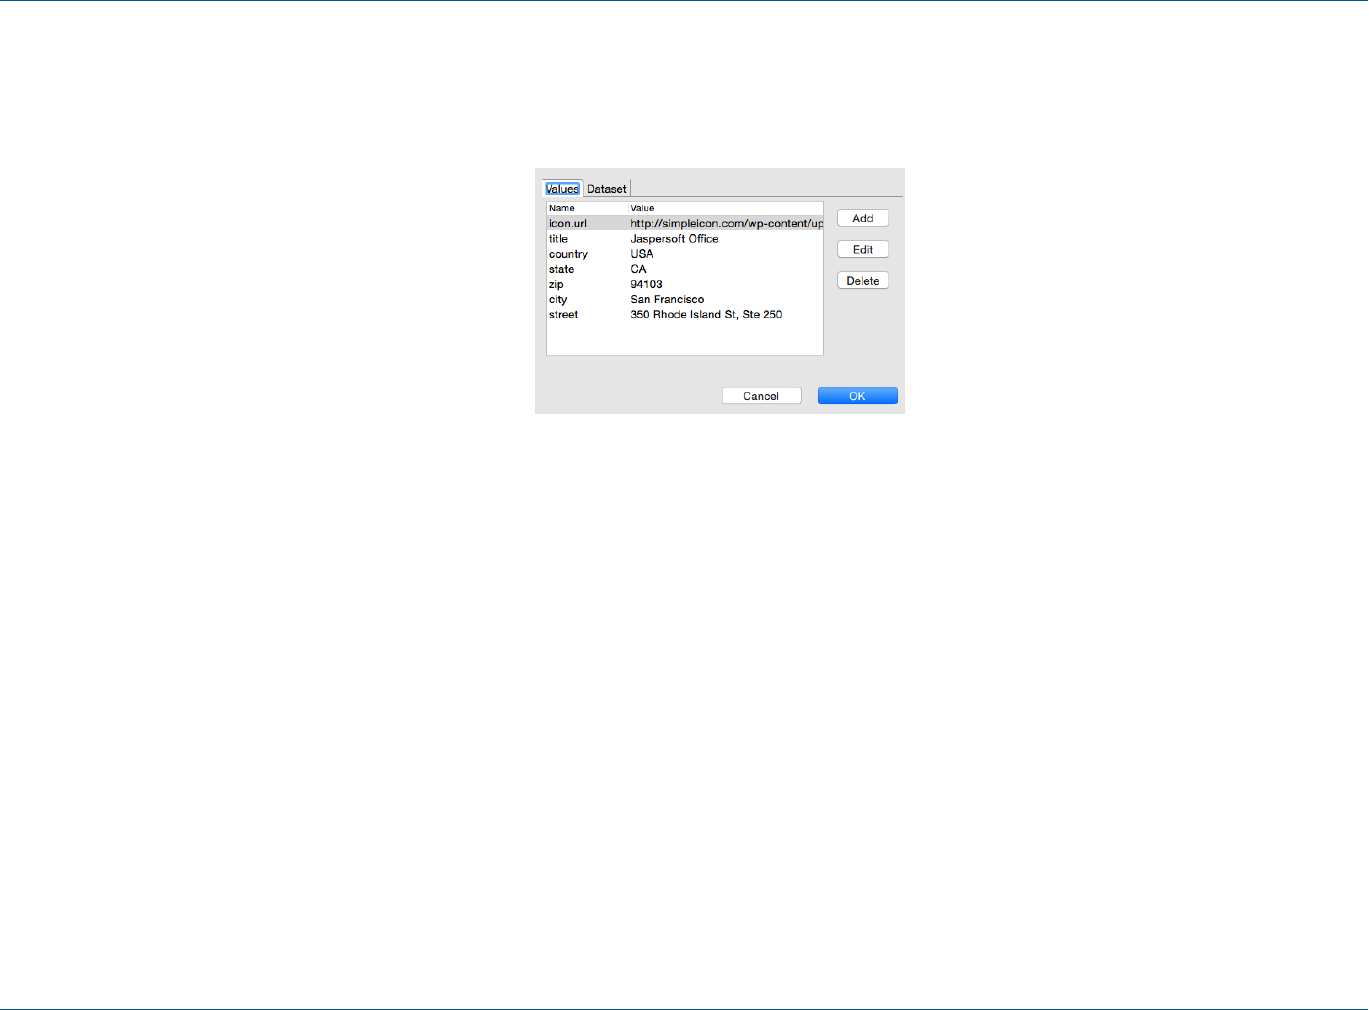
TIBCO Jaspersoft Studio User Guide
Figure 20-7 A map with a marker
5. For the addresses, set each property to form the address: country, state, zip, city, street.
Figure 20-8 Marker properties set to a static location
Marker properties include:
384 TIBCO Software Inc.
Chapter 20 Working with TIBCO GeoAnalytics Maps
Property Name Type Required? Possible Values Description
xoffset Numeric
(integer)
Optional 0 The horizontal offset of the marker icon measured in pixels
yoffset Numeric
(integer)
Optional 0 The vertical offset of the marker icon measured in pixels
anchor String Optional bottom-left, bottom-right, bottom-
center
The anchor point of the marker icon
draggable Boolean Optional false Specifies whether users can drag the marker
icon.url String Required N/A URL for the icon
title String Optional N/A The ToolTip for the marker icon; works in conjunction with
icon.url
hyperlink String Optional N/A The hyperlink text for the marker
target String Optional N/A The hyperlink target for the marker. The default value is _blank.
This is a simplified example; the more common scenario is to read location data from the database.
20.4.2 Dynamic Markers
The steps above define the marker as a static address known when the report was created. But it is far more useful to dynamically define the markers based
on locations defined in your report's data. A single map can use both static and dynamic markers, and locations can be based on data from more than one
data source.
In this example, we'll use data from City College of San Francisco's public facilities data set that we've saved as an Excel file.
TIBCO Software Inc. 385
TIBCO Jaspersoft Studio User Guide
Facilities Street Address City State Zip Latitude Longitude
Airport SF International Airport, North
Access Road, Building 928
San Francisco CA 94128 37.622511278000445 -122.39519978799973
Civic Center 750 Eddy Street San Francisco CA 94109 37.783008003000475 -122.42000284399973
Castro 450 Castro Street San Francisco CA 94114 37.76168744600045 -122.43511354199973
Chinatown/North
Beach
808 Kearny Street San Francisco CA 94108 37.79551773600048 -122.40496557999973
Downtown 88 4th Street San Francisco CA 94103 37.784588004000454 -122.40438877299971
Evans 1400 Evans Avenue San Francisco CA 94124 37.74169579700049 -122.38589540299972
Fort Mason Laguna Street & Marina
Boulevard, Building B
San Francisco CA 94123 37.80001344200048 -122.43517818299972
John Adams 1860 Hayes Street San Francisco CA 94117 37.77385843900049 -122.4469528999997
Mission 1125 Valencia Street San Francisco CA 94110 37.754794183000456 -122.42088522899968
Ocean 50 Phelan Avenue San Francisco CA 94112 37.72408746400049 -122.45231737299969
Southeast 1800 Oakdale Avenue San Francisco CA 94124 37.73684564000047 -122.39424548999972
Gough Street 31/33 Gough Street San Francisco CA 94103 37.772268634000454 -122.42098248799971
Since the data set includes both street addresses and latitude/longitude pairs, we can explore both functions.
To use dynamic locations:
1. Create an Excel file with the data provided above and a data adapter that points to it. Export the data adapter to the project folder; name it
CollegeFacilities.xml.
2. In the report, create a new dataset: right-click the root in the outline view and select Create Dataset.
386 TIBCO Software Inc.

Chapter 20 Working with TIBCO GeoAnalytics Maps
3. Right-click the new dataset and select Dataset and Query.
4. In the Query dialog, select the CollegeFacilities.xml data adapter and click Read Fields.
5. By default, the fields are all set as type String. To change the Latitude field to a Float, double-click in the Class Type column, click the button
ellipsis..., and select java.lang.Float from the type menu. Repeat these steps to set the Longitude data type to Float.
6. Click OK.
7. Use the data adapter to populate the dataset. With the CollegeFacilities dataset selected in the outline view, click the Advanced tab in the Properties
view, then select the property Properties and click the button ellipsis to open the properties dialog.
8. Add a new property: net.sf.jasperreports.data.adapter, and specify the name of the data adapter file saved earlier (CollegeFacilities.xml).
We can use this new dataset to set markers on the map.
9. Select the map in the Design tab, click the Markers tab, and click Add.
10. Click Dataset, check the Use Dataset check box, and click Add.
11. Select the CollegeFacilities dataset and accept the defaults. Studio uses the data adapter referenced by the net.sf.jasperreports.data.adapter
property set previously for this dataset.
12. Click OK.
The dataset is added to the list of datasets we'll use for markers.
13. Click Values and create an expression for each marker property: for example, provide the title, street, city, state, country, and so forth.
Figure 20-9 Location values defined as expressions
TIBCO Software Inc. 387
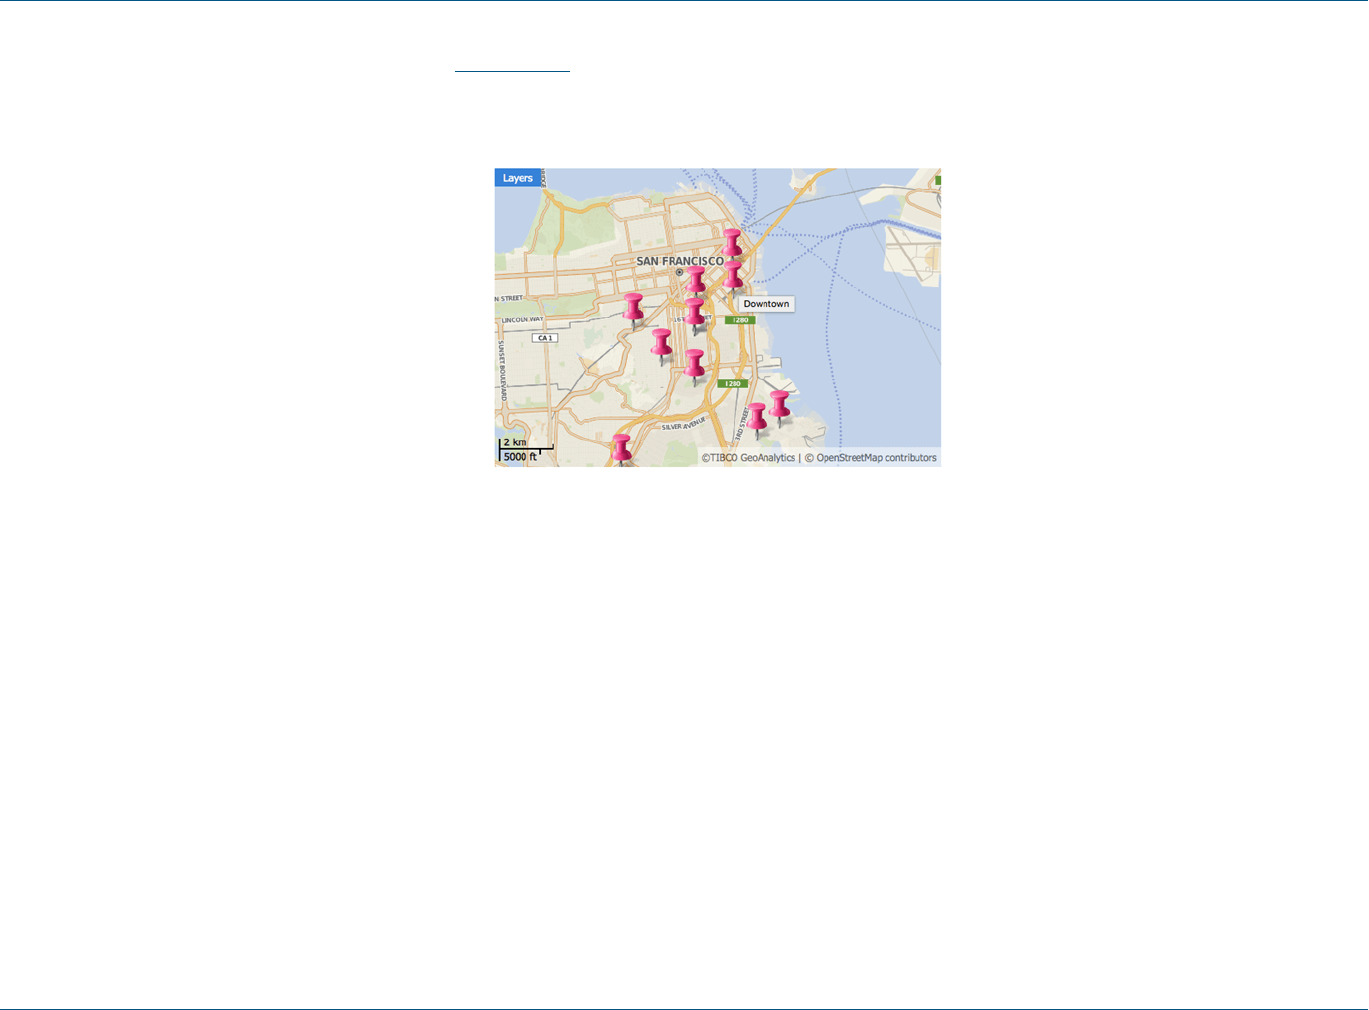
TIBCO Jaspersoft Studio User Guide
This example uses an icon from the web: Pink Push Pin.
14. Click OK.
15. Preview your report in HTML.
Figure 20-10 San Francisco City College facilities marked on a map
20.5 Working with Paths
Paths are lines rendered on the third layer of the TIBCO Map component. A path is defined by:
•A name that serves as a path identifier in case different paths will appear on the map
•A style that specifies various style configuration properties, such as line and fill color, line weight, and opacity
•A collection of places (points) on the map defined by latitude/longitude coordinates or addresses; these are connected to form the path
To define a path in Jaspersoft Studio:
1. On the Paths tab, use the Styles section to define a style to associate with the path: click Add to do so.
Style properties can be added manually or by specifying a dataset. The style name sets the style property when adding points to the path.
2. Use the Paths section to add points to the path: click Add in this UI area to do so. For each point, specify:
a. the path name (to identify which path includes the point)
b. the style property (to identify the style associated with this path)
388 TIBCO Software Inc.

Chapter 20 Working with TIBCO GeoAnalytics Maps
c. the latitude/longitude coordinates or the address of the point
Like styles, points can be added manually or by using a specific dataset. Pay close attention when adding points: they are connected on the map in the
order that they are declared in the JRXML file. If they aren't declared in a sensible order, the path won't make sense, either.
TIBCO Software Inc. 389

TIBCO Jaspersoft Studio User Guide
390 TIBCO Software Inc.
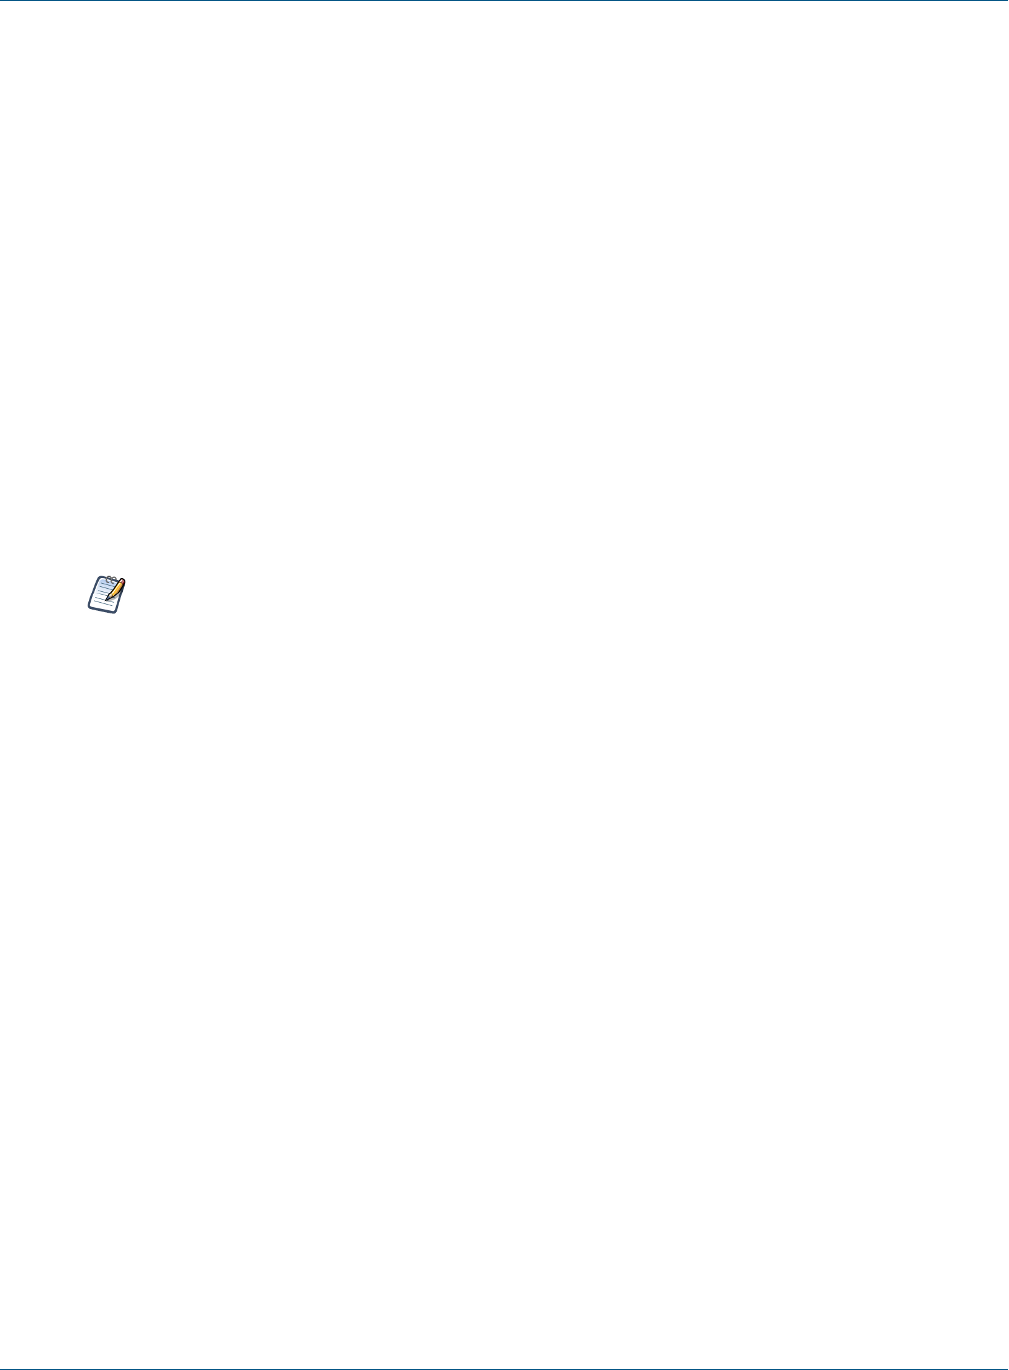
Chapter 21 Working with Subreports
CHAPTER 21 WORKING WITH SUBREPORTS
The subreport element lets you nest one report (the subreport) inside another (the master report). A subreport can
use the same database connection as the parent report or you can specify a different data source in the subreport
properties. A master report can contain multiple subreports and subreports can be nested.
Subreports are one of the most advanced features of JasperReports. They allow you to design very complex
reports by inserting one or more reports into another report.
Reflecting standard Eclipse design, saving or previewing a report that contains subreports does not
update the subreports. When you edit a subreport, you must explicitly save and build the subreport in
order for the changes to be visible when you preview the report that contains it. To build a subreport,
right-click the project in the Project Explorer and select Build Project, or type Ctrl-B to build all projects in
the workspace.
Subreports also let you combine two or more child lists of data relating to a single parent element, for example,
a report with multiple detail bands of different types. You map parameters between the master report and its
subreports to create a blended report where each subreport displays details for each record from the master
report. As the master report executes, each time a subreport element is reached, it is executed and its content is
embedded into the output of the master report.
Uses for subreports include:
•Modularizing reports – You can create a subreport with your preferred data fields and layout, then use the
subreport in multiple master reports.
•Combining multiple queries or data sources in a single report.
21.1 Creating a New Report via the Subreport Wizard
To simplify inserting a subreport, a wizard for creating subreports starts automatically when a Subreport element
is added to a report.
You can use the Subreport Wizard to create a brand new report that will be referenced as a subreport or to refer
to an existing report. In the latter case, if the report you choose contains one or more parameters, the wizard
provides an easy way to define values for them.
TIBCO Software Inc. 391
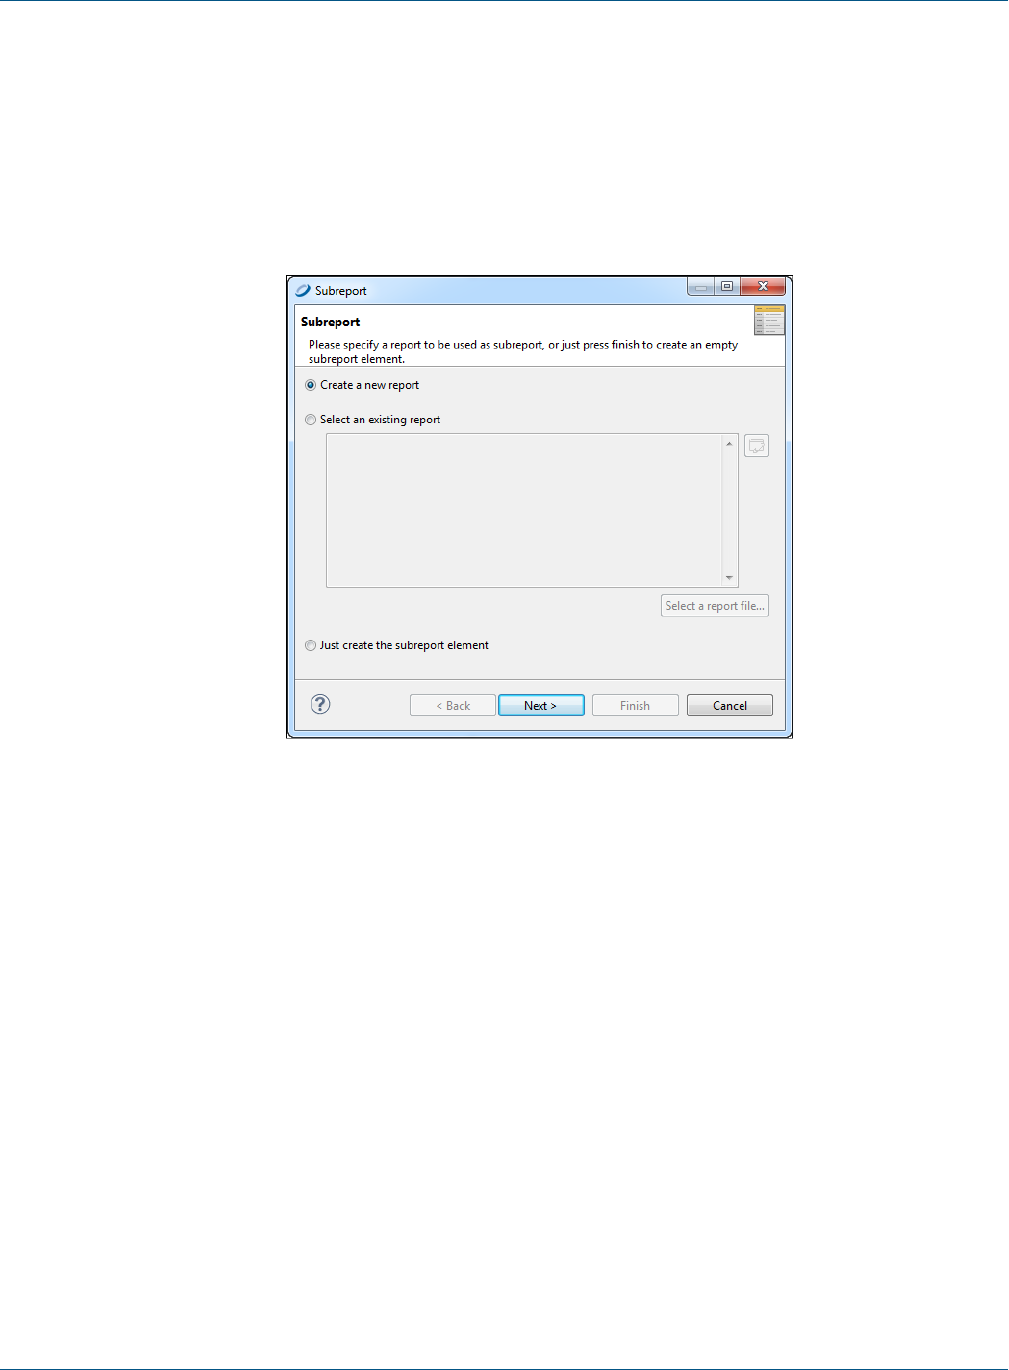
TIBCO Jaspersoft Studio User Guide
To create a new subreport using the wizard:
1. Drag the Subreport element from the Palette to the area of your report where you want to use it.
The Subreport wizard provides three options:
•Create a new report: Use this option when you need to use data or a query not available in an
existing report.
•Select an existing report: Use this option when you want to choose a report from the repository.
•Just create the subreport element: Use this option to create a placeholder to be used later.
Figure 21-1 Subreport Wizard
2. Select Create a new report and click Next. The New Report Wizard > Report Templates window is
displayed.
3. Select a template for your subreport. For this example, select one of the blank templates. Click Next. The
New Report Wizard > Report file window opens.
4. Select a location for your subreport, and name it. Click Next. The Data Source window opens.
392 TIBCO Software Inc.
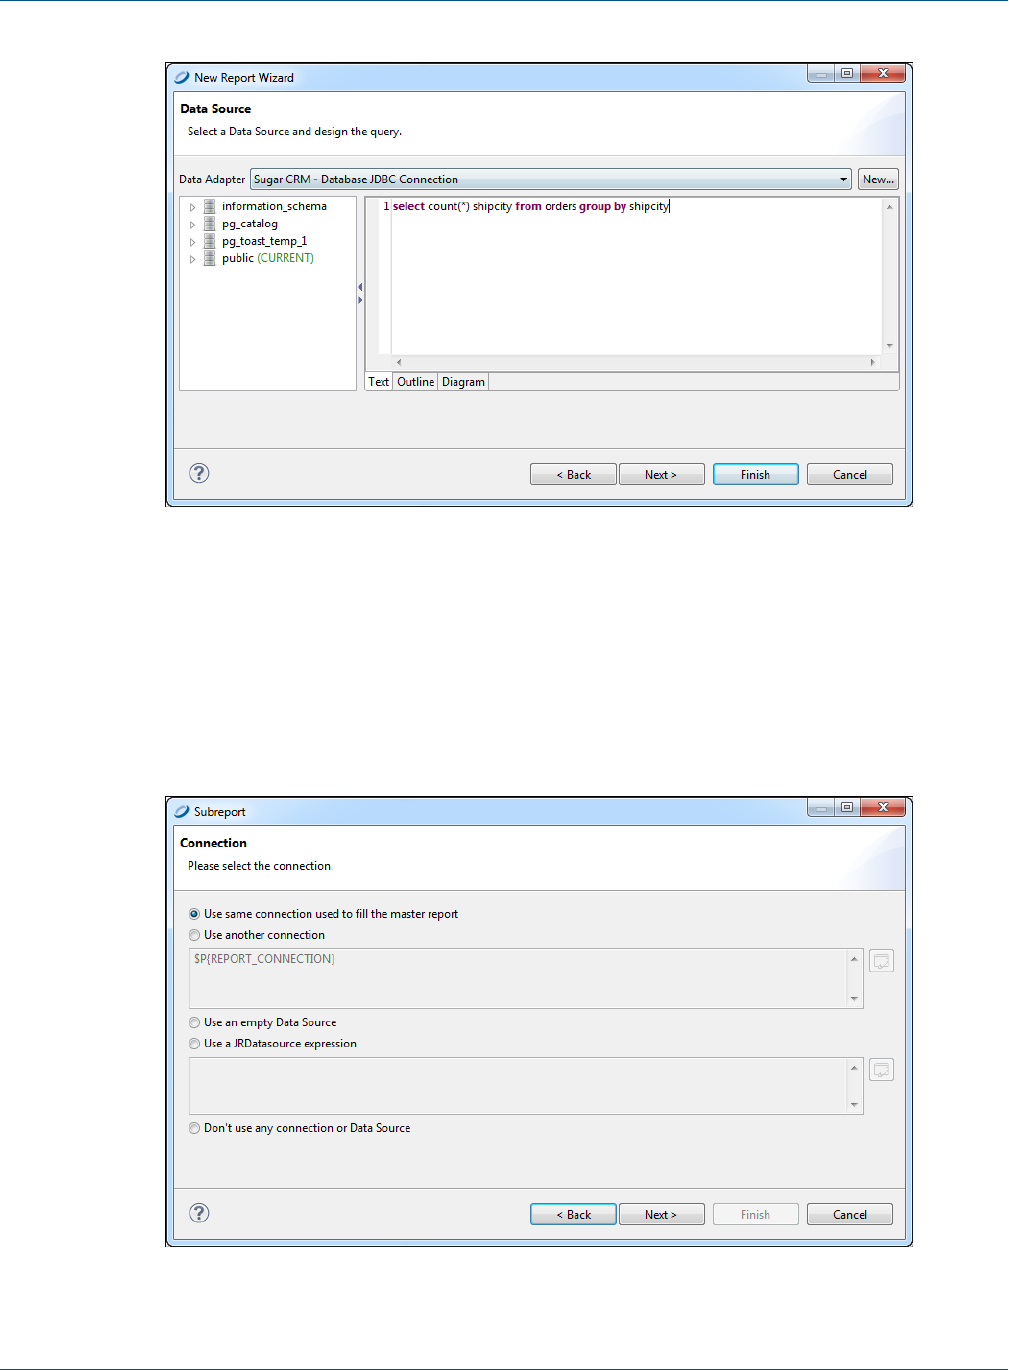
Chapter 21 Working with Subreports
Figure 21-2 Data Source and Query
5. Choose to use the same data adapter as the main report, or a different data adapter.
For this example, choose the same adapter (Sample DB). Enter the following SQL query:
select count (*), shipcity from orders group by shipcity
6. Click Next.
7. Add all the fields to the list on the right. Click Next.
8. Click Next to skip the Group By step. The Subreport> Connection window opens.
Figure 21-3 Subreport>Connection window
TIBCO Software Inc. 393
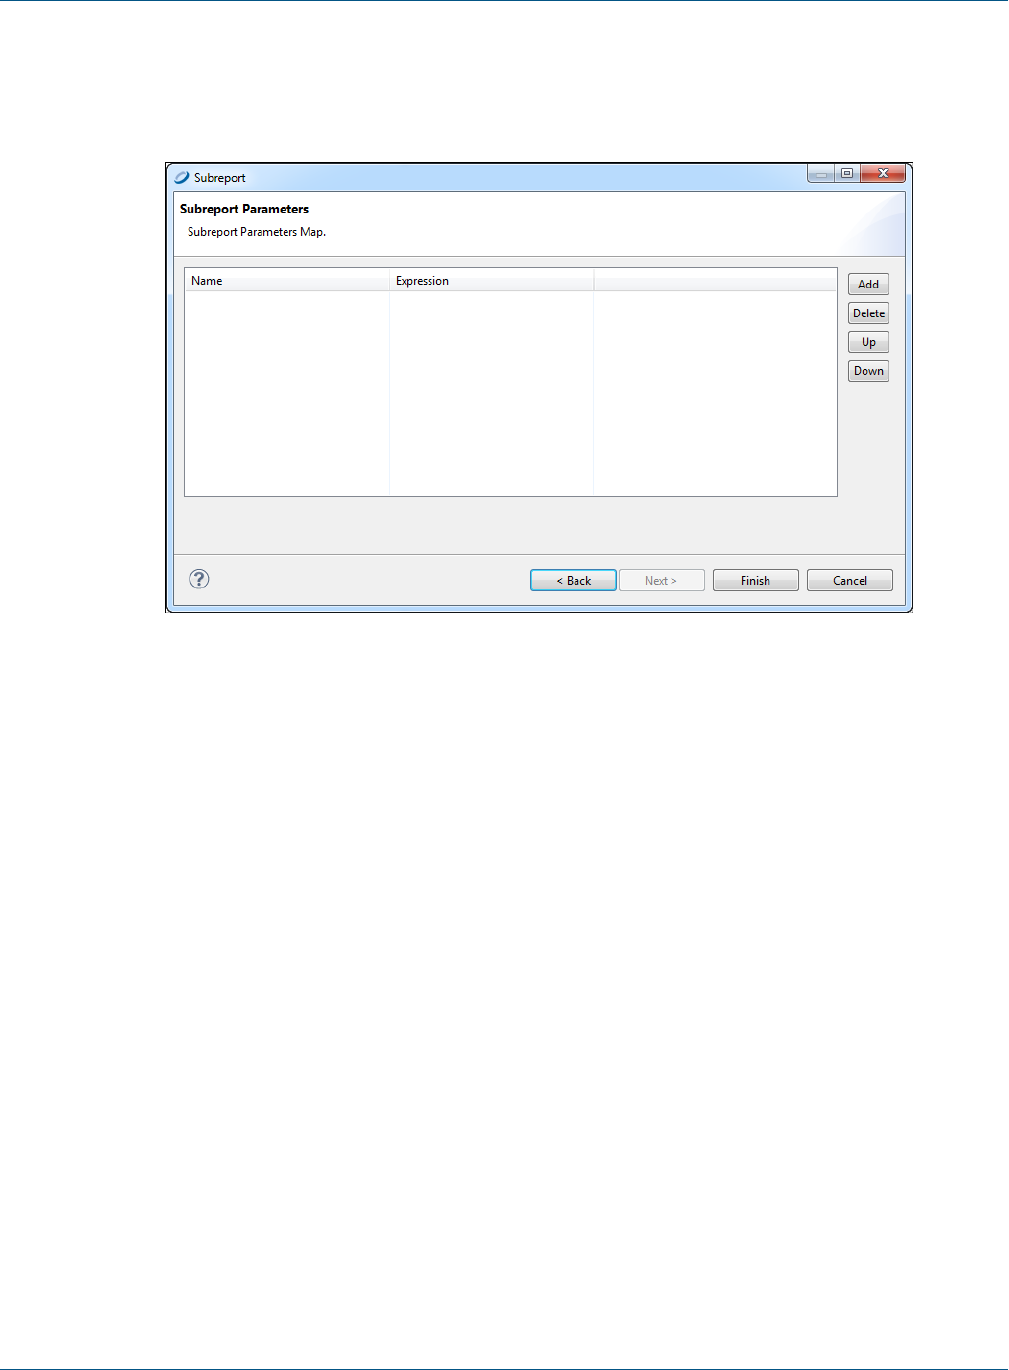
TIBCO Jaspersoft Studio User Guide
9. Choose to connect either to the same database as the main report or to a different database. For this
example, click Use same connection used to fill the master report.
10. Click Next. The Subreport Parameters window opens.
Figure 21-4 Subreport parameters window
11. For this example, skip this window and click Finish. A new report opens containing all bands.
12. Delete all bands but the Title or Summary band to eliminate extra white space in your report.
You now have a location into which to place your table, chart, or other element attached to the new
subreport.
21.2 Understanding Subreports
There are three steps to creating and adding a subreport:
1. Create a report – Create a parent or master report that will contain the subreport.
2. Create a subreport – Create and compile a subreport. Optionally create a dynamic connection to filter the
records of the subreport based on the parent’s data.
3. Add the subreport to the parent report – Insert a subreport element and specify the following:
•The data adapter or data source for the subreport.
•The location of the subreport's compiled Jasper file.
•An optional parameters map (it can be empty) to set the report parameters used in the dynamic
connection.
21.2.1 Subreports
A subreport is simply a report composed of its own JRXML source and compiled in a Jasper file. Generally
speaking, creating a subreport is very similar to creating any other report. The margins of a subreport are usually
394 TIBCO Software Inc.
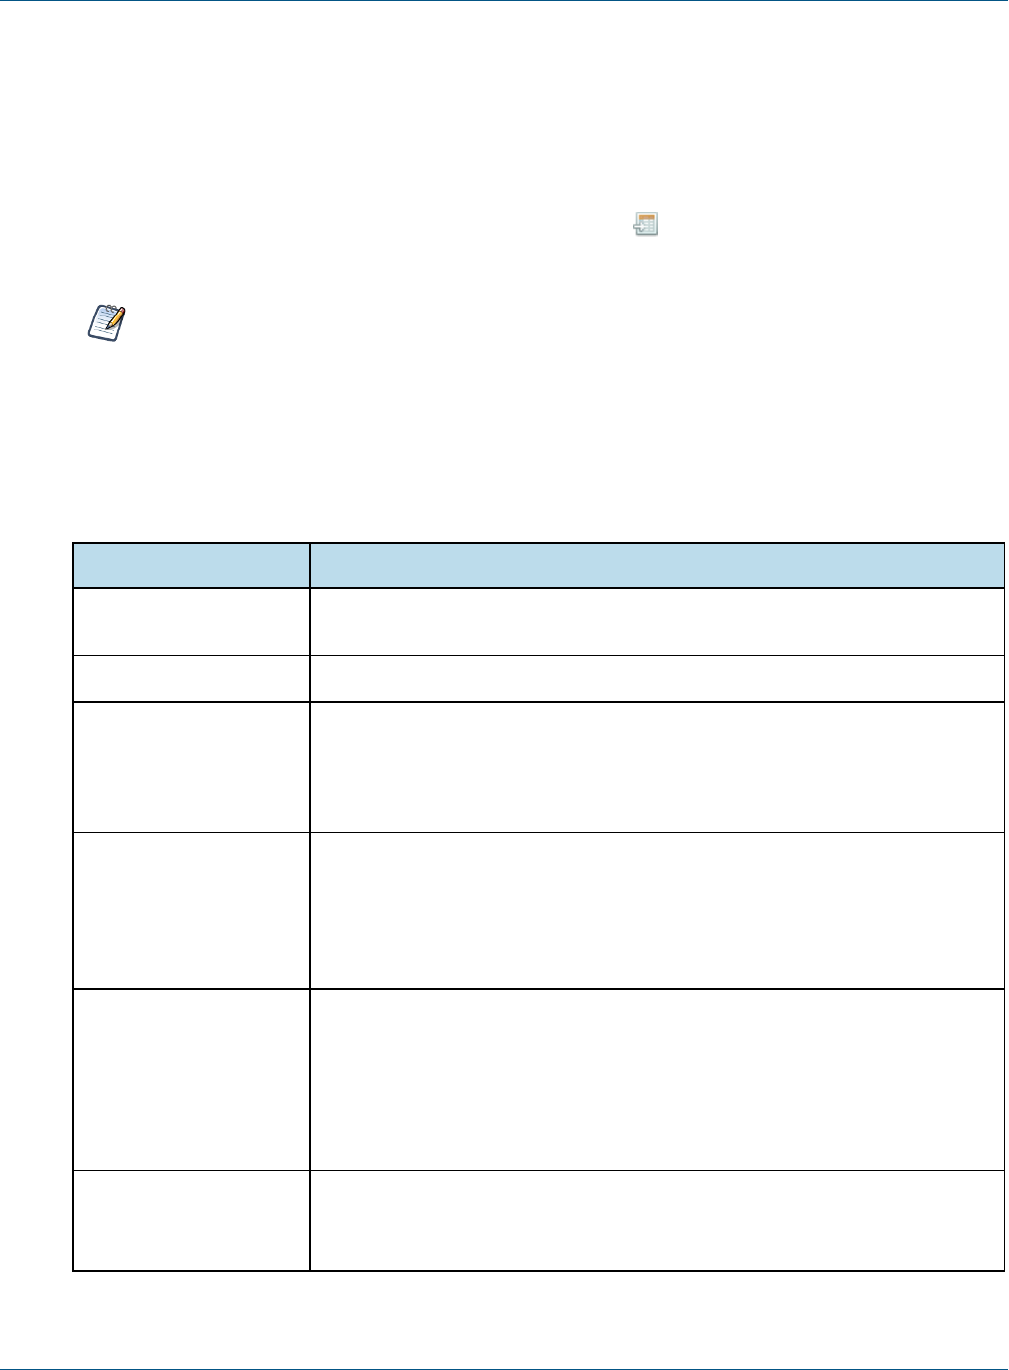
Chapter 21 Working with Subreports
set to zero for subreports because a subreport is meant to be a portion of a page, not an entire document. The
horizontal dimension of the subreport should be as large as the element into which it is placed in the parent
report.
21.2.2 Subreport Elements
You add a subreport to a report by dragging the Subreport element from the palette. At design time the
element is rendered as a rectangle with the dimensions specified in the subreport.
The Subreport element does not need to be the same size as the subreport. You can think of the
Subreport element as a place holder defining the position of the top-left corner to which the subreport is
aligned. However, we recommend that you set the dimensions of the Subreport element to the
dimensions of the subreport to best visualize the layout of the final report.
21.2.2.1 Properties of a Subreport Element
When a subreport element is selected in the master report, the following properties are available on the
Subreport tab of the Properties view:
Property Description
Run To Bottom When true, the subreport element will consume the entire vertical space available
on the report page.
Overflow Type
Expression (Required) Expression that can be used to load the Jasper object to use when
filling the subreport portion of the document. Evaluated at run time to retrieve the
Jasper object for the subreport.
See 21.2.3, “The Expression Property,” on page396 for more information.
Using Cache Specifies whether the subreport's report object is kept in memory or reloaded
each time it's used. It is common for a subreport element to be printed more than
once (or once for each record in the main dataset).
The cache works only if the subreport expression type is String, because that
string is used as key for the cache.
Connection Expression
or
Datasource Expression
At run time, returns a JDBC connection or a JRDataSource used to fill in the
subreport. Only one of these expression types can be used.
If there is no connection or data source expression, no data is passed to the
subreport. This option is useful at times. In this case, the subreport should have
the document property When No Data Type set to something like All
Sections, No Detail or No Data Section.
Parameters Map
Expression
Optional expression used to produce a java.util.Map object at run time. The
expression must contain a set of coupled names/objects that are passed to the
subreport to set a value for its parameters.
TIBCO Software Inc. 395
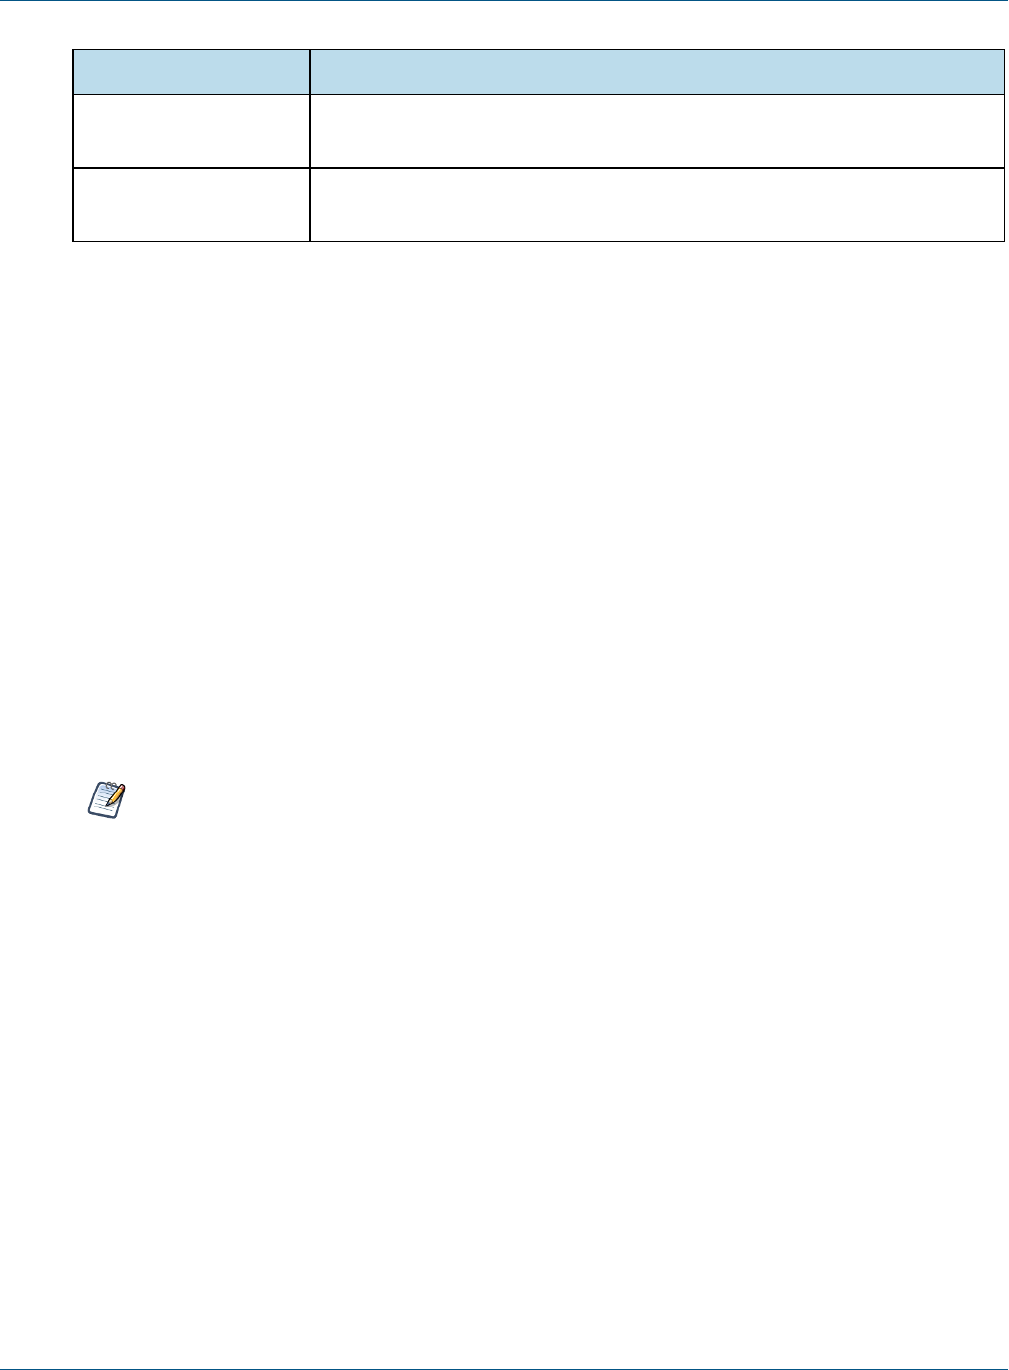
TIBCO Jaspersoft Studio User Guide
Property Description
Edit Return Values Allows you to define how to store values in local variables calculated or
processed in the subreport (such as totals and record count).
Edit Parameters Allows you to define name/expression pairs used to dynamically set a value for
the subreport parameters.
The following properties must be set to link the subreport to the parent report:
•Expression – Retrieves the Jasper object that implements the subreport.
•Connection Expression or Datasource Expression – Defines how to feed the object with data.
•Parameters – Sets the values of the subreport parameters.
21.2.3 The Expression Property
The subreport expression specifies the location of the Jasper file used to generate the subreport.
If the expression is a string (java.lang.String), JasperReports assumes that the subreport must be loaded from
a Jasper file and tries to locate the file in the same way that resources are located, as follows:
1. The string is at first interpreted as a URL.
2. In case of failure (a MalformedURLException), the string is interpreted as a physical path to a file. This is
the most common case.
3. If the file does not exist, the string is interpreted as a resource located in the classpath.
This means that using an expression of type String means you are in some way trying to specify a file path.
Optionally, you can put your Jasper file in the classpath and refer to it as a resource, using an expression
something like "subreport.jasper".
You can't use a relative path to locate the subreport file; that is, if you have a report in c:\myreport\main_
report.jasper, you cannot refer to a subreport using an expression like
..\\mysubreports\\mysubreport.jasper.
This is because JasperReports does not keep in memory the original location of the Jasper file that it’s
working with. This makes perfect sense, considering that a Jasper object is not necessarily loaded from a
physical file.
To simplify report design when loading a subreport from the file system, do one of the following:
•Place the subreport file in a directory that is in the classpath. This permits you to use very simple subreport
expressions, such as a string containing just the name of the subreport file (that is, “subreport.jasper”).
Jaspersoft Studio always includes the classpath of the directory of the report that is running, so all the
subreport Jasper files can be found easily if they are located in the same directory.
•Parametrize the Jasper file location and create on-the-fly the real absolute path of the file to load. This can
be achieved with a parameter containing the parent directory of the subreport (let’s call it SUBREPORT_
DIRECTORY) and an expression like this:
$P{SUBREPORT_DIRECTORY} + "subreport.jasper"
One advantage of this approach is that you can use the Jasper files’ local directory as the default value for
the SUBREPORT_DIRECTORY parameter. The developer who will integrate JasperReports in his applications
can set a different value for that location just by passing a different value for the SUBREPORT_DIRECTORY
parameter.
396 TIBCO Software Inc.

Chapter 21 Working with Subreports
21.2.4 Specifying the Data Source
For JasperReports to retrieve data and fill the subreport, you have to set the subreport data source. The following
options are available:
•Use the same connection used to fill the master report – Select this to use the same JDBC data
adapter for the master report and the subreport. The JDBC connection is passed to the subreport to execute
it.
•Use another connection – Select this to specify a different JDBC data adapter for the subreport.
•Use a JRDataSource expression – Select this to use a JRDataSource object to fill the subreport.
•Use an empty datasource – Select this to set the data source expression to new JREmptyDataSource().
That creates a special data source that provides a single record with all the field values set to null. This is
useful when the subreport is used to display static content such as headers, footers, and backgrounds. In this
case, in the subreport, set the report property When no data type to All Data No Details or No Data
Section to ensure that at least a portion of the document is actually printed.
JDBC connections make using subreports simple enough. A connection expression must identify a
java.sql.Connection object (ready to be used, so a connection to the database is already opened). Typically,
we’ll run the SQL query using the same database connection as the parent report; the connection can be
referenced with the REPORT_CONNECTION built-in parameter. It must be clear that if we pass a JDBC connection
to the subreport, it is because we defined an SQL query in the subreport, a query that will be used to fill it.
Using a different data source is sometimes necessary when a connection like JDBC is not being used; it is more
complicated but extremely powerful. It requires writing a data source expression that returns a JRDataSource
instance that you then use to fill the subreport. Depending on what you want to achieve, you can pass the data
source that will feed the subreport through a parameter, or you can define the data source dynamically every
time it is required. If the parent report is executed using a data source, this data source is stored in the REPORT_
DATASOURCE built-in parameter. On the other hand, the REPORT_DATASOURCE should never be used to feed a
subreport; a data source is a consumable object that is usable for feeding a report only once. Therefore, the
parameter technique is not suitable when every record of the master report has its own subreport (unless there is
only one record in the master report). When we discuss data sources this will be more clear and you will see
how this problem is easily solved with custom data sources. You will also see how to create subreports using
different type of connections and data sources.
21.2.5 Subreport Parameters
One of the most common uses of subreport parameters is to pass the key of a record printed in the parent report
in order to execute a query in the subreport through which you can extract the records referred to (report headers
and lines). For example, let’s say you have in the master report a set of customers, and you want to show
additional information about them, such as their contact info. The subreports will use the customer ID to get the
contact info. The customer ID should be passed to the subreport as a parameter, and its value changes for each
record in the master report.
TIBCO Software Inc. 397
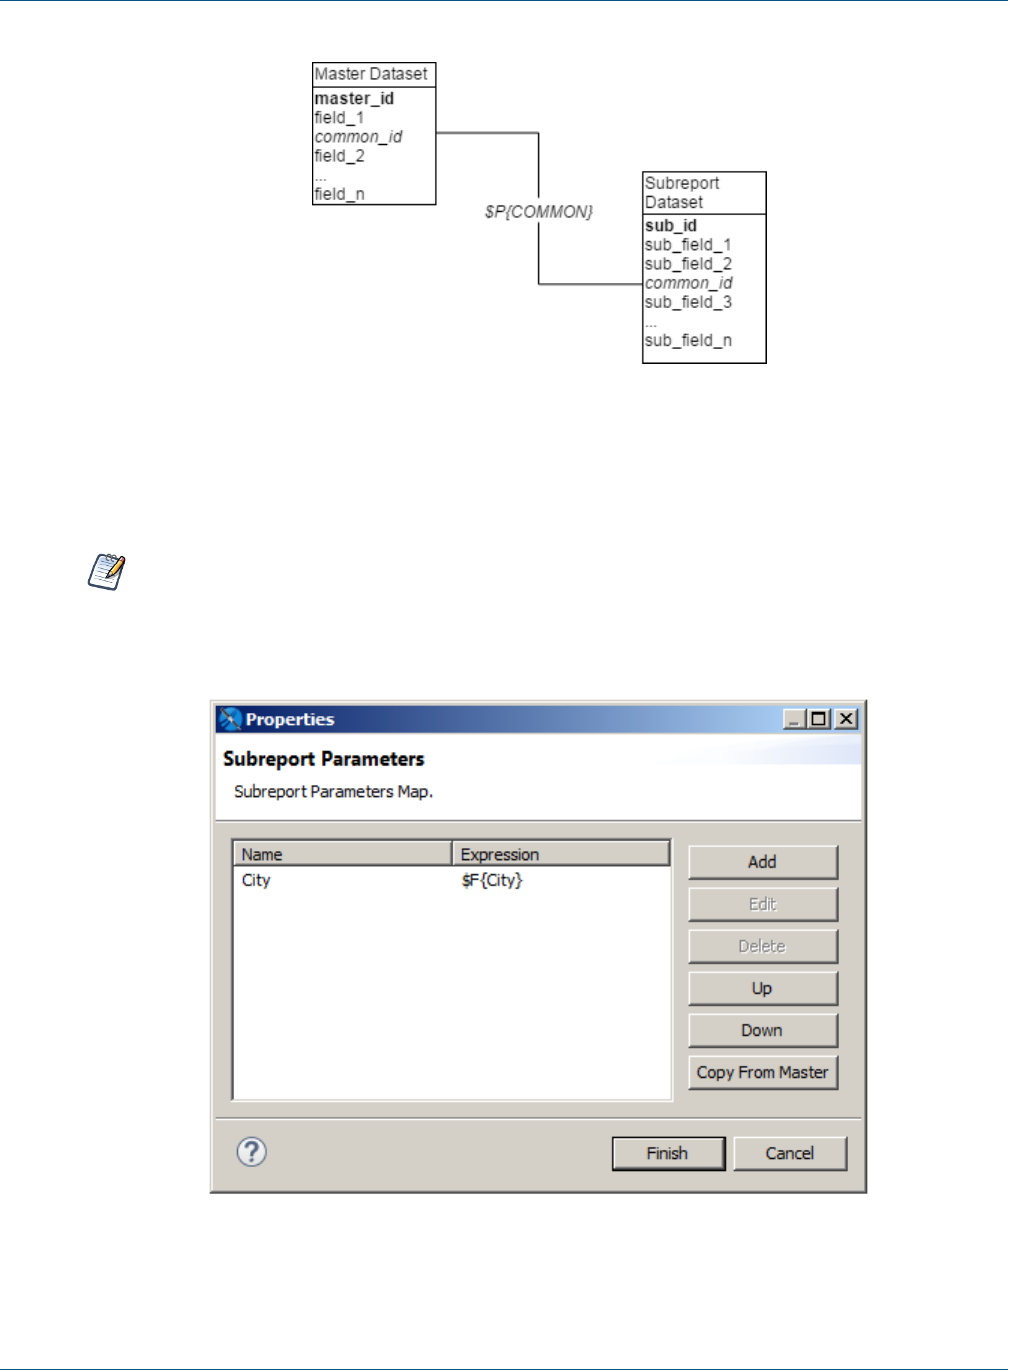
TIBCO Jaspersoft Studio User Guide
Figure 21-5 Related datasets in master and subreport
To pass parameters from the master report to a subreport, you create a set of parameter name/object pairs that
feed the parameters map of the subreport. To do this, click the Edit Parameters button on the Subreport tab of
the Properties view to open the Subreport Parameters dialog.
When a report is invoked from a program (using one of the fillReport methods, for instance), a
parameters map is passed to set a value for its parameters. A similar approach is used to set a value for
subreport parameters. With subreports you don’t have to define a map (even, if possible, specifying a
Parameters Map Expression). The report engine will take care of that for you.
Figure 21-6 Subreport Parameters dialog
398 TIBCO Software Inc.

Chapter 21 Working with Subreports
To configure a parameter you want to pass to the subreport, click Add in the Subreport Parameters dialog to
open the Parameter Configuration Dialog box, which lets you set the following:
•Name – Name of the parameter. A parameter must have the same name in the master report and the
subreport. Parameter names are case-sensitive.
If you make an error typing the name or the inserted parameter has not been defined, no error is thrown.
In most cases, the report will fail silently.
•ValueExpression – JasperReports expression for the parameter. To create or edit an expression, click to
open the expression editor. You can use fields, parameters, and variables. The return type has to be
congruent with the parameter type declared in the subreport; otherwise, an exception of
ClassCastException will occur at run time.
As cited below, you have the option of directly providing a parameters map to be used with the subreport; the
Parameters Map Expression allows you to define an expression, the result of which must be a
java.util.Map object. It is possible, for example, to prepare a map designed for the subreport in your
application, pass it to the master report using a parameter, then use that parameter as an expression (for example,
$P{myMap}) to pass the map to the subreport. It is also possible to pass to the subreport the same parameters
map that was provided to the parent by using the built-in parameter REPORT_PARAMETERS_MAP. In this case the
expression looks like t his:
$P{REPORT_PARAMETERS_MAP}
Since the subreport parameters can be used in conjunction with this map, you could even use it to pass common
parameters, such as the username of the user executing the report.
TIBCO Software Inc. 399

TIBCO Jaspersoft Studio User Guide
400 TIBCO Software Inc.

CHAPTER 22 REPORT TEMPLATES
Templates are one of the most useful tools in Jaspersoft Studio. You can use the provided templates as the basis
for new reports. You can also use a template as a model and add fields, text fields, and groups in the Report
Wizard.
This chapter explains how to build custom templates that will appear in the Template Chooser. It has the
following sections:
•Template Structure
•Creating and Customizing Templates
•Saving Templates
•Adding Templates to Jaspersoft Studio
You can also create JasperReports Server templates and upload them to the server. See 12.3, “Working
with JasperReports Server Templates,” on page216.
22.1 Template Structure
A template is a JRXML file. When you create a new report, Jaspersoft Studio loads the selected template's
JRXML file with any modifications you've specified in the wizard. If you don't use the wizard, your template is
just copied along with all the referenced images in the location the you've specified.
When you launch the Report Template dialog (File> New> Jasper Report) scans all paths specified as
template directories. Any valid JRXML files found are included in the Report Template dialog. If a template
provides a preview image, the image is displayed. Otherwise, a white box appears.
TIBCO Software Inc. 401
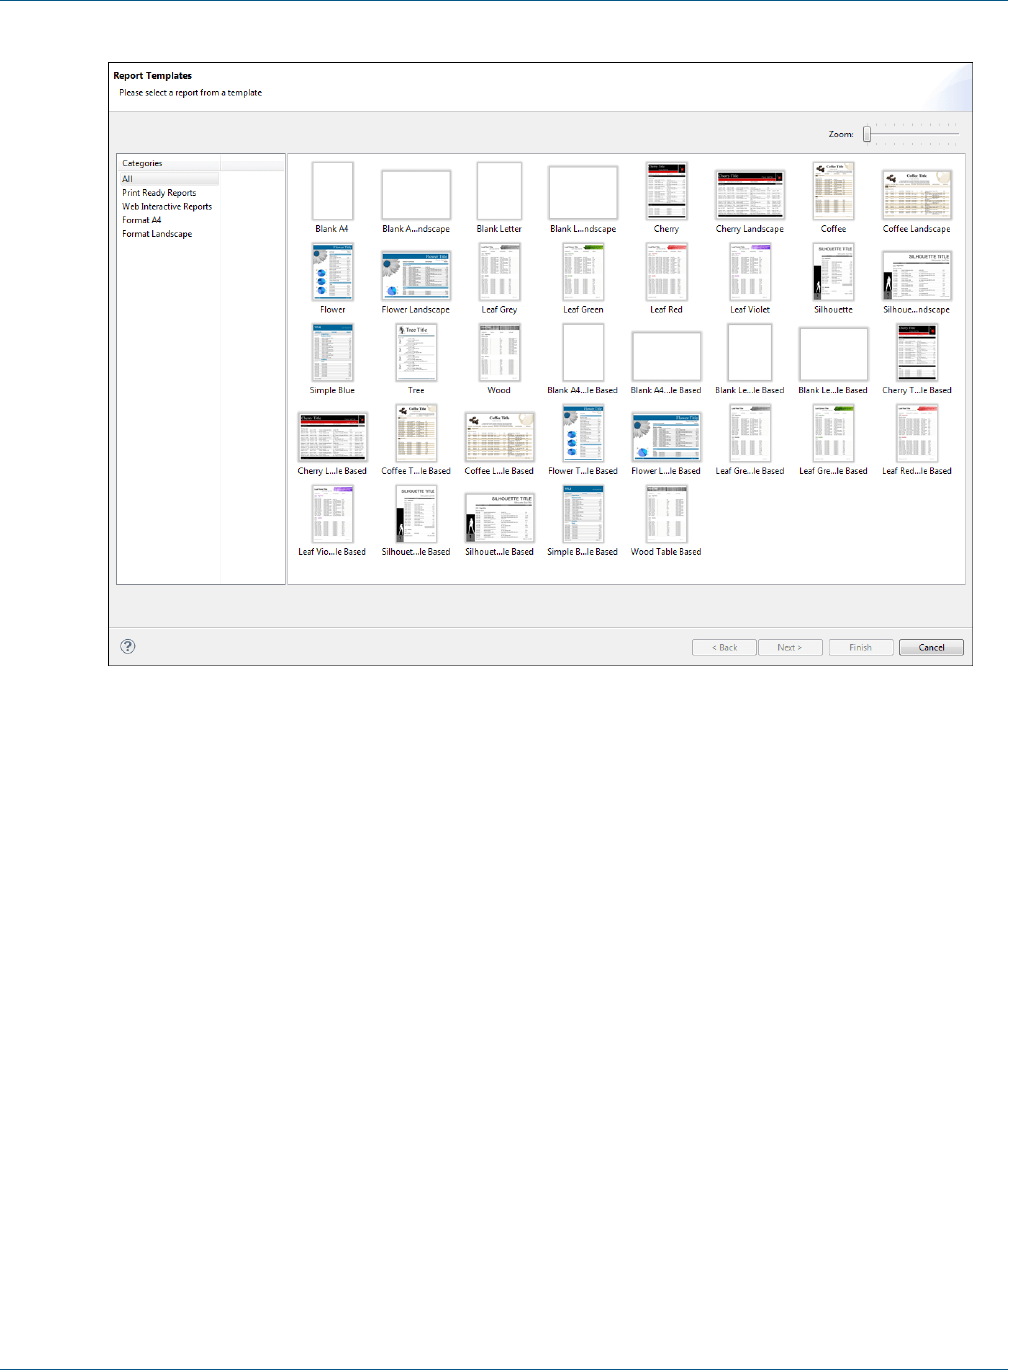
TIBCO Jaspersoft Studio User Guide
Figure 22-1 Default Report Templates
A template contains all or some of the same parts as a report. Remember the following when creating a new
template or editing an existing template:
•A report's page formatting is the page formatting of its template.
•Each band in a report is, by default, the same size as that band in its template.
•Every element placed in the Summary,Title,Page Header and Page Footer bands, of a template
appears in every report that uses that template.
•The Column Header band should contain only a Static Text element, and its text content must be Label.
The appearance, font and the other attributes of this label create every label inserted in this band.
•The Group Header band should contain only a Text Field with the string “GroupField” (including the
double quotes). As with the Column Header this assumes an example to generate every field that goes in
this band.
•The Detail band should contain only a Text Filed with the string “Field” (including the double quotes).
Again, this is used to generate every field that goes in this band.
When you group data using the wizard, the wizard creates all the necessary report structures to produce your
groups. The Report Wizard supports up to four groups, with a group header and group footer associated with
each. If the template defines one or more groups and you group the data, the wizard tries to use any existing
groups before creating new ones. By default, groups in the template are deleted if they're not used. For each
group, the wizard sets the group expression and adds a label for the name and a text field showing the value of
the group expression (which is always a field name, because the grouping criteria set using the wizard is one of
the selected fields).
402 TIBCO Software Inc.
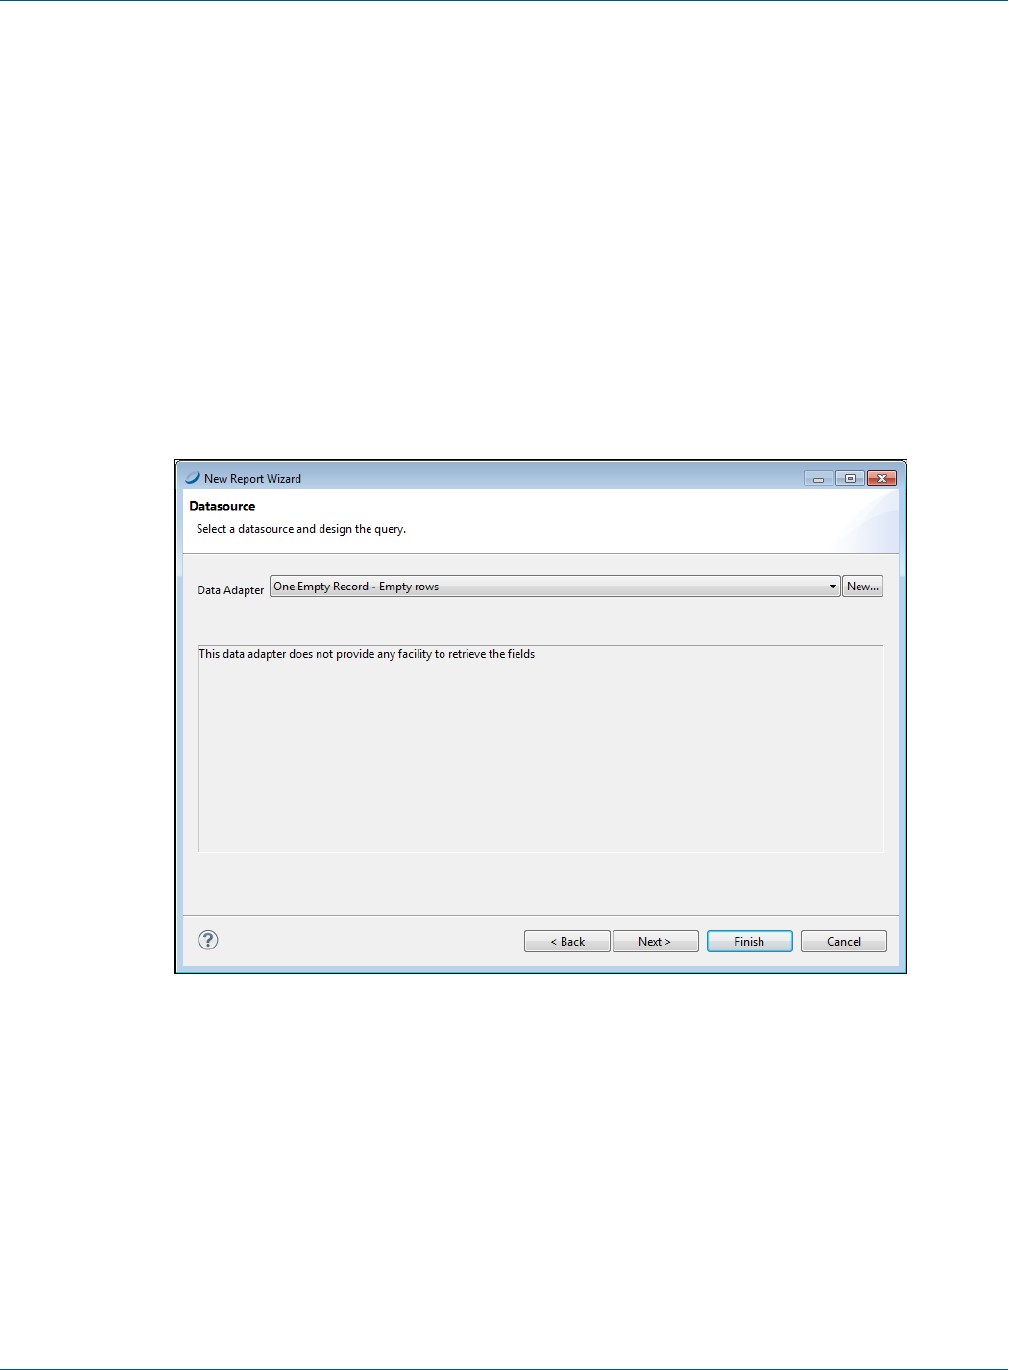
Chapter 22 Report Templates
22.2 Creating and Customizing Templates
You can create templates from scratch or edit existing templates and save them as new templates.
22.2.1 Creating a New Template
If you want to start fresh with your template, create a new one.
To create a new template:
1. Go to File > New > Jasper Report to launch the New Report Wizard.
2. Select a template to start. Click Blank Letter and Next.
3. Choose where you want to store the file, name the new template, and click Next.
For creating a template, there is no need to connect to a data source.
4. Select One Empty Record - Empty rows and click Finish.
Figure 22-2 One Empty Record Data Source
An empty report opens, containing the following bands:
•Title
•Page Header
•Column Header
•Detail
•Column Footer
•Page Footer
•Summary
TIBCO Software Inc. 403
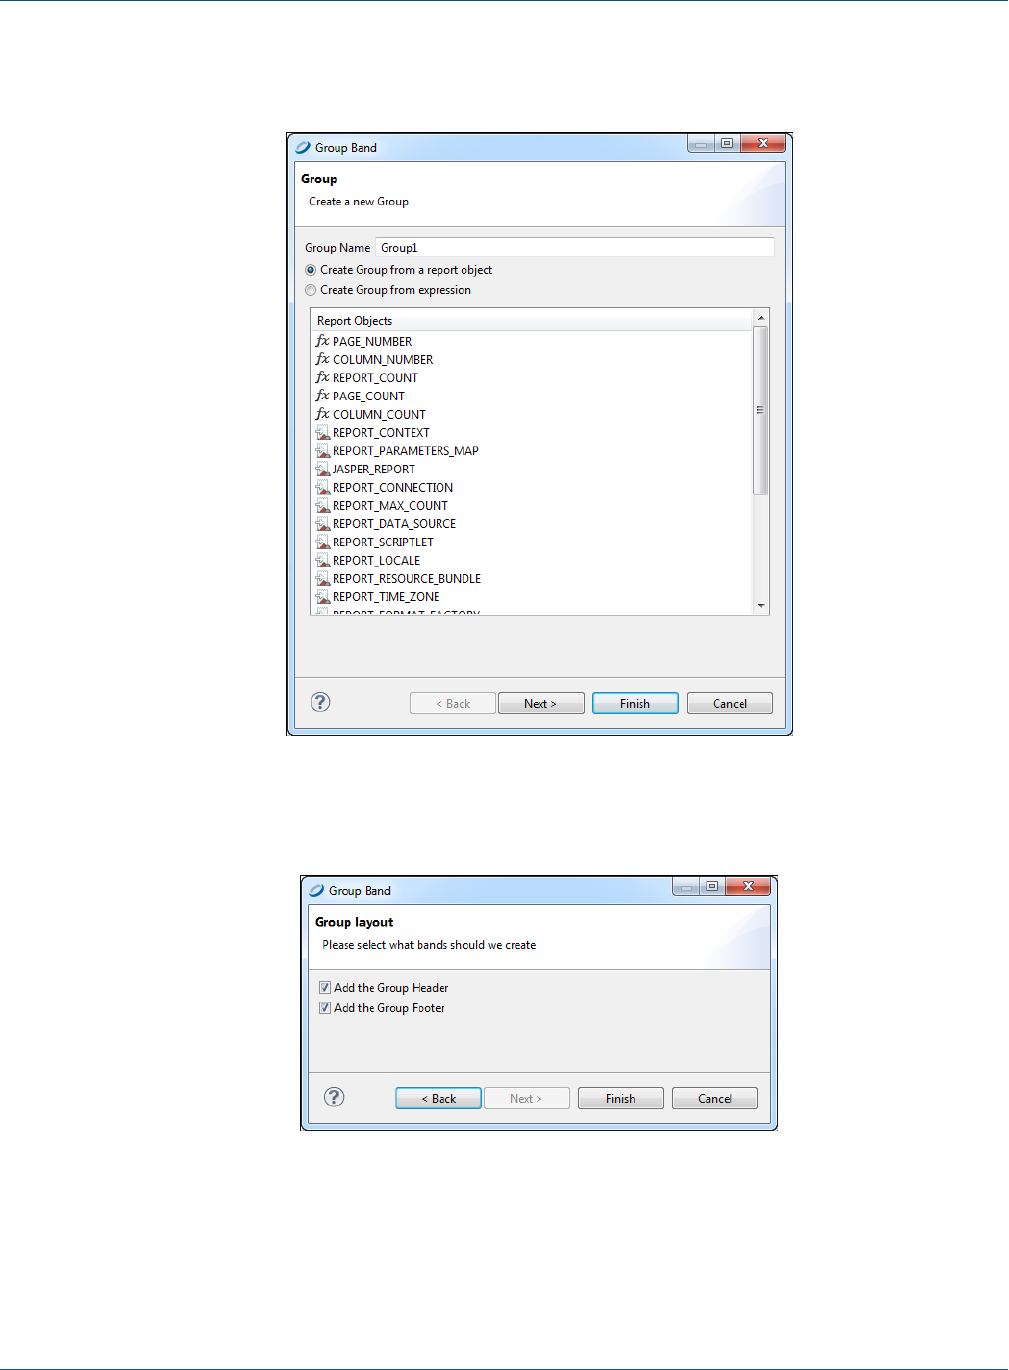
TIBCO Jaspersoft Studio User Guide
5. Right-click on the report root node in the Outline, and select Create Group. The Group Band dialog is
displayed.
Figure 22-3 Group Band Dialog
6. Name your group and click Next. The Group Layout dialog is displayed.
Figure 22-4 Group Layout Dialog
7. Leave both Add the Group Header and Add the Group Footer checked, and click Finish.
Your report is similar to the one in Figure 22-5.
404 TIBCO Software Inc.

Chapter 22 Report Templates
Figure 22-5 Report Containing Group Header and Footer
22.2.2 Customizing a Template
Now that you have a blank template, you can customize it to suit your preference. For example, you can add
your company name and logo, page numbering, add a background for your report, and set band and column
sizes. You also use this procedure to make changes to an existing template.
To customize a template:
1. Add a graphic: Drag an Image element where you want the image to appear. This is usually the Title band.
For more information about the Image element, see “Graphic Elements” on page60.
2. Add a title: Drag a Static Text element to the Title band. Style the text in the Properties view. For more
information about Static Text elements, see “Text Elements” on page61.
3. Want the background to cover the entire page? Right-click the element in the Outline and choose
Maximize Band Height. Otherwise, set the Background band to the size you want. Drag an Image
element into the Background band to create your background.
4. Add page numbering to the Page Footer band: Drag a Page Number element into the band, and place it
where you want it. You can also add a Page X of Y element if you prefer.
5. Want a label in the Column Header band? Add a Static Text element with the text “Label”.
6. Set styles for your report’s text: Add a Text field to the Group Header and a Text field to the Detail band.
Set the text of the first Text field to “GroupField” and the text of the second Text field to “Field”.
Format the text as you like.
7. Save your template file.
8. Click the Preview tab. Your template should like something like the one in Figure 22-6.
TIBCO Software Inc. 405

TIBCO Jaspersoft Studio User Guide
Figure 22-6 Template Preview
22.3 Saving Templates
Jaspersoft Studio templates require a flat folder structure (resources and report in the same folder). This way,
when you export a template, the paths and resources in the exported report point to the same directory.
22.3.1 Creating a Template Directory
You can specify one ore more directories for your custom templates.
1. Go to Window> Preferences> Jaspersoft Studio> Templates Locations.
406 TIBCO Software Inc.
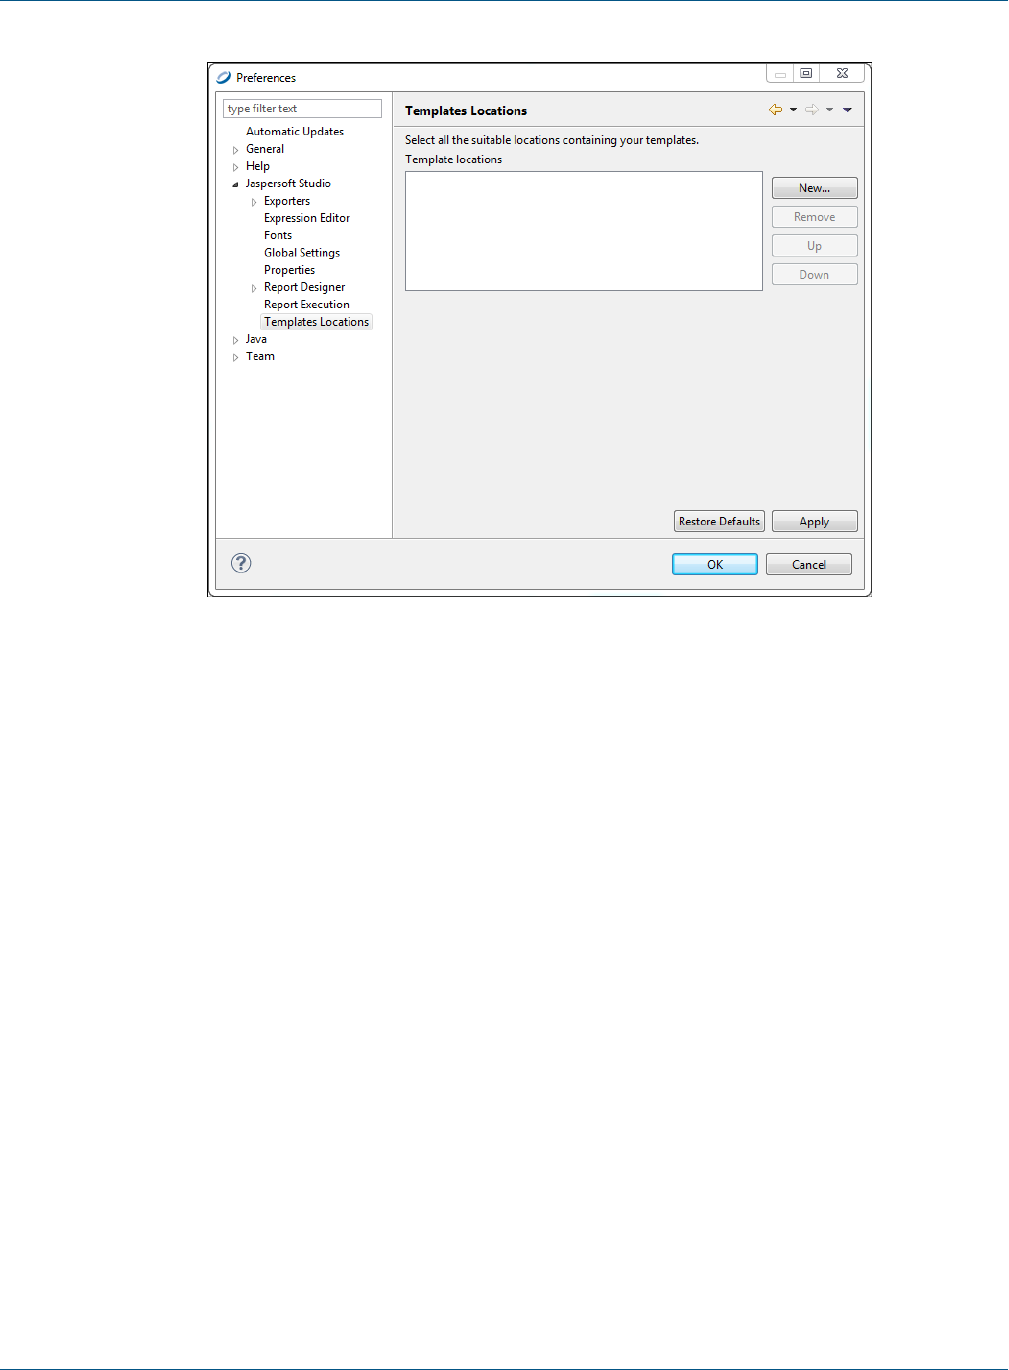
Chapter 22 Report Templates
Figure 22-7 Template Location Preferences
2. Click the New... button and navigate to the directory in which you want to store your template.
3. Click the Apply button.
4. Click OK.
22.3.2 Exporting a Template
Save your template for future use.
1. Go to File> Export as Report Template. The Template Export dialog opens.
TIBCO Software Inc. 407

TIBCO Jaspersoft Studio User Guide
Figure 22-8 Template Export Dialog
2. Click the Browse button and navigate to the directory where you want to save your template. Click Next.
The Define Type and Categories dialog opens.
Figure 22-9 Define Type and Categories Dialog
3. In the drop-down, choose whether the template type is a Standard Report or a Table-Based report.
408 TIBCO Software Inc.
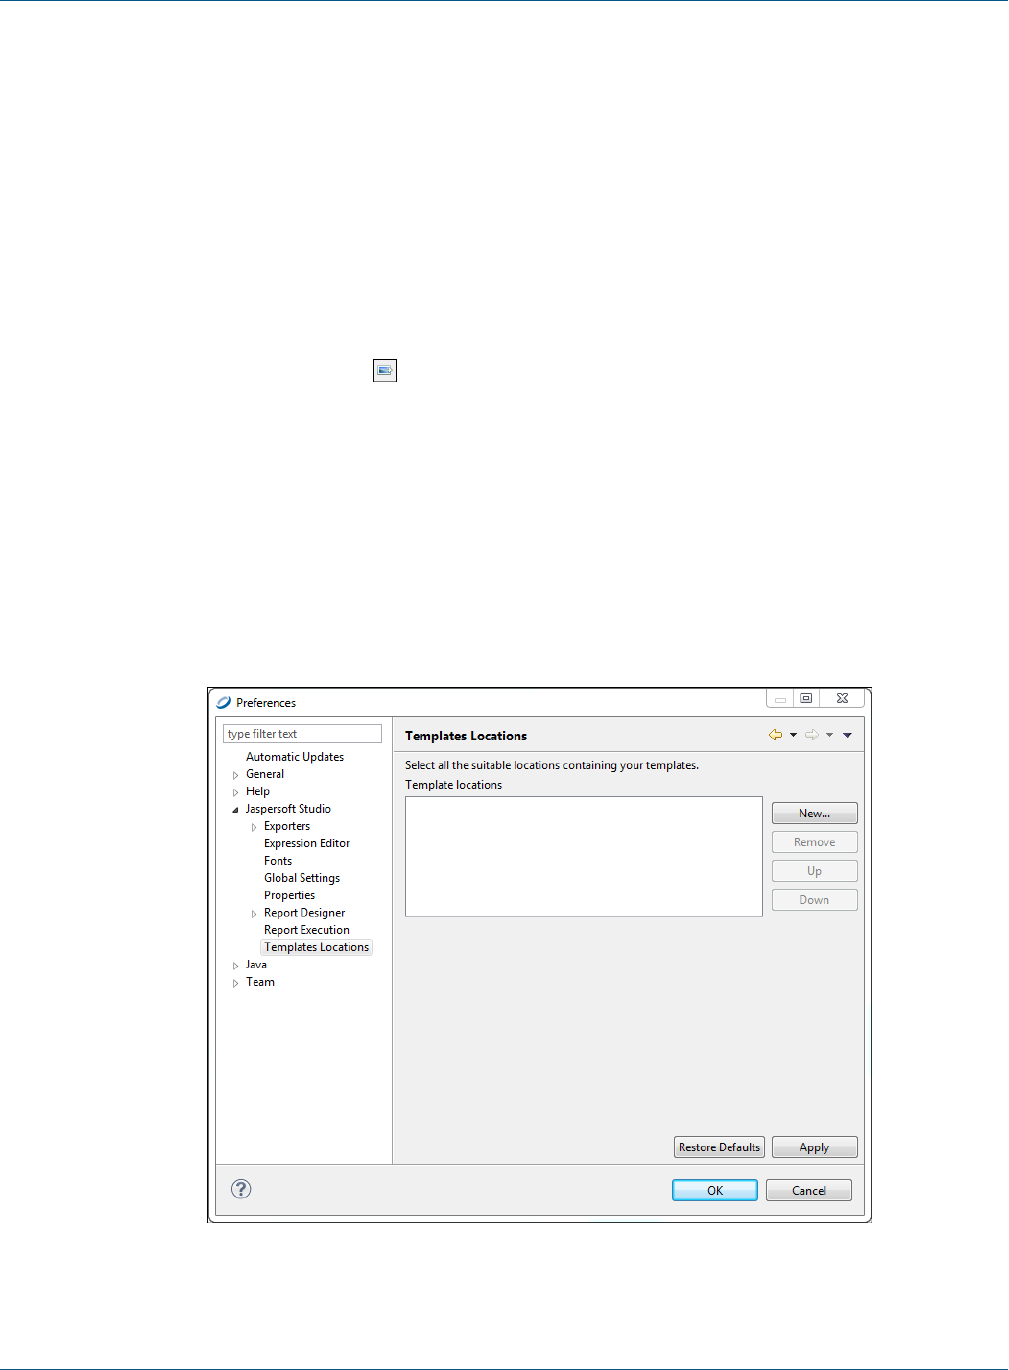
Chapter 22 Report Templates
This selection is used to validate the report. For example. by selecting Standard Report, the validation
process searches for the group field with the text group or for the column header label with the text label. If
any of the required fields are not found, an error message is displayed.
4. Select the categories for the template available and use the arrow button to add them to the Selected
Categories.
5. Click Finish.
22.3.3 Creating a Template Thumbnail
Saving a thumbnail is not required, but can be helpful if more than one person uses your templates.
1. Go to the Preview tab.
2. Click the Export Image button.
3. Save the image in the same directory and with the same name as your template.
22.4 Adding Templates to Jaspersoft Studio
Once you've created a custom template, you need to add it to Jaspersoft Studio to use it.
To add a template to Jaspersoft Studio:
1. Go to Window> Preferences (Eclipse> Preferences on Mac).
2. Go to > Jaspersoft Studio> Templates Locations.
Figure 22-10 Template Location Preferences
TIBCO Software Inc. 409

TIBCO Jaspersoft Studio User Guide
3. Navigate to the directory in which you stored your template.
4. Click Apply.
5. Click OK.
When you go to File> New> Jasper Report, your new template appears, along with the default templates.
410 TIBCO Software Inc.

CHAPTER 23 REPORT BOOKS
A report book is a single .jrxml that bundles multiple reports into a single object. Like a single report, a report
book is driven by a data set that allows you to define the flow of the book’s sections, and the parts within those
sections.
This section provides a walkthrough of the report book creation process, using the sample.db included with
your JasperReports Server installation. You'll create a cover page, table of contents, and subreports to build into
your report book.
Creating a report book has a number of separate tasks, including:
•Creating the Report Book Framework
•Creating and Adding Reports to the Report Book
•Refining the Report Book
•Configuring the Table of Contents
•Report Book Pagination
•Publishing the Report Book
23.1 Creating the Report Book Framework
The first step is to create your report book jrxml. This is the framework in which you organize the book’s parts.
To create the report book framework:
1. In Jaspersoft Studio, click and select Other... to open the Wizard selection window.
2. Expand the Jaspersoft Studio folder, select Jasper Report, and click Next.
3. In the Categories panel, select Report Books.
4. Click to select Wave Book then click Next.
5. In the Project Explorer, select the My Reports folder, change the file name to Sample_Book.jrxml, and
click Next.
6. In the Data Source window, select a data adapter. For our walkthrough, use Sample DB – Database
JDBC Connection.
7. In the text panel, enter the following query then click Next:
select distinct shipcountry from orders order by shipcountry
8. In the Fields window, move SHIPCOUNTRY from the Dataset Fields panel to the Fields panel and click
Next.
TIBCO Software Inc. 411
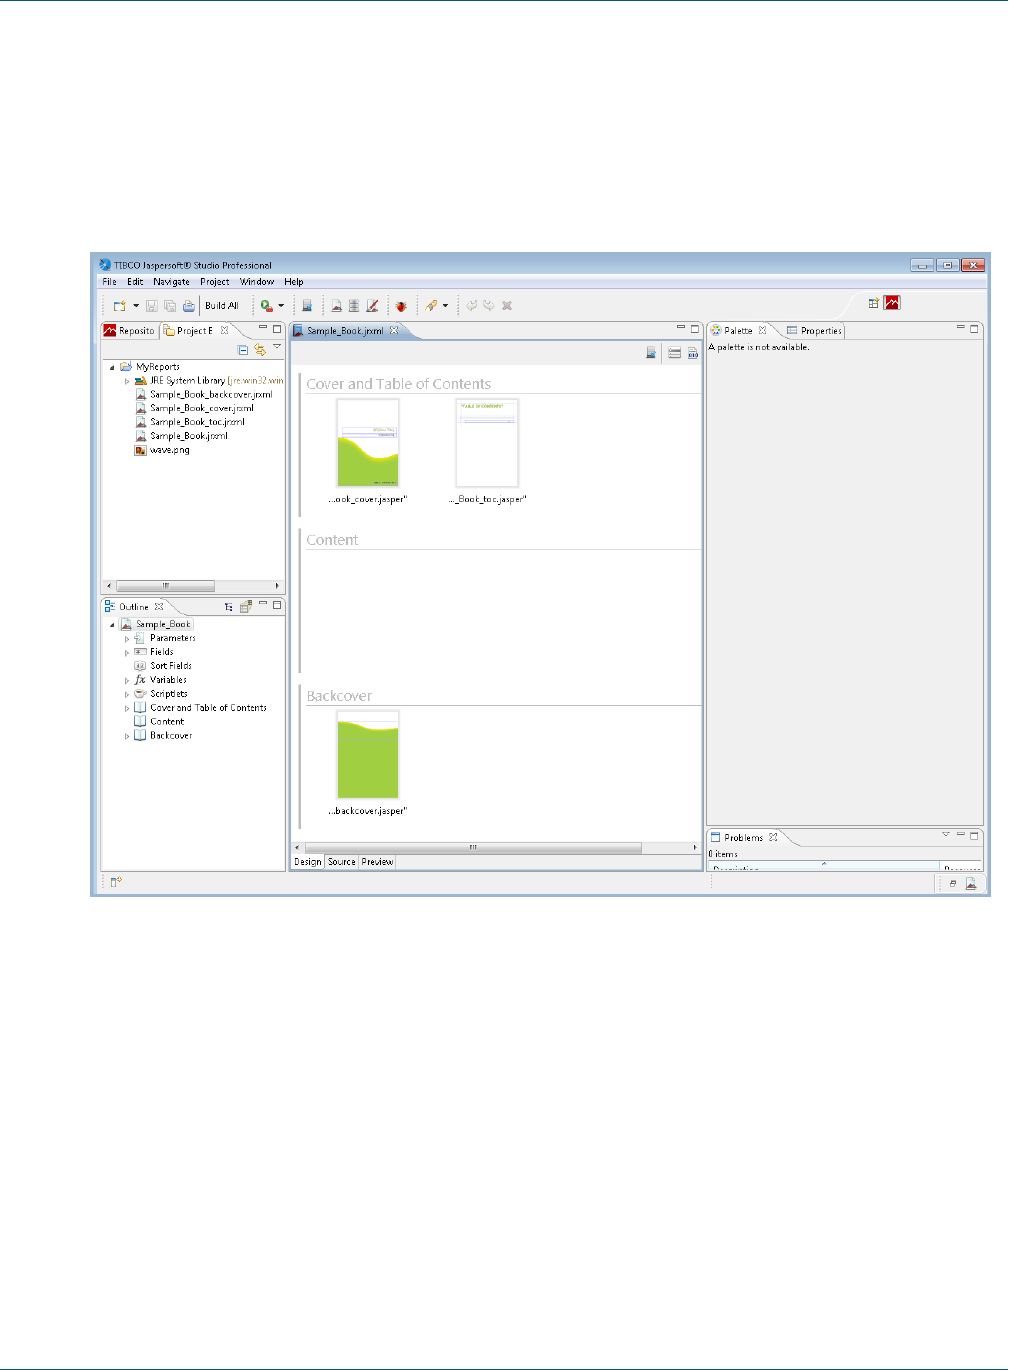
TIBCO Jaspersoft Studio User Guide
9. In the Book Sections window, make sure all three options are selected:
•Create Cover Section
•Create Table of Contents
•Create Back Cover Section
10. Click Finish.
Your Report Book project opens in Jaspersoft Studio.
Figure 23-1 Report Book Framework
In Jaspersoft Studio, open the Project Explorer and expand the My Reports folder. There, you can see the jrxml
files you just created:
•Sample_Book_backcover.jrxml
•Sample_Book_cover.jrxml
•Sample_Book_toc.jrxml
•Sample_Book.jrxml
Sample_Book.jrxml is open in the main Design tab. This is the file in which you'll organize the report parts.
You'll notice three groups for the book part types:
•Cover and Table of Contents contains Sample_Book_cover.jrxml and Sample_Book_toc.jrxml.
•Content is currently empty.
•Backcover contains Sample_Book_backcover.jrxml
412 TIBCO Software Inc.

Chapter 23 Report Books
When you select each these book parts in the design window, you can view and edit their properties in the
Properties View, as you can with standard reports and subreports.
Next, you'll create a subreport and add it to your report book.
23.2 Creating and Adding Reports to the Report Book
Now that your framework is established, you can create reports and/or subreports to include in your book.
You create a report or subreport as described here, and in Creating a New Report. You can also include
previously-created reports. See Adding a Report to the Report Book.
For our walkthrough, you'll create a report, then add it to your report book.
23.2.1 Creating a Report for the Report Book
To create a report:
1. Click and select Other... to open the Wizard selection window.
2. Expand the Jaspersoft Studio folder and select Jasper Report. Click Next.
3. In the Report Templates window, scroll to and select the Leaf Green template. Click Next.
4. In the Report file window, select the MyReports folder and change the Leaf_Green.file name to Content_
Page_One.jrxml. Click Next.
5. In the Data Source window, select Sample DB – Database JDBC Connection, and enter the following
query:
Select * from orders order by shipcity
6. Click Next.
7. In the Fields window, move the following Dataset fields to the Fields panel on the right to include then in
your subreport:
•ORDERID
•CUSTOMERID
•FREIGHT
•SHIPCITY
•SHIPCOUNTRY
8. Click Next.
9. In the Group By window, move the SHIPCITY dataset field into the Fields pane.
10. Click Finish. The Content_Page_One.jrxml appears in the Design tab.
11. In the Project Explorer, right-click Content_Page_One.jrxml and select Compile Report. The resulting
file, Content_Page_One.jasper, appears in the Project Explorer.
23.2.2 Adding a Report to the Report Book
Now you can add this new subreport to your report book. During this process, you'll assign a data source for
executing the subreport.
To add a report to your report book:
1. Double-click the Sample_Book.jrxml in the Project Explorer to open it in the Design tab.
TIBCO Software Inc. 413

TIBCO Jaspersoft Studio User Guide
2. Drag Content_Page_One.jasper from the Project Explorer into the Content group. In the Connection
dialog, click Finish.
3. In the Design tab, click to select Content_Page_One.jasper.
4. In the Properties view, click the Data button at the top, then click Edit Parameters.
5. In the Report Part Parameters window, click Add to open the Parameter Configuration dialog.
6. In the Parameter Name field, enter REPORT_CONNECTION.
7. Click to open the Expression Editor.
8. In the first column, select Parameters.
9. In the center column, double-click REPORT_CONNECTION parameter connection to add it to the
editor field, and click Finish. The expression appears in the Parameter Configuration field.
10. Click OK and confirm the parameter has been added to the Part Parameters list, then click Finish.
23.3 Refining the Report Book
You can further refine the report data to make your report easier to use, by sorting on additional fields, and by
adding pages to the book to introduce each of the sorted sections.
23.3.1 Sorting on Additional Fields
At this point, you could run the report, but the data it returns is sorted by City, which you established in
Creating and Adding Reports to the Report Book. To better organize the data, you can now modify the report
query to sort by Country as well.
To add a filter to a report in a report book:
1. In the Project Explorer, double-click to open content_page_one.jrxml in the designer.
2. In the Outline view, right-click the Parameters folder and select Create Parameter.
3. In the Properties view, change the name to country.
4. In the Designer, click and modify the query to say:
Select * from orders where shipcountry = $P{country} order by shipcity
5. Click OK to return to the designer.
6. Click the Preview tab at the bottom of the designer to open Input Parameters.
7. In the country field, enter Italy and run the report. The report preview displays only data related to Italy,
sorted by city.
8. Click the Design tab, then save and compile your report.
9. Open Sample_Book.jrxml in the design tab, and click to select Content_Page_One.jasper in the
Content group.
10. In the Data tab in the Properties view, click Edit Parameters to open the Report Part Parameters window,
and click Add.
11. In the Parameter Configuration Dialog, enter country as the parameter name.
12. Click to open the Expression Editor, and click Fields in the left panel.
13. Double-click SHIPCOUNTRY Field String to add it to the expression, then click Finish.
14. Click OK in the Parameter Configuration Dialog, then Finish in the Report Part Parameters window.
414 TIBCO Software Inc.

Chapter 23 Report Books
23.3.2 Adding Section Introductory Pages
You can insert pages in your reports to introduce each section of data, as determined in Sorting on Additional
Fields. These pages can include text, images, charts, or any number of other elements, pulled from a data source.
We'll place an introductory page before each country section and include the country name and a chart
representing the number of orders for each city in the country.
To add introductory pages to your report:
1. Click to open the Wizard selection window.
2. Expand the Jaspersoft Studio folder and select Jasper Report. Click Next.
3. In the Report Templates window, select the Blank A4 Landscape template. Click Next.
4. In the Report file window, select the MyReports folder and change the Blank_A4_Landscape.jrxml file
name to Country_Intro.jrxml. Click Next.
5. In the Data Source window, select Sample DB – Database JDBC Connection, and enter the following
query and click Next:
select count(*) c, shipcity from orders group by shipcity
6. In the Fields window, add the following Dataset fields to the Fields panel and click Next.
•C
•SHIPCITY
7. In the Group By window, click Finish. The Country_Intro.jrxml appears in the Design tab.
Now you can determine what data appears on the intro pages.
To modify the data on the intro pages:
1. With Country_Intro.jrxml open in the Design tab, click the Title band and increase its height to 350 pixels.
2. In the Outline view, right-click Parameters and select Create Parameter.
3. In the Properties view, change the Name from Parameter 1 to Country.
4. In the Designer view, click to open the Dataset and Query Dialog.
5. Modify the query to say:
select count(*) c, shipcity from orders where shipcountry = $P{Country} group by
shipcity
6. Click OK.
7. Save Country_Intro.jrxml.
8. In the Outline view, drag Country from the Parameters list into the Title band.
9. Click the Country parameter ($P{Country}).
10. In the Properties view, click Text Field. Increase the font size to 26.
11. Click outside the parameter element.
Next, you can add a chart to the intro pages, that provides a graphical representation of the data in the section.
To add a chart to the intro pages:
1. In the Palette view, select and drag HTML5 Charts from the Components Pro section and place it under the
parameter element in the designer view.
2. In the Chart type selection dialog, scroll down and select Pie. Click OK.
3. Resize the pie chart to fit the space. See Creating a Simple Chart for more information.
4. Double-click the chart element to open the Chart Properties.
TIBCO Software Inc. 415

TIBCO Jaspersoft Studio User Guide
5. Click the Chart Data tab, then click the Configuration tab.
6. In the Categories Levels section, double-click Level1.
7. In the Expression text box, delete "Change Me" and click .
8. Select Fields from the first column, and double-click SHIPCITY Field String to add it to the expression.
9. Click Finish.
10. Update the Name field to "City" and click OK.
11. Back in the Chart Properties dialog, update the following information:
•Name:Number of orders.
•Label Expression:"Number of orders"
•Calculation: Nothing
•Value Expression:Delete new Integer1, click , and double-click C Field Long, then click Finish.
12. Click OK, then save the report.
13. Compile Country_Intro.jrxml to create a .jasper file.
Now, you can add the Country_Intro page to your book, and configure it to display the correct data.
To add and configure the intro page::
1. Open Sample_Book.jrxml in the Design tab.
2. Drag Country_Intro.jasper from the Project Explorer into the Content group of Sample_Book.jrxml, and
place it to the left of the Content_Page_One.jasper file.
3. In the Design tab, click to select Country_Intro.jasper.
4. In the Properties view, click Edit Parameters.
5. In the Report Part Parameters window, click Add to open the Parameter Configuration dialog.
6. In the Parameter Name field, enter REPORT_CONNECTION.
7. Click to open the Expression Editor.
8. In the first column, select Parameters.
9. From the center column, double-click REPORT_CONNECTION parameter connection to add it to the
editor field, and click Finish. The expression appears in the Parameter Expression field.
10. Click OK and confirm the parameter has been added to the Part Parameters list.
11. Click Add to open the Parameter Configuration dialog again.
12. In the Parameter Name field, enter Country.
13. Click to open the Expression Editor.
14. In the first column, select Fields.
15. From the center column, double-click SHIPCOUNTRY Field String to add it to the editor field, and click
Finish. The expression appears in the Parameter Expression field.
16. Click OK and confirm the parameter has been added to the Part Parameters list, click Finish.
23.4 Configuring the Table of Contents
Your report book is organized and the reports are populated with data. Now you can configure your Table of
Contents so your users can find the information they need.
416 TIBCO Software Inc.

Chapter 23 Report Books
The Table of Contents is derived from a special data source created by JasperReports and included as a property
in the report book. This property, net.sf.jasperreports.bookmarks.data.source.parameter, collects
bookmarks from the report book's content pages. So you'll need to add bookmarks to your reports.
To add bookmarks:
1. Open Country_Intro.jrxml in the Design tab.
2. Click the Country parameter in the Title band.
3. In the Properties view, click Hyperlink.
4. Expand the Anchor and Bookmark section.
5. Click to open the Expression Editor, and click Parameters.
6. Double-click Country Parameter String to add it to the expression, then click Finish.
7. In the Properties view, change the Bookmark Level to 1.
8. Click outside the design space in the Design tab, then click Report in the Properties view.
9. Click to enable Create bookmarks.
10. Open the Content_Page_One.jrxml in the Design tab.
11. Click the $F{SHIPCITY} text band.
12. In the Properties view, click Hyperlink.
13. Expand the Anchor and Bookmark section.
14. Click to open the Expression Editor, and click Fields.
15. Double-click SHIPCITY Field String to add it to the expression, then click Finish.
16. In the Properties view, change the Bookmark Level to 2.
17. Save all files, and compile the Sample_Book.jrxml.
23.5 Report Book Pagination
To ensure that the report book's pagination increments correctly, you need to modify a few variables.
To establish the report book pagination:
1. In the Project Explorer, double-click to open Content_Page_One.jrxml.
2. On the Design tab, double-click the text field containing the expression " "+$V{PAGE_NUMBER}.
3. In the Expression Editor, and click Variables in the left panel.
4. Update the expression to the following:
"Page "+$V{MASTER_CURRENT_PAGE}+" of"
5. Click Finish.
6. Click to select the text field you just updated. Then in the Properties view, select Text Field.
7. Use the Evaluation Time drop-down menu to select Master.
8. Back in the Design tab, double-click the text field containing the expression "Page "+$V{PAGE_
NUMBER}.
9. In the Expression Editor, and click Variables in the left panel.
10. Update the expression to the following:
" "+$V{MASTER_TOTAL_PAGES}
11. Click Finish.
12. As you did in steps 6-7, use the Evaluation Time drop-down menu to select Master.
TIBCO Software Inc. 417

TIBCO Jaspersoft Studio User Guide
13. Save your project.
23.6 Publishing the Report Book
Now that your report book has been created, tested, refined, configured, and paginated, you can publish it to
JasperReports Server, so it is available to users
To publish your report book to JasperReports Server:
1. In the Project Explorer, double-click to open Sample_Book.jrxml in the Design tab.
2. Click to open the Report Publishing wizard.
3. Browse to JS Server >Public >Samples >Reports, and click Next.
4. In the Select Resources dialog, verify that the following resources are listed:
•Content_Page_One.jrxml
•Country_Intro.jrxml
•Sample_Book_backcover.jrxml
•Sample_Book_cover.jrxml
•Sample_Book_toc.jrxml
•wave.png
5. Click Next.
6. Specify your data source, JServer JNDI Data Source, and click Finish.
Your report book is published, and is available for use in JasperReports Server
418 TIBCO Software Inc.

CHAPTER 24 PREFERENCES AND CONFIGURATION
You can set preferences for Jaspersoft Studio in the Preferences window.
To open the Preferences window:
1. Select Window > Preferences to open the Preferences window (Eclipse> Preferences on Mac).
2. Expand the Jaspersoft Studio node.
24.1 Properties
You can set JasperReports properties in the Jaspersoft Studio > Properties page of the Preferences window.
Setting a property here sets it as the default for all reports. You can also set many properties at the report or
element level. A property set at the element level overrides a property set at the report level; a property set at
the report level overrides a property set at the Jaspersoft Studio level.
24.2 JasperReports Samples
JasperReports Library provides a number of sample reports that show how to use many of the available features.
You can download and install the samples as a project in Jaspersoft Studio as follows:
1. Select File> New> Other from the main menu.
2. In the New dialog box, expand Jaspersoft Studio.
3. Select JasperReports Samples and click Next.
4. Enter a name for the project folder and click Finish.
The sample reports are downloaded to the location you chose. You can now view and work with these reports
in Jaspersoft Studio.
24.3 Units of Measure in Jaspersoft Studio
Jaspersoft Studio can handle many units of measure, including pixels, centimeters, millimeters and inches. To
accomplish this, we included a measure component in Jaspersoft Studio. This component looks like a standard
text box with a place to enter a measure unit to the right of the value.
This component can handle a different measure unit for each field, if needed.
TIBCO Software Inc. 419
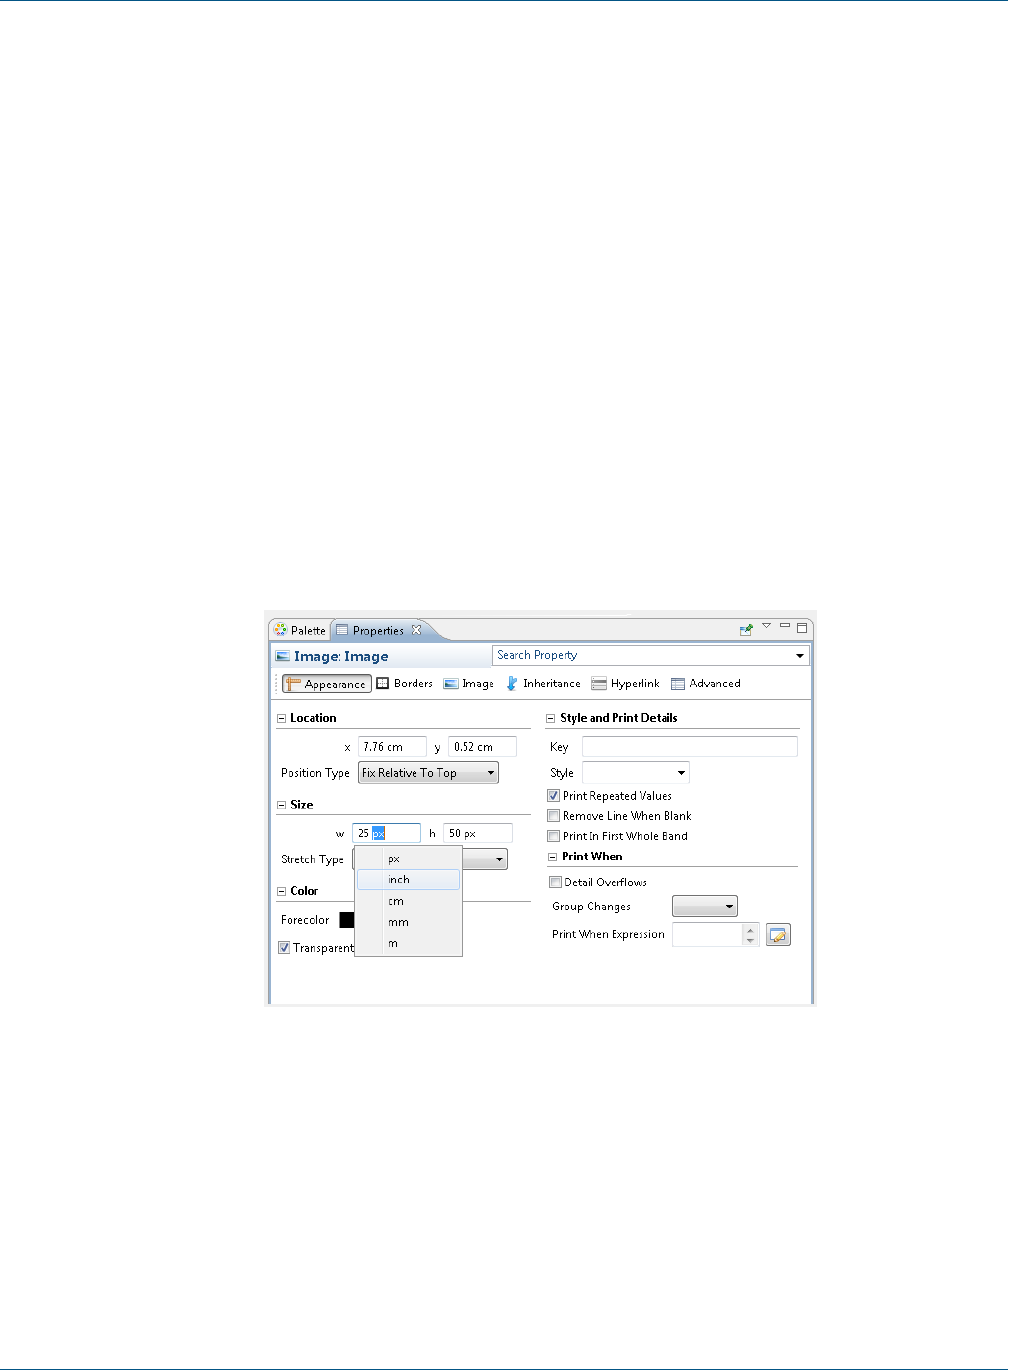
TIBCO Jaspersoft Studio User Guide
24.3.1 Configuration
You can set two preferred (default) units of measure, one at the field level, the other at the report level. The
report level unit is used wherever there is not a preferred field unit of measure. The report's default unit of
measure is the pixel.
To change the report level unit:
1. Select Window > Preferences to open the Preferences window (Eclipse> Preferences on Mac).
2. Expand Jaspersoft Studio and select Report Designer.
3. Use the Default Unit drop-down menu to select one of the following units of measure:
•Pixels
•Inches
•Millimeters
•Centimeters
•Meters
24.3.2 Changing the Field Unit of Measure
To change a field's local unit of measure select the field, double-click the unit of measure in the Properties view,
and select a supported unit from the pop-up menu:
Figure 24-1 Updating a field's measure unit
24.3.3 Alias and Auto-complete
Jaspersoft Studio has included alias and auto-complete services for units of measure. The following table shows
your options.
420 TIBCO Software Inc.

Chapter 24 Preferences and Configuration
Unit Accepted Values
centimeter centimeter, centimeters, cm
millimeter millimeter, millimeters, mm
meter meter, meters, m
pixel pixel, pixels, px
inch inch, inches, " (double quote)
Enter a value and begin typing a unit of measure. Auto-complete will list the matching supported values for you
to choose from.
24.3.4 Approximations
Even through Jaspersoft Studio handles many units of measure, JasperReports works only with pixels. So pixels
are the only unit allowed in the project file. Jaspersoft Studio approximates measurements and converts them to
pixels. For example, 5 cm is converted to the nearest whole-number value in pixels. In this case the 5
centimeters is converted to 139 pixels (approximately 4.97 cm).
24.4 Cleaning Cached Data
In some cases, you may want to clean up any cached data used by the OSGI framework and Eclipse runtime.
You might do this, for example, after you upgrade, install new plug-ins, or apply patches. You can do this via
the command line or by temporarily setting a flag in the .ini file for Jaspersoft Studio. Because the clean
operations slow down the startup time, it's better to specify it on an as-needed basis.
24.4.1 Cleaning From the Command Line
24.4.1.1 Mac OS X
To set the clean flag at startup on Mac OS X, run the following commands:
cd <jss-install>/Contents/MacOS
./Jaspersoft\ Studio\ Professional -clean
24.4.1.2 Linux
To set the clean flag at startup on Linux, run the following commands:
cd <jss-install>
./Jaspersoft\ Studio\ Professional -clean
24.4.1.3 Windows
To set the clean flag at startup on Windows, edit the desktop shortcut as follows:
1. Right-click on the desktop shortcut and select Properties.
TIBCO Software Inc. 421

TIBCO Jaspersoft Studio User Guide
2. On the Shortcut tab, append -clean to the Target field. For example:
"<jss-install>\Jaspersoft Studio Professional" -clean
3. Click OK.
4. Double-click the shortcut to run the application.
5. Once you have cleaned the application, edit the shortcut again to remove the -clean flag to avoid slowing
down application startup.
24.4.2 Setting the -clean Flag in the .ini File
As an Eclipse-based product, Jaspersoft Studio uses an .ini configuration file to control Eclipse behavior at
startup. General information about Eclipse .ini files is available on the web, for example, at
https://wiki.eclipse.org/Eclipse.ini. In the case of Jaspersoft Studio, the configuration file is found in the root
directory of your Jaspersoft Studio installation, with a name such as Jaspersoft Studio.ini or Jaspersoft Studio
Professional.ini.
To enable cleaning via the .ini file:
1. Locate the .ini file (for example, Jaspersoft Studio.ini). This file is in your <jss-install> directory on
Windows and Linux, and in the <jss-install>/Contents/Eclipse directory on Mac.
2. Open the file in a text editor.
3. Locate the following line:
-vm
This line sets the location of the JVM to be used.
4. Add the following line before -vm:
-clean
5. Save the file.
6. Start Jaspersoft Studio.
7. Once you have cleaned the application, edit the .ini file again to remove the -clean flag to avoid slowing
down application startup.
24.5 Disabling Usage Statistics
By default, the first time you run a new installation of Jaspersoft Studio, you are prompted to allow us to collect
usage statistics. These statics are anonymous This pop-up can be disabled in the .ini file in the <jss-install>
folder.
To disable the usage statistics dialog:
1. Locate the .ini file (for example, Jaspersoft Studio.ini). This file is in your <jss-install> directory on
Windows and Linux, and in the <jss-install>/Contents/Eclipse directory on Mac.
2. Open the file in a text editor.
3. Locate the following line:
-vm
This line sets the location of the JVM to be used.
4. Add the following line before -vm:
-com.jaspersoft.studio.skipUsageQuestion true
422 TIBCO Software Inc.

Chapter 24 Preferences and Configuration
5. Save the file.
24.6 Export and Import
Export and import allow you to migrate configuration resources between instances of Jaspersoft Studio. You can
export the following configuration resources:
•global data adapters
•JasperReports Server configurations
•composite elements
•text, table, and crosstab styles
•global JasperReports properties
•Jaspersoft Studio preferences
The Jaspersoft Studio application logger preferences cannot be exported, since they are determined in
part by your application INI configuration.
You can choose to export all of these categories or only a subset of them; however, you can't choose individual
items inside a category. The result of the export is a single zip file (compressed archive), which can be imported
into another Jaspersoft Studio instance. Again, you can choose which of the available categories inside the zip
you want to import.
To export configuration resources:
1. Select File> Export.
The Export dialog is displayed
2. Select Jaspersoft Studio> Jaspersoft Studio Configuration for the destination and click Next.
The export wizard shows the resource categories that can be exported, with the number of resources in each
category. If there are no resources in a category, the category does not appear on the list.
TIBCO Software Inc. 423
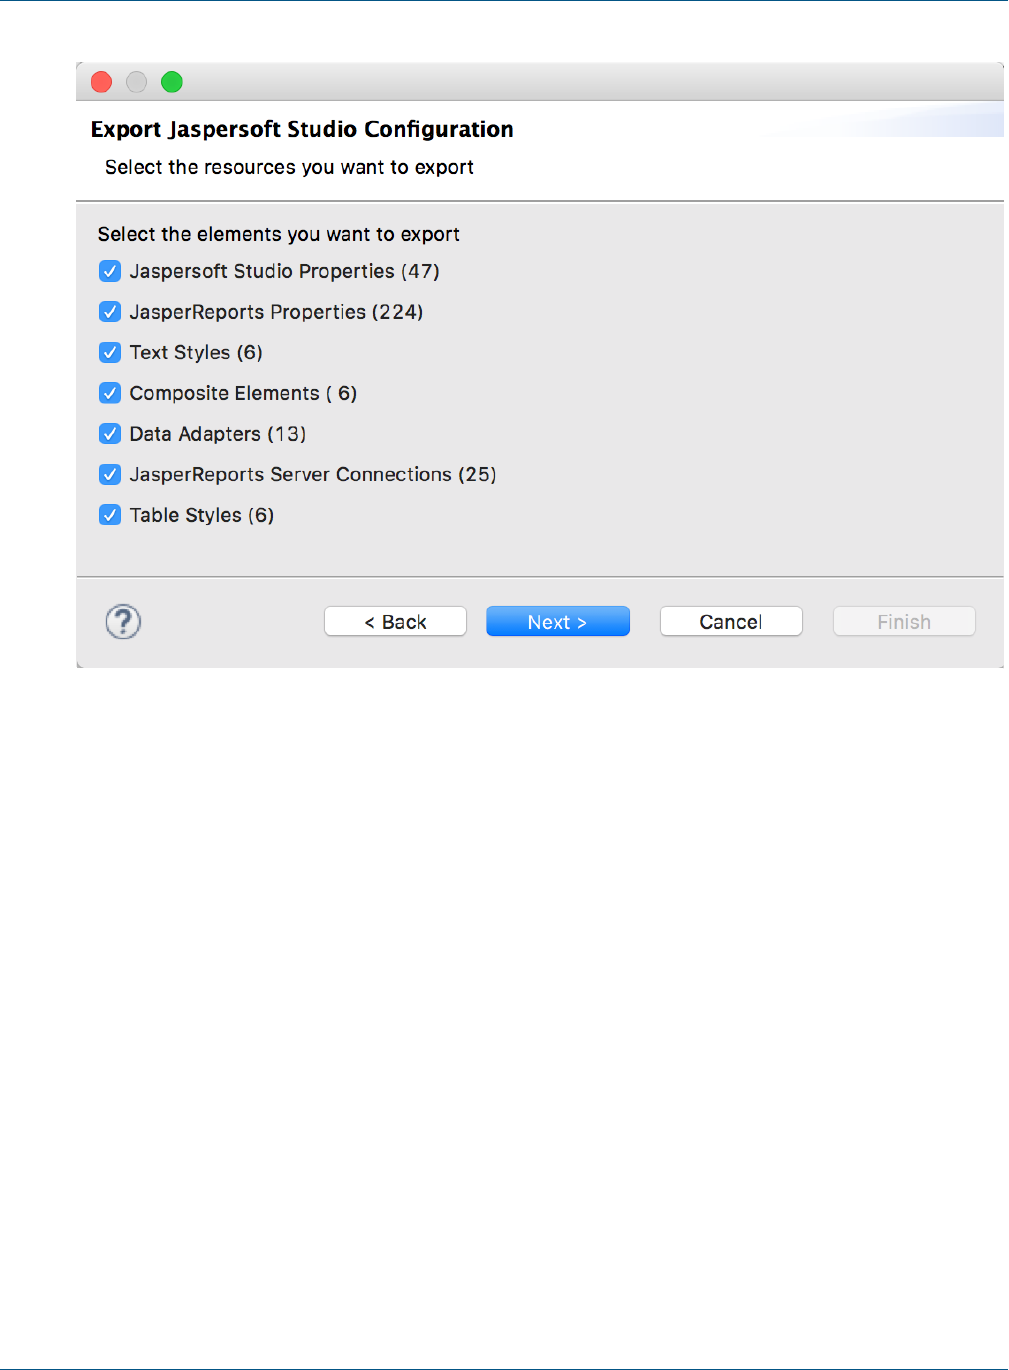
TIBCO Jaspersoft Studio User Guide
Figure 24-2 Export Jaspersoft Studio Configuration Wizard
3. Select the categories you want to export and click Next.
4. Enter the location and name you want for the exported file and click Finish.
A zip file is created in the location you chose.
To import configuration resources:
1. Select File> Import.
The Import dialog is displayed.
2. Select Jaspersoft Studio> Jaspersoft Studio Configuration and click Next.
3. Enter the location and file name of the zip file you wish to import and click Next.
If the file is a valid configuration file, the wizard shows the resource categories that can be imported, with
the number of resources in each category. If the file is not a valid configuration file, you will receive an
error message.
424 TIBCO Software Inc.
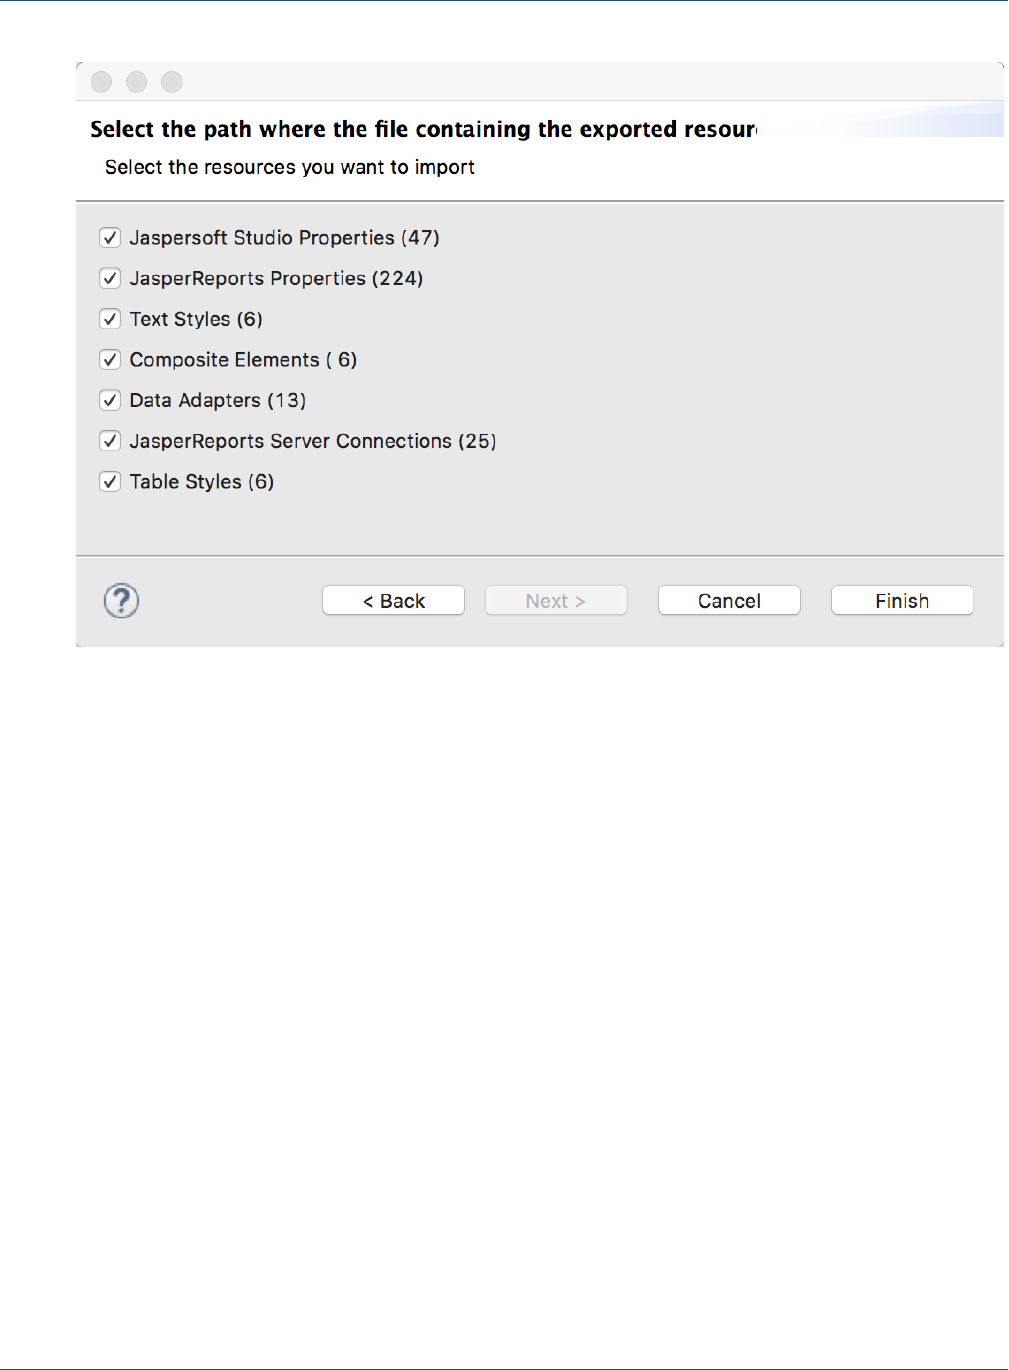
Chapter 24 Preferences and Configuration
Figure 24-3 Selecting Categories to Import
4. Select the resource categories you want to import and click Finish.
5. If there is a naming conflict between an imported resource and an existing resource in your Jaspersoft
Studio configuration, choose the action in you want in the displayed dialog. For resource categories other
than Jaspersoft Studio properties and JasperReports Library properties, you have three choices:
•Overwrite – Overwrites the existing resource(s) with the imported resource(s)of the same name.
•Keep both – Automatically renames the conflicting imported resource(s) with a unique name.
•Skip – Keeps the existing resources and discards the imported resources.
For Jaspersoft Studio properties and JasperReports Library properties, which do not support multiple
instances, you are prompted to choose to overwrite or not.
As before, you must choose the same action for all conflicting resources in a category. For example, if you
have multiple conflicting global data adapters, you must overwrite, keep both, or skip all global data
adapters. A separate dialog is shown for each category where you have conflicting resources. You can
choose different actions for different categories.
24.7 Setting Compatibility with Earlier Versions of JasperReports Library
If you are using your reports with an application you have built using JasperReports Library, you can set the
version to use for compiling your reports. Normally, when you compile a report, Jaspersoft Studio uses the
corresponding version of JasperReports Library. For example, if you compile a report from Jaspersoft Studio 7.3,
it uses JasperReports Library 7.3. For backwards compatibility with your applications, you can configure
TIBCO Software Inc. 425
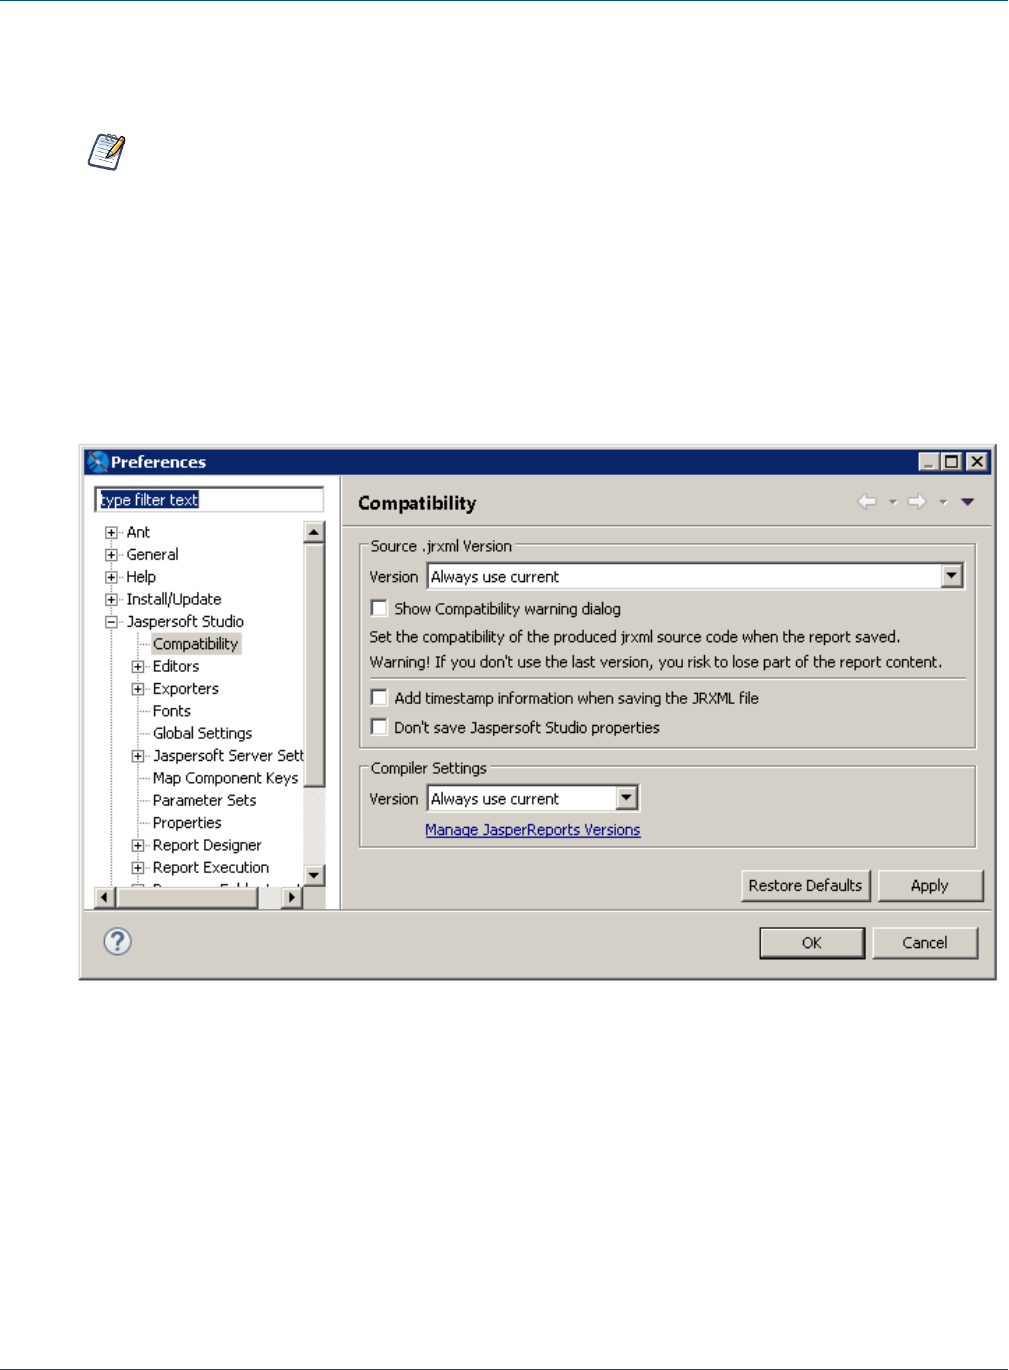
TIBCO Jaspersoft Studio User Guide
Jaspersoft Studio to use an earlier version of JasperReports Library to compile your reports. If you do this, any
features in your reports that rely on a later version of JasperReports Library will not be available.
If you are exporting your reports to JasperReports Server, you should configure the version in the
JasperReports Server connection settings, as described in 12.1.1, “Advanced Connection Settings,” on
page207. Use the compatibility setting only if you are using your reports on your own application built
from JasperReports Library.
To set the version of JasperReports Library to use for compiling reports:
1. Select Window> Preferences from the main menu (Eclipse> Preferences on Mac).
The Preferences dialog is displayed.
2. Select Jaspersoft Studio> Compatibility.
The Compatibility window is displayed.
Figure 24-4 Setting JasperReports Library Version
3. To save your reports in an earlier version of JRXML, select the version you want from the Version menu in
the Source .jrxml Version section of the dialog.
4. To remove Jaspersoft Studio properties from your compiled reports, select Don't save Jaspersoft Studio
properties. Properties specific to Jaspersoft Studio include some layout information, dimensions in pixels
or millimeters, and the data adapter that was most recently used in Jaspersoft Studio.
5. To use an earlier version of JasperReports Library to compile reports, select the version you from the
Version menu in the Compiler Settings section of the dialog. If the version you want is not available, set it
up as described in the next step.
426 TIBCO Software Inc.

Chapter 24 Preferences and Configuration
6. To add a version of JasperReports Library to the Version menu in the Compiler Settings section of the
dialog click Manage JasperReports Versions and select the version you want:
a. To use a version you already have installed, click Add From Path, then select the directory where the
JasperReports Library is located.
Jaspersoft Studio verifies that the path contains JasperReports Library and adds the version to the
Version menu in the Compiler Settings section of the Compatibility dialog.
b. To download and install JasperReports Library from a URL, click Add From URL and select the
URLfrom SourceForge (https://sourceforge.net/projects/jasperreports/) or from another location.
Jaspersoft Studio downloads and verifies the jar files, copies the files to a Jaspersoft Studio internal
directory, and adds the version to the Version menu in the Compiler Settings section of the
Compatibility dialog.
24.8 Working with Java in Eclipse
For users who are unfamiliar with Eclipse, this section describes how compile a class in Eclipse and add it to a
project in Jaspersoft Studio.
First, if you have never used Java in the Eclipse RCP, you must enable the Java perspective. You only have to
do this once.
To enable the Java perspective in Eclipse:
1. Select Window> Open Perspective on the main menu bar.
2. In the Open Perspective dialog, click Show All.
3. Select Java and click OK.
4. When prompted, click OK to enable Java development.
The Eclipse UI changes to the Java perspective. A Java icon is added to the top right of the Eclipse
window. In future, you can switch to this perspective by clicking . To switch back to the Jaspersoft Studio
perspective, click the Report Design icon .
To create a Java project:
1. Select File> New> Project or click on the main toolbar and select Project form the menu.
2. In the New Project wizard, click on Java to expand it, and select Java Project, then click Next.
3. Enter a name for your project. For this example, use SimpleChartCustomizer.
4. Click Finish.
To add libraries to your Java project:
1. Right-click your project name in the Package Explorer and select Build Path> Add Libraries.
2. In the Add Library dialog, select JasperReports Libraries, then click Finish.
The selected library is added to SimpleChartCustomizer.
3. Right-click your project name in the Package Explorer and select Build Path> Add Libraries.
4. In the Add Library dialog, select JasperReports Library Dependencies, then click Finish.
For example, if you are creating a chart customizer, the library dependencies you have added include the
JFreeCharts libraries.
TIBCO Software Inc. 427

TIBCO Jaspersoft Studio User Guide
To create a Java package and add a file:
1. Open your project in Package Explorer.
2. Right-click the src folder and select New> Package. The New Java Package dialog opens.
3. Enter a name for your package. For this example, enter com.jaspersoft.studio.sample.customizer.
4. Click Finish.
5. Drag your Java file from a folder on your file system to the package folder in Eclipse.
6. In the File Operation dialog box, select Copy files and click OK.
To build a Java project and export a JAR file:
1. Right-click the project folder and select Build Project from the menu.
2. Right-click the project folder and select Export.
3. In the Export dialog, select Java> JAR file and click Next.
4. On the JAR File Specification page, make sure your project is selected and that Export generated class
files and resources is checked.
5. Enter a name for your JAR and an export destination.
6. Click Finish.
24.8.1 Adding a JAR to Jaspersoft Studio
To add a JAR to a Jaspersoft Studio project:
1. If you have been using the Java perspective in Eclipse, click to return to the Report Design perspective.
2. Right-click your project in Project Explorer and select New> Folder. Enter lib as the name of the folder.
3. Copy your JAR files to this folder. To do this:
a. Drag the JARfiles from the folder in the file system to the lib folder in the Eclipse user interface.
b. In the File Operation dialog, select Copy files and click OK.
4. Right-click your project and select Refresh.
5. Select all the JAR files, then right-click one of them and select Build Path> Add to Build Path.
The JAR files are added to your project.
24.9 Using Data Snapshots
Data snapshots store a static snapshot of the data you need to run a report. Without data snapshots, you can
only run a report if you have access to everything the report depends on, in particular, the data used by the
report and its subreports or subdatasets. A data snapshot saves the data for a specific run so that you can run the
report without any data connections. This lets you work on report layout and presentation offline, share a
version of the report for troubleshooting, or create a sample report together with data.
The snapshot only contains the data needed by the report at the time it is run. If you make changes to the report
that affect its data use, such as adding fields, you will need to create an updated snapshot. When Cache Data
in Memory is selected and you have made changes that affect the data use, this is detected and the cached data
is automatically updated. Changes that only affect the layout, such as moving fields or resizing bands, do not
trigger a cache update.
428 TIBCO Software Inc.

Chapter 24 Preferences and Configuration
To create a data snapshot:
1. Select the Preview tab.
2. Right-click and select Cache Data in Memory.
3. Run the report to capture the report data.
To save a data snapshot to a file:
1. Select the Preview tab.
2. Right-click and select Save Data to File.
3. Enter a file name when prompted and click Save. The file is saved with a .jrds (JasperReports data
snapshot) extension.
4. Run the report to capture the report data in the file you just created.
To update a data snapshot with new data:
1. Select the Preview tab.
2. Right-click and deselect Cache Data in Memory.
3. Run the report to clear the cache.
4. Right-click , select Cache Data in Memory. If you want to save to a file, also select Save Data to File.
5. Run the report to update the latest report data.
To use a data snapshot:
1. Select the Preview tab.
2. Right-click and select Load From File.
3. Run the report.
The data in the snapshot is used to fill the report. Information about the snapshot is displayed in the Report
State window, including when the snapshot was created(Data Queried At) and the name and location of
the snapshot file.
TIBCO Software Inc. 429

TIBCO Jaspersoft Studio User Guide
430 TIBCO Software Inc.

APPENDIX A CONCEPTS OF JASPERREPORTS
This chapter illustrates JasperReports' base concepts for a better understanding of how Jaspersoft Studio works.
The JasperReports API, the XML syntax for report definition, and details for using the library in your own
programs are documented in the JasperReports Library Ultimate Guide. This guide, along with other
information and examples, is directly available on the Jaspersoft community site at
http://community.jaspersoft.com.
JasperReports is published under the LGPL license, which is a less restrictive GPL license. JasperReports can be
freely used on commercial programs without buying expensive software licenses and without remaining trapped
in the complicated net of open source licenses. This is important when reports created with Jaspersoft Studio are
used in a commercial product; in fact, programs only need the JasperReports library to produce prints, which
work something like runtime executables.
This chapter contains the following sections:
•JRXML Sources and Jasper Files
•Data Sources and Print Formats
•A Simple Program
A.1 JRXML Sources and Jasper Files
JasperReports defines a report with an XML file. A JRXML file is composed of a set of sections; some concerned
with the report’s physical characteristics (such as the dimensions of the page, positioning of the fields, and
height of the bands), and some concerned with the logical characteristics (such as the declaration of the
parameters and variables and the definition of a query for data selection).
A.1.1 The Report Lifecycle
The life cycle of a JasperReport is divided into two phases:
•Report development – designing and planning the report, creating a JRXML file, and compiling a Jasper
file from the JRXML.
•Report execution – loading the Jasper file, filling the report, and exporting the output (a Jasper print object)
in a final format.
Jaspersoft Studio is primarily focused on report development, though it is able to preview the result and export
it in all the supported formats. Jaspersoft Studio provides support for a wide range of data sources and allows
TIBCO Software Inc. 431

TIBCO Jaspersoft Studio User Guide
users to create custom data sources, thereby becoming a complete environment for report development and
testing.
When you design a report, you specify where the data comes from, how it is positioned on the page, and
additional functionality, such as parameters for input controls or complex formulas to perform calculations. The
result is a template, similar to a form containing blank space, that is filled with data when the report is executed.
The template is stored in a JRXML file, which is an XML document that contains the definition of the report
layout and design.
Before executing a report, the JRXML must be compiled in a binary object called a Jasper file. Jasper files are
what you need to ship with your application in order to run the reports.
Report execution is performed by passing a Jasper file and a data source to JasperReports. There are many data
source types. You can fill a Jasper file from an SQL query, an XML file, a .csv file, an HQL (Hibernate Query
Language) query, a collection of JavaBeans, and others. If you don't have a suitable data source, JasperReports
allows you to write your own custom data source. With a Jasper file and a data source, JasperReports is able to
generate the final document in the format you want.
Jaspersoft Studio also lets you configure data sources and use them to test your reports. In many cases, data-
driven wizards can help you design your reports much quicker. Jaspersoft Studio includes the JasperReports
engine itself to let you preview your report output, test, and refine your reports.
432 TIBCO Software Inc.

Appendix A Concepts of JasperReports
The following table shows sample report source code.
<?xml version="1.0" encoding="UTF-8"?>
<jasperReport xmlns="http://jasperreports.sourceforge.net/jasperreports"
xmlns:xsi="http://www.w3.org/2001/XMLSchema-instance"
xsi:schemaLocation="http://jasperreports.sourceforge.net/jasperreports
http://jasperreports.sourceforge.net/xsd/jasperreport.xsd"
name="My first report" pageWidth="595" pageHeight="842" columnWidth="535"
leftMargin="20" rightMargin="20" topMargin="20" bottomMargin="20">
<queryString language="SQL">
<![CDATA[select * from address order by city]]>
</queryString>
<field name="ID" class="java.lang.Integer">
<fieldDescription><![CDATA[]]></fieldDescription>
</field>
<field name="FIRSTNAME" class="java.lang.String">
<fieldDescription><![CDATA[]]></fieldDescription>
</field>
<field name="LASTNAME" class="java.lang.String">
<fieldDescription><![CDATA[]]></fieldDescription>
</field>
<field name="STREET" class="java.lang.String">
<fieldDescription><![CDATA[]]></fieldDescription>
</field>
<field name="CITY" class="java.lang.String">
<fieldDescription><![CDATA[]]></fieldDescription>
</field>
<group name="CITY">
<groupExpression><![CDATA[$F{CITY}]]></groupExpression>
<groupHeader>
<band height="27">
<staticText>
<reportElement mode="Opaque" x="0" y="0" width="139" height="27"
forecolor="#FFFFFF" backcolor="#000000"/>
<textElement>
<font size="18"/>
</textElement>
<text><![CDATA[CITY]]></text>
</staticText>
<textField hyperlinkType="None">
<reportElement mode="Opaque" x="139" y="0" width="416" height="27"
forecolor="#FFFFFF" backcolor="#000000"/>
<textElement>
<font size="18" isBold="true"/>
</textElement>
<textFieldExpression class="java.lang.String"><![CDATA[$F{CITY}]]>
</textFieldExpression>
</textField>
</band>
</groupHeader>
<groupFooter>
<band height="8">
<line direction="BottomUp">
<reportElement key="line" x="1" y="4" width="554" height="1"/>
</line>
Table A-1 A simple JRMXL file example
TIBCO Software Inc. 433

TIBCO Jaspersoft Studio User Guide
</band>
</groupFooter>
</group>
<background>
<band/>
</background>
<title>
<band height="58">
<line>
<reportElement x="0" y="8" width="555" height="1"/>
</line>
<line>
<reportElement positionType="FixRelativeToBottom" x="0" y="51" width="555"
height="1"/>
</line>
<staticText>
<reportElement x=”65” y=”13” width ”424” height=”35”/>
<textElement textAlignment=”Center”>
<font size=”26” isBold=”true”/>
</textElement>
<text><![CDATA[Classic template]]> </text>
</staticText>
</band>
</title>
<pageHeader>
<band/>
</pageHeader>
<columnHeader>
<band height="18">
<staticText>
<reportElement mode="Opaque" x="0" y="0" width="138" height="18"
forecolor="#FFFFFF" backcolor="#999999"/>
<textElement>
<font size="12"/>
</textElement>
<text><![CDATA[ID]]></text>
</staticText>
<staticText>
<reportElement mode="Opaque" x="138" y="0" width="138" height="18"
forecolor="#FFFFFF" backcolor="#999999"/>
<textElement>
<font size="12"/>
</textElement>
<text><![CDATA[FIRSTNAME]]></text>
</staticText>
<staticText>
<reportElement mode="Opaque" x="276" y="0" width="138" height="18"
forecolor="#FFFFFF" backcolor="#999999"/>
<textElement>
<font size="12"/>
</textElement>
<text><![CDATA[LASTNAME]]></text>
434 TIBCO Software Inc.

Appendix A Concepts of JasperReports
</staticText>
<staticText>
<reportElement mode="Opaque" x="414" y="0" width="138" height="18"
forecolor="#FFFFFF" backcolor="#999999"/>
<textElement>
<font size="12"/>
</textElement>
<text><![CDATA[STREET]]></text>
</staticText>
</band>
</columnHeader>
<detail>
<band height="20">
<textField hyperlinkType="None">
<reportElement x="0" y="0" width="138" height="20"/>
<textElement>
<font size="12"/>
</textElement>
<textFieldExpression class="java.lang.Integer"><![CDATA[$F{ID}]]>
</textFieldExpression>
</textField>
<textField hyperlinkType="None">
<reportElement x="138" y="0" width="138" height="20"/>
</textField>
<textElement>
<font size="12"/>
</textElement>
<textFieldExpression class="java.lang.String"><![CDATA[$F{FIRSTNAME}]]>
</textFieldExpression>
<textField hyperlinkType="None">
<reportElement x="276" y="0" width="138" height="20"/>
<textElement>
<font size="12"/>
</textElement>
<textFieldExpression class="java.lang.String"><![CDATA[$F{LASTNAME}]]>
</textFieldExpression>
</textField>
<textField hyperlinkType="None">
<reportElement x="414" y="0" width="138" height="20"/>
<textElement>
<font size="12"/>
</textElement>
<textFieldExpression class="java.lang.String"><![CDATA[$F{STREET}]]>
</textFieldExpression>
</textField>
</band>
</detail>
<columnFooter>
<band/>
</columnFooter>
<pageFooter>
<band height="26">
<textField evaluationTime="Report" pattern="" isBlankWhenNull="false"
hyperlinkType="None">
<reportElement key="textField" x="516" y="6" width="36" height="19"
forecolor="#000000" backcolor="#FFFFFF"/>
TIBCO Software Inc. 435

TIBCO Jaspersoft Studio User Guide
<textElement>
<font size="10"/>
</textElement>
<textFieldExpression class="java.lang.String"><![CDATA["" +
$V{PAGE_NUMBER}]]></textFieldExpression>
</textField>
<textField pattern="" isBlankWhenNull="false" hyperlinkType="None">
<reportElement key="textField" x="342" y="6" width="170" height="19"
forecolor="#000000" backcolor="#FFFFFF"/>
<box>
<topPen lineWidth="0.0" lineStyle="Solid" lineColor="#000000"/>
<leftPen lineWidth="0.0" lineStyle="Solid" lineColor="#000000"/>
<bottomPen lineWidth="0.0" lineStyle="Solid" lineColor="#000000"/>
<rightPen lineWidth="0.0" lineStyle="Solid" lineColor="#000000"/>
</box>
<textElement textAlignment="Right">
<font size="10"/>
</textElement>
<textFieldExpression class="java.lang.String"><![CDATA["Page " +
$V{PAGE_NUMBER} + " of "]]></textFieldExpression>
</textField>
<textField pattern="" isBlankWhenNull="false" hyperlinkType="None">
<reportElement key="textField" x="1" y="6" width="209" height="19"
forecolor="#000000" backcolor="#FFFFFF"/>
<box>
<topPen lineWidth="0.0" lineStyle="Solid" lineColor="#000000"/>
<leftPen lineWidth="0.0" lineStyle="Solid" lineColor="#000000"/>
<bottomPen lineWidth="0.0" lineStyle="Solid" lineColor="#000000"/>
<rightPen lineWidth="0.0" lineStyle="Solid" lineColor="#000000"/>
</box>
<textElement>
<font size="10"/>
</textElement>
<textFieldExpression class="java.util.Date"><![CDATA[new Date()]]>
</textFieldExpression>
</textField>
</band>
</pageFooter>
<summary>
<band/>
</summary>
</jasperReport>
During compilation of the JRXML file (using some JasperReports classes) the XML is parsed and loaded in a
JasperDesign object, which is a rich data structure that allows you to represent the exact XML contents in
memory. Regardless of the language used for expressions inside the JRXML, JasperReports creates a special Java
class that represents the whole report. The report is then compiled, instanced, and serialized in a JASPER file,
ready for loading at any time.
JasperReports' speedy operation is due to all of a report’s formulas being compiled into Java-native bytecode
and the report structure being verified during compilation instead of at run time. The JASPER file contains no
extraneous resources, such as images used in the report, resource bundles to run the report in different languages,
or extra scriptlets and external style definitions. All these resources must be provided by the host application
and located at run time.
436 TIBCO Software Inc.
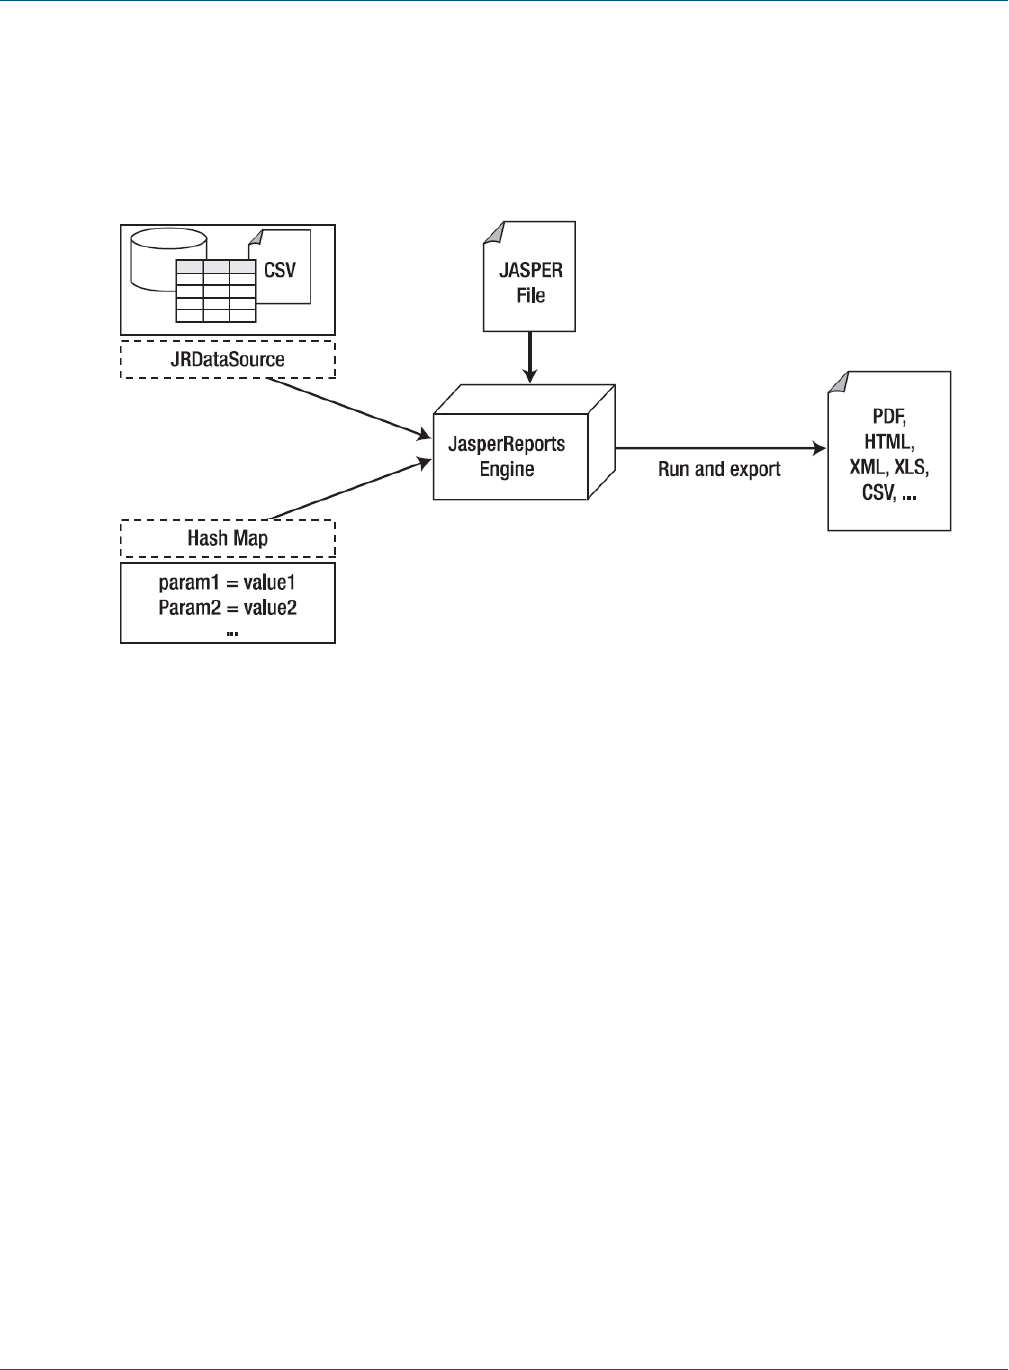
Appendix A Concepts of JasperReports
A.2 Data Sources and Print Formats
Without a means of supplying content from a dynamic data source, even the most sophisticated and appealing
report would be useless. JasperReports gives you two ways to specify fill data for the output report: parameters
and data sources. Both kinds of data are presented by means of a generic interface named JRDataSource.
Figure A-1 Data Source and Parameter Flows for Report Creation
JRDataSource allows a set of records organized in tables (rows and columns) to be read. It enables
JasperReports to fill a report with data from an explicit data source, using a JDBC connection (already instanced
and opened) to whichever relational database you want to run an SQL query on (which is specified in the
report).
If the data don't meet your requirements, you may need to specify values to condition the report’s execution;
you can create name/value pairs to pass to the print engine. These pairs are named parameters, and they have to
be preventatively declared in the report. Through fillManager, you can join a JASPER file and a data source
in a JasperPrint object. This object is a meta-print that can create a real print after you export it in the format of
your choice through appropriate classes that implement the JRExporter interface.
JasperReports give you pre-defined exporters, such as those for creating files formatted as PDF,XLS, CVS,
XML, RTF, ODF, text, HTML and SWF. Through the JRViewer class, you can view the print directly on the
screen and print a hard copy.
A.3 Using JasperReports Extensions in Jaspersoft Studio
JasperReports provides several ways to extend its functionality. In general, extensions (like components, fonts,
query executors, chart themes, and so on) are packaged in JARs. To use these extensions in Jaspersoft Studio,
just add the required JARs to the Jaspersoft Studio classpath. The Jaspersoft Studio classpath is composed of
static and reloadable paths. Extensions must be set as static paths, while objects that don’t require a proper
descriptor or special loading mechanism (such as scriptlets and custom data sources) can be reloadable.
TIBCO Software Inc. 437

TIBCO Jaspersoft Studio User Guide
A.4 A Simple Program
In conclusion, following is an example of a simple program that shows how to produce a PDF file from a Jasper
file using a data source named JREmptyDataSource, a utility data source that provides zero or more records
without fields. The file test.jasper, referenced in the example, is the compiled version of the code in Table A-1
on page 433.
import net.sf.jasperreports.engine.*;
import net.sf.jasperreports.engine.export.*;
import java.util.*;
public class JasperTest
{
public static void main(String[] args)
{
String fileName = "/devel/examples/test.jasper";
String outFileName = "/devel/examples/test.pdf";
HashMap hm = new HashMap();
try
{
JasperPrint print = JasperFillManager.fillReport(
fileName,
hm,
new JREmptyDataSource());
JRExporter exporter =
new net.sf.jasperreports.engine.export.JRPdfExporter();
exporter.setParameter(
JRExporterParameter.OUTPUT_FILE_NAME,
outFileName);
exporter.setParameter(
JRExporterParameter.JASPER_PRINT,print);
exporter.exportReport();
System.out.println("Created file: " + outFileName);
}
catch (JRException e)
{
e.printStackTrace();
System.exit(1);
}
catch (Exception e)
{
e.printStackTrace();
System.exit(1);
}
}
}
Table A-2 JasperTest.java
438 TIBCO Software Inc.

GLOSSARY
Ad Hoc Editor
The interactive data explorer in JasperReports Server Professional and Enterprise editions. Starting from a
predefined collection of fields, the Ad Hoc Editor lets you drag and drop fields, dimensions, and measures to
explore data and create tables, charts, and crosstabs. These Ad Hoc views can be saved as reports.
Ad Hoc Report
In previous versions of JasperReports Server, a report created through the Ad Hoc Editor. Such reports could be
added to dashboards and be scheduled, but when edited in Jaspersoft Studio, lost their grouping and sorting. In
the current version, the Ad Hoc Editor is used to explore views which in turn can be saved as reports. Such
reports can be edited in Jaspersoft Studio without loss, and can be scheduled and added to dashboards.
Ad Hoc View
A view of data that is based on a Domain, Topic, or OLAP client connection. An Ad Hoc view can be a table,
chart, or crosstab and is the entry point to analysis operations such as slice and dice, drill down, and drill
through. Compare OLAP View. You can save an Ad Hoc view as a report in order to edit it in the interactive
viewer, schedule it, or add it to a dashboard.
Aggregate Function
An aggregate function is one that is computed using a group of values; for example, Sum or Average. Aggregate
functions can be used to create calculated fields in Ad Hoc views. Calculated fields containing aggregate
functions cannot be used as fields or added to groups in an Ad Hoc view and should not be used as filters.
Aggregate functions allow you to set a level, which specifies the scope of the calculation; level values include
Current (not available for PercentOf), ColumnGroup, ColumnTotal, RowGroup, RowTotal, Total.
Amazon Web Services (AWS)
Cloud platform, used to provide and host a family of services, such as RDS, S3, and EC2.
Analysis View
See OLAP View.
Audit Archiving
To prevent audit logs from growing too large to be easily accessed, the installer configures JasperReports Server
to move current audit logs to an archive after a certain number of days, and to delete logs in the archive after a
certain age. The archive is another table in the JasperReports Server's repository database.
TIBCO Software Inc. 439

TIBCO Jaspersoft Studio User Guide
Audit Domains
A Domain that accesses audit data in the repository and lets administrators create Ad Hoc reports of server
activity. There is one Domain for current audit logs and one for archived logs.
Audit Logging
When auditing is enabled, audit logging is the active recording of who used JasperReports Server to do what
when. The system installer can configure what activities to log, the amount of detail gathered, and when to
archive the data. Audit logs are stored in the same private database that JasperReports Server uses to store the
repository, but the data is only accessible through the audit Domains.
Auditing
A feature of JasperReports Server Enterprise edition that records all server activity and allows administrators to
view the data.
Calculated Field
In an Ad Hoc view or a Domain, a field whose value is calculated from a user-defined formula that may include
any number of fields, operators, and constants. For Domains, a calculated field becomes one of the items to
which the Domain's security file and locale bundles can apply. There are more functions available for Ad Hoc
view calculations than for Domains.
CloudFormation (CF)
Amazon Web Services CloudFormation gives developers and systems administrators an easy way to create and
manage a collection of related AWS resources, provisioning, and updating them in an orderly and predictable
fashion.
CRM
Customer Relationship Management. The practice of managing every facet of a company's interactions with its
clientele. CRM applications help businesses track and support their customers.
CrossJoin
An MDX function that combines two or more dimensions into a single axis (column or row).
Cube
The basis of most OLAP applications, a cube is a data structure that contains three or more dimensions that
categorize the cube's quantitative data. When you navigate the data displayed in an OLAP view, you are
exploring a cube.
Custom Field
In the Ad Hoc Editor, a field that is created through menu items as a simple function of one or two available
fields, including other custom fields. When a custom field becomes too complex or needs to be used in many
reports, it is best to define it as a calculated field in a Domain.
Dashboard
A collection of reports, input controls, graphics, labels, and web content displayed in a single, integrated view.
Dashboards often present a high level view of your data, but input controls can parametrize the data to display.
For example, you can narrow down the data to a specific date range. Embedded web content, such as other web-
based applications or maps, make dashboards more interactive and functional.
Dashlet
An element in a dashboard. Dashlets are defined by editable properties that vary depending on the dashlet type.
Types of dashlet include reports, text elements, filters, and external web content.
440 TIBCO Software Inc.

Glossary
Data Island
A single join tree or a table without joins in a Domain. A Domain may contain several data islands, but when
creating an Ad Hoc view from a Domain, you can only select one of them to be available in the view.
Data Policy
In JasperReports Server, a setting that determines how the server processes and caches data used by Ad Hoc
reports. Select your data policies by clicking Manage > Server > Settings Ad Hoc Settings. By default, this
setting is only available to the superuser account.
Data Source
Defines the connection properties that JasperReports Server needs to access data. The server transmits queries to
data sources and obtains datasets in return for use in filling reports and previewing Ad Hoc reports.
JasperReports Server supports JDBC, JNDI, and Bean data sources; custom data sources can be defined as well.
Dataset
A collection of data arranged in columns and rows. Datasets are equivalent to relational results sets and the
JRDataSource type in the JasperReports Library.
Datatype
In JasperReports Server, a datatype is used to characterize a value entered through an input control. A datatype
must be of type text, number, date, or date-time. It can include constraints on the value of the input, for example
maximum and minimum values. As such, a datatype in JasperReports Server is more structured than a datatype
in most programming languages.
Denormalize
A process for creating table joins that speeds up data retrieval at the cost of having duplicate row values
between some columns.
Derived Table
In a Domain, a derived table is defined by an additional query whose result becomes another set of items
available in the Domain. For example, with a JDBC data source, you can write an SQL query that includes
complex functions for selecting data. You can use the items in a derived table for other operations on the
Domain, such as joining tables, defining a calculated field, or filtering. The items in a derived table can also be
referenced in the Domain's security file and locale bundles.
Dice
An OLAP operation to select columns.
Dimension
A categorization of the data in a cube. For example, a cube that stores data about sales figures might include
dimensions such as time, product, region, and customer's industry.
Domain
A virtual view of a data source that presents the data in business terms, allows for localization, and provides
data-level security. A Domain is not a view of the database in relational terms, but it implements the same
functionality within JasperReports Server. The design of a Domain specifies tables in the database, join clauses,
calculated fields, display names, and default properties, all of which define items and sets of items for creating
Ad Hoc reports.
TIBCO Software Inc. 441

TIBCO Jaspersoft Studio User Guide
Domain Topic
A Topic that is created from a Domain by the Data Chooser. A Domain Topic is based on the data source and
items in a Domain, but it allows further filtering, user input, and selection of items. Unlike a JRXML-based
Topic, a Domain Topic can be edited in JasperReports Server by users with the appropriate permissions.
Drill
To click on an element of an OLAP view to change the data that is displayed:
•Drill down. An OLAP operation that exposes more detailed information down the hierarchy levels by
delving deeper into the hierarchy and updating the contents of the navigation table.
•Drill through. An OLAP operation that displays detailed transactional data for a given aggregate measure.
Click a fact to open a new table beneath the main navigation table; the new table displays the low-level
data that constitutes the data that was clicked.
•Drill up. An OLAP operation for returning the parent hierarchy level to view to summary information.
Eclipse
An open source Integrated Development Environment (IDE) for Java and other programming languages, such as
C/C++.
ETL
Extract, Transform, Load. A process that retrieves data from transactional systems, and filters and aggregates the
data to create a multidimensional database. Generally, ETL prepares the database that your reports will access.
The Jaspersoft ETL product lets you define and schedule ETL processes.
Fact
The specific value or aggregate value of a measure for a particular member of a dimension. Facts are typically
numeric.
Field
A field is equivalent to a column in the relational database model. Fields originate in the structure of the data
source, but you may define calculated fields in a Domain or custom fields in the Ad Hoc Editor. Any type of
field, along with its display name and default formatting properties, is called an item and may be used in the Ad
Hoc Editor.
Frame
In Jaspersoft Studio, a frame is a rectangular element that can contain other elements and optionally draw a
border around them. Elements inside a frame are positioned relative to the frame, not to the band, and when you
move a frame, all the elements contained in the frame move together. A frame automatically stretches to fit its
contents.
Group
In a report, a group is a set of data rows that have an identical value in a designated field.
•In a table, the value appears in a header and footer around the rows of the group, while the other fields
appear as columns.
•In a chart, the field chosen to define the group becomes the independent variable on the X axis, while the
other fields of each group are used to compute the dependent value on the Y axis.
Hierarchy Level
In an OLAP cube, a member of a dimension containing a group of members.
442 TIBCO Software Inc.

Glossary
Input Control
A button, check box, drop-down list, text field, or calendar icon that allows users to enter a value when running
a report or viewing a dashboard that accepts input parameters. For JRXML reports, input controls and their
associated datatypes must be defined as repository objects and explicitly associated with the report. For
Domain-based reports that prompt for filter values, the input controls are defined internally. When either type of
report is used in a dashboard, its input controls are available to be added as special content.
Item
When designing a Domain or creating a Topic based on a Domain, an item is the representation of a database
field or a calculated field along with its display name and formatting properties defined in the Domain. Items
can be grouped in sets and are available for use in the creation of Ad Hoc reports.
JasperReport
A combination of a report template and data that produces a complex document for viewing, printing, or
archiving information. In the server, a JasperReport references other resources in the repository:
•The report template (in the form of a JRXML file)
•Information about the data source that supplies data for the report
•Any additional resources, such as images, fonts, and resource bundles referenced by the report template.
The collection of all the resources that are referenced in a JasperReport is sometimes called a report unit. End
users usually see and interact with a JasperReport as a single resource in the repository, but report creators must
define all of the components in the report unit.
JasperReports IO
An HTTP-based reporting service for JasperReports Library that provides a REST API for running, exporting,
and interacting with reports and a JavaScript API for embedding reports and their input controls into your web
pages and web applications.
JasperReports Library
An embeddable, open source, Java API for generating a report, filling it with current data, drawing charts and
tables, and exporting to any standard format (HTML, PDF, Excel, CSV, and others). JasperReports processes
reports defined in JRXML, an open XML format that allows the report to contain expressions and logic to
control report output based on run-time data.
JasperReports Server
A commercial open source, server-based application that calls the JasperReports Library to generate and share
reports securely. JasperReports Server authenticates users and lets them upload, run, view, schedule, and send
reports from a web browser. Commercial versions provide metadata layers, interactive report and dashboard
creation, and enterprise features such as organizations and auditing.
Jaspersoft Studio
A commercial open source tool for graphically designing reports that leverage all features of the JasperReports
Library. Jaspersoft Studio lets you drag and drop fields, charts, and sub-reports onto a canvas, and also define
parameters or expressions for each object to create pixel-perfect reports. You can generate the JRXML of the
report directly in Jaspersoft Studio, or upload it to JasperReports Server. Jaspersoft Studio is implemented in
Eclipse.
Jaspersoft ETL
A graphical tool for designing and implementing your data extraction, transforming, and loading (ETL) tasks. It
provides hundreds of data source connectors to extract data from many relational and non-relational systems.
TIBCO Software Inc. 443

TIBCO Jaspersoft Studio User Guide
Then, it schedules and performs data aggregation and integration into data marts or data warehouses that you
use for reporting.
Jaspersoft OLAP
A relational OLAP server integrated into JasperReports Server that performs data analysis with MDX queries.
The product includes query builders and visualization clients that help users explore and make sense of
multidimensional data. Jaspersoft OLAP also supports XML/A connections to remote servers.
Jaspersoft Studio
An open source tool for graphically designing reports that leverage all features of the JasperReports Library.
Jaspersoft Studio lets you drag and drop fields, charts, and sub-reports onto a canvas, and also define parameters
or expressions for each object to create pixel-perfect reports. You can generate the JRXML of the report directly
in Jaspersoft Studio, or upload it to JasperReports Server. Jaspersoft Studio is implemented in Eclipse.
JavaBean
A reusable Java component that can be dropped into an application container to provide standard functionality.
JDBC
Java Database Connectivity. A standard interface that Java applications use to access databases.
JNDI
Java Naming and Directory Interface. A standard interface that Java applications use to access naming and
directory services.
Join Tree
In Domains, a collection of joined tables from the actual data source. A join is the relational operation that
associates the rows of one table with the rows of another table based on a common value in given field of each
table. Only the fields in a same join tree or calculated from the fields in a same join tree may appear together in
a report.
JPivot
An open source graphical user interface for OLAP operations. For more information, visit
http://jpivot.sourceforge.net/.
JRXML
An XML file format for saving and sharing reports created for the JasperReports Library and the applications
that use it, such as Jaspersoft Studio and JasperReports Server. JRXML is an open format that uses the XML
standard to define precisely all the structure and configuration of a report.
Level
Specifies the scope of an aggregate function in an Ad Hoc view. Level values include Current (not available for
PercentOf), ColumnGroup, ColumnTotal, RowGroup, RowTotal, Total.
MDX
Multidimensional Expression Language. A language for querying multidimensional objects, such as OLAP (On
Line Analytical Processing) cubes, and returning cube data for analytical processing. An MDX query is the
query that determines the data displayed in an OLAP view.
Measure
Depending on the context:
•In a report, a formula that calculates the values displayed in a table's columns, a crosstab's data values, or a
chart's dependent variable (such as the slices in a pie).
444 TIBCO Software Inc.

Glossary
•In an OLAP view, a formula that calculates the facts that constitute the quantitative data in a cube.
Mondrian
A Java-based, open source multidimensional database application.
Mondrian Connection
An OLAP client connection that consists of an OLAP schema and a data source. OLAP client connections
populate OLAP views.
Mondrian Schema Editor
An open source Eclipse plug-in for creating Mondrian OLAP schemas.
Mondrian XML/A Source
A server-side XML/A source definition of a remote client-side XML/A connection used to populate an OLAP
view using the XML/A standard.
MySQL
An open source relational database management system. For information, visit http://www.mysql.com/.
Navigation Table
The main table in an OLAP view that displays measures and dimensions as columns and rows.
ODBO Connect
Jaspersoft ODBO Connect enables Microsoft Excel 2003 and 2007 Pivot Tables to work with Jaspersoft OLAP
and other OLAP servers that support the XML/A protocol. After setting up the Jaspersoft ODBO data source,
business analysts can use Excel Pivot Tables as a front-end for OLAP analysis.
OLAP
On Line Analytical Processing. Provides multidimensional views of data that help users analyze current and past
performance and model future scenarios.
OLAP Client Connection
A definition for retrieving data to populate an OLAP view. An OLAP client connection is either a direct Java
connection (Mondrian connection) or an XML-based API connection (XML/A connection).
OLAP Schema
A metadata definition of a multidimensional database. In Jaspersoft OLAP, schemas are stored in the repository
as XML file resources.
OLAP View
Also called an analysis view. A view of multidimensional data that is based on an OLAP client connection and
an MDX query. Unlike Ad Hoc views, you can directly edit an OLAP view's MDX query to change the data
and the way they are displayed. An OLAP view is the entry point for advanced analysis users who want to
write their own queries. Compare Ad Hoc View.
Organization
A set of users that share folders and resources in the repository. An organization has its own user accounts, roles,
and root folder in the repository to securely isolate it from other organizations that may be hosted on the same
instance of JasperReports Server.
TIBCO Software Inc. 445

TIBCO Jaspersoft Studio User Guide
Organization Admin
Also called the organization administrator. A user in an organization with the privileges to manage the
organization's user accounts and roles, repository permissions, and repository content. An organization admin
can also create suborganizations and mange all of their accounts, roles, and repository objects. The default
organization admin in each organization is the jasperadmin account.
Outlier
A fact that seems incongruous when compared to other member's facts. For example, a very low sales figure or a
very high number of help desk tickets. Such outliers may indicate a problem (or an important achievement) in
your business. The analysis features of Jaspersoft OLAP excel at revealing outliers.
Parameter
Named values that are passed to the engine at report-filling time to control the data returned or the appearance
and formatting of the report. A report parameter is defined by its name and type. In JasperReports Server,
parameters can be mapped to input controls that users can interact with.
Pivot
To rotate a crosstab such that its row groups become column groups and its column groups become rows. In the
Ad Hoc Editor, pivot a crosstab by clicking .
Pivot Table
A table with two physical dimensions (for example, X and Y axis) for organizing information containing more
than two logical dimensions (for example, PRODUCT, CUSTOMER, TIME, and LOCATION), such that each
physical dimension is capable of representing one or more logical dimensions, where the values described by
the dimensions are aggregated using a function such as SUM. Pivot tables are used in Jaspersoft OLAP.
Properties
Settings associated with an object. The settings determine certain features of the object, such as its color and
label. Properties are normally editable. In Java, properties can be set in files listing objects and their settings.
Report
In casual usage, report may refer to:
•A JasperReport. See JasperReport.
•The main JRXML in a JasperReport.
•The file generated when a JasperReport is scheduled. Such files are also called content resources or output
files.
•The file generated when a JasperReport is run and then exported.
•In previous JasperReports Server versions, a report created in the Ad Hoc Editor. See Ad Hoc Report.
Report Run
An execution of a report, Ad Hoc view, or dashboard, or a view or dashboard designer session, it measures and
limits usage of Freemium instances of JasperReports Server. The executions apply to resources no matter how
they are run (either in the web interface or through the various APIs, such as REST web services). Users of our
Community Project and our full-use commercial licenses are not affected by the limit. For more information,
please contact sales@jaspersoft.com.
Repository
Depending on the context:
446 TIBCO Software Inc.

Glossary
•In JasperReports Server, the repository is the tree structure of folders that contain all saved reports,
dashboards, OLAP views, and resources. Users access the repository through the JasperReports Server web
interface or through Jaspersoft Studio. Applications can access the repository through the web service API.
Administrators use the import and export utilities to back up the repository contents.
•In JasperReports IO, the repository is where all the resources needed to create and run reports are stored. The
repository can be stored in a directory on the host computer or in an S3 bucket hosted by Amazon Web
Services. Users access the repository through a file browser on the host machine or through the AWS
console.
Resource
In JasperReports Server, anything residing in the repository, such as an image, file, font, data source, Topic,
Domain, report element, saved report, report output, dashboard, or OLAP view. Resources also include the
folders in the repository. Administrators set user and role-based access permissions on repository resources to
establish a security policy.
Role
A security feature of JasperReports Server. Administrators create named roles, assign them to user accounts, and
then set access permissions to repository objects based on those roles. Certain roles also determine what
functionality and menu options are displayed to users in the JasperReports Server interface.
S3 Bucket
Cloud storage system for Amazon Web Services. JasperReports IO can use an S3 bucket to store files for its
repository.
Schema
A logical model that determines how data is stored. For example, the schema in a relational database is a
description of the relationships between tables, views, and indexes. In Jaspersoft OLAP, an OLAP schema is the
logical model of the data that appears in an OLAP view; they are uploaded to the repository as resources. For
Domains, schemas are represented in XML design files.
Schema Workbench
A graphical tool for easily designing OLAP schemas, data security schemas, and MDX queries. The resulting
cube and query definitions can then be used in Jaspersoft OLAP to perform simple but powerful analysis of
large quantities of multi-dimensional data stored in standard RDBMS systems.
Set
In Domains and Domain Topics, a named collection of items grouped together for ease of use in the Ad Hoc
Editor. A set can be based on the fields in a table or entirely defined by the Domain creator, but all items in a
set must originate in the same join tree. The order of items in a set is preserved.
Slice
An OLAP operation for filtering data rows.
SQL
Structured Query Language. A standard language used to access and manipulate data and schemas in a
relational database.
Stack
A collection of Amazon Web Services resources you create and delete as a single unit.
TIBCO Software Inc. 447

TIBCO Jaspersoft Studio User Guide
System Admin
Also called the system administrator. A user who has unlimited access to manage all organizations, users, roles,
repository permissions, and repository objects across the entire JasperReports Server instance. The system admin
can create root-level organizations and manage all server settings. The default system admin is the superuser
account.
Topic
A JRXML file created externally and uploaded to JasperReports Server as a basis for Ad Hoc reports. Topics are
created by business analysts to specify a data source and a list of fields with which business users can create
reports in the Ad Hoc Editor. Topics are stored in the Ad Hoc Components folder of the repository and
displayed when a user launches the Ad Hoc Editor.
Transactional Data
Data that describe measurable aspects of an event, such as a retail transaction, relevant to your business.
Transactional data are often stored in relational databases, with one row for each event and a table column or
field for each measure.
User
Depending on the context:
•A person who interacts with JasperReports Server through the web interface. There are generally three
categories of users: administrators who install and configure JasperReports Server, database experts or
business analysts who create data sources and Domains, and business users who create and view reports and
dashboards.
•A user account that has an ID and password to enforce authentication. Both people and API calls accessing
the server must provide the ID and password of a valid user account. Roles are assigned to user accounts to
determine access to objects in the repository.
View
Several meanings pertain to JasperReports Server:
•An Ad Hoc view. See Ad Hoc View.
•An OLAP view. See OLAP View.
•A database view. See http://en.wikipedia.org/wiki/View_%28database%29.
Virtual Data Source
A virtual data source allows you to combine data residing in multiple JDBC and/or JNDI data sources into a
single data source that can query the combined data. Once you have created a virtual data source, you create
Domains that join tables across the data sources to define the relationships between the data sources.
WCF
Web Component Framework. A low-level GUI component of JPivot. For more information, see
http://jpivot.sourceforge.net/wcf/index.html.
Web Services
A SOAP (Simple Object Access Protocol) API that enables applications to access certain features of
JasperReports Server. The features include repository, scheduling and user administration tasks.
XML
eXtensible Markup language. A standard for defining, transferring, and interpreting data for use across any
number of XML-enabled applications.
448 TIBCO Software Inc.

Glossary
XML/A
XML for Analysis. An XML standard that uses Simple Object Access protocol (SOAP) to access remote data
sources. For more information, see http://www.xmla.org/.
XML/A Connection
A type of OLAP client connection that consists of Simple Object Access Protocol (SOAP) definitions used to
access data on a remote server. OLAP client connections populate OLAP views.
TIBCO Software Inc. 449

TIBCO Jaspersoft Studio User Guide
450 TIBCO Software Inc.

.
.ini file 422
A
Ad Hoc views
localizing 222
resources 222
adding resources to the server 222
advanced properties 56
anchors 71
B
bands
advanced properties 56
Beans SeeJava
bookmarks 71
C
Cassandra connections 158
chart reports
theme for 224
charts
combination charts 320
datasets 273
dual-axis charts 320
multi-axis charts 320
scatter charts 316
themes 282
three-dimensional pie 273
types 273
ClassNotFound error 149
classpath 149
cleaning cached data 421
columns
column groups 268, 270-271
in Table component 268, 270
configuration
cleaning cached data 421
for JasperReports IO 240
connections
Cassandra 158
creating 147
importing from a workspace 18
JasperReports Server SeeJasperReports Server
JDBC 147
MongoDB 153
containers
grid layout 49
creating
HTML5 charts 298, 306
report templates for JasperReports Server 216
crosstabs
adding a measure 353
adding a row group 349
creating 340
crosstab parameters 346, 355
crosstab total variables 352
custom calcuation 352
datasets 341
defined 339
editing group expressions 347
INDEX
TIBCO Software Inc. 451

TIBCO Jaspersoft Studio User Guide
measures 351
properties 345
resizing columns 346
row and column groups 347
time fields and aggregation 342
CSV
Add node as field 168
data adapters 172
PersonBean 163
custom visualization component 76
D
D3 JavaScript library 76
data adapters
and datasets 245
Cassandra 158
collection of JavaBeans 160
copying 144
creating 142
CSV 172
default 145
Domain JRS 227
exporting 143
file-based 142
global 142
importing 143
importing from a workspace 19
in a project 142
in reports 145
JavaBeans 160
MongoDB 153
net.sf.jasperreports.data.adapter property 145
overview 141
publishing to JasperReports Server 212
Spotfire Information Links 188
using 145
XML 163
data snapshots 428
data sources
JRDataSource 185-186, 437
JREmptyDataSource 183
JRXmlDataSource 169
subreports 397
dataset and query dialog, discovering fields 198
dataset runs 243-244
connection expression 250
data source expression 250
parameters 251
parameters maps 252
return values 252
datasets 243
and data adapters 245
data adapters 249
dataset wizard 245
default data adapter 249
empty datasets 245
filter expressions 248
for Table component 259, 267
in charts 273
in crosstabs 341
localization 249
main datasets 243
outline view 246
properties view 247
reference 245
resource bundles 249
resource missing 248
scriptlets 249
subdatasets 243
types 273
declaring objects 79
default data adapter 249
Design tab 34
Domains 227
drivers 148-150
E
elements
adding and deleting 28-29
advanced properties 56
attributes 46
containers 49
in cells 269
in reports 28
in tables 268
layout 49
palette 29
Properties view 49
Subreport 395
extensions 437
452 TIBCO Software Inc.

Index
F
fields
adding to reports 28
CLOB 118
discovering 198
double 120
filtering 152
in Dataset and Query dialog 196
in Groovy expressions 120
in Java expressions 120
in SQL queries 80
Java types vs. SQL types 151
null 42, 120
properties 80
sorting 152
units of measure in 419
filter expressions 248
filtering fields 152
folders
repository 222
workspace 16
font extensions 123
creating 130
using in a report 135
fonts
excluding scripts in font sets 129
extensions 123
font mappings 127
font sets 129
for PDF files 123
Unicode 119
uploading to JasperReports Server 138
using font extensions 135
G
GeoAnalytics 377
getFieldValue 186
grid layout 49
Groovy 115
groups
column groups 268, 270-271
creating 404
Group Band 36, 404
Group Footer 36, 402
Group Header 36, 402
H
hardware requirements 15
HTML5 charts
hyperlinks 327
HTML5 charts
advanced configuration 316
advanced formatting 335
advanced formatting example 313
advanced settings 337
area 298
area spline 298
available chart types 291
bar 298
column 298
column-line charts 320
column-spline charts 320
creating 298
disabling chart types options 337
formatting 303
hyperlinks 305
hyperlinks to report units 333
line 298
multi-axis charts 320
multi-axis column charts 320
multi-axis line charts 320
multi-axis spline charts 320
overview 291
pie chart 306
preview in HTML5 Chart Edit Dialog 300
scatter charts 316
spider column 298
spider line 298
spline 298
stacked area 298
stacked area-spline 298
stacked bar 298
stacked column 298
stacked column-line charts 320
stacked column-spline charts 320
stacked line 298
stacked percent area 298
stacked percent area-spline 298
stacked percent bar 298
stacked percent column 298
stacked percent line 298
TIBCO Software Inc. 453

TIBCO Jaspersoft Studio User Guide
stacked percent spline 298
time-series charts 310
tree map 312
hyperlinks 71
HTML5 charts 305, 327
parameters in URL 72
URL 72
hypertext Seehyperlinks
I
importing
data adapters 19
JasperReport IO resources 239
server connections from a workspace 18
settings 19
increment expression
HTML5 charts example 301
Incrementer 352
Information Links 188
initialization 421
input controls 224
installation 14
iReport, user interface comparison 35
J
JasperReports
and Groovy 120
and Java 119
and JavaScript 121
compatiblity between versions 20
documentation 431
expressions 115
extensions 437
library 39, 45, 431
license 431
properties 419
samples 419
JasperReports IO
changing repository type 240
exporting resources 241
importing resources 239
previewing reports 241
report execution contexts 236
repository 235
testing reports 239
JasperReports Server
choosing a data source 212
connecting to 206
creating a Topic in Jaspersoft Studio 220
date/time stamp for scheduled reports 231
editing a JRXML file 223
editing a report unit 224
publishing report templates to 218
publishing reports to 212
repo syntax 231
repository 223
running a report 223
SSL 208
uploading fonts 138
Jaspersoft OLAP prerequisites 14
Jaspersoft Studio
installing 14
source code 21
Java
enabling in Eclipse 427
JasperReports IO report execution contexts 236
JavaBeans data adapter 160
JavaScript 115
perspective 427
JavaScript 76
JDBC connections 147
JDBC drivers 148-150
JFreeChart 278
JRChart 278
JRDataSource 184-186, 397, 437
JREmptyDataSource 183
subreports 397
JRExporter 437
JRFileSystemDataSource 187-188
JRViewer 437
JRXML files
about 432
editing in the server 223
example 433
field names in 222
JRXmlDataSource 169
L
languages
Java types vs. SQL types 151
MDX 171
454 TIBCO Software Inc.

Index
XPath 163
layers in TIBCO Maps 381
layout
restoring 34
tables 270
locales
in Ad Hoc views 222
REPORT_LOCALE parameter 96
localization
datasets 249
M
map component (Google Maps)
and markers 360, 364
and paths 369
using expressions for properties 373
map component (TIBCO GeoAnalytics)
and layers 381
and markers 382, 385
and paths 388
basic structure 378
configuring 378
overview 377
using expressions for properties 380
markers
in Google Maps 360, 364
markers in TIBCO Maps 382, 385
measures
adding to a crosstab 353
Microsoft SQL Server Analytic Services 170
MongoDB
specifying queries 155
N
net.sf.jasperreports.data.adapter property 145
O
Outline view 34
outputs 437
P
page format 37
palette 46
parameter set 105
parameters
adding and deleting 91
date/timestamp for scheduled reports 231
default 91, 96
in Dataset and Query dialog 196
in dataset runs 251
in subreports 397
values 91, 103
parameters maps
and subdatasets 252
paths
in Google Maps 369
in TIBCO Maps 388
PDF
font features 123
perspective 34
Pie3D 273
prerequisites for Jaspersoft OLAP 14
Preview tab 34
previewing data 196
printing 84, 394
Problems view 35
Project Explorer 34
projects
data adapters and 142
importing 16
importing from a workspace 17
upgrading 16
properties
advanced 56
advanced properties in HTML5 charts 337
fields 80
JasperReports 419
Properties view 34, 49
report properties 34, 37
setting on multiple levels 337
publishing
report templates 218
reports 212
Q
queries
fields 151
MongoDB 155
results 152
specifying 151, 160
SQL 151, 160
TIBCO Software Inc. 455

TIBCO Jaspersoft Studio User Guide
query languages
configuring menu 196-197
domain 227
selecting 196
types 82
XPath 168, 199
R
records
filtering 196
sorting 196
records, filtering 152
records, sorting 152
repo syntax 231
report editor 34
Report state 35
report templates
and JSS 219
in JasperReports Server 216
previewing in JasperReports IO 241
publishing to JasperReports Server 218
reports 428
advanced properties 56
charts 273
crosstabs 339
data adapters and 145
output files 437
page format 37
properties 34, 37
publishing to JasperReports Server 212, 215
setting advanced properties 337
repository
in JasperReports Server 223
JasperReports IO file system 235
Repository Explorer 34
resource bundles 249
resource missing type 248
resources
adding to Jaspersoft Studio from the server 222
and Ad Hoc views 222
selecting 215
restoring windows and views 34
return values
and dataset runs 252
S
samples 419
scatter charts 316
scripting languages 115
scriptlets 249
Select Resources window 215
settings
importing from a workspace 19
software requirements 14
sorting fields 152
sorting records 196
source code 21
Source tab 34
Spotfire Information Links 188
SQL queries
field types 151
fields 80
results 152
specifying 151, 160
SSL connections to JasperReports Server 208
startup
cleaning cached data 421
subdatasets 243, 259, 267
example 252
Subreport element 395
subreports
about 391
and XML data sources 168
creating 392, 394
data sources 397
dimensions in master report 395
empty datasource in 397
expression property 396
in bands 36
JDBC connections in 153
parameters 397
printing 394
properties 395
Subreport Wizard 391
T
table component 259
editing 270
layout 270
table styles 265
456 TIBCO Software Inc.

Index
Test button 150
text Seefonts
themes 282
themes, for charts 224
TIBCO Spotfire Information Links 188
time fields
in crosstabs 342
Topics 220
field names in 222
localization 222
trust store 208
U
Unicode 119
W
workspace
importing projects 16-17
upgrading 16-17
X
XML
data sources 163
report file 431
XML/A 170-171
XPath 163, 168
TIBCO Software Inc. 457

TIBCO Jaspersoft Studio User Guide
458 TIBCO Software Inc.
