Judging Manual Water Resources
User Manual:
Open the PDF directly: View PDF ![]() .
.
Page Count: 3
Hello Judges! Thanks so much for your help with reviewing the competition entries.
Here’s the process you will use to review the team submissions. Get ready to send in your
scores and comments, and come prepared to the final event ready for judging!
● Dec 6: entries submitted to GitHub, OIT Tech Team documents completeness
● Dec 7-11: Judging submissions based on ppt slides as “Virtual Presentation” to
complete the judges scoresheets.
● Dec 11: At the final event, teams have demos on tabletops with their own computers.
Attendees ask questions and walk around to see demos. 30 minutes before winners
are announced, judges will meet with fellow judges to discuss determine each
category winner.
○ 3-4:30 all teams have demos on tabletops with their own computers along with
appetizers and mingling
■ Judges bring printed version of scoresheet and a pencil to make
additional comments after talking with teams. Judges can also make a
decision solely on the GitHub submissions, and viewing the tabletop is not
mandatory.
○ 4:30-5:00 Judges final deliberation in conference room
○ 5pm The winners are announced
How to view repos and presentations in GitHub
The following teams submitted a final powerpoint presentation:
●GoCO
○ “GoCO_FinalSubmission.pptx”
●H2inf0rmation
○ “Water Portal Kevin B SMART DATA ANALYTICS CHALLENGE .pptx”
●Open Water Foundation
○ “PowerPoint-generated PDF” in ReadMe
●Nexus Colorado
○ “Colorado Nexus Final Submission.pptx”
●Regis Waterlytics CO

○ “ColoradoCDO_AnalyticsChallenge_Final_Submission_Regis Waterlytics
Co_FINAL.pptx”
How to Score the Teams
Dec 7 - Dec 11
1. Begin by navigating to the the Analytics Challenge Judges Toolkit.
2. Download a copy and open the scoresheet template from github on your local machine,
and save it as “scoresheet_yourName” for when you email it to the CDO
(jon.gottsegen@state.co.us).
a. Rename the tables in your document to reflect the teams you are judging for your
category, and include your name for when they are printed.
b. Also download a copy of the “Judges Manual” for your competition category.
3. Look at each team’s ppt in their repo and use the judging criteria to determine their
scores based on how they articulate their effort in each scoring category in their ppt.
a. Use the Data Analytics Judging Criteria
b. When necessary, look further into their repo to see details that the reference in
their ppt.
c. Specifically for the “presentation” score, use their ppt in their repo as a “Virtual
Presentation” - how easy is it for you to understand their concept, analysis and
results as well as access any details in other materials in the repo.
4. Score each team using your computer, it will be easier to make changes as you work
your way through the teams.
a. Provide a score 1-5 (higher scores are better scores).
i. You do NOT need to total the scores or calculate the weights at this time.
b. After you have scored all the teams, use the COMMENTS to write-in your “1st”,
“2nd” and “3rd” choices for the winner of the category.
5. Finalize Scores, Ranks and Comments
a. After emailing, print out and bring to judging
b. Printed version can be used for additional notes and for comparing notes with
other judges and to determine the category winner in the event there is a tie in
the judges selection for 1st place.
6. Best-of-Show
a. In addition to track winners, we are asking all judges to review the presentation
files of all items in all categories. To accomplish this, we ask that you review all
competition entries, but without the ‘relevance’ score - this will allow us to look at
teams with level comparison.
i. You will still use your same scoresheet for reviewing teams for
best-in-show - just be sure to make note of a “best-in-show’ review in the
“competition track” spot at the top of the sheet.
ii. The main difference is that in your track we ask you do a deep dive and
look into repositories, and for best-in-show only to look at their
presentation slides.
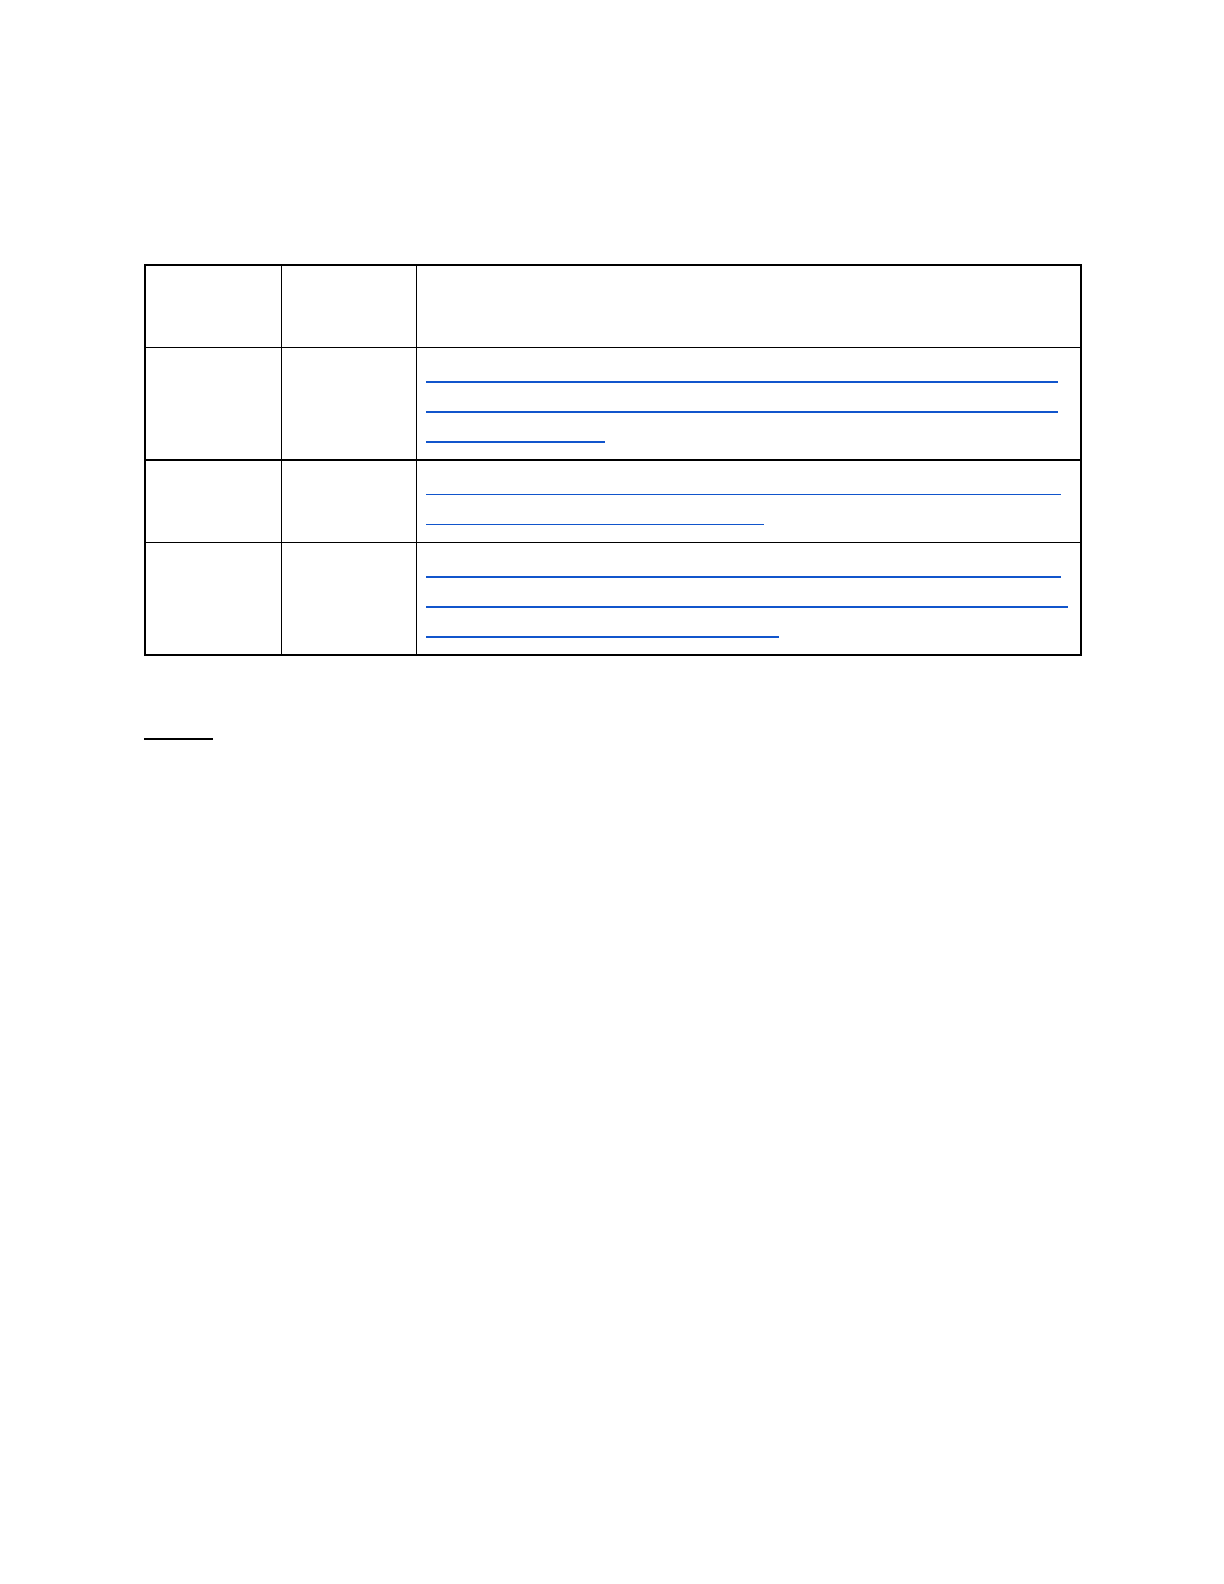
Team
Name
Category
Final Submission PowerPoint
Opioid
SOS
Opioid
Crisis
https://github.com/Colorado-Data-Analytics-Challenge/opiod-sos/
blob/master/ColoradoCDO_AnalyticsChallenge_Final_Submissio
n_Opioid-SOS.ppt
Data Tigers
Smart
Cities
https://github.com/Colorado-Data-Analytics-Challenge/Data-Tiger
s/blob/master/Data%20Tigers.pptx
General
Assembly
Smart
Cities
https://github.com/Colorado-Data-Analytics-Challenge/GeneralAs
sembly/blob/master/GeneralAssembly_Last%20Mile%20Denver%
20Smart%20Data%20Analytics.pptx
Dec 11
7. Prepare to have a conversation with your fellow judges.
a. The first step will be to see is there a clear cut winner.
i. Score Sheets and notes will be used to look at individual scores in the
event of a tie for winner.
8. During the event you have opportunity to review entries, and modify scores as you see
fit, up until 4:30pm on December 11th when the group judging begins.
a. That being said, we are requesting you email the spreadsheet and scores as they
stand before you go to the event on the 11th. Reminder -- when you have
completed your spreadsheet, email it to jon.gottsegen@state.co.us
.
b. This will give the CDO an opportunity to view the scores from all the judges
before the event, and facilitate event logistics
c. 5pm -- Winners Announced!
i. Following the official judges deliberation time.
