KE Tax Report__230310 MM900 KPMG Econtech Efficiency Of Taxes Report
User Manual: MM900
Open the PDF directly: View PDF ![]() .
.
Page Count: 178 [warning: Documents this large are best viewed by clicking the View PDF Link!]

KPMG Econtech
CGE Analysis of
the Current
Australian Tax
System
Final Report
26 March 2010

Department of the Treasury
The Excess Burden of Australian Taxes
March 2010
ABCD
i
© 2010 KPMG, an Australian partnership and a member firm of the KPMG network of independent
member firms affiliated with KPMG International, a Swiss cooperative. All rights reserved.
The KPMG logo and name are trademarks of KPMG.
Liability limited by a scheme approved under Professional Standards Legislation.
Inherent Limitations
This report has been prepared as outlined in the Engagement Letter from KPMG Econtech to
Commonwealth Treasury dated 6 February 2009. The services provided in connection with this
engagement comprise an advisory engagement which is not subject to Australian Auditing Standards or
Australian Standards on Review or Assurance Engagements, and consequently no opinions or
conclusions intended to convey assurance have been expressed.
No warranty of completeness, accuracy or reliability is given in relation to the statements and
representations made by, and the information and documentation provided by Commonwealth Treasury
as part of the process.
KPMG Econtech have indicated within this report the sources of the information provided. We have not
sought to independently verify those sources unless otherwise noted within the report.
KPMG Econtech is under no obligation in any circumstance to update this report, in either oral or
written form, for events occurring after the report has been issued in final form.
The findings in this report are subject to unavoidable statistical variation. While all care has been taken
to ensure that the statistical variation is kept to a minimum, care should be taken whenever using this
information. This report only takes into account information available to KPMG Econtech up to the date
of this report and so its findings may be affected by new information. Should you require clarification of
any material, please contact us.
The findings in this report have been formed on the above basis.
Third Party Reliance
This report is solely for the purpose set out in contract and is for Commonwealth Treasury’s information.
This report has been prepared at the request of Commonwealth Treasury in accordance with the terms of
KPMG Econtech’s Engagement letter dated 6 February 2009. Other than our responsibility to
Commonwealth Treasury, neither KPMG Econtech nor any member or employee of KPMG Econtech
undertakes responsibility arising in any way from reliance placed by a third party on this report. Any
reliance placed is that party’s sole responsibility.
Forecasting Disclaimer
In the course of our work, projections have been prepared on the basis of assumptions and methodology
which have been described in our report. It is possible that some of the assumptions underlying our
projections may not materialise. Nevertheless, we have applied our professional judgement in making
these assumptions, such that they constitute an understandable basis for estimates and projections.
Beyond this, to the extent that certain assumptions do not materialise, then you will appreciate that our
estimates and projections of achievable results will vary.
ii
© 2010 KPMG, an Australian partnership and a member firm of the KPMG network of independent
member firms affiliated with KPMG International, a Swiss cooperative. All rights reserved.
The KPMG logo and name are trademarks of KPMG.
Liability limited by a scheme approved under Professional Standards Legislation.
CONTENTS
Executive Summary 1
1 Introduction 11
1.1 Overview of the Australian Tax System 12
1.2 The Structure of this Report 13
2 Key Literature 14
3 The Cost and Incidence of Taxes 17
3.1 The Excess Burden of Taxation 18
3.2 Using MM900 to Estimate the Excess Burden of Australian Taxes 20
3.3 The Incidence of Taxes 22
3.4 Using MM900 to Estimate the Incidence of Australian Taxes 24
4 The MM900 Model 28
4.1 Over-arching Assumptions 29
4.2 Households 31
4.2.1 Labour Supply versus Leisure 31
4.2.2 Consumption versus Saving 32
4.2.3 Pattern of Consumption 32
4.3 Producers 33
4.3.1 Low and High Skilled Labour 33
4.3.2 Structures and Other Capital 34
4.3.3 Land 35
4.3.4 Natural Resources and Other Generators of Economic Rents 35
4.4 Government Sector 37
4.5 Foreign Sector 38
5 Results 40
5.1 Summary of Excess Burden Results 44
5.2 Summary of Incidence Results 47
5.3 Detailed results 51
5.3.1 Petroleum Resource Rent Tax 51
5.3.2 Land tax and Municipal rates 52
5.3.3 Company Income Tax 54
5.3.4 Resource Royalties and Crude Oil Excise 58
5.3.5 Labour income tax 59
5.3.6 Payroll tax 62
5.3.7 GST 65
5.3.8 Tobacco Excise 68
5.3.9 Alcohol taxes 69
5.3.10 Import duties 71
5.3.11 Luxury Car Tax 72
5.3.12 Fuel excise 73
5.3.13 Motor Vehicle taxes 74
5.3.14 Conveyancing duties 77
5.3.15 Stamp duties other than real property 79
iii
© 2010 KPMG, an Australian partnership and a member firm of the KPMG network of independent
member firms affiliated with KPMG International, a Swiss cooperative. All rights reserved.
The KPMG logo and name are trademarks of KPMG.
Liability limited by a scheme approved under Professional Standards Legislation.
5.3.16 Insurance taxes 80
5.3.17 Gambling taxes 81
6 References 83
Appendix A – Detailed Methodology by Individual Tax 85
A.1 Petroleum Resource Rent Tax 85
A.2 Land Taxes and Municipal Rates 87
A.3 Company Income Tax 90
A.4 Crude Oil Excise and Resource Royalties 95
A.5 Labour income tax 97
A.6 Payroll tax 105
A.7 GST 107
A.8 Tobacco Excise 109
A.9 Alcohol Taxes 111
A.10 Import Duties 114
A.11 Luxury Car Tax 115
A.12 Fuel Excise 119
A.13 Motor Vehicle Taxes 121
A.14 Conveyancing Stamp Duties 124
A.15 Stamp Duties Other than on Real Property 127
A.16 Insurance Taxes 129
A.17 Gambling Taxes 131
Appendix B – Modelling Taxes with Partial Coverage 133
Appendix C – Industry Impacts 134
Appendix D – MM900 Parameters 137
Department of the Treasury
The Excess Burden of Australian Taxes
March 2010
ABCD
1
© 2010 KPMG, an Australian partnership and a member firm of the KPMG network of independent
member firms affiliated with KPMG International, a Swiss cooperative. All rights reserved.
The KPMG logo and name are trademarks of KPMG.
Liability limited by a scheme approved under Professional Standards Legislation.
Executive Summary
Background
In May 2008, the Treasurer announced an extensive review into Australia’s tax and transfer
system (the Henry Review). Governments aim to raise tax revenue in a way that meets their
funding needs, while paying regard to the three principles of good tax design:
• simplicity (keeping administration and compliance costs low);
• equity (or fairness, which is partly a subjective judgement); and
• economic efficiency.
KPMG Econtech was commissioned to model the existing tax system against the third aim of
economic efficiency, although the modelling also provides some insights into equity. Most
taxes result in losses of economic efficiency by distorting economic behaviour. For example,
most taxes reduce incentives to work or invest, or distort consumption patterns. This leads to
losses in consumer welfare that can be compared to the amount of revenue that is being raised.
An efficient tax system relies on taxes that result in relatively low losses in consumer welfare
per dollar of revenue raised (excess burden).
With this in mind, the Treasury commissioned KPMG Econtech to undertake a rigorous
economic analysis of the economic costs of the Australian tax system. For this, KPMG
Econtech has estimated the economic inefficiencies, or the excess burdens, that arise from
Australia’s major federal, state and local taxes. This report also examines the economic
incidence of each tax, or how the final burden is shared between various sources of real income
(labour, capital, land rents and other economic rents).
The results for each tax have been estimated using KPMG Econtech’s computable general
equilibrium (CGE) model, MM900. MM900 has been constructed by further developing our
existing MM600 model specifically for this study. MM900 goes well beyond previous
Australian modelling in capturing the economic effects of the tax system on the Australian
economy. It distinguishes 19 different major taxes at the Federal, State and Local levels. For
each tax, it identifies the true tax base as closely as possible, and aims to capture the main
behavioural responses to the tax’s imposition. The modelling also allows for certain negative
externalities in consumption that may justify certain specific taxes.
MM900 contains a fine level of detail. For example, in MM900 the economy produces 889
different products, which represents eight times as much product detail as other comparable
models. This allows the model to more accurately capture the application of certain product-
based taxes. For example, MM900 treats beer, wine and spirits as separate substitutable
products within one broad group. Less disaggregated models aggregate all alcohol products
together, and therefore miss the excess burdens that arise from taxing closely substitutable
alcoholic beverages at different rates.
Another example of the fine level of detail in MM900 is that each of the 109 industries uses up
to six different primary factors (or types of labour, capital and fixed factors). The different
fixed factors include land and natural resources, allowing for much more robust modelling of
the effects of taxes based on the value of land or the value of natural resource use.
Department of the Treasury
The Excess Burden of Australian Taxes
March 2010
ABCD
2
© 2010 KPMG, an Australian partnership and a member firm of the KPMG network of independent
member firms affiliated with KPMG International, a Swiss cooperative. All rights reserved.
The KPMG logo and name are trademarks of KPMG.
Liability limited by a scheme approved under Professional Standards Legislation.
In addition, in comparison to earlier studies, this analysis incorporates a more comprehensive
analysis of the behavioural responses to each tax. In MM900, taxes can cause households to
change their supply of labour and their levels and patterns of spending. Taxes can cause
businesses to change their choices between the six primary factors of production, affecting
employment, investment and valuations of land and natural resources. Finally, taxes can affect
the propensity to import and export each of the model’s 889 products.
These behavioural responses to taxes, by impairing the functioning of the economy, can reduce
consumer welfare. In MM900, these welfare losses are captured appropriately by using a utility
function in which households derive welfare or utility from leisure, saving and consumption of
products, and then deriving all household behaviour from that same utility function. Other
comparable models include more ad hoc elements in modelling household behaviour.
This modelling approach leads to a more robust analysis of the economic inefficiency of
particular taxes as well as their economic incidence. .
Key Results on Efficiency
This analysis shows that some of Australia’s taxes are much more inefficient than others. This
variation is explained mainly by two economic principles. The mobility principle recognises
that the excess burden of a tax is higher, the higher the mobility of its tax base. When a tax is
applied to a highly mobile tax base, that tax base is likely to shrink, distorting economic activity.
The narrowness principle recognises that the excess burden of a tax is likely to be higher, the
narrower the tax base. A narrow tax base may make it possible to respond to a tax by shifting to
untaxed close substitutes. Such shifts add to economic inefficiency and reduce the revenue
yield. Taxes on goods and services with consumption externalities are exceptions to this. For
example, although the base of the tobacco excise is narrow, shifting consumption away from
tobacco entails a social benefit, so tobacco excise is expected to have a low excess burden.
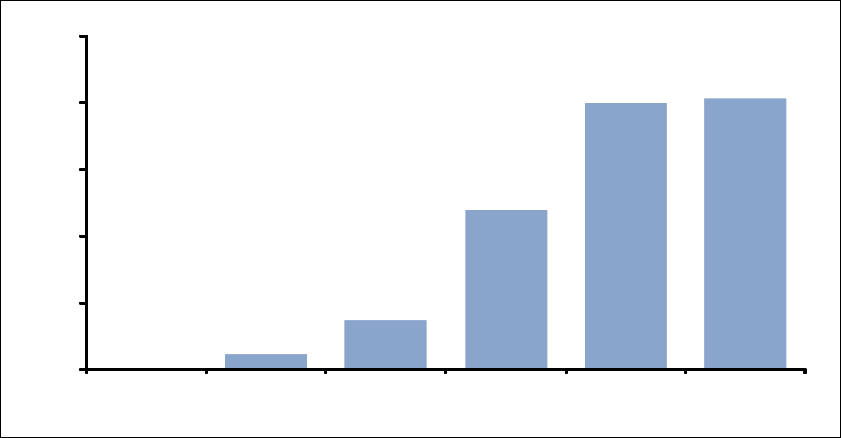
Chart A illustrates the variations in inefficiency between taxes using a selection of six out of the
19 taxes that are modelled. The inefficiency of a tax is measured by its marginal excess burden.
This refers to the effects of a small increase in a tax from its existing level, and is calculated as
the ratio of the loss in consumer welfare relative to the net gain in government revenue. Put
more simply, it is the economic harm expressed in cents per dollar of additional revenue.
The mobility principle is clearly reflected in the modelling results. Petroleum Resource Rent
Tax (PRRT) is modelled to have a marginal excess burden of zero, because it is applied to a tax
base that is assumed to be completely immobile – oil resources. Similarly, municipal rates have
a marginal excess burden of only two cents of welfare loss per additional dollar of revenue
raised because they are applied to land, which is also completely immobile. Municipal rates
only generate an excess burden to the extent that they are applied non-uniformly to different
land users, distorting the pattern of land use.
At the other extreme, company income tax is modelled to have a high marginal excess burden of
40 cents in the dollar of additional revenue, because it is applied to capital, which is highly
mobile. This high mobility is generated by the international competition for funds.
The economic incidence of the remaining three taxes shown in Chart A falls mainly on labour.
Labour has an intermediate level of mobility, and so under the mobility principle these taxes
Department of the Treasury
The Excess Burden of Australian Taxes
March 2010
ABCD
3
© 2010 KPMG, an Australian partnership and a member firm of the KPMG network of independent
member firms affiliated with KPMG International, a Swiss cooperative. All rights reserved.
The KPMG logo and name are trademarks of KPMG.
Liability limited by a scheme approved under Professional Standards Legislation.
would be expected to have medium excess burdens. However, the narrowness principle leads
their excess burdens to vary.
Payroll tax has a relatively narrow base because, under the small business exemption provision,
it applies to only around one-half of labour income. This provision provides an exemption from
payroll tax on the first tranche of labour income for small and large business alike, undermining
revenue raising, while doing little to reduce disincentive effects. This narrowness of the payroll
tax base leads to a high marginal excess burden of 41 cents in the dollar.
Chart A Marginal Excess Burden of Major Australian Taxes
(cents of consumer welfare loss per dollar of additional revenue)
0
2
8
24
40 41
0
10
20
30
40
50
PRRT Municipal rates GST Labour income
tax
Corporate
income tax
Payroll tax
Source: KPMG Econtech estimates from MM900
Personal income tax (as applied to labour income) also narrows the tax base, although to a lesser
degree. The progressive rate structure provides an exemption from tax on income earned up to
the tax-free threshold, and beyond that lower marginal tax rates are applied at lower incomes
than at higher incomes. This narrowing of the tax base (compared with a flat rate tax) leads to a
medium marginal excess burden of 24 cents in the dollar of revenue. Of course there are
compelling equity reasons for the progressive nature of the personal income tax scale, but its
efficiency implications should still be understood.
The GST can also be analysed alongside taxes on labour income. Taxes on labour income and
GST both act as a disincentive to supply labour, by reducing the purchasing power of the
additional pay earned from a given amount of additional labour. Labour income tax does this by
removing tax from the additional pay, while GST does this by reducing the purchasing power of
that pay through raising consumer prices. The GST has a relatively broad base, applying to
close to 70 per cent of consumer spending. This breadth helps keep its marginal excess burden
low, at 8 cents per dollar of additional revenue raised. Also contributing to this favourable
result is the gain in the terms-of-trade associated with applying GST to some expenditures of
international tourists.
Department of the Treasury
The Excess Burden of Australian Taxes
March 2010
ABCD
4
© 2010 KPMG, an Australian partnership and a member firm of the KPMG network of independent
member firms affiliated with KPMG International, a Swiss cooperative. All rights reserved.
The KPMG logo and name are trademarks of KPMG.
Liability limited by a scheme approved under Professional Standards Legislation.
These results are closely in line with those found by Johansson et al. in a 2008 study for the
OECD. They used both theory and empirical evidence to conclude that recurrent taxes on
immovable property (particularly residential property) are the “least distortive tax instrument in
terms of reducing long-run GDP per capita” (Johansson et al., 2008, p7). Broad based
consumption taxes, such as the GST, are found to be the second least distortive, followed by
personal income taxes and then corporate income taxes. This is the same as our ranking implicit
in Chart A.
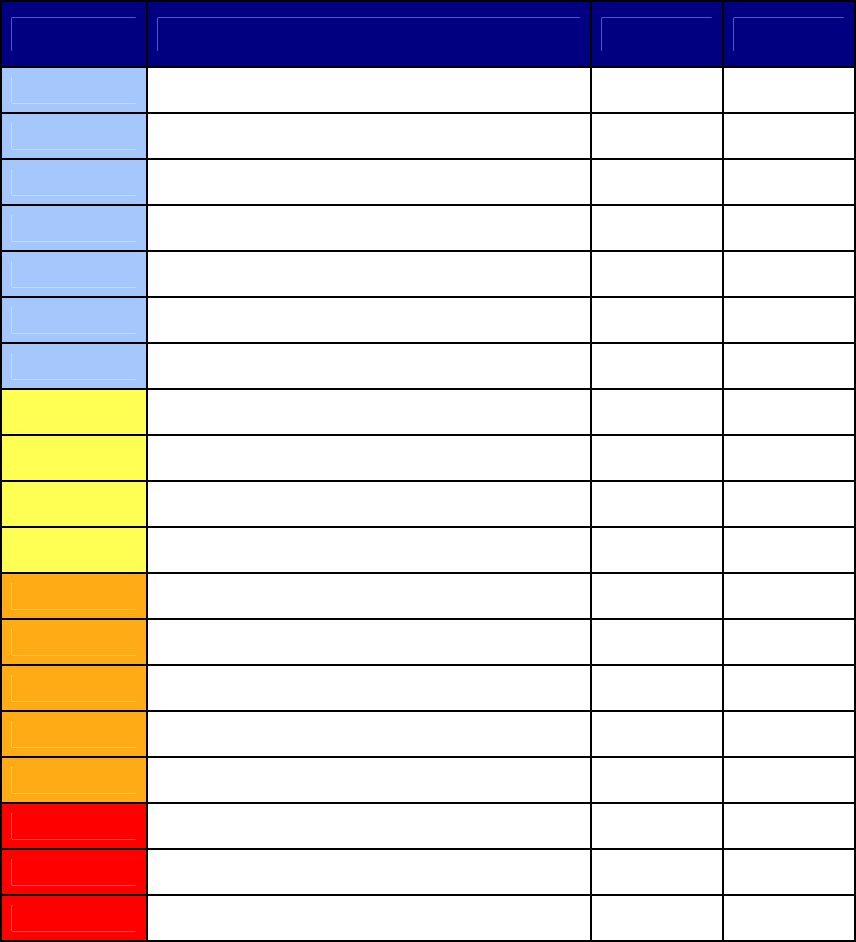
Table A below presents more detail on the relative efficiency of each of Australia’s taxes. It
presents the marginal excess burdens (MEB) and average excess burdens (AEB) for each of the
taxes modelled for this study.
As noted above, the marginal excess burden is the economic harm from a small increase in the
tax, expressed in cents per dollar of additional revenue. The average excess burden is a similar
measure, being the economic harm from introducing the whole tax, expressed in cents per dollar
of additional revenue. The marginal excess burden is useful for considering the impact of small
changes in the tax, while the average excess burden is useful for considering the impact of
abolishing the tax.
Department of the Treasury
The Excess Burden of Australian Taxes
March 2010
ABCD
5
© 2010 KPMG, an Australian partnership and a member firm of the KPMG network of independent
member firms affiliated with KPMG International, a Swiss cooperative. All rights reserved.
The KPMG logo and name are trademarks of KPMG.
Liability limited by a scheme approved under Professional Standards Legislation.
Table A: Marginal and average excess burdens of Australian taxes
(cents of consumer welfare per dollar of revenue)
Rating Tax MEB AEB
Low Tobacco excise
a -8 -23
Low Import duties
b -3 -7
Low Petroleum resource rent tax c 0 0
Low Municipal rates 2 1
Low GST 8 6
Low Land taxes
d 8 6
Low Alcohol excise and WET a 9 7
Medium Fuel taxes 15 10
Medium Stamp duties other than real property e 18 18
Medium Luxury car tax
f 20 9
Medium Labour income tax 24 16
High Conveyancing stamp duties g 34 31
High Motor vehicle registration h 37 32
High Motor vehicle stamp duties h, i 38 38
High Corporate income tax 40 23
High Payroll tax 41 22
Very High Insurance taxes 67 47
Very High Royalties and crude oil excise 70 50
Very High Gambling taxes j 92 54
Source: KPMG Econtech’s MM900 model estimates
Notes to Table 5.1:
a. The excess burden for tobacco excise and alcohol tax will be influenced by the assumptions for externalities
associated with tobacco and alcohol consumption.
b. The low (negative) excess burden estimate for import tariffs is an under-estimate in some contexts. It refers to the
efficiency of import tariffs post the tariff reductions scheduled for 1 January 2010. Those reductions mean that
all import tariffs will be five per cent or less, apart from a tariff of 10 per cent on clothing. These rates are below
a theoretical ‘optimal’ tariff of around 11 per cent (based on average export demand elasticities in MM900 of
around -10), so such low rates of tariff are not distorting. However, Australia has had much higher import tariffs
in the past, which were highly distorting. Further, the notion of an optimal tariff ignores the risk that other
countries will impose tariffs in retaliation, leading to welfare losses for Australia.
Department of the Treasury
The Excess Burden of Australian Taxes
March 2010
ABCD
6
© 2010 KPMG, an Australian partnership and a member firm of the KPMG network of independent
member firms affiliated with KPMG International, a Swiss cooperative. All rights reserved.
The KPMG logo and name are trademarks of KPMG.
Liability limited by a scheme approved under Professional Standards Legislation.
c. The zero excess burden for the PRRT rests on the assumption that it is designed so that it only taxes the excess
profits of petroleum extractors, which they derive from access to a natural resource which is in limited supply.
d. The estimate of the excess burden for land tax does not take into account that the rate structure is progressive
because of the exemptions for land holdings under a certain threshold value and an increasing tax rate for higher
valued land holdings. Also, the data for land tax collections by industry was highly aggregated and does not
reflect the full extent of the variability of land tax paid by industry. The excess burden may therefore be an under-
estimate.
e. The excess burden estimates for stamp duties other than on real property are likely to be under-estimates because
there are a number of distortions from these stamp duties that are not readily amenable to CGE modelling. For
example, these stamp duties may reduce the frequency of transactions.
f. The excess burden estimates for luxury car tax are likely to be under-estimates, because the modelling does not
capture the point that the luxury car tax distorts the choice between luxury and non-luxury cars.
g. The excess burden estimates for conveyancing duties have a downward bias because there are a number of
distortions from conveyancing duties that are not readily amenable to CGE modelling, such as the distortion
between renting and buying housing.
h. The excess burdens for motor vehicle registration and motor vehicle stamp duties are only for the proportion of
those taxes paid by businesses. This is because motor vehicle taxes paid by households do not appear in input-
output tables used to construct the model. The impact that this has on the size of the excess burden is ambiguous.
i. The excess burden estimates of motor vehicle stamp duties are likely to be under-estimates because there are a
number of distortions from motor vehicle stamp duties that are not readily amenable to CGE modelling. For
example, motor vehicle stamp duties may lead to less frequent motor vehicle transactions.
j. The excess burden estimates for gambling taxes are likely to be over-estimates if there are negative externalities of
gambling, which have not been taken into account.
k. The excess burden of state taxes (excluding land tax and resource royalties) have a conservative bias, because any
economic cost arising from differences in tax regimes between the states has not been taken account of in the
modelling.
Key Results on Incidence
While excess burdens give information about the size of the overall cost to the economy of
taxation, the question of who actually bears the burden of taxes is also important. In
considering the burden of taxes, it has long been appreciated that there is an important
distinction between who has the liability to government for a tax, and therefore carries its
impact, and who bears its final burden after all economic adjustments, and therefore bears its
incidence. It is the incidence of a tax, not its impact, which matters for economic analysis, and
often they are different.
The concept of mobility of a tax base is important for determining the incidence of a tax, just as
it is important for determining the efficiency of a tax. Highly mobile primary factors of
production are unlikely to bear much of the final incidence of a tax. Rather, they are likely to
partly move to lower taxed alternative uses. This partial withdrawal of supply from the original
use generates a shortage that is likely to push up its price for that use, partly or wholly offsetting
the tax impost on the mobile factor. The incidence of the tax will then be passed on to other
factors of production. In contrast, completely immobile factors of production have no scope for
passing on taxes, so when they carry the impact of a tax, they will also bear its final incidence.
The importance of the mobility principle can be seen in Table B below, which shows the final
incidence for each of the 19 taxes under reference. The results in the table identify where most
of the incidence of each tax falls, based on model simulations. The simulations involved
abolishing a tax, and observing the impacts on consumer prices and different sources of private
Department of the Treasury
The Excess Burden of Australian Taxes
March 2010
ABCD
7
© 2010 KPMG, an Australian partnership and a member firm of the KPMG network of independent
member firms affiliated with KPMG International, a Swiss cooperative. All rights reserved.
The KPMG logo and name are trademarks of KPMG.
Liability limited by a scheme approved under Professional Standards Legislation.
income. The full numerical results of the incidence analysis are contained in the main body of
the report.
Each of the columns in Table B corresponds to the different ways that the incidence of a tax can
be borne. For example, a tax may reduce the nominal income from any of the primary factors of
production: labour; land; other fixed factors; or capital. Or it may also be transmitted into
higher prices, reducing real incomes.
Table B reveals that none of the taxes have their main incidence falling on capital. This result
comes about because of the highly internationally mobile nature of capital. The mobility of
capital means that rather than accepting any burden of the tax, capital will move to alternative
uses in which the prevailing global after-tax rate of return can be obtained.
Table B shows that the final incidence of a large number of taxes falls mainly on consumer
prices. These taxes can be divided into two categories. The first is the group of taxes which are
levied on consumption directly. This group includes the GST, excise duties and taxes on fuel,
insurance and gambling. In this case, the party carrying the impact of the tax, consumers, is the
same as the party bearing its final incidence. The second category is taxes that are not levied on
consumption directly, yet have their final incidence on consumer prices. Thus, the party
carrying the impact of the tax is different to the party bearing its final incidence. These taxes
include payroll tax and business motor vehicle taxes.

Department of the Treasury
The Excess Burden of Australian Taxes
March 2010
ABCD
8
© 2010 KPMG, an Australian partnership and a member firm of the KPMG network of independent
member firms affiliated with KPMG International, a Swiss cooperative. All rights reserved.
The KPMG logo and name are trademarks of KPMG.
Liability limited by a scheme approved under Professional Standards Legislation.
Table B Final Incidence or Burden of Each Major Tax (Long run)
Tax labour land other rents capital
Tobacco excise X
Import duties X
Petroleum resource rent
tax X
Municipal rates X
GST X
Land taxes X
Alcohol excise and WET X
Fuel taxes X
Stamp duties other than
real property X
Luxury car tax X
Labour income tax X
Conveyancing stamp
duties X
Motor vehicle
registration X
Motor vehicle stamp
duties X
Corporate income tax X X X
Payroll tax X
Insurance taxes X
Royalties and crude oil
excise X X
Gambling taxes X
Source: KPMG Econtech estimates from MM900
Note: The table shows the party that bears the main portion of the final incidence for each tax.

Department of the Treasury
The Excess Burden of Australian Taxes
March 2010
ABCD
9
© 2010 KPMG, an Australian partnership and a member firm of the KPMG network of independent
member firms affiliated with KPMG International, a Swiss cooperative. All rights reserved.
The KPMG logo and name are trademarks of KPMG.
Liability limited by a scheme approved under Professional Standards Legislation.
Such taxes that increase consumer prices can be thought of as having their final incidence on
labour. Higher consumer prices decrease the purchasing power of the wage, reducing the return
to work. Similarly, labour income tax (i.e. personal income tax applied to labour income)
reduces the incentive to work, but through the different channel of reducing the after-tax wage.
Therefore, the results from Table B show that labour bears the main incidence for the majority
of Australian taxes – either directly through labour income or indirectly through consumer
prices.
Labour bears much of the final incidence of Australian taxes because, in contrast to capital,
labour is relatively immobile. For example, payroll tax has its impact on employers, but its final
incidence is on labour. Payroll tax increases the cost of employing labour, and since prices are
equal to the marginal cost of production, firms must pass this cost on. This will either be
through decreased nominal wages or increased consumer prices. In MM900, firms pass the cost
of payroll tax on, in the form of higher consumer prices1. This, in turn, reduces the real wage
that labour receives, and in response, labour supply falls. This fall creates a shortage of labour
that will push up the wage that employers must pay. However, households’ supply of labour
has a low responsiveness to the after-tax real wage, and so the fall in labour supply is relatively
small. Thus, the increase in the wage offsets only a small part of the initial increase in
consumer prices, and labour is left to bear the main burden of payroll tax in the form of higher
prices and lower real wages.
Land and other fixed factors also bear the burden of a number of taxes. These factors of
production are on the opposite end of the spectrum to capital, with their supply completely
fixed. When a tax is applied to any of these fixed factors, such as petroleum resource rent tax to
oil resources, municipal rates or land tax to land, the supply does not fall in response to the
lower rate of return. With no change in supply, the pre-tax price of fixed factors will not
change. Instead, the after-tax return that owners of the fixed factors are able to receive falls by
the full amount of the tax.
Company income tax has a more complex incidence. Company income tax is applied to profits,
or return to capital, land and other fixed factors, spreading its impact three ways. The fixed
supply of land and other fixed factors means that they will bear the full incidence of the
company tax that is applied to them, as described above. However, capital will not bear the
incidence of company tax that is applied to it. Instead, the supply of capital will fall until the
increase in its pre-tax return fully offsets the increase in company income tax. This process may
take several years so that returns to capital fall initially, but ultimately the higher cost of capital
will be passed on to consumers in the form of lower real wages. In MM900, this is transmitted
through higher prices2. This means that part of the final incidence of company income tax is
borne by labour. It is not borne by capital because it is highly mobile, at least in the long run.
Resource royalties and crude oil excise are applied to the output of mining industries rather than
to the profits derived from the natural resources used in mining industries. However, these
natural resources, as fixed factors, still bear some of the incidence of these taxes. In the same
way as company tax, the mobility of capital means that it will not bear the incidence of resource
1 The incidence of payroll tax is transmitted through higher prices rather than a lower nominal wage because the
nominal wage is the numeraire in MM900. However, the choice of numeraire does not affect the real outcome of the
model, which is that the real wage falls in response to a payroll tax and so labour bears the final incidence.
2 The incidence of company income tax is transmitted through higher prices rather than a lower nominal wage
because the nominal wage is the numeraire in MM900. However, the choice of numeraire does not affect the real
outcome of the model, which is that the real wage falls in response to a company income tax and so labour bears part
of the final incidence.
Department of the Treasury
The Excess Burden of Australian Taxes
March 2010
ABCD
10
© 2010 KPMG, an Australian partnership and a member firm of the KPMG network of independent
member firms affiliated with KPMG International, a Swiss cooperative. All rights reserved.
The KPMG logo and name are trademarks of KPMG.
Liability limited by a scheme approved under Professional Standards Legislation.
royalties and crude oil excise. When some of the capital in mining industries is withdrawn, this
reduces the productivity of natural resources, leading to lower rents for those natural resources.
The higher cost of capital also flows through into consumer prices, lowering the real wage and
implying that labour also bears some of the incidence.
In summary, while the impacts of our taxes are widespread, most of their final incidence falls on
labour through a reduction in the real wage either directly in the case of labour income tax, or
indirectly through higher consumer prices. The remaining incidence falls on the fixed factors of
land and natural resources. However, these fixed factors are ultimately owned by households
either directly, or through the corporate veil as shareholders. So in the end consumers bear most
of the burden of the tax system.
Since consumers bear the final burden of virtually all taxes, an informed approach to tax design
should not focus superficially on who carries the initial impact. Rather it should focus on the
three principles of good tax design – efficiency (choosing taxes that keep excess burdens low –
see Table A); equity (but with judgements based on who bears the final burden of a tax – see
Table B); and simplicity.
Department of the Treasury
The Excess Burden of Australian Taxes
March 2010
ABCD
11
© 2010 KPMG, an Australian partnership and a member firm of the KPMG network of independent
member firms affiliated with KPMG International, a Swiss cooperative. All rights reserved.
The KPMG logo and name are trademarks of KPMG.
Liability limited by a scheme approved under Professional Standards Legislation.
1 Introduction
In May 2008, the Treasurer announced an extensive review into Australia’s tax and transfer
system (the Henry Review). Governments aim to raise tax revenue in a way that meets their
funding needs, while paying regard to the three principles of good tax design:
• simplicity (keeping administration and compliance costs low);
• equity (or fairness, which is partly a subjective judgement); and
• economic efficiency.
KPMG Econtech was commissioned to model the existing tax system against the third aim of
economic efficiency, although the modelling also provides some insights into equity. Most
taxes result in losses of economic efficiency by distorting economic behaviour. For example,
certain taxes reduce incentives to work or invest, or distort consumption patterns. This leads to
losses in consumer welfare that can be compared to the amount of revenue that is being raised.
An efficient tax system relies on taxes that result in relatively low losses in consumer welfare
per dollar of revenue raised (excess burden).
With this in mind, the Treasury commissioned KPMG Econtech to undertake a rigorous
economic analysis of the economic costs of the Australian tax system. For this, KPMG
Econtech has estimated the economic inefficiencies, or the excess burdens, that arise from
Australia’s major federal, state and local taxes. This report also examines the economic
incidence of each tax, or where the final burden falls – which may be on consumer prices, or
various types of income (labour, capital, land rents and other economic rents).
The results for each tax have been estimated using KPMG Econtech’s computable general
equilibrium (CGE) model, MM900. MM900 has been constructed by further developing our
existing MM600 model specifically for this study. MM900 goes well beyond previous
Australian modelling in capturing the economic effects of the tax system on the Australian
economy. It does this by distinguishing 19 different major taxes at the Federal, State and Local
levels. Further, for each tax, the model identifies the true tax base as closely as possible, and
aims to capture the main behavioural responses to the tax’s imposition.
Some of the important features of MM900 are listed below.
• MM900 contains 109 industries producing 889 products. This is around eight times as
many products as other models, so that economic impacts of selective taxes on individual
products – such as fuel, alcohol, tobacco and gambling taxes – can be captured more fully.
• MM900 has a more detailed treatment of primary factors. The model recognises not only
capital and labour, but also land and natural resources as primary factors of production in
each industry. This allows for more appropriate modelling of the economic impacts of taxes
on land (land taxes and municipal rates) and taxes on natural resources (the existing
petroleum resource rent tax and other potential resource rent taxes).
• In MM900, particular attention has been paid to the structure of taxes. For example, the
modelling of the application of payroll tax to labour inputs takes into account the economic
impacts of the small business exemption. The modelling also recognises that the
progressive nature of personal income tax adds to work disincentives (while accepting the
compelling equity argument for such progressivity).
Department of the Treasury
The Excess Burden of Australian Taxes
March 2010
ABCD
12
© 2010 KPMG, an Australian partnership and a member firm of the KPMG network of independent
member firms affiliated with KPMG International, a Swiss cooperative. All rights reserved.
The KPMG logo and name are trademarks of KPMG.
Liability limited by a scheme approved under Professional Standards Legislation.
• The modelling allows for negative externalities that may justify certain narrowly-based
taxes. These include negative externalities from consumption of alcohol and tobacco.
• The GST is modelled in fine detailed in MM900. That is, MM900 identifies the individual
GST treatment for each of the 889 products - taxable, GST-free or exempt.
1.1 Overview of the Australian Tax System
There are currently around 125 taxes in Australia levied at the national, state and local
government level (Treasury, 2008). These taxes have two broad aims.
• First, taxes are levied to raise government revenues to meet government spending
requirements, which is often referred to as the revenue-raising requirement.
• Second, some taxes are levied to alter the behaviour of firms and households in a welfare-
improving way. Alcohol and tobacco excises are examples of this.
The structure of the Australian tax system affects the operation of businesses, households and
governments. Therefore, Australia’s tax-transfer system forms an integral part of the economic
structure – through its influence on decisions of: saving; consuming; investing; and working.
The combined revenues of federal, state and local governments in Australia was around $350
billion in 2007/08, or more than 30 per cent of the national Gross Domestic Product (GDP).
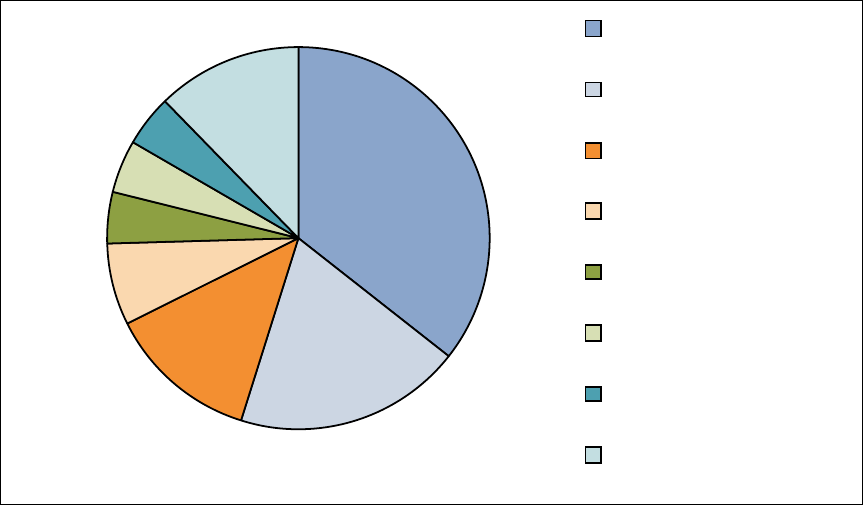
Chart 1.1 shows that Australia’s tax mix is heavily reliant on income tax revenue from both
businesses and individuals, with these taxes making up 55 per cent of total revenue. The next
most important revenue source is GST, accounting for a further 13 per cent. The efficiency of
these taxes will therefore be important for assessing the overall efficiency of our tax system.
Chart 1.1 Government Revenue Composition
36%
19%
13%
7%
5%
4%
4%
12% Personal income tax
Company income tax
GS T
Excises and levies
Payroll tax
Property taxes
Taxes on financial and
capital transactions
Other taxes
Source: ABS Taxation Revenue, Australia, 2007/08, cat. no. 5506.0, Canberra.
Department of the Treasury
The Excess Burden of Australian Taxes
March 2010
ABCD
13
© 2010 KPMG, an Australian partnership and a member firm of the KPMG network of independent
member firms affiliated with KPMG International, a Swiss cooperative. All rights reserved.
The KPMG logo and name are trademarks of KPMG.
Liability limited by a scheme approved under Professional Standards Legislation.
1.2 The Structure of this Report
This report is structured as follows.
Section 2 sets the context of this report by comparing its scope and methodology to other
studies into the efficiency and incidence of taxes.
Section 3 describes costs of Australian taxes and who pays them. It explains the concepts of the
excess burden and incidence of taxation, and how they are measured in this report.
Section 4 describes the key features of MM900 that makes it the most appropriate tool to
conduct this comprehensive evaluation.
Section 5 presents the results and a discussion of the excess burdens and incidence of each tax.
Section 6 includes the references used in the report.
Appendix A provides details on the modelling methodology for each tax individually. For each
tax, this section includes:
a description of the tax;
a literature review of previous studies into the impact of this type of tax;
theoretical and modelling issues pertinent to estimating the excess burdens and incidence of
the tax; and
considering these issues, it then describes KPMG Econtech’s modelling approach.
Appendix B includes technical details on modelling taxes with partial coverage.
Appendix C provides tables identifying the industries most impacted by each tax.
Appendix D provides additional detail in relation to the MM900 model.

Department of the Treasury
The Excess Burden of Australian Taxes
March 2010
ABCD
14
© 2010 KPMG, an Australian partnership and a member firm of the KPMG network of independent
member firms affiliated with KPMG International, a Swiss cooperative. All rights reserved.
The KPMG logo and name are trademarks of KPMG.
Liability limited by a scheme approved under Professional Standards Legislation.
2 Key Literature
There have been a number of theoretical and applied studies surrounding the excess burden and
incidence of different taxes. This literature analyses a broad range of taxes in a number of
countries, and helps to develop an idea of the likely excess burden of the major Australian taxes.
This study goes further than any previous study done in the Australian context. It analyses 19 of
the major Australian taxes in a consistent framework, allowing policy makers to easily compare
their economic costs. It is also a more detailed modelling than has been undertaken in the past,
with the model identifying the base of each tax to a high level of precision, and a large range of
behavioural responses are taken into account.
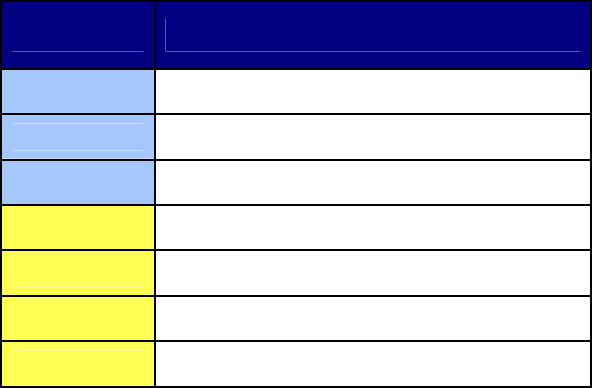
In a 2008 study for the OECD, Johansson et al. examine the efficiency of a number of taxes
commonly used among OECD countries. They determined a ranking of taxes that is similar to
the results of this study, although their conclusions are necessarily less specific because of the
cross-country nature of the study. They conclude from theory and empirical evidence that
recurrent taxes on immovable property (particularly residential property) are the “least distortive
tax instrument in terms of reducing long-run GDP per capita” (Johansson et al., 2008, p7).
Broad based consumption taxes, such as the GST, are found to be the second least distortive,
followed by personal income taxes and then corporate income taxes. These findings are
summarised in Table 2.1 below.
Table 2.1 Tax Ratings from OECD study(a)
Rating Tax
Low Immovable property tax
Low Consumption taxes
Medium Personal income taxes
High Corporate income taxes
(a) ratings by KPMG Econtech based on rankings from the OECD study
These rankings give the same qualitative results of the relative efficiency for each tax as the
estimates made with MM900 in this report.
A range of both state and local government level taxes are investigated in a 1998 report by the
Productivity Commission (PC). The PC report includes a partial equilibrium assessment of the
efficiency costs (marginal excess burdens) of a number of state taxes. The partial equilibrium
approach focuses only on the impact of the tax in one market – the market in which the tax is
levied. This means that the effects of a tax in one market on the consumption and tax
collections in other markets will not be taken into account. Therefore, such estimates of
efficiency costs of taxes will be incomplete. For example, as a tax on labour, payroll tax may
reduce employment which in turn will reduce income derived from labour. As consumption
falls in line with incomes, tax collections from consumption-type taxes will also fall. This
second-round loss of tax revenue is an additional cost of payroll tax, which a partial equilibrium
estimation will not capture. Conversely, the computable general equilibrium (CGE) model used
in this study means that all second round effects are taken into account.
Department of the Treasury
The Excess Burden of Australian Taxes
March 2010
ABCD
15
© 2010 KPMG, an Australian partnership and a member firm of the KPMG network of independent
member firms affiliated with KPMG International, a Swiss cooperative. All rights reserved.
The KPMG logo and name are trademarks of KPMG.
Liability limited by a scheme approved under Professional Standards Legislation.
The Centre for International Economics (CIE) conducted a qualitative analysis of state taxes,
focusing on those levied on businesses (CIE, 2009). The report identifies state taxes as having
high deadweight losses, partly because of the narrow bases of some state taxes, such as payroll
tax. Rather than assessing each tax individually, as is done in this study, the CIE study
estimates the economic impact of introducing a number of tax reforms concurrently. Using the
MMRF model, they model the impacts of reducing a number of state taxes and replacing the lost
revenue through an increase in the GST. The CIE modelling finds that this tax policy switch
leads to an increase in GDP and consumption. This indicates that the package of state taxes has
a higher economic cost than the GST. However, the results of the CIE study do not allow an
assessment of the relative inefficiencies of each individual tax.
The CIE findings are broadly in line with the results of the current analysis, which finds that
GST has a lower economic cost per unit of revenue raised than many state taxes. However,
features of the MMRF model used by CIE will result in some differences between the results of
the CIE study and this study. For example, the modelling of payroll tax and land tax is more
sophisticated in the MM900 than the MMRF. MM900 treats land as a fixed factor, as explained
in section 4.5.3., including distinguishing between residential, urban and rural land, and has a
detailed modelling of the payroll tax, as explained in Appendix A, section A.2.
Access Economics has also conducted a CGE analysis of states taxes, for the Financial Industry
Council of Australia (2008). Their rankings for the efficiency of these taxes are included in the
table below.
Table 2.2 Tax Ratings from Access Economics study(a)
Rating Tax
Low Municipal rates
Low Land Tax
Low Gambling tax
Medium Payroll tax
Medium Conveyancing Duty
Medium Insurance tax
Medium Motor Vehicle tax
(a) ratings by KPMG Econtech based on rankings from the Access Economics study
Similar to the results in this study, Access Economics find a low excess burden of taxes on land.
The remainder of their excess burden rankings are low compared to this study.
• While the current report does not include the consideration of any potential externalities
from gambling, the Access Economics report does. This means that the Access Economics
ranking for gambling taxes is much lower.
Department of the Treasury
The Excess Burden of Australian Taxes
March 2010
ABCD
16
© 2010 KPMG, an Australian partnership and a member firm of the KPMG network of independent
member firms affiliated with KPMG International, a Swiss cooperative. All rights reserved.
The KPMG logo and name are trademarks of KPMG.
Liability limited by a scheme approved under Professional Standards Legislation.
• The more sophisticated treatment of payroll tax in the MM900 model includes the impact of
the small business exemption, which contributes to the excess burden by reducing the
revenue raising ability of the tax, as discussed in section 5.3.
• The lower excess burden ranking for conveyancing duty, insurance tax and motor vehicle
tax reflects the smaller amount of choices that are available in the model used by Access
Economics, the Monash Multi-Regional Forecasting Model. MM900’s more comprehensive
coverage of economic decisions improves the estimates of excess burdens, as discussed in
Section 4.
Baylor and Beauséjour (2004) use a CGE model of the Canadian economy to estimate the
marginal excess burden of a number of different taxes. Their results are broadly in line with
both the literature and this study. They estimate that corporate income tax has a high economic
cost, at 37 cents per dollar of tax revenue. This is followed by personal income tax, at 32 cents
per dollar of tax revenue. Consumption taxes have the smallest economic costs, at 13 cents per
dollar of tax revenue. Baylor and Beauséjour’s estimation of the cost of payroll tax (15 cents
per dollar of tax revenue) is in line with our estimate of the cost of a payroll tax if the small
business exemption were removed, which again is discussed in section 5.3. A further
comparison of Baylor and Beauséjour’s results with the KPMG Econtech estimates is contained
in chapter 5 of this report.
Studies focused on estimating the economic costs of particular taxes are also widely available.
The results of some of these studies are compared with the results in this study in Section 5.
However, estimating the efficiency of all taxes in a consistent framework, rather than using a
series of separate studies, will be the most appropriate way to compare the relative economic
costs of different Australian taxes.
This study therefore builds on the work of the authors mentioned above, and forms the most
extensive study of the efficiency of Australian taxes to date. The contributions of this report to
the literature are summarised briefly below.
• This study uses a computable general equilibrium model, giving quantitative results which
are consistent with qualitative research that has been undertaken by the OECD.
• The general equilibrium nature of the model used takes into account both how all markets
within the economy interact as well as the constraints on the macro-economy.
• The separate analysis of each tax allows policy makers to compare all taxes on a consistent
basis.
• It is the most thorough analysis done to date, in capturing where taxes impact on the
economy, and how it responds.
Department of the Treasury
The Excess Burden of Australian Taxes
March 2010
ABCD
17
© 2010 KPMG, an Australian partnership and a member firm of the KPMG network of independent
member firms affiliated with KPMG International, a Swiss cooperative. All rights reserved.
The KPMG logo and name are trademarks of KPMG.
Liability limited by a scheme approved under Professional Standards Legislation.
3 The Cost and Incidence of Taxes
As background to the results on the efficiency and incidence of each tax presented in section 5,
this section explains the importance and meaning of the concepts of tax efficiency and
incidence, the main drivers, and how they have been modelled.
For any tax, it is usually straightforward to assess the amount of revenue that is collected and
from whom. But that only gives a superficial view of the tax system. Most taxes distort
economic incentives giving rise to excess burdens – economic costs over and above the amount
of revenue that is raised. Further, taxes may lead to economic responses such as price increases
that mean that the party who bears the economic incidence or final burden of the tax, is
different from the party who pays the tax. In assessing the merit of any tax, understanding its
economic incidence and excess burden is fundamental. This section explains these concepts and
how they have been modelled.
This study estimates the excess burdens arising from Australian federal, state and local taxes.
Most taxes carry some excess burden. For example, certain taxes reduce incentives to work or
invest, or distort consumption patterns, adversely impacting on economic performance and
ultimately on consumer welfare. This excess burden can be compared to the amount of revenue
that is being raised to assess the degree of economic inefficiency that each tax entails.
The study also identifies the incidence of (or “who really pays”) each tax. The party paying a
tax, and so carrying its impact, is sometimes different from the party who actually bears the
final burden or incidence of a tax, after economic responses. For example, while company tax is
collected from businesses, a business may pass the burden of the tax on to households through
higher prices or lower wages. In that case, while the business would carry the impact of the tax,
households would bear its economic incidence.
Understanding the incidence of a tax is an important step in assessing its implications for equity.
However, further analysis is also required, linking the incidence of a tax to the situations of
different types of households. This distribution analysis is outside of the scope of this study.
Further, good tax design is not only about economic efficiency and equity of taxes, but also their
simplicity. Taxes are considered to be simple when they involve low administration costs for
tax collectors and low compliance costs for taxpayers. An assessment of the simplicity of each
tax is also outside of the scope of this study.
MM900, KPMG Econtech’s CGE model of the Australian economy, was used to estimate the
excess burden and incidence of key Federal, State and Local taxes. The excess burden results
show, for every dollar in tax revenue raised, the additional cost to consumers in excess of that
dollar. The incidence results show how the economic incidence of each tax is spread between
consumer prices and various types of income (labour, capital, land rents and other economic
rents).
The remainder of this section discusses in further detail the excess burden and economic
incidence of taxes and how these have been modelled. Section 3.1 looks more closely at the
excess burden of taxation, section 3.2 discusses how excess burdens have been modelled,
section 3.3 discusses the economic incidence of taxes, and section 3.4 explains how incidence
has been modelled.

Department of the Treasury
The Excess Burden of Australian Taxes
March 2010
ABCD
18
© 2010 KPMG, an Australian partnership and a member firm of the KPMG network of independent
member firms affiliated with KPMG International, a Swiss cooperative. All rights reserved.
The KPMG logo and name are trademarks of KPMG.
Liability limited by a scheme approved under Professional Standards Legislation.
3.1 The Excess Burden of Taxation
Most taxes change the behaviour of households, firms and/or the foreign sector. These changes
in behaviour create distortions in economic activity. Taxation may influence behaviours in the
following ways.
• Households may change their level of consumption, their consumption patterns or the
amount that they work.
• Firms may change what they produce or how they produce it.
• The foreign sector may demand less of Australia’s exports or supply Australia with fewer
imports.
The “excess burden of taxation” is a measure of the economic costs associated with these
distortions. More specifically, the excess burden is defined as the reduction in welfare3 from
imposing or raising a tax, after the additional tax revenue has been returned to individuals as a
lump-sum payment. The higher the tax rate, the higher will be the reduction in welfare.
Moreover, if the tax rate increases, the excess burden increases at a greater rate. In fact, the
excess burden of a tax is generally roughly proportional to the square of the tax rate4. Figure 3.1
below illustrates the excess burden of a tax in a market that has variable producer and consumer
prices.
Figure 3.1 Excess Burden of a Distorting Tax
Figure 3.1(a) shows a partial equilibrium model with no taxes. In this case, an equilibrium will
be reached at the point where the demand and supply schedules intersect (at Q*). Here, the
marginal value of the last unit consumed is equal to the marginal cost of the last unit supplied.
3 Technically speaking, welfare is defined as the collective level of utility of Australian households, where the utility
of each household is determined by the commodities and leisure they consume.
4 This is because if, for example, the tax rate is doubled, then it is likely that not only will the loss in economic
activity approximately double, but also the gap between the marginal value and marginal cost of that activity will also
approximately double.
Quantity
Price
Quantity
Q* QT Q*
Demand
Supply
(
a
)
No Tax
(
b
)
Distortin
g
Tax
Supply
Demand
q = p + t
q* = p*
p
DWL
TR
PS
PS
CS
CS
Price

Department of the Treasury
The Excess Burden of Australian Taxes
March 2010
ABCD
19
© 2010 KPMG, an Australian partnership and a member firm of the KPMG network of independent
member firms affiliated with KPMG International, a Swiss cooperative. All rights reserved.
The KPMG logo and name are trademarks of KPMG.
Liability limited by a scheme approved under Professional Standards Legislation.
When a tax is imposed, as in Figure 3.1(b), it raises the price paid by consumers and lowers the
price received by producers. This drives a wedge between the marginal value and the marginal
cost and, consequently, reduces market activity. The size of this wedge, the Deadweight loss
(DWL) shown in Figure 3.1(b), is the loss to consumer and producer surplus that is not
recouped as tax revenue. This can be thought of as the welfare loss associated with the tax.
The implication is that, in practice, raising a dollar of tax revenue usually creates a welfare loss
(a positive excess burden). This report expresses the excess burden (EB) per unit of additional
tax revenue, as shown in Box 3.1.
Box 3.1: Definition of Excess Burden
revenuetax
welfare
Δ
Δ
−≡EB
Where:
(a) the change in welfare is defined as the amount of (lump sum) compensation required after
the tax change to restore the consumer’s utility back to its original level.
(b) the change in tax revenue from the tax increase is defined as the amount of the lump sum
transfer back to consumers financed by the tax increase. This is equal to the total change in tax
revenue, including any changes in revenue stemming from changes in other markets.
As indicated above, the change in welfare is the compensation required to restore the
consumer’s utility back to its original level. For this purpose, it is assumed that the revenue
raised by the tax is returned to the consumer as a non-distorting or lump sum transfer, so that the
consumer does not directly lose any income from the change in the tax. This means that the
change in welfare only arises from the distortions to economic behaviour generated by the tax.
This measure of the change in welfare is known as the compensating variation (CV). In the
MM900 model, the CV can be interpreted as the real change in consumption5, saving and leisure
enjoyed by the consumer.
The change in tax revenue from the tax increase is defined as the amount of the lump sum
transfer to consumers that would be financed by the tax increase, while keeping the budget in
balance, and given fixed government expenditures. This will reflect both the additional revenue
from the tax whose rate is increased, as well as any second round effects on tax revenues (due to
impacts on tax bases).
There are two types of excess burden that can be measured.
• The marginal excess burden (MEB) is defined as the additional welfare loss imposed by
increasing a particular tax by a small amount, divided by the change in government revenue.
The MEB is useful for considering small reforms of the current system or ways of raising
additional revenue within the existing tax framework.
5 The model uses a generalised linear expenditure system utility function, in which households derive utility from
consumption of products, saving and leisure. It specifies an essential level of consumption for each product. The
consumer then maximises their utility by choosing how to allocate the remainder of their full income.
Department of the Treasury
The Excess Burden of Australian Taxes
March 2010
ABCD
20
© 2010 KPMG, an Australian partnership and a member firm of the KPMG network of independent
member firms affiliated with KPMG International, a Swiss cooperative. All rights reserved.
The KPMG logo and name are trademarks of KPMG.
Liability limited by a scheme approved under Professional Standards Legislation.
• The average excess burden (AEB) is defined as the total welfare loss from imposing a
particular tax, expressed as a proportion of total revenue raised by that tax. These measures
are useful for considering the abolition of a certain tax.
A concept related to the excess burden is the marginal cost of funds, which is one plus the
marginal excess burden. This gives the cost to the economy of raising an additional dollar in tax
revenue, if the revenue were not returned to consumers. The marginal cost of funds exceeds one
dollar because it takes into account that raising a dollar of revenue also entails an excess burden.
To be worthwhile, the value to the community of a public spending program must exceed the
marginal cost of funds.
3.2 Using MM900 to Estimate the Excess Burden of Australian
Taxes
Estimating the Marginal Excess Burden and Average Excess Burden for each Tax
The MM900 model has been constructed so that both the change in welfare and the change in
tax revenue are standard outputs of the model. Thus, MM900 estimates the numerator and
denominator of the excess burden formula. This allows the excess burden of each tax to be
calculated and compared (see section 5 of this report). As noted above, MM900 uses a measure
of the change in welfare known as the compensating variation (CV), while the change in tax
revenue is measured by the transfer payment to consumers that can be financed from the tax
change, while keeping the budget in balance.
For each tax, two versions of the excess burden have been simulated in MM900. Specifically,
the Marginal Excess Burden (MEB) is estimated by simulating in MM900 a small
(five per cent) increase in the tax being considered and performing the excess burden
calculations. The Average Excess Burden (AEB), on the other hand, is estimated by simulating
in MM900 the abolition of the tax being considered, and performing the excess burden
calculation.
When a tax is imposed, it impacts upon behaviour not only in the taxed market, but also in other
related markets. For example, in the case of two goods that are gross substitutes, the imposition
of a tax on one good will cause consumers to reallocate their consumption spending from the
taxed good towards the untaxed good. CGE models like MM900 are designed so as to pick up
these ‘related market effects’. CGE models also identify other second round effects, such as
changes in aggregate consumption due to changes in consumers’ income. Related market
effects impact on the MEB and the AEB when the tax affects activity and tax collections in
other distorted markets. The features of MM900 relevant to modelling the excess burden of
taxes are described in Section 4.
Excess Burden in MM900
Some of Australia’s taxes are thought to be more inefficient than others. This is because of two
economic principles. The mobility principle recognises that the excess burden of a tax is higher,
the higher the mobility of its tax base. When a tax is applied to a highly mobile tax base, that
tax base is likely to shrink, distorting economic activity. The narrowness principle recognises
that the excess burden if a tax is likely to be higher, the narrower is the tax base. A narrow tax
Department of the Treasury
The Excess Burden of Australian Taxes
March 2010
ABCD
21
© 2010 KPMG, an Australian partnership and a member firm of the KPMG network of independent
member firms affiliated with KPMG International, a Swiss cooperative. All rights reserved.
The KPMG logo and name are trademarks of KPMG.
Liability limited by a scheme approved under Professional Standards Legislation.
base may make it possible to respond to a tax by shifting to untaxed close substitutes. Such
shifts add to economic inefficiency and reduce the revenue yield.
Under the mobility principle, resource rent taxes and land taxes would be expected to have low
excess burdens. This is because they are assumed to be applied to immobile tax bases – natural
resources and land. MM900 treats both land and natural resources as completely immobile. At
the other extreme, company income tax is expected to have a high marginal excess burden,
because it is applied to capital, which is highly mobile. This high mobility is generated by the
international competition for funds. In fact, in MM900, capital is treated as perfectly mobile.
Labour has an intermediate level of mobility, and so under the mobility principle taxes can fall
on it, such as payroll tax or personal income tax as applied to labour income, would be expected
to have medium excess burdens.
However, the narrowness principle adds another dimension to the analysis. Payroll tax has a
relatively narrow base because, under the small business exemption provision that is modelled
in MM900, it applies to only around one-half of labour income. On the other hand, the GST has
a broader base, applying to close to 70 per cent of consumer spending in MM900. Narrowing a
tax base tends to make a tax less efficient.
Estimating the Excess Burden from Non-Uniformity
A tax may have a high excess burden for one of two reasons. First, it may have a high excess
burden because of its inherent nature, which might indicate that the tax should be abolished. On
the other hand, it may have a high excess burden because it is implemented in a non-uniform
way that narrows the tax base, which might indicate that the base of the tax should be
broadened. It is important to be able to distinguish these two cases of high excess burden,
because the appropriate policy responses are different.
Non-uniformity in a tax may arise in a number of different ways, which can be illustrated
through three examples. For payroll tax, there is a tax-free threshold or small business
exemption. For alcohol taxation, closely-substitutable products are taxed at different rates.
Finally, for the GST, some products are taxable, some are exempt, and some are GST-free.
In MM900, simulations were conducted to identify the contribution of non-uniformity in taxes
to their excess burdens. For each tax, this involved beginning with the baseline scenario in
which the tax is in place, and conducting two simulations. In the first simulation, the tax is
abolished. In the second simulation, the tax is ‘reformed’, by replacing it with a uniform tax
that is designed to raise the same amount of revenue. The difference in consumer welfare
between the tax abolition scenario and the baseline scenario shows the excess burden of the tax.
The difference in consumer welfare between the reform scenario and the baseline scenario
shows the excess burden due to the non-uniformity of the tax. The difference between these
excess burdens shows the excess burden due to the inherent nature of the tax. Thus, this
procedure allows us to dissect the excess burden of a tax into the component due to any non-
uniformity in its application and the component due to its inherent nature.
This procedure was applied to three different non-uniform taxes - payroll tax, GST and alcohol
taxes. The results allow us to understand the different efficiency gains that could be made by
either reforming or abolishing each tax.
Department of the Treasury
The Excess Burden of Australian Taxes
March 2010
ABCD
22
© 2010 KPMG, an Australian partnership and a member firm of the KPMG network of independent
member firms affiliated with KPMG International, a Swiss cooperative. All rights reserved.
The KPMG logo and name are trademarks of KPMG.
Liability limited by a scheme approved under Professional Standards Legislation.
Modelling State Taxes
In this study, state taxes are modelled at the national level, using a weighted average of the
regimes across states. This methodology provides a reasonable overall estimate for the
efficiency of the state tax in question. However, there is potentially some downward bias in the
excess burden estimates for some state taxes. The differences between states in their tax
regimes may distort a firm’s choice of location, adding to the excess burden, and the modelling
results will not take this into account.
3.3 The Incidence of Taxes
While excess burdens give information about the size of the overall cost of taxation, the
question of who actually bears the burden of taxes is also important for tax analysis. The party
who is liable to government for a tax carries its impact. However, some taxes lead to economic
responses, such as price increases, that mean that the party or parties who bear the economic
incidence or final burden of a tax may be different from the party carrying the initial impact.
That is, economic incidence is concerned with who ultimately bears the cost of the tax.
The cost of a tax is borne by a group when the tax changes the income that they receive or the
prices that they face. When a tax is imposed in a market it either: raises the price paid by users;
lowers the price received by sellers; or both. These price changes will flow through the
economy, and alter the return to the different factors of production. Incidence can therefore be
measured by considering the changes in prices of goods and services and changes in income
from each factor of production.
The economic incidence of each tax depends on the characteristics of each market. The panels
in Figure 3.2 show three different markets, and how the demand and supply elasticities affect
the incidence of taxes using partial equilibrium analysis. In general, the side of the market
which is relatively price insensitive (inelastic) will bear more of the tax.
In each case, without any tax, the market-clearing price would be P*. However, a tax drives a
wedge between the price that consumers pay, Pc, and the price that suppliers receive, PP. The
deviation of Pc and PP from P* indicates the effect on prices of introducing each tax.
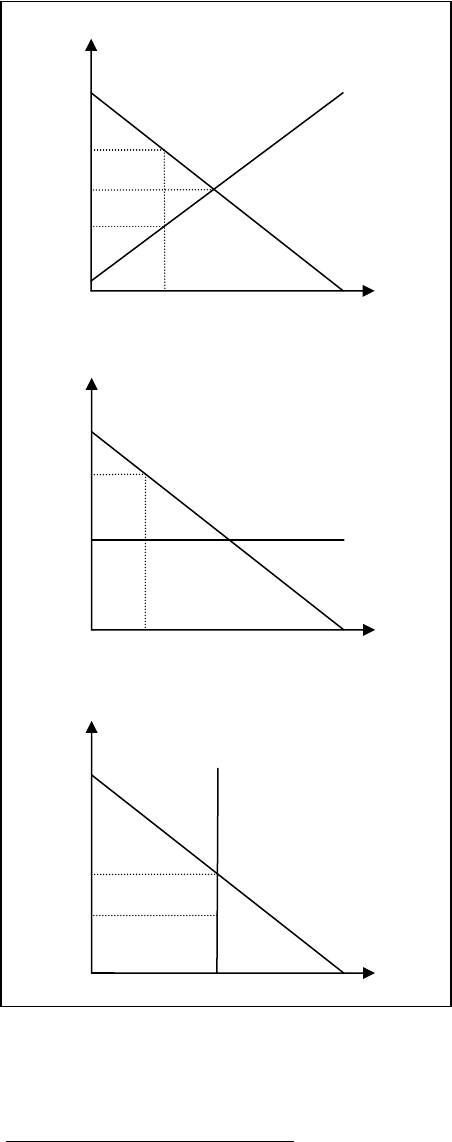
Department of the Treasury
The Excess Burden of Australian Taxes
March 2010
ABCD
23
© 2010 KPMG, an Australian partnership and a member firm of the KPMG network of independent
member firms affiliated with KPMG International, a Swiss cooperative. All rights reserved.
The KPMG logo and name are trademarks of KPMG.
Liability limited by a scheme approved under Professional Standards Legislation.
Panel (a) shows a taxed market with elastic
demand and supply curves. When a tax is
applied in this market, both the price that
consumers pay and the price that producers
receive will change. Therefore, the
incidence of a tax in this market will fall on
both consumers and producers.
Panel (b) shows a taxed market with a
perfectly elastic supply curve. This is
representative of a market with perfect
competition, and which does not use factors
of production which are fixed in supply6.
Under perfect competition, suppliers of the
good are already producing at minimum
average cost when there is no tax.
Therefore, they will not reduce their prices
when a sales tax is introduced because this
will reduce their profits below the required
rate of return. Instead, the full incidence of
the tax is passed on to consumers in the
form of higher prices.
Panel (c) of Figure 2 shows a taxed market
with a perfectly inelastic supply curve. In
MM900, this is representative of the market
for a fixed factor of production, such as
residential land. With a fixed supply of
land, its value to users (or marginal
product) will be determined only by
demand (at P*). No user will be willing to
pay an amount higher than P*, even after a
tax is applied. Therefore, the owners of
residential land must bear the full incidence
of any tax in this market, in the form of a
lower return for ownership of their land.
6 Under perfect competition, all firms will produce at minimum average cost and receive zero profits. They exit and
enter an industry until demand is satisfied and price is equal to marginal cost. This gives the flat supply curve for
any commodity, at a price equal to marginal cost. A fixed factor of production would imply increasing marginal
costs to the industry, which would result in an upward sloping supply curve, even under perfect competition.
Quantity
Q
Demand
Supply
Price
PP
Pc
P*
(a) relatively elastic demand and supply
Demand
Supply
Price
Pc
PP = P*
Demand
Supply
Price
PP
Pc = P*
(b) perfectly elastic supply
(c) perfectly inelastic supply
Figure 3.2: Economic incidence
Q
Q
Department of the Treasury
The Excess Burden of Australian Taxes
March 2010
ABCD
24
© 2010 KPMG, an Australian partnership and a member firm of the KPMG network of independent
member firms affiliated with KPMG International, a Swiss cooperative. All rights reserved.
The KPMG logo and name are trademarks of KPMG.
Liability limited by a scheme approved under Professional Standards Legislation.
The simple analysis above only reveals part of the story. In the analysis above, the incidence of
the tax is determined by considering only the market to which the tax is applied. While this
partial equilibrium analysis is instructive, a more in-depth investigation of the incidence of taxes
would use a general equilibrium approach and consider all of the flow-on impacts to other parts
of the economy. For example, a tax on labour income will reduce the return to labour, having
an impact on labour supply. This would reduce incomes in the economy, and impact on the
demand for goods and services. Thus, in turn, the demand for other factors of production may
also be reduced, reducing the income derived from them. At the same time, the increased labour
costs would lead to a switch away from labour intensive production technologies towards
production technologies more intensive in the other factors of production.
As a general equilibrium model, MM900 traces the impact of a tax in one market to all parties
across the whole economy. In this way, both the direct and indirect impacts of a tax can be fully
taken into account. The following section describes the methodology in more detail.
3.4 Using MM900 to Estimate the Incidence of Australian Taxes
To analyse the incidence of a tax, agents in the economy must first be divided into groups.
Since this study is concerned with the welfare of Australian households, the incidence analysis
divides domestic households into groups. This allows some understanding of the distributional
effects of taxes on different types of domestic households. Groups typically used in incidence
analysis include (Metcalf and Fullerton, 2002):
• consumers (as opposed to producers);
• owners of each of the factors of production;
• groups of individuals with different levels of income;
• groups of individuals living in different regions; and
• intergenerational groups.
The choice of groups will depend on the type of model used. This study divides households into
two sets of groups, as discussed below.
• Firstly, the incidence of each tax on owners of the different factors of production is
analysed.
• Second, the incidence of each tax on individuals with different levels of income is
considered.
A key observation is that Australian households are simultaneously consumers and producers.
Households derive welfare from their consumption of goods and services, which in turn,
depends on their income as owners of factors of production including labour, capital, land and
other fixed factors. Therefore, any change to either consumer prices or factor incomes will
affect overall welfare. It follows that distinguishing between the incidence on consumers and
producers would not be a meaningful analysis.
Therefore, this study divides households according to their ownership of the factors of
production – labour, capital, land and non-land fixed factors. Different taxes will have different

Department of the Treasury
The Excess Burden of Australian Taxes
March 2010
ABCD
25
© 2010 KPMG, an Australian partnership and a member firm of the KPMG network of independent
member firms affiliated with KPMG International, a Swiss cooperative. All rights reserved.
The KPMG logo and name are trademarks of KPMG.
Liability limited by a scheme approved under Professional Standards Legislation.
impacts on the income derived from each of these factors of production. Changes in factor
incomes after a tax is introduced will indicate where among the groups of households the
incidence falls. MM900 results can be used to identify these changes. The variables of interest
are listed in Table 3.1 below.
Table 3.1 Identifying Tax Incidence
Agent Variable indicating tax incidence
Labour Change in after-tax labour income
Owners of capital Change in after-tax private capital income
Owners of residential land Change in after-tax private residential
land income
Owners of rural land Change in after-tax private rural land
income
Owners of urban land Change in after-tax private urban land
income
Owners of non-land fixed factors of
production e.g. natural resources
Change in after-tax private income from
other economic rents
Examining the dollar changes in these types of income when a tax is introduced will show
which groups the incidence of the tax falls on. This may give some indication as to the impact
on different socio-economic groups.
The above analysis shows changes in nominal, private, after-tax incomes, before allowing for
any changes in consumer prices. In reality, some taxes result in changes in consumer prices,
which must be taken into account in determining the effect on real incomes. This requires some
estimate of the percentage change in the cost-of-living.
However, spending patterns vary between households, which means that percentage impacts on
the cost-of-living can vary from one household to the next. To give some indication of this
variation, this report uses two different measures of the cost of living. These are the price of
essential consumption and the price of non-essential consumption. MM900 identifies a basket
of goods and services that is considered essential consumption. Consumers will always
consume this same basket of goods and services, no matter the price of each good. After they
have purchased this basket, they then choose how to spend the remainder of their income,
depending on both the relative prices of each product and their overall income. This extra
consumption is termed non-essential consumption.7 The essential and non-essential baskets
have different mixes of the same goods and services. For example, food is more important in
the essential basket while recreation is more important in the non-essential basket.
7 Consumption decisions are explained in more detail in section 4.3.
Department of the Treasury
The Excess Burden of Australian Taxes
March 2010
ABCD
26
© 2010 KPMG, an Australian partnership and a member firm of the KPMG network of independent
member firms affiliated with KPMG International, a Swiss cooperative. All rights reserved.
The KPMG logo and name are trademarks of KPMG.
Liability limited by a scheme approved under Professional Standards Legislation.
The spending of poorer households will be dominated by essential consumption, while spending
of richer households will be dominated by non-essential consumption. Hence, other things
being equal, any tax which, in percentage terms, increases the price of essential consumption
more than it increases the price of non-essential consumption will have a greater proportional
impact on poorer households. Such a tax can be considered a regressive tax. Conversely, any
tax which, in percentage terms, increases the price of essential consumption less than it
increases the price of non-essential consumption will have a greater proportional impact on
richer households. Such a tax can be considered a progressive tax. Therefore, percentage price
changes for both essential and non-essential consumption are reported as part of the incidence
analysis. Here progressivity is implicitly defined relative to consumption levels, but it can also
be defined relative to income levels.
A full analysis of the equity of a tax would also involve an analysis of the changes in nominal
factor incomes summarised in Table 3.1 against information on the sources of factor incomes
for different types of households. For example, if poorer households rely relatively more on
labour income and richer households more on capital income, the relative impact of a tax on
labour and capital income would also influence its equity.
Importantly, the analysis from MM900 will be a long-run analysis. Long-run results may look
different to results from a short-run analysis, mainly because some prices take time to adjust in
response to tax changes. For example, an increase in the company tax rate may initially lower a
firm’s profits if they do not have the ability to change their prices straight away. However, in
the long run, as lower profits lead to a withdrawal of capital and tighter supply conditions, firms
will be able to adjust their prices upward and pass the tax burden on to consumers.
In any general equilibrium model, all prices are determined in relative terms, but expressed in
nominal terms. To do this conversion to nominal terms, one good is chosen to be the
“numeraire”. This good has a set fixed price, and all other prices can be expressed relative to
that fixed price. In MM900, the average nominal wage has been chosen as the numeraire.
Although the choice of numeraire does not affect the modelling results in real terms, it does
need to be taken into account in interpreting nominal price changes.
Tax Incidence in MM900
In the long run, the economic incidence of most Australian taxes can be expected to fall largely
on Australian labour, and this is also the case in MM900. To understand this conclusion, there
are three issues to consider in turn.
The first issue is the extent to which the incidence of Australian taxes might fall on foreigners
rather than Australians. As a relatively small part of the world economy, Australia is generally
considered to be close to being a ‘price taker’ on world markets. This implies that Australian
taxes applied in world markets can be expected to have little impact on prevailing world prices.
Rather, such taxes will largely be absorbed on the Australian side of the market, will little or
none of the incidence being borne by foreigners through changed world prices. In MM900,
Australia is a price taker for capital and imports, and is close to being a price taker for most
exports. This means that the incidence of import duty on imports, company tax on capital, and
other Australian taxes will fall largely on Australians, not foreigners.
Given that most of the incidence of our taxes can be expected to fall on Australians, the next
issue is the extent to which that incidence falls on the incomes of Australian factors of

Department of the Treasury
The Excess Burden of Australian Taxes
March 2010
ABCD
27
© 2010 KPMG, an Australian partnership and a member firm of the KPMG network of independent
member firms affiliated with KPMG International, a Swiss cooperative. All rights reserved.
The KPMG logo and name are trademarks of KPMG.
Liability limited by a scheme approved under Professional Standards Legislation.
production. MM900 makes the common assumption that production occurs under constant
returns to scale and perfect competition. This implies that the entire value of production is
distributed to the factors of production – labour, capital, land and other fixed factors – without
any leakage. It follows that the incidence of production-related taxes is borne fully by factors of
production.
Given that the incidence of our taxes falls largely on Australian factors of production, the final
issue is identifying how that incidence is shared between those factors of production – capital,
labour, land and other fixed factors. This depends on their relatively mobility. Immobile
factors of production cannot move to avoid a tax, while mobile factors can.
As already noted, capital is highly mobile internationally, as it seeks out higher rates of return.
In that environment, it is common to assume that Australia is a price taker in world capital
markets, and that approach is followed in MM900. This means that foreign investors don’t
ultimately bear a burden from Australian taxes; rather taxes that impact on capital limit
investment and are ultimately passed on into higher prices, reducing real incomes for other
factors of production, especially labour. Capital bears none of the burden of the tax system in
MM900.
In contrast, land and other fixed factors of production are completely immobile in MM900.
This means they bear the full burden of any taxes that are applied to them. It also means they
cannot avoid the burden of taxes that are passed on to them. However, fixed factors are less
important as factors of production than either labour or capital, so they bear a relatively small
share of the tax burden.
Labour is generally considered to have a low degree of mobility, and this is also the case in
MM900. This means that the incidence of taxes on labour falls largely on labour, although a
small part of it is shifted to fixed factors. It also means that labour, as the major factor of
production, also bears the largest share of the incidence of other taxes, with the exception of
taxes that are applied to fixed factors. Hence, labour bears most of the incidence of the tax
system in MM900, through reduced real wages. This reduction comes about through reduced
after tax nominal wages, in the case of personal income tax, and through increased consumer
prices, in the case of a wide range of other taxes. 8
In summary, the incidence of most Australian taxes can be expected to fall largely on labour.
This reflects the common modelling assumptions of perfect competition with constant returns to
scale, and that Australia is (almost) a price taker in world trade and capital markets. However,
land and natural resources bear some of the incidence of the tax system, and when taxes are
applied directly to them they bear the full incidence.
8 The incidence of most taxes borne by labour is transmitted through higher prices rather than a lower nominal wage
because the nominal wage is the numeraire in MM900. However, the choice of numeraire does not affect the real
outcome of the model, which is that the real wage falls in response to a wide range of taxes and so labour bears the
final incidence.

Department of the Treasury
The Excess Burden of Australian Taxes
March 2010
ABCD
28
© 2010 KPMG, an Australian partnership and a member firm of the KPMG network of independent
member firms affiliated with KPMG International, a Swiss cooperative. All rights reserved.
The KPMG logo and name are trademarks of KPMG.
Liability limited by a scheme approved under Professional Standards Legislation.
4 The MM900 Model
While section three explained the nature and significance of the concepts of tax efficiency and
incidence, this section outlines the economic model that has been used for the tax simulations.
It completes the groundwork needed for section 5, where the modelling results are presented for
the efficiency and incidence of each tax.
KPMG Econtech’s MM900 model is the latest edition of our detailed computable general
equilibrium (CGE) model of the Australian economy focussing on tax analysis. The first
edition, MM303, was developed for the South Australian Department of Treasury and Finance
in the late 1990s to assist it in participating in a developing debate on indirect tax reform. That
debate culminated in the introduction of the New Tax System (NTS) in July 2000. In the lead
up to the introduction of the NTS, MM303 was further developed to MM600+ to assist the
Australian Competition and Consumer Commission (ACCC) in its price surveillance work. For
this study for the Federal Treasury, MM600+ has been re-developed as MM900, extending its
tax analysis capabilities from indirect taxes to also include direct taxes.
This development process has meant that MM900 goes well beyond other Australian modelling
in capturing the economic effects of the tax system on the Australian economy. It does this by
distinguishing 19 different major taxes at the Federal, State and Local levels. Further, for each
tax, the model identifies the true tax base as closely as possible, and aims to capture the main
behavioural responses to the tax’s imposition. The modelling also allows for certain negative
externalities in consumption that may justify certain specific taxes. A key feature of MM900 is
its fine level of detail.
MM900 contains even a finer level of product detail than MM600+. For example, in MM900
the economy produces 889 different products (i.e. about 900 products), which represents eight
times as much product detail as other comparable models. This allows the model to more
accurately capture the application of certain product-based taxes.
As noted in Han (1998), a greater level of detail will also lead to a smaller amount of
aggregation bias in CGE estimates of excess burdens. The greater the product detail, the more
distortions the model will pick up, and the better the estimates of the excess burdens. For
example, MM900 treats beer, wine and spirits as separate substitutable products within one
broad group. Less disaggregated models aggregate all alcohol products together, and therefore
miss the excess burdens that arise from taxing closely substitutable alcoholic beverages at
different rates.
MM900 includes a detailed treatment of consumer’s responses to taxes that cause relative price
changes. MM900 does this by specifying a two-tier consumer demand system covering the 889
products in the model.
• First, the consumer decides between 17 different broad groups of products using a linear
expenditure system.
• Second, and importantly, MM900 also allows for substitution within these 17 broad groups,
between individual products, with the degree of substitutability able to vary from one group
to the next, adding extra sophistication.
This detail in consumer decisions means that MM900 will produce high quality estimates of
excess burdens.
Department of the Treasury
The Excess Burden of Australian Taxes
March 2010
ABCD
29
© 2010 KPMG, an Australian partnership and a member firm of the KPMG network of independent
member firms affiliated with KPMG International, a Swiss cooperative. All rights reserved.
The KPMG logo and name are trademarks of KPMG.
Liability limited by a scheme approved under Professional Standards Legislation.
MM900 also contains a fine level of detail in modelling production processes. Each of the 109
industries use up to six different primary factors (or types of labour, capital and fixed factors),
compared with two primary factors in MM600. The different fixed factors include land and
natural resources, allowing for much more robust modelling of the effects of taxes based on the
value of land or the value of natural resource use.
In addition, in comparison to earlier studies, MM900 incorporates a more comprehensive
analysis of the behavioural responses to each tax. In MM900, taxes can cause households to
change their supply of labour and their levels and patterns of spending. Taxes can cause
businesses to change their choices between the six primary factors of production, affecting
employment, investment and valuations of land and natural resources. Finally, taxes can affect
the propensity to import and export each of the model’s 889 products.
These behavioural responses to taxes, by impairing the functioning of the economy, can reduce
consumer welfare, that is, give rise to excess burdens on households. Capturing these welfare
losses accurately requires that the modelling of household behaviour is underpinned by a
consistent treatment of consumer welfare. In MM900, this occurs by using a utility function in
which a representative household derives welfare or utility from leisure, saving and
consumption of products, and then deriving all household behaviour from that same utility
function. Other comparable models include more ad hoc elements in modelling household
behaviour.
In summary, by better capturing where taxes impact on the Australian economy, how it
responds, and how these responses flow through to change consumer welfare, MM900 is
uniquely well suited to the analysis of the excess burdens of Australian taxes.
MM900 is also carefully designed to capture the economic incidence of each tax. This involves
recognising that, as a relatively small part of the world economy, Australia in close to being a
‘price taker’ in world trade markets. It also means taking into account that natural resources and
land are completely immobile, capital is highly mobile, and labour has a low degree of mobility.
Other comparable models have more limited or no treatments of natural resources and land.
The following sections systematically summarise the main features of MM900, emphasising
those that are most pertinent to this tax study. It begins by noting the main, over-arching
assumptions, and then moves on to summarise the behaviour of the ‘economic agents’ in the
model – households, producers, government and the foreign sector.
4.1 Over-arching Assumptions
In keeping with most long-run CGE models, in MM900 economic agents engage in optimising
behaviour, markets are in equilibrium and the government and private sectors live within their
means.
Long-run Horizon
MM900 refers to a long-run equilibrium, after the economy has fully responded to shocks. For
example, stocks of capital in each industry have fully adjusted. This long-run focus is important
Department of the Treasury
The Excess Burden of Australian Taxes
March 2010
ABCD
30
© 2010 KPMG, an Australian partnership and a member firm of the KPMG network of independent
member firms affiliated with KPMG International, a Swiss cooperative. All rights reserved.
The KPMG logo and name are trademarks of KPMG.
Liability limited by a scheme approved under Professional Standards Legislation.
for tax policy, because good tax policy is based on the lasting effects of tax policy changes, not
the transitional effects.
Optimising behaviour
Economic agents engage in optimising behaviour. In MM900, this means that a representative
business in each of the 109 industries chooses inputs and outputs to maximise profit under
perfect competition subject to a production technology with constant returns to scale. It also
means that a representative household maximises utility, which depends on leisure, saving and
consumption of products, subject to a budget constraint. This focus on consumer utility is
important for drawing conclusions about how individual taxes affect consumer welfare.
Equilibrium
In keeping with MM900’s long-run horizon, all markets are assumed to have achieved
equilibrium. This includes markets for the six factors of production – low-skilled labour, high-
skilled labour, structures, other capital, land, and other fixed factors – and markets for the 889
products (goods and services) that are produced.
Government Budget constraint
Governments must always pay their way in the long run. For simplicity, in MM900 the
government is assumed to always balance its budget. To achieve this, a budget policy
instrument must be selected that, instead of being an input to the model, automatically adjusts to
balance the budget. For this study, a hypothetical lump sum tax/transfer is chosen as the swing
instrument, because the efficiency of any tax is traditionally assessed against a lump sum tax,
which by definition is perfectly efficient. Hence, when a change in a tax rate is simulated in this
study, the potential impact on the budget balance is automatically neutralized through a change
in lump sum tax. Any change in consumer welfare can then be attributed to economic
distortions associated with the tax that has been changed. This approach to tax efficiency
analysis is standard in the literature.
Private Budget constraint
Private saving behaviour must also be sustainable in the long run. As explained further below,
the private propensity to save is constant in MM900. Based on that saving rate, together with
the return to savings and the growth rate of the economy, the model then deduces the level of
private assets. Remaining assets are owned by the foreign sector and are supplied perfectly
elastically at the world required rate of return on capital. In the long run, the stock of foreign
liabilities (just like the stock of private assets) must also grow at the same rate as GDP,
requiring a particular current account deficit. In MM900, the exchange rate adjusts to deliver
that current account deficit (external balance).
Department of the Treasury
The Excess Burden of Australian Taxes
March 2010
ABCD
31
© 2010 KPMG, an Australian partnership and a member firm of the KPMG network of independent
member firms affiliated with KPMG International, a Swiss cooperative. All rights reserved.
The KPMG logo and name are trademarks of KPMG.
Liability limited by a scheme approved under Professional Standards Legislation.
4.2 Households
In MM900, a representative household maximises utility, which depends on leisure, saving and
current consumption of products, subject to a budget constraint. This is an important
development from MM600, in which utility only depended on consumption of products.
While MM900 is a ‘static’ model, saving generates utility on the basis that it represents future
consumption of products. This approach leads to a Generalised Linear Expenditure System,
which includes relationships for labour supply, total consumption expenditure, and its spread
across 889 products. These three sets of relationships are now discussed in turn, beginning with
the labour supply choice.
4.2.1 Labour Supply versus Leisure
In MM900 households face a choice in dividing the time in which they could be working,
between work and discretionary leisure, whereas in MM600 the labour supply was fixed. Under
the MM900 utility maximising approach, the amount of time they devote to work depends on
the after-tax real wage that is available from working, and their real ‘full income’, which is the
potential income they could receive if they take no discretionary leisure. MM900 makes full
allowance for the taxes that influence this work-leisure choice.
For example, higher labour income tax directly reduces the real after-tax wage, reducing the
economic return to work. This leads to lower labour supply, but higher leisure. Lower labour
supply leads to lower incomes, reducing levels of consumption and saving.
Many other taxes reduce the economic return to work, as measured by the real after-tax wage,
by increasing consumer prices. Put another way, higher consumer prices reduce the consumer
purchasing power generated by a given work effort. GST and ‘sin taxes’ on alcohol, tobacco
and gambling have obvious effects on consumer prices. Other taxes, such as company tax and
payroll tax, have different tax bases, but ultimately are also likely to be largely passed on into
higher consumer prices or lower wages. All of these taxes act as a disincentive to work by
reducing real after-tax wages. They also have other disincentive effects that are captured in
MM900.
Importantly, explicitly including leisure in the analysis helps to make the excess burden
estimates more robust. For example, increasing labour income tax (or many other taxes) will
reduce the after-tax real wage and reduce labour supply. While reduced labour supply will
reduce utility as lower labour incomes lead to lower consumption and saving, this will be partly
offset by the utility derived from increased leisure. Without the inclusion of leisure in the utility
function, the excess burden of labour income tax would be overstated. This will also be true for
other taxes that reduce real after-tax wages, such as GST, ‘sin taxes’, payroll tax, company tax
etc.
Given the amount of labour that households choose to supply, they will receive a certain
income. The next choice is how to divide this income between consumption and saving.

Department of the Treasury
The Excess Burden of Australian Taxes
March 2010
ABCD
32
© 2010 KPMG, an Australian partnership and a member firm of the KPMG network of independent
member firms affiliated with KPMG International, a Swiss cooperative. All rights reserved.
The KPMG logo and name are trademarks of KPMG.
Liability limited by a scheme approved under Professional Standards Legislation.
4.2.2 Consumption versus Saving
Modelling saving behaviour poses an issue for long run models such as MM900. In particular,
saving (i.e. sacrificing present consumption for future consumption) can appear artificially
attractive. This is because, if saving rates are increased, long-run model results will show the
gain in future consumption, but not the sacrifice of present consumption. To avoid this
problem, the private propensity to save is constant in MM900, as a consequence of the
deliberate design of the household’s utility function. In particular, saving generates utility on
the basis that it represents future consumption of the same products that are consumed in the
present. Allowing for saving and the utility it brings is an important development in moving
from MM600+ to MM900.
Incorporating saving in the analysis of household behaviour, just like incorporating leisure,
helps to make the estimates of excess burden more robust. In particular, foregoing leisure for
the income from additional work allows additional consumption and saving, and it is important
that both of these lead to higher utility if leisure is not to appear artificially attractive.
At the same time, assuming a constant propensity to save means that MM900 is not useful for
estimating excess burdens for taxes that mainly distort the propensity to save. These taxes
include personal income tax on income from assets and taxes on superannuation earnings and
benefits.
Having determined the split of income between consumption and saving, the next choice is how
to divide consumption between the various products.
4.2.3 Pattern of Consumption
Similar to MM600, MM900 allocates total consumption expenditure between products using a
two-tier consumer demand system, corresponding to a Generalised Linear Expenditure System.
In MM900 there are 889 products and the two tiers are as follows.
• In the first tier, the consumer decides between 17 different broad groups of commodities in a
Linear Expenditure System.
• In the second tier, MM900 allows for substitution between individual products within these
17 broad groups, with the degree of substitutability able to vary from one group to the next,
adding extra sophistication.
This detail in consumer decisions means that MM900 will produce high quality estimates of
excess burdens. For example, MM900 treats beer, wine, spirits as separate products, and they
are all substitutable in consumption. Less disaggregated models treat all alcohol products as a
single product group, and will therefore miss the excess burden that arises from taxing
substitutable alcoholic beverages at different rates.
In short, MM900 includes a detailed treatment of consumers’ responses to taxes which cause
relative price changes, and so generates more robust estimates of excess burdens.
Department of the Treasury
The Excess Burden of Australian Taxes
March 2010
ABCD
33
© 2010 KPMG, an Australian partnership and a member firm of the KPMG network of independent
member firms affiliated with KPMG International, a Swiss cooperative. All rights reserved.
The KPMG logo and name are trademarks of KPMG.
Liability limited by a scheme approved under Professional Standards Legislation.
4.3 Producers
In MM900, production occurs in 109 industries that produce 889 products. Within each
industry, a representative business operating under perfect competition chooses inputs and
outputs to maximise profit subject to a production technology. Apart from the unusually large
number of products in MM900, this approach is typical of CGE models.
For its production, each industry uses products produced by other industries as well as primary
factors of production. In MM600, the two primary factors of production of labour and capital
were recognised and treated as substitutable – this is typical of CGE models. However, in
MM900 the number of primary factors is extended from two to six. As discussed further below,
this extension is important for robustly modelling the excess burden and economic incidence of
certain taxes, such as resource rent taxes, land tax, municipal rates, and motor vehicle
registration.
In each industry, the demand for the six primary factors is modelled in a two-tier approach
based on a nested CES production function. In the first tier, the representative producer chooses
a mix of the three broad primary factors – labour, capital and fixed factors – taking into account
their relative prices. In the second tier, for each broad primary factor, they choose a mix
between two types. For example, for labour, they choose a mix between low skilled labour and
high skilled labour, taking into account their relative prices. These mixes vary from one
industry to the next.
The six primary factors, which are now discussed in turn, are as follows:
• low-skilled labour;
• high-skilled labour;
• capital – structures;
• capital – other;
• land; and
• other fixed factors such as natural resources.
Demand for these six primary factors is driven by producer decisions. In the following
discussion of each primary factor, each explanation of how producer behaviour determines
demand is followed by an explanation of supply, and how an equilibrium is achieved in which
supply and demand are balanced.
4.3.1 Low and High Skilled Labour
Labour is divided into two types, low skilled and high skilled. This is equivalent to dividing
labour into a ‘heads’ aspect, which keeps track of the number of people who are employed and a
‘quality’ aspect, which determines the average productivity of labour in each industry. The
reason for dividing labour into skilled and unskilled labour is so that the model can account for
both labour input in terms of the number of people, or total employment, as well as effective
labour input, or the total productivity of labour.
Following profit maximizing behaviour, the representative producer in each industry generates a
demand for low skilled labour and high skilled labour. This demand depends on the prices of
Department of the Treasury
The Excess Burden of Australian Taxes
March 2010
ABCD
34
© 2010 KPMG, an Australian partnership and a member firm of the KPMG network of independent
member firms affiliated with KPMG International, a Swiss cooperative. All rights reserved.
The KPMG logo and name are trademarks of KPMG.
Liability limited by a scheme approved under Professional Standards Legislation.
low skilled and high skilled labour, the prices of other inputs, and industry production. These
demands are aggregated over industries to determine the total demand for low skilled labour and
the total demand for high skilled labour. This raises the question of how this demand for low
skilled and high skilled labour is balanced with supply.
The supply of labour is determined by household behaviour in the way described in section
4.2.1. The mix of that supply between low skilled and high skilled labour is held fixed as an
input to the model. The wage for low skilled labour relative to the wage for high skilled labour
then adjusts until the mix of demand matches the fixed mix of supply.
Total labour demand equals total labour supply in MM900 by virtue of Walras’ Law. That Law
states that, when considering any particular market, if all other markets in an economy are in
equilibrium, then that specific market must also be in equilibrium.
The average wage is not determined by the model but rather is fixed as the “numeraire”. The
idea here is that in any general equilibrium model, all prices are determined in relative terms,
but expressed in nominal terms. To do this conversion to nominal terms, one good is chosen to
be the “numeraire”. This good has a set fixed price, and all other prices can be expressed
relative to that fixed price. In MM900, the average nominal wage has been chosen as the
numeraire. Although the choice of numeraire does not affect the modelling results in real terms,
it does need to be taken into account in interpreting nominal price changes.
4.3.2 Structures and Other Capital
Physical capital is split into two different types. These are:
• structures - residential and other; and
• other capital, which is all other capital goods, such as motor vehicles, machinery and
computers.
Structures include residential structures, which are only used by the ownership of dwellings
industry (in producing housing services) and other structures such as commercial buildings and
engineering construction, which are used by all of the other 108 industries in the model.
Other capital is also used by all of the other 108 industries in the model. Other capital covers
all capital other than structures, and includes motor vehicles, computers, machinery etc, and has
a fixed composition.
Following profit maximizing behaviour, the representative producer in each industry generates a
demand for structures and other capital. This demand depends on the prices of the services of
structures and other capital, the prices of other inputs, and industry production. These demands
are aggregated over industries to determine the total demand for structures and the total demand
for other capital. This raises the question of how this demand for structures and other capital is
balanced with supply.
In MM900, an industry can access as much capital as it needs so long as it can achieve the after
tax rate of return required by international investors. This perfect elasticity of capital supply
means that the required after tax rate of return on capital is effectively fixed on world capital
Department of the Treasury
The Excess Burden of Australian Taxes
March 2010
ABCD
35
© 2010 KPMG, an Australian partnership and a member firm of the KPMG network of independent
member firms affiliated with KPMG International, a Swiss cooperative. All rights reserved.
The KPMG logo and name are trademarks of KPMG.
Liability limited by a scheme approved under Professional Standards Legislation.
markets in the long run. Stocks of structures and other capital adjust in each industry until this
rate of return is achieved.
As noted, it is the after tax rate of return on capital that is determined on world capital markets
and governs the terms on which capital is supplied to Australia. This means that any tax that is
put on capital in Australia will ultimately increase the required before tax rate of return to offset
the tax impost. Capital will flow out of the country until its greater scarcity achieves the
increase in its before tax rate of return. The resulting lower capital intensity of production will
reduce the marginal productivity, and therefore the incomes, of other factors of production,
including labour, land and other fixed factors of production.
4.3.3 Land
MM900 includes land as a fixed factor, which is an unusual feature in CGE models of the
Australian economy. This feature was developed to enhance the estimates of the excess burden
of land tax and municipal rates.
Specifically, MM900 has the following three types of land:
1. rural land, which is land used only by sectors within the agriculture, forestry, fishery and
mining industries;
2. residential land, which is land used only by the ownership of dwellings industry; and
3. urban land, which is used by all other industries.
Following profit maximizing behaviour, the representative producer in each industry generates a
demand for land services. This demand depends on the rental price of land, the prices of other
inputs, and industry production. These demands are then aggregated to determine the total
demand for rural land, for residential land, and for urban land. This raises the question of how
this demand for each of the three types of land is balanced with supply.
The total supply of each of the three types of land is fixed, which reflects the overall availability
of land in the economy and somewhat mimics zoning legislations. This implies that the price of
each of the three types of land will adjust until total demand is reconciled with the fixed supply.
Any tax placed on a type of land will not change the supply of that land. With the fixed supply
of land to the market, the land rents that users will be prepared to pay will be unaffected by the
tax. This means that the burden of the tax will be fully borne by the land owners.
4.3.4 Natural Resources and Other Generators of Economic Rents
The zero profit assumption is a common assumption in economic modelling. However, in
reality, excess returns do exist in some industries. These excess returns can arise as a result of
factors such as access to a natural resource (such as petroleum or minerals deposits), monopoly
power, branding, patents or barriers to entry.
In MM900, these excess returns are modelled as a return on a fixed factor, that is as a “rent”.
To identify the excess returns in an industry, the rate of return on capital in each industry was
examined. When this return has consistently been greater than the “normal” rate of return on

Department of the Treasury
The Excess Burden of Australian Taxes
March 2010
ABCD
36
© 2010 KPMG, an Australian partnership and a member firm of the KPMG network of independent
member firms affiliated with KPMG International, a Swiss cooperative. All rights reserved.
The KPMG logo and name are trademarks of KPMG.
Liability limited by a scheme approved under Professional Standards Legislation.
capital, then the industry may be making excess returns9. Further, the idea that any particular
industry would systematically make excess returns has been subject to a “reality check”. This
was done by examining whether factors that generally lead to excess returns, such as access to a
natural resource or barriers to entry, appear to be present for that industry.
The following industries are identified as having “excess returns” that, for modelling purposes,
are attributed to a fixed factor:
• Coal;
• Oil and gas;
• Iron ore;
• Non-ferrous metal ores;
• Beer;
• Banking; and
• Non-bank finance.
Each of these seven industries is assumed to use a different fixed factor. The remaining 102
industries use no fixed factor.
Following profit maximizing behaviour, the representative producer in each of the seven
industries with a fixed factor generates a demand for fixed factor services. This demand
depends on the rental price of the fixed factor, the prices of other inputs, and industry
production. This raises the question of how demand for each of the seven fixed factors is
balanced with supply.
The total supply of each fixed factor is fixed, which reflects the overall availability of natural
resources and other fixed factors in the economy. This implies that the price of each of the
seven types of fixed factors will adjust until total demand is reconciled with the fixed supply.
Any tax placed on a type of fixed factor will not change the supply of that fixed factor. With the
fixed supply of the fixed factor to the market, the rent that users will be prepared to pay for use
of the fixed factor will be unaffected by the tax, and will continue to reflect the fixed factor’s
marginal productivity. This means that the burden of the tax will be fully borne by the fixed
factor owners.
This inclusion of fixed factors is particularly useful for measuring the excess burden of the
Petroleum Resource Rent Tax, which is intended to be a tax on the above normal profits of the
oil extraction industry.
9 Industries making “excess returns” have been identified in the following way. First, a “normal” rate of return of
return for each of the 109 industries in MM900 has been estimated using employment data and an estimate of output
per employee in each industry. Next, the actual GOS according to the national accounts was compared to the
estimate of the “normal” rate of return. Where the actual GOS was significantly larger than the estimate, then it is
considered that the industry may be making “excess returns”.

Department of the Treasury
The Excess Burden of Australian Taxes
March 2010
ABCD
37
© 2010 KPMG, an Australian partnership and a member firm of the KPMG network of independent
member firms affiliated with KPMG International, a Swiss cooperative. All rights reserved.
The KPMG logo and name are trademarks of KPMG.
Liability limited by a scheme approved under Professional Standards Legislation.
4.4 Government Sector
Government sector spending accounts for part of final demand for various products, and is
financed by taxes. Table 4.1 shows the 19 key taxes in MM900 that are analysed in this study.
These include a range of Federal, State and Local taxes.
The table divides the key taxes into three groups, according to how they appear in MM900.
These are general taxes (that are applied at a single rate), industry taxes (that can be varied from
one industry to the next), and product taxes (that can be varied from one product to the next and
even between different categories of end users of a product). Some specific comments on
particular taxes can be made.
Table 4.1 Key Taxes
General By industry By product
Labour income tax Payroll tax GST
Corporate income tax Land taxes Alcohol excise and WET
Municipal rates Tobacco excise
Resource rent tax Luxury car tax
Motor vehicle registration Import duties
Fuel taxes
Royalties and crude oil excise
Gambling taxes
Conveyancing stamp duties
Motor vehicle stamp duties
Stamp duties (other)
Insurance taxes
“Labour income tax” refers to personal income tax as it applies to labour income. Other
personal income tax, which is collected from non-labour income such as interest income, is
much smaller in magnitude, and is not explicitly modelled in MM900. As explained in section
4.2.2, this is because the main excess burden from personal income tax on non-labour income
(such as income from assets) is likely to be through its influence on private saving, but the
private saving rate is fixed in MM900. Hence, MM900 is not designed to capture the excess
burden from personal income tax as it applies to non-labour income.
Company income tax is modelled in MM900. In addition, the reduction in personal income tax
collections from the claiming of franking credits is also taken into account.
In modelling payroll tax in each industry, the small business exemption is taken into account.
The model allows for resource rent tax to be applied at any rate in most sectors of the mining
sector. In constructing the model, resource rents were identified for: the coal industry; the oil
and gas industry; the iron ore industry; and the non-ferrous metal ores industry. In the baseline
scenario of the existing tax system, the existing petroleum resource rent tax is applied in the oil
and gas industry, while in the other three industries resource rents are not taxed. The model also
Department of the Treasury
The Excess Burden of Australian Taxes
March 2010
ABCD
38
© 2010 KPMG, an Australian partnership and a member firm of the KPMG network of independent
member firms affiliated with KPMG International, a Swiss cooperative. All rights reserved.
The KPMG logo and name are trademarks of KPMG.
Liability limited by a scheme approved under Professional Standards Legislation.
identifies economic rents in some other industries – the banking industry, the non-bank finance
industry, and the beer industry.
The model assumes that GST is applied at a single, specified rate, which is 10 per cent in the
baseline scenario of the existing tax system. However, GST status (taxable, GST-free or
exempt) is set product-by-product, separately for both residents and foreign tourists visiting
Australia.
In modelling fuel taxes, separate account is also taken of fuel subsidies that partly offset fuel
taxes. In simulating the model for this study, when fuel taxes are altered, associated fuel
subsidies are altered in the same proportion.
4.5 Foreign Sector
Australia’s interactions with the global economy are important for the domestic economy. As a
small country, Australia is generally considered to be close to being a ‘price taker’ on world
markets. In MM900, Australia is a price taker for capital and imports, and is close to being a
price taker for most exports.
In a world of highly mobile capital, Australia is assumed to be a price taker in world capital
markets. This means that the world supplies capital to Australia at a fixed real after-tax rate of
return. On the demand side, as explained in section 4.3.2, industries generate demand for
structures and other capital following profit-maximizing behaviour. They do not differentiate
between local and foreign owned capital. The supply of local-owned capital is determined by
saving behaviour, while remaining capital demands are met by foreign-owned capital.
Similarly, the rest of the world supplies Australia, as a small open economy, with as much
imports as demanded at the world price i.e. supply is perfectly elastic. On the demand side,
consumers and producers perceive imported and locally produced goods to be different from
one another, and choose their mix of imported and locally produced goods and services
depending on their relative prices.
For exports, Australia’s status as a small open economy is again recognised, but this time by
assuming export demand is highly elastic but not perfectly elastic. That is, Australia is close to
being a price taker, but has a small degree of pricing power. This pricing power may arise
through product differentiation or by supplying a large share of the world market. For most
goods, export demand elasticities in MM900 are set to a very responsive -12. For goods where
Australia is considered to have some market power, export demand elasticities are lower. The
smallest elasticity is for wool, where the value is -4, in recognition of our large share of the
world market. The same elasticity is used for tourism, which takes into account the product
differentiation between the tourism services that Australia offers compared with those offered
by other countries. All trade elasticities used in MM900 are reported in Appendix C.
On the supply side of export markets, in CGE models with perfect competition and constant
returns to scale, commodity supply is also elastic. The combination of highly elastic export
demand and supply commonly leads to problems because small shifts on either side of the
market can lead to large changes in export volumes.
Department of the Treasury
The Excess Burden of Australian Taxes
March 2010
ABCD
39
© 2010 KPMG, an Australian partnership and a member firm of the KPMG network of independent
member firms affiliated with KPMG International, a Swiss cooperative. All rights reserved.
The KPMG logo and name are trademarks of KPMG.
Liability limited by a scheme approved under Professional Standards Legislation.
Some models attempt to overcome this by making export demand less responsive to price
changes. However, this is not reflective of Australia’s position as a small open country. For a
more realistic approach, MM900 incorporates two features.
First, MM900 includes fixed factors of land and natural resources. This reduces the flexibility
in export supply of agricultural and mining products in a realistic way.
Second, MM900 introduces some friction between supplying domestic and export markets.
Intuitively, this friction may arise because some exported commodities are tailor made for
export, or are more narrowly defined than the corresponding home commodity. For example,
Australian consumers may eat all types of apples, but Australia may only export Fuji apples to
Japan. Thus, there will be a cost involved in switching from supplying the domestic market to
supplying the export market. This reduces flexibility in supplying the export market.
Australian taxes applied in world markets can be expected to have little impact on prevailing
world prices. Rather, such taxes will largely be absorbed on the Australian side of the market.
Taxes on foreign capital will increase the before tax rate of return on capital in Australia, and
accordingly reduce the demand for foreign capital, as discussed in section 4.3.2. Taxes on
imports will have no influence on the world price, and instead raise the price that Australian
consumers pay for imports and therefore reduce their demand for them. Likewise taxes on
exports will have little effect on the price that foreign consumers will pay because export
demand is highly elastic. Instead, they will reduce the price that Australian producers receive
and therefore reduce export supply.
Department of the Treasury
The Excess Burden of Australian Taxes
March 2010
ABCD
40
© 2010 KPMG, an Australian partnership and a member firm of the KPMG network of independent
member firms affiliated with KPMG International, a Swiss cooperative. All rights reserved.
The KPMG logo and name are trademarks of KPMG.
Liability limited by a scheme approved under Professional Standards Legislation.
5 Results
This section presents the results of this study. For each tax, the results are reported in terms of
the economic cost of the tax and the economic incidence or who ultimately pays the tax. These
concepts were explained in section 3, while the model used to generate the results was
summarised in section 4.
For ease-of-reference, Box 5.1 on the following pages summarises the information from
section 3 on the concepts and measurement of the excess burden and economic incidence of a
tax. It also explains how to interpret the detailed, tax-by-tax results of economic incidence that
are reported throughout this section.

Department of the Treasury
The Excess Burden of Australian Taxes
March 2010
ABCD
41
© 2010 KPMG, an Australian partnership and a member firm of the KPMG network of independent
member firms affiliated with KPMG International, a Swiss cooperative. All rights reserved.
The KPMG logo and name are trademarks of KPMG.
Liability limited by a scheme approved under Professional Standards Legislation.
Box 5.1 Measures of the economic cost and incidence of taxes
The excess burden of a tax measures the cost of each tax over and above the revenue raised.
These costs arise because taxes may distort incentives to work and invest, as well as production
methods and consumption patterns. The marginal excess burden (MEB) is the cost arising
from a small increase in the tax rate. The average excess burden (AEB) is the full cost arising
at the existing tax rate, starting from a situation without the tax. The MEB and AEB are
measured as cents of economic cost per dollar of revenue raised. See sections 3.1 and 3.2 for
more a detailed explanation of excess burdens and how they are measured.
The incidence of a tax refers to who ultimately bears the burden of each tax. The party who is
liable to government for a tax carries its impact. However, some taxes lead to changes in the
economy that mean that the party who is liable for the tax is different from the party who
actually bears the final burden or incidence of the tax. For example, while company tax is a
liability of businesses, so they carry its impact, a business may pass the burden of the tax on to
households through higher prices or lower wages, so that households bear its incidence. See
sections 3.3 and 3.4 for more a detailed explanation of incidence and how it is measured.
Interpreting the incidence tables
The incidence results for each tax are reported throughout this section in the form of tables. The
interpretation of these tables can be understood by using the table for labour income tax, which
appears below, as an example.
Table 5.10 Incidence of Introducing Labour Income Tax (nominal changes)
change in $m
Tax revenue: a 109,422
Change in private income by source:
After tax labour income -149,505
After tax private capital income -6,349
After tax private land income - residential -583
After tax private land income - rural -835
After tax private land income - urban -1,585
After tax private other rent income -1,240
Transfers -3,084
Change in total private income: -163,179
% change
Change in total private income: -19.0%
Change in prices:
Price essential consumption -1.4%
Price non-essential consumption -1.4%

Department of the Treasury
The Excess Burden of Australian Taxes
March 2010
ABCD
42
© 2010 KPMG, an Australian partnership and a member firm of the KPMG network of independent
member firms affiliated with KPMG International, a Swiss cooperative. All rights reserved.
The KPMG logo and name are trademarks of KPMG.
Liability limited by a scheme approved under Professional Standards Legislation.
Notes to table 5.10:
a. Tax Revenue is the net revenue from introducing the tax. It includes any offsetting revenue losses from
changes to other tax bases. It is measured by the fall in lump sum tax revenue that is required to keep the
budget in balance given the income tax collections.
b. The changes in the table are in nominal terms. In MM900, all prices are expressed relative to the nominal
wage (the numeraire). However, the incidence of taxes depends on the real impacts, so care should be
taken when interpreting the nominal results. Thus, with a fixed nominal wage, an increase in consumer
prices can be interpreted as a reduction in the real wage.
c. Changes in capital and transfers are included only for completeness, and do not have policy implications.
The amount of revenue raised from labour income tax is shown in the top row of the table. This
amount refers to the year 2009/10, but under a ‘normalised economy’. This normalised
economy abstracts from the strength of Australia’s mining exports and terms of trade growth
since 2004/05. It also removes the effects of the global financial crisis. As such, revenue
generated from this process will not align with projected outcomes for the 2009/10 financial
year and the actual tax collected will differ from the amount shown in the table.
A key observation for each tax is whether the incidence will be felt through lower nominal
income or higher prices or some combination. This can be ascertained by comparing the
percent fall in nominal total private income with the percent rise in consumer prices. For labour
income tax, the main incidence is felt through nominal private income, which is 19.0 per cent
lower as a result of labour income tax. This is slightly offset through consumer prices, which in
fact are lower, not higher, as a result of labour income tax.
For taxes where the incidence is felt mainly through lower incomes, the table can then be used
to show what types of income mainly bear this incidence. Specifically, where the incidence is
felt through lower incomes, the table shows how the total fall in nominal private income,
expressed in $ millions, is distributed across different types of income. This information can
then be matched to the types of incomes of different households, to ascertain how different
households are affected, which would assist in making judgements about the equity of the tax.
In this case, the table shows that most of the reduction in nominal private income is through a
large fall in labour income, implying that the incidence of the tax is mainly borne by households
who supply labour.
Changes in incomes from labour, the three types of land and ‘other rent’ are of most interest for
incidence analysis. ‘Other rent’ refers to income from sources of ‘economic rent’ other than
land, such as natural resources, barriers to entry or brand names.
Changes in capital income and transfers are included only for completeness. They reflect
specific model assumptions, and do not carry policy implications. Any changes in capital
income only reflect the assumption of a fixed propensity to save for Australian households. As
total income (which includes the value of net government transfers) changes, savings and
domestically owned capital stock will change in the same proportion. Since the rate of return to
capital is fixed on international capital markets, any change in private capital income only
reflects changes in the capital stock owned by Australian residents. Likewise, changes in
transfers from overseas only reflect the assumption that these transfers are fixed as a share of
nominal GDP. Therefore, the movements in incomes from capital ownership and transfers will
move with incomes generally. They are not closely linked to the nature of the tax under
consideration, and do not have policy implications.

Department of the Treasury
The Excess Burden of Australian Taxes
March 2010
ABCD
43
© 2010 KPMG, an Australian partnership and a member firm of the KPMG network of independent
member firms affiliated with KPMG International, a Swiss cooperative. All rights reserved.
The KPMG logo and name are trademarks of KPMG.
Liability limited by a scheme approved under Professional Standards Legislation.
While the incidence of labour income tax is felt through lower nominal incomes, for many other
taxes the incidence is felt mainly through higher consumer prices. The table reports two
different measures of the change in consumer prices, which refer to baskets of essential
consumption and non-essential consumption. This is so the relative burden on households with
different levels of income can then be examined. In the table above, labour income tax leads to
prices of essential and non-essential consumption falling by the same amount of 1.4 per cent,
implying a neutral result. However, for some taxes, the percentage rise in the price of essential
consumption may be larger than for non-essential consumption. This would affect low-income
households more than high-income households, because essential consumption will make up a
higher proportion of the budgets of lower income households. Hence, a comparison of the
percentage impacts of these two different measures of consumer prices assists with judgements
about the equity of a tax.
In any general equilibrium model, all prices are determined in relative terms, but expressed in
nominal terms. To do this conversion to nominal terms, one good is chosen to be the
“numeraire”. This good has a set fixed price, and all other prices can be expressed relative to
that fixed price. In MM900, the average nominal wage has been chosen as the numeraire.
Although the choice of numeraire does not affect the modelling results in real terms, it does
need to be taken into account in interpreting nominal price changes. For example, a fall in the
real wage could come about through either a reduction in the nominal wage or an increase in
consumer prices. In MM900, it will always be the latter, because the nominal wage is fixed.
Therefore, any price increases reported in the incidence tables can simply be interpreted as a fall
in the real wage.

Department of the Treasury
The Excess Burden of Australian Taxes
March 2010
ABCD
44
© 2010 KPMG, an Australian partnership and a member firm of the KPMG network of independent
member firms affiliated with KPMG International, a Swiss cooperative. All rights reserved.
The KPMG logo and name are trademarks of KPMG.
Liability limited by a scheme approved under Professional Standards Legislation.
5.1 Summary of Excess Burden Results
The efficiency cost of each tax is reported in Table 5.1 below, which contains KPMG
Econtech’s estimates of the marginal and average excess burden of each of the 19 Australian
taxes in this study. It shows that some of Australia’s taxes are much more inefficient than
others. Excess burden estimates range from negative values (indicating a welfare improving
tax) to almost 100 cents (indicating that for every dollar of revenue raised, there is an additional
dollar of welfare loss).
Table 5.1: Marginal and average excess burdens of Australian taxes
(cents of consumer welfare per dollar of revenue)
Rating Tax MEB AEB
Low Tobacco excise a -8 -23
Low Import duties b -3 -7
Low Petroleum resource rent tax c 0 0
Low Municipal rates 2 1
Low GST 8 6
Low Land taxes d 8 6
Low Alcohol excise and WET a 9 7
Medium Fuel taxes 15 10
Medium Stamp duties other than real property e 18 18
Medium Luxury car tax f 20 9
Medium Labour income tax 24 16
High Conveyancing stamp duties g 34 31
High Motor vehicle registration h 37 32
High Motor vehicle stamp duties h, i 38 38
High Corporate income tax 40 23
High Payroll tax 41 22
Very High Insurance taxes 67 47
Very High Royalties and crude oil excise 70 50
Very High Gambling taxes j 92 54
Source: KPMG Econtech’s MM900 model estimates
Department of the Treasury
The Excess Burden of Australian Taxes
March 2010
ABCD
45
© 2010 KPMG, an Australian partnership and a member firm of the KPMG network of independent
member firms affiliated with KPMG International, a Swiss cooperative. All rights reserved.
The KPMG logo and name are trademarks of KPMG.
Liability limited by a scheme approved under Professional Standards Legislation.
Notes to Table 5.1:
a. The excess burden for tobacco excise and alcohol tax will be influenced by the assumptions for externalities
associated with tobacco and alcohol consumption.
b. The low (negative) excess burden estimate for import tariffs is an under-estimate in some contexts. It refers to the
efficiency of import tariffs post the tariff reductions scheduled for 1 January 2010. Those reductions mean that
all import tariffs will be five per cent or less, apart from a tariff of 10 per cent on clothing. These rates are below
a theoretical ‘optimal’ tariff of around 11 per cent (based on average export demand elasticities in MM900 of
around -10), so such low rates of tariff are not distorting. However, Australia has had much higher import tariffs
in the past, which were highly distorting. Further, the notion of an optimal tariff ignores the risk that other
countries will impose tariffs in retaliation, leading to welfare losses for Australia.
c. The zero excess burden for the PRRT rests on the assumption that it is designed so that it only taxes the excess
profits of petroleum extractors, which they derive from access to a natural resource which is in limited supply.
d. The estimate of the excess burden for land tax does not take into account that the rate structure is progressive
because of the exemptions for land holdings under a certain threshold value and an increasing tax rate for higher
valued land holdings. Also, the data for land tax collections by industry was highly aggregated and does not
reflect the full extent of the variability of land tax paid by industry. The excess burden may therefore be an under-
estimate.
e. The excess burden estimates for stamp duties other than on real property are likely to be under-estimates because
there are a number of distortions from these stamp duties that are not readily amenable to CGE modelling. For
example, these stamp duties may reduce the frequency of transactions.
f. The excess burden estimates for luxury car tax are likely to be under-estimates, because the modelling does not
capture the point that the luxury car tax distorts the choice between luxury and non-luxury cars.
g. The excess burden estimates for conveyancing duties have a downward bias because there are a number of
distortions from conveyancing duties that are not readily amenable to CGE modelling, such as the distortion
between renting and buying housing.
h. The excess burdens for motor vehicle registration and motor vehicle stamp duties are only for the proportion of
those taxes paid by businesses. This is because motor vehicle taxes paid by households do not appear in input-
output tables used to construct the model. The impact that this has on the size of the excess burden is ambiguous.
i. The excess burden estimates of motor vehicle stamp duties are likely to be under-estimates because there are a
number of distortions from motor vehicle stamp duties that are not readily amenable to CGE modelling. For
example, motor vehicle stamp duties may lead to less frequent motor vehicle transactions.
j. The excess burden estimates for gambling taxes are likely to be over-estimates if there are negative externalities of
gambling, which have not been taken into account.
k. The excess burden of state taxes (excluding land tax and resource royalties) have a conservative bias, because any
economic cost arising from differences in tax regimes between the states has not been taken account of in the
modelling.
As discussed in section 3.2, the variation in economic efficiency between taxes is mainly
explained by two economic principles.
• The mobility principle recognises that the excess burden of a tax is higher, the higher the
mobility of its tax base. When a tax is applied to a highly mobile tax base, that tax base is
likely to shrink, distorting economic activity.
• The narrowness principle recognises that the excess burden of a tax is likely to be higher,
the narrower the tax base. A narrow tax base may make it possible to respond to a tax by
shifting to untaxed close substitutes. Such shifts add to economic inefficiency and reduce
the revenue yield.
The mobility principle is clearly reflected in the modelling results. Petroleum Resource Rent
Tax (PRRT) is modelled to have a marginal excess burden of zero, because it is applied to a tax

Department of the Treasury
The Excess Burden of Australian Taxes
March 2010
ABCD
46
© 2010 KPMG, an Australian partnership and a member firm of the KPMG network of independent
member firms affiliated with KPMG International, a Swiss cooperative. All rights reserved.
The KPMG logo and name are trademarks of KPMG.
Liability limited by a scheme approved under Professional Standards Legislation.
base that is assumed to be completely immobile – oil resources. Similarly, municipal rates have
a marginal excess burden of only two cents of welfare loss per additional dollar of revenue
raised because they are applied to land, which is also completely immobile. Municipal rates
only generate an excess burden to the extent that they are applied non-uniformly to different
land users, distorting the pattern of land use.
At the other extreme, company income tax is modelled to have a high marginal excess burden of
40 cents in the dollar of additional revenue, because it is applied to capital, which is highly
mobile. This high mobility is generated by the international competition for funds.
The excess burdens of the remaining taxes are mostly associated with the response they cause in
labour. Labour has an intermediate level of mobility, and so under the mobility principle these
taxes would be expected to have medium excess burdens. However, the narrowness principle
leads their excess burdens to vary.
Payroll tax has a relatively narrow base because, under the small business exemption provision,
it applies to only around one-half of labour income. This provision provides an exemption from
payroll tax on the first tranche of labour income for small and large business alike, undermining
revenue raising, while doing little to reduce disincentive effects. This narrowness of the payroll
tax base leads to a high marginal excess burden.
Personal income tax (as applied to labour income) also has a narrowed tax base, although to a
lesser degree. The progressive rate structure provides an exemption from tax on income earned
up to the tax-free threshold, and beyond that lower marginal tax rates are applied at lower
incomes than at higher incomes. This narrowing of the tax base10 (compared with a flat rate tax
on all labour income) leads to a medium marginal excess burden, as shown in Table 5.1 below.
Of course there are compelling equity reasons for the progressive nature of the personal income
tax scale, but its efficiency implications should still be understood.
The GST can also be analysed alongside taxes on labour income. Taxes on labour income and
GST both act as a disincentive to supply labour, by reducing the purchasing power of the
additional pay earned from a given amount of additional labour. Labour income tax does this by
removing tax from the additional pay, while GST does this by reducing the purchasing power of
that pay through raising consumer prices. The GST has a relatively broad base, applying to
close to 70 per cent of consumer spending. This breadth helps keep its marginal excess burden
low. Also contributing to this favourable result is the gain in the terms-of-trade associated with
applying GST to some expenditures of international tourists.
These results are closely aligned with those found by Johansson et al. in a 2008 study for the
OECD. This OECD study used both theory and empirical evidence to conclude that recurrent
taxes on immovable property (particularly residential property) are the “least distortive tax
instrument in terms of reducing long-run GDP per capita” (Johansson et al., 2008, p7). Broad
based consumption taxes, such as the GST, are found to be the second least distortive, followed
by personal income taxes and then corporate income taxes. This is the same as the ranking
implicit in the results of this study, as shown in Table 5.1 above.
10 This “narrowing” of the tax base can also be thought of as having an average rate of tax that is lower than the
marginal rate of tax. While the marginal tax rate determines the distortionary impact of the tax, the average tax rate
determines the revenue. Thus, the higher the marginal rate compared to the average rate, the higher will be the excess
burden.
Department of the Treasury
The Excess Burden of Australian Taxes
March 2010
ABCD
47
© 2010 KPMG, an Australian partnership and a member firm of the KPMG network of independent
member firms affiliated with KPMG International, a Swiss cooperative. All rights reserved.
The KPMG logo and name are trademarks of KPMG.
Liability limited by a scheme approved under Professional Standards Legislation.
5.2 Summary of Incidence Results
As discussed in section 3.3, while excess burdens give information about the size of the overall
cost to the economy of taxation, the question of who actually bears the burden of taxes is also
important. In considering the burden of taxes, it has long been appreciated that there is an
important distinction between who has the liability to government for a tax, and therefore carries
its impact, and who bears its final burden after all economic adjustments, and therefore bears its
incidence. It is the incidence of a tax, not its impact, that matters for economic analysis, and
often they are different.
The concept of mobility of a tax base is important for determining the incidence of a tax, just as
it is important for determining the efficiency of a tax. Highly mobile primary factors of
production are unlikely to bear much of the final incidence of a tax. Rather, they are likely to
partly move to lower taxed alternative uses. This partial withdrawal of supply from the original
use generates a shortage that is likely to push up its price for that use, partly or wholly offsetting
the tax impost on the mobile factor. The incidence of the tax will then be passed on to other
factors of production. In contrast, completely immobile factors of production have no scope for
passing on taxes, so when they carry the impact of a tax, they will also bear its final incidence.
The importance of the mobility principle can be seen in Table 5.2 on the following page, which
shows the final incidence for each of the 19 taxes under reference. The results in the table
identify where most of the incidence of each tax falls, based on model simulations. The
simulations involved abolishing each tax in turn, and observing the impacts on consumer prices
and different sources of private income.
Each of the columns in Table 5.2 corresponds to the different ways that the incidence of a tax
can be borne. For example, a tax may reduce the nominal income from any of the primary
factors of production: labour; land; other fixed factors; or capital. Or it may also be transmitted
into higher prices, reducing real incomes.

Department of the Treasury
The Excess Burden of Australian Taxes
March 2010
ABCD
48
© 2010 KPMG, an Australian partnership and a member firm of the KPMG network of independent
member firms affiliated with KPMG International, a Swiss cooperative. All rights reserved.
The KPMG logo and name are trademarks of KPMG.
Liability limited by a scheme approved under Professional Standards Legislation.
Table 5.2: Final Incidence or Burden of Each Major Tax (Long run)
Tax labour land other rents capital
Tobacco excise X
Import duties X
Petroleum resource
rent tax X
Municipal rates X
GST X
Land taxes X
Alcohol excise and
WET X
Fuel taxes X
Stamp duties other
than real property X
Luxury car tax X
Labour income tax X
Conveyancing stamp
duties X
Motor vehicle
registration X
Motor vehicle stamp
duties X
Corporate income tax X X X
Payroll tax X
Insurance taxes X
Royalties and crude oil
excise X X
Gambling taxes X
Source: KPMG Econtech estimates from MM900
Note: The table shows the party that bears the main portion of the final incidence for each tax.

Department of the Treasury
The Excess Burden of Australian Taxes
March 2010
ABCD
49
© 2010 KPMG, an Australian partnership and a member firm of the KPMG network of independent
member firms affiliated with KPMG International, a Swiss cooperative. All rights reserved.
The KPMG logo and name are trademarks of KPMG.
Liability limited by a scheme approved under Professional Standards Legislation.
Table 5.2 reveals that none of the taxes have their main incidence falling on capital. This result
comes about because of the highly internationally mobile nature of capital. The mobility of
capital means that rather than accepting any burden of the tax, capital will move to alternative
uses in which the prevailing global after-tax rate of return can be obtained.
Table 5.2 also shows that the final incidence of a large number of taxes falls on labour. For
many taxes, this is transmitted through consumer prices in MM900, which causes a reduction in
the real wage. Taxes which increase consumer prices can be divided into two categories: those
levied on consumption directly; and those that are not directly levied on consumption but still
increase consumer prices in MM900.
• The group of taxes which are levied on consumption directly includes the GST, excise
duties, luxury car tax and taxes on fuel, insurance and gambling. In this case, the party
carrying the impact of the tax (consumers) is the same as the party bearing its final
incidence.
• The group of taxes that are not levied on consumption directly, yet increase consumer prices
include payroll tax, stamp duties and business motor vehicle taxes. For these taxes, the
party carrying the impact of the tax is different to the party bearing its final incidence. For
example, payroll tax has its impact on employers, but its final incidence is on labour,
transmitted through higher consumer prices. Payroll tax increases the cost of employing
labour, and since prices are equal to the marginal cost of production, firms must pass this
cost on. This will be through either nominal wages or increased consumer prices. In
MM900, firms pass the cost of payroll tax on, in the form of higher consumer prices11. This,
in turn, reduces the real wage that labour receives, and in response, labour supply will fall.
This fall creates a shortage of labour that will push up the wage that employers must pay.
However, households’ supply of labour has a low responsiveness to the after-tax real wage,
and so the fall in labour supply is relatively small. Thus, the increase in the wage offsets
only a small part of the initial increase in consumer prices, and labour is left to bear the main
burden of payroll tax in the form of higher prices.
Such taxes that increase consumer prices can be thought of as having their final incidence on
labour. Higher consumer prices decrease the purchasing power of the wage, reducing the return
to work. Similarly, labour income tax (i.e. personal income tax applied to labour income)
reduces the incentive to work, but through the different channel of reducing the after-tax
nominal wage. Therefore, the results from Table 5.2 show that labour bears the main incidence
for the majority of Australian taxes – either directly through nominal labour income or
indirectly through consumer prices.
Labour bears much of the final incidence of Australian taxes because, in contrast to capital,
labour is relatively immobile.
Turning to the remaining taxes in Table 5.2, the burden of petroleum resource rent tax,
municipal rates and land tax all fall on land and other fixed factors. Land and other fixed
factors are on the opposite end of the spectrum to capital, with their supply completely fixed.
This means that when a tax is applied to either of these fixed factors (such as petroleum resource
rent tax to oil resources, and municipal rates or land tax to land), the supply does not fall in
response to the lower rate of return. With no change in supply, the pre-tax return to these fixed
11 The incidence of payroll tax is transmitted through higher prices rather than a lower nominal wage because the
nominal wages is the numeraire in MM900. However, the choice of numeraire does not affect the real outcome of the
model, which is that the real wage falls in response to a payroll tax and so labour bears the final incidence.
Department of the Treasury
The Excess Burden of Australian Taxes
March 2010
ABCD
50
© 2010 KPMG, an Australian partnership and a member firm of the KPMG network of independent
member firms affiliated with KPMG International, a Swiss cooperative. All rights reserved.
The KPMG logo and name are trademarks of KPMG.
Liability limited by a scheme approved under Professional Standards Legislation.
factors will not change. Instead, the after-tax return that owners of the fixed factors are able to
receive falls by the full amount of the tax. Thus, the burden of these taxes falls on the owners of
the fixed factors.
Company income tax has a more complex incidence. Company income tax applies to
company profits, or a company’s return to capital, land and other fixed factors. As such,
company tax spreads its impact three ways.
• The fixed supply of land means that the owners of this factor will bear the full incidence of
the company tax that is applied to the return on land, as described above.
• Similarly, the fixed supply of other fixed factors will bear the full incidence of the company
tax that is applied to the return on other fixed factors, as described above.
• In contrast, capital will not bear the incidence of company tax that is applied to returns to
capital. Instead, the supply of capital will fall until the increase in its pre-tax return fully
offsets the increase in company income tax. This process may take several years so that
returns to capital fall initially, but ultimately the higher cost of capital will be passed on to
consumers in the form of higher prices. Higher prices reduce the real wage, so part of the
final incidence of company income tax is borne by labour. It is not borne by capital because
it is highly mobile, at least in the long run.
Resource royalties and crude oil excise are applied to the output of mining industries rather
than just the profits derived from the natural resources used in mining industries. That is,
resource royalties and crude oil excise applies to both the return to capital and the return to other
fixed factors (natural resources), spreading its impact two ways.
• First, in the same way as company tax, the mobility of capital means that it will not bear the
incidence of resource royalties and crude oil excise. Instead, the supply of capital will fall
until the increase in its pre-tax return fully offsets the increase in tax. The higher cost of
capital flows through into consumer prices, implying that labour bears some of the
incidence.
• Second, as some of the capital in mining industries is withdrawn, this reduces the
productivity of the natural resources, leading to lower rents for those natural resources.
Thus the natural resources, as fixed factors, will bear some of the incidence of these taxes.
In summary, while the impacts of our taxes are widespread, most of their final incidence falls on
labour either directly (in the case of labour income tax), or indirectly (through higher consumer
prices). The remaining incidence falls on the fixed factors of land and natural resources.
However, these fixed factors are ultimately owned by households either directly, or through the
corporate veil as shareholders. So in the end consumers bear most of the burden of the tax
system.
Since consumers bear the final burden of virtually all taxes, an informed approach to tax design
shouldn’t focus superficially on who carries the initial impact. Rather it should focus on the
three principles of good tax design – efficiency (choosing taxes that keep excess burdens low –
see Table 5.1); equity (but with judgements based on who bears the final burden of a tax – see
Table 5.2); and simplicity.

Department of the Treasury
The Excess Burden of Australian Taxes
March 2010
ABCD
51
© 2010 KPMG, an Australian partnership and a member firm of the KPMG network of independent
member firms affiliated with KPMG International, a Swiss cooperative. All rights reserved.
The KPMG logo and name are trademarks of KPMG.
Liability limited by a scheme approved under Professional Standards Legislation.
5.3 Detailed results
The following is a detailed description of the excess burden and incidence results for each tax.
A more comprehensive discussion of the definition, modelling issues and methodology of each
tax can be found in the corresponding sections in Appendix A.
5.3.1 Petroleum Resource Rent Tax
As expected, the PRRT has an excess burden of zero. This is in line with the mobility principle,
which recognises that taxes on immobile factors will have low economic costs.
The PRRT is modelled as a tax on oil and gas natural resources, which are assumed to be in
fixed supply. This methodology rests on the assumption that the PRRT is designed so that it
only taxes the excess profits of petroleum extractors, which they derive from access to a natural
resource which is limited in supply. If only these excess profits are taxed, then the investment
decisions of petroleum extractors will not be distorted12. This means that economic activity will
not be distorted and the tax base for PRRT will not shrink.
The incidence of the PRRT is also a result of the immobile nature of the natural resources on
which it is levied. Since there is no change in the supply of oil resources, their pre-tax price will
not change. Instead, the after-tax return that owners of the resources are able to receive falls by
the full amount of the tax. Table 5.1 below shows that income from ‘other rent’, which in this
case is excess profits from the ownership of oil resources, bears the incidence of PRRT.
Table 5.1 Incidence of PRRT
change in $m
Tax revenue: a 1,398
Change in private income by source:
After tax labour income 0
After tax private capital income 0
After tax private land income - residential 0
After tax private land income - rural 0
After tax private land income - urban 0
After tax private other rent income -1,218
Transfers -180
Change in total private income: -1,398
% change
Change in total private income: -0.2%
Change in prices:
Price essential consumption 0.0%
Price non-essential consumption 0.0%
Source: MM900, KPMG Econtech estimates
12 See Appendix A1 for further discussion of this argument.
Department of the Treasury
The Excess Burden of Australian Taxes
March 2010
ABCD
52
© 2010 KPMG, an Australian partnership and a member firm of the KPMG network of independent
member firms affiliated with KPMG International, a Swiss cooperative. All rights reserved.
The KPMG logo and name are trademarks of KPMG.
Liability limited by a scheme approved under Professional Standards Legislation.
Notes to Table 5.1:
a. Tax Revenue is the net revenue from introducing the tax. It includes any offsetting revenue losses from
changes to other tax bases. It is measured by the fall in lump sum tax revenue that is required to keep the
budget in balance given the PRRT collections.
b. The changes in the table are in nominal terms. In MM900, all prices are expressed relative to the nominal
wage (the numeraire). However, the incidence of taxes depends on the real impacts, so care should be
taken when interpreting the nominal results. Thus, with a fixed nominal wage, an increase in consumer
prices can be interpreted as a reduction in the real wage.
c. Changes in income from capital and transfers are included only for completeness, and do not have policy
implications.
5.3.2 Land tax and Municipal rates
The excess burdens of land tax and municipal rates are also low. This is because, like PRRT,
these taxes are applied to a fixed factor (in this case – land), which is immobile. As discussed in
section 4.3.3, the three types of land (residential, urban and rural) are each assumed to be in
fixed supply.
KPMG Econtech estimates the marginal excess burden of land taxes to be 8 cents in the dollar,
and the average excess burden to be 6 cents in the dollar. In comparison, the marginal excess
burden of municipal rates is estimated at 2 cents in the dollar, and the average excess burden at
1 cent in the dollar. The lower excess burden for municipal rates compared to land tax is driven
by its comparatively lower effective rate. However, there are a number of factors that give a
downward bias to the excess burden estimates of for land tax and municipal rates, as explained
below.
There is a progressive land tax system in place in most states, which includes tax rates that
increase with the value of land holdings and a tax-free threshold. This narrows the base for land
tax and contributes to the excess burden. MM900 only takes this progressivity into account to
the extent that it leads to different average rates of land tax for different industries. It does not
explicitly model this progressivity, and so the excess burden for land tax may be an
underestimate.
Moreover, as explained in section 4.3, each type of land (rural, urban and residential) is fixed in
the long run. However, if re-zoning were considered a possibility, each type of land would be
substitutable for the other to some extent, and only the total quantity of land would be fixed.
Increasing the substitution possibilities for land would increase the excess burden estimates
from the model.
However, in the case of rural and urban land, each type is used by a variety of different
industries, which compete for the use of the fixed supply of land. Some of these industries face
different rates of municipal rates or land tax on their use of land, due partly to the progressive
rate structures. Thus, the industries facing lower rates will have a cost advantage over industries
facing higher rates. This will distort the distribution of land between industries toward those
facing lower tax rates. These different tax rates are particularly important for land tax and
contribute to its excess burden. However, the data used for land tax collections by industry is
only available at an aggregated level, and so all of the variation in tax rates between industries
cannot be included in the modelling, adding to the downward bias of the excess burden
estimates.

Department of the Treasury
The Excess Burden of Australian Taxes
March 2010
ABCD
53
© 2010 KPMG, an Australian partnership and a member firm of the KPMG network of independent
member firms affiliated with KPMG International, a Swiss cooperative. All rights reserved.
The KPMG logo and name are trademarks of KPMG.
Liability limited by a scheme approved under Professional Standards Legislation.
The impact of the uneven application of land tax on its efficiency can be demonstrated by
comparing the AEB of the current land tax (as estimated in MM900) with the AEB of a
hypothetical land tax that is applied uniformly across all land. The rate of this uniform land tax
has been chosen so as to raise the same amount of revenue as the current land tax system.
Table 5.2 below compares the AEB of these two forms of land tax. As expected, a uniform land
tax is more efficient than the current land tax system (as shown by a lower AEB).
Table 5.2 AEB of the actual and uniform land tax
Rating Tax AEB
Low Uniform Land tax 0
Low Actual Land tax 6
Source: MM900, KPMG Econtech estimates
The AEB of a uniform land tax is zero. This is in line with the mobility principle, which
recognises that taxes on immobile factors will have low economic costs. It confirms that any
economic costs from land tax arise through differential rates across industries and the
progressivity of land tax.
The incidence results reported in Tables 5.3 and 5.4 below support the finding of Metcalf and
Fullerton that “any inelastically-supplied factor of production bears the full burden of a tax on
that factor.” Like PRRT, the incidence of land tax and municipal rates fall on the income
derived from the immobile factor that they tax. This incidence of land tax falls mostly on urban
land, because agricultural industries and residential land are exempt from land tax.
Table 5.3 Incidence of Land Tax
change in $m
Tax revenue: a 3,229
Change in private income by source:
After tax labour income 14
After tax private capital income 0
After tax private land income - residential -2
After tax private land income - rural -72
After tax private land income - urban -2,706
After tax private other rent income -41
Transfers -418
Change in total private income: -3,225
% change
Change in total private income: -0.5%
Change in prices:
Price essential consumption 0.0%
Price non-essential consumption 0.0%
Source: MM900, KPMG Econtech estimates
Notes:

Department of the Treasury
The Excess Burden of Australian Taxes
March 2010
ABCD
54
© 2010 KPMG, an Australian partnership and a member firm of the KPMG network of independent
member firms affiliated with KPMG International, a Swiss cooperative. All rights reserved.
The KPMG logo and name are trademarks of KPMG.
Liability limited by a scheme approved under Professional Standards Legislation.
a. Tax Revenue is the net revenue from introducing the tax. It includes any offsetting revenue losses from
changes to other tax bases. It is measured by the fall in lump sum tax revenue that is required to keep the
budget in balance given the land tax collections.
b. The changes in the table are in nominal terms. In MM900, all prices are expressed relative to the nominal
wage (the numeraire). However, the incidence of taxes depends on the real impacts, so care should be
taken when interpreting the nominal results. Thus, with a fixed nominal wage, an increase in consumer
prices can be interpreted as a reduction in the real wage.
c. Changes in income from capital and transfers are included only for completeness, and do not have policy
implications.
Table 5.4 shows that the incidence of municipal rates is more evenly spread between the
different land types, because users of most types of land pay municipal rates. However, the
incidence falls mostly on residential land because it faces a higher rate than other types of land.
Table 5.4 Incidence of Municipal Rates
change in $m
Tax revenue: a 8,836
Change in private income by source:
After tax labour income 2
After tax private capital income 13
After tax private land income - residential -5,860
After tax private land income - rural -866
After tax private land income - urban -1,698
After tax private other rent income 49
Transfers -366
Change in total private income: -8,726
% change
Change in total private income: -1.2%
Change in prices:
Price essential consumption 0.0%
Price non-essential consumption 0.0%
Notes:
a. Tax Revenue is the net revenue from introducing the tax. It includes any offsetting revenue losses from
changes to other tax bases. It is measured by the fall in lump sum tax revenue that is required to keep the
budget in balance given the municipal rates collections.
b. The changes in the table are in nominal terms. In MM900, all prices are expressed relative to the nominal
wage (the numeraire). However, the incidence of taxes depends on the real impacts, so care should be
taken when interpreting the nominal results. Thus, with a fixed nominal wage, an increase in consumer
prices can be interpreted as a reduction in the real wage.
c. Changes in income from capital and transfers are included only for completeness, and do not have policy
implications.
5.3.3 Company Income Tax
Unlike PRRT and taxes on land, company income tax is estimated to have a high excess burden.
The MEB is estimated to be 40 cents per dollar of tax revenue and the AEB is estimated to be
23 cents per dollar of tax revenue. This result is mostly because it is applied to capital, which is
highly mobile. However, there are three main factors contributing to the high excess burden of
company income tax.

Department of the Treasury
The Excess Burden of Australian Taxes
March 2010
ABCD
55
© 2010 KPMG, an Australian partnership and a member firm of the KPMG network of independent
member firms affiliated with KPMG International, a Swiss cooperative. All rights reserved.
The KPMG logo and name are trademarks of KPMG.
Liability limited by a scheme approved under Professional Standards Legislation.
• Foreign capital is highly mobile. This study uses the standard assumption that capital is
highly mobile internationally and the supply of foreign capital to Australia very sensitive to
its rate of return. Thus, when company tax is increased, the required pre-tax rate of return
increases, leading to a fall in (foreign) investment.
• Capital is substitutable for other factors of production. When company tax increases the
cost of capital relative to other factors of production, such as labour, firms substitute away
from using capital and towards labour. This leads to production technologies that are more
costly than would otherwise be the case.
• Franking credits reduce the overall revenue collections. This is because individuals can
receive personal income tax credits when they receive income in the form of dividend
payments. However, MM900 does not capture the domestic saving arguments in favour of
franking credits.
Previous estimates of the excess burden of company tax have also estimated it to be relatively
high. Table 5.5 compares some of these earlier estimates with the findings of this study.
Table 5.5 Estimates of the excess burden of company tax
Authors MEB
KPMG Econtech (2009) (Australia) 40
Diewert and Lawrence (2002) (Australia) 26.15
Baylor and Beauséjour (2004) (Canada) 37
In 2002, Diewert and Lawrence estimated the marginal excess burden of business taxes at
26.15 per cent, lower than the KPMG Econtech estimate. This compares to a larger value found
by Baylor and Beauséjour in 2004, who estimated that the marginal excess burden of company
income tax in Canada was 37. These are comparable to the estimates from MM900.
As discussed in section 4.5, MM900 assumes that the international supply of capital is perfectly
mobile, which contributes to the excess burden for company income tax. This assumption
implies that no increase in the return to capital is required to attract additional investment into
Australia. If this assumption were relaxed, then the excess burden of company tax would be
smaller.
To test the sensitivity of the AEB for company income tax to the elasticity of supply of foreign
capital, the AEB simulation for company income tax has been repeated, but assuming that
capital is less internationally mobile. That is, it assumes that to increase foreign investment in
Australia, an increase in the rate of return to capital is required. Specifically, this scenario sets
the elasticity of supply of foreign capital so that to double foreign assets’ share of total assets a
50 basis points increase in the rate of return is required.
The results in Table 5.6 below show that reducing the elasticity of supply for foreign finds has
only a small effect on the AEB estimates. However, this alteration does change its ranking from
high to medium.
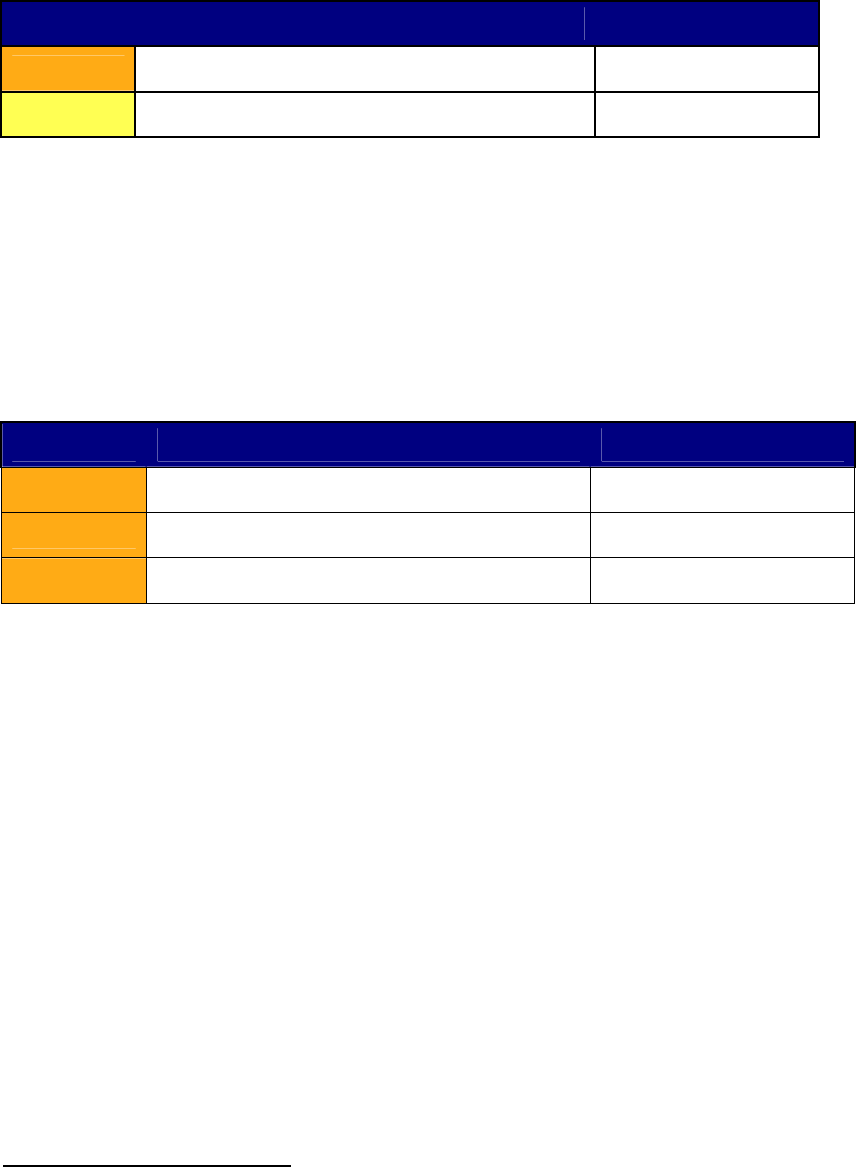
Department of the Treasury
The Excess Burden of Australian Taxes
March 2010
ABCD
56
© 2010 KPMG, an Australian partnership and a member firm of the KPMG network of independent
member firms affiliated with KPMG International, a Swiss cooperative. All rights reserved.
The KPMG logo and name are trademarks of KPMG.
Liability limited by a scheme approved under Professional Standards Legislation.
Table 5.6 Sensitivity analysis for the mobility of foreign capital
Rating Capital Mobility AEB
High Perfect capital mobility 23
Medium Less than perfect capital mobility 19
Source: MM900, KPMG Econtech estimates
As mentioned above, the substitutability of capital and other factors of production is also
important for determining the excess burden of company income tax. An analysis has been
undertaken to understand the sensitivity of the excess burden estimates to changes in these
parameters. After a consideration of the literature, MM900 sets the elasticity of substitution
between the broad categories of factors of production (capital, labour and fixed factors) at
0.7513. The results in Table 5.7 show that altering this parameter only has a small effect on the
AEB estimates. Importantly, the AEB does not change its ranking as a high excess burden tax.
Table 5.7 Sensitivity analysis for elasticity of factor substitution
Rating Elasticity of factor substitution AEB
High 0.60 21
High 0.75 23
High 0.90 25
Source: MM900, KPMG Econtech estimates
As with taxes applied to natural resources and land, the incidence of company tax reflects the
mobility of the factor to which it is applied. However, company income tax has a more complex
incidence. Company income tax is applied to profits, or return to capital, land and other fixed
factors, spreading its impact three ways. As discussed above, the fixed supply of land and other
fixed factors means that they will bear the full incidence of the company tax that is applied to
them, as seen in Table 5.8 in losses in income to rural and urban land and other rent.
However, capital is highly mobile internationally and will not bear the incidence of company tax
that is applied to it. Instead, foreigners will withdraw their investment from Australia, and this
increased scarcity of capital means that the productivity of capital will increase. The supply of
capital will continue to fall until the increase in its pre-tax return fully offsets the increase in
company income tax.
These results are consistent with Kelly and Grazini (2005) who note that “For a small capital
importing country, if capital is perfectly mobile between countries but labour (the other factor of
production) is immobile…Taxing the domestic source capital income of foreigners causes them
to reduce their investment in the country until the marginal post-tax rate of return equals the
(unchanged) returns available from investing elsewhere. Foreigners’ after-tax returns are
therefore unaffected, so they do not bear the cost of the tax.”
13 Many studies assume an elasticity of substitution elasticity of 1, which would imply a Cobb-Douglas production
function. However, other econometric studies estimate a lower value for this parameter. The value of 0.75 represents
a compromise between these two approaches.

Department of the Treasury
The Excess Burden of Australian Taxes
March 2010
ABCD
57
© 2010 KPMG, an Australian partnership and a member firm of the KPMG network of independent
member firms affiliated with KPMG International, a Swiss cooperative. All rights reserved.
The KPMG logo and name are trademarks of KPMG.
Liability limited by a scheme approved under Professional Standards Legislation.
This process may take several years so that returns to capital fall initially, but ultimately the
higher cost of capital will be passed on. In MM900, this cost is passed on in the form of higher
prices, as can be seen in Table 5.8.14 This reduces the real wage, so part of the final incidence of
company income tax is borne by labour. It is not borne by capital because capital is highly
mobile, at least in the long run.
Table 5.8 Incidence of Company Income Tax
change in $m
Tax revenue: a 35,297
Change in private income by source:
After tax labour income -3,877
After tax private capital income 3,446
After tax private land income - residential 304
After tax private land income - rural -4,735
After tax private land income - urban -7,054
After tax private other rent income -7,853
Transfers 13,648
Change in total private income: -6,122
% change
Change in total private income: -0.9%
Change in prices:
Price essential consumption 5.4%
Price non-essential consumption 5.7%
Source: MM900, KPMG Econtech estimates
Notes:
a. Tax Revenue is the net revenue from introducing the tax. It includes any offsetting revenue losses from
changes to other tax bases. It is measured by the fall in lump sum tax revenue that is required to keep the
budget in balance given the company income tax collections.
b. The changes in the table are in nominal terms. In MM900, all prices are expressed relative to the nominal
wage (the numeraire). However, the incidence of taxes depends on the real impacts, so care should be
taken when interpreting the nominal results. Thus, with a fixed nominal wage, an increase in consumer
prices can be interpreted as a reduction in the real wage.
c. Changes in income from income from capital and transfers are included only for completeness, and do not
have policy implications.
14 The incidence of company income tax is transmitted through higher prices rather than a lower nominal wage
because the nominal wages is the numeraire in MM900. However, the choice of numeraire does not affect the real
outcome of the model, which is that the real wage falls in response to a company income tax and so labour bears the
final incidence.

Department of the Treasury
The Excess Burden of Australian Taxes
March 2010
ABCD
58
© 2010 KPMG, an Australian partnership and a member firm of the KPMG network of independent
member firms affiliated with KPMG International, a Swiss cooperative. All rights reserved.
The KPMG logo and name are trademarks of KPMG.
Liability limited by a scheme approved under Professional Standards Legislation.
5.3.4 Resource Royalties and Crude Oil Excise
The analysis of resource royalties and crude oil excise is similar to that of company tax. These
taxes are mostly levied on production volumes or values of the mining sector. Resource
royalties and crude oil excise have a very high excess burden. KPMG Econtech estimates the
marginal excess burden of royalties and crude oil excise to be 70 cents in the dollar, and the
average excess burden to be 50 cents in the dollar.
The very high excess burden for these taxes does not compare favourably to the low excess
burden for petroleum resource rent tax. This is because the resource royalties and crude oil
excise are based on production volumes or values - which depend on factors that are mobile,
capital and labour, as well as on returns to immobile natural resources. Thus, the mobility of
capital is again an important factor contributing to the very high excess burden for resource
royalties and crude oil excise.
The mining sector is capital intensive, and when its output is taxed the rate of return to this
capital is affected. Thus, as with company tax, resource royalties and crude oil excise cause
capital to flow out of the sector and this reduces productivity, increasing the cost of production.
However, the mining sector is also highly trade exposed. This means that the sector has limited
scope to increase its prices in response to resource royalties and crude oil excise. Instead, there
is a contraction in production volumes, particularly from the more marginally profitable mining
operations, contributing to the very high excess burden.
As well as taxing the returns to mobile factors of production, particularly capital, resource
royalties and crude oil excise also taxes the returns to immobile factors, natural resources.
Taxing immobile factors would be an offsetting factor to the excess burden of resource royalties
and crude oil excise.
The mobility of the factors producing mining output is also important for understanding the
incidence of resource royalties and crude oil excise. As with company income tax, capital
owners will not bear the incidence. Instead, it will be passed on to the immobile factors as seen
in Table 5.9 in the loss of rent income. For mining, natural resources are an important immobile
factor, and bear much of the incidence. To a lesser extent, the rural land used by the mining
industry also bears some incidence.15 Most of the incidence is also passed through to higher
prices, reducing real incomes. These results can be seen in Table 5.9 below.
15 As discussed in section 4.3 rural land is used by mining industries, but also by agriculture, forestry and fishing
industries. It is assumed that the land used by mining is perfectly substitutable between all of these industries.
Resource royalties and crude oil excise act as a tax on rural land used by the mining industry, but does not affect land
used by the agricultural industry. This distorts the distribution of land use away from mining and towards agriculture,
contributing to the excess burden of resource royalties and crude oil excise. If rural land was less substitutable
between the mining and agriculture sectors, then the excess burden would be smaller.

Department of the Treasury
The Excess Burden of Australian Taxes
March 2010
ABCD
59
© 2010 KPMG, an Australian partnership and a member firm of the KPMG network of independent
member firms affiliated with KPMG International, a Swiss cooperative. All rights reserved.
The KPMG logo and name are trademarks of KPMG.
Liability limited by a scheme approved under Professional Standards Legislation.
Table 5.9 Incidence of Resource Royalties and Crude Oil Excise
change in $m
Tax revenue: a 3,381
Change in private income by source:
After tax labour income -135
After tax private capital income 252
After tax private land income - residential 19
After tax private land income - rural -115
After tax private land income - urban 32
After tax private other rent income -1,175
Transfers -128
Chan
g
e in total
p
rivate income: -1
,
251
% change
Change in total private income: -0.2%
Change in prices:
Price essential consumption 0.5%
Price non-essential consumption 0.5%
Source: MM900, KPMG Econtech estimates
Notes: a. Tax Revenue is the net revenue from introducing the tax. It includes any offsetting revenue losses
from changes to other tax bases. It is measured by the fall in lump sum tax revenue that is required to
keep the budget in balance given the resource royalties and crude oil excise tax collections.
b. The changes in the table are in nominal terms. In MM900, all prices are expressed relative to the
nominal wage (the numeraire). However, the incidence of taxes depends on the real impacts, so care
should be taken when interpreting the nominal results. Thus, with a fixed nominal wage, an increase in
consumer prices can be interpreted as a reduction in the real wage.
c. Changes in income from capital and transfers are included only for completeness, and do not have
policy implications.
5.3.5 Labour income tax
Personal income tax as it applies to labour16, (‘labour income tax’17) is one of the three main
taxes applied directly or indirectly to labour, with the other two being payroll tax and GST.
Labour has an intermediate level of mobility, and so under the mobility principle taxes on
labour would be expected to have medium excess burdens. However, the narrowness principle
also plays a roll in determining the excess burdens of taxed levied on labour.
The base of labour income tax is narrowed through its progressive rate structure, which provides
an exemption from tax on income earned up to the tax-free threshold. Also, beyond that
threshold, lower marginal tax rates are applied at lower incomes than at higher incomes. This
narrowing of the tax base18 (compared with a flat rate labour income tax) leads to a medium
16 This tax does not include personal income tax as it applies to income from savings, because (as explained in
section 4.2) the savings decisions of households are modelled as a constant proportion of household income.
17 The tax includes personal income tax paid out of wages, the Medicare levy, fringe benefits tax and tax on employer
superannuation contributions.
18 This “narrowing” of the tax base can also be thought of as having an average rate of tax that is lower than the
marginal rate of tax. While the marginal tax rate determines the distortionary impact of the tax, the average tax rate
determines the revenue. Thus, the higher the marginal rate compared to the average rate, the higher will be the excess
burden.

Department of the Treasury
The Excess Burden of Australian Taxes
March 2010
ABCD
60
© 2010 KPMG, an Australian partnership and a member firm of the KPMG network of independent
member firms affiliated with KPMG International, a Swiss cooperative. All rights reserved.
The KPMG logo and name are trademarks of KPMG.
Liability limited by a scheme approved under Professional Standards Legislation.
excess burden. KPMG Econtech estimates the AEB for labour income tax to be 16 and the
MEB to be 24. Of course there are compelling equity reasons for the progressive nature of the
personal income tax scale, but its efficiency implications should still be understood.
The labour supply modelling in MM900 takes into account that the marginal and average rates
of tax on labour have different impacts on the labour supply decision. These can be summarised
as follows.
• How many hours an individual chooses to work, or the intensive margin of labour supply
choice, depends on marginal tax rates.
• Whether an individual chooses to participate in the labour force or not, or the extensive
margin of labour supply, depends on average tax rates.
The progressive nature of personal income tax means that marginal tax rates are higher than
average tax rates. Thus, including both the intensive and extensive choice in the modelling
gives a higher, and more credible, excess burden for labour income tax than would otherwise be
case.
The responsiveness of labour supply to after-tax real wage is an important determinant of the
excess burden of labour income tax. The excess burden estimates reported above have the
compensated labour supply elasticity set at 0.2, so that when the real wage increases by 1 per
cent and ‘full’ real income is unchanged, total labour supply increases by 0.2 per cent. A survey
of 65 labour economists conducted by Fuchs et al. (1998) found that “modern consensus
estimates of labour force elasticity, while still low, are generally non-zero.” The study
estimated that the labour supply elasticity was of mean 0.1 and median zero for men and mean
0.45 and median 0.3 for women. The value of 0.2 used in MM900 is in line with these
estimates.
A sensitivity analysis has been conducted to illustrate the impacts of using a different value for
the labour supply elasticity on the AEB estimates. The results are reported in the table below.
Table 5.10 Sensitivity analysis for elasticity of labour supply
Rating Elasticity of Labour Supply AEB
Medium 0.1 9
Medium 0.2 16
Medium 0.3 21
Source: MM900, KPMG Econtech estimates
If the elasticity of labour supply were set to 0.1, then the estimate of the AEB falls from 16 cents
per dollar of tax revenue to 9 cents per dollar of tax revenue. Likewise, if the labour supply is
set to a higher value, of 0.3, then the estimate of the AEB rises to 21. This implies that the more
responsive labour supply is to the after tax real wage, the higher the economic costs of labour
income tax. Even with this range of AEB estimates, labour income tax still falls largely within
the medium excess burden category.
Ranking labour income tax as having a medium excess burden is in line with the ranking for
labour tax given in the OECD study ‘Tax and Economic Growth’ (2008). Table 5.11 compares

Department of the Treasury
The Excess Burden of Australian Taxes
March 2010
ABCD
61
© 2010 KPMG, an Australian partnership and a member firm of the KPMG network of independent
member firms affiliated with KPMG International, a Swiss cooperative. All rights reserved.
The KPMG logo and name are trademarks of KPMG.
Liability limited by a scheme approved under Professional Standards Legislation.
the KPMG Econtech estimate of the MEB of labour income taxes with estimates from previous
studies. The variation in the estimates can largely be accounted for by the different types of
models used in each study. The KPMG Econtech estimate is toward the upper end of the
estimates for Australia, reflecting that MM900 takes into account that the marginal and average
rate have a different impact on labour supply.
Table 5.11 Comparison of excess burden estimates for labour income tax
Authors MEB
KPMG Econtech (2010, current study) Australia 24
Diewert and Lawrence (1995) New Zealand 18
Han (1996) Australia 15 - 19
Campbell and Bond (1997) Australia 19 - 24
Baylor and Beauséjour (2004) Canada 32
Diewert and Lawrence (1995) use a small scale CGE model to estimate the marginal excess
burden of labour income tax in New Zealand. They estimate it to be 18 cents in the dollar. This
study was the “first to use key parameters calculated from consistently specified statistical
models of the economy being examined”. Their estimate of the excess burden is smaller than
that from MM900; partly because they use only the average rate of tax rather than taking into
account the different effects of the marginal and average rate.
Similarly, Han (1996) also uses a small scale econometric general equilibrium model to estimate
the marginal excess burden of wage taxes, and estimates a similar value for the MEB of labour
income tax of 15 to 19 cents in the dollar. Again, Han uses only the average rate of tax on
wages, and finds a smaller excess burden than the estimate from MM900.
Campbell and Bond (1997) use a partial equilibrium model to estimate the excess burden of the
Australian labour tax. They estimate the marginal excess burden of Australia’s labour income
tax and transfer system to be within the range 19 – 24 cents in the dollar. The model takes into
account the different effects of marginal and average rates of tax on labour supply from each
income decile. The range in their estimate comes from whether the uncompensated or
compensated elasticity of labour supply is used.
Baylor and Beausejour (2004) use a dynamic GGE model of the Canadian economy, and
produce a relatively high estimate of the excess burden of labour income tax. This may be
associated with the high responsiveness of labour supply to the real wage in their model.
The incidence results for labour income taxes are reported in Table 5.12 below, and show that
labour bears the burden of labour income taxes. This is linked to the relatively low
responsiveness of labour supply to after-tax real wages. Labour income tax reduces the after tax
real wage that workers receive. This discourages labour supply, adding to the fall in after-tax
labour income reported in Table 5.12.

Department of the Treasury
The Excess Burden of Australian Taxes
March 2010
ABCD
62
© 2010 KPMG, an Australian partnership and a member firm of the KPMG network of independent
member firms affiliated with KPMG International, a Swiss cooperative. All rights reserved.
The KPMG logo and name are trademarks of KPMG.
Liability limited by a scheme approved under Professional Standards Legislation.
Table 5.12 Incidence of Introducing Labour Income Tax
change in $m
Tax revenue: a 109,422
Change in private income by source:
After tax labour income -149,505
After tax private capital income -6,349
After tax private land income - residential -583
After tax private land income - rural -835
After tax private land income - urban -1,585
After tax private other rent income -1,240
Transfers -3,084
Change in total private income: -163,179
% change
Change in total private income: -19.0%
Change in prices:
Price essential consumption -1.4%
Price non-essential consumption -1.4%
Source: MM900, KPMG Econtech estimates
Notes: a. Tax Revenue is the net revenue from introducing the tax. It includes any offsetting revenue losses
from changes to other tax bases. It is measured by the fall in lump sum tax revenue that is required to
keep the budget in balance given the labour income tax collections.
b. The changes in the table are in nominal terms. In MM900, all prices are expressed relative to the
nominal wage (the numeraire). However, the incidence of taxes depends on the real impacts, so care
should be taken when interpreting the nominal results. Thus, with a fixed nominal wage, an increase in
consumer prices can be interpreted as a reduction in the real wage.
c. Changes in income from capital and transfers are included only for completeness, and do not have
policy implications.
5.3.6 Payroll tax
Unlike personal income tax (as it applies to labour), payroll tax is levied on the employer side of
the market. However, it is also a tax on labour, and the intermediate mobility of labour
therefore plays a role in determining the size of the excess burden of payroll tax. However,
payroll tax has a higher excess burden than labour income tax. The marginal excess burden of
the current payroll tax system is estimated to be at 41 cents in the dollar, and the average excess
burden at 22 cents in the dollar. This high excess burden comes about largely because of the
narrowness of the base for payroll tax, as explained below.
In each state, businesses do not pay payroll tax on the part of labour income which falls under a
certain threshold. This narrows the base of payroll tax so that it applies to only around one-half
of labour income. This non-uniform application of the payroll tax raises the excess burden for
two main reasons.
• The threshold reduces tax collections, making the average rate of payroll tax less, without
affecting the marginal rate for businesses above the threshold. While businesses decisions
to employ an extra person are affected by the higher marginal rate of tax, government
revenue is determined by the lower average rate of tax on the total wage-bill. Thus, while
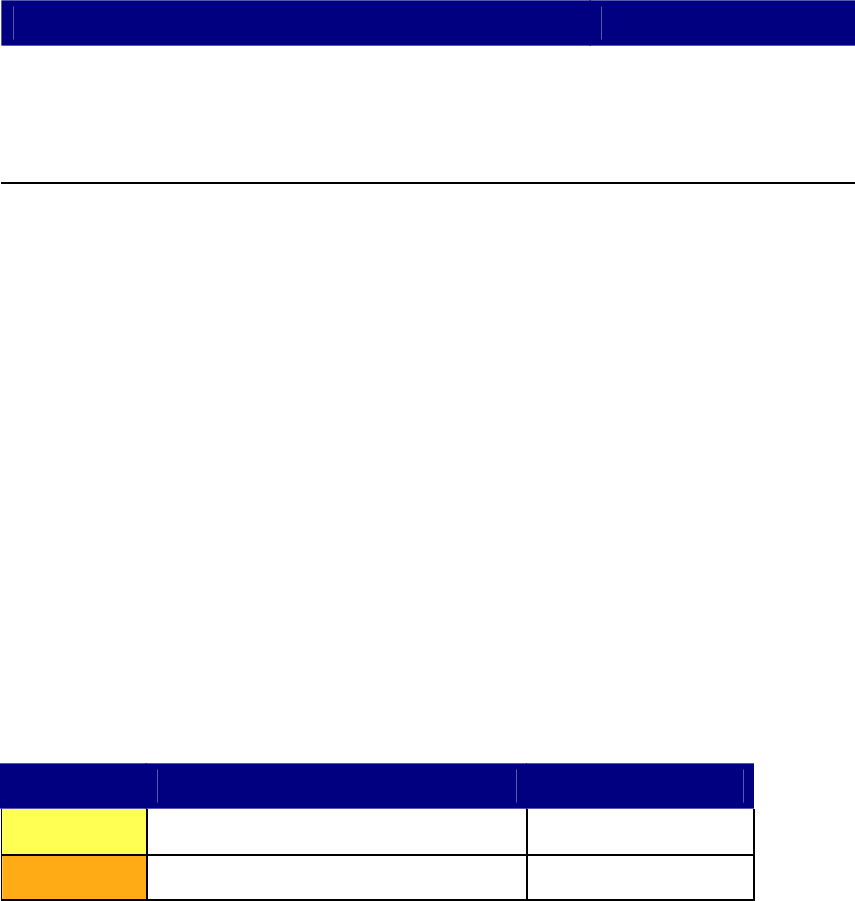
Department of the Treasury
The Excess Burden of Australian Taxes
March 2010
ABCD
63
© 2010 KPMG, an Australian partnership and a member firm of the KPMG network of independent
member firms affiliated with KPMG International, a Swiss cooperative. All rights reserved.
The KPMG logo and name are trademarks of KPMG.
Liability limited by a scheme approved under Professional Standards Legislation.
the revenue raising ability of payroll tax is undermined, little is done to reduce disincentive
effects. This leads to a high excess burden.
• The payroll tax threshold distorts business choice of their size, so businesses will be
inefficiently small. This raises the per unit cost of production and results in a welfare loss.
Table 5.13 compares KPMG Econtech’s results with some estimates of the marginal excess
burden of Australian payroll taxes from earlier studies.
Table 5.13 Estimates of the MEB of payroll tax
Author MEB
KPMG Econtech (2009) 41
Productivity Commission (1998) 3 - 12
Han (1998) 11
The marginal excess burden estimate from MM900 is much larger than the estimates by PC and
Han. This is because the estimates from MM900 take into account the costs arising from the
non-uniform application of the tax, while the other studies do not. Instead, both the Productivity
Commission (PC) and Han use only the lower average payroll tax rate to estimate the effects on
both employment decisions and revenues.
The results reported by the PC ranges across businesses operating from just below the payroll
tax threshold through to firms facing the top rate. However, for each business size, the PC used
average payroll tax rates only, rather than separately estimating the impact of average and
marginal rates on revenue and incentives. This means that, in the PC estimates, smaller
businesses will have a lower average tax rate, and so they will also have a lower estimated
excess burden. However, this result is not representative of the larger distortionary impact that
payroll tax will have on smaller businesses compared to larger businesses, because of the high
effective marginal rate of tax.
Table 5.14 below compares the average excess burden from the current payroll tax system to
that of a hypothetical uniform payroll tax. The uniform payroll tax rate has been chosen so as to
raise the same amount of revenue as the current payroll tax. As expected, a uniform payroll tax
is more efficient than the current payroll tax system (as shown by a lower AEB).
Table 5.14 AEB of the actual and uniform payroll tax
Rating Tax AEB
Medium Uniform Payroll tax 13
High Actual Payroll Tax 22
Source: KPMG Econtech’s MM900 model estimates
A common view of payroll tax is that the incidence falls on businesses. However, MM900
results show that the incidence of payroll tax falls largely on labour income. In MM900, this is

Department of the Treasury
The Excess Burden of Australian Taxes
March 2010
ABCD
64
© 2010 KPMG, an Australian partnership and a member firm of the KPMG network of independent
member firms affiliated with KPMG International, a Swiss cooperative. All rights reserved.
The KPMG logo and name are trademarks of KPMG.
Liability limited by a scheme approved under Professional Standards Legislation.
in the form of higher prices, which lead to lower real wages. As shown in Table 5.15, consumer
prices are more than 3 per cent higher as a result of the payroll tax.
Table 5.15 Incidence of Payroll Tax
change in $m
Tax revenue: a 16,043
Change in private income by source:
After tax labour income -2,668
After tax private capital income 2,215
After tax private land income - residential 173
After tax private land income - rural 401
After tax private land income - urban 768
After tax private other rent income 444
Transfers 1,378
Change in total private income: 2,710
% change
Change in total private income: 0.4%
Change in prices:
Price essential consumption 3.3%
Price non-essential consumption 3.4%
Source: MM900, KPMG Econtech estimates
Note: a. Tax Revenue is the net revenue from introducing the tax. It includes any offsetting revenue losses
from changes to other tax bases. It is measured by the fall in lump sum tax revenue that is required to
keep the budget in balance given the payroll tax collections.
b. The changes in the table are in nominal terms. In MM900, all prices are expressed relative to the
nominal wage (the numeraire). However, the incidence of taxes depends on the real impacts, so care
should be taken when interpreting the nominal results. Thus, with a fixed nominal wage, an increase in
consumer prices can be interpreted as a reduction in the real wage.
c. Changes in income from capital and transfers are included only for completeness, and do not have
policy implications.
Payroll tax has its impact on employers, but, as with labour income tax, its final incidence is on
labour. Payroll tax increases the cost of employing labour, and since prices are equal to the
marginal cost of production, firms must pass this cost on. This will be either through decreased
nominal wages or higher consumer prices. On MM900, firms pass the cost of payroll tax on in
the form of higher prices19. This, in turn, reduces the real wage that labour receives, and in
response, labour supply will fall, as reflected in the reduction in nominal labour income in Table
5.15. This fall creates a shortage of labour that will push up the wage that employers must pay.
However, households’ supply of labour has a low responsiveness to the after-tax real wage, and
so the fall in labour supply is relatively small. Thus, the increase in the wage offsets only a
small part of the initial increase in consumer prices, and labour is left to bear the main burden of
payroll tax in the form of higher prices.
19 The incidence of payroll tax is transmitted through higher prices rather than a lower nominal wage because the
nominal wages is the numeraire in MM900. However, the choice of numeraire does not affect the real outcome of the
model, which is that the real wage falls in response to a payroll tax and so labour bears the final incidence.

Department of the Treasury
The Excess Burden of Australian Taxes
March 2010
ABCD
65
© 2010 KPMG, an Australian partnership and a member firm of the KPMG network of independent
member firms affiliated with KPMG International, a Swiss cooperative. All rights reserved.
The KPMG logo and name are trademarks of KPMG.
Liability limited by a scheme approved under Professional Standards Legislation.
5.3.7 GST
The GST can also be analysed alongside taxes on labour income tax. Taxes on labour income
and GST both act as a disincentive to supply labour, by reducing the purchasing power of the
additional pay earned from a given amount of additional labour. While labour income tax does
this by removing tax from the additional pay, GST does this by reducing the purchasing power
of that pay through raising consumer prices.
However, unlike labour income tax and payroll tax, the GST has a relatively broad base,
applying to close to 70 per cent of consumer spending. This breadth helps keep its marginal
excess burden low. Specifically, KPMG Econtech estimates the marginal excess burden of GST
to be 8 cents in the dollar, and the average excess burden to be 6 cents in the dollar. Also
contributing to this favourable result is the gain in the terms-of-trade associated with applying
GST to some expenditures of international tourists. Unlike most other exports, the volume of
international tourist expenditure is not very sensitive to changes in prices, because tourism to
Australia is considered to be a differentiated ‘product’. Thus, a GST on the services provided to
international tourists provides revenue while only prompting a relatively small economic cost.
This result is in line with the OECD (2008) study which finds a broad based consumption tax to
have a low distortionary impact. Table 5.16 compares other estimates of the excess burden of
the GST with the findings of this study.
Table 5.16 Estimates of the excess burden of Consumption Taxes / GST
Authors MEB
KPMG Econtech (2009) Australia 8
Deiwert and Lawrence (1994) New Zealand 14
Baylor and Beauséjour (2004) Canada 13
Diewert and Lawrence use a small-scale general equilibrium model to estimate that the MEB of
consumption taxes in New Zealand is 14 cents in the dollar. This is higher than the estimate
from MM900 because it includes not only the GST, but also incorporates other indirect taxes,
except import duties and property taxes. However, unlike MM900, the model used only
identifies four consumption goods: motor vehicles, general consumption, housing and leisure.
This limits its ability to take into account the different rates of tax on different products and the
efficiency costs that this causes. Thus, Diewert and Lawrence’s higher estimate of the MEB is
likely to come mainly from the high effective tax rate on general consumption (which is
32 per cent).
Using a GCE model of the Canadian economy, Baylor and Beauséjour (2004) estimate a
marginal excess burden of consumption taxes of 13 cents per dollar of tax revenue for Canada.
This result is higher than the estimate from MM900, largely because of the more elastic labour
supply in Baylor and Beauséjour’s model.
Despite the GST having a very broad base, under the Australian system there are some non-
uniformities in the way GST is applied. Some products are zero rated, such as food and health
care, meaning that consumers do not pay GST on these products and producers do not pay any
GST on their inputs into these products. These zero rating provisions are made in an effort to

Department of the Treasury
The Excess Burden of Australian Taxes
March 2010
ABCD
66
© 2010 KPMG, an Australian partnership and a member firm of the KPMG network of independent
member firms affiliated with KPMG International, a Swiss cooperative. All rights reserved.
The KPMG logo and name are trademarks of KPMG.
Liability limited by a scheme approved under Professional Standards Legislation.
achieve certain equity aims. Other products, such as some financial services, are input taxed
because of difficulties identifying the true value added of the service.
These zero ratings and exemptions mean that the base of GST is somewhat narrowed. This
carries with it an efficiency cost which can be estimated. As with payroll tax, a hypothetical
GST which applies evenly to all products and raises the same revenue is simulated using
MM900. The uniform GST needed to achieve this was 7 per cent – lower than the current rate
of 10 per cent. The AEB of this uniform GST is shown in Table 5.17 below.
Table 5.17 AEB of the actual and uniform GST
Rating Tax AEB
Low Uniform GST 0
Low Actual GST 6
Source: KPMG Econtech’s MM900 model estimates
The uniform GST has an average excess burden of zero, implying that the entire excess burden
of the actual tax comes from the exemptions and zero-rating of various products. Under a
uniform GST, the choice between consuming different goods and services is not altered. This
means that the main distortion from a uniform GST is that the real wage is reduced as consumer
prices rise. Offsetting this negative distortion is the positive impact on the terms-of-trade from
applying GST to some expenditures of international tourists, as explained above.
According to Harding et al. (2004), the GST is designed to ultimately fall on domestic
consumers, not on domestic industry or foreign households. Thus, for the GST, the party
carrying the impact of the tax, consumers, is the same as the party bearing its final incidence.
That is, the incidence of GST is on consumer prices. This reduces the purchasing power of
after-tax wages, having an impact on labour supply and nominal labour income. These results
can be seen in Table 5.18 below.

Department of the Treasury
The Excess Burden of Australian Taxes
March 2010
ABCD
67
© 2010 KPMG, an Australian partnership and a member firm of the KPMG network of independent
member firms affiliated with KPMG International, a Swiss cooperative. All rights reserved.
The KPMG logo and name are trademarks of KPMG.
Liability limited by a scheme approved under Professional Standards Legislation.
Table 5.18 Incidence of GST
change in $m
Tax revenue: a 42,092
Change in private income by source:
After tax labour income -6,761
After tax private capital income 4,847
After tax private land income - residential 454
After tax private land income - rural -295
After tax private land income - urban -484
After tax private other rent income -95
Transfers 1,283
Change in total private income: -1,052
% change
Change in total private income: -0.2%
Change in prices:
Price essential consumption 6.5%
Price non-essential consumption 7.2%
Source: MM900, KPMG Econtech estimates
Note: a. Tax Revenue is the net revenue from introducing the tax. It includes any offsetting revenue losses
from changes to other tax bases. It is measured by the fall in lump sum tax revenue that is required to
keep the budget in balance given the GST collections.
b. The changes in the table are in nominal terms. In MM900, all prices are expressed relative to the
nominal wage (the numeraire). However, the incidence of taxes depends on the real impacts, so care
should be taken when interpreting the nominal results. Thus, with a fixed nominal wage, an increase in
consumer prices can be interpreted as a reduction in the real wage.
c. Changes in income from capital and transfers are included only for completeness, and do not have
policy implications.
The results reported in Table 5.18 show that the GST has a higher impact on households with
higher incomes. The price of essential consumption is 6.5 per cent higher in the presence of the
GST, while the price of non-essential consumption is 7.2 per cent higher. This is because the
basket of essential goods and services includes a higher proportion of fresh food, health and
education expenditures, which are zero rated, compared to the basket of non-essential goods and
services.

Department of the Treasury
The Excess Burden of Australian Taxes
March 2010
ABCD
68
© 2010 KPMG, an Australian partnership and a member firm of the KPMG network of independent
member firms affiliated with KPMG International, a Swiss cooperative. All rights reserved.
The KPMG logo and name are trademarks of KPMG.
Liability limited by a scheme approved under Professional Standards Legislation.
The remaining taxes to be analysed are either levied on the consumption of specific
goods and services, or on the use of specific goods, services and capital items in the
production process. Thus, while the principles of mobility and narrowness still apply to
the excess burden estimates of these taxes, other factors also become relatively
important. For example, if there are social costs associated with the consumption of a
particular good, then a tax may be welfare improving. On the other hand, if the use of a
good is very price sensitive, then changes in taxes are likely to lead to changes in
consumption patterns which, in turn, leads to a higher excess burden.
5.3.8 Tobacco Excise
The excess burden of tobacco excise is driven by the social costs associated with tobacco use.
This study has assumed that these social costs are higher than the current level of tobacco
excise. See Appendix A8 for further discussion about these assumptions.
KPMG Econtech estimates that tobacco excise has negative marginal and average excess
burdens of -8 and -23 respectively. This means that tobacco excise is welfare improving
because it reduces consumption closer to the level where the net benefits to smokers are equal to
the costs to non-smokers.
The main incidence of Tobacco excise falls on consumer prices. Tobacco excise increases the
price of essential consumption more than the price of non-essential consumption. As shown in
Table 5.19(on the following page), the price of essential consumption is higher by 1.7 per cent
in the presence of the tobacco excise, while the price of non-essential consumption is only 0.3
per cent higher. This is because tobacco products make up a higher proportion of the essential
than the non-essential basket. This means that tobacco excise impacts on the budgets of poorer
households more than the budgets of richer households.
Table 5.19 Incidence of Tobacco Excise
change in $m
Tax revenue: a 7,485
Change in private income by source:
After tax labour income -753
After tax private capital income 922
After tax private land income - residential 23
After tax private land income - rural -81
After tax private land income - urban -53
After tax private other rent income -25
Transfers 285
Change in total private income: 319
% change
Change in total private income: 0.0%
Change in prices:
Price essential consumption 1.7%
Price non-essential consumption 0.3%
Department of the Treasury
The Excess Burden of Australian Taxes
March 2010
ABCD
69
© 2010 KPMG, an Australian partnership and a member firm of the KPMG network of independent
member firms affiliated with KPMG International, a Swiss cooperative. All rights reserved.
The KPMG logo and name are trademarks of KPMG.
Liability limited by a scheme approved under Professional Standards Legislation.
Source: MM900, KPMG Econtech estimates
Notes to Table 5.19:
a. Tax Revenue is the net revenue from introducing the tax. It includes any offsetting revenue losses
from changes to other tax bases. It is measured by the fall in lump sum tax revenue that is required to
keep the budget in balance given the tobacco excise collections.
b. The changes in the table are in nominal terms. In MM900, all prices are expressed relative to the
nominal wage (the numeraire). However, the incidence of taxes depends on the real impacts, so care
should be taken when interpreting the nominal results. Thus, with a fixed nominal wage, an increase in
consumer prices can be interpreted as a reduction in the real wage.
c. Changes in income from capital and transfers are included only for completeness, and do not have
policy implications.
5.3.9 Alcohol taxes
Like tobacco taxes, social costs associated with alcohol consumption tend to reduce the excess
burden estimates for alcohol taxes. However, non-uniformities in tax rates on different
beverages tend to increase the excess burden estimates. Combining these two considerations,
KPMG Econtech estimates a low marginal excess burden of 9 cents in the dollar, and a low
average excess burden of 7 cents in the dollar from the alcohol excise.
The social costs of alcohol consumption are taken into account by MM900. More specifically,
this study assumes that externalities per litre of alcohol consumed are such that the alcohol
excise rate per litre of alcohol on packaged beer appropriately accounts for the externalities of
alcohol consumption. Thus, the modelling would be expected to show a welfare improvement
from the taxation of beer products. This result for beer would moderate any excess burden
resulting from alcohol products which have a tax rate that is higher than justified by the
externality.
However, as noted above, there is a second factor which increases the excess burden for alcohol
excise and WET – that alcohol taxes are not uniform in their application. Different alcoholic
beverages are close substitutes for each other, meaning that different tax rates on different
alcohol products will cause consumers to adjust their consumption choices. Consumers will
tend to substitute away from beverages with a high rate of tax and towards beverages with a low
rate. This distortion of consumer choices reduces their welfare and adds to the size of the
excess burden.
As discussed in section 4.2.3, MM900 treats beer, wine and spirits as separate products, and
identifies a separate tax rate for each. Given that the different alcoholic beverages are all
substitutable for each other, this detail improves the accuracy of the excess burden estimates for
alcohol taxes.
As a further step, the impact of the non-uniformity in alcohol tax rates on the excess burden
estimates has been examined. As was done for payroll tax and GST, this involved first
simulating a hypothetical tax which was applied at a uniform per unit of alcohol rate across all
alcohol products but raised the same amount of revenue as the current alcohol excise and WET.
Table 5.20 below shows the AEB of this hypothetical tax compared to the AEB of the actual
alcohol excise and WET.

Department of the Treasury
The Excess Burden of Australian Taxes
March 2010
ABCD
70
© 2010 KPMG, an Australian partnership and a member firm of the KPMG network of independent
member firms affiliated with KPMG International, a Swiss cooperative. All rights reserved.
The KPMG logo and name are trademarks of KPMG.
Liability limited by a scheme approved under Professional Standards Legislation.
Table 5.20 AEB of the actual and uniform alcohol excise and WET
Rating Tax AEB
Low Uniform Alcohol excise and WET 0
Low Actual Alcohol excise and WET 7
Source: MM900, KPMG Econtech estimates
The results in Table 5.18 show that a uniform alcohol tax would result in a zero excess burden.
If the uniform tax rate aligned with (or was less than) the externality from alcohol consumption,
then the tax would be welfare enhancing and we would expect a negative AEB. However, the
uniform tax rate which collects revenue equivalent to the current alcohol taxes is higher than the
welfare enhancing level assumed in the model. This results in an offsetting welfare loss because
alcohol is taxed more than other goods and services. The overall outcome is a zero excess
burden under a uniform alcohol tax, implying that the positive excess burden of the current
alcohol taxes can be attributed to the varied tax rates (per litre of alcohol) across products.
The incidence of alcohol excise and WET is similar to that of tobacco excise, as shown in
Table 5.21. Again, the incidence is on consumer prices, with a larger part of that incidence
falling on low-income households than high-income households. This is because alcohol
consumption makes up a higher proportion of the budgets of low-income households.
Table 5.21 Incidence of Alcohol Excise and WET
change in $m
Tax revenue: a5,778
Change in private income by source:
After tax labour income -660
After tax private capital income 701
After tax private land income - residential 22
After tax private land income - rural -47
After tax private land income - urban -51
After tax private other rent income -30
Transfers 224
Change in total private income: 159
% change
Change in total private income: 0.0%
Change in prices:
Price essential consumption 1.2%
Price non-essential consumption 0.7%
Source: MM900, KPMG Econtech estimates
Note: a. Tax Revenue is the net revenue from introducing the tax. It includes any offsetting revenue losses
from changes to other tax bases. It is measured by the fall in lump sum tax revenue that is required to
keep the budget in balance given the alcohol excise and WET collections.
b. The changes in the table are in nominal terms. In MM900, all prices are expressed relative to the
nominal wage (the numeraire). However, the incidence of taxes depends on the real impacts, so care
should be taken when interpreting the nominal results. Thus, with a fixed nominal wage, an increase in
consumer prices can be interpreted as a reduction in the real wage.
c. Changes in income from capital and transfers are included only for completeness, and do not have
policy implications.

Department of the Treasury
The Excess Burden of Australian Taxes
March 2010
ABCD
71
© 2010 KPMG, an Australian partnership and a member firm of the KPMG network of independent
member firms affiliated with KPMG International, a Swiss cooperative. All rights reserved.
The KPMG logo and name are trademarks of KPMG.
Liability limited by a scheme approved under Professional Standards Legislation.
5.3.10 Import duties
Import duties have a low (negative) excess burden. Specifically, the marginal excess burden is
estimated at -3 cents in the dollar, and the average excess burden is estimated at -7 cents in the
dollar.
These low (negative) excess burden estimates are under-estimates in some contexts. They refer
to the efficiency of import tariffs post the tariff reductions scheduled for 1 January 2010. These
reductions mean that all import tariffs will be five per cent or less, apart from a tariff of
10 per cent on clothing. These tariff rates are below a theoretical ‘optimal’ tariff of around
11 per cent (based on average export demand elasticities in MM900 of around -10), so such low
rates of tariff are not distorting. However, Australia has had much higher import tariffs in the
past, which were highly distorting. Further, the notion of an optimal tariff ignores the risk that
other countries will impose or maintain tariffs in response, leading to welfare losses for
Australia.
Table 5.22 compares earlier estimates of the marginal excess burden of trade taxes with the
findings of this study.
Table 5.22 Marginal excess burden of Tariffs
Author MEB
KPMG Econtech (2009) Australia -3
Han (1996) Australia 33 - 57
Diewert and Lawrence (1993) New Zealand 4
Han’s estimates of the MEB of tariffs are very different to KPMG Econtech’s estimates. It is
likely that this is related to the assumed level of tariff that has been modelled in the baseline. If
the baseline import tariffs are well above optimal levels, the resulting MEB will be high.
However, the estimates of Diewert and Lawrence (1993) support the low excess burden
estimated using MM900.
The incidence results for tariffs are small, reflecting their low rates. Table 5.23 shows that this
incidence is transferred mainly through prices, with tariffs at the 2010 levels resulting in prices
being 0.4 percent higher than would otherwise be the case (compared to the almost zero change
in nominal incomes).

Department of the Treasury
The Excess Burden of Australian Taxes
March 2010
ABCD
72
© 2010 KPMG, an Australian partnership and a member firm of the KPMG network of independent
member firms affiliated with KPMG International, a Swiss cooperative. All rights reserved.
The KPMG logo and name are trademarks of KPMG.
Liability limited by a scheme approved under Professional Standards Legislation.
Table 5.23 Incidence of Import Duties
change in $m
Tax revenue: a 2,888
Change in private income by source:
After tax labour income -433
After tax private capital income 302
After tax private land income - residential 21
After tax private land income - rural -133
After tax private land income - urban -13
After tax private other rent income -138
Transfers 61
Change in total private income: -334
% change
Change in total private income: 0.0%
Change in prices:
Price essential consumption 0.4%
Price non-essential consumption 0.4%
Source: MM900, KPMG Econtech estimates
Note: a. Tax Revenue is the net revenue from introducing the tax. It includes any offsetting revenue losses
from changes to other tax bases. It is measured by the fall in lump sum tax revenue that is required to
keep the budget in balance given the import duties collections.
b. The changes in the table are in nominal terms. In MM900, all prices are expressed relative to the
nominal wage (the numeraire). However, the incidence of taxes depends on the real impacts, so care
should be taken when interpreting the nominal results. Thus, with a fixed nominal wage, an increase in
consumer prices can be interpreted as a reduction in the real wage.
c. Changes in income from capital and transfers are included only for completeness, and do not have
policy implications.
5.3.11 Luxury Car Tax
KPMG Econtech estimates that there is a medium level excess burden from the luxury car tax
(LCT). Specifically, the marginal excess burden is estimated at 20 cents in the dollar, and the
average excess burden is estimated at 9 cents in the dollar. This is reflects two main factors.
• Notwithstanding its statutory rate of 33 per cent, the effective average LCT rate is low, at
2.6 per cent for locally made luxury cars and 7.9 per cent for imported luxury cars. The
lower effective rate for locally made cars is because Australian made luxury cars tend to be
sold at lower prices than imported luxury cars, and thus attract less LCT.
• However, while the modelling does take into account the different effective tax rate on
locally made and imported luxury cars, the results are likely to understate the excess burden
of the LCT. This is because the modelling does not capture the distortion that the LCT
causes between the choice of luxury and non-luxury cars. This is because the model does
not identify luxury and non-luxury cars as separate products.
As a consumption/sales tax, the incidence of luxury car tax is on consumer prices. As shown in
Table 5.24 below, LCT raises the price of non-essential consumption more than the price of
essential consumption. This affects the budgets of high-income households more than low

Department of the Treasury
The Excess Burden of Australian Taxes
March 2010
ABCD
73
© 2010 KPMG, an Australian partnership and a member firm of the KPMG network of independent
member firms affiliated with KPMG International, a Swiss cooperative. All rights reserved.
The KPMG logo and name are trademarks of KPMG.
Liability limited by a scheme approved under Professional Standards Legislation.
income households because vehicles make up a higher proportion of the consumption of richer
households.
Table 5.24 Incidence of LCT
change in $m
Tax revenue: a 1,484
Change in private income by source:
After tax labour income -288
After tax private capital income 134
After tax private land income - residential 11
After tax private land income - rural -115
After tax private land income - urban -2
After tax private other rent income -100
Transfers 13
Change in total private income: -346
% change
Change in total private income: 0.0%
Change in prices:
Price essential consumption 0.1%
Price non-essential consumption 0.3%
Source: MM900, KPMG Econtech estimates
Note: a. Tax Revenue is the net revenue from introducing the tax. It includes any offsetting revenue losses
from changes to other tax bases. It is measured by the fall in lump sum tax revenue that is required to
keep the budget in balance given the LCT collections.
b. The changes in the table are in nominal terms. In MM900, all prices are expressed relative to the
nominal wage (the numeraire). However, the incidence of taxes depends on the real impacts, so care
should be taken when interpreting the nominal results. Thus, with a fixed nominal wage, an increase in
consumer prices can be interpreted as a reduction in the real wage.
c. Changes in income from capital and transfers are included only for completeness, and do not have
policy implications.
5.3.12 Fuel excise
Fuel excise is a tax on the use of fuels by households and businesses. It has a medium excess
burden, in spite of its narrow base. This is because demand for fuels is not very responsive to
prices. Specifically, KPMG Econtech estimates the marginal excess burden of fuel excise to be
19 cents in the dollar, and the average excess burden to be 15 cents in the dollar.
However, the excess burden of fuel excise may be overstated to the extent that there are social
and environmental costs of fuel consumption. These externalities may be reduced as fuel excise
curbs fuel consumption, which would improve welfare. The externalities of fuel use have not
been taken into account in this study.
As with luxury car tax, fuel excise has its incidence on consumer prices, as shown in Table 5.25.
However, for this tax, low income households are more affected than high income households.
Specifically, fuel excise raises the price of essential consumption by 2.3 per cent, but only raises
the price on non-essential consumption by 1.3 per cent. This result comes about because fuel is

Department of the Treasury
The Excess Burden of Australian Taxes
March 2010
ABCD
74
© 2010 KPMG, an Australian partnership and a member firm of the KPMG network of independent
member firms affiliated with KPMG International, a Swiss cooperative. All rights reserved.
The KPMG logo and name are trademarks of KPMG.
Liability limited by a scheme approved under Professional Standards Legislation.
considered a necessity, and therefore makes up a higher proportion of poorer households’
budgets.
Table 5.25 Incidence of Fuel Excise
change in $m
Tax revenue: a10,739
Change in private income by source:
After tax labour income -1,137
After tax private capital income 1,309
After tax private land income - residential 50
After tax private land income - rural -110
After tax private land income - urban -74
After tax private other rent income -116
Transfers 418
Change in total private income: 341
% change
Change in total private income: 0.0%
Change in prices:
Price essential consum
p
tion 2.3%
Price non-essential consumption 1.3%
Source: MM900, KPMG Econtech estimates
Note: a. Tax Revenue is the net revenue from introducing the tax. It includes any offsetting revenue losses
from changes to other tax bases. It is measured by the fall in lump sum tax revenue that is required to
keep the budget in balance given the fuel excise collections.
b. The changes in the table are in nominal terms. In MM900, all prices are expressed relative to the
nominal wage (the numeraire). However, the incidence of taxes depends on the real impacts, so care
should be taken when interpreting the nominal results. Thus, with a fixed nominal wage, an increase in
consumer prices can be interpreted as a reduction in the real wage.
c. Changes in income from capital and transfers are included only for completeness, and do not have
policy implications.
5.3.13 Motor Vehicle taxes
A third class of taxes associated with motor vehicles is motor vehicle registration and motor
vehicle stamp duties. This study only considers the components of these two motor vehicle
taxes that fall on businesses, not households, because only the business components appear as
indirect taxes in the ABS input-output tables. While these are both taxes on the ownership of
motor vehicles, and both have high excess burdens, the nature of these taxes are quite different.
Business motor vehicle registration is paid annually, and is therefore a tax on business
ownership of vehicles (making it a tax on ‘other capital’). As a tax on capital, the excess burden
of motor vehicle registration is high. Like any capital, the use of motor vehicles is price
sensitive. By reducing the returns to motor vehicles, motor vehicle registration therefore causes
a shift in production technologies away from motor vehicle use and towards other factors of
production, including labour, land, fixed factors and structures. This distortion is a cost to the
economy because production technologies are no longer at minimum cost. This leads to a high
excess burden for motor vehicle registration fees, with an MEB of 37 cents in the dollar, and an
AEB of 32 cents in the dollar.

Department of the Treasury
The Excess Burden of Australian Taxes
March 2010
ABCD
75
© 2010 KPMG, an Australian partnership and a member firm of the KPMG network of independent
member firms affiliated with KPMG International, a Swiss cooperative. All rights reserved.
The KPMG logo and name are trademarks of KPMG.
Liability limited by a scheme approved under Professional Standards Legislation.
The excess burden of stamp duties on business motor vehicle registration is also high.
Unlike registration fees, stamp duties are only applied on a change of ownership of motor
vehicles i.e. transactions in vehicles. Stamp duties on motor vehicles directly raise the costs of
investing in motor vehicles. This higher replacement cost of capital also shifts business
incentives away from using motor vehicles and towards other factors of production.
As a tax on transactions, an additional distortion of stamp duties is that it would cause
businesses to make less frequent purchases of motor vehicles. This would lead to fewer
adjustments in their vehicle stock, and less than optimal production technologies. However, this
type of distortion is not readily amenable to CGE modelling and is not included in MM900.
Therefore, the excess burden estimates for motor vehicle stamp duties are likely to be
underestimates. Despite this, the excess burden for stamp duties is still high, estimated at
38 cents in the dollar for both the MEB and AEB.
The incidence of motor vehicle registration and of stamp duties is shown in Tables 5.26 and
5.27 respectively. Both of these taxes increase the cost of using motor vehicles in production.
Since capital is highly mobile, it will not bear the incidence of the tax. Instead, the use of motor
vehicles in production will fall until the rate of return increases to fully offset the tax. As with
other taxes on capital, then, the incidence is passed through to households in the form of higher
prices. Higher consumer prices lower the purchasing power of the wage, so that ultimately the
incidence of motor vehicle taxes fall on labour. Since most industries use motor vehicles, the
price increase is spread broadly across the economy, increasing the price of essential and non-
essential consumption in equal proportions.
Table 5.26 Incidence of Motor Vehicle Registration
change in $m
Tax revenue: a1,655
Change in private income by source:
After tax labour income -191
After tax private capital income 191
After tax private land income - residential 16
After tax private land income - rural -59
After tax private land income - urban -1
After tax private other rent income -13
Transfers 20
Change in total private income: -38
% change
Change in total private income: 0.0%
Change in prices:
Price essential consum
p
tion 0.3%
Price non-essential consumption 0.3%
Source: MM900, KPMG Econtech estimates
Note: a. Tax Revenue is the net revenue from introducing the tax. It includes any offsetting revenue losses
from changes to other tax bases. It is measured by the fall in lump sum tax revenue that is required to
keep the budget in balance given the motor vehicle registration collections.
b. The changes in the table are in nominal terms. In MM900, all prices are expressed relative to the
nominal wage (the numeraire). However, the incidence of taxes depends on the real impacts, so care
should be taken when interpreting the nominal results. Thus, with a fixed nominal wage, an increase in
consumer prices can be interpreted as a reduction in the real wage.

Department of the Treasury
The Excess Burden of Australian Taxes
March 2010
ABCD
76
© 2010 KPMG, an Australian partnership and a member firm of the KPMG network of independent
member firms affiliated with KPMG International, a Swiss cooperative. All rights reserved.
The KPMG logo and name are trademarks of KPMG.
Liability limited by a scheme approved under Professional Standards Legislation.
c. Changes in income from capital and transfers are included only for completeness, and do not have
policy implications.
Table 5.27 Incidence of Motor Vehicle Stamp Duties
change in $m
Tax revenue: a 924
Change in private income by source:
After tax labour income -111
After tax private capital income 115
After tax private land income - residential 10
After tax private land income - rural -11
After tax private land income - urban 6
After tax private other rent income -9
Transfers 52
Change in total private income: 53
% change
Change in total private income: 0.0%
Change in prices:
Price essential consumption 0.2%
Price non-essential consumption 0.2%
Source: MM900, KPMG Econtech estimates
Note: a. Tax Revenue is the net revenue from introducing the tax. It includes any offsetting revenue losses
from changes to other tax bases. It is measured by the fall in lump sum tax revenue that is required to
keep the budget in balance given the motor vehicle stamp duty collections.
b. The changes in the table are in nominal terms. In MM900, all prices are expressed relative to the
nominal wage (the numeraire). However, the incidence of taxes depends on the real impacts, so care
should be taken when interpreting the nominal results. Thus, with a fixed nominal wage, an increase in
consumer prices can be interpreted as a reduction in the real wage.
c. Changes in income from capital and transfers are included only for completeness, and do not have
policy implications.
Department of the Treasury
The Excess Burden of Australian Taxes
March 2010
ABCD
77
© 2010 KPMG, an Australian partnership and a member firm of the KPMG network of independent
member firms affiliated with KPMG International, a Swiss cooperative. All rights reserved.
The KPMG logo and name are trademarks of KPMG.
Liability limited by a scheme approved under Professional Standards Legislation.
5.3.14 Conveyancing duties
Like motor vehicle stamp duties, conveyancing duties are taxes on transactions in residential
and commercial property and are applied to the combined value of the land and building. Their
excess burden arises from three main distortions.
1. Conveyancing duties drive a wedge between the prices that producers or developers of
property receive and that which purchasers pay. Specifically, the prices that producers
receive will be lower than the prices that purchasers pay and property development will be
lower than otherwise would have been the case.
2. Conveyancing duties increase the cost of purchasing property, and some households or
businesses (who would not otherwise have rented) may switch to renting. This would lower
their welfare.
3. The presence of conveyancing duties leads property owners to adjust their property
consumption less frequently. This would lead to a welfare reduction because property
owners would be less willing to change their ownership as their needs change.
KPMG Econtech estimates the marginal excess burden of conveyancing duties to be high, with
an MEB at 34 cents in the dollar, and an AEB at 31 cents in the dollar. In MM900,
conveyancing duties raise the cost of investing in new residential and non-residential structures.
For businesses, the higher replacement cost of capital also shifts business incentives away from
using structures and towards using other factors of production. For households purchasing
residential buildings, the increased cost of investment will also lower their housing consumption
in favour of other forms of consumption.
However, standard CGE models do not capture the second and third distortions listed above, as
discussed further in Appendix A14. This means that the estimates from MM900 will be under-
estimates of the true excess burden of conveyancing duties.
The incidence results for conveyancing stamp duties are shown in Table 5.25 on the following
page. They show that the main incidence of conveyancing duties is on consumer prices rather
than nominal incomes.
• For businesses, as with other taxes on capital, structures will not bear the incidence of
conveyancing duties. Rather, the use of structures will fall to offset the tax. The incidence
is then passed through to consumers in the form of higher prices. This lowers the
purchasing power of the wage, so that ultimately the incidence falls on labour.
• The incidence of conveyancing duties on properties purchased by households is more direct,
flowing straight to increased prices.
Thus, Table 5.28 shows that conveyancing duties have a higher burden on the price of essential
spending than the price of non-essential spending. That is, residential property makes up a
higher proportion of the budget of poorer households.
In the modelling, the incidence of conveyancing duties is not shared with land because it is
modelled as a tax on investment in residential and commercial structures (which is a flow),

Department of the Treasury
The Excess Burden of Australian Taxes
March 2010
ABCD
78
© 2010 KPMG, an Australian partnership and a member firm of the KPMG network of independent
member firms affiliated with KPMG International, a Swiss cooperative. All rights reserved.
The KPMG logo and name are trademarks of KPMG.
Liability limited by a scheme approved under Professional Standards Legislation.
rather than on land (which is a stock). In reality, land is included in the base of conveyancing
duties (alongside buildings) and so some of the incidence would be shared with landowners20.
Table 5.28 Incidence of Conveyancing Duties
change in $m
Tax revenue: a 12,399
Change in private income by source:
After tax labour income -1,385
After tax private capital income 1,569
After tax private land income - residential 438
After tax private land income - rural 2
After tax private land income - urban -18
After tax private other rent income -58
Transfers 338
Change in total private income: 885
% change
Change in total private income: 0.1%
Change in prices:
Price essential consumption 2.8%
Price non-essential consumption 2.2%
Source: MM900, KPMG Econtech estimates
Note: a. Tax Revenue is the net revenue from introducing the tax. It includes any offsetting revenue losses
from changes to other tax bases. It is measured by the fall in lump sum tax revenue that is required to
keep the budget in balance given the conveyancing duty collections.
b. The changes in the table are in nominal terms. In MM900, all prices are expressed relative to the
nominal wage (the numeraire). However, the incidence of taxes depends on the real impacts, so care
should be taken when interpreting the nominal results. Thus, with a fixed nominal wage, an increase in
consumer prices can be interpreted as a reduction in the real wage.
c. Changes in income from capital and transfers are included only for completeness, and do not have
policy implications.
20 Modelling conveyancing stamp as also being a tax on land may also affect the size of the excess burden estimates.
On the one hand, it may contribute to the size of the excess burden because conveyancing duty would be applied to
land at different rates for different industries. This would involve an economic cost (see the discussion about the
uneven application of land tax in section 5.3.2.). On the other hand, this may be offset because land is an immobile
factor, and so including land in the base of conveyancing duties may lower the excess burden of conveyancing stamp
duties.

Department of the Treasury
The Excess Burden of Australian Taxes
March 2010
ABCD
79
© 2010 KPMG, an Australian partnership and a member firm of the KPMG network of independent
member firms affiliated with KPMG International, a Swiss cooperative. All rights reserved.
The KPMG logo and name are trademarks of KPMG.
Liability limited by a scheme approved under Professional Standards Legislation.
5.3.15 Stamp duties other than real property
Other stamp duties are largely taxes on financial transactions, including on shares, leases, and
mortgages. Many of these stamp duties are being phased out as part of the Intergovernmental
Agreement on Federal Financial Relations.
As discussed above for conveyancing stamp duties, there will be economic costs associated with
the nature of stamp duties on other than real property as taxes on transactions. For example,
these stamp duties may cause financial transactions to take place less frequently. There may be
welfare costs associated with this because adjustments to share holdings, leases and mortgages
would be less responsive to market conditions.
These stamp duties raise the price of the financial services on which they are levied. The
consumption of many financial services is highly sensitive to their price, so other stamp duties
will lead to reduced demand for the financial services on which they are levied. This leads to a
medium excess burden for stamp duties other than on real property. Specifically, KPMG
Econtech estimates the MEB and AEB of other stamp duties to both be 18 cents per dollar of tax
revenue.
The incidence of stamp duties other than on real property is on consumer prices as shown in
Table 5.29. This is because the duty paid by businesses is passed through into prices. Further,
the duty paid on services consumed by households is in the form of higher prices.
Table 5.29 Incidence of Stamp Duties Other than on Real Property
change in $m
Tax revenue: a 659
Change in private income by source:
After tax labour income -109
After tax private capital income 73
After tax private land income - residential 6
After tax private land income - rural 0
After tax private land income - urban -8
After tax private other rent income -25
Transfers 22
Change in total private income: -40
% change
Change in total private income: 0.0%
Change in prices:
Price essential consumption 0.1%
Price non-essential consumption 0.1%
Source: MM900, KPMG Econtech estimates

Department of the Treasury
The Excess Burden of Australian Taxes
March 2010
ABCD
80
© 2010 KPMG, an Australian partnership and a member firm of the KPMG network of independent
member firms affiliated with KPMG International, a Swiss cooperative. All rights reserved.
The KPMG logo and name are trademarks of KPMG.
Liability limited by a scheme approved under Professional Standards Legislation.
Notes to Table 5.29:
a. Tax Revenue is the net revenue from introducing the tax. It includes any offsetting revenue losses
from changes to other tax bases. It is measured by the fall in lump sum tax revenue that is required to
keep the budget in balance given the stamp duty other than on real property collections.
b. The changes in the table are in nominal terms. In MM900, all prices are expressed relative to the
nominal wage (the numeraire). However, the incidence of taxes depends on the real impacts, so care
should be taken when interpreting the nominal results. Thus, with a fixed nominal wage, an increase in
consumer prices can be interpreted as a reduction in the real wage.
c. Changes in income from capital and transfers are included only for completeness, and do not have
policy implications.
5.3.16 Insurance taxes
The excess burden of insurance taxes is very high. This is for two reasons.
• First, insurance taxes are applied to a narrow base - insurance services. By applying
insurance taxes to this service, this increases the price of these services relative to other
goods and services, and leads to inefficiently low consumption of insurance services.
• Moreover, insurance taxes have a high effective rate. An important consideration is that
while the statutory tax base is typically the value of premiums, the true cost of insurance
services to policyholders is the value of premiums net of benefits, which is a much smaller
tax base. This smaller tax base means that the effective rates of tax are far higher than the
statutory rates.21
Specifically, KPMG Econtech estimates the MEB of insurance taxes to be 67 cents per dollar of
revenue, and the AEB to be 47 cents per dollar of revenue.
The incidence of insurance taxes also falls on prices. These taxes increase the cost of
production in industries that use insurance, and also increase the cost of insurance to
households.
• Insurance tax leads to higher consumer prices for insurance services, and for the output of
industries that use insurance - eroding the real wage.
• For household consumption of insurance, there is a larger impact on households with higher
incomes, mainly because they consume proportionally more insurance services. This can be
seen in Table 5.30 below, which reports that insurance taxes cause the price of non-essential
consumption to be 0.3 per cent higher, while causing the price of essential consumption to
be 1.3 per cent higher.
21 For example, consider a statutory rate of insurance tax that is set at 10 per cent of premiums. If the gross benefits
paid are 50 per cent of the premiums paid, then the effective rate of insurance tax will be double the statutory rate - at
20 per cent of the net value of insurance services (premiums minus payouts).

Department of the Treasury
The Excess Burden of Australian Taxes
March 2010
ABCD
81
© 2010 KPMG, an Australian partnership and a member firm of the KPMG network of independent
member firms affiliated with KPMG International, a Swiss cooperative. All rights reserved.
The KPMG logo and name are trademarks of KPMG.
Liability limited by a scheme approved under Professional Standards Legislation.
Table 5.30 Incidence of Insurance Taxes
change in $m
Tax revenue: a 3,902
Change in private income by source:
After tax labour income -894
After tax private capital income 436
After tax private land income - residential 39
After tax private land income - rural -8
After tax private land income - urban -86
After tax private other rent income 152
Transfers 149
Change in total private income: -213
% change
Change in total private income: 0.0%
Change in prices:
Price essential consumption 0.3%
Price non-essential consumption 1.3%
Source: MM900, KPMG Econtech estimates
Note: a. Tax Revenue is the net revenue from introducing the tax. It includes any offsetting revenue losses
from changes to other tax bases. It is measured by the fall in lump sum tax revenue that is required to
keep the budget in balance given the insurance tax collections.
b. The changes in the table are in nominal terms. In MM900, all prices are expressed relative to the
nominal wage (the numeraire). However, the incidence of taxes depends on the real impacts, so care
should be taken when interpreting the nominal results. Thus, with a fixed nominal wage, an increase in
consumer prices can be interpreted as a reduction in the real wage.
c. Changes in income from capital and transfers are included only for completeness, and do not have
policy implications.
5.3.17 Gambling taxes
Gambling taxes have a very high excess burden. This is because they are applied at high rates
and because the negative social costs associated with gambling have not been taken into account
in this analysis. Incorporating any social costs of gambling would lower the excess burden
because it would then reflect social benefits associated with a tax-influenced reduction in
gambling. However, it is unclear to what extent gambling taxes are effective in addressing
gambling externalities.
Thus, the excess burden estimates for gambling taxes presented here may be over-estimates.
The MEB is estimated to be 92 cents per dollar of tax revenue, and the AEB is estimated to be
54 cents per dollar of tax revenue.
The incidence of gambling taxes, like other consumption taxes, falls on consumer prices (as
shown in Table 5.31 below). Gambling taxes raise the price of non-essential consumption more
than the price of essential consumption, because gambling makes up a higher proportion of
wealthier households’ expenditure.

Department of the Treasury
The Excess Burden of Australian Taxes
March 2010
ABCD
82
© 2010 KPMG, an Australian partnership and a member firm of the KPMG network of independent
member firms affiliated with KPMG International, a Swiss cooperative. All rights reserved.
The KPMG logo and name are trademarks of KPMG.
Liability limited by a scheme approved under Professional Standards Legislation.
Table 5.31 Incidence of Gambling Taxes
change in $m
Tax revenue: a 5,475
Change in private income by source:
After tax labour income -1,135
After tax private capital income 582
After tax private land income - residential 36
After tax private land income - rural -61
After tax private land income - urban -121
After tax private other rent income -4
Transfers 155
Change in total private income: -548
% change
Change in total private income: -0.1%
Change in prices:
Price essential consumption 0.5%
Price non-essential consumption 1.7%
Source: MM900, KPMG Econtech estimates
Note: a. Tax Revenue is the net revenue from introducing the tax. It includes any offsetting revenue losses
from changes to other tax bases. It is measured by the fall in lump sum tax revenue that is required to
keep the budget in balance given the gambling tax collections.
b. The changes in the table are in nominal terms. In MM900, all prices are expressed relative to the
nominal wage (the numeraire). However, the incidence of taxes depends on the real impacts, so care
should be taken when interpreting the nominal results. Thus, with a fixed nominal wage, an increase in
consumer prices can be interpreted as a reduction in the real wage.
c. Changes in income from capital and transfers are included only for completeness, and do not have
policy implications.
Department of the Treasury
The Excess Burden of Australian Taxes
March 2010
ABCD
83
© 2010 KPMG, an Australian partnership and a member firm of the KPMG network of independent
member firms affiliated with KPMG International, a Swiss cooperative. All rights reserved.
The KPMG logo and name are trademarks of KPMG.
Liability limited by a scheme approved under Professional Standards Legislation.
6 References
ABS (Australian Bureau of Statistics, Real Estate Services Australia, 2002/03, Cat no. 8663.0.
Access Economics, 2008, Analysis of State Tax Reform, Financial Industry Council of Australia
Chaloupka and Warner, 1999, The economics of smoking, Working paper 7047, National
Bureau of Economic Research, Massachusetts.
CIE, 2009, State Business Tax Reform, Centre for International Economics.
Clarke H. and Prentice D., 2009, A Conceptual Framework for the Reform of Taxes Related to
Roads and Transport, School of Economics, La Trobe University.
Commonwealth Grants Commission, 2007, State Finance Inquiries, 2007 Update Report,
http://www.cgc.gov.au/state_finances_inquiries/2007_update_report2/working_papers/html/vol
ume_2/09_insurance_tax/insurance_tax.
Department of the Treasury, August 2008, Architecture of Australia’s Tax and Transfer System.
Diewert W and Lawrence D, 1994, The Marginal Costs of Taxation in New Zealand, New
Zealand Business Round Table, Swan Consultants, Canberra.
Diewert W and Lawrence D, 1995, The Excess Burden of Taxation in New Zealand, Agenda,
Volume 2, Number 1, pp 27-34.
Diewert W and Lawrence D, 2002, The Deadweight Costs of Capital Taxation in Australia,
Efficiency in the Public Sector edited by Kevin J. Fox, Kluwer Academic Publishers.
Econtech, 1998, Payroll Tax: is it as good as a VAT or as bad as a sales tax?, prepared for the
Australian Chamber of Commerce and Industry.
Freebairn, John, Compulsory Superannuation and Labour Market Responses, Australian
Economic Papers, Blackwell Publishing, vol. 37(1), pages 58-70, March.
Federal Chamber of Automotive Industry, 2008, Submission to the Senate Economics
Committee: Inquiry into the Tax Laws Amendment (Luxury Car Tax) Bill 2008.
Fuchs, Victor R.; Alan B. Krueger; James M. Poterba; "Economists Views about Parameters,
Values, and Policies: Survey Results in Labor and Public Economics," Journal of Economic
Literature, vol. 36, September 1998.
Fullerton, Don; Yolanda Kodrzycki Henderson, 1989, The Marginal Excess Burden of Different
Capital Tax Instruments, in The Review of Economics and Statistics, Vol. 71, No. 3 (August
1989), pp. 435-442.
Fuss and Gupta, 1981, A Cost Function Approach to the Estimation of Minimum Efficient Scale,
Returns to Scale, and Suboptimal Capacity: With an Application to Canadian Manufacturing,
European Economic Review, 15(2), pp. 123-35.
Görg H., Molana H. and Montagna C., 2007, Foreign Direct Investment Tax Competition and
Social Expenditure, Leverhulme Centre for Research on Globalisation and Economic Policy,
The University of Nottingham.
Department of the Treasury
The Excess Burden of Australian Taxes
March 2010
ABCD
84
© 2010 KPMG, an Australian partnership and a member firm of the KPMG network of independent
member firms affiliated with KPMG International, a Swiss cooperative. All rights reserved.
The KPMG logo and name are trademarks of KPMG.
Liability limited by a scheme approved under Professional Standards Legislation.
Han, Sang-Hee, 1998, Efficiency Costs of State Taxes, Paper presented to the 27th Annual
Conference of Economists.
Harberger, A. C. “The Incidence of the Corporation Income Tax” Journal of Political Economy,
1962, 70(3), pp. 215-40.
Hinchy, M., Fisher, B. and Wallace, N., 1989, Mineral Taxation and Risk in Australia, ABARE
Discussion Paper 89.8, AGPS, Canberra.
Hogan, L., 2007, Mineral Resource Taxation in Australia, ABARE Research Report.
Jha, Raghbendra., 1998, Modern Public Economics, Routledge.
Johansson, Hardy, Arnold, Brys and Vartia, 2008, ‘Tax and Economic Growth’, Economics
Department Working Paper No. 620, Organisation for Economic Co-operation and
Development (OECD).
Kelly, James; Robert Graziani, International Tax and Treaties Division, 2005, Australian
Treasury, International Trends in Company Tax Rates – implications for Australia’s company
income tax, www.treasury.gov.au/documents/930/PDF/02_International.pdf.
Laux, F., 2000, Addiction as a market failure: using rational addiction results to justify tobacco
regulation, Journal of Health Economics, 19, pp. 421–437.
Metcalf, G. and Fullerton, D., 2002, The Distribution of Tax Burdens: An Introduction, NBER
Working Paper 8978.
OCED, 2007, Tax Effects on Foreign Direct Investment: Recent Evidence and Policy Analysis,
OECD Tax Policy Studies, No. 17.
OECD, 2008, Policy Brief: Tax effects on Foreign Direct Investment.
Gabbitas, O. and Eldridge, D., 1998, Directions for State Tax Reform, Productivity Commission
Staff Research Paper, AusInfo, Canberra.
Rutherford, T. and Paltsev, S., 1999, From an Input-Output Table to a General Equilibrium
Model: Assessing the Excess Burden of Indirect Taxes in Russia, Department of Economics,
University of Colorado, USA.
Sandmo, 1983, A., ‘Progressive taxation, redistribution and labour supply’, Scandinavian
Journal of Economics, vol. 85, pp.311-323
The Treasury, 2008, Architecture of Australia’s Tax Transfer System,
www.taxreview.treasury.gov.au
Townsend, J, 1996, Price and Consumption of Tobacco, British Medical Bulletin, 52 (no.1)
pp132-142.
Young D. J. and Bielinska-Kwapisz A., 2003, ‘Alcohol Consumption, Beverage Prices and
Measurement Error’, Journal of Studies on Alcohol, vol. 64, pp. 235-238.
Department of the Treasury
The Excess Burden of Australian Taxes
March 2010
ABCD
85
© 2010 KPMG, an Australian partnership and a member firm of the KPMG network of independent
member firms affiliated with KPMG International, a Swiss cooperative. All rights reserved.
The KPMG logo and name are trademarks of KPMG.
Liability limited by a scheme approved under Professional Standards Legislation.
Appendix A – Detailed Methodology by Individual Tax
This appendix provides further detail to support the modelling results presented in Section 5 of
the report. For each tax, it presents three items.
• First, it gives a definition of the tax, providing enough detail for the efficiency analysis.
• Second, any economic theory surrounding the expected excess burden results, as well as
modelling issues are discussed. This section draws on the literature and the approach of
other authors.
• Third, the modelling approach adopted in this study and the reasons for this approach are
described in detail.
• Fourth, where relevant, it outlines how the model result relates to the true excess burden of
the tax.
A.1 Petroleum Resource Rent Tax
Definition
Petroleum resource rent tax (PRRT) is applied to taxable company profits derived from the
extraction of crude oil, condensate, sales gas, natural gas, LPG and ethane products from
Australian territorial waters. The North West Shelf and the Joint Petroleum Development Area
in the Timor Sea are both exempt from PRRT.
Taxable profit is defined as the excess of revenues over deductible expenditure, which includes
expenditure associated with exploration activities undertaken in other areas by the taxpayer, and
can be carried forward. Deductible expenditure also includes costs such as development and
operating costs. PRRT is levied at 40 percent of the profits from a petroleum project.
The PRRT is not applied to profits from downstream activities such as refineries or facilities for
transporting the products.
The PRRT is designed to only apply to excess or “super” profits. Normal profits are excluded
by applying an annual uplift factor in carrying forward the losses typically incurred in the initial
phase of a project.
Modelling issues and literature review
The oil and gas extraction industry can be said to be earning economic rents from its ownership
of a factor of production which is fixed in supply: oil and gas reserves. That is, the industry is
able to make profits in excess of the normal rate of return on capital which is available in other
industries.
According to Hinchy, Fisher and Wallace (1989) – if only economic rents are taxed, then the tax
will create no distortion on a firm’s behaviour. This is because, in most cases, firms will
undertake a project only if it results in positive economic rents. Provided the economic rent is
Department of the Treasury
The Excess Burden of Australian Taxes
March 2010
ABCD
86
© 2010 KPMG, an Australian partnership and a member firm of the KPMG network of independent
member firms affiliated with KPMG International, a Swiss cooperative. All rights reserved.
The KPMG logo and name are trademarks of KPMG.
Liability limited by a scheme approved under Professional Standards Legislation.
positive before and after the tax is levied, the firm will still decide to undertake the activity.
That is, imposing a tax on positive economic rents only reduces the magnitude of the rent, and
will not change the firm’s behaviour. To the extent that firms do not change their behaviour, the
PRRT may be considered a non-distortionary tax.
However, resource taxes have the potential to have a distortionary effect on exploration
activities. This distortion is associated with the risks involved in mineral exploration activity.
When firms choose which site to explore, they have limited information on the actual nature and
content of the site to be explored, and must take into account the risks of exploring in different
areas. Usually, the firm will have to consider multiple exploration projects with differing
expected economic rents. The firm will rank these projects based on their expected economic
rents after adjusting for their risks, and choose the projects with the highest expected rent.
A tax is symmetric in its treatment of profits and losses when firms pay a percentage of their
profits in tax, but in the event they make a loss, they also receive the same percentage of their
loss in the form of a rebate. Under a symmetric resource tax, the expected value of a discovery
is reduced by the tax rate, but the expected loss from failure to discover is also reduced by the
same proportion. Therefore, the relative riskiness of different projects would be preserved after
the tax is imposed, and there would be no impact on exploration activities.
The PRRT has minimal asymmetry because exploration costs can be offset from current profits
on other mining projects of the firm. This offset can also be deferred to the future so that the
firm can claim a deduction once they begin making positive profits. Therefore, the exploration
disincentive effect is expected to be minimal from the PRRT.
Modelling Approach
As discussed in Section 4, the inclusion of fixed factors in MM900 enhances the estimates of
the excess burdens of taxes such as the petroleum resource rent tax. The fixed factor will
introduce positive rents into the model, and taxes on those rents will simply erode them, rather
than reduce the industry’s ability to achieve the normal rate of return to capital. This results in
no distortions to production choices.
MM900 simulation
In MM900, PRRT is modelled as a tax on the part of the GOS for the oil and gas industry which
represents the return to a fixed factor. This will imply a zero excess burden for the PRRT, since
it will simply be a transfer of surplus from the oil and gas industry to the government sector.
To estimate the excess burdens, the effective tax rate is altered and the changes in welfare and
tax revenues compared. This is done using the following simulations.
• The marginal excess burden of PRRT is estimated by simulating a small (5 per cent)
increase in the effective PRRT rate.
• To estimate the average excess burden of PRRT, the PRRT is abolished (by setting the
effective rate to 0 per cent).
Department of the Treasury
The Excess Burden of Australian Taxes
March 2010
ABCD
87
© 2010 KPMG, an Australian partnership and a member firm of the KPMG network of independent
member firms affiliated with KPMG International, a Swiss cooperative. All rights reserved.
The KPMG logo and name are trademarks of KPMG.
Liability limited by a scheme approved under Professional Standards Legislation.
A.2 Land Taxes and Municipal Rates
Definition
Broadly speaking, there are two types of taxes on land: land tax and municipal rates.
Land taxes are levied on the commercial use of land, including rental properties. All states and
territories (except the Northern Territory) levy land tax on the unimproved value of holdings of
land, excluding principal residences. Land used for primary production is exempt. Most states
have a progressive land tax system and a tax-free threshold.
Municipal rates are levied by local governments and the ACT government. Most types of land
are subject to rates, and the rate charged can vary between different uses. The average rate
varies across jurisdictions, with councils in areas of lower land values generally tending to
charge higher rates (Department of the Treasury, 2008). While all industries pay some
municipal rates, most revenue comes from rates levied on the private ownership of dwellings.
Modelling issues and literature review
The traditional view of land tax is that it is an efficient form of taxation. This rests upon the
assumption that land is in fixed supply (PC, 1998). A perfectly vertical supply curve implies
that there is no excess burden resulting from a tax on land. That is, no decisions of resource
allocation are affected by the existence of land tax.
In reality, as noted above, land taxes and municipal rates are not applied widely and uniformly,
but differ across different uses, and are progressive in nature. Thus, inefficiencies may arise
because of this uneven application. For example:
• agricultural landowners are exempt from land tax, which may cause a bias towards
agricultural production rather than production in other industries;
• owner-occupiers are exempt from land tax in most states, which may cause a bias towards
owning rather than renting; and
• the progressivity of land tax provides an incentive for smaller land holdings.
As explained in the modelling section below, MM900 focuses on the first distortion in the list
above. This is because feeding the owning/renting decision into consumer welfare is difficult in
CGE models. Also, the progressive nature of land tax is not modelled in MM900. Thus, the
excess burden for land tax will be an underestimate.
Modelling Approach
In MM900, land tax and municipal rates are levied as separate taxes on the value of land used in
each industry. As discussed in section 4.3, MM900 incorporates three types of land (rural,
residential and industrial) which are perfectly substitutable between industries that use the same
type of land, and are not substitutable between industries that do not use the same type of land.
Department of the Treasury
The Excess Burden of Australian Taxes
March 2010
ABCD
88
© 2010 KPMG, an Australian partnership and a member firm of the KPMG network of independent
member firms affiliated with KPMG International, a Swiss cooperative. All rights reserved.
The KPMG logo and name are trademarks of KPMG.
Liability limited by a scheme approved under Professional Standards Legislation.
However, each of the three types of land is fixed in supply and can only be used by a fixed
number of industries.
When the use of any one of the three types of land is taxed at a uniform rate, it will not change
the supply of that type of land or the behaviour of industries which are using that land. The
marginal productivity of that type of land will not change due to the tax, and there will only be a
reduction of the return to the owners of that type of land. That is, land tax can be considered a
lump sum tax with no distortionary effects.
Distortions arise when taxes on one type of land are not uniform across the industries using that
land. This is because land is perfectly substitutable between industries which use the same type
of land, and therefore the supply of land for any one of the 109 industries (except ownership of
dwellings) is perfectly elastic. For example, if the Furniture industry is exempt from paying tax
on their use of urban land, and other users of urban land must pay a positive rate of land tax,
then owners of urban land will prefer to lease their land to the Furniture industry rather than to
any other industry. Arbitrage will ensure that the rate of return received by urban land owners
from leasing their land to the Furniture industry is the same as the rate of return from leasing
their land to any other urban land user. This process means that the Furniture industry will have
a lower cost of land inputs, lowering their costs. This will lower the price of Furniture relative
to other goods and services, and result in consumption of Furniture products greater than the
efficient level.
Therefore, the excess burden of tax on land depends on the way it is applied across industries.
The excess burdens of land tax and municipal rates are modelled separately.
The model will pick up a distortion in the way that the use of rural and urban land is distributed
between the different industries using those land types. Land tax is zero for residential land
used for a principal residence and for agricultural industries. Both the mining industries and
agricultural industries use rural land, but only the mining industries pay land tax. Land tax will
therefore raise the costs of mining industries relative to the costs of agricultural industries,
causing a shift away from mining and towards agriculture. Likewise, for users of urban land,
effective land tax rates are different for the different industries. This stems from the effect of
thresholds and the increasing marginal rates on land tax payment.
Municipal rates are applied mostly to ownership of dwellings, but also to other industries. The
model identifies differences in effective rates between industries. This stems from the variation
in rates between councils and industries. MM900 will pick up a distortion from the different
effective rates of tax across industries using each of the types of land.
The data used to construct land use, land tax and municipal rates by industry in MM900 was at
an aggregated level. This means that a number of the more detailed industries in MM900 will
have the same effective rates of land tax and municipal rates. This will work to lower the
excess burden results obtained from the model, and understate the actual excess burden of land
tax and municipal rates.
Moreover, as explained in section 4.3, each type of land (rural, urban and residential) is fixed in
the long run. However, if re-zoning were considered a possibility, each type of land would be
substitutable for the other to some extent, and only the total quantity of land would be fixed.
Increasing the substitution possibilities for land would increase the excess burden estimates
from the model.
Department of the Treasury
The Excess Burden of Australian Taxes
March 2010
ABCD
89
© 2010 KPMG, an Australian partnership and a member firm of the KPMG network of independent
member firms affiliated with KPMG International, a Swiss cooperative. All rights reserved.
The KPMG logo and name are trademarks of KPMG.
Liability limited by a scheme approved under Professional Standards Legislation.
MM900 simulation
Land tax and municipal rates are simulated separately. For each tax, to estimate the excess
burdens, the effective tax rate is altered and the changes in welfare and tax revenues compared.
This is done using the following simulations.
Examining the excess burden of municipal rates is undertaken in two stages, as follows.
• The marginal excess burdens of municipal rates is estimated by simulating a small
(5 per cent) increase in the effective tax rates.
• To estimate the average excess burdens of municipal rates, municipal rates are abolished
(by setting the effective tax rates to 0 per cent).
Our efficiency analysis of Land Tax is further partitioned to show the separate contributions to
the inefficiency measures from a uniform tax on land and the departures from uniformity in
Australia’s land taxes. Thus, examining the excess burden of Land Tax is undertaken in three
stages, as follows.
• The efficiency cost of the non-uniformity in land tax application is isolated by modelling the
case where land tax is applied at a uniform rate (to achieve the same revenue) and
comparing the simulated economic welfare in this case to simulations of the current system.
• The marginal excess burdens of land tax is estimated by simulating a small (5 per cent)
increase in the effective tax rates.
• To estimate the average excess burdens of land tax, land tax is abolished (by setting the
effective tax rates to 0 per cent).
Department of the Treasury
The Excess Burden of Australian Taxes
March 2010
ABCD
90
© 2010 KPMG, an Australian partnership and a member firm of the KPMG network of independent
member firms affiliated with KPMG International, a Swiss cooperative. All rights reserved.
The KPMG logo and name are trademarks of KPMG.
Liability limited by a scheme approved under Professional Standards Legislation.
A.3 Company Income Tax
Definition
The main business income tax in Australia is company tax, which is levied on the taxable
income of Australian companies at a rate of 30 per cent.
The tax applies to incorporated and unincorporated associations, limited partnerships and some
corporate unit trusts. Special rates apply to pooled development funds, certain classes of life
insurance companies, credit unions and not for profit organisations..
Companies receive deductions because of capital depreciation. In most cases, the depreciation
rate applied for tax purposes is higher than the economic rate of depreciation, meaning that the
effective rate of tax paid is lower than the statutory rate. Research and development
concessions are also available.
There are links between the personal income tax system and the company tax system. For
example, Australian residents are able to offset their personal income tax liability with the
company tax already paid on the dividends that they receive from ownership of Australian
shares. This is done through the imputation system.
Foreign companies operating in Australia are subject to Australia’s company tax. A few foreign
countries offer tax credits for tax paid overseas. Australian equity investments held by
foreigners are subject to company tax.
Modelling issues and literature review
International company tax rates are often one factor that is considered when policy makers set
the company tax rate for a particular country. This is because, with capital becoming
increasingly mobile internationally, company tax rates are seen to be important determinants of
the relative competitiveness of a country as an investment destination. As discussed in the
Treasury’s publication, Architecture of Australia’s Tax and Transfer System, there is a trend
towards lower company tax rates among OECD countries. According to the Treasury, since
2001, the unweighted average company tax rate for the OECD countries has decreased by
around six percentage points.
International capital mobility also has important implications for the efficiency of company
income taxes. If capital is mobile internationally, then the supply of investment funds to
Australia will be highly elastic, and this will mean that company taxes will have significant
distortions. This is because company tax will reduce the attractiveness of Australia as a
destination for international investment funds. Kelly and Grazini (2005) list the potential
welfare benefits from reducing company tax, including:
“if Australia’s capital stock increases, (there will be) greater labour income through increased
productivity and possibly employment; and
positive externalities or spill-overs associated with FDI which improve labour and capital
productivity, and hence labour and (residents’) capital income.”
However, they also note that the capital income from any FDI will accrue to the foreign
investors and Australian residents will only capture a portion of this, as tax revenue.
Department of the Treasury
The Excess Burden of Australian Taxes
March 2010
ABCD
91
© 2010 KPMG, an Australian partnership and a member firm of the KPMG network of independent
member firms affiliated with KPMG International, a Swiss cooperative. All rights reserved.
The KPMG logo and name are trademarks of KPMG.
Liability limited by a scheme approved under Professional Standards Legislation.
Generally the supply of foreign investment funds to Australia is assumed to be perfectly elastic.
This reflects traditional neo-classical theory, which indicates that capital stocks adjust so that
the after tax returns on investments are equalised across countries. Under this analysis, an
increase in the Australian corporate tax rate would reduce investment into Australia, increasing
the before tax rate of return. This exit of capital would continue until the after tax rate of return
was restored to equality with the rest of the world.
However, there are a number of factors that may make the supply of foreign investment funds to
Australia less than perfectly elastic. In recent years, the new economic geography framework
has challenged the assumption of perfectly elastic capital supply (OECD, 2007). This thinking
has emphasised “the role of self-reinforcing business concentration (agglomeration) economies”
(OECD 2007, p10). Other factors affecting the overall responsiveness of international
investment to company income tax rates will include the following (Kelly and Grazini 2005,
pp. 37-39):
• economic rents – certain economic rents can be obtained in Australia that are not available
elsewhere, such as natural resources and proximity to final markets;
• sunk costs – existing investments may be ‘locked in’;
• other taxes such as tariffs;
• labour market conditions; and
• profit shifting – which is a practice mainly of multinational corporations.
FDI is also attracted to countries offering benefits such as access to markets and profit
opportunities; a predictable and non-discriminatory legal and regulatory framework;
macroeconomic stability; skilled and responsive labour markets; and well-developed
infrastructure. All of these factors will influence the long-term profitability of a project (OECD
2008). Thus, tax is only one element that impacts on international investment decisions, which
may limit the extent to which capital supply responds to changes in the company tax rate.
Görg et al (2007) found that countries with higher taxes and higher social welfare spending are
actually more successful in attracting overseas investment. The study analysed data from 18
OECD countries over a 14-year period and found that perceptions about the host country’s
economic and social environment are key to the choice of location for many multinationals.
Investment decisions depend on the combination of taxation and the provision of public goods
and services that host countries can offer because of taxation. An ‘unfavourable’ tax differential
may lead to more (and not less) investment flowing into a country.
The presence of these factors in the Australian market may mean that the responsiveness of
foreign investment funds is less than perfectly elastic.
The tax treatment of funds invested into Australia by foreign governments will also be
important for the elasticity of supply of foreign funds. Australia sources its investment mostly
from the US and the UK, which together make up around 50 per cent of foreign investment in
Australia, as shown in chart A.1. The tax regimes in these countries will therefore have most
influence on the elasticity with which investment funds are supplied to Australia.
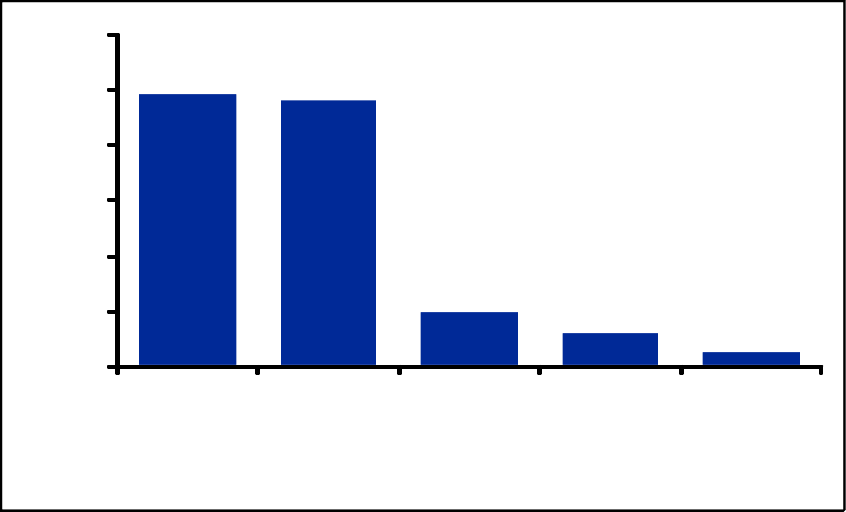
Department of the Treasury
The Excess Burden of Australian Taxes
March 2010
ABCD
92
© 2010 KPMG, an Australian partnership and a member firm of the KPMG network of independent
member firms affiliated with KPMG International, a Swiss cooperative. All rights reserved.
The KPMG logo and name are trademarks of KPMG.
Liability limited by a scheme approved under Professional Standards Legislation.
Chart A.1 Foreign investment (flow) in Australia by source, 2008 (per cent of total)
24.8% 24.3%
5.2% 3.3% 1.6%
0%
5%
10%
15%
20%
25%
30%
United
Kingdom
United
States of
America
Japan Hong Kong
(SAR of
China)
New Zealand
Source: ABS, International investment position, Cat no. 5352.0 Table 2
Traditionally, both the US and UK have offered tax credits for Australian company tax paid on
income their residents earn through Australian dividends. Under this system, if the Australian
company tax rate is higher than in the foreign country, increases in the Australian company tax
rate are likely to flow through to the cost of capital, discouraging foreign investment. However,
if the rate of company income tax in Australia is below the rate in the foreign country, any
increase in the Australian company tax may be partly offset for the foreign investor by increased
tax credits in the investor’s home country. In this case, the tax revenue would be partly
transferred from the foreign Treasury to the Australian Treasury. There would also be no
change in the costs of investing in Australia for foreign individuals, and thus no response in the
investment funds supplied from these countries. The only change would be to Australian
government revenue.
However, more recently, for portfolio investment, the UK and Japan have been moving away
from the tax credit system and towards an exemption system, under which income earned on
foreign investments (that is, investments in Australia) is exempt from tax. Moreover, although a
tax credit system is still in place in the US, it may not be very effective - since there are
numerous tax-planning measures that companies can undertake to minimise their tax liabilities.
Given that there are factors both working to raise and lower the elasticity of the supply of
foreign funds into Australia, as pointed out in a study by the OECD (2008), determining the
sensitivity of foreign investment into Australia is an empirical issue.
A study by the OECD (2008) examined 31 empirical studies, including times series, cross
section, panel data and discrete choice model studies, and developed a meta sample of 427 tax
elasticities. These elasticities were regressed on variables relating to the underlying
characteristics of the empirical studies (tax data, foreign capital data, and various control

Department of the Treasury
The Excess Burden of Australian Taxes
March 2010
ABCD
93
© 2010 KPMG, an Australian partnership and a member firm of the KPMG network of independent
member firms affiliated with KPMG International, a Swiss cooperative. All rights reserved.
The KPMG logo and name are trademarks of KPMG.
Liability limited by a scheme approved under Professional Standards Legislation.
variables) to explore the systematic impact of the study characteristics on the size of the
reported elasticities. The results are summarised below:
Table A.1: Responsiveness of cross-boarder investment to changes in company tax
Types of studies Semi-elasticity Ordinary elasticity
Mean Median Std Dev Mean Median Std Dev
Time series –2.61 –2.75 6.03 –1.23 –1.28 2.87
Cross section –7.16 –4.24 6.92 –0.85 –0.78 0.44
Panel data –2.73 –2.41 2.69 –0.78 –0.66 0.75
Discrete choice –3.43 –2.80 6.42 –0.30 –0.19 0.51
All –3.72 –2.91 5.92 –0.75 –0.57 1.55
Source: OCED 2008
Note: The semi-elasticity measures the percentage change in FDI in response to a 1 percentage point change in the
tax rate (e.g. a decline from 30% to 29%), defined as ∂ln(FDI)/∂t.
The ordinary elasticity measures the percentage change in FDI in response to a 1 per cent change in the tax
rate (e.g. a decline from 30% to 29.7%), defined as ∂ln(FDI)/∂ln(t).
As shown in the table above, studies examining cross-border flows suggest that, on average,
Foreign Direct Investment (FDI) decreases by 0.75 per cent following a 1 percent increase in the
tax rate on FDI. There is a wide range of estimates with most studies finding decreases in the
range of 0 per cent to 5 per cent. This variation partly reflects differences between the
industries and countries being examined, or the time periods concerned. Some recent studies
find, for example, that FDI is becoming increasingly sensitive to taxation, reflecting the
increasing mobility of capital as non-tax barriers to FDI are removed (OECD 2008).
As alluded to in the table above, although considerable research has been undertaken into the
responsiveness of international investment to company tax, these studies “suffer from problems
with data and in disentangling tax effects from other influences” Kelly and Grazini (2005).
However, one conclusion that Kelly and Grazini (2005) do make after considering the available
evidence, is that “cross-border investments are significantly influenced by company tax, though
this is difficult to quantify, and this influence is increasing over time”.
The elasticities that are used in MM900 are discussed below.
Modelling Approach
As noted in Section 4, MM900 assumes that the private propensity to save is constant. This is
both to ensure that the level of domestic saving is sustainable and to avoid the problem that
saving can appear artificially attractive in CGE models. The model then deduces the level of
private savings (or assets) that is consistent with that saving rate.
Department of the Treasury
The Excess Burden of Australian Taxes
March 2010
ABCD
94
© 2010 KPMG, an Australian partnership and a member firm of the KPMG network of independent
member firms affiliated with KPMG International, a Swiss cooperative. All rights reserved.
The KPMG logo and name are trademarks of KPMG.
Liability limited by a scheme approved under Professional Standards Legislation.
Fixed domestic savings means that any tax on the return to resident savings, such as company
tax, will not have any impact on local investment levels. Therefore, the impact of company tax
on foreign investment in Australia will drive the estimate of the excess burden of company
taxation from MM900.
As discussed above, the excess burden of company tax is influenced by the elasticity of the
supply of foreign investment funds. However, the available empirical studies are inconclusive
as to the actual value of this elasticity. The main results in this study assume that the elasticity
of supply of foreign investment funds is perfectly elastic. In addition, a further simulation was
run to test the sensitivity of the main results to this assumption.
MM900 simulation
Company tax is a direct tax in MM900 which drives a wedge between the after tax required rate
of return on international capital markets and the before tax rate of return. Initially, the effective
tax paid on business income in the model is 33.7 per cent of net operating surplus (which is
GOS minus capital depreciation).
As mentioned above, our efficiency analysis of company tax is further partitioned to show the
impact on the inefficiency measures if the supply of foreign investment funds is slightly
inelastic. That is, a third scenario assumes a less mobile foreign capital market - where to double
the share of assets made up by foreign assets, would require a 50 basis point increase in the rate
of return on foreign investment. Thus a third scenario has been added below.
To estimate the excess burdens, the effective tax rate is altered and the changes in welfare and
tax revenues compared. This is done using the following simulations.
• The marginal excess burden of company tax is estimated by simulating a 5 per cent (or
1.7 percentage points) increase in the effective company tax rate.
• Traditional assumption (supply of foreign investment funds is perfectly elastic) - to
estimate the average excess burden of company tax, company tax is abolished (by setting
the effective tax rate to 0 per cent).
• Sensitivity assumption (supply of foreign investment funds is slightly less than perfectly
elastic) – again, to estimate the average excess burden of company tax, company tax is
abolished (by setting the effective tax rate to 0 per cent).
Department of the Treasury
The Excess Burden of Australian Taxes
March 2010
ABCD
95
© 2010 KPMG, an Australian partnership and a member firm of the KPMG network of independent
member firms affiliated with KPMG International, a Swiss cooperative. All rights reserved.
The KPMG logo and name are trademarks of KPMG.
Liability limited by a scheme approved under Professional Standards Legislation.
A.4 Crude Oil Excise and Resource Royalties
Crude oil excise and resource royalties are modelled together, because they have similar
incentive effects on resource companies. This is because they can both be modelled as
production taxes.
Definition
The crude oil excise is levied using a progressive rate scale on the value of crude oil production
from onshore petroleum projects and the North West Shelf. The excise is collected on a per
barrel basis, and the first 30 million barrels are exempt. There is also an annual exemption of
3.1 million barrels once the 30 million barrel limit has been reached.
States and territories levy a range of resource royalties on the extraction of various natural
resources. These may be levied as ad valorem taxes on the value of production, or a constant
amount per physical unit of production.
• Mineral royalties tend to be applied to the output of mining activity rather than to the profit
earned from mining.
• Some royalties are calculated on an ad valorem basis, that is, as a proportion of the gross
invoice value of the mineral less any allowable deductions (WA Department of Mines and
Petroleum).
• Ad valorem taxes generally apply to high value mining activity.
• Low value commodities, such as clay and sand, tend to have royalties calculated on a
volumetric basis.
Resource royalties contribute significantly to the revenues of some state governments,
particularly Western Australia and Queensland. For example, the amount of mineral and
petroleum royalties collected by Queensland in 2008-09 was estimated to be $3.3 billion. For
the same year, in Western Australia, royalty collection was estimated at $2.6 billion, and in New
South Wales it was $1.4 billion.
Modelling issues and literature review
An important distinction between the PRRT and the taxes in this section (crude oil excise and
resource royalties) is that, while PRRT is applied to excess profits, the taxes in this section are
applied to production values or volumes.
The response to a tax on production in the different mining sectors will depend on the
characteristics of each industry. In general, a tax on production will create a wedge between
producer and consumer prices, creating a reduction in production and consumption and causing
a deadweight loss. However, some mining sectors own fixed factors, from which they derive
positive economic rents. Therefore, the owners of the fixed factor may bear some of the tax,
through a reduction in their economic rents, reducing the size of the excess burden.
Since the crude oil excise and resource royalties are mostly levied on an output basis, and
accordingly there are minimal allowances for offsetting losses in the event of unsuccessful
Department of the Treasury
The Excess Burden of Australian Taxes
March 2010
ABCD
96
© 2010 KPMG, an Australian partnership and a member firm of the KPMG network of independent
member firms affiliated with KPMG International, a Swiss cooperative. All rights reserved.
The KPMG logo and name are trademarks of KPMG.
Liability limited by a scheme approved under Professional Standards Legislation.
exploration activity, this tax can be considered asymmetrical. Therefore, unlike PRRT, the
crude oil excise and resource royalties can be expected to have distortionary effects on
exploration activity.
Since mining is a highly trade exposed industry, miners have little scope to increase their prices
in response to royalties. Instead, they will respond via a contraction in production volumes.
This contraction will be particularly important for the more marginal operations in the industry.
Modelling Approach
Both the crude oil excise and resource royalties are simulated together, so that the total effect of
the regime can be examined. They are simulated as production taxes on the relevant
commodities, calculated as an effective ad valorem rate.
MM900 simulation
To estimate the excess burdens, the effective tax rate is altered and the changes in welfare and
tax revenues compared. This is done using the following simulations.
• The marginal excess burden of crude oil excise and royalties is estimated by simulating a
small (5 per cent) increase in the effective crude oil excise and royalties rate.
• To estimate the average excess burden of crude oil excise and royalties, these taxes are
abolished (by setting the effective tax rates to 0 per cent).
Department of the Treasury
The Excess Burden of Australian Taxes
March 2010
ABCD
97
© 2010 KPMG, an Australian partnership and a member firm of the KPMG network of independent
member firms affiliated with KPMG International, a Swiss cooperative. All rights reserved.
The KPMG logo and name are trademarks of KPMG.
Liability limited by a scheme approved under Professional Standards Legislation.
A.5 Labour income tax
The excess burdens for all taxes on labour income are modelled together. These taxes include:
• personal income tax (including Medicare levy);
• fringe benefits tax; and
• superannuation taxes which are applied to employer superannuation contributions.
These taxes are modelled together for two main reasons. First, they are all associated with the
same economic distortions (work-leisure choice). Second, they all have the same base (income
that individuals earn from supplying labour).
This study concentrates on personal income tax on income derived from labour, rather than
from non-labour sources (such as taxes on interest earnings). MM900 treats the private
propensity to save as fixed, as explained in section 4.2.2 of the report. This means that MM900
is not designed to assess the distortionary effects of taxes on the income derived from savings.
Definition
Personal Income Tax
Personal income tax applies to the nominal income earnings of individuals, assessed across the
financial year. It raises significant revenue for the Federal Government, and accounts for the
largest share of Australian taxation revenue, at 36 percent in 2007/08.
Australian citizens pay personal income tax on income earned at home and abroad. Foreigners
pay income tax on income earned in Australia, although in some cases they may receive a credit
for this tax in their own jurisdiction.
In estimating income tax liabilities, deductions for expenses are generally allowed. There are a
broad range of deductions/concessions which reduce the amount of taxable income. Generally,
these concessions cover activities which are incurred in carrying out a business activity or used
in the process of earning income.
An individual’s taxable income is calculated by subtracting their deductions and personal losses
from their assessable income. Income from sole traders, partnerships and trusts is attributable to
the individual. In addition to basic income tax, a Medicare Levy on personal income earned is
payable at a rate of 1.5 percent of taxable income. Low-income earners are exempt from this
levy.
Personal income tax is a progressive tax because the marginal and average rates of tax increase
as earnings increase. The rates for 2009/10 are shown in the table below. The progressive
nature of the tax addresses equity and redistributive concerns.

Department of the Treasury
The Excess Burden of Australian Taxes
March 2010
ABCD
98
© 2010 KPMG, an Australian partnership and a member firm of the KPMG network of independent
member firms affiliated with KPMG International, a Swiss cooperative. All rights reserved.
The KPMG logo and name are trademarks of KPMG.
Liability limited by a scheme approved under Professional Standards Legislation.
Table A.2: 2009/10 Personal Income Tax Scales
Taxable income ($) Marginal rate (%)
0 - 6000 0
6,001 - 35,000 15
35,001 - 80,000 30
80,001 - 180,000 40
180,001+ 45
Fringe benefits tax
Fringe benefits tax (FBT) is designed to ensure that a tax concession cannot be gained by
providing fringe benefits rather than monetary income. Without FBT, payment of fringe
benefits in place of monetary income could result in avoidance of personal income tax. It could
also result in avoidance of GST, in cases where the fringe benefit is a GST-taxable supply and
the business is eligible to claim GST input tax credits.
As a result, most fringe benefits (i.e. non-monetary income) are subject to FBT. The FBT is
designed to ensure that the individual taxpayer (who is on the top marginal rate of personal
income tax) is indifferent between purchasing the benefit out of their own after-tax income or
receiving it as a fringe benefit. An efficient FBT should try to achieve this goal, because this
will not add any extra distortion to the individual’s choices.
Where the fringe benefit is a supply that is not subject to GST, the amount of fringe benefit tax
payable is equivalent to the saving in personal income tax. The FBT amount for this type of
fringe benefit is calculated as follows.
rateBT
)1(
1 F
rateFBT
amountbenefitfringeFBT ×
−
×=
In this formula, the ‘fringe benefit amount’ is the value of the total taxable fringe benefits paid
to the individual. The FBT rate appearing in the formula is currently 46.5 per cent, which
corresponds to the top marginal rate of personal income tax, inclusive of the Medicare Levy22.
The complete expression applying to the fringe benefit amount is known as the ‘gross up rate’,
and is 1.8692 when evaluated at the current FBT rate of 46.5 per cent (as shown below). The
gross up rate is used to adjust the value of the taxable fringe benefits so they are equivalent to
22 We assume that employees with incomes below the top tax bracket will not choose to take their compensation in
the form of fringe benefits, or that they use the employee contribution method to generate an equivalent tax outcome
for their marginal tax rate.

Department of the Treasury
The Excess Burden of Australian Taxes
March 2010
ABCD
99
© 2010 KPMG, an Australian partnership and a member firm of the KPMG network of independent
member firms affiliated with KPMG International, a Swiss cooperative. All rights reserved.
The KPMG logo and name are trademarks of KPMG.
Liability limited by a scheme approved under Professional Standards Legislation.
the gross value, not the net (of tax) value. This is similar to how personal income tax applies –
the income tax rate is applied to the gross income payments.
Gross up rate = )1(
1
rateFBT−= 1.8692
Where the fringe benefit is a supply that is subject to GST, the FBT payable is higher, so that it
is not only equivalent to the saving in personal income tax, but also includes the saving in GST.
The saving in GST arises if the employer can claim a GST input-tax credit. The formula for the
FBT amount in this case is as follows.
rateBT
)1()1(
rate GSTrateBT F
rateFBTrateGSTrateFBT
F
amountbenefitfringeFBT ×
×+×−
+
×≡
Using the current GST rate of 10 per cent, the gross-up rate is higher than before at 2.0647 (as
shown below), as it is making an adjustment for both personal income tax and GST.
Gross up rate = rateFBTrateGSTrateFBT
F
×+×−
+
)1()1(
rate GSTrateBT = 2.0647
While the FBT is applied to most goods or services that are provided in lieu of income, a
number of benefits are exempt from fringe benefits tax. These include benefits under the value
of $300 and on-site childcare or canteen facilities. There are also concessions for various other
fringe benefits. The most notable of these is the concession for motor vehicles. Concessions also
apply to fringe benefits paid to employees of various philanthropic and non-profit organisations.
Superannuation taxes
When assessing the efficiency of labour income taxes, it is also important to take into account
the tax treatment of labour income that is paid in the form of employer contributions to
superannuation. These contributions are currently taxed at the concessional rate of 15 per cent,
rather than at the individual’s personal marginal income tax rate. Thus, one effect of this tax
concession is to reduce the overall effective rate of tax on labour income.

Department of the Treasury
The Excess Burden of Australian Taxes
March 2010
ABCD
100
© 2010 KPMG, an Australian partnership and a member firm of the KPMG network of independent
member firms affiliated with KPMG International, a Swiss cooperative. All rights reserved.
The KPMG logo and name are trademarks of KPMG.
Liability limited by a scheme approved under Professional Standards Legislation.
There are three stages in superannuation:
1. the contributions to a superannuation fund (including those made by an individual and those
made the employer on behalf of the individual);
2. the earnings obtained by the fund; and
3. withdrawals from the fund.
Australia adopts the TTE system. Under this system, tax is imposed on the first two stages of
superannuation, and the third stage is exempt where a person is 60 years or older,
Superannuation taxes can have two distortionary effects.
• First, the extent of tax on employer superannuation contributions will affect the after-tax
wage that the individual receives. In particular, the contributions tax rate of 15 per cent is
less than the average marginal rate of personal income tax that applies to other forms of
labour income. This lessens distortions to the work/leisure choice. The 15 per cent
concessional tax rate applies to both compulsory (9 per cent) and salary-sacrifice employer
contributions.
• Second, concessional taxation of voluntary superannuation contributions and earnings
increases the after-tax return to such savings.23 This is because less tax is deducted on
income deposited into superannuation, which may increase the incentive to save. A tax rate
of 15 per cent applies to both salary-sacrifice contributions and to earnings obtained by the
fund.
This section considers the first effect, the impact on the work-leisure choice of the concessional
tax treatment of employer superannuation contributions. The second effect is not considered
because distortions to individual saving decisions are outside of the scope of the modelling.
Modelling issues and literature review
Taxes on labour income drive a wedge between the wage received by employees and the wage
paid by employers. This section discusses the economic distortions and the important model
parameters that determine the size of the excess burden. As noted above, the excess burden
from FBT and tax on employer superannuation contributions comes from the same distortions
as from personal income tax. Thus, the comments in this section apply to personal income tax,
FBT and taxes on employer superannuation contributions (all now labelled under the banner of
“labour income”).
Taxes on labour income alter individuals’ decisions about the number of hours worked, labour
force participation, saving decisions, investment in education and human capital, and can also
encourage an underground economy for labour. Taxes on labour income also increase the labour
costs paid by employers. This leads to a substitution away from labour in production and
towards capital inputs, which are now relatively cheaper. In this way, a labour income tax will
lead to an inefficiently low labour to capital ratio.
23 Since SG is compulsory, changing its tax treatment cannot alter savings decisions.

Department of the Treasury
The Excess Burden of Australian Taxes
March 2010
ABCD
101
© 2010 KPMG, an Australian partnership and a member firm of the KPMG network of independent
member firms affiliated with KPMG International, a Swiss cooperative. All rights reserved.
The KPMG logo and name are trademarks of KPMG.
Liability limited by a scheme approved under Professional Standards Legislation.
MM900 does take account of the effects of labour income tax on hours worked and labour force
participation; as well as the substitutability of labour and capital for firms. However, it does not
take into account the effects of labour taxes on investment in education and human capital or on
the underground economy for labour.
The Australian personal income tax system is a progressive system, with individuals whose
income falls into a higher tax bracket facing higher marginal and average tax rates. This
progressivity means that the excess burden is higher than would otherwise be the case. While
the marginal rate of tax will impact on the individual’s decision of how many hours of labour to
supply (the intensive margin); the average rate of tax will impact on the individual’s decision of
whether to participate in the labour force or not (the extensive margin).
In a model with many individuals facing different wage rates, the aggregate labour supply
response to an increase the progressivity of the tax regime (holding tax revenue constant) will
depend on the relative sizes of the effect on the different employee groups e.g. full-time, part-
time, second income earners. Based on a model developed by Sandmo 1983, Jha concludes the
following in Modern Public Economics (1998):
“With an increase in the progression with total tax revenue held constant, everyone faces a
higher marginal tax rate. The substitution effect from this will make everyone work less.
However, the average tax rate falls for people with low incomes and rises for people with
high incomes. The income effect will make the less well-off work less (consume more
leisure) and the more well-off work more. If this positive income effect on the more well off
outweighs the negative income effect on the less well off, as well as the negative
substitution effect for everyone, the supply of labour in the economy will actually rise.”
A sufficient condition for labour supply to fall under such an increase in progressivity is that the
substitution effects are larger than the income effects. This would imply that those with higher
incomes must have a lower income elasticity of labour supply than those with low incomes24.
This is a reasonable assumption to make for the purposes of this study.
Indeed, growth regressions undertaken for an OECD study indicate that a progressive income
tax system leads to lower GDP per capita (Johansson et al., 2008). Johansson et al. note that,
for the average OECD country in 2004, if the marginal tax rate were to decrease by 5 percentage
points (decreasing the progressivity of labour income tax), there would be an estimated
1 per cent increase in GDP per capita in the long-run. Therefore, it is important to take the
progressivity of the Australian labour income tax system into account when estimating the
excess burdens of the system.
Overall, taxes on labour income lead to individuals reducing their labour supply. The elasticity
of labour supply with respect to the wage determines how large this response is. Australian
labour demand and supply elasticities have been estimated by several authors, as listed below.
24 This is reasonable considering that lower income earners may be more likely to have higher elasticities of labour
supply. For example, they may be more likely to be more “marginally engaged” members of the labour force, such
as second earners in the household.

Department of the Treasury
The Excess Burden of Australian Taxes
March 2010
ABCD
102
© 2010 KPMG, an Australian partnership and a member firm of the KPMG network of independent
member firms affiliated with KPMG International, a Swiss cooperative. All rights reserved.
The KPMG logo and name are trademarks of KPMG.
Liability limited by a scheme approved under Professional Standards Legislation.
Table A.3: Elasticities of labour supply with respect to the after tax wage
Author Uncompensated
elasticity
Compensated
elasticity
Apps and Savage (1989) 0.12 for males
0.16 for females
Stacey and Downes (1995) 0.2
Campbell and Bond (1997) 0.07 0.14
Han (2003) 0.21
In line with these estimates, the uncompensated elasticity of labour supply in MM900 has been
set at 0.2. That is, when the real after tax wage increases by 1 per cent, and real ‘full’ income is
held constant, overall labour supply will increase by 0.2 per cent. A survey of 65 labour
economists conducted by Fuchs et al. (1998) found that “modern consensus estimated of labour
force elasticity, while still low, are generally non-zero.” The study estimated that the labour
supply elasticity was of mean 0.1 and median zero for men and mean 0.45 and median 0.3 for
women. The value of 0.2 used in MM900 is in line with these estimates.
Modelling Approach
Rationale for modelling personal income tax, FBT and tax on SG together
As noted above, personal income taxes on labour income, taxes on fringe benefits and taxes on
employer superannuation contributions can all be considered taxes on labour income. That is,
labour income includes the before tax value of monetary income, fringe benefits and employer
superannuation contributions. The tax revenue includes revenue from wage taxes, FBT and
taxes on employer superannuation contributions. The rationale for modelling these three taxes
together is outlined below.
Pre-tax labour income is equal to the marginal product of labour. Holding this marginal product
constant, a tax on any form of labour income will mean that the take home earnings of an
employee are reduced. This will affect the employee’s labour supply decision.
FBT aims to achieve the same results (incentives and revenues) as if the good or service were
purchased by the employee (out of their after-tax income), rather than by the employer. This

Department of the Treasury
The Excess Burden of Australian Taxes
March 2010
ABCD
103
© 2010 KPMG, an Australian partnership and a member firm of the KPMG network of independent
member firms affiliated with KPMG International, a Swiss cooperative. All rights reserved.
The KPMG logo and name are trademarks of KPMG.
Liability limited by a scheme approved under Professional Standards Legislation.
point is best understood by first making two provisional assumptions25:
1. that fringe benefits are only received by employees who face the top marginal rate of
personal income tax (which is the rate FBT is levies at); and
2. there are no concessional FBT treatments.
Under these assumptions, there are no incentives for individuals to receive their income in the
form of fringe benefits as opposed to monetary income. Also, FBT payments will represent the
amount of tax (personal income tax and GST) that the employee would have paid, had the
benefits been provided to them in cash instead of in kind. Therefore, FBT can be considered as
a component of the personal income tax system. That is, personal income tax and FBT should
be considered as the one tax for modelling purposes.
It follows that, from an economic perspective, FBT should be regarded as an additional
component of the overall compensation of employees. Likewise, FBT revenue should be
reallocated as additional components of personal income tax and GST revenues. For modelling
purposes, we have reallocated all FBT revenues to personal income tax26.
Similarly, tax on employer superannuation contributions are also grouped with taxes on labour
income.
The effective tax rate on labour income in the model is calculated as follows:
personal income tax + FBT + contributions tax on employer superannuation contributions
Labour Income
The numerator represents all forms of tax paid on labour income. The denominator represents
the before tax value of all forms of labour earnings. The definitions of these terms and the data
sets used for the calculation are listed below:
• Personal income tax – is based on the amount of personal income tax paid by employees on
wages and salaries, which is derived from the Federal Budget figures. This has then been
grossed up to take into account tax paid on the income from the labour supplied by those
who are not employees (and thus do not appear in the budget figures). These non-employee
workers are those supplying labour in unincorporated businesses as either self-employed or
part of a family businesses. It is assumed that these individuals pay tax at the same rate as
all other employees.
• FBT – are fringe benefit tax collections, drawn from the ATO Taxation Statistics.
• Tax on employer superannuation contributions – estimates were provided by the Treasury.
25 While these two assumptions may not be appropriate in all cases, they are useful approximations for modelling
purposes. We would expect most taxpayers who participate in the fringe benefits scheme to be in the top income
bracket because it is not tax-effective for other kinds of taxpayers to participate. This is because, as described above,
fringe benefits are taxed at the top marginal personal income tax rate. However, the second assumption may be less
appropriate, because, there are a number of concessions for certain fringe benefits.
26 For parsimony, no reallocation of FBT revenue is made to GST. This reallocation would involve identifying how
much GST would be paid on each of the 889 products in MM900 if fringe benefits were purchased by the employee
rather than the employer. The proportion of FBT that would need to be redistributed is small, at an average of 8.2 per
cent between 2004/05 and 2007/08. This is equivalent to 1 per cent of GST revenue. Given the small proportion of
FBT and GST revenues that this redistribution would involve, the redistribution has not been made for this study.
Department of the Treasury
The Excess Burden of Australian Taxes
March 2010
ABCD
104
© 2010 KPMG, an Australian partnership and a member firm of the KPMG network of independent
member firms affiliated with KPMG International, a Swiss cooperative. All rights reserved.
The KPMG logo and name are trademarks of KPMG.
Liability limited by a scheme approved under Professional Standards Legislation.
• Labour income – refers to the return to all labour supplied, including employment of
employees and non-employees. The ABS ‘total compensation of employees’ data includes
the relevant pre-tax values of monetary income, reportable fringe benefits and
superannuation income which is paid to employees. This data was then grossed up to take
into account that some of the labour supplied in the economy is not from employees. This
grossing up process means that the income earned on labour supplied by those working in
unincorporated businesses as either self-employed or part of a family businesses is included
in total labour income.
Labour supply
As highlighted in the literature review, there are three main determinants of the excess burden of
labour income taxes:
• the progressivity of the labour income tax system;
• the elasticity of labour supply in response to marginal and average tax rates; and
• the substitutability of labour and capital.
In MM900, the modelling of labour supply and demand takes these three things into account.
As discussed above, the Australian income tax system is progressive, with higher marginal tax
rates for individuals whose income falls within higher income brackets. This has implications
for the modelling approach. An individual’s marginal labour supply decisions are based on the
marginal rate of income tax (MTR), whereas their decision to participate in the labour market is
affected by the average rate of income tax (ATR). MM900 takes both effects into account by
putting equal weights on the ATR and MTR in modelling labour supply. The MTR is modelled
as the ATR times a factor of 1.5, which is greater than unity because of the progressivity of the
personal income tax rate scale.
MM900 simulation
Labour income taxes are a direct tax in MM900 which drives a wedge between the price that
employers pay for labour and the wages that individuals receive. Initially, this direct tax is set
to the effective ATR estimated under the model baseline of 19.3 per cent.
To estimate the excess burdens, this effective tax rate is altered and the changes in welfare and
tax revenues compared. The excess burdens of taxes on labour income are then estimated using
the following simulations.
• The marginal excess burden of labour income taxes is estimated by simulating a 5 per cent
(or 0.97 percentage points) increase in the effective labour income tax rate. The
progressivity of labour income tax remains unchanged (so that the tax liability at each wage
level would increase by the same proportion), with no change in the ratio of the average to
the marginal tax rate.
• To estimate the average excess burden of labour income taxes, these taxes are abolished
(by setting the effective tax rate on labour to 0 per cent).
The excess burden of personal income tax is strongly influenced by the parameters in the labour
supply function.

Department of the Treasury
The Excess Burden of Australian Taxes
March 2010
ABCD
105
© 2010 KPMG, an Australian partnership and a member firm of the KPMG network of independent
member firms affiliated with KPMG International, a Swiss cooperative. All rights reserved.
The KPMG logo and name are trademarks of KPMG.
Liability limited by a scheme approved under Professional Standards Legislation.
A.6 Payroll tax
Definition
Payroll tax is levied on employers for the total monthly payments made to employees as wages
and salaries above the tax-free threshold. Wages and salaries generally include all peripheral
payments such as bonuses, fringe benefits and employer superannuation contributions.
Payroll tax rates and tax-free thresholds differ across states, although there are currently
arrangements in place to harmonise taxes across states and territories. The following table
outlines state payroll tax rates and thresholds effective 1 July 2009.
Table A.4 Payroll taxes
State Rate
(%) Annual wages threshold
($'000)
New South Wales 5.75 623
Victoria 4.95 550
Queensland 4.75 1000
South Australia 4.95 600
Western Australia 5.5 750
Tasmania 6.1 1010
Australian Capital Territory 6.85 1500
Northern Territory 5.9 1250
As shown in Table A.4, the states with higher thresholds, such as Tasmania and the Territories,
tend to have higher rates in order to maintain revenue-raising ability.
Modelling issues and literature review
A broad-based payroll tax is expected to have a similar excess burden to a broad-based GST.
This is because the incidence of both taxes falls on labour.
However, in practice, around one-half of the payroll tax base is lost because of the small
business exemption. This undermines the revenue-raising ability of payroll tax but does little to
reduce its disincentive effects.
Further, while this exemption applies to all businesses, it provides a relatively larger cost saving
to small business (when calculated on a per unit of output basis). Treating small businesses
more favourably compared to large businesses creates an incentive for these businesses to
remain smaller than the optimal size.
This incentive may bring an efficiency cost to the economy. That is, if the tax concession for
being small outweighs any costs savings from economies of scale, smaller companies may
proliferate in an industry where it would be more technically efficient to have fewer, but larger,
companies.

Department of the Treasury
The Excess Burden of Australian Taxes
March 2010
ABCD
106
© 2010 KPMG, an Australian partnership and a member firm of the KPMG network of independent
member firms affiliated with KPMG International, a Swiss cooperative. All rights reserved.
The KPMG logo and name are trademarks of KPMG.
Liability limited by a scheme approved under Professional Standards Legislation.
As noted above, there are differences in payroll tax systems across states, which may provide
incentives for businesses to locate in states which offer lower payroll tax liabilities. This
distortion may contribute to the excess burden of payroll tax, but has not been included in the
modelling for this study.
Modelling approach
Using a methodology first developed by Econtech in 1998 (Econtech, 1998), MM900 accounts
for the bias in favour of small firm size by modelling the choice of firm size for the
representative firm in each industry. The representative firm selects its size to minimise unit
costs, and the small business exemption from payroll tax distorts this choice. In modelling the
technically efficient size, it is assumed that for the representative business in each industry the
need for primary factors (i.e. capital and labour), F, depends on its level of output, Q, according
to the following equation.
F = Q + a.(QC–Q) + a.Q.ln(Q/QC)
For technical efficiency, Q=QC. The sensitivity of efficiency to variations in Q away from QC
is given by the parameter a. Fuss and Gupta (1981) analysed 91 Canadian manufacturing
industries and found that there was an average loss of efficiency of about 4 per cent from
operating at one-half of the technically efficient scale. Using that result, in MM900 the
parameter a has been set to equal 0.13 in each industry.
The technically efficient business size, QC, was then set separately for each industry so that the
model correctly predicts industry payroll tax collections. This involves using the corollary of
the fact that industries dominated by small businesses do not pay much payroll tax because of
the tax-free threshold.
MM900 simulation
To show the contribution of the small business exemption to this excess burden, the study also
simulates a hypothetical payroll tax which is applied evenly to all business sizes, but with a
lower tax rate such that it generates the same payroll tax revenue as the current system.
To estimate the excess burdens, the effective payroll tax rate is altered and the changes in
welfare and tax revenues compared. This is done using the following simulations.
• The efficiency cost of the small business exemption is isolated by modelling the case where
there is a zero payroll tax threshold, but the rate is lowered to achieve the same revenue
collections27. This is then compared to simulations of the current system.
• The marginal excess burden of the current system of payroll taxation is found by modelling a
small (5 per cent) increase in the tax rate.
• The average excess burden is found by modelling the abolition of payroll tax (by setting the
tax rate to 0 per cent).
27 This ‘revenue neutrality’ is achieved by ensuring the overall tax collections in the economy are the same under the
current and uniform payroll tax systems. This takes into account that the economy (and therefore tax revenues in
different markets) may respond to changes in the payroll tax.

Department of the Treasury
The Excess Burden of Australian Taxes
March 2010
ABCD
107
© 2010 KPMG, an Australian partnership and a member firm of the KPMG network of independent
member firms affiliated with KPMG International, a Swiss cooperative. All rights reserved.
The KPMG logo and name are trademarks of KPMG.
Liability limited by a scheme approved under Professional Standards Legislation.
A.7 GST
Definition
The Goods and Services Tax (GST) is a broad based value-added tax, which is payable on most
goods and services consumed in Australia. The GST is applied at a rate of 10 percent of the
selling price payable on the supply or importation of goods and services. It is levied on
businesses at all stages of production, although businesses can usually gain credit for GST paid
on inputs. The credits of GST paid on business inputs mean that the GST is only actually paid
by final consumers of goods and services. That is, the GST does not cascade through all stages
of the production process.
GST zero ratings apply to a small number of essential goods and services. These are goods and
services falling in categories such as health, education, basic food, and charitable supplies.
Some other goods and services, such as financial services and residential rents, are input-taxed.
Input-taxed industries pay GST on their inputs and cannot claim a GST credit, but no GST is
charged when the industry’s service is sold.
Modelling issues and literature review
Across OECD countries, the mix of taxes on goods and services has moved notably towards
general consumption taxes, such as the GST, as noted in a report for the OECD by Johansson et
al. (2008). This is largely because of the high levels of efficiency these taxes. Johansson et al.
suggest that general consumption taxes are the least distortive taxes after recurrent taxes on
immovable property. For example, the GST applies at the same rate to most goods, having
minimal impacts on the consumption patterns of households. Also, the GST applies at the same
rate to current and future consumption, so that there will be no impacts on saving decisions.
However, that is not to say that there are no welfare costs of a GST. The GST lowers the
purchasing power of real after-tax wages, which may reduce household incentives to supply
labour. If GST were uniformly applied across all goods and services, then the excess burden
would come only from this distortion to the work-leisure choice. However, the Australian GST
treats some goods differently. As described above, some categories, such as food, are GST free
and others are input taxed. This non-uniform tax treatment will have additional efficiency costs.
Modelling approach
In MM900, the GST is modelled separately for each of the 889 products. The high level of
product disaggregation makes the model ideal for comprehensive modelling of different GST
treatments, including zero-rated and input taxed28. MM900’s allowance of a wide range of
price-sensitive choices also enhances the model’s estimation of the excess burden of the GST.
28 Despite this high level of detail, not all of the detail in the GST system can reasonably be included in an economic
model. Therefore, because some detail is necessarily lost because of the detail of the data, there will be some
aggregation of products, leading to a lower estimate of the excess burden. Nevertheless, MM900 represents the most
comprehensive modelling of the GST to date.

Department of the Treasury
The Excess Burden of Australian Taxes
March 2010
ABCD
108
© 2010 KPMG, an Australian partnership and a member firm of the KPMG network of independent
member firms affiliated with KPMG International, a Swiss cooperative. All rights reserved.
The KPMG logo and name are trademarks of KPMG.
Liability limited by a scheme approved under Professional Standards Legislation.
MM900 simulation
Our efficiency analysis of GST is partitioned to show the separate contributions to the
inefficiency measures from a uniform tax on consumption and the departures from uniformity in
Australia’s GST.
Examining the excess burden of GST is undertaken in three stages, as follows.
• The efficiency cost of the non-uniformity in GST application is isolated by modelling the
case where GST is applied at a uniform rate (lower than 10 per cent to achieve the same
revenue29) and comparing the simulated economic welfare in this case to simulations of the
current system.
• The marginal excess burden of the current GST regime is estimated by simulating an
increase in the GST rate by 5 per cent in the current regime.
• The average excess burden of the current GST regime is estimated by simulating the effect
of abolishing the GST (by setting the tax rate to 0 per cent).
29 This ‘revenue neutrality’ is achieved by ensuring the overall tax collections in the economy are the same under the
current and uniform GST systems. This takes into account that the economy (and therefore tax revenues in different
markets) may respond to changes in the GST.

Department of the Treasury
The Excess Burden of Australian Taxes
March 2010
ABCD
109
© 2010 KPMG, an Australian partnership and a member firm of the KPMG network of independent
member firms affiliated with KPMG International, a Swiss cooperative. All rights reserved.
The KPMG logo and name are trademarks of KPMG.
Liability limited by a scheme approved under Professional Standards Legislation.
A.8 Tobacco Excise
Definition
Tobacco is taxed on either a per stick basis for cigars and cigarettes, or on a weight basis for all
other products. The tax payable is $0.248 per stick or $309.47 per kilogram. As with alcohol
taxes, tobacco excises both raise revenue and alter consumer behaviour to take account of
externalities.
Modelling issues and literature review
Tobacco consumption has a negative externality on society – a cost that is not factored into its
consumption decisions. Tobacco externalities include costs such as extra costs of health
services to primary smokers as well as second hand smokers, costs of fires caused by tobacco
smoking and loss of real output not borne by the smoker (Townsend, 1996).
The imposition of a tax on tobacco consumption can correct behaviour so that it takes into
account the externality and therefore produce a net benefit to society (Abelson, 2008). The tax
can reduce the quantity of the commodity consumed, and move the market towards the socially
optimal quantity. The appropriate rate for a Pigovian tax, such as this, is that which results in a
level of consumption where the marginal cost to society of that consumption is equal to the
marginal benefit. 30
However, even if the excise imposed induced the consumer to take account of these social costs
when deciding their level of tobacco consumption, it is sometimes argued that smokers will still
fail to internalise all of the costs of tobacco consumption. Some authors argue that “costs that
smoking behaviour imposes on smokers themselves … are by far the largest social costs of
smoking”. For example, juvenile smokers may not take into account the costs that tobacco
consumption imposes on their future adult selves. Also, adult smokers may be irrational and
underestimate the present and future costs of their smoking behaviour (Laux, 2000).
Therefore, the social costs of tobacco consumption on society and individuals are uncertain and
contestable. However, Chaloupka and Warner (2000) suggest that “the social costs per pack
could easily mount toward several dollars [US]”. Likewise, Laux (2000) produced a
conservative estimate of the externalities of smoking, including health costs (but exclusive of
addiction effects), of up to three dollars [US] per pack of cigarettes.
Although the true level of these social costs is uncertain, including externalities in the modelling
leads to a more appropriate estimate of the excess burden of tobacco excise. This study uses an
estimate of tobacco consumption externalities provided by the Treasury – at 110 per cent of the
current excise, or approximately 27 cents per stick. For a pack with 20 sticks, this equates to
$5.46 per pack.
30 For a discussion about using taxes to take account of externalities, see Box 9.1 in the Treasury’s Architecture of
Australia’s tax and transfer system. This can be found at www.taxreview.treasury.gov.au.
Department of the Treasury
The Excess Burden of Australian Taxes
March 2010
ABCD
110
© 2010 KPMG, an Australian partnership and a member firm of the KPMG network of independent
member firms affiliated with KPMG International, a Swiss cooperative. All rights reserved.
The KPMG logo and name are trademarks of KPMG.
Liability limited by a scheme approved under Professional Standards Legislation.
Since the externality is assumed to be larger than the current excise, increasing the tobacco
excise will lead to a welfare improvement. This is because the tax reduces consumption to
bring it closer to the socially optimal level.
Another factor that will mean that there will be only a low excess burden associated with the
tobacco excise is that the price elasticity of demand is very low. As quoted in Abelson (2008),
the price elasticity of demand for tobacco is about -0.4 (Department of Health, UK, 1994). A
low price elasticity such as this, will mean that any change in the price (with the imposition of a
tax) will not illicit much of a change in consumption.
Modelling Approach
MM900 includes the product ‘cigarettes, cigars, cheroots and tobacco’, on which the tobacco
excise is imposed. This means that the MM900 model can specifically target the tobacco
excise.
As noted above, it is assumed here that externalities of tobacco consumption are 110 per cent of
the current excise, or around $0.27 for each stick.
MM900 simulation
To estimate the excess burdens, the effective tax rate is altered and the changes in welfare and
tax revenues compared. This is done using the following simulations.
• The marginal excess burden of tobacco excise is estimated by modelling a small (5 per cent)
increase the excise rate.
• To estimate the average excess burdens of tobacco excise, the tobacco excise is abolished
(by setting the excise rate to 0 per cent).

Department of the Treasury
The Excess Burden of Australian Taxes
March 2010
ABCD
111
© 2010 KPMG, an Australian partnership and a member firm of the KPMG network of independent
member firms affiliated with KPMG International, a Swiss cooperative. All rights reserved.
The KPMG logo and name are trademarks of KPMG.
Liability limited by a scheme approved under Professional Standards Legislation.
A.9 Alcohol Taxes
Definition
Broadly speaking, alcohol taxes vary according to the type of alcohol product in question. The
four main categories are: beer, wine, spirits, and ready to drink products (RTDs).
Excise taxes apply to beer and spirits and are levied on a per litre of alcohol basis. Taxes on beer
vary according to strength and whether it is bottled or draught. Taxes on spirits are higher than
for beer and are largely uniform, with a slightly lower rate applying to brandy. RTDs attract the
same rate of taxation per litre of alcohol as spirits.
Wine is subject to a wine equalisation tax (WET) which is levied at 29 per cent of the wholesale
price. Unlike the excise applied to beer and spirits, the WET is independent of the quantity of
alcohol contained in the product. Further, there is a rebate for producers for the first $500,000 of
applicable WET. This rebate is particularly important for small-scale wine producers.
Alcohol taxes are designed to both raise revenue and alter consumer behaviour. If taxes reduce
alcohol consumption, then any externalities associated with the consumption of alcohol may
also be reduced.
Modelling issues and literature review
There are externalities associated with the consumption of alcohol – these externalities relate to
the cost on society from alcohol consumption that is not factored into the decisions of
individuals. The existence of such externalities may justify higher taxation of alcohol relative to
other consumption goods and services.
The alcohol excise and the WET are Pigovian-type taxes, which increase the costs that
individuals must pay for alcoholic beverages to reduce their consumption of these beverages.
The appropriate rate for a Pigovian tax is that which results in a level of consumption where the
marginal cost to society of alcohol consumption is equal to the marginal benefit. There will be a
welfare loss from alcohol taxes to the extent that alcohol taxes are above this rate.31
It may also be argued that the current alcohol taxes in Australia do not satisfy the criterion for
an appropriate Pigovian tax. This is because the current tax rates vary according to type of
alcohol. However, the externality from alcohol consumption is more likely to depend on the
amount of alcohol consumed, rather than the type of alcohol consumed. Thus, it follows that
the rate of alcohol excise and effective rate of WET should be the same per litre of alcohol for
all types of alcoholic beverages.
As described above, for each different alcohol product there is a different rate of alcohol tax per
litre of alcohol. This differential tax treatment will cause distortions to the choice of alcoholic
beverages, as they are highly substitutable for each other. This distortion will also tend to
31 For a discussion about using taxes to take account of externalities, see Box 9.1 in the Treasury’s Architecture of
Australia’s tax and transfer system. This paper can be found at: www.taxreview.treasury.gov.au.

Department of the Treasury
The Excess Burden of Australian Taxes
March 2010
ABCD
112
© 2010 KPMG, an Australian partnership and a member firm of the KPMG network of independent
member firms affiliated with KPMG International, a Swiss cooperative. All rights reserved.
The KPMG logo and name are trademarks of KPMG.
Liability limited by a scheme approved under Professional Standards Legislation.
reduce the effectiveness of alcohol excise and WET as taxes on externalities, because consumer
behaviour will change so that the overall alcohol tax paid will be reduced.
Thus, the magnitude of the excess burden of alcohol taxes will be dependent on two things:
• the elasticities of substitution between both alcohol and non-alcohol products, and between
the different types of alcohol products; and
• the externalities from alcohol consumption relative to the taxes.
For elasticities, a number of authors have estimated the Australian and international price and
income elasticities for different types of alcohol. Their estimates show that beer and wine
consumption are relatively price inelastic, while spirits consumption is relatively more price
elastic.
Table A.5: Own price elasticities of alcohol consumption
KPMG
Econtech Murphy Clements
Wagenaar et
al
Selvanathan
and
Selvanathan
2008 1981 1997 2009 2008
Beverage Australia Australia Australia International Australia
Beer -0.3 -0.4 -0.4 -0.5 -0.2
Wine -0.3 -0.3 -0.5 -0.7 -0.3
Spirits -1.0 -1.4 -0.9 -0.8 -0.6
RTDs -1.5 - - - -
Note: Selvanathan and Selvanathan estimates are conditional elasticities – the elasticities of different types of alcohol
consumption, given that total alcohol consumption is fixed.
The social costs of alcohol consumption are uncertain. However, on advice from the Treasury,
this study assumes that the alcohol excise rate per litre of alcohol on packaged beer
appropriately accounts for the externalities of alcohol consumption. Further explanation of the
treatment of alcohol externalities can be found below.
Modelling Approach
As discussed in Section 4.2, MM900 models the substitution possibilities between the different
forms of alcohol, and thus takes into account the excess burden from substitution between
different alcohol products. The alcohol products in MM900 are shown in Table A.6 on the
following page.
As explained in Section 4.2, decisions about consumption of goods and services in MM900 are
made in two tiers.
• MM900 has an overall alcohol consumptions group, which is one of the 17 consumption
categories in the first tier of the decision making process. At this level, the compensated
price elasticity of demand for alcoholic beverages is -0.3, which makes overall alcohol
consumption relatively price inelastic. Likewise, the income elasticity is 0.6, which
indicates alcohol consumption is relatively income inelastic.

Department of the Treasury
The Excess Burden of Australian Taxes
March 2010
ABCD
113
© 2010 KPMG, an Australian partnership and a member firm of the KPMG network of independent
member firms affiliated with KPMG International, a Swiss cooperative. All rights reserved.
The KPMG logo and name are trademarks of KPMG.
Liability limited by a scheme approved under Professional Standards Legislation.
• For the second tier of consumption decisions - the decision between the seven different
alcohol products - the elasticity of substitution is high.
Thus, while alcohol consumption overall is relatively price and income inelastic, the choice
between each type of alcoholic beverage is relatively price sensitive.
Table A.6 MM900 Alcohol product detail
MM900 products - alcoholic beverages
Beer, ale and stout, packaged
Beer, ale and stout, bulk
Malt (excl malt extract)
Sparkling wines and other beverage wines of fresh grapes (excl vermouth)
Whisky, brandy, rum, gin and fortified spirits; other distilled alcoholic beverages
(incl. liquers and mixed drinks)
Vermouth and distillation wine
Wine, spirits and tobacco products n.e.i.
Notes: 1. Malt and Vermouth and distillation wine are not considered to have consumption externalities because they
are not consumed as alcoholic beverages.
2. Wine, spirits and tobacco products n.e.i includes wine products such as coolers.
The externalities from alcohol consumption are assumed to be constant per litre of alcohol.
Since MM900 models the real consumption value for each alcohol product, rather than the litres
of alcohol consumed, the litres of alcohol per dollar spent on each of the MM900 products
needed to be calculated for the base year. This was done using detailed information on average
retail prices and the total litres of alcohol consumed for each product. As expected, cheaper
products (such as packaged beer and wine) have higher alcohol content per dollar spent than
more expensive products such as spirits and draught beer.
MM900 simulation
As discussed in Section 3.2, the excess burden stemming from the non-uniformity in alcohol
taxes has also been modelled for this analysis.
• The efficiency cost of the non-uniformity in alcohol excise application is isolated by
modelling the case where the alcohol excise is applied at a uniform rate across all alcohol
products, which raises the same level of revenue32. This is then compared to simulations of
the current system.
• The marginal excess burden of the current system of alcohol taxation is found by modelling
a small (5 per cent) increase in each of the existing tax rates for alcohol excise and WET.
• The average excess burden is found by modelling the abolition of alcohol excise and WET
(by setting the tax rates to 0 per cent).
32 This ‘revenue neutrality’ is achieved by ensuring the overall tax collections in the economy are the same under the
current and uniform alcohol tax systems. This takes into account that the economy (and therefore tax revenues in
different markets) may respond to changes in the alcohol tax.
Department of the Treasury
The Excess Burden of Australian Taxes
March 2010
ABCD
114
© 2010 KPMG, an Australian partnership and a member firm of the KPMG network of independent
member firms affiliated with KPMG International, a Swiss cooperative. All rights reserved.
The KPMG logo and name are trademarks of KPMG.
Liability limited by a scheme approved under Professional Standards Legislation.
A.10 Import Duties
Definition
Tariffs are duties imposed on the import into Australia of various goods and services. These
mostly apply to textiles, clothing and footwear, passenger motor vehicles, and a range of other
goods such as foods, chemicals, industrial supplies, machinery and equipment, and household
electrical goods.
Over time, in line with decreasing trade barriers around the world, Australia has reduced its
tariff rates, most recently on 1 January 2010. Those reductions mean that all import tariffs will
be five per cent or less, apart from a tariff of 10 per cent on clothing. The estimated excess
burdens in this study are in relation to this post 2010 tariff regime.
Modelling issues and literature review
Tariffs are usually associated with protection for domestic industries. Indeed, most Australian
tariffs started as a form of protection for domestic producers. Further, Australia has had high
import tariffs in the past, which were highly distorting.
The model estimate of the excess burden for import tariffs is an under-estimate in some
contexts. This is because the tariff rates in the model are below a theoretical ‘optimal’ (i.e.
efficient) rate of tariff of around 11 per cent (based on average export demand elasticities in
MM900 of around -10). The optimal tariff argument suggests that, in an economy with market
power, the Government can influence the terms of trade in its favour by using tariffs, so as to
achieve a higher level of social welfare. In MM900, the restriction in trade from higher tariffs
reduces the supply of Australian exports on world markets, leading to slightly higher export
prices. This is mainly in areas where Australia has some power on world markets, such as wool
and some mining products.
However, this optimal tariff assumption ignores the risk that other countries may respond by
imposing or maintaining import tariffs of their own. Such a response can mean that Australia is
worse off, not better off, from imposing import tariffs.
Modelling approach
MM900’s product disaggregation allows it to take into account the additional excess burdens
that arise from variations in tariff rates within broader industry categories. That is, all tariffs are
applied on a product by product basis, thereby picking up a large number of distortions in
consumer and producer choices.
MM900 simulation
The excess burdens of tariffs are estimated using the following simulations.
• The marginal excess burden of import tariffs is found by modelling a small (5 per cent)
increase the rate.
• To estimate the average excess burden import tariffs are abolished (by setting the effective
tax rates to 0 per cent).

Department of the Treasury
The Excess Burden of Australian Taxes
March 2010
ABCD
115
© 2010 KPMG, an Australian partnership and a member firm of the KPMG network of independent
member firms affiliated with KPMG International, a Swiss cooperative. All rights reserved.
The KPMG logo and name are trademarks of KPMG.
Liability limited by a scheme approved under Professional Standards Legislation.
A.11 Luxury Car Tax
Definition
The luxury car tax (LCT) is payable on cars above a certain value. In 2007/08 the threshold was
$57,123, with the tax levied at a rate of 25 percent. The luxury car tax was raised to 33 percent
in 2008/09, with the threshold also slightly higher at $57,180. The tax applies to the value of
the price of the vehicle excluding GST. According to the ATO, the luxury car tax payable on a
vehicle is calculated as follows:
rateT
11
01
)( LCthresholdcarofvaluepurchaseLCT ××−≡
Vehicles are exempt from LCT if they are:
• over two years old at the time of supply;
• prescribed emergency vehicles;
• subject to GST and specially fitted out for carrying wheelchairs;
• a motorhome or campervan; or
• a commercial vehicle not designed for the principle purpose of carrying passengers.
A special concession was also introduced in 2008/09 for cars classified as fuel-efficient.
Modelling issues and literature review
According to the Federal Chamber of Automotive Industry (FCAI), the number of vehicles sold
in Australia subject to the luxury car tax in 2007 was 11 per cent. Using this figure, KPMG
Econtech estimates that over 110,000 new cars sold in 2007 fell under the definition of a luxury
car (i.e. with its price exceeding the luxury car tax threshold).
The FCAI also gives details on the number of sales of the top twenty luxury cars for 2007, as
shown in Table A.7. The Australian models are highlighted in bold italics.
The number of sales included in Table A.7 represents around 60 per cent of the number of
luxury cars sold in 2007. Using the assumption that all Australian made luxury cars are
accounted for in the FCAI data, KPMG Econtech estimates that around 13 per cent of the total
luxury car sales (or 14,000 cars) were of Australian-made vehicles. This means that the
majority, around 87 per cent, of cars attracting the luxury car tax were imported.

Department of the Treasury
The Excess Burden of Australian Taxes
March 2010
ABCD
116
© 2010 KPMG, an Australian partnership and a member firm of the KPMG network of independent
member firms affiliated with KPMG International, a Swiss cooperative. All rights reserved.
The KPMG logo and name are trademarks of KPMG.
Liability limited by a scheme approved under Professional Standards Legislation.
Table A.7 Vehicle sales exceeding luxury car tax threshold, 2007
Rank Model Group Sales (vehicles)
1 Toyota Landcruiser Wagon 6046
2 BMW 3 Series 5676
3 Toyota Prado 4807
4 Holden Commodore 4556
5 Mercedes-Benz C-Class 4169
6 Mitsubishi Pajero 4064
7 BMW X5 3399
8 Lexus RX 3121
9 Lexus IS250 3073
10 BMW 3 Series Coupe/Conv 2921
11 Mercedes-Benz M-Class 2453
12 Holden Caprice/Statesman 4005
13 Ford Territory 2080
14 Mercedes-Benz E-Class 2007
15 Volvo XC90 1905
16 Ford Falcon 1687
17 Ford Fairlane 1581
18 BMW 5 Series 1552
19 Toyota Kluger 1549
20 Land Rover Discovery 1482
Total 62133
Source: FCAI, 2008
A different picture emerges when the value of these cars is considered. Australian-made luxury
cars tend to be sold at lower prices than imported luxury cars. For example, in 2007 the highest
priced Australian-made luxury car was the Holden Caprice/Statesman, which had a
recommended retail price of $70,99033. The relatively low prices charged for Australian-made
luxury cars means that the share of LCT revenue collected from sales of Australian-made
vehicles is smaller than the Australian-made share of the total number of luxury vehicle sales.
Using price data from the Red Book, KPMG Econtech estimates that around 4 per cent of LCT
revenue is collected from Australian-made cars.
The proportion of luxury car tax collected from sales of Australian made luxury cars was
calculated using data from the FCAI submission34, federal government budget statements and
the red book, as shown in the following table.
33 This price is the price provided to the Red Book by the manufacturer and excludes additional costs (such as
options, dealer delivery, stamp duty, and other government charges) that may apply.
34 Federal Chamber of Automotive Industry, Submission to the Senate Economics Committee: Inquiry into the Tax
Laws Amendment (Luxury Car Tax) Bill 2008, July 2008.

Department of the Treasury
The Excess Burden of Australian Taxes
March 2010
ABCD
117
© 2010 KPMG, an Australian partnership and a member firm of the KPMG network of independent
member firms affiliated with KPMG International, a Swiss cooperative. All rights reserved.
The KPMG logo and name are trademarks of KPMG.
Liability limited by a scheme approved under Professional Standards Legislation.
Table A.8 Australian made luxury cars data 2007
Model Group Sales subject
to LCT
(vehicles)
Price guide
($) LCT revenue
($m)
Holden Commodore
4,556
54,490 264
Holden Caprice/Statesman
4,005
70,990 292
Ford Territory
2,080
56,990 123
Ford Falcon
1,687
44,490 98
Ford Fairlane
1,581
65,404 107
Source: Sales: FCAI, 2008
Price guide: Red Book
Notes: ‘Price guide’ refers to the price provided to the Red Book by a manufacturer and excludes costs, such as
options, dealer delivery, stamp duty, and other government charges, that may apply.
The prices quoted are for the following models:
Holden Commodore: 2007 Holden Commodore SS V VE
Colden Caprice/Statesman: 2007 Holden Caprice WM
Ford Territory: 2007 Ford Territory Ghia SY
Ford Falcon: 2007 Ford Falcon XR6 Turbo BF Mk 11
Ford Fairlane: 2007 Ford Fairlane G8 BF
LCT revenue is calculated by adding the dealer charge to the price guide, calculating the LCT
paid per vehicle and then multiplying by the number of vehicles sold. The sales and prices
shown are 2007 prices and the LCT rate and threshold used were for the 2007/08 regime. That
is, the following formula was used35:
saleseschdealerguidepricerevenueLCT ×××−+≡ 100
52
11
01
)123,57arg( 36
In most cases, KPMG Econtech assumed that the value for dealer and other charges to be added
to the price guide was $2,000. This is consistent with the assumption used by the Senate
Standing Committee on Economics report of 2008. However, for the Holden Commodore and
the Ford Falcon, the price guide plus $2,000 were sill less than the luxury car tax threshold. To
overcome this, KPMG Econtech made the simplifying assumption that the dealer charges on
these models brought the pre-LCT value to $58,000.
The estimated total LCT revenue collected from sales of Australian-made cars in 2007/08 is
$17 million. According to the 2009/10 budget papers, LCT revenue collected in 2007/08 was
$464 million. Therefore, LCT revenue collected from sales of Australian-made cars was
4 per cent of total LCT revenue in 2007/08.
35 The LCT rate of 25 per cent was used because the data refers to the year 2007.
36 The Senate, Standing Committee on Economics, Tax Laws Amendment (Luxury Car Tax) Bill 2008; A new Tax
System (Luxury Car Tax Imposition-General) Amendment Bill 2008; A New Tax System (Luxury Car Tax
Imposition-Customs) Amendment Bill 2008; A New Tax System (Luxury Car Tax Imposition-Excise) Amendment
Bill 2008, 28 August 2008
Department of the Treasury
The Excess Burden of Australian Taxes
March 2010
ABCD
118
© 2010 KPMG, an Australian partnership and a member firm of the KPMG network of independent
member firms affiliated with KPMG International, a Swiss cooperative. All rights reserved.
The KPMG logo and name are trademarks of KPMG.
Liability limited by a scheme approved under Professional Standards Legislation.
Modelling Approach
Ideally the LCT would be modelled as a sales tax applied to the sale of luxury cars. However,
the ABS IO tables do not separately identify luxury cars. Instead it applies the luxury car tax as
a sales tax on the product ‘Finished motor vehicles with less than 10 person capacity’, which
includes luxury and non-luxury cars. Because of this, using a sales tax approach will not
capture the distortion arising from substitution between luxury cars and non-luxury cars, and
will only capture the distortion arising from substitution between car and non-car products.
As a compromise, MM900 treats LCT as both a tax on imported cars and a tax on the sale of
domestically produced cars.
• Around 96 per cent of the luxury car tax revenue comes from purchases of imported cars.
Modelling part of the LCT as a tariff will capture the distortion between imported and non-
imported vehicles. (This brings the model closer to capturing the distortion between luxury
and non-luxury cars than if the LCT was modelled as a sales tax on all cars.)
• The rest of the LCT is attributable to sales of locally made vehicles. This is applied as a
sales tax in the model, and will capture the distortion between car and non-car products.
Also, because MM900 pools both luxury and non-luxury cars into the one product, the effective
LCT rate on ‘Finished motor vehicles with less than 10 person capacity’ is less than the
effective LCT rate that would be on luxury cars. This is because the tax only covers a
proportion of the base identified in the model. This would tend to understate the excess burden
of LCT, since the welfare loss increases exponentially with the tax rate.
To overcome this, the full rate of tax on luxury cars is applied as a model input, and the changes
in welfare and tax obtained as model outputs are then scaled back using an appropriate coverage
factor. This can be demonstrated algebraically using a simple linear demand and supply system
(provided in Appendix B).
Applying the coverage factor to the outputs of the model, rather than to the tax rate fed into the
model, avoids understatement of the welfare change and provides a reasonable estimate of the
excess burden associated with these taxes. It should be noted that this is not a perfect solution,
as it does not take into account any additional distortion that might arise from substitution
between luxury versus non-luxury cars.
MM900 simulation
For imported luxury cars, the effective rate is estimated to be around 7.9 per cent. For
domestically produced luxury cars, the effective rate is estimated to be around 2.6 per cent. The
simulation was then run using the following steps:
1. simulate a baseline with a 7.9 per cent tariff on car imports and a 2.6 per cent sales tax on
domestically produced cars;
2. simulate 5 per cent changes in these rates to find the marginal excess burden;
3. simulate the abolition of the 7.9 per cent tariff and 2.6 per cent sales tax to find the average
excess burden;
4. scale down the estimated excess burdens to take account of the partial coverage, as
discussed above.
Department of the Treasury
The Excess Burden of Australian Taxes
March 2010
ABCD
119
© 2010 KPMG, an Australian partnership and a member firm of the KPMG network of independent
member firms affiliated with KPMG International, a Swiss cooperative. All rights reserved.
The KPMG logo and name are trademarks of KPMG.
Liability limited by a scheme approved under Professional Standards Legislation.
A.12 Fuel Excise
Definition
Liquid fuels, chiefly petrol and diesel, are subject to an excise of 38.143 cents per litre. Fuel tax
credits can be obtained for various off road uses and for on-road use by heavy vehicles.
Aviation fuels for domestic flights are subject to an excise of around 3 cents per litre, but
international flights are exempt.
Fuel tax credits are provided for fuel used for some off-road uses, which are mostly in primary
industry. Heavy vehicles travelling on a public road are entitled to a full fuel tax credit.
However, they are charged the road user charge, which is 21.7 cents per litre.
Modelling issues and literature review
Fuel excises can be viewed as performing three different functions. The first is to raise revenue.
The second is a charge for services provided by government, which is the provision of roads and
other government services to transport. The third is to correct for negative externalities
associated with fuel use. According to a 2009 paper by Clarke and Prentice, all three of these
functions have been raised when discussing the features of the fuel excise system.
Clarke and Prentice (2009) also estimate the external costs from fuel use in Australia. They
note that 2005 air pollution costs due to vehicular travel were $2.7 billion. This includes
premature morbidity costs (“taking the value of an individual life to be $1.3 million”) and
morbidity costs of $0.8 billion (“where a healthy year of life lost due to disability is valued at
$50,000”). Further, the study estimated that the cost from congestion was $9.4 billion for the
8 capital cities in 2005. These costs include private time costs, extra business time costs, extra
vehicle operating costs and extra pollution costs.
This KPMG Econtech study focuses on the excess burden of fuel taxes excluding these
externalities.
Modelling Approach
In MM900, fuel taxes are modelled as taxes on products. The fuels identified in MM900 which
are subject to excise taxes are shown in Table A.9 below. The fuel tax credit (minus the road
user charge) is included in the model as a subsidy on Petroleum and coal products n.e.i., which
is mostly diesel.

Department of the Treasury
The Excess Burden of Australian Taxes
March 2010
ABCD
120
© 2010 KPMG, an Australian partnership and a member firm of the KPMG network of independent
member firms affiliated with KPMG International, a Swiss cooperative. All rights reserved.
The KPMG logo and name are trademarks of KPMG.
Liability limited by a scheme approved under Professional Standards Legislation.
Table A.9 MM900 fuel products
MM900 product Major fuel in this product
Automotive petrol; gasolene refining or blending;
motor spirit (incl aviation spirit) Petrol
Kerosene (incl kerosene type jet fuel) Jet fuel
Petroleum and coal products n.e.i. Diesel
MM900 simulation
The excess burdens of the fuel excise are estimated using the following simulations.
• The marginal excess burden of fuel excise is found by modelling a small (5 per cent)
increase the rate of excise and the fuel tax credit subsidy on diesel.
• The average excess burden is found by modelling the abolition of fuel excise and the fuel
tax credit subsidy on diesel (by setting both taxes to 0 per cent).

Department of the Treasury
The Excess Burden of Australian Taxes
March 2010
ABCD
121
© 2010 KPMG, an Australian partnership and a member firm of the KPMG network of independent
member firms affiliated with KPMG International, a Swiss cooperative. All rights reserved.
The KPMG logo and name are trademarks of KPMG.
Liability limited by a scheme approved under Professional Standards Legislation.
A.13 Motor Vehicle Taxes
Definition
The states and territories impose a variety of taxes on vehicle registration and vehicle sales.
Some states have different fees for business vehicles. Motorcycles have separate flat fees. The
several motor vehicle taxes that apply when purchasing, selling and registering a vehicle can be
summarised as the following.
Vehicle registration fees apply at the initial registration of a vehicle and for annual renewals.
The fees charged are dependent on the type of vehicle, with larger fees for various types of
heavy vehicles.
Charges for third party insurance indemnify vehicle owners and drivers who are legally liable
for personal injury to any other party in the event of a motor vehicle accident. These
charges are called Compulsory Third Party Insurance, Transport Accident Charge or Green
Slips. Some states provide the insurance directly and include the insurance charges as part
of the registration fee. Others require that each registered driver takes out their own third
party insurance. The charge applied depends on the type of vehicle (its sitting and carrying
capacity), its intended use and the accident risk levels of the zones where the vehicle is
located.
Motor Vehicle Duty fees (stamp duty) are payable on registering a new vehicle or transferring a
vehicle. The duty charged depends primarily on the value of the vehicle.
While the registration fees and stamp duty are considered a tax, third party insurance can be
considered a user charge37. These also include the TAC and the administration fee paid on
transfer.
Modelling issues and literature review
Motor vehicle transfer duty will have efficiency costs by lowering the frequency and size of
motor vehicle transactions. These costs would increase the size of the excess burden, but are
not taken into account in this analysis. This is because CGE models are not readily amenable to
measuring the welfare effects of transaction size and frequency.
Modelling Approach
In MM900, motor vehicle taxes paid by businesses are recorded in two places; as production
taxes and as product taxes. This treatment stems from the way the ABS has recorded the taxes
in their IO data.
Motor vehicle registration fees paid by businesses are recorded as production taxes. This is
appropriate because they are recurring payments made every year on the stock of vehicles,
rather than the flow of new vehicles. More specifically, registrations paid by businesses are
37 A user charge is where the government charges directly for the cost of providing a particular good or service. For a
more detailed discussion on user charges, please see the Treasury’s Architecture of Australia’s tax and transfer
system. This is available at www.taxreview.treasury.gov.au.

Department of the Treasury
The Excess Burden of Australian Taxes
March 2010
ABCD
122
© 2010 KPMG, an Australian partnership and a member firm of the KPMG network of independent
member firms affiliated with KPMG International, a Swiss cooperative. All rights reserved.
The KPMG logo and name are trademarks of KPMG.
Liability limited by a scheme approved under Professional Standards Legislation.
applied to the value of other capital38 in each of the 109 industries in the model. Other capital
is a composite capital good which is made up of all capital goods except structures. As
explained in section 4.3, while the other capital factor of production is a mix of various capital
goods, its composition is the same across industries.
However, in MM900, increasing motor vehicle registration fees will have a larger impact the
higher the intensity of motor vehicle use in that industry. For example, in the Road Transport
industry, motor vehicle registration fees amount to 29 percent of the GOS from other capital.
This compares to 2 percent for Retail Services. In this way, motor vehicle registrations will
make up a higher proportion of total costs in industries which have a higher reliance on motor
vehicles. Therefore, increasing registration fees will more heavily affect these industries than
those which have a lower reliance on motor vehicles.
An increase in motor vehicle registration fees will increase the cost of production in industries
which pay registration fees. This will be passed on to consumers through increased prices and
reduce the demand for the output of those industries. For industries, increasing registration fees
will also lead to substitution away from the use of other capital and towards the use of the other
factors of production.
Turning to stamp duties, those paid by businesses are recorded as taxes on the gross fixed
capital formation on the products Motor vehicles with less then 10 person capacity and Motor
scooters and motor cycles. Increasing stamp duties will increase the cost of investment in other
capital. For industries, the increased cost of investment will lead to a substitution away from
other capital and towards the use of the other factors of production. The increase in stamp
duties will also flow through to a higher cost of production for industries, raising the prices that
consumers pay. This will have a larger impact on prices in industries which have a higher
reliance on other capital. Consumers will reduce their demand for those goods whose relative
price has increased.
However, as discussed above, the estimated excess burden of stamp duties on motor vehicles is
likely to be an under-estimate. This is because CGE models are not readily amenable to
modelling the welfare impacts of changes in transaction size and frequency.
The data used in constructing MM900 did not include the motor vehicle registration or motor
vehicle stamp duties paid by households. Therefore, the excess burden of motor vehicle taxes
paid by households is not modelled. The impact of this on the overall estimated excess burden
of motor vehicle taxes is ambiguous. It will depend on whether excess burden of imposing the
taxes on households are smaller or larger than the excess burden of imposing the taxes in
businesses.
MM900 simulation
In this analysis, business motor vehicle registration fees are examined separately to business
stamp duties. That is, two sets of simulations are run to estimate the average and marginal
excess burdens for each type of motor vehicle tax.
38 See section 4.3 for details on the definition of other capital.
Department of the Treasury
The Excess Burden of Australian Taxes
March 2010
ABCD
123
© 2010 KPMG, an Australian partnership and a member firm of the KPMG network of independent
member firms affiliated with KPMG International, a Swiss cooperative. All rights reserved.
The KPMG logo and name are trademarks of KPMG.
Liability limited by a scheme approved under Professional Standards Legislation.
Examining the excess burden of business motor vehicle registration fees and the excess burden
of business stamp duties are both undertaken in two stages, as follows.
• The marginal excess burdens of each motor vehicle tax is separately estimated by
simulating a small (5 per cent) increase in the effective tax rates.
• To estimate the average excess burdens of each motor vehicle tax, each motor vehicle tax is
separately abolished (by setting the effective tax rates to 0 per cent).
Department of the Treasury
The Excess Burden of Australian Taxes
March 2010
ABCD
124
© 2010 KPMG, an Australian partnership and a member firm of the KPMG network of independent
member firms affiliated with KPMG International, a Swiss cooperative. All rights reserved.
The KPMG logo and name are trademarks of KPMG.
Liability limited by a scheme approved under Professional Standards Legislation.
A.14 Conveyancing Stamp Duties
Definition
Conveyancing stamp duty is a transaction-based tax. Each state levies a stamp duty on the
transfer of both residential and commercial property. This duty is paid on the sale price of a
property. Different rates and thresholds apply to transfers of different types of property.
Concessions apply to first home buyers and other groups.
Modelling issues
Much of the literature concentrates on how conveyancing duties affect the residential housing
market.
For example, Kim (2003) addresses the effects of property transaction taxes on housing
consumption. Kim (2003) uses a multi-period model to estimate the effect of a property
transaction tax on households, and finds that the home-ownership rate is sensitive to the
conveyancing duty rate. He notes that transaction taxes produce three main distortions.
1. The tax drives a wedge between producer and consumer prices of housing. This means that
the price of housing that consumers pay exceeds the price developers/builders receive, and
the accommodation services are inefficiently low.
2. As a result of conveyancing duties, some households will switch to renting.
3. The presence of the conveyancing duties causes homeowners to adjust their housing
consumption less frequently. As noted in Han (1998), if conveyancing stamp duty rates
increase, the frequency of transactions will tend to fall, while the value per transaction will
tend to increase. This implies that the increase in tax revenue will be less than proportional
to the increase in tax rates when all other things are equal.
Using an econometric model, Leigh (2009) finds evidence that support these impacts. He finds
that an increase in the conveyancing duty rate lowers housing turnover. Specifically, a 10
percent increase in the duty rate leads to a 4 to 5 per cent decline in turnover in the medium to
long run. He also finds that an increase in the conveyancing duty rate leads to lower house
prices.
O’Sullivan, Sexton and Sheffrin (1993) also discuss the distortions on home ownership arising
from a property transaction tax. They develop a theoretical partial equilibrium model to show
that a transfer tax “decreases mobility and increases the likelihood of home ownership for
infrequent movers at the expense of frequent movers”. This is because a property transaction
cost is equivalent to an increase in real moving costs.
However, in estimating the excess burden of conveyancing duty modelling the welfare from
owning a home as different to the welfare from renting that same home is problematic.
Therefore, the authors “assume that society places no value on residential stability” (O’Sullivan
et al. 1993, p123).

Department of the Treasury
The Excess Burden of Australian Taxes
March 2010
ABCD
125
© 2010 KPMG, an Australian partnership and a member firm of the KPMG network of independent
member firms affiliated with KPMG International, a Swiss cooperative. All rights reserved.
The KPMG logo and name are trademarks of KPMG.
Liability limited by a scheme approved under Professional Standards Legislation.
Modelling approach
Conveyancing duties will:
1. drive a wedge between producer and consumer prices of property;
2. cause some people to switch to renting rather than owning their property; and
3. will cause people to adjust their property consumption less frequently.
Standard CGE models do not capture the second and third distortions, because the distortion
between renting and buying is not readily amenable to CGE modelling. The impacts that these
distortions have on welfare is also difficult to model.
The ABS treats conveyancing stamp duties as a tax on real estate agent services in the input-
output tables. In particular, conveyancing duties are treated by the ABS as a tax paid on gross
fixed capital formation (GFCF) (or investment) in real estate services. This is because GFCF of
real estate services includes services associated with transferring ownership of real estate, such
as sales commissions. (ABS, Concepts Sources and Methods) Therefore, in MM900,
conveyancing stamp duties are modelled as a tax on investment in residential and commercial
structures39.
Modelling conveyancing stamp duties as a tax on investment in residential and commercial
structures (which is a flow) means that the value of land (which is a stock) is excluded from the
base of the tax40.
In MM900, conveyancing duties raise the cost of investment in residential and non-residential
structures. In response, they shift production technologies away from using structures and
towards other factors of production. Conveyancing duties will also raise the cost of output from
industries which use structures, which will be passed onto consumers. The price impact will be
higher for industries with a higher reliance on structures, and consumer demand for their outputs
will fall accordingly.
There is a downward bias on the excess burden estimates for conveyancing duties because there
are a number of distortions that the model does not take into account. These distortions relate to
the nature of conveyancing duties as a transactions tax, as discussed above. Further, MM900
does not take into account the excess burden created by progressive rate structures or
concessions (such as any first home buyers concessions).
39 The investment good for residential and non-residential structures includes a fixed proportion of real estate
services. Therefore, a tax in GFCF in real estate services is equivalent to a tax on investment in residential and non-
residential structures.
40 The effect that this would have on excess burden estimates is ambiguous. This is because conveyancing duties
would be applied to different industries at different rates, which would add to the excess burden, but including land in
the base would lower the excess burden, due to its immobility.
Department of the Treasury
The Excess Burden of Australian Taxes
March 2010
ABCD
126
© 2010 KPMG, an Australian partnership and a member firm of the KPMG network of independent
member firms affiliated with KPMG International, a Swiss cooperative. All rights reserved.
The KPMG logo and name are trademarks of KPMG.
Liability limited by a scheme approved under Professional Standards Legislation.
MM900 simulation
Examining the excess burden of conveyancing stamp duties is undertaken in two stages, as
follows.
• The marginal excess burden of conveyancing stamp duties is estimated by simulating a
small (5 per cent) increase in the effective tax rates.
• To estimate the average excess burden of conveyancing stamp duties, this tax is abolished
(by setting the effective tax rates to 0 per cent).
Department of the Treasury
The Excess Burden of Australian Taxes
March 2010
ABCD
127
© 2010 KPMG, an Australian partnership and a member firm of the KPMG network of independent
member firms affiliated with KPMG International, a Swiss cooperative. All rights reserved.
The KPMG logo and name are trademarks of KPMG.
Liability limited by a scheme approved under Professional Standards Legislation.
A.15 Stamp Duties Other than on Real Property
Definition
The states and territories levy stamp duty on a range of transactions including a range of
financial transactions, leases and mortgages, and hire purchase agreements.
Modelling issues
The economic costs of stamp duties on other than real property come from two main sources:
• Stamp duties on other than real property will drive a wedge between producer and consumer
prices. This will lead to inefficiently low consumption and production of the services on
which they are levied.
• There will also be economic costs associated with the nature of stamp duties on other than
real property, as taxes on transactions. For example, these stamp duties may cause financial
transactions to take place less frequently. There may be welfare costs associated with this
because adjustments to share holdings, leases and mortgages would be less responsive to
market conditions.
MM900 takes into account the first source of excess burden. It does not take the costs
associated with transaction size frequency into account, because CGE modelling is not readily
amenable to modelling the welfare impacts of these distortions.
Modelling Approach
In the input-output tables, stamp duties (other than on conveyancing of property) are treated as a
tax on business inputs. The products in MM900 which are defined as incurring stamp duties in
this category are shown in Table A.10.

Department of the Treasury
The Excess Burden of Australian Taxes
March 2010
ABCD
128
© 2010 KPMG, an Australian partnership and a member firm of the KPMG network of independent
member firms affiliated with KPMG International, a Swiss cooperative. All rights reserved.
The KPMG logo and name are trademarks of KPMG.
Liability limited by a scheme approved under Professional Standards Legislation.
Table A.10 MM900 products
MM900 Product - other stamp duties
Bank services nec
Money market corporations - explicit charges
Finance services nec
Financial asset investors
Security broking and dealing services
Services to finance and investment nec (incl imputed charge)
Property operator and developer services
Employment placement and contract staff services (excl casting agency
service)
MM900 simulation
Examining the excess burden of stamp duties (other than on conveyancing of property) is
undertaken in two stages, as follows.
• The marginal excess burden of stamp duties (other than on conveyancing of property) is
estimated by simulating a small (5 per cent) increase in the effective tax rates.
• To estimate the average excess burden of stamp duties (other than on conveyancing of
property), this tax is abolished (by setting the effective tax rates to 0 per cent).

Department of the Treasury
The Excess Burden of Australian Taxes
March 2010
ABCD
129
© 2010 KPMG, an Australian partnership and a member firm of the KPMG network of independent
member firms affiliated with KPMG International, a Swiss cooperative. All rights reserved.
The KPMG logo and name are trademarks of KPMG.
Liability limited by a scheme approved under Professional Standards Legislation.
A.16 Insurance Taxes
Definition
All states impose taxes on insurance premiums. Coverage of particular insurance classes is
neither universal nor consistent across states. For example, NSW and the ACT are the only two
states to impose a health insurance levy. Further, some states have particular concessions (for
example, NSW has a concessional rate for a range of products). Others states have insurance
exemptions (for example, WA has no duty on life insurance and NSW and ACT exempt
compulsory third party insurance on motor vehicles).41 Rates of insurance tax in each state are
consistent across types of insurance.
Broadly, there are three types of insurance taxes:
1. tax on compulsory third party (CTP) insurance;
2. tax on general and life insurance; and
3. insurance companies’ contribution to fire brigades.
The base for the second type of insurance tax includes the premiums from general and life
insurance excluding premiums from CTP, employers' liability insurance, reinsurance and
revenue from fire insurance levies.
Modelling issues
The excess burden of insurance taxes come from two main sources:
• They are applied to a narrow base - insurance services. By applying insurance taxes to this
service, this increases the price of insurance relative to other goods and services, and leads
to inefficiently low consumption of insurance services.
• Insurance taxes have a high effective rate. An important consideration is that while the
statutory tax base is typically the value of premiums, the true cost of insurance services to
policyholders is the value of premiums net of benefits, which is a much smaller tax base.
This smaller tax base means that the effective rates of tax are far higher than the statutory
rates.42
MM900 takes into account both of these distortions. However, the modelling methodology
does not take into account any variation in insurance tax systems between states. Thus, the
excess burden estimate for insurance taxes may be under-estimates.
41 Commonwealth Grants Commission, 2007
42 For example, consider a statutory rate of insurance tax 10 per cent of premiums. If the gross benefits paid are 50
per cent of the premiums paid, then the effective rate of insurance tax will be double the statutory rate at 20 per cent
of the net value of insurance services (premiums minus payouts).

Department of the Treasury
The Excess Burden of Australian Taxes
March 2010
ABCD
130
© 2010 KPMG, an Australian partnership and a member firm of the KPMG network of independent
member firms affiliated with KPMG International, a Swiss cooperative. All rights reserved.
The KPMG logo and name are trademarks of KPMG.
Liability limited by a scheme approved under Professional Standards Legislation.
Modelling Approach
These taxes are treated in the input-output tables as a tax on insurance service products, shown
in Table A.11.
Table A.11 MM900 insurance products
MM900 Product - insurance
Life insurance and superannuation fund services (7411-7412)
Fire and industrial special risks insurance services
Houseowner and household insurance services
Motor vehicle comprehensive and compulsory third party insurance
services
Public liability, product liability and professional indemnity insurance
services
Travel insurance services
Employers liability insurance services
Insurance services nec.
MM900 simulation
Examining the excess burden of insurance tax is undertaken in two stages, as follows.
• The marginal excess burden of insurance tax is estimated by simulating a small (5 per cent)
increase in the effective tax rates.
• To estimate the average excess burden of insurance tax, this tax is abolished (by setting the
effective tax rates to 0 per cent).

Department of the Treasury
The Excess Burden of Australian Taxes
March 2010
ABCD
131
© 2010 KPMG, an Australian partnership and a member firm of the KPMG network of independent
member firms affiliated with KPMG International, a Swiss cooperative. All rights reserved.
The KPMG logo and name are trademarks of KPMG.
Liability limited by a scheme approved under Professional Standards Legislation.
A.17 Gambling Taxes
Definition
The states levy a range of taxes on gambling activities. These are usually levied on total
turnover of gambling activity less payouts. Gambling activities may include government or
private lotteries, gaming machines, casinos, racing, plus others such as internet gambling and
keno.
Modelling issues and literature review
According to Smith (1999), there has been a dramatic increase in government revenue in the
gambling sector, mostly through casino gambling taxation revenue. The spread of gaming
machines in clubs and hotels has also contributed to large gambling revenue increases.
Gambling taxes are applied at high rates, and so are likely to have high efficiency costs.
However, there may be some justification for these high rates of tax. For example, there may be
social costs that could be addressed through taxation. Gambling taxes may decrease the demand
for gambling and therefore reduce any externalities. However, it is unclear to what extent any
social costs can be addressed through taxation, and regulation is often considered a more
effective means of reducing externalities. There may also be economic rents available in the
gambling industry. In this case, gambling taxes may be considered efficient.
Modelling Approach
The product detail for gambling available in MM900 is shown in Table A.12. This high level of
detail means that MM900 is able to distinguish between the different forms of gambling, and
pick up the excess burden arising from the wide differences in the average tax rates for each
product. For example, taxes on casinos are captured in the casinos operation category; and
poker machine taxes are captured in the clubs categories.
Table A.12 MM900 Gambling Products
MM900 Products - gambling
Lottery Operation
Casinos operation
Gambling services nec
Totalisator agency services
Margin - restaurant, hotel and licensed club services
Net losses from gambling - clubs
Department of the Treasury
The Excess Burden of Australian Taxes
March 2010
ABCD
132
© 2010 KPMG, an Australian partnership and a member firm of the KPMG network of independent
member firms affiliated with KPMG International, a Swiss cooperative. All rights reserved.
The KPMG logo and name are trademarks of KPMG.
Liability limited by a scheme approved under Professional Standards Legislation.
MM900 simulation
Examining the excess burden of gambling taxes is undertaken in two stages, as follows.
• The marginal excess burden of gambling taxes is estimated by simulating a small
(5 per cent) increase in the effective tax rates.
• To estimate the average excess burden of gambling taxes, these taxes are abolished (by
setting the effective tax rates to 0 per cent).
Department of the Treasury
The Excess Burden of Australian Taxes
March 2010
ABCD
133
© 2010 KPMG, an Australian partnership and a member firm of the KPMG network of independent
member firms affiliated with KPMG International, a Swiss cooperative. All rights reserved.
The KPMG logo and name are trademarks of KPMG.
Liability limited by a scheme approved under Professional Standards Legislation.
Appendix B – Modelling Taxes with Partial Coverage
In cases where a tax only covers a proportion of the base identified in the model, the full rate of
tax should be applied as a model input, and the changes in welfare and tax obtained as model
outputs should be scaled back using an appropriate coverage factor. This can be demonstrated
algebraically using the example of a simple linear demand and supply system.
As shown in the equations below, the tax revenue, R, is simply the tax rate t multiplied by the
actual base of the tax, Btrue. The dead-weight loss, DWL, which measures the welfare loss from
the tax, is proportional to the square of the tax rate in a linear, partial equilibrium model. Thus,
it is equal to some constant, k, multiplied by the square of the tax rate and the true base of the
tax.
true
true
BtkDWL
BtR
⋅⋅=
⋅=
2
When the actual tax base, Btrue, covers only a proportion, α, of tax base identified in the model,
Bmodel, the relationship can be written as follows.
modeltrue BB ⋅=
α
The correct results for the revenue yield and the DWL will be obtained by applying the full tax
rate to the model base, and then scaling the model outputs back by the coverage factor of α, as
proven below.
()( )
()()
truemodelmodel
truemodelmodel
BtkBtkBtkDWL
BtBtBtR
⋅⋅=⋅⋅=⋅⋅=
⋅=⋅=⋅=
222
αα
αα
If instead the coverage factor is applied to the model input for the tax rate, the revenue yield will
be correct but the DWL will be understated by the coverage factor, as shown below.
()
(
)
()
() ( )
truemodelmodelmodel
truemodel
BtkBtkBtkBtkDWL
BtBtBtR
⋅⋅⋅=⋅⋅⋅⋅=⋅⋅⋅=⋅⋅⋅=
⋅=⋅⋅=⋅⋅=
2222
2
model
ααααα
αα
So it is best to apply the coverage factor to the outputs of the model, not the tax rate fed into the
model, to avoid understatement of the welfare change. This is not a perfect solution as it does
not take into account any additional distortion that might arise from substitution within the
modelled tax base between the taxed and untaxed components (e.g. luxury versus non-luxury
cars). However, this would require further model disaggregation to fully isolate the true tax
base.

Department of the Treasury
The Excess Burden of Australian Taxes
March 2010
ABCD
134
© 2010 KPMG, an Australian partnership and a member firm of the KPMG network of independent
member firms affiliated with KPMG International, a Swiss cooperative. All rights reserved.
The KPMG logo and name are trademarks of KPMG.
Liability limited by a scheme approved under Professional Standards Legislation.
Appendix C – Industry Impacts
This appendix provides additional detail for the incidence results for each tax. It shows the change in GDP from each industry for the
introduction of each tax.
Table AC 1 Industry impacts of the introduction of taxes (per cent change in GDP by industry)
Petroleum
Resource
Rent Tax Land
Tax Municipal
Rates
Company
Income
Tax
Resource
Royalties and
Crude Oil Excise
Labour
Income
Tax Payroll
Tax GST
Tax Revenue ($ million) 1,398 3,229 8,836 35,297 3,381 109,422 16,043 42,092
Agriculture, Forestry & Fishing 0.0% 0.2% -0.5% -3.1% 2.3% -3.8% -0.1% -1.2%
Mining 0.0% -0.2% 0.6% -10.4% -7.5% -3.0% -0.2% -1.4%
Manufacturing 0.0% -0.1% -0.1% -5.4% 0.6% -5.1% -0.3% -2.2%
Electricity, Gas & Water 0.0% 0.2% 0.2% -4.4% -0.2% -4.0% -0.4% -0.8%
Construction 0.0% 0.0% 0.0% -8.7% -0.6% -4.0% 0.1% -1.7%
Wholesale and Retail Trade 0.0% 0.0% -0.1% -3.6% 0.0% -4.5% -0.4% -1.9%
Transport 0.0% 0.0% 0.0% -4.8% 0.0% -4.9% -0.4% -3.2%
Finance and Insurance 0.0% -0.1% -0.1% -4.2% -0.1% -6.2% -1.1% -0.5%
Government Admin. & Defence 0.0% 0.0% 0.0% -0.5% 0.0% -0.6% 0.2% -0.1%
Education 0.0% 0.0% 0.0% -0.2% 0.3% -2.6% 0.4% -0.4%
Ownership of Dwellings 0.0% 0.0% 0.0% -1.5% -0.1% -3.9% -0.5% -1.3%
Other 0.0% 0.0% 0.0% -3.4% 0.0% -3.9% -0.1% -1.4%
Total 0.0% 0.0% 0.0% -4.1% -0.3% -4.2% -0.3% -1.5%
Source: KPMG Econtech, MM900 estimates
Note: Tax revenue is in 2009/10 terms, but under a ‘normalised economy’. This normalised economy abstracts from the strength of Australia’s mining
exports and terms of trade growth since 2004/05, and removes the effects of the global financial crisis. As such, revenue shown in the table will not
align with projected outcomes for the 2009/10 financial year.

Department of the Treasury
The Excess Burden of Australian Taxes
March 2010
ABCD
135
© 2010 KPMG, an Australian partnership and a member firm of the KPMG network of independent
member firms affiliated with KPMG International, a Swiss cooperative. All rights reserved.
The KPMG logo and name are trademarks of KPMG.
Liability limited by a scheme approved under Professional Standards Legislation.
Table AC 2 Industry impacts of the introduction of taxes (per cent change in GDP by industry)
Tobacco
Excise Alcohol
Taxes Import
Duties Luxury Car
Tax Fuel
Excise Motor Vehicle
Registration
Motor
Vehicle
Stamp
Duties Conveyancing
Duties
Tax Revenue ($ million) 7,485 5,778 2,888 379 10,739 1,655 924 12,399
Agriculture, Forestry & Fishing -0.5% -0.4% -0.5% -0.1% -0.4% -0.6% -0.2% -0.1%
Mining -0.2% 0.0% -1.2% -0.2% -1.1% -0.3% -0.3% -1.6%
Manufacturing -0.5% -0.3% 0.3% 0.0% -0.6% -0.4% -0.2% -0.9%
Electricity, Gas & Water 0.0% -0.1% -0.1% 0.0% -0.2% -0.2% -0.1% -0.4%
Construction 0.0% 0.0% -0.2% 0.0% -0.3% -0.2% -0.1% -3.5%
Wholesale and Retail Trade -0.4% -0.1% -0.4% 0.0% -0.3% -0.3% -0.2% -0.4%
Transport -0.2% -0.4% -0.6% -0.1% -1.5% -0.4% -0.2% -0.8%
Finance and Insurance 0.2% 0.1% 0.0% 0.0% 0.1% -0.1% -0.1% -1.0%
Government Admin. & Defence 0.0% 0.0% 0.0% 0.0% 0.0% 0.0% 0.0% -0.1%
Education 0.0% -0.1% -0.1% 0.0% -0.2% -0.1% 0.0% 0.0%
Ownership of Dwellings 0.2% 0.2% 0.0% 0.0% 0.1% -0.1% -0.1% -4.1%
Other -0.1% -0.2% -0.1% -1.4% -0.2% -0.2% -0.1% -0.6%
Total -0.1% -0.1% -0.2% 0.0% -0.3% -0.3% -0.1% -1.2%
Source: KPMG Econtech, MM900 estimates
Note: Tax revenue is in 2009/10 terms, but under a ‘normalised economy’. This normalised economy abstracts from the strength of Australia’s mining
exports and terms of trade growth since 2004/05, and removes the effects of the global financial crisis. As such, revenue shown in the table will not
align with projected outcomes for the 2009/10 financial year.

Department of the Treasury
The Excess Burden of Australian Taxes
March 2010
ABCD
136
© 2010 KPMG, an Australian partnership and a member firm of the KPMG network of independent
member firms affiliated with KPMG International, a Swiss cooperative. All rights reserved.
The KPMG logo and name are trademarks of KPMG.
Liability limited by a scheme approved under Professional Standards Legislation.
Table AC 3 Industry impacts of the introduction of taxes (per cent change in GDP by industry)
Stamp
Duties
Other Than
Real
Property Insurance
Taxes Gambling
Taxes
Tax Revenue ($ million) 659 3,902 5,475
Agriculture, Forestry & Fishing 0.0% -0.1% -0.4%
Mining 0.0% -0.1% 0.0%
Manufacturing 0.0% 0.0% 0.0%
Electricity, Gas & Water 0.0% 0.0% -0.2%
Construction -0.1% -0.2% 0.0%
Wholesale and Retail Trade 0.0% 0.0% 0.4%
Transport 0.0% 0.0% -0.1%
Finance and Insurance -0.3% -2.2% 0.3%
Government Admin. & Defence 0.0% 0.0% 0.0%
Education 0.0% 0.0% 0.0%
Ownership of Dwellings 0.0% 0.1% 0.3%
Other 0.0% -0.1% -0.9%
Total 0.0% -0.2% -0.2%
Source: KPMG Econtech, MM900 estimates
Note: Tax revenue is in 2009/10 terms, but under a ‘normalised economy’. This normalised economy abstracts from the strength of Australia’s mining
exports and terms of trade growth since 2004/05, and removes the effects of the global financial crisis. As such, revenue shown in the table will not
align with projected outcomes for the 2009/10 financial year.

Department of the Treasury
The Excess Burden of Australian Taxes
March 2010
ABCD
137
© 2010 KPMG, an Australian partnership and a member firm of the KPMG network of independent
member firms affiliated with KPMG International, a Swiss cooperative. All rights reserved.
The KPMG logo and name are trademarks of KPMG.
Liability limited by a scheme approved under Professional Standards Legislation.
Appendix D – MM900 Parameters
This appendix provides information on the detail contained in MM900.
This attachment contains the following details:
• key substitution elasticities in production in MM900 (Table C.1);
• consumer demand parameters and the implied price and income elasticities for each MM900
group (Table C.2); and
• MM900 Industry/Product Classifications and Trade Elasticities (Table C.3).
As indicated above, Table C.1 provides a list of the key substitution elasticities in production in
MM900.
Table C.1 Key substitution elasticities in production
Substitution Possibility Elasticity of Substitution
Labour – Capital – Fixed factors 0.75
Labour: low skilled – high skilled 1.25
Capital: structures – other capital 0.5
Fixed factors: land – other fixed factors 0.5

Department of the Treasury
The Excess Burden of Australian Taxes
March 2010
ABCD
138
© 2010 KPMG, an Australian partnership and a member firm of the KPMG network of independent
member firms affiliated with KPMG International, a Swiss cooperative. All rights reserved.
The KPMG logo and name are trademarks of KPMG.
Liability limited by a scheme approved under Professional Standards Legislation.
MM900 also identifies 17 broad groups of consumption of goods and services. These groups
are listed in Table C.2 below, and correspond to the data collected in the ABS national accounts.
The consumer demand parameters,
γ
i and
β
i, are estimated in MM900 using quarterly national
accounts data. They are set out in Table C.2 below, along with the implied price and income
elasticities for each group.
As expected, consumer demand for the following groups is income inelastic: food; cigarettes &
tobacco; gas, electricity & fuel; fares; and operation of motor vehicles. Equally, consumer
demand for the following groups is income elastic: communications, financial services; and the
purchase of vehicles.
Table C.2 Consumer demand parameters
budget income comp.
β γ share elast. price v
Food 0.04 2234 10.8% 0.4 -0.2 -1.0
Cigarettes and tobacco 0.01 345 2.0% 0.6 -0.3 -0.5
Alcoholic beverages 0.01 347 2.0% 0.6 -0.3 -1.0
Clothing and footwear 0.03 612 3.8% 0.7 -0.4 -0.5
Rent and other dwelling
services 0.15 2413 17.3% 0.9 -0.4 -0.5
Electricity, gas and other fuel 0.01 353 1.9% 0.6 -0.3 -1.0
Furnishings and household
equipment 0.08 456 5.8% 1.3 -0.7 -0.5
Health 0.05 629 5.0% 1.0 -0.5 -0.5
Purchase of vehicles 0.06 159 3.9% 1.6 -0.8 -0.5
Operation of vehicles 0.03 1140 5.8% 0.5 -0.2 -0.5
Transport services 0.04 82 2.4% 1.6 -0.9 -1.0
Communications 0.05 29 2.9% 1.8 -0.9 -0.5
Recreation and culture 0.17 846 12.1% 1.4 -0.6 -0.8
Education services 0.03 445 3.3% 0.9 -0.5 -0.5
Hotels, cafes and restaurants 0.06 1179 7.6% 0.7 -0.4 -0.8
Insurance and other financial
services 0.13 43 7.0% 1.8 -0.9 -0.5
Other goods and services 0.06 781 6.5% 1.0 -0.5 -0.5
Source: KPMG Econtech estimation, MM900, 2009
Notes: β is the marginal budget shares for each broad consumption group, Σ βi = 1
γ is the essential consumption levels for each broad consumption group
ν is the intra-group substitution parameter

Department of the Treasury
The Excess Burden of Australian Taxes
March 2010
ABCD
139
© 2010 KPMG, an Australian partnership and a member firm of the KPMG network of independent
member firms affiliated with KPMG International, a Swiss cooperative. All rights reserved.
The KPMG logo and name are trademarks of KPMG.
Liability limited by a scheme approved under Professional Standards Legislation.
MM900 contains 109 industries producing 889 products, as detailed in Table C3 (below). The
table also shows the trade elasticities for each product.
The column headed “import demand” contains Armington import elasticities. These refer to the
elasticity of substitution between imported and locally produced product.
The column headed “export supply” contains elasticities of transformation. These refer to the
elasticity of transformation of local producers between supplying product to the local and export
markets.
The column headed “export demand” contains export demand elasticities.
Table C.3 Industry/Product Classification and Trade Elasticities
Import Export Export Industry Product
Demand Supply Demand
Other agriculture Plant nurseries (incl turf) 2.00 2.50 -12.00
Other agriculture Cut flower and flower seeds 2.00 2.50 -12.00
Other agriculture Potatoes 2.00 2.50 -12.00
Other agriculture Beans, french and runner; peas, green or
blue 2.00 2.50 -12.00
Other agriculture Cabbages, brussels sprouts, cauliflowers
and headed broccoli 2.00 2.50 -12.00
Other agriculture Carrots 2.00 2.50 -12.00
Other agriculture Lettuces 2.00 2.50 -12.00
Other agriculture Onions - white and brown 2.00 2.50 -12.00
Other agriculture Tomatoes 2.00 2.50 -12.00
Other agriculture Mushroom spawn and vegetables for seed 2.00 2.50 -12.00
Other agriculture Grapes - table 2.00 2.50 -12.00
Other agriculture Grapes - wine 2.00 2.50 -12.00
Other agriculture Grapes for drying 2.00 2.50 -12.00
Other agriculture Apples - fresh and sun-dried 2.00 2.50 -12.00
Other agriculture Pears and quinces - fresh and sun-dried 2.00 2.50 -12.00
Other agriculture Stone fruit - fresh and sun-dried 2.00 2.50 -12.00
Other agriculture Kiwi fruit 2.00 2.50 -12.00
Other agriculture Bananas - fresh and sun-dried 2.00 2.50 -12.00
Other agriculture Pineapples - fresh and sun-dried 2.00 2.50 -12.00
Other agriculture Citrus fruit - fresh and sun-dried 2.00 2.50 -12.00
Other agriculture Orchard fruit nec - fresh and sun-dried 2.00 2.50 -12.00
Other agriculture Almonds and macadamias 2.00 2.50 -12.00
Other agriculture Strawberries 2.00 2.50 -12.00
Grains Wheat (incl spelt) and meslin, unmilled (incl
0122 part) 0.50 2.50 -12.00
Grains Barley, unmilled (incl 0122 part) 0.50 2.50 -12.00
Grains Oats, unmilled (incl 0122 part) 0.50 2.50 -12.00

Department of the Treasury
The Excess Burden of Australian Taxes
March 2010
ABCD
140
© 2010 KPMG, an Australian partnership and a member firm of the KPMG network of independent
member firms affiliated with KPMG International, a Swiss cooperative. All rights reserved.
The KPMG logo and name are trademarks of KPMG.
Liability limited by a scheme approved under Professional Standards Legislation.
Import Export Export Industry Product
Demand Supply Demand
Grains Rice, in the husk (incl 0122 part) 0.50 2.50 -12.00
Grains Grain, sorghum (incl 0122 part) 0.50 2.50 -12.00
Grains Oilseeds (incl 0122 part) 0.50 2.50 -12.00
Grains Lupins (white or yellow) for grain 0.50 2.50 -12.00
Grains Legumes for grain nec (incl 0122 part);
forage products 0.50 2.50 -12.00
Grains Cereal grains nec (incl 0122 part) 0.50 2.50 -12.00
Sheep Sheep and lambs (incl 0122 part, 0123 part) 0.50 2.50 -12.00
Sheep Wool (shorn and dead) (incl 0122 part, 0123
part) 0.50 2.50 -4.00
Beef cattle Cattle and calves (incl 0122 part, 0123 part) 2.00 2.50 -12.00
Dairy cattle Whole milk, chilled but otherwise untreated 2.00 2.50 -12.00
Dairy cattle Dairy cattle 2.00 2.50 -12.00
Poultry Poultry, for slaughtering 2.00 2.50 -12.00
Poultry Eggs 2.00 2.50 -12.00
Poultry Egg laying hens 2.00 2.50 -12.00
Pigs Pigs 2.00 2.50 -12.00
Other agriculture Horse studs 2.00 2.50 -12.00
Other agriculture Deer farming 2.00 2.50 -12.00
Other agriculture Unblended honey and beeswax 2.00 2.50 -12.00
Other agriculture Pet breeding and live animals nec 2.00 2.50 -12.00
Other agriculture Sugar cane for planting 2.00 2.50 -12.00
Other agriculture Sugar cane for crushing 2.00 2.50 -12.00
Other agriculture Cotton (excl ginned) n/a 2.50 -6.00
Other agriculture Tobacco 2.00 2.50 -12.00
Other agriculture Grass, lucerne and clover seed 2.00 2.50 -12.00
Other agriculture Beverage and spice crops 2.00 2.50 -12.00
Other agriculture Agriculture nec 2.00 2.50 -12.00
Other agriculture Natural rubber 2.00 2.50 -12.00
Other agriculture Mushrooms & other vegetables, fresh or
chilled, n.e.i.; Edible nuts, berries & small
fruit n.e.i.; Hay, cereal grasses & fodder
2.00 2.50 -12.00
Services to agriculture;
hunting and trapping Sheep shearing services n/a 2.50 -12.00
Services to agriculture;
hunting and trapping Aerial agricultural services n/a 2.50 -12.00
Services to agriculture;
hunting and trapping Skins and pieces, raw n/a 2.50 -12.00
Services to agriculture;
hunting and trapping Other services to agriculture n.e.i. 0.00 2.50 -12.00
Forestry and logging Natural gums nes 6.00 2.50 -12.00
Forestry and logging Forestry and services to forestry 6.00 2.50 -12.00

Department of the Treasury
The Excess Burden of Australian Taxes
March 2010
ABCD
141
© 2010 KPMG, an Australian partnership and a member firm of the KPMG network of independent
member firms affiliated with KPMG International, a Swiss cooperative. All rights reserved.
The KPMG logo and name are trademarks of KPMG.
Liability limited by a scheme approved under Professional Standards Legislation.
Import Export Export Industry Product
Demand Supply Demand
Forestry and logging Softwoods - conifers 6.00 2.50 -12.00
Forestry and logging Hardwoods, brushwoods, scrubwoods, etc,
hewn timber and timber nec (incl firewood) 6.00 2.50 -12.00
Forestry and logging Forest products nec 6.00 2.50 -12.00
Commercial fishing Rock lobsters 0.50 2.50 -12.00
Commercial fishing Prawns 0.50 2.50 -12.00
Commercial fishing Finfish trawling 0.50 2.50 -12.00
Commercial fishing Line fishing 0.50 2.50 -12.00
Commercial fishing Oysters and other aquatic invertebrates nec,
live, fresh or chilled 0.50 2.50 -12.00
Commercial fishing Coral and similar, shells of molluscs,
crustaceans; natural animal sponges; algae,
fresh or dried
0.50 2.50 -12.00
Commercial fishing Farmed fish, crustaceans and molluscs;
freshwater fish 0.50 2.50 -12.00
Commercial fishing Services to fishing nec 3.85 2.50 -12.00
Coal Black coal (all types incl briquettes) 0.50 1.50 -6.00
Coal Brown coal-lignite (incl briquettes) 2.42 1.50 -6.00
Oil and gas Crude oil (incl. condensate) 7.00 1.50 -12.00
Oil and gas Liquefied natural gas 2.00 1.50 -6.00
Oil and gas Natural gas (in the gaseous state) 2.00 1.50 -6.00
Oil and gas Liquefied petroleum gases - natural; coal
gas & similar, other than petroleum gases &
other gaseous hydrocarbons nec
2.00 1.50 -6.00
Iron ores Iron ore (incl treatment; excl pelletising) 0.50 1.50 -6.00
Iron ores Iron ores n.e.i. 0.50 1.50 -6.00
Non-ferrous metal ores Bauxite 0.50 1.50 -12.00
Non-ferrous metal ores Copper concentrates, oxides and ores 6.80 1.50 -12.00
Non-ferrous metal ores Gold bullion and ores 6.80 1.50 -12.00
Non-ferrous metal ores Beneficiated ilmenite, ilmenite and
leucoxene concentrates 0.50 1.50 -12.00
Non-ferrous metal ores Zircon concentrate and mineral sand ores
nec 0.50 1.50 -12.00
Non-ferrous metal ores Silver and zinc ores 6.80 1.50 -6.00
Non-ferrous metal ores Other non-ferrous metallic ores and
concentrates n.e.i. 0.50 1.50 -6.00
Other mining Gravel 2.00 1.50 -12.00
Other mining Sand 2.00 1.50 -12.00
Other mining Dimension stone 2.00 1.50 -12.00
Other mining Pebbles, gravel, broken or crushed stone,
macadam; tarred macadam; granules,
chippings and powder of stone
2.00 1.50 -12.00
Other mining Limestone (incl shell and coral) 2.00 1.50 -12.00
Other mining Salt 2.00 1.50 -12.00

Department of the Treasury
The Excess Burden of Australian Taxes
March 2010
ABCD
142
© 2010 KPMG, an Australian partnership and a member firm of the KPMG network of independent
member firms affiliated with KPMG International, a Swiss cooperative. All rights reserved.
The KPMG logo and name are trademarks of KPMG.
Liability limited by a scheme approved under Professional Standards Legislation.
Import Export Export Industry Product
Demand Supply Demand
Other mining Gypsum; anhydrite; calcareous stone of a
kind used for the manufacture of lime or
cement (excluding limestone)
2.00 1.50 -12.00
Other mining Silica 2.00 1.50 -12.00
Other mining Chemical and fertilizer minerals nec 0.00 1.50 -12.00
Other mining Other non-metallic minerals n.e.i. 2.00 1.50 -12.00
Services to mining Petroleum exploration (own account) 2.00 1.50 -12.00
Services to mining Mineral exploration (own account) 2.00 1.50 -12.00
Services to mining Mineral exploration services nec 2.00 1.50 -12.00
Services to mining Other mining services n.e.i. 2.00 1.50 -12.00
Meat and meat products Fresh meat, chilled or frozen (excl kangaroo
or horse meat, other than for human
consumption)
0.50 2.50 -12.00
Meat and meat products Fresh kangaroo or horse meat, other than
for human consumption 0.50 2.50 -12.00
Meat and meat products Casings, bungs, weasands and runners (incl
gut materials for further processing) 0.50 2.50 -12.00
Meat and meat products Edible offals (excl poultry offals) 0.50 2.50 -12.00
Meat and meat products Meat (excl fresh) for human consumption 0.50 2.50 -12.00
Meat and meat products Blood meal (milled or screened dried blood)
for use as stock or poultry feed 0.50 2.50 -12.00
Meat and meat products Inedible meat or meat offal flours, meals and
pellets; greaves 0.50 2.50 -12.00
Meat and meat products Other animal products nec 0.50 2.50 -12.00
Meat and meat products Poultry, slaughtered 0.50 2.50 -12.00
Meat and meat products Smallgoods (incl crumbed lamb cutlets,
uncanned corned beef, frankfurters,
saveloys and salami)
0.50 2.50 -12.00
Meat and meat products Animal fats & oils (excludes refined); Raw
skins & hides; Dried, salted or smoked
pigmeat (includes canned)
0.50 2.50 -12.00
Dairy products Liquid skim milk, not concentrated or
sweetened 1.60 2.50 -12.00
Dairy products Flavoured whole milk drinks 1.60 2.50 -12.00
Dairy products Other liquid whole milk (incl pasteurised
milk), not concentrated or sweetened 1.60 2.50 -12.00
Dairy products Cream (incl thickened), not concentrated or
sweetened 1.60 2.50 -12.00
Dairy products Sour cream, yoghurt and other cultured milk
products 1.60 2.50 -12.00
Dairy products Ice cream and frozen confections 1.60 2.50 -12.00
Dairy products Buttermilk (excl cultured) and skim milk (excl
liquid skim milk) 1.60 2.50 -12.00
Dairy products Calf food of processed milk products 1.60 2.50 -12.00
Dairy products Butter 1.60 2.50 -12.00
Dairy products Whey and whey cream 1.60 2.50 -12.00

Department of the Treasury
The Excess Burden of Australian Taxes
March 2010
ABCD
143
© 2010 KPMG, an Australian partnership and a member firm of the KPMG network of independent
member firms affiliated with KPMG International, a Swiss cooperative. All rights reserved.
The KPMG logo and name are trademarks of KPMG.
Liability limited by a scheme approved under Professional Standards Legislation.
Import Export Export Industry Product
Demand Supply Demand
Dairy products Cheese and curd 1.60 2.50 -12.00
Dairy products Milk based food preparations (incl malt
extracts and milk based mixes) 1.60 2.50 -6.00
Dairy products Dairy products n.e.i. 1.60 2.50 -12.00
Fruit and vegetable products Jams 0.80 2.50 -12.00
Fruit and vegetable products Fruit juices, single strength or concentrated 0.80 2.50 -12.00
Fruit and vegetable products Dried fruit (excl sun-dried) 0.80 2.50 -12.00
Fruit and vegetable products Vegetables, frozen 0.80 2.50 -12.00
Fruit and vegetable products Vegetables, prepared or preserved (incl
dried or shelled)(excl frozen); pickles and
chutney
0.80 2.50 -12.00
Fruit and vegetable products Tomato pulp, puree and paste 0.80 2.50 -12.00
Fruit and vegetable products Vegetable juices (incl mixtures)(excl tomato);
mixtures of vegetable and fruit juices 0.80 2.50 -12.00
Fruit and vegetable products Soup and homogenised food preparations
including fruit, vegetables, meat or
composites thereof
0.80 2.50 -12.00
Fruit and vegetable products Sauces (excl worcestershire and apple);
vinegar (excl wine vinegar) 0.80 2.50 -12.00
Fruit and vegetable products Fruit and vegetable based health, invalid or
baby preparations 0.80 2.50 -12.00
Fruit and vegetable products Dried roots, tubers and vegetables 0.80 2.50 -12.00
Fruit and vegetable products Fruit and vegetable products n.e.i. 0.80 2.50 -12.00
Oils and fats Oil-cake and other solid residues, resulting
from the extraction of vegetable fats or oils 1.70 2.50 -12.00
Oils and fats Margarine 1.70 2.50 -12.00
Oils and fats Oils & Fats n.e.i. 1.70 2.50 -12.00
Flour mill products and cereal
foods Wheat and other cereal flours (excl self-
raising) 2.10 2.50 -12.00
Flour mill products and cereal
foods Wheat bran for human consumption (excl for
breakfast food) 2.10 2.50 -12.00
Flour mill products and cereal
foods Flour mill products nec, for human
consumption 2.10 2.50 -12.00
Flour mill products and cereal
foods Starch of wheat and corn 2.10 2.50 -12.00
Flour mill products and cereal
foods Glucose, glucose syrup (incl dextrose) and
modified starches (incl dextrins) 2.10 2.50 -12.00
Flour mill products and cereal
foods Wheat gluten 2.10 2.50 -12.00
Flour mill products and cereal
foods Cereal foods (incl breakfast foods) 2.10 2.50 -12.00
Flour mill products and cereal
foods Flour (self raising) 2.10 2.50 -12.00
Flour mill products and cereal
foods Prepared baking powders; jelly crystals;
custard powder 2.10 2.50 -12.00
Flour mill products and cereal
foods Rice, semi-milled or wholly milled 2.10 2.50 -12.00

Department of the Treasury
The Excess Burden of Australian Taxes
March 2010
ABCD
144
© 2010 KPMG, an Australian partnership and a member firm of the KPMG network of independent
member firms affiliated with KPMG International, a Swiss cooperative. All rights reserved.
The KPMG logo and name are trademarks of KPMG.
Liability limited by a scheme approved under Professional Standards Legislation.
Import Export Export Industry Product
Demand Supply Demand
Flour mill products and cereal
foods Pasta 2.10 2.50 -12.00
Flour mill products and cereal
foods Cereal groats, meals and pellets for human
consumption; cereal germs; other worked
cereal grains; mixes and doughs for
preparation of bakers wares
2.10 2.50 -12.00
Bakery products Bread and bread rolls 0.00 2.50 -12.00
Bakery products Meat pies 0.00 2.50 -12.00
Bakery products Cakes, pastries and crumpets 0.00 2.50 -12.00
Bakery products Biscuits and biscuit crumbs; rusks; ice cream
cones and wafers; unleavened bread 0.00 2.50 -12.00
Other food products Raw sugar 0.50 2.50 -12.00
Other food products Refined sugar in solid form (incl brown
sugar)(excl icing sugar) 0.50 2.50 -12.00
Other food products Icing sugar and molasses (incl treacle) 0.50 2.50 -12.00
Confectionery Chocolate confectionery (excl chocolate
coated biscuits and white chocolate) 2.00 2.50 -12.00
Confectionery Cocoa paste, powder, butter, fat or oil 2.00 2.50 -12.00
Confectionery Chewing gum, white chocolate and other
confectionery not containing cocoa 2.00 2.50 -12.00
Confectionery Crystallised, drained and glace fruit, nuts
and peel 2.00 2.50 -12.00
Other food products Rock lobster and crayfish (incl tails), chilled 0.50 2.50 -12.00
Other food products Rock lobster and crayfish (incl tails), frozen
(incl boiled and frozen) 0.50 2.50 -12.00
Other food products Crustaceans and molluscs, chilled, dried or
salted 0.50 2.50 -12.00
Other food products Crustaceans, molluscs & aquatic
invertebrates, frozen or otherwise prepared
(incl cooked, canned, bottled or crumbed)
0.50 2.50 -12.00
Other food products Extracts and juices of fish, crustaceans,
molluscs or other aquatic invertebrates (incl
abalone)
0.50 2.50 -12.00
Other food products Frozen fish, fish fillets and fish meat; fish
loaf, cake, balls and paste; smoked fish; fish
fingers; caviar
0.50 2.50 -12.00
Other food products Inedible flours, meals, pellets & other
products nec of fish, crustaceans & molluscs
or other aquatic invertebrates
0.50 2.50 -12.00
Other food products Dog and cat food (excl canned) 0.50 2.50 -12.00
Other food products Dog and cat food, canned 0.50 2.50 -12.00
Other food products Bran, sharps and other residues (excl rice,
wheat and rye), for animal feed 0.50 2.50 -12.00
Other food products Prepared animal and bird feeds nec (incl
poultry pellets, crumbles and mash) 0.50 2.50 -12.00
Other food products Cereal groats, meals, pellets and other
cereal products nec, other than for human
consumption
0.50 2.50 -12.00

Department of the Treasury
The Excess Burden of Australian Taxes
March 2010
ABCD
145
© 2010 KPMG, an Australian partnership and a member firm of the KPMG network of independent
member firms affiliated with KPMG International, a Swiss cooperative. All rights reserved.
The KPMG logo and name are trademarks of KPMG.
Liability limited by a scheme approved under Professional Standards Legislation.
Import Export Export Industry Product
Demand Supply Demand
Other food products Coffee and tea, including substitutes 0.50 2.50 -12.00
Other food products Yeast and yeast extracts 0.50 2.50 -12.00
Other food products Potato crisps and flakes 0.50 2.50 -12.00
Other food products Nuts, roasted 0.50 2.50 -12.00
Other food products Ice 0.50 2.50 -12.00
Other food products Spices 0.50 2.50 -12.00
Other food products Flavouring essences, industrial 0.50 2.50 -12.00
Other food products Prepared meals (incl TV dinners), of meat or
meat offal 0.50 2.50 -12.00
Other food products Peanut butter and other nut butters, pastes
and purees; apricot, peach or plum stones
and kernels
0.50 2.50 -12.00
Other food products Other food products n.e.i. (adjusted) 0.50 2.50 -12.00
Soft drinks, cordials and
syrups Natural water nec 0.00 2.50 -12.00
Soft drinks, cordials and
syrups Mineral waters and aerated waters,
sweetened or flavoured, canned 0.00 2.50 -12.00
Soft drinks, cordials and
syrups Mineral waters and aerated waters,
sweetened or flavoured, bottled 0.00 2.50 -12.00
Soft drinks, cordials and
syrups Cordials and syrups; powder flavours for soft
drinks; concentrated cordial extracts 0.00 2.50 -12.00
Soft drinks, cordials and
syrups Soft drinks, cordials and syrups n.e.i. 0.00 2.50 -12.00
Beer and malt Beer, ale and stout, packaged 0.00 2.50 -12.00
Beer and malt Beer, ale and stout, bulk 0.00 2.50 -12.00
Beer and malt Malt (excl malt extract) 0.00 2.50 -12.00
Wine, spirits and tobacco
products Sparkling wines and other beverage wines of
fresh grapes (excl vermouth) 4.80 2.50 -12.00
Wine, spirits and tobacco
products Whisky, brandy, rum, gin and fortified spirits;
other distilled alcoholic beverages (incl
liquers and mixed drinks)
4.80 2.50 -12.00
Wine, spirits and tobacco
products Vermouth and distillation wine 4.80 2.50 -12.00
Wine, spirits and tobacco
products Wine, spirits and tobacco products n.e.i. 4.80 2.50 -12.00
Wine, spirits and tobacco
products Cigarettes, cigars, cheroots and tobacco 2.00 2.50 -12.00
Wine, spirits and tobacco
products Waste from manufacture of food and
tobacco 0.00 2.50 -12.00
Textile fibres, yarns and
woven fabrics Wool, scoured (degreased but not carded,
combed or carbonised) 7.00 2.50 -4.00
Textile fibres, yarns and
woven fabrics Wool grease and fatty substances derived
from wool grease (incl lanolin) 7.00 2.50 -4.00
Textile fibres, yarns and
woven fabrics Textured, high tenacity, single, synthetic or
artificial yarns (incl elastomeric)(excl sewing
& multiple or cabled)
7.00 2.50 -12.00
Textile fibres, yarns and Other synthetic/artificial filament yarn;
sewing thread or elastomeric yarn of artificial 7.00 2.50 -12.00

Department of the Treasury
The Excess Burden of Australian Taxes
March 2010
ABCD
146
© 2010 KPMG, an Australian partnership and a member firm of the KPMG network of independent
member firms affiliated with KPMG International, a Swiss cooperative. All rights reserved.
The KPMG logo and name are trademarks of KPMG.
Liability limited by a scheme approved under Professional Standards Legislation.
Import Export Export Industry Product
Demand Supply Demand
woven fabrics filament or staple fibres
Textile fibres, yarns and
woven fabrics Man-made textile staple fibres processed for
spinning 7.00 2.50 -12.00
Textile fibres, yarns and
woven fabrics Elastomeric yarn of cotton, wool or fine
animal hair (containing polyurethane or
similar thread, excl rubber thread)
7.00 2.50 -12.00
Textile fibres, yarns and
woven fabrics Broadwoven fabric of artificial filaments or
artificial staple fibres (excl pile or chenille) 7.00 2.50 -12.00
Textile fibres, yarns and
woven fabrics Broadwoven fabric of continuous synthetic
fibres (excl pile or chenille) 7.00 2.50 -12.00
Textile fibres, yarns and
woven fabrics Broadwoven fabric of discontinuous
synthetic fibres (excl pile or chenille) 7.00 2.50 -12.00
Textile fibres, yarns and
woven fabrics Blankets & travelling rugs (excl electric or
woollen); table linen (excl cotton) & interior
furnishings, woven nec
7.00 2.50 -12.00
Textile fibres, yarns and
woven fabrics Narrow woven textile fabrics (incl tape) (excl
bias binding); tyre cord fabric of high tenacity
yarn
7.00 2.50 -12.00
Textile fibres, yarns and
woven fabrics Towels (incl tea towels) and face washers of
cotton terry towelling or similar cotton terry
fabrics
7.00 2.50 -12.00
Textile fibres, yarns and
woven fabrics Other woven fabrics of cotton (excl narrow) 7.00 2.50 -12.00
Textile fibres, yarns and
woven fabrics Woollen or worsted yarn 7.00 2.50 -12.00
Textile fibres, yarns and
woven fabrics Woollen blankets and rugs (excl electric) 7.00 2.50 -12.00
Textile fibres, yarns and
woven fabrics Labels and badges, textile, with printed
lettering or design 3.85 2.50 -12.00
Textile fibres, yarns and
woven fabrics Textile finishing nec 3.85 2.50 -12.00
Textile fibres, yarns and
woven fabrics Textile fibres, yarns and woven fabrics n.e.i. 3.85 2.50 -12.00
Textile products Textile quilted prods, hose/tubing, narrow
fabrics, nonwovens, (bonded & yarn fabrics),
transmission & conveyor belts
2.42 2.50 -12.00
Textile products Textile interior furnishing articles (incl bed &
table linen nec) (excl curtains, floor
coverings & woven articles)
2.42 2.50 -12.00
Textile products Textile tarpaulins (incl canvas), sails, tents,
annexes, pnuematic mattresses and motor
vehicle covers
2.42 2.50 -12.00
Textile products Blinds and awnings of textile fabrics (incl
canvas) and woven textile materials (incl
cotton)
2.42 2.50 -12.00
Textile products Textile life jackets, life-belts, sleeping bags
and other made-up textile products nec 2.42 2.50 -12.00
Textile products Carpets and other textile floor coverings (incl
felt, mats and matting other than coir or
sisal)(excl underfelt)
2.42 2.50 -12.00
Textile products Underfelt and other felt products (excl floor 2.42 2.50 -12.00

Department of the Treasury
The Excess Burden of Australian Taxes
March 2010
ABCD
147
© 2010 KPMG, an Australian partnership and a member firm of the KPMG network of independent
member firms affiliated with KPMG International, a Swiss cooperative. All rights reserved.
The KPMG logo and name are trademarks of KPMG.
Liability limited by a scheme approved under Professional Standards Legislation.
Import Export Export Industry Product
Demand Supply Demand
coverings, headwear or clothing)
Textile products Rope and cable (excl wire), cordage (excl
tyre cord yarn), twine or net products 2.42 2.50 -12.00
Textile products Wadding, cotton wool, gauze and bandages 2.42 2.50 -12.00
Textile products Bags, sacks and packets of textile or canvas 2.42 2.50 -12.00
Textile products Floor-cloths, dishcloths, dusters and similar
cleaning cloths 2.42 2.50 -12.00
Textile products Articles of bonded fibre or yarn fabrics (excl
labels & badges); tapestries, parachutes,
made up textile articles nec
2.42 2.50 -12.00
Textile products Special fabrics nec 2.42 2.50 -12.00
Textile products Waste from manufacture of textile products 0.00 2.50 -12.00
Textile products Textile products n.e.i. 2.42 2.50 -12.00
Knitting mill products Hosiery (incl pantyhose, stockings, tights
and socks) 2.42 2.50 -12.00
Knitting mill products Pullovers, jumpers, sweaters and cardigans
- knitted 7.00 2.50 -12.00
Knitting mill products Knitted or crocheted pile fabrics (excl elastic
or elastomeric) 7.00 2.50 -12.00
Knitting mill products Knitted or crocheted fabric nec 7.00 2.50 -12.00
Knitting mill products Curtains in the piece (incl continuous),
knitted or crocheted 7.00 2.50 -12.00
Knitting mill products Knitted articles nec, fabric knitted at the
same establishment 7.00 2.50 -12.00
Clothing Dustcoats, mens and boys trousers (excl
suit), shorts, jeans, overalls and work shirts,
textile (excl waterproof)
6.80 2.50 -12.00
Clothing Men's & boys' suits or uniforms (incl trousers
for suits & uniforms), coats & jackets, textile
(excl waterproof)
6.80 2.50 -12.00
Clothing Men's and boys' textile fabric capes, cloaks,
ensembles and breeches, other than knitted 6.80 2.50 -12.00
Clothing Mens and boys T-shirts and tank tops 6.80 2.50 -12.00
Clothing Mens and boys woven shirts (with collars) 6.80 2.50 -12.00
Clothing Mens and boys knitted shirts (with collars) 6.80 2.50 -12.00
Clothing Mens and boys outer nightwear (incl
dressing gowns, robes, etc) 6.80 2.50 -12.00
Clothing Waterproof, plastic or rubber trousers,
overalls, coats and jackets 6.80 2.50 -12.00
Clothing Plastic (unsupported film) clothing other than
waterproof 6.80 2.50 -12.00
Clothing Wetsuits and other rubber clothing nec (incl
gloves)(excl headgear) 6.80 2.50 -12.00
Clothing Womens and girls shirts and blouses 6.80 2.50 -12.00
Clothing Womens and girls T-shirts and tank tops 6.80 2.50 -12.00
Clothing Womens and girls outer nightwear (incl
dressing gowns, robes etc) 6.80 2.50 -12.00

Department of the Treasury
The Excess Burden of Australian Taxes
March 2010
ABCD
148
© 2010 KPMG, an Australian partnership and a member firm of the KPMG network of independent
member firms affiliated with KPMG International, a Swiss cooperative. All rights reserved.
The KPMG logo and name are trademarks of KPMG.
Liability limited by a scheme approved under Professional Standards Legislation.
Import Export Export Industry Product
Demand Supply Demand
Clothing Foundation garments (incl brassieres,
corsets and girdles) 6.80 2.50 -12.00
Clothing Knitted sleepwear (incl pyjamas and
nightdresses) and infants clothing 6.80 2.50 -12.00
Clothing Woven sleepwear (incl pyjamas and
nightdresses) and infants clothing 6.80 2.50 -12.00
Clothing Underwear 6.80 2.50 -12.00
Clothing Hats and other headgear (excl safety, rubber
or plastic) 6.80 2.50 -12.00
Clothing Safety headgear; textile belts for clothing;
plastic clothing accessories (excl belts and
disposable gloves)
6.80 2.50 -12.00
Clothing Fur and sheepskin articles, (incl clothing)
(excl headwear, footwear, handbags, purses
and toys)
6.80 2.50 -12.00
Clothing Swimwear; knitted sweatsuits, tracksuits,
jogging suits, leisure suits and jumpsuits 6.80 2.50 -12.00
Clothing Safety eyewear (industrial or sporting)(incl
goggles) 6.80 2.50 -12.00
Clothing Clothing (incl leather) and clothing
accessories nec 6.80 2.50 -12.00
Clothing Belts for clothing (exclude plastic, leather or
rubber) 6.80 2.50 -12.00
Clothing Other womens' and girls' outer clothing n.e.i. 6.80 2.50 -12.00
Footwear Footwear with uppers and outer soles of
rubber or plastic (incl waterproof footwear)
(excl thongs, sports footwear)
7.00 2.50 -12.00
Footwear Footwear with uppers of leather and outer
soles of rubber or plastic (excl sports
footwear)
7.00 2.50 -12.00
Footwear Footwear with uppers of leather and outer
soles of leather or composition leather (excl
sports footwear)
7.00 2.50 -12.00
Footwear Footwear n.e.c. 7.00 2.50 -12.00
Footwear Soles of or cut from rubber or rubber
composition and parts of footwear nec (excl
plastic heels)
7.00 2.50 -12.00
Footwear Rubber footwear n.e.i. 7.00 2.50 -12.00
Leather and leather products Leather, vegetable or chrome tanned (incl
re-tanned), dressed or finished; chamois
leathers
2.00 2.50 -12.00
Leather and leather products Leather (excl dressed or finished) 2.00 2.50 -6.00
Leather and leather products Raw hides and skins, pickled or otherwise
preserved 2.00 2.50 -12.00
Leather and leather products Tanned or dressed skins, with hair or wool
retained (incl sheepskin rugs) 2.00 2.50 -12.00
Leather and leather products Handbags, suitcases, bags, travel sets for
personal toilet articles, purses, key cases,
wallets and billfolds (excl paper)
2.00 2.50 -12.00
Leather and leather products Saddlery and harness, of any material; 2.00 2.50 -12.00

Department of the Treasury
The Excess Burden of Australian Taxes
March 2010
ABCD
149
© 2010 KPMG, an Australian partnership and a member firm of the KPMG network of independent
member firms affiliated with KPMG International, a Swiss cooperative. All rights reserved.
The KPMG logo and name are trademarks of KPMG.
Liability limited by a scheme approved under Professional Standards Legislation.
Import Export Export Industry Product
Demand Supply Demand
leather articles nec
Sawmill products Undressed sawn timber (incl treated) from
logs sawn at same establishment (excl
impregnated sleepers or resawn)
6.00 2.50 -12.00
Sawmill products Treated wood in the rough (excl sawn
timber, dressed or undressed); impregnated
railway sleepers
6.00 2.50 -12.00
Sawmill products Ground bark 6.00 2.50 -12.00
Sawmill products Shooks (not assembled into articles) 6.00 2.50 -12.00
Sawmill products Woodchips, softwood 6.00 2.50 -12.00
Sawmill products Woodchips, hardwood 6.00 2.50 -12.00
Sawmill products Resawn/seasoned timber (incl kiln dried)
from timber already sawn at another unit
(excl sleepers, palings & shingles)
6.00 2.50 -12.00
Sawmill products Dressed timber and mouldings of a
thickness up to and including 6mm 6.00 2.50 -12.00
Sawmill products Dressed timber and mouldings of a
thickness exceeding 6mm 6.00 2.50 -12.00
Other wood products Veneers 6.00 2.50 -12.00
Other wood products Plywood 6.00 2.50 -12.00
Other wood products Fibreboard (excl fibre paperboard and
particle board) 6.00 2.50 -12.00
Other wood products Cellular wood panels 6.00 2.50 -12.00
Other wood products Particle board (incl laminated) and similar
board of wood or other ligneous materials 6.00 2.50 -12.00
Other wood products Other boards manufactured from wood nec 6.00 2.50 -12.00
Other wood products Doors, wooden 6.00 2.50 -12.00
Other wood products Roof trusses, wooden 6.00 2.50 -12.00
Other wood products Wooden wall and window (incl complete with
glass) frames 6.00 2.50 -12.00
Other wood products Other wooden builders joinery and carpentry 6.00 2.50 -12.00
Other wood products Parquetry strips etc., assembled into panels;
shingles and shakes 6.00 2.50 -12.00
Other wood products Pallets, cases, boxes, crates, drums, casks
and barrels, wooden 6.00 2.50 -12.00
Other wood products Frames, wooden (incl for paintings,
photographs, mirrors, etc) 6.00 2.50 -12.00
Other wood products Wooden tools, tool bodies & handles; cork
articles (incl agglomerated)(excl gaskets for
motor vehicles)
6.00 2.50 -12.00
Other wood products Moulding boxes, patterns, bases; moulds for
metal (excl ingot), glass, mineral materials,
rubber or plastics
6.00 2.50 -12.00
Other wood products Waste from manufacture of wood products 6.00 2.50 -12.00
Other wood products Other wood products n.e.i. 6.00 2.50 -12.00
Pulp, paper and paperboard Paper and paperboard, coated,
impregnated, covered, surface-coloured, 6.00 2.50 -12.00

Department of the Treasury
The Excess Burden of Australian Taxes
March 2010
ABCD
150
© 2010 KPMG, an Australian partnership and a member firm of the KPMG network of independent
member firms affiliated with KPMG International, a Swiss cooperative. All rights reserved.
The KPMG logo and name are trademarks of KPMG.
Liability limited by a scheme approved under Professional Standards Legislation.
Import Export Export Industry Product
Demand Supply Demand
surface-decorated nec
Pulp, paper and paperboard Paper and paperboard, uncoated nec 6.00 2.50 -12.00
Pulp, paper and paperboard Wood pulp n.e.i.; Newsprint, copying paper
and other paper stock n.e.i. 6.00 2.50 -12.00
Paper containers and
products Solid paperboard containers 6.00 2.50 -12.00
Paper containers and
products Paper bags, packets and sacks (incl paper
multiwall bags) (excl bags of composite
material)
6.00 2.50 -12.00
Paper containers and
products Toilet, tissues, serviettes, towels & similar
paper for household & sanitary purposes, in
sheets or perforated rolls
6.00 2.50 -12.00
Paper containers and
products Paper and paperboard trays, dishes, plates,
cups, cones, egg containers and box files 6.00 2.50 -12.00
Paper containers and
products Paper festival, carnival or other
entertainment articles (incl conjuring tricks,
novelties, Christmas decorations)
6.00 2.50 -12.00
Paper containers and
products Other paper, paper pulp or paperboard
products (incl wallpaper and liquid activated
gummed or adhesive paper)
6.00 2.50 -12.00
Paper containers and
products Waste from manufacture of paper and paper
products 6.00 2.50 -12.00
Paper containers and
products Paper containers and products n.e.i. 6.00 2.50 -12.00
Printing and services to
printing Envelopes, paper (excl commission printing) 2.00 2.50 -12.00
Printing and services to
printing Paper labels, printed or imprinted (excl
commission printing) 2.00 2.50 -12.00
Printing and services to
printing Letter & correspondence cards (excl printed
or illustrated); boxes, parcels, wallets &
writing compendiums of paper
2.00 2.50 -12.00
Printing and services to
printing Printed or illustrated postcards; printed cards
bearing personal greetings or messages 2.00 2.50 -12.00
Printing and services to
printing Exercise books, writing pads, registers,
account books, diaries and other stationery
(excl commission printing)
2.00 2.50 -12.00
Printing and services to
printing Board games 2.00 2.50 -12.00
Printing and services to
printing Books (incl atlases & touring guides), maps,
charts, plans, sheet music printed not
published by this establishment
2.00 2.50 -12.00
Printing and services to
printing Newspapers, journals and periodicals
printed but not published by this
establishment
2.00 2.50 -12.00
Printing and services to
printing Trade advertising material or commercial
catalogues; other printed matter nec 2.00 2.50 -12.00
Printing and services to
printing Security printed material (incl stamps,
cheque books, banknotes, share documents
and airline tickets)
2.00 2.50 -12.00
Printing and services to
printing Composed type, prepared printing
plates/cylinders, lithographic stones or other 2.00 2.50 -12.00

Department of the Treasury
The Excess Burden of Australian Taxes
March 2010
ABCD
151
© 2010 KPMG, an Australian partnership and a member firm of the KPMG network of independent
member firms affiliated with KPMG International, a Swiss cooperative. All rights reserved.
The KPMG logo and name are trademarks of KPMG.
Liability limited by a scheme approved under Professional Standards Legislation.
Import Export Export Industry Product
Demand Supply Demand
impressed media for use in printing
Printing and services to
printing Printing trade services nec 2.00 2.50 -12.00
Publishing; recorded media
and publishing Newspapers, printing or publishing;
periodicals (excl bound) published once a
week or more
2.00 2.50 -12.00
Publishing; recorded media
and publishing Newspapers - advertising sales 2.00 2.50 -12.00
Publishing; recorded media
and publishing Magazines and bound periodicals
publishing; periodicals published less than
weekly
2.00 2.50 -12.00
Publishing; recorded media
and publishing Other periodicals - advertising sales 2.00 2.50 -12.00
Publishing; recorded media
and publishing Books, sheet music, maps, atlases, touring
guides, charts, plans or other printed articles
(eg art prints) publishing
2.00 2.50 -12.00
Publishing; recorded media
and publishing Books, maps and sheet music - advertising
sales 2.00 2.50 -12.00
Publishing; recorded media
and publishing Pre-recorded audio, video tapes, computer
tapes or disks, compact disks and records,
manufactured or published
2.00 2.50 -12.00
Petroleum and coal products Automotive petrol; gasolene refining or
blending; motor spirit (incl aviation spirit) 7.00 2.50 -12.00
Petroleum and coal products Kerosene (incl kerosene type jet fuel) 7.00 2.50 -12.00
Petroleum and coal products Liquefied petroleum gas produced at
refineries 7.00 2.50 -12.00
Petroleum and coal products Lubricating, heavy petroleum & bituminous
oils; solvents; topped/enriched crude,
refinery products nec for processing
2.00 2.50 -12.00
Petroleum and coal products Paper, composite paper and paperboard
impregnated, covered or laminated with tar,
bitumen or asphalt
2.00 2.50 -12.00
Petroleum and coal products Bituminous mixtures and other articles of
asphalt or similar materials 2.00 2.50 -12.00
Petroleum and coal products Petroleum and coal products n.e.i. 2.00 2.50 -12.00
Basic chemicals Ammonia aqua or urea, fertiliser grade;
ammonium sulphate 1.90 2.50 -12.00
Basic chemicals Mixed fertilisers 1.90 2.50 -12.00
Basic chemicals Ground phosphate 1.90 2.50 -12.00
Basic chemicals Fertilisers nec 1.90 2.50 -12.00
Basic chemicals Synthetic rubber 1.90 2.50 -12.00
Basic chemicals Polyvinyl chloride 1.90 2.50 -12.00
Basic chemicals Polypropylene 1.90 2.50 -12.00
Basic chemicals Polyvinyl acetate & synthetic resins nec (excl
adhesives) in primary forms, not
mixed/compounded (excl regranulated)
1.90 2.50 -12.00
Basic chemicals Carbon black 1.90 2.50 -12.00
Basic chemicals Rosin and resin acids, and derivatives 1.90 2.50 -12.00

Department of the Treasury
The Excess Burden of Australian Taxes
March 2010
ABCD
152
© 2010 KPMG, an Australian partnership and a member firm of the KPMG network of independent
member firms affiliated with KPMG International, a Swiss cooperative. All rights reserved.
The KPMG logo and name are trademarks of KPMG.
Liability limited by a scheme approved under Professional Standards Legislation.
Import Export Export Industry Product
Demand Supply Demand
thereof, rosin spirit and rosin oils; run gums
Basic chemicals Plasticiser;Mixed alkylbenzenes and
alkylnaphthalenes nec; other chemical
products and preparations
1.90 2.50 -12.00
Basic chemicals Other alcohols, phenols, phenol-alcohols
and derivatives; fatty acids (purity less than
90%)
1.90 2.50 -12.00
Basic chemicals Carboxylic, monocarboxylic & polycarboxylic
acids and derivatives (excl pharmaceutical
goods)
1.90 2.50 -12.00
Basic chemicals Nitrogen-function compounds (excl
saccharin) 1.90 2.50 -12.00
Basic chemicals Organo-inorganic compounds; heterocyclic
compounds; nucleic acids 1.90 2.50 -12.00
Basic chemicals Ethers, alcohol peroxides, ether peroxides,
epoxides, acetals & hemiacetals &
derivatives & organic chemicals nec
1.90 2.50 -12.00
Basic chemicals Urea, other than fertiliser grades 1.90 2.50 -12.00
Basic chemicals Other inorganic acids and inorganic oxygen
compounds of non-metals (excl industrial
gases)
1.90 2.50 -12.00
Basic chemicals Refined salt other than cooking or table salt 1.90 2.50 -12.00
Basic chemicals Artificial graphite; colloidal or semi-colloidal
graphite; preparations based on carbon in
form of semi-manufactures
1.90 2.50 -12.00
Basic chemicals Radioactive elements, isotopes and
compounds; alloys, dispersions, ceramic
products and mixtures
1.90 2.50 -12.00
Basic chemicals Other inorganic industrial chemicals nec 1.90 2.50 -12.00
Basic chemicals Miscellaneous basic chemical products
n.e.c. 1.90 2.50 -12.00
Basic chemicals Other fertilisers; Industrial Gases; Polymers
n.e.i.; Acids n.e.i.; Pigments and other
colouring agents n.e.i.
1.90 2.50 -12.00
Other chemical products Safety fuses, detonating fuses or caps 2.00 2.50 -12.00
Paints Architectural & decorative paints (incl
coatings for use on buildings), enamels &
clears (excl heavy duty coatings)
2.50 2.50 -12.00
Paints Automotive paints (incl primer &
undercoats), enamels, lacquers (excl heavy
duty coatings & bituminous mastics)
2.50 2.50 -12.00
Paints Industrial paints (incl primer, undercoats,
finishing coats and heavy duty coats),
enamels and clears
2.50 2.50 -12.00
Paints Filler or putty, caulking compound 2.50 2.50 -12.00
Paints Other paints (incl marine coatings) and other
allied products (incl thinners, wood stains,
paint and varnish remover)
2.50 2.50 -12.00
Medicinal and
pharmaceutical products,
pesticides
Saccharin 2.00 2.50 -12.00

Department of the Treasury
The Excess Burden of Australian Taxes
March 2010
ABCD
153
© 2010 KPMG, an Australian partnership and a member firm of the KPMG network of independent
member firms affiliated with KPMG International, a Swiss cooperative. All rights reserved.
The KPMG logo and name are trademarks of KPMG.
Liability limited by a scheme approved under Professional Standards Legislation.
Import Export Export Industry Product
Demand Supply Demand
Medicinal and
pharmaceutical products,
pesticides
Barrier creams and toilet lanolin;
sunscreening preparations 2.00 2.50 -6.00
Medicinal and
pharmaceutical products,
pesticides
Baby napkins (excl textile), sanitary towels
and tampons of paper or cellulose wadding 2.00 2.50 -12.00
Medicinal and
pharmaceutical products,
pesticides
Pharmaceutical goods, for human use (excl
wadding, gauze, bandages and surgical
sutures)
2.00 2.50 -6.00
Medicinal and
pharmaceutical products,
pesticides
Animal feed supplements 2.00 2.50 -12.00
Medicinal and
pharmaceutical products,
pesticides
Other veterinary products 2.00 2.50 -12.00
Medicinal and
pharmaceutical products,
pesticides
Insecticides, pesticides and seed dressings 2.00 2.50 -12.00
Medicinal and
pharmaceutical products,
pesticides
Agricultural and pastoral chemicals nec 2.00 2.50 -12.00
Soap and other detergents Candles and tapers 1.30 2.50 -12.00
Soap and other detergents Soap and soap based products 1.30 2.50 -12.00
Soap and other detergents Toothpaste and other dentifrices 1.30 2.50 -12.00
Soap and other detergents Laundry bleach 1.30 2.50 -12.00
Soap and other detergents Disinfectants (incl phenyl) 1.30 2.50 -12.00
Soap and other detergents Anionic, cationic and other organic surface
active agents (excl soap) 1.30 2.50 -12.00
Soap and other detergents Scouring preparations and abrasive cleaners 1.30 2.50 -12.00
Soap and other detergents Surface-active washing or cleaning
preparations nec 1.30 2.50 -12.00
Soap and other detergents Other soap and detergents n.e.i. 1.30 2.50 -12.00
Cosmetics and toiletry
preparations Hair shampoo, conditioner, sprays, colouring
and other hairdressing preparations 2.00 2.50 -12.00
Cosmetics and toiletry
preparations Aftershave & shaving preparations; lipstick,
eye makeup; beauty cream or lotions; face
lotions & powders
2.00 2.50 -12.00
Cosmetics and toiletry
preparations Hand cream or lotions (excl barrier &
medicated cream); nail polishes & other nail
care preparations
2.00 2.50 -12.00
Cosmetics and toiletry
preparations Perfume, deodorants, bath salts,
depilatories, talcum powder and other
preparations nec
2.00 2.50 -12.00
Other chemical products Inks 2.00 2.50 -6.00
Other chemical products Adhesives (excl bituminous) and glues 2.00 2.50 -12.00
Other chemical products Surface cleaning and degreasing
preparations (incl oven and stove cleaners) 2.00 2.50 -12.00
Other chemical products Other cleaning polishes, creams and waxes
nec 2.00 2.50 -12.00

Department of the Treasury
The Excess Burden of Australian Taxes
March 2010
ABCD
154
© 2010 KPMG, an Australian partnership and a member firm of the KPMG network of independent
member firms affiliated with KPMG International, a Swiss cooperative. All rights reserved.
The KPMG logo and name are trademarks of KPMG.
Liability limited by a scheme approved under Professional Standards Legislation.
Import Export Export Industry Product
Demand Supply Demand
Other chemical products Natural gums, outputs of Manufacturing
Industries (ie substances derived from
vegetable products)
2.00 2.50 -12.00
Other chemical products Other chemical products nec 2.00 2.50 -12.00
Other chemical products Pyrotechnic devices; Insect waxes; Gelatine;
Natural gums 2.00 2.50 -12.00
Rubber products Tyres, rubber nec (incl retreaded tyres) 1.50 2.50 -12.00
Rubber products Camel-back strips for retreading rubber tyres 1.50 2.50 -12.00
Rubber products Rubber gloves, mittens and mitts 1.50 2.50 -12.00
Rubber products Rubber belting (incl V belts) 1.50 2.50 -12.00
Rubber products Rubber sheets, strips, plates, rods, profile
shapes and primary forms (excl cellular) 1.50 2.50 -12.00
Rubber products Sponge and foam rubber 1.50 2.50 -12.00
Rubber products Other rubber products 1.50 2.50 -12.00
Rubber products Waste from manufacture of rubber and
rubber products 1.50 2.50 -12.00
Rubber products Pneumatic rubber tyres for vehicles; Rubber
tubes, pipes & hose (include pneumatic);
Rubber Mattresses
1.50 2.50 -12.00
Plastic products Plastic bottles 1.50 2.50 -12.00
Plastic products Plastic tubes, pipes and hoses 1.50 2.50 -12.00
Plastic products Self-adhesive plastic plates, film, foil, tape,
strip and other flat shapes 1.50 2.50 -12.00
Plastic products Flexible plastic strip, plates, film, foil, tape
and sheet (excl self-adhesive) 1.50 2.50 -12.00
Plastic products Plastic-coated, pressure-sensitive, gummed
or adhesive paper and paperboard 1.50 2.50 -12.00
Plastic products Textile fabrics (excl tyre cord) impregnated,
coated, covered or laminated with plastics 1.50 2.50 -12.00
Plastic products Rigid fibre reinforced plastic articles (incl
rigid plastic sheets, swimming pool shells
and tanks)
1.50 2.50 -12.00
Plastic products Foam and sponge plastic sheets, plates and
strip (incl foam insulation and padding) 1.50 2.50 -12.00
Plastic products Plastic foam products nec 1.50 2.50 -12.00
Plastic products Plastic fittings for tubes, pipes and hoses
(incl joints, elbows and flanges) 1.50 2.50 -12.00
Plastic products Plastic taps, cocks, valves and similar
attachments 1.50 2.50 -12.00
Plastic products Plastic wall or ceiling coverings (excl tiles)
and other plastic builders' hardware 1.50 2.50 -12.00
Plastic products Plastic drums, drum linings, boxes, cases,
crates & packaging accessories. (incl
stoppers, lids, caps & seals)
1.50 2.50 -12.00
Plastic products Artificial guts (sausage casing) of hardened
protein or of cellulosic materials 1.50 2.50 -12.00
Plastic products Other plastic injection moulded products
(excl toys and games) 1.50 2.50 -12.00

Department of the Treasury
The Excess Burden of Australian Taxes
March 2010
ABCD
155
© 2010 KPMG, an Australian partnership and a member firm of the KPMG network of independent
member firms affiliated with KPMG International, a Swiss cooperative. All rights reserved.
The KPMG logo and name are trademarks of KPMG.
Liability limited by a scheme approved under Professional Standards Legislation.
Import Export Export Industry Product
Demand Supply Demand
Plastic products Other plastic products nec 1.50 2.50 -12.00
Plastic products Plastic belting; Plastic bags; Plastic table
and kitchenware; Other plastic floor
coverings, wall or ceiling tiles
1.50 2.50 -12.00
Glass and glass products Safety glass (incl windscreens and
laminated sheet glass) 1.20 2.50 -12.00
Glass and glass products Rear-view mirrors for vehicles 1.20 2.50 -12.00
Glass and glass products Glassware nec 1.20 2.50 -12.00
Glass and glass products Sheet glass n.e.i.; Glass containers 1.20 2.50 -12.00
Ceramic products Clay bricks (excl refractory bricks) 1.20 2.50 -12.00
Ceramic products Refractory products (incl bricks, cement and
clay) 1.20 2.50 -12.00
Ceramic products Ceramic roofing, flooring and wall tiles (incl
terracotta) 1.20 2.50 -12.00
Ceramic products Tableware, ornamental pottery and domestic
ware nec 1.20 2.50 -12.00
Ceramic products Ceramic goods nec 1.20 2.50 -12.00
Ceramic products Ceramic sanitary ware n.e.i. 1.20 2.50 -12.00
Cement, lime and concrete
slurry Lime, quick, hydrated, slaked and
agricultural 0.75 2.50 -12.00
Plaster and other concrete
products Plaster boards, sheets, panels, tiles,
cornices and other articles of plaster (excl
ornamental)
0.80 2.50 -12.00
Cement, lime and concrete
slurry Ready mixed concrete and mortar n/a 2.50 -12.00
Cement, lime and concrete
slurry Cement, lime and concrete slurry n.e.i. 0.75 2.50 -12.00
Plaster and other concrete
products Concrete, cement, fibrous-cement or artificial
stone pipes; concrete box culverts 1.20 2.50 -12.00
Plaster and other concrete
products Concrete, cement and artificial stone bricks,
blocks, building boards and tiles 0.80 2.50 -12.00
Plaster and other concrete
products Plaster and other concrete products n.e.i. 0.80 2.50 -12.00
Other non-metallic mineral
products Worked monumental or building stone 0.80 2.50 -12.00
Other non-metallic mineral
products Glass fibre and glass wool products 0.80 2.50 -12.00
Other non-metallic mineral
products Ground limestone 0.80 2.50 -12.00
Other non-metallic mineral
products Ground clays (excl colours); andalusite,
kyanite & sillimanite; mullite; chamotte &
dinas earths
0.80 2.50 -12.00
Other non-metallic mineral
products Ground minerals & fluorspar (excl abrasives,
dust & powders of natural & synthetic
precious or semi-precious stones)
0.80 2.50 -12.00
Other non-metallic mineral
products Cement, lime and plaster nec. 0.80 2.50 -12.00
Other non-metallic mineral Crushed slag 0.80 2.50 -12.00

Department of the Treasury
The Excess Burden of Australian Taxes
March 2010
ABCD
156
© 2010 KPMG, an Australian partnership and a member firm of the KPMG network of independent
member firms affiliated with KPMG International, a Swiss cooperative. All rights reserved.
The KPMG logo and name are trademarks of KPMG.
Liability limited by a scheme approved under Professional Standards Legislation.
Import Export Export Industry Product
Demand Supply Demand
products
Other non-metallic mineral
products Other non-metallic mineral products 0.80 2.50 -12.00
Other non-metallic mineral
products Mineral wool; Ground non-metalic minerals
n.e.i.; Non-refractory mortars and concretes
n.e.i.
0.80 2.50 -12.00
Iron and steel Basic iron, pig iron, sponge iron and
spiegeleisen; iron or steel granules and
powders
0.82 2.50 -12.00
Iron and steel Iron or steel primary forms (incl ingots) and
semi-finished products 0.82 2.50 -12.00
Iron and steel Alloy steel flat-rolled products 0.82 2.50 -12.00
Iron and steel Iron and steel bars, rods, angles, shapes
and sections (incl sheet piling) 0.82 2.50 -12.00
Iron and steel Iron or steel rails, rail fastenings or other rail
accessories 0.82 2.50 -12.00
Iron and steel Light oils obtained as a by-product from
metallurgical coke, other than benzol, grease
oils, toluole and xylole
0.82 2.50 -12.00
Iron and steel Benzole, other than from petroleum 0.82 2.50 -12.00
Iron and steel Gas from coke works or blast furnaces 0.82 2.50 -12.00
Iron and steel Iron or steel expanded metal 0.82 2.50 -12.00
Iron and steel Waste from manufacture or further
processing of iron and steel (incl slag, dross,
sealings and scrap steel)
0.82 2.50 -12.00
Iron and steel Cast iron or cast steel steam, gas and water
fittings other than domestic (incl taps, cocks
and valves)
0.82 2.50 -12.00
Iron and steel Iron or steel chain (other than articulated link
chain) and other cast and forged articles of
iron or steel
0.82 2.50 -12.00
Iron and steel Iron or steel seamless tubes or pipes (excl
cast or forged) 0.82 2.50 -12.00
Iron and steel Iron or steel tubes, pipes, hollow profiles and
fittings (excl cast iron or seamless) 0.82 2.50 -12.00
Iron and steel Steel steam, gas and water fittings other
than domestic (incl taps, cocks and
valves)(excl cast steel)
0.82 2.50 -12.00
Iron and steel Iron and steel n.e.i. 0.82 2.50 -12.00
Basic non-ferrous metal and
products Alumina 0.90 2.50 -6.00
Basic non-ferrous metal and
products Aluminium alloys and aluminium recovery
(from alumina smelted at the same unit) 0.90 2.50 -12.00
Basic non-ferrous metal and
products Aluminium secondary recovery from
purchased scrap 0.90 2.50 -12.00
Basic non-ferrous metal and
products Silver and platinum primary and secondary
recovery (excl from purchased scrap) 0.90 2.50 -6.00
Basic non-ferrous metal and
products Silver and platinum secondary recovery from
purchased scrap 0.90 2.50 -6.00

Department of the Treasury
The Excess Burden of Australian Taxes
March 2010
ABCD
157
© 2010 KPMG, an Australian partnership and a member firm of the KPMG network of independent
member firms affiliated with KPMG International, a Swiss cooperative. All rights reserved.
The KPMG logo and name are trademarks of KPMG.
Liability limited by a scheme approved under Professional Standards Legislation.
Import Export Export Industry Product
Demand Supply Demand
Basic non-ferrous metal and
products Copper, brass lead and zinc secondary
recovery from purchased scrap 0.90 2.50 -6.00
Basic non-ferrous metal and
products Nickel and tin secondary recovery from
purchased scrap 0.90 2.50 -6.00
Basic non-ferrous metal and
products Basic precious metals (excl silver and
platinum) secondary recovery from
purchased scrap
0.90 2.50 -6.00
Basic non-ferrous metal and
products Antimony and other non-ferrous basic metals
nec secondary recovery from purchased
scrap
0.90 2.50 -6.00
Basic non-ferrous metal and
products Other non-ferrous metal alloys 0.90 2.50 -6.00
Basic non-ferrous metal and
products Aluminium and aluminium alloy bars, rods
(incl wire rod) and profiles (incl decking and
cladding)
0.90 2.50 -12.00
Basic non-ferrous metal and
products Aluminium foil 0.90 2.50 -12.00
Basic non-ferrous metal and
products Rolled, drawn or extruded aluminium pipes,
tubes, plates, sheets, strip & wire products;
aluminium powders & flakes
0.90 2.50 -12.00
Basic non-ferrous metal and
products Copper;copper alloy, nickel, lead, zinc and
tin rolled, extrudedand semi-finished
products
0.90 2.50 -6.00
Basic non-ferrous metal and
products Powders, wastes & scrap of tungsten,
molybdenum, tantalum, magnesium, cobalt,
cadmium, titanium, zirconium & thallium
0.90 2.50 -6.00
Basic non-ferrous metal and
products Non-ferrous metal castings, diecastings and
forgings 0.90 2.50 -12.00
Basic non-ferrous metal and
products Metal wastes and scraps nec (excl scrap
steel and aluminium) 0.90 2.50 -6.00
Basic non-ferrous metal and
products Basic non-ferrous metal and products n.e.i. 0.90 2.50 -6.00
Structural metal products Fabricated & prefabricated construction steel
(incl scaffolding, perforated plate & ready
made parts for structures)
1.50 2.50 -12.00
Structural metal products Reinforcing steel rods or bars 1.50 2.50 -12.00
Structural metal products Reinforcing welded steel mesh 1.50 2.50 -12.00
Structural metal products Aluminium/aluminium framed doors (incl
roller/concertina) & windows (incl glass);
door/window frames; roller grilles
1.50 2.50 -12.00
Structural metal products Aluminium combined door-window units 1.50 2.50 -12.00
Structural metal products Architectural aluminium products (excl sheet
metal), for building nec 1.50 2.50 -12.00
Structural metal products Other articles of aluminium nec (incl ladders) 1.50 2.50 -12.00
Structural metal products Aluminium or aluminium framed
prefabricated buildings 1.50 2.50 -12.00
Structural metal products Iron or steel window-frames 1.50 2.50 -12.00
Structural metal products Metal (excl aluminium) door or door frames 1.50 2.50 -12.00
Structural metal products Wooden fire doors 1.50 2.50 -12.00

Department of the Treasury
The Excess Burden of Australian Taxes
March 2010
ABCD
158
© 2010 KPMG, an Australian partnership and a member firm of the KPMG network of independent
member firms affiliated with KPMG International, a Swiss cooperative. All rights reserved.
The KPMG logo and name are trademarks of KPMG.
Liability limited by a scheme approved under Professional Standards Legislation.
Import Export Export Industry Product
Demand Supply Demand
Structural metal products Iron, steel or aluminium fire doors; fabricated
iron or steel stairs, balustrades and other
architectural products
1.50 2.50 -12.00
Sheet metal products Metal cylinders (incl aerosol containers) for
compressed or liquified gas 1.50 2.50 -12.00
Sheet metal products Metal containers nec 1.50 2.50 -12.00
Sheet metal products Sheet metal ducting 1.50 2.50 -12.00
Sheet metal products Sheet metal sanitary ware 1.50 2.50 -12.00
Sheet metal products Sheet metal stoppers, caps, lids, capsules
for bottles, threaded bungs, bung covers,
seals & packing accessories nec
1.50 2.50 -12.00
Sheet metal products Sheet metal reservoirs, vats, tanks and
similar containers of a capacity exceeding
300 litres
1.50 2.50 -12.00
Sheet metal products Sheet metal vats, tanks and milk and cream
cans of a capacity not exceeding 300 litres 1.50 2.50 -12.00
Sheet metal products Sheet metal non-electric tableware,
kitchenware or other household articles and
parts (excl sanitary ware)
1.50 2.50 -12.00
Sheet metal products Sheet metal machine guards (not designed
for use with a particular machine) 1.50 2.50 -12.00
Sheet metal products Sheet metal products nec 1.50 2.50 -12.00
Fabricated metal products Metal hand tools (excl gardening or power
operated or pneumatic) 2.00 2.50 -12.00
Fabricated metal products Cutlery, kitchen ware and table ware (excl
solid silver or gold); household tools nec 2.00 2.50 -6.00
Fabricated metal products Cutlery nec, non-precious metal 2.00 2.50 -6.00
Fabricated metal products Knives and cutting blades, for machines or
for metal working, wood working etc,
mechanical appliances
2.00 2.50 -12.00
Fabricated metal products Wire stranded, cables, cordage, ropes,
plaited bands and slings (excl electrically
insulated slings)
2.00 2.50 -12.00
Fabricated metal products Springs (incl leaves for springs) 2.00 2.50 -12.00
Fabricated metal products Nails, tacks, staples, spiked cramps, studs,
spikes & pins (incl drawing & cotter pins)
(excl metallic dowel pins)
2.00 2.50 -12.00
Fabricated metal products Woven or linked wire fabric (excl mattress
supports) 2.00 2.50 -12.00
Fabricated metal products Welded wire fabric (excl reinforcing) 2.00 2.50 -12.00
Fabricated metal products Iron or steel wire gates (cross-sectional
dimension of wire 16mm or less) 2.00 2.50 -12.00
Fabricated metal products Sewing machine needles and other parts
and accessories for sewing machines (incl
furniture, bases and covers)
2.00 2.50 -12.00
Fabricated metal products Iron or steel articulated link chain and parts 2.00 2.50 -12.00
Fabricated metal products Iron or steel hand sieves and hand riddles 2.00 2.50 -12.00
Fabricated metal products Domestic metal wire products; copper cloth,
grill, netting and fencing; barbed wire; other 2.00 2.50 -12.00

Department of the Treasury
The Excess Burden of Australian Taxes
March 2010
ABCD
159
© 2010 KPMG, an Australian partnership and a member firm of the KPMG network of independent
member firms affiliated with KPMG International, a Swiss cooperative. All rights reserved.
The KPMG logo and name are trademarks of KPMG.
Liability limited by a scheme approved under Professional Standards Legislation.
Import Export Export Industry Product
Demand Supply Demand
wire products
Fabricated metal products Metal nuts, bolts (incl expansion), screws,
rivets, washers, dowel pins, masonry
anchors and turnbuckles
2.00 2.50 -12.00
Fabricated metal products Non-ferrous metal steam, gas and water
fittings other than domestic (incl taps, cocks
and valves)
2.00 2.50 -12.00
Fabricated metal products Tube or pipe fittings (excl valves) (eg
couplings, elbows, sleeves), of copper or
nickel (incl alloys) or aluminium
2.00 2.50 -12.00
Fabricated metal products Munitions and ammunition (incl cartridges) 2.00 2.50 -12.00
Fabricated metal products Super heated water boilers & steam
generators (incl parts) (excl central heating);
condensers for vapour power units
2.00 2.50 -12.00
Fabricated metal products Non-electric hot water or low pressure steam
central heating boilers 2.00 2.50 -12.00
Fabricated metal products Iron, steel or aluminium vats, tanks, capacity
exc. 300 litres and containers for
compressed or liquified gas
2.00 2.50 -12.00
Fabricated metal products Plate iron, steel and aluminium vats and
tanks, capacity not exc. 300 litres (excl with
mechanical or thermal equipment)
2.00 2.50 -12.00
Fabricated metal products Aluminium venetian blinds (incl plastic
coated) 2.00 2.50 -12.00
Fabricated metal products Metal blinds and awnings (excl aluminium
venetian blinds) 2.00 2.50 -12.00
Fabricated metal products Gas or water meters 2.00 2.50 -12.00
Fabricated metal products Metal freight containers (excl stock crates) 2.00 2.50 -12.00
Fabricated metal products Fire extinguishers 2.00 2.50 -12.00
Fabricated metal products Television antennae parts 2.00 2.50 -12.00
Fabricated metal products Prefabricated chimney stacks and livestock
yarding equipment 2.00 2.50 -12.00
Fabricated metal products Solid fuel portable barbecues 2.00 2.50 -12.00
Fabricated metal products Articles, tungsten, molybdenum, tantalum,
magnesium, cobalt, cadmium, titanium,
zirconium and thallium (incl wrought)
2.00 2.50 -12.00
Fabricated metal products Non-electric lamps and lighting fittings (incl
pressure and gas lanterns) 2.00 2.50 -12.00
Fabricated metal products Woven wire, link mesh or wire spring
mattress supports (excl upholstered) 2.00 2.50 -12.00
Fabricated metal products Cigarette and other lighters 2.00 2.50 -12.00
Fabricated metal products Fabricated metal products nec 2.00 2.50 -12.00
Fabricated metal products Metal hand tools (including accessories &
attachments); Fencing wire n.e.i.; Locks;
Firearms
2.00 2.50 -12.00
Motor vehicles and parts;
other transport equipment Finished motor vehicles with less than 10
persons capacity 5.20 2.50 -12.00
Motor vehicles and parts;
other transport equipment Finished motor vehicles with 10 or more
person capacity 5.20 2.50 -12.00

Department of the Treasury
The Excess Burden of Australian Taxes
March 2010
ABCD
160
© 2010 KPMG, an Australian partnership and a member firm of the KPMG network of independent
member firms affiliated with KPMG International, a Swiss cooperative. All rights reserved.
The KPMG logo and name are trademarks of KPMG.
Liability limited by a scheme approved under Professional Standards Legislation.
Import Export Export Industry Product
Demand Supply Demand
Motor vehicles and parts;
other transport equipment Finished trucks, truck type vehicles, utilities
and panel vans 5.20 2.50 -12.00
Motor vehicles and parts;
other transport equipment Engines nec, for motor vehicles or tractors 5.20 2.50 -12.00
Motor vehicles and parts;
other transport equipment Cranks, crank & cam shafts, gears and
flywheels (associated with the manufacture
of complete vehicles or engines)
0.00 2.50 -12.00
Motor vehicles and parts;
other transport equipment Motor vehicle and truck bodies (coachwork) 5.20 2.50 -12.00
Motor vehicles and parts;
other transport equipment Agricultural self loading and unloading semi-
trailers (incl tippers) 5.20 2.50 -12.00
Motor vehicles and parts;
other transport equipment Other semi-trailers for the transport of goods
& materials (incl tankers, vans, transporters,
stock crates & jinkers)
5.20 2.50 -12.00
Motor vehicles and parts;
other transport equipment Trailers for the transport of goods and
materials (incl box trailers, boat trailers and
horse floats)
5.20 2.50 -12.00
Motor vehicles and parts;
other transport equipment Other trailers & semi-trailers nec (excl for the
transport of goods & materials, & domestic
type camper trailers)
5.20 2.50 -12.00
Motor vehicles and parts;
other transport equipment Body panels for trucks and buses 5.20 2.50 -12.00
Motor vehicles and parts;
other transport equipment Parts nec, for motor vehicle trailers and
semi-trailers 5.20 2.50 -12.00
Motor vehicles and parts;
other transport equipment Motor vehicle and truck air conditioners 5.20 2.50 -12.00
Motor vehicles and parts;
other transport equipment Motor vehicle apparatus for making,
breaking, protecting & making connections
to/in electrical circuits (excl wiring)
5.20 2.50 -12.00
Motor vehicles and parts;
other transport equipment Motor vehicle, tractor or motor cycle starting,
heaters, demisters, windscreen wipers;
lighting/signalling equipment
5.20 2.50 -12.00
Motor vehicles and parts;
other transport equipment Motor vehicle, tractor and motor cycle
filament lamps and sealed beam lamps 5.20 2.50 -12.00
Motor vehicles and parts;
other transport equipment Motor vehicle & tractor gauges, revolution &
production counters, speed indicators,
thermostats & similar instruments
5.20 2.50 -12.00
Motor vehicles and parts;
other transport equipment Motor vehicle transmission assemblies (excl
associated with the manufacture of complete
vehicles/engines)
5.20 2.50 -12.00
Motor vehicles and parts;
other transport equipment Cylinder blocks, pistons, connecting rods,
valves (excl associated with the manufacture
of complete vehicles/engines)
5.20 2.50 -12.00
Motor vehicles and parts;
other transport equipment Fuel, lubricating or cooling medium pumps
(excl associated with the manufacture of
complete vehicles or engines)
5.20 2.50 -12.00
Motor vehicles and parts;
other transport equipment Cranks, cam shafts, gears and flywheels
(excl associated with the manufacture of
complete vehicles/engines)
5.20 2.50 -12.00
Motor vehicles and parts;
other transport equipment Motor vehicle, tractor and truck gaskets (excl
associated with the manufacture of complete
vehicles or engines)
5.20 2.50 -12.00

Department of the Treasury
The Excess Burden of Australian Taxes
March 2010
ABCD
161
© 2010 KPMG, an Australian partnership and a member firm of the KPMG network of independent
member firms affiliated with KPMG International, a Swiss cooperative. All rights reserved.
The KPMG logo and name are trademarks of KPMG.
Liability limited by a scheme approved under Professional Standards Legislation.
Import Export Export Industry Product
Demand Supply Demand
Motor vehicles and parts;
other transport equipment Motor vehicle parts and equipment nec (excl
associated with motor vehicle
manufacturing)
5.20 2.50 -12.00
Motor vehicles and parts;
other transport equipment Motor vehicle body panels 5.20 2.50 -12.00
Ships and boats Vessels, 50 tonnes gross and over (incl
floating structures) 0.50 2.50 -12.00
Ships and boats Small boats (incl rowing or sail), yachts and
canoes under 5 tonnes displacement (excl
inflatables)
0.50 2.50 -12.00
Ships and boats Boats & other vessels for pleasure & sport 5
& under 50 tonnes (excl inflatables, canoes,
surfboards/ sailboards)
0.50 2.50 -12.00
Ships and boats Cruise ships, ferry and excursion boats, and
other vessels under 50 tonnes nec for the
transport of persons and goods
0.50 2.50 -12.00
Ships and boats Repairing and servicing (2821-2822) 0.50 2.50 -12.00
Railway equipment Locomotives and trams (incl underframes);
railway rolling stock 0.50 2.50 -12.00
Railway equipment Repairing and servicing (2823) 0.50 2.50 -12.00
Aircraft Aircraft and aircraft parts (including repair &
servicing) 0.50 2.50 -12.00
Motor vehicles and parts;
other transport equipment Transport equipment, parts and accessories
nec 2.00 2.50 -12.00
Motor vehicles and parts;
other transport equipment Motor scooters and motor cycles 5.20 2.50 -12.00
Motor vehicles and parts;
other transport equipment Incomplete motor vehicles n.e.i.; Caravans,
camper trailers and similar vehicles; Vehicle
electric motors n.e.i.; Wiring harnesses for
vehicles
5.20 2.50 -12.00
Photographic and scientific
equipment Objective lenses; filters and other mounted
optical elements 0.50 2.50 -6.00
Photographic and scientific
equipment Ophthalmic instruments and appliances 0.50 2.50 -6.00
Photographic and scientific
equipment Spectacle and contact lenses 0.50 2.50 -6.00
Photographic and scientific
equipment Surgical, medical equipment and appliances
(incl artificial joints, limbs or eyes,
pacemakers & needles or syringes)
0.50 2.50 -6.00
Photographic and scientific
equipment Watches (incl metal watch straps), watch
cases, clocks and parts 0.50 2.50 -6.00
Photographic and scientific
equipment X-ray equipment and parts or accessories 0.50 2.50 -6.00
Photographic and scientific
equipment Demonstrational (other than suitable for
other purposes) instruments, apparatus and
models
0.50 2.50 -6.00
Photographic and scientific
equipment Surveying, physical or chemical analysis and
other measuring, checking and testing
instruments, appliances and parts
0.50 2.50 -6.00
Photographic and scientific
equipment Other photographic and scientific equipment
n.e.i. 0.50 2.50 -6.00

Department of the Treasury
The Excess Burden of Australian Taxes
March 2010
ABCD
162
© 2010 KPMG, an Australian partnership and a member firm of the KPMG network of independent
member firms affiliated with KPMG International, a Swiss cooperative. All rights reserved.
The KPMG logo and name are trademarks of KPMG.
Liability limited by a scheme approved under Professional Standards Legislation.
Import Export Export Industry Product
Demand Supply Demand
Electronic equipment Photocopying machines and parts 1.90 2.50 -6.00
Electronic equipment Electronic machines with a calculating
device (incl cash registers, postage-franking
& ticket machines) & parts
1.90 2.50 -6.00
Electronic equipment Other data processing machine parts and
accessories (excl carrying case and covers) 1.90 2.50 -6.00
Electronic equipment Typewriters, word processors, addressing
machines, EFTPOS machines, coin counting
machines and other office machinery
1.90 2.50 -6.00
Electronic equipment Money-changing, cigarette, food, beverage
and other automatic goods vending
machines
1.90 2.50 -6.00
Electronic equipment Office machines, parts and accessories nec 1.90 2.50 -6.00
Electronic equipment Electrical line, telephone and telegraph
equipment (excl headphones) 1.90 2.50 -12.00
Electronic equipment Telecommunication equipment parts 1.90 2.50 -12.00
Electronic equipment Television receiving sets 1.90 2.50 -12.00
Electronic equipment Radio receiving sets (incl car radios and
clock radios) 1.90 2.50 -12.00
Electronic equipment Record playing (excl coin or disc operated),
sound and video recording and reproducing
equipment
1.90 2.50 -12.00
Electronic equipment Other audio and video equipment and parts
and accessories 1.90 2.50 -12.00
Electronic equipment Static converters (incl rectifiers) 1.90 2.50 -12.00
Electronic equipment Electric or electronic alarm systems and
parts 1.90 2.50 -12.00
Electronic equipment Electronic equipment and parts nec 1.90 2.50 -12.00
Electronic equipment Other electronic equipment n.e.i. 1.90 2.50 -12.00
Household appliances Domestic gas, solid fuel, oil or spirit fired
stoves, ovens and ranges 1.60 2.50 -12.00
Household appliances Domestic refrigerators and freezers 1.60 2.50 -12.00
Household appliances Domestic room air conditioners and coolers
(excl fans) 1.60 2.50 -12.00
Household appliances Compressors for refrigerating and air
conditioning equipment 1.60 2.50 -12.00
Household appliances Domestic fans (incl table, floor, wall, window,
ceiling or roof) 1.60 2.50 -12.00
Household appliances Sewing machines, vacuum cleaners, floor
polishers, food mixers & other electro-
mechanical domestic appliances & parts
1.60 2.50 -12.00
Household appliances Electric water heaters or hot water systems
and parts 1.60 2.50 -12.00
Household appliances Other household appliances n.e.i. 1.60 2.50 -12.00
Other electrical equipment Uninsulated copper and aluminium stranded
wire, ropes, cables, plaited bands and slings 0.84 2.50 -12.00
Other electrical equipment Co-axial cable and other co-axial electric
conductors 0.84 2.50 -12.00

Department of the Treasury
The Excess Burden of Australian Taxes
March 2010
ABCD
163
© 2010 KPMG, an Australian partnership and a member firm of the KPMG network of independent
member firms affiliated with KPMG International, a Swiss cooperative. All rights reserved.
The KPMG logo and name are trademarks of KPMG.
Liability limited by a scheme approved under Professional Standards Legislation.
Import Export Export Industry Product
Demand Supply Demand
Other electrical equipment Cable (excl co-axial or insulated optical
fibre), wire and strip 0.84 2.50 -12.00
Other electrical equipment Insulated optical fibre cable 0.84 2.50 -12.00
Other electrical equipment Other wet cell batteries (excl automotive) 0.84 2.50 -12.00
Other electrical equipment Electric light or lamp bulbs or tubes (incl
filament or fluorescent) (excl automotive) 0.84 2.50 -12.00
Other electrical equipment Incandescent light fittings 0.84 2.50 -12.00
Other electrical equipment Ultra-violet or infra-red apparatus (excl
sealed beam lamp units and units for ultra-
violet or infra-red lamps)
0.84 2.50 -12.00
Other electrical equipment Cold, discharge, arc (excl units for arc
lamps) and other electric lights, torches and
fittings nec (excl automotive)
0.84 2.50 -12.00
Other electrical equipment Illuminated signs, name-plates and sign-
plates having a permanently fixed light
source
0.84 2.50 -12.00
Other electrical equipment Transformers 0.84 2.50 -12.00
Other electrical equipment Electric motors and generators (exclude
automotive) 0.84 2.50 -12.00
Other electrical equipment Electrical welding (incl arc) base metal wire,
rods, tubes, plates and electrodes 0.84 2.50 -12.00
Other electrical equipment Electrical apparatus to switch,
protect/connect circuits (incl boards &
cabinets equipped with such)(excl inductors)
0.84 2.50 -12.00
Other electrical equipment Fluxes and other preparations (incl pickling
preparations, powders and pastes) for
soldering, brazing or welding
0.84 2.50 -12.00
Other electrical equipment Inductors (incl chokes, ballasts used with
lighting apparatus and current limiting
regulators)
0.84 2.50 -12.00
Other electrical equipment Electric motor and generator parts 0.84 2.50 -12.00
Other electrical equipment Electric soldering and welding (incl arc)
irons, guns and other machines, apparatus
and parts
0.84 2.50 -12.00
Other electrical equipment Industrial or laboratory electric furnaces and
ovens 0.84 2.50 -12.00
Other electrical equipment Electric heating resistors (excl carbon) 0.84 2.50 -12.00
Other electrical equipment Mechanical (incl electro-mechanical)
signalling, safety or traffic control equipment;
railway or tramway fixtures
0.84 2.50 -12.00
Other electrical equipment Electrical insulators nec and other electrical
equipment and parts nec 0.84 2.50 -12.00
Other electrical equipment Other electrical equipment n.e.i. 0.84 2.50 -12.00
Agricultural, mining and
construction machinery,
lifting and material handling
equipment
Ploughing, seeding and planting equipment
and parts (excl hand tools) 0.50 2.50 -12.00
Agricultural, mining and
construction machinery,
lifting and material handling
Harvesting, threshing and haymaking
machinery (incl straw or fodder balers or
agricultural mowers)
0.50 2.50 -12.00

Department of the Treasury
The Excess Burden of Australian Taxes
March 2010
ABCD
164
© 2010 KPMG, an Australian partnership and a member firm of the KPMG network of independent
member firms affiliated with KPMG International, a Swiss cooperative. All rights reserved.
The KPMG logo and name are trademarks of KPMG.
Liability limited by a scheme approved under Professional Standards Legislation.
Import Export Export Industry Product
Demand Supply Demand
equipment
Agricultural, mining and
construction machinery,
lifting and material handling
equipment
Agricultural wheeled tractors (excl crawler) 0.50 2.50 -12.00
Agricultural, mining and
construction machinery,
lifting and material handling
equipment
Agricultural or horticultural mechanical
appliances & parts for projecting, dispersing
or spraying liquids or powders
0.50 2.50 -12.00
Agricultural, mining and
construction machinery,
lifting and material handling
equipment
Other machines and parts for projecting
liquids and powders (excl industrial spray
guns and steam blasting)
0.50 2.50 -12.00
Agricultural, mining and
construction machinery,
lifting and material handling
equipment
Dairy machinery 0.50 2.50 -12.00
Agricultural, mining and
construction machinery,
lifting and material handling
equipment
Agricultural and horticultural machinery and
parts nec 0.50 2.50 -12.00
Agricultural, mining and
construction machinery,
lifting and material handling
equipment
Construction and earthmoving wheeled
tractors 0.50 2.50 -12.00
Agricultural, mining and
construction machinery,
lifting and material handling
equipment
Front end shovel loaders; mechanical
shovels, excavators & shovel loaders with a
360 degree revolving superstructure
0.50 2.50 -12.00
Agricultural, mining and
construction machinery,
lifting and material handling
equipment
Bulldozers & other moving, grading,
scraping, excavating, compacting or
extracting construction machinery nec
0.50 2.50 -12.00
Agricultural, mining and
construction machinery,
lifting and material handling
equipment
Bodies and cabs for construction vehicles 0.50 2.50 -12.00
Agricultural, mining and
construction machinery,
lifting and material handling
equipment
Buckets, shovels, grabs, grips, blades and
other construction and earthmoving
machinery parts
0.50 2.50 -12.00
Agricultural, mining and
construction machinery,
lifting and material handling
equipment
Machinery for crushing, grinding, mixing or
kneading earth, stones, ores or other mineral
substances in solid form
0.50 2.50 -12.00
Agricultural, mining and
construction machinery,
lifting and material handling
equipment
Mineral substances sorting, screening,
separating, washing, mixing or kneading
machinery and parts
0.50 2.50 -12.00
Agricultural, mining and
construction machinery,
lifting and material handling
equipment
Mining or drilling machinery and parts (incl
coal or rock cutters, boring, sinking or
tunnelling machinery)
0.50 2.50 -12.00
Other machinery and
equipment Non-domestic cooking or heating machinery
for food or drinks 0.50 2.50 -12.00

Department of the Treasury
The Excess Burden of Australian Taxes
March 2010
ABCD
165
© 2010 KPMG, an Australian partnership and a member firm of the KPMG network of independent
member firms affiliated with KPMG International, a Swiss cooperative. All rights reserved.
The KPMG logo and name are trademarks of KPMG.
Liability limited by a scheme approved under Professional Standards Legislation.
Import Export Export Industry Product
Demand Supply Demand
Other machinery and
equipment Cream separators; bakery machinery (excl
ovens) and other food and beverage
processing machinery and parts
0.50 2.50 -12.00
Other machinery and
equipment Distilling/rectifying plant; heat exchange
units; centrifuges nec; gas liquefying or
beverages filtering machinery
0.50 2.50 -12.00
Other machinery and
equipment Machinery for can and bottle washing,
packing, wrapping, canning, bottling and
sealing of food and drink
0.50 2.50 -12.00
Other machinery and
equipment Other food and beverage processing
machinery and parts n.e.c. 0.50 2.50 -12.00
Other machinery and
equipment Gas welding and cutting equipment (excl
filler welding rods) 0.50 2.50 -12.00
Other machinery and
equipment Converters, ingot moulds and ladles, casting
machines, metal-rolling mills and rolls and
parts
0.50 2.50 -12.00
Other machinery and
equipment Machining centres & other wood & metal
working machinery & parts nec (excl saw
blades, metal moulds & dies)
0.50 2.50 -12.00
Other machinery and
equipment Metal dies, die sets and moulds 0.50 2.50 -12.00
Other machinery and
equipment Metal work and tool holders, heads for
machine tools, and other machine tool
accessories and parts
0.50 2.50 -12.00
Agricultural, mining and
construction machinery,
lifting and material handling
equipment
Wheeled tractors (excl crawler, agricultural,
construction and earthmoving) 0.50 2.50 -12.00
Agricultural, mining and
construction machinery,
lifting and material handling
equipment
Conveyors, continuous-action, for goods &
materials (excl those specially designed for
underground use)
0.50 2.50 -12.00
Agricultural, mining and
construction machinery,
lifting and material handling
equipment
Hoists, cranes and other lifting, loading or
unloading machinery 0.50 2.50 -12.00
Agricultural, mining and
construction machinery,
lifting and material handling
equipment
Materials handling equipment parts nec 0.50 2.50 -12.00
Agricultural, mining and
construction machinery,
lifting and material handling
equipment
Other agricultural, mining and construction
machinery, lifting and material handling
equipment n.e.i.
0.50 2.50 -12.00
Other machinery and
equipment Pumps and pumping machinery (incl petrol
bowsers and air or gas compressors) 0.50 2.50 -12.00
Other machinery and
equipment Pump and compressor parts nec 0.50 2.50 -12.00
Other machinery and
equipment Complete air conditioning units nec (incl
packaged units, ducting etc) 0.50 2.50 -12.00
Other machinery and
equipment Space heating equipment nec (incl parts) 0.50 2.50 -6.00
Other machinery and Hydraulic and pneumatic motors and parts 0.50 2.50 -12.00

Department of the Treasury
The Excess Burden of Australian Taxes
March 2010
ABCD
166
© 2010 KPMG, an Australian partnership and a member firm of the KPMG network of independent
member firms affiliated with KPMG International, a Swiss cooperative. All rights reserved.
The KPMG logo and name are trademarks of KPMG.
Liability limited by a scheme approved under Professional Standards Legislation.
Import Export Export Industry Product
Demand Supply Demand
equipment
Other machinery and
equipment Industrial machinery and parts for textile
manufacture and treatment industries (excl
industrial sewing machines)
0.50 2.50 -12.00
Other machinery and
equipment Office type sheet fed printing machinery,
accessories and parts 0.50 2.50 -12.00
Other machinery and
equipment Printing machinery and parts 0.50 2.50 -12.00
Other machinery and
equipment Machine-tools for working materials other
than metal, wood; laser machine tools; hand
tools with self-contained motor
0.50 2.50 -12.00
Other machinery and
equipment Preparing or making up tobacco machinery
and parts; bakery and biscuit ovens; dryers
for agricultural products
0.50 2.50 -12.00
Other machinery and
equipment Other textile, apparel and leather production
machinery and parts nec (incl industrial
sewing machines)
0.50 2.50 -12.00
Other machinery and
equipment Non-electric industrial and laboratory
furnaces, ovens (other than bakery or
biscuit) and incinerators and parts
0.50 2.50 -12.00
Other machinery and
equipment Dishwashing machines other than household 0.50 2.50 -12.00
Other machinery and
equipment Engines nec, turbines and water wheels and
parts 0.50 2.50 -12.00
Other machinery and
equipment Motorised tanks and other armoured fighting
vehicles and parts 0.50 2.50 -12.00
Other machinery and
equipment Roundabouts, swings, shooting galleries and
fairground amusements 0.50 2.50 -12.00
Other machinery and
equipment Oil filters, petrol filters and air intake filters
for internal combustion engines 0.50 2.50 -12.00
Other machinery and
equipment Industrial machinery and equipment nec 0.50 2.50 -12.00
Other machinery and
equipment Parts for centrifuges (incl centrifugal dryers);
parts for liquid or gas filtering or purifying
machinery
0.50 2.50 -12.00
Other machinery and
equipment Parts for hand tools with self-contained non-
electric motors 0.50 2.50 -12.00
Other machinery and
equipment Parts for industrial dryers or for rubber,
plastics/hot glass working machines; special
purpose machinery & parts nec
0.50 2.50 -12.00
Other machinery and
equipment Parts nec for industrial spray guns, rolling
(excl for metals or glass) and other industrial
machinery and equipment
0.50 2.50 -12.00
Other machinery and
equipment Repairing and servicing (2863-2864, 2866-
2867, 2869) 0.50 2.50 -12.00
Other machinery and
equipment Other machinery and equipment n.e.i. 0.50 2.50 -12.00
Prefabricated buildings Complete prefabricated metal or metal
framed (other than aluminium) buildings and
other transportable buildings
1.50 2.50 -12.00
Prefabricated buildings Prefabricated and transportable buildings 2.30 2.50 -12.00

Department of the Treasury
The Excess Burden of Australian Taxes
March 2010
ABCD
167
© 2010 KPMG, an Australian partnership and a member firm of the KPMG network of independent
member firms affiliated with KPMG International, a Swiss cooperative. All rights reserved.
The KPMG logo and name are trademarks of KPMG.
Liability limited by a scheme approved under Professional Standards Legislation.
Import Export Export Industry Product
Demand Supply Demand
nec
Furniture Complete and assembled domestic seating 2.30 2.50 -12.00
Furniture Complete and assembled wooden or
predominantly wooden domestic furniture
(excl seating)
2.30 2.50 -12.00
Furniture Complete and assembled wooden or
predominantly wooden non-domestic
furniture nec
2.30 2.50 -12.00
Furniture Complete and assembled non-domestic
seats (excl wooden, predominantly wooden
or sheet metal)
2.30 2.50 -12.00
Furniture Unassembled or partly assembled wooden
furniture or shelving and parts 2.30 2.50 -12.00
Furniture Parts of passenger transport seats 2.30 2.50 -12.00
Furniture Unassembled large scale sheet metal
storage structures and shelving 2.30 2.50 -12.00
Furniture Sheet metal medical, dental, surgical or
veterinary furniture 2.30 2.50 -12.00
Furniture Sheet metal office or desk equipment other
than furniture 2.30 2.50 -12.00
Furniture Other sheet metal furniture nec (incl parts) 2.30 2.50 -12.00
Furniture Mattress supports (excl unupholstered
woven wire, link mesh, wire springs and
those of or stuffed with rubber)
2.30 2.50 -12.00
Furniture Mattresses (excl water-mattresses and those
of or stuffed with rubber) 2.30 2.50 -12.00
Furniture Pillows, cushions, bolsters, bean bags and
stuffed mattress protectors (excl those of or
stuffed with rubber)
2.30 2.50 -12.00
Furniture Water mattresses 2.30 2.50 -12.00
Furniture Base metal office or desk equipment other
than furniture (excl sheet metal) 2.30 2.50 -12.00
Furniture Complete and assembled metal or
predominantly metal (other than sheet metal)
domestic furniture (excl seating)
2.30 2.50 -12.00
Furniture Complete and assembled other domestic
furniture not elsewhere specified (excl
wooden or metal)
2.30 2.50 -12.00
Furniture Other medical, dental, surgical or veterinary
furniture and parts (other than sheet metal) 2.30 2.50 -12.00
Furniture Other complete and assembled non-
domestic furniture nec 2.30 2.50 -12.00
Furniture Unassembled large scale fabricated metal
storage structures and shelving (other than
sheet metal)
2.30 2.50 -12.00
Furniture Unassembled or partly assembled furniture
and parts nec (excl wood and sheet metal) 2.30 2.50 -12.00
Furniture Other furniture n.e.i. 2.30 2.50 -12.00
Other manufacturing Badges, coins and medals, sheet metal 2.00 2.50 -12.00

Department of the Treasury
The Excess Burden of Australian Taxes
March 2010
ABCD
168
© 2010 KPMG, an Australian partnership and a member firm of the KPMG network of independent
member firms affiliated with KPMG International, a Swiss cooperative. All rights reserved.
The KPMG logo and name are trademarks of KPMG.
Liability limited by a scheme approved under Professional Standards Legislation.
Import Export Export Industry Product
Demand Supply Demand
Other manufacturing Imitation jewellery (excl incorporating
precious metal except as plating or as minor
constituents)(excl watch straps)
2.00 2.50 -12.00
Other manufacturing Toys (excl fur or leather) 2.00 2.50 -12.00
Other manufacturing Other articles for funfair or table games (incl
billiards, snooker or pool, pintables articles
and accessories)
2.00 2.50 -12.00
Other manufacturing Sporting equipment and accessories (incl
fishing gear and gloves specially designed
for use in sport)
2.00 2.50 -12.00
Other manufacturing Paint brushes or rollers, accessories and
parts 2.00 2.50 -12.00
Other manufacturing Hair brushes, nail brushes, toothbrushes
(excl electric) and other brushes for personal
use
2.00 2.50 -12.00
Other manufacturing Advertising signs, name-plates and sign-
plates (excl electric) 2.00 2.50 -12.00
Other manufacturing Umbrellas 2.00 2.50 -12.00
Other manufacturing Musical instruments (incl parts and
accessories) 2.00 2.50 -12.00
Other manufacturing Metal (other than precious) statuettes and
other ornaments 2.00 2.50 -12.00
Other manufacturing Manufacturing nec 2.00 2.50 -12.00
Other manufacturing Jewellery and other articles of precious
metal; Writing implements; Other floor
covering of hard fibre
2.00 2.50 -12.00
Electricity supply Electricity 0.00 2.50 -12.00
Gas supply Margin - gas distribution n/a 2.50 -12.00
Water supply; sewerage and
drainage services Water, sewerage and drainage 0.00 2.50 -12.00
Residential building
construction Residential building construction (4111,
4112) n/a 2.50 -12.00
Residential building
construction Repair and maintenance of residential
buildings (4111, 4112) n/a 2.50 -12.00
Other construction Non-residential building construction (4113) n/a 2.50 -12.00
Other construction Repair and maintenance of non-residential
buildings (4113) 0.00 2.50 -12.00
Other construction Road and bridge construction (excl repair
and maintenance) (4121) n/a 2.50 -12.00
Other construction Road and bridge repair and maintenance
(4121) n/a 2.50 -12.00
Other construction Non-building construction nec (4122) n/a 2.50 -12.00
Other construction Repair and maintenance of non-building
construction nec (4122) n/a 2.50 -12.00
Construction trade services Trade services repair and maintenance n/a 2.50 -12.00
Construction trade services Other construction trade services n/a 2.50 -12.00
Wholesale trade Margin - wholesaling services n/a 2.50 -12.00
Wholesale trade Non-margin - wholesaling services (excl n/a 2.50 -12.00

Department of the Treasury
The Excess Burden of Australian Taxes
March 2010
ABCD
169
© 2010 KPMG, an Australian partnership and a member firm of the KPMG network of independent
member firms affiliated with KPMG International, a Swiss cooperative. All rights reserved.
The KPMG logo and name are trademarks of KPMG.
Liability limited by a scheme approved under Professional Standards Legislation.
Import Export Export Industry Product
Demand Supply Demand
repairing and servicing)
Wholesale trade Wholesale commission on sales n/a 2.50 -12.00
Wholesale mechanical
repairs Tractors, agricultural or construction
machinery repairing and servicing (4611
part)
n/a 2.50 -12.00
Wholesale mechanical
repairs Car audio repairs n/a 2.50 -12.00
Other wholesale repairs Business machines and equipment repairing
and servicing (4613 part, 4614 part, 4615
part)
0.00 2.50 -12.00
Other wholesale repairs Wholesale repairing and servicing nec (4539
part, 4612 part, 4619 part, 47 part) n/a 2.50 -12.00
Retail trade Margin - retailing services n/a 2.50 -12.00
Retail trade Non-margin - retailing services (excl
repairing and servicing) n/a 2.50 -12.00
Retail trade Takeaway food 0.00 2.50 -12.00
Retail trade Retail commission on sales (new) n/a 2.50 -12.00
Retail mechanical repairs Motor vehicle, outboard motor and lawn
mower repairing and servicing 0.00 2.50 -12.00
Other retail repairs Household electrical appliances repairing
and servicing (5261 part) n/a 2.50 -12.00
Other retail repairs Retail repairing and servicing nec (52 part) n/a 2.50 -12.00
Accommodation, cafes and
restaurants Margin - restaurant, hotel and licensed club
services (5720 part, 5730 part, 5740 part) n/a 2.50 -12.00
Accommodation, cafes and
restaurants Meal preparation and presentation (5730
part, 5740 part) 0.00 2.50 -12.00
Accommodation, cafes and
restaurants Accommodation services (5710) 0.00 2.50 -12.00
Accommodation, cafes and
restaurants Net losses from gambling - clubs n/a 2.50 -12.00
Road transport Margin - road freight transport services n/a 2.50 -12.00
Road transport Non-margin - road freight transport n/a 2.50 -12.00
Road transport Bus and tramway transport services 0.00 2.50 -12.00
Road transport Road passenger transport services nec 0.00 2.50 -12.00
Rail, pipeline and other
transport Margin - railway freight transport services n/a 2.50 -12.00
Rail, pipeline and other
transport Non-margin - railway freight transport
services nec n/a 2.50 -12.00
Rail, pipeline and other
transport Railway passenger transport services 0.00 2.50 -12.00
Water transport Margin - ocean and inland water freight
transport services n/a 2.50 -12.00
Water transport Water transport n.e.i. 0.50 0.50 -12.00
Air and space transport Margin - air freight transport services n/a 2.50 -12.00
Air and space transport Air and space transport n.e.i. (excl margin) 2.00 2.50 -12.00
Rail, pipeline and other Margin - pipeline transport services n/a 2.50 -12.00

Department of the Treasury
The Excess Burden of Australian Taxes
March 2010
ABCD
170
© 2010 KPMG, an Australian partnership and a member firm of the KPMG network of independent
member firms affiliated with KPMG International, a Swiss cooperative. All rights reserved.
The KPMG logo and name are trademarks of KPMG.
Liability limited by a scheme approved under Professional Standards Legislation.
Import Export Export Industry Product
Demand Supply Demand
transport
Rail, pipeline and other
transport Transport services nec n/a 2.50 -12.00
Services to transport; storage Parking services n/a 2.50 -12.00
Services to transport; storage Services to road transport nec n/a 2.50 -12.00
Services to transport; storage Margin - services to water transport (6621-
6629) n/a 2.50 -12.00
Services to transport; storage Travel and tourist agency services n/a 2.50 -12.00
Services to transport; storage Road freight forwarding n/a 2.50 -12.00
Services to transport; storage Forwarding agency services (excl road
freight forwarding) n/a 2.50 -12.00
Services to transport; storage Customs agency services; services to
transport nec (6644, 6649) n/a 2.50 -12.00
Services to transport; storage Storage n/a 2.50 -12.00
Services to transport; storage Services to transport n.e.i. 0.00 2.50 -12.00
Communication services Postal services 0.00 2.50 -12.00
Communication services Courier services n/a 2.50 -12.00
Communication services Domestic telecommunication services 0.00 2.50 -12.00
Communication services Overseas telecommunication services 0.00 2.50 -12.00
Banking Bank services - Financial intermediation
services indirectly measured 0.00 2.50 -12.00
Banking Bank services nec 0.00 2.50 -12.00
Non-bank finance Building society services - Financial
intermediation services indirectly measured n/a 2.50 -12.00
Non-bank finance Building society services nec n/a 2.50 -12.00
Non-bank finance Credit union services - Financial
intermediation services indirectly measured n/a 2.50 -12.00
Non-bank finance Credit union services nec n/a 2.50 -12.00
Non-bank finance Money market corporations - Financial
intermediation services indirectly measured n/a 2.50 -12.00
Non-bank finance Money market corporations - explicit charges n/a 2.50 -12.00
Non-bank finance Finance services - Financial intermediation
services indirectly measured n/a 2.50 -12.00
Non-bank finance Finance services nec 0.00 2.50 -12.00
Non-bank finance Financial asset investors n/a 2.50 -12.00
Insurance Life insurance and superannuation fund
services (7411-7412) n/a 2.50 -12.00
Insurance Health insurance services n/a 2.50 -12.00
Insurance Fire and industrial special risks insurance
services 0.00 2.50 -12.00
Insurance Houseowner and household insurance
services n/a 2.50 -12.00
Insurance Motor vehicle comprehensive and
compulsory third party insurance services n/a 2.50 -12.00

Department of the Treasury
The Excess Burden of Australian Taxes
March 2010
ABCD
171
© 2010 KPMG, an Australian partnership and a member firm of the KPMG network of independent
member firms affiliated with KPMG International, a Swiss cooperative. All rights reserved.
The KPMG logo and name are trademarks of KPMG.
Liability limited by a scheme approved under Professional Standards Legislation.
Import Export Export Industry Product
Demand Supply Demand
Insurance Public liability, product liability and
professional indemnity insurance services n/a 2.50 -12.00
Insurance Margin - marine insurance services n/a 2.50 -12.00
Insurance Non-margin - marine insurance services;
aviation hull/cargo insurance n/a 2.50 -12.00
Insurance Travel insurance services n/a 2.50 -12.00
Insurance Employers liability insurance services n/a 2.50 -12.00
Insurance Insurance services nec. 0.00 2.50 -12.00
Services to finance,
investment and insurance Security broking and dealing services 0.00 2.50 -12.00
Services to finance,
investment and insurance Services to finance and investment nec (incl
imputed charge) 0.00 2.50 -12.00
Services to finance,
investment and insurance Services to insurance n/a 2.50 -12.00
Ownership of dwellings Ownership of dwellings 0.00 2.50 -12.00
Other property services Property operator and developer services 0.00 2.50 -12.00
Other property services Real estate agent services 0.00 2.50 -12.00
Other property services Agricultural or pastoral property broking,
leasing, renting or valuing n/a 2.50 -12.00
Other property services Non-financial asset investors n/a 2.50 -12.00
Other property services Motor vehicle hire 0.00 2.50 -12.00
Other property services Ship and boat leasing or hire (except on a
financial lease basis) n/a 2.50 -12.00
Other property services Caravan, car trailer, box trailer or horse
trailer hire 0.00 2.50 -12.00
Other property services Transport equipment leasing nec n/a 2.50 -12.00
Other property services Plant leasing, hiring and renting services nec 0.00 2.50 -12.00
Scientific research, technical
and computer services Research services 0.00 2.50 -12.00
Scientific research, technical
and computer services Architectural services 0.00 2.50 -12.00
Scientific research, technical
and computer services Quantity surveying services 0.00 2.50 -12.00
Scientific research, technical
and computer services Meteorology services n/a 2.50 -12.00
Scientific research, technical
and computer services Technical services nec 0.00 2.50 -12.00
Scientific research, technical
and computer services Data processing services 0.00 2.50 -12.00
Scientific research, technical
and computer services Information storage and retrieval 0.00 2.50 -12.00
Scientific research, technical
and computer services Computer maintenance services 0.00 2.50 -12.00
Scientific research, technical
and computer services Computer consultancy services 0.00 2.50 -12.00
Scientific research, technical Scientific research, technical and computer 0.00 2.50 -12.00

Department of the Treasury
The Excess Burden of Australian Taxes
March 2010
ABCD
172
© 2010 KPMG, an Australian partnership and a member firm of the KPMG network of independent
member firms affiliated with KPMG International, a Swiss cooperative. All rights reserved.
The KPMG logo and name are trademarks of KPMG.
Liability limited by a scheme approved under Professional Standards Legislation.
Import Export Export Industry Product
Demand Supply Demand
and computer services services n.e.i.
Legal, accounting, marketing
and business management
services
Legal services 0.00 2.50 -12.00
Legal, accounting, marketing
and business management
services
Accounting services 0.00 2.50 -12.00
Legal, accounting, marketing
and business management
services
Advertising services 0.00 2.50 -12.00
Legal, accounting, marketing
and business management
services
Commercial art and display services n/a 2.50 -12.00
Legal, accounting, marketing
and business management
services
Market research services 0.00 2.50 -12.00
Legal, accounting, marketing
and business management
services
Business administrative services 0.00 2.50 -12.00
Legal, accounting, marketing
and business management
services
Business management services 0.00 2.50 -12.00
Other business services Employment placement and contract staff
services (excl casting agency service) n/a 2.50 -12.00
Other business services Typing, copying and mailing services n/a 2.50 -12.00
Other business services Security and investigative services (except
police) 0.00 2.50 -12.00
Other business services Pest control services n/a 2.50 -12.00
Other business services Contract packing services nec n/a 2.50 -12.00
Other business services Collecting and credit reporting services n/a 2.50 -12.00
Other business services Other business services n.e.i. 0.00 2.50 -12.00
Government administration Federal government administrative services n/a 2.50 -12.00
Government administration State government administrative services n/a 2.50 -12.00
Government administration Local government administrative services n/a 2.50 -12.00
Government administration Judicial services n/a 2.50 -12.00
Defence Defence services n/a 2.50 -12.00
Education School, post-school and educational
services nec 0.00 2.50 -12.00
Health services Hospital and nursing home services 0.00 2.50 -12.00
Health services Medical services (8621, 8622, 8631) 0.00 2.50 -12.00
Health services Dental services 0.00 2.50 -12.00
Health services Optometry and optical dispensing; health
services nec (8632, 8635, 8636, 8639) n/a 2.50 -12.00
Health services Ambulance services 0.00 2.50 -12.00
Health services Community health centre services (medical
and paramedical) n/a 2.50 -12.00
Health services Veterinary services 0.00 2.50 -12.00

Department of the Treasury
The Excess Burden of Australian Taxes
March 2010
ABCD
173
© 2010 KPMG, an Australian partnership and a member firm of the KPMG network of independent
member firms affiliated with KPMG International, a Swiss cooperative. All rights reserved.
The KPMG logo and name are trademarks of KPMG.
Liability limited by a scheme approved under Professional Standards Legislation.
Import Export Export Industry Product
Demand Supply Demand
Community services Child care services 0.00 2.50 -12.00
Community services Community care services (8721, 8722,
8729) n/a 2.50 -12.00
Motion picture, radio and
television services Motion picture production n/a 2.50 -12.00
Motion picture, radio and
television services Film hiring services n/a 2.50 -12.00
Motion picture, radio and
television services Motion picture theatre services 0.00 2.50 -12.00
Motion picture, radio and
television services Radio and television station services (9121-
9122) 0.00 2.50 -12.00
Motion picture, radio and
television services Pay TV n/a 2.50 -12.00
Libraries, museums and the
arts Library, museum and art gallery services 0.00 2.50 -12.00
Libraries, museums and the
arts Zoological and botanical services 0.00 2.50 -12.00
Libraries, museums and the
arts Recreational parks and gardens operation n/a 2.50 -12.00
Libraries, museums and the
arts Music and theatre production operation 0.00 2.50 -12.00
Libraries, museums and the
arts Sound recording studios operation 0.00 2.50 -12.00
Libraries, museums and the
arts Performing arts venue operation 0.00 2.50 -12.00
Libraries, museums and the
arts Casting agency operation n/a 2.50 -12.00
Libraries, museums and the
arts Services to the arts nec n/a 2.50 -12.00
Libraries, museums and the
arts Libraries, museums and the arts n.e.i. 0.00 2.50 -12.00
Sport, gambling and
recreational services Horse and dog racing operation 0.00 2.50 -12.00
Sport, gambling and
recreational services Sports grounds and similar facilities
operation nec n/a 2.50 -12.00
Sport, gambling and
recreational services Ski slope and similar services n/a 2.50 -12.00
Sport, gambling and
recreational services Sports and services to sports nec n/a 2.50 -12.00
Sport, gambling and
recreational services Lottery operation 0.00 2.50 -12.00
Sport, gambling and
recreational services Casinos operation 0.00 2.50 -12.00
Sport, gambling and
recreational services Gambling services nec 0.00 2.50 -12.00
Sport, gambling and
recreational services Totalisator agency services 0.00 2.50 -12.00
Sport, gambling and
recreational services Recreation services nec 0.00 2.50 -12.00

Department of the Treasury
The Excess Burden of Australian Taxes
March 2010
ABCD
174
© 2010 KPMG, an Australian partnership and a member firm of the KPMG network of independent
member firms affiliated with KPMG International, a Swiss cooperative. All rights reserved.
The KPMG logo and name are trademarks of KPMG.
Liability limited by a scheme approved under Professional Standards Legislation.
Import Export Export Industry Product
Demand Supply Demand
Personal services Television and video hire n/a 2.50 -12.00
Personal services Personal and household goods hiring nec n/a 2.50 -12.00
Personal services Laundry and dry-cleaning services 0.00 2.50 -12.00
Personal services Photographic film processing 0.00 2.50 -12.00
Personal services Photography services nec n/a 2.50 -12.00
Personal services Funeral directing services n/a 2.50 -12.00
Personal services Crematoria and cemetery services 0.00 2.50 -12.00
Personal services Hairdressing and beauty salon services 0.00 2.50 -12.00
Personal services Personal services nec 0.00 2.50 -12.00
Other services Religious organisations n/a 2.50 -12.00
Other services Services to students at post-secondary
institutions by their sports and student
unions
n/a 2.50 -12.00
Other services Police services n/a 2.50 -12.00
Other services Other services n.e.i. 0.00 2.50 -12.00
Personal services Domestic services of private household
employees n/a 2.50 -12.00
