Microsoft CBE_Survey_betterBricks CBE 10 Lehrer2006 Better Bricks POE
User Manual: CBE-10
Open the PDF directly: View PDF ![]() .
.
Page Count: 41

LEED Post-Occupancy Evaluation:
Taking Responsibility for the Occupants November 1-2, 2006
Center for the Built Environment (CBE) 1
CENTER FOR THE BUILT ENVIRONMENT – UC BERKELEY
LEEDTM Post-Occupancy Evaluation:
Taking Responsibility for the
Occupants
David Lehrer
CBE Director of Communications
Better Bricks,
USGBC/CGBC Cascadia Chapter
Portland, November 1 2006
Seattle, November 2 2006
Today’s talk
About the Center for the Built Environment (CBE)
Tour of the Occupant Indoor Environmental Quality
(IEQ) Satisfaction Survey
Recent analysis and findings
Acoustics
Thermal comfort and air quality
LEED IEQ
Case studies
Examples of POE studies using the survey
Update on LEED and surveys
Wrap-up & discussion
LEED Post-Occupancy Evaluation:
Taking Responsibility for the Occupants November 1-2, 2006
Center for the Built Environment (CBE) 2
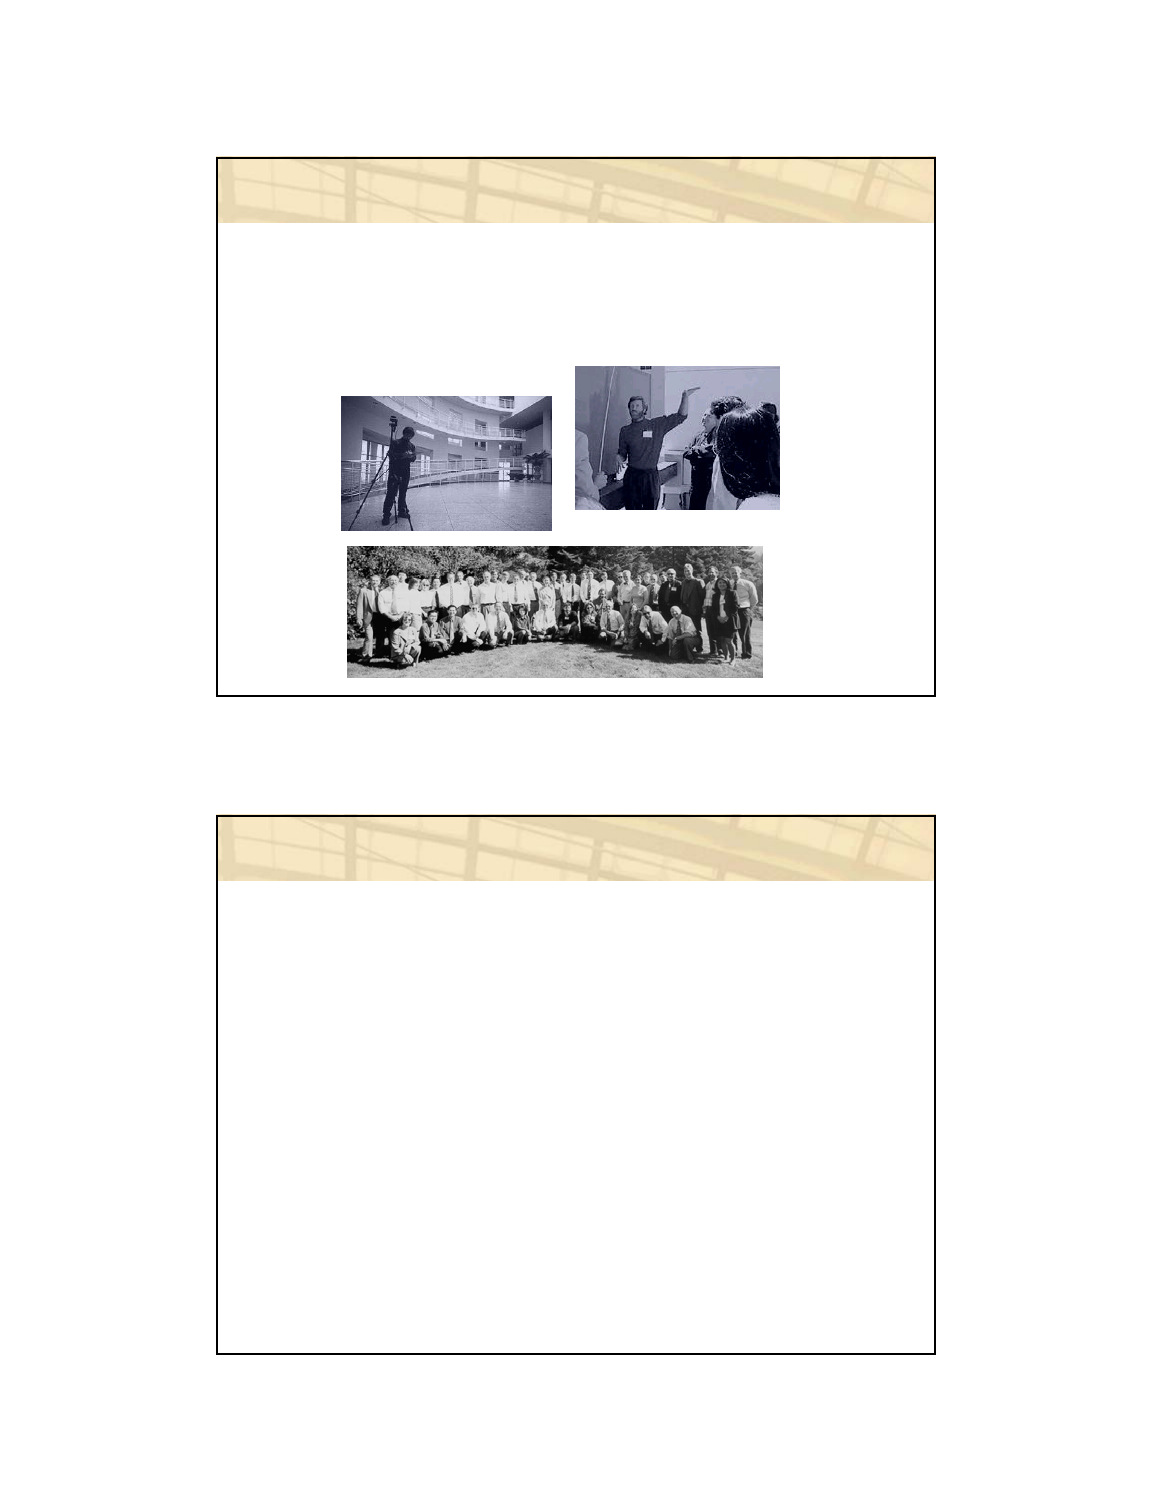
Center for the Built Environment (CBE)
Our Mission: To improve the design, operation, and
environmental quality of buildings by providing timely,
unbiased information on building technologies and design
techniques
CBE Industry Partners
Armstrong World Industries
Arup*
California Energy Commission
Charles M. Salter Associates
CPP Inc.
Flack + Kurtz
HOK
Pacific Gas & Electric Co.
Price Industries
RTKL
Skidmore Owings and Merrill
Stantec
Steelcase
Syska Hennessy Group
Tate Access Floors*
Taylor Engineering Team:
•Taylor Engineering
•CTG Energetics
•Guttmann & Blaevoet
•Southland Industries
•Swinerton Builders
Trane
U.S. Department of Energy (DOE)*
U.S. General Services Administration
(GSA)*
Webcor*
York International Corporation
*founding partner
LEED Post-Occupancy Evaluation:
Taking Responsibility for the Occupants November 1-2, 2006
Center for the Built Environment (CBE) 3
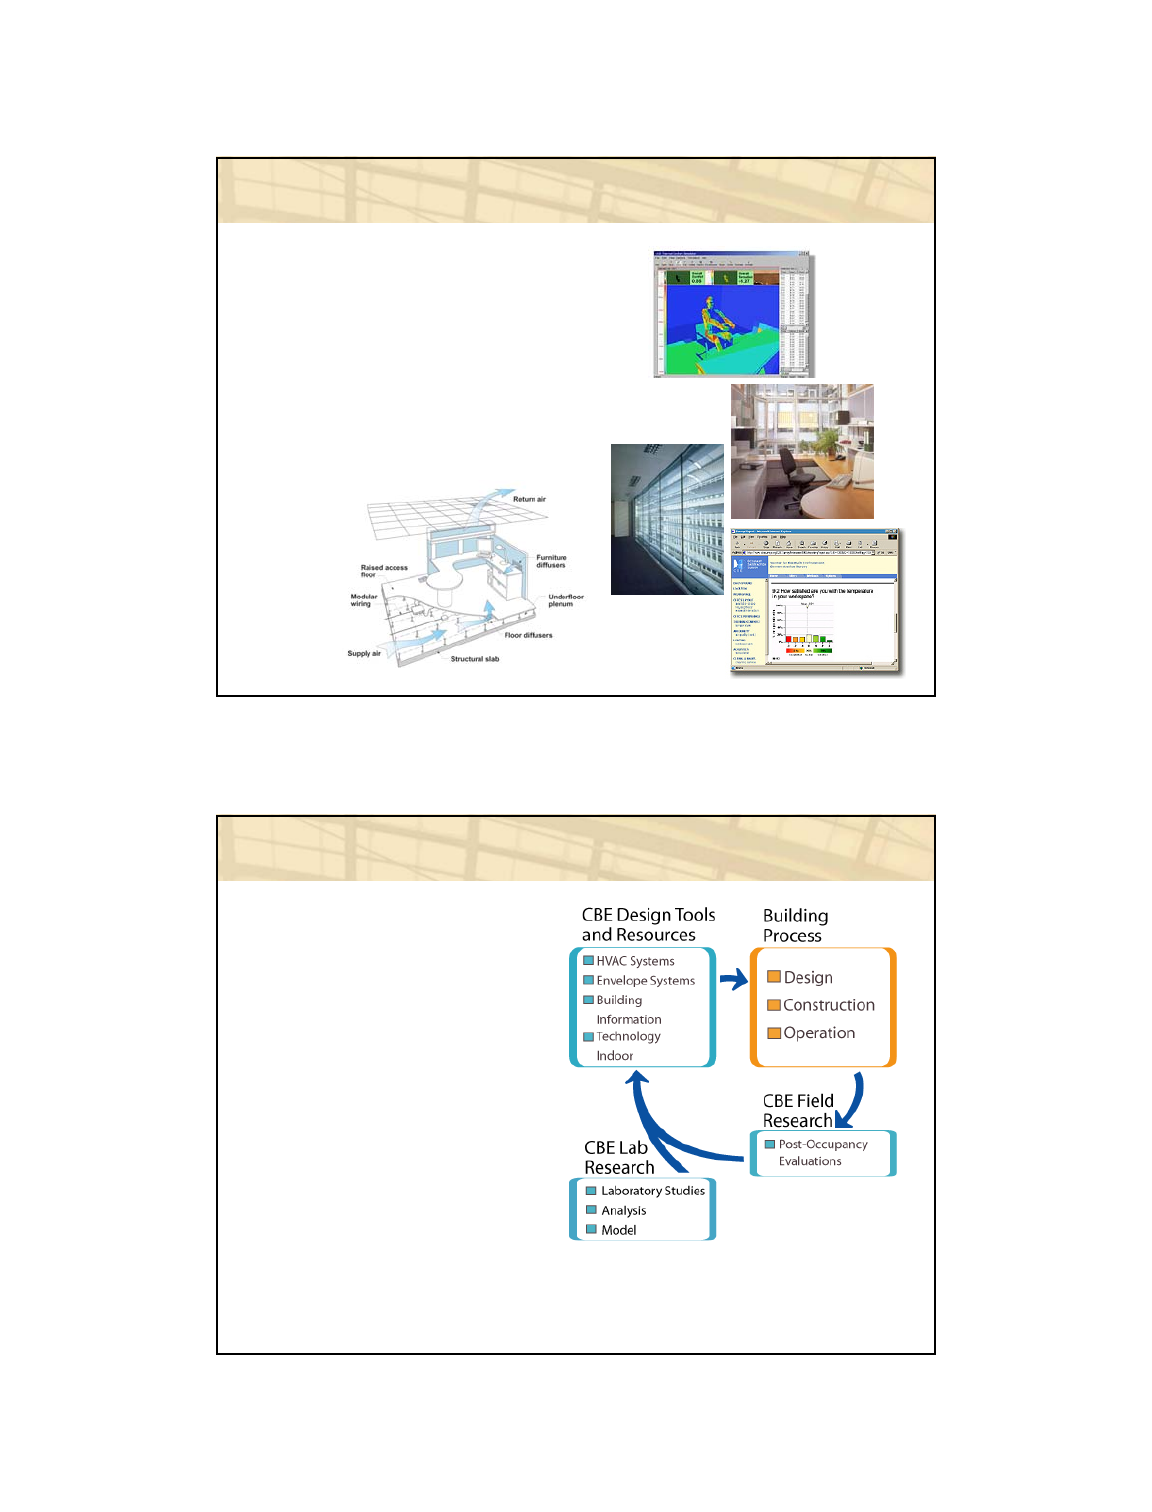
CBE research programs
Indoor Environmental Quality
Envelope and Facade Systems
HVAC Systems
Controls and Information
Technology
CBE feedback loop
Finding ways to
“take the pulse” of
buildings in operation
Helping industry to
make better buildlings
LEED Post-Occupancy Evaluation:
Taking Responsibility for the Occupants November 1-2, 2006
Center for the Built Environment (CBE) 4
Post occupancy evaluation (POE) process
POEs rarely done by design teams
POEs may include:
Surveys of building occupants
Observations and/or interviews with building
users
Performance in terms of energy and/or water
consumption
Physical measurements (temperature,
humidity, acoustical, lighting, daylighting)
When to do a POE
Part of commissioning plan – 6 months
Post commissioning – at least 12 months
LEED Post-Occupancy Evaluation:
Taking Responsibility for the Occupants November 1-2, 2006
Center for the Built Environment (CBE) 5
Occupant IEQ survey
Standardized methodology for
studying building performance
from occupants’ point of view
Provide feedback to building
designers, owners, and operators
Helps us understand how
buildings perform in practice
Web format is inexpensive, fast,
allows for branching questionos,
automatic reporting, data mining
Results can be used for:
Diagnostics
Benchmarking
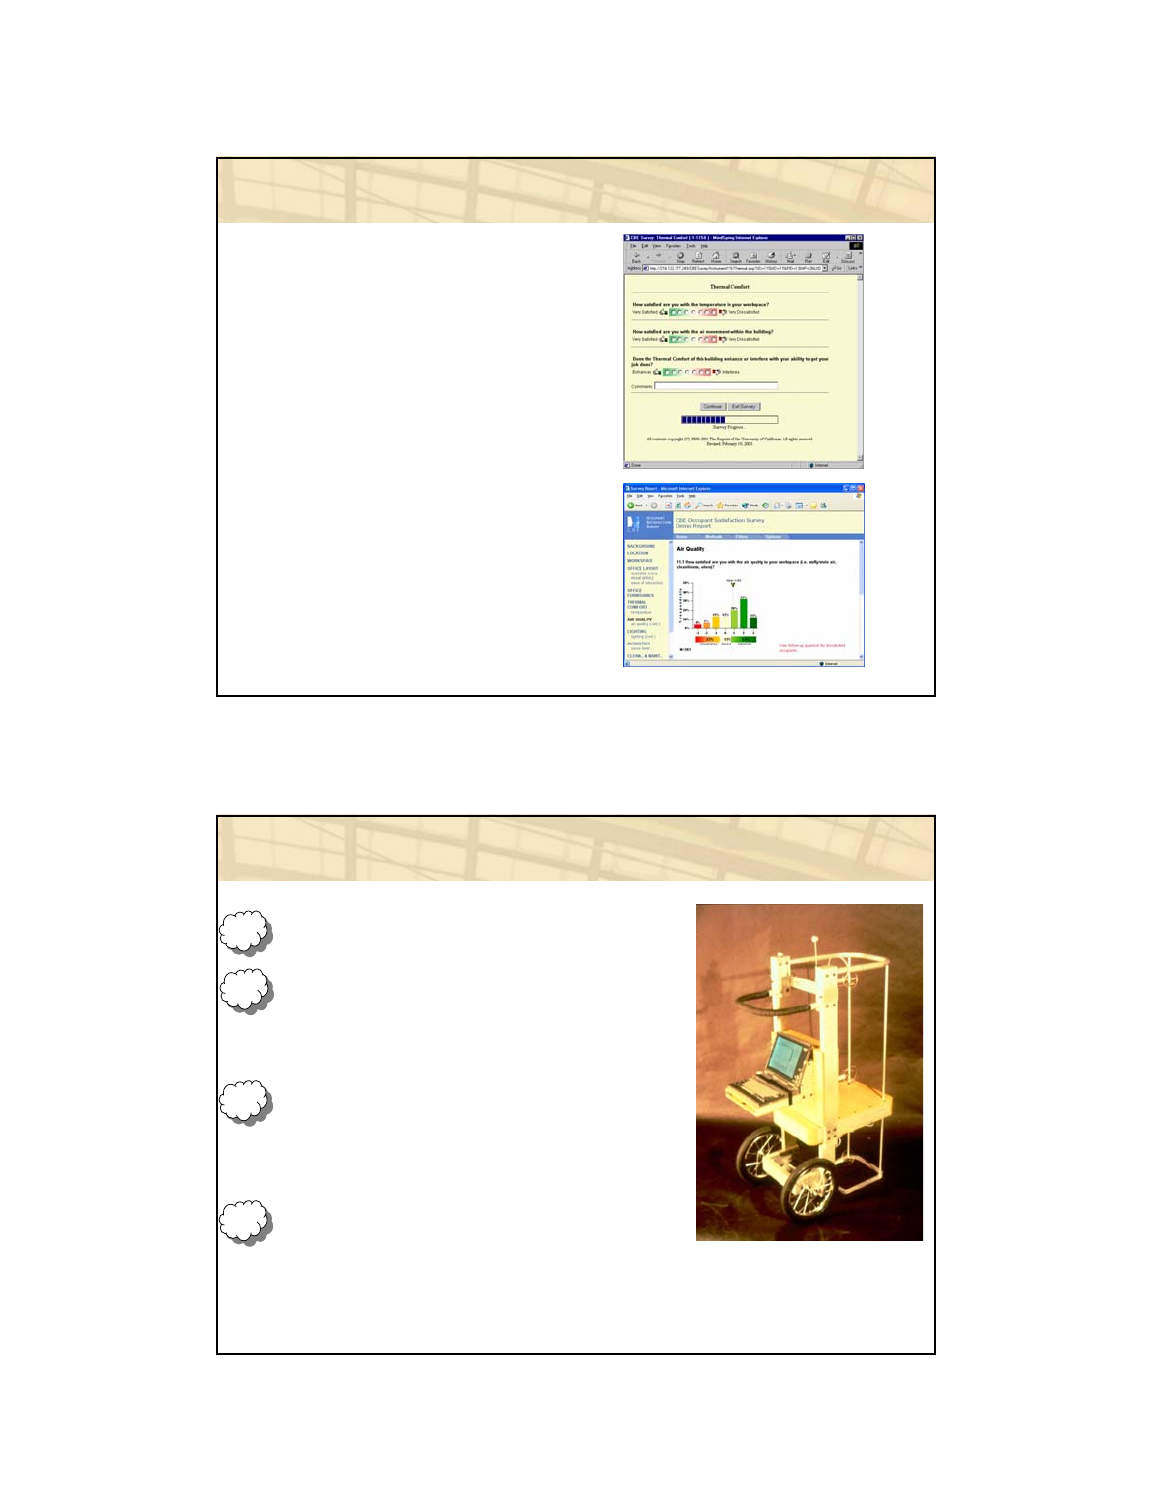
Survey history
ASHRAE Thermal Comfort Studies
Johnson Controls
Tablet-based survey
LAN-based survey
First Web-based Survey
Research projects evaluating
effectiveness of various building
attributes
U.S. General Services
Administration
Developed current core survey,
and special-purpose modules
late
80’s
early
90’s
mid
90’s
1999
LEED Post-Occupancy Evaluation:
Taking Responsibility for the Occupants November 1-2, 2006
Center for the Built Environment (CBE) 6
Usability testing
UCB Survey Research Center
Focus groups
Cognitive interviewing
Assessed
Comprehension of survey
wording
Scale size and aesthetics
Survey length
Core survey now highly
standardized for accurate
benchmarking
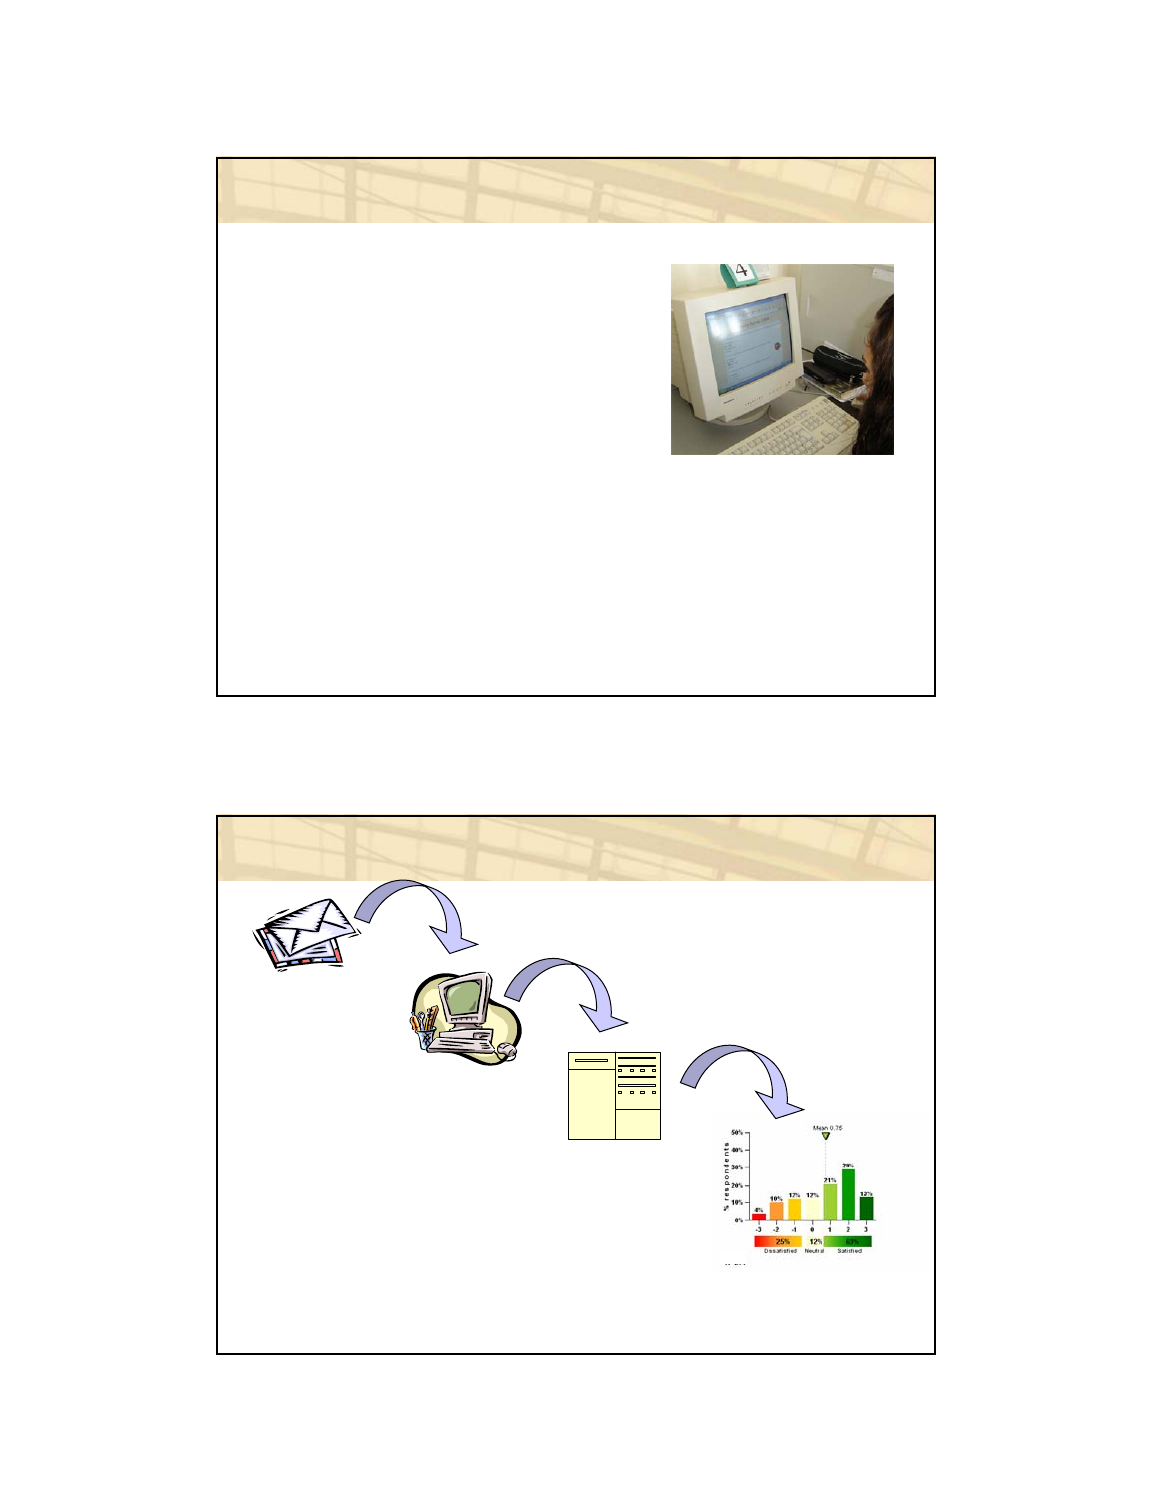
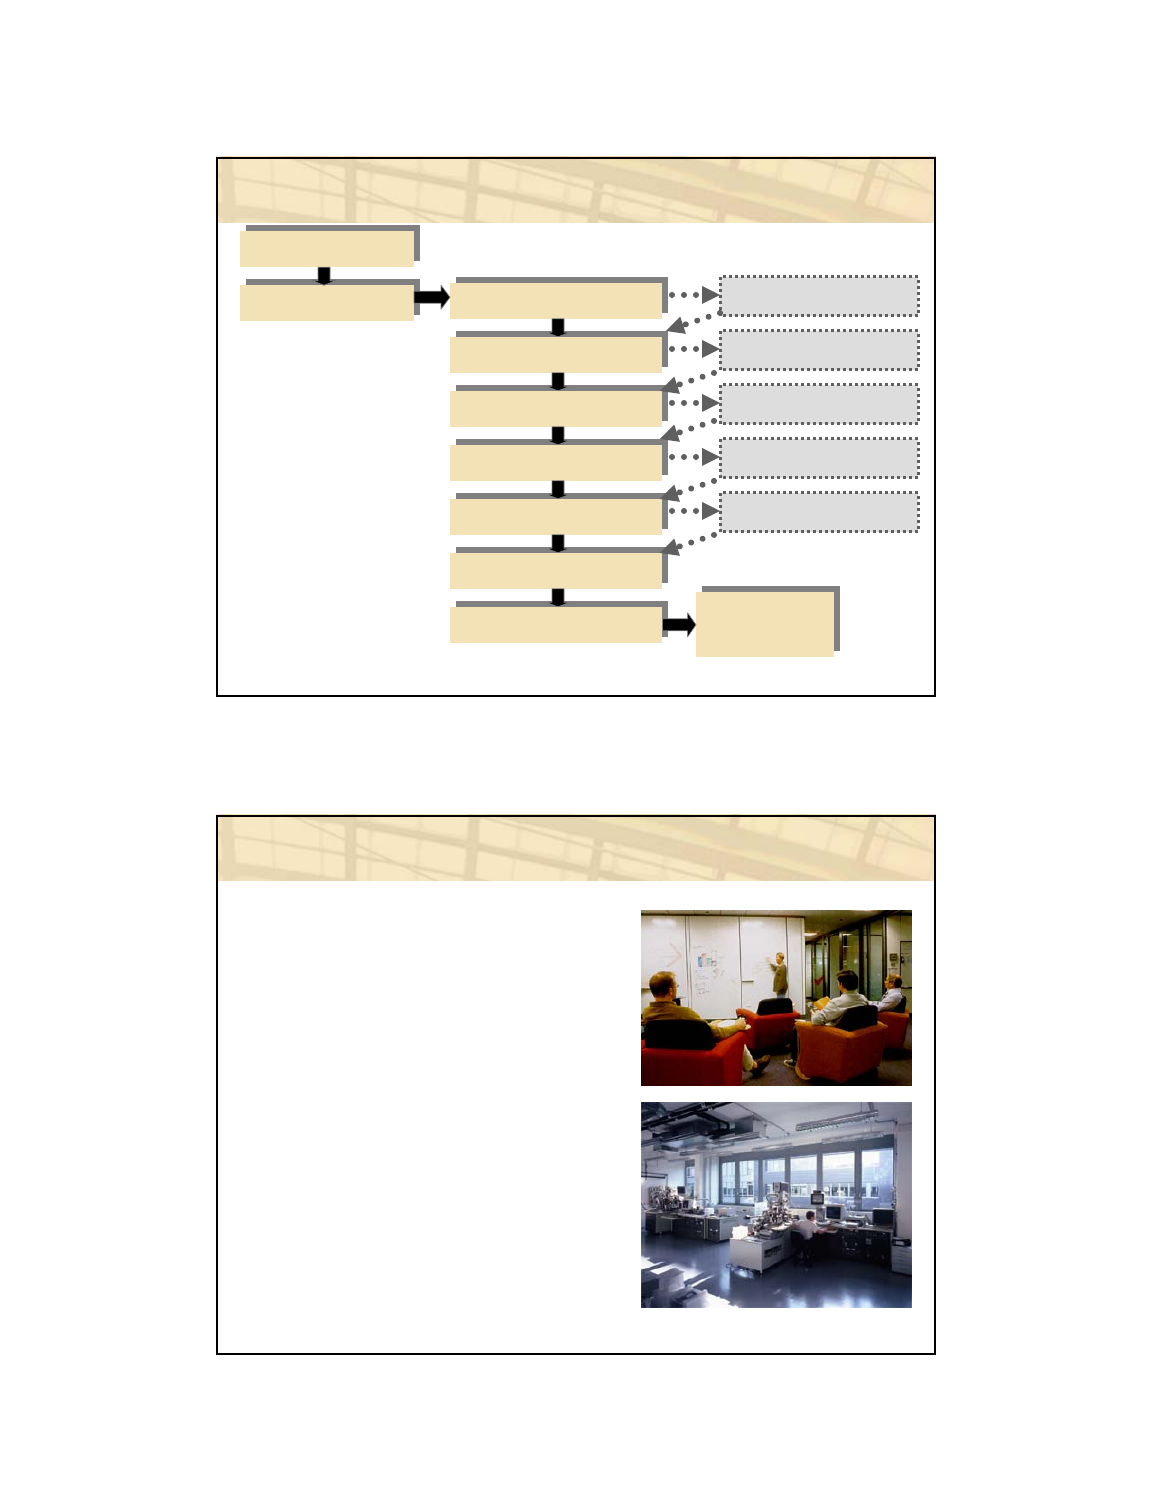
Survey implementation
Survey
notification
via email
Occupants
respond to
web-based
survey Data sent to
SQL server
database
Results reported
online
LEED Post-Occupancy Evaluation:
Taking Responsibility for the Occupants November 1-2, 2006
Center for the Built Environment (CBE) 7
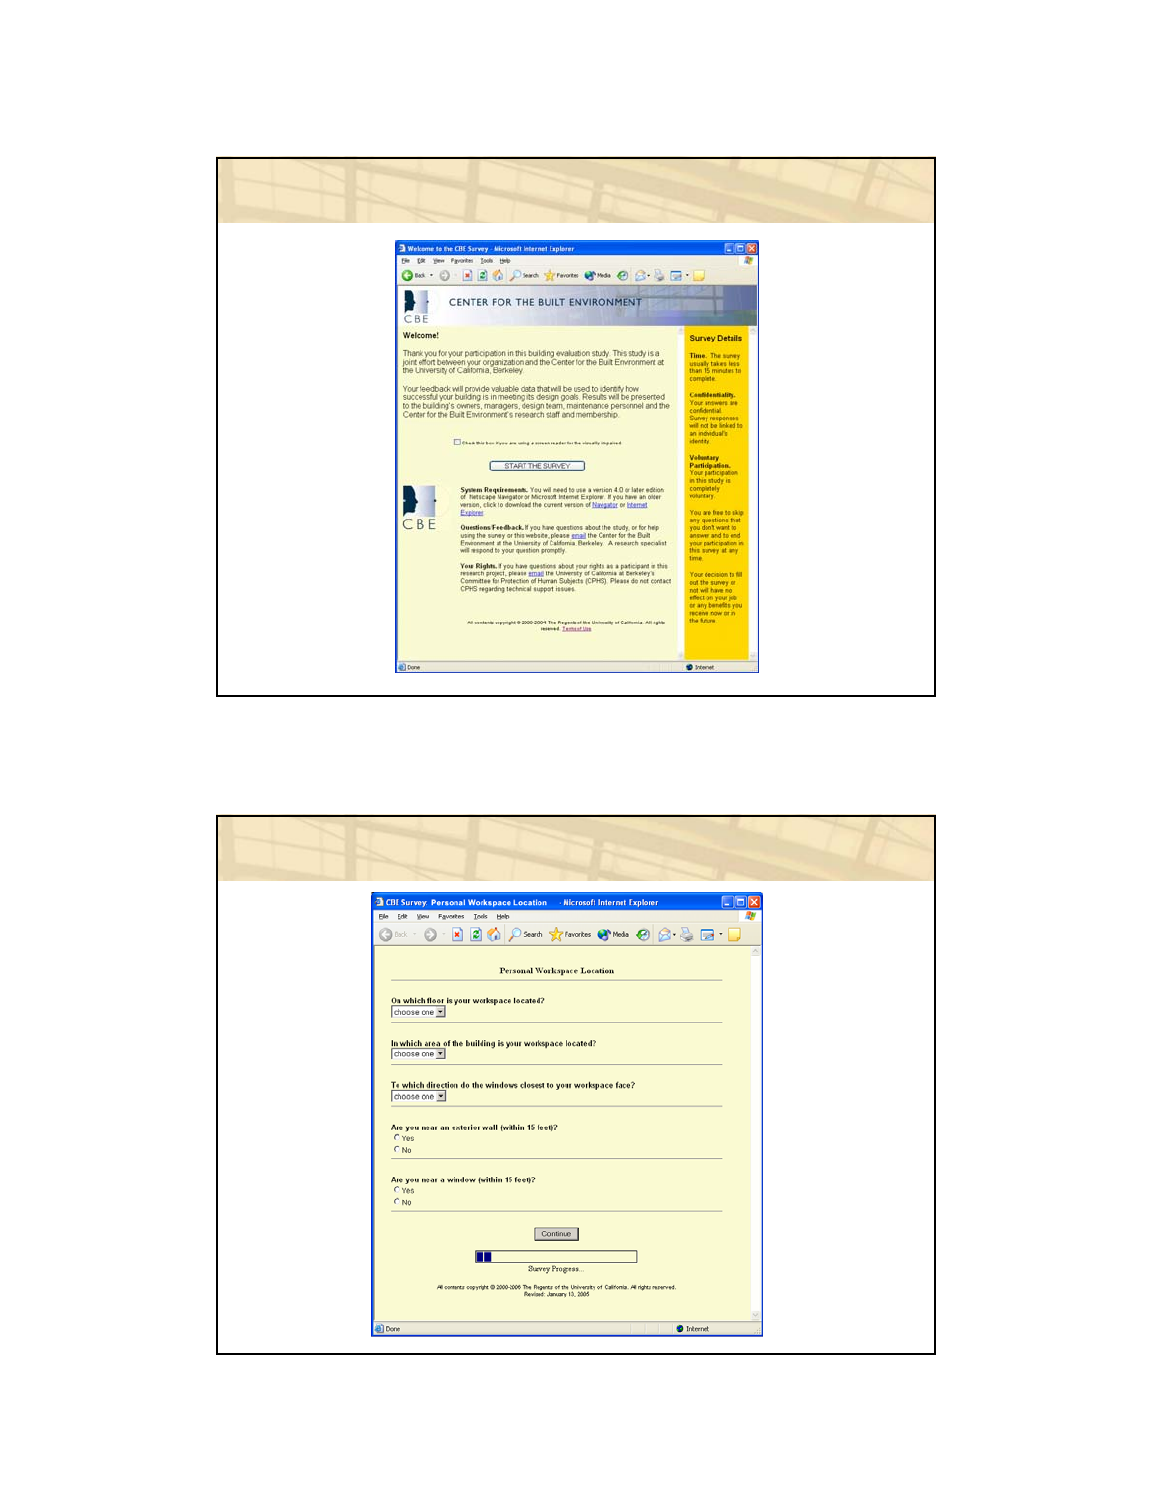
Survey welcome page
Objective information
LEED Post-Occupancy Evaluation:
Taking Responsibility for the Occupants November 1-2, 2006
Center for the Built Environment (CBE) 8
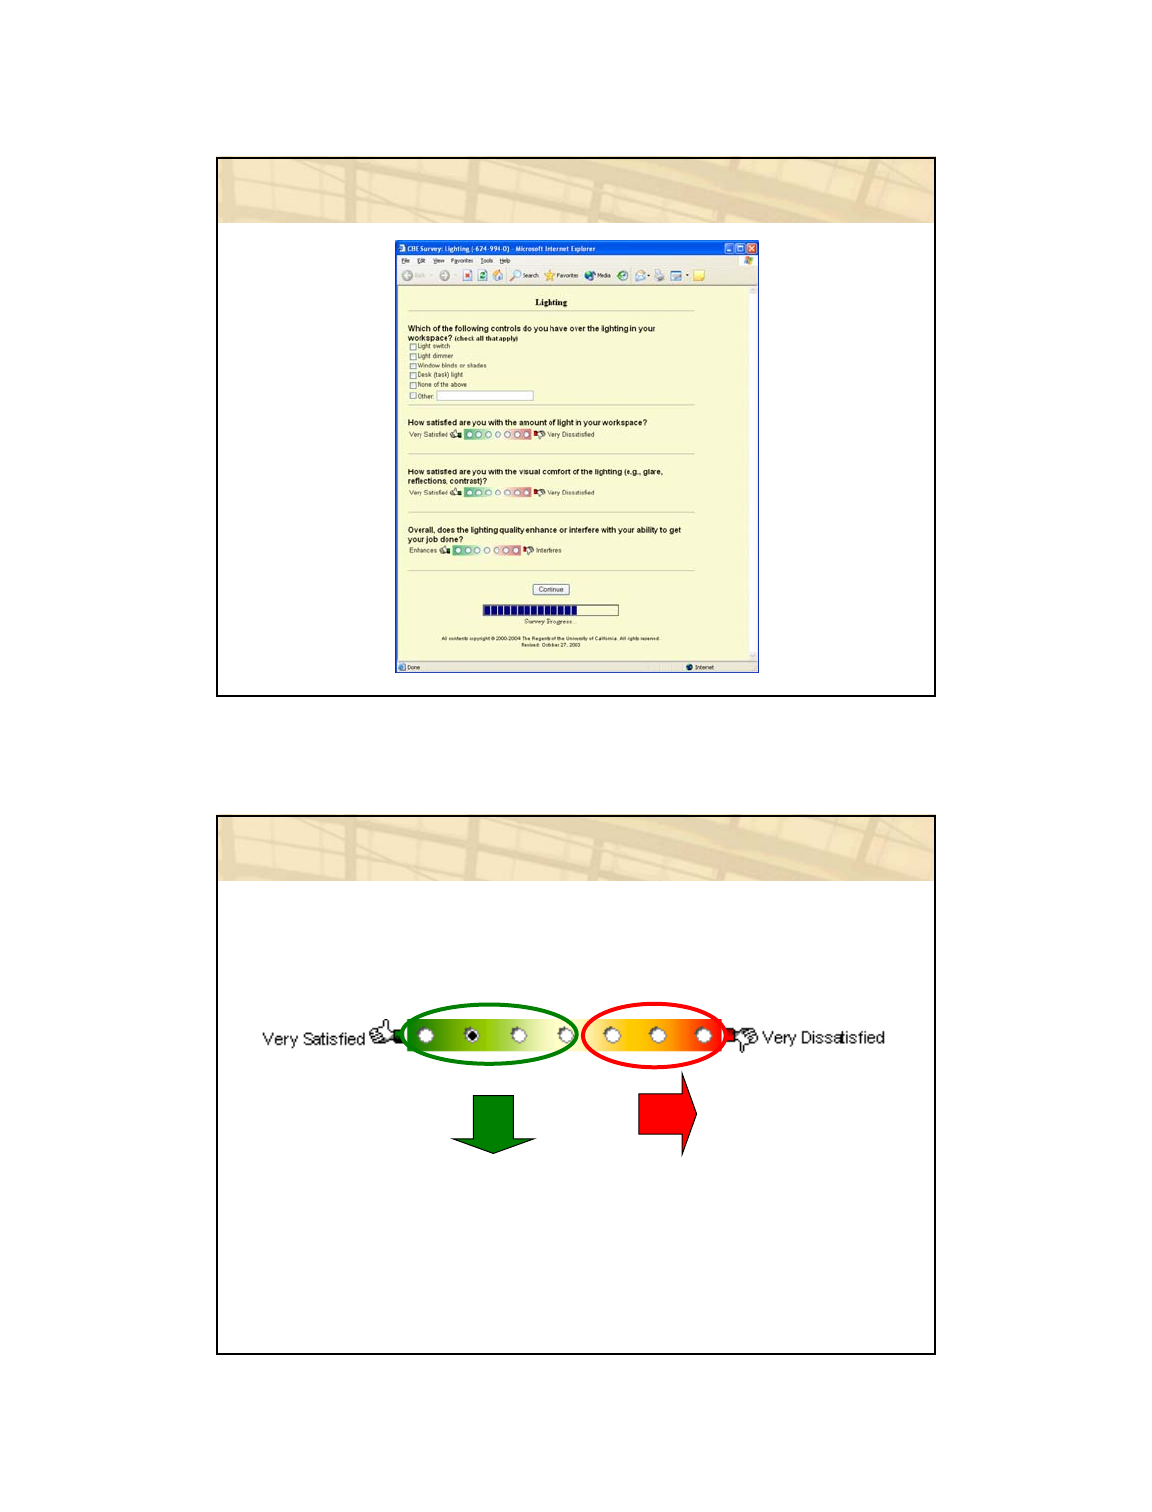
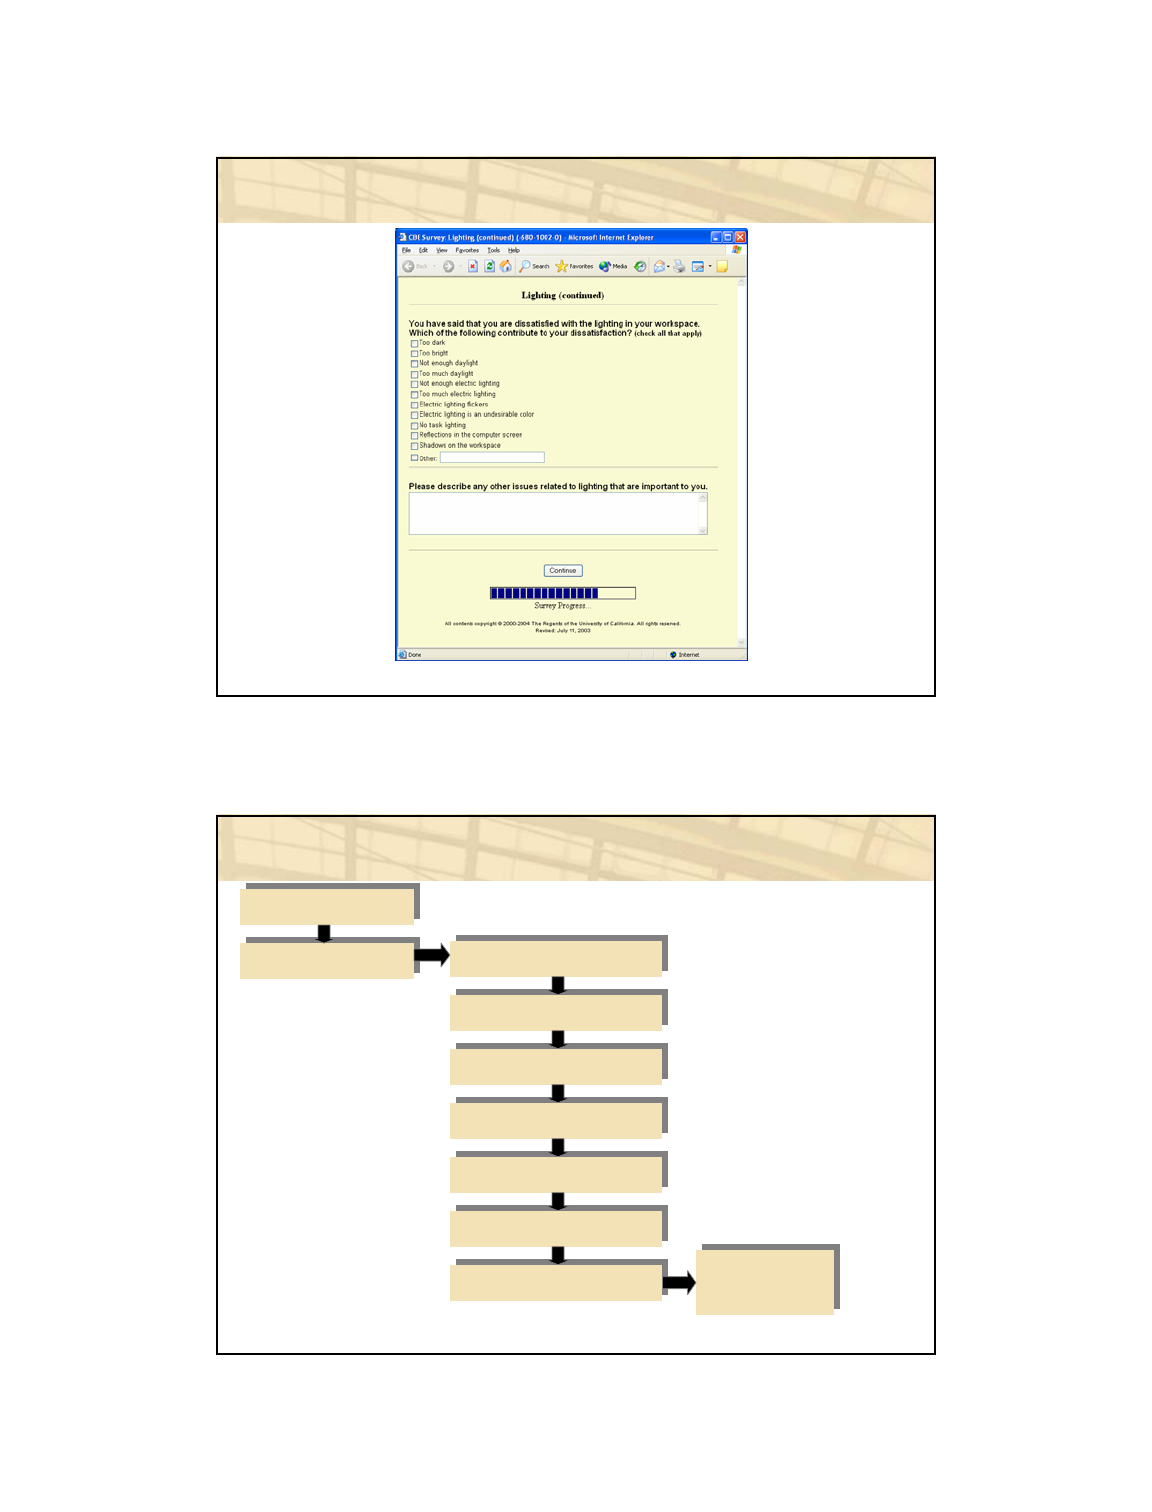
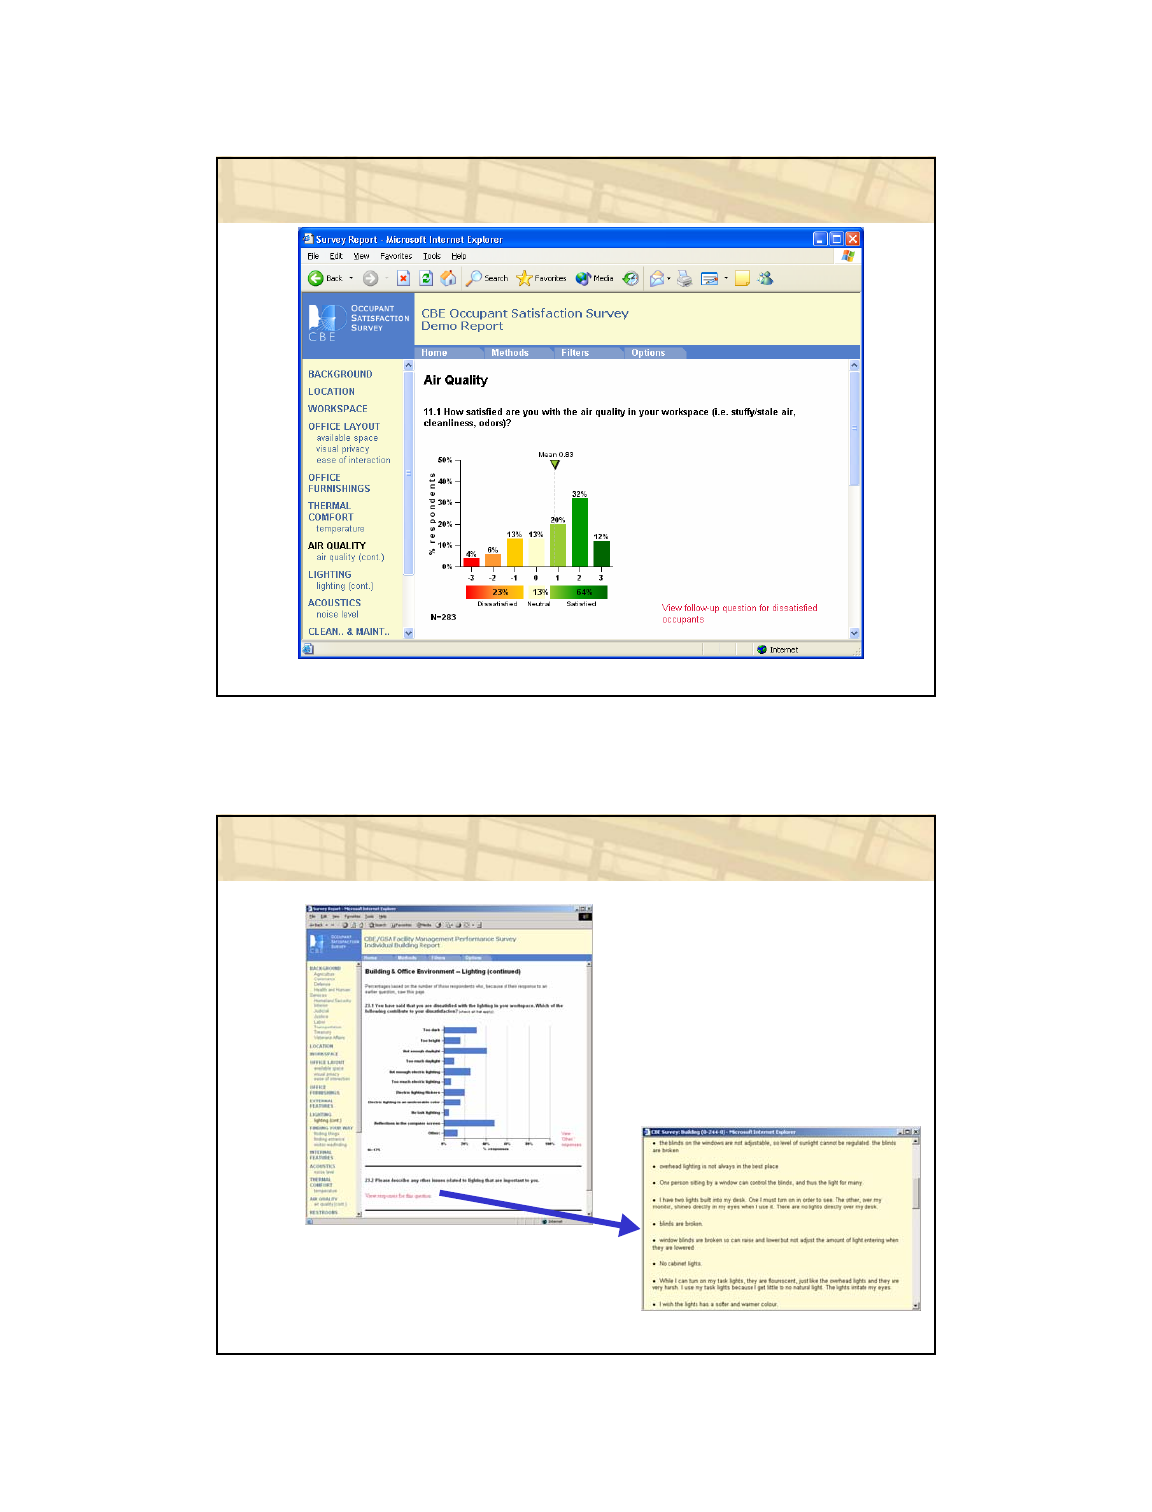
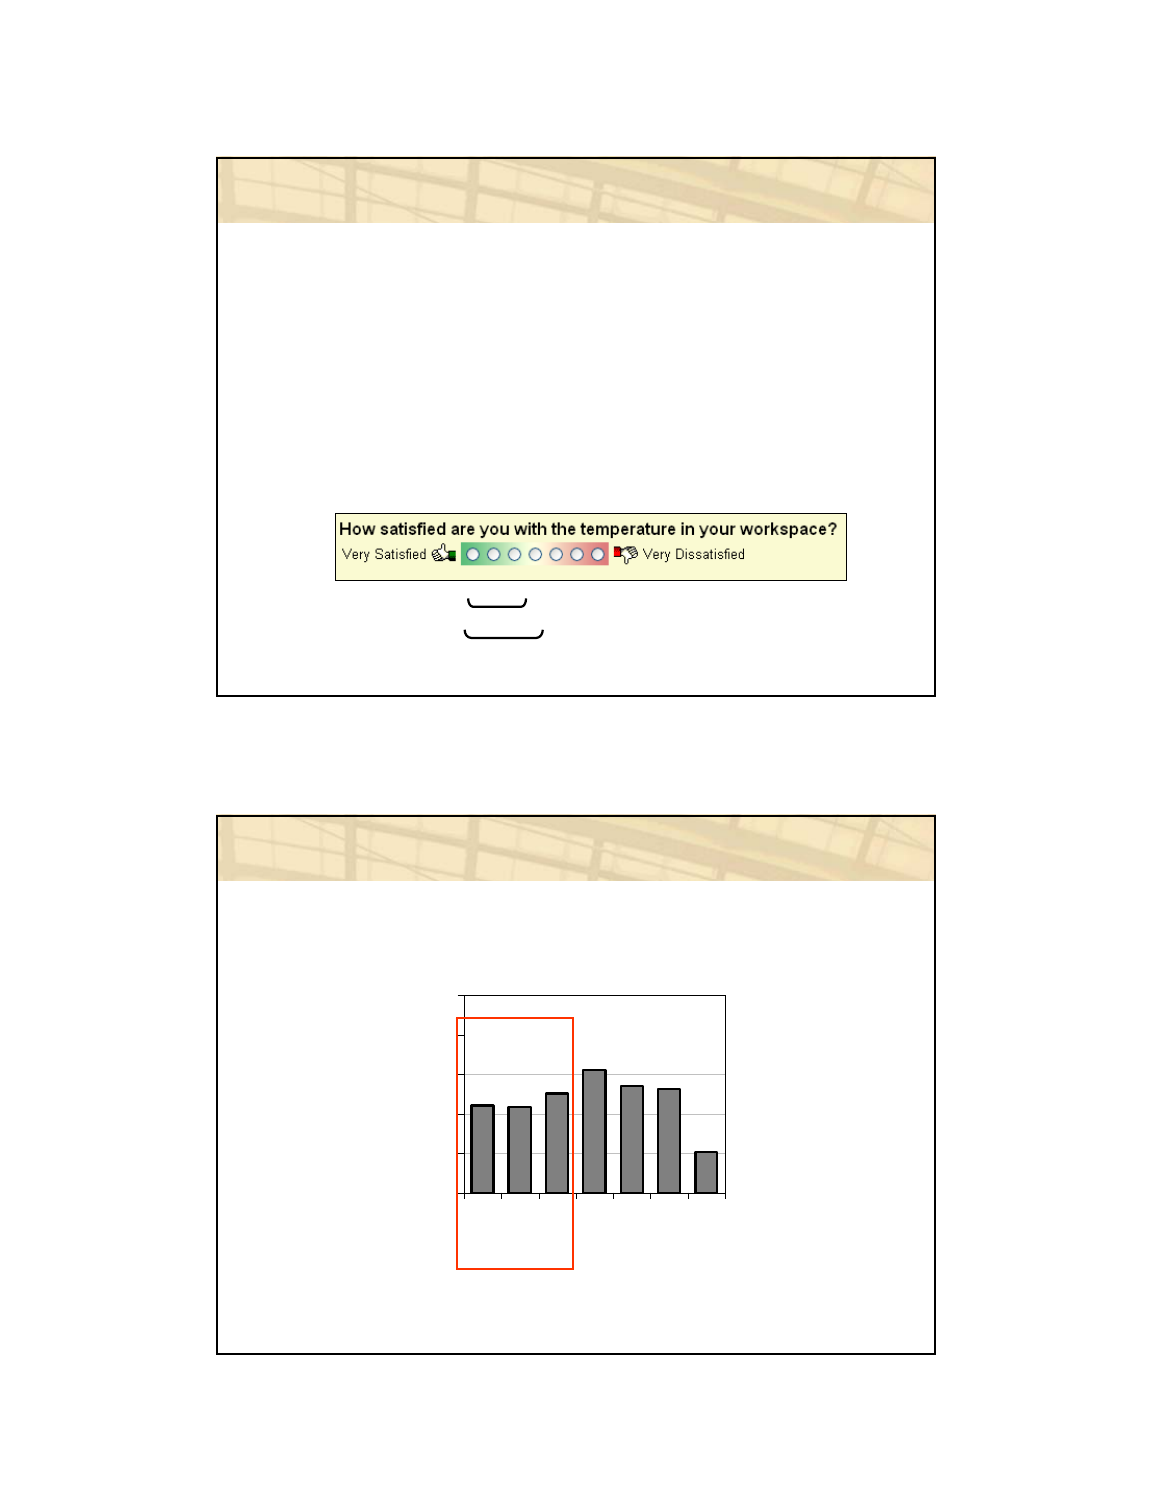
Typical survey page
Drill-down questions
Satisfaction Scale
Next
survey
topic
Branched to a
follow-up page
with probing
questions
regarding
nature of
dissatisfaction
LEED Post-Occupancy Evaluation:
Taking Responsibility for the Occupants November 1-2, 2006
Center for the Built Environment (CBE) 9
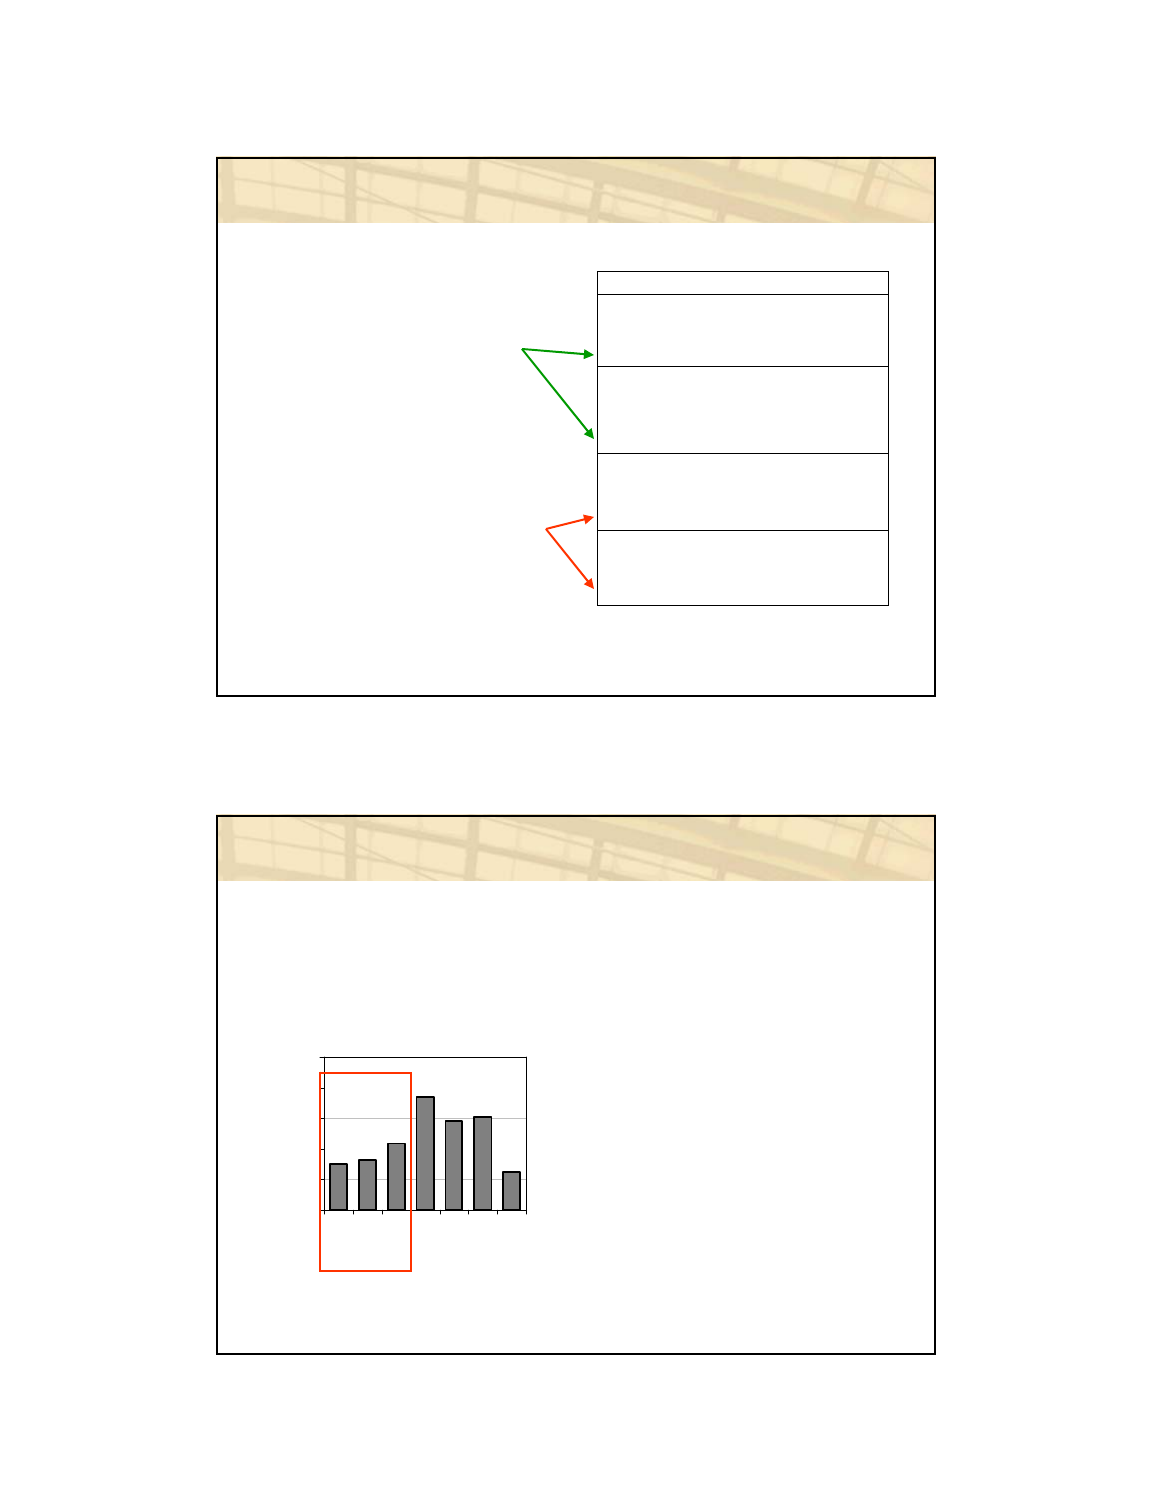
Typical follow-up page
Core survey
Office Layout
Office Layout
Office Furnishings
Office Furnishings
Thermal Comfort
Thermal Comfort
Air Quality
Air Quality
Lighting
Lighting
Acoustics
Acoustics
Clean/Maint
Clean/Maint General
Comments
General
Comments
Location
Location
Background
Background
LEED Post-Occupancy Evaluation:
Taking Responsibility for the Occupants November 1-2, 2006
Center for the Built Environment (CBE) 10
Custom modules
Office Layout
Office Layout
Office Furnishings
Office Furnishings
Thermal Comfort
Thermal Comfort
Air Quality
Air Quality
Lighting
Lighting
Acoustics
Acoustics
Clean/Maint.
Clean/Maint. General
Comments
General
Comments
Location
Location
Background
Background
Wayfinding
Commute
Restrooms
Safety/Security
etc…
Custom modules
Accessibility
Building and Grounds
Maintenance Service
Commute
Conference and Training Rooms
Court Work
Daylighting
Laboratories
Office Support Equipment
Operable Windows
Raised Floor and Floor Diffusers
Restrooms
Safety and Security
Wayfinding
LEED Post-Occupancy Evaluation:
Taking Responsibility for the Occupants November 1-2, 2006
Center for the Built Environment (CBE) 11
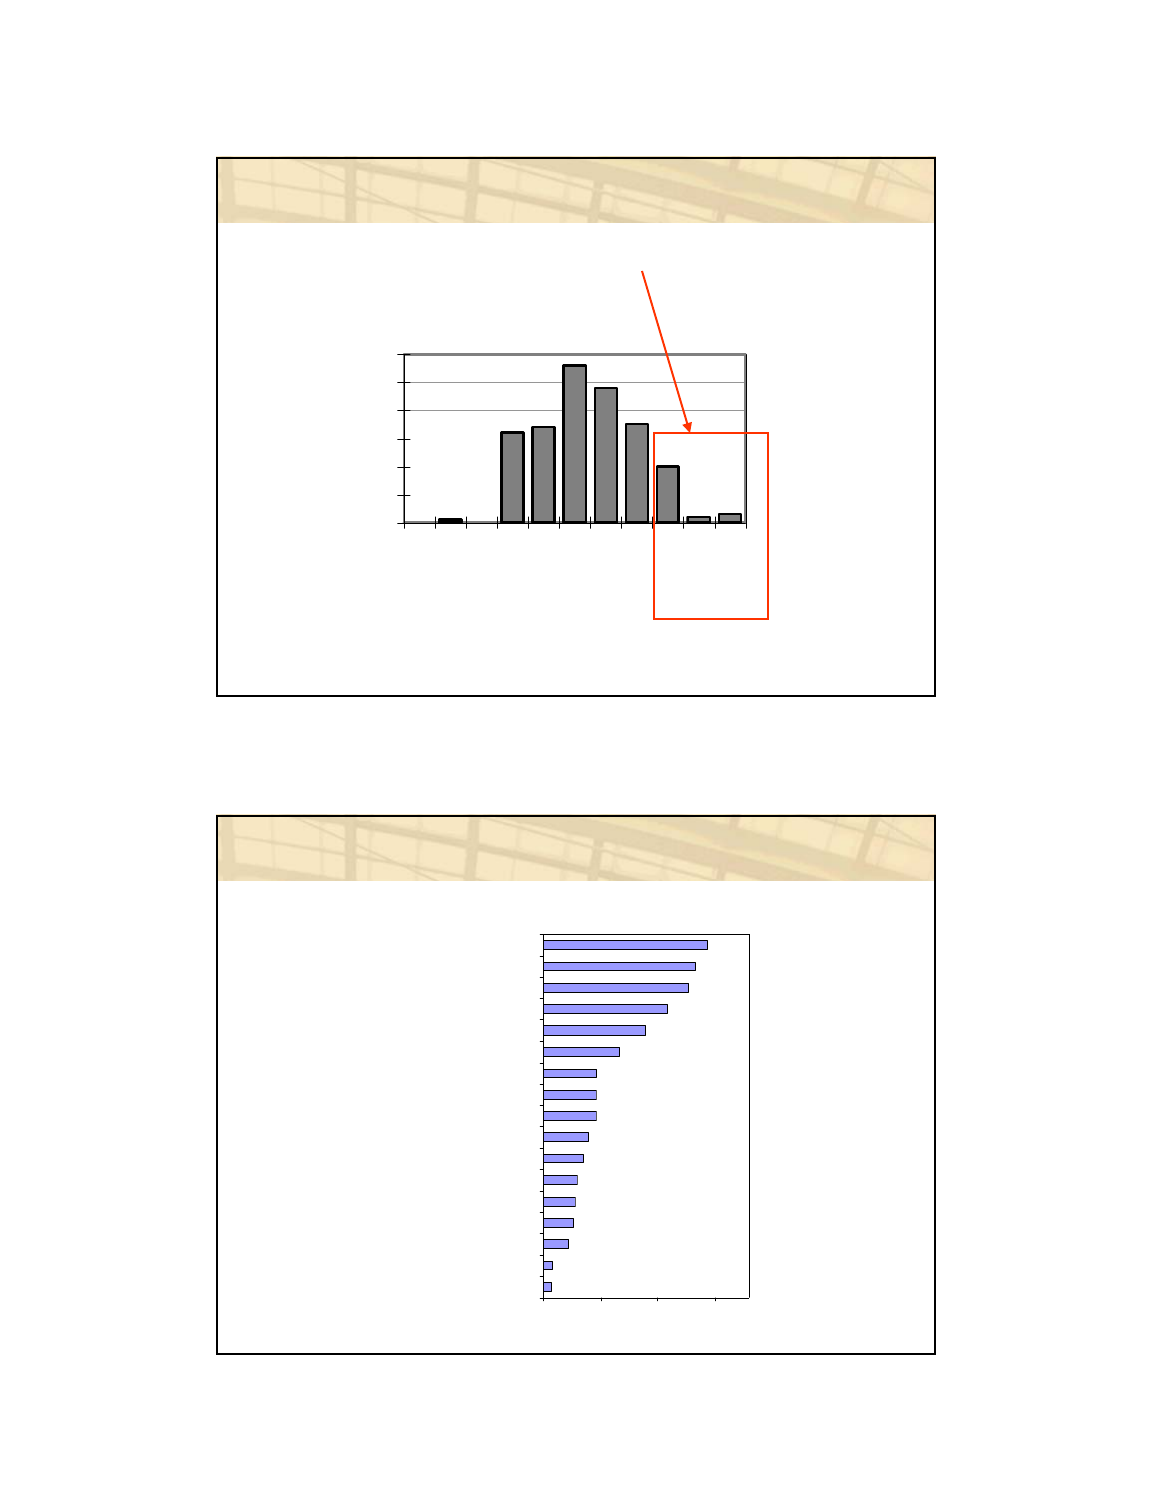
Automated reporting
Diagnosing problems
LEED Post-Occupancy Evaluation:
Taking Responsibility for the Occupants November 1-2, 2006
Center for the Built Environment (CBE) 12
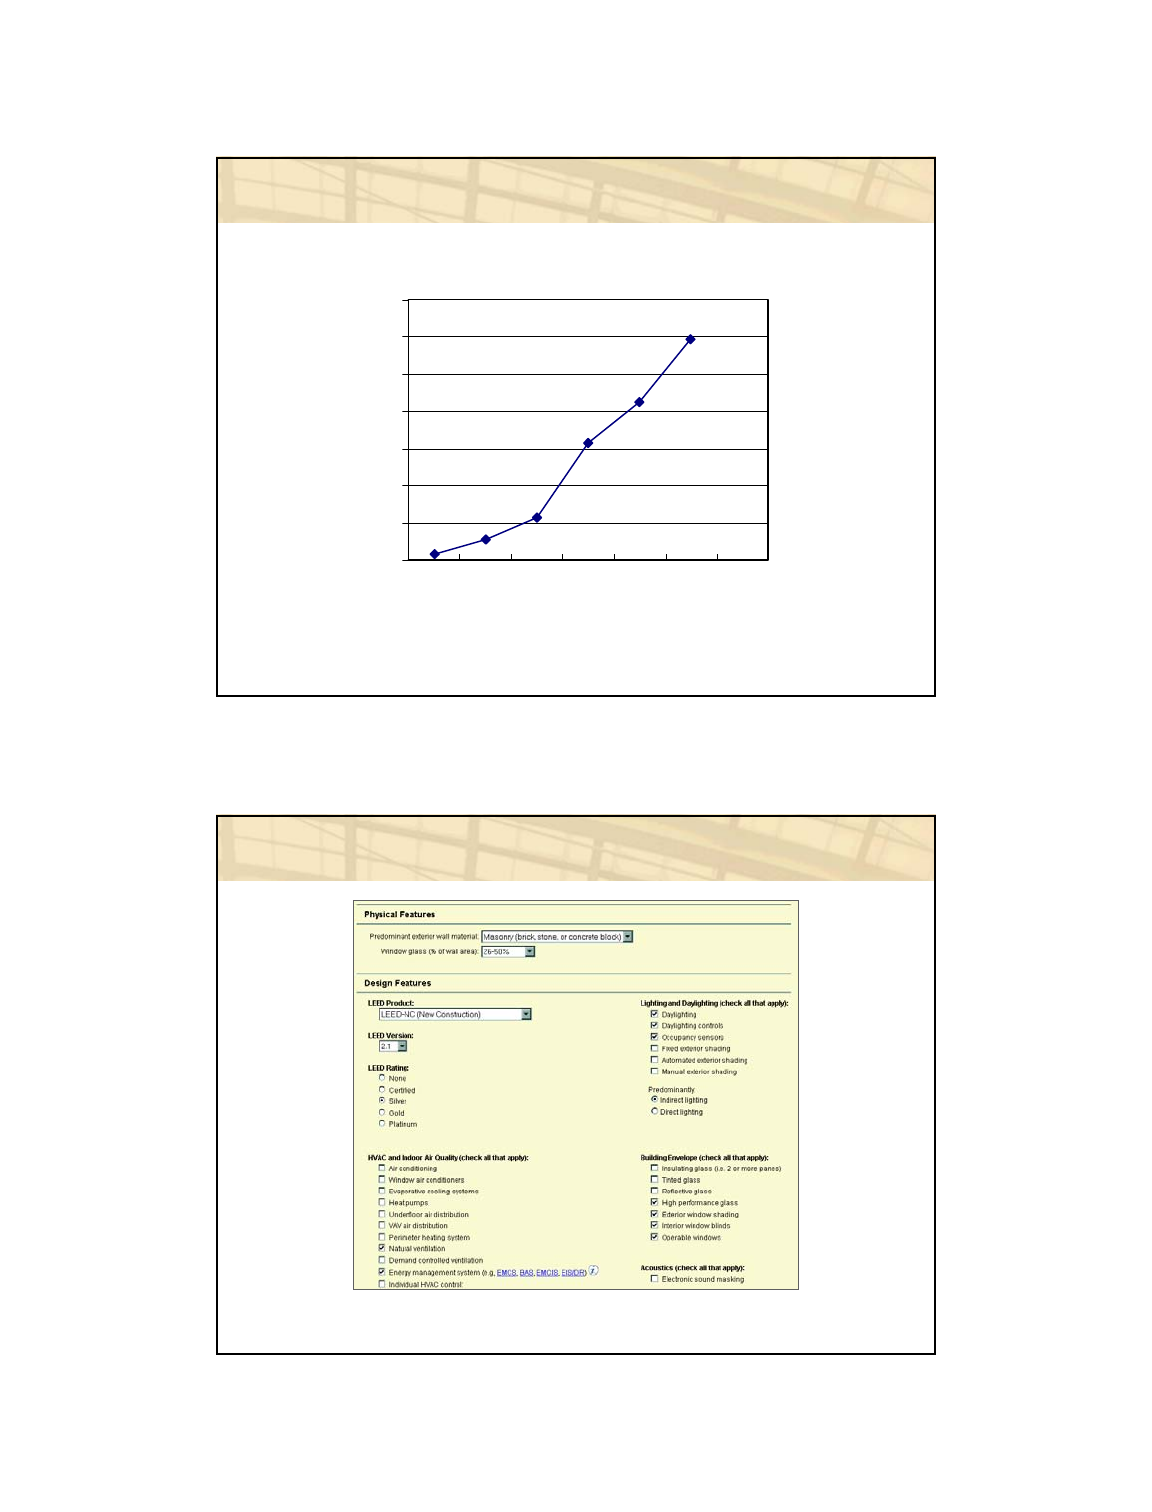
Survey database growth
To date: 290+ buildings, nearly 39,000+ respondents
0
50
100
150
200
250
300
350
2001 2002 2003 2004 2005 2006 2007
Years
# building in database
(Cumulative)
Collecting building characteristics
Excerpt from building profile form
LEED Post-Occupancy Evaluation:
Taking Responsibility for the Occupants November 1-2, 2006
Center for the Built Environment (CBE) 13
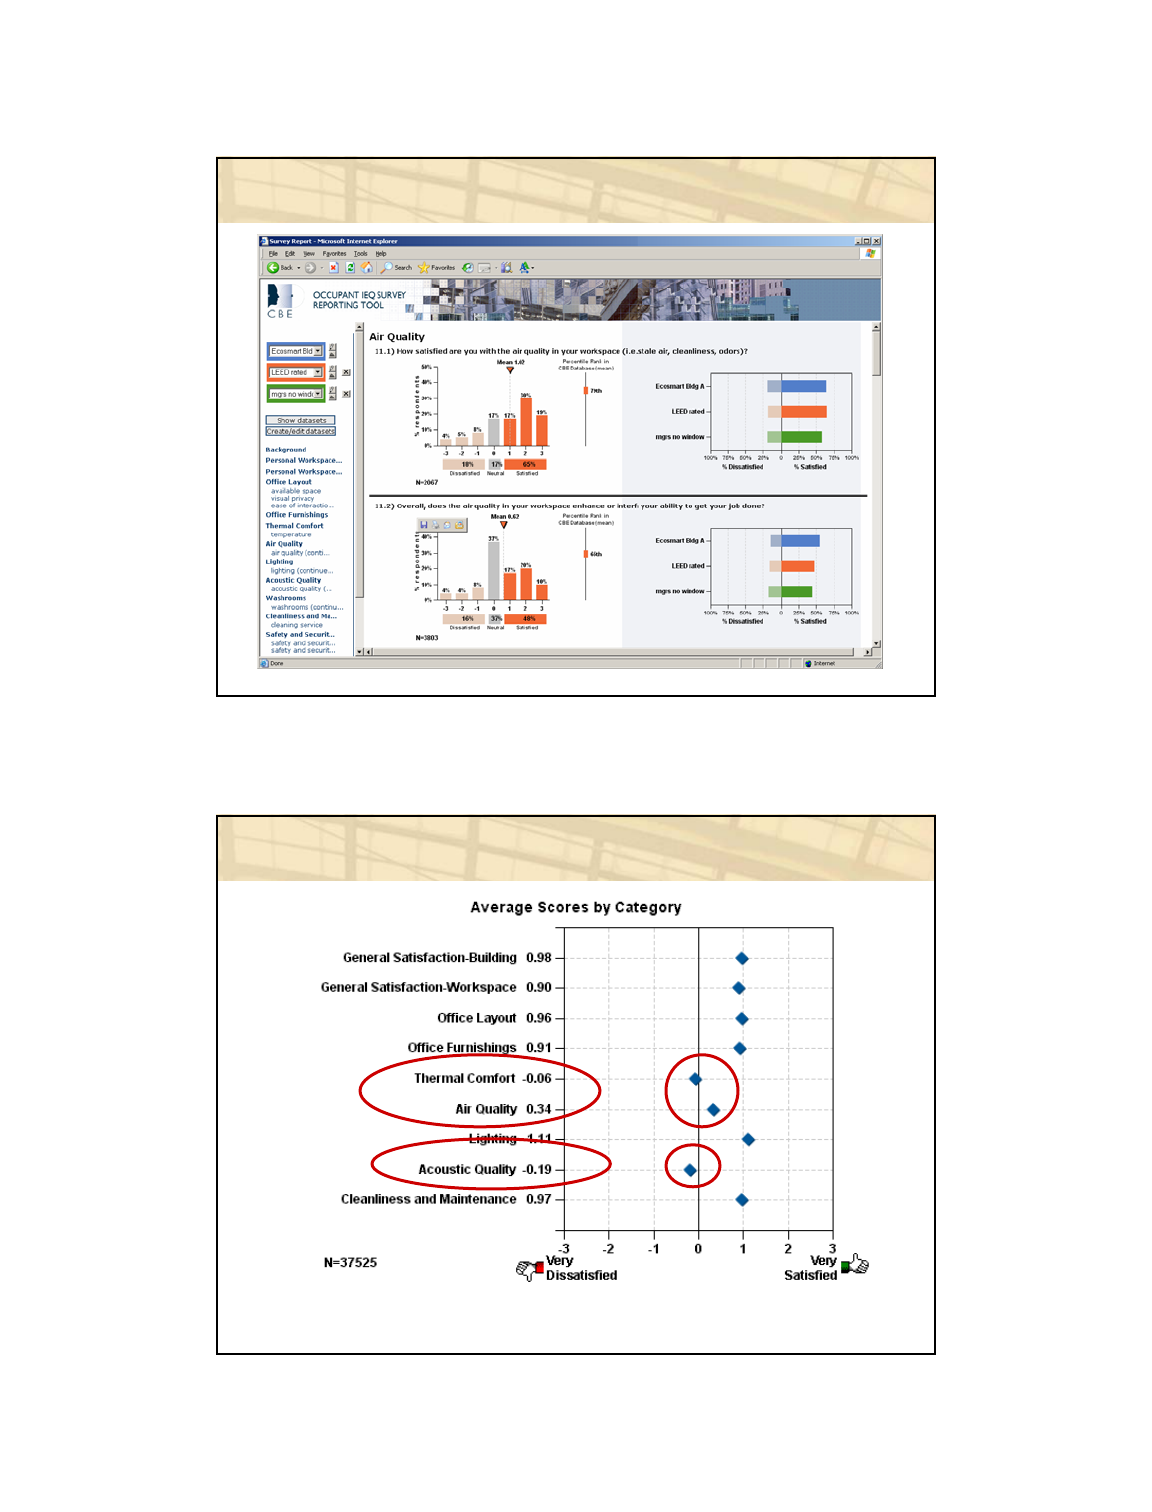
Survey data mining tool
IEQ satisfaction trends
Source: CBE survey database as of April 15, 2006
LEED Post-Occupancy Evaluation:
Taking Responsibility for the Occupants November 1-2, 2006
Center for the Built Environment (CBE) 14
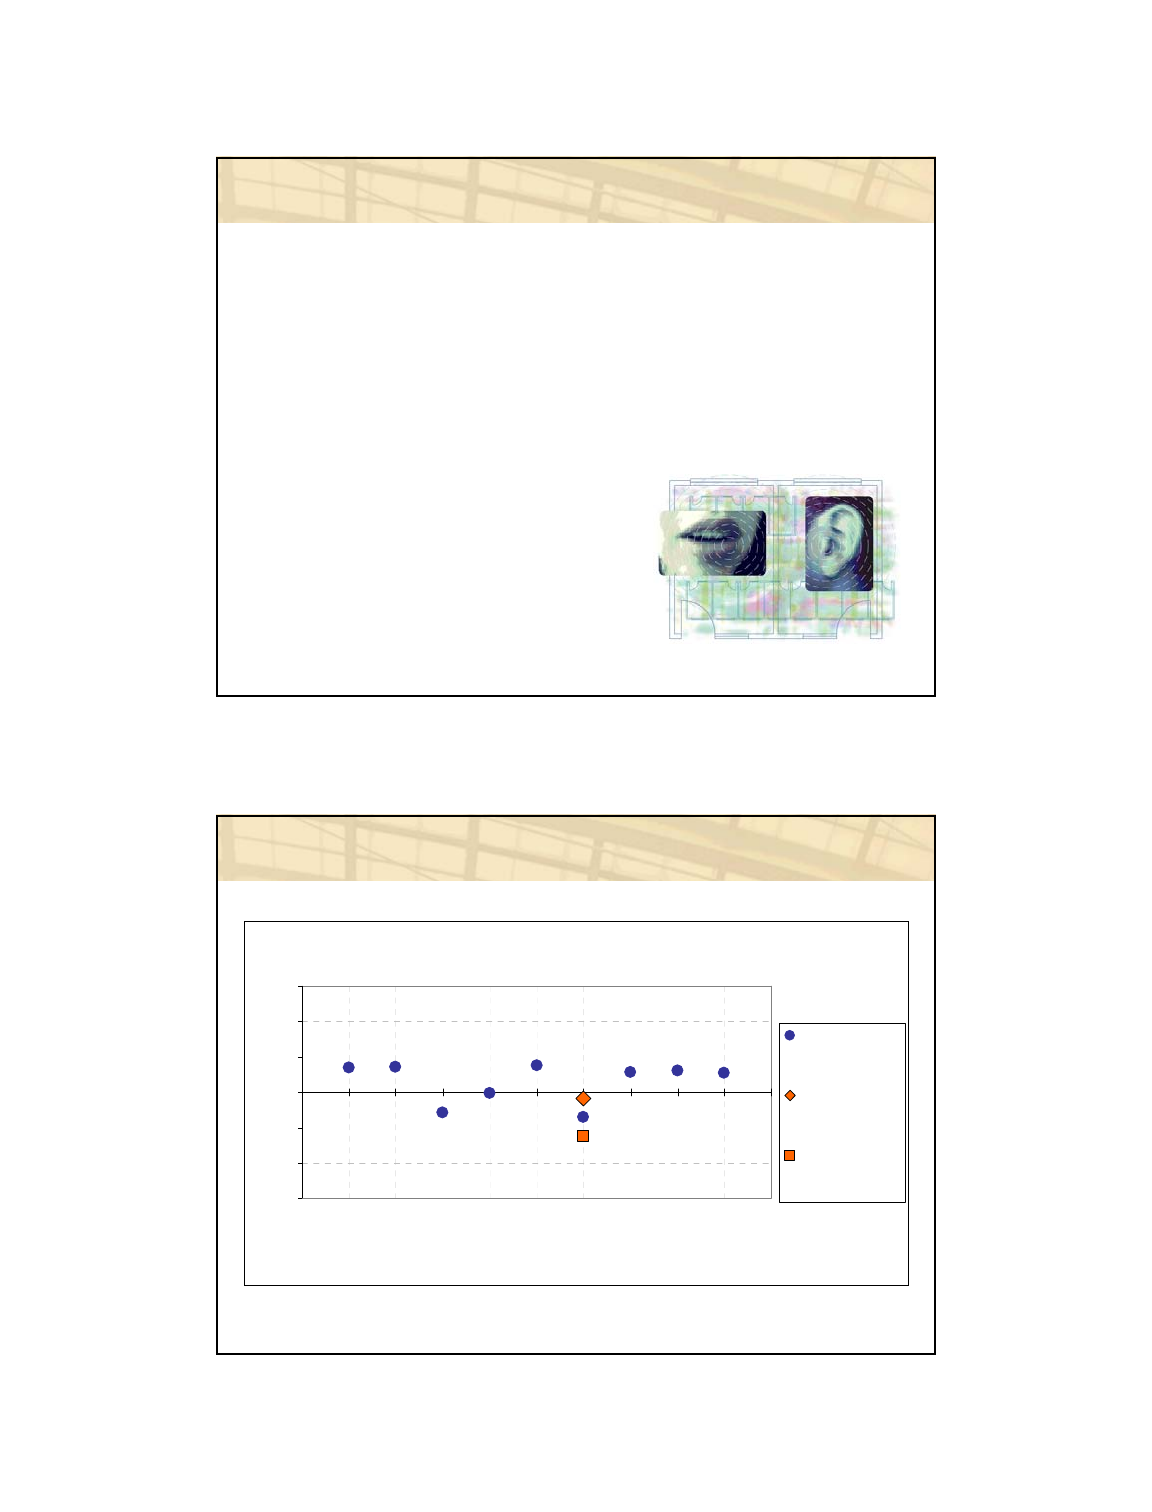
Acoustics analysis
“Acoustic Quality in Office Workstations, as
Assessed by Occupant Surveys,”
Jensen, K., E. Arens, and L. Zagreus, 2005
Proceedings, Indoor Air 2005, Sept. 4-9, Beijing,
China.
Studied satisfaction with acoustics in office
environments
Acoustical satisfaction lowest
category
Analyzed data from
142 buildings
23,450 occupants
Sound privacy vs. noise level
Overall Database Average Category Scores
-3
-2
-1
0
1
2
3
Survey Category
Mean Satisfaction Score
Largest 15
CBE Bldgs
(N=4096)
Noise Level
Sound Privacy
Ofc
Layout
Ofc
Furn
Therm Air Q Light Acoust Clean Gen
Wspce
Gen
Bldg
LEED Post-Occupancy Evaluation:
Taking Responsibility for the Occupants November 1-2, 2006
Center for the Built Environment (CBE) 15
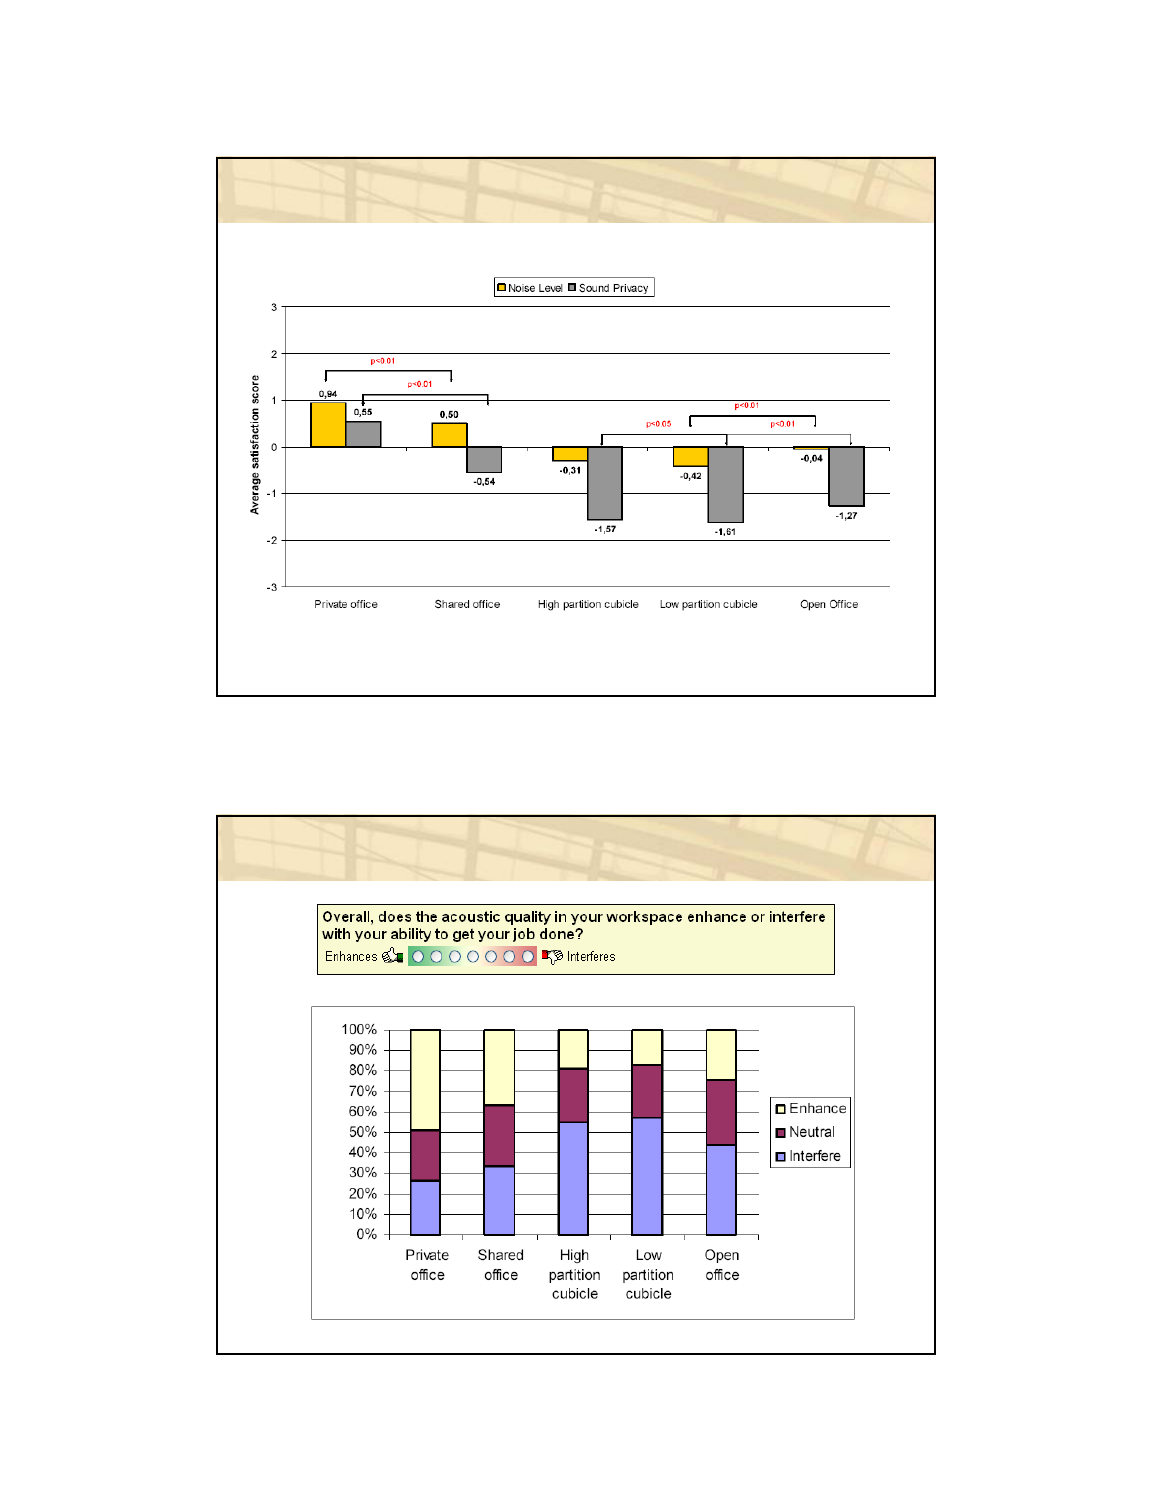
Acoustic average satisfaction score
Acoustic quality impact on productivity
LEED Post-Occupancy Evaluation:
Taking Responsibility for the Occupants November 1-2, 2006
Center for the Built Environment (CBE) 16
Top sources of dissatisfaction
6
5
4
3
2
1
Rank
14%13%5%4%
Office equipment
31%23%8%2.5%
Telephones ringing
27%25%12%6%
People talking in the corridor
54%45%21%15%
People talking in surrounding
offices
71%65%40%25%
People overhearing private
conversations
83%70%50%21%
People talking on the phone
Cubicles
with low
partitions
Cubicles
with high
partitions
Shared
office
Private
office
Source of dissatisfaction
Of those expressing dissatisfaction with acoustics…
Key findings
Over 50% of occupants in cubicles think
acoustics interfere with their ability to get their job
done
Acoustic satisfaction will not be improved much
by making cubicles higher
Occupants in open office more satisfied with
acoustics than occupants in cubicles
Of the 9 core survey categories, acoustics
causes the greatest dissatisfaction
LEED Post-Occupancy Evaluation:
Taking Responsibility for the Occupants November 1-2, 2006
Center for the Built Environment (CBE) 17
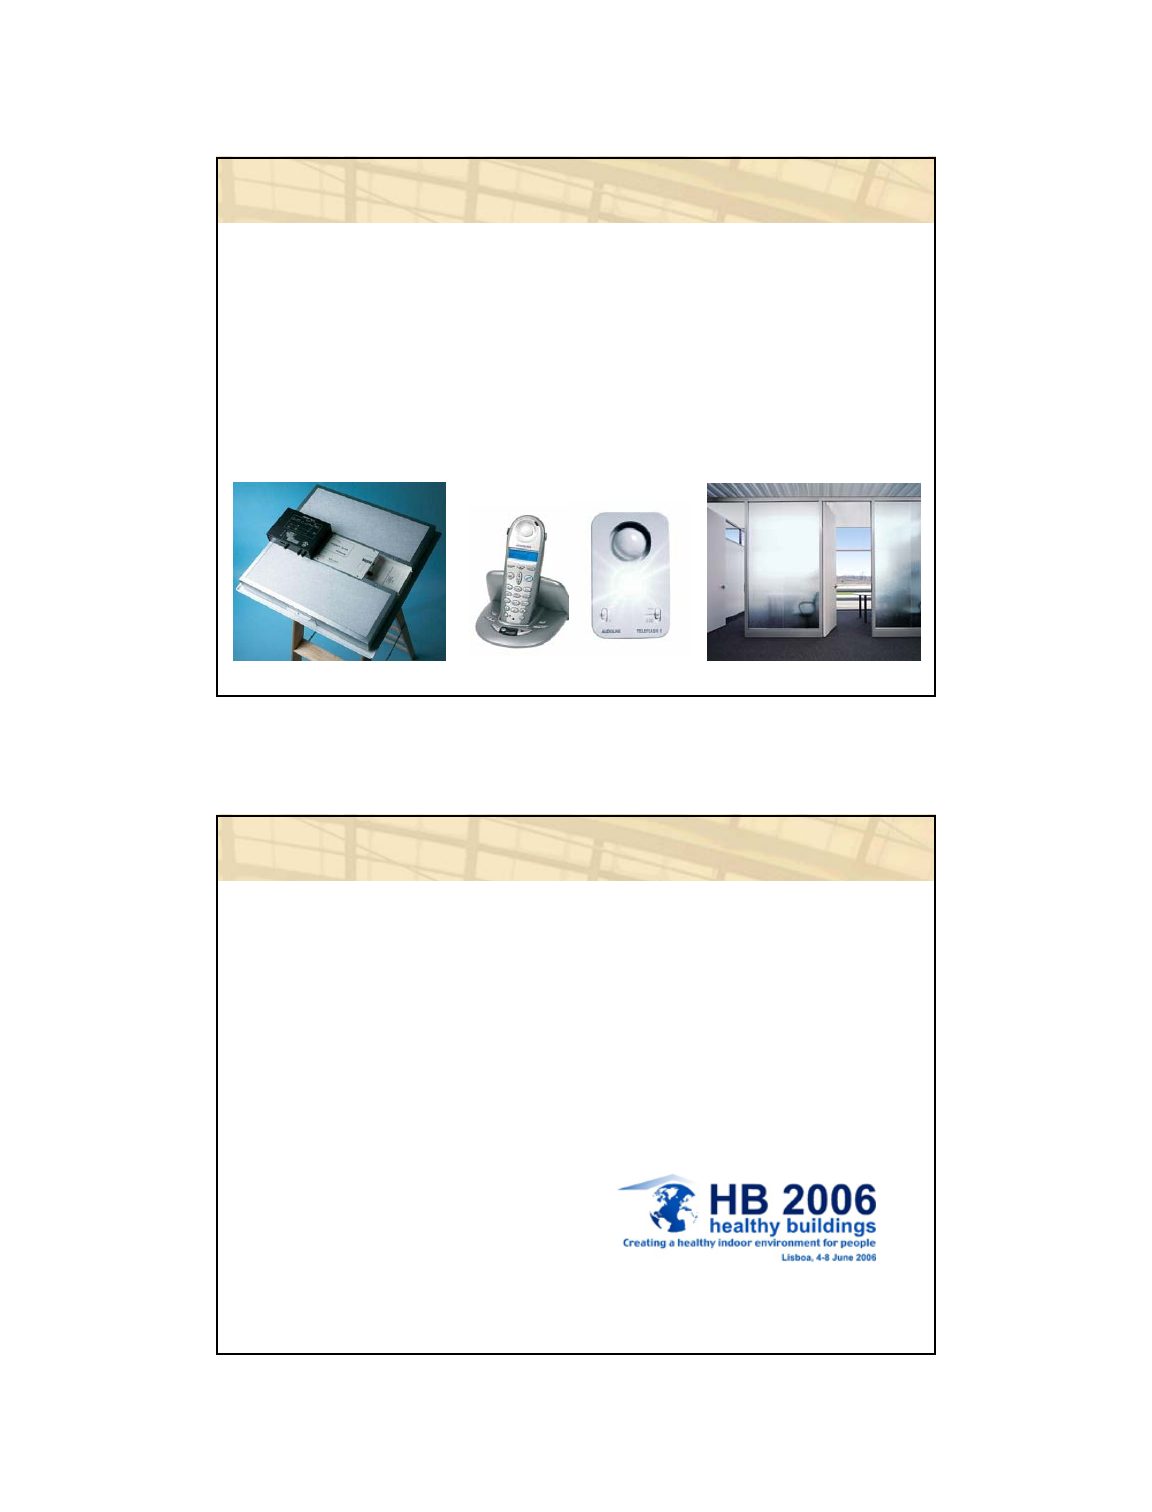
Potential solutions
Acoustical consideration during design, using
consultants or “Speech Privacy Predictor” (SPP)
Focus on improving conditions for cube-dwellers
Sound masking, improved sound absorption
Lower telephone ringing volume, visual ring
Provide varied workspace options
Thermal comfort and air quality analysis
“Air Quality and Thermal Comfort in Office Buildings:
Results of a Large Indoor Environmental Quality
Survey,” Huizenga, C., S. Abbaszadeh, L. Zagreus and
E. Arens, 2006. Proceedings, Healthy Buildings 2006,
June 4-8, Lisbon, Vol. III, 393-397.
Studied satisfaction with thermal comfort, air quality,
compared to existing standards
Analyzed data from
215 buildings
34,169 occupants
LEED Post-Occupancy Evaluation:
Taking Responsibility for the Occupants November 1-2, 2006
Center for the Built Environment (CBE) 18
Thermal comfort & air quality standards
Standards define acceptable indoor environment:
“Conditions in which more than 80% of people do not
express dissatisfaction”
ASHRAE Standard 55-2004 (Thermal comfort)
ASHRAE Standard 62.1-2004 (Air quality)
And others even more restrictive! (90% threshold)
ISO Standard 7730:1994 (Thermal comfort)
Top 3 (>0): satisfied (CBE satisfaction threshold)
Top 4 (>=0): not dissatisfied (acceptability standard)
Thermal satisfaction: 2nd lowest category
“How satisfied are you with the temperature in your
workspace?”
14%13%15%
19%16%16%
6%
-
2,000
4,000
6,000
8,000
10,000
-3 -2 -1 0 1 2 3
Number of respsonses
very dissatisfied very satisfied
Overall: 42% of respondents
dissatisfied
LEED Post-Occupancy Evaluation:
Taking Responsibility for the Occupants November 1-2, 2006
Center for the Built Environment (CBE) 19
Distribution of thermal satisfaction
11% of buildings meet acceptability standard
14%15%
24%
21%
15%
9%
1% 1%
0
10
20
30
40
50
60
0-9%
10-19%
20-29%
30-39%
40-49%
50-50%
60-69%
70-79%
80-89%
90-99%
100%
Percent satisfied
Number of buildingsx
Percent satisfied: Top 4 points (>=0) on 7-point satisfaction scale
Sources of thermal discomfort
Source of dissatisfaction with temperature in CBE survey database
(one-person/one-vote) (total number of complaints = 32,806)
1%
1%
2%
3%
3%
3%
3%
4%
5%
5%
5%
7%
9%
11%
13%
13%
14%
0% 5% 10% 15%
Heating/cooling capacity is insufficient
Clothing policy is not flexible
Air coming out of vents too hot/cold
Heat from office equipment
Drafts from windows
Humidity too low (dry)
Hot/cold surrounding surfaces (floor, ce
Humidity too high (damp)
Other
Incoming sun
Air movement too high
Drafts from vents
Heating/cooling system does not respond
Air movement too low
Thermostat is adjusted by other people
Thermostat is inaccessible
My area is hotter/colder than other area
% of total thermal dissatisfaction votes
LEED Post-Occupancy Evaluation:
Taking Responsibility for the Occupants November 1-2, 2006
Center for the Built Environment (CBE) 20
Thermal controls & satisfaction
Personal control over
environmental conditions
has a positive impact on
occupant satisfaction
Personal devices that
compensate for building
conditions can indicate
dissatisfaction
3,31544%Portable heater
29,43559%No portable heater
30,01857%No operable window
20%Difference
-9%Difference
7,32851%Portable fan
25,42260%No portable fan
-15%Difference
10%Difference
2,73267%Operable window
3,43776%Thermostat
29,31356%No thermostat
32,74958%All occupants
N% satisfied*
*(>=0 on the –3 to +3 satisfaction scale) (p<0.01)
Air quality satisfaction: 3rd lowest category
“How satisfied are you with the air quality in your
workspace (i.e. stuffy/stale air, cleanliness, odors)?”
9% 10%13%
23%
18%19%
8%
-
2,000
4,000
6,000
8,000
10,000
-3 -2 -1 0 1 2 3
Number of respsonses
very dissatisfied very satisfied
Overall: 32% of
respondents
dissatisfied
Among those who were
dissatisfied with their air quality,
major complaints were (in order):
Air is stuffy/stale 74%
Air is not clean 67%
Air is smelling bad 51%
LEED Post-Occupancy Evaluation:
Taking Responsibility for the Occupants November 1-2, 2006
Center for the Built Environment (CBE) 21
1%
8%
19%20%
25%
15%
9%
2%
1%
0
10
20
30
40
50
60
0-9%
10-19%
20-29%
30-39%
40-49%
50-50%
60-69%
70-79%
80-89%
90-99%
100%
Percent satisfied
Number of buildingsx
Distribution of air quality satisfaction
26% of buildings meet acceptability standard
Percent satisfied: Top 4 points (>=0) on 7-point satisfaction scale
LEED IEQ analysis
“Occupant Satisfaction with Indoor Environmental
Quality in Green Buildings.” Abbaszadeh Fard, S., L.
Zagreus, D. Lehrer and C. Huizenga, 2006.
Proceedings, Healthy Buildings 2006, June 4-8, Lisbon,
Vol. III, 365-370.
Compared occupant satisfaction in 21 green or LEED-
certified buildings with 160 non-green buildings
Analyzed data from
181 buildings
33,285 occupants
LEED Post-Occupancy Evaluation:
Taking Responsibility for the Occupants November 1-2, 2006
Center for the Built Environment (CBE) 22
Design and construction practices that significantly
reduce or eliminate the negative impact of buildings
on the environment and occupants in five broad
areas:
Sustainable site planning
Safeguarding water and water efficiency
Energy efficiency and renewable energy
Conservation of materials and resources
Indoor environmental quality
What is “Green” Design?
Source: Introduction to USGBC and LEED Green Rating System, 3/18/2004
Research opportunity: LEED IEQ analysis
Do LEED-rated / green buildings in fact have better
indoor environmental quality?
LEED Post-Occupancy Evaluation:
Taking Responsibility for the Occupants November 1-2, 2006
Center for the Built Environment (CBE) 23
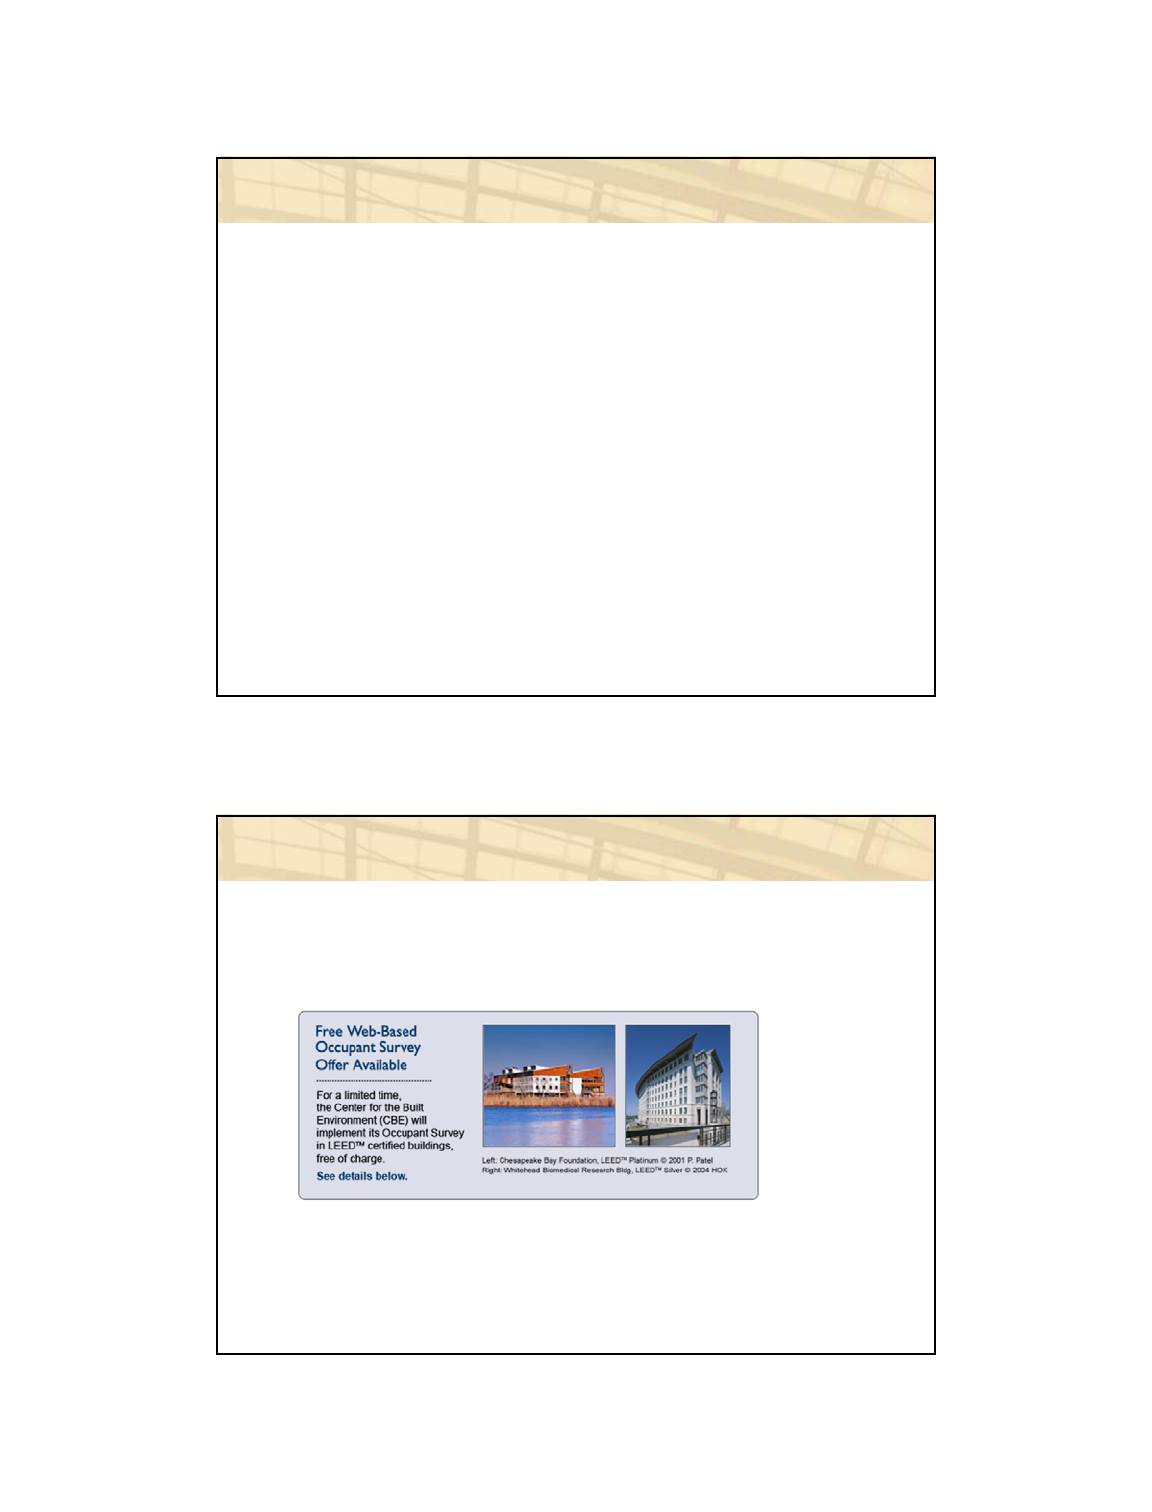
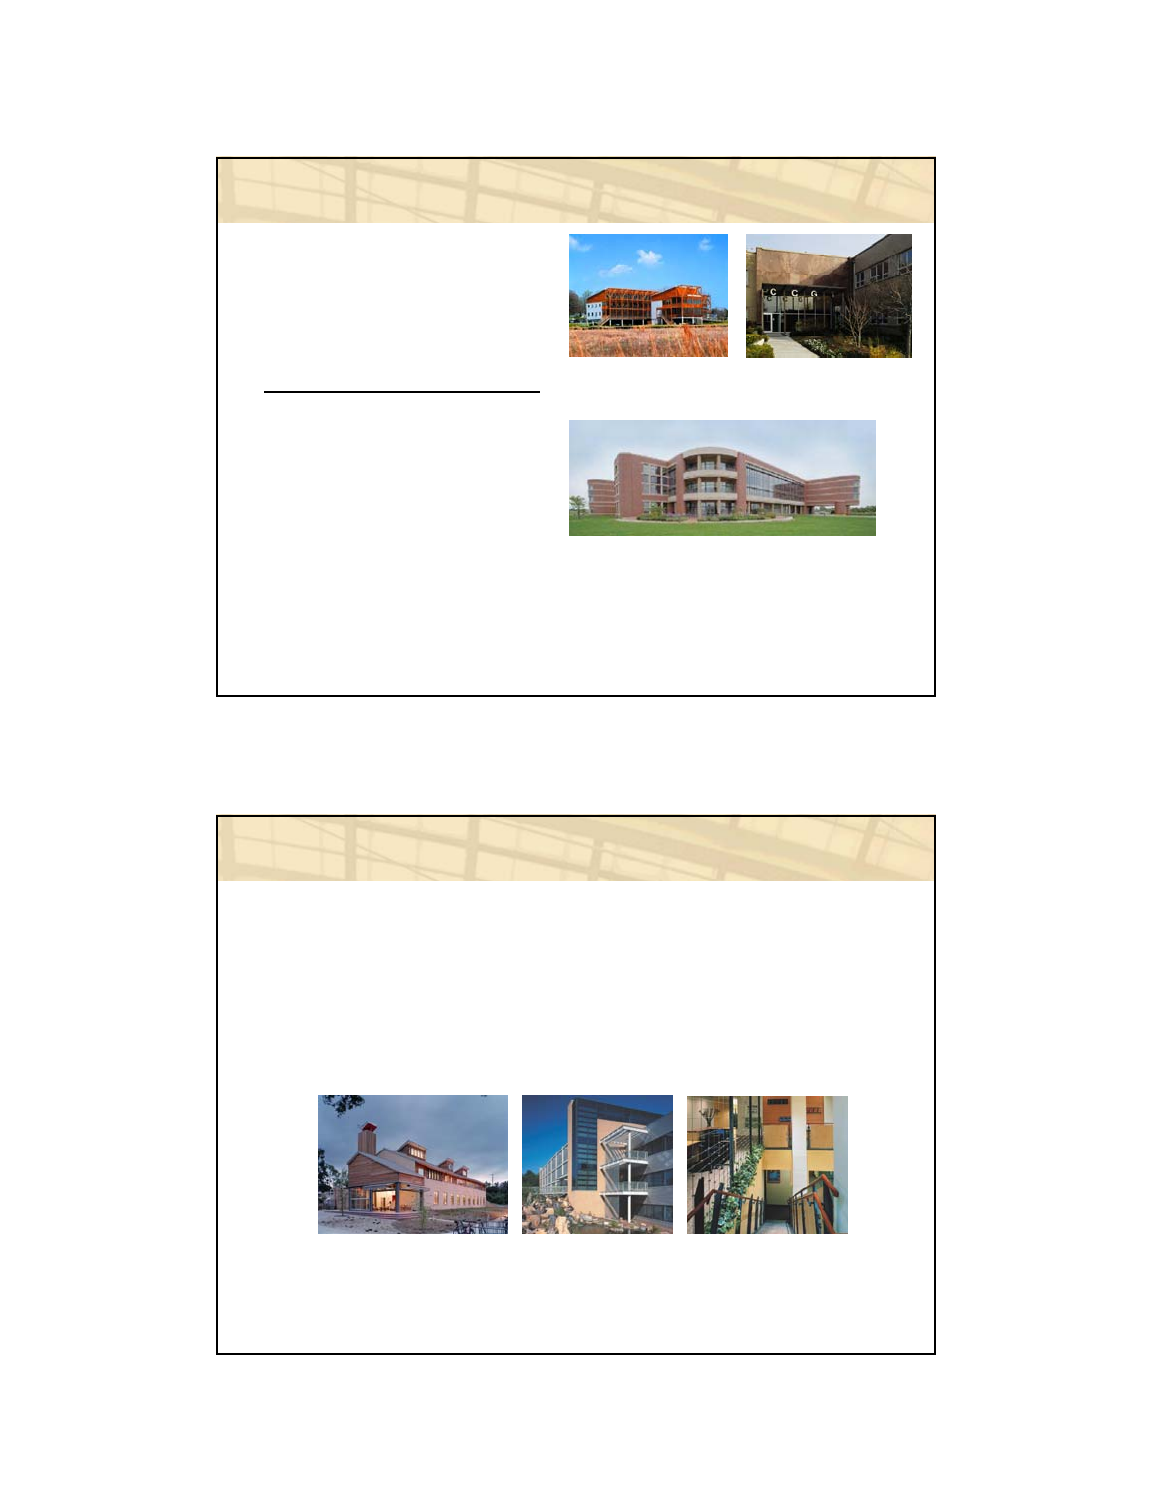
LEED-rated / green buildings in database
15 LEED-rated and 6 self-
nominated buildings
160 other buildings in CBE
database Chesapeake Bay
Foundation Chicago Center for
Green Technology
JohnsonDiversey Global Headquarters
3CI pilot
1EB pilot
2NC 1 platinum
1NC 2 certified
2NC 2.1
3NC 2 silver
2NC 2 gold
1NC 2 platinum
NC=New Construction; EB=Existing Buildings; CI=Commercial Interiors
Self-nominated green buildings
6 buildings identified by building design team or owner:
2 received national AIA Top 10 Green Building Awards
2 received Environmental Design & Construction awards
1 received Savings by Design award
1 received local awards
National Wildlife Federation World Resources InstituteCarnegie Center for Global
Ecology
LEED Post-Occupancy Evaluation:
Taking Responsibility for the Occupants November 1-2, 2006
Center for the Built Environment (CBE) 24
LEED - NC LEED - EB
Sustainable Sites 14 14
Water Efficiency 5 5
Energy & Atmosphere 17 23
Materials & Resources 13 16
Indoor Environmental Quality 15 22
Innovation & Design Process 5 5
Total 69 85
% of IEQ credit points 22% 26%
Categories in LEED – NC 2.1 & EB 2.0
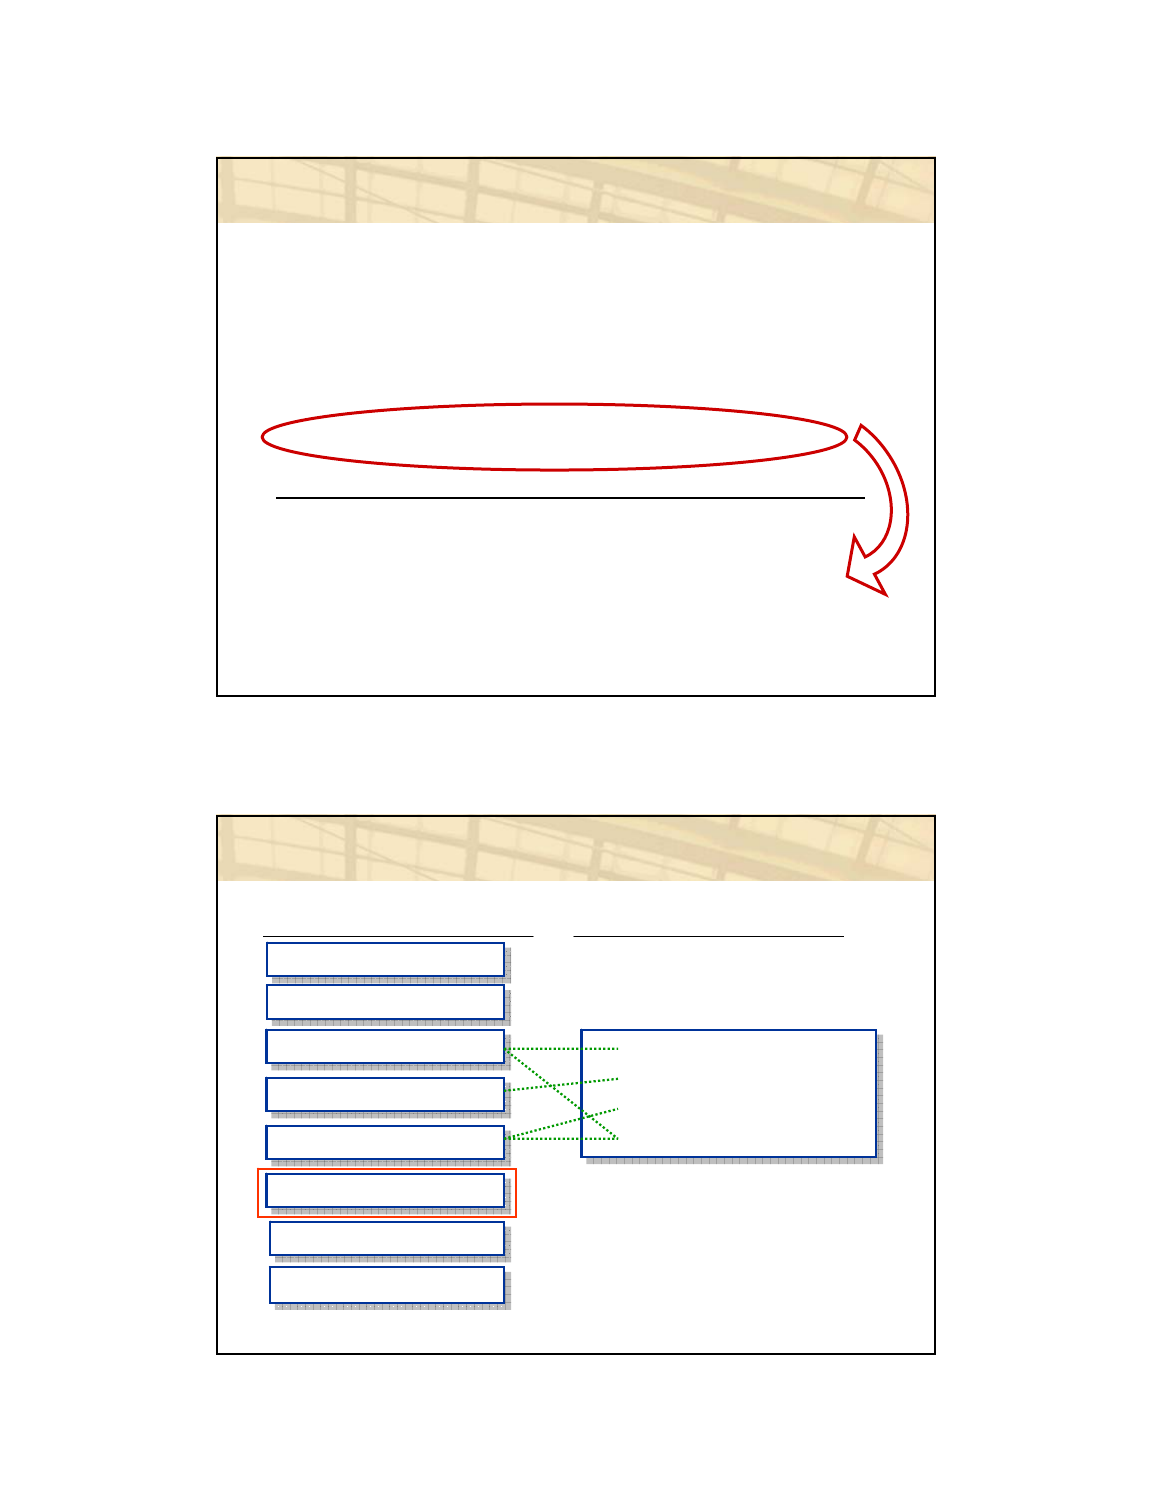
Gen. Bldg & Workspace
Gen. Bldg & Workspace
Thermal Comfort
Thermal Comfort
Air Quality
Air Quality
Lighting
Lighting
Acoustics
Acoustics
Cleaning & Maint.
Cleaning & Maint.
Survey Satisfaction categories
Thermal comfort
Air Quality
Daylight & views
Controllability of systems
Thermal comfort
Air Quality
Daylight & views
Controllability of systems
LEED IEQ credit categories
Mapping survey categories to LEED
Office Layout
Office Layout
Office Furnishing
Office Furnishing
LEED Post-Occupancy Evaluation:
Taking Responsibility for the Occupants November 1-2, 2006
Center for the Built Environment (CBE) 25
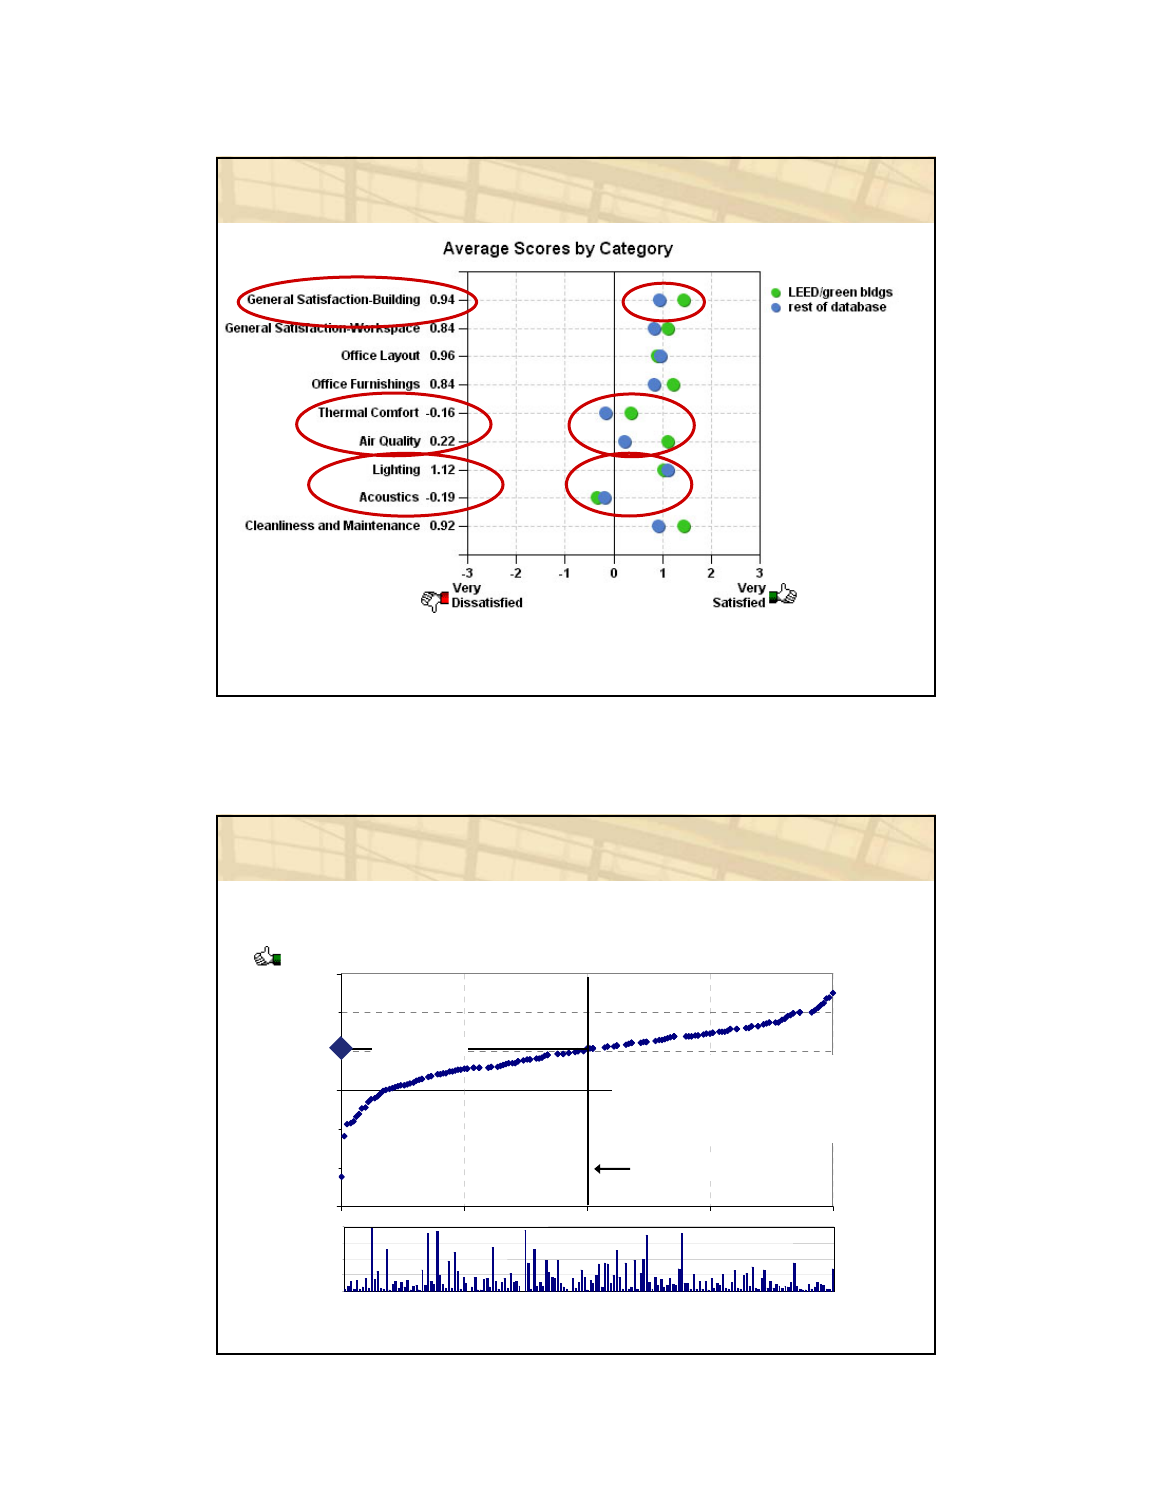
IEQ in LEED-rated/green buildings paper
Source: CBE survey database as of September 27, 2005
(n=21)
(n=160)
Overall Satisfaction - Building
CBE Database, buildings with responses >15 (n=161)
-3
0
3
0% 25% 50% 75% 100%
Percentile Rank
Mean Satisfaction Scor
e
Percentile charts overview
Very
dissatisfied
Very
satisfied
Median entire database
161 buildings
Un-weighted average: 1 bldg. = 1 vote
Approx. 28,000 occupant responses
Average response rate 49%
0
200
400
600
800
Median 1.07
LEED Post-Occupancy Evaluation:
Taking Responsibility for the Occupants November 1-2, 2006
Center for the Built Environment (CBE) 26
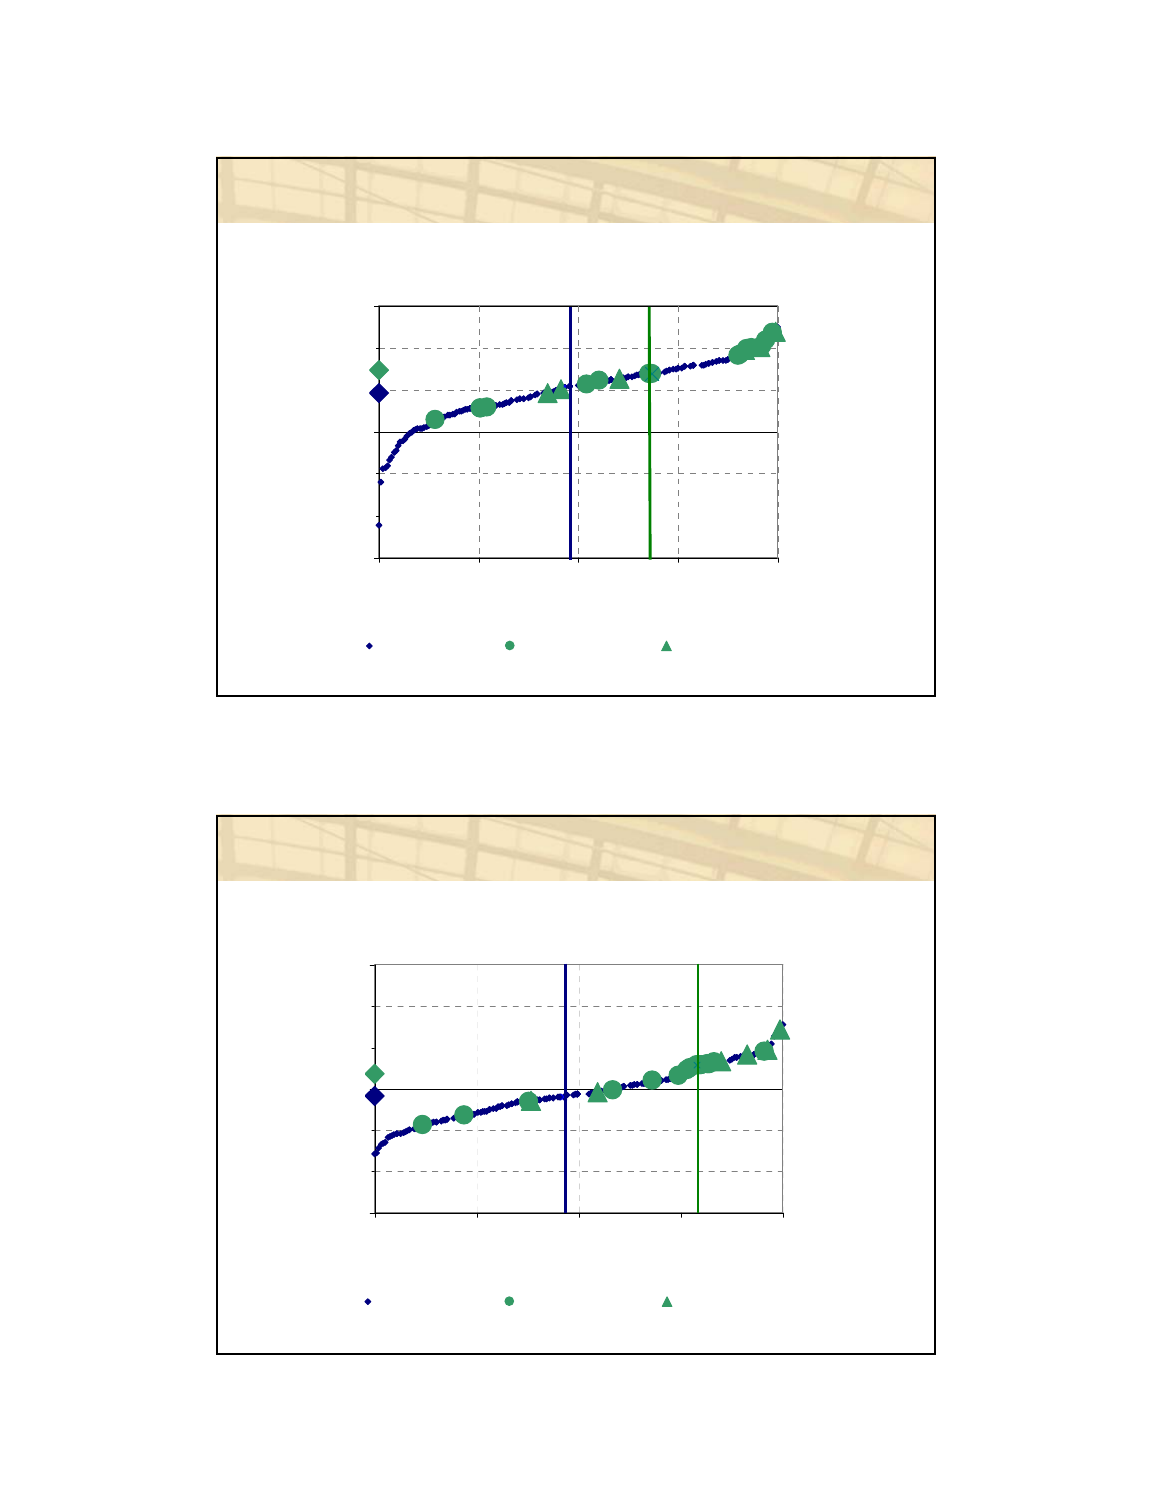
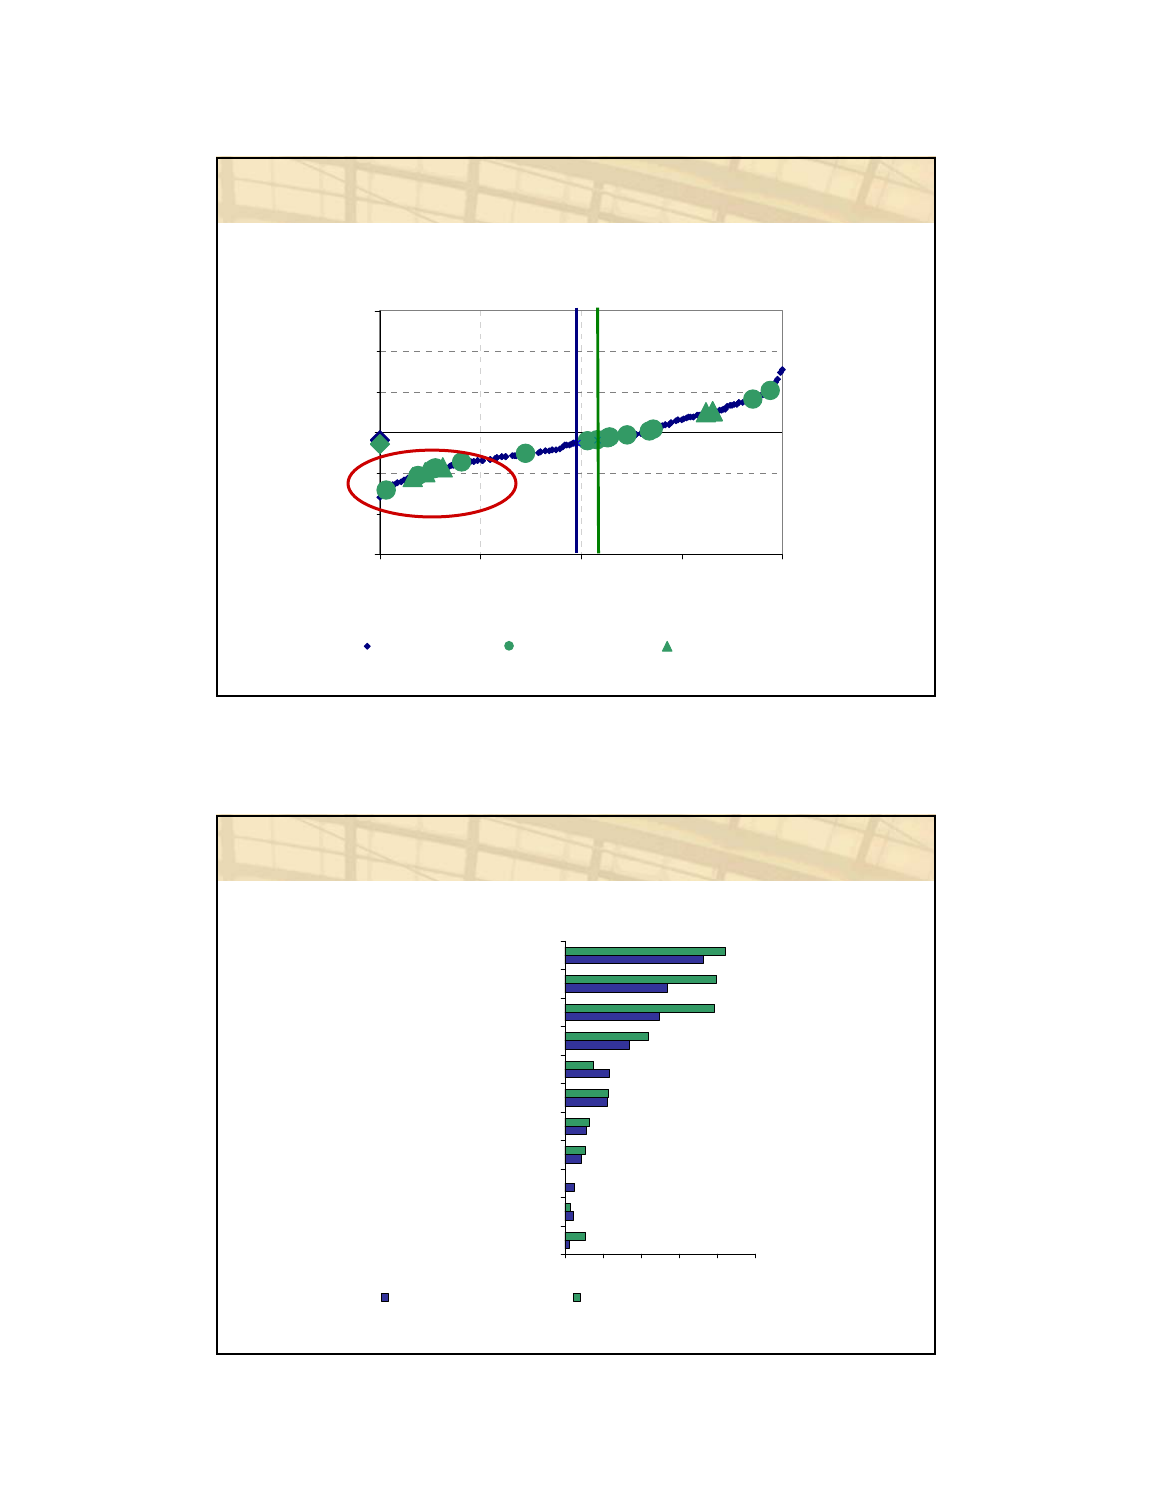
Building overall: satisfaction
Overall Satisfaction - Building
LEED-rated/green (n=21) Compared to CBE Database (n=160)
0.93
1.47
-3
0
3
0% 25% 50% 75% 100%
Percentile Rank
Mean Satisfaction Score
Database building LEED-rated building Green building
Median of rest of
database
Median of LEED
-
rated/green
buildings
Thermal Comfort: satisfaction
Overall Satisfaction - Thermal Comfort
LEED-rated/green (n=21) Compared to CBE Database (n=160)
-0.16
0.36
-3
0
3
0% 25% 50% 75% 100%
Percentile Rank
Mean Satisfaction Score
Database building LEED-rated building Green building
Median of rest
of database Median of
LEED-
rated/
g
reen
LEED Post-Occupancy Evaluation:
Taking Responsibility for the Occupants November 1-2, 2006
Center for the Built Environment (CBE) 27
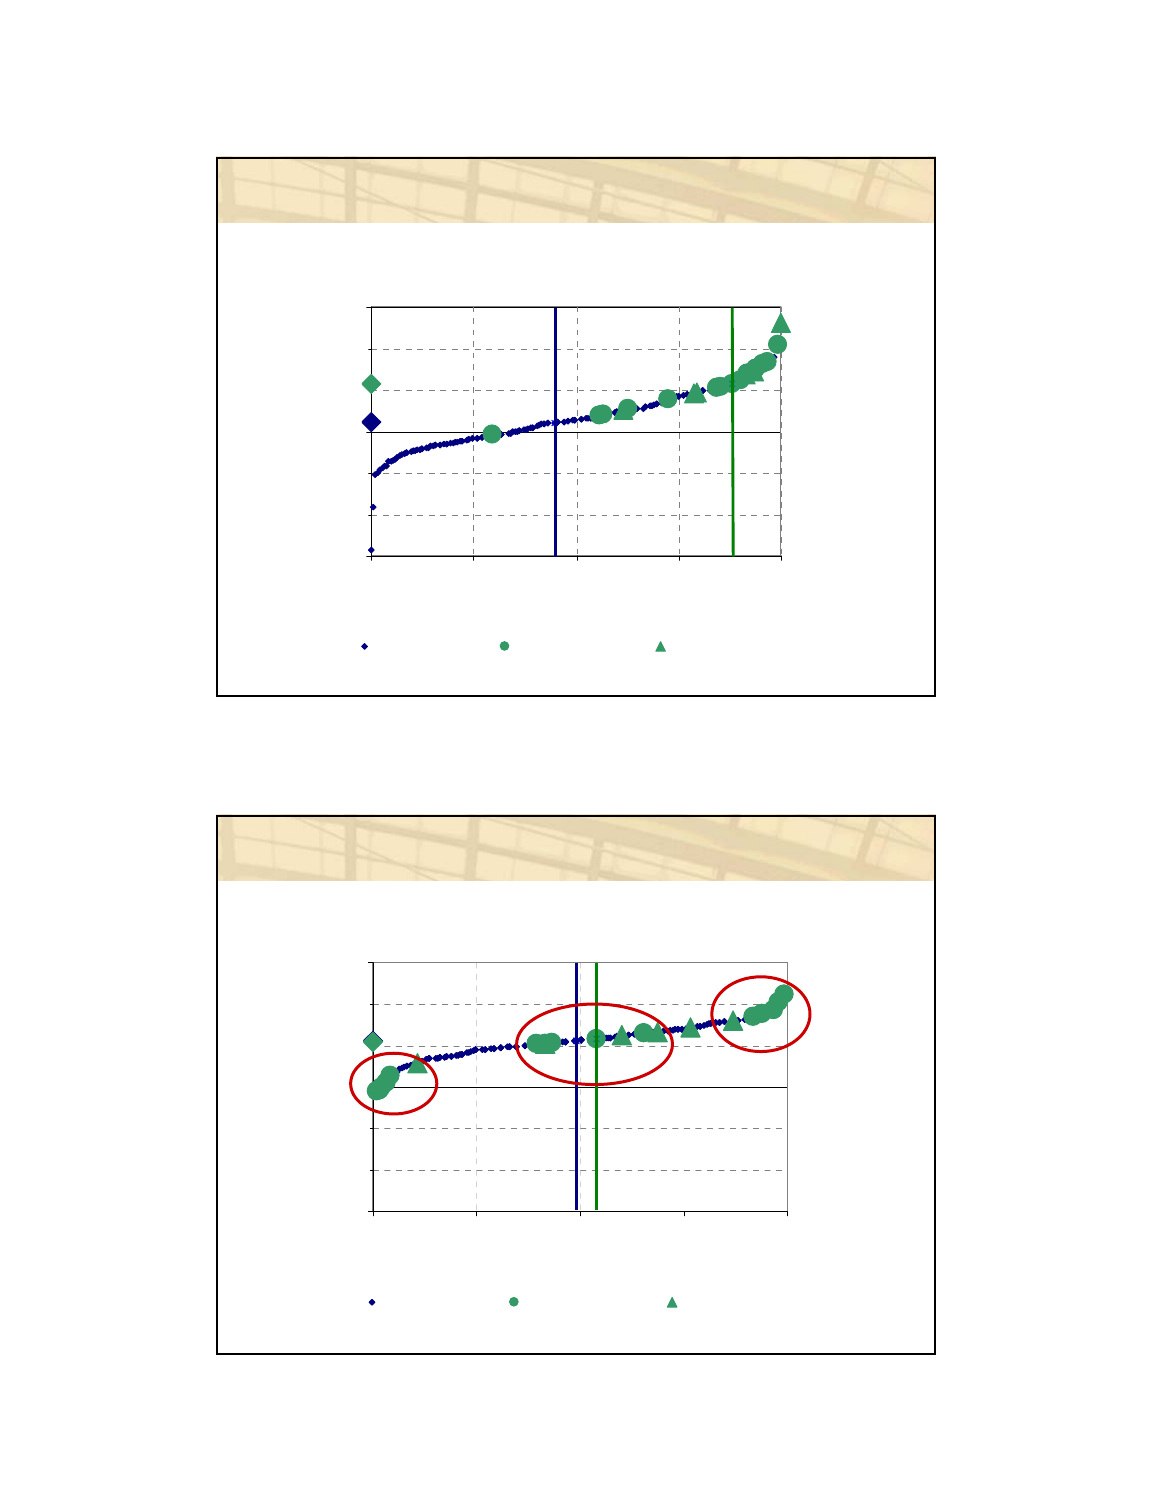
Air Quality: satisfaction
Overall Satisfaction - Air Quality
LEED-rated/green (n=21) Compared to CBE Database (n=160)
0.21
1.14
-3
0
3
0% 25% 50% 75% 100%
Percentile Rank
Mean Satisfaction Score
Database building LEED-rated building Green building
Median of rest
of database
Median of LEED-
rated / green
buildings
Overall Satisfaction - Lighting
LEED-rated/green (n=21) Compared to CBE Database (n=160)
1.12
1.08
-3
0
3
0% 25% 50% 75% 100%
Percentile Rank
Mean Satisfaction Score
Database building LEED-rated building Green building
Median of rest
of database
Median of LEED-
rated / green
buildings
Lighting: satisfaction
LEED Post-Occupancy Evaluation:
Taking Responsibility for the Occupants November 1-2, 2006
Center for the Built Environment (CBE) 28
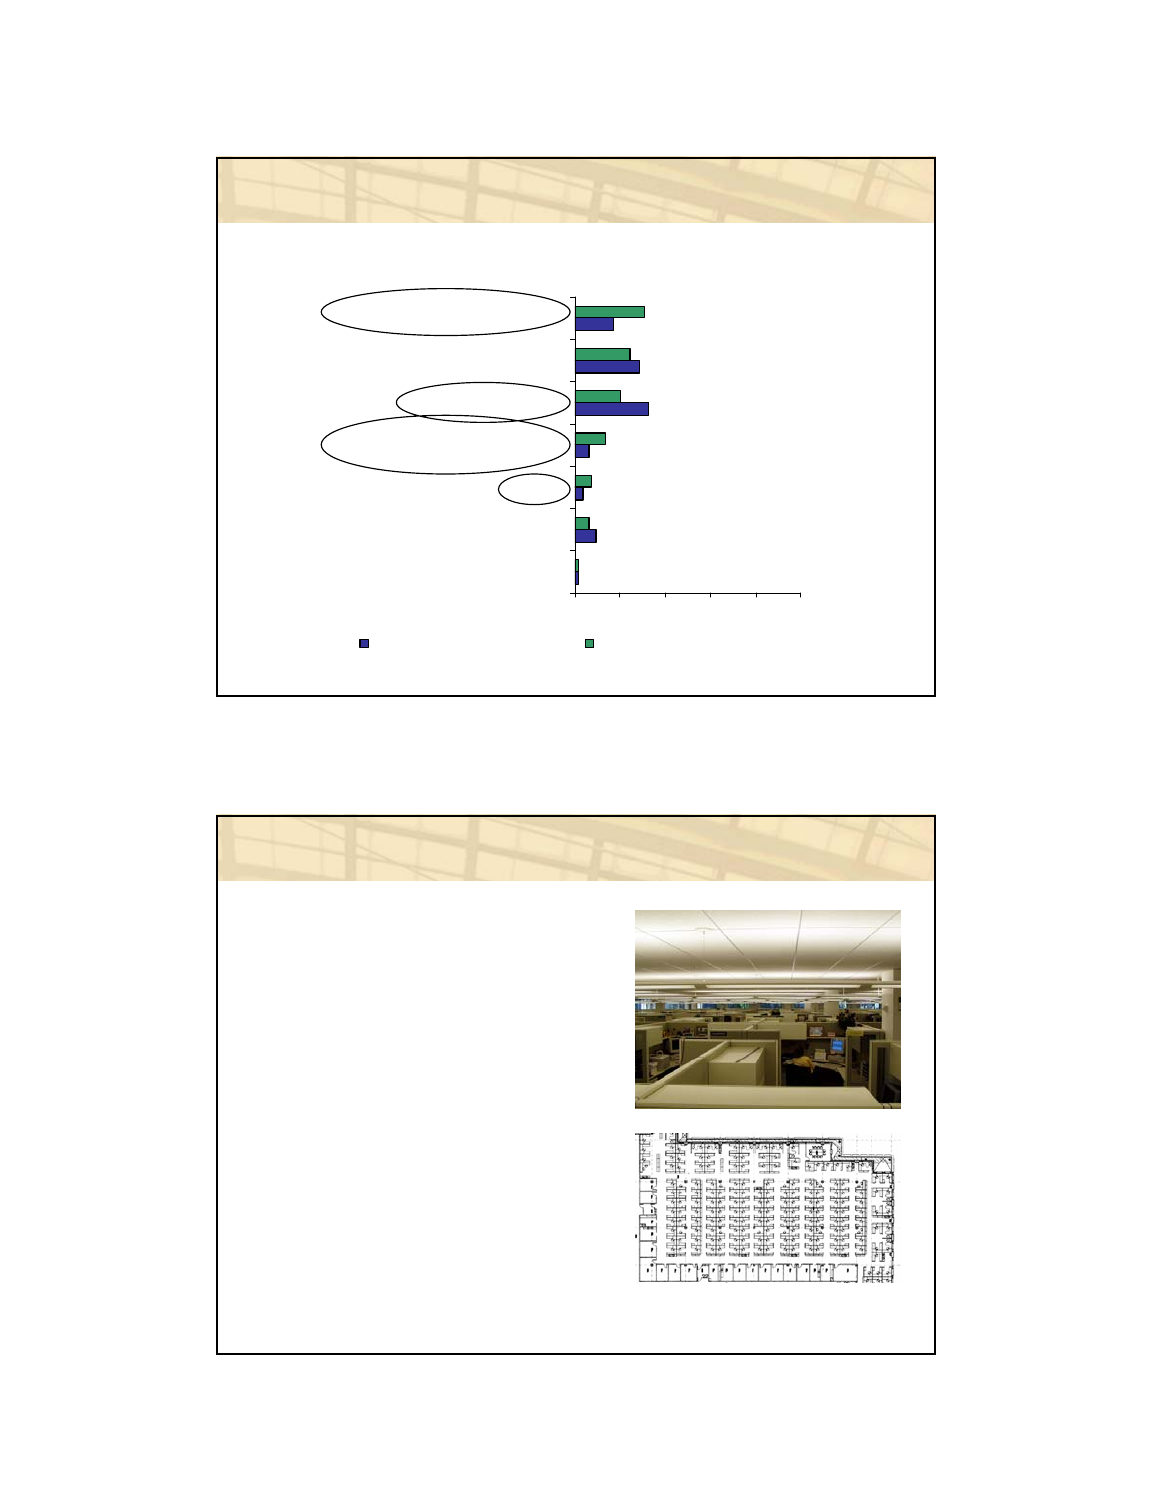
Lighting complaints
Average lighting complaints in LEED-rated/green buildings (n=21)
and the rest of CBE database (n=160)
0% 20% 40% 60% 80% 100%
No control over sunlight/daylight
too much daylight
Other:
Electric lighting flickers
Shadows on the workspace
Electric lighting is an undesirable
color
Too much electric lighting
Not enough electric lighting
no task lighting
too bright
too dark
Reflections in the computer screen
not enough daylight
Database building LEED-rated/green building
Lighting dissatisfaction comments
Building A
“task lights don’t work”
“…the only light is above the light shelf, I had to bring in my own
lamp..”
Building B
“Too bright in some places, too dark in others, and not enough
task lighting…”
“The light sensors need to be adjusted… to come on sooner.”
“Task light mounted on wrong side of workstation.”
Building C
“The lighting in my cube was woefully inadequate from day one.
The task lighting does not shine where I do my reading and
writing. Another light…lights the space behind my computer
monitor and over my telephone…”
LEED Post-Occupancy Evaluation:
Taking Responsibility for the Occupants November 1-2, 2006
Center for the Built Environment (CBE) 29
Lighting controls
Average lighting controls in LEED-rated/green buildings
(n=21) and the rest of CBE database (n=160)
0% 20% 40% 60% 80% 100%
Light dimmer
Other:
None of the above
Window blinds or shades
Light switch
Desk (task) light
Database building LEED-rated/green building
Sustainable design strategies – Lighting
Common strategies include
Provide lower levels of ambient electric lighting
Rely more on daylight to conserve energy and enhance IEQ
Can result in
Thermal discomfort
Glare/reflections
Workspace too dark/bright
Lessons learned
Provide effective controls to occupants such as task lighting,
blinds and shades
Commission automated systems such as occupancy/daylight
sensors and shading systems
LEED Post-Occupancy Evaluation:
Taking Responsibility for the Occupants November 1-2, 2006
Center for the Built Environment (CBE) 30
Acoustics: satisfaction
Overall Satisfaction - Acoustics
LEED-rated/green (n=21) Compared to CBE Database (n=160)
-0.20
-0.27
-3
0
3
0% 25% 50% 75% 100%
Percentile Rank
Mean Satisfaction Score
Database building LEED-rated building Green building
Median of rest
of database
Median of LEED-
rated / green
buildings
Acoustic complaints
Average acoustic complaints in LEED-rated/green
buildings (n=21) and the rest of CBE database (n=160)
0% 20% 40% 60% 80% 100%
Excessive echoing of voices or
other sounds
Office lighting noise
people in corridor
Other:
outdoor traffic noise
Office equipment noise
Mechanical (heating, cooling and
ventilation systems) noise
telephones ringing
People talking on the phone
People overhearing my private
conversations
People talking in neighboring areas
Database building LEED-rated/green building
LEED Post-Occupancy Evaluation:
Taking Responsibility for the Occupants November 1-2, 2006
Center for the Built Environment (CBE) 31
Office type
Average distribution of office types in LEED-rated/green
buildings (n=21) and the rest of CBE database (n=160)
0% 20% 40% 60% 80% 100%
Cubicles with partitions of different
heights
Enclosed office, shared with other
people
Other:
Workspace in open office with no
partitions (just desks)
Enclosed office, private
Cubicles with high partitions (about
five or more feet high)
Cubicles with low partitions (lower
than five feet high)
Database building LEED-rated/green building
Acoustics dissatisfaction comments
Building A (96% open office, n=703)
“Desks too close…everyone can hear
everything. Even a tiny sneeze.”
“You can hear noises emanating 20 to
25 feet away. There is no sound
deadening effect from the cubicle
walls and the floor always sounds like
a herd of elephants is doing a ballet.”
Building B (97% open office, n=173)
“…obnoxious neighbors who think
they are the only ones on the block.”
“No one can ever hear my radio even
though I think it's turned up loud.”
… I'm a loud talker and I'm sure I
disturb other people…”
LEED Post-Occupancy Evaluation:
Taking Responsibility for the Occupants November 1-2, 2006
Center for the Built Environment (CBE) 32
Conclusions: LEED IEQ analysis
LEED-rated / green buildings had
significantly higher satisfaction scores in:
building overall
indoor air quality
thermal comfort
LEED-rated / green buildings did not have
higher scores in:
lighting
acoustics
No clear relationship found between LEED
credit points and occupant satisfaction with
IEQ
LEED rating by itself does not guarantee
better IEQ
Overall Satisfaction - Building
LEED & GREEN (n=20) Compared to CBE Database (n=161)
-3
0
3
0% 25% 50% 75% 100%
Percentile Rank
Mean Satisfaction Score
Case studies
Very
dissatisfied
Very
satisfied
Carnegie
Center
Carnegie
Center
Chesapeake
Bay
Foundation
Chesapeake
Bay
Foundation
LEED-certified bldg.
Self-nominated green bldg.
Non-green bldg.
Johnson
Diversey
Johnson
Diversey
LEED Post-Occupancy Evaluation:
Taking Responsibility for the Occupants November 1-2, 2006
Center for the Built Environment (CBE) 33
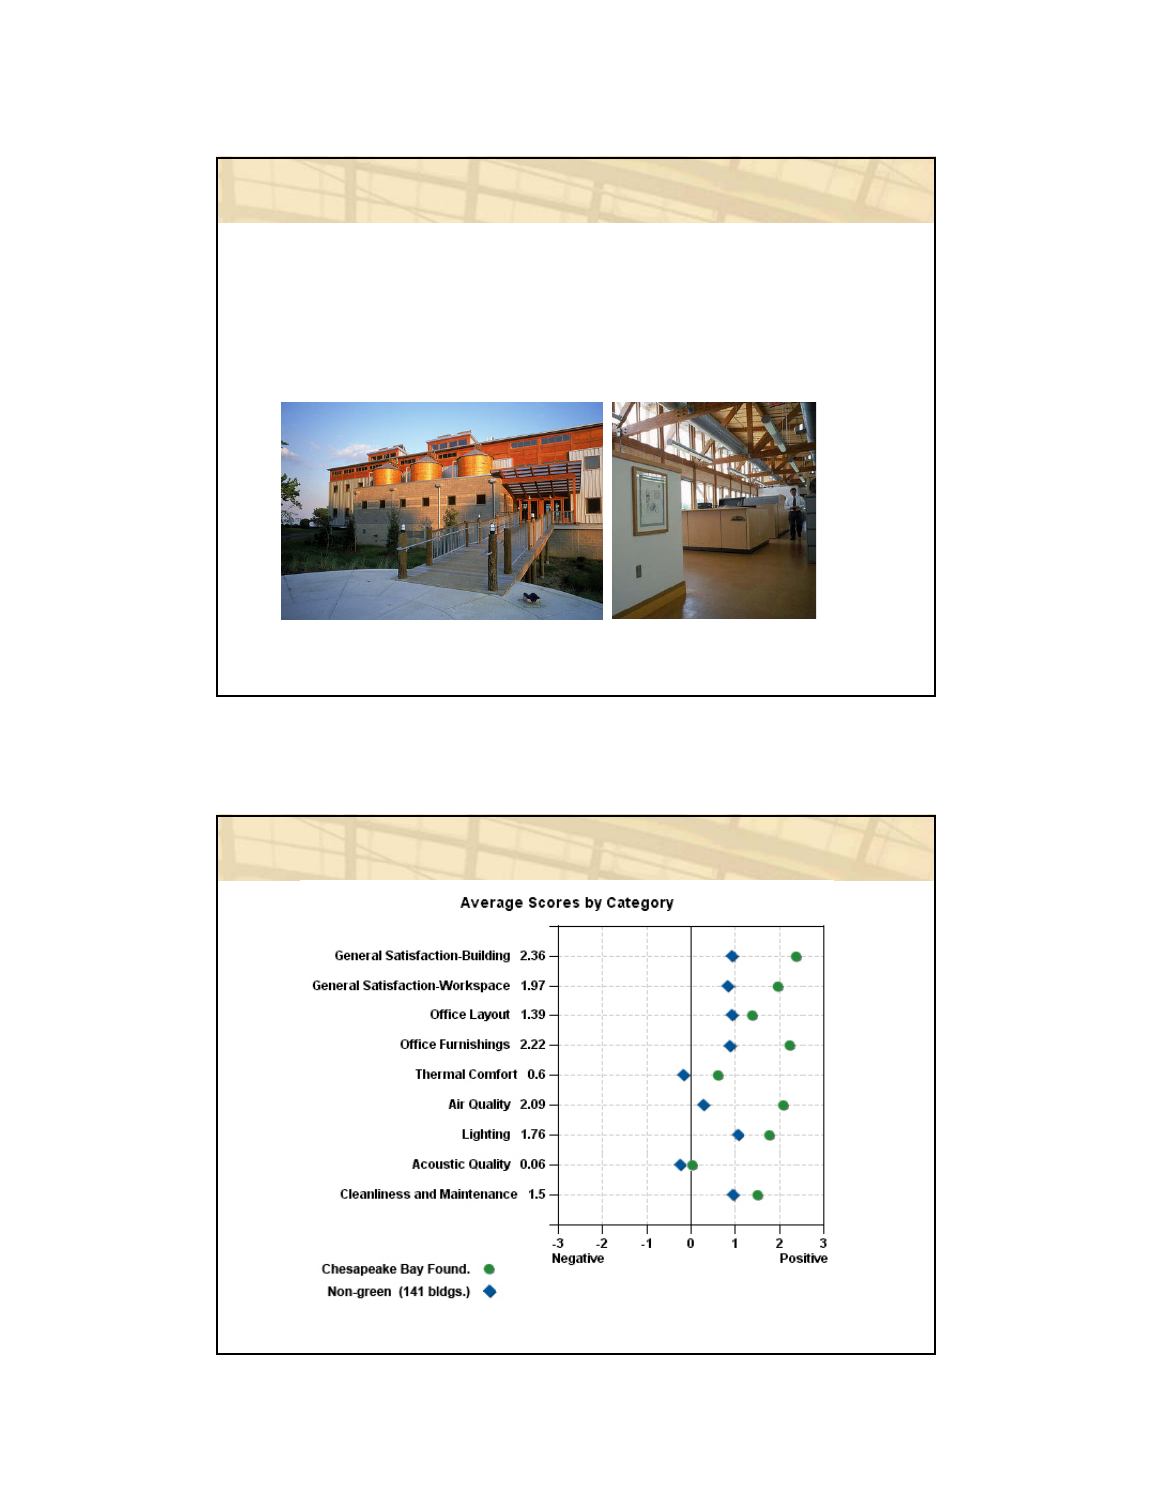
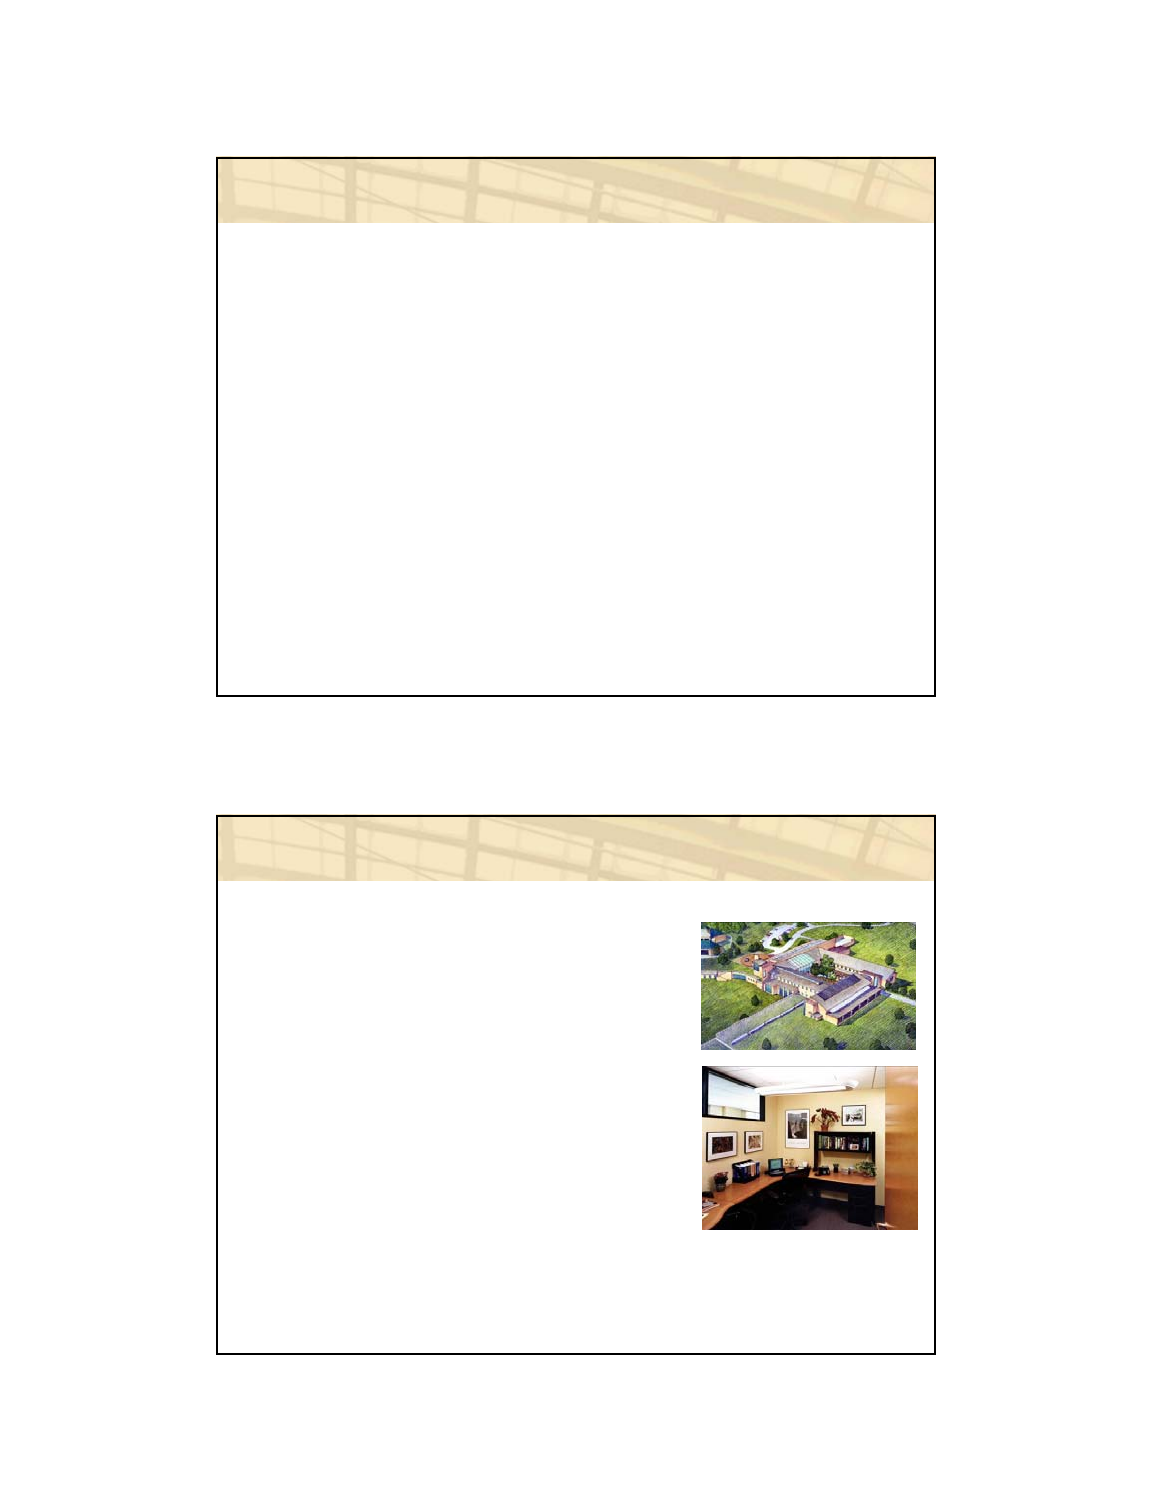
Case study: Chesapeake Bay Foundation
First LEED-certified Platinum (version 1.0), completed in 2001
5 of 7 possible IEQ points (36 of 52 total possible points)
Numerous sustainable features
DOE-sponsored field study conducted by Judith Heerwagen, used
extended version of occupant survey, interviews and observations
Heerwagen, J. and L. Zagreus, “The Human Factors of Sustainability: A Post Occupancy
Evaluation of the Philip Merrill Environmental Center.” April 2005
Case study: Chesapeake Bay Foundation
LEED Post-Occupancy Evaluation:
Taking Responsibility for the Occupants November 1-2, 2006
Center for the Built Environment (CBE) 34
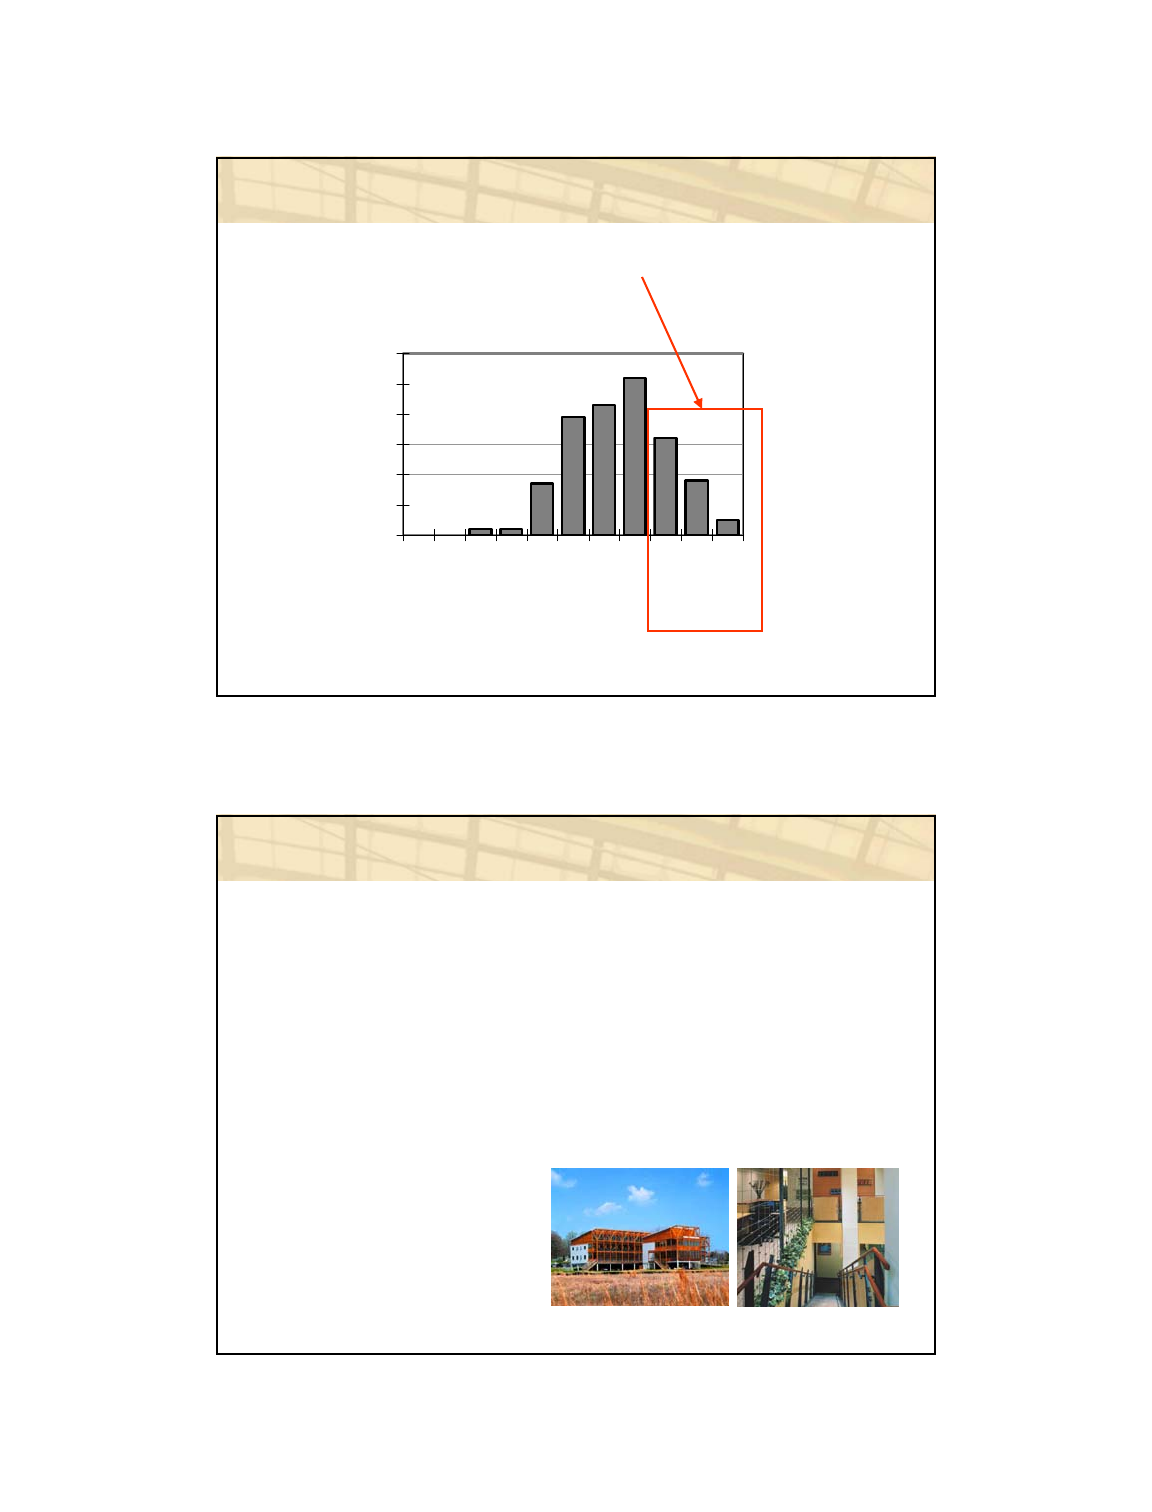
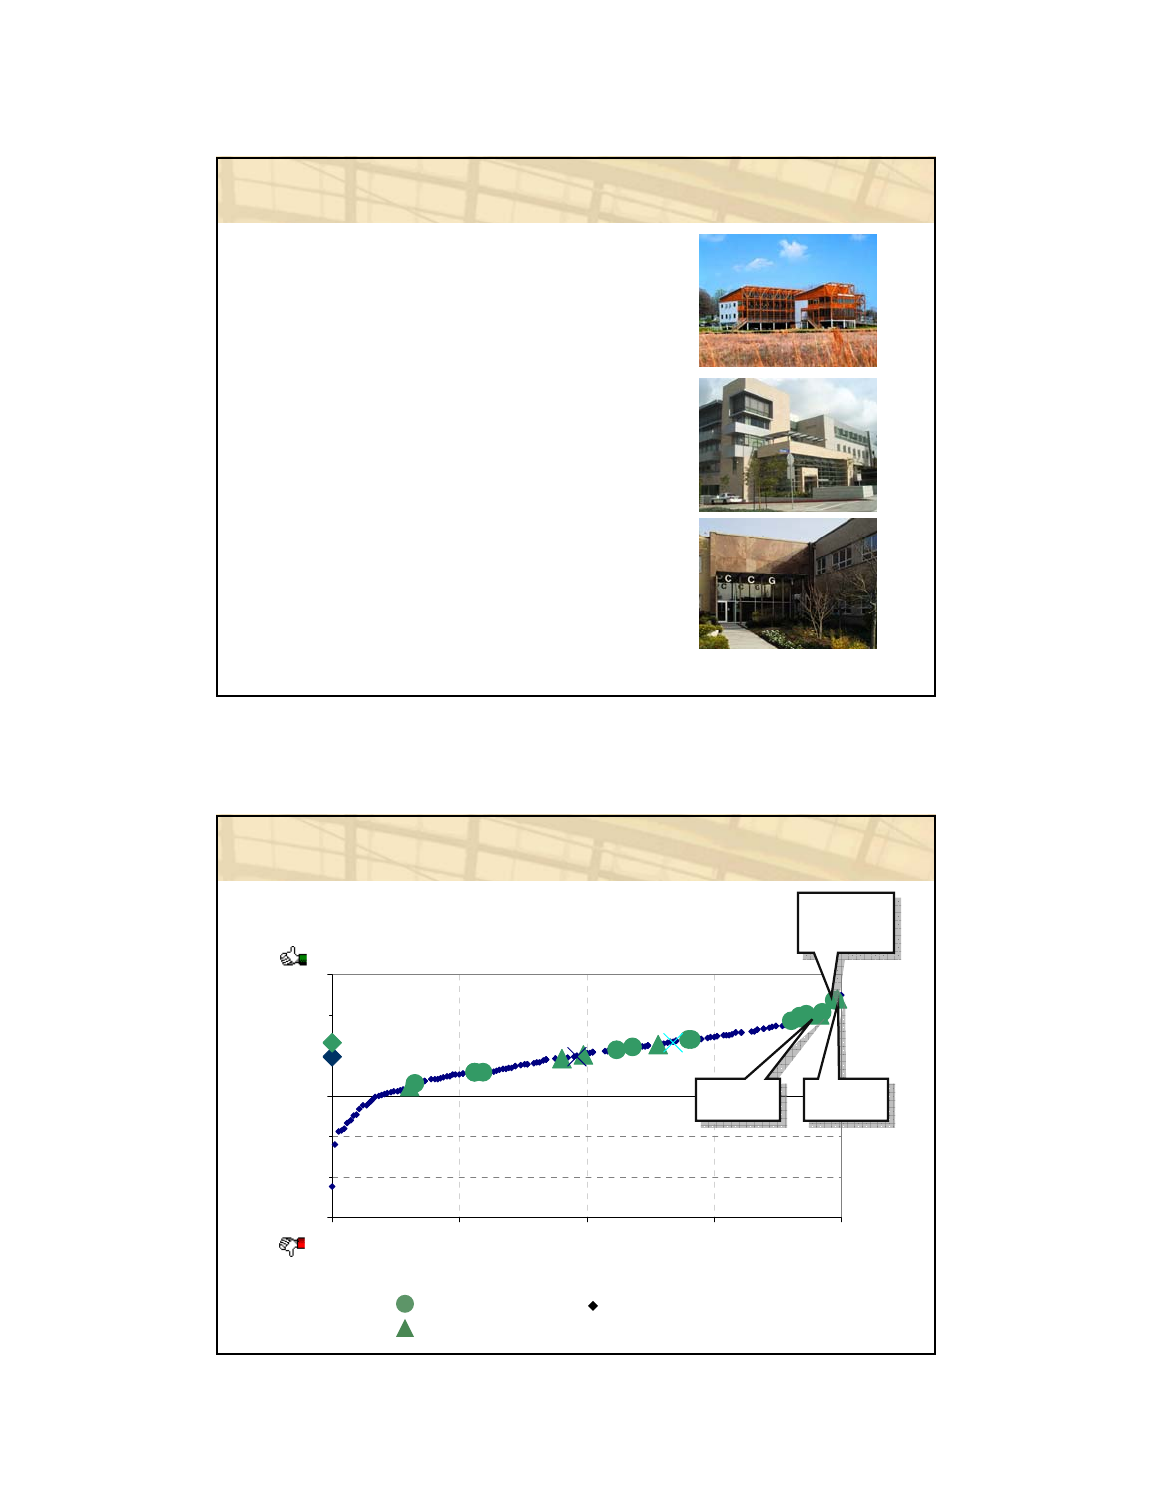
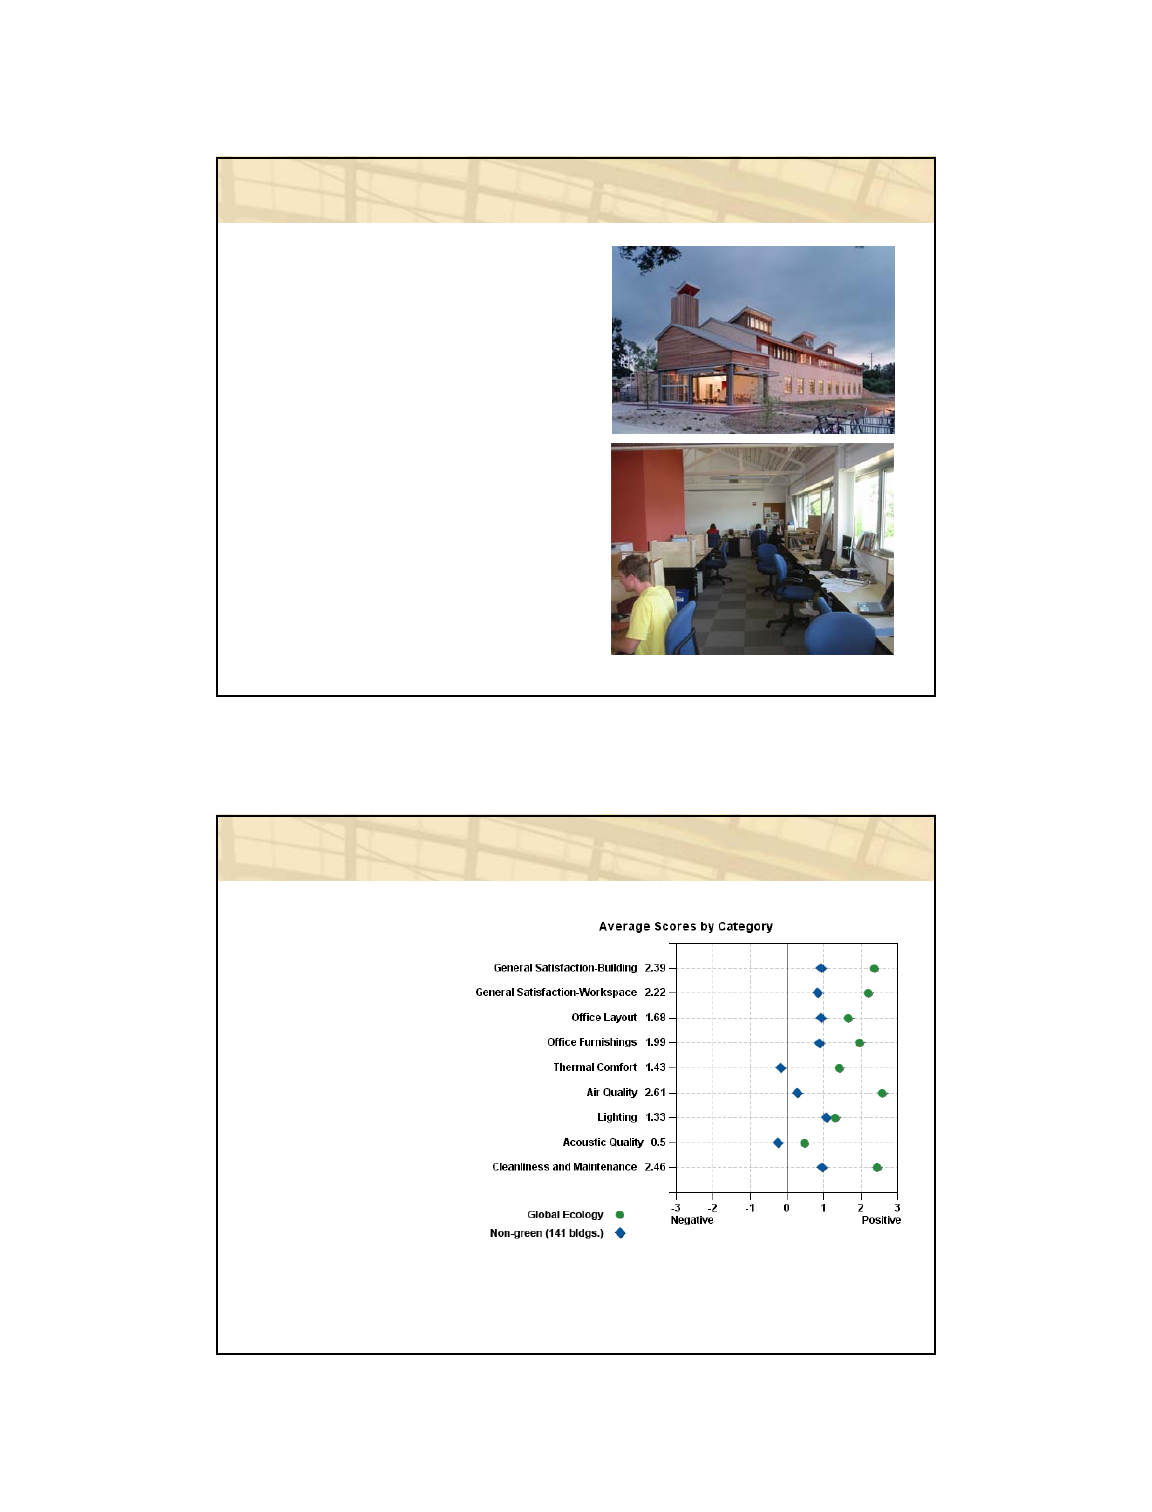
Case study: Carnegie Center for Global Ecology
Stanford campus, Palo Alto, CA
Clients understood green
building priorities, did not rely
on LEED
Selected design team with
extensive green building
experience
Designed to beat California
energy code by 57%
IEQ features include
daylighting, radiant heating and
cooling, natural ventilation with
operable windows
Case study: Carnegie Center for Global Ecology
High marks overall
Acoustical score
puts building in top
quartile
83% in open office,
no partitions
LEED Post-Occupancy Evaluation:
Taking Responsibility for the Occupants November 1-2, 2006
Center for the Built Environment (CBE) 35
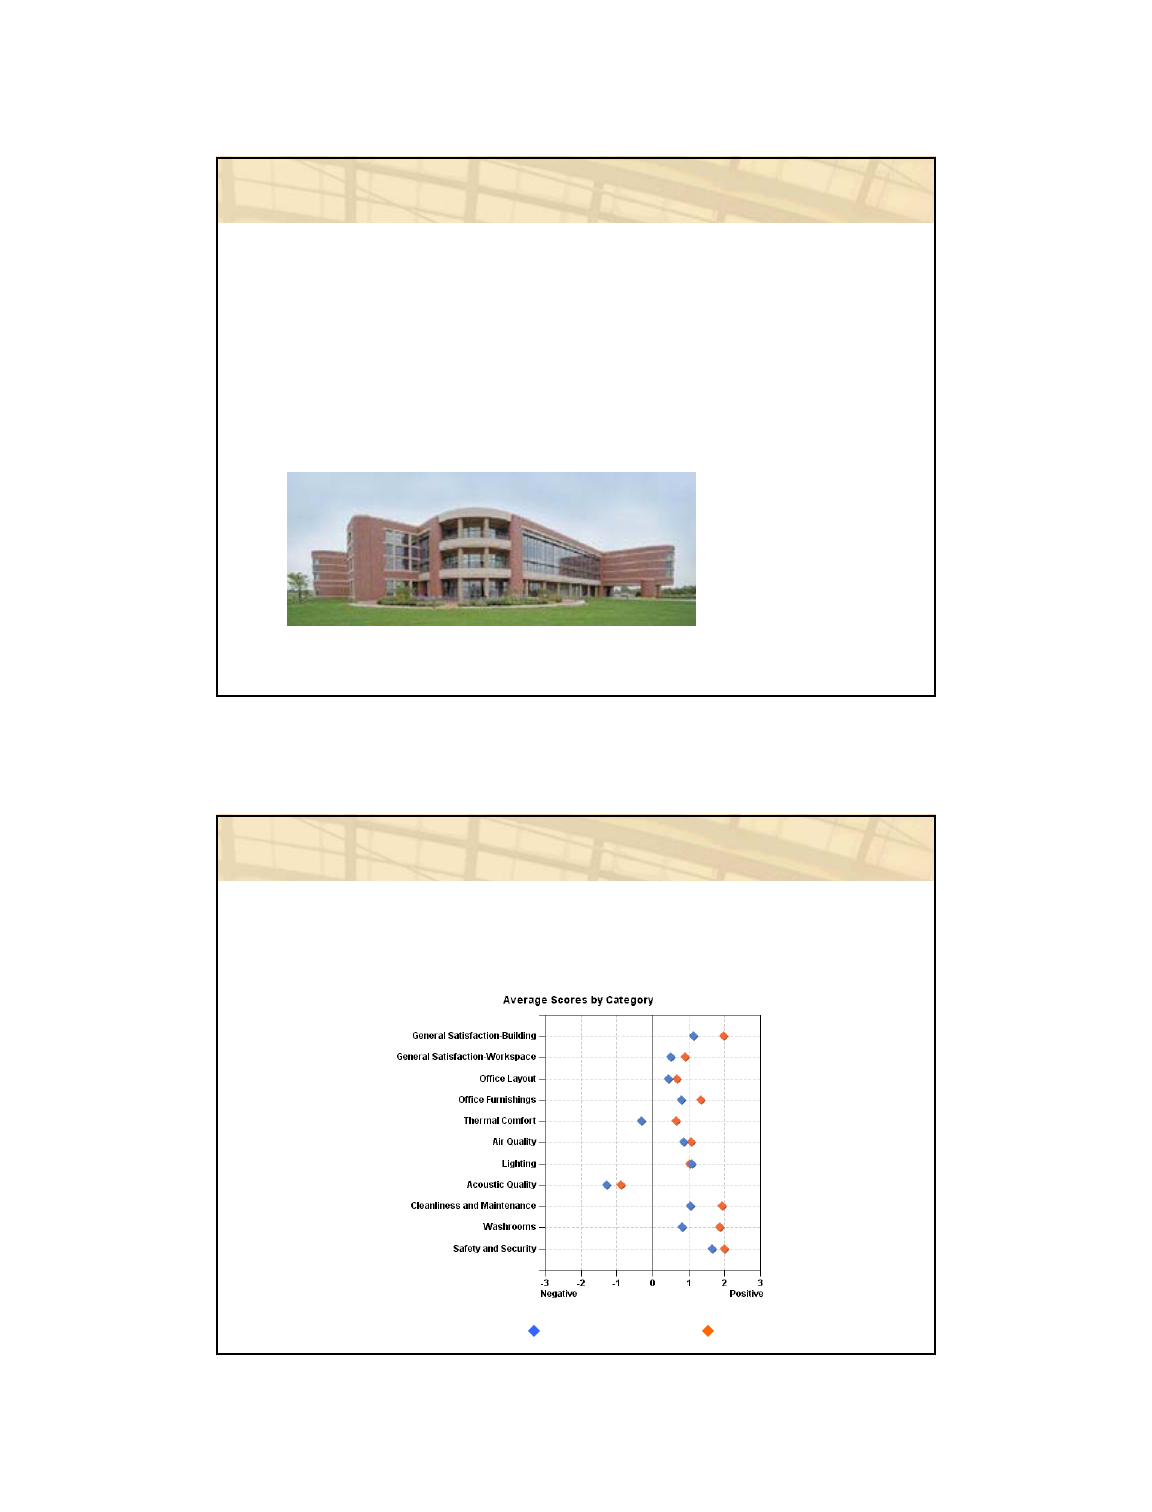
Case study: JohnsonDiversey
Survey client: JohnsonDiversey
2 buildings surveyed
One LEED-EB certified
The other not LEED certified
Core survey plus washrooms
and security modules
JohnsonDiversey Headquarters – LEED-EB pilot (gold)
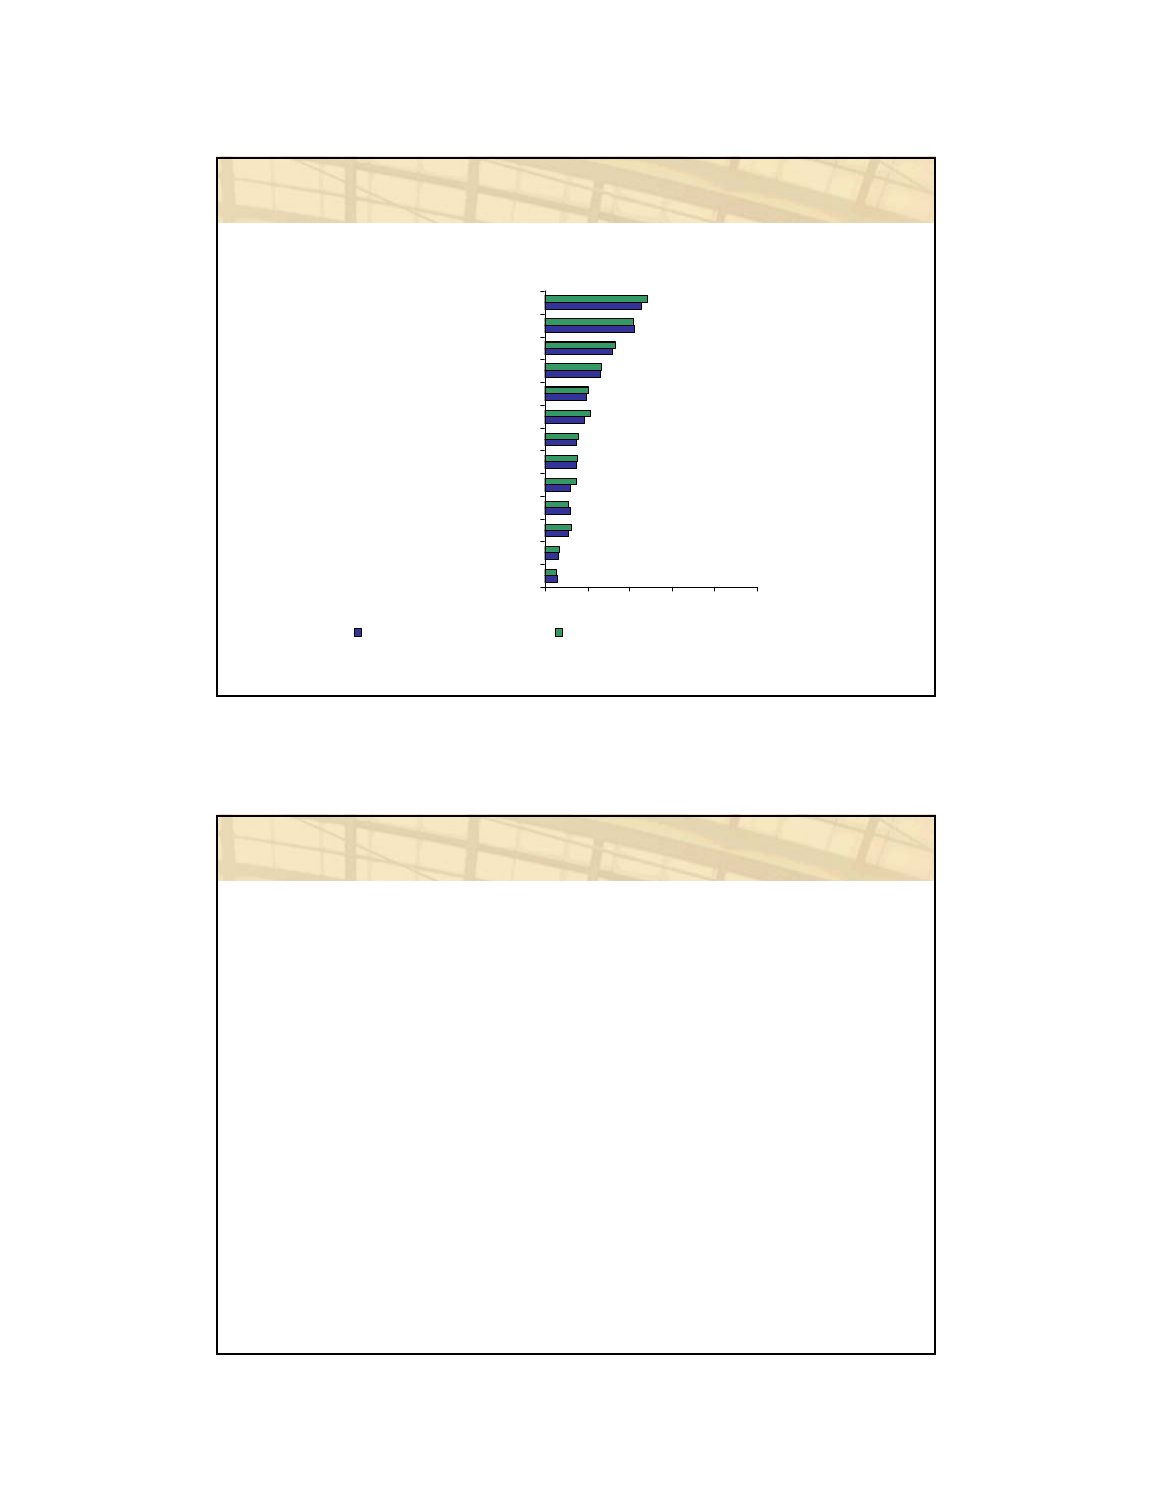
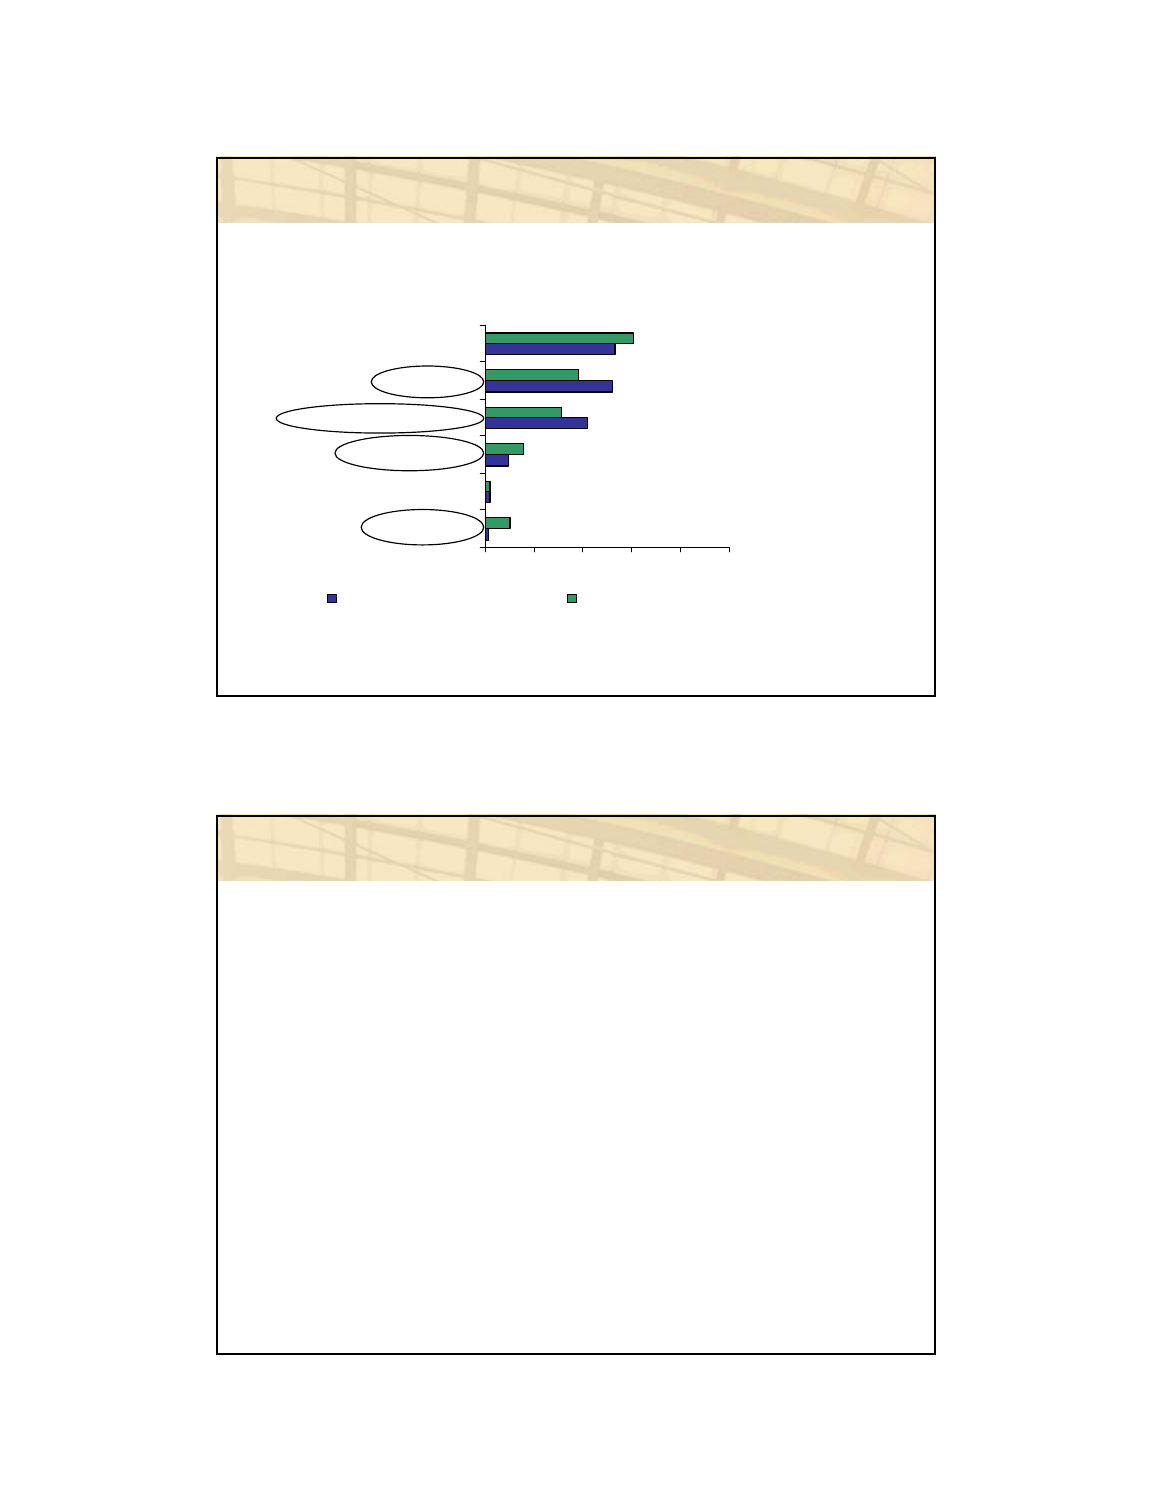
JohnsonDiversey survey results
Certified building performed significantly better than the
non-certified building in nearly every category
Non LEED certified building LEED certified building
LEED Post-Occupancy Evaluation:
Taking Responsibility for the Occupants November 1-2, 2006
Center for the Built Environment (CBE) 36
JohnsonDiversey survey results, cont’d
Operational applications resulting from the study
Certified building
Continue IAQ and other management programs
Non-certified building
Instituted new cleaning and lighting programs to align with
LEED standard
Plans improvements to HVAC, lighting and acoustics
Both buildings
Numerous “low hanging fruit” fixes
Comments a rich source of information
POE Applications: HOK
HOK Process
1. CBE occupant satisfaction survey
2. Energy evaluation
3. Interviews
Customized survey questions
Solar control
Automated lighting controls
Occupancy sensors
Building recycling program
9 buildings included
Images: HOK
LEED Post-Occupancy Evaluation:
Taking Responsibility for the Occupants November 1-2, 2006
Center for the Built Environment (CBE) 37
POE Applications: HOK
Source: Sandra Mendler, AIA, HOK
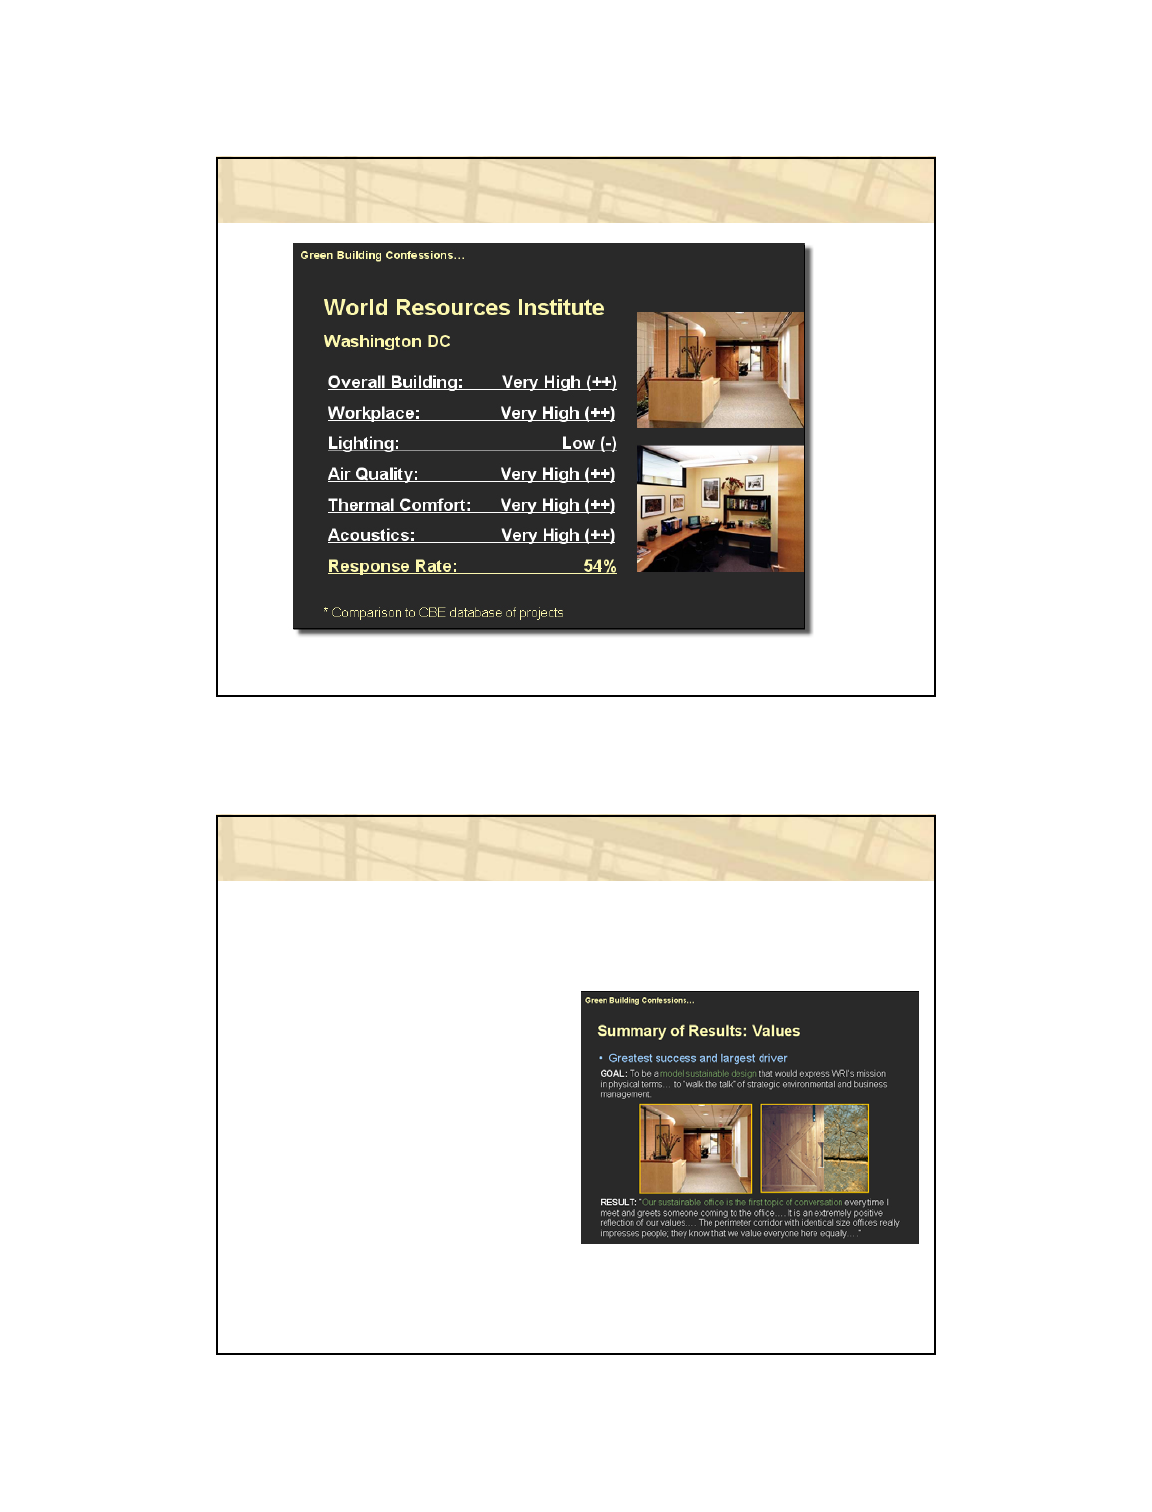
POE Applications: HOK
Summary of POEs identified:
Workplace
Conservation of resources
Placemaking & values
What’s working
Room for improvement
Source: Sandra Mendler, AIA, HOK
Occupant comments:
“There’s not a day that goes by that
I take these working conditions for
granted...”
“I feel like a rat in a cage,...
Otherwise everything’s fine.
Thank you for asking my opinion.”

LEED Post-Occupancy Evaluation:
Taking Responsibility for the Occupants November 1-2, 2006
Center for the Built Environment (CBE) 38
HOK POE outcomes
Disseminated findings in
guidebook
Presentations to AIA membership,
Green building confessions
Motivate industry to conduct POEs
Assist design of future projects
Fosters closer relationship with clients
Raise awareness of need to focus on
issues like daylighting
Study anticipated vs. actual energy use
Show importance of building
commissioning
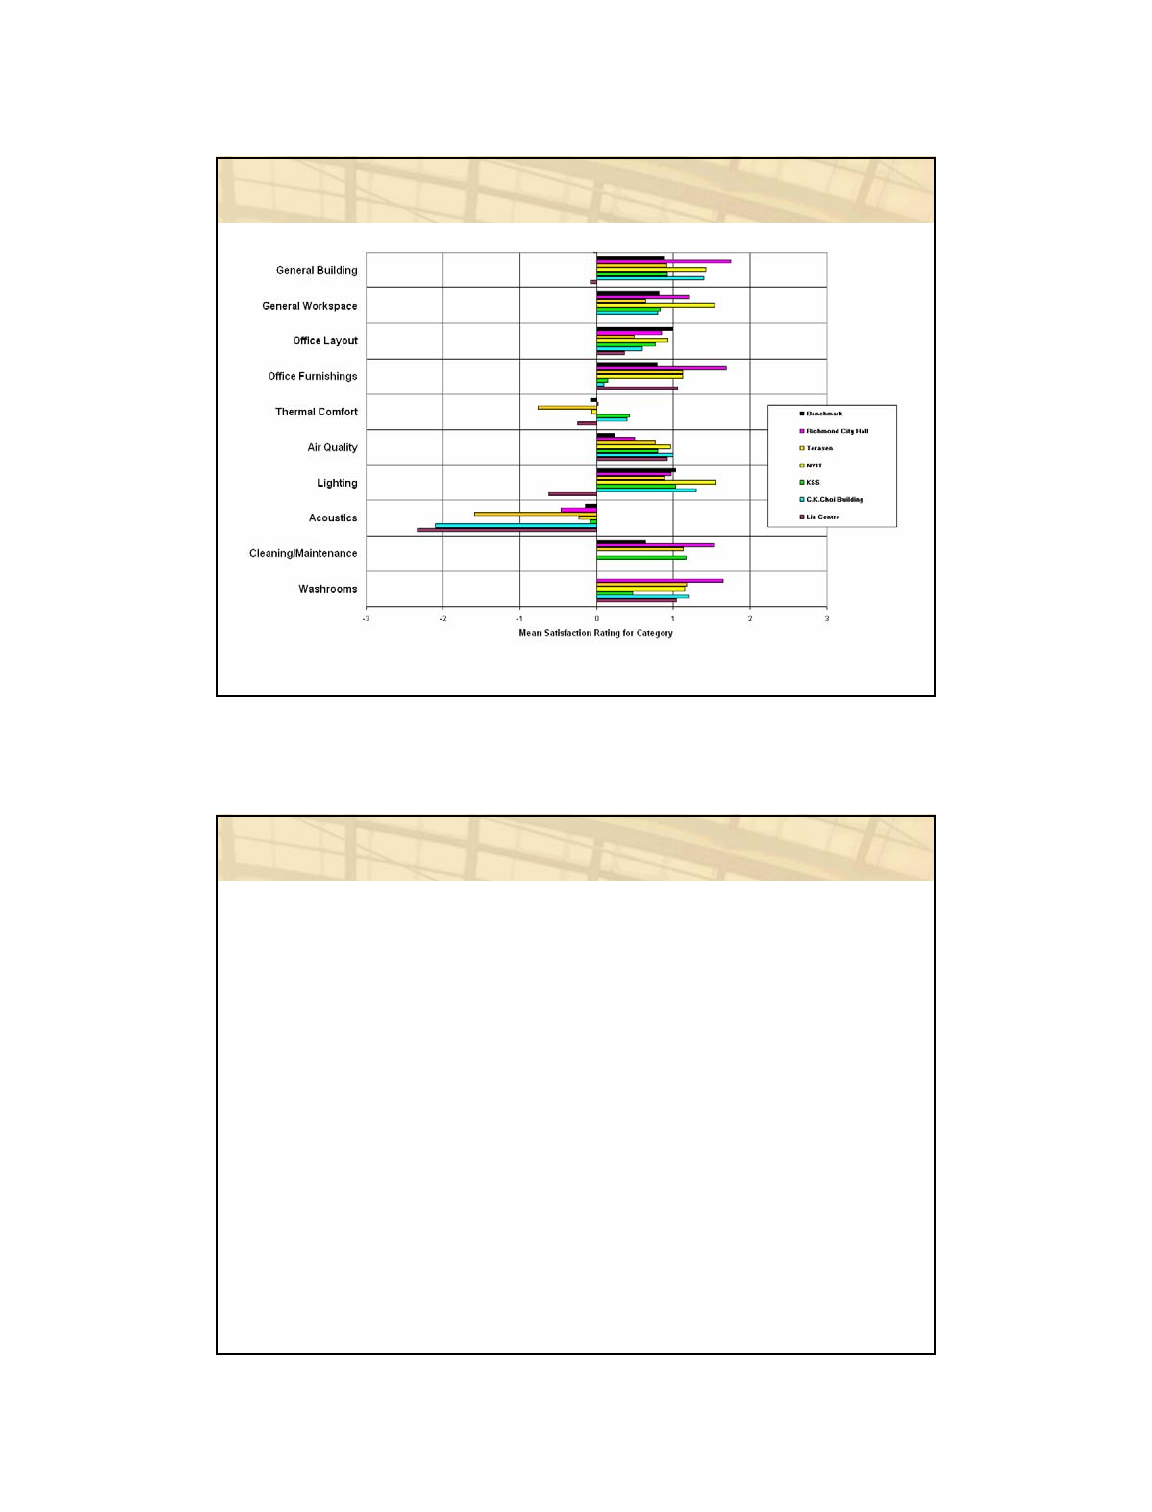
Southwestern B.C. study
Detailed studies of five green
buildings in SW British
Columbia
Led by Greater Vancouver
Regional District, Green
Buildings BC, and Stantec
(Keen)
Completed Nov. 2004
Project led to the development
of building performance
evaluation (BPE) protocol now
in development with Stantec
and the EcoSmart Foundation
LEED Post-Occupancy Evaluation:
Taking Responsibility for the Occupants November 1-2, 2006
Center for the Built Environment (CBE) 39
Southwestern B.C. study
Source: Stantec
Previous version LEED – NC 2.1
Credit 7.1 (Comply w/ ASHRAE 55-1992)
Credit 7.2 (Permanent monitoring system)
New version LEED – NC 2.2 (November 2005)
Credit 7.1 (Comply w/ ASHRAE 55-2004)
Credit 7.2 (Verification)
LEED –NC 2.2 updates thermal comfort credits

LEED Post-Occupancy Evaluation:
Taking Responsibility for the Occupants November 1-2, 2006
Center for the Built Environment (CBE) 40
“Agree to implement a thermal comfort survey of
building occupants within a period of six to 18
months after occupancy.
This survey should collect anonymous responses
about thermal comfort in the building including an
assessment of overall satisfaction with thermal
performance and identification of thermal
comfort-related problems.
Agree to develop a plan for corrective action if the
survey results indicate that more than 20% of
occupants are dissatisfied…”
IEQ Credit 7.2 Thermal Comfort: Verification
Additional resources
CBE Publications Page:
http://www.cbe.berkeley.edu/research/publications.htm
Environmental Building News, Volume 12, Number 9,
September 2003
(available free from BuildingGreen.com)
Federal Facilities Council, Technical Report 145,
“Learning from our buildings: a state-of-the-practice
summary of post-occupancy evaluation” (2001)
Mendler, S., W. Odell, M. A. Lazarus
“The HOK Guidebook to Sustainable Design” (2006)

LEED Post-Occupancy Evaluation:
Taking Responsibility for the Occupants November 1-2, 2006
Center for the Built Environment (CBE) 41
Questions/discussion
David Lehrer
lehrer@berkeley.edu
Survey demo
http://www.cbesurvey.org
Center for the Built Environment
http://www.cbe.berkeley.edu
Survey researcher wanted!
http://www.cbe.berkeley.edu/jobs
