Level Loading Tool Instructions
User Manual:
Open the PDF directly: View PDF ![]() .
.
Page Count: 22

Level Load Tool Instructions
Updated: 8/17/2016
Table of Contents
Overview ........................................................................................................... 1
Updating the Data ............................................................................................. 2
Step-by-step instructions (Abbreviated) ........................................................... 3
Step-by-step instructions (Expanded) ............................................................... 4
Troubleshooting LL/SS Values ......................................................................... 12
Appendix A: Mathematics ................................................................................ 14
- Initialize SS Calculation ......................................................................... 14
- Minimize SS Calculation ........................................................................ 16
Appendix B: Making changes by sheet
Level Load Tool Instructions| 1
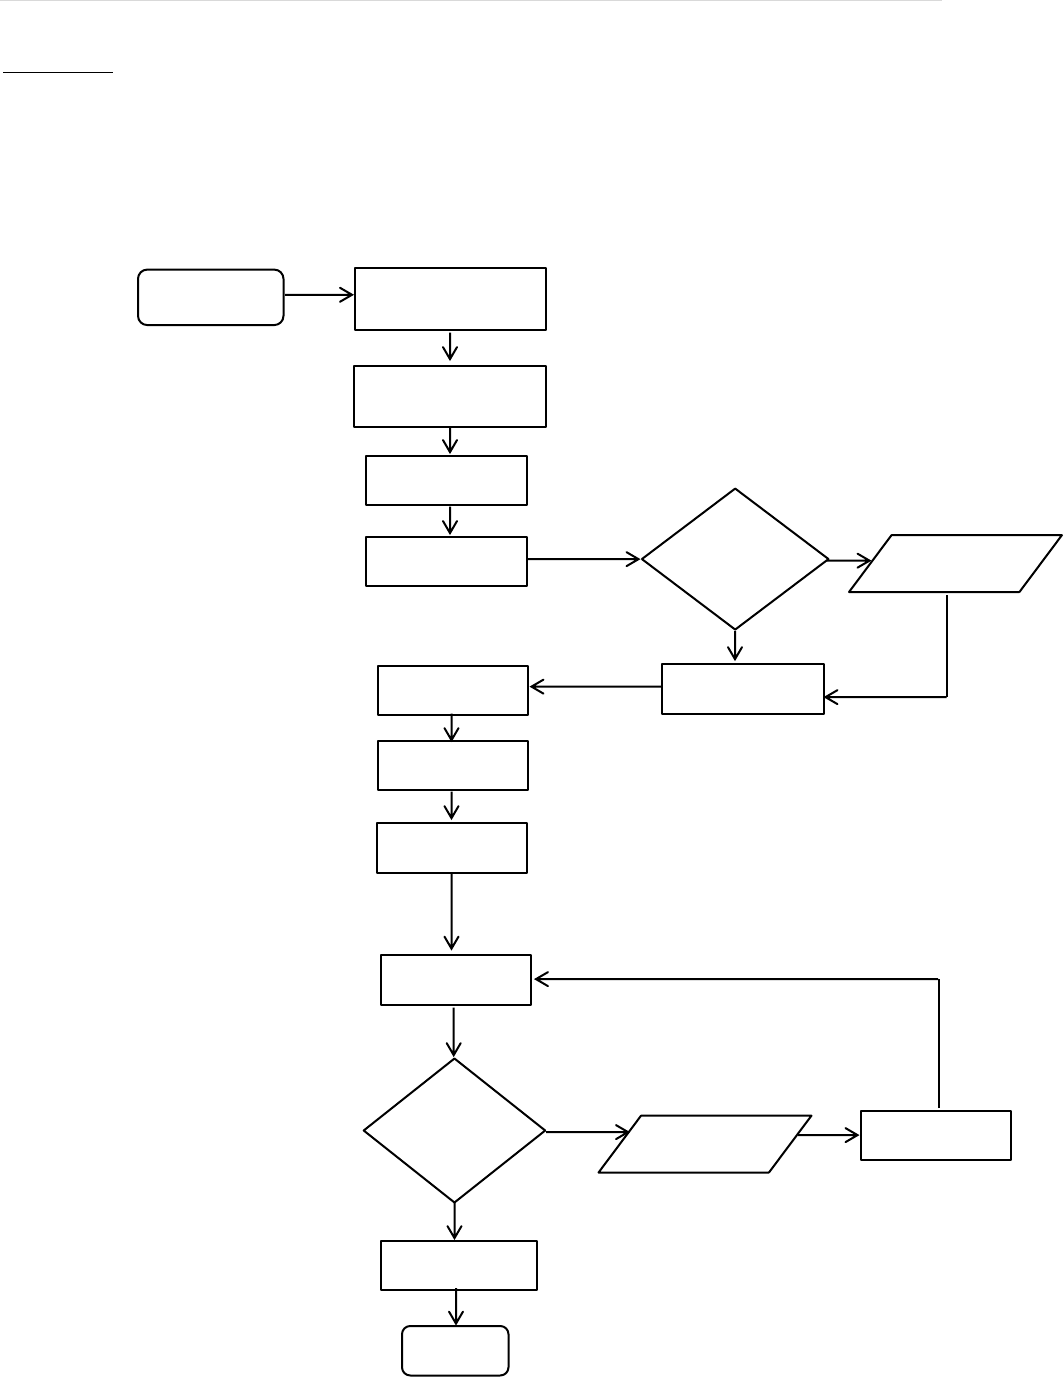
Check blank planner IDs
Export MRP Data
Verify Rules and
Exclusion sheet values
Are the ship/braze
quantities correct?
Yes
No
Edit any incorrect
values
Enter any delinquent
quantities
Initialize SS
Minimize SS
Review LL values
Update Summary
sheet
Are these values
realistic?
Yes
No
Edit LL values on
the Analysis sheet
Recalculate SS
Print summary for
each workstation
End
Populate qty field
Overview
The purpose of this tool is to calculate a constant number of parts that must be built per day in order to
meet customer demand in time, i.e., the level load. Production leveling helps to minimize fluctuation on
the assembly line which, in turn, provides a more predictable and less erratic production system than the
build-to-order model can. The objective of this document is serve as a tutorial by discussing the usage,
processes, and mathematics of the tool. The flowchart below outlines the steps required by the user.
Start
Select date range
Level Load Tool Instructions| 2
Updating the Data
Before the level load tool can be used, the latest data must be exported from Exact MAX as an XML file.
At this time, there is also a precautionary step that must be taken to ensure all relevant parts are being
captured by the correct Planner ID. There is a known issue where some shop orders have nothing in the
Planner ID field. Any such order will not appear in the plan if left unchanged.
Planner ID Check
1. Open Exact MAX and log in
2. Materials > MRP > Activity > Order Navigator > Select “Planner ID” from the drop
down menu
3. Leave the Start and End fields blank and press Ente” or click the Query button
4. Now, scroll to the right and look under “Planner ID.” If the field is blank, look at the part
ID. If this part ID ought to be considered when planning the schedule, make a note of the
order number for the next step. Do this for all parts without a Planner ID.
5. Close the MRP module and return to the Exact MAX main screen.
6. Production > Shop Floor Execution > Activity > Shop Order
7. Type into the “Ord Num” field one of the order numbers you wrote down then press
Enter
8. When the record comes up, look for the Planner ID field and enter the correct Planner ID
there
9. Save the changes and search for the next order, if any.
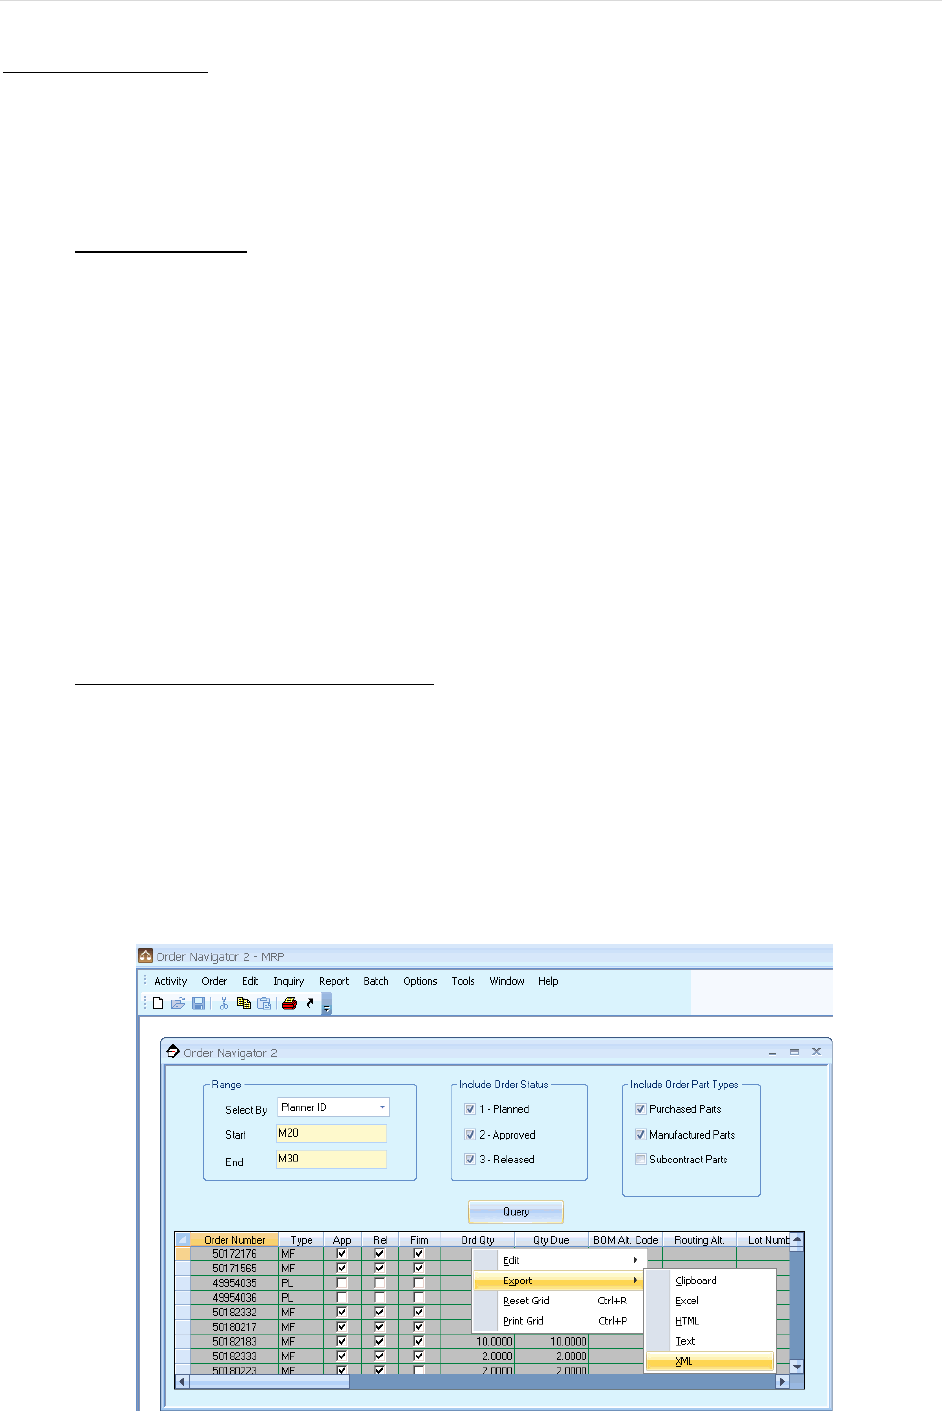
Exporting the data from Exact MAX:
1. Open Exact MAX and log in
2. Materials > MRP module > Activity > Order Navigator
3. Select “Planner ID” from the “Select by” drop down list
4. Start-End: M20-M30
5. Press Enter or click the Query button
6. Right-click anywhere in the data field > Export > XML
7. Save the XML file to C:\MRP Data (you may need to create this folder)
Level Load Tool Instructions| 3
Step-by-step instructions (Abbreviated)
1. Update the data
2. Open the tool and verify that the values in the Rules and Exclusion sheets are up-to-date.
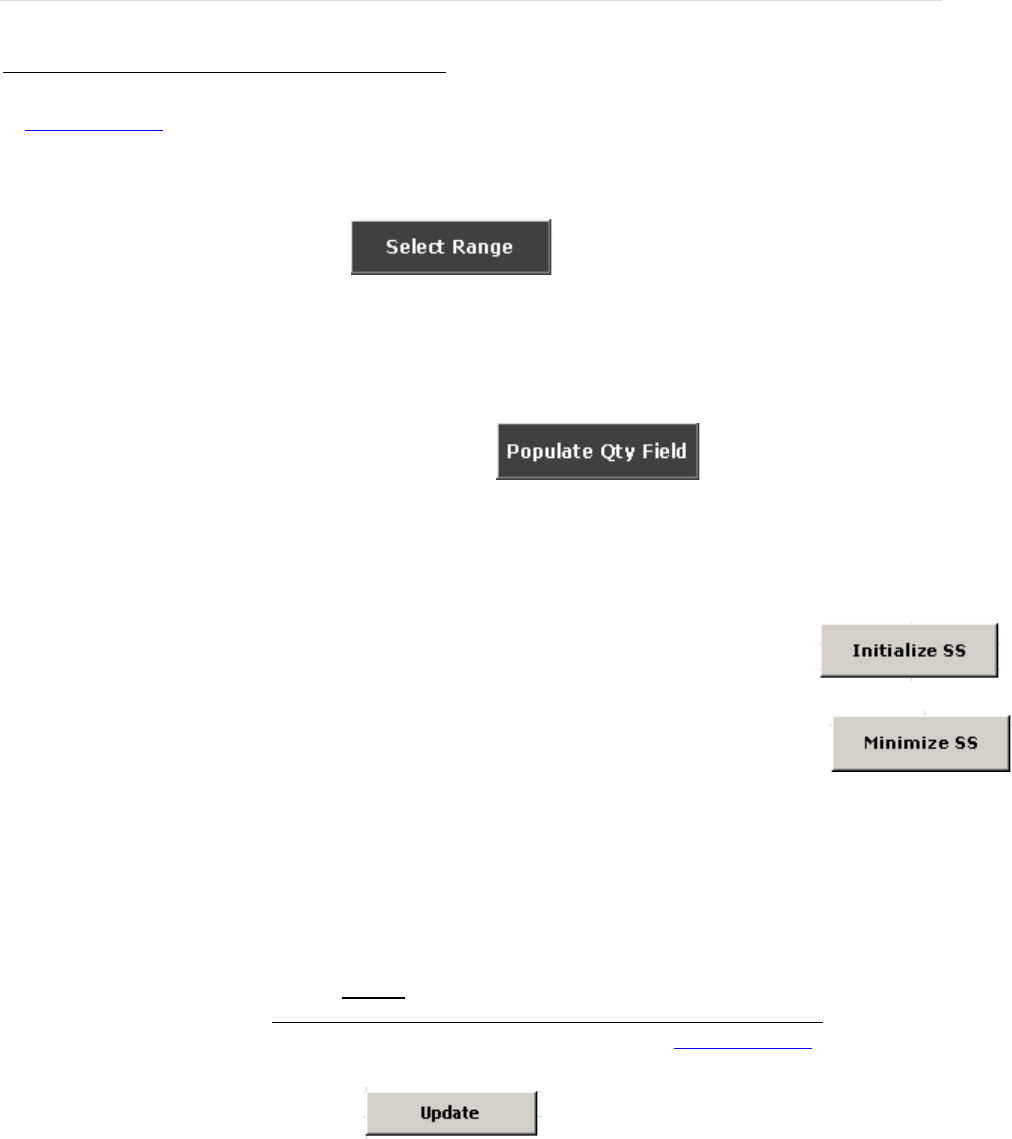
3. Go to the Analysis sheet and click
A dialog box will now come up. Enter in a start date, choose the “3 months” option, and click “OK”.
(While it is possible to manually enter an end date or to select the other available options, 3 months is
recommended as a good range for mathematical reasons.)
4. With the range selected, click “OK” and then click
The Populate Qty Field button will:
- Refresh the data in the workbook by referring to the XML file exported into C:\MRP Data
- Insert the ship and braze quantities into the sheet for every part
5. Enter in all delinquent quantities and the target number of days to complete. Now, click
6. If you wish to minimize the safety stock value by increasing the level load number, click
Otherwise, skip this step.
7. Click on row 7. On the Ribbon, go to View > Freeze Panes > Freeze Panes
8. With the pane frozen, scroll through all the parts and review the level load and safety stock values. If
you wish to change the level load number, enter into the level load cell the value you want. Once all cells
have been changed, click the Recalculate SS button. This button will calculate the safety stock required
using the level load values you chose. Do not use the Initialize SS or Minimize SS buttons once you start
making these manual changes as they will undo your work by recalculating the LL/SS values. If the issue
cannot be resolved using the Recalculate SS button, consider some possible troubleshooting methods.
9. Go to the Summary sheet and click
This will initiate a routine that will sum the weekly quantities due to be built for every part based on the
information available on the Analysis sheet. Consider filtering the Operator column by looking at one
individual’s schedule at a time to check the feasibility.
Level Load Tool Instructions| 4
Step-by-step instructions (Expanded)
*Note: This section assumes the latest XML data file has already been exported to C:\MRP Data.
The following visual guide will illustrate the intended use of the level load tool. It follows closely the
flowchart in the Overview section. An even more in-depth explanation for select topics will be at the end
of this document.
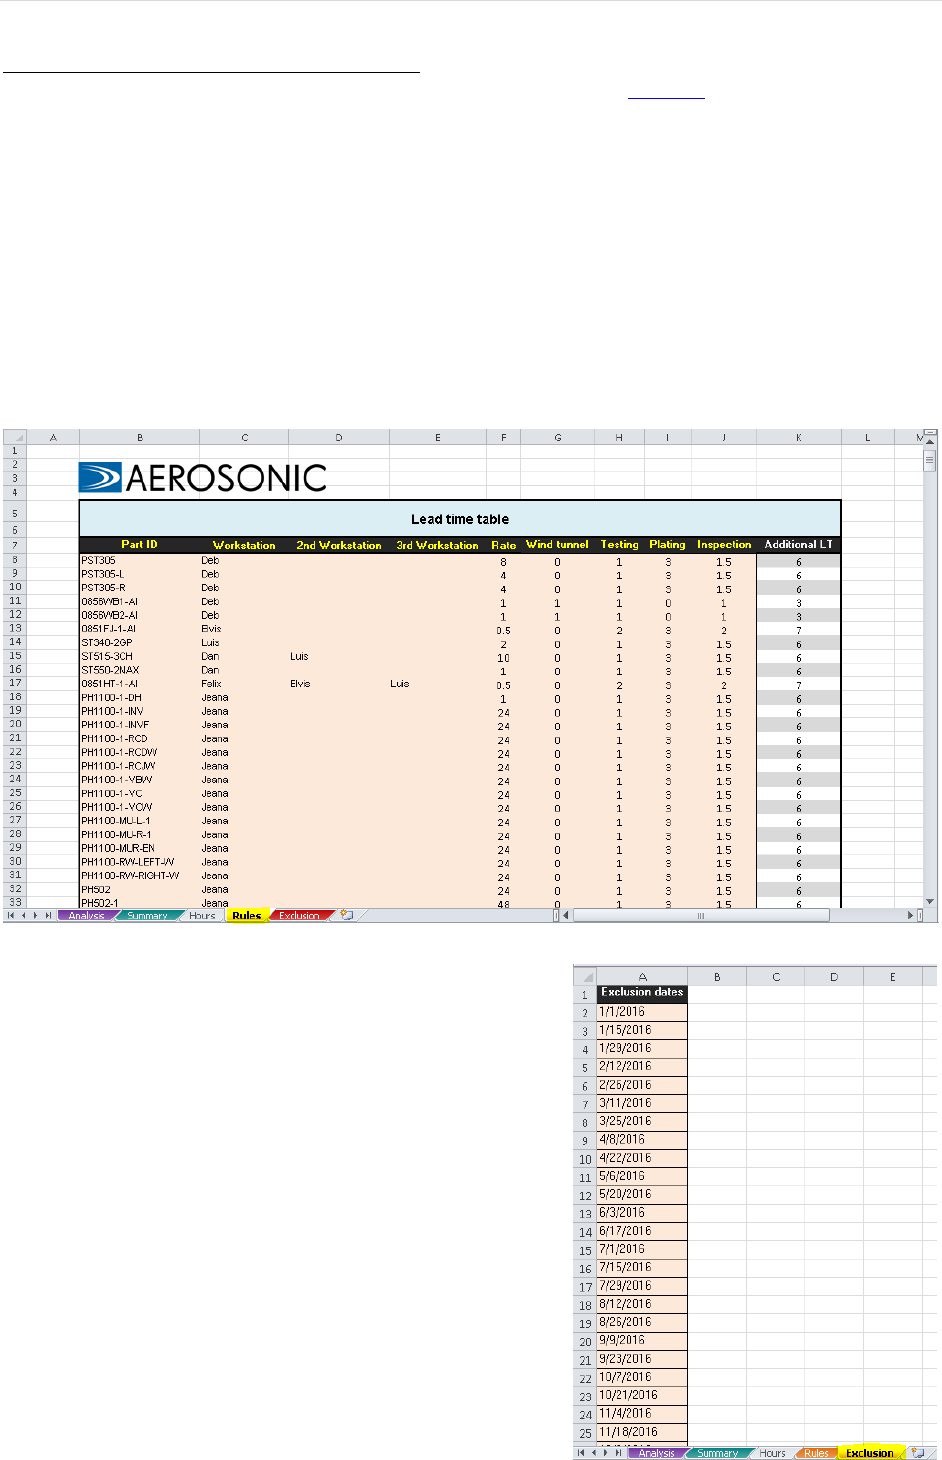
1. As a first step, it is important to ensure that the data in the “Lead time table” on the Rules sheet is
up-to-date. This table is referred to in other places in the workbook that rely on the data in this
table being accurate. It associates a part ID with: a workstation, a rate, and the amount of time a
given part would spend in the wind tunnel, testing, out for plating, or for inspection. The values in
the “Additional LT” column dictate how much time there should be between when a part is
finished brazing until it is completely ready to ship.
2. The dates on the Exclusion sheet are all non-working
days at Aerosonic that are not weekends. So these
dates should include every non-working Friday and
holidays. It is important that all non-working dates are
included on this list; otherwise, it will appear on the
level load schedule that more time is available than
there is.
Level Load Tool Instructions| 5
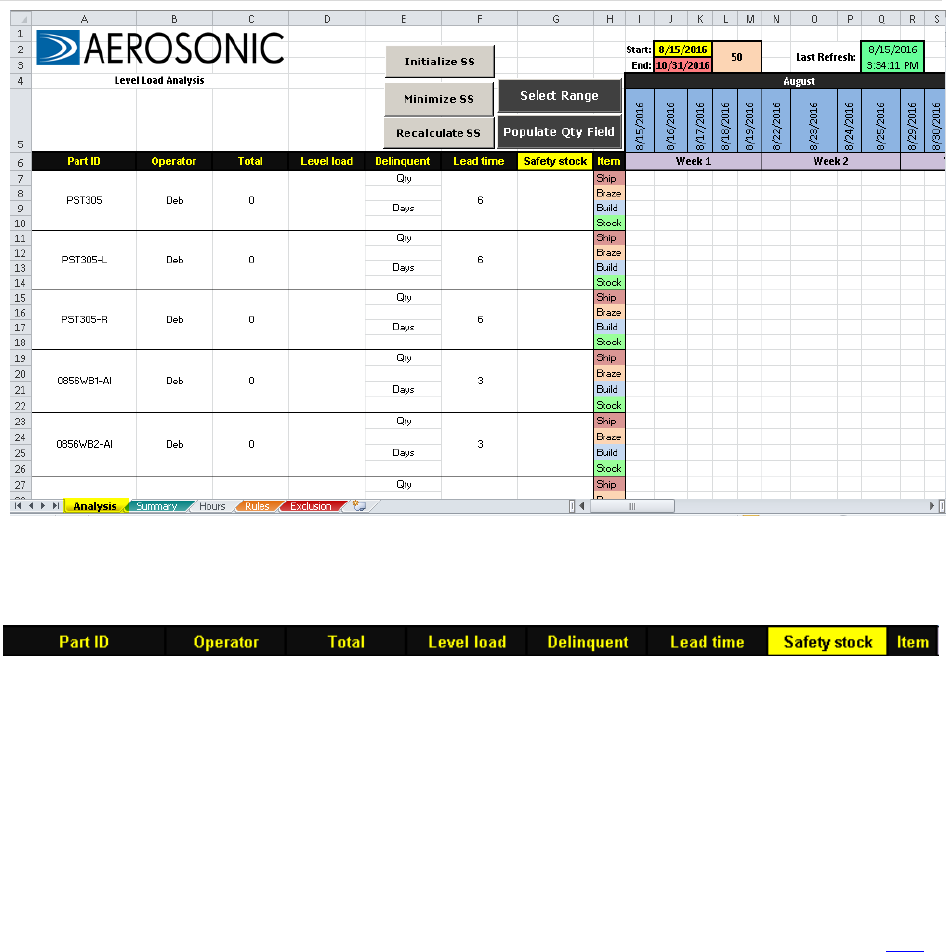
3. With the Rules and Exclusion sheets updated, navigate to the “Analysis” sheet. Before moving to
the next step, we will break down each section of this sheet.
The values in the Part ID, Operator, and Lead time columns all come from the Rules sheet. The
Operator and Lead time values are retrieved formulaically using Excel’s VLOOKUP function. The
function uses the Part ID as the look-up value, refers to the table on the Rules sheet, and returns the
primary Operator name and Lead time values to the appropriate cell.
The Total column is the sum of all the quantities to be shipped for a given part within the specified date
range. This is done using Excel’s built-in SUM function.
The Level Load value is initially calculated but can be edited by the user if the computed value is too low
or too high. This value represents a constant number of units that must be built from one day to the next
in order to satisfy all customer orders in time. The discussion on how this value is calculated begins here.
The Delinquent column requires user input, if applicable. If there are any delinquencies before the start
of the cycle, there is a field to enter the number of delinquent parts (“Qty”) and the number of days from
the start of the cycle that they ought to be completed (“Days”).
The Safety stock column is calculated with the level load. This value cannot be directly changed by the
user. This value represents the number of units that must be available on-hand before the start of the cycle
in order to cover peak customer demand.
Level Load Tool Instructions| 6
The Item column repeats the same set of row names for each part: Ship, Braze, Build, Stock.
- The Ship row holds the quantities due in the cell corresponding to the date that matches the
current date defined in the work order.
- The Braze row places the same quantity back from the current date by an amount equal to the
lead time value defined on the Rules table.
- The Build row inserts the level load number into each cell in the row until the amount held in
stock exceeds the remaining number of units needing to be built by the end of the cycle; when
that occurs, a ‘0’ is inserted into the cell instead of the level load number.
- The value in any given cell in the Stock row is calculated as:
*where subscript ‘t’ indicates “today”; ‘t-1’ is “yesterday”
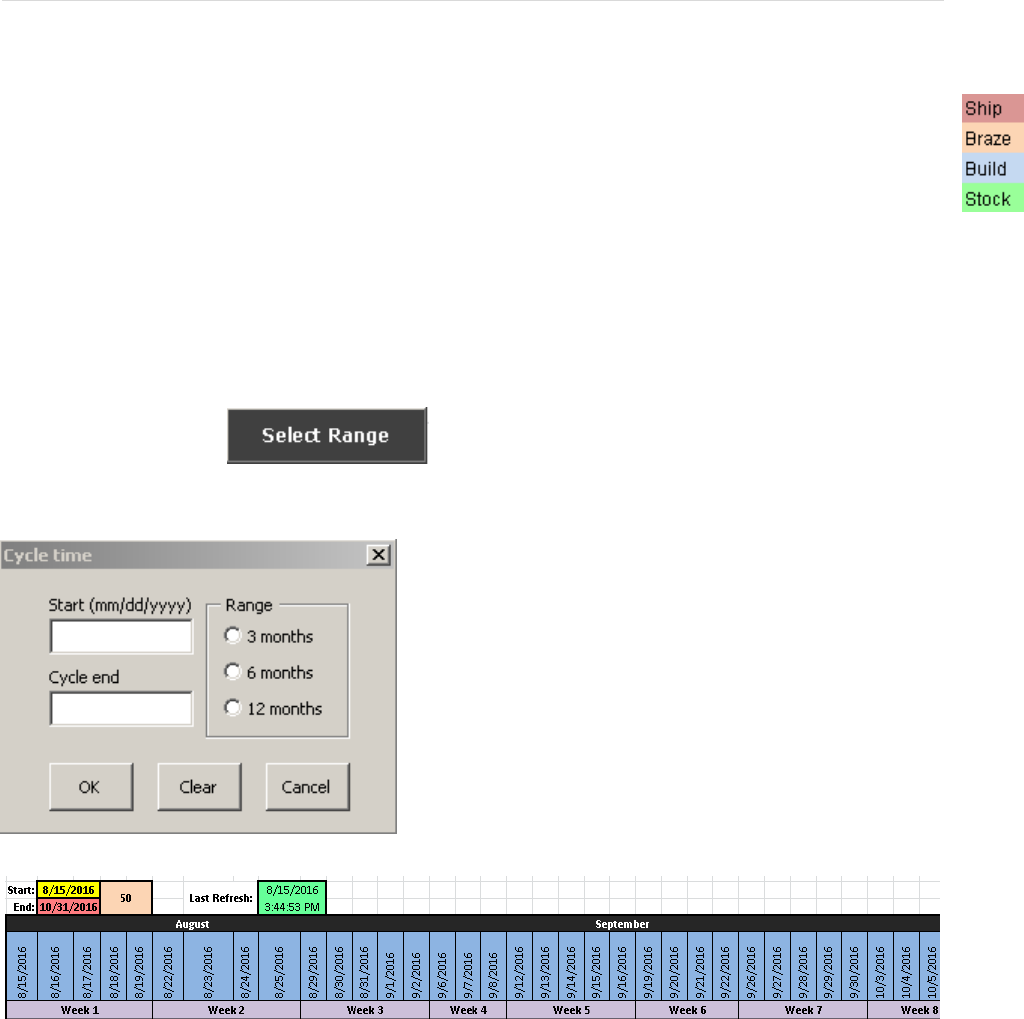
4. To get started, click
This will bring up the Cycle time dialog box:
On the right side of the form, there are three radio buttons
available to generate an end date that is 3 months, 6
months, or 12 months from the start date. However, any
value can be manually input into the end date field. Once
the OK button is clicked, the sheet is reformatted – clearing
all values, borders, and shading from the table. The dates
are inserted and broken into months and weeks.
Once the date range is selected, all dates excluding weekends and the dates specified on the Exclusion
sheet will be generated as shown. Above the date range, there is a “start” and “end” box. The values in
that box are inserted after using the Select Range button; the value next to it is the number of days in the
cycle. The “Last Refresh” box is stamped whenever a new range is specified and the quantity field is re-
populated. Changing these values by interacting with the cells they are in directly will not do anything.
Level Load Tool Instructions| 7
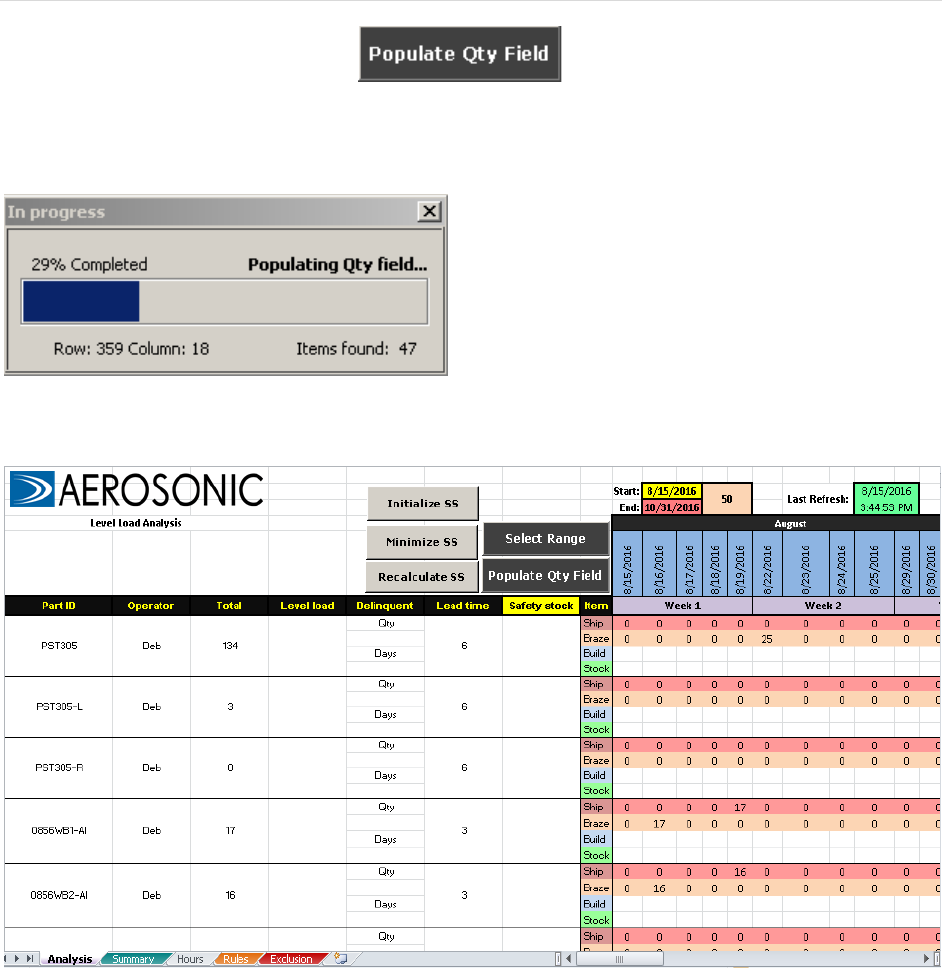
5. With the date range specified, click
You should now see the following loading bar pop up.
This routine cycles through every Ship and Braze row
on the Analysis sheet for each column; the columns
contain working days and the rows contain part IDs.
Each part ID and date from the Analysis sheet is
evaluated against every date-part pair on the Pivot
sheet until a match is found, at which time, the
Quantity Due value from the Pivot sheet is retrieved
and written into the corresponding cell on the
Analysis sheet.
The sheet should look like this. The Total column is now able to calculate a value.
Level Load Tool Instructions| 8
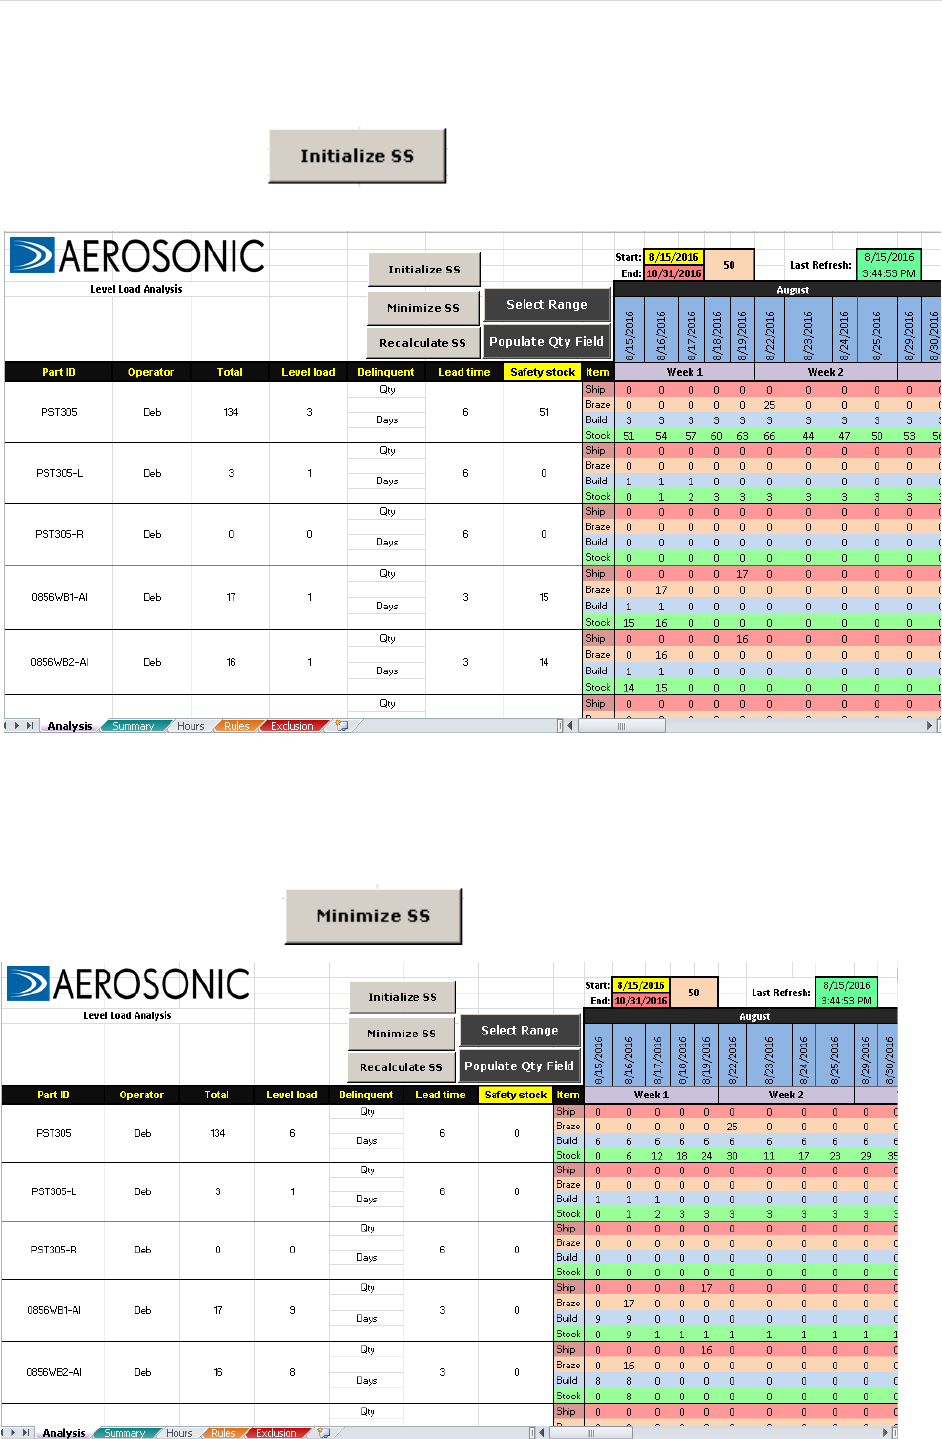
6. With the quantities inserted into the sheet, we can determine what the safety stock and level load values
should be in order to meet customer demand.
To begin the analysis, click
Taking the PST305 as an example, we can see that there is a level load of 3 and a safety stock of 51. We
know the operator can build more than 3 of these parts per day but we may not have 51 units on hand
before starting this cycle. In fact, there are many cases where the safety stock will be computed as a value
much higher than is realistic.
7. To resolve this issue, click
Level Load Tool Instructions| 9
Figure A
Figure B
The Minimize SS button determines the smallest level load number possible in order to make it so a
minimal amount of safety stock need be available before the cycle start. In the case of the PST305, the
safety stock was driven to 0 as the level load was to 6. We know that the operator can build 6 per day so
this is a very convenient result.
The Recalculate SS button is the last button available to the user. It gives the user the opportunity to
define themselves what the level load value ought to be. Here are two important rules to bear in mind:
1. After using the Minimize SS button, lowering the level load value and recalculating SS will
mean that your safety stock number is going to go up.
2. After using the Minimize SS button, increasing the level load value and recalculating SS will
keep the SS value minimized while decreasing the number of days an operator needs to build
that part.
Therefore, the recalculate SS button works best when: the safety stock is 0 and the calculated level load
value is less than what the operator is capable of. The example below illustrates this:
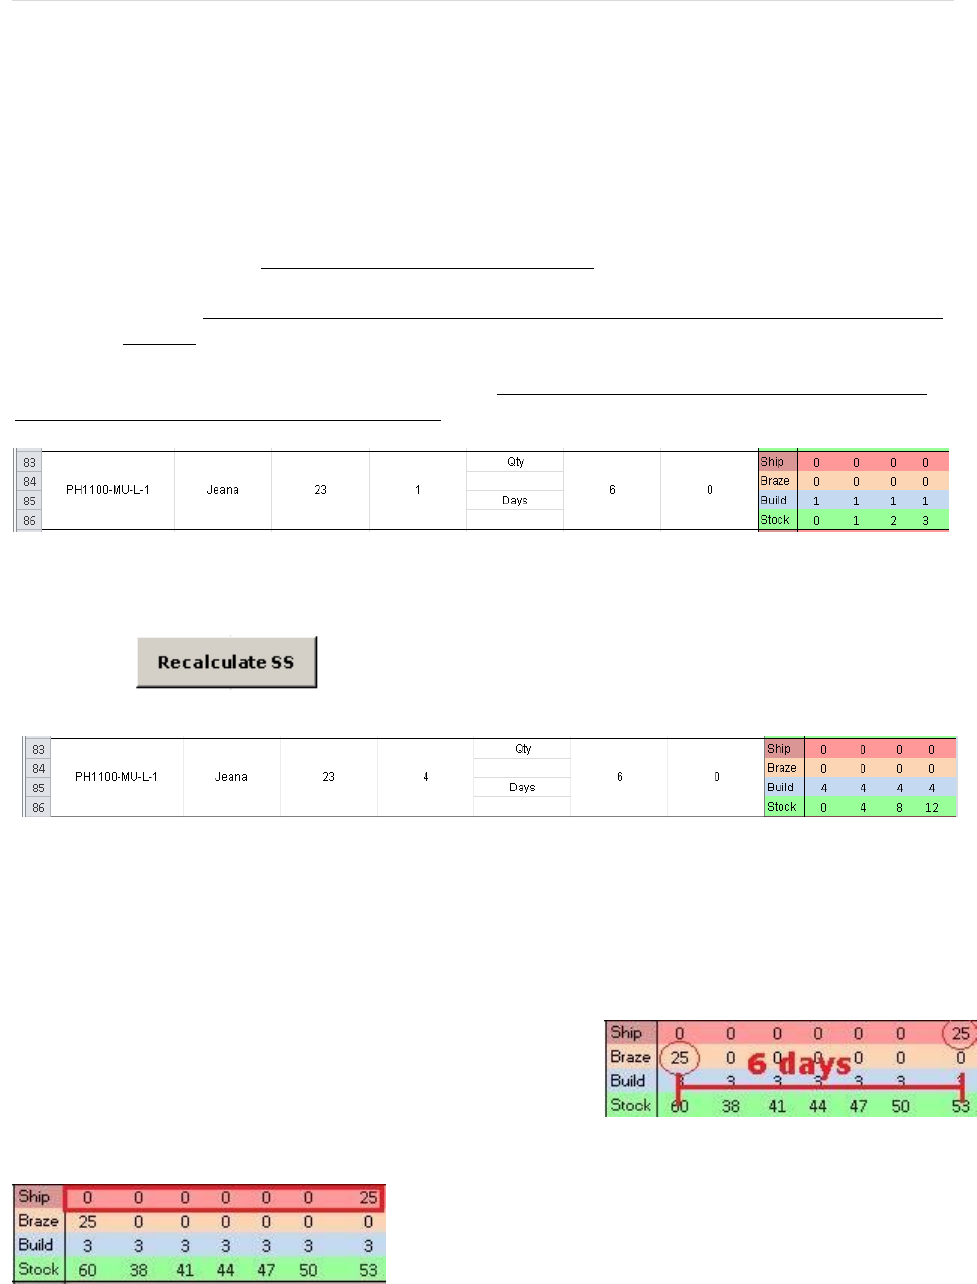
Here, the Minimize SS button has already been used. The safety stock is 0 and the level load is just 1.
Let’s say we know the operator can build 4 units per day. Type ‘4’ into the level load cell.
Now, click
This effectively reduces the number of days the operator will need to build the total quantity due from 23
days to just 6. Decreasing the number of days she needs to dedicate to building this particular part doesn’t
impact our ability to ship on time – she was going to do that anyway building one per day. However, if
her workload was thin, there is no penalty for increasing the level load here and having her build the order
sooner; filling up time in the day that otherwise might have gone wasted.
The distance in time between when a part is to ship and when it
needs to be finished with brazing is controlled by the Additional
LT value on the Rules sheet (Fig A).
This is important to know because if a ship date occurs within
a number of days equal to the lead time from the cycle start
date – the tool looks at that and says there is not enough time
to finish brazing those orders (Fig B). Therefore, the quantity
needed within that window of time must be held in safety
stock.
Level Load Tool Instructions| 10
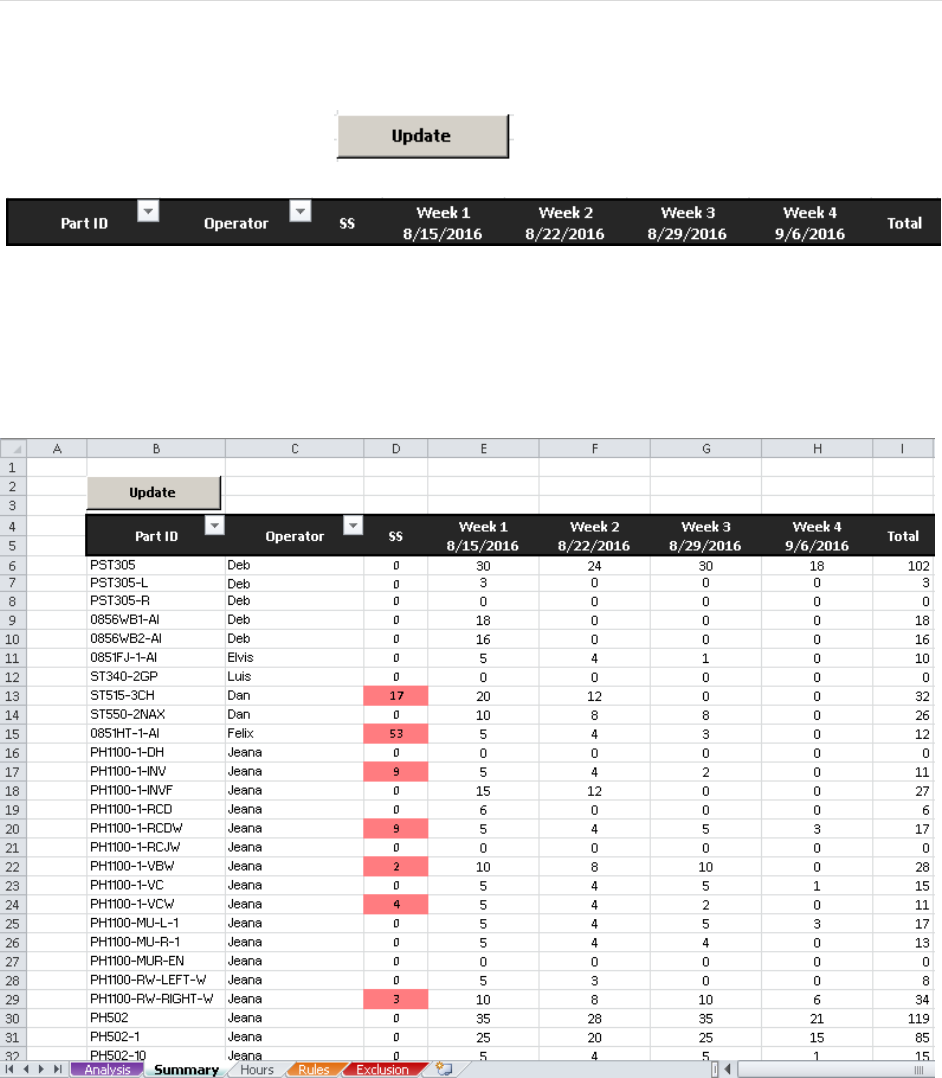
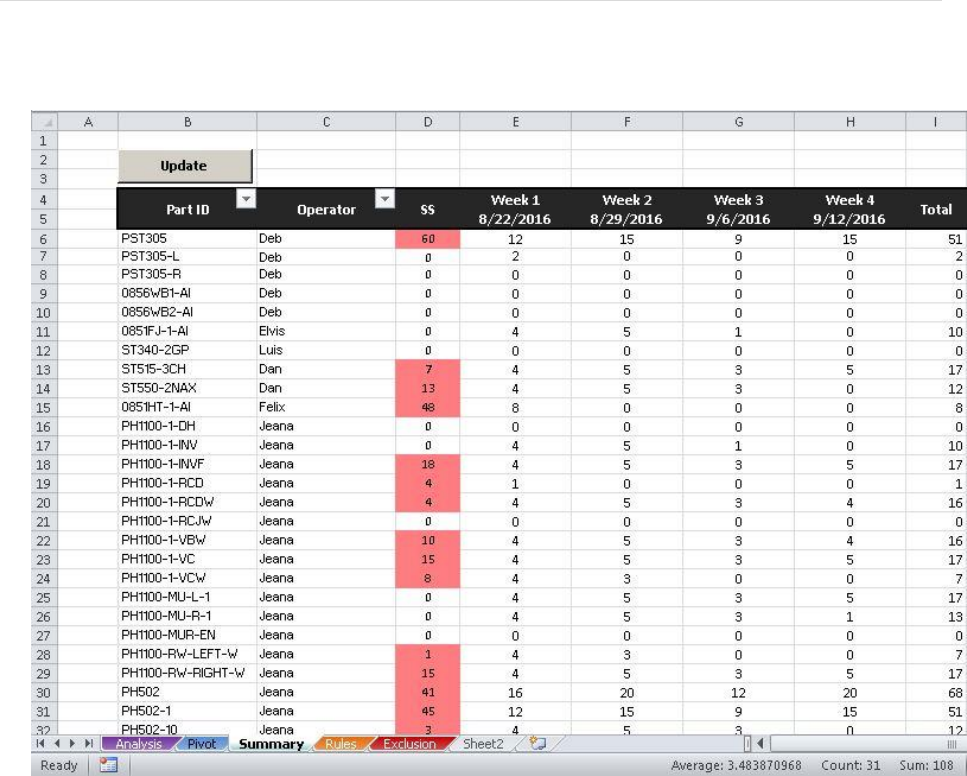
8. The Summary sheet, as its name implies, summarizes the quantities needing to be completed for every
part on a weekly basis.
Update the table values by clicking
The Operator column uses VLOOKUP to insert an operator name from the Rules sheet based on the value
in the corresponding Part ID cell. The SS is taken from the Analysis sheet and if the value is greater than
‘0’, the cell is shaded in red. Taking Week 1 as an example, the values in this column represent the sum of
the build quantities that occur in that week for a given part. The SS and weekly quantities are inserted
using a macro.
Level Load Tool Instructions| 11
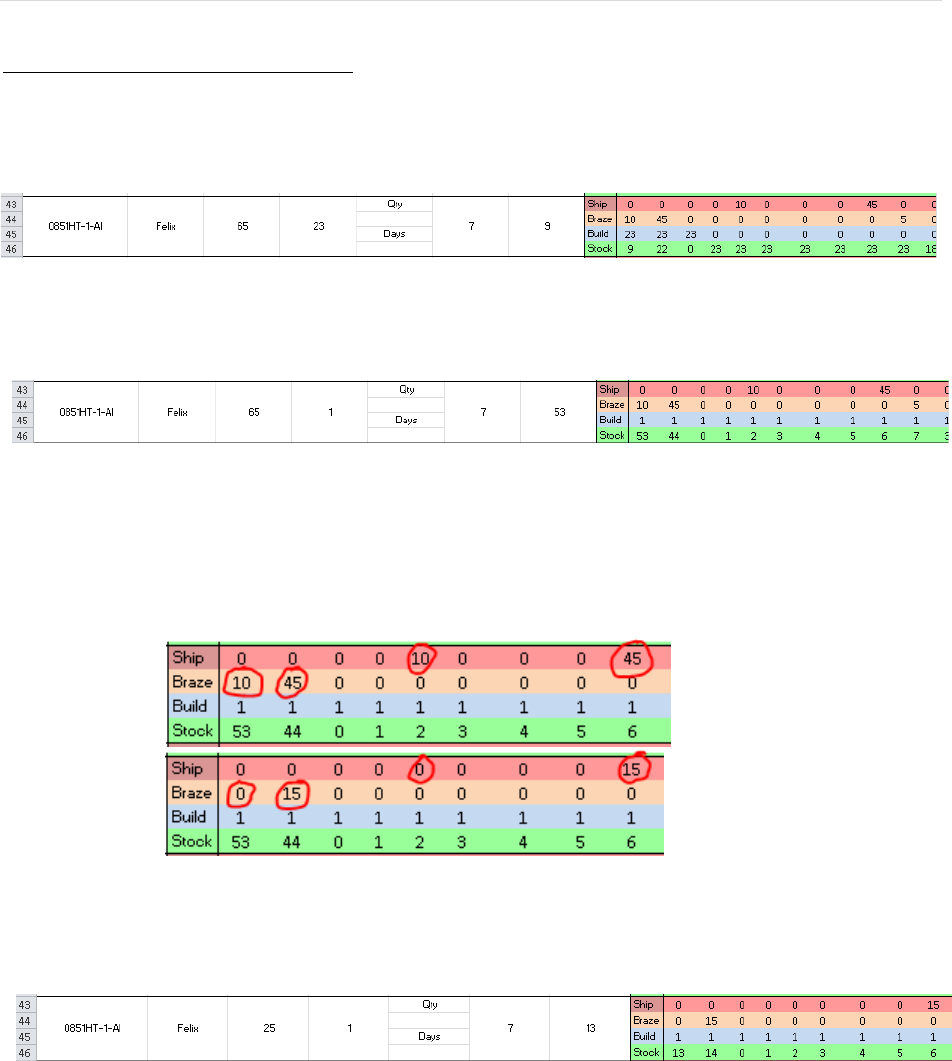
Troubleshooting LL/SS Values
Unfortunately, not all cases are convenient and can be handled by the formulas and algorithms offered by
this tool. Below, we are looking at the 0851HT-1-Al as an example. The Minimize SS button has been
utilized and it was determined that the smallest safety stock value is 9 for a level load of 23.
We know this operator can build maybe 1 of these parts per day, so we change the level load number to 1
and use the Recalculate SS button. This gives the following result:
What this is saying is that we may build 1 unit per day because that is compatible with reality, but we will
need to have 53 units on hand to cover all shipments. What else can be done here? There are a few
options if the safety stock is not entirely there.
1. Let’s assume we do have some amount on hand, say 40 units. We can manually change the
values in the Ship and Braze rows by subtracting 40 from the existing values like so:
We wanted to remove 40 so we eliminated the 10 from the braze and ship rows by manually
replacing it with a ‘0’. We still want to subtract 30, so we take 30 from the quantity of 45 in
both the braze and ship rows. With the desired changes made, click Recalculate SS.
After accounting for the 40 we had on hand and maintaining a manual level load of ‘1’, we
still need to have a safety stock of 13.
2. We should also take into consideration that multiple operators can build this part. By default,
the operator field retrieves the value from the Rules table indicating who the primary operator
is. This by no means is to say that, in this case, Felix is the only operator who should work on
this part. Let’s say we have 4 operators who all work at the same rate of 1 per day. We are
effectively saying that our level load then can be ‘4’ (1 part per day per operator). Enter ‘4’
into the level load field and recalculate. This gives us:
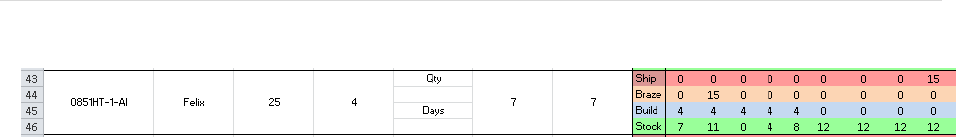
Level Load Tool Instructions| 12
At this point, we have really done all we can to manipulate our parameters inside the tool so
as to minimize the safety stock and keep the level load reasonable. The safety stock of ‘7’ can
be said to be the true amount required to have on hand to be on time.
3. Our problem here is that we need 15 units on the 2nd day from the cycle start date to be
finished with brazing. The tool says our only option is to drive up the level load number to
eliminate the safety stock. However, a solution outside the scope of the tool is to change the
current date for the work order in Exact MAX. By pushing back the due date, we are, of
course, allowing for more time to build up the order.
Level Load Tool Instructions| 13
Appendix A: Mathematics
This section covers the math used to calculate the level load and safety stock values.
I. Initialize SS Calculation
First, we will look at how the Initialize SS button works. Immediately below is an example assuming a
lead time of 1 day, i.e., after brazing the part has one additional day of processing before being ready to
ship.
Total
16
Days
8
LL
2
RoundUp_LL
2
SS
7
The Total is the sum of the quantities in the braze row:
The Days represent the number of days in the cycle. In this case, it’s 8.
The LL (Level Load) value is calculated as:
To discuss how the SS (Safety Stock) is calculated we must understand the table above in more detail.
The Build row in the table above works like this: If the remaining quantity to be brazed exceeds the
amount we Have, then we need to build in increments equal to the level load value; if not, then as
indicated in the last column, insert a ‘0’.
The X, Have, and Safety Stock rows are calculated differently for the 1st column than for every
subsequent column thereafter.
For the 1st column,
Ship
0
0
5
0
10
0
0
1
Braze
0
5
0
10
0
0
1
0
Build
2
2
2
2
2
2
2
0
X
0
2
-1
2
-6
2
4
5
Have
0
2
0
2
0
2
4
5
Safety Stock
0
0
-1
0
-6
0
0
0

Level Load Tool Instructions| 14
For the 2nd column until the last (where is a subscript representing the current column),
Example 1:
Example 2:
The Have value is determined with the following logical statement:
The Safety Stock value is determined with the converse logical statement:
In words, the X value is just a placeholder. Simply put, if its value is above zero then we carry this
amount as stock for the next day – it’s how much we Have. If its value is less than zero, that’s how much
we should have had in stock up to this point – since we don’t, we assign this amount to the safety stock
needed for that day and say we Have 0 available for the next day.
The final SS value takes the absolute value of the sum of all the safety stock values.
The SS value of 7 tells us that we must have 7 units on hand before the start of the cycle in order to cover
all the shipments if a level load of 2 is used. Inserting 7 as our initial Have value gives:
Ship
0
0
5
0
10
0
0
1
Braze
0
5
0
10
0
0
1
0
Build
2
2
2
2
2
0
0
0
X
0
9
6
8
0
2
2
1
Have
7
9
6
8
0
2
2
1
Safety Stock
0
0
0
0
0
0
0
0
Level Load Tool Instructions| 15
II. Minimize SS Calculation
The Minimize SS button works similarly to the Initiate SS button except that we start with the level load
value as being unknown. Instead, we initialize an estimated level load value at 1 and increment by 1 until
the safety stock is 0. In effect, we are discovering the smallest level load value for which we would need
either no or a minimal amount of safety stock. The algorithm used to determine what the level load
value should be is summarized below in pseudocode:
est_LL = 1
Do While (SS does not equal 0)
Calculate SS
If (SS equals 0) Then
Exit Loop
End if
est_LL = est_LL + 1
Loop
Using the same data set for the ship and braze quantities as was used in the Initialize SS discussion, the
resulting table of values for the first iteration of the loop is made available below.
Total
16
Days
8
Est. LL
1
Min LL
1
SS
-11
Ship
0
0
5
0
10
0
0
1
Braze
0
5
0
10
0
0
1
0
Build
1
1
1
1
0
1
1
0
X
0
1
-3
1
-8
0
1
1
Have
0
1
0
1
0
0
1
1
Safety Stock
0
0
-3
0
-8
0
0
0
The program initializes the level load at 1 and checks whether the safety stock is 0 before incrementing
the level load again. Since the safety stock is 11, the condition to end the loop has not been satisifed and it
will therefore perform another iteration. On the next page, let’s see how these values change with each
iteration. Bear in mind, the only variable being manipulated is the estimated level load:
Level Load Tool Instructions| 16
Total
16
Days
8
Est. LL
2
Min LL
2
SS
-7
Ship
0
0
5
0
10
0
0
1
Braze
0
5
0
10
0
0
1
0
Build
2
2
2
2
0
2
2
0
X
0
2
-1
2
-6
0
2
3
Have
0
2
0
2
0
0
2
3
Safety Stock
0
0
-1
0
-6
0
0
0
Total
16
Days
8
Est. LL
3
Min LL
3
SS
-3
Ship
0
0
5
0
10
0
0
1
Braze
0
5
0
10
0
0
1
0
Build
3
3
3
3
0
3
3
0
X
0
3
1
4
-3
0
3
5
Have
0
3
1
4
0
0
3
5
Safety Stock
0
0
0
0
-3
0
0
0
Total
16
Days
8
Est. LL
4
Min LL
4
SS
0
Ship
0
0
5
0
10
0
0
1
Braze
0
5
0
10
0
0
1
0
Build
4
4
4
4
0
0
0
0
X
0
4
3
7
1
1
1
0
Have
0
4
3
7
1
1
1
0
Safety Stock
0
0
0
0
0
0
0
0
At this point, the loop ends because the condition that the safety stock be 0 has been satisifed. If we
continued to increment the level load until it was 5, 6, 7, and so on… the safety stock would still be 0. So
‘4’ is the smallest level load value for which we need not carry any safety stock. As a point of interest,
compare the safety stock value we got in the table above for an estimated level load of ‘2’ to the safety
stock we found in Section I using the level load that was calculated as an average (it’s the same).

Level Load Tool Instructions| 17
Appendix B: Making changes by sheet
I. Analysis
It is not advisable to try and make changes to the Analysis sheet except the occasional and
necessary task of inserting new Part IDs to the bottom of the sheet; additional, blank rows have
been formatted and made available on the bottom of the table for that purpose but new ones can
be created manually so long as the formatting is identical. The only information that needs to be
inserted is the Part ID – the other columns use VLOOKUP and macros to generate their values.
The difficulty with adding rows and columns to the Analysis sheet is that many of the values are
calculated using loops with Visual Basic that define a starting point using a specific row and a
specific column. A common “For” loop in the program is structured like this:
startRow = 7
startCol = 9
for i = startRow to LastRow
for j = startCol to LastColumn
Cells(i + 2, j).Value = some_value
Next j
i = i + 3
Next i
In words, this says we are starting on row 7 (the ship row for the first part) and column 9 (the
column corresponding to the first date in the cycle). We then assign some value to the cell that is
2 rows below the ship row (which is the build row) corresponding to the 1st date.
The “Next j” line increments ‘j’ by 1 to point to the next column (date) on the next iteration. We
continue to assign values to the same build row until the last column is reached. Then, we directly
increment ‘i’ by ‘3’ to the current value before the “Next i” line, again, increments ‘i’ by 1. So on
the next iteration of the loop, the program is looking at the ship row of the 2nd part (i = 4) and
will cycle through every column, assigning values to the build row for that part. The loop is
executed until the last row is evaluated.
The point being made here is that in order to create new rows and columns on the Analysis sheet,
changes would need to be made to the starting indices for these loops. This is both time
consuming and may cause faults elsewhere in the program. If new columns or rows need to be
added, here some suggestions, in order of ease:
Repurpose the Operator or Delinquent columns. The Operator column is largely not
needed on this sheet. Nothing would be affected by leaving it blank – do not, however,
delete the column.
Create a new sheet with the rows and columns needed and simply pull information off the
Analysis sheet. Creating new sheets will not affect how the tool works if those sheets are
added at the end (after the Exclusion sheet).
To add columns to the Analysis sheet, insert them after the last date in the cycle has been
generated with the Select Range button. This would need to be done every time a new
range was generated unless a new macro was created to insert and format the additional
columns.
Level Load Tool Instructions| 18
If the alternative solutions presented in the bulleted list at the end of the last page will not suffice, here is
how to change the indices.
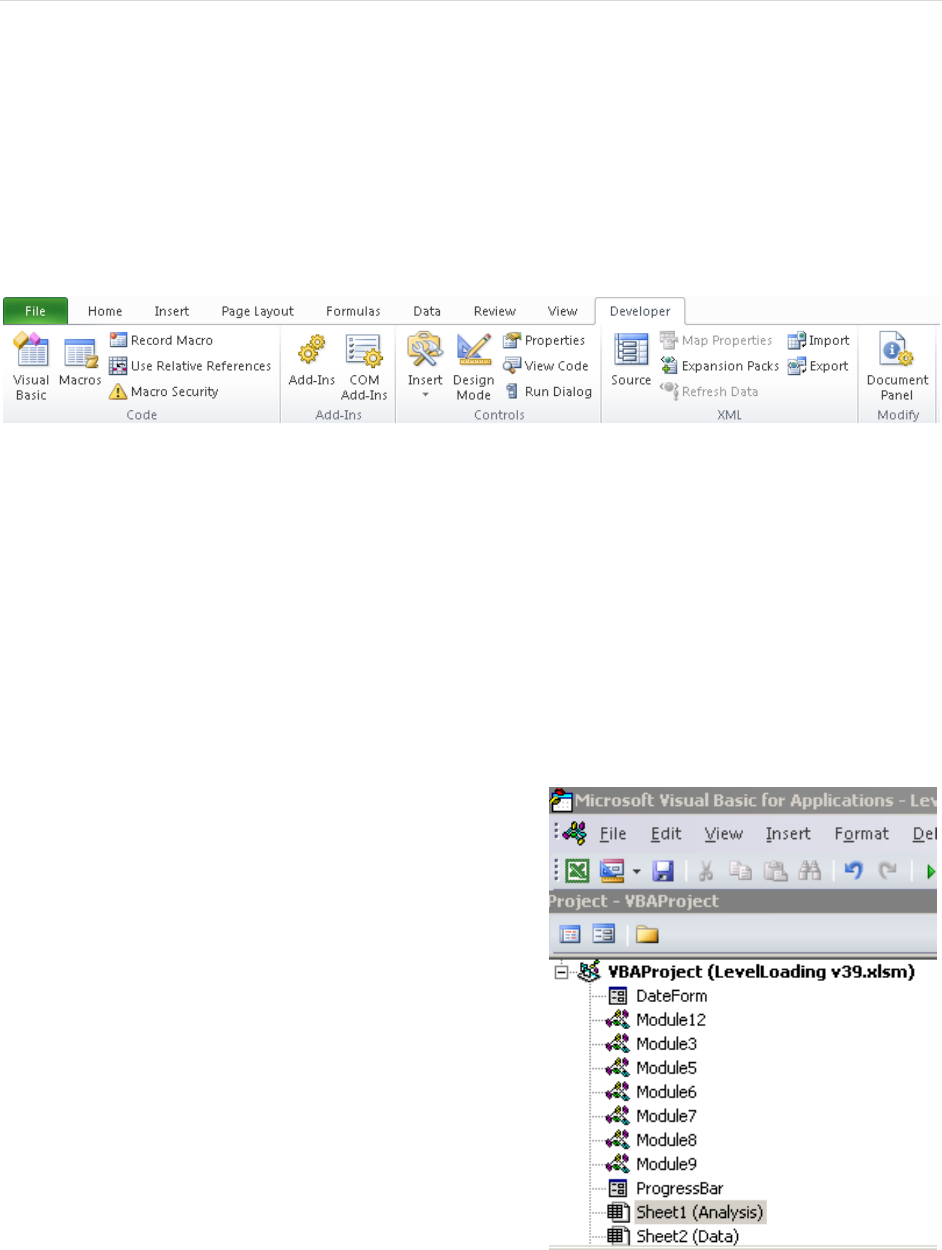
If the Developer tab is not available on the Ribbon, do the following to make it visible:
File > Options > Customize Ribbon > Add the Developer tab to the list on the right > Click “OK”
With the Developer tab selected, click on the Visual Basic button on the far left.
If columns need to be added to the Analysis sheet, take note of the following before moving forward:
Module > Subroutine > Button [Sheet]
Module 12 > SS_Calculation > Initiate SS [Analysis]
Module 6 > SS_Calculation2 () > Recalculate SS [Analysis]
Module 7 > Optimize_SS () > Minimize SS [Analysis]
Module 3 > Delinquent ()
*Subroutine gets called by: SS_Calculation, SS_Calculation2, Optimize_SS
The ProgressBar and DateForm items can and will need
to be changed. These are userforms. To view the code,
right-click on either of those items and click “View Code”
After the Visual Basic button has been clicked, you should
see screen on the right.
Level Load Tool Instructions| 19
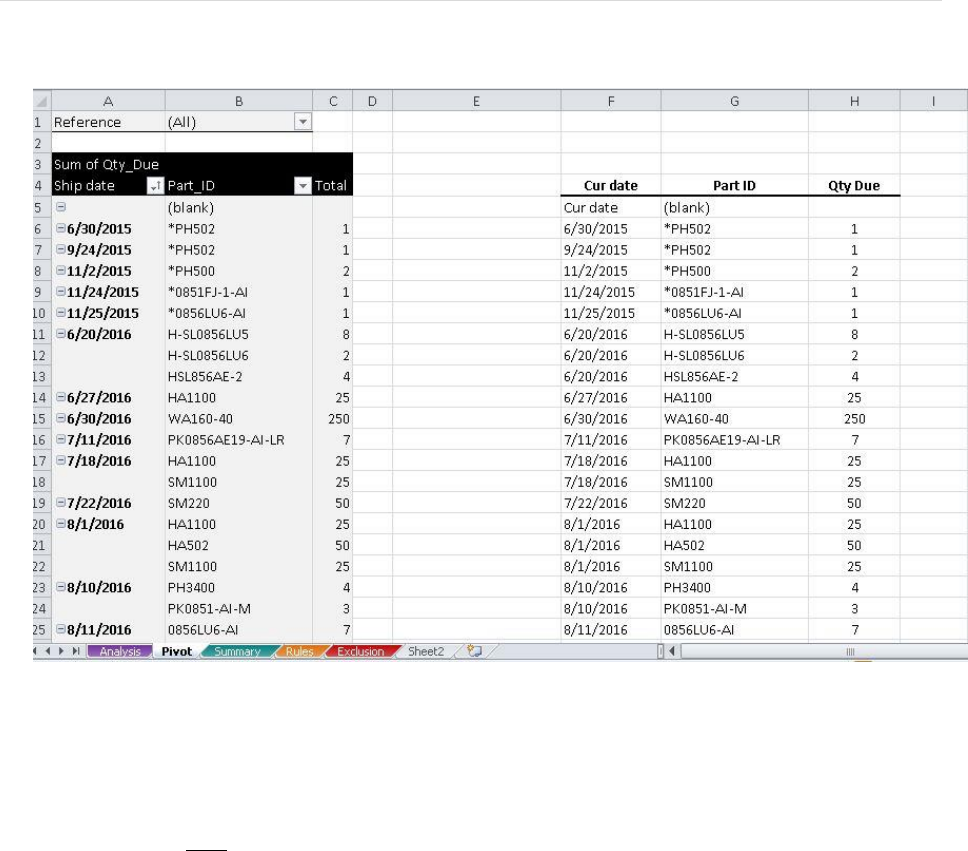
II. Pivot
The Pivot sheet is hidden by default as there has been no need for a user to access and
manipulate its contents. If needed, additional columns can be added past the “H” column
without affecting the rest of the workbook. To remove Part IDs with a “*” preceding the
name, click on the Reference filter, check the box that says “Select Multiple Items”, and then
deselect all items starting with: “800…”. “Blanks” and “Reworks” may also be deselected, if
desired. Note: by checking the “Select Multiple Items” box, new items that populate in the
filter will be deselected by default.
Level Load Tool Instructions| 20
III. Summary
The Summary page can have columns added after the “H” column. The “B”, “E”, “F”, “G”, and
“H” columns have values populated into its cells via the Update button on the top left of the table.
IV. Rules
The information on the Rules page is used elsewhere in the tool using the VLOOKUP function.
Columns should be added to the far-right of the table, if needed. Inserting columns between
columns with existing values can cause the incorrect value being returned for the places where
VLOOKUP is being used.
V. Exclusion
The Exclusion sheet only exists to have a list of non-working days excluded from the date cycle
generation when the Select Range button is used on the Analysis sheet. The Select Range button
will only evaluate the dates up to the last shaded cell in that list. Replace old dates with newer
ones, as needed.

Level Load Tool Instructions| 21
Populate Qty Field process
This process will populate the table with the sum of the quantities due for a given part on a given date.
This routine will first refresh the table containing data exported from Exact MAX. It will look for the
source data in: C:\MRP Data\mrpnav. It is imperative that the XML file name is “mrpnav” and that
it is saved in a folder named “MRP Data” in “C:\”. All order numbers less than 50,000,000 are then
deleted from the record – these orders are not in production. A pivot table on the “Pivot” sheet sources its
data from the Data sheet and filters all the available information down to: Current date, Part ID, and
Quantity Due. This table is refreshed automatically. Though there are multiple instances of the same dates
and the same parts, there is a unique pair of date-part. This is because the Quantity Due column shows the
sum of the total quantity due of a part for a particular day. In other words, if there are several orders of the
same part due to be completed on the same day, the sum of all the parts across those orders are what you
will find under the Quantity Due column.
Now, the routine will cycle through every “Ship” and “Braze” row on the Analysis sheet for each column;
the columns contain working days and the rows contain part IDs. Each part ID and date from the Analysis
sheet is evaluated against every date-part pair on the Pivot sheet until a match is found, at which time, the
Quantity Due value from the Pivot sheet is retrieved and written into the corresponding cell on the
Analysis sheet. The “Braze” row is populated by writing the same value into a column that is ‘X’ places
less the column in which the value was inserted into the Ship row. The ‘X’ value is the lead time. For the
purposes of this tool, lead time is defined as the amount of time required to fully process a part after it has
been brazed (aggregate time required to go through: wind tunnel, testing, plating, and inspection).
