ArcSight Logger Administrator's Guide Admin 6.2
User Manual:
Open the PDF directly: View PDF ![]() .
.
Page Count: 623 [warning: Documents this large are best viewed by clicking the View PDF Link!]
- Chapter 1: Overview
- Chapter 2: User Interface and Dashboards
- Chapter 3: Searching and Analyzing Events
- The Process of Searching Events
- Elements of a Search Query
- Using the Advanced Search Builder
- Search Analyzer
- Regex Helper Tool
- Search Helper
- Searching for Events
- The Search Results Display
- Adjusting the Displayed Search Results
- Canceling a Search in Progress
- The Histogram
- The Search Results Table
- Additional Fields in the Search Results
- Refining a Search from the Search Results Table
- Viewing Raw Events
- Changing the Displayed Search Results Using Field Sets
- Multi-line Data Display
- Auto Refresh Search Results
- Chart Drill Down
- The Field Summary Panel
- Saving the Search Results
- Saving Queries (Creating Saved Searches and Saved Filters)
- Enriching Logger Data Through Static Correlation
- Indexing
- Viewing Alerts
- Live Event Viewer
- Chapter 4: Reporting
- The Reports Home Page
- The Navigation Menu
- Categories
- Dashboards
- Widgets
- Using Dashboards Created in Pre-5.2 Logger
- Running, Viewing, and Publishing Reports
- Scheduled Reports
- Designing Reports
- Queries
- Parameters
- Template Styles
- Administration
- Deploying a Report Bundle
- Report Server Administration
- Backup and Restore of Report Content
- iPackager
- Chapter 5: Configuration
- Search
- Data
- Storage
- Scheduled Tasks
- Advanced Configuration
- Chapter 6: System Admin
- Appendix A: Search Operators
- Appendix B: Using SmartConnectors to Collect Events
- Appendix C: Using the Rex Operator
- Appendix D: Logger Audit Events
- Appendix E: Examples of System Health Events
- Appendix F: Event Field Name Mappings
- Appendix G: Logger Content
- Reports
- Parameters
- System Filters
- Queries
- Access Events by Resource
- Accounts Created By User Account
- Accounts Deleted by Host
- Accounts Deleted by User Account
- Alert Counts by Device
- Alert Counts by Port
- Alert Counts by Severity
- Alert Counts by Type
- Alert Counts per Hour
- Alerts from IDS
- Anti-Virus Errors
- Anti-Virus Updates-All-Failed
- Anti-Virus Updates-All-Summary
- Asset Startup and Shutdown Event Log
- Attack Events By Destination
- Authentication Errors
- Bandwidth Usage by Hour
- Bandwidth Usage by Protocol
- Bottom Destinations
- Bottom Sources
- Bottom Targets
- By User Account - Accounts Created
- Common Account Login Failures by Source
- Configuration Changes by Type
- Configuration Changes by User
- Connection Counts by User
- Connections Accepted by Address
- Connections Denied by Address
- Connections Denied by Hour
- Daily Bandwidth Usage
- Daily Byte Count
- Database Errors and Warnings
- Denied Connections by Address
- Denied Connections by Port
- Denied Connections per Hour
- Destination Counts by Device Severity
- Destination Counts by Event Name
- Device Configuration Changes
- Device Configuration Events
- Device Misconfigurations
- Failed Anti-Virus Updates
- Failed Login Attempts
- Failed Logins by Destination Address
- Failed Logins by Source Address
- Failed Logins by User
- Failed Res Access Events
- Failed Resource Access
- Firewall Traffic by Service
- Hourly Bandwidth Usage
- IDS Signature Destinations
- IDS Signature Sources
- Infected Systems
- Least Common Accessed Ports
- Least Common Events
- Login Errors by User
- Login Event Audit
- Most Common Events
- Most Common Events by Severity
- Network-Device Critical Events
- Network-Device Errors
- Network-Device Events
- Network-Device Interface Down Notifications
- Network-Device Interface Status Messages
- Network-Device SNMP Authentication Failures
- Network-Top Device System Authentication Events
- Number of Failed Logins
- Password Change
- Password Changes
- Probes on Blocked Ports by Source
- Resource Access by Users - Failures
- Resource Access by Users - Success-Attempt
- Source Counts By Destination
- Source Counts by Destination Port
- Source Counts by Device
- Source Counts by Device Severity
- Source Counts by Source Port
- Source Port Counts
- Successful Logins by Destination Address
- Successful Logins by Source Address
- Successful Logins by User
- Target Attack Counts by Severity
- Target Counts by Device Severity
- Target Counts by Event Name
- Target Counts by Source
- Target Counts by Source Port
- Target Counts by Target Port
- Target Port Counts
- Top 10 Talkers
- Top 10 Types of Traffic
- Top Alerts
- Top Attack Sources
- Top Attacker Details
- Top Attacker Ports
- Top Attackers
- Top Bandwidth Hosts
- Top Bandwidth Usage by Destination
- Top Bandwidth Usage by Destination Port
- Top Bandwidth Usage by Source
- Top Destination IPs
- Top Destination Ports
- Top Destinations Across Firewalls
- Top Destinations in IDS Events
- Top Hosts by Number of Connections
- Top IDS Attack Events
- Top IDS Events
- Top IDS and IPS Alerts
- Top Machines Accessing the Web
- Top Machines Traversing Firewall
- Top Sources Detected by Snort
- Top Sources Traversing Firewalls
- Top Target IPs
- Top Targets
- Top User Logins
- Top Users with Failed Logins
- Top VPN Accesses by User
- Top VPN Event Destinations
- Top VPN Event Sources
- Top VPN Events
- Top Web Traffic
- Update Summary
- User Account Creations
- User Account Deletions
- User Account Modifications
- User Activity
- User Administration
- User Password Changes
- Users by Connection Count
- VPN Connection Attempts
- VPN Connection Failures
- Virus Activity by Hour
- Vulnerability Scanner Logs
- Vulnerability Scanner Logs by Host
- Vulnerability Scanner Logs by Vulnerability
- Windows Events
- Worm Infected System
- Worm Infected Systems
- Appendix H: Restoring Factory Settings
- Appendix I: Logger Search From ArcSight ESM
- Send Documentation Feedback

HPE SecurityArcSightLogger
Software Version: 6.2
Administrator's Guide
March 9, 2016

Legal Notices
Warranty
The only warranties for Hewlett Packard Enterprise products and services are set forth in the express warranty statements
accompanying such products and services. Nothing herein should be construed as constituting an additional warranty.
Hewlett Packard Enterprise shall not be liable for technical or editorial errors or omissions contained herein.
The information contained herein is subject to change without notice.
The network information used in the examples in this document (including IP addresses and hostnames) is for illustration
purposes only.
HPE Security ArcSight products are highly flexible and function as you configure them. The accessibility, integrity, and
confidentiality of your data is your responsibility. Implement a comprehensive security strategy and follow good security
practices.
This document is confidential.
Restricted Rights Legend
Confidential computer software. Valid license from Hewlett Packard Enterprise required for possession, use or copying.
Consistent with FAR 12.211 and 12.212, Commercial Computer Software, Computer Software Documentation, and Technical
Data for Commercial Items are licensed to the U.S. Government under vendor's standard commercial license.
Copyright Notice
© Copyright 2016 Hewlett Packard Enterprise Development, LP
Follow this link to see a complete statement of copyrights and acknowledgements:
https://www.protect724.hpe.com/docs/DOC-13026
Support
Phone A list of phone numbers is available on the HPE Security ArcSight Technical
Support Page:https://softwaresupport.hp.com/documents/10180/14684/esp-
support-contact-list
Support Web Site https://softwaresupport.hp.com
Protect 724 Community https://www.protect724.hpe.com
Contact Information
Administrator's Guide
HPE Logger 6.2 Page 2 of 623

Contents
Chapter 1: Overview 22
Introduction 22
Logger Features 23
Storage Configuration 23
Receiver Configuration 24
Analyzing Events 25
Grouping Events 26
Exporting Events 26
Forwarder Configuration 27
User Management 27
Other Setup and Maintenance 27
Deployment Scenarios 28
Centralized Management 30
Running Logger on Encrypted Appliances 30
Chapter 2: User Interface and Dashboards 31
Connecting to Logger 31
Navigating the User Interface 33
Menus, Take Me To, and Bar Gauges 33
Server Clock, Current User, and Options Dropdown 34
Logger Options 35
Customizing the Maximum EPS 35
Customizing the Logo 35
Customizing the Start Page 36
Help, About, and Logout 37
Summary 37
Summary Dashboard Panels 39
The Effect of Search Group Filters on the Summary Page 39
Dashboards 40
Out-of-Box Dashboards 40
The Monitor Dashboard 41
The New Monitor Dashboard 49
The Intrusion and Configuration Events Dashboard 51
Chart Drill-Down 52
The Login and Connection Activity Dashboard 52
Chart Drill-Down 53
The Event Count Dashboard 53
HPE Logger 6.2 Page 3 of 623

Chart Drill-Down 54
Custom Dashboards 55
Chart Drill-Down 56
Creating and Managing Custom Dashboards 56
Adding and Managing Panels in a Dashboard 58
Setting a Default Dashboard 61
Chapter 3: Searching and Analyzing Events 63
The Process of Searching Events 63
Elements of a Search Query 66
Query Expressions 66
Indexed Search Portion of a Query 67
Keyword Search (Full-text Search) 67
Field-Based Search 69
Search Operator Portion of a Query 74
Time Range 74
Time Stamps in Logger 76
Fieldsets 77
Predefined Fieldsets 77
The User Defined Fields Field-Set 78
The Raw Event Field-Set 78
Custom Fieldsets 78
Constraints 81
Syntax Reference for Query Expressions 83
Using the Advanced Search Builder 87
Accessing the Advanced Search Builder 87
Nested Conditions 90
Alternate Views for Query Building in Search Builder 90
Search Analyzer 91
Performance Optimizations for Indexed Fields in Queries 92
Regex Helper Tool 92
Search Helper 94
Autocomplete Search 95
Opening Filters and Saved Searches via Autocomplete 96
Search History and Search Operator History 97
Examples, Usage, Suggested Next Operators, and Help 98
Searching for Events 98
Running a Search 99
Things You Should Know About Logger Searches 101
Searching Peers (Distributed Search) 102
Tuning Search Performance 103
Administrator's Guide
HPE Logger 6.2 Page 4 of 623

Searching for Rare Field Values 103
Writing Searches to Increase Search Speed on Super-Indexed Fields 104
The Search Results Display 107
Adjusting the Displayed Search Results 108
Canceling a Search in Progress 109
The Histogram 109
Displaying the Histogram 110
Mouse-Over 110
Histogram Drill Down 111
The Search Results Table 111
Additional Fields in the Search Results 112
Refining a Search from the Search Results Table 113
Viewing Raw Events 113
Changing the Displayed Search Results Using Field Sets 113
Multi-line Data Display 114
Auto Refresh Search Results 114
Chart Drill Down 115
The Field Summary Panel 116
Displaying the Field Summary Panel 116
Selected Fields List 117
Field Summary Drill Down 118
Discovering Fields in Raw Event Data 118
Refining and Charting a Search from Field Summary 119
Saving the Search Results 120
Example of a Quick Report in PDFFormat (Search ResultsExport) 120
Exporting Search Results 121
Scheduling an Export Operation 123
Saving Queries (Creating Saved Searches and Saved Filters) 124
System Filters/Predefined Filters 128
Searching with Saved Queries 132
Enriching Logger Data Through Static Correlation 133
Indexing 133
Full-Text Indexing (Keyword Indexing) 134
Field-Based Indexing 134
Superindexing 136
Viewing Alerts 136
Live Event Viewer 137
Chapter 4: Reporting 142
The Reports Home Page 142
Getting Started 143
Administrator's Guide
HPE Logger 6.2 Page 5 of 623

The Navigation Menu 144
The Explorers 144
The Explorer Actions Menus 145
Category Explorer 145
Report Explorer 146
Query Explorer 147
Parameter Explorer 148
Favorites Explorer 148
Categories 149
System-defined Categories 150
Dashboards 153
Viewing Dashboards 154
Designing Dashboards 154
What Items Can a Dashboard Include? 155
Creating a New Dashboard 155
Viewing Existing Dashboards the Dashboard Viewer 156
Removing an Existing Tab from the Dashboard Viewer 156
Deleting a Dashboard 156
Editing an Existing Dashboard 157
Selecting a Default Dashboard View for the Reports Home Page 157
Widgets 158
The Widget Designer 158
Creating a New Widget 158
Deleting a Widget 162
Editing an Existing Widget 162
Placing Widgets in a Dashboard 162
Moving an Existing Widget within a Dashboard 162
Using Dashboards Created in Pre-5.2 Logger 162
Viewing a Classic Dashboard 162
Designing Classic Dashboards 163
What Items Can a Dashboard Include? 163
Creating a New Classic Dashboard 163
Placing Items on an Existing Dashboard 164
Dashboard Properties 164
Creating Widgets 164
Placing Dashboard Items on the Layout 165
Placing a Report on a Dashboard 165
Linking Widgets 167
Placing a Use Case on a Dashboard 167
Widget Properties for Use Cases 168
Placing an External Link on a Dashboard 168
Administrator's Guide
HPE Logger 6.2 Page 6 of 623

Swapping Items on Widgets 170
Setting Pre-5.0 Dashboard Preferences 170
Working with Available Dashboards 171
Selecting a Dashboard View 171
Running, Viewing, and Publishing Reports 171
Best Practices 172
Finding Reports 172
Viewing Recently Run Reports 172
Task Options on Available Reports 173
Running and Viewing Reports 173
About the Pagination of Reports 174
About Running a Report 175
Running a Report Manually 175
Quick Run with Default Options or Run In Background Report Parameters 176
Selecting Device Groups, Storage Groups, Devices, or Peers 178
Run Report Parameters 179
Report File Formats 181
Publishing Reports 181
Add Report Job Settings 183
Report Delivery Options 185
Emailing a Report 185
Exporting and Saving a Report 186
Viewing the Output of a Published Report 187
Deleting Published Reports 187
Scheduled Reports 188
Viewing and Editing Scheduled Reports 188
Jobs Execution Status 189
Scheduling a Report 190
Designing Reports 193
Opening the Report Designer 193
Creating New Reports 194
Quick Start: Base a New Report on an Existing One 195
Designing New Reports (The Ad hoc Report Designer) 196
Toolbar Buttons 197
Report Components 197
Data Source 198
Creating a New Report 198
Fields 199
Filter 200
Group 202
Totals 204
Administrator's Guide
HPE Logger 6.2 Page 7 of 623

Sort 204
Highlight 205
Matrix 206
Chart 207
Assigning Fields 208
Map 208
Adding a Map to a Report 210
Editing a Report 212
Private Reports 213
Running a Report While Designing It 213
Setting Access Rights on Reports 214
Determining What Access Rights to Give 214
Example: Giving a User Group Access Rights for a Report 214
Queries 216
How Search and Report Queries Differ 217
Overview of Query Design Elements 218
Creating a Copy of an Existing Query 218
Designing a New Query 219
Working with Steps 220
The Query Design Process 221
Steps 223
Data Source Step 224
Join Step 226
Union Step 227
Filter Step 227
Sort Step 228
Formula Fields Step 228
Dynamic Fields Step 229
External Task Step 229
Format Step 230
Parameters 231
Parameter Object Editor 231
Creating New Parameters 232
Setting Parameter Name, Data Type, and Default Values 233
Default Value for Date Type Parameter 233
Defining Input Type 234
Setting up Boolean Parameters 235
Setting Various Run Time Behaviors 235
Setting the Data Source List 236
Setting Multiple Default Values 236
Modifying a Parameter 237
Administrator's Guide
HPE Logger 6.2 Page 8 of 623

Deleting a Parameter 237
Configuring Parameter Value Groups 237
Template Styles 239
Defining a New Template 240
Administration 241
Deploying a Report Bundle 241
Report Server Administration 242
Timeouts when Running Reports 242
Report Configuration 243
Report Categories 244
Adding a New Category 245
Deleting an Existing Category 247
Report Category Filters 247
Placing a System-defined Query or Parameter into a Category 248
Backup and Restore of Report Content 249
iPackager 249
The iPackager Page 249
Buttons Available from the iPackager 250
Importing References from the Report Server 251
Modifying Properties for Imported Objects 252
Category Properties 252
Report Properties 252
Query Properties 253
Parameter Properties 253
Template Properties 253
Opening a .conf File 254
Deleting an Item from the .conf File 254
Clearing the Contents in a .conf File 254
Building the CAB File 254
Deploying a Repository (CAB) File 255
Chapter 5: Configuration 256
Search 256
Filters 257
Search Group Filters 259
Saved Searches 260
Scheduled Searches/Alerts 262
Adding a Scheduled Search or Scheduled Alert 264
Saved Search Alerts 271
Creating Saved Search Alerts (Scheduled Alerts) 271
Saved Search Files 273
Administrator's Guide
HPE Logger 6.2 Page 9 of 623

Search Indexes 274
Guidelines for Field-Based Indexing 275
Search Options 276
Managing Fieldsets 280
Default Fields 281
Custom Fields 282
Running Searches 282
Lookup Files 283
Creating Lookup Files 283
Naming Lookup Files 284
Naming Fields in the Lookup File 284
Duplicate Values in the Lookup File 284
Lookup Capacity 284
Uploading Lookup Files 285
Managing Uploaded Lookup Files 288
Data 292
Devices 293
Device Groups 294
Receivers 296
File Based Receivers 297
Multi-line Receivers 297
Folder Follower Receivers 298
Using Source Types with File Follower Receivers 298
Working with Receivers 299
Receiver Parameters 302
Date and Time Specification 312
Source Types 314
Working with Source Types 314
Parsers 318
Using Parsers with Source Types 319
Using the Parse Command 319
Working with Parsers 320
Example: Creating an Extract Parser 322
Forwarders 324
Real Time Alerts 331
Creating Real Time Alerts 333
Types of Alert in Logger 335
Alert Triggers and Notifications 337
When are Alert events triggered? 337
Receiving Alert Notifications 337
Sending Notifications to E-mail Destinations 338
Administrator's Guide
HPE Logger 6.2 Page 10 of 623

Setting Up Alert Notifications 339
Sending Notifications to Syslog and SNMP Destinations 339
SNMP Destinations 340
Syslog Destinations 341
Sending Notifications to ESM Destinations 342
ESM Destinations 343
Certificates 346
Forwarding Log File Events to ESM 347
Data Validation 348
Storage 351
Storage Groups 351
Storage Rules 353
Storage Volume 355
Event Archives 355
Guidelines for Archiving Events 356
Archiving Events 358
Daily Archive Settings 359
Archive Storage Settings 360
Loading and Unloading Archives 361
Indexing Archived Events 362
Scheduled Tasks 362
Scheduled Tasks 363
Currently Running Tasks 364
Finished Tasks 364
Advanced Configuration 365
Retrieve Logs 365
Maintenance Operations 367
Database Defragmentation 369
Guidelines for Database Defragmentation 369
Defragmenting a Logger 370
Freeing storage space for defragmentation 371
Global Summary Persistence Defragmentation 373
Guidelines for Global Summary Persistence Defragmentation 373
Storage Volume Size Increase 374
About Increasing Storage Volume Size on a SAN Logger 375
Adding Storage Groups 376
Adding Fields to the Schema 379
Importing Schema Fields from Peers 380
Maintenance Results 384
Configuration Backup and Restore 385
Running a Configuration Backup 386
Administrator's Guide
HPE Logger 6.2 Page 11 of 623

Scheduling Reoccurring Backups 388
Restoring from a Configuration Backup 389
Content Management 390
User Rights for Importing Content 391
Importing Content 391
User Rights for Exporting Content 392
Exporting Content 393
License Information 395
Data Volume Restrictions 395
Peers 396
Overview Steps for Configuring Peers 396
Guidelines for Configuring Peers 397
Authenticating Peers 398
Selecting a Peer Authentication Method 398
Authorizing a Peer 398
Adding and Deleting Peer Relationships 399
Adding a Peer 399
Deleting a Peer 402
Chapter 6: System Admin 403
System 403
System Locale 404
System Reboot 404
Network 405
System DNS 405
Hosts 406
NICs 406
Static Routes 408
Time/NTP 409
Impact of Daylight Savings Time Change on Logger Operations 410
SMTP 411
License & Update 412
Process Status 413
System Settings 413
SNMP 413
SNMPMetrics Supported 414
Configuration on the Logger Appliance 415
Configuration on the NMS 416
SSH Access to the Appliance 417
Logs 418
Audit Logs 418
Administrator's Guide
HPE Logger 6.2 Page 12 of 623

Audit Forwarding 418
Storage 419
Remote File Systems 419
Managing a Remote File System 419
SAN 422
Managing a LUN 423
Restoring a SAN 425
Creating Multiple Paths to a LUN 425
Restoring Multipath on RMA or Factory Reset Loggers 428
RAID Controller/Hard Disk SMART Data 428
Security 428
SSL Server Certificate 429
Generating a Self-Signed Certificate 429
Generating a Certificate Signing Request (CSR) 431
Importing a Certificate 432
SSL Client Authentication 433
Configuring Logger to Support SSL Client Authentication 433
Uploading Trusted Certificates 434
Uploading a Certificate Revocation List 435
FIPS 140-2 435
FIPSCompliance 435
Enabling and Disabling FIPSMode on Logger 436
Installing or Updating a SmartConnector to be FIPS-Compliant 437
Users/Groups 439
Authentication 440
Sessions 440
Local Password 441
Users Exempted From Password Expiration 443
Forgot Password 444
External Authentication 445
Local Password Authentication 446
Client Certificate Authentication 446
Client Certificate and Local Password Authentication 447
LDAP/AD and LDAPS Authentication 448
RADIUS Authentication 449
Local Password Fallback 450
Login Banner 451
User Management 452
Users 452
Reset a User's Password 455
Change My Password 455
Administrator's Guide
HPE Logger 6.2 Page 13 of 623

User Groups 456
Managing User Groups 457
Other System Administration Information 458
Monitoring System Health 458
System Health Events 459
Using the Appliance Command Line Interface 462
Software Logger Command Line Options 465
Appendix A: Search Operators 467
cef (Deprecated) 467
Synopsis 468
Usage Notes 468
chart 468
Synopsis 468
Usage Notes 469
Percentile Function 469
Aggregation Functions 470
Multi-Series Charts 470
The Span Function 471
Example One 472
Example Two 472
dedup 472
Synopsis 472
Example One 473
Example Two 473
Example Three 473
eval 473
Synopsis 473
Usage Notes 474
extract 479
Synopsis 479
Understanding How the Extract Operator Works 480
Usage Notes 480
Example 481
fields 481
Synopsis 481
Usage Notes 481
Example One 482
Example Two 482
head 482
Synopsis 482
Administrator's Guide
HPE Logger 6.2 Page 14 of 623

Usage Notes 482
Example 482
keys 482
Synopsis 482
Usage Notes 483
Example One 483
Example Two 483
lookup 484
Synopsis 484
Usage Notes 486
Using IP Addresses in Lookup Files 487
Example One 487
Example Two 488
parse 488
Synopsis 488
Usage Notes 489
Example 489
rare 489
Synopsis 489
Usage Notes 489
Example 490
regex 490
Synopsis 490
Usage Notes 490
Examples 490
rename 490
Synopsis 490
Usage Notes 491
Examples 491
replace 491
Synopsis 492
Usage Notes 492
Example One 493
Example Two 493
rex 493
Synopsis 493
Understanding How Extraction Works 493
Understanding How Substitution Works 494
Usage Notes 495
Example One 495
Example Two 495
Administrator's Guide
HPE Logger 6.2 Page 15 of 623

Example Three 495
sort 496
Synopsis 496
Usage Notes 496
Example 496
tail 497
Synopsis 497
Usage Notes 497
Example 497
top 497
Synopsis 497
Usage Notes 497
Examples 498
transaction 498
Synopsis 498
Usage Notes 499
Understanding How the Transaction Operator Works 499
Example One 500
Example Two 500
Example Three 500
Example Four 500
where 500
Synopsis 500
Usage Notes 501
Examples 501
Appendix B: Using SmartConnectors to Collect Events 502
SmartMessage 502
Downloading SmartConnectors 503
Configuring a SmartConnector to Send Events to Logger 503
Configuring SmartConnectors to Send Events to Both Logger and an ArcSight Manager 504
Configuring SmartConnectors for Failover Destinations 504
Sending Events from ArcSight ESM to Logger 505
Appendix C: Using the Rex Operator 508
Syntax of the rex Operator 508
Understanding the rex Operator Syntax 508
Ways to Create a rex Expression 509
Creating a rex Expression Manually 510
Example rex Expressions 510
Appendix D: Logger Audit Events 514
Types of Audit Events 514
Administrator's Guide
HPE Logger 6.2 Page 16 of 623

Information in an Audit Event 514
Platform Events 515
Application Events 522
Appendix E: Examples of System Health Events 539
Appendix F: Event Field Name Mappings 546
Appendix G: Logger Content 552
Reports 552
Device Monitoring 553
Anti-Virus 553
CrossDevice 554
Database 558
Firewall 558
IDS-IPS 559
Identity Management 560
Network 560
Operating System 561
VPN 562
Foundation 563
Configuration Monitoring 563
Intrusion Monitoring 565
Attackers 567
Resource Access 570
Targets 571
User Tracking 574
NetFlow Monitoring 574
Network Monitoring 575
Logger Administration 576
SANS Top 5 577
1 - Attempts to Gain Access through Existing Accounts 577
2 - Failed File or Resource Access Attempts 578
3 - Unauthorized Changes to Users Groups and Services 578
4 - Systems Most Vulnerable to Attack 580
5 - Suspicious or Unauthorized Network Traffic Patterns 580
Parameters 582
IPAddress 583
categoryObjectParameter 583
commonlyBlockedPorts 584
destinationAddress 584
destinationPort 584
deviceGroupParameter 584
Administrator's Guide
HPE Logger 6.2 Page 17 of 623

deviceProduct 585
deviceSeverityParameter 585
deviceVendor 585
dmBandwidthParameter 585
dmConfigurationParameter 586
dmLoginParameter 586
eventNameParameter 586
resourceTypeParameter 586
webPorts 587
zoneParameter 587
zones 587
System Filters 588
Queries 596
Access Events by Resource 596
Accounts Created By User Account 596
Accounts Deleted by Host 596
Accounts Deleted by User Account 596
Alert Counts by Device 596
Alert Counts by Port 596
Alert Counts by Severity 596
Alert Counts by Type 596
Alert Counts per Hour 596
Alerts from IDS 597
Anti-Virus Errors 597
Anti-Virus Updates-All-Failed 597
Anti-Virus Updates-All-Summary 597
Asset Startup and Shutdown Event Log 597
Attack Events By Destination 597
Authentication Errors 597
Bandwidth Usage by Hour 597
Bandwidth Usage by Protocol 597
Bottom Destinations 597
Bottom Sources 597
Bottom Targets 598
By User Account - Accounts Created 598
Common Account Login Failures by Source 598
Configuration Changes by Type 598
Configuration Changes by User 598
Connection Counts by User 598
Connections Accepted by Address 598
Connections Denied by Address 598
Administrator's Guide
HPE Logger 6.2 Page 18 of 623

Connections Denied by Hour 598
Daily Bandwidth Usage 598
Daily Byte Count 598
Database Errors and Warnings 599
Denied Connections by Address 599
Denied Connections by Port 599
Denied Connections per Hour 599
Destination Counts by Device Severity 599
Destination Counts by Event Name 599
Device Configuration Changes 599
Device Configuration Events 599
Device Misconfigurations 599
Failed Anti-Virus Updates 599
Failed Login Attempts 599
Failed Logins by Destination Address 600
Failed Logins by Source Address 600
Failed Logins by User 600
Failed Res Access Events 600
Failed Resource Access 600
Firewall Traffic by Service 600
Hourly Bandwidth Usage 600
IDS Signature Destinations 600
IDS Signature Sources 600
Infected Systems 600
Least Common Accessed Ports 600
Least Common Events 601
Login Errors by User 601
Login Event Audit 601
Most Common Events 601
Most Common Events by Severity 601
Network-Device Critical Events 601
Network-Device Errors 601
Network-Device Events 601
Network-Device Interface Down Notifications 601
Network-Device Interface Status Messages 601
Network-Device SNMP Authentication Failures 601
Network-Top Device System Authentication Events 602
Number of Failed Logins 602
Password Change 602
Password Changes 602
Probes on Blocked Ports by Source 602
Administrator's Guide
HPE Logger 6.2 Page 19 of 623

Resource Access by Users - Failures 602
Resource Access by Users - Success-Attempt 602
Source Counts By Destination 602
Source Counts by Destination Port 602
Source Counts by Device 602
Source Counts by Device Severity 602
Source Counts by Source Port 603
Source Port Counts 603
Successful Logins by Destination Address 603
Successful Logins by Source Address 603
Successful Logins by User 603
Target Attack Counts by Severity 603
Target Counts by Device Severity 603
Target Counts by Event Name 603
Target Counts by Source 603
Target Counts by Source Port 603
Target Counts by Target Port 603
Target Port Counts 604
Top 10 Talkers 604
Top 10 Types of Traffic 604
Top Alerts 604
Top Attack Sources 604
Top Attacker Details 604
Top Attacker Ports 604
Top Attackers 604
Top Bandwidth Hosts 604
Top Bandwidth Usage by Destination 604
Top Bandwidth Usage by Destination Port 604
Top Bandwidth Usage by Source 605
Top Destination IPs 605
Top Destination Ports 605
Top Destinations Across Firewalls 605
Top Destinations in IDS Events 605
Top Hosts by Number of Connections 605
Top IDS Attack Events 605
Top IDS Events 605
Top IDS and IPS Alerts 605
Top Machines Accessing the Web 605
Top Machines Traversing Firewall 605
Top Sources Detected by Snort 606
Top Sources Traversing Firewalls 606
Administrator's Guide
HPE Logger 6.2 Page 20 of 623

Top Target IPs 606
Top Targets 606
Top User Logins 606
Top Users with Failed Logins 606
Top VPN Accesses by User 606
Top VPN Event Destinations 606
Top VPN Event Sources 606
Top VPN Events 606
Top Web Traffic 606
Update Summary 607
User Account Creations 607
User Account Deletions 607
User Account Modifications 607
User Activity 607
User Administration 607
User Password Changes 607
Users by Connection Count 607
VPN Connection Attempts 607
VPN Connection Failures 607
Virus Activity by Hour 607
Vulnerability Scanner Logs 608
Vulnerability Scanner Logs by Host 608
Vulnerability Scanner Logs by Vulnerability 608
Windows Events 608
Worm Infected System 608
Worm Infected Systems 608
Appendix H: Restoring Factory Settings 609
Before Restoring Your System 609
Restoring Your System 609
Restoring LX400 and Earlier Appliance Models 613
Appendix I: Logger Search From ArcSight ESM 616
Understanding the Integrated Search Functionality 616
Setup and Configuration 617
On ESM 618
On Logger 619
Supported Search Options 619
Guidelines 619
Searching on Logger From ArcSight Console 620
Send Documentation Feedback 623
Administrator's Guide
HPE Logger 6.2 Page 21 of 623
Chapter 1: Overview
The following topics provide an overview of ArcSight Logger 6.2 (Logger), including information on
storage, receiver, and forwarder configuration; working with events; user management; and setup and
maintenance considerations.
• Introduction 22
• Logger Features 23
• Deployment Scenarios 28
• Centralized Management 30
• Running Logger on Encrypted Appliances 30
Introduction
Logger is a log management solution that is optimized for extremely high event throughput, efficient
long-term storage, and rapid data analysis. Logger receives and stores events; supports search, retrieval,
and reporting; and can optionally forward selected events. Logger compresses raw data, but can always
retrieve unmodified data on demand for forensics-quality litigation data.
An event consists of a receipt time, an event time, a source (host name or IP address), and an un-parsed
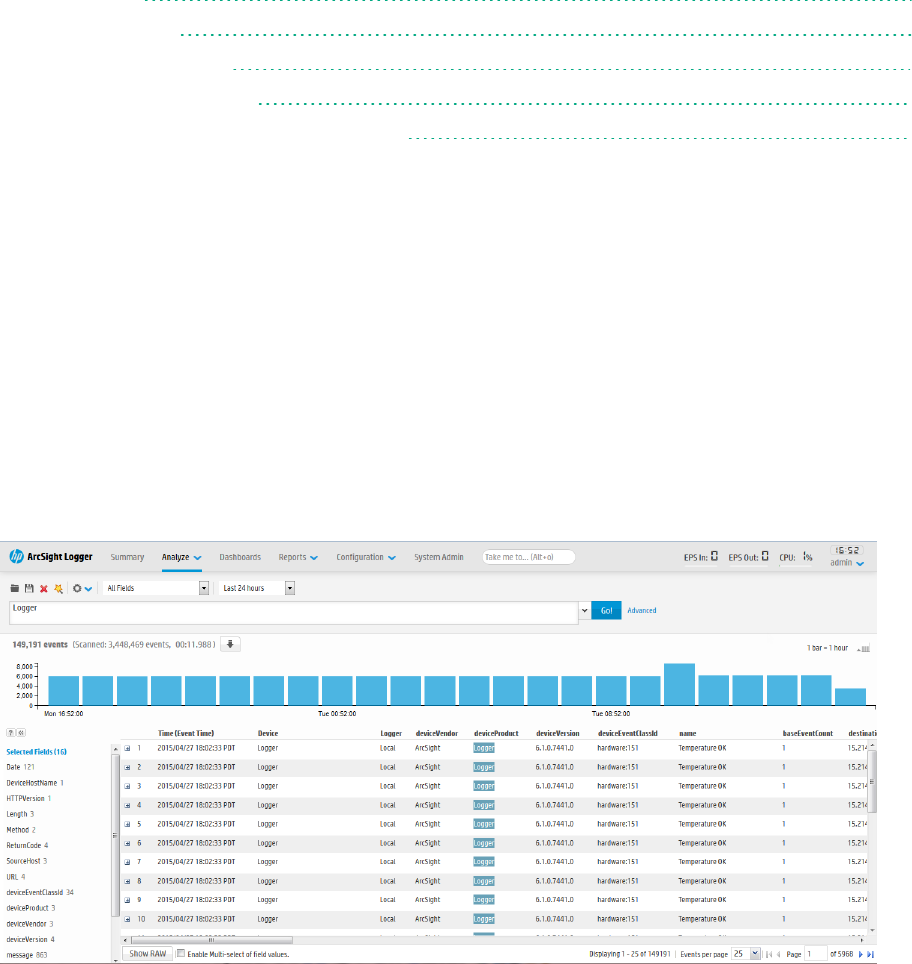
message portion. Logger displays events in a tabular form, with fields that describe how Logger
received the event.
Analyze>Search page, displaying search results
Similar to ArcSight Manager, Logger receives structured data in the form of normalized Common Event
Format (CEF) events and unstructured data, such as syslog events. The file-type receivers configured
HPE Logger 6.2 Page 22 of 623

on Logger only parse event time from an event. Although Logger is message-agnostic, it can do more
with messages that adhere to the Common Event Format (CEF), an industry standard for the
interoperability of event- or log-generating devices.
For more information about CEF, refer to the document "ArcSight CEF". For a downloadable a copy of
this guide, search for “ArcSight Common Event Format (CEF) Guide” in the ArcSight Product
Documentation Community on Protect 724.
Logger is available in two form factors: an appliance and software. The appliance-based solution is a
hardened, dedicated, enterprise-class system that is optimized for extremely high event throughput,
efficient long-term storage, and rapid data analysis. The software-based solution is similar in feature
and functionality to the appliance-based solution, however, the software solution enables you to install
ArcSight Logger on a supported platform of your choice.
Multiple Loggers can work together to scale up to support extremely high event volume with search
queries distributed across all Loggers.
Logger Features
The following sections provide an overview of key Logger features with links to relevant sections of this
guide.
• Storage Configuration 23
• Receiver Configuration 24
• Analyzing Events 25
• Grouping Events 26
• Exporting Events 26
• Forwarder Configuration 27
• User Management 27
• Other Setup and Maintenance 27
Storage Configuration
Logger events can be stored locally on any Logger and remotely on Logger Appliance models that
support Storage Area Network (SAN). SAN can be used for storing events on both types of Loggers;
however, only one LUN can be used for storing events. Using a Network File System (NFS) as primary
storage for events is not recommended.
The Logger Appliance includes onboard storage for events. Some Logger models include RAID 1 or
RAID 5 storage systems. (See Logger specifications at http://www8.hp.com/us/en/software-
solutions/enterprise-security.html.)
Events are stored compressed. You cannot configure the compression level.
Administrator's Guide
HPE Logger 6.2 Page 23 of 623
An NFS or a CIFS system can be used for archiving Logger data such as event archives, Saved Searches,
exported filters and alerts, and configuration backup information. You can also configure the Logger to
read event data or log files from a CIFS host.
The storage volume, either external or local, can be divided into multiple storage groups, each with a
separate retention policy. Two storage groups are created when Logger is first configured. New storage
groups can be added later. A storage group’s size can be increased or decreased and the retention
policy defined for it can be changed.
For more information on storage strategy, refer to the Logger Installation Guide. For more information
on event storage, see "Storage" on page351.
Receiver Configuration
Logger receives events as syslog messages, encrypted SmartMessages, Common Event Format (CEF)
messages, or by reading log files. Traditionally, syslog messages are sent using User Datagram Protocol
(UDP), but Logger can receive syslog and CEF messages using the more reliable Transmission Control
Protocol (TCP) as well.
Logger can also read events from text log files on remote hosts. Log files can contain one event per line
or event messages that span multiple lines separated by characters such as newline (\n) or a carriage
return (\r). Each event must include a timestamp. Logger can be configured to poll remote folders for
new files matching a filename pattern. Once the events in the new file have been read, Logger can delete
the file, rename it, or simply remember that it has been read. Logger can read remote files on network
drives using SCP, SFTP, or FTP protocol, or using a previously-established NFS or CIFS mount or, on
some Logger Appliance models, a SAN.
Administrator's Guide
HPE Logger 6.2 Page 24 of 623
Logger may also receive events from an ArcSight Manager as CEF-formatted syslog messages. These
events are forwarded to Logger through a special software component called an ArcSight Forwarding
SmartConnector that converts the events into CEF-formatted syslog messages before sending them to
Logger.
lFor more information on setting up receivers, see "Receivers" on page296
lFor more information on setting up SmartConnectors, refer to the Logger Installation Guide.
lFor more information on collecting events from ArcSight ESM, refer to the Logger Installation Guide.
Analyzing Events
Events can be searched, yielding a table of events that match a particular query. Queries can be entered
manually or automatically created by clicking on terms in the event table. Queries can be based on plain
English keywords (full-text search), predefined fields, or specified as regular expressions. Logger
supports a flow-based search language that allows you to specify multiple search commands in a
pipeline format.
By default, a Logger queries only its primary data store even if peer Loggers are configured. However,
you can configure it to distribute a query across peer Loggers of your choice.
Queries can be saved as a filter or as a saved search. Saved filters can be used to select events for
forwarding or to filter for the same things later. A Saved Search is used to export selected events or to
save results to a file, typically as a scheduled task.
Administrator's Guide
HPE Logger 6.2 Page 25 of 623
The following topics provide more information about analyzing events:
l"Searching for Events" on page98
l"Saving Queries (Creating Saved Searches and Saved Filters)" on page124
l"Filters" on page257
l"Saved Searches" on page260
l"Parsers" on page318
Grouping Events
The combination of a source IP address and a Logger receiver is called a device. As events are received,
devices are automatically created for each IP/receiver pair. Devices can also be created manually.
Devices can be categorized by membership in one or more device groups. While an incoming event
belongs to one and only one device, it can be associated with more than one device group.
Storage rules associate a device group with a storage group. Storage rules are ordered by priority, and
the first matching rule determines to which storage group an incoming event will be sent.
Device groups, devices, storage groups, and peer Loggers can each be used to filter events using Search
Constraints, which can be specified interactively on the Analyze page as well as when creating filters or
Saved Searches.
The following topics provide more information about grouping events:
l"Event Archives" on page355
l"Storage Rules" on page353
l"Searching Peers (Distributed Search)" on page102
Exporting Events
A Logger Appliance can export events to various sources. Events that match the current query can be
exported locally, to an NFS mount, a CIFS mount, as a file or to a SAN, when the appliance supports
SANs.
Events from a Software Logger can be exported locally to the Logger (to the
<install_dir>/data/logger directory) or to the browser from which you connect to the Logger.
The <install_dir>/data/logger directory can be mounted to an NFS or CIFS.
Events can be exported in Comma-Separated Values (CSV) format for easy processing by external
applications or as a PDF file for generating a quick report. A PDF report includes a table of search
results and any charts generated for the results. Both raw (unstructured data) and CEF events
(structured data) can be included in the PDF exported report.
Events in Common Event Format (CEF) have more columns defined, making the data more useful, but
non-CEF events can be exported as well, if desired. The user can control which fields are exported.
Administrator's Guide
HPE Logger 6.2 Page 26 of 623
Exports can be scheduled to run regularly by creating a Saved Search Job. First, a Saved Search is
created, either manually or by saving a query on the Analyze page. A Saved Search can be based on an
existing filter. A Saved Search Job combines one or more Saved Searches and a schedule with export
options.
The following topics provide more information about exporting events:
l"Exporting Search Results" on page121
l"Time/NTP" on page409
l" Scheduled Searches/Alerts" on page262
Forwarder Configuration
Logger can send events (as they are received or past events) to other hosts using UDP or TCP, to a
Logger Streaming SmartConnector, or to an ArcSight Manager. The events sent to a particular host can
be filtered by a query that events must match. Outgoing syslog messages can be configured to either
pass the original source IP and timestamp or to use Logger's “send time” and IP address.
Syslog messages can be sent to an ArcSight Manager using a syslog SmartConnector, but Logger can
also send CEF events directly to an ArcSight Manager using its built-in SmartConnector. Logger can act
as a funnel, receiving events at very high volumes and sending fewer, filtered events on to an ArcSight
Manager, as depicted under "Logger can act as a funnel, forwarding selected events to ArcSight
Manager" on the next page.
The following topics provide more information about forwarding events:
l"Forwarders" on page324
l"ESM Destinations" on page343
User Management
User accounts can be created by the Logger administrator to distinguish between different users of the
system. User accounts inherit privileges from the User Group to which they belong. User Groups can
have an enforced event filter applied to them, limiting the events that a specific user can see.
The following topics provide more information about user management:
l"Users/Groups" on page439
l"Change My Password" on page455
l"Search Group Filters" on page259
Other Setup and Maintenance
Logger configuration settings, such as receivers, filters, Saved Search jobs, and so on—everything
except events—can be backed up as a configuration backup file to any disk and later restored.
Administrator's Guide
HPE Logger 6.2 Page 27 of 623
Logs detailing Logger activity can be downloaded through the browser on demand, for debugging or
other reasons. Other system information is available for viewing. Various system settings can be
modified. Some require a system reboot or restart for the changes to take effect.
The Logger Appliance can be rebooted using controls in the user interface. For Software Logger, the
Logger service and related processes can be restarted. Follow instructions in "Software Logger
Command Line Options" on page465 to start, stop, or restart Software Logger.
The following topics provide more information about setup and maintenance:
l"Configuration Backup and Restore" on page385
l" Retrieve Logs" on page365
l"Storage" on page419
l"System" on page403
l"License & Update" on page412
l"Network " on page405
Deployment Scenarios
Typically, Logger is deployed inside the perimeter firewall with a high degree of physical security to
prevent tampering with the collected event information. Logger does not require other ArcSight
products. It receives and forwards syslog and log file events created by a wide variety of hardware and
software network products.
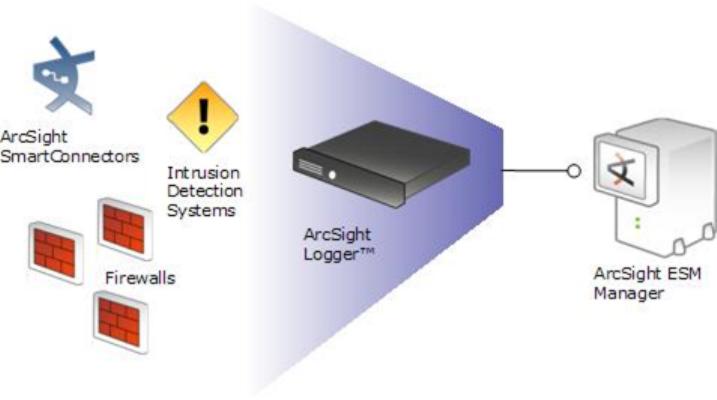
Logger also inter-operates with ArcSight Manager as shown in the following figures. A typical use of
Logger is to collect firewall or other data and forward a subset of the data to ArcSight Manager for real-
time monitoring and correlation, as shown below. Logger can store the raw firewall data for compliance
or service-level agreement purposes.
Logger can act as a funnel, forwarding selected events to ArcSight Manager
Administrator's Guide
HPE Logger 6.2 Page 28 of 623
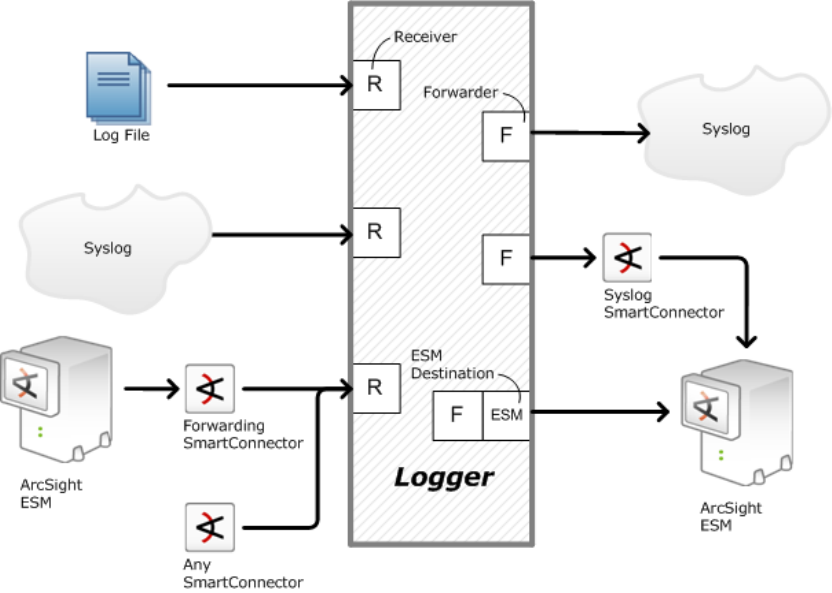
Logger can store events sent by ArcSight Manager
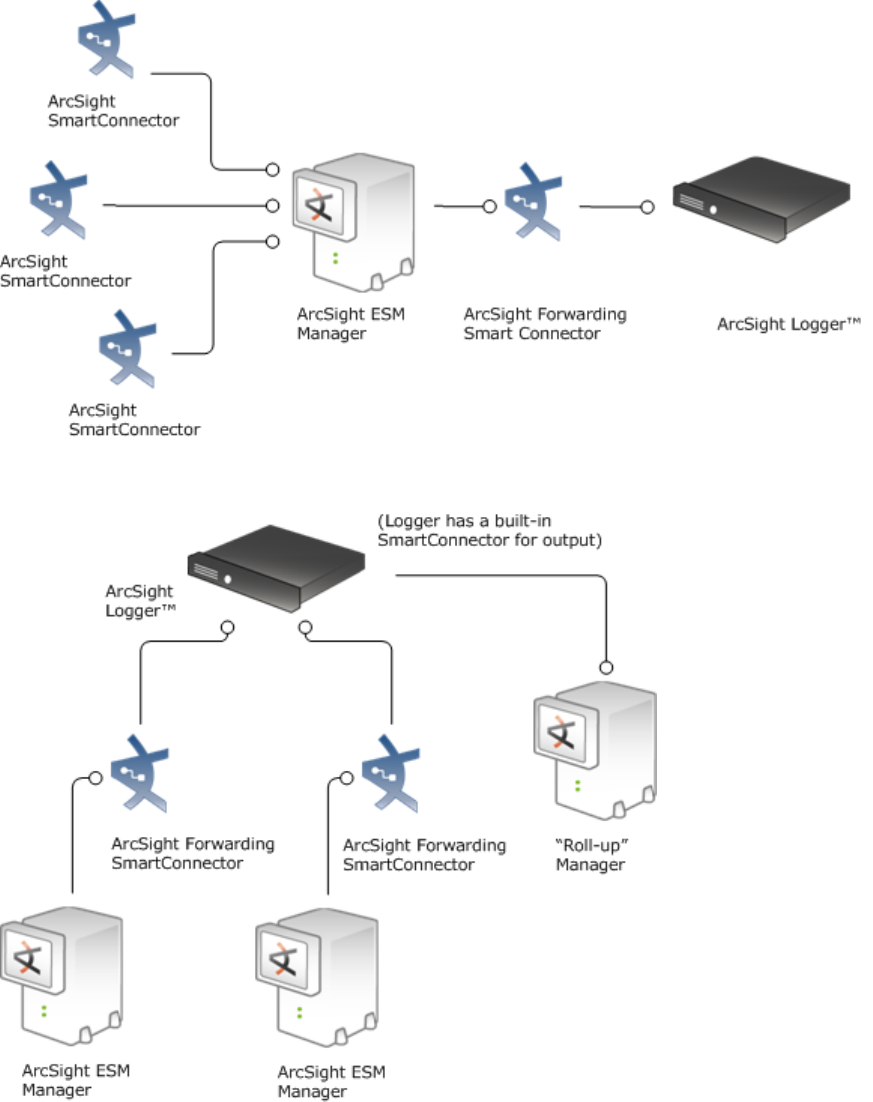
Logger can store and forward filtered events in a hierarchical ArcSight Manager deployment
Administrator's Guide
HPE Logger 6.2 Page 29 of 623

Centralized Management
HPE ArcSight Management Center (ArcMC) provides centralized management for Loggers and
software connectors with a single panel view of all managed ArcSight products.
Note: Centralized Management is not available for trial Loggers. To take advantage of this feature,
you need the Enterprise version.
Using ArcSight Management Center, you can create or import configurations for managed products,
and then rapidly push them to products of the same type across your network, ensuring consistent
configuration for managed products with one action. You can perform a variety of remote management
tasks, singly and in bulk, on Loggers and software connectors. Logger tasks you can perform using
ArcMC include initial configuration, peer configuration, and user management.
For more information, consult your sales representative or refer to the ArcSight Management Center
Administrator's Guide.
Running Logger on Encrypted Appliances
Logger can be run on encrypted hardware to help you to meet compliance regulations and privacy
challenges by securing your sensitive data at rest.
You can encrypt your L7600 Logger Appliance by using HP Secure Encryption, available from the
Server Management Software > HP Secure Encryption web page. For instructions, refer to the HP
Secure Encryption Installation and User Guide, available in PDFand CHM formats through the
Technical Support / Manuals link on that page.
L7600 Logger Appliances are encryption-capable. They come pre-installed with everything necessary
for you to encrypt them using HP Secure Encryption. The length of time encryption takes depends on
the amount of data on the server being encrypted. In our testing, a Gen 9 appliance with 7.5 TBof
stored data took about 72 hours to encrypt. You can continue using Logger while the encryption runs.
You may notice some performance degradation after encrypting your existing Logger appliance.
Caution:After encryption, you cannot restore your Logger to its previously unencrypted state.
Administrator's Guide
HPE Logger 6.2 Page 30 of 623

Chapter 2: User Interface and Dashboards
The following topics provide an overview of how to connect to Logger, and explores Logger's
dashboards. Logger includes standard dashboards that display the real-time and historical status of
receivers and forwarders as well as storage, CPU, and disk usage statistics. You can create your own
dashboards for an all-in-one view of Logger information that is of interest to you.
• Connecting to Logger 31
• Navigating the User Interface 33
• Summary 37
• Dashboards 40
• Setting a Default Dashboard 61
Connecting to Logger
You can connect to Logger and log in with most browsers, including Chrome, Firefox and Internet
Explorer. Refer to the Release Notes document to find out the browsers and their versions supported
for this release.
To connect and log into Logger:
1. Use the URL configured during Logger installation to connect to Logger through a supported
browser.
For the Logger appliance, use https://<hostname or IP address>
The End User License Agreement is displayed. Review and accept the EULA.
For Software Logger, use https://<hostname or IP address>:<configured_port>
where the hostname or IP address is the system on which the Logger software is installed, and
configured_port is the port set up during the Logger installation, if applicable.
The Login screen is displayed.
HPE Logger 6.2 Page 31 of 623
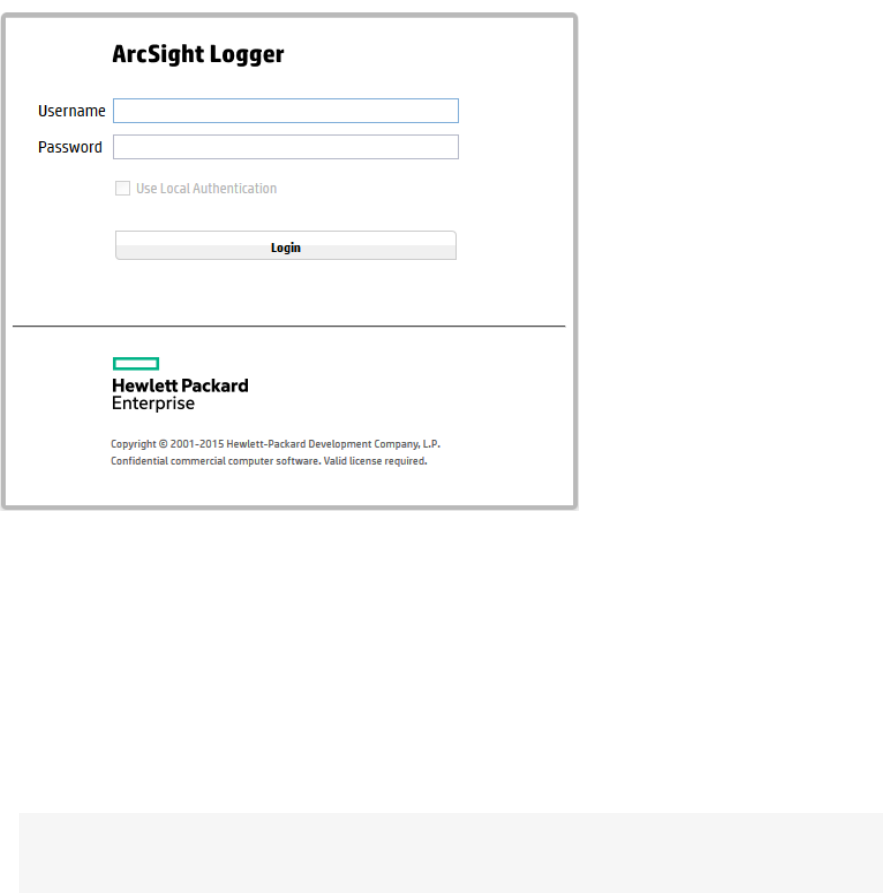
2. Enter your user name and password, and click Login. Use the following default credentials if you
are connecting for the first time or have not yet changed the default credentials:
Username: admin
Password: password
lIf login succeeds, the Summary page (Logger’s default home page) is displayed. For information
on the Summary page see "Summary" on page37.
lIf login fails, the message Authentication Failed is displayed at the top of the login screen. Enter
the correct username and password combination to try again.
Note:The first time you log in with the default user name and password, you will be required
to change the password.
Depending on your system administration settings, the following options maybe also be available.
lForgot Password?: A “Forgot Password?” link is displayed if your Logger is configured to show it.
Click this link to change your password. For more information on the Forgot Password link, see
"Forgot Password" on page444.
lUse Local Authentication: The “Use Local Authentication” checkbox is always displayed, but only
becomes active when a login attempt fails. By default, this option is available only for the default
admin. For more information on the Use Local Authentication option, see "Local Password" on
page441.
Administrator's Guide
HPE Logger 6.2 Page 32 of 623
Navigating the User Interface
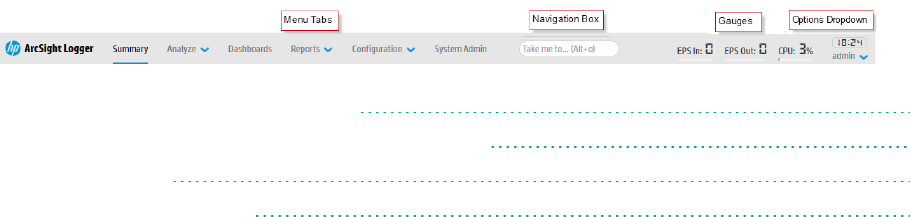
A navigation and information band runs across the top of every page in the user interface.
Logger navigation
• Menus, Take Me To, and Bar Gauges 33
• Server Clock, Current User, and Options Dropdown 34
• Logger Options 35
• Help, About, and Logout 37
Menus, Take Me To, and Bar Gauges
The Summary, Analyze, Dashboards, and Reports menu tabs provide access to various Logger
functions and data stored on it. You can configure system settings and administrative functions in the
Configuration and System Admin menus. For more information on each, refer to the sections below.
lThe options available in the Summary menu are discussed in "Summary" on page37.
lThe options available in the Dashboards menu are discussed in "Dashboards" on page40.
lThe options available in the Analyze menu are discussed in "Searching and Analyzing Events" on
page63.
lThe options available in the Reports menu are discussed in "Reporting" on page142
lThe options available in the Configuration menu are discussed in "Configuration" on page256.
lThe options available in the System Admin menu are discussed in "System Admin " on page403.
Take me to...
To the right of the menu tabs, the Take me to… navigation box provides a quick and easy way to
navigate to any location in the UI. The Take me to… feature enables you to navigate to any Logger
feature simply by starting to type the feature’s name.
Administrator's Guide
HPE Logger 6.2 Page 33 of 623
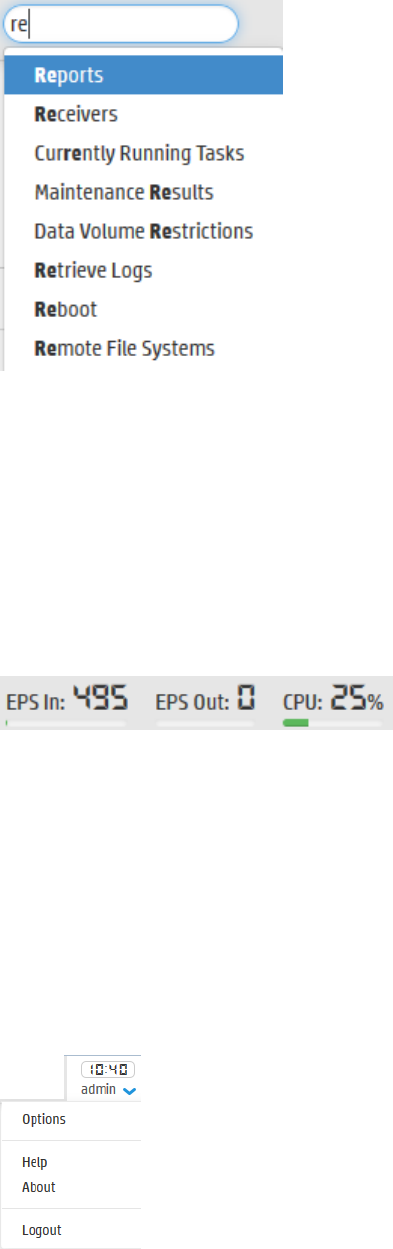
You can access the Take me to… navigation box by clicking in it or by using the Alt+o, Alt+p, or
Ctrl+Shift +o hot keys. As you type, a list of features that match drops down. Click an item in the list or
press enter to go to the specified feature.
You can open the help for the current page by typing help in the Take me to… search box.
Bar Gauges
Bar gauges at the top right of the screen provide an indication of the throughput and CPU usage,
which is available in more detail on the Monitor Dashboard discussed in "Dashboards" on page40.
The range of the bar gauges can be changed on the Options page, as discussed in "Logger Options" on
the next page.
Server Clock, Current User, and Options Dropdown
The server clock is shown to the right of the bar gauges, along with the currently logged-in user’s name
and the Options dropdown arrow.
The server clock displays the Logger server’s system time. This may be different from the user’s local
time.
Administrator's Guide
HPE Logger 6.2 Page 34 of 623
Below the clock is the login name of the current user. To the right of the user's login name is the
dropdown arrow that you can use to open the "Logger Options" below and the "Help, About, and
Logout" on page37 options.
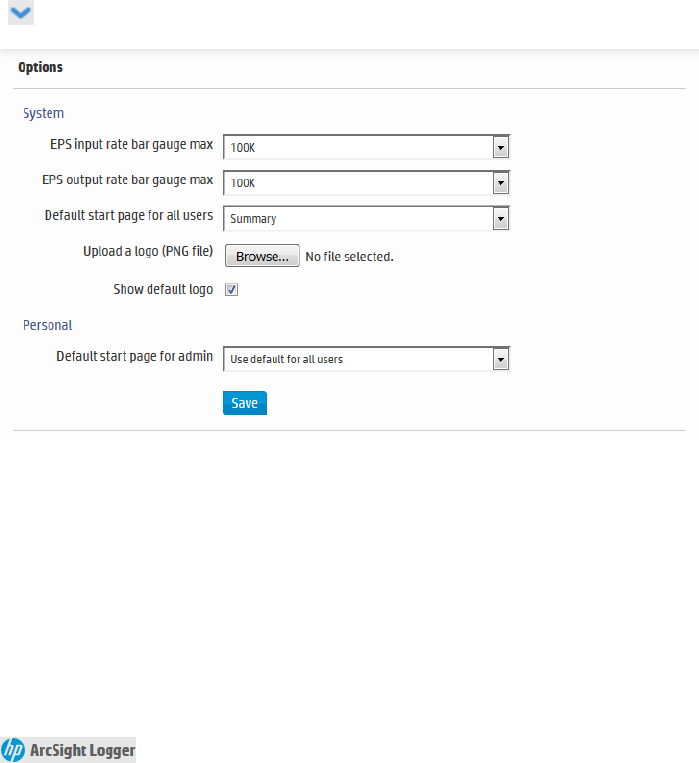
Logger Options
When you click the Options drop-down arrow, you can access the Options page and the "Help, About,
and Logout" on page37 options as well.
The Options page enables you to set the default start page (home page) for all users and specific start
pages for individual users and to upload a custom logo to display instead of the default logo.
To access the Options page from any user interface page: Click the down-arrow by your user name
( ) and then select Options.
Customizing the Maximum EPS
You can set the maximum rate on the EPS In and EPS Out bar gauges from by using the EPS Input
rate bar gauge max and EPS output rate bar gauge max dropdowns. If the event rate exceeds the
specified maximum, the range is automatically increased.
Customizing the Logo
The Upload a logo (PNG file) option enables you to replace the HPEArcSight Logger logo (
)with your custom logo. The logo must be in .png format. The recommended logo size
is 150 X 30 pixels and the maximum file size is 1MB.
Administrator's Guide
HPE Logger 6.2 Page 35 of 623

To display a custom logo:
1. Click Browse, navigate to the logo you want to use, and click Open. The name of your logo is
displayed by the browse button.
2. Then uncheck Show default logo. The custom logo will be displayed on the login page and on the
menu bar.
To display the default HPArcSight logo:Check the Show default logo checkbox.
Customizing the Start Page
To set your own personal start page: Select one of the drop-down options under Personal
>Default start page for <current user>
The Default start page for all users option indicates which user interface page is displayed after a
user logs in. You can set the default start page (home page) for all users and specific start pages
individual users. Refer to the following table for information on how to configure a specific start page.
If you want to set… Configure the…
The same start page
for all users
Default start page for all users option to the desired page.
This is a global setting for your Logger. To override this setting, configure a
different start page for specific users by using the Default start page for
<username> option.
When you set Default start page for all users option to Dashboards, the
Monitor Dashboard is the default dashboard displayed for all users, except
users who have configured other dashboards as their defaults, as described
in "Setting a Default Dashboard" on page61.
A different start
page for specific
users
Default start page for <username> option to the desired page.
This setting overrides the global Default start page for all users setting.
When this option is set to “Use default for all users”, the global default page
(Default start page for all users) value is used for all users.
A specific dashboard
for a specific user
OR
A specific dashboard
for all users
Default start page for <username> option to Dashboards.
The Monitor Dashboard is the default dashboard displayed for all users.
However, if you want to display a different dashboard for one or more users,
set the desired dashboard as the default when logged in as those users. For
details, see "Setting a Default Dashboard" on page61.
Administrator's Guide
HPE Logger 6.2 Page 36 of 623
Help, About, and Logout
When you click the Options drop-down arrow, you can access the following options and the "Logger
Options" on page35 page as well.
To access the online help: From any user-interface page, click the down-arrow by your user name(
) and then select Help.
Tip:The latest Logger documentation is available in Adobe Acrobat PDF format, through the
ArcSight Product Documentation Community on Protect 724.
To access version information about your Logger: From any user-interface page, click the down-
arrow by your user name( ) and then select About.
To log out of Logger: From any user interface page, click the down arrow by your user name( )
and then select Logout. You will be returned to the Login screen.
Tip:Logging out is good security practice, to eliminate the chance of unauthorized use of an
unattended Logger session. Logger automatically logs you out after a user-configurable length of
time (15 minutes by default). To change this length of time, see "Users/Groups" on page439.
Caution: Simply closing the browser window does not automatically log you out. Click the Logout
link to prevent the possibility of a malicious user restarting the browser and resuming your Logger
session.
Summary
Logger’s default home page is the Summary page. (For information on how to use a different page as
your home page, see "Logger Options" on page35. ) The Summary page is a dashboard that provides
summarized event information about your Logger in one screen. It enables you to gauge incoming
events activity and the status of indexing. The events that are in Logger’s primary storage (not aged
out due to retention or archived data) are used to generate the summary information.
Logger's home page, the Summary page, displays data in four panels. Each panel is displayed in a donut
chart by default. You can change the display setting for each panel by clicking the appropriate icon.
lSelect for a list.
lSelect for a column chart.
lSelect for a donut chart.
Administrator's Guide
HPE Logger 6.2 Page 37 of 623
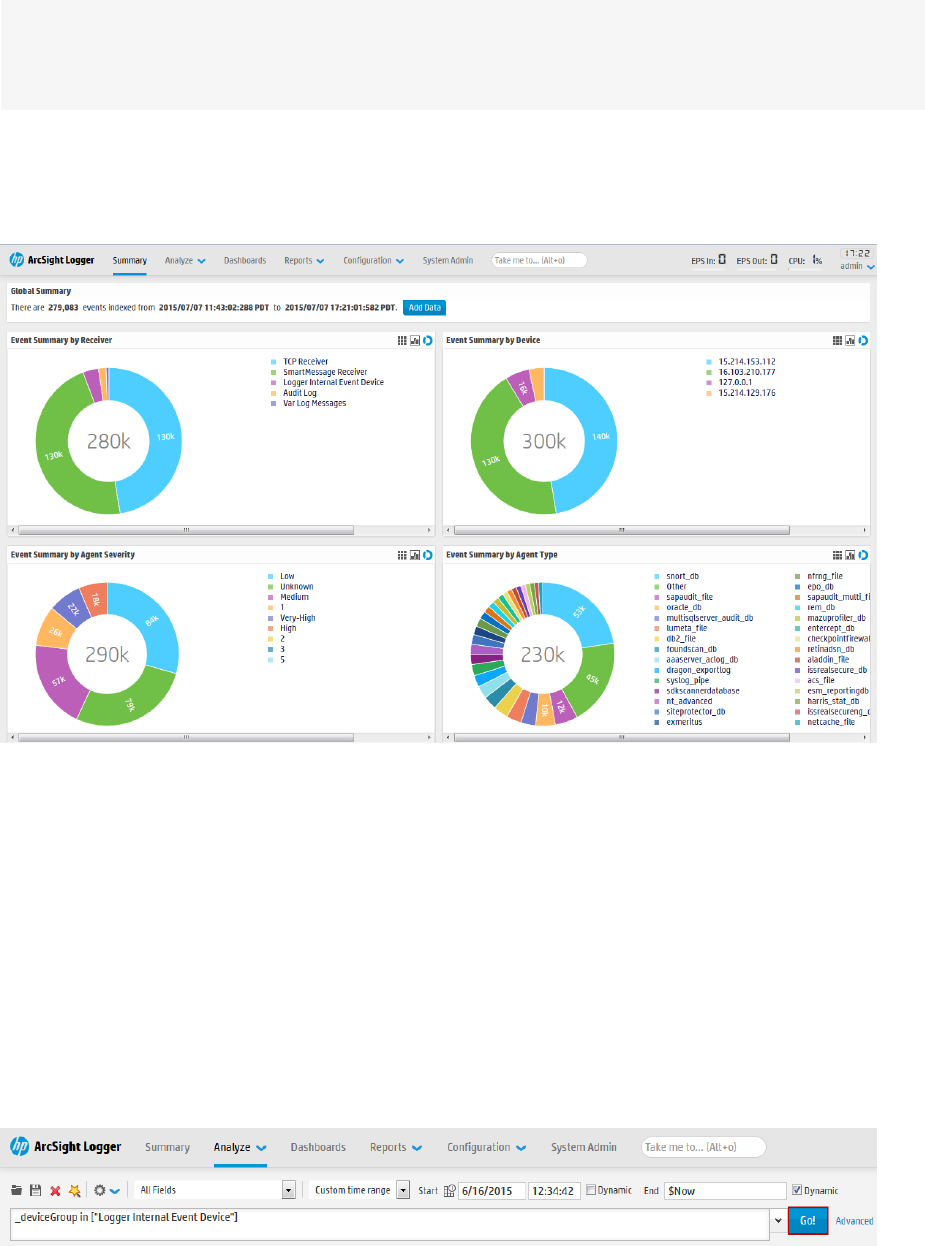
Note:Donut charts display an event total in the middle of the donut. This is the total number of
events displayed in that chart. If the number of events is more than 1000, the event total is
displayed using the appropriate standard metric prefix (k, M, G, T).
The panels on the Summary page can display up to 30 items. If there are more than 30, the panels
display the top 30, by count.
Logger’s Home Page: The Summary Page
Hover your pointer over a column, donut slice, or over the item in the legend to display information
about it. For even more details, you can drill down to view the events by a specific resource—receiver,
device, agent severity, or agent type. To do so, click the column, donut slice, or list resource to search for
those events. The Search page opens and the search box is automatically populated with the search
that generated the information you clicked on the Summary page. The Start and End fields are
populated with the time of oldest events stored on your system (that have not aged out due to
retention) and the current time, respectively.
For example, if you click Logger Internal Event Device under Event Summary by Receiver, the Analyze
>Search page opens with the following query populated, and the search is run. If desired, you can
further refine the search query to filter the search results to suit your needs click Go!to run the search
again.
Administrator's Guide
HPE Logger 6.2 Page 38 of 623

You cannot change or add other panels to the Summary page. If you need to display other information,
you can create a custom Dashboard as described in "Dashboards" on the next page.
The information displayed on the Summary page is for your local Logger only, and does not include
information about peer Loggers even if peers are configured.
Summary Dashboard Panels
lGlobal Summary:The number of events indexed on your Logger during the time period displayed
on the screen. This time period is dependent on the retention policy set on your Logger. The start is
the time of the oldest event stored in the Logger since the Logger was restarted, that has not aged
out due to retention; the end time is current time. The Add Data button at the top opens the
Receivers page where you can add and manage the receivers that put log data into your Logger.
For more information on managing receivers, see "Receivers" on page296.
lEvent Summary By Receiver:The list of receivers configured on your Logger, the number of
events received on each receiver (that are in Logger’s primary storage, not aged out due to retention
or archived data), and the timestamp of the last event received on each receiver. If a receiver is
deleted, the summary information for it will continue to display until the events received on it age out
from Logger’s primary storage. However, the receiver name is changed to the receiver ID (a numerical
string) associated with the deleted receiver.
lEvent Summary By Device:A device is a named event source, comprising of an IP address (or
hostname) and a receiver name. The Devices panel lists devices configured on your Logger, the
number of events received on each device (that are in Logger’s primary storage, not aged out due to
retention or archived data), and the timestamp of the last event received on each device. If a device is
deleted, the summary information for it will continue to display until the events received on it age out
from Logger’s primary storage. However, you cannot click the device name to view the events
associated with the deleted device.
lEvent Summary By Agent Severity:The list of severity levels of the incoming events from
ArcSight SmartConnectors to your Logger, the number of events received of each severity level, and
the timestamp of the last event received of each severity level. Only events in Logger’s primary
storage (not aged out due to retention or archived data) are considered when summarizing this
information.
lEvent Summary By Agent Type:The list of ArcSight SmartConnectors sending events to your
Logger, the number of events received from each SmartConnector (for events that are in Logger’s
primary storage, not aged out due to retention or archived data), and the timestamp of the last event
received from each SmartConnector. If a SmartConnector is deleted, the summary information for it
will continue to display until the events received from it age out from Logger’s primary storage.
The Effect of Search Group Filters on the Summary Page
Search Group filters that enforce privileges on storage groups are applied to the content displayed on
the Summary page. However, Search Group filters that enforce privileges on device groups are not
applied. Therefore, the Summary page includes counts of events in device groups to which a user does
Administrator's Guide
HPE Logger 6.2 Page 39 of 623

not have privileges. However, if the user tries to drill down to view events, search results in accordance
with access privileges are returned as the search query is run on the Analyze page, which enforces all
types of Search Group filters. Similarly, if a Search Group filter enforces privileges on both, storage
groups and device groups, only the storage group enforcement is applied on the Summary page.
Dashboards
Dashboards are an all-in-one view of the Logger information of interest to you. You can select and view
any of several out-of-box dashboards or create and display your own custom dashboard.
Each Logger dashboard contains one or more panels of these types:
lSearch Results: Search Results panels display events that match the query associated with the
panel.
lMonitor: Monitor panels display the real-time and historical status of various Logger components
such as receivers, forwarders, storage, CPU, and disk.
lSummary: Summary panels display summarized event information about your Logger—the number
of events received of a specific resource or field type, and the timestamp of the last event received for
that resource or field type.
• Out-of-Box Dashboards 40
• Custom Dashboards 55
Out-of-Box Dashboards
Logger comes with several out-of-box dashboards, described below. The Monitor dashboard is
displayed by default unless you configure another dashboard to display as your default.
lThe Event Count dashboard, described in "The Event Count Dashboard" on page53, displays how
many events each receiver or forwarder handled.
lThe Intrusion and Configuration Events dashboard, described in "The Intrusion and Configuration
Events Dashboard" on page51, displays information about configuration changes and intrusions on
your system.
lThe Login and Connection Activity dashboard, described in "The Login and Connection Activity
Dashboard" on page52, displays information about login and connection activity on your system.
lThe Monitor dashboard displays the Summary panel, which shows the status of CPU Usage, Event
Flow, Receivers, Forwarders, and Storage Groups in a summarized view. The other panels available in
this dashboard are Platform, Network, Logger, Receivers, Forwarders, and Storage. These views are
described in detail in "The Monitor Dashboard" on the next page.
You cannot change or adjust the panels available in the out-of-box dashboards, except the new
Monitor Dashboard (See "The New Monitor Dashboard" on page49). However, you can add specific
Search Results panels to a custom dashboard, as described in "Creating and Managing Custom
Dashboards" on page56.
Administrator's Guide
HPE Logger 6.2 Page 40 of 623
You can add also Monitor and Summary panels to it. These panels provide the same information
available through the default Monitor dashboard and the default Summary dashboard , however in a
modular form that enables you to choose specific views. (See "Summary" on page37 for more
information about default Summary dashboard.)
For example, if you want to view the EPS for the last 4 hours on all receivers, add the panel Type
“Monitor Graph”, and select “(Logger) All EPS Out-All EPS In - 4 hour” as the Graph, or if you want to
view the EPS on Forwarders in a table form, select the “Monitor (Forwarders)” panel Type. Similarly, if
you want to view only the summary information for receivers on your Logger, add the panel of Type
“Summary (Receivers)”. Besides the four Summary panels (Agent Severities, Agent Types, Receivers,
and Devices), you can also create a user-defined Summary panel in which you can select any indexed,
non-time field by which you want to categorize event summary. For example, if you want to add a
Summary panel to display event summary categorized by “destinationAddress”, you can add a panel of
Type “Summary (User Defined)” for this field if it is indexed on your Logger.
You can also drill down on any of the resources listed in Monitor and Summary panels you add to view
events by a specific resource or field value on the Analyze (Search) page. For example, you can click on a
storage group in a Monitor panel to view its events in the last 24 hours, or you can click on an event
name “Network Usage - Inbound” to view all events of that name in the last one hour. Additionally, you
can access the Configuration page for any of the resources listed in the Monitor panels to configure
them. For example, if you want to configure a receiver, click the Configure link on top of the Monitor
(Receiver) panel.
Search Group filters that restrict privileges on device groups are not enforced on Summary panels.
Therefore, Summary panels include counts of events in device groups to which a user does not have
privileges. However, if the user tries to drill down to view events, search results in accordance with
access privileges are returned as the search query is run on the Analyze page, which enforces all types
of Search Group filters. Similarly, if a Search Group filter enforces privileges on both, storage groups and
device groups, only the storage group enforcement is applied on Summary panels.
Users can create both shared and private dashboards.
lShared dashboards are visible to all users with the appropriate privileges.
lPrivate dashboards are visible only to the creator or users with "admin" privileges.
lOnly the creator or users with "admin" privileges can edit or delete dashboards of either type.
A user accessing a shared dashboard must have privileges to view the information displayed in the
dashboard; otherwise, the information to which they do not have the privileges is not displayed, and the
associated panel displays a message that indicates the reason for the undisplayed information.
The Monitor Dashboard
The Monitor Dashboard, displayed by default, contains the real-time and historical status of receivers,
forwarders, and storage, CPU, and disk usage statistics. On Software Logger, the CPU and disk usage
statistics indicate the total use of these resources on the system, not just the use of these resources by
the Logger process.
Administrator's Guide
HPE Logger 6.2 Page 41 of 623
The Monitor panels, available through a pull-down menu display Summary, Platform, Network, Logger,
Receivers, Forwarders, and Storage information. You cannot change or adjust any of these out-of-box
panels, but you can create your own dashboards to monitor the things in which you are most interested.
For more information, see "Creating and Managing Custom Dashboards" on page56
All monitor panels, except the Summary panel, include a pull-down menu for duration control. The
summary panel has buttons instead. In both cases, you can choose one of the following time spans for
historical data: 4 hours, 24 hours, 7 days, 30 days, 90 days, or 365 days. As you hover your pointer over
the data, more details are displayed. In the case of dashboards that displays two fields, details of both
are displayed, and a legend indicates the color that represents each field.
In these dashboards, events per second (e/s) are displayed using standard metric prefixes (k, M, G, T)
for numbers over 1000. Numbers under 1000 are displayed as integers.
The newmonitor dashboard provides a different view of these panels. See "The New Monitor
Dashboard" on page49 for more information about that view.
Administrator's Guide
HPE Logger 6.2 Page 42 of 623
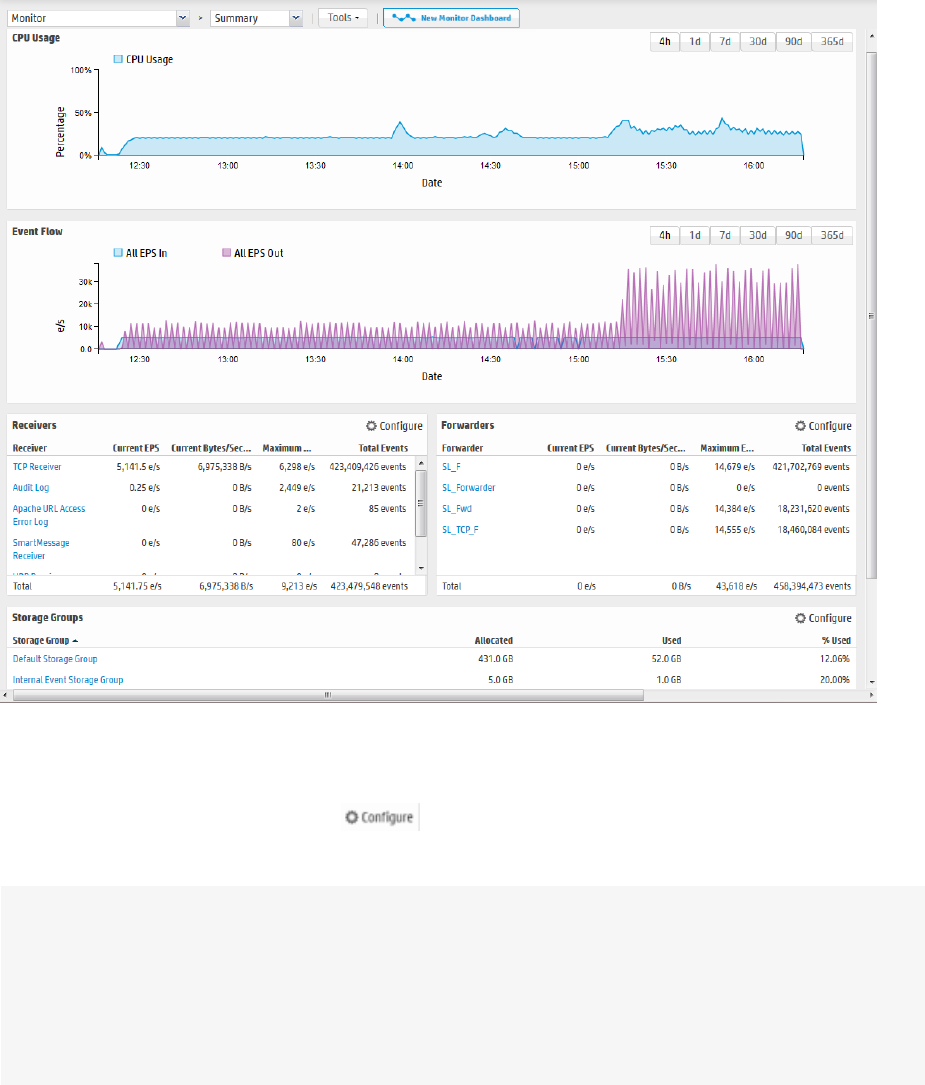
Summary Panel
The summary panel, displayed by default, shows the status of CPU Usage, Event Flow, Receivers,
Forwarders, and Storage Groups in a summarized view.
Monitor dashboard - Summary panel
On the Summary panel, click on a Receiver, Forwarder, or Storage Group name to jump to the Search
page and include the selected resource in the query.
Additionally, you can click Configure ( ) to open the Configuration page for Receivers,
Forwarders, and Storage Groups.
Note: The total space allocated for a storage group includes a certain amount that has been set
aside to ensure that the group can receive new events when it is almost full. As a result, the
percentage of used space for a storage group never reaches 100% (as displayed on the Monitor >
Summary panel). For Software Loggers installed using the Minimal setting, the maximum % Used
(On the Monitor > Summary panel) for each storage group reaches up to 66.33%. (Two storage
groups of 3 GB each; 1 GB is set aside for new events in each group. After 2 GB of space has been
Administrator's Guide
HPE Logger 6.2 Page 43 of 623
used and the new events are being written to the last 1 GB, Logger automatically triggers retention
and reclaims 1 GB of the used space. Thus, the % Used field for each storage group only reaches up
to 66.33%.)
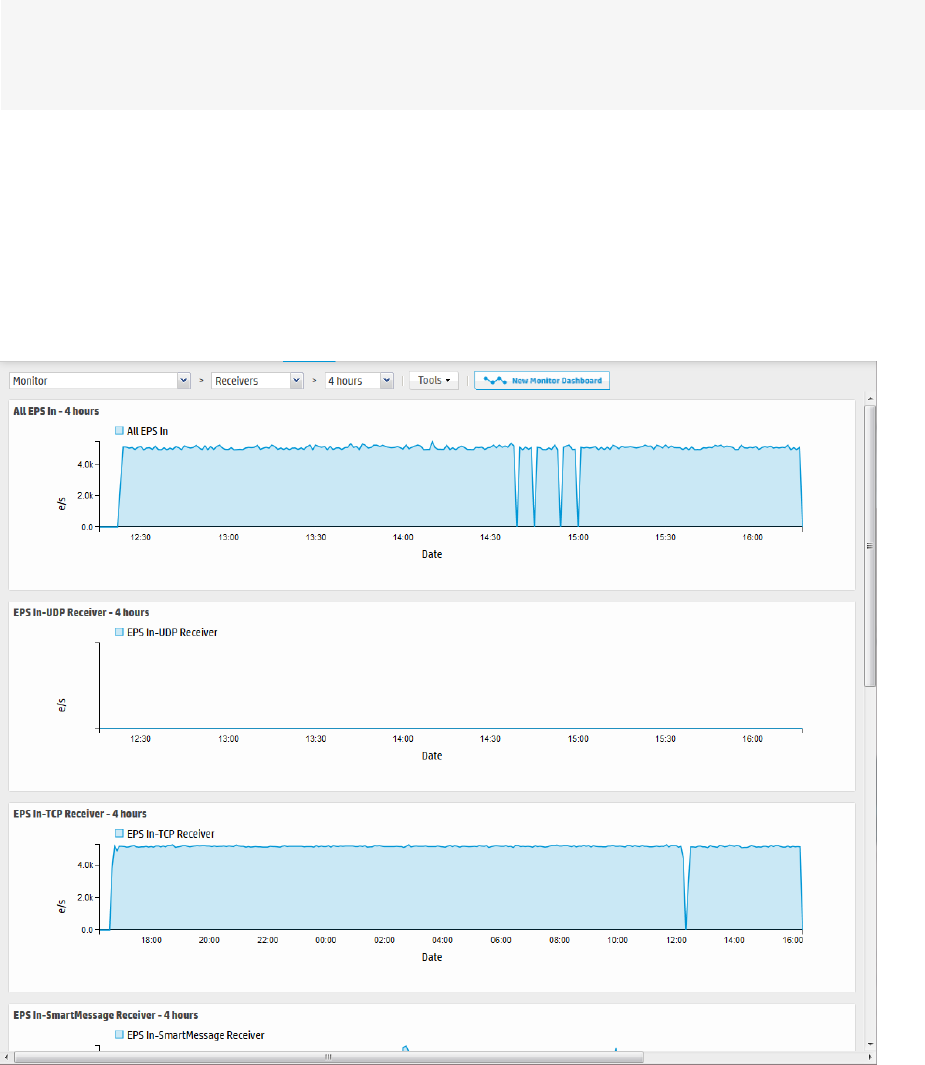
Receivers Panel
The Receivers monitor panel shows the total Events per Second (EPS) received and displays values for
each configured receiver. The list of receivers includes all receivers known to the system, including those
that are disabled. (To create a new receiver, or to enable or disable one, see "Working with Receivers" on
page299.)
Monitor dashboard - Receivers panel
Administrator's Guide
HPE Logger 6.2 Page 44 of 623
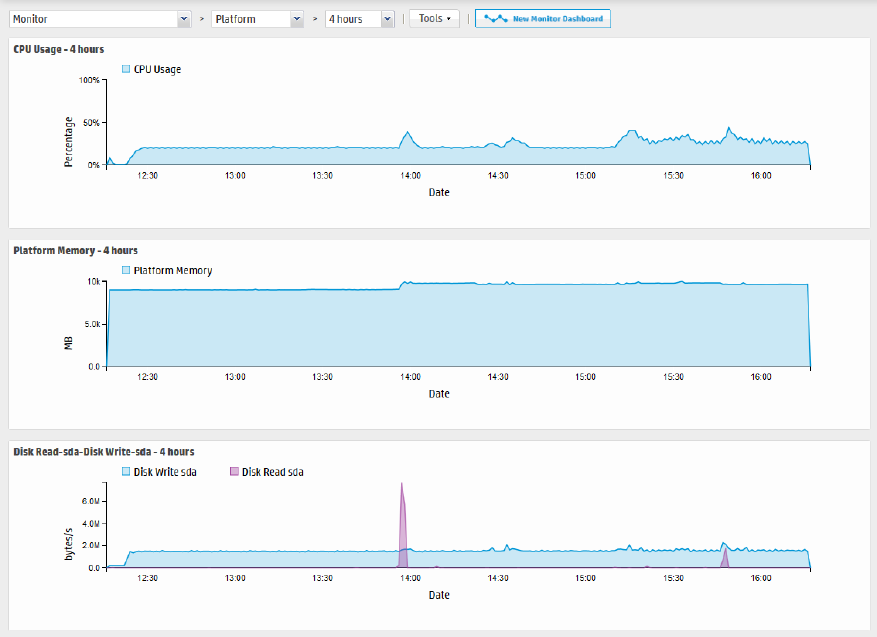
Platform Panel
The Platform monitor panel displays information about CPU usage, memory usage, bytes received and
sent on the network, and raw disk reads and writes.
Monitor dashboard - Platform panel
Administrator's Guide
HPE Logger 6.2 Page 45 of 623
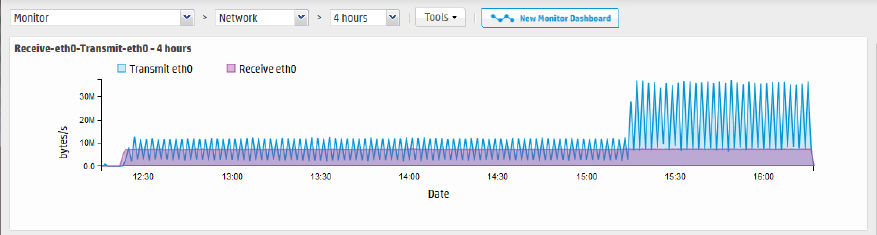
Network Panel
The Network monitor panel display a graph for each network interface card. (The number of network
interface cards varies by the hardware model.) The graph displays the bytes transmitted, overlaid on the
bytes received.
Monitor dashboard - Network panel
Administrator's Guide
HPE Logger 6.2 Page 46 of 623
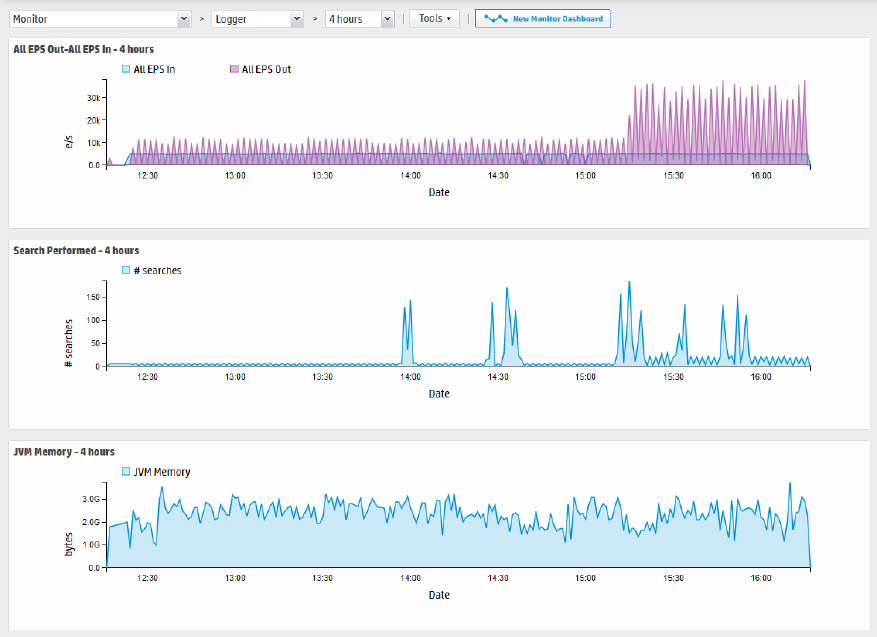
Logger Panel
The Logger monitor panel displays information about events, searches, and memory. JVM Memory
Usage chart displays the memory used by the Logger's back-end server process. For example, this could
be the memory used to perform the search after receiving the search query from the UI.
Monitor dashboard - Logger panel
Administrator's Guide
HPE Logger 6.2 Page 47 of 623
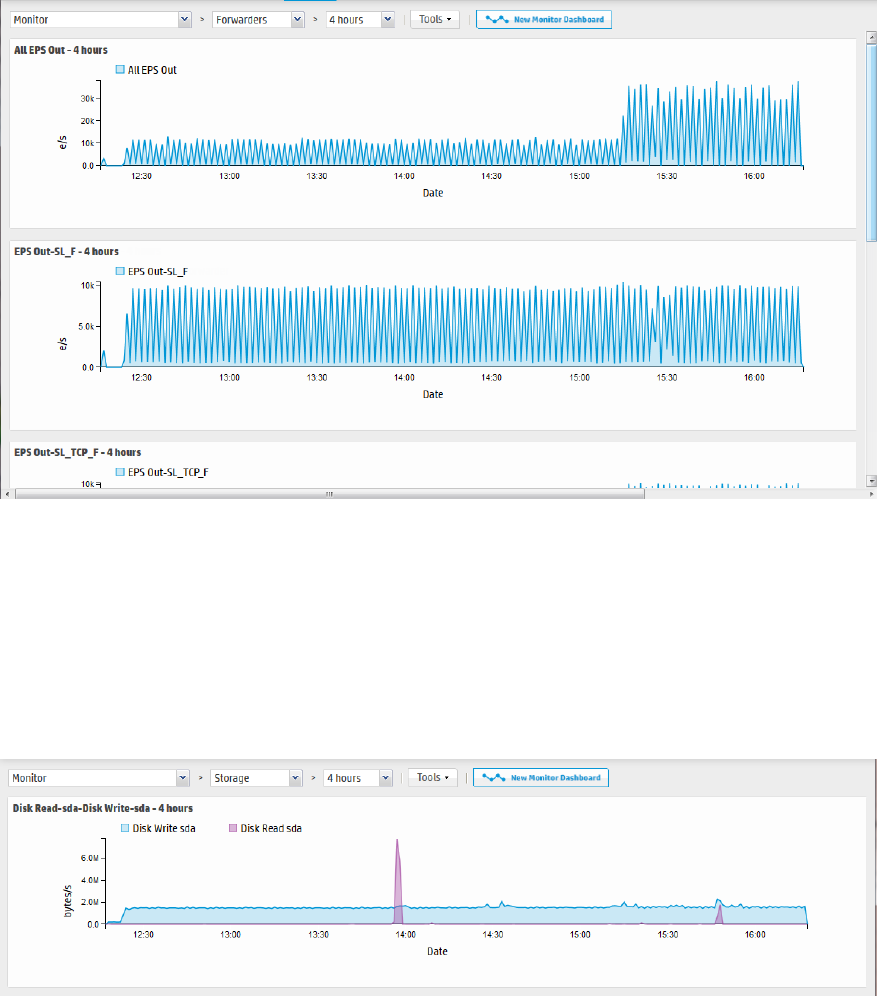
Forwarders Panel
The Forwarders monitor panel shows total Events per Second (EPS) sent and displays values for each
configured forwarder. The list of forwarders includes all forwarders known to the system, including
those that are disabled. To create a new forwarder, or to enable or disable one, see "Forwarders" on
page324.
Monitor dashboard - Forwarders panel
Storage Panel
The Storage monitor panel displays disk read and disk write information. The list of storage groups
compares allocated and used space in each group. Space is used in 1GB files so a 5 GB storage group
appears 20% used as soon as it is set up. For more information about storage groups, see "Storage
Groups" on page351.
Monitor dashboard - Storage panel
Administrator's Guide
HPE Logger 6.2 Page 48 of 623
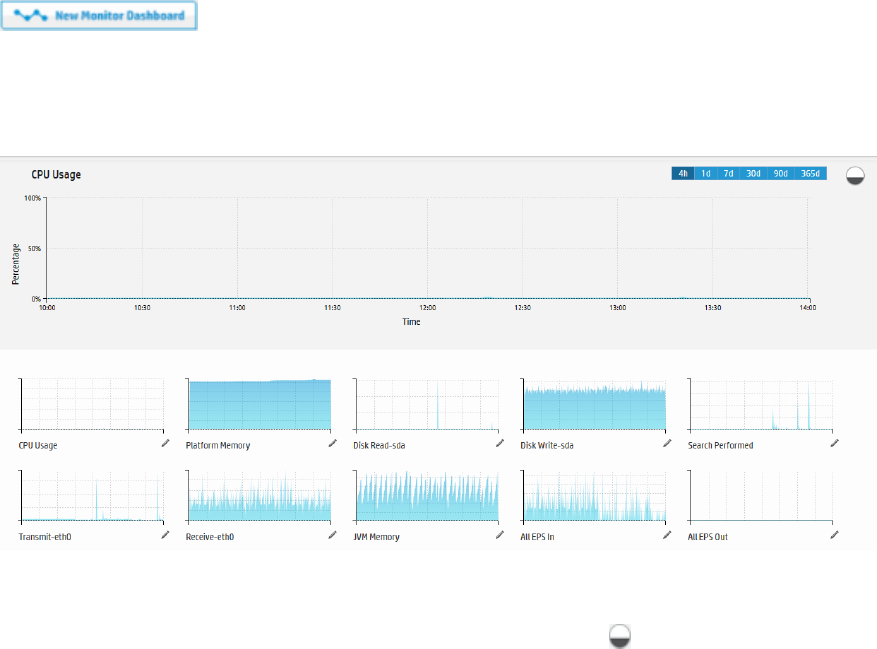
The New Monitor Dashboard
The newMonitor dashboard provides an alternate view of several Monitor dashboard panels. This
dashboard displays the CPU Usage, Platform Memory, Disk Read-sda, Disk Write-sda, Search
Performed, Transmit-eth0, Receive-eth0, JVM Memory, All EPS In, All EPS Out panels that you use to
Monitor your Logger. You can replace any of these panels with other Logger monitor panels to adjust
the display to your needs.
To view the new dashboard, open the Dashboards menu and click New Monitor Dashboard (
)at the top of the Monitor Dashboard.
The new dashboard is displayed.
NewMonitor Dashboard, Light Background
The newmonitor display can have a dark or light background.
To change the background color, click the Switch Background icon ( ) in the top right.
Administrator's Guide
HPE Logger 6.2 Page 49 of 623
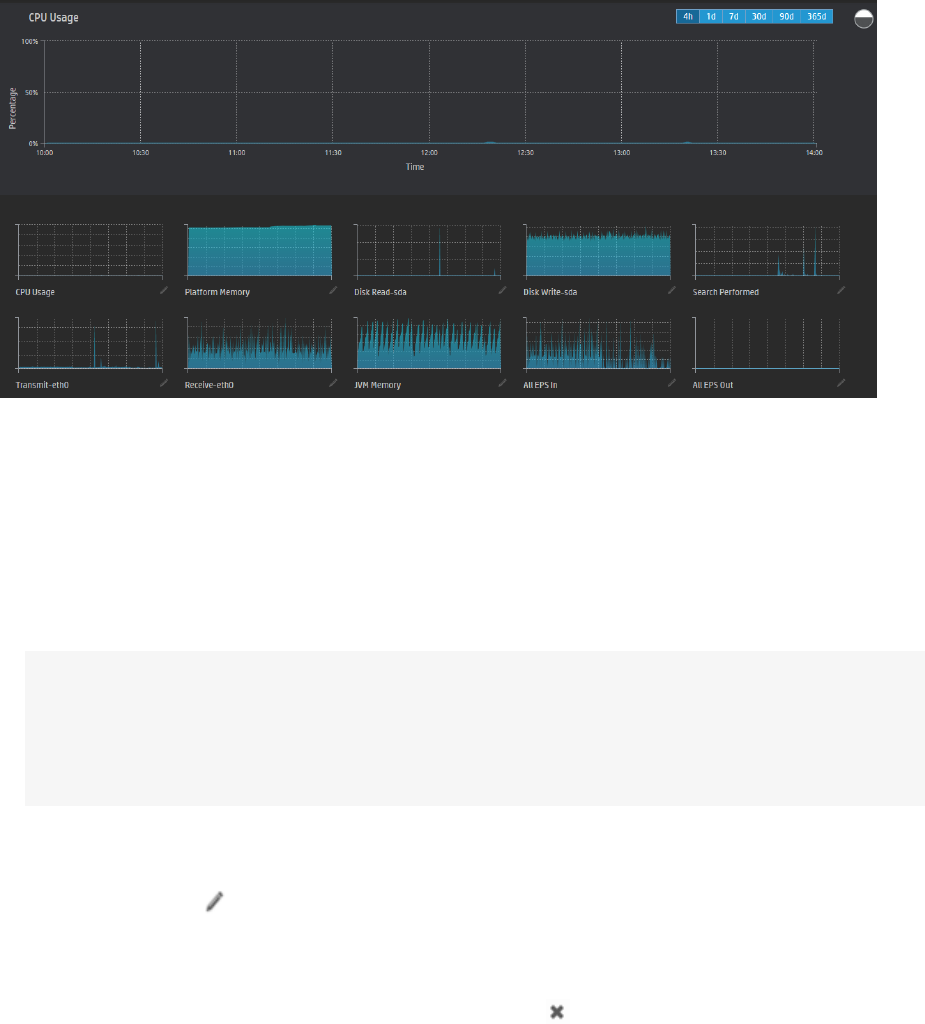
NewMonitor Dashboard, Dark Background
One Monitor panel is displayed in a large format at the top of the screen, the others are smaller and
displayed in rows across the bottom.
lClick 4h, 1d, 7d, 30d, 90d, or 365d at the top of the large panel to adjust the displayed time range.
lHover your pointer over a section on the large panel for more detail.
lClick a small panel on the bottom of the screen to move it to the large display at the top.
lYou can display other monitor panels in place of the out-of-box panels.
Note: You can only display existing monitor panels; you cannot display search results or
summary panels.
The available forwarder, receiver and storage panels available for display varies based on your
Logger configuration.
To display a custom panel in place of one of the out-of-box panels:
1. Click the edit icon next to the panel's name.
2. Start typing in the text box to see the list of available panels. For example, to display a receiver,
start typing "re".
3. Click a panel in the list to select it, or click the cancel icon to close the dialog without selecting
another panel.
Administrator's Guide
HPE Logger 6.2 Page 50 of 623
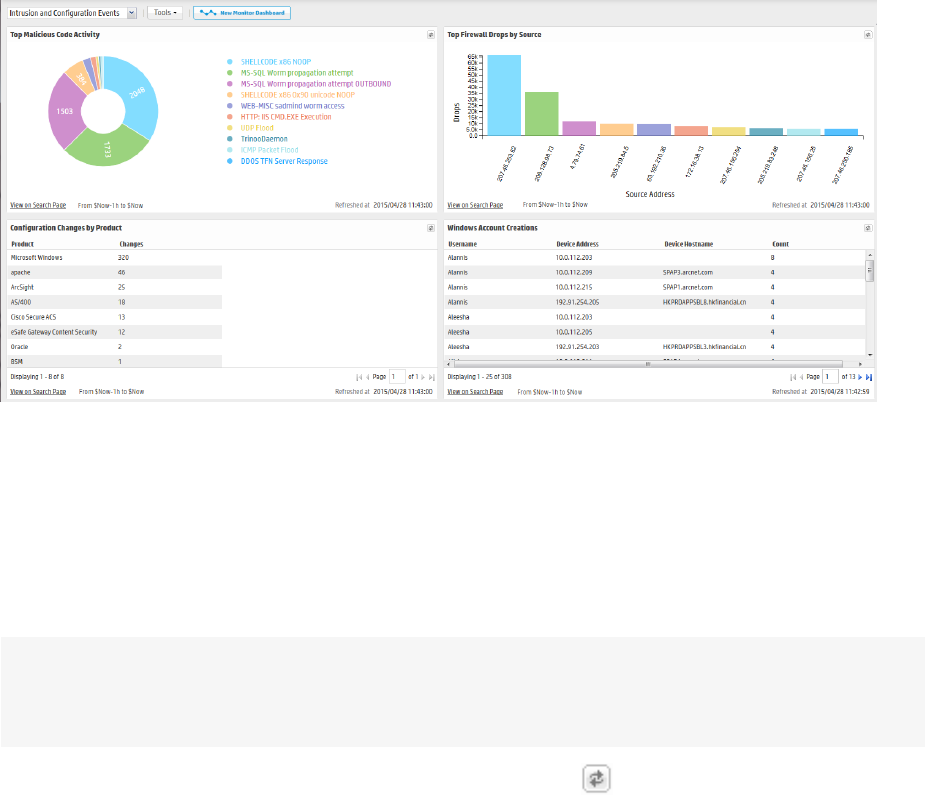
The Intrusion and Configuration Events Dashboard
The Intrusion and Configuration Events dashboard displays information about the following types of
configuration changes and intrusions on your system.
lTop Malicious Code Activity: displays the most active malicious code.
lTop Firewall Drops by Source: displays events in which traffic was dropped by a firewall.
lConfiguration Changes by Product: shows products that have had their configurations modified.
lWindows Account Creations: shows user accounts created on Microsoft Windows operating systems.
Intrusion and Configuration Events dashboard
Each dashboard displays the search results of a Saved Search found in the standard system content
along with the time and date the query was most recently refreshed.
While you cannot update the system content used in the out-of-box dashboard, you can then edit the
search to meet your needs, save your changes, and use your new saved search in your own dashboard
to find exactly what you are interested in. To create a new dashboard, follow the instruction in "Creating
and Managing Custom Dashboards" on page56.
Note: Dashboards that display charts are aggregated queries. Therefore, the entire search must
complete before the chart is displayed. This can take some time if there are a large number of
events.
lThe dashboards are not automatically refreshed. Click refresh to refresh the search results.
lClick View on Search Page to open the Analyze > Search page and run the Saved Search
automatically.
Administrator's Guide
HPE Logger 6.2 Page 51 of 623
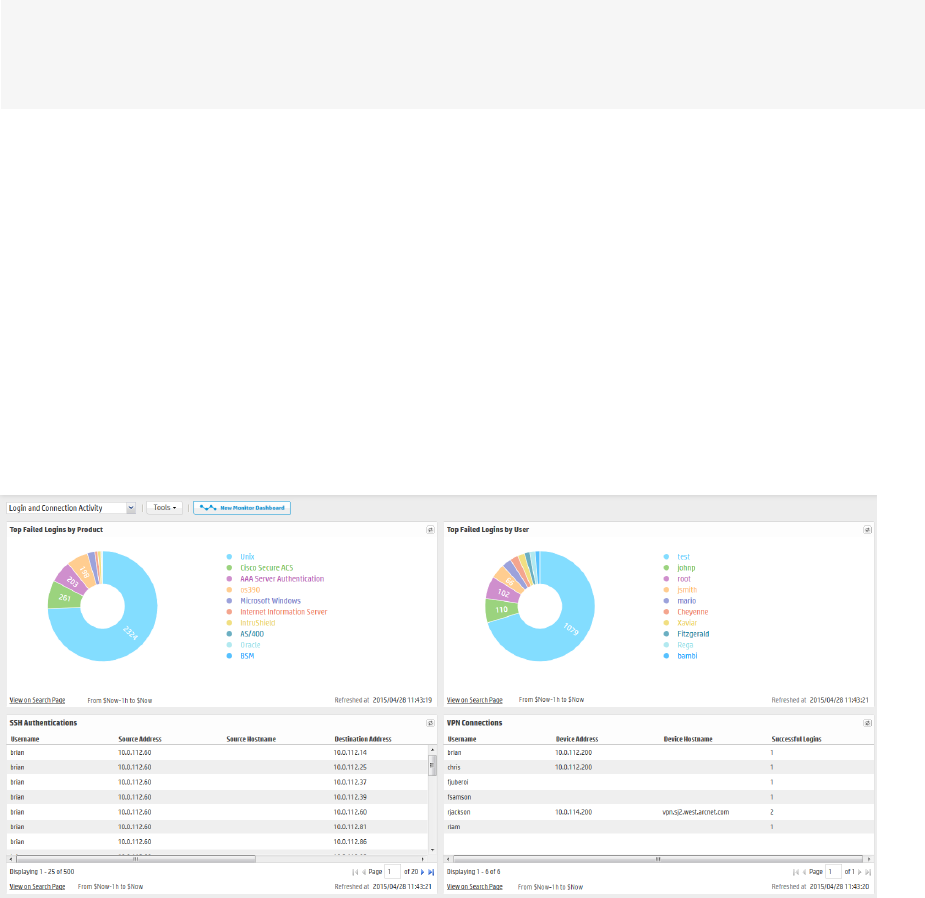
lClick a chart value (a column, bar, or donut section) to drill down to events with specific field values.
(Drill-down is not available for dashboards that display tables.)
Chart Drill-Down
When you click on a chart value (a column, bar, or donut section), the query is rerun on the Analyze
(Search) page with an additional WHERE operator clause that includes the field name and value you
clicked on the chart.
The drill-down information includes a histogram and a table of the search results. You can drill down on
the histogram for further information. For more information on drilling down on a histogram, see
"Histogram Drill Down" on page111.
Note: The saved search query associated with the Search Results panel in the dashboard is not
modified. If you need to return to the dashboard from the drill-down screen, use the Back function
of your browser.
The Login and Connection Activity Dashboard
The Login and Connection Activity dashboard displays information about the following types of login
and connection activity on your system.
lTop Failed Logins by Product: displays the top failed logins sorted by device product.
lTop Failed Logins by User: displays the top failed logins sorted by user name.
lSSH Authentications: shows the top users of SSH that have logged in or attempted to log into a
system.
lVPN Connections: shows the users that have logged into VPN.
Login and Connection Activity Dashboard
Administrator's Guide
HPE Logger 6.2 Page 52 of 623
Each dashboard displays the search results of a Saved Search found in the standard system content
along with the time and date the query was most recently refreshed.
While you cannot update the system content used in the out-of-box dashboard, you can then edit the
search to meet your needs, save your changes, and use your new saved search in your own dashboard
to find exactly what you are interested in. To create a new dashboard, follow the instruction in "Creating
and Managing Custom Dashboards" on page56.
Note: Dashboards that display charts are aggregated queries. Therefore, the entire search must
complete before the chart is displayed. This can take some time if there are a large number of
events.
lThe dashboards are not automatically refreshed. Click refresh to refresh the search results.
lClick View on Search Page to open the Analyze > Search page and run the Saved Search
automatically.
lClick a chart value (a column, bar, or donut section) to drill down to events with specific field values.
(Drill-down is not available for dashboards that display tables.)
Chart Drill-Down
When you click on a chart value (a column, bar, or donut section), the query is rerun on the Analyze
(Search) page with an additional WHERE operator clause that includes the field name and value you
clicked on the chart.
The drill-down information includes a histogram and a table of the search results. You can drill down on
the histogram for further information. For more information on drilling down on a histogram, see
"Histogram Drill Down" on page111.
Note: The saved search query associated with the Search Results panel in the dashboard is not
modified. If you need to return to the dashboard from the drill-down screen, use the Back function
of your browser.
The Event Count Dashboard
The Event Count dashboard displays information about the following types of event input and output
activity on your system.
lIndividual Receivers: displays the events received per receiver.
lIndividual Forwarders: displays events forwarded per forwarder.
lAll Receivers: displays the total events received by all receivers.
lAll Forwarders: displays the total events forwarded by all forwarders.
Administrator's Guide
HPE Logger 6.2 Page 53 of 623
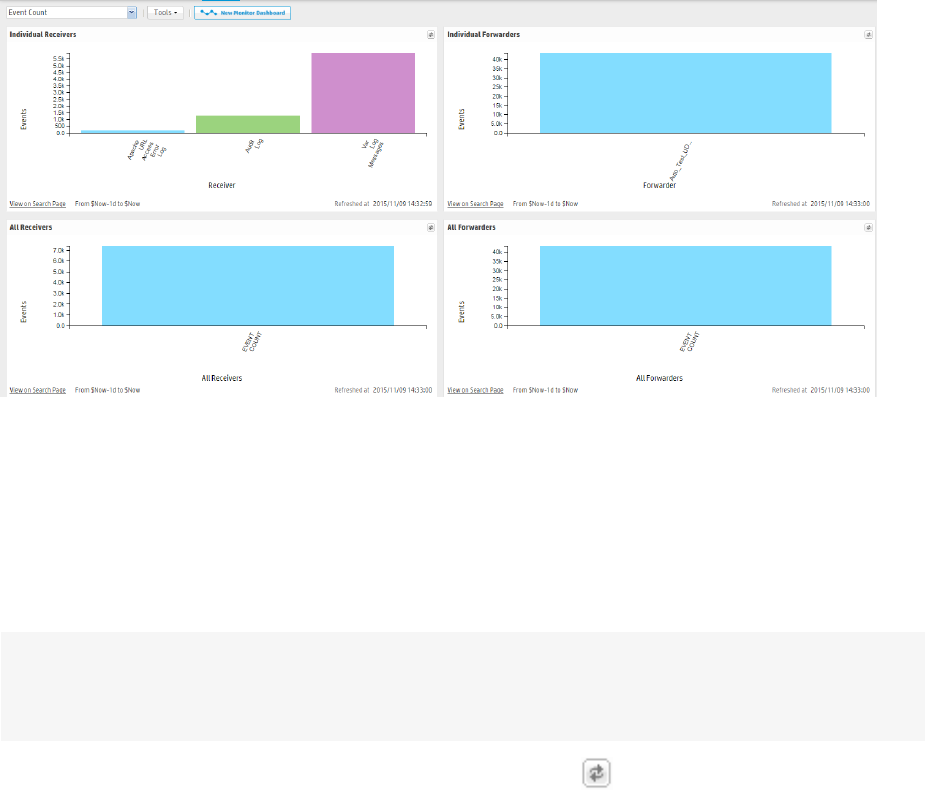
Event Count Dashboard
Each dashboard displays the search results of a Saved Search found in the standard system content
along with the time and date the query was most recently refreshed.
While you cannot update the system content used in the out-of-box dashboard, you can then edit the
search to meet your needs, save your changes, and use your new saved search in your own dashboard
to find exactly what you are interested in. To create a new dashboard, follow the instruction in "Creating
and Managing Custom Dashboards" on page56.
Note: Dashboards that display charts are aggregated queries. Therefore, the entire search must
complete before the chart is displayed. This can take some time if there are a large number of
events.
lThe dashboards are not automatically refreshed. Click refresh to refresh the search results.
lClick View on Search Page to open the Analyze > Search page and run the Saved Search
automatically.
lClick a chart value (a column, bar, or donut section) to drill down to events with specific field values.
(Drill-down is not available for dashboards that display tables.)
Chart Drill-Down
When you click on a chart value (a column, bar, or donut section), the query is rerun on the Analyze
(Search) page with an additional WHERE operator clause that includes the field name and value you
clicked on the chart.
The drill-down information includes a histogram and a table of the search results. You can drill down on
the histogram for further information. For more information on drilling down on a histogram, see
"Histogram Drill Down" on page111.
Administrator's Guide
HPE Logger 6.2 Page 54 of 623
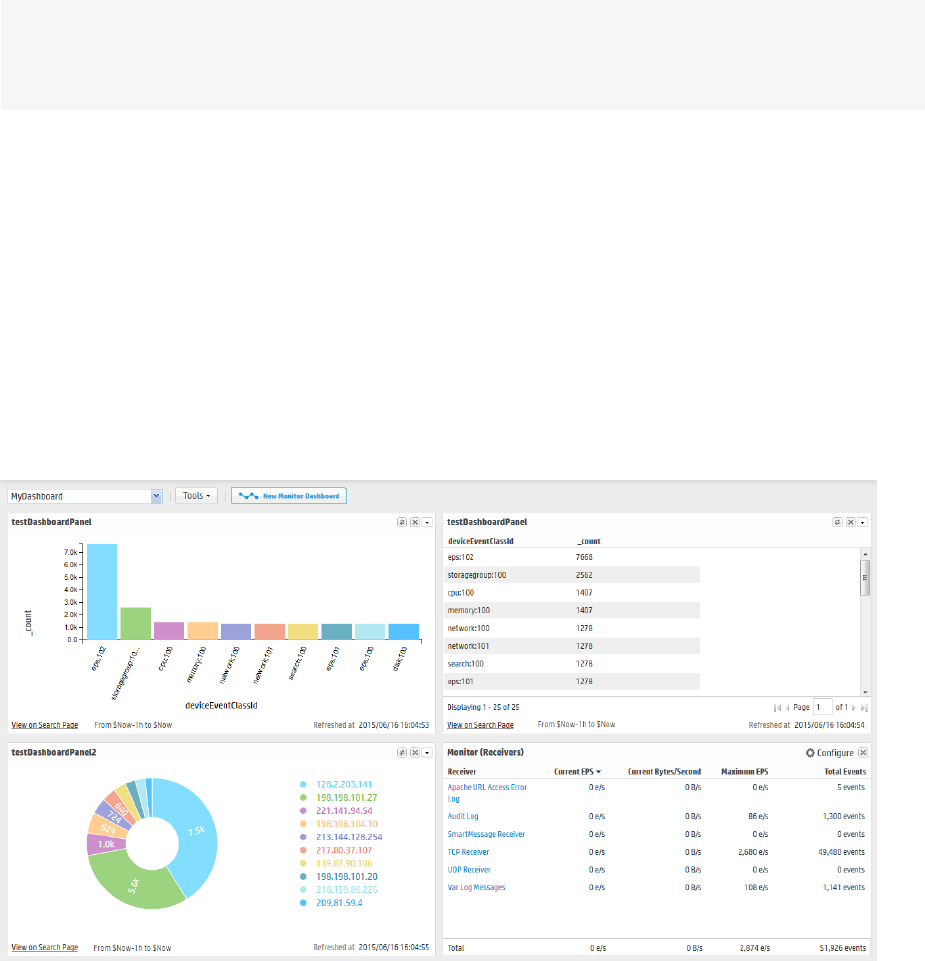
Note: The saved search query associated with the Search Results panel in the dashboard is not
modified. If you need to return to the dashboard from the drill-down screen, use the Back function
of your browser.
Custom Dashboards
You can assemble various search queries that match events of interest to you, status of Logger
resources such as receivers, forwarders, storage, CPU, and disk, or a combination of both on a single
dashboard for status at-a-glance.
A dashboard can contain a mix of Search Results, Monitor, and Summary panels. There is no limit on the
number of Monitor and Summary panels you add to a single dashboard; however, you can only add up
to four Search Results panels.
Sample Custom Dashboard
Each Search Results panel is associated with a saved search query. You can only associate saved search
queries that contain an aggregation operator such as chart or top for this type of panel.
Click “View on Search Page” in the Search Results panels to go to the Analyze > Search page and
view the event details; the panel query is automatically run and the search results are displayed.
Additionally, you can drill down from any chart to quickly filter down to events with specific field values.
To do so, identify the value in the chart on a Search Results Chart panel and click it to drill down to
events that match the value.
Administrator's Guide
HPE Logger 6.2 Page 55 of 623
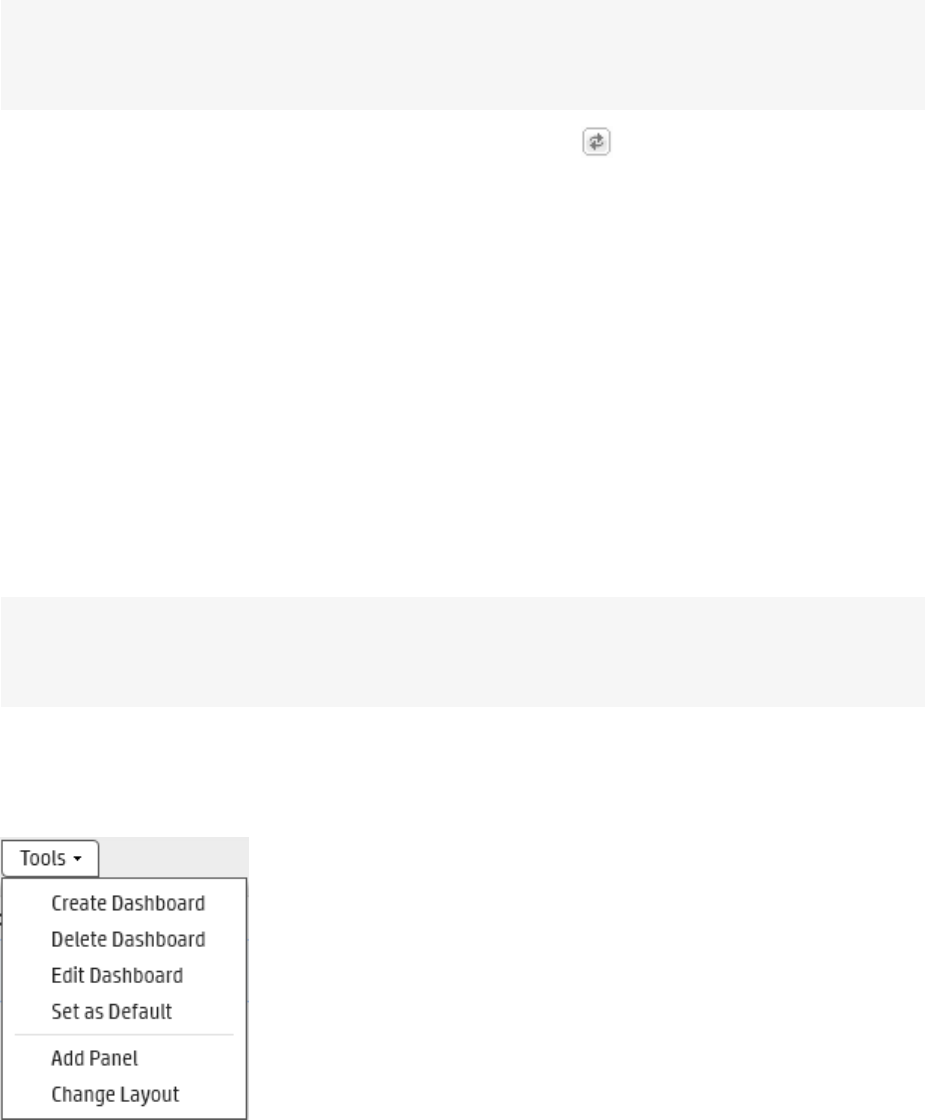
When you click on a chart value (a column, bar, or donut section), the query is rerun on the Analyze
(Search) page with an additional WHERE operator clause that includes the field name and value you
clicked on the chart.
Note: Dashboards that display charts are aggregated queries. Therefore, the entire search must
complete before the chart is displayed. This can take some time if there are a large number of
events.
lThe dashboards are not automatically refreshed. Click refresh to refresh the search results.
lClick View on Search Page to open the Analyze > Search page and run the Saved Search
automatically.
lClick a chart value (a column, bar, or donut section) to drill down to events with specific field values.
(Drill-down is not available for dashboards that display tables.)
Chart Drill-Down
When you click on a chart value (a column, bar, or donut section), the query is rerun on the Analyze
(Search) page with an additional WHERE operator clause that includes the field name and value you
clicked on the chart.
The drill-down information includes a histogram and a table of the search results. You can drill down on
the histogram for further information. For more information on drilling down on a histogram, see
"Histogram Drill Down" on page111.
Note: The saved search query associated with the Search Results panel in the dashboard is not
modified. If you need to return to the dashboard from the drill-down screen, use the Back function
of your browser.
Creating and Managing Custom Dashboards
The options displayed in the Dashboards > Tools menu vary depending on your permissions.
You need these privileges (in the Logger Rights group) to perform dashboard operations:
Administrator's Guide
HPE Logger 6.2 Page 56 of 623
lUse and view dashboards
lEdit, save, and remove dashboards
The following steps outline the process of creating a dashboard:
1. Ensure that you have the privileges to create a dashboard.
2. Create a dashboard. See "To add a dashboard: " below.
3. Add panels to the dashboard you created. See "Adding and Managing Panels in a Dashboard" on
the next page.
If you are adding a Search Results panel, the saved search must exist. If no saved searches exist, the
Search Results panel option is not displayed.
To add a dashboard:
1. Open the Dashboards menu.
2. Click the Tools pull-down menu and select Create Dashboard.
3. Enter a meaningful name for the dashboard in the Name field.
4. Select whether the dashboard Type is Private or Shared.
The private dashboards are only visible to the user who created them, and the shared dashboards
are visible to all users of Logger.
5. Click Create.
After creating the dashboard you must add panels to it, as described in "To add a panel to a
dashboard: " on the next page.
To edit a dashboard:
When you edit a dashboard, you can change its name or privacy setting—Private or Shared. When you
make a dashboard Shared, all Logger users can see it; however, they will not see the information to
which they do not have privileges. For example, if a user does not have privileges to a storage group
and a panel in a Shared dashboard includes a query that accesses the events in that storage group, the
panel will be blank when the user accesses the shared dashboard.
1. Open the Dashboards menu.
2. Click the Tools pull-down menu and select Edit Dashboard.
3. If you want to change the name of the dashboard, enter a new name in the Name field.
4. If you want to change the privacy setting of the dashboard, select the appropriate setting from the
Type pull-down menu, and click Save.
5. To add or edit dashboard panels, see "Adding and Managing Panels in a Dashboard" on the next
page.
Administrator's Guide
HPE Logger 6.2 Page 57 of 623

To delete a dashboard:
1. Open the Dashboards menu.
2. Select the dashboard that you want to delete.
3. Click the Tools pull-down menu and select Delete Dashboard.
4. Click Yes to confirm your action in the confirmation message, or click No to exit without making a
change.
Adding and Managing Panels in a Dashboard
After you create a dashboard, you need to add panels to display the information you want to see. A
dashboard can contain a mix of Search Results, Monitor, and Summary panels. There is no limit on the
number of Monitor and Summary panels you add to a single dashboard; however, you can only add up
to four Search Results panels for optimum performance.
Before you can add panels to a dashboard, you must first create the dashboard. See "Creating and
Managing Custom Dashboards" on page56 for more information.
You can add the following types of panels:
lSearch Results: Chart and Table
lMonitor: All four types available under the default Monitor dashboard
lSummary: All four types available under the default Summary dashboard and user-defined Summary
panels.
To add a panel to a dashboard:
1. Open the Dashboards menu.
2. Select the dashboard to which you want to add the panel.
3. Click the Tools pull-down menu and select Add Panel.
4. Configure these parameters and click Add.
Parameter Description
Type Select the type of panel:
lSearch Results (Chart): Displays search results in a chart form.
lSearch Results (Table): Displays search results in a table form.
lMonitor (Graph): Displays a graph of the selected resource.
lMonitor (Forwarders): Displays forwarder information in a table form.
lMonitor (Receivers): Displays receiver information in a table form.
lMonitor (Storage Groups): Displays storage group information in a table form.
Administrator's Guide
HPE Logger 6.2 Page 58 of 623

Parameter Description
lSummary (Agent Severities): Displays event summary categorized by agent
severities configured on your Logger.
lSummary (Agent Types): Displays event summary categorized by receivers
configured on your Logger.
lSummary (Receivers): Displays event summary categorized by receivers
configured on your Logger.
lSummary (Devices): Displays event summary categorized by devices configured
on your Logger.
lSummary (User Defined): Displays event summary categorized by the field you
select when adding the panel.
Note: If no saved search queries exist on your Logger, the “Saved Search”
panel types are not available as selections in the pull-down menu.
Title Enter a meaningful name for the panel.
A default name is present in this field, but you can change it.
Graph Only applicable to Monitor Graph panels.
Select the type of graph you want the panel to display. Some of the available
options are CPU Usage - 4 hour, Platform Memory Usage - Daily, and Disk Read-
Write - Weekly.
Saved
Search
Only applicable to Search panels.
Select the saved search query to use for searching events that will be displayed in
the panel.
Chart Type Only applicable to Search Result Chart panels.
Type of chart to display matching events. You can select from:
Column, Bar, Donut, Area, Line, Stacked Column, Stacked Bar.
Default: Column
Chart Limit Only applicable to Search Result Chart panels.
Number of unique values to plot. Default: 10
Field Name Only applicable to Summary (User Defined) panels.
The event field name by which the event summary on a Summary panel will be
categorized. Default: agentSeverity
Administrator's Guide
HPE Logger 6.2 Page 59 of 623
To edit a panel:
Once you add a panel to a dashboard, whether you can edit it depends on the type of panel. You can
edit the Search Results panels and the user-defined Summary panels; the Monitor panels and some of
the Summary panels are not editable.
The following table lists the panels you can edit and what you can edit in them.
Action Description
All Panels
Delete Removes a panel from a dashboard.
Search Result Panels
Edit Panel Change Title, associated saved search, Chart Type, or Chart Limit
Edit Saved
Search
Access the Edit Saved search page to edit the associated saved search query
View on Search
Page
Runs the panel’s query on the Search Results page (Analyze > Search) and
displays matching events on that page
Refresh Refreshes the current contents of the panel.
Note: All other panel types are automatically refreshed; therefore, an explicit
refresh is not required for them.
Summary Panels - User Defined
Edit Panel Change Title or field name by which events are categorized.
1. Open the Dashboards menu.
2. Select the dashboard that contains the panel you want to edit.
3. If you are editing a user-defined Summary panel:
a. Click the Edit ( )icon.
b. Edit the title, field name, or both.
4. If you are editing a Search Result panel:
a. Click the ( ) icon.
b. Select Edit Panel if you want to edit the panel title, select a different saved search; or, if
applicable, chart type or chart limit.
c. Select Edit Saved Search if you want to access the Edit Saved Search page (Configuration |
Administrator's Guide
HPE Logger 6.2 Page 60 of 623

Search > Saved Searches) to edit the saved search query.
5. Click Save.
To delete a panel from a dashboard:
You cannot delete panels from the default Monitor dashboard or the default Summary dashboard.
However, Monitor and Summary panels added to the dashboards you created under the Dashboards
menu option can be deleted.
1. Open the Dashboards menu.
2. Select the dashboard that contains the panel you want to delete.
3. Click the ( ) icon.
4. Click Yes to confirm your action in the confirmation message, or click No to exit without making a
change.
To change the layout of a dashboard:
You can only change the layout of the dashboards you create. The Monitor dashboard layout cannot
be changed.
1. Open the Dashboards menu.
2. Select the dashboard that contains the panel you want to rearrange.
3. Click the Tools pull-down menu and select Change Layout.
4. Point your cursor in the blue band that shows the panel title and drag the panel to a different
position.
5. Click Save after you rearrange the panels.
Setting a Default Dashboard
When you set a dashboard as default, it is the default dashboard screen that displays when you
navigate to the Dashboards menu. This setting is user-specific; therefore, your default dashboard can
be different from that of another user.
The Summary page (accessible from the Summary navigation option in the top-level menu bar) is the
default home page for all Logger users. That is, unless another page has been selected as your home
page, the Summary page is displayed when you first log in.
You can configure Logger to display a specific dashboard as your home page, including one your
created.
Administrator's Guide
HPE Logger 6.2 Page 61 of 623
To select a specific dashboard as your home page:
1. Select the Dashboard option when configuring the Personal Default start page for
<username>, following the instructions in "Logger Options" on page35.
2. Open the Dashboards menu.
3. Select the dashboard that you want to configure as default.
4. Click the Tools pull-down menu and select Select as Default.
5. Click Yes to confirm your action in the confirmation message, or click No to exit without making a
change.
Administrator's Guide
HPE Logger 6.2 Page 62 of 623

Chapter 3: Searching and Analyzing Events
When you want to analyze events matching specific criteria, include them in a report, or forward them to
another system such as ArcSight ESM, you need to search for them. To search for events, you create
queries. The queries you create can vary in complexity based on your needs. Queries can be simple
search terms or they can be complex enough to match events that include multiple IP addresses or
ports, and that occurred between specific time ranges from a specific storage group.
The following topics describe how to search for specific events in Logger. They discuss the methods
available for search, how to query for events, how to save a defined query and the events that the query
finds for future use. They also describe how to set up alerts to notify particular users when Logger
receives events that match specified criteria.
• The Process of Searching Events 63
• Elements of a Search Query 66
• Using the Advanced Search Builder 87
• Search Analyzer 91
• Regex Helper Tool 92
• Search Helper 94
• Searching for Events 98
• The Search Results Display 107
• Saving the Search Results 120
• Saving Queries (Creating Saved Searches and Saved Filters) 124
• Enriching Logger Data Through Static Correlation 133
• Indexing 133
• Viewing Alerts 136
• Live Event Viewer 137
The Process of Searching Events
The search process uses an optimized search language that allows you to specify multiple search
commands in a pipeline format. In addition, you can customize the display of search results, view search
results as charts, and so on.
The most straightforward way to run a search is to enter the keywords or information you are searching
for (the query) in the Search text box, select the time range, and click Go! You can enter a simple
keyword, such as, hostA.companyxyz.com or a complex query that includes Boolean expressions,
keywords, fields, and regular expressions. The system searches for data that matches the criteria you
specified and displays the results on the page where you entered your query.
HPE Logger 6.2 Page 63 of 623
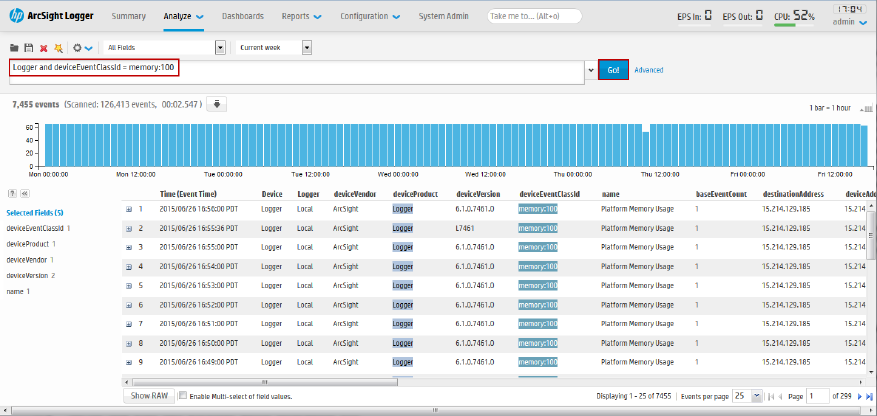
The search results are displayed in a table and as a histogram as soon as they are returned, even if the
query has not finished scanning all data. For an example, see "Simple Query Example" below.
You can also add a chart to your search to display the most important information in a more meaningful
fashion. Charts are not displayed until all the data is returned. For an example, see "Query Example
Using a Chart" on the next page.
There are several convenient ways to enter a search query. You can type the query in the Search text
box, use the Search Builder tool to create a query, click a field in the current search results, or use a
previously saved query (referred to as a filter or saved search).
When you type a query, the Search Helper provides suggestions and possible matches to help you build
the query expression. (See "Search Helper" on page94 for more information.)
In addition to typing the query in the Search text box, you can do the following:
lCreate queries by using the Advanced Search tool. For more information, see "Using the Advanced
Search Builder" on page87.
lSave queries and use them later. For more information, see "Saving Queries (Creating Saved Searches
and Saved Filters)" on page124.
lCreate new queries from the predefined queries that come with your system. For more information,
see "System Filters/Predefined Filters" on page128.
Although a search query can be as simple as a keyword, you will be better able to utilize the full
potential of the search operation if you are familiar with all the elements of a query, as described in
"Elements of a Search Query" on page66.
Simple Query Example
This example query finds events containing the word “Logger.” Type Logger in the search box and
then click Go!
Administrator's Guide
HPE Logger 6.2 Page 64 of 623
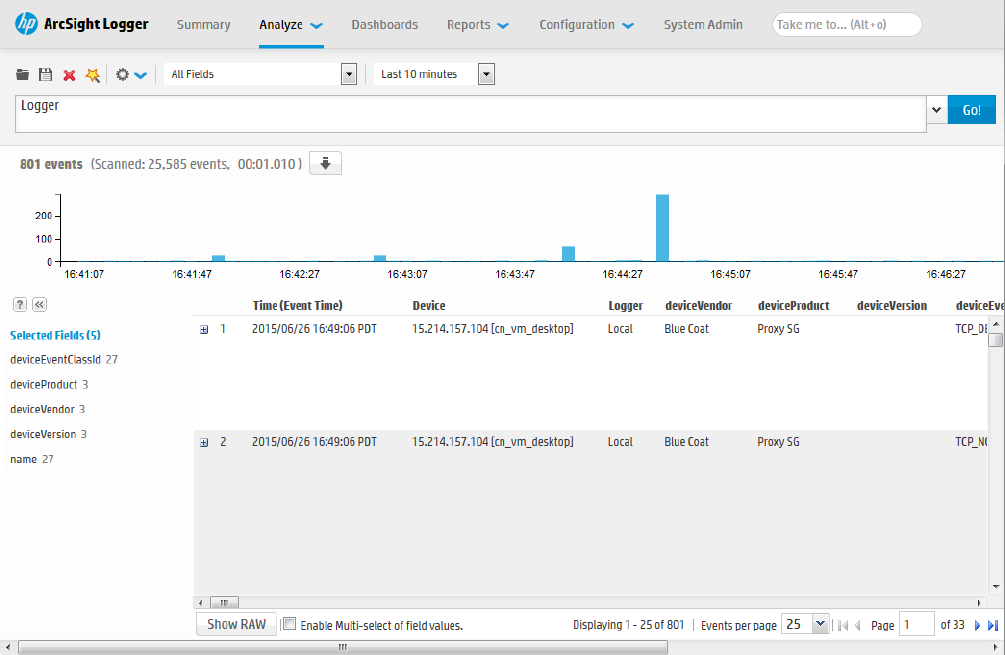
Query Example Using a Chart
Aggregated search operators such as chart, top, and rare generate charts of search results. This
example query finds events containing the word “Logger” and charts the number of events by the
contents of the name field. (Only the top 10 names are charted)Type the following query in the search
box and then click Go!
Logger | chart count by name
Administrator's Guide
HPE Logger 6.2 Page 65 of 623
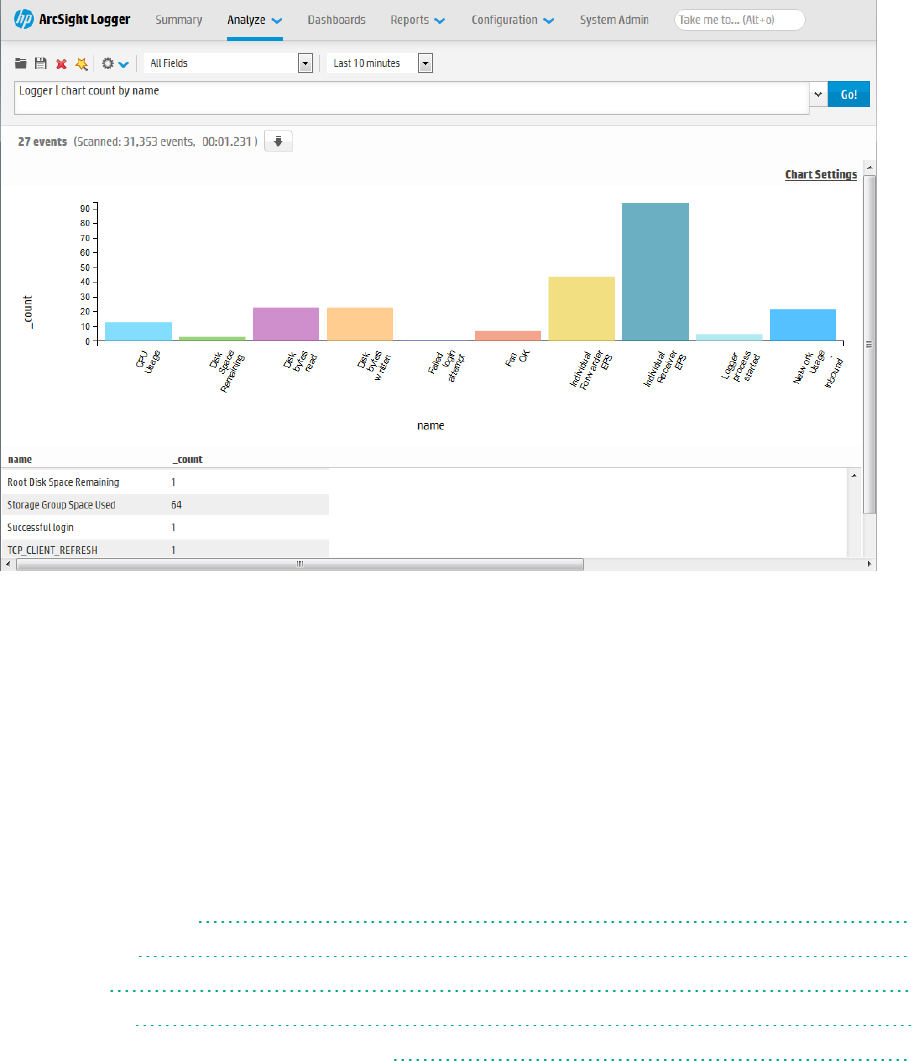
For more information on the search operators, see "Search Operators" on page467. For more
information on creating and using charts, see "Chart Drill Down" on page115 and "Refining and Charting
a Search from Field Summary" on page119.
Elements of a Search Query
A simple search query consists of a query expression, a time range and a field set. An advanced Logger
search query can also include constraints that limit the search to specific device groups, storage groups,
and peer Loggers.
• Query Expressions 66
• Time Range 74
• Fieldsets 77
• Constraints 81
• Syntax Reference for Query Expressions 83
Query Expressions
A query expression is a set of conditions used to select events when a search is performed. An
expression can specify a very simple term to match such as “login” or an IP address; or it can be more
complex enough to match events that include multiple IP addresses or ports, and that occurred
between specific time ranges from a specific storage group.
Administrator's Guide
HPE Logger 6.2 Page 66 of 623

Specify the query in the Search text box by using the following syntax:
<Indexed Search> | <Search Operators>
The query expression is evaluated from left to right in a pipeline fashion. First, events matching the
specified Indexed Search portion of the query are found. The search operator after the first pipe (“|”)
character is then applied to the matched events followed by the next search operator, and so on to
further refine the search results.
The search results table and the histogram display the events that match the query as they are found.
As additional events are matched, the search results table and the histogram are refreshed. Certain
search operators such as head and tail, require a query to finish running before search results can be
displayed.
lThe indexed search section of the query is described in "Indexed Search Portion of a Query" below.
lThe search operator portion of the query is described in "Search Operator Portion of a Query" on
page74.
lAddition points to take into consideration when writing queries are described in "Things You Should
Know About Logger Searches" on page101.
Indexed Search Portion of a Query
The Indexed Search section of the query uses fields to search for relevant data quickly and efficiently.
You can use a search expression to specify keywords to search for in the event text or to search using
field-based expressions in a Boolean format.
Keyword Search (Full-text Search)
Keywords are simply the words you want to search for, such as failed, login, and so on. You can specify
multiple keywords in one query expression by using Boolean operators (AND, OR, or NOT) between them.
Boolean expressions can be nested, for example, (John OR Jane) AND Doe*. If you need to search
for the literal occurrence of AND, OR, or NOT (in upper-, lower-, or mixed case), enclose them in double
quotes (“”) so the search engine does not interpret them as operators. For example, “and”, “Or”, and
so on.
Note: Although the Boolean operators AND, OR, and NOT can be specified in upper-, lower-, or
mixed case when used as an operator, HPE recommends that you use uppercase for ease of reading
the query.
Administrator's Guide
HPE Logger 6.2 Page 67 of 623

Guidelines for Writing Keyword Search Expressions
Follow these guidelines when specifying keyword search expressions:
lFollow the requirements described in "Syntax Reference for Query Expressions" on page83.
lAddition points to take into consideration when writing queries are described in "Things You Should
Know About Logger Searches" on page101.
lKeyword search is not case sensitive.
lUse Boolean operators (AND, OR, or NOT) to connect multiple keywords. If no Boolean operator is
specified between two keywords, the AND operator is applied by default. Also, use the Boolean
operators to connect keywords to fields you specify.
lUse double quotes (“ ”) to enclose a single word for an exact match. Otherwise, the word is treated as
<search string>*. For example, to search for log, type “log”. If you type log (without the double
quotes), the search will match all words that begin with log; for example, log, logger, logging, and so
on.
lWhen specifying Boolean operators (AND, OR, or NOT) as keywords, enclose them in double quotes (“
”). For example, “AND”.
lUse the backslash (\) as an escape character for \, “, and *. However, backslash will not escape these
characters if the keyword is enclosed in double quotes.
The following table summarizes how special characters are treated in a keyword search.
Character Usage
Space Tab
Newline
, ; ( ) [ ]
{ } “ | *
You cannot specify keywords that contain the characters in the left column.
Therefore, to search for a phrase such as failed login, enter “failed” AND
“login”.
Note: * is a valid character for wildcard character searches.
= : / \ @ -
? # $ & _
% > < !
To specify a keyword that contains any of the characters in the left column,
enclose the keyword in double quotes (“ ”). You can also specify an asterisk
(*) at the end of the keyword for an exact match.
Examples:
l“C:\directory”
l“result=failed”
*You can use the wildcard character asterisk (*) to search for keywords, however,
the wildcard cannot be the leading character in the keyword. Therefore, the
following usages are valid:
Using Special Characters in Keyword Searches
Administrator's Guide
HPE Logger 6.2 Page 68 of 623

Character Usage
log* log*app
"log*" log*app
log\* log*app*app
log\\*
However, the following usages are not valid:
*log *log*app*
Using Special Characters in Keyword Searches, continued
Field-Based Search
The Logger schema contains a predefined set of fields. You can add fields that are relevant to the
events you collect on your Logger to its schema. A field-based search can only contain fields in Logger’s
schema. (See additional guidelines at "Guidelines for Writing Field-Based Search Expressions" on
page72.)
The Logger indexing capability allows schema fields to be indexed. Logger’s search operation and
reports utilize the indexed fields to yield significant search and reporting performance gains. Although
you can include both indexed and non-indexed fields to a search query, search and reporting
performance will be much faster if all fields in a query are indexed. For more information and a list of
fields you can index, see "Indexing" on page133. For discussion on field-based query performance, see
"Performance Optimizations for Indexed Fields in Queries" on page92.
The field operators you can use in a query expression are listed in the table below. In addition to the
field operators, you can use search operators, as discussed in "Search Operator Portion of a Query" on
page74.
You can specify multiple field conditions in one query expression by using the listed operators between
them. The conditions can be nested; for example, (name=“John Doe” OR name=“Jane Doe”) AND
message!=“success”.
Note: If a query includes the Boolean operator OR and the metadata identifiers (discussed in
"Constraints" on page81), the expression to be evaluated with OR must be enclosed in parentheses,
as shown in this example:
(success OR fail) _storageGroup IN [“Default Storage Group”]
If the expression is not enclosed in parentheses, an error message displays.
Administrator's Guide
HPE Logger 6.2 Page 69 of 623

Any literal operator in the table can be specified in upper-, lower-, or mixed case. To search for these
words as literals in events, enclose them in double quotes (“”). For example, message CONTAINS
“Between”.
lTo determine the data type of a field, see "Default Fields" on page281.
lTo determine the size of a custom field, see "Custom Fields" on page282.
Operator Example Notes
AND name=“Data List” AND
message=“Hello”
AND 1.2.3.4
Valid for all data types.
OR (name=“TestEvent” OR
message=“Hello”) AND
type=2 AND 1.2.4.3
Valid for all data types.
NOT NOT name=“test 123” Valid for all data types.
!= destinationPort != 100
message!=“failed login”
message!=failed*login
(* means wildcard) “test”
message!=failed\*login
(* is literal in this case)
Valid for all data types.
=bytesIn = 32
message=“failed login”
message=“failed*login”
(* means wildcard)
Valid for all data types.
The size of each field in the schema is
predetermined. If the string you are
searching for is longer than the field-
length, you should use a STARTSWITH
rather than an = search, and include no
more than the number of characters in the
field size. To determine the size of a
default field, see "Default Fields" on
page281. To determine the size of a
custom field, see "Custom Fields" on
page282.
Using Operators in Field-Based Searches
Administrator's Guide
HPE Logger 6.2 Page 70 of 623

Operator Example Notes
>* bytesIn > 100 Valid for all data types.
* These operators evaluate the condition
lexicographically. For example,
deviceHostName BETWEEN AM AND EU
searches for all devices whose names start
with AM, AMA, AMB, AN, AO, AP and so
on, up to EU. Therefore, any device whose
name starts with AK, AL, and so on is
ignored. Similarly, devices with names
EUA, EUB, FA, GB, and so on will be
ignored.
<* startTime <“$Now - 1d”
>=* endTime
>=“01/13/2015 07:07:21”
endTime >=“2015/13/01
00:00:00 PDT”
endTime >=“Sep 10 2015
00:00:00 PDT”
<=* startTime <=“$Now - 1d”
IN* priority IN [2,5,4,3]
destinationAddress IN
[“192.0.2.4”,
“192.0.2.14”]
_deviceGroup IN [“DM1”]
_storageGroup NOT IN
[“Internal Event Storage
Group”, “SG1”]
_peerLogger IN
[“192.0.2.10”,
“192.0.2.11”]
BETWEEN* priority BETWEEN 1 AND 5
STARTSWITH message STARTSWITH “failed” Valid for string (text) data types only.
ENDSWITH message ENDSWITH “login” Valid for string (text) data types only.
CONTAINS message CONTAINS “foobar” Valid for string (text) data types only.
IS sessionId IS NULL
sessionId IS NOT NULL
Valid for all data types.
INSUBNET sourceAddress insubnet
"192.0.2.*"
Filters IP addresses based on subnets in
address fields such as sourceAddress,
deviceAddress, and
Using Operators in Field-Based Searches, continued
Administrator's Guide
HPE Logger 6.2 Page 71 of 623

Operator Example Notes
agentAddress insubnet
"192.0.*.*"
AND NOT
deviceAddress insubnet
"192.0.2.*"
agentAddress insubnet
"192.0.2.1-192.0.2.24"
agentAddress insubnet
"192.0.1.0-192.0.2.0"
AND NOT
deviceAddress insubnet
"198.51.100.0/24"
agentAddress insubnet
"192.0.*.*" AND NOT
deviceAddress insubnet
"192.0.2.*"
agentAddress insubnet
"192.0.2.0/24" AND
deviceAddress insubnet
"198.51.100.0/24"
agentAddress insubnet
"192.0.2.0/16" AND
deviceAddress insubnet
"198.51.100.*"
destinationAddress.
You can specify a subnet in one of the
following ways:
lIn CIDR notation: “address/prefix-
length”, such as 192.0.2.23/24,
lAs an address range: “address1-
address2”, such as 192.0.2.0-
192.0.2.255.
lAs a wildcard expression where one or
more asterisks replace data on the
right-hand side of an address, such as
192.0.2.*.
Using Operators in Field-Based Searches, continued
Guidelines for Writing Field-Based Search Expressions
Follow these guidelines when specifying field-based search expressions:
lFollow the requirements described in "Syntax Reference for Query Expressions" on page83.
lAddition points to take into consideration when writing queries are described in "Things You Should
Know About Logger Searches" on page101.
lFor faster searches, follow the recommendations in "Searching for Rare Field Values" on page103 and
"Tuning Search Performance" on page103.
lBy default, field-based search is case sensitive. You can change the sensitivity from the Field Search
Options section of the Configuration | Search > Search Options page. For more information, see
"Search Options" on page276.
Administrator's Guide
HPE Logger 6.2 Page 72 of 623
lYou can specify any predefined Logger schema field. For example, cat = /Monitor/CPU/Usage. For a
complete list, see "Indexing" on page133.
lYou can specify any custom field you have added to the schema. For example, SSN=333-333-3333.
For more information about custom schema fields, see "Adding Fields to the Schema" on page379.
lYou cannot specify user-defined fields created through a predefined or user-defined parser in the
Indexed Search portion of a query. (The Indexed Search portion of a query is the expression before
the first pipeline character.)
lA query expression (Indexed Search | Search Operators) is evaluated from left to right in a pipeline
fashion. By design, a parser—predefined or user-defined—is applied to an event when the Search
Operators are processed in a search query. Therefore, field creation when a parser is applied to an
event occurs later than the Indexed Search stage. As a result, you cannot specify these fields in a
field-based search query.
For example, the Apache Access Log parser creates the field SourceHost. You cannot specify the
following query expression:
SourceHost=“192.0.2.0”
However, you can use this field after the first pipeline, as shown in this example.
| where SourceHost=“192.0.2.0”
Or, if you want to search only the Apache Access Logs for SourceHost=“192.0.2.0”, you can
specify this expression:
| where parser=“Apache Access Log” and clientIP=“192.0.2.0”
Additionally, you can run a full-text (keyword) search on “192.0.2.0”, as follows:
“123.456.789” | where SourceHost=“192.0.2.0”
lIf an event field contains data of an unexpected type (for example, a string when an integer is
expected), the data is ignored. Therefore, search for that data value will not yield any results. For
example, if the port field contains a value 8080A (alphanumeric) instead of 8080 (numeric), the
alphanumeric value is ignored. The data types of the schema fields are available from the
Configuration | Search > Default Fields page. For more information on how to view this
information, see "Default Fields" on page281.
lFor optimal search performance, make sure that event fields on ALL peers are indexed for the time
range specified in a query. If an event field is indexed on one system but not on its peers for a specific
time range, a distributed search will run slower on the peers. However, it will run at optimal speed on
the local system. Therefore, the search performance in such a setup will be slow.
lFor faster report generation, ALL fields of a report (including the fields being displayed in the report)
need to be indexed. That is, in addition to the fields in the WHERE clause of the query, the fields in
the SELECT clause also need to be indexed.
Administrator's Guide
HPE Logger 6.2 Page 73 of 623
Search Operator Portion of a Query
The Search Operators portion of the query enables you to further refine the data that matched the
indexed search filter. See "Search Operators" on page467 for a complete list of search operators and
examples of how to use them.
The rex search operator is useful for syslog events (raw or unstructured data) or if you want to
extract information from a specific point in an event, such as the 15th character in an event. Other
operators such as head, tail, top, rare, chart, sort, fields, and eval are applied to the fields you
specify or the information you extract using the rex operator.
Prior to Logger5.2, you needed to use a special search operator—cef—to extract CEF fields from CEF
events (structured data) that matched the indexed search filter (the query portion before the first
pipeline in the query expression) before you could use other search operators to act upon those fields.
However, starting with Logger5.2, you do not need to explicitly extract the CEF fields and then apply
other search operators to those fields. You can specify the event fields directly in queries. The CEF
operator has been deprecated as of Logger5.2.
Time Range
An event is timestamped with the receipt time when it is received on the Logger. A search query uses
the receipt time to search for matching events.
Under most circumstances, the Logger receipt time is same as the event time. However, the event time
and the Logger receipt time for an event can be different because there is usually a small lag between
the time an event leaves a device and it is received at the Logger. If the device’s clock is ahead or behind
the Logger clock, the lag or lead can be significant.
A search operation requires you to specify the time range within which events would be searched. You
can select from many predefined time ranges or define a custom time range to suit your needs.
When defining a time range for your query, be sure to take the information in "Impact of Daylight
Savings Time Change on Logger Operations" on page410 into consideration.
Predefined time range: When you select a predefined time range such as “Last 2 Hours” or “Today”,
the time range is relative to the current time. For example, if you select “Last 2 Hours” at 2:00:00 PM on
July 13th, events from 12:00:00 to 2:00:00 PM on July 13th will be searched. If you refresh your search
results at 5:00:00 PM on the same day, the time window is recalculated. Therefore, events that match
the specified criteria and occurred between 3:00:00 and 5:00:00 PM on July 13th are displayed.
Custom time range: You can specify a time range in a 24-hour format to suit your needs. For example,
a custom time range is:
Start: 8/13/2015 13:36:30
End: 8/13/2015 22:36:30
Administrator's Guide
HPE Logger 6.2 Page 74 of 623
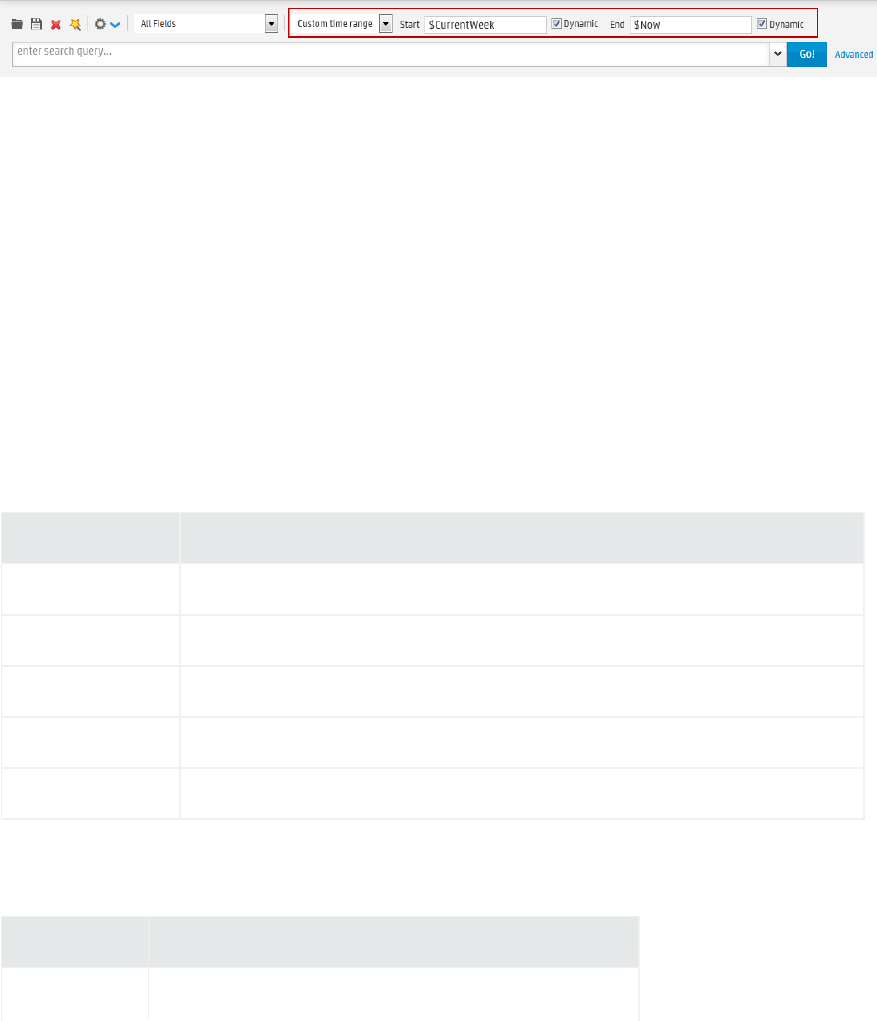
By default, the end time for a custom time range is the current time on your Logger and the start time is
two hours before the current time.
You can also use variables to specify custom time ranges. For example, a dynamic date range might start
at $Now - 2h (two hours ago) and end at $Now (the current time). The dynamic search is relative to
when the query is run. Scheduled search operations use this mechanism to search through newer event
data each time they are run.
The “Dynamic” field in the user interface enables you to specify the dynamic time, as shown in the
following figure:
Following is a typical example of a dynamic search that limits results to the last two hours of activity:
Start: $Now - 2h
End: $Now
The syntax for dynamic search is:
<current_period> [ +/- <units>]
Where <current_period>, such as $Now, either stands alone or is followed by either a plus (‘+’) or
minus (‘-’) and a number of units, such as 2h for two hours. The <current_period> always starts with
a ‘$’ and consists of a word, case-sensitive, with no spaces, as shown in the table "Current Period" below.
The <units> portion, if given, consists of an integer and a single, case-sensitive letter, as shown in the
table "Units" below.
Period Description
$Now The current minute
$Today Midnight (the beginning of the first minute) of the current day
$CurrentWeek Midnight of the previous Monday (or same as $Today if today is Monday)
$CurrentMonth Midnight on the first day of the current month
$CurrentYear Midnight on the first day of the current year
Current Period
Unit Description
m (lowercase) Minutes (Do not confuse with ‘M’, meaning months)
Units
Administrator's Guide
HPE Logger 6.2 Page 75 of 623
Unit Description
hHours
dDays
wWeeks
M (uppercase) Months (Do not confuse with ‘m’, meaning minutes)
Units, continued
Time Stamps in Logger
Events consist of a receipt time, event time, a source (host name or IP address), and an un-parsed
message portion.
Event Time is the time the events are received by the Logger Receiver. Logger uses this field to find
matching events when Searching and Reporting.
Receipt Time is the time the events are written to the Storage Group (disk). All events are timestamped
with the receipt time when received on the Logger.
Note: Under most circumstances, the Logger receipt time is same as the event time. However, the
event time and the Logger receipt time for an event may be different because there is a small lag
between the time an event is received and when it is stored on the Logger. Other things may also
cause some lag. For example, if event time parsing is enabled in file receiver, the receipt time may lag
behind event time.
lLogger uses the receipt time field to find matching events when forwarding as well as for storage
retention and archives.
lThe Logger receipt time of an event is used to determine whether an event will be forwarded to a
destination when a forwarder filter specifies a time range by which events are evaluated for
forwarding.
lLogger uses the receipt time of an event to determine its archival day.
lSearch results are sorted by the Logger event time.
lThe histogram is based on the Logger event time.
lThe default fields are automatically indexed. For the remaining fields, Logger uses the receipt time of
an event and the time when a field was added to the index to determine whether that event will be
indexed. If the receipt time of the event is equal to or later than the time when the field was added to
the index, the event is indexed; otherwise, it is not.
Administrator's Guide
HPE Logger 6.2 Page 76 of 623
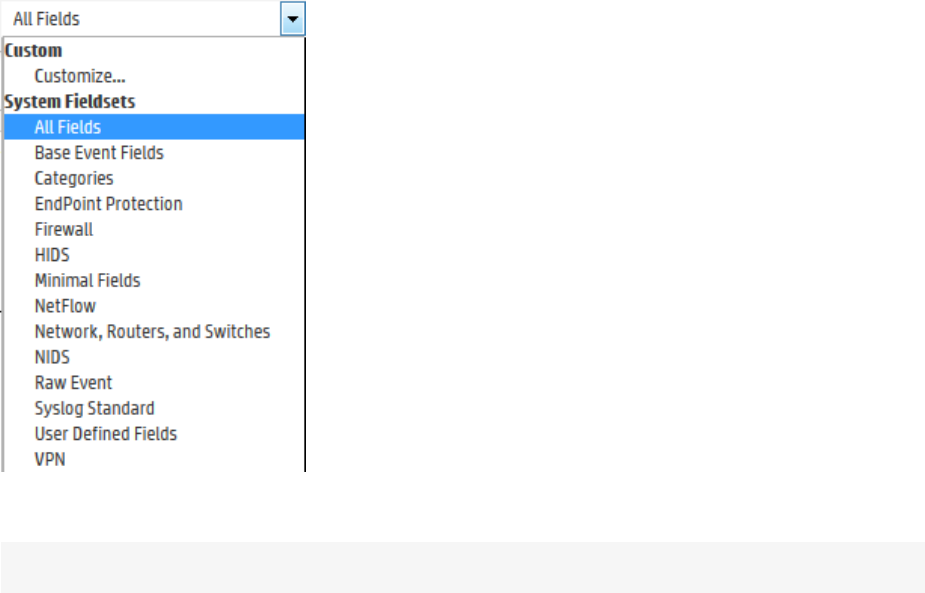
In addition to the event time and the receipt time, you may see several other time stamps in Logger
events, including the following:
Agent Receipt Time is the time the Connector received the event. Logger does not use this field, but
you can search it.
End Time is the original time of the event on the device. Logger does not use this field, but you can
search it.
Manager Receipt Time is the time the ESM received the event. Logger does not use this field, but you
can search it.
Fieldsets
A field set determines the fields that are displayed in the search results for each event that matched a
search query. By selecting the field set, you select which fields you see in the search results. For
information, see "Changing the Displayed Search Results Using Field Sets" on page113. You can use a
predefined field set or create your own.
Predefined Fieldsets
The system provides a number of predefined field sets.
To view the list of available field sets: Click the down-arrow in the Fields dialog box. The System
Fieldsets list is displayed.
To display the search results using a specific field set: Click the field set from the drop-down list.
Note: Only fields available for matched events are displayed in a Search Results display (or the
Administrator's Guide
HPE Logger 6.2 Page 77 of 623
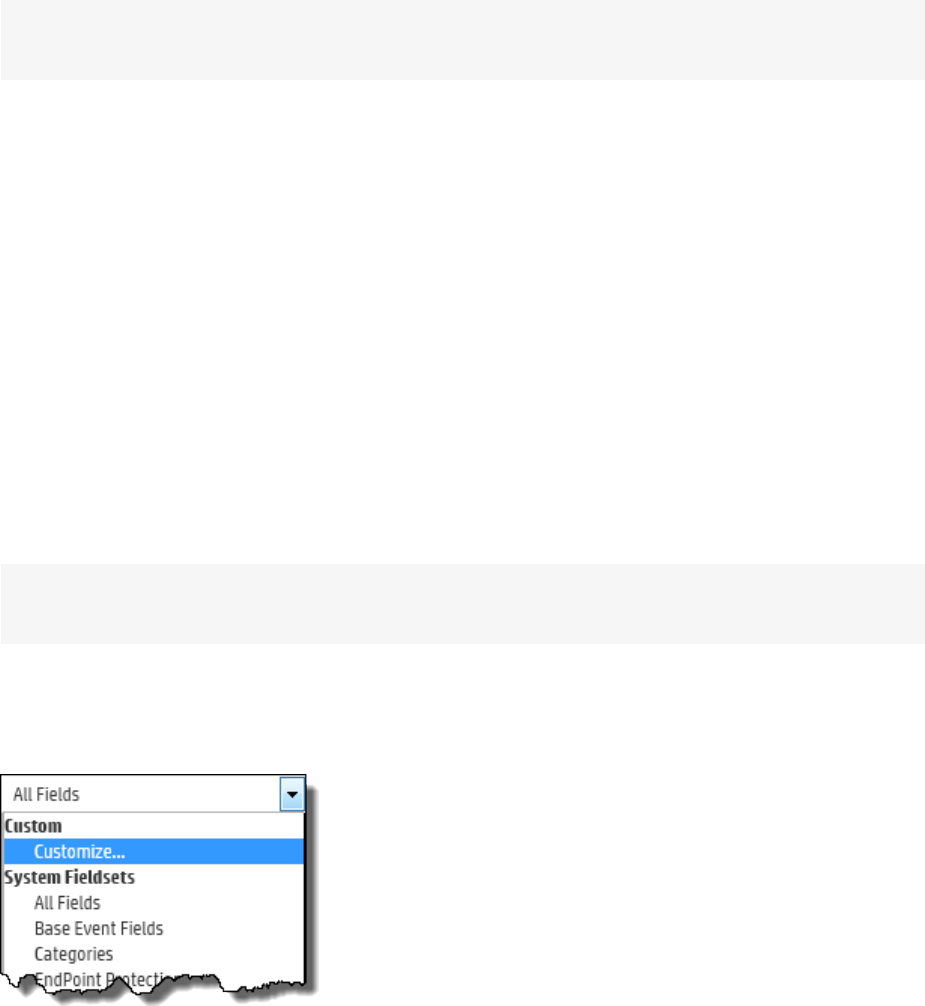
exported file). Therefore, even if you select the All Fields field set, you might not see all fields
displayed in the search results, only the fields included in the events found by the search.
For more information about field sets, see "Managing Fieldsets" on page280.
The User Defined Fields Field-Set
When you use a search operator that defines a new field, such as rex, rename, or eval, a new column for
each field is added to the currently selected display. These newly defined fields are displayed by default.
The User Defined Fields field set enables you to view only the newly defined fields.
The Raw Event Field-Set
The Raw Event field set displays the whole raw syslog event in a column called rawEvent, with the
event formatted to fit in the column.
Although the Raw Event field is most applicable for syslog events, you can also display the raw event
associated with CEF events in the rawEvent column. To do so, make sure the connector that is sending
events to the Logger populates the rawEvent field with the raw event.
Note: To see the raw events in the rawEvent column, enable the Search Option, “Populate
rawEvent field for syslog events”. See "Search Options" on page276 for more information.
Custom Fieldsets
You can create your own field sets by selecting “Customize…” from the “Fields” pull-down menu.
The user interface enables you to select and move event fields you want to include in a field set, as
shown in the following figure.
Administrator's Guide
HPE Logger 6.2 Page 78 of 623
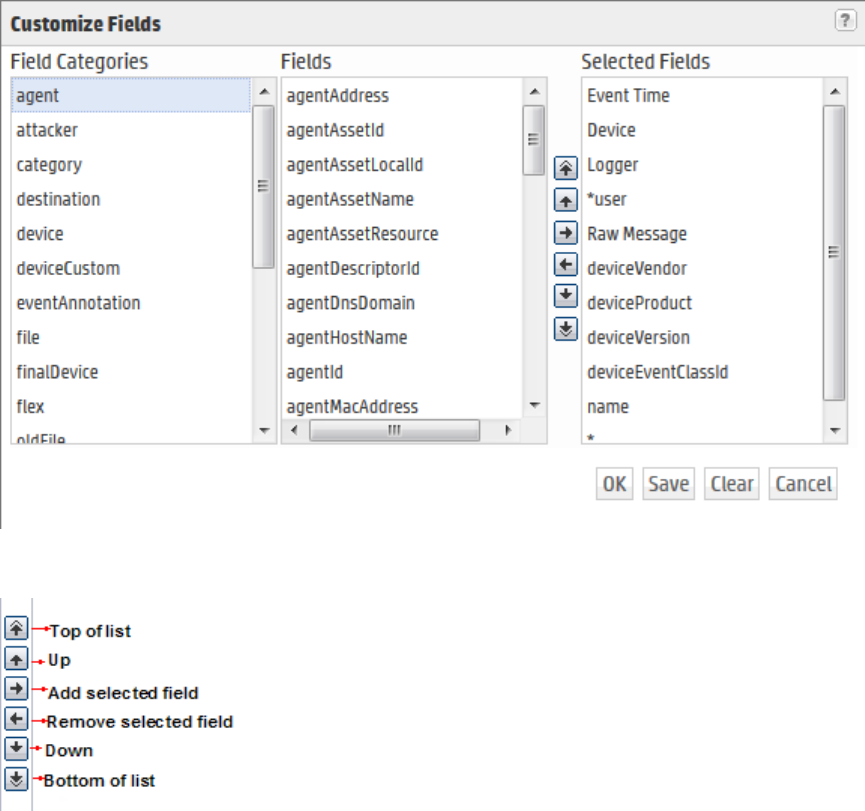
Use these buttons to create and edit a custom field set.
A wildcard field (“*”) is available in the Fields list when you create a custom field set. This field includes
all fields available in an event that are not individually listed in the custom field set definition. For
example, for the following custom field set definition, the search results will list the fields before the
asterisk (“*”) first, followed by any other fields in an event. Lastly, the deviceEventClassId and Name
fields will be listed.
Administrator's Guide
HPE Logger 6.2 Page 79 of 623
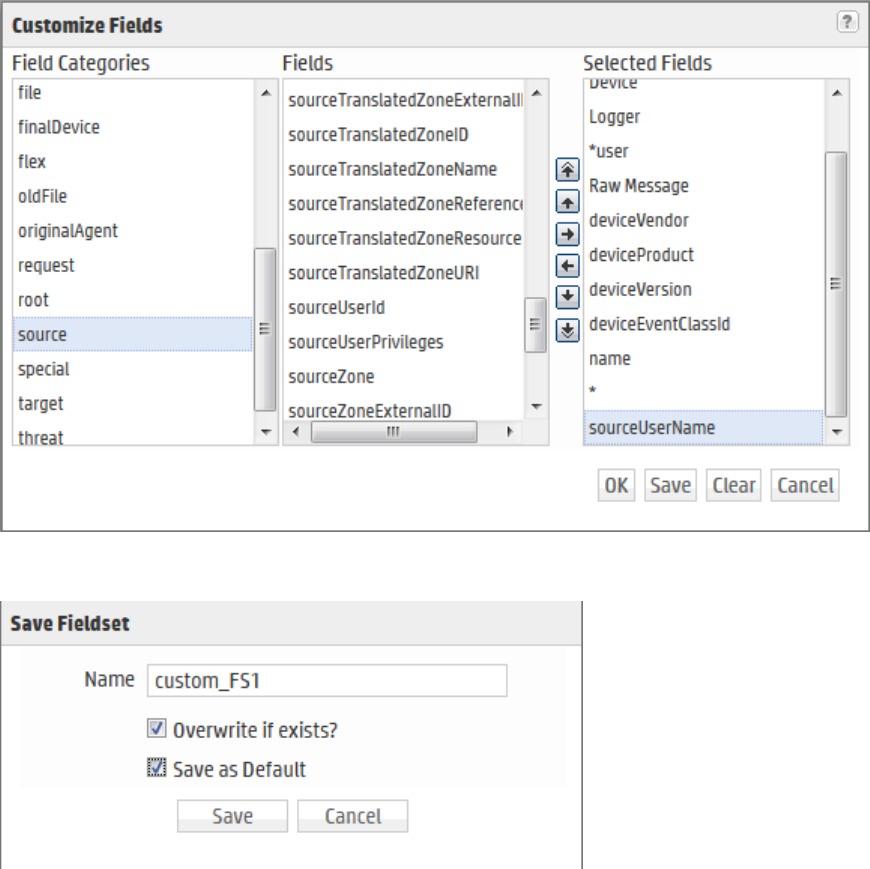
You can save the custom field set or use it only for the current session.
If you click OK, the field set appears in the Custom category. It is labeled as “Custom (not saved)” and is
not visible to other users. It will remain available to you for this session. Once you log out of the current
session, the temporary field set will be deleted. You can only have one temporary custom field set at a
time.
If you click Save, the field set appears under the Shared Fieldsets category and is visible and available to
the other users, as shown in the following figure. After a field set is saved, you can edit and delete it.
When saving a custom field set, you can specify it as the default for this system. If you do so, it is the
default field set for all users on that system. If do not select it as the default, the field set is used only for
your search results and does not affect other users connecting to the same system.
Administrator's Guide
HPE Logger 6.2 Page 80 of 623
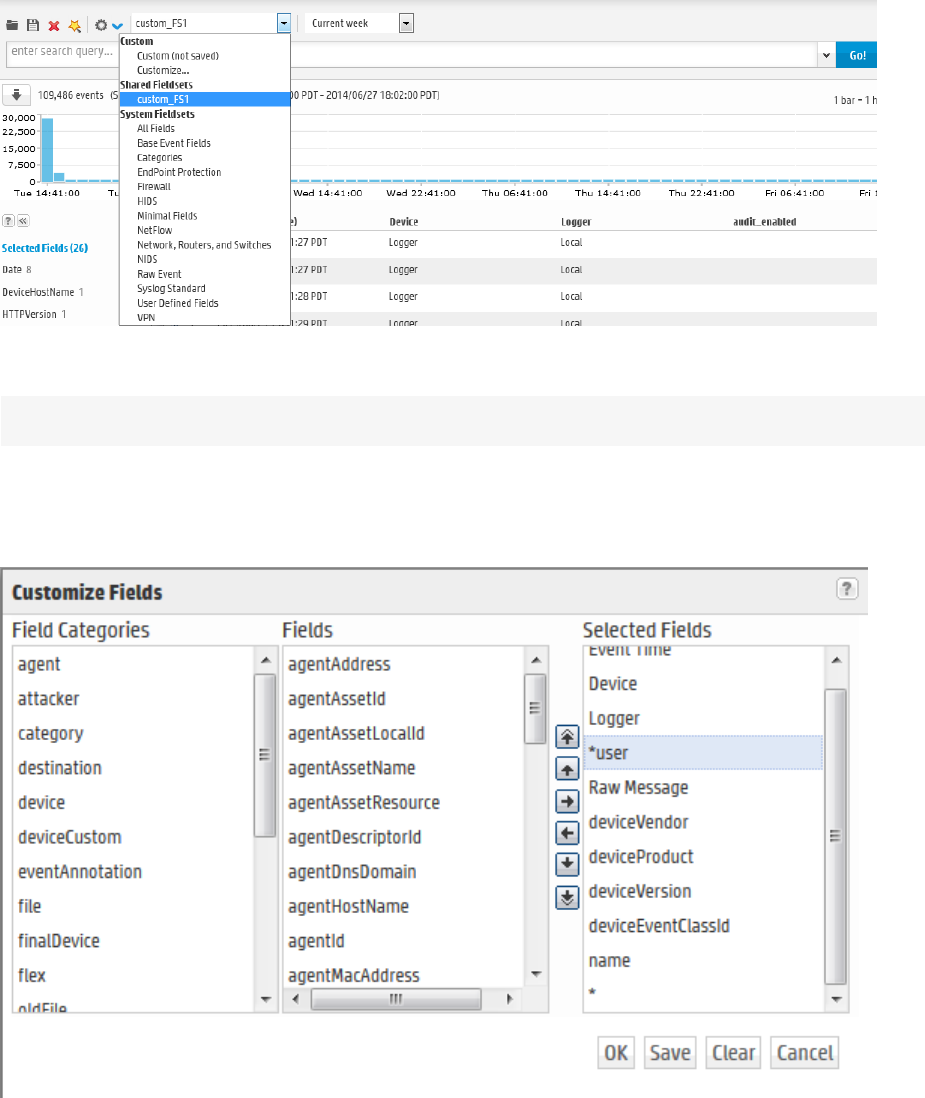
For information about deleting custom field sets, see "Managing Fieldsets" on page280
Note: Field sets are not included in the saved filter definition.
The *user field, shown below, controls the display of fields defined by search operators (rex, rename,
extract, or eval) as well as the fields created when a parser is applied to an event. When *user is
included in the Selected Fields list of a custom field set, the created or defined fields are displayed.
Constraints
Using constraints in a query can speed up a search operation as they limit the scope of data that needs
to be searched. Constraints enable you to limit a query to events from one or more of the following:
Administrator's Guide
HPE Logger 6.2 Page 81 of 623
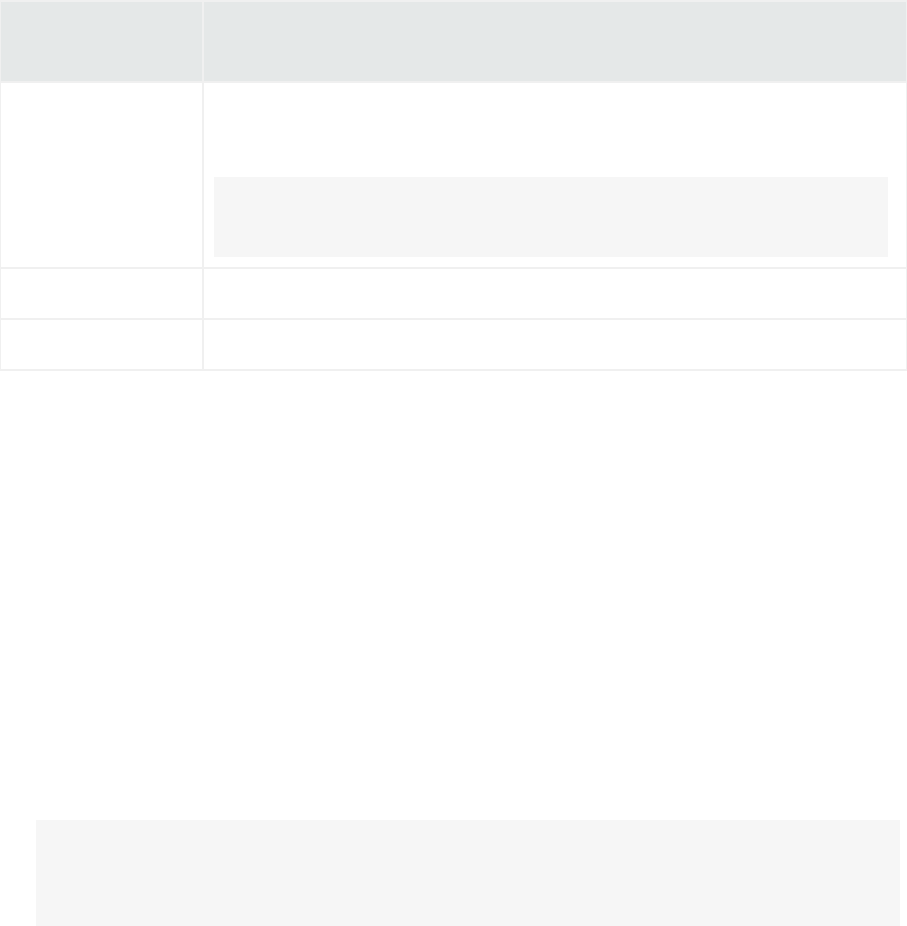
lParticular device groups
lParticular storage groups
lSpecific peers
For example, you might want to search for events in the SG1 and SG2 storage groups on the local
system only.
For information about storage groups and peers, see "Storage" on page351, "Device Groups" on
page294, and "Peers" on page396.
Follow these guidelines when specifying constraints:
lUse the following operators to specify constraints in a search query expression:
Metadata
Identifier Example
_deviceGroup _deviceGroup IN [“DM1”, “HostA”]
where DM1 is a device group, while HostA is a device.
Note: You can use this field to specify individual devices, as shown in
the example above.
_storageGroup _storageGroup IN [“Internal Event Storage Group”, “SG1”]
_peerLogger _peerLogger IN [“192.0.2.10”, “192.0.2.11”]
lIf a query includes the Boolean operator OR and metadata identifiers, the expression to be evaluated
with OR must be enclosed in parentheses, as shown in this example:
(success OR fail) _storageGroup IN [“Default Storage Group”]
If the expression to be evaluated with OR is not enclosed in parentheses, an error message is
displayed on the user interface screen.
lWhen specifying multiple groups in a constraint, ensure that the group names are enclosed in square
brackets; for example, _storageGroup IN [“SGA”, “SGB”].
lYou can apply constraints to a search query by:
a. Typing the constraint in the Search text box
Once you type “_s” (for storage group), “_d” (for device group), or “_p” (for peer) in the Search
text box, Search Helper automatically provides a drop-down list of relevant terms and operators
from which you can select.
Caution: If a search query contains constraints and a regular expression, make sure that the
constraints are specified before the regular expression. For example, _peerLogger IN
[“192.0.2.10”] name contains abc | REGEX=“:\d31”
Administrator's Guide
HPE Logger 6.2 Page 82 of 623

b. Selecting Storage Groups or peers from the Advanced Search tool. (To access the Advanced
Search tool, click Advanced Search beneath the text box where you type the query.) For more
information about the Advanced Search, see "Using the Advanced Search Builder" on page87.
Syntax Reference for Query Expressions
To create valid and accurate query expressions, follow these requirements.
Behavior Full Text Search Field Search Regular Expression
Case sensitivity Insensitive
(Cannot be changed.)
Sensitive
(Can be changed using
Tuning options. See "Search
Options" on page276.)
Insensitive
(Can be changed using
Tuning options. See "Search
Options" on page276.)
Escape character \
Use to escape \. You cannot
escape any other character.
\
Use to escape \, “, and *.
Examples:
name=log\\ger
(matches log\ger)
name=logger\*
(matches logger*)
\
Use to escape any special
character.
Example:
To search for a term with
the character “[” :
|REGEX= “logger\[”
Escaping wildcard
character
Cannot search for *
Example:
log\* is invalid
Can search for * by escaping
the character
Example:
name=log\* is valid
Can search for * by escaping
the character
Example:
name=log\* is valid
Exact Match/Search
string includes an
operator or a special
character
Enclose keyword in double
quotes; Otherwise, keyword
treated as keyword*.
Example:
log (matches log, logging,
logger, and so on)
“log” (matches only log)
Tip: See the list of special
characters that cannot be
searched even when
enclosed in double quotes,
later in this table.
Enclose value in double
quotes
Example:
message=“failed
login”
No special requirement.
Nesting, including
parenthetical clauses,
Allowed
lUse Boolean operators to
Allowed
lUse any operator listed in
Multiple regular expressions
can be specified in one
Query Syntax Requirements
Administrator's Guide
HPE Logger 6.2 Page 83 of 623

Behavior Full Text Search Field Search Regular Expression
such as (a OR b) AND c connect and nest keywords.
lMetadata identifiers
(_storageGroup, _
deviceGroup, and _
peerLogger), but can only
appear at the top level in a
query expression). If the
query contains a regular
expression, the metadata
identifiers need to precede
the regular expression.
the "Field-Based Search"
on page69 section to
connect and nest field
search expressions.
lMetadata identifiers
(_storageGroup, _
deviceGroup, and _
peerLogger), but can
only appear at the top
level in a query
expression
query using this syntax:
|REGEX= “<REGEX1>”
|REGEX=“<REGEX2>”|...
Operators Upper-, lower-, or mixed case
Boolean operators—AND, OR,
NOT. If an operator is not
specified, AND is used.
To search for literal operator
AND, OR, NOT, in an event,
enclose them in double quotes.
Example: “AND”, “OR”, “Not”
Note: If a query includes
the Boolean operator OR
and the metadata
identifiers
(_storageGroup,
_deviceGroup, and
_peerLogger), the
expression to be
evaluated with OR must
be enclosed in
parentheses
Example:
(success OR fail) _
storageGroup IN
[“Default Storage
Group”]
Use any operator listed in
the "Field-Based Search" on
page69 section.
lUnless a value is
enclosed between double
quotes, a space between
values is interpreted as
an AND.
For example, name=John
Doe is interpreted as
John AND Doe.
lIf an operator is not
specified between
multiple field
expressions, AND is used.
lTo search for literal
operator, enclose the
operator in double
quotes.
Examples:
message
STARTSWITH=“NOT”
message=“LOGIN DID
NOT SUCCEED”
lIf a query includes the
Boolean operator OR and
the metadata identifiers
(_storageGroup,
_deviceGroup, and
_peerLogger), the
expression to be
evaluated with OR must
be enclosed in
| and the operators
described in "Time Range"
on page74.
Use this operator to AND
multiple regular expressions
in one query expression.
Query Syntax Requirements, continued
Administrator's Guide
HPE Logger 6.2 Page 84 of 623

Behavior Full Text Search Field Search Regular Expression
parentheses.
Example:
(success OR fail)
_storageGroup IN
[“Default Storage
Group”]
Primary
Delimiters:
Space
, ; ( ) [ ] } “
| * > < !
You can search for keywords
containing primary delimiters
by enclosing the keywords in
double quotes.
Examples:
“John Doe”“Name=John
Doe”“www.hp.com”
You can search for these
characters. Enclose value in
double quotes if value
contains any of these
characters.
Example: name=“John*”
Cannot contain ^ in the
beginning and $ at the end
as a matching character
unless the regular
expression you specify must
look for an event that
contains only the pattern
you are specifying.
Special regular expression
characters such as \ and ?
need to be escaped.
Example:
|REGEX= “^test$” will
search only for events
containing the word test .
Secondary Delimiters:
= . : / \ - ? #
$ & _ %
You can also search for
keywords containing secondary
delimiters once you have
configured the full-text search
options as described in "Search
Options" on page276.
Example:
You can search for hpe.com in
a URL
http://www.hpe.com/apps
by specifying hpe.com as the
search string.
You can search for these
characters. Enclose value in
double quotes if value
contains any of these
characters.
Example: name=“John”
lCannot contain ^ in the
beginning and $ at the
end as a matching
character unless the
regular expression you
specify must look for an
event that contains only
the pattern you are
specifying; for example,
|REGEX= “^test$”
will search for events
containing the word
“test” (without quotes)
only.
lSpecial regular
expression characters
such as \ and ? need to
be escaped.
Syntax keyword1 boolean_
operator keyword2
boolean_operator
keyword3 ....
field_name operator
field_value
(List of fields in the "Event
Field Name Mappings" on
|REGEX=“<REGEX1>” |
REGEX=“<REGEX2>”|...
Query Syntax Requirements, continued
Administrator's Guide
HPE Logger 6.2 Page 85 of 623

Behavior Full Text Search Field Search Regular Expression
page546 section.)
(List of operators in the
"Field-Based Search" on
page69 section.)
Tab
Newline
{ “ *
Cannot search for these
characters.
Examples:
“John{Doe” is invalid
No restrictions.
Enclose special character in
double quotes. Escape the
wildcard character and
double quotes.
Example:
name=“John\* \“Doe”
(matches John* “Doe")
No restrictions.
Special regular expression
characters such as ()[]{}
"|, and * need to be
escaped.
Time format, when
searching for events
that occurred at a
particular time
No specific format. The query
needs to contain the exact
timestamp string. For example,
“10:34:35”.
Note: The string cannot
contain spaces. For
example, “Oct 19” is
invalid.
Use this format to specify a
timestamp in a query
(including double quotes):
“mm/dd/yyyy hh:mm:ss”
Or
“yyyy/mm/dd hh:mm:ss
timezone”
Or
“MMM dd yyyy hh:mm:ss
timezone”
where
mm = month
dd = day
yyyy = year
hh = hour
mm = minutes
ss = seconds
timezone = EDT, CDT,
MDT, PDT
MMM = First three letters of a
month’s name; for example,
Jan, Mar, Sep, and so on.
Use the <= and >= operators
to narrow down the time
range. Do not use = or !=.
No restrictions.
Wildcard * Cannot be the leading
character; only a suffix or in-
between a keyword.
* Can appear anywhere in
the value.
Examples:
* Can appear anywhere.
Query Syntax Requirements, continued
Administrator's Guide
HPE Logger 6.2 Page 86 of 623
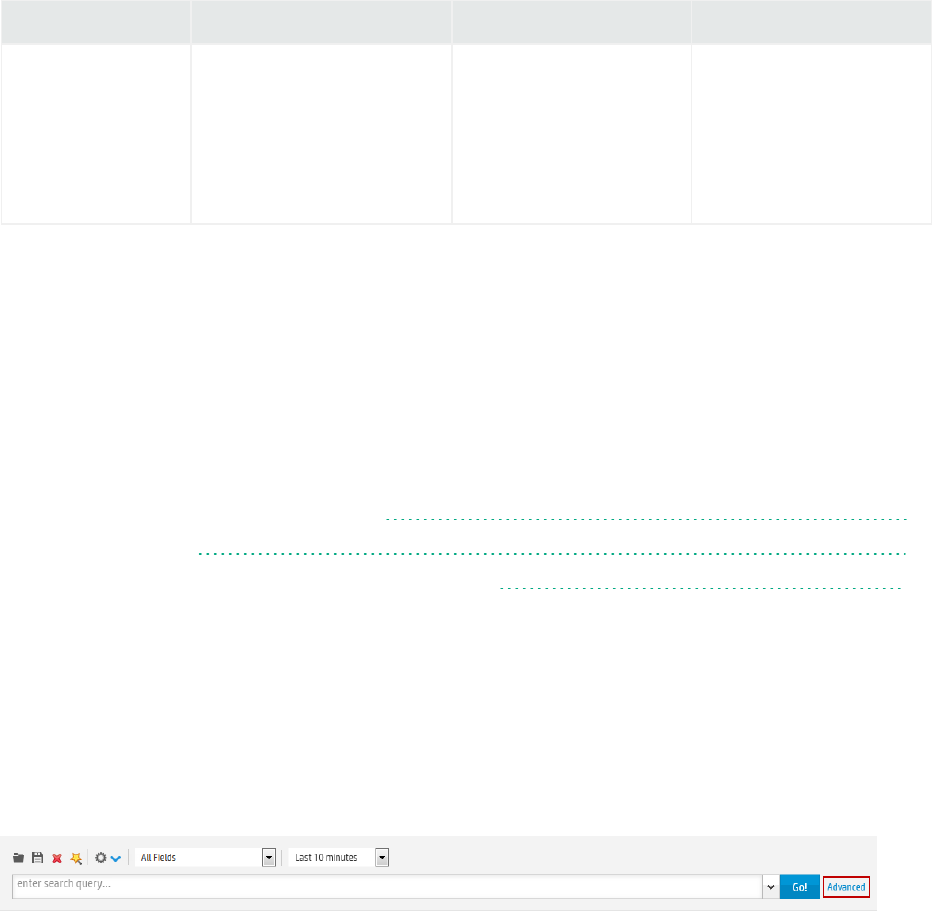
Behavior Full Text Search Field Search Regular Expression
Examples:
l*log is invalid
llog* is valid
llo*g* is valid
name=*log (searches for
ablog, blog, and so on.)
name=“\*log”
name=\*log
(both search for *log)
Query Syntax Requirements, continued
Using the Advanced Search Builder
The Advanced Search tool is a Boolean-logic conditions editor that enables you to build search queries
quickly and accurately. The tool provides a visual representation of the conditions you are including in a
query. You can specify keywords, field-based conditions, and regular expressions using this tool. You
can also specify search constraints such as peers, device groups, and storage groups (see "Constraints"
on page81). This section describes how to use the tool.
• Accessing the Advanced Search Builder 87
• Nested Conditions 90
• Alternate Views for Query Building in Search Builder 90
Accessing the Advanced Search Builder
To display the Advanced Search builder:
Click Analyze > Search to open the search page, and then click Advanced Search, below the Search
text box, as shown in the following figure.
The Advanced Search builder is displayed, as follows:
Administrator's Guide
HPE Logger 6.2 Page 87 of 623
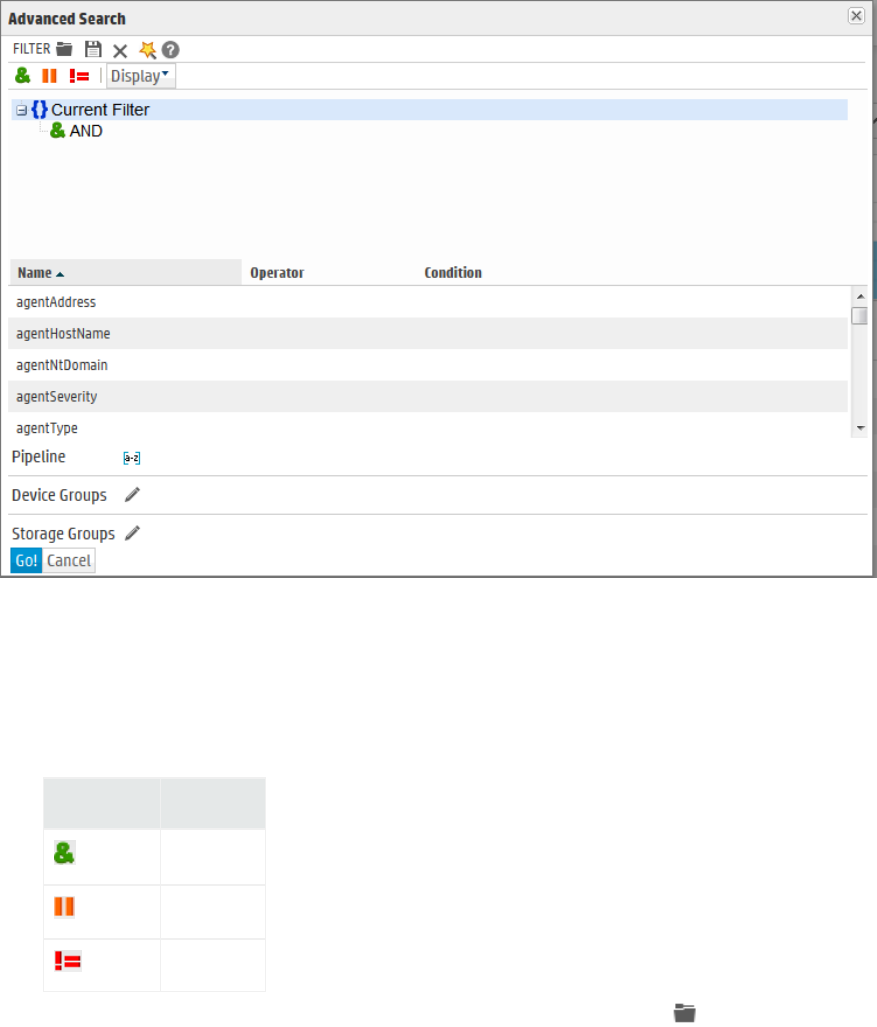
To build a new search query in the Advanced Search builder:
1. Click Analyze > Search to open the search page, and then click Advanced Search.
2. Select the Boolean operator that applies to the condition you are adding from the top of Search
Builder. You can select these operators:
Operator Meaning
AND
OR
NOT
3. If you want to load a system or saved filter, or a saved search, click the icon. Select the filter or
the saved search from the displayed list and click Load+Close.
For more information, see "Saving Queries (Creating Saved Searches and Saved Filters)" on
page124 and "System Filters/Predefined Filters" on page128.
4. To add a keyword (full-text search) or field condition:
a. Locate the field you want to add under the Name column.
To specify a keyword (full-text search), use the fullText field under the Name column, as shown
in the following figure.
Administrator's Guide
HPE Logger 6.2 Page 88 of 623
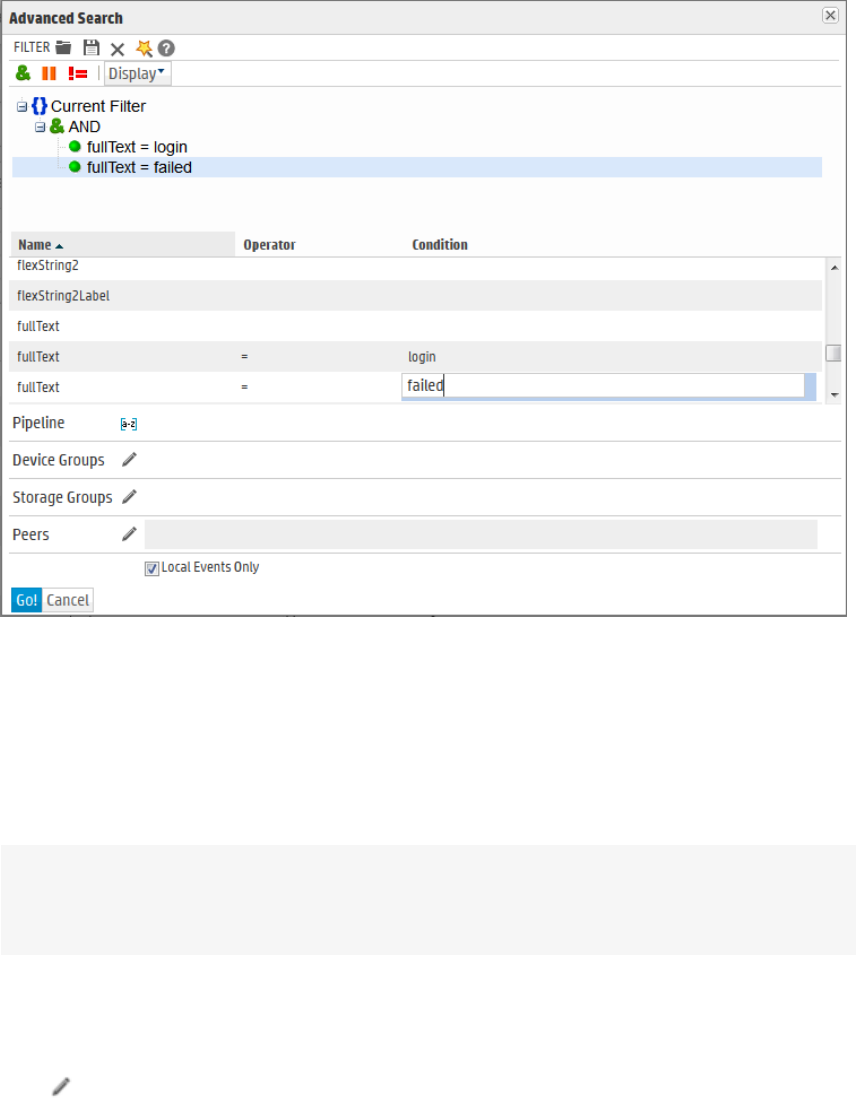
b. Click the Operator column associated with the field, select the operator from the displayed list,
and press Enter.
c. Only operators applicable to a field are displayed in the list.
d. In the Condition column associated with the field, enter a value and press Enter.
To edit a condition, right click on the condition for a pull-down menu that enables you to edit,
cut, copy, or delete the condition.
Note: You cannot specify a range of IP addresses. Therefore, to search for multiple IP
addresses in a range, use the CONTAINS operator and wildcard characters in the Condition
column; for example, enter “192.0.2.*”.
5. Repeat the steps above until you have added all the conditions.
6. If your search query will include a regular expression, type it in the Regex field.
7. If you want to constrain your search query to specific device groups, storage groups, and Loggers,
click the icon next to the constraint category. Select the relevant groups and Loggers. (To
select multiple groups, hold the Ctrl-key down.)
You can specify devices or device groups in the Device Groups constraint.
The Logger constraint category is displayed only if Loggers are configured on your Logger.
If multiple values are selected for a constraint, those values are OR’ed together. For example, if you
specify Device Group A, B, C, the query will find events in Device Group A, B, or C.
Administrator's Guide
HPE Logger 6.2 Page 89 of 623
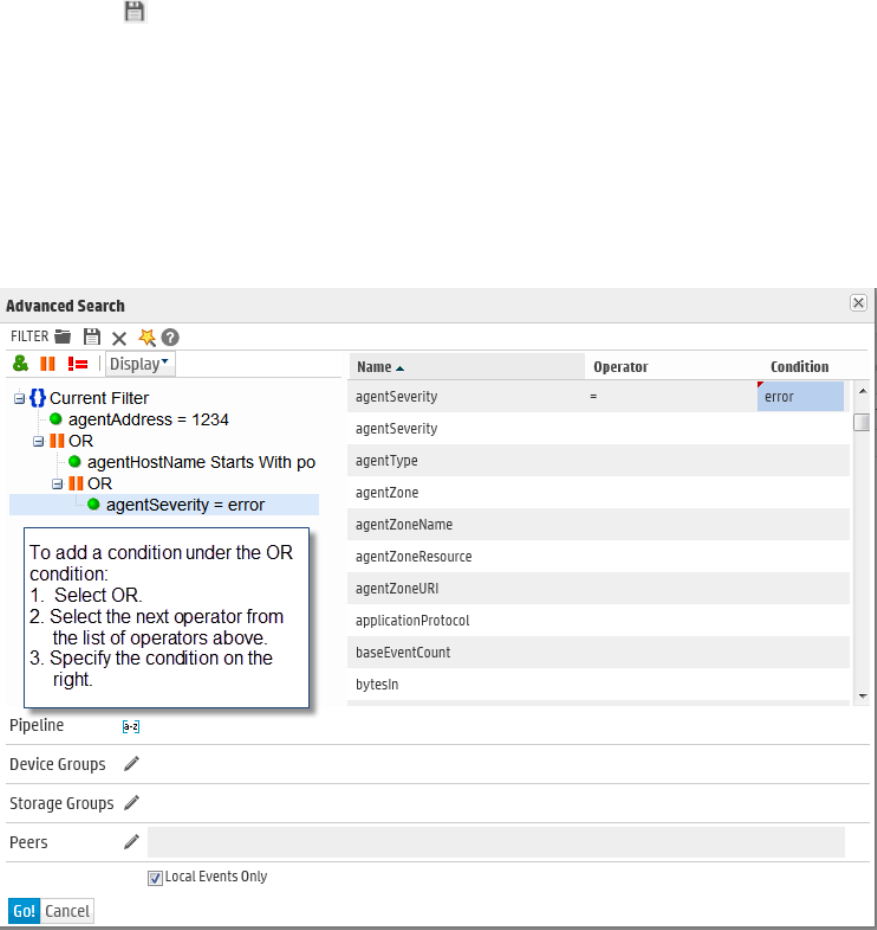
8. Click Go.
The query is automatically displayed in the Search text box and is ready to be run.
OR
Click the icon to save the query (referred as Saved Filter or a Saved Search) for a later use. For
more information about saving queries, see "Saving Queries (Creating Saved Searches and Saved
Filters)" on page124.
Nested Conditions
You can create search queries with nested conditions in Search Builder. To do so, click the operator
under which you want to nest the next condition and add the condition as described in "Accessing the
Advanced Search Builder" on page87.
Alternate Views for Query Building in Search Builder
By default, a tree view representation of the conditions is displayed, as shown in the previous figures in
this section. You can change the view to a color-block scheme and the location where the fields you
select are displayed. They can in the lower part of the screen or to the right of where conditions are
displayed.
Administrator's Guide
HPE Logger 6.2 Page 90 of 623
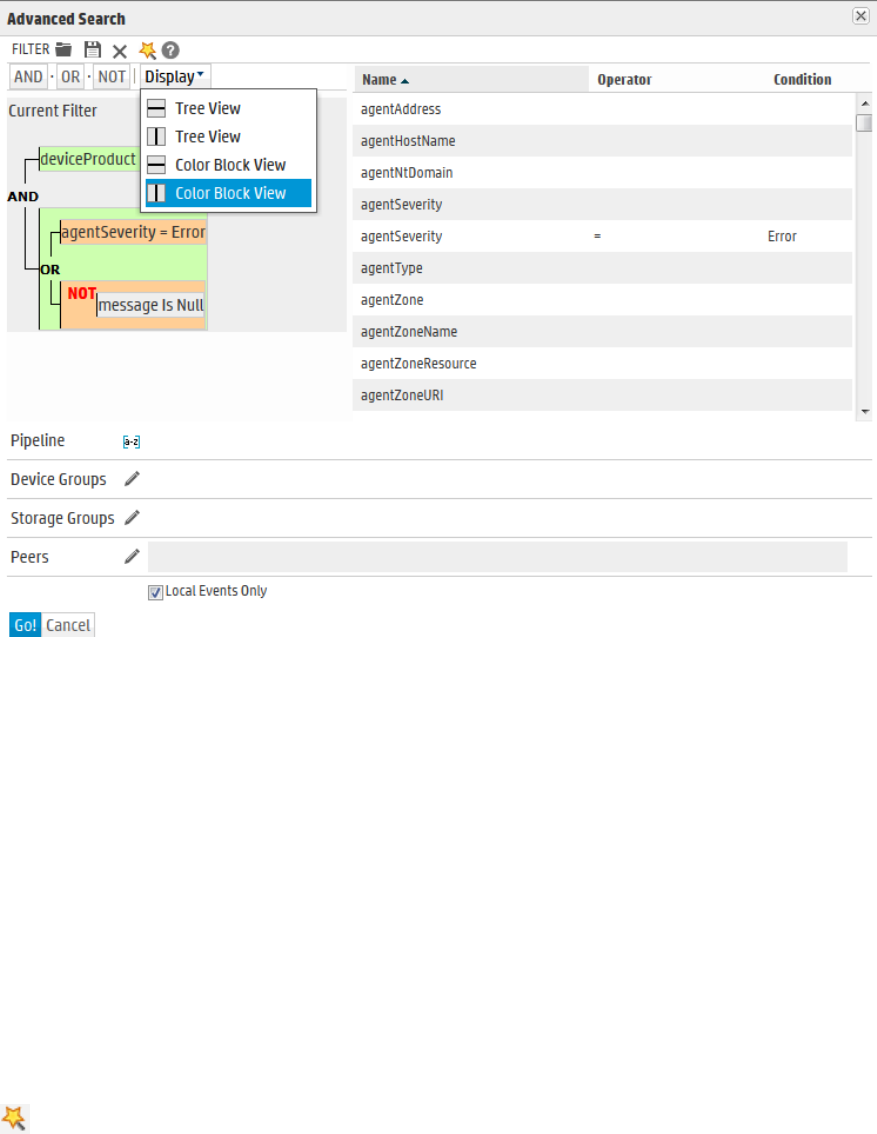
To change views:
Click Display in the Search Builder tool and select the view of your choice.
Search Analyzer
A query’s performance is dependent on many factors such as load on the system, size of data to be
searched, indexed or non-indexed fields included in the query, the complexity of a query (a large
number of conditions, wildcard characters, nesting), and so on.
The Search Analyzer tool analyzes a query to determine if any of the fields included in the query are
non-indexed for the time range specified and thus affect the query’s performance.
You can run this tool as needed; for example, if a query runs slower than expected. You can use Search
Analyzer on a query after you have run it or while building a query using the Search Builder. Click the
icon to access the Search Analyzer tool, as shown in the following figure.
Administrator's Guide
HPE Logger 6.2 Page 91 of 623
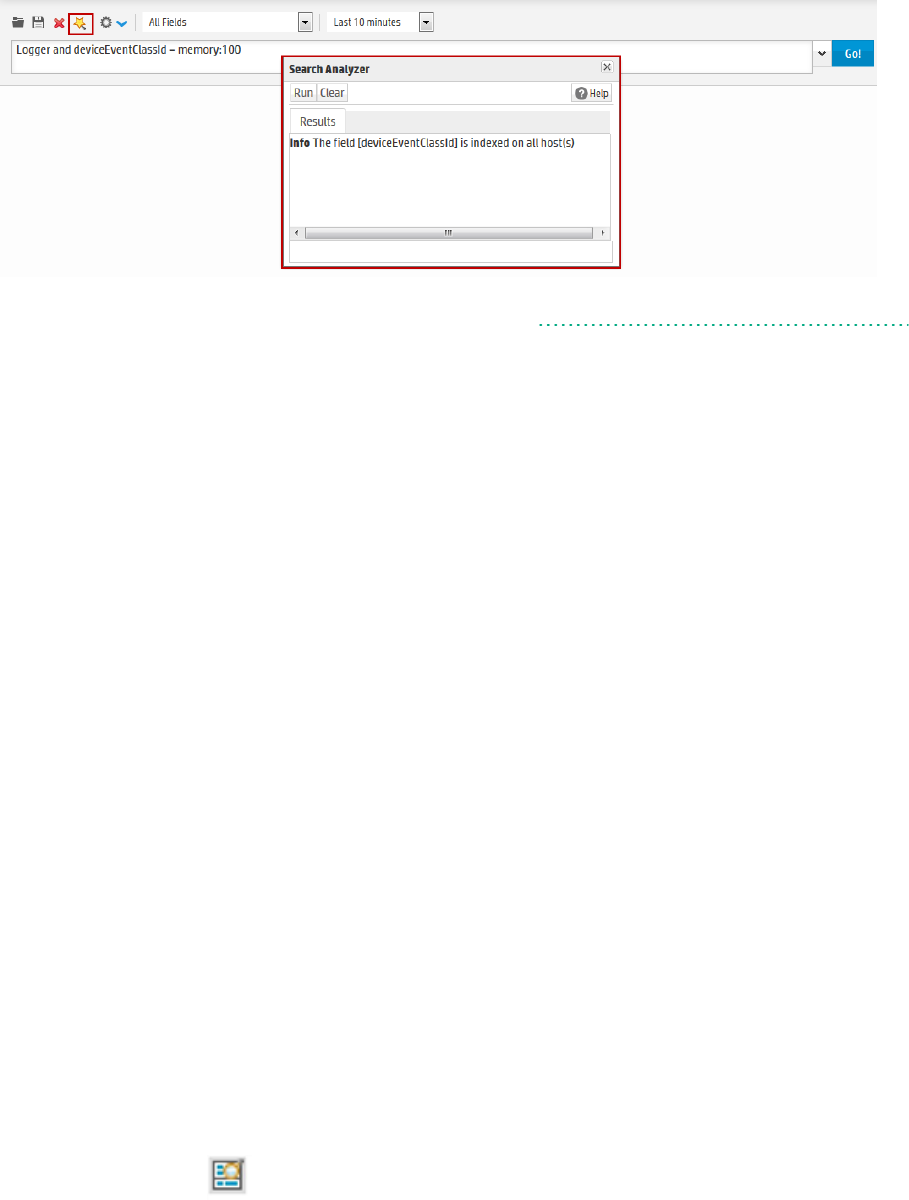
• Performance Optimizations for Indexed Fields in Queries 92
Performance Optimizations for Indexed Fields in Queries
Even though a search query includes indexed fields, you might not realize the performance gain you
expect in these situations:
lWhen you include indexed and non-indexed fields in a query. Therefore, HPE recommends that you
identify the fields that you will most commonly use in queries and index all those fields.
lWhen you include fields that are not super-indexed or field operators other than = in a needle-in-a-
haystack search, your search speed may not see the expected performance increase for super-
indexed fields. For fastest results when searching for rare values, be sure to follow the
recommendations in "Searching for Rare Field Values" on page103.
lWhen you perform search on data in a time range in which a currently indexed field (included in the
query) was non-indexed.
lFor example, you index the “port” field on August 13th at 2:00 PM You run a search on August 14th
at 1:00 PM to find events that include port 80 and occurred between August 11th and August 12th.
The “port” field was not indexed between August 11th and the 12th; therefore, the query runs slower.
lWhen you include a field in your search query that Logger is in the process of indexing. Therefore,
allow some time between adding a field to the index and using it in a search query.
lWhen a query that includes indexed field is performed on archived events, the query runs slower than
when the data was not archived. This occurs because the index data on Logger is not archived with
events. To improve the search speed of archived events, you can index them. For more information,
see "Indexing Archived Events" on page362
Regex Helper Tool
The Regex Helper tool enables you to create regular expressions that can be used with the rex
pipeline operator to extract fields of interest from an event. (For information about rex, see "Search
Operator Portion of a Query" on page74 or "Using the Rex Operator" on page508.) This tool not only
Administrator's Guide
HPE Logger 6.2 Page 92 of 623
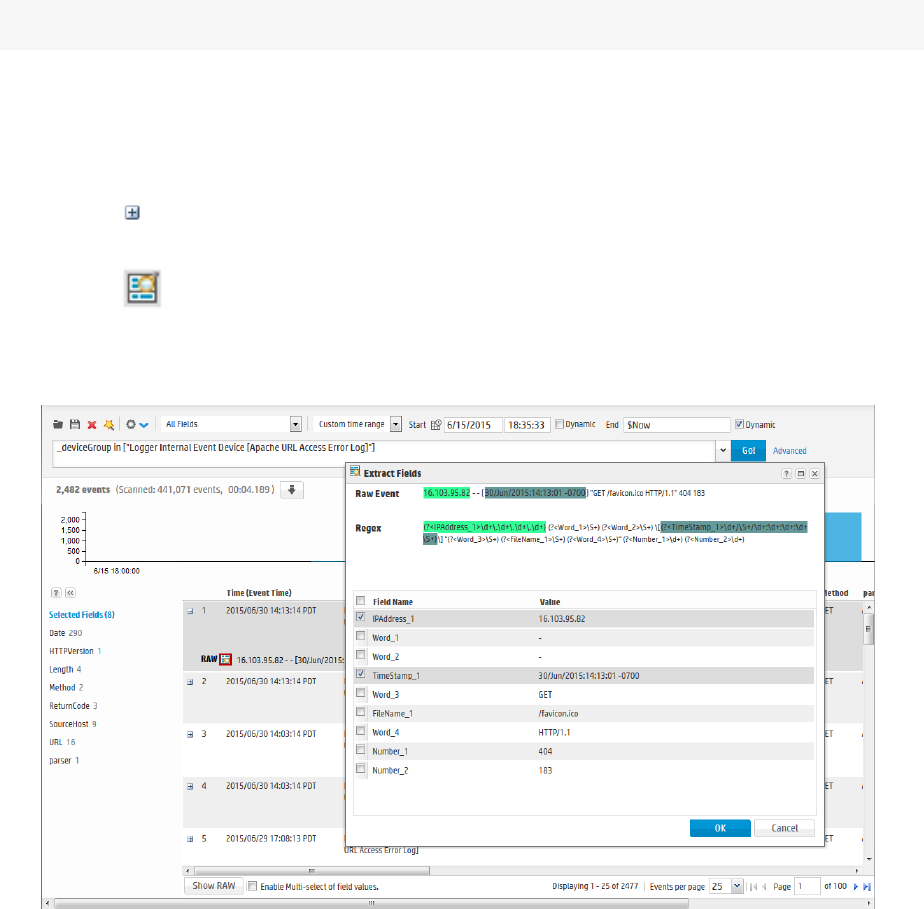
simplifies the task of creating regular expressions for the rex operator but also makes it efficient and
error free.
The tool, which is only available for non-CEF events (unstructured data), parses raw syslog events into
fields and displays them as a list. You select the fields that you want to include in the rex expression of
a query. The selected fields are automatically inserted in a search query as a rex expression.
To use the tool, you need to perform the following steps:
Note: These steps are also depicted in the figure that follows the steps.
1. Enter a search query that finds events of interest to you. (For information about running a search,
see "Searching for Events" on page98.)
2. Identify a syslog event that you want to analyze further. For example, in the shown figure, event
#7 is the event we will analyze further.
3. Click the icon (in the left-most column) for the identified event to expand it and display its raw
event.
4. Click the icon (next to the word RAW) to launch the Regex Helper tool.
5. Select the fields that you want to extract.
6. Click OK.
The rex expressions pertaining to the selected fields are automatically entered in the Search query box.
In this example we want to extract the IP addresses from events. Therefore, the IPAddress_1 field is
selected in the Regex Helper tool. (The Regex Helper tool assigns incremental labels if a data type
Administrator's Guide
HPE Logger 6.2 Page 93 of 623
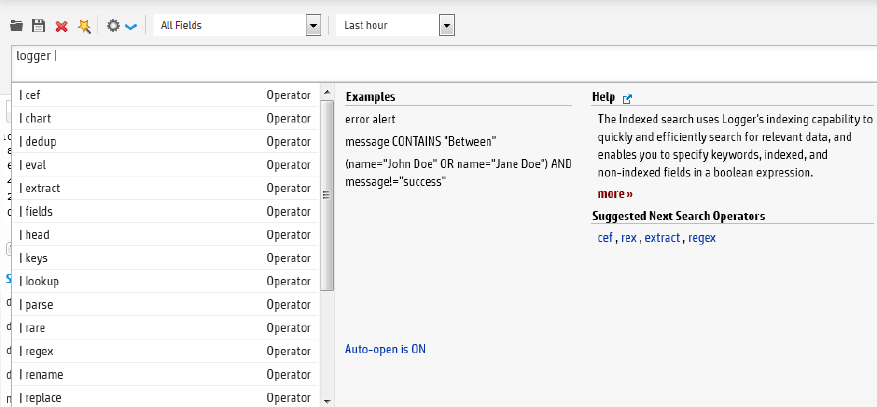
appears more than once in an event. For example, IP addresses are assigned IPAddress_1, IPAddress_2,
IPAddress_3, and so on labels.)
Once the IP address is selected and you click OK, the rex expression that includes the regular
expression for those IP addresses is displayed in the Search text box, as shown in the following
example.
_deviceGroup in ["Logger Internal Event Device [Apache URL Access Error Log]
"] | rex "(?<IPAddress_1>\d+\.\d+\.\d+\.\d+) \S+ \S+ \[(?<TimeStamp_
1>\d+/\S+/\d+:\d+:\d+:\d+ \S+)\.*"
From this point, you can include additional pipeline operators in this query to create charts, identify the
top five IP addresses, and so on. In the following example, the above query is modified to identify the
top IP addresses.
_deviceGroup in ["Logger Internal Event Device [Apache URL Access Error Log]
"] | rex "(?<IPAddress_1>\d+\.\d+\.\d+\.\d+) \S+ \S+ \[(?<TimeStamp_
1>\d+/\S+/\d+:\d+:\d+:\d+ \S+)\.*" | top IPAddress_1
Search Helper
Search Helper is a search-specific utility that automatically displays relevant information based on the
query currently entered in the Search text box.
Search Helper is available by default; if you do not want the Search Helper to display information
automatically, click the “Auto-open is ON” link (in the Search Helper window). The link toggles to
“Auto-open is OFF”. To access Search Helper once it has been turned off, click the down-arrow button
to the right of the Search text box.
Search Helper displays auto-complete search functionality, a search history, a search operator history, a
link to the help system, and suggested next operators.
Administrator's Guide
HPE Logger 6.2 Page 94 of 623
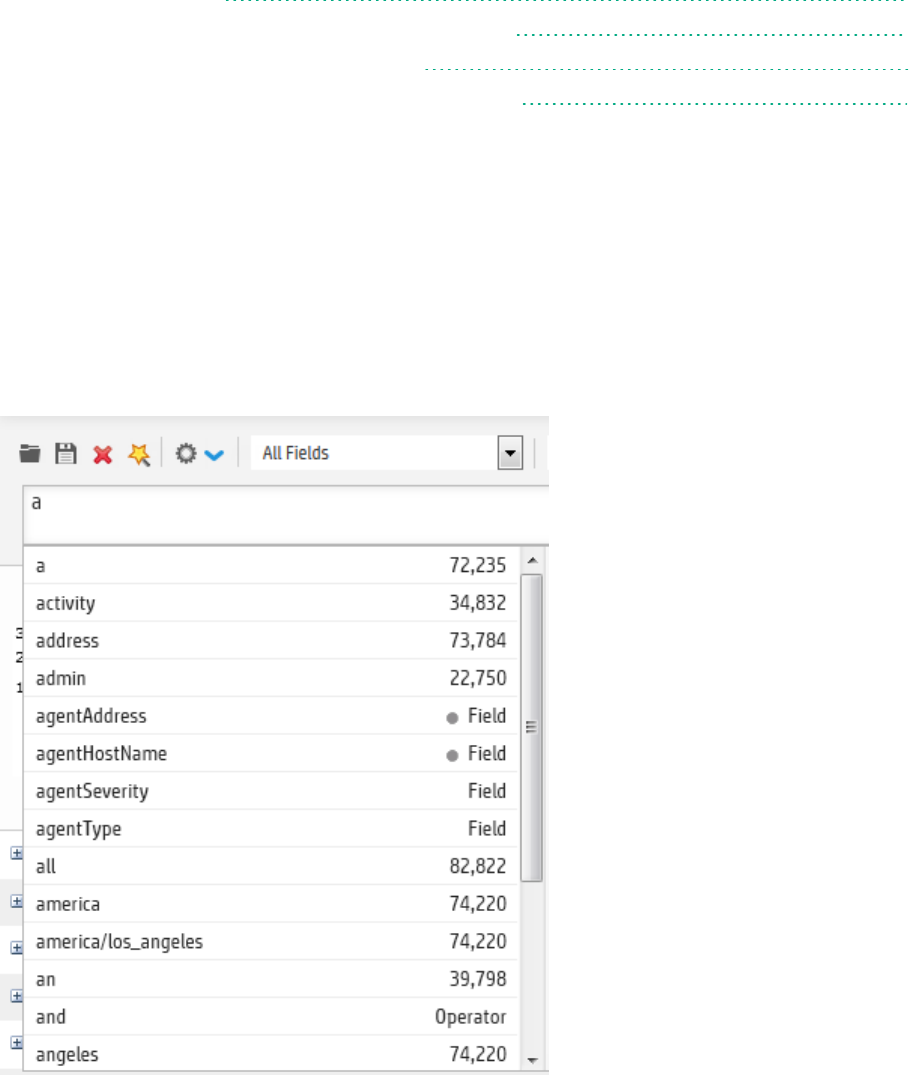
• Autocomplete Search 95
• Opening Filters and Saved Searches via Autocomplete 96
• Search History and Search Operator History 97
• Examples, Usage, Suggested Next Operators, and Help 98
Autocomplete Search
The autocomplete functionality provides full-text keywords and field suggestions based on the text
currently entered in the Search box. The suggestions enable you to select keywords, fields, field values,
search operators, or metadata terms from a list instead of typing them in, thus enabling you to build a
query expression more quickly.
When you start typing, the suggestion list displays many types of entries, as displayed in the following
image.
If the entered text is contained in both full-text keywords and schema fields, all of them are displayed in
the suggested list.
If you type “|” (the pipeline character), the list of operators available on Logger are displayed.
The full-text keyword suggestions are obtained from the full-text keywords that are already indexed on
your Logger.
Administrator's Guide
HPE Logger 6.2 Page 95 of 623
If the entered Logger schema field is indexed on Logger, field values associated with it are displayed.
However, if the field is not indexed, no field value suggestions are provided. The fields that are indicated
by a dot ( ) next to the word “Field” in the autocomplete list are not indexed on Logger.
Note:System-defined fields are not available as fields in the auto-complete (They will not have a
dot ( ) . For more information about system-defined fields and Logger searches, see "Things You
Should Know About Logger Searches" on page101 and "Additional Fields in the Search Results" on
page112.
The full-text keywords and field values display a count next to each suggestion that indicates the
number of the instances of the keyword or field value stored on Logger.
The count represents the number of values stored for a field. The count is dependent on many factors
and may not be exact. It does not indicate how many events might match the query. Many factors
determine the number of event matches, including the time range, search constraints, and search
operators for the query.
Note: The autocomplete suggestions and counts are based on data stored on the local system
only. Counts are reset when the Logger restarts. Peer data is not included.
Search Group filters (that restrict privileges on storage and device groups) are not enforced on the
autocomplete list. Therefore, the list includes keywords, fields, field values, and counts of events in
storage and device groups to which a user might not have privileges.
When an archive is loaded back on Logger, the autocomplete list does not include the full-text keywords
or field values that were available before the events were archived. This happens because summary data
is not archived along with the event data. Therefore, when the event data is loaded back from an
archive, the archive data is not included in the summary.
On a Logger that is upgraded from 5.2 Patch 1 or earlier, the autocomplete list contains keywords and
fields that were indexed after the upgrade; keywords and fields included in the index prior to the
upgrade are not included. Therefore, if your query matches events that were in Logger prior to the
upgrade, there will be an inconsistency between the displayed count and the number of events found.
Opening Filters and Saved Searches via Autocomplete
Logger 6.0 adds the autocomplete constants $filter$ and $ss$ to enable you to open Filters and
Saved Searches directly from the search box.
If you type $filter$ in the search box, the available Filters show up in the autocomplete. (Filters
include only the query.) You can click a suggestion to select it or continue typing the filter name to
narrow down the options. Once you select a filter from the autocomplete, Logger replaces the search
box contents with the Filter definition.
Administrator's Guide
HPE Logger 6.2 Page 96 of 623
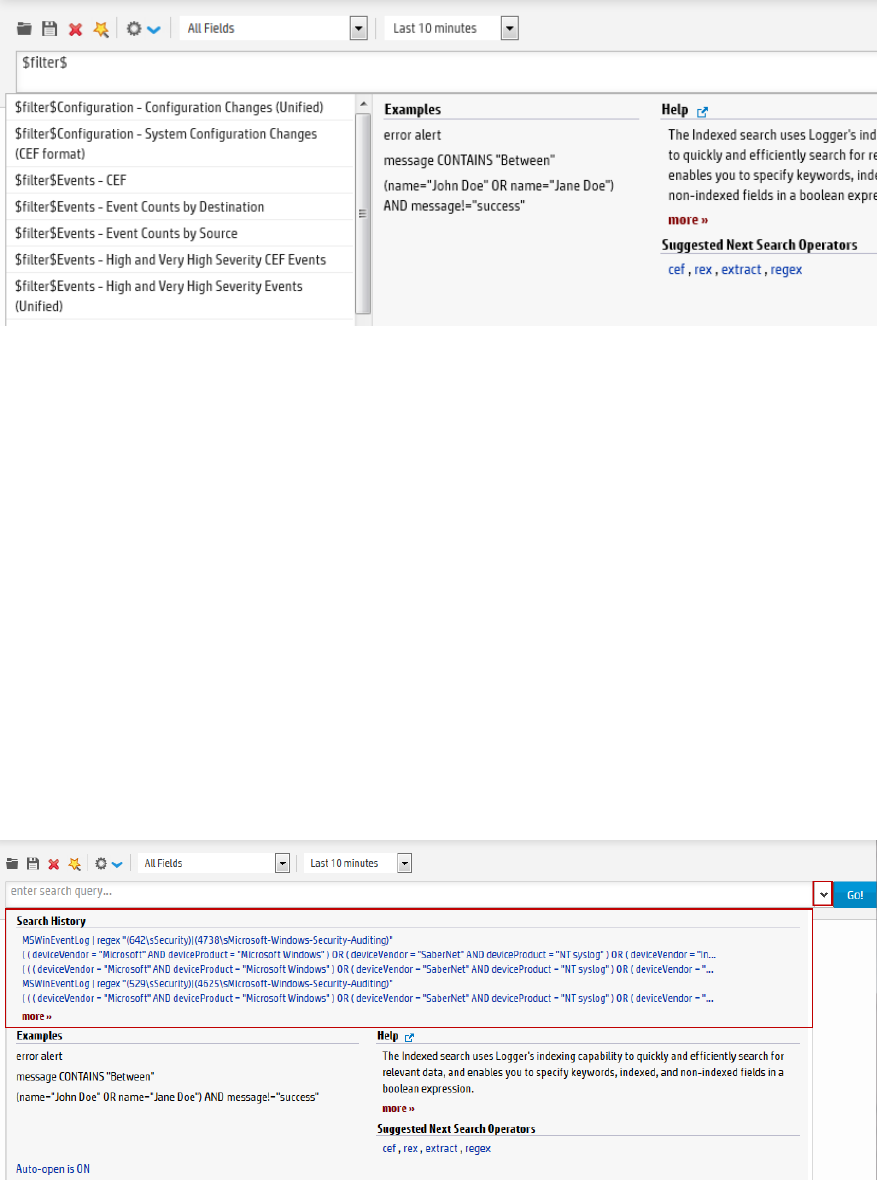
If you type $ss$ in the search box, the available Saved Searches show up in the autocomplete. (Saved
searches include the query, the start date/time, the end date/time, local only, and so on.) You can click a
suggestion to select it or continue typing the saved search name to narrow down the options. Once you
select a saved search from the autocomplete, Logger replaces the search box contents with the Saved
Search definition.
To use an autocomplete suggestion:
Click the suggestion to move it up to the search box. Then click Go! to run that search or continue
typing in the search box to narrow your search further.
Search History and Search Operator History
The Search History displays recently run queries that match the currently entered search. Click a recent
query to run it again. To see the search history, start typing a search or click the down-arrow next to the
Go! button.
The
Search Operator History displays the fields used previously with the search operator that is currently
typed in the Search text box. The Search Operator History only displays if you have previously used the
Administrator's Guide
HPE Logger 6.2 Page 97 of 623
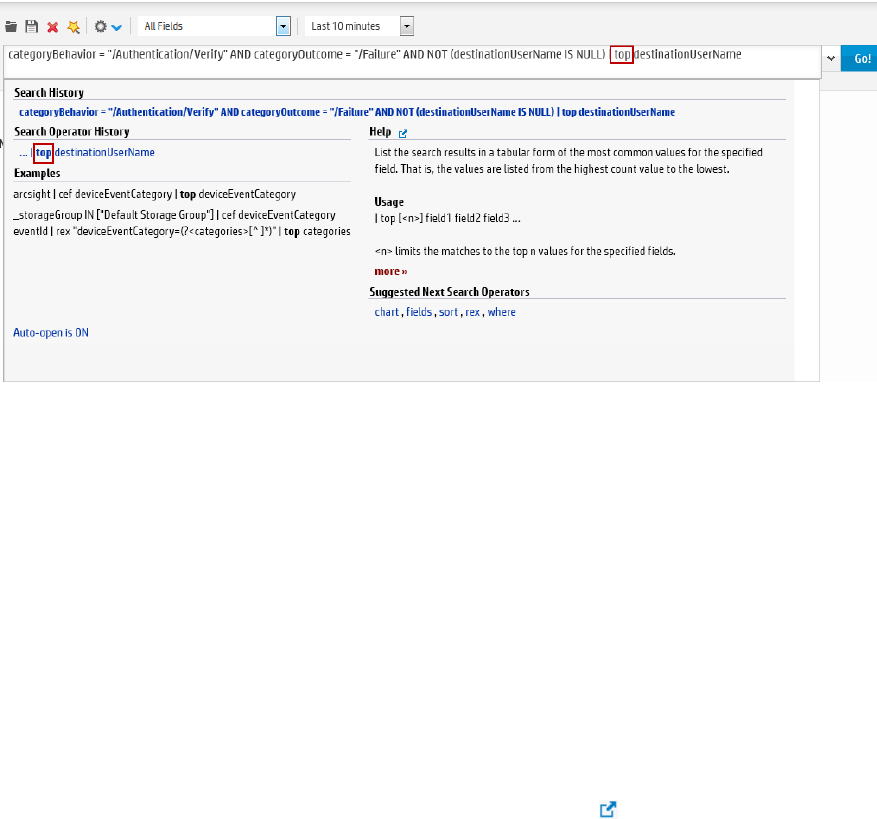
operator you have currently typed to perform searches on this system. Click the operator to add it to
your search.
Examples, Usage, Suggested Next Operators, and Help
The Examples section lists examples relevant to the latest query operator you have typed in the Search
text box.
The Usage section provides the syntax for the search operator.
The Suggested Next Operators section provides a list of operators that generally follow the currently
typed query. For example, if you type logger |, the operators that often follow are rex, extract, or
regex. You can select one of the listed operators to automatically append to the currently typed query
in the Search text box. This list saves you from guessing the next possible operators and manually
typing them in.
The Help section provides context-sensitive help for the last-listed operator in the query that is
currently typed in the Search text box. Additionally, if you click the icon, Logger online Help
launches.
Searching for Events
The topics in this section explain how to search for events on Logger.
To perform local searches, a user must belong to a Logger Search Group with the “Search for events”
user right set to Yes.
To perform searches on peers and view the search results, a user needs to belong to these user groups
with the listed permissions:
lLogger Search Group with “Search for events on remote peers” user right set (checked).
lLogger Rights Group with the “View registered peers” user rights set (checked).
Administrator's Guide
HPE Logger 6.2 Page 98 of 623
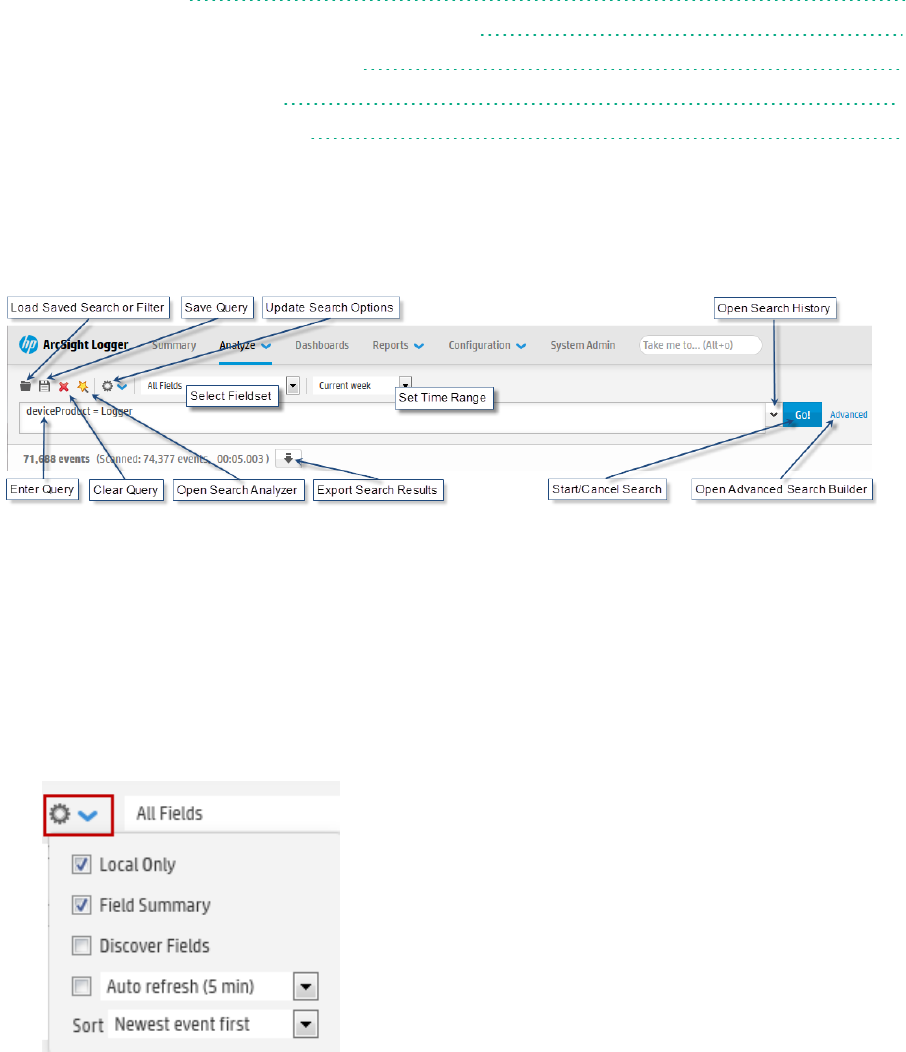
• Running a Search 99
• Things You Should Know About Logger Searches 101
• Searching Peers (Distributed Search) 102
• Tuning Search Performance 103
• Searching for Rare Field Values 103
Running a Search
You can use the options displayed on the search page to help create and run your search query.
In addition to the options displayed on the search page, search options enable you to tune search
operations to suit your environment. Those options are discussed in "Search Options" on page276.
To search for events on Logger:
1. Open the Analyze menu and click Search.
2. Click the down-arrow to view and adjust the search options. Use the default values or change them
suit your needs:
a. Local Only: This option is only displayed when peers have been configured for your system.
Local Only is checked by default. If you want to include peers in your search, uncheck the Local
Only checkbox. If you do not see this checkbox, no peers have been configured on your Logger.
See "Searching Peers (Distributed Search)" on page102 for more information.
b. Field Summary: Lists the selected CEF fields in the displayed events. By default, the selected
fields include: deviceEventClassId, deviceProduct, deviceVendor, deviceVersion, and name; you
Administrator's Guide
HPE Logger 6.2 Page 99 of 623
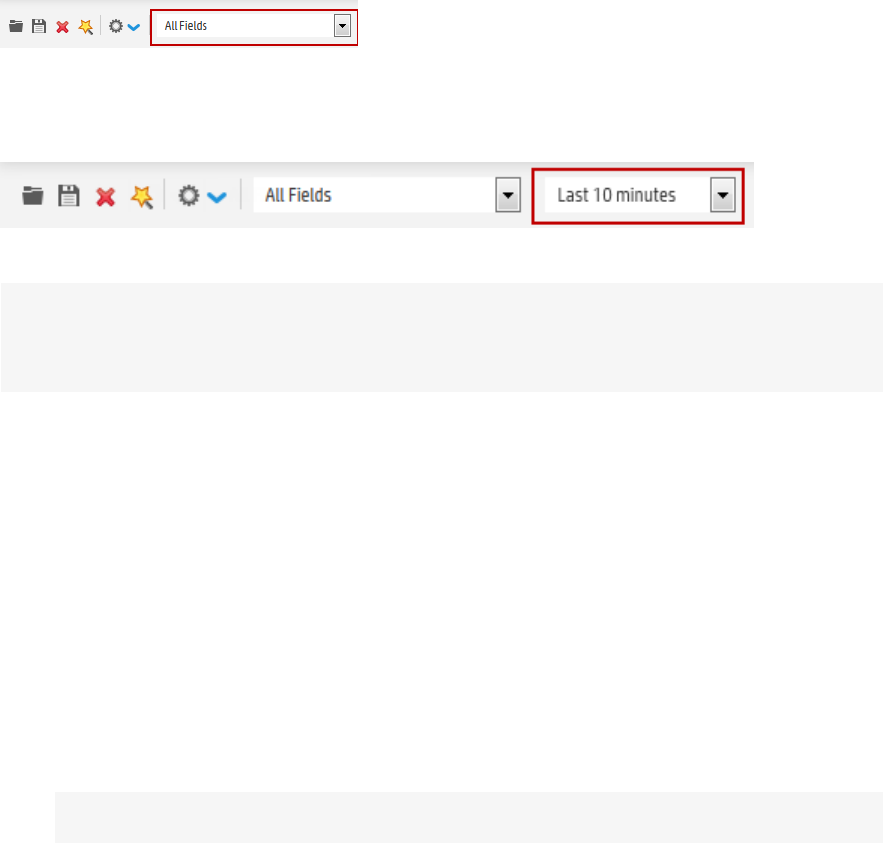
can edit this list to suit your needs. Selecting this option enables the Discover Fields option. See
"The Field Summary Panel" on page116 for more information about the Field Summary and
Discover Fields options.
c. Discover Fields: Lists the non-CEF fields discovered in raw events. This option is only taken
into consideration when Field Summary has been selected.
d. Auto Refresh: By default, the search results are not refreshed. Select this option to have the
Search results auto refresh. You can select from the following refresh intervals: 30 seconds, 60
seconds, 2 minutes, 5 minutes, or 15 minutes.
e. Sort : Select Oldest Event First or Newest Event First, depending on how you want the search
results to display.
3. Fieldset: By default, all fields (All Fields) are displayed in the search results. However, you can
select another predefined field set or specify a customized field set. See "Fieldsets" on page77 for
more information.
4. Time Range: By default, the query is run on the data received in the last ten minutes. Click the
drop-down list to select another predefined time range or specify a custom time range. See "Time
Range" on page74 for more information.
5. Specify a query expression in the Search text box using one or more of the following methods.
Note: Refer to "Keyword Search (Full-text Search)" on page67, "Field-Based Search" on
page69, and "Searching for Rare Field Values" on page103 for instructions, exceptions, and
invalid characters before you create a query expression.
a. Type the query expression in the Search text box. For information about building a query
expression, including lists of applicable operators, see "Elements of a Search Query" on page66.
b. When you type a query, Logger’s Search Helper enables you to quickly build a query expression
by automatically providing suggestions, possible matches, and applicable operators. See "Search
Helper" on page94 for more information.
c. Use these guidelines to include various elements in a search query:
oFor a complete list of fields in Logger schema, see "Field-Based Indexing" on page134.
oMetadata terms (_storageGroup, _deviceGroup, _peerLogger)
Type “_s” (for storage group), “_d” (for device group), or “_p” (for Logger) in the Search text
box to obtain a drop-down list of constraint terms and operators.
oRegular expression term (|REGEX=)
Note: If your query expression includes multiple device groups and storage groups to
Administrator's Guide
HPE Logger 6.2 Page 100 of 623

which search should be constrained, make sure that the group names are enclosed in a
square bracket; for example, _storageGroup IN [“SGA”, “SGB”].
oClick Advanced to use the Search Builder tool. (See "Using the Advanced Search Builder" on
page87 for more information.) Also, use this option to specify device groups, storage
groups, and Loggers to which search should be limited.
d. Click the icon to load a saved filter, a system filter, or a saved search. Select the filter or the
saved search from the displayed list and click Load+Close.
For more information, see "Saving Queries (Creating Saved Searches and Saved Filters)" on
page124 and "System Filters/Predefined Filters" on page128.
6. Click Go.
The search results are displayed in the bottom section of same screen in which you ran the search.
For more information about how search results are displayed and various controls available within
the user interface to use those results, see "The Search Results Display" on page107.
You can also save the search you ran as a saved filter or saved search. Click the icon to do so.
For more information about a saved filter or a saved search, see "Saving Queries (Creating Saved
Searches and Saved Filters)" on page124.
Things You Should Know About Logger Searches
Take the following points into consideration when writing search queries.
lValues in the system-defined fields, which include Time, Device, Logger, parser, source, and
sourceType, cannot be searched by either keyword or field based searches. These fields are system-
defined and do not exist in the raw event text. Therefore, searching for data in these fields returns no
result.
While the parser field includes only the name of the parser and is not searchable, the parser defines
fields based on its associated source type, and those fields are searchable. See "Additional Fields in
the Search Results" on page112 for more information.
Note:Fields that are not searchable are not highlighted by mousing over them in the search
results and are not marked as fields in the auto-complete search. See "Refining a Search from the
Search Results Table" on page113 and "Autocomplete Search" on page95 for more information.
lNull values are not included in the Search results. For example, when performing a search on event
data such as "NOT deviceCustomString1=bar", the search returns results that match
deviceCustomString1 not equal to "bar", but does not return events where the deviceCustomString1
value is NULL. You must explicitly call out NULL values with <field> IS NOT NULL or <field> IS NULL.
Note: Logger can be configured to make NOT search conditions include NULL values. This
implementation is available through Customer Support.
lData contained within a string that has already been tokenized cannot be searched. Searchable
Administrator's Guide
HPE Logger 6.2 Page 101 of 623
keywords are determined by the set of delimiters used to parse the raw text string into searchable
units called tokens. These delimiters are controlled on the Configuration > Search Options page.
lLogger includes the following primary delimiters for use during full-text (keyword) search: space,
tab, newline, comma, semi-colon, (, ), [, ], {, }, ", |, and *. If only these primary delimiters are set to yes
on the Configuration > Search Options screen and the raw event contains a string like this:
dmz:10.9.9.9/20, then that entire string would be a single, searchable keyword.
lThe Configuration > Search Options screen also enables you to use secondary delimiters when
searching. If the secondary delimiters are also set to yes, the following list of delimiters would
further tokenize the string: =, . , :, /, \, @, -, ?, #, &, _, >, and <. As a result, if the raw event contains
the string: dmz:10.9.9.9/20, then the searchable keywords for this event, will be dmz, 10, 9, and
20.
See "Search Options" on page276 for more information on setting primary and secondary
delimiters.
Searching Peers (Distributed Search)
When you run a search query, by default, only your local Logger is searched for matching events.
However, when specifying a query, you can select an option to run the search on the peer Loggers. You
can select the Loggers to which the search should be constrained, as described in "Searching for Events"
on page98.
Follow these guidelines for searching across peers:
lSearches across peers are limited by the ability of the earliest version peer. For example, operators
you can use are limited by the operators of the earliest peer.
Logger supports searching up to 40 peers.
lFor best performance of non-pipeline searches, all peers must be on Logger 6.0 or later, and the
query must not include the regex, rex, parse, keys, transaction, extract, or lookup
operators.
lIf Loggers do not have identical storage or device group names, a search query operation skips
searching for events for those groups on those peers.
lIf you added custom schema fields to your Logger schema, those fields must exist on all peers.
Otherwise, a search query containing those fields will not run (when run across peers) and return an
error. See "Adding Fields to the Schema" on page379.
lA user needs to belong to these user groups with the listed permissions set to perform searches and
view their search results:
lLogger Search Group with “Search for events on remote peers” user right set (checked).
lLogger Rights Group with the “View registered peers” user rights set (checked).
Administrator's Guide
HPE Logger 6.2 Page 102 of 623

lWhen a Logger becomes unavailable during a search operation, error messages are displayed. The
displayed message varies depending on the error detected. This is most likely because there is a
problem with the network or the peer is down. In some cases it may be because there is an issue with
the peering relationship. The error messages may still display for the search that was in progress even
after the problem is fixed. However, you can ignore such messages if they go away when you run a
new distributed search. For more information about peers, see "Peers" on page396.
Tuning Search Performance
Search performance depends on many factors and will vary from query to query. Some of factors that
can affect search performance are listed below. To optimize search performance, ensure that you follow
these recommendations:
lWhen searching for uncommon field values, use superindexing to narrow the range of data that
needs to be searched, as described in "Searching for Rare Field Values" below.
lEnable field-based indexing for all fields that occur in your events. When events are indexed, Logger
can quickly and efficiently search for relevant data. By default, a recommended set of fields are
indexed on your Logger; you might need to add additional fields, as described in "To add fields to the
field-based index:" on page274.
lAvoid specifying a time range that results in a query that needs to scan multi-millions of events.
lLimit the search to specific storage groups and peers.
lReduce other load on the system when your query needs to run, such as scheduled jobs, large
number of incoming events, and multiple reports being run.
lBefore running a query, make sure all Loggers on which it will run support the query features.
For more information on improving search performance, refer to the Logger Configuration and Tuning:
Best Practices technical note.
Searching for Rare Field Values
To enable you to quickly search common IP address, host name, and user name fields for rare field
values; Logger creates superindexes on new data as it comes in. Searches written to take advantage of
super-indexed fields will tell you very quickly if there are no hits and will return results more quickly than
regular searches when there are very few hits. Therefore, they are excellent for fast needle-in-a-
haystack searches. For more information, see " Superindexing" on page136.
Note: Since superindexes are built on new data as it comes in on, they only apply to data collected
by Logger 5.5 or later. Any data brought forward from an upgrade from an earlier version of
Logger will not be superindexed and will not exhibit this search speed improvement.
Administrator's Guide
HPE Logger 6.2 Page 103 of 623

Writing Searches to Increase Search Speed on Super-Indexed Fields
To take advantage of superindexing and get the fastest search results, run an equal to (=) search, such
as sourceAddress=192.0.2.0, and write the indexed search portion of your query to find
uncommon values in the super-indexed fields listed in the table below.
deviceEventClassId deviceProduct deviceVendor destinationHostName
destinationPort destinationAddress destinationUserId destinationUserName
deviceAddress deviceHostName sourceHostName sourcePort
sourceAddress sourceUserId sourceUserName
Super-indexed Fields
Note: Unlike the indexed fields discussed in "Field-Based Indexing" on page134, you cannot add to
the list of super-indexed fields.
Search on super-indexed fields only using the = operator, and only AND with non-super-indexed fields
for fastest search performance. Superindexes speed up searches that use the equal to (=) operator in
the indexed search portion of the query expression. They have no performance impact on searches that
use greater than (>), less than (<), not equal to (!=), or other operators in the indexed search portion of
the query. While Logger supports full-text search, search on fields that are not super-indexed, and
searches that use operators such as >, less than <, !=, and so on; such searches may not provide the
greatest search speed.
Using AND and OR with the = operator can be very powerful when searching super-indexed fields.
However, to obtain the greatest search speed improvement, you must use them carefully. The table
below provides examples to help you understand how to write queries that take advantage of the
power of superindexing.
Query Does It Improve Search Speed?
arcsight
(full text)
No difference.
This is a full text query, and so does not take advantage of super-
indexed field-search speed improvements.
192.0.2.0
(full text that looks like a super-
indexed field)
No difference.
While this could be an IP address, it is a full text search, not an =
search against one of the super-indexed fields, and so does not
take advantage of super-indexed field-search speed
improvements.
Query Examples for Superindexing in Needle-in-a-Haystack Searches
Administrator's Guide
HPE Logger 6.2 Page 104 of 623

Query Does It Improve Search Speed?
sourceAddress = 192.0.2.0
(= on a super-indexed field)
The search speed is improved and the results return very quickly
when there are no hits.
If Logger has not encountered 192.0.2.0 as a sourceAddress, it
quickly returns the message "No results were found". If it has
encountered that sourceAddress, the range of events to be
searched is narrowed down.
sourceAddress = 192.0.2.0 OR
sourceAddress = 192.0.2.2
(= using OR on super-indexed
fields)
The search speed is improved and the results return very quickly
when there are no hits.
If Logger has not encountered 192.0.2.0 or 192.0.2.2 as a
sourceAddress, it quickly returns the message "No results were
found". If it has encountered one or the other, the range of events
to be searched is narrowed down.
sourceAddress = 192.0.2.0 AND
destinationAddress = 192.0.2.2
(= using AND on super-indexed
fields)
The search speed is improved and the results return very quickly
when there are no hits.
If Logger has not encountered 192.0.2.0 as a sourceAddress, it
quickly returns the message "No results were found".
Similarly, if Logger has not encountered 192.0.2.2 as a
destinationAddress, it quickly returns the message "No results
were found", even if it has encountered 192.0.2.0 as a
sourceAddress.
If Logger has encountered both, the range of events to be
searched is narrowed down.
sourceAddress != 192.0.2.0
(!= on a super-indexed field)
No difference.
Superindexing does not help with negations, so this query does
not take advantage of super-indexed field-search speed
improvements.
sourceAddress != 192.0.2.0 OR
destinationAddress= 192.0.2.2
(!= using OR on Super-indexed
fields)
No difference.
Since there is a negation on the sourceAddress and this is an OR
condition, this query does not take advantage of super-indexed
field-search speed improvements.
sourceAddress != 192.0.2.0
AND destinationAddress =
192.0.2.2
The search speed is improved and the results return very quickly
when there are no hits.
Query Examples for Superindexing in Needle-in-a-Haystack Searches, continued
Administrator's Guide
HPE Logger 6.2 Page 105 of 623

Query Does It Improve Search Speed?
(!= using AND on Super-
indexed fields)
Since this is an AND condition, both conditions need to be true.
Even though there is a negation on the sourceAddress, if Logger
has not encountered a destinationAddress address of 192.0.2.2,
this AND condition will never be satisfied. In that case, it quickly
returns the message "No results were found".
If Logger has encountered that destinationAddress, the range of
events to be searched is narrowed down.
sourceAddress = 192.0.2.0 AND
arcsight
(= on super-indexed field AND
full text)
The search speed is improved and the results return very quickly
when there are no hits.
If Logger has not encountered a sourceAddress of 192.0.2.0, this
AND condition will never be satisfied. In that case, it quickly
returns the message "No results were found", even though there is
a full text search.
If Logger has encountered that sourceAddress, the range of
events to be searched is narrowed down.
sourceAddress = 192.0.2.0 OR
arcsight
(= on super-indexed field OR
full text)
No difference.
Regardless of whether Logger has encountered a sourceAddress
of 192.0.2.0, the OR condition requires a full text search for
"arcsight", so this query does not take advantage of super-indexed
field-search speed improvements.
requestMethod = GET AND
sourceAddress = 192.0.2.0
(NON-super-indexed field AND
super-indexed field)
The search speed is improved and the results return very quickly
when there are no hits.
Even though requestMethod is not one of the super-indexed
fields, because the query uses an AND condition, Logger quickly
returns the message "No results were found" if it has not
encountered a sourceAddress of 192.0.2.0.
If Logger has encountered that sourceAddress, the range of
events to be searched is narrowed down.
requestMethod = GET OR
sourceAddress = 192.0.2.0
(NON-super-indexed field OR
super-indexed field)
No difference.
Even though sourceAddress is one of the super-indexed fields,
because it is in an OR condition with requestMethod, which is not
super-indexed, this query does not take advantage of super-
indexed field-search speed improvements.
Query Examples for Superindexing in Needle-in-a-Haystack Searches, continued
Administrator's Guide
HPE Logger 6.2 Page 106 of 623

Query Does It Improve Search Speed?
sourceAddress = 192.0.2.0 AND
(sourceHostName =
myhost.com OR sourcePort =
80) AND (destinationAddress =
192.0.2.2 OR arcsight)
(super-indexed field AND
(nested OR condition) AND
(nested OR condition))
Results return very quickly when there are no hits.
If Logger has not encountered a sourceAddress of 192.0.2.0, the
top level AND will never be true. It quickly returns the message
"No results were found" in that case.
If Logger has not encountered a sourceHostName of myhost.com
AND it has not encountered a sourcePort of 80, then the OR
condition will never be true. Thus the top level AND condition will
never be true. It quickly returns the message "No results were
found" in that case.
If Logger cannot show that the above conditions are false, then
there will be no difference in search speed.
Even though destinationAddress is one of the super-indexed
fields, because it is in an OR condition with a full-text search for
"arcsight", the range of events to be searched cannot be narrowed
down.
Query Examples for Superindexing in Needle-in-a-Haystack Searches, continued
The Search Results Display
After you have initiated a search, the search results are displayed in the bottom section of the same
screen in which you ran the search. A search operation can take time when millions of events need to be
searched. When the first screen of events that match the specified conditions is available, Logger
automatically pauses the search and displays the matched events.
Event data is categorized by field name and each field is displayed as a separate column. For example,
the time when an event was received on the Logger (Event Time) is displayed in a column labeled Time
(Event Time).
• Adjusting the Displayed Search Results 108
• Canceling a Search in Progress 109
• The Histogram 109
• The Search Results Table 111
• Additional Fields in the Search Results 112
• Refining a Search from the Search Results Table 113
• Viewing Raw Events 113
• Changing the Displayed Search Results Using Field Sets 113
• Multi-line Data Display 114
• Auto Refresh Search Results 114
Administrator's Guide
HPE Logger 6.2 Page 107 of 623
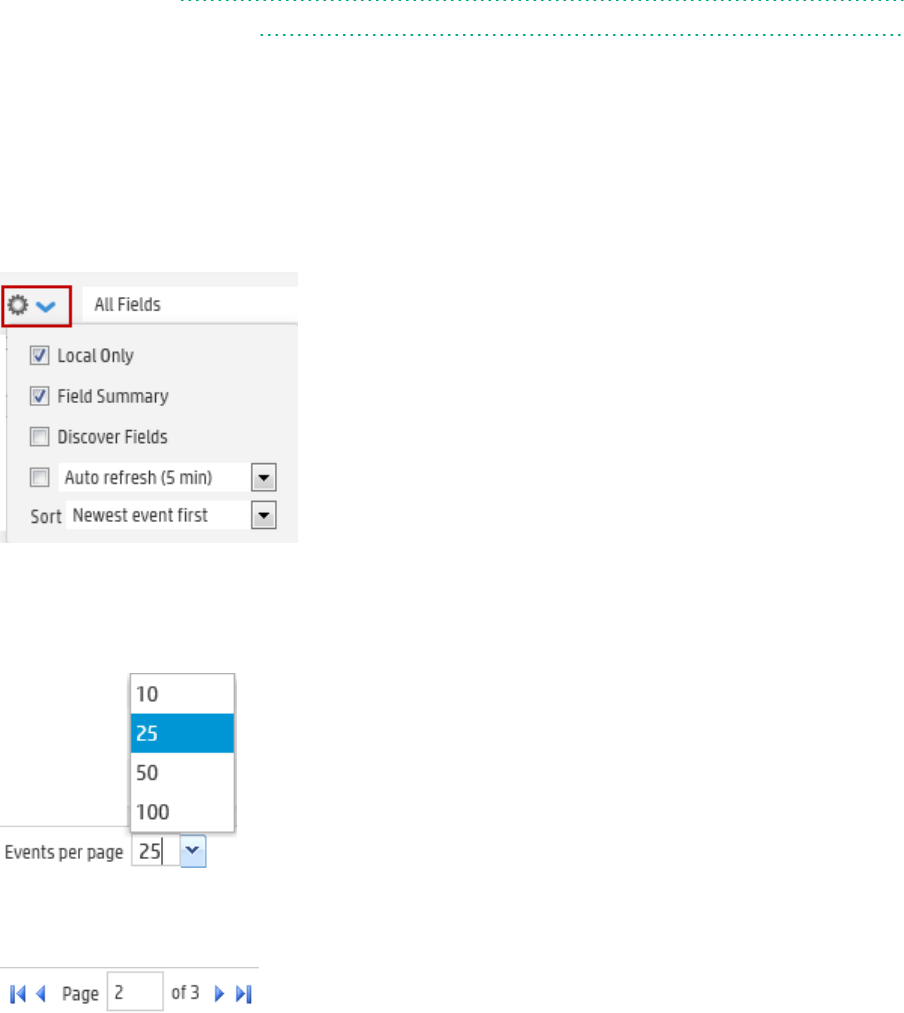
• Chart Drill Down 115
• The Field Summary Panel 116
Adjusting the Displayed Search Results
Search results are sorted by the Logger receipt time. The events are displayed either oldest first or
newest first, depending on what you selected when you ran the search. If you want to change the sort
order, you will need to rerun the search. To change the sort order, open the search options drop-down
and in the Sort field select Oldest event first or Newest event first.
By default, 25 events are displayed on one screen. To change the number of events displayed per
screen, open the Events per Page pop-up menu, located at the bottom of the search results, and select
the number of events to display.
Some searches may return many pages of results. To move from page to page in the search results, click
the appropriate arrow or type number of the page that you want to move to and then press Enter.
Each event is available in its raw form or parsed data. You can show or hide the raw event data from this
page. See "Viewing Raw Events" on page113 for details.
In addition to changing how the data is displayed, you can refine your search from the search results
display. See "Refining a Search from the Search Results Table" on page113 for details.
Administrator's Guide
HPE Logger 6.2 Page 108 of 623

Canceling a Search in Progress
While the search is in progress, the Go! button changes to Cancel—click Cancel to terminate the search
early. When a query is running, search results are displayed as matching events are found. Therefore,
when you click Cancel, any matching events found so far are displayed as the search results. This might
be helpful in cases when the query needs to scan a large data set, but the search results displayed so far
display the events you were looking for. You can further process the displayed (partial) results; for
example, export the results, use the histogram to drill down in the results, or click on any text in the
Search Results to add it to the query for further drill-down in the search results.
Note: If a query includes chart-able operators such as chart, rare, or top, and the query is
terminated early, a chart of the partial results is not displayed. Additionally, if a query includes the
head, tail, or sort operators, partial results are not generated.
The Histogram
The Search Results page displays a histogram that provides a graphical representation of the events
that match a search query. The histogram is based on the Logger receipt time of the events (similar to
search queries that also use the Logger receipt time to search for events).
The X-axis represents event time and Y-axis represents the number of matching events, as shown in the
following figure. The time distribution on the X-axis is determined automatically, based on the time
range specified in the query.
Note: The time range on the X-axis might not match the time range specified in the search query
because the start and end times on the X-axis are determined by the event times of the first and last
matching events of the search query.
Administrator's Guide
HPE Logger 6.2 Page 109 of 623
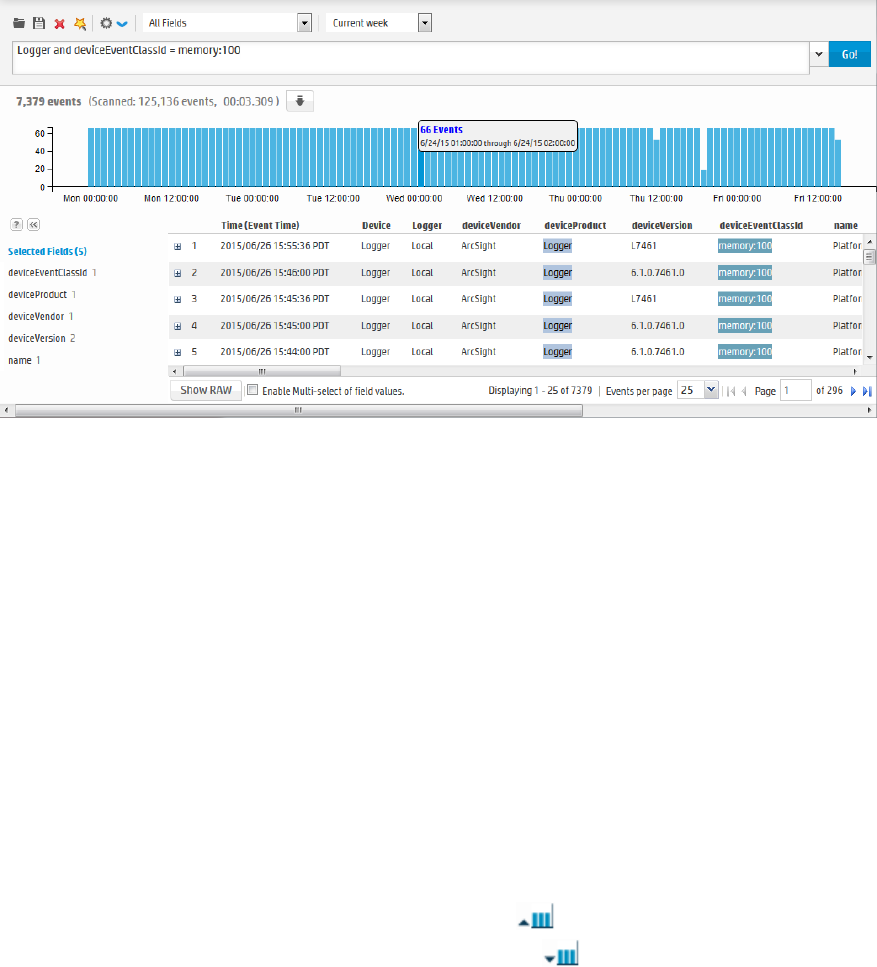
Histogram with mouse over showing details
A histogram is progressively built and displayed as events match a search query. If the search query
needs to scan a large amount of data or a large time period, the histogram displayed initially might
refresh multiple times while the query is running. To view the complete (and final) histogram of a search
query, wait until the query has finished running (that is, the screen does not display the circular
“waiting” icon anymore).
The first one million matching events are plotted on the histogram. If a search query matches more than
one million events, an informational message is displayed on the screen. If you need to use the
histogram view for event analysis for a search query that matches more than one million events,
ArcSight suggests that you adjust the time range specified in your search query so that than less than
one million are matched. This will allow you to obtain a complete and meaningful histogram. You can
also use a pipeline operator such as top, head, or chart to further refine search results so that the total
number of hits is under one million events.
Displaying the Histogram
You cannot disable the histogram, however, you can click to the upper-right corner of the
histogram to hide it. To display a hidden histogram, click the icon. (The histogram icons are gray
until you hover over them.)
Mouse-Over
You can mouse-over any histogram bar to highlight it and view the number of matching events and the
date and time period that the bar represents. For example, in the last figure, the highlighted bar
represents 2,712 events from 7/1/2011 19:00:00 through 7/1/14 20:00:00. The matching events listed
below the histogram do not change, and the histogram continues to display all matching events.
Administrator's Guide
HPE Logger 6.2 Page 110 of 623
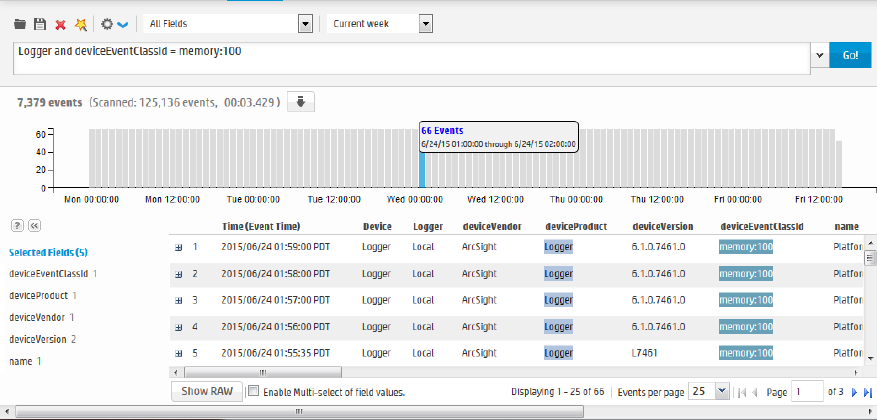
Histogram Drill Down
You can drill down to events in a specific time period by clicking the bar on the histogram that
represents that time period. The bar you drilled down to is highlighted and the events matching that
time period are listed below the histogram. The histogram continues to display all of matching events, as
shown in the following figure.
To deselect the time period, click the bar again. You can also select multiple consecutive bars on the
histogram to view matching events in all of the selected time units.
The Search Results Table
The search result page displays the number of events found and the number of events scanned, and
how long the search took.
Below the histogram, events are shown in table form, one row per event. Terms that match your query
are highlighted in blue to make it easy to see why an event matched the query. As you roll the mouse
over other terms in the events table, they highlight in green.
You can drill down into the displayed search results by clicking a green-highlighted term to add it to the
current query. For example, if you search for “login” and roll over the word “fail” in the search results,
“fail” will highlight in green. Click the word “fail” to change the query to “login AND fail.”
You can also highlight and copy text from any displayed column. This feature is handy when you need
to copy an IP address or a URL. (Highlight the term by dragging your pointer over it. Then, right-click to
display the Copy option.)
By default, a Field Summary panel is displayed on the left side of the matched events. This section lists
the fields that occur in matching events and the number of unique values for each in those events. For
more information about Field Summary, see "The Field Summary Panel" on page116.
Administrator's Guide
HPE Logger 6.2 Page 111 of 623

Additional Fields in the Search Results
In addition to Logger's schema fields, you may see other types of fields in the Search results.
User-Defined Fields
User-defined fields are created when a search query includes operators such as rex, extract, and
rename. See "Search Operators" on page467 for information on these operators. These fields are
displayed as additional columns in the All Fields view (of the System Fieldsets). To view only these
columns, select User Defined Fieldsets from the System Fieldsets list.
System-Defined Fields
When a search query matches events that were received from a defined source type and were parsed
using a pre-defined or user-defined parser, the search results include a parser field, and may include
fields for the source type, and source, depending on the setting in the Search Options page. For more
information, see "Search Options" on page276.
System-defined fields contain no event data and are not searchable. See "Things You Should Know
About Logger Searches" on page101 for more information.
Field Description
parser Indicates whether or not an event was parsed, and if so, which parser was used.
Note:While the parser field itself is not searchable, the parser defines
searchable fields based on its associated source type. These fields vary based
on the source type. For more information, see "Parsers" on page318.
If the event was parsed, this field contains the name of the parser. If the event
was not parsed successfully, this field contains “Not parsed”. If no parser is
defined for the source type or if there is no source type, the field is blank.
source type The type of file from which the event was received, as defined on the Source
Type page (Configuration | Data > Source Types). For more information, see
"Source Types" on page314.
If no source type was applied when the event was received, this field is blank.
You can control whether this field is displayed from the Search Options page.
source The name of the log file from which the event was received. For example,
/opt/mnt/testsoft/web_server.out.log.
If no source was applied when the event was received, this field is blank. You
can control whether this field is displayed from the Search Options page.
Administrator's Guide
HPE Logger 6.2 Page 112 of 623
Refining a Search from the Search Results Table
Use these shortcuts to select terms from the displayed search result columns or the raw events to refine
your search query:
lClick a term in search results to add it to the search query, and rerun the search immediately.
lFlag the Enable Multi-select of field values checkbox ( ) and then
click multiple terms to add to the search query. When multiple terms are added, they are joined by
AND operators. Click Go! to run the search.
lCtrl+click to replace the entire search query with <field name> + "CONTAINS" + <selected term>, and
rerun the search immediately.
lAlt or Shift + click the term in search results to add NOT to the term, and rerun the query, thus
eliminating the events that match the term you selected.
lAdd multiple NOT conditions by holding the Alt key and selecting terms in search results. When
multiple conditions are added, they are joined by AND operators. If Enable Multi-select of field
values is checked, click Go! to run the search. If it is not checked, the search runs when you click the
term.
lCombine Ctrl+Alt, (or Ctrl+Shift) to replace the search query with
NOT + <field name> + "CONTAINS" + <selected term>.
Note: Fields that are not searchable are not highlighted by mousing over them in the search
results and cannot be clicked on to add to the search. For more information about what is
searchable, see "Things You Should Know About Logger Searches" on page101, and "Additional
Fields in the Search Results" on the previous page.
Viewing Raw Events
Each event is available in its raw form or parsed data. By default, the parsed data is displayed.
lTo view raw data for a single event, click the icon to the left of the event.
lTo view raw data for all displayed events, click Show Raw ( ) at the bottom of the screen.
You can also view the Syslog raw events in a formatted column called rawEvent if you have enabled the
“Populate rawEvent field for syslog events” option on the Search Options page, as discussed in "Search
Options" on page276. See "Predefined Fieldsets" on page77 to learn more about displaying raw events.
Changing the Displayed Search Results Using Field Sets
By default, the Search Results are displayed using the All Fields field set, which displays all fields
contained in an event. Once you select another field set, it becomes your default view until you change it
the next time. For a detailed discussion about field sets, see "Fieldsets" on page77.
Administrator's Guide
HPE Logger 6.2 Page 113 of 623
If you view the Search Results using the Raw Event field set, remember these guidelines:
lEven though the rawEvent column displays the raw event, this column is not added to the Logger
database and is not indexed. Therefore, you can only run a keyword (full-text) or regular expression
to search on the event.
lYou can use the Regex Helper tool to identify strings from the raw syslog events in the rawEvent
column that you want to add to a query. (You cannot use the Regex Helper for CEF events displayed
in the rawEvent column.) See "Regex Helper Tool" on page92 for details about the Regex Helper
tool.
Multi-line Data Display
An event field might span multiple lines separated by characters such as newline (\n) or carriage return
(\r). For example,
0x0000: 0000 0100 0000 0000 0000 0000 0000 0000 ................
0x0010: 0000 0000 0000 0000 0000 0000 0000 0000 ................
0x0020: 0000 0000 0000 0000 0000 0000 0000 ..............
The Logger user interface displays these in multi-line format and does not remove the line separators
and collapse the message into one line.
Auto Refresh Search Results
The Auto refresh feature executes the search over specified intervals, updating the search results if new
events match the query.
Depending on your needs, you can auto update the search results every:
l30 seconds
l60 seconds
l2 minutes
l5 minutes (default)
l15 minutes
You can enable this option for a search operation before or after running it. Once you enable this
option, the setting persists for all search operations until you explicitly disable it.
To auto update search results:
1. Open the Analyze menu and click Search.
2. Check the Auto refresh box and select the refresh interval if different from the default, 5 minutes.
Administrator's Guide
HPE Logger 6.2 Page 114 of 623
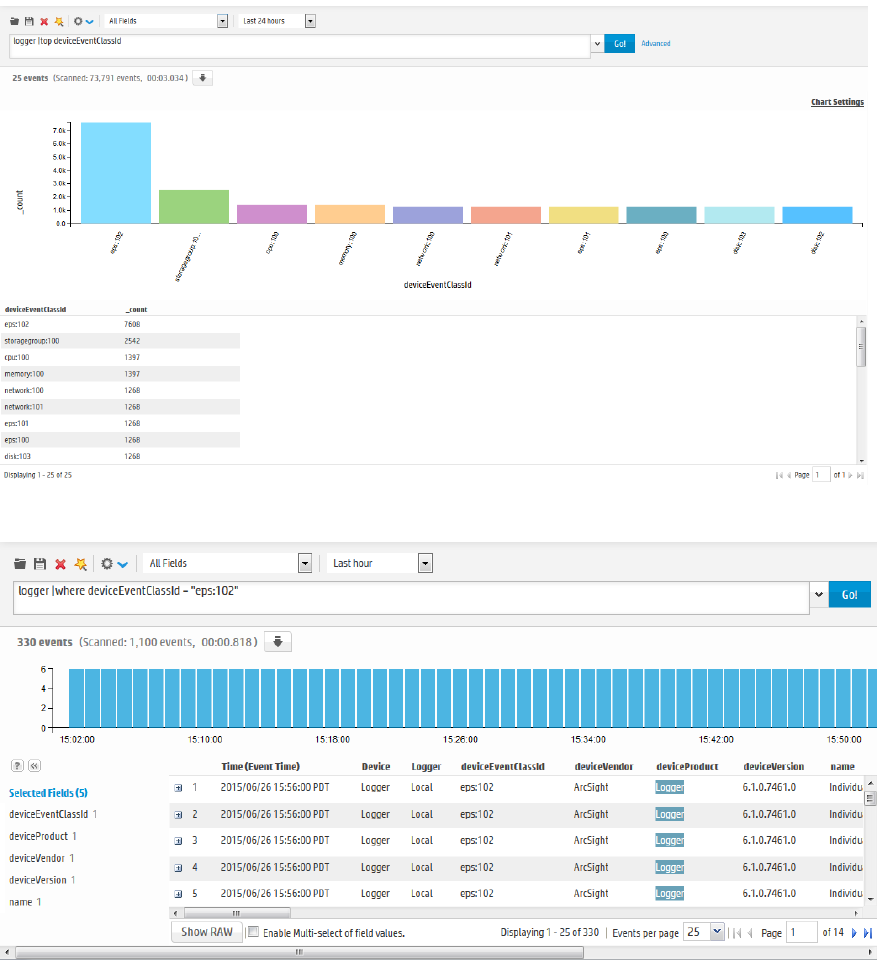
Chart Drill Down
Aggregated search operators such as chart, top, and rare generate charts of search results. The chart
drill down feature enables you to quickly filter down to events with specific field values. You identify the
value on a search results chart and click it to drill down to events that match the value. For example, in
the following chart, if you want to see events in which the device event class ID is eps 102, click the
column labeled eps:102 to display events shown in the second figure.
Administrator's Guide
HPE Logger 6.2 Page 115 of 623
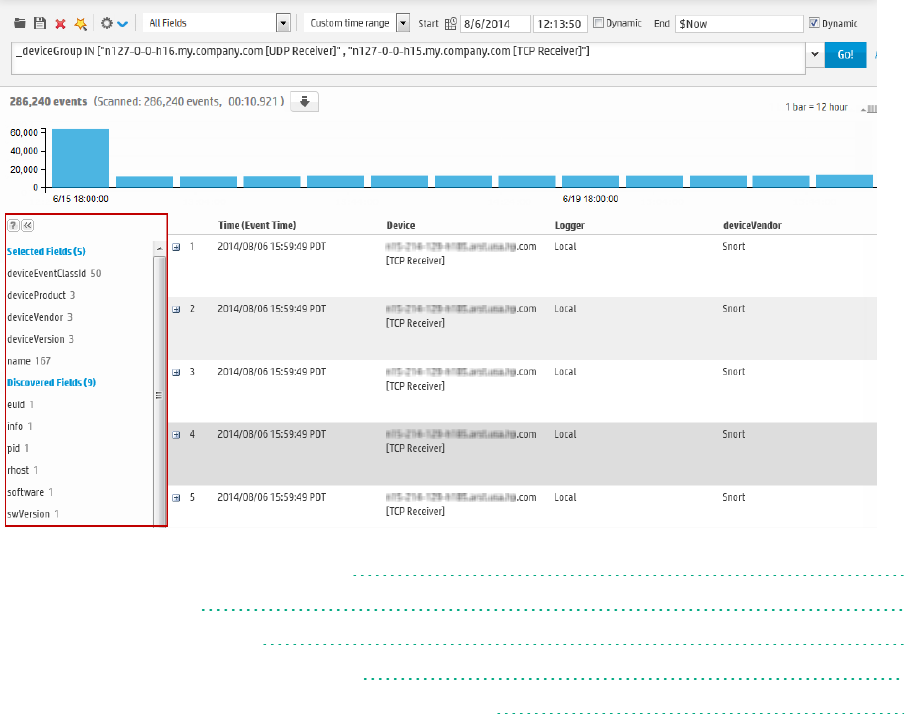
When you click on a chart value (a column, bar, or donut section), the existing search query is modified
to include the WHERE operator with the field name and value, and automatically rerun. If you need to
return to the original query from the drill-down screen, use the Back function of your browser.
The Field Summary Panel
When a query is run, the Field Summary panel lists the CEF and non-CEF fields that occur in matching
events and the number of unique values for each in those events. This panel is only displayed for
queries that do not generate charts. If a peer search is performed, the summarized field values include
counts from peer Loggers.
The Field Summary panel contains two sections: Selected Fields and Discovered Fields. The Selected
Fields section lists the CEF fields, while the Discovered Fields section lists the non-CEF fields discovered
in raw events.
• Displaying the Field Summary Panel 116
• Selected Fields List 117
• Field Summary Drill Down 118
• Discovering Fields in Raw Event Data 118
• Refining and Charting a Search from Field Summary 119
Displaying the Field Summary Panel
By default, the Field Summary feature is enabled and the Discover Fields option is disabled. These
options are controlled globally in the "Search Options" on page276, and locally with checkboxes in the
Administrator's Guide
HPE Logger 6.2 Page 116 of 623
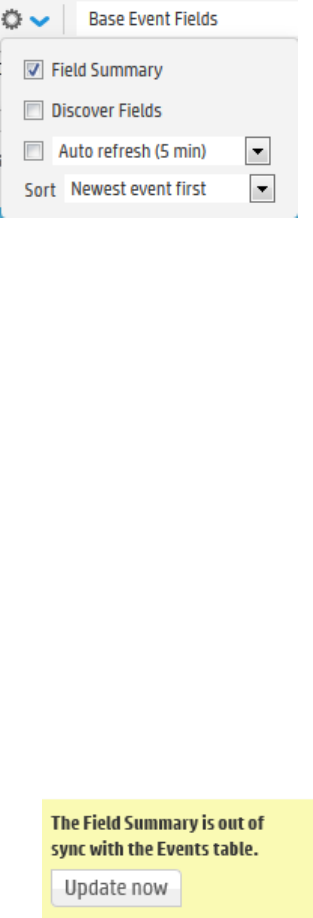
search results display options. Selecting these options on the Analyze >Search page overrides the
setting for these options on the Search Options page. For more information on the Discover Fields
option, see "Discovering Fields in Raw Event Data" on the next page.
You can display or hide the Field Summary panel by using the Fields Summary checkbox in the search
results display options.
Selected Fields List
By default, the Selected Fields list contains these fields: deviceEventClassId, deviceProduct,
deviceVendor, deviceVersion, and name; you can edit this list to suit your needs. For both lists, by
default, the top 10 values for each field are listed.
You can change the fields displayed in the Field Summary panel's Selected Fields list by changing the
field-set. You can use one of the predefined fieldsets or create your own to include only the fields you
need.
To change the Selected Fields list:
1. Define or update an existing custom field set to include fields you want the Selected Fields list to
contain. See "Fieldsets" on page77 for information on creating custom field sets.
2. Select the custom field set you defined to view search results.
3. After running a search query, if you select a different field set, the Field Summary panel displays
the following message:
The Field Summary is out of sync with the Events table.
This message indicates that the fields listed in the Field Summary panel do not match the ones
specified in the newly selected field set. To display the fields specified in the new field set, click
Update now.
Administrator's Guide
HPE Logger 6.2 Page 117 of 623
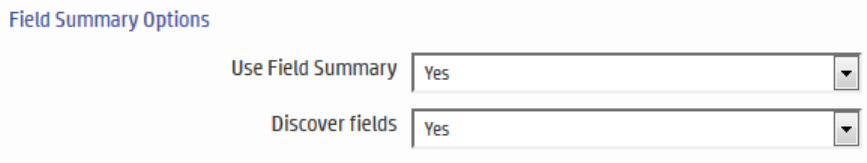
Field Summary Drill Down
You can drill down on any of the listed fields or a specific value of the listed fields in the Fields Summary
panel.
For example, you might want to view all events containing deviceEventClassId (specific field) or you
might want to view events of deviceEventClassId “storagegroup:100” (specific value of a field).
For fields whose values are of type String, you can view all events, view the top 10, or create charts of
the matching events. For fields whose values are of type Numeric, you can perform mathematical
operations such as average, min, and max.
Every time you run a query or drill down on a specific field or value, a new query using the newly
selected criteria is run and the Field Summary list is updated.
To view drill down in the field summary:
1. Click Search to open the search page.
2. Click the down arrow to configure the search display options and check the Field Summary
checkbox.
3. Then run a search.
4. In the Field Summary list, click the field name you want more detail on.
5. The<fieldname><number of values> dialog box displays the top ten field values.
6. Optionally, click Display events containing <fieldname> to run a search that displays only those
events.
7. Optionally, click a field value to run a search that displays only those events.
8. Optionally, create a chart of the results as discussed in "Refining and Charting a Search from Field
Summary" on the next page.
Discovering Fields in Raw Event Data
The Field Summary feature can automatically discover non-CEF fields from a raw event if the Discover
Fields is enabled. By default, the Discover Fields option is disabled.
If you need to enable the Discover Fields option for all searches on your Logger, change the default
values (“No”) on the Search Options page (Configuration | Search > Search Options) to “Yes” for
these options, as shown in the following figure.
Administrator's Guide
HPE Logger 6.2 Page 118 of 623
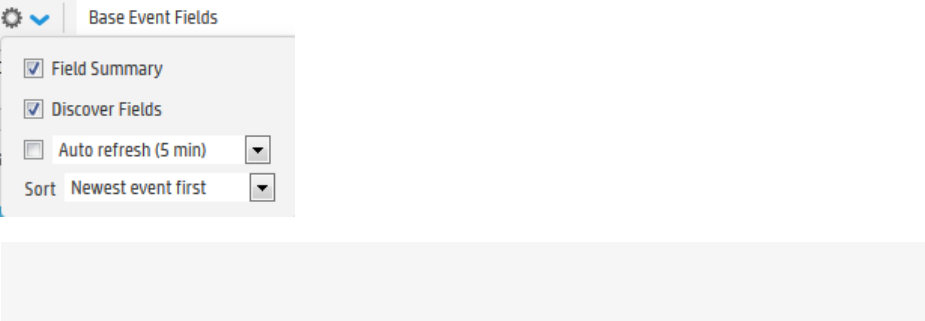
However, if you need to use the Discover Fields option occasionally—not for all searches—you can
enable this option for one-time use on the user interface page from where you run the search query
(Analyze > Search). To do so, click the Discover Fields checkbox in the search display options before
clicking Go! to run the query. Selecting these options on the Search page overrides the setting for these
options on the Search Options page.
Tip: To auto discover fields, the raw event must contain data in the “key=value” format, and none
of these characters can be the first character of the “value”: comma, space, tab, and semicolon.
For each “key=value” pair found in a raw event, a new field of the name “key” is created. The Field
Summary includes a summary of the values for all the new fields under the Discovered Fields section.
The discovered fields are assigned the type “String” by default. The auto-discovery capability works
only if at least 2,500 of the first 10,000 matching events contain “key=value” pairs. If this threshold is
not met, auto discovery is automatically turned off. However, this threshold does not apply if there are
less than 10,000 matching events; in that case, fields are discovered regardless.
Refining and Charting a Search from Field Summary
When you click a field in the Field Summary, a dialog box labeled <fieldname><number of values>
displays information about the field. From here, you can drill down to see more details and create a chart
of the search results.
To view field details from field summary:
1. Run a search and drill down to the data you are interested in, as described in "Field Summary Drill
Down" on the previous page.
2. To create a chart of the search results, click one of the Chart on values, such as Values by time or
Top values.
3. The results display in a Result Chart and a Result Table.
4. In the Result Chart, click Chart Settings to adjust the chart.
5. Enter a useful Chart Title.
lSelect the Chart Type best suited to your data.
lSet the Display Limit. The highest valid value is 100.
Administrator's Guide
HPE Logger 6.2 Page 119 of 623

6. In the Result Table, you can use navigation buttons to move forward and backward through list of
results, and refresh the search.
To create a PDF or CSV file containing the search results, click Export Results. For more
information, see "Exporting Search Results" on the next page.
Saving the Search Results
You can save the results of any search by exporting them in PDFor CSVformat:
lPDF: Useful in generating a quick report of the search results. The report includes a table of search
results and any charts generated for the results. Both raw (unstructured data) and CEF (structured
data) events, can be included in the exported report.
lComma-separated values (CSV) file: Useful for further analysis with other software applications. The
report includes a table of search results. Charts cannot be included in this format.
Data for the following time fields is exported in human-readable format: deviceReceiptTime, startTime,
endTime, agentReceiptTime. For example, 2015/03/21 20:22:09 PDT.
• Example of a Quick Report in PDFFormat (Search ResultsExport) 120
• Exporting Search Results 121
• Scheduling an Export Operation 123
Example of a Quick Report in PDFFormat (Search ResultsExport)
The following is an example of a quick report generated in PDF format. The chart is displayed first,
followed by a table of matched events (not shown in this example). All generated charts (including
stacked charts) can be exported.
Administrator's Guide
HPE Logger 6.2 Page 120 of 623
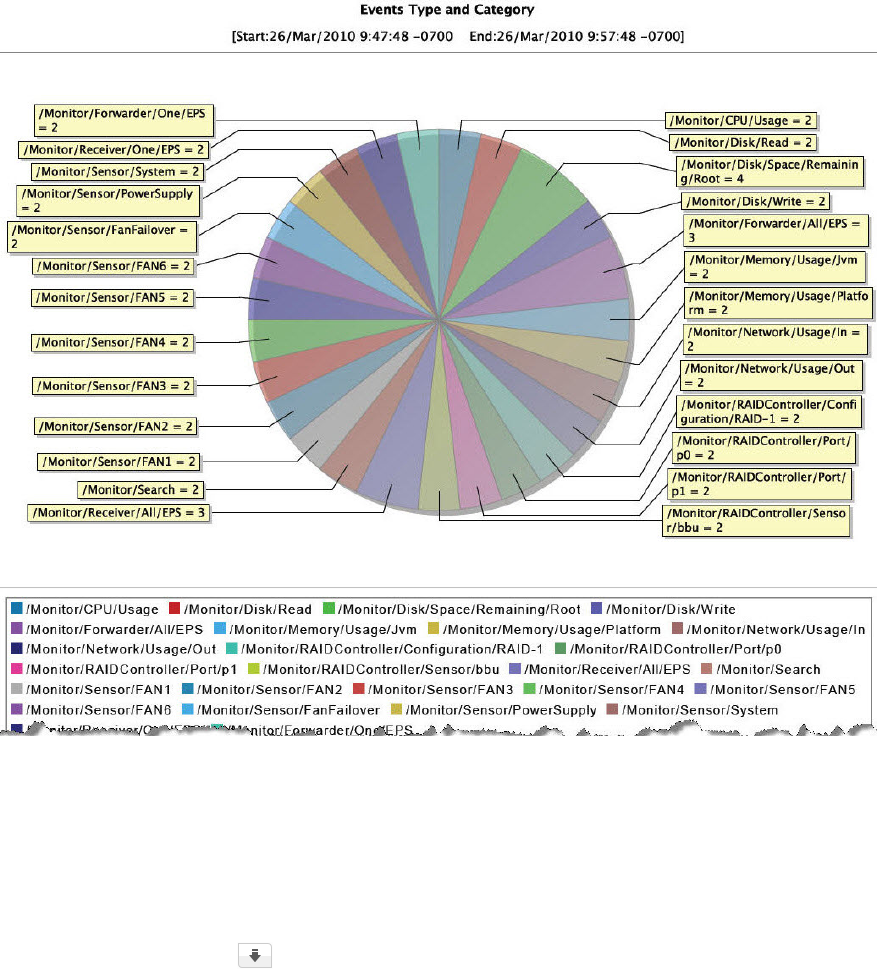
Exporting Search Results
To export the results of your search:
1. Run a search query from the Analyze > Search page or the Analyze > Alerts page.
2. Click Export Results on the top of the search results.
Administrator's Guide
HPE Logger 6.2 Page 121 of 623
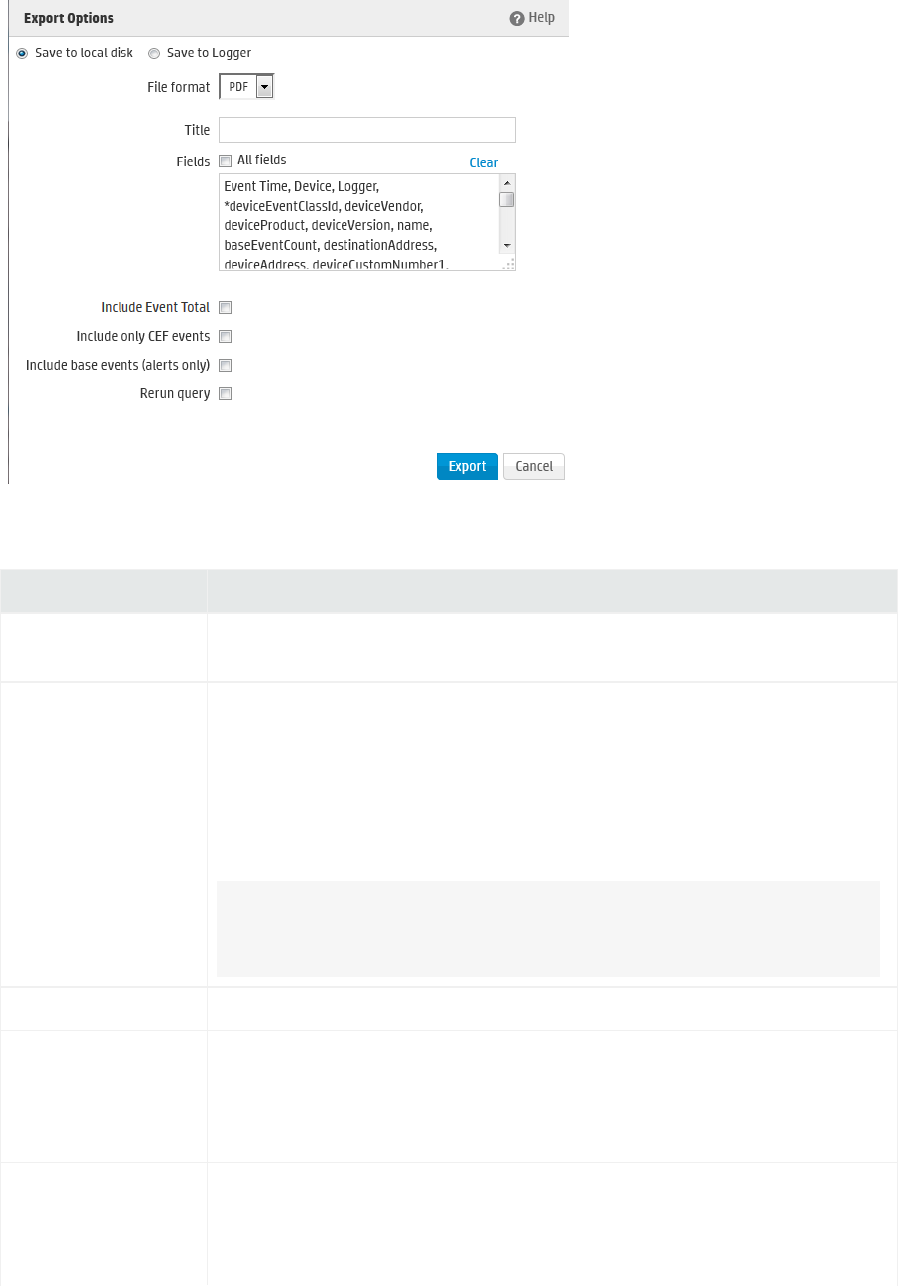
3. Select from the available options and then click Export. The displayed options change based on
your selections.
Option Description
Save to local disk Select to save the file to a local system from which you are accessing Logger or is it sent
to the browser for viewing or saving.
Export to remote
location
Select to export the file
On a Logger Appliance, the file is written to an NFS mount, a CIFS mount, or a SAN
system.
On Software Logger, data is always stored in the <install_dir>/data/logger
directory. This directory can reside locally on the system running the Logger software,
or on a remote storage system such as NFS or CIFS.
Note: The Logger Appliance supports mounting through the user interface.
Software Logger uses its filesystem, which can contain remote folders mounted
through the operating system.
Save to Logger Select to write the file to Logger’s local system.
File Format Select CSV to produce a comma-separated values file.
Select PDF to produce a report-style PDF that contains the search results in tables and
charts. Charts are only included if the search query contains an operator that creates
charts, such as chart, top, and so on.
Export file name (Available only when the “Export to remote location” option is selected)
Specify the name of the file to which events will be exported.
If a file of the specified name does not exist, it is created. If a file of the specified name
Administrator's Guide
HPE Logger 6.2 Page 122 of 623

Option Description
exists and the Overwrite box is not checked, an error is generated. If the Overwrite box
is checked, the existing file is overwritten.
Title (Optional, available only when the File Format is “PDF”)
Enter a meaningful name that appears on top of the PDF file. If no title is specified,
“Untitled” is included.
Fields Displays the list of event fields to be included in the exported file. By default, all fields
are included.
Enter fields or edit the displayed fields by deselecting All Fields.
To export fields created as a result of rex, extract, rename, or eval operators, or
field created when a parser is applied to an event, ensure that *user is selected in the
Fields list.
Chart Type (for PDF
only)
(Available only when a chart is available in search results)
Select the type of chart to include in the PDF file. You can select from: Column, Bar,
Donut, Area, Line, Stacked Column, Stacked Bar.
Note: If the Chart Type is different from the chart displayed on the Search Results
screen, the value selected for this option overrides the one shown in the screen.
Therefore, the exported PDF contains the chart you specify for this option and not
the one shown on the screen.
Chart Result Limit (for
PDF only)
(Available only when a chart is available in search results)
Specify the number of unique values to plot. Default: 10
If the configured Chart Result Limit is less than the number of unique values for a
query, the top values equal to the Chart Result Limit are plotted. That is, if the Chart
Result Limit is 5 and 7 unique values are found, the top 5 values will be plotted.
Include Event Total Select to include the total number of events in the exported search results.
Include Only CEF Events Select to include CEF events in the exported search results.
Include Base Events
(Available for Alerts
only)
Select to include base events in the exported search results.
Tip: The base events option is available ONLY when you Export the search results
from the Analyze > Alerts page.
Rerun query Select to rerun the query before exporting the search results.
Scheduling an Export Operation
The time it takes to export search results is proportional to the number of events being exported.
Therefore, for a large number of events, HPE recommends that you schedule the export operation to
be performed at a later time by saving the query and time parameters as a Saved Search, and then
Administrator's Guide
HPE Logger 6.2 Page 123 of 623
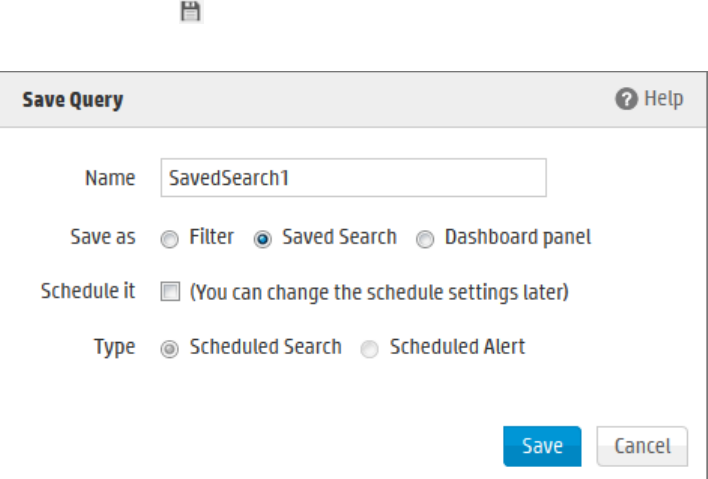
scheduling a Saved Search Job. For more information about Saved Search jobs, including how to create
a scheduled search, see " Scheduled Searches/Alerts" on page262.
Saving Queries (Creating Saved Searches and Saved Filters)
If you need to run the same search query regularly, you can save it in as a filter or as a saved search.
lSaving it as a filter saves the query expression, but does not save the time range or the field set
information.
lSaving it as a saved search saves the query expression and the time range that you specified.
To save a query:
1. Define a query as described in "Searching for Events" on page98 or "Using the Advanced Search
Builder" on page87.
2. Click the Save icon ( ) and enter a name for the query in the Name field, as shown in the
following figure.
3. In the Save as field, select whether you want to save this query as a Filter, as a Saved Search, or as a
Dashboard panel.
lIf you select to save as a Saved Search, you can either keep the saved query as Saved Search or
change it to a Scheduled Search of Schedule Alert by clicking the Schedule it Check box. (Queries
with aggregation operators cannot be used in Saved Search Alerts.) For further information
about Saved Search Alerts, see "Saved Search Alerts" on page271.
lIf the search query includes an aggregation operator such as chart or top, an option to save the
query for a Dashboard panel is also displayed.
lIf you select the Dashboard panel option, dashboard options are displayed.
Administrator's Guide
HPE Logger 6.2 Page 124 of 623
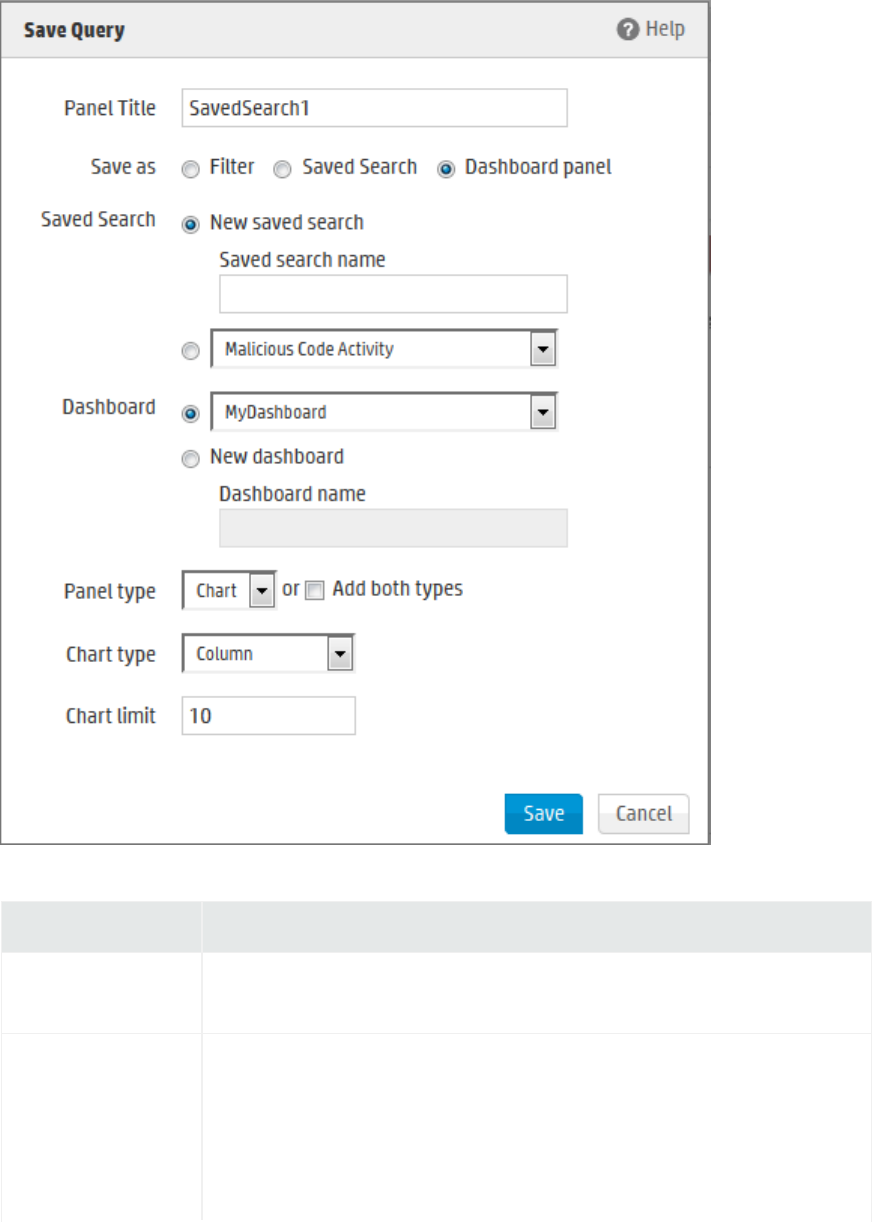
Enter the following parameters:
Parameter Description
Title Enter a meaningful name for the panel that will be added to the
Dashboard.
Saved search Select an existing saved search from the drop-down box that will be
overwritten with this query.
OR
Select “New saved search” to create a new saved search query. Enter the
new name in the text box.
Administrator's Guide
HPE Logger 6.2 Page 125 of 623

Parameter Description
Dashboard Select an existing Dashboard from the drop-down box to which the
Search Results panel will be added.
OR
Select “New dashboard” to add the Search Results panel to a new
Dashboard. Enter the name of the new Dashboard in the “Dashboard
Name” field.
Panel type Select the type of panel:
oChart: Displays search results in a chart form
oTable: Displays search results in a table form
oChart and Table: Adds two panels, one for displaying search results
in the chart form and the other for displaying search results in the
table form
Chart type Select the type of chart to display matching events. You can select from:
Column, Bar, Donut, Area, Line, Stacked Column, Stacked Bar.
Default: Column
Chart limit Only applicable to Search Result Chart panels.
Specify the number of unique values to plot. Default: 10
4. Click Save.
5. If you selected Schedule it, you are asked if you'd like to edit the schedule setting now. Click OK. If
you click Cancel, the Saved Search or Alert is not created.
6. Set the schedule options as appropriate.
Tip: Make sure you are familiar with the information in "Time/NTP" on page409 before
setting the schedule.
Choose Every Day, Days of Week, or Days of Month from the upper pull-down menu.
Note: When specifying multiple days, separate them with a comma. When specifying the time,
use 24-hour format.
a. If Every Day, select one of the following options from the lower pull-down menu, and enter
the necessary values:
oHour of day: (0-23) Enter the time you want the task to run in the Hours (24 hour
format) field. Midnight is zero (0).
oEvery: Select Hours or Minutes from the right-most pull-down menu and specify how
Administrator's Guide
HPE Logger 6.2 Page 126 of 623

frequently you want the task to run.
Hours: (1-23) Enter how frequently in hours you want the task to run. The result is every n
hours every day.
Minutes: (15-59) Enter how frequently in minutes you want the task to run. The result is
every n minutes every day.
b. If Days of Week, select from the following options from the lower pull-down menu, and enter
the necessary values:
oDays: (1-7) Enter the days of the week you want the task to run (Sunday=1, Monday=2, and
so on).
oHour of Day: (0-23) Enter the time you want the task to run in the text field to the right. 0
is midnight.
oEvery: Select Hours or Minutes from the right-most pull-down menu and specify how
frequently you want the task to run.
Hours: (1-23) Enter how frequently in hours you want the task to run. The result is every n
hours on the selected days.
Minutes: (15-59) Enter how frequently in minutes you want the task to run. The result is
every n minutes on the selected days.
c. If Days of Month, Select from the following options from the lower pull-down menu, and enter
the necessary values:
oDays: (1-31) Enter the day or days of the month you want the task to run.
Note: The number of days in a month vary. Scheduled tasks will only run if the
specified day exists for that month. Tasks scheduled on the 31st day of the month will
not run in April, February, June, November, and September. Tasks scheduled on the
29th day of the month will only run in February during leap years.
oHour of Day: (0-23) Enter the time of day you want the task to run. (You cannot select
Every for this option.)
Examples:
lTo run the scheduled job every 45 minutes of every day, select Every Day in the upper
Schedule pull-down menu. Choose Every from the lower pull-down menu, enter 45 in the text
box and the select Minutes.
lTo run the scheduled job every four hours on Tuesdays and Thursdays , select Days of Week
from the upper Schedule pull-down menu and enter 3,5 as the Days. Then choose Every from
the lower pull-down menu, enter 4 in the text box.
Administrator's Guide
HPE Logger 6.2 Page 127 of 623
lTo run the scheduled job on the 14th of each month at 3 AM, select Days of Month from the
upper Schedule pull-down menu and enter 14 as the Days. Then choose Hour of day from the
lower pull-down menu and enter 3 in the text box. (To run the scheduled job at 3 AM and 3 PM,
you would enter 3,15.)
7. For Scheduled Saved Searches, select the desired options. For details about the parameters, see
"Search Job Options" on page268.
8. For Scheduled Alerts, select the desired options. For details about the parameters, see "Alert Job
Options" on page270.
9. Click Save.
System Filters/Predefined Filters
Your Logger ships with a number of predefined filters, also known as system filters. These filters define
queries for commonly searched events. For example, unsuccessful login attempts or the number of
events by source. Filter queries are available as Unified queries and as Regular Expression queries.
Unified queries can be used for searching and reporting while Regular Expression queries are for
defining alerts and forwarders.
Note: To effectively use the Firewall or UNIX Server use case filters (listed in the following table),
define device groups that include the firewall devices or UNIX servers that you are interested in and
then constrain your search to those device groups. If you do not create device groups specific to
device types, the search results would match all Deny, Drop, or Permit events from all devices
instead of only the firewall devices. Similarly, the “Unix-IO Errors and Warnings” filter would include
IO errors and warnings from all devices and not only the UNIX servers.
The following is a list of all the system filters. For a description of each filter, see "System Filters" on
page588.
To use a predefined system filter, follow instructions in "Searching with Saved Queries" on page132.
Note: Even though the filters in the System Alert category (listed in the last section of the following
table) are displayed on the user interface of Software Logger, these filters do not apply to it.
Category Unified Query Filters Regular Expression Query Filters
Login Status use case All Logins All Logins (Non-CEF)
All Logins (CEF format)
Unsuccessful Logins Unsuccessful Logins (Non-CEF)
Unsuccessful Logins (CEF format)
Successful Logins Successful Logins (Non-CEF)
System Filters
Administrator's Guide
HPE Logger 6.2 Page 128 of 623

Category Unified Query Filters Regular Expression Query Filters
Successful Logins (CEF format)
Failed Logins
Configuration Configuration Changes System configuration changes
(CEF format)
Events use case High and Very High Severity Events High and Very High Severity
CEF events
Event Counts by Source
Event Counts by Destination
All CEF events
Intrusion use case Malicious Code Malicious Code (CEF format)
Firewall use case Deny (Firewall Deny)
Drop (Firewall Drop)
Permit (Firewall Permit)
Network use case DHCP Lease Events
Port Links Up and Down
Protocol Links Up and Down
Connector System
Status use case
CPU Utilization by Connector Host
Disk Utilization by Connector Host
Memory Utilization by Connector
Host
UNIX Server use case CRON related events
IO Errors and Warnings
PAM and Sudo Messages
Password Changes
SAMBA Events
SSH Authentications
User and Group Additions
User and Group Deletions
System Filters, continued
Administrator's Guide
HPE Logger 6.2 Page 129 of 623

Category Unified Query Filters Regular Expression Query Filters
Windows Events
use case
Account Added to Global Group
Account Added to Global Group (CEF)
Audit Policy Change
Audit Policy Change (CEF)
Change Password Attempt
Change Password Attempt (CEF)
Global Group Created
Global Group Created (CEF)
Logon Bad User Name or Password
Logon Bad User Name or Password
(CEF)
Logon Local User
Logon Local User (CEF)
Logon Remote User
Logon Remote User (CEF)
Logon Unexpected Failure
Logon Unexpected Failure (CEF)
New Process Creation
New Process Creation (CEF)
Pre-Authentication Failure
Pre-Authentication Failure (CEF)
Special Privileges Assigned to New
Logon
Special Privileges Assigned to New
Logon (CEF)
User Account Changed
User Account Changed (CEF)
User Account Password Set
User Account Password Set (CEF)
Windows Events (CEF)
System Alerts The following filters search for specific internal alert events, which are written in CEF
System Filters, continued
Administrator's Guide
HPE Logger 6.2 Page 130 of 623

Category Unified Query Filters Regular Expression Query Filters
format to a special Internal Storage Group. These filters are available for both search
methods. In addition to the following filters, you can define your own alerts based on the
system health events listed in "System Health Events" on page459.
Note: Although these filters are displayed on Software Logger, these do not apply to
it.
CPU Utilization Above 90 Percent CPU Utilization Above 90 Percent
CPU Utilization Above 95 Percent CPU Utilization Above 95 Percent
Disk Failure Disk Failure
Root Partition Below 10 Percent Root Partition Below 10 Percent
Root Partition Below 5 Percent Root Partition Below 5 Percent
Device Configuration Changes Device Configuration Changes
Filter Configuration Changes Filter Configuration Changes
High CPU Temperature High CPU Temperature
Bad Fan
Power Supply Failure Power Supply Failure
RAID Controller Issue RAID Controller Issue
RAID Status Battery Failure RAID Status Battery Failure
RAID Status Disk Failure RAID Status Disk Failure
Storage Configuration Changes Storage Configuration Changes
Storage Group Usage Above 90% Storage Group Usage Above 90%
Storage Group Usage Above 95% Storage Group Usage Above 95%
Zero Events Incoming Zero Events Incoming
Zero Events Outgoing Zero Events Outgoing
System Filters, continued
Administrator's Guide
HPE Logger 6.2 Page 131 of 623
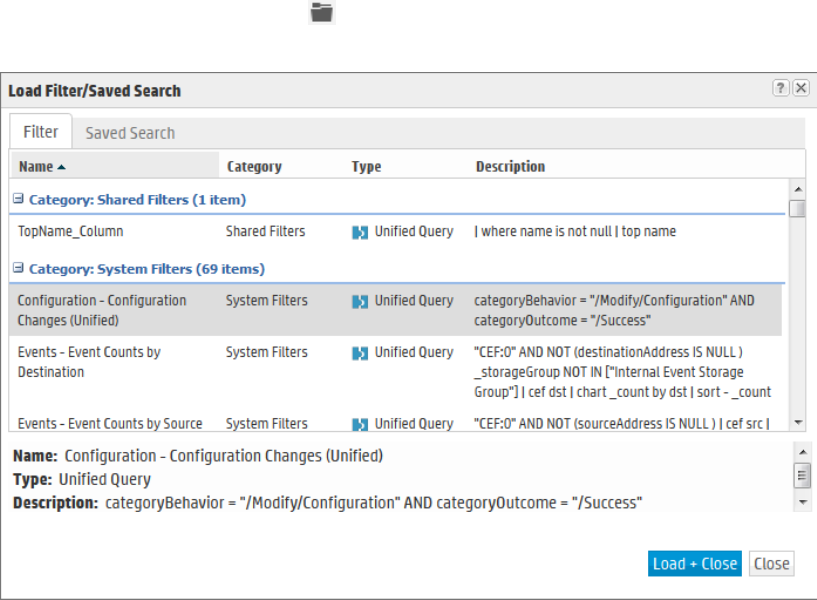
Searching with Saved Queries
You can search using the Filters and Saved Searches that you create as well as the pre-defined system
filters, explained in "System Filters/Predefined Filters" on page128.
To use an existing query:
1. Open the Analyze menu and click Search.
2. Use one of these options to select the desired Filter, System Filter, or Saved Search.
lType $filter$ or $ss$ in the search text box and select a filter or a saved search from the
dropdown list. See for more information, "Opening Filters and Saved Searches via Autocomplete"
on page96.
lClick the Load a Saved Filter icon ( ) to view a list of all the saved filters and saved searches to
display the Load Filter/Saved Search interface, as shown in the following figure.
The Load Filter/Saved Search interface enables you to quickly locate the saved filters and the
saved search queries. Click on any of the column names to sort information. To view details of a
filter or a saved search, click its row. Details are displayed in the text box below.
To load a filter, select the filter or saved search you want to use and click Load+Close. The filter
rows display the search query.
To load a saved query, open the Saved Searches page, select a search, and click Load+Close.
Administrator's Guide
HPE Logger 6.2 Page 132 of 623

Enriching Logger Data Through Static Correlation
The lookup search operator enables you to augment data in Logger with data from an external file.
This enables geo-tagging, asset tagging, user identification, and so on, through static correlation.
You can use the lookup operator to add information to your search results that is not part of the
original data stored on Logger. You do this by creating an external file containing the data, uploading
that Lookup file to Logger, and then using the lookup operator to create a join between Logger events
and the uploaded Lookup file.
For example, if you want Logger search results to include which country source IP addresses are located
in, you can create a file listing the IP addresses and countries and then upload that file to Logger as a
Lookup file. After that, you can use the lookup operator to perform a join between the sourceAddress
field in the Logger events and the IP address column in the Lookup file, and display the country in the
search results.
lFor information about creating Lookup files and uploading them to Logger, see "Lookup Files" on
page283.
lFor information on how to use the lookup operator when searching, see "lookup" on page484.
Indexing
Once you have initialized Logger, it starts scanning events automatically and indexing them.
Logger’s storage technology enables automatic indexing of events in these ways:
lFull-text indexing: Each event is tokenized and indexed. See "Full-Text Indexing (Keyword Indexing)"
on the next page.
lField-based indexing: Event fields are indexed based on a predetermined schema. See "Field-Based
Indexing" on the next page.
lSuperindexing: Certain event fields are super-indexed so that you can find rare field values quickly.
See " Superindexing" on page136.
All events received after initialization are indexed for full-text search, a default set of fields is indexed
for field-based search, and a default set of fields is superindexed for fast needle-in-a-haystack searches.
All events are timestamped with the receipt time when received on the Logger. The default fields are
automatically indexed. For the remaining fields, Logger uses the receipt time of an event and the time
when a field was added to the index to determine whether that event will be indexed. If the receipt time
of the event is equal to or later than the time when the field was added to the index, the event is
indexed; otherwise, it is not.
Note: Indexing information is not archived when the archive is created. You can choose to add
indexing information to an archive after it has been created. For more information, see "Indexing
Administrator's Guide
HPE Logger 6.2 Page 133 of 623

Archived Events" on page362
Full-Text Indexing (Keyword Indexing)
For full-text indexing, each event (CEF or non-CEF) received on Logger is scanned and divided into
keywords and stored on the Logger. The full-text search options control the manner in which an event
is tokenized as described the Full-text Search Options section of the "Search Options" on page276.
Field-Based Indexing
The field-based indexing capability allows for fields of events to be indexed. The fields are based on a
predetermined schema. The Logger’s reports and the field search method utilize these indexed fields to
yield significant search and reporting performance gains.
Field-based indexing for a recommended set of fields is automatically enabled at Logger initialization
time. You can add more fields to an index at any time. (See "To add fields to the field-based index:" on
page274 for instructions.) Once a field has been added, you cannot remove it.
A list of the default index fields, along with their field descriptions is available from the Logger
Configuration menu. For instructions on how to view the default Logger Schema fields, see "Default
Fields" on page281.
Note: HPE strongly recommends that you index fields that you will be using in search and report
queries.
The fields created when a predefined or user-defined rex parser parses the non-CEF events cannot be
indexed using the field-based indexing capability. See "Parsers" on page318 for more information about
rex parsers.
In addition to indexing the fields included in the field-based indexing list, Logger indexes event
metadata fields—event time, Logger receipt time, and device address—for every event. The event
metadata fields are also known as “internal” fields.
The following fields are available for indexing. The fields that Logger starts indexing automatically after
Logger initialization are indicated in bold font.
In addition to the following fields, the requestUrl field is available for search queries. However, this
field cannot be indexed.
Index Fields
agentAddress deviceCustomDate2 flexDate1
agentHostName deviceCustomDate2Label flexDate1Label
Administrator's Guide
HPE Logger 6.2 Page 134 of 623

Index Fields
agentNtDomain deviceCustomNumber1 filePath
agentSeverity deviceCustomNumber1Label flexNumber1
agentType deviceCustomNumber2 flexNumber1Label
agentZone deviceCustomNumber2Label flexNumber2
agentZoneName deviceCustomNumber3 flexNumber2Label
agentZoneResource deviceCustomNumber3Label flexString1
agentZoneURI deviceCustomString1 flexString1Label
applicationProtocol deviceCustomString1Label flexString2
baseEventCount deviceCustomString2 flexString2Label
bytesIn deviceCustomString2Label message
bytesOut deviceCustomString3 name
categoryBehavior deviceCustomString3Label priority
categoryDeviceGroup deviceCustomString4 requestClientApplication
categoryObject deviceCustomString4Label requestContext
categoryOutcome deviceCustomString5 requestMethod
categorySignificance deviceCustomString5Label requestUrlFileName
categoryTechnique deviceCustomString6 requestUrlQuery
customerName deviceCustomString6Label sessionId
destinationAddress deviceEventCategory sourceAddress
destinationDnsDomain deviceEventClassId sourceHostName
destinationHostName deviceExternalId sourceMacAddress
destinationMacAddress deviceHostName sourceNtDomain
destinationNtDomain deviceInboundInterface sourcePort
destinationPort deviceOutboundInterface sourceProcessName
Administrator's Guide
HPE Logger 6.2 Page 135 of 623

Index Fields
destinationProcessName deviceProduct sourceServiceName
destinationServiceName deviceReceiptTime sourceTranslatedAddress
destinationTranslatedAddress deviceSeverity sourceUserId
destinationUserPrivileges deviceVendor sourceUserName
destinationUserId deviceVersion sourceUserPrivileges
destinationUserName deviceZone sourceZone
destinationZone deviceZoneName sourceZoneName
destinationZoneName deviceZoneResource sourcezoneResource
destinationZoneResource deviceZoneURI sourceZoneURI
destinationZoneURI endTime startTime
deviceAction eventId transportProtocol
deviceAddress externalId type
deviceCustomDate1 fileName vulnerabilityExternalID
deviceCustomDate1Label vulnerabilityURI
Superindexing
In addition to full text and field based indexing, Logger and later creates superindexes for common IP
address, host name, and user name fields. Superindexes enable Logger to quickly determine whether a
particular field value has been stored on this Logger, and if it has, to narrow down the search to sections
of data where that field value exists. Therefore, searches that can take advantage of superindexes
return very quickly if there are no hits and return results more quickly than regular searches when there
are very few hits.
lFor information on how to use superindexes, see "Searching for Rare Field Values" on page103.
lA complete list of super-indexed fields is included in "Super-indexed Fields" on page104.
Viewing Alerts
You can configure Logger to alert you by e-mail, an SNMP trap, or a Syslog message when a new event
that matches a specific query is received or when a specified number of matches occur within a given
Administrator's Guide
HPE Logger 6.2 Page 136 of 623
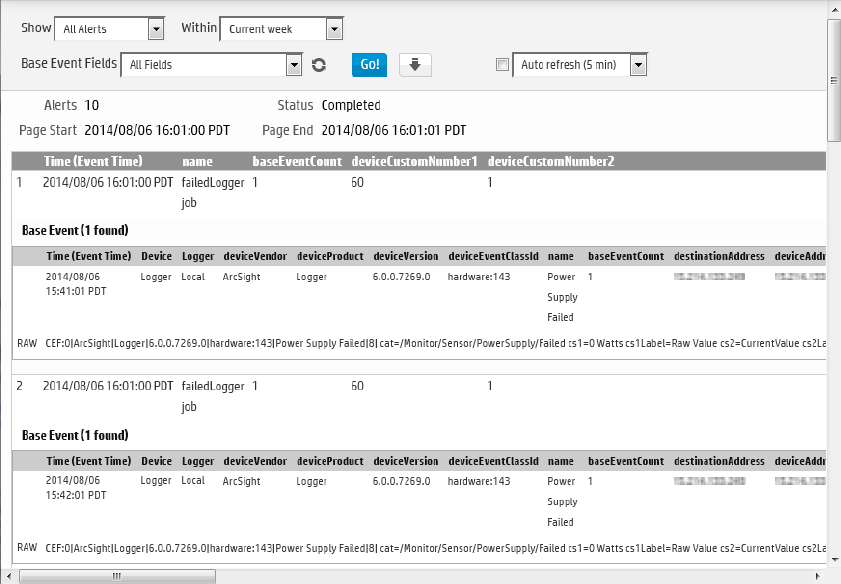
time threshold. For more information, see"Types of Alert in Logger" on page335. In addition to
receiving an alert via e-mail, an SNMP trap, or a Syslog message, you can view Alerts and the base
events that triggered them on the Analyze > Alerts page.
To view Alerts, choose a predefined time range, such as “Last 2 hours” or “Today,” or choose “Custom
Time Range” to reveal additional fields for specifying a time range manually. This aspect works like
Search. Refer to "Time Range" on page74 for more detail.
When you create Alerts, you name them. Use the Show options to view only events associated with a
particular Alert. The default is All Alerts.
Events that are labeled ‘Action Engine’ are Alert events. The events that triggered the alert are base
events. You can also select whether to view the base events and which fields to view by using the Base
Event Fields:option.
Like on the Search page, the Go button triggers the search, the Export Results button enables you to
create a PDFor CSVfile that contains the search results, and the Auto Refresh option determines
whether and how frequently the displayed search results are updated.
Live Event Viewer
The Live Event Viewer provides real-time view of the incoming events that match the criteria you
specify. This functionality is useful in environments where the need to view an event quickly is
important; for example, a financial institution might be interested in viewing a specific transaction type
Administrator's Guide
HPE Logger 6.2 Page 137 of 623
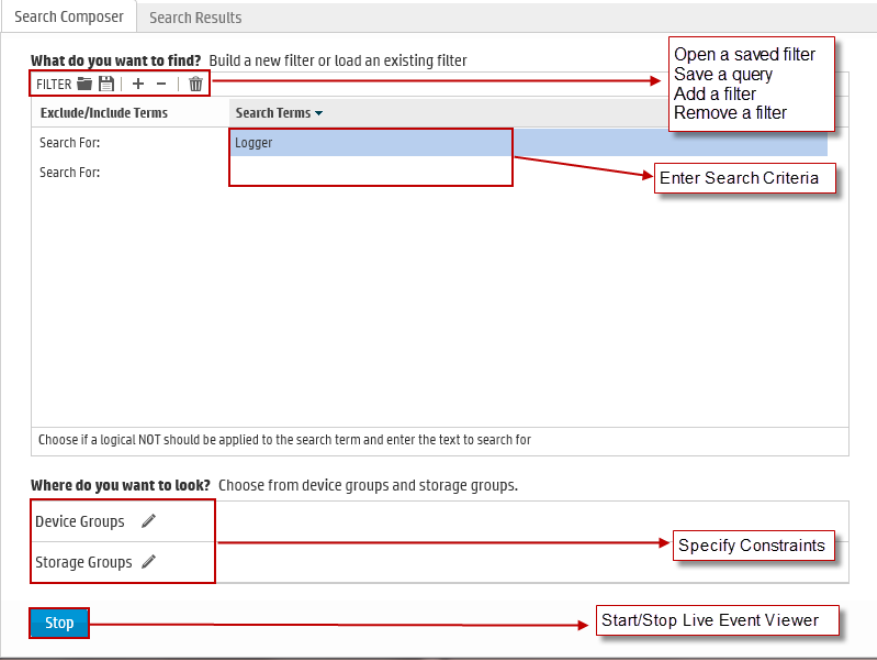
as soon as it occurs. Because the latency between the events arriving at Logger and the display time is
quite less, events might not have been indexed on Logger before being displayed.
The Live Event Viewer composes of two tabs—Search Composer and Search Results. The Search
Composer is for defining the search criteria and the Search Results tab displays the matching events in
real time.
The following figure shows the Search Composer. If you specify more than one search term, the
resulting query uses the AND operator to combine them. For example, if the first search term searches
for “failure” and the second one excludes “admin”, the resulting query is “failure AND NOT admin”.
The Search Results tab provides the Play, Pause, Stop, Clear, and Export buttons that enable you to
control the display in a manner similar to any electronic device, as shown in the following figure.
Administrator's Guide
HPE Logger 6.2 Page 138 of 623
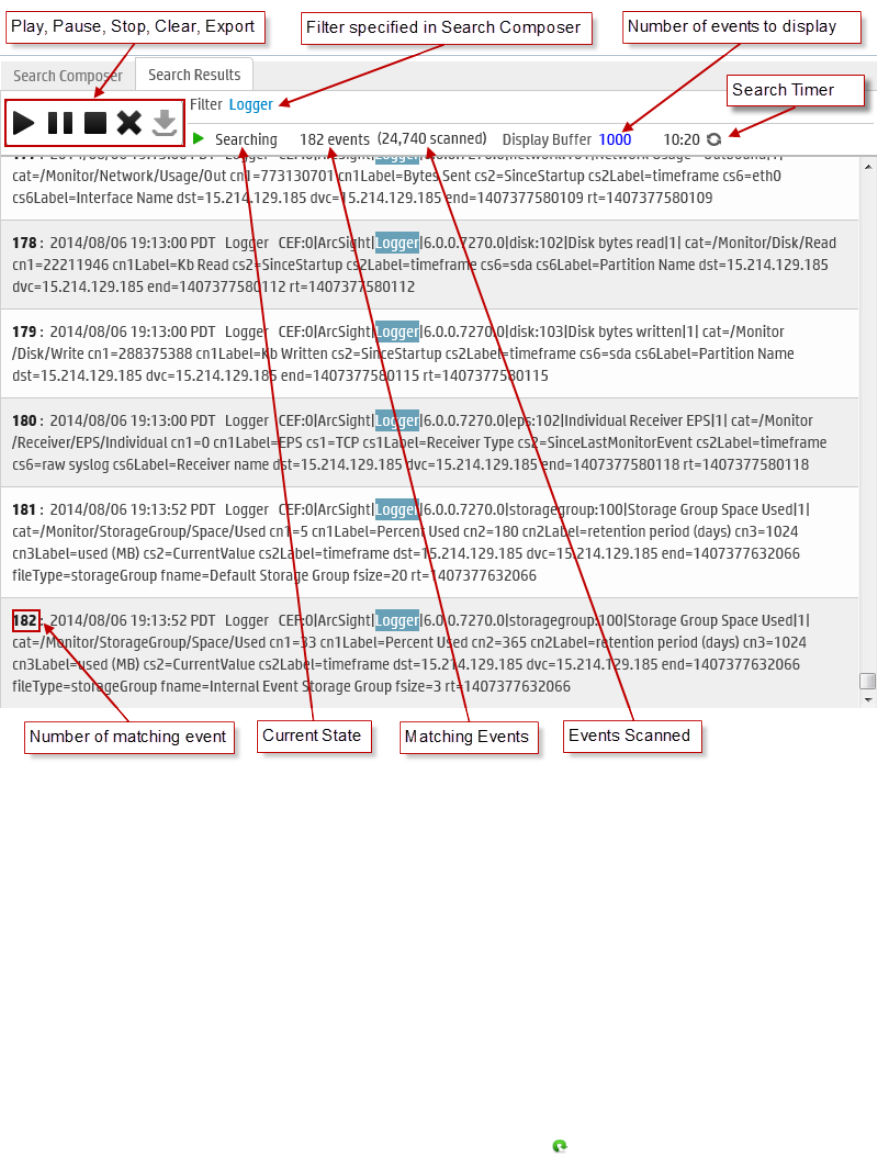
The following list highlights the features of Search Results display:
lEvents are displayed in the raw event format and not in the columnar, table form as displayed in the
Search Results page (Analyze > Search) when you run a search query.
lA user can launch a maximum of one Live Event Viewer. There can be a maximum of five Live Event
Viewers running on Logger at any time.
lThe regular expression search method is used to identify matching events. Therefore, you can
specify regular expressions as the search term in the Search Composer.
lBuffer Size defines the maximum number of events displayed in the Viewer. By default, the Buffer
Size is 1000; however, it can be set to any number between the range of 20 and 5000.
lBy default, the search is run for 15 minutes and then stopped to preserve system resources. If you
need to run the search for longer than 15 minutes, click the icon next to the countdown timer to
reset the timer to 15 minutes.
lWhen you click Pause, the Search Results display is frozen. However, the search operation continues
in the background and the new matching events are buffered until a maximum of 1000 events have
Administrator's Guide
HPE Logger 6.2 Page 139 of 623
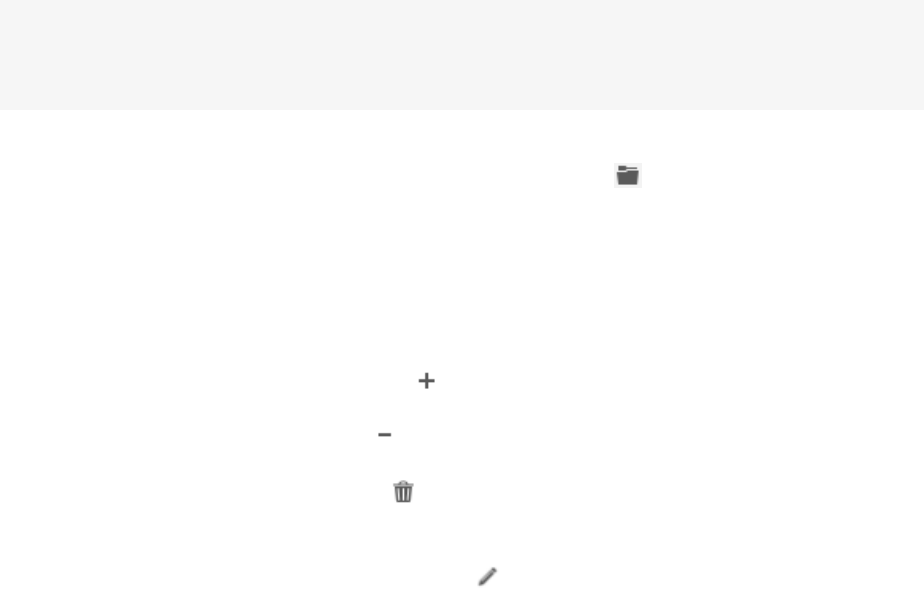
been buffered or the search timer, which continues to count down even when the Search Results
display is frozen, reaches 00:00.
lIf the timer has not reached 00:00, you can click Play to resume the paused search operation. When
you click Play, the buffered events are displayed. The newly found events are appended to the
previously found events on the Search Results display screen.
lWhen you click Stop, the search for matching events and the countdown of the search timer stop.
When you click Play, the search is started afresh—the currently displayed events are cleared from the
Search Results screen, the search timer is reset to 15 minutes, and the search starts again.
lYou must stop the search operation to export the matching events.
To launch a Live Event Viewer:
Note: Live Event Viewer is a resource-intensive application that can impact the overall performance
of your Logger if run for a long period of time. Therefore, use this feature selectively and for short
periods of time.
1. Open the Analyze menu and click Live Event Viewer.
2. In the Search Composer tab, enter the search terms or click the ( ) icon to select a saved filter.
You can enter search terms that the event must contain (Search For:) or terms that the events must
not contain (Exclude From Search:). Click the “Search For:” field to display a drop-down list from
which you can select “Exclude From Search:”.
If you specify more than one search term Logger uses the AND operator to combine them in the
resulting search query.
lTo add additional search term click the ( ) icon.
lTo remove a search term, click the ( ) icon.
lTo remove all search terms, click the ( ) icon.
3. Enter constraints to limit your search to specific device groups, devices, or storage groups in the
“Where do you want to look?” section. Click the ( ) icon to display a list from which you can
choose the constraints.
4. Click Start.
5. The search results are automatically displayed in the Search Results display screen.
To update the Live Event Viewer query:
1. In the Search Composer tab of the Live Event Viewer, update the search terms.
2. Click Stop first and then click Start to start search using the new search terms.
Administrator's Guide
HPE Logger 6.2 Page 140 of 623

To export Search Results display:
1. Make sure you have stopped the Live Event Viewer. To do so, click the ( ) icon in the Search
Results display window.
2. Click the ( ) icon to open the Export Options window.
3. To export the displayed search results, select the Export options, as described in "To export the
results of your search:" on page121 Then click Export.
Administrator's Guide
HPE Logger 6.2 Page 141 of 623
Chapter 4: Reporting
Reporting is an essential tool for communicating the state of your network security to internal and
external stakeholders. A report is a captured view or summary of events. Reports can be viewed from
the Logger Reports page or exported for sharing in a variety of file formats.
Note: Reporting is not available for the trial version of Logger.
The following topics describe how to create, run, and view reports in Logger. For information in about
the out-of-box reports that come with your Logger, see "Logger Content" on page552.
• The Reports Home Page 142
• The Navigation Menu 144
• Categories 149
• Dashboards 153
• Widgets 158
• Using Dashboards Created in Pre-5.2 Logger 162
• Running, Viewing, and Publishing Reports 171
• Scheduled Reports 188
• Designing Reports 193
• Queries 216
• Parameters 231
• Template Styles 239
• Administration 241
• Deploying a Report Bundle 241
• Report Server Administration 242
• Backup and Restore of Report Content 249
• iPackager 249
The Reports Home Page
To access the Reports home page, in the main menu, click Reports.
To view the Reports home page from within the Reporting tool, in the left panel, click Dashboard.
If a dashboard is configured to display, the Reports Home page shows the selected dashboard view. (If a
dashboard has not yet been configured to display, you will see an Untitled blank placeholder tab instead
of a dashboard.)
HPE Logger 6.2 Page 142 of 623

At the top of the Reports home page, there are links for Dashboard Viewer, Dashboard Preferences,
Widget Designer, Recent Reports, Jobs Execution Status, Classic Viewer, Classic Designer, and Classic
Preferences.
lThe Dashboard Viewer enables you to view your dashboards. You can use the buttons in the upper
right corner of the Dashboard Viewer page to add a widget to the dashboard, save edit, and
subscribe the dashboard. For more information, see "Dashboards" on page153.
lThe Dashboard Preferences link enables you to specify a default dashboard to display as your
Reports home page, and to display multiple dashboards as tabs in the Reports home page. For more
information, see "Selecting a Default Dashboard View for the Reports Home Page" on page157.
lThe Widget Designer page enables you to create a widget displaying either a report or a web link.
You can place the widget in the dashboard from the Dashboard Viewer page. For more information,
see "The Widget Designer" on page158.
lThe Recent Reports link lists the status of currently running, recently run, or accessed reports. By
default, all reports except the completed scheduled reports are displayed. You can also use the
Filters tab to restrict the reports displayed. For more information, see "Viewing Recently Run
Reports" on page172.
lThe Jobs Execution Status link displays a graphic summary of the execution status of all completed,
succeeded, failed, and upcoming report run jobs. For more information, see "Jobs Execution Status"
on page189.
lThe Classic Viewer, Classic Designer, and Classic Preferences links enable the view, design and
maintenance of dashboards created in pre-5.2 versions of Logger. See "Using Dashboards Created in
Pre-5.2 Logger" on page162 for more information.
Getting Started
You can get started with Logger reporting with any of the following:
lYou can schedule any report to run once at a later date or on a specified frequency (such as daily or
weekly). Monthly reports cannot be scheduled currently. To begin, see "Scheduled Reports" on
page188.
lYou can design a dashboard to show the things you are most interested in as your Reports Home
page. To begin, see "Designing Dashboards" on page154.
lYou can create reports to track information that you are interested in. To begin, see "Designing
Reports" on page193
lYou can run, view, and publish the results of any type of report. To begin, see "Running, Viewing, and
Publishing Reports" on page171.
lYou can adjust the configuration on your report server. To begin, see "Report Server Administration"
on page242.
Administrator's Guide
HPE Logger 6.2 Page 143 of 623
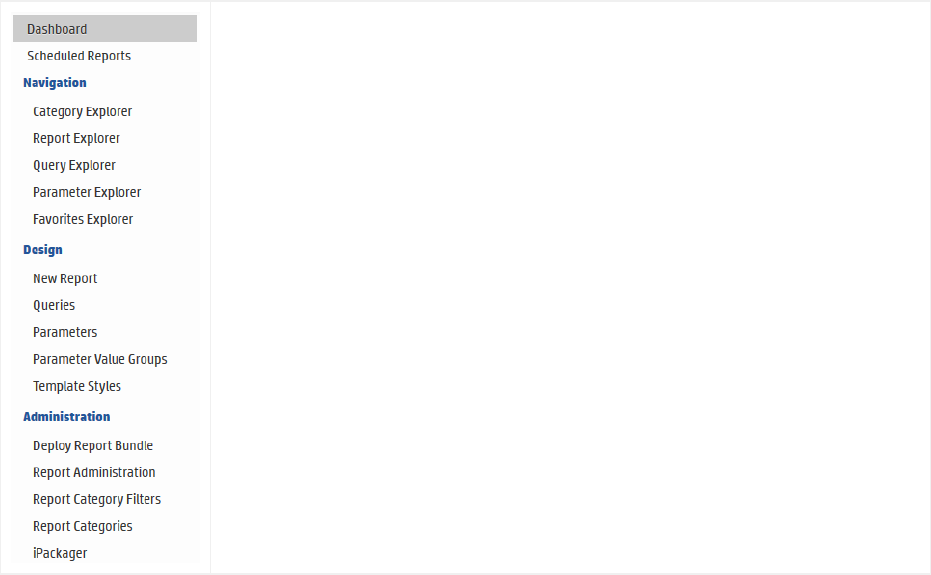
lYou can create a new query for use in reports, using the visual Query Object Editor. To begin, see
"Queries" on page216.
The Navigation Menu
The navigation menu in the left pane provides links to reporting features. A dropdown menu, under
Reports in the main menu, provides the same options.
lThe Dashboard link provides access to the reports Dashboard features.
lThe Scheduled Reports link enables you to specify when to run your
reports.
lThe links listed under Navigation enable you to navigate to a category,
report, query, parameter, or favorite item. You can select multiple objects in
any of the Explorers and perform actions such as set access rights, copy,
cut, paste or delete actions.
lThe links listed under Design enable you to create a new report and create,
view and configure any object of the Reporting tool.
lThe links listed under Administration enable you to perform
administrative reporting tasks.
To navigate using the Explorers:
lClick the arrow next to a category to access its subcategories.
lClick a category to display the objects in that category.
lClick a category or an object in a category to perform an action on it.
The Explorers
You can use the Explorers listed under the Navigation heading in the left pane to navigate to a desired
report, query, parameter, dashboard, dashboard widget, or favorite item. The following Explorers are
available:
l"Category Explorer" on the next page
l"Report Explorer" on page146
l"Query Explorer" on page147
Administrator's Guide
HPE Logger 6.2 Page 144 of 623
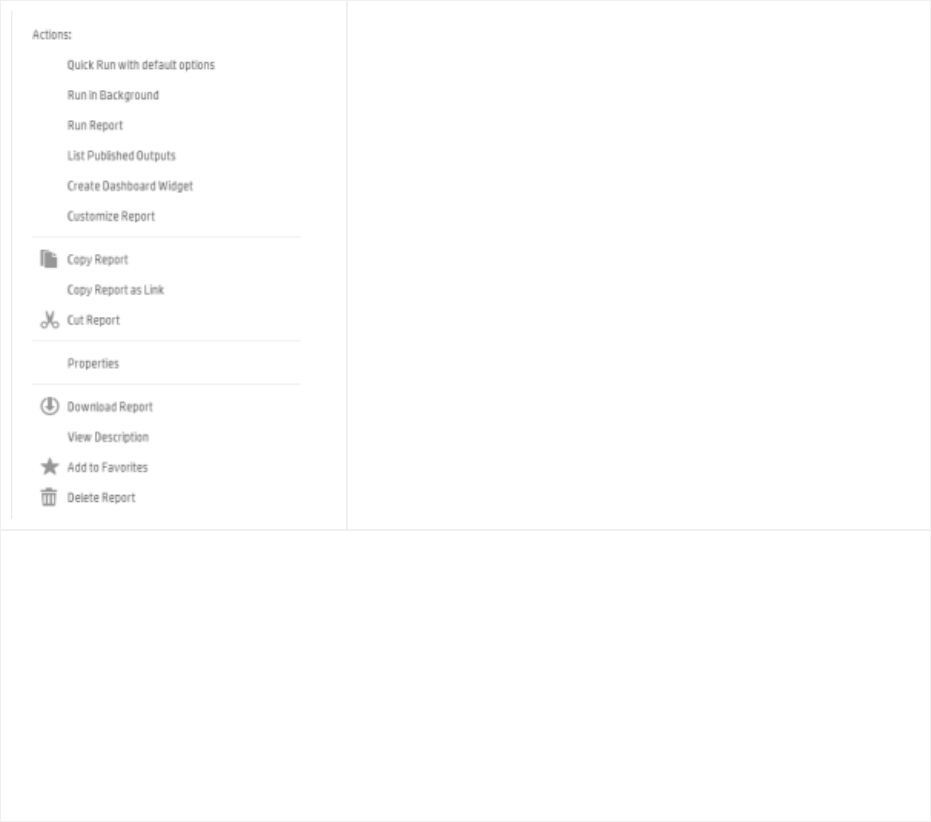
l"Parameter Explorer" on page148
l"Favorites Explorer" on page148
The Explorer Actions Menus
The Explorers include context-sensitive Actions menus, which give quick access to tasks that can be
performed with a selected item.
To access the Actions menu for an Explorer, select an item
category in the left column. Then, continue to drill down in the
right columns to the level of an individual item (such as a
report or query). The Actions menu is displayed in the right-
hand column.
The list of items in the Actions menu depends on the Explorer
context. The illustration here shows the Actions menu for the
Report Explorer, with appropriate actions related to reports. In
the Query Explorer, the Actions menu would show a different
set of actions related to queries.
To execute an action from the menu, click the appropriate link
in the menu.
For example, to access the Actions menu for the Report Explorer:
1. Click Reports, then, under Navigation, click Report Explorer. The list of report categories is
displayed.
2. In the report categories list, click Device Monitoring, then click Anti-Virus. The list of Anti-
Virus reports is displayed to the right of the category list.
3. From the list of Anti-Virus reports, select Virus Activity by Hour. The Actions menu is displayed
to the right of the reports list. The Actions menu includes items appropriate for running,
viewing, or editing the Virus Activity by Hour report.
Category Explorer
Reports and report objects, such as queries and parameters, can be organized and grouped based on
their function. Such functional groups are called categories. For example, a report pertaining to a
database can be stored under the Database category.
The Category Explorer lists all categorized reports and report objects. It comes with some pre-defined,
commonly used categories. You can also add custom categories based on your requirements.
Administrator's Guide
HPE Logger 6.2 Page 145 of 623

You can use the Category Explorer to display an overview of all reports, published reports only, Query
Objects, Parameter Objects, Dashboards, Dashboard Widgets, Reports, and Saved Reports (published
reports)
To access objects from the Category Explorer:
1. Click Reports on the top-level menu bar.
2. Click Category Explorer in the Navigation section in the left pane. The Repository pane opens to
the right of the navigation pane and displays the available categories and objects.
3. Navigate to the desired location using the arrows .
For example, click the next to Root, the next to Foundation, the next to Intrusion
Monitoring, and then click Targets > Query Objects.
The Category Explorer displays the Query Objects in the Foundation > Intrusion Monitoring >
Targets category.
4. Click an object and then select an action to take by clicking a link in the Actions menu.
For example, click Target Counts by Device Severity and then click Edit Query Details. The
Query Object Editor opens, displaying the selected Query Object.
For a complete list and description of reports available on Logger, see "Logger Content" on page552.
Report Explorer
The Report Explorer is the central location for viewing (publishing), running, or editing existing reports.
For more information, see "Running, Viewing, and Publishing Reports" on page171.
Note: You cannot create a new report from the Report Explorer. To create a new report, click New
Report under the Design section in the left pane. For more information, see "Designing Reports" on
page193.
You can view, publish, and edit any type of report. For information on common reporting tasks available
for all reports, see "Task Options on Available Reports" on page173.)
You can schedule any report to run once at a later date (an ad hoc report) or at a specified frequency
(such as daily or weekly). For more on this, see "Scheduled Reports" on page188.
To access reports from the Report Explorer:
1. Click Reports on the top-level menu bar.
2. Click Report Explorer in the Navigation section in the left pane. The Reports pane opens to the
right of the navigation pane and displays the available report categories and reports.
3. Navigate to the desired location using the arrows .
For example, click the next to Root, the next to Device Monitoring, and then click Anti-Virus.
The Report Explorer displays the reports in the Device Monitoring > Anti-Virus category.
Administrator's Guide
HPE Logger 6.2 Page 146 of 623
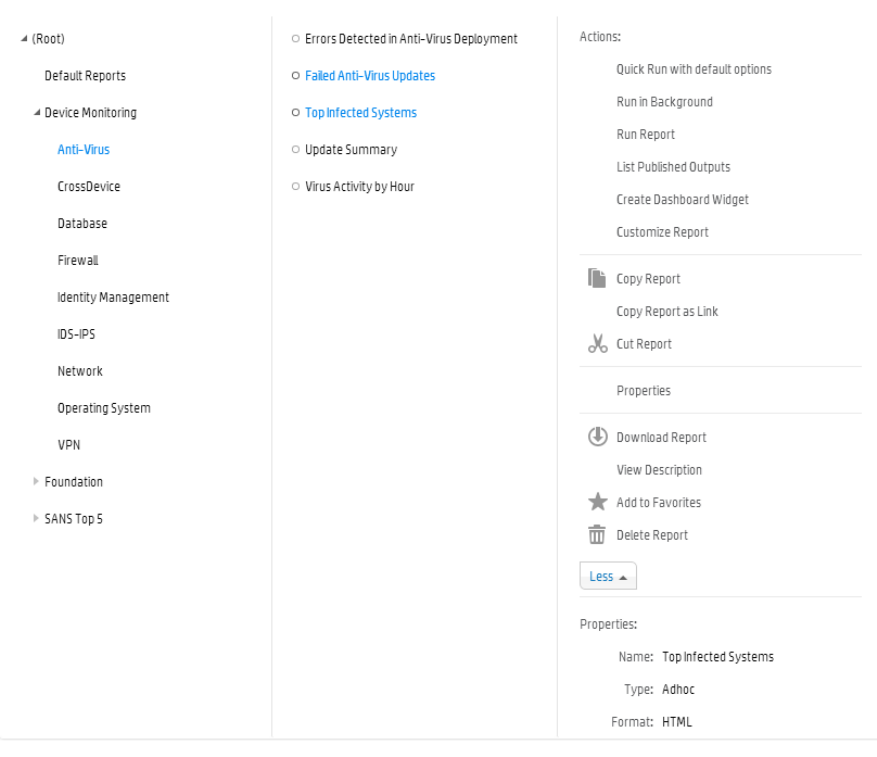
4. Click a report, and then select an action to take by clicking the appropriate link in the Actions menu.
For example, click Top Infected Systems and then, on the Actions menu, click Run Report.) The
Run Ad Hoc Report dialog box opens, displaying the selected report.
For a complete list and description of reports available on Logger, see "Logger Content" on page552.
Query Explorer
Queries comprise query objects (or parameters). You can use the Query Explorer to create new queries
and view or edit existing queries.
To access queries from the Query Explorer:
1. Click Reports on the top-level menu bar.
2. Click Query Explorer in the Navigation section in the left pane. The Query Objects pane opens to
the right of the navigation pane. It displays the existing categories under which you can find
existing query objects and store newly created objects.
Administrator's Guide
HPE Logger 6.2 Page 147 of 623

3. Navigate to the desired location using the arrows .
For example, click the next to Root > SANS Top 5 > 5 - Suspicious or Unauthorized Network
Traffic Patterns.
The Query Explorer displays the query objects in the SANS Top 5 > 5 - Suspicious or
Unauthorized Network Traffic Patterns category.
4. Click a query, and then select the action to take by clicking the appropriate link in the Actions
menu.
For example, click Top Ten Types of Traffic and then click More.
Parameter Explorer
Queries comprise parameters (or query objects). You can use the Parameter Explorer to create new
parameters and view or edit existing parameters.
To access parameters from the Parameter Explorer:
1. Click Reports on the top-level menu bar.
2. Click Parameter Explorer in the Navigation section in the left pane.
The Parameter Objects pane opens to the right of the navigation pane. It displays the existing
categories under which you can find existing parameters and store newly created parameters.
Default parameters are shown in the right column.
3. Navigate to the desired location using the arrows .
For example, if you click Parameter Explorer > Root, the Parameter Explorer displays the
parameters in the Root category.
4. Click a parameter in the right column, and then select the action to take by clicking a link in the
Actions menu.
For example, click deviceVendor and then click More.
5. Click Add to Favorites. The selected object is added to the favorites list.
For a complete list of parameters available on Logger, see " Parameters" on page582.
Favorites Explorer
For quick access to frequently-used items, you can mark any report, query, parameter, dashboard, or
dashboard widget as a favorite. An item marked as a favorite will be listed in the Favorites Explorer.
Any action that you can perform on an object from its own Explorer can performed from the Favorites
Explorer too. For example, you can run, save, or publish a report published from the Report Explorer. If
you have marked the report as a Favorite, you can run, save, or publish it from the Favorites Explorer
too.
Objects listed in the Favorites Explorer cannot be organized into categories.
Administrator's Guide
HPE Logger 6.2 Page 148 of 623
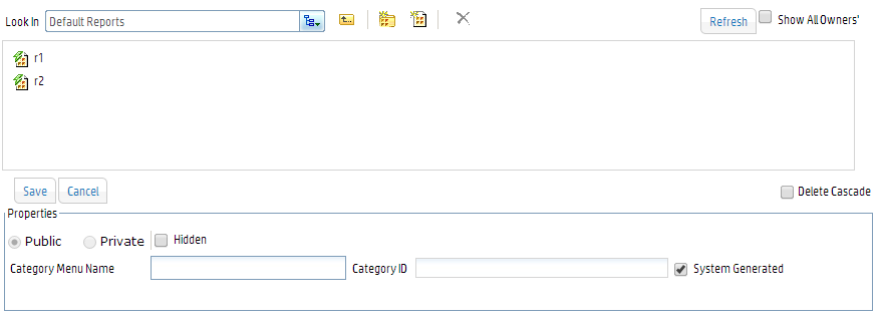
To add an object to your favorites list:
1. Navigate to the object in another Explorer. In the Actions menu, click More.
2. Click Add to Favorites.
See "Parameter Explorer" on the previous page for an example of adding a favorite.
To access an object from your favorites list:
1. Click Reports on the top-level menu bar.
2. Click Favorites Explorer in the Navigation section in the left pane.
The Favorites pane opens to the right of the navigation pane, displaying any favorites you have
added.
3. Click the desired favorite and then select the action to take by clicking a link in the Actions menu.
Categories
Reports, queries, and parameters can be organized and stored under categories for ease of access. You
can create your own categories or edit the existing categories’ properties by clicking on the Report
Categories link in the left pane of the Reports Home page.
Objects in each category can be accessed by using the Category Explorer or the appropriate Explorer
for that type of object. For more information, refer to the appropriate Explorer:
l"Category Explorer" on page145
l"Report Explorer" on page146
l"Query Explorer" on page147
l"Parameter Explorer" on the previous page
l"Favorites Explorer" on the previous page
For information on how to run, view, and publish reports, see "Running, Viewing, and Publishing
Reports" on page171
Administrator's Guide
HPE Logger 6.2 Page 149 of 623

System-defined Categories
The several categories, based on common areas of usage, come with your system. The Default Reports
> Saved Reports category is for user-created reports. The other categories come with predefined
reports ready for your use. For a complete list of reports in each category, access the category in the
Report Explorer.
Default Reports
User-generated reports are placed in this category.
Device Monitoring
This category includes the following subcategories.
lAnti-Virus: Use this category to store reports, queries, parameters, dashboards, and dashboard
widgets that provide information on anti-virus activity, such as the anti-virus update status, virus
activity by hour, and top infected systems.
lCrossDevice: These reports provide information on functions that apply to multiple kinds of devices,
such as failed login attempts, bandwidth usage by hosts, and accounts created by user.
lDatabase: The report in this category provides information on database errors and warnings.
lFirewall: These reports provide information on firewall activity, such as denied connections by port,
address, and hour.
lIdentity Management: This report provides information on the number of connections per user as
reported by the Identity Management devices in your network.
lIDS-IPS: These reports provides information on activity involving Intrusion Detection Systems (IDS)
and Intrusion Prevention Systems (IPS), such as alert count by device, port, severity, top alert
destinations, worm-infected systems, and related metrics.
lNetwork: These reports provide information on activity involving network infrastructure, including
interface status, device errors, and SNMP authentication failures.
lOperating System: These reports provide information on activity involving operating systems, such
as login errors per user, user and user group creation, and modification events.
lVPN: These reports provide information on activity involving VPN connections, including
authentication errors, connection information such as counts, accepted and denied by address, and
related metrics.
Tip: More reports may be available for download as report packages on the HPECustomer
Support site (SSO). (For information about deploying report packages, see "Deploying a Report
Bundle" on page241.)
Administrator's Guide
HPE Logger 6.2 Page 150 of 623

Foundation
This category includes the following subcategories.
lConfiguration Monitoring: Logger provides reports that address configuration monitoring.
lIntrusion Monitoring Reports: Logger provides reports that address intrusion monitoring.
For example, reports are provided to track password changes, firewall configuration events, firewall
traffic, top attackers traversing firewalls, and so forth.
lIntrusion Monitoring Reports: Logger provides reports that address intrusion monitoring.
For example, reports are provided to track password changes, firewall configuration events, firewall
traffic, top attackers traversing firewalls, and so forth.
lNetflow Monitoring: Netflow Monitoring reports IP traffic information.
lNetwork Monitoring Reports: Network Monitoring reports describe activities on Virtual Private
Networks.
Logger Administration
This category includes Logger Administration tasks such as Daily Byte Count.
SANS Top 5 Reports
Logger provides reports that address the SANS Top 5 log reports scenarios, all pre-built and available
to run on-demand or schedule for a specified frequency.
The SANS Institute is a cooperative training, certification, and research organization with a focus on
developing solutions for securing information against a variety of potential threats. SANS facilitates
and supports a collaborative effort of a large number of security practitioners in various industries and
sectors around the world to share experience, solutions, and resources related to information security.
Note: SANS stands for “SysAdmin, Audit, Network, Security”. More information is available on their
Web site at www.sans.org
The SANS Top 5 represents the current set of most critical log reports for a wide cross-section of the
security community, and should be reviewed on a regular basis. This quote from the SANS Web site
describes the strategy and focus of the SANS Top 5 Essential Log Reports:
“The goal is to include reports that have the highest likelihood of identifying suspect activity, while
generating the lowest number of false positive report entries. The log reports may not always clearly
indicate the extent of an intrusion, but will at least give sufficient information to the appropriate
administrator that suspect activity has been detected and requires further investigation.”
The SANS Top 5 log reports cover the following five scenarios:
Administrator's Guide
HPE Logger 6.2 Page 151 of 623
l1 - Attempts to gain access through existing accounts
l2 - Failed file or resource access attempts
l3 - Unauthorized changes to users, groups and services
l4 - Systems most vulnerable to attack
l5 - Suspicious or unauthorized network traffic patterns
For a complete description of the SANS Top 5 log reports, see www.sans.org/resources/top5_
logreports.pdf or look for associated topics in SANS resources on their Web site.
The Logger SANS Top 5 Reports offered to address these threat scenarios are:
lSANS Top 5 - 1 Number of Failed Logins
lSANS Top 5 - 1 Top Users with Failed Logins
lSANS Top 5 - 2 Failed Resource Access by Users and Drilldown
lSANS Top 5 - 2 Failed Resource Access Events and Drilldown
lSANS Top 5 - 3 Password Changes
lSANS Top 5 - 3 User Account Creations, Deletions, and Modifications
lSANS Top 5 - 4 Vulnerability Scanner Logs by Host or by Vulnerability
lSANS Top 5 - 5 Alerts from IDS
lSANS Top 5 - 5 IDS Signature Destinations and Source
lSANS Top 5 - 5 Top 10 Talkers
lSANS Top 5 - 5 Top 10 Types of Traffic
lSANS Top 5 - 5 Top Destination and Target IPs
Administrator's Guide
HPE Logger 6.2 Page 152 of 623

Solution Reports
Any solution packages installed on the Logger are listed in separate report groups. Solution packages
address specific compliance requirements or scenarios and are installed separately. Solutions Reports
are available as add-on packages to Logger for specific compliance requirements or scenarios.
Note: You must log into Logger and open the Reports page at least once before installing any
Solutions package.
The available solution packages include:
lITGov (ISO 27002 & NIST 800-53 based reports)
lPayment Card Industry, (PCI based reports)
lSOX (Sarbanes-Oxley compliance reports)
For information on deploying Solutions Packages, see "Deploying a Report Bundle" on page241. Once
deployed, these solution reports are listed in categories under the Solution Reports report group. To
access these reports (once deployed), click Reports | Solutions Reports |<report category name> on
the left menu, where <report category name> is the solution name, for example: Payment Card
Industry.
For more information on report categories, including how to edit them, see "Report Categories" on
page244.
Dashboards
Dashboards display reporting data to provide a quick view of the latest information about network
events. You can assemble various reports and external links onto a dashboard. However, you must place
each report or link into its own widget and then place the widget in the dashboard. A dashboard can
contain multiple widgets.
Placing reports on a dashboard gives you access to the most recently published results for those
reports. Keep in mind, reports must be run and published in order for the results to be accessible on a
dashboard viewer. If you schedule a report to run, publish, and save for a reasonable retention period
(for example, one month), then those results will always be available for dashboard views.
For example, you can add one or more reports to a dashboard, and configure reports to auto-refresh on
a specified interval (for example, every hour). The dashboard will access the latest published reports
results, in this case, every hour.
If you have also scheduled the reports to run and publish every hour, your dashboard will show current
results. This eliminates the need to manually run and view each report once per hour in order to retrieve
the same information updates.
Note: To view or edit Dashboards created in pre-5.2 Logger releases see "Using Dashboards
Administrator's Guide
HPE Logger 6.2 Page 153 of 623

Created in Pre-5.2 Logger" on page162.
The process for configuring dashboards consists of these tasks:
1. Create a new dashboard. See "Creating a New Dashboard" on the next page for details.
2. Create one widget for every report or web link you want to display on the dashboard. See "Creating
a New Widget" on page158 for details.
3. Add the widgets to the dashboard. See "Placing Widgets in a Dashboard" on page162 for details.
4. Optionally, you can configure the dashboard to display as a tab in the Dashboard Viewer. See
"Viewing Existing Dashboards the Dashboard Viewer" on page156 for details.
Viewing Dashboards
If a dashboard is configured and selected for display, it is shown on the Dashboard Viewer page, and
serves as the Reports Home page. If you are viewing other pages within the Reports page, click
Dashboard on the left panel to return to the Dashboard Viewer (Reports Home page).
Note: If no dashboard is configured and selected for display, the default Reports home page shows
an empty Dashboard Viewer.
Reports must be run and published first in order for the results to be accessible in a dashboard viewer.
(Reports cannot be run from the Dashboard Viewer but may be viewed there.)
You can set a dashboard to auto-refresh at a certain interval, but auto-refreshing a dashboard simply
updates the dashboard display with the most recently published results, not run the report. Use the
dashboard refresh interval in conjunction with scheduled reports to ensure that report results are
always published and retained long enough to be available to dashboards. For more information, see
"Designing Dashboards" below and "Scheduled Reports" on page188.
The Dashboard Viewer page displays the all items placed on the dashboard. If the dashboard includes
reports, reports will show current data from recently run reports.
Dashboards created in pre-5.2 Logger can be viewed and edited from the Classic Viewer, Classic
Designer, and Classic Preferences links. See "Using Dashboards Created in Pre-5.2 Logger" on
page162 for information on how to view or edit dashboards created in pre-5.2 Loggers.
Note: Do not use these links to create new dashboards. Use the Dashboard Viewer link to create
new Dashboards. See "Designing Dashboards" below for details.
Designing Dashboards
Use the Dashboard Viewer page to create a new dashboard, name it, add items to it, and design the
layout. You can design and save multiple dashboards, but only one at a time can be set as the default
Administrator's Guide
HPE Logger 6.2 Page 154 of 623
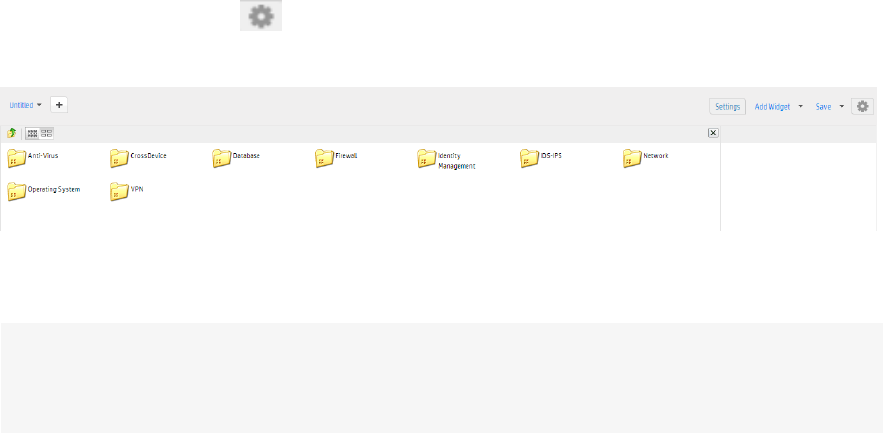
Dashboard Viewer for the Reports home page. Other dashboards can be saved for later use. Each
dashboard can include multiple items (reports, use cases, and Web links).
To access the Dashboard Viewer, click the Dashboard link in the left pane.
What Items Can a Dashboard Include?
The following information is available for placement on a dashboard. However, each report or Web Link
must be placed inside a widget and the widget in turn is placed into the dashboard. A dashboard can
contain one or more widgets containing either of the following:
lReports: any report can be included. The dashboard will show the latest published version of the
report. Reports must be published in order for the report data to be accessible to users on the
Dashboard View. If no published results are available for a report on a dashboard, the Dashboard
View will display a message indicating this. When the report is published, a refresh of the Dashboard
view will display the report.
lExternal Links: any external URLs that you want included as a part of a particular Dashboard View.
Creating a New Dashboard
The high-level steps to create a dashboard are described here. A detailed explanation of each of these
steps is provided in the topics that follow. The Reports home page opens with the Dashboard Viewer
open.
To add a new dashboard:
1. In the navigation pane, click Dashboard. This opens a new empty dashboard tab with the name
“Untitled”.
2. Click Dashboard Options and pick Switch to Edit Mode.
3. To place items onto the dashboard, in the right corner, click Add Widget.
4. Select a widget and click-and-drag it onto the dashboard.
5. For each widget placed, specify Widget Properties, as needed.
Note: By default, a scroll bar is not available in the Dashboard for external links. To include a
scroll bar, set the “Show Scrollbar” property to “Yes” in the Widget Properties section of
“External Links” under Dashboard Items.
6. Click Save to save the dashboard.
Administrator's Guide
HPE Logger 6.2 Page 155 of 623

Once saved, new dashboards become available in the Dashboard Preferences list of “Available
Dashboard(s)”.
See "Dashboards" on page153 for information on how to display the new dashboard you just created or
set the default display to a different dashboard.
Viewing Existing Dashboards the Dashboard Viewer
To open multiple dashboards as tabs in the Dashboard Viewer:
1. Click the Dashboard Preferences link on top of the Dashboard Viewer page.
2. In the Available Dashboards box, navigate to the dashboard that you want to display in a tab.
3. Click +. The dashboard name is displayed in the Selected Dashboard box.
4. Click Save .
5. Click the Dashboard link in the left panel to display the Dashboard Viewer. The dashboard you
selected is displayed.
Note: The set or subset of dashboards shown under Available Dashboard(s) is based on
your user group status and the selection status of Show All Owners' checkbox. A user with
Administrative rights is able to see more or all dashboards than a user with fewer privileges. If
you limit the view to only your dashboards, the list will not include dashboards designed by
other users.
To access dashboards from all users (designers), select the Show All Owners checkbox.
To view only your dashboards, deselect this checkbox.
Removing an Existing Tab from the Dashboard Viewer
To remove an existing tab from the Dashboard Viewer without deleting the dashboard
from its saved location:
1. Click the dashboard title, and then click Delete.
2. Click OK to confirm deletion.
Deleting a Dashboard
You can delete an existing dashboard from the Dashboard Viewer.
To delete the dashboard from the Dashboard Viewer:
1. Select the Dashboard, then click Settings.
2. Select Switch to Edit Mode.
Administrator's Guide
HPE Logger 6.2 Page 156 of 623

3. In Edit Mode, select the down arrow next to the Dashboard title and click Delete.
4. In the Remove Tab dialog, check the Remove this dashboard from saved location checkbox and
click OK.
Editing an Existing Dashboard
To modify an existing dashboard:
1. Click Settings, and then pick Switch to Edit Mode. Its current configuration is displayed and you
can modify then save settings as needed.
2. The Properties area displays basic dashboard settings. To automatically refresh a dashboard at a
regular interval, check the Auto-refresh every checkbox and specify the automatic refresh time in
terms of minutes in Min(s). Check the Prompt on First Run checkbox to display the Input
Parameter Form, which shows the values of the Dashboard parameters before reports are run
from the dashboard for the first time after they have been displayed on the dashboard.
3. The Layout area enables you to select panes for the dashboard.
4. The Information area displays Description, Scope and Location where the dashboard is saved.
5. The Dashboard Parameters area shows formatting parameters (Maximum Columns and Column
Width).
Selecting a Default Dashboard View for the Reports Home Page
If you have multiple dashboards open in tabs in the Dashboard Viewer, you can set one of the
dashboards to display as the default dashboard for the Reports home page.
To set a default dashboard:
1. Click the Dashboard Preferences link on top of the Dashboard Viewer page.
2. In the Selected Dashboards box, click the radio button corresponding to the dashboard that you
would like to display as the default dashboard on the Reports home page. Click the up arrow to
move that dashboard to the top of the list.
3. Click the Save button.
4. Click the Dashboard link in the left pane and your selected dashboard will show as the default tab
(the first tab).
The Dashboard Preferences page has the following fields:
Field Description
Show All Owners To display all dashboards made by all the users in the Available
Dashboard(s) box, check the Show All Owners' checkbox.
Administrator's Guide
HPE Logger 6.2 Page 157 of 623

Field Description
Available Dashboards This box shows a list of all dashboards that are available for display in
the Dashboard Viewer.
Selected Dashboards Move the dashboards you want to display in the Dashboard Viewer
from the Available Dashboards list to the Selected Dashboards box.
Dashboards listed in this box will be displayed as tabs in the
Dashboard Viewer.
Widgets
A widget is a mechanism for the display of data. After you have created a new dashboard, you will need
to add one or more widgets to display your reports or web links. A widget is designed in the Widget
Designer. Each dashboard item must be placed in its own widget for display on the dashboard. A widget
can be placed on multiple dashboards.
The Widget Designer
The Widget Designer enables you to create a new widget, save a widget, edit a widget, or delete a
widget. You can place a report or a web link (an external link) into a widget. Each widget can contain
only one object.
Creating a New Widget
To open the Widget Designer page and create a new widget, above the Dashboard Viewer, click Widget
Designer.
On the Widget Designer page, you can choose what to place in the widget, a report, or a web link.
You cannot run reports from a Dashboard view. You can only view results of previously saved,
published reports. A refresh or auto-refresh on a dashboard simply updates the dashboard display with
the most recently published result, but does not run the report. Therefore, reports on dashboards must
be run, saved, and published in order for the report data to be viewable on the Dashboard view. If a
report on a dashboard has not been saved or published, its widget will display an error message on the
Dashboard view the report data is not available to the dashboard.
Administrator's Guide
HPE Logger 6.2 Page 158 of 623
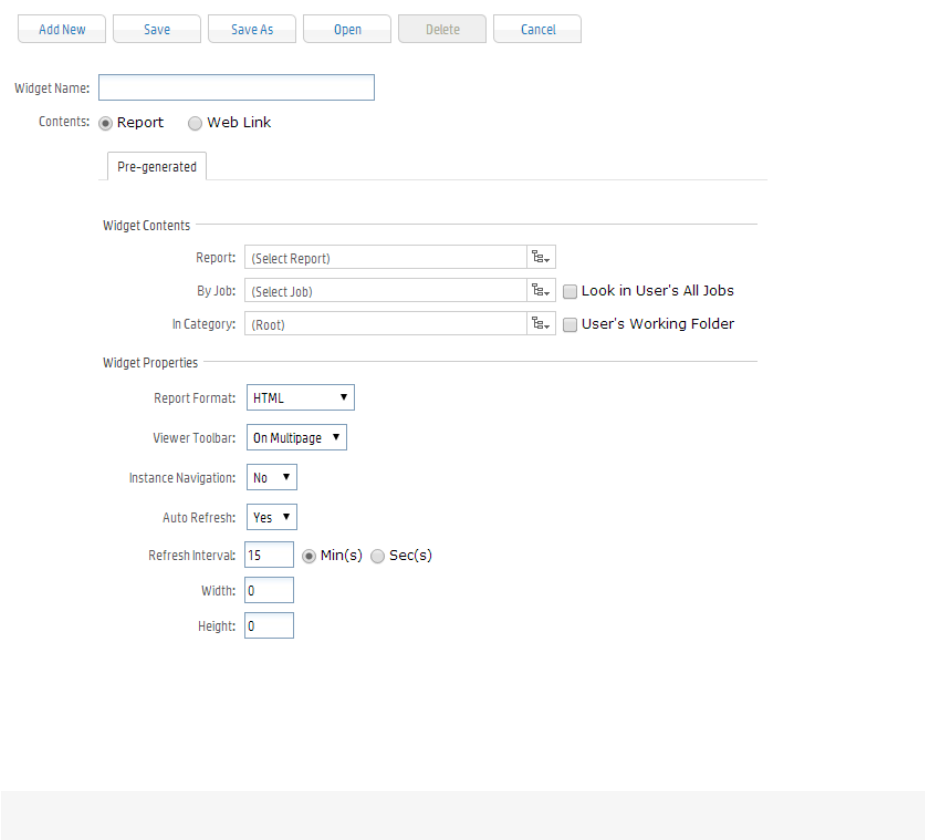
To create a Report widget:
Click the Report radio button on the Widget Designer page to place a report in the widget.
Note: You can only add reports that have already been run and published.
In your widget, you can include the last published instance of the following:
lA report: You need not make any selection in the Report field, By Job or In Category.
lA specific report: Navigate to the report in the Report field. You can leave the By Job and In
Category fields blank.
lA report executed by a specific scheduled report job: Navigate to the job in the By Job field. You can
leave the Report field and the In Category field blank.
lA report deployed in a specific category and executed by a specific job: From the In Category field,
navigate to a category and navigate to a job in the By Job field.
lAny of the reports from the jobs you own: You own the jobs that you created or were created on
your behalf. Check the Look in User's All Jobs checkbox.
lAny of the reports deployed in your default category: Check the User's Working Folder checkbox.
Administrator's Guide
HPE Logger 6.2 Page 159 of 623

Specify the following widget properties:
Label Description
Widget Name Enter a name for the new widget to be created.
Report Format Select the format in which you would like the report displayed.
Toolbar Select whether you want a toolbar displayed and whether you want it
displayed on all pages if this is a multi-page report.
Instance Navigation Sets whether to include a report navigation feature on the dashboard.
lSelect Yes to provide a pull-down menu that enables Dashboard users to
select a saved report and view it.
lSelect No if you do not want to provide this feature on the dashboard.
Auto Refresh Set to Yes, if you want the report to refresh automatically after a certain
interval, and then set the Refresh Interval parameter.
Refresh Interval This is the time in minutes. Refresh will take place at the end of specified
number of minutes. For example, if you want the report results to refresh
every 15 minutes, set the Refresh Interval to 15.
Width Select the width of the widget in pixels. You can select only whole numbers
(no decimals allowed)
Height Select the height of the widget in whole pixels (no decimals allowed)
Administrator's Guide
HPE Logger 6.2 Page 160 of 623
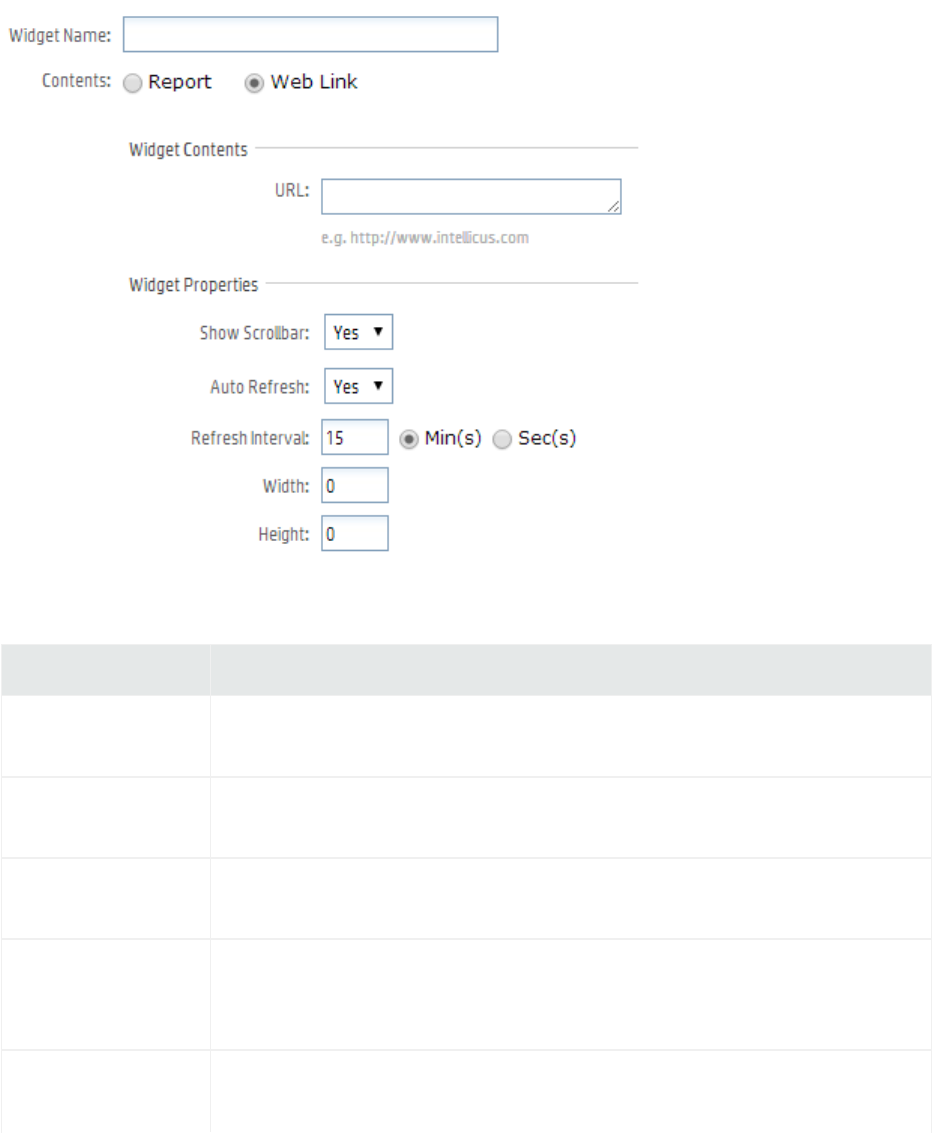
To create a Web Link widget:
Click the Web Link radio button on the Widget Designer page to place a web link in the widget.
Specify the following properties:
Label Description
URL Specify the URL for the external link of the page that you want to display in
the widget
Show Scrollbar Select whether you want a scroll bar in the widget. By default, the scrollbar is
visible.
Auto Refresh By default, the web page will be automatically refreshed. Select No if you want
to turn this feature off.
Refresh Interval This is the time in minutes. Refresh will take place at the end of specified
number of minutes. For example, if you want the web page to refresh every 15
minutes, set the Refresh Interval to 15.
Width Select the width of the widget in pixels. You can select only whole numbers
(no decimals allowed).
Administrator's Guide
HPE Logger 6.2 Page 161 of 623

Label Description
Height Select the height of the widget in pixels. You can select only whole numbers
(no decimals allowed).
Deleting a Widget
To delete a widget, open the widget in the Widget Designer and click the Delete button on top of the
Widget Designer page. When a dashboard uses a widget that is deleted, an error message explaining
that the widget has been deleted is displayed in the widget on the dashboard.
Editing an Existing Widget
Click the Widget Designer link to open it. Click the Open button on top of the Widget Designer page
and select the widget that you want to edit. After editing it, click the Save button.
Placing Widgets in a Dashboard
Reports and Web Link (external link) objects are available to be placed on a dashboard. However, these
objects must first be placed in a widget and then the widget can be added to the dashboard.
1. With the report in Edit Mode, click the Add Widget button on the upper right corner of the empty
dashboard page.
2. Navigate to the widget you want to place on the dashboard and click-and-drag it to the dashboard.
3. Repeat steps 1 and 2 to add more widgets.
Moving an Existing Widget within a Dashboard
To move an existing widget on a dashboard, hover your mouse over the top boundary of the widget.
The widget name bar will drop down. Click the widget name bar and drag it to move the widget to the
desired location on the dashboard.
Using Dashboards Created in Pre-5.2 Logger
This section is applicable to dashboards created in versions of Logger earlier than 5.2.
To create, edit or view new dashboards, follow the instructions in "Dashboards" on page153.
Viewing a Classic Dashboard
To view the dashboard, click the Classic Viewer link on top of the Reports page. If no dashboard is
configured and selected for display, the default Reports home page shows the My Reports page that
lists the status of recently run or accessed reports.
Administrator's Guide
HPE Logger 6.2 Page 162 of 623

To set a dashboard as the default Dashboard View:
1. Open the dashboard in the Classic Designer.
2. Select the Add to My Preferred List checkbox.
The Classic Viewer page displays the contents of various items placed on the dashboard during the
dashboard’s design time. If the dashboard includes reports, reports will show current data from recently
run reports.
Reports must be run and published first in order for the results to be accessible on a dashboard view.
There are no options available to run reports from the Dashboard view. On a Dashboard view, you can
view saved or published reports but not run them.
Tip: A refresh or auto-refresh on a dashboard simply updates the dashboard display with the most
recently published results, but does not run the report. Use the dashboard refresh interval in
conjunction with scheduled reports to ensure that report results are always published and retained
long enough to be available to dashboards.
Designing Classic Dashboards
Use the Classic Designer page to edit the dashboard, add items to it, and change the layout. Each
dashboard can include multiple items (reports, use cases, and Web links).
What Items Can a Dashboard Include?
The following information is available for placement on a dashboard:
lReports: any report can be included. The dashboard will show the latest published version of the
report. Reports must be published in order for the report data to be accessible to users on the
Dashboard View. If no published results are available for a report on a dashboard, the Dashboard
View will display a message indicating this. When the report is published, a refresh of the Dashboard
view will display the report.
lCommon Use Cases, including a Report List, Saved Report List, Health Monitor, Recent Run Report
List, Quick Job List, Schedule History, and Audit Log: These are provided as dashboard elements so
that users access a use case without leaving the Dashboard View page.
lExternal Links: Any URLs that you want included as a part of a particular Dashboard View
Creating a New Classic Dashboard
Do not use the Classic Designer page to create new dashboards. Create new dashboards using the
Dashboard Viewer link. See "Dashboards" on page153 for more information.
Administrator's Guide
HPE Logger 6.2 Page 163 of 623
Placing Items on an Existing Dashboard
To place an item on a dashboard, click the Classic Preferences link. In the Widgets provided in the
Layout area, click-and-drag an item from the Dashboard Items list on the left into an empty widget to
the right. Alternatively, click next to the dashboard item you want to place the item on an empty
widget.
You can also click-and-drag an item onto a currently occupied widget if you want to replace an item in a
widget with a different one.
To add a new widget, click (Divide Widget Horizontally) or (Divide Widget Vertically) on a
widget to split it into two widgets. The original widget remains a new empty widget is placed on the
dashboard layout.
For each item (widget) placed, specify Widget Properties, as needed.
By default, a scroll bar is not available in the Dashboard for external links. To include a scroll bar, set the
“Show Scrollbar” property to “Yes” in the Widget Properties section of “External Links” under
Dashboard Items.
Dashboard Properties
The Dashboard Properties are described in the following table.
Property Description
Name Name of the dashboard
Description Descriptive information about this dashboard
Dashboard Properties Description
Creating Widgets
Each dashboard item must be placed in its own widget for display on the dashboard. Create a new
widget using the Widget Designer link.
To add a new widget:
To add a new widget, click (Divide Widget Horizontally) or (Divide Widget Vertically) on a widget
to split it into two widgets. The original widget remains a new empty widget is placed on the dashboard
layout.
To remove a widget:
To remove a widget, click Remove Widget, located on the top right corner on the widget you want to
remove.
Administrator's Guide
HPE Logger 6.2 Page 164 of 623
Placing Dashboard Items on the Layout
Click the Classic Designer link on the Reports page. Reports, use cases, and external link objects are
available under Dashboard Items (to the left of the Layout area).
To place a dashboard item, click to expand the menu for the type of item you want, click-and-drag an
item onto a widget in the Layout area, and specify widget properties as needed. (Widget properties vary
depending on the type of item you place on the dashboard.)
The following sections provide more detail on placing each type of dashboard item and setting
appropriate widget properties.
Placing a Report on a Dashboard
The following sections describe in detail how to place and configure reports on dashboards, including
setting widget properties, report parameters, and dashboard parameters.
A dashboard can only be used to view results of previously saved, published reports. A refresh or auto-
refresh on a dashboard simply updates the dashboard display with the most recently published results,
but does not run the report.
Therefore, reports on dashboards must be run, saved, and published in order for the report data to be
viewable on the Dashboard view. If a report on a dashboard has not been saved or published, its widget
will display an error message on the Dashboard view the report data is not available to the dashboard.
To place a report on a dashboard:
1. Under Dashboard Items, click Reports bar to expand the list of available reports.
2. If available, select a Reports submenu. (Different reports are displayed depending on the submenu
you select.)
Optionally, select the Saved Reports checkbox to display a list of saved reports.
3. Select a category to view reports deployed in that category.
4. Click and drag the report to the widget in which you want to place the report. Alternatively, click
next to the dashboard item you want to place the item on an empty widget.
The report name is displayed in the widget in the Layout area.
5. Set Widget Properties for the report.
The following table describes Widget Properties settings for Reports dashboard items.
Note: By default, a scroll bar is not available in the Dashboard for external links. To include a scroll
bar, set the “Show Scrollbar” property to “Yes” in the Widget Properties section of “External Links”
under Dashboard Items.
Administrator's Guide
HPE Logger 6.2 Page 165 of 623

Property Description
Report Name The name of the report that occupies this widget.
Refresh Interval
(in minutes)
Report refresh will take place at the end of specified number of minutes. For
example, if you want the report results to refresh every 15 minutes, set the
Refresh Interval to 15.
Note: Reports must be run and published first in order for the results to
be accessible on a dashboard view. A refresh or auto-refresh on a
dashboard simply updates the dashboard display with the most recently
published results, but does not run the report. Use the dashboard refresh
interval in conjunction with scheduled reports to ensure that report
results are always published and retained long enough to be available to
dashboards. (See also, "Scheduled Reports" on page188.)
Format Output format in which you want to view the report. Available options are:
lHTML
lAcrobat PDF
lInteractive HTML
Auto Refresh Enables or disables auto-refresh option.
lSelect Yes to refresh the reports at the Refresh Interval.
lSelect No to view the report generated when dashboard was loaded for the
first time.
Note: Reports must be run and published first in order for the results to
be accessible on a dashboard view. A refresh or auto-refresh on a
dashboard simply updates the dashboard display with the most recently
published results, but does not run the report. Use the dashboard refresh
interval in conjunction with scheduled reports to ensure that report
results are always published and retained long enough to be available to
dashboards. (See also "Scheduled Reports" on page188.)
Toolbar Specifies Toolbar settings.
lSelect Yes to always show toolbar.
lSelect No to never show the toolbar.
lSelect Multipage to show the toolbar only for multi-page reports.
The Multipage setting is applicable to HTML and Interactive output
formats.
Widget Properties for Reports on a Dashboard
Administrator's Guide
HPE Logger 6.2 Page 166 of 623
Property Description
Instance Navigation Sets whether to include a report navigation feature on the dashboard.
lSelect Yes to provide a pull-down menu that allows Dashboard users to
select a saved report and view it.
lSelect No if you do not want to provide this feature on the dashboard.
Link Widgets Click to display the Link Widget dialog in which you can specify a link
from any of the charts in the report in this widget to another widget.
See "Linking Widgets" below.
Description Description of the widget.
Widget Properties for Reports on a Dashboard, continued
Linking Widgets
You can link a widget that contains a report (although, not saved reports) to another widget. The
widget that is the link target can contain a use case, a report, or external link.
To link a chart in a report to data in another widget:
1. Select a widget in which you want to provide a link. (The widget that is the link “source” must
contain a report with a chart on it).
2. Under Widget Properties for the selected widget, click to display the Link Widgets dialog in
which you can specify a link from any of the charts in the report to another widget. (The widget
that is the target of the link can contain a report, use case or external link.)
3. In the Link Widget dialog, select an Item (chart series) from the Item(s) and select (link) it to an item
in one of the other Widgets.
4. Click (add button) next to “Series” to add another row to specify another set of link information
in the same report with a different widget/series combination.
To remove a row, click (delete button) next to the row you want to remove.
5. Click OK to save the settings and close the dialog.
Placing a Use Case on a Dashboard
The following sections describe in detail how to place and configure use cases on dashboards.
To place a use case on a dashboard:
1. Under Dashboard Items, click Use Cases bar to expand the list of available use cases.
2. Click and drag a use case to the widget in which you want to place it. Alternatively, click next to
Administrator's Guide
HPE Logger 6.2 Page 167 of 623

the dashboard item you want to place the item on an empty widget.
The use case name is displayed in the widget in the Layout area.
3. Set Widget Properties for the use case.
Widget Properties for Use Cases
The following table describes Widget Properties settings for Use Case dashboard items.
Property Description
Name The name of the use case that occupies this widget.
Refresh Interval
(in minutes)
This is the time in minutes. The external link page is refreshed at the specified
interval.
Auto Refresh Enables or disables auto-refresh option.
lSelect Yes to refresh the use case as per Refresh Interval.
lSelect No to execute only once, when the dashboard is loaded.
Show Scroll Bar Select Yes to add a scroll bar if the use case does not fit in widget width.
Description Description of the widget.
Category This option is displayed when Report List, Saved Report List or Quick Job List
is placed on widget. Select the category to carry out respective task (get a list
of reports in selected category, display a list of saved reports or quick job lists
for the selected report).
Report This option is displayed when Saved Report List or Quick Job List is selected.
Select the report for which saved report list or quick job list is to be viewed.
Widget Properties for Use Cases on a Dashboard
The use cases displayed in the list will depend on the permissions associated with your user group.
Other properties are displayed based on the use case.
Placing an External Link on a Dashboard
The following sections describe in detail how to place and configure an external link on a dashboard.
To place a link on a dashboard:
1. Under Dashboard Items, click External Links bar to expand the list.
2. Click and drag an External Link URL object to the widget in which you want to place it.
Alternatively, click next to the dashboard item you want to place the item on an empty widget.
Administrator's Guide
HPE Logger 6.2 Page 168 of 623

The External Link URL object is displayed in the widget in the Layout area.
3. Set Widget Properties for the URL.
The following table describes Widget Properties settings for External Links dashboard items.
Property Description
Name The name of the external link that occupies this widget.
Refresh Interval
(in minutes)
This is the time in minutes. The use case page is refreshed at the specified
interval.
Auto Refresh Enables or disables auto-refresh option.
lSelect Yes to refresh the URL as per Refresh Interval.
lSelect No to execute only once, when the dashboard is loaded.
Show Scroll Bar Select Yes to display a scroll bar if external link does not fit in widget width.
Description Description of the widget.
URL Specify the URL for this widget.
If you want to add multiple Web pages to the dashboard, use a different
widget for each URL.
Widget Properties for External Links on a Dashboard
Administrator's Guide
HPE Logger 6.2 Page 169 of 623
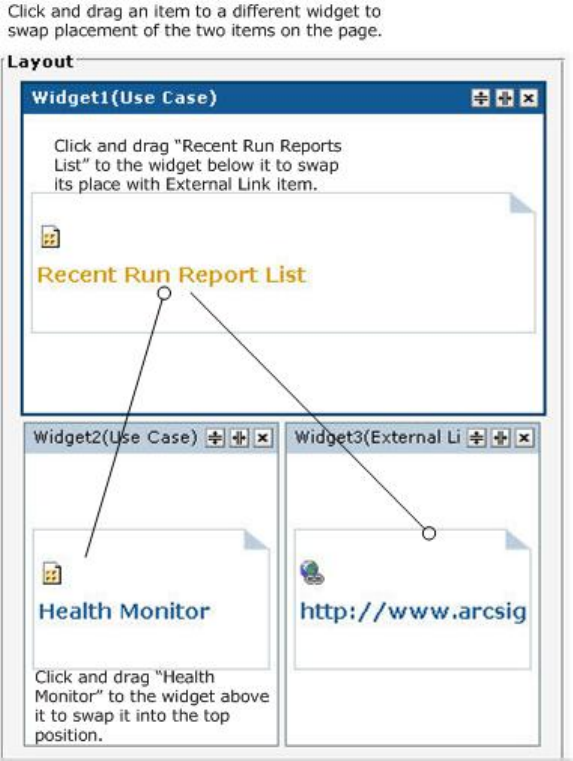
Swapping Items on Widgets
You can swap items placed in widgets. To do this, click and drag the item to the widget where you want
to place it.
In the above example, the Recent Run Reports List item is swapped to the position of the External Link
URL, which is then swapped with the Health Monitor item, which will end up at the top of the
dashboard.
Setting Pre-5.0 Dashboard Preferences
In the Classic Preferences page, you can specify the dashboard to be made available for viewing.
Administrator's Guide
HPE Logger 6.2 Page 170 of 623

Working with Available Dashboards
The set or subset of dashboards shown under Available Dashboard(s) is based on your user group
status. For example, it is likely that a user with Administrative status will be able to see more or all
dashboards than a user with fewer privileges.
Selecting a Dashboard View
Once you have created one or more dashboards, you can select one of them as the default display for
the Dashboard View page, which also serves as the Reports home page. Only one dashboard at a time
can be displayed as the default dashboard view.
Tip: You must have at least one dashboard in order to set a preference for the Dashboard View.
You can also set a dashboard as the “Selected Dashboard” (default dashboard view) in the Dashboard
Designer by enabling the Add to my preferred list, as described in "Viewing a Classic Dashboard" on
page162.
To select a default Dashboard View for the Reports home page:
1. Navigate to Dashboard > Preferences.
2. Select a dashboard from the Available Dashboard(s) list and click the right arrow button to
move it into the Select Dashboard(s) list for display. Only one dashboard can occupy the “Selected
Dashboard(s)” list at any one time.
3. Click Save to save your preferences and display the selected dashboard.
To remove or change the currently displayed dashboard:
1. Return to the Classic Preferences page.
2. Move the currently selected dashboard out of the Select Dashboard(s) list by selecting it and
clicking the left arrow button .
3. Choose a different one to display if so desired (or none).
4. Click Save to save your preferences.
Running, Viewing, and Publishing Reports
Reports are deployed (made available) under their respective categories. (See "Report Explorer" on
page146.)
You can run, view, and publish reports you create, as well as reports in categories for which the
administrator has given you user access rights. You can run up to 5 ad hoc reports, or up 10 scheduled
reports, concurrently.
Administrator's Guide
HPE Logger 6.2 Page 171 of 623

Tip: There are no options available to run reports from a Dashboard viewer. On a Dashboard
viewer, you can view saved or published reports, but not run them.
You can run, view, customize or publish reports in the following ways:
lClicking the Report Explorer link, clicking on a category, selecting the report and clicking on a
desired button on the button bar. OR
lDouble-clicking on a category in any Explorer, then selecting the report by clicking the radio button
next to it, and then clicking on a desired button on top of the page.
Best Practices
Logger is designed to process events while running a report, but event processing has priority. Running
a complex report while the event processing system is under load will result in report timeout rather
than dropped events.
To effectively manage demands for system resources, HPE recommends using the Scheduled Report
feature so that reports run during periods of light load. If an ad hoc report must be run, run it when the
system is not under load.
For information on working with scheduled reports, see "Scheduled Reports" on page188.
If you are running a distributed report, also see the best practices discussed in "Selecting Device Groups,
Storage Groups, Devices, or Peers" on page178.
Finding Reports
You can find reports on the following pages within the Reports page:
lCategory Explorer
lReport Explorer
lFavorites Explorer (if you have marked the report as a Favorite)
lScheduled Reports page (if the report you are looking for is a scheduled report and it has been run
and published)
lThe Recent Reports link on top of any Reports page.
Viewing Recently Run Reports
To view the most recently run reports, click the Recent Reports link on top of the Reports page. Click
on the radio button next to a report to select it.
Administrator's Guide
HPE Logger 6.2 Page 172 of 623
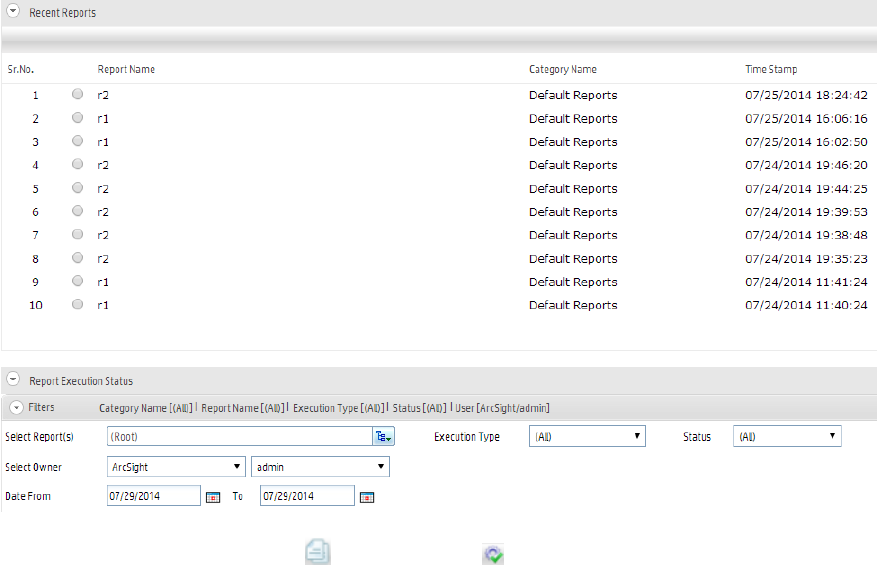
After you select a report, the Run and the Re-Run buttons are displayed in the top left corner.
You can run the selected report using the same filter options as the original run by clicking the Run
button, or you can run the selected report using different field values by clicking on the Re-Run button.
See "Run Report Parameters" on page179 for details.
Task Options on Available Reports
Your access to various reports and report options (view, publish, edit, etc.) depends the access rights
associated with your user role and Logger Report Group affiliation. For example, depending on your
access rights, you may have privileges to view some reports but not others, to view but not schedule or
publish a report, or to view and schedule but not edit a report.
Access rights to report options are configured and managed with the User/Groups option on the
System Admin page. For more information on setting permissions and on Logger Report Group
management, see "Setting Access Rights on Reports" on page214.
The following sections describe details of running and viewing reports, setting report parameters on a
report run, and the various options for working with report output.
Running and Viewing Reports
To begin running and viewing reports, choose a report category in the Report Explorer, and then
choose a report within the category.
Administrator's Guide
HPE Logger 6.2 Page 173 of 623
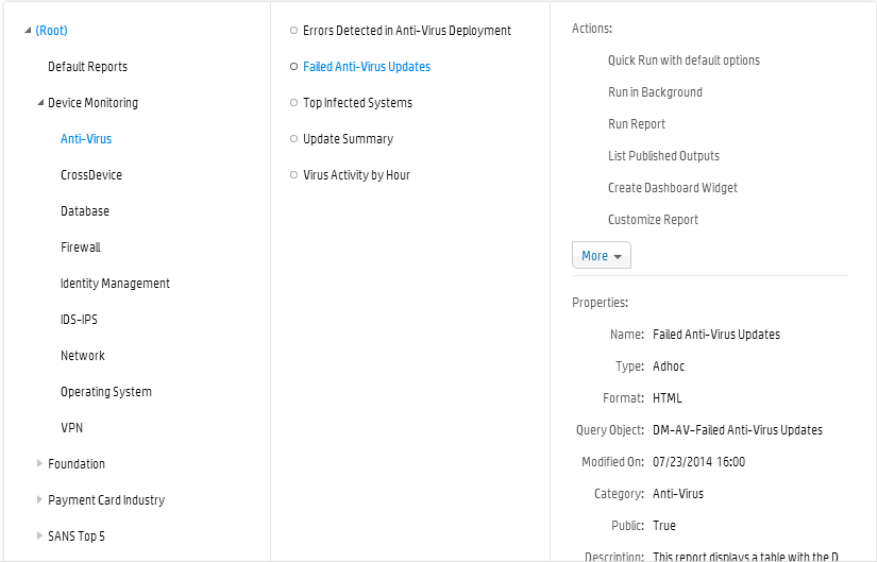
About the Pagination of Reports
The default view option for the report results is Multipage. If Multipage is deselected in the View
Options link, your report will be formatted as a single page. HPE strongly recommends using the
Multipage option for all reports. Specifically, if a report will result in more than 826 records, using the
Multipage option will ensure that the generated report is not blank. By default, PDF reports are set by
default to use the Multipage option. However, if your PDF format report is blank, ensure that the
Multipage option is still checked for that report.
If a report contains more columns than can be displayed horizontally using the default width specified in
the report query, the report is paginated horizontally, such that additional columns are displayed on the
following pages. For example, if a report contains 45 columns and only 5 can be displayed at once, the
report would be paginated such that Page 1 displays columns 1 through 5, Page 2 displays columns 6
through 10, and so on. Consequently, if the report contained more rows than can be displayed vertically,
the second group of rows would be displayed starting at Page 10.
Currently, Logger limits the number of pages for horizontal pagination to 10. As a result, if a report
requires more than 10 pages to display all columns, complete report results may not be displayed. To
view all columns of such reports, manually set the width of each column such that all columns fit in 10 or
less pages in the report query (in the Query Object Editor).
Administrator's Guide
HPE Logger 6.2 Page 174 of 623

About Running a Report
Reports can be run from any of the following Explorers:
lCategory Explorer
Click a category in the Repository column, click Reports, select a report in the Reports column and
click Quick Run with default options, Run in Background, or Run Report. Then, set the
parameters and click Run Now, Run in Background, or Run button depending upon what type of
run you chose.
lReport Explorer
Click a category in the Reports column, select a report in the next column, and click the Quick Run
with default options, Run in Background, or Run Report buttons. Then, set the parameters and
click Run Now, Run in Background, or Run depending upon what type of run you chose.
lFavorites Explorer (if you have marked the Report as a Favorite)
Click on a report in the Favorites column and click Quick Run with default options, Run in
Background, or Run Report buttons. Then, set the parameters and click Run Now, Run in
Background, or Run depending upon what type of run you chose.
Note: Even if you selected Run Report initially, you can run a report in the background after
setting the Run Report parameters.
The report output is displayed in the specified format (such as HTML or PDF).
At this point, the results of this report generation is available as a file for viewing only by you. If you
close the file without saving or publishing it, the results are no longer available.
If you want to make the results of this run available for others, you need to publish it. To do this,
leave the file open, click Publish Report, available in the button bar located on top of the report, and
follow the steps in "Publishing Reports" on page181.
For information about other delivery options available to you at this point, see "Report Delivery
Options" on page185.
Running a Report Manually
To run a report manually:
1. Click the Report Explorer in the left pane.
2. Click the category in which the report is stored.
3. Select the report.
4. Click the Run Report, Quick Run with Default Options, or Run in Background button.
Administrator's Guide
HPE Logger 6.2 Page 175 of 623
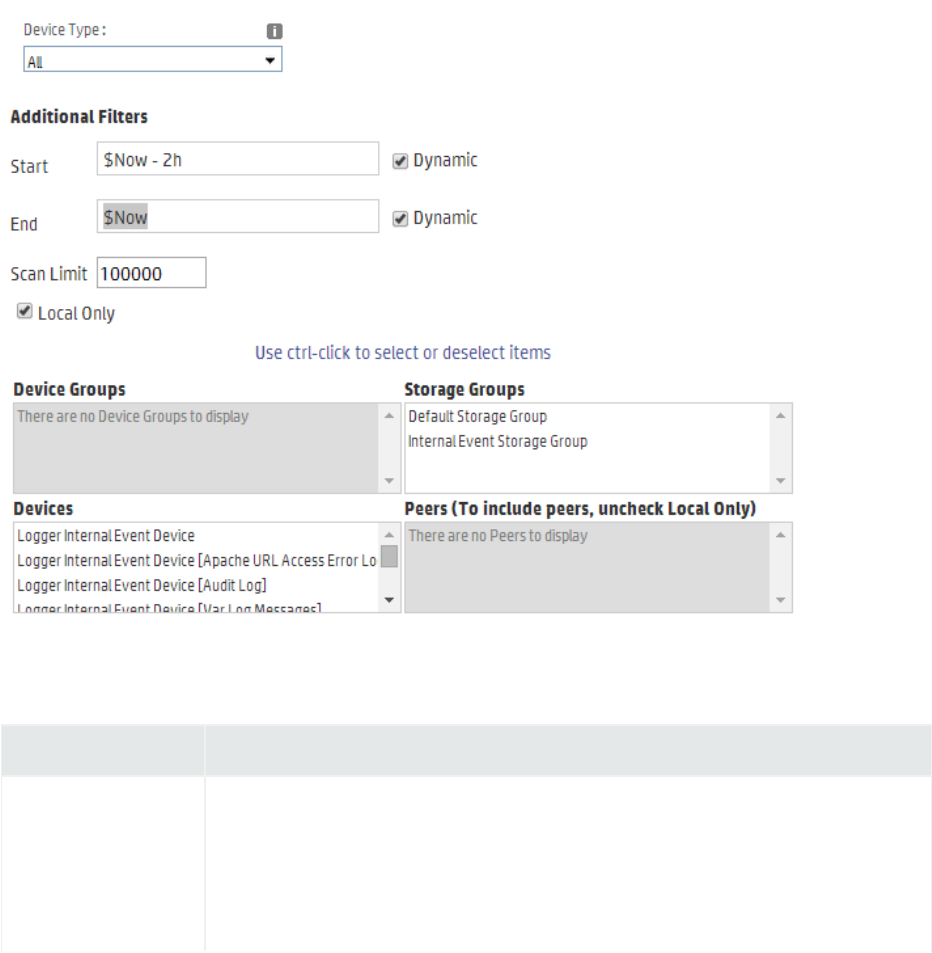
Quick Run with Default Options or Run In Background Report Parameters
When you click either the Quick Run with default options or the Run in Background button, the
report will run with the data filters specified in the deployed report. Options are available to select
additional filters on time frame and constraints, such as Device Groups, Storage Groups, Devices, and
Peers.
You can also run a distributed report: a report that also includes matching events from the specified
peers of a Logger. You select the peers on which the report should run in the Peers list, as shown in the
following figure. If no peers are configured, the Peers list contains only the localhost IP address
(127.0.0.1). However, if peers are configured, their IP addresses are listed.
The following table describes Quick Run with default options or Run in Background report parameters.
Option Description
Start Specify the starting point for the data gathering from the events database.
By default, the start time is specified with a dynamic data expression ($Now
- 2h).
You can modify the dynamic expression to specify a different dynamic start
Quick Run with default options / Run in Background Report Parameters
Administrator's Guide
HPE Logger 6.2 Page 176 of 623

Option Description
time, or disable Dynamic and use the calendar options to specify a fixed start
time.
End Specify the ending point for the data gathering that is some time after the
starting point.
Keep in mind that large time spans can mean large amounts of data, which can
affect system performance.
By default, the end time is specified with a dynamic data expression ($Now).
You can modify the dynamic expression to specify a different dynamic end
time, or disable Dynamic and use the calendar options to specify a fixed end
time.
Scan Limit Specify the number of events to scan.
When you specify a scan limit, the number of events scanned for manually run
reports is restricted to the specified limit. Doing so results in faster report
generation and is beneficial in situations when you only want to process the
latest N number of events in the specified time range instead of all the events
stored in Logger.
The scan limit is 100,000 by default. If you set the scan limit to 0 (zero), all
events are scanned.
This setting does not apply to the scheduled reports.
Device Groups Select any device groups on which to run the report query, if any. (See
"Selecting Device Groups, Storage Groups, Devices, or Peers" on the next
page.)
Storage Groups Select any storage groups on which to run the report query. (See "Selecting
Device Groups, Storage Groups, Devices, or Peers" on the next page.)
Devices Select any devices on which to run the report query. (See "Selecting Device
Groups, Storage Groups, Devices, or Peers" on the next page.)
Peers Select the peer Loggers on which to run the report query. If no peers are
configured on the Logger, this option only lists the localhost IP address
(127.0.0.1). However, if peers are configured, their IP addresses are listed. (See
"Selecting Device Groups, Storage Groups, Devices, or Peers" on the next
page.)
Quick Run with default options / Run in Background Report Parameters, continued
Administrator's Guide
HPE Logger 6.2 Page 177 of 623
Selecting Device Groups, Storage Groups, Devices, or Peers
You can select or deselect items on Device Groups, Storage Groups, Devices, or Peers as a part of
setting the Quick Run with default options or Run in Background parameters.
lOnly highlighted (selected) items will be included in the report query when the report is run.
lTo select an item, click on it. To select multiple items in a list, use Ctrl-Click. To deselect a currently
selected item, use Ctrl-Click.
lIf none of the storage groups, device groups, or devices are selected, all items are included in the
report query. However, peers must be explicitly selected to run a report query on them. If none of the
peers are selected, the query will only run on the local Logger.
lThe selected items in the Device Groups, the Devices lists, and Peers are ORed in the report query,
and these items are ANDed with the other selected items such as Storage Groups.
Follow these guidelines when you run a distributed report (a report on peer Loggers):
lYou can run a distributed report in the Quick Run, Run in Background, Run, or Scheduled Reports
mode.
lAll Loggers on which you are running the distributed report must be running Logger5.2 or later.
lIf peer Loggers do not have identical storage or device group names, the report query skips
searching for events for those groups on those peers.
lIf you added custom schema fields to your Logger schema, those fields must exist on all peers.
Otherwise, a query containing those fields will not run (when run across peers) and return an error.
See "Adding Fields to the Schema" on page379.
lA user needs to belong to these user groups with the listed permissions set to run distributed
reports:
a. Logger Search Group with “Search for events on remote peers” user right set (checked).
b. Logger Rights Group with the “View registered peers” user rights set (checked).
c. Logger Reports Group with “View, run, and schedule reports” rights set (checked) for specific
reports or the global permission set to run all reports.
For more information on setting permissions, see "Setting Access Rights on Reports" on page214
lIf a peer is unavailable when a distributed report is run, an error message is displayed and the report
is aborted. Similarly, if a peer becomes unavailable while a distributed report is running, the report will
continue to run and displayed. However, the server log will contain exceptions indicating the cause.
Use the following best practices for optimal performance when running a distributed report:
lAvoid running a distributed report on a Wide Area Network (WAN) link.
lIf you are running the report on a very large data set and the performance of the report is not
optimal, reduce the size of the data set, and/or defragment the device..
lEnsure that all fields in the report query are indexed on all peer Loggers. The report query will run
slower on the Logger on which the fields are not indexed.
Administrator's Guide
HPE Logger 6.2 Page 178 of 623
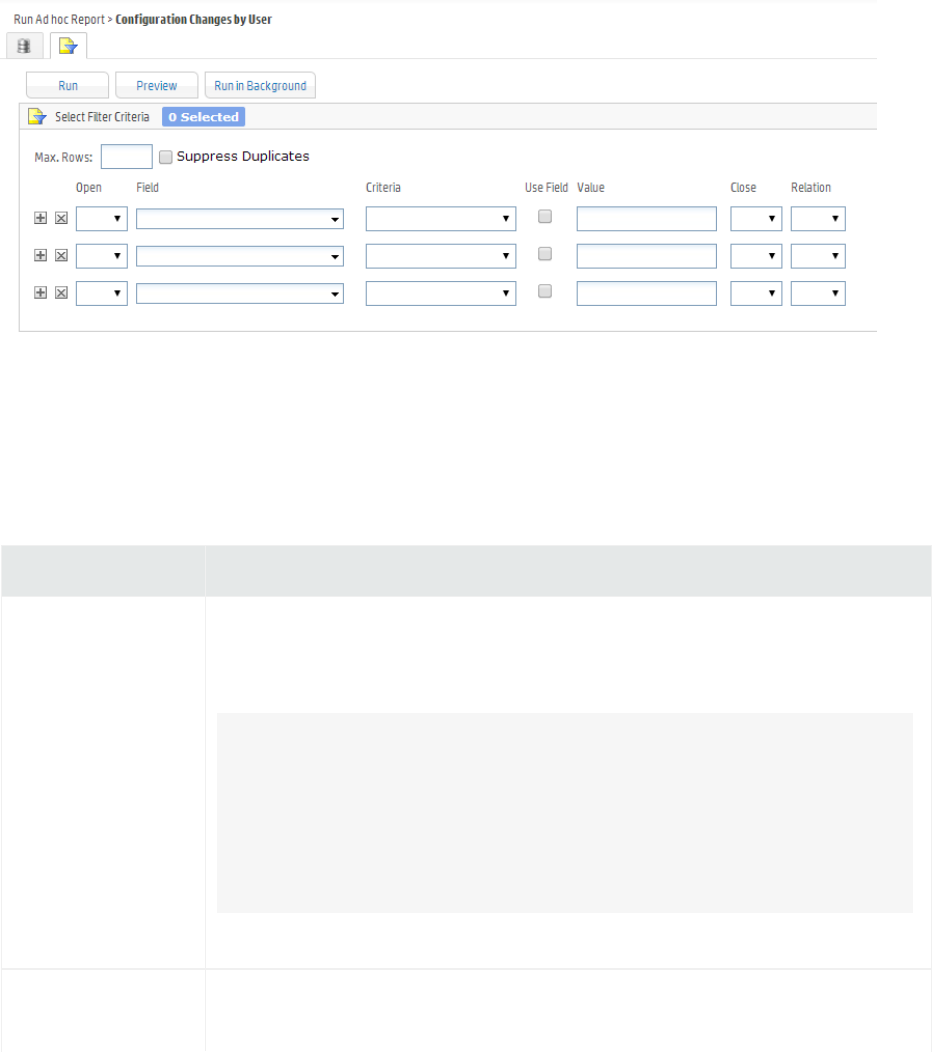
Refer to the HPE Security Security ArcSight Logger Configuration and Tuning: Best Practices guide for
more Logger best practices.
Run Report Parameters
When you choose the Run Report link for a report, options are available to choose a file format, specify
pagination, and to modify the data filter criteria for only this run of the report.
If you run the report without specifying any override run-time parameters here, the report is generated
with the defaults specified at design time for this report. You can run a report in the background after
specifying the Run Report parameters.
The following table describes Run Report parameters.
Option Description
Report Format Specify a file type or “format” option of the output, and toggle on or off the
Multipage option to generate a report as a multi-page or a single-page
document. By default, Multipage is checked.
Note: HPE strongly recommends using the Multipage option for all
reports. Specifically, if a report will result in more than 826 records, using
the Multipage option will ensure that the generated report is not blank.
By default, the reports generated in the PDF format are set to use the
Multipage option. However, if your PDF format report is blank, ensure
that the Multipage option is still checked for that report.
For descriptions of report formats, see "Report File Formats" on page181.
Select Filter Criteria Provides options to define filters, or modify default filters if any are already
built in to the report.
Run Report Parameters
Administrator's Guide
HPE Logger 6.2 Page 179 of 623

Option Description
The filter expression is applied when the report runs, narrowing the focus of
the report to the specified criteria.
For example, you could set the filter criteria on a report on Top Password
Changes to report only on password changes related to specified user names
or involving specified IP addresses.
For details on how to create these filters (with Field, Criteria, and Value fields),
see "Filter" on page200 in "Designing New Reports (The Ad hoc Report
Designer)" on page196.
Note: Filter criteria defined at report run time applies only to this run of
the report. Filters set in this way are not saved nor made available to other
users. You can also set built-in, default filter criteria as a part of designing
a report.
Template Select the template to apply to this report. The templates pull-down menu
shows supplied templates, and any custom templates you may have added. To
include the start time, end time, scan limit, device group, storage group, and
devices information (used to run a report) in a report, choose the
BlankWithHeader template.
See "Template Styles" on page239 for more information on working with
templates.
View Options The default view option for the report results is Multipage. If you deselect the
Multipage option, your report will be formatted as a single page. HPE
strongly recommends using the Multipage option for all reports. You
also have the option to download the report results as a zipped file. To do so,
check the Download Zipped option.
Run Report Parameters, continued
When you click Run on this first “Parameters” dialog, the same dialog is displayed as for a Quick Run
with default option (or Run in Background) report where you can specify filters on timeframe and
storage groups on which to run the report. (See "Quick Run with Default Options or Run In Background
Report Parameters" on page176 for details on this “Additional Filters” dialog. Clicking Run Now on this
second dialog runs the report.
Administrator's Guide
HPE Logger 6.2 Page 180 of 623

Report File Formats
Report file formats include:
lHTML (Web page format)
lPDF (Acrobat PDF)
lMS Excel
lComma-separated (Delimiter-separated file. The delimiter is usually a comma.)
lMS Word
lInteractive HTML (iHTML)
lXML
For most formats, you can select the Multipage option by clicking on the View Options link. HPE
strongly recommends using the Multipage option for all reports.(If this option is checked, the
report results will be formatted for a multi-page report.)
The report formats made available to you depend on access rights associated with your user account.
(See "Setting Access Rights on Reports" on page214 for more information.)
Some report formats require that the local machine has a separate viewer installed. For example, viewing
reports in PDF format requires Adobe Reader.
Publishing Reports
If you publish a report after you run it ("Running and Viewing Reports" on page173), the output results
for that run of the report are saved for subsequent use.
You configure scheduled reports to publish after each scheduled run. The publish options for
scheduled reports are the same as for on-demand reports described here. For more about scheduled
reports, see "Scheduled Reports" on page188 and "Scheduled Reports" on page188 and "Add Report
Job Settings" on page183.
To publish a report:
1. In a generated report output file from running a report, click the Publish Report button at the
top of the page.
Administrator's Guide
HPE Logger 6.2 Page 181 of 623
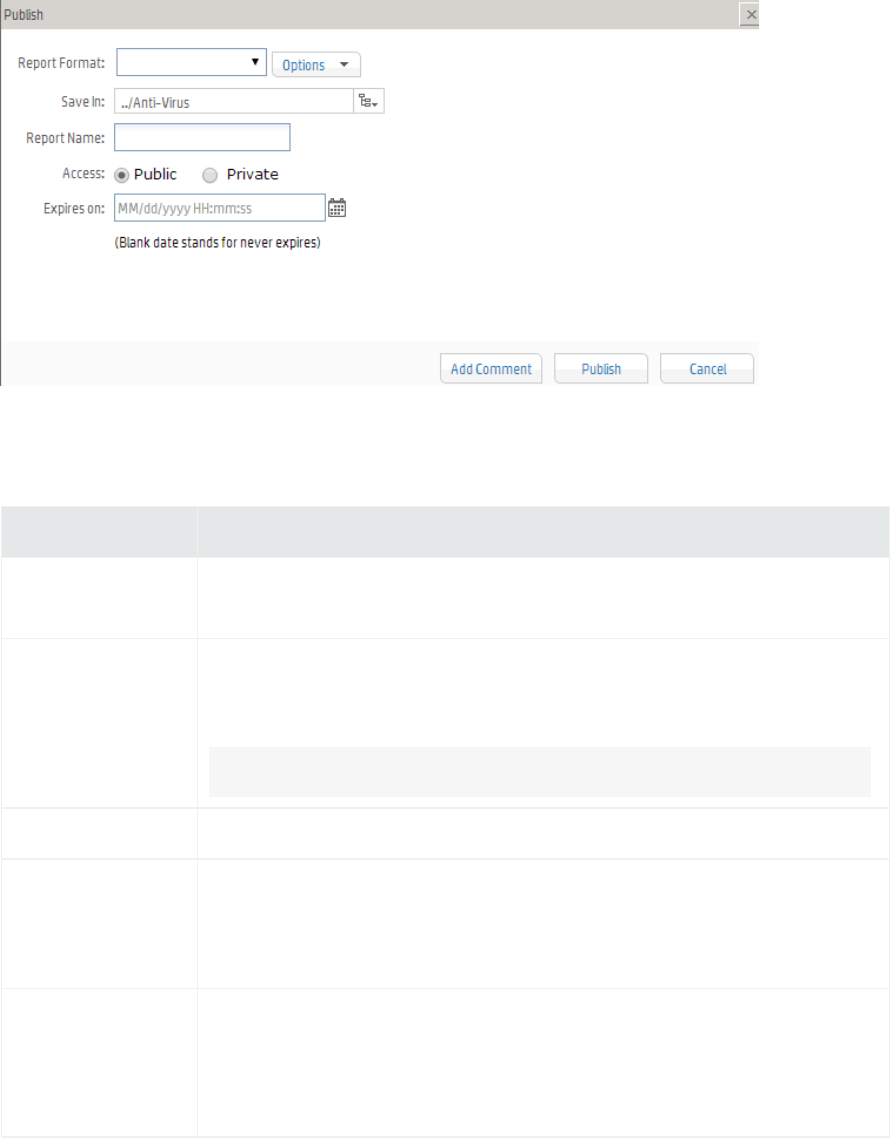
2. In the Publish dialog, specify the report details. The following table describes the publish report
options.
Option Description
Report Format Format of the report. To publish a zipped version of the file format, in click
Options, then select Publish Zipped File.
Save In Category under which to save the report. If you specify a category in the
preferences, you can navigate to it. If you had not specified a category, the
published report will be saved in the category in which the report resides.
Note: You cannot save a report in the root category.
Report Name Name for this report on the published reports list.
Access Select a value for access:
lPublic makes this report available to everyone.
lPrivate makes this report available to you only.
Expires on Date and time after which the report output is discarded (and, therefore,
unavailable for viewing).
If you do not want the report results to expire (keep always available),
then leave this field blank (that is, do not set a value for this field).
Publish Report Settings
3. Click Publish.
For information on how to view a published report, see "Viewing the Output of a Published Report" on
page187.
Administrator's Guide
HPE Logger 6.2 Page 182 of 623

Add Report Job Settings
The following table describes the Add Report Job settings.
Option Description
Name Name displayed on the Scheduled Jobs list.
Schedule Set the frequency for the scheduled run of the report.
Tip: Make sure you are familiar with the information in "Time/NTP" on
page409 before setting the schedule.
Choose Every Day, Days of Week, or Days of Month from the upper pull-
down menu.
Note: When specifying multiple days, separate them with a comma. When
specifying the time, use 24-hour format.
1. If Every Day, select one of the following options from the lower pull-
down menu, and enter the necessary values:
lHour of day: (0-23) Enter the time you want the task to run in the
Hours (24 hour format) field. Midnight is zero (0).
lEvery: Select Hours or Minutes from the right-most pull-down menu
and specify how frequently you want the task to run.
Hours: (1-23) Enter how frequently in hours you want the task to run.
The result is every n hours every day.
Minutes: (15-59) Enter how frequently in minutes you want the task
to run. The result is every n minutes every day.
2. If Days of Week, select from the following options from the lower pull-
down menu, and enter the necessary values:
lDays: (1-7) Enter the days of the week you want the task to run
(Sunday=1, Monday=2, and so on).
lHour of Day: (0-23) Enter the time you want the task to run in the
text field to the right. 0 is midnight.
lEvery: Select Hours or Minutes from the right-most pull-down menu
and specify how frequently you want the task to run.
Hours: (1-23) Enter how frequently in hours you want the task to run.
Add Report Job Settings
Administrator's Guide
HPE Logger 6.2 Page 183 of 623

Option Description
The result is every n hours on the selected days.
Minutes: (15-59) Enter how frequently in minutes you want the task
to run. The result is every n minutes on the selected days.
3. If Days of Month, Select from the following options from the lower pull-
down menu, and enter the necessary values:
lDays: (1-31) Enter the day or days of the month you want the task to
run.
Note: The number of days in a month vary. Scheduled tasks will
only run if the specified day exists for that month. Tasks
scheduled on the 31st day of the month will not run in April,
February, June, November, and September. Tasks scheduled on
the 29th day of the month will only run in February during leap
years.
lHour of Day: (0-23) Enter the time of day you want the task to run.
(You cannot select Every for this option.)
Examples:
lTo run the scheduled job every 45 minutes of every day, select Every Day
in the upper Schedule pull-down menu. Choose Every from the lower pull-
down menu, enter 45 in the text box and the select Minutes.
lTo run the scheduled job every four hours on Tuesdays and Thursdays ,
select Days of Week from the upper Schedule pull-down menu and enter
3,5 as the Days. Then choose Every from the lower pull-down menu, enter
4 in the text box.
lTo run the scheduled job on the 14th of each month at 3 AM, select Days
of Month from the upper Schedule pull-down menu and enter 14 as the
Days. Then choose Hour of day from the lower pull-down menu and enter
3 in the text box. (To run the scheduled job at 3 AM and 3 PM, you would
enter 3,15.)
Report Name Select a report from the list, and click Go to load the report.
Note: You must click Go to load the selected report at the Report Name
field before you save the scheduled report job.
Delivery Depending on which delivery option you choose, the associated parameters
Add Report Job Settings, continued
Administrator's Guide
HPE Logger 6.2 Page 184 of 623

Option Description
Options are displayed. Select to enable or disable these options.
Both Email and Publish options for scheduled reports are the same as those
provided after you run a report on demand.
Select a delivery option:
lEmail: For details on setting Email delivery options, see "Emailing a Report"
below.
lPublish: For details on setting publishing options, see "Publishing Reports"
on page181.
Report Format Select a report format (Acrobat PDF, HTML, and so forth.)
For details on report formats, see "Report File Formats" on page181.
Report
Parameters
You can either accept the default parameters, or modify them here. These are
the same parameters that can be specified for an on-demand report run.
For information on specifying report parameters, see "Quick Run with Default
Options or Run In Background Report Parameters" on page176.
Add Report Job Settings, continued
Report Delivery Options
When you run a report from the Report Explorer (as described in "Running and Viewing Reports" on
page173), many options are available for delivering the generated output.
The most common next step is to publish the resulting report (described in "Publishing Reports" on
page181), but you can also save the report output to a file, Email it to other users, refresh the results,
change the output format, and so forth. Refreshing a Report
To re-run the report for an updated result set, click Refresh.
Emailing a Report
You can send a report using email as either a Web link or an attachment. You can also configure these
Email options on scheduled reports, as described in "Scheduled Reports" on page188.
Before you can email a report, you must first set up SMTP for reports. Navigate to Reports > Reports
Administration and configure the SMTP settings.
Administrator's Guide
HPE Logger 6.2 Page 185 of 623
To email a report:
1. In the Report Explorer, after you run a report, click Email Report on top of the page.
2. Specify the following information about the email as shown in the table below.
Option Description
Send Report As Choose one of these:
lTo provide a link to the report in the body of the email, select Link.
lTo send the report as an attachment to the email, click Attachment,
and select a format for the attachment file.
Report Format Select a format for the file to be attached to the email.
Options Select the following options before attaching a report file to an email:
lPagination: Select whether you would like the report to display in a
single page or multiple pages and whether you want horizontal breaks.
lDownload Zipped: If selected, the file is zipped before being attached
to email.
lInclude comments: If selected, any comments added to the report are
included.
Save In You have the option to save the report in a location that you can specify
here.
Note: You cannot save a report in the root category. Save it in one of
the existing categories or create a new one.
To and CC Specify email addresses to which to send the report.
Subject Provide email subject header.
Message For the body of the email, you can use the default message provided,
modify it, or enter your own message.
Email Report Settings
3. Click Email to send the report.
Exporting and Saving a Report
You can export a report to a file format of your choice and save it.
Administrator's Guide
HPE Logger 6.2 Page 186 of 623
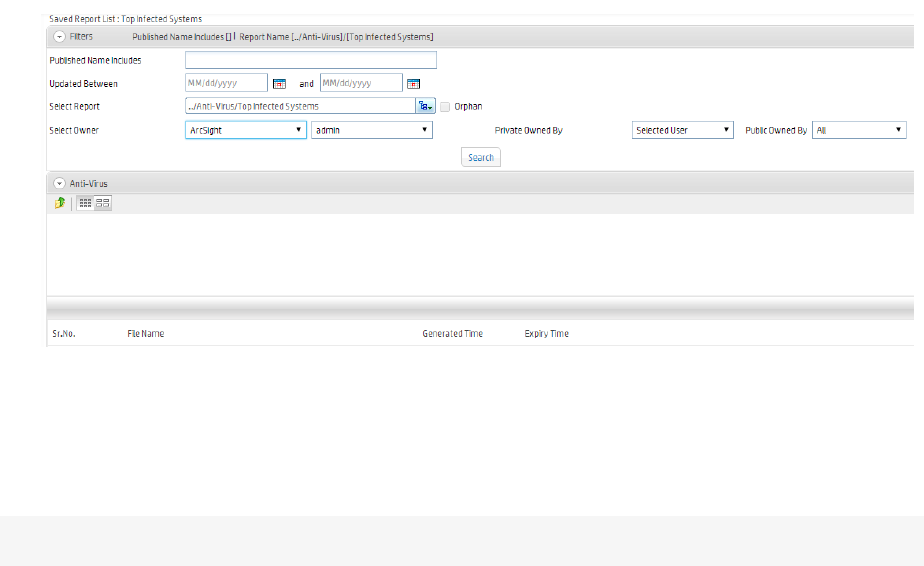
To export and save a report:
1. Click the Export button or click one of the file format buttons on the published report top-level
menu bar.
2. In the Export Options dialog, specify the Export Format and associated settings you want in the
Export Options dialog. Depending on the Export Format you choose, other settings are displayed
as appropriate.
3. Click Generate.
You can save the generated report as a file locally or elsewhere just as you would any other file.
Viewing the Output of a Published Report
To view the output of a published report:
1. In the Report Explorer, navigate to the report for which you want to view output results.
2. In the Actions menu, click List Published Outputs. The published outputs are displayed. You can
use the Filters to search for a desired output result.
Deleting Published Reports
You can delete old instances of the report output that have accumulated over time from this page. To
delete the report, select it and click the Delete button in the toolbar.
Note: Please be certain that you want to remove these old reports, and do so carefully.
Administrator's Guide
HPE Logger 6.2 Page 187 of 623
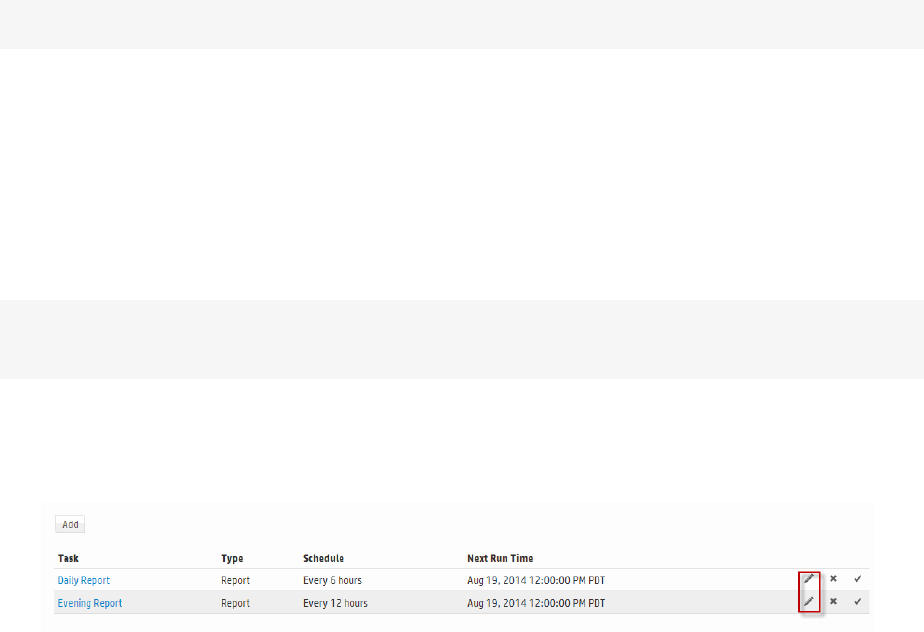
Scheduled Reports
You can schedule a reports to run as a scheduled job, either on a one-time basis, or at regular intervals
(hourly, daily, and weekly). As part of scheduling a report job, you can set delivery options to email,
save, or publish the resulting reports.
HPErecommends using the Scheduled Report feature in lieu of running on-demand (ad hoc) reports
whenever possible, so that reports run during periods of light load. For more on this see "Best Practices"
on page172.
Time changes due at the beginning or end of Daylight Savings Time may affect your scheduled reports.
For more information, see "Impact of Daylight Savings Time Change on Logger Operations" on
page410
Note: If not completed, by default, a scheduled report times out in 4 hours.
Viewing and Editing Scheduled Reports
Reports that are already scheduled are displayed on the Scheduled Reports page.
To view scheduled reports:
On the left pane, click Scheduled Reports.
Note: To view scheduled reports, a user must belong to a Logger Reports Group, a Logger Search
Group, and a Logger Rights Group.
To edit a scheduled report:
1. Click Edit next to the scheduled report job you want to edit.
Administrator's Guide
HPE Logger 6.2 Page 188 of 623
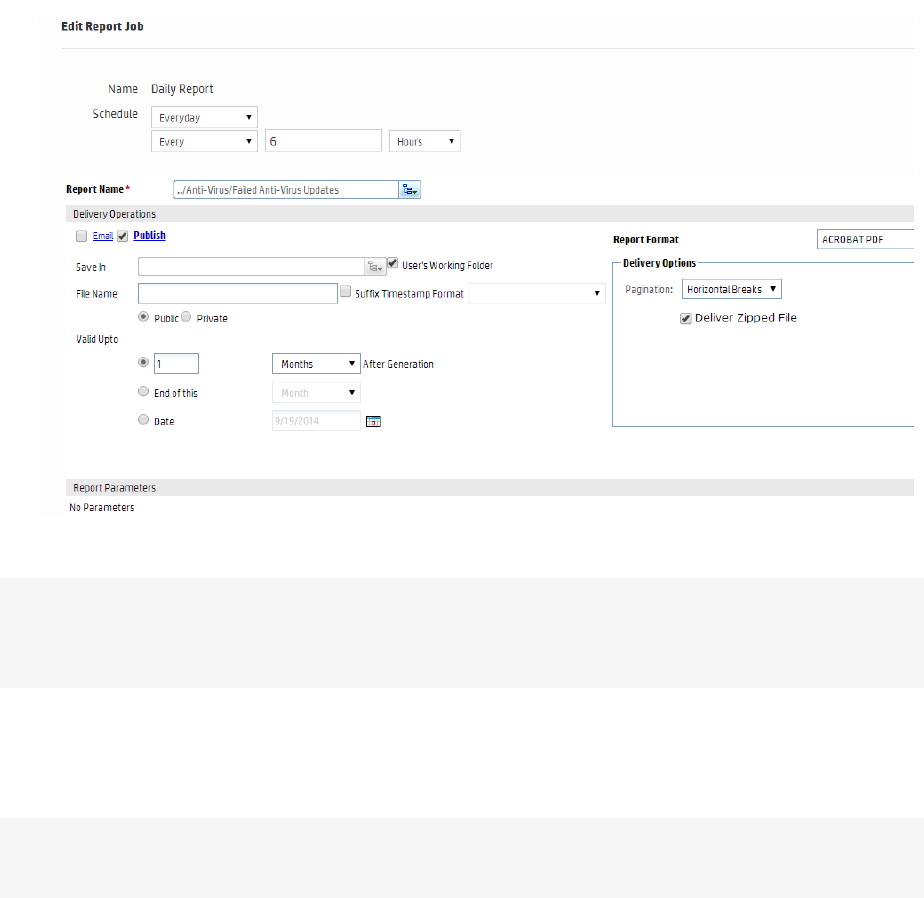
2. On the Edit Job Report page, modify the settings as needed, and then click Save.
For details on how to specify these settings, see "Scheduling a Report" on the next page.
Note: The job name is not editable once the scheduled report job is created. Other settings can be
modified with an edit, and work the same way as on the Add a Report Job page described in
"Scheduling a Report" on the next page.
To remove a scheduled report:
Click Delete next to the scheduled report job you want to remove.
Tip: Removing the report from Scheduled Reports list here deletes the scheduled job, not the
report itself nor any instances of its previously published output.
Jobs Execution Status
Click the Jobs Execution Status link at the top of the Reports page to display the Jobs Execution
Status page. The page displays a graphic representation of the status of all executed jobs. The page
has two panels: the Jobs Summary panel, and the Filters panel.
Administrator's Guide
HPE Logger 6.2 Page 189 of 623
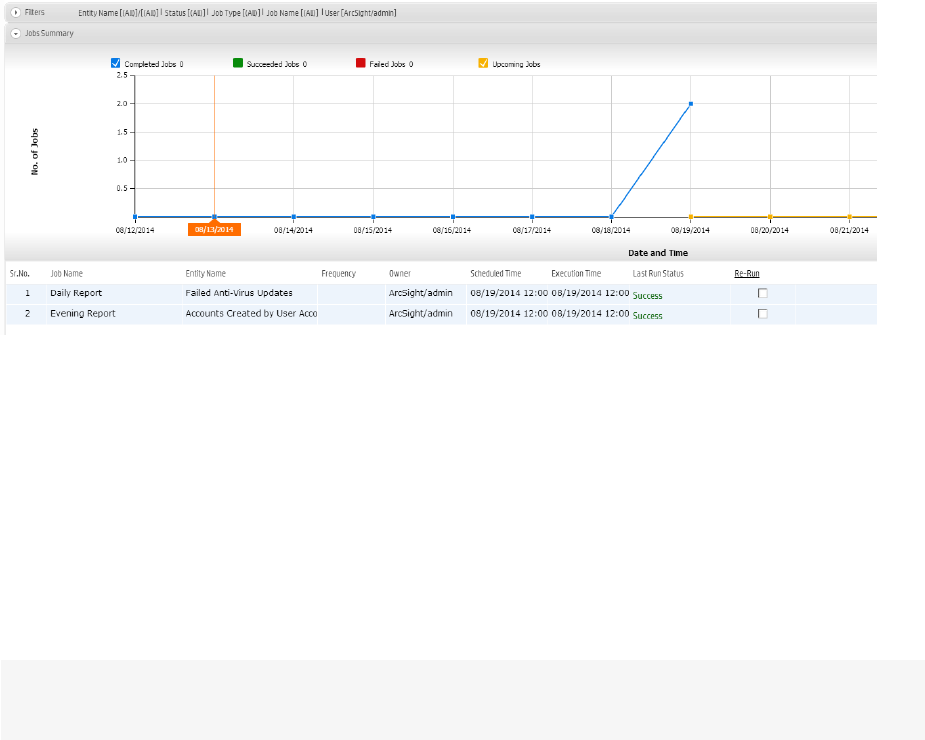
The Jobs Summary shows a graph indicating the number of executed jobs by day. Jobs are assigned a
status as follows:
lCompleted
lSucceeded
lFailed
lUpcoming
Select a Job Status button (for example, the Failed Jobs button) to display the jobs corresponding to
that status in the graph.
Note: Upcoming jobs will not be displayed when the Upcoming Jobs status button is clicked. Only
a blank list is shown.
Click a date to show jobs for that day in a pop-up.
Beneath the Jobs Summary is a table listing each job and its details.
Under Filters, you can filter the results of the Jobs Summary to show results matching a variety of
criteria.
To create a filter, enter values for the criteria shown, and then click Refresh. (Next to the Filters label,
the current filter is summarized in text format.) The results in the Jobs Summary include results that
only match the filter criteria.
Scheduling a Report
You can schedule a report to run daily at a specified time or every so many hours, or on specified days of
week or month, at a specified time.
To schedule a report:
1. Click Scheduled Reports on the Reports page left menu. The page shows the list of currently
scheduled report jobs, if any.
Administrator's Guide
HPE Logger 6.2 Page 190 of 623
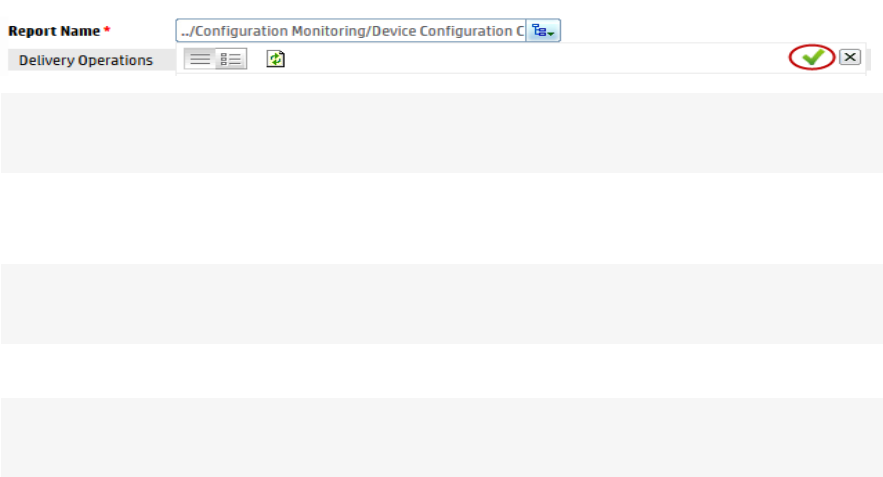
2. Click Add to display the Add Report Job page.
3. Use the pull-down menu next to Report Name to select a report, and then click the Select Entity
checkmark to load the report.
Note: Attempting to save the scheduled job without first loading the report name will result in
an error, and the report will not be saved.
4. Enter the name to be displayed in the Scheduled Jobs list.
5. Use the schedule options to specify how frequently the report should run.
Tip: Make sure you are familiar with the information in "Time/NTP" on page409 before
setting the schedule.
Choose Every Day, Days of Week, or Days of Month from the upper pull-down menu.
Note: When specifying multiple days, separate them with a comma. When specifying the time,
use 24-hour format.
a. If Every Day, select one of the following options from the lower pull-down menu, and enter
the necessary values:
oHour of day: (0-23) Enter the time you want the task to run in the Hours (24 hour
format) field. Midnight is zero (0).
oEvery: Select Hours or Minutes from the right-most pull-down menu and specify how
frequently you want the task to run.
Hours: (1-23) Enter how frequently in hours you want the task to run. The result is every n
hours every day.
Minutes: (15-59) Enter how frequently in minutes you want the task to run. The result is
every n minutes every day.
b. If Days of Week, select from the following options from the lower pull-down menu, and enter
the necessary values:
oDays: (1-7) Enter the days of the week you want the task to run (Sunday=1, Monday=2, and
so on).
oHour of Day: (0-23) Enter the time you want the task to run in the text field to the right. 0
is midnight.
oEvery: Select Hours or Minutes from the right-most pull-down menu and specify how
frequently you want the task to run.
Hours: (1-23) Enter how frequently in hours you want the task to run. The result is every n
hours on the selected days.
Administrator's Guide
HPE Logger 6.2 Page 191 of 623

Minutes: (15-59) Enter how frequently in minutes you want the task to run. The result is
every n minutes on the selected days.
c. If Days of Month, Select from the following options from the lower pull-down menu, and enter
the necessary values:
oDays: (1-31) Enter the day or days of the month you want the task to run.
Note: The number of days in a month vary. Scheduled tasks will only run if the
specified day exists for that month. Tasks scheduled on the 31st day of the month will
not run in April, February, June, November, and September. Tasks scheduled on the
29th day of the month will only run in February during leap years.
oHour of Day: (0-23) Enter the time of day you want the task to run. (You cannot select
Every for this option.)
Examples:
lTo run the scheduled job every 45 minutes of every day, select Every Day in the upper
Schedule pull-down menu. Choose Every from the lower pull-down menu, enter 45 in the text
box and the select Minutes.
lTo run the scheduled job every four hours on Tuesdays and Thursdays , select Days of Week
from the upper Schedule pull-down menu and enter 3,5 as the Days. Then choose Every from
the lower pull-down menu, enter 4 in the text box.
lTo run the scheduled job on the 14th of each month at 3 AM, select Days of Month from the
upper Schedule pull-down menu and enter 14 as the Days. Then choose Hour of day from the
lower pull-down menu and enter 3 in the text box. (To run the scheduled job at 3 AM and 3 PM,
you would enter 3,15.)
6. Choose one or both delivery options under Delivery Operations (Email, Publish). By default,
only Publish is selected.
Both Email and Publish options for scheduled reports are the same as those provided after you run
a report on demand.
lTo keep the Publish option, select it and enter its associated parameters. For details on setting
publishing options, see "Publishing Reports" on page181.
lTo include the Email option, select it and enter its associated parameters. For details on setting
Administrator's Guide
HPE Logger 6.2 Page 192 of 623
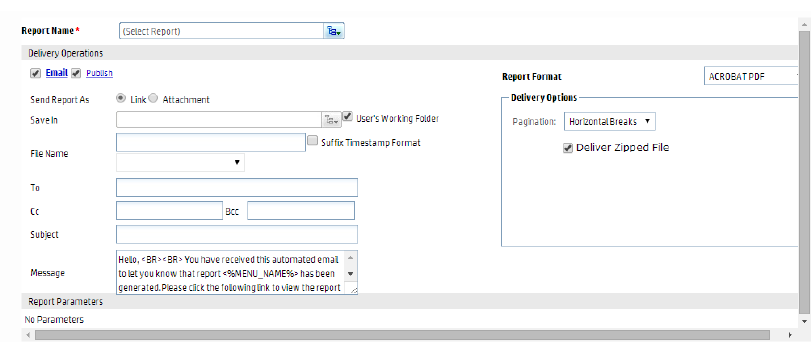
email delivery options, see "Emailing a Report" on page185.
7. Enter settings in the remaining fields based on the report you chose.
lDelivery Operations:Depending on which delivery option you choose, the associated
parameters are displayed. Select to enable or disable these options.
lReport Format:Select a report format (Acrobat PDF, HTML, and so forth.) For details on
report formats, see "Report File Formats" on page181.
lReport Parameters: You can either accept the default parameters, or modify them here. These
are the same parameters that can be specified for an on-demand report run. For information on
specifying report parameters, see "Quick Run with Default Options or Run In Background
Report Parameters" on page176.
8. Click Save.
The report you added is scheduled, and now shows on the Scheduled Reports list.
Designing Reports
You can use the Ad hoc Report Designer to design simple columnar reports, as well as mixed reports
with embedded charts and matrices. For columnar reports, the Report Designer provides options for
setting up filters, grouping, totals, and sort order to create a full-featured report.
Opening the Report Designer
To open the Report Designer to create a new report from scratch, on the left menu bar, under Design,
click New Report. The Ad hoc Report Designer will open with a new, blank report.
Administrator's Guide
HPE Logger 6.2 Page 193 of 623
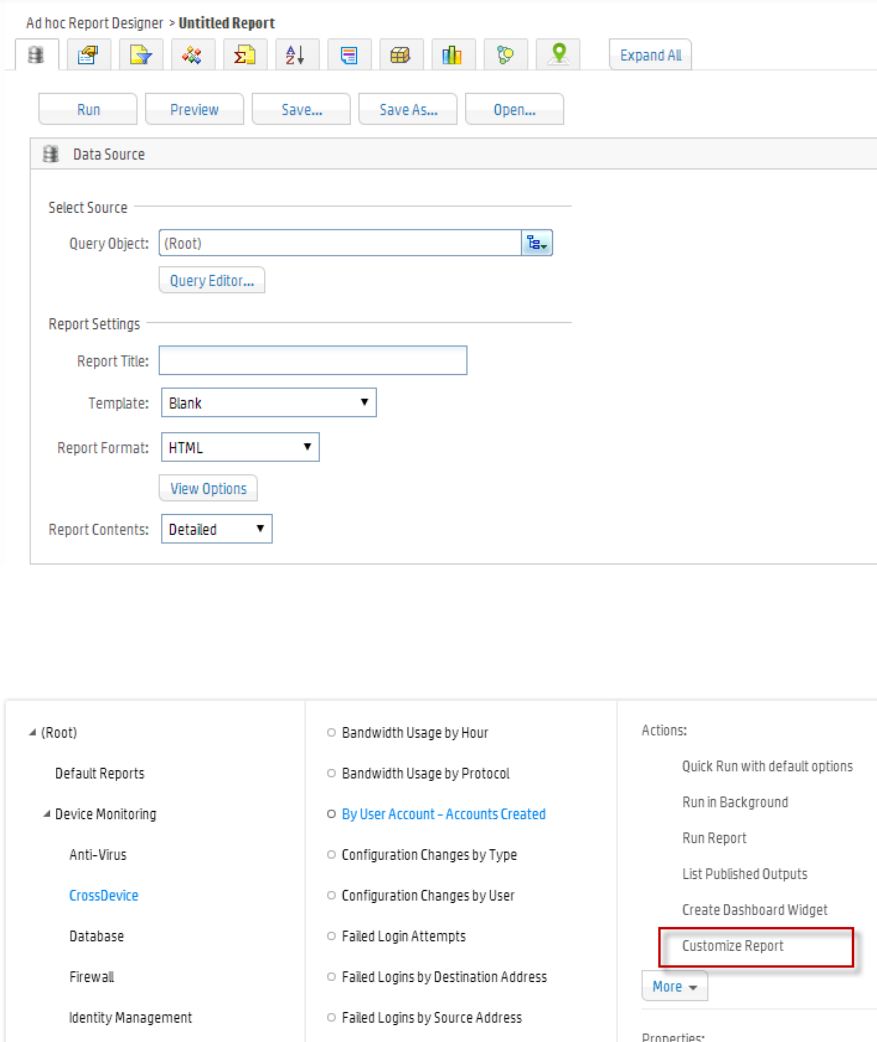
To open the Report Designer to edit an existing report, browse to the report in the Report Explorer.
Then, in the Actions menu, click Customize Report. The Ad hoc Report Designer will open with the
selected report.
Creating New Reports
If you are new to the Logger Report Designer, we recommend starting with an existing report as a basis
for a new one, as described in "Quick Start: Base a New Report on an Existing One" on the next page.
If you are starting a new report from scratch, or for more details on each of the settings in the Report
Designer, see "Designing New Reports (The Ad hoc Report Designer)" on page196.
Administrator's Guide
HPE Logger 6.2 Page 194 of 623
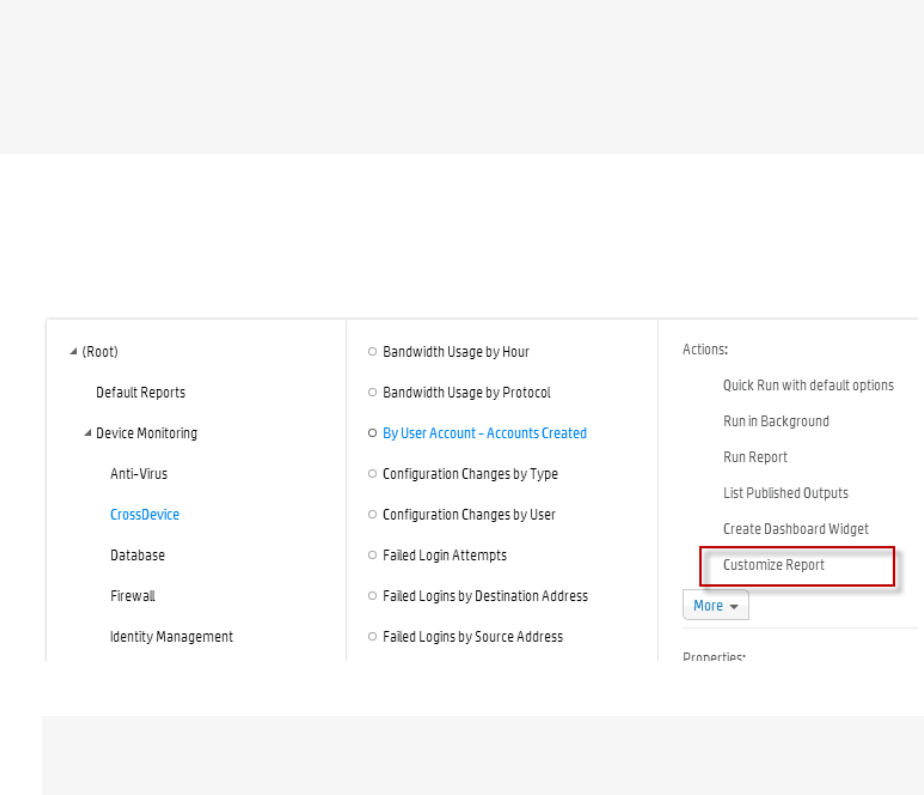
Quick Start: Base a New Report on an Existing One
Since Logger ships with a variety of useful, pre-built reports for common security scenarios, you can use
these not only to run as-is but also as templates for building new reports. If you are just beginning with
the Report Designer, a good way to learn fast is to start with an existing report that has some of the
features you want in your new report, save the original report under a new name, and then modify it.
Caution: Modifications to reports and other ArcSight-defined content may be overwritten without
warning when the content is upgraded. Do not modify ArcSight-defined content directly.
Make modifications to a copy of any ArcSight-defined content as a general practice, and
subsequent upgrades will not affect the modifications.
To create a new report based on an existing report:
1. In the Report Explorer, browse to the report you want to use as a starting point.
2. In the Actions menu, click Customize Report.
This opens the Report Designer with the report’s properties filled in.
Note: Some reports, such as the ones obtained from ArcSight, or other custom developer
sources, might not be editable. For such reports, the Customize Report link is disabled.
3. Click Save As. This displays the Save Report Layout As dialog for the selected report (and shows
all reports stored in the same category as the one you selected).
Administrator's Guide
HPE Logger 6.2 Page 195 of 623
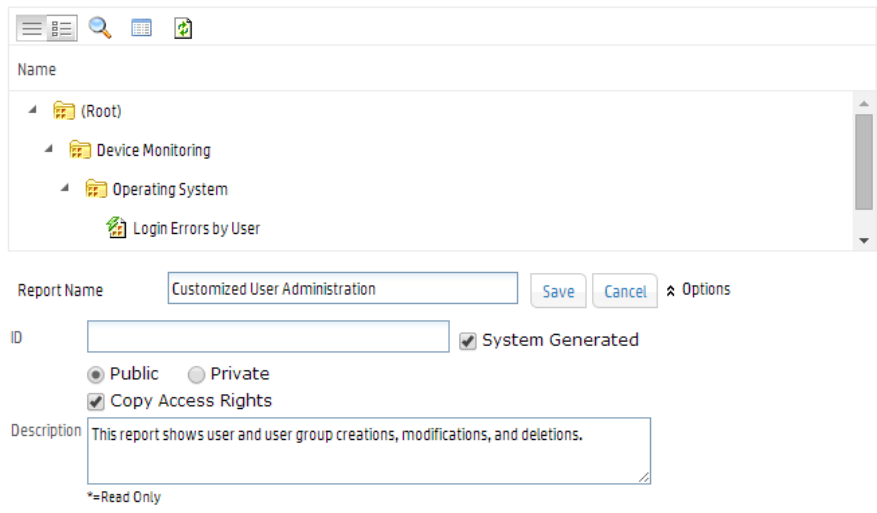
4. In Report Name, enter a name for your report.
5. Click Options, and then enter values for the following:
lID: Enter a custom ID for the report, if desired. Alternatively, select System Generated to
automatically generate one (selected by default).
lPublic/Private: select one. If public, everyone will have access to this report; if private, only you.
lDescription: Enter a description, if needed.
6. Click Save.
7. Click OK to confirm the save. Your new report is now shown under the category in which you saved
it.
8. Select the report you just saved and click the Customize Report button to start modifying the new
report to suit a specific scenario. (See the next section, "Designing New Reports (The Ad hoc
Report Designer)" below.)
Designing New Reports (The Ad hoc Report Designer)
To access the Report Designer to create a new report from scratch, under Design, click New Report link
in the left panel. The Ad hoc Report Designer is displayed with a blank template.
The following sections explain how to use the Report Designer.
Administrator's Guide
HPE Logger 6.2 Page 196 of 623
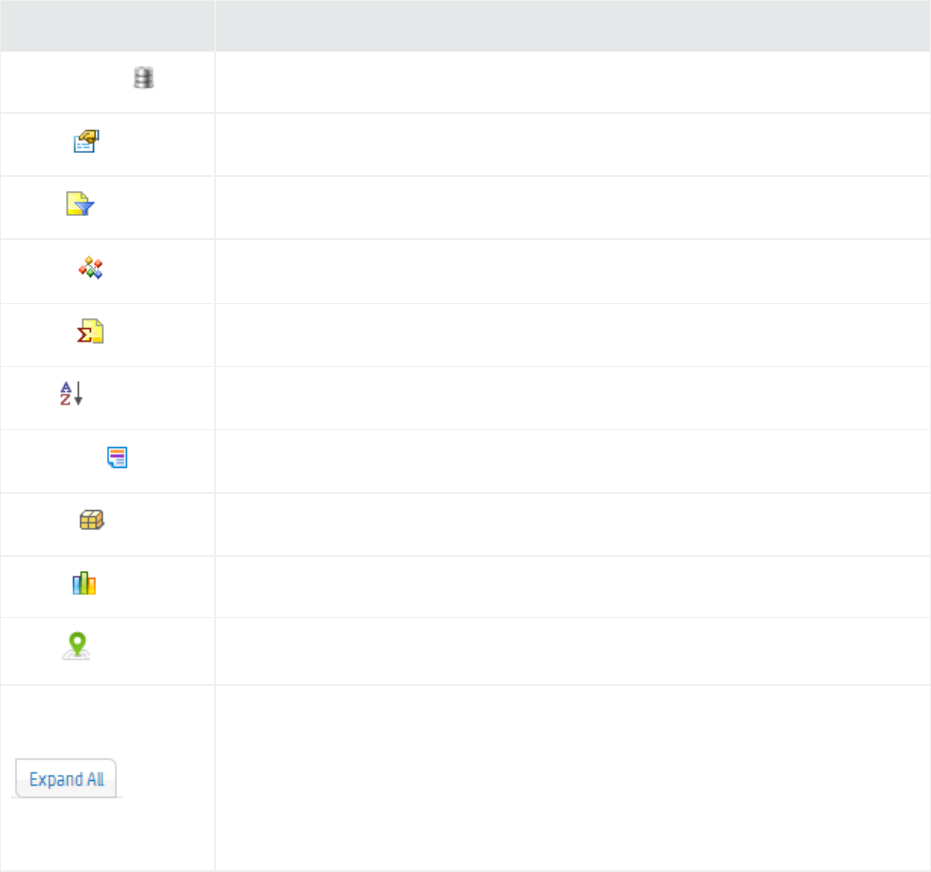
Toolbar Buttons
The toolbar includes these buttons.
lClick Run to test the current version of the report.
lClick Preview to preview the report before saving it.
lClick Save to save the report.
lClick Save As to save it under a different name.
lClick Open to open another report in the Report Designer.
Report Components
Report components can be accessed by the tabs at the top of the designer page:
Tab Description
Data SourceSee "Data Source" on the next page for more information.
FieldsSee "Fields" on page199 for more information.
Filter See "Filter" on page200 for more information.
GroupSee "Group" on page202 for more information.
TotalsSee "Totals" on page204 for more information.
SortSee "Sort" on page204 for more information.
HighlightSee "Highlight" on page205 for more information.
MatrixSee "Matrix" on page206 for more information.
ChartSee "Chart" on page207 for more information.
MapSee "Map" on page208 for more information.
Expand All/
Collapse All
Toggles the detail view.
Once expanded, you can also toggle visibility of an individual component in
the Designer by clicking the component’s title bar. For example, to toggle
visibility of the Highlighting component, click the Highlighting title bar
(above the Create Matrix title bar).
Administrator's Guide
HPE Logger 6.2 Page 197 of 623
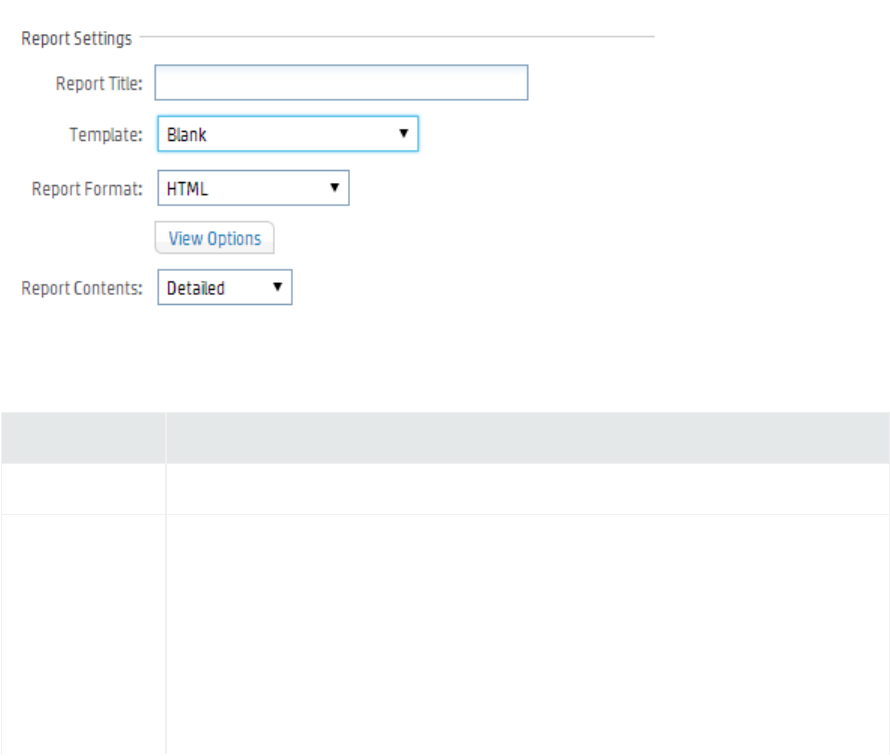
Data Source
Every report is built on a base query. To select one for your report, under Select Source, in Query
Object, browse to a query to use.
For instructions on how to view a list of the default search fields, see "Default Fields" on page281. For
information about custom schema fields added to the default schema, see "Adding Fields to the
Schema" on page379.
You can edit the selected query by clicking Query Editor. (For information on building new queries, see
"Queries" on page216.)
Creating a New Report
To create a new report:
1. Under Design, click the New Report link in the left panel. The Ad hoc Report Designer is displayed
with a blank template.
2. Under Report Settings, enter or select values for each of the following settings:
Option Description
Report Title Title of the report.
Template Select the template to apply to this report. The templates pull-down menu
shows supplied templates, and any custom templates you may have added. To
include the start time, end time, scan limit, device group, storage group, and
devices information (used to run a report) in a report, choose the
“BlankWithHeader” template.
See "Template Styles" on page239 for more information on working with
templates.
General Report Design Settings
Administrator's Guide
HPE Logger 6.2 Page 198 of 623
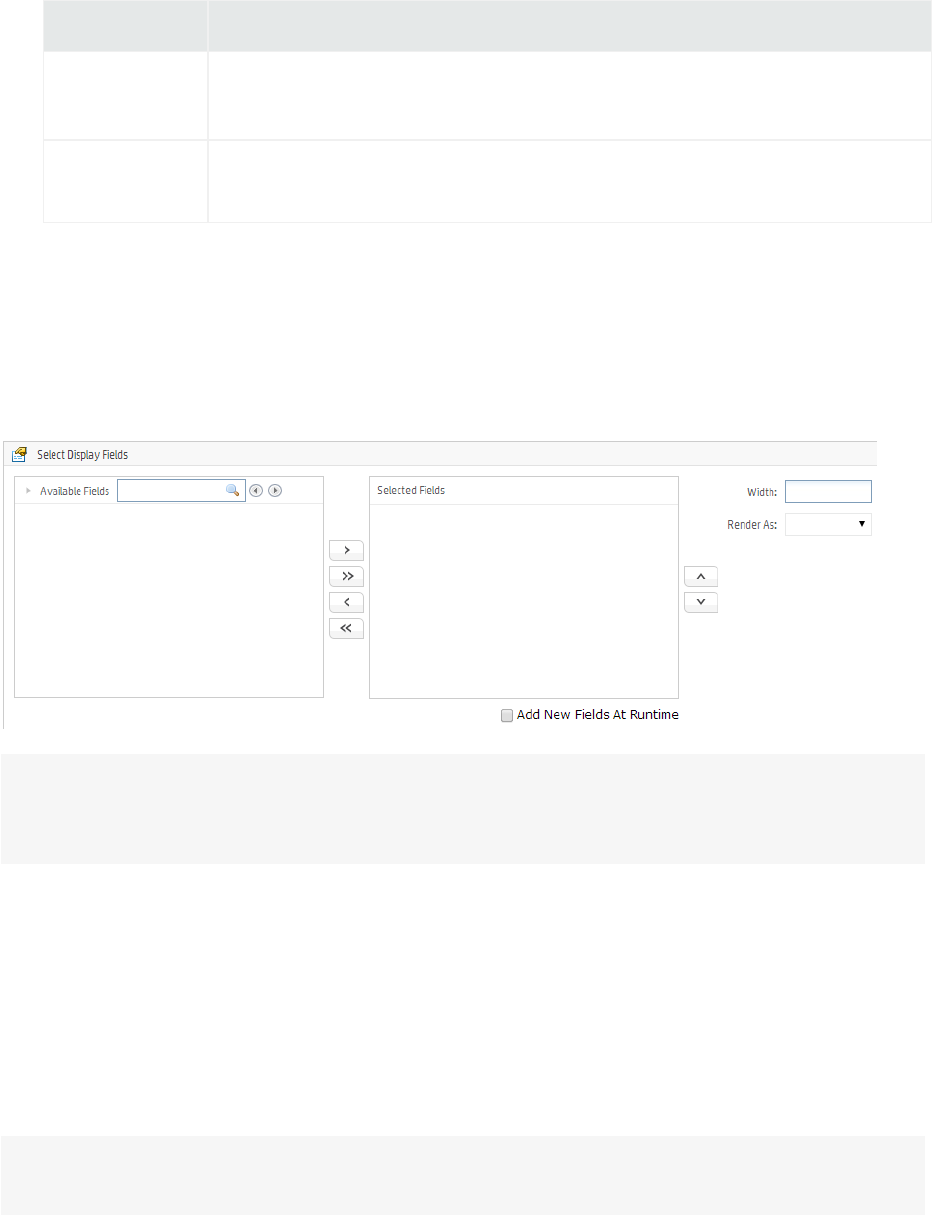
Option Description
Report Format Select the default format for the report.
For information on available formats, see "Report File Formats" on page181.
Report
Contents
Select whether report should detailed or summarized.
General Report Design Settings, continued
Fields
Once you select a query to use in the report, the display fields it contains are shown in the Available
Fields list. You can select which of these display fields you want to use in your report. You can edit the
selected query by clicking on the Query Editor link. (For information on building new queries, see
"Queries" on page216.)
Note: In addition to the fields in the WHERE clause of the query, the fields in the SELECT clause
also need to be indexed to yield faster report generation. For more information about indexing
fields, see "Indexing" on page133.
Enter a title for the report in the Report Title field, and then select whether the report contents should
be Detailed or Summarized in the Report Contents field. The report title is displayed at the top of a
report.
Select the query you want to use for the report from the drop-down list located on top of the Select
Display fields section. The Available Fields list is populated with the fields defined in the selected query.
Select the fields to use in the report by moving fields from Available Fields into the Selected Fields
list.
Note: You must move at least some available fields to the Selected Fields list, or the report will not
run correctly
Administrator's Guide
HPE Logger 6.2 Page 199 of 623
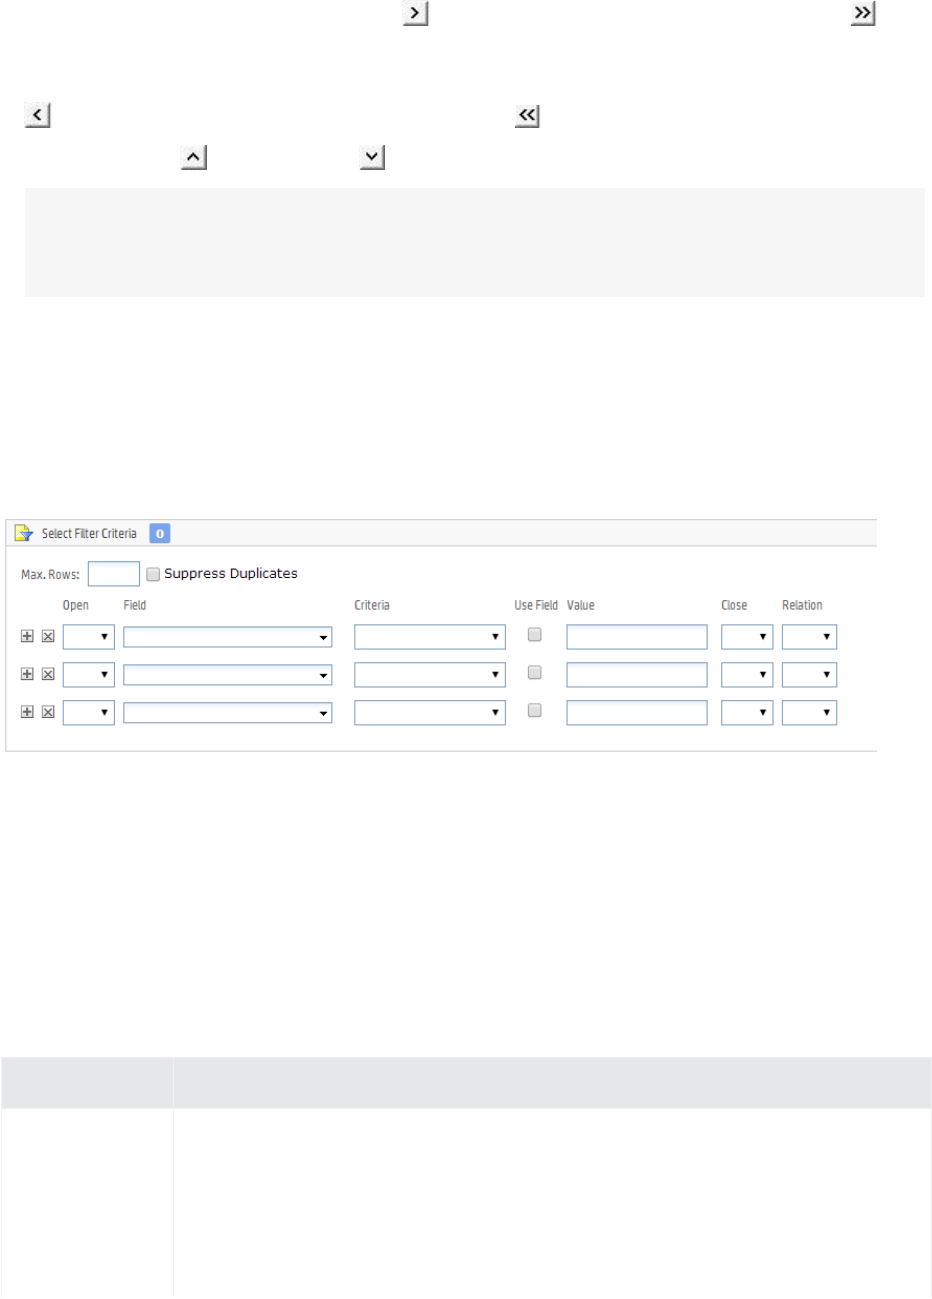
lSelect a field in Available Fields and click to move it into the Selected Fields list, or click to
add all fields.
lTo deselect fields that you do not want in the report, select a field in the Selected Fields list and click
to move it back to the Available Fields list, or click to deselect all fields.
lUse the move up and move down arrows to order the Selected Fields.
Tip: For information on how to create query objects for use in reports, see "Queries" on page216.
All available queries, including new queries you create, show up in the pull-down menu in the
Select Display Fields section of the Ad hoc Report Designer.
Filter
Filter criteria are defined as part of a report design. When other users run the report, they receive the
built-in filters by default. You can also set filter criteria and row limits on an ad hoc basis when you run a
report. However, values set at run time are not built in to the report like those set at design time. Run-
time parameters are only applicable to a particular report run and do not persist.
If a report does include default filter criteria, users have the option to run the report with the defaults,
or modify or remove the built-in filters at run time. For more information, see "Run Report Parameters"
on page179.
You can set filters on the results of the base query with logical expressions to narrow the focus of the
report results. For example, you could set the filter criteria on a report on Top Password Changes to
report only on password changes related to specified user names or involving specified IP addresses.
You can limit the number of rows in a report by defining a Max. Rows value.
Option Description
Maximum Rows
(Max. Rows)
Specify the maximum number of rows in the report output. Results that push the
number of rows beyond the Max. Rows limit you define will not be included in the
report.
lSelecting set Max. Rows and also specifying a grouping under Set Grouping
(as described in "Group" on page202), may produce a different result than if
Select Filter Criteria Options
Administrator's Guide
HPE Logger 6.2 Page 200 of 623

Option Description
you just specified Max. Rows without grouping.
lSetting this field to 0 returns an unlimited number of rows.
lIncreasing the maximum rows for report may not always increase the number
of rows returned by the report. If the query invoked by the report limits the
number of rows returned, increasing the Max. Rows setting in the report has
no affect. For example, if you edit the NIST IR Top 10 High Risk Events report
and change the value in the Max. Rows column from 10 to 20, when the report
is run report only 10 rows are returned. This is because the query invoked by
the report is returning 10 rows. However, you can limit the number of rows
returned by the report to a number less than the default value. For example, if
the value of the Max. Rows field is changed from 10 to 5 for the NIST IR Top 10
High Risk Events report, this report returns 5 rows during run time.
lYou can increase the number of rows returned by editing the query and
changing the number of rows returned by the query and change the number
specified in the Max. Rows field of the report.
Field The Fields will be populated with event data fields specified in the base query.
(Fields will generally equate to columns in reports.)
Select a field on which to filter.
To add another field on which to filter, click (Add Filter).
To remove a filter, click (Remove Filter).
For instructions on how to view a list of the default search fields, see "Default
Fields" on page281. For information about custom schema fields added to the
default schema, see "Adding Fields to the Schema" on page379.
lMultiple filters with conditions set on different fields will be AND’ed together.
Multiple filters with conditions set on the same field will be OR’ed together.
For example, if you want to filter on events to return data based on a
value/count (of rows or other) between 90 and 100, use the Between criteria
to do this (for example, <Field> Between 90 and 100)
Setting two filters on the same field with criteria “Above 90” and the other as
“Below 90” would not give you the data you are looking for. Only one of these
filters would be triggered.
lIf the query you choose for this report has mandatory filtering, the “Select
Criteria Select a logical operator. (For example, Is, Is Not, Starts With, Ends With, Contains,
and so forth.)
Select Filter Criteria Options, continued
Administrator's Guide
HPE Logger 6.2 Page 201 of 623
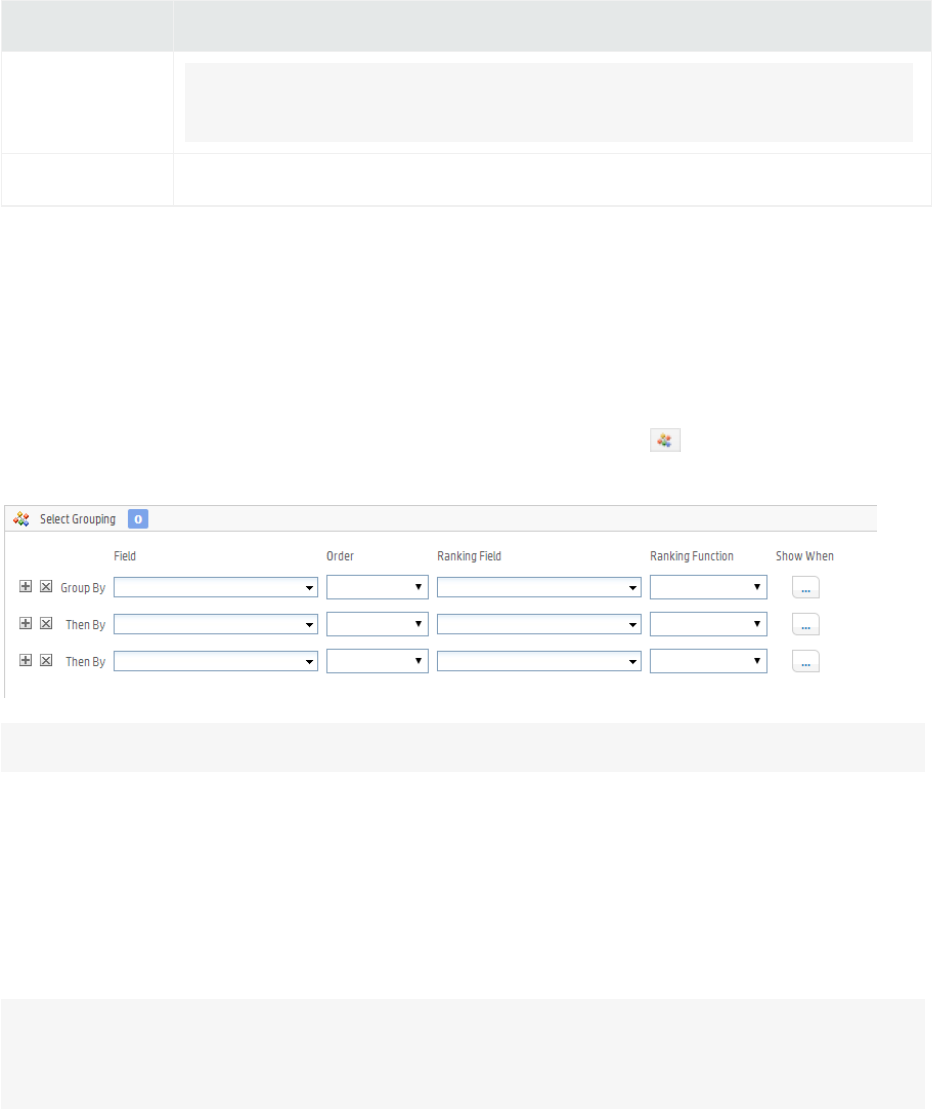
Option Description
Tip: To make the query case-sensitive, select the Match Case option for your
operator.
Value Select a value to complete the conditional filter expression.
Select Filter Criteria Options, continued
Group
Grouping brings together related report data into logical groups based on particular fields. The data can
be arranged in ascending or descending order, and can display the selected field value, or a summary
value. You can create different groups to display information in different ways.
To configure report groups, select Reports | New Report, then click New Report from the Design
menu. The Ad hoc Report Designer page displays. Click the Group tab ( ) to open the Select
Grouping menu.
Note: A report that has a group defined can only display up to 100,000 lines.
Example 1: Let's say you create a group that displays "Total Sales" in descending order (Z to A). The
total sales of "East Region" is 1000 units, and total sales of "West Region" is 1900 units. In the report, the
"West Region" group detail will appear before "East Region" group details.
Example 2: If the report uses a query that includes a Date field, you can group results by date. You
could add additional statements to group by “User Name”, “Source Address”, “Destination Address”,
and so forth, depending on what other fields are available in the report query.
Note: Selecting set Max. Rows under Select Filter Criteria (as described in "Filter" on page200)
and also specifying grouping may produce a different result than if you just specified Max. Rows
without grouping.
See the table "Add Report Job Settings" on page183 for more information about report settings.
Administrator's Guide
HPE Logger 6.2 Page 202 of 623
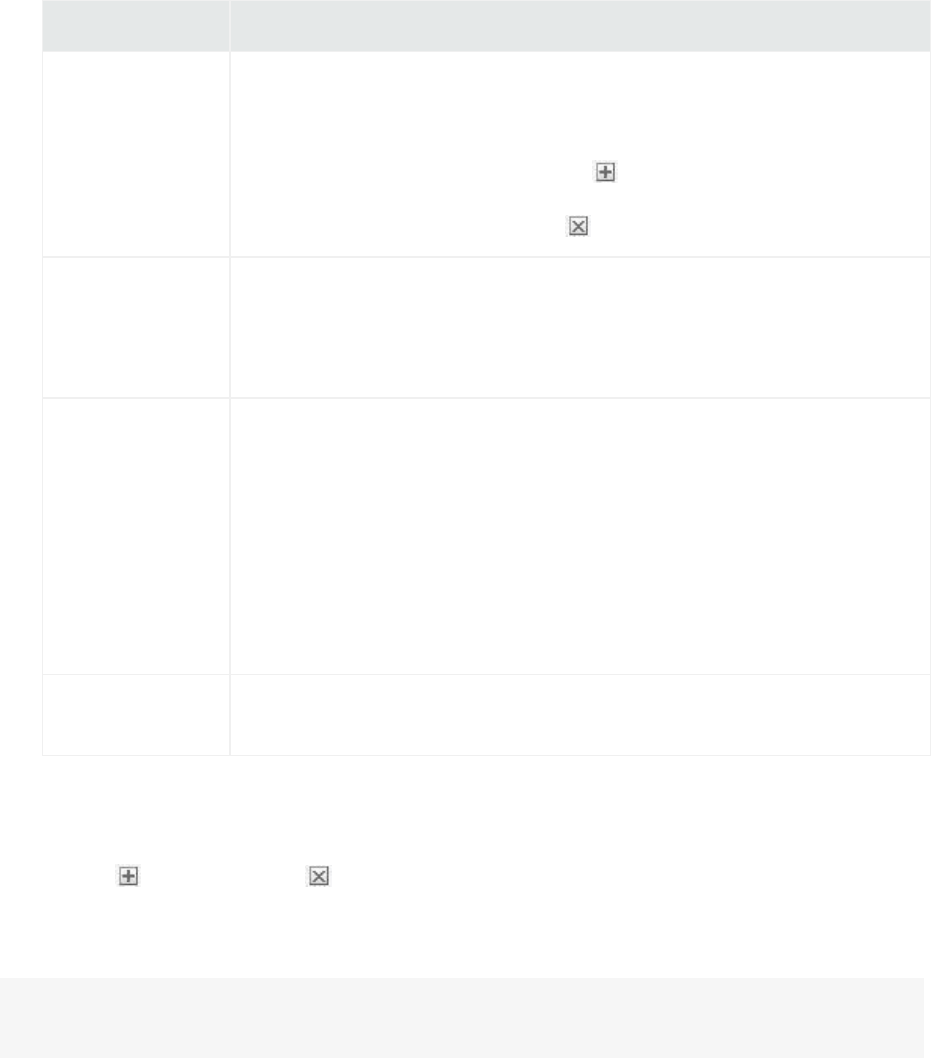
To define a group:
1. From the Group By menu, select available options from the following menus to specify what event
information should be groups, in what order, and under what conditions.
The Group By field is the primary field in the data group, organized by the ranking field, in
ascending or descending order.
Option Description
Field Select an option from the menu to make it the primary field in the report
group. The Field menu is populated with event data fields specified in the
base query.
lTo add another grouping field, click (Add Field).
lTo remove a group-by field, click (Delete Field).
Order Select in what order you want the information to display.
lAscending (0, 1, 2... or A-Z)
lDescending (2, 1, 0... or Z-A)
Ranking Field
Ranking Function
Select a field to order by (Ranking Field) and the type of information you
want the report to show (Ranking Function). Logger can group the data by
date, number, and character.
For example, if you select the query object "Login Errors by User," you can
group the data by "User Name", in "Ascending" order, with "Error" as the
ranking field, and "Count" as the ranking function.
This allows you to see users with the highest number of errors listed at the
top of the data group section of the report.
Show When Use this menu if you want information to display when more detailed
criteria are met.
Select Group By Fields
2. If you want to include secondary groups, populate the Then By fields. For example, if your report
uses a query that reports on password changes and includes a “User Name” field, you might want
to sub-group the results for each date by “User Name”.
Use the (Add Field) and (Remove Field) buttons to add or remove Then By fields for
sub-groups.
The report will generate records organized and grouped in the order you selected.
Tip: Alternatively, you can specify only a sort order (instead of groups). See also, "Sort" on the next
page.
Administrator's Guide
HPE Logger 6.2 Page 203 of 623
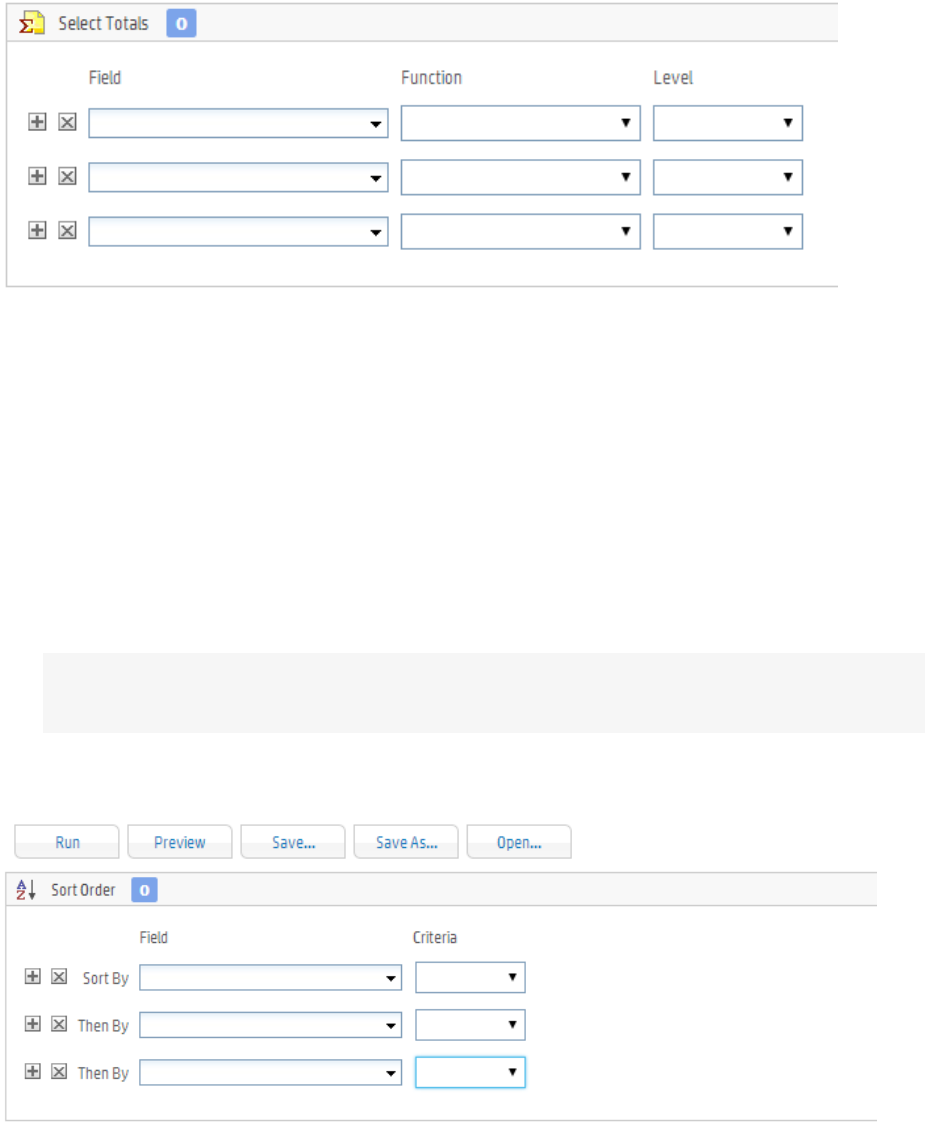
Totals
You can specify the summary (total) fields. You can apply a summary on any of the following levels:
lReport
lPage
lGroup
To specify summary details:
1. From Field, select the field that will be processed to calculate summary information.
2. On the same row, from Function, select the summary function.
3. On the same row, from Level, select the level at which you want the summary.
Note: If a Total is applied to a field that is not already in the Selected Fields list, that field is
automatically added to the Selected Fields list.
Sort
If you do not want grouped report results (as described in a "Group" on page202) but you do expect
sorted results, then specify a sort (instead of a grouping).
Administrator's Guide
HPE Logger 6.2 Page 204 of 623
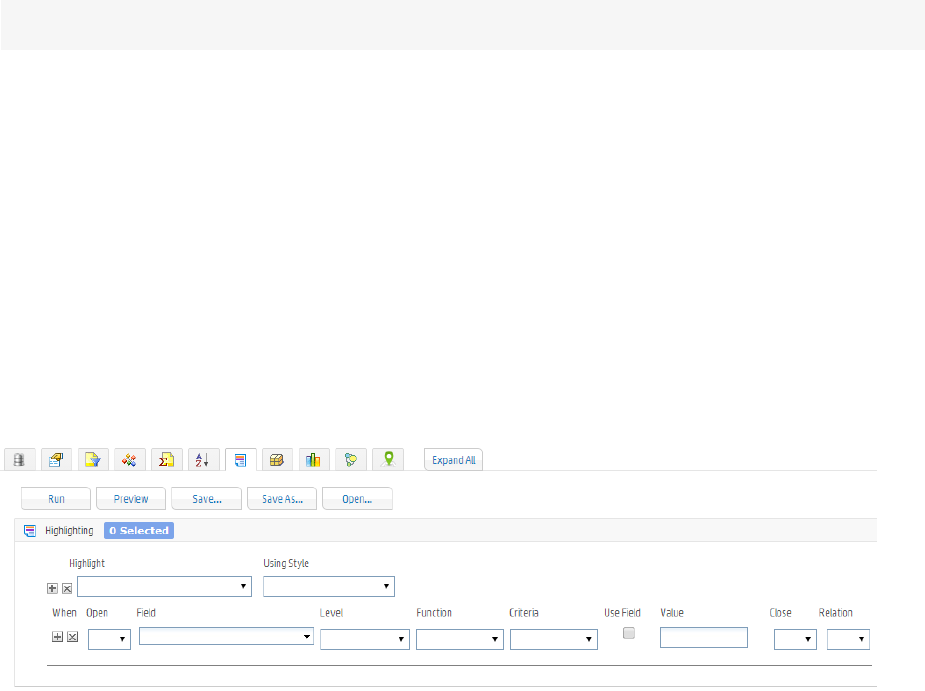
Note: A report that has a sort order defined can only display up to 100,000 lines.
You can have up to three levels of sorting.
To specify a sort order:
1. In Field, select the field on which you want to sort the report.
2. In Criteria (in the same row), select the sort criteria.
3. If desired, provide values in the “Then By” rows to specify more sorting criteria.
Highlight
A report can include multiple levels of highlighting for specified fields. Highlighted items can serve as
visual alerts on generated reports when specified set conditions are satisfied.
To set up a highlight:
1. In Highlight, select the field that should be highlighted. Select Entire Row to highlight an entire
record.
2. In Using Style, select the style to be applied to highlight it.
3. Select Alert checkbox to receive a visual alert on report viewer.
4. In Field, select the fields to evaluate for highlight (alert).
5. In Level, select the level at which the selected field should be evaluated:
lDETAIL evaluates each row (record)
lREPORT evaluates at the end of report
lRespective groups evaluate at the end of each group
lPAGE evaluates at the end of the page
6. When REPORT or PAGE is selected in Level, select a Function to be applied.
7. Select Criteria and specify its Value.
Administrator's Guide
HPE Logger 6.2 Page 205 of 623
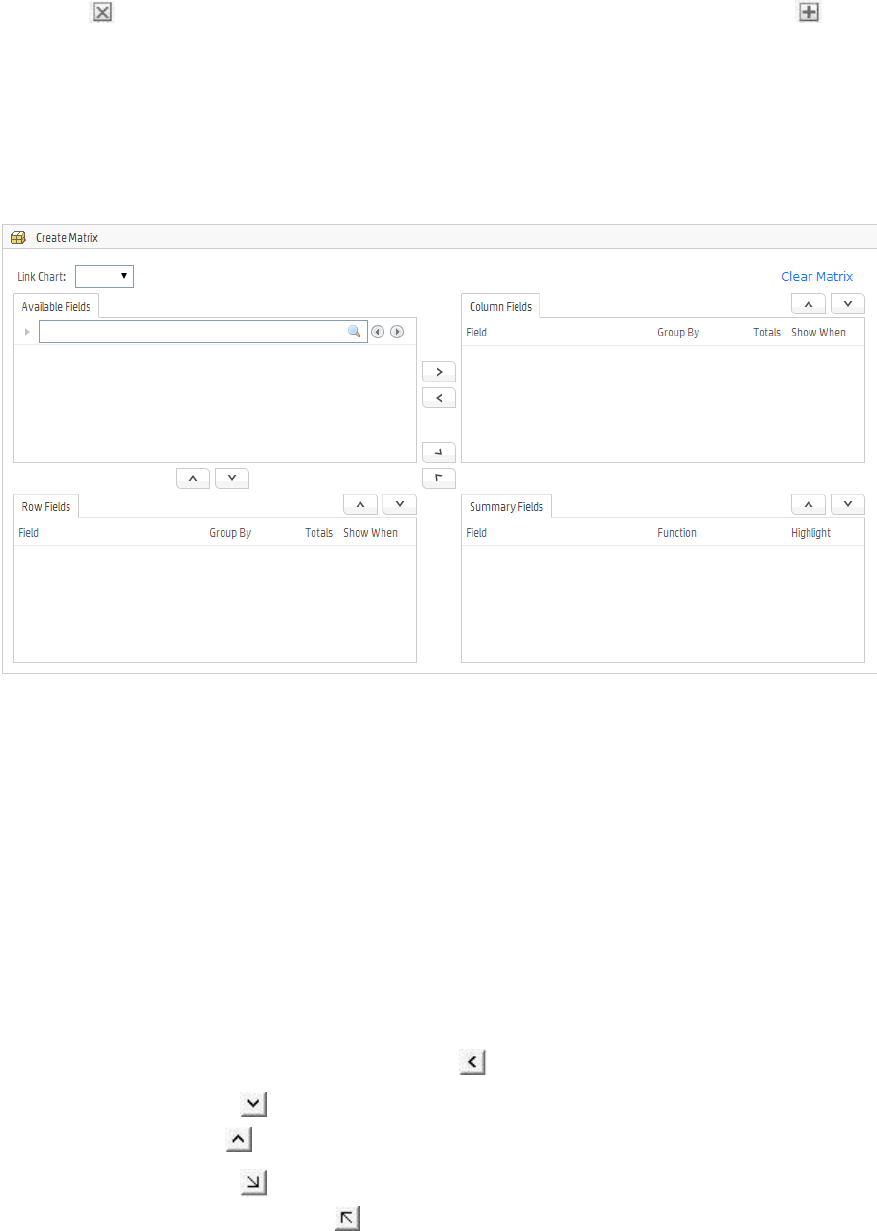
Click (Remove Condition) on the left of the criteria entry to delete an entry. Click (Add
Condition) to add another entry.
Matrix
You might choose to include a matrix in your report, since it presents a summary of data. Make sure that
the appropriate query object is selected (under Select Display Fields).
To create a matrix:
1. To place a field in Row or Column, click the field and drag it to the Row Fields or Column Fields
boxes.
2. To place a field as a cell (summary), click the field and drag into the Summary Fields box.
3. Select a Function from the pull-down menu provided for a field placed in Summary Fields.
4. Optionally, for numeric or date fields in columns or rows, specify a Group By function in the pull-
down menu provided.
5. Optionally, for fields in columns or rows, check the Totals checkbox to view a row or column.
Select a field and click padding-right: 0px; to add that field to the matrix as one of the Column
Fields. Select a field in Column Fields and click to remove it from the matrix.
Select a field and click to add that field to the matrix as one of the Row Fields. Select a field in
Row Fields and click to remove it from the matrix.
Select a field and click to add that field to the matrix as one of the Summary Fields. Select a
field in Summary Fields and click to remove it from the matrix.
Administrator's Guide
HPE Logger 6.2 Page 206 of 623
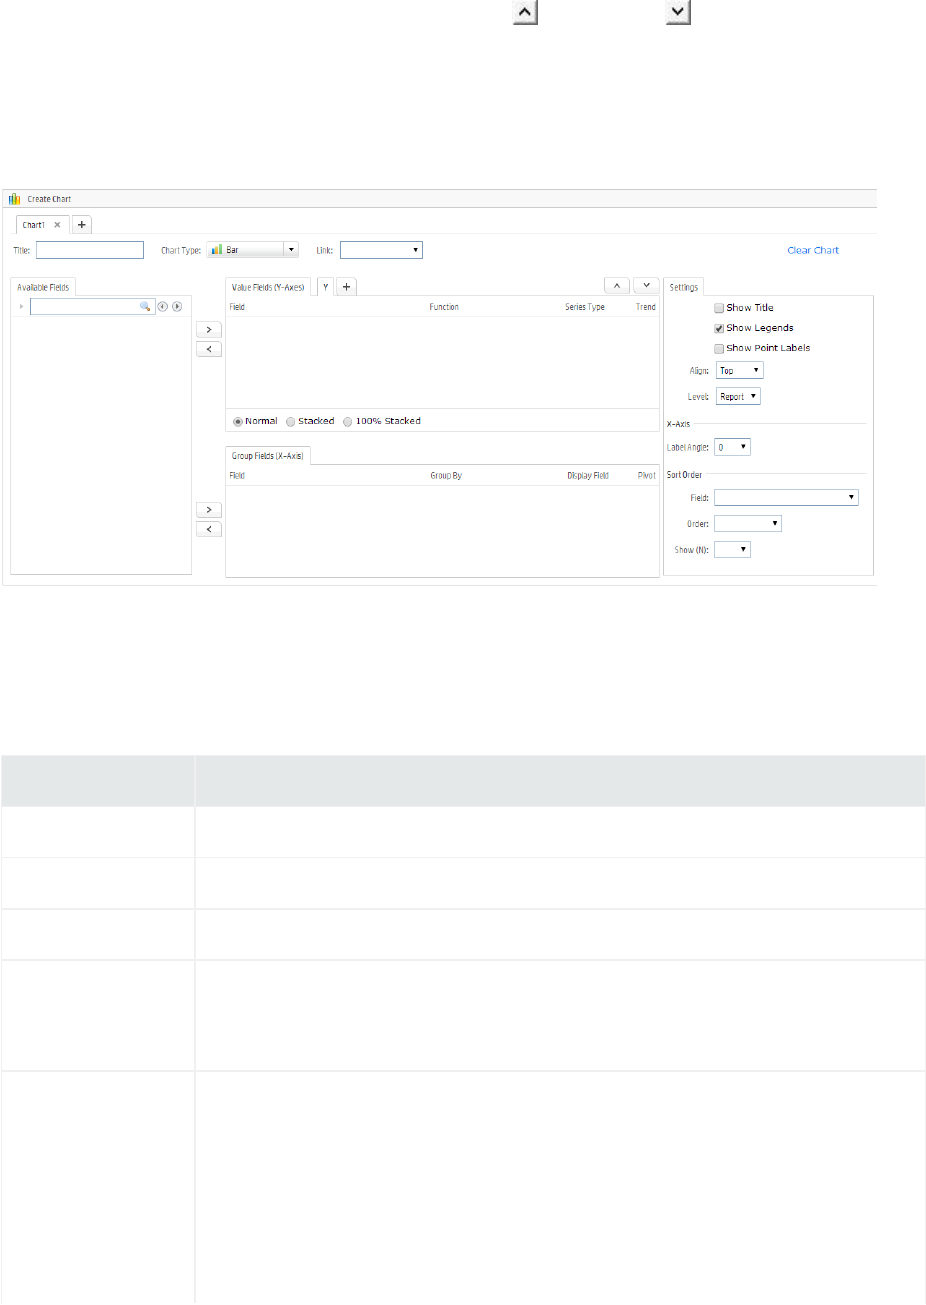
To move a field up or down, select the field and click (Move up) or (Move down), to move
the field in the respective direction.
To remove all settings and contents of the current matrix, click Clear Matrix.
Chart
For pictorial representation of summary data, you can add a chart to your report. Make sure that the
appropriate query object is selected (under Select Display Fields).
To create a chart, specify values for the following:
Setting Description
Title Title of the chart.
Chart Type Select a chart type from the drop-down list.
Link Choose to link the chart to either report fields or a matrix.
Available Fields Available Fields are drawn from the report query. Using the > button, assign
these fields to Value Fields (Y-axes on the chart) or Group Fields. See
"Assigning Fields" on the next page.
Settings lShow Title: if selected, the chart title displays.
lShow Legends: if selected, the chart will show legends for each field.
lShow Point Labels: if selected, a label is shown with the number of
matches for a value of a field in a chart.
lAlign: Select an alignment for chart placement.
lLevel: Select a level from which to draw data for the chart:
Administrator's Guide
HPE Logger 6.2 Page 207 of 623
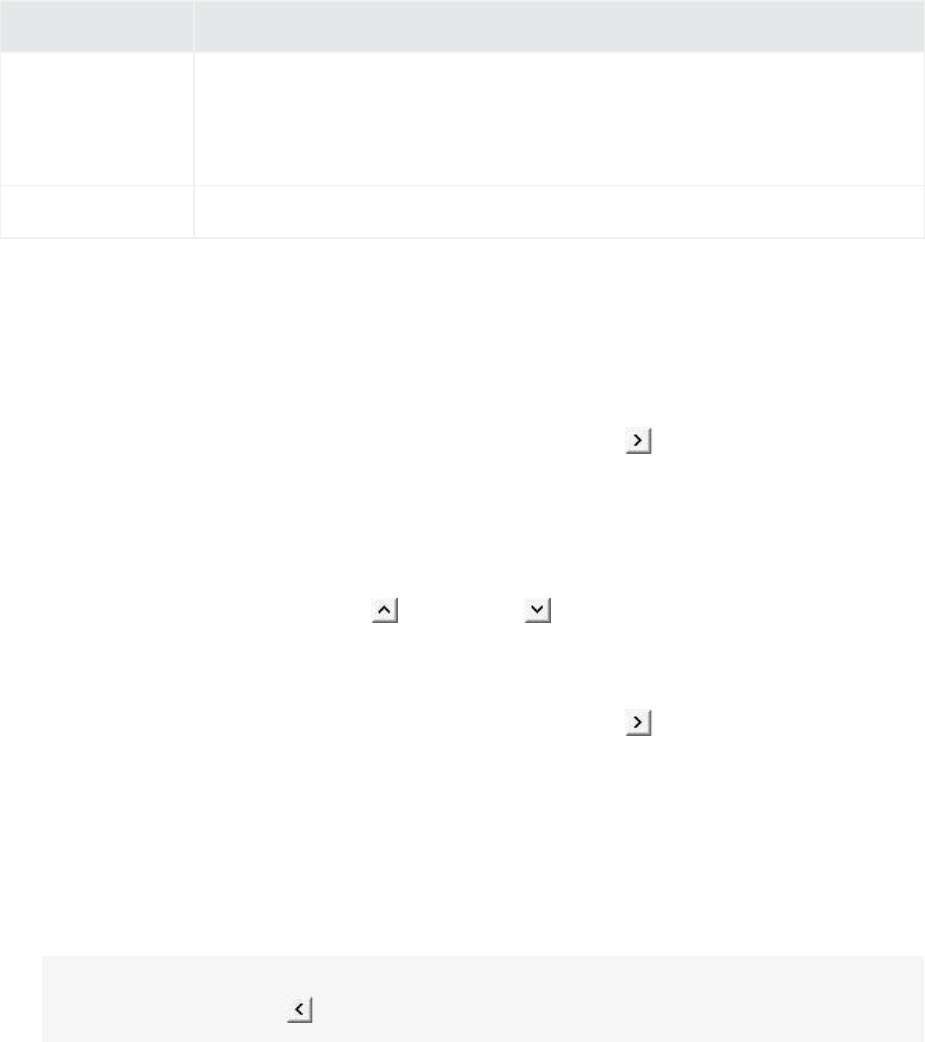
Setting Description
lReport: Data will be plotted with data from entire report
lPage: Data will be plotted with data from the page where the chart is
located)
Sort Order Select a sort order for the chart.
Assigning Fields
You can set value and sort fields for a chart.
To Set Value Fields (Y-Axis):
1. Click and drag the Field in Value Fields (Y-Axis) box, or use the button (Add field) to add the
selected field.
2. Select summary function for the field.
3. To select a different chart type, click the button on the right to open a box with chart types. Select
the type you need. Follow steps 1 through 3 above for each attribute to be placed as series. To re-
position fields, select a field and click (Move up) or (Move down) as needed.
To Set Group Fields (X-Axis):
1. Click and drag the field in Group Fields (Y-Axis) box, or use the button (Add field) to add the
selected field.
2. Select the method to group (for Numeric or date type).
You can specify groups in numeric fields. For example, to have groups of 10, specify 10 in Groups
box.
You can specify groups in date fields. From the drop-down box select from Day, Week (Sunday to
Saturday), Month, Quarter (Jan-Mar, Apr - Jun, Jul - Sep, Oct - Dec), Year.
Tip: To remove fields from Value fields (Y-Axis) or Group Fields (X-Axis), drag them out of the
respective box or use the button (Remove field) on selected fields.
To remove all settings and contents of the current chart, click Clear Chart.
Map
Your report can include a GIS (Geographic Information System) map based on your data.
Administrator's Guide
HPE Logger 6.2 Page 208 of 623
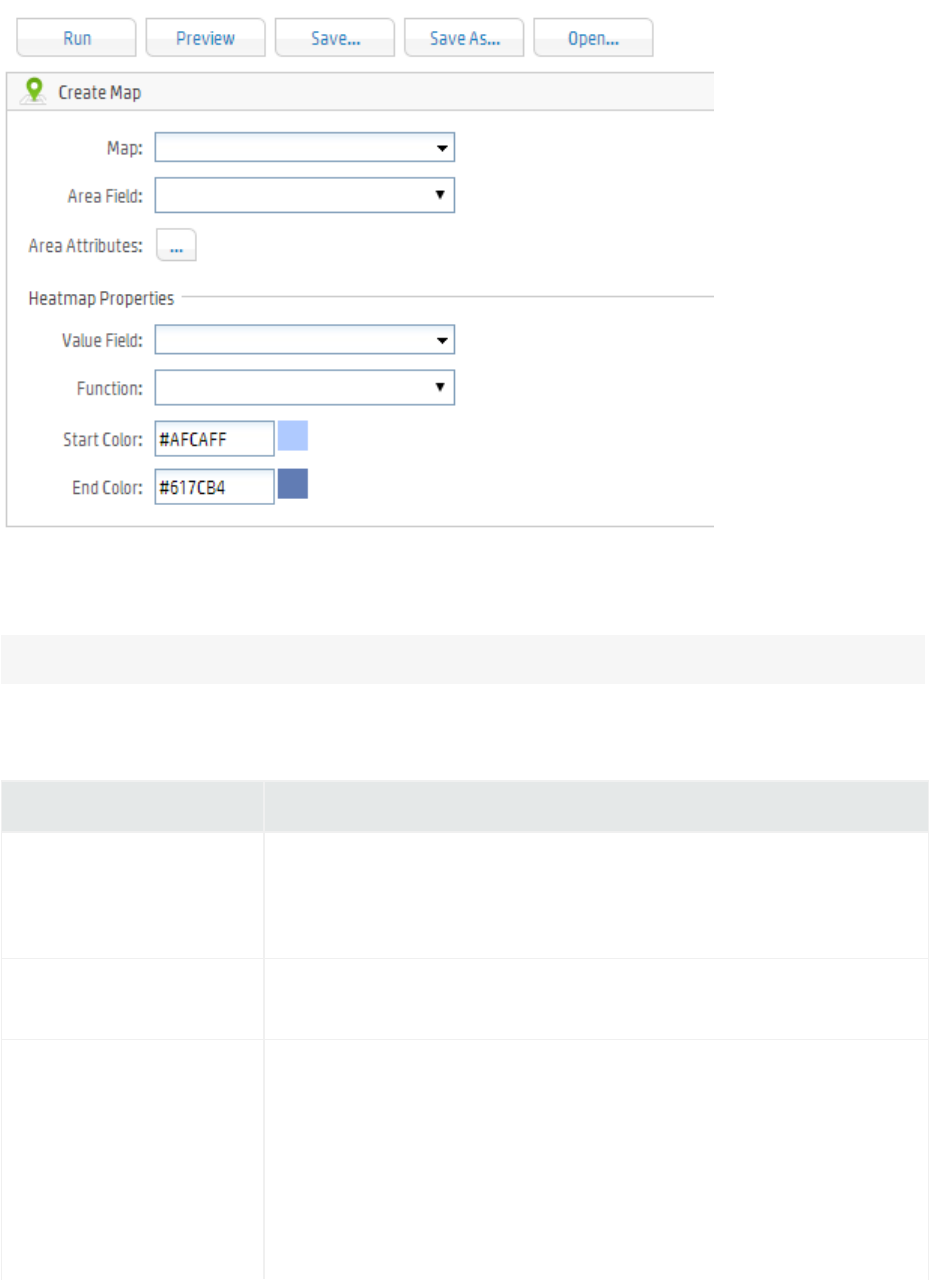
The GIS map can include a heat map, which highlights by color the areas of most activity that you
specify.
Note: In the context of a GIS heat map, heat refers to activity level.
A map includes the following parameters:
Parameter Description and Values
Map Select the map name for initial loading of data.
For example, if you want to depict a map of US states, then select “USA
- Regions”.
Area Field This is the value used to group map data. Select an area based on the
initial selection of value for Map.
Area Attributes Click an area of the map to see an informational balloon. Set values for
the following attributes in the balloon display.
lPrefix: the prefix caption value for the field
lField: the value of the field
lFunction: the aggregation summary for the field
lSuffix: the suffix caption for the field
Map Parameters
Administrator's Guide
HPE Logger 6.2 Page 209 of 623

Parameter Description and Values
lAs Title: if selected, this line appears as a title bar in the balloon.
Heatmap Properties -
Value Field
Select the value field by which the heatmap is calculated.
Function Select the aggregation summary for the field by which the heatmap is
calculated.
Start Color Select a color representing the lowest value of the value field.
End Color Select a color representing the highest value of the value field. All in-
between colors will be assigned values automatically by an even
distribution.
Map Parameters, continued
Adding a Map to a Report
You can create a GIS map reflecting the values of a field in a query. This map can be included in a report.
When adding a map to a report you must select a GIS-enabled field a map type, as described in the steps
below. The map displays in interactive HTML (iHTML) format.
To add a map to a report:
1. In the navigation pane, under Design, click Queries to open the Query Object Editor.
2. Click Open to browse to and open an existing query, or, alternatively, create a new query to use in
the report. (If creating a new query, specify the query as discussed in "Designing a New Query" on
page219.)
3. In the Transformation workspace, click the Format step.
4. On the Properties tab, select the field to add to the map.
5. In the field details, select GIS Enabled. The field that you select must contain GIS classification data
such as country names, state, or city names.
Administrator's Guide
HPE Logger 6.2 Page 210 of 623
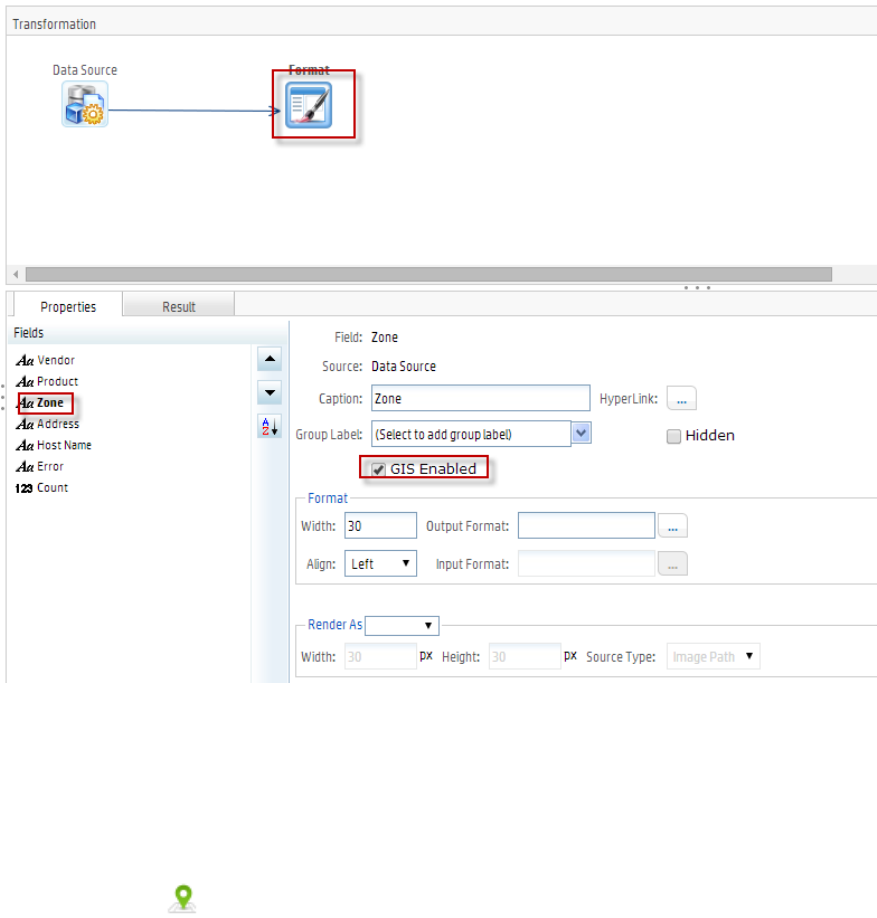
6. In the toolbar, click Save to save the modified query object.
7. In the navigation pane, under Design, click New Report. The Ad hoc Report Designer opens.
8. In Data Source, browse to and select the query object in which you previously GIS enabled the
field.
9. Under Report Settings, in Format, select iHTML from the drop-down list.
10. Click the Map tab.
11. In Map, select a map type from the drop-down list.
12. In Area Field, select the field you enabled for GIS earlier.
Administrator's Guide
HPE Logger 6.2 Page 211 of 623
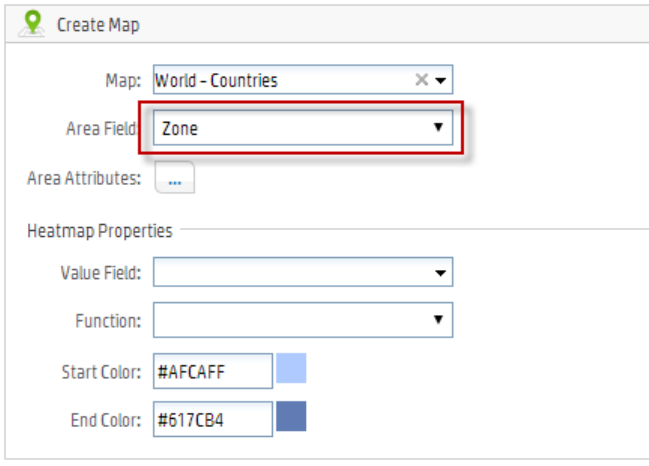
13. Click Area Attributes. In the Attributes dialog, select a field to display in the information balloon,
as described in the table "Map Parameters" on page209.
14. Under Heatmap Properties, in Value Field, select the field from which the map is to derive its
values from, to populate the map.
15. For Start and End Color, select two colors from the palette to display the range of values on the
map. For example, a lighter color on the map would indicate a lower value, while a darker color
would represent a higher value.
16. Make any additional edits to the report as needed, and then run the report.
Editing a Report
You can use the Report Designer to edit existing user-designed reports. (The supplied reports are not
editable.)
To edit an existing report:
1. Browse to the report in the Report Explorer.
2. In the Actions menu, click Customize Report. This displays the Report Designer for the selected
report.
Administrator's Guide
HPE Logger 6.2 Page 212 of 623
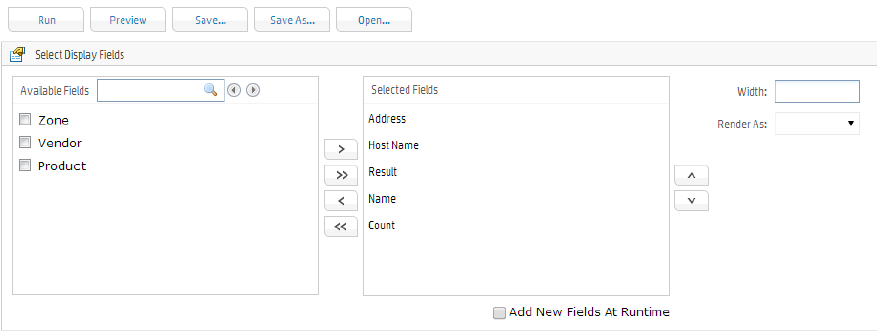
3. Modify the report as needed (using the settings described in "Creating New Reports" on page194).
4. (Optional) Before saving the report, you can run it to ensure that the changes you expected in the
report output suit your needs. To do so, click Run. (For more information see, "Running a Report
While Designing It" below.
5. Click Save.
See also "Quick Start: Base a New Report on an Existing One" on page195.
Private Reports
If you have access rights to view, run, and schedule all reports, you can create private reports. If you do
not have permissions to edit a public report that you want to modify but you do have permissions to
create private reports, then you can save the public report as a private one and edit the private report.
For more about publishing a report as public or private, see "Publish Report Settings" on page182. For
more about access rights for reports, see "Setting Access Rights on Reports" on the next page.
Running a Report While Designing It
While editing or designing a report in the Ad hoc Report Designer, you can run it before saving it to
ensure that the output meets expectations.
To run a report while designing it:
1. With the report open in the Ad hoc Report Designer, click Run.
2. Edit the report parameters as needed.
3. Click Run Now. The report is displayed using the parameter values you set.
The Ad hoc Report Designer is useful in adding formatting and display elements to a report definition
and viewing the output with those elements before saving the report definition. For example, you can
specify a sort pattern or add a chart to a report.
Administrator's Guide
HPE Logger 6.2 Page 213 of 623

Setting Access Rights on Reports
Administrators can set access rights on various report categories, reports, and report options (such as
view, publish, and edit) based on user roles and Logger Report Group affiliation. For example, you can
grant users privileges to view some reports but not others, to view but not schedule or publish a report,
or to view and schedule but not edit a report.
Access rights are given at the folder level. If you want to give access only to specific reports, you can put
them in their own folder and give access to it. Access rights on report options are configured and
managed with the User/Groups option on the Logger System Admin page. For more information on
System Admin User/Group management, see "User Management" on page452.
Determining What Access Rights to Give
When setting access rights for a user or group, be sure to give the user all the necessary permissions. In
order to access a particular child node, users need access rights to all higher nodes in that branch of the
tree.
To determine the necessary rights for a report, open the report tree to that report.
Note: In order to access a particular child node, users need access rights to all higher nodes in that
branch of the tree.
Example: Giving a User Group Access Rights for a Report
Suppose you want to give a Group the rights to view, run, and schedule, but not to change the
Attackers reports. To determine the necessary rights, scan the report tree and note the nodes. You will
then need to navigate to the System Admin menu to set the rights.
To view Attackers Report tree and determine the necessary rights to access it:
1. Click Reports in the menu bar.
2. Click Report Explorer in the Navigation section on the left panel.
3. In the Reports list, navigate to the group of reports you want to give access to. For the example,
click Foundation > Intrusion Monitoring > Attackers.
Administrator's Guide
HPE Logger 6.2 Page 214 of 623
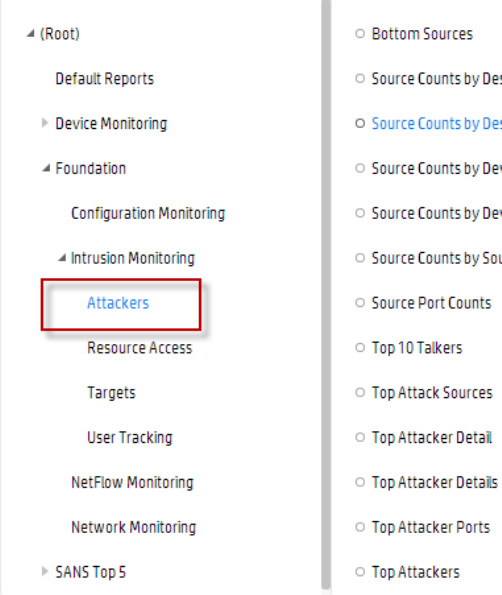
4. In the Reports list, navigate to the group of reports you want to give access to. For the example,
click Foundation > Intrusion Monitoring > Attackers.
5. Make a note of each node you open.
Now that you know the nodes you need to give access rights to, you can set them from the System
Admin menu.
To create a new User Group and give it Logger Reports Rights:
1. Click System Admin in the menu bar.
2. Click Use Management in the Users/Groups section on the left panel.
3. Open the Groups tab, and click Add.
4. Type in a Name for the group and add a description.
5. Select Logger Reports from the Group Type drop down menu.
6. Click the arrow to display the list of Logger Reports Rights.
7. Click Clear All to remove all permissions.
8. Click the box next to each permission you want to give the user group.
For the example, you noted Foundation, Intrusion Monitoring, and Attackers, and you wanted to
give the rights to view, run, and schedule these reports. Therefore, put a mark in the box next to
each of the following access rights:
Administrator's Guide
HPE Logger 6.2 Page 215 of 623
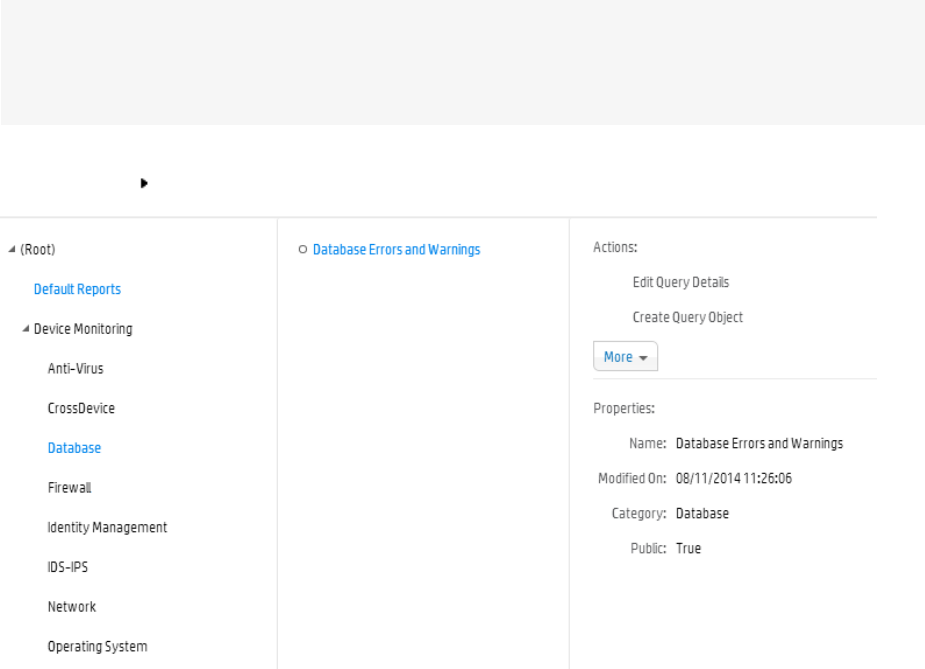
Report folder [Attackers]: view, run, and schedule reports
Report folder [Foundation]: view, run, and schedule reports
Report folder [Intrusion Monitoring]: view, run, and schedule reports
9. Click Save and Edit Membership.
10. Click Add in the Edit Group Membership dialog.
11. Put a mark in the box for the user you want to add to the group, and click OK.
12. Log in as a member of the group you created and test whether you can perform the desired
functions. For the example, the user should be able to view, run, and schedule the Attackers
reports only.
Queries
Query objects (which comprise queries bundled with additional metadata) are used as the basis for
designing reports.
Note: Some queries may require parameters. We recommend first designing all needed parameter
objects before creating the query object that will use those parameter objects.
For information on developing parameter objects, see "Parameters" on page231.
To view a query object, in the navigation pane, click Query Explorer. You can then browse queries by
category. Click to toggle visibility of each category and drill down.
Logger Reporting provides a set of pre-built queries, which are used as the basis for the System-defined
Reports and Solutions Reports to address common security use cases (as described in "The Explorers"
on page144).
Administrator's Guide
HPE Logger 6.2 Page 216 of 623

To search for an existing query by name or other criterion:
1. In the navigation pane, under Design, click Queries.
2. On the toolbar, click Open.
3. Click Search.
4. In the criteria dialog, select the criteria for your search.
5. Click Search. All queries matching your criteria are returned.
For instructions on how to view a list of the default search fields, see "Default Fields" on page281. For
information about custom schema fields added to the default schema, see "Adding Fields to the
Schema" on page379.
You can use a provided query object as is, as the basis for your own reports, or design new query
objects on the Query Object List page. You can use existing query objects as a starting point for new
ones.
Note:Reports that directly invoke SQL queries can use the standard insubnet SQL function as
follows: insubnet( "subnet string", address_column )
Caution: Modifications to reports and other ArcSight-defined content may be overwritten without
warning when the content is upgraded. It is not good practice to modify ArcSight-defined content
directly.
Make modifications to a copy of any ArcSight-defined content as a general practice, and
subsequent upgrades will not affect the modifications.
This topic explains how to design new query objects (either from scratch or based on existing ones).
How Search and Report Queries Differ
Even though a search and a report query both perform the same function (finding events that match
specific conditions) the two queries are distinct in these ways:
lYou use Logger’s Query Object Editor to create a report query.
lYou use the Logger’s Search UI to create a search query. The query can be specified using plain
English keywords, field names, or regular expressions. See "Searching for Events" on page98 for
more information.
However, report queries and field name queries can utilize indexed fields to expedite the underlying
search.
Administrator's Guide
HPE Logger 6.2 Page 217 of 623
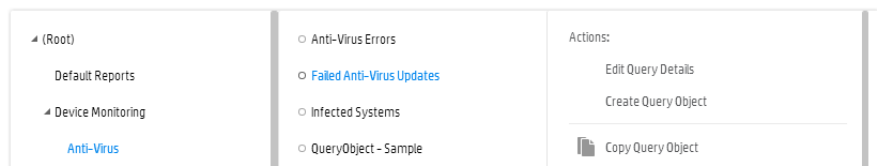
Overview of Query Design Elements
To create a new query object, you need to specify a query name, define a data transformation, and save
it. The data source for Logger Report queries is always the Logger databases, so there is no need to
specify this as part of the query object.
Optionally, you can specify formulas, set field properties, define transformations, define formatting,
define field groups, provide hyperlinking, define lookup values, and build mandatory filtering into the
query.
Creating a Copy of an Existing Query
To use an existing query object as the basis for a new one:
1. In the Query Explorer, click on a category and select the name of the query that you want to copy
from the query list.
2. On the Actions menu, click More to expand the menu.
3. Click Copy Query Object.
4. In the list of categories, right-click the category name under which you want to place the copied
query, and select Paste.
Administrator's Guide
HPE Logger 6.2 Page 218 of 623
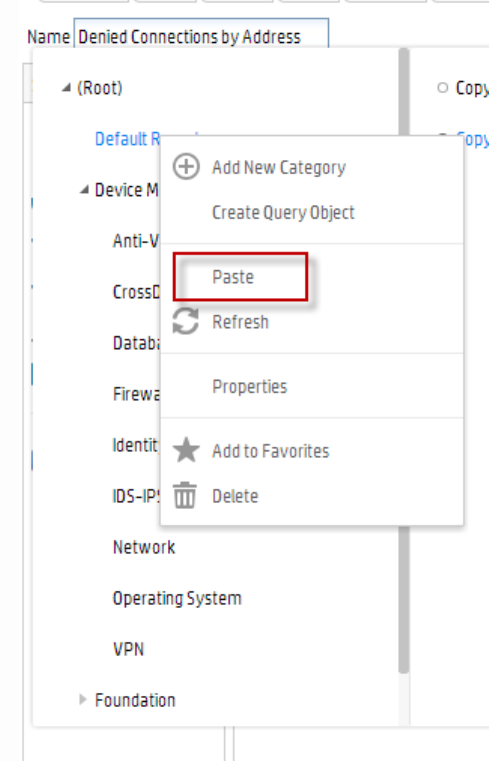
A temporary version of the new query object is created with the same contents as the original and
the same name pre-fixed with “Copy of.”
Designing a New Query
A query object represents a data transformation, which comprises a set of steps (elements) to produce
the final output. A step can be a data source, a sort, a filter, an output, or other element. You design a
query interactively using the Query Object Editor.
The Query Object Editor is shown here. Highlighted are the Steps list and the Transformation
workspace.
Administrator's Guide
HPE Logger 6.2 Page 219 of 623
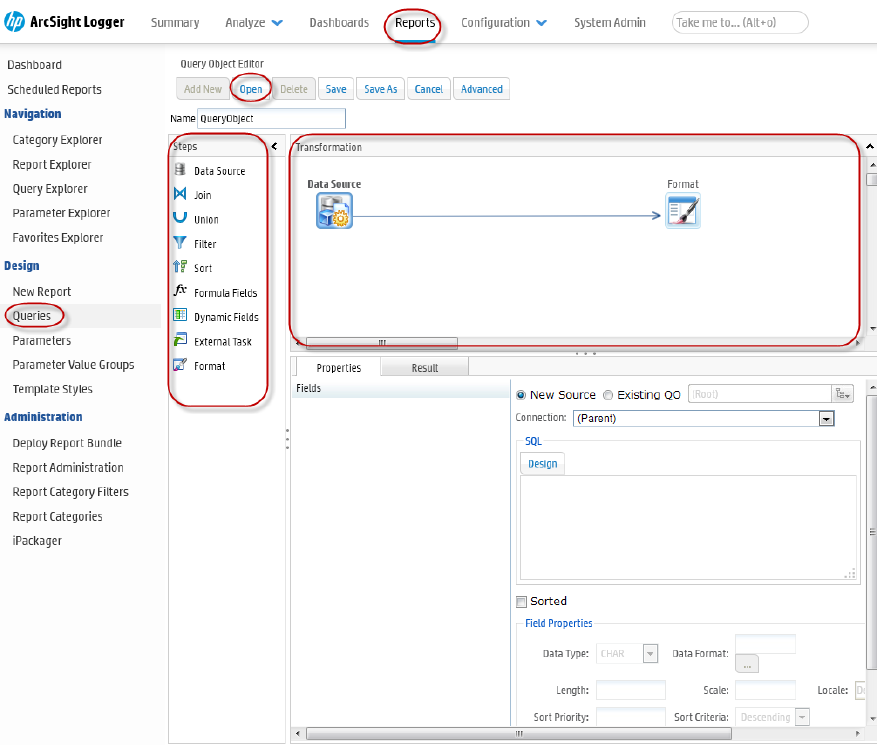
To create a transformation, you drag query elements (steps) from the Steps list to the Transformation
workspace, linking them in the sequence in which they will be evaluated. Then, you specify properties
for each Step.
Working with Steps
lTo add a Step to a query, drag it from the list to the Transformation workspace.
a. To specify properties for a Step, select the Step, then enter values for it in the Properties tab.
Values for Steps are listed in "Steps" on page223
b. To see the results of a Step after you’ve added it, click the Results tab.
c. To link one Step to another, in the Transformation workspace, select the Step. Holding your
Administrator's Guide
HPE Logger 6.2 Page 220 of 623
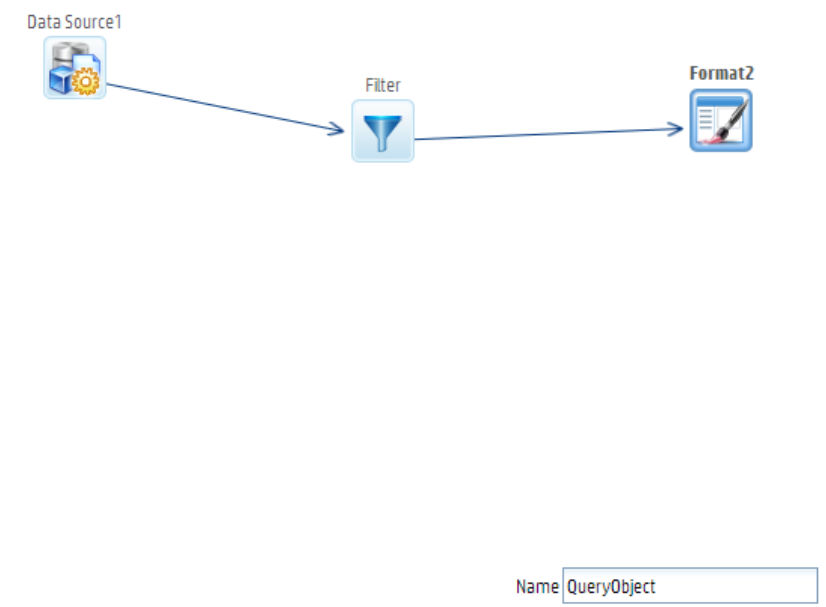
mouse button down, drag and draw an arrow (link) to the linked Step.
lTo add a Step between two linked steps, drag and drop the step on the link.
lTo rename a Step, right-click it and choose Rename Step. Then enter a new name.
lTo delete a link or a Step, right-click on the item, then choose Delete Link or Delete Step.
The Query Design Process
You design a query visually in the Transformation workspace.
To design a query:
1. In the navigation menu, under Design, click Queries. The Query Object Editor opens.
2. In Name field, specify a unique name for this query object.
3. In the Transformation workspace, drag and drop the required steps for the query from the Steps
menu into the desired sequence. (By default, the Transformation window already includes a Data
Source and Format step.)
For example, to add a sort to the transformation, drag a Sort element from the Step list to the
Transformation field and drop it on a link.
Administrator's Guide
HPE Logger 6.2 Page 221 of 623
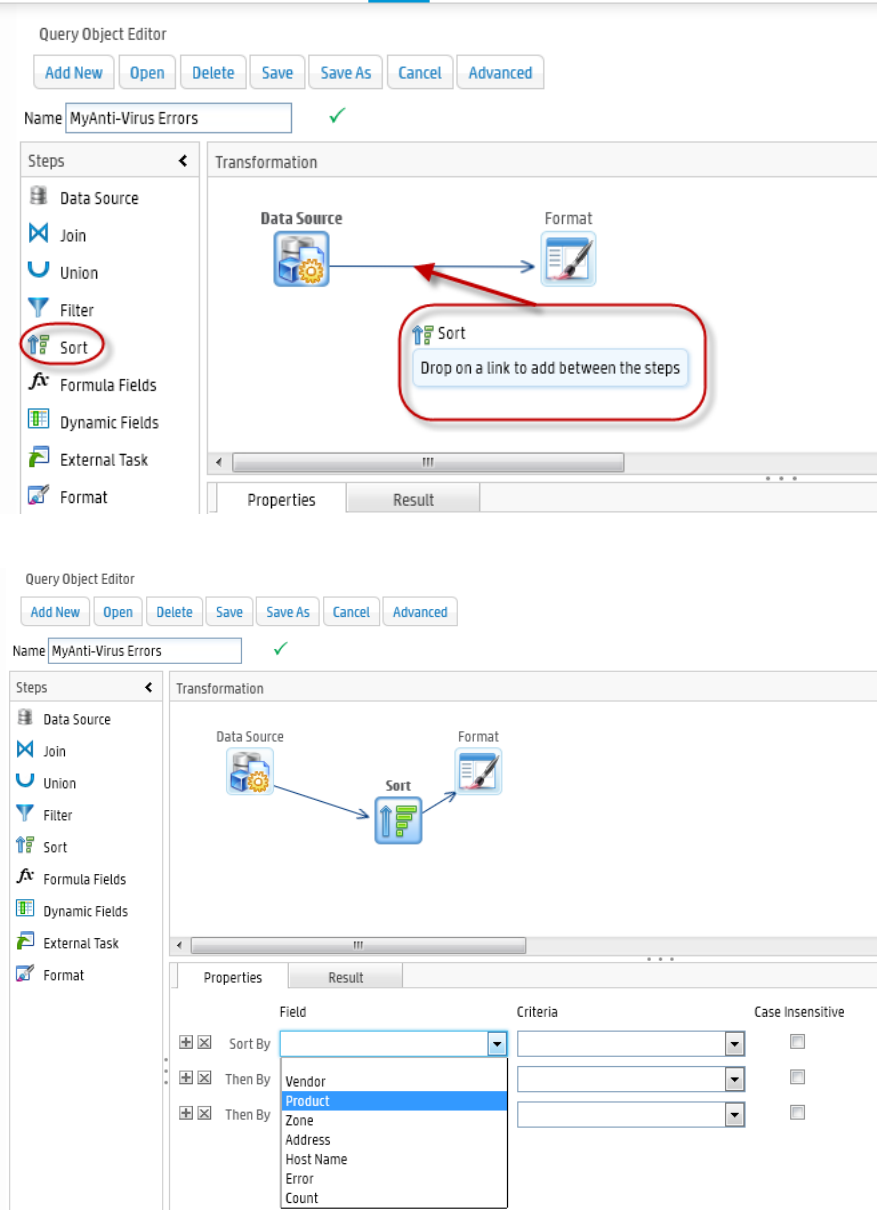
Then, in the Properties tab, select a field to sort by.
4. Optionally, in the toolbar click Advanced, then set any advanced properties for the query object.
5. Click Save.
Administrator's Guide
HPE Logger 6.2 Page 222 of 623
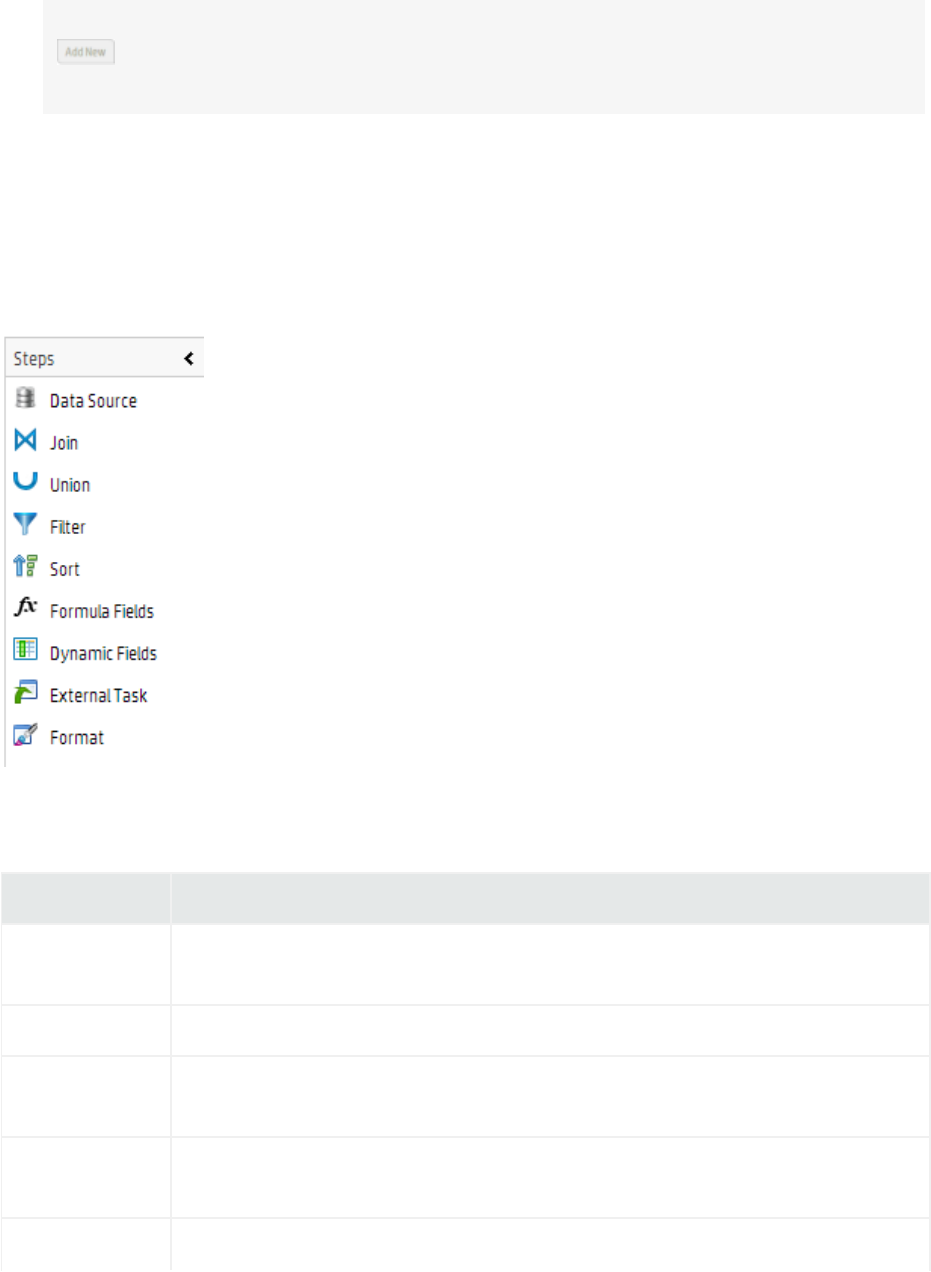
Note: A blank (empty) query object is displayed when this page is opened, and the Add New
button on the toolbar is disabled until the blank query object is saved. After saving, you
can add a new query object by clicking Add New.
Steps
A step is an element of a transformation, used in the construction of query objects. To use a step, drag
it from the Steps menu to the Transformation window. The behavior of a step depends on the
properties you assign to it on the Properties tab. You can check the results of a step on the data on the
step’s Result tab.
The following steps are available for use in the Query Object Editor:
Step Description
Data Source Brings data into the query object. You must have at least 1 data source. For more
information, see "Data Source Step" on the next page.
Join Joins two inputs. For more information, see "Join Step" on page226.
Union Appends one input to another. For more information, see "Union Step" on
page227.
Filter Applies pre-defined filters and sets lookup values. For more information, see
"Filter Step" on page227.
Sort Sets sorting criteria. For more information, see "Sort Step" on page228.
Steps
Administrator's Guide
HPE Logger 6.2 Page 223 of 623
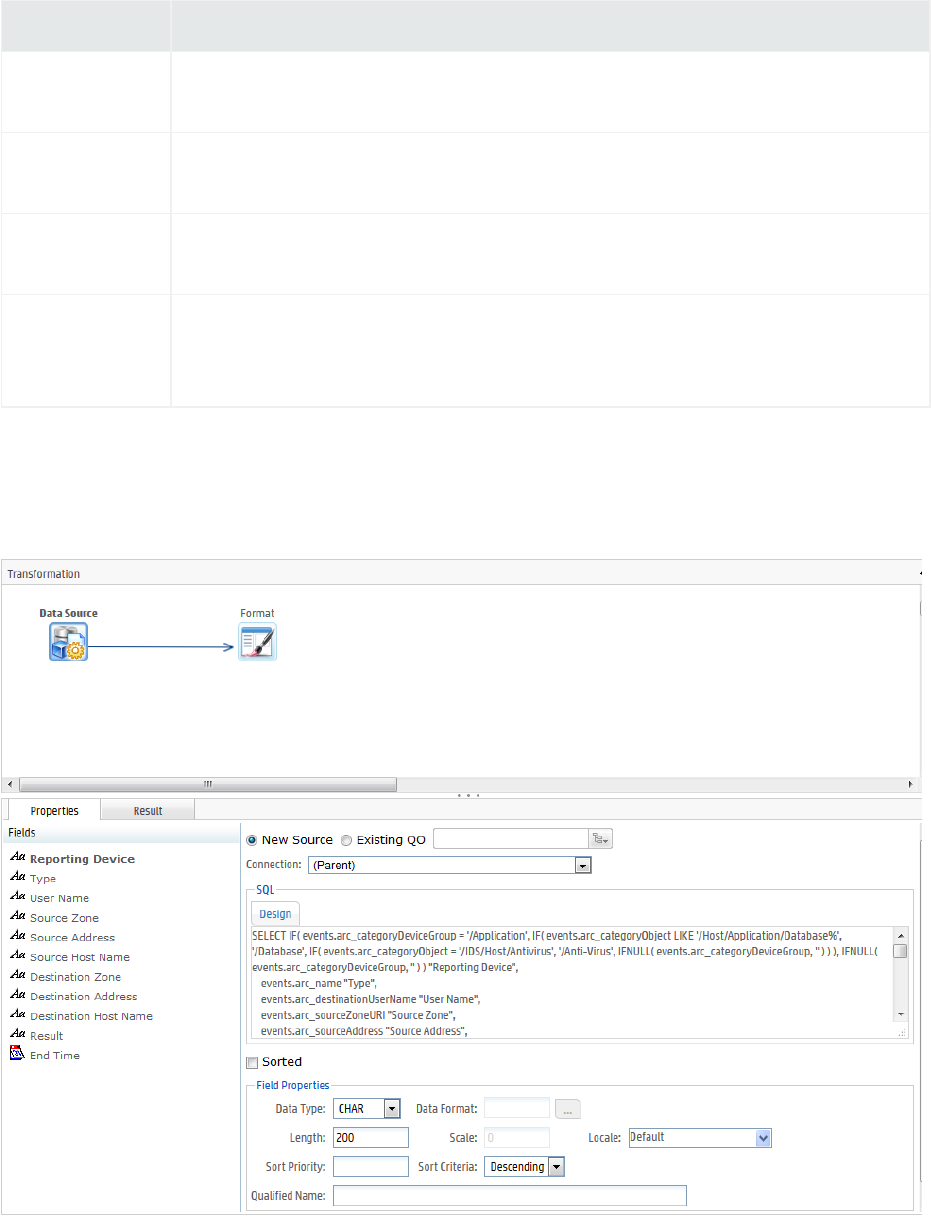
Step Description
Formula Fields Enables addition of calculated fields populated at runtime. For more information,
see "Formula Fields Step" on page228.
Dynamic Fields Add or remove fields to the query object at runtime. For more information, see
"Dynamic Fields Step" on page229.
External Task Call standard and custom 3rd party procedures. For more information, see
"External Task Step" on page229.
Format Lists all fields provided by the query object. Generally, the format step is the last
one in the transformation workflow. For more information, see "Format Step" on
page230.
Steps, continued
Data Source Step
A Data Source step brings data into the query object from the Logger database or an existing query
object. A query can have multiple data source steps.
Administrator's Guide
HPE Logger 6.2 Page 224 of 623

A data source step has the following properties:
Property Description
New Source/
Existing QO
Choose whether to use the Logger database or existing Query Object.
Connection Select either parent or the name of a connection.
lParent: data is fetched from the connection specified at the Query Object
level, or falls back to the default connection configured for the user.
lConnection name: data is fetched only from the specified connection.
SQL A complete SQL statement designed with the SQL Designer. Only visible if
the Logger database is the data source.
The SQL Designer enables you to design SQL statements by dragging and
dropping tables (on the Design tab) or by typing the complete SQL (Edit tab).
When using the Query Editor, be sure to use the appropriate SQL syntax for
your data type. For example, to call a string data type, you must enclose the
string with single quotes, as in the query below.
select arc_deviceVendor from events where lower(arc_
deviceVendor) = 'arcsight'
Sorted If selected, the data is sorted.
Field Properties The Field Properties sub-menu (when enabled) allows you to configure the
properties of the selected field. See the "Field Properties Sub-menu" below
for a description of these properties.
Data Source Step Properties
Field Properties Sub-menu
Property Values Comments
Data Type CHAR, NUMBER, DATE,
BINARY
Select the data type of the incoming data.
Data Format Format String Specify the format of the incoming data. This
is useful only if the Date or IP Address type
data are incoming in CHAR fields, but need to
be converted to Date and Number types for
further use.
Database Time Select Time zone from the list Specify the time zone in which the incoming
Administrator's Guide
HPE Logger 6.2 Page 225 of 623

Property Values Comments
Zone date data is stored. This is useful only if date
time data needs to be converted to other time
zone data based on reporting requirement.
For example when incoming GMT data should
be converted to another time zone in the
report, specify that the incoming data is GMT.
The output format is generally specified in the
Format Step or in user preferences.
Length/Precision Enter Enter the length of field for Char data types,
and the precision or length of field for the
Number data type.
Scale Enter Enter the Scale or number of digits after the
decimal point.
Locale Select from menu Select the language/ country in which the
incoming date data is stored.
Sort Priority Number 0-NIf the data is sorted on multiple fields, then
specify the sort priority number of this field.
Primary sort field should be the lowest
number.
Sort Criteria Ascending/ Descending Specify sort as either ascending or descending
order.
Qualified Name Enter This name helps by providing a field name for
SQL clauses such as WHERE and ORDER BY.
It can also be used to resolve field name
ambiguity when the same field comes from
different tables or expressions.
Join Step
A Join step joins two inputs. A join step has the following properties:
Property Description
Select All Fields If enabled, all fields from both sources will be available in the output of this
step. If deselected, you can select which fields will be available in the
Join Step Properties
Administrator's Guide
HPE Logger 6.2 Page 226 of 623

Property Description
output.
Join Type Select from one of the following join types:
lInner Join
lLeft Outer
lRight Outer
lFull Outer
Join Conditions Forms the Join Key.
Join Step Properties, continued
Union Step
A Union step appends one input to another. A union step has the following properties:
Property Description
Union Type Select either Sorted or Unsorted.
Remove Duplicate Rows If selected, each row in the result will be distinct.
Column Enter the name of a column.
Click to rename the column.
Click to add a column
Click to delete the column.
Union Step Properties
Filter Step
A Filter step will apply pre-defined filters and set lookup values. A Filter step has the following
properties:
Property Description
Ad hoc filters To apply one or more ad hoc filters, under Select Filter Criteria, enter the
Field Name, Criteria, and Value. Click + to add more filters or click X to
delete one.
Lookup Values If enabled, a list of lookup values is provided to the end user to easily choose
Filter Step Properties
Administrator's Guide
HPE Logger 6.2 Page 227 of 623

Property Description
values to apply a filter.
Mandatory If enabled, then any reports using this Query Object must apply the filter on
the selected field.
Hide If enabled, the field will be hidden from the end user in the list of fields that
can be filtered on.
Filter Step Properties, continued
Sort Step
A Sort step sets sorting criteria. A Sort step has the following properties:
Property Description
Field Select a field from the list on which to sort. You can add multiple fields for the
sort using Sort by and Then by lines.
Criteria Sorting criteria, either ascending or descending order.
Case Insensitive If enabled, then case is ignored for sorting. (ABC would be the same level as
abc).
Hide If enabled, the field not be seen by the end user in the list of fields that can
be filtered on.
Sort Step Properties
Formula Fields Step
A Formula Fields step enables you to add calculated fields populated at run time. These calculated fields
are generally based on existing fields.
To add a formula field, click +. Then specify values for the field as follows:
Property Description
Name Name and caption of the field.
Return Type Data type of the formula field (Number, Char, or Date).
Length/
Precision
lLength of field for Char data type
lPrecision or length of field for Number data type.
Formula Fields Properties
Administrator's Guide
HPE Logger 6.2 Page 228 of 623

Property Description
Scale Scale or number of digits after decimal point.
Formula Formula, using JavaScript syntax. To create a formula, you can use field
names and define variables.
lA formula can include an if construct as well as nested if and logical
operators.
lTo include more than one statement in a formula, use a semicolon (;) to
separate them.
Example: For a formula field named TotalAmount,
var total ;
if (unitprice < 10 )
{total = unitprice*quantity;}
else
{total = unitprice;}
TotalAmount = total;
Formula Fields Properties, continued
Dynamic Fields Step
A Dynamic Fields step can add fields to, or remove fields from, a query object at runtime. Dynamic fields
can be added by pivoting data from a single data source, or dynamically fetching metadata for field
properties.
lDynamic Mapping takes each field from the metadata result set and maps it to Query Object Field
Properties. The primary mappings are Field ID, Field Name, Caption, and Data Type.
lPivoting converts normalized, name-value paired data into flattened tabular data. The Pivot tab
includes these fields.
lPivot Columns: specifies which column has field ID and which column has value.
lSelect Grouping: specifies grouping fields, which when grouped on, the normalized data converts
to a flat table.
External Task Step
An external task step enabled you to call standard and custom third-party processes. Logger includes
the following pre-configured external tasks:
lJava Row Processor: for processing of Java rows
lR Job: for R Analytics Server scripts. (See the table "R Job Parameters" on the next pagefor the
properties).
lHive Job: for Hive scripts
Administrator's Guide
HPE Logger 6.2 Page 229 of 623

lPig Job: for Pig scripts
lCustom Map Reduce Job: for custom map reduce scripts
Property Description
Server IP IP address of R server.
Plot Type If Format Type is an image format, select a plot type from the drop-down list.
Format Type Select a format type.
Model File Location of the R model file.
No. of Images If Format Type is an image format, enter the number of images in the output.
Script R script file name.
Validate Click to validate the R job.
R Job Parameters
Format Step
A format step is the last step in the workflow, and lists all fields provided by the Query Object. A Format
Step includes these parameters:
Property Description
Field Original name of field.
Source Step in which this field originated.
Caption The end user will see the field by this name.
Hyperlink Drilldown detail or hyperlink URL.
Group Label To assign this field to an existing group, select the group name from the drop-
down list. To create a new group, type the new group name.
Hidden If selected, the field will be invisible to users for the reporting process.
GIS Enabled The selected field must contain GIS classification data such as country names,
state, or city names. A GIS Enabled field will appear in the selection list for the
grouping option in the GIS Mapping dialog and the Area field and the Heat
Map Properties > Value fields on the Create Map dialog. For more
information, see "Map" on page208 .
Format Step Parameters
Administrator's Guide
HPE Logger 6.2 Page 230 of 623

Property Description
Format properties
Width The default width of this field when dragged onto a report. Valid values 1-100.
Output Format Enter a format string. The field value will be formatted using the format string.
Useful for date and number formatting. (If you need to decide the format
string at runtime, select Apply Locale Default.)
Align Field alignment (left, center, right) when assigned to a report.
Input Format Enter a format string. The string determines the prompting format for the
value of this field in Ad hoc filters. Useful in prompting date or IP values in the
desired format.
User Time Zone Time zone for the display of report data. The Report Server calculates the
difference between Database Time Zone and User Time Zone, and does time
conversion. To decide time zone at runtime, select SYS_USER_TZ.
Format Step Parameters, continued
Parameters
Reports retrieve data by running pre-built query objects. If a query needs a value at report run time, it
uses built-in, run-time parameters. At report run time, the user is prompted to provide values for run-
time parameters as a prerequisite for running the report. The report is then generated based on the
user-provided values for those parameters.
Parameters are stored on the server, and therefore can be used in one or more report and query
objects.
Note: We recommend first designing all needed parameter objects before creating the query object
that will use those parameter objects. (For information on creating queries, see "Queries" on
page216.)
Parameter Object Editor
To view and work with Logger Report parameters, under Design, click Parameters in the Reports left
pane or click Parameter Explorer and click on a category, select a parameter, and click the Edit
Parameter Details button to open the Parameter Object Editor.
Administrator's Guide
HPE Logger 6.2 Page 231 of 623
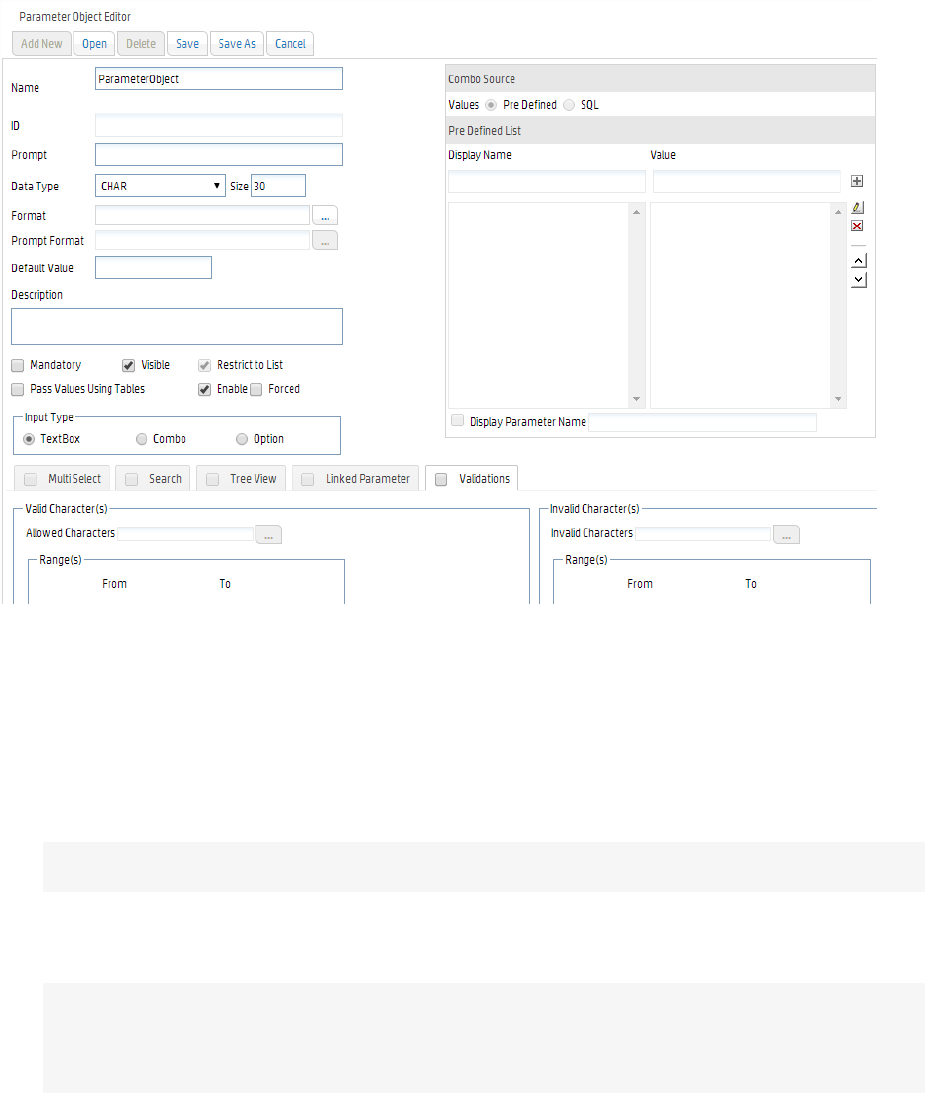
Creating New Parameters
To create a new parameter:
1. In the Parameter Object Editor, click the Add New button located at the top left.
2. Specify values for the new parameter. (Details are given in the topics below.)
Caution: The parameter name must be unique amongst all parameters in the system.
3. After providing all required values, click Save.
4. The parameter is added to the Parameters list.
Note: A blank (empty) parameter object is displayed when this page is opened, and the Add
New button on the toolbar is disabled until the blank parameter object is saved. After saving,
you can add a new parameter object by clicking Add New.
Administrator's Guide
HPE Logger 6.2 Page 232 of 623
Setting Parameter Name, Data Type, and Default Values
Specify the parameter unique ID, display name, data type, size, format, and default value as described in
the table below.
Option Description
Name Provide a name to uniquely identify this parameter. This name should be unique
amongst all parameters in the system.
Prompt Parameter name displayed to the user at report run time.
Data Type Specify type of value the user must provide at report run time:
lCHAR - Value may include alphabetical characters, numbers and special
characters.
lNUMBER - Value may include digits and decimal points
lDATE - A date or part of a date, like day, month, or year
lBOOLEAN (For more information, see "To set up a BOOLEAN parameter:" on
page235.)
Size Specify number of characters or digits this parameter should accept.
Note: This is only applicable to CHAR and NUMBER data types, not for
BOOLEAN or DATE parameters.
Format Select the appropriate format in which user should provide value for this
parameter. Click to open a Data Format dialog box. Based on the format you
have selected, a format string is displayed in the entry box.
Default
Value
Specify a default value that is appropriate in most cases to provide for this
parameter at report run time.
The default value will be automatically selected at report run time. The user can
change the default value, if needed. If the user does not change it, the report will
run using the default value you specify here for this parameter.
Parameter Name, Data Type, and Default Values
Default Value for Date Type Parameter
For a date type parameter, the Default Value field provides a pull-down menu and a calendar. Click the
calendar icon to provide an explicit date, or select one of these dynamic variable values from the
pull-down menu:
Administrator's Guide
HPE Logger 6.2 Page 233 of 623
lCURRENT_DATE
lMONTH_START_DATE
lYEAR_START_DATE
You can also set a default date that is relative to any of the above three dynamic variable dates.
For example, to set a default date as 3 days after CURRENT_DATE, specify
CURRENT_DATE + 3.
To set a default date as 5 days before MONTH_START_DATE, specify
MONTH_START_DATE - 5.
To provide a value that is relative to a dynamic variable, select one of the dynamic variables, then type a
suffix to it in the Default Value field by adding + or - and the number.
At report run time, a parameter with a Date format will display with the default date set here.
Defining Input Type
The parameter input type describes the style of interface provided to users at report run time in which
to enter a value for this parameter. Choose from Text Box, Combo, or Option as described below.
Note: In the Reports Designer, changing the parameter type TextBox to another type causes an
error. If you need to change the parameter type to TextBox, do not edit an existing parameter,
delete that parameter and add a new one.
Option Description
Text Box Select Text Box input type if you want the user to type the value for the parameter.
Combo Select Combo if you want the user to select one value or multiple values from a pull-
down menu.
Select the Multi Select checkbox so that user can select multiple values from the box.
See "Setting Multiple Default Values" on page236 to configure other settings for this
option.
Option Select Option if you want the user to select values represented as options.
Select the Multi Select checkbox to have value options in the form of checkboxes.
Keep the Multi Select checkbox deselected to have options in the form of radio
buttons.
Input Type
Administrator's Guide
HPE Logger 6.2 Page 234 of 623

Setting up Boolean Parameters
Parameters that have a Boolean data type are represented to the user as checkboxes (the input type)
and have only two states:
lChecked (chosen at run time)
lUnchecked (deselected at run time)
To set up a BOOLEAN parameter:
1. Select Data Type as BOOLEAN.
2. In the Values area, select an option:
a. Checked: Specify the value to be passed when the user selects this option at run time.
b. Unchecked: Specify the value to be passed when the user does not select this option at run
time.
Setting Various Run Time Behaviors
You can specify a variety of options on how the parameter will look and act at report run time. These
options are generally related to the input type, and further define acceptable user input values, whether
the parameter will be displayed or hidden, which values can be searched, and so forth.
Option Description
Mandatory Select this checkbox if you want to require the user to specify a value for this
parameter at report run time.
Visible Select this checkbox if you want the parameter to be displayed on the input
form at report run time.
Keep this deselected if the value for this parameter is populated from another
report or if you want the parameter to use the default value in all cases.
Restrict to List This setting is applicable for parameters with Input Type of Combo. select the
Restrict to List checkbox here to force user input of a parameter value from
the available run-time options only.
If Restrict to List is not selected in the parameter definition you create here,
the user can specify a value or can select values from available options.
Pass Values
Using Tables
This setting is applicable for Multi Select. Select this checkbox when you want
to pass parameter values through a table. This is done especially when the
number of values that can be passed (total number of bytes of selected values)
as part of the SQL is more than allowed.
Parameter Options
Administrator's Guide
HPE Logger 6.2 Page 235 of 623

Option Description
Enable
Forced Select this checkbox if you want to restrict parameter values to a pre-specified
list of values.
Parameter Options, continued
Setting the Data Source List
Specify values for Check box, Combo, and Option input type. Values can be predefined only.
To Set Predefined Values:
1. In the Display Name field, specify the value to be displayed to the user at run time.
2. In the Value field, specify the value to pass as a filter.
3. Click (Add) to add the display name to the list.
(To delete an option from the list, select the value and click .)
4. Repeat these steps for each option.
5. Select the Display Parameter Name checkbox if you want to provide the user with the option of
adding the parameter as a control on a report.
Once selected, the Display Parameter Name field is auto-filled with the parameter display name
that can be selected for use on a report. The name displayed on the report is the one specified in
the Prompt field.
Tip: The Display Parameter Name settings have no effect when the Parameter Object is
used in an ad hoc report.
Setting Multiple Default Values
If you selected Combo Input Type (as described in "Defining Input Type" on page234), you need to
define the following settings in the Parameter editor:
lMaximum Selectable Values: Specify the maximum number of values that can be selected or provided
for a parameter.
lEnclosed By: Specify the character to use to enclose the set of values. This will depend on the
database.
lSeparator: Specify the character to use to separate the two values. This will depend on the database.
lSelect Default Values: Specify the number of default values to display at report run time. You can
choose from the following:
Administrator's Guide
HPE Logger 6.2 Page 236 of 623

lSelected: Only values for the selected parameters are displayed.
lAll: Values for all parameters are displayed.
lNone: No default values are defined.
Modifying a Parameter
To modify a parameter:
1. On the Reports right panel menu, click Parameter Explorer to display the Parameter Object list.
2. Browse to the parameter you want to modify.
3. In the Actions menu, click Edit Parameter Details.
4. Edit the parameter as needed (using the settings described in "Creating New Parameters" on
page232) and click Save.
Note: Only custom parameters can be modified, not supplied parameters, since supplied
parameters are required for use in system Reports and Solution pack add-ons.
Deleting a Parameter
To delete a parameter:
1. On the Reports left panel, click Parameter Explorer to display the Parameters Object list.
2. Browse to the parameter you want to modify.
3. In the Actions menu, click Delete.
4. Click Yes to confirm deletion.
Note: Only custom parameters can be removed, not supplied parameters, since supplied
parameters are required for use in foundation Reports and Solution pack add-ons.
Configuring Parameter Value Groups
Some reports may require users to provide multiple run-time values that would be easier to select if they
were grouped. For example, a report that requires a user to select more than one country name might
be a good candidate for parameter value groups. Users might find it difficult to select a few country
names from a single, long list of countries.
As an alternative, the query designer could create parameter value groups for the Americas, Europe,
Asia, Africa, and so forth. Each parameter value group would contain lists of countries belonging to
those continents or areas. At report run time, when the user selects a group, values belonging to the
Administrator's Guide
HPE Logger 6.2 Page 237 of 623
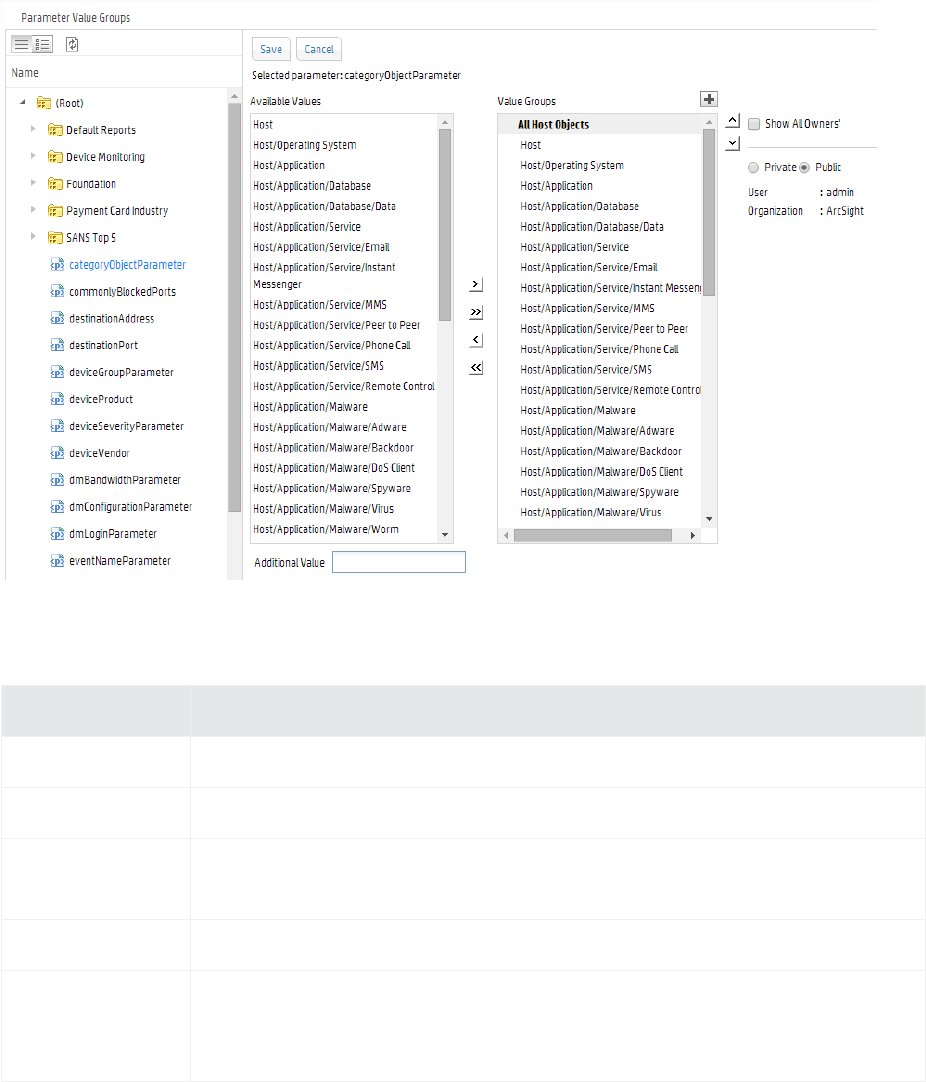
group are pre-selected. Users do not have to manually select countries in parameter groups for every
report run. Selections are saved from one report run to the next.
Using parameter value groups as a part of your query design strategy can save users time and reduce
error at report run time.
To view and work with Logger Report parameter value groups, under Design, click Parameter Value
Groups on the Reports left panel.
The following table describes the options on the Parameter Value Groups page.
Option Description
Name Lists all the parameter objects.
Available Values Lists available values for the selected parameter.
Value Groups Lists groups created and the values selected within a group. An icon is
displayed on the left of a Private group.
Show All Owners If selected, displays groups created by all users.
Option buttons:
Private
Public
Select Private to list the groups you have set for you only.
Select Public if you wish to list the groups you have set for everyone.
Parameter Value Groups
Administrator's Guide
HPE Logger 6.2 Page 238 of 623
To create a group:
1. Click (Add Group) next to the Value Groups box. A group is created and listed under Value
Groups with a default name (based on the currently selected parameter in Parameters list).
2. In the Value Groups list, edit the new group name as needed. (Double-click the name to edit it, if it is
not already in edit mode.) Double-click the name again to set it, or click outside the box.
3. Add the values you want in the group by selecting a value in Available Values list and clicking
(Add value to selected group) button. The selected value is added to the selected group in the
Value Groups list.
4. Repeat the previous step for each value you want to add to the group.
If a value that you want to add to a group is not listed in Available Values list, specify the value in
Additional Value field (under Available Values) press Return key. The custom value is added to
the currently selected group.
Select an Available Value and click to add all the values to the selected group in Value Groups,
click to remove the selected value from Value Groups, and click to remove all the values from
Value Groups box.
Select a group and click up and down arrows to move the selected group up or down. Select
a value and click up and down arrows to move the selected value up or down (within the
group).
5. Click Save.
Note: If the name of a group is changed by a user, the values under that group will be removed
from the Selected Values group of that user's preferences.
To create a tree view parameter:
1. Click the leaf node and click the right arrow button.
lTo select all values in a branch (only for a multi-select parameter), click the branch and click the
button.
lTo make changes in name of a group, double-click the group name to make it editable. Specify a
new name and click outside the box.
lTo delete a group, click in the title of group you want to delete, and then click the Save
button to save the changes.
Template Styles
Logger reports use a style file (.sty) to generate report output in a specified format. The style file
defines the look and feel, arrangement, and orientation of the report output.
Administrator's Guide
HPE Logger 6.2 Page 239 of 623
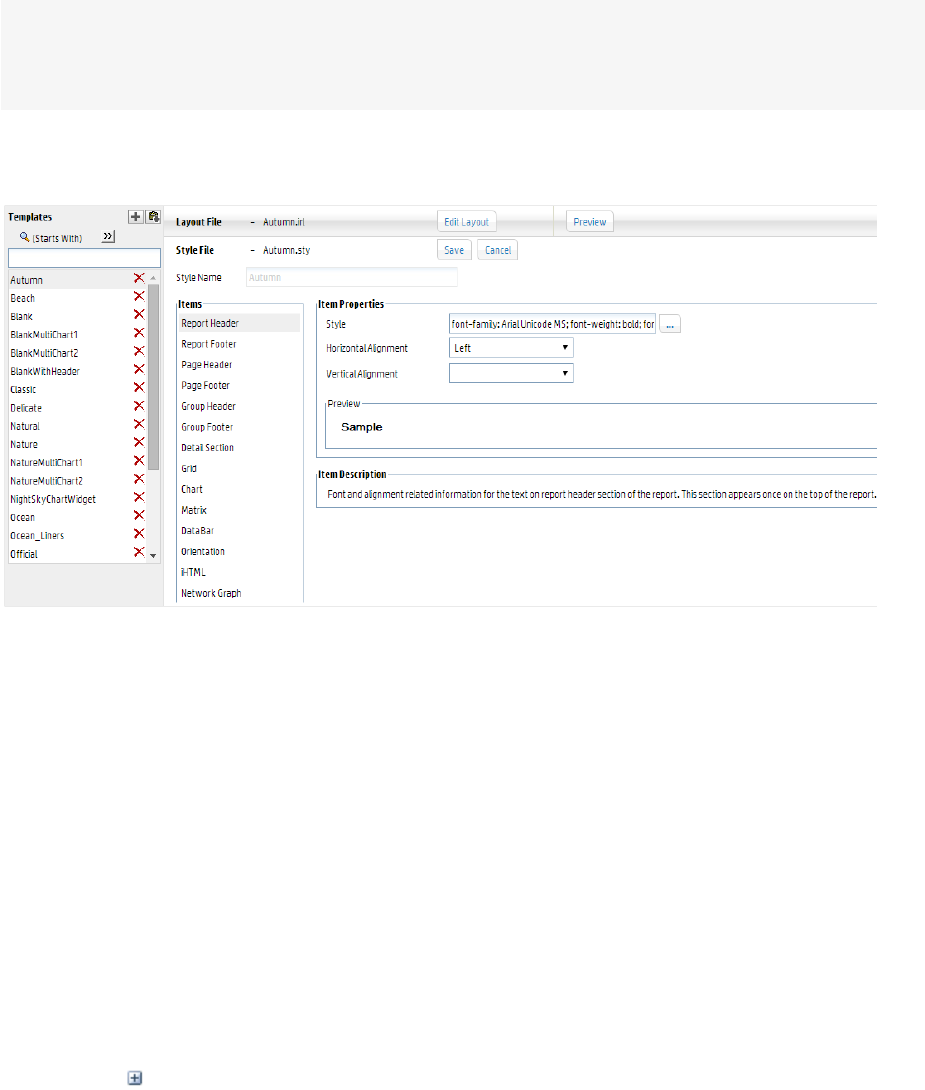
You can modify any of the style files from the Logger Reports Template Styles page or you can define a
new style to suit your needs.
Note: A report layout file (.irl) defines factors like paper size, static controls, and headers and
footers to include in a report. You can define your own layout files. See "Defining a New Template"
below for more information.
To view and work with Logger Report template styles, under Design, click Template Styles on the
Reports left menu bar.
Defining a New Template
Before creating a new template, you may want to check whether there is an existing one that meets
your needs.
To search for an existing template, do one of the following:
lEnter the first few letters with which the template name begins (if the Starts With search criteria is
selected) in the text box above the list of existing templates.
lEnter a word or part of a word that the template name contains (if the Contains search criteria is
selected) in the text box above the list of existing templates.
To define a new template:
1. Under Design, click Template Styles on the Reports left menu bar.
2. Click the icon in the right panel.
3. Define the Items and Item Properties for the template.
4. If you want to define or change the report layout file, click Edit Layout.
Administrator's Guide
HPE Logger 6.2 Page 240 of 623
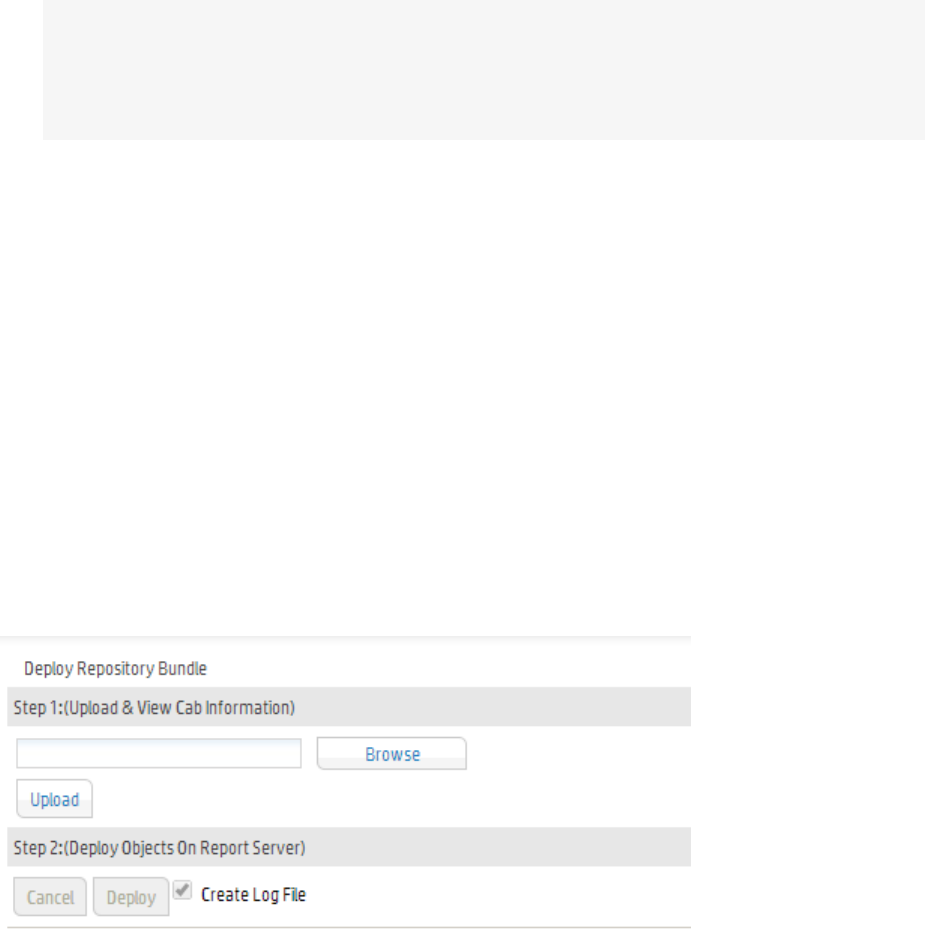
Tip: You will need to edit the layout of the report to include a header or footer in a report.
After clicking Edit Layout, click “Report Header” (to include a header) or “Page Footer” (to
include a footer) to select that section. Click Insert > Layout Control > select an option from
the sub-menu.
5. Click Save.
Administration
This section discusses Logger report administration. It discusses how to deploy report bundles,
configure report server settings, administer report categories and category filters, and manage report
packages.
Deploying a Report Bundle
You might obtain additional sets of reports from ArcSight to address new security scenarios, add
packaged solutions, or enhance your current coverage with updated reports. You can use the Deploy
Report Bundle page to load and deploy packages of new reports onto your Logger system.
On the Reports page left panel menu, click the Deploy Repository Bundle link to start.
A report package (or CAB file) can contain several types of reporting resources, including:
lCategories and reports
lOrganization information
lSchedules
lPortal properties and server properties
lParameter objects
lQuery objects
lAd hoc report templates
Administrator's Guide
HPE Logger 6.2 Page 241 of 623

lPrinter settings
lDatabase connections
To upload and deploy report package:
1. In the entry box provided under Step 1, specify the reports package file name and with its full path.
Click Browse to locate the file.
2. Click Upload.
The content is uploaded and information is displayed about the included categories and reports. (A
legend is provided below these steps).
3. If you want to create log of the deployment process, select the Create Log File option.
4. Click Deploy to continue with the deployment process, or click Cancel to discontinue with
deployment process.)
Status information is displayed about the objects in the package being deployed.
A legend is displayed just below the Deploy button. Information about each of the components in
the package is displayed in respective tabs.
Note: Overwrite behaviors are determined when the package was created.
For example, protocol on whether or not an object in the deployed package will overwrite an
existing object on the system, and under what circumstances, is determined at package
creation time. Therefore, these settings on package deployment are not available to you at
deploy time.
A log file will be created if the Create Log File checkbox was selected.
The content of the deployed reports package is available on the respective Logger Reports pages.
Solution Reports will be listed under Solution Reports on the left panel menu. For more information
about these types of reports, see "Solution Reports" on page153.
Report Server Administration
Logger Reporting provides a default configuration for the report server. If you do not modify the
report server, reports will run with the default settings.
Timeouts when Running Reports
There are two timeouts that can affect long running reports.
lThe client timeout is 1 hour. If an ad hoc report takes more than an hour to run, it will time out. Use a
scheduled report instead.
Administrator's Guide
HPE Logger 6.2 Page 242 of 623
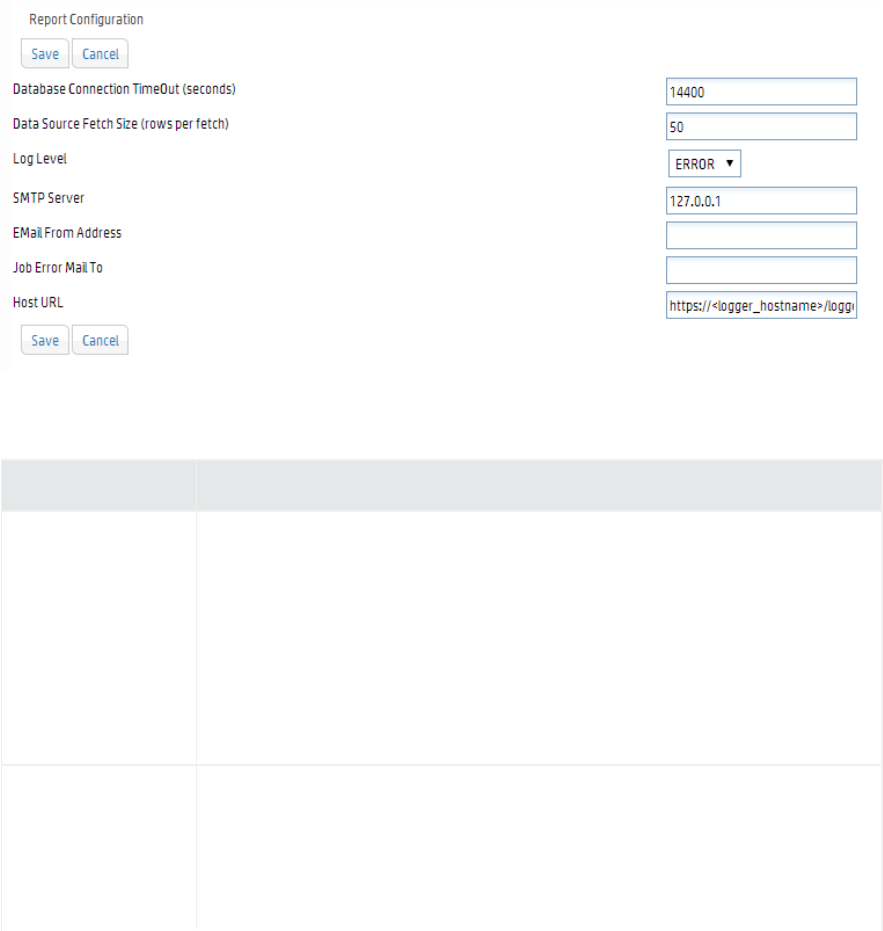
lThe default database connection timeout for scheduled reports is 4 hours. If a scheduled report
takes more than 4 hours to run, you can increase the database connection timeout from the Report
Configuration pane.
Report Configuration
To view or modify the report server configuration:
1. Click Reports in the menu bar.
2. Click Report Administration in left panel menu. The Report Configuration dialog is displayed.
The following table describes the report configuration settings.
Option Description
Database
Connection
Timeout
Time in seconds after which the database connection will be closed, if not
used for that many seconds.
Valid values for this timeout include any integer greater than zero.
Default: 14400
Example: If DATABASE_CONNECTION_TIMEOUT is set to 50, the report
server will close the connection to a database if there is no communication
between the report server and database server for 50 seconds.
Log Level Sets the level of criticality to be considered for logging.
Valid values are DEBUG, INFO, WARN, ERROR, FATAL.
Default: ERROR
Example: LOG_LEVEL = ERROR
Reports Configuration
Administrator's Guide
HPE Logger 6.2 Page 243 of 623

Option Description
Data Source Fetch
Size
Specifies the number of records to be fetched from the data source at one
time (in one “read”).
A valid value is any positive integer.
Default: 50
Example: DATA_SOURCE_FETCH_SIZE=50
Email from
Address
Sets the email address to be displayed as the sender's address in emails
originating from the Logger Reporting system.
Default: None.
Example: loggeradmin@companyxyz.com
Job Error Mail To Email address to receive job error messages, when generated. To include
multiple addresses, separate them by commas.
Host URL Host URL (URL to be specified to run the Logger application) sent as part
of Logger Reporting Emails.
Syntax: HOST_URL=[Host URL](String)
Default: https://<logger_hostname>/logger/report
Example: HOST_URL=https://loggerA.xyz.com/logger/report
SMTP Server Sets the server IP address or domain name (as IP or URL) used to email
scheduled reports. All email communications, such as notifications and
report delivery, are sent by Logger Reporting using this email server.
Example: SMTP_SERVER=127.0.0.1
For information on Logger’s SMTP settings, see "SMTP" on page411.
Reports Configuration, continued
Report Categories
The Category Explorer comes with some System-defined commonly used categories. You can edit them
as needed.
To navigate to an existing report category:
1. Click Reports on the top-level menu bar.
2. Click Report Categories in the Administration section in the left pane. The Deploy Reports and
Categories displays available categories.
Administrator's Guide
HPE Logger 6.2 Page 244 of 623
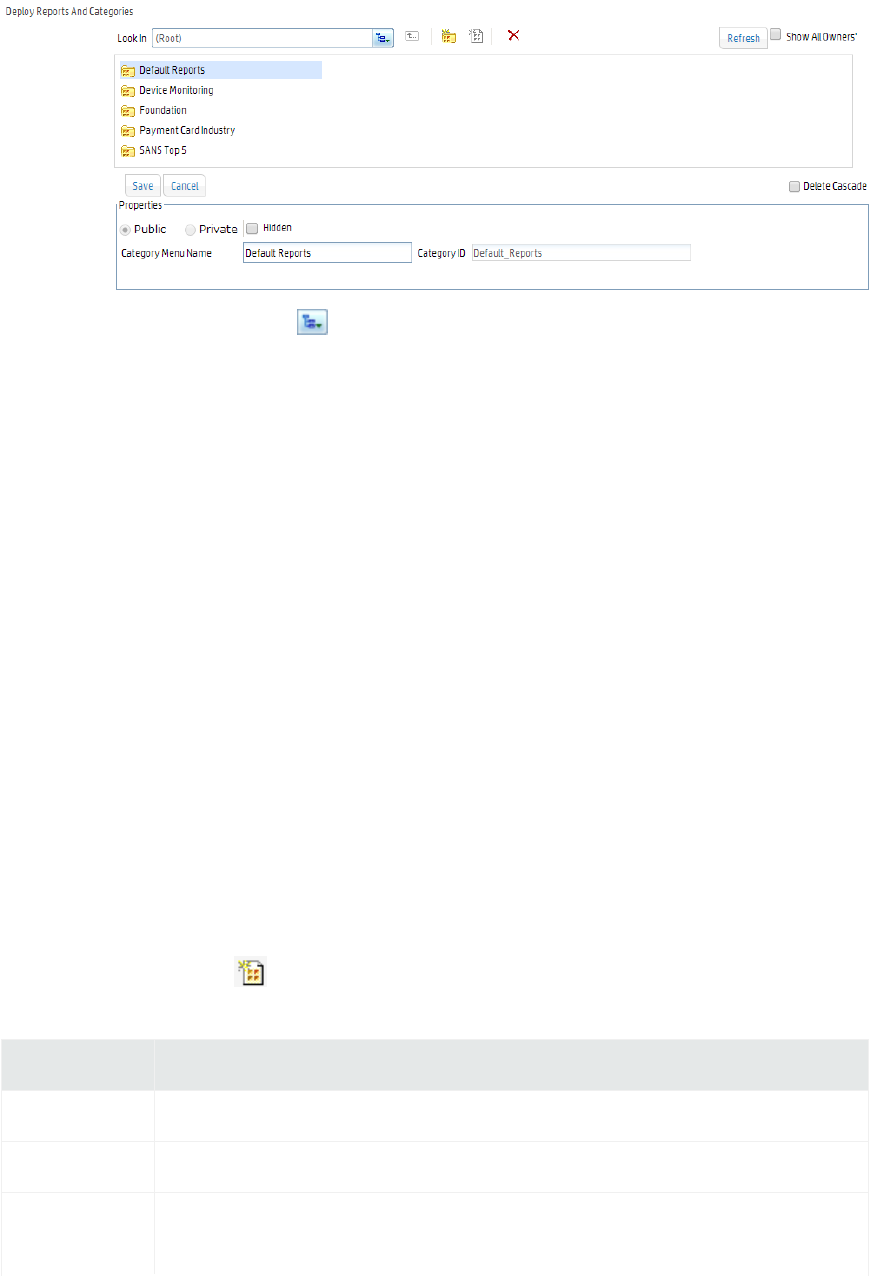
3. Click the navigation tree button ( ) next to the Look In field, and navigate through the tree to
the desired location.
For this example, navigate to Root > Foundation and double click Intrusion Monitoring.
The Deploy Reports and Categories dialog displays the subcategories and reports in that
category.
4. Click the report you want to access.
For this example, click Device Interface Down Notifications.
The Deploy Reports and Categories dialog displays the properties and Default output format of
the report you selected.
Adding a New Category
In addition to using the existing report categories, you can create additional categories to meet your
business needs.
To add a custom category:
1. Click Report Categories in the Administration section in the left pane.
The Deploy Reports and Categories displays the available categories. A toolbar across the top of
the page displays buttons for the available actions.
2. Click Add New Category .
3. Define the properties for the new category and click the Save button.
Property Used for…
Public Setting this as Public makes the category available to everyone
Private Setting this as Private make the category available to you only
Hidden Select the Hidden checkbox to hide the display of this category in the Report
Explorer. It will still be displayed in other Explorers.
Administrator's Guide
HPE Logger 6.2 Page 245 of 623
Property Used for…
Category
Menu Name
Name of the Category
Category ID Category ID should be unique across all the categories. By default, the
Category ID is auto-generated by the system. To specify the Category ID
manually, deselect the System Generated checkbox and specify the
category ID.
System
Generated
To specify the Category ID manually, deselect the System Generated
checkbox and specify the category ID.
Delete
Cascade
You can delete a category only if it is empty. To delete a category including
its contents, check the Delete Cascade checkbox.
Note: Once set, Category ID and scope (Public / Private options) cannot be changed.
4. You can optionally add a report to the category. To do so, double-click any category to open it and
click the Add New Report button. Define the following properties in the Properties box:
Property Used for…
Public Setting this as Public makes the report available to everyone
Private Setting this as Private make the report available to you only
Hidden Check the Hidden checkbox, if you do not want to display this report in any of
the dialogs and pages (except in the Report Explorer). Mark a report as hidden to
stop users from directly accessing it.
Report File An existing data file from which a report is generated. See "Report File Formats"
on page181.
Report
Name
The Report Name has to be unique within a category
Report ID A unique ID for the report that is auto-generated by the system by default when
you run and publish the report. To manually enter an ID of your choice, deselect
the System Generated checkbox and enter an ID in the Report ID field.
Design
Mode
Text in Design Mode indicates if the report was designed using Studio (Web
Studio or Desktop Studio) or ad hoc Report Wizard.
Deployment
Type
A report deployed as Read Only cannot be modified and uploaded with same
name. A report deployed as Custom can be modified and uploaded with the same
Administrator's Guide
HPE Logger 6.2 Page 246 of 623
Property Used for…
name.
Output
Format
Output Formats in which this report can be generated. Formats not selected
here will not be available for this report.
System
Generated
To specify a Report ID manually, deselect the System Generated checkbox and
specify the Report ID.
Deleting an Existing Category
You can delete a category only if it is empty.
To delete an empty category:
1. Click Reports on the top-level menu bar.
2. Click Report Categories in the Administration section in the left pane.
The Deploy Reports and Categories displays the available categories. A toolbar across the top of
the page displays icons for the available actions.
3. Click the tree button ( ) next to the Look In field, and navigate through the tree to the desired
category.
4. Select the category click the Delete ( ) button to delete the selected category.
To delete a category and its contents:
Click the Report Categories link in the left pane, select the category, check the Delete Cascade
checkbox and click the Delete Selected Category button.
Note: If you attempt to delete a category that is not empty, and the Delete Cascade checkbox is
deselected, a message Failed to delete the category is displayed on top left of the page.
Report Category Filters
A Search Group filter can be optionally assigned to each report category. Assigning a Search Group
filter to a report category means that all the reports in the category will only process events returned by
this filter.
To assign a search group filter to a report category:
1. Create the filter that you would like to apply to every report in a given category. See "Filters" on
page257 for the details of creating a filter of type Search Group.
2. Open the Reports page.
Administrator's Guide
HPE Logger 6.2 Page 247 of 623
3. In the menu, under Administration, click Report Category Filters.
4. The new search group filter are displayed in the pull-down menu associated with each category.
Select the desired filter for each category.
5. Click Save.
To remove a search group filter from a report category:
1. Open the Reports page. In the menu, under Administration, click Report Category Filters.
2. In the pull-down menu associated with the report category from which you want to remove the
filter, select None.
3. Click Save.
Placing a System-defined Query or Parameter into a Category
You can place a pre-defined query or parameter into a category. Use the cut/paste feature to do so
because cutting and pasting will preserve its ID.
To cut and paste a query/parameter:
1. Click the Query Explorer or Parameter Explorer link (depending on what you want to place in
the category) in the left pane.
2. Click on the pre-defined query/parameter you want to move.
3. Click the Cut Query Object/Cut Parameter Object button on the side button bar.
4. Click the category name under which you would like to place this query/parameter.
Note: You cannot save a report in the root category. Save it in one of the existing
subcategories, or create a new category.
5.
Click the Paste button on the side button bar.
Do not copy and paste a query or parameter to place it in a category. Doing so will give the query
or parameter a new ID and render it unusable to reports or other existing objects that are using it.
Use cut and paste, instead.
You can schedule any report to run once at a later date or on a specified frequency (such as daily or
weekly). Monthly reports cannot be scheduled currently. For more on this, see "Scheduled Reports" on
page188.
You can run, publish, and save the results of any type of report. For information on these common
reporting tasks available on all reports, see "Running, Viewing, and Publishing Reports" on page171 and
"Task Options on Available Reports" on page173.)
Administrator's Guide
HPE Logger 6.2 Page 248 of 623

Backup and Restore of Report Content
You can back up and restore report content. For more information about this feature, see
"Configuration Backup and Restore" on page385.
iPackager
The iPackager utility enables you to package reports and report objects residing in Logger. This
package can be later imported to a different Logger installation. If you own multiple Loggers, you can
use the packages created by iPackager to configure the reporting feature on them. Set it up at one
location and create a package using the iPackager, and then you can upload the package at other
locations. This method eliminates the need of re-doing all the configuration activities at multiple
locations.
The iPackager utility can only be used by users with administrator privileges.
Note: Java must be enabled on your browser for iPackager to run.
To access the iPackager, click the iPackager link in the left panel of the Reports page.
The iPackager enables you to first create a configuration (.conf) file in which you can collect (import)
the references for all the components that you want to include in the package. You can save the
configuration file and edit it at any time. Once you are satisfied with the contents of the .conf file, you
can build the package. The package is built into a CAB file. The components referenced in the .conf file
are actually picked up when building the CAB. Data to be packaged in a single CAB can be imported
from multiple report servers.
You can open only one .conf file in iPackager at a time. When iPackager opens a .conf file, it checks for
the availability of the components already imported in the .conf file. If any of the components already
imported are not found on the report server, it is indicated on the tree-view. In such a case, a CAB
cannot be built.
The iPackager Page
The iPackager page consists of three panes that are located to the right of the navigation pane on the
Reports page. The pane to the immediate right of the navigation pane in the Reports page displays the
presently included contents of a .conf file that is open in the iPackager. These contents are displayed in
a tree view. The Build Properties box displays the details of the object selected from the CAB. You can
edit what contents you would like to include in the CAB file in the Build Properties box using the
buttons described below. The Messages and Problems tabs display messages, logging details and
problems faced while creating or editing a package.
Administrator's Guide
HPE Logger 6.2 Page 249 of 623
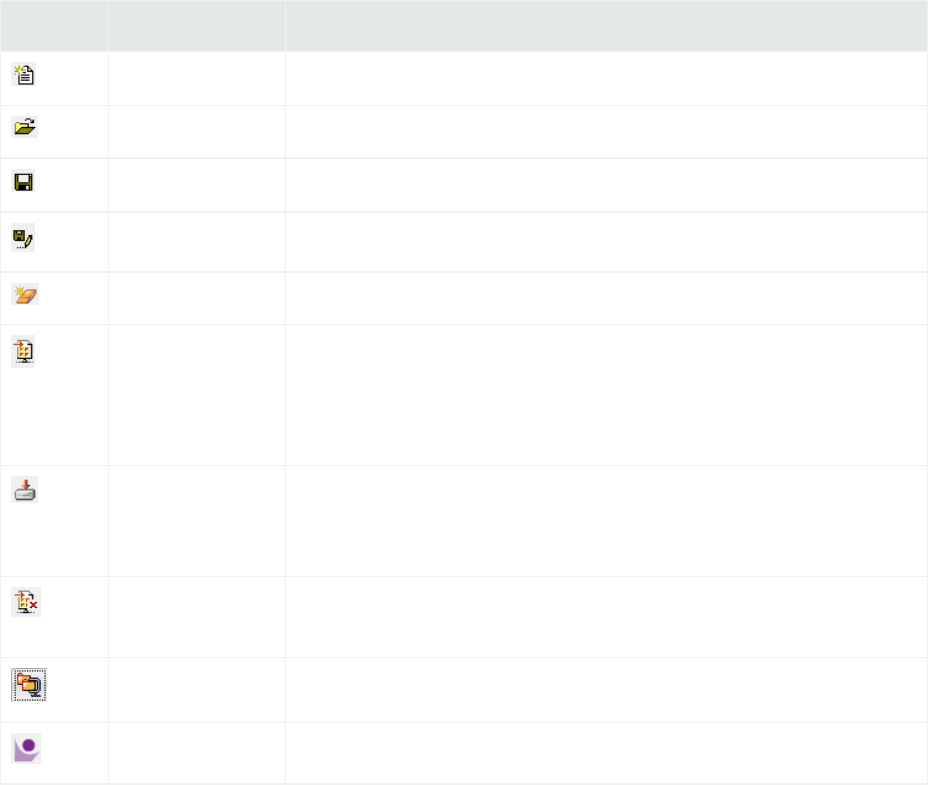
Buttons Available from the iPackager
The following buttons available on top of the iPackager page represent the various actions that can be
performed from within the iPackager:
Buttons Name Description
New Creates a .conf file.
Open Opens an existing .conf file in iPackager.
Save Saves the currently open .conf file.
Save As Saves the .conf file that is currently open under a new name.
Clear Package Clears the contents of a package that is currently open in iPackager.
Import Selective
Data from
Report Server
Imports data as references into the .conf file that is currently open
in iPackager. You can specify what you would like to import. For
example, you can choose to import query objects parameter objects
and reports only.
Import Complete
Data from
Report Server
Imports everything from the report server.
Cancel Server
Import
Cancels a current import action from the report server.
Build CAB Initiates the process of building a CAB file.
About Gives you the version number of the iPackager
When you first open the iPackager page or when you click New, you will be prompted to enter the
following identifying information for the CAB file that you will be creating with the currently displayed
.conf file:
lAuthor
lCompany
lVersion
lComment
Administrator's Guide
HPE Logger 6.2 Page 250 of 623
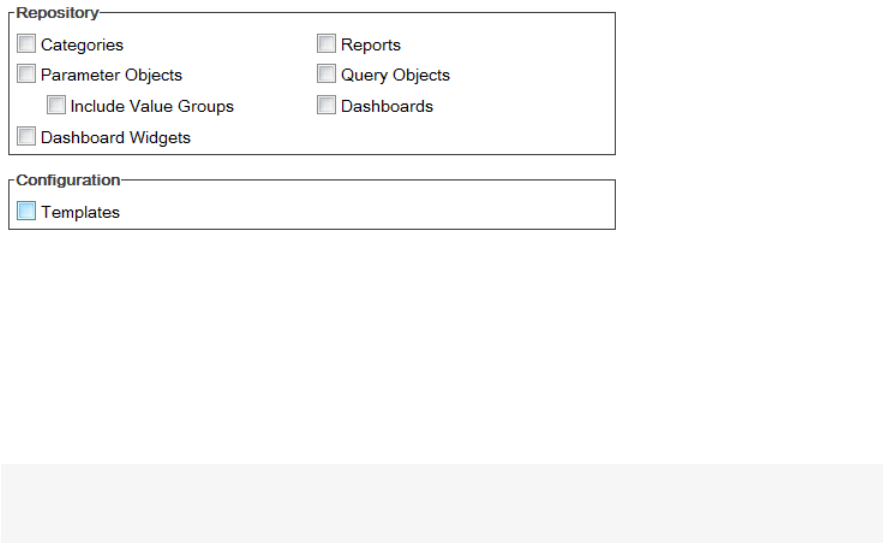
Importing References from the Report Server
You can import references from a report server into a .conf file. Keep in mind that only references to
those components will be imported into the currently open .conf file in the iPackager. The actual
components will be picked up during the creation of the CAB.
To import selective data:
1. Click the Import Selective Data from the Report Server button located on top of the iPackager
page. You will see the following form:
2. Check whatever components you want to import.
3. You will prompted to select specific pieces within the component for example, if you checked the
Reports checkbox, you will further be prompted to select the specific reports you want included.
4. Once iPackager completes importing the selected data, you can see the references to that data in a
tree structure in the left pane of the iPackager page.
5. Click Save or Save As icons to save the .conf file.
Note: Since Reports are saved in categories, if you select only a report, its category is
automatically selected too.
Click the Cancel Server Import button from the toolbar at any point of time to cancel the data
transfer. In this case, the .conf file state will be restored to the state before the import began. None
of the data from the current import will be included in the package.
To import everything from the Report server:
1. Click the Import Complete Data from Report Server button. You will see the same page as
shown above with every checkbox checked for you.
2. Deselect the box corresponding to any component you do not want to import.
3. Click Import.
4. Once iPackager completes importing the selected data, you can see the references to that data in a
tree structure in the left pane of the iPackager page.
5. Click Save or Save As icons to save the .conf file.
You can see the status of the import in the Messages tab located below the Build Properties box.
Administrator's Guide
HPE Logger 6.2 Page 251 of 623
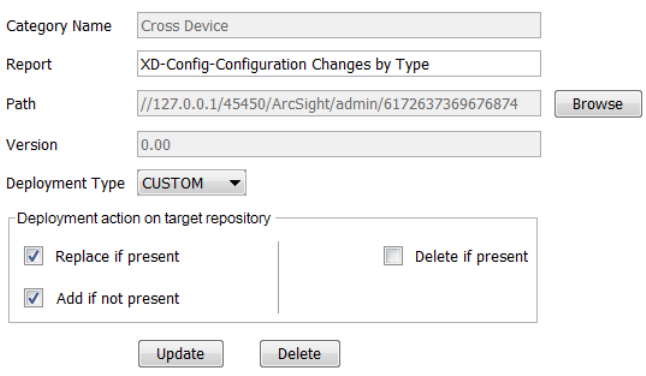
Modifying Properties for Imported Objects
You can modify component details as well as delete one or more components in an open conf file. To do
so, click on the object in the navigation tree in the iPackager page. The properties page for the object is
displayed in the upper right pane. All of the following properties enable you to choose any of the
following deployment action on the target chosen:
lReplace if present: While importing, if the component is found in the package, replace the one in
package with the one on the report server.
lAdd if not present: While importing, if the component is not found in the package, add it to the
package.
lDelete if present: While importing, if the component is found in the package, delete it.
lCascade Delete: For Categories only, delete the folder (category) even if it contains reports.
Category Properties
When you click on a Category in the navigation tree of the iPackager page, its property page opens.
The Category box is pre-populated with the category name found on the report server. You can
change the name of the category. If you change the name here, the category is packaged with the new
name, but its original name on the report server will not change.
Report Properties
When you click on a report in the navigation tree of the iPackager page, the following property page
opens.
The Report box is pre-populated with the report name found on the report server. You can change the
name of the report. If you change the name here, the report is packaged with the new name, but its
original name on the report server will not change.
Administrator's Guide
HPE Logger 6.2 Page 252 of 623
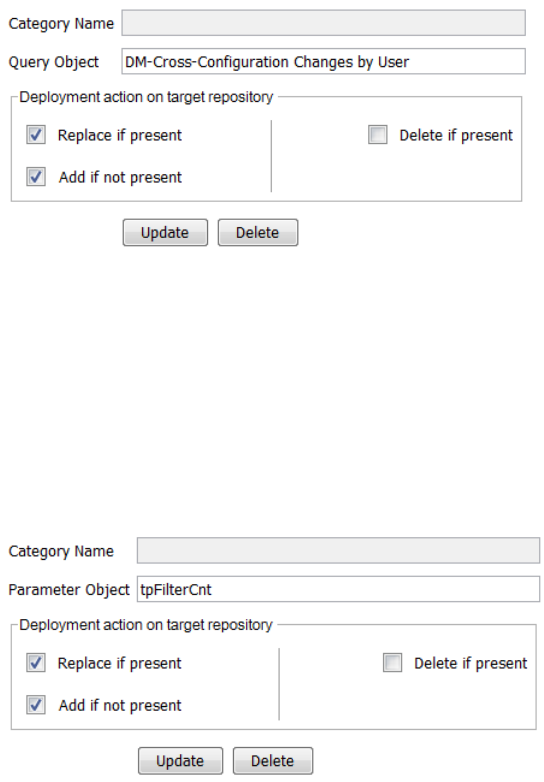
Query Properties
When you click on a query in the navigation tree of the iPackager page, the following property page
opens.
The Query Object box is pre-populated with the query object name found on the report server. You
can change the name of the query object. If you change the name here, the query object is packaged
with the new name, but its original name on the report server will not change.
Parameter Properties
When you click on a parameter in the navigation tree of the iPackager page, the following property
page opens.
The Parameter Object box is pre-populated with the parameter object name that is found on the
report server. You can change the name of the parameter object. If you change the name here, the
parameter object is packaged with the new name, but its original name on the report server will not
change.
Template Properties
When you click on a template in the navigation tree of the iPackager page, the following property page
opens.
Administrator's Guide
HPE Logger 6.2 Page 253 of 623
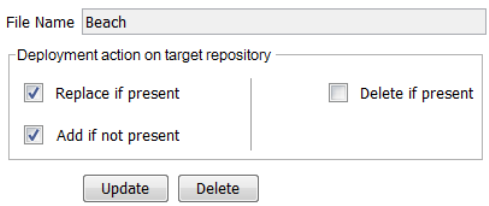
Opening a .conf File
To open an existing file in iPackager:
1. Click Open in the toolbar on top of the iPackager page.
2. Navigate to the saved .conf file and click Open.
Deleting an Item from the .conf File
To delete an item:
1. Open the .conf file in iPackager.
2. From the iPackager page, navigate to the item and select it. Selected item’s details will be displayed
on the right pane (properties area).
3. Click Delete in the Properties area.
4. On the warning dialog, click Yes to confirm deletion of the selected item.
Clearing the Contents in a .conf File
To clear the contents of a .conf file:
1. Open the .conf file in iPackager.
2. Click Clear package.
3. On the warning dialog, click Yes to confirm deletion.
Building the CAB File
When you issue command to build the CAB file, the actual objects specified in the references in your
open .conf file are actually picked up from the respective locations and a CAB file is built. This CAB file
will contain all the objects.
Administrator's Guide
HPE Logger 6.2 Page 254 of 623
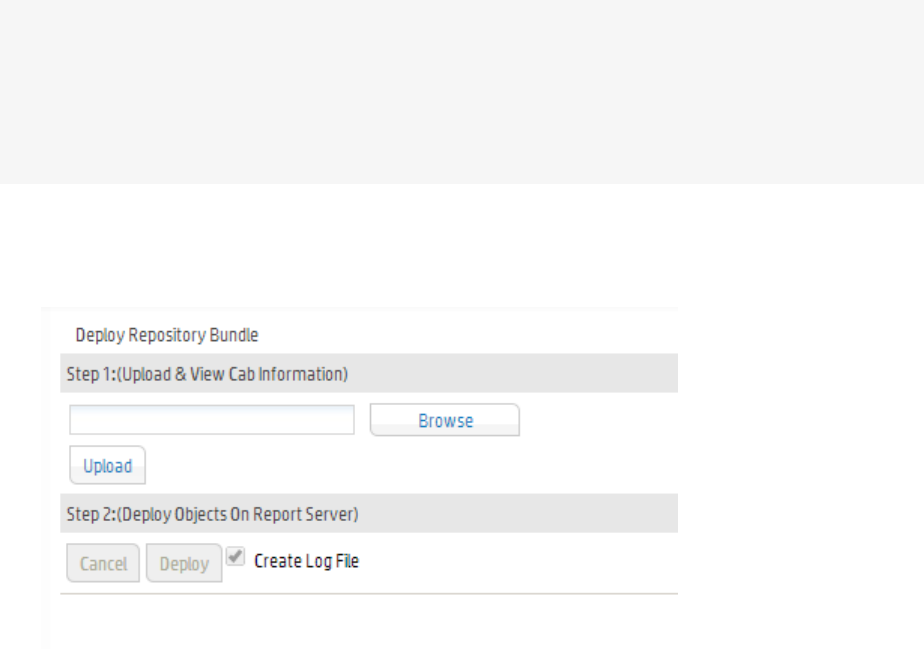
If any of the information saved in the .conf file is not available at the right source while building the
CAB, then you will see an error message and the CAB building process will be stopped. You will need to
fix any errors before rebuilding the CAB file.
To build the CAB file:
1. Click Build CAB.
2. On the Build Properties dialog, specify the build properties and click the Build Cab button.
3. On the Save dialog, specify the credentials and location to save the file.
4. The CAB building process will begin.
Deploying a Repository (CAB) File
Caution: When deploying a CAB file from a source Logger to a target Logger, if the categories
being imported do not have identical names and IDs on both Loggers the deployment will fail.
Should you encounter this issue, rename the conflicting category in the target Logger or the source
Logger (you will need to recreate the CAB file if you do this on the source Logger) such that the
category has a unique name or ID. Then, redeploy the CAB file.
To deploy a CAB file:
1. In the navigation pane, click Deploy Report Bundle.
2. Click Browse to select the CAB file to be uploaded, and click Upload.
3. Click Deploy. The CAB file is deployed.
Administrator's Guide
HPE Logger 6.2 Page 255 of 623
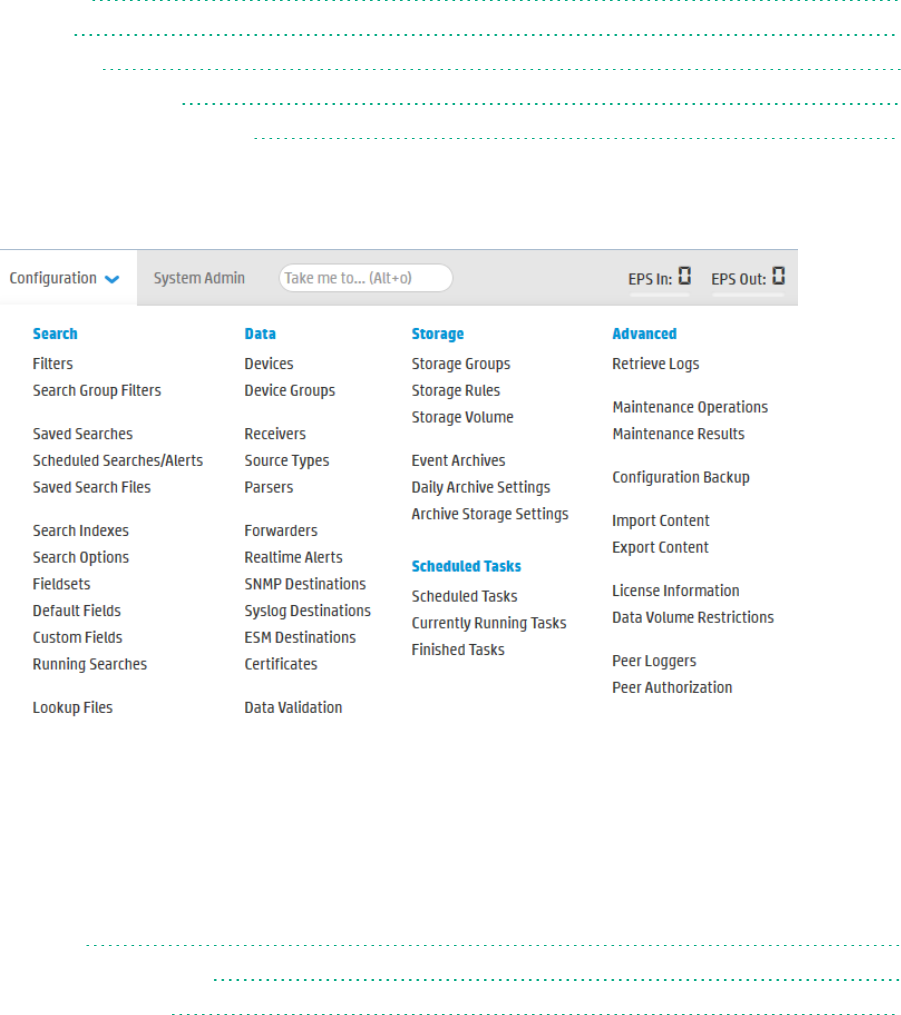
Chapter 5: Configuration
The following topics describe how to create and manage receivers, forwarders, devices, device groups,
SmartConnectors, and filters. Receivers, devices, and other resources created by one user are visible to
all other users, although subject to user group privileges. Resources are shared by all sessions.
• Search 256
• Data 292
• Storage 351
• Scheduled Tasks 362
• Advanced Configuration 365
You can access these configuration options in the Logger UIfrom the Configuration dropdown menu
or by starting to type the feature name in the Take Me To... text box and clicking it in the dropdown list.
Search
The options in the Configuration | Search category enable you to manage how search works on your
Logger.
• Filters 257
• Search Group Filters 259
• Saved Searches 260
HPE Logger 6.2 Page 256 of 623
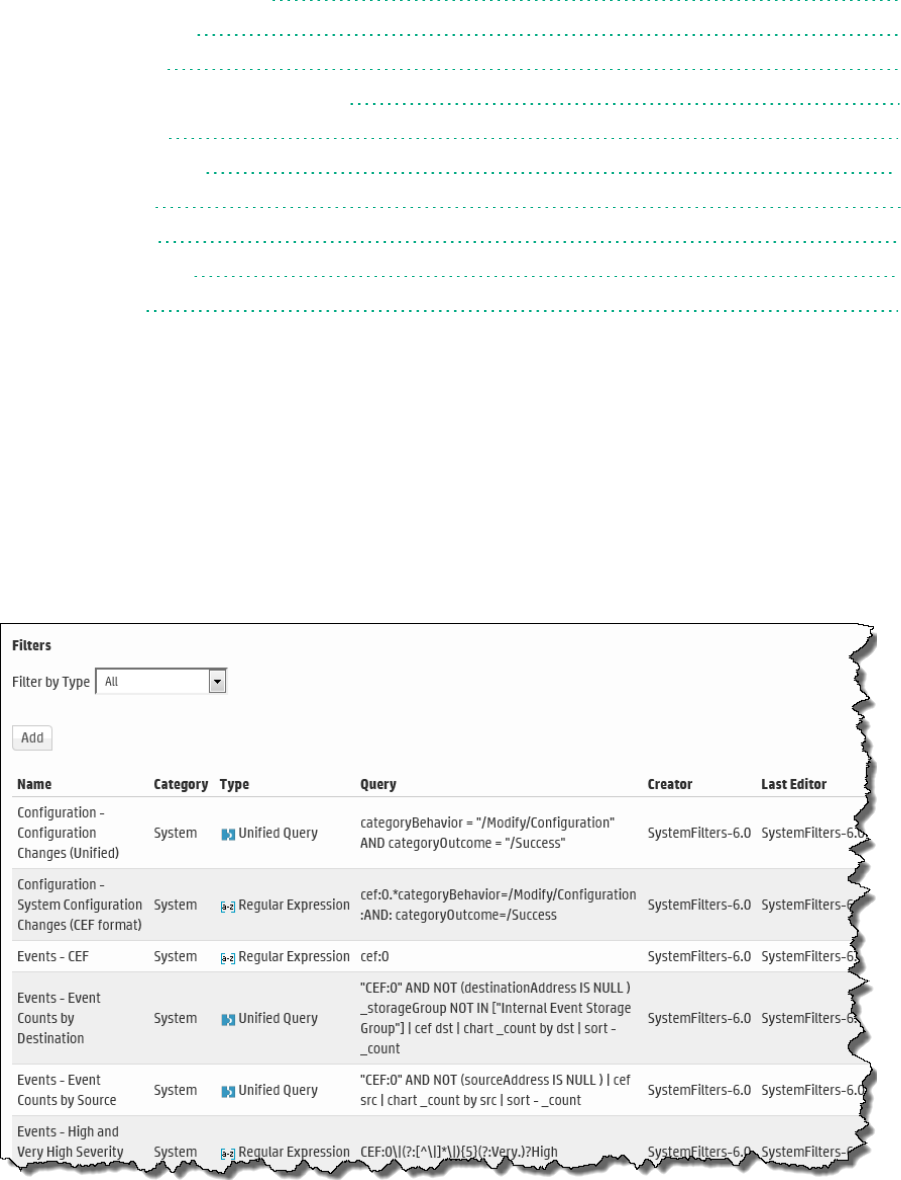
• Scheduled Searches/Alerts 262
• Saved Search Files 273
• Search Indexes 274
• Guidelines for Field-Based Indexing 275
• Search Options 276
• Managing Fieldsets 280
• Default Fields 281
• Custom Fields 282
• Running Searches 282
• Lookup Files 283
Filters
You can create search filters to save specific queries so that you can easily use them again. Filters are
similar to saved searches. However, filters save the query only, while saved searches save the time range
information in addition to the query.
Your system comes with a set of predefined search filters. For more information about these filters, see
"System Filters/Predefined Filters" on page128. You can add new filters and edit the existing ones from
the Filters page.
Administrator's Guide
HPE Logger 6.2 Page 257 of 623

The following categories of filters are displayed on the Filters page.
lShared: Shared search filters are user-created and are visible to all users. Once created, any user can
use a shared search filter to search for events.
lSearch Group: Search group filters provide an access control mechanism to limit the events that users
in a particular user group can see. Search group filters can also be used to limit the events processed
by a category of reports (see "Report Category Filters" on page247). The query for these filters can
only contain regular expressions. For more information, see "Search Group Filters" on the next page.
You must have admin-level privileges to create or edit search group filters. See "Users/Groups" on
page439 for more information on Logger user rights and how to administer them.
lSystem: A set of pre-defined filters, known as system filters, come with your system. For more
information about system filters, see "System Filters/Predefined Filters" on page128.
Search filters can have one of two different types of query:
lUnified Query: Unified Query (Unified) search queries specify keywords and fields.
lRegular Expression: Regular Expression (Regex Query) search queries specify a regular expression.
Regular expression based search filters are useful for creating real time alerts, which accept only
regex queries.
To create a filter:
1. Open the Configuration | Search menu.
2. Click Filters to create a shared filter or click Search Group Filters to create a search group filter.
(See "Filters" on the previous page for information about shared and search group filters.)
3. Click Add to display the Add Filter dialog box.
4. Enter a name for the new filter in the Name field. Filter names are case-sensitive.
5. If you are creating a shared filter, select Unified or Regex Query.
For Search Group filters, select Search Group.
Note: Non-administrator users cannot create Search Group filters. See "Users/Groups" on
page439 for more information on Logger user rights and how to administer them.
6. Click Next.
7. If you selected Unified or Regex Query method in the previous step, enter the query for the new
filter.
lFor Unified queries:
When you type a query, Logger’s Search Helper enables you to quickly build a query expression
by automatically providing suggestions, possible matches, and applicable operators. See "Search
Helper" on page94 for more information.
OR
Administrator's Guide
HPE Logger 6.2 Page 258 of 623

Click Advanced Search to use the Search Builder Tool to create the query. For details about
using the Search Builder Tool, see "Using the Advanced Search Builder" on page87.
lFor Regex queries: Enter the regular expression in the Query text box.
8. Click Save.
Note: If you created a Search Group filter, make sure that you associate it to a user group, as
described in "Search Group Filters" below.
To create a filter by copying an existing one:
1. Open the Configuration | Search menu and click Filters.
2. Locate the filter that you want to copy from the list of filters. Click the Copy icon ( ).
A new filter with the name “Copy of <filtername>” is created.
3. Change the name of the filter and edit the query for the new filter if necessary.
4. Click Save.
To edit a filter:
1. Open the Configuration | Search menu and click Filters.
2. Find the filter that you want to edit and click the Edit icon ( ) on that row.
3. Change the information in the form and click Save.
To delete a filter:
1. Open the Configuration | Search menu and click Filters.
2. Find the filter that you want to delete and click the Delete icon ( ) on that row.
3. Confirm the delete.
Search Group Filters
The Search Group Filters manage the association of User Groups with Search Group Filters. Search
Group Filters can be used to restrict events in the following two ways:
lRestrict the events processed by a Report Category: A Search Group Filter can be associated
directly with a Report Category. This association provides a way to restrict the events processed by
all the reports in a Report Category.
When a Search Group filter is used to restrict the events processed by a Report Category, you do not
need configure the Search Group in the Search Group Filters page as described below. After adding a
filter of type “Search Group”, you can go directly to the Reports Category Filters page under the
Administrator's Guide
HPE Logger 6.2 Page 259 of 623
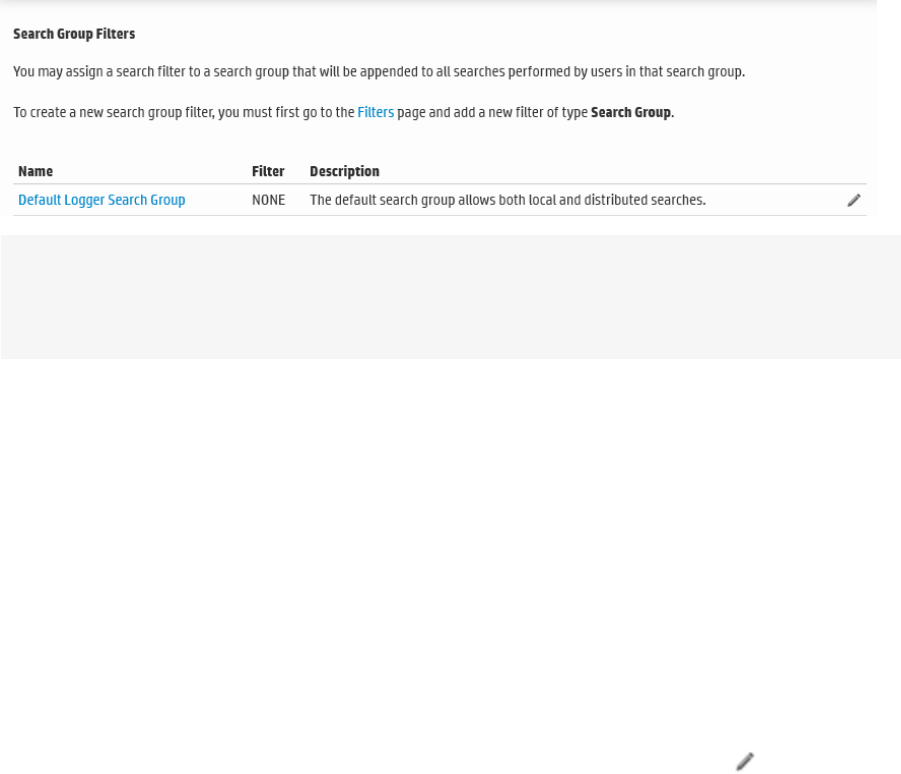
Reports menu and select the filter for the Report Category. For more information, see "Report
Category Filters" on page247.
lRestrict the events visible by members of a user group: A Search Group Filter can be associated
with a user group (of type Logger Search). This association means that all members of the user
group only see events that match the Search Group Filter. User groups (described in more detail later
in this chapter) provide a way of assigning privileges to a specified set of users.
Search Group Filters Page
Tip: The User Group of type Default Logger Search Group is listed in the Name column and the
associated filter is listed in the middle column.
Users who belong to a User Group that does not have a Search Group Filter will see all events.
To add, edit, or delete Search Group Filters, see "Filters" on page257. To add, edit, or delete User
Groups, see "Users/Groups" on page439 for more information on Logger user rights and how to
administer the. Only users that are members of a System Admin group can assign Search Group Filters.
To associate a Search Group Filter with a User Group:
1. If the User Group that you want to associate with the Search Group Filter does not exist, create a
new User Group of type Search Group. For instructions, see "Users/Groups" on page439.
2. If the Search Group Filter you want to associate with the User Group does not exist, create a filter
of type Search Group. For instructions, see "To create a filter:" on page258. When creating the
filter, from the Type pull-down menu select the Search Group option.
3. Open the Configuration | Search menu and click Search Group Filters.
4. Find the User Group to which to apply a Search Group Filter. Click the Edit icon ( ).
5. Select a filter from the pulldown list. (Only Search Group type filters are listed.)
6. Click Save.
Saved Searches
A saved search, like a search filter, recalls a specific query. However, in addition to the query, a saved
search saves the time range and the field set to display in the search results. Saving the time range
supports scheduled searches and reports. You can schedule a Saved Search to run at a specific interval.
Administrator's Guide
HPE Logger 6.2 Page 260 of 623
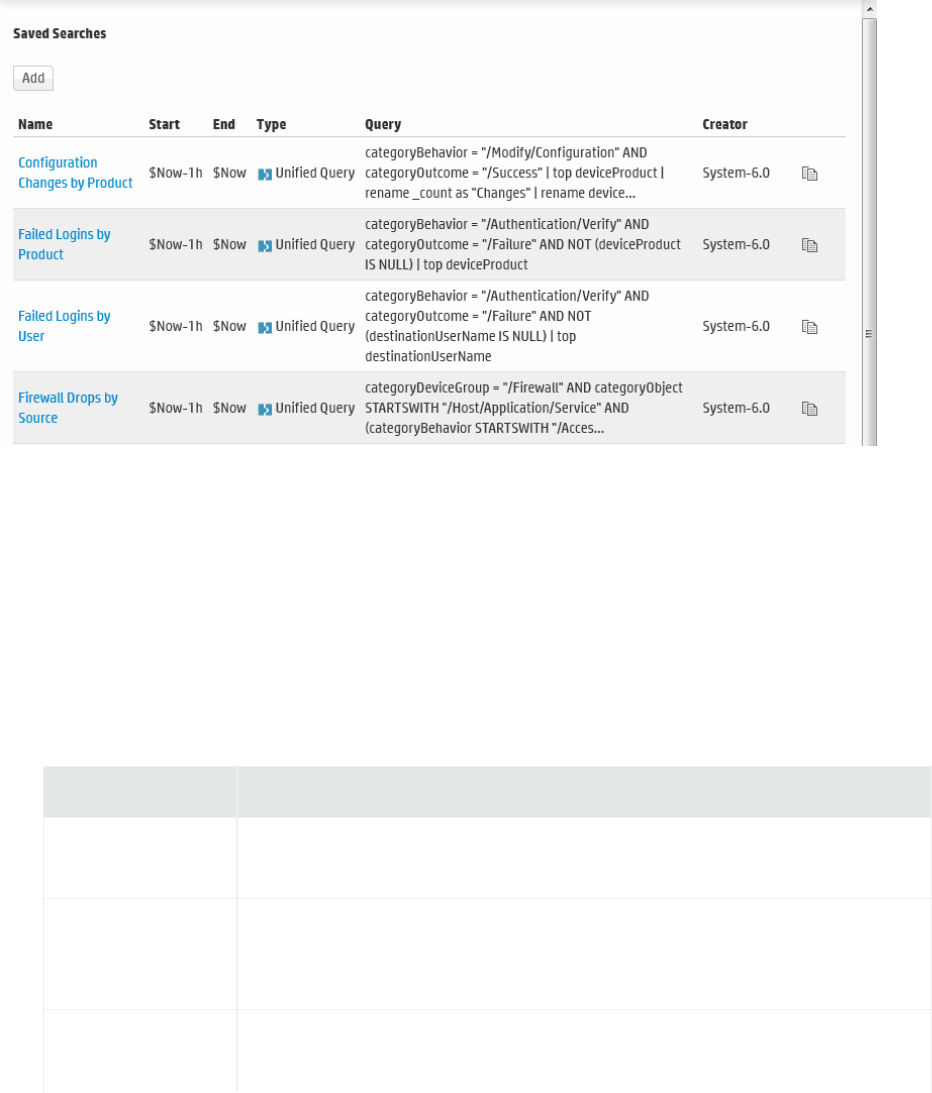
A scheduled Saved Search can be also configured to generate an alert. For more information, see "
Scheduled Searches/Alerts" on the next page.
The Saved Searches page displays all Saved Searches and supports adding, editing, and deleting Saved
Searches. You can add a saved search here or directly from the Search page.
Saved Search Page
For information on how to save a search from the Search page, see "Saving Queries (Creating Saved
Searches and Saved Filters)" on page124.
For information on how to use the saved searches created on this page, see "Searching with Saved
Queries" on page132.
To add a Saved Search:
1. Open the Configuration | Search menu and click Saved Searches.
2. Click Add and enter the following parameters:
Parameter Description
Name A name for this Saved Search. This name will be used for exported output
files, with the Saved Search date and time appended.
Start Time Absolute date and time of earliest possible event. Alternatively, check
Dynamic to specify the start time relative to the time when the Saved
Search job is run.
End Time Absolute or Dynamic date and time of latest possible event, as described
above.
Administrator's Guide
HPE Logger 6.2 Page 261 of 623
Parameter Description
Query Terms Enter the query in the text field or select one or more Filters from the list
below the text field.
When you type a query, Logger’s Search Helper enables you to quickly
build a query expression by automatically providing suggestions, possible
matches, and applicable operators. See "Search Helper" on page94 for
more information.
Local Search Check this box to limit the Saved Search to the local Logger box. If the
Local Search box is left unchecked, the Saved Search will include all Peer
Loggers as well as the local Logger.
3. Click Save to add the new Saved Search, or Cancel to quit.
To edit a Saved Search:
1. Open the Configuration | Search menu and click Saved Searches.
2. Find the Saved Search that you want to edit and click the Edit icon ( ) on that row.
3. Change the information in the form and click Save.
To delete a Saved Search:
1. Open the Configuration | Search menu and click Saved Searches.
2. Find the Saved Search that you want to delete and click the Delete icon ( ) on that row.
3. Confirm the delete.
Scheduled Searches/Alerts
You can schedule a Saved Search to run at a specific interval. A scheduled Saved Search can be
configured to generate an alert. The results of a scheduled search are written to a file, as described in
"Saved Search Files" on page273. The results of a scheduled Alert are sent to a specified destination.
The Scheduled Searches/Alerts page displays a list of currently scheduled Saved Searches and Alerts.
From here you can add a new Scheduled Search or Alert and manage existing ones. For more
information about scheduled Saved Search Alerts, see "Saved Search Alerts" on page271.
Note: Before you schedule a Saved Search Alert, you must have created at least one Saved Search.
Saved searches used in Alerts cannot contain aggregation operators such as chart or top.
Administrator's Guide
HPE Logger 6.2 Page 262 of 623

To add an new Scheduled Search or Alert:
You can add a new Scheduled Search or Alert from the Configuration menu or directly from the search
results page.
lTo set up a Scheduled Search Alert from the search results page (Analyze > Search), see "Creating
Saved Search Alerts (Scheduled Alerts)" on page271.
lTo set up a Scheduled Search from the search results page (Analyze > Search), follow the
instruction in "Saving Queries (Creating Saved Searches and Saved Filters)" on page124, set the Type
to Scheduled Search and select the Schedule it option.
lTo set up a Scheduled Search or Alert from the configuration menu (Configuration | Search >
Scheduled Searches/Alerts, see "Adding a Scheduled Search or Scheduled Alert" on the next page.
To see list of the existing Scheduled Searches and Alerts:
Open the Configuration | Search menu and click Scheduled Searches/Alerts.
A list of the current Scheduled Searches and Alerts is displayed.
To edit a existing Scheduled Search or Alert:
1. Open the Configuration | Search menu and click Scheduled Searches/Alerts.
2. Locate the Scheduled Search/Alert that you want to edit and click the Edit icon ( ) on that row.
3. Click the Edit icon ( ) and update the parameters as needed. For details about the settings, see
"To set up a Scheduled Search or Alert from the Scheduled Searches/Alerts page:" on the next
page.
4. Click Save to update the Scheduled Search/Alert or Cancel to abandon your changes.
To remove a Scheduled Search or Alert:
1. Open the Configuration | Search menu and click Scheduled Searches/Alerts.
2. Identify the Scheduled Search/Alert that you want to remove, and click the Remove icon ( ) on
that row.
3. Click OK to confirm the removal, or click Cancel to keep the Scheduled Search/Alert.
To enable or disable a Scheduled Search or Alert
1. Open the Configuration | Search menu and click Scheduled Searches/Alerts.
2. Identify the Scheduled Search/Alert that you want to enable.
3. Click the associated icon ( or ) to enable or disable the alert.
To view triggered Alerts:
See "Viewing Alerts" on page136.
Administrator's Guide
HPE Logger 6.2 Page 263 of 623
Adding a Scheduled Search or Scheduled Alert
You can schedule a Saved Search or an Alert to run at any time. Before you schedule a Saved Search or
Alert to run, you must have created or saved at least one Saved Search. See "Saving Queries (Creating
Saved Searches and Saved Filters)" on page124.
You can add a new Scheduled Search or Alert from the Configuration menu or directly from the search
results page.
lTo set up a Scheduled Search Alert from the search results page (Analyze > Search), see "Creating
Saved Search Alerts (Scheduled Alerts)" on page271.
lTo set up a Scheduled Search from the search results page (Analyze > Search), follow the
instruction in "Saving Queries (Creating Saved Searches and Saved Filters)" on page124, set the Type
to Scheduled Search and select the Schedule it option.
lTo set up a Scheduled Search or Alert from the configuration menu (Configuration | Search >
Scheduled Searches/Alerts, see "Adding a Scheduled Search or Scheduled Alert" above.
To set up a Scheduled Search or Alert from the Scheduled Searches/Alerts page:
1. Open the Configuration | Search menu and click Scheduled Searches/Alerts.
2. Click Add. The screen like the following is displayed.
Administrator's Guide
HPE Logger 6.2 Page 264 of 623
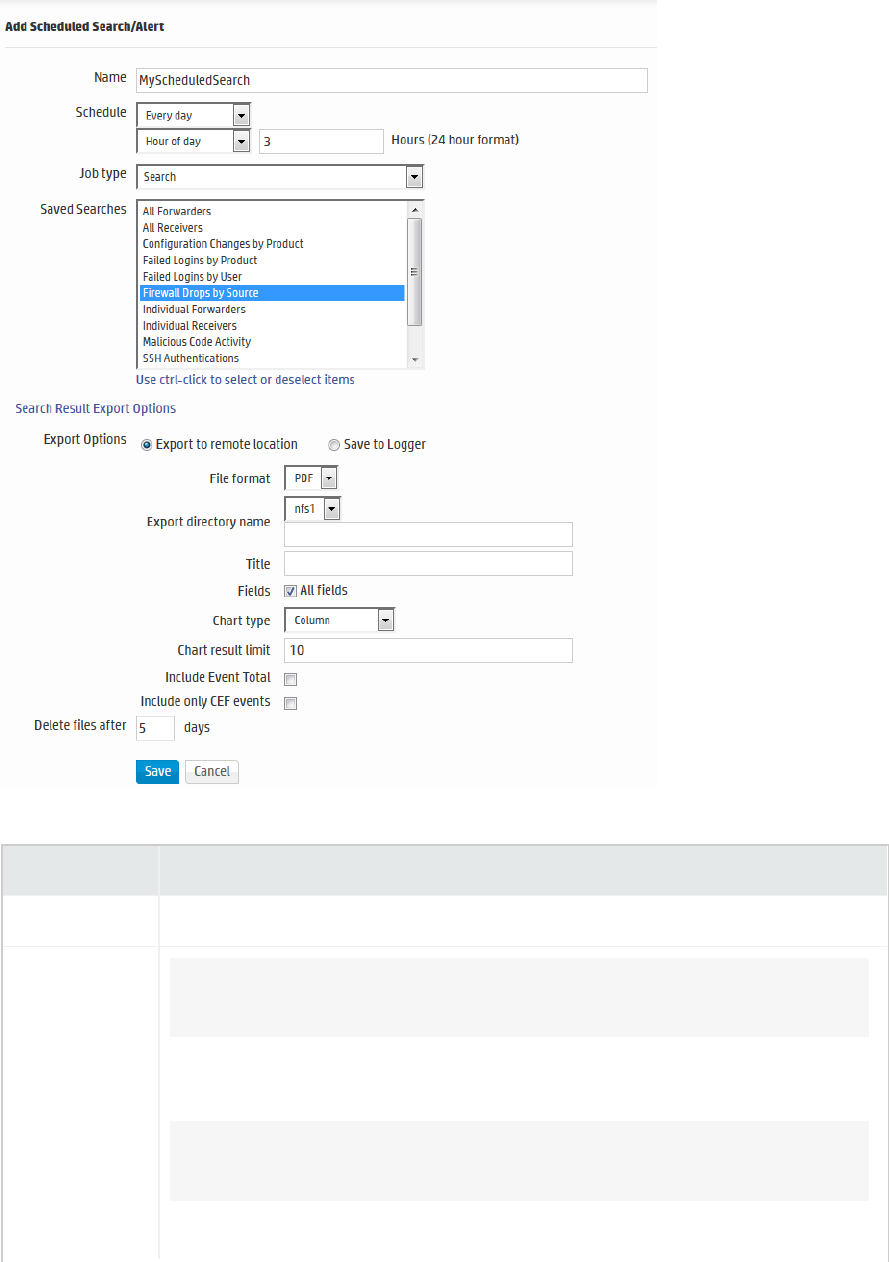
3. Enter the following parameters:
Parameter Description
Name A name for this Scheduled Search.
Schedule Tip: Make sure you are familiar with the information in "Time/NTP" on
page409 before setting the schedule.
Choose Every Day, Days of Week, or Days of Month from the upper pull-
down menu.
Note: When specifying multiple days, separate them with a comma. When
specifying the time, use 24-hour format.
a. If Every Day, select one of the following options from the lower pull-down
Administrator's Guide
HPE Logger 6.2 Page 265 of 623

Parameter Description
menu, and enter the necessary values:
oHour of day: (0-23) Enter the time you want the task to run in the
Hours (24 hour format) field. Midnight is zero (0).
oEvery: Select Hours or Minutes from the right-most pull-down menu
and specify how frequently you want the task to run.
Hours: (1-23) Enter how frequently in hours you want the task to run.
The result is every n hours every day.
Minutes: (15-59) Enter how frequently in minutes you want the task to
run. The result is every n minutes every day.
b. If Days of Week, select from the following options from the lower pull-
down menu, and enter the necessary values:
oDays: (1-7) Enter the days of the week you want the task to run
(Sunday=1, Monday=2, and so on).
oHour of Day: (0-23) Enter the time you want the task to run in the text
field to the right. 0 is midnight.
oEvery: Select Hours or Minutes from the right-most pull-down menu
and specify how frequently you want the task to run.
Hours: (1-23) Enter how frequently in hours you want the task to run.
The result is every n hours on the selected days.
Minutes: (15-59) Enter how frequently in minutes you want the task to
run. The result is every n minutes on the selected days.
c. If Days of Month, Select from the following options from the lower pull-
down menu, and enter the necessary values:
oDays: (1-31) Enter the day or days of the month you want the task to
run.
Note: The number of days in a month vary. Scheduled tasks will
only run if the specified day exists for that month. Tasks scheduled
on the 31st day of the month will not run in April, February, June,
November, and September. Tasks scheduled on the 29th day of
the month will only run in February during leap years.
oHour of Day: (0-23) Enter the time of day you want the task to run.
(You cannot select Every for this option.)
Examples:
Administrator's Guide
HPE Logger 6.2 Page 266 of 623

Parameter Description
lTo run the scheduled job every 45 minutes of every day, select Every Day
in the upper Schedule pull-down menu. Choose Every from the lower pull-
down menu, enter 45 in the text box and the select Minutes.
lTo run the scheduled job every four hours on Tuesdays and Thursdays ,
select Days of Week from the upper Schedule pull-down menu and enter
3,5 as the Days. Then choose Every from the lower pull-down menu, enter
4 in the text box.
lTo run the scheduled job on the 14th of each month at 3 AM, select Days
of Month from the upper Schedule pull-down menu and enter 14 as the
Days. Then choose Hour of day from the lower pull-down menu and enter
3 in the text box. (To run the scheduled job at 3 AM and 3 PM, you would
enter 3,15.)
Job Type Select Search to schedule a Saved Search.
Select Alert to schedule a Saved Search Alert.
Saved
Searches
Select from the list of saved searches. If none of the saved searches suits your
needs, click the Saved Searches page to define a new search. Then come back
to this page to schedule it. For more information about defining a Saved
Search query, see "Saved Searches" on page260.
You can use Ctrl+click to select and remove items from the list.
Note: When multiple saved searches are specified in one scheduled search
job, the resulting file contains the number of hits for each saved search
and not the actual events.
Note: You can only select one Saved Search for each Alert you configure.
Note: Aggregation operators such as chart and top cannot be included in
the search query for Scheduled Alerts. Saved searches that contain
aggregation operators are not displayed in the selection list after you
specify searches you have created are not displayed in the selection list for
Saved Search Alerts.
4. If you selected the job type Search, specify the Search Result Export Options
Administrator's Guide
HPE Logger 6.2 Page 267 of 623

Parameter Description
Export Options For the Logger Appliance:
Select from one of these options:
lExport to remote location: The file is written to an NFS mount, a CIFS
mount, or a SAN system location that you specify.
lSave to Logger: The file is saved to the Logger’s onboard disk. If the file
is saved locally, you can use the Saved Search Files ("Saved Search Files"
on page273) feature to access those files.
For Software Logger, the only available option is “Save to Logger,” which is
preselected for you.
Tip: The Logger Appliance supports mounting through the user
interface. Software Logger uses its filesystem, which can contain remote
locations mounted through the operating system.
File Format Select a format for the exported search results.
lCSV, for comma-separated values file.
lPDF, for a report-style file that contains search results as charts and in
tables. You must specify a title for the report in the Title field. If the
search query contains an operator that creates charts such as chart, top,
and so on, charts are included in the PDF file. In that case, you can also
set the Chart Type and Chart Result Limit fields. These fields are
described later in this table.
Remote File
System
(unlabeled field)
This field is only available on the Logger Appliance. Use the dropdown to
select an existing Remote File System location. If there are none, a link to the
Remote File System location page is displayed.
Export Directory
Name
For the Logger Appliance, select the directory where the search results will
be exported from the pull-down menu.
For Software Logger, enter the directory path in this field, which can be a
path to a local directory or to a mount point on the machine on which
Software Logger is installed.
By default, all saved searches are stored in /opt/arcsight/logger
/userdata/logger/user/logger/data/savedsearch.
Tip: To group your searches in folders, indicate a subdirectory in which
Search Job Options
Administrator's Guide
HPE Logger 6.2 Page 268 of 623

Parameter Description
to store them.
If a directory of the specified name does not exist, it is created. If a directory
of the specified name exists and the Overwrite box is not checked, an error is
generated. If the Overwrite box is checked, the existing directory contents
are overwritten.
Title (Optional) Enter a title to appear at top of the PDF file. If no title is specified,
the default “Untitled” is used.
Tip: This field becomes available when you select the PDF output
format.
Fields A list of event fields that will be included in the exported file. By default, all
listed fields are included.
Deselect All Fields to the view and edit the list of fields. Click Clear to
remove the listed fields.
Chart Type (for
PDF only)
Type of chart to include in the PDF file. You can select from:
Column, Bar, Donut, Area, Line, Stacked Column, Stacked Bar.
Note: This option overrides the Chart Type displayed on the Search
Results screen.
(If the search query includes an operator that creates a chart, this field is
meaningful; otherwise, it is ignored.)
Chart Result
Limit (for PDF
only)
The maximum number of unique values to include on the chart. The default
is 10.
(If the search query includes an operator that creates a chart, this field is
meaningful; otherwise, it is ignored.)
If the configured Chart Result Limit is less than the number of unique values
for a query, the top values equal to the Chart Result Limit are plotted. That
is, if the Chart Result Limit is 5 and 7 unique values are found, the top 5
values will be plotted.
Include Event
Total
Check this box to include an event count with the Saved Search, or a total
when more than one Saved Search is specified.
Search Job Options, continued
Administrator's Guide
HPE Logger 6.2 Page 269 of 623
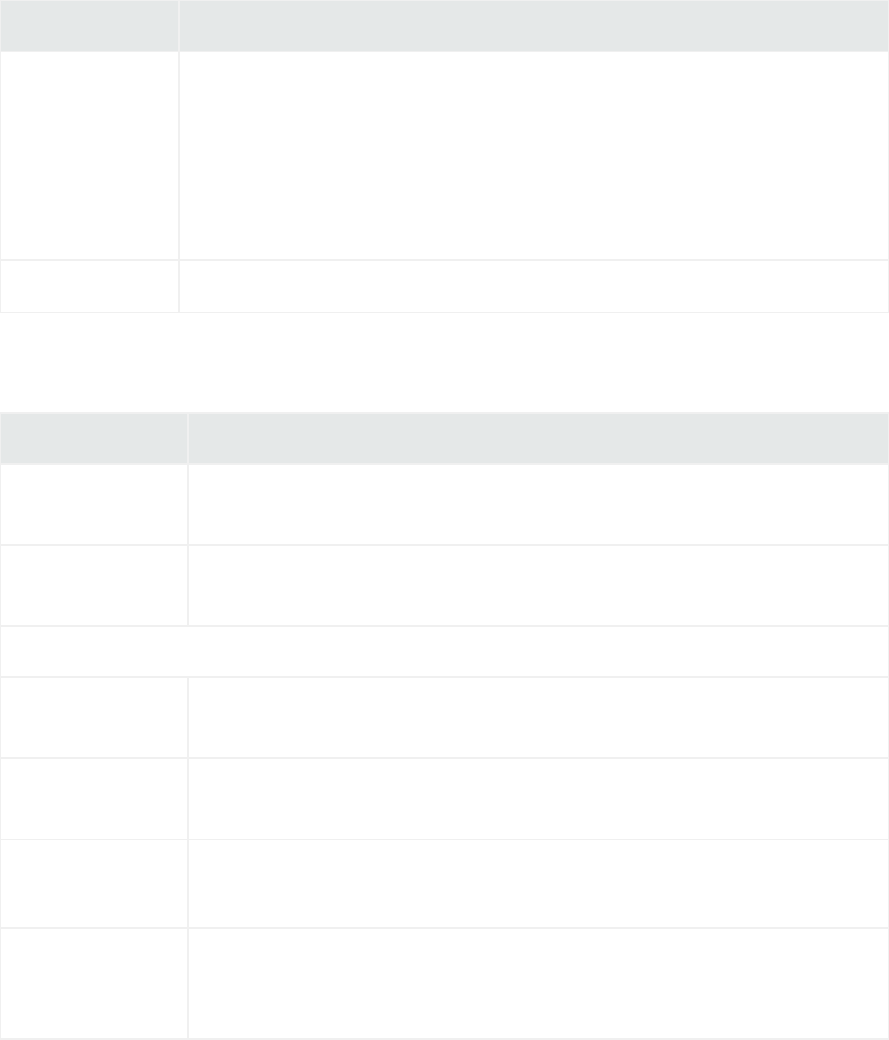
Parameter Description
Include only CEF
Events
Check this box to include only Common Event Format (CEF) events.
Uncheck the box to include all events in the output.
For more information about CEF, refer to the document "ArcSight CEF." For
a downloadable a copy of this guide, search for “ArcSight Common Event
Format (CEF) Guide” in the ArcSight Product Documentation Community
on Protect 724.
Delete Files After Specify how many days to keep the saved search results.
Search Job Options, continued
5. If you selected the job type Alert, specify the Alert Options
Parameter Description
Match count Number of events that should be matched in Threshold number of seconds
for an alert to be triggered.
Threshold (sec) Number of seconds within which the “Match count” events should be
matched for an alert to be triggered.
Notification destinations are optional. If none is specified, a notification is not sent.
Email address(es) (Optional) A comma-separated list of email addresses to which the alert will
be sent
SNMP destination (Optional) An SNMP destination to which the alert will be sent. For more
information, see "SNMP Destinations" on page340.
Syslog
destination
(Optional) A syslog server address to which the alert will be sent.
For more information, see "Syslog Destinations" on page341.
ESM Destination (Optional) An ArcSight Manager address to which the alert will be sent. For
more information, see "Sending Notifications to ESM Destinations" on
page342.
Alert Job Options
6. Click Save to add the new Scheduled Search/Alert, or Cancel to quit.
7. Once a Scheduled Search is created, enable it as described in "To enable or disable a Scheduled
Search or Alert" on page263.
Administrator's Guide
HPE Logger 6.2 Page 270 of 623

Saved Search Alerts
This section describes Saved Search Alerts. Saved Search Alerts are based on the search queries that
you have saved on Logger. For detailed information about Saved Search queries, see "Saved Searches"
on page260.
Note: For information on Real Time Alerts, see "Real Time Alerts" on page331. For information on
alerts in general, see "Types of Alert in Logger" on page335.
For each Saved Search Alert, you configure a match count, threshold, destination, and a schedule at
which the alert will be triggered (if specified number of matches occurs within the specified threshold). If
the new Alert will send notifications to an email, SNMP, or Syslog Destination, set up the destination
before creating the Alert.
See "Static Routes" on page408, "Receiving Alert Notifications" on page337, and "Setting Up Alert
Notifications" on page339 for more information. Audit events for alerts are only written to the Internal
Storage Group and not forwarded to ESM Destinations by default. If you need to forward these audit
events to ESM, please contact customer support for assistance.
Note: This change only applies to audit events generated for alerts; other audit events are can be
sent to ESMDestinations.
Note: To ensure system performance, a maximum of 200 alerts are allowed per saved search alert
job. Therefore, if a saved search alert job triggers more than 200 alerts, only the first 200 alerts are
sent out for that job iteration; the rest are not sent. Additionally, the job is aborted so it does not
trigger more alerts for that iteration and the status for that job is marked “Failed” in the Finished
Tasks page (Configuration| Scheduled Tasks > Finished Tasks). The job runs as scheduled at
the next scheduled interval and alerts are sent out until the maximum limit is reached.
This limit does not exist on the real-time alerts.
Creating Saved Search Alerts (Scheduled Alerts)
This section describes how to schedule Saved Searches to run as Scheduled Alerts. For information on
creating Real Time Alerts, see "Creating Real Time Alerts" on page333. For a description of the types of
alerts, see "Types of Alert in Logger" on page335.
You can schedule a Saved Search to run at any time. Before you schedule a Saved Search Alert, you
must have created at least one Saved Search.
Note: Saved searches used in Alerts cannot contain aggregation operators such as chart or top.
See "Saving Queries (Creating Saved Searches and Saved Filters)" on page124 for more
information.
Administrator's Guide
HPE Logger 6.2 Page 271 of 623
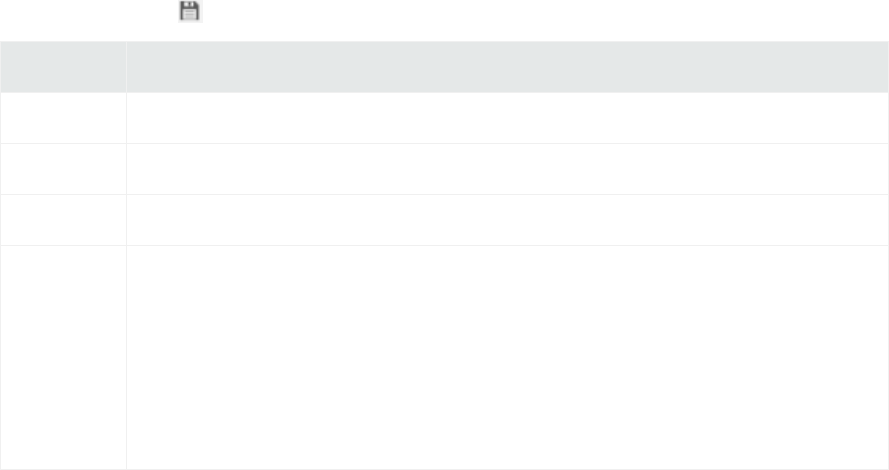
You can add a new Scheduled Search or Alert from the Configuration menu or directly from the search
results page.
lTo set up a Scheduled Search Alert from the search results page (Analyze > Search), see "Creating
Saved Search Alerts (Scheduled Alerts)" on the previous page.
lTo set up a Scheduled Search from the search results page (Analyze > Search), follow the
instruction in "Saving Queries (Creating Saved Searches and Saved Filters)" on page124, set the Type
to Scheduled Search and select the Schedule it option.
lTo set up a Scheduled Search or Alert from the configuration menu (Configuration | Search >
Scheduled Searches/Alerts, see "Adding a Scheduled Search or Scheduled Alert" on page264.
To set up a Saved Search Alert from the search results page:
1. Run a search, as described in "Searching for Events" on page98.
2. Click the Save icon ( ) and enter the following settings.
Parameter Description
Name A name for the query you are saving.
Save as To enable the Scheduling option, select Saved Search.
Schedule it Click to schedule now or leave blank to schedule later.
Type Select whether you want to schedule a Search or an Alert.
Scheduled searches run on a predetermined schedule and export results to a pre-
specified location.
Scheduled alerts run a search on a predetermined schedule but only generate an
alert if the specified number of events within the specified threshold is found.
Select Scheduled Alert to create an Alert.
3. Click Save.
If you checked the “Schedule it” setting in the previous step, you are prompted to choose if you
want to edit the schedule. If you click OK, the Edit Scheduled Search page is displayed, as shown in
the next step. If you click Cancel, the search is saved but it is not scheduled to run.
4. The Edit Scheduled Search/Alert page enables you to define a schedule for the saved search job
and alert options. Select the desired options, and click Save. For details about the parameters, see
"Alert Job Options" on page270.
Administrator's Guide
HPE Logger 6.2 Page 272 of 623
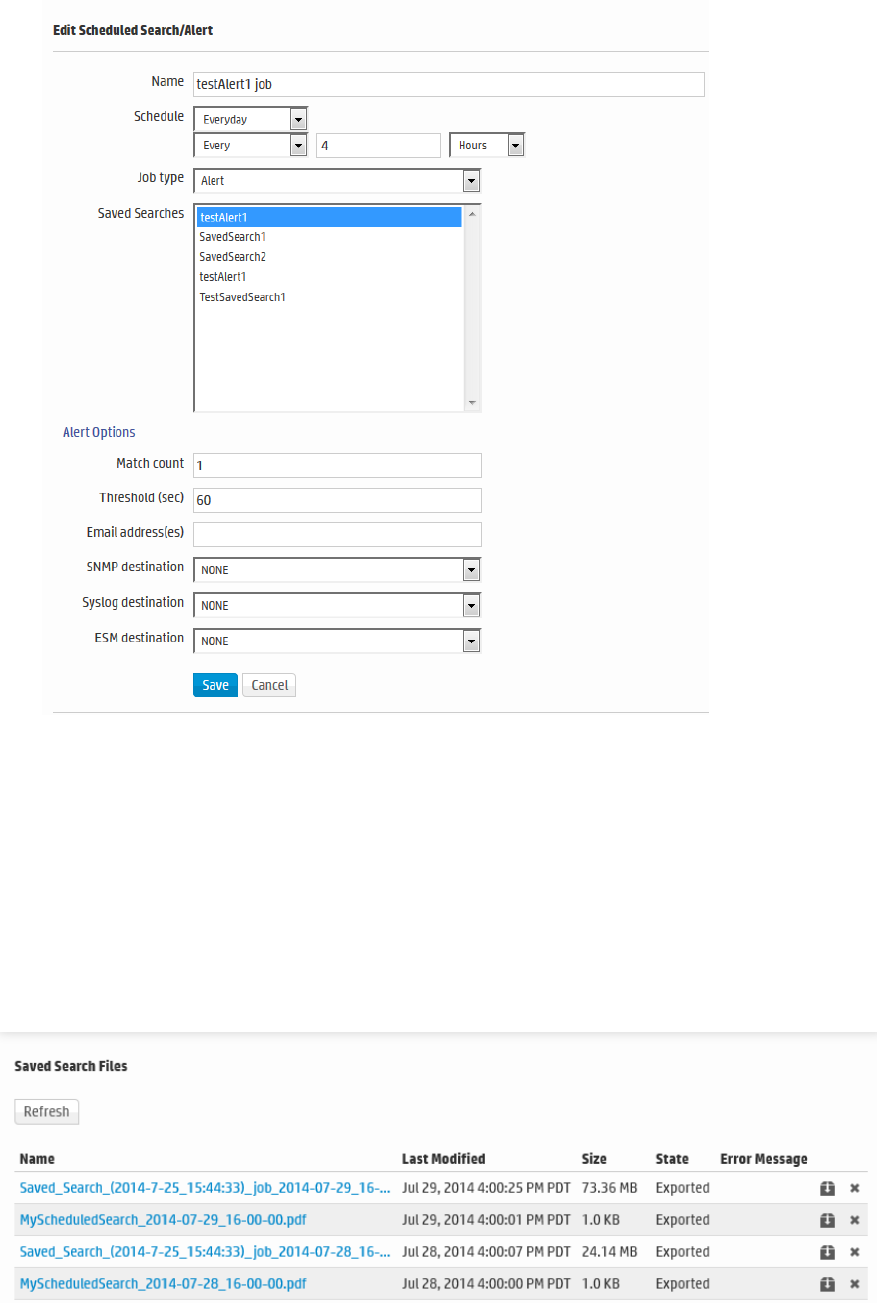
5. After creating the Scheduled Alert, enable it as described in "To enable or disable a Scheduled
Search or Alert" on page263.
Saved Search Files
Access Saved Search results that were saved to Logger with the Saved Search Files command. Saved
Search Files can be retrieved (streamed to the browser) or deleted. Click Refresh to update the list of
files.
Saved Search Files page
Administrator's Guide
HPE Logger 6.2 Page 273 of 623

Access the saved search results:
1. Open the Configuration | Search menu and click Saved Search Files. The files containing the
search results are displayed.
2. To download and open a file, click a link in the Name column or click the Retrieve icon in the row.
Search Indexes
You can add fields to the field-based index at any time. However, once a field has been added to the
index, you cannot remove it.
Caution Before adding any fields to the index, make sure you are familiar with the information in
"Guidelines for Field-Based Indexing" on the next page.
To add fields to the field-based index:
1. Open the Configuration | Search menu and click Search Indexes.
2. Select the fields from the Indexable Fields list.
Administrator's Guide
HPE Logger 6.2 Page 274 of 623
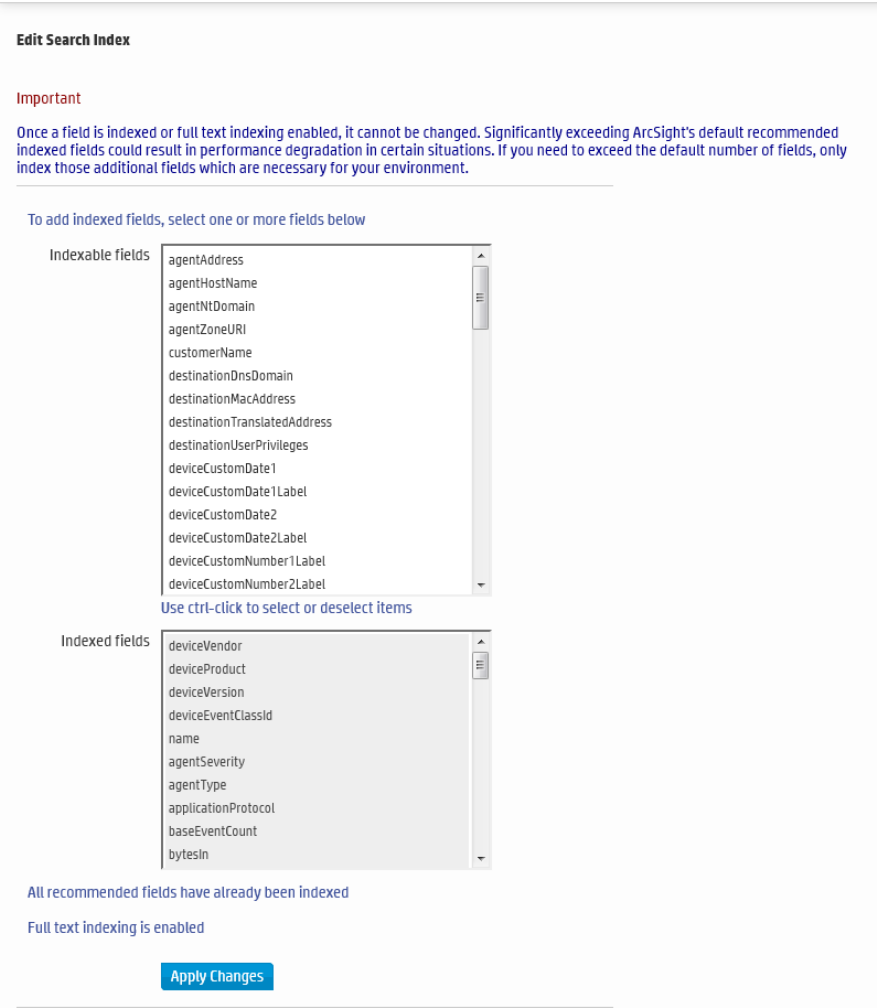
3. To select multiple fields at the same time, hold the Ctrl key down and click on the fields.
4. Click Apply Changes.
Guidelines for Field-Based Indexing
Make sure you are familiar with these guidelines before you index any fields:
lEvents are indexed by the fields in the “Indexed fields” list (on the Search Indexes page) and the
default event metadata fields—event time, Logger event, and device address.
Administrator's Guide
HPE Logger 6.2 Page 275 of 623
lYou can index up to 123 fields on Logger. This number includes the custom schema fields you may
have added to your Logger.
lOnce a field has been added to the index, it cannot be undone.
lOnly users belonging to a System Admin Group can add fields to index.
lAfter you add a field to the index, Logger might not immediately start indexing on that field.
Therefore, allow some time between adding a field and using it in the search query. If Logger is in the
process of indexing on a field and you use that field to run a search query, the search performance
for that operation will be slower than expected.
lIf an event field contains data of unexpected type (for example, a string when an integer is expected),
the data is ignored. Therefore, search for that data value will not yield any results. For example, if the
port field contains a value 8080A (alphanumeric) instead of 8080 (numeric), the alphanumeric value
is ignored.
lFor faster report generation, ALL fields of a report (including the fields being displayed in the report)
need to be indexed. That is, in addition to the fields in the WHERE clause of the query, the fields in
the SELECT clause also need to be indexed.
lFor optimal search performance, make sure that event fields on ALL peers are indexed for the time
range specified in a query. If an event field is indexed on a Logger but not on its peers for a specific
time range, a distributed search will run slower on the Loggers. However, it will run at optimal speed
on the local Logger. Therefore, the search performance in such a setup will be slow.
lAlthough the requestUrl field is available for search and report queries, it cannot be indexed.
Including this field in such queries will result in the query running slower than a search performed on
indexed data.
Search Options
The search options on this page support internationalization (i18n) choices. To adjust these options,
open the Configuration | Search menu and click Search Options.
Administrator's Guide
HPE Logger 6.2 Page 276 of 623
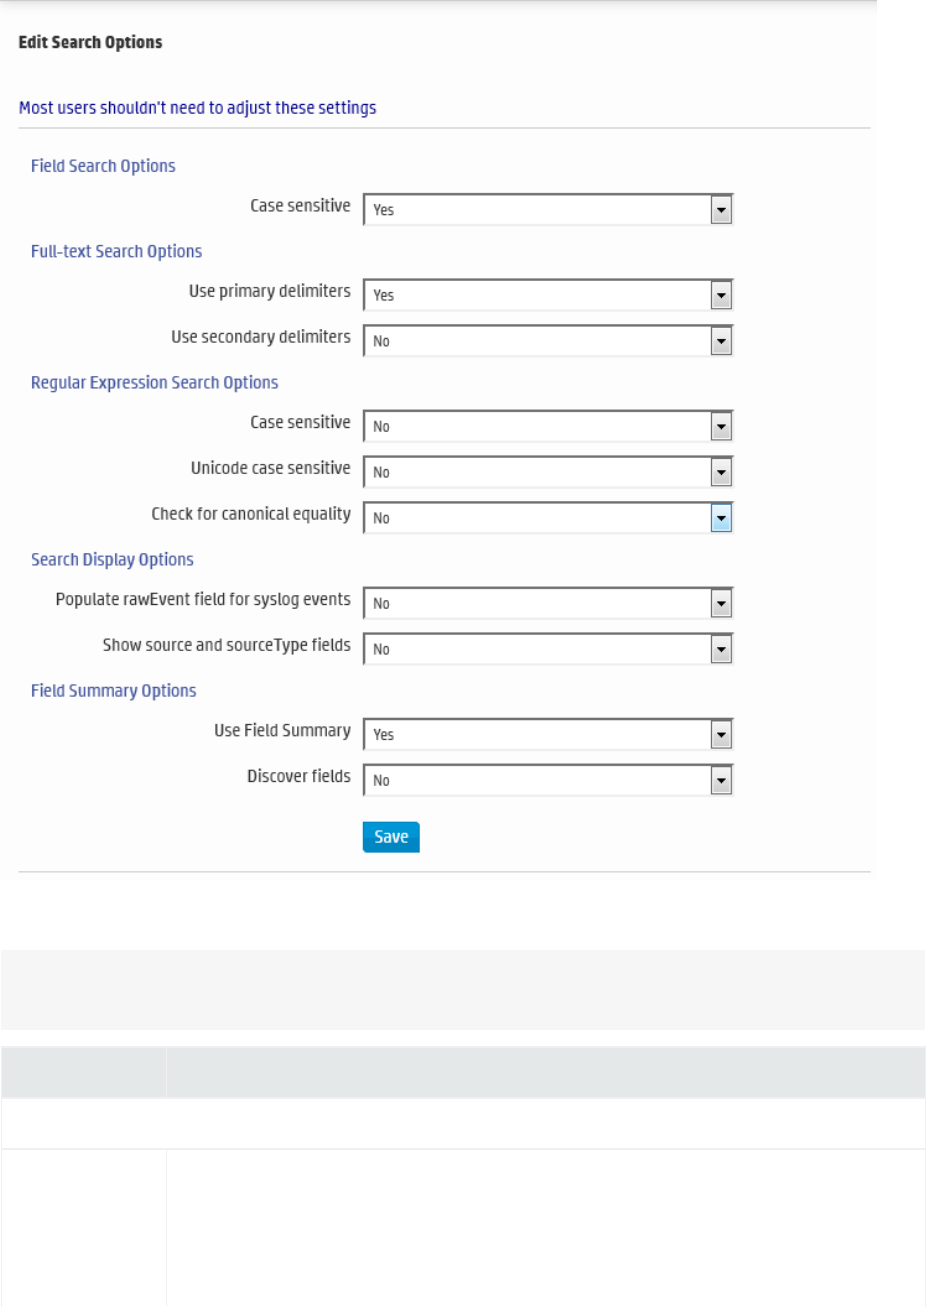
The following table lists the advanced search options you can view and configure.
Note: Several of the options on this screen will require you to reboot your Logger Appliance or
restart your Software Logger.
Option Description
Field Search Option
Case sensitive Default: Yes
Controls whether to differentiate between upper- and lower-case characters
during a search. When this option is set to No, searching for "login" will find "login,"
"Login," and "LOGIN".
Administrator's Guide
HPE Logger 6.2 Page 277 of 623

Option Description
You must reboot the Logger Appliance/restart the Software Logger for this
change to take effect.
Notes:
1. Setting this option to No may affect query performance.
2. Changing the case-sensitivity only applies to the local Logger. Peer Loggers
will continue to use their own settings.
3. Full-text search (keyword search) is case insensitive. You cannot change its
case sensitivity.
Full-text Search Options
Use primary
delimiters
Default: Yes
Controls whether primary delimiters are applied to an event to tokenize it for
indexing.
A primary delimiter tokenizes an event for indexing. For example, an event "john
doe the first" is tokenized into "john" "doe" "the" "first" using the “space” primary
delimiter.
The primary delimiters are:
space, tab, newline, comma, semi-colon, ( ) [ ] { } “ | *
Use secondary
delimiters
Default: No
Controls whether secondary delimiters are applied to an event to further tokenize
a token created by a primary delimiter thus enabling searches that can match a
part of a primary token.
For example, you can search for "hpe.com" in http://www.hpe.com.
The secondary delimiters are:
period, = : / \ @ - ? # & _ > <
Regular Expression Search Options
Case sensitive Default: No
See "Case sensitive" on the previous page.
You must reboot the Logger Appliance/restart the Software Logger for this
change to take effect.
Unicode case
sensitive
Default: No
Controls whether events in languages other than English should be compared in a
Administrator's Guide
HPE Logger 6.2 Page 278 of 623

Option Description
case-sensitive way.
Caution: HPEstrongly recommends that you do not change this option.
You must reboot the Logger Appliance/restart the Software Logger for this
change to take effect.
Check for
canonical
equality
Default: No
Controls whether events in languages other than English should be compared
using locale-specific algorithms.
Caution: HPEstrongly recommends that you do not change this option.
You must reboot the Logger Appliance/restart the Software Logger for this
change to take effect.
Search Display Options
Populate
rawEvent field
for syslog
events
Default: No
Controls whether raw events are displayed in a formatted column called rawEvent
using the Raw Event field set. This option applies to syslog events only. If you
want to view the raw events associated with CEF events, you do not need to
configure this setting. Instead, configure the connector that is sending events to
Logger to populate the rawEvent field with the raw event.
Note: Even though the rawEvent column displays the raw event, this column
is not added to the Logger database and is not indexed. Therefore, you can
only run a keyword (full-text) or regular expression search on the event.
Show Source
and
SourceType
fields
Default: No
Controls whether the Source and SourceType fields are included in the Field
Summary and query results.
You must reboot the Logger Appliance/restart the Software Logger for this
change to take effect.
Note: Setting this option to Yes can impact query performance.
Field Summary Options
Use Field
Summary
Default: Yes
Controls the whether the Field Summary panel is included in the search results by
Administrator's Guide
HPE Logger 6.2 Page 279 of 623
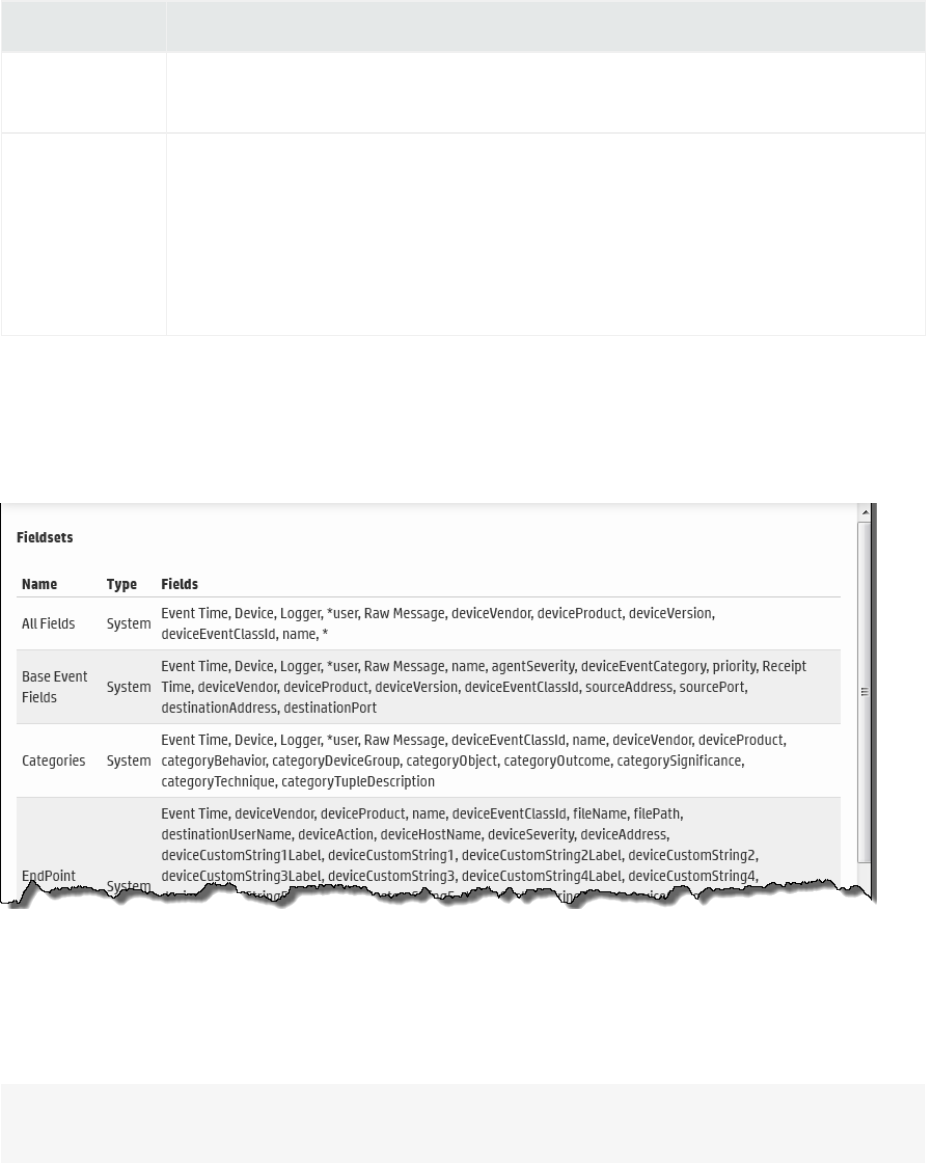
Option Description
default. Regardless of the default, you can change the setting on-the-fly by using
the Fields Summary checkbox on the Search screen.
Discover Fields Default: No
Controls whether the Field Summary feature automatically detects non-CEF fields
in raw events. Regardless of the default, you can change the setting on-the-fly by
using the Discover Fields checkbox on the Search screen.
This field is hidden if Use Field Summary is set to No.
Managing Fieldsets
You can view the predefined fieldsets and the ones you have created on the Fieldsets page
(Configuration | Search > Fieldsets).
In this list of fieldsets, *user indicates user-created fields. An asterisk (*) at the end of the list of fields
indicates that more fields are included than are listed.
If you have “Edit, save, and remove fieldsets” privileges, you can delete your custom fieldsets from this
screen.
Note: You can only delete the field sets you create, and not the predefined ones available on
Logger.
Administrator's Guide
HPE Logger 6.2 Page 280 of 623
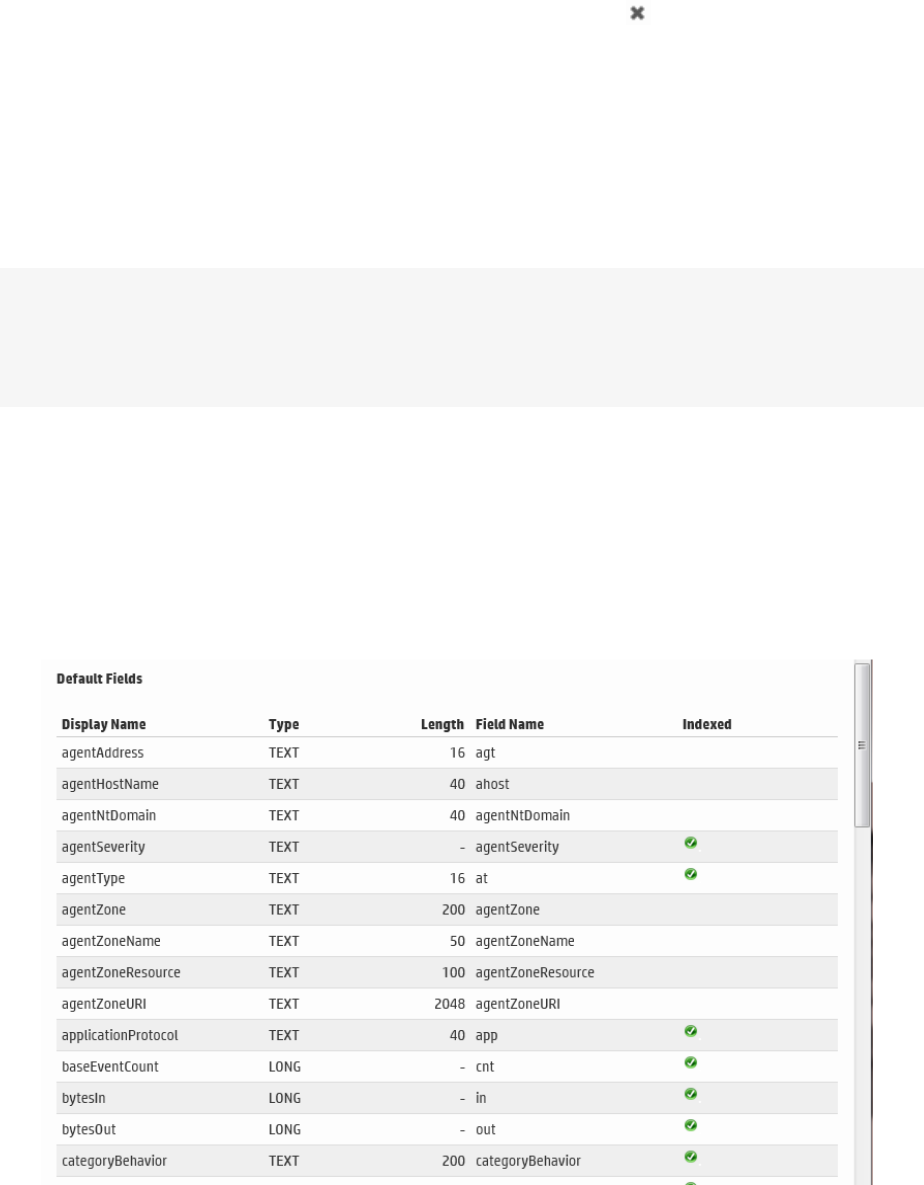
To delete a custom field set:
1. Open the Configuration | Search menu and click Fieldsets.
2. Identify the field set you want to delete and click the Delete icon ( ).
3. Confirm the deletion.
Default Fields
The Logger schema comes with a set of predefined fields. Some of these fields are already indexed for
improved search speed and efficiency. You can add custom fields to Logger's schema and index them
for field-based search. A field-based search can only use fields in the schema.
Note: The size of each field in the schema is predetermined. If the string you are searching for is
longer than the field-length, you should use a STARTSWITH rather than an = search, and include no
more than the number of characters in the field size. For more information, see “Field-based
Search” on page1.
The Default Fields page (Configuration | Search > Default Fields) displays the predefined fields
included in the schema. It includes the Display Name, Type, Length, and Field Name for each default
field. To view information on existing custom fields, see “Custom Fields” on page1.
To view the default schema fields:
1. Open the Configuration | Search menu and click Default Fields.
Administrator's Guide
HPE Logger 6.2 Page 281 of 623
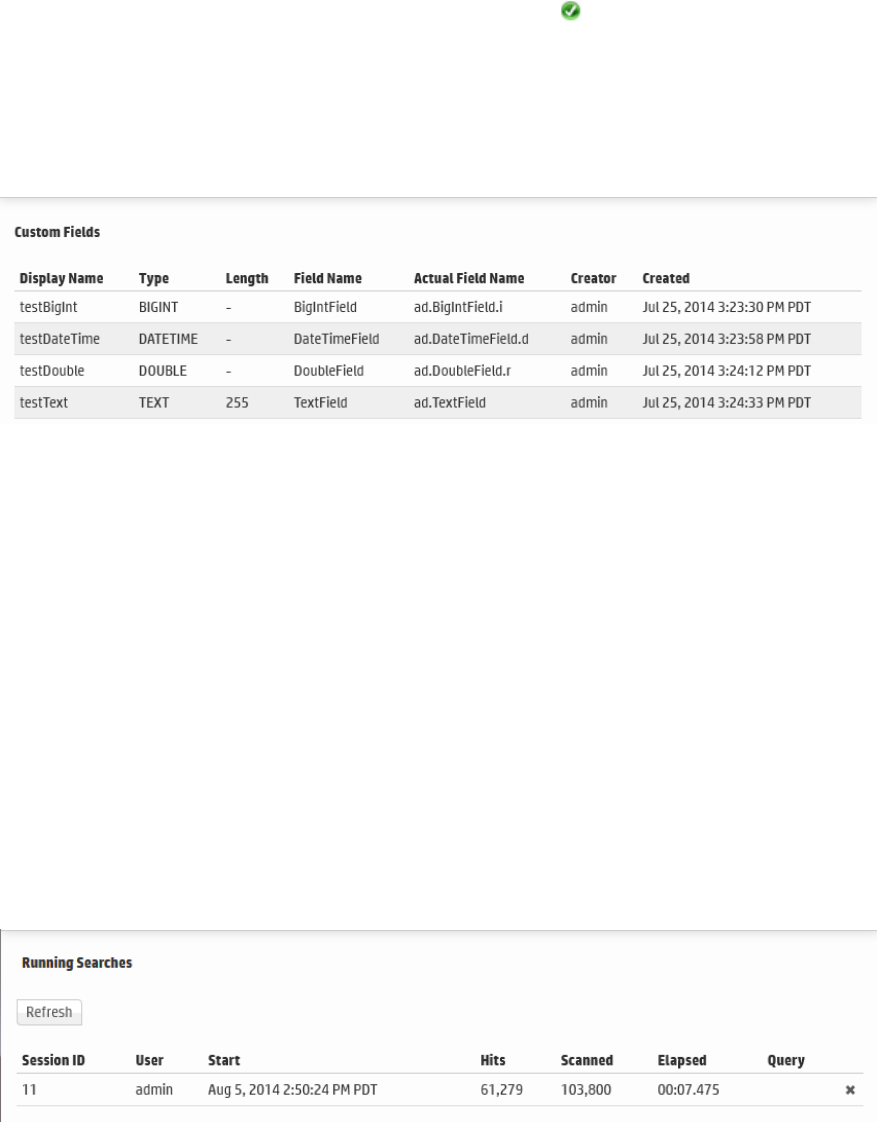
2. The Default Fields page displays the default fields. You can sort the fields by clicking the column
headers.
Fields included in the index are indicated by a checkmark ( ).
Custom Fields
You can view the custom fields that have been added to the Logger schema under Configuration |
Search > Custom Fields.
This page lists all custom schema fields that have been saved. You can view the alphabetical list of fields,
but cannot edit or delete them. For detailed information about custom fields, see "Adding Fields to the
Schema" on page379.
Running Searches
When a search initiated as a result of any of the following operations is in-progress, the Running
Searches page (Configuration | Search > Running Searches) displays the currently running process.
lA manual search on local or peer Logger (Analyze > Search)
lA scheduled search (Configuration | Search > Saved Search
lA saved search alert (Configuration | Search > Scheduled Searches/Alerts)
lA search export, with the “Rerun query” option checked (Analyze > Search > Export Results)
The table shows the session ID, user who started the tasks, the date and time that the task started, the
number of hits, the number of scanned events, the elapsed time, and the query.
Administrator's Guide
HPE Logger 6.2 Page 282 of 623
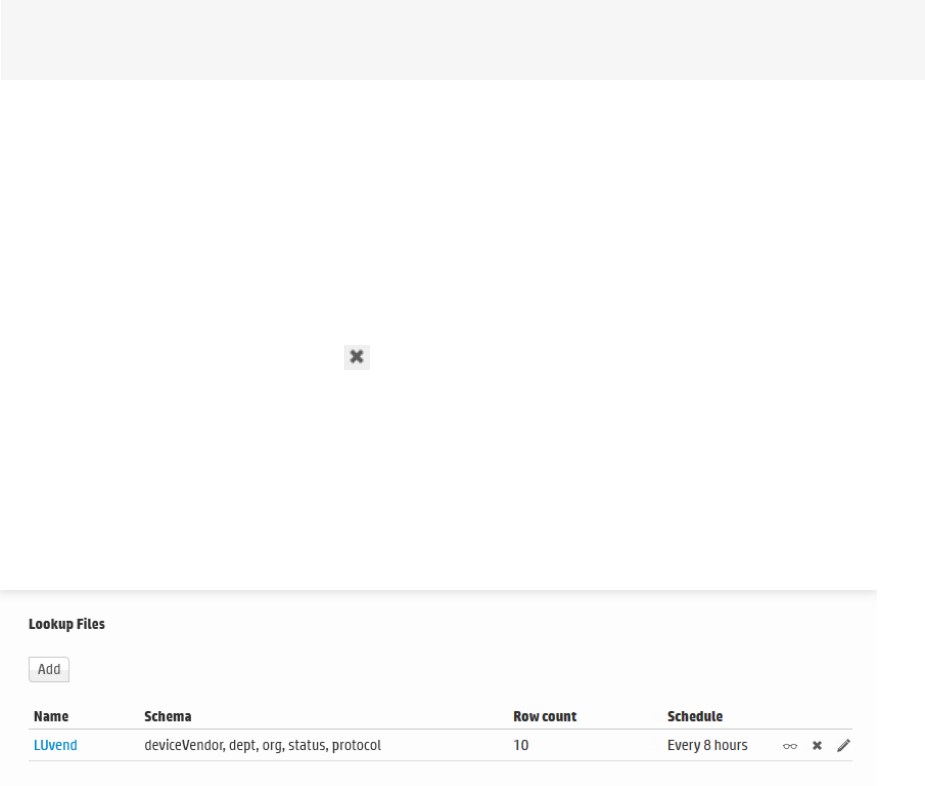
Once a task finishes, the task’s entry on the Running Searches page is removed. (The task entry is
removed upon page refresh, either when you refresh the browser page or when you navigate away
from this page and come back to it.)
You might need to end a currently running search task when it is taking too long to run, or appears to
be stuck and slowing the overall Logger performance.
Note:You must have admin user privileges to end a running search process. See "Users/Groups" on
page439 for more information on Logger user rights and how to administer them.
To view the currently running searches:
Open the Configuration | Search menu and click Running Searches.
Any searches that are currently running are displayed.
To end a currently running search:
1. Open the Configuration | Search menu and click Running Searches.
2. To end a search process, click the icon for the task.
Lookup Files
Lookup files are used by the lookup search operator to enrich Logger data during a search. After you
upload a valid Lookup file to Logger, you can use that Lookup file in a lookup search command.
The Lookup Files page displays the uploaded Lookup files.
lFor information on when to use the lookup operator, see "Enriching Logger Data Through Static
Correlation" on page133.
lFor information on how to use the lookup operator when searching, see "lookup" on page484.
Creating Lookup Files
Lookup files must be in CSV format with the Lookup field names as the first row. (A Lookup field is an
individual column in the Lookup file.) Each row in the table is loaded sequentially and the first row is
treated as the definition of the columns in the table. Any subsequent row that does not contain the
same number of comma-separated values as the first row will be skipped during the search by the
Administrator's Guide
HPE Logger 6.2 Page 283 of 623

lookup operator. If a search using the lookup operator needs to skip one or more rows, a warning
message displays on the search page. HP recommends that you check the table with a tool such as
MicroSoft Excel to make sure that each row has the same number columns as the header row before
uploading it as a lookup file.
Tip:For more information on the CSVformat your lookup files need to follow, refer to RFC 4180.
Naming Lookup Files
The Lookup filenames can contain only alphanumeric characters and underscore, and mustNOT begin
with a number. Do not include +, -, or * in the filename. These characters are reserved for the lookup
command.
Creating a short and meaningful Lookup filenames make it easy to identify Lookup fields in the output.
To help differentiate them from Logger fields, fields from the Lookup file are appended with the first six
characters of the Lookup file name when displayed in the search results.
As an example, look at the following search:
lookup _table_20160608 ip as src output hostname
In this example, “_table_” will be appended to the Lookup field "hostname”. The date (20160608) will
not be included. The name displayed in the search results will be "hostname_table_" because only the
first six characters of the Lookup file name are appended.
Naming Fields in the Lookup File
Lookup fieldnames can contain only alphanumeric characters and underscore, and must NOT begin
with a number. Do not include +, -, or * in the fieldname. These characters are reserved for the lookup
command.
Duplicate Values in the Lookup File
When there are multiple rows with identical values in a Lookup column, the lookup operation only uses
the first row that matches and ignores any subsequent matches.
When using Logger exported search results as Lookup file, you can use "dedup" operator to remove the
duplicate values in the fields that will be used as Lookup fields. For more information on duplication in
Lookup fields, see the lookup operator "lookup" on page484. For more information on the dedup
operator, see "dedup" on page472.
Lookup Capacity
lThe maximum size Lookup file that can be uploaded is 50 MB (uncompressed or compressed)
lThe maximum disk space allocated for storing Lookup files is 1 GB. This is the cap on overall disk
space allowed for storing all Lookup files.
lMaximum number of Lookup entries is 5,000,000 (A Lookup entry is an individual comma-
Administrator's Guide
HPE Logger 6.2 Page 284 of 623
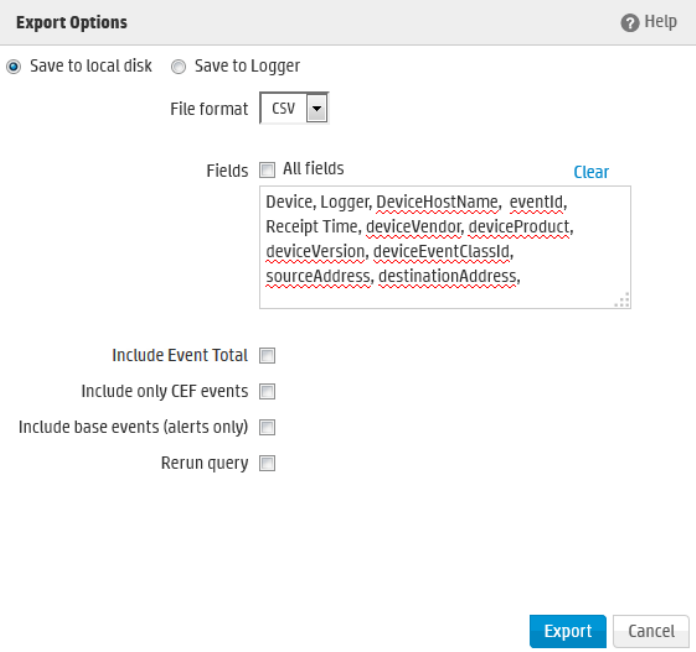
separated value in the Lookup file.)
For example, if a Lookup file has four columns and ten rows, the total number of lookup entries is
4x10=40. When such a Lookup file is used in the search, all of its entries will be loaded into memory. It
is worth noting that the maximum number of rows loaded for lookup varies depending on the
number of columns in the Lookup file.
For example, if a Lookup file contains 500 columns, the maximum number of rows allowed for lookup
will be 5,000,000/500 = 10,000 rows, and any subsequent rows will not be used. On the other hand,
if the table has only four columns, the maximum number rows allowed for lookup will be
5,000,000/4 = 1,250,000 rows.
When exporting Logger search results to use them as Lookup files, uncheck All Fields and export
only the fields you need.
Since there is an overall limit of 5 million lookup entries, exporting only the necessary fields will reduce
the number of rows loaded for lookup.
Uploading Lookup Files
Click Add on the Lookup Files page to upload a Lookup file in .csv, .zip, or .gz format. You can
upload an individual Lookup file from your local desktop or schedule a lookup file to be uploaded
regularly from a location accessible to Logger.
Administrator's Guide
HPE Logger 6.2 Page 285 of 623
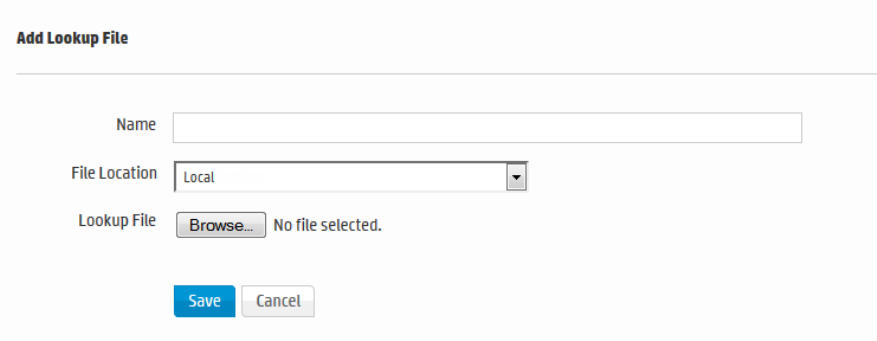
Uncompressed files (files uploaded in .csv format) will be compressed into .zip format and stored with
the name you specified (<name>.zip.) Compressed files will be uploaded and stored in their original
compression format with the name you specified (<name>.zip or <name>.gz.) Upload compressed
Lookup files (.zip or .gz) when possible. This saves upload time and loads more information for the
same upload file size. You can only include one Lookup file in .csv format in each .zip or .gz file.
For information on how to use the lookup operator when searching, see "lookup" on page484.
To add a Lookup file:
1. Open the Configuration | Search menu and click Lookup Files.
2. Click Add. The Add Lookup File page opens.
3. Enter a meaningful name for the Lookup file. This name can contain only alphanumeric characters
and underscore, and must NOT begin with a number. Do not include +, -, or * in the name. These
characters are reserved for the lookup command.
4. Select where to access the Lookup file.
lSelect Local to browse to a location on your local machine and upload the file one time only.
lSelect On Logger to enter a path on the Logger's server. If you select this option, you can
choose to set up a regular update schedule.
The available options change based on your selection.
5. Specify the Lookup file's location:
lIf you selected Local, click Browse, navigate to the desired .csv, .zip or .gz file, and then click
Open.
lIf you selected On Logger, specify the absolute path and file name on the Logger system. For
example, if the file is in the /opt folder on your Logger you could specify /opt/lookup.csv.
The lookup file must already exist in this location. The user Logger was installed with must have
read permissions on the lookup file itself and on the directory you specify here.
Administrator's Guide
HPE Logger 6.2 Page 286 of 623

Note: The Logger Appliance supports mounting through the user interface. Software
Logger uses its file system, which can contain remote folders mounted through the
operating system.
6. If you selected On Logger, specify how often to upload the Lookup file.
lTo upload the Lookup file only once, check One time only.
lTo schedule the Lookup file to be uploaded now and at regularly scheduled interval, remove the
checkmark by One time only and then use the schedule options to specify how frequently to
update the lookup file.
Tip: Make sure you are familiar with the information in "Time/NTP" on page409 before
setting the schedule.
Choose Every Day, Days of Week, or Days of Month from the upper pull-down menu.
Note: When specifying multiple days, separate them with a comma. When specifying the
time, use 24-hour format.
i. If Every Day, select one of the following options from the lower pull-down menu, and
enter the necessary values:
lHour of day: (0-23) Enter the time you want the task to run in the Hours (24 hour
format) field. Midnight is zero (0).
lEvery: Select Hours or Minutes from the right-most pull-down menu and specify how
frequently you want the task to run.
Hours: (1-23) Enter how frequently in hours you want the task to run. The result is
every n hours every day.
Minutes: (15-59) Enter how frequently in minutes you want the task to run. The result is
every n minutes every day.
ii. If Days of Week, select from the following options from the lower pull-down menu, and
enter the necessary values:
lDays: (1-7) Enter the days of the week you want the task to run (Sunday=1, Monday=2,
and so on).
lHour of Day: (0-23) Enter the time you want the task to run in the text field to the
right. 0 is midnight.
lEvery: Select Hours or Minutes from the right-most pull-down menu and specify how
frequently you want the task to run.
Hours: (1-23) Enter how frequently in hours you want the task to run. The result is
every n hours on the selected days.
Administrator's Guide
HPE Logger 6.2 Page 287 of 623
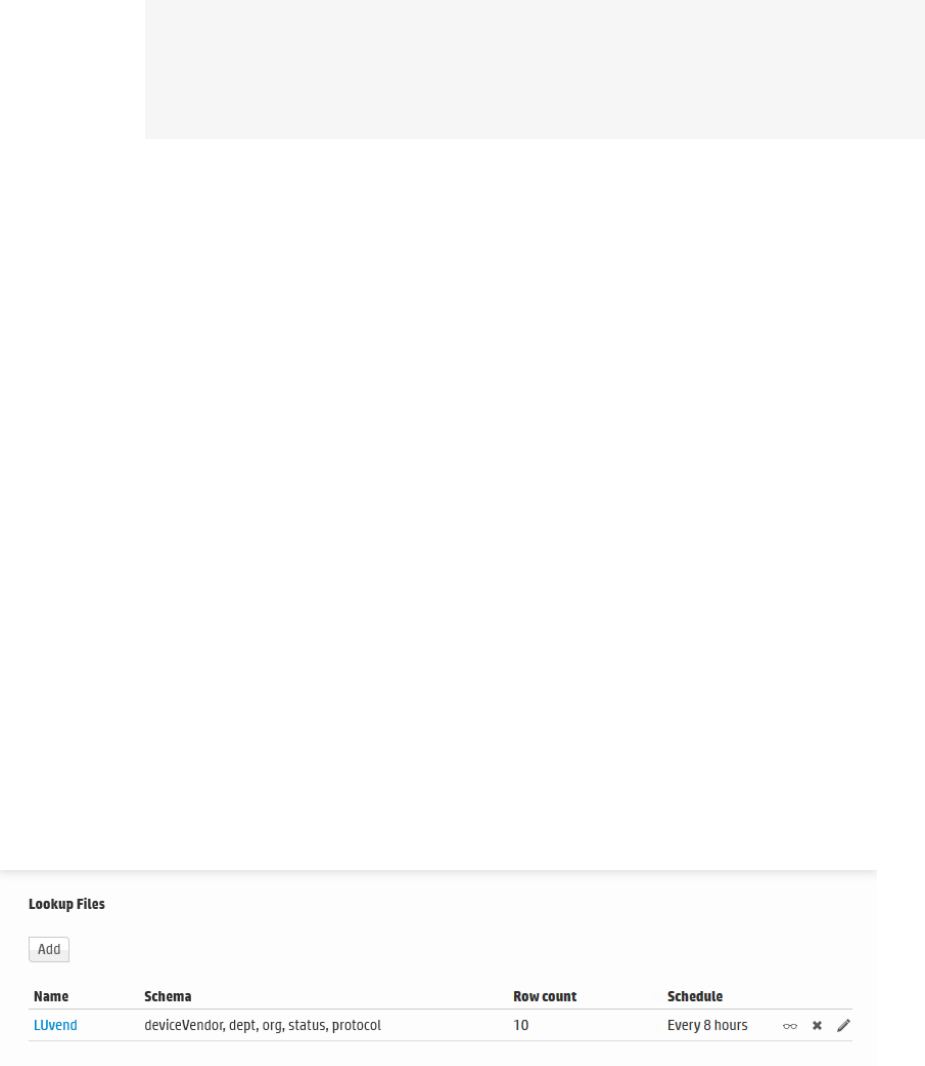
Minutes: (15-59) Enter how frequently in minutes you want the task to run. The result is
every n minutes on the selected days.
iii. If Days of Month, Select from the following options from the lower pull-down menu, and
enter the necessary values:
lDays: (1-31) Enter the day or days of the month you want the task to run.
Note: The number of days in a month vary. Scheduled tasks will only run if the
specified day exists for that month. Tasks scheduled on the 31st day of the month
will not run in April, February, June, November, and September. Tasks scheduled
on the 29th day of the month will only run in February during leap years.
lHour of Day: (0-23) Enter the time of day you want the task to run. (You cannot select
Every for this option.)
Examples:
oTo run the scheduled job every 45 minutes of every day, select Every Day in the upper
Schedule pull-down menu. Choose Every from the lower pull-down menu, enter 45 in the
text box and the select Minutes.
oTo run the scheduled job every four hours on Tuesdays and Thursdays , select Days of
Week from the upper Schedule pull-down menu and enter 3,5 as the Days. Then choose
Every from the lower pull-down menu, enter 4 in the text box.
oTo run the scheduled job on the 14th of each month at 3 AM, select Days of Month from the
upper Schedule pull-down menu and enter 14 as the Days. Then choose Hour of day from
the lower pull-down menu and enter 3 in the text box. (To run the scheduled job at 3 AM and
3 PM, you would enter 3,15.)
7. Click Save. After the Lookup file is uploaded, it will be displayed in the list of Lookup files. If you
specified a schedule, the Lookup process will look in the specified location at the indicated time and
upload the new version (if there is one).
Managing Uploaded Lookup Files
After you upload a Lookup file, you can view it, edit it or delete it by using the icons at the end of the
row for that file.
Administrator's Guide
HPE Logger 6.2 Page 288 of 623
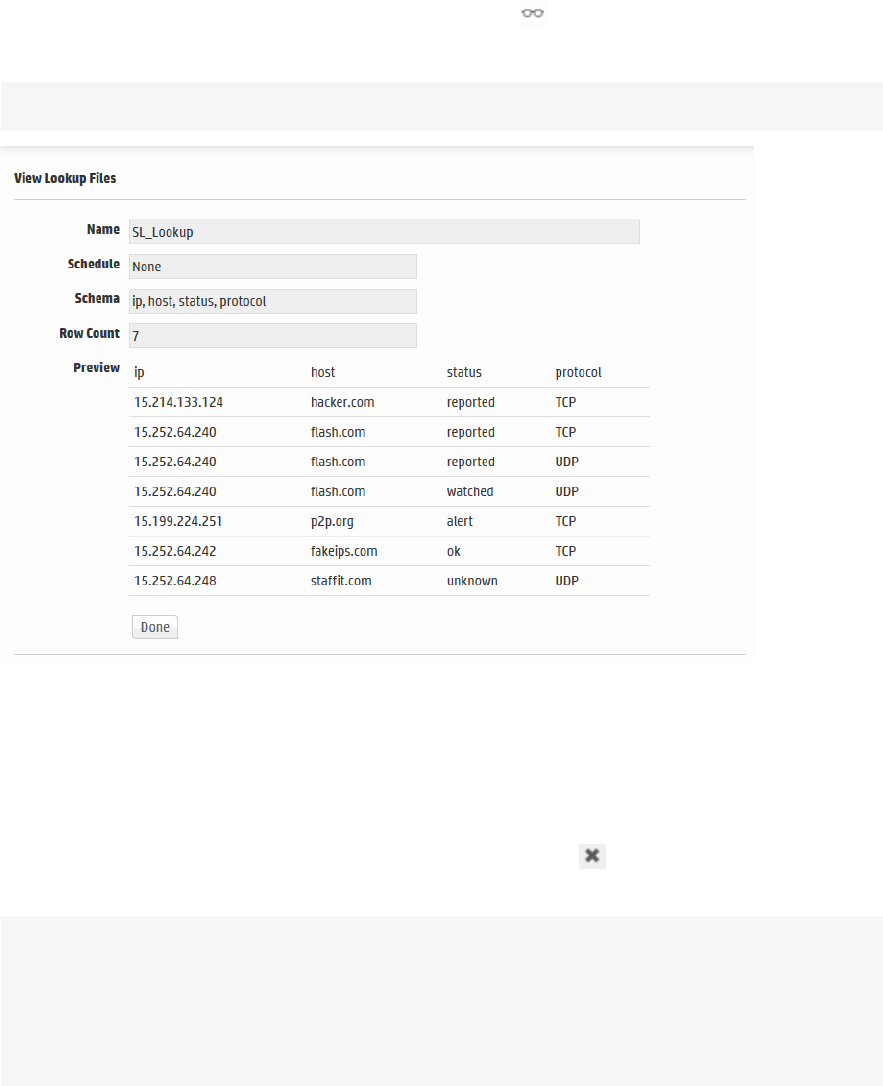
To view an uploaded Lookup file:
1. Open the Configuration | Search menu and click Lookup Files.
2. Find the Lookup file you want to view, click the view icon ( ) or the Lookup file’s name.
This view only shows a few rows. The entire file may not be displayed.
Note:The Schedule field is only displayed if the Lookup file has been scheduled for update.
3. Click Done to return to the list of Lookup files. You cannot edit the file from here. If you need to
change something, follow the steps under "To edit a Lookup file: " on the next page.
To delete a Lookup file:
1. Open the Configuration | Search menu and click Lookup Files.
2. Find the Lookup file you want to remove, click the Remove icon ( ) on that row and then click
OK.
Note: Attempting to remove a Lookup file that is still being used in a current search session
will result in an error message. The file will not be deleted. To quickly clear such files from the
search cache so that they can be removed, run a search that does NOT use the lookup
operator. This closes the lookup search session and ensures that the Lookup file is no longer in
use. Once the session is closed, you can remove the Lookup file.
Administrator's Guide
HPE Logger 6.2 Page 289 of 623
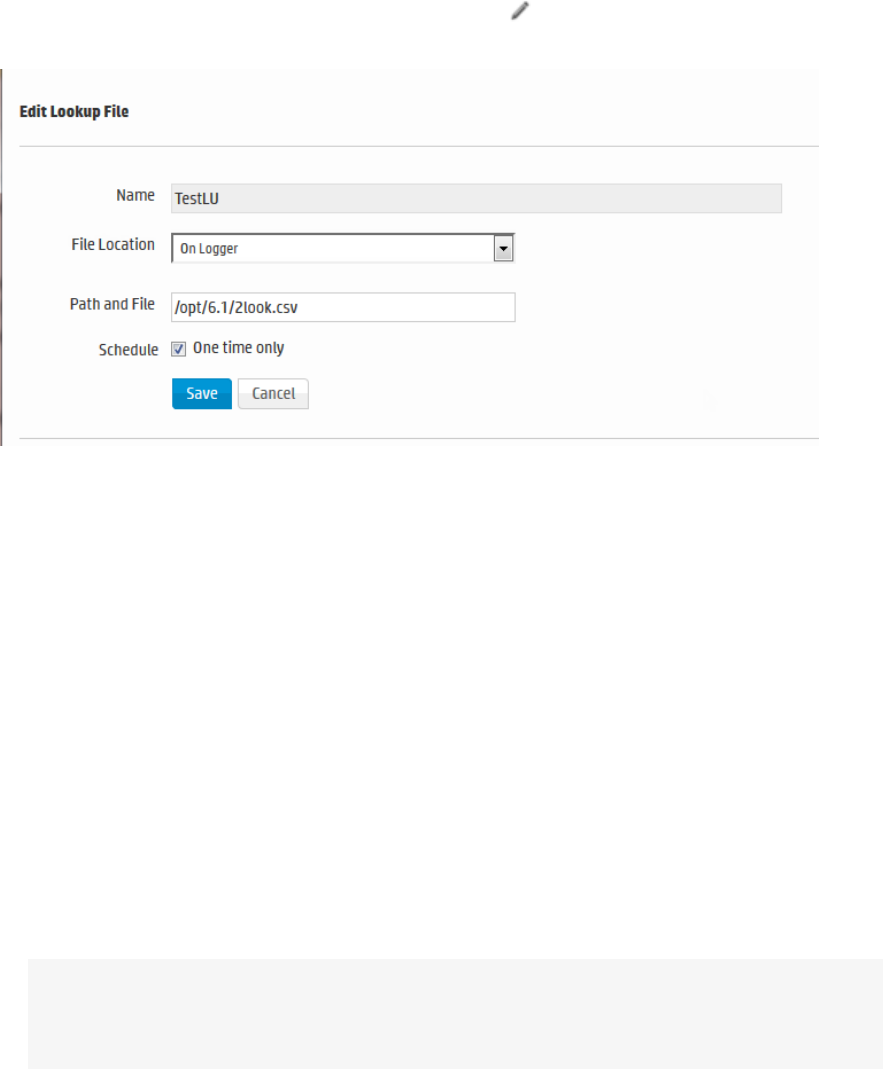
To edit a Lookup file:
1. Open the Configuration | Search menu and click Lookup Files.
2. Find the Lookup file you want to edit, click the Edit icon ( ) on that row and then click OK. The
Edit Lookup File page opens.
You can upload a new version of the Lookup file, schedule a lookup update, or change the existing
update schedule.
3. Select where to access the Lookup file.
lSelect Local to browse to a location on your local machine and upload the file one time only.
lSelect On Logger to enter a path on the Logger's server. If you select this option, you can
choose to set up a regular update schedule.
The available options change based on your selection.
4. Specify the Lookup file's location.
lIf you selected Local, click Browse, navigate to the desired .csv, .zip or .gz file, and then click
Open.
lIf you selected On Logger, specify the absolute path and file name on the Logger system. For
example, if the file is in the /opt folder on your Logger you could specify
/opt/lookup.csv.The lookup file must already exist in this location.
Note: The Logger Appliance supports mounting through the user interface. Software
Logger uses its file system, which can contain remote folders mounted through the
operating system.
5. If you selected On Logger, specify how often to upload the Lookup file.
Administrator's Guide
HPE Logger 6.2 Page 290 of 623

lTo upload the Lookup file only once, check One time only.
lTo schedule the Lookup file to be uploaded now and at regularly scheduled interval, remove the
checkmark by One time only and then select a schedule.
Tip: Make sure you are familiar with the information in "Time/NTP" on page409 before
setting the schedule.
Choose Every Day, Days of Week, or Days of Month from the upper pull-down menu.
Note: When specifying multiple days, separate them with a comma. When specifying the
time, use 24-hour format.
i. If Every Day, select one of the following options from the lower pull-down menu, and
enter the necessary values:
lHour of day: (0-23) Enter the time you want the task to run in the Hours (24 hour
format) field. Midnight is zero (0).
lEvery: Select Hours or Minutes from the right-most pull-down menu and specify how
frequently you want the task to run.
Hours: (1-23) Enter how frequently in hours you want the task to run. The result is
every n hours every day.
Minutes: (15-59) Enter how frequently in minutes you want the task to run. The result is
every n minutes every day.
ii. If Days of Week, select from the following options from the lower pull-down menu, and
enter the necessary values:
lDays: (1-7) Enter the days of the week you want the task to run (Sunday=1, Monday=2,
and so on).
lHour of Day: (0-23) Enter the time you want the task to run in the text field to the
right. 0 is midnight.
lEvery: Select Hours or Minutes from the right-most pull-down menu and specify how
frequently you want the task to run.
Hours: (1-23) Enter how frequently in hours you want the task to run. The result is
every n hours on the selected days.
Minutes: (15-59) Enter how frequently in minutes you want the task to run. The result is
every n minutes on the selected days.
iii. If Days of Month, Select from the following options from the lower pull-down menu, and
enter the necessary values:
lDays: (1-31) Enter the day or days of the month you want the task to run.
Note: The number of days in a month vary. Scheduled tasks will only run if the
Administrator's Guide
HPE Logger 6.2 Page 291 of 623

specified day exists for that month. Tasks scheduled on the 31st day of the month
will not run in April, February, June, November, and September. Tasks scheduled
on the 29th day of the month will only run in February during leap years.
lHour of Day: (0-23) Enter the time of day you want the task to run. (You cannot select
Every for this option.)
Examples:
oTo run the scheduled job every 45 minutes of every day, select Every Day in the upper
Schedule pull-down menu. Choose Every from the lower pull-down menu, enter 45 in the
text box and the select Minutes.
oTo run the scheduled job every four hours on Tuesdays and Thursdays , select Days of
Week from the upper Schedule pull-down menu and enter 3,5 as the Days. Then choose
Every from the lower pull-down menu, enter 4 in the text box.
oTo run the scheduled job on the 14th of each month at 3 AM, select Days of Month from the
upper Schedule pull-down menu and enter 14 as the Days. Then choose Hour of day from
the lower pull-down menu and enter 3 in the text box. (To run the scheduled job at 3 AM and
3 PM, you would enter 3,15.)
6. Click Save. After the Lookup file is uploaded, it will be displayed in the list of Lookup files. If you
specified a schedule, the Lookup process will look in the specified location at the indicated time and
upload the new version (if there is one).
Data
The options in the Configuration | Data category enable you to control the data going in and out of
your Logger.
• Devices 293
• Device Groups 294
• Receivers 296
• Source Types 314
• Parsers 318
• Forwarders 324
• Real Time Alerts 331
• SNMP Destinations 340
• Syslog Destinations 341
• Sending Notifications to ESM Destinations 342
• ESM Destinations 343
• Certificates 346
Administrator's Guide
HPE Logger 6.2 Page 292 of 623
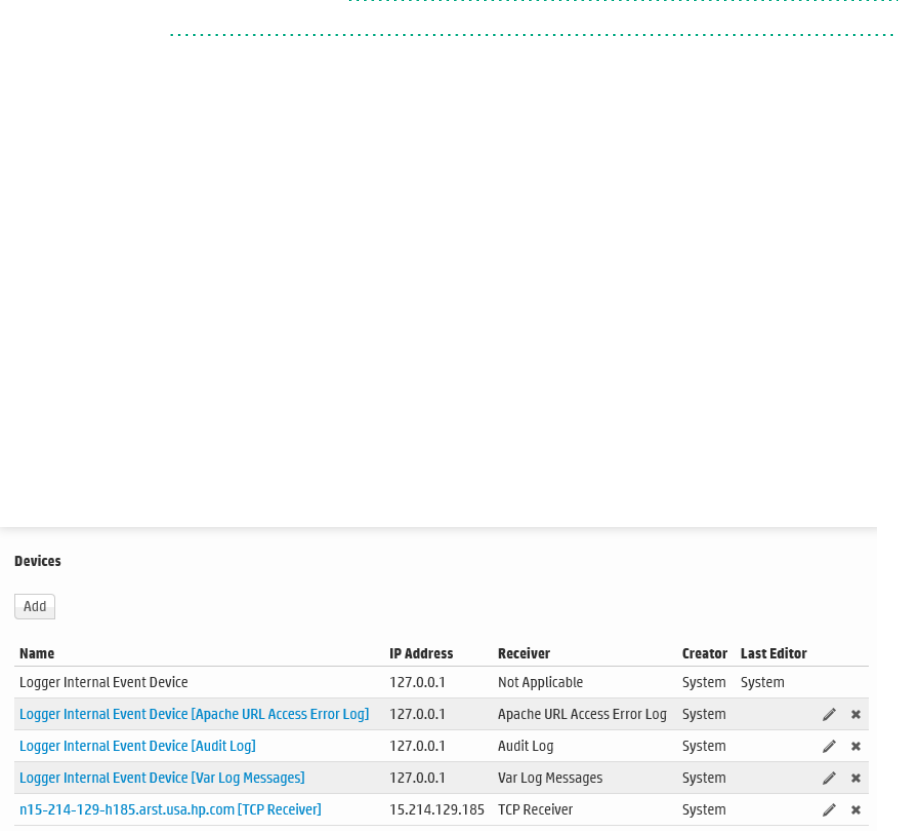
• Forwarding Log File Events to ESM 347
• Data Validation 348
Devices
A device is a named event source, comprising of an IP address (or hostname) and a receiver name. Two
receivers can receive events from the same IP address, so IP address alone is insufficient to identify a
device. Event source is the device that directly sends the event to Logger. When an event is sent
through a SmartConnector, the event source is the system on which the SmartConnector is running and
not the device that sent the event to the SmartConnector.
Devices can be added to device groups, and device groups can be referenced in filters and queries.
Receivers perform autodiscovery by automatically creating a device for each source IP address. Devices
created by autodiscovery are named for their hostname, or if the hostname cannot be determined, their
IP address.
The Devices page displays all defined devices and includes controls to add, edit, or delete them.
Devices page
Maximum number of devices that can be defined on Logger: No limit.
Autodiscovery creates devices automatically, but you can also define them manually.
To define a device:
1. Open the Configuration | Data menu and click Devices.
A display similar the "Devices page" above appears.
2. Click Add.
3. Enter a name, an IP address, and select a receiver for the new device.
4. Click Save to add the new device, or Cancel to abandon it.
One reason for editing a device is to replace the default name created by autodiscovery (the IP address
or hostname) with a more meaningful one.
Administrator's Guide
HPE Logger 6.2 Page 293 of 623

To edit a device:
1. Open the Configuration | Data menu and click Devices.
A display similar the "Devices page" on the previous page appears.
2. Locate the device that you want to edit and click the Edit icon ( ) on that row.
3. Change the Name or IP address for the device.
4. Click Save to update the device group, or Cancel to abandon your changes.
To delete a device:
1. Open the Configuration | Data menu and click Devices.
A display similar the "Devices page" on the previous page appears.
2. Locate the device that you want to delete and click the Remove icon ( ) on that row.
Deleting a device does not block the source IP address from sending events. If new events are
received, autodiscovery recreates the device.
3. Confirm the deletion by clicking OK, or click Cancel to retain the device.
Device Groups
Device groups allow you to categorize named source IP addresses called devices. The Device Groups
page lists all device groups with edit and delete icons and includes the ability to create new device
groups.
Tip: Device groups can be associated with storage rules that define in which storage group events
from specific devices are stored. Doing so enables you to retain event data from different sources
for different lengths of times (because you can define different retention policies on different
storage groups). For more information about storage rules, see "Storage Rules" on page353.
Tip: There is no maximum number of device groups that can be created on Logger.
To create a device group:
1. Open the Configuration | Data menu and click Device Groups.
2. Click Add. A display similar to that shown below appears.
Administrator's Guide
HPE Logger 6.2 Page 294 of 623
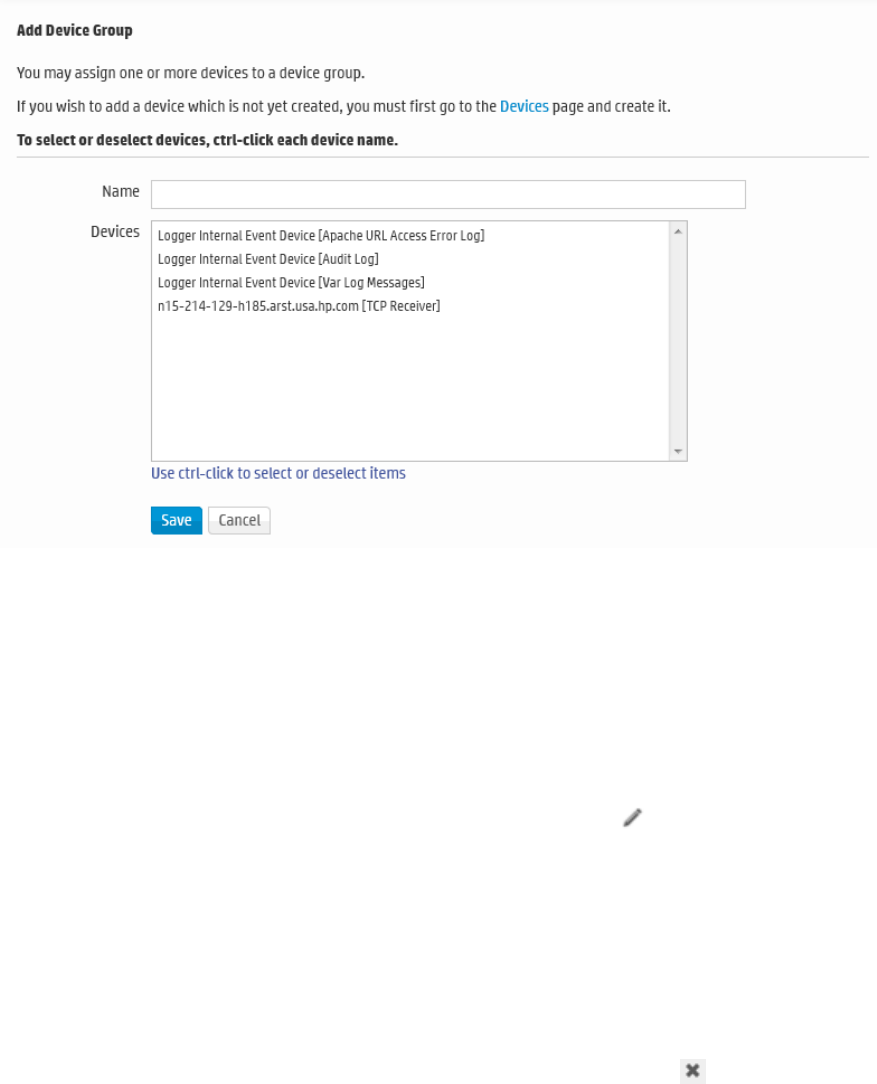
3. Enter a name for the new device group. Click to select devices from the list. Press and hold the Ctrl
key when clicking to add additional devices to the selection. To select a range of devices, click to
select the first device, then press and hold the Shift key while clicking the last device.
4. Click Save to create the new device group, or Cancel to abandon it.
To edit a device group:
1. Open the Configuration | Data menu and click Device Groups.
2. Locate the device group that you want to edit and click the Edit icon ( ) on that row.
3. Change the Name, add, or remove devices from the selection. Ctrl-Click devices that are not
selected to select them, or Ctrl-Click selected devices to remove them from the selection.
4. Click Save to update the device group, or Cancel to abandon your changes.
To delete a device group:
1. Open the Configuration | Data menu and click Device Groups.
2. Locate the device group that you want to delete and click the Remove icon ( ) on that row.
Deleting a device group does not affect the set of devices.
3. Confirm the deletion by clicking OK, or click Cancel to retain the device group.
Administrator's Guide
HPE Logger 6.2 Page 295 of 623

Receivers
Logger can receive text events, either sent through the network or read from a file. From the Receivers
page, you can set up and configure the receivers that will capture event data, and populate each event
with information about its origin. Some receivers capture streaming events transmitted over the
network by devices, applications, services, and so on. Other types of receivers monitor individual files for
events or monitor files selected from a directory tree, based on a pattern you specify. Since receivers can
only receive events of a single source type, you should set up separate receivers for each type of log file.
To start receiving events, direct your event sources to the default receivers. For more information about
the default receivers, refer to the Logger Installation guide.
Receiver types include UDP, TCP, SmartMessage, and three types of file based receivers, File Transfer,
File Receiver, and Folder Follower Receiver.
You can configure the following types of receivers:
lUDP Receiver: UDP receivers listen for User Datagram Protocol messages on the port you specify.
Logger comes pre-configured with a UDP Receiver on port 514 or 8514, enabled by default. For
Software Loggers, this port may vary based on the port numbers available at installation time.
lCEF UDP Receiver: UDP receivers that receive events in Common Event Format.
lTCP Receiver: TCP receivers listen for Transmission Control Protocol messages on the port you
specify. Logger comes pre-configured with a TCP receiver on port 515 or 8515, enabled by default.
For Software Loggers, this port may vary based on the port numbers available at installation time.
lCEF TCP Receiver: TCP receivers that receive events in Common Event Format.
lFile Receiver: Depending on the type of Logger, file receivers read log files from a local file system,
Network File System (NFS), Common Internet File System (CIFS), or Storage Area Network (SAN).
File receivers read single or multi-line log files. They provide a snapshot of a log file at a single point in
time.
lFolder Follower Receiver: Folder follower receivers actively read the log files in a specified directory
as they are updated. If the source directory contains different types of log files, you can create a
receiver for each type of file that you want to monitor. Logger comes pre-configured with folder
follower receivers for Logger’s Apache Access Error Log, the system Messages Log, and Audit Log
(when auditing is enabled). You must enable these receivers in order to use them.
lFile Transfer: File Transfer receivers read remote log files using SCP, SFTP, or FTP protocol. These
receivers can read single- or multi-line log files. You can schedule the receiver to read a file or batch of
files periodically.
Note: Be aware of the following when setting up file transfer receivers.
lThe SCP, SFTP, and FTP file transfer receivers depend on the FTP (File Transfer Protocol)
SCP (Secure Copy Protocol) and SFTP (SSH file transfer protocol) clients installed on your
system. Ensure that the appropriate client is installed on the system before you create the
Administrator's Guide
HPE Logger 6.2 Page 296 of 623

receiver.
lThe SCP and SFTP protocols on Logger Appliances are not FIPS compliant.
lSmartMessage Receiver: SmartMessage receivers listen for encrypted messages from ArcSight
SmartConnectors. Logger comes pre-configured with a SmartMessage receiver with the name
“SmartMessage Receiver.” To use this receiver to receive events from a SmartConnector, set the
Receiver Name to be “SmartMessage Receiver” when configuring the SmartConnector’s destination.
For more information on SmartConnectors, see "Using SmartConnectors to Collect Events " on
page502.
File Based Receivers
File based receiver types include File Receivers, File Transfer Receivers, and Folder Follower Receivers.
You can set them up as multiline receivers, and configure them to use source types with associated
parsers to extract data from captured events.
Note: When a receiver cannot read the file it logs from, such as when the file or folder is deleted or
renamed, Logger records a message in current/arcsight/logger/logs/logger_
receiver.log.
Multi-line Receivers
TCP and UDP receivers interpret line break characters, such as \r or \n, as the end of the event. If the
input event contains embedded \r or \n characters, the event will be treated as more than one event. If
your events span more than one line, you may want to use a multi-line receiver. Multi-line receivers
include the File Transfer, File Receiver, and Folder Follower Receivers.
A multi-line receiver can read events that span more than one line, such as a server log. You could set up
the receiver to handle stack traces reported in the log by reading the entire stack trace as a single event
instead of reading each line separately.
When creating a multi-line receiver, you must specify a regular expression that the receiver should use
to detect the start of a new event in the log file. Each new event starts where the characters in the log
file match the regular expression.
For example, in the following log file, each event starts with a timestamp embedded within square
brackets ([yy-MM-dd HH:mm:ss.SSS]); therefore, you can use this regular expression to identify
each event:
^\[\d+-\d+-\d+ \d+:\d+:\d+,\d+\].*
Administrator's Guide
HPE Logger 6.2 Page 297 of 623
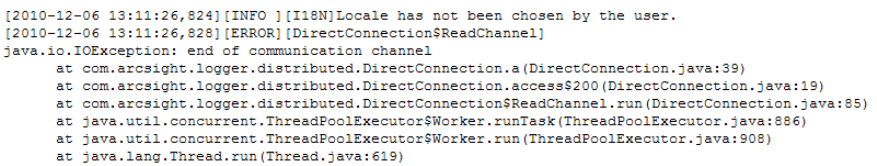
lFor multi-line file receivers and file transfer receivers, the regular expression that identifies the
beginning of a new event must be specified in the receiver’s Multiline Event Starts With field.
lFor multi-line folder follower receivers, the regular expression that identifies the beginning of a new
event must be specified in the Multiline Event Starts With field of the source type associated with
that receiver, rather than in the receiver itself.
For information on creating and using receivers, see "Working with Receivers" on the next page. For
information on creating and using source types, see "Source Types" on page314.
Folder Follower Receivers
When you want to monitor active files as they are updated, use a folder follower receiver. After you set
up a folder follower receiver and enable it, it will monitor the specified files in that directory and
continuously upload new events to the system. Folder follower receivers recognize file rotation.
Overview of the steps to monitor a directory:
1. Determine the types of logs you need to monitor.
2. Determine whether the out-of-box source types or source type/parser pairs will satisfy your needs.
For more information, see "Source Types" on page314, and "Parsers" on page318.
If so, proceed to the next step.
If not, create the parsers and source types that you need.
a. Select an appropriate parser or set of parser for the log files in the directory you want to follow.
If the out-of-box parsers do not provide what you need, create appropriate parsers.
b. Assign a source type for each parser. If the out-of-box source types do not provide what you
need, create appropriate source types.
3. Create the folder follower receivers required to monitor the logs in the directory, selecting the
source type you chose or created, above. For more information, see "Working with Receivers" on
the next page.
4. Enable the receivers.
5. Optionally, to forward log file events, set up and configure one or more forwarders. For more
information, see "Forwarders" on page324.
Using Source Types with File Follower Receivers
Logger uses the parser associated with the source type you select for a receiver to extract fields and
their respective values from the received events. These fields are parsed at search time. For more
Administrator's Guide
HPE Logger 6.2 Page 298 of 623
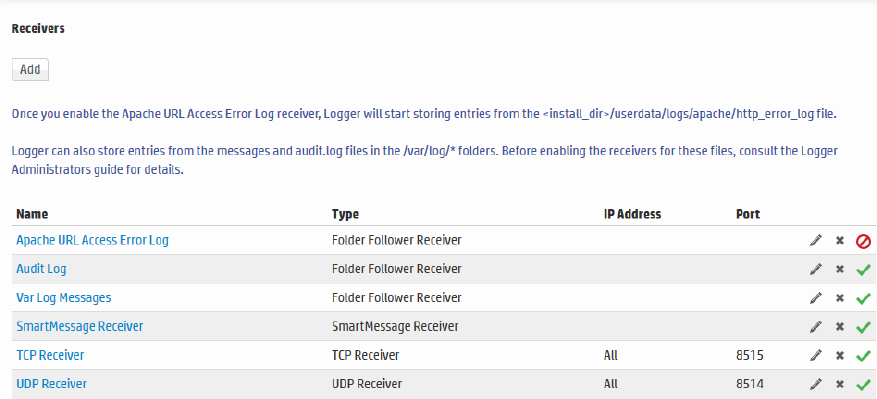
information on using source types and parsers, see "Source Types" on page314, and "Parsers" on
page318.
When creating a file follower receiver, you must select a source type appropriate to monitor a specific
type of log file. After you select the source type for the file follower receiver, ensure that the parser
associated with it works with your source files.
Events from different versions of the same source type can be in different formats. Similarly, events
from different source types of the same vendor might be formatted differently. Therefore, if the source
type of your source file does not exactly match the specifications of your source type, the associated
parser will not parse events correctly, and the search results will not display any parsed fields.
To confirm whether the source type has a valid parser for your source type, after you have set up the
receiver, check whether the incoming events are parsed. To determine this, run a search and review the
“parser” field in the search results. The parser used in the search will be displayed in the parser column
of the search results. If the event was parsed, this field contains the name of the parser. If the event was
not parsed successfully, this field contains “Not parsed.” If no parser is defined for the source type or if
there is no source type, the field is blank.
Working with Receivers
Several receivers come set up on your system. You can add other receivers as needed. The maximum
number of receivers that you can create is limited by system resources—memory, CPU, disk
input/output and possibly network bandwidth.
The receiver ports available on your system may vary from the image shown.
Receivers page
Administrator's Guide
HPE Logger 6.2 Page 299 of 623

Before creating a receiver of type File Receiver:
lFor the Logger Appliance, set up a Network File System mount. See "Storage" on page351.
lFor Software Logger, the file system from which the log files will be read needs to be mounted on the
system on which you have installed Logger.
Note: Before creating a receiver of type File Transfer, ensure that the appropriate SCP, SFTP, and
FTP client is installed on your system.
The Logger Appliance supports mounting through the user interface. Software Logger uses its file
system, which can contain remote folders mounted through the operating system.
To create a receiver:
1. Open the Configuration | Data menu and click Receivers.
The "Receivers page" on the previous page displays the current receivers and their status. You can
sort the fields by clicking the column headers.
2. Click Add.
3. Enter a name for the new receiver. SmartMessage receiver names are used when configuring the
associated ArcSight SmartConnectors.
4. Choose the receiver type. Select UDP Receiver, TCP Receiver, CEF UDP Receiver, CEF TCP
Receiver, File Receiver, Folder Follower Receiver, File Transfer, or SmartMessage Receiver.
Note: The receiver type cannot be changed after the receiver is created.
5. Click Next to edit receiver parameters.
The fields displayed in the Edit Receiver dialog box vary according to the type of Logger and the
type of receiver.
6. Fill in the appropriate fields. Refer to the following tables for field descriptions.
l"Parameters used in UDP Receivers, TCP Receivers, CEF UDP Receivers, and CEF TCP
Receivers" on page302
l"Parameters used in File Receivers" on page303
l"Parameters used in Folder Follower Receivers" on page306
l"Parameters used in File Transfer Receivers" on page308
l"Parameters used in SmartMessage Receivers" on page312
7. The Enable checkbox is flagged by default, so that the receiver will be enabled immediately after
you create. If you do not want to enable the receiver now, click the checkbox to remove the flag.
You can enable it later.
8. Click Save.
Administrator's Guide
HPE Logger 6.2 Page 300 of 623
To enable or disable a receiver:
Note: Before enabling the following preconfigured folder follower receivers for Software Logger,
ensure that the files are readable by the non-root user that you installed with or specified during
installation.
l/var/log/messages
l/var/log/audit/audit.log
1. Open the Configuration | Data menu and click Receivers.
The "Receivers page" on page299 displays the current receivers and their status. You can sort the
fields by clicking the column headers.
2. Locate the receiver that you want to enable or disable.
lIf the receiver is currently disabled, click the Disabled icon ( ) to enable it.
lIf the receiver is currently enabled, click the Enabled icon ( ) to disable it.
Tip: Wait a few minutes after enabling a receiver before disabling it. Likewise, wait before
enabling a receiver that has just been disabled. Background tasks initiated by enabling or
disabling a receiver can produce unexpected results if they are interrupted.
To edit a receiver:
1. Open the Configuration | Data menu and click Receivers.
The "Receivers page" on page299 displays the current receivers and their status. You can sort the
fields by clicking the column headers.
2. Locate the receiver that you want to update and click the Edit icon ( ) on that row.
The fields displayed in the Edit Receiver dialog box vary according to the type of Logger and the
type of Receiver.
3. Edit the appropriate fields. Refer to the following tables for field descriptions.
l"Parameters used in UDP Receivers, TCP Receivers, CEF UDP Receivers, and CEF TCP
Receivers" on the next page
l"Parameters used in File Receivers" on page303
l"Parameters used in Folder Follower Receivers" on page306
l"Parameters used in File Transfer Receivers" on page308
l"Parameters used in File Transfer Receivers" on page308
4. Flag the Enable checkbox to have the receiver immediately enabled, or remove the flag from the
checkbox to enable the receiver later.
5. Click Save.
Administrator's Guide
HPE Logger 6.2 Page 301 of 623

To delete a receiver:
1. Open the Configuration | Data menu and click Receivers.
The "Receivers page" on page299 displays the current receivers and their status. You can sort the
fields by clicking the column headers.
2. Locate the receiver that you want to delete and click the Remove icon ( ) on that row.
3. Click OK to confirm the delete.
Receiver Parameters
Use these parameters when creating and editing receivers.
Parameters used in UDP Receivers, TCP Receivers, CEF UDP Receivers, and CEF
TCP Receivers
Parameter Description
Name The name of the receiver, used for reporting and status monitoring.
IP/Host Select one of the available network connections for the receiver to listen to, or select
All to listen on both network connections.
Note: If localhost (127.0.0.1) appears in the list, it means that the Logger
hostname has not been configured. To configure the hostname, see "Network " on
page405.
Port For the Logger Appliance:
lThe default UDP Receiver is pre-configured on port 514.
lFor SmartMessage receivers, configure the SmartConnector for port 443.
For Software Logger:
lIf you installed Software Logger as a root user, you can use any available port. The
default UDP Receiver is pre-configured on port 514. If that port is not available, then
the next higher available port is chosen.
lIf you installed Software Logger as a non-root user, you can only use a port
numbers greater than 1024. The default UDP Receiver is pre-configured on port
8514. If that port is not available, then the next higher available port is chosen.
Encoding Select a character encoding, such as US-ASCII, Big5, or EUC-KR, from the pulldown list.
CEF UDP, CEF TCP, and SmartMessage receivers must use US-ASCII or UTF-8
encoding.
Administrator's Guide
HPE Logger 6.2 Page 302 of 623

Parameter Description
Source
Type
Select from the pull-down list of log file types, including:
lApache HTTP Server Access
lApache HTTP Server Error
lJuniper Steel-Belted Radius
lMicrosoft DHCP Log
lIBM DB2 Audit
lMore options...
Additionally, you can define your own source types, based on the needs of your
company. See "Source Types" on page314.
A receiver can only receive events of a single source type. Set up separate receivers for
each type of log file.
Note: CEF TCP and CEF UDP receivers are set to the CEF source type, and cannot
be changed. Currently, there is no parser associated with the CEF source type.
Associating Source types with TCP and UDP receivers was introduced in Logger 5.3
SP1. When upgrading, TCP and UDP receivers from earlier releases are set to the
“Other” source type.
Parameters used in File Receivers
Fill in the following fields when creating or editing File Receivers.
Parameter Description
Name The name of the receiver, used for reporting and status monitoring.
RFS Names Select from the pulldown list of NFS or CIFS mount names. The list also includes
attached SANs on Logger models that support SAN.
To mount NFS volumes, see "Storage" on page419. To mount CIFS shares, see
"Storage" on page419. For more information about SAN, see "SAN" on page422.
Folder Choose “Local” and then specify the directory on your Logger where the remote file
system is mounted in the “Folder” field.
To mount a remote file system on the system on which you have installed Logger, see
its operating system’s documentation.
Administrator's Guide
HPE Logger 6.2 Page 303 of 623

Parameter Description
Source
Type
Select from the pulldown list of log file types, including:
lApache HTTP Server Access
lApache HTTP Server Error
lJuniper Steel-Belted Radius
lMicrosoft DHCP Log
lIBM DB2 Audit
lMore options...
Additionally, you can define your own source type, based on the needs of your
enterprise. See "Source Types" on page314.
A receiver can only receive events of a single source type. Set up separate receivers for
each type of log file.
Wildcard
(regex)
A regular expression (regex) describing the log files to read.
This is a regular expression, not a typical file wildcard like “*.*”.
The default is .*, meaning all files.
Examples:
To include all files ending with .process, you could use:
.*\.process
To monitor only *.properties files, you could use:
.*\.properties
To include only .log files with eight digit filenames, you could use:
\d{8}.log
Note: Uploading any type of data other than text, including binary files such as
.zip or .bin, may prevent Logger from functioning correctly. Use caution when
pulling everything from a directory by specifying .* in the Regex field, as you
could inadvertently include binary files.
Mode Select one of the following:
lDelete - delete the log file once it has been processed
lRename - rename the log file once it has been processed. The file is named by
appending the Rename Extension.
lPersist - Logger remembers which files have been processed and only processes
them once.
Administrator's Guide
HPE Logger 6.2 Page 304 of 623
Parameter Description
Rename
extension
The suffix to append to log files that have been processed.
Character
encoding
Select a character encoding, such as US-ASCII, Big5, or EUC-KR, from the pulldown list.
CEF UDP, CEF TCP, and SmartMessage receivers must use US-ASCII or UTF-8
encoding.
Delay after
seen
Number of seconds to wait after a source file is first seen until it is processed. This
allows the entire file to be copied to Logger or (in the case of File Receiver) copied to
the remote file system, before processing begins.
The default is 10 seconds.
Note: For File Transfer Receivers, this parameter should be set to a larger value if
large files are expected. The default, 10 seconds, does not allow enough time for a
large file, such as 1 GB.
Event Time
Locale
Select a locale from the pulldown list, such as English (United States), Chinese (Hong
Kong), Chinese (Taiwan), and so on.
Date/time
zone
Required if the timestamp in the log file does not specify a time zone.
For File Transfer and File Receivers, this parameter is ignored if either Date/time format
or Date/time location regex are blank.
On appliance Loggers you can see the time zone configured on the Logger System
Admin | System | Network > Time/NTP tab. Software Loggers use the system time.
Event Time
Location
A regular expression describing which characters represent the timestamp in the log
file. For example:
.*\[(.*?)\].*
This regular expression specifies that the timestamp is found inside the first set of
square brackets on each line. The first capturing group (the part of the regex in
parentheses) is that part that is then parsed using the Date/time format.
The default is no timestamp.
Event Time
Format
Required if the log file contains timestamps in the same format for each event. If not
specified (or if the Date/time location regex is blank), each event in the file will be
stamped with the date that the file itself was first seen by Logger (not its file system
timestamp).
See "Date/Time Format Specification" on page313 for a list of formats.
Administrator's Guide
HPE Logger 6.2 Page 305 of 623

Parameter Description
The default is no timestamp.
Multiline
Event
Starts With
A regular expression that specifies the start of a new event in a log file. Specify this
expression to enable the receiver to read multi-line log files. Each new event starts at
the point where the regular expression is matched to the characters in the log file. For
example,
^\[\d+-\d+-\d+ \d+:\d+,\d+].*
This regular expression matches timestamps such as:
[2010-12-06 13:09:46,818]
When this field is left blank, each line in the log file is treated as a single event.
The default is each line in the log file is a single event.
Parameters used in Folder Follower Receivers
Fill in the following fields when creating or editing Folder Follower Receivers.
Parameter Description
Name The name of the receiver, used for reporting and status monitoring.
Local
Folder
Specify the local folder to process. On the Logger Appliance, this field is only available
if you select “Local” for the Mount Name.
Source
Type
Select from the pulldown list of log file types, including:
lApache HTTP Server Access
lApache HTTP Server Error
lJuniper Steel-Belted Radius
lMicrosoft DHCP Log
lIBM DB2 Audit
lMore options...
Additionally, you can define your own source type, based on the needs of your
company. See "Source Types" on page314.
A receiver can only receive events of a single source type. Set up separate receivers for
each type of log file.
Wildcard A regular expression (regex) describing the log files to read.
Administrator's Guide
HPE Logger 6.2 Page 306 of 623

Parameter Description
(regex) This is a regular expression, not a typical file wildcard like “*.*”.
The default is .*, meaning all files.
Examples:
To include all files ending with .process, you could use:
.*\.process
To monitor only *.properties files, you could use:
.*\.properties
To include only .log files with eight digit filenames, you could use:
\d{8}.log
Note: Uploading any type of data other than text, including binary files such as
.zip or .bin, may prevent Logger from functioning correctly. Use caution when
pulling everything from a directory by specifying .* in the Regex field, as you could
inadvertently include binary files.
Blacklist
(regex)
A regular expression (regex) describing the name of the log files to ignore. Files are not
monitored if they match this expression.
This is a regular expression, not a typical file wildcard like *.*.
Example:
To exclude files that end in .txt, you could use:
.*\.txt
To monitor all files except *.txt, you could use:
Wildcard: .*
Blacklist: .*\.txt
Character
encoding
Select a character encoding, such as US-ASCII, Big5, or EUC-KR, from the pulldown list.
CEF UDP, CEF TCP, and SmartMessage receivers must use US-ASCII or UTF-8
encoding.
Date/time
zone
Required if the timestamp in the log file does not specify a time zone.
For File Transfer and File Receivers, this parameter is ignored if either Date/time format
or Date/time location regex are blank.
You can see the time zone configured on the Logger System Admin | System |
Network > Time/NTP tab.
Software Loggers use the system time.
Administrator's Guide
HPE Logger 6.2 Page 307 of 623
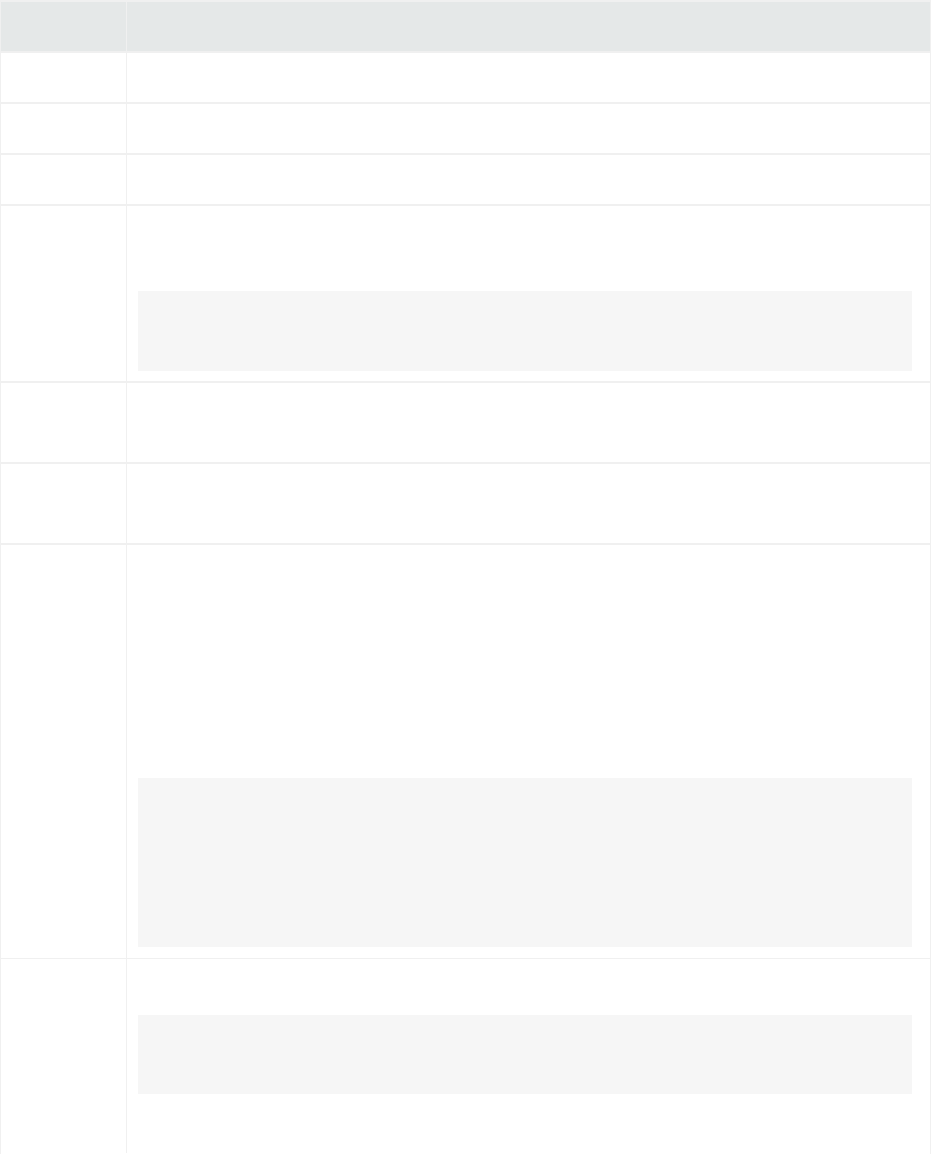
Parameters used in File Transfer Receivers
Fill in the following fields when creating or editing File Transfer Receivers.
Parameter Description
Name The name of the receiver, used for reporting and status monitoring.
Protocol Select SCP, SFTP or FTP protocol.
Port The port number for the receiver. The default port is 22.
IP/Host Select one of the Logger’s network connections for the receiver to listen to, or select
All to listen on both network connections.
Note: If localhost (127.0.0.1) appears in the list, it means that the Logger hostname
has not been configured. To configure hostname, see "Network " on page405.
User A user on the host with privileges to view and read the source log files. If the protocol is
FTP, you can specify the special user, “anonymous.”
Password The password of the specified User. The password must not be empty, even in the case
of anonymous FTP (although in this case, the password will be ignored.)
File path The path and the name of the log file(s) to be read. You can use wild cards like ? and *
(for example, *.log or Log-??.txt) in the path name and the file name. Separate
directories with forward slashes (/).
Separate multiple file specifications with commas.
Example: /tmp/SyslogData/syslog.log.gz, /security/logs/*/,
/security/ log?/admin/special/
Note: Uploading any type of data other than text, including binary files such as
.zip or .bin, may prevent Logger from functioning correctly. Be sure that any
directories you specify do not include binary files. Use caution when pulling
everything from a directory by specifying *, as you could inadvertently include
binary files.
Schedule If no schedule is specified, the File Transfer will occur just once.
Tip: Make sure you are familiar with the information in "Time/NTP" on page409
before setting the schedule.
Choose Every Day, Days of Week, or Days of Month from the upper pull-down
Administrator's Guide
HPE Logger 6.2 Page 308 of 623

Parameter Description
menu.
Note: When specifying multiple days, separate them with a comma. When
specifying the time, use 24-hour format.
1. If Every Day, select one of the following options from the lower pull-down menu,
and enter the necessary values:
lHour of day: (0-23) Enter the time you want the task to run in the Hours (24
hour format) field. Midnight is zero (0).
lEvery: Select Hours or Minutes from the right-most pull-down menu and
specify how frequently you want the task to run.
Hours: (1-23) Enter how frequently in hours you want the task to run. The
result is every n hours every day.
Minutes: (15-59) Enter how frequently in minutes you want the task to run.
The result is every n minutes every day.
2. If Days of Week, select from the following options from the lower pull-down
menu, and enter the necessary values:
lDays: (1-7) Enter the days of the week you want the task to run (Sunday=1,
Monday=2, and so on).
lHour of Day: (0-23) Enter the time you want the task to run in the text field to
the right. 0 is midnight.
lEvery: Select Hours or Minutes from the right-most pull-down menu and
specify how frequently you want the task to run.
Hours: (1-23) Enter how frequently in hours you want the task to run. The
result is every n hours on the selected days.
Minutes: (15-59) Enter how frequently in minutes you want the task to run.
The result is every n minutes on the selected days.
3. If Days of Month, Select from the following options from the lower pull-down
menu, and enter the necessary values:
lDays: (1-31) Enter the day or days of the month you want the task to run.
Note: The number of days in a month vary. Scheduled tasks will only run if
the specified day exists for that month. Tasks scheduled on the 31st day of
the month will not run in April, February, June, November, and September.
Tasks scheduled on the 29th day of the month will only run in February
during leap years.
Administrator's Guide
HPE Logger 6.2 Page 309 of 623

Parameter Description
lHour of Day: (0-23) Enter the time of day you want the task to run. (You
cannot select Every for this option.)
Examples:
lTo run the scheduled job every 45 minutes of every day, select Every Day in the
upper Schedule pull-down menu. Choose Every from the lower pull-down menu,
enter 45 in the text box and the select Minutes.
lTo run the scheduled job every four hours on Tuesdays and Thursdays , select Days
of Week from the upper Schedule pull-down menu and enter 3,5 as the Days. Then
choose Every from the lower pull-down menu, enter 4 in the text box.
lTo run the scheduled job on the 14th of each month at 3 AM, select Days of Month
from the upper Schedule pull-down menu and enter 14 as the Days. Then choose
Hour of day from the lower pull-down menu and enter 3 in the text box. (To run the
scheduled job at 3 AM and 3 PM, you would enter 3,15.)
Zip Format Choose gzip, zip, or none.
Source
Type
Select from the pulldown list of log file types, including:
lApache HTTP Server Access
lApache HTTP Server Error
lJuniper Steel-Belted Radius
lMicrosoft DHCP Log
lIBM DB2 Audit
lMore options...
Additionally, you can define your own source type, based on the needs of your
enterprise. See "Source Types" on page314.
A receiver can only receive events of a single source type. Set up separate receivers for
each type of log file.
Character
encoding
Select a character encoding, such as US-ASCII, Big5, or EUC-KR, from the pulldown list.
CEF UDP, CEF TCP, and SmartMessage receivers must use US-ASCII or UTF-8
encoding.
Delay after
seen
Number of seconds to wait after a source file is first seen until it is processed. This
allows the entire file to be copied to Logger or (in the case of File Receiver) copied to
the remote file system, before processing begins.
Administrator's Guide
HPE Logger 6.2 Page 310 of 623

Parameter Description
The default is 10 seconds.
For File Transfer Receivers, this parameter should be set to a larger value if large files
are expected. The default, 10 seconds, does not allow enough time for a large file, such
as 1 GB.
Event Time
Locale
Select a locale from the pulldown list, such as English (United States), Chinese (Hong
Kong), Chinese (Taiwan), and so on.
Date/time
zone
Required if the timestamp in the log file does not specify a time zone.
For File Transfer and File Receivers, this parameter is ignored if either Date/time format
or Date/time location regex are blank.
You can see the time zone configured on the Logger System Admin | System |
Network > Time/NTP tab.
Software Loggers use the system time.
Event Time
Location
A regular expression describing which characters represent the timestamp in the log
file. For example:
.*\[(.*?)\].*
This regular expression specifies that the timestamp is found inside the first set of
square brackets on each line. The first capturing group (the part of the regex in
parentheses) is that part that is then parsed using the Date/time format.
The default is no timestamp.
Event Time
Format
Required if the log file contains timestamps in the same format for each event. If not
specified (or if the Date/time location regex is blank), each event in the file will be
stamped with the date that the file itself was first seen by Logger (not its file system
timestamp).
See "Date/Time Format Specification" on page313 for a list of format specifiers.
The default is no timestamp.
Multiline
Event
Starts With
A regular expression that specifies the start of a new event in a log file. Specify this
expression to enable the receiver to read multi-line log files. Each new event starts at
the point where the regular expression is matched to the characters in the log file. For
example,
^\[\d+-\d+-\d+ \d+:\d+,\d+].*
This regular expression matches timestamps such as:
Administrator's Guide
HPE Logger 6.2 Page 311 of 623

Parameter Description
[2010-12-06 13:09:46,818]
When this field is left blank, each line in the log file is treated as a single event.
The default is each line in the log file is a single event.
Parameters used in SmartMessage Receivers
Fill in the following fields when creating or editing SmartMessage Receivers.
Parameter Description
Name The name of the receiver, used when configuring an associated
ArcSightSmartConnector.
Encoding Select a character encoding, such as US-ASCII, Big5, or EUC-KR, from the pulldown list.
CEF UDP, CEF TCP, and SmartMessage receivers must use US-ASCII or UTF-8
encoding.
Date and Time Specification
To specify the date and time format so that it can be parsed from a file receiver, (File Receiver, Folder
Follower Receiver, or File Transfer), refer to the table "Date/Time Format Specification" on the next
page. Internally, Logger uses a common Java method called SimpleDateFormat. Sophisticated uses of
SimpleDateFormat, as described in Java sources, will work with Logger. Pattern letters are usually
repeated, as their number determines the exact presentation.
The following examples show how date and time patterns are interpreted in the U.S. locale. The given
date and time are July 4th 2013, at 12:08:56 local time, in the “U.S. Pacific Time” time zone.
Source Date and Time Pattern
2013.07.04 AD at 12:08:56 PDT yyyy.MM.dd G 'at' HH:mm:ss z
Wed, Jul 4, '13 EEE, MMM d, ''yy
12:08 PM h:mm a
12 o'clock PM, Pacific Daylight Time hh 'o'clock' a, zzzz
0:08 PM, PDT K:mm a, z
2013.July.04 AD 12:08 PM yyyyy.MMMMM.dd GGG hh:mm aaa
Date/Time Examples
Administrator's Guide
HPE Logger 6.2 Page 312 of 623

Source Date and Time Pattern
Wed, 4 Jul 2013 12:08:56 -0700 EEE, d MMM yyyy HH:mm:ss Z
130704120856-0700 yyMMddHHmmssZ
2013-07-04T12:08:56.235-0700 yyyy-MM-dd'T'HH:mm:ss.SSSZ
Date/Time Examples, continued
Symbol Meaning Presentation Examples
G Era designator (Text) AD
y Year (Number) 2013 or 13
M Month in year (1-12) (Month) July or Jul or 07
w Week in year (1-52) (Number) 39
W Week in month (1-5) (Number) 2
D Day in year (1-366) (Number) 129
d Day in month (1-31) (Number) 10
E Day in week (Text) Tuesday or Tue
F Day in week of month
a Am/pm marker (Text) AM or PM
H Hour in day (0-23) (Number) 0
k Hour in day (1-24) (Number) 24
K Hour in am/pm (0-11) (Number) 0
h Hour in am/pm (1-12) (Number) 12
m Minute in hour (0-59) (Number) 30
s Second in minute (0-59) (Number) 55
S Millisecond (0-999) (Number) 978
z Time zone (Text) Pacific Standard Time, or PST, or GMT-08:00
Z Time zone (RFC 822) -0800 (indicating PST)
Date/Time Format Specification
Administrator's Guide
HPE Logger 6.2 Page 313 of 623
Source Types
Source types identify the kind of event that comes from a specific data source. For example, an event
could come from an Apache access log, a simple syslog, or the log of an application you created. You can
use parsers to parse event data from a specified source type.
Once events are associated with a source type, if the source type is associated with a parser, the events
are parsed by that parser when you run a search that matches those events. The search result displays
the matching parsed event fields in columns, similar to the CEF events. (Use the “User Defined Fields”
field set to view these events.) For more information, see "Parsers" on page318.
The source of the event, the source type, and the parser will be displayed in the column list of the search
results if any row is fetched from a search that contains a non-CEF source type.
The following columns are displayed in the search results when a source type is used:
lSource: The name of the log file from which the event was received.
For example, /opt/mnt/testsoft/web_server.out.log. If no source was applied when the
event was received, this field is blank. You can control whether this field is displayed from the Search
Options page. See "Search Options" on page276 for how to set this option.
lSource Type: The type of file from which the event was received, as defined on the Source Type
page (Configuration | Data > Source Types). If no source type was applied when the event was
received, this field is blank. You can control whether this field is displayed from the Search Options
page. See "Search Options" on page276 for how to set this option.
lParser: If the event was parsed, this field contains the name of the parser. If the event was not
parsed successfully, this field contains “Not parsed.” If no parser is defined for the source type or if
there is no source type, the field is blank.
Working with Source Types
Logger provides a number of source types with pre-configured parsers. Additionally, you can define
new source types and assign parsers to them. This lets you choose the set of fields you want to extract
for a given kind of event. Only one parser can be associated with a source type, however, multiple
source types can be associated with a parser. Out-of-box source types cannot be edited or deleted, but
you can copy them to make similar source types to meet your needs. You can edit or delete custom
source types, as desired. The source types available on your Logger may vary from the image below.
Administrator's Guide
HPE Logger 6.2 Page 314 of 623
Source Types page
The following source types have associated parsers:
Source type Description
Apache_access Apache Access Log
Apache_error Apache Error Log
audit_log Syslog for Audit Log files
Bluecoat_proxy Bluecoat Proxy SG
Cisco_PIX Cisco PIX
IBM_DB2 IBM DB2 9.x Audit Log
Juniper_NSM Juniper NSM 2009 Syslog
logger_syslog Syslog for syslog files on Logger Appliance
Microsoft_DHCP Microsoft DHCP for 2008 v6 log files
syslog Simple Syslog
TippingPoint_SMS Tipping Point SMS 2.5 Syslog
VMware_ESX VMware ESX Syslog
Administrator's Guide
HPE Logger 6.2 Page 315 of 623
Logger can forward an event to ESM by using a Connector forwarder, which then forwards it to a
Streaming Connector. This connector normalizes the event and forwards it to ESM.
If you need forward events to ESM by using a Connector forwarder, you must choose one of the
following source types:
Source Type
Apache HTTP Server Access Juniper Steel-Belted Radius
Apache HTTP Server Error Microsoft DHCP Log
IBM DB2 Audit Other
To add a source type:
1. Open the Configuration | Data menu and click Source Types.
The "Source Types page" on the previous page displays the current source types. You can sort the
fields by clicking the column headers.
2. Click Add.
Administrator's Guide
HPE Logger 6.2 Page 316 of 623

3. Fill in the fields to define the source type:
Field Description
Name The name of the source type.
Description A description of the source type.
Parser The parser you want to associate with this source type. If the parser you need
does not appear in the drop-down list, you can add one. For information on how
to add a parser, see "Parsers" on the next page.
Event Time
Location
A regular expression describing the timestamp in the log file. For example:
.*\[(.*?)\].*
This expression specifies that the timestamp is found inside the first set of square
brackets on each line. The first capturing group (the part of the regex in
parentheses) is the part that is then parsed using the Date/time format.
You can specify that there is no timestamp in the log file with ‘’.
Event Time
Format
A regular expression describing the date and time format in the log file. For
example, dd/MMM/yyyy:HH:mm:ss Z
You can specify that there is no timestamp in the log file with ‘’.
For more information about event time, see "Time Range" on page74 and "Date
and Time Specification" on page312.
Multiline
Event
Starts With
A regular expression describing how to recognize when adjacent lines are of the
same event or when a new event starts. For example if each event starts with the
date in the format, yy-MM-dd HH:mm:ss.SSS you could use (\d+-\d+-\d+
\d+:\d+:\d+.\d+) to indicate the start of a new event.
Locale Select a locale from the pulldown list, such as English (United States), Chinese
(Hong Kong), Chinese (Taiwan), and so on. This is locale of the data Logger
should find in the file.
Source Type Fields
4. Click Save.
To edit a source type:
1. Open the Configuration | Data menu and click Source Types.
The "Source Types page" on page315 displays the current source types. You can sort the fields by
clicking the column headers.
2. Locate the source type that you want to update and click the Edit icon ( ) on that row.
Administrator's Guide
HPE Logger 6.2 Page 317 of 623
Note: The Edit icon ( ) is not available for out-of-box source types. You can copy the
source type and make a similar one instead.
3. Edit the fields as appropriate.
See the table "Source Type Fields" on the previous page for field details.
4. Click Save.
5. Disable and then re-enable any receivers that use this source type.
Note: Changes in source type are not reflected in the associated receivers until you have re-
enabled them.
To copy a source type:
1. Open the Configuration | Data menu and click Source Types.
The "Source Types page" on page315 displays the current source types. You can sort the fields by
clicking the column headers.
2. Locate the source type that you want to copy and click the Copy icon ( ) on that row.
3. Enter a name for the new source type and edit the fields as appropriate.
See the table "Source Type Fields" on the previous page for field details.
4. Click Save.
To delete a source type:
1. Open the Configuration | Data menu and click Source Types.
The "Source Types page" on page315 displays the current source types. You can sort the fields by
clicking the column headers.
2. Locate the source type that you want to delete and click the Remove icon ( ) on that row.
Note: The Remove icon ( ) is not available for out-of-box source types. You can only
remove source types that you added.
3. Click OK to confirm the removal.
Parsers
Parsers enable you to extract and manipulate raw events (non-CEF data) from different sources in your
network environment. Once you have parsed event fields, you can easily search for data, chart it, and
perform other operations on it. One user with in-depth knowledge of the events can create the parser,
and then all users who look at those events will get the benefit of that work.
Administrator's Guide
HPE Logger 6.2 Page 318 of 623
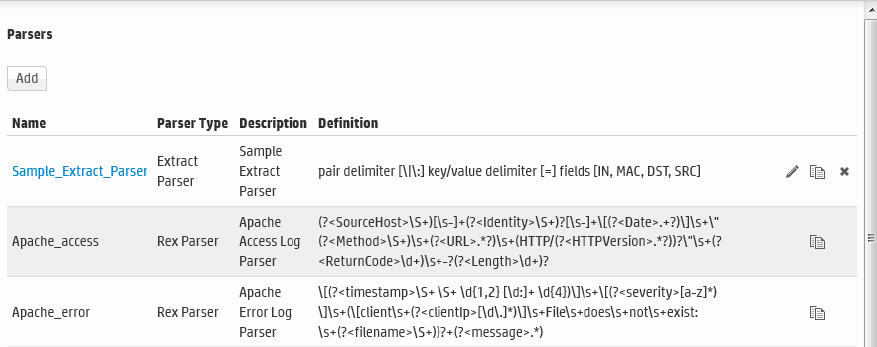
Parsers provide you with a simple way to read events. Instead of looking at raw event data and trying to
figure out what it means, you can use a parser to extract portions of non-CEF events into fields.
However, the fields created by the parser are available only for search operations, and are not added to
the Logger schema.
You can use a parser either of the following ways:
lUse the parser with a source type: You can associate the parser with a source type to extract any
set of fields in any kind of event. For more information, see "Source Types" on page314.
lUse the parse command in a search: During a search, you can use the parse command to extract
fields from events and use other search operators (such as where, chart, top, and so on) to further
refine the search or manipulate the data in the fields. This is particularly useful for IT operations and
other customers who need to extract and manipulate raw event data.
Using Parsers with Source Types
Logger provides a number of pre-configured parsers with associated source types. You can also define
new parsers and associate them with source types. Only one parser can be associated with a source
type, however, multiple source types can use the same parser. Out-of-box parsers cannot be edited or
deleted, but you can copy them to make a similar parser to meet your needs. You can edit or delete
custom parsers as desired.
Parsers page
Using the Parse Command
The parse command can be used to invoke a parser on any non-CEF events that are returned by a
search. It applies the definition of the parser, such as the regular expression of a rex parser, to each
event. Then it adds the fields that are extracted by that regular expression to the fields that are being
passed through. For a REX parser, this is functionally the same as having a rex command with the same
regular expression as the definition of the parser, so you can think of a REX parse command as invoking
a saved rex expression.
Administrator's Guide
HPE Logger 6.2 Page 319 of 623
For more information about the parse command, see "parse" on page488. For information about
searching in general, see "Searching and Analyzing Events" on page63.
Working with Parsers
You can define two types of parsers—a REX parser or an Extract parser. Before adding the parser, you
need to define the query you want to use for parsing events.
For a Rex parser, one way to do this is to use the rex search operator to test and adjust a regular
expression until it returns the desired fields from the events that you want it to handle. Then copy the
rex expression and paste it into the parser’s Definition field. For an Extract parser, use the extract
operator. For more information about the search operators, see "parse" on page488, "rex" on page493,
and "extract" on page479.
The parser used in a search will be displayed in the Parser column of the search results. If the event was
parsed, this field contains the name of the parser. If the event was not parsed successfully, this field
contains “Not parsed.” If no parser is defined for the source type or if there is no source type, the field is
blank.
To add a parser:
1. Open the Configuration | Data menu and click Parsers.
The Parsers page, shown in "Parsers page" on the previous page, displays the current parsers. You
can sort the fields by clicking the column headers.
2. Click Add.
3. Enter a name for the parser.
4. Choose the Parser Type from the drop-down list.
5. Click Save.
The fields display in the Edit Parser dialog box according to the type of parser.
Administrator's Guide
HPE Logger 6.2 Page 320 of 623

6. Fill in the fields for the parser.
Field Description
Name The name of the parser. Enter a new name if you want to change the existing
name.
Description A meaningful description of the purpose of the parser.
Rex parsers only
Definition The rex expression that you want to use to parse events.
Extract parsers only
Pair Delimiter The characters separate key/value pairs within an event. Enter only the
separator characters, for example:
\|,
Key/Value
Delimiter
The characters that separate the key from the value. Enter only the delimiter
character, for example:
=
Fields The list of field names to use when parsing events.
Enter the field names, separated by comma (,). For example, to parse events
like: foo=abc, bar=xyz, baz=def
Enter: foo,bar,baz
Parser Fields
7. Click Save.
To edit a parser:
1. Open the Configuration | Data menu and click Parsers.
The Parsers page, shown in "Parsers page" on page319, displays the current parsers. You can sort
the fields by clicking the column headers.
2. Locate the parser that you want to update and click the Edit icon ( ) on that row.
Note: The Edit icon ( ) is not available for out-of-box parsers. You can copy the parser and
make a similar one instead.
3. Edit the parser fields as appropriate.
The fields displayed in the Edit Parser dialog box according to the type of parser. Parser fields are
documented in the table "Parser Fields" above.
4. Click Save.
Administrator's Guide
HPE Logger 6.2 Page 321 of 623
To copy a parser:
1. Open the Configuration | Data menu and click Parsers.
The Parsers page, shown in "Parsers page" on page319, displays the current parsers. You can sort
the fields by clicking the column headers.
2. Locate the parser that you want to copy and click the Copy icon ( ) on that row.
The fields displayed in the Edit Parser dialog box according to the type of parser.
3. Enter a name for the new parser and edit the fields as appropriate.
Parser fields are documented in the table "Parser Fields" on the previous page, above.
4. Click Save.
To delete a parser:
1. Open the Configuration | Data menu and click Parsers.
The Parsers page, shown in "Parsers page" on page319, displays the current parsers. You can sort
the fields by clicking the column headers.
2. Locate the parser that you want to delete and click the Remove icon ( ) on that row.
Note: The Remove icon ( ) not available for out-of-box parsers. You can only remove
parsers that you added.
3. Click OK to confirm the removal.
Example: Creating an Extract Parser
Suppose you want to create a parser to find the contents of the INT, MAC, DST, and SRC fields of a log
like the one below.
Jul 12 14:30:31 n15-214-128-h92 kernel: IN=eth2
MAC=00:24:e8:60:cb:82:00:50:56:92:2a:d5:08:00 SRC=192.0.2.9 | DST=192.0.2.2
LEN=52 TOS=0x00 PREC=0x00 TTL=128 ID=21408 DF PROTO=TCP SPT=56978 DPT=443
WINDOW=8192 RES=0x00 SYN URGP=0
Jul 12 14:30:31 n15-214-128-h92 kernel: IN=eth2 |
MAC=00:24:e8:60:cb:82:00:50:56:92:2a:d5:08:00 | SRC=192.0.2.9 | DST=192.0.2.2
LEN=52 TOS=0x00 PREC=0x00 TTL=128 ID=21408 DF PROTO=TCP SPT=56978 DPT=443
WINDOW=8192 RES=0x00 SYN URGP=0
Jul 12 14:30:31 n15-214-128-h92 kernel: IN=eth2 |
MAC=00:24:e8:60:cb:82:00:50:56:92:2a:d5:08:00 | SRC=192.0.2.9 | DST=192.0.2.2
LEN=52 TOS=0x00 PREC=0x00 TTL=128 ID=21408 DF PROTO=TCP SPT=56978 DPT=443
WINDOW=8192 RES=0x00 SYN URGP=0
Administrator's Guide
HPE Logger 6.2 Page 322 of 623
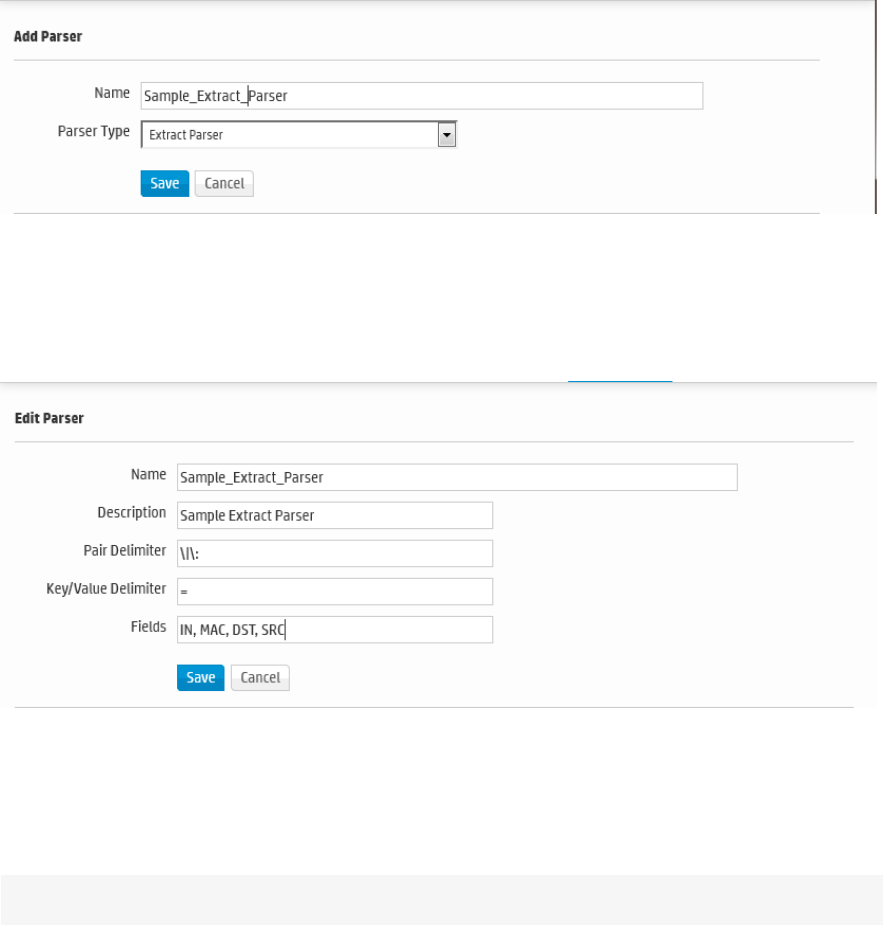
In this sample log, the field values are indicated with an equal sign (=), and fields are delimited by pipe (|)
and colon (:). You could use the following query to search for the contents of the IN, MAC, DST, and
SRC fields.
extract pairdelim= “|:” kvdelim= “=” fields= “IN,MAC,DST,SRC”
The following steps describe how to make an extract parser using that query.
To create an example extract parser:
1. Open the Configuration | Data menu and click Parsers.
2. Click Add. The Add Parser dialog box opens.
3. Enter a Name and select the Parser Type. For the example, enter:
Name: Sample_Extract_Parser
Parser Type: Extract Parser
4. Click Save. The Edit parser dialog box opens.
5. Enter the Pair Delimiter, Key value, and Fields for the parser. For the example, enter:
Pair Delimiter: \|\:
Key/Value Delimiter: =
Fields: INT, MAC, DST, SRC
Note: You need to escape the pipe (|) and the colon (:) with a backslash (\).
Administrator's Guide
HPE Logger 6.2 Page 323 of 623
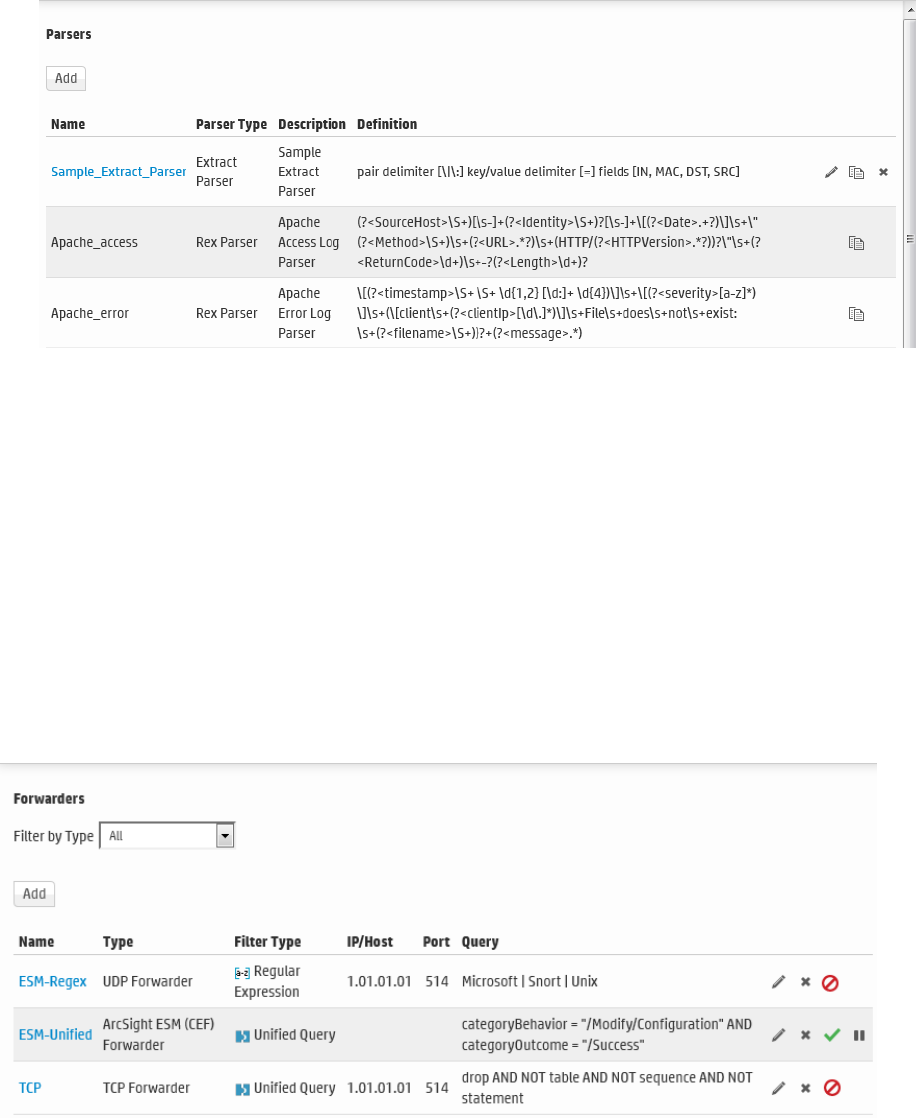
6. Click Save. The Parsers page displays the new parser.
Forwarders
Forwarders send all events, or events that match a particular filter, on to a particular host or destination
such as ArcSight Manager.
The ability to define a different filter for each forwarder allows Logger to divide traffic among several
destinations. For example, because Logger can handle much higher event rates than ArcSight Manager,
Logger might be used to forward events to a number of ArcSight Managers. Forwarder filters make it
possible to split the flow between the Managers, using one forwarder for each Manager. Additionally,
forwarding enables you to send a subset of events to other destinations for further processing while
maintaining all events on Logger for long-term storage.
Forwarders page
Administrator's Guide
HPE Logger 6.2 Page 324 of 623

The forwarding filter is a query that searches for matching events, optionally within a time range. You
can create two types of forwarder filters—continuous and time-range bound.
lA continuous filter constantly evaluates the incoming events and forwards the matching ones to the
specified destination.
lA time-range bound filter uses a time range in addition to the specified condition to determine
whether an event should be forwarded to the destination. If the event falls within the specified time
range and matches the specified condition, it is forwarded; otherwise, it is not. The Logger receipt
time of an event is used to determine whether an event will be forwarded to a destination when a
forwarder filter specifies a time range by which events are evaluated for forwarding. Once a
forwarder has forwarded all events within a time range, it does not forward any more events.
A forwarder only forwards events from the Logger that it is configured on; it cannot forward events
from peers.
A forwarder’s operation can be paused and resumed at any point in time. When a forwarder resumes
operation, forwarding resumes from the last checkpoint that was established before the forwarding
operation was paused.
You can also disable and re-enable a forwarder. When you re-enable a forwarder, all previously
established checkpoints are removed and forwarding starts over again as per the forwarder
configuration-forwarders with continuous filters start from the current time, while forwarders with time-
range bound filters start from beginning of the configured time range.
Forwarder types include UDP Forwarder, TCP Forwarder, Connector Forwarder, and ArcSight ESM
Forwarder:
lUDP: UDP forwarders forward events by using the User Datagram Protocol.
lTCP: TCP forwarders forward events by using the Transmission Control Protocol.
lConnector Forwarder: Connector forwarders send events to the Logger Streaming Connector.
lArcSight ESM: ArcSight ESM forwarders send Common Event Format (CEF) events to an ESM
Destination. The built-in connector on Logger is used to forward these events to ESM.
Note: In order to create an ArcSight ESMforwarder, you must first create an ESMDestination.
See "ESM Destinations" on page343 for more information.
As a best practice, do not add more than ten regular expression forwarders. Even though each
additional forwarder improves the forwarding rate, the relation is not proportional. In high EPS (events
per second) situations or situations where other resource-intensive features are running in parallel
(alerts, reports, and several search operations) and the forwarding filter is complex, adding too many
forwarders may reduce performance because forwarders have to compete for the same Logger
resources besides competing for the same built-in connector for forwarding.
Prior to Logger5.2, you could only specify a regular expression query for the filter. However, you can
now also specify indexed search queries (known as Unified Queries). Doing so enables you to take
advantage of the indexing technology to quickly and efficiently search for events to forward.
Administrator's Guide
HPE Logger 6.2 Page 325 of 623
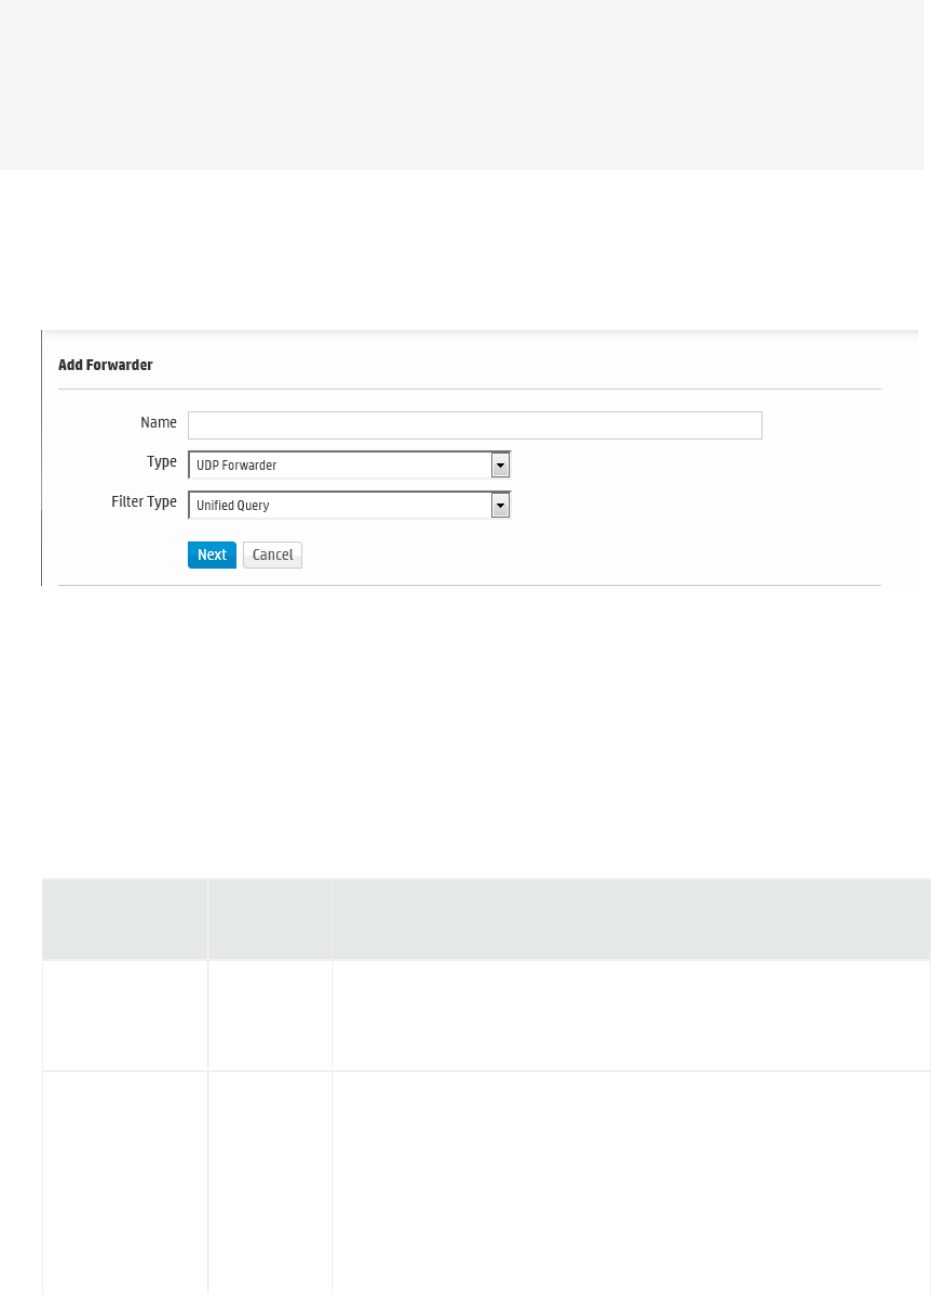
Note: Unified query-based forwarders forward events once they have been indexed. Therefore,
these forwarders can exhibit “bursty” behavior because indexing occurs in batches on Logger. You
might notice the bursty behavior in the EPS out bar gauge (on top of the Logger interface screen)
—the bar gauge will display high EPS level as a burst of data is forwarded and then drop back to
normal level.
To create a forwarder:
1. Open the Configuration | Data menu and click Forwarders.
2. Click Add to display the following form.
3. Enter a name for the new forwarder and choose the forwarder type appropriate for your need:
UDP Forwarder, TCP Forwarder, Connector Forwarder, or ArcSight ESM (CEF) Forwarder type.
4. Select the type of forwarding filter you want this forwarder to use—Unified or Regular
Expression. Select “Unified” if you want to specify an indexed search query or “Regular
Expression” to specify a regular expression query.
5. Click Next.
6. Enter additional, type-specific information as described in "Forwarder Parameters" below.
Parameter
Forwarder
Types Description
Name All The name that you entered in the previous screen is displayed
automatically. If you want to change the name, make the
change on this screen.
Query All Enter the query that will be used to filter events that the
forwarder will forward, or select a filter from the Filters list.
Forwarder queries can be constrained by device groups and
storage groups, but not by Peers.
If you selected Unified Query in the previous screen, enter an
indexed search query that includes full-text and field-based
Forwarder Parameters
Administrator's Guide
HPE Logger 6.2 Page 326 of 623

Parameter
Forwarder
Types Description
indexed fields. You can click the Advanced Search link to access
the Search Builder tool to build an indexed query. (See
"Accessing the Advanced Search Builder" on page87 for more
information.)
Tip: The unified query you specify must follow the
following guidelines, or you will not be able to save the
query or the forwarder.
Queries in the following format are valid; no other formats are
allowed.
(full-text terms | field search)* | regex
That is, the query must only contain full-text (keyword) and
field-based query elements; it cannot contain any aggregation
search operators, or operators that process the searched data
further to refine the search. For example, chart, sort, eval, top,
and so on.
Therefore, this is a valid query:
failed message CONTAINS “failed device”
However, this is an invalid query:
failed message CONTAINS “failed device” | sort
deviceEventCategory
The query can contain the regex operator after a pipeline
character (|). Therefore, this is a valid query for a forwarder:
failed message CONTAINS “failed device” | regex
deviceEventCategory = “fan”
Tip: All search terms (except the “regex” portion) in a query
must be indexed. If a query contains full-text (keyword)
terms, full-text indexing must be enabled. Similarly, if the
query contains a field, field-based indexing must be
enabled and the specified field must be indexed.
If you selected Regular Expression in the previous screen,
specify a regular expression in this text box. See "Searching for
Events" on page98.
Filters All Instead of specifying a unified query, you can select a filter from
Forwarder Parameters, continued
Administrator's Guide
HPE Logger 6.2 Page 327 of 623

Parameter
Forwarder
Types Description
the Filters list. The Filters list contains all saved filters and
predefined system filters on your Logger. Select a filter that
meets the validity guidelines described in "Query" on page326.
Otherwise, the user interface will display an error when you save
the forwarder definition.
You can only select one unified query filter per forwarder.
However, You can select multiple filters for a regular
expression-based forwarder.
Similarly, when creating a regular expression-based filter, select
a filter from this list.
Filter by time
range
All If you are creating a continuous filter, which continuously
evaluates incoming events and forwards the matching ones,
skip this parameter. In this case, the query is run continuously
and forwarding continues until you pause it.
If you are creating a time range bound filter, check this box to
specify a time range of events that the forwarder will forward. If
you enter a time range, the forwarder sends events that are
within that time range and stops.
When you check this box, the Start and End dates and Time
fields are displayed.
Start must be earlier than End. Specifying a time in the future
changes that field to the current time. For example, specifying a
Start of the current day at 7 AM and an End of current day at 7
PM will produce events with timestamps from 7 AM to the time
the filter is saved (that is, earlier than 7 PM).
Source Type Connector Select from the pull-down list of log file types, including:
lApache HTTP Server Access
lApache HTTP Server Error
lIBM DB2 Audit
lJuniper Steel-Belted Radius
lMicrosoft DHCP Log
lOthers...
Forwarder Parameters, continued
Administrator's Guide
HPE Logger 6.2 Page 328 of 623

Parameter
Forwarder
Types Description
Note: The Source type must be the same in receiver,
forwarder, and SmartConnector. See "Forwarding Log File
Events to ESM" on page347.
A receiver can only receive events of a single source type. Set up
separate receivers for each type of log file.
Preserve Syslog
Timestamp
UDP, TCP Set to true to preserve the syslog timestamp. The default is
true. In this case, the timestamp is the original receipt time of
the event.
If set to false, original timestamp is replaced with Logger’s
receipt time.
Preserve
Original Syslog
Sender
UDP, TCP Set to true to send the event as-is, without inserting Logger’s
IP address in the hostname (or equivalent) field of the syslog
event. The default is true.
If set to false, Logger’s information is inserted in the hostname
(or equivalent) field of the syslog event.
IP/Host UDP, TCP,
Connector
The IP address or host name of the destination that will the
receive forwarded events.
Note: You cannot configure a Logger forwarder to send
data to the same system on which it is configured.
Port UDP, TCP,
Connector
The port on the destination that will receive the forwarded
events.
The default port is 514.
Connection
Retry Timeout
TCP,
Connector,
ESM
The time, in seconds, to wait before retrying a connection. The
default is 5 seconds.
ESM
Destination
ESM An existing ESM Destination that will receive the forwarded
events. (For more information, see "ESM Destinations" on
page343.)
Forwarder Parameters, continued
7. Flag the Enable checkbox to have the forwarder immediately enabled. If you choose not to enable
the forwarder now, you can enable it later.
8. Click Save.
Administrator's Guide
HPE Logger 6.2 Page 329 of 623
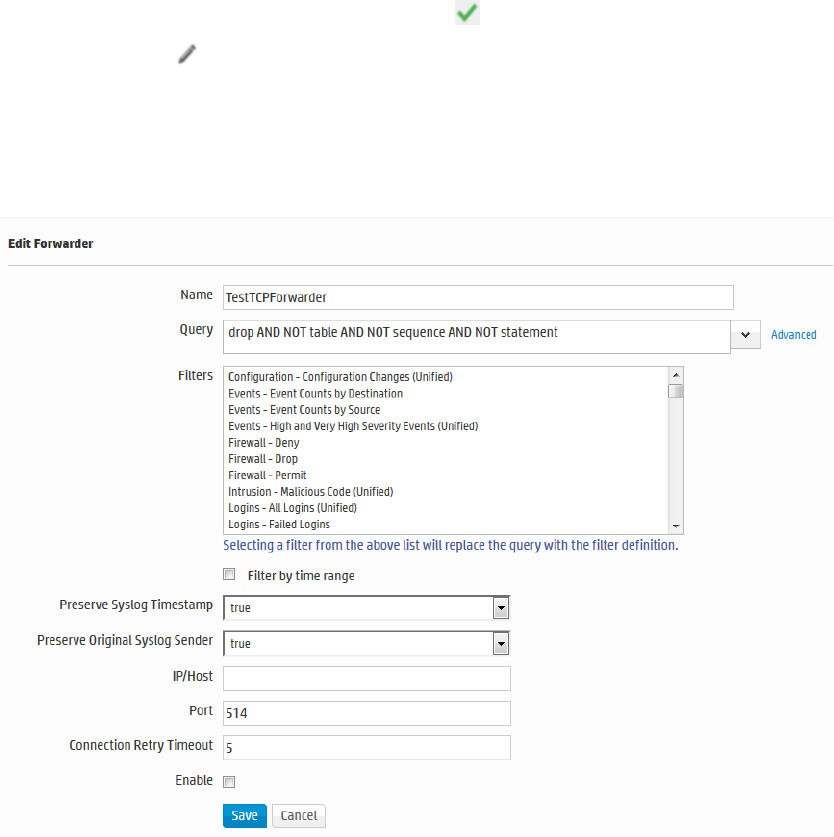
To edit a forwarder:
1. Open the Configuration | Data menu and click Forwarders.
2. Locate the forwarder you want to edit.
3. If the forwarder is enabled, click the Enabled icon ( ) to disable it.
4. Click the Edit icon ( ).
The following screen shows the Edit Forwarder screen for a regular expression based forwarder.
The Edit Forwarder screen for a Unified Query forwarder lists the Unified Query based filters and
the Query text box only allows you to specify one query.
Specifying Query Terms, Filters, and other forwarder parameters
5. Edit the information in the form, as described in the table "Forwarder Parameters" on page326.
6. Flag the Enable checkbox to have the forwarder immediately enabled. If you choose not to enable
the forwarder now, you can enable it later.
7. Click Save.
To delete a forwarder:
1. Open the Configuration | Data menu and click Forwarders.
2. Locate the forwarder that you want to delete.
Administrator's Guide
HPE Logger 6.2 Page 330 of 623
3. If the forwarder is enabled, click the Enabled icon ( ) to disable it.
4. Click the Remove icon ( ).
5. Click OK to confirm the delete.
To pause a forwarder:
1. Open the Configuration | Data menu and click Forwarders.
2. Locate the forwarder that you want to pause.
3. Click the Running icon ( ) to pause the forwarder.
To resume a forwarder:
1. Open the Configuration | Data menu and click Forwarders.
2. Locate the forwarder whose operation you want to resume.
3. Click the Paused icon ( ) to resume forwarder operation.
To disable a forwarder:
1. Open the Configuration | Data menu and click Forwarders.
2. Click Event Output in the left panel.
3. Locate the forwarder that you want to disable.
4. Click the Enabled icon ( ) to disable it.
To enable or re-enable a forwarder:
Tip: Wait a few minutes to disable a forwarder that was just enabled. Likewise, wait before enabling
a forwarder that has just been disabled. Background tasks initiated by enabling or disabling a
forwarder can produce unexpected results if they are interrupted.
1. Open the Configuration | Data menu and click Forwarders.
2. Locate the forwarder that you want to enable or re-enable.
3. Click the Disabled icon ( ).
Real Time Alerts
This section describes Real Time Alerts. For information on Saved Search Alerts, see "Saved Search
Alerts" on page271. For a description of the types of alerts, see "Types of Alert in Logger" on page335.
You can set up real time alerts that will be triggered by specified events or event patterns, and
optionally, send notifications to previously configured destinations such as an email address or an
SNMP server. Event patterns are specified events that occur above a particular frequency (a threshold
Administrator's Guide
HPE Logger 6.2 Page 331 of 623
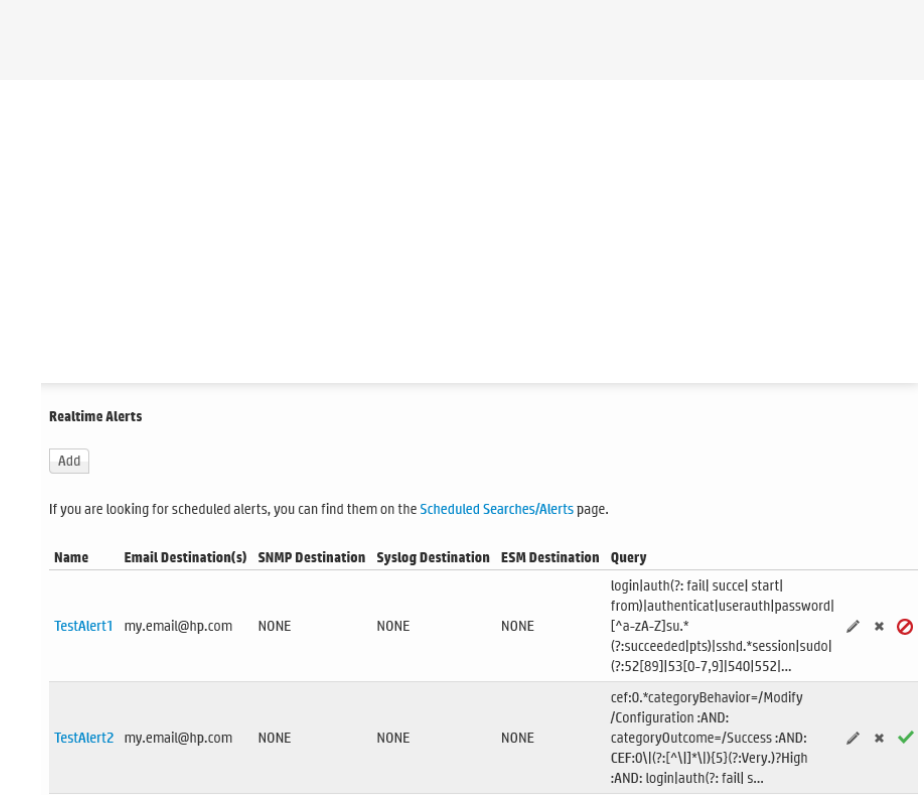
number of events in a specified period). For example, you could create alert that is generated when five
events from a specific device contain the word “unauthorized” within a five-minute interval.
Additionally, alerts can also be generated for internal events such as storage capacity warnings or, on
some Logger Appliance models, CPU temperature warnings.
To create an Alert, you will need to specify a query or filter, event aggregation values (Match count and
Threshold), and (optional) one or more notification destinations. If the new Alert will send notifications
to an email, SNMP, or Syslog Destination, set up the destination before creating the Alert. See "Static
Routes" on page408, "Receiving Alert Notifications" on page337, and "Setting Up Alert Notifications"
on page339 for more information.
Audit events for alerts are only written to the Internal Storage Group and not forwarded to ESM
Destinations by default. If you need to forward these audit events to ESM, please contact customer
support for assistance.
Note: This change only applies to audit events generated for alerts; other audit events are can be
sent to ESMDestinations.
Logger comes with predefined filters with commonly needed event patterns so that you can use to
quickly create the alerts you need. You can also create new filters that to find specific event patterns of
interest.
To see a list of the configured Real Time Alerts:
1. Open the Configuration | Data menu and click Alerts.
The Realtime Alert list is displayed.
Realtime Alerts
To add a Real Time Alert:
See "Creating Real Time Alerts" on the next page.
Administrator's Guide
HPE Logger 6.2 Page 332 of 623
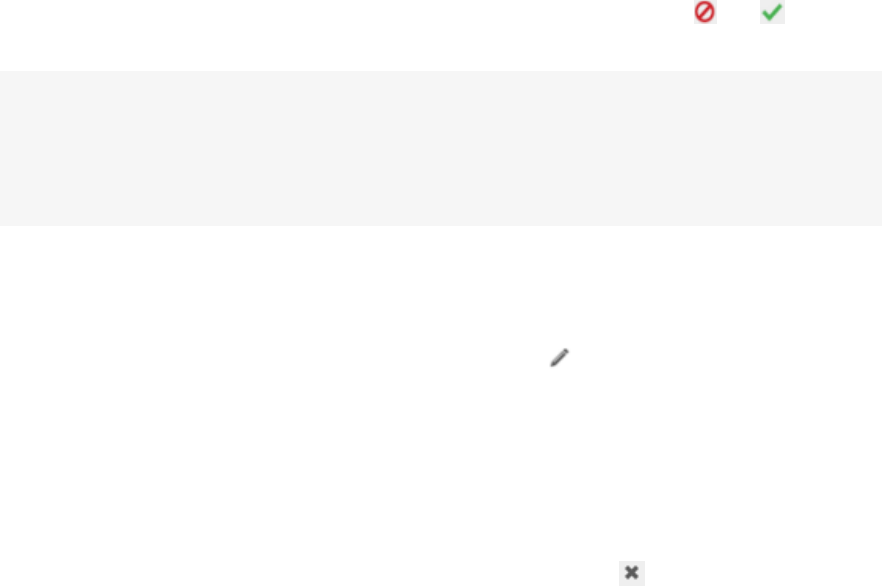
To enable or disable a Real Time Alert:
1. Open the Configuration | Data menu and click Alerts.
2. Locate the Alert that you want to disable or enable. Click the associated icon ( or ) to
enable or disable the Alert.
Note: A maximum of 25 alerts can be enabled at one time. To enable an additional alert, you
will need to disable a currently enabled alert.
If you have the maximum number of alerts enabled, and the receiver EPS is higher than 30k,
you may see some slow-down in receiver EPS to prevent slower search times.
To edit a Real Time Alert:
1. Open the Configuration | Data menu and click Alerts.
2. Locate the Alert that you want to edit and click the Edit icon ( ) on that row.
A screen similar to the "Add Realtime Alert dialog box" below is displayed. Only alphanumeric
characters can be used in an Alert name.
To remove a Real Time Alert:
1. Open the Configuration | Data menu and click Alerts.
2. Locate the Alert that you want to remove and click the Remove icon ( ) on that row.
3. Confirm the deletion by clicking OK, or click Cancel to retain the Alert.
To view triggered alerts:
See "Viewing Alerts" on page136.
Creating Real Time Alerts
This section describes how to create Real Time Alerts. For information on Saved Search Alerts, see
"Creating Saved Search Alerts (Scheduled Alerts)" on page271. For a description of the types of alerts,
see "Types of Alert in Logger" on page335.
To create a Real Time Alert:
1. Open the Configuration | Data menu and click Alerts.
2. Click Add. The Add Realtime Alert dialog box is displayed.
Add Realtime Alert dialog box
Administrator's Guide
HPE Logger 6.2 Page 333 of 623
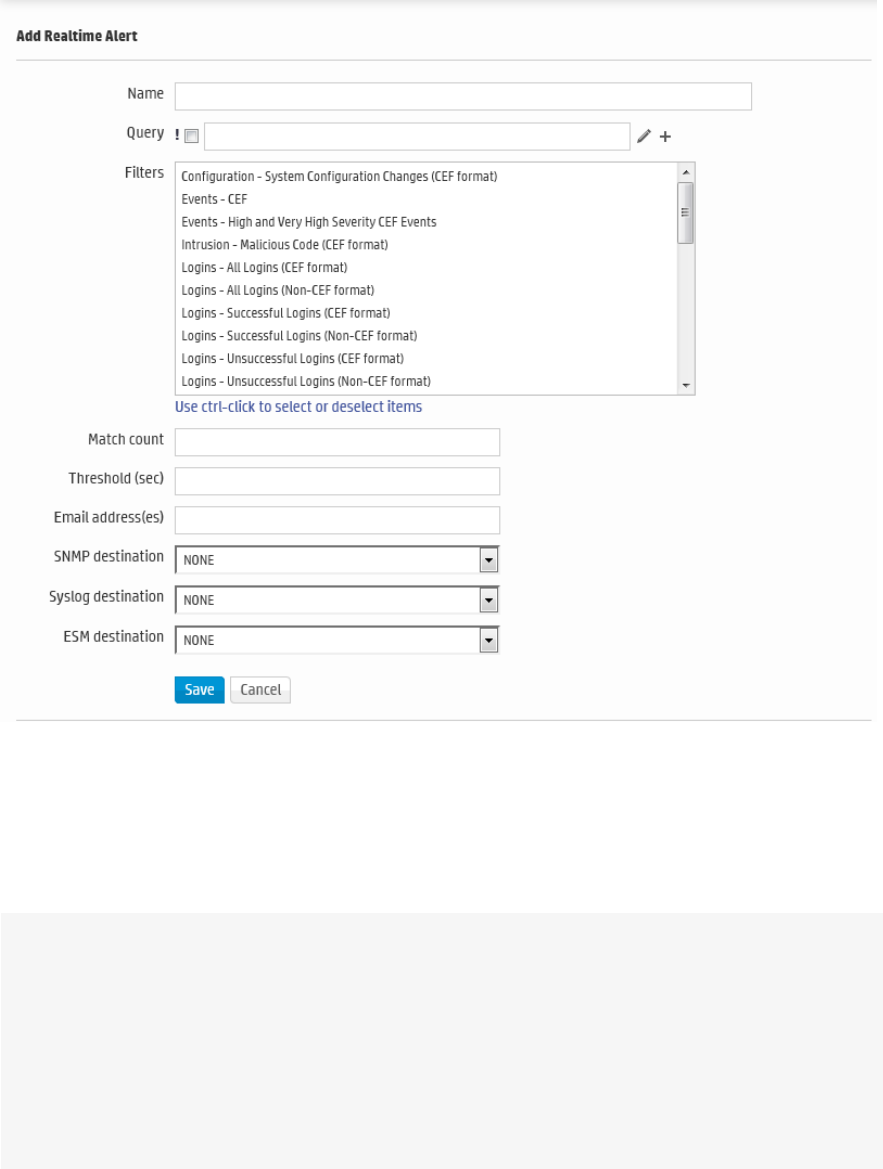
3. Enter a name for the new Alert, specify a query, or select an available Filter from the list. Events that
match this query are candidates for the Alert.
4. You can edit the search filter query to meet your needs. Alphanumeric characters and spaces are
acceptable, however, some special characters such as % and & are not.
For more information on Filters, see "Filters" on page257.
Tip: To test the validity of an alert query, use the Search user interface. Enter the query in the
Search text box in the following format:
Real time Alert: |regex “regex expression”
Scheduled saved alert: _deviceGroup IN [“192.0.2.3 [TCPC]”] name=“*
[4924TestAlert]*” AND (“192.0.*” OR categoryBehavior CONTAINS Stop)
If the query is valid, cut and paste the regular expression between the double quotes (“ ”) in
the Query text box on the Add Alert page.
5. Enter Match count and Threshold values. If the number of candidate events equals or exceeds the
Match count within the Threshold number of seconds, the Alert will be triggered.
Administrator's Guide
HPE Logger 6.2 Page 334 of 623

If you want to be notified when any event matches the filter (for example, for an internal event
such as High CPU Temperature), enter a Match count of 1 and a Threshold of 1.
Note: To maintain an optimal size of an alert event, the event does not contain event IDs of all
the triggering events if you specify Match count of 101 or higher. As a result, the
baseEventCount field in the event does not reflect the true number of matching events for
such alert events.
Triggering events are truncated in multiples of 100. Therefore, if you specify a Match count of
101, only one event is included in the alert event and the baseEventCount field value is 1.
Similarly, if you specify a Match count of 720, only 20 events are included and the
baseEventCount field value is 20.
6. Enter notification destinations. Enter any combination of:
lOne or more e-mail addresses, separated by commas
lAn SNMP Destination—for more information, see "SNMP Destinations" on page340.
lA Syslog Destination—for more information, see "Syslog Destinations" on page341.
lAn ArcSight Manager—for more information, see "Sending Notifications to ESM Destinations"
on page342.
7. Click Save.
When you create an alert, it is in disabled state. Enable it using the instructions in "To enable or
disable a Real Time Alert:" on page333.
Types of Alert in Logger
Logger provides two types of alerts:
lReal time alerts search continually and automatically send notifications if specified criteria are found.
For more information, see "Real Time Alerts" on page331.
lSaved Search Alert search at a scheduled interval and send notifications if specified criteria are found.
For more information, see "Saved Search Alerts" on page271.
The following table compares the two types of alerts.
Real Time Alerts Saved Search Alerts
No limit on the number of alerts that
are defined.
A maximum of 25 alerts can be
enabled at any time.
Any number of alerts can be defined. All defined alerts are
enabled and effective, however, a maximum of 50 alerts can
run concurrently.
No limit on the number of configured
e-mail destinations; however, you can
No limit on the number of configured e-mail destinations;
however, you can only set one SNMP, one Syslog, and one
Administrator's Guide
HPE Logger 6.2 Page 335 of 623

Real Time Alerts Saved Search Alerts
only set one SNMP, one Syslog, and
one ESM Destination.
ESM Destination.
Only regular expression queries can
be specified for these alerts.
Queries for these alerts are defined using the flow-based
search language that allows you to specify multiple search
commands in a pipeline format, including regular
expressions.
Aggregation operators such as chart and top cannot be
included in the search query.
Alerts are triggered in real time. That
is, when specified number of matches
occurs within the specified threshold,
an alert is immediately triggered.
These alerts are triggered at scheduled intervals. That is,
when a specified number of matches occurs within the
specified threshold, an alert is triggered at the next
scheduled time interval.
To define a real time alert, you specify
a query, match count, threshold, and
one or more destinations.
A time range is not associated with
the queries defined for these alerts.
Therefore, whenever the specified
number of matches occurs within the
specified threshold, an alert is
triggered.
To define a Saved Search Alert, you specify a Saved Search
(which is a query with a time range), match count, threshold,
and one or more destinations.
A time range (within which events should be searched) is
specified for the query associated with these alerts.
Therefore, specified number of matches within the specified
threshold (in minutes) must occur within the specified time
range. You can also use dynamic time range (for example,
$Now-1d, $Now, and so on).
For example, if a Saved Search query has these start and end
times:
lStart Time: 5/11/2010 10:38:04
lEnd Time: 5/12/2010 10:38:04
And, the number of matches and threshold are the
following:
lMatch count: 5
lThreshold: 3600
This will trigger an alert whenever five events occur within
one hour between May 11th, 2016 10:38:04 AM and May
12th, 2016 10:38:04.
Administrator's Guide
HPE Logger 6.2 Page 336 of 623
Alert Triggers and Notifications
An alert is triggered if a specified number of matches occurs within the specified threshold (time interval
in seconds). When an alert is triggered, Logger creates an alert event containing the triggering events or
event IDs, and sends notification through previously configured destinations—e-mail addresses, SNMP
server, Syslog server, and ArcSight Manager.
By default, only alert notifications sent to e-mail destinations include all matching events that triggered
the alert. You can configure your Logger to include matched events for SNMP, Syslog, and ESM
Destinations as well. However, that kind of configuration is only possible through the command-line
interface of the Logger; therefore, please contact customer support for instructions.
When are Alert events triggered?
You also specify a time window and a number of matching events. When that number of matching
events is detected within the time window, an alert event is triggered.
Logger resets the count after detecting 100 matching events. Therefore, all events that occur in the
time window will not necessarily be recorded in an alert. For example, if you configure the alert to be
sent when there are 20 matching events in two minutes, and 152 events occur within two minutes, you
will get seven alerts, and 12 matching events will not be included in any alert. In this situation, the
following alert events are triggered:
lAlert one has 20 matching events.
lAlert two has 40 matching events.
lAlert three has 60 matching events.
lAlert four has 80 matching events.
lAlert five has 100 matching events (1-100).
lAlert six has 20 matching events (101-120).
lAlert seven has 40 matching events (101-140).
The remaining 12 events are being held, waiting to meet the threshold of 20 more events in a two-
minute interval.
Receiving Alert Notifications
In order to receive notification from an alert, set up the alert to be sent to a previously configured
destination, such as an e-mail address, SNMP server, Syslog server, and ArcSight Manager.
By default, only alerts to e-mail destinations include all matched events that triggered the alert. You can
configure your Logger to include matched events for SNMP, Syslog, and ESM Destinations as well.
However, such a configuration is only possible through the command-line interface of the Logger;
therefore, please contact customer support for instructions.
Administrator's Guide
HPE Logger 6.2 Page 337 of 623

For information on how to configure destinations, see "ESM Destinations" on page343, "SNMP
Destinations" on page340, and "Syslog Destinations" on page341. To configure e-mail destinations, see
"Static Routes" on page408, as well.
Note: Audit events for alerts are only written to the Internal Storage Group and not forwarded to
ESM by default. If you need to forward these audit events to ESM destinations, please contact
customer support for assistance. This only applies to audit events generated for alerts; other audit
events can be sent to ESMdestinations.
Sending Notifications to E-mail Destinations
When you send notifications for an alert via e-mail, the e-mail message contains both the trigger alert
information and the matched (base) events.
The following is an example of the trigger alert information:
Alert event match count [1], threshold [10] sec
And the matched event:
Event Time [Tue Nov 11 16:46:49 PST 2008]
Event Receipt Time [Tue Nov 11 16:46:50 PST 2008]
Event Device Address [192.0.2.1]
Event Content [Dec 11 10:31:20 localhost
CEF:0|NetScreen|Firewall/VPN||traffic:1|Permit|Low| eventId=590 msg=start_
time\= “2004-07-28 15:25:02” duration\=15 policy_id\=0 service\=SSH proto\=6
src zone\=Trust dst zone\=Untrust action\=Permit sent\=656 rcvd\=680
src\=192.0.2.4 dst\=192.0.2.5 src_port\=54759 dst_port\=22 translated
ip\=192.0.2.2 port\=54759 app=SSH proto=TCP in=680 out=656
categorySignificance=/Normal categoryBehavior=/Access
categoryDeviceGroup=/Firewall categoryOutcome=/Success
categoryObject=/Host/Application/Service art=1165861874880 cat=Traffic Log
deviceSeverity=notification act=Permit rt=1165861874880 shost=n111-
h046.qa.arcsight.com src=192.0.2.4 sourceZoneURI=/All Zones/System
Zones/Private Address Space/RFC1918: 192.0.2.0-192.255.255.255
sourceTranslatedAddress=192.0.2.2 sourceTranslatedZoneURI=/All Zones/System
Zones/Public Address Space/192.0.2.0-192.0.255.255 spt=54759
sourceTranslatedPort=54759 dst=192.0.2.10 destinationZoneURI=/All
Zones/System Zones/Private Address Space/RFC1918: 192.0.2.0-192.255.255.255
dp]
Administrator's Guide
HPE Logger 6.2 Page 338 of 623

Setting Up Alert Notifications
To set up alerts notifications:
1. Configure the Logger’s SMTP with the desired e-mail address destination (see "Static Routes" on
page408) or create an SNMP Destination (see "SNMP Destinations" on the next page) or Syslog
Destination (see "Syslog Destinations" on page341).
Number of destinations per alert:
lE-mail: Multiple, each separated by a comma.
lSNMP: One
lSyslog: One
2. Create a query to find the events of interest; save the query as a filter. See "Saving Queries
(Creating Saved Searches and Saved Filters)" on page124.
Note:Only regular expressions can be used in queries specified for alerts.
3. Create an Alert that uses the new filter and specify match count and threshold (see "Saved
Searches" on page260.)
4. Enable the new Alert.
Sending Notifications to Syslog and SNMP Destinations
When configuring Logger to send alerts to SNMP and Syslog destinations, you should be familiar with
this information:
lLogger supports SNMP v2c and v3.
lUnlike an e-mail alert, a trigger alert is sent separately from the alert that contains the matched (base)
events that triggered the alert.
lAll SNMP alerts are sent as SNMP traps; therefore, trigger alerts and their associated matched (base)
events are received as SNMP traps on an SNMP destination. The SNMP trap includes the trigger
event, but it does not include the events that caused the alert to trigger (matched events). The
trigger event does include the event IDs of all the matched events. You can use the event IDs in the
trigger alert to identify the associated matched events.
Administrator's Guide
HPE Logger 6.2 Page 339 of 623
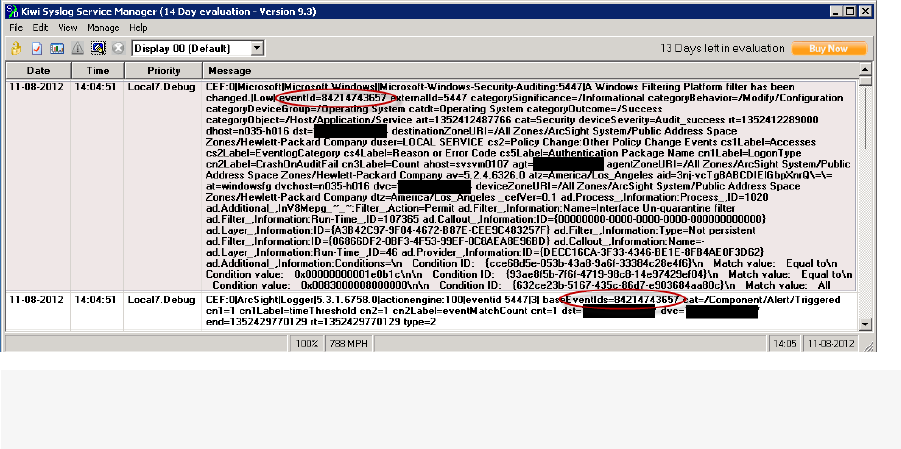
A triggered alert event and matching base event shown in Kiwi Syslog Service Manager
Note: Non-CEF events do not contain event IDs. If you need to associate such base events with
their trigger alert, send such events to Logger through a connector.
lSNMP uses UDP to send packets. As a result, the order in which alerts arrive at an SNMP destination
is not guaranteed.
lWhen Syslog events are sent using UDP, the order in which the trigger alert and matched events
arrive is not guaranteed.
SNMP Destinations
SNMP Destinations describe how Alert notifications should be sent using Simple Network Management
Protocol (SNMP). Set up SNMP Destinations before creating Alerts that will use them. Before
configuring SNMP destinations, you should be familiar with the information in "Sending Notifications to
Syslog and SNMP Destinations" on the previous page.
To add an SNMP Destination:
1. Open the Configuration | Data menu and click SNMP Destinations.
2. Click the Add button.
Administrator's Guide
HPE Logger 6.2 Page 340 of 623

3. Enter parameters:
Parameter Description
SNMP
Destination
Name
A name for this destination.
Connector Name The SmartConnector name.
Connector
Location
The physical location of the SmartConnector machine. If you do not want to
specify a location, enter “None.”
Logger Location Optional comment describing Logger’s physical location.
SNMP Host Host name or IP address.
SNMP Port 162, by default.
Community
Name
SNMP community name.
4. Click Save to create the new SNMP Destination.
To remove an SNMP Destination:
1. Open the Configuration | Data menu and click SNMP Destinations.
2. Locate the SNMP Destination that you want to remove and click the Remove icon ( ) on that
row.
3. Confirm the deletion by clicking OK, or click Cancel to retain the SNMP Destination.
Syslog Destinations
Syslog Destinations describe how Alert notifications should be sent using the comparatively simple
syslog protocol. You need to set up Syslog Destinations before creating Alerts that will use them.
Before configuring Syslog destinations, you should be familiar with the information in "Sending
Notifications to Syslog and SNMP Destinations" on page339.
To add a Syslog Destination:
1. Open the Configuration | Data menu and click Syslog Destinations.
2. Click the Add button.
3. Enter parameters:
Administrator's Guide
HPE Logger 6.2 Page 341 of 623
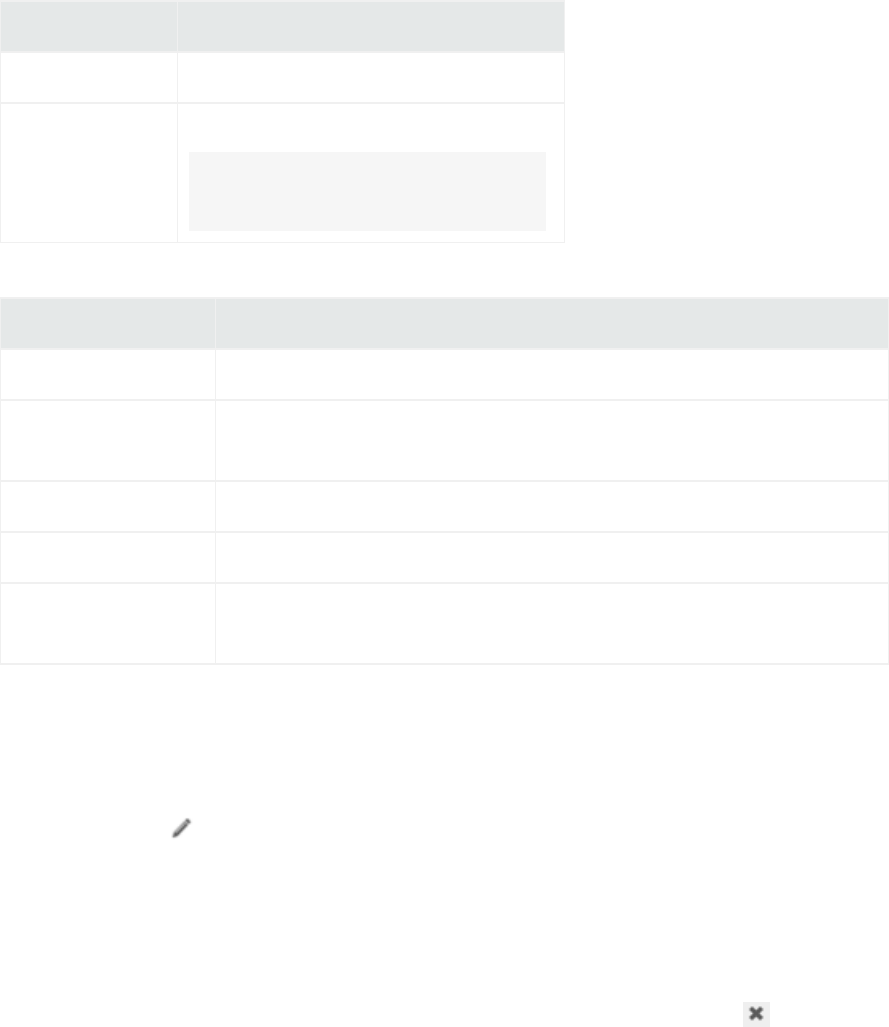
Parameter Description
Name A name for this destination.
Type UDP or TCP Syslog.
Note: This choice cannot be edited
later.
4. Click Next. Enter the secondary parameters:
Parameter Description
Name The name for the destination.
Type This is the value you entered in the previous screen. This value cannot
be changed.
Ip/Host Host name or IP address.
Port Port (default is 514).
Connection Retry
Timeout
(Only for TCP Syslog Destinations) The time, in seconds, to wait before
retrying a connection. The default is 5 seconds.
5. Click Save to create the new Syslog Destination.
To edit a Syslog Destination:
1. Open the Configuration | Data menu and click Syslog Destinations.
2. Click the Edit icon ( ). You can edit the parameters of the Syslog Destination except its type.
3. Click Save to make the changes, or Cancel to return to the Syslog Destination table.
To remove a Syslog Destination:
1. Open the Configuration | Data menu and click Syslog Destinations.
2. Locate the Syslog Destination that you want to remove and click the Remove icon ( ) on that
row.
3. Confirm the deletion by clicking OK, or click Cancel to retain the Syslog Destination.
Sending Notifications to ESM Destinations
ESM Destinations describe how Alert notifications should be sent to an ArcSight Manager. Set up ESM
destinations before creating Alerts that will use them.
If an ArcSight Manager uses a signed SSL certificate, you will need to load it on the Logger.
Administrator's Guide
HPE Logger 6.2 Page 342 of 623

Note: Audit events for alerts are only written to the Internal Storage Group and not forwarded to
ESM by default. If you need to forward the audit events generated for alerts to ESM, please contact
customer support for assistance.
To setup Logger to send alerts to an ArcSight Manager:
1. If the ArcSight Manager uses a certificate, copy the server SSL certificate file from an ArcSight
Console or other component that is already communicating with the target Manager, and upload
the certificate file to Logger, as described " Uploading a Certificate to the Logger:" on page346.
Note: You cannot import the cacerts file, which is a repository of trusted certificates, to the
Logger. Instead, you need to import specific SSL certificate files.
2. Create an ESM Destination, as described in " To create an ESM Destination:" on page345.
ESM Destinations
An ESMDestination establishes a trusted connection between Logger and an ArcSight Manager so
that you can forward events and alerts in Common Event Format (CEF) from the Logger to the
Manager using Logger’s built-in SmartConnector.
The CEF events are already normalized or categorized. For more information about CEF, refer to the
document "Implementing ArcSight CEF". For a down-loadable a copy of this guide, search for ”ArcSight
Common Event Format (CEF) Guide” in theArcSight Product Documentation Community on Protect
724.
Logger can forward these types of events to an ArcSight Manager:
lSyslog events to an ArcSight Syslog SmartConnector that is connected to an ArcSight Manager
lCommon Event Format (CEF) events directly to an ArcSight Manager using Logger ESM
Destinations. An ESM Destination appears as a SmartConnector to an ArcSight Console.
lEvents received by file receivers where the type specified is not Other. Such events are forwarded
using the ArcSight Streaming SmartConnector.
Maximum number of ESM Destinations that can be configured: As many destinations as are
allowable on the SmartConnectors you are using. However, for performance reasons, HPArcSight
recommends that you create no more than two ESM Destinations pointing to a single ArcSight
Manager. (One should suffice in most cases.)
Note: Do not use basic aggregation for Logger’s built-in SmartConnector because it is resource
intensive. (Basic aggregation is set using the Enable Aggregation (in seconds) field from the
ArcSight Console.) Instead, follow these steps on the ArcSight Console to configure field-based
aggregation:
Administrator's Guide
HPE Logger 6.2 Page 343 of 623
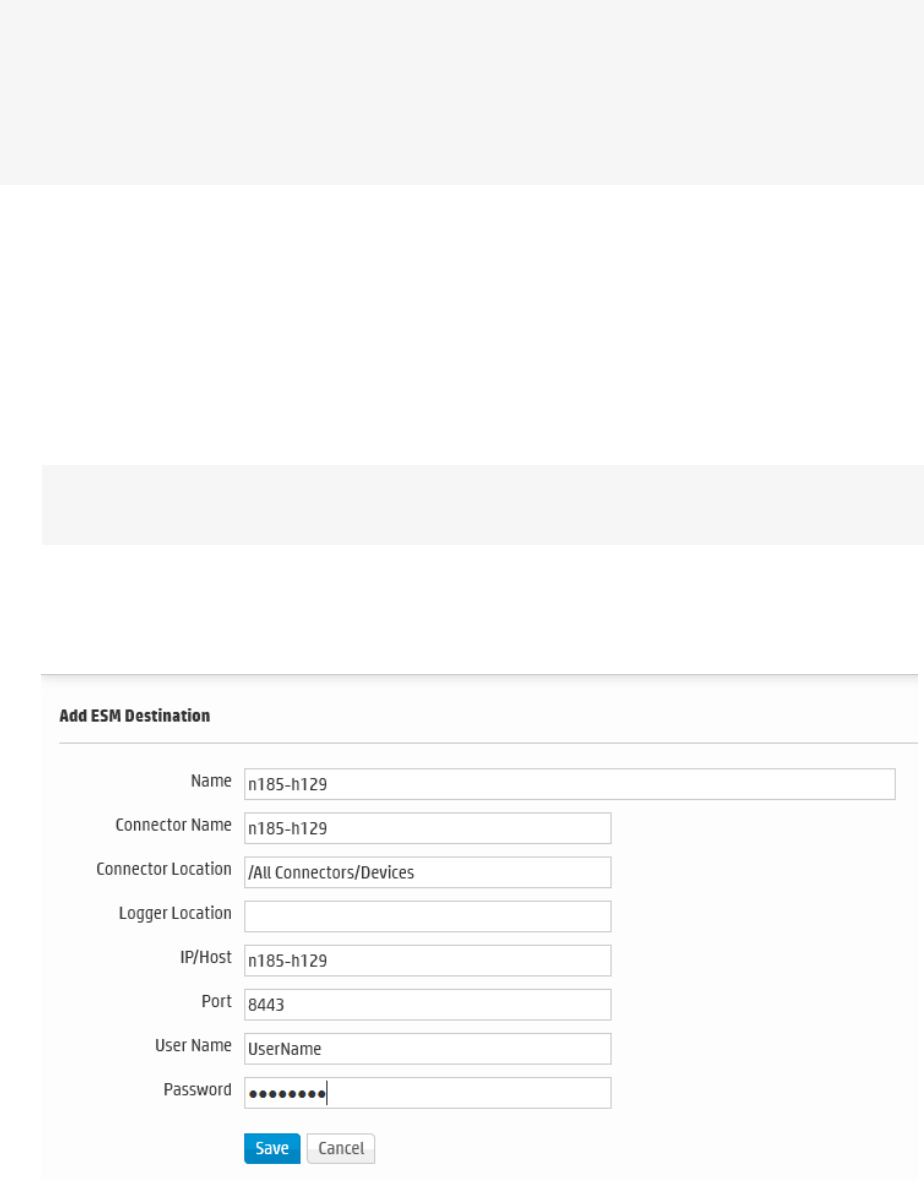
1. Ensure that Processor > Enable Aggregation (in seconds) is set to Disabled, to disable basic
aggregation.
2. Right-click the connector and select inspect/edit/.
For additional details about configuring field-based aggregation, refer to the ArcSight
SmartConnector User’s Guide.
To setup Logger to forward events to an ArcSight Manager:
1. Copy the server SSL certificate file from an ArcSight Console or other component that is already
communicating with the target Manager, and upload the certificate file to Logger, as described "
Uploading a Certificate to the Logger:" on page346.
If your Logger operates in FIPS mode, a valid and current (non-expired) server SSL certificate file
from the ArcSight Manager is required on the Logger; otherwise, the forwarder will not forward
events to it.
Note: You cannot import the cacerts file, which is a repository of trusted certificates, to the
Logger. Instead, you need to import specific SSL certificate files.
2. Create an ESM Destination, as described in " To create an ESM Destination:" on the next page.
3. Create an ESM forwarder that refers to this ESM Destination. (See "Forwarders" on page324).
ESM Destinations page
Administrator's Guide
HPE Logger 6.2 Page 344 of 623

To create an ESM Destination:
Make sure you have loaded the certificate file for ArcSight Manager as described in " Uploading a
Certificate to the Logger:" on the next page before adding it as a destination on the Logger. If the
certificate file does not exist on the Logger, you will not be able to create an ESM Destination.
1. Open the Configuration | Data menu and click ESM Destinations.
2. Click Add. The ESM Destinations page is displayed.
3. Enter the following parameters:
Parameter Description
Name The name for this ESM Destination.
Connector
Name
The SmartConnector name.
Connector
Location
The physical location of the SmartConnector machine. If you do not want to
specify a location, enter “None.”
Logger
Location
The physical location of the Logger. If you do not want to specify a location, enter
“None.”
IP or Host The ArcSight Manager to which the forwarder will direct events.
Note: Make sure the name or IP address you specify in this field is exactly
the name or IP address configured on the ArcSight Manager. If the two
names or IP addresses do not match, you will not be able to set up an
ESM Destination successfully.
Port Typically 8443.
User Name The name of an existing User of the ArcSight Manager with administrator
privileges.
Password The password for the Login user.
This password cannot contain the special characters percent (%), equal to (=),
semicolon (;), double quote (“), single quote (‘), less than (<), or greater than (>).
Caution: While ArcSight Manager allows these special characters in
passwords, Logger does not. If the ArcSight Manager user’s password
contains those characters, you will need to change the password in ArcSight
Manager before configuring this password.
4. Click Save.
Administrator's Guide
HPE Logger 6.2 Page 345 of 623
Tip: If you receive the following error when adding a new ESM Destination, make sure the host
name you specified in the IP or Host field exactly matches the name configured on the
ArcSight Manager.
There was a problem: Failed to add destination
Additionally, if the ArcSight Manager is configured using a host name instead of IP address,
make sure you add the ArcSight Manager host name and IP address in the Logger’s hosts file
(System Admin > Network > Hosts).
To delete an ESM Destination:
1. Open the Configuration | Data menu and click ESM Destinations (or click Alerts and then open
the ESM Destinations page if you are deleting an ESM Destination for forwarding Alerts.)
2. Locate the ESM Destination that you want to delete and click the Delete icon ( ) on that row.
3. Confirm the deletion by clicking OK, or click Cancel to retain the ESM Destination.
Certificates
Uploading a Certificate to the Logger:
Upload a valid server SSL certificate file for the ArcSight Manager that you are establishing as a Logger
destination for forwarding events and alerts.
If your Manager does not have FIPS 140-2 mode enabled, you can obtain a certificate file for your
Manager in these ways:
lFrom the Manager’s keystore
lFrom the ArcSight Console’s truststore
lFrom the truststore of one of the SmartConnectors that communicates with the Manager
Use the keytoolgui utility to export a Manager’s certificate as described in the “Using Keytoolgui to
Export Certificate” procedure in the ArcSight ESM Administrator’s Guide. For detailed information
about keystore, truststore, their locations on the Manager, ArcSight Console, and the
SmartConnectors, see the ArcSight ESM Administrator’s Guide.
Once you have exported a certificate for your Manager, copy it to the machine from which you connect
to your Logger.
If your Manager has FIPS 140-2 mode enabled, run this command to export the Manager’s certificate
from the Manager’s <ARCSIGHT_HOME>/bin directory:
arcsight runcertutil -L -n managerkey -r -d <ARCSIGHT_
HOME>/config/jetty/nssdb -o <absolute_path_to_manager.cert>
Administrator's Guide
HPE Logger 6.2 Page 346 of 623
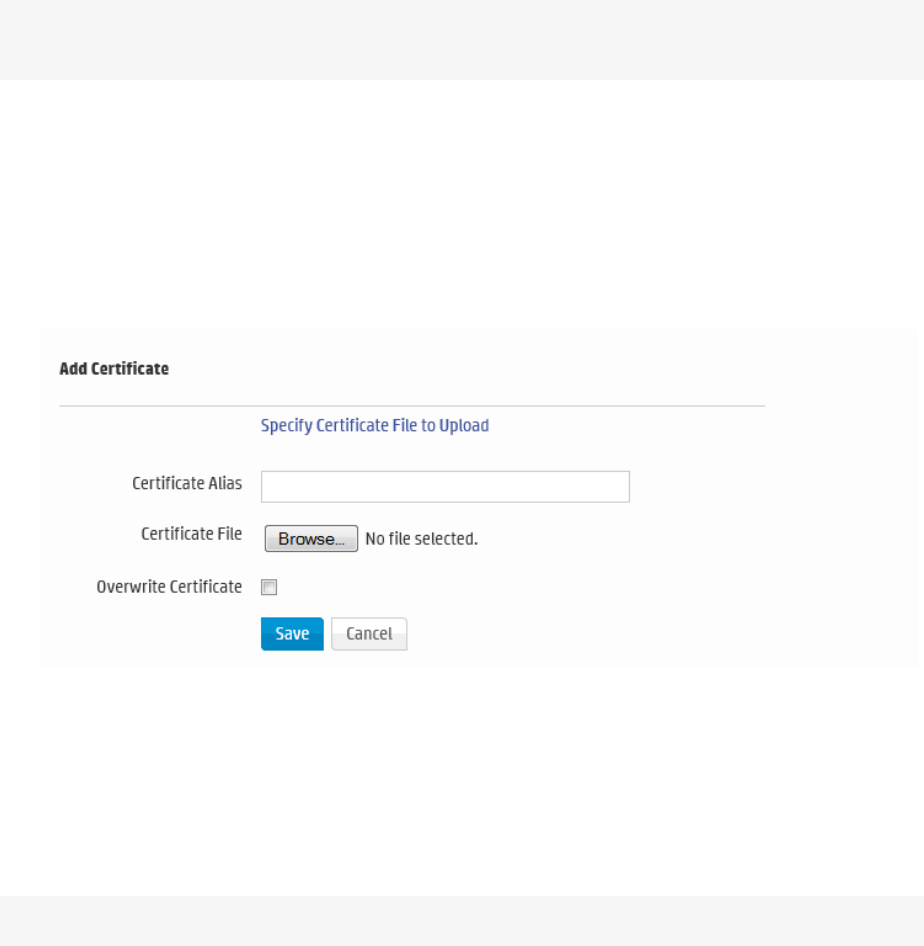
This command generates the manager.cert file, the Manager’s certificate, in the location that you
specified in the above command.
Note: By default, the manager.cert file will be exported to your <ARCSIGHT_HOME> directory if
you do not specify the absolute path to the manager.cert file destination.
To upload a certificate file for an ESM Destination:
1. Make sure you have copied the Manager certificate to the machine from which you connect to your
Logger.
2. Open the Configuration | Data menu and click Certificates.
3. Click Add to display the following screen.
4. Enter an alias for the certificate file. This name is used to easily identify a certificate file. For
example, arcsight_esm_manager1_cert.
5. Click Browse to locate the Manager Certificate file you copied.
6. Check the “Overwrite Certificate” box if you want this certificate to overwrite an existing certificate
with the same alias.
7. Click Save.
Note: This feature is not available on Trial Logger.
Forwarding Log File Events to ESM
Logger can read events from a log file and forward those events to a Logger streaming
SmartConnector that sends the events on to ArcSight Manager.
To forward log file events to ESM, configure the receiver, forwarder, and SmartConnector to accept the
same source type (as described in "Working with Source Types" on page314).
Administrator's Guide
HPE Logger 6.2 Page 347 of 623
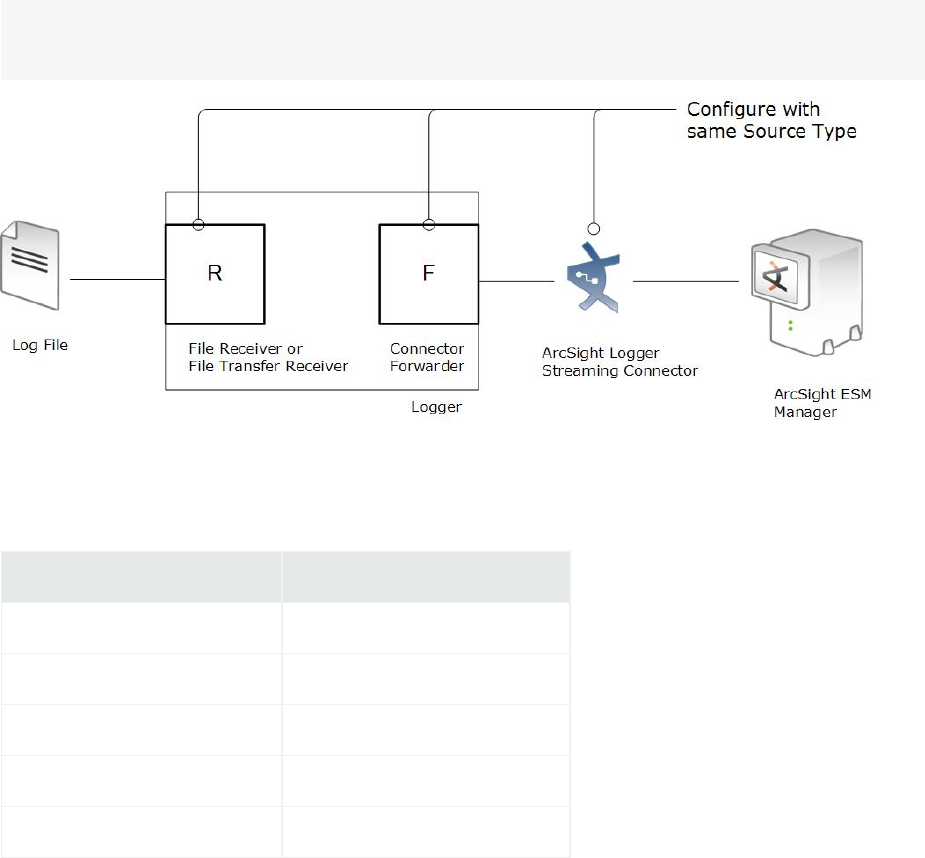
Note: The receiver, forwarder, and SmartConnector must all be configured with the same Source
Type value to successfully forward log file events from Logger to ArcSight ESM.
Unlike events that Logger receives, such as syslog, SmartMessage, or CEF, log file events must be
parsed to determine event timestamp. Therefore, if you need forward events to ESM by using a
Connector forwarder, you must choose one of the following source types for the receiver:
Source Type
Apache HTTP Server Access Microsoft DHCP Log
Apache HTTP Server Error Other
IBM DB2 9.x Audit Log Tipping Point SMS 2.5 Syslog
IBM DB2 Audit VMware ESX Syslog
Juniper Steel-Belted Radius
Data Validation
The data validation screen enables you to perform audit-quality validation on your Logger data files.
From here, you can check the hash value of all data files within specified time range to validate the data.
This feature is only available to administrators. See "Users/Groups" on page439 for more information
on Logger user rights and how to administer them.
The data validation process uses the SHA1 hash algorithm to compute the hash value for the data files
in the specified time range and compares it to the pre-computed value to determine the integrity of the
data file. Each data file contains up to 1 GB of data; the hash value is computed once the data file is full.
If a data file is not full yet, its validation result cannot be computed.
Administrator's Guide
HPE Logger 6.2 Page 348 of 623
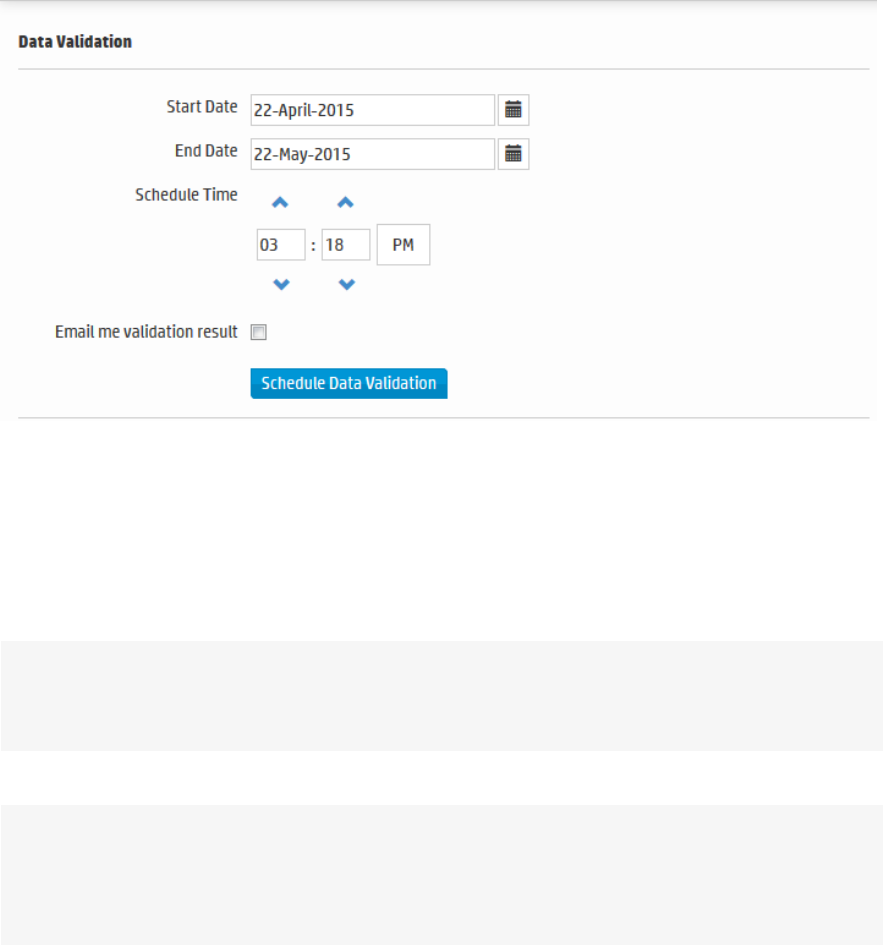
To validate data on Logger:
1. Open the Configuration | Data menu and then click Data Validation.
2. Specify the range of data you want to validate in the Start Date and End Date fields.
3. Specify the time you want to run the validation by using the up and down-arrows on the Schedule
Time fields.
4. Check the Email Me Validation Results checkbox to have Logger send an email letting you know
the validation result as soon as the validation process is complete. Logger sends this to the email
address stored for the logged-in user.
Note: If the Email Me option is not available, Logger's SMTPserver has not been configured.
Logger's system administrator may be able to enable this feature. For more information, see
"SMTP" on page411.
5. Click Schedule Data Validation.
Note: You cannot cancel a Data Validation in progress. The data validation process can
take a long time for large amounts of data. Therefore you should schedule the process to run
during off-peak hours, and narrow down the time range to include only the data you are
interested in.
Once the data validation process is complete, each data file in the specified time range is displayed along
with its Validation Result. If the emailme checkbox was selected, an email with the subject, "Data
Validation results from Logger <logger host name>" is sent to the email address stored for the logged-in
user.
Administrator's Guide
HPE Logger 6.2 Page 349 of 623
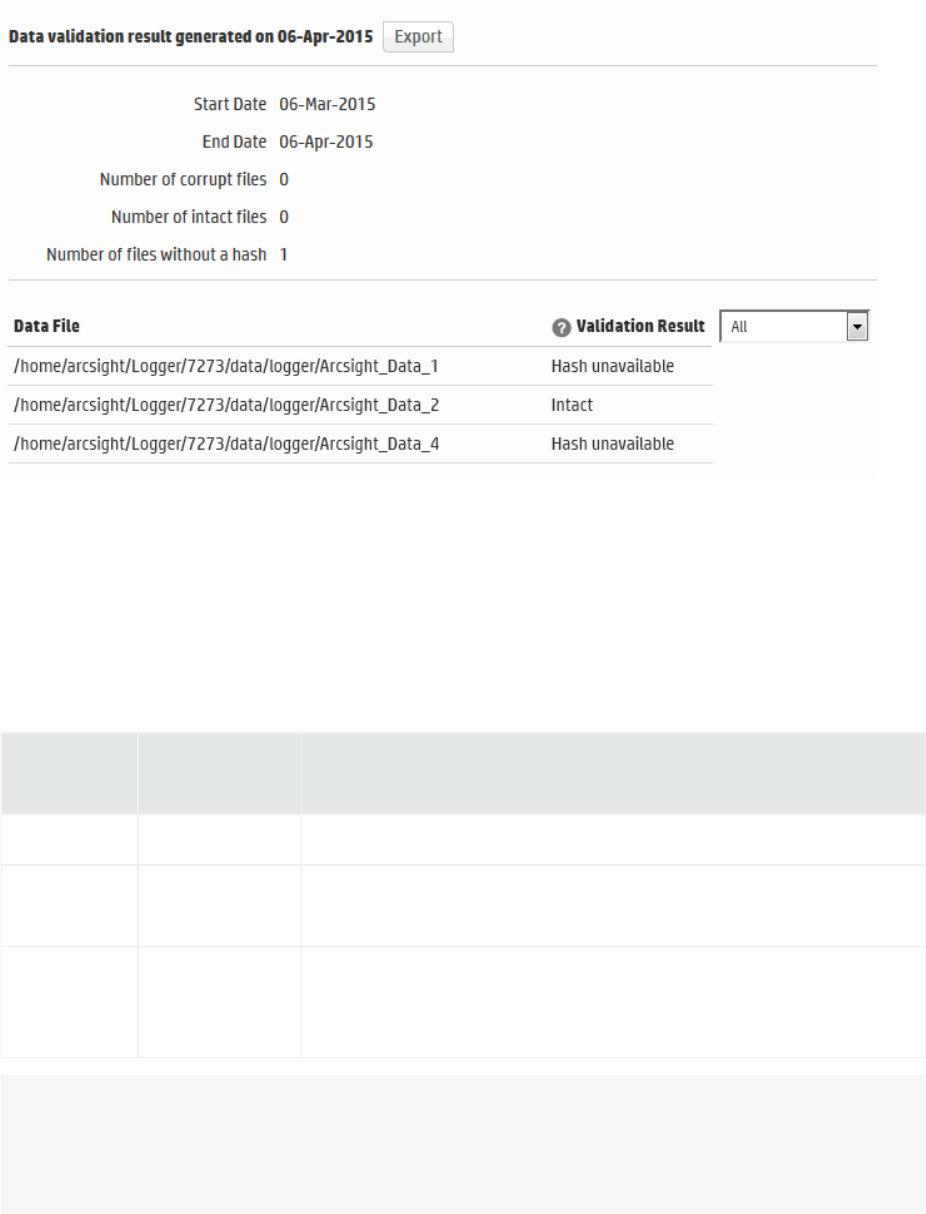
To view the validation results:
lClick the down-arrow in the Validation Result dropdown to select the type of result that you want
to see. You can select All, Corrupt, Intact, or Hash Unavailable.
OR
lClick Export to download a spreadsheet containing the validation data.
The following table describes the possible validation results:
Displayed
Value
Value in
Exported File Description
Intact True The hashes match; the data is intact.
Corrupt False The hashes do not match; the data has been changed or become
corrupt.
Hash
unavailable
N/A The file has no hash; the data could not be validated. This is most
likely because the data file is not yet full or the data file was created
by an older version of Logger.
Note: If the system is upgraded to Logger 6.0, data from the earlier version will have a status of
N/A. This is because no data validation hash value was stored when the data was created. However,
in the case of future upgrades, hash validation data will be kept, and you will be able to validate the
data after an upgrade.
Administrator's Guide
HPE Logger 6.2 Page 350 of 623

Storage
The options in the Configuration | Storage category enable you to manage how data is stored in
Logger. Different storage groups support the implementation of multiple retention policies. Each group
can have a different policy, and storage rules determine which storage group is used for events from
specific device groups. For more information, refer to the Logger Installation Guide.
• Storage Groups 351
• Storage Rules 353
• Storage Volume 355
• Event Archives 355
• Guidelines for Archiving Events 356
• Archiving Events 358
• Daily Archive Settings 359
• Archive Storage Settings 360
• Loading and Unloading Archives 361
• Indexing Archived Events 362
Storage Groups
Storage Groups support multiple retention policies by defining a maximum size (Allocated (GB)) and
number of days (Maximum Age) to retain events. Once events are older than the specified Maximum
Age or there are more events than the storage group will hold (as specified by Allocated size), the
oldest events are deleted at the next retention cycle. The retention process triggers periodically on
Logger, therefore, events might not be deleted immediately when events gets older than maximum age
or the storage group size exceeds the allocated size.
Logger can have a maximum of 6 storage groups—two that pre-exist on your Logger (Internal Storage
Group and Default Storage Group) and four that you can create. You can add the additional storage
groups (up to the maximum of six) at any time.
HPErecommends that you create the four additional storage groups in addition to the two that pre-
exist, so that you have five storage groups available for event storage and one for Logger’s internal
events.
To add additional storage groups, follow the instructions in "Adding Storage Groups" on page376.
Once a storage group is created, it cannot be deleted; however its size can be increased or
decreased any time. If you are decreasing the size of the storage group and the new size is lesser than
the currently used space on the storage group, you will need to delete data to achieve the new size. In
this situation, the Logger UI guides you to delete sufficient data.
Administrator's Guide
HPE Logger 6.2 Page 351 of 623
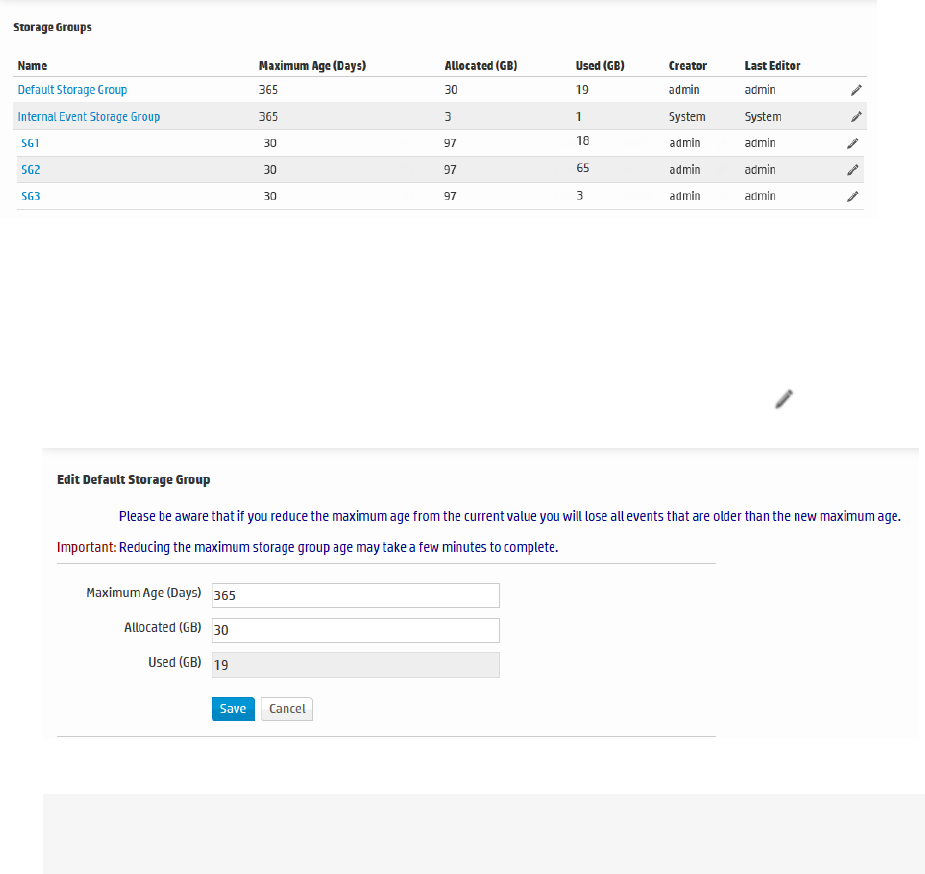
Storage Groups page
To edit (including resizing) a storage group:
1. Open the Configuration | Storage menu and then click Storage Groups.
The Storage Groups page displays the available storage groups.
2. Identify the storage group you want to modify and click the associated Edit icon ( ). The
Storage Groups page displays the Edit <Storage Group Name>Storage Group pane.
3. Change the name of the storage group, or increase or decrease Maximum Age or Allocated size.
Note: The names of the Internal Storage Group and Default Storage Group cannot be
modified.
If you are reducing the size of the storage group and the new size is smaller than the current
size indicated the Used (GB) field on the Edit Storage Group page, Logger displays a message
indicating that reducing storage group size in this situation will require you to delete existing data.
If you choose to delete data to reduce the storage group size, follow these steps:
a. Set the Maximum Age value to the number indicated in the message. Doing so triggers the
deletion of events.
b. Refresh the Edit Storage Group screen. When the Used (GB) value is less than or equal to the
storage group size you want to set, go to the next step. Otherwise, keep refreshing the screen
periodically.
Administrator's Guide
HPE Logger 6.2 Page 352 of 623

Note: The Used (GB) value changes as data are deleted, which can take some time.
Therefore, you need to wait before proceeding to the next step.
c. Set the Allocated (GB) value to suit your needs.
d. If you wish, restore the Maximum Age setting (that you changed in Step a) to the original
value.
If you choose not to delete data, go to the next step to exit the procedure.
Note: If there is sufficient space to reduce the storage group size, you can change it
without modifying the Maximum Age value (to modify the retention policy to delete data).
4. Click Save to store the changes, or Cancel to quit.
Storage Rules
Storage rules create a mapping between device groups and storage groups. Doing so enables you to
store events from specific sources to a specific storage group. You can configure these storage groups
with different retention policies, and thus retain event data based on the source of incoming events. For
example, all events from firewall devices can be subject to a short retention period. To accomplish this,
manually assign the firewall devices to a device group and then create a storage rule that maps the
device group to a storage group with the desired short retention period.
Tip: Events that are not subject to any storage rule are sent to the Default Storage Group.
Before you add a storage rule, make sure that the storage group to which you want to store the events
and the device group that contains the devices whose events you want to store exist. For information
on how to create device groups, see "Device Groups" on page294.
Logger allows you to create up to 40 storage rules. If you create additional rules, an error might be
generated.
To add a storage rule:
1. Open the Configuration | Storage menu and then click Storage Rules.
2. Click Add. The Add Storage Rule page displays.
Administrator's Guide
HPE Logger 6.2 Page 353 of 623
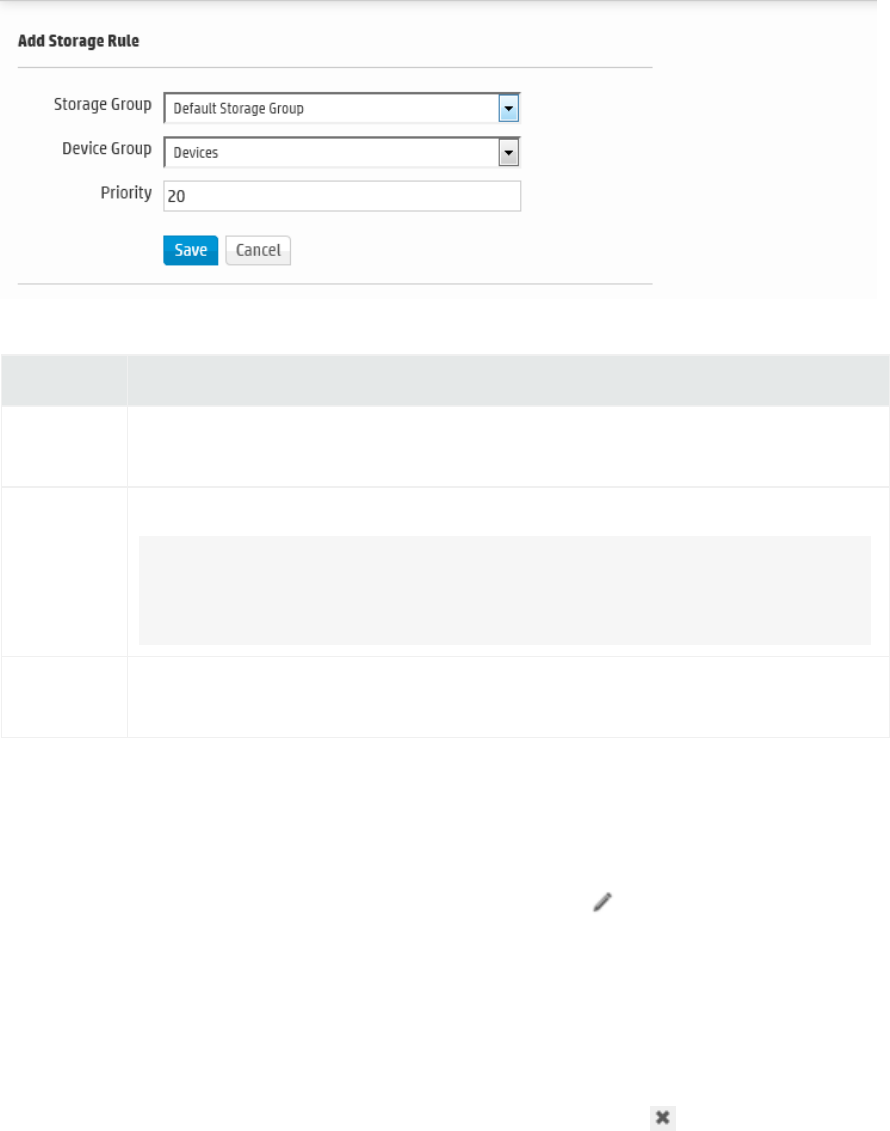
3. Enter the following parameters:
Parameter Description
Storage
Group
Select a storage group from the drop-down list. The storage groups must already
be set up before any storage rules are added.
Device
Groups
Select a device to associate with the storage group.
Note:If you want to include events from more than one device in the storage
group, create a Device Group which contains all the Logger Devices you want
and then select that Device Group for the Storage Rule.
Priority An integer that indicates the new rule’s priority. The number must be unique for
each storage rule. The smaller the number, the higher the rule’s priority.
4. Click Save to add the new storage rule, or Cancel to quit.
To edit or reorder a storage rule:
1. Open the Configuration | Storage menu and then click Storage Rules.
2. Find the storage rule that you want to edit and click the Edit icon ( ) on that row.
3. Change the information in the form–for example, change the priority value to reposition the
storage rule in the table–and click Save.
To delete a storage rule:
1. Open the Configuration | Storage menu and then click Storage Rules.
2. Find the storage rule that you want to delete and click the Remove icon ( ).
3. Click OK to confirm the delete.
Administrator's Guide
HPE Logger 6.2 Page 354 of 623

Storage Volume
The Storage Volume page displays the mount location and current storage volume settings. To increase
the Storage Volume size, go to the System Maintenance page. You must have admin-level privileges to
perform this operation. See "Users/Groups" on page439 for more information on Logger user rights
and how to administer them.
Event Archives
Event Archives enable you to save the events for any day in the past, not including the current day.
Archive Storage Settings must be configured before Event Archives can be created. Archive Storage
Settings specify the location to which event archives will be written.
Caution: Ensure that both Configuration Backups (for configuration settings) and Event Archives
(for data) run on a regular basis and are stored in a remote location. In the event of catastrophic
failure, you will need to restore the most recent Configuration Backup and Event Archive. For
information on Configuration Backups, see "Configuration Backup and Restore" on page385.
lFor Logger Appliances, the location needs to be an NFS mount, CIFS mount, or SAN, which is
configured using the Logger user interface.
lFor Software Loggers, the location is a directory (either local or a mount point that you have already
established on the Logger host).
Events in each storage group are archived separately. That is, one archive file is created for each storage
group, for each day. In addition, you can bulk archive events—that is, specify a range of dates to archive
events in a single archive operation.
Archiving events from each storage group to a separate archive location enables you to keep data in
specific storage groups longer than others. You need to specify these locations when you configure the
Archive Storage Settings before archiving any events, as shown in the following figure. This figure is
from a Logger Appliance. The Mount Location field is not available on a Software Logger.
lFor Logger Appliances, the path you specify in the Archive Path field is appended to the path
specified in the Mount Location.
lOn a Software Logger, you need to enter a complete path where the archive file will be written in the
Archive Path field. This path could be a local directory or a mount point that is already established on
the machine on which the Logger software is installed. The Mount Location field is not available on a
Software Logger.
Logger uses the receipt time of an event to determine its archival day. For example, an event with a
timestamp of 11:55:00 PM on December 7 is received at 12:01:00 AM on December 8 on the Logger. This
event is archived in the archive file created for December 8th and not December 7th. When an archive
operation occurs, one archive file per storage group is created at the location specified in Archive
Storage Settings. Each archive file contains events from 12:00:00 AM to 11:59:59 PM for a single
Administrator's Guide
HPE Logger 6.2 Page 355 of 623

storage group of any given day. When you specify a range of dates, one archive file per storage group,
for each specified day is created.
You can archive events in two ways: manually and scheduled. When archiving events manually, you
specify the start and end dates of the event archive, and the storage groups that should be archived.
This operation occurs once for the specified date range. When scheduling event archives, you specify
the time at which the archive operation should occur every day and select the storage groups that
should be included.
Note: You cannot set event archives to start at 1 AM for scheduled archives. This restriction is by
design to account for the Daylight Savings Time (DST) changes.
When Logger starts archiving, it proceeds sequentially through the various storage groups, as listed on
the Daily Task Settings page (for scheduled archives) or the Add Event Archives page (for manual
archives).
Once the events have been archived, they are not deleted from the local storage until the events (and
their related indexing information) age out due to the configured retention policy. These events
continue to be included in search operations until they age out.
Once events that have been archived are deleted from Logger's local storage, they are not included in
search operations. To include such events in search operations, you must load the archive in which
those events exist back to the Logger. When an Event Archive is loaded, its events are included in
searches, but the archive itself remains on the remote storage.
When events are archived, index information for those events is not archived. Therefore, when event
archives are loaded, indexes are not available. As a result, a search query that runs on archived events
(that have been loaded on Logger) is slower than when the data was not archived because the index
data for the archived data is not available. You can choose to index an archive's events. This process can
take some time. After this indexing process completes, search will run at the regular speed on events in
the indexed archive.
Caution: Archives take a long time to index and searches may be slower while indexing is taking
place. Only index the archives you need.
The source type information (if associated with an event) is preserved when the event is archived. For
information on creating and using source types, see "Source Types" on page314.
Guidelines for Archiving Events
lBe sure to run configuration backups as well as event archives regularly, and to store them in a
remote location. In the event of catastrophic failure, you will need to restore the most recent
configuration backup and event archive. For information on configuration backups, see
"Configuration Backup and Restore" on page385.
Administrator's Guide
HPE Logger 6.2 Page 356 of 623

lIf you need to archive a large number of events (in the order of tens of GB), HPE recommends that
you archive during the off-peak hours to prevent impacting the performance of your Logger.
lMultiple archiving operations such as loading, unloading, archiving, and deletion of archives can
occur simultaneously. Therefore, you can initiate the loading of an existing archive, while an archive
operation is in progress.
Tip: Only one manual archive job can run at a time. However, a scheduled archiving operation
can run in parallel with a manual job.
lYou cannot re-archive the events that have been archived already. If you try to do so, the Logger
reports an error.
lDo not move the archived files from their archive location. The archives that have been moved from
the originally archived location cannot be loaded on to the Logger. If you need to delete the archives,
use the Logger user interface to do so.
lIf an archive job fails, you need to initiate it manually. To do so, delete the failed archive and archive it
manually. To be notified of a failed archive, configure an alert for this audit event: Event Archive
Failed. For more information about this event, see "Logger Audit Events" on page514. For more
information about configuring alerts, see "Saved Searches" on page260.
lIf a Logger Appliance goes down while an archive operation is in progress, you need to re-initiate the
archive operation for only the storage groups that were not archived when the operation failed. The
status of such storage groups is marked “Failed” in the Status column on the Event Archives page.
For example, you archive the event data of 12/1/10, which consists of events from four storage
groups “Default”, “Internal”, “Short-Term”, and “Long-Term”. The appliance goes down after the
events from the “Default” and “Internal” groups have been successfully archived, and the events from
“Short-Term” are being archived. The status of the “Short-Term” storage group on the Event
Archives page will display “Failed”, while the status of the “Default” and “Internal” groups will display
“Archived”. (The status of the “Long-Term” storage group will not be displayed.) In this case, you
need to manually re-initiate the archive for the “Short-Term” and “Long-Term” storage groups.
Note: In the above example, the status of the “Long-Term” storage group is not displayed on
the Event Archives page after the failure occurs because archival of this group was never
initiated during that archive operation.
If an archive operation fails, make sure you determine the storage groups that could not be
archived and re-initiate the archival for all of those groups manually.
lYou can cancel an in-progress archive operation that was manually initiated at any time using the
Cancel link that displays on top of the Event Archives page.
Administrator's Guide
HPE Logger 6.2 Page 357 of 623
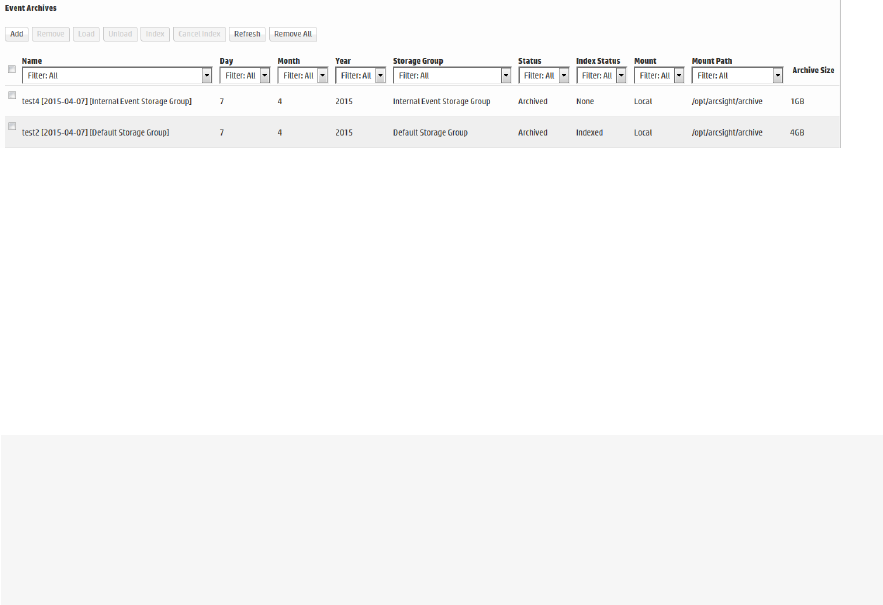
Archiving Events
To save events for a particular day, you need to add an Event Archive. The table in the Event Archives
page shows the current archives and their status.
An archive storage location must be established on the Logger before you can archive its events. This is
a one-time configuration. To establish an archive storage location, see "Archive Storage Settings" on
page360.
To add an Event Archive:
1. Open the Configuration | Storage menu and then click Event Archives.
2. Click Add in the Event Archives page.
3. Enter a meaningful name in the Name field for the new Event Archive and specify the Start and
End dates in the format m/dd/yy, where m is month number, dd is the day of the month (with a
leading zero if necessary), and yy is the two-digit year number.
When the Start and End dates are different, one archive file per storage group, for each specified
day is created. For example, if you specify the following Start and End dates:
Start Date: 8/12/15
End Date: 8/13/15
Note:If a day's events have already been archived, you will not be able to archive them again. If
you try to archive the same day's events twice, Logger will display a message with the already
archived day or dates. If you are archiving a range of dates and some of them have been
archived, the archive process will complete, skipping any days already archived, and a message
will display the already archived dates.
And, if you configure both storage groups—Internal Event Storage Group and Default Storage
Group, four archive files will be created as a result of this archive operation—two files per storage
group for the specified two days.
The Event Archives table (under the Event Archives page) lists the archives by an alias in this
format: <archive_name> [<yyyy-m-dd>] [<storage_group_name>].
4. Select the names of storage groups that need to be included in the archive.
5. Click Save to start archiving events, or Cancel to quit.
Administrator's Guide
HPE Logger 6.2 Page 358 of 623
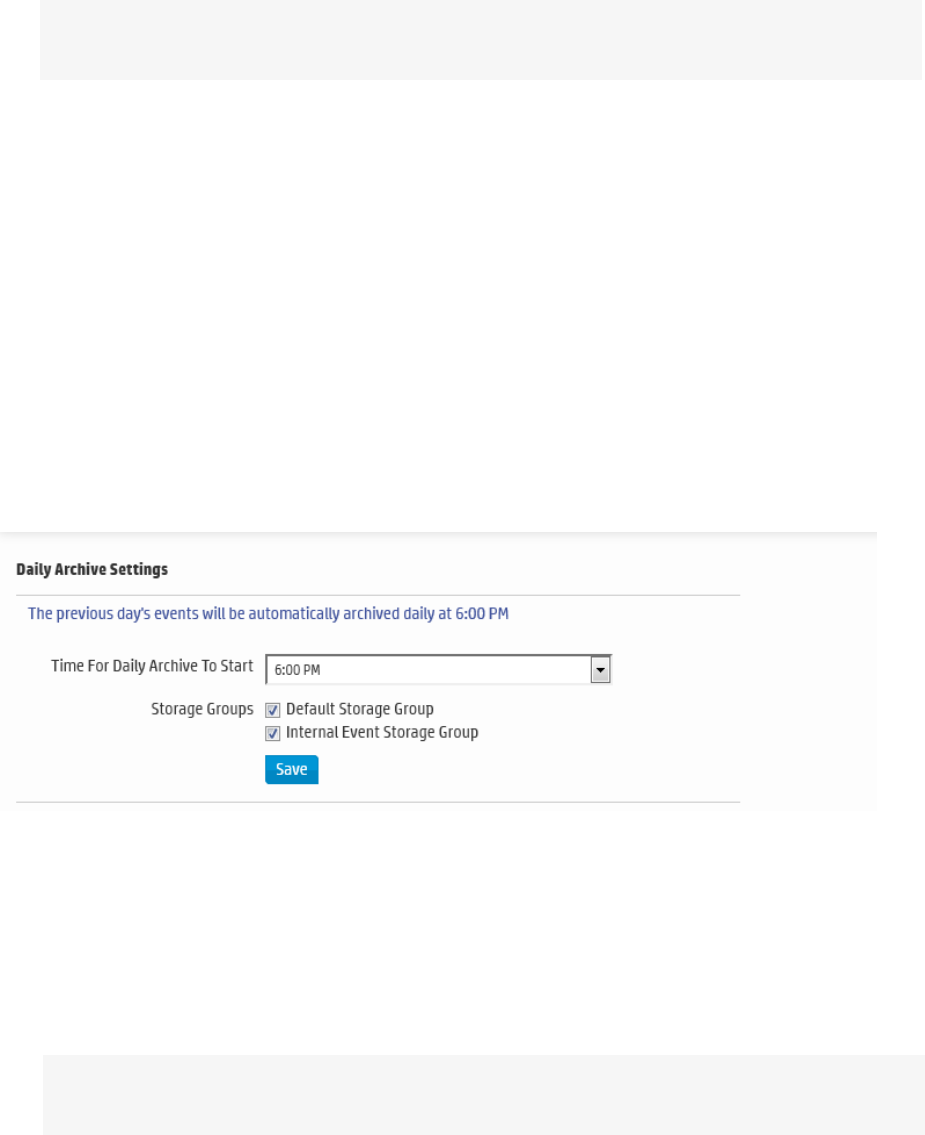
Note: You can cancel an in-progress archive operation at any time using the Cancel link that
displays on top of the Event Archives page.
To delete an Event Archive:
1. Open the Configuration | Storage menu and then click Event Archives.
2. Click the checkboxes in the left-most column to select the event archives that you want to delete.
3. Click Remove from the top of the screen to delete the selected archives.
4. Confirm the deletion by clicking OK, or click Cancel to retain the Event Archive.
Daily Archive Settings
You can schedule a daily event archive and specify what hour of the day it should run. Scheduled event
archives that have finished running appear on the archive list on the Event Archives page. Only one
scheduled event archive can run at a time; however, it can run in parallel with a manually scheduled
archive.
Make sure you are familiar with the information in "Time/NTP" on page409 before you schedule an
event archive.
To schedule a daily event archive:
1. Open the Configuration | Storage menu and then click Daily Archive Settings.
2. Select a time from the Time For Daily Archive to Start list.
Tip: Scheduled archives must start on the hour. Midnight and 1:00 AM are not on the list to
allow your Logger to receive all of the previous day’s events.
3. Select the storage groups whose events should be included in the scheduled archive.
4. Click Save to schedule daily event archive, or click on another page to cancel.
Administrator's Guide
HPE Logger 6.2 Page 359 of 623

Archive Storage Settings
On the Logger Appliance, Event Archives are saved to a specific NFS or CIFS mount point, or SAN. For
the Software Logger, event archives are saved to the specified directory, which can be a path to a local
directory or to a mount point on the machine on which the Software Logger is installed. To establish a
mount point, see your system’s operating system documentation.
To perform Archive Storage Setting setup:
1. If you are using the Logger Appliance, create the NFS or CIFS mount point. (See "Storage" on
page419 and "Remote File Systems" on page419.)
If you are using Software Logger and intend to use an NFS or CIFS mount point, ensure that the
external storage point is mounted on the machine on which Logger is installed. See your system’s
operating system documentation for more information.
2. Open the Configuration | Storage menu and then click Archive Storage Settings.
3. Specify a mount location and an archive path for each storage group. You can specify a different
path for each storage group, thus enabling the Logger to archive events to a different location for
each storage group.
lFor Logger Appliances, choose the name of an NFS mount, CIFS mount, or SAN mount point
for the Mount Location field. This drop-down list contains the names you specified when
creating the NFS, CIFS, or SAN mount points (System Admin > Storage > Remote File
Systems).
For example, if the mount location you selected refers to the path /opt/ARCHIVES, and the
archive directory in that location is archivedir, then specify archivedir in the Archive Path
field.
lFor Software Loggers, the Mount Location field does not exist. You need to enter a complete
path where the archive file will be written in the Archive Path field. This path could be a local
directory or a mount point that is already established on the machine on which the Logger
software is installed.
For example, you could specify /opt/ARCHIVES/archivedir.
Note: You must configure settings for all storage groups on the Archive Storage Settings
page even if you do not intend to archive all of them.
Administrator's Guide
HPE Logger 6.2 Page 360 of 623
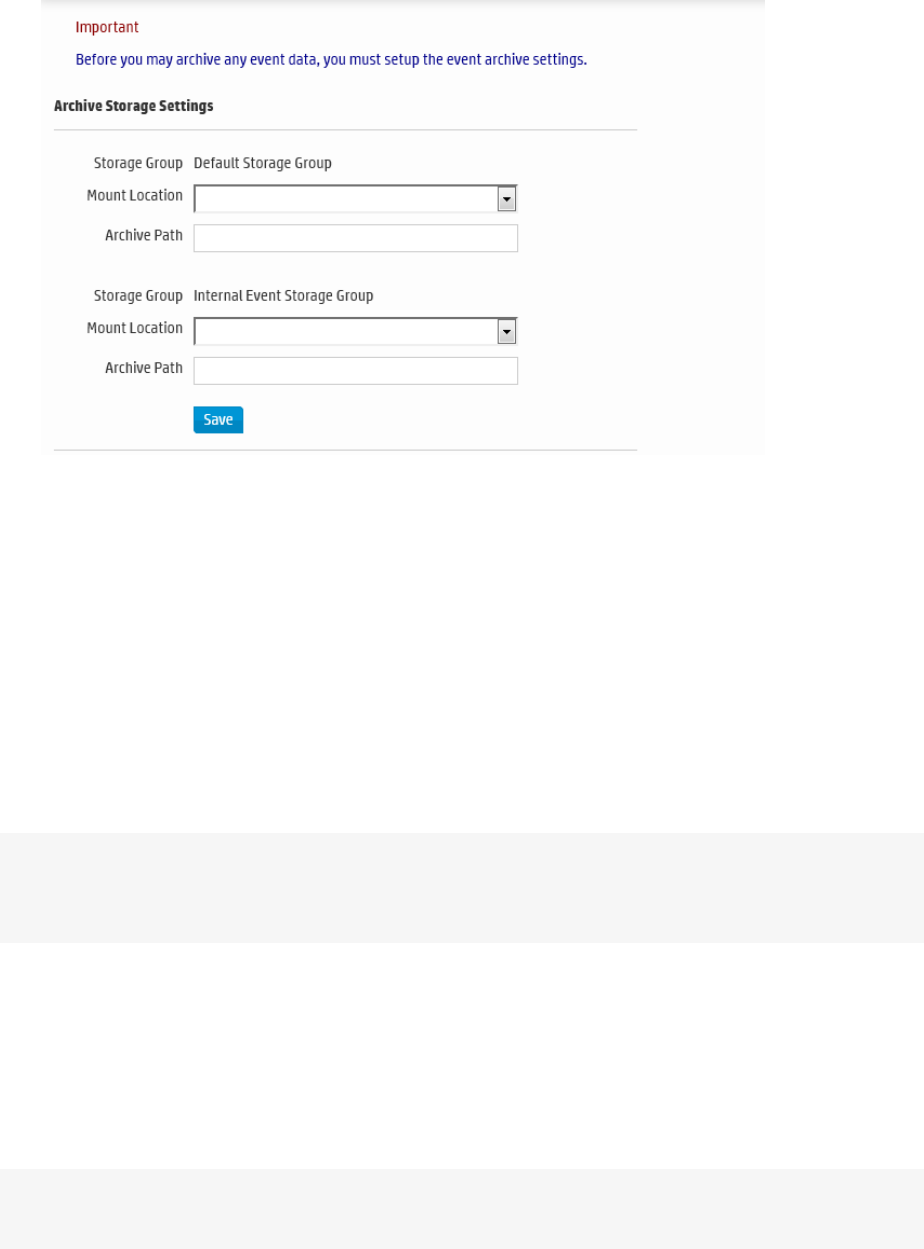
4. Click Save.
Loading and Unloading Archives
Archived events must be loaded back on Logger before they can be included in a search operation.
When an Event Archive is loaded, its events are included in searches, but the archive itself remains on
the remote storage. When an Event Archive is unloaded, it is available for loading, but its events are not
included in searches. You can unload a loaded archive if you no longer need to include it in your search
operations.
Archive indexes are loaded and unloaded with the archive. See "Indexing Archived Events" on the next
page for more information.
Note:Even though an archive has been created, you cannot load an archive for data that is still in
current storage. That is, loading the archive will fail if that data has not already passed it's retention
date and been aged out of current storage.
To load or unload an Event Archive:
1. Open the Configuration | Storage menu and then click Event Archives.
2. Click the checkboxes in the left-most column to select the event archives that you want to load or
unload.
3. Click Load or Unload from the top of the screen to load or unload the selected archives.
Note:If you index an archive while the archive is loaded, the archive will be automatically reloaded
after the index is created.
Administrator's Guide
HPE Logger 6.2 Page 361 of 623

Indexing Archived Events
Although Index data is not stored when the events are archived, you can build an index for existing
archives. After creation, the index will be located in the same root of current archive and in the newly
created subdirectory name with “Index” postfix.
Searching for events in loaded archives that do not have indexes is slower than searching events that
still exist in current storage. Indexing an archive will increase performance when searching the archived
data. After indexing an archive searching on events in that archive will be as fast as searches in local
storage.
If you index an archive while that archive is already loaded, the archive will be automatically reloaded
once the index had been created.
Tip:The tmp directory and the archive directory must both be writable and have enough space for
the index to be created.
To index an Event Archive:
1. Open the Configuration | Storage menu and then click Event Archives.
2. Click the checkboxes in the left-most column to select the event archives that you want to index.
Caution: Archives take a long time to index and searches may be slower while indexing is
taking place. Only index the archives you need.
3. Click Index from the top of the screen to index the selected archives.
Tip: You cannot cancel the indexing once it is in progress, but you can cancel indexing of
archives in the pending queue. To cancel indexing, click the checkboxes in the left-most column
and select event archives with the Indexing Status of Pending. Then click Cancel Index.
Note: If indexing fails, check the log for the cause of failure. After you fix the problem, try
indexing again.
Scheduled Tasks
Scheduled tasks are jobs that are programmed to happen automatically. Job types include
Configuration Backup, File Transfer, Event Archive, and Saved Search. The options in the
Configuration | Scheduled Tasks category enable you to manage the scheduled tasks.
Make sure you are familiar with the information in "Time/NTP" on page409 that can impact a scheduled
task.
Administrator's Guide
HPE Logger 6.2 Page 362 of 623
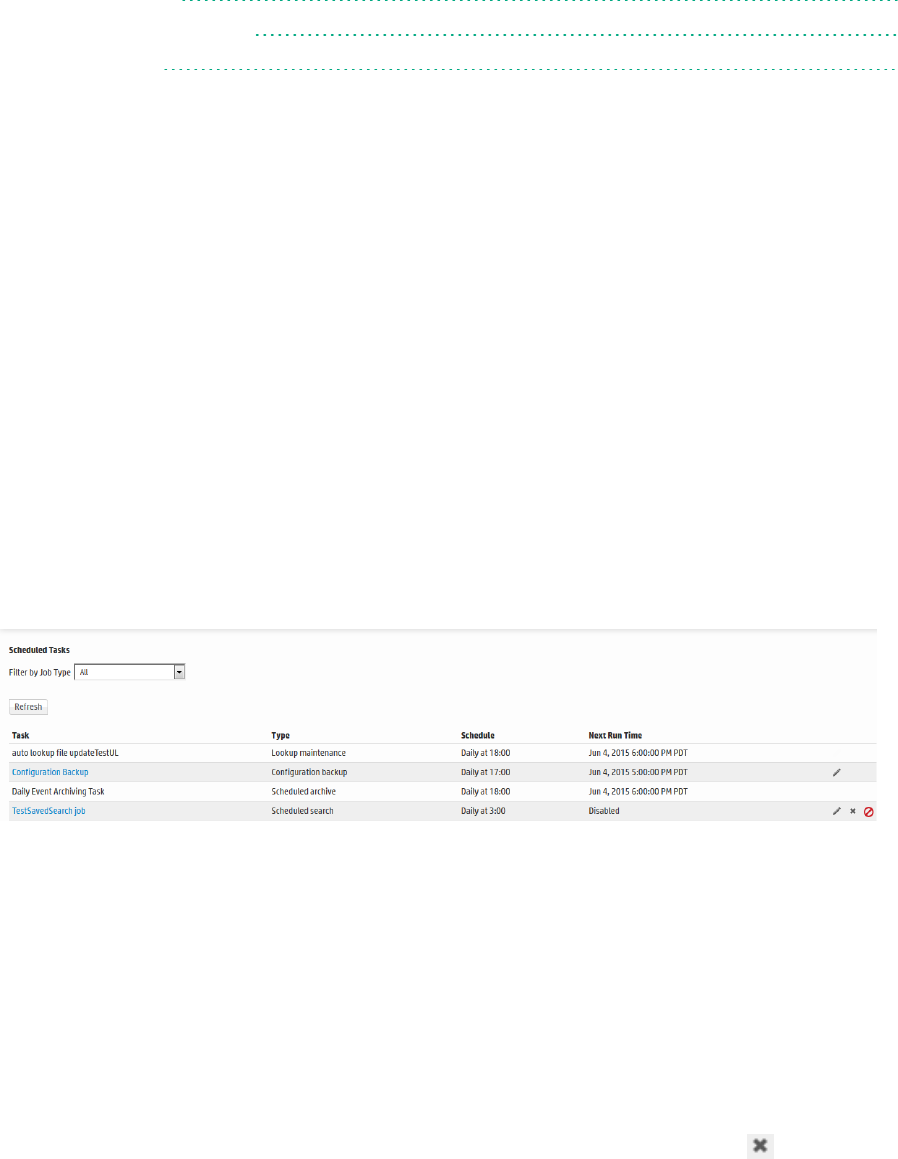
• Scheduled Tasks 363
• Currently Running Tasks 364
• Finished Tasks 364
Scheduled Tasks
Scheduled Tasks can be created for the following activities:
lSaved Searches (See " Scheduled Searches/Alerts" on page262.)
lFile Receivers and File Transfer Receivers (See "Receivers" on page296.)
lEvent Archives (See "Archiving Events" on page358.)
lConfiguration Backups (See "Configuration Backup and Restore" on page385.)
lLookup File Updates (See "Lookup Files" on page283.)
The Scheduled Tasks page displays the list of scheduled jobs. Some tasks can be managed from this
screen. The available management options, which may include edit, enable, disable and delete, are
displayed at the right end of the column.
A drop-down list at the top of the page lets you display all scheduled tasks (All), or only tasks of a
specific type.
Scheduled Tasks page
To view Scheduled Tasks:
1. Open the Configuration | Scheduled Tasks menu and then click Scheduled Tasks.
2. Filter the list by selecting a specific type of Scheduled Task from the drop-down list, or select All.
3. Click Refresh to update the list of tasks.
To delete a Scheduled Task:
1. Open the Configuration | Scheduled Tasks menu and then click Scheduled Tasks.
2. Locate the Scheduled Task that you want to delete and click the Remove icon ( ) on that row.
3. Confirm the deletion by clicking OK, or click Cancel to retain the Scheduled Task.
Administrator's Guide
HPE Logger 6.2 Page 363 of 623
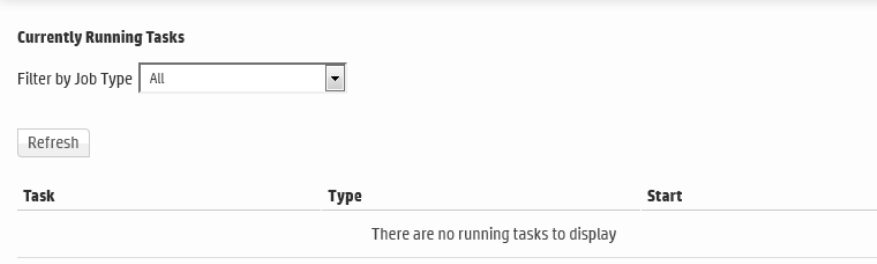
Currently Running Tasks
The Currently Running Tasks page displays the Scheduled Tasks that are running right now. The table
shows task name, type, and the date and time that the task started.
To view tasks that are running now:
1. Open the Configuration | Scheduled Tasks menu and then click Currently Running Tasks.
2. Click Refresh to update the list of tasks.
3. Filter the list by selecting a specific type of Scheduled Task from the drop-down list, or select All.
Finished Tasks
The Finished Tasks page acts like a log of all Scheduled Task runs, with the most recently finished tasks
on top.
To view Finished Tasks:
1. Open the Configuration | Scheduled Tasks menu and then click Finished Tasks.
2. Click Refresh to update the list of tasks.
Administrator's Guide
HPE Logger 6.2 Page 364 of 623
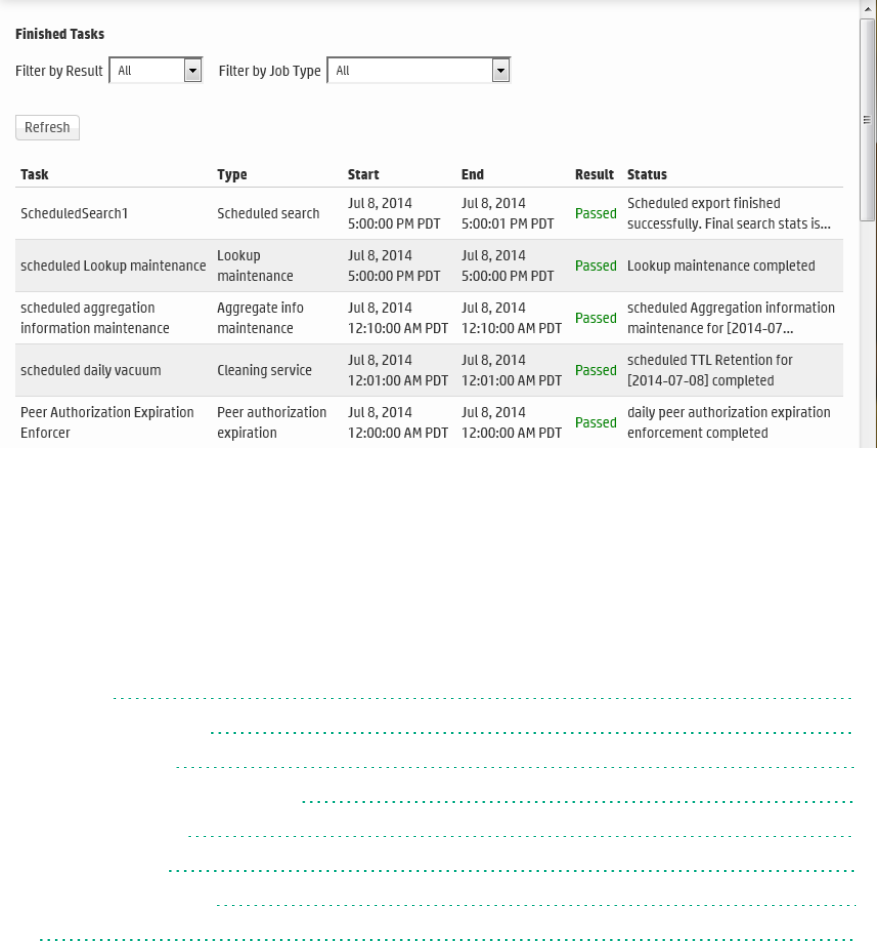
3. Filter the list by selecting a specific type of Scheduled Task from the drop-down list, or select All.
Advanced Configuration
The options in the Configuration | Advanced category enable you to manage the advanced tasks.
Most of these tasks require administrator privileges.
• Retrieve Logs 365
• Maintenance Operations 367
• Maintenance Results 384
• Configuration Backup and Restore 385
• Content Management 390
• License Information 395
• Data Volume Restrictions 395
• Peers 396
Retrieve Logs
Logger records some audit and debug information, including details of any issues that occur. These
system logs (not be confused with the event logs), are like the "black box" on an airliner. If something
goes wrong, the logs can be helpful. Customer support may ask you to retrieve logs as part of an
incident investigation. If so, follow the steps below and provide the resulting .zip file to customer
support.
When retrieving logs, you have the option to sanitize the log files by obfuscating the IP addresses,
hostnames, and email addresses. However, sanitizing adds extra time to log retrieval. Each sanitized IP
Administrator's Guide
HPE Logger 6.2 Page 365 of 623
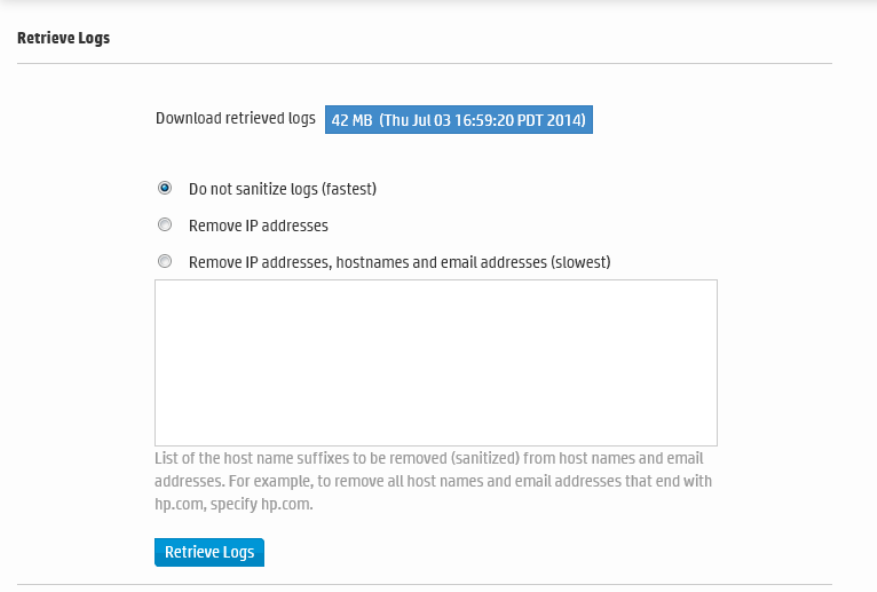
address, hostname, and email address is replaced by the symbols xxx.xxx.xxx.xxx (for IP addresses),
sanitized@email (for emails) and sanitized.host.name (for hostnames).
Retrieve Logs page
To retrieve Logger system logs:
1. Open the Configuration | Advanced menu and then click Retrieve Logs.
2. Select the Log Retrieval options to use when creating the Log file.
lIf you select Do not sanitize logs (fastest), then all IP addresses, hostnames and email
addresses will be kept in the log file.
lIf you select Remove IP addresses, all IP addresses in the log will be obfuscated. You cannot
specify individual IP addresses.
lIf you select Remove IP addresses, hostnames and email addresses, you must specify the
suffixes of the hostnames and email addresses in the text box.
Separate multiple suffixes with comma, space, or line-break. For example, to obfuscate all
hostnames and email addresses that end with hp.com and gmail.com, you could specify the
following:
hp.com, gmail.com
Administrator's Guide
HPE Logger 6.2 Page 366 of 623
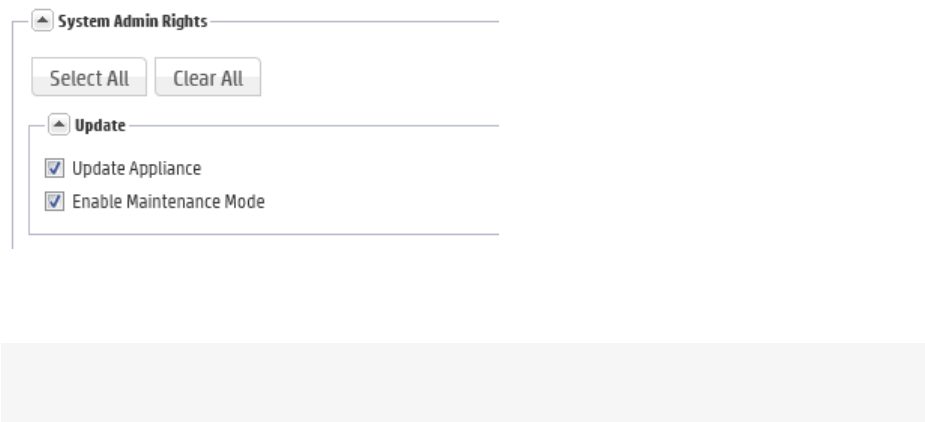
All IP addresses, hostnames, and email addresses with the specified suffixes will be obfuscated.
Specifying individual email addresses like name@hp.com is not supported. Individual email
addresses and their suffixes will be ignored.
3. Click Retrieve Logs. The page will display a progress bar while the logs are being retrieved.
4. When the collection is complete, the system log files have been compressed into a single zip file. A
link to this file is displayed on the Log Retrieval page. Click the link to download the file.
Maintenance Operations
Certain operations on Logger, such as database defragmentation, extending the storage volume size,
adding storage groups, and adding additional schema fields, require that Logger be in a maintenance
state—a state in which operations related to data on the Logger are not running. Maintenance mode
enables you to place the Logger in such a state. When a Logger is in maintenance mode:
lEvents are not processed
lReports are not generated
lSearch cannot run
lScheduled jobs do not run
Logger users who will be performing operations that require it to be in maintenance mode must have
the “Enable Maintenance Mode” privilege checked (System Admin > User Management > Groups
tab > System Admin Group). See "Users/Groups" on page439 for more information on Logger user
rights and how to administer them.
Entering Maintenance Mode:
Tip: You cannot place a Logger in maintenance mode directly. A Logger can enter maintenance
mode only to perform an operation that requires it to be in that mode.
When you open the Configuration | Advanced menu and click Maintenance Operations, the
Maintenance Operations panel displays the available options.
Administrator's Guide
HPE Logger 6.2 Page 367 of 623
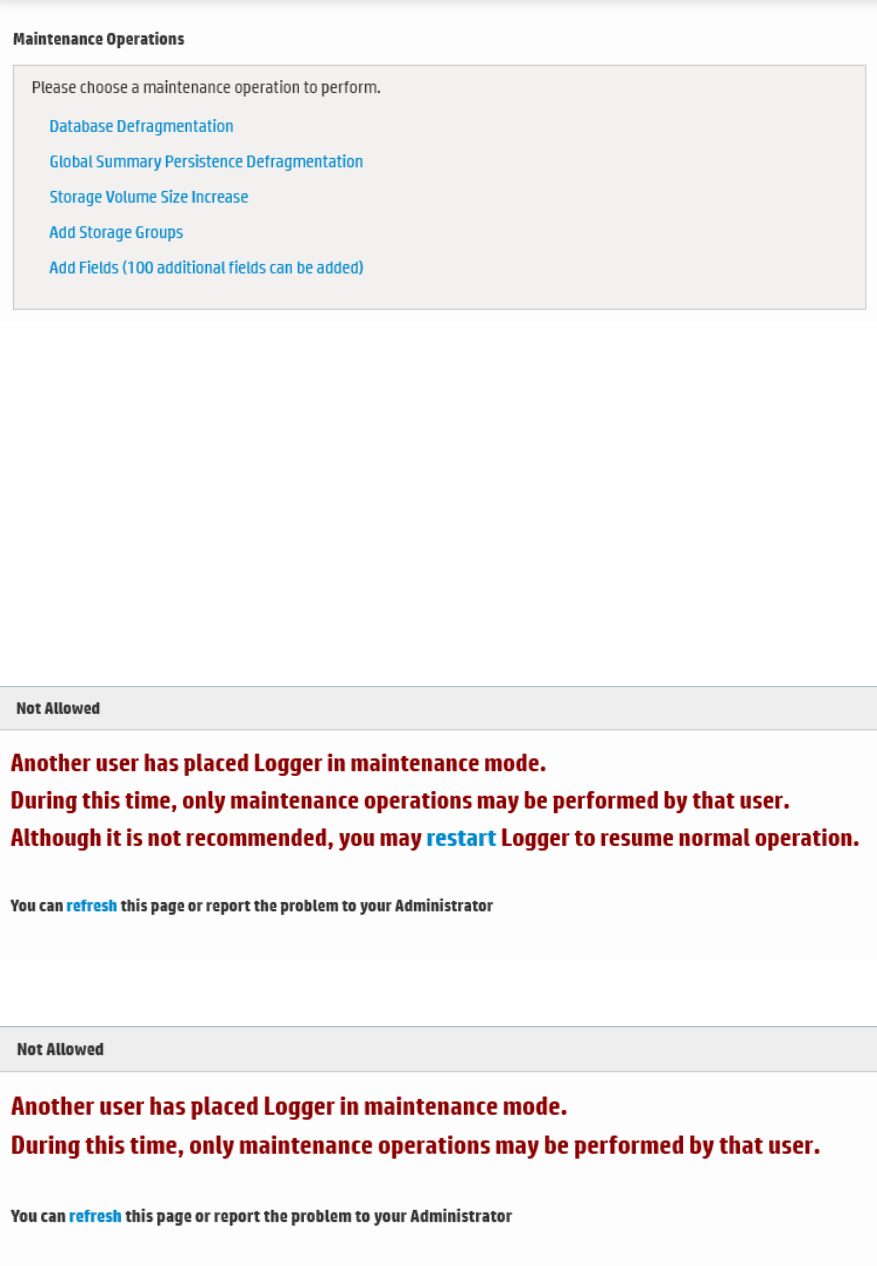
Maintenance Operations panel
Click an option on the Maintenance Operations panel to enter maintenance mode. Instructions for each
option are included below:
l"Database Defragmentation" on the next page
l"Global Summary Persistence Defragmentation" on page373
l"Storage Volume Size Increase" on page374
l"Adding Storage Groups" on page376
l"Adding Fields to the Schema" on page379
When a Logger is in maintenance mode, users with the “Enable Maintenance Mode” privilege see this UI
message:
For all other users, the log-in screen displays this message:
Administrator's Guide
HPE Logger 6.2 Page 368 of 623

Exiting Maintenance Mode:
To exit maintenance mode, use the link on the current Maintenance Mode page to reboot the Logger
Appliance or restart the Software Logger. Do not restart/reboot from the command line.
Database Defragmentation
Logger’s database can become fragmented over time. Frequent retention tasks can exacerbate this
issue. The following symptoms appear on a Logger when the database should be defragmented:
lSlow search and reporting
For example, even a search operation over the last two minutes of data is slow.
lLong pauses in the receiver and forwarder operations
You can defragment a Logger that exhibits these symptoms. Make sure that you have read the
following guidelines before starting the defragmentation process.
Guidelines for Database Defragmentation
Ascertain that the Logger symptoms are not due to issues related to network infrastructure, such as
network latency or unexpected load on the Logger.
The Logger system needs to be placed in maintenance mode before defragmentation can begin. As a
result, most processes on the Logger are stopped—no events are processed or scheduled jobs run, and
most user interface operations are unavailable. For more information about maintenance mode, see
"Maintenance Operations" on page367.
A minimum amount of free disk space is required on your system to run database defragmentation. The
utility automatically checks for the required free space and displays a message if it doesn't have
sufficient disk space.
Tip: Although you can defragment as needed, if you are using this utility too often (such as on a
system that was defragmented over the last few days), contact customer support for guidance.
If the defragmentation process fails at any point, the Logger returns to the same state that it was in
before you started defragmentation:
You can safely reboot the Logger Appliance and restart the process from the beginning. For the
Software Logger, restart the Logger process as described in "Process Status" on page413.
You can perform this process only if you have the “Enable Maintenance Mode” privilege set to Yes in
the System Admin Rights list for the System Admin Group to which you are assigned. To set, navigate
to System Admin > User Management > Groups tab > Manage Groups page, select a System Admin
Group and click Add or Edit.
See "Users/Groups" on page439 for more information on Logger user rights and how to administer
them.
Administrator's Guide
HPE Logger 6.2 Page 369 of 623
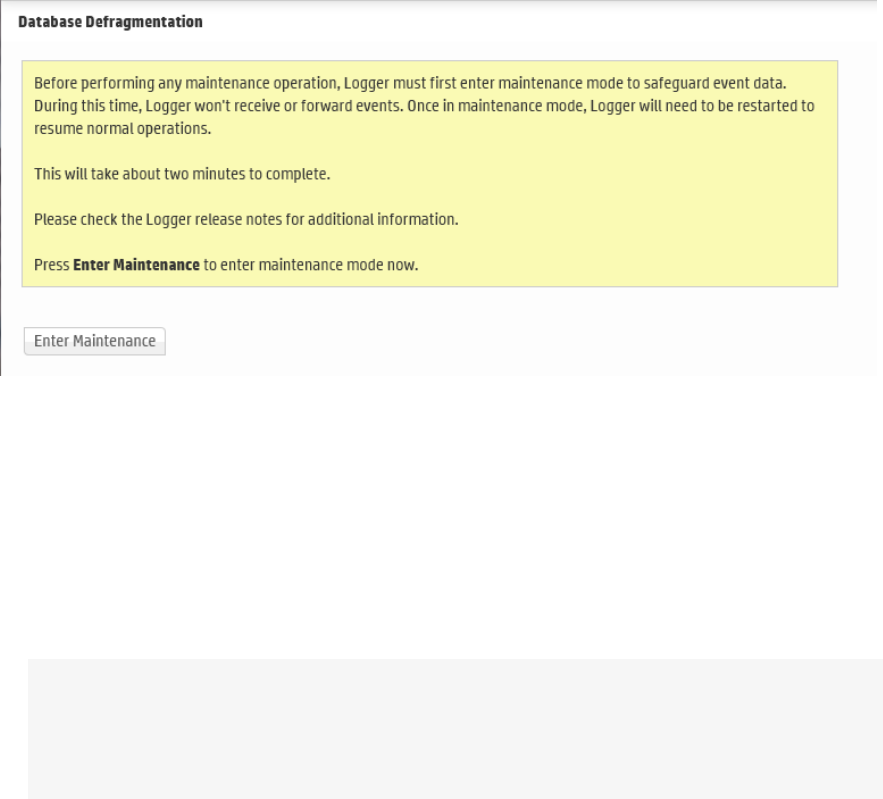
Defragmenting a Logger
To defragment a Logger:
1. Open the Configuration | Advanced menu and then click Maintenance Operations.
The Maintenance Operations panel, described in "Maintenance Operations panel" on page368
displays the available options.
2. Click Database Defragmentation.
3. Click Enter Maintenance so that the Logger can enter maintenance mode. For more information
about maintenance mode, see "Maintenance Operations" on page367.
4. A minimum amount of free storage is required for the database defragmentation process to
proceed. Therefore, Logger performs a check to determine free storage when entering
maintenance mode.
lIf the required storage is not found, follow the instructions found in "Freeing storage space for
defragmentation" on the next page.
lIf the required amount of free storage is found and Logger successfully enters maintenance
mode, the following screen is displayed. Click Begin Defragmentation to start the
defragmentation process.
Note: On the Software Logger, the following Database Defragmentation screens instruct
you to click Restart to resume normal operation when Logger is in maintenance mode.
When you click restart, only the Logger service and its related processes are started on the
machine on which the Software Logger is installed.
Administrator's Guide
HPE Logger 6.2 Page 370 of 623
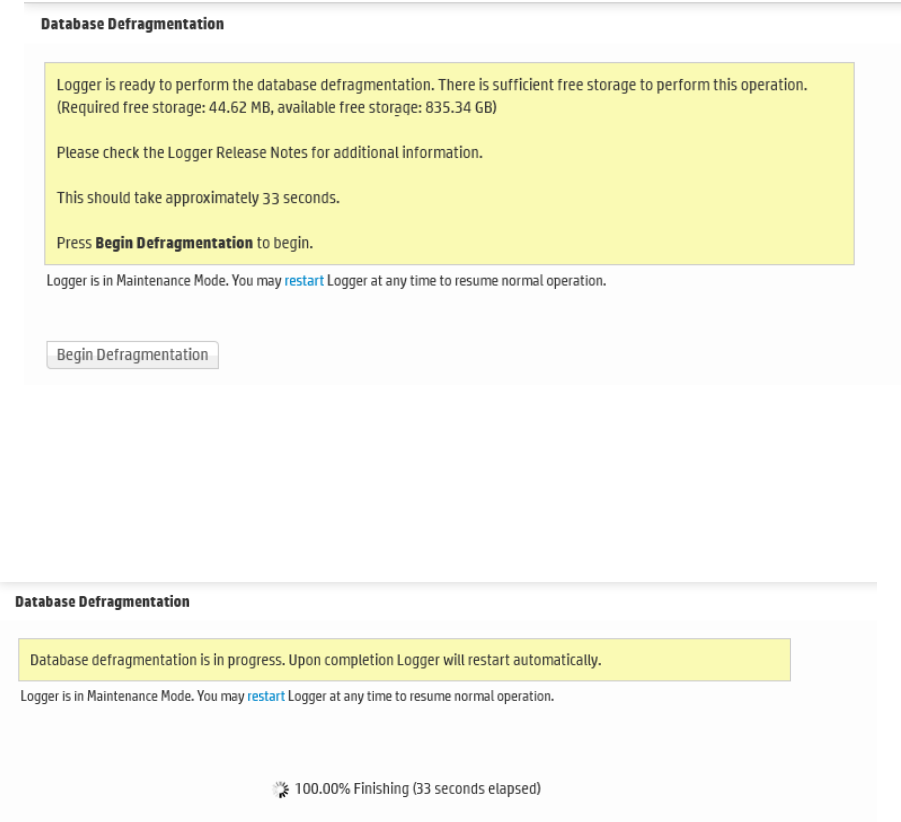
Begin Database Defragmentation
5. The defragmentation process starts. A progress indicator shows the status of defragmentation, as
shown in the example below. HPErecommends that you do not attempt any operation on the
Logger until defragmentation has completed.
Once defragmentation is complete, the Logger reboots automatically. This exits maintenance
mode.
Freeing storage space for defragmentation
If the required storage is not found, Logger prompts you to free sufficient space:
Administrator's Guide
HPE Logger 6.2 Page 371 of 623

You can choose from one of the following options:
lManual Deletion
Note: The Manual Deletion option is not available on L7x00 Loggers.
A text file is automatically created on your Logger that lists the files you can safely delete. On the
Logger appliance, this file is located in
/opt/arcsight/logger/user/logger/defragmentation/filelist.txt
On Software Loggers, this file is located in <install_
dir>/current/arcsight/logger/user/logger/
defragmentation/filelist.txt.
The files are listed in descending order of size in the text file. You can delete sufficient number of files
to free up storage. However, do not delete the files before contacting customer support for
instructions and guidance.
Follow these steps to proceed:
a. Leave the message screen without taking any action.
b. Contact customer support for instructions on deleting files listed in the text file.
c. After deleting sufficient number of files, resume the Database Defragmentation process from the
message screen. To resume, click Recheck to check whether sufficient storage is now available for
defragmentation to proceed.
If sufficient storage is found, the "Begin Database Defragmentation" on the previous page is
displayed. Click Begin Defragmentation to proceed further.
If sufficient storage is still not found, a message displayed. Choose from the listed options to
create additional space.
Note: If you need to exit the defragmentation process without creating sufficient storage,
click Reboot.
lDelete Database Indices
Logger automatically deletes a sufficient number of database indices, starting with the largest index,
to free up the required amount of storage. If sufficient space becomes available after deleting
database indices, defragmentation proceeds further automatically.
However, if sufficient storage is not available even after dropping database indices, follow these
steps to proceed:
a. Click Manual Deletion.
Note: The Manual Deletion option is not available on L7x00 Loggers.
A text file is created on your Logger that lists the files you can safely delete. The files are listed in
descending order of size in a text file.
b. Click Reboot.
Administrator's Guide
HPE Logger 6.2 Page 372 of 623

Logger exits the maintenance mode.
c. Contact customer support for instructions on manually deleting the files.
You can delete sufficient number of files to free up storage.
d. After deleting the files, restart the defragmentation process as described in "To defragment a
Logger:" on page370.
Note: If the defragmentation process fails or is aborted at any time, Logger must recover
those indices. Although the recovery process is automatic, it can take at least a few hours to
complete. You will not lose any data during this process.
lReboot
The database defragmentation process is aborted and Logger returns to the state it was in before
you started the defragmentation utility.
Global Summary Persistence Defragmentation
There is a known issue with the Global Summary Persistence functionality in version 5.3 of Logger. This
feature is designed to persist the statistics reported in the global summary section of Logger through a
reboot. In some environments, disk space may be affected due to this feature.
Global Summary Persistence is disabled in this release. However, if you are upgrading from Logger 5.3
to Logger 5.3 SP1 or later, you should defragment the Global Summary Table as soon as possible. Make
sure that you have read the following guidelines before starting the defragmentation process.
Guidelines for Global Summary Persistence Defragmentation
lThe Logger system needs to be placed in maintenance mode before Global Summary Persistence
defragmentation can begin. As a result, most processes on the Logger are stopped—no events are
processed or scheduled jobs run, and most user interface operations are unavailable. For more
information about maintenance mode, see "Maintenance Operations" on page367.
lA minimum amount of free disk space is required on your system to run Global Summary Persistence
defragmentation. The utility automatically checks for the required free space and displays a message
if sufficient disk space is not found.
lIf the defragmentation process fails at any point, the Logger returns to the same state that it was in
before you started defragmentation. You can safely reboot the appliance or restart the Software
Logger process and try again.
a. Reboot the Logger Appliance as described in "System Reboot" on page404.
b. For the Software Logger, restart the Logger process as described in "Process Status" on page413.
lYou can perform this process only if you have the “Enable Maintenance Mode” privilege set to Yes
(System Admin > User/Groups > Manage Groups > System Admin Group). See "Users/Groups"
on page439 for more information on Logger user rights and how to administer them.
Administrator's Guide
HPE Logger 6.2 Page 373 of 623
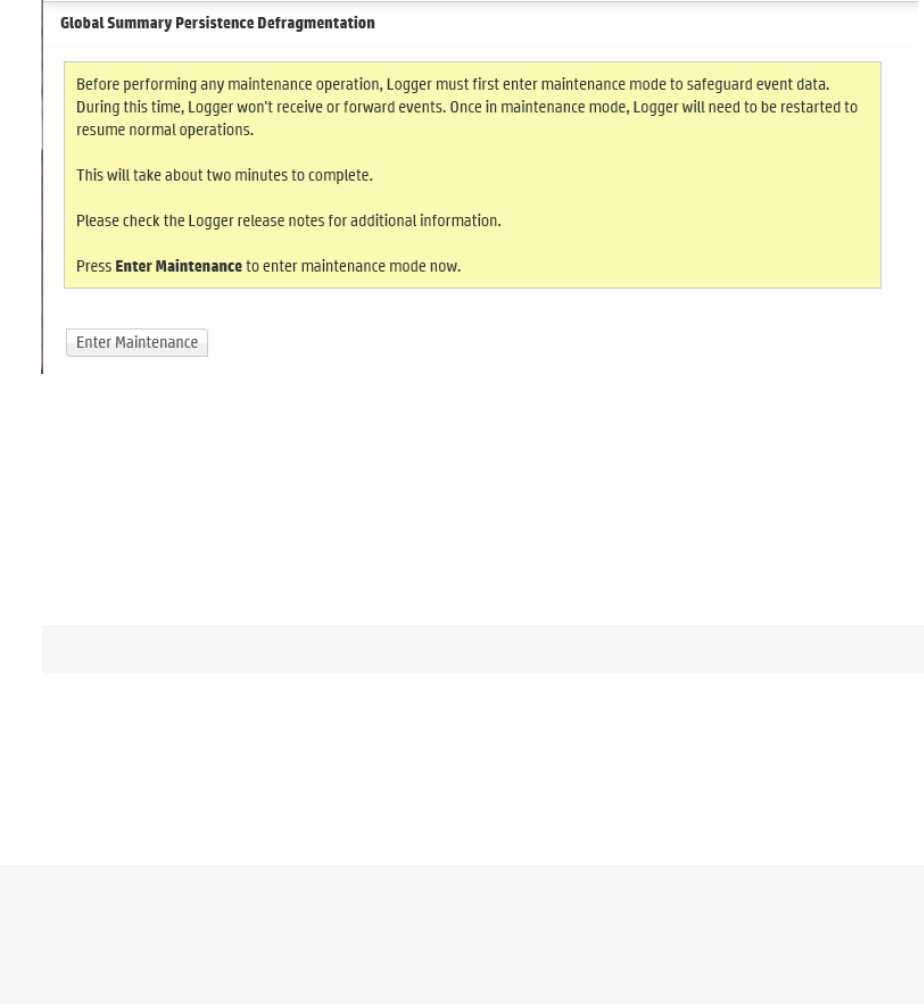
To defragment for the Global Summary Persistence issue:
1. Open the Configuration | Advanced menu and then click Maintenance Operations.
The Maintenance Operations panel, described in "Maintenance Operations panel" on page368
displays the available options.
2. Click Global Summary Persistence Defragmentation.
3. Click Enter Maintenance so that the Logger can enter maintenance mode. For more information
about maintenance mode, see "Maintenance Operations" on page367.
4. Click Begin Global Summary Persistence Defragmentation to start the defragmentation
process.
5. The defragmentation process starts. A progress indicator shows the status of defragmentation.
HPErecommends that you do not attempt any operation on the Logger until defragmentation has
completed.
Once defragmentation is complete, the Logger reboots or restarts. This automatically exits
maintenance mode.
Note: On Software Loggers, only the Logger service and its related processes are restarted.
Storage Volume Size Increase
You can extend the storage volume size you established during initialization at any time. Once
extended, the volume size cannot be reduced. The Logger interface guides you about current and the
maximum value to which you can increase the size.
Note: For the “Storage Volume Size Increase” operation to show as an option under the System
Maintenance operations (Configuration | Advanced > Maintenance Operations), you need to
belong to the System Admin group (with “Enable Maintenance Mode” privilege enabled) and the
Logger Rights group. See "Users/Groups" on page439 for more information on Logger user rights
Administrator's Guide
HPE Logger 6.2 Page 374 of 623
and how to administer them.
About Increasing Storage Volume Size on a SAN Logger
Logger cannot detect a resized LUN. Therefore, if you change the LUN size after it has been mounted
on a Logger, the new size is not recognized by Logger. As a result, you can only increase the size of a
storage volume to the LUN size that was initially mounted on the Logger.
You should make your initial LUNsize a large as possible before mounting. The following examples
illustrate storage volume increase on a SAN Logger.
Initial
LUN Size
LUN
Resized
Current Storage
Volume Size
Storage Volume Size
Increase Allowed
4 TB No 1 TB Yes, up to 4 TB
4 TB No 4 TB No
8 TB No 4 TB Yes, up to 8 TB
2 TB 8 TB 1 TB Yes, only up to 2 TB
4 TB 8 TB 1 TB Yes, only up to 4 TB
8 TB 8 TB 4 TB Yes, up to 8 TB
To increase the size of a storage volume:
1. Open the Configuration | Advanced menu and then click Maintenance Operations.
The Maintenance Operations panel, described in "Maintenance Operations panel" on page368
displays the available options.
2. Click Storage Volume Size Increase.
3. Click Enter Maintenance so that the Logger can enter maintenance mode.
For more information about maintenance mode, see "Maintenance Operations" on page367.
Administrator's Guide
HPE Logger 6.2 Page 375 of 623
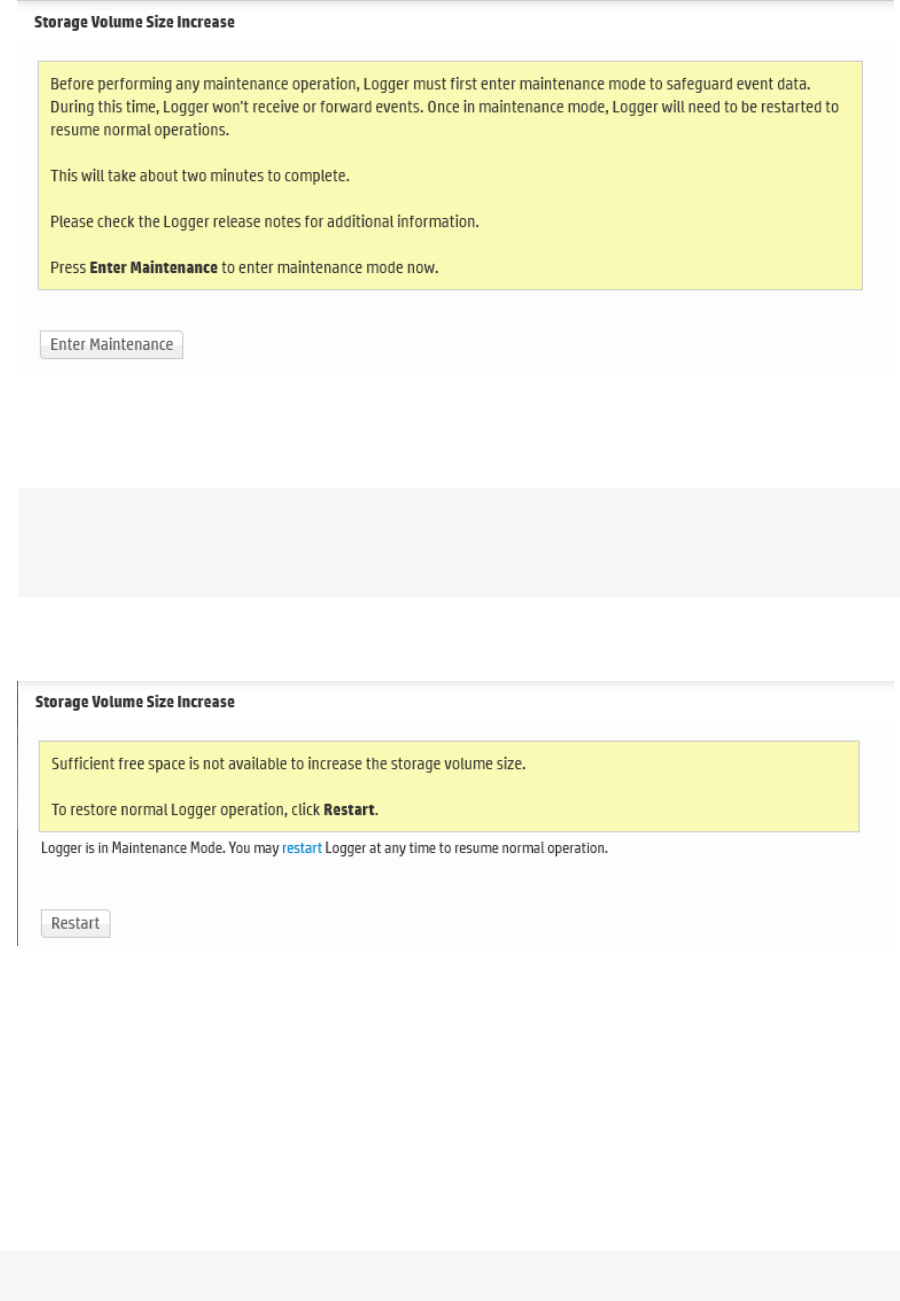
4. While entering the maintenance mode, Logger performs a check to determine if the storage volume
size can be increased and by what amount. If the storage volume can be increased, then enter the
new size and click OK.
Note: On the Software Logger, the following Storage Volume Size Increase screens instruct
you to click restart to resume normal operation when Logger is in maintenance mode. When
you click restart, only the Logger service and its related processes are restarted.
If sufficient space is not found to increase the storage volume, the following message is displayed.
Click Reboot to restart Logger and exit maintenance mode.
Adding Storage Groups
In addition to the two storage groups that exist on your Logger by default, you can add up to four
additional storage groups.You can add storage groups at any time if the following conditions are met:
lThe maximum allowed six storage groups do not exist on your Logger already.
lThe storage volume contains spare storage space that can be allocated to the storage groups you will
add.
Tip: If you do not have sufficient space in the storage volume to add another storage group and
Administrator's Guide
HPE Logger 6.2 Page 376 of 623

the existing groups have free space, consider reducing the size of existing storage groups to
make space available for the storage groups you want to add. Alternatively, increase the size of
your existing storage volume, as described in "Storage Volume Size Increase" on page374.
The Logger must be in maintenance mode when adding storage groups. When you add a storage
group, Logger automatically checks to ensure that the storage group size you specified is greater than
the minimum size required (5 GB) and less than the amount of space available in the storage volume.
Once you have added storage groups and rebooted your Logger to exit the maintenance mode,
remember to configure the Archive Storage Settings for the groups you just added so that event
archives are created for them.
To add a storage group:
1. Open the Configuration | Advanced menu and then click Maintenance Operations.
The Maintenance Operations panel, described in "Maintenance Operations panel" on page368
displays the available options.
2. Click Add Storage Groups.
A maximum of six storage groups can exist on Logger. Therefore, you can add up to four storage
groups in addition to the two that exist by default on Logger.
If the maximum number of allowed storage groups do not exist on Logger, a screen prompts you
to enter maintenance mode, as described in the next step.
If all six storage groups exist on Logger or sufficient space does not exist in the storage volume to
add additional group, a message is displayed on your screen and the Logger cannot enter
maintenance mode.
3. Click Enter Maintenance so that the Logger can enter maintenance mode.
For more information about maintenance mode, see "Maintenance Operations" on page367.
Administrator's Guide
HPE Logger 6.2 Page 377 of 623
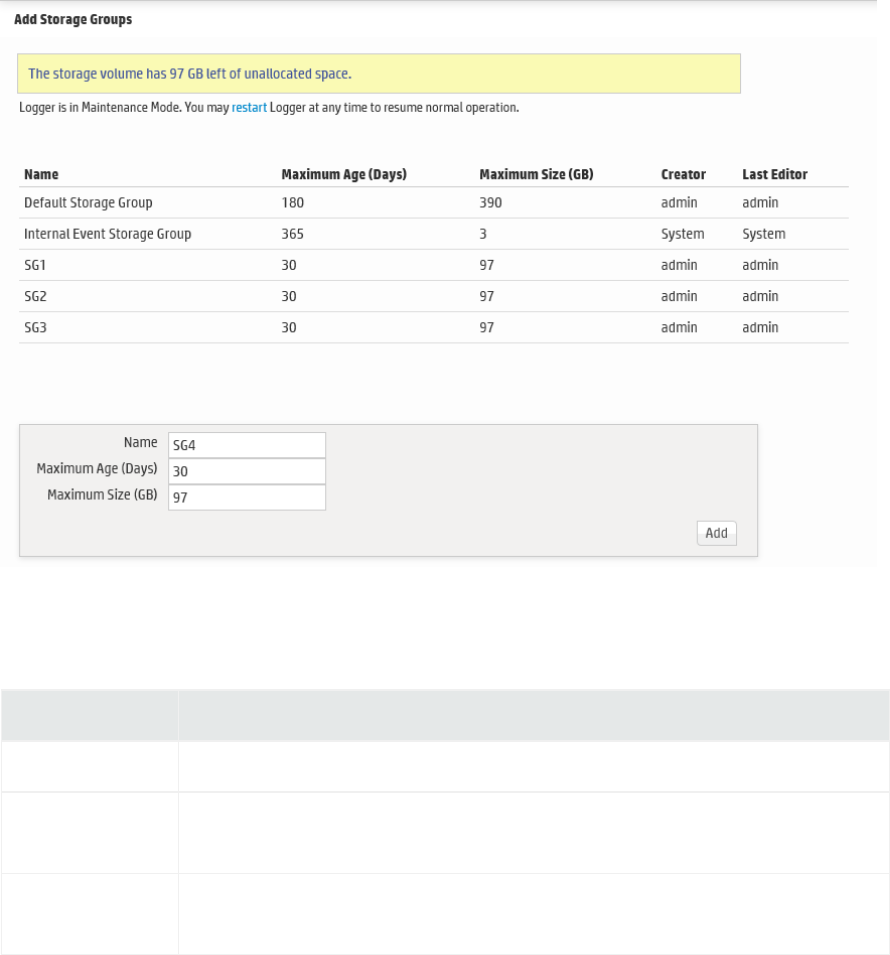
4. Once Logger enters maintenance mode, the following Add Storage Groups page is displayed.
This screen also lists information about the existing storage groups and the amount of space
remaining in the storage volume.
5. Enter the following information.
Parameter Description
Name Choose a name for the storage group
Maximum Age
(Days)
Specify the number of days to retain events. Events older than this number
of days are deleted.
Maximum Size
(GB)
Enter a maximum event data size, in GB.
6. Click Add.
The storage group is added to your Logger. If your Logger has not reached the maximum allowed
six storage groups, you can click Add to add more storage groups. However, if the maximum
number has been reached, the Add button is not displayed. If you do not want to add more storage
group, go to the next step.
7. Reboot your Logger Appliance or restart Software Logger for changes to take effect and for the
appliance to exit the maintenance mode
Administrator's Guide
HPE Logger 6.2 Page 378 of 623

Adding Fields to the Schema
The Logger schema contains a predefined set of fields. A field-based query can contain only these
fields. Additionally, you can index only these fields for faster search operations. For instructions on how
to view the default Logger schema fields, see "Default Fields" on page281.
Prior to Logger5.2, if your log analysis needs required you to search on a field that is currently not
present in the Logger schema, you did not have a way of adding it to the schema yourself. Starting with
Logger5.2, you can add additional fields to the Logger schema. That is, you can insert fields in your
Logger schema that are relevant to the events you collect on your Logger, thus enabling you to search
and report using these fields. Additionally, you can index the fields you add so that the search and
report queries that use these fields run faster. For example, a financial institution might want to add
credit card numbers or social security numbers to the schema.
You can add up to 100 custom schema fields on Logger. You can also import custom fields from a peer
Logger. However, the total number of added and imported fields cannot exceed the maximum allowed
100 fields.
You can index up to 123 fields on Logger. Therefore, the number of custom schema fields you can index
will depend on the number of default fields you currently have indexed on your Logger.
The events that contain custom fields must be in CEF format (key-value pairs) for Logger to process
them. Therefore, you will need to either use a SmartConnector that generates additional data or define
an ArcSight FlexConnector to collect and parse events containing custom fields from the event source,
convert them into CEF format, and forward them to the Logger.
Logger can only process events from FlexConnectors written using connector build 5.0.0.5560 or later.
For details about designing FlexConnectors, see the ArcSight FlexConnector Developer’s Guide.
Note: Logger cannot process the additional fields data received in CEF version 0 from a
FlexConnector, and assumes a NULL value for such fields when they are present in a CEF version 0
event. As a result, you cannot search on these fields or index them. However, these fields are
displayed in the UI display when you select “*” in the field set because the interface displays
information contained in the raw event. Therefore, if Logger receives “ad.callnumber=5678”, the
Logger UI will display a column, ad.callnumber, with value 5678. However, a search on “5678” will
not return this event in the search results.
You need to be in maintenance mode to add or import custom schema fields. The process of adding or
importing schema fields involves an add or import operation followed by a save operation. The add or
import operation adds the specified fields but does not write them to the Logger schema. You can edit
or delete the added or imported fields at this point. Once you save these fields, the fields are written to
the schema. From this point on, these fields cannot be edited or deleted. Therefore, carefully review the
fields you are adding to the schema before saving them.
Note: For the “Add Fields” operation to show as an option under the System Maintenance
Administrator's Guide
HPE Logger 6.2 Page 379 of 623
operations (Configuration | Advance > Maintenance Operations), you need to belong to the
System Admin group (with “Enable Maintenance Mode” privilege enabled) and the Logger Rights
group. See "Users/Groups" on page439 for more information on Logger user rights and how to
administer them.
You need to specify the following information to add a custom schema field:
lDisplay name — A meaningful name for the field. This name is displayed as the column header name
for the field and is the one you specify in a search query. For example, SocialSecurityNumber.
lType — The type of data this field will contain. The available options are Double, BigInt, DateTime,
Text.
The following table describes each data type.
Type Description
Double Use to store decimal numbers or fractions.
Numbers from
-1.79769313486231570E+308 through -4.94065645841246544E-324
for negative values, and
4.94065645841246544E-324 through 1.79769313486231570E+308
for positive values.
BigInt Use to store whole numbers.
Numbers from
-2^63 through 2^63-1, or
-9,223,372,036,854,775,808 through 9,223,372,036,854,775,807.
DateTime Use to store both dates and time or only dates.
Text Use to store any characters. You can store a maximum of 255 characters per
field.
lLength — This field is only relevant when the Type specified is Text. This field specifies the
maximum number of characters allowed in the value of the field when the data type is Text.
This field is only relevant when the Type specified is Text. This field specifies the maximum number
of characters allowed in the value of the field when the data type is Text.
lField name — The field name that you want to add to the Logger schema. Typically, this is an
abbreviated version of the Display name. For example, SSN.
Importing Schema Fields from Peers
If your Logger is a peer of another Logger, you can import the custom fields added to the peer’s
schema. You specify the peer from which you want to import fields in the user interface screen. Fields
can be imported if the following conditions are met:
Administrator's Guide
HPE Logger 6.2 Page 380 of 623
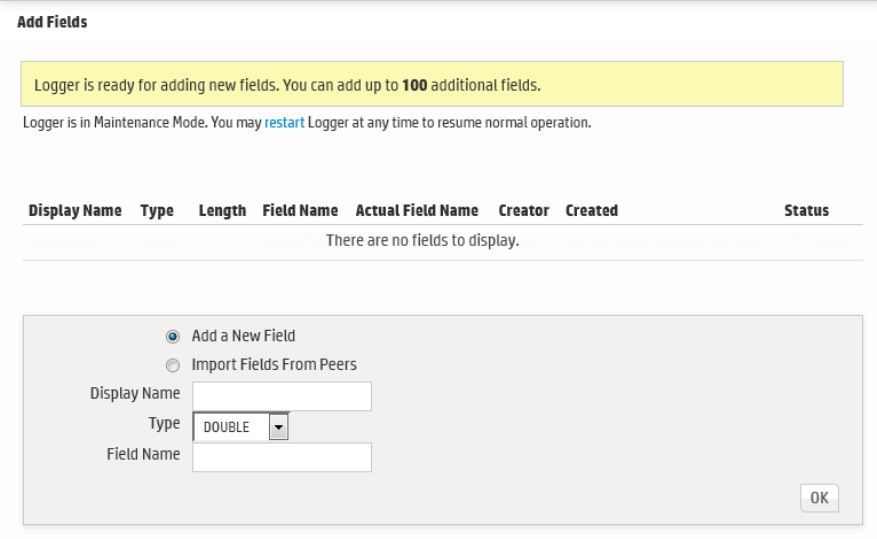
lA field of the same Display name and Field name does not exist on the Logger to which you are
importing schema fields. If conflicting fields exist, they are still imported but are flagged in the user
interface screen. You cannot save the imported fields to schema until you resolve the conflicts.
lA maximum of 100 custom fields has not been reached on the importing Logger. If there are more
fields than can be imported, only the first N until the allowed maximum is reached will be imported.
The custom schema fields contained in a search query must exist on all peers on which the query is run.
Otherwise, the query will not run and return an error.
To add or import custom schema fields:
1. Open the Configuration | Advanced menu and then click Maintenance Operations.
The Maintenance Operations panel, described in "Maintenance Operations panel" on page368
displays the available options.
2. Click Add Fields (100 additional fields can be added).
You can add a maximum of 100 custom fields to Logger schema. The number in the “Add Fields”
link reflects the number of custom fields you can add. This number decreases as you add fields to
Logger schema.
3. Click Enter Maintenance so that the Logger can enter maintenance mode.
For more information about maintenance mode, see "Maintenance Operations" on page367.
4. Once Logger enters maintenance mode, the Add Fields page is displayed.
You can add fields manually or import them from a peer Logger.
Administrator's Guide
HPE Logger 6.2 Page 381 of 623

To manually add fields:
1. After entering Maintenance Mode, click Add a New Field, if it is not selected.
2. Enter a meaningful name in the Display Name field.
The display name is the one you specify in a search query and is the column header for the field in
search results. For example, SocialSecurityNumber. It is not added to the Logger schema.
Follow these guidelines when specifying a display name:
lThe display name must be unique; that is, another field (custom or Logger schema) of the same
display name must not already exist on the Logger.
lOnly ASCII characters are allowed. That is, no native Chinese or Japanese characters are accepted
in this field.
lThe display name can contain up to 100 alphanumeric and underscore characters.
Note: To be valid, the display name must not start with "arc_" or an underscore.
3. Select a data type for the field from the Type pull-down menu. The available options are Double,
BigInt, DateTime, Text. See "Type — The type of data this field will contain. The available options
are Double, BigInt, DateTime, Text." on page380 for more information.
4. In the Length field, enter the maximum number of characters allowed in the value of the field when
the data type is Text. This field is only available when the Type specified is Text. You can specify
from 1 to 255 characters in this field.
5. Enter a name in the Field name field.
This is the name that will be added to the Logger schema. Typically, this is an abbreviated version
of the Display name. For example, SSN.
Follow these guidelines when specifying a Field name:
lThis is a required field.
lThe field name must be unique; that is, a custom field of the same Field name must not already
exist on the Logger.
lOnly ASCII characters are allowed. That is, no native Chinese or Japanese characters are
accepted in this field.
lThe field name can contain up to 40 characters and can contain alphanumeric, hyphen, and
underscore characters. The underscore (_) is used as an escape character for the actual field
name. Therefore, if you include an underscore in the field name, the actual field name will
contain a double underscore (__).
Administrator's Guide
HPE Logger 6.2 Page 382 of 623
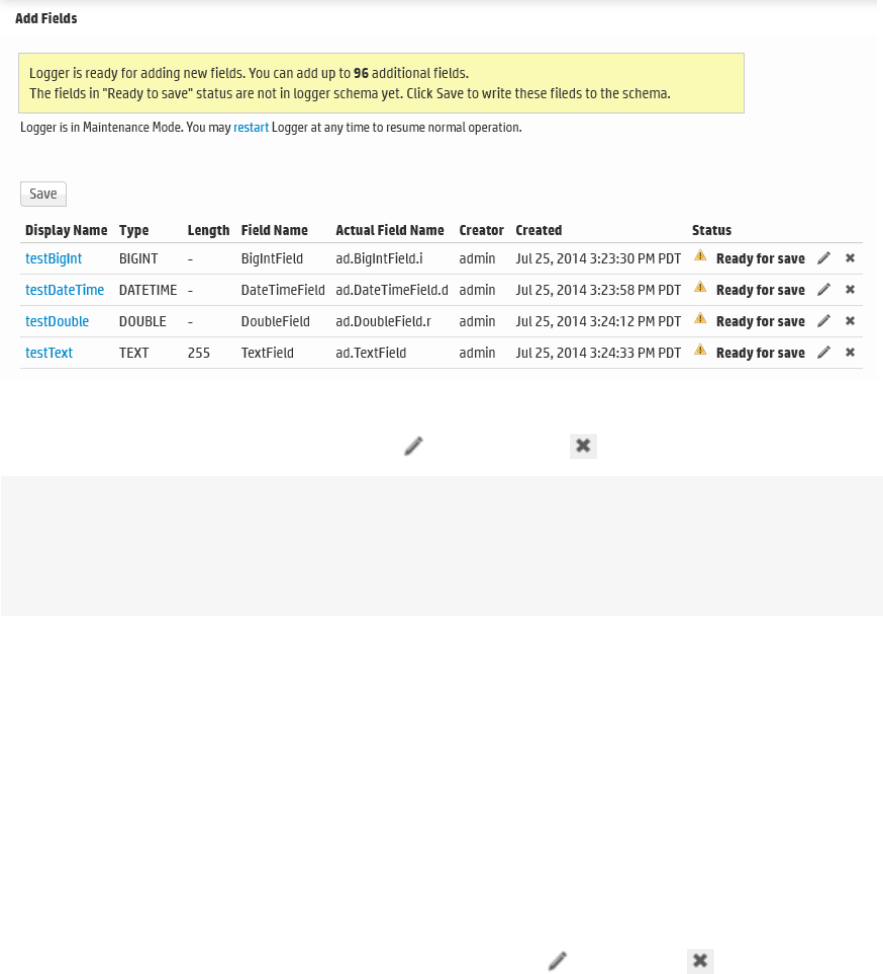
Once you enter a name in this field, a prefix and a suffix is automatically added to it, and the
resulting name is displayed in the Actual Field Name field, as shown in the following figure. This
field displays the way the field name you entered earlier will be stored on Logger. The prefix, “ad.”
6. Click OK.
The field you added is displayed in the upper section of the Add Fields form, as shown in the
following figure. This field is not saved yet (in “Ready to Save” state) and you can edit or delete it.
Once you click Save, the field is added to the schema and cannot be changed or deleted.
7. Repeat the steps above to add additional fields.
8. Review the added fields and make any edits ( ) or deletions ( ), if necessary.
Caution: The next step commits the added fields to Logger’s schema. This process is
irreversible; that is, once the fields are written to Logger’s schema, they cannot be edited or
deleted. If you exit this process without saving, the fields you were adding are not remembered
and your changes are lost.
9. Click Save to commit the added fields and write them to your Logger’s schema.
To import fields from a peer:
1. After entering Maintenance Mode, click Import Fields From Peers, if it is not selected.
2. Select the peer from which you want to import the fields from the Peer Host Name drop-down list.
3. Click OK in the bottom right corner of the screen.
If there are no conflicting fields, all fields from the peer are imported successfully.
If there are conflicts, the conflicting fields are displayed ahead of the ones that were imported
successfully. The Status column describes the reason for the conflict. You must fix the listed issues
before you can save these fields to the schema. Use the edit( ) or delete( ) icons at the end
of the row to make changes or delete the added fields.
Administrator's Guide
HPE Logger 6.2 Page 383 of 623
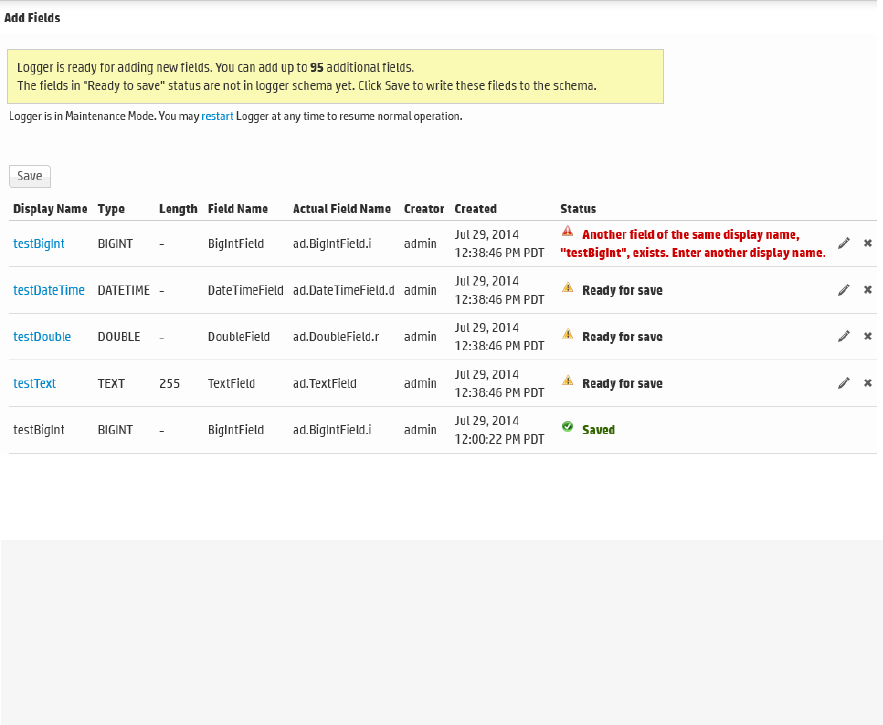
If there are more fields than can be imported, only the first N until the allowed maximum (100) is
reached will be imported.
Caution: The imported fields are not committed to Logger’s schema yet. The next step
commits them. This process is irreversible; that is, once the fields are written to Logger’s
schema, they cannot be edited or deleted.
If you exit this process without saving, the fields you were adding are not remembered and
your changes are lost.
4. Click Save to commit the added fields and write them to your Logger’s schema. Restart Logger to
put the changes into effect.
If you added fields from a peer Logger, be sure to add the same fields to any other peers.
To view the custom schema fields, see "Custom Fields" on page282.
Maintenance Results
You can check the status of a maintenance operation on the Maintenance Results page.
To access the Maintenance Results page (as shown in the example below), open the Configuration |
Advanced menu and then click Maintenance Results.
Administrator's Guide
HPE Logger 6.2 Page 384 of 623
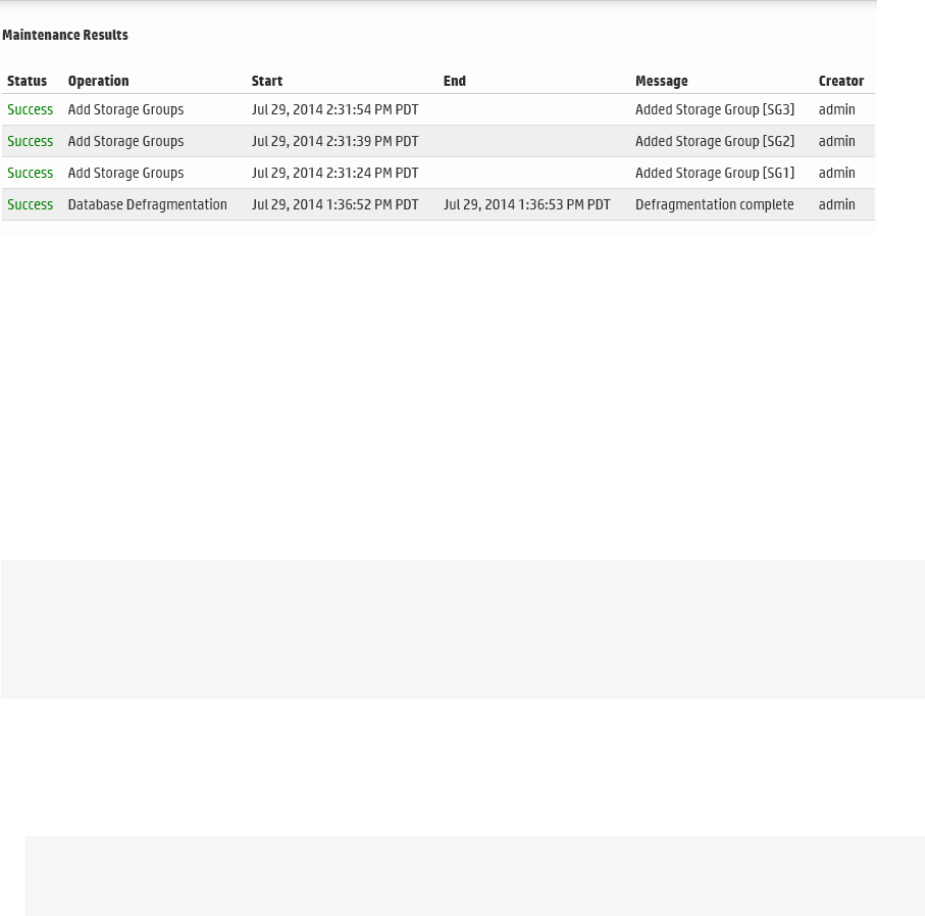
Configuration Backup and Restore
By default, Logger does not back up any content. However, you can configure it to back up the
following content to a remote system:
lAll non-event data (Except Lookup files)
lReports content only
You can back up this content on ad-hoc basis or schedule it to run periodically. The content is saved to
the backup location in a single .tar.gz format file.
Caution: Ensure that both Configuration Backups (for configuration settings) and Event Archives
(for data) run on a regular basis and are stored in a remote location. In the event of catastrophic
failure, you will need to restore the most recent Configuration Backup and Event Archive. For
information on Event Archives, see "Event Archives" on page355.
You can use the backed-up content to:
lRestore a Logger that is not functioning as expected or that has been reset to its factory defaults.
lCopy content from one Logger to another.
Caution: When you restore content to a Logger, the existing content on it is deleted or over-
written.
Administrator's Guide
HPE Logger 6.2 Page 385 of 623
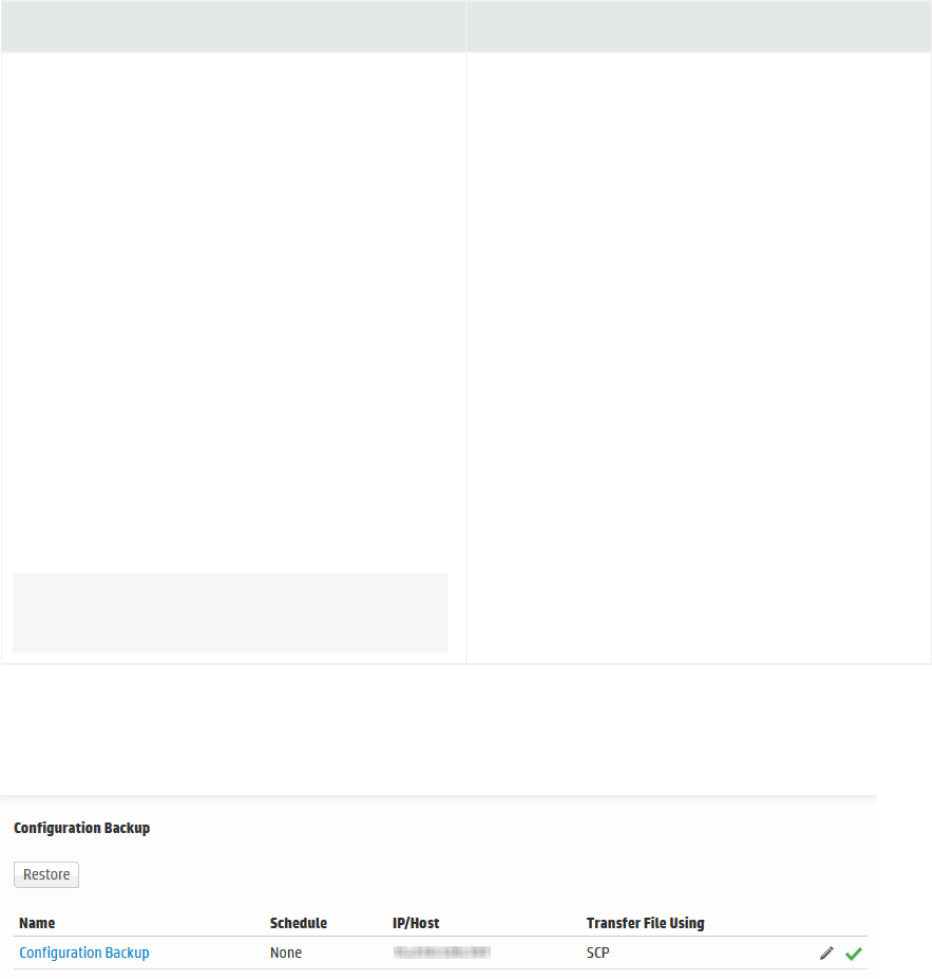
The following table lists the information included in the backup when you back up all non-event data
and reports-only data.
All non-event data backup includes… Reports-only backup includes…
System information
License *
Logs
Global settings
User and group information
All configuration settings
Existing filters and saved searches
Logger Monitor settings
The following Reports content:
lQueries, Reports, Parameters, Parameter
Value Groups, Dashboards
lTemplates
Note: Lookup files are not included in
configuration backups.
The following Report content only:
lQueries, Reports, Parameters, Parameter
Value Groups, Dashboards
lTemplates
Running a Configuration Backup
Follow these steps to create and run a backup of your Logger configuration information.
Administrator's Guide
HPE Logger 6.2 Page 386 of 623

To run a configuration backup or to edit the configuration backup settings:
1. Open the Configuration | Advanced menu and then click Configuration Backup.
2. Click the ( ) icon and enter the following parameters:
Parameter Description
Transfer File Using lSelect SCP to transfer the file to a remote host.
lSelect CP to copy the file to location on Logger.
The available options change depending on what you select.
Port
(SCPOnly)
The port on which the Logger should connect to the remote system.
IP/Host (SCPOnly) The IP address or hostname of the remote system.
User
(SCPOnly)
A user on the remote system with write privileges on the backup
folder (specified in Remote Directory, below).
Password
(SCPOnly)
Password for the user. The password cannot contain these
characters: % = ; " ' <>
Mount location
(appliance only)
Select a mount location that has previously added on the appliance.
Remote Directory The location in which to save the configuration backup files. The
remote directory name cannot contain spaces.
Note: The Logger Appliance supports mounting through the user
interface. Software Logger uses its file system, which can contain
remote folders mounted through the operating system.
Schedule Schedule when and how often the Backup is run.
lIf you leave the default One Time Only checkbox enabled, other
fields are hidden and the configuration backup occurs just once
(ad-hoc), when you click Save.
lIf you disable the One Time Only checkbox, you can use the
schedule options to specify how frequently the configuration
backup should run. See "Scheduling Reoccurring Backups" on the
next page.
Backup Content Whether to backup all non-event data or only the report content.
lSelect All for all non-event data
lSelect Report Content Only for only the report content.
Administrator's Guide
HPE Logger 6.2 Page 387 of 623
3. Click Save. The configuration backup you set up is displayed on the Configuration Backup page.
Note: If you chose to run the backup One Time Only, the configuration backup is run right
away. Otherwise, it is scheduled to run at the specified time.
4. Once you have created one or more configuration backups, you can take the following optional
actions from the Configuration Backup page:
a. Click Restore to begin restoring your configuration backup. See "Restoring from a
Configuration Backup" on the next page.
b. Click the associated edit icon ( ) or the name of the backup file to change your configuration
backup parameters.
c. If the backup file you want is disabled, click the associated ( ) icon to enable it ( ) .
d. If a backup file you want is enabled , click the associated ( ) icon to disable it ( ).
Scheduling Reoccurring Backups
When scheduling reoccurring backups, select from the following options:
Tip: Make sure you are familiar with the information in "Time/NTP" on page409 before setting the
schedule.
Choose Every Day, Days of Week, or Days of Month from the upper pull-down menu.
Note: When specifying multiple days, separate them with a comma. When specifying the time, use
24-hour format.
1. If Every Day, select one of the following options from the lower pull-down menu, and enter the
necessary values:
lHour of day: (0-23) Enter the time you want the task to run in the Hours (24 hour format)
field. Midnight is zero (0).
lEvery: Select Hours or Minutes from the right-most pull-down menu and specify how
frequently you want the task to run.
Hours: (1-23) Enter how frequently in hours you want the task to run. The result is every n
hours every day.
Minutes: (15-59) Enter how frequently in minutes you want the task to run. The result is every n
minutes every day.
2. If Days of Week, select from the following options from the lower pull-down menu, and enter the
necessary values:
lDays: (1-7) Enter the days of the week you want the task to run (Sunday=1, Monday=2, and so
on).
Administrator's Guide
HPE Logger 6.2 Page 388 of 623

lHour of Day: (0-23) Enter the time you want the task to run in the text field to the right. 0 is
midnight.
lEvery: Select Hours or Minutes from the right-most pull-down menu and specify how
frequently you want the task to run.
Hours: (1-23) Enter how frequently in hours you want the task to run. The result is every n
hours on the selected days.
Minutes: (15-59) Enter how frequently in minutes you want the task to run. The result is every n
minutes on the selected days.
3. If Days of Month, Select from the following options from the lower pull-down menu, and enter the
necessary values:
lDays: (1-31) Enter the day or days of the month you want the task to run.
Note: The number of days in a month vary. Scheduled tasks will only run if the specified day
exists for that month. Tasks scheduled on the 31st day of the month will not run in April,
February, June, November, and September. Tasks scheduled on the 29th day of the month
will only run in February during leap years.
lHour of Day: (0-23) Enter the time of day you want the task to run. (You cannot select Every
for this option.)
Examples:
lTo run the scheduled job every 45 minutes of every day, select Every Day in the upper Schedule
pull-down menu. Choose Every from the lower pull-down menu, enter 45 in the text box and the
select Minutes.
lTo run the scheduled job every four hours on Tuesdays and Thursdays , select Days of Week from
the upper Schedule pull-down menu and enter 3,5 as the Days. Then choose Every from the lower
pull-down menu, enter 4 in the text box.
lTo run the scheduled job on the 14th of each month at 3 AM, select Days of Month from the upper
Schedule pull-down menu and enter 14 as the Days. Then choose Hour of day from the lower pull-
down menu and enter 3 in the text box. (To run the scheduled job at 3 AM and 3 PM, you would
enter 3,15.)
Restoring from a Configuration Backup
Make sure you are familiar with these guidelines before you restore a backup file on Logger:
lWhen you restore content to a Logger, the existing content on it is deleted or over-written.
Logger restores the specific environment settings that were current at the time the backup was
taken. Any configuration settings that were updated between the time of the backup and the time of
the restoration are lost. This includes the license file.
Administrator's Guide
HPE Logger 6.2 Page 389 of 623

lYou must restore the content to the same version of Logger that was used to create the backup file.
lYou must restore to the same form of Logger (Software, Appliance, or VMware.)
lFor Appliance Loggers, the Logger Appliance model must be the same as the one used to create the
backup file.
lFor Software Loggers and Loggers on VMware, the operating system that Logger is running must be
the same as the one used to create the backup file.
lSince the current license will be over-written by the backup, retain a copy of the existing license to re-
apply after the Restore is complete, if appropriate.
To restore from a configuration backup:
1. Open the Configuration | Advanced menu and then click Configuration Backup.
2. Click Restore.
The Upload Configuration Backup option displays on the Configuration Backup page. You will
see a message that after restoring the configuration, Logger will need to be restarted.
3. Click Browse to locate the backup file.
4. Click Submit to start the restore process.
5. When the restore process is complete, you will be prompted to reboot your Logger:
a. Logger Appliance—When the restore process is complete, you will be redirected to the System
Admin > System > System Reboot page. Select Reboot and click Reboot. See "System
Reboot" on page404.
b. Software Logger—When the restore process is complete, you will be prompted to reboot your
system. See "Software Logger Command Line Options" on page465.
Tip: You may need to upload a new license or re-apply a copy of the license in place before the
backup.
Content Management
Depending on their rights, users can export Alerts, Dashboards, Fieldsets, Filters, Parsers, Saved
Searches, and Source Types from a Logger to a file, and then import that content onto another Logger
or re-import it onto that same Logger, as a backup. For information on the user rights necessary to
import or export a particular type of content, instructions, and guidelines for importing and exporting
Logger content, see "User Rights for Exporting Content" on page392 and "User Rights for Importing
Content" on the next page.
Content import and export is useful in these situations:
lWhen you want to make a backup of Logger content. If your Logger becomes unavailable or is reset
to its factory defaults, you can quickly restore its content by importing the saved content.
Administrator's Guide
HPE Logger 6.2 Page 390 of 623

lWhen multiple Loggers with the same content need to be installed in your network, you need to
configure only one Logger. Subsequent Loggers can be deployed by importing the first Logger’s
content on them, thus reducing deployment time.
lWhen you want to add content from one Logger to the content on another.
The Export function saves the content from a Logger to a storage location on your network or to the
local disk of the computer from which you connect to the Logger. When you need to use that content
for any of the situations described previously, simply import the saved content.
User Rights for Importing Content
The content you are able to import depends on your user rights. If you have any of the following rights,
the Import Content dialog box is available:
lLogger Rights > Filters: Edit, save, and remove shared filters.
lLogger Rights > Forwarders and Alerts: Edit, save, and remove forwarders and alerts.
Note: While this Logger right enables you to edit, save, and remove both forwarders and alerts,
you can only import alerts, but not forwarders.
lLogger Rights > Dashboards: Edit, save, and remove dashboards.
If the user has the dashboard save right but does not have the saved search save right, then the
dashboards using search results panels will not be imported (A warning message will indicate which
dashboards are skipped).
lLogger Rights > Saved Search: Edit, save, and remove saved search.
lSystem Admin: For parsers and source types, the user can be assigned to any System Admin group.
If the user is not an admin, then Parsers and Source Types are not importable.
See "Users/Groups" on page439 for more information on Logger user rights and how to administer
them.
Even if you see the Import page, you may not be able to import all of the content types. If you do not
have the associated user rights, then you cannot import that type of content, and will get a warning
message instead.
Importing Content
Make sure you are familiar with these guidelines before importing Logger content:
lIf an object with the same name exists on the importing system, the object being imported is named
<ObjectName> [import]. For example, an imported alert is named AlertName [import] and an
imported filter is named FilterName [import].
If an object with the name <ObjectName> [import] already exists on the importing Logger (from
a previous import procedure), the object being imported is named <ObjectName> [import]
[import].
Administrator's Guide
HPE Logger 6.2 Page 391 of 623
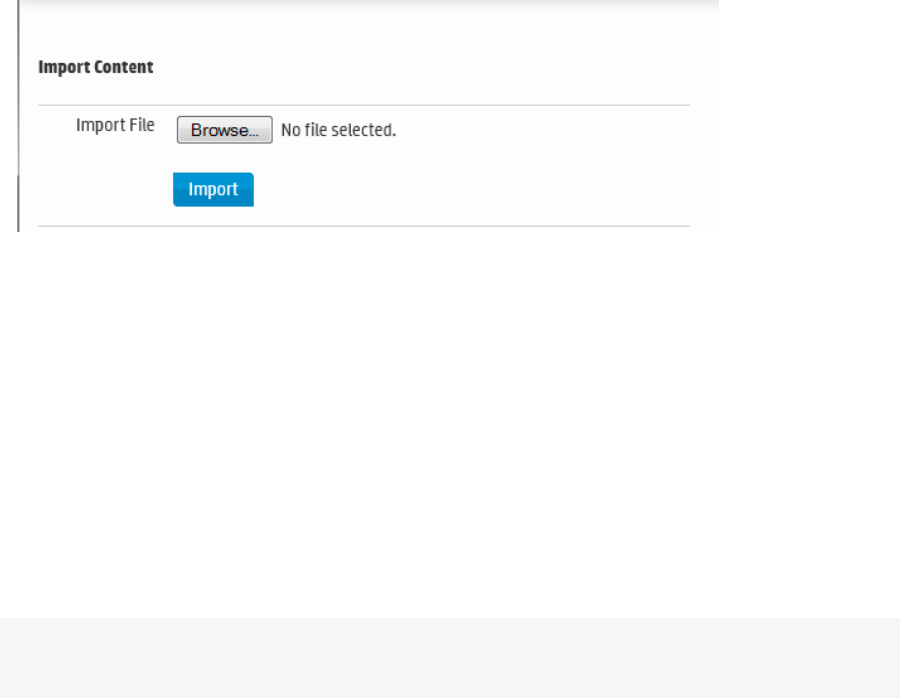
lBe sure to set the alert destinations (SNMP, Syslog, ESM Destination, and SMTP servers) for alerts
you import, because this information is not included in the exported content.
To import content from another Logger:
1. Open the Configuration | Advanced menu and then click Import Content.
2. Click Browse to locate the file
The file must reside on a local or remote drive accessible to the system whose browser you are
using to access Logger’s user interface.
3. Click Import.
User Rights for Exporting Content
The content you are able to export depends on your user rights. If you have any of the following rights,
the Export page discussed in "Exporting Content" on the next page is available:
lLogger Rights > Filters: Use and view shared filters.
lLogger Rights > Forwarders and Alerts: View forwarders and alerts.
Note: While this Logger right enables you to view both forwarders and alerts, you can only
export alerts, but not forwarders.
lLogger Rights > Dashboards: Use and view dashboards.
If the user has the dashboard read right but does not have the saved search read right, then
dashboards having search results panels are not available for selection from the Content to Export
dialog box.
lLogger Rights > Fieldsets: View fieldsets.
lLogger Rights > Saved Search: View saved search.
lSystem Admin: For parsers and source types, the user can be assigned to any System Admin Group.
If the user is not an admin, then Parsers and Source Types are not exportable.
See "Users/Groups" on page439 for more information on Logger user rights and how to administer
them.
Administrator's Guide
HPE Logger 6.2 Page 392 of 623
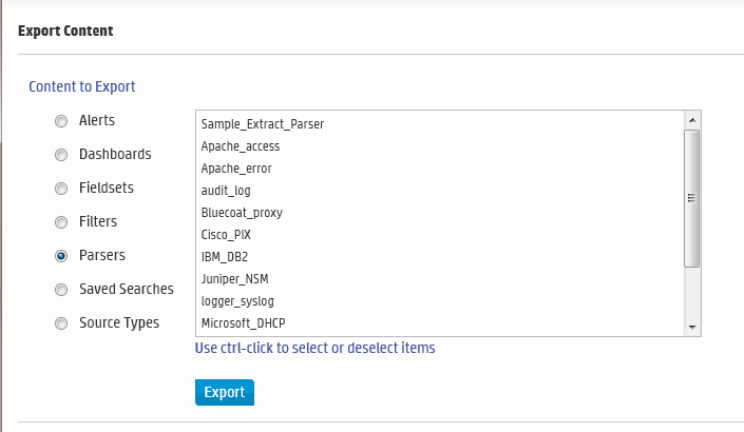
Even if you see the Export page, you may not be able to export all of the content types. If you do not
have one of the above user rights, then the corresponding content type is not available in the Content
to Export dialog box.
Exporting Content
Make sure you are familiar with these guidelines before exporting Logger content:
lThe exported content is in XML format in a gzip file. For example, allfilters.xml.gz.
lThe folder on the remote file system to which you are exporting Logger content needs to exist
before you can export content to it.
lWhen exporting alerts, the query associated with the alert, match count, threshold, and status are
included in the export. The export does not include e-mail, SNMP, ESM Destination information, or
syslog destination information. Since alert destination (SNMP, Syslog, ESM Destination, and SMTP
servers) information is not exported, you will need to set this information for alerts you import.
lWhen exporting dashboards, the content of any saved searches used in the exported dashboards is
also exported.
lWhen exporting source types, the content of the parsers used in the exported source types is also
exported.
To export Logger content:
1. Open the Configuration | Advanced menu and then click Export Content.
2. Select the radio button for the type of content that you want to export. The available objects menu
changes with the type of content you select.
3. Select the objects to export from the menu.
To select one object, click its name. To select multiple objects, hold the Ctrl key down and click the
names.
Administrator's Guide
HPE Logger 6.2 Page 393 of 623
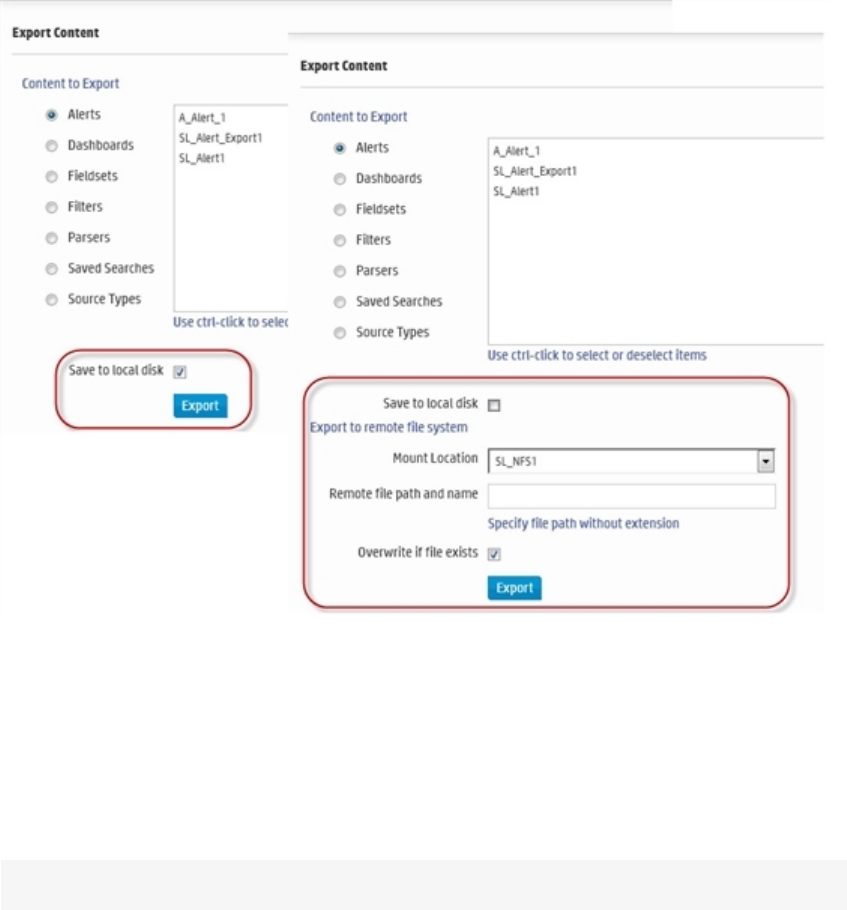
4. For Software Loggers, click Export. The content will be saved according to your browser settings.
If you are using a Logger Appliance, continue to the next step.
5. For Appliance Loggers, choose where to save the exported content. Save to local disk is the
default option.
To save on the local disk of the computer from which you connect to the Logger, leave Save to
local disk checked.
To export to a remote location:
a. Uncheck Save to local disk to display options for exporting to a remote file system.
b. Select the location to which you want to export the content in the Mount Location field. If the
location you want is not in the drop-down list, you need to add it. For information about
adding a network storage location, see "Storage" on page419.
c. In the Remote file path and name field, enter the folder location in which the exported
contents file will be created at the Mount Location you specified in the previous step. The
folder location you specify in this step must already exist on the Mount Location. It is not
created by the Logger.
Note: Specify the filename without using an extension.
6. Click Overwrite if file exists if you want to overwrite a file with the same name as the exported
contents file in the folder location that you specified in the previous step.
Administrator's Guide
HPE Logger 6.2 Page 394 of 623
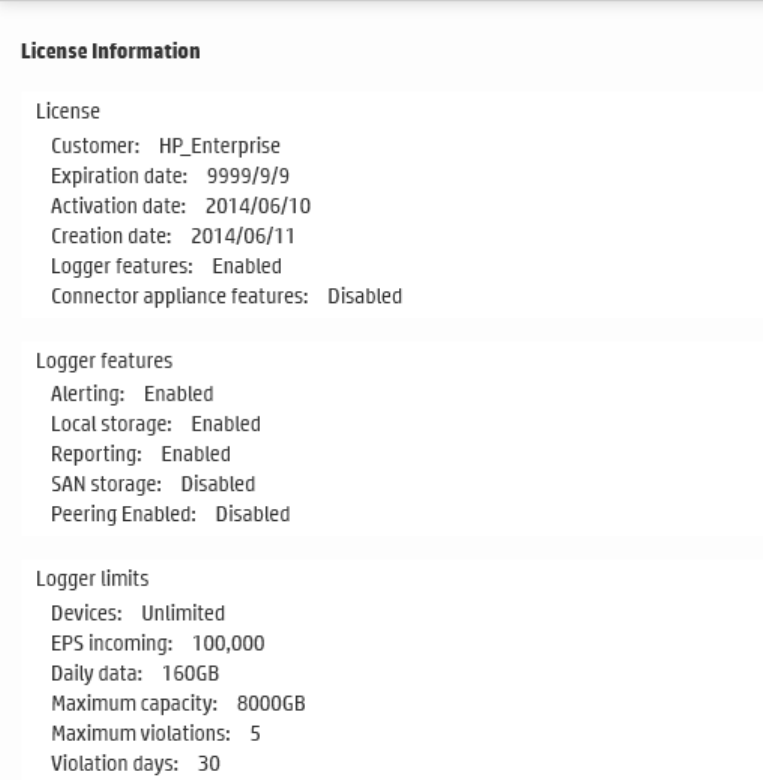
7. Click Export.
License Information
The License Information page (Configuration | Advanced > License Information) provides
information about the currently applied license, as shown in the following example.
To upload a new license, open System Admin in the menu bar, and then click License & Update in the
System section. For details, see "License & Update" on page412.
Data Volume Restrictions
The Data Volume Restrictions page (Configuration | Advanced > Data Volume Restrictions) show
the amount of data stored on your Software Logger for each of the last 30 days. It also displays the
licensed GBper day and the number of violations that have occurred.
Administrator's Guide
HPE Logger 6.2 Page 395 of 623
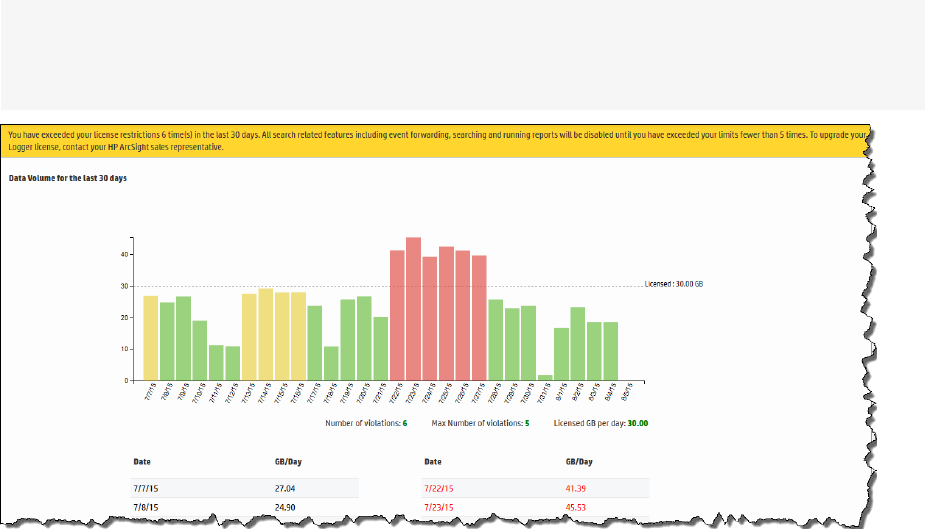
In the Data Volume chart, a green bar indicates you are below 90%of your license limit for that day, a
yellow bar indicate that you have reached 90%of your license limit for that day, and a red bar indicates
that you have exceeded your license limit for that day.
There is a limit of five data volume license violations in a 30 day period.
The Data Volume Restriction function measures the daily data for the previous 24 hours at 00:00:00
UTC and posts that information on the Data Volume Restrictions page. The time this functions uses is
independent of the Logger's local time.
Caution:If the data-limit has been exceeded six times in 30 days, you cannot use any search-
related features until the listed 30 days have five or fewer violations. The disabled search-related
features include forwarders as well as all searching and reporting functionality.
Peers
Logger can establish peer relationships with one or more Loggers or ArcSight Managers to enable
distributed searches. To search other Loggers or Managers, you must define one or more peers.
When two systems peer with each other, one initiates the relationship. The initiator sends credentials to
authenticate itself to the target system. If the authentication succeeds, a peer relationship is established
between the two systems.
Overview Steps for Configuring Peers
The following steps are required to set up peer relationships:
1. Determine which Manager or Logger will initiate the peer relationship. Manager or Logger A is the
initiator in this example, and Logger B is the target.
Administrator's Guide
HPE Logger 6.2 Page 396 of 623
2. Decide on a peer authentication method, based on the information in "Selecting a Peer
Authentication Method" on the next page.
lTo authenticate with a user name and password:
Determine which user name and password Manager or Logger A should to use to authenticate
itself when peering with B, or set up a user, as described in "Users/Groups" on page439.
lTo authenticate with an Authorization ID and Code:
On Manager or Logger B, generate an Authorization ID and Code for A to use to authenticate
itself when peering with B. For instructions, see "Authorizing a Peer" on the next page.
3. On Manager or Logger A, add the authentication information from B, as described in "Adding a
Peer" on page399.
lIf authenticating with a user name and password, use the user name and password that you
determined.
lIf authenticating with an Authorization ID and Code, use the Authorization ID and Code that
you generated.
Guidelines for Configuring Peers
Consider these guidelines when configuring peers:
lLogger 6.2 can peer with ESM 6.8c, ESM 6.5c, Logger6.0, Logger5.5, Logger 5.3 SP1, and Logger 5.3.
lYou can configure a maximum of 40 peers for a Logger.
lThe system time and date on each Manager or Logger in the peer relationship must be set correctly
for its time zone. HPErecommends that you configure your system to synchronize its time with an
NTP server regularly.
lIf the remote Logger is configured for SSL Client authentication (SSL/CAC Authentication), you
must configure an authorization ID and code on the initiator Logger.
lThere are no special authentication requirements for FIPS-enabled Loggers. Such Loggers can use
any of the allowed authentication methods.
lPeers cannot be edited, however you can delete and re-add a peer.
lIf you are running distributed searches (searches across peers), follow these additional guidelines:
a. A user must belong to the Logger Search User Group with “Search for events on remote peers”
privilege set to Yes and the Logger Rights Group with “View registered peers” privilege set to
Yes. See "Searching Peers (Distributed Search)" on page102.
b. Users performing search operations on peers have the same privileges on the peer that they have
on the Logger they are logged into. For example, User A is restricted by a search group filter to
only search for events in which deviceVendor is set to “Cisco.” When User A performs a search
operation across Logger A's peers, the same constraint (to search events where deviceVendor =
“Cisco”) is applied on all peers.
Administrator's Guide
HPE Logger 6.2 Page 397 of 623

lIf you are running distributed reports (reports across peers), see "Running a Report Manually" on
page175.
lWhen user name and password are used for authenticating to a remote peer, changes to the user
name and password after the peer relationship is established do not affect the relationship. However,
if you delete the peer relationship or it breaks for other reasons, you will need to provide the changed
credentials to re-establish the relationship.
Authenticating Peers
Authentication happens only once, at the time the peer relationship is created. The authorization to use
peer services is implicit each time a remote system receives peer requests from a system that previously
authenticated as a peer.
You can authenticate a peer in one of two ways:
lPeer Authorization ID and Code: These credentials are generated on one Manager or Logger and
used on another to configure peering between the two. When generating the Authorization ID and
Code, enter the IP address of the Manager or Logger you will use to initiate peering in the Peer
Authorization page of the one you want to peer with. The IP address is used to generate a unique ID
and code that can be used only for peering from that address. Therefore, this method is more secure
than using a user name and password.
Note: HP ArcSight recommends using Peer Authorization ID and Code for authentication.
lUser name and password: A user name and password already configured on the target system is
used for authentication.
Selecting a Peer Authentication Method
lWhen using a user name and password to configure peering, you must use the user password for
local authentication, even if your system is configured to use LDAP or RADIUS authentication.
lIf the peer Manager or Logger is configured for SSL Client authentication (CAC), you must configure
an Authorization ID and Code on the target Manager or Logger. You cannot use a user name and
password.
lFIPS-enabled systems are not limited to a specific authentication method.
Authorizing a Peer
Use the following procedure to generate the Authorization ID and Code on the target Manager or
Logger with which you want to establish a peer relationship. (Manager or Logger B in the example in
"Peers" on page396.) After that, use the ID and Code on the initiating Manager or Logger when
configuring the peer relationship (Manager Logger A in that example) .
Administrator's Guide
HPE Logger 6.2 Page 398 of 623
To generate the Authorization ID and Code to use when configuring a peer relationship:
1. Open the Configuration | Advanced menu and click Peer Authorizations.
2. Click Add.
3. Enter the hostname or IP address and port for the Manager or Logger you want to peer with this
system.
4. Click Save.
The authorization ID and authorization code display. Copy this information and use it on the other
Manager or Logger when adding this system as a peer.
5. Click Done to return to the Peer Authorization list.
Adding and Deleting Peer Relationships
The Peer Loggers page displays the current peer relationships. From here, you can add and delete
peers.
Adding a Peer
Adding a peer creates a peer relationship between two Loggers, two ArcSight Managers, or a Logger
and a Manager. Once added, you can delete a peer, but you cannot edit it. See "Guidelines for
Configuring Peers" on page397 for more information.
Adding a peer on a Logger is a bi-directional process. That is, when Logger A adds peer access for
Logger B, Logger B automatically adds peer access for Logger A. Similarly, if you delete the peer access
for B on A, the peer access for A is automatically deleted on B.
Administrator's Guide
HPE Logger 6.2 Page 399 of 623
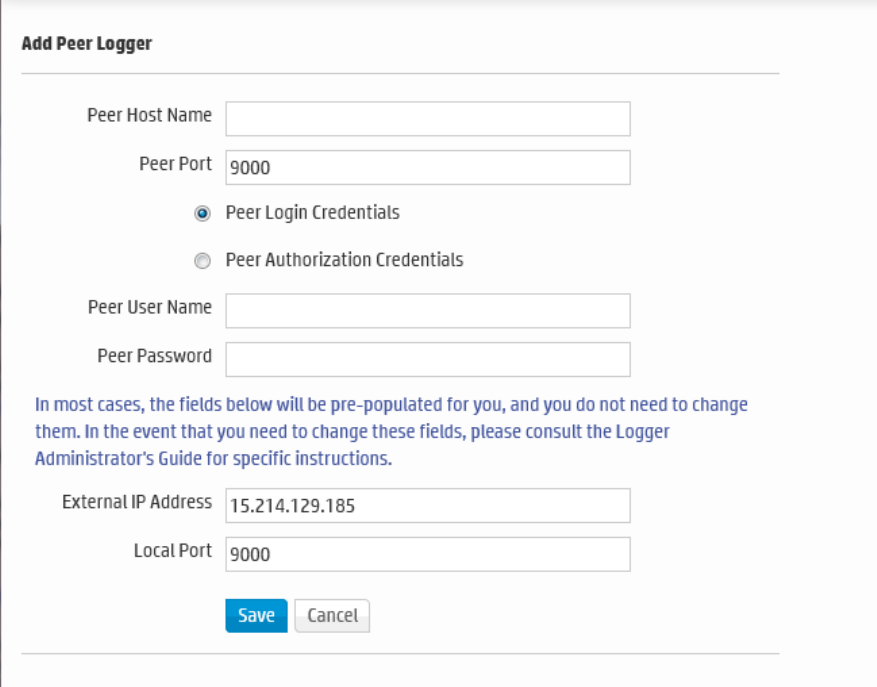
To add a peer:
1. Open the Configuration | Advanced menu and click Peer Loggers.
Administrator's Guide
HPE Logger 6.2 Page 400 of 623

2. Click Add and enter the following parameters.
Parameter Description
Peer Host
Name
Enter the target Manager or Logger’s hostname or IP address.
Peer Port Use the port configured when installing or initially configuring the target
system. See "Guidelines for Configuring Peers" on page397.
By default, this is Port 443 for the Logger Appliances.
Peer Login
Credentials
Peer
Authorization
Credentials
Select Peer Login Credentials for password-based authentication.
OR
Select Peer Authorization Credentials to use an Authorization ID and Code.
lOn systems using local or RADIUS authentication, you can use either
authentication method, although peer Authorization ID and Code are
recommended.
lOn systems using SSL Client Authentication (CAC), Authorization ID and
Code is the only way to authenticate a peer. You cannot use a user name and
password. (See "SSL Client Authentication " on page433.)
lFIPS-enabled systems are not limited to a specific authentication method.
If you selected Peer Login Credentials…
Peer User
Name
Enter a user name already configured on the target system.
Peer
Password
Enter the password for the user specified in the Peer User Name field.
If you selected Peer Authorization Credentials…
Peer
Authorization
ID
Enter the authorization ID generated on the target Manager or Logger. (See
"To generate the Authorization ID and Code to use when configuring a peer
relationship:" on page399 for more information.)
Peer
Authorization
Code
Enter the authorization code generated on the target Manager or Logger. (See
"To generate the Authorization ID and Code to use when configuring a peer
relationship:" on page399 for more information.)
Other Fields These fields need to be updated in rare circumstances.
External IP In most cases, the value in this field matches the IP address you use to connect
Administrator's Guide
HPE Logger 6.2 Page 401 of 623

Parameter Description
Address to this Logger from your browser, and you do not need to do anything.
However, if the IP address does not match (for example, when the Logger is
behind a VPN concentrator), change the value to match the IP address with
which you connect to this Logger.
Local Port In most cases, the value in this field matches the port in your browser when you
logged into this system (the initiating Manager or Logger), and you do not
need to do anything.
However, if the port here does not match the port in the IP address, (for
example, when the Manager or Logger is behind a VPN concentrator), change
the value to match the port in the IP address in your browser.
3. Click Save to add the new Logger, or Cancel to quit.
Deleting a Peer
Deleting a peer removes the peer relationship between two Loggers or two ArcSight Managers, or a
Manager and a Logger. You can perform this process from either peer.
To delete a peer:
1. Open the Configuration | Advanced menu and click Peer Loggers.
2. Locate the peer you want to delete the peer relationship to and click the Delete icon ( ) on that
row.
3. Confirm the deletion by clicking OK, or click Cancel to retain the Peer.
Administrator's Guide
HPE Logger 6.2 Page 402 of 623

Chapter 6: System Admin
System Administration tools enable you to create and manage users and user groups, and to configure
security settings, SMTP, and other system settings.
Note: Some System Administration topics apply to Software Loggers, some to Logger appliances,
and some to both types of Logger. The type of Logger to which the topic applies is noted at the top
of each System Administration topic.
The following subjects are covered in this section:
• System 403
• Logs 418
• Storage 419
• Security 428
• Users/Groups 439
• Other System Administration Information 458
System
This topic appliestoboth Software Logger and the Logger Appliance.
From the System tab, you can configure system-specific settings.
• System Locale 404
• System Reboot 404
• Network 405
• SMTP 411
• License & Update 412
• Process Status 413
• System Settings 413
• SNMP 413
• SSH Access to the Appliance 417
HPE Logger 6.2 Page 403 of 623

System Locale
This topic appliestoboth Software Logger and the Logger Appliance.
The System Locale setting ensures that the user interface displays information such as date, time,
numbers, and messages in the format and language appropriate for the selected country.
The System Locale is configured during the Logger installation process. Once configured it cannot be
changed.
To view the System Locale:
1. Click System Admin from the top-level menu bar.
2. Click System Locale in the System section. The System Locale Setting dialog box displays the
Locale.
System Reboot
This topic appliestoLogger Appliances only.
You can reboot or shutdown your appliance. For related information for Software Logger, see
"Software Logger Command Line Options" on page465
To reboot or shutdown your system:
1. Click System Admin from the top-level menu bar.
2. Click System Reboot in the System section.
3. Select from the following options:
Button Description
Reboot Your system reboots in about 60 seconds.
The reboot process normally takes 5-10 minutes, during which time the
system is unavailable.
Reboot in 5
Minutes
Your system reboots after a 5-minute delay.
The reboot process normally takes 5-10 minutes, during which time the
system is unavailable.
Shutdown Automatically shuts down (powers off) the system.
Each of the above actions can be canceled. “Reboot” and “Shutdown” allow for cancellation within
60 seconds. “Reboot in 5 Minutes” can be canceled within 300 seconds.
4. Click Reboot, Reboot in 5 Minutes, or Shutdown to execute the chosen action.
Administrator's Guide
HPE Logger 6.2 Page 404 of 623

Caution: During reboot, Logger is not able to receive events. Events may be lost while Logger
reboots, unless SmartConnectors are used. SmartConnectors cache events when destinations
like Logger are temporarily unavailable.
Network
This topic appliestoLogger Appliances only.
On the Logger Appliance, you can configure the DNS, Hosts, NICs, static routes, and system time
settings from the Network menu. For Software Loggers, these are configured through the operating
system.
• System DNS 405
• Hosts 406
• NICs 406
• Static Routes 408
• Time/NTP 409
System DNS
This topic appliestoLogger Appliances only.
The System DNS tab enables you to edit the DNS settings and to add DNS search domains.
To change DNS settings:
1. Click System Admin from the top-level menu bar.
2. Click Network in the System section.
3. In the System DNS tab, enter new values for the IP address of the primary and secondary DNS
servers, or edit the list of search domains.
To add a new domain, click the icon. To remove a domain, click the icon. To change the
search order of domains, select a domain name, and click the up or down arrow until the domain is
in the desired position.
4. Click Save.
5. Click Restart Network Service to put the changes into effect.
Administrator's Guide
HPE Logger 6.2 Page 405 of 623
Hosts
This topic appliestoLogger Appliances only.
The Hosts tab enables direct editing of your system’s /etc/hosts file. You can enter data in the
System Hosts text box or import it from a local file.
To change the Hosts information:
1. Click System Admin from the top-level menu bar.
2. Click Network in the System section, and then click the Hosts tab.
3. In the System Hosts text box, enter hosts information (one host per line) in this format:
<IP Address> <hostname1> <hostname2> <hostname3>
To import information from a file, click Import from Local File, and locate the text file on the
computer from which you are accessing your system.
4. Click Save.
NICs
This topic appliestoLogger Appliances only.
The NICs tab enables you to set the IP addresses for the network interface cards (NICs) on your system.
Additionally, you can configure the hostname and default gateway for your system.
To set or change the NICs settings:
1. Click System Admin from the top-level menu bar.
2. Click Network in the System section.
3. In the NICs tab, enter the following settings. To edit the IP address, subnet mask, or speed/duplex
of an NIC, select the NIC and click Edit above the NIC Name list.
Setting Description
Default Gateway The IP address of the default gateway.
Hostname The network host name for this system. Make sure that your DNS can
resolve the host name you specify to your system’s IP address.
Performance is significantly affected if DNS cannot resolve the host
name.
This name must be identical to the domain specified in the Certificate
Signing Request, described in "Generating a Certificate Signing
Administrator's Guide
HPE Logger 6.2 Page 406 of 623

Setting Description
Request (CSR)" on page431.
Note: If you previously used a self-signed or CA-signed certificate
on this system and are now changing its host name, you must
regenerate a new self-signed certificate or CSR. A new certificate
ensures that the connectors in FIPS mode which communicate
with your system are able to validate the host name. For more
information about generating a CSR, see "Generating a Certificate
Signing Request (CSR)" on page431.
Automatically route
outbound packets
(interface homing)
When this option is enabled (checked box), the response packets are
sent back on the same system interface on which the request packets
had arrived. Enabling this option can improve performance as the
routing decisions do not need to be made (using the default gateway
information and static routes) to send packets out from your system. If
you have static routes configured, they are ignored when this feature
is enabled.
When this feature is disabled (unchecked box), the static routes (if
configured) are used to determine the interface through which the
response packets should leave your system.
If you configure only one network interface, this setting does not
provide any additional benefit.
IP Address The IP address for each network interface card (NICs) in your system.
These IP addresses should be on separate subnets to avoid confusion
and to allow load balancing between receivers and forwarders.
Add NIC Alias
You can create an alias for any listed NIC. To do so:
a. Highlight the NIC for which you want to create an alias.
b. Click Add.
c. Create an alternative IP address for the alias.
d. Click Save.
You can identify the alias from its original by an appended colon
alongside a digit indicating the number of aliases you have created on
a particular NIC.
Note: You cannot alter the speed of an IP alias.
You can create as many aliases as you choose.
Administrator's Guide
HPE Logger 6.2 Page 407 of 623

Setting Description
Subnet Mask The subnet mask associated with the IP address you entered for an
NIC.
Speed/Duplex Choose a speed and duplex mode, or let your system determine the
network speed automatically:
lAuto (recommended)
l10 Mbps - Half Duplex
l10 Mbps - Full Duplex
l100 Mbps - Half Duplex
l100 Mbps - Full Duplex
l1 Gbps - Full Duplex
4. Click Save.
5. Click Restart Network Service to put the changes into effect.
Static Routes
This topic appliestoLogger Appliances only.
You can specify static routes for the NICs on your system.
To add, edit, or delete a static route:
1. Click System Admin from the top-level menu bar.
2. Click Network in the System section.
3. In the Static Routes tab:
lTo add a new static route, click Add.
lTo edit or delete an existing route, select the route first, then click Edit or Delete.
When adding or editing a static route, you need to configure these settings.
Setting Description
Type Whether the static route is to a Network or a Host
Destination The IP address for the static route destination
Subnet Mask The subnet mask if you specify a network as the destination
Gateway The IP address of the gateway for the route
Administrator's Guide
HPE Logger 6.2 Page 408 of 623

4. Click Save.
Time/NTP
This topic appliestoLogger Appliances only.
You do not need to configure the time, date, or time zone for a Software Logger. Software Loggers use
the operating system’s settings for the time and time zone.
The Time/NTP tab enables you to configure system time, date, local timezone, and NTP servers.
HPEstrongly recommends using an NTP server instead of manually configuring the time and date on
your system.
Precise timestamping of events is also critical for accurate and reliable log management. The times
displayed for Logger operations such as searches, reports, and scheduled jobs are in the Logger’s local
time zone.
To set or change the system time, date, or time zone manually:
1. Click System Admin from the top-level menu bar.
2. Click Network in the System section.
3. In the Time/NTP tab, configure these settings.
Setting Description
Current Time
Zone
The time zones appropriate to your system’s location. To change this setting,
click Change Time Zone…
Local times zones follow the Daylight Savings Time (DST) rules for that area.
Greenwich Mean Time (GMT) + and - time zones are DST-agnostic.
For example, the America/Los Angeles time zone varies by an hour compared
with GMT when DST goes into and out of effect.
lPacific Standard Time (PST) = GMT-8
lPacific Daylight Time (PDT) = GMT-7
Current Time The current date and time at the system’s location. To change this setting,
click Change Date/Time…
4. The Time Zone change requires that you reboot the appliance. However, the Current Time change
takes effect immediately.
Caution: If you manually set the date and time settings and are also using an NTP service, the
date and time entered manually cannot be more than 16 minutes ahead of or behind the time
that the NTP server is providing. If the manually entered time is more than 16 minutes different
from the NTP server time, then the NTP service will fail to start.
Administrator's Guide
HPE Logger 6.2 Page 409 of 623
To configure your system as an NTP server or for using an NTP server for your
system:
1. Click System Admin from the top-level menu bar.
2. Click Network in the System section.
3. Click the Time/NTP tab.
4. Under NTP Servers, configure these settings.
To add a new NTP server, click the icon. To remove a server, click the icon. To change the
order in which the NTP servers should be used, select a server and click the up or down arrow until
the NTP server is in the desired position.
Setting Description
Enable as an NTP
server
Check this setting if this system should be used as an NTP server.
NTP Servers Enter the host name of an NTP server. For example, time.nist.gov.
HPErecommends using at least two NTP servers to ensure precise time
on your system. To enter multiple NTP servers, type one server name per
line.
Once you add servers to this list, you can click the “Click to Test” link to
verify if the servers that you added are reachable from your system.
lAn ArcSight system can serve as an NTP server for any other ArcSight
system.
lIf System A serves as an NTP server for System B, System B needs to
list System A in its NTP Servers list.
lUse the Test Servers button to verify the status of the servers
entered into the NTP Servers box.
5. Click Save.
Tip: You may need to scroll down to view the Save button and Restart NTP Service.
6. Click Restart NTP Service to put the changes into effect.
Impact of Daylight Savings Time Change on Logger Operations
This topic appliestoboth Software Logger and the Logger Appliance.
To search for events that occur between 1 a.m. to 2 a.m. when the time change due to the end of
Daylight Savings Time (DST) takes place in the fall, (time is set back one hour), specify a start time of
12:59:59 or earlier and end time of 2:00:01 or later to ensure that all events are returned.
Administrator's Guide
HPE Logger 6.2 Page 410 of 623

To search for events that occur between 1 a.m. to 2 a.m. when the time change due to the start of
Daylight Savings Time (DST) takes place in the spring (time is set ahead one hour), specify an end time
of 2:00:01 or later to ensure that all events are returned.
Scheduled operations on Logger such as reports, event archives, and file transfers are also impacted
when system time is adjusted on the Logger at the start and end of the US Daylight Savings Time
period (DST).
Operations scheduled for the hour lost at the start of DST (for example, on March 9, 2015) are not run
on the day of time adjustment. Similarly, operations scheduled for the hour gained at the end of the
DST (for example, on November 2, 2015) are run at standard time instead of DST time.
Examples:
lA report scheduled to run at 1 a.m. DST on November 2, 2015 will run at 1 a.m. standard time, which is
an hour later than the DST time on that day.
lA report scheduled to run at 2 a.m. on November 2, 2015 will run at 2 a.m.; however, due to time
adjustment, an hour later than it ran on the previous day (November 1, 2015).
lA report scheduled to run at 2 a.m. on March 9, 2015 will not run.
SMTP
This topic appliestoboth Software Logger and the Logger Appliance.
Your system uses the Simple Mail Transfer Protocol (SMTP) setting to send email notifications such as
alerts and password reset emails.
To add or change SMTP settings:
1. Click System Admin from the top-level menu bar.
2. Click SMTP in the System section and enter values for these settings.
Setting Description
Primary
SMTP Server
The IP address or hostname of the SMTP server that will process outgoing
email.
Backup SMTP
Server
The IP address or hostname of the SMTP server that will process outgoing
email in case the primary SMTP server is unavailable.
Outgoing
Email Address
The email address that will appear in the From: field of outbound email.
3. Click Save.
Note: Be sure to configure your reports to use the same SMTP settings. For instructions, see
"Report Server Administration" on page242.
Administrator's Guide
HPE Logger 6.2 Page 411 of 623
License & Update
This topic appliestoboth Software Logger and the Logger Appliance.
This page displays license information, the version of the components, and the elapsed time since
Logger was last rebooted (Logger Appliance)or restarted (Software Logger. On this page, you can
apply a new license your Logger.
To view details of your current license, open Configuration from the top-level menu bar, and then click
License Information. For details, see "License Information" on page395. You can also update a Logger
Appliance from here. However, to upgrade Software Logger, you must install an upgrade package.
Refer to the Release Notes for the upgrade version for instructions.
To update your Logger license:
1. Download the update file from the HPECustomer Support site (SSO) at
https://softwaresupport.hp.com to a computer from which you can connect to Logger.
2. From the computer to which you downloaded the update file, log in to the Logger user interface
using an account with administrator (upgrade) privileges.
3. Click System Admin from the top-level menu bar.
4. Click License & Update in the System section.
5. Browse to the license file you downloaded earlier, and click Upload Update. The Update in
Progress page displays the update progress.
Once the update has completed, the Update Results page displays the update result (success/failure).
A reboot or restart is not required.
To update a Logger Appliance:
1. Download the update file from the HPECustomer Support site (SSO) at
https://softwaresupport.hp.com to a computer from which you can connect to Logger.
2. Click System Admin from the top-level menu bar.
3. Click License & Update in the System section.
4. Click Browse to locate the file.
5. Click Upload Update. The Update in Progress page displays the update progress.
6. Once the update has completed, the Update Results page displays the update result
(success/failure) and whether the update requires a reboot or restart. If it does, the Logger
reboots/restarts automatically.
Administrator's Guide
HPE Logger 6.2 Page 412 of 623

Process Status
This topic appliestoboth Software Logger and the Logger Appliance.
The Process Status page lists all processes related to your system and enables you to view the details
of those processes and start, stop, or restart them.
To view the Process Status page:
1. Click System Admin from the top-level menu bar.
2. In the System section, click Process Status. A list of Logger processes display.
Tip: In this context, the "processors" listed in the Processes table refers to forwarders.
3. On the Process Status dialog, to toggle the view of the details of a process, click the icon to
the left of the process name.
To start, stop, or restart a process, select the process and click Start, Stop, or Restart at the top of the
process list.
System Settings
This topic appliestoSoftware Loggers only.
If you did not select Logger to start as service during the installation process, you can do so using the
System Settings page. When you select this option Logger will use a service called arcsight_
logger, enabled to run at levels 2, 3, 4, and 5.
To configure Logger to start as a service:
1. Click System Admin from the top-level menu bar.
2. Click System Settings in the left panel.
3. From under Service Settings, choose the appropriate option:
lStart as a Service
lDo not start as a Service
4. Click Save.
SNMP
This topic appliestoLogger Appliances only.
You can use SNMP (Simple Network Management Protocol) to monitor the health of your appliance.
Logger appliance supports SNMP v2c and SNMP v3.
Administrator's Guide
HPE Logger 6.2 Page 413 of 623
You can configure SNMP polling and notifications (traps):
lIf you configure SNMP polling, a manager station can query the SNMP agent residing on Logger.
The information retrieved provides detailed information at the hardware and Operating System level.
lIf you configure and SNMP destination, Logger can send notifications for the set of events below.
These notifications differ from the ones sent by Alerts. (For more information on using Alerts to
send event information as SNMPnotifications, see "Real Time Alerts" on page331 and "SNMP
Destinations" on page340.) Instead of a notification being for a generic event, the new notifications
are specific to a single event, making more easily understood by a Network Management System
(NMS)such as HP NMMi.
SNMPMetrics Supported
Hardware
Logger supports polling and notifications for the following hardware parameters.
lCPU Usage
lMemory Usage
lDisk Almost Full
lFan Failure
lPower Supply Failure
lTemperature Out of Range
lEthernet Link Down
Logger application
The following notifications are defined in the ARCSIGHT-EVENT-MIB.
lLogin attempt failed
lPassword change attempt failed
lUser account locked
lReboot command launched
lManual backup failed
lScheduled backup failed
lEnable FIPS mode successful
lDisable FIPS mode successful
lEnable FIPS mode failed
lDisable FIPS mode failed
Administrator's Guide
HPE Logger 6.2 Page 414 of 623

Configuration on the Logger Appliance
To configure SNMP polling:
1. In the main menu bar, click System Admin.
2. In the navigation tree, under System, click SNMP. The SNMP Poll Configuration tab displays.
3. Status: Select Enabled or Disabled.
4. Port: Enter a port number. The default is 161 (UDP) but can be any available port.
5. SNMP Version: Select V2c or V3. The default is V2c.
lV2c — Enter the following value:
Community String: 6–128 alphanumeric, underscore (_),and dash (-) characters.
lV3 — Enter values for the following fields:
Username: 4–16 alphanumeric, lower-case characters. The user name must begin with an
alphabetic character and may include underscores.
Authentication Protocol: Select MD5 or SHA.
Authentication Passphrase: Enter a password consisting of 4–256 characters.
Privacy Protocol: Select DES or AES128.
Privacy Passphrase: Enter a password consisting of 4–256 characters.
Note: To be valid, the values for Poll Configuration and Trap Configuration must match.
6. System Name: Enter a name for the system you want to poll.
7. Point of Contact: Enter a valid notification contact.
8. Location: Enter a location for the system you want to poll.
9. Click Save.
If an SNMP destination is configured, Logger can send notifications for a limited set of events (see
"SNMPMetrics Supported" on the previous page.
SNMP notifications differ from those sent by SmartConnectors, which are for a generic ArcSight event.
The notifications listed here are specific to a single event, making them easier for understanding by a
network management system like HP NMMi.
To configure the destination for SNMP notifications:
1. In the main menu bar, click System Admin.
2. In the navigation tree, under System, click SNMP. The SNMP Poll Configuration tab displays.
3. Select the SNMP Destination tab to open the SNMP Trap Configuration menu.
4. Status: Select Enabled or Disabled.
Administrator's Guide
HPE Logger 6.2 Page 415 of 623

5. NMS IP Address: Enter the IP address of the Network Management System (NMS) host.
6. Port: Enter a port number. The default is 162 (UDP) but can be any available port.
7. SNMP Version: Select V2c or V3. The default is V2c.
lV2c — Enter the following value:
Community String: 6–128 alphanumeric, underscore (_),and dash (-) characters.
lV3 — Enter values for the following fields:
Username: 4–16 alphanumeric, lower-case characters. The user name must begin with an
alphabetic character and may include underscores.
Authentication Protocol: Select MD5 or SHA.
Authentication Passphrase: Enter a password consisting of 4–256 characters.
Privacy Protocol: Select DES or AES128.
Privacy Passphrase: Enter a password consisting of 4–256 characters.
Note: To be valid, the values for Poll Configuration and Trap Configuration must match.
8. Click Save.
Configuration on the NMS
1. Download ArcSight MIB file and other standard Net-SNMP MIB files using following URLs:
lhttps://<system_name_or_ip>/platform-service/ARCSIGHT-EVENT-MIB.txt
lhttps://<system_name_or_ip>/platform-service/DISMAN-EVENT-MIB.txt
lhttps://<system_name_or_ip>/platform-service/HOST-RESOURCES-MIB.txt
lhttps://<system_name_or_ip>/platform-service/IF-MIB.txt
lhttps://<system_name_or_ip>/platform-service/UCD-SNMP-MIB.txt
2. Load the MIB.
3. Configure the node (appliance) in the NMS (or MIB browser) according to the protocol used, either
v2c or v3.
MIBContents
The standard MIB files contain the following types of notifications:
Module Notification Types
DISMAN-EVENT-MIB Event triggers and actions for standard network management.
IF-MIB Objects for network interfaces.
Administrator's Guide
HPE Logger 6.2 Page 416 of 623
Module Notification Types
IP-MIB IP and ICMP implementations.
HOST-RESOURCES-MIB Standard hardware parameters.
SSH Access to the Appliance
This topic appliestoLogger Appliances only.
Note: SSHaccess to Software Logger is controlled through the operating system.
When you report an issue to customer support that requires them to access your appliance for
troubleshooting and diagnostics in situations such as an upgrade failure, unresponsive appliance, and
so on, they will direct you to enable SSH access on it.
By default, SSH access (known as Support Login in previous releases) to your appliance is disabled.
(This also includes Loggers upgraded to version 6.0 from previous versions.) However, you can select
one of these options in the appliance’s user interface to enable SSH:
lEnabled: SSH access is always enabled.
lEnabled, only for 8 hours: SSH access is disabled automatically eight hours after it was enabled.
lEnabled, only during startup/reboot: SSH access is enabled during the time the appliance reboots
and is starting up. It is disabled once all processes on the appliance are up and running. This option
provides a minimal period of SSH access for situations such as when the appliance does not start
successfully after a reboot.
For optimal security, you should set a strong password for the root account. In addition, leave SSH
access disabled and enable it only when necessary, such as for troubleshooting purposes.
Note: If SSH is disabled on your appliance, you can still access its console if you have it setup for
remote access using the HPProLiant Integrated Lights-Out (iLO) Advanced remote
management card. For more information, refer to the Logger Installation Guide.
Enabling or Disabling SSH Access
1. Click System Admin from the top-level menu bar.
2. Click SSH in the System section.
3. On the SSH Configuration dialog, select an SSH configuration.
4. Confirm the new SSH configuration for it to take effect.
Once you have enabled SSH access on your appliance, follow these steps to connect to it using SSH.
Administrator's Guide
HPE Logger 6.2 Page 417 of 623

Connecting to Your Appliance Using SSH
1. Connect to the appliance as “root” using an SSH client.
2. At the password prompt, type the root password and press Enter.
Logs
This topic appliestoboth Software Logger and the Logger Appliance.
Your system can generate audit logs at the application and platform levels. Use the Logs sub-menu to
search audit logs.
Audit Logs
Your system’s audit logs are available for viewing. Audit logs, as Common Event Format (CEF) audit
events, can be sent to ArcSight ESM directly for analysis and correlation. For information about
forwarding audit events, see "Audit Forwarding" below.
To view audit logs:
1. Click System Admin from the top-level menu bar.
2. Click Audit Logs in the Logs section.
3. Select the date and time range for which you want to obtain the log.
4. (Optional) To refine the audit log search, specify a string in the Description field and a user name
in the User field. When a description string is specified, only logs whose Description field contains
the string are displayed. Similarly, when a user is specified, only logs whose User field contains the
username are displayed.
5. Click Search.
Audit Forwarding
You can forward audit events to an ArcSight ESM for correlation and analysis. For a list of audit events
that you can forward, see "Application Events" on page522.
To forward audit events to specific ESM destinations:
1. Click System Admin from the top-level menu bar.
2. Click Audit Forwarding in the Logs section.
3. Select destinations from the Available Destinations list and click the right arrow icon ( ) to
move the selected destination to the Selected Destinations list.
Administrator's Guide
HPE Logger 6.2 Page 418 of 623

You can select multiple destinations at the same time and move them, or you can move all available
destinations by clicking the ( ) icon.
The destinations are ESM destinations that you configure on the ESM Destinations page
(Configuration>Event Input/Event Output>ESM Destinations).
4. Click Save Settings.
Storage
This topic appliestoLogger Appliances only.
Use the Storage sub-menu to add an NFS mount or a CIFS mount, or SAN (if applicable) and to view
the status of the hard disk array (RAID) controller and specific system processes.
• Remote File Systems 419
• SAN 422
• RAID Controller/Hard Disk SMART Data 428
Remote File Systems
This topic appliestoLogger Appliances only.
Your system can mount Network File System (NFS) and CIFS (Windows) shares. As a result, it can read
log files and event data from UNIX, Linux, Windows remote hosts, and any Network Attached Storage
(NAS) solutions based on these operating systems. In addition, you can use the NFS and CIFS mounts
for archiving data such as events, exported filters and alerts, and saved searches. Loggers with Storage
Area Network (SAN) capability can also interface with a SAN.
Logger appliance supports NFSv4. However, using a NFS for primary storage of Logger events is not
recommended. Using a CIFS share for primary storage is not supported.
• Managing a Remote File System 419
Managing a Remote File System
This topic appliestoLogger Appliances only.
Make sure the following requirements are met before you mount a share.
File System
Type Requirements
CIFS (Windows) lA user account that has access to the shared drive exists on the Windows
system.
Administrator's Guide
HPE Logger 6.2 Page 419 of 623
File System
Type Requirements
lThe folder to which you are establishing the mount point is configured for
sharing.
NFS lGrant your ArcSight system read and write permission on the NFS system.
lThe account used for mounting must use the numeric ids 1500 for uid, or 750
for gid.
To add a Remote File System mount:
1. Click System Admin from the top-level menu bar.
2. Click Remote File Systems in the Storage section in the left panel.
The Remote File Systems table is displayed.
3. Click Add from the top left side of the page and enter values for the following fields in the resulting
form.
Parameter Description
Select File System
Type
Whether you want to mount an NFS or a CIFS share.
NFS Settings
Name A meaningful name for the mount point. This name is used locally on your
system to refer to the mount point, and needs to be specified when
configuring archive settings for data that will be stored on the share.
Tip: The mount name cannot contain spaces.
Hostname / IP
Address
The name or IP address of the host to which you are creating the mount.
Remote Path (for
NFS)
The folder on the remote host that will act as the root of the network file
system mount. For example, /public/system_logs.
Make sure that only this system can write to the location you specify in this
field. If multiple systems (or other systems) mount this location and write to
it, data on this location will be corrupted.
Mount Options AutoFS options. For example, ro for read-only from the remote host, rw for
read-write, or hard to keep retrying until the remote host responds.
Note: Even if you configure rw permission at your mount point, read-
Administrator's Guide
HPE Logger 6.2 Page 420 of 623

Parameter Description
write permission is not granted to the remote host if the host is
configured to allow read-only access.
Description A meaningful description of the mount point.
CIFS Settings
Name Name is used locally on your system to refer to the mount point, and needs
to be specified when configuring archive settings for data that will be
stored on the share.
Note: The mount name can include alpha-numeric, dash (-), and
underscore (_) characters. It must begin with an alpha-numeric
character.
Location Enter the share name in one of the following ways:
lShare name in this format:
<IP Address> or <Hostname>:<share_name>
For example, 198.0.2.160:myshare
This folder needs to be configured for sharing. (Typically, to configure a
Windows folder for sharing, right click on the folder name > Properties
> Sharing.)
Caution: When mounting from a Windows Server 2008 in cluster,
you must use the Hostname and not the IP address for a successful
mount.
lUNC path:
For example, //198.0.2.160/myshare
Mount Options Autofs options. For example, ro for read-only from the remote host, rw
for read-write, or hard to keep retrying until the remote host responds.
Note: Even if you configure rw permission at your mount point, read-
write permission is not granted to the remote host if the host is
configured to allow read-only access.
Description A meaningful description of the mount point.
Administrator's Guide
HPE Logger 6.2 Page 421 of 623

Parameter Description
Credentials for CIFS
Username The name of the user account with read-write privileges to the Windows
share.
Make sure the username is prefixed with the domain information. For
example, tahoe\arcsight.
Password The password for the user name specified above.
4. Click Add.
All mount points are created under /opt/mnt.
To edit a Remote File System mount:
Note: You cannot edit a mount point if it is in use. The Edit link is displayed only if the mount point
can be edited.
If you rename a mount point, access to the archives that were made using the original name is lost
until you revert the mount point name to the original name.
1. Click System Admin from the top-level menu bar.
2. Click Remote File Systems in the Storage section in the left panel.
3. Select the mount point you want to edit, and click Edit from the top left side of the page.
4. Change the field values.
5. Click Save.
To delete a Remote File System mount:
Note: You cannot delete a mount point that is in use. The Delete link is displayed only if the mount
point can be deleted.
1. Click System Admin from the top-level menu bar.
2. Click Remote File Systems in the Storage section in the left panel.
3. Select the mount point you want to delete, and click Delete from the top left side of the page.
SAN
This topic appliestoLogger Appliances only.
Some models of the Logger Appliance include the ability to connect to a Storage Area Network (SAN).
SANs contain Logical Units (LUNs), identified by their World Wide Name.
Administrator's Guide
HPE Logger 6.2 Page 422 of 623
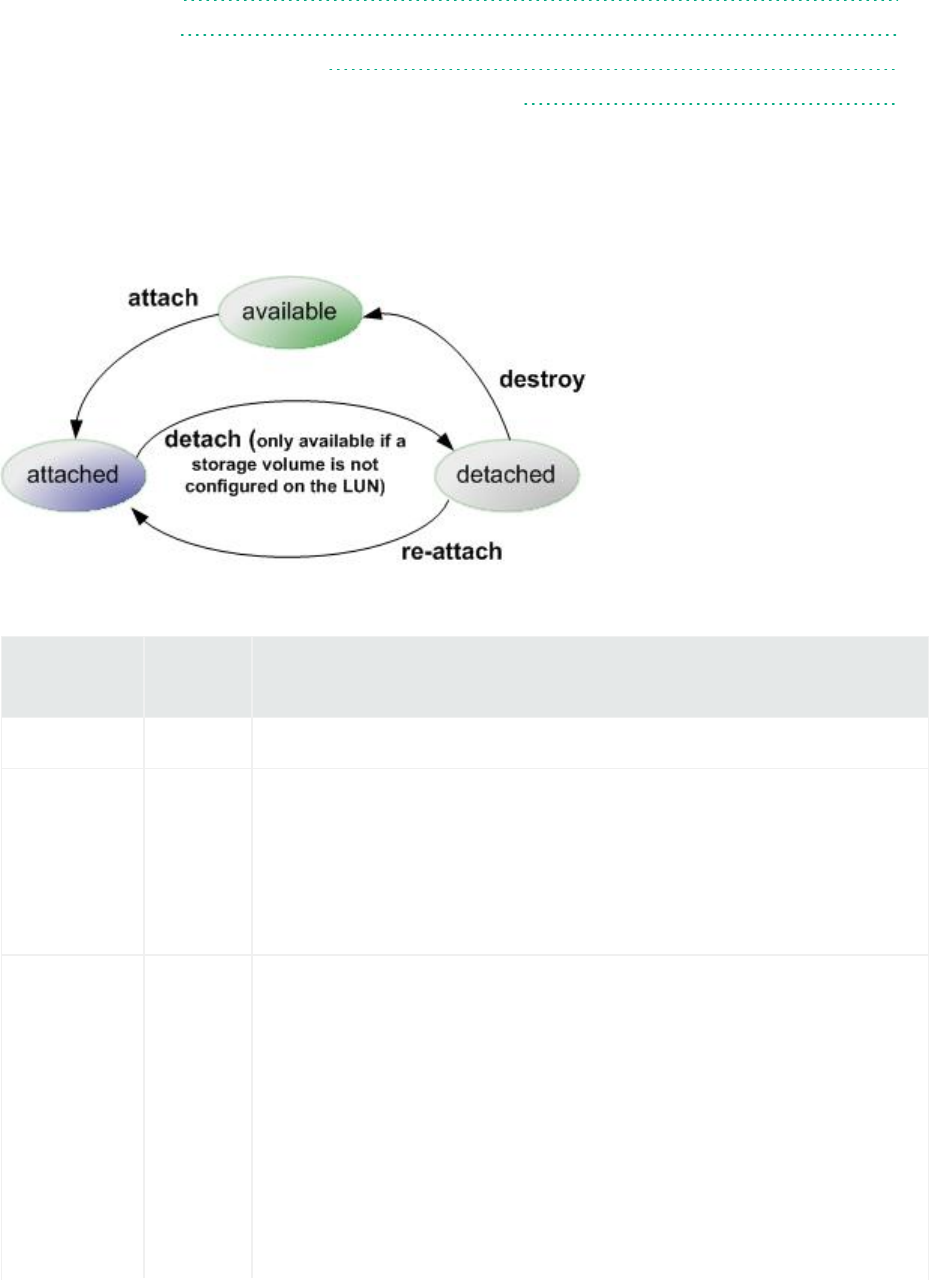
• Managing a LUN 423
• Restoring a SAN 425
• Creating Multiple Paths to a LUN 425
• Restoring Multipath on RMA or Factory Reset Loggers 428
Managing a LUN
As shown in the following figure, a LUN’s Attachment Status can be one of the following: “available”,
“attached”, or “detached”. Available actions, such as “attach”, vary depending on LUN’s status.
The following table summarizes the LUN states and possible actions.
Attachment
Status Actions Description
available attach LUNs detected on a SAN are initially available for attachment.
attached detach Attached LUNs can be accessed by Logger.
The “detach” action is only available if a storage volume has not been
configured on the LUN. Once a storage volume has been configured,
you cannot “detach” the LUN unless you follow the factory reset
instructions, described in "Restoring Factory Settings" on page609.
detached re-attach
destroy
When an attached LUN is detached, its data is preserved, but it cannot
be accessed by Logger. To make it available again, use the “re-attach”
action. The “destroy” action releases the LUN back to the “available”
state.
When you detach, the only action available immediately is “re-attach”.
The “destroy” state takes a few minutes to appear because it takes a
few minutes for the LUN to detach on the system.
Destroying a LUN puts it into a state in which a subsequent attach will
erase any data stored on the LUN. If a LUN is accidentally destroyed,
Administrator's Guide
HPE Logger 6.2 Page 423 of 623

Attachment
Status Actions Description
customer support may be able to recover the data, provided there has
been no subsequent attempt to attach the LUN.
Logger can attach to only one LUN at a time for primary storage. You can attach an additional LUN for
event archiving, configuration backup, and export.
The L7500-SAN has two HBAs. This enables you to use one for multipathing and one for event
archival, configuration backup, and export. For information about multipathing, see “Creating Multiple
Paths to a LUN” on page 458.
To attach a LUN:
1. Click System Admin from the top-level menu bar.
2. Click SAN in the Storage section in the left panel.
3. Under SAN Configuration, locate and select the LUN in the LUN Name List.
4. Click Attach from the top left of the SAN Configuration page. If you do not see the Attach menu
option, no LUNs can be attached to the Logger at this time.
Note: You can attach a LUN only if the LUN is in the "Available" status.
The LUN’s Attachment Status will change to “Attached” when the LUN is ready for use.
To detach a LUN:
1. Click System Admin from the top-level menu bar.
2. Click SAN in the Storage section in the left panel.
3. In the LUN Name List, locate the LUN to be detached.
4. Click Detach from the top left of the SAN Configuration page. If you do not see the Detach menu
option, no LUNs can be detached from the Logger at this time.
Note: You cannot detach a LUN if a storage volume is configured on it.
To re-attach a LUN:
1. Click System Admin from the top-level menu bar.
2. Click SAN in the Storage section in the left panel.
3. In the LUN Name List, locate the LUN to be re-attached. The LUN must be in the Detached state.
4. Click Re-attach from the top left of the SAN Configuration page.
If you do not see the Re-attach menu option, no LUNs can be re-attached from the Logger at this
time.
Administrator's Guide
HPE Logger 6.2 Page 424 of 623

To destroy a LUN:
1. Click System Admin from the top-level menu bar.
2. Click SAN in the Storage section in the left panel.
3. In the LUN Name List, locate the LUN to be destroyed. The LUN must be in the ‘detached’ state.
4. Click Destroy in the top left corner of the SAN Configuration page.
Caution: Destroying a Logical Unit (LUN) that has been detached, puts that LUN into a state
in which a subsequent attach will erase any data stored on the LUN. If a LUN is accidentally
destroyed, customer support may be able to recover the data, provided there has been no
subsequent attempt to attach the LUN.
Restoring a SAN
This topic appliestoLogger Appliances only.
You can restore a SAN to either the Logger to which it was formerly attached, or to a new Logger (in
the case of disaster recovery).
To restore a SAN:
1. With Logger powered off, attach the SAN physically.
2. Turn on Logger.
3. Restore the configuration to Logger. HPErecommends backing up the configuration regularly so
that a backup file will be available for this purpose. If no backup file is available, skip this step and
manually add receivers, forwarders, users, and so on, after the SAN has been restored. For more
information, see "Configuration Backup and Restore" on page385.
4. Enable SSH access to your Logger (see "SSH Access to the Appliance" on page417).
5. Contact customer support at https://softwaresupport.hp.com.
6. Customer support will log in remotely, stop all Logger processes, and migrate the internal database
to the SAN.
7. When customer support has finished, reboot Logger.
Creating Multiple Paths to a LUN
This topic appliestoLogger Appliances only.
The HBA card on your Logger has two ports. You can connect both of those ports to the same LUN.
Using those ports to create two different paths between the Logger and the LUN (multipathing)
reduces the possibility of a single point of failure causing the LUN to become unavailable.
Note: Although any SAN vendor that supports multipathing can work with Logger, ArcSight
Administrator's Guide
HPE Logger 6.2 Page 425 of 623

specifically tests with HPE 3PAR SANs.
Logger provides a default multipath configuration as a starting point. However, make sure that you
consult your SAN documentation for information specific to your environment.
A multipath user interface (UI) is available by default on Logger models that support SAN. However,
you must connect the LUN to both HBA ports and configure multipath configuration in the UI for it to
function. Once enabled, multipath cannot be disabled on Logger.
Multipath does not enable you to attach an additional LUN to Logger. Only one LUN can be attached at
any given time. If multipathing is enabled on your Logger, you cannot use an additional LUN for event
archival, configuration backup, and export.
You do not need to enable multipath in order to connect to two different LUNs on different SANs, since
there are no duplicate paths. To connect to two different LUNs on the same SAN, or to have two
connections to the same LUN, you must configure multipathing. Otherwise, the OS will see duplicate
paths to the same LUN, and will be unable to resolve which path to use.
To enable multipath for a new Logger installation, configure multipathing before attaching the LUN. To
enable multipath when upgrading from a version prior to Logger 5.1, refer to the release notes for your
Logger version.
Enabling Multipath
To enable multipath:
1. Ensure that a LUN is not attached to the Logger, as described in "SAN" on page422.
2. Click System Admin from the top-level menu bar.
3. Click Multipath in the Storage section in the left panel.
4. Select a SAN multipathing configuration from the pull-down menu.
5. If you chose Custom, or if the displayed configuration does not meet your needs, customize the
parameters.
6. Click Test to ensure that the configuration you chose or the changes you made are valid.
If the test fails, make additional changes, or click Reset to start over.
7. Click Save.
When you configure multipath SAN connectivity to the appliance, you must also make sure that the
multipathd service is configured to start on boot.
To verify that the multipathd service is configured to start on boot:
1. Run chkconfig --list multipathd
Make sure '#:on' is shown for your run level. The current run level can be displayed with the
'runlevel' command.
Administrator's Guide
HPE Logger 6.2 Page 426 of 623

2. If the service is not enabled, do so with:
chkconfig multipathd on
3. Reboot the appliance or start the multipath daemon with:
/sbin/service multipathd start
Note: Be sure to also configure any vendor-specific multipath configuration accordingly in the
/etc/multipath.conf file.
To convert a single path LUN to multipath:
1. Upgrade your Logger Appliance to version 5.1 or later.
2. After a successful upgrade, connect to your Logger using SSH, as described in the ArcSight Logger
Administrator’s Guide.
3. Run these commands:
cd /opt/arcsight/aps/mpath
./mpath_prepare.sh
4. Connect the second fiber cable to the second port on the HBA card.
5. Create the multipath.conf file for your SAN.
The contents of this file will vary depending on your SAN vendor and configuration. The Logger
user interface includes a default multipath configuration for EMC CLARiiON SANs that can be used
as a starting point to populate the multipath.conf file. However, consult your SAN
documentation for information specific to your setup and environment.
To view the default multipath configuration for EMC CLARiiON SAN, connect to the Logger UI, go
to System Admin > Multipath, copy the configuration from the UI, and then paste the copied
configuration in the /opt/arcsight/aps/mpath/multipath.conf file.
6. Run this test command:
./mpath_test.sh <path_to_your_multipath.conf >
Review the output of the test command to ensure that multipath devices that will be created are
listed at the bottom of the output.
7. If test output is not correct, repeat the steps "Create the multipath.conf file for your SAN. " above
and "Run this test command:" above until the multipath devices are correctly listed.
8. Run this command:
./mpath_enable.sh <path_to_your_multipath.conf >
9. Reboot your appliance.
Administrator's Guide
HPE Logger 6.2 Page 427 of 623

Restoring Multipath on RMA or Factory Reset Loggers
If you need to restore Logger to its last working state—running version 5.1 or later, with multipath
enabled—from 5.0 Patch 3 or earlier, be sure to upgrade your system to Logger 5.1 or later before
attaching the LUN.
This could happen in either of the following situations:
lYou received a new system that is running Logger 5.0 Patch 3 or earlier after you RMA’d the system
to ArcSight.
lYou restored the system to its factory default settings, and that reset the Logger version to 5.0
Patch 3 or earlier.
If you will be restoring the configuration of the Logger from a backup, ensure that the Logger is first
running the version that matches the backup, perform the restoration, and then complete the upgrade
to the desired version. See "Restoring Factory Settings" on page609 for more information.
RAID Controller/Hard Disk SMART Data
This topic appliestoLogger Appliances only.
You can view information about the RAID controller or hard disk SMART data in the General Controller
Information screen. This information is not needed during normal system operations, but it can be
helpful for diagnosing specific hardware issues. Due to the redundant nature of RAID storage, a single
drive failure will not disable your system. Instead, performance degrades. Use this report to determine
whether a performance issue is caused by a disk failure. Customer support can also use this information
to diagnose problems.
To view the General Controller Information screen:
1. Click System Admin from the top-level menu bar.
2. Click RAID Controller in the Storage section in the left panel.
3. The information displayed depends on the hardware model of your system. Click the arrows to
toggle the information displays.
Security
This topic appliestoboth Software Logger and the Logger Appliance.
Security settings enable you to configure SSL server certificates, enable and disable FIPS (Federal
Information Processing Standards) mode on your system, and configure SSL client authentication for
client certificate and Common Access Card (CAC) support.
Tip: For steps on how to create a user DN, see "Users" on page452, and refer to the section “Use
Administrator's Guide
HPE Logger 6.2 Page 428 of 623

Client DN” in the parameters table.
• SSL Server Certificate 429
• SSL Client Authentication 433
• FIPS 140-2 435
SSL Server Certificate
This topic appliestoboth Software Logger and the Logger Appliance.
Your system uses Secure Sockets Layer (SSL) technology to communicate securely over an encrypted
channel with its clients, such as SmartConnectors, when using the SmartMessaging technology and
other ArcSight systems. Your system ships with a self-signed certificate so that an SSL session can be
established the first time you use the appliance. For more information on this option, see "Generating a
Self-Signed Certificate" below.
Although a self-signed certificate is provided for your use, HPEstrongly recommends using a certificate
authority (CA) signed certificate. Even if FIPS is not enabled on your system, it must use a CA-signed
certificate if it is a destination of a software-based SmartConnector. Additionally, ensure that the root
certificate of the CA that signed your system’s certificate is trusted on the SmartConnector. If the CA’s
root certificate is not trusted on the SmartConnector, follow instructions in "Installing or Updating a
SmartConnector to be FIPS-Compliant" on page437.
To facilitate obtaining a CA-signed certificate, your system can generate a Certificate Signing Request.
Once a signed certificate file is available from the CA, it can be uploaded to your system for use in a
subsequent authentication. For detailed instructions, see "Generating a Certificate Signing Request
(CSR)" on page431.
Your system generates an audit event when the installed SSL certificate is going to expire in less than
30 days or has already expired. The event with Device Event Class ID “platform:407” is generated
periodically until you replace the certificate with one that is not due to expire within 30 days.
• Generating a Self-Signed Certificate 429
• Generating a Certificate Signing Request (CSR) 431
• Importing a Certificate 432
Generating a Self-Signed Certificate
This topic appliestoboth Software Logger and the Logger Appliance.
Your appliance ships with a self-signed certificate so that an SSL session can be established the first
time you connect. This type of certificate does not require signing from another entity and can be used
immediately.
Administrator's Guide
HPE Logger 6.2 Page 429 of 623
To generate a self-signed certificate:
1. Click System Admin from the top-level menu bar.
2. Click SSL Server Certificate from the Security section in the left panel to display the Generate
Certificate/Certificate Signing Request page.
3. Click the Generate Certificate tab.
4. From the Enter Certificate Settings field, enter new values for the following fields:
Parameter Description
Country A two-letter country code, such as ‘US’ for the United States.
State/Province State or province name, such as ‘California.’
City/Locality City name, such as ‘Sunnyvale’.
Organization Name Company name, governmental entity, or similar overall organization.
Organizational Unit Division or department within the organization.
Hostname The host name or IP address of this system.
When specifying the host name, make sure that this name matches the
name registered in the Domain Name Service (DNS) server for the system.
On the Logger Appliance, this name must be identical to the host name
specified in "NICs" on page406.
Note: If the host name or IP address of this system changes in the
future, you must generate a new self-signed certificate or CSR. Once
a new certificate is obtained, you must upload it to ensure that the
connectors (in FIPS mode) which communicate with the system are
able to validate the host name.
Email Address The email address of the administrator or contact person for this CSR.
Private Key Length Select the length (in bits) of the private key: 1024, 2048, 4096, or 8192.
Use the first two buttons to generate a CSR or a self-signed certificate. The View Certificate
button is only used to view the resulting certificate.
Button Description
Generate CSR Click to generate a Certificate Signing Request (CSR).
Generate Certificate Click to generate a self-signed certificate.
View Certificate Click to view the generated certificate.
Administrator's Guide
HPE Logger 6.2 Page 430 of 623

5. Click the Generate Certificate button to generate the self-signed certificate.
Note: The Apache server restarts while generating the certificate. You may get an error
communicating to the web server while this is happening. This is expected behavior, and
communication is automatically restored once Apache is back up.
6. Click Ok to confirm generation.
7. Click the View Certificate button to view the PEM-encoded self-signed certificate.
Generating a Certificate Signing Request (CSR)
This topic appliestoboth Software Logger and the Logger Appliance.
Generating a Certificate Signing Request (CSR) is the first step to obtain a certificate signed by a 3rd
party Certificate Authority (CA), for example, VeriSign. The resulting CSR must be sent to a CA, such as
VeriSign, which responds with a signed certificate file. The CSR must be generated on the system for
which you are requesting a certificate. That is, you cannot generate a CSR for System A on System B or
use a third-party utility for generation.
To generate a certificate signing request:
1. Click System Admin from the top-level menu bar.
2. Click SSL Server Certificate from the Security section in the left panel to display the Generate
Certificate/Certificate Signing Request page.
3. Click the Generate Certificate tab.
4. From the Enter Certificate Settings field, enter new values for the following fields:
Parameter Description
Country A two-letter country code, such as ‘US’ for the United States.
State /
Province
State or province name, such as ‘California.’
City / Locality City name, such as ‘Sunnyvale’.
Organization
Name
Company name, governmental entity, or similar overall organization.
Organizational
Unit
Division or department within the organization.
Hostname The host name or IP address of this system.
When specifying the host name, make sure that this name matches the name
Administrator's Guide
HPE Logger 6.2 Page 431 of 623
Parameter Description
registered in the Domain Name Service (DNS) server for the system. For
Logger Appliances, this name must be identical to the host name specified in
"NICs" on page406.
Note: If the host name or IP address of this system changes in the future, you
must generate a new self-signed certificate or CSR. Once a new certificate is
obtained, you must upload it to ensure that the connectors (in FIPS mode)
which communicate with the system are able to validate the host name.
Email Address The email address of the administrator or contact person for this CSR.
Private Key
Length
Select the length (in bits) of the private key: 1024, 2048, 4096, or 8192.
5. Use the first two buttons to generate a CSR or a self-signed certificate. The View Certificate
button is only used to view the resulting certificate.
Button Description
Generate CSR Click to generate a Certificate Signing Request (CSR).
Generate Certificate Click to generate a self-signed certificate.
View Certificate Click to view the generated certificate.
6. Choose Generate CSR to generate a certificate signing request.
7. If the CSR was successfully generated, a pop-up window is shown, enabling you to either download
the CSR file or to copy/paste its content.
To copy/paste, copy all the lines (inclusive) from -----BEGIN CERTIFICATE REQUEST-----
to -----END CERTIFICATE REQUEST-----.
8. Send the CSR file to your certificate authority to obtain the CA-signed certificate.
9. Once the CA-signed certificate file is obtained, continue on to "Importing a Certificate" below
below.
Importing a Certificate
This topic appliestoboth Software Logger and the Logger Appliance.
After you have obtained a certificate from your certificate authority (CA), you can follow the steps
below to import it onto your system.
1. Click System Admin from the top-level menu bar.
2. Click SSL Server Certificate under the Security section in the left panel.
3. Click the Import Certificate tab.
Administrator's Guide
HPE Logger 6.2 Page 432 of 623

4. Click the Browse button to locate the signed certificate file on your local file system.
Note: The imported certificate must be in Privacy Enhanced Mail (PEM) format.
5. Click Import and Install to import the specified certificate.
6. If using HTTPS and depending on your browser, you may need to close and restart the browser for
the new certificate to take effect. If you are unsure of your browser's requirements, close and
restart it.
SSL Client Authentication
This topic appliestoboth Software Logger and the Logger Appliance.
Your system supports client authentication using SSL certificates. SSL client authentication is a form of
two-factor authentication that can be used as an alternate or in addition to local password
authentication. As a result, your system can be configured for SmartCards, such as Common Access
Card (CAC) based authentication. CAC is a standard identification card for active duty members of the
Uniformed Services, Selected Reserve, DOD civilian employees, and eligible contractor personnel.
Note: CAC is a form of client certificate authentication. Information on client certificate
authentication applies to CAC.
Your system also supports LDAPS authentication. The SSL certificate for the LDAPS server must be
uploaded into the trusted store. After uploading the SSL certificate, the aps process must be restarted
(System Admin > Process Status > aps > Restart).
• Configuring Logger to Support SSL Client Authentication 433
• Uploading Trusted Certificates 434
• Uploading a Certificate Revocation List 435
Configuring Logger to Support SSL Client Authentication
This topic appliestoboth Software Logger and the Logger Appliance.
Perform the following steps to configure Logger to support SSL client authentication.
On the Logger:
1. If the Logger uses the default signed certificate it shipped with from ArcSight, replace it with a
FIPS-compliant, signed SSL server certificate. Follow instructions at "Uploading Trusted
Certificates" on the next page to load the certificate.
Caution: All SSL client certificates used for authentication must be FIPS-compliant (that is,
hashed with FIPS-compliant algorithms) even if FIPS is not enabled on your Logger.
Administrator's Guide
HPE Logger 6.2 Page 433 of 623
2. Enable client certificate authentication, as described in "Client Certificate Authentication" on
page446.
3. Choose one of the following:
lIf the client certificates are CA-signed, upload the root certificate of the authority who signed the
certificates that will be used for authenticating clients, as described in "Uploading Trusted
Certificates" below.
lIf the client certificates used to authenticate with Logger are signed by different CAs, make sure
you upload root certificates of all CAs.
lIf the client certificates are self-signed, upload the public portion of the client certificate.
4. Configure a user name for each user who will be connecting to the Logger using a client certificate,
as described in "User Management" on page452.
5. (Optional) Upload a certificate revocation list (CRL), as described in "Uploading a Certificate
Revocation List" on the next page.
6. (Optional) If this Logger is configured to use only SSL Client Authentication, make sure this
Logger’s Authorization ID and Code are appropriately configured on other Loggers that with it.
For more information, see "Peers" on page396.
On the Client (Web browser):
Configure your browser to provide the SSL client certificate when accessing Logger. (Upload the
private key in PKCS 12 format in your browser.)
Uploading Trusted Certificates
This topic appliestoboth Software Logger and the Logger Appliance.
A trusted certificate is used to authenticate users that log in to your system. Uploading a trusted
certificate is required if you are using LDAPS authentication. The trusted certificate is used to
authenticate the remote LDAPS server. The certificate needs to be in Privacy Enhanced Mail (PEM)
format.
To upload a trusted certificate:
1. Click System Admin from the top-level menu bar.
2. Click SSL Client Authentication in the Security section in the left panel.
3. On the Trusted Certificates tab, click Browse to find the trusted certificate on your local file
system.
4. Click Upload. The trusted certificate is uploaded and listed in the Certificates in Repository list.
To view details about a trusted certificate, click the link displayed in the Certificate Name column.
To delete a trusted certificate, select the certificate and click Delete.
Administrator's Guide
HPE Logger 6.2 Page 434 of 623

Uploading a Certificate Revocation List
This topic appliestoboth Software Logger and the Logger Appliance.
A certificate revocation list (CRL) is a computer-generated record that identifies certificates that have
been revoked or suspended before their expiration dates. To support CAC, you need to upload a CRL
file to your ArcSight system. The CRL file needs to be in PEM format.
To upload a CRL file:
1. Click System Admin from the top-level menu bar.
2. Click SSL Client Authentication in the Security section in the left panel.
3. In the Certificate Revocation List tab, click Browse to find the CRL file on your local file system.
4. Click Upload. The CRL is uploaded and listed in the Certificate Revocation list.
To view details about a CRL, click the link displayed in the Issuer Name column.
To delete a CRL file, select it and click the Delete button.
Note: To enable client certificate authentication, see "Client Certificate Authentication" on
page446.
FIPS 140-2
This topic appliestoboth Software Logger and the Logger Appliance.
Your system supports the Federal Information Processing Standard 140-2 (FIPS 140-2). FIPS 140-2 is a
standard published by the National Institute of Standards and Technology (NIST) and is used to
accredit cryptographic modules in software components. The US Federal government requires that all
IT products dealing with Sensitive, but Unclassified (SBU) information meet these standards.
• FIPSCompliance 435
• Enabling and Disabling FIPSMode on Logger 436
• Installing or Updating a SmartConnector to be FIPS-Compliant 437
FIPSCompliance
If your system needs to be FIPS 140-2 compliant, you can enable FIPS. Once you do so, the system uses
the cryptographic algorithms defined by the NIST for FIPS 140-2 for all encrypted communication
between its internal and external components.
Note: To be fully FIPS 140-2 compliant, all components of your Logger deployment need to be in
FIPS 140-2 mode. For example, if you enable FIPS 140-2 on your Logger but the SmartConnectors
that send events to it are not running in FIPS 140-2 mode, your deployment is not fully FIPS 140-2
Administrator's Guide
HPE Logger 6.2 Page 435 of 623

compliant.
In a typical deployment, your Logger will communicate with the following components. To be fully FIPS-
compliant, all of these components should be FIPS-enabled:
lSmartConnectors that send events to the Logger: FIPS mode is supported on SmartConnectors
running version 4.7.5.5372 and later. Follow instructions in "Installing or Updating a SmartConnector
to be FIPS-Compliant" on the next page to ensure that your connector is FIPS-compliant.
lLogger forwarders, such as ArcSight Managers to which Logger forwards events and alerts: The
system to which your FIPS-compliant Logger forwards events should be FIPS-compliant as well.
Additionally, you need to import that system’s SSL server certificate on the Logger so that Logger
can communicate with it.
If you forward events and alerts to an ArcSight Manager, it needs to run ESM4.0 SP2 or later to
enable FIPS 140-2 on it. For more information, see the ArcSight ESM Installation and Configuration
Guide for the ESM version you are running. Additionally, follow instructions in "ESM Destinations" on
page343 to complete configuration of this setup.
lLoggers: Logger automatically uses FIPS 140-2 compliant algorithms. Therefore, no action is
required on Logger, except enabling FIPS as described in this section. When enabling FIPS on a
Software Logger, make sure that the machine on which Logger is installed is used exclusively for
Logger.
Note: Enabling FIPS 140-2 on Software Logger does not make the system on which it is installed
FIPS 140-2 compliant. Consult your system’s documentation to determine the requirements for
making the entire system FIPS 140-2 compliant.
lA Logger must use a CA-signed certificate if it is a destination of a software-based SmartConnector.
Additionally, ensure that the root certificate of the CA that signed Logger's certificate is trusted on
the SmartConnector. If the CA’s root certificate is not trusted on the SmartConnector, follow
instructions in "Installing or Updating a SmartConnector to be FIPS-Compliant" on the next page.
Enabling and Disabling FIPSMode on Logger
This topic appliestoboth Software Logger and the Logger Appliance.
You can enable or disable FIPS mode on Logger to suit your needs; however, you will need to reboot
(Logger Appliance) or restart (Software Logger) before the new mode will be effective.
Things to be Aware of When Enabling FIPS Mode on Logger:
lYour Logger must be set up with a CA-signed SSL certificate. For more information, see "SSL Server
Certificate" on page429.
lA Logger, even when in non-FIPS mode, must use a CA-signed certificate if it is software-based
SmartConnector. Additionally, ensure that the root certificate of the CA that signed Logger's
certificate is trusted on the SmartConnector. If the CA’s root certificate is not trusted on the
Administrator's Guide
HPE Logger 6.2 Page 436 of 623

SmartConnector, follow instructions in "Installing or Updating a SmartConnector to be FIPS-
Compliant" below.
lOnce FIPS is enabled on your Logger, the SmartMessage receiver (if configured) stops receiving
events from non-FIPS connectors if those connectors are not running version 4.7.5.5372 or later.
Make sure you have the correct connectors.
To enable or disable FIPS mode:
Note: Make sure you are familiar with the configuration requirements on your Logger as described
in "Things to be Aware of When Enabling FIPS Mode on Logger:" on the previous page.
1. Click System Admin from the top-level menu bar.
2. Click FIPS 140-2 in the Security section in the left panel.
3. Click Enable or Disable for the Select FIPS Mode option.
4. Click Save.
5. Do one of the following:
lUse the following command to restart Software Logger:
<install_dir>/current/arcsight/logger/bin/loggerd restart
lReboot your Logger Appliance.
The FIPS Status Table shows which processes and components of the Logger are FIPS-enabled.
Installing or Updating a SmartConnector to be FIPS-Compliant
This topic appliestoboth Software Logger and the Logger Appliance.
The information in this section is same as that in the ArcSight Installing FIPS-Compliant
SmartConnectors document except that the information in that document is generally applicable, while
information in this section is in the context of Logger.
FIPS mode is supported on SmartConnectors running version 4.7.5.5372 or later.
If you are… Then…
Installing a new SmartConnector to send
events to a Logger in FIPS-compliant mode
Follow the installation prompts. No additional steps
are necessary.
Updating a SmartConnector to be FIPS-
compliant and the SmartConnector is not
running version 4.7.5.5372 or later.
1. Upgrade the SmartConnector to a FIPS-
supported version. Follow instructions in the
SmartConnector User’s Guide to upgrade the
SmartConnector.
2. Create an agent.properties file (see Step
2a, below). No additional steps are necessary.
Administrator's Guide
HPE Logger 6.2 Page 437 of 623

If you are… Then…
Updating a SmartConnector to be FIPS-
compliant and the SmartConnector is running
version 4.7.5.5372 or later.
Create an agent.properties file (see Step 2a,
below). No additional steps are necessary.
To make a SmartConnector FIPS-compliant:
1. Follow device configuration steps provided in the SmartConnector’s configuration guide (available
from the HPECustomer Support site (SSO) at https://softwaresupport.hp.com), then follow the
installation procedure through installation of the core Connector software (SmartConnector
Installation Step 2).
At Step 3 of the Connector setup, click Cancel to exit the setup. You must then configure the NSS
DB, which is necessary for installing the connector in FIPS-compliant mode.
Once the NSS DB is configured, continue to the next step.
2. To enable FIPS Mode on the SmartConnector:
a. Create an agent.properties file at the following location if it does not exist already:
$ARCSIGHT_HOME/current/user/agent
b. Enter the following property, then save and close the file.
fips.enabled=true
3. Import Logger’s certificate on the SmartConnector:
a. In a command window on your SmartConnector machine, from $ARCSIGHT_
HOME/current/bin, enter the following command to turn off FIPS mode:
./arcsight runmodutil -fips false -dbdir $ARCSIGHT_
HOME/current/user/agent/nssdb.client
b. Export the Logger certificate file and import it to the SmartConnector’s NSS DB as follows:
oExport Logger’s certificate file from the browser you use to connect to it. Refer to your
browser’s Help for instructions. For example, to export a Logger’s certificate file on Firefox
v.44, click to open the Options menu, then select Advanced > Certificates > View
Certificates > Servers > your Logger Appliance and click Export…. Save the certificate file
with a .crt or .cer extension.
oCopy the certificate file you exported in the previous step (in this example, loggercert.crt)
to the $ARCSIGHT_HOME/current/bin directory on the SmartConnector. From
$ARCSIGHT_HOME/current/bin, enter the following:
./arcsight runcertutil -A -n mykey -t “CT,C,C” -d $ARCSIGHT_
HOME/current/user/agent/nssdb.client -i bin/loggercert.crt
c. Enter the following command to re-enable FIPS mode that you turned off in Step1:
Administrator's Guide
HPE Logger 6.2 Page 438 of 623

./arcsight runmodutil -fips true -dbdir $ARCSIGHT_
HOME/current/user/agent/nssdb.client
d. Ensure that the SmartConnector can resolve the name specified in the CN value of the Logger
certificate’s Subject: field. If the name is not resolvable, add it to the SmartConnector system’s
Hosts file.
e. If you are installing a new SmartConnector, continue to the next step.
If you are updating your SmartConnector to be FIPS-compliant, ensure that the Connector’s
Logger destination host name is same as the CN value in the certificate’s Subject field, and exit
this procedure.
4. To return to the SmartConnector configuration wizard, enter the following from $ARCSIGHT_
HOME/current/bin:
./arcsight connectorsetup
5. When prompted whether you want to start in Wizard Mode, click Yes.
The Destination selection window is again displayed. Return to Installation Step 4 of your
SmartConnector Configuration Guide to continue the Connector configuration.
Note: When configuring the connector, ensure that the connector’s Logger destination host
name is same as the CN value in the certificate’s Subject: field.
For the remainder of the configuration process, see the Configuration Guide for the SmartConnector
you are installing. The specific configuration guide provides information about how to configure the
device for event collection, specific installation parameters required during the configuration process,
and a table of vendor-specific field mappings to ArcSight events.
Users/Groups
This topic appliestoboth Software Logger and the Logger Appliance.
Use the Users/Groups sub-menu to configure users and user groups, and to set authentication
options.
• Authentication 440
• Login Banner 451
• User Management 452
Administrator's Guide
HPE Logger 6.2 Page 439 of 623

Authentication
This topic appliestoboth Software Logger and the Logger Appliance.
Authentication Settings enable you to specify the settings and policies for user log in sessions,
password rules and lockouts, and external authentication options.
• Sessions 440
• Local Password 441
• Users Exempted From Password Expiration 443
• Forgot Password 444
• External Authentication 445
Sessions
This topic appliestoboth Software Logger and the Logger Appliance.
The Session tab lets you specify the maximum number of simultaneous sessions for a single user
account, and the length of time after which a user session is automatically logged out or a user account
disabled. By default, a single user account can have up to 15 simultaneous active sessions, and a user
account is logged out after 15 minutes of inactivity.
To change session settings:
1. Click System Admin from the top-level menu bar.
2. Click Authentication in the Users/Groups section.
3. On the Sessions tab, update the parameters described in the following table.
Parameters Description
Max Simultaneous
Logins/User
The maximum number of simultaneous sessions allowed for a single
user account. The default is15 sessions.
Logout Inactive
Session After
The length of time, in minutes, after which an inactive session is
automatically ended. The default is15 minutes.
Disable Inactive
Account After
The number of days after which an inactive user account is disabled.
The default is0, meaning the account is never disabled.
4. Click Save to make the changes, or click another tab to cancel.
Administrator's Guide
HPE Logger 6.2 Page 440 of 623
Local Password
This topic appliestoboth Software Logger and the Logger Appliance.
The Local Password tab enables you to set password policies, such as the minimum and maximum
number of characters and other password requirements.
Tip: For better security, if the configured authentication method is "Local Password", ensure that
the Account Lockout policy is enabled.
To change the password settings:
1. Click System Admin from the top-level menu bar.
2. Click Authentication in the Users/Groups section.
3. Choose the Local Password tab.
Use the parameters described in the following table to customize your password settings.
Parameter Description
Lockout Account
Enable Account
Lockout
Select the checkbox to enable user accounts to be locked out as defined
by the following settings. By default, the policy is disabled.
Note:You should enable this if you will be using the "Local
Password" authentication method.
Lockout Account
After
Number of failed login attempts after which a user account is locked out.
The default is3.
Remember Failed
Attempts For
The length of time, in minutes, for which a failed login attempt is
remembered. The default is1.
Lockout Account For The length of time, in minutes, for which a locked out account cannot be
unlocked. The default is15.
Password Expiration
Enable Password
Expiration
Select the checkbox to enable user passwords to expire as defined by
the following settings. By default, the policy is disabled.
Password Expires in Number of days after which the password expires. The default is90.
Notify User Number of days before expiration to notify the user. Select this option
Administrator's Guide
HPE Logger 6.2 Page 441 of 623

Parameter Description
to allow users to update their password before expiration. The default
is5.
Users Exempted
From Password
Expiration Policy
Click the link to set the users whose password should never expire.
For information on how to use this feature, see "Users Exempted From
Password Expiration" on the next page.
Password Strength Rules
Enforce Password
Strength
Select the checkbox to enforce password policy as defined by the
following settings. By default, the policy is disabled.
Minimum Length Minimum number of characters that a password must contain. The
default is10.
Maximum Length Maximum number of characters that a password can contain. The
default is20.
Password Character Rules
Password character rules define additional character requirements to ensure password strength.
Numeric Minimum number of numeric characters (0-9) in a password. The
default is2.
Uppercase Minimum number of uppercase characters (A-Z) in a password. The
default is0.
Special Minimum number of non-digit and non-letter characters that are
required in a password. The default is2.
Lowercase Minimum number of lowercase characters (a-z) in a password. The
default is0.
Password Must be At
Least N Characters
Different From Old
Password
Minimum number of characters by which the new password must differ
by from the previous one. The default is2.
Include “Forgot
Password” link on
Login Screen
lSelect the checkbox to enable users to reset their local password
using a “Forgot Password” link on the login page. By default, the
option is disabled.
lAn SMTP server must be configured on the system, and the
Administrator's Guide
HPE Logger 6.2 Page 442 of 623

Parameter Description
username must have a correct email address for this feature to work
successfully.
lIf an SMTP server is not set, you will not be able to reset the
password because the email containing the temporary password
cannot be sent.
lAn email address must be specified in the user settings for the user
name. The temporary password is sent to that email address. If no
email address is specified or if the email address is incorrect, the user
will not receive the email.
For information on how to use this feature, see "Forgot Password" on
the next page.
4. Click Save to save the changes, or click another tab to cancel.
Users Exempted From Password Expiration
This topic appliestoboth Software Logger and the Logger Appliance.
Even though you have set a password expiration policy for most users, you may want to have a user
whose password does not expire automatically.
To exempt a user from the password expiration policy:
1. Click System Admin from the top-level menu bar.
2. Click Authentication in the Users/Groups section.
3. Choose the Local Password tab, and then click Users Exempted From Password Expiration
Policy.
4. The Exempt Users From Password Expiration page is displayed.
5. Select users from the Non-exempted Users list and click the right arrow icon to move the
selected users to the Exempted Users list. Do the reverse to remove users from the list of
exempted users.
You can select multiple users at the same time and move them over. Or you can move all users by
clicking the icon.
6. Click Save to save the policy or Cancel to exit.
Administrator's Guide
HPE Logger 6.2 Page 443 of 623
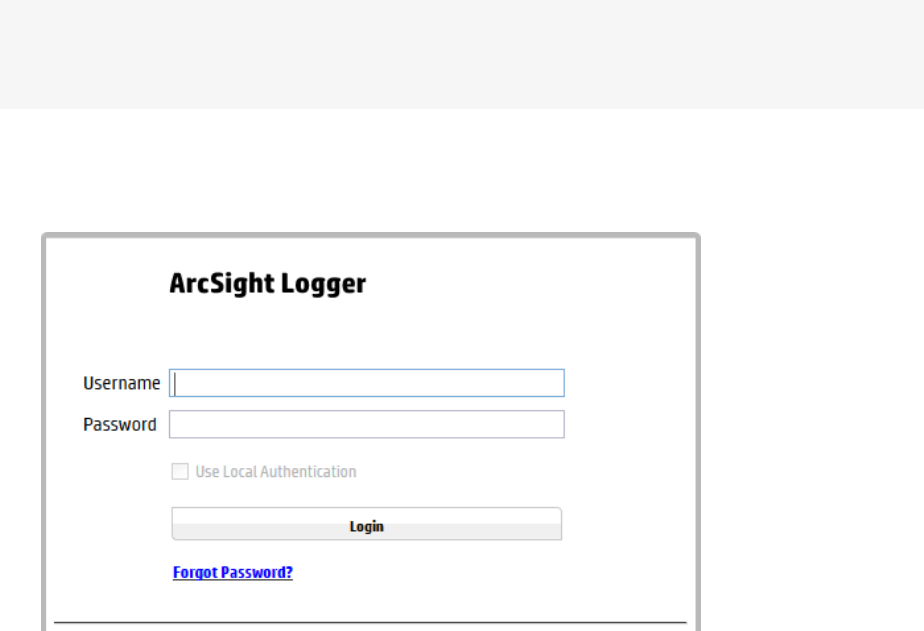
Forgot Password
This topic appliestoboth Software Logger and the Logger Appliance.
This feature enables users to reset their own password from a Forgot Password? link accessible from
the login screen. Logger sends the user a temporary password to the email address on file.
This feature is disabled by default. To enable it, go to System Admin > Authentication > Local
Password tab, scroll down to the bottom of the page, and check Include "Forgot Password" link on
Login Screen and click Save.
The next time a user logs in, the link is enabled.
An SMTP server must be configured in order to use this feature. For more details on how to enable it,
see "Local Password" on page441.
Tip: The temporary password is valid until the time specified in the email. The default is five hours.
If you do not log in within the specified time, only an administrator can reset the password to
generate another temporary password.
To reset your password:
1. On the Login dialog box, click the Forgot Password link.
2. The Reset Password screen displays.
Administrator's Guide
HPE Logger 6.2 Page 444 of 623
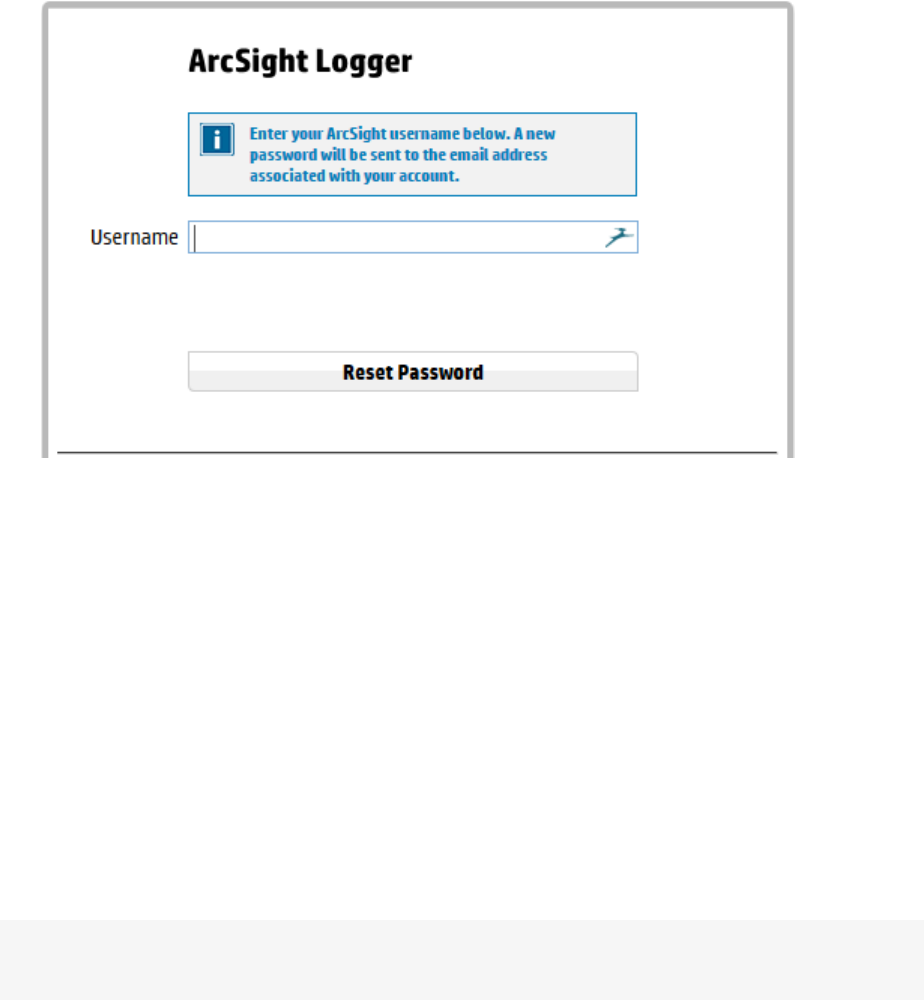
3. Enter a user name on the Reset Password screen.
4. Click Reset Password.
An automated email with a temporary password is sent to the email address specified for that user.
After logging in with the temporary password, Logger redirects you to the Change Password page,
where you can reset your password.
External Authentication
This topic appliestoboth Software Logger and the Logger Appliance.
Besides providing a local password authentication method, your system supports Client
Certificate/CAC, LDAP, and RADIUS authentication. It is not possible to enable all authentication
methods simultaneously.
From the External Authentication tab, use the pull-down menu to choose an authentication method.
Note: CAC is a form of client certificate authentication. Information on client certificate
authentication applies to CAC.
Administrator's Guide
HPE Logger 6.2 Page 445 of 623

Local Password Authentication
This topic appliestoboth Software Logger and the Logger Appliance.
Local Password Authentication is the default authentication method. It implements the local password
policies set in the Local Password tab. For more information, see "Local Password" on page441.
To configure local password authentication:
1. Click System Admin from the top-level menu bar.
2. Click Authentication in the Users/Groups section.
3. Choose the ExternalAuthentication tab.
4. From the pull-down menu, choose Local Password Authentication
5. Click Save.
Client Certificate Authentication
This topic appliestoboth Software Logger and the Logger Appliance.
This authentication method requires that users authenticate using a client certificate. For each client
certificate, a user account with a Distinguished Name (DN) matching the one in the client certificate
must exist on your system.
Caution: All SSL client certificates used for authentication must be FIPS-compliant (hashed with
FIPS-compliant algorithms) even if FIPS is not enabled on your system.
To configure client certificate authentication:
1. Click System Admin from the top-level menu bar.
2. Click Authentication in the Users/Groups section.
3. Choose the External Authentication tab.
4. From the pull-down menu, choose Client Certificate.
5. Allow Local Password Fallback provides two options:
lAllow Local Password Fallback for Default Admin Only
Select this option to allow the default admin user to log in using only a username and password if
the client certificate is not available or invalid. This privilege is restricted to the default admin user
only—other users must have a valid client certificate to gain access to the system. This option is
enabled by default.
lAllow Local Password Fallback for All Users
Administrator's Guide
HPE Logger 6.2 Page 446 of 623

Select this option to allow all users to log in using their local user name and password if their
client certificate is invalid or unavailable.
For more information, see "Local Password Fallback" on page450.
6. Click Save.
Client Certificate and Local Password Authentication
This topic appliestoboth Software Logger and the Logger Appliance.
This authentication method requires that users authenticate using an SSL client certificate and a valid
local password. Local Password refers to the password associated with the user credentials created in
User Management in the Users/Groups section. See "Users" on page452 for details.
A user account on your system must be defined with a Distinguished Name (DN) that matches the one
in the client certificate.
For instructions on how to create a user DN, see "Users" on page452 and refer to the section called “Use
Client DN” in the parameters table.
Caution: All SSL client certificates used for authentication must be FIPS-compliant (hashed with
FIPS-compliant algorithms) even if FIPS is not enabled on your system.
To configure client certificate and password authentication:
1. Click System Admin from the top-level menu bar.
2. Click Authentication in the Users/Groups section.
3. Choose the External Authentication tab.
4. From the pull-down menu, choose Client Certificate AND Local Password.
5. Allow Local Password Fallback provides two options:
lAllow Local Password Fallback for Default Admin Only
This option, always enabled, enables the default admin user to log in using only a username and
password.
lAllow Local Password Fallback for All Users
This option is always disabled. You cannot enable it when using the Client Certificate AND
Local Password authentication method.
For more information, see "Local Password Fallback" on page450.
6. Click Save.
Administrator's Guide
HPE Logger 6.2 Page 447 of 623

LDAP/AD and LDAPS Authentication
This topic appliestoboth Software Logger and the Logger Appliance.
This authentication method authenticates users against an LDAP server. Even when LDAP is enabled,
each user account must exist locally on your system. Although the user name specified locally can be
different from the one specified on the LDAP server, the Distinguished Name (DN) specified for each
user account must match the one in the LDAP server.
Tip: For steps on how to create a user DN, see "Users" on page452, and the parameter "Use Client
DN" on page453.”
To set up LDAP authentication:
1. Click System Admin from the top-level menu bar.
2. Click Authentication in the Users/Groups section.
3. Choose the ExternalAuthentication tab.
4. From the pull-down menu, choose LDAP.
5. Allow Local Password Fallback provides two options:
lAllow Local Password Fallback for Default Admin Only
Select this option to allow the default admin user to log in using only a username and password if
LDAP authentication fails. This privilege is restricted to the default admin user only—all others
must be authenticated by LDAP. This option is enabled by default.
lAllow Local Password Fallback for All Users
Select this option to allow all users to log in using their local user name and password if LDAP
authentication fails.
For more information, see "Local Password Fallback" on page450.
LDAP Server has the following parameters:
Parameter Description
Server Hostname
[:port] (optional)
(Optional) Enter the host name or IP address and port of the LDAP
server in the following format:
ldap://<hostname or IP address>:<port>
ldaps://<hostname or IP address>:<port>
Additional steps are required for the use of LDAPS. See .
Backup Server
Hostname[:Port]
(Optional) Enter the backup LDAP server to use if the primary server
does not respond. If the server returns an authentication failure (bad
Administrator's Guide
HPE Logger 6.2 Page 448 of 623

Parameter Description
(optional) password, unknown username, etc), then the backup server is not tried.
The backup server is tried only when the primary server has a
communication failure.
Use the same format as the primary server to specify the host name and
port.
Request Timeout The length of time, in seconds, to wait for a response from the LDAP
server. The default is10.
6. When finished, click Save.
Using the LDAP over SSL (LDAPS) Protocol
When choosing the LDAPS protocol to authenticate users, make sure the following conditions are true:
lThe SSL certificate for the LDAPS server has been uploaded into the trusted store.
lThe external authentication method is set to “LDAP”.
lThe URL for the LDAPS server(s) starts with “ldaps://”.
After uploading the SSL certificate, the aps process must be restarted (System Admin > Process
Status > aps Restart).
Caution: If the aps process is not restarted, attempts to authenticate through LDAPS will fail.
RADIUS Authentication
This topic appliestoboth Software Logger and the Logger Appliance.
This authentication method enables users to authenticate against a RADIUS server. Even when
RADIUS authentication is enabled, each user account must exist locally on your system. The username
must match the one in the RADIUS server, although the password can be different. A user must present
a valid username and (RADIUS) password to be successfully authenticated.
To configure RADIUS authentication settings:
1. Click System Admin from the top-level menu bar.
2. Click Authentication in the Users/Groups section.
3. Choose the External Authentication tab.
4. From the pull-down menu, choose RADIUS.
5. Allow Local Password Fallback provides two options:
Administrator's Guide
HPE Logger 6.2 Page 449 of 623

lAllow Local Password Fallback for Default Admin Only
Select this option to allow the default admin user to log in using only a username and password if
RADIUS authentication fails. This privilege is restricted to the admin user only—all others must
be authenticated by RADIUS. This option is enabled by default.
lAllow Local Password Fallback for All Users
Select this option to allow all users to log in using their local user name and password, if RADIUS
authentication fails. For more information, see "Local Password Fallback" below.
6. Update the RADIUS Server parameters as necessary:
Parameter Description
Server Hostname[:port] Enter the host name and port of the RADIUS server.
Backup Server
hostname[:port]
(optional)
(Optional) Enter the backup RADIUS server to use if the primary
server does not respond. If the server returns an authentication
failure (bad password, unknown username, etc), then the backup
server is not tried. The backup server is tried only when the primary
server has a communication failure.
Use the same format as the primary server to specify the host name
and port.
Shared Authentication
Secret
Enter a RADIUS passphrase.
NAS IP Address The IP address of the Network Access Server (NAS).
Request Timeout The length of time, in seconds, to wait for a response from the
RADIUS server (in seconds). The default is10.
Retry Request Number of times to retry a RADIUS request. The default is1.
RADIUS Protocol Use the pull-down menu to choose a protocol option. The default
isNone.
7. Click Save.
Local Password Fallback
This topic appliestoboth Software Logger and the Logger Appliance.
You can use this feature to log in using your local user name and password if the external
authentication (Certificate, LDAP, or RADIUS) fails, if you forgot your password to the authentication
server, or if the authentication server is not available.
Administrator's Guide
HPE Logger 6.2 Page 450 of 623

The Use Local Authentication feature enables the default admin to log in even when the remote
authentication server is not available, by adding a Use Local Authentication checkbox to the login
screen. Out-of-box, this option is enabled only for the default administrator. However, it is possible to
allow local password fallback for all users. For example, you could configure the RADIUS authentication
method to allow users to log in using local authentication instead of RADIUS should they fail to
authenticate to any configured external RADIUS servers.
For information on how to allow local password fallback for all users for all users, see "Client Certificate
Authentication" on page446, "LDAP/AD and LDAPS Authentication" on page448, or "RADIUS
Authentication" on page449.
To log in when authentication fails:
1. On the ArcSight Logger Login dialog, select the Use Local Authentication checkbox.
Note: This option is only available to the default admin unless it has been enabled for other
users.
2. Enter your user name and password and click Login.
Login Banner
This topic appliestoboth Software Logger and the Logger Appliance.
You can customize the message on the login screen to suit your needs. The text you enter in the
Content field is displayed above the Username and Password fields on the login screen. In addition, you
can enter a confirmation message that the user must click to enable the Username and Password
fields.
You must have the “Configure Login Settings” permission enabled for your user account to edit the
login banner.
To customize the login banner:
1. Click System Admin from the top-level menu bar.
2. Click Login Banner in the Users/Groups section.
3. Enter the text you want to display as the login banner in the Content field.
You can enter only unformatted text in this field; however, you can apply standard HTML tags to
display formatted text. Loading images in this field is not allowed.
4. (Optional) Enter text in the Confirmation field.
If you enter text in this field, the text will be accompanied by a checkbox that the user must click to
enable the Username and Password fields. For example, if you enter “Are you sure?”, “Do you want
to proceed?”, or “I agree” in this field, the user must click the checkbox in order to log in.
5. Click Save.
Administrator's Guide
HPE Logger 6.2 Page 451 of 623

User Management
This topic appliestoboth Software Logger and the Logger Appliance.
The Users and Groups tabs enable you to manage users and user groups on your system. User groups
are a way to enforce access control to various sections of your system.
• Users 452
• Reset a User's Password 455
• Change My Password 455
• User Groups 456
• Managing User Groups 457
Users
This topic appliestoboth Software Logger and the Logger Appliance.
Open the Users tab to manage the users that can log in to your system. You can add a new user, edit
user information, or delete a user at any time. You must have the appropriate System Admin group
rights to perform these functions.
To add a new user:
1. Click System Admin from the top-level menu bar.
2. Click User Management in the Users/Groups section in the left panel.
3. In the Users tab, click Add.
Administrator's Guide
HPE Logger 6.2 Page 452 of 623

4. Enter the following parameters.
Parameter Description
Credentials
Login The user's login name.
Password The user's password.
Confirm
Password
Reenter the users’ password.
Contact Information
Use Client
DN
If you enabled SSL client certificate or LDAP authentication, click this link to enter
user’s the Distinguished Name (Certificate Subject) information. The
Distinguished Name should be similar to this format:
CN=UserA,OU=Engg Team,O=ArcSight\,
Inc.,L=Cupertino,C=US,ST=California
To determine the DN, use this URL to display the certificate:
https://<hostname or IP address>/platform-service/
DisplayCertificate
OR
Obtain the DN information for a user from the browser that the user will open to
connect to the system. For example, in Firefox, click Tools > Options > Advanced
> Encryption > View Certificates > Your Certificates > Select the certificate
> View.
First Name The user’s first name.
Last Name The user’s last name.
Email The user’s email address.
Phone
Number
(Optional) The user’s phone number.
Title (Optional) The user’s title.
Department (Optional) The user’s department.
Fax (Optional) The user’s fax number.
Alternate (Optional) The user’s alternate phone number.
Administrator's Guide
HPE Logger 6.2 Page 453 of 623

Parameter Description
Number
Assign to
Groups
Select the groups to which this user belongs. This setting controls the privileges a
user has on this Logger.
Notes (Optional) Other information about the user.
5. Click Save and Close.
To edit a user:
1. Click System Admin from the top-level menu bar.
2. Click User Management in the Users/Groups section in the left panel.
3. In the Users tab, select the user (or users) you want to edit.
4. Click Edit.
5. Update the user information as necessary.
6. Click Save User.
To delete a user:
1. Click System Admin from the top-level menu bar.
2. Click User Management in the Users/Groups section in the left panel.
3. In the Users tab, select the user (or users) you want to delete.
4. Click Delete from the top left side of the page.
Caution: Deleting a user will also delete all of that user’s reports.
To activate a user:
1. Click System Admin from the top-level menu bar.
2. Click User Management in the Users/Groups section in the left panel.
3. In the Users tab, select the user (or users) that you want to activate.
4. Choose Edit.
5. Check the Active box.
6. Save the changes.
Administrator's Guide
HPE Logger 6.2 Page 454 of 623
Reset a User's Password
This topic appliestoboth Software Logger and the Logger Appliance.
The Reset Password feature enables you to reset a user's password without knowing their password. If
you are using an SMTP-configured server and have permissions to create and update users, you can
reset a user’s password by clicking the Reset Password button. An automated email is sent to the user
with the new password string.
An SMTP server must be configured for the automated email containing the temporary password to be
sent. If an SMTP server is not configured, the password will not be reset because an email cannot be
sent.
To reset a user’s password:
1. Click System Admin from the top-level menu bar.
2. Click User Management in the Users/Groups section in the left panel.
3. In the Users tab, select the user (or users) whose passwords you want to reset.
4. Click Reset Password from the top left side of the page.
The user must use the temporary string to log in within the time specified in the email. If the user does
not log in within the specified time, the account becomes deactivated. If the account has been
deactivated, the admin must re-activate it before resetting the password.
Change My Password
This topic appliestoboth Software Logger and the Logger Appliance.
You can use the Change Password menu to change your password. This feature is available to all users
for changing their passwords, unlike the Reset Password feature that enables a system administrator to
reset the password of users without knowing the password. Passwords are subject to the password
policy specified by the Admin user.
To change your password:
1. Click System Admin from the top-level menu bar.
2. Click Change Password in the Users/Groups section in the left panel to display the Change
Password for <User Name> page.
3. Enter the Old Password, the New Password, and enter the New Password a second time to confirm.
4. Click Change Password.
Administrator's Guide
HPE Logger 6.2 Page 455 of 623
User Groups
This topic appliestoboth Software Logger and the Logger Appliance.
User groups define privileges to specific functions on your system and serve to enforce access control
to these functions. For example, if you want User A to be able to run searches but not reports, assign
that user to the Search group but not to the Reports group.
User groups are organized by the following types: System Admin, Read Only System Admin,Logger
Rights, Logger Search, and Logger Reports. Each type has a pre-defined, default user group in which all
privileges for the type are enabled. To authorize a subset of the privileges for a specific group type,
create a new user group and enable only the privileges you want to provide for that group. Then, assign
restricted users to the newly created group.
System Admin Group
The System Admin Group controls the system administration operations for your system, such as
configuring network information, setting storage mounts, installing SSL certificates, and user
management.
Read Only System Admin Group
In addition to the default System Admin Group that enables all system administration rights (privileges),
a Read Only System Admin Group is available on your system. Users assigned to this group can view
System Admin settings, but cannot change them.
Refer to your system’s user interface for a complete list of privileges available to this group.
Logger Rights Group
The Logger Rights Group controls the Logger application operations for your system, such as viewing
the Logger dashboards and configuring all the settings in the Configuration menu (including event
archives, storage groups, alerts, filters, and scheduling tasks.)
Refer to your system’s user interface for a complete list of privileges available to this group.
Logger Search Group
The Logger Search Group controls local and peer searches through the following privileges:
lSearch for events
lSearch for events on remote peers
If the group is configured to allow users to run local and peer searches, users assigned to this group can
perform those operations. Conversely, if the group is configured to prevent users from running local
and peer searches, users assigned to this group cannot perform those operations.
Administrator's Guide
HPE Logger 6.2 Page 456 of 623

Logger Reports Group
The Logger Reports group controls all report operations on Logger such as run, edit, delete, schedule,
and view published reports.
Refer to your system’s user interface for a complete list of privileges available to this group.
Managing User Groups
This topic appliestoboth Software Logger and the Logger Appliance.
To create a new user group:
1. Click System Admin from the top-level menu bar.
2. Click User Management in the Users/Groups section in the left panel.
3. Click the Groups tab.
4. Click Add.
5. Define the new group:
a. In the Group Name field, provide a name for the group.
b. In the Description field, provide a description for the group.
c. From the Group Type drop-down box, select the group type.
d. Click the down arrow icon ( ) next to the group type name to view and select privileges that
you want to assign to the users in this group.
6. Click Save and Close to save the settings of the group, or click Save and Edit Membership to add
users to this group.
To edit a user group:
1. Click System Admin from the top-level menu bar.
2. Click User Management in the Users/Groups section in the left panel.
3. Click the Groups tab.
4. Select the group that you want to edit, and click Edit.
5. Update the user group information.
If you need to edit the group’s membership:
a. Click Save and Edit Membership to display the Edit Group Membership page.
b. Click Add from the top left of the Edit Group Membership page.
c. Select users you want to add. By default, you can add only users who do not belong to other
groups of the type that you are editing. To add such users, click Show users that belong to
other <group_type> groups.
Administrator's Guide
HPE Logger 6.2 Page 457 of 623

When you add a user who belongs to another group of the same group type as the one you are
updating, that user is automatically removed from the previous group.
d. Click OK.
e. Click Back to Group List.
6. Click Save and Close.
To delete a user group:
1. Click System Admin from the top-level menu bar.
2. Click User Management in the Users/Groups section in the left panel.
3. Click the Groups tab.
4. Select the group (or groups) that you want to delete.
5. Click Delete at the top left side of the page.
Other System Administration Information
This topic appliestoboth Software Logger and the Logger Appliance.
This section contains information related to system administration that you will need to fully administer
your Logger, including starting and stopping Software Logger, system health events, and SNMP
polling.
• Monitoring System Health 458
• System Health Events 459
• Using the Appliance Command Line Interface 462
• Software Logger Command Line Options 465
Monitoring System Health
This topic appliestoboth Software Logger and the Logger Appliance.
You can monitor your Logger’s health in these ways:
lBy using a pre-defined system filter, as listed in "System Filters/Predefined Filters" on page128. The
pre-defined system health filters are based on the system health events listed in "System Health
Events" on the next page.
lBy searching for system health events in Logger’s Internal Storage Group, as listed in "System Health
Events" on the next page. If a pre-defined system health filter does not suit your needs, you can
create alerts based on the system health events.
lBy polling system health events (Logger Appliance only), as explained in "SNMP" on page413. You
can poll system health information from your system by using SNMP version 2c or 3 from any
standard network management system.
Administrator's Guide
HPE Logger 6.2 Page 458 of 623
To set up notification of system health events:
1. Configure the Logger’s SMTP settings (see "SMTP" on page411) or create an SNMP Destination
(see "SNMP Destinations" on page340) or Syslog Destination (see "Syslog Destinations" on
page341).
2. Create an Alert that uses one or more System Alert Filters or define a query that searches for the
system health events in Logger’s Internal Storage Group, and specify match count and threshold
(see "Types of Alert in Logger" on page335).
3. Enable the new Alert.
System Health Events
This topic appliestoboth Software Logger and the Logger Appliance.
The following table lists the system health events that Logger generates. These events are also referred
as Logger Internal Events because they are stored in Logger’s Internal Storage Group. See "Examples of
System Health Events" on page539 for examples of these events.
The pre-defined System Filters that provide system health status are based on some of these events. If
a pre-defined filter does not suit your needs, create an alert using one of these events.
Starting with Logger 5.1, the format in which system health events are generated was changed to
provide more meaningful information. These changes include:
lAddition of new events (for example, Current and Voltage).
lInstead of referring to all system health events as Logger Internal Event in the name field, meaningful
names are used (for example, Fan OK, Temperature OK).
lThree severity levels for each event have been added to the agentSeverity field—1 (OK), 5
(Degraded), and 8 (Severe).
lThe deviceCustomString and deviceCustomStringLabel field mappings have changed.
Refer to a specific event to see the changes.
lDevice Event Class ID (deviceEventClassId) and Device Event Category
(deviceEventCategory) of the events have changed. An updated list is available in the following
table.
lAll hardware-related events are classified as hardware:nnn events, where nnn is a three-digit
number that identifies the hardware component (for example, hardware:13x identifies the fan
events.)
Keep the following in mind when working with System Health Events.
lThe sensor names in each event are hardware specific; therefore, they are not consistent across
various Logger platforms. Use the event name (Name) and status (CustomString3) fields to
determine the status of a sensor. The raw status (CustomString4), location (CustomString5), and
Administrator's Guide
HPE Logger 6.2 Page 459 of 623
sensor name (CustomString6) fields are for informational use when diagnosing a hardware problem
and are not consistent across appliance types.
lHPErecommends that you develop custom alerts for certain System Health Events to prevent users
from being alerted too often. Some of the conditions that your system alerts on may be self-clearing
or warnings that you do not want to be alerted about until a specific number of warnings have been
generated.
System Health Events for Both Types of Logger
Group Device Event Category
Device Event Class
ID
CPU /Monitor/CPU/Usage cpu:100
Disk /Monitor/Disk/Read disk:102
/Monitor/Disk/Write disk:103
EPS /Monitor/Receiver/EPS/All eps:100
/Monitor/Receiver/EPS/Individual eps:102
/Monitor/Forwarder/EPS/All eps:101
/Monitor/Forwarder/EPS/Individual eps:103
Memory /Monitor/Memory/Usage/Platform memory:100
Network /Monitor/Network/Usage/In network:100
/Monitor/Network/Usage/Out network:101
Search /Monitor/Search/Performed search:100
Storage Group /Monitor/StorageGroup/Space/Used
Note: The size of the storage group, indicated by
the “fsize” field is in GB.
storagegroup:100
System Health Events for Logger Appliances Only
Group Device Event Category Device Event Class ID
Battery /Monitor/Sensor/Battery/OK hardware:121**
Administrator's Guide
HPE Logger 6.2 Page 460 of 623

Group Device Event Category Device Event Class ID
/Monitor/Sensor/Battery/Degraded hardware:122**
/Monitor/Sensor/Battery/Failed hardware:123**
Current (Electrical) /Monitor/Sensor/Current/OK hardware:101**
/Monitor/Sensor/Current/Degraded hardware:102**
/Monitor/Sensor/Current/Failed hardware:103**
Disk /Monitor/Disk/Space/Remaining/Root disk:101
Fan /Monitor/Sensor/Fan/OK hardware:131
/Monitor/Sensor/Fan/Degraded hardware:132
/Monitor/Sensor/Fan/Failed hardware:133
Power Supply /Monitor/Sensor/PowerSupply/OK hardware:141
/Monitor/Sensor/PowerSupply/Degraded hardware:142
/Monitor/Sensor/PowerSupply/Failed hardware:143
RAID /Monitor/RAID/Controller/OK raid:101
/Monitor/RAID/Controller/Degraded raid:102
/Monitor/RAID/Controller/Failed raid:103
/Monitor/RAID/BBU/OK raid:111
/Monitor/RAID/BBU/Degraded raid:112
/Monitor/RAID/BBU/Failed raid:113
/Monitor/RAID/Disk/OK raid:121
/Monitor/RAID/Disk/Rebuilding raid:122
/Monitor/RAID/Disk/Failed raid:123
Temperature /Monitor/Temperature/OK hardware:151
/Monitor/Temperature/Degraded hardware:152
Administrator's Guide
HPE Logger 6.2 Page 461 of 623

Group Device Event Category Device Event Class ID
/Monitor/Temperature/Failed hardware:153
Voltage /Monitor/Sensor/Voltage/OK hardware:111**
/Monitor/Sensor/Voltage/Degraded hardware:112**
/Monitor/Sensor/Voltage/Failed hardware:113**
Note: In the table, the notation ** indicates an event generated only on older non-HP model
appliances.
Using the Appliance Command Line Interface
This topic appliestoLogger Appliances only.
Use one of the following methods to connect to the appliance Command Line Interface (CLI):
lLog into HP ProLiant Integrated Lights-Out (iLO) and launch the remote console feature. For more
information, refer to the Logger Installation Guide.
lConnect a keyboard and monitor to the ports on the rear panel of the appliance.
lConnect a terminal to the serial port on the appliance using a null modem cable with DB-9 connector.
The serial port expects a standard VT100-compatible terminal: 9600 bps, 8-bits, no parity, 1 stop
bit (8N1), no flow control.
Once you are connected to the CLI, a Login prompt displays.
The following commands are available at the CLI prompt:
Category Command Description
System Commands
exit Logout
halt Stop and power down the Logger Appliance
help Opens the command line interface help
reboot Reboot the Logger Appliance
Admin Commands
show admin Show the default administrator user’s name
Administrator's Guide
HPE Logger 6.2 Page 462 of 623

Category Command Description
Authentication Commands
reset
authentication
Reset to local authentication
Config Commands
show config Show host name, IP address, DNS, and default gateway for the
Logger
Date Commands
show date Show the date and time currently configured on the Logger
set date Set the date and time on Logger. The date/time format is
yyyyMMddhhmmss.
Example date: 20101219081533
Default Gateway
Commands
set defaultgw
<IP> [nic]
Set the default gateway for one or all network interfaces
show defaultgw
[nic]
Display the default gateway for all or the specified network
interface
DNS Commands
show dns Show the currently configured DNS servers on the Logger
set dns <sd> <ns>
set dns
<sd1>,<sd2> <ns1>
<ns2>
Set DNS name server(s).
sd=search domain, ns = name server
You can add up to three name servers and six search domains.
Note: When using multiple search domains, separate them with a
comma, but no space. When using multiple name servers separate
them with a space but no comma.
Hostname Commands
show hostname Show the currently configured hostname on the Logger
set hostname
<host>
Set Logger’s host name
Administrator's Guide
HPE Logger 6.2 Page 463 of 623

Category Command Description
IP Commands
show ip [nic] Show the IP addresses of all or the specified network interface
set ip <nic> <IP>
[/prefix]
[netmask]
Set Logger’s IP address for a specific network interface
NTP Commands
set ntp <ntp
server> <ntp
server> <ntp
server> ...
Sets the NTP server addresses. This entry over writes the current
NTP server setting.
You can specify as many NTP servers as you like. If you specify
multiple NTP servers, they are each checked in turn. The time given
by the first server to respond is used.
Example:
logger> set ntp
ntp.arcsight.com time.nist.gov 0.rhel.pool.org
show ntp Show the current NTP server setting.
Example:
logger> show ntp
ntp.arcsight.com time.nist.gov 0.rhel.pool.org
Password Commands
set password Set the password the current user’s account
Process Commands
restart process Restart a process
start process Start a process
status process Show process status
stop process Stop a process
SSL Certificate Commands
show sslcert Show the currently loaded SSL certificate on Logger
reset sslcert Creates and installs a new self-signed certificate with the original
Administrator's Guide
HPE Logger 6.2 Page 464 of 623
Category Command Description
default information, then restarts the HTTPS server.
diag sslcert Display the SSL session information
Status Commands
show status Show the Logger configuration
Software Logger Command Line Options
This topic appliestoSoftware Loggers only.
The loggerd command enables you to start or stop the Logger software running on your machine. In
addition, the command includes a number of subcommands that you can use to control other processes
that run as part of the Logger software.
Note: If your Logger is installed to run as a system service, you can use your operating system’s
service command to start, stop, or check the status of a process on Logger.
<install_dir>/current/arcsight/logger/bin/loggerd
{start|stop|restart|status|quit}
<install_dir>/current/arcsight/logger/bin/loggerd {start <process_name> |
stop <process_name> | restart <process_name>}
To view the processes that can be started, stopped, or restarted with loggerd, click System Admin
from the top-level menu bar. Then, under System, pick Process Status. The processes are listed on the
right under Processes.
The following table describes the subcommands available with loggerd and their purpose.
Command Purpose
loggerd start Start all processes listed under the System and Process sections. Use this
command to launch Logger.
loggerd stop Stop processes listed under the Process section only. Use this command when
you want to leave loggerd running but all other processes stopped.
loggerd restart This command restarts processes listed under the Process section only.
Note: When the loggerd restart command is used to restart Logger,
the status message for the “aps” process displays this message:
Process ‘aps’ Execution failed.
Administrator's Guide
HPE Logger 6.2 Page 465 of 623

Command Purpose
After a few seconds, the message changes to:
Process ‘aps’ running.
loggerd status Display the status of all processes.
loggerd quit Stops all processes listed under the System and Process sections. Use this
command to stop Logger.
loggerd start
<process_name>
Start the named process. For example, loggerd start apache
loggerd stop
<process_name>
Stop the named process. For example, loggerd stop apache
loggerd restart
<process_name>
Restart the named process. For example, loggerd restart apache
Administrator's Guide
HPE Logger 6.2 Page 466 of 623

Appendix A: Search Operators
The following topics describe the operators you can specify in the Search box (Analyze > Search) and
give examples of their use.
• cef (Deprecated) 467
• chart 468
• dedup 472
• eval 473
• extract 479
• fields 481
• head 482
• keys 482
• lookup 484
• parse 488
• rare 489
• regex 490
• rename 490
• replace 491
• rex 493
• sort 496
• tail 497
• top 497
• transaction 498
• where 500
cef (Deprecated)
Prior to Logger
5.2, you needed to use the cef operator to extract CEF fields from CEF events that
matched the indexed search filter (the query portion before the first pipeline in the query expression)
before you could use other search operators to act upon those fields. However, starting with
Logger
5.2, you do not need to explicitly extract the CEF fields and then apply other search operators
to those fields. You can specify the event fields directly in queries.
Extracts values for specified fields from matching CEF events. If an event is non-CEF, the field value is
set to NULL.
HPE Logger 6.2 Page 467 of 623
Synopsis
...| cef <field1> <field2> <field3> ...
Usage Notes
If multiple fields are specified, separate each field name with a white space or a comma.
To identify the name of a CEF field, use the Search Builder tool (click Advanced Search under the
Search text box), which lists the names of all fields alphabetically.
The extracted fields are displayed as additional columns in the All Fields view (of the System Fieldsets).
To view only the extracted columns, select User Defined Fieldsets from the System Fieldsets list.
Examples
...| cef categorySignificance agentType
...| cef deviceEventCategory name
chart
Displays search results in a chart form of the specified fields.
Synopsis
...| chart count by <field1> <field2> <field3> ... [span [<time_field>]
=<time_bucket>]
...| chart {{sum | avg | min | max | stdev | perc<N>} (<field>)}+ by
<field1>, <field2>, <field3> ...[span [<time_field>]= <time_bucket>]
...| chart {<function> (<field>)} as <new_column_name> by <field> [span
[<time_field>]=<time_bucket>]
where <field>, <field1>, <field2> are the names of the field that you want to chart. The fields
can be either event fields available in the Logger schema or a user-defined fields created using the rex
or eval operator prior in the query.
<time> is the bucket size for grouping events. Use d for day, h for hour, m for minute, s for seconds.
For example, 2h, 5d, 1m. (See Usage Notes for details.)
<function> is one of these: count, sum, avg (or mean), min, max, stdev, percN
<new_column_name> is the name you want to assign to the column in which the function’s results are
displayed. For example, Total.
Administrator's Guide
HPE Logger 6.2 Page 468 of 623

<N> is the percentile, and so can be a number between 0 and 100, inclusive.
Deprecated: The following deprecated usage contains “_count”. The recommended usage, as
shown above, is “count”.
...| chart _count by <field1> <field2> <field3> ...
Usage Notes
By default, a column chart is displayed. Other chart types you can select from: bar chart, line chart,
donut chart, area chart, stacked column, or stacked bar.
To change the chart settings (including its type), click in the upper right corner of the Result Chart
frame of the screen. You can change these settings:
lTitle: Enter a meaningful title for the chart.
lType: Column, Bar, Donut, Area, Line, Stacked column, Stacked Bar. The last two types create
stacked charts in which multiple values are plotted in a stack form. These charts are an alternate way
of representing multi-series charts, which are described below.
lDisplay Limit: Number of unique values to plot. Default: 10
If the configured Display Limit is less than the number of unique values for a query, the top values
equal to the specified Display Limit are plotted. That is, if the Display Limit is 5, and seven unique
values are found, only the top five values will be plotted.
All chart commands except “count by” accept only one field in the input. The specified field must
contain numeric values.
If multiple fields are specified, separate the field names with a white space or a comma.
You can click on a charted value to quickly filter down to events with specific field values. For more
information, see "Chart Drill Down" on page115.
Percentile Function
The perc<N> function returns the <N>percentile. <N> can be a number between 0 and 100, inclusive.
...| chart perc by field list" (with no specified <N>) returns all results generated by ...|
chart count by field list.
...| chart perc50 by field list returns the median value of all the results generated by ...|
chart count by field list.
...| chart perc90 by field list returns the 90 percentile value of all the results generated by
...| chart count by field list.
The percentile value is derived based on the increasing order of the field values. The derived value of
string fields rely on alphabetical order (ASCII value).
Administrator's Guide
HPE Logger 6.2 Page 469 of 623

Aggregation Functions
Note: Aggregation functions only work on numeric fields. The specified fields must contain
numeric values. If a field you specify is of the wrong data type, you will receive an error message like
the following:"java.lang.NumberFormatException".
If an aggregation function such as count, sum, or avg is specified, a chart of the aggregated results is
displayed along with the tabular results of the aggregation operation in a Results Table. For example,
for the aggregation function sum(deviceCustomNumber1), the sum_deviceCustomNumber1
column in the Results Table displays the sum of unique values of the deviceCustomNumber1 field.
If this field had two unique values 1 and 20, occurring 2 times each, the sum_deviceCustomNumber1
column displays sum of those two values.
The mathematical operators avg and mean are identical.
You can include multiple functions in the same chart command. When doing so, separate each function
with a comma, as shown in this example:
...| chart count, sum(deviceCustomNumber3) by deviceEventClassId
When you include multiple functions, one column per function is displayed in the search Results Table.
The Results Chart, however, plots the chart for the field specified in the “by” clause.
You can use the “as new_column_name” clause to name any column resulting from the aggregation
functions, as shown in this example:
...| chart sum(deviceCustomNumber3) as TotalStorage, avg(deviceCustomNumber3) as
AverageStorage by deviceCustomNumber3
Once defined, the newly defined column can be used in the pipeline as any other field. For example,
...| chart sum(deviceCustomNumber3) as TotalStorage, avg(deviceCustomNumber3) as
AverageStorage by deviceCustomNumber3 | eval UpdatedStorage = TotalStorage + 100
When you export the search results of a chart operator, the newly defined column name (using the
chart function as new_column_name command) is preserved.
Multi-Series Charts
A multi-series chart can plot the values of multiple aggregation functions in a single chart. If you include
multiple aggregation functions in a chart command, Logger generates a multi-series chart that plots
the values of the specified aggregation functions along the Y-axis, as illustrated in "Example Two" on
page472. Multi-series charts can be any of the chart types except Donuts= charts. For example, you can
Administrator's Guide
HPE Logger 6.2 Page 470 of 623
choose to plot a multi-series chart as a stacked chart—Stacked column or Stacked Bar—in which
multiple values are plotted in a stack form.
The Span Function
In addition to grouping events by the Logger schema fields (or the ones defined by the rex or eval
operators), the span function provides an additional way to group events by a time field (such as
EventTime or deviceReceiptTime) and a time bucket. In the following example, deviceReceiptTime is the
time field and 5m (5 minutes) is the time bucket:
...| chart count by deviceEventCategory span (deviceReceiptTime) = 5m
If a time field is not specified for the span function, EventTime is used as the default. For example, the
following query uses EventTime by default:
...| chart count by deviceEventCategory span = 5m
By default, the chart command displays the first 10 unique values. If the span function creates more
than 10 unique groups, not all of them will be displayed. If you want to view all of the unique groups,
increase the Display Limit value under Chart Settings. (Click in the upper right corner of the Result
Chart frame of the screen.)
Grouping with span is useful in situations when you want to find out the number of occurrences in a
specific time span.
If you want to find out the total number of incoming bytes every 5 minutes on a device, you can specify
a span of 5m, as shown in this example:
...| chart sum(deviceCustomNumber1) span=5m
The above example assumes that deviceCustomNumber1 field provides the incoming bytes information
for these events.
The span field can be used for grouping in conjunction with or without the event fields that exist in
Logger schema or user-defined fields using the rex or eval operators. When a span field is specified in
conjunction with an event field, the unique sets of all those fields is used for grouping. The following
example uses deviceCustomNumber3 and deviceAddress in conjunction with span to find out the
number of events (using deviceCustomNumber3) from a specific source (using deviceAddress) in one
hour:
...| chart sum(deviceCustomNumber3) by deviceAddress span=1h
When span is included in a query, search results are grouped by the specified time bucket. For example,
if span=5m, the search results will contain one row for each 5-minute span. If there are no events within
a specific 5-minute span, that row will be empty.
Additionally, the span function assumes a 24-hour day, all year long. If span=1d or 24h, on the day of
daylight savings time change, the event time indicated by the span_eventTime field in the search results
will be different from the previous day by one hour. On the day when there are 23 hours in a day (in
Administrator's Guide
HPE Logger 6.2 Page 471 of 623
March), the span bucket will still include events from the last 24 hours. Similarly, on the day when there
are 25 hours in the day (in November), the span bucket will include events from the last 24 hours.
Example One
Use the default chart setting (Column Chart) to specify multiple fields. In this example, a count of
unique groups of deviceEventCategory and name fields is displayed and plotted.
... | chart count by deviceEventCategory name
Example Two
Include average and sum in a chart command, to generate a multi-series chart that plots the values of
these functions along the Y-axis in a single chart. You can display a multi-series chart as a stacked
chart—Stacked column or Stacked Bar—in which multiple values are plotted in a stack, by changing the
Chart Settings.
dedup
Removes duplicate events from search results. That is, events that contain the same value in the
specified field. The first matching event is kept, and the subsequent events with the same value in the
specified field are removed.
Synopsis
... | dedup [N] <field1>,<field2>, ... [keepevents=(true|false)] [keepempty=
(true|false)]
N is an optional number that specifies the number of duplicate events to keep. For example, “dedup 5
deviceEventClassId” will keep the first five events containing the same deviceEventClassId values for
each deviceEventClassId, and remove the events that match after the first five have been kept.
Default:1.
field1, field2 is a field or a comma-separated field list whose values are compared to determine
duplicate events. If a field list is specified, the values of the unique sets of all those fields are used to
remove events. For example, if name and deviceCustomNumber1 are specified, and two events contain
“Network Usage - Outbound” and “2347896”, only the first event is kept in the search results.
keepevents specifies whether to set the fields specified in the field list to NULL or not. When this
option is set to True, the values are set to NULL and events are not removed from search results.
However, when this option is set to False, duplicate events are removed from the search results. Default:
False.
Administrator's Guide
HPE Logger 6.2 Page 472 of 623
keepempty specifies whether to keep events in the search results whose specified fields contain NULL
values. When this option is set to True, events with NULL values are kept, however if this option is set to
False, events with NULL values are removed. Default: False.
Example One
To view events from unique devices:
... | dedup deviceAddress
Example Two
To view unique deviceEventClassId events from unique devices:
... | dedup deviceEventClassId deviceAddress
Example Three
To view the className in events with Java exceptions in the message field:
exception | <rex_expression> | dedup 5 className
In the example above, <rex_expression> is not shown in detail; however this expression extracts the
class name in a field called className, which the dedup operator acts upon.
eval
Displays events after evaluating the result of the specified expression. The expression can be a
mathematical, string, or Boolean operation and is evaluated when the query is run. The resulting value
of the expression is assigned to a field name (specified in the expression). Once a new field has been
defined by the eval operator in a query, this field can be used in the query for further refining the search
results (see "Example Three" on page479 below, in which a new field “Plus” is defined by the eval
operator; this field is then used by the sort operator.)
Synopsis
...|eval <type> <newField>=function([<field>|<value>]*)
Where:
<newField>is a derived field displayed in the search results.
<type>is the datatype of the new field and can beint, bigint, long, float or double. If you do not
include a data type, the default is string. Including a <type> is optional; include when you need some
data type other than string. For example, if you do not include a type, the sort will be alphabetical. If you
want to sort numerically, make <type>one of the number data types. The datatype you specify should
Administrator's Guide
HPE Logger 6.2 Page 473 of 623
match the data that will be displayed in the <newField>, according to standard datatype definitions.
The temporary field is not part of the Logger schema and its data type does not have to match the
Logger schema data type of <field>.
<function> is one of these: abs(X), case(X,"Y",...), ceil(X), ceiling(X), exp(X),
floor(X), if(X,Y,Z), isfalse(X), istrue(X), len(X), ln(X), log(X), lower(X),
tolower(X), mod(x,y), rand(), replace(X,Y,Z), round(X), sqrt(X), substr
(X,Y,Z), sum(x,y,z,…), trim(X), ltrim(X), rtrim(X), upper(X)toupper(X),
urldecode(X).
Note: These functions are described in detail in the usage notes below.
<field> is the name of the field that you want to evaluate. It can be either an event field available in
the Logger schema or a user-defined field created using the rex or eval operator earlier in the query.
<value> can be a string or a number.
Operation Symbol
Addition, Subtraction +, -
Multiplication, Division *, /
Boolean And, Or, Not &&, ||, !
Equal, Not Equal ==, !=
Less Than, Greater Than <, >
Less Than or Equal, Greater Than or Equal <=, >=
Modulus, Power %, ^
Unary Plus, Unary Minus +x, -x
Operators supported for eval expressions
Usage Notes
Typically, a cef or rex operator (to extract fields from matching events) precedes the eval operator,
as shown in the examples below. However, you can use the eval operator on a field that has been
defined by a previous eval operator in a query.
Keep the following in mind when working with eval functions:
lFunctions can accept either the literal value of a string or a field.
lTo indicate that Xis a literal string, surround it with double quotes ("X"). If there are no double
Administrator's Guide
HPE Logger 6.2 Page 474 of 623

quotes, the function assumes that X is a field.
lThe derived value of string fields rely on alphabetical order (ASCII value).
Function Description Example
abs(X) Takes a number, X, and
returns its absolute
value.
The function assigns the evaluated value to the new
field. If the value of X is 3 or -3, the function assigns
the evaluated value of 3 to the field absnum.
... | eval absnum=abs(number)
case(X,"Y",...) Takes pairs of
arguments, X and Y.
The X arguments are
Boolean expressions
that are evaluated from
first to last. When case
encounters the first X
expression that
evaluates to true, it
returns the
corresponding Y.
Subsequent arguments
are ignored. If none are
true, it returns NULL.
The following example returns outcome =Success or
outcome =Failure, depending on whether
deviceCustomNumber1 is 200.
... | eval outcome=case
(deviceCustomNumber1== 200, "Success",
deviceCustomNumber1 != 200, "Failure")
ceil(X), ceiling
(X)
Rounds a number, X, up
to the next highest
integer.
The following example returns n=2.
... | eval n=ceil(1.9)
exp(X) Takes a number, X, and
returns eX.
The following example returns y=e3.
... | eval y=exp(3)
floor(X) Rounds a number, X,
down to the nearest
whole integer.
The following example returns 1.
... | eval n=floor(1.9)
if(X,Y,Z) Takes three arguments.
The first argument, X,
must be a Boolean
expression. If X
evaluates to TRUE, the
result is the second
The following example looks at the values of
deviceCustomNumber1 and returns
outcome=Succeeded if outcome=200, otherwise
returns outcome=Failed.
... | eval outcome=if
(deviceCustomNumber1 == 200,
Functions supported for eval operations
Administrator's Guide
HPE Logger 6.2 Page 475 of 623

argument, Y. If, X
evaluates to FALSE, the
result evaluates to the
third argument, Z.
"Succeeded", "Failed")
isfalse(X) Checks whether
expression X is false.
Returns true if
expression X is false,
otherwise returns false.
Note: If X > 0,
results are false. If X
<=0, results are true.
The following example returns true because 4+4 is
not equal to 9.
... | eval newField = isfalse(4+4==9)
istrue(X) Checks whether
expression X is true.
Returns true if
expression X is true,
otherwise returns false.
Note: If X > 0,
results are true, If X
<=0, results are
false.
The following example returns true because 8 is
greater than 0.
... | eval newField = istrue(8)
len(X) Returns the character
length of a string, X.
The following example returns the length of (field). If
the field is 256 characters long, it returns n=256,
... | eval n=len(field)
The following example returns n=3. (abc is a literal
string, surrounded by double quotes.)
... | eval n=len("abc")
ln(X) Takes a number, X, and
returns its natural log.
The following example returns the natural log of the
value of "bytes". If "bytes" contains 100, it returns
4.605170186.
... | eval lnBytes=ln(bytes)
log(X) Evaluates the log of
number X with base 10.
The following example returns 4.
... | eval num=log(10000).
Functions supported for eval operations, continued
Administrator's Guide
HPE Logger 6.2 Page 476 of 623

lower(X)
tolower(X)
Takes a string argument,
X, and returns the
lowercase version.
The following example returns the value of the field
username in lowercase. If the username field contains
FREDBROWN, it returns name=fred brown.
... | eval name=lower("username")
mod(X,Y) Returns the modulo of X
and Y. (X%Y; the
remainder of X divided
by Y.)
The following example returns 5.
... | eval newField = mod(25,10)
rand() Returns a random
number between 0 and 1,
inclusively.
The following example might return a number like
0.56789.
... | eval newField = rand()
replace(X,Y,Z) Returns a string formed
by substituting string Z
for every occurrence of
regex string Y in string X.
The third argument, Z,
can also reference
groups that are matched
in the regex.
The following example replaces instances of the
value "ArcSight" with the value "HP" in the
deviceVendor field.
... | eval n=replace(deviceVendor,
"ArcSight", "HP")
round(X) Rounds X to the nearest
integer.
The following example returns 1.
... | eval n=round(1.4)
The following example returns 2.
... | eval n=round(1.5)
sqrt(X) Takes one numeric
argument, X, and returns
its square root.
The following example returns 3.
... | eval n=sqrt(9)
substr(X,Y,Z) This function returns a
new string that is a
substring of string X.
The substring begins
with the character at
index Y and extends up
to the character at index
Z-1.
The following example returns "g".
...| eval n=substr("ArcSight",5,6)
The following example returns "cSig".
...| eval n=substr("ArcSight",2,6)
The following example returns "ght".
...| eval n=substr("ArcSight",5,8)
Functions supported for eval operations, continued
Administrator's Guide
HPE Logger 6.2 Page 477 of 623

Note: The index is a
number that
indicates the
location of the
characters in string
X, from left to right,
starting with zero.
The following example returns "ArcSight".
...| eval n=substr("ArcSight",0,8)
The following example returns "Sight".
...| eval n=substr("ArcSight",3,8)
The following example returns "Arc".
...| eval n=substr("ArcSight",0,3)
sum(X,Y,Z,…) Adds all the numbers
together.
The following example returns the sum of the values
in the baseEventCount, deviceCustomNumber1, and
deviceCustomNumber2 fields.
... | eval newnum = sum(baseEventCount,
deviceCustomNumber1,
deviceCustomNumber2)
trim(X)
ltrim(X)
rtrim(X)
trim(X) removes all
spaces from both sides
of the string X.
ltrim(X) removes all
spaces from the left side
of the string X.
rtrim(X) removes all
spaces from the right
side of the string X.
For the sake of the example, assume that Xis a literal
string and _ represents any number of space
characters.
The following example returns trimmed=
"string_".
... | eval trimmed=ltrim("_string_")
The following example returns trimmed="_
string".
... | eval trimmed=rtrim("_string_")
The following example returns "string".
... | eval trimmed=trim("_string_")
upper(X)
toupper(X)
Takes one string
argument and returns
the uppercase version.
The following example returns the value of the field
username in uppercase. If username contains fred
brown, it returns name=FREDBROWN.
... | eval name=upper("username")
urldecode(X) Takes one URL string
argument X and returns
the unescaped or
decoded URL string.
The following example returns
"http://www.hp.com/download?r=header".
... | eval n=urldecode
("http%3A%2F%2Fwww.hp.com%2Fdownload%3Fr
%3Dheader")
Functions supported for eval operations, continued
Administrator's Guide
HPE Logger 6.2 Page 478 of 623
Example One
If the Category Behavior is “Communicate”, then assign the value “communicate” to a new field “cat”;
otherwise, assign the value “notCommunicate” to it.
_storageGroup IN [“Default Storage Group”] | cef categoryBehavior | eval
cat=if(categoryBehavior== “/Communicate”, “communicate”, “notCommunicate”)
Example Two
Append the word, “END”, at the end of extracted event name. For example, if event name is “Logger
Internal Event”, after the eval operation it is “Logger Internal EventEND” and is assigned to a new field,
“fullname”.
logger | cef msg name | eval fullname=name + “END”
Example Three
Add 100 to the value of bytes In and assign it to a new field, “Plus”. Then, sort the values assigned to
“Plus” in ascending order.
_storageGroup IN [“Default Storage Group”] | cef bytesIn bytesOut name | eval
Plus=bytesIn +100 | sort Plus
Example Four
Find the longest URLs from the vendor ArcSight.
deviceVendor = ArcSight |eval (int)urllength=len(requestUrl) |sort urllength
extract
Extracts key value pairs from raw events.
Synopsis
...| extract [pairdelim=“<delimiters>”] [kvdelim=“<delimiters>”] [maxchars=<n>]
fields=“key1,key2,key3...”
Where:
lpairdelim is a delimiter (or a list of delimiters) that separates one key-value pair from another key-
value pair in an event. By default, semi colon, pipe, and comma (; | ,) are used.
lkvdelim is a delimiter (or a list of delimiters) that separates a key from its value. By default, “=".
lmaxchars is the maximum number of characters in an event that would be scanned for extracting
key value pairs. By default, 10240.
Administrator's Guide
HPE Logger 6.2 Page 479 of 623
lfields is a key (or a list of comma-separated keys) whose values you want to display in the search
results.
For example, if you want to display the Name Age, and Location values from this event:
Name:Jane | Age:30 | Location:LA
extract the “Name”, “Age”, and “Location” keys and list them in the fields list.
Understanding How the Extract Operator Works
The key represents a field in the raw event and its value consists of the characters that appear after the
key until the next key in the event. The following raw event is used to illustrate the concept:
[Thu Jul 30 01:20:06 2009] [error] [client 69.63.180.245] PHP Warning: memcache_pconnect() [<a
href='function.memcache-pconnect'>function.memcache-pconnect</a>]: Can't connect to 10.4.31.4:11211
To extract the URL from the above event, you can define these key-pair delimiters, which separate the
key-value pairs in the event:
- Greater than sign (“>”)
- Square bracket (“[“)
And, define this key delimiter, which separates the key from its value:
- Equal to sign (“=")
Thus, the following command will extract the URL
... | extract pairdelim= “>\[” kvdelim= “=" fields=“<a href”
The key value pairs in the event will be: [<a href='function.memcache-pconnect'>
The key in the event will be: <a href
The extracted URL will be: 'function.memcache-pconnect'
Usage Notes
This operator only works on raw events. That is, you cannot extract key value pairs from CEF events or
the fields defined by the rex operator.
You can specify the pairdelim and kvdelim delimiters in the extract operator command to extract
keys and their values. However, if you want to determine the key names that these delimiters will
generate, use the keys operator as described in "keys" on page482. The keys operator can only be
used to determine keys; you cannot pipe those keys in the extract operator. That is, ...| keys |
extract fields=field1 is incorrect.
The keys specified in the fields list can be used further in the pipeline operations. For example, ...|
extract pairdelim= “|” kvdelim= “:” fields= “count” | top count
Administrator's Guide
HPE Logger 6.2 Page 480 of 623

If none of the specified pairdelim characters exists in an event, the event is not parsed into key value
pairs. The whole event is skipped. Similarly, if the specified kvdelim does not exist, values are not
separated from the keys.
To specify double quotes (“) as the delimiter, enter it within the pair of double quotes with backslash(\)
as the escape character. For example, “=\”|”. Similarly, use two backslashes to treat a backslash character
literally. For example, “\\”.
Example
... | extract pairdelim= “|” kvdelim= “:” fields= “Name,Age,Location”
Extracts values from events in this format:
Name:Jane | Age:30 | Location:LA
fields
Includes or excludes specified fields from search results.
Synopsis
... | fields ([(+ | -)] <field>)+
Where:
+ includes only the specified field or fields in the search results. This is the default.
- excludes only the specified field or fields from the search results.
Usage Notes
Typically, the <field> list contains event fields available in the Logger schema or user-defined fields
created using the rex operator prior in the query, as shown in the examples below. However, fields
might also be defined by other operators such as the eval operator.
The + and - can be used in the same expression when multiple fields are specified. For example:
| fields + name - agentType
Tip: A complete field name must be specified for this operator; wildcard characters in a field name
are not supported.
When this operator is included in a query, select User Defined Fieldsets from the System Fieldsets list
to view the search results.
Administrator's Guide
HPE Logger 6.2 Page 481 of 623
Example One
... | fields - agentType + categorySignificance
Example Two
... | fields - name
head
Displays the first <N> lines of the search results.
Synopsis
... | head [<N>]
<N> is the number of lines to display. Default: 10, if <N> is not specified.
Usage Notes
When this operator is included in a query, the search results cannot be previewed. That is, the query
must finish running before search results are displayed.
Example
... | head
keys
Identifies keys in raw events based on the specified delimiters.
Synopsis
... | keys [pairdelim= “<delimiters>”] [kvdelim= “<delimiters>”] [limit=<n>]
Where:
lpairdelim is a delimiter (or a list of delimiters) that separates one key-value pair from another key-
value pair in an event. By default, semi colon, pipe, and comma (; | ,) are used.
lkvdelim is a delimiter (or a list of delimiters) that separates a key from its value. By default, “=”.
llimit is the maximum number of key value pairs to find. There is no default or maximum number for
this parameter.
Administrator's Guide
HPE Logger 6.2 Page 482 of 623
Usage Notes
This operator only works on raw events. That is, you cannot identify key value pairs from CEF events or
fields defined by the rex operator.
Although this operator is not required to determine keys, it is recommended that you use it to first
determine the keys whose values you want to obtain using the extract operator. This operator
returns aggregated results. Therefore, the search results list the keys found in the matching events and
their counts.
The keys operator can only be used to determine keys; you cannot pipe those keys in the extract
operator. That is, | keys | extract fields=field1 is incorrect.
If a key value is blank (or null), it is ignored and not counted toward the number of hits.
For example, for the following event data:
Date=3/24/2011 | Drink=Lemonade
Date=3/23/2011 | Drink=
Date=3/22/2011 | Drink=Coffee
Search Query: keys pairdelim= “|” kvdelim= “=”
Search Result: Date, 3 hits and Drink, 2 hits
If none of the specified pairdelim characters exists in an event, the event is not parsed into key value
pairs. The whole event is skipped. Similarly, if the specified kvdelim does not exist, values are not
separated from the keys.
To specify double quotes (“) as the delimiter, enter it within the pair of double quotes with backslash(\)
as the escape character. For example, “=\”|”. Similarly, use two backslashes to treat a backslash character
literally. For example, “\\”.
Example One
...| keys pairdelim= “|” kvdelim= “=”
Identifies keys (Date and Drink) in event of this format:
Date=3/24/2011 | Drink=Lemonade.
Example Two
...| keys pairdelim= “,” kvdelim= “>=”
Identifies keys (Path and IPAddress) in the event of this format:
Path>c:\usr\log, IPAddress=1.1.1.1
Administrator's Guide
HPE Logger 6.2 Page 483 of 623
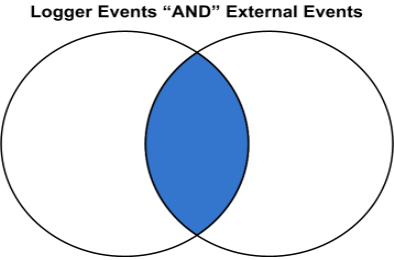
lookup
Returns an augmented or filtered set of events based on whether they have identical values in the
corresponding fields in an uploaded Lookup file.
Before you can use this operator, you must upload a Lookup file to Logger. You can add a Lookup file
by uploading a CSV file from the List Lookup configuration page.
lFor information on when to use the lookup operator, see "Enriching Logger Data Through Static
Correlation" on page133.
lFor information about creating Lookup files and uploading them to Logger, see "Lookup Files" on
page283.
Synopsis
... | lookup [+/-/*] lookupTableName externalField1 [as loggerField1] [,
externalField2 [as loggerField2] ...] [output [ * | externalField1,
externalField2... ] ]
+ Selects events where the value in the Lookup field (loggerField1, loggerField2) is identical with that in
the uploaded Lookup file (externalField1, externalField2). When the output clause is used, it augments
the search results with the specified output columns from in the uploaded Lookup file. + is the default
lookup operator. If you do not specify +, -, or *, + is used.
When a Lookup field value matches multiple rows in the uploaded Lookup file, only the first matched
row is used. Logger displays an alert message indicating that the Lookup field contains multiple matches
in the Lookup file, and that only the first match is included.
- Selects events where the value in the Lookup field is not in the uploaded Lookup file. When you do a
lookup with negation, the results will not display the external fields in the UI fields. The output clause is
not applicable for negative lookup. This is because the negative lookup excludes matches from the
uploaded lookup file.
Administrator's Guide
HPE Logger 6.2 Page 484 of 623
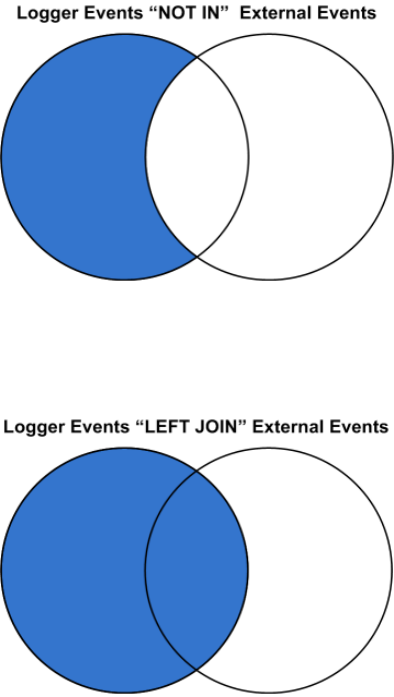
* Includes all events regardless of whether they are in the uploaded Lookup file. (Performs a left-outer
join between the Logger events table and the Lookup file.) When the output clause is used, the output
fields will be empty (null) for Logger events that do not have a match in the Lookup file.
If +, -, or * is not provided, the default is +.
loggerField1 and loggerField2 are valid field names in Logger search results.
externalField1 and externalField2 are valid column names from the Lookup file.
loggerField1 as externalField1 looks up values between loggerField1 in Logger search
results and externalField1 in the uploaded Lookup file.
In the first lookup operator in a search pipeline, loggerField1, must be a valid field name in a
Logger event, otherwise, this field can be a Logger field or a search-generated field in the search results
from the previous pipeline operator.
loggerField1 as externalField1, loggerField2 as externalField2 performs value
lookup on multiple fields between Logger search results and uploaded Lookup file.
[output [ * | externalField1, externalField2...]] if you specify one or more external
fields, augments the search results with the indicated fields. If you use output *, all fields from
uploaded Lookup file are added. When the output clause is not used, no fields from uploaded Lookup
file are added to the search results.
Administrator's Guide
HPE Logger 6.2 Page 485 of 623

Usage Notes
The lookup operator supports specific date/time formats. Logger event fields can be of three
different data types, string, integer, and date/time. The lookup operator converts values in the Lookup
fields to a value of the same data type as the corresponding Logger event field.
The lookup operator supports the following formats for date/time fields:
MM/dd/yyyy HH:mm:ss z
MM/dd/yyyy HH:mm:ss
yyyy/MM/dd HH:mm:ss z
dd/MMM/yyyy HH:mm:ss Z
dd MMM yyyy HH:mm:ss z
yyyy-M-d H:mm:ss
yyyy-MM-dd'T'HH:mm:ss
yyyy-MM-dd'T'HH:mm:ssZ
Logger allows about 1GB system memory for all lookup searches. Running multiple lookup
searches simultaneously on large lookup tables could use up the 1GB memory. When this limit is reached,
some lookup searches may run more slowly or may time out. If a user starts a lookup search when other
lookup searches are running and the memory is full, Logger will display a message that suggests that
the user runs the lookup search after the current lookup searches finish and the memory is released.
Choose Lookup fields that have unique values in the uploaded Lookup file. The lookup operation
only uses the first row that matches and ignores any subsequent matches. Therefore, it is best to have
unique values in the lookup column and avoid having duplicate matches ignored.
As an example, look at the following search.
| lookup testLU deviceVendor output status
where the Lookup file "testLU" contains four rows with same deviceVendor value, "ArcSight", as shown
below.
deviceVendor dept org
ArcSight sales HPE
ArcSight marketing HPE
BlueCoat sales BlueCoatINC
ArcSight engineering HPE
ArcSight marketing ESP
testLU
Administrator's Guide
HPE Logger 6.2 Page 486 of 623

When the lookup operation finds duplicates in the Lookup field, ("deviceVendor=ArcSight" in testLU
and "deviceVendor=ArcSight" in the Logger events table), the search results use only the first entry,
"status_testLU=ok" to augment the matching Logger event, while subsequent matches, such as "status_
testLU=alert", are NOT used.
Tip: In some rare situations, a blank page may be returned after you upload a Lookup File from the
Add Lookup File page. If this happens, refresh the page manually. After the refresh, you are
returned to the loading page and the process tries to load the Lookup File again. Since the file was
already uploaded, you get an error message. You can safely ignore the error.
Using IP Addresses in Lookup Files
The Lookup process automatically determines whether the Lookup file consists of IP addresses, and if
so treats them as IP addresses rather than strings. When performing a search using a Lookup file,
Logger checks the first ten rows of each Lookup column to determine whether it contains only IP
addresses.
lIf a Lookup column contains only IP addresses in the first ten rows, Logger assumes that the rest of
rows in that column contain IP addresses.
Note:Including non-IP address data later in the same column may cause an exception.
lIf the first ten rows contain strings that are not IP addresses, Logger uses the field type of the
corresponding Logger event column to determine the data type.
lIf the Lookup process determines that it's an IP address lookup based on the above rule, the search
will find matching IP addresses in any equivalent IP address format.
For example, if your Lookup column has some things that are not IP addresses in the first ten rows:
lSearching for the string “2001:db8:250:0:0:fefe:0:1” would find only events where the target field is
the exact string “2001:db8:250:0:0:fefe:0:1”
lSearching for the string “192.168.10.100” would find only events where the target field is the exact
string “192.168.10.100”.
Whereas, if your Lookup file has only IP addresses in the first ten rows:
lSearching for the address “192.0.2.010” could find events with addresses such as: “192.0.2.010” and
“192.0.2.10”.
Example One
The following example looks up events where the sourceAddress comes from the IP address listed in a
lookup file named “maliciousIP” under the column named “ip”.
lookup maliciousIP ip as sourceAddress
Administrator's Guide
HPE Logger 6.2 Page 487 of 623

Example Two
The following example looks up access events with a sourcePort different from the sourcePort in day_x,
where day_x is the lookup file generated from the exported Logger events on a day before.
access | lookup - day_x sourcePort
parse
Applies the named parser to the matching events of a search query.
Synopsis
...| parse <parser_name>
Where <parser_name> is the name of the parser to use. For information on how to create a parser, see
"Working with Parsers" on page320.
Tip: The parser must exist before it can be used in a query.
The parse operator is useful in parsing the non-CEF (unstructured textual) data stored on Logger and
parsing it into specific fields according to the parser’s definition.
Once parsed into fields, this data can be used further in search operations. For example, the following
parse operator parses the events using a user-defined parser “Web Server Access Logs” such that
“username”, “login_status”, “num_attempts” fields are created.
You can use these created fields further in a pipeline query to display the top 10 user names that
resulted in the maximum failed login attempts and the number of attempts they made.
...| parse Web Server Access Log | where login_status = “failed” | top
username num_attempts
Because the parser definitions are rex or extract expressions, they create additional fields to contain
values that match the specified expression. These fields are displayed in the Search Results just like the
results of any rex or extract expression. Therefore, in the above example, three additional fields will
be added to the Search Result:username, login_status, num_attempts.
An additional field called “parser” is also added to the Search Results when the parse operator is used
in a search query.
This field contains the name of the parser when the parser is able to parse one or more fields specified in
the definition for the matching events. If the event was not parsed successfully, if no parser is defined
for the source type, or if there is no source type, this field displays, this field contains “Not parsed”.
Similarly, the field contains the value “not parsed” when the parser definition is not able to parse any
fields of the matching event.
Administrator's Guide
HPE Logger 6.2 Page 488 of 623
You can also use this field to find out events that were successfully parsed or did not parse, as shown in
the following example:
... | parse Web Server Access Log | where parser = “not parsed”
Usage Notes
When to use the parse operator: When non-CEF events are received through TCP or UDP receivers on
Logger, they are not associated with a source type and thus a parser definition. Therefore, such events
not parsed automatically. Similarly, non-CEF events stored on Logger version 5.2 or earlier are not
parsed since the parser feature did not exist in those versions. If you need such events parsed when
they match a query, use the parse operator.
When an event for which a defined source type exists on Logger is parsed through the parse operator,
it can result in the creation of multiple user-defined fields—through the parser associated with the
source type and through the parser you specified in the parser pipeline command. If both parsers
create unique field names, all those fields are created when a query that matches the event is run. If the
parsers specify one or more same name fields, the field names specified in the parse operator parser
take precedence as this parser is applied last.
Example
...| parse Web Server Access Log | where url CONTAINS “.org” | top url
rare
Lists the search results in a tabular form of the least common values for the specified field. That is, the
values are listed from the lowest count value to the highest.
When multiple fields are specified, the count of unique sets of all those fields is listed from the lowest to
highest count.
Synopsis
...| rare <field1> <field2> <field3> ...
Usage Notes
Typically, the <field> list contains event fields available in the Logger schema or user-defined fields
created using the rex or eval operators prior in the query, as shown in the examples below. However,
fields might also be defined by other operators such as the eval operator.
A chart of the search results is automatically generated when this operator is included in a query. You
can click on a charted value to quickly filter down to events with specific field values. For more
information, see "Chart Drill Down" on page115.
Administrator's Guide
HPE Logger 6.2 Page 489 of 623
If multiple fields are specified, separate the field names with a white space or a comma.
Example
... | rare deviceEventCategory
regex
Selects events that match the specified regular expression.
Synopsis
...| regex <regular_expression>
OR
...| regex <field> (=|!=) <regular_expression>
Usage Notes
Regular expression pattern matching is case insensitive.
The first usage (without a field name) is applied to the raw event. While the second usage (with a field
name), is applied to a specific field.
If you use the second usage (as shown above and in the second example, below), either specify an event
field that is available in the Logger schema or a user-defined field created using the rex or eval
operators.
Examples
... | regex “failure”
... | regex deviceEventCategory != “fan”
rename
Renames the specified field name.
Synopsis
...| rename <field> as <new_name>
Where:
Administrator's Guide
HPE Logger 6.2 Page 490 of 623
l<field> is the name of an event field that is available in the Logger schema or a user-defined field
created using the rex or eval operator.
l<new_name> is the new name you want to assign to the field.
Usage Notes
An additional column is added to the search results for each renamed field. The field with the original
name continues to be displayed in the search results in addition to the renamed field. For example, if
you rename deviceEventCategory to Category, two columns are displayed in the search results:
deviceEventCategory and Category.
You can include the wildcard character, *, in a field name. However, you must enclose the field that
contains a wildcard character in double quotes (“ ”). For example:
...| rename “*IPAddress” as “*Address”
OR
...| rename “*IPAddress” as Address
If a field name includes a special character (such as _, a space, #, and so on), it should be included in
double quotes (“ ”) in the rename operator expression. For example:
...| rename src_ip as “Source IP Address”
If the resulting field of a rename operation includes a special character, it must be enclosed in double
quotes (“ ”) whenever you use it in the pipeline operator expression. For example,
...| rename src_ip as “Source IP Address” | top “Source IP Address”
The internal field names (that start with “_raw”) cannot be renamed.
The renamed fields are valid only for the duration of the query.
The resulting field of a rename operation is case sensitive. When using such a field in a search
operation, make sure that you the same case that was used to define the field.
When you export the search results of a search query that contains the rename expression, the
resulting file contains the renamed fields.
Examples
...| rename src_ip as IPAddress
...| rename src_ip as “Source IP Address”
replace
Replaces the specified string in the specified fields with the specified new string.
Administrator's Guide
HPE Logger 6.2 Page 491 of 623

Synopsis
<orig_str> with <new_str> [in <field_list>]
Where:
l <orig_str> is the original string you want to replace.
l<new_str> is the new string you want to replace with.
l<field_list> is the optional, however highly recommended.
Usage Notes
Tip: Even though the field list is optional for this command, HPEstrongly recommends that you
specify the fields on which the replace operator should act in this command.
If you skip the field list, the replace operator acts on the fields that have been either explicitly defined
using the cef, rex, and eval operators preceding the replace command, or any fields that were used
in other operator commands that preceded the replace operator command.
For example, the replace command acts on deviceEventCategory in all of the following cases and
replaces all instances of “EPS” with “Events”:
...| replace *EPS* with *Events* in deviceEventCategory
...| cef deviceEventCategory | replace *EPS* with *Events*
...| top deviceEventCategory | replace *EPS* with *Events*
An additional column of the same name is added to the search results for each field in which string is
replaced. The column with the original value continues to be displayed in the search results in addition
to the column with replaced values. For example, if you replace “err” with “Error” in the “message”
column, an additional “message” column is added to the search results that contains the modified value.
If you want to replace the entire string, specify it in full (as it appears in the event). For example,
“192.168.35.3”.
If you want to replace a part of the string, include wildcard character (*) for the part that is not going to
change.
For example, if the original string (the string you want to replace) is “192.168*”, only the 192.168 part in
an event is replaced. The remaining string is preserved. As a result, if an event contains 192.168.35.3,
only the first two bytes are replaced. The rest (35.3) will be preserved. Similarly, if the event contains
192.168.DestIP, DestIP will be preserved. However, if the event contains the string 192.168, it will not be
replaced.
If both, the original and the new strings contain wildcard characters, the number of wildcard characters
in the original string must match the number of wildcard characters in the new string.
...| replace “*.168.*” with “*.XXX.*
Administrator's Guide
HPE Logger 6.2 Page 492 of 623
If the original or the new string includes a special character such as / or ?, enclose the string in double
quotes (“ ”):
...| replace “/Monitor” with Error
You can replace multiple values for multiple fields in a single operation by separating each expression
with a comma (,). Note that you must specify the field list after specifying the “with” expression for all
values that you want to replace, as shown in the following example:
...| replace "Arc*" with HP, "cpu:100" with EPS in deviceVendor,
deviceEventClassId
The original string is case-insensitive. Therefore, the string “err” will replace an event that contains “Err”.
Example One
Replace any occurrence of “a” with “b” but the characters preceding “a” and succeeding it are preserved.
...| replace *a* with *b*
Example Two
Replace any occurrence of “a” with “b” without retaining any characters preceding or succeeding “a”.
...| replace *a* with b in name
rex
Extracts (or capture) a value based on the specified regular expression or extract and substitute a value
based on the specified “sed” expression. The value can be from a previously specified field in the query
or a raw event message.
Synopsis
... | rex <regular_expression containing a field name>
Or
... | rex field = <field> mode=sed “s/<string to be
substituted>/<substitution value>”
Understanding How Extraction Works
When the value is extracted based on a regular expression, the extracted value is assigned to a field
name, which is specified as part of the regular expression. The syntax for defining the field name is
Administrator's Guide
HPE Logger 6.2 Page 493 of 623
?<fieldname>, where fieldname is a string of alphanumeric characters. Using an underscore (“_”) is
not recommended.
For example, use the following event to illustrate the power of rex.
[Thu Jul 30 01:20:06 2009] [error] [client 69.63.180.245] PHP Warning: Can't
connect to 10.4.31.4:11211
If you want to extract any IP address from the above event and assign it to a field called IP_Address,
specify the following rex expression:
| rex “(?<IPAddress>\d{1,3}\.\d{1,3}\.\d{1,3}\.\d{1,3})”
However, if you wanted to extract the IP address after the word “client” from the following event and
assign it to a field called SourceIP, you will need to specify a start and end point for IP address
extraction, so that the second IP address in the event is not captured. The starting point in this event
can be [client and the end point can be ]. Thus, the rex expression will be:
| rex “\[client (?<SourceIP>[^\]]*)”
In this rex expression ?<SourceIP> is the field name defined to capture IP address and client
specifies the text or point in the event AFTER which data will be extracted. The [^\]]* expression will
match every character that is not a closing right bracket, therefore, for our example event, the
expression will match until the end of the first IP address and not the second IP address that appears
after the word “to” in the event message.
Understanding How Substitution Works
When the rex operator is used in sed mode, you can substitute the values of extracted fields with the
values you specify. For example, if you are generating a report of events that contain credit card
numbers, you might want to substitute the credit card numbers to obfuscate the real numbers.
The substitution only occurs in the search results. The actual event is not changed.
In the following example, the credit card numbers in the CCN field are substituted with “xxxx”, thus
obfuscating sensitive data:
| rex field=CCN mode=sed “s/*/xxxx/g”
The “/g” at the end of the command indicates a global replace, that is, all occurrences of the specified
pattern will be replaced in all matching events. If “/g” is omitted, only the first occurrence of the specified
pattern in each event is replaced.
Administrator's Guide
HPE Logger 6.2 Page 494 of 623
Multiple substitutions can be performed in a single command, as shown in the following example. In this
example, the word “Authentication” is substituted with “xxxx” globally (for all matching events), the first
byte of the agent address that start with “192” is substituted with “xxxx” and an IP address that starts
with “10” is substituted with “xxxx”.
| rex field=msg mode=sed “s/Authentication/xxxx/g” | rex field=agentAddress
mode=sed “s/192/xxxx/g” | rex field=dst mode=sed “s/10.*/xxxx/g”
Usage Notes
A detailed tutorial on the rex operator is available at "Using the Rex Operator" on page508.
A Regex Helper tool is available for formulating regular expressions of fields in which you are interested.
The Regex Helper parses an event into fields. Then, you select the fields that you want to include in the
rex expression. The regular expression for those fields is automatically inserted in the Search box. For
detailed information on the Regex Helper tool, see "Regex Helper Tool" on page92.
The extracted values are displayed as additional columns in the All Fields view (of the System Fieldsets).
To view only the extracted columns, select User Defined Fieldsets from the System Fieldsets list. In the
above example, an additional column with heading “SourceIP” is added to the All Fields view; IP address
values extracted from events are listed in this column.
If you want to use other search operators such as fields, sort, chart, and so on to refine your search
results, you must first use this operator to extract those fields.
Example One
The following example extracts name and social security number from an event that contains data in
name:John ssn:123-45-6789 format and assigns them to Name and SSN fields:
... | rex “name: (?<Name>.*) ssn: (?<SSN>.*)”
Example Two
The following example extracts URLs from events and displays the top 10 of the extracted URLs:
... | rex “http://(?<URL>[^ ]*)” | top URL
Example Three
The following example substitutes the last four digits of social security numbers extracted in the first
event with xxxx:
... | rex field=SSN mode=sed “s/-\d{4}/-xxxx/g”
Administrator's Guide
HPE Logger 6.2 Page 495 of 623
sort
Sorts search results as specified by the sort criteria.
Synopsis
... | sort [<N>] ((+ | -) field)+
Where:
l+ Sorts the results by specified fields in ascending order. This is the default.
l- Sorts the results by specified fields in descending order.
l<N> Keep the top N results, where N can be a number between 1 and 10,000. Default: 10,000.
Usage Notes
Typically, the <field> list contains event fields available in the Logger schema or user-defined fields
created using the rex operator prior in the query. However, fields might also be defined by other
operators such as the eval operator.
Sorting is based on the data type of the specified field.
When multiple fields are specified for a sort operation, the first field is used to sort the data. If there are
multiple same values after the first sort, the second field is used to sort within the same values, followed
by third field, and so on. For example, in the example below, first the matching events are sorted by “cat”
(device event category). If multiple events have the same “cat”, those events are further sorted by
“eventId”.
When multiple fields are specified, you can specify a different sort order for each field. For example, |
sort + deviceEventCategory - eventId.
If multiple fields are specified, separate the field names with a white space or a comma.
Sorting is case-sensitive. Therefore, “Error:105” will precede “error:105” in the sorted list (when sorted in
ascending order).
When a sort operator is included in a query, only the top 10,000 matches are displayed. This is a known
limitation and will be addressed in a future Logger release.
When this operator is included in a query, the search results are not previewable. That is, the query must
finish running before search results are displayed.
Example
... | sort deviceEventCategory eventId
Administrator's Guide
HPE Logger 6.2 Page 496 of 623
tail
Displays the last <N> lines of the search results.
Synopsis
...| tail [<N>]
Where:
<N> is the number of lines to display. Default: 10, if <N> is not specified.
Usage Notes
When this operator is included in a query, the search results cannot be previewed. That is, the query
must finish running before search results are displayed.
Example
... | tail 5
top
Lists the search results in a tabular form of the most common values for the specified field. That is, the
values are listed from the highest count value to the lowest.
Synopsis
...| top [<n>] <field1> <field2> <field3> ...
<n> limits the matches to the top n values for the specified fields. Default: 500, if <N> is not specified.
Usage Notes
The fields can be either event fields available in the Logger schema or user-defined fields created using
the rex or eval operators prior in the query. If multiple fields are specified, separate the field names
with a white space or a comma.
When multiple fields are specified, the count of unique sets of all those fields is listed from the highest to
lowest count.
Administrator's Guide
HPE Logger 6.2 Page 497 of 623

A chart of the search results is automatically generated when this operator is included in a query. You
can click on a charted value to quickly filter down to events with specific field values. For more
information, see "Chart Drill Down" on page115.
To limit the matches to the top n values for the specified fields, specify a value for n.
The value you specify overrides the default value of 500. For example, the following query:
...| top 1000 deviceEventCategory
charts the events with the 1000 most common values in the deviceEventCategory field.
Note: When a chart displays too many events, it can be difficult to read. Therefore, the number of
events returned is limited to 500 by default. If you need to change that default number, please
contact Customer Support.
Examples
... | top deviceEventCategory
... | top 5 categories
transaction
Groups events that have the same values in the specified fields.
Synopsis
... | transaction <field1> <field2>... [maxevents=<number>] [maxspan=<number>
[s|m|h|d]] [maxpause=<number>[s|m|h|d]] [startswith=<reg_exp>]
[endswith=<reg_exp>]
Where:
field1, field2 is a field or a comma-separated field list whose values are compared to determine
events to group. If a field list is specified, the values of the unique sets of all those fields are used to
determine events to group. For example, if host and portNum are specified, and two events contain
“hostA” and “8080”, the events are grouped in a transaction.
maxevents specifies the maximum number of events that can be part of a single transaction. For
example, if you specify 5, after five matching events have been found, additional events are not included
in the transaction. Default: 1000
maxspan specifies the limit on the duration of the transaction. That is, the difference in time between
the first event and all other events in a transaction will never be more than the specified maxspan limit.
For example, if you specify maxspan=30s, the event time of all events within the transaction will be at
most 30 seconds more than the event time of the first event in the transaction. Default: Unlimited
Administrator's Guide
HPE Logger 6.2 Page 498 of 623

maxpause specifies the length of time by which consecutive events in a transaction can be apart. That
is, this option ensures that events in a single transaction are never more than the maxpause value from
the previous event in the transaction. Default: Unlimited
startswith specifies a regular expression that is used to recognize the beginning of a transaction. For
example, if a transaction operator includes startswith= “user [L|l]ogin”, all events are scanned
for this regular expression. When an event matches the regular expression, a transaction is created, and
subsequent events with matching fields are added to the transaction.
Note: The regular expression is applied to the raw event, not to a field in an event.
endswith specifies a regular expression that is used to recognize the end of an existing transaction.
That is, an existing transaction is completed when an event matches the specified “endswith” regular
expression. For example, if a transaction operator includes endswith= “[L|l]ogout”, any event
being added to a transaction is checked, and if the regular expression matches the event, the
transaction is completed.
Note: The regular expression is applied to the raw event, not to a field in an event.
Usage Notes
Several of the above options specify conditions to end a transaction. Therefore, when multiple end
conditions are specified in a transaction operator, the first end condition that occurs will end the
transaction even if the other conditions have not been satisfied yet. For example, if maxspan is reached
but maxevents has not been reached, or if the endswith regular expression is matched but
maxevents has not been reached.
Understanding How the Transaction Operator Works
A transaction is a set of events that contain the same values in the specified fields. The events may be
further filtered based on the options described above, such as maxspan, maxpause, and so on. In
addition to grouping events, the transaction operator adds these fields to each event: transactionid,
duration, and eventcount. These fields are displayed in the Search Results as separate columns.
A transactionid is assigned to each transaction when the transaction completes. Transaction IDs are
integers, assigned starting from 1 for the transactions (set of events) found in the current query. All
events in the same transaction will have the same transaction ID.
If an event does not belong to any transaction found in the current query, it is assigned the transaction
ID 0. For example, in a transaction operator with a startswith regular expression, if the first event
in the pipeline does not match the regular expression, that event is not part of the transaction, and is
assigned transaction ID 0.
Administrator's Guide
HPE Logger 6.2 Page 499 of 623
The duration is the time in milliseconds of the duration of a transaction, which is the difference between
the event time of the last event in the transaction and the first event in the transaction. The duration
field for all events in a transaction is set to the duration value of the transaction.
The eventcount displays the number of events in a transaction.
Example One
To view source addresses accessed within a 5-minute duration:
... | transaction sourceAddress maxspan=5m
Example Two
To group source addresses by source ports and view 5 events per group:
...| transaction sourceAddress sourcePort maxevents=5
Example Three
To group users and URLs they accessed within a 10-minute duration:
... | transaction username startswith= “http://” maxspan=10m
Example Four
To view login transactions from the same session ID and source address in a 1-hour duration:
... | transaction sessionID sourceAddress maxspan=1h startswith= “user [L|l]
ogin”
where
Displays events that match the criteria specified in the “where” expression.
Synopsis
...| where <expression>
<expression> can be any valid field-based query expression, as described in "Indexed Search Portion
of a Query" on page67.
Administrator's Guide
HPE Logger 6.2 Page 500 of 623
Usage Notes
<expression> can only be a valid field-based query expression. Arithmetic expressions or functions
are not supported.
Examples
... | where eventId is NULL
... | where eventId=10006093313 OR deviceVersion CONTAINS “4.0.6.4924.1”
... | where eventId >=10005985569 OR categories= “/Agent/Started”
Administrator's Guide
HPE Logger 6.2 Page 501 of 623

Appendix B: Using SmartConnectors to
Collect Events
Similar to ArcSight Manager, Logger leverages the ArcSight SmartConnectors to collect events.
SmartConnectors can read security events from heterogeneous devices on a network (such as firewalls
and servers) and filter events of interest (and optionally aggregate them) and send them to a Logger
receiver. Logger can receive structured data in the form of normalized Common Event Format (CEF)
events from the SmartConnectors.
The following topics give basic information. For details on a specific Connector, refer to the
documentation for that Connector.
• SmartMessage 502
• Downloading SmartConnectors 503
• Configuring a SmartConnector to Send Events to Logger 503
• Configuring SmartConnectors to Send Events to Both Logger and an ArcSight Manager 504
• Configuring SmartConnectors for Failover Destinations 504
• Sending Events from ArcSight ESM to Logger 505
SmartMessage
SmartMessage is an ArcSight technology that provides an efficient secure channel for Common Event
Format (CEF) events between ArcSight SmartConnectors and Logger.
Caution: SmartMessage and FIPS require SmartConnector 4.7.5 or later. If you do not have the
current build, download the latest from the HPEArcSight web site.
Older SmartConnectors will work with Logger, but may not support SmartMessage or FIPS.
SmartMessage provides an end-to-end encrypted secure channel using secure sockets layer (SSL). One
end is an ArcSight SmartConnector, receiving events from the many devices supported by ArcSight
SmartConnectors. The other end is a SmartMessage receiver on Logger.
Note: The SmartMessage secure channel uses SSL protocol to send encrypted events to Logger.
This is similar to, but different from, the encrypted binary protocol used between SmartConnectors
and ArcSight Manager.
HPE Logger 6.2 Page 502 of 623

Downloading SmartConnectors
For the Enterprise Version of Logger, contact your HPEArcSight sales representative or customer
support for the location to download SmartConnectors.
A restricted set of ArcSight SmartConnectors are available for trial versions of Software Logger. You
can download these SmartConnectors from the same location you downloaded Logger. The
configuration guides for the supported SmartConnectors are available at the same web site. To learn
more about ArcSight SmartConnectors, visit http://www8.hp.com/us/en/software-solutions/enterprise-
security.html.
Configuring a SmartConnector to Send Events to Logger
Logger comes pre-configured with a SmartMessage Receiver. To use it to receive events from a
SmartConnector, you must configure the SmartConnector as described below. You can also create new
SmartMessage receivers and configure the SmartConnectors with these newly created receivers. When
configuring a SmartConnector, be sure to specify the correct receiver name.
To configure a SmartConnector to send events to Logger:
1. Install the SmartConnector component using the SmartConnector User’s Guide as a reference.
Specify Logger as the destination instead of ArcSight ESM or a CEF file.
Note: Refer to the documentation that came with your SmartConnector for instructions.
2. Specify the required parameters. Enter the Logger hostname or IP address and the name of the
SmartMessage receiver. These settings must match the receiver in Logger that listen for events
from this connector.
lTo use the preconfigured receiver, specify SmartMessage Receiver as the Receiver Name.
lTo use SmartMessage to communicate between an ArcSight SmartConnector and a Logger
Appliance, configure the SmartConnector to use port 443.
lTo communicate between an ArcSight SmartConnector and Software Logger, configure the
SmartConnector to use the port configured for the Software Logger.
lFor unencrypted CEF syslog, enter the Logger hostname or IP address, the desired port, and
choose UDP or TCP output.
Administrator's Guide
HPE Logger 6.2 Page 503 of 623
Configuring SmartConnectors to Send Events to Both
Logger and an ArcSight Manager
You can configure a SmartConnector to send CEF syslog output to Logger and send events to an
ArcSight Manager at the same time.
For more information about CEF, refer to the document “ArcSight CEF.” For a downloadable a copy of
this guide, search for “ArcSight Common Event Format (CEF) Guide” in the ArcSight Product
Documentation Community on Protect 724.
1. Install the SmartConnector normally. Register the SmartConnector with a running ArcSight
Manager and test that the SmartConnector is up and running.
2. Start the SmartConnector configuration program again using the $ARCSIGHT_
HOME/current/bin/runagentsetup script (or arcsight agentsetup -w).
3. Select I want to add/remove/modify ArcSight Manager destinations, then choose Add new
destination.
4. Choose Logger and specify the requested parameters. Restart the SmartConnector for changes to
take effect.
Configuring SmartConnectors for Failover Destinations
SmartConnectors can be configured to send events to a secondary, failover, destination when a primary
connection fails.
To configure a failover destination, follow these steps:
1. Configure the SmartConnector for the primary Logger as described above. The transport must be
raw TCP in order to detect the transmission errors that trigger failover.
2. Edit the agent.properties file in the directory $ARCSIGHT_HOME/current/user/agent, where
$ARCSIGHT_HOME is the root directory where the SmartConnector component was installed.
Add this property: transport.types=http,file,cefsyslog
Delete this property: transport.default.type.
3. Start the SmartConnector configuration program again using the $ARCSIGHT_
HOME/current/bin/runagentsetup script (or arcsightagentsetup -w).
4. Choose I want to add/remove/modify and, with the primary Logger selected, choose Modify.
Then select Add failover destination.
5. Enter information for the secondary Logger.
6. Restart the SmartConnector for the changes to take effect.
Administrator's Guide
HPE Logger 6.2 Page 504 of 623
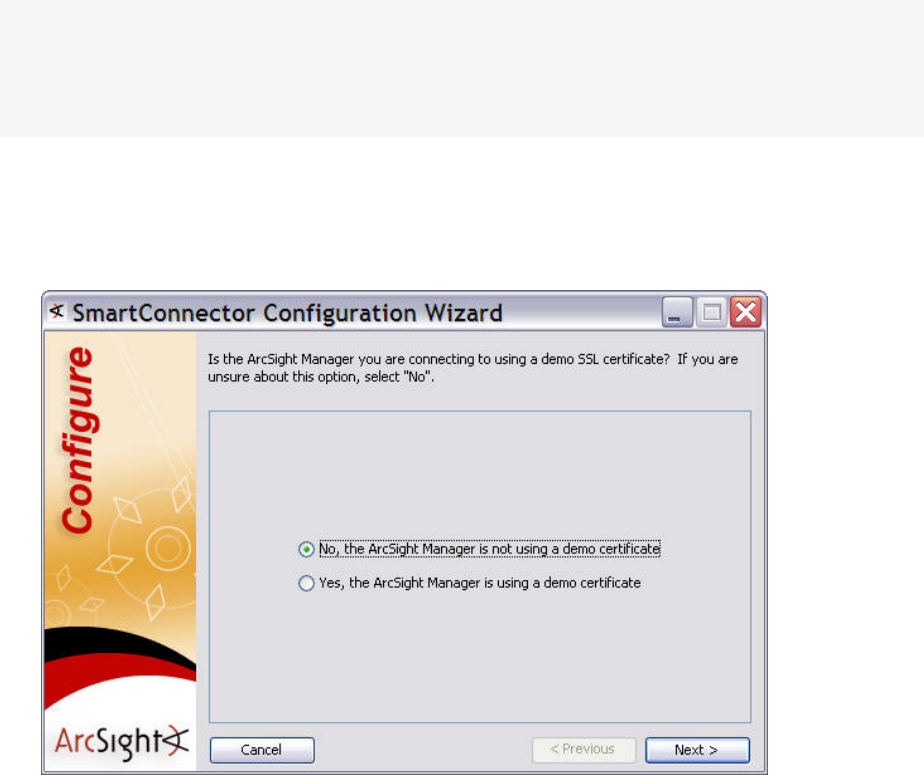
7. For more information about installing and configuring ArcSight SmartConnectors, refer to the
ArcSight SmartConnector User's Guide, or specific SmartConnector Configuration Guides, available
from the ArcSight Product Documentation Community on Protect 724.
Sending Events from ArcSight ESM to Logger
The ArcSight Forwarding SmartConnector can read events from an ArcSight Manager and forward
them to Logger as CEF-formatted syslog messages.
Note: The Forwarding SmartConnector is a separate installable file, named similar to this:
ArcSight-4.x.x.<build>.x-SuperConnector-<platform>.exe
Use build 4810 or later for compatibility with Logger.
To configure the ArcSight Forwarding SmartConnector to send events to Logger:
1. Install the SmartConnector component normally, but cancel the installation when the
SmartConnector Wizard asks whether the target Manager uses a demo certificate.
When the first screen of the SmartConnector Configuration Wizard appears, asking about a demo
certificate, click Cancel.
2. Confirm that you want to exit, then click Done to dismiss the Install Wizard. This will install the
SmartConnector, but leave it un-configured.
Administrator's Guide
HPE Logger 6.2 Page 505 of 623

3. Create a file called agent.properties in the directory $ARCSIGHT_HOME/current/user/agent,
where $ARCSIGHT_HOME is the root directory where the SmartConnector component was installed.
This file should contain a single line:
transport.default.type=cefsyslog
4. Start the SmartConnector configuration program again using the $ARCSIGHT_
HOME/current/bin/runagentsetup script (or arcsight agentsetup -w).
5. Specify the required parameters for CEF output. Enter the desired port for UDP or TCP output.
Tip: These settings will need to match the receiver you create in Logger to listen for events
from ArcSight ESM.
Parameter Description
Ip/Host IP or host name of the Logger
Port 514 or another port that matches the receiver
Protocol UDP or Raw TCP
ArcSight Source Manager
Host Name
IP or host name of the source ArcSight Manager
ArcSight Source Manager
Port
8443 (default)
ArcSight Source Manager
User Name
A user account on the source Manager with sufficient privileges
to read events
ArcSight Source Manager
Password
Password for the specified Manager user account
SmartConnector Name A name for the ESM to Logger connector (visible in the
Manager)
SmartConnector Location Notation of where this connector is installed
Device Location Notation of where the source Manager is installed
Comment Optional comments
To configure the Forwarding SmartConnector to send CEF output to Logger and send events to
another ArcSight Manager at the same time, see "Configuring SmartConnectors to Send Events to Both
Logger and an ArcSight Manager" on page504.
Administrator's Guide
HPE Logger 6.2 Page 506 of 623

Appendix C: Using the Rex Operator
The rex operator is a powerful operator that enables you to extract information that matches a
specified regular expression and assigns it to a field, whose field name you specify. You can also specify
an optional start point and an end point in the rex expression between which the information matching
the regular expression is searched.
When a rex expression is included in a search query, it must be preceded by a basic search query that
finds events from which the rex expression will extract information. For example:
failed | rex “(?<srcip>[^ ]\d{1,3}\.\d{1,3}\.\d{1,3}\.\d{1,3})”
The following topics describe the rex search operator in detail.
• Syntax of the rex Operator 508
• Ways to Create a rex Expression 509
• Example rex Expressions 510
Syntax of the rex Operator
| rex “text1(?<field1>text2regex)”
Where:
ltext1: The text or point in the event AFTER which information extraction begins. The default is the
beginning of the event.
ltext2: The text or point in the event at which information extraction ends.
lfield1: The name of the field to which the extracted information is assigned.
lregex: The pattern (regular expression) used for matching information to be extracted between
text1 and text2.
Tip: If you are an experienced regular expression user, see the Note in the next section for a quick
understanding of how rex enables you to capture named input and reference it for further
processing.
Understanding the rex Operator Syntax
Extract all information after text1 and until text2 that matches the specified regex (regular
expression) and assign to field1.
ltext1 and [text2] can be any points in an event—start and end of an event, specific string in an
event (even if the string is in the middle of a word in the event), a specific number of characters from
the start or end of an event, or a pattern.
HPE Logger 6.2 Page 508 of 623

lTo specify the next space in the event as text2, enter [^ ].
This is interpreted as “not space.” Therefore, entering a “not” results in the capture to stop at the
point where the specified character, in this case, a space, is found in the event.
lTo specify [text2] to be the end of the line, enter [^$].
This is interpreted as "not end of line." Therefore, when an end-of-line in an event is encountered, the
capture will stop at that point. The [^$] usage only captures one character if it is not an end-of-line
character. However, by specifying [^$]* in a rex expression, the usage captures all characters until
end-of-line.
You can also specify .* to capture all characters in an event instead of [^$]. Examples in this
document, however, use [^$].
lAny extra spaces within the double quotes of the rex expression are treated literally.
lThe characters that need to be escaped for rex expressions are the same as the ones for regular
expressions. Refer to a regular expressions document of your choice to obtain a complete list of such
characters.
lInformation captured by a rex expression can be used for further processing in a subsequent rex
expression as illustrated in the following example in which an IP address is captured by the first rex
expression and the network ID (assuming the first three bytes of the IP address represent it) to
which the IP address belongs is extracted from the captured IP address:
logger | rex "(?<srcip>[^ ]\d{1,3}\.\d{1,3}\.\d{1,3}\.\d{1,3})" | rex
field=srcip "(?<netid>\d{1,3}\.\d{1,3}\.\d{1,3})"
Note: If you are an experienced regular expression user, you can interpret the rex expression
syntax as follows:
rex "(?<field1>regex)"
where the entire expression in the parentheses specifies a named capture. That is, the captured
group is assigned a name, which can be referenced later for further processing. For example, in
the following expression “srcip” is the name assigned to the capture.
failed | rex "(?<srcip>[^ ]\d{1,3}\.\d{1,3}\.\d{1,3}\.\d{1,3})"
Once named, use “srcip” for further processing as follows:
failed | rex "(?<srcip>[^ ]\d{1,3}\.\d{1,3}\.\d{1,3}\.\d{1,3})" | top
srcip
Ways to Create a rex Expression
You can create a rex expression in two ways:
lManually: Follow the syntax and guidelines described in this appendix to create a rex expression to
suit your needs.
Administrator's Guide
HPE Logger 6.2 Page 509 of 623

lRegex Helper: Use the Regex Helper tool, as described in "Regex Helper Tool" on page92. This tool
not only simplifies the process, it also makes it less error prone and more efficient.
Creating a rex Expression Manually
Start with a simple search that finds the events that contains the information in which you are
interested. Once the events are displayed, identify a common starting point in those events that
precedes the information.
For example, say you want to extract the client IP address, which always appears after the word
“[client” in the following event:
[Thu Jul 30 01:20:06 2009] [error] [client 69.63.180.245] PHP Warning:
memcache_pconnect() [<a href='function.memcache-pconnect'>function.memcache-
pconnect</a>]: Can't connect to 10.4.31.4:11211
Therefore, “[client” is the starting point. A good end point is the “]” after the last byte of the client IP
address. Now, we need to define the regular expression that will extract the IP address. Because in this
example, only the client IP address appears after the word “client”, we use “*” as the regular expression,
which means “extract everything”. (We could be more specific and use \d{1,3}\.\d{1,3}\.\d{1,3}
\.\d{1,3} for the IP address.) We assign the extracted IP address to a field name “clientIP”. We are
almost ready to create a rex expression, except that we need to escape the “[” and “]” characters in the
expression. The escape character to use is “\”.
Now, we are ready to create the rex expression to extract the IP address that appears after the word
“client” in the event shown above:
| rex "\[client(?<clientip>[^\]]*)"
Example rex Expressions
This section contains several sample examples for extracting different types of information from an
event. The specificity of the information extracted increases with each example. Use these examples as a
starting point for creating rex expressions to suit your needs. Also, use the Regex Helper tool that
simplifies rex expression creation.
The following event examples illustrate how different rex expressions extract information.
Example One
The following rex example uses this event for illustration:
Administrator's Guide
HPE Logger 6.2 Page 510 of 623
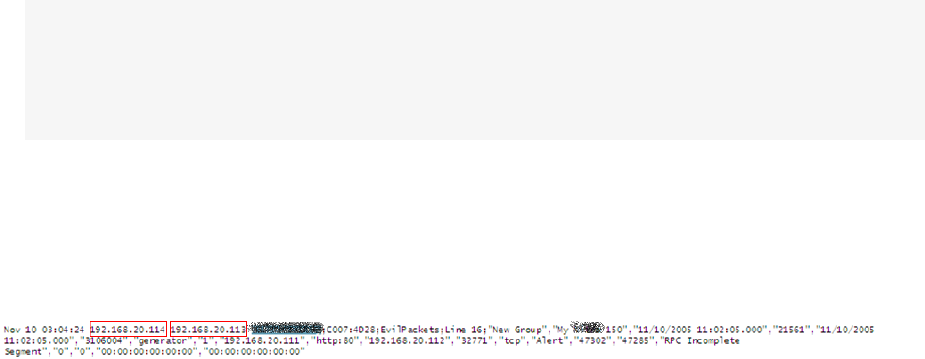
lCapture matching events from the left of the pipeline and assign them to the field message. The
entire event is assigned to the message field.
| rex “(?<message>[^$]*)”
This expression extracts the entire event (as shown above), starting at the word “CEF:0”.
lSpecifying the starting point as number of characters from the start of an event instead of a specific
character or word
| rex “[a-zA-Z0-9:\.\s]{16}(?<message>[^$]*)”
This expression starts extracting after 16 consecutive occurrences of the characters specified for
text1—alphanumeric characters, colons, periods, or spaces. Although the first 16 characters of the
first event are CEF:0|ArcSight|L, the extraction does not begin at “Logger|4.5.0…” because the
pipeline character is not part of the characters we are matching, but this character is part of the
beginning of the event. Therefore, the first 16 consecutive occurrences are “Logger Internal” As a
result, information starting at the word Event is extracted from our example event.
lExtract a specified number of characters instead of specifying an end point such as the next space or
the end of the line
| rex “[a-zA-Z0-9:\.\s]{16}(?<message>[^$]{5})”
This expression only extracts the word “Event.” (See the previous sample rex expression for a
detailed explanation of the reason extraction begins at the word “Event”.)
lExtract everything after “CEF:0|” into the message field. Then, pipe events for which the message
field is not null through another rex expression to extract the IP address contained in the matching
events and assign the IP addresses to another field, msgip. Only display events where msgip is not
null.
| rex “CEF:0\|(?<message>[^$]*)” | where message is not null | rex “dvc=
(?<msgip>[^ ]\d{1,3}\.\d{1,3}\.\d{1,3}\.\d{1,3})” | where msgip is not null
Note: The colon (:) and equal sign (=) characters do not need to be escaped; however, pipe (|)
characters must be escaped. The characters that need to be escaped for rex expressions are the
same as the ones for regular expressions. Refer to a regular expressions document of your
choice to obtain a complete list of such characters.
This expression extracts the device IP address from the event.
Example Two
The following rex example uses this event for illustration:
Administrator's Guide
HPE Logger 6.2 Page 511 of 623

lExtract the first two IP addresses from an event and assign them to two different fields, IP1 and IP2.
| rex “(?<IP1>[^$]\d{1,3}\.\d{1,3}\.\d{1,3}\.\d{1,3})” | rex “\d{1,3}\.\d
{1,3}\.\d{1,3}\.\d{1,3}(?<IP2>[^$]\d{1,3}\.\d{1,3}\.\d{1,3}\.\d{1,3})”
This expression extracts the first and second IP addresses in the above event.
Because the two IP addresses are right after one another in this event, you can also specify the
extraction of the two IP addresses in a single rex expression as follows:
| rex “(?<IP1>[^$]\d{1,3}\.\d{1,3}\.\d{1,3}\.\d{1,3})(?<IP2>[^$]\d{1,3}\.\d
{1,3}\.\d{1,3}\.\d{1,3})”
Note: Do not enter any spaces in the expression.
lBuilding on the previous example, add a new field called Ignore. Assign the value “Y” to this field if
the two IP addresses extracted in the previous example are the same and assign the value “N” if the
two IP addresses are different. Then, list the top IP1 and IP2 combinations for events for which
Ignore field is “N”.
| rex (?<IP1>[^$]\d{1,3}\.\d{1,3}\.\d{1,3}\.\d{1,3})” | rex “\d{1,3}\.\d
{1,3}\.\d{1,3}\.\d{1,3}(?<IP2>[^$]\d{1,3}\.\d{1,3}\.\d{1,3}\.\d{1,3})” |
eval Ignore=if(IP1==IP2,“Y”,“N”) | where Ignore=“N” | top IP1 IP2
Note: The eval command uses a double equal sign (==) to equate the two fields.
lInformation captured by a rex expression can be used for further processing in a subsequent rex
expression as illustrated in the following example. The first IP address is captured by the first rex
expression and the network ID (assuming the first three bytes of the IP address represent it) to
which the IP address belongs is extracted from the captured IP address:
logger | rex “(?<srcip>[^ ]\d{1,3}\.\d{1,3}\.\d{1,3}\.\d{1,3})” | rex
field=srcip “(?<netid>\d{1,3}\.\d{1,3}\.\d{1,3})
Example Three
The following rex example uses this event for illustration:
127.0.0.1 - name [10/Oct/2010:13:55:36 -0700] "GET /apache_pb.gif HTTP/1.0"
200 2326 "http://www.example.com/start.html" "Mozilla/4.08 [en] (Win98; I
;Nav)"
lExtract all URLs from events and generate a chart of the URL counts, excluding blank URLs. (The
events contain the URL string in “http://” format.)
| rex “http://(?<customURL>[^ ]*)” | where customURL is not null | chart
Administrator's Guide
HPE Logger 6.2 Page 512 of 623
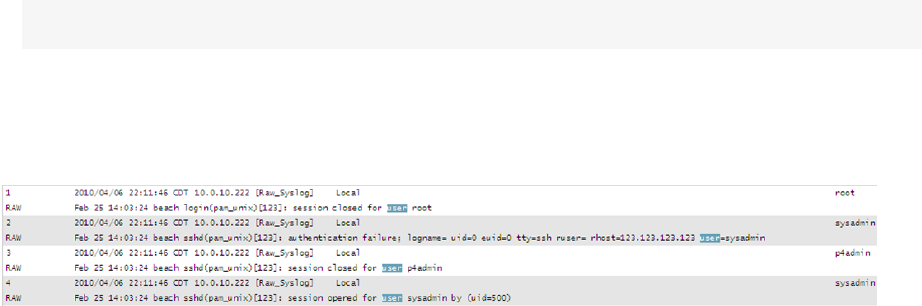
count by customURL | sort - customURL
Note: The meta character “/” needs to be enclosed in square brackets [] to be treated literally.
Example Four
The following rex example uses this event for illustration:
lExtract the first word after the word “user” (one space after the word) or “user=”. The word “user”
is case-insensitive in this case, and must be preceded by a space character. That is, words such as
“ruser” and “suser” should not be matched.
| rex “\s[u|U][s|S][e|E][r|R][\s|=](?<CustomUser>[^ ]*)”
Administrator's Guide
HPE Logger 6.2 Page 513 of 623

Appendix D: Logger Audit Events
You can forward the Logger audit events, which are in Common Event Format (CEF), to ArcSight ESM
directly for analysis and correlation. Use the Audit Forwarding feature (as described in "Audit
Forwarding" on page418) to forward the events.
For more information about CEF, refer to the document "ArcSight CEF". For a downloadable a copy of
this guide, search for “ArcSight Common Event Format (CEF) Guide” in the ArcSight Product
Documentation Community on Protect 724.
The following topics describe Logger’s audit events:
• Types of Audit Events 514
• Information in an Audit Event 514
• Platform Events 515
• Application Events 522
Types of Audit Events
Two types of audit events are generated on Logger and available for Audit Forwarding to ArcSight
ESM.
l"Platform Events" on the next page, which are related to the Logger hardware/system.
l"Application Events" on page522, which are related to Logger functions and configuration changes
on it.
Both types of events are stored in the Logger Internal Storage Group. As a result, these events can be
searched using the Logger Search UI. For example, you can search for this platform event:
“/Platform/Authentication/Failure/Password”
Information in an Audit Event
A Logger audit event (in CEF format) contains information about the following prefix fields:
lDevice Event Class ID
lDevice Severity
lMessage
lDevice Event Category—(keyName for this CEF extension is “cat”)
HPE Logger 6.2 Page 514 of 623

For example:
Sep 19 08:26:10 zurich CEF:0|ArcSight|Logger|3.5.0.13412.0|logger:500|Filter
added|2| cat=/Logger/Resource/Filter/Configuration/Add
msg=Filter [Regex Query Test] has been added
Platform Events
The following table lists the information contained in audit events related to the Logger platform. All
events include the following fields.
lduser—UserName
lduid—User ID
lsrc—IP address of client
ldst—IP address of appliance
lcat—Device Event Category
lcn1—Session number
lcn1label—Session
Additional fields (if applicable) are listed in the following table.
Device Event
Class ID Sev. Device Event Category (cat) Message Additional Fields
platform:200 5 /Platform/Authentication/
PasswordChange/Failure
Failed password change
platform:201 7 /Platform/Authentication/Failure Failed login attempt
platform:202 5 /Platform/Authentication/
PasswordChange
Password changed cs1: Affected User Id
cs2: Affected User Login
cs3: Affected User Full
Name
platform:203 7 /Platform/Authentication/
InactiveUser/Failure
Login attempt by inactive
user
platform:213 7 /Platform/Configuration
/Global/AuditEvents
Audit forwarding modified cs1: Audit Forwarders
platform:220 5 /Platform/Certificate
/Install
Installed certificate cs1: Network Protocol
platform:221 7 /Platform/Certificate/Mismatch Certificate mismatch
failure
cs1: Network Protocol
platform:222 1 /Platform/Certificate/Request Created certificate signing
request
cs1: Certificate Signing
Request
cs2: Network Protocol
Administrator's Guide
HPE Logger 6.2 Page 515 of 623

Device Event
Class ID Sev. Device Event Category (cat) Message Additional Fields
platform:224 5 /Platform/Certificate/
Regenerate
Re-generate self-signed
certificate
cs1: Certificate Signing
Request
cs2: Network Protocol
platform:226 7 /Platform/Update/Failure/
CorruptPackage
Uploaded update file
damaged or corrupt
cs1: Error
cs2: fname
cs3: fsize
platform:227 5 /Platform/Update/Applied Update installation
success
cs1: Update Name
cs2: Is Reboot Required
platform:228 7 /Platform/Update/Failure
/Installation
Update installation failure cs1: Error
cs2: Update Name
platform:230 3 /Platform/Authentication
/Login
Successful login
platform:234 7 /Platform/Authentication
/Failure/LOCKED
Failed login attempt
(LOCKED)
platform:239 3 /Platform/Authentication
/Logout
User logout
platform:240 3 /Platform/Authorization
/Groups/Add
Added user group cn2: Current Number of
Users
cn3: Current Number of
User Rights
cs1: Affected Group
Name
cs2: Affected Group Id
flexNumber1: Old
Number of Users
flexNumber2: Old
Number of User Rights
platform:241 3 /Platform/Authorization
/Groups/Update
Updated user group cn2: Current Number of
Users
cn3: Current Number of
User Rights
cs1: Affected Group
Name
cs2: Affected Group Id
flexNumber1: Old
Number of Users
flexNumber2: Old
Number of User Rights
platform:242 5 /Platform/Authorization
/Groups/Membership
/Update/Clear
Removed all members
from group
Administrator's Guide
HPE Logger 6.2 Page 516 of 623

Device Event
Class ID Sev. Device Event Category (cat) Message Additional Fields
platform:243 3 /Platform/Authorization
/Groups/Membership/Update
Modified user group
membership
platform:244 3 /Platform/Authorization
/Groups/Delete
Deleted user group cs1: Affected Group
Name
cs2: Affected Group Id
platform:245 3 /Platform/Authorization
/Users/Add
Added user cs1: Affected User Id
cs2: Affected User Login
cs3: Affected User Full
Name
platform:246 3 /Platform/Authorization
/Users/Update
Updated user cs1: Affected User Id
cs2: Affected User Login
cs3: Affected User Full
Name
platform:247 3 /Platform/Authorization/Users
/Delete
Deleted user cs1: Affected User Id
cs2: Affected User Login
cs3: Affected User Full
Name
platform:248 3 /Platform/Authentication
/Logout/SessionExpiration
Session expired
platform:249 7 /Platform/Authentication
/AccountLocked
Account locked
platform:250 5 /Platform/Storage/RFS
/Add
Added remote mount
point
cs1: RFS Mount Name
cs2: RFS Mount Host and
Remote Path
platform:251 5 /Platform/Storage/RFS
/Edit
Edited remote mount
point
cs1: RFS Mount Name
cs2: RFS Mount Host and
Remote Path
platform:252 7 /Platform/Storage/RFS
/Failure
Failed to create remote
mount point
cs1: Server
cs2: Remote Directory
cs3: Mount Name
cs4: Mount Type
cs5: Username
platform:253 5 /Platform/Storage/RFS
/Remove
Removed remote mount
point
cs1: RFS Mount Name
cs2: RFS Mount Host and
Remote Path
platform:254 5 /Platform/Storage/SAN
/Destroy
Destroyed SAN Logical
Unit
cs1: Volume label
platform:255 5 /Platform/Storage/SAN
/Attach
Attached SAN Logical Unit cn2: Volume size (in MB)
cs1: Volume label
Administrator's Guide
HPE Logger 6.2 Page 517 of 623

Device Event
Class ID Sev. Device Event Category (cat) Message Additional Fields
cs2: World-wide Name
cs3: Filesystem type
platform:256 7 /Platform/Storage/SAN
/Detach
Detached SAN Logical
Unit
cs1: Storage unit details
platform:259 5 /Platform/Storage/SAN
/Reattach
Reattached SAN Logical
Unit
cs1: Volume label
cs2: Filesystem type
platform:260 5 /Platform/Configuration
/Network/Route/Update
Static route modified cs1: Destination
cs2: Subnet
cs3: Gateway
platform:261 5 /Platform/Configuration
/Network/Route/Remove
Static route removed cs1: Destination
cs2: Subnet
cs3: Gateway
platform:262 5 /Platform/Configuration
/Time
Appliance time modified cs1: Old Date/Time
cs2: New Date/Time
cs3: Old Time Zone
cs4: New Time Zone
platform:263 5 /Platform/Configuration
/Network
NIC settings modified cs1: NIC
cs2: IP Address
cs3: Netmask
cs4: Speed
platform:264 5 /Platform/Configuration
/Network/NTP
NTP server settings
modified
cs1: NTP Servers
cs2: Is Appliance NTP
Server
platform:265 5 /Platform/Configuration
/Network/DNS
DNS settings modified
platform:266 5 /Platform/Configuration
/Network/Hosts
Hosts file modified cs1: Difference from
previous hosts file
platform:267 5 /Platform/Configuration
/SMTP
SMTP settings modified cs1: EMail Address
cs2: SMTP Server
cs3: Backup SMTP Server
platform:268 5 /Platform/Configuration
/Network/Route/Add
Static route added cs1: Destination
cs2: Subnet
cs3: Gateway
platform:270 5 /Platform/Authorization
/Users/Inactive/Disable
Inactive user disabled cs1: User Login
deviceCustomDate1: Date
Last Active
platform:280 7 /Appliance/State/Reboot
/Initiate
Appliance reboot initiated
Administrator's Guide
HPE Logger 6.2 Page 518 of 623

Device Event
Class ID Sev. Device Event Category (cat) Message Additional Fields
platform:281 3 /Appliance/State/Reboot
/Cancel
Appliance reboot canceled
platform:282 7 /Appliance/State/
Shutdown
Appliance poweroff
initiated
platform:284 5 /Platform/Storage/
Multipathing/Enable
Enabled SAN
Multipathing
cs1: Multipath
Configuration
platform:285 5 /Platform/Storage/
Multipathing/Disable
Disabled SAN
Multipathing
platform:300 5 /Platform/Certificate
/Install
Installed trusted certificate cs1: Certificate details
platform:301 5 /Platform/Certificate
/Revocation/Install
Installed certificate
revocation list
cs1: CRL details
platform:302 5 /Platform/Certificate/Delete Deleted trusted certificate cs1: Certificate details
platform:303 5 /Platform/Certificate/
Revocation/Delete
Deleted certificate
revocation list
cs1: CRL details
platform:304 7 /Platform/Certificate/
Install/Failure
Failed installing trusted
certificate
cs1: Error
cs2: File Size
cs3: File Name
platform:305 7 /Platform/Certificate/
Revocation/Install/Failure
Failed installing certificate
revocation list
cs1: Error
cs2: File Size
cs3: File Name
platform:306 5 /Platform/Process/Start Start process cs1: Process Name
platform:307 5 /Platform/Process/Stop Stop process cs1: Process Name
platform:308 5 /Platform/Process/Restart Restart process cs1: Process Name
platform:310 5 /Platform/Configuration
/FIPS/Enable
Enabled FIPS mode
platform:311 7 /Platform/Configuration
/FIPS/Disable
Disabled FIPS mode
platform:312 7 /Platform/Configuration
/WebServer/CipherStrength
Web server cipher
strength changed
cs1: New Value
cs2: Old Value
platform:320 3 /Appliance/State
/Shutdown/Cancel
Appliance poweroff
canceled
platform:371 5 /Platform/Service/Restart Restarted OS service cs1: Service Name
platform:400 2 /Platform/Diagnostics
/Command
Ran diagnostic command cs1: Diagnostic Command
Administrator's Guide
HPE Logger 6.2 Page 519 of 623

Device Event
Class ID Sev. Device Event Category (cat) Message Additional Fields
platform:407 7 /Platform/Certificate
/SSL/Expiration
SSL certificate expiration
warning
cs1: Issuer
cs2: Subject
deviceCustomDate1:
Expiration Date
platform:408 5 /Appliance/State/Startup Appliance startup
completed
deviceCustomDate1:
Startup Date
platform:409 3 /Platform/Configuration
/LoginBanner
Configure login warning
banner
cs1: Acknowledgment
Prompt
cs2: Banner Text
platform:410 5 /Platform/Configuration
/Network
Network settings modified cs1: Gateway
cs2: Multi-homing
cs3: Hostname
platform:411 5 /Platform/Authentication
/PasswordChange
Automated Password
Reset
cn2: User ID
cs1: User Login
platform:412 3 /Platform/Configuration
/Locale
Set Locale cs1: Locale
platform:440 3 /Platform/Configuration/
SNMP
SNMP configuration
modified
cn2: Port Number
cn3: Refresh Interval
cs1: SNMP Enabled
cs2: Community String
cs3: Listen Address(es)
platform:460 3 /Platform/Network/Alias/Add NIC alias added cs1: NIC
cs2: IP Address
cs3: Netmask
platform:462 3 /Platform/Network/Alias
/Remove
NIC alias removed cs1: NIC
cs2: IP Address
cs3: Netmask
platform:500 5 /Platform/Authorization
/Groups/Membership
/Remove
Remove member from
group
cs1: Affected Group
Name
cs2: Affected User Login
cs3: Affected Group Id
cs4: Affected User Id
platform:501 5 /Platform/Authorization
/Groups/Membership/Add
Group member added cs1: Affected Group
Name
cs2: Affected User Login
cs3: Affected Group Id
cs4: Affected User Id
platform:502 5 /Platform/Authorization
/Users/Groups/Remove
User removed from group cs1: Affected Group
Name
cs2: Affected User Login
Administrator's Guide
HPE Logger 6.2 Page 520 of 623

Device Event
Class ID Sev. Device Event Category (cat) Message Additional Fields
cs3: Affected Group Id
cs4: Affected User Id
platform:503 5 /Platform/Authorization
/Users/Groups/Add
User added to group cs1: Affected Group
Name
cs2: Affected User Login
cs3: Affected Group Id
cs4: Affected User Id
platform:530 5 /Platform/Configuration
/Authentication/Sessions
/Success
Authentication Session
settings successfully
changed.
cn2: New Value
cn3: Old Value
cs1: Parameter Changed
platform:540 5 /Platform/Configuration
/Authentication/Password
/Lockout/Success
Password Lockout settings
successfully updated.
cn2: New Value
cn3: Old Value
cs1: Parameter Changed
platform:550 5 /Platform/Configuration
/Authentication/Password
/Expiration/Success
Password Expiration
settings successfully
updated.
cn2: New Value
cn3: Old Value
cs1: Parameter Changed
platform:560 5 /Platform/Configuration
/Authentication/Password
/Validation/Success
Password Validation
settings successfully
updated.
cn2: New Value
cn3: Old Value
cs1: Parameter Changed
platform:570 5 /Platform/Configuration
/Authentication/Password
/AutomatedPasswordReset
/Success
Password Automated
Password Reset setting
successfully updated.
cs1: Parameter Changed
cs2: New Value
cs3: Old Value
platform:580 5 /Platform/Configuration
/Authentication/Certificate
/Success
Client Certificate
authentication settings
successfully changed.
cs1: Parameter Changed
cs2: New Value
cs3: Old Value
platform:590 5 /Platform/Configuration
/Authentication/RADIUS
/Success
RADIUS authentication
settings successfully
changed.
cs1: Parameter Changed
cs2: New Value
cs3: Old Value
platform:600 5 /Platform/Configuration
/Authentication/LDAP/
Success
LDAP authentication
settings successfully
changed.
cs1: Parameter Changed
cs2: New Value
cs3: Old Value
platform:610 5 /Platform/Configuration
/Authentication/Global
/Success
Global Authentication
settings successfully
changed.
cs1: Parameter Changed
cs2: New Value
cs3: Old Value
Administrator's Guide
HPE Logger 6.2 Page 521 of 623

Application Events
The following table lists the information contained in audit events related to various Logger functions
and configuration changes on it. The Severity for all Logger application events is2.
Device
Event
Class ID
Device Event
Category (cat) Message Additional Fields
Alerts
logger:610 /Logger/Component
/Alert/Configuration
/Add
Alert [name] has been
added
fname=AlertName
duser=UserName
duid=userId
cs4=sessionIdfile
cs4Label=Session ID
fileType=forwarderType
dvc=syslogOrSnmpIpAddr
dvchost=syslogOrSnmpHostName
cn1Label=Syslog or SNMP Destination Port
cn1=syslogOrSnmpPort
cs1Label=Filter
cs1=filter
cs2Label=Email Destination(s)
cs2=emailAddresses
logger:611 /Logger/Component
/Alert/Configuration
/Delete
Alert [name] has been
deleted
fname=AlertName
duser=UserName
duid=userId
cs4=sessionIdfile
cs4Label=Session ID
fileType=forwarderType
dvc=syslogOrSnmpIpAddr
dvchost=syslogOrSnmHostName
cn1Label=Syslog or SNMP Destination Port
cn1=syslogOrSnmpPort
cs1Label=Filter
cs1=filter
cs2Label=Email Destination(s)
cs2=emailAddresses
logger:612 /Logger/Component
/Alert/Configuration
/Update
Alert [name] has been
updated
fname=AlertName
duser=UserName
duid=userId
cs4=sessionIdfile
cs4Label=Session ID
fileType=forwarderType
dvc=syslogOrSnmpIpAddr
dvchost=syslogOrSnmpHostName
Administrator's Guide
HPE Logger 6.2 Page 522 of 623

Device
Event
Class ID
Device Event
Category (cat) Message Additional Fields
cn1Label=Syslog or SNMP Destination Port
cn1=syslogOrSnmpPort
cs1Label=Filter
cs1=filter
cs2Label=Email Destination(s)
cs2=emailAddresses
logger:613 /Logger/Component
/Alert/Configuration
/Enable
Alert [name] has
been enabled
fname=AlertName
duser=UserName
duid=userId
cs4=sessionIdfile
cs4Label=Session ID
fileType=forwarderType
dvc=syslogOrSnmpIpAddr
dvchost=syslogOrSnmpHostName
cn1Label=Syslog or SNMP Destination Port
cn1=syslogOrSnmpPort
cs1Label=Filter
cs1=filter
cs2Label=Email Destination(s)
cs2=emailAddresses
logger:614 /Logger/Component
/Alert/Configuration
/Disable
Alert [name] has been
disabled
fname=AlertName
duser=UserName
duid=userId
cs4=sessionIdfile
cs4Label=Session ID
fileType=forwarderType
dvc=syslogOrSnmpIpAddr
dvchost=syslogOrSnmpHostName
cn1Label=Syslog or SNMP Destination Port
cn1=syslogOrSnmpPort
cs1Label=Filter
cs1=filter
cs2Label=Email Destination(s)
cs2=emailAddresses
logger:615 /Logger/Alert
/Configuration/Sent
Alert [name] has been
sent
fname=AlertName
duser=UserName
duid=userId
cs4=sessionIdfile
cs4Label=Session ID
fileType=forwarderType
dvc=syslogOrSnmpIpAddr
dvchost=syslogOrSnmpOr
EsmHostName
cn1Label=Syslog Or SNMP Or ESM Destination
Administrator's Guide
HPE Logger 6.2 Page 523 of 623

Device
Event
Class ID
Device Event
Category (cat) Message Additional Fields
Port
cn1=syslogOrSnmpOrEsmPort
cs1Label=Filter
cs1=filter
cs2Label=Email Destination(s)
cs2=emailAddresses
Certificates
logger:643 /Logger/Component/
Certificate/Configuration
/Add
Certificate [name] has
been added
fname=alias
duser=UserName
duid=userId
cs4=sessionId
cs4Label=Session ID
fileType=Certificate
logger:650 /Logger/Component/
Certificate/Configuration
/Delete
Certificate [name] has
been deleted
fname=alias
duser=UserName
duid=userId
cs4=sessionId
cs4Label=Session ID
fileType=Certificate
logger:651 /Logger/Component/
Certificate/Configuration
/Update
Certificate [name] has
been updated
fname=alias
duser=UserName
duid=userId
cs4=sessionId
cs4Label=Session ID
fileType=Certificate
Configuration Backup
logger:660 /Logger/Component/
ConfigBackup
/Configuration/Update
Configuration backup
has been updated
fname=Configuration Backup
duser=UserName
duid=userId
cs4=sessionId
cs4Label=Session ID
fileType=Configuration Backup
logger:661 /Logger/Component/
ConfigBackup
/Configuration/Enable
Configuration backup
has been enabled
fname=Configuration Backup
duser=UserName
duid=userId
cs4=sessionId
cs4Label=Session ID
fileType=Configuration Backup
logger:662 /Logger/Component/
ConfigBackup
/Configuration/Disable
Configuration backup
has been disabled
fname=Configuration Backup
duser=UserName
duid=userId
Administrator's Guide
HPE Logger 6.2 Page 524 of 623

Device
Event
Class ID
Device Event
Category (cat) Message Additional Fields
cs4=sessionId
cs4Label=Session ID
fileType=Configuration Backup
logger:665 /Logger/Component
/ConfigBackup
/Configuration/Backup
Configuration backup
succeeded. Transfer
process finished.
fname=Configuration Backup
fileType=Configuration Backup
fpath=pathToBackupFile
fsize=fileSizeInByte
ESM Destinations
logger:640 /Logger/Component/
EsmDestination/
Configuration/Add
ESM destination [name]
has been added
fname=esmDestinationName
duser=UserName
duid=userId
cs4=sessionIdfile
cs4Label=Session ID
fileType=ESM Destination
fileId=esmDestinationId
dvc=esmDestinationIp
dvchost=esmDestinationHost
cn1Label=ESM Destination Port
cn1=esmDestinationPort
cs1Label=Connector Name
cs1=connectorName
cs2Label=Connector Location
cs2=connectorLocation
cs3Label=Logger Location
cs3=loggerLocation
logger:641 /Logger/Component/
EsmDestination/
Configuration/Delete
ESM destination [name]
has been deleted
fname=esmDestinationName
duser=UserName
duid=userId
cs4=sessionId file
cs4Label=Session ID
fileType=ESM Destination
fileId=esmDestinationId
dvc=esmDestinationIp
dvchost=esmDestinationHost
cn1Label=ESM Destination Port
cn1=esmDestinationPort
cs1Label=Connector Name
cs1=connectorName
cs2Label=Connector Location
cs2=connectorLocation
cs3Label=Logger Location
cs3=loggerLocation
Administrator's Guide
HPE Logger 6.2 Page 525 of 623

Device
Event
Class ID
Device Event
Category (cat) Message Additional Fields
Forwarders
logger:605 /Logger/Component
/Forwarder/Configuration
/Add
Forwarder [name] has
been added
fname=forwarderName
duser=UserName
duid=userId
cs4=sessionIdfile
cs4Label=Session ID
fileType=forwarderType
dvc=forwarderIpAddr
dvchost=forwarderHostName
cn1Label=Forwarder Port
cn1=forwarderPort
cs1Label=Forwarder Filter
cs1=forwarderFilter
logger:606 /Logger/Component/
Forwarder/Configuration
/Delete
Forwarder [name] has
been deleted
fname=forwarderName
duser=UserName
duid=userId
cs4=sessionIdfile
cs4Label=Session ID
fileType=forwarderType
dvc=forwarderIpAddr
dvchost=forwarderHostName
cn1Label=Forwarder Port
cn1=forwarderPort
cs1Label=Forwarder Filter
cs1=forwarderFilter
logger:607 /Logger/Component/
Forwarder/Configuration
/Update
Forwarder [name] has
been updated
fname=forwarderName
duser=UserName
duid=userId
cs4=sessionIdfile
cs4Label=Session ID
fileType=forwarderType
dvc=forwarderIpAddr
dvchost=forwarderHostName
cn1Label=Forwarder Port
cn1=forwarderPort
cs1Label=Forwarder Filter
cs1=forwarderFilter
logger:608 /Logger/Component/
Forwarder/Configuration
/Enable
Forwarder [name] has
been enabled
fname=forwarderName
duser=UserName
duid=userId
cs4=sessionIdfile
cs4Label=Session ID
fileType=forwarderType
Administrator's Guide
HPE Logger 6.2 Page 526 of 623

Device
Event
Class ID
Device Event
Category (cat) Message Additional Fields
dvc=forwarderIpAddr
dvchost=forwarderHostName
cn1Label=Forwarder Port
cn1=forwarderPort
cs1Label=Forwarder Filter
cs1=forwarderFilter
logger:609 /Logger/Component/
Forwarder/Configuration
/Disable
Forwarder [name] has
been disabled
fname=forwarderName
duser=UserName
duid=userId
cs4=sessionIdfile
cs4Label=Session ID
fileType=forwarderType
dvc=forwarderIpAddr
dvchost=forwarderHostName
cn1Label=Forwarder Port
cn1=forwarderPort
cs1Label=Forwarder Filter
cs1=forwarderFilter
logger:663 /Logger/Component/
Forwarder/Configuration
/Pause
Forwarder [name] has
been paused
fname=forwarderName
duser=UserName
duid=userId
cs4=sessionIdfile
cs4Label=Session ID
fileType=forwarderType
dvc=forwarderIpAddr
dvchost=forwarderHostName
cn1Label=Forwarder Port
cn1=forwarderPort
cs1Label=Forwarder Filter
cs1=forwarderFilter
logger:664 /Logger/Component/
Forwarder/Configuration
/Resume
Forwarder [name] has
been resumed
fname=forwarderName
duser=UserName
duid=userId
cs4=sessionIdfile
cs4Label=Session ID
fileType=forwarderType
dvc=forwarderIpAddr
dvchost=forwarderHostName
cn1Label=Forwarder Port
cn1=forwarderPort
cs1Label=Forwarder Filter
cs1=forwarderFilter
Receivers
Administrator's Guide
HPE Logger 6.2 Page 527 of 623

Device
Event
Class ID
Device Event
Category (cat) Message Additional Fields
logger:600 /Logger/Component/
Receiver/Configuration
/Add
Receiver [name] has
been added
fname=receiverName
duser=UserName
duid=userId
cs4=sessionIdfile
cs4Label=Session ID
fileType=receiverType
dvc=receiverIpAddr
dvchost=receiverHostName
cn1Label=Receiver Port
cn1=receiverPort
logger:601 /Logger/Component/
Receiver/Configuration
/Delete
Receiver [name] has
been deleted
fname=receiverName
duser=UserName
duid=userId
cs4=sessionIdfile
cs4Label=Session ID
fileType=receiverType
dvc=receiverIpAddr
dvchost=receiverHostName
cn1Label=Receiver Port
cn1=receiverPort
logger:602 /Logger/Component/
Receiver/Configuration
/Update
Receiver [name] has
been updated
fname=receiverName
duser=UserName
duid=userId
cs4=sessionIdfile
cs4Label=Session ID
fileType=receiverType
dvc=receiverIpAddr
dvchost=receiverHostName
cn1Label=Receiver Port
cn1=receiverPort
logger:603 /Logger/Component/
Receiver/Configuration
/Enable
Receiver [name] has
been enabled
fname=receiverName
duser=UserName
duid=userId
cs4=sessionIdfile
cs4Label=Session ID
fileType=receiverType
dvc=receiverIpAddr
dvchost=receiverHostName
cn1Label=Receiver Port
cn1=receiverPort
logger:604 /Logger/Component/
Receiver/Configuration
/Disable
Receiver [name] has
been disabled
fname=receiverName
duser=UserName
duid=userId
Administrator's Guide
HPE Logger 6.2 Page 528 of 623

Device
Event
Class ID
Device Event
Category (cat) Message Additional Fields
cs4=sessionIdfile
cs4Label=Session ID
fileType=receiverType
dvc=receiverIpAddr
dvchost=receiverHostName
cn1Label=Receiver Port
cn1=receiverPort
SNMP Destinations
logger:644 /Logger/Component/
SnmpDestination/
Configuration/Add
SNMP destination
[name] has been added
fname=snmpDestinationName
duser=UserName
duid=userId
cs4=sessionIdfile
cs4Label=Session ID
fileType=SNMP Destination
fileId=snmpDestinationId
dvc=snmpDestinationIp
dvchost=snmpDestinationHost
cn1Label=SNMP Destination Port
cn1=snmpDestinationPort
cs1Label=Connector Name
cs1=connectorName
cs2Label=Connector Location
cs2=connectorLocation
cs3Label=Logger Location
cs3=loggerLocation
logger:645 /Logger/Component/
SnmpDestination/
Configuration/Delete
SNMP destination
[name] has been deleted
fname=snmpDestinationName
duser=UserName
duid=userId
cs4=sessionIdfile
cs4Label=Session ID
fileType=SNMP Destination
fileId=snmpDestinationId
dvc=snmpDestinationIp
dvchost=snmpDestinationHost
cn1Label=SNMP Destination Port
cn1=snmpDestinationPort
cs1Label=Connector Name
cs1=connectorName
cs2Label=Connector Location
cs2=connectorLocation
cs3Label=Logger Location
cs3=loggerLocation
Syslog Destinations
Administrator's Guide
HPE Logger 6.2 Page 529 of 623

Device
Event
Class ID
Device Event
Category (cat) Message Additional Fields
logger:647 /Logger/Resource/
SyslogDestination/
Configuration/Add
Syslog destination
[name] has been added
fname=syslogDestinationName
duser=UserName
duid=userId
cs4=sessionIdfile
cs4Label=Session ID
fileType=Syslog Destination
fileId=syslogDestinationId
dvc=syslogDestinationIp
dvchost=syslogDestinationHost
cn1Label=Syslog Destination Port
cn1=syslogDestinationPort
logger:648 /Logger/Component/
SyslogDestination/
Configuration/Delete
Syslog destination
[name] has been deleted
fname=syslogDestinationName
duser=UserName
duid=userId
cs4=sessionIdfile
cs4Label=Session ID
fileType=Syslog Destination
fileId=syslogDestinationId
dvc=syslogDestinationIp
dvchost=syslogDestinationHost
cn1Label=Syslog Destination Port
cn1=syslogDestinationPort
logger:649 /Logger/Component
/SyslogDestination
/Configuration/Update
Syslog destination
[name] has been
updated
fname=syslogDestinationName
duser=UserName
duid=userId
cs4=sessionIdfile
cs4Label=Session ID
fileType=Syslog Destination
fileId=syslogDestinationId
dvc=syslogDestinationIp
dvchost=syslogDestinationHost
cn1Label=Syslog Destination Port
cn1=syslogDestinationPort
Archives
logger:520 /Logger/Resource
/Archive/Configuration
/Add
Archive [archiveName]
has been added
fname=archiveName
duser=UserName
duid=userId
cs4=sessionIdfile
cs4Label=Session ID
fileType=EventArchive
fileId=archiveId
logger:521 /Logger/Resource
/Archive/Configuration
Archive [archiveName]
has been deleted
fname=archiveName
duser=UserName
Administrator's Guide
HPE Logger 6.2 Page 530 of 623

Device
Event
Class ID
Device Event
Category (cat) Message Additional Fields
/Delete duid=userId
cs4=sessionIdfile
cs4Label=Session ID
fileType=EventArchive
fileId=archiveId
logger:523 /Logger/Resource
/Archive/Configuration
/Load
Archive [archiveName]
has been loaded
fname=archiveName
duser=UserName
duid=userId
cs4=sessionIdfile
cs4Label=Session ID
fileType=EventArchive
fileId=archiveId
logger:524 /Logger/Resource
/Archive/Configuration
/Unload
Archive [archiveName]
has been unloaded
fname=archiveName
duser=UserName
duid=userId
cs4=sessionIdfile
cs4Label=Session ID
fileType=EventArchive
fileId=archiveId
logger:525 /Logger/Resource
/Archive/Configuration
/Archive
Archive [archiveName]
has been archived
fname=archiveName
duser=UserName
duid=userId
cs4=sessionIdfile
cs4Label=Session ID
fileType=EventArchive
fileId=archiveId
logger:526 /Logger/Resource
/Archive/Add
Event archive settings
added
fname=archiveName
duser=UserName
duid=userId
cs4=sessionIdfile
cs4Label=Session ID
fileType=EventArchive
fileId=archiveId
logger:527 /Logger/Resource
/Archive/Update
Daily archive task
settings updated
fname=archiveName
duser=UserName
duid=userId
cs4=sessionIdfile
cs4Label=Session ID
fileType=EventArchive
fileId=archiveId
logger:528 /Logger/Resource
/Archive/Failed
Event archive failed fname=archiveName
duser=UserName
Administrator's Guide
HPE Logger 6.2 Page 531 of 623

Device
Event
Class ID
Device Event
Category (cat) Message Additional Fields
duid=userId
cs4=sessionIdfile
cs4Label=Session ID
fileType=EventArchive
fileId=archiveId
Dashboards
logger:580 /Logger/Resource
/Dashboard
/Configuration/Add
Dashboard [name] has
been added
fname=dashboardName
duser=UserName
duid=userId
cs4=sessionIdfile
cs4Label=Session ID
fileType=Dashboard
fileId=DashboardId
rt=receiptTime
logger:581 /Logger/Resource
/Dashboard
/Configuration/Add
Dashboard [name] has
been deleted
fname=dashboardName
duser=UserName
duid=userId
cs4=sessionIdfile
fileType=Dashboard
fileId=DashboardId
rt=receiptTime
logger:582 /Logger/Resource
/Dashboard
/Configuration/Update
Dashboard [name] has
been updated
fname=dashboardName
duser=UserName
duid=userId
cs4=sessionIdfile
cs4Label=Session ID
fileType=Dashboard
fileId=DashboardId
rt=receiptTime
Devices
logger:510 /Logger/Resource
/Device/Configuration
/Add
Device [deviceName] has
been added
fname=deviceName
duser=UserName
duid=userId
cs4=sessionIdfile
cs4Label=Session ID
fileType=Device
fileId=deviceId
logger:511 /Logger/Resource
/Device/Configuration
/Delete
Device [deviceName] has
been deleted
fname=deviceName
duser=UserName
duid=userId
cs4=sessionIdfile
Administrator's Guide
HPE Logger 6.2 Page 532 of 623

Device
Event
Class ID
Device Event
Category (cat) Message Additional Fields
cs4Label=Session ID
fileType=Device
fileId=deviceId
logger:512 /Logger/Resource
/Device/Configuration
/Update
Device [deviceName] has
been updated
fname=deviceName
duser=UserName
duid=userId
cs4=sessionIdfile
cs4Label=Session ID
fileType=Device
fileId=deviceId
Filters
logger:500 /Logger/Resource/Filter
/Configuration/Add
Filter [filterName] has
been added
fname=filterName
duser=UserName
duid=userId
cs4=sessionIdfile
cs4Label=Session ID
fileType=Filter
fileId=filterId
logger:501 /Logger/Resource/Filter
/Configuration/Delete
Filter [filterName] has
been deleted
fname=filterName
duser=UserName
duid=userId
cs4=sessionIdfile
cs4Label=Session ID
fileType=Filter
fileId=filterId
logger:502 /Logger/Resource/Filter
/Configuration/Update
Filter [filterName] has
been updated
fname=filterName
duser=UserName
duid=userId
cs4=sessionIdfile
cs4Label=Session ID
fileType=Filter
fileId=filterId
Groups
logger:513 /Logger/Resource
/Group/Configuration
/Add
Group [groupName] has
been added
fname=groupName
duser=UserName
duid=userId
cs4=sessionIdfile
cs4Label=Session ID
fileType=Group
fileId=groupId
logger:514 /Logger/Resource Group [groupName] has fname=groupName
Administrator's Guide
HPE Logger 6.2 Page 533 of 623

Device
Event
Class ID
Device Event
Category (cat) Message Additional Fields
/Group/Configuration
/Delete
been deleted duser=UserName
duid=userId
cs4=sessionIdfile
cs4Label=Session ID
fileType=Group
fileId=groupId
logger:515 /Logger/Resource
/Group/Configuration
/Update
Group [groupName] has
been updated
fname=groupName
duser=UserName
duid=userId
cs4=sessionIdfile
cs4Label=Session ID
fileType=Group
fileId=groupId
Peer Loggers
logger:550 /Logger/Resource
/PeerLogger
/Configuration/Add
Peer Logger [name] has
been added
fname=Name
duser=UserName
duid=userId
cs4=sessionIdfile
cs4Label=Session ID
fileType=Peer Logger
fileId=LoggerId
logger:551 /Logger/Resource
/PeerLogger
/Configuration/Delete
Peer Logger [name] has
been deleted
fname=Name
duser=UserName
duid=userId
cs4=sessionIdfile
cs4Label=Session ID
fileType=Peer Logger
fileId=LoggerId
logger:570 /Logger/Resource
/Peer/Authorizations
/Configuration/Add
Peer Logger
authorization [name] has
been added
fname=Name
duser=UserName
duid=userId
cs4=sessionIdfile
cs4Label=Session ID
fileType=Peer Logger Authorization
logger:571 /Logger/Resource
/PeerLogger
/Authorizations
/Configuration/Delete
Peer Logger
authorization [name] has
been deleted
fname=Name
duser=UserName
duid=userId
cs4=sessionIdfile
cs4Label=Session ID
fileType=Peer Logger Authorization
fileId=LoggerId
Administrator's Guide
HPE Logger 6.2 Page 534 of 623

Device
Event
Class ID
Device Event
Category (cat) Message Additional Fields
Parsers
logger:590 /Logger/Resource
/ParserDescription
/Configuration/Add
Parser Description
[name] has been added
fileType=Parser Description
duid=1
cs4=sessionIdfile
cs4Label=Session ID
duser=UserName
rt=receiptTime
fname=parserName
logger:591 /Logger/Resource
/ParserDescription
/Configuration/Delete
Parser Description
[name] has been deleted
fileType=Parser Description
cs4=sessionIdfile
duser=UserName
fileId=ParserID 710
duid=1
cs4Label=Session ID
rt=receiptTime
fname=parserName
logger:592 /Logger/Resource
/ParserDescription
/Configuration/Update
Parser Description
[name] has been
updated
fileType=Parser Description
cs4=sessionIdfile
duser=UserName
fileId=ParserID
duid=1
cs4Label=Session ID
rt=receiptTime
fname=parserName
Saved Searches
logger:540 /Logger/Resource/
SavedSearch
/Configuration/Add
Saved search [name] has
been added
fname=savedSearchName
duser=UserName
duid=userId
cs4=sessionIdfile
cs4Label=Session ID
fileType=Saved Search
fileId=savedSearchId
logger:541 /Logger/Resource/
SavedSearch
/Configuration/Delete
Saved search [name] has
been deleted
fname=savedSearchName
duser=UserName
duid=userId
cs4=sessionIdfile
cs4Label=Session ID
fileType=Saved Search
fileId=savedSearchId
logger:542 /Logger/Resource/
SavedSearch
/Configuration/Update
Saved search [name] has
been updated
fname=savedSearchName
duser=UserName
Administrator's Guide
HPE Logger 6.2 Page 535 of 623

Device
Event
Class ID
Device Event
Category (cat) Message Additional Fields
duid=userId
cs4=sessionIdfile
cs4Label=Session ID
fileType=Saved Search
fileId=savedSearchId
Source Types
logger:596 /Logger/Resource/
SourceType
/Configuration/Add
Source Type [name] has
been added
cs4=sessionIdfile
fileType=Source Type
duid=1
cs4Label=Session ID
duser=UserName
rt=receiptTime
fname=SourceTypeName
logger:597 /Logger/Resource
/SourceType
/Configuration/Delete
Source Type [name] has
been deleted
fileType=Source Type
cs4=sessionIdfile
duser=UserName
fileId=SourceTypeID
duid=1
cs4Label=Session ID
rt=receiptTime
fname=SourceTypeName
logger:598 /Logger/Resource
/SourceType
/Configuration/Update
Source Type [name] has
been updated
fileType=Source Type
cs4=sessionIdfile
duser=UserName
fileId=1SourceTypeID
duid=1
cs4Label=Session ID
rt=receiptTime
fname=SourceTypeName
Storage Groups
logger:530 /Logger/Resource/
StorageGroup
/Configuration/Add
Storage group
[storageGroupName] has
been added
fname=storageGroupName
duser=UserName
duid=userId
cs4=sessionIdfile
cs4Label=Session ID
fileType=Storage Group
fileId=storageGroupId
logger:532 /Logger/Resource/
StorageGroup
/Configuration/Update
Storage group
[storageGroupName] has
been updated
fname=storageGroupName
duser=UserName
duid=userId
cs4=sessionIdfile
Administrator's Guide
HPE Logger 6.2 Page 536 of 623

Device
Event
Class ID
Device Event
Category (cat) Message Additional Fields
cs4Label=Session ID
fileType=Storage Group
fileId=storageGroupId
Storage Rules
logger:533 /Logger/Resource/
StorageRule
/Configuration/Add
Storage rule [name] has
been added
fname=storageRuleName
duser=UserName
duid=userId
cs4=sessionIdfile
cs4Label=Session ID
fileType=Storage Rule
logger:535 /Logger/Resource/
StorageRule
/Configuration/Update
Storage rule [name] has
been updated
fname=storageRuleName
duser=UserName
duid=userId
cs4=sessionIdfile
cs4Label=Session ID
fileType=Storage Rule
Storage Volume
logger:536 /Logger/Resource
/StorageVolume/
Configuration/Add
Storage volume [name]
has been added
fname=storageVolumeName
duser=UserName
duid=userId
cs4=sessionIdfile
cs4Label=Session ID
fileType=Storage Volume
fileId=storageVolumeId
Search
logger:680 /Logger/Search/Index
/Update
Search indices have
been added
OR
Search index has been
added
cs4=sessionId
fileType=Search Index Configuration
duser=UserName
msg=Search index has been added
cn1=1
duid=1
cs4Label=Session ID
rt=receiptTime
cn1Label=No. of fields added
logger:690 /Logger/Search/Options
/Update
Search options have
been updated
cs6=false
cs7=true
cs4=sessionId
cs5=false
cs2=false
cs3=false
Administrator's Guide
HPE Logger 6.2 Page 537 of 623

Device
Event
Class ID
Device Event
Category (cat) Message Additional Fields
cs1=true
cs8=false
cs1Label=Field Search Case
Sensitivity
duid=1
cs7Label=Field Summary
cs8Label=Field Summary Field Discovery
cs6Label=Display options raw Event
cs3Label=Regex Search
Unicode Case Sensitivity
fileType=Search Options
duser=UserName
cs5Label=Regex Search Canonical Equality
Check
cs4Label=Session ID
rt=receiptTime
cs2Label=Regex Search Case Sensitivity
logger:710 /Logger/Search
/Canceled
Search session
[sessionID] has been
canceled by [user]
cs1Label=Session ID
duid=1
cs1=sessionIdfile
duser=UserName
rt=receiptTime
Maintenance Mode
logger:700 /Logger/Server
/MaintenanceMode/
Enter
Maintenance mode
entered
fname=Maintenance Mode
duser=UserName
duid=userId
cs4=sessionId
cs4Label=Session ID
fileType=Maintenance Mode
Administrator's Guide
HPE Logger 6.2 Page 538 of 623

Appendix E: Examples of System Health Events
The following table provides examples of system health events generated on Logger. These examples
are intended to help you understand the format and various fields of the generated events.
Note: You can set up Alerts to be triggered to let you know when system health events are
generated. For more information, see "Saved Searches" on page260.
The table includes information on the following system heath event classes:
Device Event
Class: ID Example
cpu
cpu:100 CEF:0|ArcSight|Logger|5.1.0.5780.0|cpu:100|CPU Usage|1|
cat=/Monitor/CPU/Usage cn1=3 cn1Label=Percent Usage cs2=CurrentValue
cs2Label=timeframe dst=192.0.2.6 dvc=192.0.2.6 end=1302739080014
rt=1302739080014
disk
disk:101 CEF:0|ArcSight|Logger|5.1.0.5803.0|disk:101|Root Disk Space Remaining|1|
cat=/Monitor/Disk/Space/Remaining/Root cn1=99 cn1Label=Percent Available
cs2=CurrentValue cs2Label=timeframe cs3=Ok cs3Label=Status cs4=Ok
cs4Label=Raw Status cs5=Root cs5Label=Location
cs6=Disk/Space/Remaining/Root cs6Label=Sensor Name dst=192.0.2.6
dvc=192.0.2.6 end=1303927171790 rt=1303927171790
disk:102 CEF:0|ArcSight|Logger|5.1.0.5780.0|disk:102|Disk bytes read|1|
cat=/Monitor/Disk/Read cn1=373524 cn1Label=Kb Read cs2=SinceStartup
cs2Label=timeframe cs6=c0d0 cs6Label=Partition Name dst=192.0.2.6
dvc=192.0.2.6 end=1302743760036 rt=1302743760036
disk:103 CEF:0|ArcSight|Logger|5.1.0.5780.0|disk:103|Disk bytes written|1|
cat=/Monitor/Disk/Write cn1=24474998 cn1Label=Kb Written cs2=SinceStartup
cs2Label=timeframe cs6=c0d0 cs6Label=Partition Name dst=192.0.2.6
dvc=192.0.2.6 end=1302743760038 rt=1302743760038
eps
HPE Logger 6.2 Page 539 of 623

Device Event
Class: ID Example
eps:100 CEF:0|ArcSight|Logger|5.1.0.5780.0|eps:100|Overall Receiver EPS|1|
cat=/Monitor/Receiver/All/EPS cn1=0 cn1Label=EPS cs2=SinceLastMonitorEvent
cs2Label=timeframe dst=192.0.2.6 dvc=192.0.2.6 end=1302733680034
rt=1302733680034
eps:101 CEF:0|ArcSight|Logger|5.1.0.5780.0|eps:101|Overall Forwarder EPS|1|
cat=/Monitor/Forwarder/All/EPS cn1=0 cn1Label=EPS cs2=SinceLastMonitorEvent
cs2Label=timeframe dst=192.0.2.6 dvc=192.0.2.6
eps:102 CEF:0|ArcSight|Logger|6.1.0.0.1|eps:102|Individual Receiver EPS|1|
cat=/Monitor/Receiver/EPS/Individual cn1=0 cn1Label=EPS cn2=0
cn2Label=EVENT COUNT cs1=TCP cs1Label=Receiver Type
cs2=SinceLastMonitorEvent cs2Label=timeframe cs3=up cs3Label=STATUS
cs6=TCP Receiver cs6Label=Receiver name dst=192.0.2.6 dvc=192.0.2.6
end=1420620420064 rt=1420620420064
eps:103 CEF:0|ArcSight|Logger|6.1.0.0.1|eps:103|Individual Forwarder EPS|1|
cat=/Monitor/Forwarder/EPS/Individual cn1=0 cn1Label=EPS cn2=0
cn2Label=EVENT COUNT cs1=TCP cs1Label=Forwarder Type
cs2=SinceLastMonitorEvent cs2Label=timeframe cs3=up cs3Label=STATUS
cs6=TCP Forwarder cs6Label=Forwarder name dst=192.0.2.6 dvc=192.0.2.6
end=1420620420064 rt=1420620420064
hardware
hardware:101 CEF:0|ArcSight|Logger|5.1.0.5784.0|hardware:101|Electrical (Current) OK|1|
cat=/Monitor/Sensor/Current/Ok cs1=0.80 Amps cs1Label=Raw Value
cs2=CurrentValue cs2Label=timeframe cs3=Ok cs3Label=Status cs4=ok
cs4Label=Raw Status cs5=10.2 (Power Supply) cs5Label=Location cs6=Current 2
cs6Label=Sensor Name dst=192.0.2.5 dvc=192.0.2.5 end=1303937520837
rt=1303937520837
hardware:102 CEF:0|ArcSight|Logger|5.1.0.5776.0|hardware:102|Electrical (Current) Degraded|5|
cat=/Monitor/Sensor/Current/Degraded cs1=126 Watts cs1Label=Raw Value
cs2=CurrentValue cs2Label=timeframe cs3=Degraded cs3Label=Status cs4=lnc
cs4Label=Raw Status cs5Label=Location cs6=Power Meter cs6Label=Sensor Name
dst=192.0.2.4 dvc=192.0.2.4 end=1302817019262 rt=1302817019262
hardware:103 CEF:0|ArcSight|Logger|5.1.0.5776.0|hardware:103|Electrical (Current) Failed|8|
cat=/Monitor/Sensor/Current/Failed cs1=126 Watts cs1Label=Raw Value
cs2=CurrentValue cs2Label=timeframe cs3=Failed cs3Label=Status cs4=lcr
Administrator's Guide
HPE Logger 6.2 Page 540 of 623

Device Event
Class: ID Example
cs4Label=Raw Status cs5Label=Location cs6=Power Meter cs6Label=Sensor Name
dst=192.0.2.4 dvc=192.0.2.4 end=1302817019262 rt=1302817019262
hardware:111 CEF:0|ArcSight|Logger|5.1.0.5780.0|hardware:111|Electrical (Voltage) OK|1|
cat=/Monitor/Sensor/Voltage/Ok cs1=State Deasserted cs1Label=Raw Value
cs2=CurrentValue cs2Label=timeframe cs3=Ok cs3Label=Status cs4=ok
cs4Label=Raw Status cs5=3.1 (Processor) cs5Label=Location cs6=VCORE
cs6Label=Sensor Name dst=192.0.2.6 dvc=192.0.2.6 end=1302819047959
rt=1302819047959
hardware:112 CEF:0|ArcSight|Logger|5.1.0.5780.0|hardware:112|Electrical (Voltage) Degraded|5|
cat=/Monitor/Sensor/Voltage/Degraded cs1=State Deasserted cs1Label=Raw Value
cs2=CurrentValue cs2Label=timeframe cs3=Degraded cs3Label=Status cs4=lnc
cs4Label=Raw Status cs5=3.1 (Processor) cs5Label=Location cs6=VCORE
cs6Label=Sensor Name dst=192.0.2.6 dvc=192.0.2.6 end=1302819047959
rt=1302819047959
hardware:113 CEF:0|ArcSight|Logger|5.1.0.5780.0|hardware:113|Electrical (Voltage) Failed|8|
cat=/Monitor/Sensor/Voltage/Failed cs1=State Deasserted cs1Label=Raw Value
cs2=CurrentValue cs2Label=timeframe cs3=Failed cs3Label=Status cs4=lcr
cs4Label=Raw Status cs5=3.1 (Processor) cs5Label=Location cs6=VCORE
cs6Label=Sensor Name dst=192.0.2.6 dvc=192.0.2.6 end=1302819047959
rt=1302819047959
hardware:121 CEF:0|ArcSight|Logger|5.1.0.5803.0|hardware:121|Battery OK|1|
cat=/Monitor/Sensor/Battery/Ok cs1=cs1Label=Raw Value cs2=CurrentValue
cs2Label=timeframe cs3=Ok cs3Label=Status cs4=ok cs4Label=Raw Status cs5=7.1
(System Board) cs5Label=Location cs6=CMOS Battery cs6Label=Sensor Name
dst=192.0.2.6 dvc=192.0.2.6 end=1303937972008 rt=1303937972008
hardware:122 CEF:0|ArcSight|Logger|5.1.0.5803.0|hardware:122|Battery Degraded|5|
cat=/Monitor/Sensor/Battery/Degraded cs1=cs1Label=Raw Value
cs2=CurrentValue cs2Label=timeframe cs3=Degraded cs3Label=Status cs4=lnc
cs4Label=Raw Status cs5=7.1 (System Board) cs5Label=Location cs6=CMOS
Battery cs6Label=Sensor Name dst=192.0.2.6 dvc=192.0.2.6 end=1303937972008
rt=1303937972008
hardware:123 CEF:0|ArcSight|Logger|5.1.0.5803.0|hardware:123|Battery Failed|8|
cat=/Monitor/Sensor/Battery/Degraded cs1=cs1Label=Raw Value
cs2=CurrentValue cs2Label=timeframe cs3=Failed cs3Label=Status cs4=lcr
cs4Label=Raw Status cs5=7.1 (System Board) cs5Label=Location cs6=CMOS
Battery cs6Label=Sensor Name dst=192.0.2.6 dvc=192.0.2.6 end=1303937972008
Administrator's Guide
HPE Logger 6.2 Page 541 of 623

Device Event
Class: ID Example
rt=1303937972008
hardware:131 CEF:0|ArcSight|Logger|5.1.0.5780.0|hardware:131|Fan OK|1|
cat=/Monitor/Sensor/Fan/Ok cs1=29.01 unspecified cs1Label=Raw Value
cs2=CurrentValue cs2Label=timeframe cs3=Ok cs3Label=Status cs4=lnc
cs4Label=Raw Status cs5=7.1 (System Board) cs5Label=Location cs6=Fan Block 1
cs6Label=Sensor Name dst=192.0.2.1 dvc=192.0.2.1 end=1302823237825
rt=1302823237825
hardware:132
hardware:133 CEF:0|ArcSight|Logger|5.1.0.5780.0|hardware:133|Fan Failure|8|
cat=/Monitor/Sensor/Fan/Failed cs1=29.01 unspecified cs1Label=Raw Value
cs2=CurrentValue cs2Label=timeframe cs3=Failed cs3Label=Status cs4=lcr
cs4Label=Raw Status cs5=7.1 (System Board) cs5Label=Location cs6=Fan Block 1
cs6Label=Sensor Name dst=192.0.2.1 dvc=192.0.2.1 end=1302823237825
rt=1302823237825
hardware:141 CEF:0|ArcSight|Logger|5.1.0.5803.0|hardware:141|Power Supply OK|1|
cat=/Monitor/Sensor/PowerSupply/Ok cs1=cs1Label=Raw Value cs2=CurrentValue
cs2Label=timeframe cs3=Ok cs3Label=Status cs4=ok cs4Label=Raw Status
cs5=10.1 (Power Supply) cs5Label=Location cs6=Status cs6Label=Sensor Name
dst=192.0.2.6 dvc=192.0.2.6 end=1303938572149 rt=1303938572149
hardware:142
hardware:143 CEF:0|ArcSight|Logger|5.1.0.5776.0|hardware:143|Power Supply Failed|8|
cat=/Monitor/Sensor/PowerSupply/Failed cs1=0 Watts cs1Label=Raw Value
cs2=CurrentValue cs2Label=timeframe cs3=Failed cs3Label=Status cs4=lcr
cs4Label=Raw Status cs5=10.2 (Power Supply) cs5Label=Location cs6=Power
Supply 2 cs6Label=Sensor Name dst=192.0.2.4 dvc=192.0.2.4 end=1302817019263
rt=1302817019263
hardware:151 CEF:0|ArcSight|Logger|5.1.0.5776.0|hardware:151|Temperature OK|1|
cat=/Monitor/Sensor/Temperature/Ok cs1=17 degrees C cs1Label=Raw Value
cs2=CurrentValue cs2Label=timeframe cs3=Ok cs3Label=Status cs4=ok
cs4Label=Raw Status cs5=64.1 (Unknown (0x40)) cs5Label=Location cs6=Temp 1
cs6Label=Sensor Name dst=192.0.2.4 dvc=192.0.2.4 end=1302823560051
rt=1302823560051
hardware:152
hardware:153
Administrator's Guide
HPE Logger 6.2 Page 542 of 623

Device Event
Class: ID Example
memory
memory:100 CEF:0|ArcSight|Logger|5.1.0.5780.0|memory:100|Platform Memory Usage|1|
cat=/Monitor/Memory/Usage/Platform cn1=2757 cn1Label=MB Used
cs2=CurrentValue cs2Label=timeframe dst=192.0.2.6 dvc=192.0.2.6
end=1302797940018 rt=1302797940018
network
network:100 CEF:0|ArcSight|Logger|5.1.0.5780.0|network:100|Network Usage - Inbound|1|
cat=/Monitor/Network/Usage/In cn1=41837428 cn1Label=Bytes Received
cs2=SinceStartup cs2Label=timeframe cs6=eth0 cs6Label=Interface Name
dst=192.0.2.6 dvc=192.0.2.6 end=1302733620026 rt=1302733620026
network:101 CEF:0|ArcSight|Logger|5.1.0.5780.0|network:101|Network Usage - Outbound|1|
cat=/Monitor/Network/Usage/Out cn1=158442791 cn1Label=Bytes Sent
cs2=SinceStartup cs2Label=timeframe cs6=eth0 cs6Label=Interface Name
dst=192.0.2.6 dvc=192.0.2.6 end=1302733620028 rt=1302733620028
raid
raid:101 CEF:0|ArcSight|Logger|5.1.0.5780.0|raid:101|RAID Controller OK|1|
cat=/Monitor/RAID/Controller/Ok cs1=Type: RAID-5 cs1Label=Raw Value
cs2=CurrentValue cs2Label=timeframe cs3=Ok cs3Label=Status cs4=Optimal
cs4Label=Raw Status cs5=RAIDController/Configuration cs5Label=Location
cs6=RAIDController/Configuration cs6Label=Sensor Name dst=192.0.2.6
dvc=192.0.2.6 end=1302886250104 rt=1302886250104
raid:102 CEF:0|ArcSight|Logger|5.1.0.5780.0|raid:102|RAID Controller Degraded|5|
cat=/Monitor/RAID/ControllerDegraded cs1=Type: RAID-5 Critical Disks: 0 Failed
Disks: 0 cs1Label=Raw Value cs2=CurrentValue cs2Label=timeframe cs3=Degraded
cs3Label=Status cs4=Degraded cs4Label=Raw Status
cs5=RAIDController/Configuration cs5Label=Location
cs6=RAIDController/Configuration cs6Label=Sensor Name dst=192.0.2.6
dvc=192.0.2.6 end=1302826128482 rt=1302826128482
raid:103
raid:111 CEF:0|ArcSight|Logger|5.1.0.5776.0|raid:111|RAID BBU OK|1|
cat=/Monitor/RAID/BBU/Ok cs1=Battery/Capacitor Count: 1 cs1Label=Raw Value
cs2=CurrentValue cs2Label=timeframe cs3=Ok cs3Label=Status cs4=OK
Administrator's Guide
HPE Logger 6.2 Page 543 of 623

Device Event
Class: ID Example
cs4Label=Raw Status cs5=RAIDController/Battery/bbu cs5Label=Location
cs6=RAIDController/Battery/bbu cs6Label=Sensor Name dst=192.0.2.4
dvc=192.0.2.4 end=1302890169285 rt=1302890169285
raid:112 CEF:0|ArcSight|Logger|5.1.0.5780.0|raid:112|RAID BBU Degraded|5|
cat=/Monitor/RAID/BBU/Degraded cs1=Fully Charged: false Remaining Time
Alarm: false Remaining Capacity Alarm: false Over Charged: false isSOHGood: true
cs1Label=Raw Value cs2=CurrentValue cs2Label=timeframe cs3=Degraded
cs3Label=Status cs4=Degraded cs4Label=Raw Status
cs5=RAIDController/Battery/bbu cs5Label=Location
cs6=RAIDController/Battery/bbu cs6Label=Sensor Name dst=192.0.2.6
dvc=192.0.2.6 end=1302820608015 rt=1302820608015
raid:113
raid:121 CEF:0|ArcSight|Logger|5.1.0.5780.0|raid:121|RAID Disk OK|1|
cat=/Monitor/RAID/DISK/Ok cs1=Port: 1I Box: 1 Bay: 1 Size: 500 GB Serial Number:
9SP24JD5 cs1Label=Raw Value cs2=CurrentValue cs2Label=timeframe cs3=Ok
cs3Label=Status cs4=OK cs4Label=Raw Status cs5=Port: 1I Box: 1 Bay: 1 Serial
Number: 9SP24JD5 cs5Label=Location cs6=RAIDController/Port/p0
cs6Label=Sensor Name dst=192.0.2.1 dvc=192.0.2.1 end=1302849041777
rt=1302849041777
raid:122 CEF:0|ArcSight|Logger|5.1.0.5776.0|raid:122|RAID Disk Rebuilding|5|
cat=/Monitor/RAID/DISK/Rebuilding cs1=Port: 2I Box: 1 Bay: 1 Size: 1 TB Serial
Number: WMATV6348517 cs1Label=Raw Value cs2=CurrentValue
cs2Label=timeframe cs3=Rebuilding cs3Label=Status cs4=Rebuilding
cs4Label=Raw Status cs5=Port: 2I Box: 1 Bay: 1 Serial Number: WMATV6348517
cs5Label=Location cs6=RAIDController/Port/p0 cs6Label=Sensor Name
dst=192.0.2.4 dvc=192.0.2.4 end=1302826980530 rt=1302826980530
raid:123 CEF:0|ArcSight|Logger|5.1.0.5780.0|raid:123|RAID Disk Failed|8|
cat=/Monitor/RAID/DISK/Failed cs1=Port: 1I Box: 1 Bay: 2 Size: 500 GB Serial
Number: 9SP23M08 cs1Label=Raw Value cs2=CurrentValue cs2Label=timeframe
cs3=Failed cs3Label=Status cs4=Failed cs4Label=Raw Status cs5=Port: 1I Box: 1
Bay: 2 Serial Number: 9SP23M08 cs5Label=Location cs6=RAIDController/Port/p1
cs6Label=Sensor Name dst=192.0.2.1 dvc=192.0.2.1 end=1302826358346
rt=1302826358346
search
Administrator's Guide
HPE Logger 6.2 Page 544 of 623

Device Event
Class: ID Example
search:100 CEF:0|ArcSight|Logger|5.1.0.5780.0|search:100|Number of Searches Performed|1|
cat=/Monitor/Search cn1=0 cn1Label=Number of Searches cs2=SinceStartup
cs2Label=timeframe dst=192.0.2.6 dvc=192.0.2.6 end=1302741300026
rt=1302741300026
storagegroup
storagegroup:
100
CEF:0|ArcSight|Logger|5.1.0.5803.0|storagegroup:100|Storage Group Space
Used|1| cat=/Monitor/StorageGroup/Space/Used cn1=1 cn1Label=Percent Used
cn2=7 cn2Label=retention period (days) cn3=1024 cn3Label=used (MB)
cs2=CurrentValue cs2Label=timeframe dst=192.0.2.6 dvc=192.0.2.6
end=1303928072008 fileType=storageGroup fname=Default Storage Group
fsize=1534 rt=1303928072008
Administrator's Guide
HPE Logger 6.2 Page 545 of 623

Appendix F: Event Field Name Mappings
The nomenclature for field names depends on the function area of the Logger. The following table
provides the mapping between these types of names.
lDatabase Name: Field name created in the database when you index this field. There will be no
database name for a field if you have not indexed it. This field name is used when creating a SQL
query for generating a report.
lSearch Results: Field name displayed in the search results when your search returns data in this field.
lCEF Field Name: The key or field name as defined in Implementing ArcSight CEF. For a
downloadable a copy of this guide, search for ”ArcSight Common Event Format (CEF) Guide” in the
ArcSight Product Documentation Community on Protect 724.
lReports: Field name displayed in a report containing data from this field.
Database Name Search Results CEF Field Name Reports
arc_agentAddress agentAddress agt Agent Address
arc_agentHostName agentHostName ahost Agent Host Name
arc_agentNtDomain agentNtDomain agentNtDomain Agent NT Domain
arc_agentSeverity agentSeverity Severity Severity
arc_agentType agentType at Agent Type
arc_agentZone agentZone agentZone Agent Zone
arc_agentZoneName agentZoneName agentZoneName Agent Zone Name
arc_agentZoneResource agentZoneResource agentZoneResource Agent Zone
Resource
arc_agentZoneURI agentZoneURI agentZoneURI Agent Zone URI
arc_applicationProtocol applicationProtocol app Application
Protocol
arc_baseEventCount baseEventCount cnt Base Event Count
arc_bytesIn bytesIn in Bytes In
arc_bytesOut bytesOut out Bytes Out
arc_categoryBehavior categoryBehavior categoryBehavior Category Behavior
arc_categoryDeviceGroup categoryDeviceGroup categoryDeviceGroup Category Device
Group
HPE Logger 6.2 Page 546 of 623

Database Name Search Results CEF Field Name Reports
arc_categoryObject categoryObject categoryObject Category Object
arc_categoryOutcome categoryOutcome categoryOutcome Category Outcome
arc_categorySignificance categorySignificance categorySignificance Category
Significance
arc_categoryTechnique categoryTechnique categoryTechnique Category
Technique
arc_customerName customerName customerName Customer Name
arc_destinationAddress destinationAddress dst Destination
Address
arc_destinationDnsDomain destinationDnsDomain destinationDnsDomain Destination DNS
Domain
arc_destinationHostName destinationHostName dhost Destination Host
Name
arc_destinationMacAddress destinationMacAddress dmac Destination Mac
Address
arc_destinationNtDomain destinationNtDomain dntdom Destination NT
Domain
arc_destinationPort destinationPort dpt Destination Port
arc_destinationProcessName destinationProcessName dproc Destination Process
Name
arc_destinationServiceName destinationServiceName destinationServiceName Destination Service
Name
arc_
destinationTranslatedAddress
destinationTranslatedAddress destinationTranslatedAddress Destination
Translated
Address
arc_destinationUserId destinationUserId duid Destination User ID
arc_destinationUserName destinationUserName duser Destination User
Name
arc_destinationUserPrivileges destinationUserPrivileges dpriv Destination User
Privileges
arc_destinationZone destinationZone destinationZone Destination Zone
arc_destinationZoneName destinationZoneName destinationZoneName Destination Zone
Name
arc_destinationZoneResource destinationZoneResource destinationZoneResource Destination Zone
Resource
Administrator's Guide
HPE Logger 6.2 Page 547 of 623

Database Name Search Results CEF Field Name Reports
arc_destinationZoneURI destinationZoneURI destinationZoneURI Destination Zone
URI
arc_deviceAction deviceAction act Device Action
arc_deviceAddress deviceAddress dvc Device Address
arc_deviceCustomDate1 deviceCustomDate1 deviceCustomDate1 Device Custom
Date 1
arc_deviceCustomDate1Label deviceCustomDate1Label deviceCustomDate1Label Device Custom
Date 1 Label
arc_deviceCustomDate2 deviceCustomDate2 deviceCustomDate2 Device Custom
Date 2
arc_deviceCustomDate2Label deviceCustomDate2Label deviceCustomDate2Label Device Custom
Date 2 Label
arc_deviceCustomNumber1 deviceCustomNumber1 cn1 Device Custom
Number 1
arc_
deviceCustomNumber1Label
deviceCustomNumber1Label cn1Label Device Custom
Number 1 Label
arc_deviceCustomNumber2 deviceCustomNumber2 cn2 Device Custom
Number 2
arc_
deviceCustomNumber2Label
deviceCustomNumber2Label cn2Label Device Custom
Number 2 Label
arc_deviceCustomNumber3 deviceCustomNumber3 cn3 Device Custom
Number 3
arc_
deviceCustomNumber3Label
deviceCustomNumber3Label cn3Label Device Custom
Number 3 Label
arc_deviceCustomString1 deviceCustomString1 cs1 Device Custom
String 1
arc_deviceCustomString1Label deviceCustomString1Label cs1Label Device Custom
String 1 Label
arc_deviceCustomString2 deviceCustomString2 cs2 Device Custom
String 2
arc_
deviceCustomString2Label
deviceCustomString2Label cs2Label Device Custom
String 2 Label
arc_deviceCustomString3 deviceCustomString3 cs3 Device Custom
String 3
arc_
deviceCustomString3Label
deviceCustomString3Label cs3Label Device Custom
String 3 Label
Administrator's Guide
HPE Logger 6.2 Page 548 of 623

Database Name Search Results CEF Field Name Reports
arc_deviceCustomString4 deviceCustomString4 cs4 Device Custom
String 4
arc_
deviceCustomString4Label
deviceCustomString4Label cs4Label Device Custom
String 4 Label
arc_deviceCustomString5 deviceCustomString5 cs5 Device Custom
String 5
arc_
deviceCustomString5Label
deviceCustomString5Label cs5Label Device Custom
String 5 Label
arc_deviceCustomString6 deviceCustomString6 cs6 Device Custom
String 6
arc_
deviceCustomString6Label
deviceCustomString6Label cs6Label Device Custom
String 6 Label
arc_deviceEventCategory deviceEventCategory cat Device Event
Category
arc_deviceEventClassId deviceEventClassId Signature ID Signature Id
arc_deviceExternalId deviceExternalId deviceExternalId Device External Id
arc_deviceHostName deviceHostName dvchost Device Host Name
arc_deviceInboundInterface deviceInboundInterface deviceInboundInterface Device Inbound
Interface
arc_deviceOutboundInterface deviceOutboundInterface deviceOutboundInterface Device Outbound
Interface
arc_deviceProduct deviceProduct Device Product Device Product
arc_deviceReceiptTime deviceReceiptTime rt Device Receipt
Time
arc_deviceSeverity deviceSeverity deviceSeverity Device Severity
arc_deviceVendor deviceVendor Device Vendor Device Vendor
arc_deviceVersion deviceVersion Device Version Device Version
arc_deviceZone deviceZone deviceZone Device Zone
arc_deviceZoneName deviceZoneName deviceZoneName Device Zone Name
arc_deviceZoneResource deviceZoneResource deviceZoneResource Device Zone
Resource
arc_deviceZoneURI deviceZoneURI deviceZoneURI Device Zone URI
arc_endTime endTime end End Time
Administrator's Guide
HPE Logger 6.2 Page 549 of 623

Database Name Search Results CEF Field Name Reports
arc_eventId eventId eventId Event Id
arc_externalId externalId externalId External Id
arc_fileName fileName fname File Name
arc_filePath filePath filePath File Path
arc_flexDate1 flexDate1 flexDate1 Flex Date 1
arc_flexDate1Label flexDate1Label flexDate1Label Flex Date 1 Label
arc_flexNumber1 flexNumber1 flexNumber1 Flex Number1
arc_flexNumber1Label flexNumber1Label flexNumber1Label Flex Number 1
Label
arc_flexNumber2 flexNumber2 flexNumber2 Flex Number 2
arc_flexNumber2Label flexNumber2Label flexNumber2Label Flex Number 2
Label
arc_flexString1 flexString1 flexString1 Flex String 1
arc_flexString1Label flexString1Label flexString1Label Flex String 1 Label
arc_flexString2 flexString2 flexString2 Flex String 2
arc_flexString2Label flexString2Label flexString2Label Flex String 2 Label
arc_message message msg Message
arc_name name Name Name
arc_priority priority priority Priority
arc_requestClientApplication requestClientApplication requestClientApplication Request Client
Application
arc_requestContext requestContext requestContext Request Context
arc_requestMethod requestMethod requestMethod Request Method
arc_requestUrl requestUrl request Request URL
arc_requestUrlFileName requestUrlFileName requestUrlFileName Request URL File
Name
arc_requestUrlQuery requestUrlQuery requestUrlQuery Request URL Query
arc_sessionId sessionId sessionId Session Id
arc_sourceAddress sourceAddress src Source Address
arc_sourceHostName sourceHostName shost Source Host Name
Administrator's Guide
HPE Logger 6.2 Page 550 of 623

Database Name Search Results CEF Field Name Reports
arc_sourceMacAddress sourceMacAddress smac Source Mac
Address
arc_sourceNtDomain sourceNtDomain sntdom Source NT Domain
arc_sourcePort sourcePort spt Source Port
arc_sourceProcessName sourceProcessName sproc Source Process
Name
arc_sourceServiceName sourceServiceName sourceServiceName Source Service
Name
arc_sourceTranslatedAddress sourceTranslatedAddress sourceTranslatedAddress Source Translated
Address
arc_sourceUserId sourceUserId suid Source User Id
arc_sourceUserName sourceUserName suser Source User Name
arc_sourceUserPrivileges sourceUserPrivileges spriv Source User
Privileges
arc_sourceZone sourceZone sourceZone Source Zone
arc_sourceZoneName sourceZoneName sourceZoneName Source Zone Name
arc_sourceZoneResource sourcezoneResource sourceZoneResource Source Zone
Resource
arc_sourceZoneURI sourceZoneURI sourceZoneURI Source Zone URI
arc_startTime startTime start Start Time
arc_transportProtocol transportProtocol proto Transport Protocol
arc_type type type Type
arc_vulnerabilityExternalID vulnerabilityExternalID vulnerabilityExternalID Vulnerability
External Id
arc_vulnerabilityURI VulnerabilityURI vulnerabilityURI Vulnerability URI
Administrator's Guide
HPE Logger 6.2 Page 551 of 623
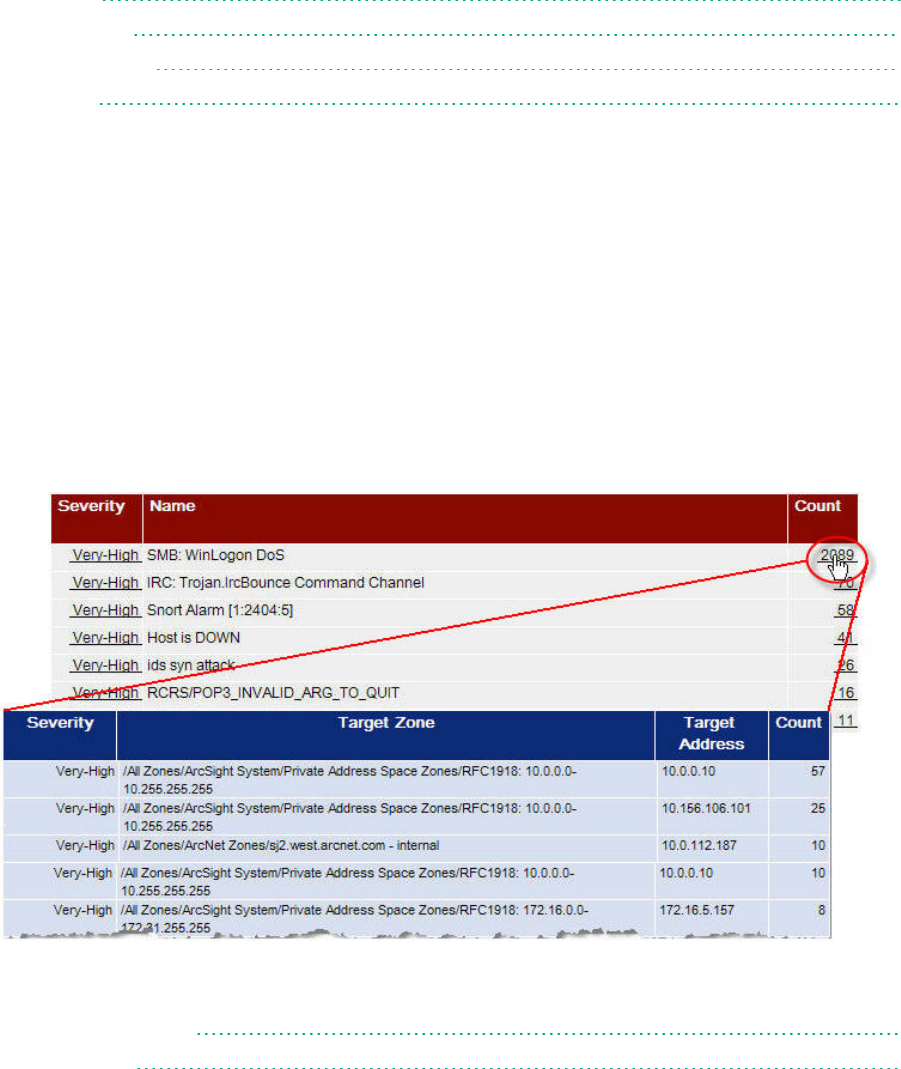
Appendix G: Logger Content
The following topics provide information about the out-of-box Logger reports:
• Reports 552
• Parameters 582
• System Filters 588
• Queries 596
Reports
Logger provides the reports described in the tables below. In the Logger UI, these reports are listed in
categories, accessible through the Category Explorer (in the left pane). For example, the "Top Infected
Systems" report is listed in the Anti-Virus category, which is listed in the parent category called Device
Monitoring.
The reports contain hyperlinks that drill down to other reports. For example, the report "Most Common
Events" displays a field called Count. Clicking on the Count field drills down to the report Target Attack
Counts by Severity, which provides additional detail information, as shown in the following figure. The
drill-down relationship between reports is shown in the tables below.
Logger provides the following top-level categories:
• Device Monitoring 553
• Foundation 563
HPE Logger 6.2 Page 552 of 623

• Logger Administration 576
• SANS Top 5 577
Device Monitoring
This category provides a device or application based view on events.
The following categories are located under the Device Monitoring category:
• Anti-Virus 553
• CrossDevice 554
• Database 558
• Firewall 558
• IDS-IPS 559
• Identity Management 560
• Network 560
• Operating System 561
• VPN 562
Anti-Virus
This is a sub-category of the Device Monitoring category, focusing on events related to Anti-Virus
systems.
The Anti-Virus category is located under the following path.
Device Monitoring\Anti-Virus
The Anti-Virus category reports are listed in the following table.
Report Description
Drill
Down Parameters
Errors Detected in
Anti-Virus Deployment
This report shows a summary of information on
the anti-virus errors, including the Anti-Virus
product information, host details, error
information, and the number of errors.
none none
Failed Anti-Virus
Updates
This report displays a table with the Device
Vendor, Device Product Target Zone Name,
Target Host Name, Target Address, and Minute
(EndTime).
none none
Top Infected Systems This report displays summaries of the systems none none
Anti-Virus
Administrator's Guide
HPE Logger 6.2 Page 553 of 623

Report Description
Drill
Down Parameters
reporting the most infections.
Update Summary This report shows a summary and details of anti-
virus update activity.
none none
Virus Activity by Hour This report shows malware activity by hour. none none
Anti-Virus, continued
CrossDevice
This is a sub-category of the Device Monitoring category. It provides information on events that are
similar across devices, e.g., logins, start up and shut down, etc.
The CrossDevice category is located under the following path.
Device Monitoring\CrossDevice
The CrossDevice category reports are listed in the following table.
Report Description Drill Down Params
Bandwidth
Usage by Hour
This report shows the network bandwidth
usage per hour by device type. Note that
the bandwidth values are based on all
reported traffic, including traffic within the
network, as well as traffic to and from
internal and external sources. There is a
parameter allowing the limitation of the
devices to one of the following: Firewalls,
Network Equipment, or VPNs. By default,
the parameter is set to all devices and
applications that report data.
The Reporting Device
field drill downs to the
Bandwidth Usage by Hour
report.
This report drills down to
itself.
none
Bandwidth
Usage by
Protocol
This report shows all the protocols sorted
by bandwidth usage, by device type. Note
that the bandwidth values are based on all
reported traffic, including traffic within the
network, as well as traffic to and from
internal and external sources. There is a
parameter allowing the limitation of the
devices to one of the following: Firewalls,
The Reporting Device
field drill downs to the
Bandwidth Usage by
Protocol report.
This report drills down to
itself.
none
CrossDevice
Administrator's Guide
HPE Logger 6.2 Page 554 of 623

Report Description Drill Down Params
Network Equipment, or VPNs. By default,
the parameter is set to all devices and
applications that report data.
By User
Account -
Accounts
Created
This report shows all newly created
accounts that were reported to Logger.
none none
Configuration
Changes by
Type
This report shows recent configuration
changes that were reported to Logger.
The Reporting Device
field drill downs to the
Configuration Changes by
Type report.
This report drills down to
itself.
none
Configuration
Changes by
User
This report shows recent configuration
changes that were reported to Logger.
The Reporting Device
field drill downs to the
Configuration Changes by
User report.
This report drills down to
itself.
none
Failed Login
Attempts
This report shows authentication failures
from login attempts by hour. There is a
parameter allowing the limitation of the
devices to one of the following: Database,
Firewalls, Identity Management systems,
Network Equipment, Operating Systems,
or VPNs. By default, the parameter is set
to all devices and applications that report
data.
The Reporting Device
field drill downs to the
Failed Login Attempts
report.
This report drills down to
itself.
none
Failed Logins
by Destination
Address
This report shows authentication failures
from login attempts by destination
address. There is a parameter allowing the
limitation of the devices to one of the
following: Database, Firewalls, Identity
Management systems, Network
Equipment, Operating Systems, or VPNs.
The Reporting Device
field drill downs to the
Failed Logins by
Destination Address
report.
This report drills down to
itself.
none
CrossDevice, continued
Administrator's Guide
HPE Logger 6.2 Page 555 of 623

Report Description Drill Down Params
By default, the parameter is set to all
devices and applications that report data.
Failed Logins
by Source
Address
This report shows authentication failures
from login attempts by source address.
There is a parameter allowing the
limitation of the devices to one of the
following: Database, Firewalls, Identity
Management systems, Network
Equipment, Operating Systems, or VPNs.
By default, the parameter is set to all
devices and applications that report data.
The Reporting Device
field drill downs to the
Failed Logins by Source
Address report.
This report drills down to
itself.
none
Failed Logins
by User
This report shows authentication failures
from login attempts by user. There is a
parameter allowing the limitation of the
devices to one of the following: Database,
Firewalls, Identity Management systems,
Network Equipment, Operating Systems,
or VPNs. By default, the parameter is set
to all devices and applications that report
data.
The Reporting Device
field drill downs to the
Failed Logins by User
report.
This report drills down to
itself.
none
Login Event
Audit
This report shows all authentication
events. There is a parameter allowing the
limitation of the devices to one of the
following: Database, Firewalls, Identity
Management systems, Network
Equipment, Operating Systems, or VPNs.
By default, the parameter is set to all
devices and applications that report data.
The Reporting Device
field drill downs to the
Login Event Audit report.
This report drills down to
itself.
none
Password
Changes
This report shows all password changes
that were reported to Logger.
The Reporting Device
field drill downs to the
Password Changes report.
This report drills down to
itself.
none
Successful
Logins by
Destination
This report shows successful
authentication events by destination
The Reporting Device
field drill downs to the
Successful Logins by
none
CrossDevice, continued
Administrator's Guide
HPE Logger 6.2 Page 556 of 623

Report Description Drill Down Params
Address addresses. There is a parameter allowing
the limitation of the devices to one of the
following: Database, Firewalls, Identity
Management systems, Network
Equipment, Operating Systems, or VPNs.
By default, the parameter is set to all
devices and applications that report data.
Destination Address
report.
This report drills down to
itself.
Successful
Logins by
Source
Address
This report shows successful
authentication events by source
addresses. There is a parameter allowing
the limitation of the devices to one of the
following: Database, Firewalls, Identity
Management systems, Network
Equipment, Operating Systems, or VPNs.
By default, the parameter is set to all
devices and applications that report data.
The Reporting Device
field drill downs to the
Successful Logins by
Source Address report.
This report drills down to
itself.
none
Successful
Logins by User
This report shows successful
authentication events by user. There is a
parameter allowing the limitation of the
devices to one of the following: Database,
Firewalls, Identity Management systems,
Network Equipment, Operating Systems,
or VPNs. By default, the parameter is set
to all devices and applications that report
data.
The Reporting Device
field drill downs to the
Successful Logins by User
report.
This report drills down to
itself.
none
Top Bandwidth
Hosts
This report shows the top hosts, sorted by
bandwidth usage. Note that the
bandwidth values are based on all
reported traffic, including traffic within the
network, as well as traffic to and from
internal and external sources. There is a
parameter allowing the limitation of the
devices to one of the following: Firewalls,
Network Equipment, or VPNs. By default,
the parameter is set to all devices and
applications that report data.
none none
Top Hosts by This report shows a summary of the The Reporting Device none
CrossDevice, continued
Administrator's Guide
HPE Logger 6.2 Page 557 of 623

Report Description Drill Down Params
Number of
Connections
number of connections by the top hosts.
There is a parameter allowing the
limitation of the devices to one of the
following: Firewalls, Network Equipment,
or VPNs. By default, the parameter is set
to all devices and applications that report
data.
field drill downs to the
Top Hosts by Number of
Connections report.
This report drills down to
itself.
CrossDevice, continued
Database
This is a sub-category of the Cross Device category, focusing on database events.
The Database category is located under the following path.
Device Monitoring\Database
The Database category reports are listed in the following table.
Report Description
Drill
Down Parameters
Database Errors and
Warnings
This report shows recent database errors and
warnings.
none none
Database
Firewall
This is a sub-category of the Device Monitoring category, focusing on firewall events.
The Firewall category is located under the following path.
Device Monitoring\Firewall
The Firewall category reports are listed in the following table.
Report Description
Drill
Down Parameters
Denied
Connections
by Address
This report shows a summary and details of inbound and
outbound connections denied by Firewall devices.
none none
Firewall
Administrator's Guide
HPE Logger 6.2 Page 558 of 623

Report Description
Drill
Down Parameters
Denied
Connections
by Port
This report shows a summary and details of inbound and
outbound ports denied by Firewall devices.
none none
Denied
Connections
per Hour
This report shows a summary and details of inbound and
outbound connections denied by Firewall devices on an
hourly basis.
none none
Firewall, continued
IDS-IPS
This is a sub-category of the Device Monitoring category, focusing on Intrusion Detection System and
Intrusion Prevention System events.
The IDS-IPS category is located under the following path.
Device Monitoring\IDS-IPS
The IDS-IPS category reports are listed in the following table.
Report Description
Drill
Down Parameters
Alert Counts by
Device
This report shows counts of IDS and IPS alerts. none none
Alert Counts by
Port
This report shows count of IDS and IPS alerts by
destination port.
none none
Alert Counts by
Severity
This report shows count of IDS and IPS alerts by agent
severity.
none none
Alert Counts by
Type
This report shows the count of IDS and IPS alerts by
type (category technique).
none none
Alert Counts per
Hour
This report shows the count of IDS and IPS alerts for
each hour.
none none
Top Alert
Destinations
This report shows the top destinations of IDS and IPS
alerts.
none none
Top Alerts from This report shows the top alerts coming from Intrusion none none
IDS-IPS
Administrator's Guide
HPE Logger 6.2 Page 559 of 623

Report Description
Drill
Down Parameters
IDS and IPS Detection Systems (IDS) and Intrusion Prevention
Systems (IPS).
Top Alert
Sources
This report shows the top sources of IDS and IPS alerts. none none
Worm Infected
Systems
This report shows a list of systems that have been
infected by a worm.
none none
IDS-IPS, continued
Identity Management
This is a sub-category of the Device Monitoring category, focusing on Identity Management system
events.
The Identity Management category is located under the following path.
Device Monitoring\Identity Management
The Identity Management category reports are listed in the following table.
Report Description
Drill
Down Parameters
Connection
Counts by
User
This reports shows count information about connections for
each user reported by Identity Management devices.
none none
Identity Management
Network
This is a sub-category of the Device Monitoring category, focusing on network devices such as routers
and switches.
The Network category is located under the following path.
Device Monitoring\Network
Administrator's Guide
HPE Logger 6.2 Page 560 of 623

The Network category reports are listed in the following table.
Report Description
Drill
Down Parameters
Device Critical
Events
This report shows information regarding critical events on
network devices. These critical events could be indications
of hardware failure, resource exhaustion, configuration
issues, or attacks.
none none
Device Errors This report shows information regarding error events on
network devices. These critical events could be indications
of hardware failure, resource exhaustion, configuration
issues, or attacks.
none none
Device Events This report shows information regarding events on
network devices. These critical events could be indications
of hardware failure, resource exhaustion, configuration
issues, or attacks.
none none
Device
Interface
Down
Notifications
This report shows a table displaying the network devices
that report a down link.
none none
Device
Interface
Status
Messages
This report shows the network devices reporting link status
changes.
none none
Device SNMP
Authentication
Failures
This report shows information regarding network device
SNMP failures.
none none
Network
Operating System
This is a sub-category of the Device Monitoring category, focusing on operating system events.
The Operating System category is located under the following path.
Device Monitoring\Operating System
Administrator's Guide
HPE Logger 6.2 Page 561 of 623

The Operating System category reports are listed in the following table.
Report Description
Drill
Down Parameters
Login Errors
by User
This report shows the details of failed logins for each
username (time, event name, source, and destination).
none none
User
Administration
This report shows user and user group creations,
modifications, and deletions.
none none
Operating System
VPN
This is a sub-category of the Device Monitoring category, focusing on virtual private network events.
The VPN category is located under the following path.
Device Monitoring\VPN
The VPN category reports are listed in the following table.
Report Description
Drill
Down Parameters
Authentication
Errors
This report shows errors generated by a VPN connection
attempt. The address is the IP address of the VPN
connection source. This report can be used to see which
users are having difficulties using or setting up their VPN
clients.
none none
Connection
Counts by
User
This report shows count information about VPN
connections for each user. Details of each user\'s
connection counts are provided, including connection
count and systems accessed.
none none
Connections
Accepted by
Address
This report shows successful VPN connection data. none none
Connections
Denied by
Address
This report shows denied VPN connection data. none none
Connections This report shows denied VPN connection data for each none none
VPN
Administrator's Guide
HPE Logger 6.2 Page 562 of 623
Report Description
Drill
Down Parameters
Denied by
Hour
hour.
VPN, continued
Foundation
This category covers a broad range of events, from security and perimeter defense to network
bandwidth usage and configuration events.
The following categories are located under the Foundation category:
• Configuration Monitoring 563
• Intrusion Monitoring 565
• NetFlow Monitoring 574
• Network Monitoring 575
Configuration Monitoring
This category covers configuration changes to systems and applications.
The Configuration Monitoring category is located under the following path.
Foundation\Configuration Monitoring
The Configuration Monitoring category reports are listed in the following table. There are no
parameters.
Report Description Drill Down
Accounts Created
by User Account
This report details the successfully created accounts
created on network hosts. The table includes the timestamp
of when the account was created, the created account
name (Destination User Name), the name of the user
creating the account (Source User Name), the account
creation event name, and the zone and host name of the
device on which the account was created.
none
Accounts Deleted
by Host
This report provides a listing of user deletions, ordered by
Customer, Zone, and System.
none
Accounts Deleted This report displays a table showing the date, the deleted none
Configuration Monitoring
Administrator's Guide
HPE Logger 6.2 Page 563 of 623

Report Description Drill Down
by User Account user name, the user name that deleted the account, the
account deletion event name, and the zone and host name
of the system from which the account was deleted.
Anti-Virus
Updates-All-
Failed
This report displays a table with the Device Vendor, Device
Product Target Zone Name, Target Host Name, Target
Address and Minute(EndTime), of all failed anti-virus
update events.
none
Anti-Virus
Updates-All-
Summary
This report displays a table showing the Target Zone Name,
Target Host Name, Target Address, Device Vendor, Device
Product, Category Outcome and the sum of the
Aggregated Event Count of all anti-virus events.
none
Asset Startup and
Shutdown Event
Log
This report provides a listing of the system startup and
shutdown events.
none
Device
Configuration
Changes
This report shows a table of events related to successful
device configuration modification events. The information
provided includes the Device Group, the Zone, Address and
Host Name, the Configuration Event name, the User ID and
Name making the change, and the hour the change was
made. Clicking on a device entry in the Device Group
column will bring up a new report, Device Configuration
Changes Drilldown, which will show only configuration
events for that particular device type.
The Device
Group field drill
downs to the
Device
Configuration
Changes report.
This report drills
down to itself.
Device
Configuration
Events
This report shows a table of events related to various
device configuration modification events, whether
successful or not. The information provided includes the
Device Group, the Zone, Address and Host Name, the
Configuration Event name, the User ID and Name making
the change, and the hour the change was made. Clicking on
a device entry in the Device Group column will bring up a
new report, Device Configuration Events Drilldown, which
will show only configuration events for that particular
device type.
The Device
Group field drill
downs to the
Device
Configuration
Events report.
This report drills
down to itself.
Device
Misconfigurations
This report shows a table of events related to device
configuration checks. The information provided includes
The Device
Group field drill
Configuration Monitoring, continued
Administrator's Guide
HPE Logger 6.2 Page 564 of 623

Report Description Drill Down
the Device Group, the Zone, Address and Host Name, the
Misconfiguration name, and the count of the number of
misconfigurations found. Clicking on a Device Group entry
will run the Device Misconfigurations Drilldown report,
focusing on the device type that was clicked.
downs to the
Device
Misconfigurations
report.
This report drills
down to itself.
Password
Changes
This report displays a table of user accounts having their
passwords changed. The table shows the time the
password was changed, the user name of the account with
the new password, the zone and address of the system on
which the password was changed, and the zone and
address from which the change originated.
none
Vulnerability
Scanner Logs by
Host
This report shows Vulnerability Scanner Logs grouped by
Zone and Host IP Address.
none
Vulnerability
Scanner Logs by
Vulnerability
This report shows Vulnerability Scanner Logs grouped by
Vulnerability IDs and Names.
none
Configuration Monitoring, continued
Intrusion Monitoring
This is a sub-category of the Foundation category, focusing on security, perimeter defense, resource
access and user tracking events.
The Intrusion Monitoring category is located under the following path.
Foundation\Intrusion Monitoring
The Intrusion Monitoring category reports are listed in the following table. There are no parameters.
Report Description Drill Down
Firewall
Traffic by
Service
This report displays a table showing the Port, transport
protocol, application protocol, and the number of events
reported by firewalls.
none
Least
Common
This report displays all events in the time period selected and
orders them by the sum of the aggregated event count in
The Event Name field drill
downs to the Bottom
Intrusion Monitoring
Administrator's Guide
HPE Logger 6.2 Page 565 of 623

Report Description Drill Down
Events ascending order. The columns are hyperlinked for
convenience. The Event Name column will bring up the
Bottom Destinations report using the same time frame. The
Count column will bring up the Bottom Sources report using
the same time frame.
Destinations report.
The Count field drill downs
to the Bottom Sources
report.
Most
Common
Events
This report displays the 200 most common events within the
time range specified. The event name is hyperlinked to
drilldown to the Destination Counts by Event Name report,
which will show destination information for the event selected.
The Count field will bring up the Source Counts by Destination
Port report, which will include information about all sources by
destination port.
The arc_name field drill
downs to the Destination
Counts by Event Name
report.
The SUM(events.arc_
baseEventCount) field
drill downs to the Source
Counts by Destination
Port report.
Most
Common
Events by
Severity
This report displays a table showing the Severity, event name
and count of events in descending order.
The Severity field drill
downs to the Source
Counts by Device Severity
report.
The Count field drill downs
to the Destination Counts
by Device Severity report.
Probes on
Blocked Ports
by Source
This report displays a table of events showing the source
zone, address and host name, the transport protocol, the
destination port, and the count of events where the
destination port is in the list of commonly blocked ports. The
query uses the commonlyblockedPorts parameter, which can
be edited to include other ports (please make a copy of the
report, the query, and the parameter, and modify your
version as updates to the Foundation Content may overwrite
your changes).
none
SecurityDash
BoardRpt
This custom report displays a table showing the source
address, category behavior, destination address and event ID.
none
SecurityDB
Report
This custom Security Dashboard report displays two charts
and a table. The first chart shows the number of events by
source address. The second chart shows the number of
events by destination address. The table shows the counts of
events for each source and destination.
none
Intrusion Monitoring, continued
Administrator's Guide
HPE Logger 6.2 Page 566 of 623

Report Description Drill Down
Top IDS
Attack
Events
This report displays a table showing the top events from IDS
systems, with the IDS Event name, the type of IDS, and the
count of each IDS event where the category significance is
Compromise or Hostile.
none
Top IDS
Events
This report displays a table showing the top events from IDS
systems, with the IDS Event name, the type of IDS, and the
count of each IDS event.
none
Top Machines
Traversing
Firewall
This report displays the source zone, address and hostname,
and number of events reported by firewalls.
none
Top Web
Traffic
This report displays a table showing the hour, source zone,
address and host name, the web port and the count of events
where the destination port is listed in the webPorts
parameter.
none
Windows
Events
This report displays a table showing the device zone, address
and host name, the device event ID, the source user ID, user
name and NT domain, the destination user ID, user name and
NT domain, the behavior, outcome and event type, and the
count of events of each type reported by any Microsoft
operating system.
none
Worm
Infected
Systems
This report displays a table showing the Zone Name, Host
Name and Address of systems exhibiting symptoms of being
infected by a worm.
none
Intrusion Monitoring, continued
The following categories are located under Intrusion Monitoring:
• Attackers 567
• Resource Access 570
• Targets 571
• User Tracking 574
Attackers
This is a sub-category of the Intrusion Monitoring category, focusing on events based on source or
attacker information.
The Attackers category is located under the following path.
Foundation\Intrusion Monitoring\Attackers
Administrator's Guide
HPE Logger 6.2 Page 567 of 623

The Attackers category reports are listed in the following table. There are no parameters.
Report Description Drill Down
Bottom Sources This report displays the Source Zone Names, Source
Addresses and event Count ordered by the sum of the
base event counts in ascending order. Clicking on the
hyperlink for the Count column will bring up the
Bottom Targets report. It is the target of the Least
Common Events report\'s Count column.
The Count field drill
downs to the Bottom
Targets report.
Source Counts
by Destination
This report displays a table showing the destination
zone and address, the source zone and the number of
each event for a specific destination zone and address
where the category significance is Compromise or
Hostile.
The Destination
Zone field drill downs to
the Source Counts by
Destination report.
The Destination
Address field drill
downs to the Source
Counts by Destination
report.
The Source Count
field drill downs to the
Attack Events by
Destination report.
This report drills down
to itself.
Source Counts
by Destination
Port
This report displays a table showing the Destination
Port, the source zone and address, and the number of
events for each port.
none
Source Counts
by Device
This report displays a table showing the device zone
and address, the source zone and address, and the
number of each event where the category significance
is Compromise or Hostile.
none
Source Counts
by Device
Severity
This report displays a table showing the Severity,
source zone and address, and the number of events at
that severity.
none
Source Counts
by Source Port
This report displays a table showing the Source Port,
source zone and address, and a count of events where
none
Attackers
Administrator's Guide
HPE Logger 6.2 Page 568 of 623

Report Description Drill Down
the category significance is Compromise or Hostile.
Source Port
Counts
This report displays a table showing the Source Port,
Event Name and count of the events where the
category significance is Compromise or Hostile.
none
Top 10 Talkers This report displays a table of the Top 10 systems
generating events, showing the Source zone and
address, as well as the number of events from that
system.
none
Top Attacker
Detail
This report displays a table showing the severity,
attacker zone and address, the target zone and
address, and the count of events for a specified source
zone and address where the category significance is
Compromise or Hostile.
none
Top Attacker
Details
This report displays the Severity, Attacker Zone,
Attacker Address, Target Zone, Target Address and
Count of events where the Category Significance of
the event is compromise or hostile, ordered by the
event count in descending order. This report is the
target of the Top Attackers report\'s Attacker Address
column.
none
Top Attacker
Ports
This report displays a table showing the Attacker Port,
Transport Protocol and the count of events where the
category significance is Compromise or Hostile.
none
Top Attackers This report shows the Attacker Zone Names, Attacker
Addresses and Count of events where the Category
Significance of the events is compromise or hostile, in
descending order of the sum of the base event count.
This report has hyperlinks that will run reports showing
more information base on the field selected. The
Attacker Zone column will run the Top Attack Sources
report. The Attacker Address will run the Top Attacker
Details report. The Count column will run the Top
Targets report.
The Attacker
Address field drill
downs to the Top
Attacker Details report.
The Count field drill
downs to the Top
Targets report.
Top Attack
Sources
This report displays the Attacker Zone and Count of
events where the Category Significance of the event is
The Attacker Zone
field drill downs to the
Attackers, continued
Administrator's Guide
HPE Logger 6.2 Page 569 of 623

Report Description Drill Down
compromise or hostile, ordered by the event count in
descending order. This report has a hyperlink in the
Attacker Zone column that will run the Top Attackers
report.
Top Attackers report.
Top Sources
Detected by
Snort
This report displays a table showing the source zone,
address and host name and the number of events
detected by Snort.
none
Top Sources
Traversing
Firewalls
This report displays a table of the source zone, address
and host name, as well as the count of events, where
the event was reported by a firewall device.
none
Attackers, continued
Resource Access
This is a sub-category of the Intrusion Monitoring category, focusing on protected resources.
The Resource Access category is located under the following path.
Foundation\Intrusion Monitoring\Resource Access
The Resource Access category reports are listed in the following table. There are no parameters.
Report Description Drill Down
Access Events by
Resource
This report displays a table showing the Resource
Type, the zone and address, the access event, the
outcome and the number of times this has happened
over the time period selected. Clicking on a resource
type will run the Access Events by Resource Drilldown
report showing the events for the selected resource
type.
The Resource Type
field drill downs to the
Access Events by
Resource report.
This report drills
down to itself.
Least Common
Accessed Ports
This report displays a table showing the Destination
Port, the Transport Protocol and a count of the events
for that port where the transport protocol is TCP or
UDP.
none
Resource Access
by Users -
Failures
This report displays a table showing the Resource
Type, the User ID and Name, Destination zone and
address, the Access Event and number of failed
The Resource Type
field drill downs to the
Resource Access by
Users - Failures
Resource Access
Administrator's Guide
HPE Logger 6.2 Page 570 of 623

Report Description Drill Down
attempts to access a given resource. Clicking on an
entry in the Resource Type column will bring up the
Resource Access by Users - Failures Drilldown report,
which will show all related events for that resource
type.
report.
This report drills
down to itself.
Resource Access
by Users -
Successes-
Attempts
This report displays a table showing the Resource
Type, Outcome, destination user ID and name,
destination zone and address, the access event name
and the number of such events. The Resource Type
column is hyperlinked so that clicking on a resource
type will run the Resource Access by Users - Successes-
Attempts Drilldown report, showing only events for the
selected resource type.
The Resource Type
field drill downs to the
Resource Access by
Users - Successes-
Attempts report.
This report drills
down to itself.
Top Machines
Accessing the
Web
This report displays a table showing the source zone,
address and host name, the destination port and the
number of events where the destination port is in the
webPorts parameter list.
none
Resource Access, continued
Targets
This is a sub-category of the Intrusion Monitoring category, focusing on events based on destination or
target information.
The Targets category is located under the following path.
Foundation\Intrusion Monitoring\Targets
The Targets category reports are listed in the following table. There are no parameters.
Report Description Drill Down
Attack Events by
Destination
This report displays a table showing the
destination zone and address, the source zone and
address, the event name and the number of each
event for a specific destination zone and address
where the category significance is Compromise or
Hostile.
The Destination Zone
field drill downs to the
Attack Events by
Destination report.
The Destination
Address field drill downs
to the Attack Events by
Destination report.
Targets
Administrator's Guide
HPE Logger 6.2 Page 571 of 623

Report Description Drill Down
This report drills down to
itself.
Bottom
Destinations
This report displays the Destination Zone Names,
Destination Addresses and event Count ordered
by the sum of the base event counts in ascending
order. It is the target of the Least Common Events
report\'s Event Name column.
none
Bottom Targets This report shows the Target Zone Names, Target
Addresses and Count of events where the
Category Significance of the events is compromise
or hostile, in ascending order of the sum of the
base event count. This report is the target of the
Bottom Sources report\'s Count column.
none
Destination
Counts by Device
Severity
This report displays a table showing the Severity,
target zone and address, and the number of
events for each severity.
none
Destination
Counts by Event
Name
This report displays a table showing the event
name, the target zone and address, and the
number of events for each destination.
none
Target Attack
Counts by
Severity
This report displays a table showing the Severity,
the target zone and the number of events where
the event has a category significance of
Compromise, Hostile or Suspicious.
none
Target Counts by
Event Name
This report displays a table showing the event
name, target zone and address, and the number of
time that event has occurred where the category
significance is Compromise or Hostile.
none
Target Counts by
Severity
This report displays a table showing the Severity,
the target zone and address, and the number of
events where the event has a category significance
of Compromise, Hostile or Suspicious.
none
Target Counts by
Source
This report displays a table showing the Source
zone and address, the target zone and address,
and the number of events where the event has a
none
Targets, continued
Administrator's Guide
HPE Logger 6.2 Page 572 of 623

Report Description Drill Down
category significance of Compromise, Hostile or
Suspicious.
Target Counts by
Source Port
This report displays a table showing the Source
Port, the count of events for that port, with the
destination zone and address, where the category
significance is Compromise or Hostile.
none
Target Counts by
Target Port
This report displays a table showing the
Destination Port, the number of events for each
port, and the target zone and address for events
with category significance of Compromise or
Hostile.
none
Target Port
Counts
This report displays a table showing the Target
Port, the number of events for that port, and the
target zone and address of events where the
category significance is Compromise or Hostile.
none
Top Destination
Ports
This report displays a table of the top destination
ports and the number of events for each port.
none
Top Destinations
Across Firewalls
This report displays a table of the destination
zone, address and host name, as well as the count
of events, where the event was reported by a
firewall device.
none
Top Destinations
in IDS Events
This report displays a table showing the
Destination zone, address and host name, as well
as the count of event going to each host, for all
events coming from an IDS.
none
Top Targets This report displays the Target Zone, Target
Address and Count of events where the Category
Significance of the event is compromise or hostile,
ordered by the event count in descending order.
This report is the target of the Top Attackers
report\'s Count column.
none
Targets, continued
Administrator's Guide
HPE Logger 6.2 Page 573 of 623

User Tracking
This is a sub-category of the Intrusion Monitoring category, focusing on events based on user
information.
The User Tracking category is located under the following path.
Foundation\Intrusion Monitoring\User Tracking
The User Tracking category reports are listed in the following table. There are no parameters.
Report Description
Drill
Down
Common Account
Login Failures by
Source
This report displays a table of the Resource Type, Attacker
Address, Attacker Asset Name, Attacker NT Domain, Attacker
User ID, Attacker User Name, Attacker Zone Name and the sum
of the Aggregated Event Count.
none
Number of Failed
Logins
This report displays a table showing the number of failed logins
for each hour covered by the report time-range.
none
Top User Logins This report displays a table showing the NT Domain, the user ID
and name, and the number of successful logins.
none
Top Users with
Failed Logins
This report displays a table showing the user ID and name, time
(by minute) and the number of failed login attempts.
none
User Activity This report displays a table of events, showing the source user ID
and user name, the destination user ID and user name, the time
of the event, the event name and the result (success, attempt,
failure).
none
User Tracking
NetFlow Monitoring
This is a sub-category of the Foundation category, focusing on NetFlow data.
The NetFlow Monitoring category is located under the following path.
Foundation\NetFlow Monitoring
Administrator's Guide
HPE Logger 6.2 Page 574 of 623

The NetFlow Monitoring category reports are listed in the following table.
Report Description Drill Down
Daily Bandwidth Usage This report displays a chart and a table to show the
bandwidth usage by day.
none
Hourly Bandwidth Usage This report displays a chart and a table to show the
bandwidth usage by hour.
none
Top Bandwidth Usage by
Destination
This report displays a chart and a table to show the
bandwidth usage by destination address.
none
Top Bandwidth Usage by
Destination Port
This report displays a chart and a table to show the
bandwidth usage by destination port.
none
Top Bandwidth Usage by
Source
This report displays a chart and a table to show the
bandwidth usage by source address.
none
NetFlow Monitoring
Network Monitoring
This is a sub-category of the Foundation category, focusing on network bandwidth and status events.
The Network Monitoring category is located under the following path.
Foundation\Network Monitoring
The Network Monitoring category reports are listed in the following table. There are no parameters.
Report Description Drill Down
Top VPN Accesses
by User
This report displays a table showing the source user ID and
name, and the count of events for VPN access, authorization
or authentication events.
none
Top VPN Event
Destinations
This report displays a table showing the VPN destination zone,
address and host name, and the count of events for that host,
reported by the VPN device, excluding modification events.
none
Top VPN Events This report displays a table showing the VPN event name,
source zone and address, destination zone and address, and
the count of events for that event reported by the VPN device,
excluding modification events.
none
Top VPN Event This report displays a table showing the VPN source zone, none
Network Monitoring
Administrator's Guide
HPE Logger 6.2 Page 575 of 623

Report Description Drill Down
Sources address and host name, and the count of events for that
source, reported by the VPN device, excluding modification
events.
Traffic Statistics This report displays two charts and a table. The first chart
shows the bytes in and out by hour. The second chart shows
the bytes in and out by device. The table shows the hour,
firewall zone and address, the transport protocol and the bytes
in and out.
none
VPN Connection
Attempts
This report displays a table showing the source hostname,
source user name, destination zone, address and host name,
destination user ID and user name and the count of events
where the VPN access, authorization or authentication event
did not result in failure.
none
VPN Connection
Failures
This report displays a table showing the VPN device zone,
address and host name, the VPN event, the source user ID,
host name and user name, the destination zone, address, host
name and user name, and the count of each event, where the
VPN device reports and access, authorization or
authentication failure.
none
Network Monitoring, continued
Logger Administration
This category covers Logger administration tasks. The Logger Administration category reports are
listed in the following table.
Report Description
Drill
Down Params
Daily Byte Count This report displays a daily count of bytes from events that
have been received from connectors.
none none
Logger Administration
Administrator's Guide
HPE Logger 6.2 Page 576 of 623

SANS Top 5
This category covers the SANS Top 5 Essential Log Reports (http://www.sans.org/security-
resources/top5-logreports.pdf). Each of the sub-categories addresses one of the 5 areas.
The following categories are located under the SANS Top 5 category:
• 1 - Attempts to Gain Access through Existing Accounts 577
• 2 - Failed File or Resource Access Attempts 578
• 3 - Unauthorized Changes to Users Groups and Services 578
• 4 - Systems Most Vulnerable to Attack 580
• 5 - Suspicious or Unauthorized Network Traffic Patterns 580
1 - Attempts to Gain Access through Existing Accounts
This is a sub-category of the SANS Top 5 Essential Log Reports. It addresses attempts to gain access to
a system through existing accounts.
The 1 - Attempts to Gain Access through Existing Accounts category is located under the following
path.
SANS Top 5\1 - Attempts to Gain Access through Existing Accounts
The 1 - Attempts to Gain Access through Existing Accounts category reports are listed in the following
table.
Report Description
Drill
Down Params
Number of
Failed Logins
This report, based on the SANS Top 5 Essential Log Reports,
section 1 - Attempts to Gain Access Through Existing
Accounts, displays a table showing the number of failed logins
for each hour covered by the report time-range.
none none
Top Users with
Failed Logins
This report, based on the SANS Top 5 Essential Log Reports,
section 1 - Attempts to Gain Access Through Existing
Accounts, displays a table showing the user ID and name, the
time and the number of attempts to login to a system during
that minute.
none none
1 - Attempts to Gain Access through Existing Accounts
Administrator's Guide
HPE Logger 6.2 Page 577 of 623

2 - Failed File or Resource Access Attempts
This is a sub-category of the SANS Top 5 Essential Log Reports. It addresses failed file or resource
access attempts.
The 2 - Failed File or Resource Access Attempts category is located under the following path.
SANS Top 5\2 - Failed File or Resource Access Attempts
The 2 - Failed File or Resource Access Attempts category reports are listed in the following table.
Report Description Drill Down Params
Failed Resource
Access by Users
This report, based on the SANS Top 5
Essential Log Reports, section 2 - Failed
File or Resource Access Attempts, displays
a table showing the Resource Type, the
User ID and Name, Destination zone and
address, the Access Event and number of
failed attempts to access a given resource.
Clicking on an entry in the Resource Type
column will bring up the SANS Top 5 -2-
Failed Resource Access by Users Drilldown
report, which will show all related events
for that resource type.
The Resource Type
field drill downs to the
Failed Resource Access by
Users report.
This report drills down to
itself.
none
Failed Resource
Access Events
This report, based on the SANS Top 5
Essential Log Reports, section 2 - Failed
File or Resource Access Attempts, displays
a table showing the Resource Type, the
User ID and Name, Destination zone and
address, the Access Event and number of
failed attempts to access a given resource.
Clicking on an entry in the Resource Type
column will bring up the SANS Top 5 -2-
Failed Resource Access Events Drilldown
report, which will show all related events
for that resource type.
The Resource Type
field drill downs to the
Failed Resource Access
Events report.
This report drills down to
itself.
none
2 - Failed File or Resource Access Attempts
3 - Unauthorized Changes to Users Groups and Services
This is a sub-category of the SANS Top 5 Essential Log Reports. It addresses unauthorized changes to
users, groups and services.
Administrator's Guide
HPE Logger 6.2 Page 578 of 623

The 3 - Unauthorized Changes to Users Groups and Services category is located under the following
path.
SANS Top 5\3 - Unauthorized Changes to Users Groups and Services
The 3 - Unauthorized Changes to Users Groups and Services category reports are listed in the following
table.
Report Description
Drill
Down Params
Account
Modifications
This custom report, based on the SANS Top 5 Essential Log
Reports, section 3 - Unauthorized Changes to Users, Groups
and Services, displays a chart and a table. The chart shows the
top user account modifications. The table shows the source
user name, source zone and address, destination user name,
destination zone and address, the modification event, and the
date of the modification.
none none
Password
Changes
This report, based on the SANS Top 5 Essential Log Reports,
section 3 - Unauthorized Changes to Users, Groups and
Services, displays a table showing the user name, source zone
and address, destination zone and address, and the date of
password change events.
none none
User Account
Creations
This report, based on the SANS Top 5 Essential Log Reports,
section 3 - Unauthorized Changes to Users, Groups and
Services, displays a table showing the source user name, the
source zone and address, the destination user name, the
destination zone and address, the modification event name
and the date of the account creation.
none none
User Account
Deletions
This report, based on the SANS Top 5 Essential Log Reports,
section 3 - Unauthorized Changes to Users, Groups and
Services, displays a table showing the source user name, the
source zone and address, the destination user name, the
destination zone and address, and the time when a user
account was deleted.
none none
User Account
Modifications
This report, based on the SANS Top 5 Essential Log Reports,
section 3 - Unauthorized Changes to Users, Groups and
Services, displays a table showing the source user name, the
source zone and address, the destination user name, the
destination zone and address, the modification event name,
and the date of the account modification.
none none
3 - Unauthorized Changes to Users Groups and Services
Administrator's Guide
HPE Logger 6.2 Page 579 of 623

4 - Systems Most Vulnerable to Attack
This is a sub-category of the SANS Top 5 Essential Log Reports. It addresses the systems that are most
vulnerable to attack.
The 4 - Systems Most Vulnerable to Attack category is located under the following path.
SANS Top 5\4 - Systems Most Vulnerable to Attack
The 4 - Systems Most Vulnerable to Attack category reports are listed in the following table.
Report Description Drill Down Params
Vulnerability
Scanner Logs
by Host
This report, based on the SANS
Top 5 Essential Log Reports,
section 4 - Systems Most
Vulnerable to Attack, displays a
table showing the system zone
and address, the vulnerability ID
and name, and the number of
times that vulnerability has been
reported for that system.
The arc_destinationAddress
field drill downs to the
Vulnerability Scanner Logs by
Host report.
This report drills down to itself.
none
Vulnerability
Scanner Logs
by Vulnerability
This report, based on the SANS
Top 5 Essential Log Reports,
section 4 - Systems Most
Vulnerable to Attack, displays a
table showing the vulnerability ID
and name, the zone and address,
and the number of times that
vulnerability has been reported
for that system.
The arc_destinationAddress
field drill downs to the
Vulnerability Scanner Logs by
Host report.
This report drills down to itself.
none
4 - Systems Most Vulnerable to Attack
5 - Suspicious or Unauthorized Network Traffic Patterns
This is a sub-category of the SANS Top 5 Essential Log Reports. It addresses suspicious or
unauthorized network traffic patterns.
The 5 - Suspicious or Unauthorized Network Traffic Patterns category is located under the following
path.
SANS Top 5\5 - Suspicious or Unauthorized Network Traffic Patterns
Administrator's Guide
HPE Logger 6.2 Page 580 of 623

The 5 - Suspicious or Unauthorized Network Traffic Patterns category reports are listed in the following
table.
Report Description
Drill
Down Params
Alerts from IDS This report, based on the SANS Top 5 Essential Log
Reports, section 5 - Suspicious or Unauthorized Network
Traffic Patterns, displays a table showing the device
vendor and product, the device event ID, the IDS signature
name and the number of times that signature was
reported.
none none
IDS Signature
Destinations
This report, based on the SANS Top 5 Essential Log
Reports, section 5 - Suspicious or Unauthorized Network
Traffic Patterns, displays a table showing the destination
zone and address, the device vendor and product and the
count of events reported for the address by the IDS.
none none
IDS Signature
Sources
This report, based on the SANS Top 5 Essential Log
Reports, section 5 - Suspicious or Unauthorized Network
Traffic Patterns, displays a table showing the destination
zone and address, the device vendor and product, and the
count of each event.
none none
Top 10 Talkers This report, based on the SANS Top 5 Essential Log
Reports, section 5 - Suspicious or Unauthorized Network
Traffic Patterns, displays a table showing the source zone
and address, and the number of events coming from each
address.
none none
Top 10 Types of
Traffic
This report, based on the SANS Top 5 Essential Log
Reports, section 5 - Suspicious or Unauthorized Network
Traffic Patterns, breaks down the traffic by the Application
Protocol, Port number and Transport Protocol, where at
least one of the three must be available and the bytes in or
bytes out are available. The count is bases on the number
of base events, presuming that each event with these
conditions represents a packet of some type.
none none
Top Alerts from
IDS
This report, based on the SANS Top 5 Essential Log
Reports, section 5 - Suspicious or Unauthorized Network
Traffic Patterns, displays a chart and a table. The chart
shows the top 10 alerts from IDSes. The table shows the
none none
5 - Suspicious or Unauthorized Network Traffic Patterns
Administrator's Guide
HPE Logger 6.2 Page 581 of 623

Report Description
Drill
Down Params
Signature ID, the signature name, the device vendor and
the number of times that signature was reported.
Top Destination
IPs
This report, based on the SANS Top 5 Essential Log
Reports, section 5 - Suspicious or Unauthorized Network
Traffic Patterns, displays a table showing the target zone
and address and the count of events for each destination
address.
none none
Top IDS Signature
Destinations
This report, based on the SANS Top 5 Essential Log
Reports, section 5 - Suspicious or Unauthorized Network
Traffic Patterns, displays a chart and a table. The chart
shows the top signature destinations by address. The table
shows the destination zone and address, the device vendor
and product, and the count of events to that host.
none none
Top IDS Signature
Sources
This report, based on the SANS Top 5 Essential Log
Reports, section 5 - Suspicious or Unauthorized Network
Traffic Patterns, displays a chart and a table. The chart
shows the top signature sources by address. The table
shows the source zone and address, the device vendor and
product, and the count of events by that host.
none none
Top Target IPs This report, based on the SANS Top 5 Essential Log
Reports, section 5 - Suspicious or Unauthorized Network
Traffic Patterns, displays a table showing the target zone
and address, and the number of IDS event reported for
that address where the category significance is
Compromise or Hostile.
none none
5 - Suspicious or Unauthorized Network Traffic Patterns, continued
Parameters
Some reports invoke queries that prompt for field values during report runtime. The values entered for
these fields are passed to the query using parameters. To change the value of the parameter that is
passed to the query, you can enter a new value when prompted by the report during runtime or you can
change the default value of the parameter. SQL wildcards are supported values for parameters; for
example, the % wildcard character matches one or more characters. For more information about
parameters, see "Parameters" on page231.
Administrator's Guide
HPE Logger 6.2 Page 582 of 623

Logger reports invoke queries that use the following parameters:
• IPAddress 583
• categoryObjectParameter 583
• commonlyBlockedPorts 584
• destinationAddress 584
• destinationPort 584
• deviceGroupParameter 584
• deviceProduct 585
• deviceSeverityParameter 585
• deviceVendor 585
• dmBandwidthParameter 585
• dmConfigurationParameter 586
• dmLoginParameter 586
• eventNameParameter 586
• resourceTypeParameter 586
• webPorts 587
• zoneParameter 587
• zones 587
IPAddress
When a report invokes a query that expects the IPAddress parameter as input, the IP Address prompt
is displayed during report runtime with a default value of %.
This is a single value character type (CHAR) parameter that takes an IP address, such as
192.168.35.5.
This parameter is used with the LIKE keyword in the WHERE clause of an SQL query. See the
Foundation \\ Intrusion Monitoring \\ Attackers \\ Top Attacker Details query object for an example of
a query using this parameter.
categoryObjectParameter
When a report invokes a query that expects the categoryObjectParameter parameter as input, the
Resource Type prompt is displayed during report runtime with a default value of
'/Host/Application/Database','/Host/Application/Database/Data','/Host/Applica
tion/Service/Email','/Host/Resource/File'.
This is a multiple value character type (CHAR) parameter that allows the selection of one or more
Category Object URIs, such as Host/Application/Database.
Administrator's Guide
HPE Logger 6.2 Page 583 of 623
This parameter is used with the IN keyword in the WHERE clause of an SQL query. See the Foundation
\\ Intrusion Monitoring \\ Resource Access \\ Access Events by Resource query object for an example of
a query using this parameter.
commonlyBlockedPorts
When a report invokes a query that expects the commonlyBlockedPorts parameter as input, the
Blocked Ports prompt is displayed during report runtime with all default values listed in the Combo
Source panel.
This is a multiple value number type (NUMBER) parameter that allows the selection of one or more
listed port numbers, such as 135,139.
This parameter is used with the IN keyword in the WHERE clause of an SQL query. See the Foundation
\\ Intrusion Monitoring \\ Probes on Blocked Ports query object for an example of a query using this
parameter.
destinationAddress
When a report invokes a query that expects the destinationAddress parameter as input, the
Destination IP Address prompt is displayed during report runtime with a default value of %.
This is a single value character type (CHAR) parameter that takes an IP address, such as
192.168.35.5.
This parameter is used with the LIKE keyword in the WHERE clause of an SQL query. See the
Foundation \\ Intrusion Monitoring \\ Attackers \\ Source Counts by Destination query object for an
example of a query using this parameter.
destinationPort
When a report invokes a query that expects the destinationPort parameter as input, the Destination
Port prompt is displayed during report runtime with a default value of 80.
This is a single value number type (NUMBER) parameter that allows the entry of one port number, such
as 80.
deviceGroupParameter
When a report invokes a query that expects the deviceGroupParameter parameter as input, the
Category Device Group prompt is displayed during report runtime with a default value of
'/Firewall','/IDS','/IDS/Host','/IDS/Host/Antivirus','/IDS/Host/File
Integrity','/IDS/Network','/IDS/Network/Traffic Analysis','/Network
Equipment','/Network Equipment/Router','/Network Equipment/Switches','/VPN'.
Administrator's Guide
HPE Logger 6.2 Page 584 of 623
This is a multiple value character type (CHAR) parameter that allows the selection of one or more
Category Object URIs, such as Host/Application/Database.
This parameter is used with the IN keyword in the WHERE clause of an SQL query. See the Foundation
\\ Configuration Monitoring \\ Device Configuration Changes query object for an example of a query
using this parameter.
deviceProduct
When a report invokes a query that expects the deviceProduct parameter as input, the Device
Product prompt is displayed during report runtime with a default value of %.
This is a single value character type (CHAR) parameter that takes a string, such as Snort.
This parameter is used with the LIKE keyword in the WHERE clause of an SQL query. See the
Foundation \\ Configuration Monitoring \\ Vulnerability Scanner Logs by Host query object for an
example of a query using this parameter.
deviceSeverityParameter
When a report invokes a query that expects the deviceSeverityParameter parameter as input, the
Device Severity prompt is displayed during report runtime with a default value of %.
This is a single value character type (CHAR) parameter that takes a string, such as High.
This parameter is used with the LIKE keyword in the WHERE clause of an SQL query. See the
Foundation \\ Intrusion Monitoring \\ Attackers \\ Source Counts by Device Severity query object for
an example of a query using this parameter.
deviceVendor
When a report invokes a query that expects the deviceVendor parameter as input, the Device Vendor
prompt is displayed during report runtime with a default value of %.
This is a single value character type (CHAR) parameter that takes a string, such as Snort.
This parameter is used with the LIKE keyword in the WHERE clause of an SQL query. See the
Foundation \\ Configuration Monitoring \\ Vulnerability Scanner Logs by Host query object for an
example of a query using this parameter.
dmBandwidthParameter
When a report invokes a query that expects the dmBandwidthParameter parameter as input, the
Device Type prompt is displayed during report runtime with a default value of all.
Administrator's Guide
HPE Logger 6.2 Page 585 of 623
This is a single value character type (CHAR) parameter that allows the selection of predefined value,
such as Firewall.
This parameter is used with the LIKE keyword in the WHERE clause of an SQL query. See the
Foundation \\ Configuration Monitoring \\ Vulnerability Scanner Logs by Host query object for an
example of a query using this parameter.
dmConfigurationParameter
When a report invokes a query that expects the dmConfigurationParameter parameter as input, the
Device Type prompt is displayed during report runtime with a default value of all.
This is a single value character type (CHAR) parameter that allows the selection of predefined value,
such as Firewall.
This parameter is used with the LIKE keyword in the WHERE clause of an SQL query.
dmLoginParameter
When a report invokes a query that expects the dmLoginParameter parameter as input, the Device
Type prompt is displayed during report runtime with a default value of all.
This is a single value character type (CHAR) parameter that allows the selection of predefined value,
such as Firewall.
This parameter is used with the LIKE keyword in the WHERE clause of an SQL query. See the Device
Monitoring \\ CrossDevice \\ Failed Login Attempts query object for an example of a query using this
parameter.
eventNameParameter
When a report invokes a query that expects the eventNameParameter parameter as input, the Event
Name prompt is displayed during report runtime with a default value of %.
This is a single value character type (CHAR) parameter that takes a string, such as Connector Raw
Event Statistics.
This parameter is used with the LIKE keyword in the WHERE clause of an SQL query. See the
Foundation \\ Intrusion Monitoring \\ Targets \\ Destination Counts by Event Name query object for an
example of a query using this parameter.
resourceTypeParameter
When a report invokes a query that expects the resourceTypeParameter parameter as input, the
Resource Type prompt is displayed during report runtime with a default value of
/Host/Application/Database.
Administrator's Guide
HPE Logger 6.2 Page 586 of 623
This is a single value character type (CHAR) parameter that takes a string, such as
/Host/Application/Database.
This parameter is used with the LIKE keyword in the WHERE clause of an SQL query.
webPorts
When a report invokes a query that expects the webPorts parameter as input, the Web Ports prompt is
displayed during report runtime with all default values listed in the Combo Source panel.
This is a multiple value number type (NUMBER) parameter that allows the selection of one or more
listed port numbers, such as 80,443.
This parameter is used with the IN keyword in the WHERE clause of an SQL query. See the Foundation
\\ Intrusion Monitoring \\ Top Web Traffic query object for an example of a query using this parameter.
zoneParameter
When a report invokes a query that expects the zoneParameter parameter as input, the Zone prompt
is displayed during report runtime with a default value of %.
This is a single value character type (CHAR) parameter that takes an IP address, such as /All
Zones/ArcSight System/Private Address Space Zones/RFC1918: 10.0.0.0-
10.255.255.255.
This parameter is used with the LIKE keyword in the WHERE clause of an SQL query. See the
Foundation \\ Intrusion Monitoring \\ Attackers \\ Top Attacker Details query object for an example of
a query using this parameter.
zones
When a report invokes a query that expects the zones parameter as input, the Zone prompt is
displayed during report runtime with a default value of %.
This is a multiple value character type (CHAR) parameter that allows the selection of one or more
Category Object URIs, such as /All Zones/ArcSight System/Private Address Space
Zones/RFC1918: 10.0.0.0-10.255.255.255,/All Zones/ArcSight System/Private
Address Space Zones/RFC1918: 192.168.0.0-192.168.255.255.
This parameter is used with the IN keyword in the WHERE clause of an SQL query. See the Foundation
\\ Intrusion Monitoring \\ Attackers \\ Source Counts by Destination query object for an example of a
query using this parameter.
Administrator's Guide
HPE Logger 6.2 Page 587 of 623

System Filters
Logger provides the system filters listed in the following table.
Filter Type Description
Configuration -
Configuration Changes
(Unified)
Unified
Query
This filter looks for events categorized as configuration
changes events.
Configuration - System
Configuration Changes
(CEF format)
Regular
Expression
This filter looks for events categorized as configuration
changes events. It is a Regular Expression filter and can be
used to create alerts.
Events - CEF Regular
Expression
This filter looks for all CEF formatted events. It is a Regular
Expression filter and can be used to create alerts.
Events - Event Counts
by Destination
Unified
Query
This filter looks for all CEF events that have a destination
address and shows a chart.
Events - Event Counts
by Source
Unified
Query
This filter looks for all CEF events that have a source address
and shows a chart.
Events - High and Very
High Severity CEF
Events
Regular
Expression
This filter looks for CEF events with a high or very high
severity. It is a Regular Expression filter and can be used to
create alerts.
Events - High and Very
High Severity Events
(Unified)
Unified
Query
This filter looks for CEF events with a high or very high
severity.
Firewall - Deny Unified
Query
This filter looks for events with deny or shun.
Firewall - Drop Unified
Query
This filter looks for drop events that are not database
related.
Firewall - Permit Unified
Query
This filter looks for events that have the word permit.
Intrusion - Malicious
Code (CEF format)
Regular
Expression
This filter looks for CEF events categorized to indicate
malicious code. It is a Regular Expression filter and can be
used to create alerts.
Filters
Administrator's Guide
HPE Logger 6.2 Page 588 of 623

Filter Type Description
Intrusion - Malicious
Code (Unified)
Unified
Query
This filter looks for CEF events categorized to indicate
malicious code.
Logins - All Logins
(CEF format)
Regular
Expression
This filter looks for CEF events categorized as authentication
events. It is a Regular Expression filter and can be used to
create alerts.
Logins - All Logins
(Non-CEF format)
Regular
Expression
This filter looks for non-CEF format events with words
indicating it is an authentication event. It is a Regular
Expression filter and can be used to create alerts.
Logins - All Logins
(Unified)
Unified
Query
This filter looks for CEF events categorized as authentication
events.
Logins - Failed Logins Unified
Query
This filter looks for failure events related to logins, user
authentication and user authorization.
Logins - Successful
Logins (Non-CEF
format)
Regular
Expression
This filter looks for events with keywords indicating a
successful login attempt. It is a Regular Expression filter and
can be used to create alerts.
Logins - Successful
Logins (CEF format)
Regular
Expression
This filter looks for CEF events categorized as successful
login events. It is a Regular Expression filter and can be used
to create alerts.
Logins - Successful
Logins (Unified)
Unified
Query
This filter looks for CEF events categorized as successful
login events.
Logins - Unsuccessful
Logins (Non-CEF
format)
Regular
Expression
This filter looks for failure events related to logins, user
authentication and user authorization. It is a Regular
Expression filter and can be used to create alerts.
Logins - Unsuccessful
Logins (CEF format)
Regular
Expression
This filter looks for failure events related to logins, user
authentication and user authorization. It is a Regular
Expression filter and can be used to create alerts.
Logins - Unsuccessful
Logins (Unified)
Unified
Query
This filter looks for failure events categorized as login
events.
Network - DHCP Lease
Events
Unified
Query
This filter looks for DHCP lease related events.
Network - Port Links Unified This filter looks for port or link status messages.
Filters, continued
Administrator's Guide
HPE Logger 6.2 Page 589 of 623

Filter Type Description
Up and Down Query
Network - Protocol
Links Up and Down
Unified
Query
This filter looks for protocol status messages.
SystemAlert - CPU
Utilization Above 90%
(CEF format)
Regular
Expression
This filter looks for internal events indicating that CPU
utilization is above 90%. It is a Regular Expression filter and
can be used to create alerts.
SystemAlert - CPU
Utilization Above 90%
(Unified)
Unified
Query
This filter looks for internal events indicating that CPU
utilization is above 90%.
SystemAlert - CPU
Utilization Above 95%
(CEF format)
Regular
Expression
This filter looks for internal events indicating that CPU
utilization is above 95%. It is a Regular Expression filter and
can be used to create alerts.
SystemAlert - CPU
Utilization Above 95%
(Unified)
Unified
Query
This filter looks for internal events indicating that CPU
utilization is above 95%.
SystemAlert - Device
Configuration Changes
(CEF format)
Regular
Expression
This filter looks for internal events indicating a Logger
configuration change. It is a Regular Expression filter and
can be used to create alerts.
SystemAlert - Device
Configuration Changes
(Unified)
Unified
Query
This filter looks for internal events indicating a Logger
configuration change.
SystemAlert - Filter
Configuration Changes
(CEF format)
Regular
Expression
This filter looks for internal events indicating a Logger filter
change. It is a Regular Expression filter and can be used to
create alerts.
SystemAlert - Filter
Configuration Changes
(Unified)
Unified
Query
This filter looks for internal events indicating a Logger filter
change.
SystemAlert - High
CPU Temperature (CEF
format)
Regular
Expression
This filter looks for internal events indicating potential CPU
over-heating. It is a Regular Expression filter and can be used
to create alerts.
SystemAlert - High
CPU Temperature
Unified
Query
This filter looks for internal events indicating potential CPU
over-heating.
Filters, continued
Administrator's Guide
HPE Logger 6.2 Page 590 of 623

Filter Type Description
(Unified)
SystemAlert - Bad Fan
(CEF format)
Regular
Expression
This filter looks for Logger appliance internal events related
to fan failure. It is a Regular Expression filter and can be used
to create alerts.
SystemAlert - Power
Supply Failure (CEF
format)
Regular
Expression
This filter looks for internal events indicating that a power
supply has failed. It is a Regular Expression filter and can be
used to create alerts.
SystemAlert - Power
Supply Failure (Unified)
Unified
Query
This filter looks for internal events indicating that a power
supply has failed.
SystemAlert - RAID
Status Battery Failure
(CEF format)
Regular
Expression
This filter looks for internal events indicating that the RAID
battery backup unit (BBU) has failed. It is a Regular
Expression filter and can be used to create alerts.
SystemAlert - RAID
Status Battery Failure
(Unified)
Unified
Query
This filter looks for internal events indicating that the RAID
battery backup unit (BBU) has failed.
SystemAlert - Disk
Failure (CEF format)
Regular
Expression
This filter looks for Logger appliance internal events
indicating a disk failure. It is a Regular Expression filter and
can be used to create alerts.
SystemAlert - Disk
Failure (Unified)
Unified
Query
This filter looks for Logger appliance internal events
indicating a disk failure.
SystemAlert - RAID
Controller Issue (CEF
format)
Regular
Expression
This filter looks for internal events indicating that a RAID
disk has failed. It is a Regular Expression filter and can be
used to create alerts.
SystemAlert - RAID
Controller Issue
(Unified)
Unified
Query
This filter looks for internal events indicating that a RAID
disk has failed.
SystemAlert - Root
Partition Free Space
Below 5% (Unified)
Unified
Query
This filter looks for internal events indicating that the root
partition disk free space is below 5%.
SystemAlert - Root
Partition Free Space
Below 10% (Unified)
Unified
Query
This filter looks for internal events indicating that the root
partition disk free space is below 10%.
Filters, continued
Administrator's Guide
HPE Logger 6.2 Page 591 of 623

Filter Type Description
SystemAlert - Root
Partition Free Space
Below 10% (CEF
format)
Regular
Expression
This filter looks for internal events indicating that the root
partition disk free space is below 10%. It is a Regular
Expression filter and can be used to create alerts.
SystemAlert - Root
Partition Free Space
Below 5% (CEF format)
Regular
Expression
This filter looks for internal events indicating that the root
partition disk free space is below 5%. It is a Regular
Expression filter and can be used to create alerts.
SystemAlert - Storage
Configuration Changes
(CEF format)
Regular
Expression
This filter looks for Logger internal events related to
changes of the storage configuration. It is a Regular
Expression filter and can be used to create alerts.
SystemAlert - Storage
Configuration Changes
(Unified)
Unified
Query
This filter looks for Logger internal events related to
changes of the storage configuration.
SystemAlert - Storage
Group Usage Above
90% (CEF format)
Regular
Expression
This filter looks for Logger internal events indicating that the
storage group usage is above 90%. It is a Regular Expression
filter and can be used to create alerts.
SystemAlert - Storage
Group Usage Above
90% (Unified)
Unified
Query
This filter looks for Logger internal events indicating that the
storage group usage is above 90%.
SystemAlert - Storage
Group Usage Above
95% (CEF format)
Regular
Expression
This filter looks for Logger internal events indicating that the
storage group usage is above 95%. It is a Regular Expression
filter and can be used to create alerts.
SystemAlert - Storage
Group Usage Above
95% (Unified)
Unified
Query
This filter looks for Logger internal events indicating that the
storage group usage is above 95%.
SystemAlert - Zero
Events Incoming (CEF
format)
Regular
Expression
This filter looks for Logger internal events indicating that the
no events are being received by Logger. It is a Regular
Expression filter and can be used to create alerts.
SystemAlert - Zero
Events Incoming
(Unified)
Unified
Query
This filter looks for Logger internal events indicating that the
no events are being received by Logger.
SystemAlert - Zero
Events Outgoing (CEF
Regular
Expression
This filter looks for Logger internal events indicating that the
no events are being forwarded by Logger. It is a Regular
Filters, continued
Administrator's Guide
HPE Logger 6.2 Page 592 of 623

Filter Type Description
format) Expression filter and can be used to create alerts.
SystemAlert - Zero
Events Outgoing
(Unified)
Unified
Query
This filter looks for Logger internal events indicating that the
no events are being forwarded by Logger.
SystemStatus - CPU
Utilization by
Connector Host
Unified
Query
This filter looks for SmartConnector system health events
and charts the CPU utilization by host.
SystemStatus - Disk
Utilization by
Connector Host
Unified
Query
This filter looks for SmartConnector system health events
and charts the disk utilization by host.
SystemStatus - Memory
Utilization by
Connector Host
Unified
Query
This filter looks for SmartConnector system health events
and charts the memory utilization by host.
Unix - CRON related
events
Unified
Query
This filter looks for events with the cron keyword.
Unix - IO Errors and
Warnings
Unified
Query
This filter looks for I/O events with error or warning
keywords.
Unix - PAM and Sudo
Messages
Unified
Query
This filter looks for events with the keywords PAM or sudo.
Unix - Password
Changes
Unified
Query
This filter looks for events related to password changes.
Unix - SAMBA Events Unified
Query
This filter looks for events related to SAMBA.
Unix - SSH
Authentications
Unified
Query
This filter looks for SSH authentication events.
Unix - User and Group
Additions
Unified
Query
This filter looks for events related to adding users or groups.
Unix - User and Group
Deletions
Unified
Query
This filter looks for events related to deleting users or
groups.
Windows - Account
Added to Global Group
Unified
Query
This filter looks for non-CEF events related to adding a
Windows account to a Global Group.
Filters, continued
Administrator's Guide
HPE Logger 6.2 Page 593 of 623

Filter Type Description
Windows - Account
Added to Global Group
(CEF)
Unified
Query
This filter looks for CEF events related to adding a Windows
account to a Global Group.
Windows - Audit Policy
Change
Unified
Query
This filter looks for non-CEF events related to Windows
Audit Policy changes.
Windows - Audit Policy
Change (CEF)
Unified
Query
This filter looks for CEF events related to Windows Audit
Policy changes.
Windows - Change
Password Attempt
Unified
Query
This filter looks for non-CEF events related to Windows
password changes.
Windows - Change
Password Attempt
(CEF)
Unified
Query
This filter looks for CEF events related to Windows password
changes.
Windows - Global
Group Created
Unified
Query
This filter looks for non-CEF events related to the creation of
Windows global groups
Windows - Global
Group Created (CEF)
Unified
Query
This filter looks for CEF events related to the creation of
Windows global groups.
Windows - Logon Bad
User Name or Password
Unified
Query
This filter looks for non-CEF events related to Windows
logon failures.
Windows - Logon Bad
User Name or Password
(CEF)
Unified
Query
This filter looks for CEF events related to Windows logon
failures.
Windows - Logon Local
User
Unified
Query
This filter looks for non-CEF events related to Windows
logons to the local system.
Windows - Logon Local
User (CEF)
Unified
Query
This filter looks for CEF events related to Windows logons to
the local system.
Windows - Logon
Remote User
Unified
Query
This filter looks for non-CEF events related to Windows
logons to a remote system.
Windows - Logon
Remote User (CEF)
Unified
Query
This filter looks for CEF events related to Windows logons to
a remote system.
Windows - Logon
Unexpected Failure
Unified
Query
This filter looks for non-CEF events related to Windows
logons with an unexpected failure.
Filters, continued
Administrator's Guide
HPE Logger 6.2 Page 594 of 623

Filter Type Description
Windows - Logon
Unexpected Failure
(CEF)
Unified
Query
This filter looks for CEF events related to Windows logons
with an unexpected failure.
Windows - New Process
Creation
Unified
Query
This filter looks for non-CEF events related to the creation of
new Windows processes.
Windows - New Process
Creation (CEF)
Unified
Query
This filter looks for CEF events related to the creation of new
Windows processes.
Windows - Pre-
Authentication Failure
Unified
Query
This filter looks for non-CEF events related to failures with
Windows pre-authentication.
Windows - Pre-
Authentication Failure
(CEF)
Unified
Query
This filter looks for CEF events related to failures with
Windows pre-authentication.
Windows - Special
Privileges Assigned to
New Logon
Unified
Query
This filter looks for non-CEF events related to logons for
accounts with special privileges (power user or
administrator-like accounts).
Windows - Special
Privileges Assigned to
New Logon (CEF)
Unified
Query
This filter looks for CEF events related to logons for
accounts with special privileges (power user or
administrator-like accounts).
Windows - User
Account Changed
Unified
Query
This filter looks for non-CEF events related to user account
changes.
Windows - User
Account Changed
(CEF)
Unified
Query
This filter looks for CEF events related to user account
changes.
Windows - User
Account Password Set
Unified
Query
This filter looks for non-CEF events related to user account
password changes.
Windows - User
Account Password Set
(CEF)
Unified
Query
This filter looks for CEF events related to user account
password changes.
Windows - Windows
Events (CEF)
Unified
Query
This filter looks for all CEF events that are generated by
Microsoft Windows.
Filters, continued
Administrator's Guide
HPE Logger 6.2 Page 595 of 623
Queries
This content contains the following queries:
Access Events by Resource
This query has no input parameters.
Accounts Created By User Account
This query has no input parameters.
Accounts Deleted by Host
This query has no input parameters.
Accounts Deleted by User Account
This query has no input parameters.
Alert Counts by Device
This query has no input parameters.
Alert Counts by Port
This query has no input parameters.
Alert Counts by Severity
This query has no input parameters.
Alert Counts by Type
This query has no input parameters.
Alert Counts per Hour
This query has no input parameters.
Administrator's Guide
HPE Logger 6.2 Page 596 of 623
Alerts from IDS
This query has no input parameters.
Anti-Virus Errors
This query has no input parameters.
Anti-Virus Updates-All-Failed
This query has no input parameters.
Anti-Virus Updates-All-Summary
This query has no input parameters.
Asset Startup and Shutdown Event Log
This query has no input parameters.
Attack Events By Destination
This query has no input parameters.
Authentication Errors
This query has no input parameters.
Bandwidth Usage by Hour
This query has no input parameters.
Bandwidth Usage by Protocol
This query has no input parameters.
Bottom Destinations
This query has no input parameters.
Bottom Sources
This query has no input parameters.
Administrator's Guide
HPE Logger 6.2 Page 597 of 623
Bottom Targets
This query has no input parameters.
By User Account - Accounts Created
This query has no input parameters.
Common Account Login Failures by Source
This query has no input parameters.
Configuration Changes by Type
This query has no input parameters.
Configuration Changes by User
This query has no input parameters.
Connection Counts by User
This query has no input parameters.
Connections Accepted by Address
This query has no input parameters.
Connections Denied by Address
This query has no input parameters.
Connections Denied by Hour
This query has no input parameters.
Daily Bandwidth Usage
This query has no input parameters.
Daily Byte Count
This query has no input parameters.
Administrator's Guide
HPE Logger 6.2 Page 598 of 623
Database Errors and Warnings
This query has no input parameters.
Denied Connections by Address
This query has no input parameters.
Denied Connections by Port
This query has no input parameters.
Denied Connections per Hour
This query has no input parameters.
Destination Counts by Device Severity
This query has no input parameters.
Destination Counts by Event Name
This query has no input parameters.
Device Configuration Changes
This query has no input parameters.
Device Configuration Events
This query has no input parameters.
Device Misconfigurations
This query has no input parameters.
Failed Anti-Virus Updates
This query has no input parameters.
Failed Login Attempts
This query has no input parameters.
Administrator's Guide
HPE Logger 6.2 Page 599 of 623
Failed Logins by Destination Address
This query has no input parameters.
Failed Logins by Source Address
This query has no input parameters.
Failed Logins by User
This query has no input parameters.
Failed Res Access Events
This query has no input parameters.
Failed Resource Access
This query has no input parameters.
Firewall Traffic by Service
This query has no input parameters.
Hourly Bandwidth Usage
This query has no input parameters.
IDS Signature Destinations
This query has no input parameters.
IDS Signature Sources
This query has no input parameters.
Infected Systems
This query has no input parameters.
Least Common Accessed Ports
This query has no input parameters.
Administrator's Guide
HPE Logger 6.2 Page 600 of 623
Least Common Events
This query has no input parameters.
Login Errors by User
This query has no input parameters.
Login Event Audit
This query has no input parameters.
Most Common Events
This query has no input parameters.
Most Common Events by Severity
This query has no input parameters.
Network-Device Critical Events
This query has no input parameters.
Network-Device Errors
This query has no input parameters.
Network-Device Events
This query has no input parameters.
Network-Device Interface Down Notifications
This query has no input parameters.
Network-Device Interface Status Messages
This query has no input parameters.
Network-Device SNMP Authentication Failures
This query has no input parameters.
Administrator's Guide
HPE Logger 6.2 Page 601 of 623
Network-Top Device System Authentication Events
This query has no input parameters.
Number of Failed Logins
This query has no input parameters.
Password Change
This query has no input parameters.
Password Changes
This query has no input parameters.
Probes on Blocked Ports by Source
This query has no input parameters.
Resource Access by Users - Failures
This query has no input parameters.
Resource Access by Users - Success-Attempt
This query has no input parameters.
Source Counts By Destination
This query has no input parameters.
Source Counts by Destination Port
This query has no input parameters.
Source Counts by Device
This query has no input parameters.
Source Counts by Device Severity
This query has no input parameters.
Administrator's Guide
HPE Logger 6.2 Page 602 of 623
Source Counts by Source Port
This query has no input parameters.
Source Port Counts
This query has no input parameters.
Successful Logins by Destination Address
This query has no input parameters.
Successful Logins by Source Address
This query has no input parameters.
Successful Logins by User
This query has no input parameters.
Target Attack Counts by Severity
This query has no input parameters.
Target Counts by Device Severity
This query has no input parameters.
Target Counts by Event Name
This query has no input parameters.
Target Counts by Source
This query has no input parameters.
Target Counts by Source Port
This query has no input parameters.
Target Counts by Target Port
This query has no input parameters.
Administrator's Guide
HPE Logger 6.2 Page 603 of 623
Target Port Counts
This query has no input parameters.
Top 10 Talkers
This query has no input parameters.
Top 10 Types of Traffic
This query has no input parameters.
Top Alerts
This query has no input parameters.
Top Attack Sources
This query has no input parameters.
Top Attacker Details
This query has no input parameters.
Top Attacker Ports
This query has no input parameters.
Top Attackers
This query has no input parameters.
Top Bandwidth Hosts
This query has no input parameters.
Top Bandwidth Usage by Destination
This query has no input parameters.
Top Bandwidth Usage by Destination Port
This query has no input parameters.
Administrator's Guide
HPE Logger 6.2 Page 604 of 623
Top Bandwidth Usage by Source
This query has no input parameters.
Top Destination IPs
This query has no input parameters.
Top Destination Ports
This query has no input parameters.
Top Destinations Across Firewalls
This query has no input parameters.
Top Destinations in IDS Events
This query has no input parameters.
Top Hosts by Number of Connections
This query has no input parameters.
Top IDS Attack Events
This query has no input parameters.
Top IDS Events
This query has no input parameters.
Top IDS and IPS Alerts
This query has no input parameters.
Top Machines Accessing the Web
This query has no input parameters.
Top Machines Traversing Firewall
This query has no input parameters.
Administrator's Guide
HPE Logger 6.2 Page 605 of 623
Top Sources Detected by Snort
This query has no input parameters.
Top Sources Traversing Firewalls
This query has no input parameters.
Top Target IPs
This query has no input parameters.
Top Targets
This query has no input parameters.
Top User Logins
This query has no input parameters.
Top Users with Failed Logins
This query has no input parameters.
Top VPN Accesses by User
This query has no input parameters.
Top VPN Event Destinations
This query has no input parameters.
Top VPN Event Sources
This query has no input parameters.
Top VPN Events
This query has no input parameters.
Top Web Traffic
This query has no input parameters.
Administrator's Guide
HPE Logger 6.2 Page 606 of 623
Update Summary
This query has no input parameters.
User Account Creations
This query has no input parameters.
User Account Deletions
This query has no input parameters.
User Account Modifications
This query has no input parameters.
User Activity
This query has no input parameters.
User Administration
This query has no input parameters.
User Password Changes
This query has no input parameters.
Users by Connection Count
This query has no input parameters.
VPN Connection Attempts
This query has no input parameters.
VPN Connection Failures
This query has no input parameters.
Virus Activity by Hour
This query has no input parameters.
Administrator's Guide
HPE Logger 6.2 Page 607 of 623
Vulnerability Scanner Logs
This query has no input parameters.
Vulnerability Scanner Logs by Host
This query has no input parameters.
Vulnerability Scanner Logs by Vulnerability
This query has no input parameters.
Windows Events
This query has no input parameters.
Worm Infected System
This query has no input parameters.
Worm Infected Systems
This query has no input parameters.
Administrator's Guide
HPE Logger 6.2 Page 608 of 623

Appendix H: Restoring Factory Settings
The following topics describe how to restore your appliance to its original factory settings by over-
writing the current files with an image of the original system.
Caution: Restoring an appliance to its original factory settings irrevocably deletes all event data
and some configuration settings.
• Before Restoring Your System 609
• Restoring Your System 609
Before Restoring Your System
Note the following cautions and guidelines before you restore to factory settings.
When restoring the configuration of the Logger from a backup, first ensure that the appliance is
restored, then complete the upgrade to the desired version.
After restoring, you can restore backups of your data and configuration settings.
Logger With Multipath SAN Enabled
If your Logger is running version 5.1 or later and multipath SAN is enabled, AND you encounter one of
these situations:
lYou have returned a system to HPEand received a new system that is either running Logger5.0
Patch 3 or earlier;
lYou restored the system to its factory default settings, which resets the Logger version to 5.0 Patch 3
or earlier
You must upgrade your system to Logger5.1 or later before attaching the LUN, in order to restore your
Logger to its last working state—running version 5.1 or later, with multipath enabled.
Restoring Your System
Instructions for performing a factory reset vary by the appliance model. Refer to the appropriate section
for your appliance.
Restoring LX500 and Later Appliance Models
You can restore LX500 or LX600 model appliances to their original factory settings by using the built-
in System Restore utility.
HPE Logger 6.2 Page 609 of 623
To restore an LX500 or LX600appliance:
1. Attach a keyboard, monitor, and mouse directly to the appliance or, if your appliance is configured
for remote access through iLO, you can use that functionality to access the appliance console. (For
information on how to set up the Logger Appliance for remote access, refer to the Logger
Installation Guide.) You will see something like the following image.
2. Log into the appliance with your username and password.
3. At the command prompt, type reboot, and then press Enter.
4. As the system reboots, messages scroll by. As soon as a message like the following appears on the
screen, press any key on your keyboard.
Press any key to enter the menu
Booting Red Hat Enterprise Linux <version> in N seconds...
This message is displayed for a very short time. Make sure you press a key on your keyboard
quickly; otherwise, the appliance will continue to boot normally. You need to press the key after the
BIOS is done booting but before the OS boots.
If the OS starts booting, you will see something like the screen capture below. You’ll need to try
again in that case.
5. The session viewer window opens.
Use the mouse or arrow keys to select System Restore L<XXXX>and press Enter.
6. System Restore automatically detects and displays the archive image. The image is named following
the pattern YYYY-MM-DD_LXX00_L<XXXX>.ari, where YYYY-MM-DD is the date, LXX00 is the
appliance version and L<XXXX> is the appliance build number.
Administrator's Guide
HPE Logger 6.2 Page 610 of 623
7. Press F1 (auto-select) to automatically map the Source Image, displayed in the top panel, to the
Target Disk, displayed in the bottom panel. The restore image name is displayed in the right-most
column.
8. Optionally, press F10 (VERIFY) to check the archive for damage before performing the restore.
Once the archive has been verified, press Enter to continue.
9. Press F2 (RESTORE) to begin the restore process. A dialog box asks whether you want to restore.
Press y to proceed with the restore or n to cancel.
10. Progress bars show the status of the restoration.
Caution: Do not interrupt or power-down the appliance during the restore process.
Interrupting the restore process may force the system into a state from which it cannot be
recovered.
11. When the restore process is complete, press F12 to reboot the appliance. A dialog box asks whether
you want to reboot. Press y to proceed with the reboot.
Restoring LX400 and Earlier Appliance Models
You can restore LX400 and earlier appliances to the original factory settings by using the built-in
Acronis True Image software.
To restore LX400 and earlier appliances:
1. Attach a keyboard, monitor, and mouse directly to the appliance or, if your appliance is configured
for remote access through iLO, you can use that functionality to access the appliance console. ( For
information on how to set up the Logger Appliance for remote access, refer to the Logger
Installation Guide.) You will see something like the following image.
2. Log into the appliance, type reboot at the command prompt, and then press Enter.
3. As the system reboots, messages scroll by. As soon as a message like the following appears on the
Administrator's Guide
HPE Logger 6.2 Page 611 of 623
screen, press any key on your keyboard.
Press any key to enter the menu
Booting Red Hat Enterprise Linux <version> in N seconds...
This message is displayed for a very short time. Make sure you press a key on your keyboard
quickly; otherwise, the appliance will continue to boot normally. You need to press the key after the
BIOS is done booting but before the OS boots.
If the OS boots, you will see something like the screen capture below. You’ll need to try again in
that case.
4. The session viewer opens.
Use the mouse or arrow keys to select System Restore and press Enter.
5. In the Acronis True Image Echo Server dialog box, select Recovery from the Pick a Task list and
then press Enter.
6. When the Restore Data Wizard starts, click Next to continue.
7. On the Welcome to the Restore Data Wizard page, click Next to continue.
8. On the Backup Archive Selection page, select Acronis Secure Zone and click Next. You will have
a chance to review the choices you make on this page and the wizard pages that follow before
initiating the restore process.
9. On the Restoration Type Selection page, select Restore disks or partitions and click Next. Only
choose other options if specifically directed to do so by customer support.
Administrator's Guide
HPE Logger 6.2 Page 612 of 623

10. On the Partition or Disk to Restore page, select the entire drive, labeled cciss/c0d0 or sda
(depending on the appliance model) and click Next.
11. On the NT Signature selection for image restoration page, select how you want the NT
signature for the restored disk to be processed and click Next.
12. On the Restored Hard disk Location page, select the drive to restore (cciss/c0d0 or sda) and
click Next.
13. On the Non-empty Destination Hard Disk Drive page, select Yes, I want to delete all
partitions on the destination hard disk drive before restoring and click Next.
14. On the Next Selection page, select No, I do not and click Next (there are no other partitions or
disks to restore).
15. On the Restoration Options page, select Validate backup archive for the data restoration
process if you want to validate the archive before resetting the appliance. Select Reboot the
computer automatically after the restoration is finished if you want to reboot the appliance
automatically. Click Next.
16. Review the checklist of operations to be performed and click Proceed to begin factory reset. Click
Back to revisit previous pages.
Caution: Do not interrupt or power-down the Logger Appliance during the restore process.
Interrupting the restore process may force the system into a state from which it cannot be
recovered.
Progress bars show the status of the current operation and the total progress.
17. When you see a message indicating that the data was restored successfully, click OK.
If you specified automatic reboot, the appliance reboots when the restore is complete. Otherwise,
reboot manually.
Restoring LX400 and Earlier Appliance Models
You can restore LX400 and earlier appliances to the original factory settings by using the built-in
Acronis True Image software.
To restore LX400 and earlier appliance models:
1. Attach a keyboard, monitor, and mouse directly to the appliance or, if your appliance is configured
for remote access through iLO, you can use that functionality to access the appliance console. ( For
information on how to set up the Logger Appliance for remote access, refer to the Logger
Installation Guide.) You will see something like the following image.
Administrator's Guide
HPE Logger 6.2 Page 613 of 623
2. Log into the appliance, type reboot at the command prompt, and then press Enter.
3. As the system reboots, messages scroll by. As soon as a message like the following appears on the
screen, press any key on your keyboard.
Press any key to enter the menu
Booting Red Hat Enterprise Linux <version> in N seconds...
This message is displayed for a very short time. Make sure you press a key on your keyboard
quickly; otherwise, the appliance will continue to boot normally. You need to press the key after the
BIOS is done booting but before the OS boots.
If the OS boots, you will see something like the screen capture below. You’ll need to try again in
that case.
4. The session viewer opens.
Administrator's Guide
HPE Logger 6.2 Page 614 of 623

Use the mouse or arrow keys to select System Restore and press Enter.
5. In the Acronis True Image Echo Server dialog box, select Recovery from the Pick a Task list and
then press Enter.
6. When the Restore Data Wizard starts, click Next to continue.
7. On the Welcome to the Restore Data Wizard page, click Next to continue.
8. On the Backup Archive Selection page, select Acronis Secure Zone and click Next. You will have
a chance to review the choices you make on this page and the wizard pages that follow before
initiating the restore process.
9. On the Restoration Type Selection page, select Restore disks or partitions and click Next. Only
choose other options if specifically directed to do so by customer support.
10. On the Partition or Disk to Restore page, select the entire drive, labeled cciss/c0d0 or sda
(depending on the appliance model) and click Next.
11. On the NT Signature selection for image restoration page, select how you want the NT
signature for the restored disk to be processed and click Next.
12. On the Restored Hard disk Location page, select the drive to restore (cciss/c0d0 or sda) and
click Next.
13. On the Non-empty Destination Hard Disk Drive page, select Yes, I want to delete all
partitions on the destination hard disk drive before restoring and click Next.
14. On the Next Selection page, select No, I do not and click Next (there are no other partitions or
disks to restore).
15. On the Restoration Options page, select Validate backup archive for the data restoration
process if you want to validate the archive before resetting the appliance. Select Reboot the
computer automatically after the restoration is finished if you want to reboot the appliance
automatically. Click Next.
16. Review the checklist of operations to be performed and click Proceed to begin factory reset. Click
Back to revisit previous pages.
Caution: Do not interrupt or power-down the Logger Appliance during the restore process.
Interrupting the restore process may force the system into a state from which it cannot be
recovered.
Progress bars show the status of the current operation and the total progress.
17. When you see a message indicating that the data was restored successfully, click OK.
If you specified automatic reboot, the appliance reboots when the restore is complete. Otherwise,
reboot manually.
Administrator's Guide
HPE Logger 6.2 Page 615 of 623

Appendix I: Logger Search From ArcSight ESM
If you have ArcSight Logger and ArcSight ESM deployed in your network infrastructure, you can
perform a Logger search operations from ArcSight Command Center or the ArcSight Console.
If you are running ESM 6.5c or later, you can use the search functionality provided by the ArcSight
Command Center. For information on this feature, refer to the ArcSight Command Center User’s Guide.
For ESM 6.0c and earlier versions, you can perform a Logger search from your ArcSight Console.
The following topics discuss how use the integrated search functionality from the ArcSight Console.
• Understanding the Integrated Search Functionality 616
• Setup and Configuration 617
• Supported Search Options 619
• Guidelines 619
• Searching on Logger From ArcSight Console 620
Understanding the Integrated Search Functionality
Tip:If you are using ESM 6.5c and above, you can search from ArcSight Command Center in
addition to the ArcSight Console described here. Refer to the ArcSight Command Center User's
Guide for details.
There are several ways to perform a search operation on Logger from an ArcSight Console:
lSearch: a regular search operation in which you can specify search options.
lQuick search: a search operation based on field and value you select in an ArcSight Console active
channel; you are not prompted for any search options.
To run a Logger search, right click on an event in an active channel of the ArcSight Console to display a
menu to select a search method—Logger Search or Logger Quick Search.
If you select Logger Search, you need to select search options such as Event Name, Destination, Source,
and so on, and the Logger Appliances on which the search should be run (if there are multiple Logger
Appliances). If you select Logger Quick Search, you are not prompted to specify any search options
because the search is run on the field you had clicked on.
The search results are displayed in the ArcSight Console, as shown in the following figure:
Note:This figure is from ESM 5.x. In ESM 6.x, the results are displayed in a separate browser
window.
HPE Logger 6.2 Page 616 of 623
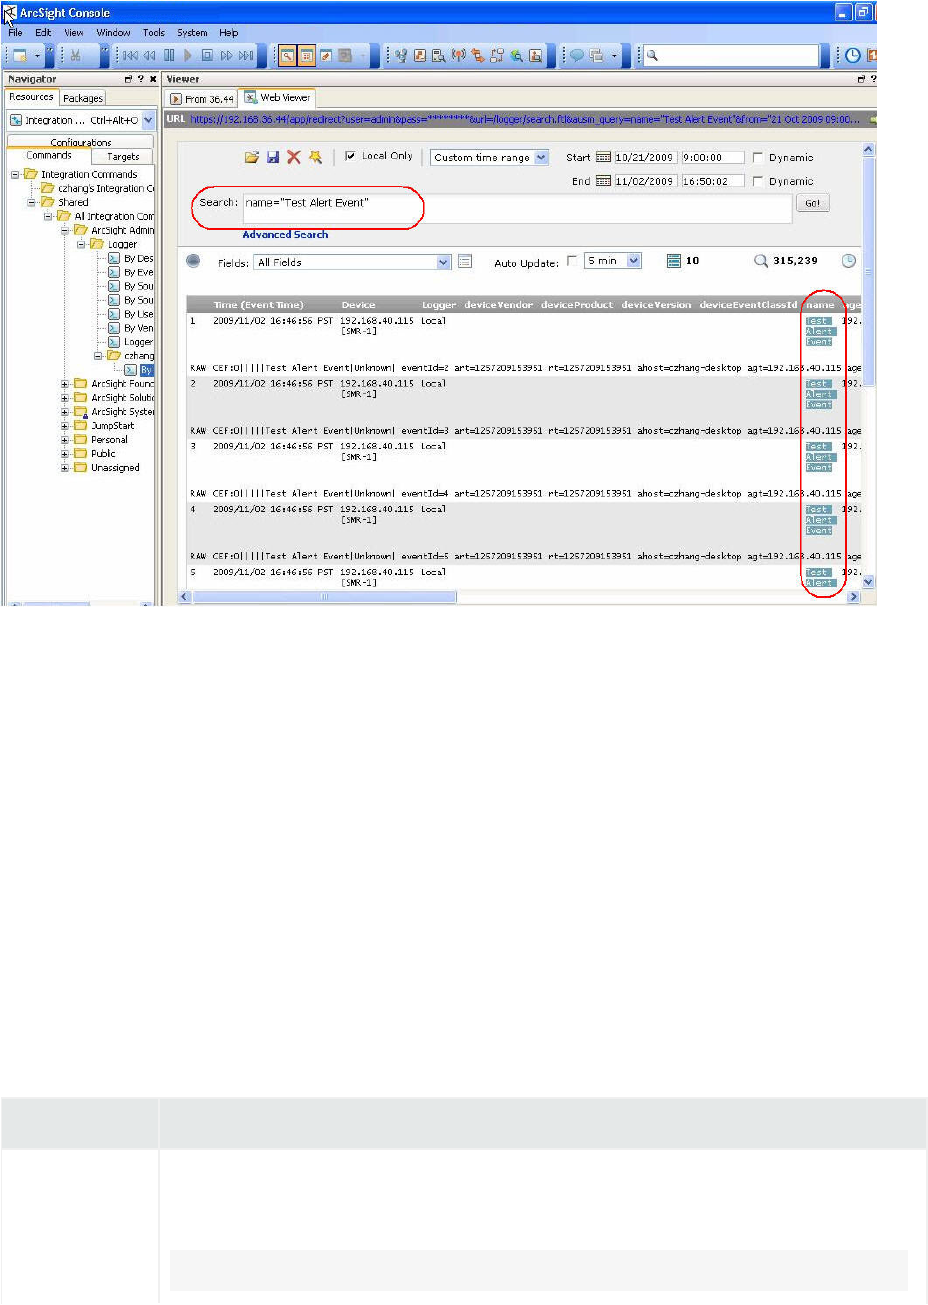
Before you can run a search operation on Logger from ArcSight Console, you need to set up
parameters in the ArcSight Console that are used to authenticate the user who performs the search.
Authentication can be done via Basic Authentication (user name and password) or a One Time
Password (OTP). This option makes the user authentication between Logger and ArcSight Console
highly secure. For OTP option to work, Logger must be running 5.1 or later, and the ArcSight Console
must be running ESM5.0 SP1 Patch 2 or later, as described in "Setup and Configuration" below.
By default, a Logger search from the ArcSight Console uses the OTP method to authenticate. However,
if Logger or ArcSight Console is not running a release that supports the OTP option, an error message
is displayed and basic authentication is used.
Setup and Configuration
The following table lists the minimum and recommended versions that Logger and ArcSight Console
must be running.
Option Requirement
Recommended
Logger 6.2
ESM 6.8
Tip: To verify the latest supported ESM release, refer to ArcSight Product
Administrator's Guide
HPE Logger 6.2 Page 617 of 623
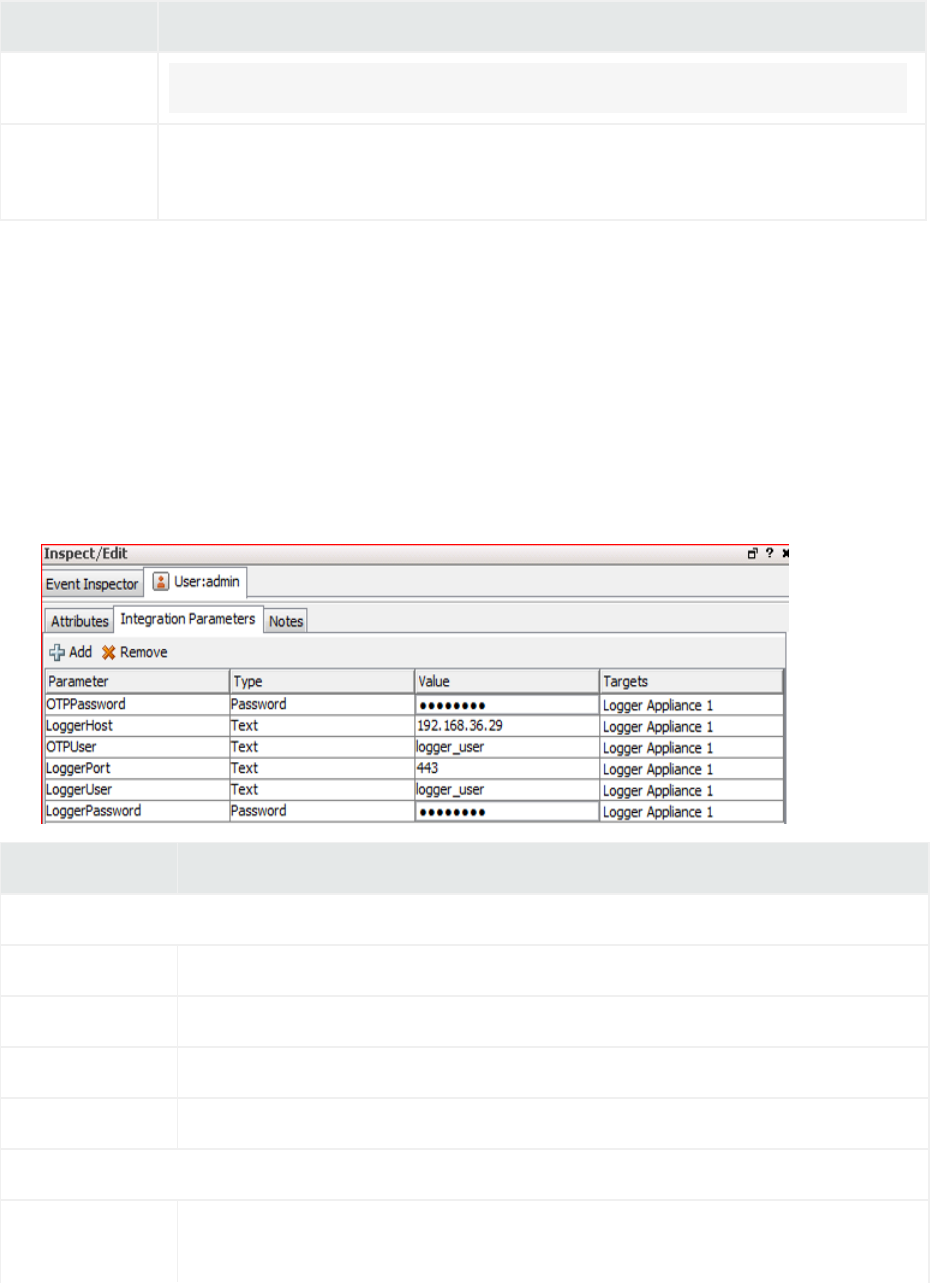
Option Requirement
Documentation on HPE ArcSight Protect 724.
Minimum Logger5.1
ESM5.0 SP1 Patch 2
On ESM
Follow these instructions to set up and configure ArcSight Manager to run integrated search
operations:
1. Ensure that the ArcSight Manager is running one of the recommended versions.
2. Follow instructions in the ArcSight ESM User’s Guide to set up ArcSight Console for integrated
searches on Logger. When setting up a user for Logger access (as described in the “Set Up Users
for Logger Access” section of the User’s Guide), specify the following integration parameters.
Parameter Description
For a Logger Appliance Target
LoggerUser The user account for a Logger Appliance target.
LoggerPassword The password for LoggerUser.
LoggerHost The IP address of the Logger host.
LoggerPort 443
For a Software Logger Target
OTPUser The user account for one-time password (OTP) authentication. This account
must exist on the Logger.
Administrator's Guide
HPE Logger 6.2 Page 618 of 623

Parameter Description
OTPPassword The password for OTPUser.
LoggerHost The IP address of the Logger host.
LoggerPort The Logger port number you assigned it during installation.
The ArcSight ESM User’s Guide is available from the ArcSight Product Documentation Community on
Protect 724.
On Logger
Make sure:
1. Your Logger is one of the recommended versions.
2. The Logger user name is the one you specified while creating an integration parameter (in) on the
ArcSight Console.
Supported Search Options
You can select from the following search options when running a Logger search (not Quick Search)
from the ArcSight Console:
lBy Destination
lBy Event Name
lBy Source
lBy Source and Destination
lBy User
lBy Vendor and Product
Additionally, if multiple Loggers are configured on your ArcSight Console, you can select the one on
which the integrated search should be run.
Guidelines
Make sure you are aware of the following guidelines about Logger Search when it is run from ArcSight
Console:
lA field-based search query is used to perform search on the Logger.
lOnly searches from an active channel of an ArcSight Console is supported; searches from other ESM
resources are not supported.
Administrator's Guide
HPE Logger 6.2 Page 619 of 623
lOnly one search option per search operation is supported. That is, you cannot select by both Event
Name and By Destination for one search operation. For multiple search options, see "Supported
Search Options" on the previous page.
lYou can run the search operation on only one Logger at a time. That is, you cannot select multiple
Loggers from the menu list on ArcSight Console.
Additionally, even if a Logger peers with other Loggers, integrated search runs only on the local
Logger that you select from the menu list on ArcSight Console.
lThe one-time password (OTP) authentication is available for use only when Logger is running 5.1 or
later and ArcSight Console is running 5.0 SP1 Patch 2 or later.
If OTP cannot be used, the searches run from the ArcSight Console display a message that a single-
use session token could not be negotiated, thus regular authentication will be used. Click OK.
LoggerUser and LoggerPassword is then used to authenticate.
Searching on Logger From ArcSight Console
You can perform two types of searches on Logger from ArcSight Console—Quick search, and regular
search. Follow the steps for the type of search you want to run.
Running a Quick Search:
To run a Quick Search on Logger (as described in "Understanding the Integrated Search Functionality"
on page616:
1. Right click on the event field in an active channel of the ArcSight Console.
2. From the menu list, select Integration Commands>Logger Quick Search, as shown in the
Administrator's Guide
HPE Logger 6.2 Page 620 of 623
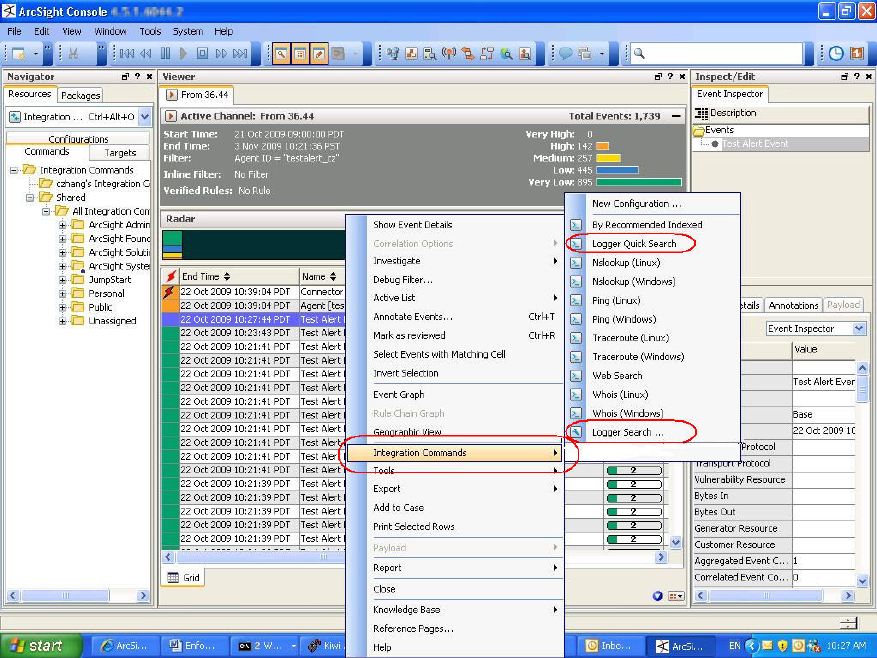
following figure.
Running a Regular Search:
To run a regular Search (in which you specify search options):
1. Right click on any field of an event in an active channel of the ArcSight Console.
2. From the menu list, select Integration Commands > Logger Search > Select Search Options, as
shown in the following figure.
Administrator's Guide
HPE Logger 6.2 Page 621 of 623
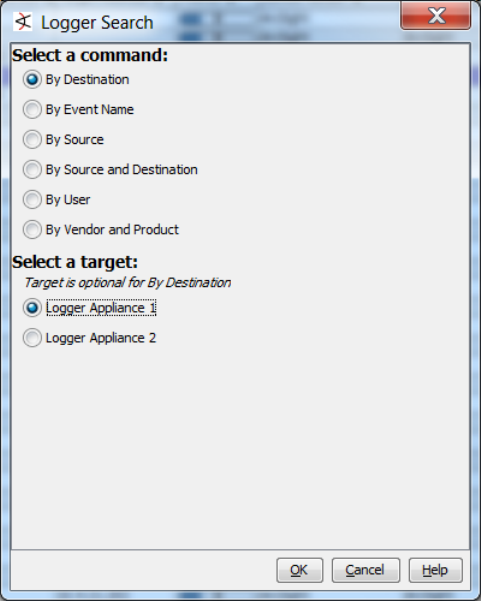
3. Click OK to run the search or Cancel to quit.
a. If Logger or ArcSight Console is not running a release that supports the OTP option, an error
message is displayed indicating that a single-use session token was not negotiated and basic
authentication will be used instead.
b. If that option is acceptable, click OK to proceed.
The search results are displayed in the ArcSight Console Web Viewer.
Administrator's Guide
HPE Logger 6.2 Page 622 of 623
Send Documentation Feedback
If you have comments about this document, you can contact the documentation team by email. If an
email client is configured on this system, click the link above and an email window opens with the
following information in the subject line:
Feedback on Administrator's Guide (Logger 6.2)
Just add your feedback to the email and click send.
If no email client is available, copy the information above to a new message in a web mail client, and send
your feedback to arc-doc@hpe.com.
We appreciate your feedback!
HPE Logger 6.2 Page 623 of 623
